Reagan, M.K., Pearce, J.A., Petronotis, K., and the Expedition 352 Scientists, 2015
Proceedings of the International Ocean Discovery Program Volume 352
publications.iodp.org

doi:10.14379/iodp.proc.352.103.2015
Site U1439 1
M.K. Reagan, J.A. Pearce, K. Petronotis, R. Almeev, A.A. Avery, C. Carvallo, T. Chapman, G.L. Christeson, E.C. Ferré, M. Godard, D.E. Heaton, M. Kirchenbaur, W. Kurz, S. Kutterolf, H.Y. Li, Y. Li, K. Michibayashi, S. Morgan, W.R. Nelson, J. Prytulak, M. Python, A.H.F. Robertson, J.G. Ryan, W.W. Sager, T. Sakuyama, J.W. Shervais, K. Shimizu, and S.A. Whattam 2
Keywords: International Ocean Discovery Program, IODP, JOIDES Resolution, Expedition 352, Site U1439, Izu-Bonin-Mariana fore arc, subduction initiation, mantle melting, ophiolites, boninite, high-magnesium andesite, volcanic rocks, dikes, drill core
MS 352-103: Published 29 September 2015
Background and objectives
The Izu-Bonin-Mariana (IBM) fore arc is believed to carry one of the best records worldwide of processes associated with the initiation of subduction. If current models are correct, subduction began with a period of rapid rollback and sinking of a newly subducting Pacific plate, continued through a transitional period of reorganization, and ended with the stable trench-parallel subduction that we see today. In geological terms, it evolved from seafloor spreading through proto-arc volcanism to normal arc volcanism. Reconstruction of the IBM volcanic stratigraphy is key to understanding and dating this evolutionary sequence. At the base of the volcanic section is a distinctive magma type known as fore-arc basalt (FAB). This FAB is overlain by lavas with compositions that are transitional between FAB and boninite, then by boninite lavas themselves, and finally by members of the tholeiitic and calc-alkaline series typical of normal island arcs (Reagan et al., 2010). This stratigraphy is speculative, however, having been pieced together from a series of partial sections that are typically a considerable distance apart. Site U1439 provides an important test of the stratigraphy of the middle part of this sequence, namely the period that records the transition from spreading to arc volcanism. It thus records the birth of an island arc.
Information on this part of the volcanic stratigraphy is currently limited and dispersed. Whereas FAB from both the Izu-Bonin and Mariana fore arcs typically is dated between 52 and 51 Ma (Ishizuka et al., 2011; Reagan et al., 2013), compositions that are transitional between FAB and boninite have only been dated (~49 Ma) at Deep Sea Drilling Project (DSDP) Site 458 in the Mariana fore arc (Cosca et al., 1998). Boninite series lavas erupted either above these transitional lavas and/or farther to the west, both on the Bonin Islands and offshore Guam, give ages between ~48 and 43 Ma (Ishizuka et al., 2006). These lavas vary from low-calcium to high-calcium boninites, the former being particularly distinct in their high MgO and high (andesitic) SiO2 concentrations, low high-field-strength element concentrations (e.g., TiO2 < 0.2), low Sm/Zr, low rare earth element (REE) contents, and U-shaped REE patterns. The basal lavas from the type locality of Chichijima (Bonin Island) have these characteristics, as do some samples from dive sites near Site U1439. The basal lavas are considered to be low-pressure remelts of depleted mantle (harzburgite) in response to a slab flux comprising fluids and/or melts from subducted pelagic sediment and oceanic crust (e.g., Meijer, 1980; Pearce et al., 1992). The low-calcium boninites are distinct from most reported high-magnesium andesites (HMA) and “boninite-series” lavas, many of which have chemical compositions that are transitional between boninite and arc basalts. The oldest lavas of this type are ~46 Ma, slightly younger than the oldest low-calcium boninites (Ishizuka et al., 2006).
The start of normal arc volcanism may not be the same in every location. The oldest samples recovered to date are the ~44 Ma lavas exposed on and around Hahajima Island (Ishizuka et al., 2006) and the ~45 Ma rhyolites from Saipan (Reagan et al., 2008). They have the characteristic negative Nb anomalies of island arc lavas and are enriched in fluid-mobile elements such as Sr, Ba, U, and Pb while lacking the distinctive major and trace element characteristics of the boninites. Thus, we believe that by about 45–44 Ma (some 7–8 Ma after subduction initiation), near-normal subduction-related configurations of mantle flow and melting conditions were established along the IBM arc.
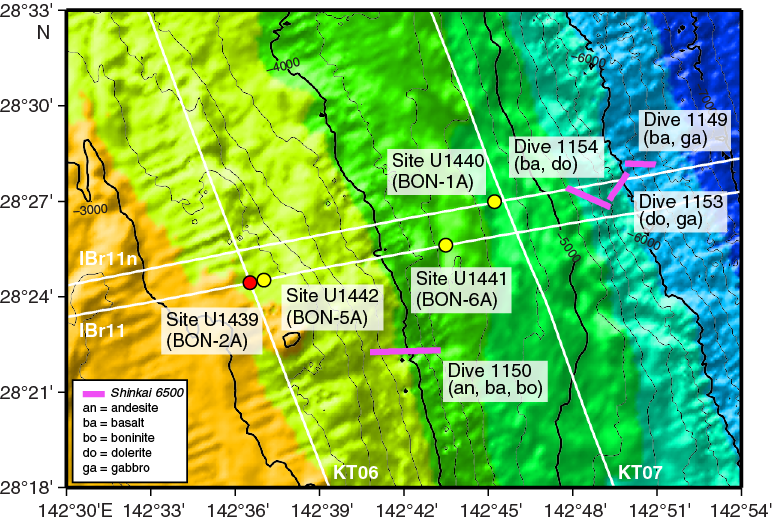
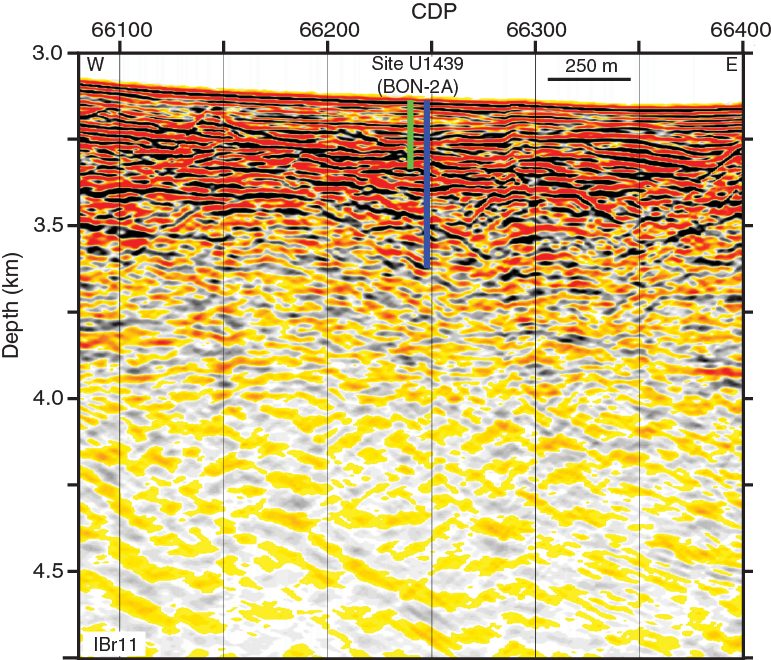
In order to maximize the likelihood that coring at this site would record the upper part of the volcanic sequence (i.e., the transition from proto-arc to underlying fore-arc oceanic crust), its location was targeted bathymetrically shallower (~3200 m water depth) than Site U1440 on the basis of observations from nearby Shinkai 6500 dives (Figure F1). Dive 1150 found outcrops of basalt, andesite, and boninite between ~3600 and 4400 m water depth (Ishizuka et al., 2011). Site U1439 was located some 400 m shallower than the minimum depth of this dive in order to drill through the full proto-arc sequence and, eventually, the contact with transitional lavas and fore-arc basalts. The precise site was chosen to lie on seismic Line IBr11 (S. Kodaira, pers. comm., 2013) and in a sediment pond with sufficient sediment thickness for coring operations (Figures F1, F2).
The specific objectives for Site U1439 fit into the four overall expedition objectives as follows.
- Obtain a high-fidelity record of magmatic evolution during subduction initiation by coring volcanic rocks down to underlying intrusive rocks, including radiometric and biostratigraphic ages.
Coring the volcanic succession at Site U1439 sampled a potentially continuous section through the proto-arc into underlying oceanic crust, thus providing the opportunity to understand the age and petrogenetic progression from spreading to nascent arc volcanism.
- Use the results of Objective 1 to test the hypothesis that fore-arc basalt lies beneath boninites and to understand chemical gradients within these units and across their transitions.
The drilling results address whether the transition from spreading to arc volcanism following subduction initiation is progressive or whether it is accomplished by alternations of one magma type with another. A key question is whether the boninites vary systematically uphole, for example from high-calcium boninite at the base to low-calcium boninite near the top or vice versa. The drilling results also address whether the sequence from FAB to boninite forms a vertically stacked stratigraphy or whether these lavas erupted at different distances from the trench. The nature of these transitions in magma composition provide important constraints on how mantle, subducted materials, and petrogenetic processes change with time as subduction initiation progresses.
- Use drilling results to understand how mantle melting processes evolve during and after subduction initiation.
Our accomplishments toward Objectives 1 and 2 further address how the mantle responds to subduction initiation. For example, existing data indicate that initiation of the arc is marked by influx of more depleted mantle or by remelting of mantle already depleted beneath the oceanic ridge that produced the FAB. Lava compositions allow us to monitor the changes in mantle depletion and degree of melting with time and so construct more realistic geodynamic and petrologic models.
- Test the hypothesis that the forearc lithosphere created during subduction initiation is the birthplace of suprasubduction zone ophiolites.
Results from drilling at Site U1439 allow us to illustrate a detailed volcanic chemostratigraphy expected for subduction initiation, especially in the part of the sequence formed by the transition from spreading to arc volcanism. This, in turn, allows more detailed comparisons with ophiolites where boninite overlies basalt, such as Pindos in Greece, Mirdita in Albania, Semail in Oman, and Troodos in Cyprus, as well as ophiolites overlain by, or associated with, more complex arc-like sequences such as the Coast Range ophiolite in California or Baie Verte in Newfoundland.
Operations
Transit to Site U1439
The R/V JOIDES Resolution left Yokohama, Japan, at 1100 h (all times are ship local time, which is UTC + 9 h) on the morning of 4 August 2014 and, after a 457 nmi transit, the vessel stabilized at Site U1439 (proposed Site BON-2A) at 0324 h on 6 August.
Hole U1439A
GPS was used to position the ship. A seafloor positioning beacon was not deployed because of the short initial period planned at this site. The advanced piston corer/extended core barrel (APC/XCB) bottom-hole assembly (BHA; see Introduction in the Expedition 352 methods chapter [Reagan et al., 2015a]) was assembled and lowered to 3134 m below rig floor before shooting the first core. When we were ready to spud Hole U1439A, the sinker bars became stuck, and core line spooled off the drum, requiring 2 h to repair. After an initial unsuccessful attempt to obtain a mudline core, Hole U1439A was spudded at 2340 h on 6 August 2014 (28°24.4487′N, 142°36.5120′E; 3128 m water depth). The mudline core recovered 6.8 m of sediment, and the seafloor was calculated to be at 3128 m below sea level. Nonmagnetic core barrels were used for Cores 352-U1439A-1H through 10H. Core orientation was performed using the FlexIT tool on Cores 1H through 10H. Temperature measurements were taken with the advanced piston corer temperature tool (APCT-3) on Cores 4H, 6H, 8H, and 10H. After switching to the XCB coring system, coring continued through Core 23X to 199.4 m below seafloor (mbsf). At the conclusion of coring the drill string was pulled out of the hole, clearing the seafloor and ending Hole U1439A at 1520 h on 8 August. Ten APC cores were taken over a 92.3 m interval and recovered 84.3 m (91%) (Table T1). Thirteen XCB cores were taken over a 107.1 m interval and recovered 86.4 m (81%). Overall core recovery for Hole U1439A was 86%. The total time spent on Hole U1439A was 60 h.
Table T1. Coring summary, Site U1439. Download table in .csv format. View PDF table.
Hole U1439B
The vessel was offset 20 m to the east of Hole U1439A, and a jet-in test was conducted in Hole U1439B for casing operations. Hole U1439B was spudded at 1545 h on 8 August 2014, and the jet-in test reached 42.2 mbsf. The drill string was raised to ~100 m above the seafloor, and at 2030 h the ship started the 8.2 nmi transit to Site U1440 in dynamic positioning mode.
Hole U1439C
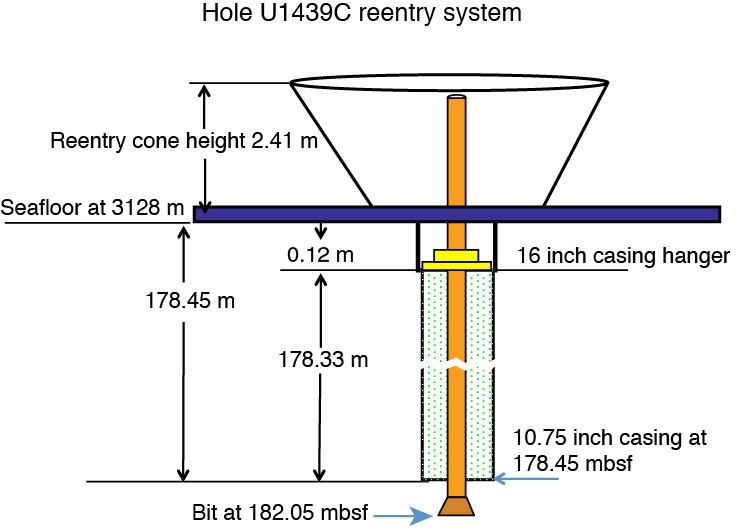
After completion of operations at Site U1440, the vessel returned to Site U1439 at 1430 h on 26 August 2014 and a seafloor positioning beacon was deployed. Preparations began for installing the reentry system in Hole U1439C. The original plan included the installation of two casing strings, with 6.4 days allocated for this operation. Given how well the casing installation went at Site U1440 (see Operations in the Site U1440 chapter [Reagan et al., 2015b]), we decided again to drill in a single casing string and reentry cone in one step. First, the previously assembled reentry cone was moved to the moonpool doors at 1400 h, and a 16 inch casing hanger was latched in it. Second, a 178.45 m long casing string was assembled, comprising a 10.75 inch casing hanger and 13 joints of 10.75 inch casing welded together to reinforce the connections (Figure F3). A casing running tool was used to latch the casing string into the reentry cone at 2000 h. Third, a drilling BHA was made up that comprised a bit, an underreamer, and a mud motor (see REENTRY in Supplementary material). The mud motor enables the underreamer and bit to rotate during drilling while keeping the casing stationary. The underreamer and mud motor were tested, and a running tool was used to latch the BHA into the reentry cone. The reentry system was lowered to the seafloor, and the underwater camera was deployed to monitor the reentry cone while drilling the system into the seafloor. Hole U1439C was spudded at 0745 h on 27 August (28°24.4491′N, 142°36.5368′E; 3129 m water depth). Drilling continued for 10.75 h until the reentry cone landed on the seafloor and the casing shoe was at 178 mbsf. The running tool was unlatched from the reentry cone at 1830 h, and the drill string was back on the surface by 0415 h on 28 August. The reentry system took 40 h to make up and install, saving 4.7 days of operation time from the original plan.
A rotary core barrel (RCB) BHA was assembled with a new C-4 bit, and the drill string was lowered to the seafloor. The subsea camera was sent to the seafloor at 1245 h, and Hole U1439C was reentered at 1415 h. RCB coring with nonmagnetic core barrels began at 1700 h on 28 August. As we pulled out of the hole on 8 September to make the third RCB bit change, we encountered high torque, loss of rotation, and loss of circulation for several hours. The drill string was eventually freed by using 190,000 lb of overpull, and the decision was made to stop coring at 544.3 mbsf. A total of 45 rotary cores were taken over a 362.3 m interval and recovered 107.8 m (30%). An additional 1.5 m of material was recovered during hole-cleaning operations. The hole was logged to ~400 mbsf with the triple combo–Magnetic Susceptibility Sonde (triple combo-MSS) and Formation MicroScanner (FMS)-sonic tool strings. Hole U1439C was reentered 4 times. The total time spent in Hole U1439C was 382.75 h. The total time spent at Site U1439 was 447.75 h, or 18.7 days. The acoustic beacon was recovered at 0727 h on 11 September, and the vessel started the slow transit to Site U1441 in dynamic positioning mode while continuing to pull the drill string to the surface.
Sedimentology
Sediment and sedimentary rock were recovered from the seafloor to 176.47 mbsf in Hole U1439A, beneath which a thin interval of basic volcanic and volcaniclastic rock was recovered from the igneous basement. The sediment represents the late Eocene to recent deep-sea sedimentary cover of the Izu-Bonin fore-arc basement (see Biostratigraphy). The underlying volcanogenic rock is interpreted as the highest levels of the fore-arc basement (see Petrology).
The core recovery overall was 86%, including the basement, and 89% for the sediment alone, distributed as 91% for APC coring and 79% for XCB coring. Igneous basement recovery with the XCB was 20%.
The sedimentary succession (Figure F4) is divided into five lithologically distinct units, the upper two units of which are further divided into two subunits (Table T2). The volcanogenic basement is classified as igneous Unit 1 (see Petrology). The main criteria for recognition of the lithologic units and subunits are a combination of primary lithology, grain size, color, and diagenesis.
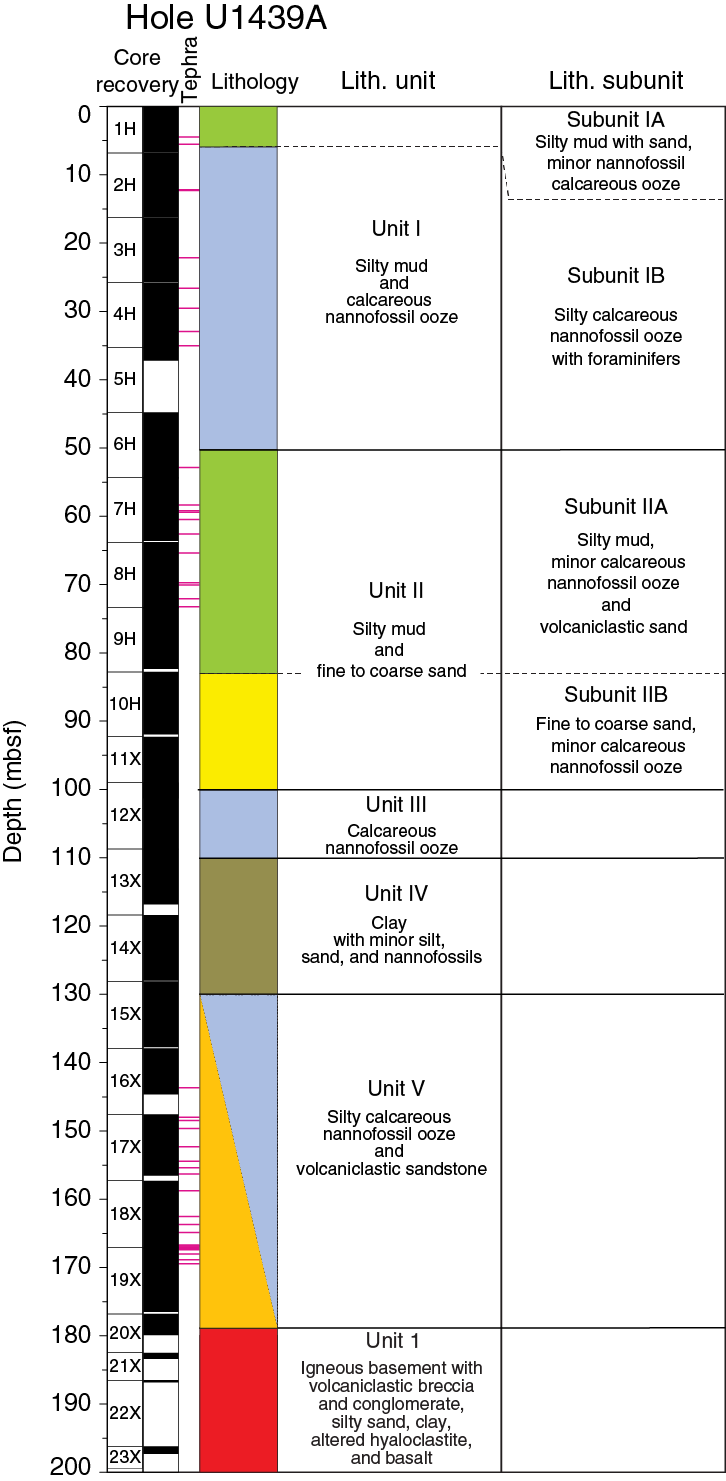
Table T2. Lithologic unit and subunit summary, Hole U1439A. Download table in .csv format.
Within the overall succession, 44 ash or tuff layers were observed, although because of limited recovery the original number must be considerably higher.
Unit I (0–50.43 mbsf) is recognized mainly on the basis of a relatively high abundance of calcareous nannofossils compared to the sediment beneath. Unit l is divided into an upper, relatively nannofossil-poor subunit (0–5.54 mbsf) and a lower, relatively nannofossil-rich subunit (5.54–50.43 mbsf).
Unit ll (50.43–100.50 mbsf) is recognized on the basis of a downhole change to more clastic rich sediment, in which the upper subunit (50.43–82.80 mbsf) is relatively fine grained and the lower subunit (82.80–100.50 mbsf) is relatively coarse grained.
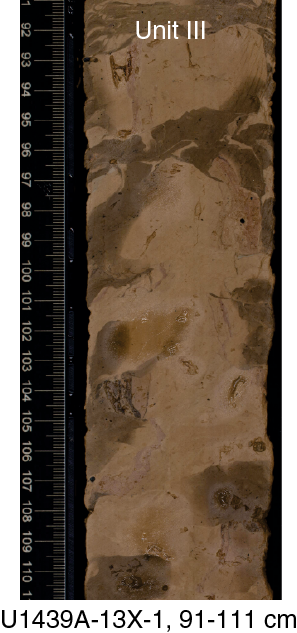
Unit III (100.50–110.93 mbsf) is easily recognizable because of a predominance of pale-colored nannofossil ooze.
Unit IV (110.93–129.76 mbsf) is marked by a distinct downhole change to more clastic sediment dominated by clay with minor silt and sand, together with nannofossil-bearing sediment.
Unit V (129.76–178.50 mbsf) is characterized by a diverse mixture of fine- to coarse-grained clastic sediment interbedded with fine-grained, nannofossil-rich sediment and sedimentary rock. The base of Unit V is defined as a thin (<3 cm) layer of dark gray to black weakly consolidated manganese oxide–rich sediment.
Unit descriptions
The cores recovered from Hole U1439A are divided into the five units summarized above comprising variably consolidated or lithified sediments (Figure F4). Overall, the sedimentary succession is 178.50 m thick, whereas only 0.97 m of the volcanogenic basement was recovered (see Petrology).
The succession includes 44 discrete layers of volcanic ash, mainly derived by fall-out, gravity flow, and/or bottom-reworking processes. Textures and vesicles of the pyroclasts vary between the ash layers (Figure F5).

Unit I
- Interval: 352-U1439A-1H-1, 0 cm, through 6H-4, 113 cm
- Thickness: 50.43 m
- Depth: 0–50.43 mbsf
- Age: early Pliocene to recent
- Lithology: silty mud with sand and silty calcareous nannofossil ooze with foraminifers
Unit l begins with alternations of brownish to beige muddy, sandy, and clayey nannofossil ooze with calcareous mudstones with or without foraminifers (Figure F6). Eleven generally grayish to whitish brown felsic ash layers are as thick as 10 cm. At ~5.15 mbsf, the sediment becomes paler and more calcareous, with a predominance of silty nannofossil ooze.
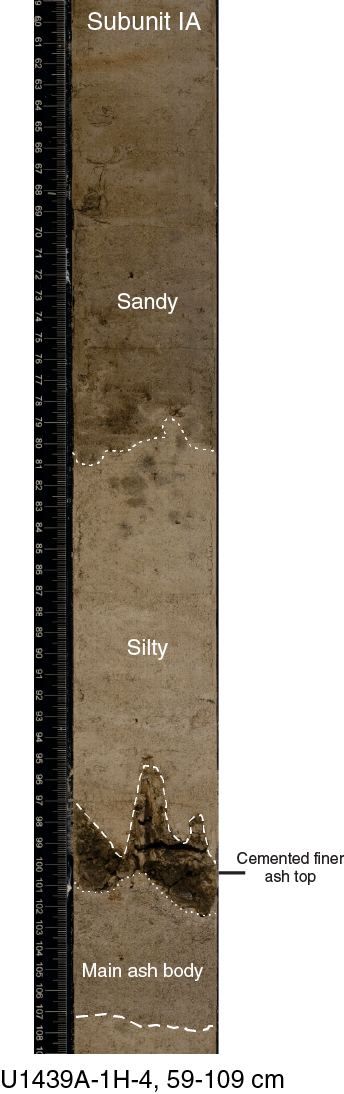
Subunit IA: Holocene (0–5.54 mbsf)
The uppermost levels of Subunit IA are characterized by silty mud with subordinate alternations of pale silty nannofossil ooze (Figure F7). Three discrete ash layers were recorded, one of which is partly cemented.
Smear slide analysis shows that the predominant mud is composed of a mixture of clay and silt that cannot be distinguished by simple inspection of the cores. The typical silty clay and clayey silt facies are dominated by calcareous nannofossils with rare (1%–5%) but persistent admixtures of quartz and plagioclase. Trace amounts of biotite, clinopyroxene, orthopyroxene, pale (felsic) volcanic glass, and, very rarely, volcanogenic apatite and palagonite are present. Rare lithic volcanic clasts include plagioclase and ferromagnesian minerals. There are also rare sedimentary lithic clasts and small granules of opaque iron oxide.
The fine-grained sediment commonly contains significant amounts of well-preserved siliceous microfossils in the form of radiolarians and sponge spicules, plus spasmodic occurrences of diatoms. Several samples also contain traces of apatite of biogenic origin (e.g., fish debris) and fine-grained organic matter.
Inductively coupled plasma–atomic emission spectroscopy (ICP-AES) analyses indicate compositions within the range of typical mixed calcareous-siliciclastic sediment: calcium carbonate is ~46 wt%. Relatively high Sr (991 ppm) and Ba (719 ppm) contents probably also reflect the relatively high carbonate content of this sediment (see Sediment and rock geochemistry).
The ash layers in Subunit IA are dominated by colorless volcanic glass with rare but persistent occurrences of plagioclase plus traces of quartz, clinopyroxene, orthopyroxene, and brown mafic glass shards. Pyroclasts in two ash layers (Samples 352-U1439A-1H-3A, 98–99 cm; and 1H-3A, 144–145 cm) exhibit predominantly pumiceous and blocky shapes, whereas the lowermost ash layer in Subunit IA contains mostly cuspate glass shards. Vesicularity is highly variable, ranging from absent to abundant, and is characterized by predominantly elliptical or rounded vesicles, as seen in the first ash layer (Sample 1H-3A, 98–99 cm) and, beneath this, within predominantly dense glass shards (Samples 1H-3A, 144–145 cm; and 1H-4A, 101–102 cm).
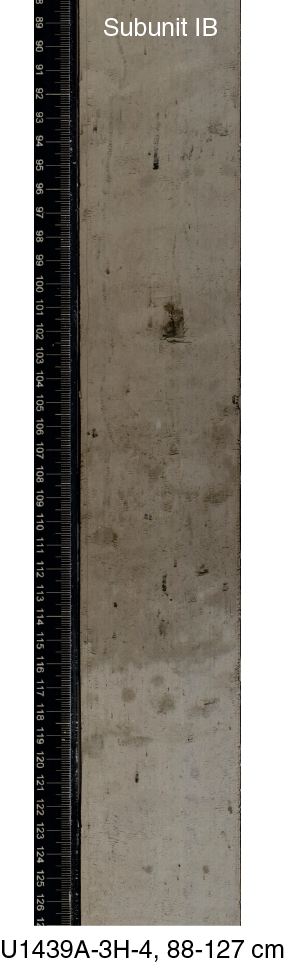
Subunit IB: early Pliocene to Pleistocene (5.54–50.43 mbsf)
The top of Subunit IB is characterized by centimeter- to decimeter-thick alternations of muddy, sandy, and clayey nannofossil ooze. A color change from beige to grayish starts at ~13.30 mbsf. Muddy layers are darker and more greenish, whereas nannofossil layers are off-white and ash layers are pale grayish. Alternations of silty nannofossil ooze and calcareous mudstone occur beneath these layers. Changes between lithologies are gradational, and the sediment is burrow-mottled throughout. A marked gradational downhole change is observed at ~50.30 mbsf, from grayish silty nannofossil ooze to pale pink, less silty nannofossil ooze and then to brownish, more silty calcareous mud.
A single tephra layer (10 cm thick) was noted at 12.30 mbsf. Additionally, seven graded ash layers, each several centimeters thick, are present from 26.40 to 35.10 mbsf (Figure F8). The ash layers are generally nonbioturbated or weakly bioturbated, in contrast to the interbedded sediment; however, a few ash layers are more strongly bioturbated (e.g., intervals 352-U1439A-3H-1, 0–7 cm; and 6H-4, 70–74 cm).
Smear slide analysis indicates that the observed change to paler colors corresponds to an increase in the relative abundance of nannofossils. The nannofossil ooze samples are mostly silty with persistently occurring quartz and plagioclase plus rare spasmodic planktonic foraminifers, radiolarians, diatoms, sponge spicules, and rare silicoflagellates. In addition, there are trace amounts of felsic glass, volcanic and sedimentary rock fragments, and mineral grains (e.g., clinopyroxene) in a few samples. Trace amounts of subhedral calcite may be either authigenic carbonate or, more probably, fragments of foraminifers.
The ICP-AES analyses are as expected for mixed calcareous-siliciclastic sediment in which calcium carbonate ranges from ~53 to 60 wt%. Relatively high Sr and Ba values reflect the high carbonate content. One sample of silty calcareous nannofossil ooze with foraminifers exhibits unusually high values of Zn (298 ppm), which may correspond to a layer rich in volcanogenic ferromagnesian grains (see Sediment and rock geochemistry).
The ash layers in Subunit IB were extensively sampled for smear slide analyses. The thicker, coarser ash layers are dominated by colorless glass with rare but persistent occurrences of plagioclase and variable occurrences of quartz, hornblende, clinopyroxene, orthopyroxene, and traces of biotite. One exception is a strongly bioturbated (and therefore disseminated) mafic ash layer in interval 4H-7, 4–11 cm, which is characterized by a mixture of brownish and transparent glass shards plus common feldspar crystals. Rare to trace amounts of calcareous and planktonic foraminifers are also present. A few grains of relatively mafic green glass are present in several other samples.
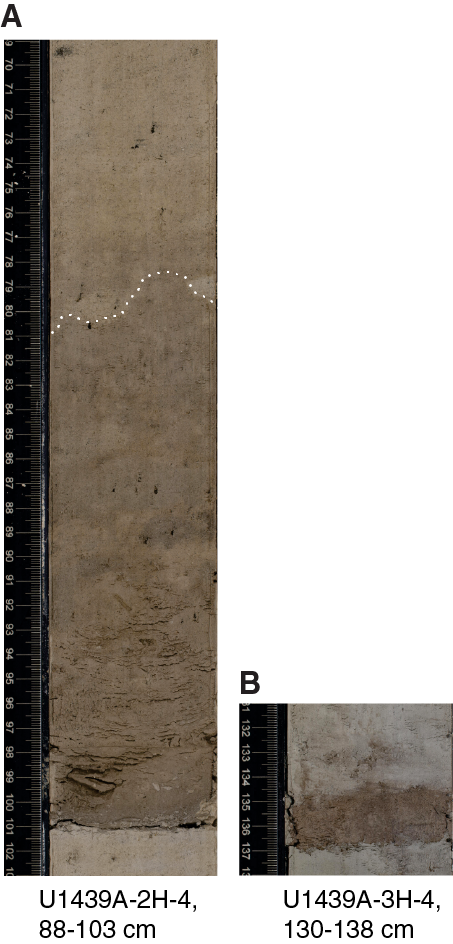
Overall, three groups of tephra are recognized at different stratigraphic levels based on the relative abundance of textures and vesicles:
- An upper group characterized by predominant dense, blocky, and commonly cuspate shards together with common tubular vesicular pumiceous clasts (Samples 2H-4A, 100–101 cm; 3H-4A, 136–137 cm; and 4H-3A, 66–67 cm);
- A transitional group with an abundance of tubular and elongate vesicle-rich pumiceous clasts together with less abundant cuspate and blocky-shaped, predominantly dense glass shards (Samples 3H-1A, 7–8 cm; and 4H-6A, 6–7 cm); and
- A lower group made up of a mixture of abundant cuspate and blocky-shaped, predominantly dense glass shards along with less abundant highly vesicular, tubular pumiceous grains (Samples 6H-4A, 40–41 cm; and 6H-4A, 73–74 cm).
As an exception to the above grouping, one mixed mafic and felsic ash layer (interval 4H-7, 4–11 cm) has a nearly equal mixture of pumiceous, blocky, and cuspate pyroclasts. This sample has a bimodal distribution of the predominant vesicle types with large amounts of rounded and elliptical forms together with abundant tubular vesicles.
Unit II
- Interval: 352-U1439A-6H-4, 113 cm, through 12X-1, 150 cm
- Thickness: 50.07 m
- Depth: 50.43–100.50 mbsf
- Age: early Miocene to early Pliocene
- Lithology: silty mud and fine to coarse sand
Unit II is characterized by alternations of silty mud, minor calcareous nannofossil ooze, and volcaniclastic sand. The unit is on average coarser grained than Unit I. The grain size and relative abundance of clastic sediment increase deeper than 50.43 mbsf, with a predominance of fine- to coarse-grained sand together with subordinate calcareous nannofossil ooze.
Thirteen intercalated felsic ash and tuff layers, each up to 5 cm thick, were recorded within Unit II.
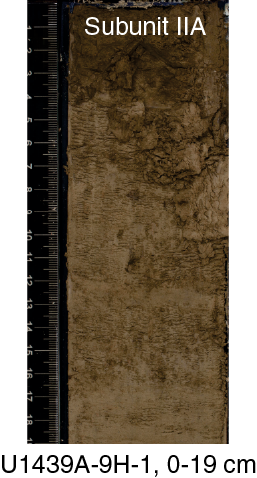
Subunit IIA: late Miocene to early Pliocene (50.43–82.80 mbsf)
Subunit IIA is characterized by regular alternations of beige nannofossil ooze and brownish silty/sandy calcareous mud (Figure F9). Eleven felsic ash layers, each several centimeters thick, are present from 52.84 to 73.30 mbsf. In addition, a mafic ash layer was recorded in interval 7H-4, 35–38 cm. Downhole in the succession, the average grain size of the sediment decreases to light brown clayey silt with nannofossils alternating with brown silty to sandy calcareous mud. Further downhole, from 73.60 to 78.00 mbsf, recovery is dominated by brown silty/sandy calcareous mud with thin (centimeters thick) fine- to medium-grained tuffaceous sandstone layers. The lowest part of the subunit is pale brown, mottled, calcareous nannofossil ooze without significant volcanogenic input.
Smear slides of the “background” silty clays in Subunit IIA show that these are dominated by calcareous nannofossils with variable admixtures of minor amounts of quartz and feldspar plus trace amounts of amphibole, clinopyroxene, orthopyroxene, and colorless volcanic glass shards. Planktonic foraminifers, radiolarians, siliceous sponge spicule fragments, and, very rarely, diatoms are also present.
X-ray diffraction (XRD) analysis revealed calcite, quartz, plagioclase, and illite/muscovite (Table T3). The illite/muscovite likely reflects the presence of a fine-grained terrigenous component that was not recognizable in smear slides.
Table T3. Minerals intensified in fine-grained sediment, Hole U1439A. See Sedimentology in the Methods chapter (Expedition 352 Scientists, 2015a) for XRD analysis details and interpretation software. Download table in .csv format.
ICP-AES analyses (see Sediment and rock geochemistry) indicate a marked drop in calcium carbonate content (ranging from ~6 to 29 wt%) compared to Unit l. There is a corresponding increase in major element (Ti, Al, Fe, and Mn) and trace element (Co, Zn, V, Sc, and V) contents; this mainly reflects a marked reduction in calcium carbonate compared to the amount of siliciclastic plus ash components in this sediment.
Similar to Unit l, the ash layers that were studied in smear slides are dominated by colorless volcanic glass together with traces of plagioclase, orthopyroxene, clinopyroxene, and rarely, quartz. There are also rare to trace amounts of both calcareous and siliceous microfossils. The thinner, finer grained ash layers are, in places, redistributed by bioturbation. These disturbed ash deposits tend to exhibit a mixture of felsic glass, calcareous and siliceous microfossils, and clay.
The felsic tephra can be divided into two groups. The first is a mostly crystal poor, low-vesicularity type characterized by dominantly dense, blocky, and cuspate glass shards together with abundant pumiceous clasts with mostly rounded and elongate vesicles (e.g., Samples 7H-6, 70–71 cm; 8H-3, 60–61 cm; 8H-5, 25–26 and 149–150 cm; 8H-6, 72–73 cm; and 8H-7, 52–53 cm). The second is a more crystal rich type, characterized by a mixture of dense, blocky, and cuspate glass shards together with highly vesicular pumiceous clasts that have predominantly tubular and elongate gas bubbles (e.g., Samples 8H-2, 5–6 cm; 8H-7, 25–26 cm; and 8H-CC, 25–26 cm). In addition, a distinctive mafic ash layer at 59.15 mbsf contains a mixture of predominantly blocky, brownish, mafic glass shards with moderate vesicularity and mostly rounded and elliptical gas bubbles. Most of the pumiceous clasts are mafic, but a few felsic clasts are also present; these are typically highly vesicular with elongate bubble shapes.
Subunit IIB: early to middle Miocene (82.80–100.50 mbsf)
Subunit IIB is characterized by a lower abundance of volcaniclastic sediment compared with Subunit IIA. However, where present, the grain size of the volcaniclastic sediment is larger than in Subunit IIA, which is mainly silty sand. Intercalated, decimeter-thick, paler intervals are more nannofossil rich (Figure F10). In the lower part of Subunit IIB, sediment exhibits a downhole gradation to an overall paler color (pinkish to grayish) and reflects a relative downhole increase in the abundance of silty nannofossil ooze, with the addition of fine to medium to locally coarse-grained silty sand (especially from 99.00 to 100.50 mbsf). The contacts between the more or less nannofossil rich sediment and the sandy layers are gradational. The sandy layers are generally strongly bioturbated, with occurrences of Chrondrites, Planolites, and rarely Zoophycos.

Smear slides from Subunit IIB reveal dominantly nannofossils accompanied by trace to rare planktonic foraminifers, radiolarians, and siliceous sponge spicules. In several slides, the planktonic foraminifers are poorly preserved and appear to be partly dissolved. A sparse but nearly ubiquitous volcanogenic component of quartz, feldspar, colorless glass, and mineral grains (amphibole and pyroxene) is also observed. Large euhedral, colorless, isotropic minerals were tentatively identified as a zeolite mineral. XRD revealed calcite, quartz, plagioclase, a zeolite (possibly clinoptilolite), and also mixed-layer clay, possibly montmorillonite, although this could not be confirmed without further characterization (e.g., glycolation) that was not possible during Expedition 352 (Table T3).
The ICP-AES analyses indicate a decrease in carbonate values to <0.5 wt% within the clay-rich sediment compared to the overlying sediment. However, the presence of interbedded nannofossil-rich layers is confirmed by high values (~50 wt%) of calcium carbonate (see Sediment and rock geochemistry).
Throughout Subunit IIB, occasional “pods” of relatively well cemented, pale-colored, mostly medium-grained tuffaceous sand and ash were observed. Two horizons contain numerous pods of centimeter-thick ash layers (lithified) that have been strongly bioturbated or disturbed by drilling (intervals 352-U1439A-10H-3, 88–90 cm; and 11X-4, 98–104 cm). During coring, relatively hard layers were fragmented and left as pseudoclasts or pods within the softer fine-grained background sediment. For the purposes of statistical analysis, each pod-rich layer should be counted as a discrete ash-fall layer.
Smear slide analysis indicates that the pods are dominated by felsic glass shards with persistent common to rare pyroxene, rare to trace plagioclase and quartz, and also biogenic constituents, mostly calcareous nannofossils. Occasional radiolarians and siliceous sponge fragments are also observed. Glass shards are predominantly dense and blocky. Numerous highly vesicular pumiceous clasts with mainly tubular and elongate bubbles are also observed.
Subunit IIB is further characterized by two sand-rich intervals. The first is a 3.69 m thick tuffaceous (>25% pyroclasts) interval near the top of the subunit. This interval starts with a disseminated ash layer at 86.72 mbsf (interval 10H-3, 88–90 cm) and ends near the subunit boundary at 83.03 mbsf. This interval decreases in grain size and ash content upcore. Coarse-grained ash at the base of the unit grades upward into tuffaceous coarse sand in the middle part of the unit and then into tuffaceous mud at the top of the unit. Consolidated tuff lenses occur spasmodically throughout the entire interval.
The second of the distinctive sand-rich layers occurs toward the base of the subunit within a distinctive interval of grayish sand (100.05–100.40 mbsf). In smear slides this layer was found to be relatively coarse with unusually homogeneous colorless volcanic glass. Trace amounts of biotite, orthopyroxene, clinopyroxene, apatite, and volcanic lithic fragments accompany the glass. Biogenic components other than sparse nannofossils are virtually absent.
Unit III
- Interval: 352-U1439A-12X-2, 0 cm, through 13X-2, 73 cm
- Thickness: 10.43 m
- Depth: 100.50–110.93 mbsf
- Age: early Miocene
- Lithology: calcareous nannofossil ooze
The Unit II/III boundary is characterized by a change to a predominance of relatively well consolidated, fine-grained calcareous sediment alternating with some nannofossil-bearing silty clay. The contacts between the pinkish gray, more or less nannofossil rich sediment and the pinkish nannofossil ooze are gradational. The whole of Unit III is moderately to strongly bioturbated (Figure F11).
Smear slide analysis confirms the dominance of calcareous nannofossils with trace amounts of quartz, plagioclase, pyroxene, amphibole, and felsic glass. Other biogenic components are typically restricted to variably shaped siliceous sponge spicules, although radiolarians are rarely present. Large euhedral crystals, tentatively identified as clinoptilolite, are rarely present. In addition, most slides contain significant amounts of very fine grained material assumed to be clay minerals. XRD revealed common calcite, quartz, and plagioclase plus minor amounts of zeolite and mixed-layer clays (Table T3).
A single sample of carbonate-poor clay was analyzed from Unit III. For practical reasons, sampling for ICP-AES analysis was normally restricted to one sample per core, and it was thought that a clay-rich sample would yield a more informative analysis than the more abundant nannofossil ooze. The clay-rich sample contains only 0.77 wt% carbonate and thus has correspondingly elevated values of many other constituents (e.g., Fe2O3, MgO, MnO, Na2O, and K2O) and some trace elements (e.g., Cu and V).
Unit IV
- Interval: 352-U1439A-13X-2, 73 cm, through 15X-2, 16 cm
- Thickness: 18.83 m
- Depth: 110.93–129.76 mbsf
- Age: early Miocene
- Lithology: clay with minor silt, sand, and nannofossils
Unit IV is characterized by a marked downhole decrease in grain size; the sediment is dominantly clay with subordinate silty, sandy, and, rarely, nannofossil-rich ooze.
The clay frequently alternates between pinkish, pinkish red, grayish, brownish, and reddish brown, resulting in color banding (Figure F12); it is carbonate-poor based on frequent testing with 10% HCl and confirmed by ICP-AES analysis (see Sediment and rock geochemistry). The clays are well consolidated but unlithified. The interval from 111.40 to 111.60 mbsf is unusually dark (nearly black) and was interpreted as being rich in manganese oxide, as confirmed by ICP-AES chemical analysis.

The contacts between the different color bands do not correspond to changes in grain size or sediment composition and are instead interpreted as being of mainly diagenetic origin, probably related to the mobilization of iron and/or manganese (Figure F12).
Smear slide analysis shows that nannofossils are poorly preserved or absent from the carbonate-poor clay. Some samples of clay are rich in fine-grained iron oxide, imparting a reddish hue. Numerous tiny needles (colorless and isotropic) are interpreted as authigenic zeolite (probably phillipsite). Small shark teeth are present but rare. In keeping with the smear slide analysis, XRD analysis revealed significant amounts of quartz and plagioclase plus minor amounts of zeolite and mixed-layer clay (Table T3).
Samples of the pale nannofossil ooze and the weakly calcareous claystone were analyzed by ICP-AES. The nannofossil ooze is unusually pure with up to ~76 wt% carbonate, in keeping with the smear slide analysis. Barium values reach the highest recorded in this hole (1764 ppm). In contrast, calcium carbonate is as low as ~0.3 wt% in the claystones. In the analyzed claystones, Fe2O3, MgO, MnO, Na2O, and K2O values are enriched compared to the clay-rich sediment present generally higher in the succession.
Unit IV is typically devoid of ash layers; however, a single angular clast of highly altered pumice was noted at 121.05 mbsf.
Unit V
- Interval: 352-U1439A-15X-2, 16 cm, through 20X-2, 20 cm
- Thickness: 48.74 m
- Depth: 129.76–178.50 mbsf
- Age: early Miocene to Eocene
- Lithology: nannofossil-rich ooze, nannofossil-rich clay, and silty to sandy to granule-sized clastic deposits
The Unit V succession comprises variable-thickness (centimeter to decimeter) alternations of nannofossil-rich ooze, nannofossil-rich clay, and silty to sandy to granule-sized clastic deposits (Figure F13). The nannofossil oozes and nannofossil-rich clays are variably admixed with silty and sandy volcaniclastic grains, especially in the lower part of the unit. Overall, bioturbation ranges from moderate to intense. Compared to the higher parts of the succession, the sequence is lithified, especially the nannofossil ooze.
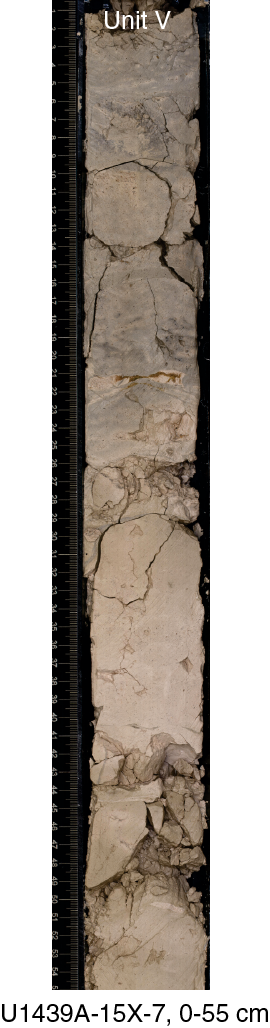
The intercalations of nannofossil ooze and nannofossil-rich clay are color banded. The finest grained layers, composed of the purest nannofossil ooze, are generally grayish and relatively weakly bioturbated compared to the slightly pinkish nannofossil ooze, which is more iron oxide rich and generally more bioturbated (Figure F14). Pinkish, relatively ferruginous, iron-rich nannofossil ooze predominates low in the unit, near the volcanogenic basement.
Smear slide analysis shows that the pale, lithified ooze intervals are dominated by nannofossils with only trace amounts of quartz and feldspar. In contrast, the fine-grained background, clay-rich sediment reveals variable amounts of calcareous nannofossils, and rarely, planktonic foraminifers. The lithogenous components, plagioclase, quartz, pyroxene, amphibole, biotite, and volcanic glass, are present in trace amounts. Clinoptilolite is locally abundant. XRD of the argillaceous sediment revealed significant amounts of calcite and plagioclase; mixed-layer clays are also locally abundant. However, quartz is very minor in contrast to Units I–III.
The coarser grained, dark brown clastic sedimentary intervals encompass layers of fine- to medium- to coarse-grained tuffaceous sediment as thick as several centimeters. Normally graded sandy beds typically exhibit sharp bases, grading upward into bioturbated tops. The sandy layers are generally moderately bioturbated and, in places, mixed with nannofossil ooze. The clastic layers are typically rich in mineral grains. In addition to quartz and feldspar, there are (1) amphibole-rich sands with subordinate amounts of pyroxene and glass, (2) clinopyroxene and orthopyroxene-bearing sands with subordinate amphibole and glass, and (3) amphibole, clinopyroxene, and orthopyroxene-bearing sands with subordinate glass.
In contrast, a small number of the sandstone-siltstone layers contain variable mixtures of glass, mineral grains (e.g., amphibole and pyroxene), and minor biogenic components (calcareous nannofossils and rare planktonic foraminifers). These volcaniclastic sandstones are concentrated from 138.96 to 144.65 mbsf, above the first appearance of tuff layers in Unit V. Several additional volcaniclastic layers below this are classified as tuffaceous sandstone because they are very rich in colorless glass but contain lesser amounts of quartz, calcareous nannofossils, and mineral grains (e.g., amphibole and pyroxene).
Twenty intercalations of felsic tuffs of generally grayish to pinkish to whitish-brown color and up to 41 cm thick were observed in Unit V. These occur from 143.38 to 158.75 mbsf and from 162.05 to 171.22 mbsf. Some of these layers are massive, normally graded, and in some cases finely laminated. Other layers are reverse graded with pumiceous granular tops, or reverse graded with convolute lamination. In detail, several individual tuff layers encompass repeated normally graded thin layers, up to several centimeters thick individually (e.g., between 158.6 and 167.2 mbsf) (Figure F14).
Smear slide analysis of the coarser tuffaceous layers showed that the silt- to sand-sized layers fall into three categories:
- Fine–medium to locally coarse felsic ash (tuff),
- Mineral-rich silts and sands, and
- Mixed volcaniclastic-biogenic sediment.
Investigation of the texture of the glass shards and the shape of the vesicles reveals two major compositional groups of tephra, with a slight tendency for the less vesicular pyroclasts to occur toward the base of the unit. The first category consists predominantly of highly vesicular, tabular, elongate, bubble-bearing pumiceous clasts, along with less abundant dense, blocky, and cuspate glass shards (e.g., Samples 15X-44, 136–137 cm; 16X-5, 9–10 cm; 17X-5, 118–119 cm; 18X-4, 63–64 cm; and 18X-5, 143–144 cm). In contrast, the second category of tuff is predominantly made up of dense, blocky, and cuspate glass shards; there is moderate abundance of rounded to elongate bubbles, but only a minor amount of highly vesicular pumiceous clasts (e.g., Samples 17X-1, 85–86 cm; 17X-4, 8–9 cm; 17X-4, 56–57 cm; 17X-6, 62–63 cm; 18X-1, 144–145 cm; and 18X-5, 35–36 cm). The lowermost tuffs (e.g., Samples 18X-7, 58–59 cm; and 18X-CC, 30–31 cm) commonly include large, blocky, mostly dense glass shards, consistent with an origin in a submarine environment. There is no clear correlation between crystal abundance and mineral type throughout Unit V as a whole or between the two groups.
Taken as a whole, the tuffs contain common to rare feldspar and rare to trace amounts of pyroxene, quartz, amphibole, and biotite; they also contain biogenic constituents, mostly calcareous nannofossils, plus occasional radiolarians and siliceous sponge fragments.
Lower in Unit V, the primary lithologic variation is partly obscured by a marked color variation between grayish, pinkish, and brownish sediments. The variation ranges from decimeter-scale banding to centimeter- or millimeter-scale mottling and segregations. Much of this color variation is likely to be caused by diagenetic mobilization of iron and manganese.
Also, in the lower part of the unit, fibrous and platy variants of a zeolite, probably phillipsite, are abundant in the smear slides. The associated greenish volcanic glass is tentatively interpreted as altered hyaloclastite. Comparable but less altered greenish hyaloclastite is present within the underlying volcanogenic sequence (see Petrology). There are also grains of relatively dark glass of inferred mafic composition.
The base of Unit V (178.50 mbsf) is observed as a thin (<3 cm), consolidated but unlithified black layer, which is interpreted as a manganese crust. Directly above this layer (<5 cm), colors vary from pinkish to brownish to grayish, probably reflecting variable iron and manganese contents. XRD analysis of the lowermost ~30 cm of the succession revealed minor manganese oxide (not specifically characterized), a serpentine mineral, and muscovite. In addition, two samples of the dark-colored basal sediment were analyzed by ICP-AES; compared to the sediment in the overlying succession these are strongly enriched in Fe2O3 (up to 20.9%) and MnO (up to 5.4%) (see Sediment and rock geochemistry).
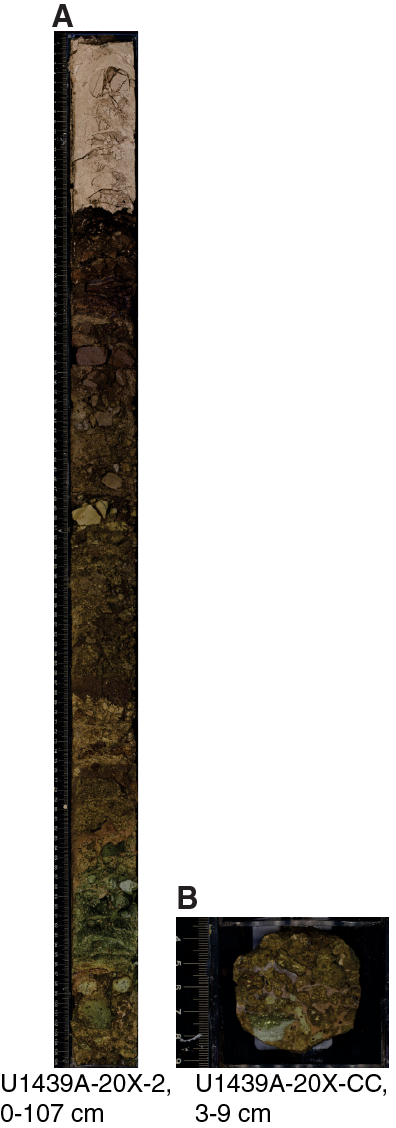
Basement Unit 1
- Interval: 352-U1439A-20X-2, 17 cm, through 22X-CC, 7 cm
- Thickness: 8.35 m
- Depth: 178.50–199.40 mbsf
- Age: unknown
- Lithology: volcanogenic sequence made up of volcaniclastic breccia and conglomerate, silty sand, clay, altered hyaloclastite, and basalt
Limited recovery reflects the resistant nature of the well-lithified volcanogenic sequence directly beneath the deep-sea sedimentary cover. The manganese crust, taken as the base of sedimentary Unit V, is directly underlain by greenish to pinkish brown noncalcareous claystones. Smear slide examination showed that the noncalcareous claystone contains abundant euhedral crystals of phillipsite, together with undevitrified mafic glass, basic volcanic grains, and trace amounts of plagioclase. The presence of phillipsite was confirmed by XRD (see Petrology).
Lower in the volcanogenic succession, coarse sand– to granule-grade clastic sediment alternates with unconsolidated sand made up of highly altered volcanic material. The lowermost recovery includes greenish breccia and sand composed of pieces of altered hyaloclastite and vesicular lava. A single recovered breccia fragment (interval 20X-CC, 4–8 cm) exhibits angular, centimeter-sized volcanic clasts set in a pink fine-grained matrix; this is probably altered pelagic carbonate (Figure F15). See Petrology for a detailed description of basement Unit 1.
Biostratigraphy
The microfossil contents of core catcher samples from Hole U1439A were examined and described for preliminary biostratigraphic constraints. Biostratigraphy was based solely on calcareous nannofossils.
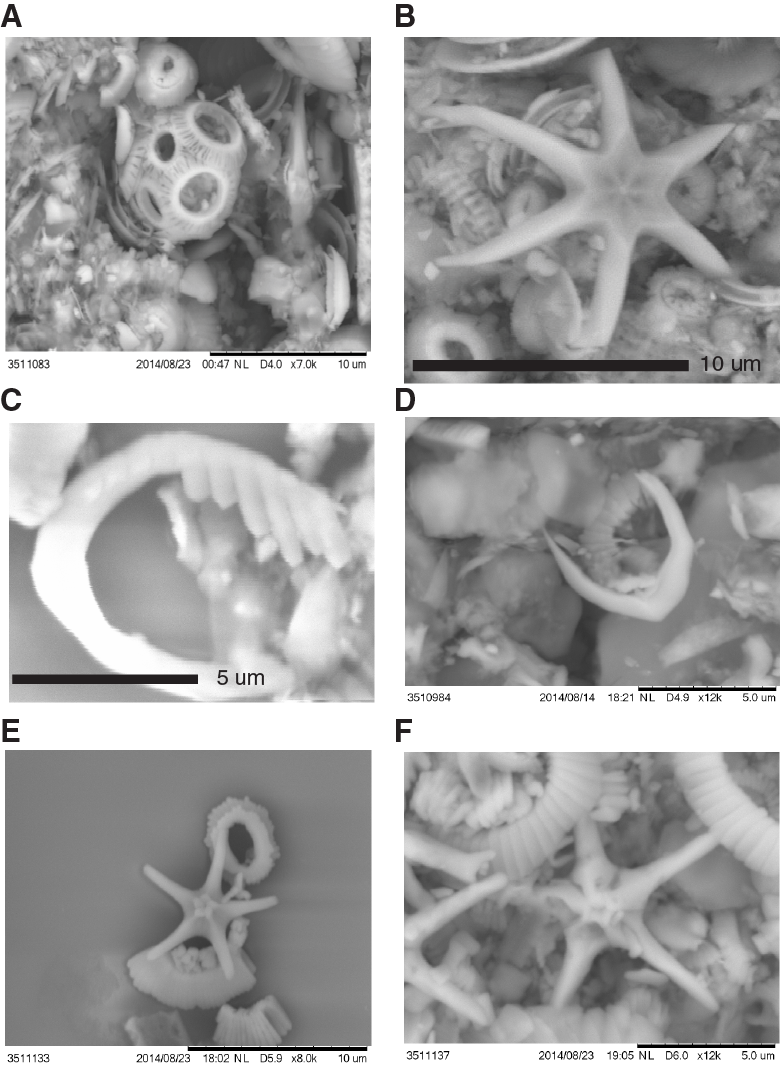
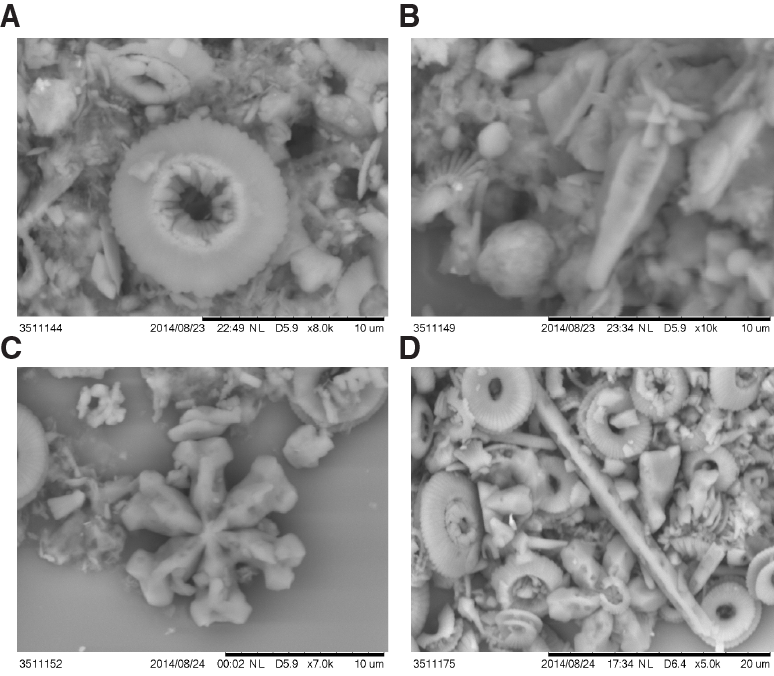
Calcareous nannofossils were present in 19 of 22 core catcher samples and Sample 352-U1439A-20X-2, 0–2 cm. Preservation of calcareous nannofossils was variable, ranging from good in the most recent samples to poor in certain taxa and intervals. The oldest samples in the section exhibit more diagenesis than younger material. Reworking may be common throughout the section, making initial age constraints somewhat difficult. Close examination reveals a somewhat continuous recovery from the Late Pleistocene to late Eocene with a few gaps, especially in Miocene-aged sediment. Examination by scanning electron microscope (SEM; Figures F16, F17) was used to help constrain ages and better understand levels of preservation.
Samples 1H-CC through 12X-CC contain a somewhat consistent sediment record of calcareous nannofossils with a barren interval in Sample 13X-CC. Samples 1H-CC through 3H-CC are Pleistocene in age based on the lack of Emiliania huxleyi. High abundance, the small size of recent calcareous nannofossil markers (i.e., E. huxleyi, Gephyrocapsa caribbeanica, and Pseudoemiliania lacunosa), and reworking made absolute constraints based on light microscope examination difficult. Sample 1H-CC may be placed in Subzone CN14b (0.24–0.42 Ma) based on the absence of E. huxleyi and P. lacunosa and the presence of Gephyrocapsa oceanica (Table T4), which were confirmed through SEM examination. Samples 2H-CC and 3H-CC are tentatively placed in Pleistocene Zones NN19 and NN18, respectively. Sample 2H-CC contains the first downhole occurrence of Helicosphaera sellii, constraining the age to middle lower Zone NN19 (1.26–1.73 Ma). Sample 3H-CC contains the first downhole occurrence of Discoaster brouweri (1.93–2.39 Ma; GTS2012 scaling/2.06–2.39 Ma for the equatorial Pacific) and may be placed in Zone NN18.
Table T4. Calcareous nannofossils, Hole U1439A. Download table in .csv format.
Samples 4H-CC and 5H-CC are placed in Pliocene Subzones CN12a and CN11b, respectively. Sample 4H-CC contains the first occurrence of Discoaster tamalis (Table T4) with a short range constrained to lower Zones NN16/CN12a and NN14, and may be placed at the D. tamalis subtop (2.87 Ma equatorial Pacific) at the Subzone CN12a/12b boundary. Sample 5H-CC contains the first downhole occurrence of Reticulofenestra pseudoumbilica (Table T4) and may be placed just below Sample 4H-CC at the Subzone CN12a/CN11b boundary (3.70 Ma).
Samples 6H-CC, 7H-CC, and 8H-CC were placed in Subzones NN11b, NN11a, and NN10a/NN9 of the upper Miocene, respectively. Sample 6H-CC (5.59–6.91 Ma) was placed based on the first downhole occurrence of Discoaster quinqueramus without Discoaster berggrenii. Zonation of Sample 7H-CC was based on the occurrence of D. berggrenii with D. quinqueramus, likely placing it in Subzone NN11a (7.53–8.12 Ma). Sample 8H-CC was constrained by the presence of Discoaster prepentaradiatus from Zone NN9 to Subzone NN10a (9.37–10.52 Ma), with its total age range likely placing it at the early middle Miocene/late Miocene boundary.
Samples 9H-CC and 10H-CC were placed in middle Miocene Zones NN7 and NN5, respectively. Sample 9H-CC shows a significant drop in the diversity of discoasters, which is dominated by the common mid-Miocene form Discoaster exilis. The first downhole occurrences of Cyclicargolithus floridanus and Calcidiscus premacintyrei along with the base first occurrence of Sphenolithus abies constrain this sample to Zone NN7 (~11.85 Ma). Sample 10H-CC, based on observed markers, was tentatively placed in (lower) middle Miocene Zone NN5 (13.53–14.91) based on the occurrence of Sphenolithus heteromorphus with the absence of Sphenolithus belemnos and Helicosphaera ampliaperta.
Samples 11X-CC through 15X-CC (except for Sample 13X-CC, which was barren) were placed in lower Miocene Zones NN4, NN3, NN1, or Subzone CN1b, and Zone NN1 or Subzone CN1a, respectively. Sample 11X-CC may be placed in Zone NN4 (17.95–18.28 Ma) based on the occurrence of H. ampliaperta without S. belemnos. Sample 12X-CC has a monospecific assemblage of Discoaster deflandrei including many of its various morphotypes, but the occurrence of possibly poorly preserved Discoaster druggii, considered to be in the same evolutionary lineage as D. deflandrei, cause it to likely be placed just below Sample 11X-CC at the Zone NN3/NN2 boundary (18.28 Ma). This sample also lacks Triquetrorhabdulus carinatus, which would have its first downhole occurrence just below this boundary. Therefore, Sample 11X-CC may actually be slightly younger (Zones NN3–NN4), as key marker taxa were missing from the assemblage. Sample 13X-CC is barren of calcareous nannofossils. Sample 14X-CC is constrained to the upper part of Zone NN1 (22.97 Ma) based on the presence of T. carinatus and absence of D. druggii and Sphenolithus ciperoensis. Sample 15X-CC may be in the lower part of Zone NN1 (23.11 Ma) based on the presence of T. carinatus along with the first downhole occurrence of Cyclicargolithus abisectus. This zone more or less straddles the Oligocene/Miocene boundary in most sequences; however, the lack of S. ciperoensis may indicate that it lies just above the Oligocene/Miocene boundary, as S. ciperoensis is rarely found in the earliest Neogene.
Samples 16X-CC, 17X-CC, 18X-CC, and 19X-CC are placed in Oligocene Zones NP25, NP24, CP17, and NP21, respectively. Sample 16X-CC may be placed in the upper Oligocene Zone NP25 (23.21–26.57 Ma) based on the occurrence of S. ciperoensis and the absence of Sphenolithus distentus. Sample 17X-CC may be placed in Zone NP24 (26.93–29.73 Ma) based on the occurrence of S. distentus and S. ciperoensis without Sphenolithus predistentus; however, this sample requires closer examination, as intergraded morphotypes make it difficult to discern these closely related marker taxa. Sample 18X-CC may be placed in Zone CP17 (~31.35 Ma) based on the occurrence of S. predistentus with the absence of S. distentus. Sample 19X-CC may be placed in the lowermost Oligocene Zone NN21 (33.43–33.97 Ma) based on the occurrence of Sphenolithus akropodus (restricted to Zones NP21 and NP22) along with Coccolithus subdistichus and Coccolithus formosus, which have their last occurrences at the boundary between Zones NP21 and NP22.
Sample 20X-2, 0–2 cm, is likely the only Eocene-aged sediment containing calcareous nannofossils and may be placed in upper Eocene Zone NP20. The downhole absence of the previously abundant S. akropodus, together with the base (downhole) or first occurrence of Sphenolithus pseudoradians may place this sample in the upper Eocene Zone NP20 (34.76–35.92 Ma). The presence of C. subdistichus restricts this sample from being older than late Eocene, and the presence of C. formosus restricts it from being younger than the lowermost Oligocene Zone NP21.
High diversity is observed in Samples 1H-CC through 11X-CC, except for a nearly monospecific assemblage observed in Samples 8H-CC and 12X-CC. Sample 13X-CC is barren of calcareous nannofossils. Samples 14X-CC through 20X-2, 0–2 cm, contain calcareous nannofossils, whereas Sample 21X-CC contains igneous rocks only and Samples 22X-CC and 23X-CC are barren. Oligocene-aged samples appear to have the poorest preservation of all samples, showing high amounts of overgrowth and etching.
Figure F18 shows an age-depth plot with a comparison of calcareous nannofossil ages throughout Hole U1439A. Minimum, maximum, and average ages of nannofossil zones are plotted (red squares, green triangles, and blue diamonds, respectively) to show an uncalculated range of error. Paleomagnetic values correlate well with nannofossil ages with the only considerable variation appearing lower in the section near the Oligocene/Miocene boundary.
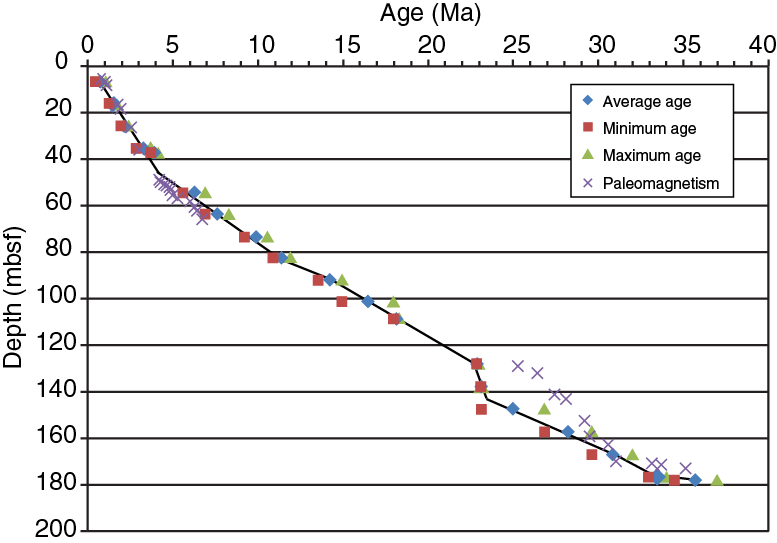
Figure F19 shows a comparison of sedimentary units with calcareous nannofossil biozonations providing approximate ages for each unit.

Fluid geochemistry
Headspace hydrocarbon gas analysis was performed on 21 samples from Hole U1439A as part of the standard shipboard safety monitoring procedure. One sample per core was collected (typically at the top of Section 4) from Cores 352-U1439A-1H through 23X, except for Cores 21X and 22X from which no sediment was recovered. Thirteen whole-round samples were collected for interstitial water analyses from Cores 1H through 19X (typically at the bottom of Section 3 above the headspace hydrocarbon gas sample): 1 sample per core from Cores 1H through 10H and 1 sample every 3 cores from Cores 13X through 19X downhole to the sediment/basement interface. The interstitial water samples were typically 5 cm long from Cores 1H through 9H and 10 cm long from Cores 10H through 19X. The volume of recovered interstitial water was 15–20 mL. Headspace gas and interstitial water samples were collected and analyzed following the protocol described in Fluid geochemistry in the Expedition 352 methods chapter (Reagan et al., 2015a).
Headspace gas
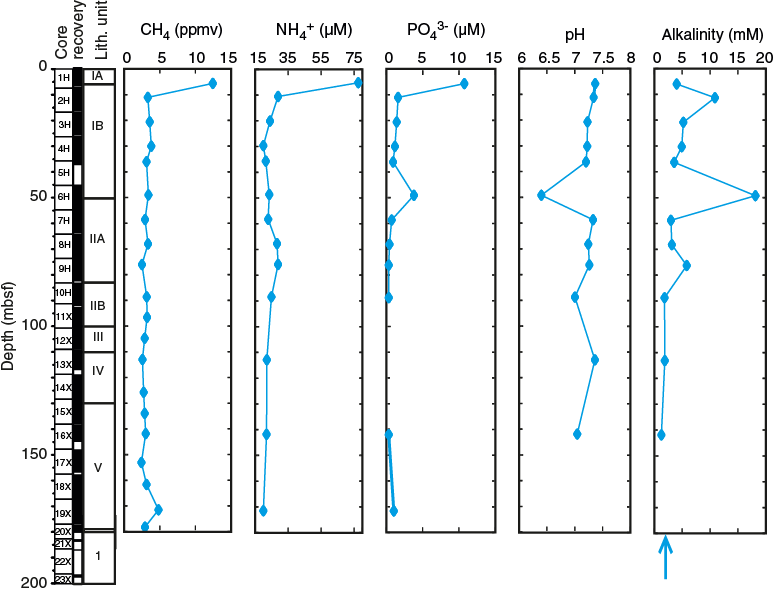
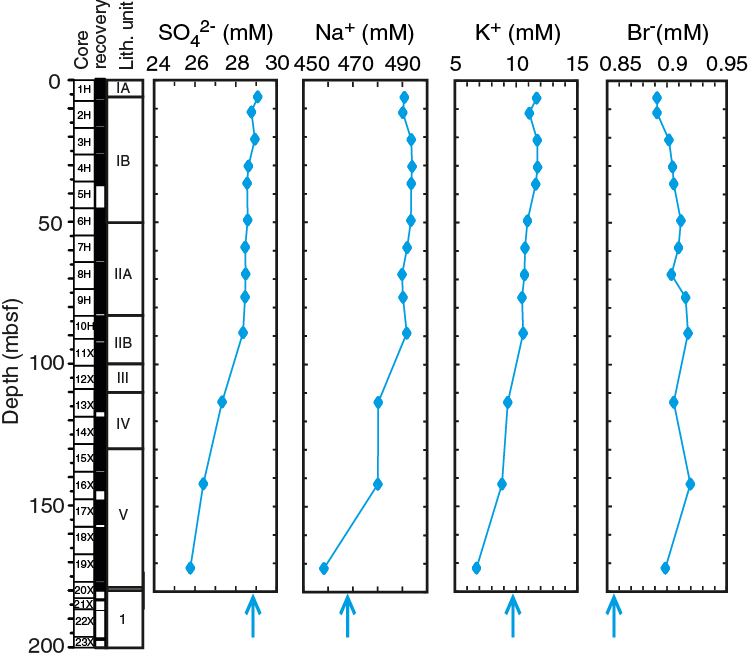
The concentrations of methane, ethane, and propane in the 21 headspace gas samples are reported in Table T5. Methane concentrations range from 2.49 to 12.44 ppmv in Hole U1439A; the highest methane concentration was measured in Core 1H at 5.9 mbsf (Figure F20). Below this depth, methane concentrations are low and relatively constant (2.49–4.81 ppmv). No ethane or propane was detected in Hole U1439A samples.
Table T5. Headspace gas concentrations (methane, ethane, and propane); Hole U1439A. Download table in .csv format.
Interstitial water
Salinity, pH, alkalinity, and chlorine contents of the 13 interstitial water samples collected from Hole U1439A were measured immediately after sampling. The interstitial water samples were also analyzed for ammonium, phosphate, and sulfate and for Ca, Mg, K, and Na concentrations. The results of these analyses are reported in Table T6 and illustrated in Figures F20, F21, and F22.
Table T6. Interstitial water cations and anions, Hole U1439A. Download table in .csv format.

Alkalinity, pH, sulfate, ammonium, and phosphate
Ammonia and phosphate concentrations are highest in the uppermost sample from Section 352-U1439A-1H-4 at 77.35 µM NH4+ and 10.72 µM PO43–. (Figure F20). These high NH4+ and PO43– concentrations also coincide with high methane concentrations (12.44 ppmv), which might be attributed to decomposition of organic matter in the uppermost layers of the sedimentary column. Values are lower deeper in the hole, reaching minima of 19.91 µM NH4+ (in Cores 4H and 19X) and 0.33 µM PO43– (in Cores 8H through 16X). PO43– concentrations increase again to 1.02 µM at the base of the hole.
Alkalinity values generally decrease from 3.98 mM in uppermost Section 1H-4 (5.91 mbsf) to a value of 0.74 mM at 171.5 mbsf at the base of the hole. However, there are a number of outliers, the largest of which, in Section 6H-3 (49.19 mbsf), has an alkalinity of 18.2 mM. This outlier also yields an anomalously low pH of 6.4, whereas all other samples show near constant pH of 7.0–7.4. It is notable that phosphate concentration in this outlier is also higher (3.79 µM) than surrounding values. The anomalously high PO43– and alkalinity in combination with the low pH in Core 6H correspond to a sharp lithologic boundary that marks the transition from pelagic sediment ooze to more terrigenous sediment with thin intercalated layers of ash. The high values may reflect local alteration of the silica-rich ash layers.
Salinity, chlorinity, and bromide
Salinity is constant downhole with values of 36–37, which lie in the range of seawater values. Chlorinity averages ~558 mM, which is slightly higher than that of average seawater. Bromide concentrations are rather uniform, ranging from 0.89 to 0.91 mM, also slightly higher than that of average seawater. No systematic variation with depth or lithology could be observed.
Sulfate, sodium, and potassium
Sulfate, Na, and K concentrations are relatively uniform from 5.9 to 88.9 mbsf (SO42– = 28.4–29.1 mM, Na+ = 491–493 mM, and K+ = 10.5–11.8 mM) and then steadily decrease downhole to minima of SO42– = 25.8 mM, Na+ = 459 mM, and K+ = 6.78 mM (Figure F21). This change mainly corresponds to downhole variations in lithology toward more clay rich sediment and may relate to the formation of zeolites (e.g., phillipsite was identified by XRD; see Petrology) and of minor sulfide.
Magnesium and calcium
Ca and Mg profiles are depicted in Figure F22. Ca and Mg concentrations in uppermost Section 1H-4 are close to seawater values (Ca = 12.6 mM and Mg = 54.1 mM). Ca steadily increases downhole to 40.5 mM with a concomitant decrease in Mg to 39.2 mM. This leads to a steadily increasing Ca/Mg ratio (from 0.23 to 1.0). These variations appear independent of the drilled lithologies and may reflect incipient dolomitization in which Ca solubility increases with depth so favoring Mg–Ca exchange in carbonates. Alternatively, these variations may reflect alteration of volcanic basement and ashes, marked by the dissolution of Ca-rich phases and the precipitation of Mg-rich clay minerals (e.g., Gieskes et al., 1990; Lawrence and Gieskes, 1981). Similar downhole variations were observed during Integrated Ocean Drilling Program Expedition 322 (Saito, Underwood, Kubo, and Expedition 322 Scientists, 2010) and were interpreted as marking exchanges with the underlying basement rocks.
Petrology
Igneous rocks were recovered in Holes U1439A and U1439C. Basement in Hole U1439A was tagged during XCB coring (Section 352-U1439A-20X-2 through Core 23X; 3.53 m recovered), whereas Hole U1439C penetrated more than 362 m of igneous basement (Cores 352-U1439C-2R through 45R; 109.3 m recovered). The uppermost part of the section comprises heterolithic breccias that represent seafloor colluvium, whereas the lowermost part of the section is composed of mafic dikes or sills. The volcanic rocks in between are dominated by pillow lava with intercalations of massive sheet flows, igneous breccias, and pyroclastic flow deposits. This site is notable for the variety of boninites sampled by the core and for the intercalation of primitive boninites and high-magnesium andesites at several levels throughout the section. In some units, these magmas appear to have erupted simultaneously, forming magma mingling textures.
Petrologic and geochemical classification
Phenocrysts are common throughout Holes U1439A and U1439C; however, the variations in phase assemblages and abundances are not always diagnostic. As a result, chemical distinctions based on portable X-ray fluorescence (pXRF) spectrometry were also used to assess changes in rock composition and to track the occurrence of different magma series. Rapid (~5 min per sample, each an average of three analyses), nondestructive pXRF measurements directly on the surface of the section halves of core were particularly advantageous. This allowed high-density sampling of several important elements to a relatively high precision. Though not a substitute for complete whole-rock analyses by ICP-AES, pXRF measurements have the advantage of rapid turn-around time, which provides the ability to refine the chemostratigraphy and unit boundaries within minutes.
Three elements (Ti, Cr, and Zr) were selected to define the chemical characteristics of each unit and the chemical differences between them. All of these elements have relatively high precision and accuracy by pXRF (for cross-calibration with ICP-AES and a complete discussion of calibrations and data correction, see Sediment and rock geochemistry in the Expedition 352 methods chapter [Reagan et al., 2015a]).
Almost all of the igneous rocks at Site U1439 are either boninites or high-magnesium andesites genetically related to the boninites. Chemical groupings based on Ti, Cr, and Zr were combined with petrographic information on phase assemblages (e.g., phenocryst assemblages and presence or absence of groundmass plagioclase), physical volcanology (pillows versus hyaloclastite versus massive lavas), and physical property data (magnetic susceptibility) in order to define the igneous units (Figures F23, F24). Geochemical data from pXRF analyses provided a rapid, near real-time way to monitor chemical variations in the core and to recognize major changes in composition related to unit boundaries. In addition, the high magnetic susceptibility of high-magnesium andesite relative to more primitive boninite makes these data useful in recognizing evolved intercalations within the sections. A stratigraphic column with unit summaries is presented in Figure F25. Typical or notable macroscopic features of the core are depicted in Figures F26 and F27, whereas microscopic thin section observations of note are shown in Figure F28.
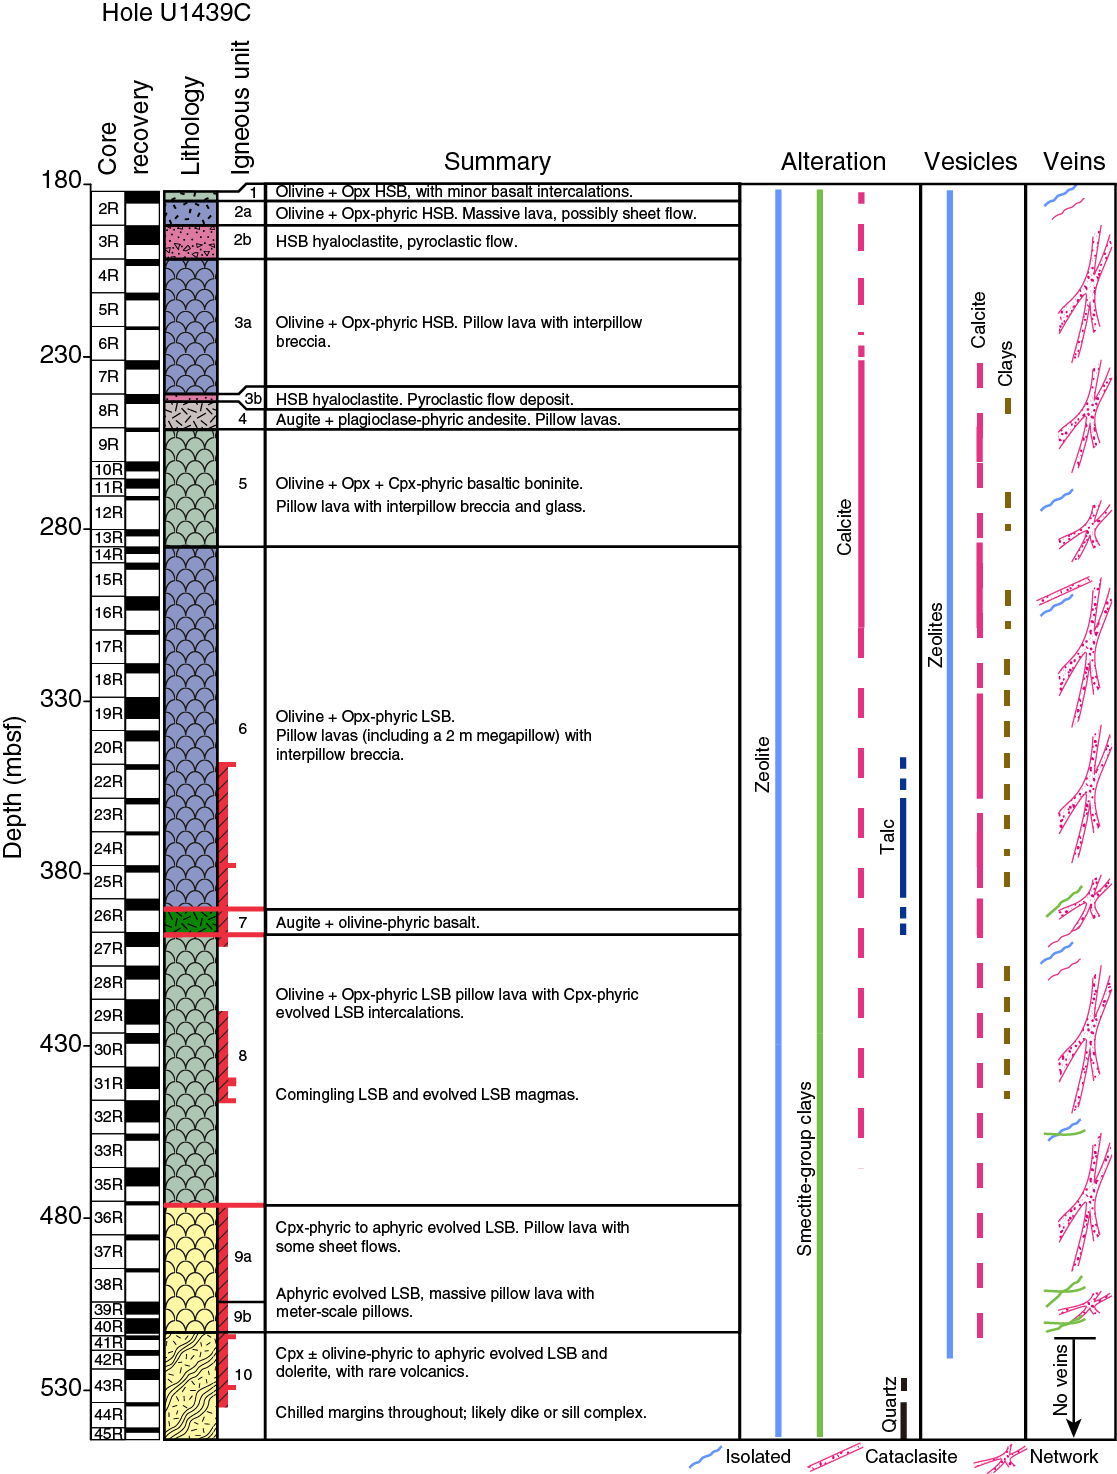
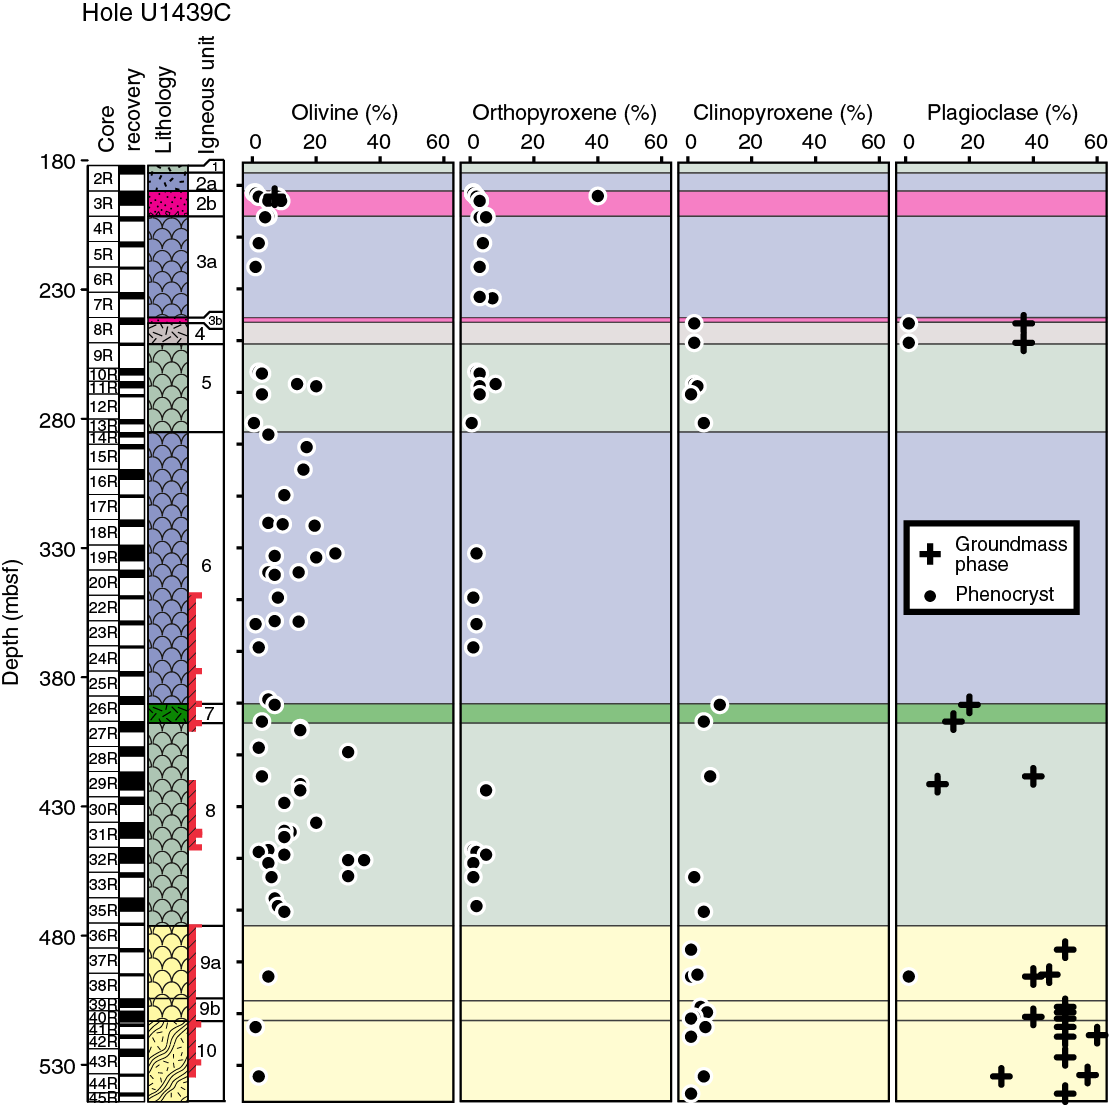
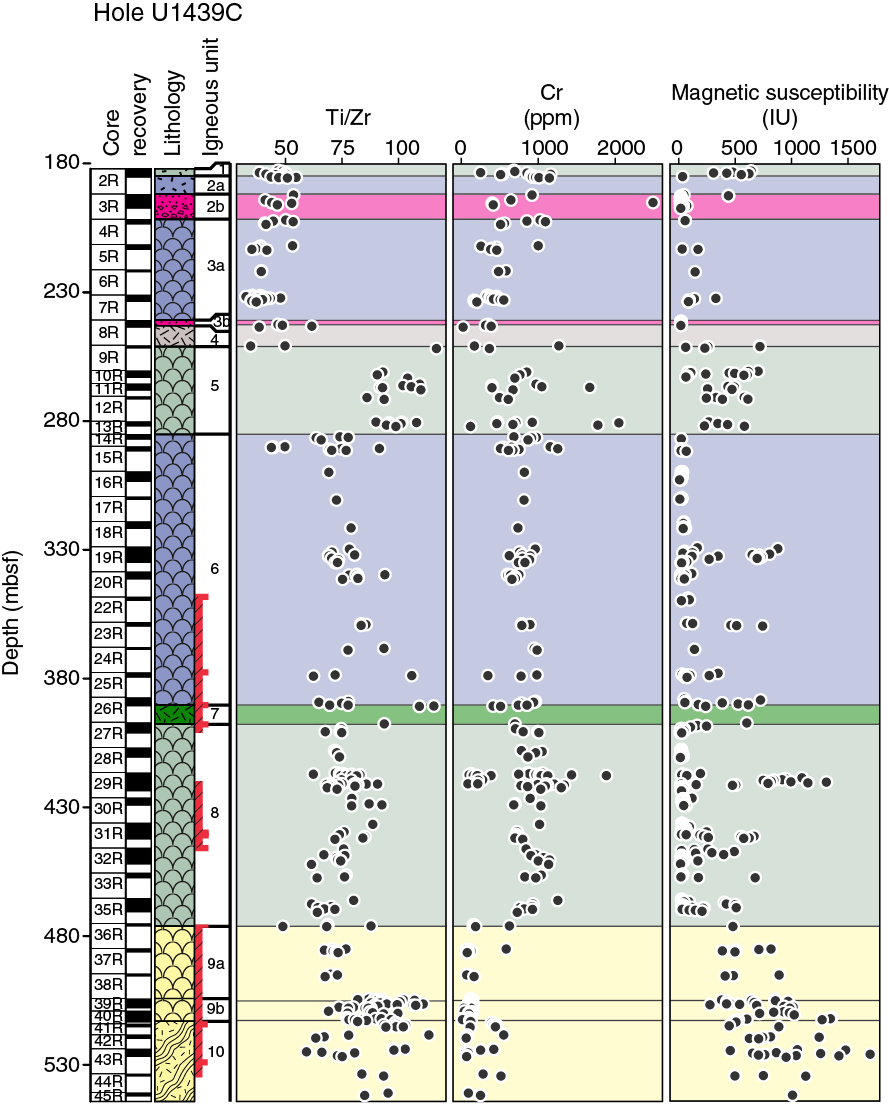
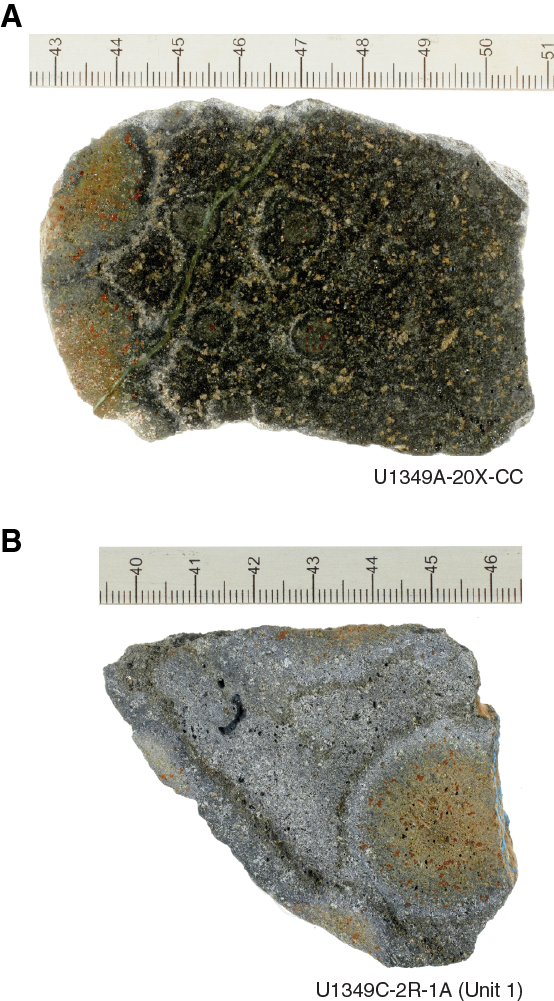
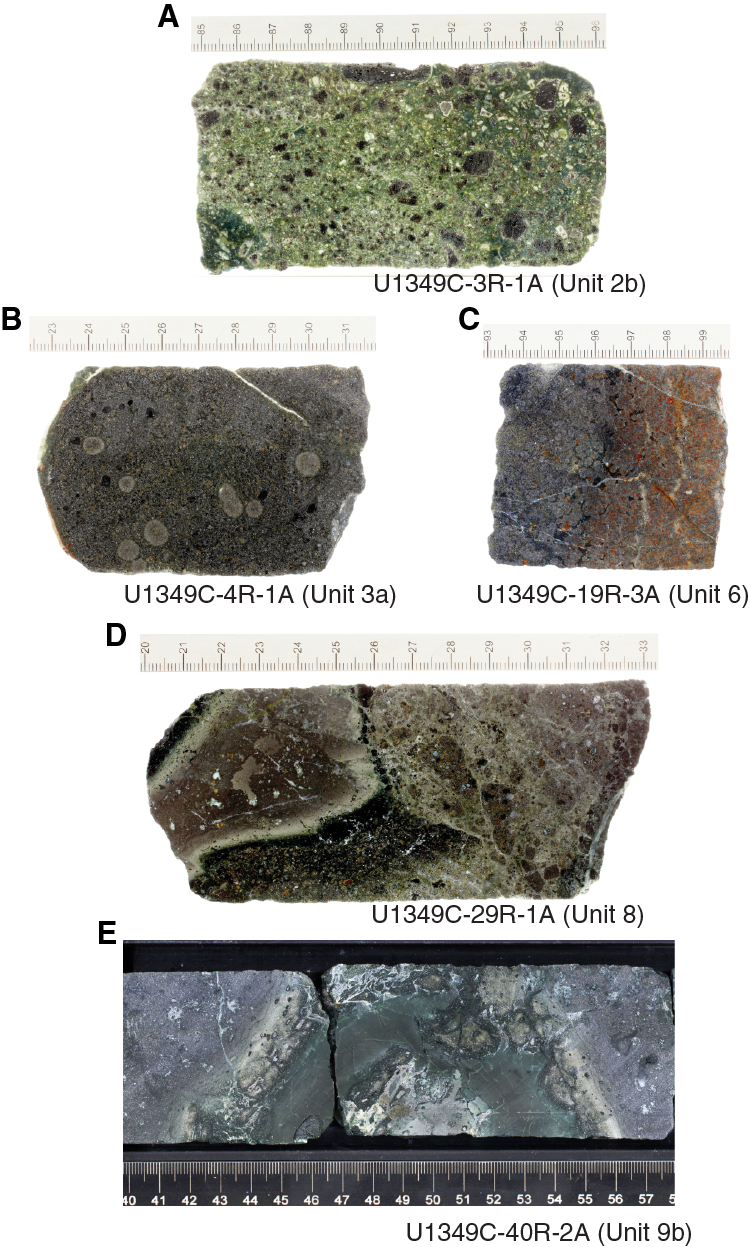
Figure F27. Macroscopic features, Hole U1439C. A. Pyroclastic breccia containing partially welded glass fragments. B. Globular structures in olivine-orthopyroxene-phyric boninite. C. Olivine, orthopyroxene, and augite phenocrysts in boninitic pillow lava. D. Diffuse and sharp contacts between clast and host magma. E. Pillow margin in boninitic lava.
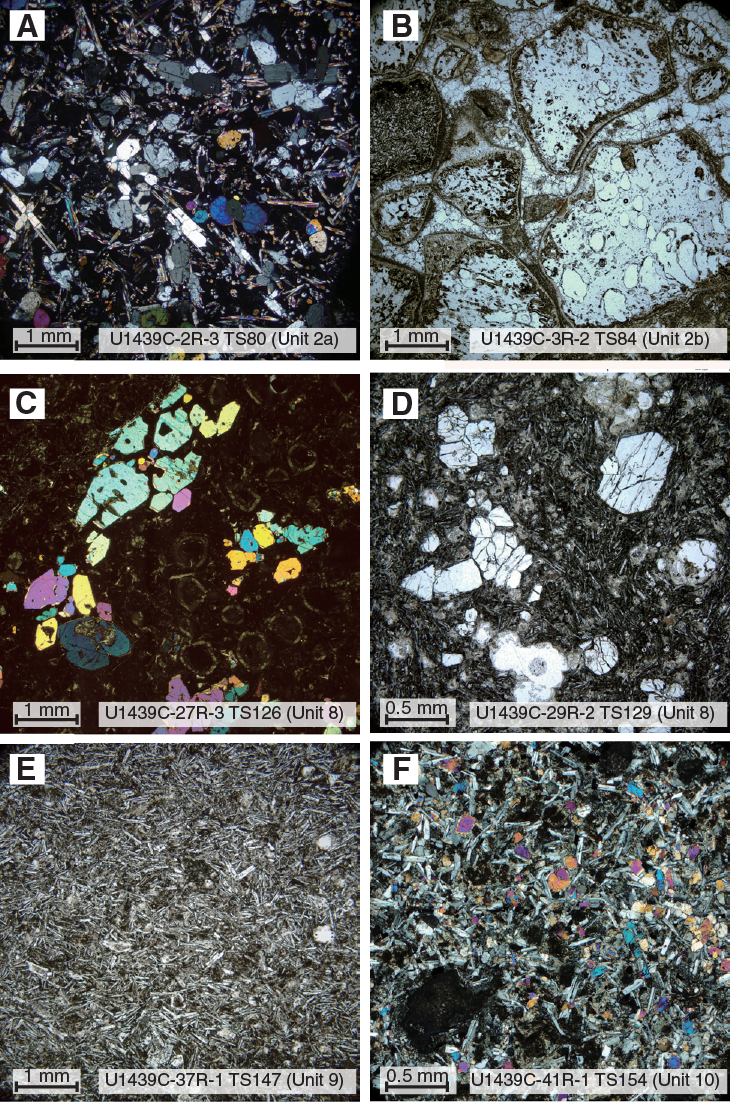
Figure F28. Microscopic features, Hole U1439C. A. Orthopyroxene-olivine-phyric boninite with augite and orthopyroxene in vitrophyric groundmass. B. Pyroclastic breccia with glassy boninite in calcite cement. C. Vesicular olivine-phyric boninite with hypohyaline augite/plagioclase groundmass. E. Aphyric basalt with intersertal augite and plagioclase in groundmass. F. Dolerite with intergranular–subophitic texture from augite and plagioclase.
Igneous units in Hole U1439C (Figure F23) contain rock types belonging to the high-silica boninite (HSB), low-silica boninite (LSB), and basaltic boninite (BB) series (see Petrology in the Expedition 352 methods chapter [Reagan et al., 2015a], for detailed criteria used to classify boninites). Below, we summarize the criteria used to categorize the major rock types encountered at Site U1439 using the petrologic data included in this report and geochemical data from Sediment and rock geochemistry.
Boninite
Boninites are characterized by phenocrysts of olivine (commonly with chromite inclusions) and/or low-calcium pyroxene (typically enstatite or clinoenstatite), which may occur as single crystals or glomerocrysts. High-calcium pyroxene occurs as a phenocryst phase only in basaltic boninites and high-magnesium andesites. The groundmass consists of pale tan glass with abundant acicular to skeletal pyroxene microlites, which include either or both low-calcium pyroxene (orthopyroxene) and high-calcium pyroxene (augite). When present, the high-calcium pyroxene typically forms as an overgrowth on low-calcium pyroxene, although discrete high-calcium pyroxenes occur as well. Boninites are recognized in the pXRF data by their high Cr concentrations (>300 ppm) and low TiO2 (<0.5 wt%); Ti/Zr ratios vary with silica content (see Petrology in the Expedition 352 methods chapter [Reagan et al., 2015a]).
High-silica boninites
High-silica boninites are characterized by high silica (SiO2; 55–60 wt%), MgO (8–17 wt%), and Cr (300–2000 ppm), low TiO2 (≤0.5 wt%), and Ti/Zr ratios of <60 (see Sediment and rock geochemistry). Orthopyroxene is the dominant phenocryst phase, typically as blocky euhedral crystals, but olivine phenocrysts are only slightly less abundant (Figure F24). High-silica boninites lack groundmass augite and plagioclase. The higher silica contents and low Ti/Zr ratios of high-silica boninites distinguish them from low-silica boninites and basaltic boninites, whereas their very low TiO2, high MgO, and lack of modal feldspar distinguish them from high-magnesium andesites.
Low-silica boninites
Low-silica boninites are characterized by low SiO2 (50–55 wt%) and TiO2 (≤0.35 wt%), high MgO (10–17 wt%) and Cr (500–1000 ppm), and Ti/Zr ratios of ~55–80 (at or just above the upper limit of canonical boninites; see Sediment and rock geochemistry). Olivine is the dominant phenocryst phase, typically as blocky euhedral crystals, whereas orthopyroxene phenocrysts are much less abundant (Figure F24). All low-silica boninites have groundmass augite (with or without orthopyroxene cores). The low silica contents and slightly higher Ti/Zr ratios of low-silica boninites distinguish them from high-silica boninites, whereas their very low TiO2, high MgO, and lack of modal feldspar distinguish them from high-magnesium andesites. Their fractionation is controlled by olivine-orthopyroxene, and their liquid line of descent does not cross that of normal high-silica boninites (Kanayama et al., 2013).
Basaltic boninites
Basaltic boninites are characterized by low SiO2 (50–52 wt%) and TiO2 (≤0.35 wt%), high MgO (8–20 wt%) and Cr (300–2000 ppm), and Ti/Zr ratios of 80–110 (above the upper limit of other boninites; see Sediment and rock geochemistry). The typical phenocryst assemblage is olivine, orthopyroxene, and high-calcium pyroxene, with olivine typically being slightly more abundant than the pyroxenes. Groundmass augite (with or without orthopyroxene cores) is ubiquitous. The basaltic silica contents and much higher Ti/Zr ratios distinguish them from high-silica boninites and low-silica boninites. Their fractionation is controlled by olivine-orthopyroxene-clinopyroxene, and their liquid line of descent in silica-MgO essentially parallels those of other boninites (see Sediment and rock geochemistry).
High-magnesium andesites
High-magnesium andesites are evolved boninite-series rocks with <8 wt% MgO and are characterized petrographically by modal plagioclase and high-calcium pyroxene (augite). Augite phenocrysts are common, but plagioclase and olivine phenocrysts are rare. Plagioclase and augite are the dominant groundmass phases and may be intergrown intimately in quench textures. High-magnesium andesites are recognized in pXRF data by their low Cr (<300 ppm) and TiO2 (<0.5 wt%) concentrations. Ti/Zr ratios range from <50 to as high as 120, reflecting the range in their presumed parent magmas (because Ti/Zr ratios change little during fractional crystallization). High-magnesium andesites with Ti/Zr < 55 derive from high-silica boninites, whereas those derived from basaltic boninites have Ti/Zr > 80. The most abundant group of high-magnesium andesites has Ti/Zr ratios of 55–80, reflecting their derivation from the low-silica boninite series.
High-magnesium andesites are also distinguished from primitive boninites by their high magnetic susceptibility (≥400 IU), which results from groundmass Fe-Ti oxides and is distinct from the low magnetic susceptibility of primitive boninite (typically <300 IU; Figure F25).
Igneous rock lithostratigraphy
Hole U1439A
Hole U1439A contains a single igneous unit, Unit 1. This unit consists of hyaloclastite with centimeter-scale fragments of glass and pillow breccia with clasts of boninite pillow lavas in a green hyaloclastite matrix (Section 352-U1439A-20X-2, 18 cm, through Core 23X). The hyaloclastites are highly altered to zeolites, serpentine, and clay muds, but fragments of fresh glass are present throughout the section (e.g., intervals 21X-1W, 28–30 and 44–46 cm). The uppermost hyaloclastite is separated from the overlying calcareous nannofossil ooze by ~1 cm of Mn-rich crust, which defines the top of basement (see Sedimentology).
The boninites occur as pieces up to 6 cm across parallel to the core length. Some display a striking centimeter-scale ovoidal texture, perhaps from sintering or remelting of spherical lava globules (Figure F26A). At least one fragment has a glassy margin (Section 20X-CC [Piece 3]), suggesting that it was near the outer rim of a pillow lava. Thus, the recovered fragments of boninite represent either a thin pillow lava flow intercalated with the hyaloclastites or possibly isolated pillow buds within the hyaloclastite.
Hole U1439C
Ten lithostratigraphic units were identified in Hole U1439C (Figures F23, F24, F25). Unit boundaries represent an abrupt change in chemical characteristics, phenocrysts, and groundmass assemblages. Subunits typically represent changes in the eruptive nature of a unit (e.g., from hyaloclastite to pillow lava or massive lava, or lava to intrusive sheets). Minor changes in chemical composition may also occur at subunit boundaries.
Unit 1
- Interval (top): 352-U1439C-2R-1, 0 cm
- Depth: 182.00–184.75 mbsf
- Thickness: 2.75 m (1.86 m recovered)
- Rock type: olivine-orthopyroxene phyric boninite and olivine-phyric high-magnesium andesite
- Deposit: massive lavas overlain by a breccia layer
Unit 1 consists of massive lavas with no pillow structures apparent. The uppermost layer (~1 m thick) consists of lava clasts in a matrix of gravel-sized lava fragments and altered glass; the remainder of the unit comprises massive lavas (interpreted as sheet flows). Unit 1 boninites are moderately phyric with 2%–5% olivine and 5%–15% orthopyroxene phenocrysts up to ~1 mm in size; some boninites are vitrophyres, whereas others are hypocrystalline with a groundmass of orthopyroxene, augite, and glass. Unit 1 basalts are sparsely olivine + augite-phyric, with groundmass plagioclase.
All of the boninites are low in TiO2 (≤0.3 wt%) and relatively high in Cr (250–1200 ppm) with Ti/Zr ratios ≤50 (Figure F25). Unit 1 in Hole U1439C correlates with Unit 1 in Hole U1439A not only in chemical characteristics but also as evidenced by the distinctive centimeter-scale ovoidal texture pervasive in Unit 1 of both holes (Figure F26B).
Subunit 2a
- Interval (top): 352-U1439C-2R-3, 0 cm
- Depth: 184.75–191.80 mbsf
- Thickness: 7.05 m (0.50 m recovered)
- Rock type: olivine ± orthopyroxene-phyric high-silica boninite
- Deposit: massive lava, sheet flows
Subunit 2a consists of massive olivine ± orthopyroxene-phyric boninite. The phenocrysts are set in a groundmass of acicular orthopyroxene prisms, which has a diktytaxitic texture, in which orthopyroxene needles form a framework that outlines interstitial vesicles (with orthopyroxene taking the role of plagioclase in traditional diktytaxitic textures) within the glass matrix (Figure F28A). The lava has few vesicles, no glassy rims or pillow margins, and is thus interpreted to represent massive sheet flows. Subunit 2a lavas are high-silica boninites, with low TiO2 (≤0.25 wt%), low Ti/Zr (≤60), and 900–1150 ppm Cr.
Subunit 2b
- Interval (top): 352-U1439C-3R-1, 0 cm
- Depth: 191.80–201.60 mbsf
- Thickness: 9.80 m (5.25 m recovered)
- Rock type: high-silica boninite scoria
- Deposit: hyaloclastite/pyroclastic flow deposit
Subunit 2b is a hyaloclastite breccia composed of high-silica boninite. The upper 75 cm is a heterolithic breccia consisting of scoria (10%) and lithic volcanics (80%) in a matrix composed of sand-sized granules of volcanic rock, olivine crystals, and altered glass (Figures F27A, F28B). The lithic volcanics are olivine-phyric boninites with ovoidal structures internally and rounded to angular clast shapes. The rounded fragments appear to be lava blobs, whereas the angular fragments may have formed by thermal shock. The upper 75 cm breccia likely represents the culmination of the eruption that formed the underlying portion of Subunit 2b, as the lithic volcanics have the same phenocryst assemblage as the scoria and glass.
The remainder of Subunit 2b is a homolithic hyaloclastite containing clasts of black, glassy olivine + orthopyroxene-phyric scoria (up to 4 cm diameter; most 1–2 cm across; 20%–30% of the deposit) in a matrix of altered glass and mineral fragments (olivine and orthopyroxene). Vesicles in the scoria are commonly elongated, likely by magma flow in a volcanic conduit. The matrix consists of glass ash (now replaced by calcite and clay), small glass granules, and mineral grains (olivine and orthopyroxene) replaced in part by calcite and clay. It is interpreted as a primary submarine pyroclastic flow deposit, in part resedimented by gravity flows (rare graded horizons). The primary nature is suggested by the lack of exotic clasts and by the common mineral assemblage in both the scoria clasts and the matrix. The clasts contain (on average) 3%–5% olivine and 3% orthopyroxene phenocrysts that range in size from 0.5 to 1 mm. The groundmass material in the various clasts ranges from moderately altered mesostasis to fresh glass. Subunit 2b is chemically identical to Subunit 2a (high-silica boninite).
Subunit 3a
- Interval (top): 352-U1439C-4R-1, 0 cm
- Depth: 201.60–240.80 mbsf
- Thickness: 39.20 m (5.50 m recovered)
- Rock type: olivine + orthopyroxene-phyric high-silica boninite
- Deposit: pillow lava with interpillow breccia
Subunit 3a consists of small pillows and pillow “knobs” interbedded with a breccia consisting of boninite fragments in an altered matrix. Subunit 3a lavas are purple-gray and sparsely to moderately phyric, with ~5% orthopyroxene and up to 25% olivine. Phenocryst sizes range up to 1 mm in diameter. The groundmass consists of acicular orthopyroxene and clinopyroxene in a glassy matrix. The groundmass varies from fresh glass to a moderately altered crystalline mesostasis. A perplexing common subcentimeter-scale “globular” texture is observed in many lavas, perhaps formed as a result of quenching (Figure F27B). Subunit 3a lavas are high-silica boninites, with low TiO2 (≤0.25 wt%), low Ti/Zr (≤50), and 300–1000 ppm Cr.
Subunit 3b
- Interval (top): 352-U1439C-8R-1, 0 cm
- Depth: 240.8–243.02 mbsf
- Thickness: 2.22 m (1.94 m recovered)
- Rock type: olivine-phyric high-silica boninite
- Deposit: hyaloclastite breccia/pyroclastic flow deposit
Subunit 3b consists of a hyaloclastite breccia containing three distinct clast types: (1) moderately olivine-phyric boninite containing 15% vesicles, (2) sparsely to moderately olivine-phyric boninitic scoria containing 40% vesicles, and (3) fresh aphyric glass with orthopyroxene microlites. The clasts are embedded in a green hyaloclastite matrix. Olivine phenocrysts are present in the hyaloclastite material and likely derive from the olivine-rich scoria. Subunit 3a may represent a primary or partially resedimented submarine pyroclastic flow deposit, with lithic clasts derived from the same source as the glass and scoria. Subunit 3b is chemically similar to Subunit 3a.
Unit 4
- Interval (top): 352-U1439C-8R-2, 76.5 cm
- Depth: 243.02–251.04 mbsf
- Thickness: 8.02 m (0.98 m recovered)
- Rock type: augite + plagioclase-phyric high-magnesium andesite
- Deposit: pillow lava
Unit 4 is composed of macroscopically aphyric high-magnesium andesite lava with 3%–10% vesicles, some of which are pipe vesicles. Microscopic examination of thin sections shows sparse augite (2%) and plagioclase (1%) microphenocrysts suspended in a matrix of plagioclase needles. Moderately altered mesostasis is found between plagioclase crystals. Some of this mesostasis was removed into segregation veins. Note that the uppermost two pieces in Section 352-U1439C-9R-1 are purple-gray pillow lava and are interpreted as fall-in from Subunit 3a higher in the section. Unit 4 is low in TiO2 (≤0.4 wt%), low in Cr (<400 ppm), and has a low Ti/Zr ratio (<80), which is similar to that of the overlying boninites.
Unit 5
- Interval (top): 352-U1439C-9R-1, 44 cm
- Depth: 251.04–285.10 mbsf
- Thickness: 34.06 m thick (8.62 m recovered)
- Rock type: olivine + orthopyroxene ± augite-phyric basaltic boninite
- Deposit: pillow lava with interpillow breccia and glass
Unit 5 consists of boninite pillow lava that is moderately to highly phyric with olivine > orthopyroxene (typically 5%–20% olivine phenocrysts, ~2%–8% orthopyroxene phenocrysts, and ≤5% augite phenocrysts [Figure F24]). The common occurrence of augite phenocrysts (in addition to olivine and orthopyroxene) and the absence of groundmass plagioclase are characteristic of basaltic boninite. Pillow rims and glass are commonly preserved along with slivers of interpillow breccia. In many places it appears that the highly phyric lavas represent the cumulus-enriched lower portions of large pillow lavas; the upper portions and small pillows are commonly aphyric or sparsely phyric. This unit tends to be highly altered, as described below in Alteration.
Unit 5 is characterized chemically by low TiO2 (≤0.4 wt%), ~200–2000 ppm Cr, and very low Zr (15–25 ppm), resulting in high Ti/Zr ratios (80–110). The higher magnetic susceptibility compared to other boninites likely results from the high degree of alteration and the presence of secondary iron oxides (Figure F25).
Unit 6
- Interval (top): 352-U1439C-14R-1, 0 cm
- Depth: 285.10–390.40 mbsf
- Thickness: 105.3 m (45.0 m recovered)
- Rock type: olivine ± orthopyroxene-phyric low-silica boninite
- Deposit: pillow lavas (including megapillows) with interpillow breccia
Unit 6 is a sparsely to highly olivine-phyric boninite consisting entirely of pillow lava flows with interpillow breccia. Orthopyroxene phenocrysts are rare, but chromite microphenocrysts are relatively common (up to 1%; Figure F24). The unit is a distinctive purple-gray color, similar to Subunit 3a, again with common globular textures (Figure F27C). Olivine phenocrysts (0%–25% modal) are typically ≤1.0 mm but can be up to 7 mm in diameter; orthopyroxene phenocrysts (0%–2% modal) are smaller. Unit 6 contains a likely megapillow in its lower part, as exposed across multiple sections of a single core (19R). The megapillow has margins at Sections 19R-2, 116 cm (top), and 19R-4, 75 cm (bottom). This suggests a thickness of ~229 cm (2.3 m), much greater than normal pillow thicknesses (30–60 cm). The interpretation of a megapillow instead of a sheet flow is supported by the presence of smaller pillows above and below. Unit 6 is a low-silica boninite with high Cr (600–1200 ppm), low TiO2 (0.30–0.40 wt%), and Ti/Zr of 65–75, on the border of the canonical limit for boninites.
Unit 7
- Interval (top): 352-U1439C-26R-3, 38 cm
- Depth: 390.40–397.75 mbsf
- Thickness: 7.35 m thick (1.67 m recovered)
- Rock type: augite ± olivine ± plagioclase-phyric high-magnesium andesites
- Deposit: massive lava; allochthonous, with fault breccias at upper and lower contacts
Unit 7 is an allochthonous (fault bounded) sliver of massive high-magnesium andesite. Two varieties are present: (1) augite + plagioclase-phyric high-magnesium andesite with groundmass plagioclase and transitional chemistry (TiO2 = ~0.5 wt%; upper sliver) and (2) augite ± olivine-phyric high-magnesium andesite with groundmass plagioclase replaced by zeolites (TiO2 = ~0.25 wt%; lower sliver). The lower high-magnesium andesite has euhedral to subhedral augite phenocrysts that commonly form glomerocrysts and are associated with alteration products that may pseudomorph olivine and plagioclase. These allochthonous high-magnesium andesite are bounded on their upper and lower contacts by cataclasites and may also be separated from one another by fault(s) (see Structural geology). Unit 7 is characterized by high Ti/Zr (100–120) and relatively high magnetic susceptibilities.
Unit 8
- Interval (top): 352-U1439C-27R-1, 75 cm
- Depth: 397.75–476.21 mbsf
- Thickness: 78.46 m thick (36.37 m recovered)
- Rock type: olivine (± orthopyroxene, ± augite)-phyric low-silica boninite with intercalated augite-phyric high-magnesium andesite
- Deposit: pillow lava, some massive flows
Unit 8 consists of sparsely to moderately olivine ± orthopyroxene ± augite-phyric boninite pillow lava (typically 5%–25% olivine, 0%–5% orthopyroxene, and 0%–5% augite phenocrysts; Figure F28C). Phenocrysts are typically <1.0 mm but can range up to 7 mm across. The boninites are dark gray to black and are commonly characterized by the globular texture previously documented in Subunit 3a and Unit 6 (Figures F27B, F27C). In the lower half of the section, many of the boninites have vitrophyric textures with olivine phenocrysts (typically 10%–20%; 0.5–2.0 mm in size) embedded in a glassy matrix of hyaloclastite and pillow rim breccias. The pale tan glass commonly features biogenic microtubules (Figures F29C, F29D; see Alteration).
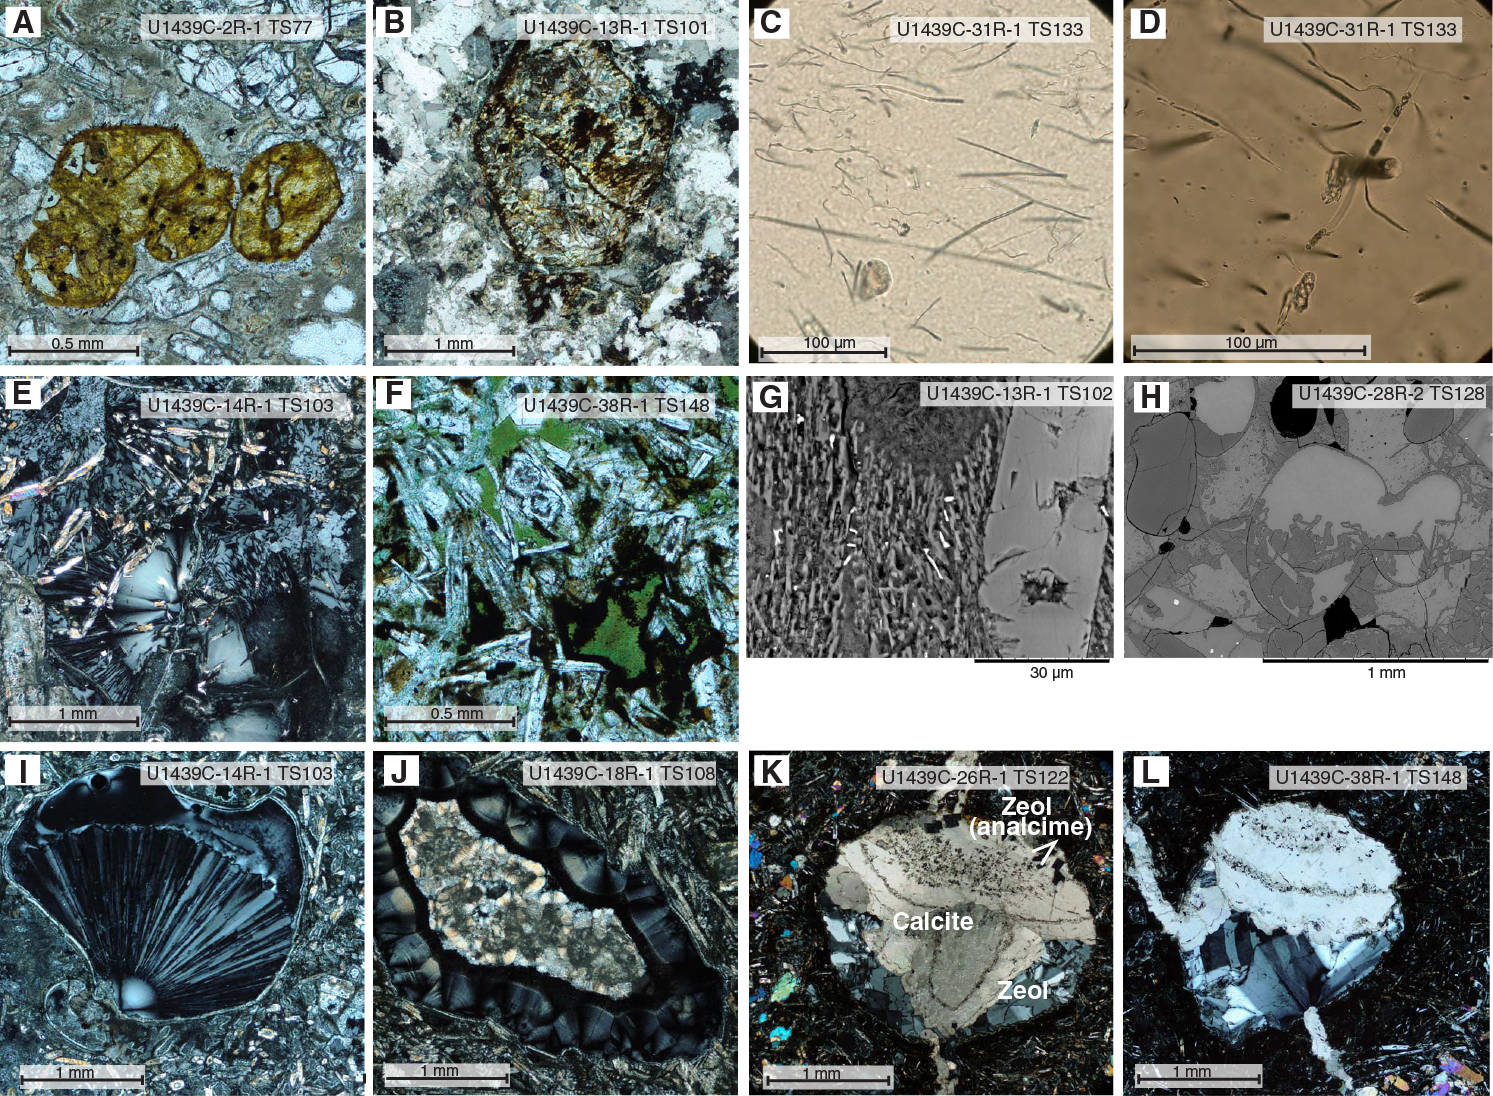
Figure F29. Alteration features, Hole U1439C. A. Smectite pseudomorphs in boninite. B. Clay, calcite, and Fe oxyhydroxide pseudomorph of olivine in calcite matrix. C, D. Biogenic tubules. E. Zeolite replacing glass. F. Green smectite or mixed-layer clay replacing groundmass. G. Groundmass altered to fibrous zeolites. H. Calcite replacing glass. I. Zeolite vesicules in vesicular boninites. J. Secondary saponite in zeolite. K, L. Zeolite and calcite geopetals.
High-magnesium andesite is intercalated with low-silica boninite throughout Unit 8. The high-magnesium andesite is typically light gray with augite and less abundant olivine phenocrysts, which range in size from 0.5 to 1 mm in diameter. Augite phenocrysts (5%–10% modally) are more abundant than olivine (2%–3% modally) (Figure F28D). High-magnesium andesites are recognized using pXRF data by their low Cr concentrations (<300 ppm) and high magnetic susceptibilities (≥400 IU compared to <300 IU typical of boninites; Figure F25). Vesicularity is highly variable over short length increments, the boninites being more vesicular than the high-magnesium andesites.
Intervals where high-magnesium andesite is present commonly show evidence for magma mingling (Figure F27D). Mingling is readily observable between dark, highly vesicular boninite (Cr > 700 ppm) and lighter, relatively homogeneous nonvesicular high-magnesium andesite (Cr < 300 ppm and magnetic susceptibility > 400 IU). Contacts between the boninite and high-magnesium andesite range from diffuse around smoothly curved boundaries to sharp against more angular boundaries. Boninites of Unit 8 are low-silica boninites containing low TiO2 but relatively high Ti/Zr (65–75). Unit 8 high-magnesium andesites have low Cr concentrations (<300 ppm), but their Ti/Zr ratios are essentially identical to the low-silica boninites, suggesting they are derived from a similar parent magma.
Subunit 9a
- Interval (top): 352-U1439C-36R-1, 110.5 cm
- Depth: 476.21–504.30 mbsf
- Thickness: 28.10 m (2.96 m recovered)
- Rock type: aphyric to sparsely augite-phyric high-magnesium andesite
- Deposit: pillow lava with some massive sheet flows
Subunit 9a consists of microcrystalline, sparsely vesicular high-magnesium andesite lava with plagioclase and clinopyroxene in the groundmass (Figure F28E). Augite is the dominant phenocryst phase (0%–7% modally), ranging in size from 0.2 to 0.5 mm. Cataclastic deformation is common, and many fragments have polished surfaces with slickensides. The contact between Subunits 9a and 9b may be a fault (see Structural geology). Subunit 9a high-magnesium andesites have low Cr (<200 ppm) and Ti/Zr ratios of 60–70, similar to Unit 8.
Subunit 9b
- Interval (top): 352-U1439C-39R-1, 0 cm
- Depth: 504.30–514.10 mbsf
- Thickness: 9.80 m thick (7.32 m recovered)
- Rock type: aphyric high-magnesium andesite
- Deposit: pillow lava (single flow)
Subunit 9b consists of aphyric microcrystalline high-magnesium andesite with modal plagioclase in the groundmass and sparse microphenocrysts of olivine. Dark gray-green pillow lava forms massive lobes that span several sections and range from 30 to 100 cm in height. These lavas are characterized by abundant dark spots and linear millimeter-scale features that appear to be segregations of late magmatic melt. These segregations contain the same phase assemblage as the host basalt but have significantly lower Cr concentrations. Pillow margins are defined by dark gray-green clay (altered volcanic glass) that curves through the core and allows robust estimates of pillow size (Figure F27E). The consistency in appearance of this subunit from top to bottom, the well-defined pillow margins apparent throughout, and its thickness (no more than 9.8 m, based on high-recovery core runs) all suggest it represents a single lava flow. Subunit 9b has higher Ti/Zr ratios (75–120) than Subunit 9a.
Unit 10
- Interval (top): 352-U1439C-41R-1, 0 cm
- Depth: 514.10–542.23 mbsf
- Thickness: 28.13 m thick (7.56 m recovered)
- Rock type: aphyric to olivine + augite-phyric high-magnesium andesite and boninitic dolerite
- Deposit: dikes and/or sills
Unit 10 consists of microcrystalline to fine-grained high-magnesium andesite with modal plagioclase in the groundmass and microphenocrysts of olivine and augite (Figure F28F). Massive dark gray to black high-magnesium andesite dominates in the shallower sections, but coarser grained gray-green dolerites become dominant downsection. Only one piece in this unit appears volcanic (Sample 352-U1439C-44R-1 [Piece 11]). Chilled margins are present, indicating that much of this unit is a dike complex with relatively minor screens of remnant volcanic rocks. This unit is characterized chemically by relatively high TiO2 (0.35–0.5 wt%), high Ti/Zr (75–110), and low Cr (<500 ppm).
Fault rocks are common in Cores 41R to 43R, including breccia and sheared phacoidal fragments with polished surfaces.
Alteration
Cores 2R to 3R in Hole U1439C are variably altered, with fresh glass contrasting with completely altered olivine-rich boninites. Olivine-rich zones tend to be more altered, with complete replacement of olivine phenocrysts by smectite and partial alteration of groundmass to zeolites (largely phillipsite) with greater or lesser amounts of clay minerals (Figure F29A). Aphyric or microporphyritic zones are typically less altered with fresh pyroxene microlites and fresh glass (Figure F28). Devitrification spherulites are common and may be associated with an alteration front (Figure F30A). Zeolites and clay minerals with minor calcite and sulfides form the alteration mineral assemblage in these cores, and the abundant vesicles are filled with zeolites (e.g., Figure F29I).

Figure F30. Main alteration features, Hole U1439C. A. Alteration of phyric to aphyric pillow rim: olivine is completely altered to smectite, whereas the glassy rim remains mainly fresh. B. Highly vesicular boninite showing zeolite, saponite, and calcite fillings. C. Fe oxyhydroxide alteration along veins in dolerites.
The amount of calcite replacing phenocrysts and groundmass increases in Unit 3 and reaches a maximum in Unit 4–6 pillow breccias (from Core 352-U1439C-7R to 17R), where boninitic matrix can be entirely replaced by calcite (Figure F29B). The interpillow breccia is more altered with the primary lithologies transformed into zeolite and calcite (Figures F29E, F29H). In the most altered samples in Cores 10R to 13R, tiny iron oxides aligned with zeolite fibers are frequently observed (Figure F29G). They are probably the alteration product of groundmass alteration along with zeolite. Pillow centers are generally slightly altered, whereas rims are more commonly strongly altered. Whatever the alteration degree, the secondary assemblage remains the same (i.e., local but pervasive replacement of the original minerals and glass by zeolites and calcite) (Figures F29B, F29E). Vesicles are commonly filled with calcite, zeolite and minor clays in this interval (Figure F29I–F29K). Geopetal structures in vesicles, with later calcite overlying early crystallizing zeolites and indicating the orientation of the samples, are frequently observed from Unit 5 to the bottom of the hole (Figures F29K, F29L).
Below Core 18R and downhole to Core 27R, the amount of calcite as a replacement mineral decreases and the alteration type again becomes dominated by zeolites (phillipsite, natrolite, and analcime) with minor clay minerals. The alteration degree is variable but stays low on average. Intensity of alteration in olivine-phyric intervals is moderate, with complete replacement of olivine by clays, Fe oxyhydroxides, and calcite. Altered glass is transformed in varying degrees to zeolite or palagonite. Saponite is abundant, and talc is present in altered groundmass and as vesicle-filling minerals over a short interval from Core 22R to 26R. Zeolite-filled vesicles (Figure F29H) remain common and may coexist with calcite and/or clay-filled vesicles in the same piece (Figure F30C). Secondary calcite is commonly present in rocks downhole to Core 42R, although vesicularity drops to almost zero. Native copper was found in Core 18R.
Greenish smectite-group or mixed-layer clays first replaces groundmass in Core 26R (Figure F29F) and becomes the main alteration phase below Core 29R down to the bottom of the hole. In this interval, calcite is sporadically abundant but generally tends to decrease. The alteration degree is low in this interval (i.e., glass, groundmass, and minerals are replaced only to a low degree by secondary minerals). However, high amounts of zeolites (largely natrolite, but also chabazite and phillipsite), calcite, and clay minerals may be present in the rocks within the vesicles (Figures F29H, F29L, F30B). Lizardite serpentine was found in Core 29R. In Cores 28R through 33R, microtubules probably produced by microorganisms were commonly observed in fresh glass, attesting to the physicochemical conditions favorable to these organisms (Figures F29C, F29D).
Below Core 41R and to the bottom of the hole, quartz is present in the altered doleritic groundmass and rarely replaces plagioclase, suggesting a change in the alteration conditions at the very bottom of the hole. Fe oxyhydroxides (Figure F30D) and minor sulfide also were encountered in this section of the hole. Green amphibole is observed sporadically replacing the margins of pyroxene grains adjacent to pockets of altered mesostasis in the dolerites. This amphibole is interpreted to represent pneumatolytic alteration formed in response to high water contents during the final stages of magma crystallization.
In summary, alteration in Hole U1439C is characterized by the presence of several types of zeolite, clay minerals, and variable amounts of calcite. Background alteration minerals tend to be the same as in vesicle filling. Exotic alteration products such as native copper and sulfides appear rarely associated with veins.
Veins and halos
Veins are extremely abundant in Hole U1439C downhole to the boundary between boninite pillow lavas and dolerites. Isolated zeolite or calcite veins and calcite vein networks are present. Rare green phyllosilicate veins (possibly smectite group or interlayered chlorite-smectite) appear below Core 352-U1439C-26R (Figure F31F). Veins are usually thin (<5 mm) and show irregular dips and shapes (see Structural geology). Clasts of the host rock of various sizes are present in the veins. In the highly vesicular zones, veins tend to join the vesicles (Figure F31C). Zeolite and calcite veins can have fibrous textures with grains growing from the borders to the cores of the cracks (Figure F31E, F31F). XRD analysis of the content of the zeolite veins showed that phillipsite and natrolite are dominant. Secondary crystallization of calcite or clays in the center of zeolite veins is frequent and shows that zeolite is the first mineral to crystallize in veins. Calcite may replace phillipsite (Figure F31D) or contain euhedral microcrystals of another type of zeolite (most probably analcime or natrolite), evidence for a complex equilibrium in zeolite stability field during vein crystallization.
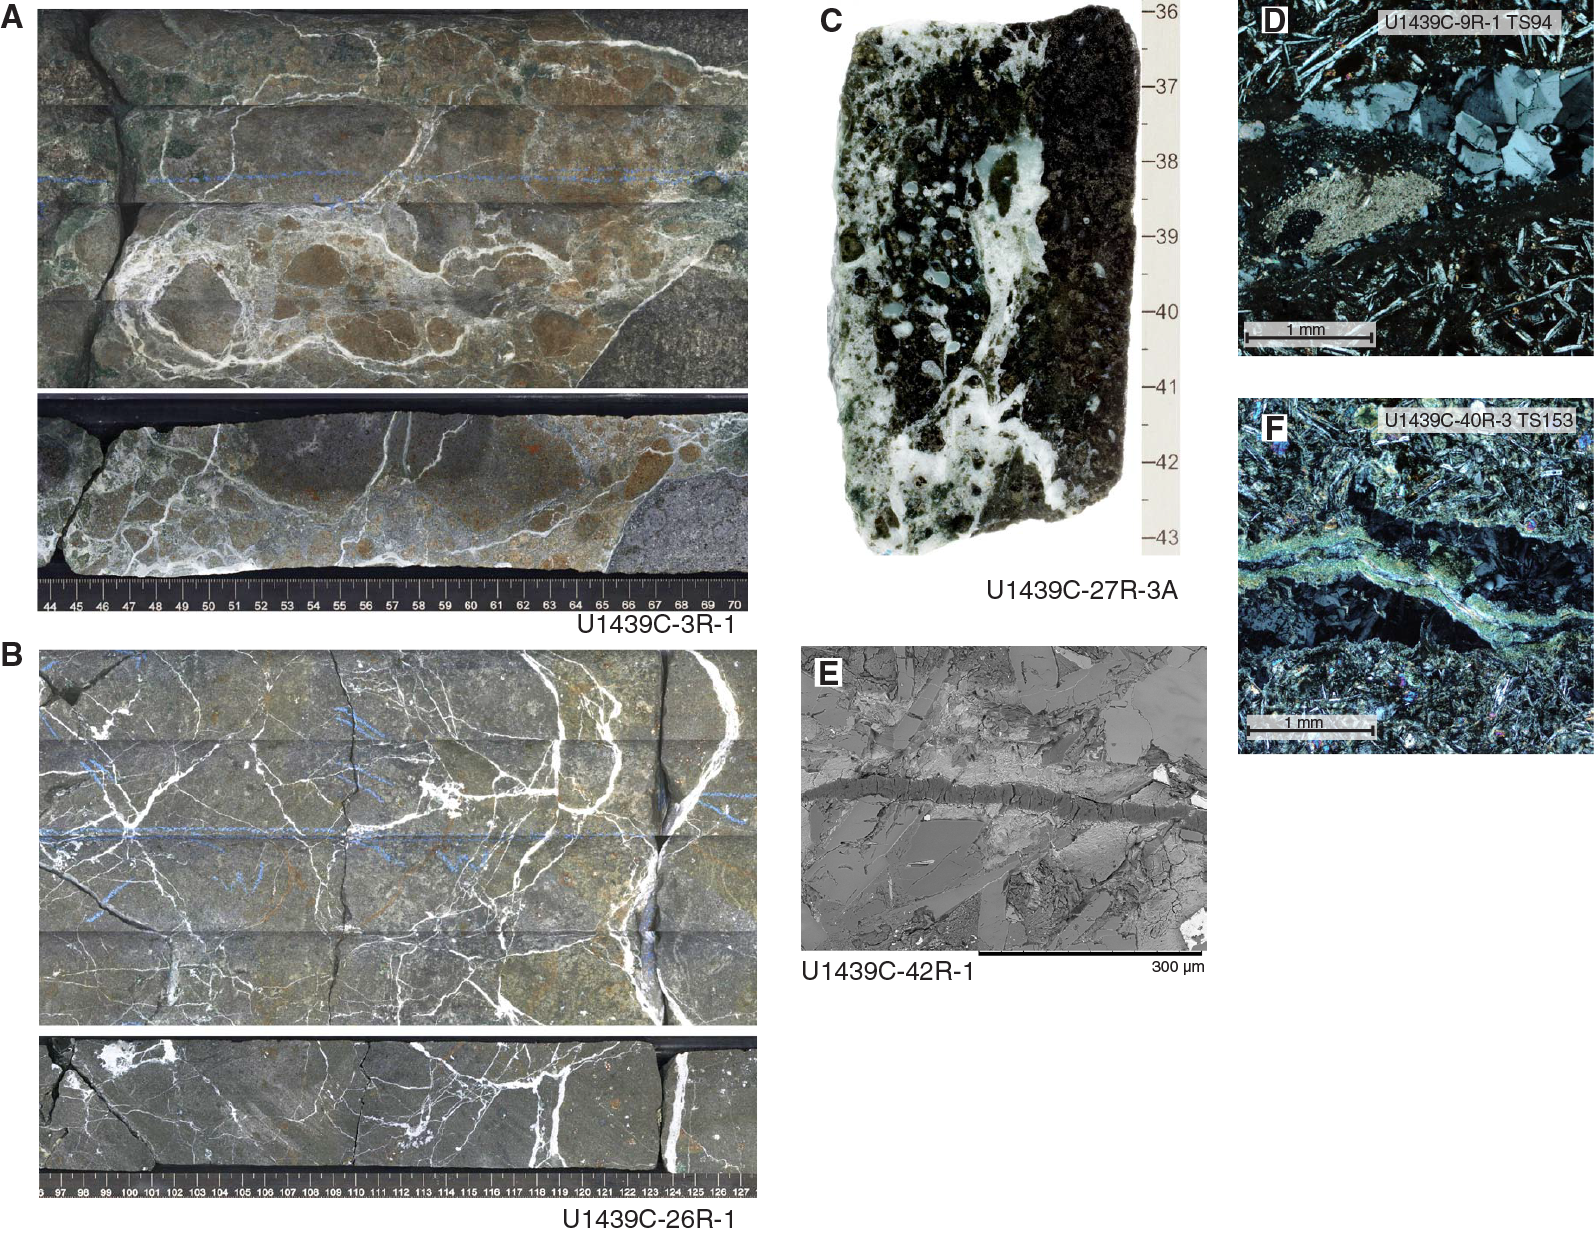
Figure F31. Vein features, Hole U1439C. A. Highly fracturing calcite vein network. B. Relatively dense network of calcite veins. C. Partly brecciated boninite with cataclastic calcite vein network partly connected to vesicles. D–F. Zeolite veins showing partial replacement by calcite, oxidizing halo, and crosscut by a clay vein.
The most common and abundant type of vein is filled with calcite, sometimes associated with minor clay or zeolite. Calcite veins form complex networks of variable density with random orientations (Figures F31A, F31B, F31C). These networks are omnipresent below the hyaloclastite in the pillow lava formations from Core 4R and downhole to Core 41R. Calcite vein thickness ranges from <1 mm to ~1 cm with textures varying from polycrystalline to cataclastic. Variations in thickness within a vein may indicate an irregular fracturing regime. Most of the veins do not show any alteration halos, implying rapid sealing of the fractures and little pervasive reaction with the host. Alteration halos are more common at the bottom of the hole, below Core 32R, along veins, consisting mainly of replacement of the primary lithology by smectite or mixed-layer clays (i.e., the same mineral as the vein filling). Alteration halos along zeolite veins, when present, mainly exist in an oxidization front from the vein with microcrystallization of iron oxide in fractures, affecting the original lithology within a few hundreds of micrometers from the vein (Figure F31E).
Discussion
Igneous rocks at Site U1439 are dominantly boninites characterized by phenocrysts of olivine and orthopyroxene, which are typically set in a groundmass of pale glass and acicular pyroxene prisms. Phenocryst and groundmass assemblages document a range in boninite compositions: (1) orthopyroxene ≥ olivine phenocrysts with an orthopyroxene-dominated groundmass (Units 1–3), (2) olivine > orthopyroxene ± augite phenocrysts with augite + orthopyroxene in the groundmass (Units 6 and 8), and (3) olivine + orthopyroxene + augite phenocrysts in subequal proportions with an augite-rich groundmass (Unit 5). Geochemically, these correspond to (1) very low Ti/Zr ratios (<60) and TiO2 contents (<0.4 wt%), (2) intermediate Ti/Zr ratios (65–75) with low TiO2 (<0.45 wt%), and (3) high Ti/Zr ratios (80–110) with low TiO2 (<0.45 wt%). Group 1 comprises high-silica boninites, Group 2 comprises low-silica boninites, and Group 3 comprises basaltic boninites.
High-magnesium andesites at Site U1439 may be identified in the core based on the occurrence of modal plagioclase in the groundmass and high magnetic susceptibilities. They are notable, however, for their very low TiO2 concentrations (generally <0.5 wt%) and Ti/Zr ratios (70–110). These values are similar to those in Group 2 low-silica boninites and Group 3 basaltic boninites and suggest that the Site U1439 high-magnesium andesites formed by fractionation of these boninite parent magmas. High-magnesium andesites with Ti/Zr < 60 are rare, which implies that few are related to Group 1 high-silica boninites.
The abundance of low-silica boninites is interesting because they are considered subsidiary to high-silica boninites in the IBM system, though they are common in the Tonga system and in many ophiolites.
Sediment and rock geochemistry
Whole-rock chemical analyses were performed on 70 samples representative of the different sediment and igneous rock lithologies recovered from Holes U1439A and U1439C.
In Hole U1439A, 20 sediment samples were collected from Cores 352-U1439A-1H through 20X (1 per core) together with two samples marking the transition from sediment to igneous basement in Section 352-U1439A-20X-2W at 178.5 mbsf. Where possible, an XRD sample was taken next to the geochemistry sample for detailed mineralogical characterization (see Alteration). Additionally, one orthopyroxene-phyric volcanic rock was sampled in Section 21X-1 next to a thin section (see Petrology for thin section petrographic description), and one volcanic glass was sampled in Section 23X-1. The 24 samples were analyzed for major and trace element concentrations and volatile contents following the protocol described in Sediment and rock geochemistry in the Expedition 352 methods chapter (Reagan et al., 2015a). Three samples were, however, too small to be analyzed for loss on ignition (LOI): the two sediment samples from Section 20X-2 and the glass sample from Section 23X-1.
In Hole U1439C, 46 igneous rocks were selected by the shipboard science party as representative of the different lithologic units recovered from this hole. All samples were taken next to a thin section. On the basis of petrography, recovered igneous rocks were described as boninites or high-magnesium andesites, with several samples showing evidence of intermingling. See Petrology for lithologic units, thin section petrographic descriptions, and macroscopic descriptions.
The sample powders of the 46 igneous rocks from Hole U1439C were ignited and analyzed for major and trace element concentrations by ICP-AES. Samples having LOI > 2 wt% were additionally analyzed for volatile element content (CO2 and H2O) via gas chromatography on nonignited powders. An aliquot of each ignited sample powder used for ICP-AES analyses was subsequently used for XRF analyses, which were carried out using the Niton handheld pXRF spectrometer. The analytical procedures, precision, and accuracy of these methods are described in detail in Sediment and rock geochemistry in the Expedition 352 methods chapter (Reagan et al., 2015a).
The major, trace, and volatile element compositions of the sediment and igneous rock samples are reported in Tables T7 and T8. The results of the pXRF analyses of Hole U1439C igneous rock powders are in Table T9. The pXRF spectrometer was also used as a tool for the chemostratigraphic analysis of cores. The rock surfaces of 350 pieces from the archive halves of Hole U1439C cores were analyzed for Ti, Ca, K, Rb, Sr, Zn, Cu, Cr, V, and Zr. These results are reported in PXRF in Supplementary material and discussed in Petrology.
Table T7. ICP-AES, CHNS, and coulometry major, trace, and volatile element concentrations of sediment samples, Hole U1439A. Download table in .csv format.
Table T8. ICP-AES and CHNS major, trace, and volatile element concentrations of igneous rocks, Holes U1439A and U1439C. Download table in .csv format.
Table T9. pXRF major and trace element concentrations of igneous rocks, Holes U1439A and U1439C. Download table in .csv format.
Sediments
Analyzed sediment samples from Hole U1439A have LOI values ranging from 11 to 30 wt%. These values primarily reflect the high CO2 and H2O contents of samples that are dominantly composed of carbonates and/or clay (see Sedimentology). The samples have total CO2 contents ranging from 3 to 39.6 wt%. Carbon is primarily concentrated in carbonates in these samples (inorganic CO2 = 0.3–32.4 wt%; Figure F32) and directly reflects the lithologic units described in Sedimentology. Total organic carbon ranges from 0.11 to 1.6 wt%, with many samples falling below the detection limit. Total nitrogen values are <0.02 wt%. LOI was performed at 700°C for 6 h on all sediment to prevent devolatilization of alkali elements. Low LOI values compared to carbon concentrations in some samples demonstrate that such samples were affected by incomplete decarbonation during ignition. This is particularly pronounced in carbonate-rich samples, although it probably affects all ignited sediment. As a consequence, the measured concentrations are anomalously low and the sum of major oxides is commonly <100 wt% in the sediment samples. To overcome the effects of incomplete decarbonation, the chemical compositions of the sediment samples are normalized to 100% in Figures F33, F34, and F35.
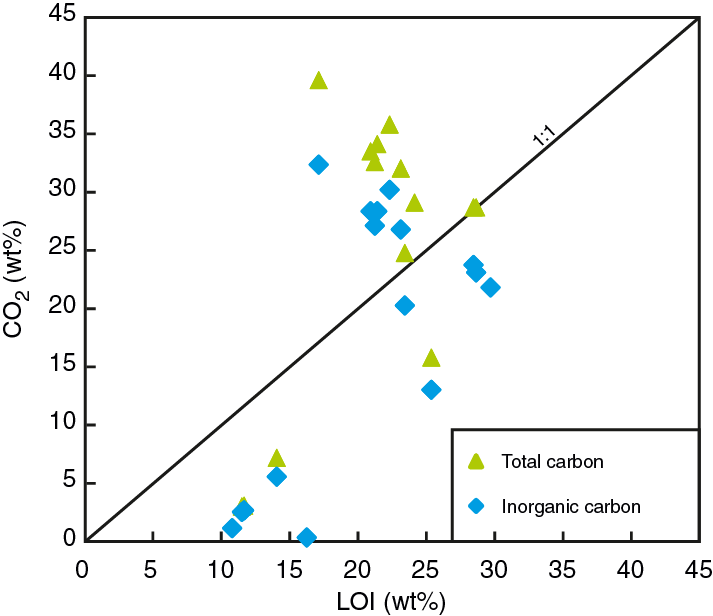
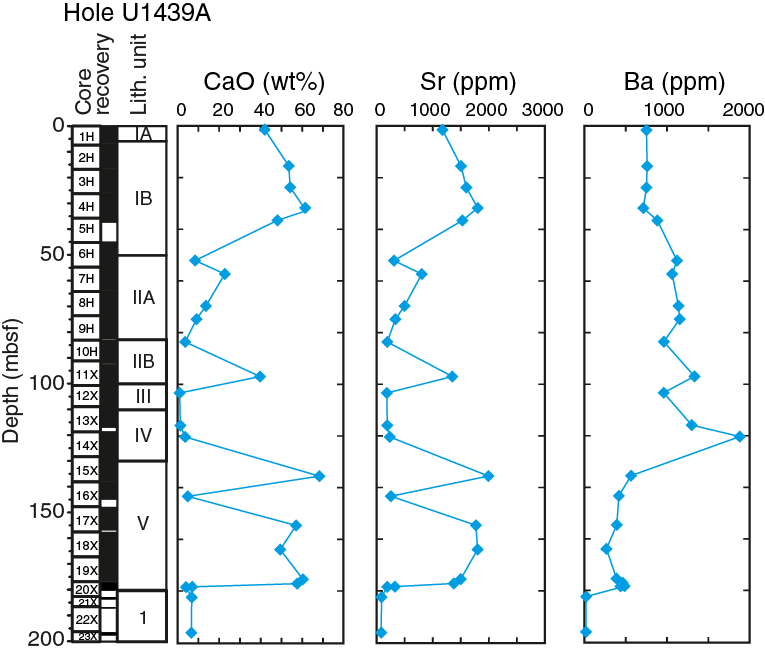
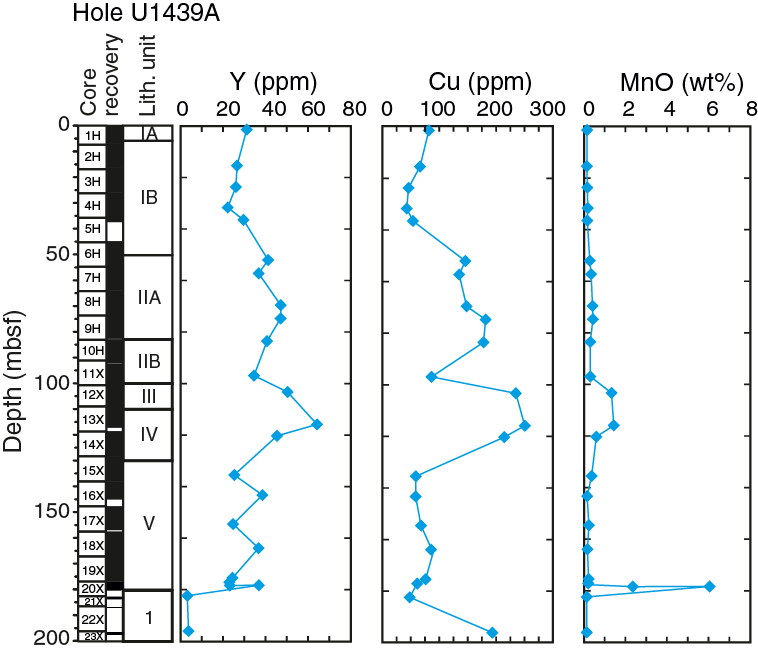
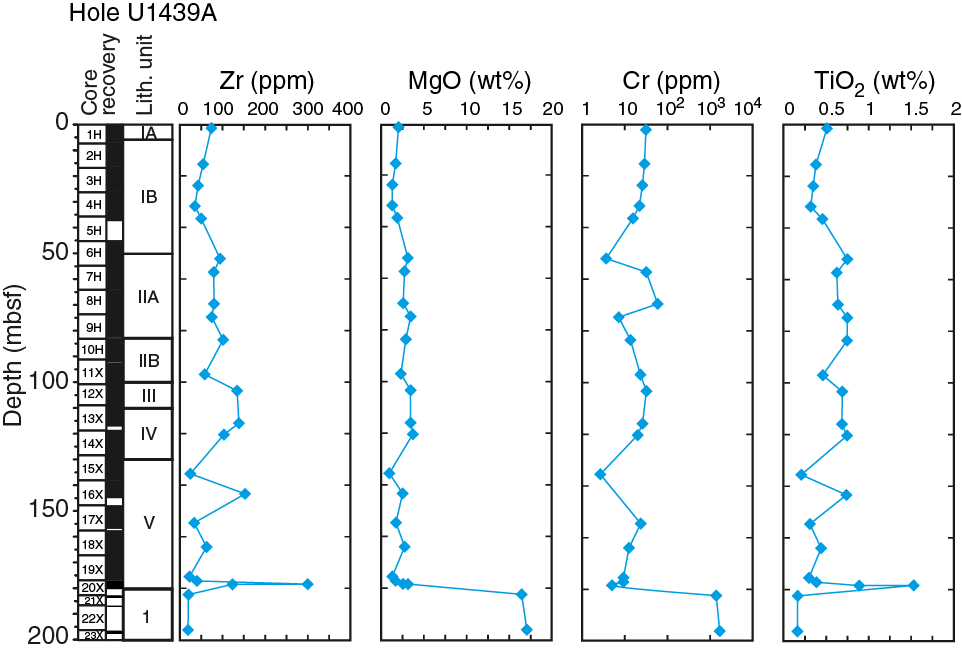
As described in detail in Sedimentology, Hole U1439A sediment shows a broad range of compositions that directly reflects the lithologic units, from the carbonate-rich calcareous ooze to the metal-rich clay and volcaniclastic-dominated silty muds. Their main characteristics are summarized below.
The calcareous nannofossil ooze and silty mud–dominated lithologies are characterized by high inorganic carbon (3.5–8.2 wt%) and CaO (22.7–61 wt%) contents (Figure F33). This is consistent with XRD analyses and indicates abundant calcite in these samples. These samples also display high Sr (800–2000 ppm) and relatively low Cu (46–135 ppm) concentrations. These compositions dominate Units I and V and are observed where minor amounts of calcareous nannofossil ooze were sampled toward the bottom of Subunit IIA.
The clay- and volcaniclastic-dominated silty muds are distinguished by higher contents of SiO2 (55–62 wt% relative to 20–31 wt% in carbonate-dominated lithologies) and Al2O3 (14.6–18.7 wt% relative to 5.5–13.7 wt% in carbonate-dominated lithologies). They are characterized also by variably enriched concentrations in trace elements such as Zr (75–150 ppm), Ba (420–1880 ppm), Y (40–65 ppm), Sc (20–35 ppm), and Cu (150–250 ppm), which probably reflect the relative abundance of volcaniclastic material in the analyzed samples. The highest values for these elements were measured in the lower part of Unit IV (~116–120 mbsf), which is also characterized by a slight enrichment in MnO (1.3–1.5 wt%).
A thin, muddy manganese-rich layer (MnO = 2–5 wt%) marks the lower limit of the sediment and the transition to igneous basement. The layer is characterized by strong enrichments in TiO2 (0.9–1.5 wt%), Ni (320–880 ppm), Cu (520–540 ppm), V (180–700 ppm), and Zr (120–300 ppm).
Igneous rocks
Two igneous rocks were sampled in Hole U1439A: one hyaloclastite (Sample 352-U1439A-23X-1, 0–33 cm) and one olivine-orthopyroxene-phyric volcanic rock (Sample 21X-1, 0–7 cm). These samples appear to be only slightly altered (LOI = 3.36 wt% in Sample 21X-1, 0–7 cm). Both samples are characterized by high MgO (16.4–17.1 wt%) and Cr (1400–1700 ppm) concentrations and have 54.7–56.2 wt% SiO2, 6.5–6.9 wt% CaO, and ~0.2 wt%. TiO2 (Figure F34). Such compositions are characteristic of boninites (Le Bas, 2000; Taylor et al., 1994). These samples are also depleted in Y and the heavy rare-earth elements (e.g., Y = 3–4 ppm), which is typical of this magma type.
The 46 igneous rocks sampled in Hole U1439C exhibit a broad range of mineral assemblages and chemical compositions, and on this basis are classified as high-silica boninites, low-silica boninites, basaltic boninites, and high-magnesium andesites (see unit names and thin section descriptions in Petrology). Boninites dominate most of the hole (igneous Units 1–8), with several sections in Units 6 and 8 showing evidence of magmatic intermingling between low-silica boninites and high-magnesium andesites. Olivine and orthopyroxene phenocrysts were observed throughout the cores recovered in Hole U1439C, and some sections, such as the Unit 5 basaltic boninite, are highly phyric with olivine, orthopyroxene, and augite phenocrysts. Low-silica boninites and high-magnesium andesites are the dominant lithology in Units 9 and 10. For simplicity, in the following paragraphs, we distinguish the analyzed samples on the basis of their thin section descriptions into 2 groups: plagioclase-bearing (largely high-magnesium andesite; Units 4, 7, 9, and 10) and olivine-pyroxene-bearing (plagioclase free, boninite; Units 1–3, 5, 6, and 8).
Hole U1439C igneous rocks are slightly to highly altered (see Alteration), as illustrated by LOI values ranging from 2.5 to 16.2 wt% (Table T8; Figure F36). No systematic variations in the degree of alteration downhole were observed petrographically, yet LOI values increase downhole and reach a maximum between 380 and 480 mbsf (LOI = 7.7–16.2 wt%). At 480 mbsf, a dry, brittle fault zone crosscuts the drilled section (see Structural geology) and marks the transition from Unit 8 to Subunit 9a. Below this zone, in Units 9 and 10, recovered samples have lower LOI (2.49–9.38 wt%). The LOI values primarily vary with H2O contents and thus with the amount and type of hydrous minerals present.
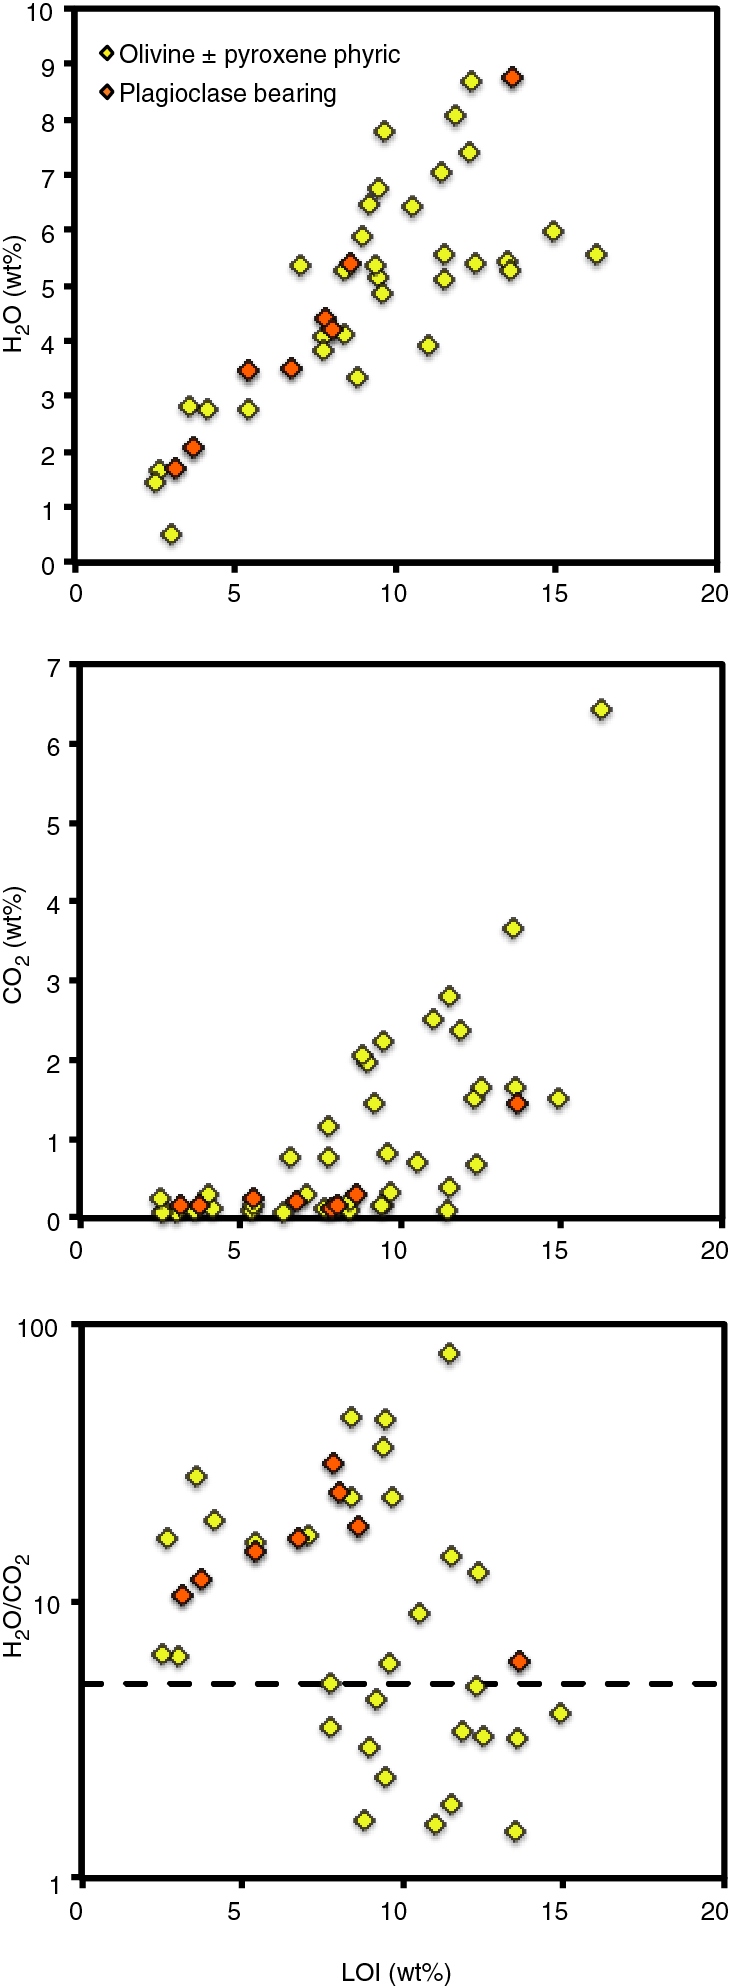
The olivine-pyroxene–bearing igneous rocks (Units 1–3, 5, 6, and 8) have CO2 contents of 0.10–3.67 wt%, while the plagioclase-bearing igneous rocks (Units 4, 7, 9, and 10) have CO2 contents <0.3 wt%. The highest CO2 values (2.2–6.4 wt%) were measured in plagioclase-bearing samples in Unit 7. However, several samples in Units 1–8 have high CO2 values whatever their primary assemblages. These high CO2 contents reflect the presence of carbonates, either in altered groundmass or mineral phases for the most altered olivine-pyroxene-bearing igneous rocks or in veins and fractured zones such as Unit 7 (see Alteration and Structural geology). In several samples, high CO2 is also associated with relatively high contents of CaO (e.g., 13.46–18.52 wt% in Unit 7 samples), demonstrating that alteration was not isochemical but may have significantly modified the primary major element compositions of these rocks. For this reason, Hole U1439C samples with micro- and macroscopic evidence for intense sample alteration (see Petrology), and with CO2 > 3 wt%, were considered unreliable for interpretation of their primary geochemical signatures.
Igneous rocks recovered from Hole U1439C are characterized by a broad range of SiO2 and MgO contents. The olivine-pyroxene-bearing and plagioclase-bearing igneous rocks overlap in SiO2 concentrations with ranges of 51.3–60.2 and 50.9–58.8 wt%, respectively. Both rock types plot predominantly in the basaltic andesite and andesite fields on the TAS diagram (Le Bas et al., 1986; Figure F37A), but this largely reflects their boninitic character rather than degree of differentiation. All of our analyzed samples have low TiO2 (<0.5 wt%). Together with their high SiO2 and MgO contents, this characteristic defines the igneous rocks recovered from Hole U1439C as belonging to the boninitic magma series (Figures F37, F38). They also have geochemical signatures, including high Cr and Ni concentrations (>221 and >109 ppm, respectively), high Mg# (cationic Mg/[Mg + Fe], with all Fe as Fe2+) of 64–80 (Figure F38), and CaO/Al2O3 of 0.49–0.93, which are largely similar to boninite series rocks described by Crawford (1989).
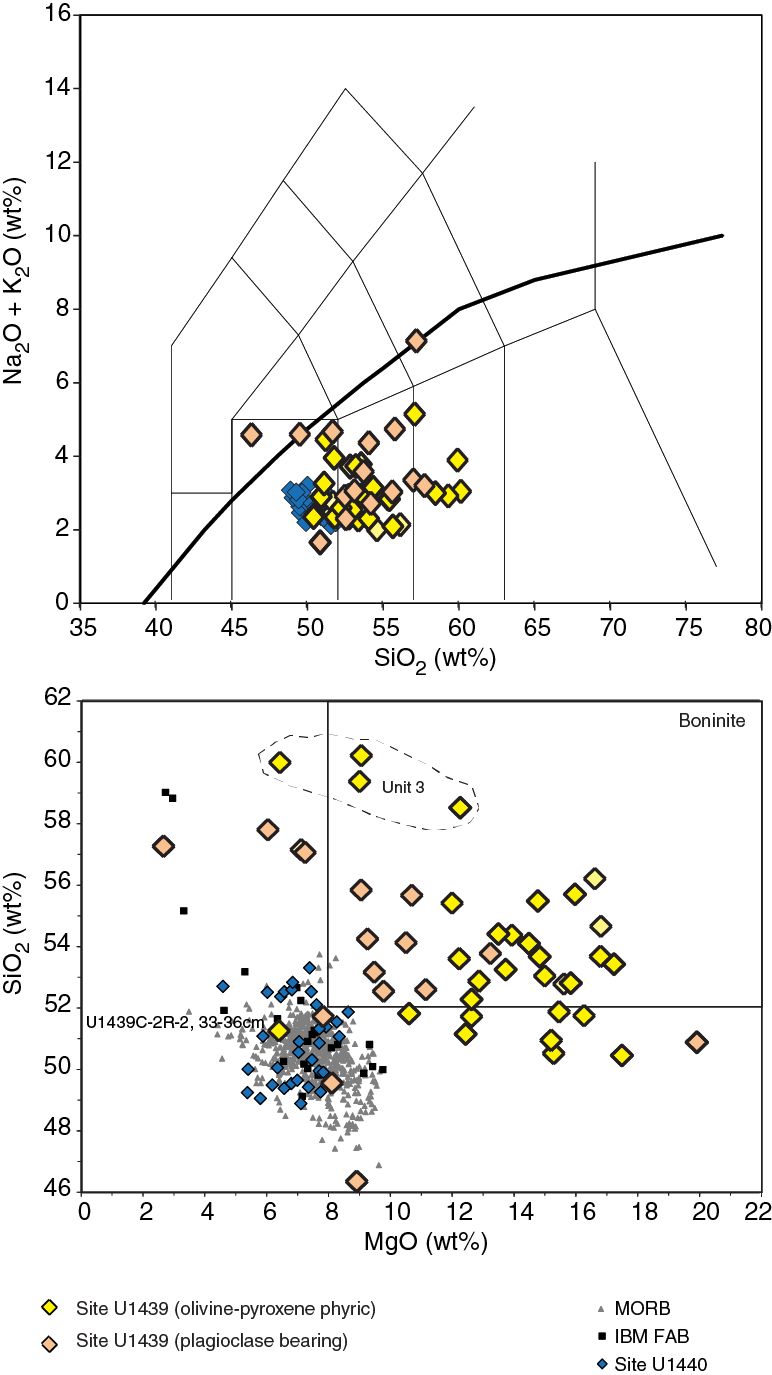
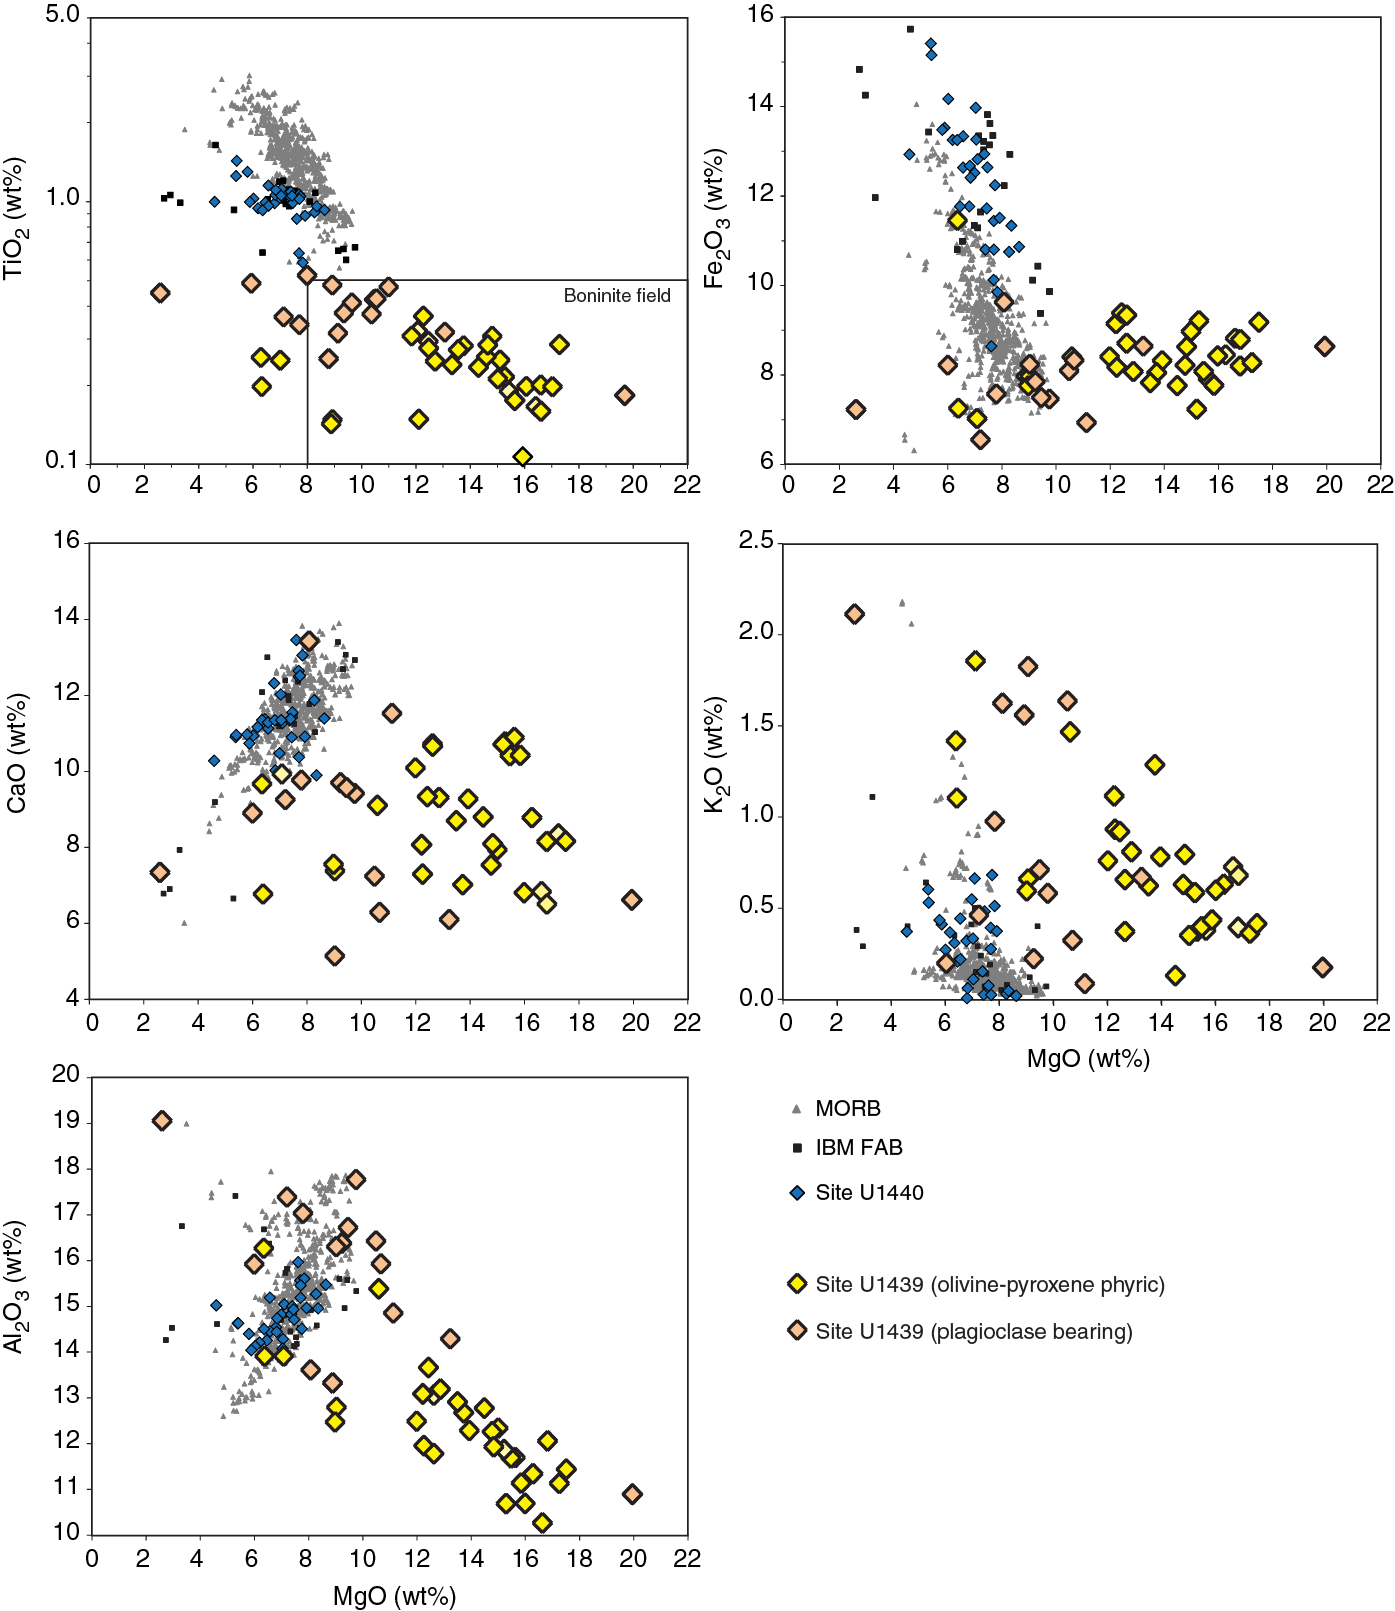
Boninite classification diagrams, plots of MgO versus SiO2 and TiO2 versus MgO, provide the means for assigning formal names to Site U1439 rocks based on the International Union of Geological Sciences (IUGS) boninite classification, which defines boninites as rocks with >8 wt% MgO, >52 wt% SiO2, and <0.5 wt% TiO2 (Le Bas, 2000). Pearce and Robinson (2010) argued that these constraints should be modified to take into account the presence of evolved members of the boninite series other than boninite sensu stricto. These diagrams have been used together with petrographic criteria to classify the boninitic lithologies recovered at Site U1439 (see Petrology). A part of the variability in the chemical compositions of the recovered samples reflects variable abundances of pyroxene and olivine phenocrysts. Highly olivine-phyric samples recovered in Units 5 and 8 (plagioclase-bearing Sample 352-U1439C-29R-4, 78–82 cm) have low SiO2 contents (50.4–51.8 wt%) but relatively high MgO (up to 20 wt%) and Ni (up to 710 ppm) contents compared to the other igneous rocks recovered at Site U1439 (Figures F37, F38, F39), reflecting crystal accumulation.
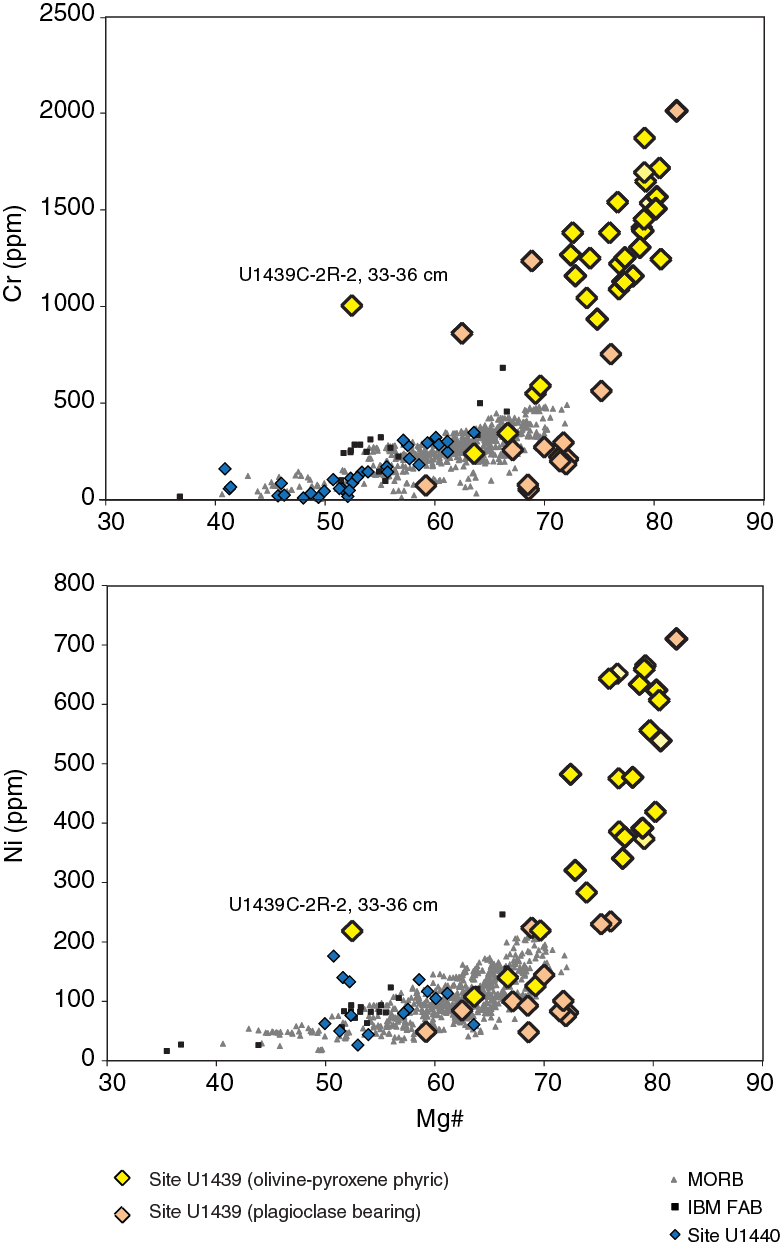
The Hole U1439C samples recovered from the upper part of the hole (Units 1–3) are distinguished by overall more Ti depleted compositions at a given MgO content as compared to those below (Figure F38). The most SiO2-rich samples are the olivine-pyroxene-bearing samples recovered from Unit 3 (58.5–60.2 wt%). Unit 3 samples have MgO contents overlapping those of the plagioclase-bearing samples, with MgO contents of 6.4–12.3 wt%. One olivine-pyroxene-bearing sample, Sample 352-U1439C-2R-2, 33–36 cm, an aphyric clast recovered in Unit 1, is distinguished by its low MgO (6.5 wt%) and SiO2 (51.3 wt%) concentrations. Units 1–3 have been defined as sampling high-silica boninites (see Petrology), and they plot mainly in the boninite field defined by Le Bas (2000) except for the most differentiated end-members of the series, Samples 7R-2, 59–61 cm, and 2R-2, 33–36 cm, which classify as high-magnesium andesites. This trend from boninites to high-magnesium andesites represents a “boninite volcanic series” (see Petrology).
With the exception of the samples recovered in Units 1–3, the olivine-pyroxene–bearing igneous rocks have overall higher MgO concentrations than the plagioclase-bearing samples, ranging from 10.6–17.5 wt% as compared to 6.05–13.2 wt%. Samples from deeper in Hole U1439C have generally higher TiO2 contents and show considerable variation in their CaO, Al2O3, and Fe2O3 abundances and are classified as low-Si boninites, and their differentiates to high-magnesium andesites (see Petrology). A number of these samples contain modal plagioclase in the groundmass, and these extend to lower MgO and compatible trace element abundances (Figure F39). In addition, a subset of the deeper Hole U1439C samples contain substantial clinopyroxene ± olivine phenocrysts. The higher proportions of these phenocryst phases in these rocks lead to lower abundances of SiO2 and higher abundances of MgO, and in one case (Sample 29R-4, 78–82 cm) to MgO values approaching 20 wt%. The effects of abundant olivine phenocrysts are also evident in their Cr and Ni concentrations, as the olivine-bearing samples form the high-abundance ends of these data arrays (Figure F39).
Overall, the igneous rocks at Site U1439 are distinguished from the basaltic suite recovered at Site U1440 by their MgO- and SiO2-rich and TiO2-poor compositions (Figures F38, F39), as well as by the large observed ranges for MgO (6.0–17.5 wt%), CaO (5.2–11.6 wt%), Al2O3 (10.7–18.1 wt%), and K2O (0.1–1.8 wt%) contents. Site U1439 igneous rocks are also significantly depleted in incompatible, high–field strength trace elements compared to mid-ocean-ridge basalt (MORB) and FAB from Site U1440 (Figure F40). Although they overlap in composition, olivine-pyroxene-phyric samples have broadly lower V (115–228 ppm), Y (5–19 ppm), and Zr (13–46 ppm) contents compared to the plagioclase-bearing samples (V = 207–245 ppm, Y = 11–17 ppm, and Zr = 34–52 ppm). They plot at the most depleted end of Site U1440 compositions for Ti, V, and Y and overlap in composition with Site U1440 igneous rocks for the most incompatible element, Zr.

Variations in highly incompatible and mobile alkaline elements such as Sr and K also distinguish Site U1439 from Site U1440 samples. These elements are sensitive to chemical exchange between water and rock and, as such, hydrothermal alteration and seafloor weathering can modify their primary abundances. However, these elements show no correlations with LOI or volatile contents in the subset of least altered Site U1439 igneous rocks. Figure F41 plots Sr concentrations versus TiO2 for the alteration-filtered suite from Site U1439 as compared to equivalent data for Site U1440 samples. The two sample sets show very different trajectories: Site U1440 samples form a near-horizontal array with relatively little Sr variation over a span of TiO2 contents, whereas Site U1439 samples form a steeply sloping positive trend with the plagioclase-bearing samples showing the highest Sr concentrations. The trend of Site U1440 samples is consistent with the effects of extensive plagioclase crystallization, which raises the Ds/l for Sr to values near 1.0 in basaltic systems. The Sr concentrations of these samples are lower than are typical for MORBs, perhaps reflecting a regional mantle source depletion that is also evident in immobile trace elements (e.g., Reagan et al., 2010). In contrast, the trend of Site U1439 samples is not consistent with plagioclase crystallization, even though modal plagioclase is evident in the groundmass of higher Sr samples. The pattern of these data is consistent with Sr behaving as a strongly incompatible trace element, probably with a Ds/l lower than that of Ti. The Sr/TiO2 ratios of all the Site U1439 igneous rocks are higher than those observed in any Site U1440 samples, consistent with their derivation from a source that is both more depleted in fluid-immobile incompatible elements and relatively enriched in species that may be derived from fluids released from a downgoing plate.
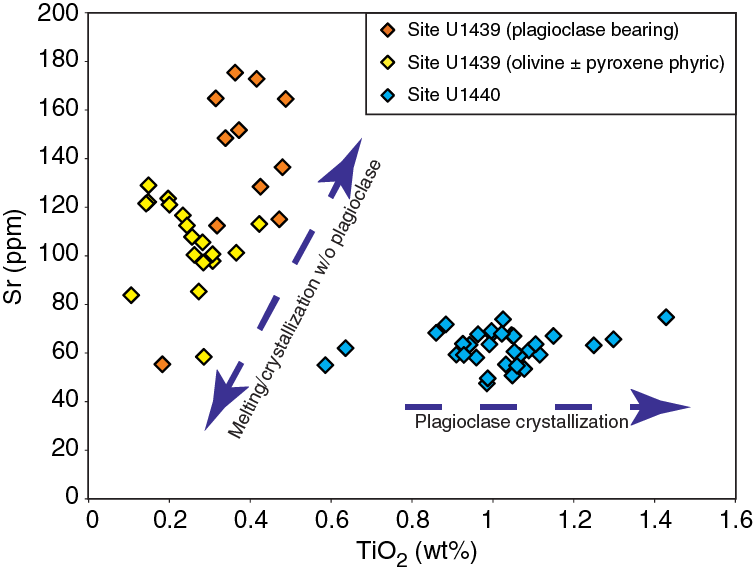
Structural geology
Structural observations on sedimentary units were made solely on core from Hole U1439A. Structural observations on igneous units were made on core from both Holes U1439A and U1439C. Deformation features observed in the sedimentary units varied according to depth and drilling method (see Introduction in the Expedition 352 methods chapter [Reagan et al., 2015a] for drilling methods). The APC system was used for depths shallower than 92.30 mbsf, whereas the XCB system was used deeper than 92.30 mbsf. Coring with the APC resulted in undetectable to minimal drilling-induced deformation. In contrast, the XCB method resulted in a significant overprint of geological structures by drilling-induced deformation, particularly between 92.30 and 155.00 mbsf. Below 155.00 mbsf, geological structures were generally less affected by XCB drilling–induced deformation, most likely because sedimentary units were mechanically stronger. The following sections describe drilling-induced, sedimentary, igneous, and tectonic structures successively.
Drilling-induced structures
Dragging down of sedimentary material along core liner
This deformation consists of the systematic downward vertical dragging of all structural elements toward the core liner flank (Figure F42; interval 352-U1439A-20X-1W, 0–18 cm). The downward push of the coring tool, both with APC and XCB methods, causes this lateral shear strain. The width of the area affected by this type of deformation depends primarily on the viscosity of the sedimentary material drilled and the rate of advance of the piston corer. Mud-like materials seem more deformed than coarser grained sediments. This plastic shear strain increases from the core center toward the core margin. Jutzeler et al. (2014) describe similar drilling-induced structures in cores from Expedition 340.
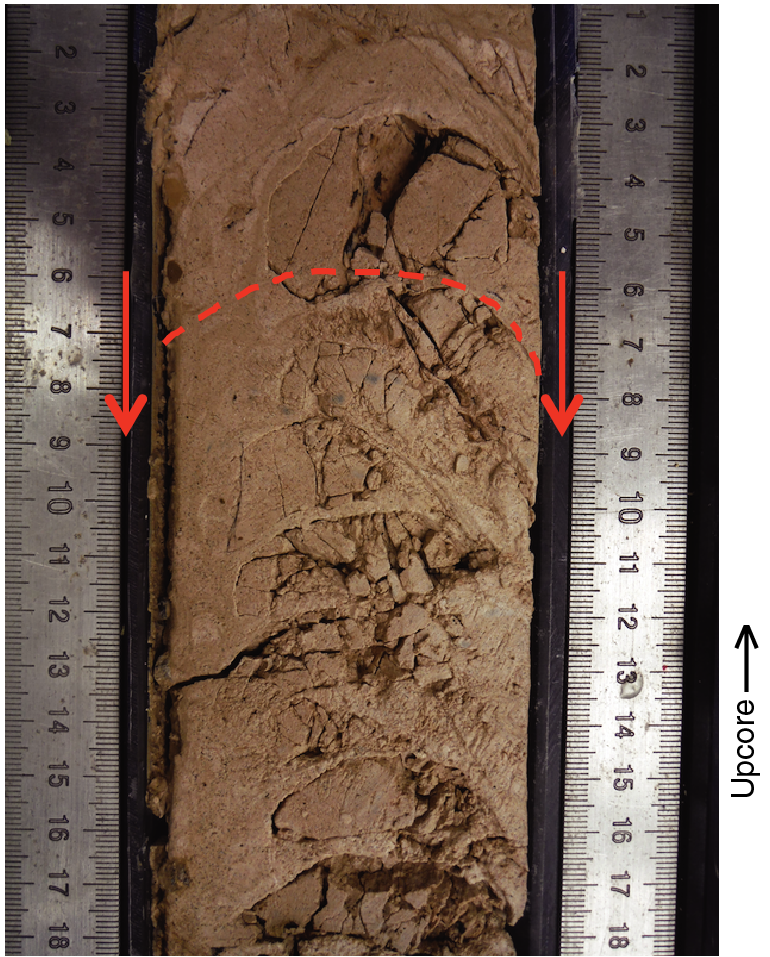
Rotational shear of sedimentary material against core liner
In the clockwise rotational shearing about the core axis, this deformation consists of all structural elements between the core and the core liner (Figure F43; interval 352-U1439A-19X-1A, 127–135 cm). The rotational motion of the XCB coring tool causes this concentric shear strain. The width of the sheared area depends primarily on the viscosity of the sedimentary material drilled and the rotation speed of the coring tool. Mud-like materials seem more deformed than coarser-grained sediments. Rotational shear increases from the core center toward the core margin. Increasing strain localization along the core margin commonly results in the preservation of structures in the center of the core.
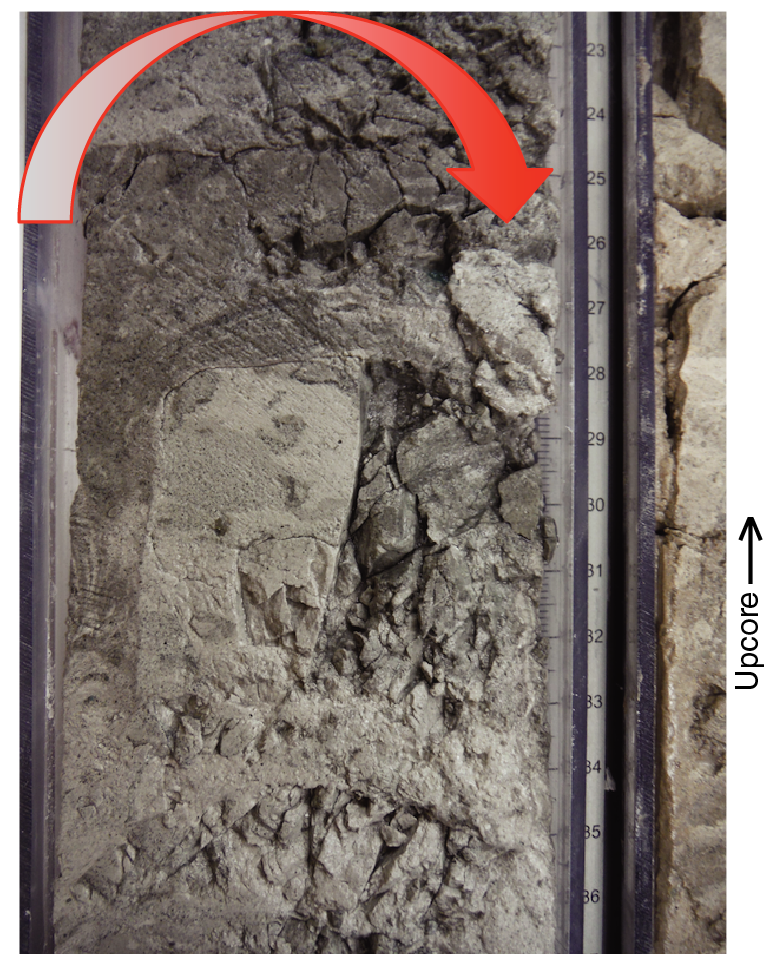
Postretrieval core dilation
After recovery on the core deck, the core is cut into 150 cm long sections, with end caps glued to the core liner at both ends. As the cored sedimentary material was under hydraulic and lithostatic pressure at depth, it progressively dilates due to recovery of elastic deformation. Several hours after core retrieval, the core length increases by up to 2.5% of its original length. This dilation, while the core is blocked at both ends of the core liner, results in contractional deformation exemplified by reverse shear fractures with a slip direction parallel to core axis (Figure F44; interval 15X-2W, 45-57 cm]). While the half-core is lying horizontally, these structures form small-scale thrusts, which tend to be localized along centimeter-scale lithologic discontinuities. In the core reference framework, these small-scale thrusts correspond to small-displacement normal faults (Figure F45). Similar shear fractures, caused by relaxation of elastic strain, affect other sections of the core. One of these fractures spontaneously slipped, within minutes, while the core was being described and cut through an initially circular small reduction spot (interval 13X-6W, 38–48 cm).
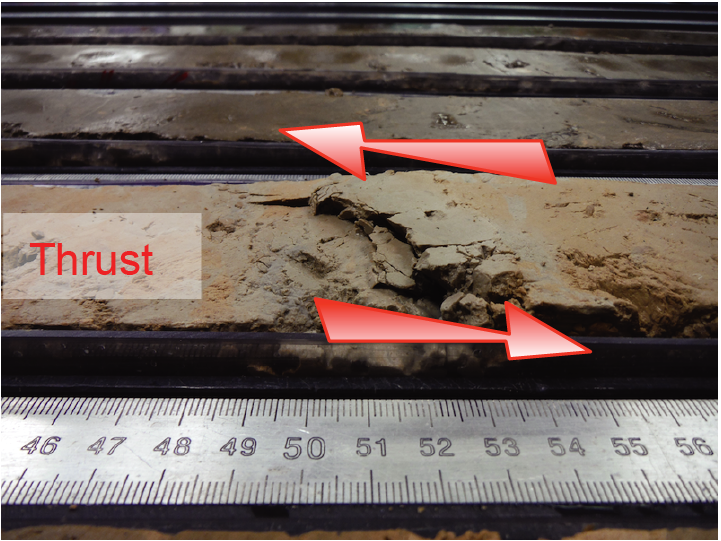
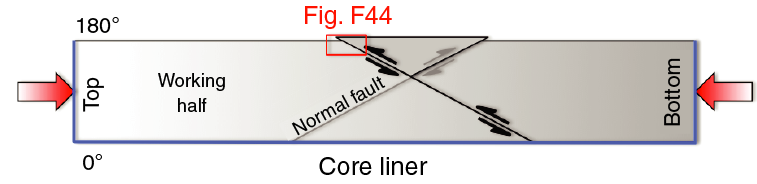
The following criteria were applied to distinguish drilling-induced fractures from tectonic fractures: drilling-induced shear fractures tend to cut through all lithological boundaries within the sediment and also cut through the split core surface. In contrast, tectonic tension and shear fractures are generally cohesive and filled with sedimentary or precipitated material.
Sedimentary structures
Bedding planes
Variations in lithological composition, color, and/or grain size of the sedimentary material commonly mark the bedding plane of sedimentary units. Dark pyroclastic beds, a few centimeters in thickness, and thin sandy beds, a few millimeters in thickness, conform to the local bedding plane attitude. Above 92.30 mbsf, the dominant attitude of the bedding plane is subhorizontal, with dips generally <15° (Figure F46). Between 92.30 and 155.00 mbsf, drilling-induced deformation causes a conical distribution of poles to bedding planes (Figure F47), similar to that described elsewhere by Herr et al. (1998), Aubourg and Oufi (1999), and Acton et al. (2002). From 155.00 to 178.44 mbsf, the dip angle of bedding planes significantly increases from subhorizontal to 17°.

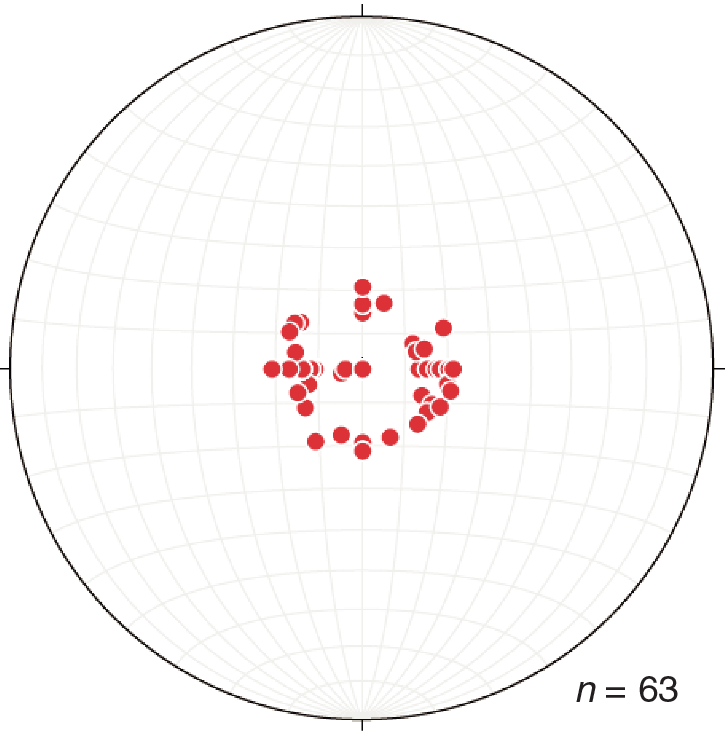
Pressure solution and dewatering structures
Subhorizontal stylolites, caused by pressure-solution applied to chalky sediment, occur between 159.20 and 160.00 mbsf. Subvertical dewatering structures, resulting in fluidization of the sediment, occur between 152.20 and 164.00 mbsf (Figure F48; interval 18X-5A, 42–51 cm). The mechanical strength of the sedimentary material increases notably in units situated below these dewatering structures.
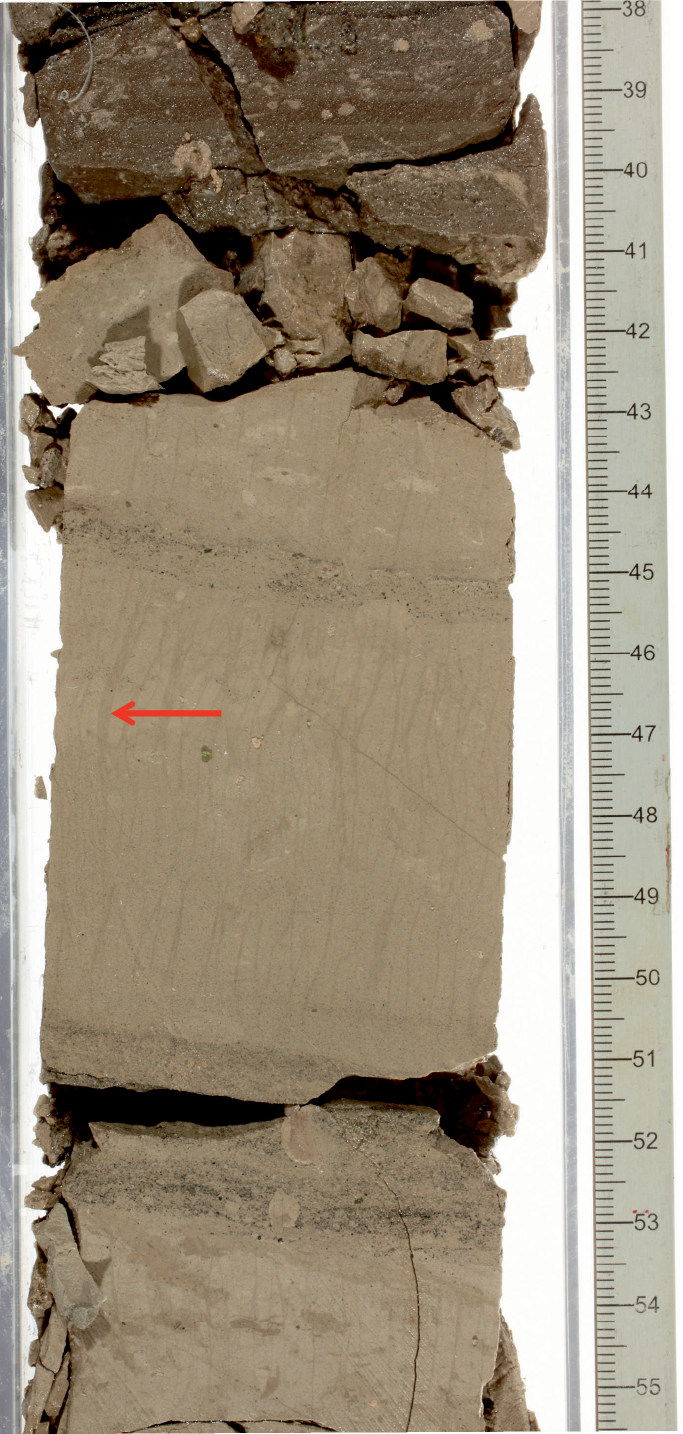
Sedimentary flow structures
Sedimentary flow structures, such as cross-bedding and convolute folds, occur between 148.40 and 152.20 mbsf (Figure F49; interval 17X-4W, 43-53 cm]). The cross-bedding top planes are inclined to the main bedding planes at angles between 10° and 20°. Convolute folds are tight to isoclinal and show a wide range of orientations of fold axes and fold hinges.
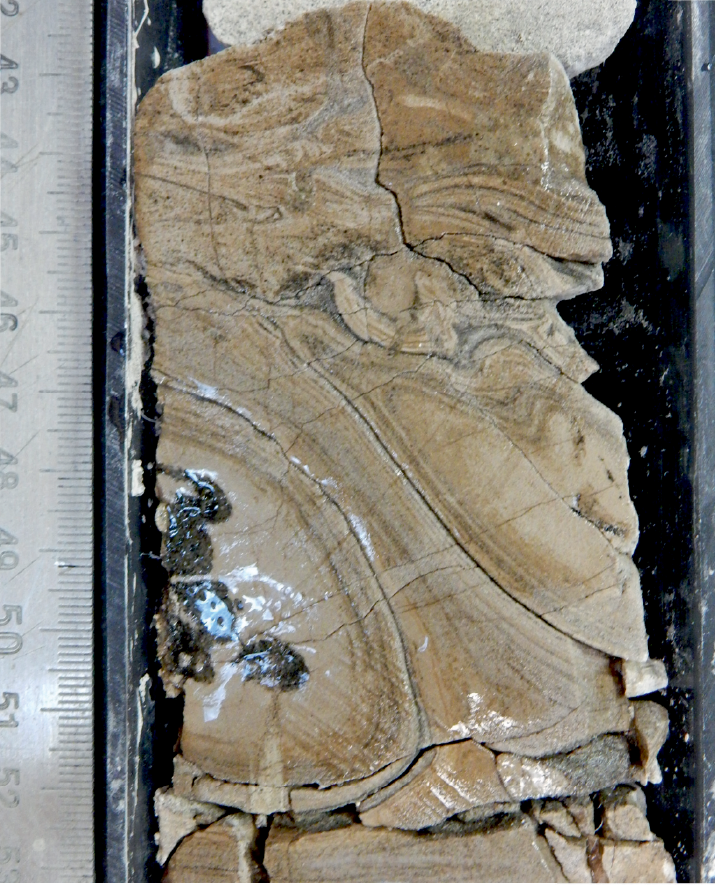
Igneous structures
Few magmatic structures were observed in basement cores from Holes U1439A and U1439C. Those present include magmatic foliations, igneous contacts between petrographic units, magmatic inclusions, and other fine-grained margins. In most thin sections, however, magmatic minerals exhibit no shape-preferred orientation (SPO) and rocks are characterized by isotropic microstructures.
Magmatic foliations, defined by preferred alignment of prismatic plagioclase or clinopyroxene grains, or by elongate vesicles, occur only locally. The apparent aspect ratio (length/width ratio) and orientation of vesicles are consistent at the scale of the core diameter. Vesicles do not seem to provide a reliable indication of a general magma flow direction because they primarily track the local stretching direction of the melt, which, in the case of these pillows, tends to be concentric with respect to the pillow shape. Igneous contacts between distinct petrographic units are straight, relatively sharp, and do not show significant variation in grain size across the contact. Magmatic enclaves consist of a few centimeter-long, oval-shaped inclusions of one petrographic rock type within another one (e.g., Sample 352-U1439C-37R-1W, 47–49 cm; TS147). Pillow glassy margins tend to be strongly altered and commonly exhibit, over a few centimeters, gradation from massive crystalline rock to glassy rims that are occasionally rich in vesicles. There are a few steeply dipping, fine-grained margins within essentially the same rock units; these may represent chilled margins of dikes.
Tectonic structures
Sediment
Minor structures caused by tectonic deformation become common between 165.00 and 178.44 mbsf (i.e., above the igneous basement). Between 165.00 and 178.44 mbsf, subvertical shear fractures (Figure F50; interval 18X-2A, 87–96 cm) and extensional fractures (Figure F51; interval 18X-4W, 94–104 cm) are relatively abundant. Shear fractures display a normal sense of shear with displacement up to 5 cm. A few discrete shear fractures develop into millimeter-scale shear zones characterized by fine-grained, slightly cohesive cataclasite. From 155.00 mbsf to the igneous basement, bedding dip angles tend to increase from subhorizontal up to 17° (Figure F52). Overall, the entire sedimentary section of Hole U1439A is characterized by a lack of structures related to tectonic deformation.
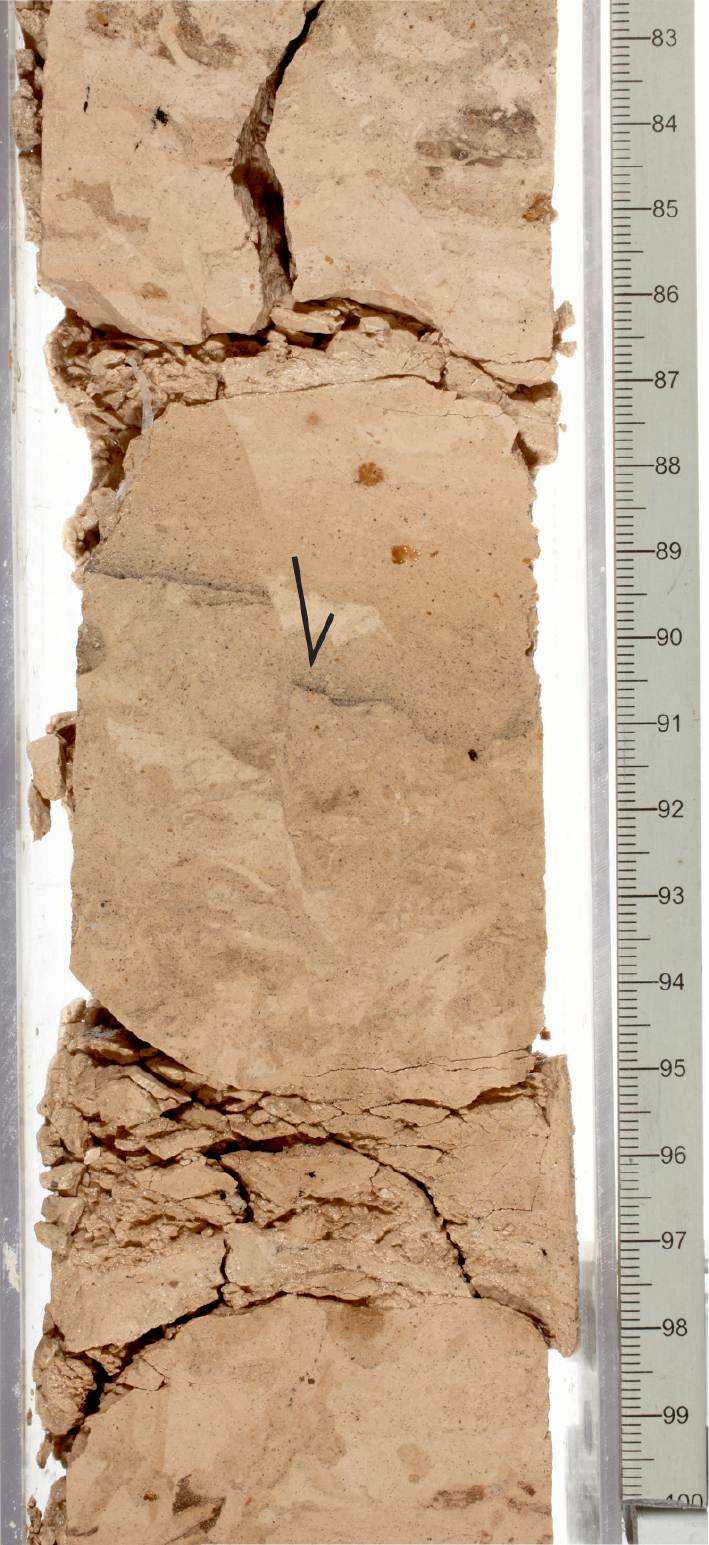
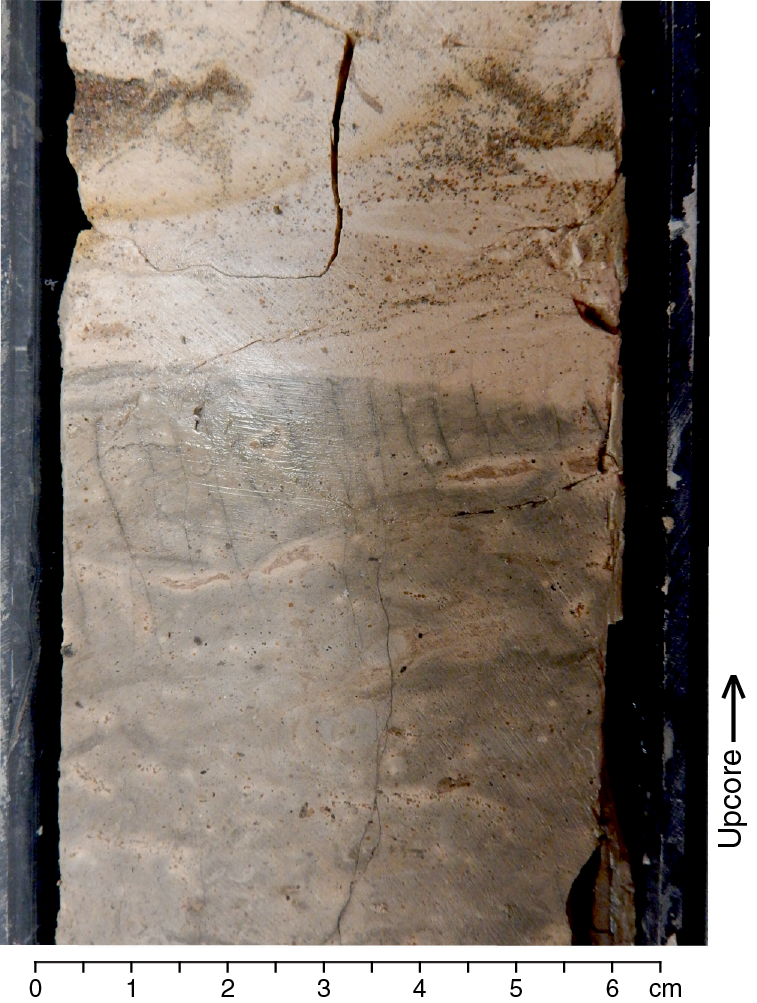
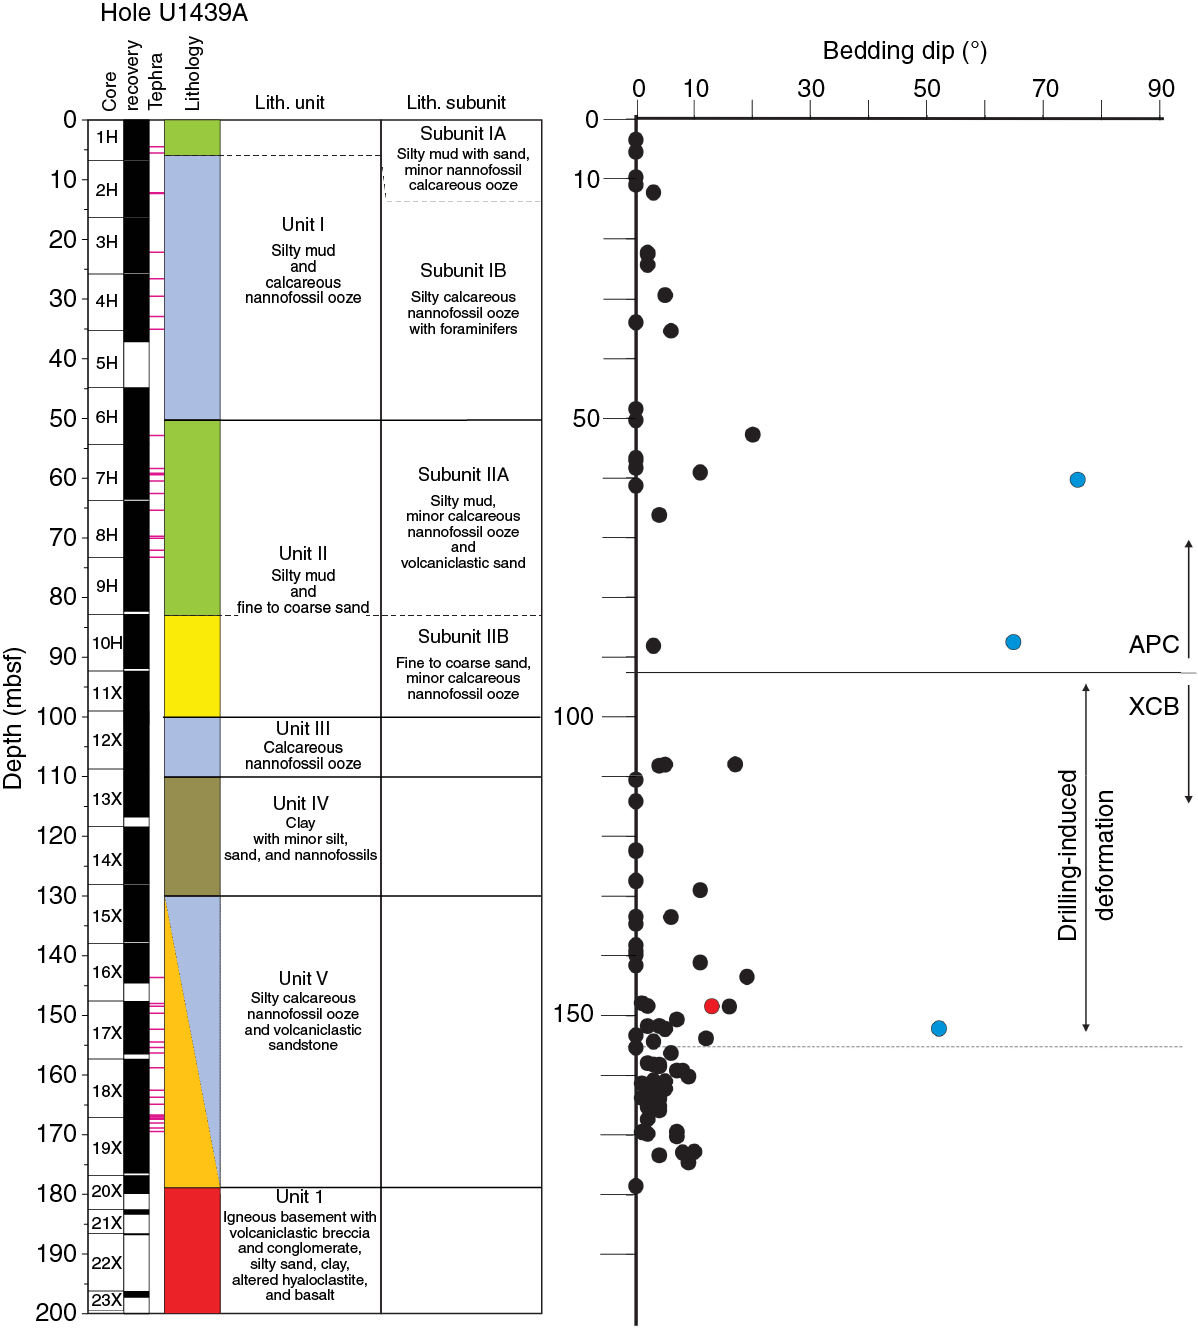
Basement
In Cores 352-U1439C-2R through 45R, 541 structures related to brittle deformation were measured. These structures comprise tension fractures, transtensional (hybrid) fractures, shear fractures, cataclastic/brecciated shear zones, and fault zones. Veins form by mineral filling of tension or hybrid fractures and, generally, show no or limited observable macroscale displacement along the fracture plane. Conversely, shear fractures usually show evidence of displacement along the fracture plane such as slickensides.
The vein filling generally consists of magnesian calcite and/or various types of zeolite as well as clay. Vein abundance is estimated by the number of veins per unit length of core. This abundance varies with depth but does not correlate with the proximity of faults (Figure F53). This may indicate that these carbonate veins are genetically related to the hydrothermal activity taking place shortly after magma cooling rather than related to tectonic deformation. Vein thickness varies from <1 to 15 mm. Vein thickness varies with depth intervals and decreases from 350 to 500 mbsf (Figure F54). The vein dip angle tends to be higher than 45° (Figure F55). The wider veins appear to have formed in incremental steps of extension. The veins locally form crisscrossed networks with 2 dominant orientations at a high angle from each other (Figure F56; interval 23R-2W, 14–34 cm). Host-rock fragments are commonly embedded within precipitated vein material (Figure F57; interval 3R-2W, 106–117 cm).
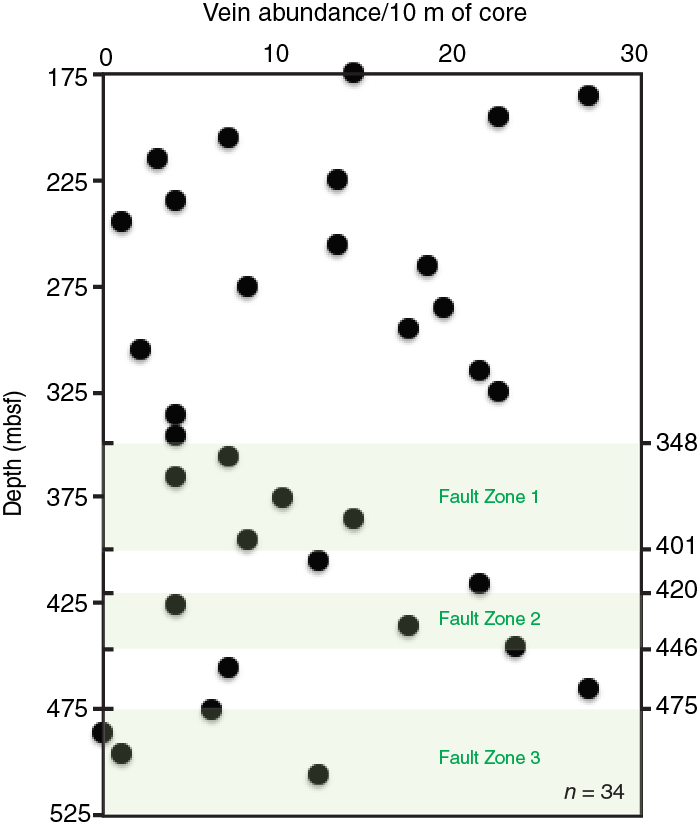
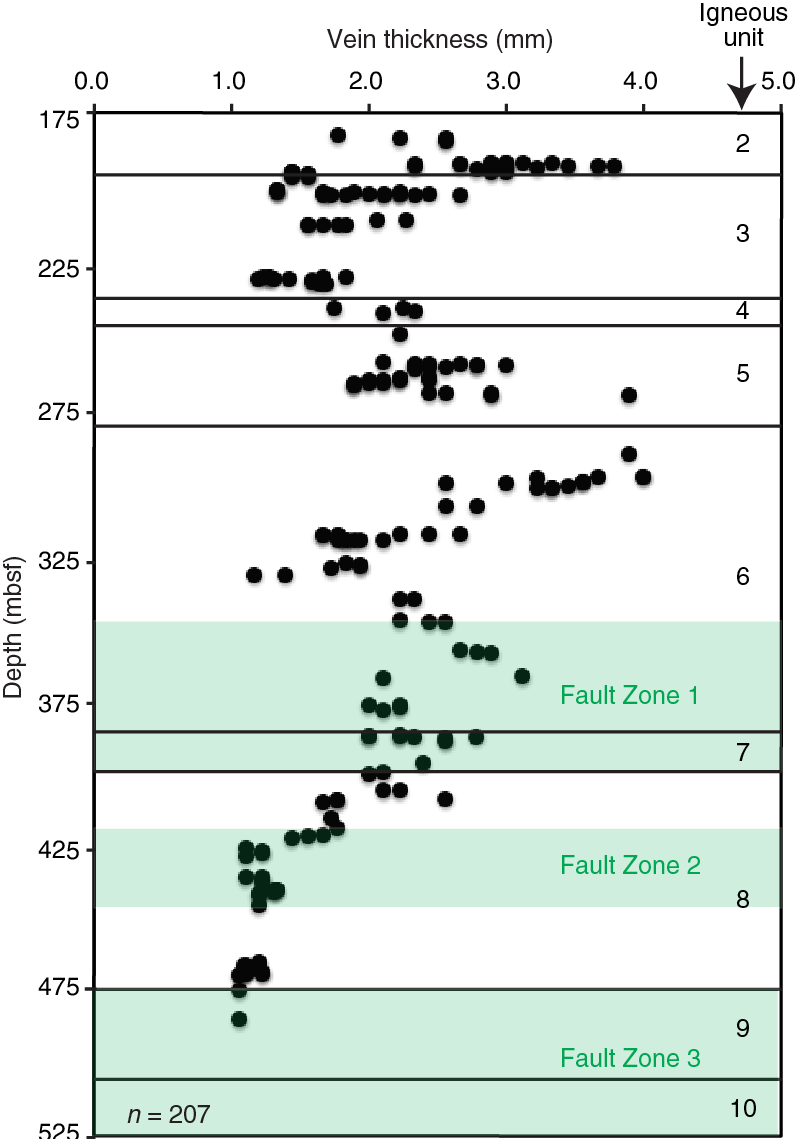
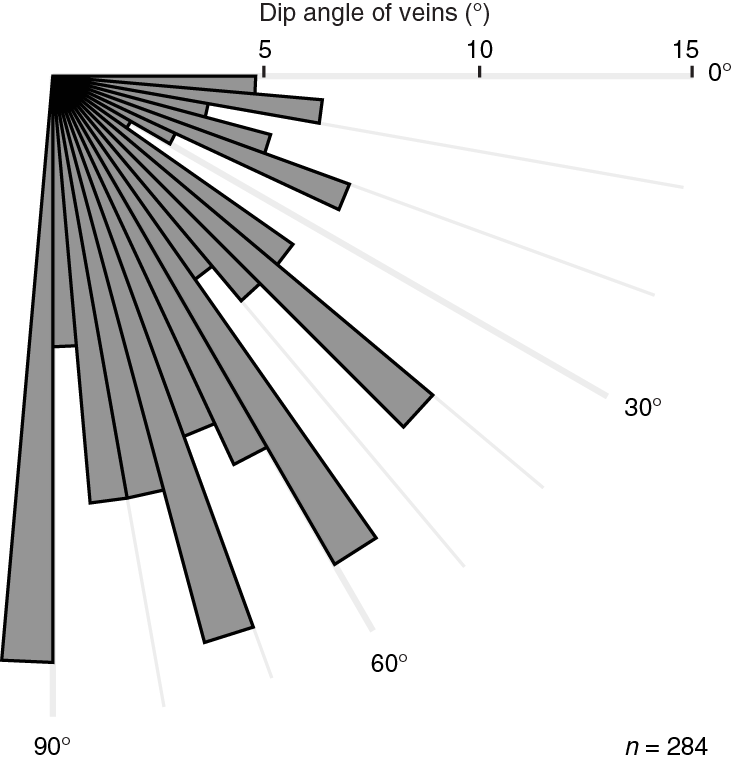

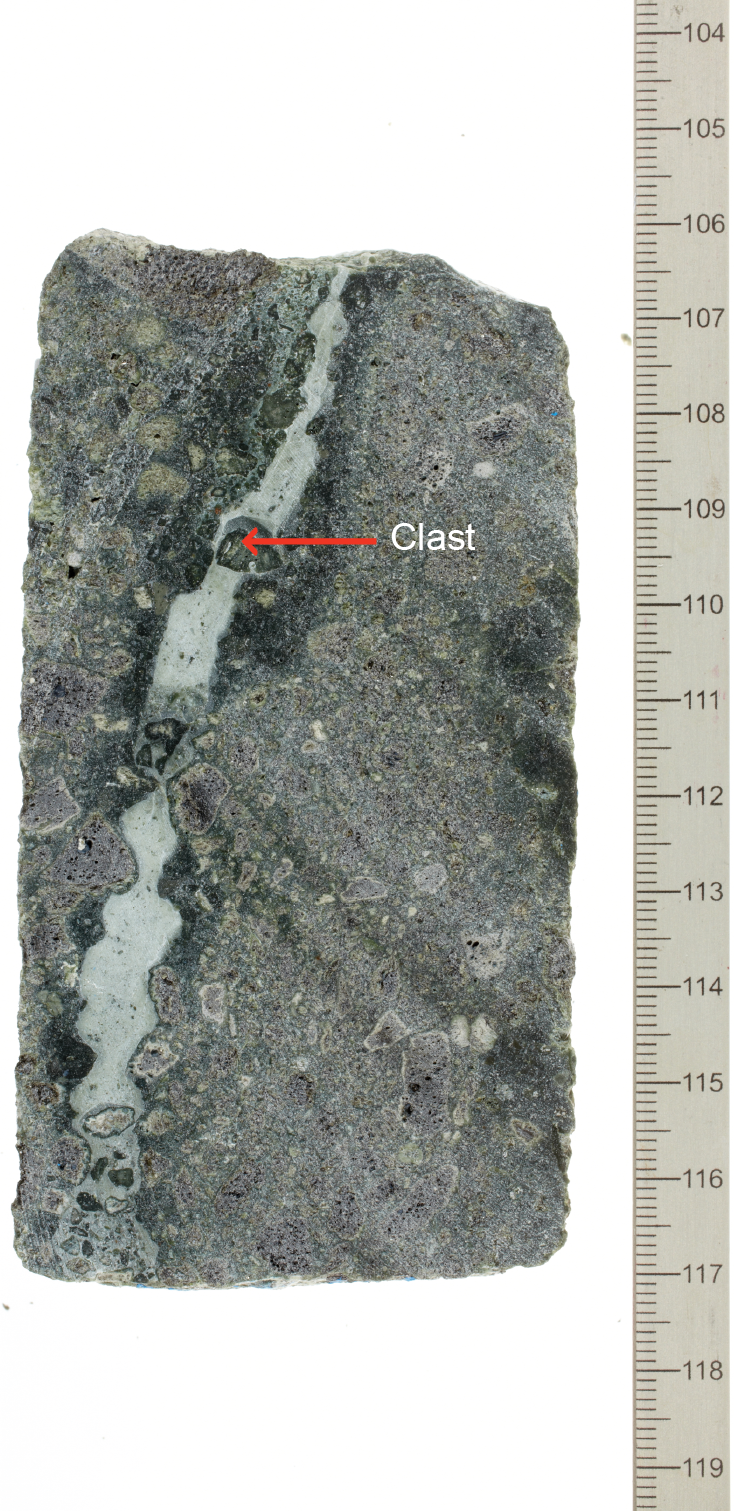
One minor fault zone observed at ~261 mbsf is defined by distinct steeply dipping slickensides with normal sense of shear and cohesive fault breccia with fragments as large as 1 cm (Figure F58; interval 10R-1A, 49–59 cm) embedded in fine-grained matrix.
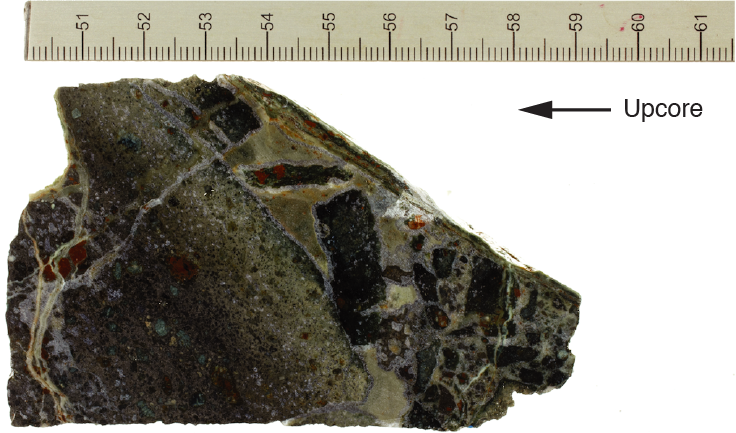
Based on the distribution of slickensides and cataclastic shear zones, three fault zone intervals were defined in Hole U1439C:
Fault zone boundaries, however, have a few meters of uncertainty because of the low core recovery. Some of the faults are characterized by abundant waxy slickensides coated with a greenish mineral assemblage consisting of clays and/or chlorite and/or serpentine and/or talc; other faults are marked by localized cataclastic shear over centimeter-wide domains. In general, both reverse and normal shear-sense indicators were observed on slickensides and cataclastic offsets, but overall the normal sense of slip dominates. Extensional structures, including extensional fractures and normal-sense slickensides, tend to offset reverse faults. The slickenside-bearing faults, which also correspond to intervals of low core recovery, caused borehole instability and prevented the deepening of Hole U1439C.
Fault Zone 1 is defined by the first appearance of a ~1 cm thick cataclastic shear zone at 348.8 mbsf. This shear zone comprises a fine-grained, cohesive fault gouge with single host-rock fragments of millimeter to centimeter size. The interval from the top of this shear zone to 401 mbsf is characterized by host-rock (boninite) alteration with abundant veining between 348.8 and 359.8 mbsf and an interval of strong host-rock alteration, bleaching, and fracturing from 359 to 398 mbsf. This interval is bound by a fine-grained, subhorizontally layered cataclastic shear zone of ~2 cm thickness at 398 mbsf (Figures F59 [interval 27R-1A, 100–118 cm], F60 [interval 27R-1W, 100–104 cm]). Microscopic observations show that this shear zone underwent multistage evolution and actually comprises two centimeter-wide shear zones transecting each other. Kinematic indicators within the shear zones cannot be clearly defined but seem to indicate low-angle reverse shear. Both shear zones are crosscut by subvertical veins and high-angle shear fractures that formed at subsequent deformation phases: high-angle reverse shears are crosscut and transected by high-angle normal shear fractures and extensional veins arranged in en echelon geometry indicating normal sense of shear, as well. Other fine-grained cataclastic shear zones within fault Zone 1 are localized at 358.7, 359, 399, and 401 mbsf (Figure F61).
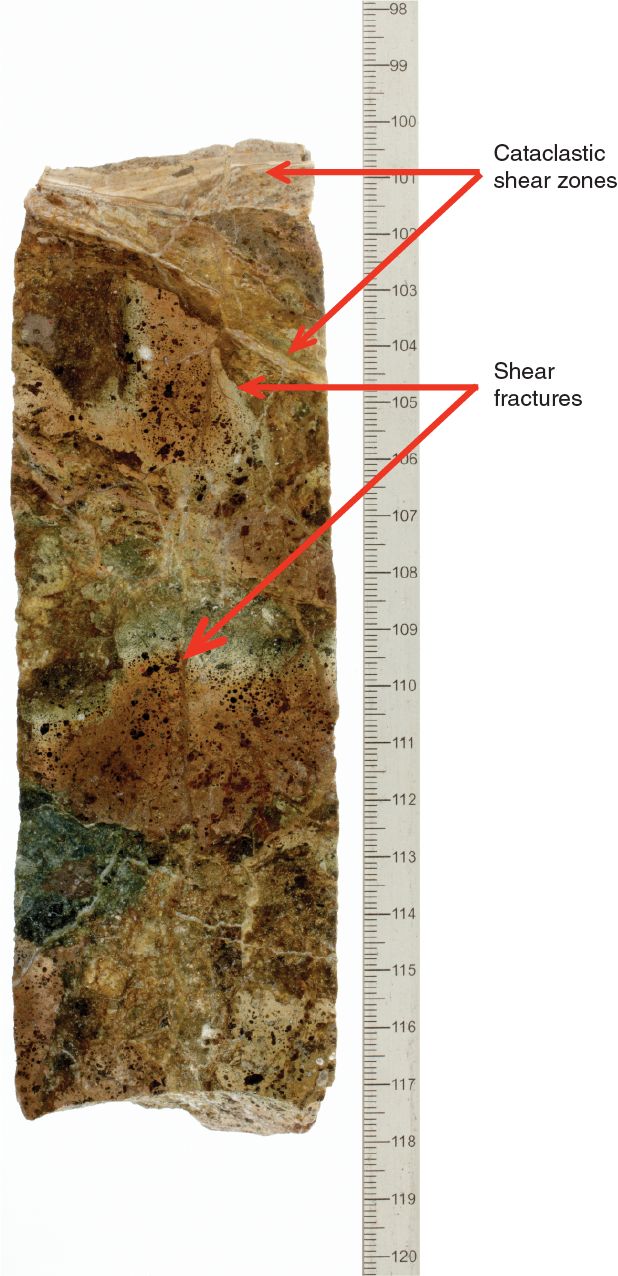
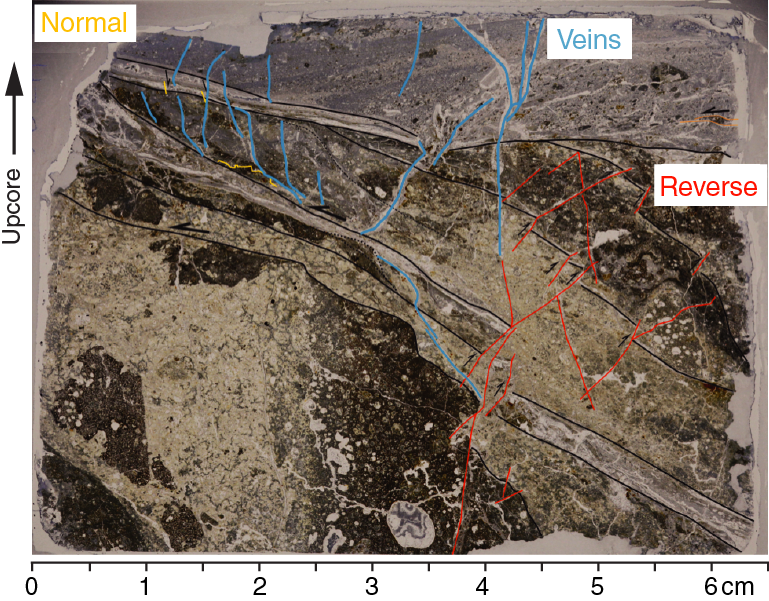
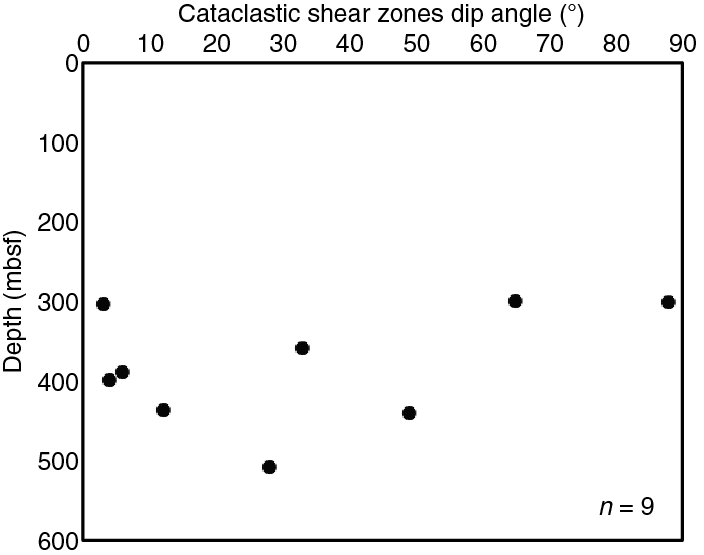
The top of fault Zone 2 is defined by a single, ~3 cm wide cataclastic shear zone at 420 mbsf (Figure F62; interval 29R-3A, 64–79 cm). The fault rock comprises a cohesive fault breccia with millimeter- to centimeter-sized host-rock fragments. The fine-grained matrix material with <0.2 mm grain size amounts to <20%. The interval between 436 and 439 mbsf is characterized by prominent slickensides (Figure F63). Distinct cataclastic shear zones occur at 440, 441, and 445.95 mbsf, the latter defining the bottom fault zone boundary.
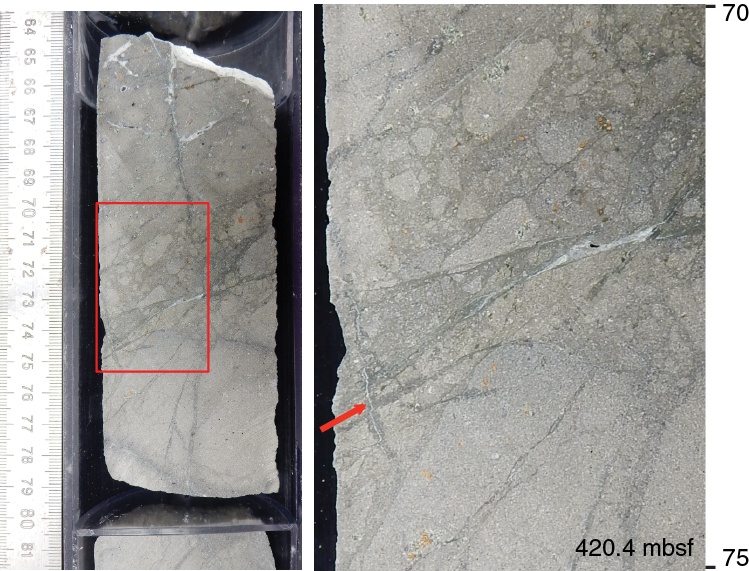
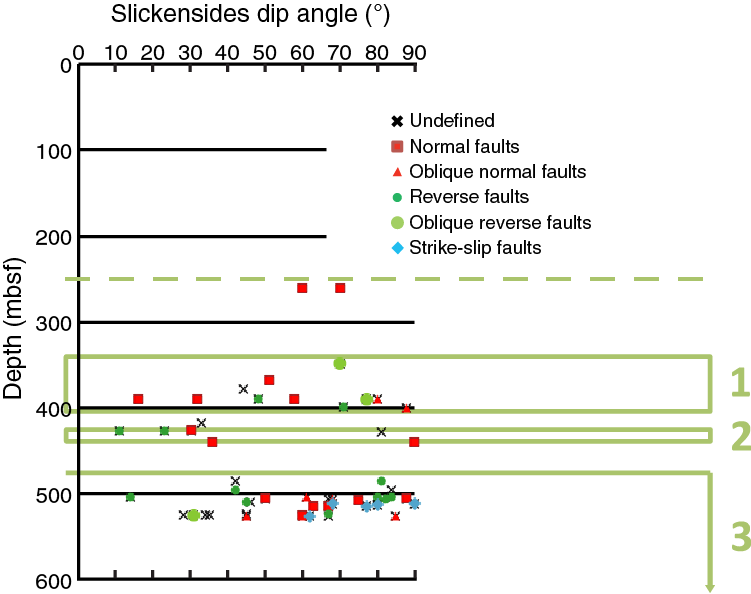
Fault Zone 3 is generally characterized by increasing fracturing downhole and an increasing number of slickensides with depth. The top of this shear zone is defined by a fragmented domain consisting of incohesive, friable fragments of host-rock material, partly surrounded by fine-grained fault gouge and a network of irregularly oriented fractures. Zeolite coats some of these fractures. Distinct cataclastic shear zones comprising incohesive cataclasite (centimeter-sized host-rock fragments embedded in a fine-grained fault gouge matrix) occur at 475.6, 525.39, 533.57, and 534.22 mbsf. The latter was defined as the bottom of this fault zone, as the core below retrieved pieces of unfractured boninite/transitional FAB (see Petrology). An interval with abundant slickensides ranges from ~504 to 505 mbsf. Zones of slightly cohesive fault breccia (centimeter-sized fragments) were recovered at ~524 mbsf and from 529.39 to 525.52 mbsf, accompanied by a highly slickensided domain from 524 to 526.2 mbsf. The majority of slickensides are inclined or steeply dipping (dip angles > 45°; Figure F63). Most of these show normal or oblique normal kinematics, although a few slickensides reveal strike-slip or reverse sense of shear. A reverse sense of shear was often observed for subvertically oriented slickensides. The kinematics on these faults, however, must be interpreted with caution, as the sense of shear can be inverted by slight deviation of the drill core axis. Well-preserved cataclastic shear zones generally display top-down kinematics.
As cataclasites and fault breccias in fault Zones 1 and 2 are either cohesive and/or cemented by carbonate precipitation, fault Zone 3 is characterized by continuous downward loss of cohesion. Fault rocks in fault Zone 2 develop from slightly cohesive cataclasites and fault breccias to noncohesive breccias and fault gouge. The number of veins, as well as vein thickness, decreases remarkably downhole within fault Zone 3. This coincides with an increasing abundance of slickensides and shear fractures. The cored intervals below 515 mbsf are almost barren of veins.
Microstructures were described in 85 petrographic thin sections. Calcite veins tend to be purely dilational at shallow depths but gradually evolved toward oblique tensional veins at depth, as shown by the oblique growth of fibrous calcite grains with respect to vein margins. With increasing depth the calcite grains also exhibit deformation microstructures that are not present at shallower core intervals. These microstructures include thin twinning (Type I twins; Burkhard, 1993), increasing in width with depth (Type I and II twins; Figure F64; Sample 352-U1439C-31R-3W, 106–109 cm; TS135), curved twins, and subgrain boundaries (Figure F65; Sample 32R-4W, 82–85 cm; TS140) indicative of incipient plastic deformation. The formation of subgrain boundaries within single, mainly coarse grained calcite grains becomes increasingly prominent with depth, indicating that dislocation glide and/or dislocation creep within calcite was activated as a complementary deformation mechanism in addition to twinning, with subgrain rotation being the mechanism of dynamic recrystallization. The carbonate veins overprint zeolite vesicles and locally replace zeolite fills in the intersected vesicles. This overprint indicates that the calcite veins postdate the growth of zeolite. Several clusters of deformed quartz grains, up to 1 mm in diameter, were observed in Sample 44R-1W, 73–76 cm; TS146.
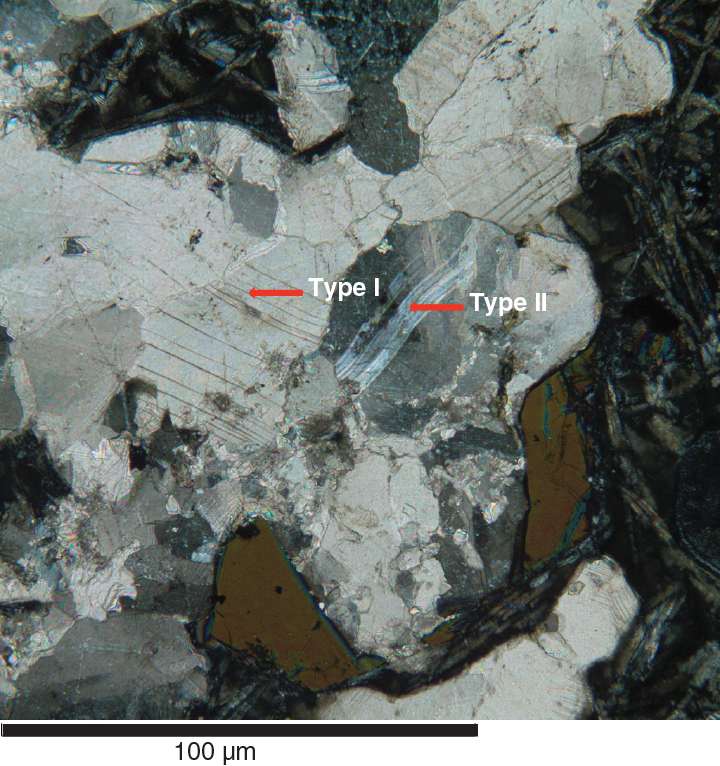

Physical properties
Physical properties of the cores recovered at Site U1439 were characterized through a set of measurements on core sections and discrete samples (see details in Physical properties in the Expedition 352 methods chapter [Reagan et al., 2015a]). Gamma ray attenuation (GRA) density, magnetic susceptibility (Magnetic Susceptibility Logger [MSL]), and P-wave velocity (P-wave Logger [PWL]) were obtained on the sediment cores using the Whole-Round Multisensor Logger (WRMSL), whereas only GRA and MSL were obtained on the hard rock cores. Natural gamma radiation (NGR) was measured by the Natural Gamma Radiation Logger (NGRL). Point magnetic susceptibility (MSP) and reflectance spectroscopy and colorimetry (RCS) data were acquired using the Section Half Multisensor Logger (SHMSL). Thermal conductivity (TCON) was obtained on whole-round sediment sections and discrete hard rock samples. Moisture and density (MAD) measurements were obtained on sediment and hard rock discrete samples, and P-wave velocities and magnetic susceptibility were obtained on discrete hard rock samples. All raw data were uploaded to the Laboratory Information Management System (LIMS) database and subsequently filtered to remove spurious points that correspond to empty intervals in the liner or broken pieces.
Sediment samples
P-wave velocity
Within the interval from the seafloor to 138 mbsf (lithologic Units I–IV and upper part of Unit V; Figure F66), P-wave velocities are between 1500 and 1550 m/s. At depths below 138 mbsf (Core 352-U1439A-16X; Unit V), P-wave velocities start to vary significantly: the minimum value is ~1500 m/s, the maximum value reaches 1900 m/s, and the average value is ~1650 m/s (e.g., see Unit V in Figure F66).
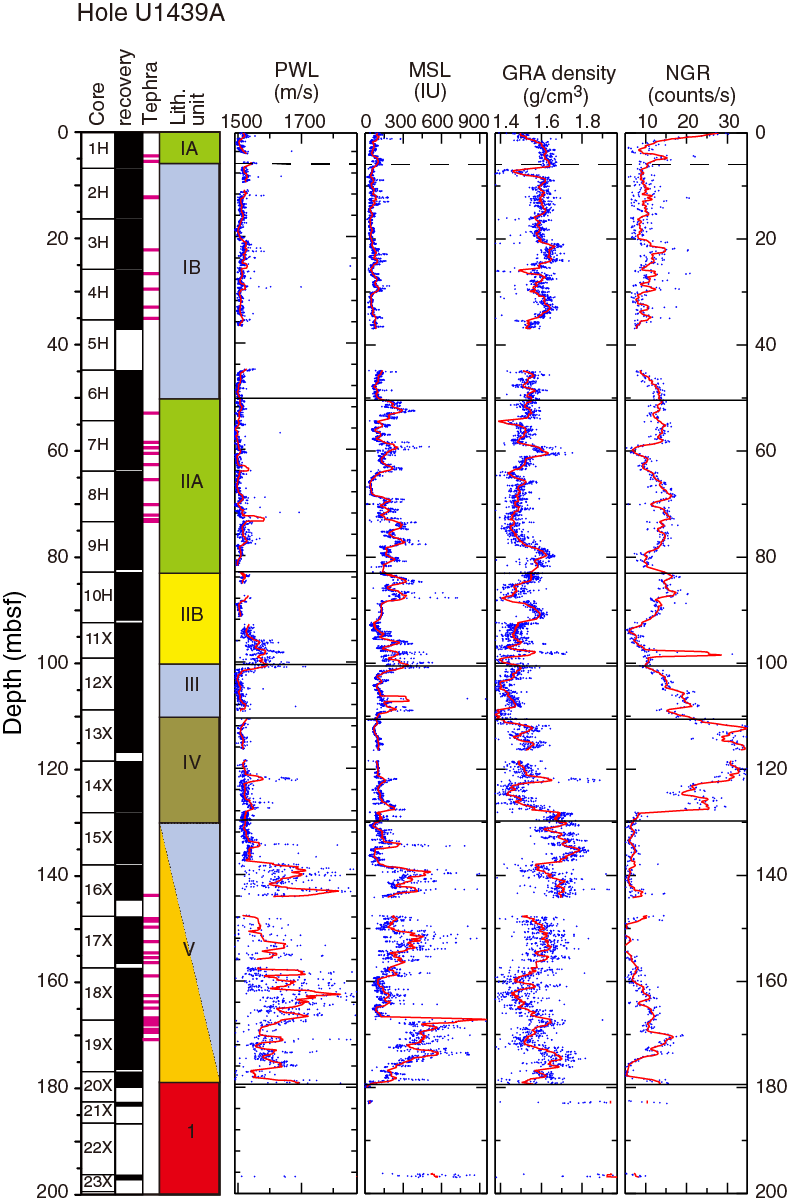
Magnetic susceptibility
Magnetic susceptibility values increase from the seafloor to ~110 mbsf (Units I–III), decrease in the interval from 110 to 128 mbsf (Unit IV), and increase significantly at 138–180 mbsf (Unit V) (Figure F66). At this depth, magnetic susceptibility data show similar variability to P-wave velocities. MSP data (Figure F67) are almost identical to those measured on whole-round sections.
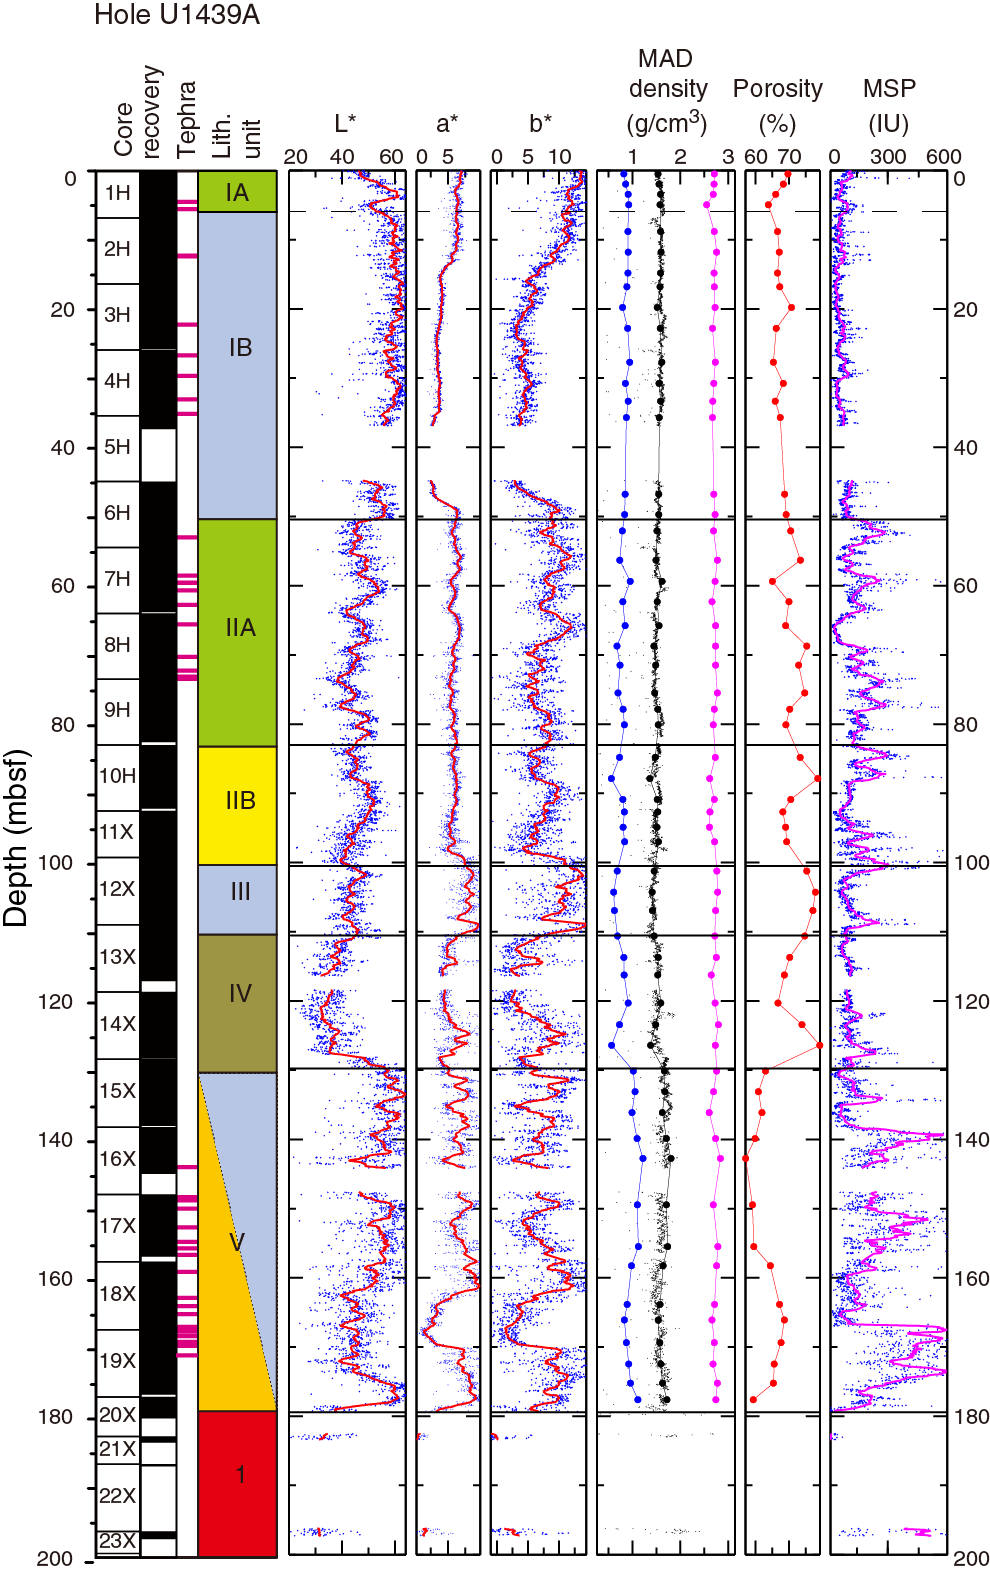
GRA density
Bulk GRA density slightly but gradually decreases from ~1.6 g/cm3 at the seafloor to ~1.45 g/cm3 at 128 mbsf (Units I–IV) (Figure F66). At ~135 mbsf near the Unit IV/V transition, GRA values increase sharply to ~1.75 g/cm3 (Core 15X; Unit V). GRA density average values tend to slightly decrease from ~1.75 to ~1.50 g/cm3 at 135–158 mbsf and slightly increase from ~1.50 to ~1.60 g/cm3 at 158–180 mbsf. In general, along the sedimentary section of Hole U1439A, the GRA density data vary between 1.4 and 1.8 g/cm3.
Natural gamma radiation
NGR values are ~10 counts/s from the seafloor to 193 mbsf, except between ~110 and 130 mbsf (Unit IV; clay), where higher values of ~30 counts/s are observed (Figure F66).
Reflectance spectroscopy and colorimetry
Reflectance parameter L* decreases from ~60 at the seafloor to ~40 at ~130 mbsf (Units I–IV), abruptly increases to ~60 at ~130 mbsf at the top of Unit V, and is 20–60 from 130 to 197 mbsf (Units V–VII) (Figure F67). Reflectance parameter a* has a mean value of 6 at 0–15 and 45–100 mbsf; it varies from 2 to 5 at 15–45 mbsf (most of Subunit IB) and displays more variability with values of 0–11 at 100–197 mbsf. Reflectance parameter b* systematically decreases from 14 to 4 from the seafloor to 21 mbsf (in Subunit IA and partly in Subunit IB), and has a constant value of ~4 from 21 to 46 mbsf (Subunit IB). Beginning from the lower part of Subunit IB downhole to the contact with igneous basement (Unit V), b* displays larger variability around an average value of 7.5.
Moisture and density
Dry density is ~0.9 g/cm3 from the seafloor to ~130 mbsf (Units I–IV) and increases slightly to ~1.1 g/cm3 between ~130 and 180 mbsf (Units IV and V), whereas grain and bulk density are relatively constant from the seafloor to 180 mbsf at ~2.6 g/cm3 and ~1.6 g/cm3, respectively (Figure F67). Porosity is ~70% from the seafloor to ~130 mbsf (Units I–IV) and is ~60% between ~130 and ~180 mbsf (Unit V).
Basement samples
Magnetic susceptibility (MSL, MSP, and discrete cubes)
Magnetic susceptibility was measured on whole-round basement cores, with maximum magnetic susceptibility values found at the center of each intact core piece (red circles in Figure F68). There is a clear magnetic susceptibility boundary at ~470 mbsf (between igneous Units 8 and 9). Maximum magnetic susceptibility values are 600 IU in Unit 1 (182–185 mbsf) and decrease to <300 IU in Units 2 and 3 (185–243 mbsf). Maximum magnetic susceptibility values are 700 IU in Units 4 and 5 (243–285 mbsf) and decrease to <300 IU in Unit 6 (285–390 mbsf), with the exception of 3 peaks >500 IU at 330, 360, and 390 mbsf. Magnetic susceptibility values are highly variable in Unit 8 (398–476 mbsf; 0–1300 IU), with the values of ~1300 IU located at ~420 mbsf. Magnetic susceptibility values abruptly increase to 300–1500 IU in Units 9 and 10. The 476 mbsf magnetic susceptibility boundary is also observed in MSP and discrete measurements (Figure F69), which were carried out on split core sections and discrete cubes, respectively (see details in Physical properties in the Expedition 352 methods chapter [Reagan et al., 2015a]). Maximum MSP values are ~1200 IU in Unit 1 and decrease to <800 IU in Units 2 and 3. Maximum MSP values increase to 1200 IU in Units 4 and 5 and decrease to <300 IU in Unit 6, with the exception of 2 peaks >1200 IU at 330 and 390 mbsf. Maximum MSP values are highly variable in Unit 8: <300 IU in the upper part of Unit 8, increasing to 2000 IU at ~420 mbsf, and 0–1000 IU in the lower part of Unit 8. MSP values abruptly increase to >3200 IU in Units 9 and 10, with only a few values <1000 IU. Discrete cube magnetic susceptibility values are systematically lower than MSP values: 10–600 IU at 182–480 mbsf increasing to 600–1200 IU at 480–542 mbsf.

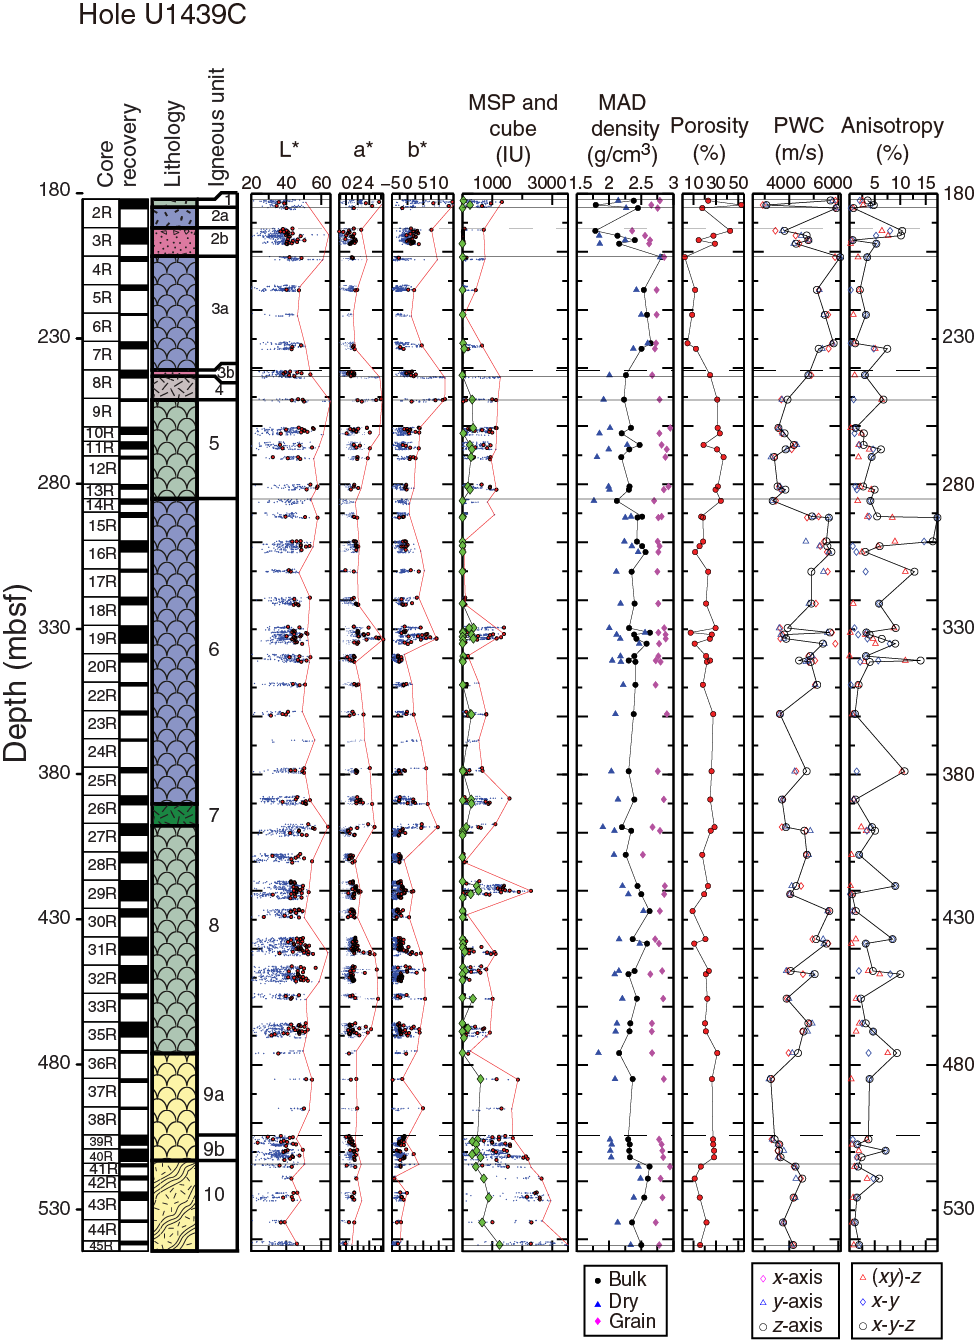
GRA density
GRA density values have a maximum at the center of each intact core piece (red circles in Figure F68). Maximum GRA density varies from 1.8 to 2.5 g/cm3, with a mean value of 2.0 g/cm3 in Units 1–5 and Units 9–10, and a mean value of 2.2 g/cm3 in Units 6–8.
Natural gamma radiation
NGR values decrease from 10 to 2 counts/s from the top to the bottom of the hole (Figure F68). NGR values are 3–14 counts/s in Units 1–4, with 2 peaks at 193 and 250 mbsf; 2.5–8 counts/s in Units 5–7; 2–5 counts/s in Unit 8, with the exception of 2 peaks at 420 and 440 mbsf; and 3–5 counts/s in Subunit 9a. NGR values increase to 10 counts/s in Subunit 9b, and decrease to 2.5–5 counts/s in Unit 10.
Reflectance spectroscopy and colorimetry
Reflectance parameters L*, a*, and b* show no systematic pattern with depth, with the exception of a weak peak of a* and b* at 330 mbsf. L*, a*, and b* range from 40 to 65, 1.5 to 6, and –5 to 15, respectively, in Units 1–10 (180–542 mbsf; Figure F69).
Moisture and density
Dry density, bulk density, grain density and porosity were calculated after the measurements of density on dry and wet rock cubes taken from the working-half sections (see details in Physical properties in the Expedition 352 methods chapter [Reagan et al., 2015a]). The calculated dry, bulk, and grain densities average 2.1, 2.4, and 2.6 g/cm3, respectively (Figure F69). Bulk densities vary from 1.8 to 2.8 g/cm3 in Units 1 and 2 (180–202 mbsf) but are almost constant at 2.5–2.7 g/cm3 in Unit 3 (202–242 mbsf). Bulk densities are 2.2–2.6 g/cm3 in Units 4–10 (242–542 mbsf). Dry density and grain densities have the highest variability of 1.3–2.8 g/cm3 in Unit 1 and 2.5–2.9 g/cm3 in Unit 2 and are relatively constant at 2.4–2.6 and 2.7 g/cm3 in Unit 3. Dry densities decrease to 1.8–2.3 g/cm3 in Units 4 and 5 and are 1.8–2.6 g/cm3 in Units 6–10. Grain densities are 2.5–2.9 g/cm3 in Units 4–10, with no systematic trend with depth. Porosities are 15%–53% in Units 1 and 2 (182–202 mbsf) and 2%–12% at 202–233 mbsf in Unit 3. Porosities increase to 19%–30% at 243–285 mbsf in Units 3–5. Porosities are 7%–31% in Units 6–8 (285–476 mbsf), increase to 26%–29% in Unit 9 (476–514 mbsf), and decrease to 11%–22% in Unit 10 (514–542 mbsf).
P-wave velocity
P-wave velocities measured on discrete samples (Figure F69) are 3000–6000 m/s in Units 1 and 2 (180–202 mbsf), 5000–6000 m/s in Unit 3 (202–232 mbsf), and decrease in Unit 5 (251–285 mbsf) to 3500–4200 m/s. P-wave velocities increase to 3800–5700 m/s in Units 6–8 (285–476 mbsf), decrease to 3400–3600 m/s in Unit 9 (476–514 mbsf), and increase to 3900–4500 m/s in Unit 10 (514–542 mbsf).
Thermal conductivity
Thermal conductivity of sediment was measured (usually once per core in the middle part of the third section) using a needle sensor. Most of the measurements, which consisted of 3 replicate analyses in the same spot, gave unreliable results, although all raw data are available in the LIMS database. Successful thermal conductivity measurements range from 0.6 to 1.4 W/(m·K), with an average value of ~1 W/(m·K) (Figure F70).

Thermal conductivity on basement rocks often required 5 replicate analyses but delivered reliable results. An average thermal conductivity value of 1.65 W/(m·K) was measured for discrete samples in Units 1–10 (180–540 mbsf). Thermal conductivity values are variable at 1–2 W/(m·K) at 180–240 mbsf (Units 1–3), and they are stable at ~1.6 W/(m·K) at 240–540 mbsf (Units 5–10), with 2 smaller peaks of 0.5 W/(m·K) at 325 and 450 mbsf (Units 6 and 8, respectively).
Downhole temperature
Downhole temperature measurements were conducted using the advanced piston corer temperature tool (APCT-3) (see details in Physical properties in the Expedition 352 methods chapter [Reagan et al., 2015a]) between 35.4 and 92.3 mbsf in Hole U1439A (Figure F70). All measurements were made in a calm sea state. Equilibrium temperatures plotted as a function of depth are linear. Coupled with the average bottom water temperature (~3°C), downhole temperature measurements give a least-squares gradient of ~25°C/km. We calculate a heat flow of ~25 mW/m2 as a product of the average thermal conductivity (~1 W/[m·K]) and the thermal gradient. This value is similar to a heat flow of 23 mW/m2 in the sediment at ODP Site 783 (Shipboard Scientific Party, 1990) and is at the lower end of expected values in fore-arc regions (20–70 mW/m2; e.g., Currie and Hyndman, 2006).
Paleomagnetism
Sediment
Paleomagnetic measurements were made with the pass-through cryogenic magnetometer on all APC cores recovered from Hole U1349A (Cores 352-U1349A-1H through 10H) as well as selected XCB cores. Measurements were made at 5 cm intervals, and 5 sets of measurements were made with different alternating field (AF) demagnetization levels (0, 15, 20, 25, and 30 mT). Many XCB cores contain small pieces, which are unlikely to produce consistent results because pieces with different magnetic directions can enter the sensing region of the cryogenic magnetometer, producing spurious direction measurements. For this reason, Cores 11X through 14X and 20X through 23X were not measured. However, Cores 15X through 19X, which contained many large pieces, were measured. In all, 62 archive-half core sections were measured, producing ~10,800 readings of core magnetization.
Sediment recovered from Site U1439 has relatively strong magnetizations, which can be measured with the shipboard JR-6A spinner magnetometer. Thus, to characterize the sedimentary remanent magnetization, routine paleomagnetic measurements were made on ~1 discrete sample per section. Discrete samples were mostly taken using 8 cm3 plastic cubes, oriented along the core axis. In more lithified cores, cube samples were cut with a 2-bladed rock saw. The volume of the cut cubes is approximately the same, 8 cm3. In total, 107 discrete samples from Hole U1439A were measured using the spinner magnetometer. All discrete samples were treated with AF or thermal demagnetization to remove overprints and reveal the characteristic sample magnetization. AF demagnetization was used on all samples acquired in plastic cubes. Thermal demagnetization was used on most cut samples.
Core natural remanent magnetization (NRM) intensity is scattered, but strong, for sediment. NRM values range from 8 mA/m to 2.6 A/m, the latter in the range of basalt magnetization (Figure F71). The median NRM value is 168 mA/m. These high intensities likely reflect a high content of igneous lithic fragments, which include magnetic grains. The high intensity values are in part a result of remagnetization of the core by the strong magnetic field of the drill string, a phenomenon termed “drill string overprint.” This phenomenon is one of two drilling-induced overprints recognized on sediment samples acquired by the JOIDES Resolution (Roberts et al., 1996; Fuller et al., 1998; Acton et al., 2002). Drill string overprint results from exposure of samples to strong magnetic fields, probably as they pass through the drill pipe. It is thus an isothermal remanent magnetization (IRM) and is often easily removed by AF demagnetization (Acton et al., 2002). This overprint is seen in measurements of most discrete samples, which show NRM directions pointing downward (Figures F72, F73). Many of the samples from soft sediment cored with the APC gave NRM directions that are nearly directly downward (Figure F72). These directions may also be affected by the second type of overprint, which is caused by core deformation in APC cores (Acton et al., 2002). This deformational bias should be seen in the section-half core pass-through measurements with the cryogenic magnetometer. Because discrete samples come from the less-deformed middle of the cores, these samples should be affected less by this overprint (Acton et al., 2002).
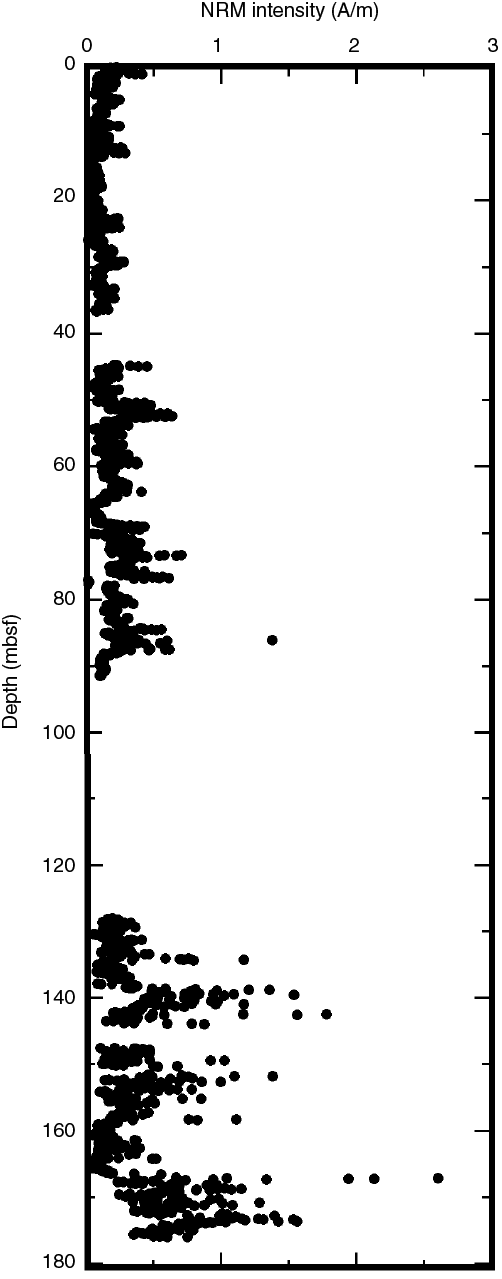
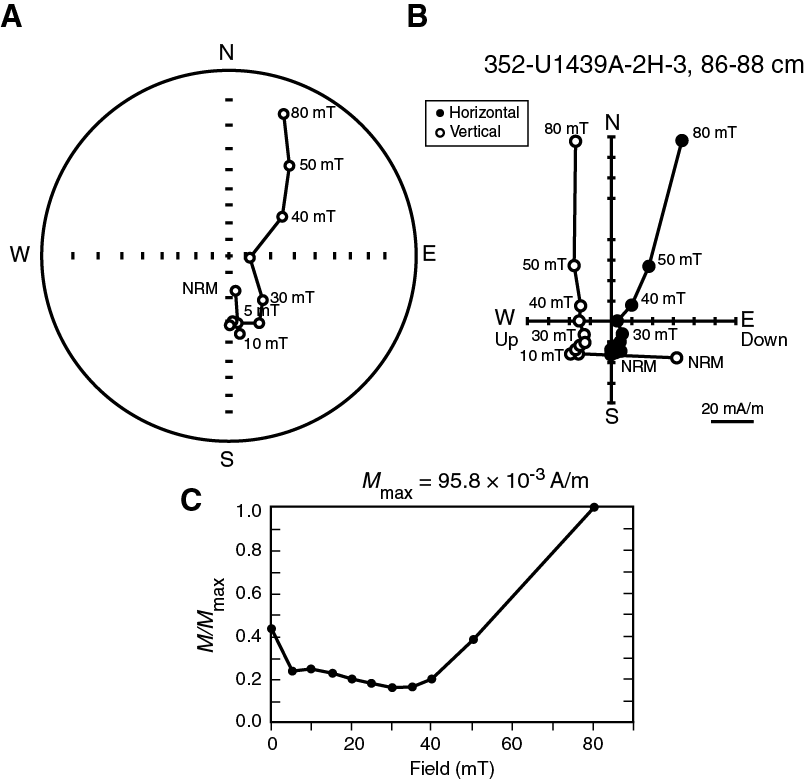
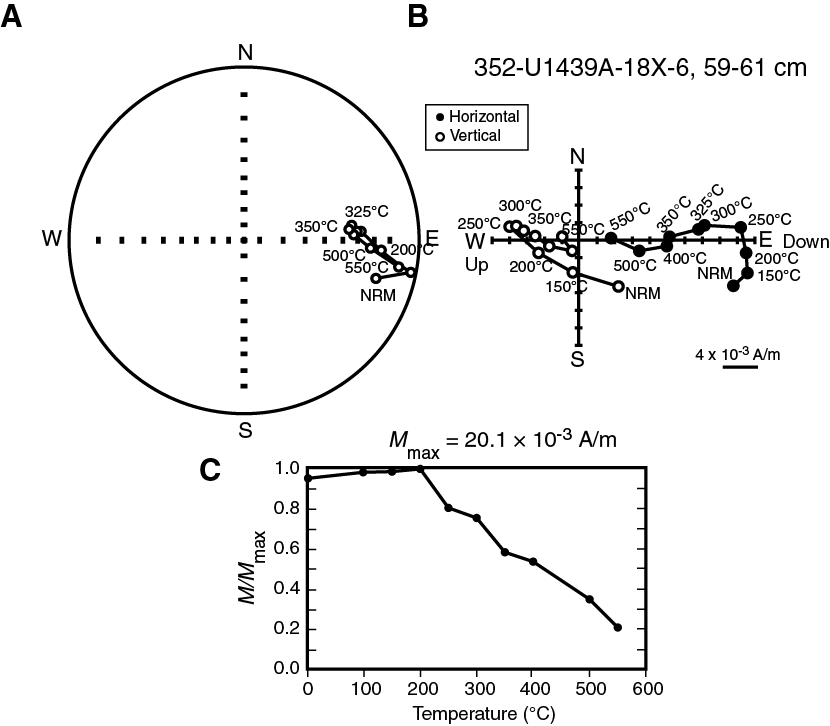
Discrete sample demagnetization measurements show that the magnetizations of Hole U1439A sediment tend to be unstable. Most AF demagnetized samples display low median destructive fields (MDF; the field at which half of the magnetization is removed) of <10 mT. The drill string overprint is removed with 5–10 mT of demagnetization, and sample directions stabilize for a few steps (Figure F72). However, after demagnetization at 25–30 mT, the sample acquires a spurious magnetization, possibly an anhysteretic remanent magnetization (ARM) caused by imperfectly balanced coils in the demagnetizer. Testing of sample demagnetizations indicates that this problem is linked to one of the 2 amplifiers of the D-Tech demagnetizer. However, this ARM probably also reflects a problem with the samples themselves because other samples (not from Expedition 352) were tested and found not to acquire this ARM. The discrete sample tests suggest that the 20–25 mT demagnetization step is probably the best for interpretation of the pass-through cryogenic measurements for Hole U1439A.
Thermal demagnetization of the discrete samples worked better for some samples, but not all. Many samples showed erratic behavior during demagnetization. A few of the less magnetic of the cut samples give reasonably well-behaved demagnetization results (Figure F73). However, even with the better demagnetization results, steps above 400°–450°C appeared inconsistent. Nevertheless, in many of the thermally demagnetized samples a significant fraction of the magnetization remained at 500°–550°C, implying the presence of nearly pure magnetite (e.g., Tauxe, 2010).
Magnetic polarity was interpreted from the 25 mT AF demagnetization step inclination (Figures F74, F75). APC cores show a distinctive set of polarity zones that correlate well with the classic Pliocene–Pleistocene sequence from Chrons C3–C1. The Brunhes, Matuyama, and probable Gauss magnetozones are represented, as are the Jaramillo and Olduvai Subchrons (Figure F74). The lower part of Chron C2A (Gauss Chron) appears to be missing in a core gap within Core 352-U1439A-5H. Beneath the gap, the core polarity record is largely normal. In Cores 6H and 7H, three narrow normal polarity zones have an appearance similar to the three subchrons of Chron C3. However, beneath these zones, correlation of the polarity record with the geomagnetic polarity timescale (GPTS; Gradstein et al., 2012) is difficult. A plausible match, based on biostratigraphic zones (see Biostratigraphy), is shown in Figure F74. However, the predominance of normal polarity in the Hole U1439A cores does not compare well with the GPTS, which shows more time in reversed polarity. Given that the average normal inclination has a steeper dip than the reversed directions, it is likely that some drill string overprint remains on the measurements, and this overprint may bias the record toward normal polarity.
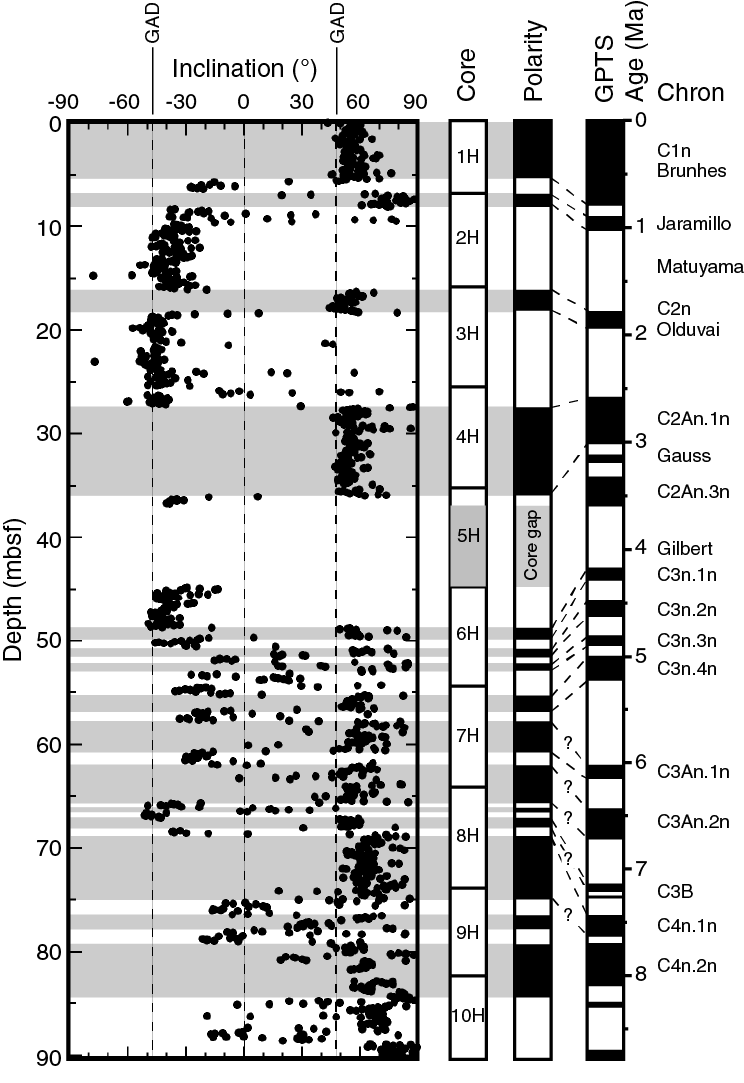
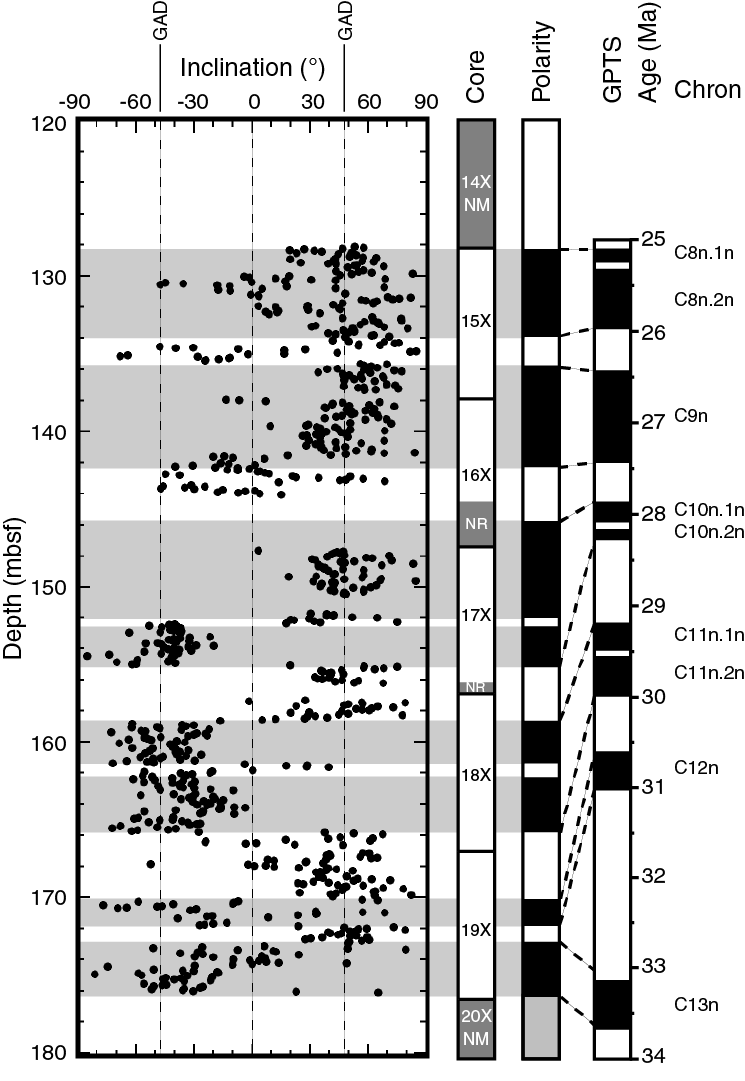
Paleomagnetic inclinations from the XCB cored section also define apparently coherent polarity intervals. As with the higher section, normal polarity dominates, implying that the drill string overprint was not removed entirely. Nevertheless, a plausible correlation can be made with the GPTS using biostratigraphic zones for support. It appears that Cores 15X through 18X record Chrons C8–C11 (Figure F75). In the lower part of Cores 18X and 19X, core polarity does not match the dominant reversed polarity of the GPTS, implying that some of the time between Chrons C12 and C13 may be missing or that some reversed polarity intervals may be masked by the drill string overprint.
Igneous rock
Archive-half measurements
Oriented pieces larger than ~10 cm from the archive-half cores were measured in the cryogenic magnetometer. AF demagnetization was used to remove overprint magnetizations, using 5, 10, 15, 20, 25, 30, 40, and 50 mT steps. Each piece was measured using the cryogenic magnetometer discrete sample routine. This sample routine is a nonstandard measurement for the cryogenic magnetometer because the pieces are irregular in shape, which is not ideal for accurately measuring the magnetization. In addition, the sample volumes are much larger than the 8 cm3 that is assumed for discrete samples. For this reason, the magnetization intensities in the LIMS database are incorrect and the directions must be treated with caution. Nevertheless, these measurements provided a routine evaluation of magnetic properties of the cores.
A total of 106 pieces were measured. Most were characterized by high coercivity, which meant that the samples were not effectively demagnetized with the cryogenic magnetometer demagnetizer system. As a result, only 49 samples were demagnetized sufficiently that principal component analysis (PCA; Kirshvink, 1980) could be performed on the results. With many of these samples, a large part of the remanence (sometimes more than half) was still present even after 50 mT demagnetization, making it impossible to isolate a stable paleomagnetic direction. This occurred with 23% of the samples. A significant percentage of the samples produced erratic results (32%), with the sample showing no consistent direction during demagnetization. Some samples displayed both problems simultaneously.
Having noted that the PCA directions for the archive-half pieces were scattered, we restricted the interpretable results by selecting only those pieces longer than 15 cm. The rationale for this restriction is that this length is twice the half-width of the cryogenic magnetometer sensor, so these pieces should be long enough that edge effects should not significantly influence the measurements. In the end, because of all the high-coercivity, unstable, and short samples, only 12 PCA results could be considered reliable.
Discrete samples
Discrete samples were taken as 8 cm3 cubes at a rate of ~1 per section, except in sections in which there were no core pieces long enough to be considered oriented. Whenever AF demagnetization of the archive-half piece produced results that appeared reliable, AF demagnetization was applied to the corresponding discrete sample from the working-half core. Use of the nondestructive AF demagnetization method allowed other groups to use the same sample for measurements. Otherwise, the discrete sample was thermally demagnetized. In total, 23 discrete samples were treated with AF demagnetization, and 57 were treated with thermal demagnetization.
Only 16 AF-demagnetized samples produced results that could be analyzed with PCA. The AF samples generally do not yield good quality results because of high sample coercivities. The samples are often not sufficiently demagnetized to display univectorial decay before they begin to acquire a spurious ARM in the D-Tech AF demagnetizer at fields over ~30 mT. In the upper part of the hole down to Core 352-U1439C-7R, MDFs are >25 mT and sometimes even too high to be determined with the equipment on hand (Figure F76). Except for 1 sample, MDFs remain >14 mT in the rest of the hole. Demagnetization spectra usually show an initial plateau, which indicates that the magnetization carriers are most likely single-domain grains. When it was possible to demagnetize the samples, most had only 1 component that could be easily identified (Figure F77).
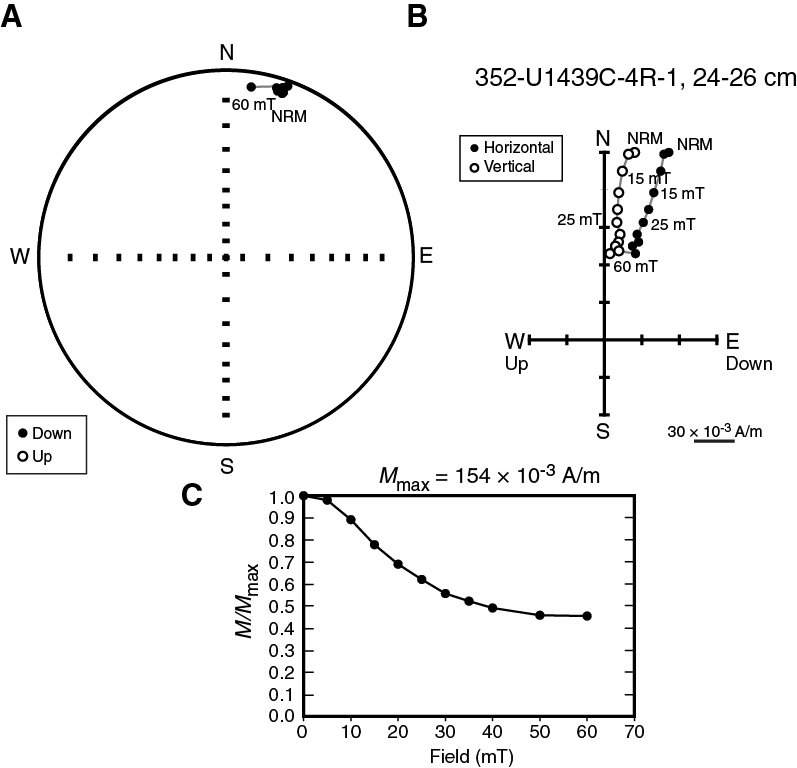
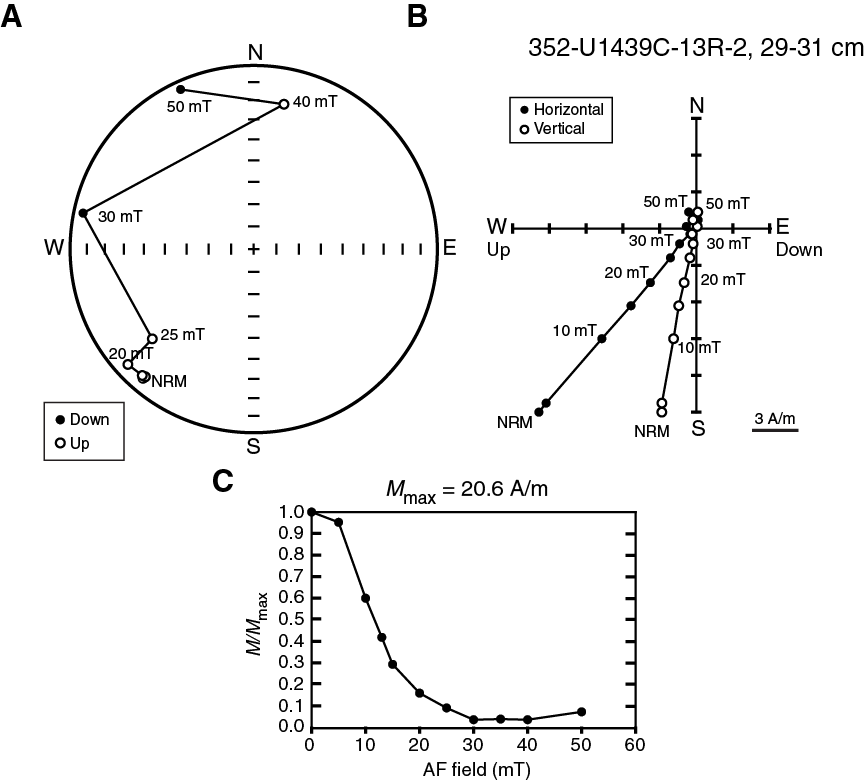
Thermal demagnetizations were carried out between 120° and 625°C, typically with 50°C steps up to 450° or 500°C and 25°C steps at higher temperatures. No low-temperature demagnetization in liquid nitrogen was used, as samples were fine grained and we did not identify any multidomain behavior in the AF demagnetizations on archive-half pieces. Most samples were completely demagnetized by 600°C, and all were completely demagnetized by 625°C (implying no hematite content). As with samples from Site U1440, some of the Hole U1439C igneous samples display an initial plateau in the demagnetization curve or a slight decrease, followed by an increase of magnetization around 350°C that appears to result from partial self-reversal (Doubrovine and Tarduno, 2004, 2005) (Figure F78). The self-reversal behavior of Hole U1439C samples is usually not as pronounced as those from Hole U1440B. At temperatures >350°C, the magnetization declines between ~400° and 600°C and can be used to identify a stable magnetic direction in many samples using PCA (Figures F78, F79). A characteristic of Hole U1439C samples is that many have high Curie temperatures, indicated by a demagnetization plot that declines slowly through ~500°C, followed by a rapid decline between ~500° and 600°C (Figure F80). Such samples must contain nearly pure magnetite because titanomagnetite Curie temperature varies with titanium content, with increased titanium content lowering the Curie temperature from that of pure magnetite, which is 575°C (O’Reilly and Banerjee, 1965). Another indication of the purity of the magnetite is that the bulk magnetic susceptibility of most seafloor basalts increases as the sample is progressively heated because of the inversion of titanomaghemite, an alteration product, to magnetite (Özdemir and O'Reilly, 1982). Although this happens with some samples from Hole U1439C, many samples show no significant increase in susceptibility with heating. Thus, the magnetic grains in those samples must be lacking in titanomaghemite.
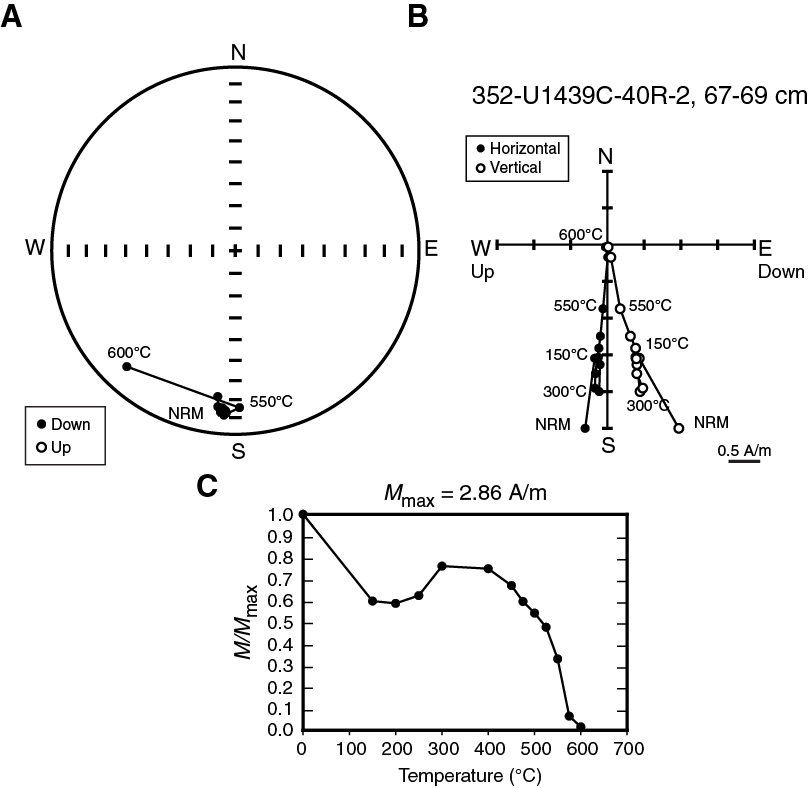
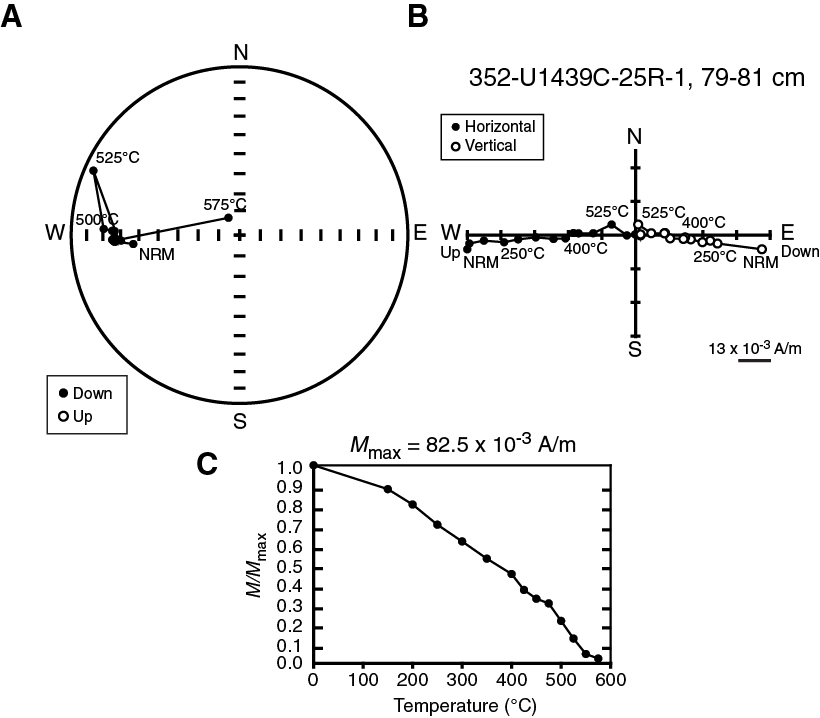
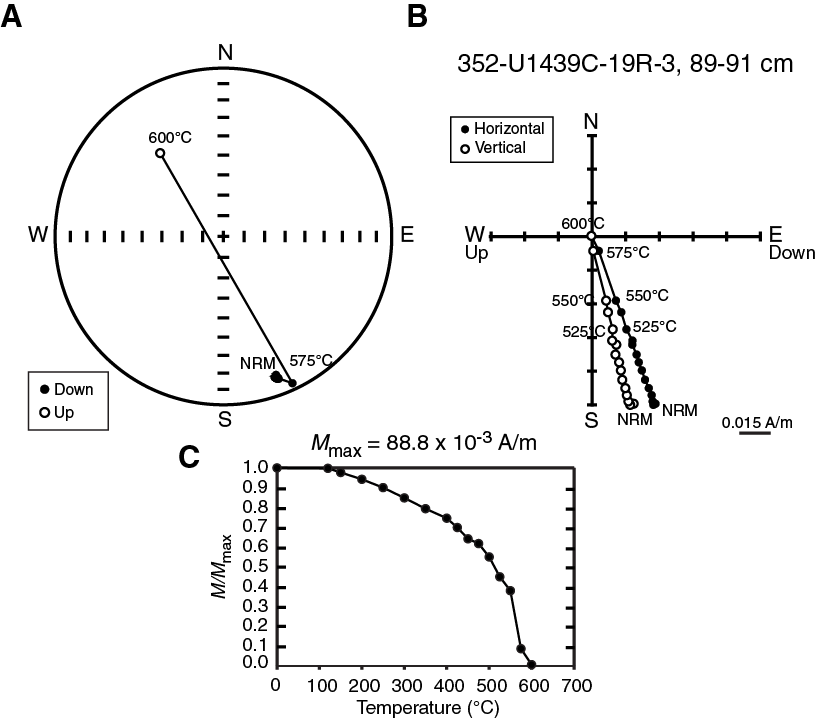
Rock magnetic measurements
In order to characterize the magnetization carriers, we measured the acquisition of partial ARM (pARM) on a few representative samples that were used for AF demagnetization, using 10 mT steps up to 100 mT (Figure F81). It was impossible to start from a demagnetized state because of the high coercivity of the samples and because they acquired a spurious ARM in the AF demagnetizer, which is why the baseline on these graphs is not zero. The pARM acquisition for most samples peaks between 20 and 60 mT, which is consistent with the high MDF values. The peak is very broad for the samples that are shallowest in the hole (Samples 352-U1439C-2R-1, 34–36 cm, and 15R-1, 135–137 cm). When compared with measurements made on synthetic magnetite (Jackson et al., 1988), our peak values correspond to magnetic grain sizes between 0.1 and 3 μm.
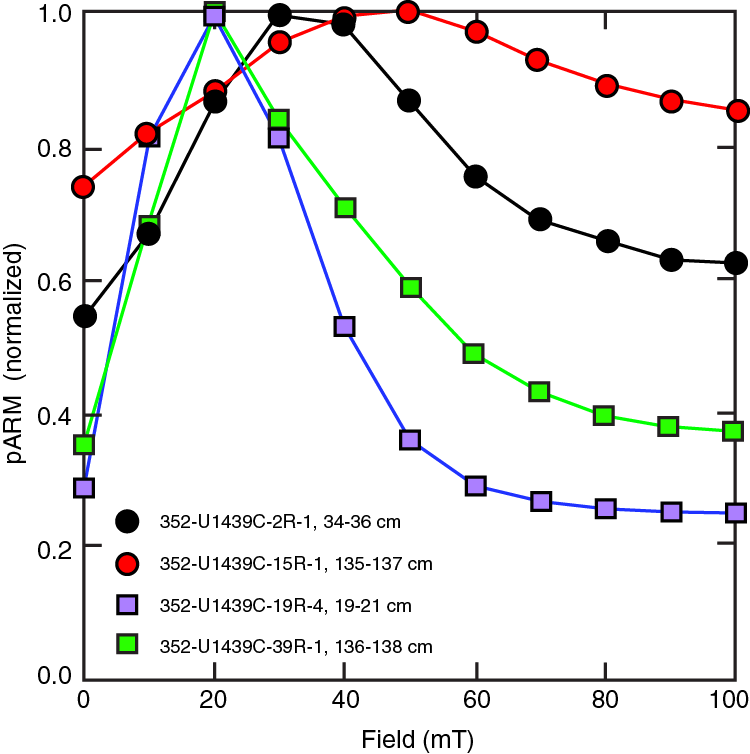
Isothermal remanent magnetization (IRM) acquisition was measured in fields up to 300 mT for 5 of the samples used for AF demagnetization (Figure F82). Three of the samples are saturated between 50 and 100 mT, but the other 2 are barely saturated at 300 mT, which is consistent with the high coercivity of these 2 samples. Nevertheless, saturation of IRM in fields less than 100–300 mT is a signature of titanomagnetite (Tauxe, 2010), so the magnetic grains in these samples are probably magnetite.
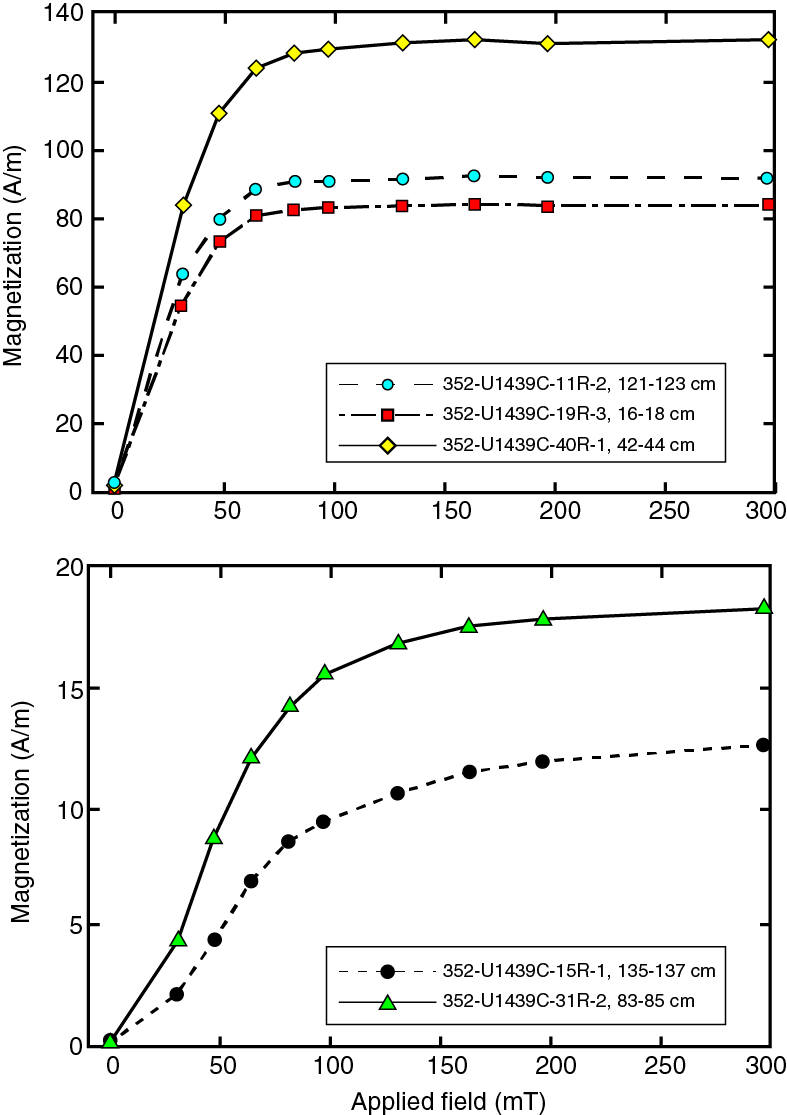
Paleomagnetic inclination
Paleomagnetic directions were calculated using PCA on a subset of higher demagnetization steps that appear to show a linear decay toward the origin of an orthogonal vector (Zijderveld) plot. This consistent set of demagnetization steps is assumed to be the characteristic remanent magnetization that was recorded at the time of initial sample cooling. Of the 80 discrete samples, 57 yielded results of sufficient consistency for PCA analysis and 23 did not. Although there appears to be significant scatter in the inclination values, which range in value from –55° to 53°, it is clear that most are clustered near 0° (Figure F83). Considering all values, the average for thermally demagnetized samples is –2.2°, but the average for AF demagnetized samples is 4.9°. This difference is insignificant because the thermal demagnetization inclination values are biased by the large number of negative inclinations between –40° and –60° (Figure F84). Indeed, if inclinations with absolute values >40° are excluded from averaging, both the AF and thermal samples have identical averages of 5.5°.
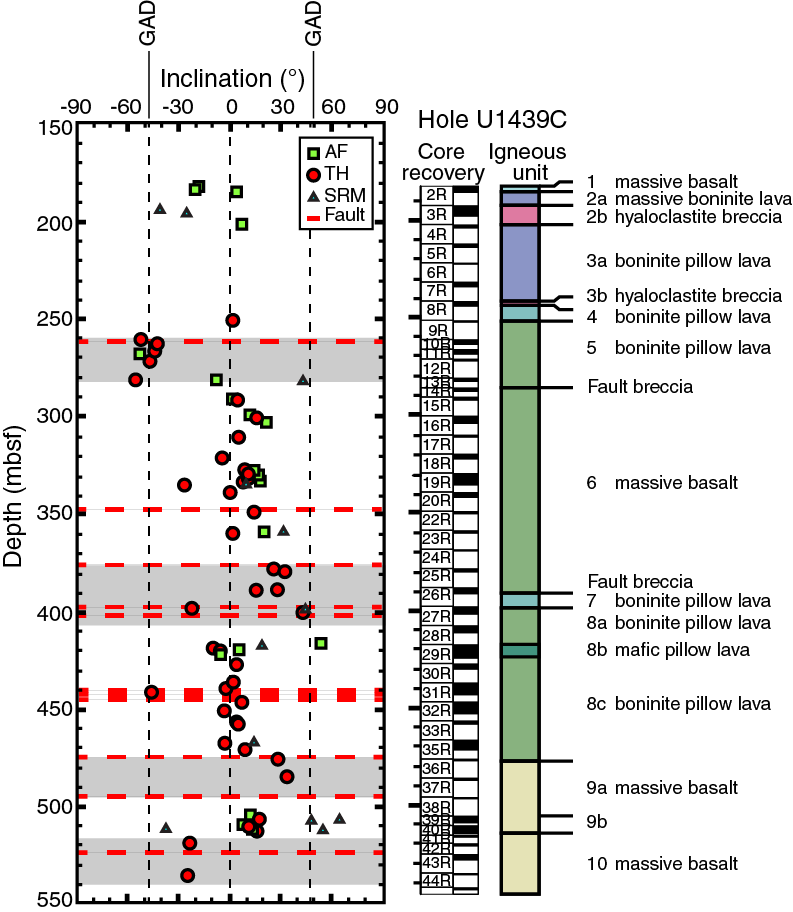
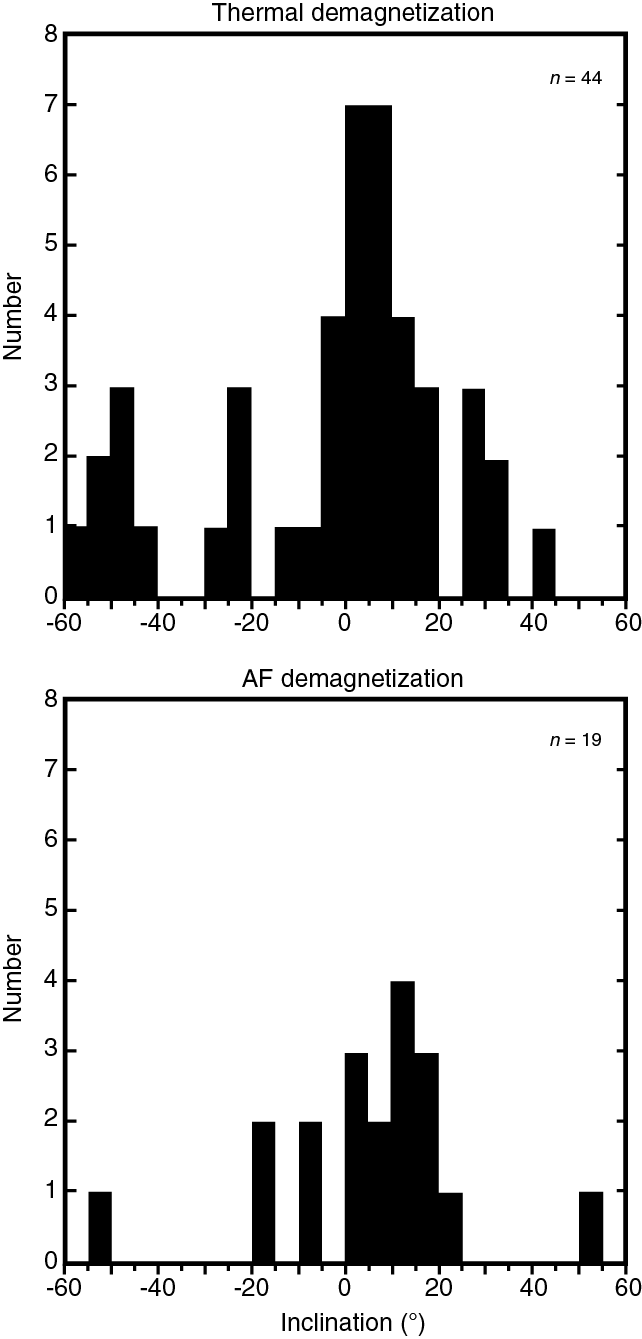
Most samples give low positive inclinations ranging from ~0° to 30°. Many negative inclinations are also near 0°. Low inclinations are expected because the Izu-Bonin arc formed at lower latitude than its present position (e.g., Hall et al., 1995). Because there are many negative inclinations scattered among the positive inclinations, it is most likely that these values are not magnetic reversals but periods during which secular variation caused the inclination to change sign. This is not an uncommon occurrence for low-latitude sites.
Several zones show inclinations with high absolute values. One such zone, from ~260 to 280 mbsf, displays negative values from −50° to –55° (Figure F83). The fact that eight samples from Cores 352-U1439C-8R through 13R all give consistent negative inclinations indicates that these values are not caused by measurement error. They indicate a difference of ~50° from those of surrounding units. Either these negative values represent a reversed magnetic zone or they indicate tectonic rotation. Although a fault was observed at ~251 mbsf (see Structural geology), there is no indication of tectonic rotation. Thus, this zone is probably reversed in magnetic polarity. The fact that the average of the inclinations is near the present field inclination (47.5°) suggests it is a recent remagnetization.
Other samples with anomalously high absolute value inclinations occur near faults and fault zones. This association is observed in Cores 25R through 27R (378–401 mbsf), one sample from Cores 31R (441 mbsf), 36R, and 37R (476 and 485 mbsf, respectively), and at the bottom of the hole in Cores 42R and 44R (519 and 534 mbsf, respectively). In all of these instances, the anomalous samples appear near faults (Figure F83), and thus the anomalous values are probably related to fault processes.
Downhole logging
A ~220 m open-hole interval of Hole U1439C was logged with two downhole logging tool strings over a period of ~18 h (Figure F85). The borehole was stable during logging operations despite numerous discrete washouts along its length and deteriorating weather conditions. Gamma ray, bulk density, electrical resistivity, magnetic susceptibility, and sonic velocity data were successfully collected in addition to microresistivity images.
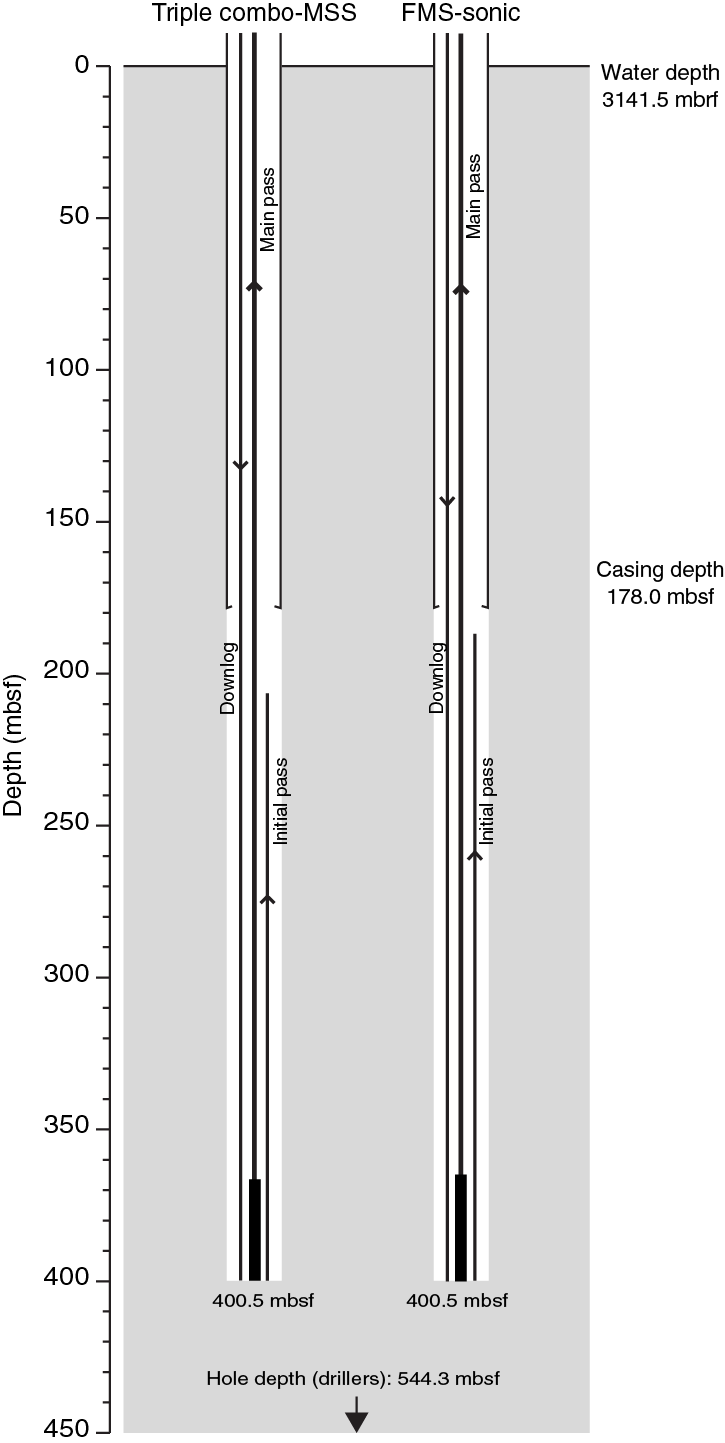
Logging operations
Downhole logging operations in Hole U1439C commenced at 1200 h local time on 10 September 2014. Challenging hole conditions were reported by the drillers, with numerous tight spots, many of which were attributed to fault zones identified by the science party. One of these fault zones (at ~400 mbsf) had bridged over the hole between the time the drill string was pulled into pipe and the time the first logging tool string was deployed in the hole. This is the maximum depth that either of the tool strings reached, ~140 m short of the total depth of the hole. The sea state made it necessary to utilize the wireline heave compensator (WHC) to minimize the effect of ship’s heave on tool motion in the hole. Weather conditions deteriorated through the course of logging operations, with maximum heave >3 m.
The first tool string deployed was the triple combo-Magnetic Susceptibility Sonde (MSS) tool string, which included the Hostile-Environment Natural Gamma Ray Sonde (HNGS), Hostile-Environment Litho-Density Sonde (HLDS), High-Resolution Laterolog Array (HRLA), and the deep-reading cartridge of the MSS-B (see Downhole logging in the Expedition 352 methods chapter [Reagan et al., 2015a] for tool string diagrams, descriptions, and acronym definitions). An initial uplog with the triple combo-MSS was undertaken at ~365 m/h from ~400 to ~208 mbsf. This was followed by a repeat pass from the bottom of the open hole interval back through the casing and drill pipe to the seafloor at the same speed. The tool string arrived back at the rig floor, where it was dismantled by 2100 h local time.
The second tool string deployed in Hole U1439C was the Formation MicroScanner (FMS)-sonic tool string. This tool string included the HNGS, Dipole Sonic Imager (DSI), and FMS tools, which generated spectral gamma ray, acoustic velocity, and electrical image data, respectively. The tool string reached a maximum depth of ~400 mbsf. An initial uplog was undertaken to ~188 mbsf at ~365 m/h. Maximum tool motion, because of heave, was much greater in the second uplog compared to the initial pass (~3 m compared to ~1.5 m during the initial uplog). To try to optimize the data from this second pass, the tool string speed was increased to ~460 m/h. The FMS-sonic tool string was then retrieved at the rig floor, with logging operations concluding at 0520 h local time on the morning of 11 September.
Data processing and quality assessment
To ensure consistency across the data sets, the logs were first depth shifted to a reference datum and then depth matched to a reference logging pass. Seafloor was identified from the gamma ray data sets acquired during both tool string deployments. The reference log was taken as the second uplog (main pass) of the triple combo-MSS, with seafloor picked at 3141.5 mbrf. The log curves were then depth matched using the gamma ray logs, with the reference also taken as the triple combo-MSS main pass. The logs from the other tool string passes (triple combo-MSS initial pass and both FMS-sonic passes) were matched to this reference log based on identification of common features.
Caliper data from both tool strings (HLDS and FMS tools) show that Hole U1439C had a relatively smooth profile (~11–14 inches), punctuated by discrete washed out zones (Figures F86, F87, F88, F89). The FMS calipers (two orthogonal caliper sets) indicate that the hole was not perfectly symmetrical (Figure F88). The range in hole size is such that the measurements acquired should be of reasonable quality, with effective centralization of the HRLA and DSI tools, and eccentralization of the HLDS. However, the washed out zones do affect the quality of the data in these intervals, particularly those measurements that require sensor contact with the borehole wall or tool centralization. For example, the bulk density measurements are systematically lower where the borehole is washed out and the sensor was not in direct contact with the borehole wall (Figure F87). Equally, the FMS images give consistently conductive readings through the washed out zones where the sensor is reading borehole fluid rather than formation resistivity. The discrepancy in the caliper profile from one tool string run to the next (Figure F90) is likely a consequence of borehole cross-sectional asymmetry rather than indicating any changes in hole conditions.
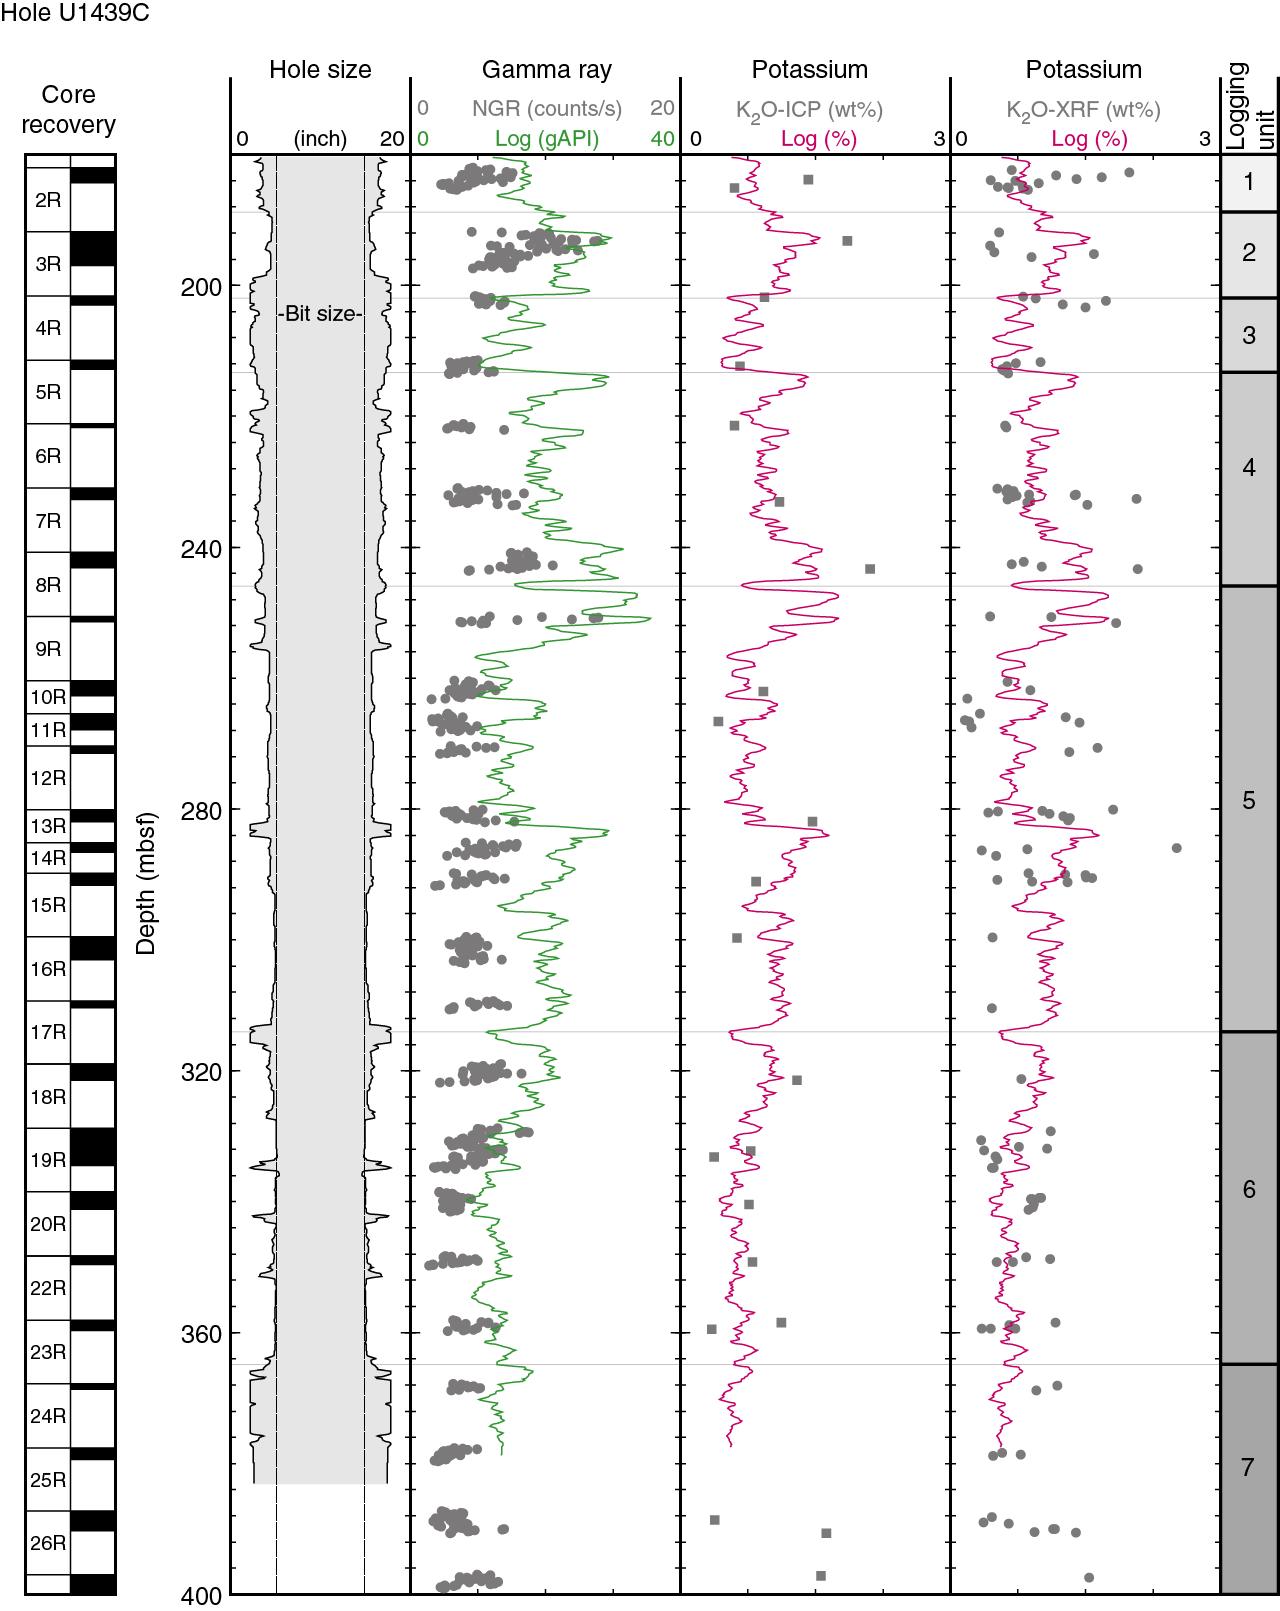
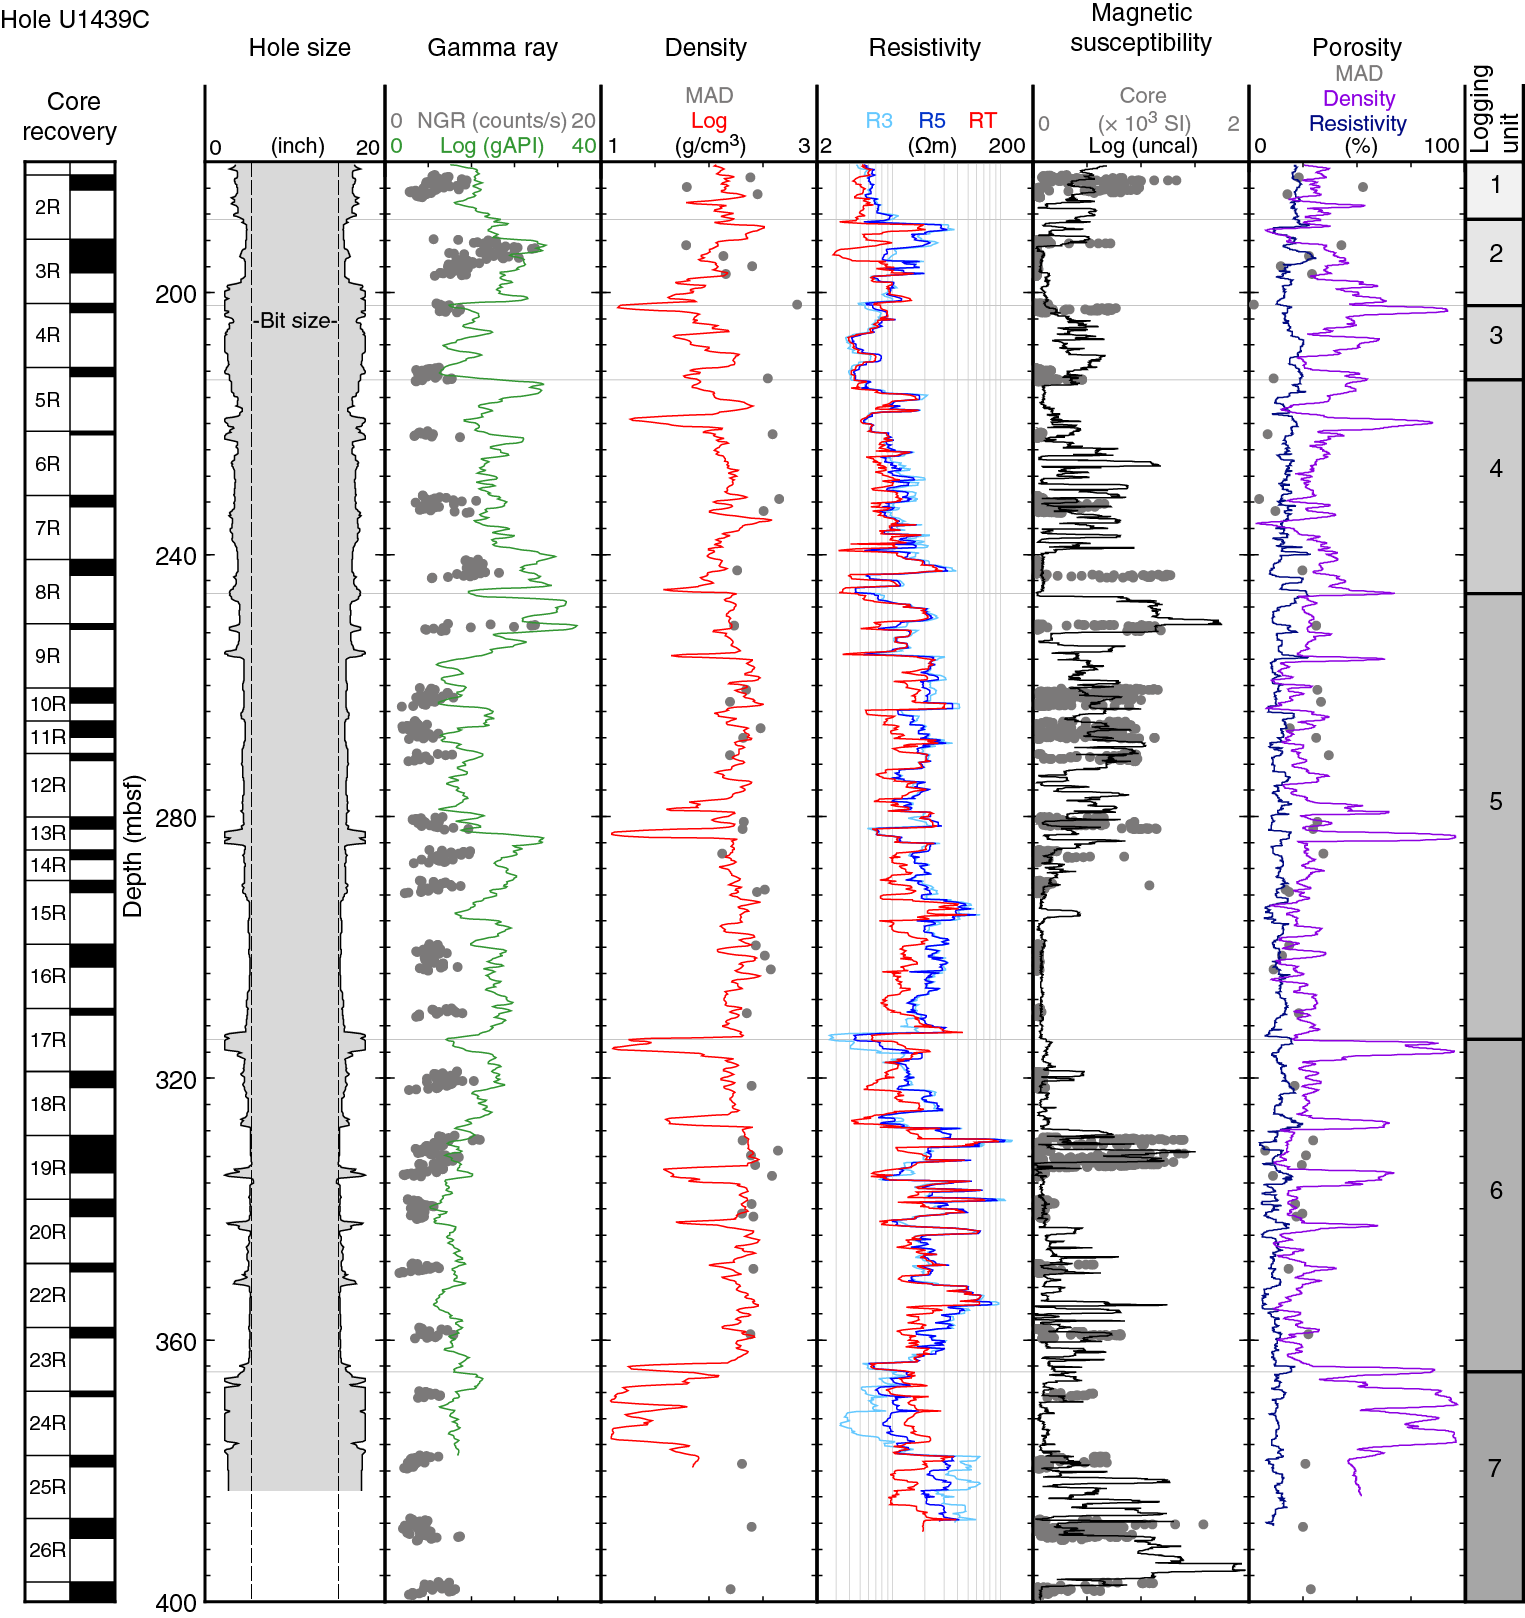
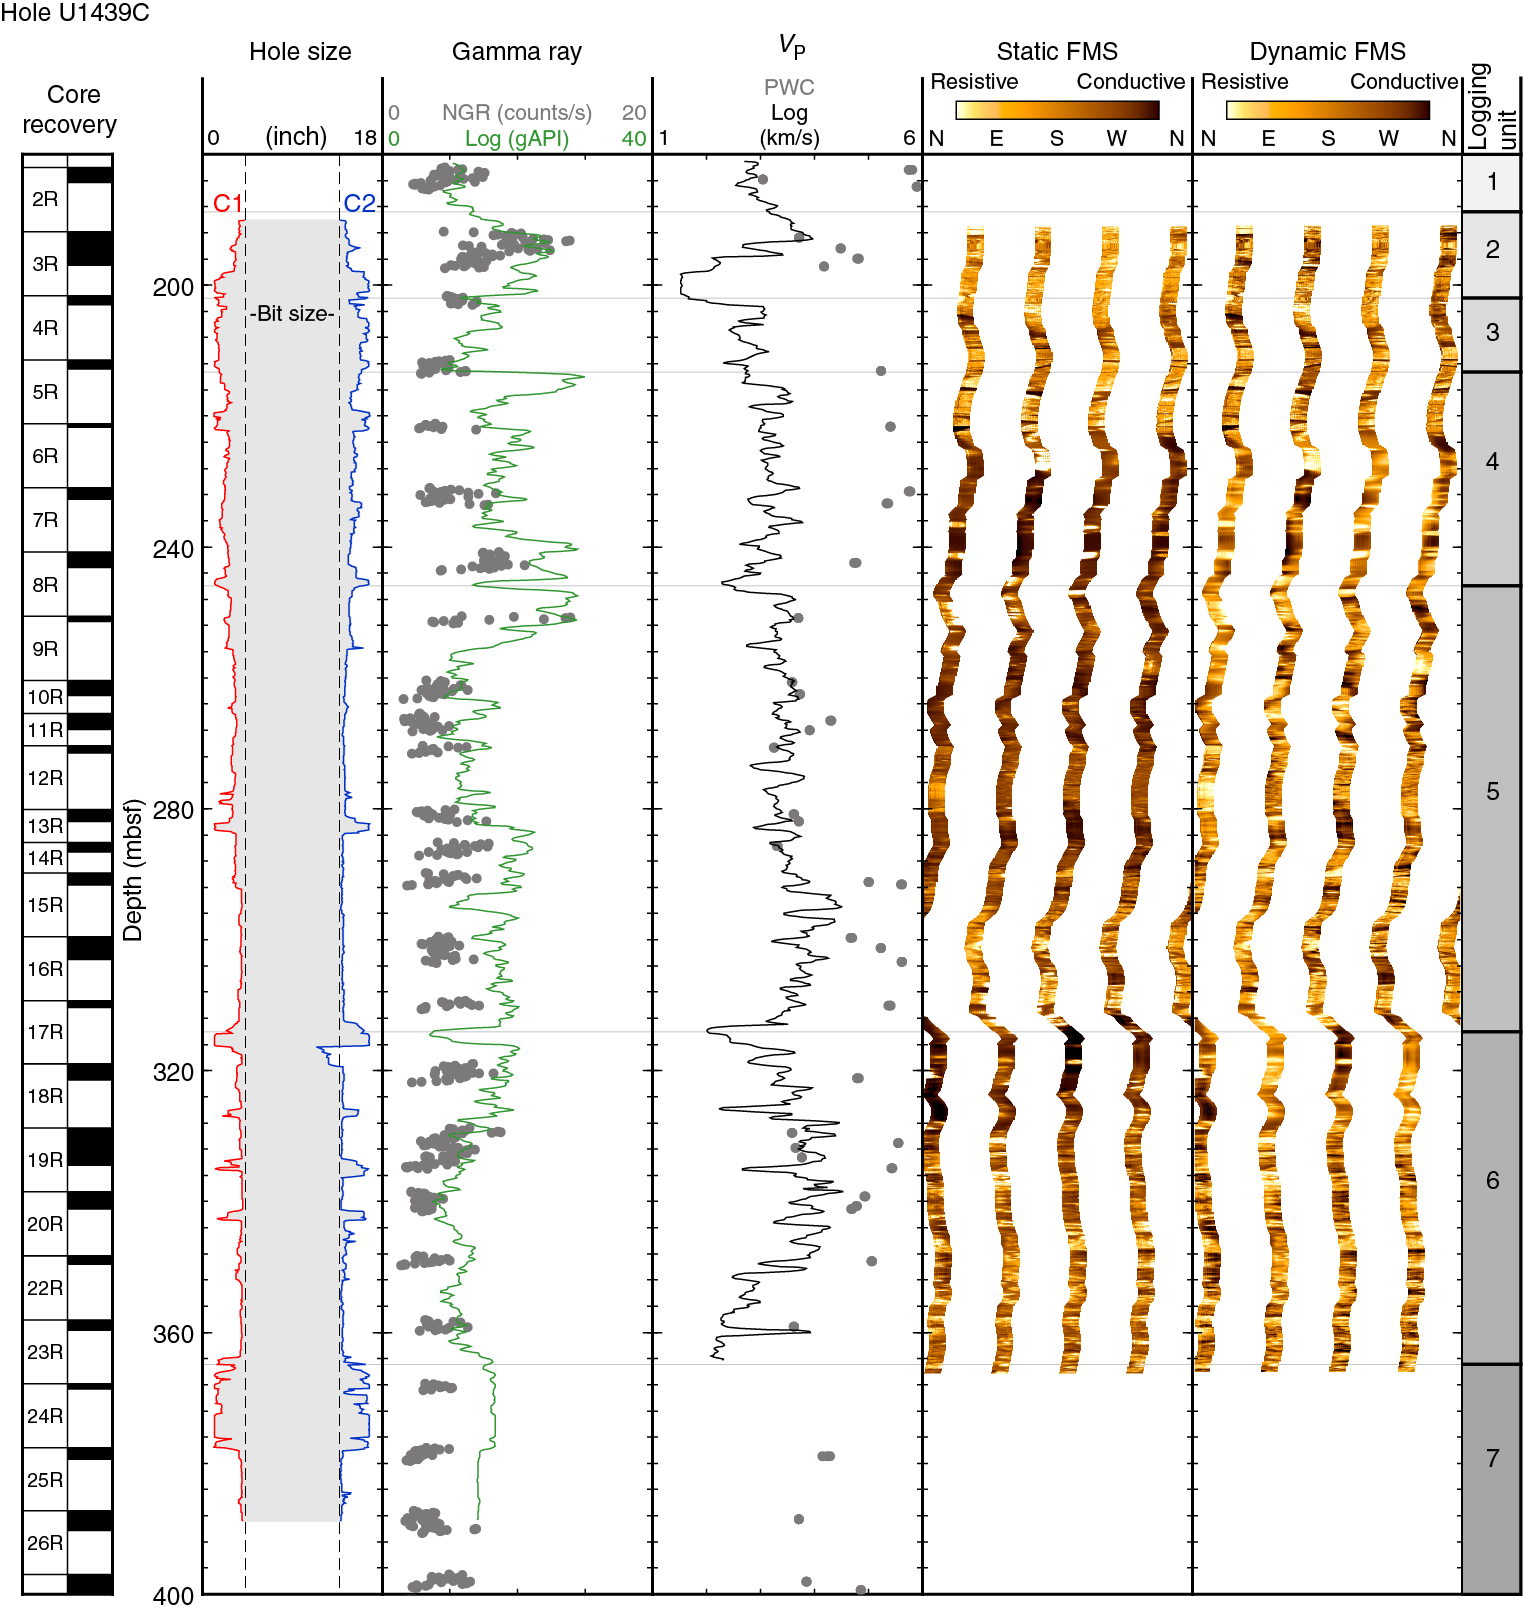
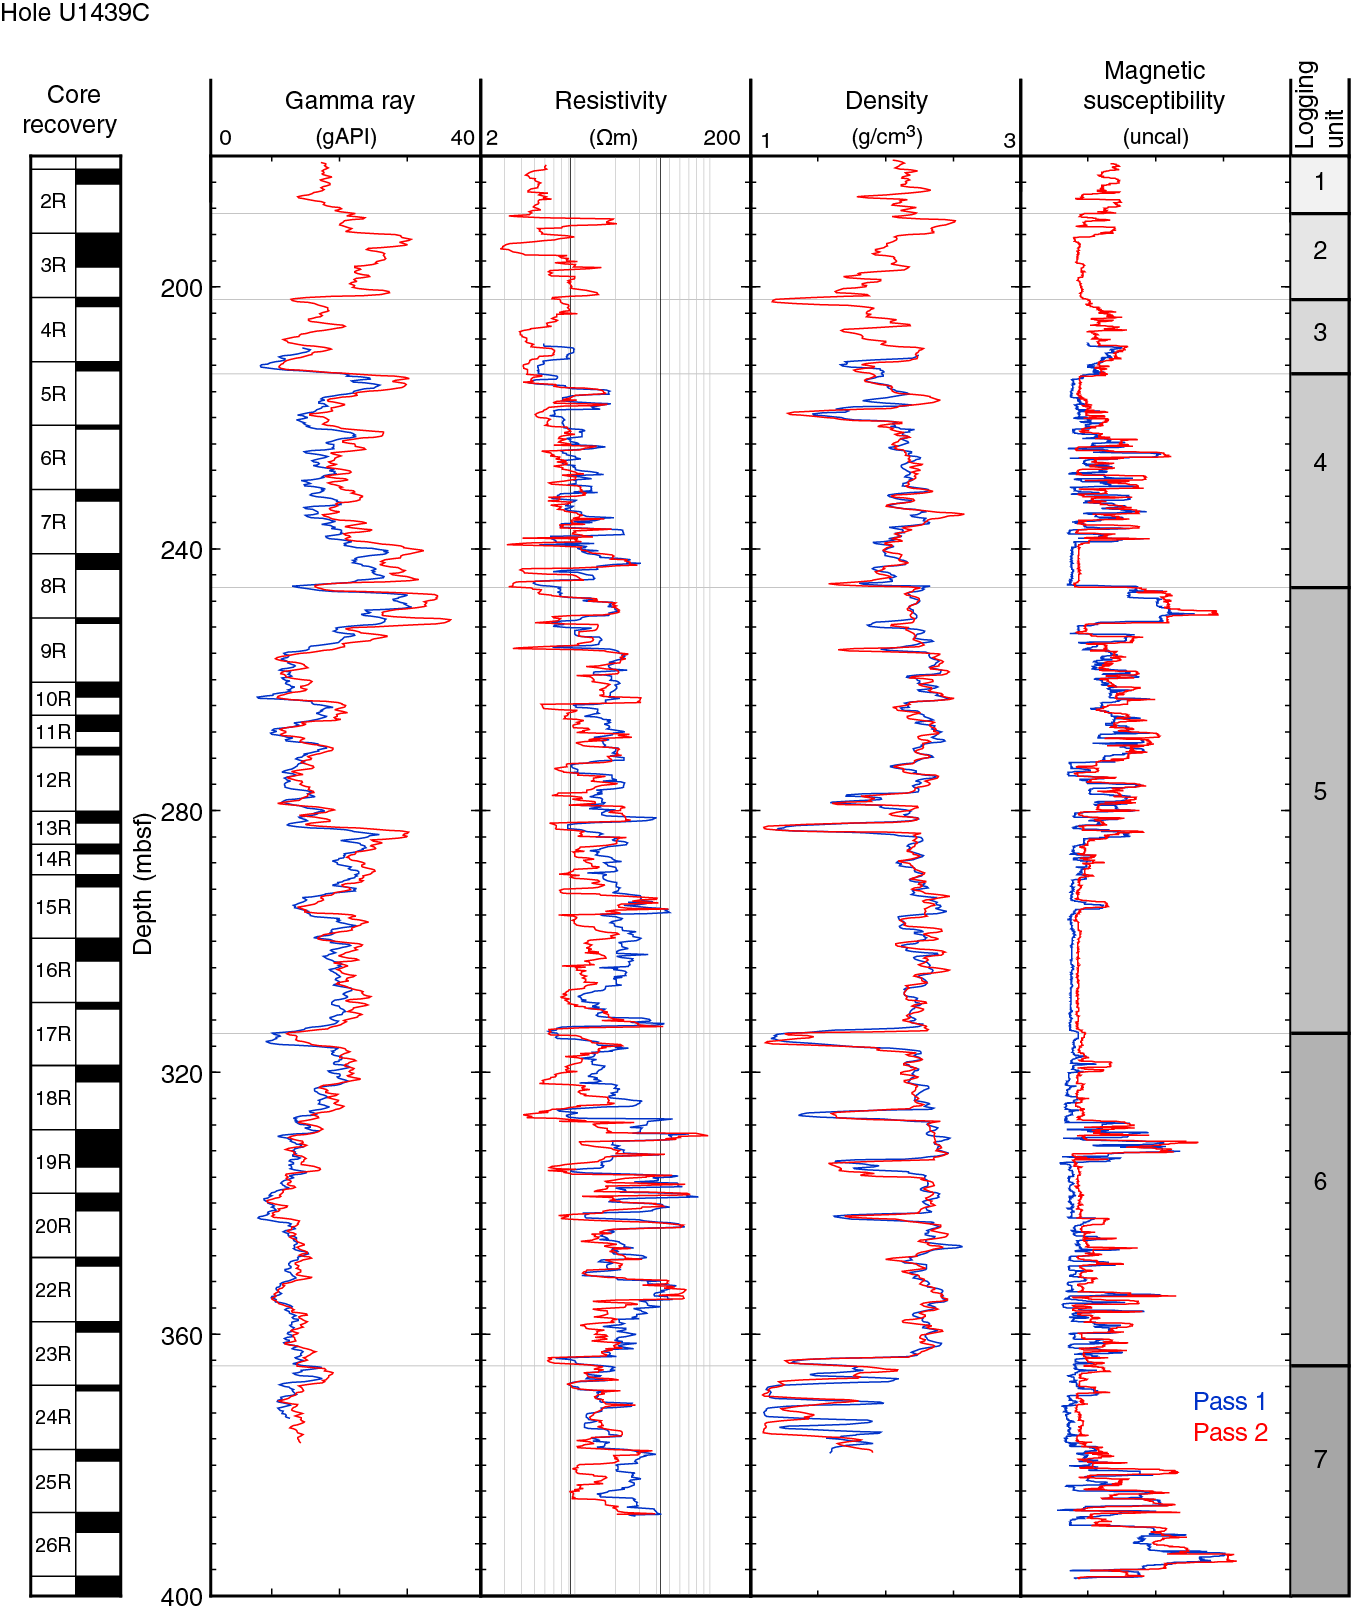
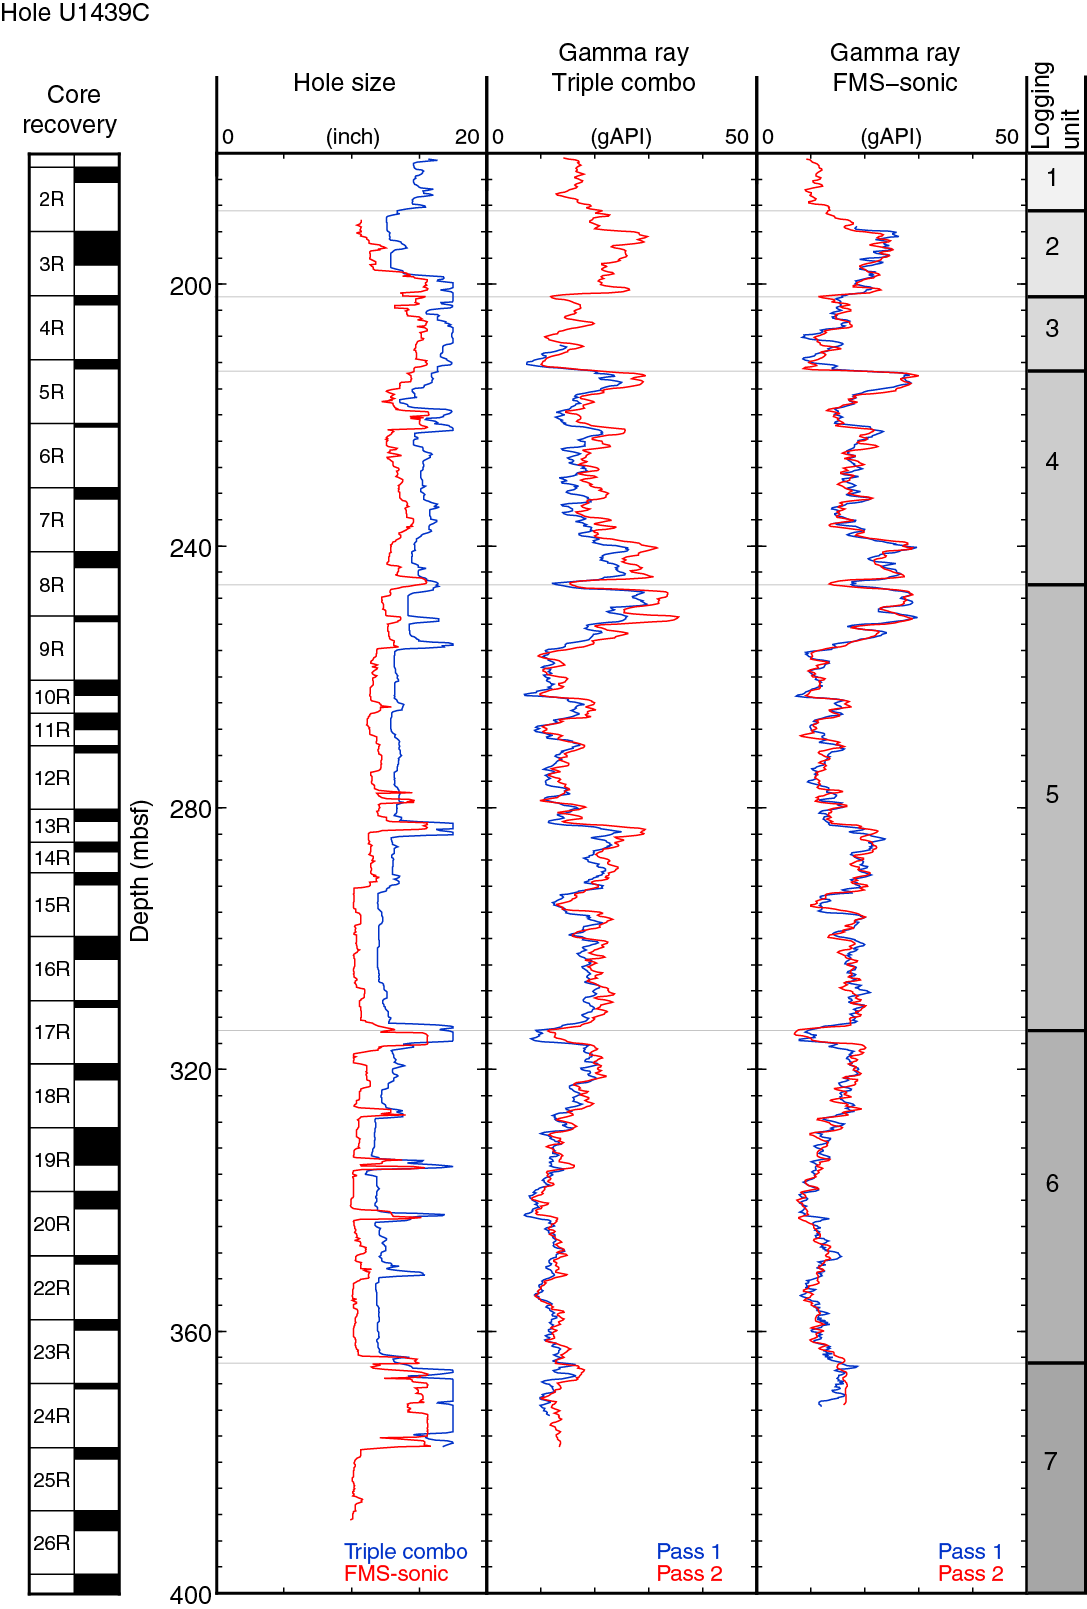
The repeatability of the logging data between subsequent passes of the triple combo-MSS is summarized in Figure F89, which shows excellent agreement in log curve trends and generally good agreement in absolute values. Figure F90 summarizes repeatability of common measurements acquired by the two tool strings. Although the gamma ray logs are in good agreement, the absolute values are slightly offset, which may be attributed to different orientation of the HNGS in the two tool strings. Thorium and uranium data from the spectral gamma ray sonde (HNGS) are below the limits of detection for the tool so these data are not presented here.
Overall, the electrical resistivity data from the HRLA are of good quality with reasonable agreement between the different depths of investigation (medium [R3] and deep [R5] in Figure F87). These curves tend to separate in the washed out zones (for example, below ~365 mbsf) where tool centralization is not as effective. A porosity measurement, derived from the true resistivity log using Archie’s law, is presented alongside a porosity measurement derived from the density in Figure F87.
Of all the measurements acquired in Hole U1439C, magnetic susceptibility appears to be the least affected by borehole rugosity, with no apparent systematic changes with borehole diameter. The MSS-B provides an uncalibrated magnetic susceptibility measurement. Repeatability of the trends between subsequent tool string passes is very good (Figure F89), with a minor offset in the absolute values that may be attributed to changes in tool temperature during the tool string deployment.
The DSI was operated with the upper dipole in low-frequency mode and the three other modes (P&S monopole, Stoneley, and lower dipole) all operating at standard frequency. These operating modes were selected to optimize the velocity data acquired from Hole U1439C based on the lithologies encountered. Slowness data from the DSI was converted to acoustic velocities (VP [monopole] and VS [lower dipole]) (Figure F88). Data quality is generally good, although the washed out intervals yield poor quality data owing to tool centralization issues where the diameter is enlarged.
The quality of borehole images from the FMS tool relies on good contact of its four tool pads with the borehole wall and on steady tool motion uphole. The maximum borehole diameter the FMS can achieve good pad/hole contact is ~15 inches. Contact was therefore possible through much of Hole U1439C, with the exception of the bottom of the hole and the washed out zones present through the logged interval (Figure F88). An additional factor in image quality is tool motion, which should be minimized where possible. Owing to deteriorating weather conditions during logging and consequently increasing heave, maintaining constant tool motion was challenging, especially during the second pass of the tool string. Processing of the data can correct for a certain amount of this tool motion (typically <1 m), but there are discrete intervals where motion exceeded the limits of the processing software. The resulting image appears smeared out in these zones and should be discarded when interpreting the electrical image data set.
Logging stratigraphy
Seven logging units are identified in Hole U1439C on the basis of distinctive features and trends in the downhole logging data sets. The logged interval at this site only penetrated the volcanic extrusive section as defined by the shipboard science party. Figures F86, F87, F88, F89, and F90 indicate the logging unit boundaries and a description of the defining petrophysical characteristics of each unit follows.
Logging Unit 1
Unit 1 (~180–189 mbsf) is characterized by increasing values in gamma radiation, resistivity, density, and velocity combined with decreasing magnetic susceptibility downhole. The gamma ray profile exhibits low-amplitude variations (mean = 24.0 gAPI), and the potassium data mirrors this trend. There is a drop in gamma radiation at ~186 mbsf to 19.1 gAPI, an excursion that is also present in the density profile (minimum = 1.16 g/cm3). Overall, bulk density in this unit has a mean value of 2.14 g/cm3. Resistivities are low relative to the overall logged interval, ranging in value from 4.32 to 11.46 Ωm. Magnetic susceptibility shows relatively high frequency and moderate amplitude variations, decreasing overall with depth. The P-wave velocity profile exhibits the opposite trend, with a mean value of 3977 m/s.
Logging Unit 2
Unit 2 (~189–202 mbsf) shows a change in the character and trend of most of the log curves. Overall, density, resistivity, and magnetic susceptibility decrease with depth. Gamma radiation is higher in this logging unit than in the units above and below, with a mean value of 23.1 gAPI. Electrical resistivity is also distinct from its neighboring logging units, with higher amplitude variations and elevated values ranging from 2.81 to 20.4 Ωm. These variations in resistivity are echoed in the bulk density profile, which has a mean of 2.01 g/cm3. P-wave velocity is slightly lower in Unit 2 compared to the units above and below, with a mean of 2601 m/s. However, the coherence of the acoustic signal in this unit was poor, likely due to the washed out hole at this depth, and data should therefore be treated with caution. The top half of Unit 2 has some high-amplitude variations in magnetic susceptibility, whereas the bottom half has a much flatter profile.
Logging Unit 3
Unit 3 (~202–213 mbsf) is characterized by increasing density combined with decreasing gamma radiation, resistivity, and magnetic susceptibility and relatively constant velocity. The gamma ray profile (mean = 14.6 gAPI) shows two distinct highs at ~206 and ~210 mbsf and has less small-scale variation compared to any other logging unit in Hole U1439C. The peaks in gamma radiation are coincident with peaks in bulk density, which has an overall mean value of 1.92 g/cm3. Resistivity values in Unit 3 are some of the lowest in this hole (mean = 5.39 Ωm), with finer scale variability superimposed on low-frequency variations. The magnetic susceptibility data in this unit represent a local high compared to the base of Unit 2 and the top of Unit 4. There is no net change in P-wave velocity with depth through this unit (mean = 2710 m/s) and this trend continues into the underlying Unit 4.
Logging Unit 4
Overall, density and gamma radiation exhibit opposite trends through Unit 4 (~213–246 mbsf), with gamma radiation first decreasing and then increasing, whereas density initially increases and then decreases, resulting in opposing arced profiles. Gamma radiation shows a net increase in value with depth, with a mean of 21.7 gAPI. The density log curve (mean = 2.08 g/cm3) is punctuated by two discrete highs at ~218 and ~235 mbsf, both corresponding with lows in gamma radiation (opposite to what is seen in Unit 3). Overall, resistivity increases with depth with values ranging from 3.15 to 29.0 Ωm. The uppermost and lowermost ~6 m of this logging unit are characterized by low magnetic susceptibility and elevated resistivity. Both profiles are smoother through these intervals, with the middle portion of the logging unit being characterized by higher frequency variations. P-wave velocity continues an overall increasing downhole trend, with a mean value of 3104 m/s.
Logging Unit 5
Unit 5 (~246–314 mbsf) is characterized by decreasing magnetic susceptibility, no net change in resistivity, a minor increase in velocity, and variable but opposing trends in gamma ray (mean = 19.0 gAPI) and density (mean = 2.21 g/cm3), which is similar to Unit 4. The uppermost 6 m of this logging unit has very high magnetic susceptibility and the highest gamma ray values in the logged interval of this hole. Resistivity exhibits some interesting variations, some of which are mirrored in the magnetic susceptibility data (for example, a local high at ~294 mbsf), with values ranging between 3.48 and 49.1 Ωm. P-wave velocity, though relatively constant with depth (mean = 3496 m/s), is elevated in the ~290–304 mbsf interval.
Logging Unit 6
Unit 6 (~314–365 mbsf) is delineated from Unit 5 by a major washed out zone (~313–316 mbsf). Downhole, this logging unit has decreasing density (mean = 2.17 g/cm3) and gamma radiation (mean = 14.0 gAPI), both of which exhibit low-amplitude, high-frequency variability. Resistivity, magnetic susceptibility, and velocity have more complicated profiles. Two discrete magnetic susceptibility highs mark this logging unit at ~319–321 and ~328–333 mbsf. From ~342 mbsf, there are a series of high-amplitude variations in the magnetic susceptibility through the lower portion of this unit. Some, but not all, of this variability is echoed in the resistivity data set. Resistivity is very variable, ranging from 4.13 to 96.7 Ωm (mean = 25.5 Ωm), though some of this variability can be attributed to borehole rugosity. P-wave velocity initially increases downhole but then decreases, with values ranging from 1526 to 4537 m/s (mean = 3293 m/s).
Logging Unit 7
The data set in Unit 7 (below ~365 mbsf) is limited owing to the length of the tool strings and also based on the fact the borehole is very washed out through much of this interval. Magnetic susceptibility increases significantly with depth to its highest value in the entire logged interval at ~394–396 mbsf. Resistivity (mean = 23.6 Ωm) and gamma ray (mean = 13.7 gAPI) both also increase with depth through this logging unit.
FMS images
Figure F88 provides a summary of the FMS images from Hole U1439C. Some examples of the range of textures and features from this data set are summarized in Figure F91. Part A illustrates some vertical conductive features, which may represent open fractures. High-angle features, including vein networks, were identified in the core material recovered (see Alteration). Part B illustrates a more massive unit that has been fractured. The conductive (dark) sinusoid across the middle of the image represents a dipping planar feature. Similarly, the sinusoid in Part C represents a dipping planar feature, but probably with a higher angle of dip compared to that in Part B. Part C also highlights some interesting textures in the formations encountered in this hole. Given the scale of the dark speckles in this image, they could be interpreted as being vesicles in this extrusive volcanic sequence.
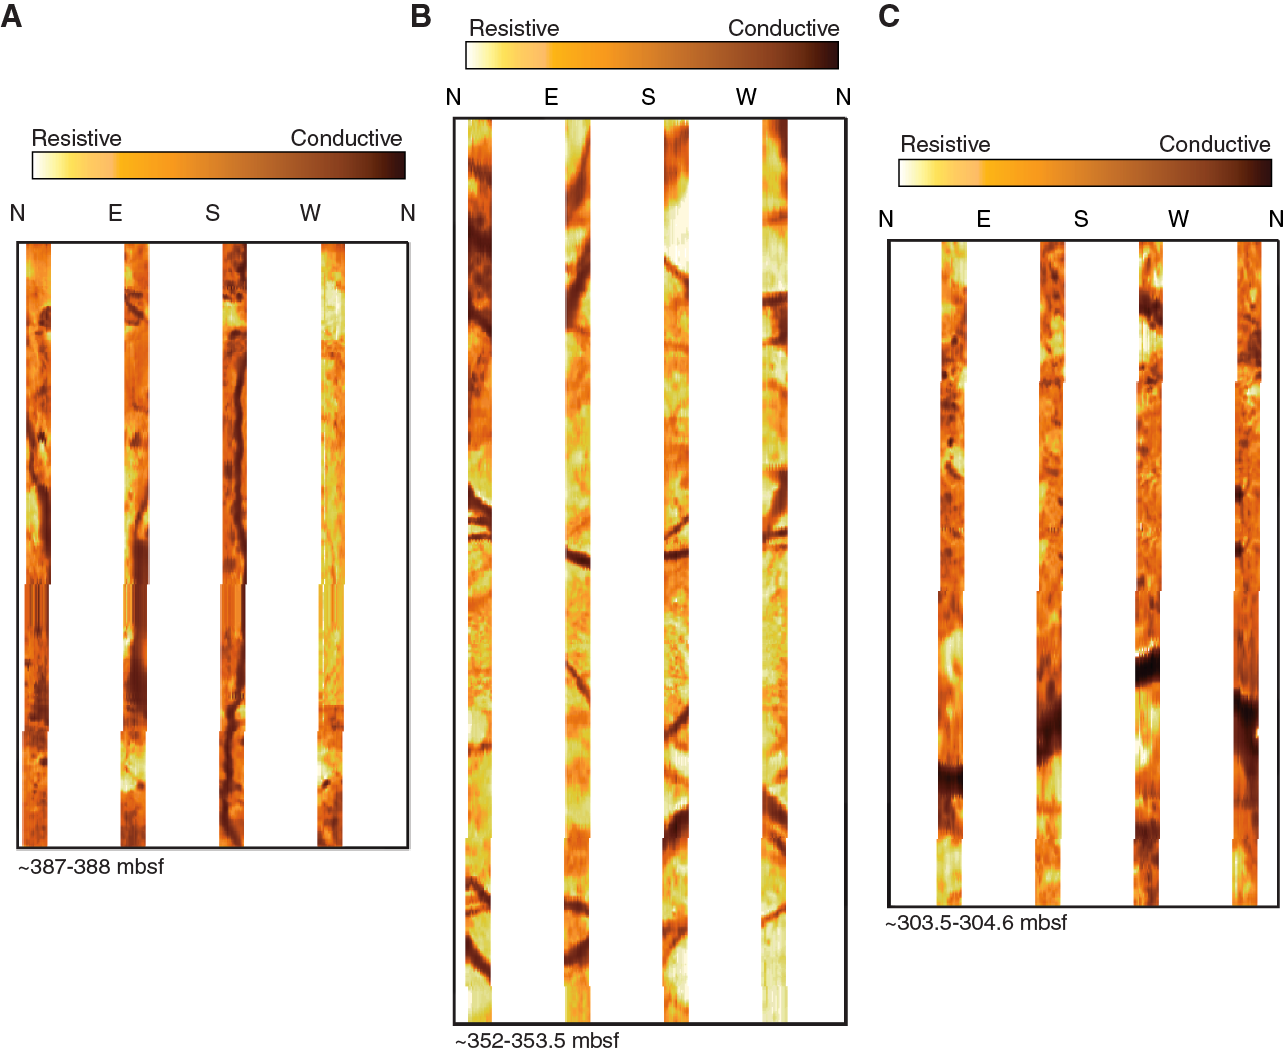
Preliminary assessment of the oriented FMS images indicates a wide range of textures and features. There are a number of measurable linear features that, when measured, will prove important for integration with other data sets, such as structural geology data. Overall, this data set will be very useful for core-log interpretation postcruise and will be a valuable tool in filling in some of the gaps in core recovery from this hole.
Core-log correlations
Correlating the logging unit boundaries to the petrological boundaries in Hole U1439C is not clear-cut. Comparison of the downhole logging data with the corresponding core data (indicated by gray data points in Figures F86, F87, F88) does, however, demonstrate some interesting similarities between the two data sets. The gamma radiation measurements have different units (core in counts/s and logs in gAPI units) but overall show similar trends downhole. Similarly, the core and log data sets for magnetic susceptibility show comparable downhole variability, despite the core data set having SI units and the log data set being unitless. Variability exhibited in the gamma ray and magnetic susceptibility data indicate that depth matching of core to the logging data may be possible postcruise. This should enable reconstruction of the in situ depths of the 30% of core recovered from Hole U1439C.
Density and velocity data are elevated in the core samples compared to the downhole logs (Figure F87), which is to be expected given preferential sampling of more-cohesive and less-fractured material for core analyses (see Physical properties). In addition, the two density measurements, although both bulk density, are based on different principles: the core data set is derived from pycnometer measurements, whereas the log data are based on gamma ray attenuation (see Physical properties and Downhole logging in the Expedition 352 methods chapter [Reagan et al., 2015a]).
Two porosity data sets derived from the logging data, one from resistivity and one from density, are presented in Figure F87. The resistivity-derived porosity is calculated using Archie’s law, whereas fractional porosity is calculated from density (assuming average grain density of 2.65 g/cm3 and fluid density of 1.026 g/cm3). Compared with the MAD porosity measurements from the pycnometer, the log values are comparable. The discrepancies in the porosity data sets may be attributed to a combination of the mode of analysis and differences in the scale of the measurements.
Figure F86 shows potassium data from two methods of chemical analysis undertaken on cores (ICP-AES and pXRF; see Sediment and rock geochemistry). The ICP-AES data in particular agree very well with the corresponding potassium log curve from the spectral gamma ray tool.
Through-pipe gamma ray data
Total gamma ray measurements taken through-pipe can indicate changes in the formation, although absolute values are unreliable. The BHA, drill string, and casing attenuate the signal, with the joints of the drill collars and drill pipe evident in the gamma ray logs at intervals of ~10 m. The casing joints, which are spaced slightly wider (~11–13 m), do not significantly affect the signal.
There is an overall decrease in gamma radiation with depth through the sediment interval logged through-pipe in Hole U1439C (Figure F92). This interval is divided into six logging units on the basis of the character and trend of the gamma ray log curve. Unit P1 from seafloor to ~10 mbsf (bit depth) decreases with depth, with meter-scale variations. The top of Unit P2 (~10–45 mbsf) has markedly higher gamma radiation than the overlying unit with peaks at ~21, 26, 35, and 43 mbsf. Unit P3 (~45–98 mbsf) decreases dramatically with depth, with high-frequency, low-amplitude variations superimposed on this trend. Unit P4 (~98–108 mbsf) forms a local high in the gamma ray log, with a significant peak from ~101 to 103 mbsf. An increase in gamma ray below this marks the top of Unit P5 (~108–127 mbsf), which exhibits meter-scale variations between ~114 and 126 mbsf with a slight decrease in depth overall. Unit P6 (~127–148.5 mbsf) continues this decreasing trend but is distinguished from the overlying unit by finer scale variations.
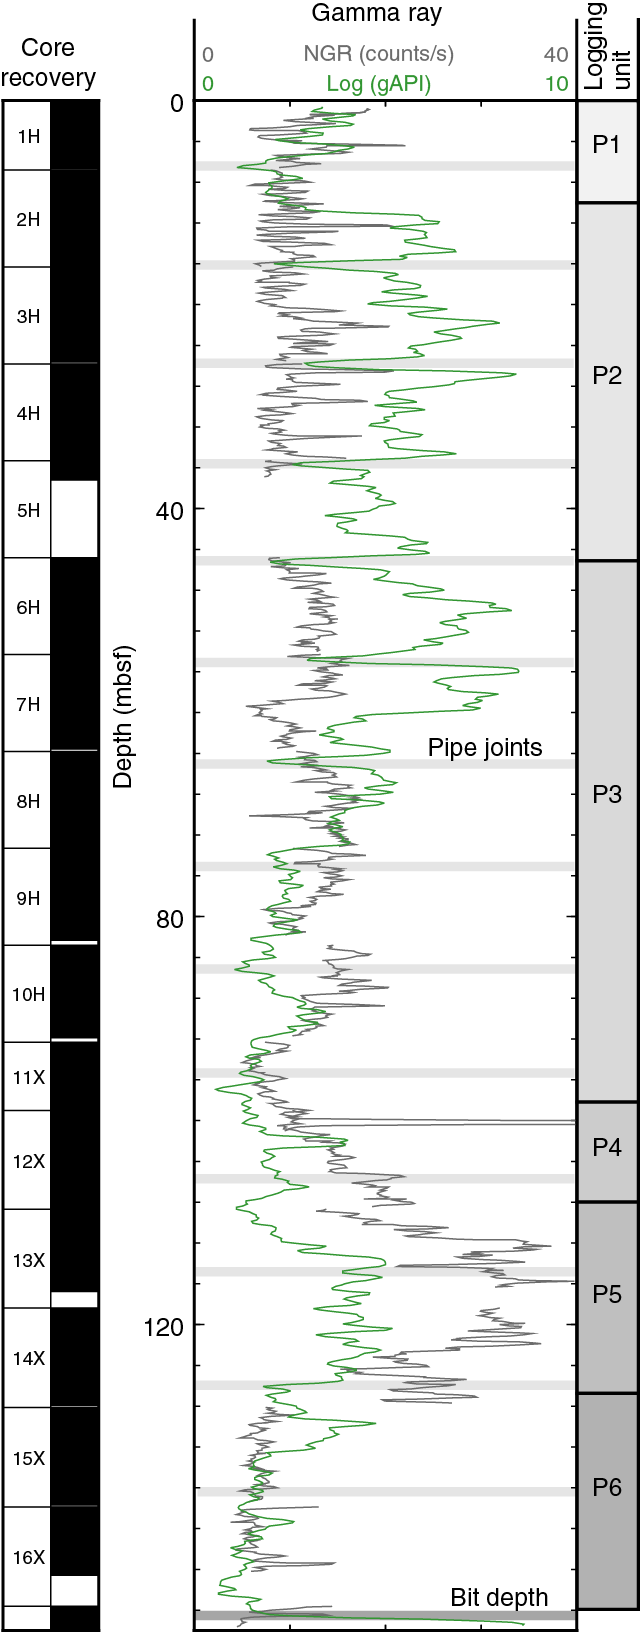
Comparison with the corresponding core data (Figure F92) indicates some similarities in the trends encountered through the sedimentary interval of Site U1439. The unit boundaries defined on the basis of core description (see Sedimentology) are in reasonable agreement with the boundaries defined on the basis of the through-pipe gamma ray data. Unit P1 corresponds to lithologic Subunit IA and boundaries for logging Units P2, P3, P4, P5, and P6, correlate reasonably well with those defined for lithologic Subunit IB and Units II, III, IV, and V, respectively.
References
Acton, G.D., Okada, M., Clement, B.M., Lund, S.P., and Williams, T., 2002. Paleomagnetic overprints in ocean sediment cores and their relationship to shear deformation caused by piston coring. Journal of Geophysical Research: Solid Earth, 107(B4):2067–2081. http://dx.doi.org/10.1029/2001JB000518
Aubourg, C., and Oufi, O., 1999. Coring-induced magnetic fabric in piston cores from the western Mediterranean. In Zahn, R., Comas, M.C., and Klaus, A. (Eds.), Proceedings of the Ocean Drilling Program, Scientific Results, 161: College Station, TX (Ocean Drilling Program), 129–136. http://dx.doi.org/10.2973/odp.proc.sr.161.255.1999
Burkhard, M., 1993. Calcite twins, their geometry, appearance and significance as stress-strain markers and indicators of tectonic regime: a review. Journal of Structural Geology, 15(3–5):351–368. http://dx.doi.org/10.1016/0191-8141(93)90132-T
Cande, S.C., and Kent, D.V., 1995. Revised calibration of the geomagnetic polarity timescale for the Late Cretaceous and Cenozoic. Journal of Geophysical Research: Solid Earth, 100(B4):6093–6095. http://dx.doi.org/10.1029/94JB03098
Cosca, M.A., Arculus, R.J., Pearce, J.A., and Mitchell, J.G., 1998. 40Ar/ 39Ar and K-Ar geochronological age constraints for the inception and early evolution of the Izu-Bonin-Mariana arc system. Island Arc, 7(3):579–595. http://dx.doi.org/10.1111/j.1440-1738.1998.00211.x
Crawford, A.J., Falloon, T.J., and Green, D.H., 1989. Classification, petrogenesis and tectonic setting of boninites. In Crawford, A.J. (Ed.), Boninites and Related Rocks: London (Unwin Hyman), 1–49.
Currie, C.A., and Hyndman, R.D., 2006. The thermal structure of subduction zone back arcs. Journal of Geophysical Research: Solid Earth, 111(B8):B08404. http://dx.doi.org/10.1029/2005JB004024
Doubrovine, P.V., and Tarduno, J.A., 2004. Self-reversed magnetization carried by titanomaghemite in oceanic basalts. Earth and Planetary Science Letters, 222(3–4):959–969. http://dx.doi.org/10.1016/j.epsl.2004.04.009
Doubrovine, P.V., and Tarduno, J.A., 2005. On the compositional field of self-reversing titanomaghemite: constraints from Deep Sea Drilling Project Site 307. Journal of Geophysical Research: Solid Earth, 110(B11):B11104. http://dx.doi.org/10.1029/2005JB003865
Fuller, M., Hastedt, M., and Herr, B., 1998. Coring-induced magnetization of recovered sediment. In Weaver, P.P.E., Schmincke, H.-U., Firth, J.V., and Duffield, W. (Eds.), Proceedings of the Ocean Drilling Program, Scientific Results, 157: College Station, TX (Ocean Drilling Program), 47–56. http://dx.doi.org/10.2973/odp.proc.sr.157.103.1998
Gieskes, J.M., Blanc, G., Vrolijk, P., Elderfield, H., and Barnes, R., 1990. Interstitial water chemistry—major constituents. In Moore, J.C., Mascle, A., et al., Proceedings of the Ocean Drilling Program, Scientific Results, 110: College Station, TX (Ocean Drilling Program), 155–178. http://dx.doi.org/10.2973/odp.proc.sr.110.170.1990
Gradstein, F.M., Ogg, J.G., Schmitz, M.D., and Ogg, G.M. (Eds.), 2012. The Geological Time Scale 2012: Amsterdam (Elsevier).
Hall, R., Fuller, M., Ali, J.R., and Anderson, C.D., 1995. The Philippine Sea plate: magnetism and reconstructions. In Taylor, B., and Natland, J. (Eds.), Active Margins and Marginal Basins of the Western Pacific. Geophysical Monograph, 88:371–404. http://dx.doi.org/10.1029/GM088p0371
Herr, B., Fuller, M., Haag, M., and Heider, F., 1998. Influence of drilling on two records of the Matuyama–Brunhes polarity transition in marine sediment cores near Gran Canaria. In Weaver, P.P.E., Schmincke, H.-U., Firth, J.V., and Duffield, W. (Eds.), Proceedings of the Ocean Drilling Program, Scientific Results, 157: College Station, TX (Ocean Drilling Program), 57–69. http://dx.doi.org/10.2973/odp.proc.sr.157.105.1998
Ishizuka, O., Kimura, J.-I., Li, Y.B., Stern, R.J., Reagan, M.K., Taylor, R.N., Ohara, Y., Bloomer, S.H., Ishii, T., Hargrove, U.S., III, and Haraguchi, S., 2006. Early stages in the evolution of Izu-Bonin arc volcanism: new age, chemical, and isotopic constraints. Earth and Planetary Science Letters, 250(1–2):385–401. http://dx.doi.org/10.1016/j.epsl.2006.08.007
Ishizuka, O., Tani, K., Reagan, M.K., Kanayama, K., Umino, S., Harigane, Y., Sakamoto, I., Miyajima, Y., Yuasa, M., and Dunkley, D.J., 2011. The timescales of subduction initiation and subsequent evolution of an oceanic island arc. Earth and Planetary Science Letters, 306(3–4):229–240. http://dx.doi.org/10.1016/j.epsl.2011.04.006
Jackson, M., Gruber, W., Marvin, J., and Banerjee, S.K., 1988. Partial anhysteretic remanence and its anisotropy: applications and grainsize-dependence. Geophysical Research Letters, 15(5):440–443. http://dx.doi.org/10.1029/GL015i005p00440
Jenner, F.E., and O’Neill, H.St.C., 2012. Analysis of 60 elements in 616 ocean floor basaltic glasses. Geochemistry, Geophysics, Geosystems, 13(2):Q02005. http://dx.doi.org/10.1029/2011GC004009
Jutzeler, M., White, J.D.L., Talling, P.J., McCanta, M., Morgan, S., Le Friant, A., and Ishizuka, O., 2014. Coring disturbances in IODP piston cores with implications for offshore record of volcanic events and the Missoula megafloods. Geochemistry, Geophysics, Geosystems, 15(9):3572–3590. http://dx.doi.org/10.1002/2014GC005447
Kanayama, K., Kitamura, K., and Umino, S., 2013. New geochemical classification of global boninites. IAVCEI 2013 Scientific Assembly Abstracts. (Poster 4W_1B-P13)
Kirschvink, J.L., 1980. The least-squares line and plane and the analysis of palaeomagnetic data. Geophysical Journal of the Royal Astronomical Society, 62(3):699–718.
http://dx.doi.org/10.1111/j.1365-246X.1980.tb02601.x
Lawrence, J.R., and Gieskes, J.M., 1981. Constraints on water transport and alteration in the oceanic crust from the isotopic composition of pore water. Journal of Geophysical Research: Solid Earth, 86(B9):7924–7934. http://dx.doi.org/10.1029/JB086iB09p07924
Le Bas, M.J., 2000. IUGS reclassification of the high-Mg and picritic volcanic rocks. Journal of Petrology, 41(10):1467–1470. http://dx.doi.org/10.1093/petrology/41.10.1467
Le Bas, M.J., Le Maitre, R.W., Streckeisen, A., Zanettin, B., and the IUGS Subcommission on the Systematics of Igneous Rocks, 1986. A chemical classification of volcanic rocks based on the total alkali-silica diagram. Journal of Petrology, 27(3):745–750.
http://petrology.oxfordjournals.org/content/27/3/745.abstract
Meijer, A., 1980. Primitive arc volcanism and a boninite series: examples from the western Pacific island arcs. In Hayes, D.E. (Ed.), The Tectonic and Geologic Evolution of Southeast Asian Seas and Islands. Geophysical Monograph, 23:269–282. http://dx.doi.org/10.1029/GM023p0269
O’Reilly, W., and Banerjee, S.K., 1965. Cation distribution in titanomagnetites (1–x)Fe 3O 4−xFe 2TiO 4. Physics Letters, 17(3):237–238. http://dx.doi.org/10.1016/0031-9163(65)90504-4
Özdemir, Ö., and O’Reilly, W., 1982. Magnetic hysteresis properties of synthetic monodomain titanomaghemites. Earth and Planetary Science Letters, 57(2):437–447.
http://dx.doi.org/10.1016/0012-821X(82)90162-5
Pearce, J.A., and Robinson, P.T., 2010. The Troodos ophiolitic complex probably formed in a subduction initiation, slab edge setting. Gondwana Research, 18(1):60–81. http://dx.doi.org/10.1016/j.gr.2009.12.003
Pearce, J.A., van der Laan, S.R., Arculus, R.J., Murton, B.J., Ishii, T., Peate, D.W., and Parkinson, I.J., 1992. Boninite and harzburgite from Leg 125 (Bonin-Mariana forearc): a case study of magma genesis during the initial stages of subduction. In Fryer, P., Pearce, J.A., Stokking, L.B., et al., Proceedings of the Ocean Drilling Program, Scientific Results, 125: College Station, TX (Ocean Drilling Program), 623–659. http://dx.doi.org/10.2973/odp.proc.sr.125.172.1992
Reagan, M.K., Hanan, B.B., Heizler, M.T., Hartman, B.S., and Hickey-Vargas, R., 2008. Petrogenesis of volcanic rocks from Saipan and Rota, Mariana Islands, and implications for the evolution of nascent island arcs. Journal of Petrology, 49(3):441–464.
http://dx.doi.org/10.1093/petrology/egm087
Reagan, M.K., Ishizuka, O., Stern, R.J., Kelley, K.A., Ohara, Y., Blichert-Toft, J., Bloomer, S.H., Cash, J., Fryer, P., Hanan, B.B., Hickey-Vargas, R., Ishii, T., Kimura, J.-I., Peate, D.W., Rowe, M.C., and Woods, M., 2010. Fore-arc basalts and subduction initiation in the Izu-Bonin-Mariana system. Geochemistry, Geophysics, Geosystems, 11(3):Q03X12. http://dx.doi.org/10.1029/2009GC002871
Reagan, M.K., McClelland, W.C., Girard, G., Goff, K.R., Peate, D.W., Ohara, Y., and Stern, R.J., 2013. The geology of the southern Mariana fore-arc crust: implications for the scale of Eocene volcanism in the western Pacific. Earth and Planetary Science Letters, 380:41–51. http://dx.doi.org/10.1016/j.epsl.2013.08.013
Reagan, M.K., Pearce, J.A., Petronotis, K., Almeev, R., Avery, A.A., Carvallo, C., Chapman, T., Christeson, G.L., Ferré, E.C., Godard, M., Heaton, D.E., Kirchenbaur, M., Kurz, W., Kutterolf, S., Li, H.Y., Li, Y., Michibayashi, K., Morgan, S., Nelson, W.R., Prytulak, J., Python, M., Robertson, A.H.F., Ryan, J.G., Sager, W.W., Sakuyama, T., Shervais, J.W., Shimizu, K., and Whattam, S.A., 2015a. Expedition 352 methods. In Reagan, M.K., Pearce, J.A., Petronotis, K., and the Expedition 352 Scientists, Proceedings of the International Ocean Discovery Program, 352: Izu-Bonin-Mariana Fore Arc: College Station, TX (International Ocean Discovery Program). http://dx.doi.org/10.14379/iodp.proc.352.102.2015
Reagan, M.K., Pearce, J.A., Petronotis, K., Almeev, R., Avery, A.A., Carvallo, C., Chapman, T., Christeson, G.L., Ferré, E.C., Godard, M., Heaton, D.E., Kirchenbaur, M., Kurz, W., Kutterolf, S., Li, H.Y., Li, Y., Michibayashi, K., Morgan, S., Nelson, W.R., Prytulak, J., Python, M., Robertson, A.H.F., Ryan, J.G., Sager, W.W., Sakuyama, T., Shervais, J.W., Shimizu, K., and Whattam, S.A., 2015b. Site U1440. In Reagan, M.K., Pearce, J.A., Petronotis, K., and the Expedition 352 Scientists, Proceedings of the International Ocean Discovery Program, 352: Izu-Bonin-Mariana Fore Arc: College Station, TX (International Ocean Discovery Program). http://dx.doi.org/10.14379/iodp.proc.352.104.2015
Roberts, A.P., Stoner, J.S., and Richter, C., 1996. Coring-induced magnetic overprints and limitations of the long-core paleomagnetic measurement technique: some observations from Leg 160, eastern Mediterranean Sea. In Emeis, K.-C., Robertson, A.H.F., Richter, C., et al., Proceedings of the Ocean Drilling Program, Initial Reports, 160: College Station, TX (Ocean Drilling Program), 497–505. http://dx.doi.org/10.2973/odp.proc.ir.160.115.1996
Saito, S., Underwood, M.B., Kubo, Y., and the Expedition 322 Scientists, 2010. Proceedings of the Integrated Ocean Drilling Program, Expedition 322: NanTroSEIZE Stage 2: Subduction Inputs: Tokyo (Integrated Ocean Drilling Program Management International, Inc.). http://dx.doi.org/10.2204/iodp.proc.322.2010
Shipboard Scientific Party, 1990. Site 783. In Fryer, P., Pearce, J.A., Stokking, L.B., et al., Proceedings of the Ocean Drilling Program, Initial Reports, 125: College Station, TX (Ocean Drilling Program), 253–272. http://dx.doi.org/10.2973/odp.proc.ir.125.111.1990
Tauxe, L., 2010. Essentials of Paleomagnetism: Berkeley, California (University California Press).
Taylor, R.N., Nesbitt, R.W., Vidal, P., Harmon, R.S., Auvray, B., and Croudace, I.W., 1994. Mineralogy, chemistry, and genesis of the boninite series volcanics, Chichijima, Bonin Islands, Japan. Journal of Petrology, 35(3):577–617. http://dx.doi.org/10.1093/petrology/35.3.577
1Reagan, M.K., Pearce, J.A., Petronotis, K., Almeev, R., Avery, A.A., Carvallo, C., Chapman, T., Christeson, G.L., Ferré, E.C., Godard, M., Heaton, D.E., Kirchenbaur, M., Kurz, W., Kutterolf, S., Li, H.Y., Li, Y., Michibayashi, K., Morgan, S., Nelson, W.R., Prytulak, J., Python, M., Robertson, A.H.F., Ryan, J.G., Sager, W.W., Sakuyama, T., Shervais, J.W., Shimizu, K., and Whattam, S.A., 2015. Site U1439. In Reagan, M.K., Pearce, J.A., Petronotis, K., and the Expedition 352 Scientists, Izu-Bonin-Mariana Fore Arc. Proceedings of the International Ocean Discovery Program, 352: College Station, TX (International Ocean Discovery Program). http://dx.doi.org/10.14379/iodp.proc.352.103.2015