Reagan, M.K., Pearce, J.A., Petronotis, K., and the Expedition 352 Scientists, 2015
Proceedings of the International Ocean Discovery Program Volume 352
publications.iodp.org

doi:10.14379/iodp.proc.352.104.2015
Site U14401
M.K. Reagan, J.A. Pearce, K. Petronotis, R. Almeev, A.A. Avery, C. Carvallo, T. Chapman, G.L. Christeson, E.C. Ferré, M. Godard, D.E. Heaton, M. Kirchenbaur, W. Kurz, S. Kutterolf, H.Y. Li, Y. Li, K. Michibayashi, S. Morgan, W.R. Nelson, J. Prytulak, M. Python, A.H.F. Robertson, J.G. Ryan, W.W. Sager, T. Sakuyama, J.W. Shervais, K. Shimizu, and S.A. Whattam2
Keywords: International Ocean Discovery Program, IODP, JOIDES Resolution, Expedition 352, Izu-Bonin-Mariana fore arc, Site U1440, mantle melting, ophiolites, basalt, volcanic rocks, dikes, drill core
MS 352-104: Published 29 September 2015
Background and objectives
According to the Stern and Bloomer (1992) hypothesis being tested, the Izu-Bonin-Mariana (IBM) fore arc formed during the period of seafloor spreading that accompanied the rapid rollback and sinking of the newly subducting plate immediately following subduction initiation. According to the related hypothesis of Reagan et al. (2010), the deepest volcanic rocks should primarily be fore-arc basalt (FAB), a distinctive type of volcanic rock recovered during dredging and submersible sampling of the IBM fore arc. Both hypotheses predict that FAB is underlain by sheeted dikes, as these are characteristic of crust accreted during seafloor spreading at all but the slowest spreading rates. Reconstruction of the IBM volcanic stratigraphy also provides evidence for the inference that the FAB should be overlain by the initial products of arc volcanism, specifically by
- Lavas with compositions that are transitional between FAB and boninite;
- Boninite lavas themselves; and finally,
- Members of the tholeiitic and calc-alkaline series typical of “normal” island arcs (Ishizuka et al., 2011).
Drilling at this site provides an important test of the lower part of this sequence.
In detail, the FAB described by Reagan et al. (2010) differs from normal mid-ocean-ridge basalt (MORB) by having lower Ti/V ratios and rare earth element (REE) contents. Notably, it also differs from the “ambient MORB” erupted in the nearby West Philippine Basin by having small and variable subduction signatures (e.g., higher concentrations of some fluid-soluble elements and Pb isotope ratios that are displaced toward ratios characteristic of the subducted Pacific plate). These features should be distinctive enough to be recognized in core recovered from this site. Dating is also critical in the recognition and interpretation of FAB. Information is presently limited: cored boninites and lavas transitional between FAB and boninites recovered from Deep Sea Drilling Project Sites 458 and 459 in the Mariana fore arc are dated at ~49 Ma (Cosca et al., 1998), whereas FAB and gabbro recovered from the Bonin and Mariana inner trench walls typically are dated at ~51–52 Ma (Ishizuka et al., 2011; Reagan et al., 2013). Thus, available ages indicate that subduction initiation had begun by ~52 Ma. However, any ages obtained from Site U1440 will be valuable in refining this estimate.
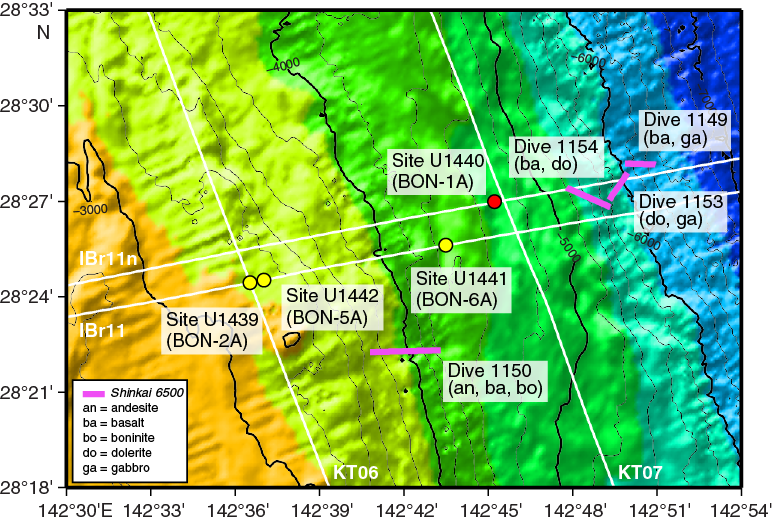
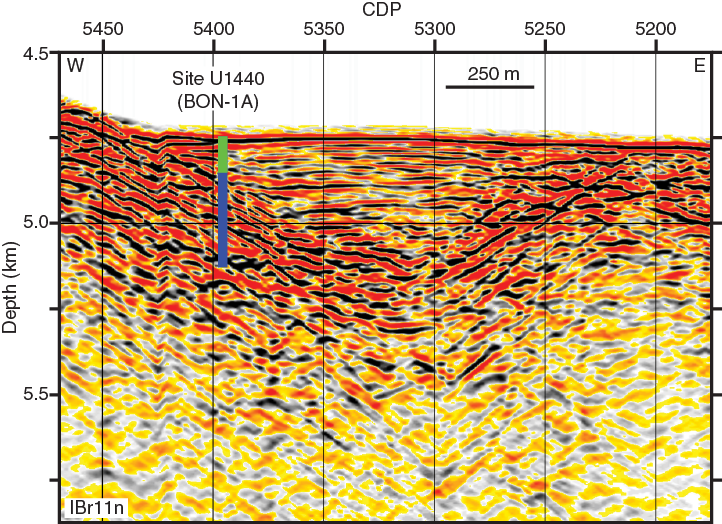
Although the stated aim of drilling at Site U1439 was to core the upper (boninitic) part of the fore-arc volcanic sequence, the aim of drilling at Site U1440 was to core the lower basaltic part of the sequence. In order to maximize the likelihood that coring at this site would record the lowest part of the volcanic sequence (i.e., the first lavas associated with subduction initiation), its location was targeted bathymetrically deeper (~4800 m water depth) than Site U1439 on the basis of observations from nearby Shinkai 6500 Dives 1153 and 1154 (Figure F1), which encountered outcrops of gabbro, dolerite, and basalt lava cut by dikes (Ishizuka et al., 2011). The contact between basalt and dolerite was thus inferred to be at ~5400 m water depth. Site U1440 is ~600 m shallower in order to drill through sediment into FAB and, eventually, the contact with dolerite. The precise site location was chosen to lie on seismic Line IBr11n (S. Kodaira, pers. comm., 2013) and in a sediment pond with sufficient sediment thickness for coring operations (Figures F1, F2).
The specific objectives for Site U1440 fit into the four overall expedition objectives as follows:
- Obtain a high-fidelity record of magmatic evolution during subduction initiation by coring volcanic rock down to underlying intrusive rock, including radiometric and biostratigraphic ages.
Operations at Site U1440 cored a continuous section of FAB representing the first suite of lavas generated by subduction initiation. Dikes feeding FAB lavas, and perhaps dikes associated with later transitional or boninite lavas, also may be present.
- Use the results of Objective 1 to test the hypothesis that fore-arc basalt lies beneath boninites and to understand chemical gradients within these units and across their transitions.
The changes in magma compositions and mineral abundances associated with the progression from FAB to boninite to arc-like lavas in the Bonin fore arc reflect changing mantle compositions, subduction influence, and petrogenetic processes as subduction advanced from initiation onward. Operations at Site U1440 drilled into FAB and underlying dikes, allowing detailed investigation of magma genesis related to the earliest stage of subduction.
- Use drilling results to understand how mantle melting processes evolve during and after subduction initiation.
The drilling results are being used to investigate how the mantle responds to subduction initiation. For example, FAB compositions indicate that adiabatic decompression is the most important process at the very beginning of subduction initiation, and boninites indicate that fluid flux melting was important shortly thereafter. The precise nature of this transition is, however, presently unclear. Whatever information is obtained from the cores can be used to construct more realistic geodynamic and petrologic models.
- Test the hypothesis that the fore-arc lithosphere created during subduction initiation is the birthplace of suprasubduction zone ophiolites.
Results from drilling at Site U1440 allow us to prepare a detailed volcanic chemostratigraphy expected for subduction initiation, which will in turn allow more detailed comparisons with ophiolites containing boninite overlying basalt, such as Pindos in Greece, Mirdita in Albania, Semail in Oman, and Troodos in Cyprus.
Operations
Transit to Site U1440
The R/V JOIDES Resolution completed the 8.2 nmi transit from Site U1439 in dynamic positioning mode in 9.75 h. Upon arrival at Site U1440 (proposed Site BON-1A), a positioning beacon was deployed at the approved site coordinates at 0548 h (all times are ship local time, which is UTC + 9 h) on 9 August 2014. The ship was then offset 200 m to the west where the sediment/basement interface was shown to be at a shallower depth on seismic Line IBr11n (Figure F2).
Hole U1440A
Upon arrival, the drill string was extended to 4757 m below rig floor and Hole U1440A was spudded at 1255 h on 9 August 2014 (28°26.9890′N, 142°45.2243′E; 4775 m water depth). Hole U1440A was cored with the advanced piston corer (APC) to 103.5 m below seafloor (mbsf) and then with the extended core barrel (XCB) to a final depth of 106.1 mbsf (Table T1). Nonmagnetic core barrels were used with all APC cores. Cores 352-U1440A-1H through 4H and 6H were oriented using the FlexIT tool, which was removed with Core 7H as a result of the high heave conditions experienced by the vessel. Advanced piston corer temperature tool (APCT-3) measurements were taken with Cores 4H, 6H, 8H, and 11H. The basement contact was recorded at ~101 mbsf. The APC coring system was deployed 12 times, with 103.5 m cored and 96.4 m recovered (93%). The XCB coring system was deployed twice, with 2.6 m cored and 0.2 m recovered (8%). The total time spent in Hole U1440A was 49.25 h.
Table T1. Coring summary, Site U1440. Download table in .csv format. View PDF table.
Hole U1440B
The drill string with the APC/XCB coring assembly was pulled to the surface at 0735 h on 11 August 2014, and the rig floor crew prepared to install a reentry system. The original plan included installation of two casing strings, and 7.6 days were allocated for this operation. To save time, we decided to drill in a single casing string and the reentry cone in one step. The casing running tool was made up, the reentry cone was moved onto the moonpool doors beneath the rotary table, and the casing string was assembled. The 98.65 m long casing string is composed of 7 joints of 10.75 inch casing welded together to enforce the connections, a transition piece that measured 10.75 inches on one end and 16 inches on the other, and a 16 inch casing hanger (Figure F3). The casing string was latched into the reentry cone at 1700 h. The next step was to make up the bit, underreamer, and mud motor assembly and lower it through the reentry cone and casing. The mud motor enables the underreamer and bit to rotate during drilling while keeping the casing stationary (see REENTRY in Supplementary material). The underreamer and mud motor were tested, the reentry system was lowered to the seafloor, and the underwater camera was sent down so that we could observe the reentry cone while the casing was drilled into the seafloor.
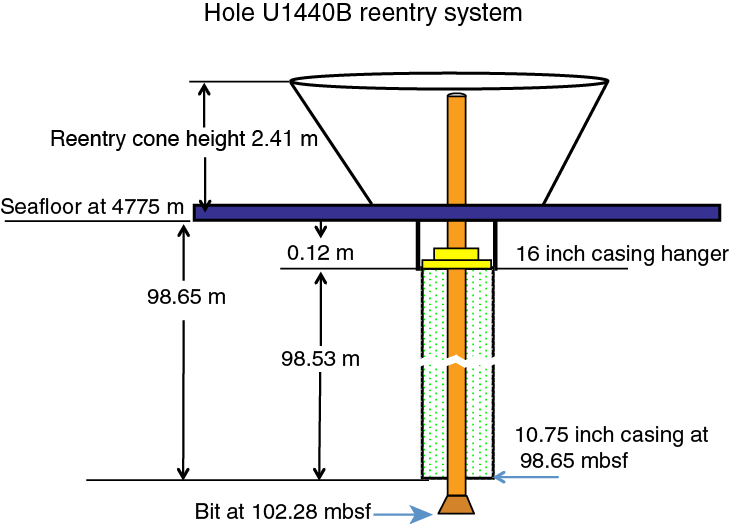
Hole U1440B was spudded 15 m north of Hole U1440A at 1100 h on 12 August (28°26.9976′N, 142°45.2244′E; 4775 m water depth). It took ~4.5 h for the ~100 m of casing to be drilled into the formation, and at 1535 h the reentry cone settled on the seafloor. The camera was brought to the surface, followed by the drill string with the underreamer and bit at the end. The reentry system took 44.5 h to make up and install, saving 5.7 days of operation time from the original plan. This marks only the second time a casing string was drilled in since Ocean Drilling Program Leg 196 and the first time a complete reentry system was deployed in this way.
The rig floor crew assembled the rotary core barrel (RCB) bottom-hole assembly (BHA; see Introduction in the Expedition 352 methods chapter [Reagan et al., 2015a]) with a new RCB C-4 bit, and the drill string was lowered to the seafloor. The underwater camera was sent to the seafloor, and Hole U1440B was reentered at 0021 h on 14 August. RCB coring began at 102.3 mbsf and was terminated after bit failure at a final depth of 383.6 mbsf (Table T1). The RCB coring system with nonmagnetic core barrels was deployed 36 times (Cores 352-U1440B-2R through 38R), with 281.3 m cored and 34.7 m recovered (12%). Basement contact was estimated to be at ~125 mbsf. Hole conditions were difficult at times, requiring the hole to be cleaned several times. The RCB bit was changed on 18 August, and Hole U1440B was reentered at 1305 h on 19 August. Coring with the second bit continued until recovery dropped to 0 and we had difficulty circulating mud in the hole. The decision was made to terminate coring on 23 August. When the bit was brought to the surface, it was severely damaged with all 4 of its cones missing.
A logging BHA was made up, the drill string was lowered to the seafloor, and Hole U1440B was reentered at 2125 h on 24 August. The end of the drill string was placed at ~96 mbsf, just inside the end of the casing. Two logging runs were made with the triple combo-Ultrasonic Borehole Imager (triple combo-UBI) and Formation MicroScanner (FMS)-sonic tool strings. As a result of deteriorating hole conditions, the logging tool strings were only able to log ~130 m of open hole interval. The FMS-sonic tool string was brought to the surface and rigged down at 0330 h, and the crew started raising the drill string. Hole U1440B was reentered 4 times. The total time spent in Hole U1440B was 364.75 h. The total time spent at Site U1440 was 414 h, or 17.25 days. The acoustic beacon was recovered at 0612 h on 26 August, and the vessel started the slow transit to Site U1439 in dynamic positioning mode while continuing to pull the drill string to the surface.
Sedimentology
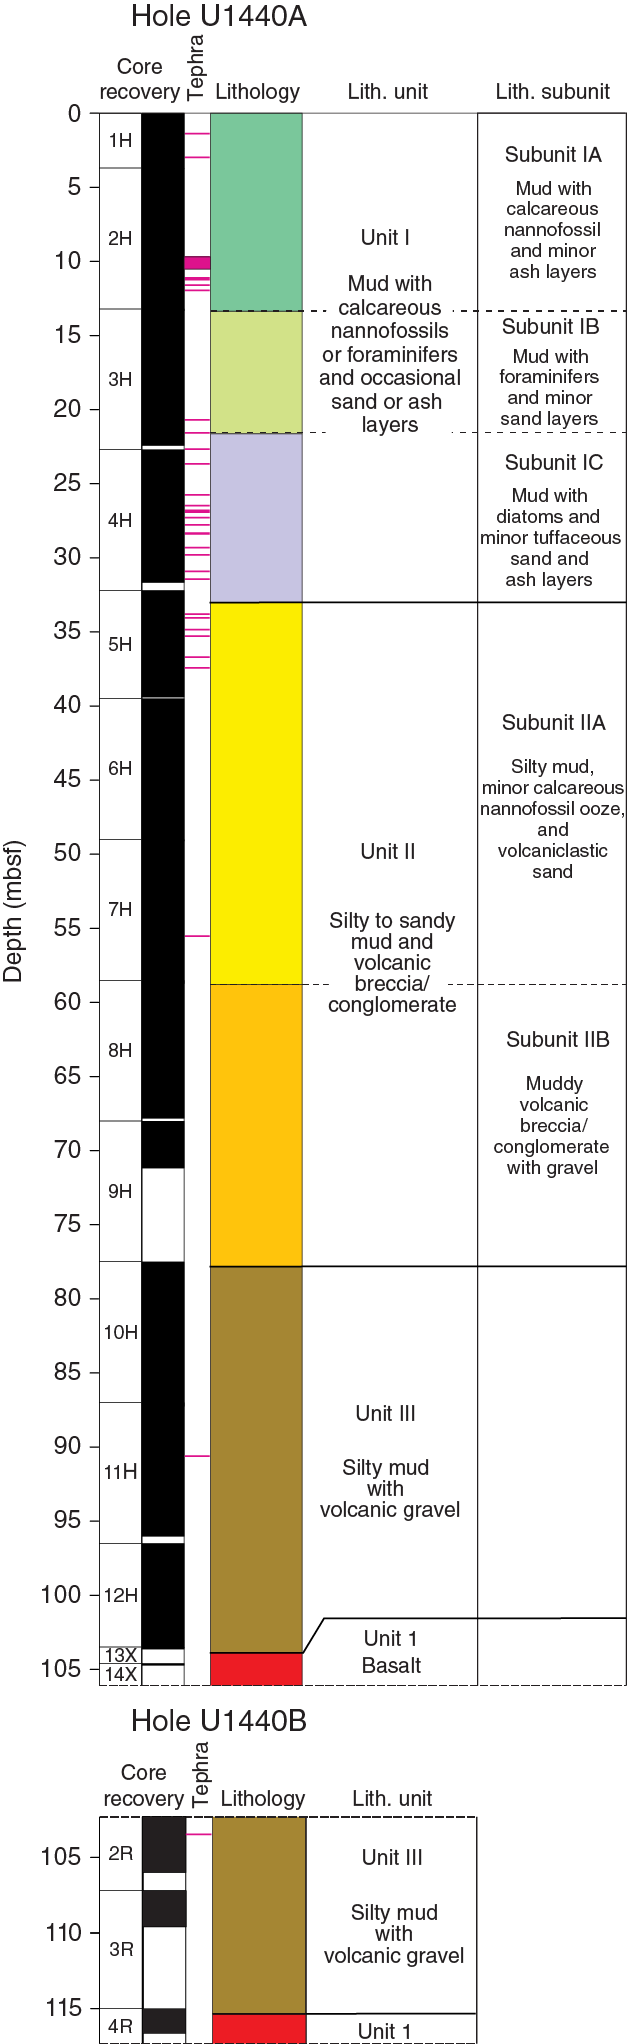
Sediment and sedimentary rock were recovered from the seafloor to 103.52 mbsf, beneath which a thin interval of basic volcanic rocks was recovered (Figure F4). The sediment documents a section through the recent to early Miocene deep-sea sedimentary cover of the Izu-Bonin fore-arc basement. The underlying basaltic rocks are interpreted as representing the highest levels of the fore-arc basement. The discussion below focuses on the deep-sea sedimentary cover, whereas the basement lithologies are discussed in detail elsewhere (see Petrology).
Core recovery was 93% for APC sediment cores. Basement recovery with the XCB was <1%.
The sedimentary succession in Hole U1440A is divided into three lithologically distinct units, of which Unit I is divided into three subunits, and Unit II is divided into two subunits (Table T2). The main criterion for recognition of the lithologic units and subunits is a combination of primary lithology, grain size, color, and diagenesis.
Table T2. Lithologic unit and subunit summary, Holes U1440A and U1440B. Download table in .csv format.
Unit l is recognized mainly on the basis of a relatively high abundance of poorly consolidated brownish mud. Unit l is divided into Subunit IA, which is made up of mud with calcareous nannofossil layers and ash layers, Subunit IB, which is composed of mud with foraminifers and minor sand layers, and Subunit IC, which comprises mud with diatoms, together with minor tuffaceous sandstone and ash layers.
Unit ll is recognized on the basis of a downhole increase in grain size to more clastic and volcanogenic sediment. Subunit IIA is relatively coarse grained and volcanogenic, whereas Subunit IIB is even coarser grained and includes muddy volcanogenic breccia/conglomerate with gravel.
Unit III exhibits a return to finer grained silty mud with subordinate volcanogenic gravel. The basalt beneath the basal sediments represents the top of the basement (see Petrology).
The proportions of the main sediment types recovered are
- Ash/tuff (2.89 m or 2.80% of the total recovered sediment);
- Coarse-grained sediment (sand to conglomerate; 16.5 m or 15.93%);
- Fine-grained mud, silt/mudstone, and siltstone (75.51 m or 80.07%); and
- Nannofossil ooze (1.24 m or 1.20%).
In addition, sediment was recovered in three cores below the drilled interval in Hole U1440B, from 102.30 to 115.3 mbsf. These cores correspond to Unit III.
Unit descriptions
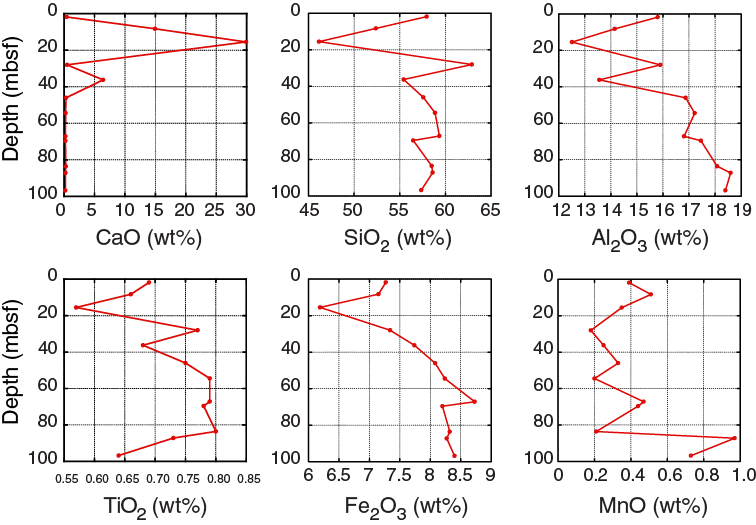
Overall, the sedimentary succession is 103.52 m thick. The cores were described systematically, and smear slides were taken from the “background” sediment and from many of the ash layers. X-ray diffraction (XRD) data were obtained from the fine-grained background sediment and from the highly altered sediment in the lower part of the succession (Figure F4; Table T2). In addition, inductively coupled plasma–atomic emission spectroscopy (ICP-AES) analysis was carried out on 12 samples of the background sediment. The results of the ICP-AES analyses show that the background sediment is effectively noncalcareous (<0.5 wt% CaCO3), except for several layers of nannofossil-rich sediment near the top of the succession (Figure F5). The chemical data as a whole are typical of noncalcareous, hemipelagic, and tuffaceous fine-grained deep-sea sediments (see Sediment and rock geochemistry). The succession also contains a number of discrete layers of tephra that were studied in detail.
Unit I
- Interval: 352-U1440A-1H-1, 0 cm, through 5H-1, 78 cm
- Thickness: 32.98 m
- Depth: 0–32.98 mbsf
- Age: early Pliocene to recent
- Lithology: mud with calcareous nannofossils or foraminifers and rare sand layers or ash layers
Unit l is characterized by alternations of brownish to grayish to greenish mud with calcareous nannofossils or foraminifers and localized volcaniclastic sand or ash layers. Seven layers of grayish to whitish brown felsic ash, individually as thick as 39 cm, are distributed throughout Unit I.
Subunit IA: Holocene (0–13.33 mbsf)
Subunit IA is predominantly weakly bioturbated brownish mud with seven thin, graded tephra interbeds (Figure F6). The highest levels of the subunit (0–3.71 mbsf) are distinctly dark brown and soupy, reflecting proximity to the seafloor. Two isolated pumice clasts are present from 1.92 to 1.94 mbsf. Smear slides indicate the presence of silty clay with relatively abundant quartz, feldspar, organic matter, and siliceous microfossils (radiolarians, sponge spicules, and diatoms). XRD analysis of the fine-grained sediment revealed quartz, with or without calcite, plagioclase, and rare illite and zeolite (Table T3).
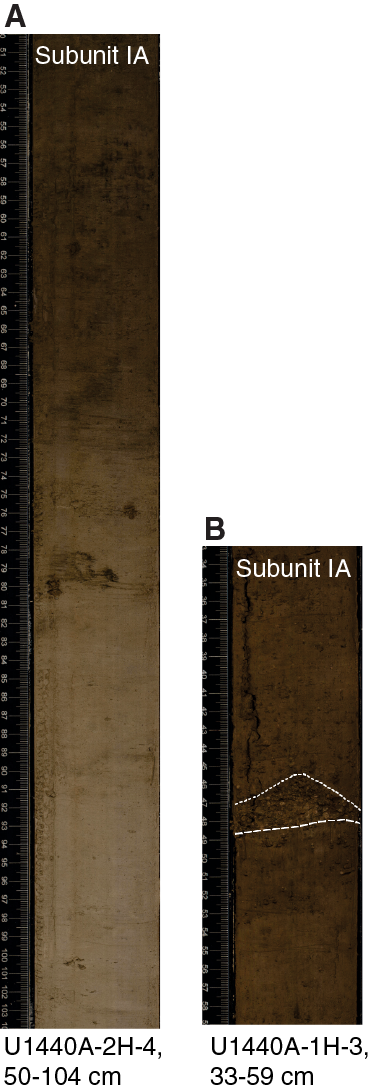
Table T3. X-ray diffraction analyses of background muddy sediment, Hole U1440A. Download table in .csv format.
The ash-rich layers are variable mixtures of colorless tephra, nannofossil ooze, and silt with plagioclase, quartz, clinopyroxene, orthopyroxene, amphibole, biotite, and siliceous biota, mostly radiolarians. Four tuffaceous silt and sand layers in the upper part of Subunit IA (1.92–10.56 mbsf) contain a large amount of mostly dense, blocky, transparent or brownish glass shards. These layers are generally rich in feldspar and quartz.
In contrast, the seven normally graded tephra layers are divided into two categories, crystal-poor and crystal-rich ash layers. The crystal-poor ash exhibits predominantly transparent, dense, blocky, and cuspate glass shards (e.g., Samples 352-U1440A-1H-3A, 30–31 cm; 2H-6A, 43–44 cm; and 2H-6A, 80–81 cm). The three tephra layers that make up the crystal-rich ash have nearly equal mixtures of transparent, dense, blocky, pumiceous, and cuspate glass shards. Highly vesicular, pumiceous clasts contain tubular and elongate bubbles.
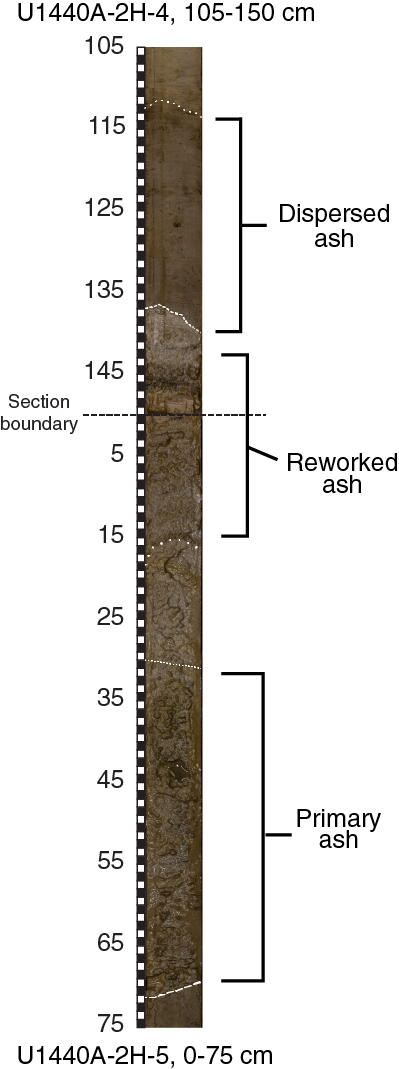
The ash layer between 9.58 and 10.41 mbsf is unusual in thickness and composition. This ash is massive until ~29 cm below the top of Section 352-U1440A-2H-5, above which planar bedding and planar lamination are present to the top of the layer (Figure F7). The ash layer comprises a minimum of 39 cm of inferred primary fall-out material followed by 47 cm of reworked ash-rich material. The ash layer as a whole predominantly contains transparent, dense, and blocky glass shards together with common, highly vesicular pumiceous and cuspate glass shards. The mineral content of the ash layer is moderate at the base (Sample 2H-5A, 60–61 cm) but increases uphole overall, resulting in a dark gray color (e.g., Samples 2H-5A, 15–16 cm; 2H-4A, 146–147 cm; and 2H-4A, 140–141 cm). The ash-rich intervals contain rare to common feldspar and quartz, plus rare to trace amounts of pyroxene, amphibole, and biotite, and opaque minerals. The mixed mineral content within the ash-rich interval cannot be assigned to one or the other of the two tephra categories, probably as a result of reworking.
Unusually, one sample (2H-6A, 80–81 cm) contains abundant carbonate spar both as single crystals and as radiating sheaves of crystals within typical felsic volcanic ash. This carbonate could be authigenic but more likely resulted from break-up of calcite-secreting organisms.
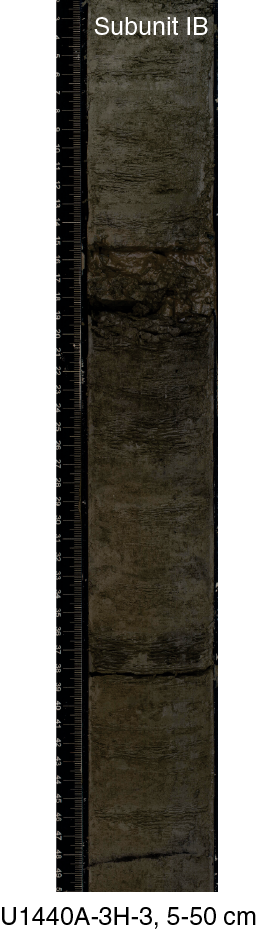
Subunit IB: early Pliocene to Pleistocene (13.33–21.61 mbsf)
Subunit IB is hemipelagic mud with foraminifers, together with minor sand layers (Figure F8). The overall recovery is divided into three main sedimentary facies based on smear slide analysis: background hemipelagic mud, ash-rich layers, and mixed hemipelagic mud and ash.
Smear slides show that the background sediment is silty clay with quartz, plagioclase, rare grains of biotite, a zeolite, iron oxide, colorless volcanic glass, and siliceous microfossils. XRD analyses revealed common calcite, quartz, and plagioclase, together with minor illite and zeolite (Table T3).
The ash facies is represented by two layers made up of ash and lapilli-ash from 20.57 to 21.58 mbsf. These layers are dominated by colorless glass with rare quartz and feldspar and also trace amounts of biotite, pyroxene, amphibole, and apatite. In addition to abundant pumice lapilli, the matrix of the lapilli-ash contains numerous relatively large mineral grains (>250 µm). Authigenic carbonate is present in small amounts in some samples. Some of the ash is virtually homogeneous, but otherwise contains trace amounts of calcareous nannofossils, planktonic foraminifers, and radiolarians. Dense, blocky, and cuspate glass shards are the main pyroclasts, together with pumiceous clasts that are rich in tabular and elongate vesicles.
The third facies comprises variable mixtures of background mud together with felsic ash. The mud ranges from volumetrically dominant silty clay, to mud that is rich in tuffaceous silt or sand, to mud with only a minor ash or sand component.
Subunit IC: early Pliocene to Pleistocene (21.61–32.98 mbsf)
Subunit IC, although mud dominated, is more heterogeneous than Subunits IA and IB, as shown by the presence of interlayers of tuffaceous mud and ash (Figure F9). Siliceous microfossils are locally abundant.
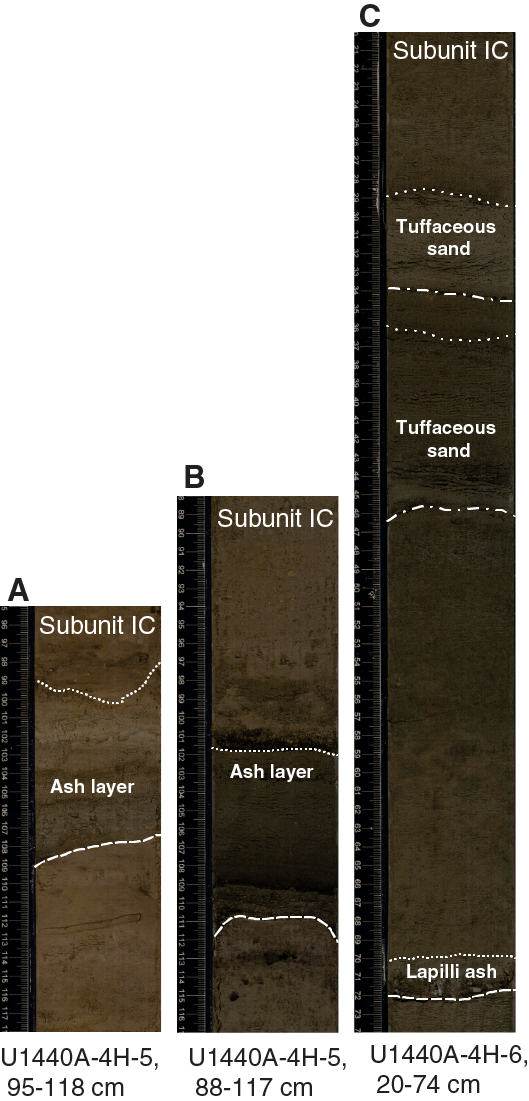
The typical background sediment is dark greenish gray to greenish brown silty mud (Figure F9). The main constituents are calcareous nannofossils, indeterminate clay, quartz, plagioclase, radiolarians, rare diatoms, and siliceous sponge spicule fragments. There are also minor amounts of “colored” mineral grains (e.g., biotite and pyroxene). Nannofossils are relatively less abundant than in Subunits IA and IB.
In some intervals, the background silty clay and ash are variably mixed, as in Subunit IB. XRD results (Table T3) indicate calcite, quartz, plagioclase, minor illite, and mixed-layer clay. One sample contains detectable (but not specifically characterized) manganese oxide.
Fourteen thin, centimeter-thick ash and lapilli-ash layers are present throughout Subunit IC. In addition, seven tuffaceous sandstone layers with >25% pyroclasts are present mainly in the lower part of the subunit (28.17–31.18 mbsf). In contrast to the ash layers in Subunits IA and IB, those in Subunit IC commonly contain only sparse mineral grains, namely plagioclase, quartz, biotite, apatite, orthopyroxene, and clinopyroxene. In addition, authigenic calcite and iron oxide (goethite?) are locally present in minor amounts. Even the purest of the ash layers contains a minor biogenic component of nannofossils and siliceous microfossils; planktonic foraminifers are also rarely present.
Crystal-poor tephra layers occur throughout Subunit IC and make up the majority of the ash layers in the subunit. Examples are shown in Samples 4H-1A, 1–2 cm; 4H-1A, 98–99 cm; 4H-3A, 8–9 cm, 78–79 cm, 108–109 cm, and 124–125 cm; 4H-4A, 9–10 cm and 60–61 cm; 4H-5A, 61–62 cm; and 4H-6A, 118–119 cm.
In addition, a small number of tephra layers are moderately crystal rich (e.g., Samples 4H-4A, 53–54 cm and 119–120 cm; 4H-5A, 109–110 cm; and 4H-6A, 72–73 cm). These tephra layers are limited to the interval between 27.7 and 30.92 mbsf.
In general, crystal-poor tephra are present in rare amounts with pumiceous clasts and contain predominantly dense cuspate to blocky glass shards with some round and elliptical vesicles. Other examples, mostly of the crystal-rich tephra layers, are pumiceous clast rich with numerous vesicles, mainly of tubular and elongate shape. Minor amounts of dense, blocky to cuspate glass shards, with mainly round to elliptical vesicles, are present in these tephra layers.
Two other samples from Subunit IC are notable: a smear slide sample taken at 4H-5A, 102–103 cm, contains relatively coarse sand with numerous grains of pyroxene, plagioclase, and some quartz. Many of the grains are subrounded, in contrast to the typical angular to subangular grains in most of the ash layers. Another smear slide sample, from Section 4H-6A, 97–98 cm, was similarly characterized by the presence of relatively large subrounded mineral grains. It should be noted that distinguishing between quartz and feldspar in smear slides is not always feasible unless mineral twinning is clearly visible.
Unit II
- Interval: 352-U1440A-5H-1, 78 cm, through 9H-3, 62 cm
- Thickness: 44.52 m
- Depth: 32.98–77.50 mbsf
- Age: early Miocene to early Pliocene
- Lithology: silty to sandy mud and volcanic breccia/conglomerate
Unit ll is characterized by an overall downhole increase in grain size and the appearance of relatively coarse-grained volcaniclastic material. The detritus in the upper part of the succession is mainly restricted to layers that contain pebble-sized pumiceous material, whereas the detritus in the lower part of the succession is generally scattered.
Subunit IIA: late Miocene to early Pliocene (32.98–58.72 mbsf)
Description and interpretation of Subunit IIA is hindered by core disturbance, especially flow-in. This subunit is dominated by greenish gray to brownish volcaniclastic-rich, variably bioturbated silty mud that represents background sedimentation (Figure F10). XRD analyses of this background sediment reveal quartz, calcite, plagioclase, illite, mixed-layer clays, manganese oxide (not precisely characterized), and serpentinite (Table T3).
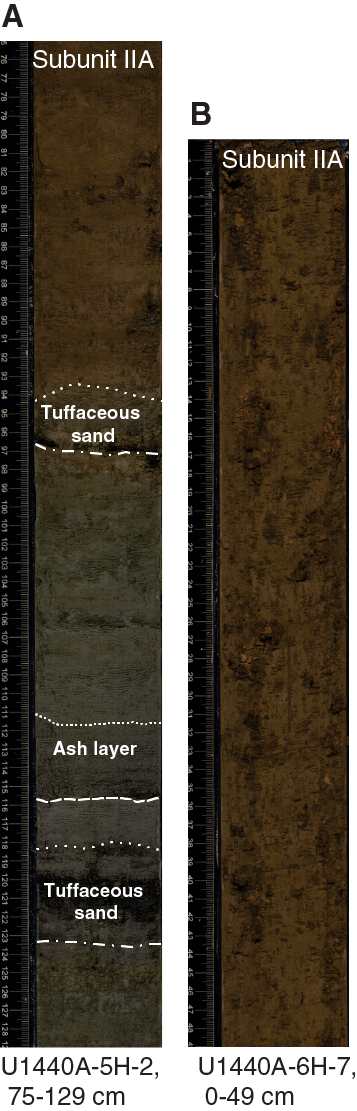
Figure F10. Sediment layers, Hole U1440A. A. Greenish gray and brown volcaniclastic-rich, variably bioturbated silty mud and an intercalated light grayish tephra, together with several dark tuffaceous sand layers. B. Lower part of the subunit with brown coarser grained sediment within bioturbated silty mud.
Four light grayish tephra layers and several dark tuffaceous sand layers are intercalated with background muddy sediment near the top of Subunit IIA, from 33.78 to 36.7 mbsf. In addition, a distinctive black tephra layer exists between 36.63 and 37.39 mbsf. Similar dark-colored tephra is mixed with background muddy sediment for several meters below this (37.39–39.40 mbsf) as a result of drilling disturbance (Figure F11). The dark tuffaceous facies was therefore originally more abundant than the one recovered layer.

The interval beneath the dark tephra layer shows the first appearance of much coarser grained sediment within bioturbated silty mud. Alternations of more or less clast-rich layers are typically present on a decimeter scale. Individual matrix-supported, clast-rich layers are as thick as several tens of centimeters. The debris includes several centimeter-sized, poorly consolidated clasts of pink noncalcareous siltstone and highly altered basalt (Figure F10). The coarse clastic layers, in some cases, are impregnated with nearly black iron oxide or manganese oxide–rich material. One of the clast-rich intervals includes isolated angular clasts of basalt (<2.5 cm in size).
The lower part of Subunit IIA is heavily disturbed by flow-in (Figure F11). Intact intervals comprise silty mud with scattered clasts (<1 cm in size). A thin, dark tephra layer is present at 55.55 mbsf.
The base of Subunit IIA is marked by a sharp downhole change to relatively homogeneous pinkish silty mud. Testing with 10% HCl showed that this muddy sediment contains very little carbonate.
Smear slides confirm the lithologic diversity of Subunit IIA. Three volcanogenic categories are present: relatively pure ash, ash mixed with background hemipelagic sediment, and brownish altered volcanic glass, which represents an additional component compared to the overlying units and subunits.
The relatively subordinate “pure” ash layers contain felsic glass–rich silts and sands. Four of these felsic ash layers have very diverse pyroclastic clasts (Samples 5H-2A, 11–12 cm, 35–36 cm, and 115–116 cm; and 5H-3A, 10–11 cm). Where highly vesicular, pumiceous-rich pyroclasts are present, these differ greatly in the abundance and shapes of vesicles, ranging from rare to abundant tubular vesicles to round and elongate bubbles. Crystal contents are moderate to low, characterized by rare amounts of feldspar and quartz, together with trace amounts of pyroxene, amphibole, and biotite. One sample (5H-2A, 115–116 cm) contains abundant authigenic carbonate and an unusually large amount of iron oxide (goethite?). In addition, a distinctive mafic ash layer at 36.63 mbsf includes a mixture of abundant brownish and common transparent pumiceous clasts that have predominantly tubular and elongate vesicles (Samples 5H-3A, 149–150 cm; and 5H-4A, 9–10 cm).
The mixed ash and background hemipelagic sediment category (tuffaceous sediment) typically contains up to 75% ash mixed with calcareous and siliceous microfossils, including radiolarians and rarely silicoflagellates.
The third volcanogenic category, mentioned above, is characterized by brownish volcanic glass, which ranges from relatively fresh to strongly altered (e.g., Sample 7H-5A, 57–58 cm). Abundant reddish iron oxide and minor zeolites are present. Minor quartz, plagioclase, and colored minerals are also seen, together with biotite, clinopyroxene, apatite, and persistent but sparse calcareous and siliceous pelagic biota. Another sample (7H-5A, 98–99 cm) contains abundant ferruginous oxide–rich clay. There are also basaltic grains, which include plagioclase microphenocrysts set in a glassy mesostasis.
Subunit IIB: early to middle Miocene (58.72–77.5 mbsf)
Subunit IIB is characterized by pale brownish, silty, noncalcareous mud with scattered clasts ranging up to granule or pebble size (Figure F12). The clast lithologies are similar to those of Subunit IIA, namely pumice/lithified ash and variably altered basalt. Although still relatively numerous, the clasts generally become smaller downhole within Subunit IIB (<0.5 cm). However, relatively large (centimeter sized) subangular pumice clasts are present in places.
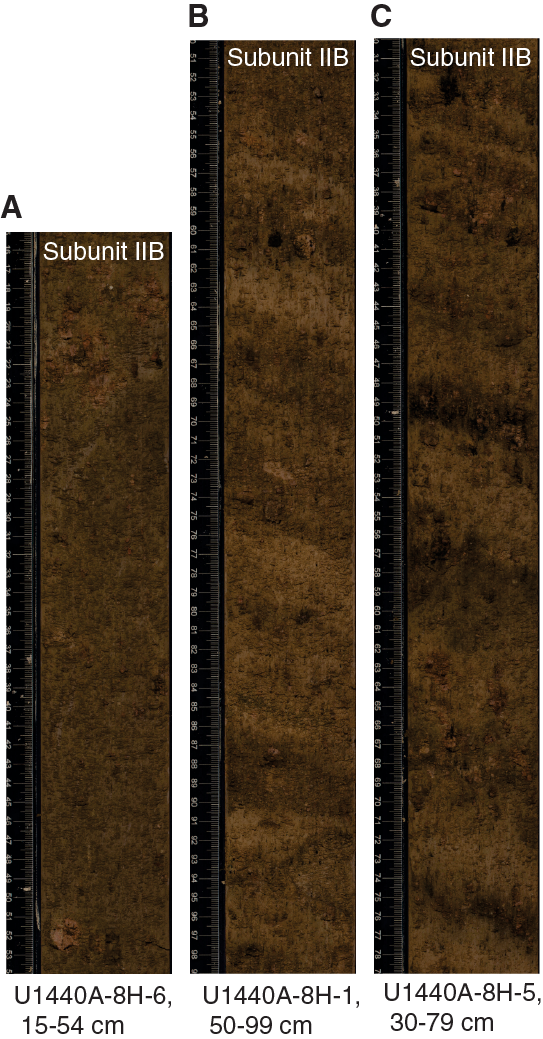
Indistinct layering of more or less clast rich intervals is detectable in places, typically on a centimeter to decimeter scale. The layering ranges from subhorizontal to distinctly inclined (see Structural geology). In addition, vague subhorizontal color banding is visible in places, together with rare dark metal-oxide (manganese?) segregations (Figure F12).
Owing to the coarse grain size, smear slides were not prepared from Subunit IIB. However, XRD analyses of the fine-grained sediment matrix revealed quartz and plagioclase, together with minor illite, mixed-layer clay, and chlorite (Table T3).
Unit III
- Intervals: 352-U1440A-10H-1, 0 cm, through 12H-CC, 20 cm; 352-U1440B-2R-1, 0 cm, through 4R-1, 36 cm
- Thicknesses: 26.02 m (Hole U1440A), 13.06 m (Hole U1440B)
- Depths: 77.5–103.52 mbsf (Hole U1440A), 102.30–115.36 mbsf (Hole U1440B)
- Age: early Miocene
- Lithology: silty mud with mud-supported breccia/conglomerate
Most of Unit III is mud-supported granule-grade breccia/conglomerate. The term breccia/conglomerate designates an indiscriminate mixture of relatively angular clasts and subrounded clasts, up to several centimeters in size. The clasts are invariably matrix supported, range from millimeters to several centimeters in size, and are dispersed through a muddy matrix (Figure F13). The clasts are volcanic in origin, mostly highly altered basaltic material. In the lower part of the core the color of the matrix changes from grayish-brownish to pinkish.
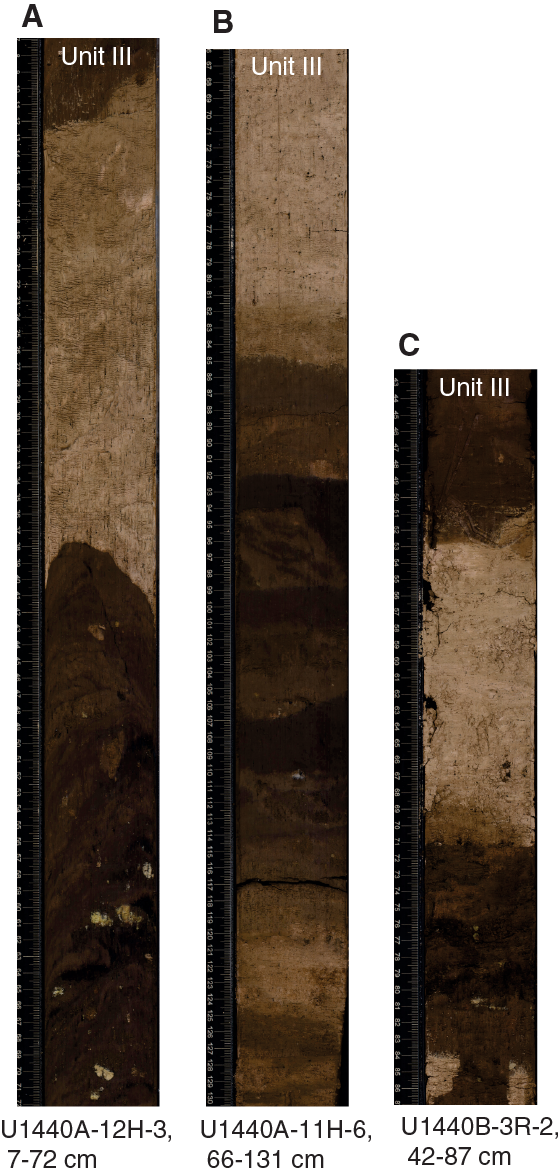
Figure F13. A. Brown–dark brown mud-supported granule-grade breccia/conglomerate alternate with grayish brownish–pinkish calcareous ooze. B. Homogeneous noncalcareous dark brown mud beds intercalated with distorted layers of silty volcaniclastic sand. C. Silty nannofossil ooze layers alternate with dark layers enriched in Fe and/or Mn oxide.
The lower levels of Unit III include thin (several centimeters) beds of homogeneous noncalcareous dark brown mud intercalated with thin distorted layers of silty volcaniclastic sand (Figure F13). Low in the unit there are also several layers of homogeneous nannofossil ooze (e.g., Sample 11H-6A, 130–131 cm).
One interval of Unit III contains numerous “pods” of ash that represent original centimeter-thick layers that have been strongly bioturbated, disturbed by drilling, or both (e.g., interval 352-U1440A-11H-3, 57–63 cm). Where fresh, this ash consists of transparent, mainly blocky glass shards. However, the original shape of the shards is obscured by diagenetic conversion of much of the glass to zeolite.
Typical mud-matrix conglomerates were also recovered in the uppermost two cores (from Section 352-U1440B-2R-2 through Core 3R) in Hole U1440B. This sediment is predominantly silty noncalcareous mud with scattered clasts of altered basalt and altered pumice. A disseminated layer of pinkish felsic lapilli-ash also occurs in interval 2R-2, 110–119 cm. This interval is characterized by fresh to altered mostly pumiceous grains and blocky pyroclasts that include dense, elliptical, or elongate vesicles. This ash layer also contains numerous calcareous nannofossils, authigenic calcite, iron oxides, and trace amounts of feldspar, quartz, pyroxene, radiolarians, and sponge spicule fragments.
A single conspicuous dark layer in Hole U1440A (<20 cm thick) and several similar layers in Hole U1440B (<15 cm thick) appear to be enriched in iron and/or manganese oxide (Figure F13).
In addition, several decimeter-thick layers of silty nannofossil ooze are present near the base of the sedimentary succession in Hole U1440A and are also present in the three cores of sediment recovered in Hole U1440B. In Hole U1440A, no specific basal features were observed. However, in Hole U1440B the sediment recovery terminated with the first appearance of basaltic rock. The uppermost recovered volcanic rock is covered by a several millimeter-thick coating of black manganese oxide. The precise contact between the manganese coating and the overlying sediment was not recovered, but it is likely that the highest basaltic unit was originally covered by a film of manganese oxide followed by the onset of clastic-dominated sedimentation.
Smear slide analysis revealed much variation in the composition of the volcanogenic sediment in Hole U1440A Unit III and in the three sediment cores from Hole U1440B. The most common material is altered volcanic glass, which is mostly brownish and nonvesicular to sparsely vesicular, and coexists with abundant brownish iron oxide. The glass is associated with rare crystals of plagioclase, orthopyroxene, and clinopyroxene. The colored minerals form large ragged crystals with common inclusions and are interpreted as reworked phenocrysts from the volcanic basement. The glass is partially altered to distinctive needles of phillipsite, together with rare large euhedral crystals, probably also phillipsite. The altered volcanogenic material coexists with a minor abundance of nannofossils, radiolarians, and siliceous sponge spicules.
Reflecting the mixed origin of the fine-grained sediment, XRD analyses revealed the presence of common quartz and plagioclase, together with illite, mixed-layer clay, chlorite, and serpentinite (Table T3) in the lower part of Unit III in Hole U1440A. Therefore, the two cores recovered by rotary drilling (Cores 352-U1440B-2R through 3R) are correlated with Unit III or with a downward continuation of the same lithologic assemblage that was not recovered in Hole U1440A.
Biostratigraphy
The microfossil contents of samples from Cores 352-U1440A-1H through 13X and Core 352-U1440B-2R through Section 4R-1 were examined and described for preliminary biostratigraphic constraints. Biostratigraphy was based solely on calcareous nannofossil biozonation.
Calcareous nannofossils were recovered intermittently in Hole U1440A, showing productive intervals interspersed with barren intervals dominated by siliceous microfossils (especially radiolarians) and volcaniclastic material. There is a long barren interval from Samples 352-U1440A-6H-CC through 10H-CC that likely encompasses most, or all, of the Miocene Epoch. Three samples were examined from Hole U1440B. Samples 352-U1440B-2R-CC and 4R-1, 14–15 cm, produced calcareous nannofossils sufficient for age diagnostic determination, whereas Sample 3R-CC was barren. Preservation was moderate to poor, with many taxa showing strong dissolution and overgrowth. Scanning electron microscopy (SEM) verification was used to confirm age ranges in Samples 352-U1440A-1H-CC and 2H-CC, as moderate to poor preservation made identification of Pseudoemiliania lacunosa and Gephyrocapsa oceanica difficult.
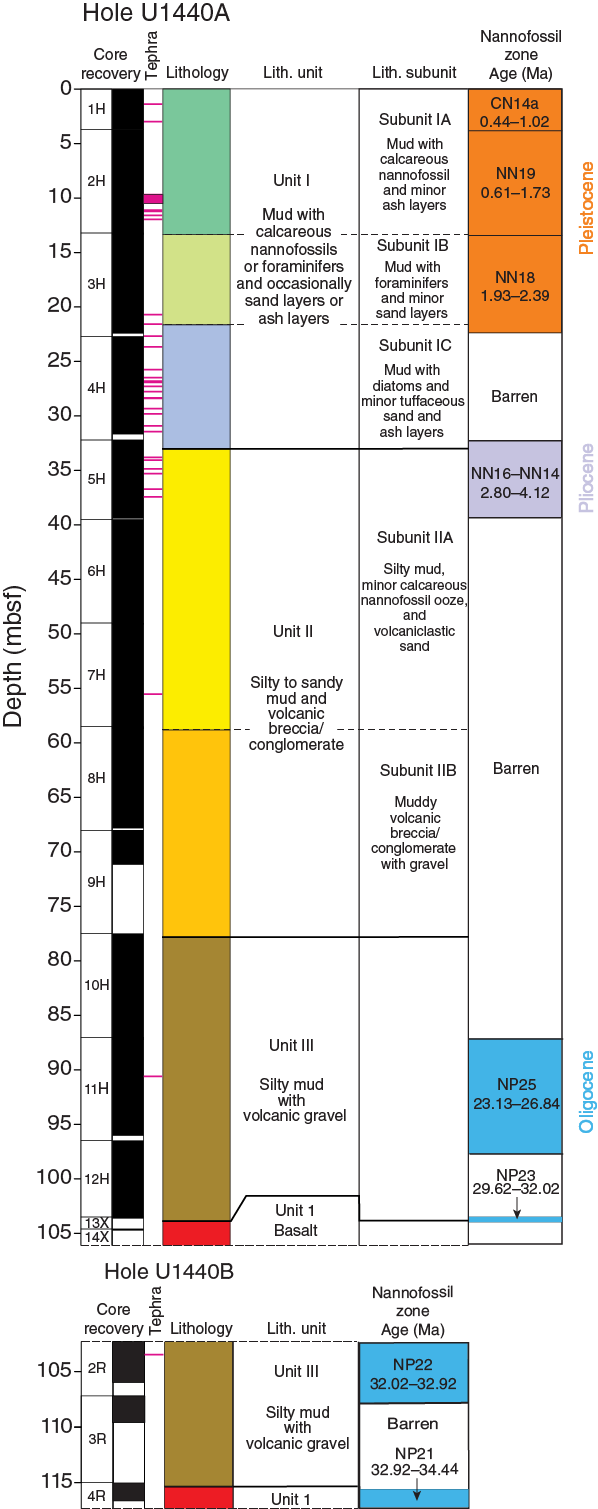
Samples 352-U1440A-1H-CC through 3H-CC are approximately Pleistocene in age. Sample 1H-CC contains both G. oceanica and P. lacunosa (Table T4), placing it in Subzone CN14a/upper Zone NN19 (0.44–1.04 Ma). Sample 2H-CC contains few age-diagnostic taxa, but the occurrence of P. lacunosa and the absence of G. oceanica and Discoaster brouweri constrain it to lower Zone NN19 (1.04–1.73 Ma). Sample 3H-CC contains the first downhole occurrence of D. brouweri and was placed in Pleistocene Zone NN18 (1.93–2.39 Ma) because of the absence of Discoaster pentaradiatus.
Table T4. Calcareous nannofossils, Holes U1440A and U1440B. Download table in .csv format.
Sample 4H-CC is barren of nannofossils but contains abundant siliceous microfossils. Sample 5H-CC contains the first downhole occurrence of Discoaster tamalis, but the absence of other age-diagnostic taxa made it difficult to limit the base of this interval. Sample 5H-CC may be placed in Zones NN16–NN14 (2.80–4.12 Ma), the entire range of this taxa.
Samples 6H-CC through 10H-CC are barren of calcareous nannofossils but contain abundant siliceous microfossils that may be useful for age diagnostics.
Samples 11H-CC through 13X-CC are approximately of Oligocene age and have been divided somewhat arbitrarily, as the Sphenolithus species that serve as marker taxa in the upper Oligocene are difficult to separate because of the occurrence of intermediate morphotypes, possibly as a result of reworking or poor to moderate preservation. Sample 11H-CC shows the first downhole occurrence of Sphenolithus ciperoensis (Table T4) and may be placed in upper Oligocene Zone NP25 (23.13–26.84 Ma). Sample 12H-CC contains scarce nannofossils and is therefore not useful for age diagnostics. Sample 13X-CC is placed in the “gap” Zone NP23 (29.62–32.02 Ma) because of the absence of key marker taxa.
Hole U1440B samples begin 2 m below the depth of Section 352-U1440A-13X-CC and provide Oligocene ages coincident with the Hole U1440A Oligocene ages. Again, absolute determination of zonal placement was made difficult by sample conditions. Sample 352-U1440B-2R-CC is tentatively placed in Zone NP22 (30.02–32.92 Ma) based on the co-occurrence of Sphenolithus tribulosis (which may be an overgrown form of another Sphenolithus species) and Coccolithus formosus. Sample 3R-CC provided scarce nannofossils that were likely reworked and does not provide useful age diagnostics. Sample 4R-1, 14–15 cm, contains both Sphenolithus akropodus and C. formosus, limiting its range to Zone NP21 (32.92–34.44 Ma).
Figure F14 is an age-depth plot with all approximate ages from productive intervals in Holes U1440A and U1440B. Barren intervals make it difficult to assess the quality of these data, but correlation at the top of Hole U1440A with paleomagnetic ages is quite good. The dashed line represents the large barren interval found in Samples 352-U1440A-6H-CC through 10H-CC.
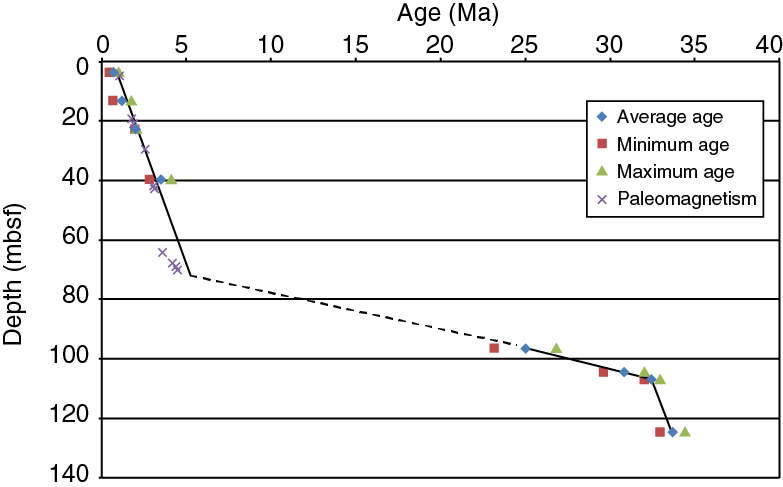
Figure F15 shows a comparison of sedimentary units with calcareous nannofossil biozonations providing approximate ages for each unit.
Fluid geochemistry
Twelve samples were collected from Hole U1440A for headspace hydrocarbon gas analysis as part of the standard shipboard safety monitoring procedure: one sample per core was collected (typically at the top of Section 4) from Cores 352-U1440A-1H through 12X. Twelve whole-round samples were collected for interstitial water analyses from Cores 1H through 12X, typically at the bottom of Section 3 above the headspace hydrocarbon gas sample. The interstitial water samples were 5 cm long and the volume of recovered interstitial water was 15–20 mL. No headspace gas or interstitial water samples were collected in Hole U1440B. Headspace gas and interstitial water samples were collected and analyzed following the protocol described in Fluid geochemistry in the Expedition 352 methods chapter (Reagan et al., 2015a).
Headspace gas
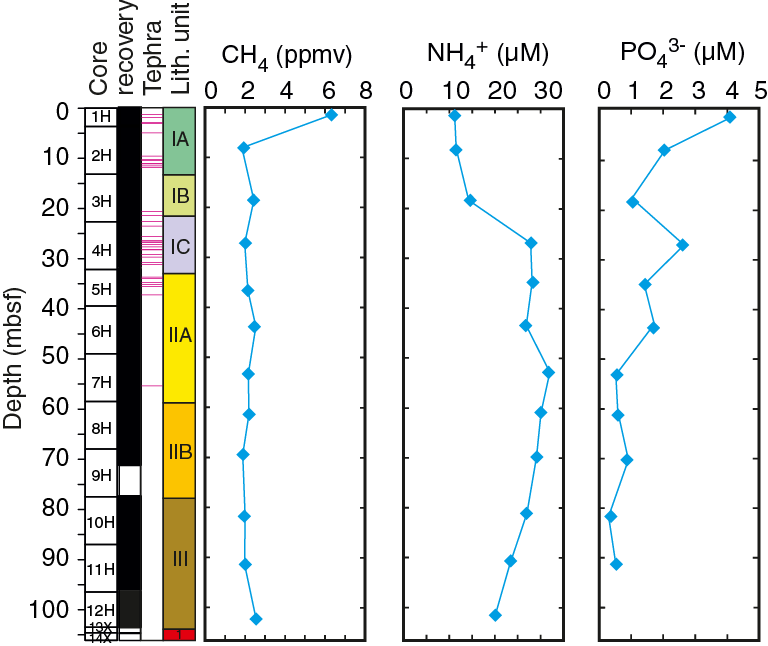
The concentrations of methane, ethane, and propane in the 12 headspace gas samples are reported in Table T5. Methane concentrations range from 1.85 to 5.84 ppmv in Hole U1440A, with the highest methane concentration measured in Core 1H at 1.5 mbsf (Figure F16). This slightly higher concentration is attributed to decomposition of organic matter in the uppermost layers of the sedimentary column. Below this depth, methane concentrations are low and relatively constant (1.84–2.56 ppmv). No ethane or propane was detected in Hole U1440A.
Table T5. Headspace gas concentrations, Hole U1440A. Download table in .csv format.
Interstitial water
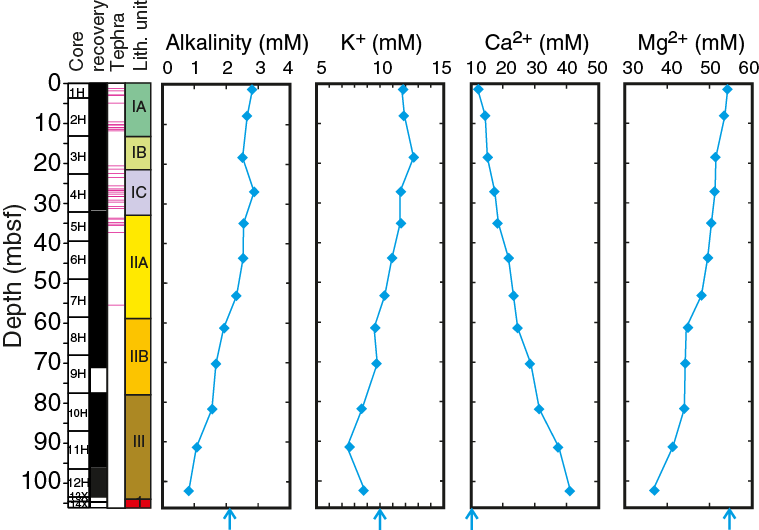
Salinity, pH, alkalinity, and chlorinity contents of the 12 interstitial water samples were measured immediately after sampling. The interstitial water samples were also analyzed for concentrations of ammonium, phosphate, sulfate, Ca2+, Mg2+, K+, and Na+. The results of these analyses are reported in Table T6 and illustrated in Figures F16, F17, and F18.
Table T6. Interstitial water cations and anions, Hole U1440A. Download table in .csv format.
Salinity, pH, ammonium, phosphate, and chlorinity
Salinity is consistent in the interstitial water samples and within the range of seawater values, with a value of 36 in the shallower cores from Hole U1440A, 37 in the deeper cores, and a single value of 38 in Section 352-U1440A-4H-3. pH declines slightly downhole, from 7.4 in Core 1H to 7.0 in Core 11H, with spikes to relatively high values in Cores 3H (7.8) and 12H (7.3).
Similarly, ammonium, phosphate, and chlorinity show very little variation with depth or with changes in the lithologic units (see Sedimentology), although all show a slight change in trend between the more carbonate rich layers of Subunits IA and IB and the more silty units below (Figure F16). NH4+ concentrations lie between 10 and 15 µM at the top of Unit I (Subunits IA and IB) then increase to 25–30 µM in the more silt- and ash-rich layers of Subunits IC and IIA (Cores 4H through 8H). Below Core 8H, NH4+ declines moderately from Subunit IIB (Core 9H) until a minimum of ~20 µM) is reached at the interface with igneous basement. Phosphate shows an overall decline through the sediment, from 4 µM near the surface to <1 µM within Unit III (Core 11H), with a spike (to 2.65 µM) in Core 4H in Subunit IC. Chlorinity averages 556 mM, which is slightly higher than average seawater.
Sulfate, bromide, and sodium
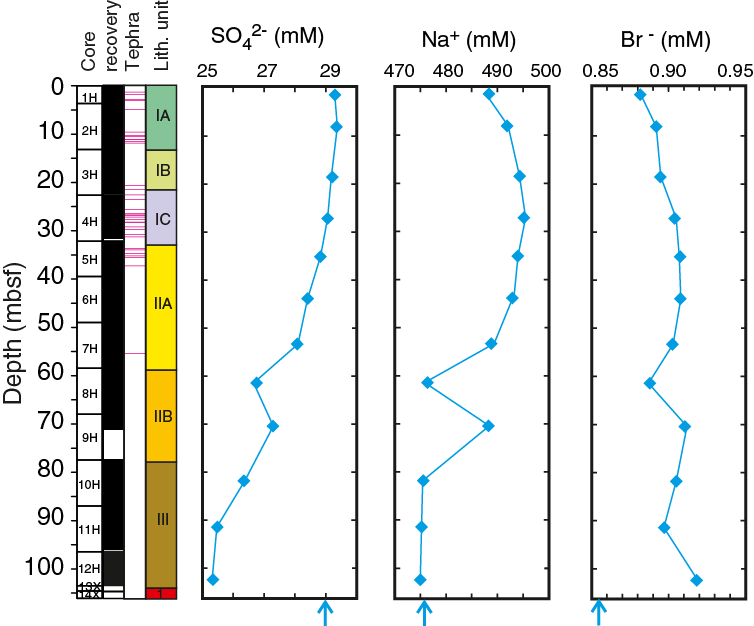
Sulfate, bromide, and sodium display variable downhole trends, but all show negative spikes in concentrations within Unit II. Bromide increases downhole from 0.88 mM in Core 1H to 0.92 mM in Core 12H with a single negative spike near the Subunit IIA/IIB boundary (Core 8H). Both SO42– and Na+ concentrations decline downhole, from 29 and 488 mM, respectively, in the shallowest core to 25 and 475 mM, respectively, in Core 12H (Figure F17). Both species, together with Br–, also show a pronounced negative concentration spike at the Subunit IIA/IIB boundary (Core 8H), accompanied by a small decline in pH. Subunit IIB contains a higher proportion of volcanogenic materials than Subunit IIA, so these compositional changes may relate to exchange between interstitial water and volcanogenic sediment during alteration similar to that observed in Hole U1439A.
Alkalinity, potassium, magnesium, and calcium
Alkalinity, potassium, magnesium, and calcium vary continuously with depth, but these changes in interstitial water compositions appear mostly independent of the different drilled lithologies (Figure F18). Total alkalinity declines consistently downhole, from 2.84 mM in the carbonate-rich uppermost units to 0.83 mM above the igneous basement. K+ concentrations decrease progressively downhole, from high values of 12.7 mM in Core 3H to low values of 7.4 mM in Core 11H. Ca2+ and Mg2+ concentrations in the uppermost sample (352-U1440A-1H-1), at 12.1 and 54.3 mM, respectively, are close to mean seawater values (Ca2+ = 12.6 mM; Mg2+ = 54.1 mM).
Ca2+ steadily increases downhole to 41.2 mM, whereas Mg2+ decreases downhole to 36.6 mM. This results in a steady downhole increase in Ca/Mg (from 0.22 to 1.1). These changes may reflect incipient dolomitization, with Ca solubility increasing with depth, which in turn would favor Mg-Ca exchange in carbonates. Such variations can also reflect the alteration of volcanic ashes and basement (e.g., Gieskes et al., 1990; Lawrence and Gieskes, 1981) within the drilled sedimentary sequence and/or they could mark exchanges with the underlying basement rocks (e.g., Saito, Underwood, Kubo, and Expedition 322 Scientists, 2010). Similar downhole changes in the interstitial water composition were observed in Hole U1439A and at Sites 458 and 459, which were drilled >1000 km to the south along the Mariana Trench (Gieskes and Johnson, 1982). In detail, downhole Mg-Ca variations differ slightly from Hole U1439A to Hole U1440A; they appear conservative at Hole U1439A compared to Hole U1440A. The same trend was observed between the interstitial water sampled at Sites 458 and 459, the latter being, as Hole U1440B, the deeper and closer to the trench. These differences in Mg-Ca downhole trends were interpreted as evidence that, at Site 459, in addition to possible interactions with underlying igneous basement, reactions in the sediments must also have contributed to the observed Mg-Ca concentration changes. The same scenario seems most likely at Hole U1440A, which is rich in volcanogenic material in the lower sedimentary lithologies (see Sedimentology).
Petrology
Igneous rocks were recovered from both Holes U1440A and U1440B. Hole U1440A tagged basement during XCB coring, with low recovery (Cores 352-U1440A-13X and 14X; 1.27 m recovered), whereas Hole U1440B penetrated more than 253 m of igneous basement (Cores 4R through 36R). The basement/sediment contact is marked in both drill holes by a Mn-rich sediment layer or coating, similar to the umbers that commonly overlie ophiolites. The uppermost igneous units in both holes comprise volcanic rock fragments in a sediment matrix, which may represent a talus or hyaloclastite breccia. In Hole U1440B, this unit is underlain by >175 m of volcanic rock. This transitions over ~60 m into dikes at 329.0 mbsf, which is interpreted as part of a sheeted dike complex. The igneous basement is divided into 15 lithologic units (including the uppermost breccia), numbered in order of increasing depth (Figure F19). The lowermost unit, Unit 15, is the sheeted dike complex, which has been further divided into 5 chemically distinct subunits (15a–15e). Chemical distinctions between the units of Hole U1440B are based on portable XRF (pXRF) spectrometer analyses carried out by the geochemistry group (for pXRF data as well as calibration and accuracy assessment versus shipboard ICP-AES analyses, see Sediment and rock geochemistry). Figure F20 summarizes the pXRF chemostratigraphy of Hole U1440B. Figure F21 depicts notable macroscopic igneous characteristics, and Figure F22 highlights representative and/or notable microscopic features.
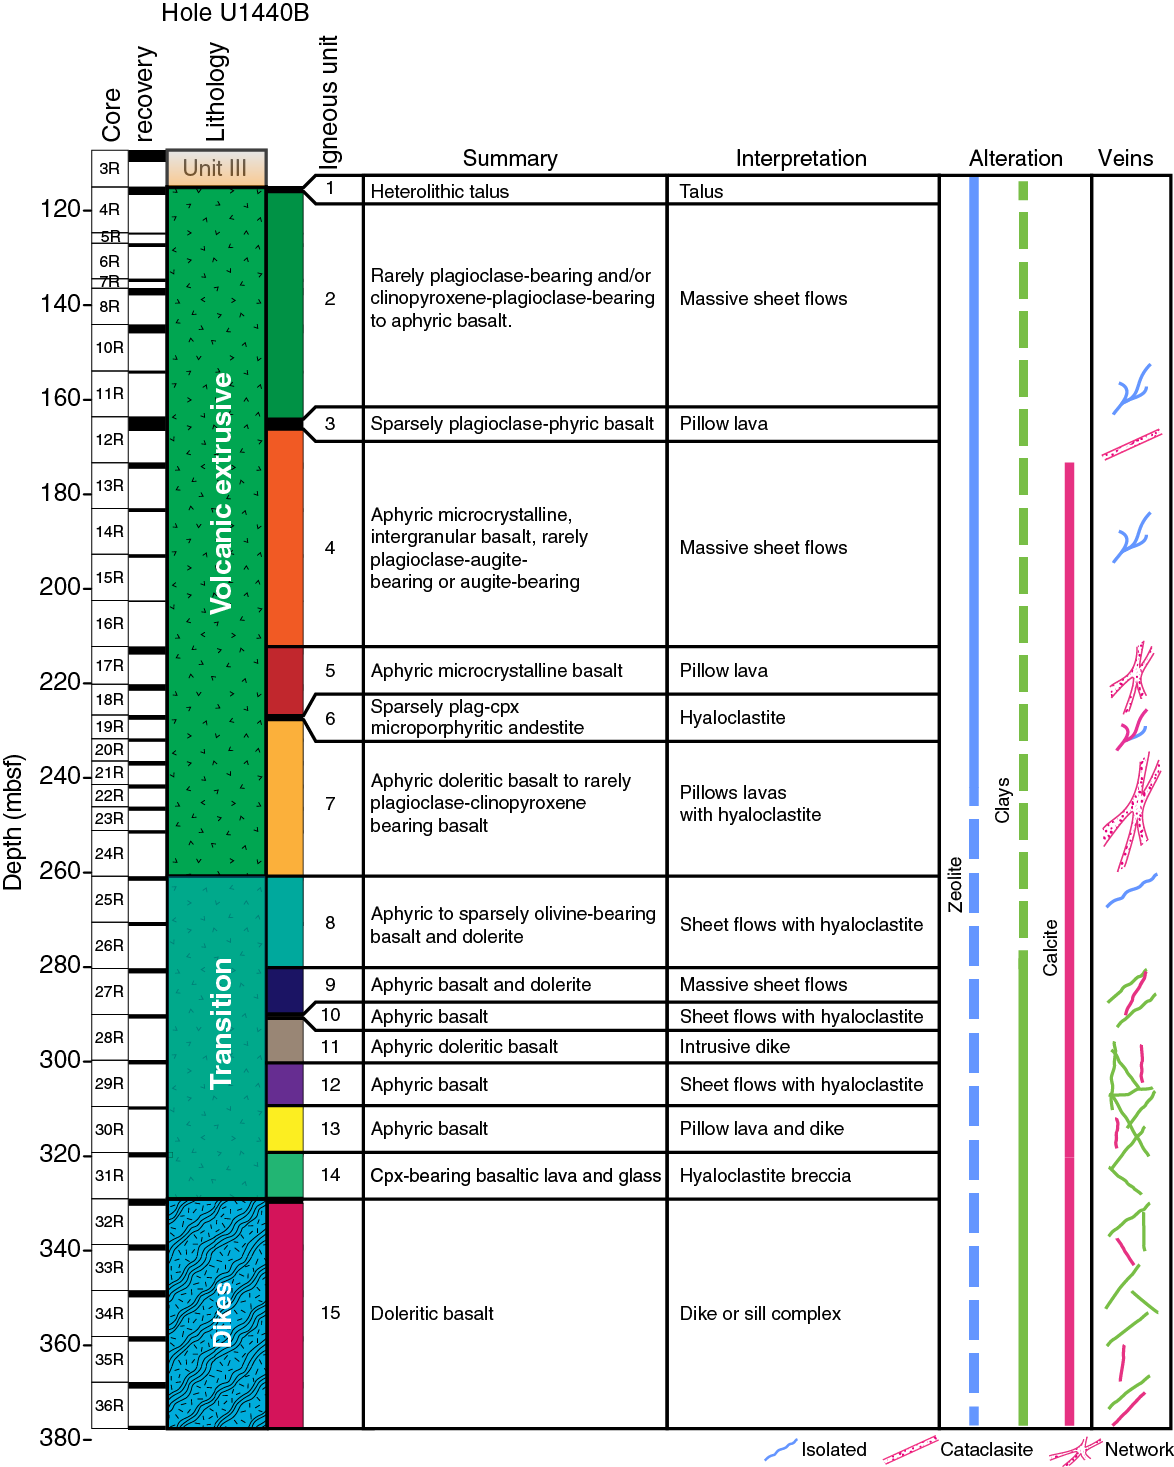

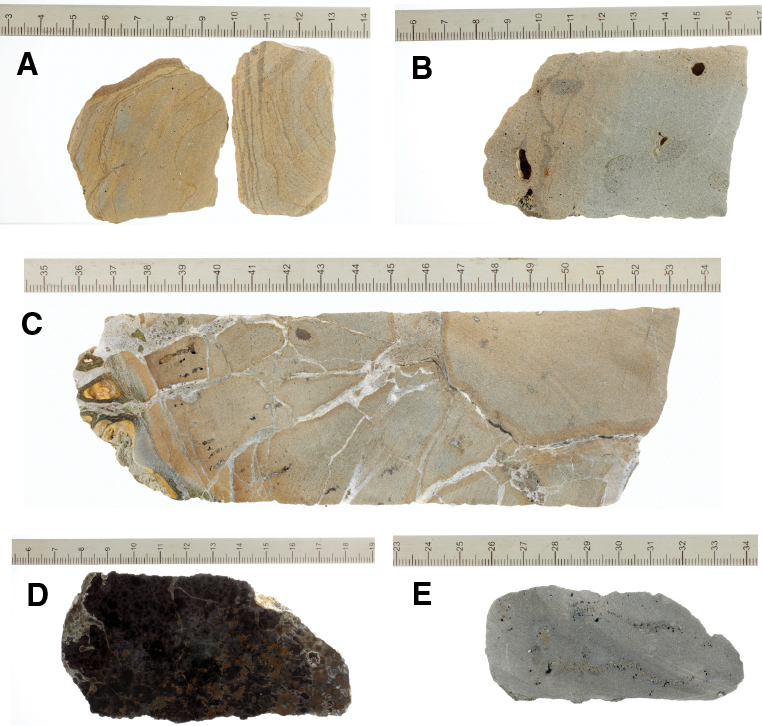
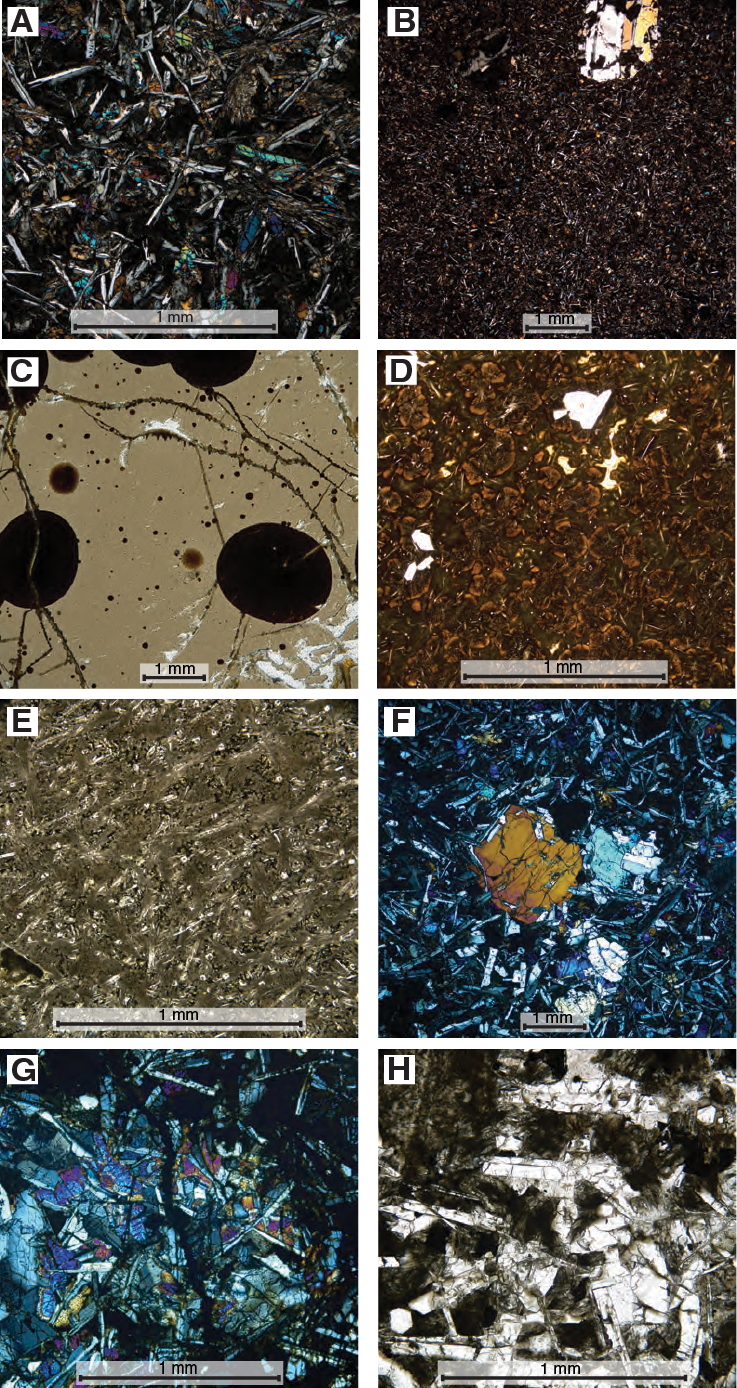
Figure F22. A. Aphyric intersertal–intergranular plagioclase and augite. B, D. Plagioclase phenocrysts. C. Fresh clear glass with devitrified spherulites. E. Quench-textured basalt. F. Subophitic augite phenocrysts. G. Ophimottled augite enclosing plagioclase. H. Euhedral interstitial quartz crystals between plagioclase in dolerite.
Chemostratigraphy
Overall, igneous rocks in Hole U1440A and the upper part of Hole U1440B vary little in their petrographic characteristics. As described below in the Hole U1440B lithostratigraphy section, most are aphanitic to fine-grained basalts that are typically aphyric. The rare phyric samples contain only plagioclase or plagioclase + augite as their phenocryst assemblage, which rarely exceeds 1% modally. As a result, it is difficult to define lithologic units based solely on petrographic characteristics. Low recovery also makes it challenging to define physical volcanic units unambiguously.
To address this problem, chemical measurements by pXRF were used to define chemostratigraphic units while the core was being described. Although the homogeneity, small grain size, and lack of phenocrysts in Hole U1440B hinder traditional petrologic classification, these characteristics make these recovered materials ideal for pXRF analyses. Rapid (~5 min for three analyses per sample), nondestructive pXRF measurements directly on the surface of the archive half of the core proved particularly useful. The method allowed piece-by-piece sampling to precisely define chemostratigraphic boundaries. Though not a substitute for complete whole-rock analyses by ICP-AES, pXRF measurements have the advantage of rapid turn-around time and reasonable precision and accuracy for several elements, so allowing geochemical variations and chemostratigraphic boundaries to be determined within minutes (for cross-calibration with ICP-AES and a complete discussion of calibrations and data correction, see Sediment and rock geochemistry). Three elements were selected to define the chemostratigraphic units: Ti, Cr, and Zr. These data were supplemented with Sr, CaO, and K2O for some units where variations were striking and core pieces were relatively fresh.
Our principal chemostratigraphic elements vary significantly throughout Hole U1440B (Figure F20). In most cases, these variations correspond to subtle petrographic differences. Thus, compositional data for Cr, Ti, and Zr are included in the Hole U1440B lithostratigraphic section in addition to primary petrographic characteristics.
Igneous rock lithostratigraphy
Hole U1440A
Unit 1
- Interval (top): 352-U1440A-13X, 5 cm
- Depth: 103.55–104.72 mbsf
- Thickness: 1.17 m
- Rock type: aphyric basalt
- Deposit: volcanic breccia with minor pillow or lava
Igneous rocks were recovered in Cores 352-U1440A-13X through 14X (Unit 1). Unit 1 begins in Section 352-U1440A-13X-1, 5 cm (103.55 mbsf), and continues through Section 14X-1, 12 cm (104.72 mbsf). Recovery was very poor (7.1%), making characterization difficult. Nevertheless, the unit appears to consist largely of volcanic breccia made up of minor pillow or lava fragments in a matrix of mud or hyaloclastite, most of the matrix of which was lost during drilling. The recovered volume consists almost entirely of basalt fragments, which range from ~1 to 9 cm in length. All of these basalts are aphyric and microcrystalline to very fine grained. Unit 1 in Hole U1440B has a comparable appearance and is therefore correlated with Unit 1 in Hole U1440A.
Hole U1440B
The basement rocks recovered in Cores 352-U1440B-4R through 36R comprise Units 1–15. This igneous sequence has both lavas and dikes and has been interpreted here as an extrusive volcanic lava suite and a sheeted dike complex, separated by a transition zone containing both dikes and lavas. The relative concentrations of TiO2, Cr, and Zr were diagnostic in separating most lithologic units. TiO2 has an overall variation of 0.5 to 1.5 wt%, Cr varies from below practical limits of determination (~25 ppm; see Sediment and rock geochemistry) to 250 ppm, and Zr ranges from 23 to 150 ppm. Intragroup variation is small for TiO2 (14%) and Zr (10%), but Cr often displays a wider range of values per given unit (>30%) (Figure F20).
Unit 1
- Interval (top): 352-U1440-4R-1, 36 cm
- Depth: 115.36–115.88 mbsf
- Thickness: 0.52 m
- Rock type: heterolithic breccia
- Deposit: talus breccia or similar
Unit 1 begins in Core 4R (Section 352-U1440B-4R-1, 36 cm; 115.36–115.88 mbsf) and is separated from the overlying sedimentary section by 2–3 cm of Mn-rich crust similar to that found in Section 13X-1. Unit 1 is a heterolithic breccia with a mixed suite of clasts, including yellow-brown vesicular basalts; dark gray, fine-grained aphyric basalts; plagioclase-phyric basalts; and fine- to medium-grained dolerite. Preliminary pXRF chemical data yield a range of compositions, supporting interpretation of this unit as a talus breccia or similar deposit.
Unit 2
- Interval (top): 352-U1440B-4R-1, 88.5 cm
- Depth: 115.9–164.2 mbsf
- Thickness: 48.3 m
- Rock type: aphyric basalt
- Deposit: massive or sheet flows
Unit 2 is the first continuous sequence of volcanic rock. This unit has an inferred thickness of 48.3 m (115.9–164.2 mbsf; Figure F19). The upper 2 m is strongly affected by oxidative seawater weathering (halmyrolysis) as demonstrated by orange-brown color and “onion-skin” weathering (Figure F21A). The unit is dominated by aphyric basalt with rare (≤1%) microphenocrysts of plagioclase or clinopyroxene + plagioclase. The unit lacks significant macroscopic structures except for rare glassy rims. Magma segregation vesicles (commonly elongate upward), which have a spongy vesicular texture and contain large crystals of the same phase assemblage as the lava, make this unit conspicuous compared to adjacent units (Figure F21B). Texturally, it is equigranular or seriate, with a prevalent intergranular to intersertal microcrystalline groundmass of plagioclase (~40%–50%), augite (~10%–20%), magnetite (~1%–3%), and varying proportions of fresh and altered glass (Figure F22A). Quench-texture groundmass involving random splays of devitrified glass surrounding plagioclase is commonly present. Locally, pieces preserve spherulitic devitrified glass adjacent to glassy rims.
Unit 2 is characterized by relatively low Cr (<60 ppm) and intermediate TiO2 (0.8–1.2 wt%) concentrations and is interpreted to represent a series of massive or sheet flows based on its grain size, the presence of segregation and pipe vesicles, and the general lack of glass and radial fractures. Local glass-rich horizons may represent hyaloclastite interbeds.
Unit 3
- Interval (top): 352-U1440B-12R-1, 51.5 cm
- Depth: 164.2–166.3 mbsf
- Thickness: 2.14 m
- Rock type: plagioclase-phyric basalt
- Deposit: pillow lava
Unit 3 (Section 12R-1, 51.5 cm; 164.2–166.3 mbsf) consists of 2.14 m of sparsely (≤3%) plagioclase-phyric basalt. Plagioclase forms both large (1.5 mm) euhedral phenocrysts and glomerocrysts with augite (1.2 mm). The fine-grained groundmass consists of plagioclase (10%–45%), augite (5%–20%), magnetite (1%–5%), and mesostasis (30%–80%), interpreted on the basis of its texture to represent quenched melt. Unit 3 is chemically distinguished from the units above and below it by the combination of relatively high Cr concentrations (≥150 ppm), the lowest TiO2 in Hole U1440 (~0.5 wt%), and the dominance of quench-textured mesostasis. Unit 3 is interpreted to represent a pillow lava, based on the quench textures, fractures, and common oxidation overprint.
Unit 4
- Interval (top): 352-U1440B-12R-2, 120 cm
- Depth: 166.3–212.4 mbsf
- Thickness: 46.1 m
- Rock type: aphyric basalt
- Deposit: massive sheet flow
Unit 4 (Section 12R-2, 120 cm; 166.3–212.4 mbsf) is a microcrystalline aphyric basalt that is rarely plagioclase-augite or augite microphyric (0.3–0.5 mm). The groundmass is typically intersertal to intergranular with plagioclase (40%–50%), augite (15%–20%), magnetite (1%–3%), and up to 30% mesostasis (largely quench textured). This 46.1 m thick unit is characterized by higher Ti than any of the other units (1.2–1.5 wt% TiO2) and by low Cr (<85 ppm) relative to Unit 3. It is interpreted to be massive sheet flows based on its lack of glass, variable, but generally coarser, grain size, and the presence of pipe vesicles.
Unit 5
- Interval (top): 352-U1440B-17R-1, 21.5 cm
- Depth: 212.4–226.7 mbsf
- Thickness: 14.3 m
- Rock type: aphyric microcrystalline to fine-grained basalt
- Deposit: pillow lavas
Unit 5 (Section 17R-1, 21.5 cm; 212.4–226.7 mbsf) consists of aphyric, microcrystalline to fine-grained basalt with common oxidative overprint (varying from pale gray-green to tan color). Augite and plagioclase microphenocrysts (1 mm) are rare (Figure F22B). The groundmass is equigranular with intersertal to intergranular textures, comprising plagioclase (40%–50%), augite (20%–45%), magnetite (5%), and mesostasis (20%–40%). Radial fractures emanate from unfractured cores appear to represent pillow interiors; outer rims of these pillows are devitrified glass, which is typically highly oxidized (orange in color). Furthermore, small (~1 cm long) pipe vesicles radiate perpendicular to the pillow rims (Figure F21C).
Abundant veins of calcite/zeolite crosscut the sequence with surrounding brown alteration halos. Many of the veins fill the radial fractures, and vein minerals also fill interstices between adjacent pillows. In places, the veins form breccias containing a spectrum of colored clasts within matrix. Unit 5 is clearly distinguished from the adjacent units on the basis of its color, macroscopic structures, and high Cr content (~100 ppm) relative to Units 4 and 6.
Unit 6
- Interval (top): 352-U1440B-19R-1, 0 cm
- Depth: 226.7–227.5 mbsf
- Thickness: 0.8 m
- Rock type: andesite vitrophyre
- Deposit: hyaloclastite or glassy lava flow
Unit 6 (Section 19R-1, 0 cm; 226.7–227.5 mbsf) is a hyaloclastite/vitrophyre consisting of aphyric to sparsely plagioclase-augite microporphyritic, black to dark green, quench-textured mesostasis and glass (Figure F21D). The glass is completely devitrified in most samples, but fresh glass is preserved in some partially devitrified samples (Figure F22C). Rare lithic pieces are fine-grained to hypohyaline with 1 mm sized glomerocrysts of augite and/or plagioclase. Groundmass in the lithic pieces is intersertal with plagioclase, augite, and high proportions of devitrified glass (up to 40%). Unit 6 is an andesite characterized chemically by its relatively high Zr concentrations (110–150 ppm) and relatively low Cr concentrations (<50 ppm). It is easily distinguished texturally by the dominance of glass and quench features and is interpreted to represent a hyaloclastite or glassy lava flow.
Unit 7
- Interval (top): 352-U1440B-19R-1, 79 cm
- Depth: 227.5–260.8 mbsf
- Thickness: 33.3 m
- Rock type: basalt vitrophyre and microcrystalline basalt
- Deposit: sheet flows/hyaloclastite breccia
Unit 7 is glass rich near its base and microcrystalline at its top (Section 19R-1, 79 cm; 227.5–260.8 mbsf). The upper basalts are aphyric with intergranular to intersertal groundmass textures, whereas the lower vitrophyres contain sparse microphenocrysts of augite and plagioclase (each <1%), commonly as glomerocrysts, in a groundmass of spherulitic devitrified glass (Figure F22D). Quench textures are again apparent in thin section, as in Units 2, 3, and 4, and are typified by fibrous splays of devitrification products (Figure F22E). Glass-rimmed lava fragments up to 6 cm across and small glass globules 1–2 cm in diameter suggest that the lower glass-rich section represents a hyaloclastite breccia. The upper microcrystalline basalts lack pillow features and are interpreted to represent sheet flows. Unit 7 is clearly distinguishable chemically from Unit 6 by its lower Zr content.
Unit 8
- Interval (top): 352-U1440B-25R-1, 0 cm
- Depth: 260.8–280.36 mbsf
- Thickness: 19.5 m
- Rock type: aphyric to augite-plagioclase phyric basalt
- Deposit: sheet or massive flows and hyaloclastite
Unit 8 (Section 25R-1, 0 cm; 260.8–280.3 mbsf) consists of aphyric to augite-plagioclase phyric and, rarely, olivine-phyric basalt. The phenocryst assemblage is dominated by augite (~1 mm) and plagioclase (~1.2 mm); olivine phenocrysts were observed in one hand specimen but could not be confirmed microscopically. The intergranular to intersertal groundmass varies from microcrystalline to fine-grained, with plagioclase (40%–55%), augite (20%–40%), and magnetite (2%–3%). This unit is interpreted to consist dominantly of sheet flows or massive flows with doleritic textures, but hyaloclastite horizons are indicated by glass-rimmed lava fragments, devitrified glass, and quench-textured lava. Hyaloclastite fragments contain sparse microphenocrysts of augite and plagioclase in a spherulitic devitrified glass matrix. Unit 8 is characterized by high concentrations of Cr (150–220 ppm) relative to the units above and below it.
Unit 9
- Interval (top): 352-U1440B-27R-1, 0 cm
- Depth: 280.3–290.0
- Thickness: 9.7 m
- Rock type: aphyric basalt
- Deposit: massive sheet flows
Unit 9 (Section 27R-1, 0 cm; 280.3–290.0 mbsf) consists of basalt with sparse plagioclase microphenocrysts. The groundmass ranges from aphanitic to fine-grained intergranular (doleritic) with plagioclase (55%), augite (22%), magnetite (1%–3%), and mesostasis (20%). It contains no glass or hyaloclastite and is interpreted to represent massive sheet flows, based on the fact that volcanic rocks are present within this chemical unit (e.g., Section 27R-1 [Pieces 1–5]). Unit 9 is distinguished from Unit 8 by its lower Cr (50–70 ppm) and from Unit 10 by lower TiO2 (<1 wt%). The lowermost rock piece (Section 27R-1 [Piece 15]), which has a fine-grained doleritic texture, has the highest magnetic susceptibility in Hole U1440B, nearly three times higher than that of the upper extrusive sequence (see Physical properties).
Unit 10
- Interval (top): 352-U1440B-28R-1, 0 cm
- Depth: 290.0–290.4 mbsf
- Thickness: 0.4 m
- Rock type: aphyric basalt
- Deposit: hyaloclastite breccia and pillow lava
Unit 10 (Section 28R-1, 0 cm; 290.0–290.4 mbsf) is an aphyric to sparsely microphyric basalt dominated by quench-textured mesostasis and devitrified glass. Sparse microphenocrysts (0.5 mm) of euhedral plagioclase and augite are set in a cryptocrystalline to microcrystalline groundmass of plagioclase and augite (10%–30%), quenched mesostasis, and devitrified glass. This unit is interpreted to represent a hyaloclastite breccia, possibly interbedded with pillow lava, texturally contrasting with the overlying sheet flows. It is distinguished from the adjacent units by its higher Cr concentrations (~110–120 ppm) and by its glass-rich horizons.
Unit 11
- Interval (top): 352-U1440B-28R-1, 43 cm
- Depth: 290.4–303.3 mbsf
- Thickness: 12.9 m
- Rock type: aphyric doleritic basalt
- Deposit: intrusive sheet (dike/sill), or sheet flow
Unit 11 (Section 28R-1, 43.0 cm; 290.4–303.3 mbsf) is an aphyric doleritic basalt with a nonvesicular fine- to medium-grained groundmass (up to 1 mm grain size) consisting of plagioclase (50%), augite (40%–43%), and oxides (1%–2%). The groundmass is subophitic to intergranular and appears to coarsen away from the contact with Unit 10. The overall increase in grain size with depth suggests a single cooling unit, either a sheet flow or a dike no more than 15 m thick. Texturally, it closely resembles rocks from the dike complex (Unit 15). Unit 11 is distinguished from the adjacent units by its overall coarser grain size and low Cr concentrations (~70 ppm).
Unit 12
- Interval (top): 352-U1440B-29R-1, 58 cm
- Depth: 300.3–309.5 mbsf
- Thickness: 6.2 m
- Rock type: aphyric basalt
- Deposit: sheet flow (or intrusive sill)
Unit 12 (Section 29R-1, 58 cm; 300.3–309.5 mbsf) is an aphyric nonvesicular basalt with a microcrystalline groundmass consisting of plagioclase, augite, and oxides. It is essentially identical chemically to Unit 10 (above), implying that Unit 11 represents a dike or sill that intruded a single volcanic flow (Units 10 and 12).
Unit 13
- Interval (top): 352-U1440B-30R-1, 0 cm
- Depth: 309.5–319.7 mbsf
- Thickness: 10.2 m
- Rock type: sparsely to moderately plagioclase- and augite-microphyric basalt
- Deposit: pillow lava flows
Unit 13 (Section 30R-1, 0 cm; 309.5–319.7 mbsf) is a sparsely to moderately plagioclase- and augite-microphyric basalt with a microcrystalline to cryptocrystalline groundmass. The microphenocrysts vary in abundance from 1%–5% and range in size from 0.5 to 0.8 mm, in places forming glomerocrysts. The groundmass is intersertal to intergranular with 25%–30% plagioclase, 10%–15% augite, and ~60% altered and devitrified mesostasis. Unit 13 is characterized by abundant large segregation vesicles in sparsely vesicular basalt (Figure F21E). These segregation vesicles are up to 1 cm across. Elongate pipe segregation vesicles up to 4 cm long also are present. Based on the high proportion of glassy margins, curved glass-coated surfaces, and segregation vesicles, Unit 13 is interpreted to represent one or more pillow lava flows, which may contain thin sheet flows.
Unit 13 is cut by a nonvesicular, moderately augite-microphyric basaltic dike. The dike is fine grained with an intergranular to subophitic texture and contains ~5% augite microphenocrysts. Approximately 10 cm of dike material was recovered (Section 30R-1 [Pieces 10–12]). The dike is clearly distinguished texturally from the volcanic rocks by its coarser grain size and by the lack of segregation vesicles, which characterize almost all samples of the volcanic rocks. Unit 13 volcanics are characterized by the highest Sr concentrations of any unit sampled (>80 ppm) and by relatively low Cr concentrations. In contrast, the dike is chemically similar to rocks in the overlying volcanic section, with Sr of <70 ppm and Cr of ≥150 ppm.
Unit 14
- Interval (top): 352-U1440B-31R-1, 50.5 cm
- Depth: 319.7–329.0 mbsf
- Thickness: 9.3 m
- Rock type: aphyric to augite or plagioclase-microphyric basalt
- Deposit: hyaloclastite breccia
Unit 14 (Section 31R-1, 50.5 cm; 319.7–329.0 mbsf) consists of aphyric to augite or plagioclase-microphyric basalt and basaltic glass. Quenched margins are visible on many samples, and fresh glass is common. The basalt is intersertal to vitrophyric, with up to 30% glass groundmass, which is 99% devitrified. Plagioclase phenocrysts are large (≥1 mm) and euhedral in comparison to smaller prismatic augite (0.5 mm). Unit 14 is chemically distinguished from Unit 13 by a 3- to 4-fold increase in Cr concentration. It is texturally distinguished from the underlying Unit 15, and it has the lowermost glass recovered in Hole U1440B. One small piece of this unit, a dolerite (Section 31R-1 [Piece 19]), does not correlate with other samples in this unit. Based on its pXRF chemical composition, that piece is a dikelet associated with Unit 15 or was displaced upward in the section during coring or curating.
Unit 15
- Interval (top): 352-U1440B-32R-1, 0 cm
- Depth: 329.0 mbsf
- Thickness: NA
- Rock type: aphyric to plagioclase-augite phyric basalts
- Deposit: intrusive sheets: dike or sill complex
Unit 15 (Section 32R-1, 0 cm; 329.0 mbsf) marks the possible beginning of the dike/sill complex. It consists of aphyric to plagioclase-augite phyric basalts, which range in texture from intergranular to granular and, rarely, subophitic or ophimottled (dolerites; Figures F22F, F22G). Vesicles are rare and small (<0.5 mm). Oscillatory-zoned plagioclase phenocrysts (0.8–1.6 mm) are common, in addition to large augite (0.4–0.6 mm). Plagioclase and augite are seriate, displaying a range of grain sizes from 0.2 to 1.6 mm, the largest grains being the phenocrysts in the phyric samples. A unique feature of some samples is the presence of ophimottled textures in which large augite grains subophitically enclose several plagioclase laths, all of which project radially outward from the center of the augite grain (Figure F22G ). These textures require the formation of augite prior to plagioclase crystallization, with plagioclase nucleating on the early augite crystals. Rare microcrystalline rocks within Unit 15 may represent thin rapidly cooled dikes or screens of older volcanic rock. Texturally, there is little to distinguish individual dikes, and no unambiguous chilled margins were recovered.
The coarser grained samples generally have less mesostasis, which is altered in all samples but appears to represent quenched interstitial melt. Small (0.01–0.05 mm) euhedral to subhedral quartz crystals are common as a late crystallizing phase in the mesostasis, forming euhedral crystal faces where they project into the mesostasis (Figure F22H). Unit 15 is divided into five subunits (15a–15e), perhaps corresponding to individual dikes, based dominantly on Cr abundances obtained by pXRF measurements. The subunit boundaries are
- Subunit 15a: top at 352-U1440B-32R-1, 0 cm; depth = 329.00–338.70 mbsf; thickness = 9.7 m
- Subunit 15b: top at 352-U1440B-33R-1, 0 cm; depth = 338.70–339.82 mbsf; thickness = 1.12 m
- Subunit 15c: top at 352-U1440B-33R-1, 112 cm; depth = 339.82–349.46 mbsf; thickness = 9.64 m
- Subunit 15d: top at 352-U1440B-34R-1, 106 cm; depth = 349.46–367.8 mbsf; thickness = 18.34 m
- Subunit 15e: top at 352-U1440B-36R-1, 0 cm; depth = 367.8–369.09 mbsf; thickness = 1.29 m
Because of the relatively low recovery, it is not known whether these subunits represent individual dikes/sills, or composites of multiple intrusive sheets. The thinnest subunits (15b, 15e) are likely individual intrusive bodies, whereas the thickest unit (15d) is likely composite. The other subunits (15a, 15c) could be either.
Alteration
The degree of alteration in Hole U1440B is low and fairly constant downhole to Core 25R-1, after which it increases somewhat. Alteration mineral assemblages are dominated by clays (montmorillionite, interlayered montmorillionite-illite, and illite), with lesser zeolite (largely phillipsite) and with calcite appearing beneath Core 12R. (Figure F16). The alteration of primary phases is similar whatever their size and therefore we will not distinguish alteration of phenocrysts from alteration of groundmass in this section.
Alteration in lavas
Except in some rare pieces (Sections 352-U1440B-4R-1 [Piece 4; 42–47 cm], 30R-1 [Piece 7; 27–30 cm], and 31R-1 [Pieces 1–3; 0–12 cm) and alteration halos, the degree of alteration is low in all of the volcanic section downhole to Section 25R-1. Groundmass is affected by limited zeolite and clay crystallization, but silicate minerals, mainly plagioclase and clinopyroxene, remain mostly fresh (Figure F23A). Opaque minerals are significantly altered downhole to Section 18R-1, which is probably related to the overall oxidation observed in the uppermost sections (Figure F21A). Below Section 18R-1, the degree of alteration in opaque phases decreases and disappears at the top of the transition zone.
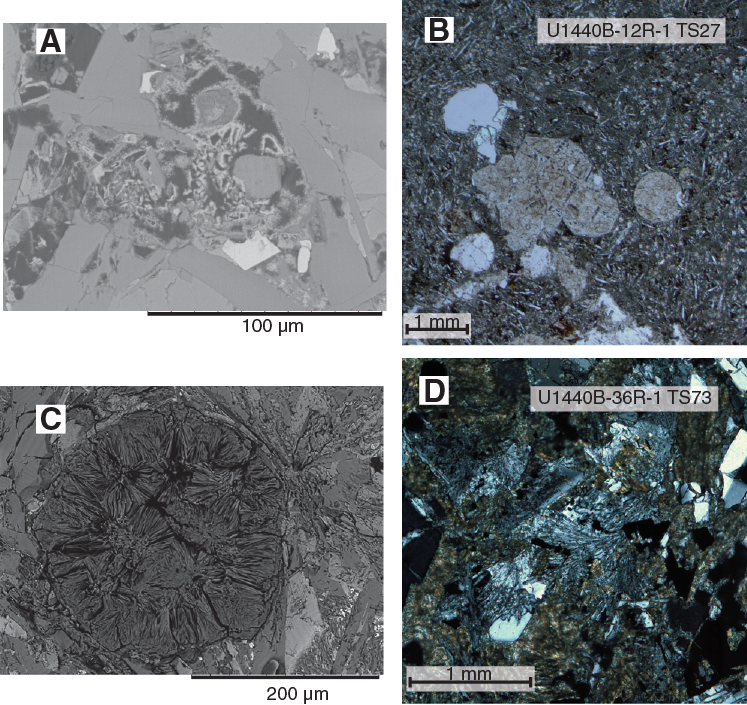
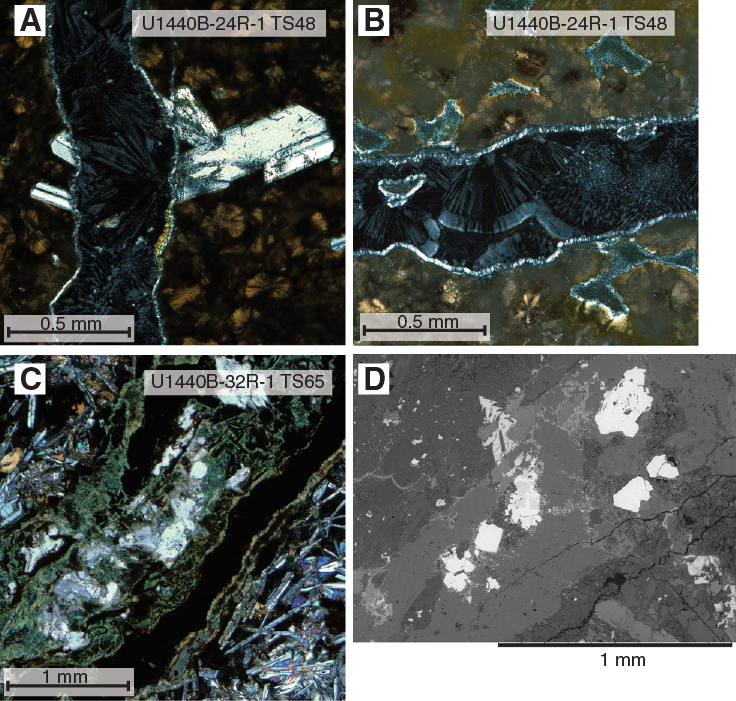
Figure F23. Transformation of groundmass to a zeolites, clays, and oxidized Fe oxides. A. Lava groundmass showing fresh primary phases with interstitial zeolite and clay. B. Plagioclase phenocryst transformed to zeolite next to calcite- and zeolite-filled vesicles C. Zeolite-filled vesicle. D. Brownish alteration zone parallel to calcite veins corresponding to microcracks filled with clay/ sulfides.
Vesicle-filling minerals follow a similar alteration pattern: (1) clays associated with minor zeolite from Section 4R-1 to 10R-1, 126 cm; (2) zeolite in association with minor oxides, sulfides, and clays from the top of Section 10R-2 to 14R-1, 70 cm (Figures F23B, F23D); and (3) mainly calcite with quartz and minor sulfides and zeolites below Section 15R-1 (Figure F23C ).
Thin rims of glass are found on some pieces in some sections (intervals 352-U1440B-10R-1, 119–126 cm; 22R-1, 58–63 cm; 23R-1, 73–79 cm; 31R-1, 69–103 cm; and Sections 24R-1 through 26R-1). Some glass-bearing pieces retain fresh selvages of glass, whereas most glass typically is devitrified, or more rarely, altered to calcite, zeolites, or clays.
From Section 4R-1 to 6R-1, alteration zones frequently parallel fracture faces and are not related to veining (see below for description of vein-related halos) (Figure F21A). Below Section 6R-1 and downhole to 19R-1, these zones are less important but still present, and they tend to disappear closer to the transition zone. Veins and their halos often cut these alteration zones, indicating at least two stages of alteration, the first one pervasive and the second related to vein emplacement. In these zones, the alteration is dominated by strong oxidation of matrix and minerals without significant hydration (i.e., without transformation into hydrated minerals such as clays or zeolites). Thus, plagioclase and pyroxenes are yellowish to brownish color due to iron oxidation but were not replaced by secondary hydrated alteration minerals. The overall prevalence of alteration in the lava sequence is <50% in general, even in the alteration halos where it is highest.
Alteration in the transition and dike zones
The transition zone is characterized by the overall prevalence of greenish clays with less abundant zeolite. The degree of alteration is higher in the dikes (10%–30%), although oxide phases tend to be fresh. Primary igneous minerals in the dolerites are rarely altered to green amphibole and chlorite adjacent to mesostasis, suggesting pneumatolytic alteration. The mesostasis is typically altered to a mixture of clays, zeolite, and calcite, and some of these areas have euhedral quartz (Figures F22, F23 ). In general, the deeper units are coarser grained and more altered than those above them.
Brownish alteration zones parallel to veins, but distinct from the vein halos, are locally observed in Sections 33R-1 through 36R-1 (Figure F23). The degree of alteration is not very different from what is observed in the fresh zones of the rocks, but the colored zones are characterized by a high density of microfractures filled with a fine-grained mixture of greenish clay and sulfides.
Veins and halos
Veins are absent from the top of Hole U1440B downhole to Section 11R-1, 47 cm. From Section 11R-1 to the bottom of the hole, whitish veins rich in calcite become common, forming a network with variable orientations and thicknesses (Figure F21C). Angular clasts of the host rock (basalt) are abundant even in the thinnest veins. The main vein-filling mineral is magnesian calcite, but small amounts of zeolites, clays, native copper, and sulfides may also be present (Figures F24A, F24B). Alteration halos are often absent but where present they show a specific type of pseudomorphic alteration and are separated from the vein by a thin border of zeolite. In the halos, alteration is dominated by the precipitation of calcite; plagioclase phenocrysts and microlites may be entirely replaced by calcite, and vesicles are filled with calcite with minor zeolite and sulfide (Figure F24D).
Veins of clay are present in association with the calcite veins from Section 27R-1 to the bottom of the hole. They are only rarely associated with an alteration halo. When visible, cross-cutting relationships between the two types of vein indicate a more-or-less contemporaneous genesis (Figure F24C)
Summary
Although investigation of Site U1440 is still in its early stages, a number of significant scientific observations have been made and many of the preliminary scientific objectives of Expedition 352 have been met. These include
- Confirmation of in situ FAB by drilling. All of the igneous rocks obtained at this site are FAB as defined by Reagan et al. (2010) (e.g., aphyric or nearly aphyric, with MORB-like phenocryst assemblages and some chemical similarities to MORB).
- Documentation of chemical groups that show significant ranges of compositional variation with depth. These data show that FAB comprises a significant component of early arc magmatism and form a complex suite of rocks that documents the dynamic melting conditions immediately following subduction initiation.
- Recovery of the uppermost part of the dike complex (Unit 15). This demonstrates that FAB represents the first magma type to erupt at this locality during subduction initiation.
Sediment and rock geochemistry
Whole-rock chemical analyses were performed on 33 igneous rock samples and 16 sediment samples representative of the different lithologies recovered at Site U1440.
Twelve sediment samples were collected from Hole U1440A (one per core from Cores 352-U1440A-1H through 12H), and three samples were collected from the deepest part of the sediment sequence in Hole U1440B from 104.37 to 115.06 mbsf (Cores 352-U1440B-2R through 4R). Additionally, one sandstone was recovered in the igneous sequence in Section 352-U1440B-15R-1 at 192.8 mbsf. Where possible, an XRD sample was taken next to the geochemistry sample for detailed mineral characterization (see Alteration). The 16 sediment samples were analyzed for major and trace element concentrations and volatile contents following the protocol described in Sediment and rock geochemistry in the Expedition 352 methods chapter (Reagan et al., 2015a), except for the sandstone from Section 15R-1, which was too small to be analyzed for loss on ignition (LOI). The chemical compositions of the sediments are reported in Table T7.
Table T7. ICP-AES major, trace, and volatile element contents of sediment samples, Holes U1440A and U1440B. Download table in .csv format.
One aphyric basalt was collected in Core 352-U1440A-14X at the bottom of Hole U1440A, and 32 volcanic and doleritic samples were selected by the Shipboard Scientists as representative of the different lithologic units recovered from Hole U1440B. All samples were taken next to a thin section (see Petrology for thin section petrographic descriptions). The 33 igneous rocks were analyzed for major and trace element concentrations by ICP-AES and for H2O and CO2 contents for samples with LOI > 2 wt%. An aliquot of the powder prepared for ICP-AES analysis was subsequently used for pXRF analyses, which were carried out with a Niton handheld pXRF meter. The analytical procedures, precision, and accuracy of the methods are described in detail in Sediment and rock geochemistry in the Expedition 352 methods chapter (Reagan et al., 2015a). The chemical compositions of igneous rocks are reported in Tables T8 and T9.
Table T8. Major, trace, and volatile element contents of igneous rocks, Holes U1440A and U1440B. Download table in .csv format.
Table T9. pXRF major and trace element contents of igneous rocks, Hole U1440B. Download table in .csv format.
The pXRF instrument was used also as a tool for chemostratigraphic analysis of the igneous rocks cored in Hole U1440B. The rock surfaces of 190 archive-half pieces were analyzed for Ti, Ca, K, Rb, Sr, Zn, Cu, Cr, and Zr. The results are reported in PXRF in Supplementary material and discussed in Petrology.
Sediments
Sediments at Site U1440 have C contents ranging from 0.03 to 3.77 wt%, which mainly reflects their variable carbonate contents. Inorganic carbon concentrations range from 0.02 to 1.79 wt% (Table T7; Figure F25). The highly variable LOI values measured in Site U1440 sediments (6.6–18.4 wt%) mostly record variations in carbonate contents, with the highest values measured toward the top of the hole in Subunits IA and IB, where calcareous nannofossils were observed (see Sedimentology). These values are lower than those measured in Hole U1439A sediments, where total carbon concentrations reach up to 10.4 wt%, indicating that the proportion of carbonate in the sediments is significantly lower at Site U1440 than at Site U1439. Several samples from Unit III in the lower part of the hole have relatively low carbon contents but high LOI. Unit III is composed dominantly of silty mud with sandy gravel, and these high LOI values probably reflect significantly higher water contents in these samples. All Site U1440 sediments have low N contents (0.01–0.03 wt%). In most samples, particularly in the most carbon rich samples, the sum of major oxides is significantly lower than 100 wt%. As with Hole U1439A sediments, the samples probably experienced incomplete decarbonation during ignition. To overcome these effects, the chemical compositions of the sediment samples are normalized to 100% in Figure F25 and in text.
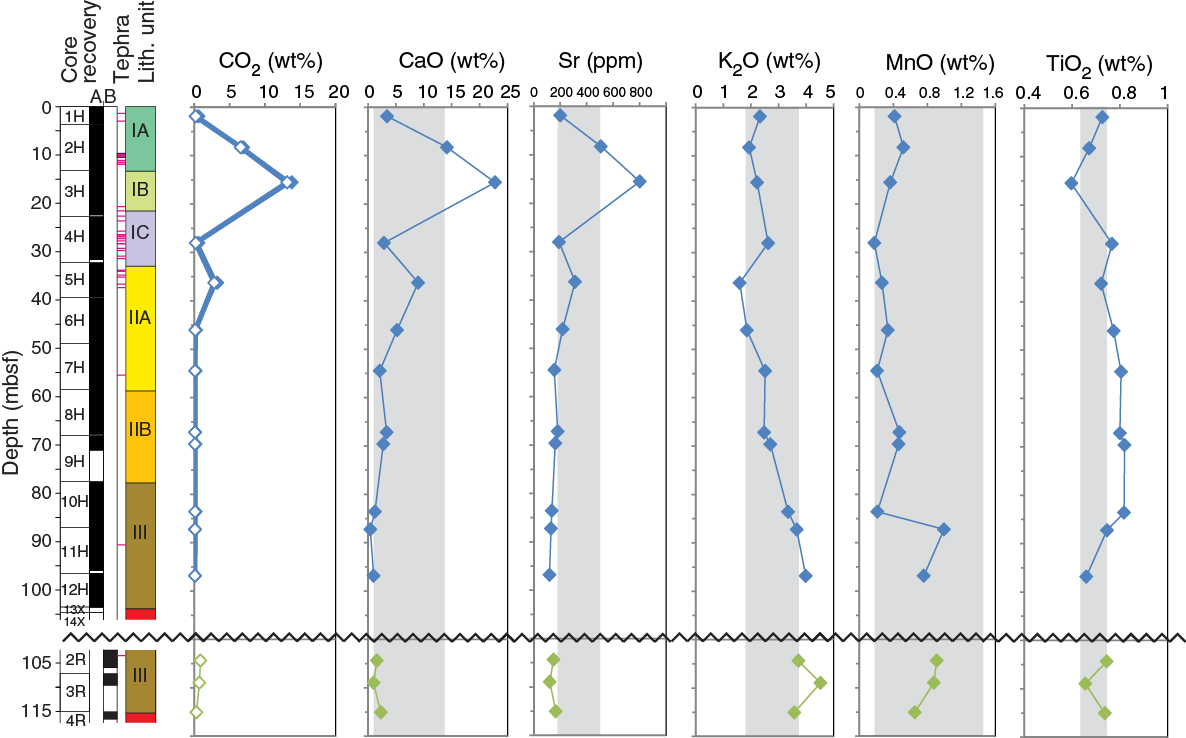
The chemical compositions of Site U1440 sediments correlate directly with the lithologic units as described in detail in Sedimentology. Their main characteristics are summarized below. The highest CaO (3–23 wt%) and Sr (200–800 ppm) contents are recorded in the carbonate-rich sediments of Subunits IA and IB, which are dominantly composed of mud with calcareous nannofossils, and of Subunit IIA, which comprises silty muds with minor calcareous nannofossil oozes and volcaniclastic sands. The concentrations of these elements decrease steadily downhole to <1.20 wt% CaO and <140 ppm Sr in Unit III in Hole U1440A. In the deepest part of Hole U1440A and in Hole U1440B, where the sediments mainly consist of mud with variable amounts of volcanogenic and/or silty material, analyzed samples are characterized by slightly higher concentrations of K, Ti, and Mn, particularly in lower Unit III. Unit III sediments have 0.6–0.8 wt% TiO2, 1.6–4.5 wt% K2O, and 0.18–1.00 wt% MnO. Calcareous sediments in Subunits IA, IB, and IIA have maximum values for TiO2, K2O, and MnO of 0.7, 2.2, and 0.5 wt%, respectively. Hole U1440B sediments overlap in composition with the Unit III sediments sampled in Hole U1440A (Figure F25).
Site U1440 sediments have compositions similar to the carbonate-poor silty mud units sampled in Hole U1439A. Overall, the sediments are low in carbonate, which reflects formation near or below the carbonate compensation depth (CCD; see Sedimentology). These low carbonate concentrations contrast with the more carbonate rich sediments of Hole U1439A, which are thought to have accumulated above the CCD.
A sandstone was recovered within igneous Unit 4 at 192.8 mbsf, with a composition broadly similar to that of sediments recovered from Subunit IIB and Unit III, with higher Na2O (4.6 wt%, compared to 2.3–3.7 wt% in Unit III) and Al2O3 (20.1 wt%, compared to 18.9–19.1 wt% in Unit III) and slightly lower Fe2O3 (7 wt%, compared to 8.4–9.6 wt% in Unit III). These differences hint at a marginally higher degree of alteration (e.g., albitization).
Igneous rocks
The igneous rocks recovered at Site U1440 vary in composition downhole from the upper volcanics (one sample in Hole U1440A and Units 1–7 in Hole U1440B), through the mixed volcanic-doleritic units (Units 8–14), to the dolerite-dominated Unit 15, which is interpreted as a sheeted dike complex (Figure F26). The changes in composition reflect mainly magmatic differentiation processes and subsequent alteration. Fifteen units were identified in Hole U1440B by micro- and macroscopic observations in combination with pXRF chemostratigraphic measurements of core pieces (see Petrology for detailed description of units and chemostratigraphy).
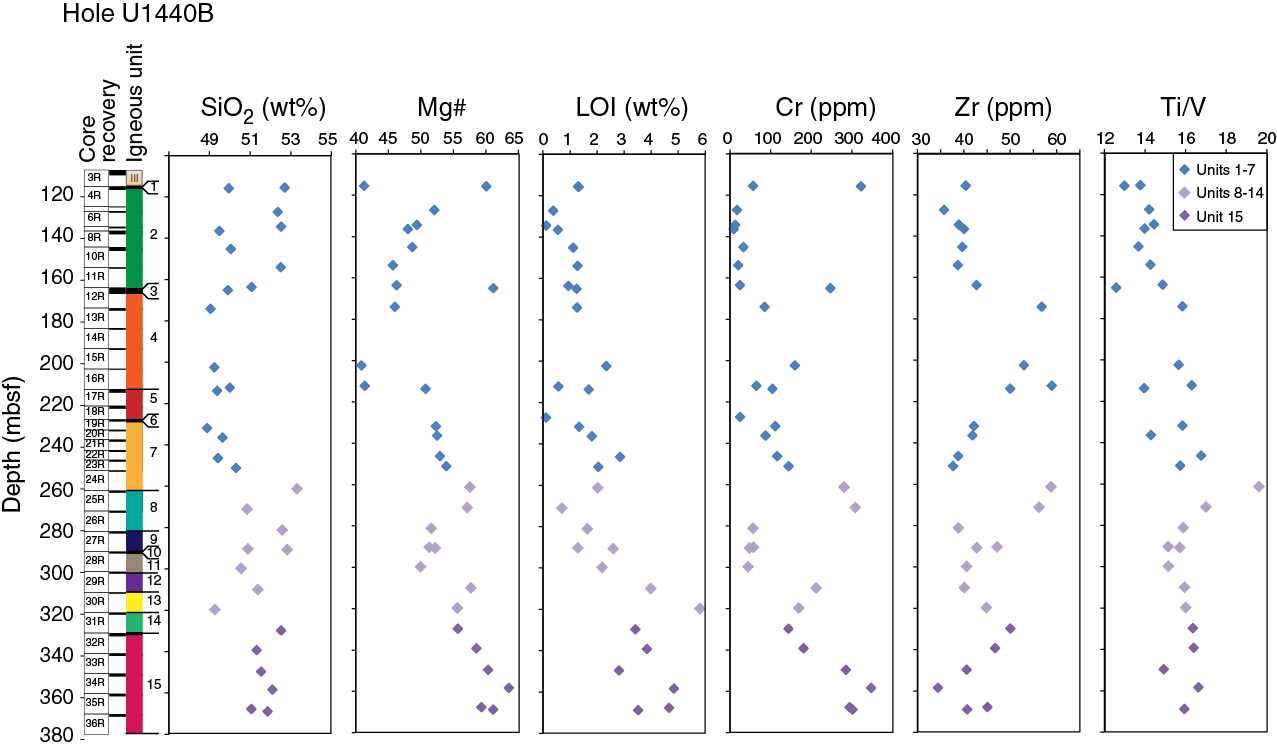
LOI generally increases downhole, with Unit 15 dolerites having the highest LOI values (Figure F26). This variation in LOI reflects the progressive transition at ~280 mbsf from clay- and zeolite-dominated alteration in the top volcanic units (which was systematically avoided in our geochemistry sampling) to more pervasive alteration in the doleritic units. H2O and CO2 contents were analyzed for high LOI samples (LOI > 2 wt%). The combined volatile contents of the lavas (H2O + CO2) are lower than their LOI values, which illustrates that other volatile phases are being lost during ignition for LOI or that all CO2 and H2O are not liberated during CHNS analysis (see Sediment and rock geochemistry in the Expedition 352 methods chapter [Reagan et al., 2015a]). Most analyzed samples have low and relatively constant CO2 contents (0.093–0.18 wt%) and higher H2O contents (1.26–2.95 wt%). The latter correlate well with LOI values (Figure F27), indicating a first-order control by the presence of variable amounts of hydrous minerals. Samples 352-U1440B-31R-1, 54–58 cm, and 35R-1, 35–40 cm, differ from most samples in having low H2O contents (as low as 0.42 wt%) and high CO2 contents (1.19–1.27 wt%). Both samples have high LOI of 4.85 and 5.80 wt%, respectively. Sample 35R-1, 35–40 cm, contains calcite (see Alteration), and its high CO2 content can be attributed to the presence of this mineral. Abundant carbonate veins are present in Sample 352-U1440B-31R-1, 54–58 cm, and thin section descriptions of an adjacent sample indicate high degrees of alteration resulting from extensive glass devitrification (see Alteration; Figure F27). We therefore interpret the high CO2 content of Sample 31R-1, 54–58 cm, as the result of alteration and the presence of finely disseminated carbonate veins.

The igneous rocks recovered at Site U1440 are primarily basalts (23 samples) and basaltic andesites (9 samples) according to the total alkali-silica classification (Le Bas et al., 1986) (Figure F28). Site U1440 igneous rocks exhibit only a small dispersion in total alkalis (Na2O + K2O = 2.1–3.2 wt%). In terms of SiO2 the upper volcanics (Units 1–7) have 48.9–52.7 wt% SiO2, with concentrations increasing slightly downhole throughout the lava–dike transition zone and Unit 15 dolerite (49.3–53.3 wt%). A single evolved glass sample recovered from Section 352-U1440B-19R-1 (Unit 6; see Petrology) has an andesitic composition (SiO2 = 57.2 wt%). Site U1440 igneous rocks show significant downhole variations in Mg# (cationic 100 × Mg/[Mg + Fe] with all Fe as Fe2+; Figure F26). Samples from Units 1–4 have variable Mg# with most values <50. Mg# then increases downhole through the basalt–dike transition zone in Units 8–14 (Mg# 50–58) and reaches its highest values (55–64) in the dolerite of Unit 15 (Figure F26).
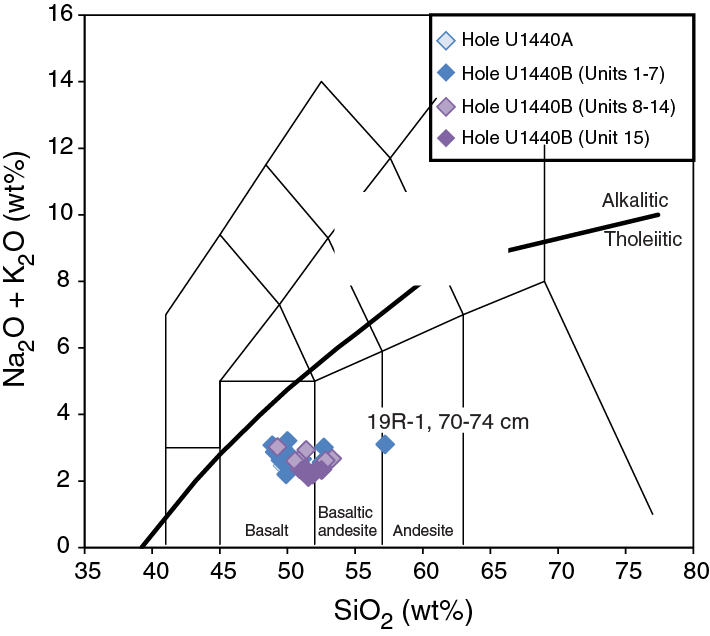
The Site U1440 samples have major element compositions that overlap those of FAB. Apart from two samples (352-U1440B-4R-1, 57–60 cm, and 19R-1, 70–74 cm), Site U1440 samples plot in the compositional field of MORB in Figure F29. These two anomalous samples extend toward island-arc tholeiite (IAT) compositions, having lower MgO contents (as low as 3.5% wt) and lower CaO/Al2O3, (<0.7), with higher SiO2 (up to 57.2 wt%; Figure F29). However, the MORB database does include evolved compositions, so this need not have any tectonic significance.

Site U1440 igneous rocks have depleted incompatible trace element compositions and plot at the most depleted end of the MORB field, overlapping in composition with IAT and FAB from the IBM arc (Figures F30, F31). Samples from Site U1440 show more variation in TiO2 contents in the upper core sections (Units 1–7; 0.60–1.40 wt%) than in the deeper sections (Units 8–15; 0.86–1.12 wt%). The two samples from Units 1–7 that are the most depleted in TiO2 (0.60–0.64 wt%), Samples 352-U1440B-4R-1, 81–85 cm (Unit 1), and 12R-2, 4–8 cm (Unit 3), are also the most enriched in compatible trace element Cr (247–323 ppm), indicating that they are less evolved than other igneous rocks from these units. Site U1440 samples have Y contents of 17–40 ppm and Zr contents of 35–60 ppm (Tables T8, T9). Although no significant downhole variations were observed for Y, Zr varies by as much as a factor of two in the Hole U1440B igneous sections (Figure F26). Cr broadly increases downhole, with the lowest concentrations in Unit 2 and the highest concentrations in the dolerites of Unit 15 (Figure F26). The recovered andesitic glass (Sample 19R-1, 70–74 cm) has the highest Zr (148 ppm) and lowest Cr (25 ppm) contents. The observed downhole changes in Cr and Zr abundances mostly reflect the variable degree of differentiation of the sampled basalts. Similar patterns have been documented in drilled mid-ocean-ridge magmatic sequences (e.g., ODP Hole 1256D; Wilson, Teagle, Acton, et al., 2003) and in ophiolites (e.g., Oman; Einaudi et al., 2003) where they provide insight into magma chamber processes during the formation of the upper oceanic crust.
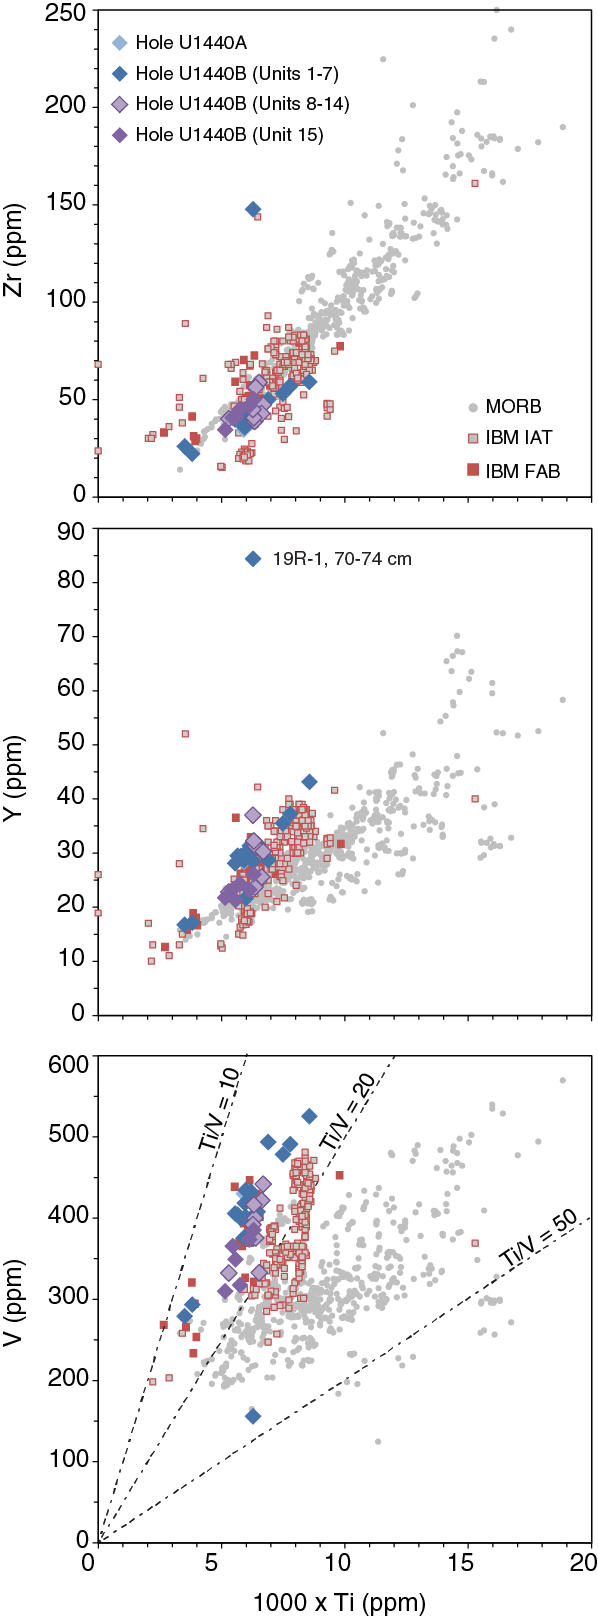
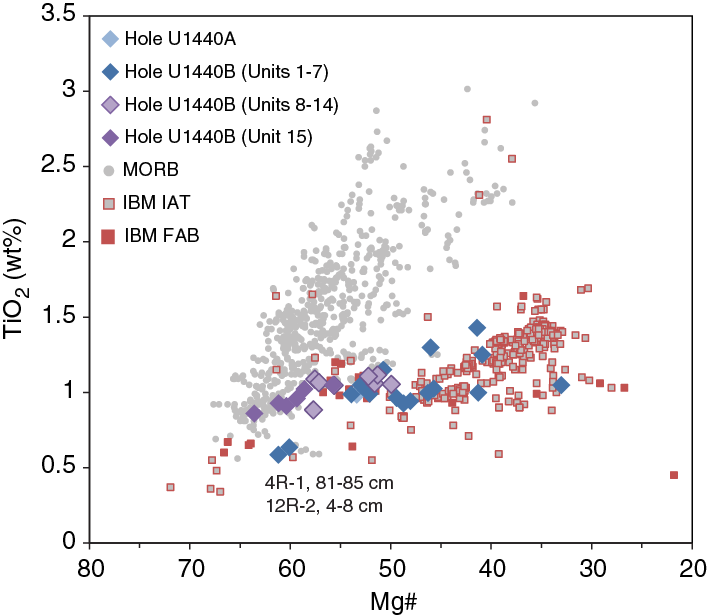
Site U1440 basalts and basaltic andesites have V concentrations ranging from 280 to 490 ppm, similar to values measured in MORB and IBM IAT (Figure F30). They are, however, significantly depleted in Ti. This results in overall lower Ti/V ratios compared to both the IBM IAT and MORB. Low Ti/V ratios in subduction-related magmatic systems are commonly interpreted as a result of melting of a more oxidized and/or more refractory and depleted mantle compared to MORB mantle (e.g., Shervais 1982; Reagan et al., 2010). An additional characteristic feature of Site U1440 basalts is their strong depletion in more incompatible elements relative to less incompatible elements, as revealed by their low Zr/Y ratios (<2). Site U1440 basalts plot at the most depleted end of the MORB and IBM IAT compositional fields (Figure F31), which is an additional indicator that they may have derived from a trace element–depleted mantle source. However, in contrast to IAT, the major element compositions of Site U1440 basalts largely overlap those of MORB (e.g., Figures F28, F29). Subtle changes in petrogenetic indicators such as the slight increase in the Ti/V ratio from the bottom of Hole U1440B to the top of the sampled magma series in Holes U1440A and U1440B (Figure F26), suggest that a transition from MORB-type magmatism to a more subduction influenced magmatism may have been recovered at Site U1440. Thus in key ways, the basaltic igneous rocks drilled at Site U1440 are hybrids, with most major element parameters showing similarities with mid-ocean-ridge volcanic rocks, but most trace element parameters ranging from those of depleted MORB to those more characteristic of subduction-related lavas. This characteristic is typical of the FAB previously collected by diving along the IBM fore arc (Reagan et al., 2010; Figure F32).
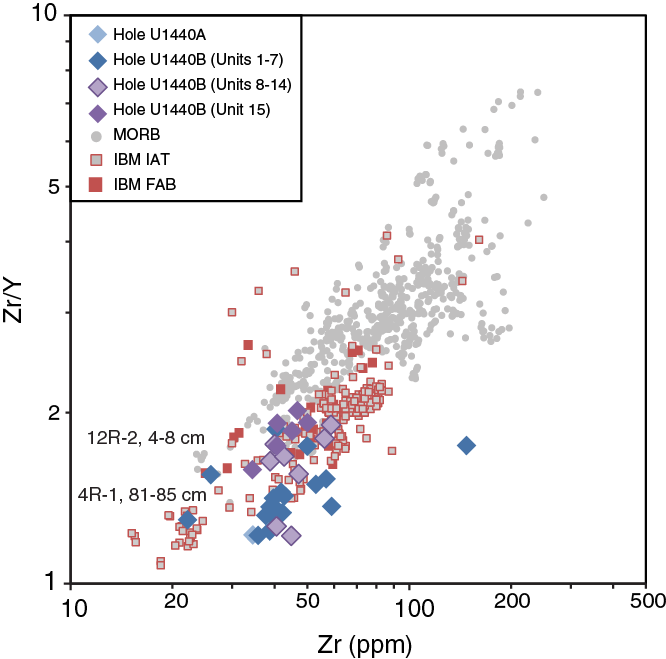
Structural geology
Sedimentary structures
Variations in lithologic composition, color, and/or grain size of the sedimentary material commonly mark the bedding planes of sedimentary units at Site U1440. Dark pyroclastic beds and thin sandy beds, both a few millimeters to centimeters in thickness, conform to the local bedding plane attitude. Twenty-five sedimentary bedding planes were measured in Hole U1440A down to 56.94 mbsf, where severe drilling-induced deformation prevailed, preventing further measurement of sedimentary or tectonic structures in the sedimentary material. Five additional bedding plane orientations were measured in Hole U1440B between 102.78 and 109.43 mbsf. The bedding planes are generally subhorizontal; the dip angles do not exceed 10° (Figure F33).
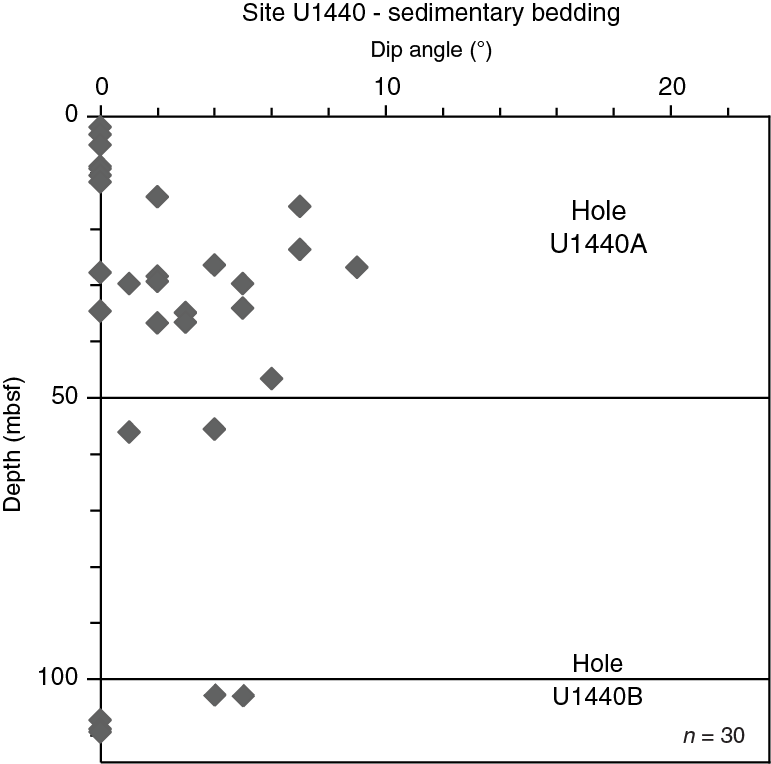
Magmatic structures
Within the igneous units, viscous-plastic fabrics related to magmatic flow are rare and are limited to millimeter- to centimeter-wide domains, defined primarily at the microscopic scale. In general, the magmatic microstructures are texturally equilibrated, isotropic, and without indication of magmatic flow (Figure F34; Sample 352-U1440B-22R-1W, 65–68 cm; TS43). Glassy materials and fine-grained rocks (basalts) generally exhibit circular vesicles, although in one exception vesicles are elongate. Granular rocks (dolerites) usually display no shape-preferred orientation (SPO) of plagioclase laths, apart from a few small elliptical domains (Figure F35; Sample 23R-1W, 29–32 cm; TS45). Both basalts and dolerites exhibit a typical radial microstructural arrangement of plagioclase laths indicative of rapid cooling (Figure F36; Sample 21R-1W, 10–13 cm; TS41).
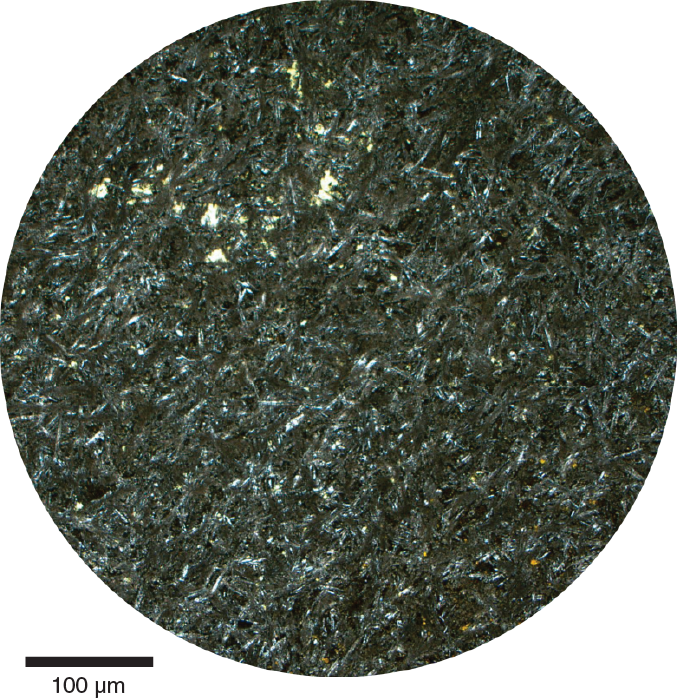
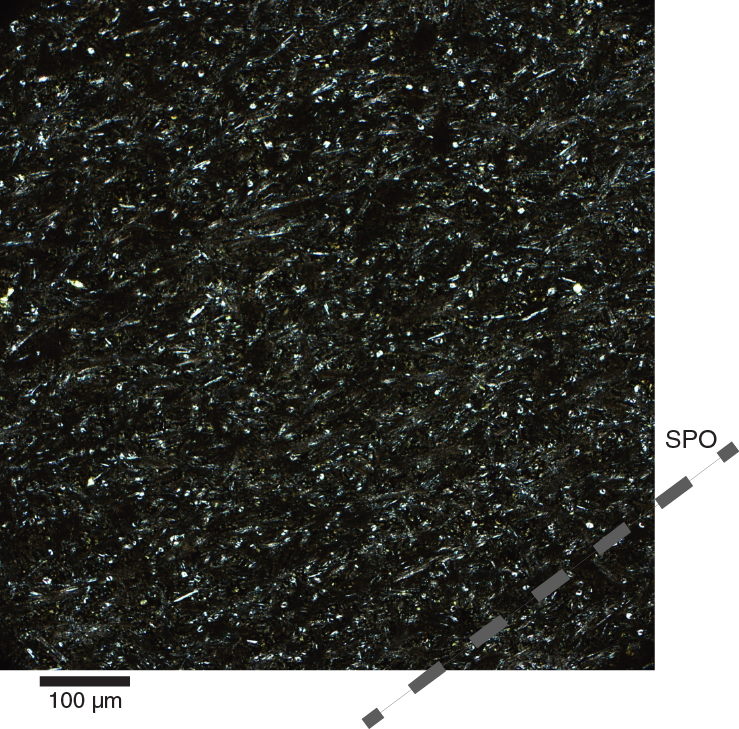
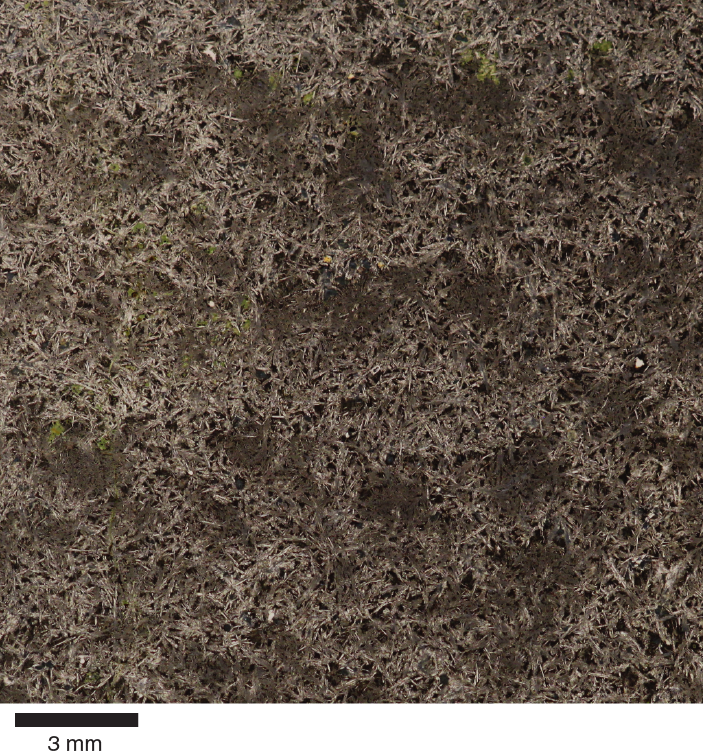
Tectonic structures
Macroscopic foliations (Figure F37) occur between 145.00 and 146.00, 281.00 and 291.00, and 358.00 and 369.00 mbsf. These foliations are inclined to steeply inclined with dip angles between 40° and 87° (Figure F38). Microscopic observations reveal that elongate clusters of chlorite define the macroscopic foliation (Figure F37). Chlorite grains display an irregular orientation within clusters. Consequently, these foliations are interpreted as resulting from a metamorphic overprint.


Extensional fractures with a systematically inclined to subvertical orientation occur from 144.76 to 164.20 and 183.00 to 183.50 mbsf. The distribution of dip angles forms two clusters, which range from ~20° to 50° and ~65° to 90° (Figures F39, F40). These fractures may show ≤1 mm thick filling and are surrounded by millimeter-thick alteration halos. Neither slickensides nor slickenlines were observed along these fractures.
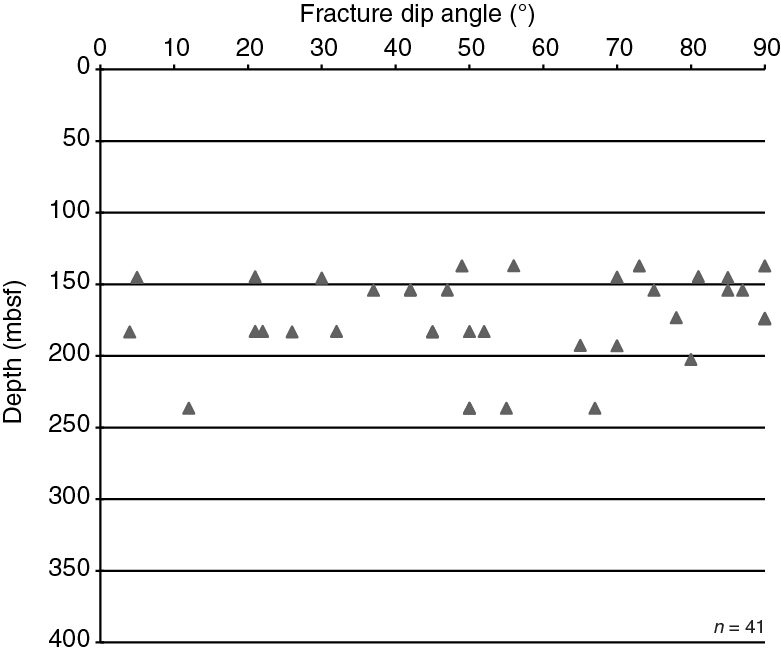
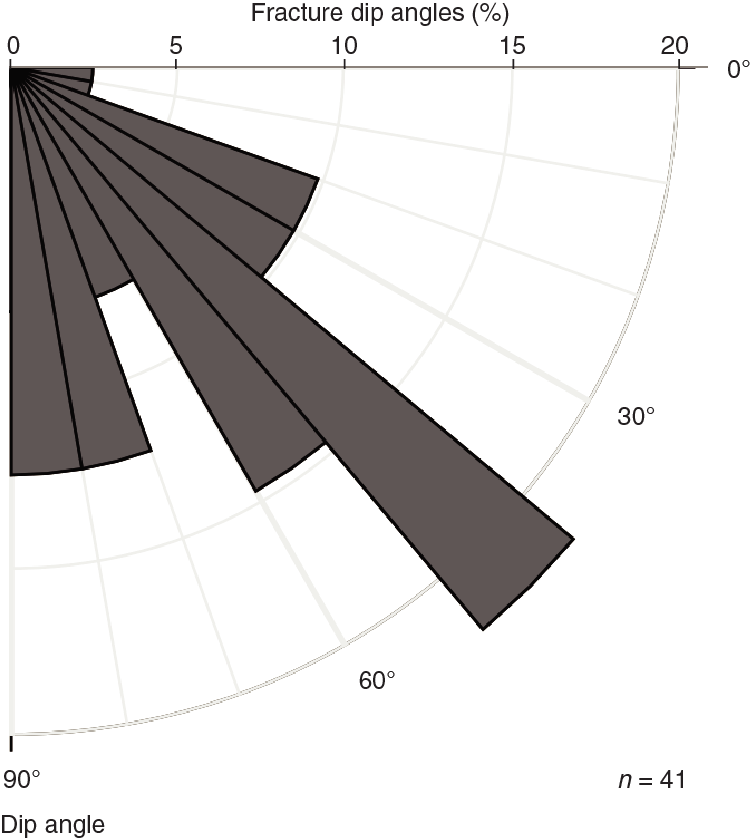
Subvertical to inclined, whitish crystalline veins, up to 7 mm thick, constitute the dominant tectonic feature from 164.20 to 165.90, 202.60 to 263.60, and 319.00 to 369.00 mbsf. These veins locally form criss-crossed networks with two dominant orientations at high angles to each other. Dip angles therefore form two clusters, from ~25° to 50° and ~65° to 90°, respectively (Figures F41, F42, F43). The wider veins appear to have formed during several successive steps of tensional opening.
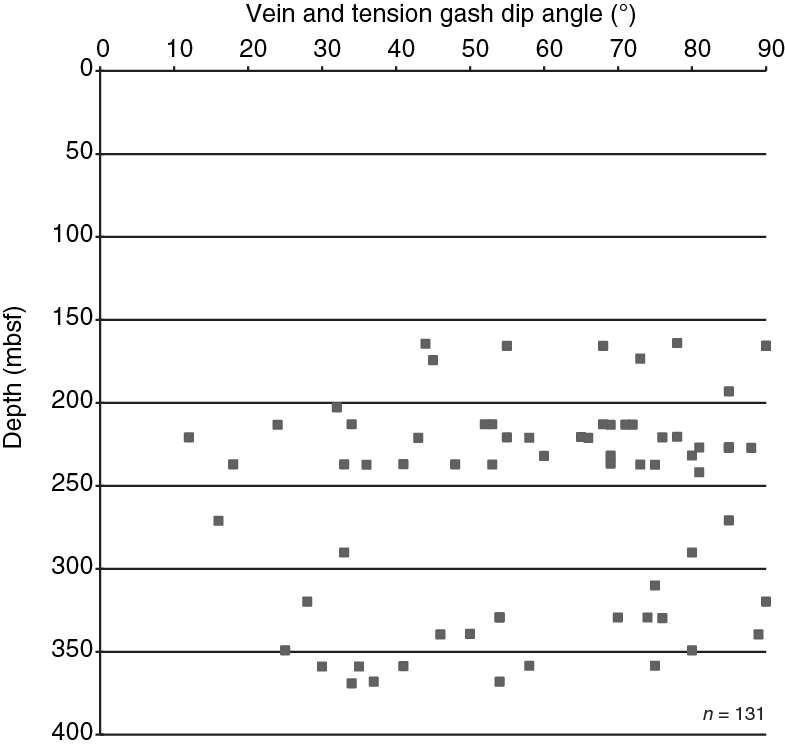
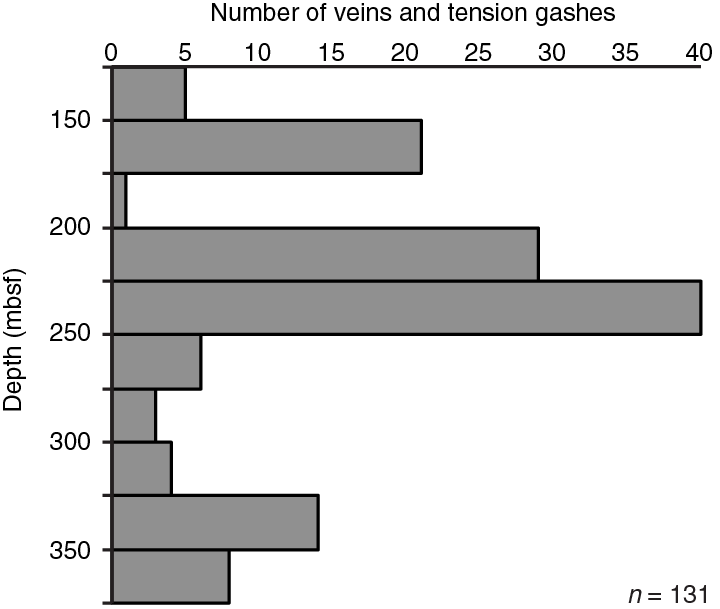
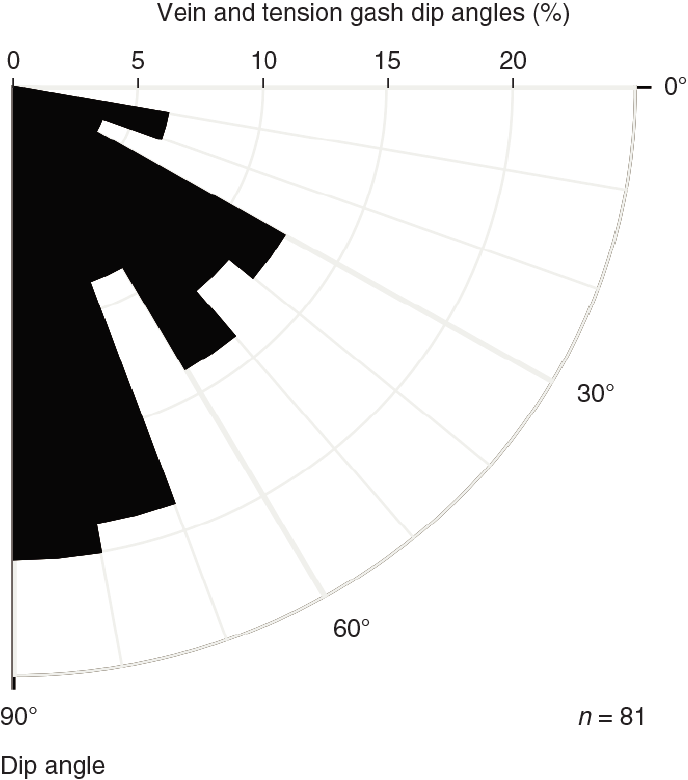
Millimeter-thick alteration seams (halos) surround most veins. Veins with a thickness of up to 5 mm become very abundant in Cores 352-U1440B-12R and 13R, as well as in Cores 17R and 19R. Within these cores, host rock fragments are commonly embedded within precipitated vein material. Distinct parts are brecciated and consist of slightly dismembered host rock fragments embedded within mainly sparitic carbonate cement (Figure F44). The wider veins appear to have formed in incremental steps of extension. Below 225.00 mbsf, veins become less pronounced and decrease in abundance and thickness (between 1 and 2 mm).
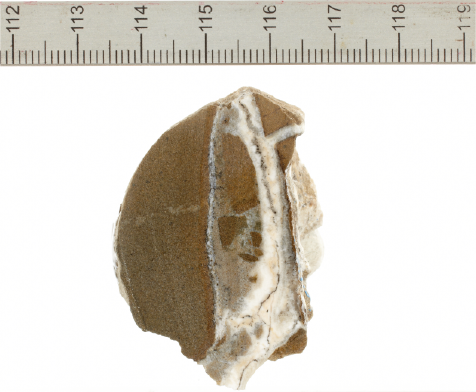
The vein-filling material consists of (magnesian) calcite and/or zeolite and/or chlorite as well as variable amounts of clays, limonite, and boxwork secondary minerals after sulfide. Magnetite fillings are present in a few cases. This mineralogical composition of the vein material was confirmed by petrographic examination of thin sections and by XRD.
Within the veins, calcite (or magnesian calcite) often shows a bimodal grain size distribution, forming coarse- and fine-grained domains. Coarse grains form fibers subperpendicular to the vein margins and are moderately twinned (Figure F45). Single coarse grains may show slight undulatory extinction. The shape of the calcite grain boundaries is highly variable. Fine-grained calcite aggregates preferentially occur along the vein center and form a fine-grained suture. Calcite veins might be crosscut, or replaced, by chlorite veins.
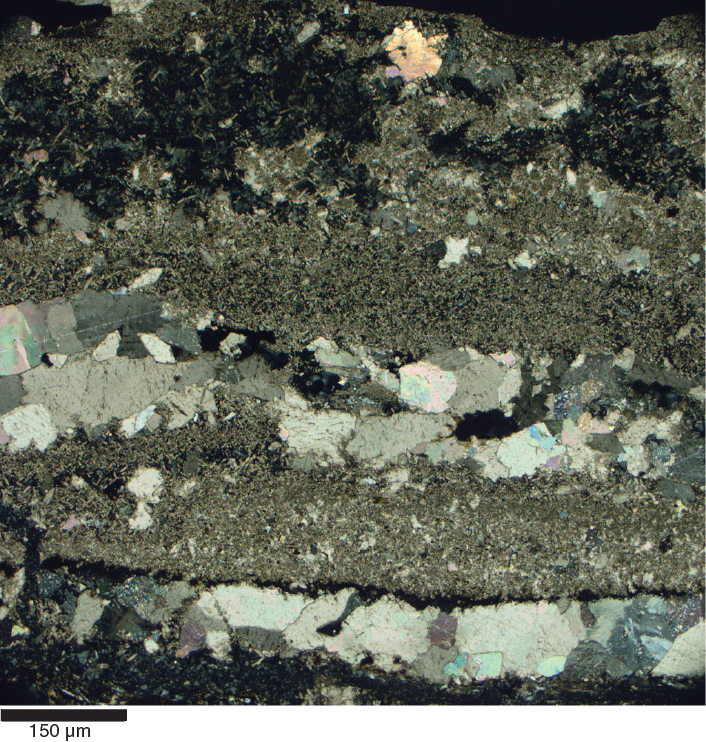
Between 358.00 and 359.00 mbsf, centimeter- to decimeter-wide domains are characterized by macroscopic foliation and subparallel to inclined, 1–2 mm thick calcite veins (Figure F46). These domains are accompanied by alteration halos. Microstructural examination shows that these domains consist of millimeter-spaced subparallel microfractures resulting in microbrecciation, thus forming a cataclastic fabric. The isotropic magmatic fabric can still be discerned. The magmatic minerals, such as prismatic plagioclase and clinopyroxene are, however, fragmented by multiple sets of microfractures (Figure F47).

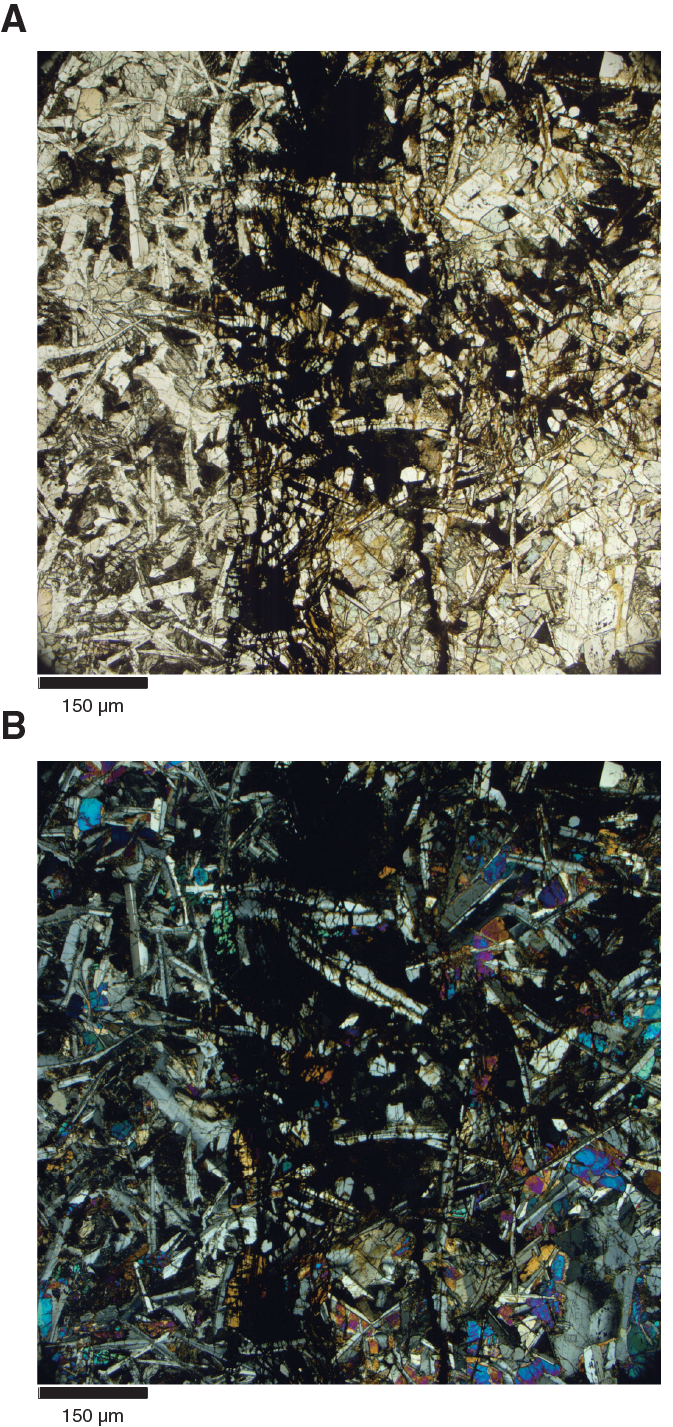
Physical properties
Physical properties of the cores recovered at Site U1440 were characterized through a set of measurements on whole-round core sections and discrete samples (see details in Physical properties in the Expedition 352 methods chapter [Reagan et al., 2015a]). Gamma ray attenuation (GRA) density, magnetic susceptibility (Magnetic Susceptibility Logger [MSL]), and P-wave velocity (P-wave Logger [PWL]) measurements were obtained on the sediment cores using the Whole-Round Multisensor Logger (WRMSL), whereas only GRA and magnetic susceptibility were obtained on the hard rock cores. Natural gamma radiation (NGR) was measured on the Natural Gamma Radiation Logger (NGRL) for whole-round core sections. Point magnetic susceptibility (MSP) and reflectance spectroscopy and colorimetry (RSC) data were acquired using the Section Half Multisensor Logger (SHMSL). Thermal conductivity (TCON) was obtained on whole-round sediment sections and discrete hard rock samples. Moisture and density (MAD) measurements were obtained from sediment and hard rock discrete samples, and P-wave velocities were obtained from discrete hard rock samples. All raw data were uploaded to the Laboratory Information Management System (LIMS) database and subsequently filtered to remove the spurious points that correspond to empty intervals in the liner or broken pieces.
Sediment samples
P-wave velocities
P-wave velocities are 1500–1525 m/s from 0 to 37 mbsf (lithologic Unit I to upper Subunit IIA), increase to 1500–1550 m/s from 37 to 57 mbsf (Subunit IIA), and increase further to ~1560 m/s from 57 to 71 mbsf (Subunit IIB; Figure F48). P-wave velocities are ~1540 m/s in the upper half of Unit III and vary from ~1560 to ~1600 m/s in the interval from the lower half of Unit III downhole to ~100 mbsf. P-wave velocities decrease to 1500–1525 m/s at 100–105 mbsf (lower Unit III) and increase to ~1540 m/s at 105–109 mbsf, just above the contact with igneous basement in Hole U1440B.
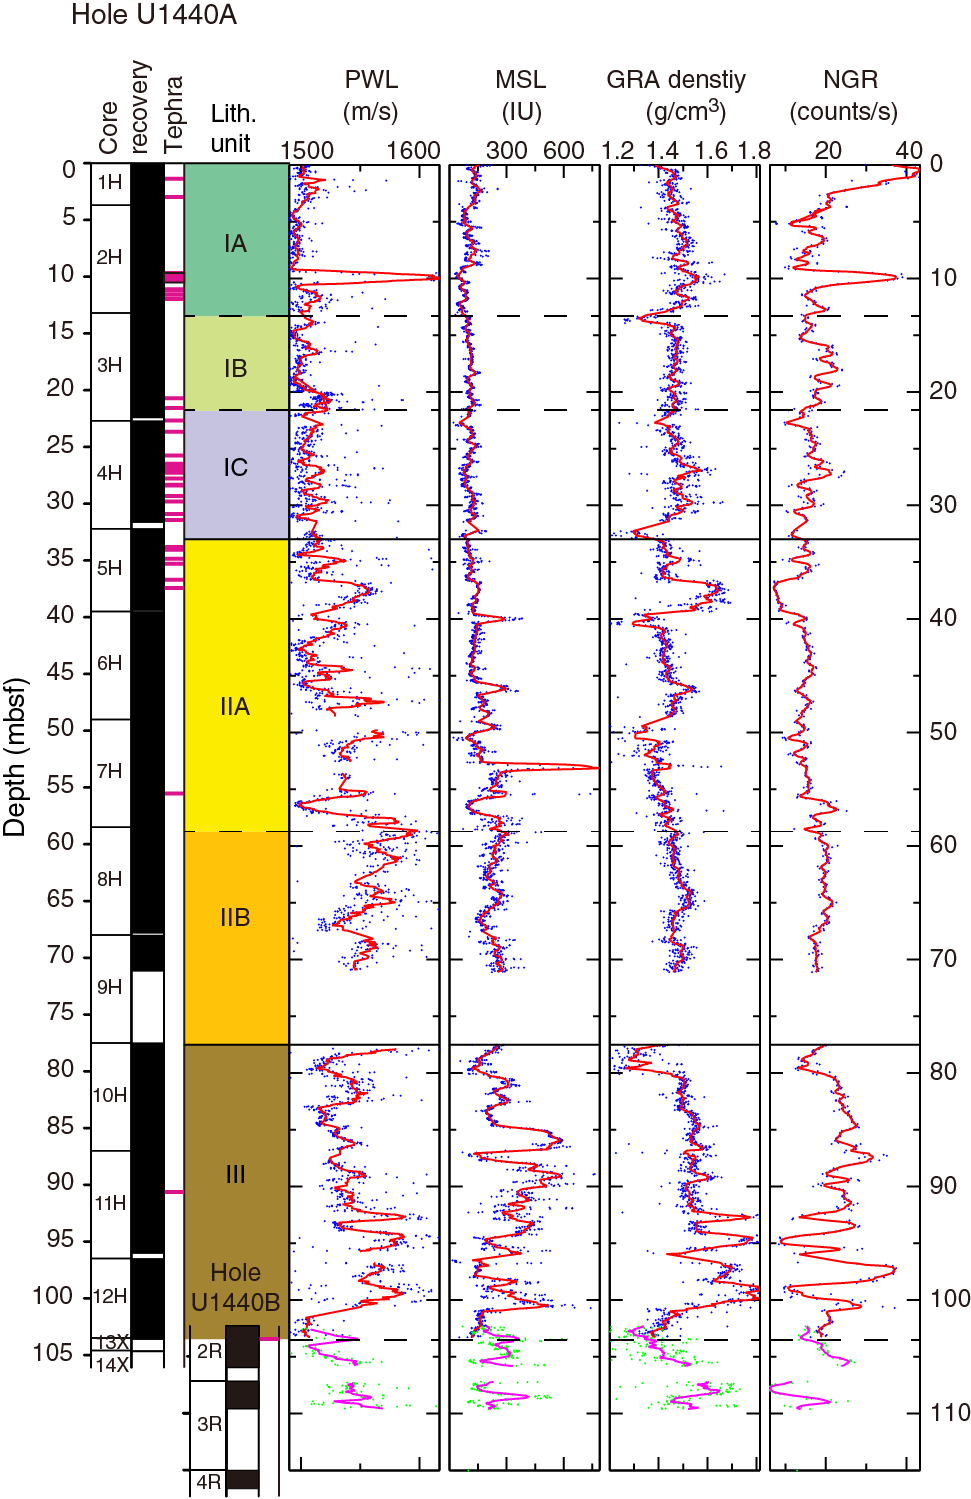
Magnetic susceptibility
MSL values gradually increase from ~100 IU at the seafloor to ~250 IU at ~85 mbsf (from Unit I to the upper part of Unit III), with a sharp spike >300 IU at ~53 mbsf. MSL values increase abruptly to ~500 IU from 85 to 87 mbsf, vary from 150 to 450 IU between 87 and 101 mbsf in Unit III, and decrease to 150–300 IU at 101–109 mbsf in lowermost Unit III, just above the contact with igneous basement in Hole U1440B (Figure F48). In general, MSP (Figure F49) and MSL (Figure F48) values have similar trends, although MSP values are systematically lower than MSL values by ~70%.

GRA density
Bulk GRA density is 1.4–1.6 g/cm3 from the seafloor to 72 mbsf (Units I and II) with a local peak of 1.6–1.7 g/cm3 between ~37 and 40 mbsf in Subunit IIA. Decreased densities of 1.2–1.3 g/cm3 are measured at 78–80 mbsf at the top of Unit III, with an abrupt increase to 1.5 g/cm3 at 80 mbsf. GRA density values increase to ~1.8 g/cm3 at 100 mbsf, decrease to 1.3–1.4 g/cm3 from 100 to 103 mbsf, and increase to 1.4–1.6 g/cm3 at 130–109 mbsf at the bottom of Unit III (Figure F48).
Natural gamma radiation
In general, within the interval from the seafloor to ~72 mbsf (from Unit I to Subunit IIB), NGR values are 10–25 counts/s. However, 2 sharp peaks up to 40 counts/s are present at ~0 and ~10 mbsf (Subunit IA). NGR values increase from 20 at the top of Unit III (~77 mbsf) to ~30 counts/s at ~90 mbsf. Further downhole until the contact with igneous basement (~109 mbsf at the bottom of Unit III) the NGR data exhibit large variations of between 10 and ~40 counts/s (Figure F48).
Reflectance spectroscopy and colorimetry
The reflectance parameter L* increases from ~35 at the seafloor to ~50 at 5 mbsf, then gradually decreases to ~40 at the bottom of Subunit IIB (~73 mbsf) (Figure F49). In Subunit IIA, 2 negative spikes are observed at ~37 and ~50 mbsf (L*= ~30 and ~35, respectively). In Unit III, L* values decrease from ~50 at ~83 mbsf to ~35 at 92 mbsf. In the lower half of Unit III, L* becomes more variable, ranging from ~35 to 45. Subunits IA–IIB exhibit bimodal variations of the reflectance parameter a* with two modes at ~6–8 and ~2–4. In the lower half of Unit III, a* values gradually decrease with depth from ~8 to ~4 with nonsystematic variations. The values of the reflectance parameter b* show large variations (from 5 to 10) in Subunit IA. From 13 mbsf (Subunit IB) to 73 mbsf (Subunit IIB), b* values vary between 0 and 10. In Unit III, b* gradually decreases with depth from ~15 to <5, with larger variations in the lower half of the unit.
Moisture and density
The calculated dry and bulk densities are 0.6–0.8 and 1.4–1.5 g/cm3, respectively, in the interval from the seafloor to ~90 mbsf (Unit I to the upper half of Unit III). They then increase with depth to ~1.2 and ~1.8 g/cm3, respectively, at ~100 mbsf, drop abruptly to ~0.7 and ~1.4 g/cm3 at ~102–104 mbsf, and increase to ~1.2 and ~1.8 g/cm3 at 109 mbsf above basement in Hole U1440B (Figure F49). Grain density is 2.6–2.8 g/cm3 and shows no variations with depth. Calculated porosity is 70%–80% in the interval from the seafloor to ~85 mbsf (from Unit I to the middle of Unit III); it gradually decreases to ~50% at a depth of ~100 mbsf, increases to ~80% at ~102–104 mbsf, and decreases to ~50% at 109 mbsf just above basement in Hole U1440B.
Basement samples
Magnetic susceptibility (MSL, MSP, and discrete cubes)
Magnetic susceptibility was measured on whole-round basement cores, with maximum MSL values found at the center of each intact core piece (red circles in Figure F50). There is a clear MSL peak at 280 mbsf (Unit 9). MSL values are 250–1000 IU from 115 to 270 mbsf (Units 1–8) and increase to 500–3500 IU from 280 to 370 mbsf (Units 9–15). The same magnetic susceptibility pattern is also observed in the split core MSP and discrete sample measurements (Figure F51). MSP values are 900–1500 IU at 115–260 mbsf (Units 1–8) and increase to 3000–4700 IU at 270–370 mbsf (Units 8–15). The high magnetic susceptibility values coincide with doloritic intervals. Discrete sample magnetic susceptibility values are systematically lower; 500–750 IU at 115–260 mbsf, increasing to 500–2000 IU at 270–370 mbsf.
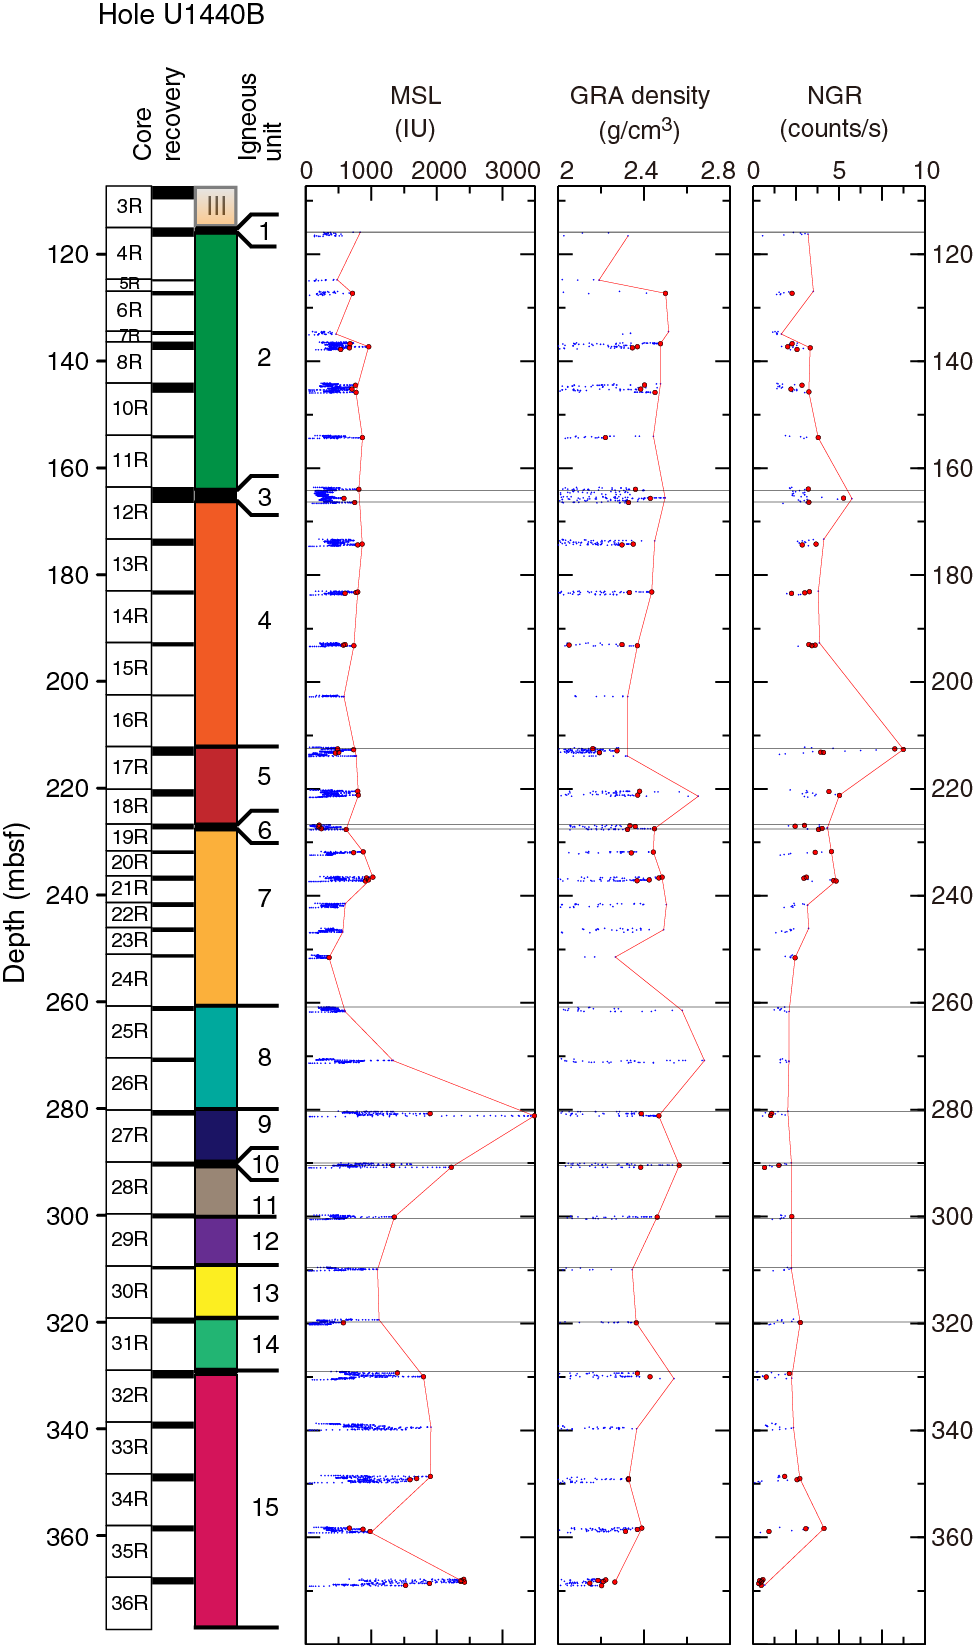
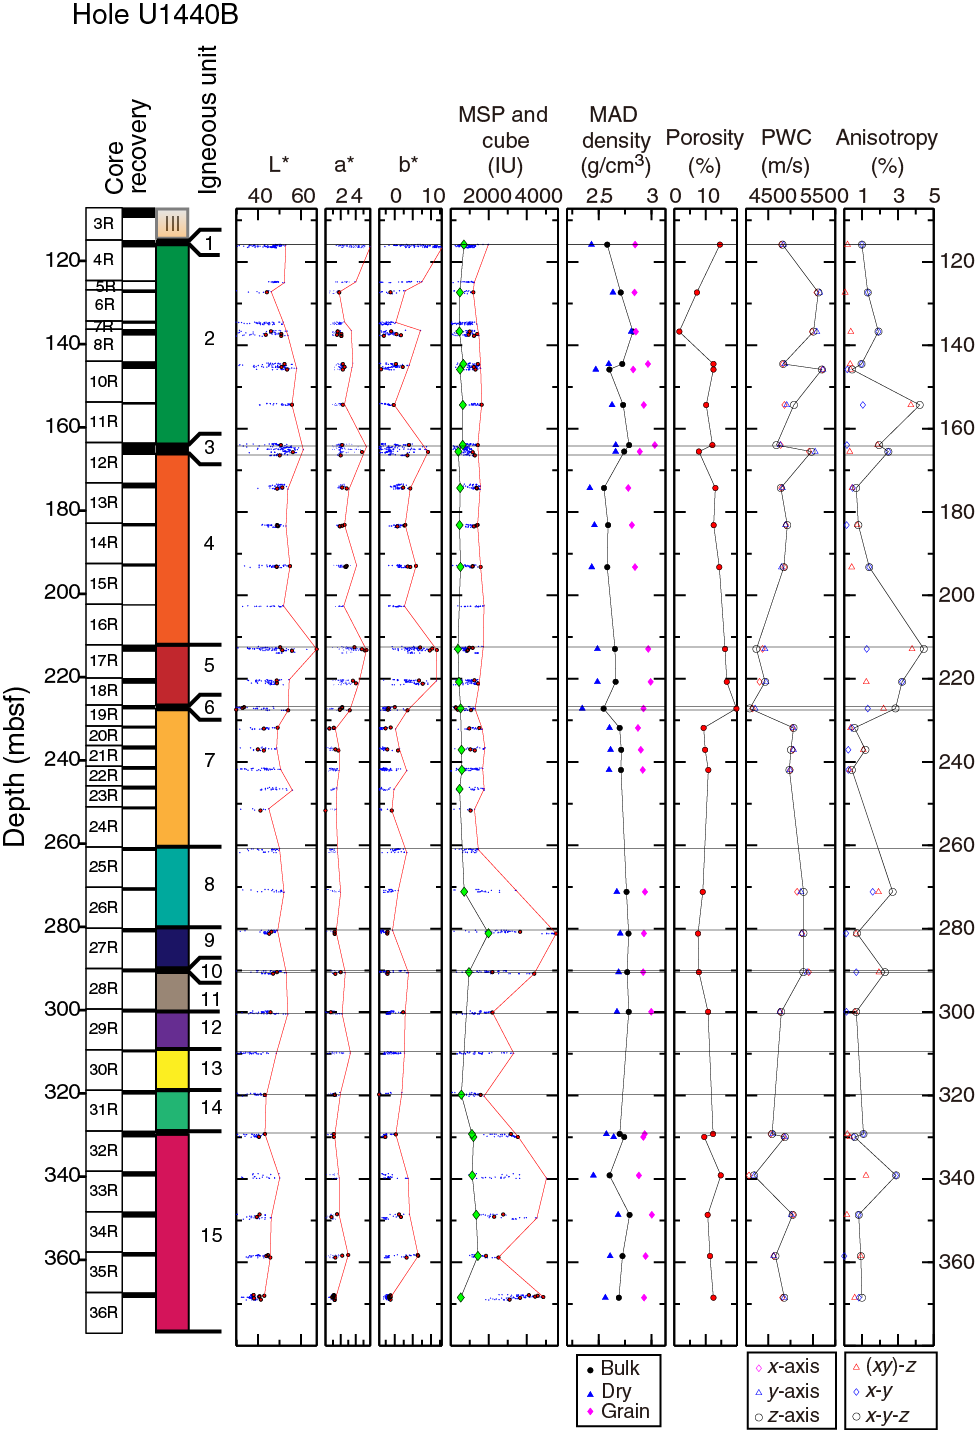
GRA density
As with MSL values, GRA density values reach a maximum at the center of each intact core piece (red circles in Figure F50). The maximum GRA density varies from 2.2 to 2.6 g/cm3, showing no clear pattern with depth.
Natural gamma radiation
NGR measurements are 0.5–5 counts/s from 110 to 250 mbsf (Units 1–7), with slightly high values of ~6 and ~9 counts/s at 165 mbsf (Unit 3) and 213 mbsf (Unit 5), respectively. These 2 peaks coincide with the presence of strongly altered or brecciated material in the cores (see Petrology and Structural geology). NGR values decrease to 0.5–4 counts/s from 251 to 369 mbsf (Units 7–15).
Reflectance spectroscopy and colorimetry
The reflectance parameters L*, a*, and b* increase from 40 to 65, 1.5 to 6, and 0 to 10, respectively, from 115 to 369 mbsf (Figure F51).
Moisture and density
Dry density, bulk density, grain density, and porosity were calculated after the measurements of density on dry and wet rock cubes taken from the working-half sections (see details in Physical properties in the Expedition 352 methods chapter [Reagan et al., 2015a]). The calculated dry, bulk, and grain densities average 2.6, 2.7, and 2.9 g/cm3, respectively (Figure F51). Bulk density and dry densities exhibit more variability at 115–227 mbsf (Units 1–6) than 232–349 mbsf (Units 7–15), whereas grain density shows no systematic relationship with depth. Porosities decrease from 15% to 2% between 115 and 137 mbsf (Units 1–2) and increase from 12% to 20% between 145 and 227 mbsf (Units 2–7). Porosity decreases sharply to 9% at 232 mbsf, with values of 9%–15% observed between 232 and 349 mbsf (Units 7–15).
P-wave velocity
P-wave velocities measured on discrete samples (PWC) (Figure F51) vary between 4700 and 5700 m/s from 116 to 193 mbsf (Units 1–4), and decrease to 4100–4300 m/s from 213 to 227 mbsf (Units 5–7). PWC increases abruptly with values of 5000–5400 m/s observed from 232 to 290 mbsf (Units 7–11). PWC decreases at 300 mbsf, with velocities of 4000–5000 m/s from 300 to 369 mbsf. P-wave velocity anisotropy is mostly 1% with peaks of ~4% at 155 and 212 mbsf.
Thermal conductivity
The thermal conductivity of sedimentary rocks was measured (usually once per core in the middle part of the third section) using a needle sensor. Most of the measurements (which consisted of 3 replicate analyses in the same spot) were unreliable, and only few measurements were successful, although all the raw data are available in the database. Thermal conductivity ranges from 0.7 to 0.9 W/(m·K) with an average value of ~0.86 W/(m·K) (Figure F52). Thermal conductivity on basement rocks often required 5 replicate analyses and delivered reliable results. An average thermal conductivity value of 1.65 W/(m·K) was measured for discrete samples in Units 2–15 at 127–368 mbsf. Values are 1.4–1.6 W/(m·K) from 127 to 236 mbsf, exhibiting a general decrease with depth. Higher values of 1.6–1.9 W/(m·K) are observed from 281 to 368 mbsf.
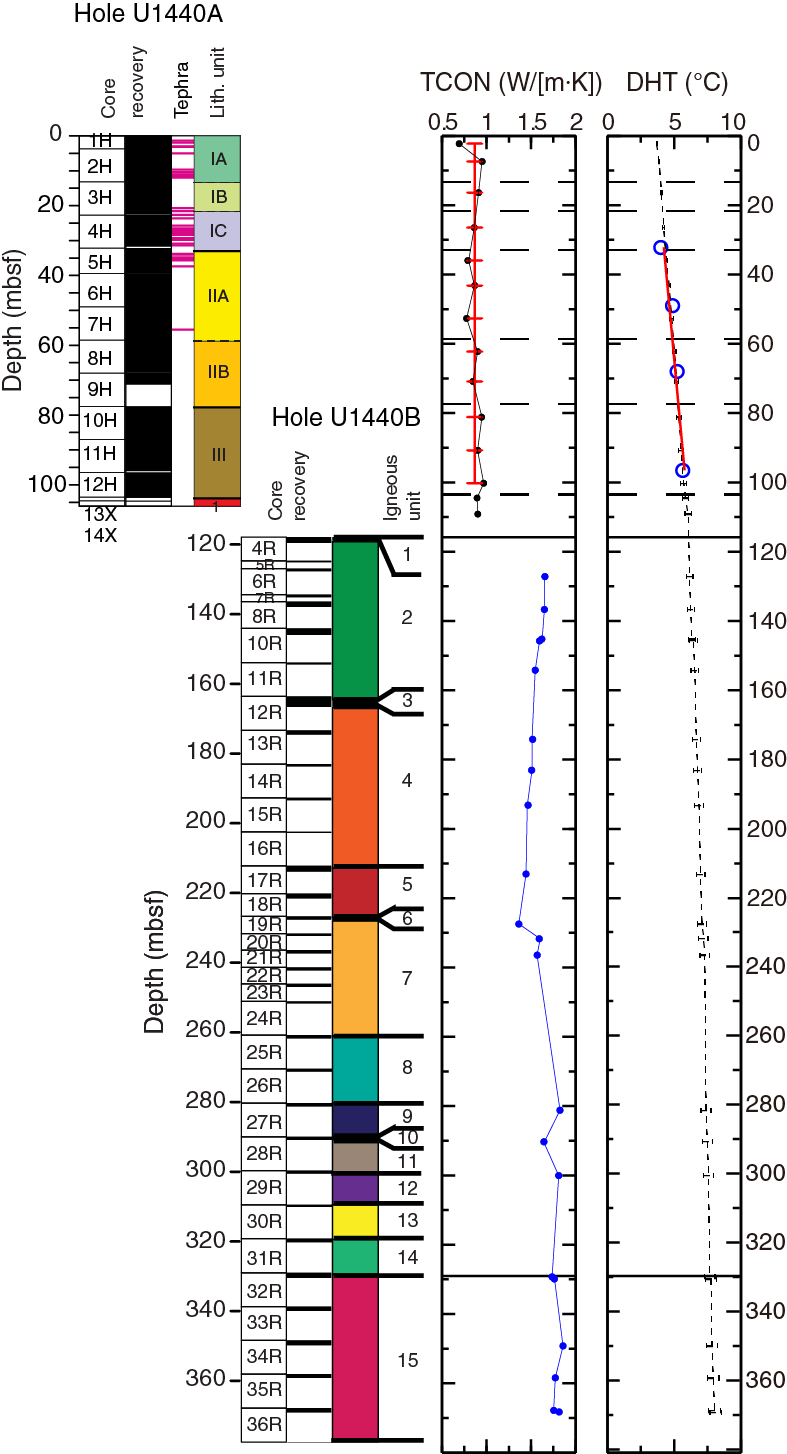
Downhole temperature
Four in situ downhole temperature measurements were conducted using the APCT-3 between 32.2 and 96.5 mbsf in Hole U1440A (Figure F52). All measurements were made in a relatively rough sea state. Note that at this site the APCT-3 was not able to be stopped at the mudline for as long as required for effective tool temperature equilibration prior to measurement acquisition. Equilibrium temperature values plotted as a function of depth are relatively linear. Coupled with the average bottom water temperature (~3.5°C), they give a least-squares gradient of ~24°C/km. We calculate a heat flow of ~23.8 mW/m2 as a product of the average thermal conductivity (~0.87 W/[m·K]) and the thermal gradient. This value is similar to the heat flow of 25 mW/m2 calculated for the sediment at Site U1439 and just slightly greater than the heat flow obtained for the sediment at Ocean Drilling Program Hole 783A (23 mW/m2; Shipboard Scientific Party, 1990), also in the IBM fore-arc. Heat flow is at the lower end of expected values in fore-arc regions (20–70 mW/m2; e.g., Currie and Hyndman, 2006).
Paleomagnetism
Sediment
Paleomagnetic measurements were made with the pass-through cryogenic magnetometer on all APC cores recovered from Hole U1440A (Cores 352-U1440A-1H through 12H). The measurement routine was the same as that used for Hole U1439A: measurements were made at 5 cm intervals and the natural remanent magnetization (NRM) was measured in addition to measurements after treatment at four alternating field (AF) demagnetization levels (15, 20, 25, and 30 mT). In all, 72 archive-half core sections were measured, producing 8340 readings of core magnetization.
Sediment recovered from Hole U1440A has magnetizations strong enough to be measured with the shipboard JR-6A spinner magnetometer. Thus, to characterize the sedimentary remanent magnetization, routine paleomagnetic measurements were made with the spinner magnetometer on ~1 discrete sample per section. Discrete samples were taken using 8 cm3 plastic cubes, oriented along the core axis. In total, 54 discrete samples from Hole U1440A were measured using the spinner magnetometer. All discrete samples were treated with AF demagnetization to remove overprints and reveal the characteristic sample magnetization. Most samples were measured at the NRM and 5, 10, 15, 20, 25, and 30 mT AF demagnetization steps. A few samples were treated with higher fields, but most did not produce reliable, consistent data above 20–25 mT.
Core NRM intensity is scattered but strong for sediment. NRM values range from 14 mA/m to 1.8 A/m, the latter in the range of typical basalt magnetization (Figure F53). The median NRM value is 200 mA/m. These high intensities likely reflect a high content of igneous lithic fragments, which include magnetic grains. The high intensity values are in part a result of remagnetization of the core by the strong magnetic field of the drill string (Roberts et al., 1996; Fuller et al., 1998; Acton et al., 2002). The drill string overprint occurs because of exposure of the samples to strong magnetic fields, which likely happens as they pass through the drill pipe. The overprint is therefore an isothermal remanent magnetization (IRM) and is often easily removed by AF demagnetization (Acton et al., 2002). This overprint is seen in measurements of most discrete samples, which show NRM directions pointing downward.
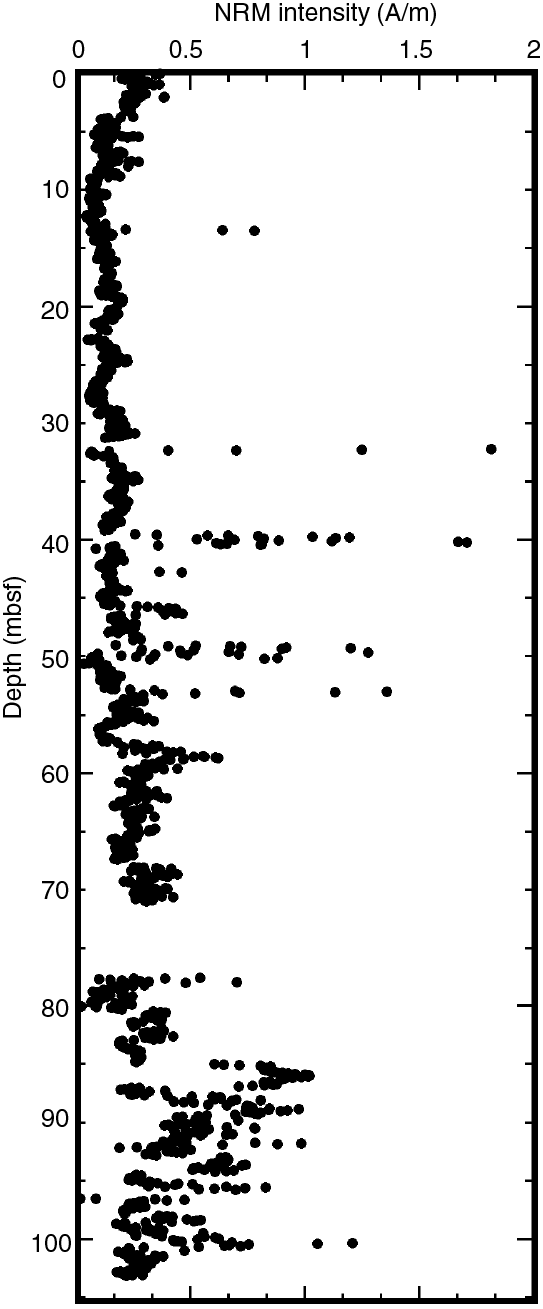
Discrete sample demagnetization measurements give results similar to those from Hole U1439A (i.e., the magnetizations of Hole U1440A sediment tend to be unstable). Most AF demagnetized samples display low median destructive fields (MDF; the field at which half of the magnetization is removed) of <10 mT. The drill string overprint is removed with 5–10 mT of demagnetization and subsequently sample directions stabilize for a few steps, very similar to results from Hole U1439A APC samples (see Figure F72 in the Site U1439 chapter [Reagan et al., 2015b]). However, after demagnetization at 20–30 mT, the sample acquires a spurious magnetization, possibly an anhysteretic remanent magnetization (ARM) caused by imperfectly balanced coils in the demagnetizer. Testing of sample demagnetizations suggests that this problem is linked to a glitch with one of the two amplifiers of the D-Tech demagnetizer. However, this ARM likely also reflects a problem with the samples themselves because other samples (not from Expedition 352) were tested and found not to acquire this ARM. The appearance of this spurious ARM is also more likely to be found on weak samples such as sediment samples. The discrete sample tests suggest that the 20–25 mT demagnetization step is probably the best for interpretation of the pass-through cryogenic measurements for Hole U1440A.
Magnetic polarity was interpreted from the 25 mT AF demagnetization step inclination (Figure F54). APC cores show a distinctive set of polarity zones that correlate well with the classic Pliocene–Pleistocene sequence from the top of Chron C3 up to Chron C1. The Brunhes Chron is at the top of the section, in Core 352-U1440A-1H and the top of 2H. Although this is clearly the Brunhes Chron, the Jaramillo Subchron, which should lie just below, is not evident. Because this coincides with the break between Cores 1H and 2H, the reversed interval between the Jaramillo and Brunhes is probably lost in a gap between cores. Thus, the bottom of this normal polarity zone is correlated with the onset of the Jaramillo Subchron. Beneath the Brunhes Chron, a long reversed polarity interval spans Cores 2H through 4H, and this likely represents the Matuyama reversed interval. The short normal zone appearing within the Matuyama is in the right location to be Chron 2n, the Olduvai Subchron. Below the Matuyama zone, a long normal interval is measured from the bottom of Core 4H through the top of Core 6H, with a short reversed polarity zone near its base. This normal zone is in the right position to be the Gauss Chron, Anomaly C2An. The Gauss Chron normally appears as a normal interval with two short, reversed polarity subchrons, as shown in the geomagnetic polarity timescale (GPTS; Gradstein et al., 2012) of Figure F54. Unfortunately, Core 7H was highly deformed by drilling, and the magnetic record within is uninterpretable. A normal polarity zone at the top of Core 8H appears to be the bottom of the Gauss normal subchron (C2An.3n). In the bottom of Core 8H and top of Core 9H, a largely reversed zone is observed with 2 short normal polarity zones within it. This probably represents the top of the Gilbert Chron and the 2 normal subchrons are probably C3n.1n and C3n.2n. Drilling disturbance beneath this level has rendered the polarity record uninterpretable.
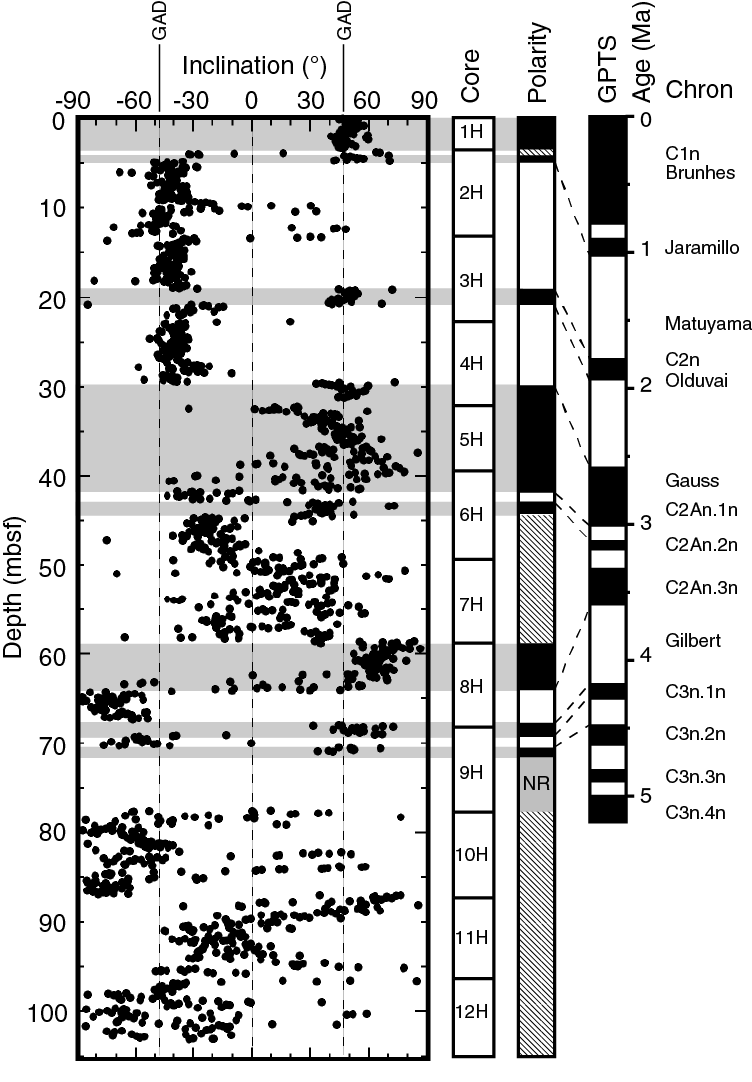
Igneous rocks
Archive-half measurements
Because recovery was low in the igneous section, oriented pieces from the archive half of the core were AF demagnetized in the pass-through cryogenic magnetometer with seven steps of 5, 10, 15, 20, 25, 30, and 40 mT. Each piece was measured using the cryogenic magnetometer discrete sample routine. This is a nonstandard measurement for the cryogenic magnetometer because the pieces are irregular in shape, which is not ideal for accurately measuring the magnetization, but the volumes are also much larger than the 8 cm3 that is usual for discrete samples. For this reason, the magnetization intensities in the LIMS database are incorrect and the directions must be treated with caution. Nevertheless, these measurements provided a routine evaluation of magnetic properties of the cores.
Discrete samples
Discrete samples were taken as 8 m3 cubes at a rate of approximately one per section, except in sections in which there were no core pieces long enough to be considered oriented. Low recovery limited the number of samples that could be measured. Whenever AF demagnetization of the archive half piece produced results that appeared reliable, AF demagnetization was applied to the corresponding discrete sample from the working-half core. Use of the nondestructive AF demagnetization method allowed other groups to use the same sample for other studies. Otherwise the discrete sample was thermally demagnetized. In total, 17 discrete samples were treated with AF demagnetization and 12 samples were treated with thermal demagnetization.
Despite generally low MDF values, AF demagnetization spectra often show an initial slow decay through 5–10 mT and rapid decline thereafter (Figures F55, F56). MDF values range from 6.9 to 25 mT, with most values between 7 and 12 mT. A drilling overprint was usually removed after demagnetizing at 10–13 mT and the magnetization was almost completely destroyed by 50 mT, except for three higher coercivity samples with high MDF.
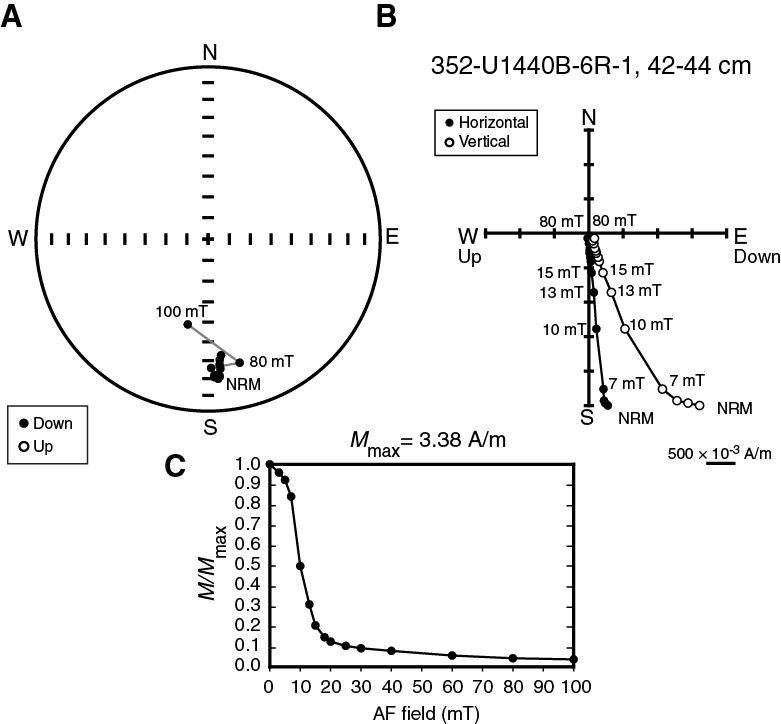
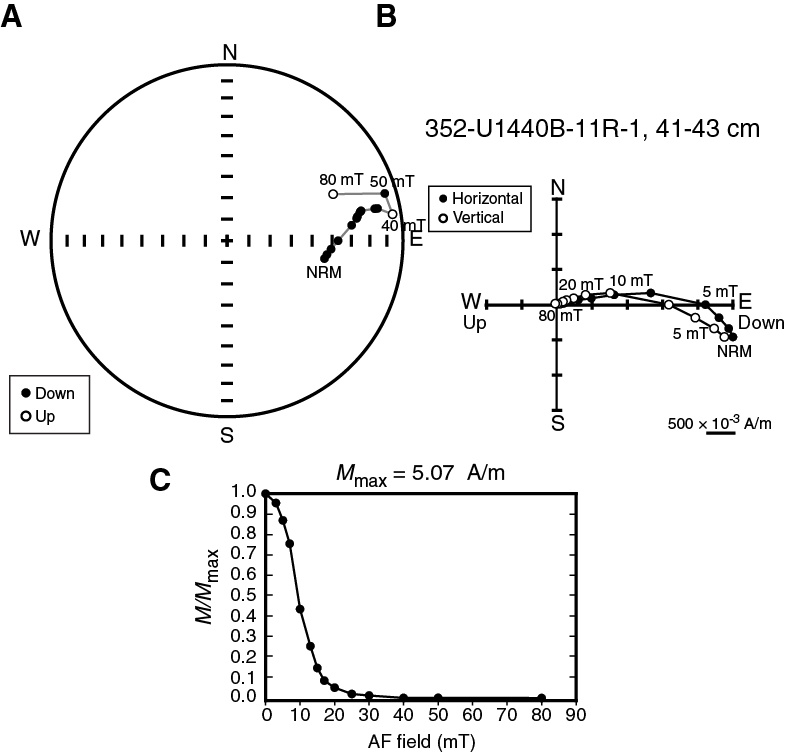
Thermal demagnetizations were carried out between 120° and 600°C by temperature steps of 25° or 50°C depending on the demagnetization behavior. Prior to demagnetization, the samples that were suspected of having a strong multidomain contribution to the remanence (typically coarse-grained samples) were subjected to low-temperature demagnetization (Heider et al., 1992). The samples were bathed in liquid nitrogen (N2) and then placed within a mu-metal shield while the liquid nitrogen boiled off and the samples warmed up to room temperature, which took between ~30 and 60 min. This also helped remove the overprint that some samples acquired during physical property experiments before the thermal demagnetization (because of low recovery, shipboard paleomagnetic samples often did double duty and were also measured for physical properties). Figure F57 shows an example of a sample that displays demagnetization from the liquid nitrogen dunking, implying that part of the magnetization resides in multidomain magnetic grains. All samples were completely demagnetized by 600°C (implying no hematite content), and most samples showed near-zero magnetizations after 500°–550°C. After an initial plateau in the demagnetization curve or a slight decrease, most samples show an increase of magnetization around 350°C that appears to result from partial self-reversal (Doubrovine and Tarduno, 2004, 2005). Between ~250° and 350°C, the magnetization vector reverses its decay as a result of the self-reversal (Figure F58). At temperatures above 350°C, the magnetization declines rapidly and the directions between ~400° and 600°C lead to the identification of a fairly stable magnetic direction in about half of the samples. Curie temperatures of this magnetization component range between 400° and 500°C, which indicate the presence of low-Ti titanomagnetite or titanomaghemite as the magnetic carrier (e.g., O’Reilly, 1984). A strong increase of bulk magnetic susceptibility with heating also indicates that many of the samples undergo mineralogical transformations during the heating steps. This behavior may indicate that the primary magnetic carrier is titanomaghemite that inverts to strongly magnetic magnetite as a result of heating (Özdemir and O’Reilly, 1982). Samples from Cores 352-U1440B-32R through 36R generally did not display such a pronounced magnetization increase during thermal demagnetization, and the bulk susceptibility variation with heating was also not as dramatic as for the other samples. This could indicate that titanomaghemite is less present, as confirmed by SEM analysis showing that iron oxides are rather fresh in these cores.
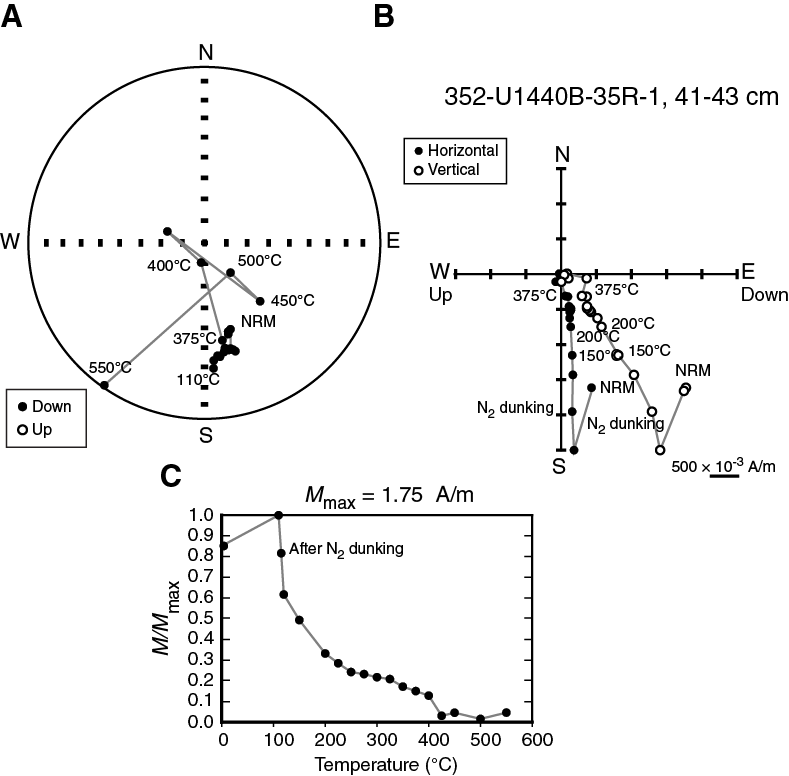
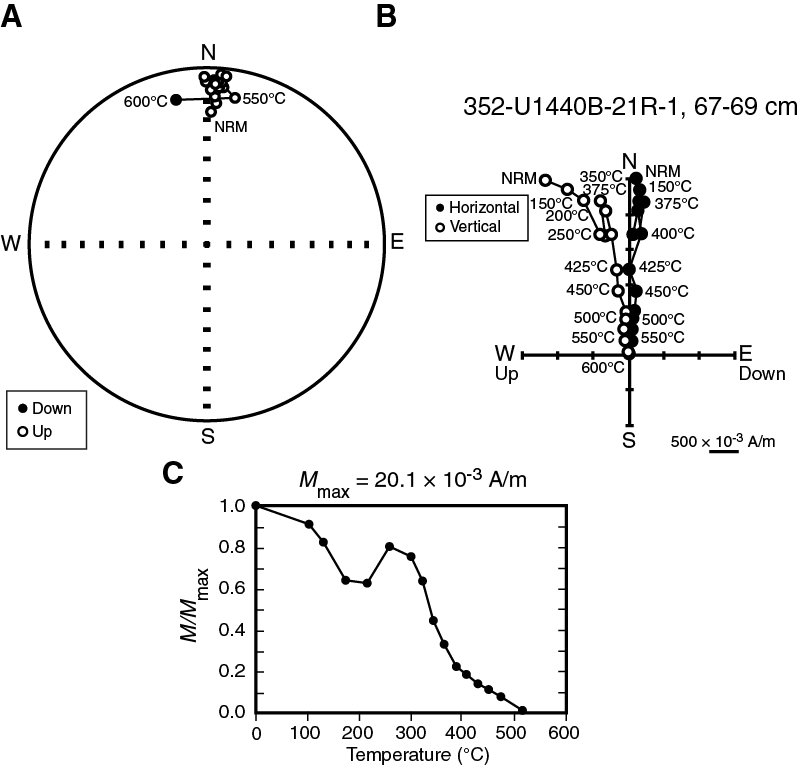
Rock magnetic measurements
In order to characterize the magnetization carriers, we measured the acquisition of partial ARM (pARM) on samples used for AF demagnetization, using 10 mT steps up to 100 mT, as well as 5 mT steps up to 40 mT for a more detailed measurement at low coercivity (Figure F59). The pARM acquisition for most samples peaks at 15–10 mT, which is consistent with the MDF values around 10–15 mT. Some samples show a very small secondary peak at 90 mT, which could indicate the presence of a high-coercivity mineral, but it is not evident in the AF demagnetizations. When comparing with measurements made on synthetic magnetite (Jackson et al., 1988), our peak values correspond to 5 μm grains.
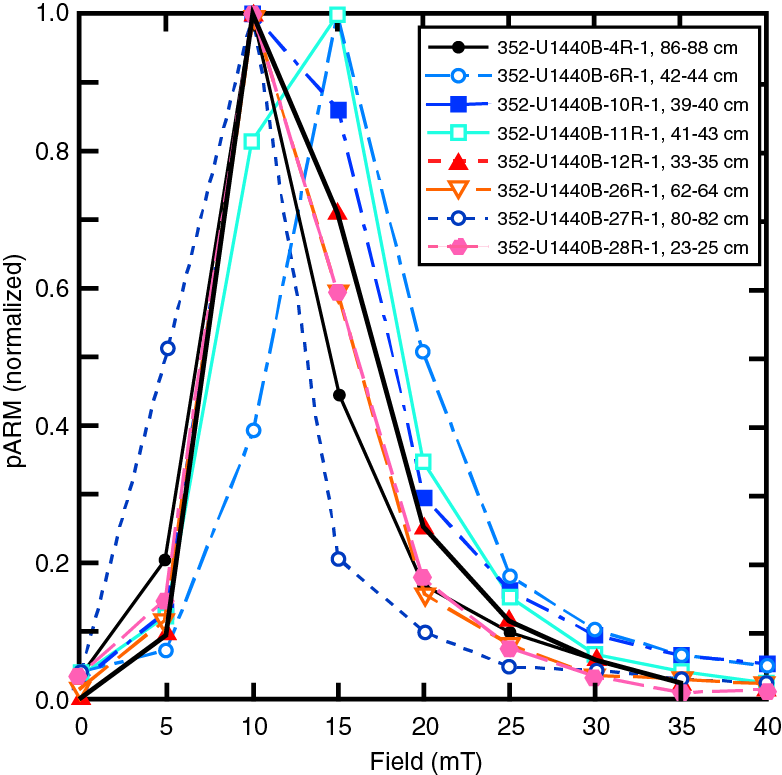
IRM acquisition was measured in fields up to 300 mT for five of the samples used for AF demagnetization (Figure F60). All samples are saturated between 50 and 100 mT, indicating that titanomagnetite or titanomaghemite is the main carrier of magnetization. Although the IRM acquisition occurs in relatively low applied fields, the samples were not saturated in fields lower than 50 mT, implying that the magnetic grains have moderate coercivity values, which is consistent with the observed MDF values.
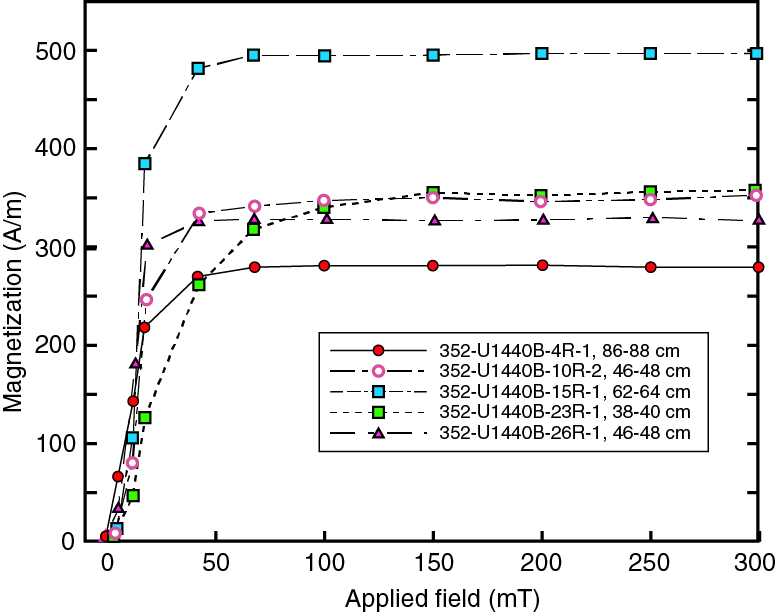
Paleomagnetic inclination
Paleomagnetic directions were calculated using principal component analysis (PCA; Kirschvink, 1980) on a subset of demagnetization values, usually at high demagnetization steps, that appear to show a linear decay toward the origin of an orthogonal vector (Zijderveld) plot. This consistent set of demagnetization steps is assumed to be the characteristic remanent magnetization that was recorded at the time of initial sample cooling. Finding this consistent set of high demagnetization steps proved a challenge for Hole U1440B igneous samples. Demagnetization often produced inconsistent results, implying that there is no stable magnetization in the rock sample. In a few samples, different demagnetization directions were highly scattered. In many others, the magnetization endpoints moved throughout the demagnetization procedure, never stabilizing on any consistent direction (Figure F56). In all, 47 of the 84 archive core piece samples gave inconsistent results. Interestingly, almost all of these poor results were found in two zones, ~154–251 mbsf (Cores 352-U1440B-12R through 22R) and below~349 mbsf (Cores 34R through 36R) (Figure F61). This grouping implies that the magnetic minerals in those zones are not conducive to long-term recording of the magnetic field.

Results from discrete 8 cm3 samples were superior to those from the archive pieces, with only a few samples showing unstable behavior. Sample 352-U1440B-11R-1, 41–43 cm (Figure F56), is an example of unstable behavior, with a magnetization vector that never stops moving through the demagnetization process. In contrast, Samples 352-U1440B-6R-1, 42–44 cm (Figure F55), and 21R-1, 67–69 cm (Figure F58), illustrate well-behaved AF and thermal demagnetization, respectively. Even with these well-behaved samples, the highest demagnetization steps are usually inconsistent. For AF demagnetization, this may occur because the demagnetizer imparts an ARM above ~50 mT, or because the remaining magnetization at high AF steps is incoherent. An ARM from AF demagnetization may also explain the poor results from many of the archive samples measured with the shipboard cryogenic magnetometer. The highest thermal steps are probably erratic because the sample was nearly completely demagnetized by ~500°C and there is no coherent magnetization remaining at higher temperature steps.
A plot of magnetic inclination versus depth (Figure F61) shows that the igneous section has zones of different magnetic polarity, with positive inclinations corresponding to normal polarity and negative inclinations to reversed polarity. The section is likely divided into 2 normal zones, at the top and bottom, with a reversed zone in between. The lower boundary of the reversed zone occurs between Samples 352-U1440B-23R-1, 38–40 cm (246.48 mbsf), and 21R-1, 67–69 cm (237.07 mbsf), implying the shift occurs at ~240 mbsf. Sample 22R-1, 48–50 cm, falls in between these samples and gives an inclination of 0°, which may be a direction transitional between normal and reversed. The upper boundary of the reversed zone is between Samples 13R-1, 95–97 cm (174.50 mbsf), and 12R-2, 42–44 cm (165.52 mbsf), implying the transition is at ~170 mbsf. It is notable that the discrete sample inclinations in the reversed zone display a lesser average absolute value (–16°) compared with the normal polarity samples (~26°). This bias is consistent with incomplete removal of the downward-directed drill string overprint (Audunsson and Levi, 1989; Acton et al., 2002). Although this bias does not greatly affect the magnetic polarity interpretation, it does indicate a challenge for determining a reliable paleolatitude. Nevertheless, the observed inclinations (15°–26°) are significantly less than the present-day averaged dipole field inclination (vertical dash line at 47.6°), indicating that the igneous rocks were formed at a lower latitude.
Two solitary discrete samples give slightly negative values within these normal zones. One is at the very top of the section, Sample 352-U1440B-4R-1, 86–88 cm (115.86 mbsf), and the other is deep in the section, Sample 28R-1, 40–42 cm (290.40 mbsf). Normally, a single sample is not a reliable indicator of a polarity zone because of the potential for a single misleading measurement. Consequently, the two reversed “zones” defined by these two samples (Figure F61) should be treated with caution.
Figure F61 shows significant scatter in the inclinations measured from the archive core pieces. Not only do many inclinations have high absolute value (~60°), but these samples do not show a consistent polarity record. In the reversed polarity zone, the 2 measured archive core pieces both give a negative inclination, as expected, but in the normal polarity zones, the samples are almost equally divided between positive and negative inclinations, with little consistency. Because the core pieces are irregular, the magnetic fields measured by the magnetometer are probably asymmetric, resulting in erroneous measurements since the magnetometer assumes the sample is equidimensional and homogeneous. Opposite inclinations cannot be explained by accidental inversion of the pieces because the same would occur for the discrete samples taken from the working half core. Unfortunately, this problem means that the archive core piece measurements are virtually uninterpretable. However, these samples do give two interesting clues to paleomagnetism in Hole U1440B. Unstable pieces occur predominantly in two zones. One of these zones spans Sections 352-U1440B-22R-1 through 12R-1, ~251 to 154 mbsf. This is very close in depth to the reversed magnetic zone defined by working-half core discrete samples (Figure F61). The unstable behavior implies that something about the magnetic grains in this section makes recording or measurement of a stable magnetism less reliable. This is also a zone where brown alteration was noted in the cores. It is possible that the reversed zone is a chemical remagnetization that postdated the production of the crust. The second unstable zone occurs in Cores 352-U1440B-34R through 36R. These cores are characterized by coarse-grained rocks and for that reason may contain large magnetic grains that do not make reliable magnetic field recorders.
Downhole logging
Two downhole logging tool strings were used to log a ~130 m open-hole interval of Hole U1440B over a period of ~24 h (Figure F62). The borehole deteriorated in condition while downhole logging proceeded, but measurements including gamma radiation, density, electrical resistivity, velocity, and borehole images were successfully collected.
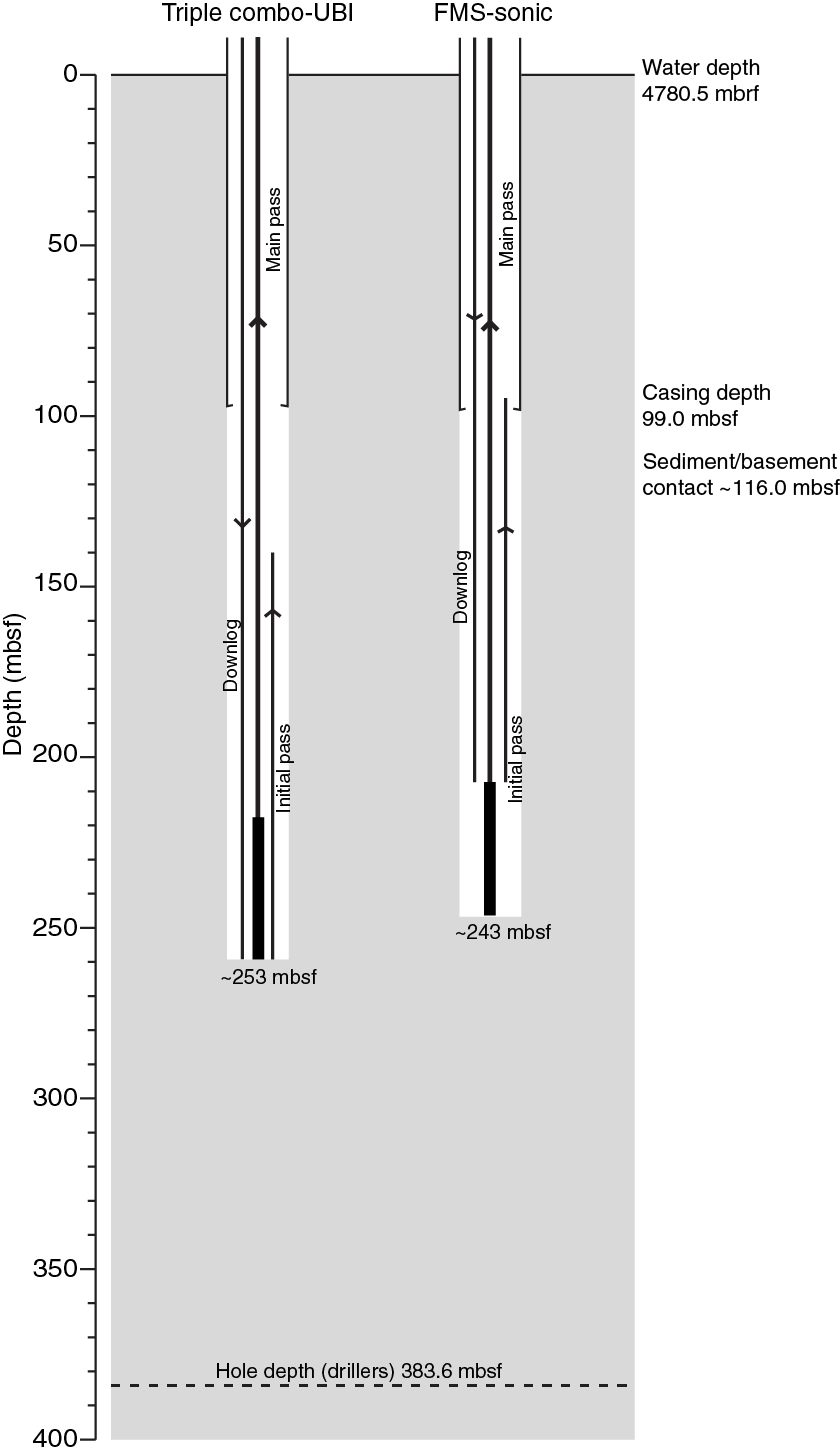
Logging operations
Downhole logging operations commenced at 0430 h local time on the morning of 25 August 2014. The first tool string deployed was the triple combo-Ultrasonic Borehole Imager (UBI), which included the Hostile-Environment Natural Gamma Ray Sonde (HNGS), Hostile-Environment Litho-Density Sonde (HLDS), High-Resolution Laterolog Array (HRLA), and UBI tools (see Downhole logging in the Expedition 352 methods chapter [Reagan et al., 2015a] for tool string diagrams, descriptions, and acronym definitions). Borehole conditions were reported by the drillers as favorable, though a number of ledges were noted. Those ledges at 164 and 232 mbsf were deemed clear following earlier wiper trips. However, the ledges at 237 and 335 mbsf were still in evidence, though not difficult to pass, during the last wiper trip conducted on 22 August. On this basis, it was decided to proceed with logging as planned, including the UBI as the bottom tool of the triple combo tool string and deployment of the 137Cs source in the HLDS, to allow acquisition of bulk density measurements. The tool string was lowered to ~253 mbsf, ~125 m shallower than the total depth of the hole. The hole was blocked by a sticky mud bridge, which had formed prior to logging (there was a hiatus of 36 h from the coring assembly being pulled out of hole and the first logging tool string reaching the new bottom of the hole). An initial uplog at ~120 m/h was completed from 253 to ~140 mbsf. This was followed by a repeat pass from total depth back through the casing and drill pipe to the seafloor at the same speed. The tool string was then recovered and disassembled at the rig floor by 1750 h local time.
The FMS-sonic tool string was the second tool string to be run in this hole, acquiring HNGS, acoustic velocity (Dipole Sonic Imager [DSI]), and electrical image (FMS) data. At first, the tool string was not able to reach 253 mbsf, and instead was stopped ~45 m short at 208 mbsf by a new bridge in the hole. However, the tool was eventually able to punch through this bridge, reaching a total depth of ~243 mbsf prior to the second uplog through the open-hole section. Both uplogs were undertaken at a speed of ~550 m/h. The tool string was then retrieved at the rig floor with logging operations being completed by 0255 h local time on the morning of 26 August.
Data processing and quality assessment
A depth shift to seafloor was applied to all logs, with the seafloor identified from the gamma ray data sets acquired during both tool string runs. A subtle inflection in gamma radiation (as recorded by the Enhanced Digital Telemetry Cartridge [EDTC] and HNGS) was observed on the logs at 4780.5 mbrf. Following this shift to seafloor, the log curves were depth-matched using gamma ray data recorded during the main pass of the FMS-sonic tool string as the reference curve. The logs from the other tool string passes (both passes of the triple combo-UBI tool string and the initial pass of the FMS-sonic tool string) were matched to this log through the identification of common features throughout the logged interval.
Caliper data from both tool strings (obtained with the HLDS and FMS tools) indicate that Hole U1440B has a relatively smooth profile in the lower portion of the logged interval (diameters of ~11–14 inches at depths below 165 mbsf), whereas the hole diameter is greater and more variable in the upper portion (diameters of ~12–18 inches at depths above 165 mbsf) (Figures F63, F64, F65, F66). Overall, the range in borehole diameter is such that the data quality for most of the measurements acquired should be reasonable, with effective centralization of the HRLA and DSI tools and eccentralization of the HLDS. A smooth borehole profile gives better conditions for acquisition of good downhole measurements, so data quality may be poorer in the upper portion of the logged interval. Figure F67 shows the caliper data (left-hand track) from the second passes of the triple combo-UBI and FMS-sonic tool string runs. These passes were undertaken ~9 h apart, and the plot indicates that the profile changed within that time frame, especially in the upper half of the hole. The deviation and trajectory of Hole U1440B were confirmed as near vertical by the General Purpose Inclinometry Tool (GPIT).


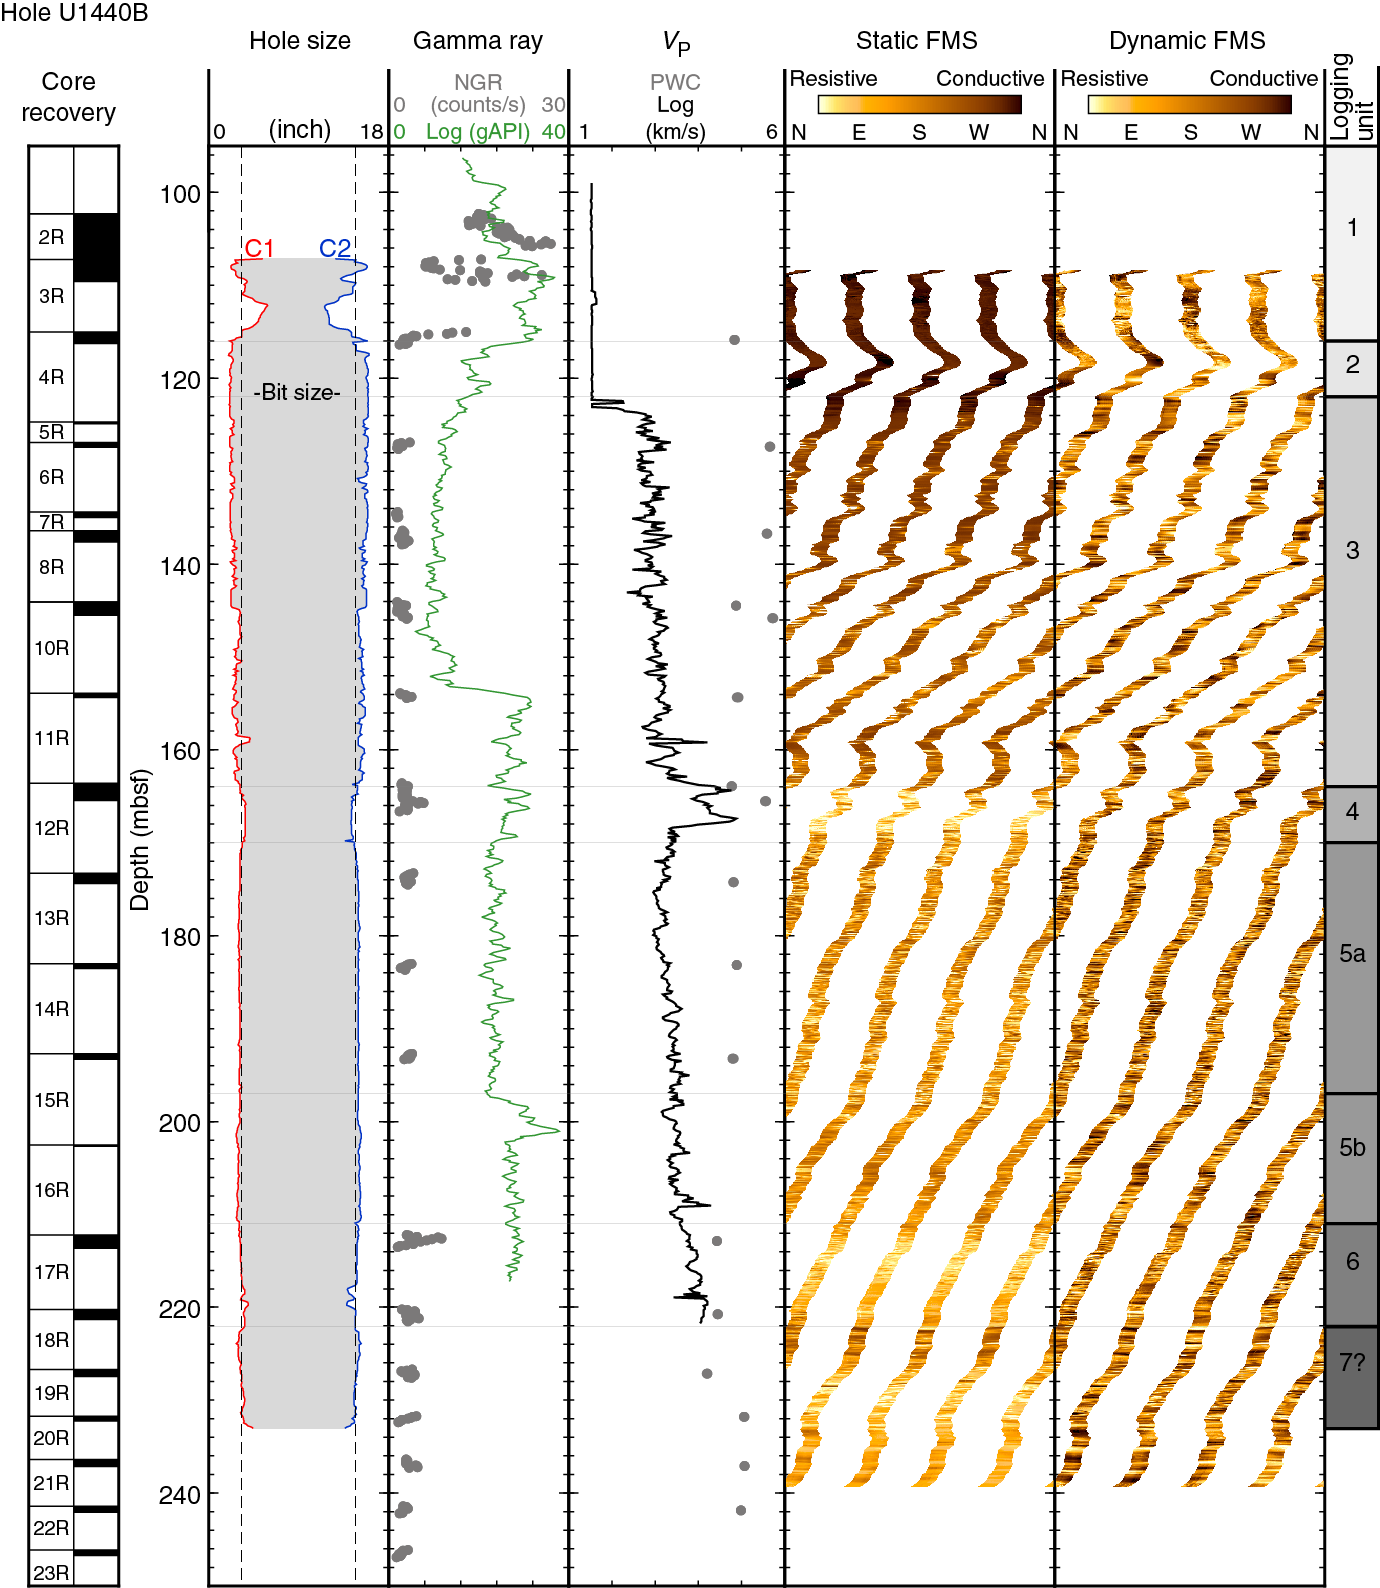
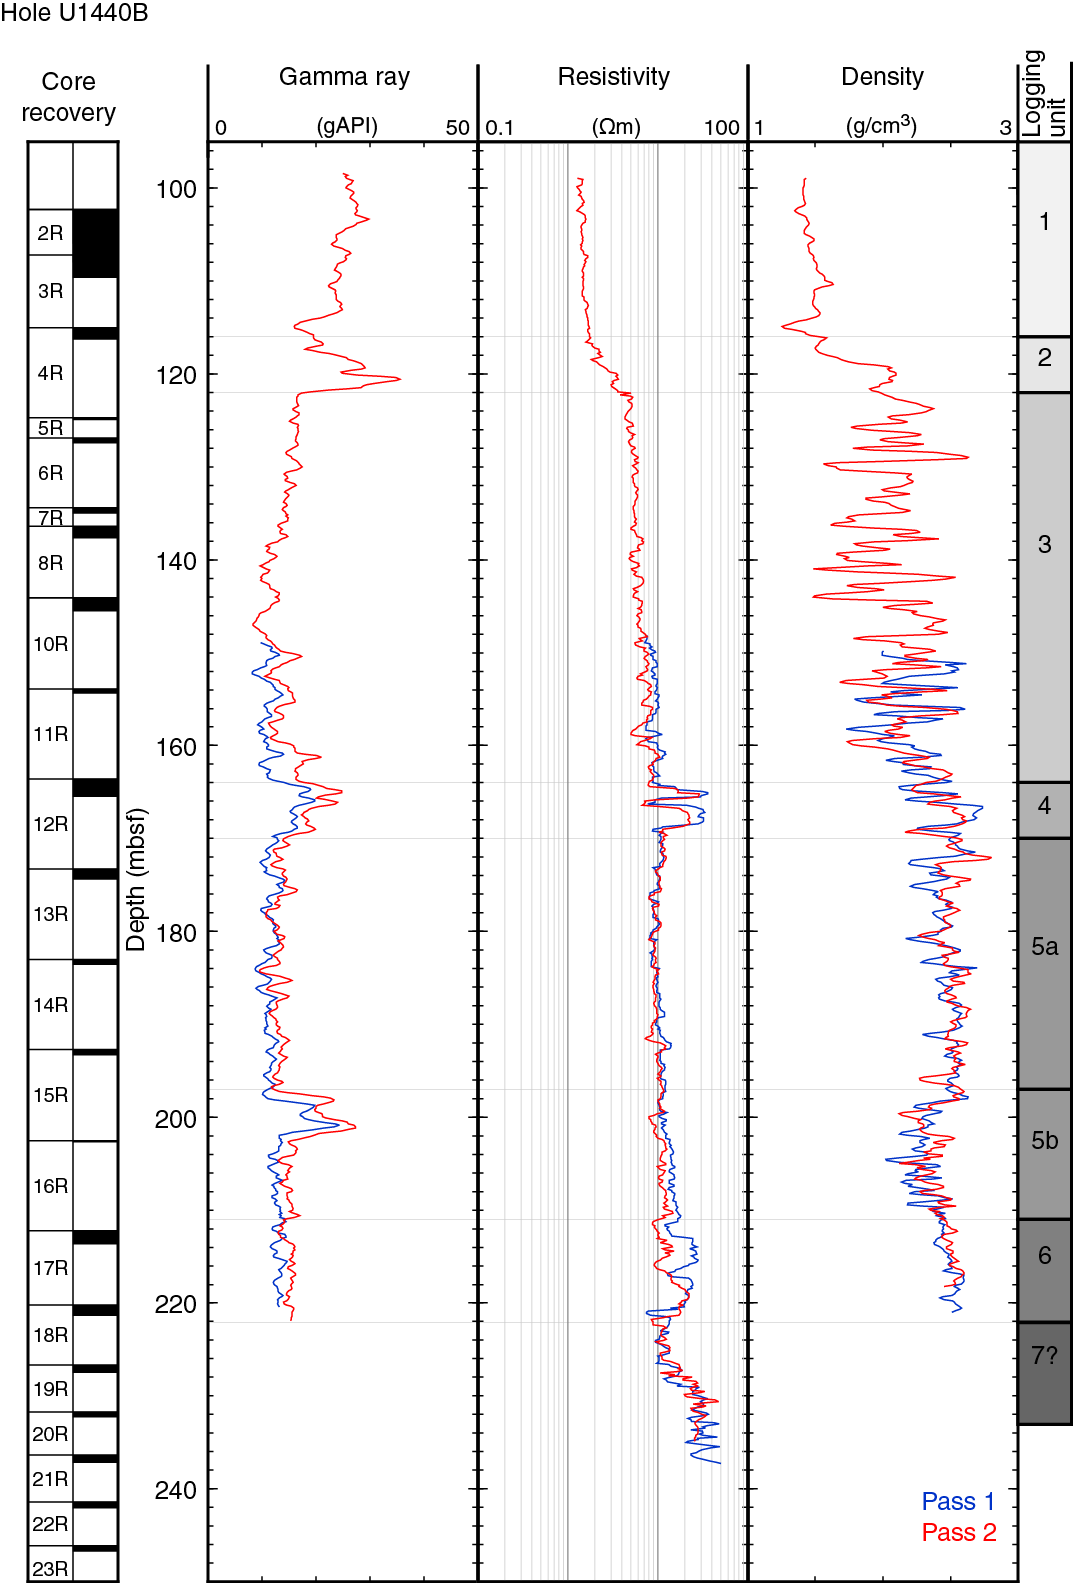
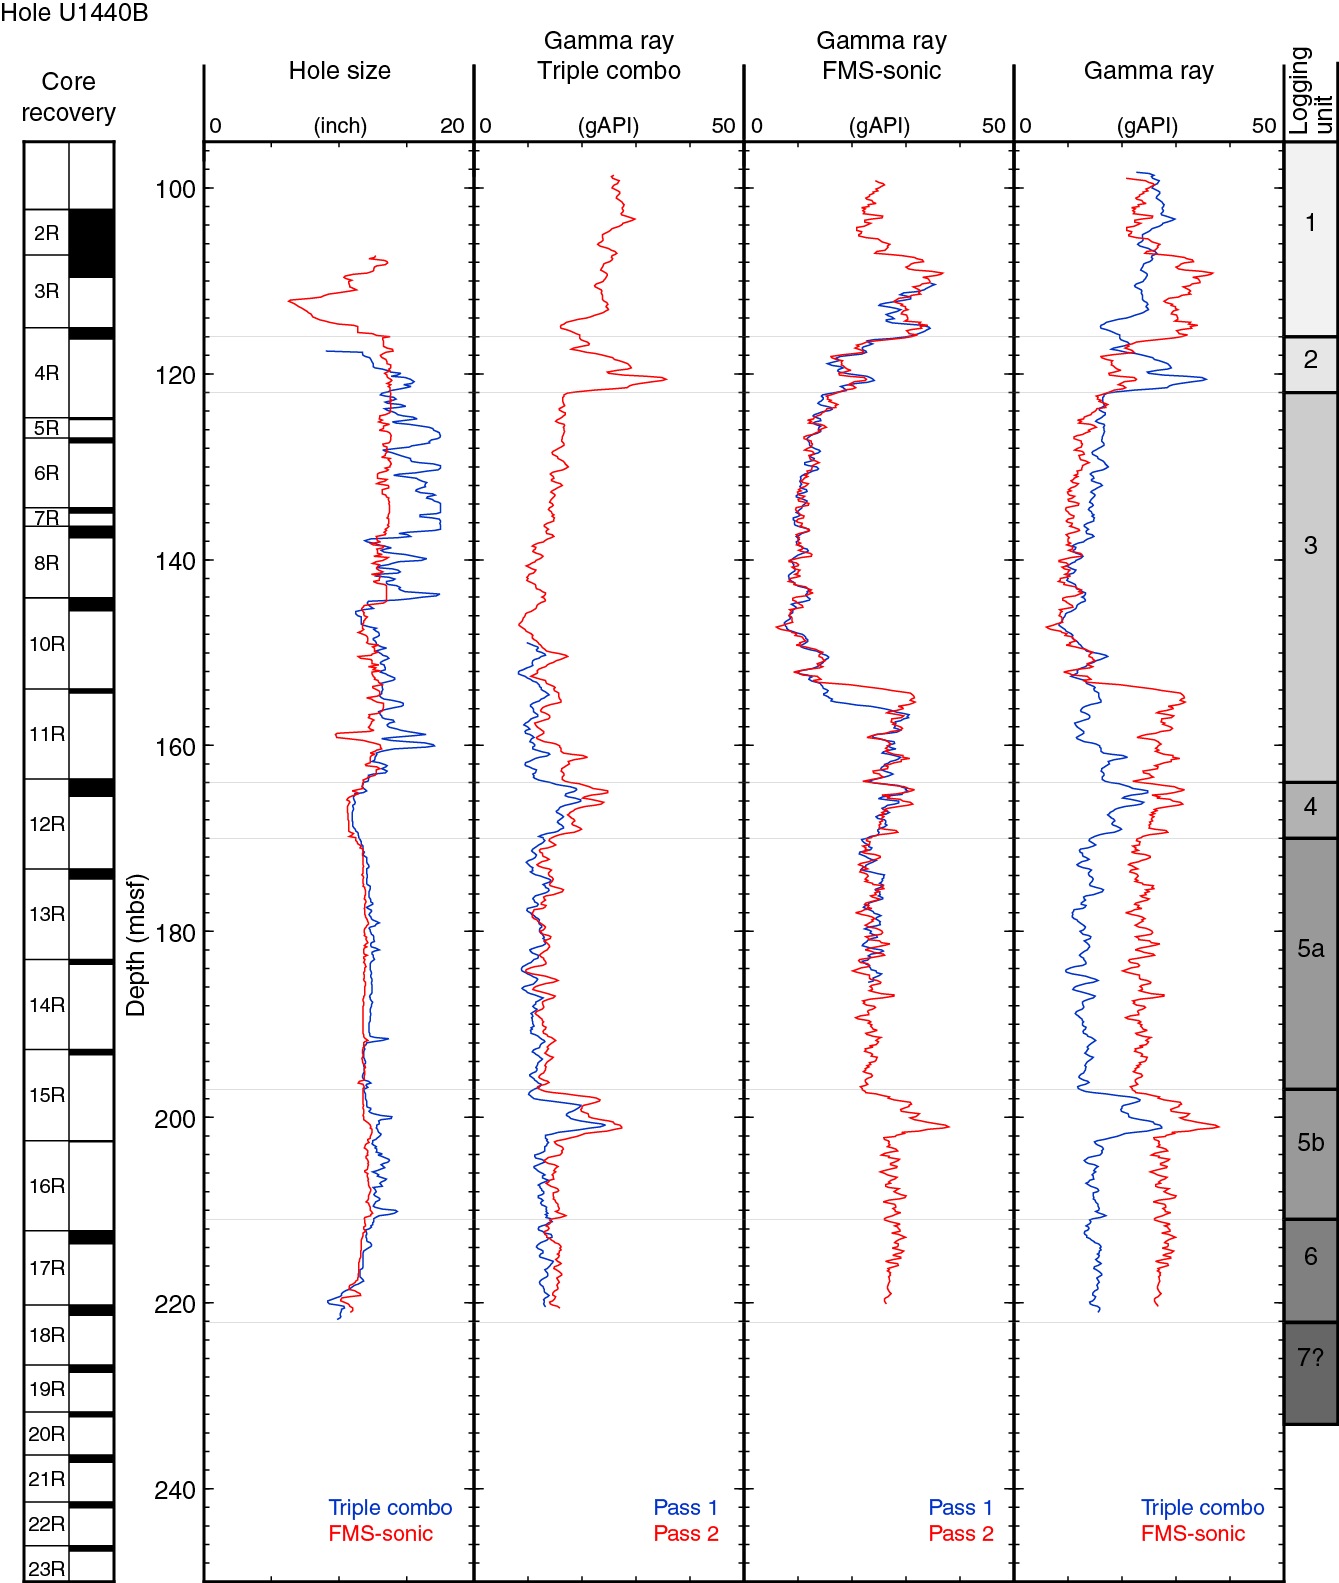
The repeatability of the logging measurements between subsequent passes of individual tool strings and the repeatability of common measurements acquired by the two tool strings are summarized in Figure F67. The gamma ray logs from the two passes of the triple combo-UBI tool string agree reasonably well, with values being marginally higher in the second pass. The same data for the two FMS-sonic tool string passes indicate good agreement for much of the logged interval, although repeatability is poor at ~154 to 158 mbsf. The gamma ray data sets acquired on the second passes of the two tool strings agree in trend for the lower half of the hole, but the absolute values are offset, which may be attributed to a different tool orientation in the borehole. Values and trends are in better agreement in the upper half of the hole from ~122 to 152 mbsf. However, the gamma ray logs do not agree in the interval above this, and this is most likely due to deteriorating hole conditions above the sediment/basement interface (~116 mbsf).
Volcanic basement typically has very low gamma ray values, and the basement interval in Hole U1440B is no exception. The total gamma ray logs and potassium concentrations for this hole are well within the limits of detection (Figure F63). However, the spectral gamma ray logs for both uranium and thorium are below the limits of detection and are therefore not presented here.
The HRLA resistivity data are of generally very good quality, and the logs from the different depths of investigation agree very well (Figure F64). The resistivity curves tend to separate in the sediment interval (above ~116 mbsf) and in two discrete intervals where resistivity is elevated (~164–171 mbsf and ~212–222 mbsf). This is most likely a function of the formations encountered rather than hole condition or tool function. Two porosity measurements, 1 derived from the density log and 1 derived from the true resistivity log using Archie’s law, are also presented.
The DSI was operated in 4 modes: P&S monopole, upper dipole in low-frequency mode, lower dipole in standard-frequency mode, and Stoneley. These modes were selected on the basis of the formations recovered in order to optimize data quality. The resulting slowness data were subsequently converted to acoustic velocities (VP [monopole] and VS [lower dipole]). The preliminary velocity data exhibited very variable coherence through the logged interval, and the automatic labeling of wave arrivals was problematic in places. Consequently, additional data processing was undertaken to account for this and improve the quality of the data set.
Good FMS image quality relies on contact between the tool’s four pads and the borehole wall, which requires a borehole diameter of <15 inches. The resulting images indicate that this was generally the case in Hole U1440B (Figure F65). The lower portion of the logged interval appears to be filled with sticky mud originating from the sedimentary interval at the top of the hole (as confirmed by Shipboard Scientists). This mud may contribute to potentially anomalous images at the base of the image log.
Similar to the FMS tool, the UBI has operational limitations relating to borehole diameter. The maximum diameter for effective data acquisition of acoustic images is <12 inches. On that basis, the data acquired by this tool are unusable for the purposes intended and therefore not presented here.
Log quality can also be assessed by comparison with measurements made on the cores from the same hole. However, owing to the poor recovery at this hole drawing direct comparisons between log and core data sets is extremely challenging.
Logging stratigraphy
Overall, density, resistivity, and sonic velocity increase downhole, whereas gamma ray and porosity (as derived from resistivity) decrease downhole. Seven logging units were identified on the basis of the characteristic features and trends in the downhole measurement data sets. The logged interval only penetrates the volcanic extrusive section, as defined by the petrologists. The units are identified in Figures F63, F64, F65, F66, and F67.
Logging Unit 1
Unit 1 (~99–116 mbsf) is characterized by relatively consistent downhole profiles in resistivity (mean = 1.46 Ωm) and P-wave velocity (VP; mean = 1537 m/s), both of which exhibit low-amplitude variability. The separation in the resistivity curves likely results from a larger hole diameter in this interval, although it is not possible to confirm this because the calipers are closed before reentering casing. Overall, gamma ray values decrease with depth (mean = 24.3 gAPI), which is consistent with the potassium data from the HNGS (Figure F63). Density data increase downhole to ~110 mbsf, after which density decreases. However, owing to the caliper being closed through this section, the tool was not eccentralized, so the data quality is compromised and absolute data values should be treated with caution.
The bottom boundary of this unit, as defined by the downhole logging measurements, is interpreted to correspond with the sediment–basement transition (see Figure F4), and as such, Unit 1 corresponds to lithologic Unit III (see Sedimentology). The discrepancy in the depth of this boundary can be attributed to the different depth scales used.
Logging Unit 2
Unit 2 (~116–122 mbsf) is distinguished from the overlying Unit 1 on the basis of increasing trends in gamma radiation and resistivity (mean = 2.59 Ωm). The mean gamma ray value (25.6 gAPI) is greater in the logging units above and below, and 3 discrete peaks are present in this unit. A similar trend is exhibited in the density profile but is discounted because the caliper transitioned from an open to a closed position uphole through this interval. The compressional velocity is similar in value and variability to the overlying unit, with relatively constant values (mean = 1540 m/s).
Unit 2 is interpreted to correspond to the talus unit (see Petrology). The difference in recovered and logged thicknesses of this unit is likely the result of low core recovery.
Logging Unit 3
Below Unit 2 (~122–164 mbsf), the character and value of the various logging parameters change. The resistivity log flattens out with a low-amplitude, high-frequency profile and a subtle overall increase in resistivity with depth from 3.81 to 10.45 Ωm (mean = 6.34 Ωm). Density values are variable through this interval, ranging from 1.37 to 2.77 g/cm3 with a mean value of 1.74 g/cm3. The gamma ray log exhibits an overall decrease in depth from ~122 to 140 mbsf, with some relatively low amplitude variations. Between ~140 and 164 mbsf, the gamma ray profile increases, with higher amplitude, lower frequency variations. The mean gamma ray value for this unit is 13.9 gAPI, with the overall profile paralleling the variations in potassium content (Figure F63). P-wave velocity in Unit 3 is elevated in comparison to Units 1 and 2, with a mean of 2967 m/s. Variability in VP is much greater than the overlying units (minimum = 1528 m/s; maximum = 4354 m/s), with a significant peak at ~159 mbsf.
Unit 3 corresponds approximately in depth and thickness to the upper massive sheet flow unit (igneous Unit 2), which was defined on the basis of the core recovered from Hole U1440B (see Petrology).
Logging Unit 4
Unit 4 (~164–170 mbsf) is a narrow interval characterized by a local high in total gamma radiation, elevated resistivity, and highs in VP and VS. The gamma ray log has a mean value of 19.8 gAPI in Unit 4, with 2 discrete highs that are echoed in the potassium spectral gamma ray data (Figure F63). The resistivity (mean = 16.16 Ωm) also exhibits two discrete highs (maximum = 28.70 Ωm at different depths compared to the gamma ray highs) delineated by a low at ~166.5 mbsf. The P-wave velocity data suggest this interval has the highest VP encountered in the logged interval of this hole, with mean values of 4053 m/s. Density values are slightly elevated relative to the overlying unit, with a mean of 2.44 g/cm3.
Like the overlying units defined by the petrophysical data, Unit 4 boundaries are roughly consistent with the petrological divisions. Igneous Unit 3 (see Petrology) is defined as a pillow lava interval and may correspond to this logging unit.
Logging Unit 5
Below the pillow lavas, the petrophysical attributes of the formation change to generally more constant profiles with lower variability. Unit 5 (~170–211 mbsf) is divided into 2 subunits.
Subunit 5a
Subunit 5a (~170–197 mbsf) is characterized by low gamma radiation (mean = 13.1 gAPI) and high density relative to the other logging units. Densities range from 2.19 to 2.87 g/cm3, with a mean of 2.52 g/cm3. P-wave velocity increases downward with a mean value of 3284 m/s. Resistivity values continue to increase downhole (mean = 9.83 Ωm), though these values are low compared to the peaks encountered in Unit 4. This downward trend continues into Subunit 5b below.
Subunit 5b
The boundary between Subunits 5a and 5b (~197–211 mbsf) is defined by elevated gamma ray values that then drop off with depth, resuming similar levels to the overlying subunit (mean = 17.5 gAPI). Density exhibits the opposite trend: decreasing at the top of Subunit 5b and then increasing to its base (minimum = 1.89 g/cm3; maximum = 2.67 g/cm3). The P-wave velocity data exhibit slightly higher frequency variations in Subunit 5b compared to Subunit 5a (minimum = 3159 m/s; maximum = 4293 m/s).
Overall, Unit 5 approximately corresponds in depth and thickness to igneous Unit 4, the second massive sheet flow unit (see Petrology).
Logging Unit 6
Unit 6 (~211–222 mbsf) is defined largely on the basis of the change in character of the resistivity log, with greater variability compared to the overlying unit. There remains an overall increasing downhole trend in resistivity (minimum = 8.44 Ωm; maximum 22.32 Ωm) through this unit. P-wave velocity in Unit 6 continues the overall increasing downhole trend (mean = 3922 m/s). The gamma ray profile is constant with depth, with very low amplitude variability (mean = 15.1 gAPI), whereas the density log continues the increasing downward trend from the overlying unit (mean = 2.31 g/cm3).
This logging unit is interpreted to be the second pillow lava unit (igneous Unit 5; see Petrology), although the logging unit is thicker.
Logging Unit 7
Unit 7 (below ~222 mbsf) only has resistivity and sonic data coverage and a microresistivity image log. The boundary with the overlying unit is defined primarily by the change in character of the resistivity log. A drop in resistivity at the boundary is followed by a steady increase to the base of the measured unit (minimum = 8.79 Ωm; maximum = 47.14 Ωm). Variability in resistivity through this unit is much higher in amplitude than the overlying units (mean = 19.50 Ωm), whereas the VP profile shows markedly less variation than Unit 6 (mean = 4015 m/s). Unit 7 is assumed to represent the hyaloclastite interval (igneous Unit 6; see Petrology).
FMS images
Across the logged interval of the hole, a range of textures and features can be seen in the FMS images (Figure F68). Overall resistivity in the FMS images increases with depth, with Units 4 and 6 being the most resistive (Figure F65). None of the logging units are bounded by sharp resistivity contrasts, and provisional assessment of the images suggests that there are generally few linear through-going features in the imaged interval. Postcruise assessment and interpretation of the borehole images may identify measurable structural features, and use of the images in tandem with other data sets (notably petrology) will aid in the effective analysis of this data set.
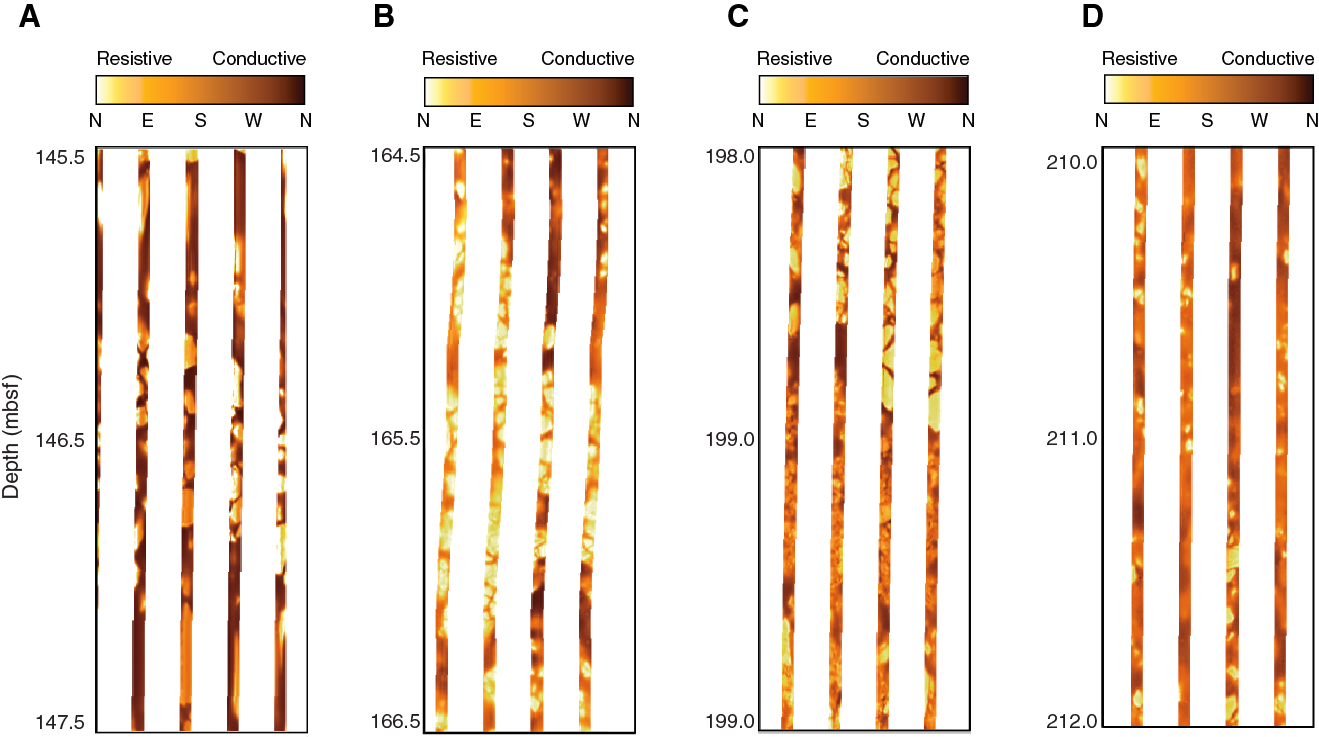
Core-log correlation
Correlation between core data and the corresponding downhole logging data can be very effective at repositioning core closer to its original depth in a borehole. However, where core recovery is very poor, depth matching between the 2 data sets is very challenging, and it is not always possible to confidently match individual features. Hole U1440B yielded only 12% core recovery, and consequently reconciling the differences in the depth scales is extremely difficult. The corresponding core data sets are plotted alongside the logging data (Figures F63, F64, F65) for comparison, highlighting the challenges in effective core-log correlation in this hole.
Comparison of the core physical properties and downhole logging data sets reveals some similarities and some differences. The gamma ray measurements have different units (core data in counts/s and downhole data in gAPI units) but overall show elevated levels in the sedimentary interval and lower values in the volcanic extrusive section (Figure F63). The density measurements are both bulk measurements, but the downhole data are based on gamma ray attenuation, whereas the core data are pycnometer measurements (see Physical properties). Core density for the top portion of the logged interval is generally higher than the in situ density, whereas the data sets agree below ~170 mbsf (Figure F64). P-wave velocity data are higher in the core data set than in the corresponding logging data set and the trends downhole are opposed, with the downhole VP increasing with depth and the overall core VP decreasing with depth (Figure F65). Two porosity measurements have been derived from the downhole data set (Figure F64), one from resistivity (using Archie’s law) and the other from density (assuming average grain density of 2.65 g/cm3 and fluid density of 1.026 g/cm3). Both exhibit decreasing downhole trends, though values of the porosity from density are significantly higher (note the different scales in the figure). Porosities acquired from the analysis of core samples with the pycnometer are more comparable in value to the porosity from resistivity, although their downhole trends are opposed, with in situ porosity decreasing with depth and core porosity increasing. The discrepancies between the continuous downhole measurements and the core data sets can be attributed to differences in the scale of the measurements as well as the proxies used to derive them.
Through-pipe gamma ray data
The gamma ray signal is attenuated by the BHA and the casing string, with the actual values reported being unreliable. However, total gamma ray measurements through the pipe and casing can indicate changes in the formation that can be correlated with the core description and core data. The joints in the BHA attenuate the signal more and this is indicated in the gamma ray log (Figure F69) by regular (every ~10 m) excursions in the log to the left. The joints in the casing (every ~11–13 m) do not appear to affect the signal in the same way.
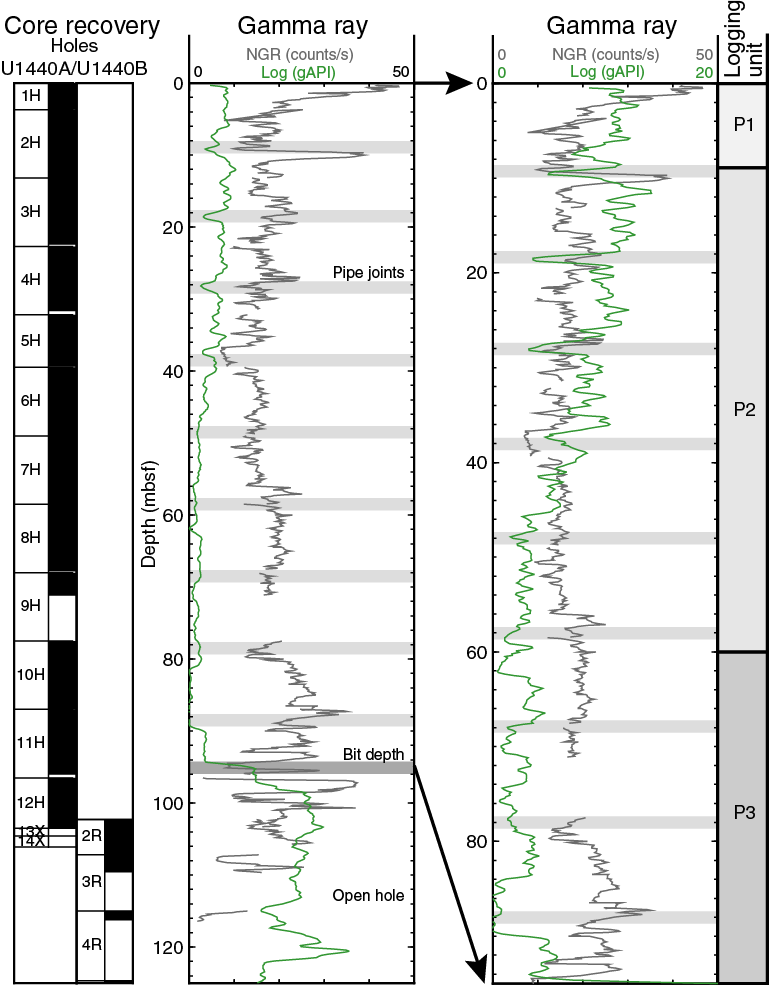
Total gamma ray values from the HNGS in Hole U1440B indicates an overall decreasing trend downhole that can be divided into three units. Gamma ray values in logging Unit P1 from seafloor to ~9 mbsf (bit depth), decrease downhole with submeter-scale variations and with highs at ~2, 6, and 8 mbsf. There is an increase in the intensity of the signal at the top of logging Unit P2 (~9–60 mbsf), which then decreases significantly with depth. Logging Unit P3 (~60–94.5 mbsf) demonstrates a change in character of the gamma ray log with lower frequency variation and no net change in value with depth. There are, however, block changes in the log curve that occur on the order of every 8 m that do not correspond with the BHA joints. Comparison with the corresponding core natural gamma radiation data (indicated by the gray curve on Figure F69) indicates some similarities in the trends encountered through the cased sedimentary interval of Hole U1440B.
Comparison with core description (see Sedimentology) indicates that logging Unit P1 corresponds to stratigraphic Subunit IA (mud with calcareous nannofossils). The boundary between logging Units P2 and P3 coincides with the boundary between stratigraphic Subunits IIA and IIB (from silty mud to muddy volcanic breccia).
References
Acton, G.D., Okada, M., Clement, B.M., Lund, S.P., and Williams, T., 2002. Paleomagnetic overprints in ocean sediment cores and their relationship to shear deformation caused by piston coring. Journal of Geophysical Research: Solid Earth, 107(B4):2067–2081. http://dx.doi.org/10.1029/2001JB000518
Audunsson, H., and Levi, S., 1989. Drilling-induced remanent magnetization in basalt drill cores. Geophysical Journal International, 98(3):613–622. http://dx.doi.org/10.1111/j.1365-246X.1989.tb02294.x
Cande, S.C., and Kent, D.V., 1995. Revised calibration of the geomagnetic polarity timescale for the Late Cretaceous and Cenozoic. Journal of Geophysical Research: Solid Earth, 100(B4):6093–6095. http://dx.doi.org/10.1029/94JB03098
Cosca, M.A., Arculus, R.J., Pearce, J.A., and Mitchell, J.G., 1998. 40Ar/ 39Ar and K-Ar geochronological age constraints for the inception and early evolution of the Izu-Bonin-Mariana arc system. Island Arc, 7(3):579–595. http://dx.doi.org/10.1111/j.1440-1738.1998.00211.x
Currie, C.A., and Hyndman, R.D., 2006. The thermal structure of subduction zone back arcs. Journal of Geophysical Research: Solid Earth, 111(B8):B08404. http://dx.doi.org/10.1029/2005JB004024
Doubrovine, P.V., and Tarduno, J.A., 2004. Self-reversed magnetization carried by titanomaghemite in oceanic basalts. Earth and Planetary Science Letters, 222(3–4):959–969. http://dx.doi.org/10.1016/j.epsl.2004.04.009
Doubrovine, P.V., and Tarduno, J.A., 2005. On the compositional field of self-reversing titanomaghemite: constraints from Deep Sea Drilling Project Site 307. Journal of Geophysical Research: Solid Earth, 110(B11):B11104. http://dx.doi.org/10.1029/2005JB003865
Einaudi, F., Godard, M., Pezard, P., Cochemé, J.-J., Brewer, T., and Harvey, P., 2003. Magmatic cycles and formation of the upper oceanic crust at spreading centers: geochemical study of a continuous extrusive section in the Oman ophiolite. Geochemistry, Geophysics, Geosystems, 4(6):8608. http://dx.doi.org/10.1029/2002GC000362
Fuller, M., Hastedt, M., and Herr, B., 1998. Coring-induced magnetization of recovered sediment. In Weaver, P.P.E., Schmincke, H.-U., Firth, J.V., and Duffield, W. (Eds.), Proceedings of the Ocean Drilling Program, Scientific Results, 157: College Station, TX (Ocean Drilling Program), 47–56. http://dx.doi.org/10.2973/odp.proc.sr.157.103.1998
Gieskes, J.M., Blanc, G., Vrolijk, P., Elderfield, H., and Barnes, R., 1990. Interstitial water chemistry—major constituents. In Moore, J.C., Mascle, A., et al., Proceedings of the Ocean Drilling Program, Scientific Results, 110: College Station, TX (Ocean Drilling Program), 155–178. http://dx.doi.org/10.2973/odp.proc.sr.110.170.1990
Gieskes, J.M., and Johnson, J., 1982. Interstitial water studies, Deep Sea Drilling Project Leg 60. In Hussong, D.M., Uyeda, S., et al., Initial Reports of the Deep Sea Drilling Project, 60: Washington, DC (U.S. Government Printing Office), 749–754. http://10.2973/dsdp.proc.60.142.1982
Gradstein, F.M., Ogg, J.G., Schmitz, M.D., and Ogg, G.M. (Eds.), 2012. The Geological Time Scale 2012: Amsterdam (Elsevier).
Heider, F., Dunlop, D.J., and Soffel, H.C., 1992. Low-temperature and alternating field demagnetization of saturation remanence and thermoremanence in magnetite grains (0.037 µm to 5 mm). Journal of Geophysical Research: Solid Earth, 97(B6):9371–9381. http://dx.doi.org/10.1029/91JB03097
Ishizuka, O., Tani, K., Reagan, M.K., Kanayama, K., Umino, S., Harigane, Y., Sakamoto, I., Miyajima, Y., Yuasa, M., and Dunkley, D.J., 2011. The timescales of subduction initiation and subsequent evolution of an oceanic island arc. Earth and Planetary Science Letters, 306(3–4):229–240. http://dx.doi.org/10.1016/j.epsl.2011.04.006
Jackson, M., Gruber, W., Marvin, J., and Banerjee, S.K., 1988. Partial anhysteretic remanence and its anisotropy: applications and grainsize-dependence. Geophysical Research Letters, 15(5):440–443. http://dx.doi.org/10.1029/GL015i005p00440
Jenner, F.E., and O’Neill, H.St.C., 2012. Analysis of 60 elements in 616 ocean floor basaltic glasses. Geochemistry, Geophysics, Geosystems, 13(2):Q02005. http://dx.doi.org/10.1029/2011GC004009
Kirschvink, J.L., 1980. The least-squares line and plane and the analysis of palaeomagnetic data. Geophysical Journal of the Royal Astronomical Society, 62(3):699–718.
http://dx.doi.org/10.1111/j.1365-246X.1980.tb02601.x
Lawrence, J.R., and Gieskes, J.M., 1981. Constraints on water transport and alteration in the oceanic crust from the isotopic composition of pore water. Journal of Geophysical Research: Solid Earth, 86(B9):7924–7934. http://dx.doi.org/10.1029/JB086iB09p07924
Le Bas, M.J., Le Maitre, R.W., Streckeisen, A., Zanettin, B., and the IUGS Subcommission on the Systematics of Igneous Rocks, 1986. A chemical classification of volcanic rocks based on the total alkali-silica diagram. Journal of Petrology, 27(3):745–750.
http://petrology.oxfordjournals.org/content/27/3/745.abstract
O’Reilly, W., 1984. Rock and Mineral Magnetism: New York (Chapman and Hall).
Özdemir, Ö., and O’Reilly, W., 1982. Magnetic hysteresis properties of synthetic monodomain titanomaghemites. Earth and Planetary Science Letters, 57(2):437–447. http://dx.doi.org/10.1016/0012-821X(82)90162-5
Reagan, M.K., Ishizuka, O., Stern, R.J., Kelley, K.A., Ohara, Y., Blichert-Toft, J., Bloomer, S.H., Cash, J., Fryer, P., Hanan, B.B., Hickey-Vargas, R., Ishii, T., Kimura, J.-I., Peate, D.W., Rowe, M.C., and Woods, M., 2010. Fore-arc basalts and subduction initiation in the Izu-Bonin-Mariana system. Geochemistry, Geophysics, Geosystems, 11(3):Q03X12. http://dx.doi.org/10.1029/2009GC002871
Reagan, M.K., McClelland, W.C., Girard, G., Goff, K.R., Peate, D.W., Ohara, Y., and Stern, R.J., 2013. The geology of the southern Mariana fore-arc crust: implications for the scale of Eocene volcanism in the western Pacific. Earth and Planetary Science Letters, 380:41–51. http://dx.doi.org/10.1016/j.epsl.2013.08.013
Reagan, M.K., Pearce, J.A., Petronotis, K., Almeev, R., Avery, A.A., Carvallo, C., Chapman, T., Christeson, G.L., Ferré, E.C., Godard, M., Heaton, D.E., Kirchenbaur, M., Kurz, W., Kutterolf, S., Li, H.Y., Li, Y., Michibayashi, K., Morgan, S., Nelson, W.R., Prytulak, J., Python, M., Robertson, A.H.F., Ryan, J.G., Sager, W.W., Sakuyama, T., Shervais, J.W., Shimizu, K., and Whattam, S.A., 2015a. Expedition 352 methods. In Reagan, M.K., Pearce, J.A., Petronotis, K., and the Expedition 352 Scientists, Proceedings of the International Ocean Discovery Program, 352: Izu-Bonin-Mariana Fore Arc: College Station, TX (International Ocean Discovery Program). http://dx.doi.org/10.14379/iodp.proc.352.102.2015
Reagan, M.K., Pearce, J.A., Petronotis, K., Almeev, R., Avery, A.A., Carvallo, C., Chapman, T., Christeson, G.L., Ferré, E.C., Godard, M., Heaton, D.E., Kirchenbaur, M., Kurz, W., Kutterolf, S., Li, H.Y., Li, Y., Michibayashi, K., Morgan, S., Nelson, W.R., Prytulak, J., Python, M., Robertson, A.H.F., Ryan, J.G., Sager, W.W., Sakuyama, T., Shervais, J.W., Shimizu, K., and Whattam, S.A., 2015b. Site U1439. In Reagan, M.K., Pearce, J.A., Petronotis, K., and the Expedition 352 Scientists, Proceedings of the International Ocean Discovery Program, 352: Izu-Bonin-Mariana Fore Arc: College Station, TX (International Ocean Discovery Program). http://dx.doi.org/10.14379/iodp.proc.352.103.2015
Roberts, A.P., Stoner, J.S., and Richter, C., 1996. Coring-induced magnetic overprints and limitations of the long-core paleomagnetic measurement technique: some observations from Leg 160, eastern Mediterranean Sea. In Emeis, K.-C., Robertson, A.H.F., Richter, C., et al., Proceedings of the Ocean Drilling Program, Initial Reports, 160: College Station, TX (Ocean Drilling Program), 497–505. http://dx.doi.org/10.2973/odp.proc.ir.160.115.1996
Saito, S., Underwood, M.B., Kubo, Y., and the Expedition 322 Scientists, 2010. Proceedings of the Integrated Ocean Drilling Program, Expedition 322: NanTroSEIZE Stage 2: Subduction Inputs: Tokyo (Integrated Ocean Drilling Program Management International, Inc.). http://dx.doi.org/10.2204/iodp.proc.322.2010
Shervais, J.W., 1982. Ti–V plots and the petrogenesis of modern and ophiolitic lavas. Earth and Planetary Science Letters, 59(1):101–118. http://dx.doi.org/10.1016/0012-821X(82)90120-0
Shipboard Scientific Party, 1990. Site 783. In Fryer, P., Pearce, J.A., Stokking, L.B., et al., Proceedings of the Ocean Drilling Program, Initial Reports, 125: College Station, TX (Ocean Drilling Program), 253–272. http://dx.doi.org/10.2973/odp.proc.ir.125.111.1990
Stern, R.J., and Bloomer, S.H., 1992. Subduction zone infancy: examples from the Eocene Izu-Bonin-Mariana and Jurassic California arcs. Geological Society of America Bulletin, 104(12):1621–1636. http://dx.doi.org/10.1130/0016-7606(1992)104<1621:SZIEFT>2.3.CO;2
Wilson, D.S., Teagle, D.A.H., Acton, G.D., et al., 2003. Proceedings of the Ocean Drilling Program, Initial Reports, 206: College Station, TX (Ocean Drilling Program). http://dx.doi.org/10.2973/odp.proc.ir.206.2003
1Reagan, M.K., Pearce, J.A., Petronotis, K., Almeev, R., Avery, A.A., Carvallo, C., Chapman, T., Christeson, G.L., Ferré, E.C., Godard, M., Heaton, D.E., Kirchenbaur, M., Kurz, W., Kutterolf, S., Li, H.Y., Li, Y., Michibayashi, K., Morgan, S., Nelson, W.R., Prytulak, J., Python, M., Robertson, A.H.F., Ryan, J.G., Sager, W.W., Sakuyama, T., Shervais, J.W., Shimizu, K., and Whattam, S.A., 2015. Site U1440. In Reagan, M.K., Pearce, J.A., Petronotis, K., and the Expedition 352 Scientists, Izu-Bonin-Mariana Fore Arc. Proceedings of the International Ocean Discovery Program, 352: College Station, TX (International Ocean Discovery Program). http://dx.doi.org/10.14379/iodp.proc.352.104.2015