Clemens, S.C., Kuhnt, W., LeVay, L.J., and the Expedition 353 Scientists
Proceedings of the International Ocean Discovery Program Volume 353
publications.iodp.org
doi:10.14379/iodp.proc.353.104.2016

Site U14441
S.C. Clemens, W. Kuhnt, L.J. LeVay, P. Anand, T. Ando, M. Bartol, C.T. Bolton, X. Ding, K. Gariboldi, L. Giosan, E.C. Hathorne, Y. Huang, P. Jaiswal, S. Kim, J.B. Kirkpatrick, K. Littler, G. Marino, P. Martinez, D. Naik, A. Peketi, S.C. Phillips, M.M. Robinson, O.E. Romero, N. Sagar, K.B. Taladay, S.N. Taylor, K. Thirumalai, G. Uramoto, Y. Usui, J. Wang, M. Yamamoto, and L. Zhou2
Keywords: International Ocean Discovery Program, IODP, Expedition 353, JOIDES Resolution, Site U1444, Indian monsoon, monsoon, Bay of Bengal, paleoclimate, Pliocene, Pleistocene, Holocene, Indian Ocean, salinity, Bengal Fan
MS 353-104: Published 29 July 2016
Background and objectives
The main scientific objective of International Ocean Discovery Program (IODP) Expedition 353 was to analyze the variability of precipitation and runoff in the Bay of Bengal on suborbital to orbital timescales. To achieve this objective, site locations were selected according to their proximity to the main sources of freshwater feeding the northern Bay of Bengal, including the Mahanadi River and the Ganges-Brahmaputra river complex, and the Andaman Sea, including the Irrawaddy and Salween river systems.
Within 1 month prior to the expedition start, the development of an alternate drilling plan that included only sites in international waters was required. To comply, we utilized existing site survey data acquired by the University of Bremen in 1994, 1997, and 2006 (Kudrass, 1994, 1997; Spieß et al., 2006) to locate drilling targets in the central Bengal Fan, following a latitudinal transect approach. This alternate plan included transects of sites at three different latitudes in international waters (11°N, 14°N, and 17°–18°N).
Drilling these alternative sites was unlikely to fulfill the paleoclimatic time-series oriented scientific objectives of Expedition 353 because the sedimentary archive of the Bengal Fan does not record the salinity history of the Indian monsoon core region, and the abundant turbidite sequences do not have the stratigraphic integrity required for high-resolution reconstruction of climate change. However, these alternate drill sites on the Bengal Fan are complementary to the goals of IODP Expedition 354 (France-Lanord et al., 2014). One of the crucial issues for Expedition 354 is the continuity of the terrigenous flux from the Himalayan source to the ~8°N drilling targets. Channel migration may, at times, decouple the middle fan from the supply. The addition of sites north of 8°N may help to evaluate these processes and provide additional material for the understanding of terrigenous flux into the Bengal Fan, one of the main objectives of Expedition 354.
Site U1444 (14°N, 84°49.74′E; 3133 meters below sea level [mbsl]) is located at common midpoint (CMP) 1302 on seismic Line GeoB97-041 (Schwenk and Spieß, 2009) (Figure F1). The site is located in the western part of the Bengal Fan, close to the westernmost abandoned channel that fed the western part of the lower fan (Emmel and Curray, 1984). Interpretation of the seismic lines suggests that these sediments are composed of a series of buried channel-levee sequences incised into hemipelagic sediments atop the underlying 85°E Ridge. Schwenk and Spieß (2009) identified two prominent unconformities (Uc and Ud) bounding a more transparent hemipelagic unit between 4.32 and 4.20 s two-way traveltime, corresponding to ~105 to 185 meters below seafloor (mbsf). These unconformities can be traced for several hundred kilometers to the east along Line GeoB97-041 (Schwenk and Spieß, 2009). Similar regional-scale unconformities in the lower fan have been correlated to Deep Sea Drilling Project Site 218 and dated as early Pliocene (~4.8 Ma) and Middle Pleistocene (~0.65 Ma) in age (Von der Borch, Sclater, et al., 1974; Schwenk and Spieß, 2009). Unconformities Uc and Ud were inferred to be correlative with these lower fan unconformities. A primary objective of this site was to determine the lithologic changes associated with seismic reflectors (Unconformities Uc and Ud) and to date these reflectors in an effort to assess the degree to which turbidite and intercalated hemipelagic sequences can be correlated from the upper to lower fan regions.
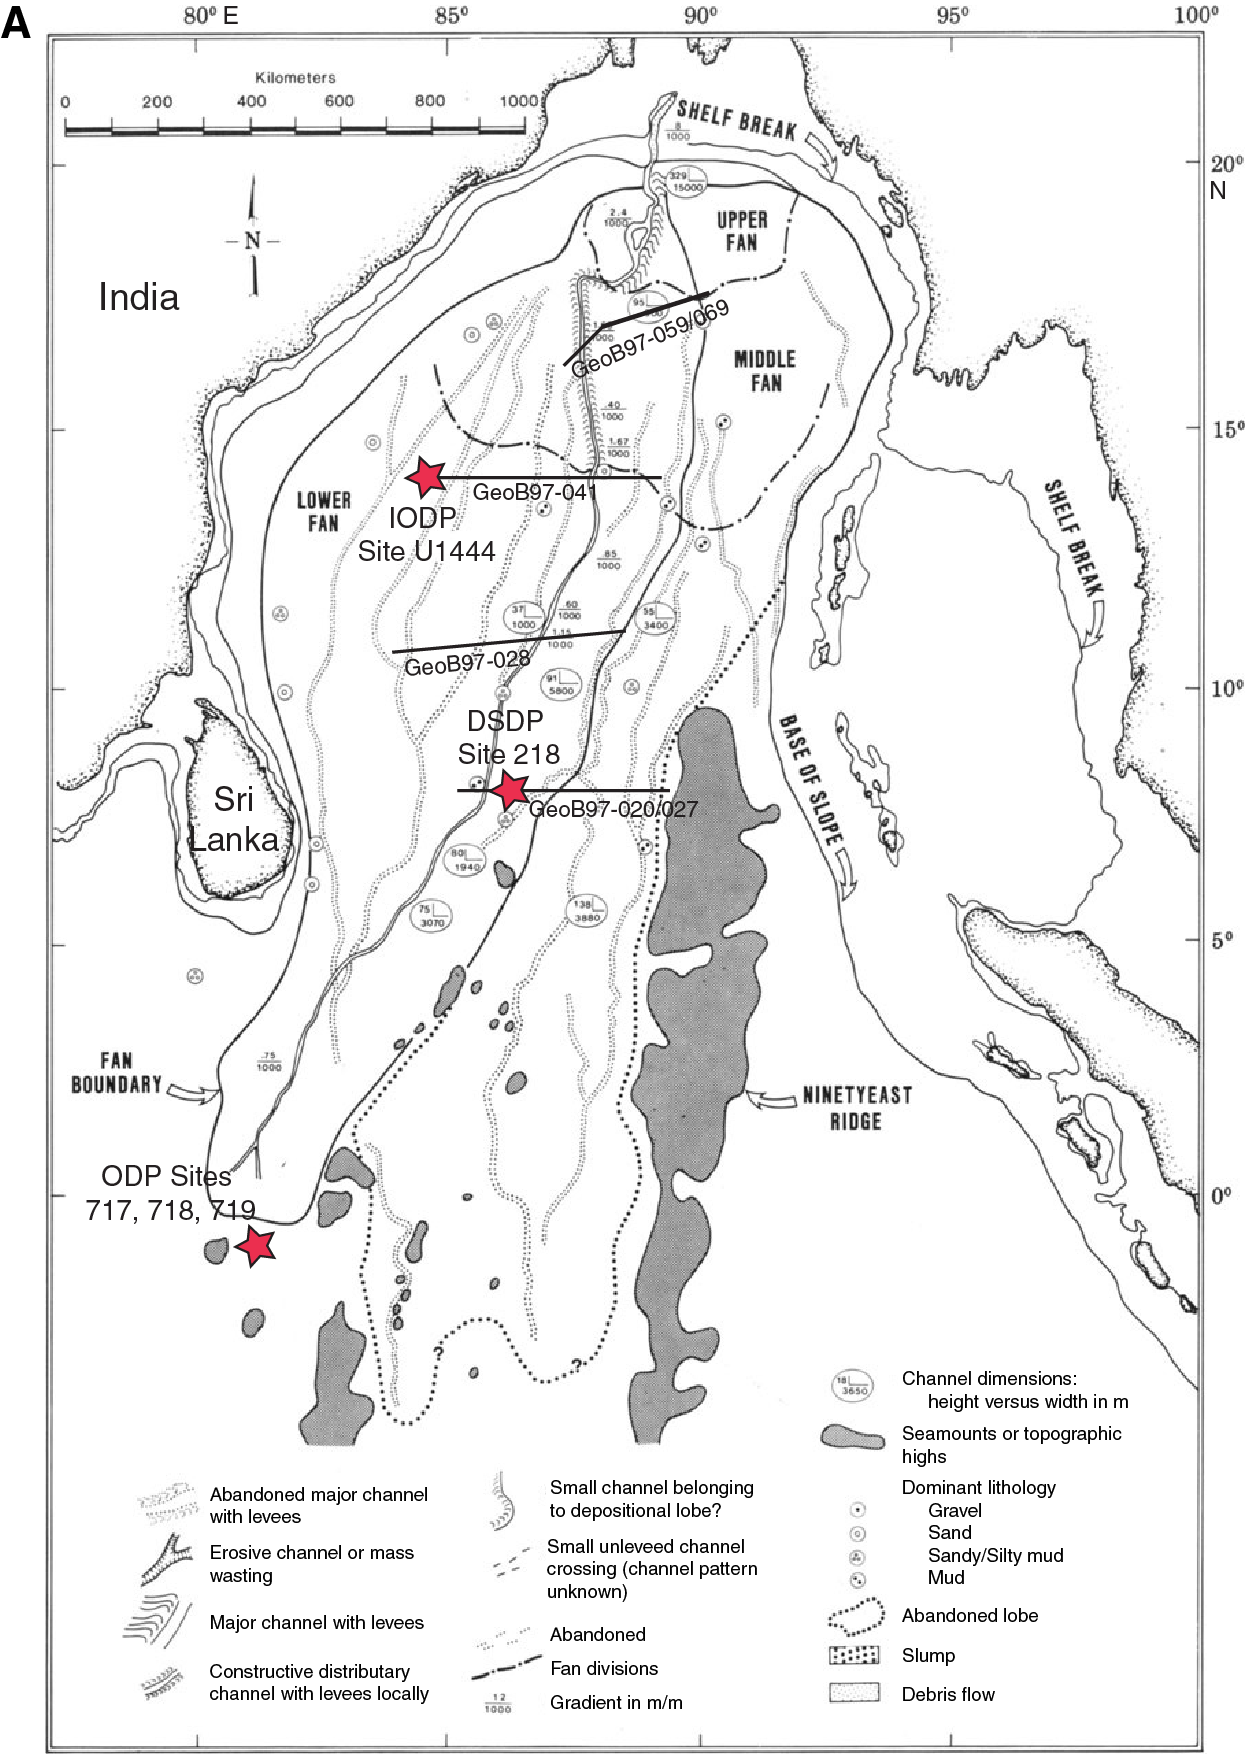
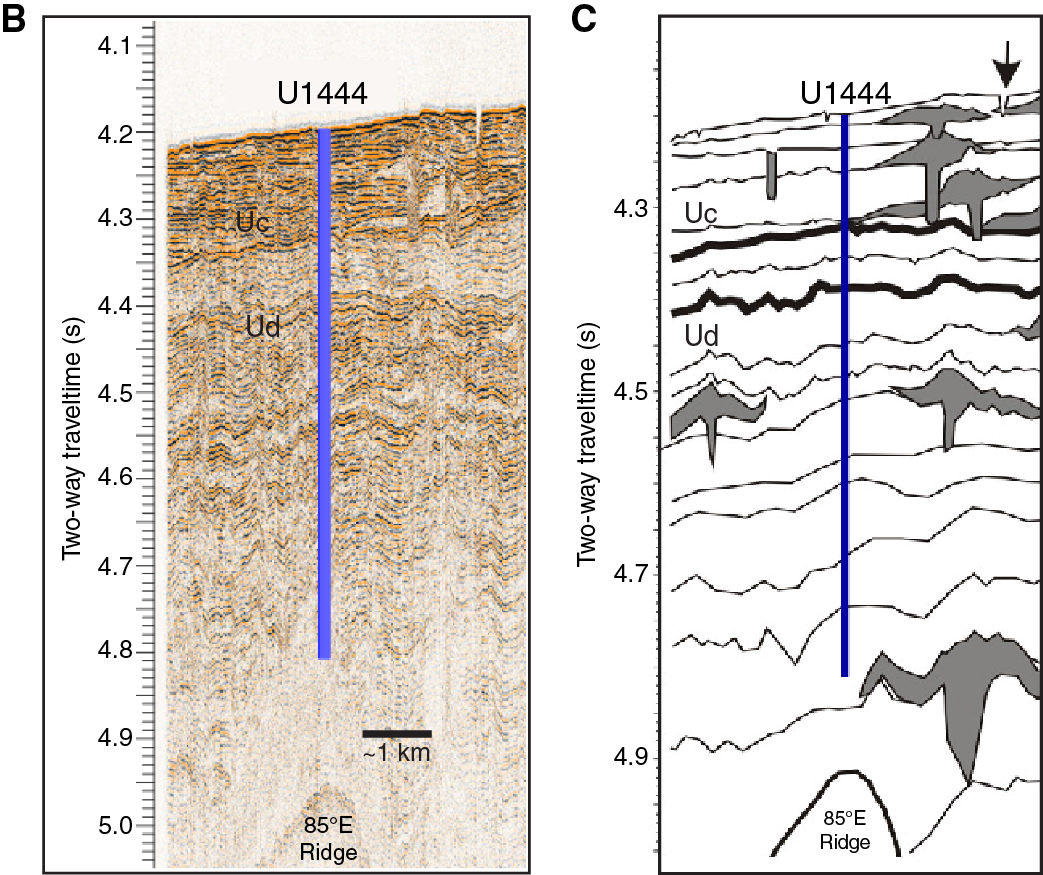
Figure F1. Site U1444 location, seismic line, and line-drawing interpretation.
Operations
Site U1444 consisted of two holes (Table T1), ranging in depth from 128.6 to 330.6 m drilling depth below seafloor (DSF). Overall, 46 cores were recorded for the site. A total of 156.21 m of core over a 160.0 m cored interval was recovered using the advanced piston corer (APC) system (98% recovery). The half-length advanced piston corer (HLAPC) system was used to core a 4.8 m interval and 3.94 m of core was recovered (82%). The cored interval with the extended core barrel (XCB) system was 246.9 m with a core recovery of 140.06 m (57%). The overall recovery percentage for Site U1444 was 73%. The total time spent on Site U1444 was 3.9 days.
Table T1. Site U1444 core summary. Download table in .csv format. View PDF table.
Transit to Site U1444
Following the end of Site U1443, the vessel had an 826 nmi transit to Visakhapatnam, India, in order to undergo a Naval Inspection and board three Indian scientists. This inspection is mandatory for receiving clearance to operate within the Indian exclusive economic zone. At 1048 h (UTC + 8 h) on 18 December 2014, the ship arrived ~36 nmi outside of the port. The port agent alerted the ship not to come into port until all of the necessary permits and exemptions were in place. After 5 days of waiting on standby at the operator’s request, the decision was made to begin coring operations at alternative Bengal Fan sites in international waters. After learning that Indian customs would not allow any additional passengers, including Indian scientists, to board until the ship docked and port formalities were conducted, the vessel began the transit to Site U1444 (proposed alternate Site BoB-11A).
Site U1444
The vessel arrived at Site U1444 at 0715 h on 24 December 2014, after a 191 nmi transit. A beacon was deployed, an APC/XCB bottom-hole assembly was made up, and the drill string was assembled.
Hole U1444A
The first attempt at a mudline core resulted in a broken and bent core barrel (the fifth and final broken core barrel of Expedition 353). The vessel was offset 10 m north to avoid core barrel debris, and a second mudline core was attempted. Hole U1444A was spudded at 2035 h on 24 December. The water depth was estimated to be 3143.4 meters below rig floor (mbrf) based on the precision depth recorder. APC coring continued to 112.5 mbsf. The XCB system was then deployed. Core recovery dropped significantly between Cores 353-U1444A-20X and 30X (15%). The HLAPC was deployed for Core 24F in an attempt to recover more sediment. This core returned 3.94 m of watery, unconsolidated sand. When Core 37X was retrieved from 330.9 mbsf, it was noted that the cutting shoe had failed and part of it was left in the hole. Coring was terminated in Hole U1444A. The drill string was pulled out of the hole and cleared the seafloor at 0600 h on 27 December, ending Hole U1444A.
Nonmagnetic core barrels were used on Cores 353-U1444A-2H through 13H and 24F. Core orientation using the Icefield MI-5 tool was performed on Cores 2H through 13H. Temperature measurements were taken on Cores 4H, 7H, 10H, and 13H using the advanced piston corer temperature tool (APCT-3); however, the temperature measurement for Core 13H appears to be erroneous, potentially because of the difficulties extracting the core barrel from the sediment.
A total of 13 APC cores were taken over a 112.5 m interval with a total core recovery of 112.93 m (100% core recovery). One HLAPC core was retrieved over a 4.8 m interval with 3.94 m recovered (82%). The XCB system was used for 23 cores over a cored interval of 213.3 m with 109.18 m recovered (51%). Total core recovery for Hole U1443A was 68%.
Hole U1444B
The vessel was offset 20 m to the south, and Hole U1444B was spudded from 3142.5 mbrf. A full core was retrieved and the seafloor was estimated at 3142.5 mbrf. The APC system was deployed for Cores 353-U1444B-1H through 5H, which reached a depth of 47.5 mbsf. Nonmagnetic core barrels were used for Cores 2H through 5H. The hole was then drilled to 95 mbsf, and the XCB system was deployed for Cores 7X through 10X. Hole U1444B was terminated at a total depth of 128.6 mbsf. The drill string was recovered and the bit cleared the seafloor at 2220 h on 27 December. The bit cleared the rotary table at 0445 h on 28 December, and the beacon was recovered at 0600 h. The thrusters were raised at 0630 h, and the sea voyage back to Visakhapatnam began at 0645 h.
A total of five APC cores were taken over a 47.5 m interval with a total core recovery of 43.28 m (91% core recovery). The XCB system was used for four cores over an interval of 33.6 m with 30.88 m recovered (92%). A drilled interval was recorded in Hole U1444B of 47.5 m. Total core recovery for Hole U1443B was 91%.
Lithostratigraphy
Sediments recovered from Holes U1444A and U1444B can be divided into four lithostratigraphic units based on macroscopic and smear slide description and physical property measurements (Figures F2, F3, F4, F5, F6). The recovered lithologies are predominantly siliciclastic and comprise turbidites and some hemipelagic intervals. Unit I (0–95.01 m core depth below seafloor, Method A [CSF-A]) is composed of silty sand and silty clay with numerous turbidites. Unit II (95.01–168.91 m CSF-A) is primarily nannofossil-rich clay with silt and foraminifers. Turbidites in Unit II are still present but less abundant, thinner, and finer than in Unit I. Unit III (168.91–255.6 m CSF-A) is characterized by very poor recovery and is dominated by silty fine to medium sand. Unit IV (255.6–323.39 m CSF-A) comprises primarily nannofossil-rich clay and clayey silt interbedded with sand and silt turbidites. Turbidites at this site show typical erosional bases and normal (fining-upward) grading but rarely show structures typical of classic Bouma or Stow sequences (e.g., parallel, wavy, or lenticular laminae). Structureless turbidites suggest very rapid sedimentation, bioturbation, and/or coring disturbance. Turbidites are classified by their maximum grain size as either silt or sand and by their bedding thickness (Table T2). At Site U1444, turbidites are also classified compositionally as mica rich, well-sorted quartz dominant, organic debris rich, and glauconite rich (Figure F6E–F6H). The overall lithologic differences between units and variation in turbidite grain size and thickness are consistent with fluctuations in the proximity of active turbidity current channels on the Bengal Fan and may also result from the combination of tectonic and sea level (orbital timescales) effects. Sediments transported downslope within large submarine fan systems in the Bay of Bengal are further distributed through a multitude of channels from the northern Bay of Bengal toward the south. We observed several different compositions of turbidites, in particular mica-, quartz-, glauconite-, and organic-rich turbidites, suggesting changes in the source of the material. Erosive contacts observed at the base of the turbidites indicate that some portion of hemipelagic sedimentation has not been preserved at this site.
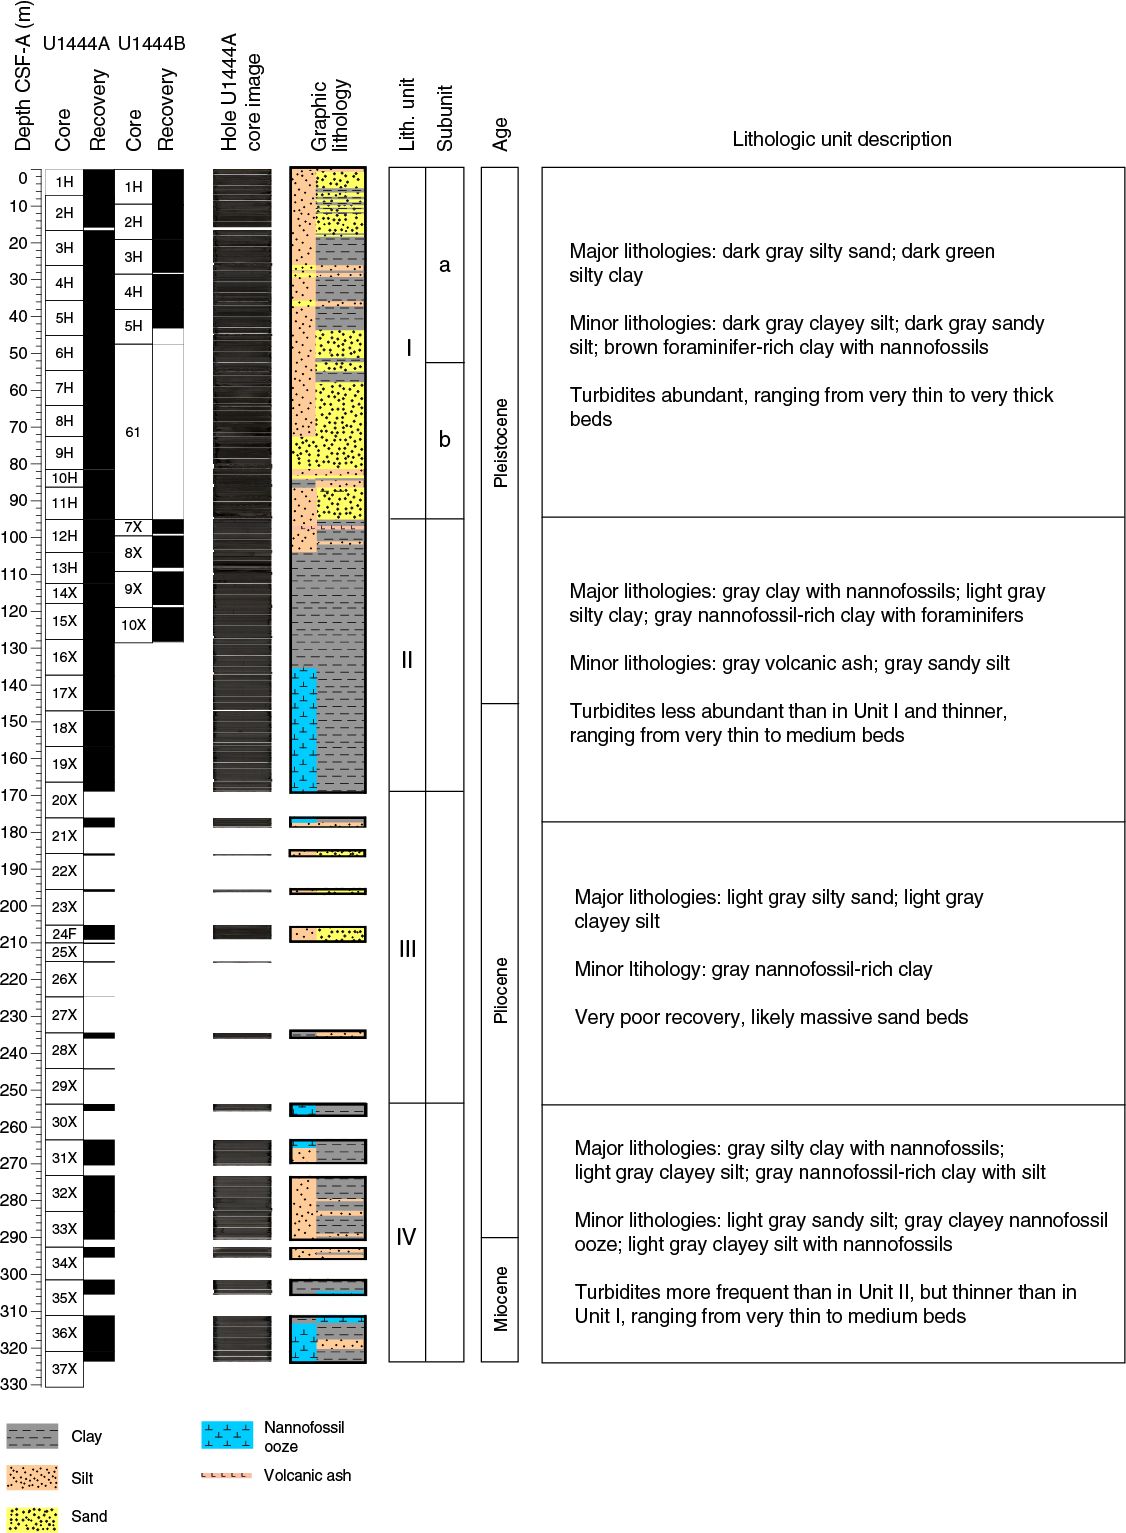
Figure F2. Lithostratigraphic summary, Site U1444.
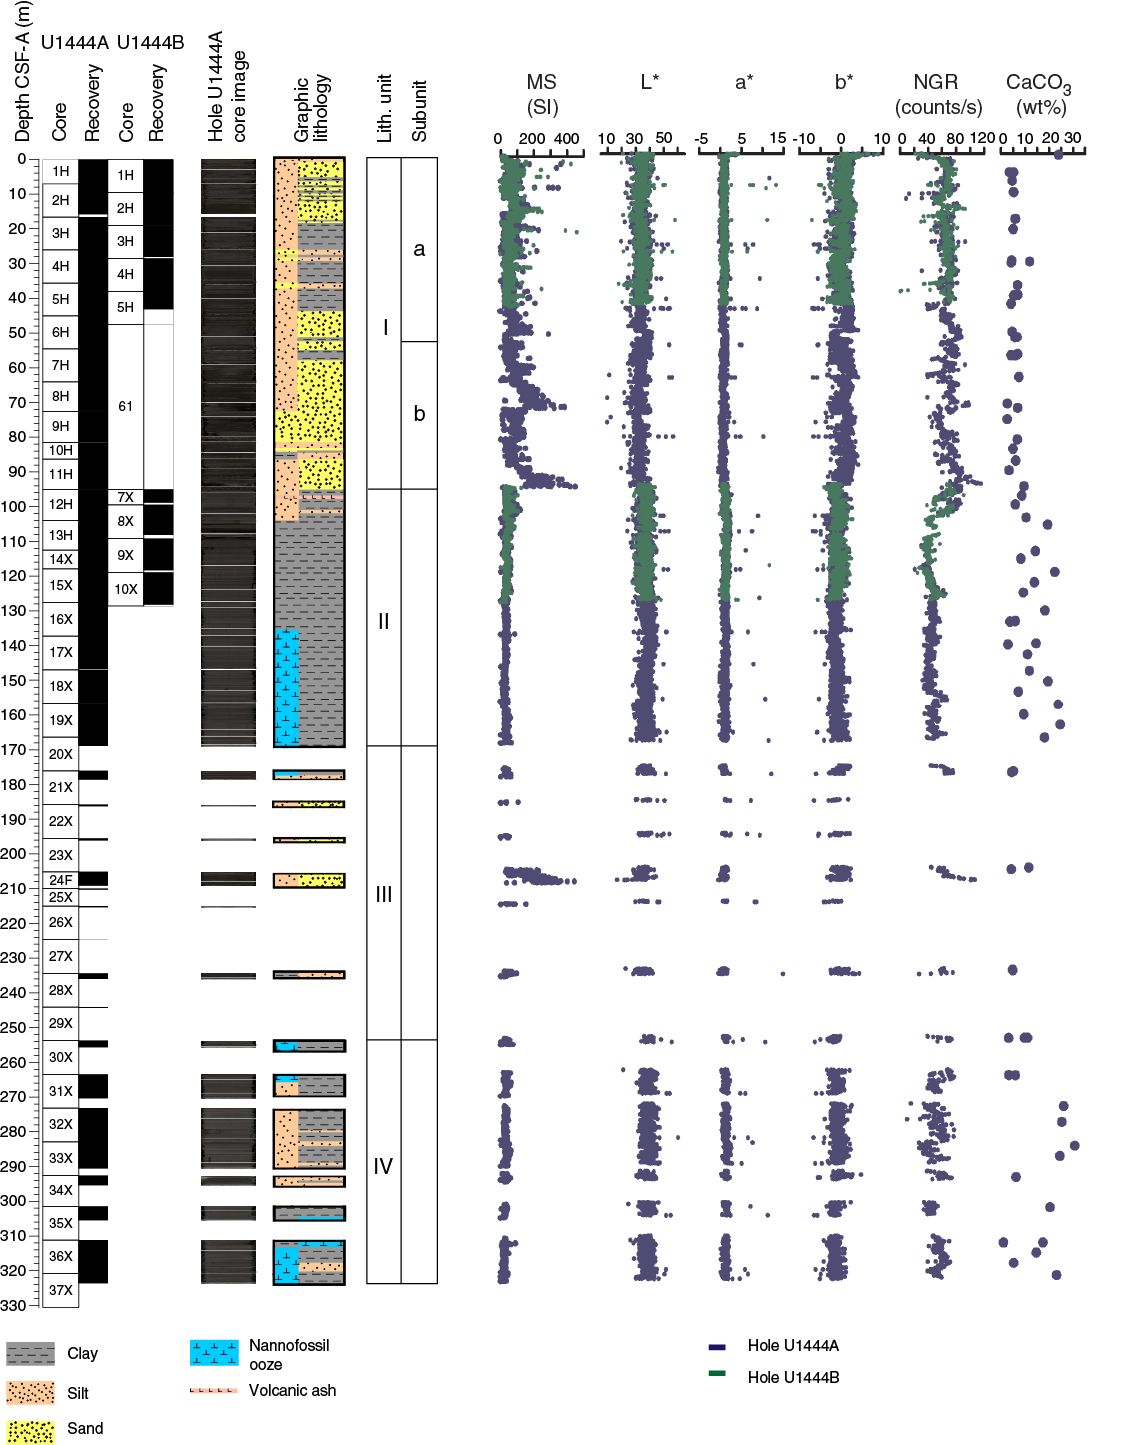
Figure F3. Lithostratigraphic summary with selected physical property and geochemical data from Holes U1444A and U1444B.
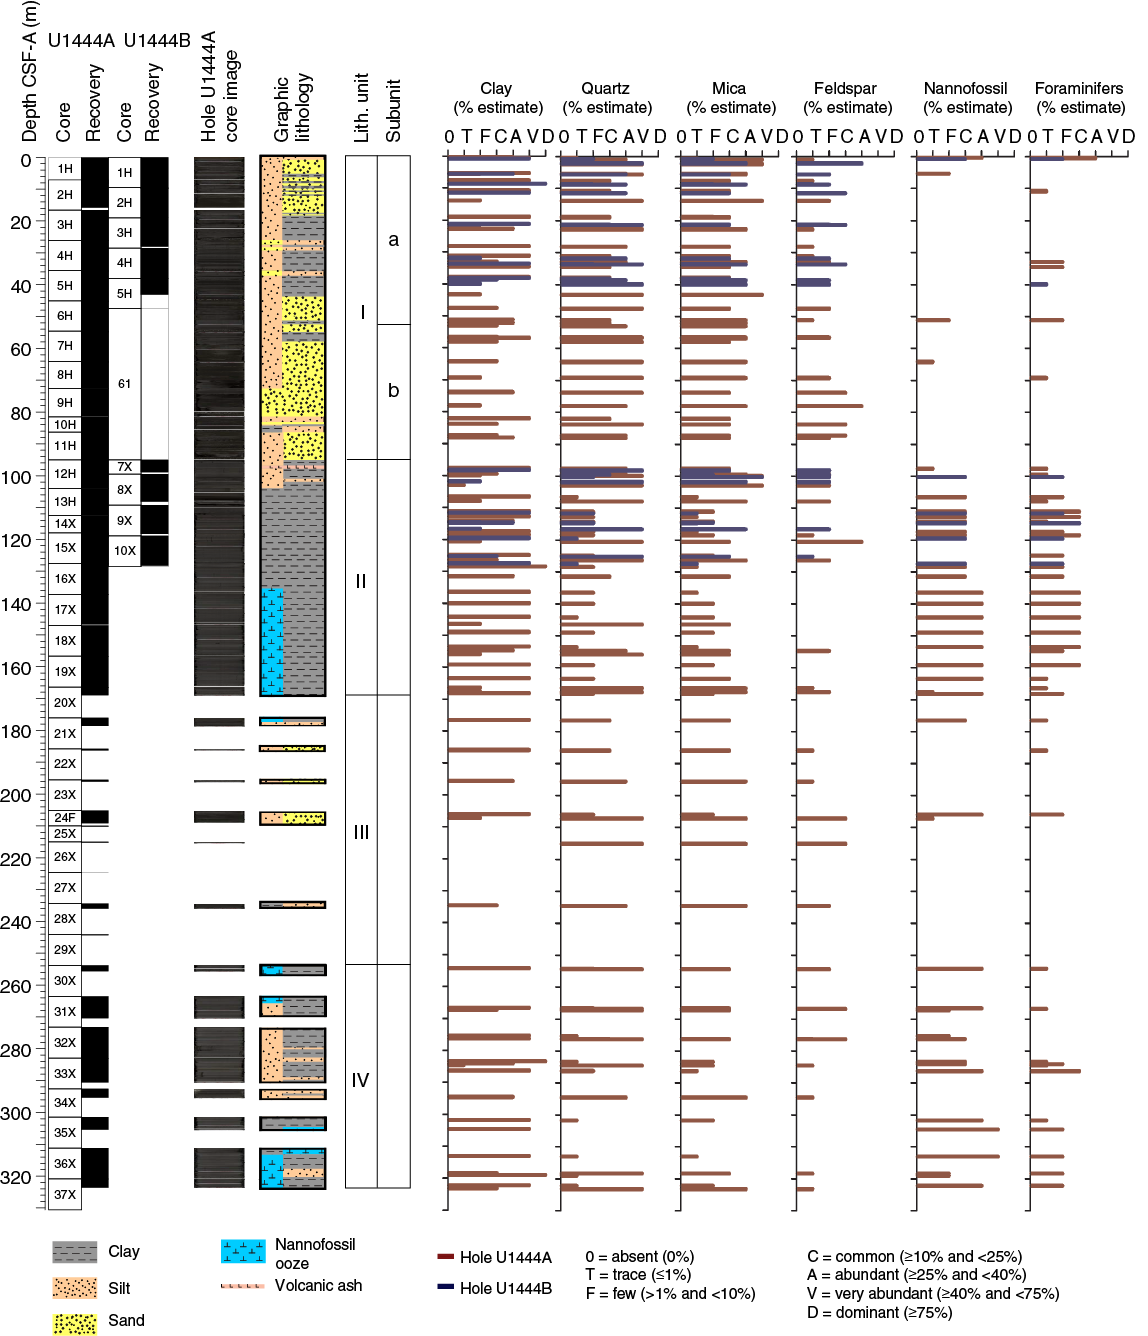
Figure F4. Smear slide data, Holes U1444A and U1444B.
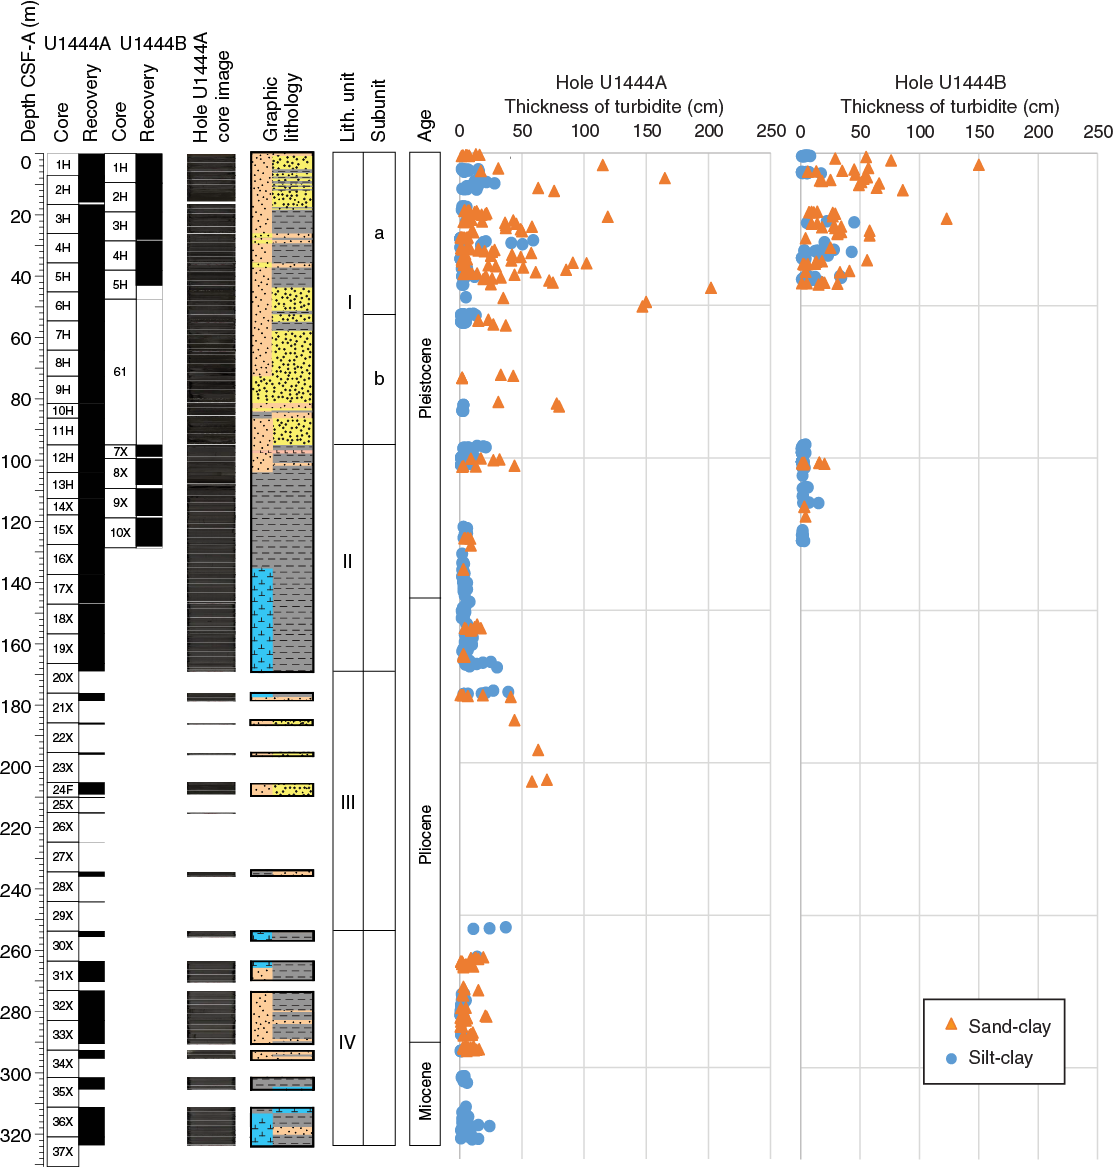
Figure F5. Turbidite thickness and maximum grain size class, Site U1444.
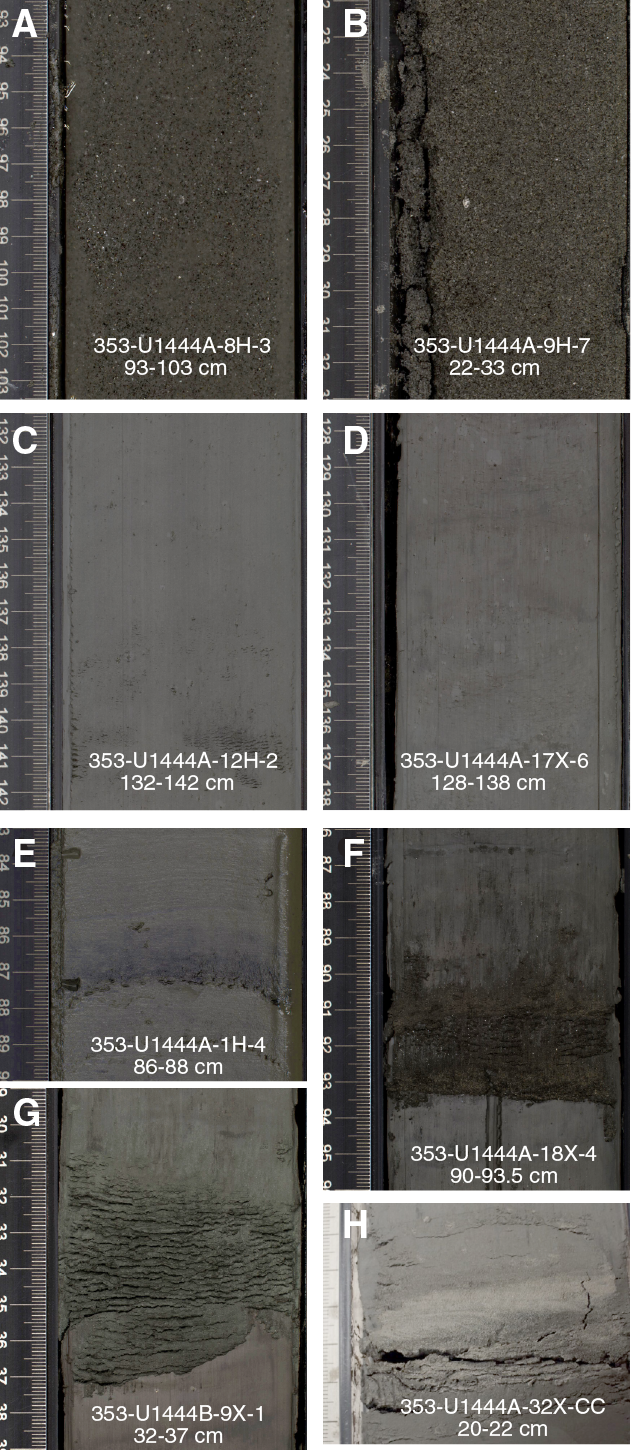
Figure F6. Major lithologies and representative turbidite compositions. A. Silty sand. B. Sandy silt. C. Silty clay. D. Nannofossil-rich clay with foraminifers. E. Organic-rich turbidite. F. Mica-rich turbidite. G. Glauconite-rich turbidite. H. Quartz-rich turbidite.
Table T2. Number, grain-size classification, and thickness of turbidites, Hole U1444A. Download table in .csv format.
Unit I
- Intervals: 353-U1444A-1H-1, 0 cm, through 11H-CC, 8 cm; 353-U1444B-1H-1, 0 cm, through 5H-CC, 19 cm
- Depths: Hole U1444A = 0–95.01 m CSF-A; Hole U1444B = 0–43.11 m CSF-A
- Age: Pleistocene
- Lithology: silty sand and silty clay
Unit I is a 94 m thick sequence dominantly comprising turbidites with lithologies ranging from silty sand to silty clay (Figure F6). Sand grains are composed of quartz and mica, with variable feldspar and lithic fragment content (Figure F7A–F7B). Bulk X-ray diffraction (XRD) measurements of sand intervals in Unit I show a dominant quartz and mica component. Plant debris was commonly observed in smear slides (Figure F7G–F7I). Iron oxides and, to a lesser extent, pyrite framboids were observed as trace components in smear slides from Unit I. Pyrite framboids were most commonly observed in smear slides with more abundant plant debris/organic fragments. In total, 241 turbidites were observed (2.54/m) in Unit I ranging up to 2 m thick (14 cm thick on average). Because some fine-grained overlying sediment may have been deposited along with the coarser basal portion as a turbidite sequence and some fine-grained sequences may have been subsequently eroded, the measured thickness and occurrence of turbidites in Unit I provide only a minimum estimate. In general, turbidites with a maximum grain size in the sand size range are thicker than finer turbidites with silt as the maximum grain size (Figure F5). Unit I is divided into two subunits; Subunit Ib is distinguished from Subunit Ia by increased dominance of sand downhole. Many core sections comprised loose, soupy sand that was actively moving/sorting within the core liner prior to splitting. The predominance of coarse-grained (silty sand) and thick beds within this unit is an indication of deposition proximal to the sediment source or to the channel.
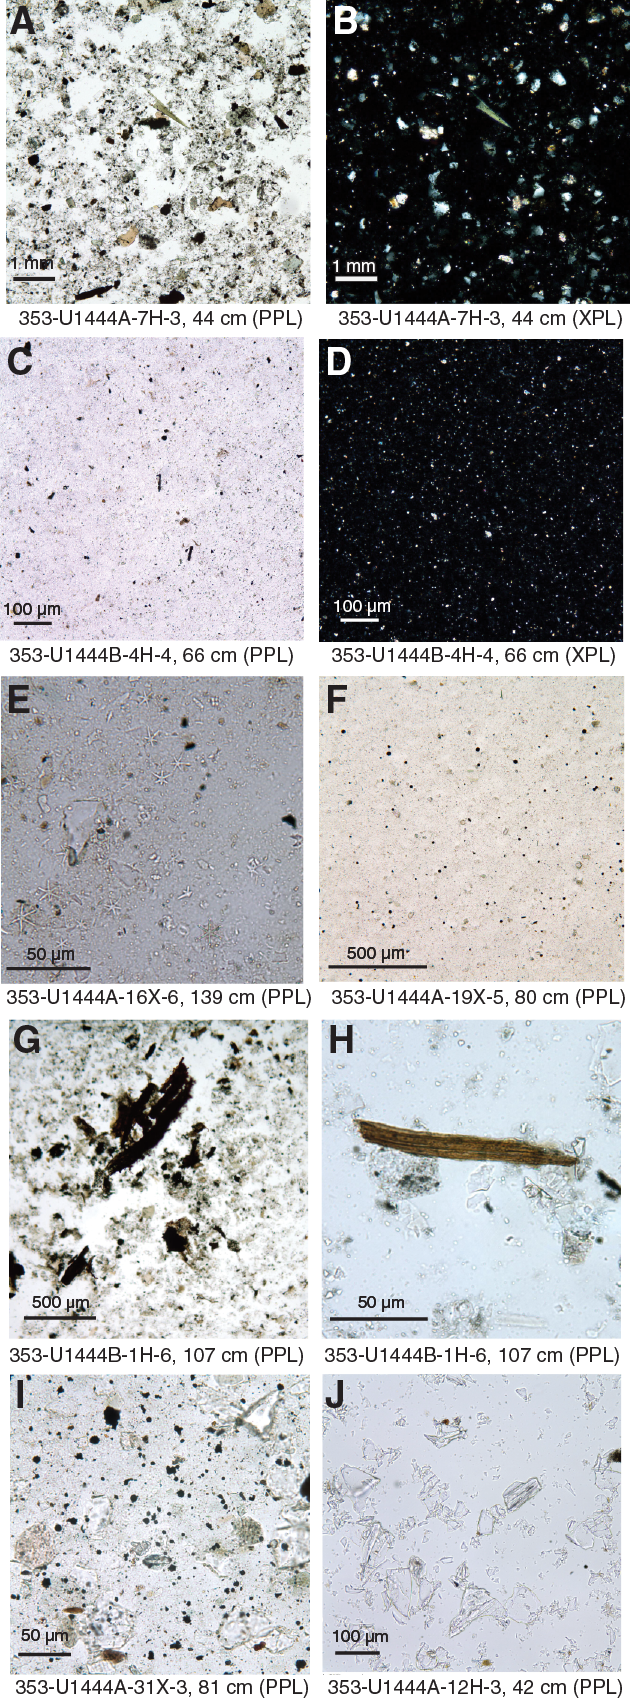
Figure F7. Main sedimentary components. A, B. Quartz, feldspar, and mica-rich silty sand. C, D. Silty clay with quartz and woody fragments. E. Nannofossil-rich clay with silt and foraminifers. F. Silty clay with pyrite. G, H. Black layer, silty clay rich in woody fragments. I. Greenish black layer. J. Vitric volcanic ash layer.
Subunit Ia
- Intervals: 353-U1444A-1H-1, 0 cm, through 6H-5, 150 cm; 353-U1444B-1H-1, 0 cm, through 5H-CC, 19 cm
- Depths: Hole U1444A = 0–52.60 m CSF-A; Hole U1444B = 0–43.11 m CSF-A
- Age: Pleistocene
- Lithology: silty clay and silty sand
Dark greenish gray (GLEY 1 4/10Y) silty clay and silty sand are the primary lithologies, with turbidites ranging in thickness from very thin beds (<3 cm) to very thick beds (>100 cm). Sand grains within turbidites are dominated by quartz and mica with variable feldspar and plant debris content (Figure F6). The upper 0.42 m of Section 353-U1444A-1H-1 is a brown (10YR 5/4) foraminifer-rich clay with nannofossils that appears to be oxidized. In the remainder of Unit I, foraminifers and nannofossils were rarely observed. Diatoms and other biosiliceous fragments were observed in this uppermost interval of the core and were absent from the remainder of the hole. Rare volcanic glass shards were observed in smear slides from the upper 10 m. Glauconite was observed in samples between 28 and 32 m CSF-A. The base of Subunit Ia is defined by a decrease in the abundance of clay intervals and a transition to massive sand beds in Subunit Ib, illustrating a change in the proximity to active turbidity currents.
Subunit Ib
- Interval: 353-U1444A-6H-6, 0 cm, through 11H-CC, 8 cm
- Depth: Hole U1444A = 52.60–95.01 m CSF-A
- Age: Pleistocene
- Lithology: silty sand, silty clay, and clayey silt
In Subunit Ib, the relative amount of dark gray (GLEY 1 3/N) silty sand and sand with silt to dark gray (GLEY 1 4/10Y) silty clay increases. Cores 353-U1444A-8H and 11H are composed almost entirely of loose sand that shows magnetic susceptibility (MS) evidence of mechanical sorting of ferrimagnetic heavy minerals within the core during the coring and recovery process (see Physical properties). Quartz and mica are the most common sand components, with minor plagioclase and plant debris/charcoal present.
Unit II
- Intervals: 353-U1444A-11H-CC, 8 cm, through 20X-CC, 48 cm; 353-U1444B-7X-1, 0 cm, through 10X-CC, 57 cm
- Depths: Hole U1444A = 95.01–168.91 m CSF-A; Hole U1444B = 95.00–128.23 m CSF-A
- Age: Pleistocene to Pliocene
- Lithology: clay with nannofossils, silty clay, and nannofossil-rich clay with silt
Unit II is a 74 m thick mostly hemipelagic interval of gray (5Y 5/1) nannofossil-rich clay and clay with nannofossils with light gray (GLEY 1 5/10Y) silty clay. Foraminifers were commonly observed in nannofossil clay intervals and sometimes as a constituent within turbidites. Foraminifers likely represent primary deposition in clay intervals but are likely reworked in turbidites. Faint color variations within the hemipelagic intervals suggest variable and cyclic delivery of siliciclastic and biogenic material. Turbidites are less common (2.15/m) and thinner (mean thickness = 6.5 cm) in this interval (Figure F5). Fewer turbidites contain sand and most have a maximum grain size in the silt range. XRD analyses indicate higher quartz and mica content and lower calcite content in turbidites relative to surrounding hemipelagic sediment (Figure F8). Clay mineralogy from XRD indicates a high abundance of smectite relative to illite in the Pleistocene-age sediments of Unit II (Figure F9), transitioning with depth to higher peaks of illite relative to smectite in the Pliocene and Miocene sediments of Units III and IV. In addition, the abundance of kaolinite relative to chlorite decreases below the Pleistocene/Pliocene boundary. A volcanic ash layer was observed in intervals 353-U1444A-12H-3, 40–45 cm (97.92–97.96 m CSF-A), and 353-U1444B-8X-1, 8–13 cm (99.58–99.64 m CSF-A) (Figure F7J). Glauconite was observed sporadically throughout Unit II, and glauconite-rich layers and blebs were observed between 114 and 116 m CSF-A. A bleb of volcanic ash was also observed at 114.26 m CSF‑A in Hole U1443B. Plant debris was commonly observed in smear slides but with a lower abundance than in Unit I. Pyrite framboids were observed more commonly than in Unit I.
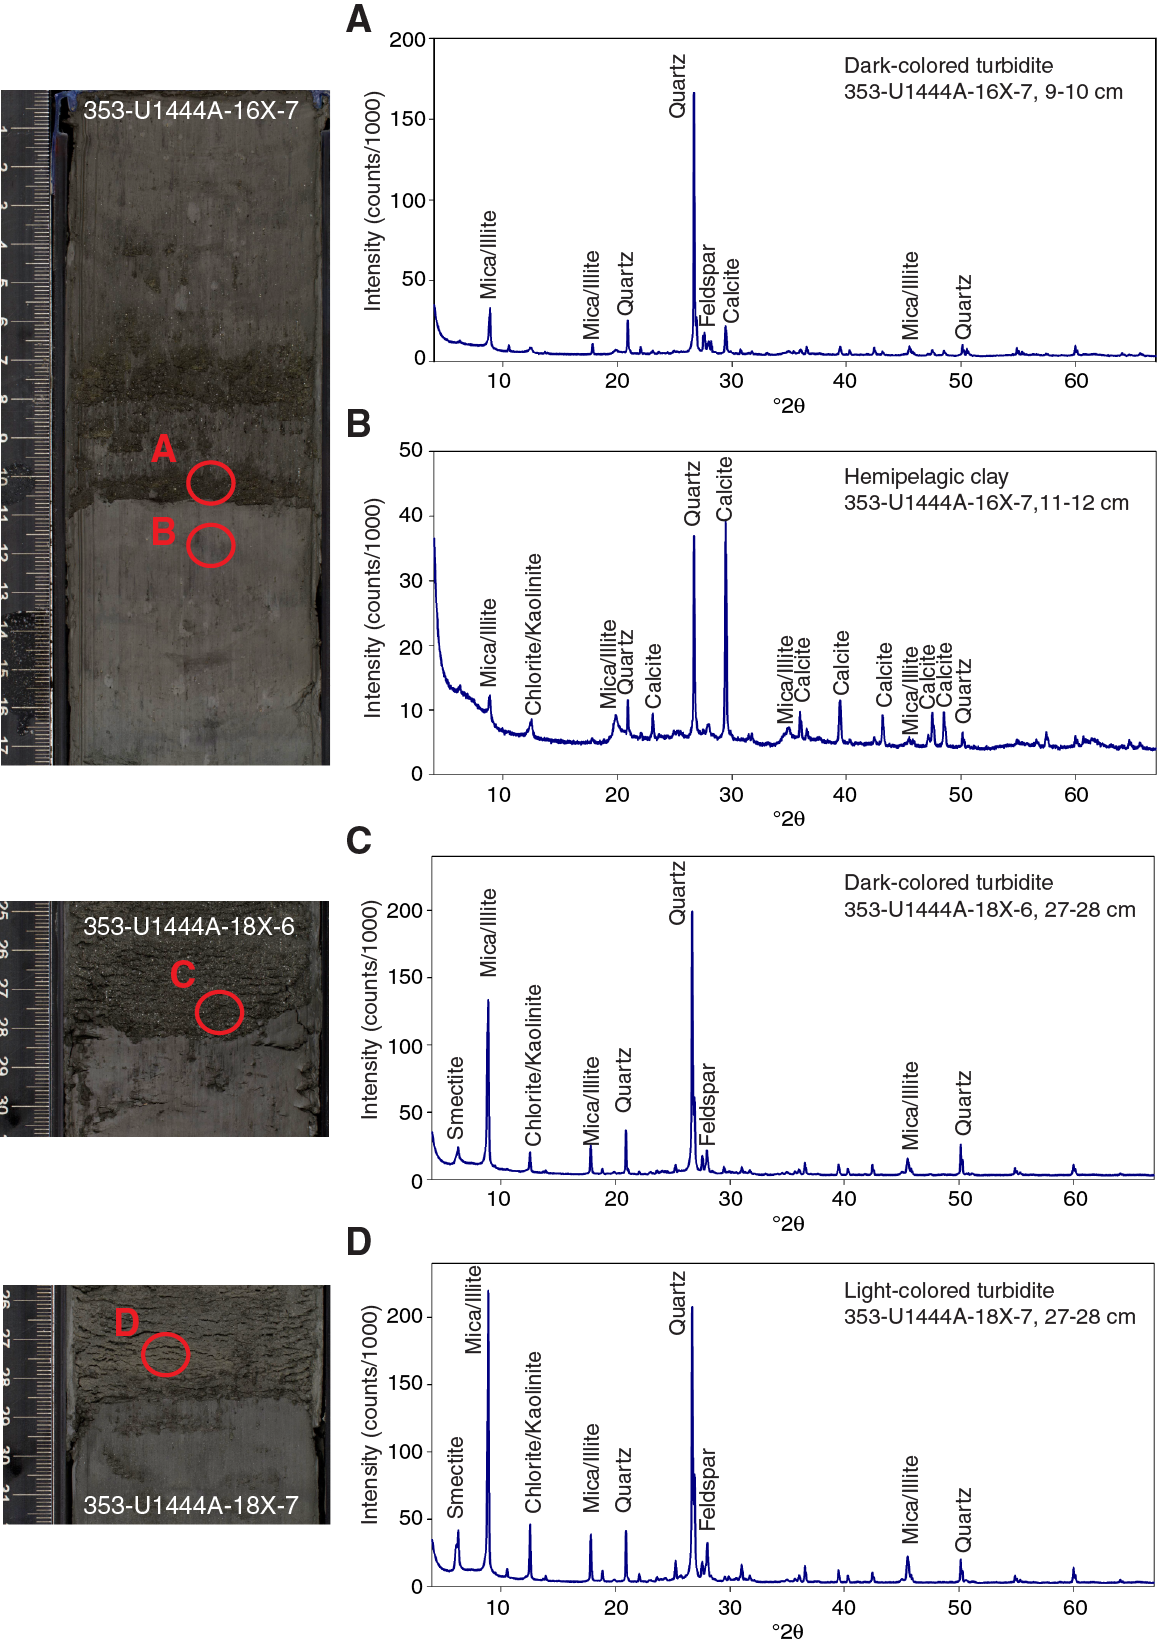
Figure F8. XRD diffractograms of bulk powders. A, C. Dark-colored turbidites. B. Hemipelagic clay. D. Light-colored turbidite.

Figure F9. XRD diffractograms of oriented clay aggregates treated with ethylene glycol, Hole U1444A.
Unit III
- Interval: 353-U1444A-20X-CC, 48 cm, through 31X-1, 0 cm
- Depth: Hole U1444A = 168.91–255.60 m CSF-A
- Age: Pliocene
- Lithology: silty fine to medium sand, silty clay, and silty clay with nannofossils
Unit III is an 86.7 m interval in which only 11% of the sediment was recovered. Recovered cores are most commonly light gray (GLEY 1 5/10Y) silty sand, with intervals of gray (5Y 5/1) silty clay with variable nannofossil abundance. In Unit III, clay XRD analyses show a high relative abundance of illite relative to chlorite and a high abundance of chlorite relative to kaolinite, continuing the trend observed in the Pliocene sediments of Unit II (Figure F9). Unit III contains sandy turbidites thicker than 50 cm. The lack of recovery suggests that the missing intervals likely comprise unconsolidated sand, although a ~5 cm fragment of silica-cemented organic-rich sandstone at the top of Core 353-U1444A-31X suggests more lithified beds are also present but not recovered. Sand grains are most commonly quartz and mica with minor feldspar and lithic fragment components.
Unit IV
- Interval: 353-U1444A-31X-1, 0 cm, through 37X-CC, 30 cm
- Depth: Hole U1444A = 255.60–323.39 m CSF-A
- Age: Pliocene to Miocene
- Lithology: nannofossil-rich clay and clayey silt
Unit IV is a largely hemipelagic unit of gray (5Y 5/1) nannofossil-rich clay and clayey silt in the lowermost 68.4 m of Hole U1444A, with better recovery (64%) compared to Unit III. Silt and sand turbidites are common (2.39/m) and are relatively thin (mean thickness = 4.8 cm) (Figure F5). Turbidites with a maximum grain size of silt are found throughout the unit, whereas sandy turbidites are found between 255 and 295 m CSF-A. A quartz-rich turbidite with wavy laminations (Stow sequence Component T2) was observed within interval 353-U1444A-32X-CC, 20–22 cm (Figure F6E–F6H). Foraminifers were observed within Unit IV but less frequently than in Unit II. Bulk XRD analyses of turbidites show high abundances of quartz and mica. Clay XRD analyses indicate that the clay content is similar to Unit III, with high illite and chlorite peaks and low smectite and kaolinite peaks. Clay intervals within Unit IV are disturbed by slight to moderate biscuiting from XCB drilling. An authigenic carbonate concretion (approximately 1 cm diameter) was observed at 284.09 m CSF-A. Glauconite was observed sporadically throughout Unit IV. Pyrite was commonly observed in Unit IV (Figure F7I).
Biostratigraphy
Calcareous microfossils (nannofossils, planktonic foraminifers, and benthic foraminifers) at Site U1444 are rare (<1% of particles) or absent in turbidite-rich sequences and common (10%–50% of particles) to abundant (50%–90% of particles) in intervals dominated by hemipelagic sediments. Where calcareous microfossils are present, preservation is good to moderate and rarely poor. All samples are nearly or completely barren of diatoms.
The biostratigraphic age model for Site U1444 was established by combining calcareous nannofossil and planktonic foraminifer datums (Figure F10; Tables T3, T4). The oldest planktonic foraminifer datum encountered is the base of Globigerinoides conglobatus, which suggests that the sediments in Sample 353-U1444A-35X-CC are of late Miocene (Messinian) age. The oldest sample studied (Sample 37X-CC, 18 cm) contains common calcareous nannofossils belonging to the species Discoaster loeblichii and Discoaster quinqueramus, suggesting that this sample has an age between 5.59 and 7.53 Ma. The biostratigraphic scheme constructed for Site U1444 provides reasonable age control in the two hemipelagic intervals recovered in Hole U1444A (Figures F10, F11). However, biostratigraphic age control is poor in the two sandy lithostratigraphic units containing frequent turbidites.
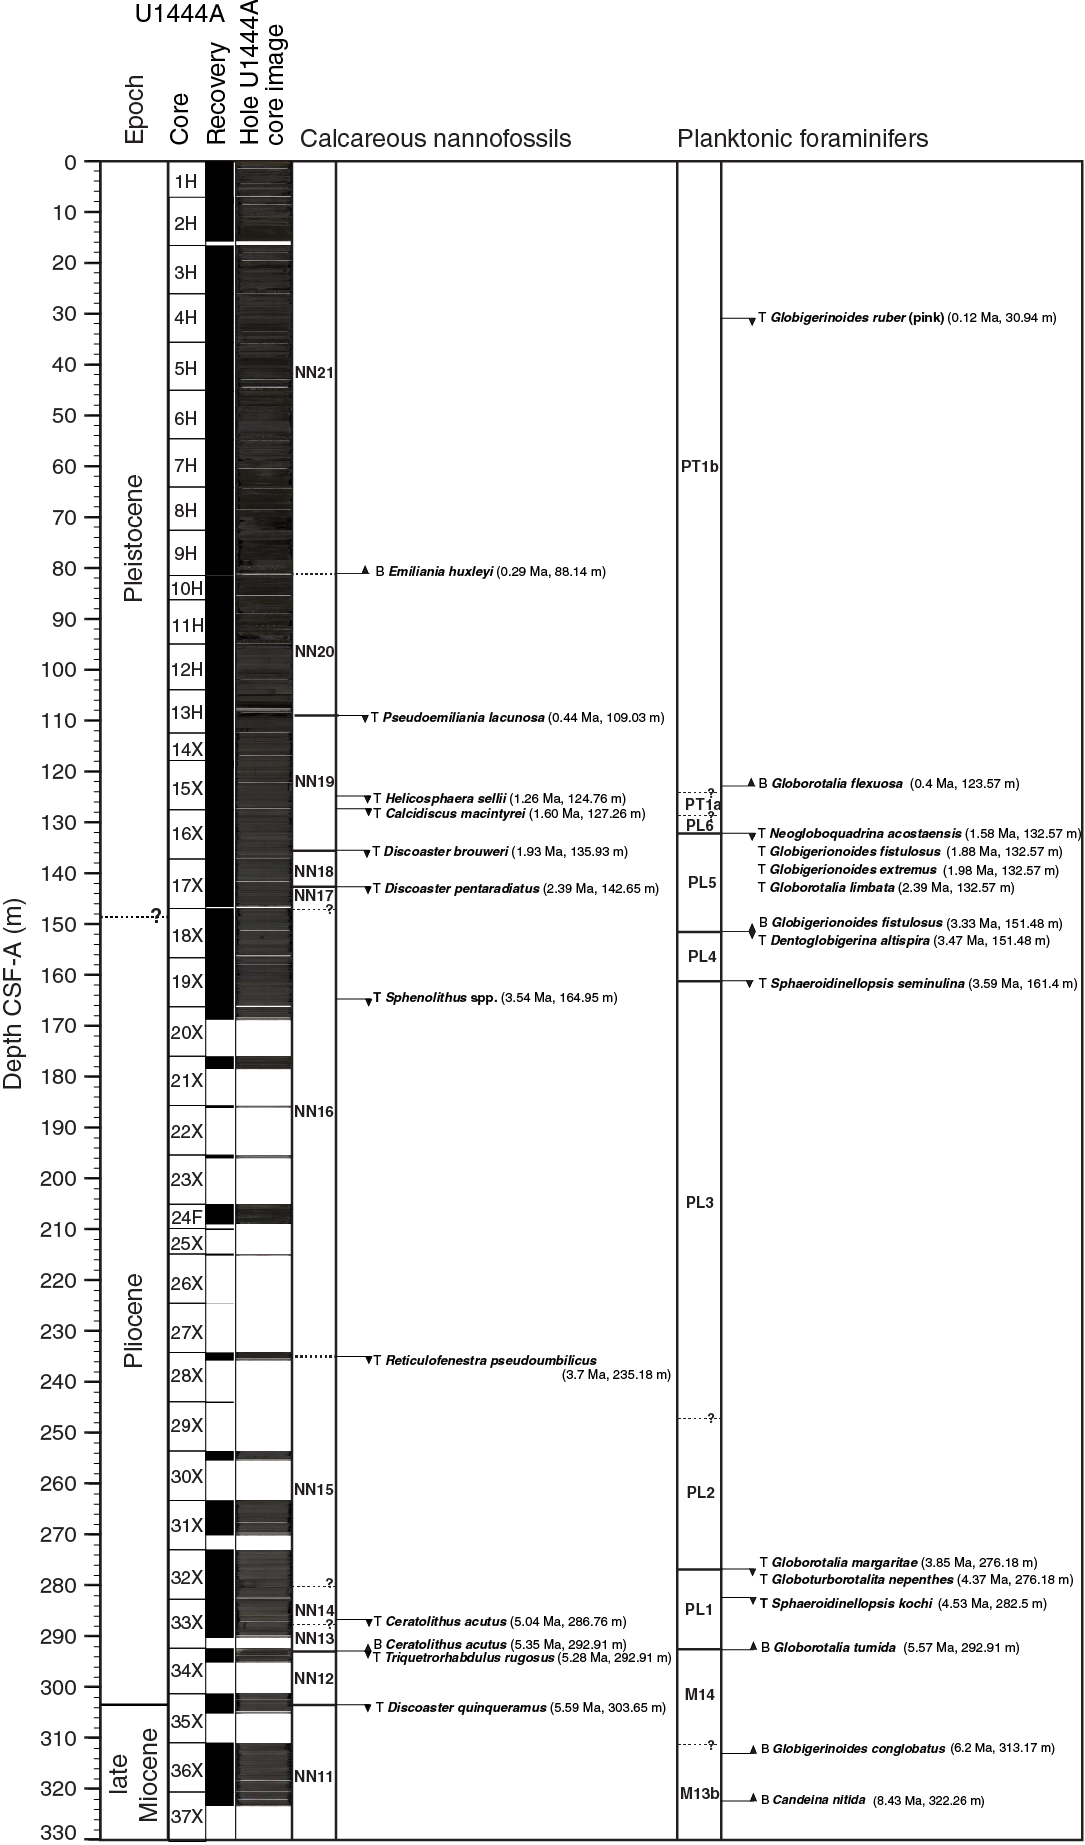
Figure F10. Summary of biostratigraphic events identified in Hole U1444A.
Table T3. Calcareous nannofossil datums, Hole U1444A. Download table in .csv format.
Table T4. Planktonic foraminifer datums, Hole U1444A. Download table in .csv format.
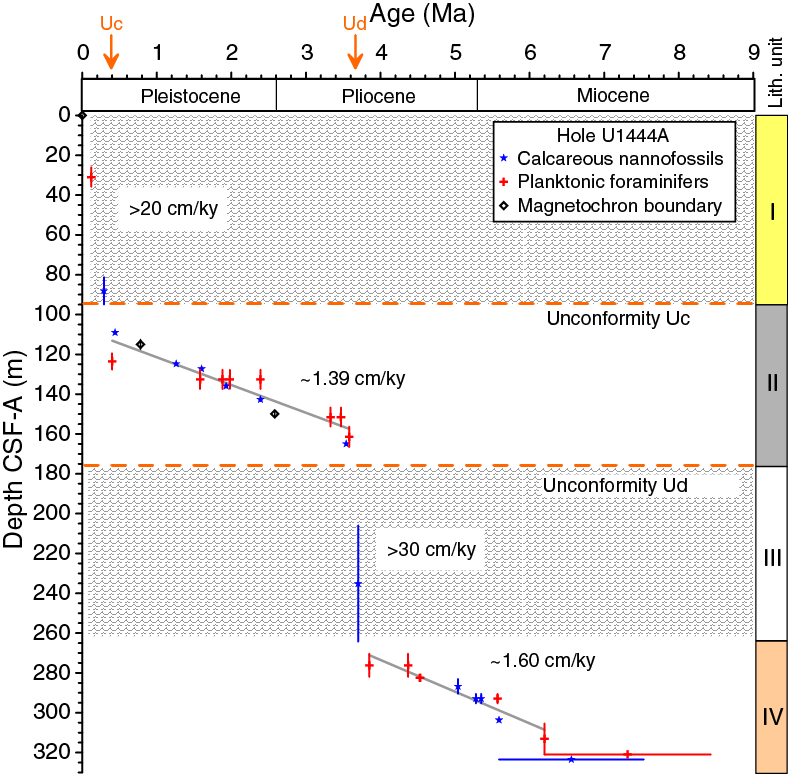
Figure F11. Biostratigraphy and paleomagnetic reversal-based age-depth plot, Hole U1444A.
Calcareous nannofossils
Calcareous nannofossils were examined in all core catcher samples from Hole U1444A. Additional split core samples from Hole U1444A were examined to refine the stratigraphic position of biostratigraphic datum events. Semiquantitative nannofossil species abundance estimates as well as preservation and group abundance are shown in Table T5.
Table T5. Semiquantitative calcareous nannofossils abundance counts from core catcher samples, Site U1444. Download table in .csv format.
Common to abundant calcareous nannofossils were present in two discrete intervals. These intervals, which mainly consist of silty clays and clayey silts with rare sands, correspond to lithostratigraphic Units II (95.01–168.91 m CSF-A in Hole U1444A) and IV (255.60~264–323.395 m CSF-A in Hole U1444A). Lithostratigraphic Units I (0–95.01 m CSF-A) and III (168.91–255.60 m CSF‑A), composed of silty sands and clayey silts with occasional and sometimes thick sandy turbidites, contain few (1%–10% of particles), rare (<1% of particles), or absent nannofossils. Nannofossils were also absent in Sample 353-U1444A-37X-CC, the deepest core catcher examined. However, another toothpick sample analyzed from a deeper interval of the same core catcher sample (37X-CC, 18 cm) contained abundant nannofossils.
Pleistocene to late Miocene nannofossil assemblages are tropical–subtropical and include abundant Florisphaera profunda, Gephyrocapsa spp., and Reticulofenestra spp. Other significant components of nannofossil assemblages include different species of the genera Ceratolithus, Sphenolithus, Discoaster, Pseudoemiliania, Helicosphaera, Calcidiscus, and Umbilicosphaera. The presence of rare reworked Cretaceous and Paleogene nannofossils is detected in several samples, both in hemipelagic and turbiditic sequences.
Most Pleistocene, Pliocene, and late Miocene bioevents used to define the zones by Martini (1971) and Okada and Bukry (1980) (see Biostratigraphy in the Expedition 353 methods chapter [Clemens et al., 2016] for zonal schemes used) were found (Figure F10; Table T3), and all ages cited in the text and figures are those of Gradstein et al. (2012). Useful biostratigraphic marker species that are not found in Hole U1444A are large Gephyrocapsa spp., Discoaster tamalis, Amaurolithus spp., and Nicklithus amplificus. Sample 353-U1444A-9H-CC is the lowermost sample found to contain Emiliania huxleyi, which delineates the base of Zone NN21 (0.29 Ma), based on light microscope observations. The presence of E. huxleyi in Sample 9H-CC and shallower samples was confirmed shipboard by scanning electron microscope. Therefore, we tentatively assign this Pleistocene event to a midpoint depth of 83.79 m CSF-A, between Samples 9H-CC and 10H-CC. The very low abundances of nannofossils in the upper 95 m of Hole U1444A hampered the detection of a shift in dominance from Gephyrocapsa caribbeanica to E. huxleyi (dated at 0.09 Ma in tropical waters).
The last occurrence (LO) of Pseudoemiliania lacunosa in Sample 353-U1444A-13H-6W, 40 cm (midpoint depth of event = 109.03 m CSF-A), allowed us to place the top of lithostratigraphic Unit II (95.01–168.91 m CSF-A) within Late Pleistocene nannofossil Zone NN20. Sample 20X-CC (168.89 m CSF-A), near the base of Unit II, contained Sphenolithus abies and no Reticulofenestra pseudoumbilicus larger than 7 µm, which allowed us to assign it to nannofossil Zone NN16 in the late Pliocene.
The LO of Ceratolithus acutus, dated at 5.04 Ma, is the first nannofossil event identified in lithostratigraphic Unit IV (the second hemipelagic sequence) and occurs between Samples 353-U1444A-32X-CC and 33X-CC (midpoint depth = 286.76 m CSF-A). Sample 37X-CC, 18 cm (collected from the core catcher 12 cm above the bottom of Core 37X and the bottom of Hole U1444A), contains D. quinqueramus (LO at 5.59 Ma) and common D. loeblichii (first common occurrence at 7.53 Ma) and was assigned to Zone NN11. This suggests that the Unit IV sequence spans Zone NN13 in the middle Pliocene to Zone NN11 in the late Miocene and that the oldest sediments in Hole U1444A are not older than 7.53 Ma.
Planktonic foraminifers
The planktonic foraminifer biostratigraphy for Site U1444 is based on the shipboard study of core catcher samples from Hole U1444A. Foraminifers range in preservation from poor to good at Site U1444 in the samples in which they occur. Sandy samples are barren (or nearly so), whereas mud-rich samples produce foraminifers in abundances ranging from dominant to rare. Though index species are missing from many nonbarren samples, planktonic foraminifer biostratigraphic datums identify these sediments as late Miocene to Pleistocene. Planktonic foraminifer distribution is shown in Table T6. The absolute ages assigned to biostratigraphic datums listed in Table T4 follow the references given in Table T2 in the Expedition 353 methods chapter (Clemens et al., 2016).
Table T6. Semiquantitative planktonic foraminifer abundance counts from core catcher samples, Hole U1444A. Download table in .csv format.
Planktonic foraminifer assemblages in Hole U1444A are tropical to subtropical throughout the Neogene and include abundant Globigerinoides ruber, Globigerinoides trilobus, Globorotalia menardii, and Neogloboquadrina dutertrei. Globigerina bulloides and Globigerinita glutinata are common in many samples, indicating wind-driven upwelling along the eastern Indian coastal margin.
The LO of G. ruber (pink) in Sample 353-U1444A-4H-CC and the first occurrence (FO) of Globorotalia flexuosa in Sample 14X-CC indicate that sediments between 35.83 and 119.42 m CSF-A are of Pleistocene age. This depth range includes nine core catchers that are either barren of planktonic foraminifers or contain assemblages with no index species.
Pliocene datums are found in Samples 353-U1444A-16X-CC through 19X-CC (137.41–166.53 m CSF-A) and in Cores 32X and 33X (282.00–290.50 m CSF-A). The LO of Globorotalia limbata in Sample 16X-CC and the FO of Globigerinoides fistulosus in Sample 17X-CC place these samples in Zone PL5. The LO of Dentoglobigerina altispira in Sample 18X-CC marks the top of Zone PL4, and the LO of Sphaeroidinellopsis seminulina in Sample 19X-CC marks the top of Zone PL3. Eleven core catcher samples that are either barren or contain no index species range from 168.89 to 270.34 m CSF-A. The LO of Globoturborotalita nepenthes in Sample 32X-6W, 126 cm, the LO of Sphaeroidinellopsis kochi in Sample 32X-CC, and the FO of Globorotalia tumida in Sample 33X-CC mark the top, middle, and base of Zone PL1, respectively. Sample 34X-CC (295.32 m CSF-A) was unique in that benthic foraminifers outnumbered planktonic foraminifers and that all planktonic foraminifers were >250 µm in size, indicating some size sorting.
Miocene sediments are identified in Samples 353-U1444A-35X-CC and 36X-CC. The base of G. conglobatus in Sample 35X-CC places these sediments in Zone M13b, and the occurrence of Candeina nitida in Sample 36X-CC (320.96 m CSF-A) indicates that it can be no older than 8.43 Ma (Zone M13b).
Diatoms
In order to define the sediment age and paleoenvironmental conditions, core catcher samples and samples from selected split core sections from Hole U1444A were investigated. A few Late Pleistocene warm-water species (Fragilariopsis doliolus, Shionodiscus oestrupii, and Azpeitia nodulifera) were found in Sample 353-U1444A-1H-1W, 40–41 cm. Sediments at Site U1444 are otherwise barren of siliceous microfossils.
Sedimentation rates and age model
Age-depth relationships for Hole U1444A are based on planktonic foraminifer and calcareous nannofossil bioevents, as well as two magnetostratigraphic events that are considered to be reliable (Brunhes/Matuyama and Matuyama/Gauss boundaries). All datums show reasonable agreement (Figure F11). Large variations in sedimentation rate occur because of repeated large-scale episodes of sediment deposition and redeposition on the Bengal Fan. This high sediment flux results in sedimentation rates of >20 cm/ky in lithostratigraphic Unit I (0–95.01 m CSF-A) and >30 cm/ky in Unit III (168.91–255.60 m CSF-A) in Hole U1444A. Although age control in the turbidite-rich intervals is poor because of the absence of microfossils, the base of Unit I is constrained by the LO of P. lacunosa (0.44 Ma), whereas Unit III is constrained by the LO of Sphenolithus spp. (3.54 Ma) at its upper limit and the LO of Globorotalia margaritae (3.85 Ma) at its base. This suggests that sediments in both Units I and III accumulated in less than 0.44 My. Lithostratigraphic Units II and IV are mostly hemipelagic with sedimentation rates an order of magnitude lower than Units I and III, around 1.39 cm/ky for Unit II (95.01–168.91 m CSF-A) and 1.60 cm/ky for Unit IV (255.60–323.39 m CSF-A).
Geochemistry
Site U1444 is located in the central Bay of Bengal and is characterized by numerous and variable turbidite layers as a result of continental runoff and deposition/redeposition of material in the Bengal Fan. Consequently, the geochemistry is influenced by these layers and provides insight into the remineralization of material deposited on the fan. Pore water profiles also exhibit the influence of basalt weathering at depth and major lithologic boundaries. Bulk sediment geochemistry is dominated by the relatively small-scale (centimeter) changes driven by episodic deposition of organic and inorganic substrate in turbidite layers.
Sediment gas sampling and analysis
Headspace gas samples were taken at a frequency of one sample per core in Hole U1444A as part of the routine environmental protection and safety monitoring program (Table T7). Methane concentration increased from 8 ppm at 4.5 m CSF-A, peaked at 533 ppm at 33.6 m CSF-A, and decreased to background level (<2 ppmv) by 60.6 m CSF-A. Very low levels of methane (C1 < 2 ppmv) were present deeper than 60.6 m CSF-A (Figure F12). The heavier hydrocarbons such as ethane, propene, and propane were detected in significant amounts (>12 ppmv) at 4.5 m CSF-A and then abruptly decreased in subsequent cores and were not detected deeper than 42.9 m CSF-A.
Table T7. Headspace gas concentrations, Hole U1444A. Download table in .csv format.
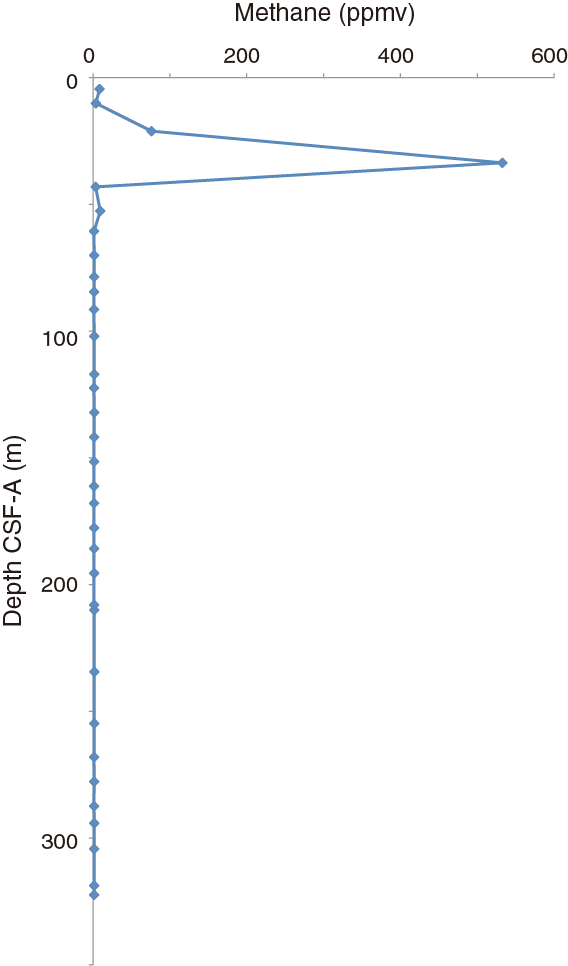
Figure F12. Headspace methane profile, Hole U1444A.
Bulk sediment geochemistry
Carbonate, inorganic carbon, total organic carbon (TOC), and total nitrogen (TN) contents were determined on sediment samples from Hole U1444A (Table T8; Figure F13). Carbonate content ranges between 1 and 31 wt% and is generally higher in lithostratigraphic Units II and IV than in Units I and III (Figure F13). The average CaCO3 content of Units I and III is 4–5 wt% with less variation in Unit I. Units II and IV exhibit more variability with an average carbonate content of 15–20 wt%. Low carbonate values are observed in quartz-rich turbidite layers. TOC ranges between below detection (see the Expedition 353 methods chapter [Clemens et al., 2016]) and 2 wt% (Figure F13). Sand layers generally have low TOC content. In the same turbidite layer (Samples 353-U1444A-7H-3, 10–11 cm, and 7H-3, 37–38 cm), the silt interval has higher carbonate and TOC contents than the underlying sand layer. One sand sample that contains charcoal fragments at 57.9 m CSF-A has relatively high TOC (2.0 wt%). TN ranges between 0.01 and 0.20 wt%. TN showed a similar stratigraphic pattern to that of TOC (Figure F13). Overall, the inorganic and organic content of the sediment and its variability reflect the complex, turbiditic depositional history of the site.
Table T8. Calcium carbonate, TOC, and TN contents, Hole U1444A. Download table in .csv format.
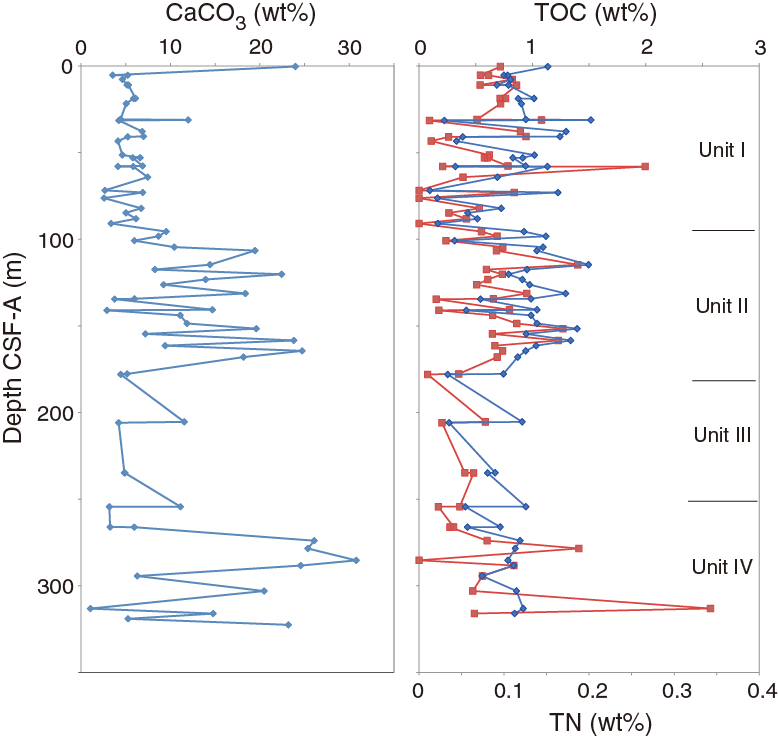
Figure F13. Calcium carbonate, TOC, and TN contents, Hole U1444A.
Interstitial water sampling and chemistry
A total of 43 samples from Holes U1444A and U1444B were analyzed for interstitial water chemistry (Table T9), focusing mainly on Hole U1444A. Most samples were kept under N2 during scraping and squeezing for pore water extraction. High-resolution pore water sampling (one per section) was conducted for the uppermost 20 m, with coarser sampling (one per core) deeper. In certain sections, notably lithostratigraphic Unit III, sampling was limited by recovery and pore water data are absent between 161 and 268 m CSF-A.
Chloride concentration increases up to ~565 mM in the uppermost 50 m followed by a general decrease downcore to 550 mM at the bottom of the sampled sediment column (Table T9). Alkalinity increased rapidly in the uppermost 20 m, reaching a peak of 19.9 mM before decreasing (Figure F14). Subsequent secondary peaks as high as 26.6 mM at the bottom of lithostratigraphic Unit I (61 and 84 m CSF-A) occur before a rapid decrease through Unit II. By Unit IV in the bottom of the sampled section, alkalinity is below seawater values. Concomitant with the initial increase in alkalinity are increases in bromide, ammonium, and phosphate, with a corresponding depletion of sulfate. Sulfate decreases rapidly to values between 0 and 1 mM between 19.5 and 52.6 m CSF-A before increasing again to a maximum >12 mM at 132 m CSF-A in lithostratigraphic Unit II. Deeper than 132 m CSF-A, sulfate decreases again to values between 4 and 6 mM in the bottom of Hole U1444A. Bromide, phosphate, and ammonium show similar decreases to flat profiles in the bottom of Hole U1444A (lithostratigraphic Unit I). The bromide profile is somewhat variable but reaches a peak above 0.9 mM at 43 m CSF-A near the core of the sulfate-depleted zone, and after a secondary peak around ~84 m CSF-A, decreases in lithostratigraphic Unit II and remains mostly unchanged deeper. Ammonium shows a smooth increase to a peak at 34 m CSF-A, also in the sulfate-depleted zone; values decrease deeper than 34 m CSF‑A and, after the secondary peak at 94 m CSF-A, decrease rapidly to <1 mM in Unit II. Silicate shows little trend in Unit I but is somewhat higher in Unit II before decreasing in the bottom of the hole. Structure in the phosphate profile is a little more complex, showing the same rapid increase in the uppermost 15 m CSF-A but with increased variability above and below the sulfate-depleted zone. A phosphate minimum of 30 µM is apparent in the middle of the sulfate-depleted zone at 43 m CSF-A. Phosphate decreases rapidly in Unit II and is below detection downcore. Taken together with the sharp methane peak in the sulfate-depleted zone, these profiles suggest a zone of relatively intense organic matter remineralization between 20 and 50 m CSF-A. Paleomagnetic proxies for iron sulfide formation (greigite) also peak in this range, suggesting biologically mediated sulfate reduction coupled to precipitation of iron sulfides (see Paleomagnetism).
Table T9. Interstitial water data, Holes U1444A and U1444B. Download table in .csv format.
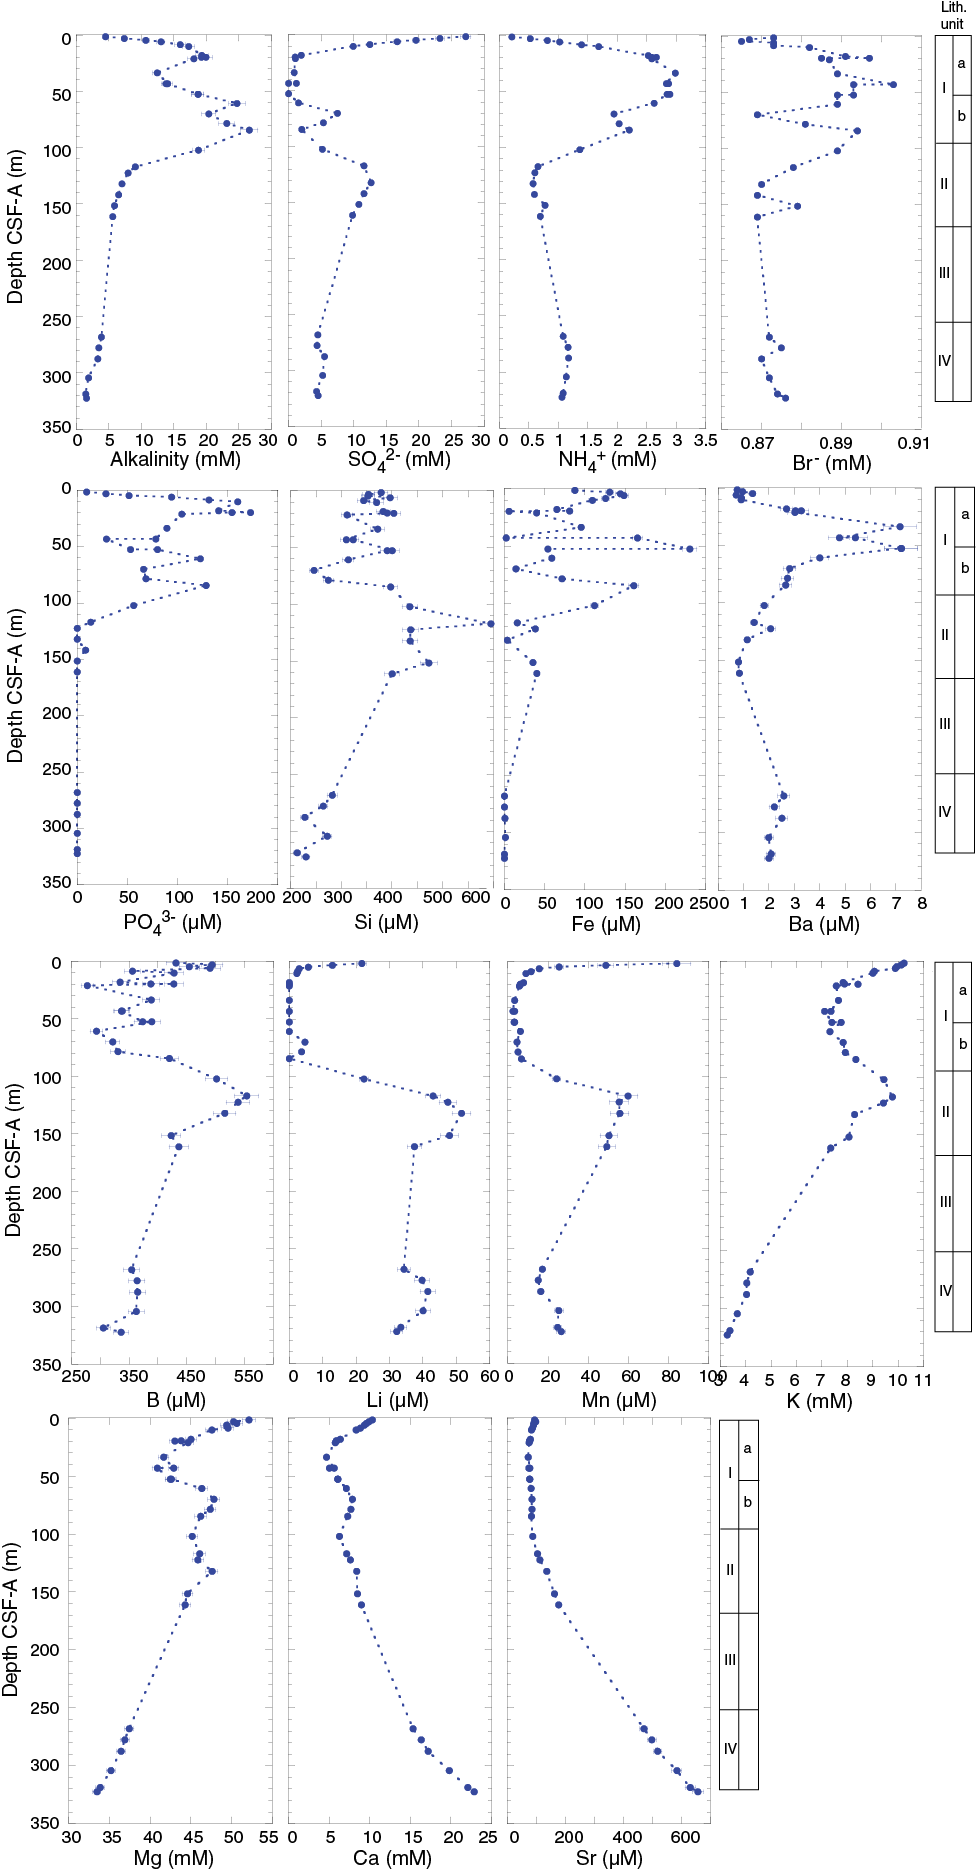
Figure F14. Interstitial water chemistry profiles, Site U1444.
Several cations, including Ca, Mg, and K, also exhibit structure in lithostratigraphic Unit I similar to sulfate. All decrease in the uppermost 30 m (Figure F14). Potassium decreases from 11 to 7 mM, whereas Ca reaches a minimum <5 mM at 33.6 m CSF-A. Magnesium decreases from 53 to 43 mM at 33.6 m CSF-A. This coeval removal of Mg and Ca from pore waters likely reflects authigenic carbonate precipitation, probably in response to increasing alkalinity. Below the sulfate-depleted zone, all three elements increase to slightly less than their original values, though K does not reach the secondary peak until the upper section of Unit II. Deeper than this depth, all of the cations, including Na, appear to exhibit the influence of crustal weathering; K, Na, and Mg decrease whereas Ca increases. Basement depth is estimated at around 400 m CSF-A based on seismic data (Schwenk and Spieß, 2009).
Iron, Mn, Li, and Ba also have structure apparently related to the geochemistry of Unit I (Figure F14). Iron has several peaks and troughs in Unit I, with values as high as 240 µM around 50 m CSF‑A. Deeper than 50 m CSF-A, Fe concentration decreases to low values (16–40 µM) in Unit II to levels at or below detection in Unit IV. An increase in Unit I followed by lower values downcore was also found for Ba. Manganese has an inverse profile, rapidly decreasing in the first core to near zero values throughout Unit I. Manganese values then increase sharply in upper Unit II to 60 µM before slowly decreasing. The behavior of Li is very similar, with a rapid decrease to zero in the uppermost 10 m, then a large increase to 50 µM around the bottom of Unit II. The depth profiles of both Li and Mn are strikingly similar to that of sulfate. Boron concentrations are variable in Unit I but, similar to Mn and Li, show a pronounced peak at 120–130 m CSF-A, followed by an observed decrease. Strontium is also low in Unit I but flat with little change until a gradual and steady increase between 120 m CSF-A and the bottom of Hole U1444A at 330 m CSF-A. Barium concentrations in pore waters peak around 50 m CSF-A in the sulfate-depleted zone.
Paleomagnetism
Paleomagnetic measurements were conducted on archive-half sections (Figures F15, F16) for both holes at Site U1444. Sections dominated by sand were not measured because of unstable texture and risk of contaminating the magnetometer. All sections from XCB cores were severely affected by drilling-related overprints and were difficult to interpret. A selection of discrete samples (N = 119) taken from working-half sections were also analyzed. In most cases, finer grained sediment was selected for discrete sampling because of its more consolidated nature.
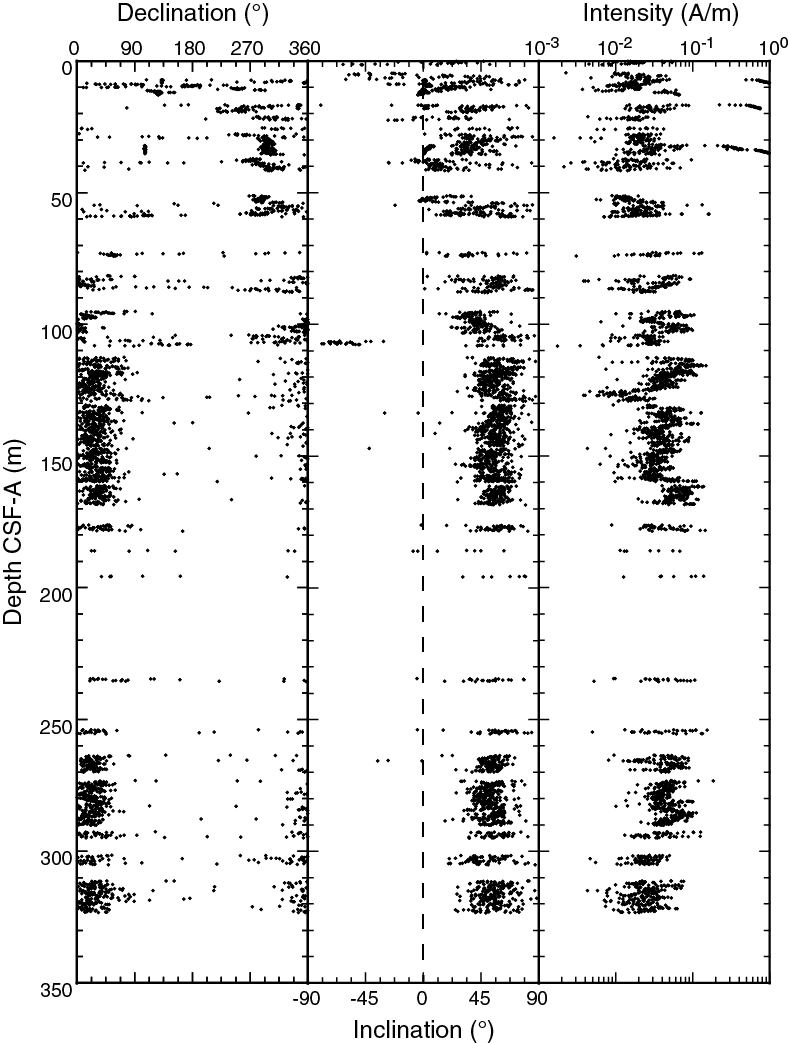
Figure F15. Downhole variations in declination, inclination, and intensity after 10 mT AF demagnetization, Hole U1444A.

Figure F16. Downhole variations in declination, inclination, and intensity after 10 mT AF demagnetization, Hole U1444B.
Discrete measurements were conducted using the JR-6 spinner magnetometer and the superconducting quantum interference device magnetometer. For samples treated in the cryogenic magnetometer, the final alternating field (AF) demagnetization step (80 mT) was conducted by the D-2000 demagnetizer, with demagnetization along the x-, y- and z-axes in this order. The characteristic remanent magnetization (ChRM) of discrete samples was calculated using the principal component analysis (PCA) technique or assumed to be the endpoints after 15 mT AF demagnetization (Table T10). Most of the discrete data from 0 to 100 m CSF-A were influenced by gyroremanent magnetization (GRM), likely due to the presence of greigite (a ferrimagnetic iron sulfide). On the basis of the section measurements for APC cores and the discrete data, we propose a tentative magnetic polarity stratigraphy.
Table T10. Summary of discrete sample ChRM, Hole U1444A. Download table in .csv format.
Magnetostratigraphy
Cores 353-U1444A-2H through 13H were oriented using the Icefield MI-5 tool, and therefore we obtained “true” declinations for this data between 7 and 112 m CSF-A (Figure F17). The majority of true declination values are around 0° (360°), indicating normal polarity. Most of the inclination data for this interval after 10 mT AF demagnetization are positive, also suggesting normal polarity. Section 13H-3A exhibits negative inclination; we strongly suspect this is an artifact due to severe drilling disturbances that were noted throughout Core 13H. The supporting observations for this interpretation include the observations that (1) this section shows entirely negative inclination, whereas Sections 13H-2A and 13H-4A show entirely positive inclinations, and (2) declination is highly variable inside this section. We conclude that all the APC cores in Hole U1444A (0–112.5 m CSF-A) are in the Brunhes Chron (i.e., <0.781 Ma) (Gradstein et al., 2012).
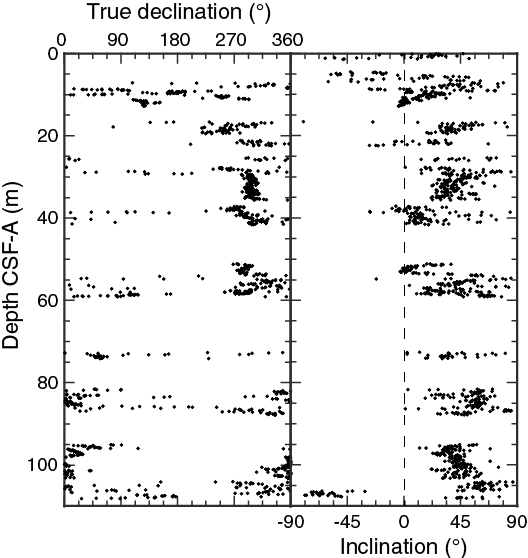
Figure F17. Zoomed-in true declination and inclination data after 10 mT AF demagnetization, Hole U1444A.
For XCB cores, we relied entirely on the discrete sample results beginning with the observation that some samples show a negative inclination in ChRM after removing a large vertical downward drilling-related overprint (Figure F18A). Because ChRM inclination is opposite in sign from the overprint, we interpret that negative inclination indeed reflects reversed polarity. Using the same logic, we inferred that a positive inclination in ChRM does not always correspond to normal polarity. Some samples show much steeper inclination than the values expected from the geocentric axial dipole (GAD) field (26.7° for the present-day site latitude of 14°N). It is very likely that the vertical downward drilling-related overprint was not completely removed. Similarly, the drilling-related overprint could bring ChRM of reversed polarity samples to positive inclination. Considering the above argument, we divided the ChRM of discrete samples into four categories:
- Negative inclination = reversed polarity.
- Shallow positive inclination (I < 10°) = likely to be reversed polarity.
- Moderate positive inclination (10° ≤ I < 45°) = likely to be normal polarity.
- Steep positive inclination (45° < I) = unknown (possibly overprinted or deformed).

Figure F18. Stepwise AF demagnetization results on a representative sample.
Based on these categories and the observed depth variations, we assigned magnetozones to Hole U1444A (Figure F19). The first occurrence of negative or shallow positive inclination in XCB cores was observed in Samples 353-U1444A-14X-4W, 48–50 cm (117.48 m CSF-A top depth), and 353-U1444B-9X-6W, 75–77 cm (117.45 m CSF-A top depth). Because the archive halves of Hole U1444A indicate that sediments shallower than 112.5 m CSF-A are in the Brunhes Chron, we interpret the observed reversed polarity as reflecting the Matuyama Chron (>0.781 Ma). In other words, the Brunhes/Matuyama boundary (0.781 Ma) is assigned to the depth interval between 112.5 and 117.48 m CSF-A for Hole U1444A. Similarly, we correlate magnetozones with the geomagnetic polarity timescale (GPTS) (Gradstein et al., 2012) down toward the Gilbert Chron at ~170 m CSF-A (Figure F19; Table T11). Many discrete samples from the deeper part of Hole U1444A show negative inclination; however, poor recovery between Cores 353-U1444A-20X and 30X makes it difficult to correlate the magnetozones to the GPTS. We emphasize that these interpreted polarity changes are speculative.
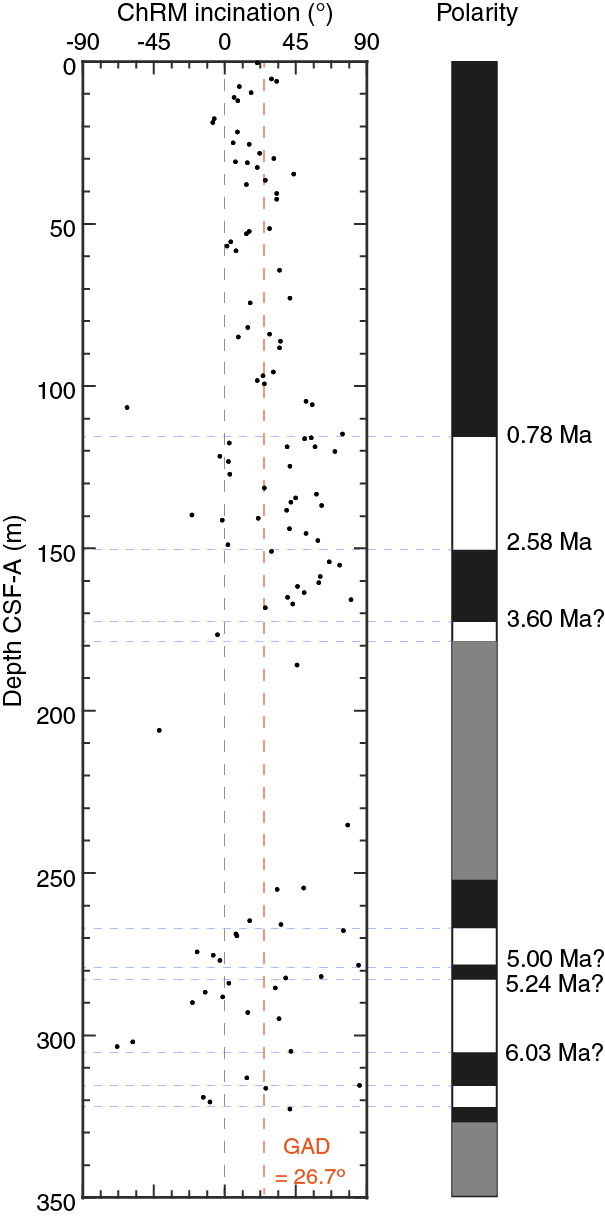
Figure F19. Variations in the ChRM inclination of discrete samples, Hole U1444A.
Table T11. Summary of magnetostratigraphy, Hole U1444A. Download table in .csv format.
A steep negative inclination observed in two samples just deeper than 300 m CSF-A (Figure F19) is difficult to interpret. There is no evidence of overturning in the sediment cores, and drilling disturbances or overprinting are usually associated with a bias toward positive inclination. Therefore, if these points of negative polarity are reliable, they may represent some previous effect of ground tilting or deformation within their respective sediment unit, causing a steepening of the original inclination. In this scenario, the sediment should tilt toward the north by 10°–15°. This prediction may be tested in the future by structural and seismic investigations.
Gyroremanence
For discrete samples between 0 and 110 m CSF-A in Hole U1444A, we observed an increase in natural remanent magnetization (NRM) intensity with increasing fields during AF demagnetization, typically above 60 mT (Figure F20). This behavior is observed in samples demagnetized on both the D-2000 AF demagnetizer and the in-line demagnetizer of the cryogenic magnetometer. In addition, not all samples demagnetized in a run exhibit this behavior. These observations eliminate the possibility that the observed remanence increase is due to machine imperfection.
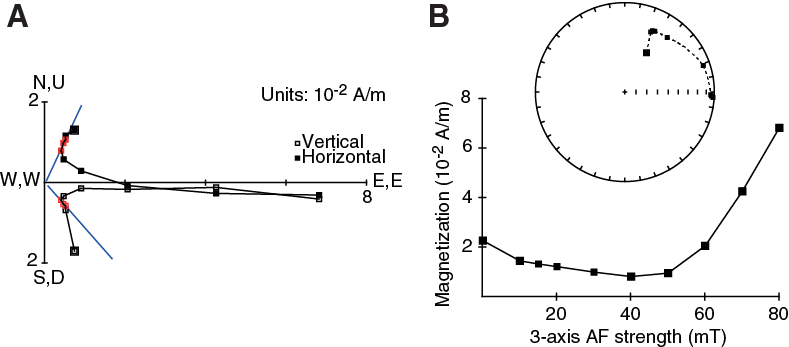
Figure F20. Stepwise AF demagnetization results on a representative sample.
The remanence direction of samples treated with the D-2000 demagnetizer after the final demagnetization step (along the x-axis) is y-axis concentrated (Figure F21). This behavior matches with the GRM characteristics produced by static AF demagnetization (e.g., Stephenson, 1993); GRM is produced in a plane perpendicular to the last alternating field, and these observations therefore suggest that the increase in remanence is due to this phenomenon. Because the interval where GRM was observed corresponds to that with sulfate reduction (see Geochemistry), we infer that the samples contain the mineral greigite (Fe3S4). Previous studies have reported that sediments rich in greigite show significant GRM (e.g., Snowball, 1997; Fu et al. 2008). The preferred orientation of GRM is considered to reflect the intrinsic anisotropy of the sample, and since the GRM direction was common across several cores, we speculate that the anisotropy may have been introduced during the curation/sampling processes.
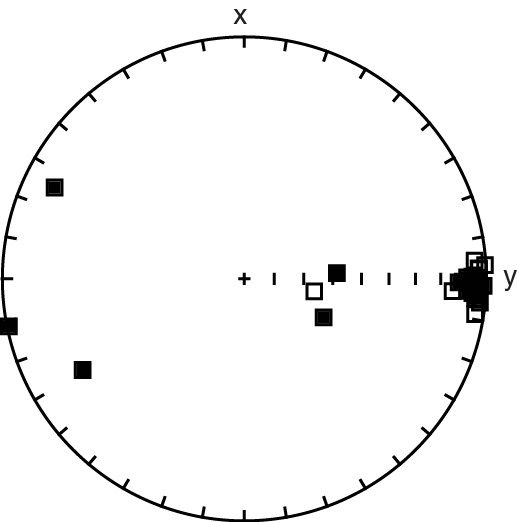
Figure F21. Equal area lower hemispheric projection of NRM after AF demagnetization.
To quickly quantify the relative contribution of gyroremanence, we introduced the gyroremanence ratio (rG) (based upon work by Fu et al., 2008):
rG = (NRM80mT − NRM40mT)/NRM10mT ,
where NRM80mT is the NRM after AF demagnetization by 80 mT, NRM40mT by 40 mT, and so on. If GRM is absent, rG should be negative or close to zero and, conversely, high positive values of rG would indicate strong GRM relative to NRM. Applying this crude estimate, we find high rG to ~95 m CSF-A (Figure F22). The uppermost two samples (353-U1444A-1H-1W, 35–37 cm, and 1H-4W, 81 cm) show negative rG, indicating the absence of greigite. This is possibly caused by a decrease in sedimentation rate or a delay in sulfate reduction. Particularly high rG seems to center around 40 m CSF-A, though values are highly scattered.

Figure F22. Plot of the rG parameter, which roughly quantifies the relative contribution of GRM to the NRM, calculated for discrete samples, Hole U1444A.
Physical properties
Physical property measurements were taken at Site U1444 on both whole-round sections and split-core section halves from Holes U1444A and U1444B. For Hole U1444A, a large data gap exists between Cores 353-U1444A-20X and 27X (166.4–224.7 m CSF-A) as a result of poor recovery. The turbidite-rich intervals were washed out in Hole U1444B in order to quickly reach the clay-rich units identified in Hole U1444A. No data were collected in Hole U1444B from 42.9 to 95.0 m CSF-A. Hole U1444B was terminated at 128.2 m DSF to accommodate the drilling schedule. Thus, this report primarily focuses on the physical property data from Hole U1444A.
Gamma ray attenuation (GRA), MS, P-wave velocity (VP), and natural gamma radiation (NGR) measurements were each made on all whole-round sections using the Special Task Multisensor Logger (STMSL), the Whole-Round Multisensor Logger (WRMSL), and the Natural Gamma Radiation Logger (NGRL). Whole-round sections in Hole U1444A were first run through the STMSL (2.5 cm resolution) and WRMSL (5 cm resolution) and then taken to the core rack for thermal equilibration. In Hole U1444B, all sections were run on the STMSL (2.5 cm resolution). P-wave data were found to be unreliable in the uppermost 17 cores, and sections were only logged on the STMSL for Cores 353-U1444A-17X through 37X. Following thermal equilibration (>19°C), the sections were logged on the NGRL. Approximately 10 cm3 sediment samples were collected from Sections 2, 4, and 6 for moisture and density (MAD) analyses. Color reflectance and point MS on the Section Half Multisensor Logger (SHMSL) and red, green, and blue (RGB) on the Section Half Imaging Logger (SHIL) were measured on the archive-half sections. The data reported here have been conditioned to remove outliers related to endcaps (see Physical properties in the Expedition 353 methods chapter [Clemens et al., 2016]). We identified four physical property units in Hole U1444A and three physical property units in Hole U1444B that are not directly related to the Hole U1444A units (Table T12).
Table T12. Physical property units, Holes U1444A and U1444B. Download table in .csv format.
Magnetic susceptibility
The MS values recorded for Hole U1444A whole-round core (STMSL and WRMSL) analyses showed moderate variability in physical property (PP) Unit A1 (0–95.01 m CSF-A) with a range of high (~200 instrument units [IU]) and low (~25 IU) values, low variability in Unit A2 (~95.01–168.91 m CSF-A) with an average of ~30 IU, missing data from poor core recovery in Unit A3 (~168.91–255.6 m CSF-A), and similarly low (~30 IU) values with a few scattered high value peaks in Unit A4 (255.6–323.39 m CSF-A) (Figure F23). The MS data from whole-round core measurements closely track point MS (SHMSL) fluctuation patterns; however, the absolute values of the whole-round core data are consistently higher than the point measurements. The variability in Unit A1 is a reflection of the sediment grain size distribution in the 241 stacked turbidites that characterize this unit (see Lithostratigraphy). The higher MS values correlate with the coarser, more sand rich portion of each turbidite, whereas the lower MS values correlate with the silty layers. The low variability in Unit A2 parallels the relatively uniform nannofossil-rich clay layers. Unit A3 cannot be characterized because of poor core recovery. The few high peaks in Unit A4 line up with sand intervals scattered throughout a predominantly silty clay background. The MS trends showing high values at the bottom to low values at the top of Cores 353-U1443A-8H, 9H, and 11H are likely coring artifacts related to mechanical sorting.
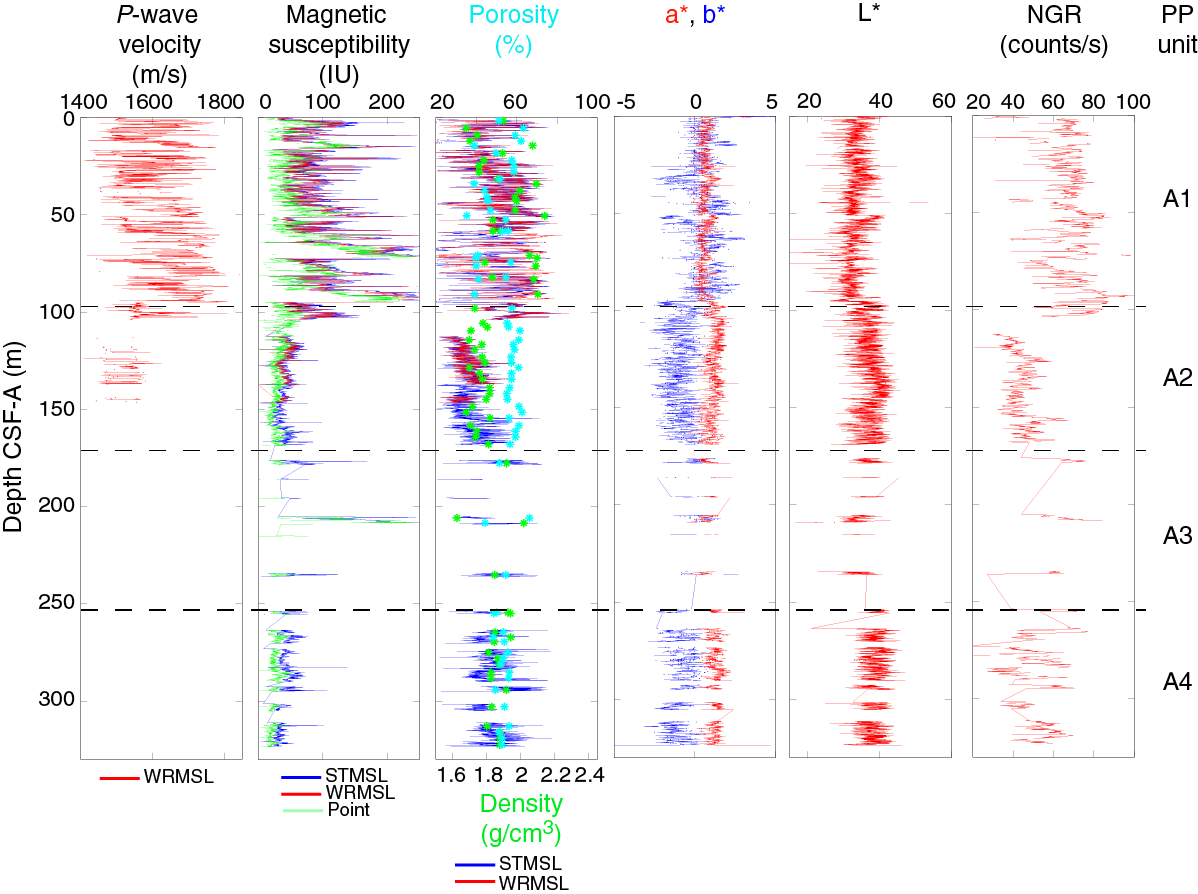
Figure F23. Physical properties including P-wave velocity, magnetic susceptibility, GRA bulk density, porosity, L*, a*, b*, and NGR, Hole U1444A.
The MS data for Hole U1444B (Figure F24) were collected using the WRMSL only. The WRMSL was set to a 2.5 cm sampling interval and the data scattered between 6.91 and 300.42 IU. We see a similar pattern of variability in Unit B1 and with decreasing variability in Unit B3 (which correlates well with decreased variability in Hole U1444A Unit A2) (Table T12). However, the MS data from Hole U1444B were not found to be useful for correlation with Hole U1444A (see Stratigraphic correlation).

Figure F24. Physical properties including magnetic susceptibility, GRA bulk density, L*, a*, b*, and NGR, Hole U1444B.
Natural gamma radiation
NGR counts range from ~9 to 115 counts/s and show variations downhole in a similar configuration as MS, with high variability in Unit A1 and more consistent values throughout Unit A2. There is a small data gap from 103.9 to 112.5 m CSF-A in Unit A2. Unit A3 is characterized by poor core recovery and lack of data. Moderately variable, but generally low, NGR values were found in Unit A4 (Figure F23). The variations in NGR counts represent total variation in the activity of the radioactive elements uranium, thorium, and potassium. The higher variability in NGR counts within Unit A1 is likely from K-rich minerals (e.g., feldspars) within the sandy portion of the turbidite layers that formed a large part of Unit A1 and were intercalated with silty and sandy clay layers. Unit A2 has lower NGR counts with little variability, indicating that this unit is compositionally less variable and mainly composed of clay-rich layers with nannofossils and intercalations of sandy and silty turbidites. Again, Unit A3 cannot be characterized because of sparse data due to poor core recovery. Unit A4 shows similar average NGR counts as compared to Unit A2, but the data pick up the thicker units of sandy clay turbidites, which is reflected in the higher variability in the NGR counts.
The NGR counts in Hole U1444B Unit B1 show a comparable trend to the first 42 m CSF-A of Hole U1444A (Figure F24). The data in Hole U1444B Unit B3 fill in the gap in Hole U1444A Unit A2.
GRA and MAD bulk density
Bulk density at Site U1444 was measured using two different methods: (1) the GRA method using the STMSL that provides bulk density estimates from whole-round sections and (2) MAD measurements on discrete samples that provide a second, independent measure of bulk density and the dry density, grain density, water content, and porosity. The GRA bulk density values range from 0 to 2.284 g/cm3 (Figure F23). Grain density varies between 2.689 and 2.866 g/cm3. The mean MAD bulk density is 1.624 g/cm3 (bulk) and 2.83 g/cm3 (grain) with a minimum dry density of 0.946 g/cm3 and a maximum dry density of 2.14 g/cm3. The porosity values vary significantly downhole and range between 35.2% and 66.3%, whereas the volume of the pore water content per 10 cm3 sample is between 2.243 and 6.391 cm3.
The density data are divided into four units that agree with the MS and NGR unit depths. Unit A1 is characterized by high variability, lower density, high porosity, and high moisture content correlating with the sand-rich layers of the stacked turbidites. The lower density, lower porosity, and lower moisture content line up well with the clay-rich portions of the turbidites in Unit A1. Unit A2 has a more uniform density and porosity relationship as a result of this being a generally undisturbed, clay-rich unit with nannofossils. There are too few data points to define Unit A3, and Unit A4 is similar to Unit A2 but generally has lower density and lower porosity values because of compaction with depth.
The density data for Hole U1444B were collected using the WRMSL only (Figure F24) and are in good agreement with Hole U1444A. Similar to the NGR data gap, the density data from Hole U1444B recovered data that are useful for filling in a data gap in Hole U1444A at 103.9–112.5 m CSF-A. The density peak of 2.145 g/cm3 at 101.672 m CSF-A in Hole U1444B correlates with a density peak of 2.195 g/cm3 at 101.638 m CSF-A in Hole U1444A.
Compressional wave velocity
Compressional P-wave velocity measurements using the P-wave logger were performed on whole-round sections for Cores 353-U1444A-1H through 17X (0–146 m CSF-A). The P-wave velocity data range between 1400 and 1800 m/s downhole (Figure F23). The very low values are a product of air and water in partially filled core liners, particularly in the semiconsolidated sands. P-wave values were found to be unreliable and were not measured on core sections deeper than 146 m CSF-A.
Diffuse reflectance spectroscopy and digital color image
Spectral reflectance was measured on all archive halves using the SHMSL. L* ranges between 9.5 and 60.2 with average values of 34.5 in Unit A1, 37.6 in Unit A2, 36.1 in Unit A3, and 43.1 in Unit A4 (Figure F23). Reflectance a* and b* values show ranges between −0.5 and 14.9 and −6.9 and 7.7, respectively. There is a stepwise change in the b* and a* data at the Unit A1/A2 boundary showing an increase in a* values and a decrease in b* values corresponding to a transition to gray clays. Changes in color reflectance are directly related to compositional changes of the sediment (e.g., at this site higher a* and L* with corresponding lower b* values are related to higher clay concentrations in the top unit and the presence of darker sediments). The L*, b*, and a* values showed generally the same broader trend with less variability in Hole U1444B (Figure F24).
The SHIL data were obtained from the surface of the split archive halves, recording RGB color prior to drying (Figures F25, F26). The RGB data average R = 39.3, G = 39.6, and B = 35.62. These data were used to assist in identifying turbidite layers and distinguishing slight differences in clay composition, particularly with variable green and gray layers.
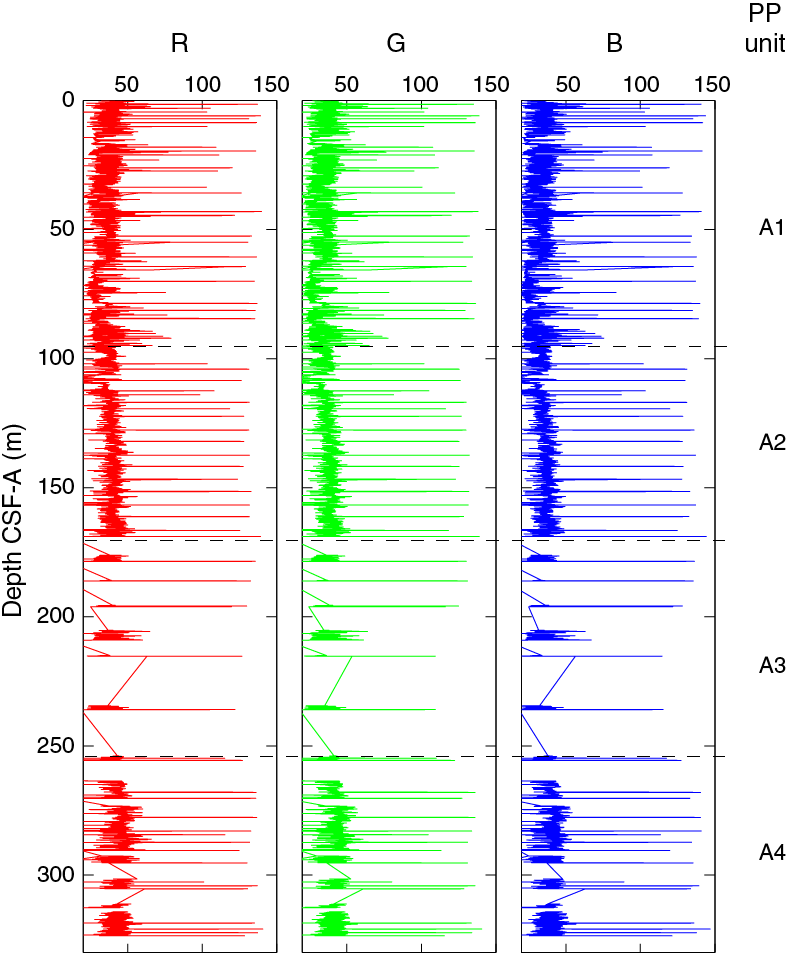
Figure F25. SHIL RGB color data, Hole U1444A.
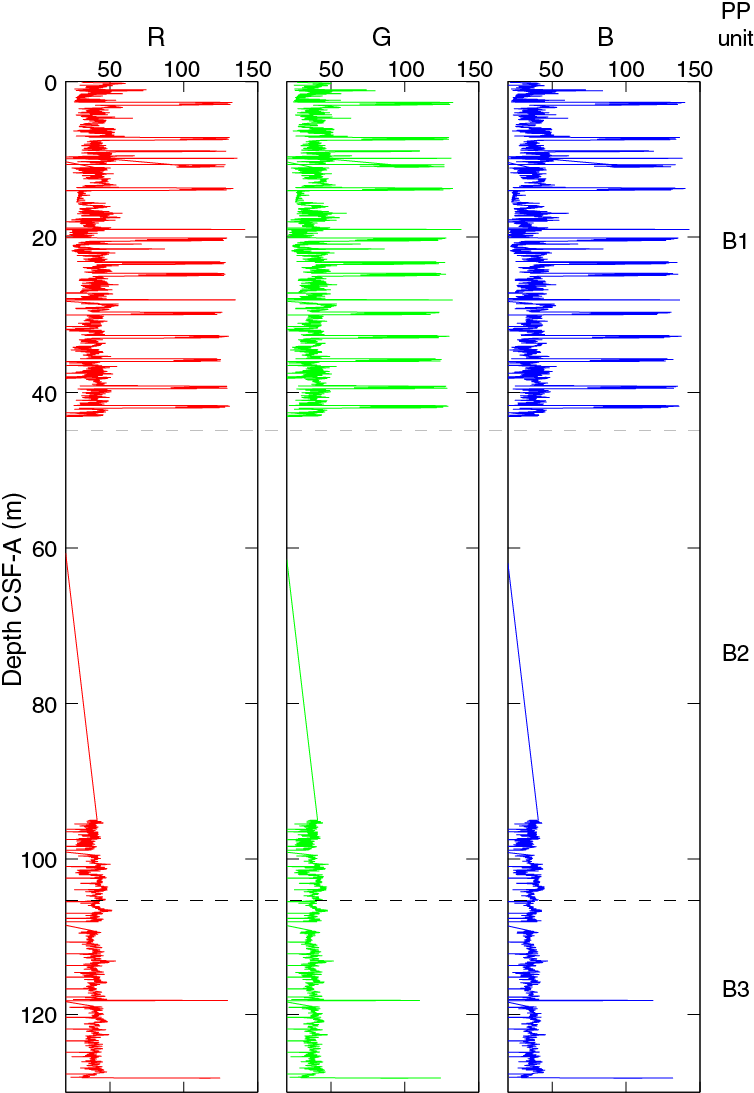
Figure F26. SHIL RGB color data, Hole U1444B.
Downhole temperature
Standard downhole temperature measurements were made on Cores 353-U1444A-4H, 7H, 10H, and 13H using the APCT-3. Temperature increased linearly with depth until ~85 m CSF-A, starting at 2.87°C at 35 m CSF-A to 6.24°C at 85 m CSF-A (Figure F27; Table T13). The fourth temperature value (5.54°C at 114 m CSF-A) is unlikely to be an accurate reading because it was difficult to extract the core barrel from the sediment. Using the first three measurements, the geothermal gradient was calculated to be higher than expected at ~67.4°C/km, which could be related to the close proximity of the sedimentary section to the basement.
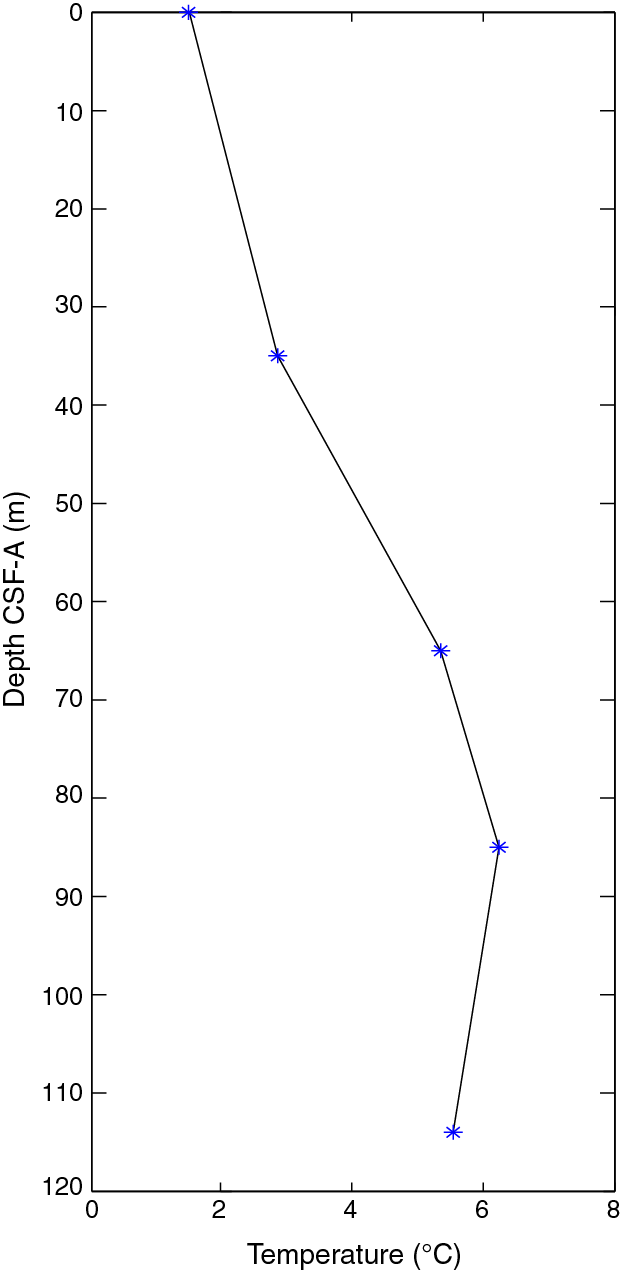
Figure F27. Downhole temperature data, Hole U1444A.
Table T13. Downhole temperature measurements from the APCT-3, Site U1444. Download table in .csv format.
Summary
We identified four physical property units in Hole U1444A that are identical to the units identified by the Lithostratigraphy group (see Lithostratigraphy) and three physical property units in Hole U1444B that are different and are not directly related to the units defined for Hole U1444A. The distinct difference in physical property characteristics of Hole U1444A between Units A1 and A2 is likely to be related to the lithologic changes that were found at the boundary of these two units based on biostratigraphic age (see Lithostratigraphy and Biostratigraphy). The MS values were higher in coarse-grained sediments than in clays, and some anomalous trends in the MS data could be potentially due to mechanical sorting. Unfortunately, poor recovery over much of Unit A3 leaves much of this unit a mystery. Unit A4 showed similar overall trends as Unit A2 with the exception of higher density and lower porosity values as a result of compaction with depth.
Stratigraphic correlation
No stratigraphic correlation was possible for Site U1444. Coring disturbance and mechanical sorting of turbidite sands leading to a restructuring of the physical properties on a core-by-core basis in the upper part of the site (see Physical properties) and a lack of signal in XCB cores in the lower part of the site prevented establishment of reliable tie points between Holes U1444A and U1444B.
References
Clemens, S.C., Kuhnt, W., LeVay, L.J., Anand, P., Ando, T., Bartol, M., Bolton, C.T., Ding, X., Gariboldi, K., Giosan, L., Hathorne, E.C., Huang, Y., Jaiswal, P., Kim, S., Kirkpatrick, J.B., Littler, K., Marino, G., Martinez, P., Naik, D., Peketi, A., Phillips, S.C., Robinson, M.M., Romero, O.E., Sagar, N., Taladay, K.B., Taylor, S.N., Thirumalai, K., Uramoto, G., Usui, Y., Wang, J., Yamamoto, M., and Zhou, L., 2016. Expedition 353 methods. In Clemens, S.C., Kuhnt, W., LeVay, L.J., and the Expedition 353 Scientists, Indian Monsoon Rainfall. Proceedings of the International Ocean Discovery Program, 353: College Station, TX (International Ocean Discovery Program). http://dx.doi.org/10.14379/iodp.proc.353.102.2016
Emmel, F.J., and Curray, J.R., 1984. Bengal Fan, Indian Ocean. In Bouma, A.H., Normark, W.P., and Barnes, N.E. (Eds.), Submarine Fans and Related Systems: New York (Springer-Verlag), 248–275.
France-Lanord, C., Schwenk, T., and Klaus, A., 2014. Expedition 354 Scientific Prospectus: Bengal Fan. International Ocean Discovery Program. http://dx.doi.org/10.14379/iodp.sp.354.2014
Fu, Y., von Dobeneck, T., Franke, C., Heslop, D., and Kasten, S., 2008. Rock magnetic identification and geochemical process models of greigite formation in Quaternary marine sediments from the Gulf of Mexico (IODP Hole U1319A). Earth and Planetary Science Letters, 275(3–4):233–245. http://dx.doi.org/10.1016/j.epsl.2008.07.034
Gradstein, F.M., Ogg, J.G., Schmitz, M.D., and Ogg, G.M. (Eds.), 2012. The Geological Time Scale 2012: Amsterdam (Elsevier).
Kudrass, H.R., 1994. Cruise report SO 93-1—Bengal Fan (R/V Sonne, 01/08–01/22, Colombo to Trincomalee).
Kudrass, H.R., 1997. Cruise report SO 126—Bengal Shelf (R/V Sonne, 11/18–12/16, Chittagong to Port Kelang). http://edok01.tib.uni-hannover.de/edoks/e001/319718735.pdf
Martini, E., 1971. Standard Tertiary and Quaternary calcareous nannoplankton zonation. In Farinacci, A. (Ed.), Proceedings of the Second Planktonic Conference, Roma 1970: Rome (Edizioni Tecnoscienza), 2:739–785.
Okada, H., and Bukry, D., 1980. Supplementary modification and introduction of code numbers to the low-latitude coccolith biostratigraphic zonation (Bukry, 1973; 1975). Marine Micropaleontology, 5:321–325. http://dx.doi.org/10.1016/0377-8398(80)90016-X
Schwenk, T., and Spieß, V., 2009. Architecture and stratigraphy of the Bengal Fan as response to tectonic and climate revealed from high-resolution seismic data. In Kneller, B.C., Martinsen, O.J., and McCaffrey, B. (Eds.), External Controls on Deep-Water Depositional Systems. Special Publication - SEPM (Society of Sedimentary Geologists), 92:107–131.
Snowball, I.F., 1997. Gyroremanent magnetization and the magnetic properties of greigite-bearing clays in southern Sweden. Geophysical Journal International, 129(3):624–636. http://dx.doi.org/10.1111/j.1365-246X.1997.tb04498.x
Spieß, V., Schwenk, T., Bartels, T., Blanz, T., Etourneau, J., Gainusa-Bogdan, A., Gueneli, N., Huppenkothen, D., Keil, H., Palamenghi, L., et al., 2006. Cruise report SO 188-1—Bengal Sea Level (R/V Sonne, 06/06–07/04, Singapore to Chittagong). http://dx.doi.org/10.2312/cr_so188_1
Stephenson, A., 1993. Three-axis static alternating field demagnetization of rocks and the identification of natural remanent magnetization, gyroremanent magnetization, and anisotropy. Journal of Geophysical Research: Solid Earth, 98(B1):373–381. http://dx.doi.org/10.1029/92JB01849
von der Borch, C.C., Sclater, J.G., et al., 1974. Initial Reports of the Deep Sea Drilling Project, 22: Washington (U.S. Government Printing Office). http://dx.doi.org/10.2973/dsdp.proc.22.1974
1Clemens, S.C., Kuhnt, W., LeVay, L.J., Anand, P., Ando, T., Bartol, M., Bolton, C.T., Ding, X., Gariboldi, K., Giosan, L., Hathorne, E.C., Huang, Y., Jaiswal, P., Kim, S., Kirkpatrick, J.B., Littler, K., Marino, G., Martinez, P., Naik, D., Peketi, A., Phillips, S.C., Robinson, M.M., Romero, O.E., Sagar, N., Taladay, K.B., Taylor, S.N., Thirumalai, K., Uramoto, G., Usui, Y., Wang, J., Yamamoto, M., and Zhou, L., 2016. Site U1444. In Clemens, S.C., Kuhnt, W., LeVay, L.J., and the Expedition 353 Scientists, Indian Monsoon Rainfall. Proceedings of the International Ocean Discovery Program, 353: College Station, TX (International Ocean Discovery Program). http://dx.doi.org/10.14379/iodp.proc.353.104.2016
- F1. Site U1444 location, seismic line, and line-drawing interpretation.
- F2. Lithostratigraphic summary, Site U1444.
- F3. Lithostratigraphic summary with selected physical property and geochemical data from Holes U1444A and U1444B.
- F4. Smear slide data, Holes U1444A and U1444B.
- F5. Turbidite thickness and maximum grain size class, Site U1444.
- F6. Major lithologies and representative turbidite compositions. A. Silty sand. B. Sandy silt. C. Silty clay. D. Nannofossil-rich clay with foraminifers. E. Organic-rich turbidite. F. Mica-rich turbidite. G. Glauconite-rich turbidite. H. Quartz-rich turbidite.
- F7. Main sedimentary components. A, B. Quartz, feldspar, and mica-rich silty sand. C, D. Silty clay with quartz and woody fragments. E. Nannofossil-rich clay with silt and foraminifers. F. Silty clay with pyrite. G, H. Black layer, silty clay rich in woody fragments. I. Greenish black layer. J. Vitric volcanic ash layer.
- F8. XRD diffractograms of bulk powders. A, C. Dark-colored turbidites. B. Hemipelagic clay. D. Light-colored turbidite.
- F9. XRD diffractograms of oriented clay aggregates treated with ethylene glycol, Hole U1444A.
- F10. Summary of biostratigraphic events identified in Hole U1444A.
- F11. Biostratigraphy and paleomagnetic reversal-based age-depth plot, Hole U1444A.
- F12. Headspace methane profile, Hole U1444A.
- F13. Calcium carbonate, TOC, and TN contents, Hole U1444A.
- F14. Interstitial water chemistry profiles, Site U1444.
- F15. Downhole variations in declination, inclination, and intensity after 10 mT AF demagnetization, Hole U1444A.
- F16. Downhole variations in declination, inclination, and intensity after 10 mT AF demagnetization, Hole U1444B.
- F17. Zoomed-in true declination and inclination data after 10 mT AF demagnetization, Hole U1444A.
- F18. Stepwise AF demagnetization results on a representative sample.
- F19. Variations in the ChRM inclination of discrete samples, Hole U1444A.
- F20. Stepwise AF demagnetization results on a representative sample.
- F21. Equal area lower hemispheric projection of NRM after AF demagnetization.
- F22. Plot of the rG parameter, which roughly quantifies the relative contribution of GRM to the NRM, calculated for discrete samples, Hole U1444A.
- F23. Physical properties including P-wave velocity, magnetic susceptibility, GRA bulk density, porosity, L*, a*, b*, and NGR, Hole U1444A.
- F24. Physical properties including magnetic susceptibility, GRA bulk density, L*, a*, b*, and NGR, Hole U1444B.
- F25. SHIL RGB color data, Hole U1444A.
- F26. SHIL RGB color data, Hole U1444B.
- F27. Downhole temperature data, Hole U1444A.
- T1. Site U1444 core summary.
- T2. Number, grain-size classification, and thickness of turbidites, Hole U1444A.
- T3. Calcareous nannofossil datums, Hole U1444A.
- T4. Planktonic foraminifer datums, Hole U1444A.
- T5. Semiquantitative calcareous nannofossils abundance counts from core catcher samples, Site U1444.
- T6. Semiquantitative planktonic foraminifer abundance counts from core catcher samples, Hole U1444A.
- T7. Headspace gas concentrations, Hole U1444A.
- T8. Calcium carbonate, TOC, and TN contents, Hole U1444A.
- T9. Interstitial water data, Holes U1444A and U1444B.
- T10. Summary of discrete sample ChRM, Hole U1444A.
- T11. Summary of magnetostratigraphy, Hole U1444A.
- T12. Physical property units, Holes U1444A and U1444B.
- T13. Downhole temperature measurements from the APCT-3, Site U1444.