Tobin, H., Hirose, T., Ikari, M., Kanagawa, K., Kimura, G., Kinoshita, M., Kitajima, H., Saffer, D., Yamaguchi, A., Eguchi, N., Maeda, L., Toczko, S., and the Expedition 358 Scientists
Proceedings of the International Ocean Discovery Program Volume 358
publications.iodp.org

https://doi.org/10.14379/iodp.proc.358.105.2020
Site C00251
G. Kimura, T. Hirose, M. Ikari, K. Kanagawa, M. Kinoshita, H. Kitajima, D. Saffer, H. Tobin, A. Yamaguchi, N. Eguchi, L. Maeda, S. Toczko, J. Bedford, S. Chiyonobu, T.A. Colson, M. Conin, P.H. Cornard, A. Dielforder, M.-L. Doan, J. Dutilleul, D.R. Faulkner, R. Fukuchi, G. Guérin, Y. Hamada, M. Hamahashi, W.-L. Hong, A. Ijiri, D. Jaeger, T. Jeppson, Z. Jin, B.E. John, M. Kitamura, A. Kopf, H. Masuda, A. Matsuoka, G.F. Moore, M. Otsubo, C. Regalla, A. Sakaguchi, J. Sample, A. Schleicher, H. Sone, K. Stanislowski, M. Strasser, T. Toki, T. Tsuji, K. Ujiie, M.B. Underwood, S. Yabe, Y. Yamamoto, J. Zhang, Y. Sanada, Y. Kido, E. Le Ber, and S. Saito with contributions by T. Kanamatsu2
Keywords: International Ocean Discovery Program, IODP, Chikyu, Expedition 358, NanTroSEIZE Plate Boundary Deep Riser 4: Nankai Seismogenic/Slow Slip Megathrust, Site C0025, Kumano Basin, Nankai accretionary prism, mud diapir, slope sediment, fore-arc basin, gas hydrate
MS 358-105: Published 18 July 2020
Introduction and operations
Site C0025 (proposed Site KB-01C) is located near the northwestern margin of the Kumano Basin (Figure F1). The Nankai Trough Seismogenic Zone Experiment (NanTroSEIZE) drilling campaign demonstrated that the outer wedge of the Nankai fore arc has been growing since ~2.2 Ma (Strasser et al., 2009), and the inner wedge beneath the present Kumano fore-arc basin is inferred to have developed for several million years based on the ages of fore-arc basin sediments and the underlying accretionary prism (Moore et al., 2015; Tsuji et al., 2015; Kimura et al., 2018; Underwood, 2018). The timing of the switch in the subducting plate at the Nankai Trough from the Pacific plate (PA) to the Philippine Sea plate (PSP) is uncertain and controversial. The traditional model suggested continuous subduction of the PSP since ~15 Ma (e.g., Seno and Maruyama, 1984; Taira, 2001; Kimura et al., 2005), whereas Hall et al. (1995), Hall (2002), Clift et al. (2013), Pickering et al. (2013), and Underwood (2018) suggested the switch occurred after ~10 Ma. Reviewing the terrestrial geology of southwest Japan and recent drilling results, Kimura et al. (2014, 2018) discussed the possibility that the subducting plate mostly switched from the PA to the PSP at ~12 Ma and subduction of the PSP stopped but resumed at ~6 Ma after a long interruption.
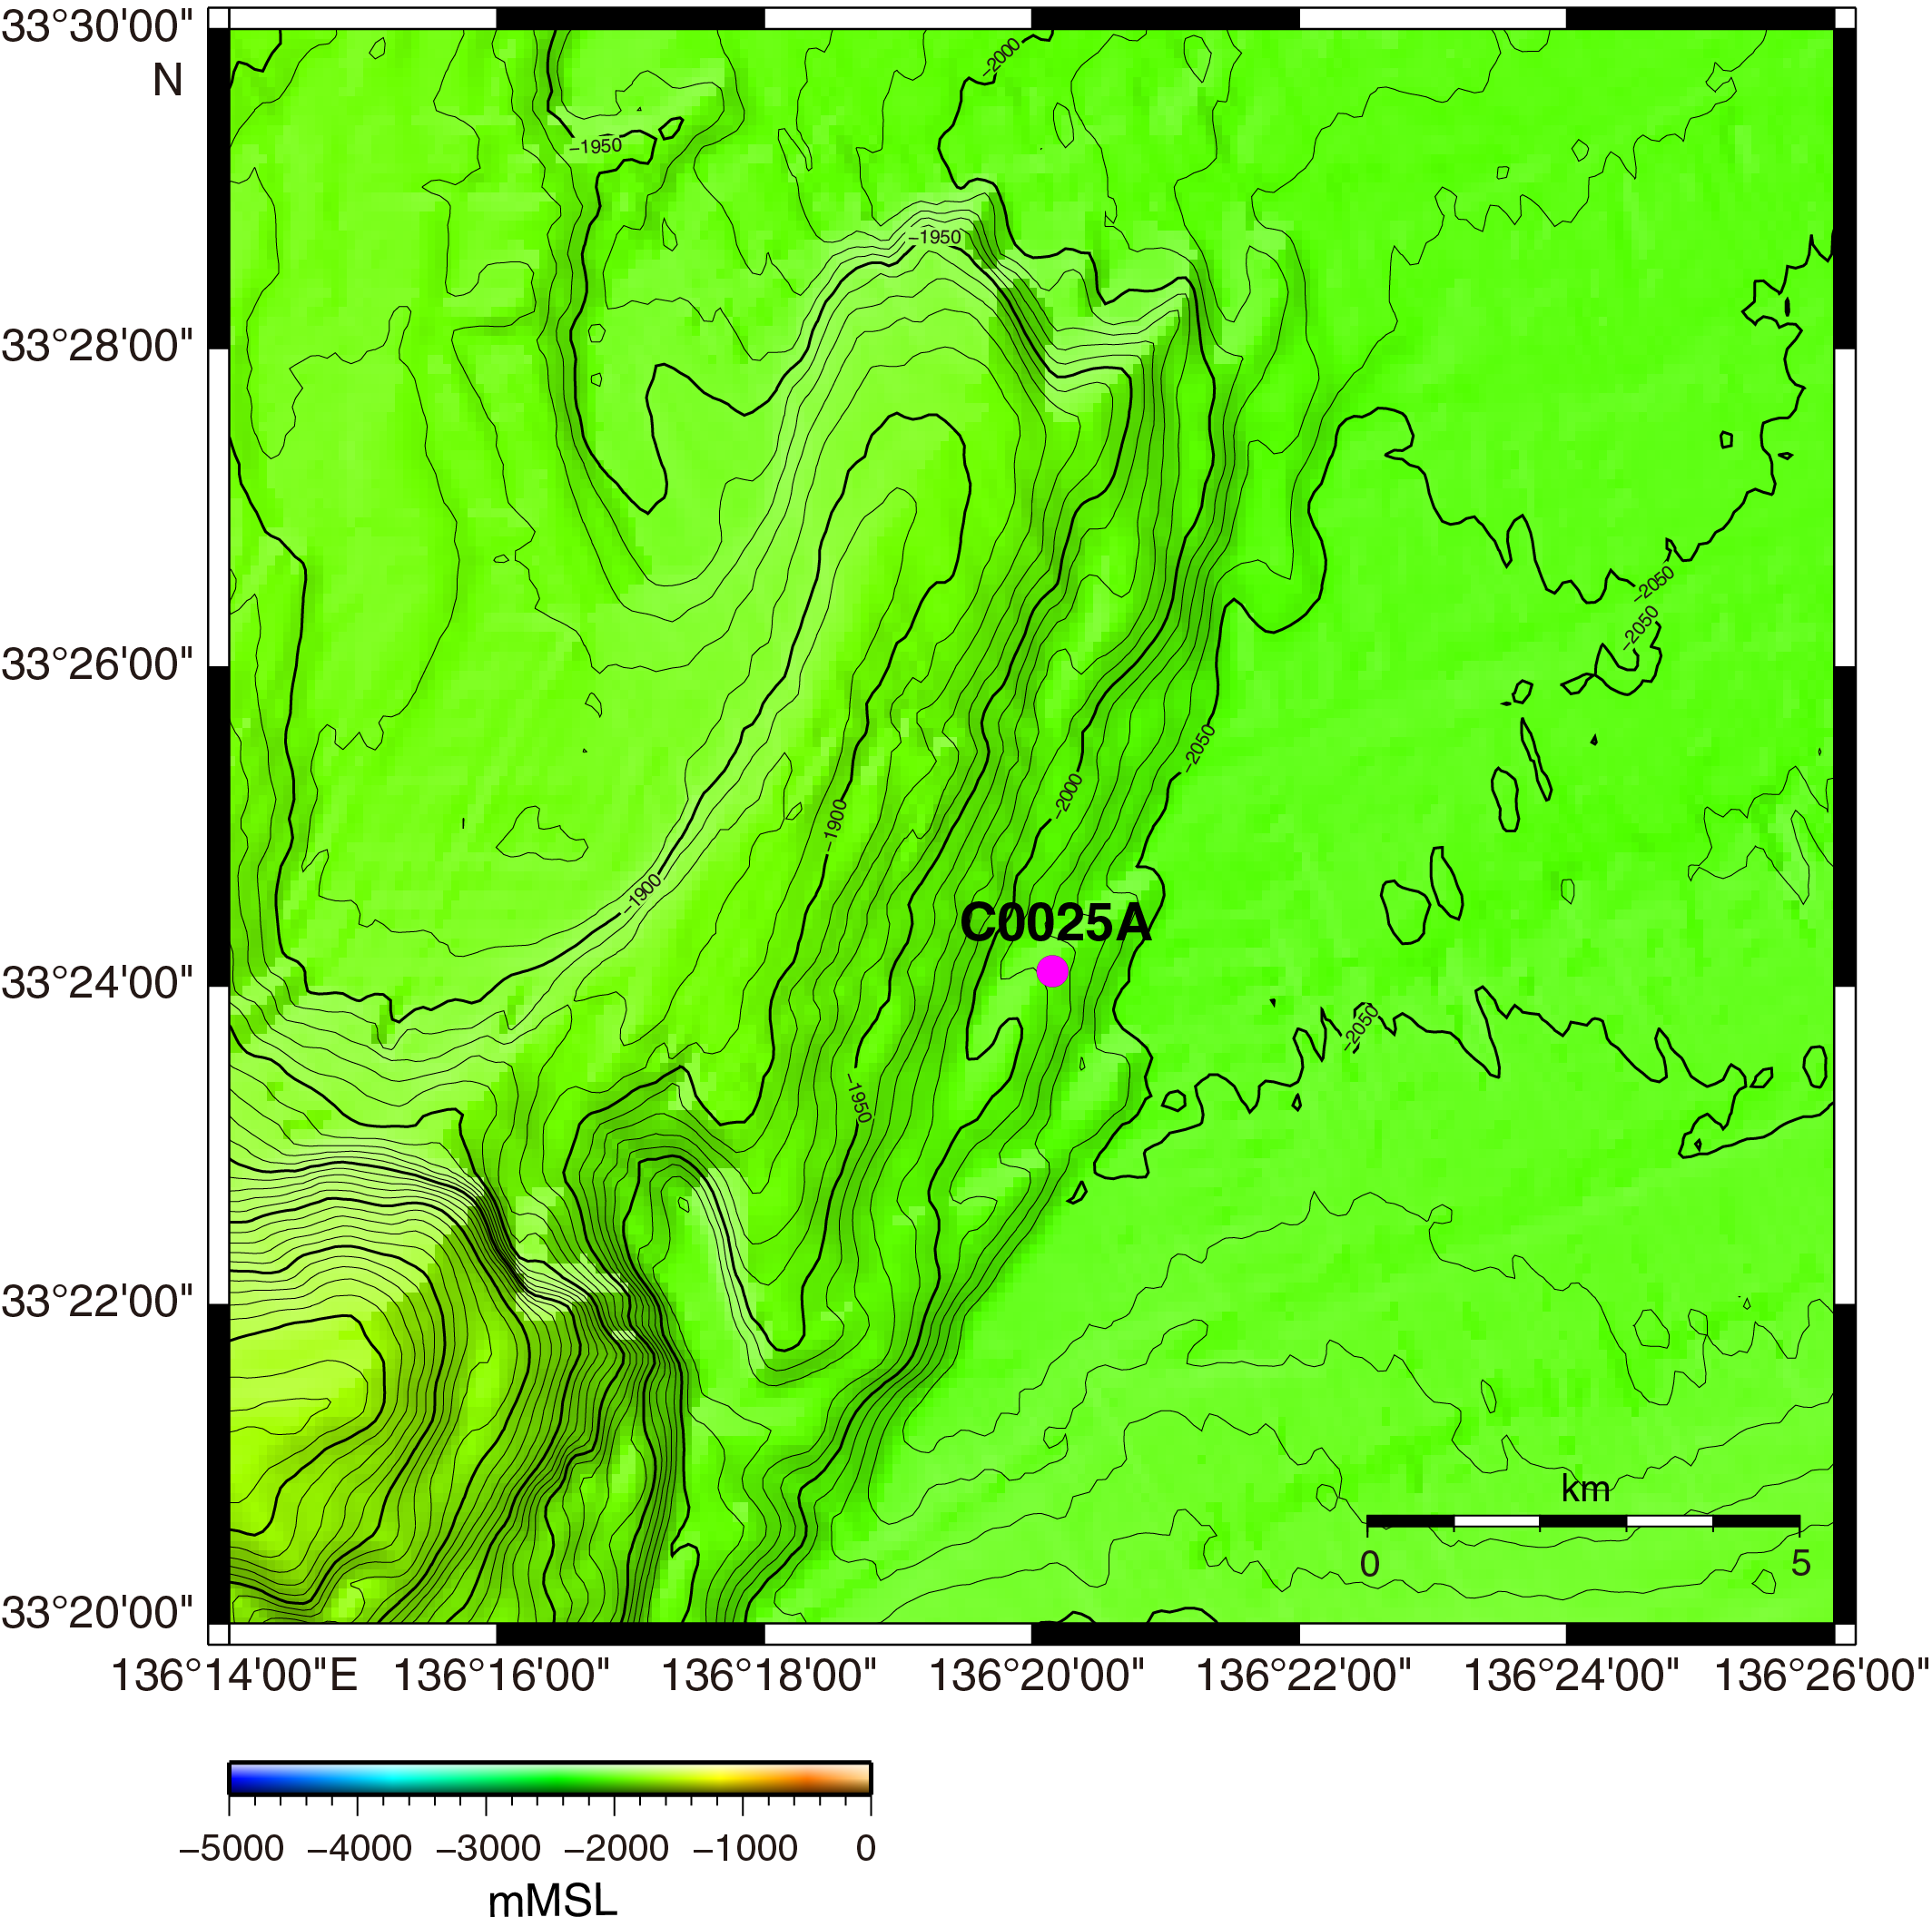
Figure F1. Bathymetric map.
The geologically young accretionary prism and fore-arc sediments of the inner and outer wedges constitute more than half of the hanging wall of the seismogenic megathrust in the Nankai subduction zone (Figure F2). Therefore, understanding the evolution of the geological and geophysical evolving processes of the prism and fore-arc basin is important to clarify their effect on the onset of the hanging wall megathrust.
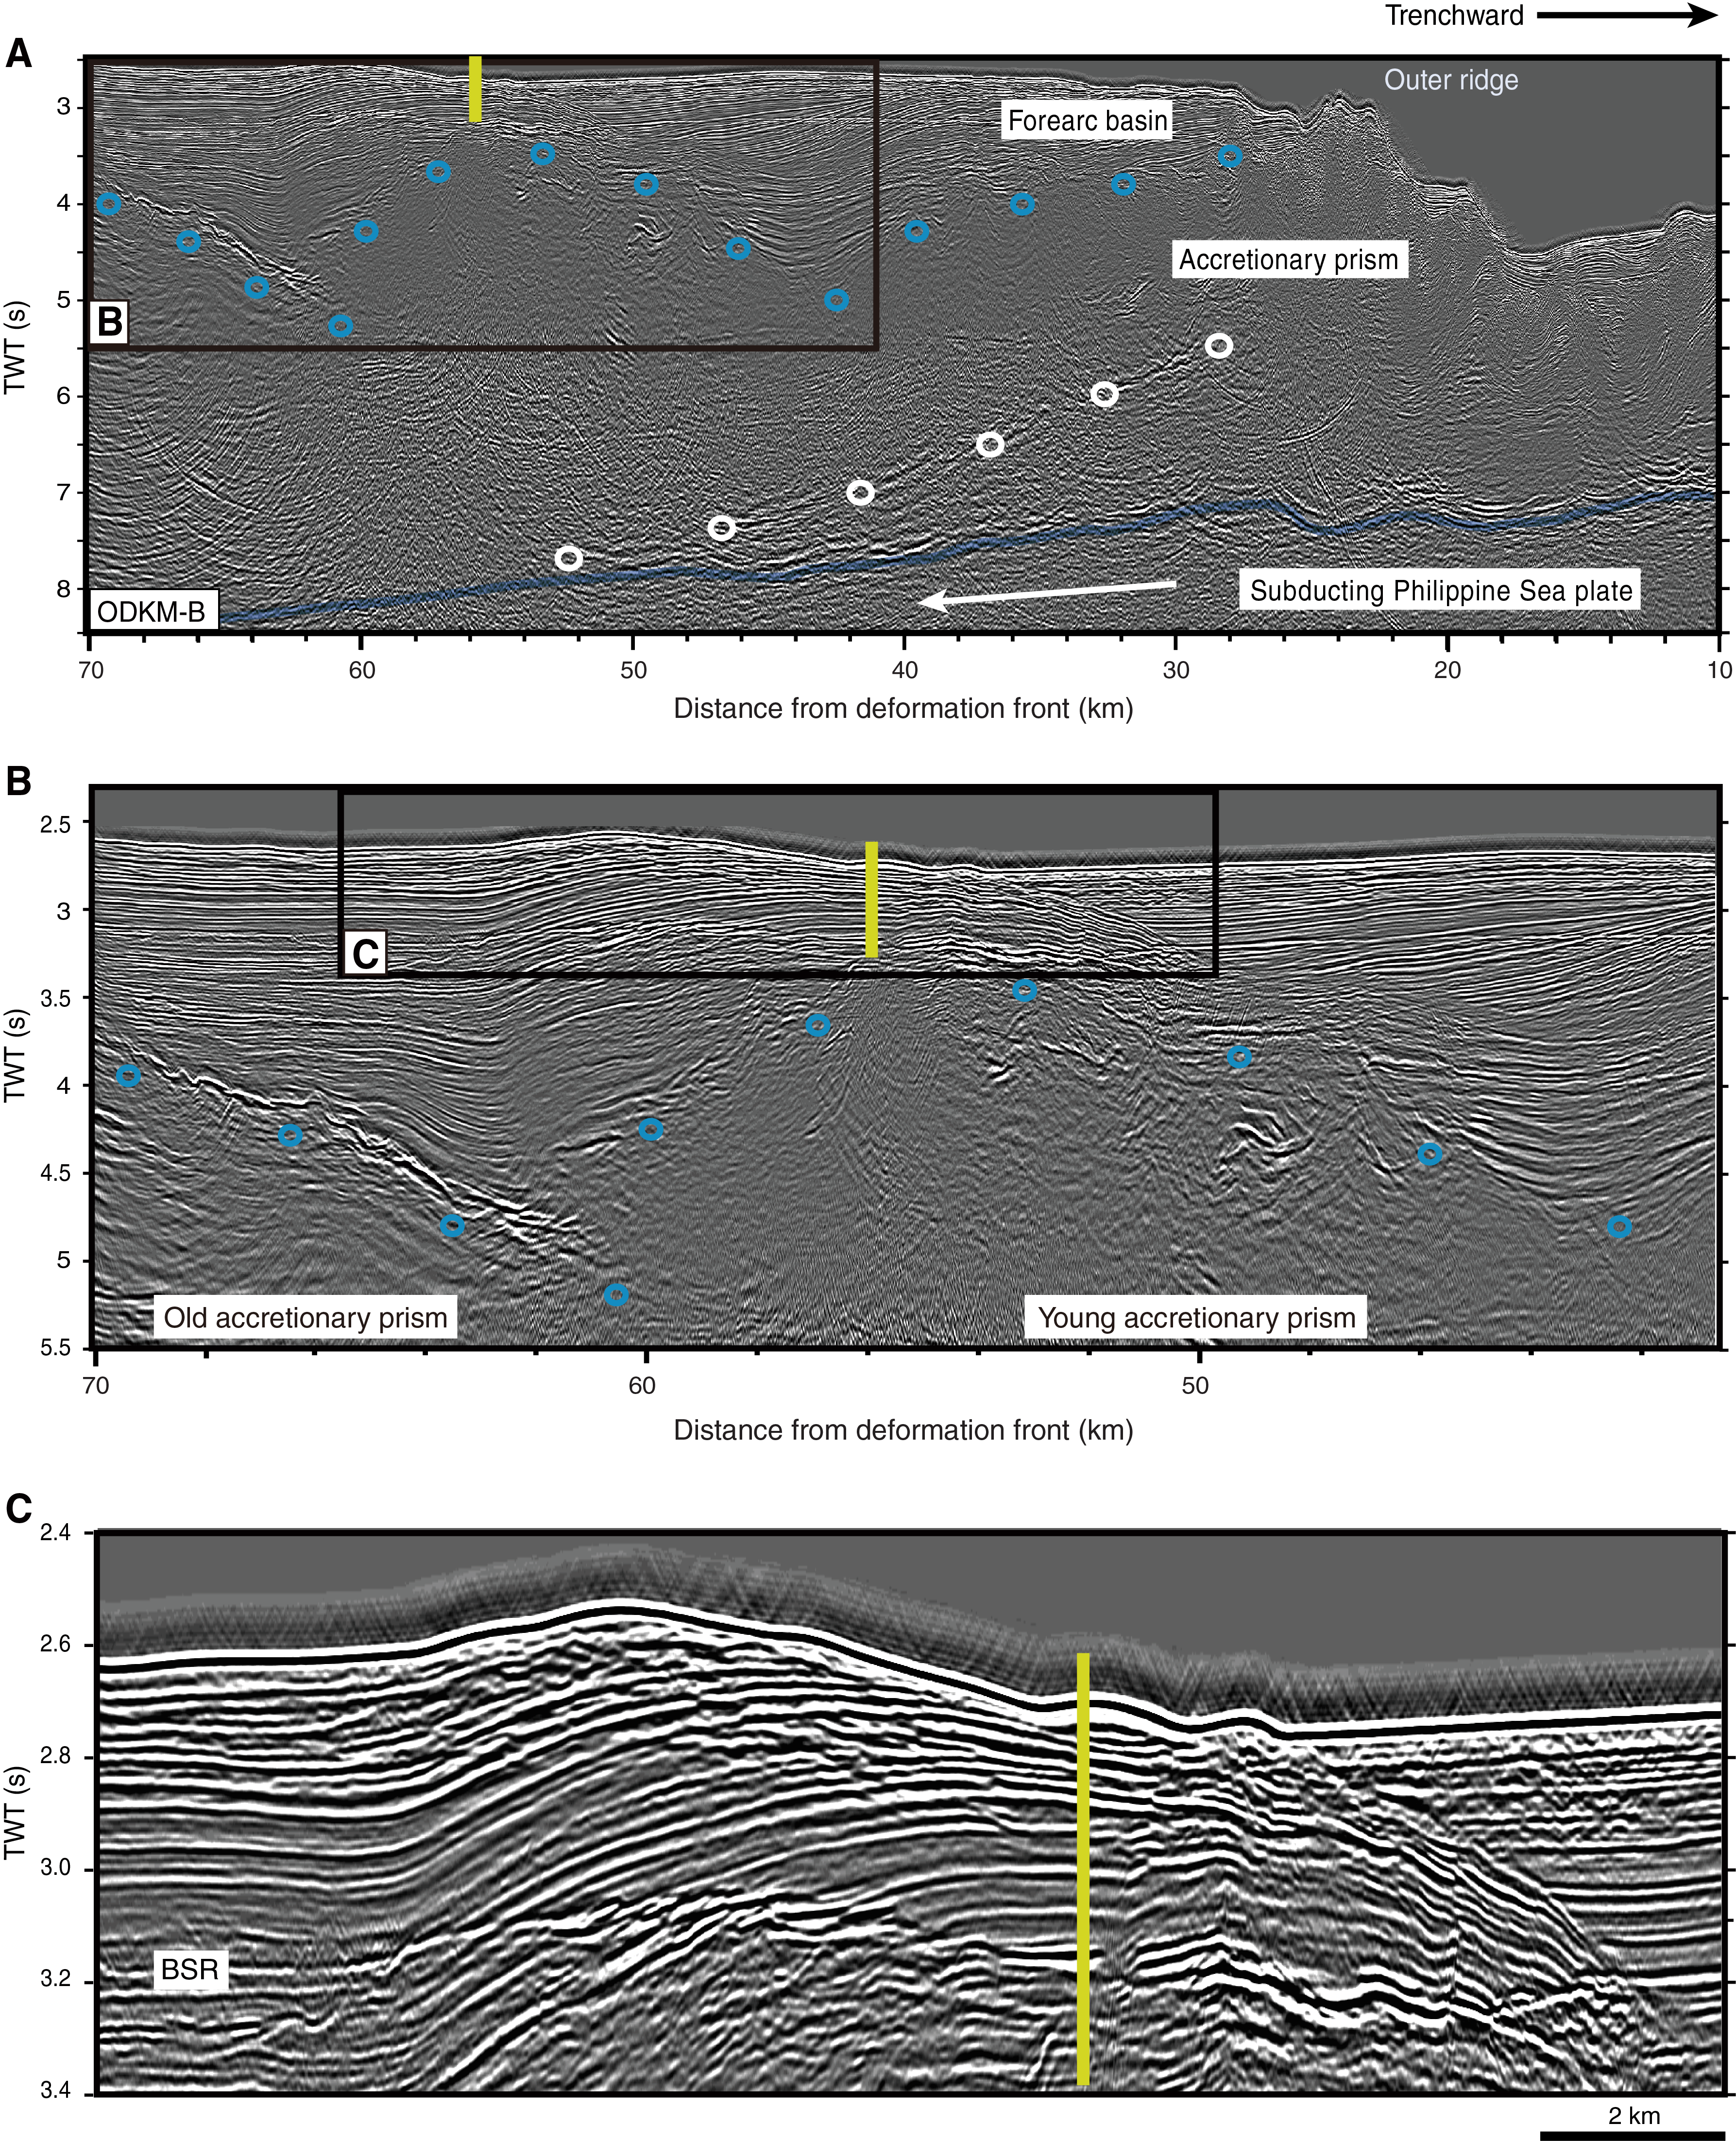
Figure F2. Seismic profile.
Site C0025 presents a key location to understand the beginning of the inner wedge prism and development of the Kumano fore-arc basin. One interpretation for the northern edge of the Kumano Basin is that the incipient accretionary prism began to thrust upon the northern old accretionary prism or the igneous basement concurrently with slope deposition (Tsuji et al., 2015; Kimura et al., 2018) (Figure F2). The thrust has finally grown to an anticlinal dome of fault-bend folding and set up as the northern margin of the Kumano fore-arc basin (Tsuji et al., 2015; Kimura et al., 2018).
An alternative interpretation for the domal uplift of the mass shown could be a large upwelling structure related to mud diapirism (Morita et al., 2004; Moore et al., 2017). The Kumano Basin is well known for the many mud volcanoes, likely the surface expression of these mud diapirs (Moore et al., 2017). Drilling at Site C0025 targeted the geologic structure, components, and present status of the northern margin of the Kumano Basin. This chapter presents the preliminary description and interpretation from core samples collected at this site.
Site C0025
The D/V Chikyu arrived at Site C0025 at 2100 h (Japan Standard Time [JST]) on 25 March 2019 (Figure F1; Table T1; also see Table T2 in the Expedition 358 summary chapter [Tobin et al., 2020a]). After completing transponder deployment, dynamic positioning calibration, and a field arrival check, the 10⅝ inch rotary core barrel (RCB) bottom-hole assembly (BHA) (Table T2) was run in the hole at 0430 h on 26 March.
Hole C0025A
The RCB BHA was spudded in at 2039.5 m below rotary table (BRT) at 1030 h and washed down to 2049 m BRT by 1315 h on 26 March 2019. Drilling ahead without coring continued to the target depth to begin coring (2439.5 m BRT; 400 meters below seafloor [mbsf]) by 0615 h on 27 March. Cutting and retrieving cores started at 0845 h and continued until coring reached 2620 m BRT (581 mbsf) by the end of the contingency time at 1100 h on 29 March. A total of 19 RCB cores were recovered (Table T3). The BHA was pulled out of the hole while recovering transponders at 1415 h on 29 March and stopped at 1962 m BRT to spot cement. The BHA was recovered on deck, and all operations for Site C0025 were completed by 1000 h on 30 March.
Transit to Shimizu, Japan
The ship began sailing at 1000 h on 30 March 2019 and arrived at the stand-by point off the port of Shimizu, Japan, at 0230 h on 31 March 2019.
Lithology
We documented the lithologic character of 18 cores from Hole C0025A. All of the cores were retrieved using the RCB system. The cored interval is limited, extending from 400.00 to 574.77 mbsf (Figure F3; Table T4). Sediment in Core 358-C0025A-1R is weakly consolidated to soupy and largely homogenized to a slurry of sandy mud or muddy sand, and Core 2R had no recovery. Most of the remaining RCB cores are lithified (e.g., "silty claystone") and stratified. Sedimentary layering is obscured, however, in fragmented zones and intervals of structureless sandy mudstone to muddy sandstone.
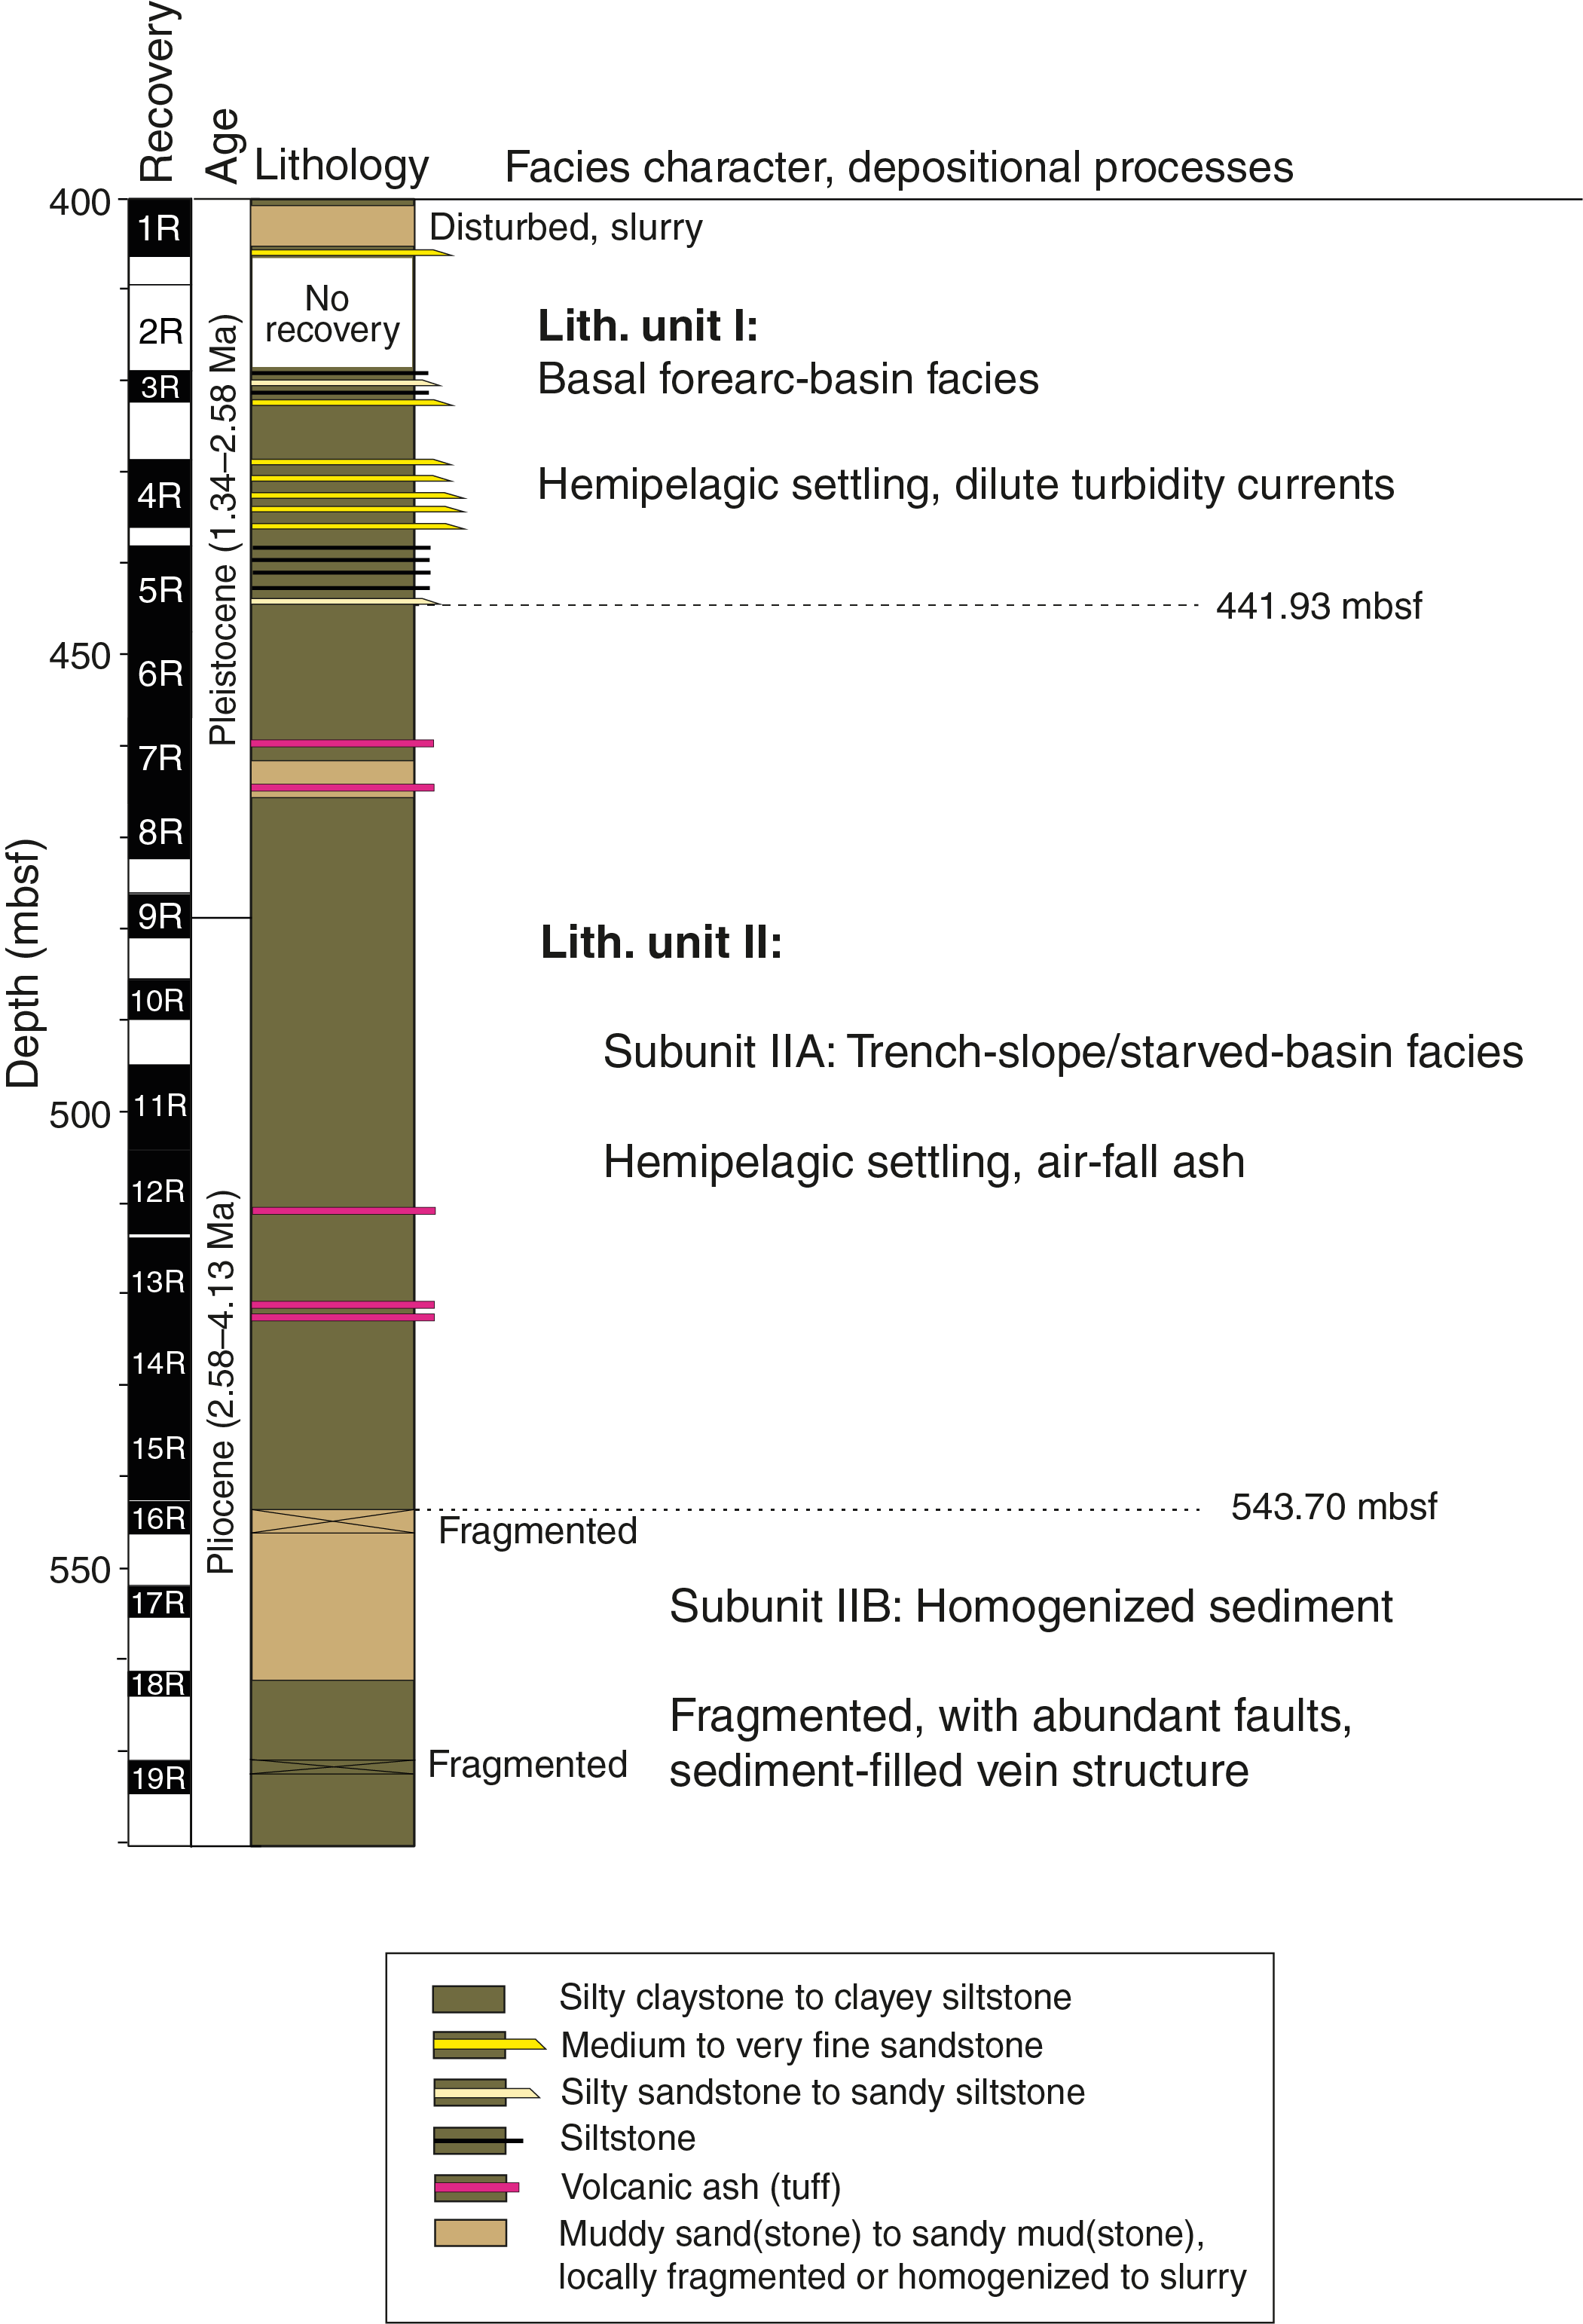
Figure F3. Stratigraphic column.
We discriminated among lithologies based on visual observations of the split core, smear slide petrography, bulk powder X-ray diffraction (XRD), and bulk sediment X-ray fluorescence (XRF) (see Lithology in the Expedition 358 methods chapter [Hirose et al., 2020]). Division of lithologic units at the scale of depositional facies (Figure F3) is based on differences in grain size, bed thickness, composition (especially calcium carbonate content), internal sedimentary structures, and inferred mode of deposition. Depositional ages are based on nannofossil assemblages (see Biostratigraphy). The section recovered from Hole C0025A appears to be conformable throughout and has a maximum age of 4.13 Ma.
Unit I (basal fore-arc basin facies)
- Interval: 358-C0025A-1R-1, 0 cm, to 5R-4, 122 cm
- Depth: 400.00–441.93 mbsf
- Age: early Pleistocene (1.34–1.59 Ma)
Description and interpretation of lithology
Most of Core 358-C0025A-1R consists of a weakly lithified mixture of silty clay and sand without clear stratification; homogenization of grains to muddy sand or sandy mud is probably an artifact of drilling disturbance. Below Core 2R, the intact portion of Lithologic Unit I is composed of mudstone (silty claystone to clayey siltstone) with thin interbeds (generally <5 cm) of medium to fine sandstone, silty sandstone, sandy siltstone, and siltstone. The base of Unit I coincides with the lowermost sandy bed in Core 5R at 441.93 mbsf (Figure F3). The age range of nannofossil assemblages is consistent with early Pleistocene deposition.
The dominant lithology in Lithologic Unit I is greenish gray silty claystone to clayey siltstone (Figure F4A). Except for its mottled color, manifestations of bioturbation are rare. The mudstone contains scattered silt and fine sand lamination, pyrite nodules, and opaque grains, as well as local concentrations of organic matter and fine-grained pyrite. Thin interbeds (<5 cm) are common and have textures ranging from medium to fine sandstone, silty sandstone to sandy siltstone, and siltstone. Most such beds display sharp bases and are internally structureless, but some display subtle normal size grading (Figure F4A). These features are indicative of deposition by turbidity currents. The abundance of silt and sand in the Unit I turbidites results in consistently higher magnetic susceptibility values compared to Unit II below (see Physical properties).
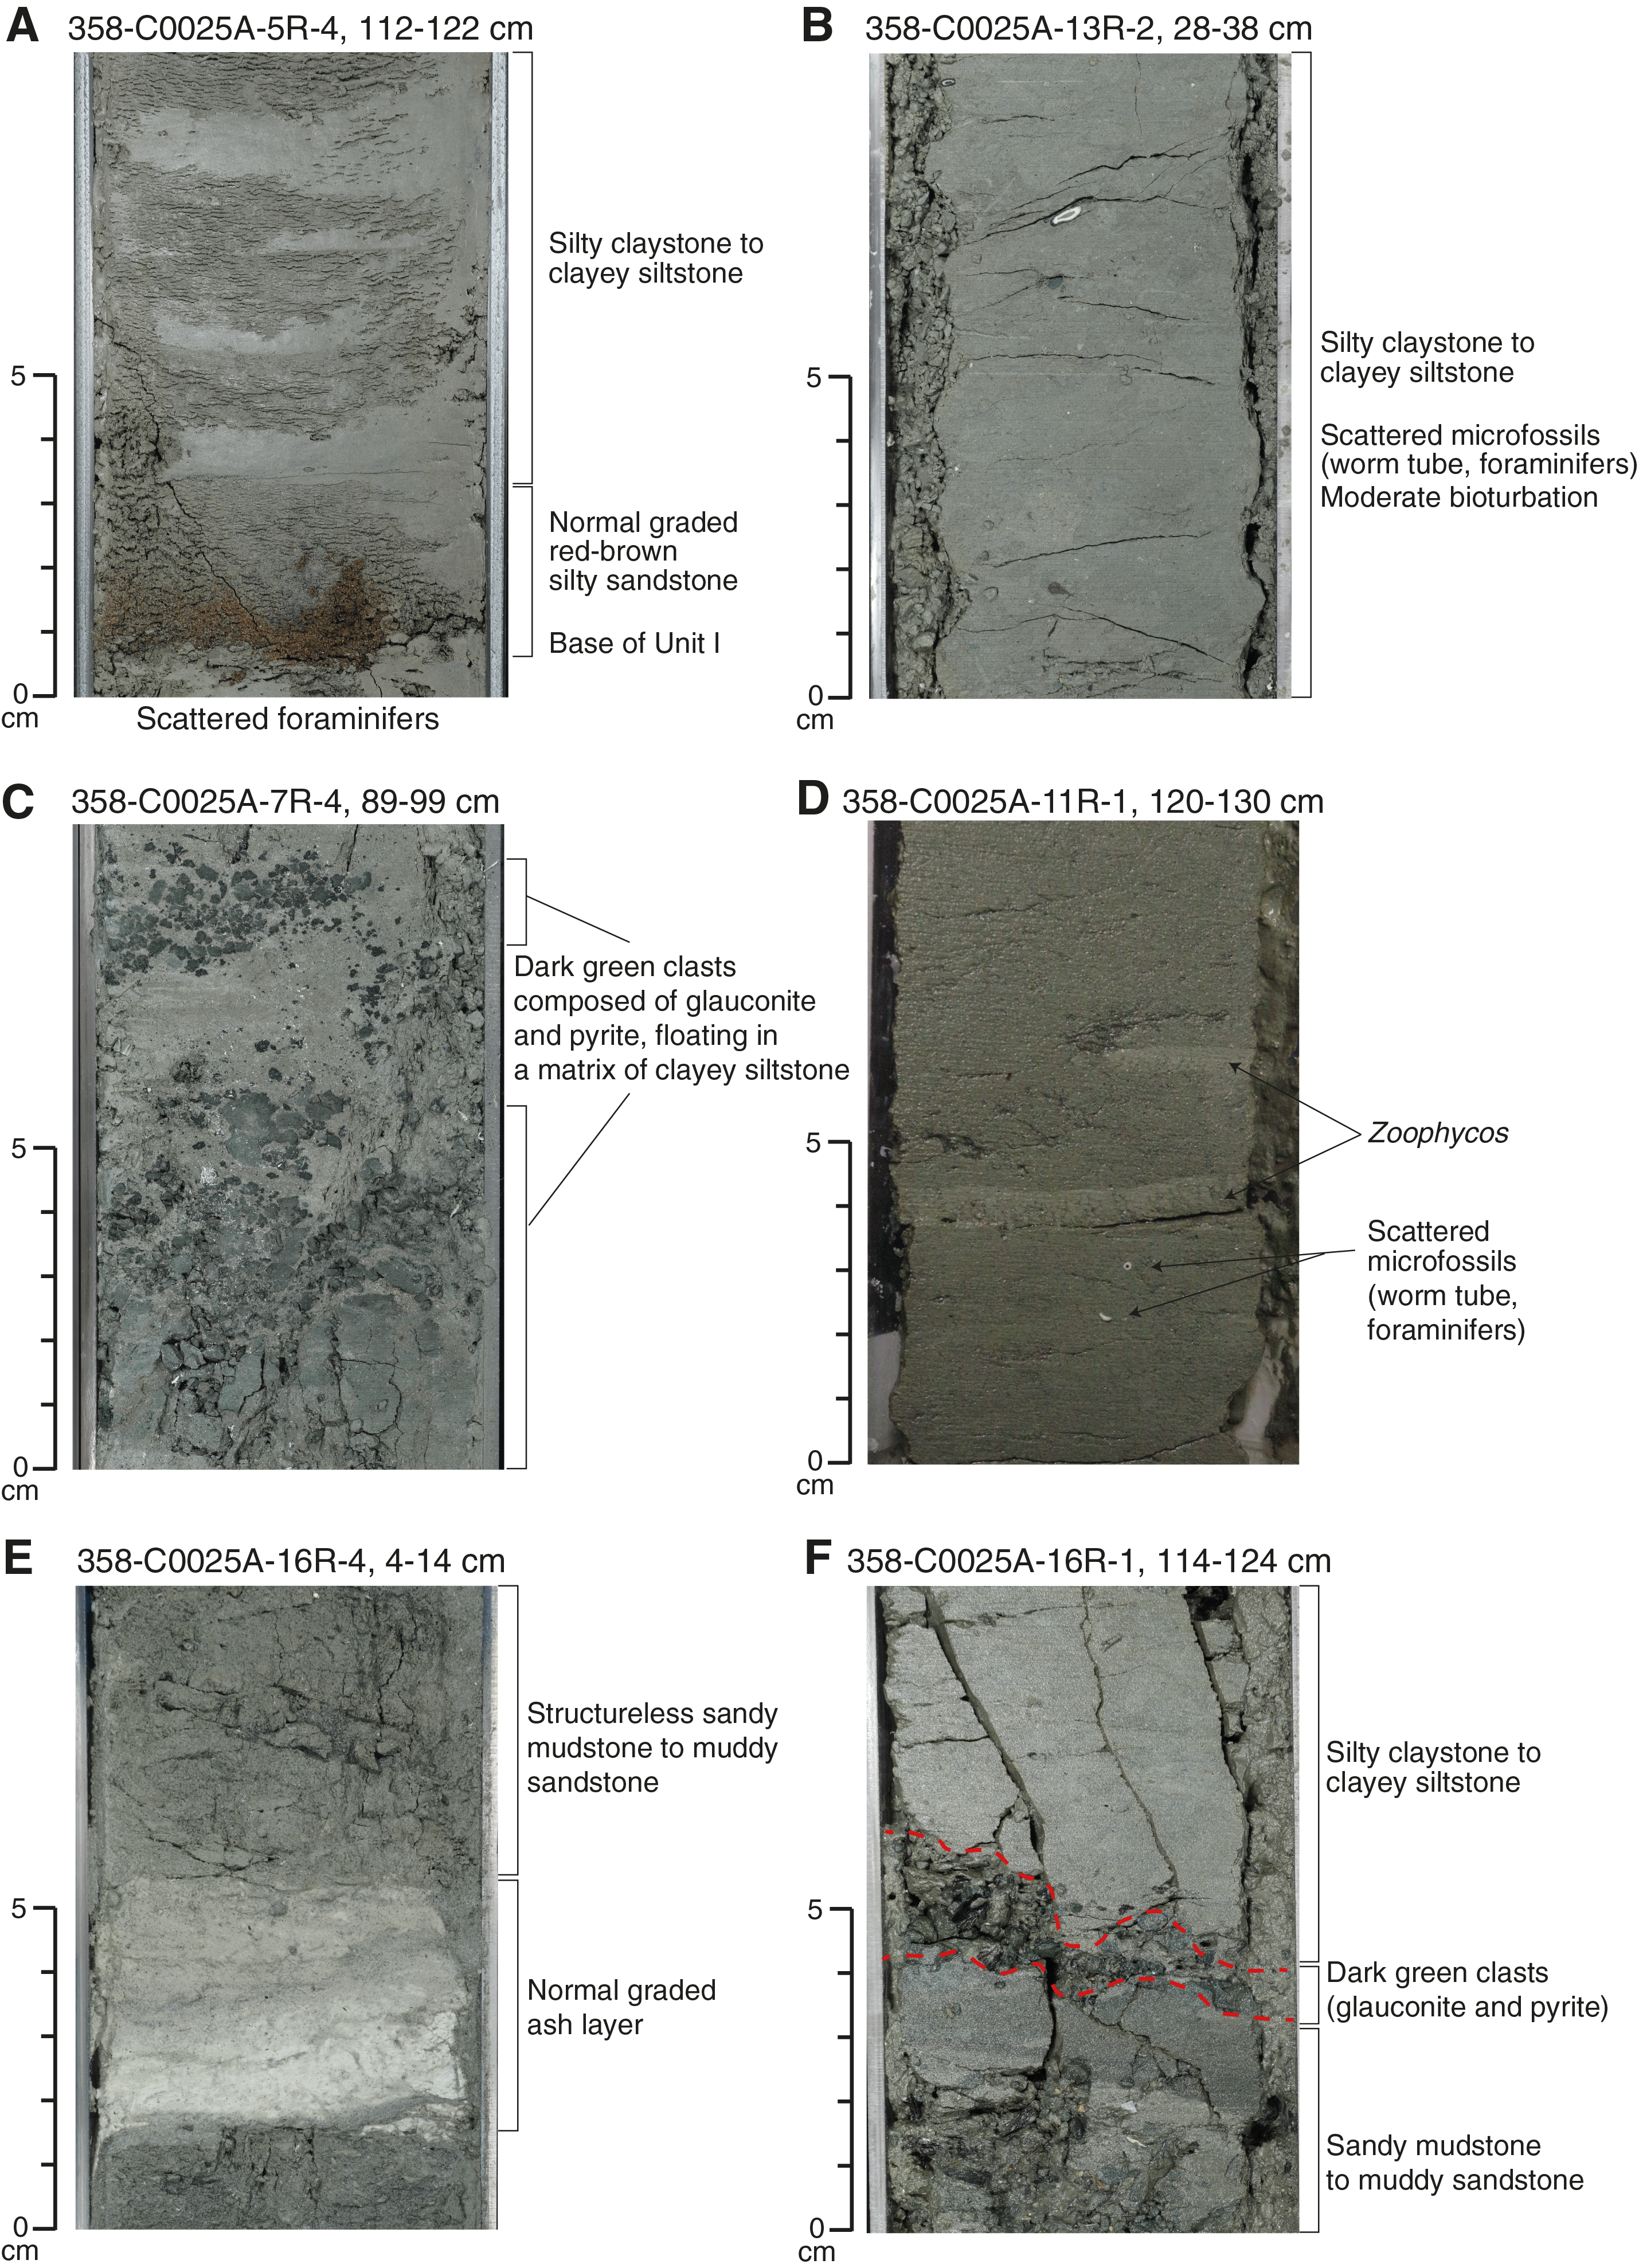
Figure F4. Common lithologies.
Unit II (trench-slope facies)
- Interval: 358-C0025A-5R-4, 122 cm, to 19R-CC, 40 cm
- Depth: 441.93–574.77 mbsf
- Age: late Pliocene to early Pleistocene (1.59–4.13 Ma)
Description of lithologies
The silty claystone to clayey siltstone of Unit II is also greenish gray to dark olive-gray. Irregular changes in color are related to bioturbation, variable concentrations of calcareous nannofossils, higher concentrations of dispersed sand-sized lithic fragments, and terrigenous organic matter. Rare sedimentary structures include parallel lamination, but most of the fine-grained sediment is mottled or structureless (Figure F4B). This common lithology also contains scattered occurrences of dark green clay-rich bands, organic matter, pyrite, glauconite, foraminifers, worm tubes, sponge spicules, fine sand lamination, Chondrites and Zoophycos trace fossils (Figure F4D), pumice clasts, thin volcanic ash beds (Figure F4E), and irregular ash pods. Glauconite occurs as dispersed grains and in concentrated clusters (Figure F4C). The zones with higher concentrations of glauconite are probably responsible for increases in natural gamma radiation (NGR) values (see Physical properties).
Intervals in Cores 358-C0025A-7R, 16R, and 17R are composed of roughly equal mixtures of fine sand-, silt-, and clay-sized particles (Figure F4F). Most such examples are heavily fragmented or in extreme cases reduced to slurry. The sand grains are evenly dispersed among finer particles rather than concentrated in discrete layers. Accordingly, these intervals lack both primary stratification and internal sedimentary structures. It is unclear whether the fragmentation and blending of diverse grain sizes are primary attributes (i.e., created during transport and deposition of sediment), products of structural deformation, or artifacts of drilling disturbance. Additional work using X-ray computed tomography (CT) scan images might help resolve some of these questions. Networks of sediment-filled veins and high-angle fractures are also distinctive in Cores 16R–19R (see Structural geology).
Petrography
The smear slides we used to record the compositional proportions and texture of dominant lithologies from Hole C0025A were positioned in "clusters" next to whole-round sample intervals (for tabulated results, see Core descriptions; also see SMEARSLD in Supplementary material). Silt- and clay-sized grains are dominant in most specimens. Sand-sized content increases in the lower portions of Unit II (i.e., the sandy mudstone to muddy sandstone lithology). Quartz and clay minerals are ubiquitous constituents of silty claystone to clayey siltstone. Grains of feldspar, mica, and heavy minerals are common in Unit I. Their content decreases in Unit II. Dispersed shards of volcanic glass and volcanic lithic fragments are few to common. Calcareous nannofossils are common to abundant; their content is substantially higher in Unit II, which generally imparts a lighter gray macroscopic color. That observation is also consistent with the results of XRF and XRD analyses (see below), which reveal higher CaO and calcite concentrations. Fragments of sponge spicules, foraminifers, diatoms, and terrestrial organic matter are rare to common. Diatom and sponge spicule content increases from Unit I to Unit II. Opaque grains (e.g., pyrite) are common, and grains of glauconite are rare in the smear slides of background sediment.
X-ray fluorescence geochemistry
XRF analysis of bulk sediment samples was used to quantify compositional trends of silty claystone with depth (Table T5). The XRF samples were colocated in clusters next to whole-round samples (e.g., for interstitial water [IW]), along with specimens for XRD, coulometric carbon measurements, and smear slides. The XRF results (Figure F5) provide contents of major and minor element oxides (SiO2, Al2O3, CaO, K2O, Na2O, Fe2O3, MgO, TiO2, P2O5, and MnO) complemented by loss on ignition (LOI) measurements.
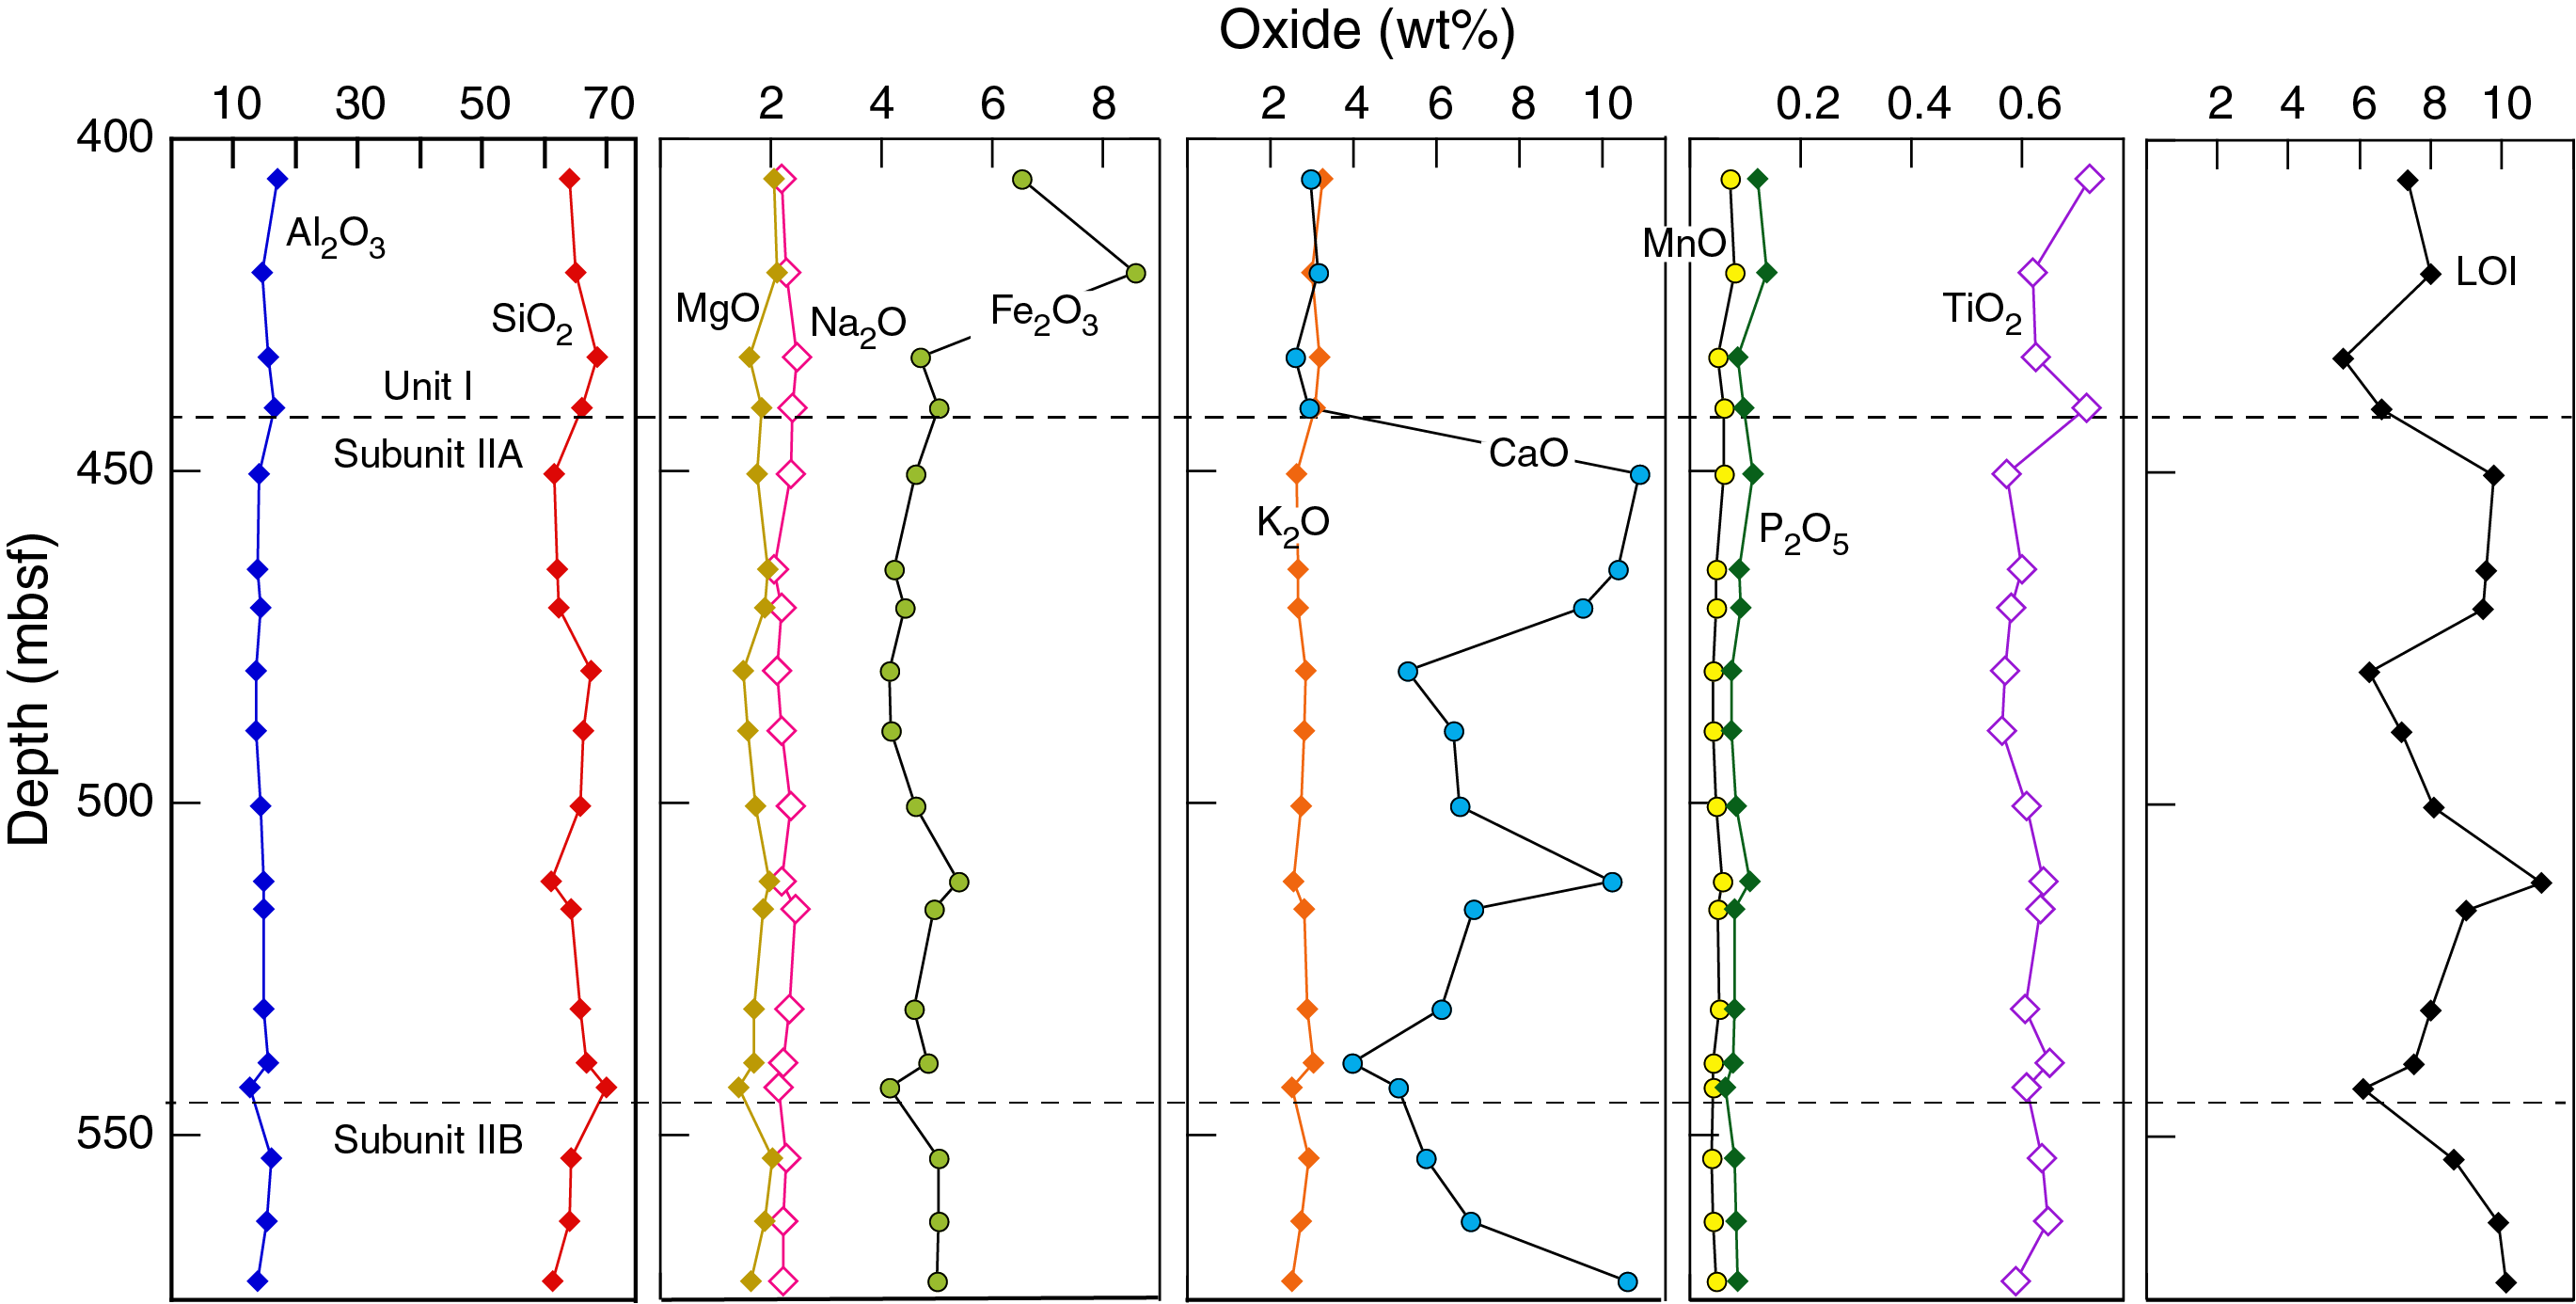
Figure F5. XRF chemical compositions.
CaO values are the most definitive for discriminating between the lithologic units, increasing significantly in Unit II. Smear slides verify that the pronounced CaO enrichment coincides with increases in the proportion of calcareous nannofossils. The upper portion of Unit I displays higher Fe2O3 concentrations. We also see a shift in Unit II to lower TiO2 values and irregular scattering of LOI values in both units. Overall, however, bulk sediment geochemistry does not change systematically with depth.
X-ray diffraction mineralogy
We used bulk powder XRD to calculate proportions of common minerals in the dominant lithology of silty claystone to clayey siltstone (Figure F6; Table T6), where total clay minerals + quartz + feldspar + calcite = 100%. The XRD specimens were also colocated in clusters next to whole-round intervals. Calcite is above the detection limit in all samples, and weight percent values show the most variability among common minerals; the normalized abundances of calcite correlate reasonably well with coulometric carbonate data (see Geochemistry).
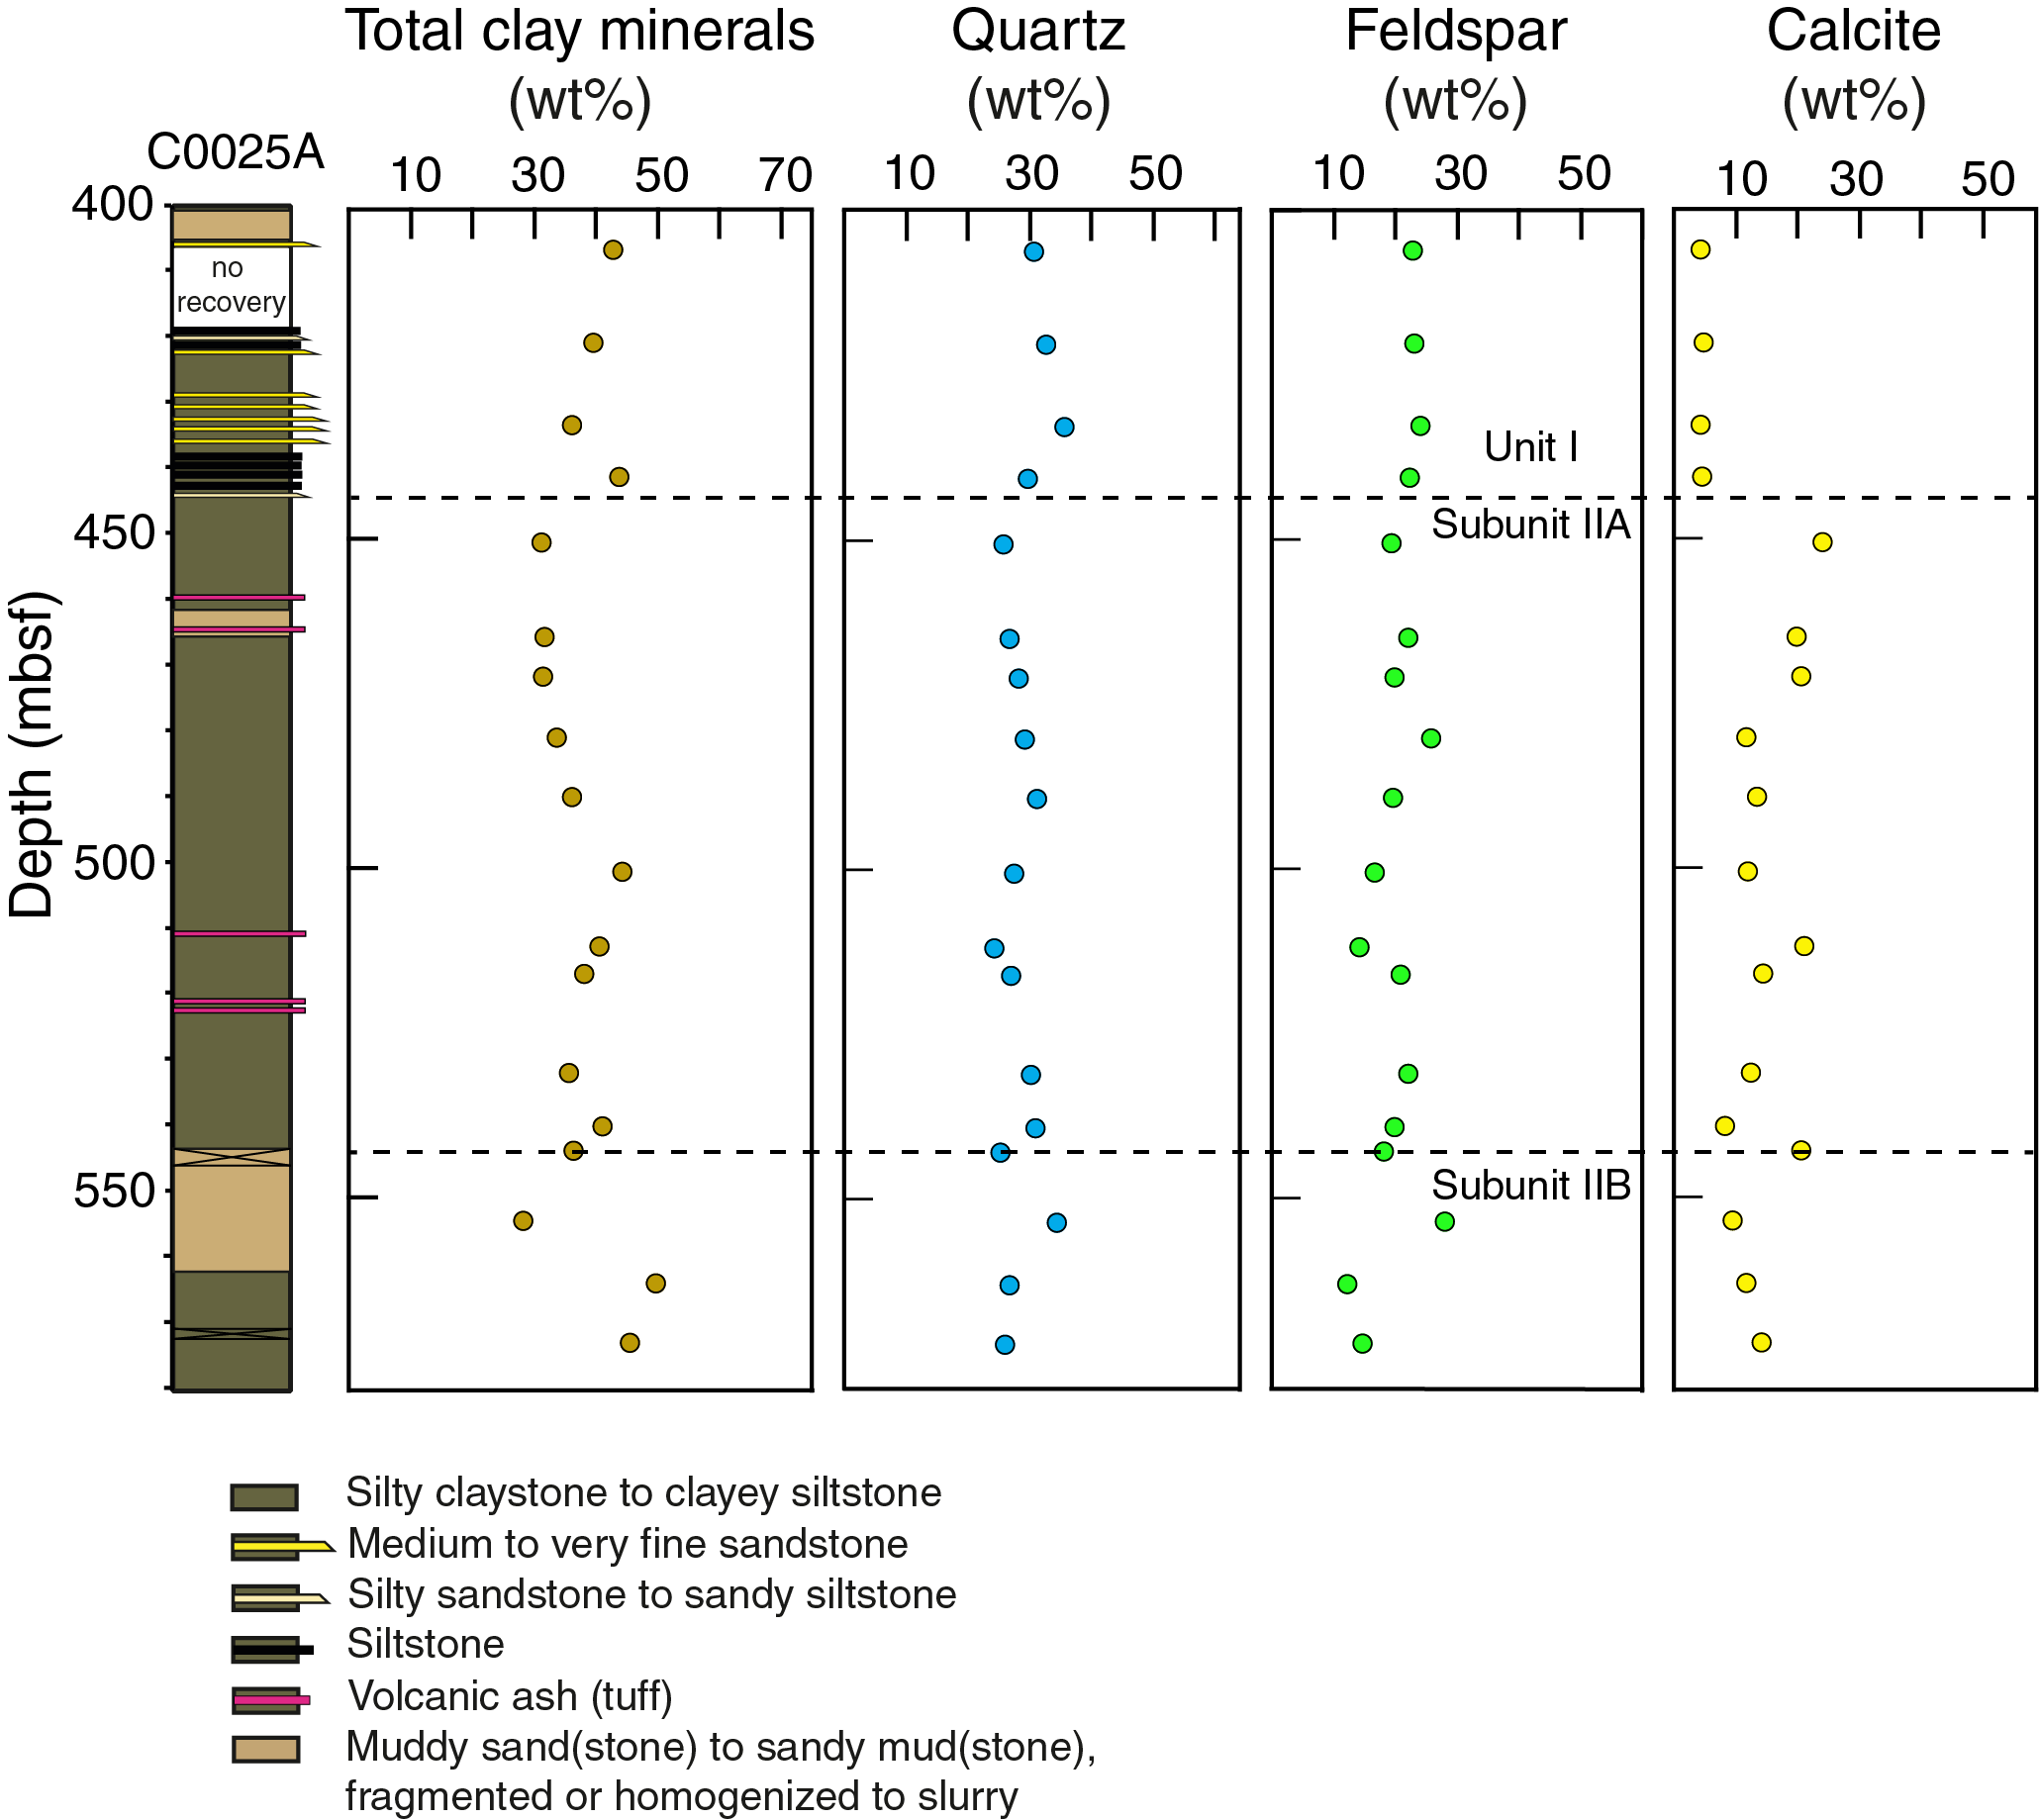
Figure F6. Random bulk powder XRD.
In Unit I, the average total clay mineral content is 40.5 wt% and ranges from 36.2 to 43.7 wt%. The average quartz content is 32.1 wt% and ranges from 29.6 to 35.6 wt%. Feldspar content ranges from 22.4 to 23.9 wt%, and calcite varies between 4.3 and 4.7 wt%. Calcite content increases significantly in Unit II with an average of 15.2 wt% and a range of 8.2–23.9 wt%. This sharp increase relative to Unit I matches smear slide estimates of calcareous nannofossils and CaO contents from XRF. Conversely, the normalized content of total clay minerals decreases to an average of 37.4 wt% in Unit II (range = 28.3–49.7 wt%). The average for quartz also decreases to 28.0 wt% (range = 24.2–34.3 wt%), and feldspar content ranges from 12.2 to 27.9 wt% (average = 19.4 wt%).
Definition of subunits
Separation of Unit II into distinctive subunits is not definitive based solely on compositional criteria, but we considered differences in related attributes and place a provisional subunit boundary at 543.70 mbsf (Section 358-C0025A-16R-1, 120 cm). Above that depth, the sediment consists mostly of bioturbated clayey siltstone to silty claystone with moderate levels of disturbance to primary layering. Below that depth, internally structureless intervals of sandy mudstone to muddy sandstone are common. Those unusual deposits without clear stratification contain roughly equal portions of sand-, silt-, and clay-sized particles. The higher concentration of dispersed sand grains is evident in smear slides and XRD data (lower clay mineral weight percent and higher quartz weight percent). It is difficult to explain how such diverse clast sizes became thoroughly mixed and disseminated while they were suspended and transported by ocean currents. Diagnostic indicators of sediment gravity flow or mass transport are also lacking (e.g., no graded beds, matrix-supported intraclasts, soft-sediment folds, or convolute lamination). In addition, deformation is more intense and widespread below 543.70 mbsf with fragmentation, abundant faults, and sediment-filled vein structures (see Structural geology). Additional research is required to determine how primary attributes of the sediment might have influenced the spatial distribution of different varieties of structural deformation.
Interpretation of depositional processes and environmental evolution
Our ability to reconstruct the full history of deposition at Site C0025 is hampered by spot coring and the lack of a defined base for Unit II. With the exception of some intervals in Cores 358-C0025A-7R, 16R, and 17R that have higher concentrations of dispersed sand-sized grains, the facies character of Unit II is monotonous, indicative of a long-lasting phase of slow mud accumulation in an environment that was persistently isolated from pathways of sediment gravity flow. The mottled mudstone with elevated concentrations of calcite and calcareous nannofossils is consistent with hemipelagic settling above the calcite compensation depth. Concentrations of glauconite are indicative of prolonged exposure of the seafloor to authigenic reactions with bottom water.
We correlate the heavily bioturbated mudstone in Unit II with coeval Unit III deposits at Integrated Ocean Drilling Program Site C0002, which is located toward the seaward edge of the Kumano Basin. The total thickness of Unit III (starved-basin facies) is approximately 87 m (Expedition 315 Scientists, 2009), and its age ranges from late Pliocene to early Pleistocene (~3.8–1.6 Ma). In addition to coeval ages, both facies counterparts include similar occurrences of glauconite, sediment-filled vein structures, and calcite contents that are consistently greater than 10 wt% (Expedition 315 Scientists, 2009).
The base of Unit III at Site C0002 is separated from the underlying inner accretionary prism by an angular unconformity (Expedition 315 Scientists, 2009). In contrast, the top of the accretionary prism at Site C0025 remains unsampled. This lack of critical information makes interpretation of the subunit boundary in Unit II (at 543.70 mbsf) more speculative. Mud diapirism or mud volcanism is one possible mechanism to explain the combination of stratal disruption (fragmentation and faulting) and widespread homogenization of the grain size distribution (i.e., sand evenly dispersed in silt and clay) although there is no involvement of basement rocks of accretionary prism. Such injection features are active in the present-day Kumano Basin (e.g., Tsunogai et al., 2012; Pape et al., 2014; Ijiri et al., 2018). Additional shore-based research will be required to test this hypothesis.
In Unit I, we recovered abundant thin beds of medium to fine sandstone, sandy siltstone to silty sandstone, and siltstone. These beds are likely products of turbidity currents that flowed into the Kumano Basin early in its history, similar to those in Unit II at Site C0002 (Expedition 315 Scientists, 2009; Underwood and Moore, 2012). Reduction of calcite and nannofossils above the Unit I/II boundary at Site C0025 can be explained by dilution from elevated influxes of siliciclastic silt and clay during those initial stages of turbidite deposition. At Site C0002, where the age-depth model is better constrained, turbidite deposition started at ~1.6 Ma (Expedition 315 Scientists, 2009). That period of time falls within the same range as the Unit I nannofossil assemblage from Site C0025 (1.34–2.58 Ma), which reinforces the stratigraphic correlation between the two sites.
Direct comparisons of composition and lithofacies character between Site C0025 and Integrated Ocean Drilling Program Site C0009 (Expedition 319 Scientists, 2010; Hayman et al., 2012; Moore et al., 2015; Ramirez et al., 2015) are more problematic because coring was limited to deeper intervals at Site C0009 and the cuttings from such poorly indurated sediments are difficult to distinguish from (and are contaminated by) the drilling mud that is used during riser drilling operations; in addition, more friable lithologies and authigenic phases (e.g., glauconite) are not likely to survive as cuttings. With those caveats in mind, the "lower fore-arc basin" or slope facies at Site C0009 (Subunit IIIB; ~2.5–3.8 Ma) appears to be broadly coeval with Unit II at Site C0025. Interpretations of the underlying Unit IV at Site C0009 are debated (Hayman et al., 2012; Moore et al., 2015; Ramirez et al., 2015), but those strata (either slope sediments or accretionary prism) are significantly older (>5.5 Ma) than what was recovered from Site C0025.
Structural geology
Structural geology analyses at Site C0025 included description of cores retrieved from 400 to 580.5 mbsf (Hole C0025A). Features observed and measured in cores include bedding planes, sediment-filled veins (vein structure), and faults. Where possible, we corrected the measurements of planar and linear structures to true geographic coordinates using paleomagnetic data (see Structural geology in the Expedition 358 methods chapter [Hirose et al., 2020]). The distribution of planar structures is shown in Figure F7 (see StructureMeasurementSheet_C0024_C0025.xls in CORE in STRUCTURE in Supplementary material). Deformation related to drilling and core recovery was noted but not recorded. Here, we describe and provide examples of each of the features that were recorded.
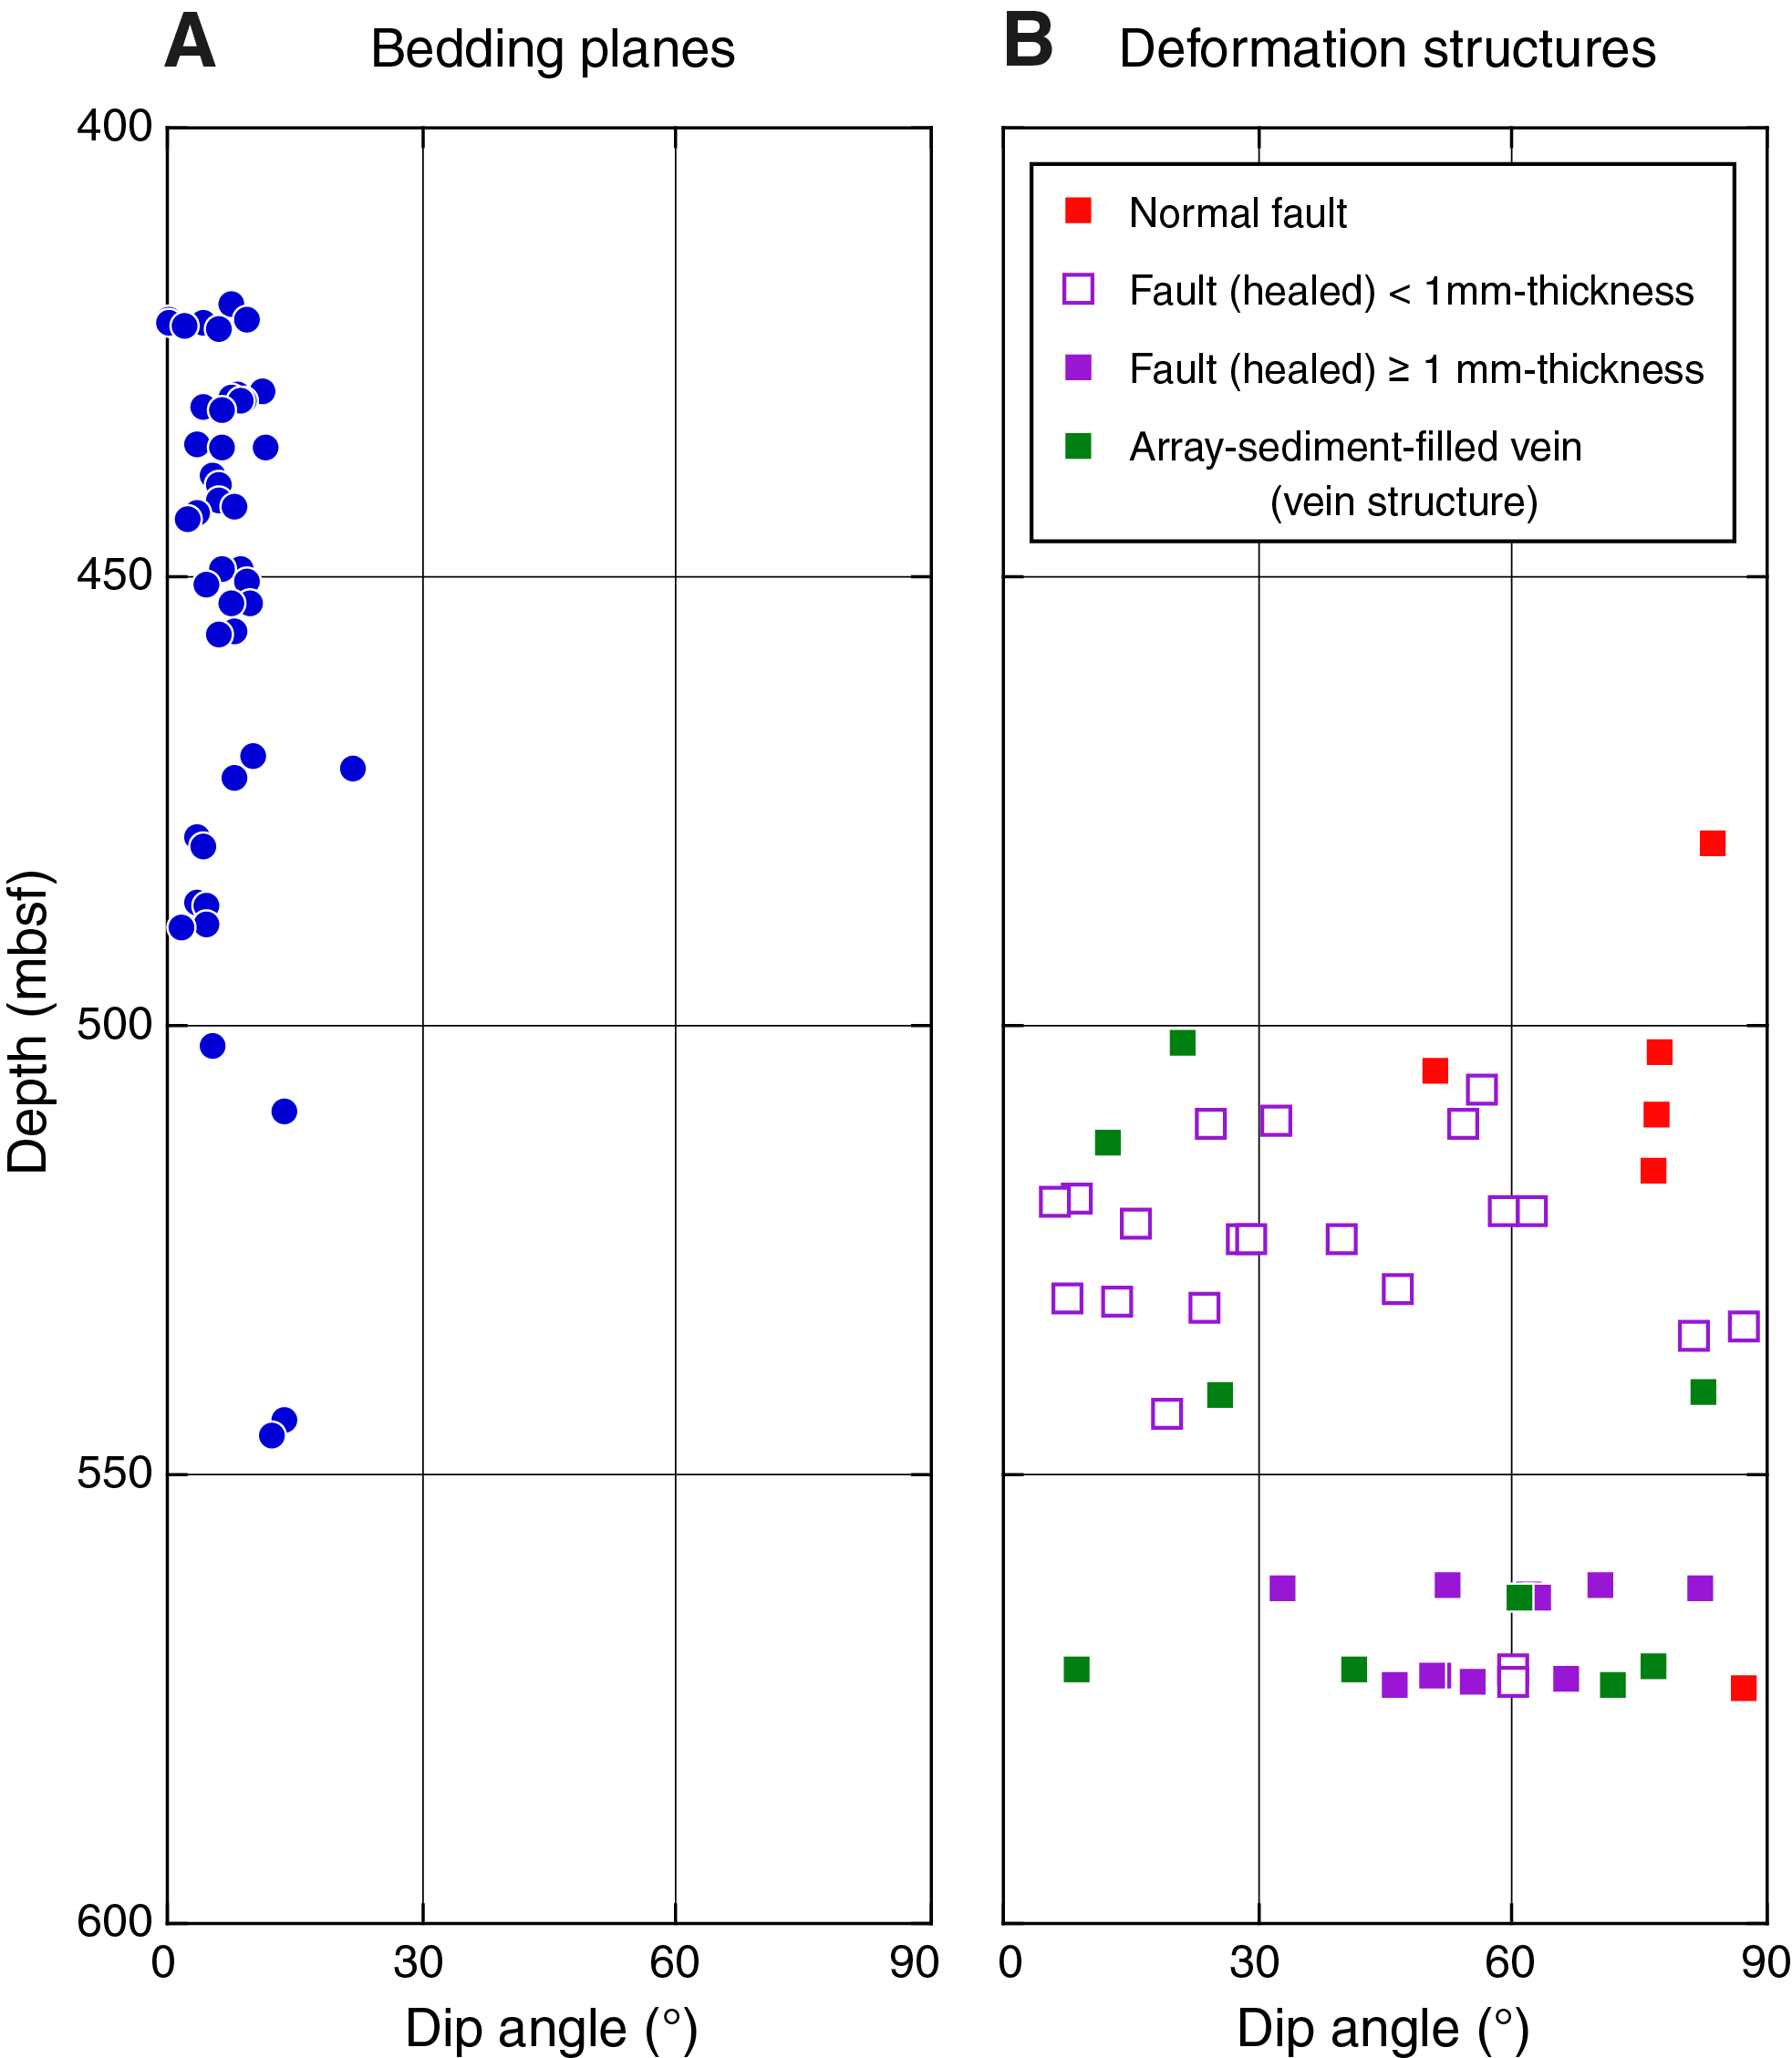
Figure F7. Dip data.
Bedding
Bedding planes (N = 44) measured mainly on thin sand layers/laminae are gently inclined or subhorizontal (less than or equal to ~11° with one exception; mean dip = 6.4°; Figure F7). Because of severe coring disturbance, paleomagnetic corrections could only be performed to four orientations of bedding planes, which do not show specific dip directions (Figure F8A). Observable bedding planes are common between 420 and 460 mbsf, whereas they are rare below 500 mbsf.
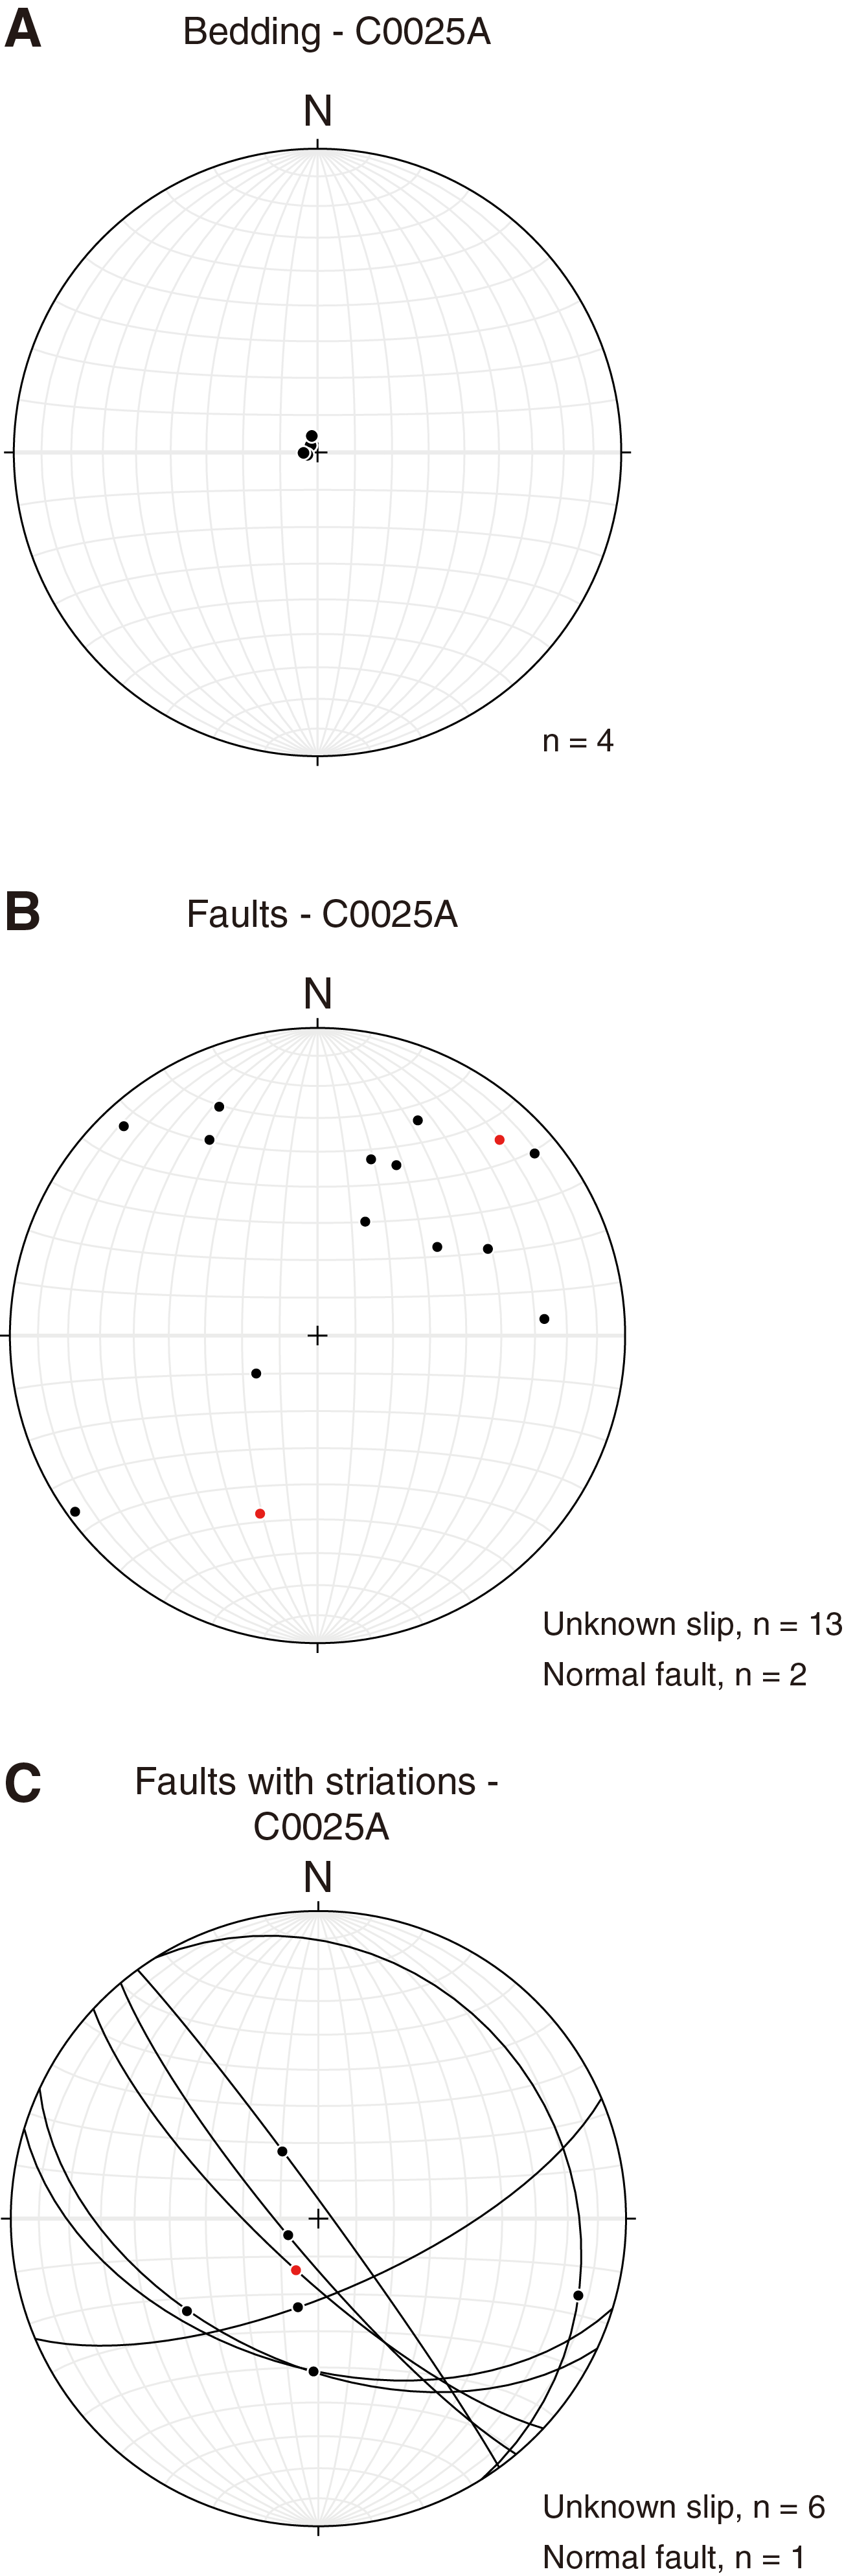
Figure F8. Poles to bedding, faults, and striations on faults.
Deformation structures observed at Site C0025
Sediment-filled veins (vein structure)
Sediment-filled veins recognized as parallel sets or arrays of sigmoidal or curviplanar seams generally <1 mm wide were found in cores from 500 to 575 mbsf (Cores 358-C0025A-11R through 19R) (Figure F9A–F9D). The typical thickness of these vein arrays ranges from 1 to 10 cm.
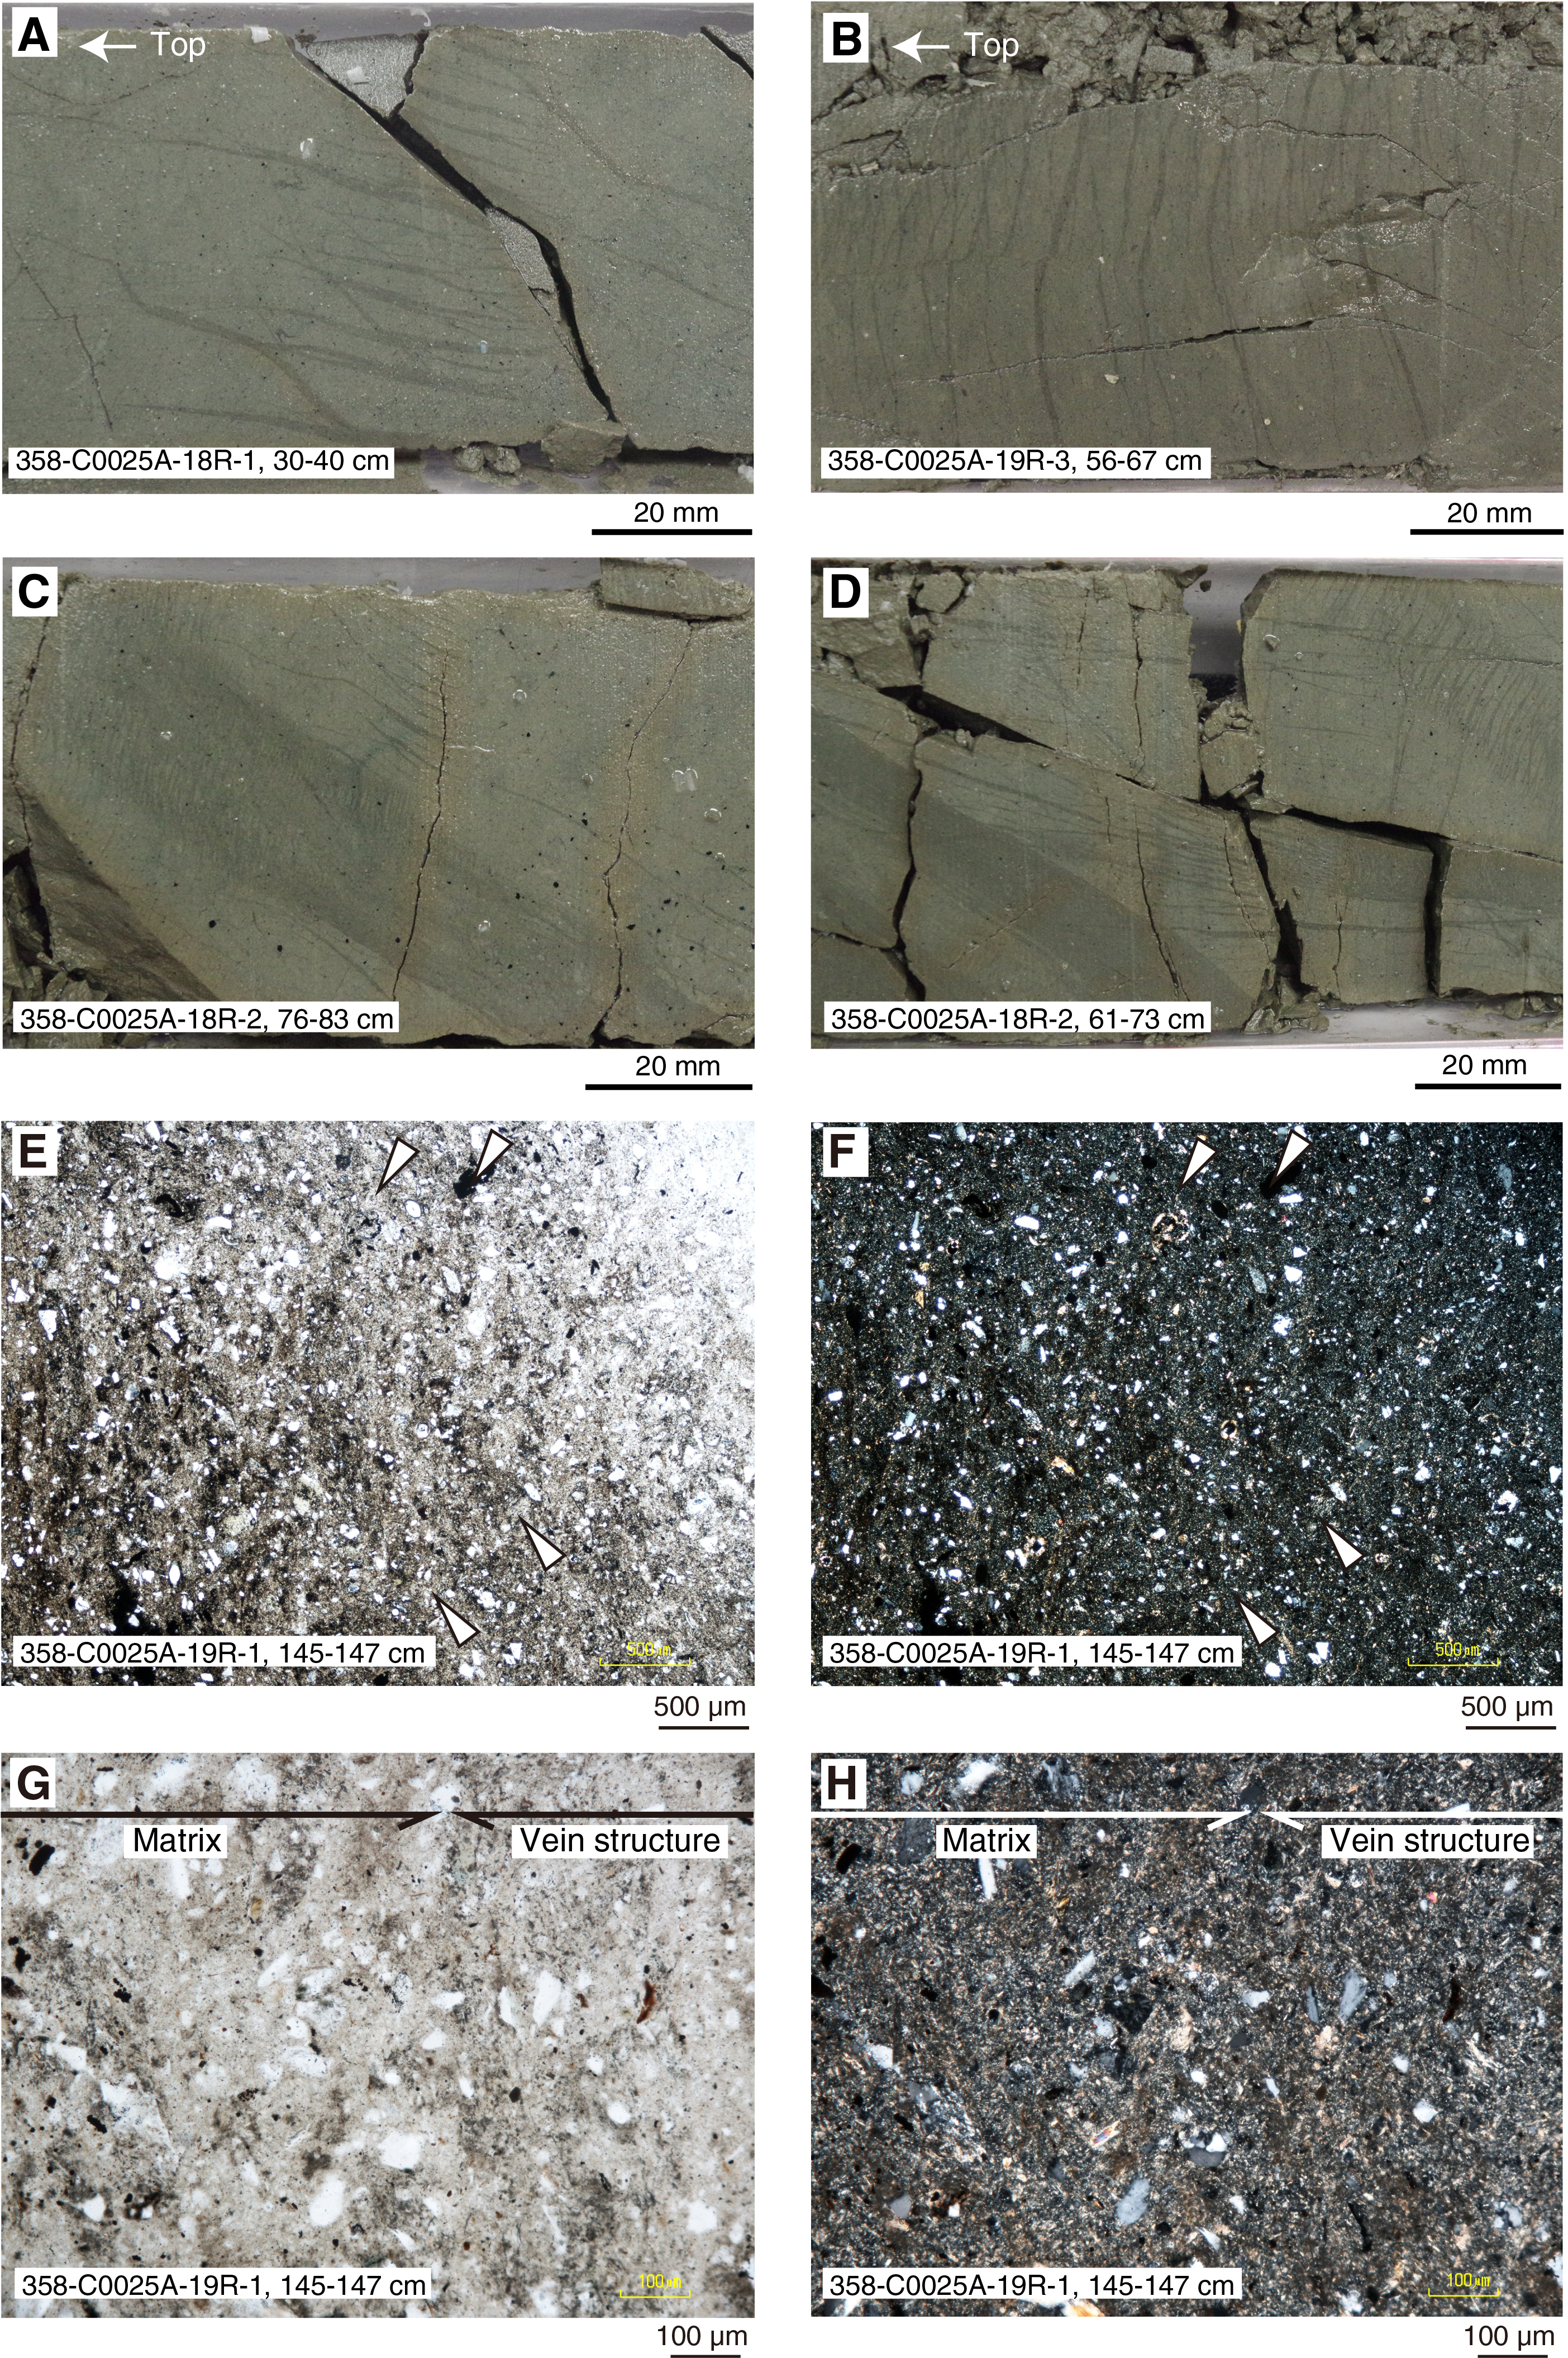
Figure F9. Sediment-filled veins.
Sediment-filled veins are common in sediments at subduction zones (accretionary prism, slope, and fore-arc basins; Hanamura and Ogawa, 1993; Maltman et al., 1993) and were also identified in cores from Sites C0002 (Kumano Basin interval) and C0024. Similar vein structures have been reported in cores from other subduction zones sampled in ocean drilling, including Nankai, Costa Rica, and Oregon, and also in shallowly buried accretionary prism/slope sediments exposed on land in the Miura/Boso Peninsulas (Japan) and the Monterey Formation (United States) (Hanamura and Ogawa, 1993; Maltman et al., 1993; Shipboard Scientific Party, 2001; Expedition 334 Scientists, 2012). Field and experimental studies have shown that these structures are likely caused by shaking of sediments during earthquakes (Hanamura and Ogawa, 1993; Brothers et al., 1996).
Although typical arrays of sediment-filled veins are oriented subhorizontally or subparallel to bedding, they tend to show steeper inclinations (40°–80°; Figure F7) in the lower portion (540–575 mbsf) of Hole C0025A. Where they coexist with subhorizontal sediment-filled veins, steeper ones always cut the subhorizontal ones. Some arrays of sediment-filled veins exhibit small spacing between veins and in some cases coalesce to form a 1–3 cm thick dark seam/fault (e.g., Figure F9C). In microscopic observation, the mineral assemblages inside and outside each vein appear to be similar; they are differentiated by a smaller dominant grain size within the vein structure (Figure F9E–F9H).
The sediment-filled veins are also resolved on X-ray CT images, depending on their thickness. The thickest ones (1–4 mm) occur as bright structures (CT number = ~1400–1500) (Figure F10B, F10D). Veins <1 mm thick are generally not resolved (Figure F10B) or may correspond to very thin, high–CT number features (Figure F10F).
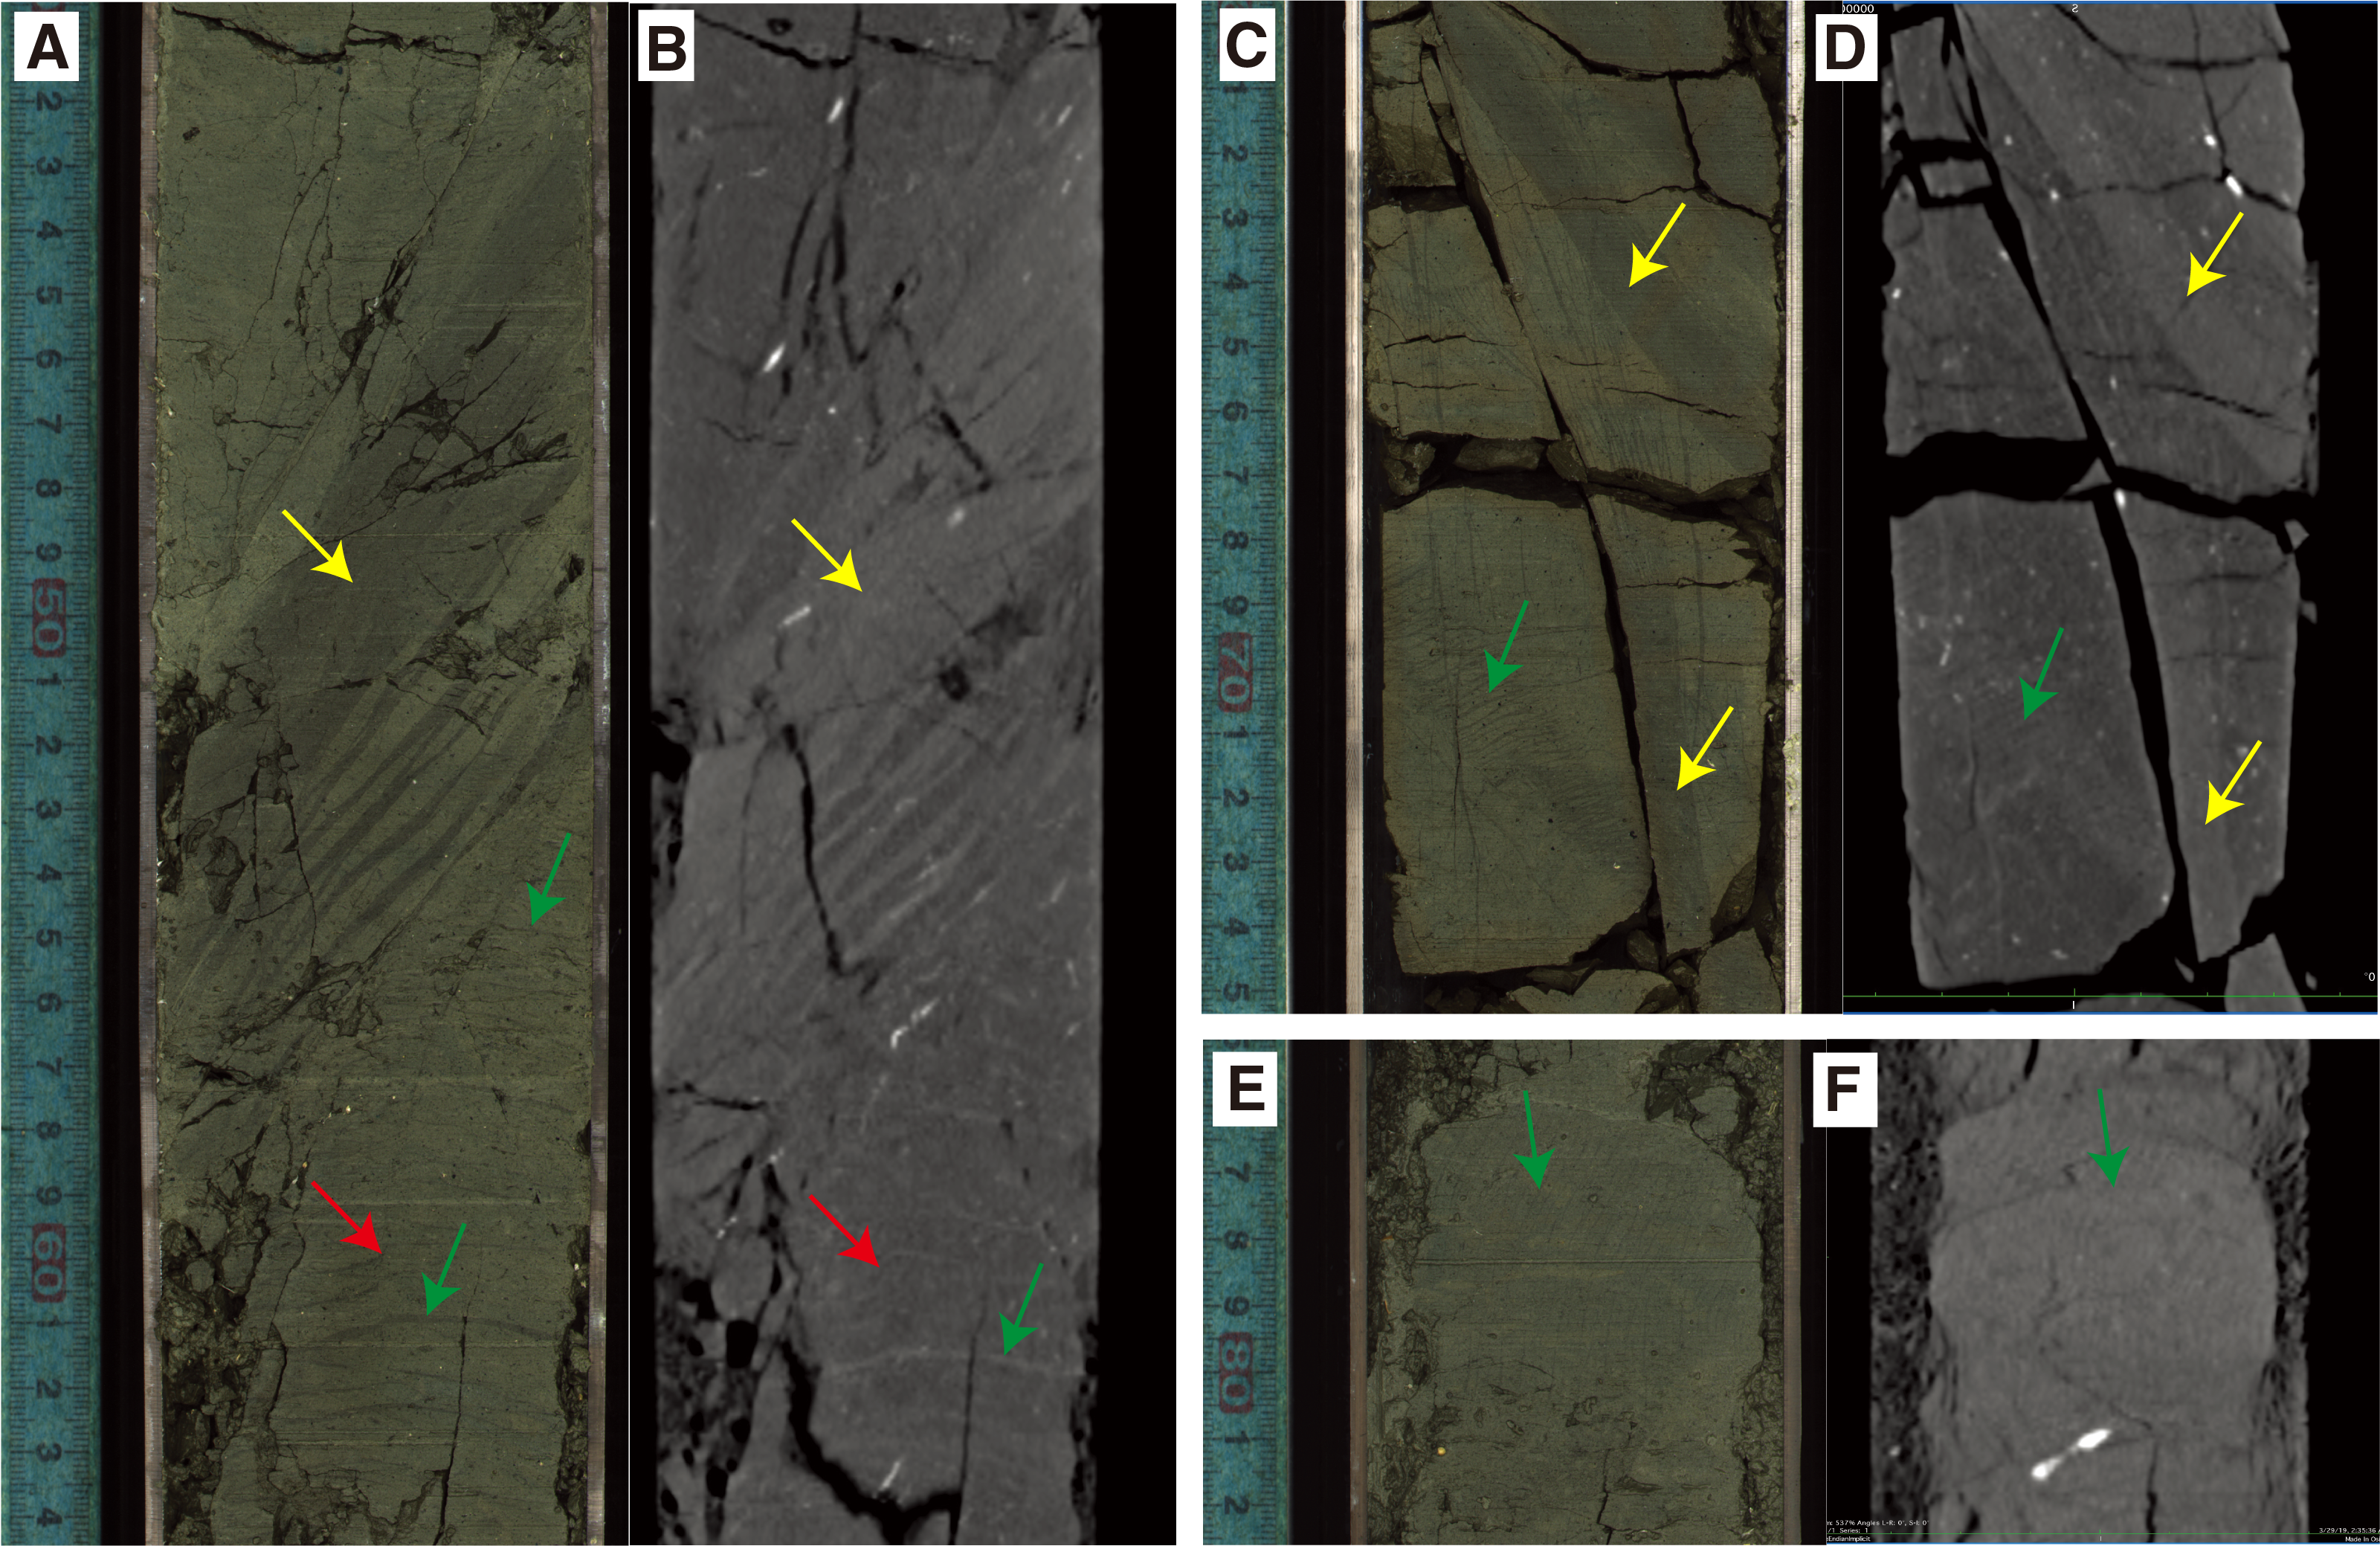
Figure F10. Sediment-filled veins, cohesive healed faults, and normal fault.
Faults
Minor small-displacement fault structures are readily apparent on split core surfaces (Figure F11). They show apparent displacements of a few millimeters to a few centimeters. Minor faults in Hole C0025A are divided into two groups, one with a normal sense of displacement and stepped slickensides on open surfaces and the other with cohesive ("healed") and closed surfaces similar to the dark seams described in the previous section. The sense and/or amount of displacement is defined by where they cut bioturbation or sedimentary structures or by asymmetric fabrics along the faults (Figure F11C, F11D). The latter group is divided into two subgroups: <1 or ≥1 mm thick fault planes/zones. The thinner faults are darker than the host rock, have planar surfaces with sharp boundaries, exhibit various dip angles, and are developed in the upper part of the cored interval in Hole C0025A (Figures F7, F11A, F11B). Deformation structures in fault planes are unclear in macroscopic view. When the fault plane is opened, some faults have slickenlines, mostly indicating dip-slip (Figure F11B).
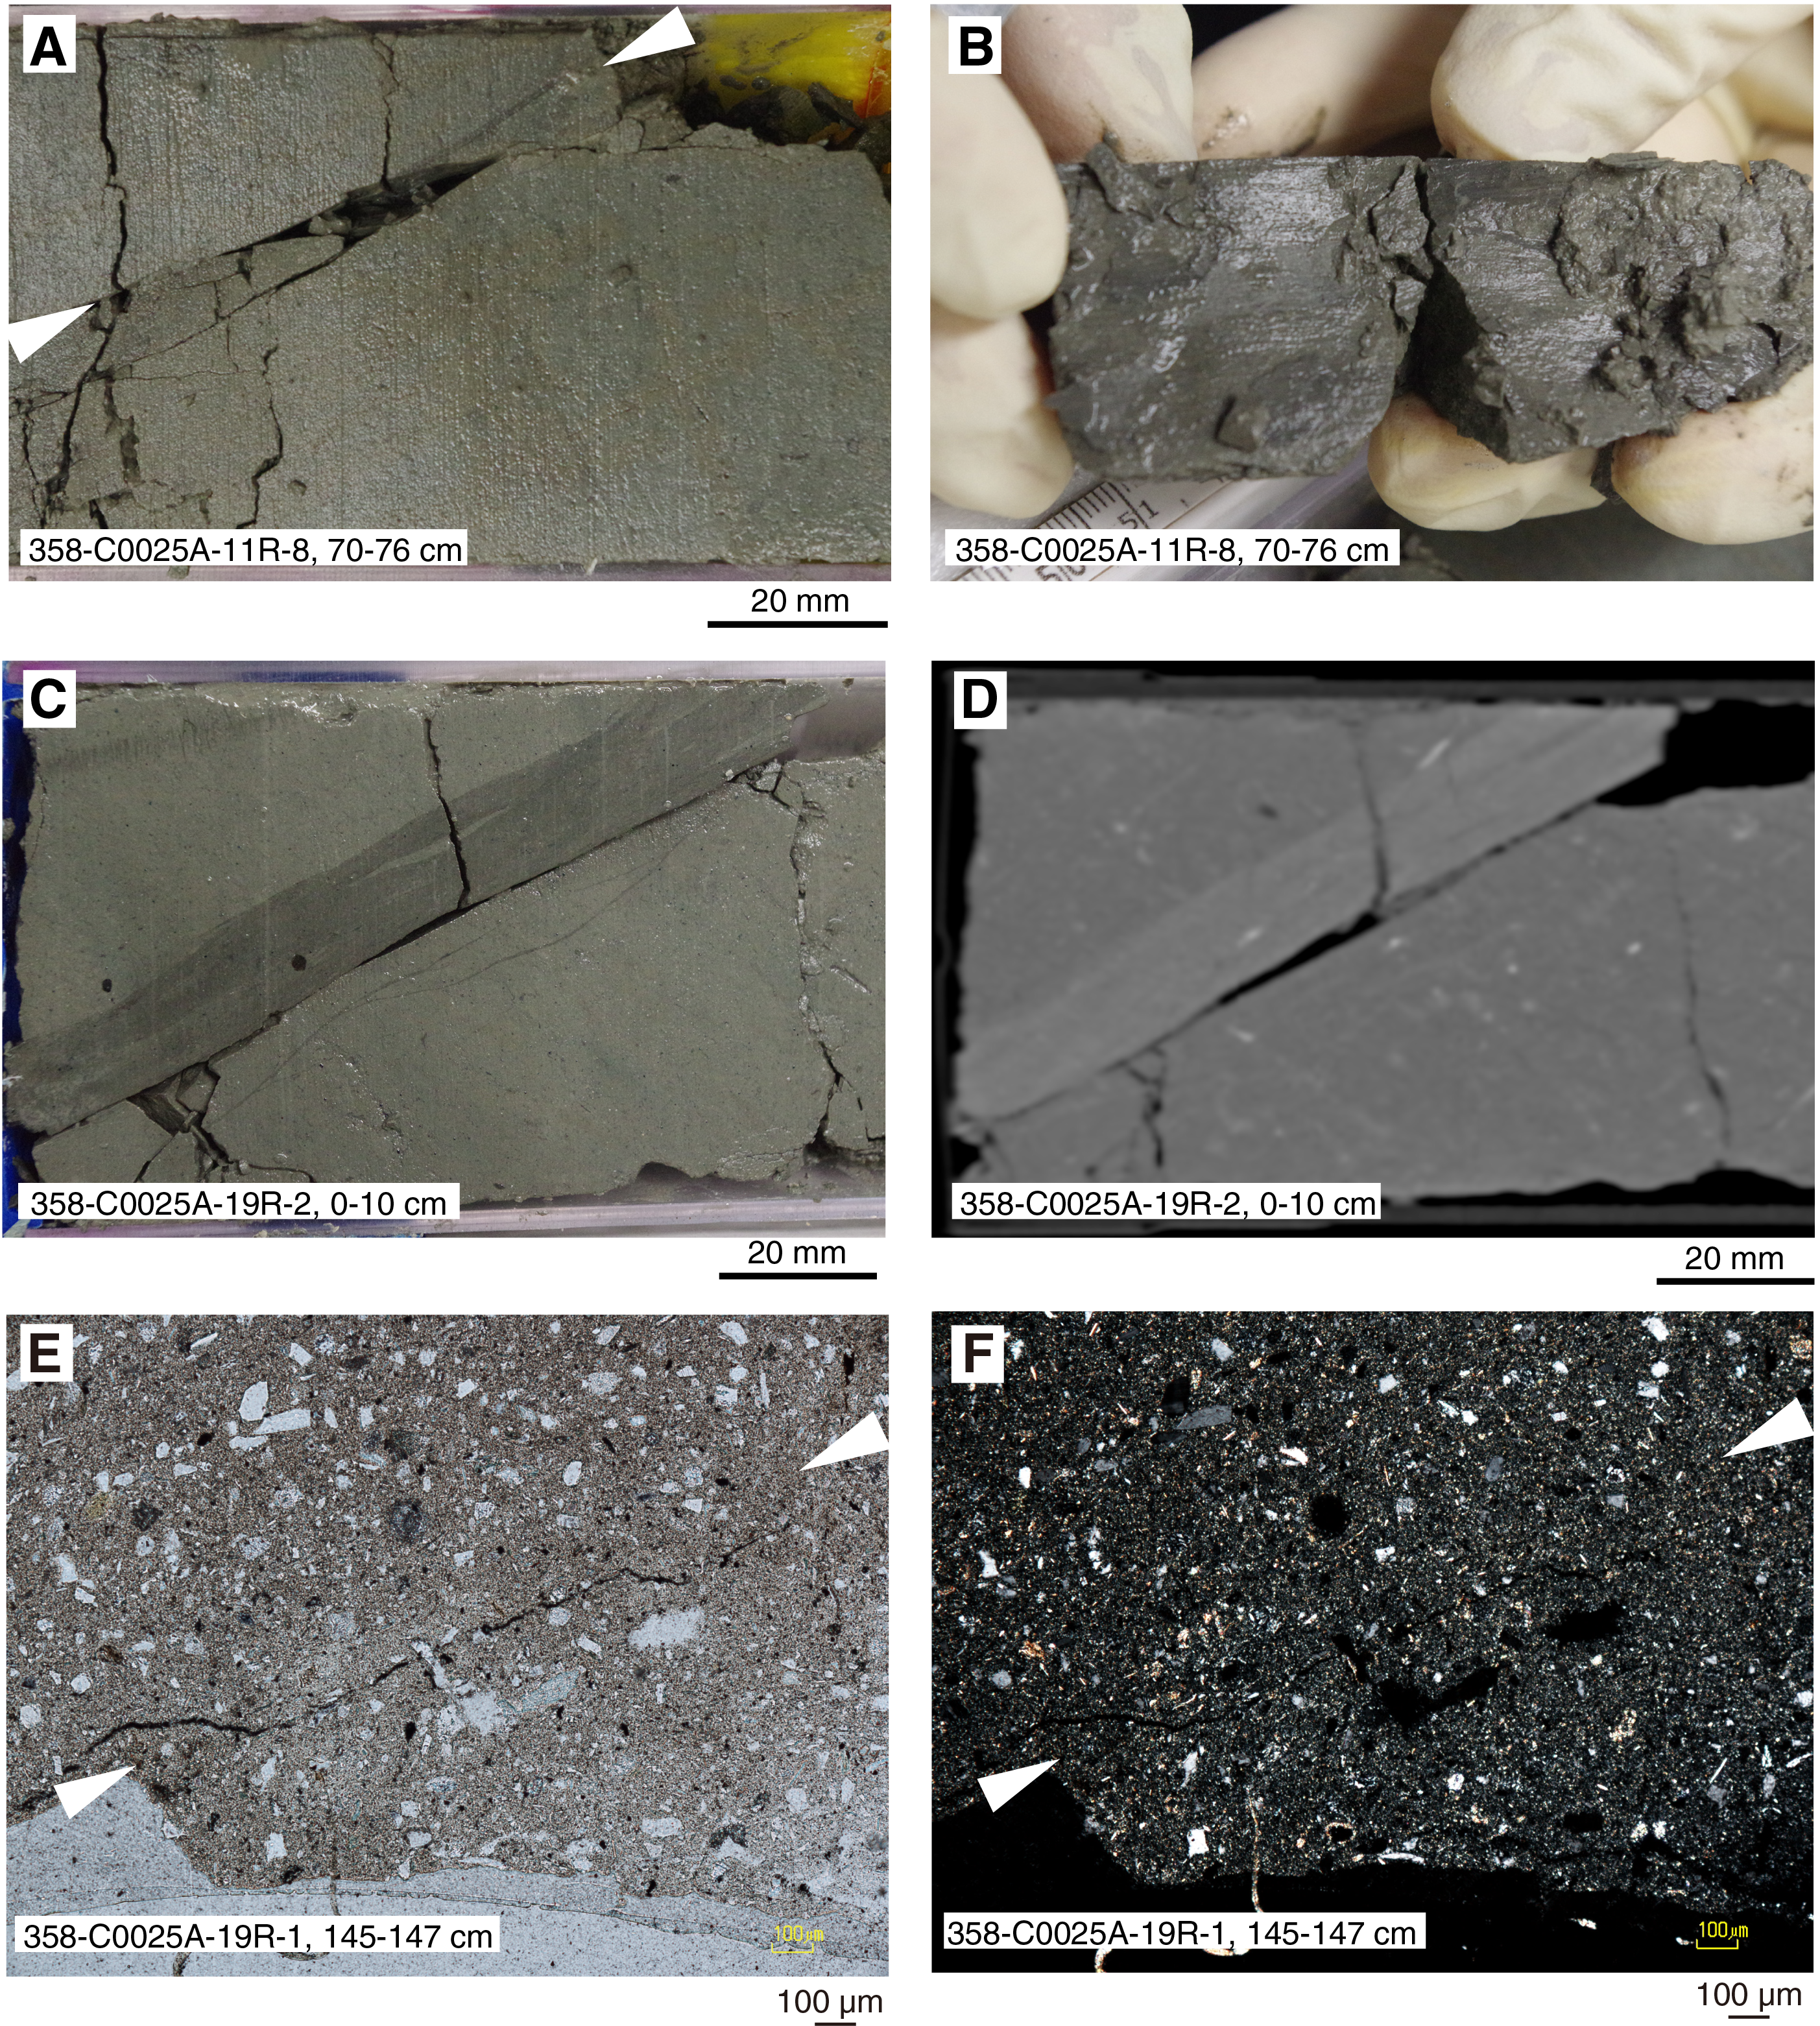
Figure F11. Thin cohesive fault and slickenlines.
On the other hand, the thicker faults defined by zones ≥1 mm wide (on the split surface) appear darker in color than the host rock, have planar surfaces with sharp boundaries, incline moderately to steeply (35°–85°), and are developed only in the deeper part of the cored interval (Cores 358-C0025A-18R and 19R). The thickness of these faults reaches >10 cm in places. Some examples of the thick faults are characterized by a dense distribution of sediment-filled veins (Figure F9C). Therefore, both thick faults and vein structures represent similarly scattered dips (Figure F7). Macroscopically asymmetric deformation textures can be observed in some thick faults; however, no cataclastic deformation was identified (Figure F11C, F11D). In microscopic view, the boundary between thick faults and the host rock is unclear. Grain size in the fault zone is similar to that of the host rock, and no preferred orientation of grains was found (Figure F11E, F11F).
Normal faults are not well resolved in X-ray CT images that are parallel to the core split surface but can be visually identified where they displace bedding or other deformation structures (Figure F10B). They occur as bright (CT number = 1400–1600), thin features. The thicker healed faults are clearly visible and occur as bright features with higher CT numbers (1500–1650) than the surrounding matrix (1200–1350) (Figure F10B, F10D). This suggests that healed faults are composed of material that is slightly denser than the surrounding matrix.
Although the orientations of these faults are scattered, the largest population dips toward the southwest (Figure F8B). Two reoriented normal faults strike northwest–southeast and dip toward both southwest and northeast (Figure F8B). Where striations are measurable, dip-slip striations on northwest–southeast fault planes are dominant (Figure F8C). These observations suggest that most of the faults at Site C0025 were formed under a normal faulting stress regime, with northwest–southeast SHmax.
Biostratigraphy and paleomagnetism
Biostratigraphy
Preliminary age determination for core samples from Hole C0025A is based exclusively on the examination of calcareous nannofossils.
Calcareous nannofossils
We examined all core catcher samples from Hole C0025A for calcareous nannofossil biostratigraphy. Poorly to moderately preserved nannofossils were found in most samples, and species diversity is comparatively low. Most Quaternary datum planes described by Sato et al. (2009) and the lower Pliocene zonal markers of Martini (1971) and Okada and Bukry (1980) were identified in the sedimentary sequence. The numerical ages of calcareous nannofossil biostratigraphy follow a review by Raffi et al. (2006). Calcareous nannofossils obtained from Hole C0025A are listed in Table T7.
Samples 358-C0025A-1R-CC, 10.5–15.5 cm (406.14–406.19 mbsf), 3R-CC, 0.0–5.0 cm (422.45–422.50 mbsf), and 4R-CC, 17.0–22.0 cm (435.695–435.745 mbsf), are characterized by the occurrence of large Gephyrocapsa spp. (>5.5 µm) and Helicosphaera sellii, which are found in the middle Pleistocene (Zone NN19/CN13b; 1.34–1.59 Ma). Samples 5R-CC, 15.0–20.0 cm (447.135–447.185 mbsf), 6R-CC, 0.0–5.0 cm (457.185–457.235 mbsf), and 7R-CC, 27.0–32.0 cm (465.96–466.01 mbsf), are characterized by the occurrence of medium Gephyrocapsa spp. (4–5.5 µm), H. sellii, and Pseudoemiliania lacunosa and by the absence of large Gephyrocapsa spp. (>5.5 µm), which indicates that these intervals are assigned to an age of 1.59–1.67 Ma. The early Pleistocene assemblages found at this site are characterized by the occurrence of discoasters including marker species of Pliocene to Pleistocene successions. The occurrence of Discoaster brouweri (last occurrence [LO] at the top of Zone NN18/CN12d; i.e., 2.06 Ma) was found in the intervals between Samples 8R-CC, 12.5–17.5 cm, and 9R-CC, 25.5–30.5 cm (472.42–480.73 mbsf). Discoaster pentaradiatus, Discoaster surculus, and Discoaster tamalis, corresponding to ages of 2.45, 2.52, and 2.87 Ma, respectively, were recognized in Sample 10R-CC, 15.5–20.5 cm (489.835–489.885 mbsf), and below. Sphenolithus abies (LO at 3.65 Ma) was identified between Samples 15R-CC, 9.5–14.5 cm (541.59–541.64 mbsf), and 16R-CC, 25.0–30.0 cm (546.195–546.245 mbsf). Reticulofenestra pseudoumbilicus (LO at 3.79 Ma) was found in Sample 17R-CC, 20.0–25.0 cm (555.42–555.47 mbsf), and below. Discoaster asymmetricus was continuously found in Sample 9R-CC, 25.5–30.5 cm (480.68–480.73 mbsf), and below. Discoaster quinqueramus (LO at 5.59 Ma) was absent in samples from Hole C0025A. These results indicate that the sediments recovered from Hole C0025A correlate with Zones NN14–NN15/CN10–CN11 to NN19/CN13b (1.34–4.13 Ma).
Paleomagnetism
Remanent magnetizations of archive halves and discrete samples from Hole C0025A were measured at demagnetization levels of 0, 5, 10, and 20 mT peak alternating fields for archive halves and at 0, 5, 10, 15, 20, 30, 40, 50, 60, 70, and 80 mT for discrete samples to recognize stable magnetic components. Because X-ray CT scan images show strong drilling disturbance in the upper cores from Hole C0025A, discrete samples were not collected between Cores 358-C0025A-1R and 6R. Magnetostratigraphic interpretations were therefore not implemented in that interval. It is confirmed that low-coercivity components can be removed by demagnetization at levels of 5–10 mT for discrete samples (Figure F12). Therefore, the data after demagnetization at 20 mT are used for magnetostratigraphic interpretations.
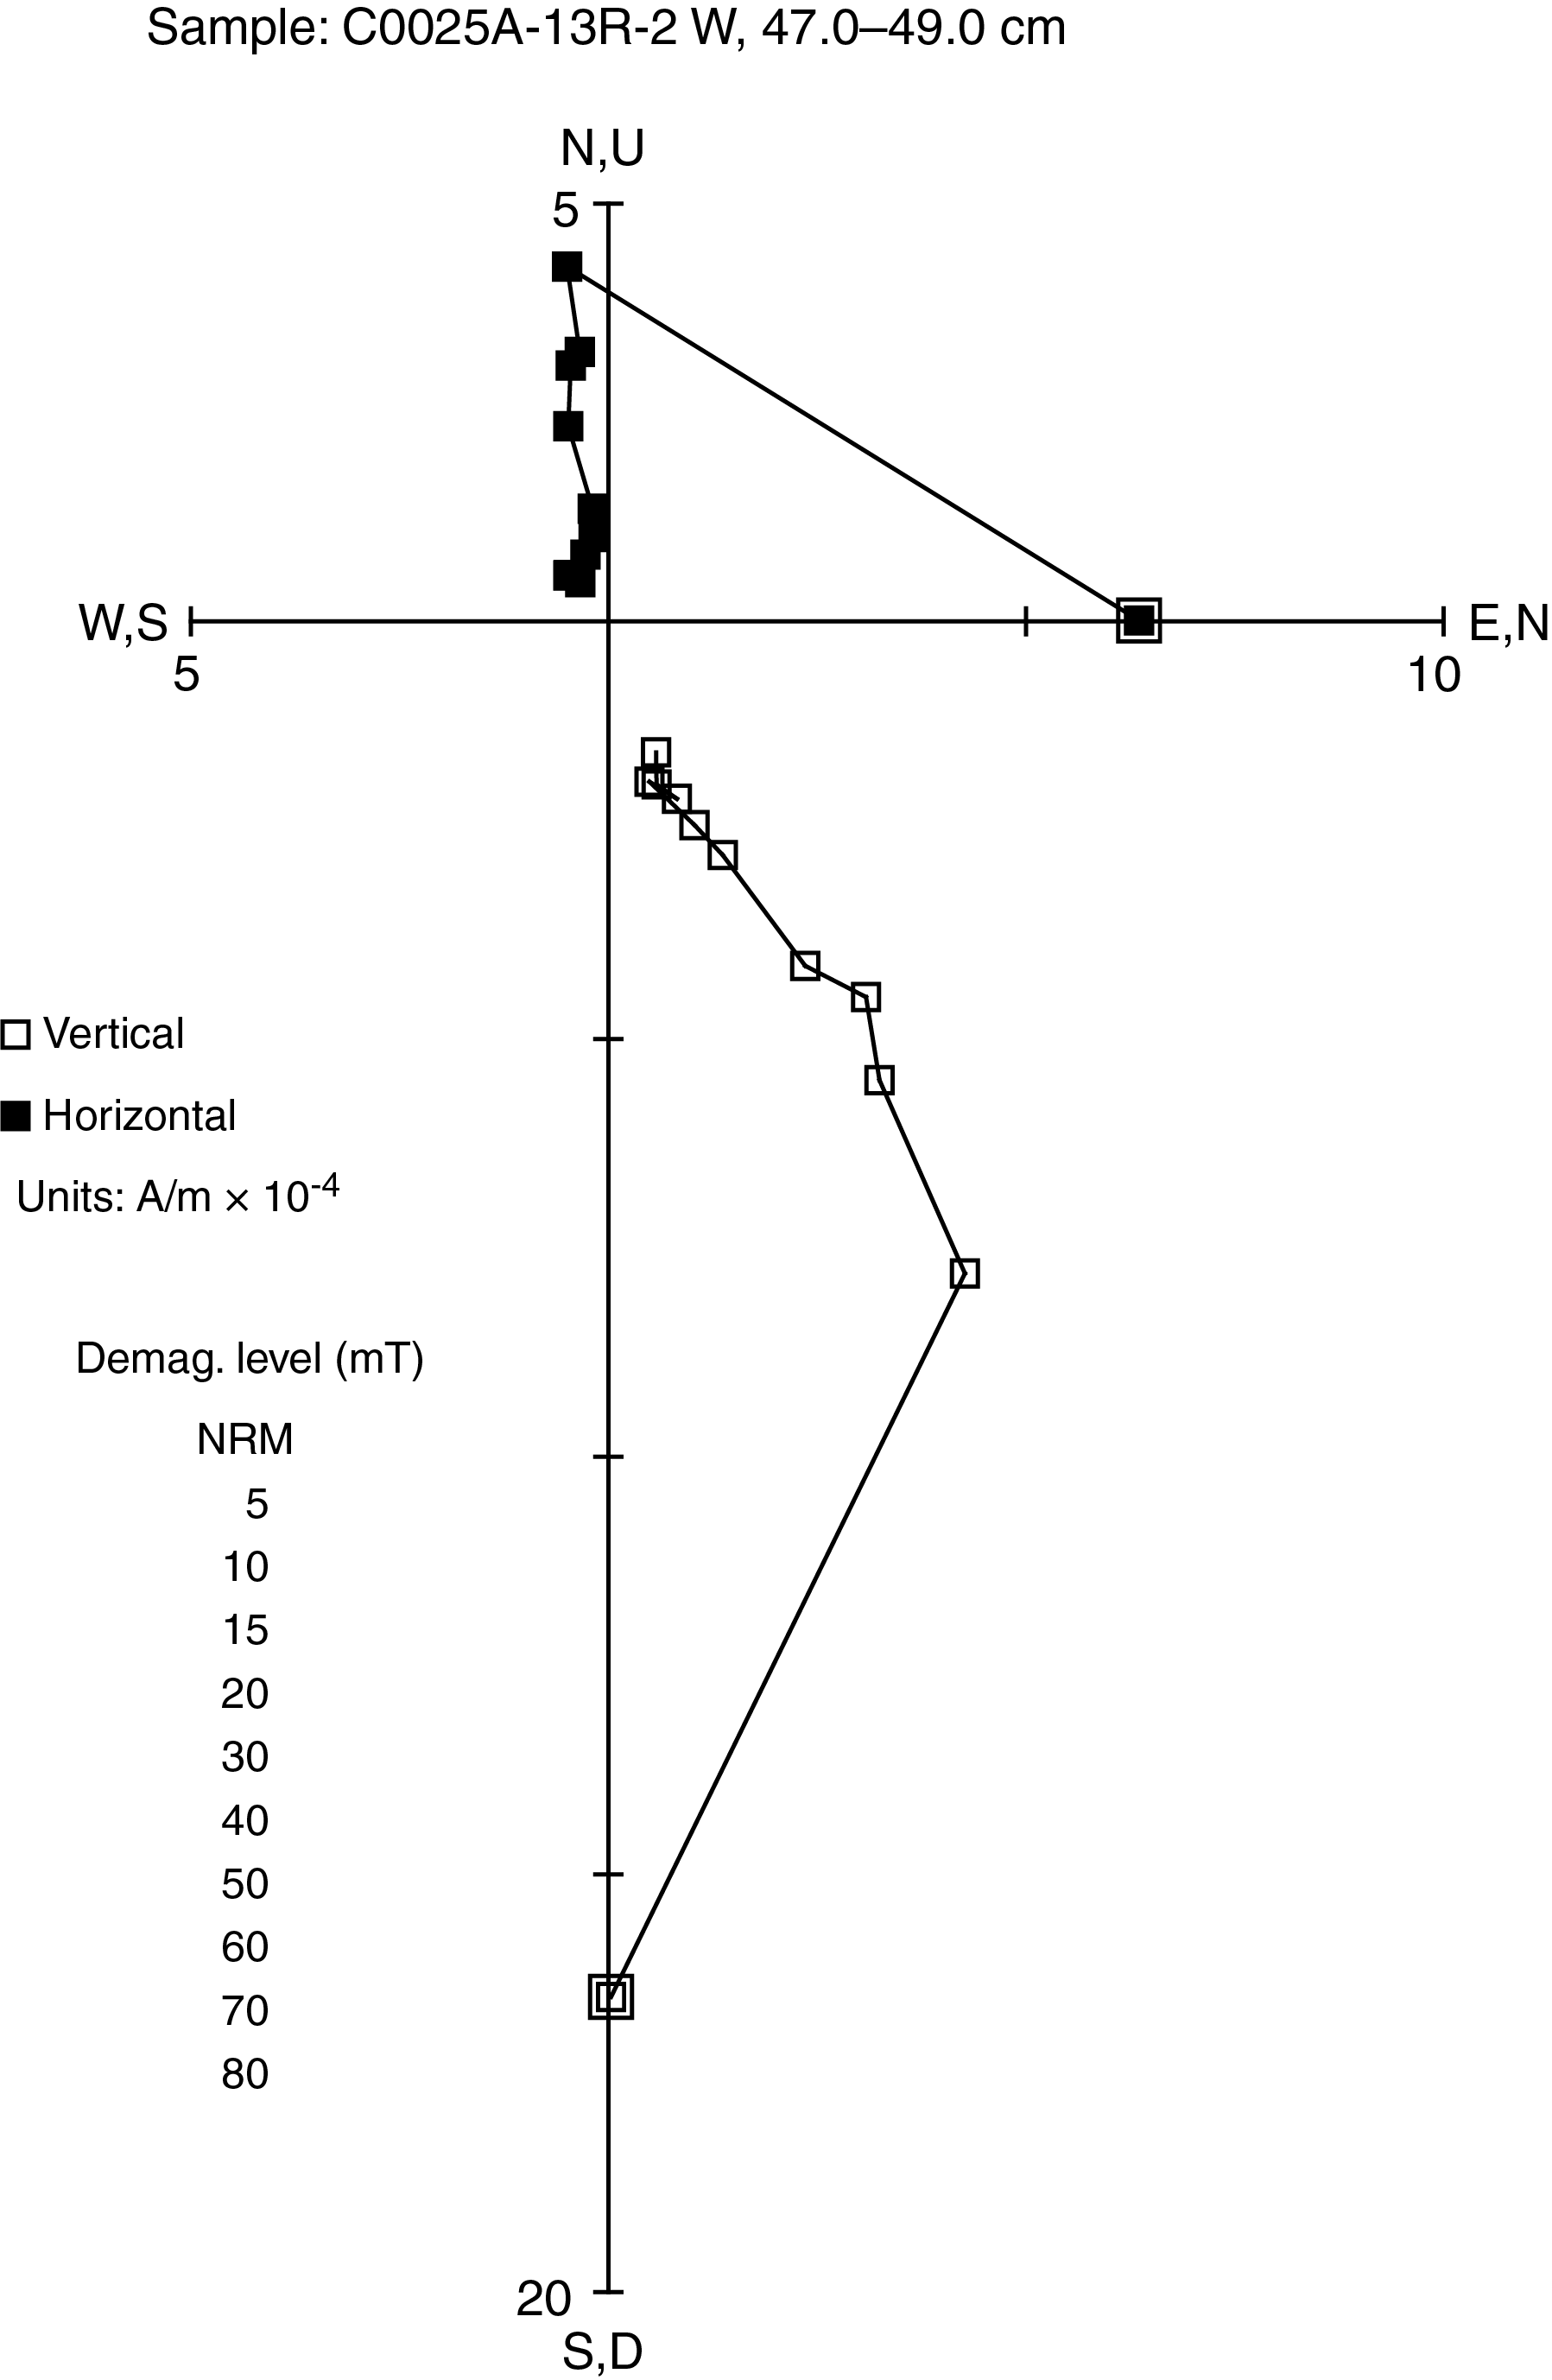
Figure F12. Alternating field demagnetization.
Stratigraphic interpretation
Inclinations are used to identify magnetic polarity (Figure F13). Inclination values are dominantly positive except for at 500–520 and 570–580 mbsf based on discrete samples. Calcareous nannofossil ages (see Biostratigraphy; Table T7) indicate that the sediments recovered from Hole C0025A correlate with Zones NN14–NN15/CN10–CN11 to NN19/CN13b (1.34–4.13 Ma). A normal dominant interval during this period of time is the Gauss Chron (2.581–3.596 Ma), which is intercalated by a few reversed short subchrons. Therefore, the magnetic results suggest that the cored interval from Cores 358-C0025A-7R through 19R (457–574.775 mbsf) possibly correlates with the Gauss Chron (2.581–3.596 Ma).
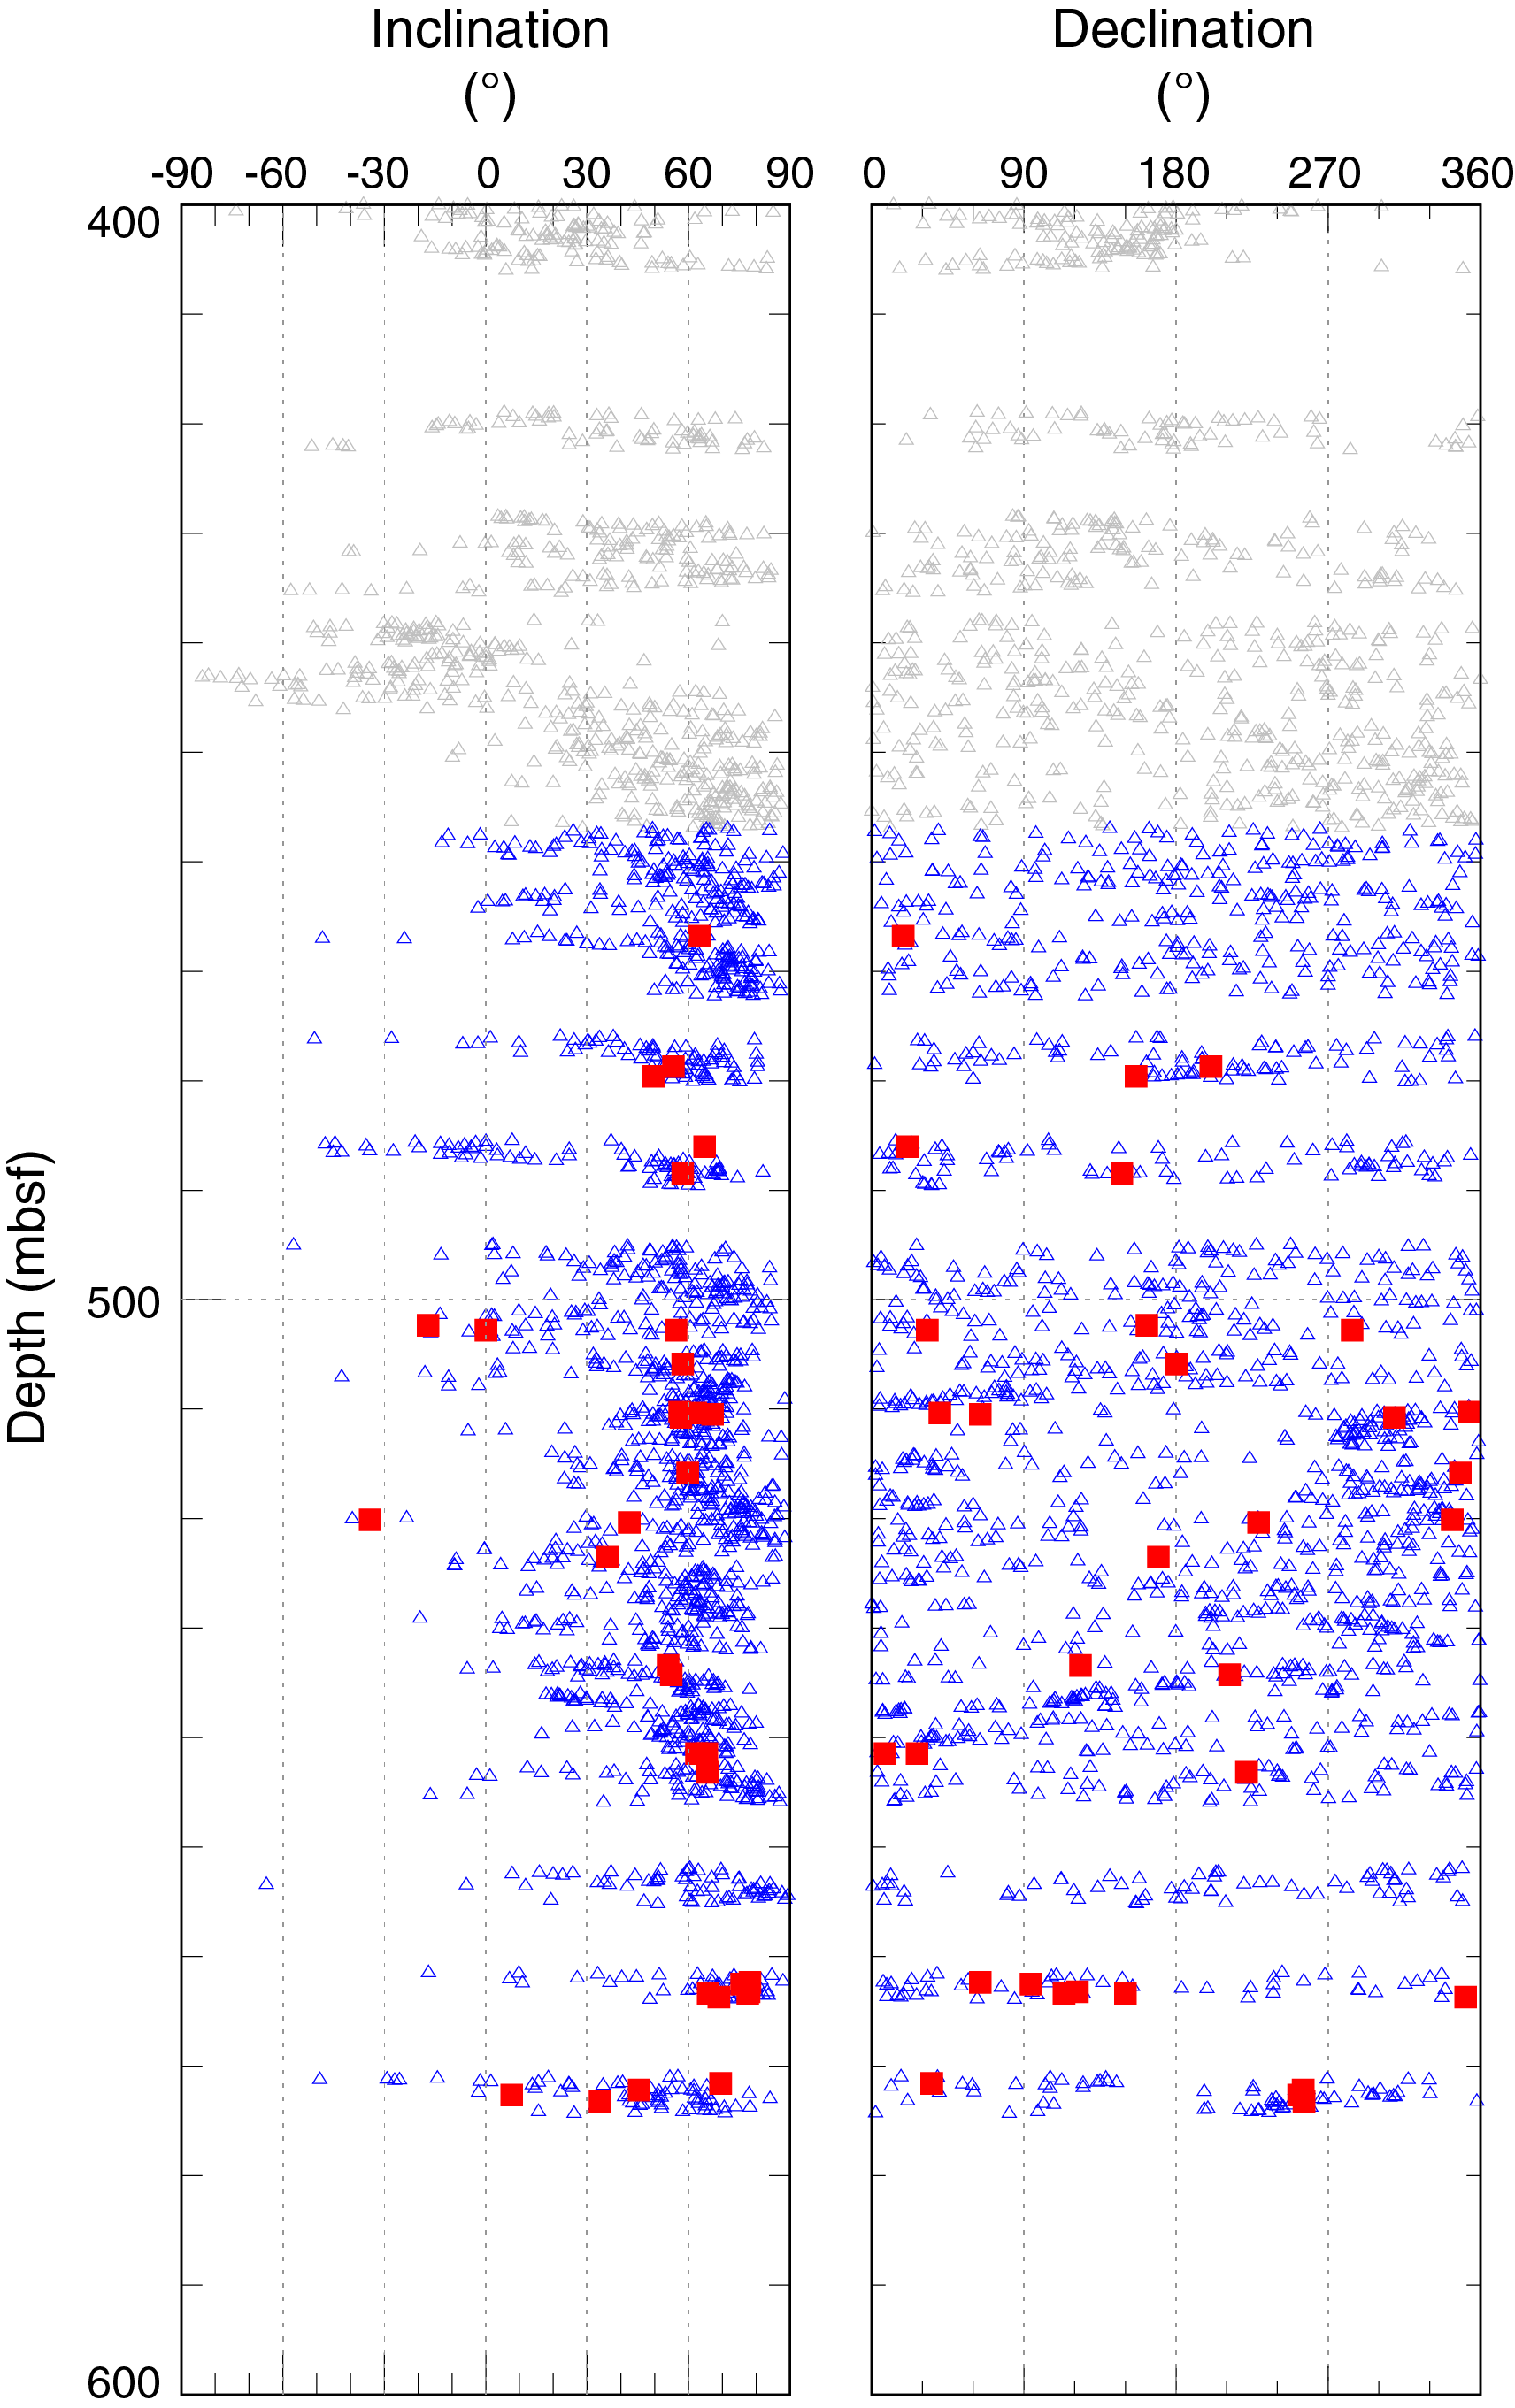
Figure F13. Inclination and declination.
Geochemistry
Inorganic geochemistry
IW was taken from Hole C0025A cores. Because the intent was to drill through slope cover and penetrate into the inferred depth of the accretionary prism, only 420–572 mbsf was cored because of time constraints. Evidence of gas expansion was observed in many cores, and this process is likely responsible for some contamination of sediments by seawater while cutting and retrieving cores. Concentration data not corrected for seawater contamination are shown in Table T8. IW yields and squeezing parameters are shown in Table T9.
Salinity and chlorinity
One of the clear observations from this site is the pronounced freshening of IW throughout the cored interval. Salinity and chlorinity have measured values of 23.5–26.8 and 389.8–460.5 mM, respectively (Table T8; Figure F14). These values represent freshening of 18%–35% as compared to normal seawater. Both measurements show the lowest values at 450.3 mbsf, which is the estimated depth of the bottom-simulating reflector (BSR). Both measurements also covary closely and values vary smoothly with depth. One possible explanation is that decomposition of gas hydrate during core recovery and before shipboard analysis causes the freshening. A low-temperature anomaly (7.5°–8.9°C) was observed using the infrared camera at 449.70–449.88 mbsf (interval 358-C0025A-6R-2, 80–98 cm), and no anomalies were observed in Cores 7R–10R. Similarly, low chlorinity values were observed in Kumano Basin pore water at Site C0002, where they were also ascribed to dissociation of gas hydrate (Expedition 315 Scientists, 2009). The relatively smooth downhole trends in the chlorinity profiles suggest that if hydrate dissociation is the cause of pore water freshening, the hydrate is evenly disseminated rather than concentrated in discrete layers. Other possible explanations for low chlorinity values are flux of low-chlorinity fluids from an underlying source (e.g., deep-seated clay mineral dehydration) or that meteoric fluid is circulating at the margin.

Figure F14. Salinity, pH/pmH, alkalinity, sulfate, chlorinity, bromide, ammonium, and phosphate.
Sulfate and alkalinity
Sulfate (SO42−) concentrations are uniformly low, ranging from 0.57 to 2.95 mM (Figure F14). The pattern indicates that the cored interval is well below the sulfate–methane transition zone. The presence of methane throughout the interval also supports this inference (Figure F15). Therefore, it is likely that the minor sulfate found represents small amounts of contamination from seawater drilling fluid. Alkalinity is relatively low and scattered as compared to Site C0024, though it is still higher than seawater alkalinity. The low alkalinity may result from the formation of diagenetic carbonate minerals during burial.
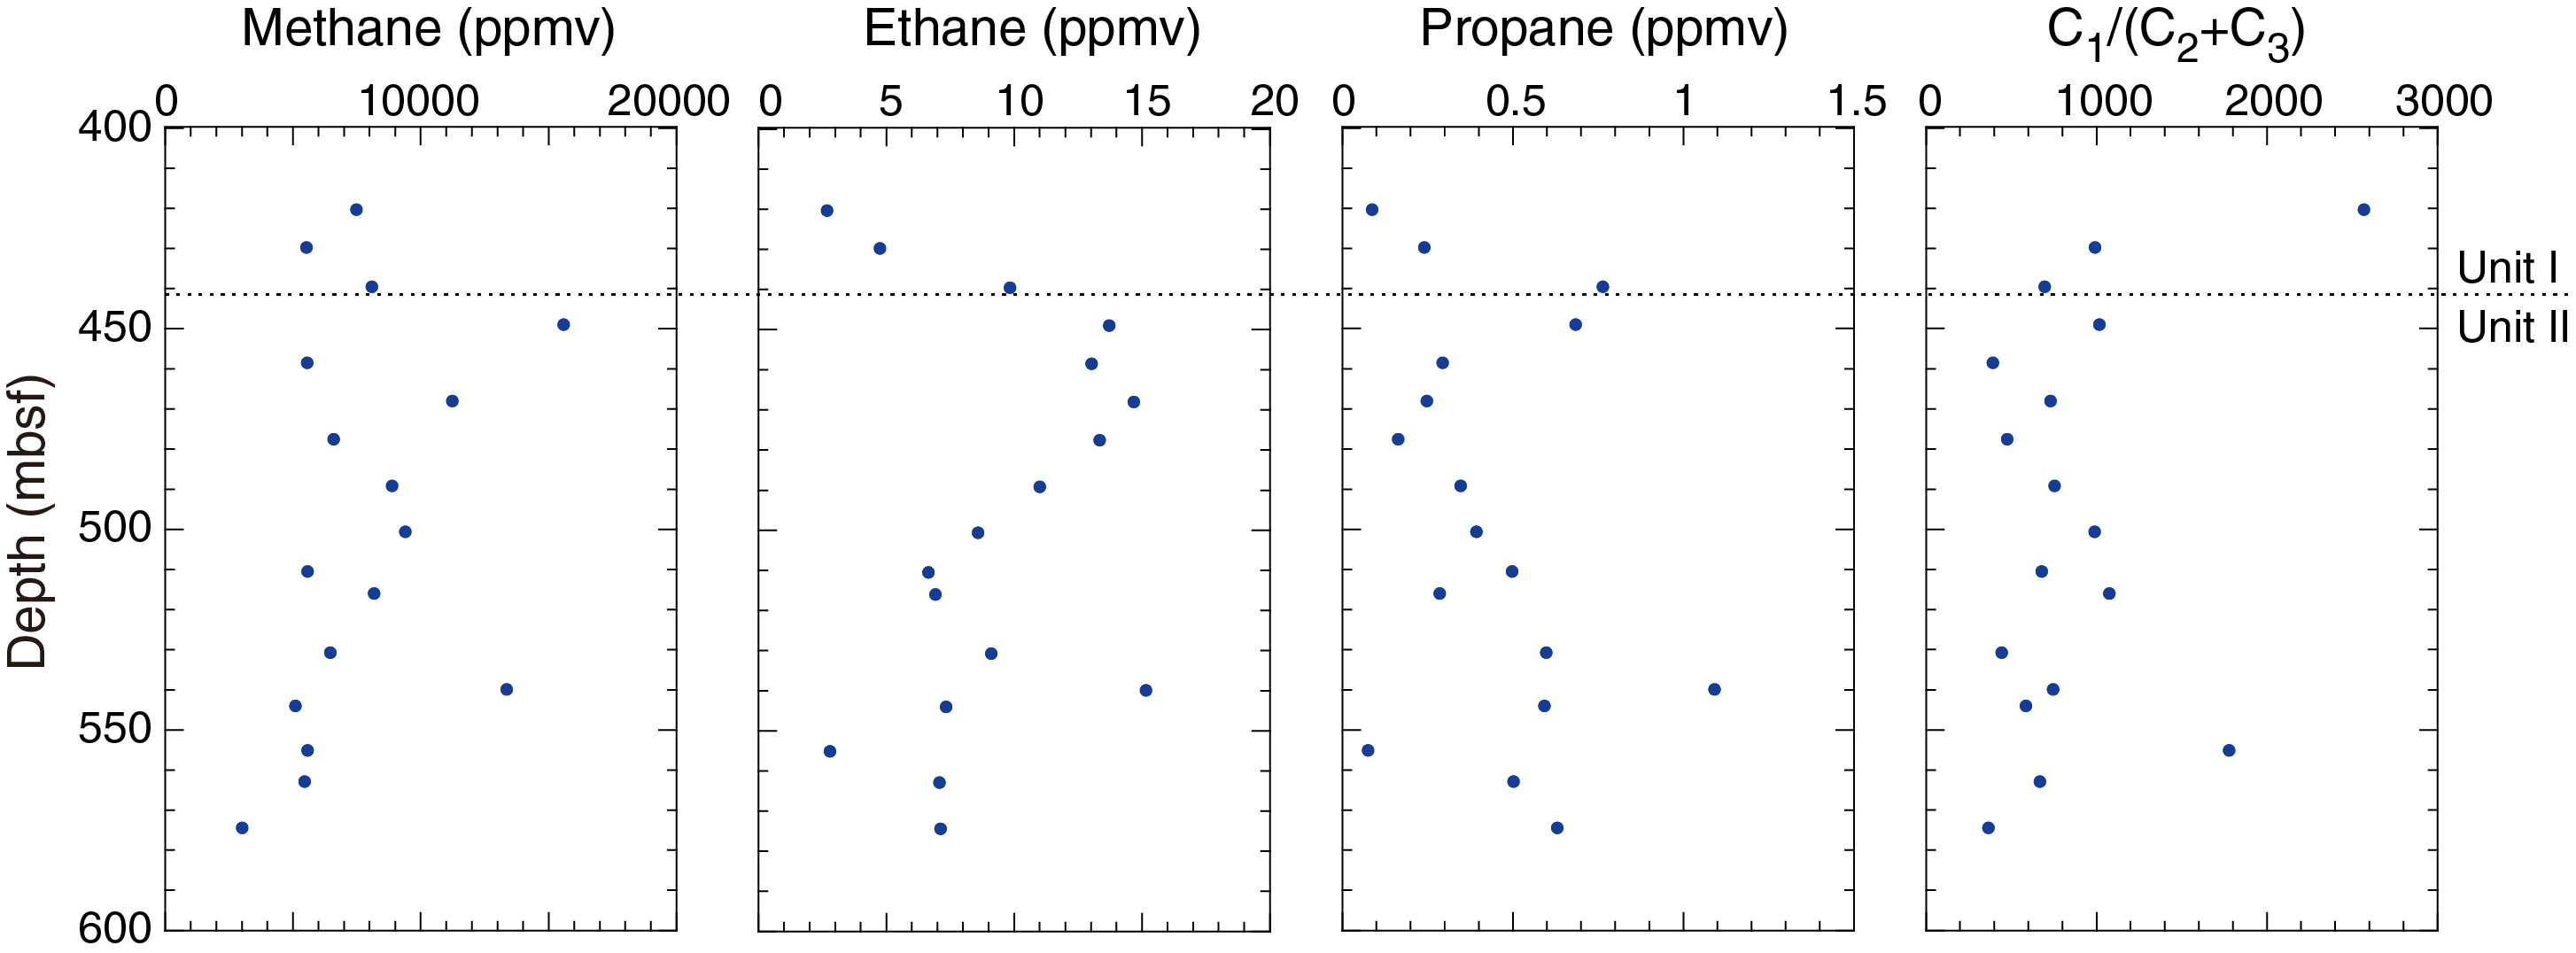
Figure F15. Headspace gases.
Ammonium, phosphate, bromide, and manganese
Ammonium (NH4+) was not detected in IW. Bromide (Br−) concentrations are low and close to seawater concentrations with few fluctuations in values. The concentrations range from 0.77 to 0.89 mM over the entire cored interval of >150 m (Figure F14). The depth-concentration pattern of bromide mimics that of chloride, suggesting there are likely few additional bromide inputs from organic matter breakdown. However, the elevated Br/Cl ratios (1.84–2.20 mmole/mole) are higher than the seawater ratio of 1.45 mmole/mole, suggesting the addition of Br other than seawater. Manganese (Mn) concentrations vary between 0 and 2 µM with exceptions from two measurements at 432.8 and 440.5 mbsf (Figure F16). There is no reduced manganese in the oxygenated bottom seawater; therefore, all IW samples have manganese concentrations higher than seawater. The low but detectable dissolved manganese may be due to the reduction of Mn oxides as documented from Integrated Ocean Drilling Program Site C0012 (Torres et al., 2015). Phosphate (PO43−) concentrations show very little variance and are only slightly elevated above a typical seawater concentration of 3 µM (Figure F14). This suggests little diagenetic influence related to precipitation of apatite.
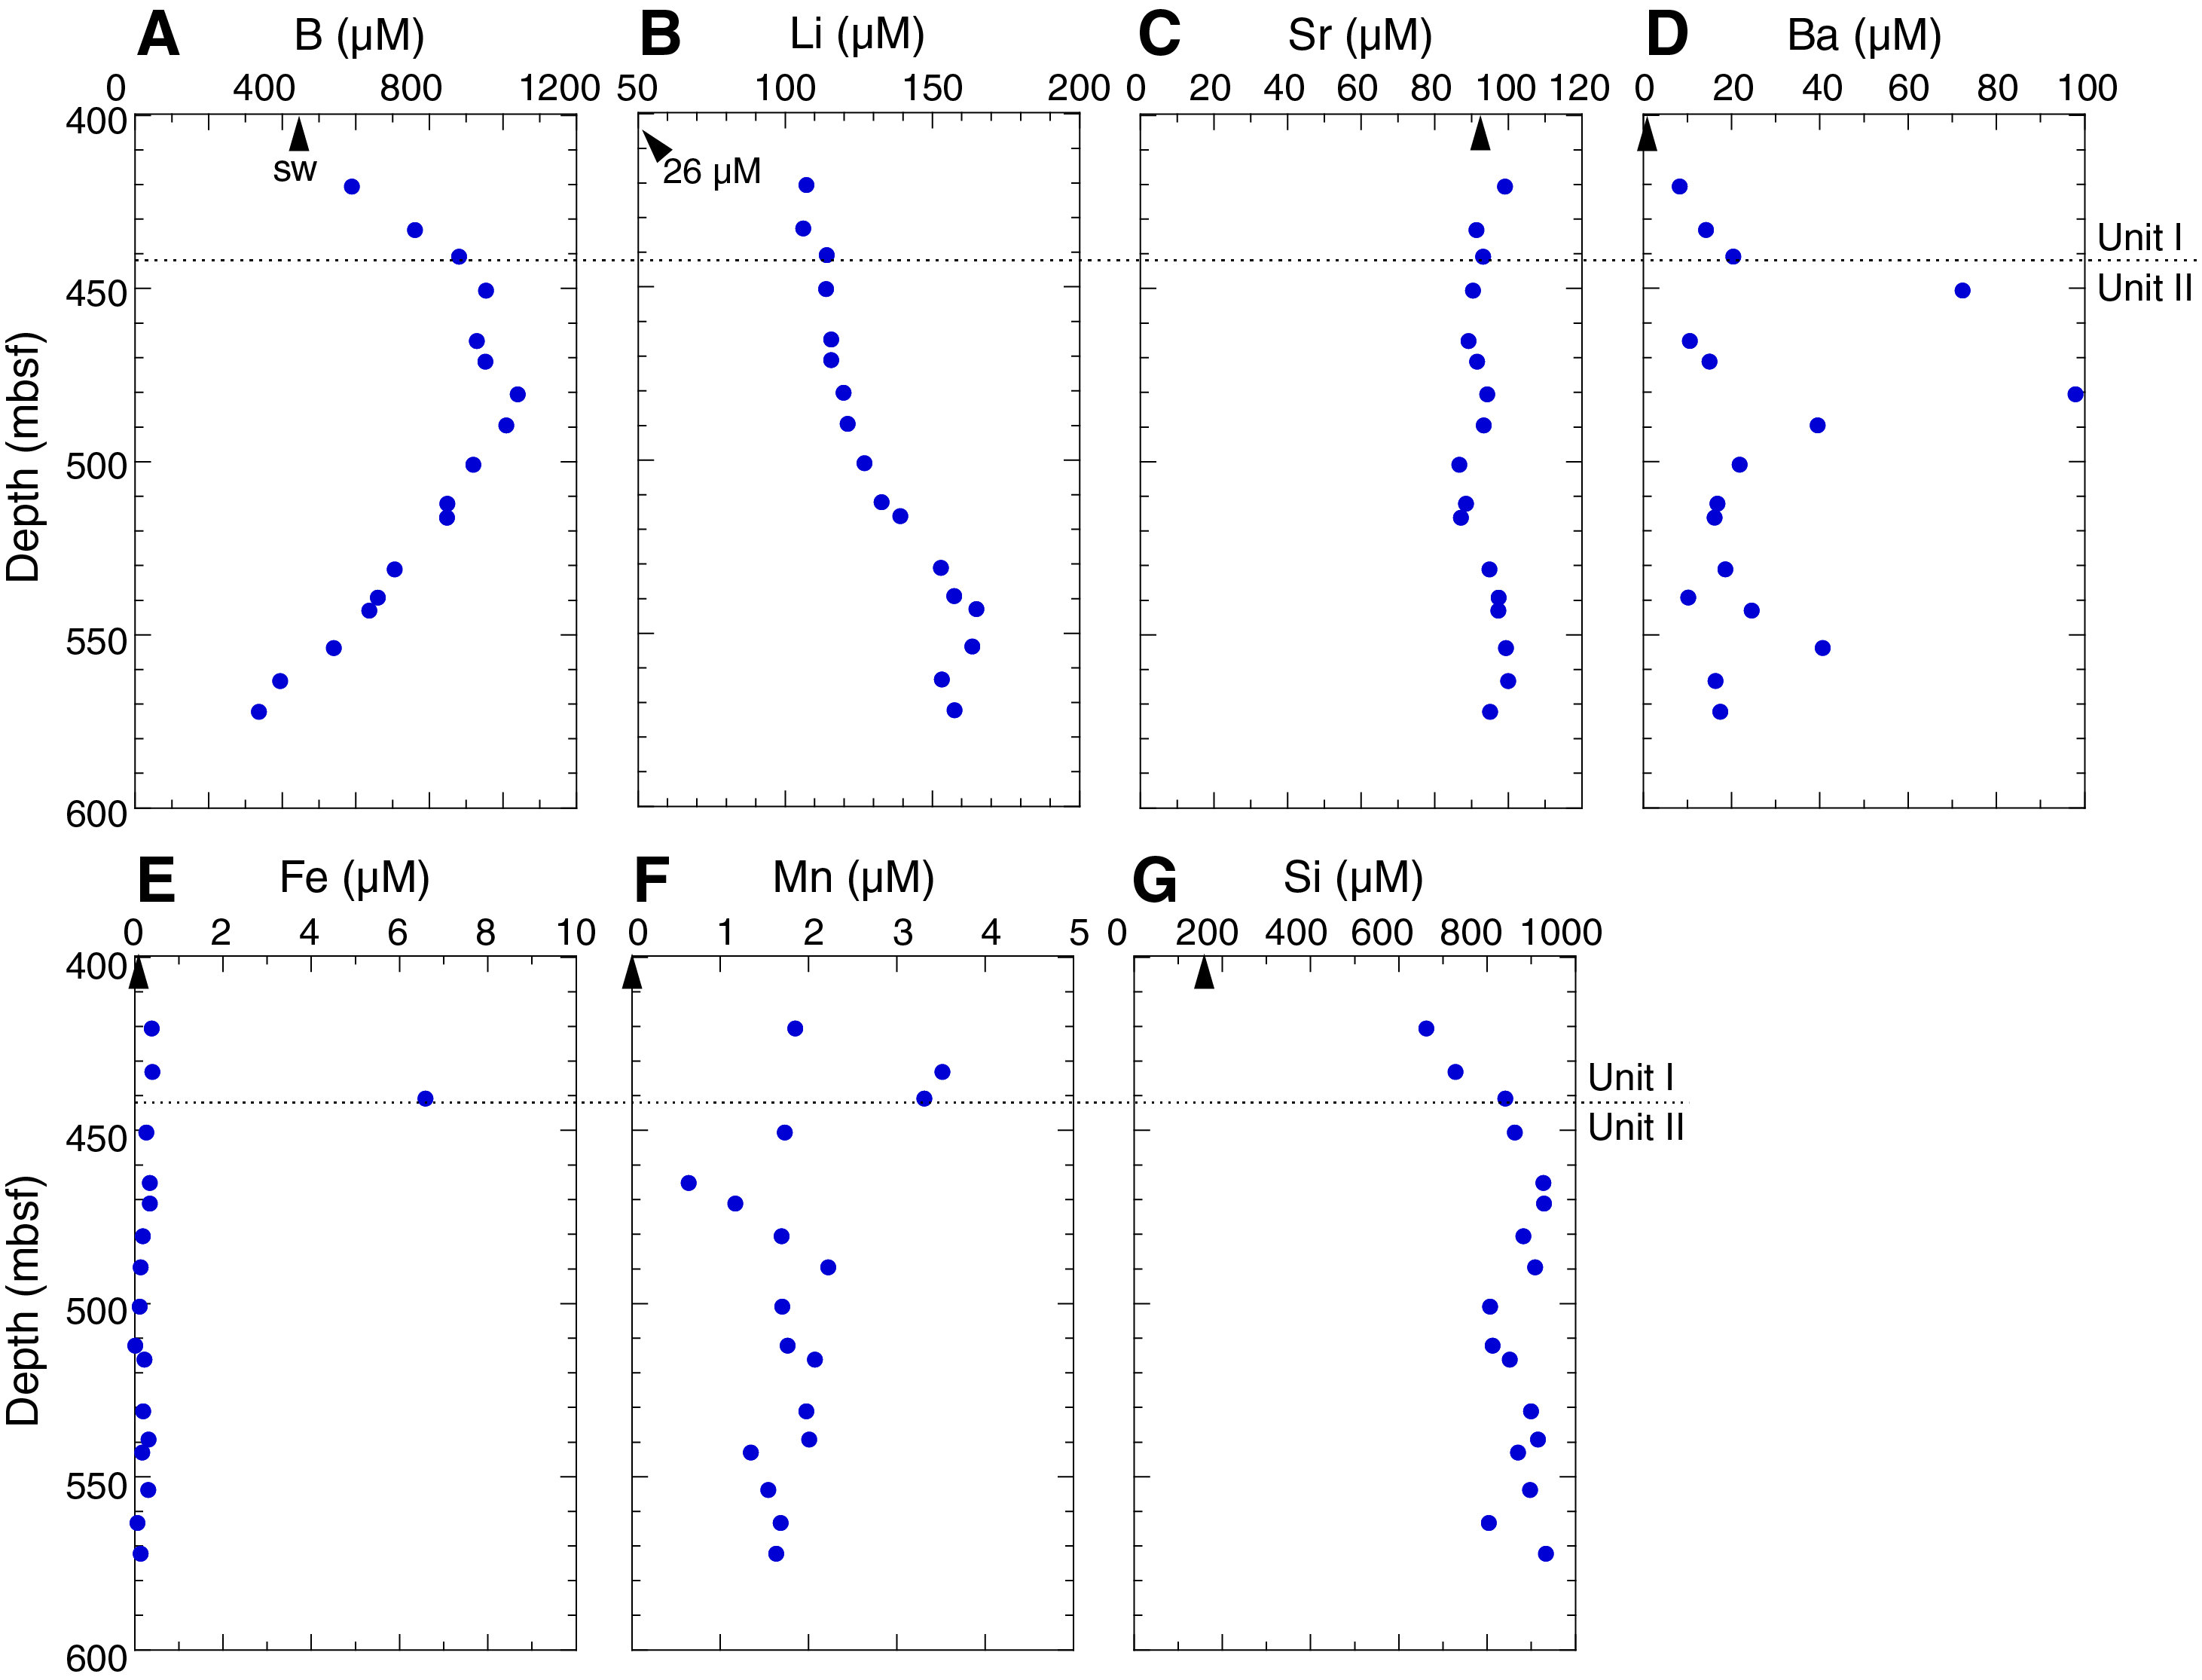
Figure F16. Minor elements.
Major cations (Na, Ca, Mg, and K)
Except for calcium (Ca2+), downcore concentrations of major cations (sodium [Na+], potassium [K+], and magnesium [Mg2+]) show similar patterns. The concentrations remain below seawater values with small local minima at 450.3 mbsf (Figure F17), which is probably related to the same dilution process documented by the salinity and chlorinity profiles (Figure F14). The pattern of calcium and magnesium concentrations suggests reductions relative to seawater due to carbonate formation during burial but also that no horizons occur over the cored interval with active carbonate formation (Figure F17). This is consistent with the observed low alkalinities (Figure F14).
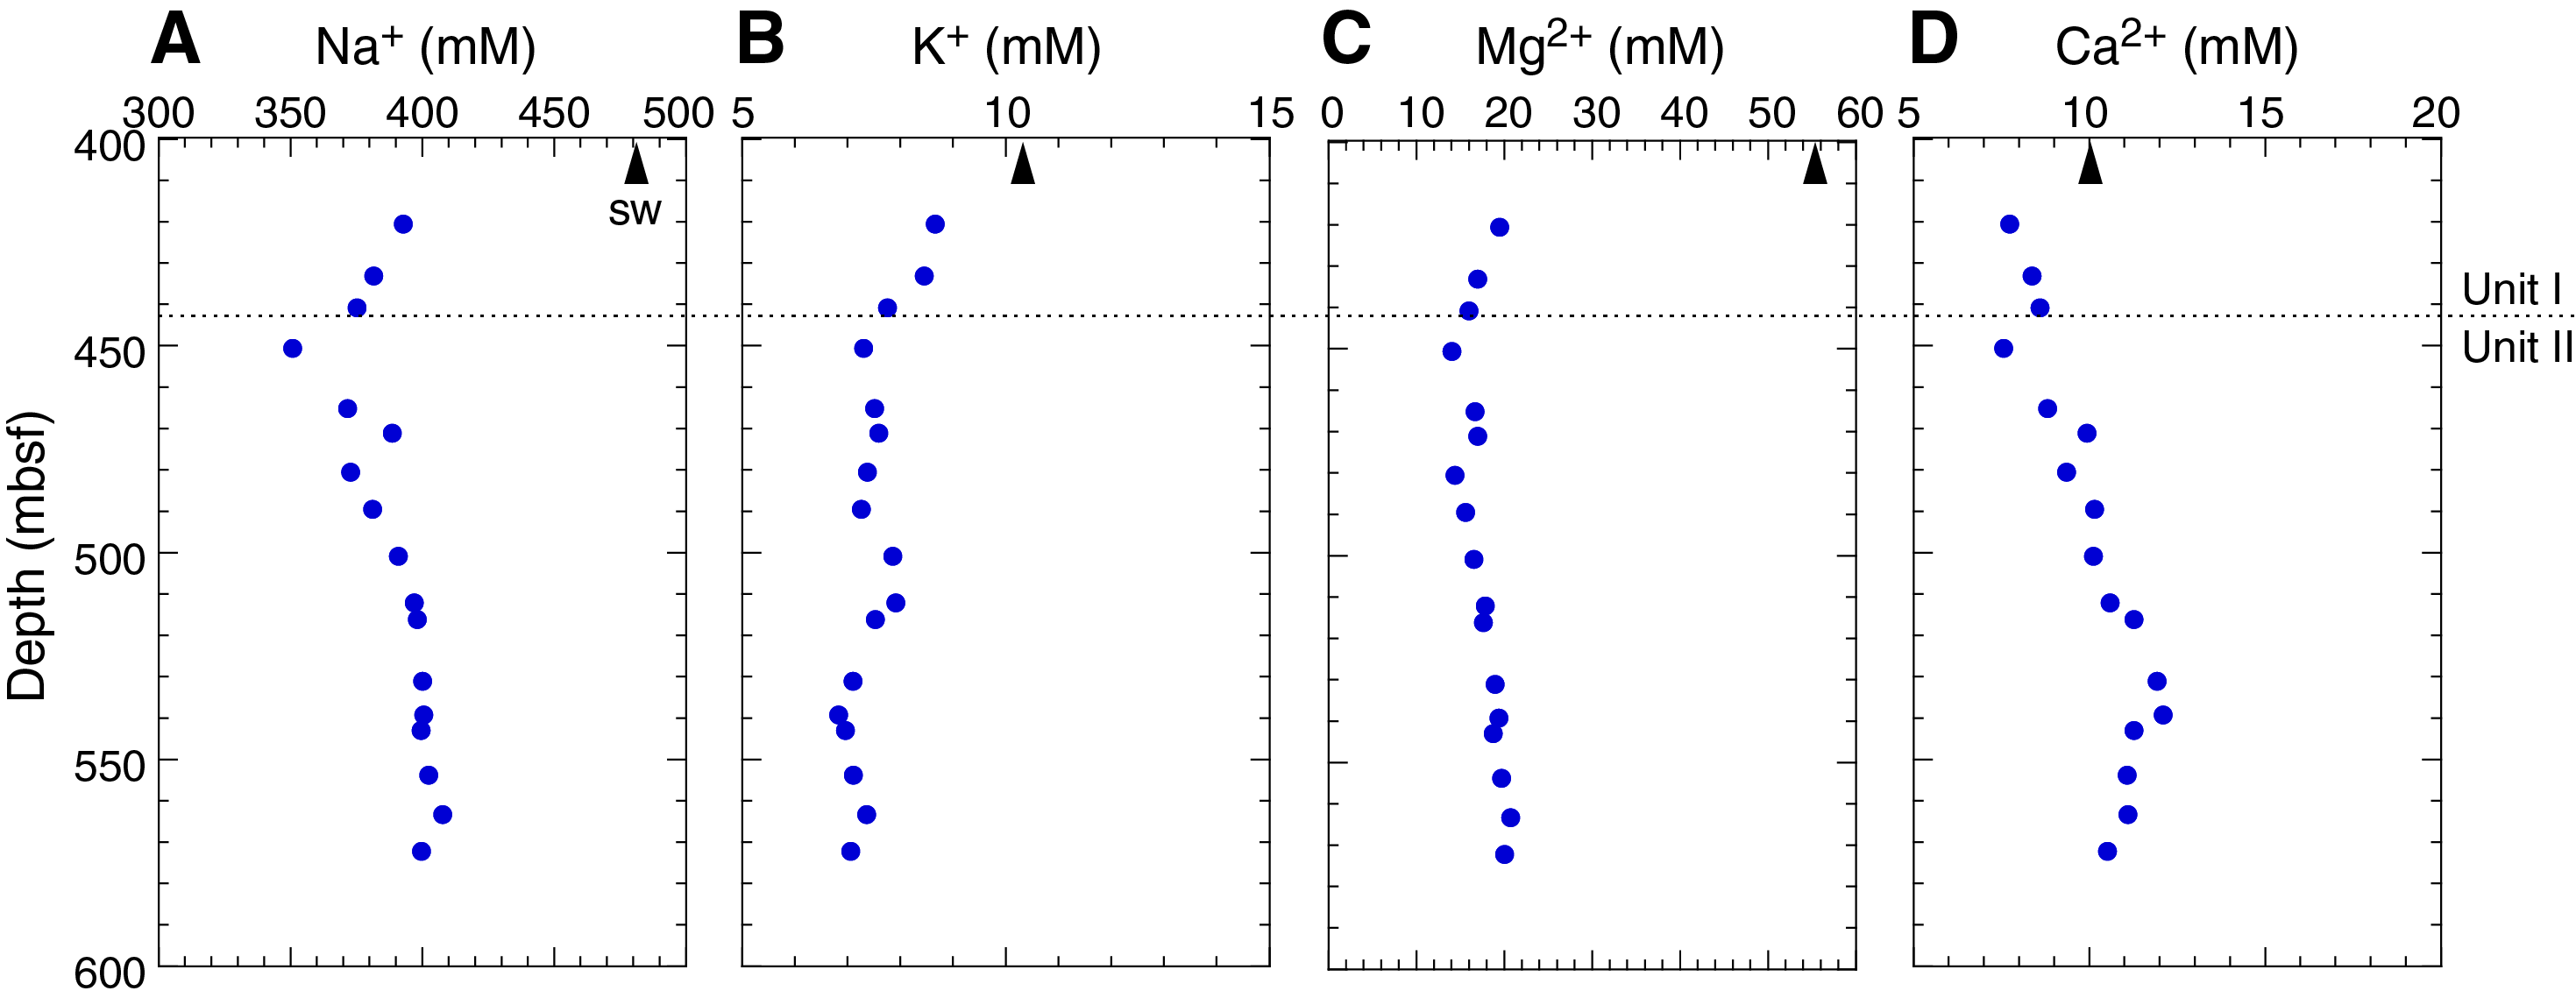
Figure F17. Major cations.
Minor elements (B, Li, Si, Sr, and Ba)
Boron (B) concentrations show enrichment relative to seawater values and a broad maximum 2.5 times higher than the concentration in seawater across 450.3–489.2 mbsf (Figure F16). Boron concentrations increase between 420.2 and 450.3 mbsf and then gradually decrease between 489.2 and 571.9 mbsf. These trends may suggest diffusion profiles both upward and downward centered around a horizon with elevated boron concentrations. Boron is soluble in formation waters and can be added to IW by low-temperature alteration of volcanic matter or higher pressure/temperature desorption from clays and removed from IW by low-temperature adsorption onto clay minerals. Enrichment is commonly inferred as an indicator of fluid flux from greater depths and higher temperatures (Palmer, 2017). The top of the boron concentration maximum observed at Site C0025 is centered at the estimated depth of the BSR, but lateral flux of a deeper fluid cannot be excluded as a cause of the maximum. Shore-based boron isotope studies on IW may help identify the process leading to increased boron concentrations from 450.3 to 489.2 mbsf.
Lithium (Li) concentrations (105.96–164.79 µM) are approximately 4–6 times higher than seawater concentration (~26 µM; Figure F16). A flux from depth could account for the high concentrations, which are typical for deep fluids in subduction zone fore arcs (e.g., You et al., 1995; Kopf et al., 2003) and often covary with elevated boron. However, the local lithium maximum at 542.7 mbsf is deeper than the peak in boron and the minima in chlorinity and major cation concentrations. Shore-based lithium isotope studies may also help distinguish the source of elevated lithium.
Silica (Si) concentrations range from 660.95 to 931.92 µM (Figure F16). The values fluctuate by 10%–20% with local maxima at 465 and 539.0 mbsf and a local minimum at 563.0 mbsf. The variations could be caused by local dissolution of volcanic glass. Strontium (Sr) concentrations are remarkably similar to seawater concentrations with little variation (Figure F16). The depth profile is similar to that of calcium and is consistent with a general lack of diagenesis related to carbonate formation or alteration of plagioclase in volcanic matter. Barium (Ba) concentrations are scattered with no obvious downhole trends (Figure F16). The scattered nature could be related to localized dissolution or formation of barite.
Trace elements (Rb, Cs, V, Cu, Zn, Fe, As, Mo, Pb, and U)
Generally, the scatter in trace element concentrations at Site C0025 is lower than those typically observed at other sites along the Nankai margin (Figure F18). Rubidium (Rb) behaves chemically similar to potassium and mimics the potassium profile. Cesium (Cs) shows a downhole trend similar to rubidium, but cesium is enriched relative to seawater concentrations, whereas rubidium is depleted.
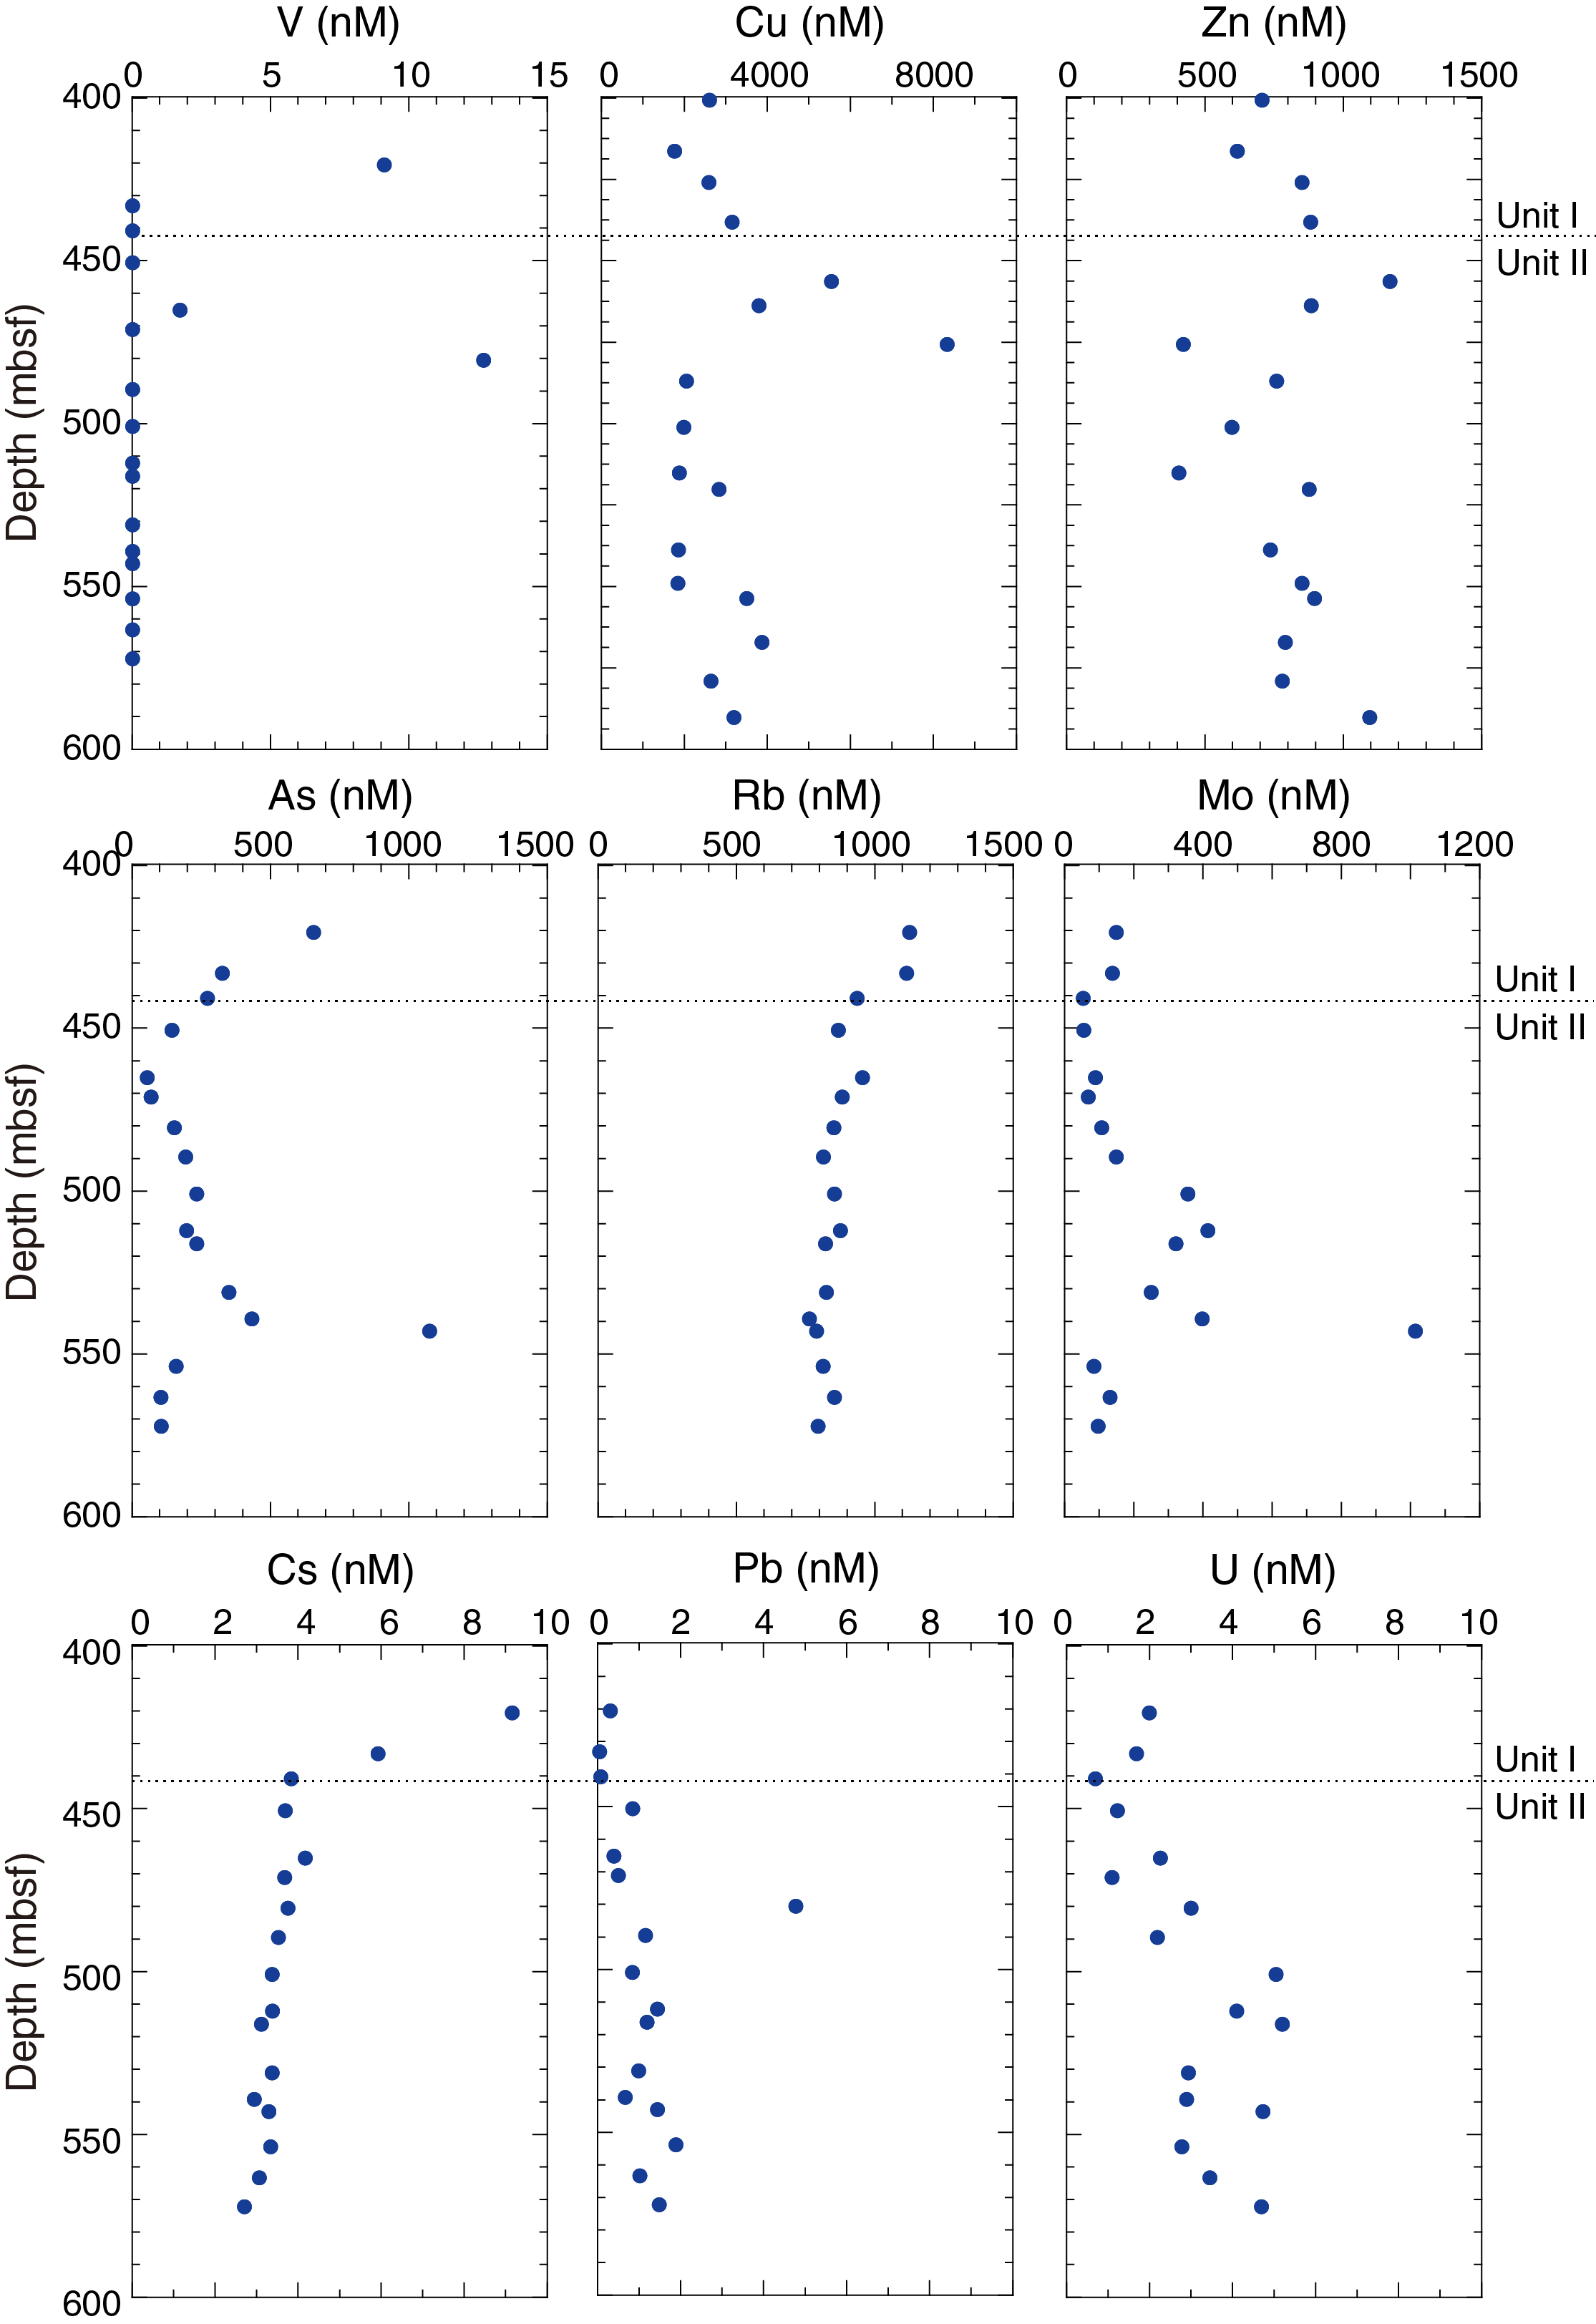
Figure F18. Trace elements.
Zinc (Zn), copper (Cu), molybdenum (Mo), and uranium (U) concentrations are highly variable. Zinc, copper, and molybdenum concentrations are higher than seawater values, whereas uranium concentrations are lower. The latter reflects the lower solubility in reducing environments.
Organic geochemistry
Chemical compositions of hydrocarbon gases
Hydrocarbon gases in headspace gas
The composition and concentration of hydrocarbon gases detected from headspace gas samples are shown in Table T10. The depth trends of methane, ethane, and propane concentrations and C1/(C2 + C3) molar ratios are shown in Figure F15. Methane concentrations range mostly between 0.5 and 1.6 vol% (2,994–15,562 ppmv). The concentrations are scattered but show slightly elevated values at 448.9 (peak value = 1.6 vol%) and 539.8 mbsf. Propane concentrations are ≤1 ppmv. C1/(C2 + C3) ratios are <1100 except for two samples with ratios of 1800 and 2600 at 420.2 and 554.9 mbsf, respectively. The variations of hydrocarbon components are coincident with the freshening of IW relative to seawater, suggesting the presence of methane hydrate at the cored depths.
Hydrocarbon gases in void gas
The hydrocarbon compositions of void gases sampled from the gas expansion in the cored sediments just after recovery are shown in Table T11. The gas taken from 463.8 mbsf contains >96 vol% methane. The C1/(C2 + C3) molar ratio of 1550 from the sample at 463.8 mbsf is similar to the range of values measured in headspace gases.
Carbonates, organic carbon, and total nitrogen of cores
The results for calcium carbonate, total organic carbon (TOC), total nitrogen (TN), total sulfur (TS), and the TOC/TN ratio are shown in Table T12 and Figure F19. TOC varies, ranging from 0.2 to 0.9 wt%. The deeper cored interval (500–570 mbsf) has slightly higher TOC than the interval above. Calcium carbonate content ranges between 3 and 16 wt%. Values >15 wt% appear from 450.5 to 470.8 mbsf and again at 511.8 and 542.9 mbsf. TN and TS contents are low and highly variable throughout the cored intervals. The TOC/TN ratio generally decreases downhole. In the upper 100 m, ratios of >10 are common and are consistent with burial of terrestrial organic matter. The lowest cored section has TOC/TN ratios mostly <10, which is more consistent with organic matter dominated by marine material.
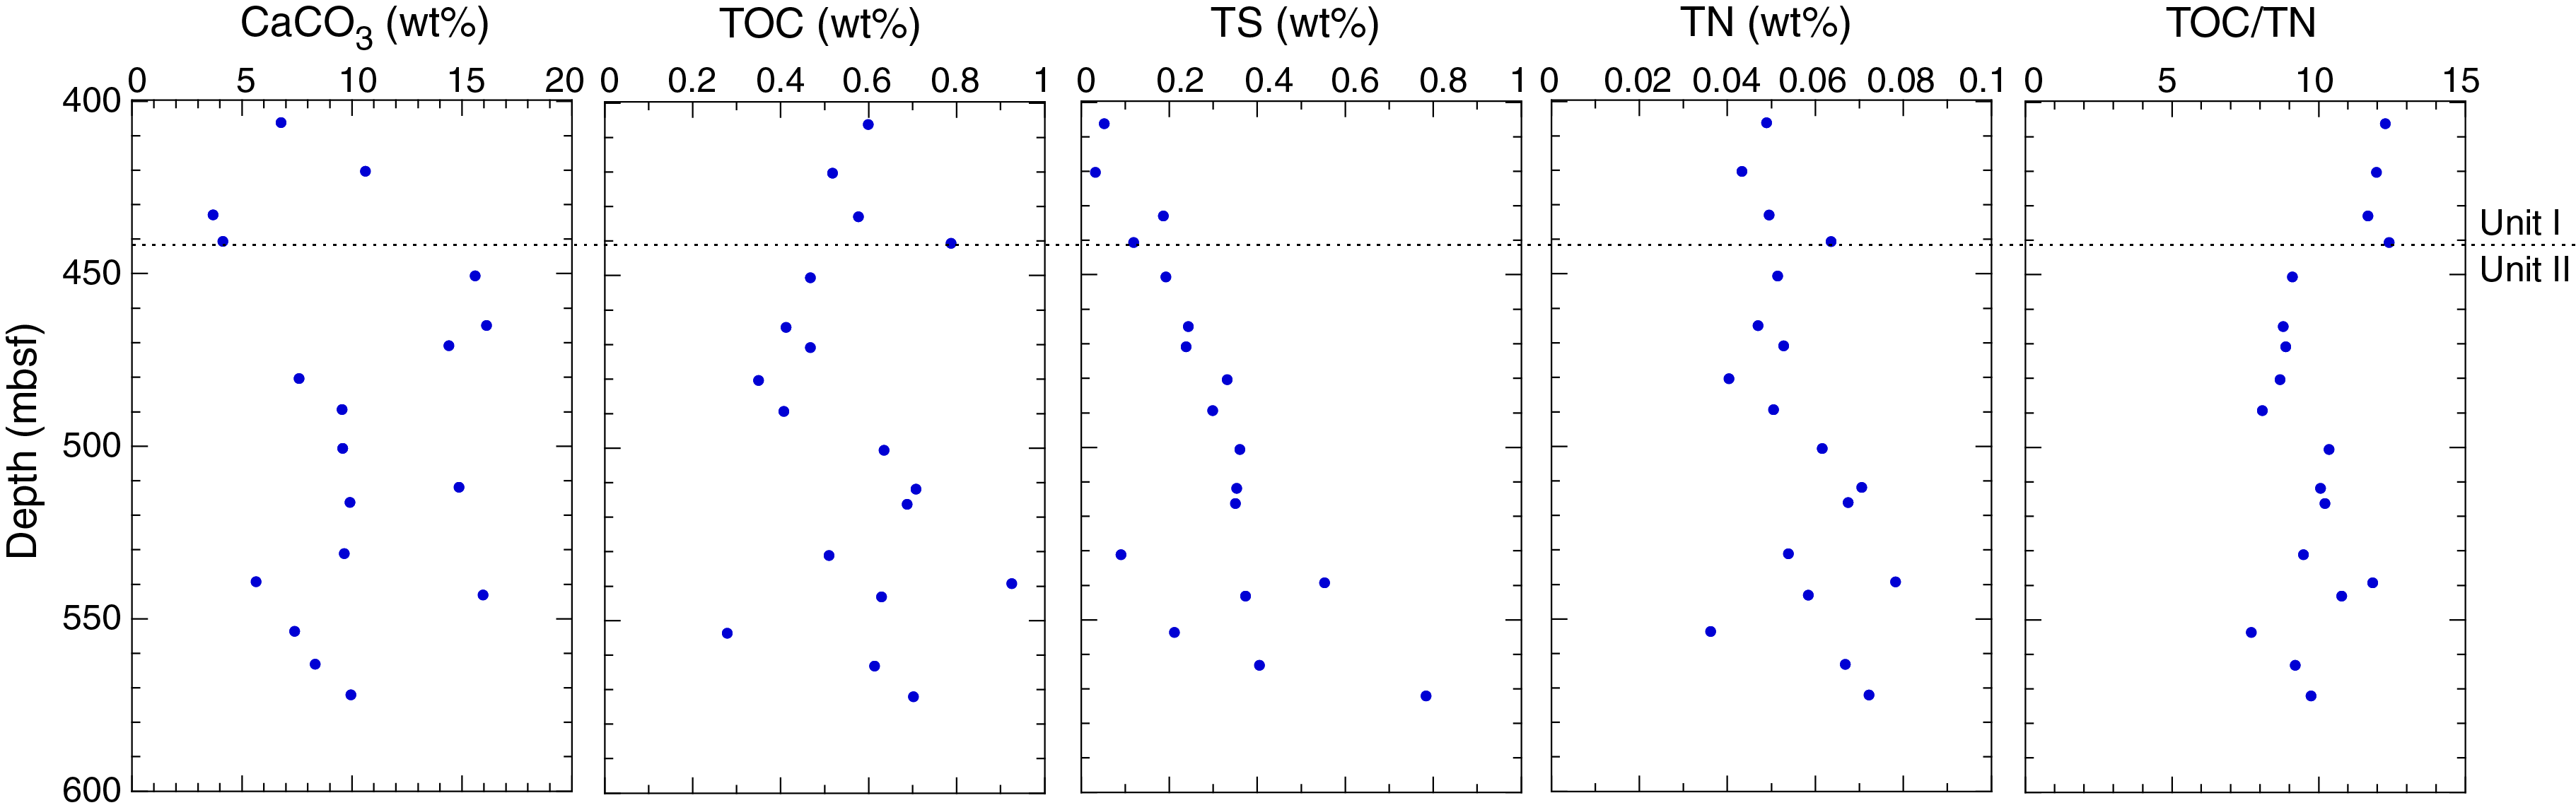
Figure F19. Calcium carbonate, TOC, TS, TN, and TOC/TN.
Physical properties
A range of physical property measurements were performed on core samples from Hole C0025A. Moisture and density (MAD) and P-wave velocity measurements were conducted on discrete samples taken from working halves and cluster samples from whole-round cores. Electrical resistivity measurements were performed on either the same discrete samples taken for MAD and P-wave velocity measurements using two electrodes or working halves using a four-pin array electrode. Whole-round multisensor core logger (MSCL-W) measurements were conducted on whole-round cores. Thermal conductivity was measured on either whole-round cores using a full-space needle probe or working halves using a half-space line source probe. Undrained shear strength was measured on working halves using the penetrometer.
MSCL-W (whole-round cores)
Whole-round cores from Hole C0025A (400–574.34 mbsf) were analyzed by the MSCL-W (see Physical properties in the Expedition 358 methods chapter [Hirose et al., 2020]). The results of gamma ray attenuation (GRA) bulk density, magnetic susceptibility, NGR, and electrical resistivity measurements are summarized in Figure F20. Core liners made of polycarbonate were used in Hole C0025A.
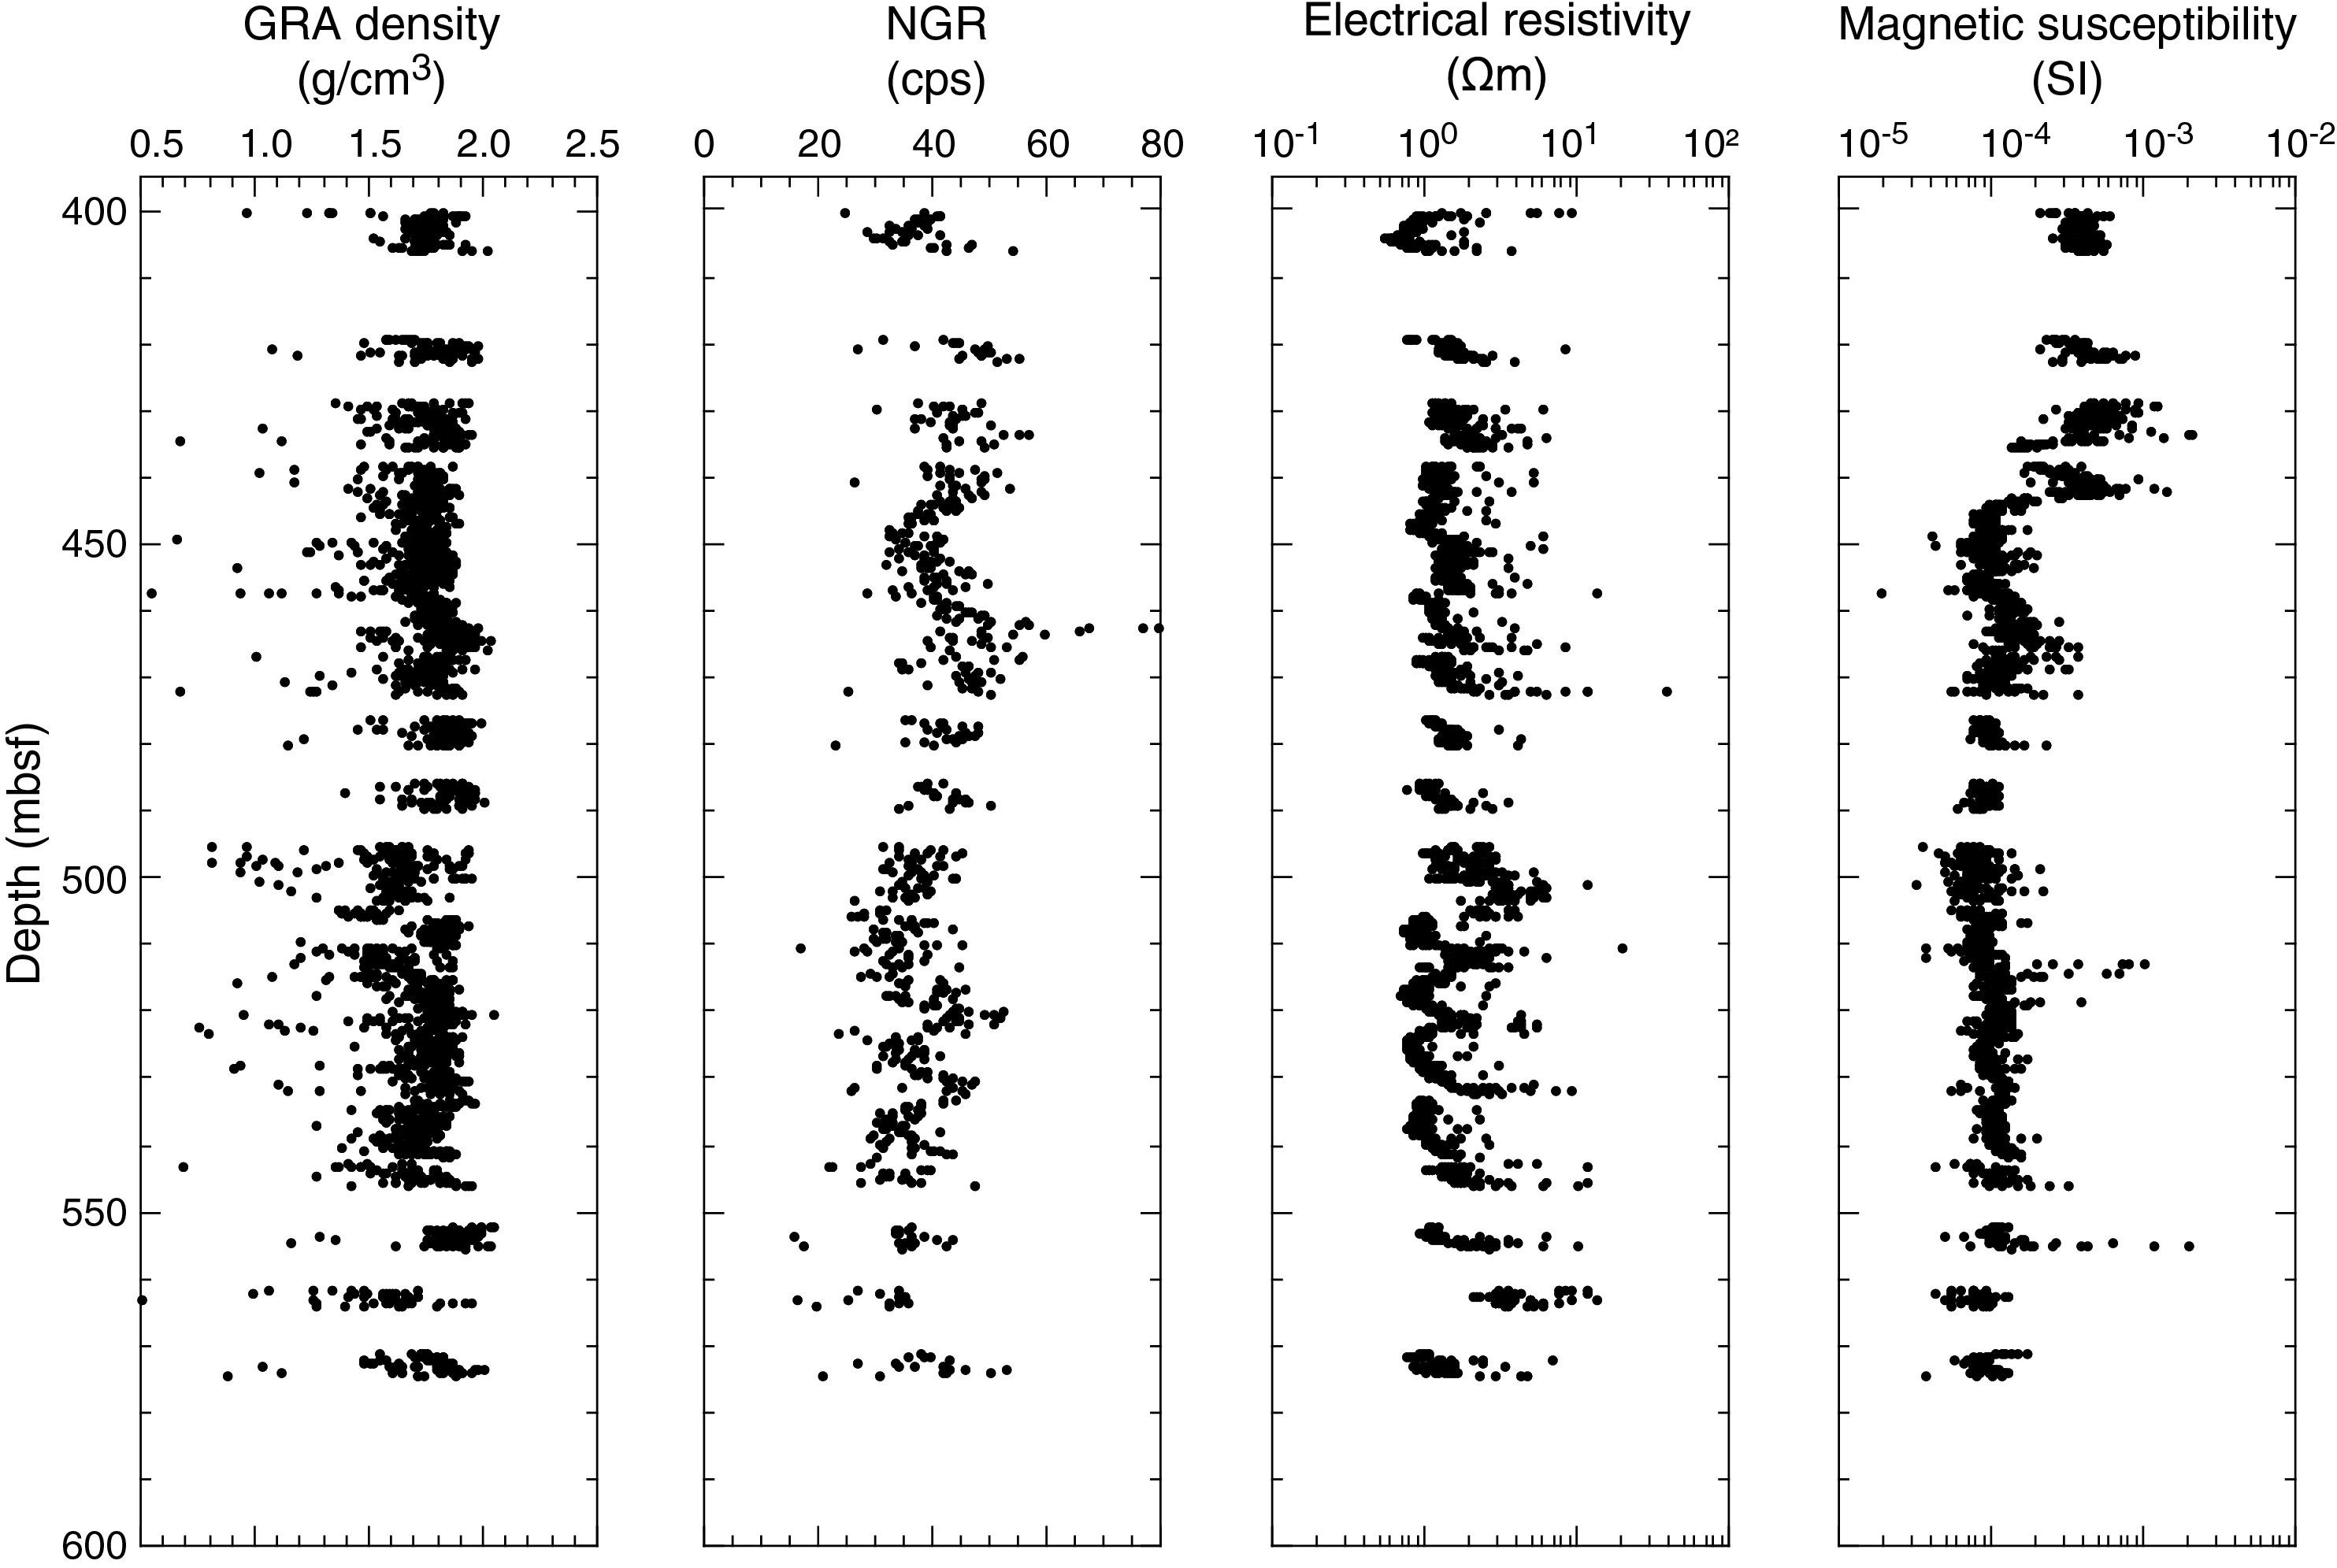
Figure F20. MSCL-W measurements.
GRA bulk density, NGR, and electrical resistivity mostly range from ~1.5 to 2.0 g/cm3, from 15 to 79 counts/s, and from 0.5 to 39 Ωm, respectively, between 400 and 574.34 mbsf. GRA bulk density values are scattered less than ~1.5 g/cm3, and the sporadic high values seen in the electric resistivity data correspond to zones where core quality was poor at the ends of core runs (both top and bottom) and influenced by air pockets inside the core liner. NGR shows a spike as high as 79 counts/s at ~465 mbsf corresponding to a depth interval where glauconite fragments were found in the core (see Lithology). Magnetic susceptibility values range mostly between 1.3 × 10⁻⁴ and 1.12 × 10⁻³ SI at 400–442 mbsf before rapidly decreasing to about 1 × 10⁻⁴ SI at ~450 mbsf. This drop in magnetic susceptibility coincides approximately with the Lithologic Unit I/II boundary (see Lithology). Magnetic susceptibility then remains relatively constant between 5 × 10⁻⁵ and 1.5 × 10⁻⁴ SI to 574 mbsf, except for a broad peak as high as 3.7 × 10⁻⁴ SI at 465 mbsf. The peaks in magnetic susceptibility at 510–520 mbsf may reflect the presence of ash layers (see Lithology).
Moisture and density measurements
MAD measurements were carried out on a total of 182 discrete core samples (Table T13) to determine grain density, bulk density, and porosity (Figure F21). Grain density values mostly scatter between 2.63 and 2.79 g/cm3. Bulk density and porosity scatter between 1.77 and 2.08 g/cm3 and between 38.5% and 54.5%, respectively, with no clear overall compaction trend. We did not observe a noticeable change in porosity at the lithologic unit boundary at 441 mbsf. However, a slight shift occurred in the average porosity from about 48% to 44% between 450 and 460 mbsf, likely correlating with the depth where the core became more indurated and a change in measurement method was required for resistivity (from four-pin array to two electrodes) and thermal conductivity (full-space needle probe to half-space line source probe). There are also depth intervals where porosity values cluster at relatively lower values with less variation. Between 480 and 500 mbsf and between 545 and 555 mbsf, porosity ranges between 40% and 45% and between 41% and 43%, respectively. These lower porosity values generally correspond to relatively sandier and calcite-poor zones at these depth intervals (see Lithology). The transition to lower porosity values at 480–500 mbsf also coincides with the Lithologic Subunit IIA/IIB boundary.
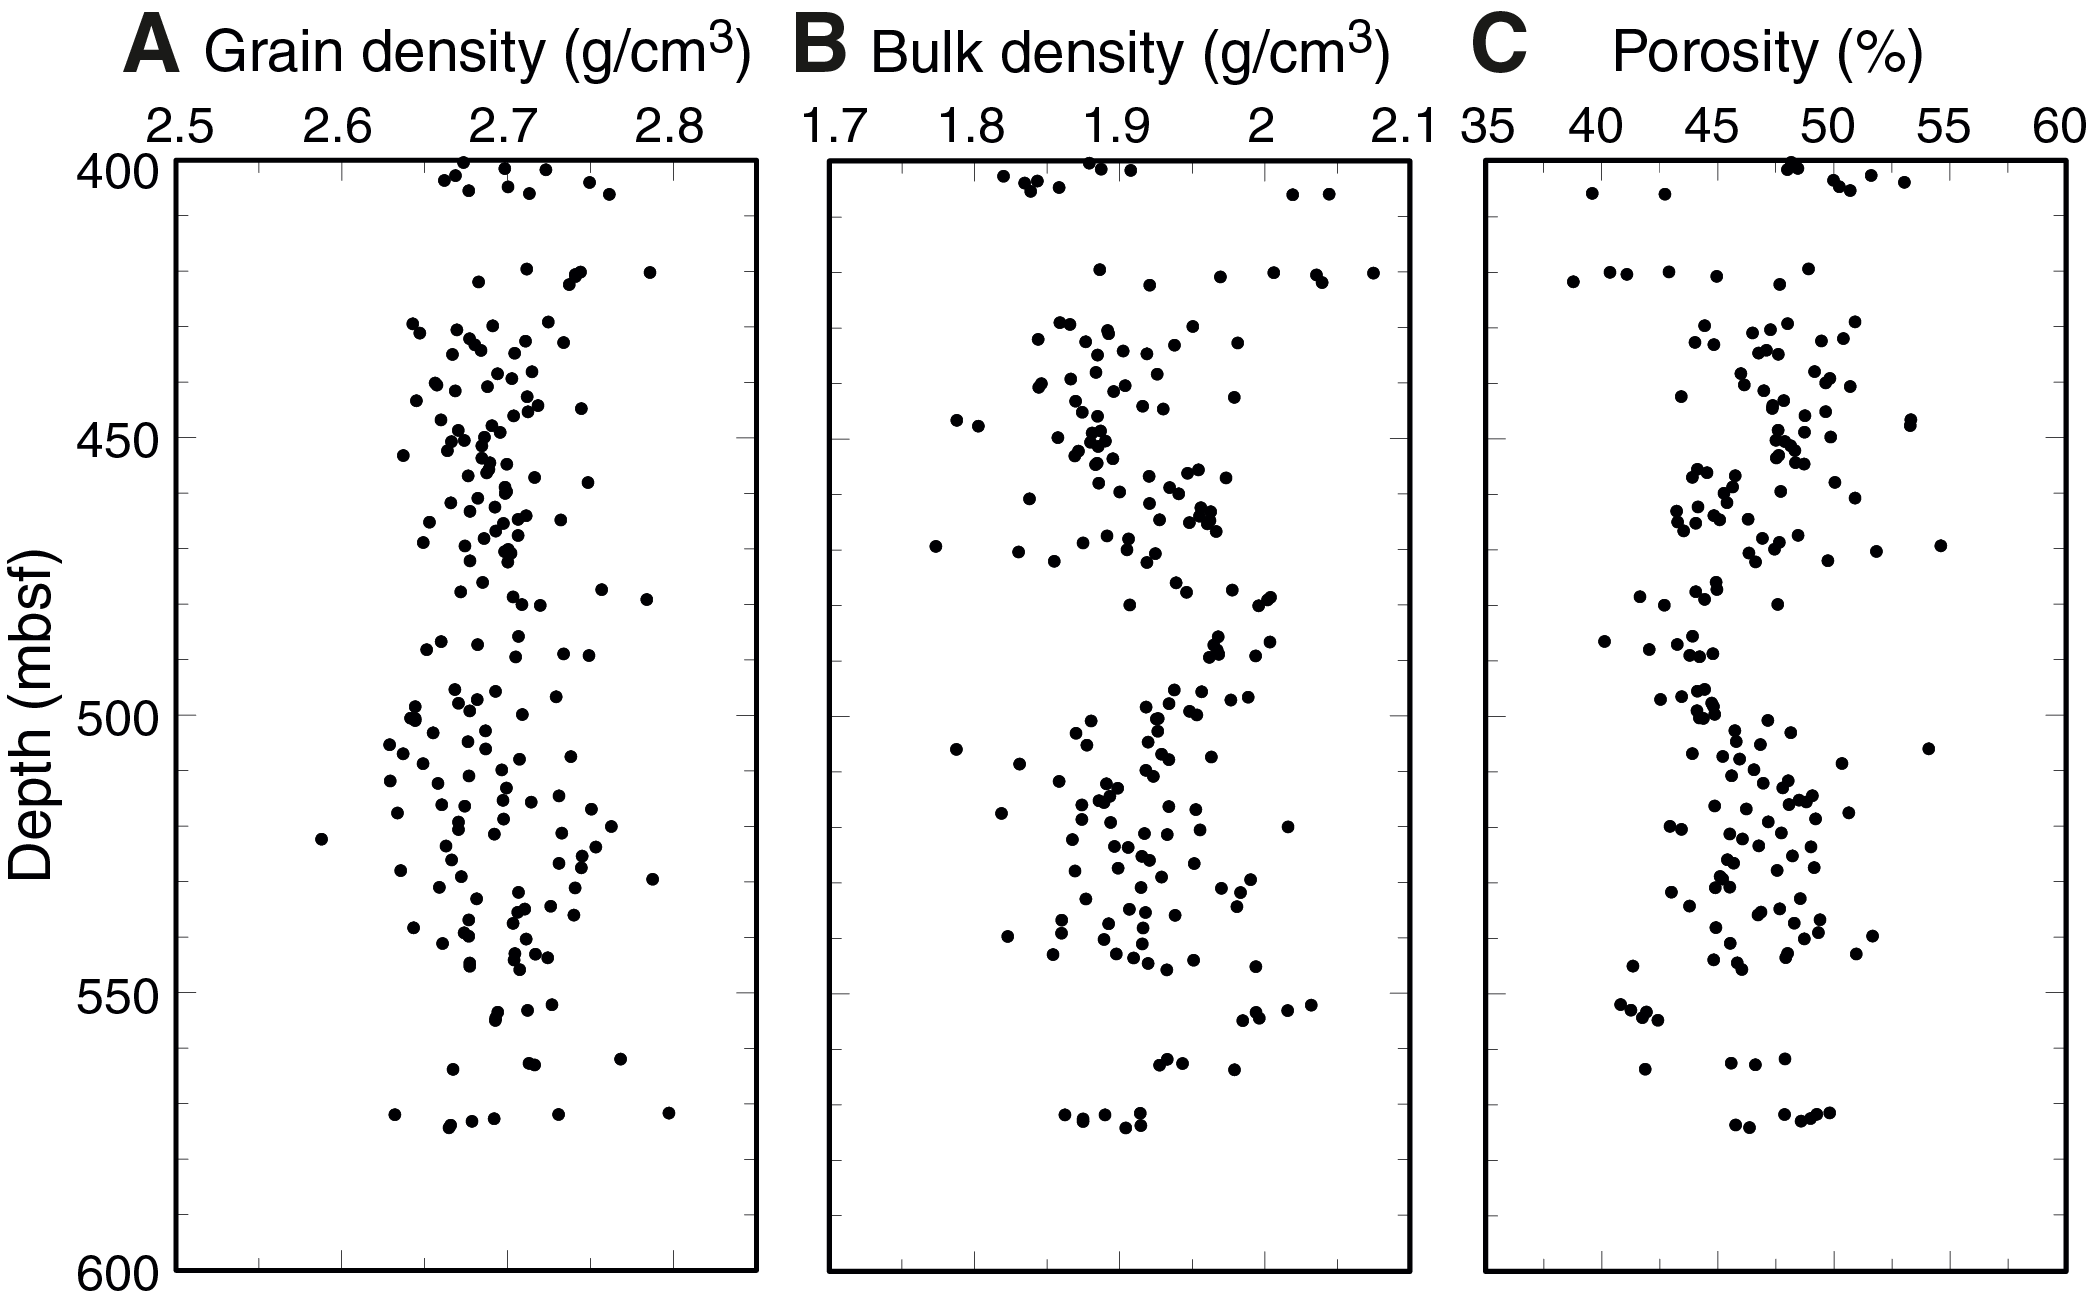
Figure F21. MAD, discrete core samples.
Electrical resistivity and P-wave velocity measurements (working half and discrete core samples)
Electrical resistivity and P-wave velocity measurements were made along x-, y-, and z-directions from 466.5 to 574.3 mbsf, where the material was sufficiently indurated to be cut into cubic samples. For cores recovered from shallower depths (400–457.18 mbsf), the material was unconsolidated and could not be cut into cubic samples. Therefore, P-wave velocity measurements were not made in this depth range and electrical resistivity measurements were made only along the y- and z-directions using the four-pin electrode array pushed into the soft sediment in the core liner.
Despite significant scatter, we note an increase in resistivity with depth from ~1 Ωm at 400 mbsf to ~2 Ωm at 574.3 mbsf (Figure F22A). This increase is primarily due to a shift from values of ~1.2 to 1.8 Ωm at ~460 mbsf. This shift may reflect sediment properties either related to primary sediment character or disturbance associated with gas hydrate dissolution (although this interval is deeper than the maximum depth for gas hydrate stability at this site, predicted by a BSR in the site survey data; Tsuji et al., 2015) or could result from using different measurement techniques (see Physical properties in the Expedition 358 methods chapter [Hirose et al., 2020]). Vertical electrical resistivity anisotropy shows significant scatter but a decreasing trend with depth from predominantly positive values at shallower depths to negative values at greater depths (Figure F22B). The transition from positive to negative values correlates well with the shift in electrical resistivity at 460 mbsf. Below 460 mbsf, where anisotropy was characterized in both the horizontal and vertical directions, vertical anisotropy is on average lower than horizontal anisotropy. This indicates that resistivity values are higher in the z-direction, likely reflecting a fabric caused by vertical compaction that leads to a greater degree of pore space connectivity in the horizontal direction.
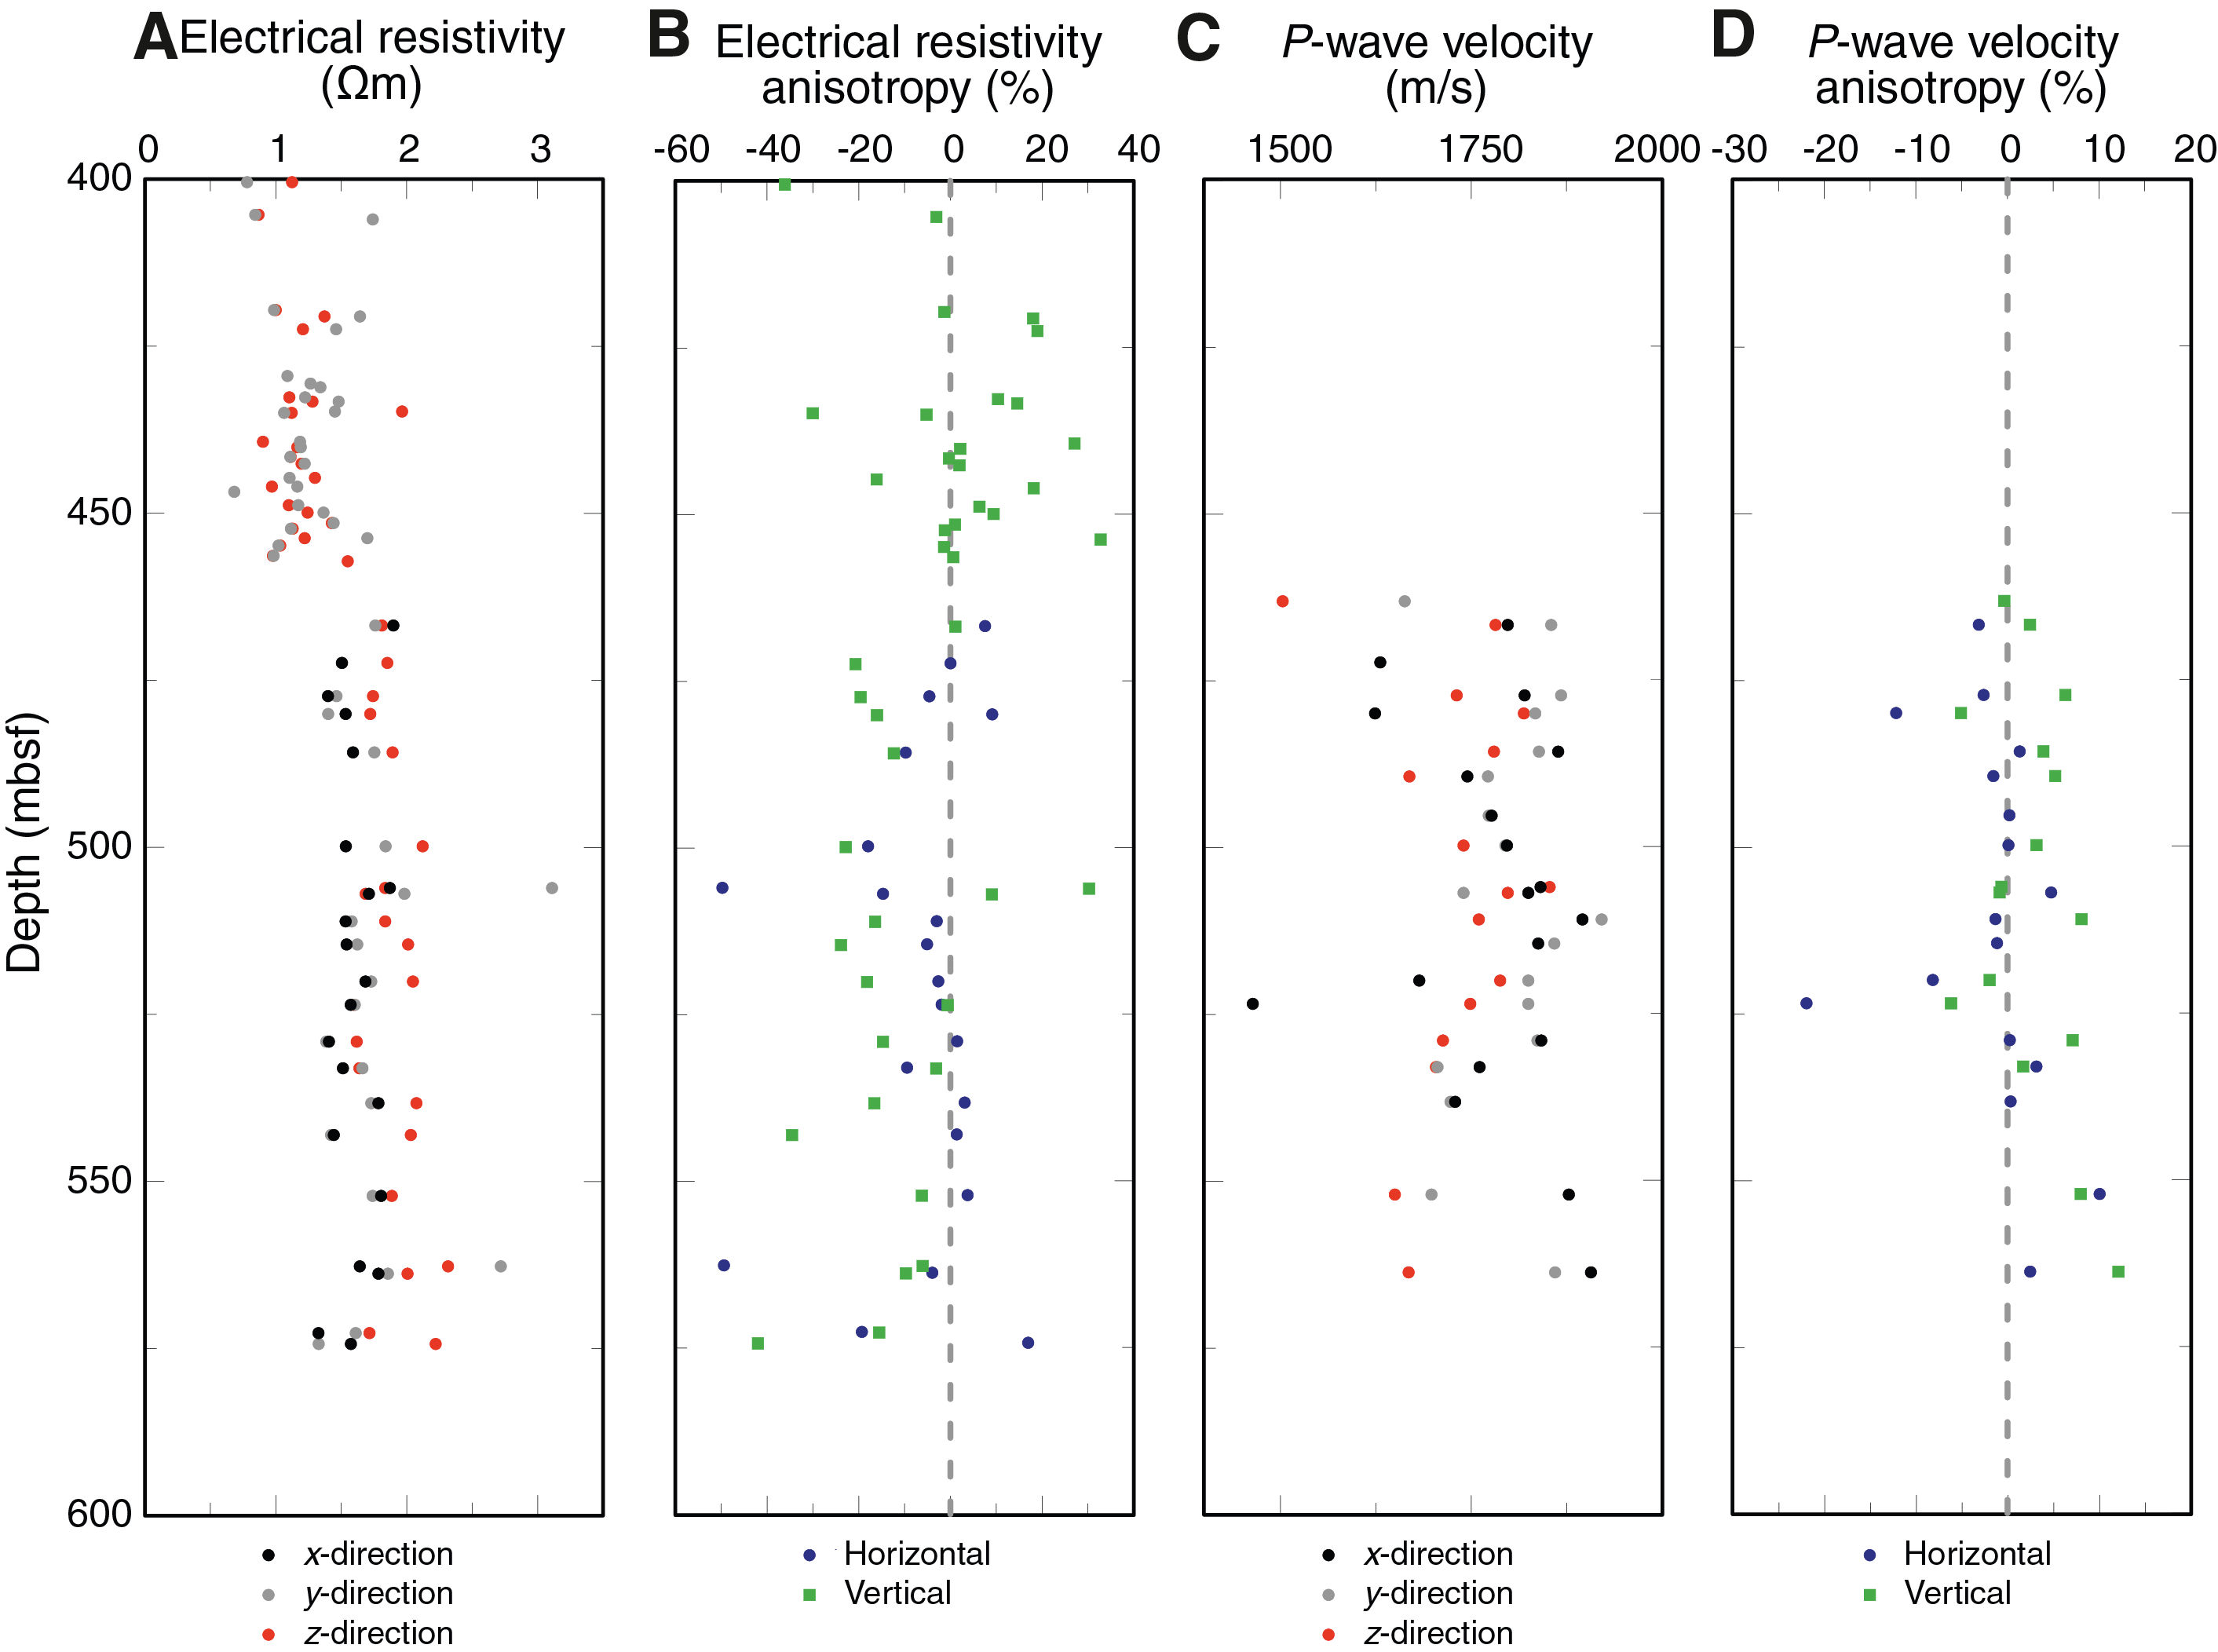
Figure F22. Electrical resistivity, P-wave velocity, and anisotropy.
P-wave velocity values generally scatter between 1500 and 1900 m/s without any clear trend with depth (Figure F22C). A total of 16 measurements on 6 different samples, especially from greater depths, were omitted because the waveforms are disturbed and picking of P-wave arrivals is not possible. The most likely cause is a technical problem with the transducer. Although horizontal anisotropy scatters around 0% and remains within a range of ~20% (Figure F22D), vertical P-wave velocity anisotropy is slightly higher than the horizontal, suggesting lower P-wave velocity values in z-direction. We note that the measurements were conducted 3.5 months after the cores were recovered; thus, the observed velocity anisotropy may have been enhanced by preferential strain recovery in the vertical direction.
Thermal conductivity (whole-round cores and working halves)
Thermal conductivity (k) was measured on whole-round cores from 406 to 471 mbsf using a full-space needle probe and on working halves from 479 to 573 mbsf using a half-space line source probe (Figure F23; Table T14). Thermal conductivity decreases from 1.56 W/(m·K) at 406 mbsf to 1.31 W/(m·K) at 454 mbsf and then increases to as much as 1.74 W/(m·K) at 512 mbsf. Values then remain relatively constant between 1.24 and 1.58 W/(m·K) to 573 mbsf. This trend is generally in negative correlation with porosity (Figure F21).
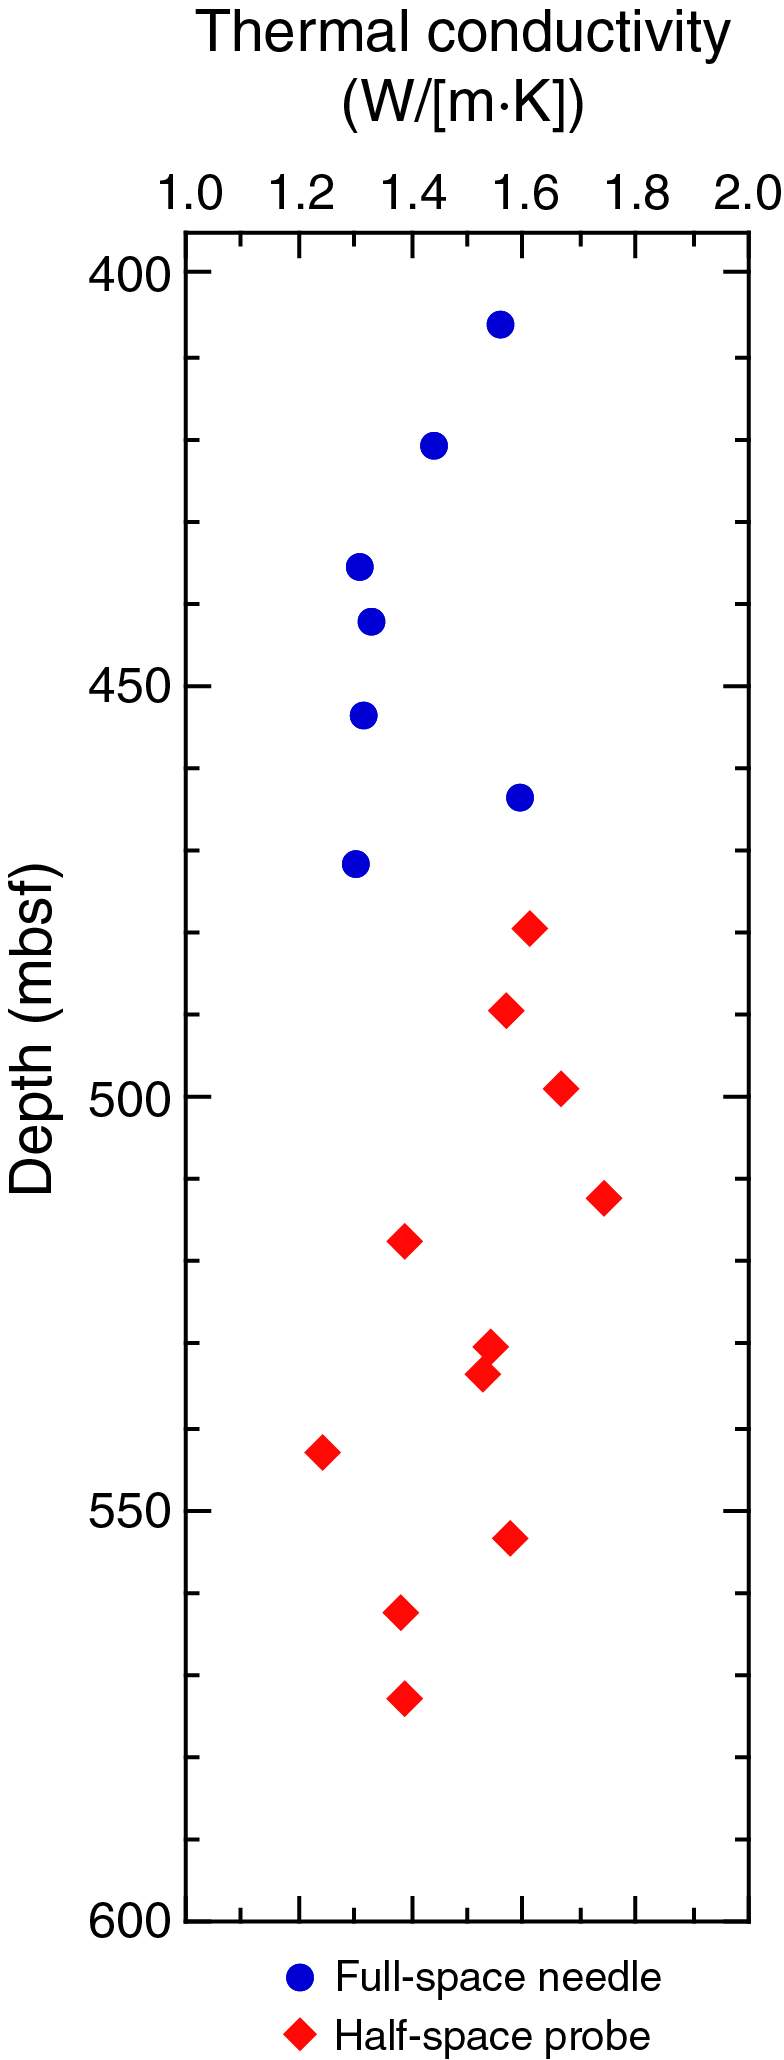
Figure F23. Thermal conductivity.
Thermal conductivity values are reasonably well described as a function of porosity (ϕ) and grain thermal conductivity (ks) using a geometrical mean model (e.g., Brigaud and Vasseur 1989) (Figure F24):
where kw is the thermal conductivity of pore water (0.6 W/[m·K]). The relationship between thermal conductivity and porosity from Site C0025 follows the trend obtained from Kumano Basin sediments at Site C0002 (Expedition 315 Scientists, 2009; Strasser et al., 2014; Tobin et al., 2015).
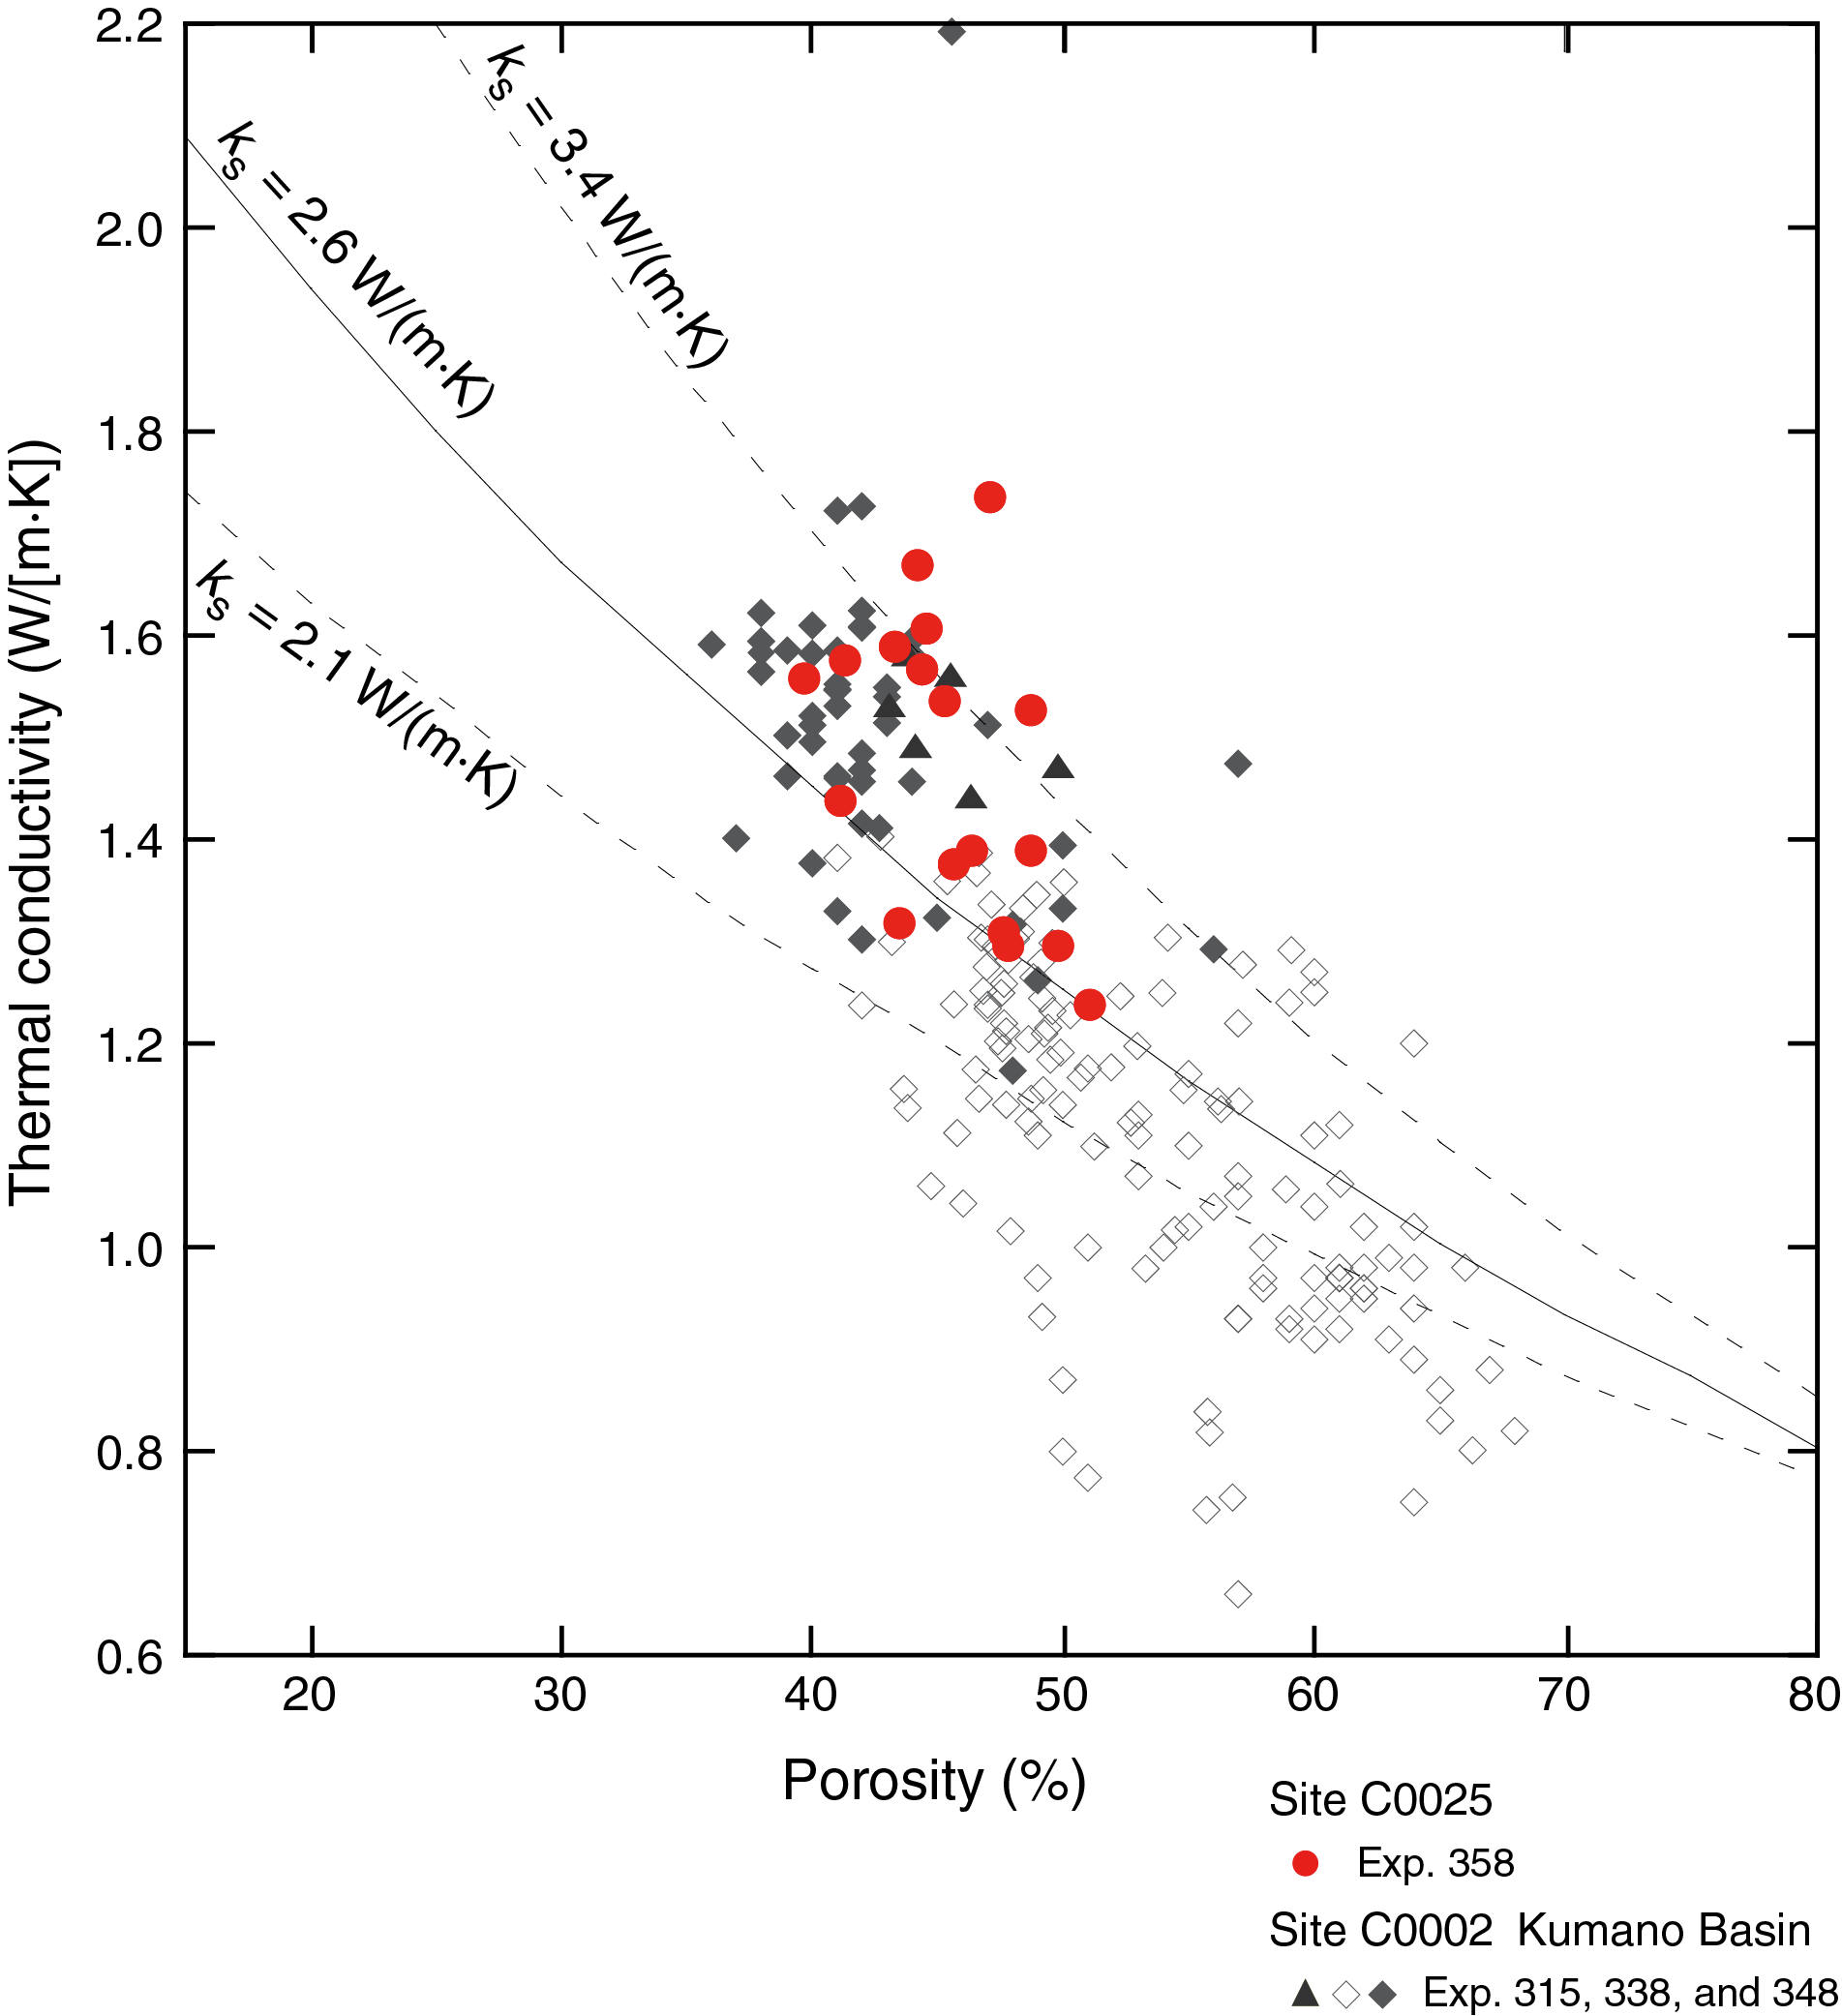
Figure F24. Thermal conductivity vs. porosity.
Shear strength (working halves)
Shear strength was measured using a standard pocket penetrometer (see Physical properties in the Expedition 358 methods chapter [Hirose et al., 2020]) on working halves from 400 to 472 mbsf at Site C0025 (Figure F25). At least one but occasionally two measurements were made per section. Given the increasing stiffness of the sedimentary succession with depth, we made measurements only on Cores 358-C0025A-1R through 9R.
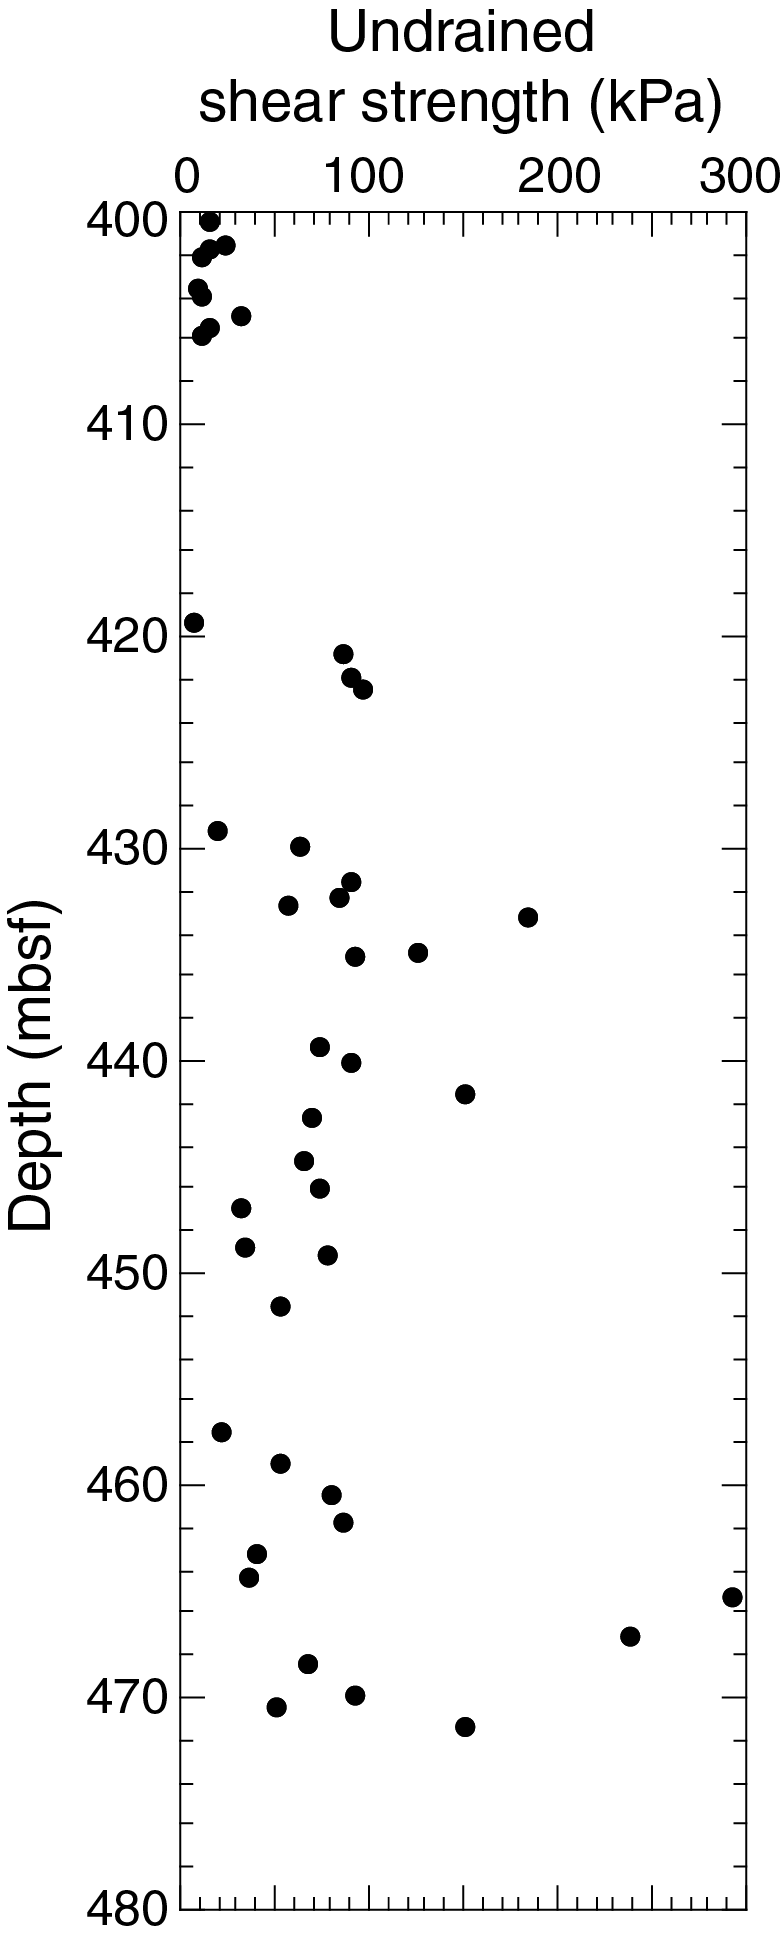
Figure F25. Undrained shear strength.
Undrained shear strength values range from 8.5 to 30.9 kPa between 400 and 406 mbsf. Below 420 mbsf, undrained shear strength increases and is characterized by increased scatter (Figure F25). The majority of the strength values between 420 and 472 mbsf are <100 kPa, with a few values for more indurated sediments that reach values of almost 300 kPa at 466 mbsf.
Anelastic strain recovery
During the expedition, we conducted anelastic strain recovery (ASR) measurements using fresh whole-round core samples on the ship to estimate the in situ stress orientation and the 3-D stress regime. The time-sensitive ASR measurements were started a few hours after the core samples were cut from the formation. We applied the same ASR measurement techniques as those successfully used during previous NanTroSEIZE expeditions (Byrne et al., 2009; Yamamoto et al., 2013; Oohashi et al., 2017).
At Site C0025, we conducted shipboard ASR measurements for three whole-round core samples (358-C0025A-11R-8, 97–111 cm, 18R-1, 46–57 cm, and 19R-1, 132–147.5 cm). As a representative result of the shipboard ASR measurements, the anelastic strain data, the three principal strains, and mean strains are shown in Figure F26.
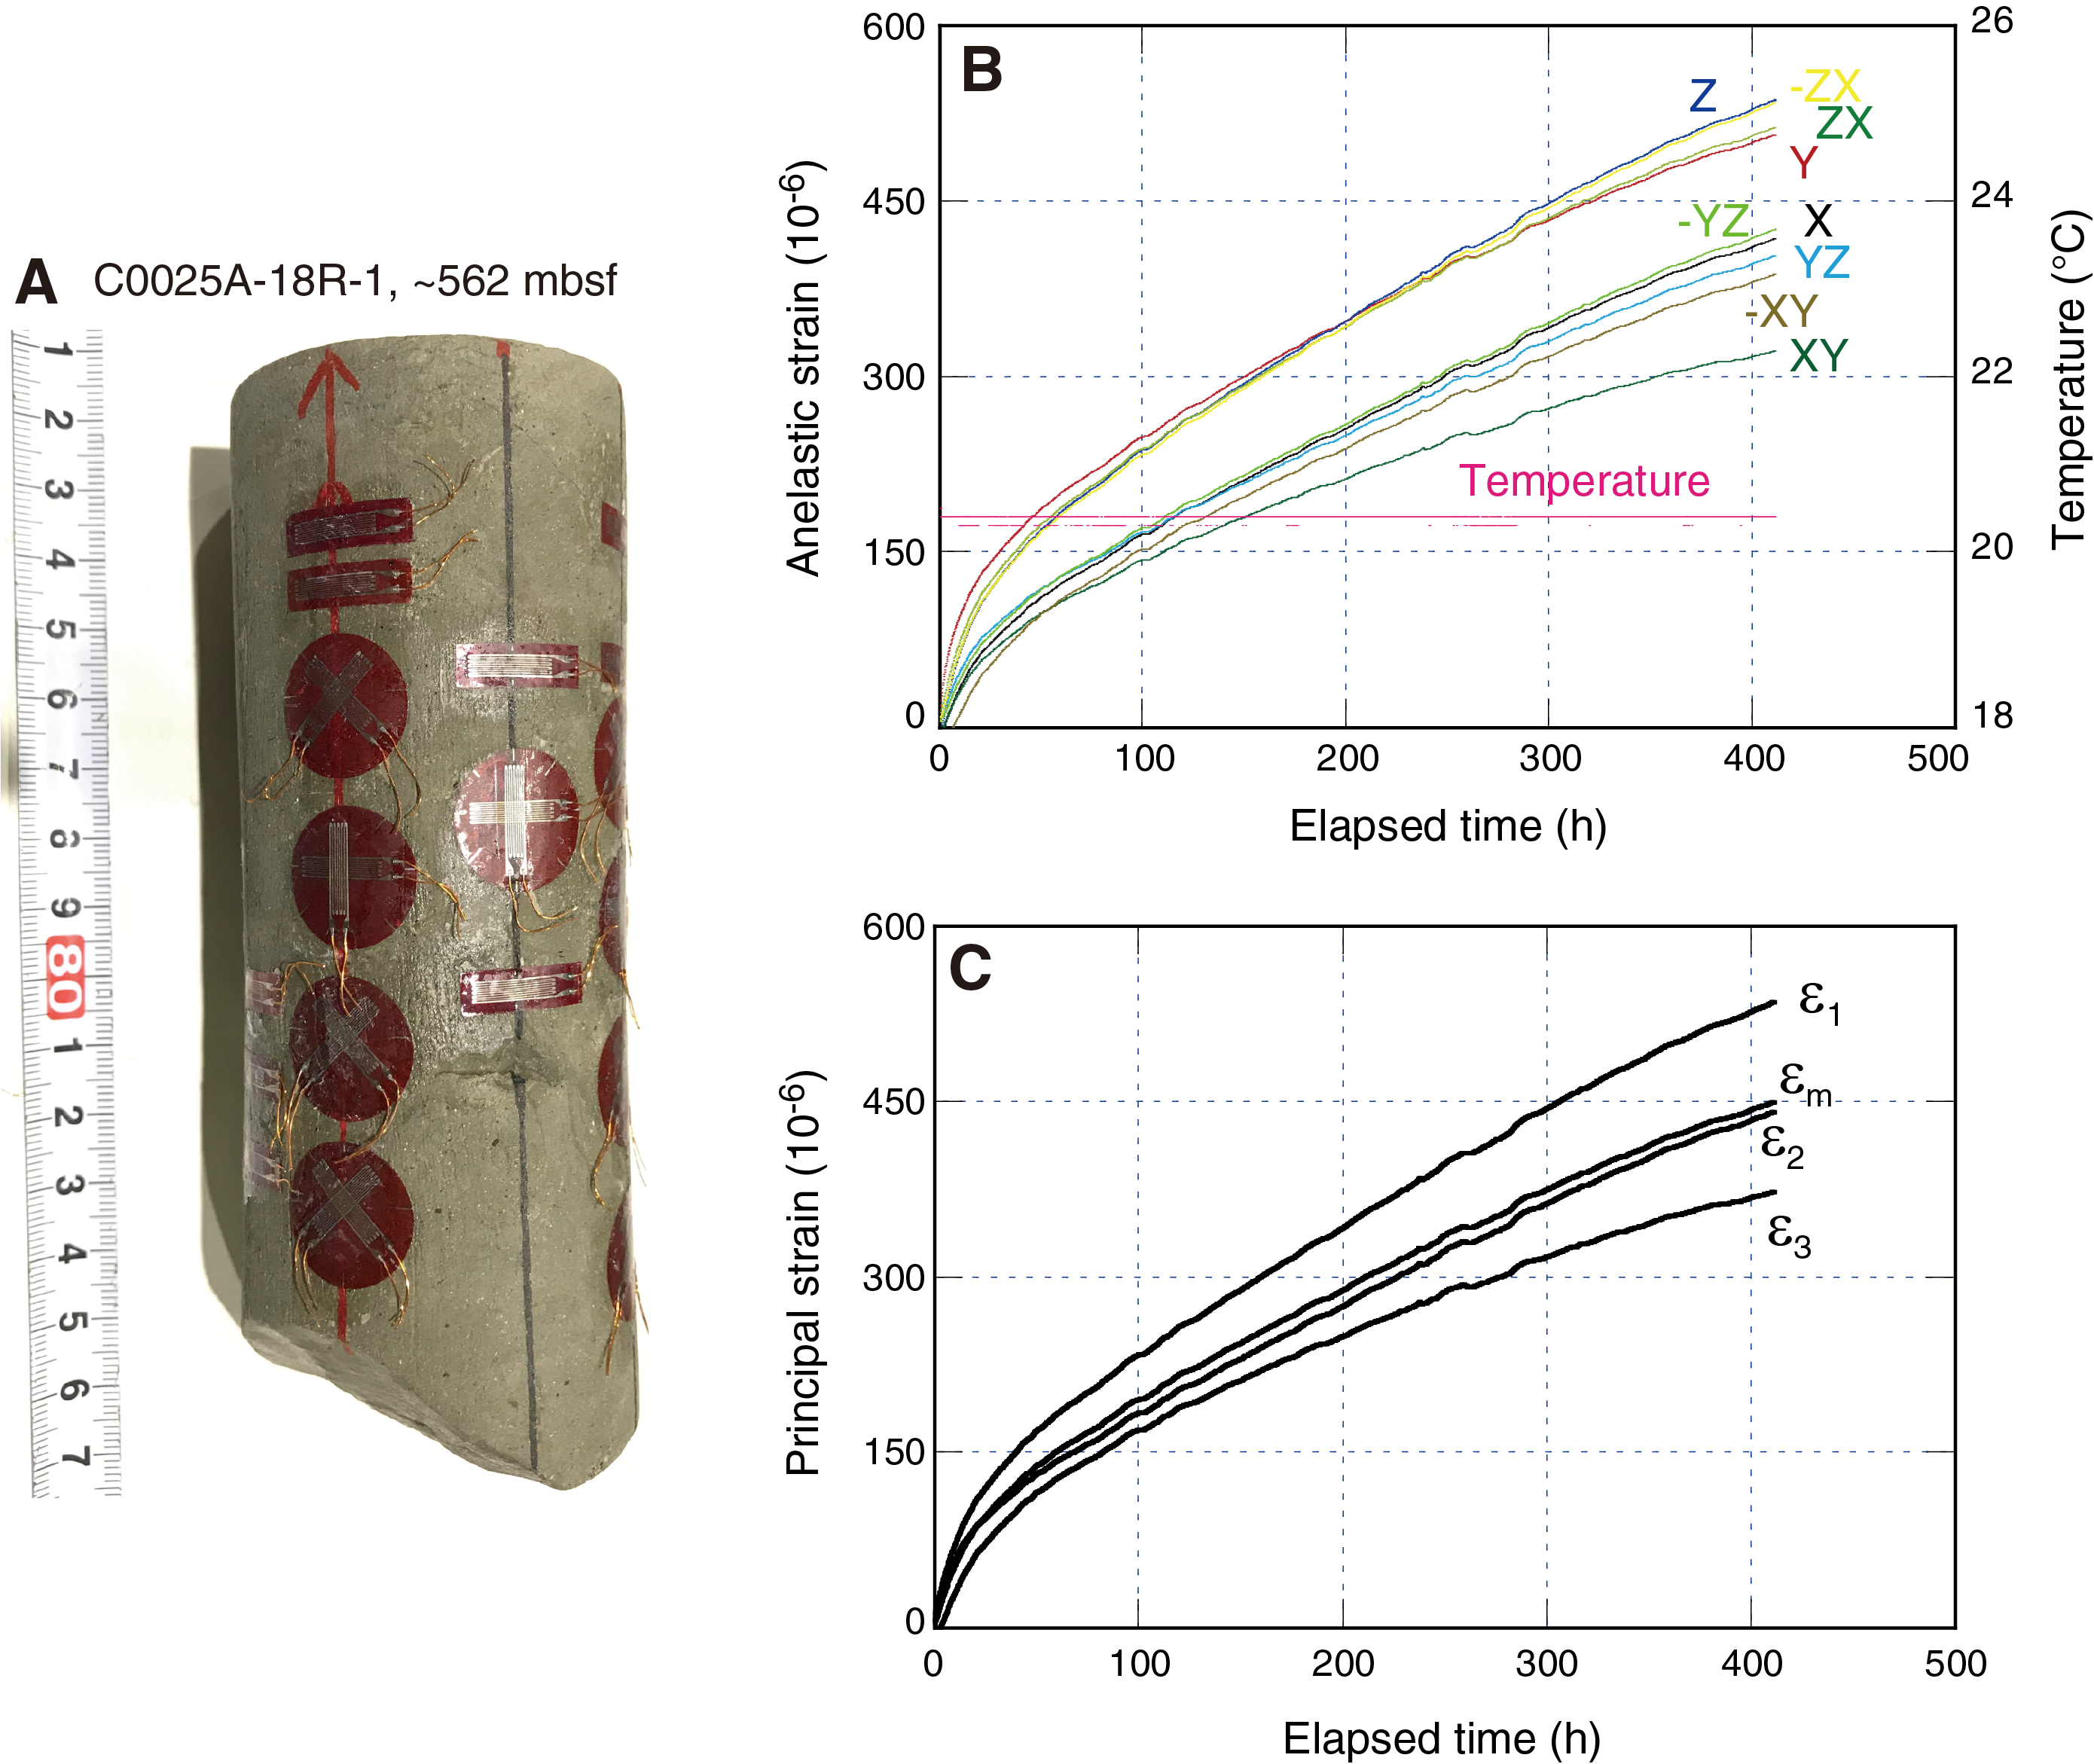
Figure F26. ASR.
References
Brigaud, F., and Vasseur, G., 1989. Mineralogy, porosity and fluid control on thermal conductivity of sedimentary rocks. Geophysical Journal International, 98(3):525–542. https://doi.org/10.1111/j.1365-246X.1989.tb02287.x
Brothers, R.J., Kemp, A.E.S., Maltman, A.J., 1996. Mechanical development of vein structures due to the passage of earthquake waves through poorly consolidated sediments. Tectonophysics, 260(4):227–244. https://doi.org/10.1016/0040-1951(96)00088-1
Byrne, T.B., Lin, W., Tsutsumi, A., Yamamoto, Y., Lewis, J.C., Kanagawa, K., Kitamura, Y., Yamaguchi, A., and Kimura, G., 2009. Anelastic strain recovery reveals extension across SW Japan subduction zone. Geophysical Research Letters, 36(23):L01305. https://doi.org/10.1029/2009GL040749
Clift, P.D., Carter, A., Nicholson, U., and Masago, H., 2013. Zircon and apatite thermochronology of the Nankai Trough accretionary prism and trench, Japan: sediment transport in an active and collisional margin setting. Tectonics, 32(3):377–395. https://doi.org/10.1002/tect.20033
Expedition 315 Scientists, 2009. Expedition 315 Site C0002. In Kinoshita, M., Tobin, H., Ashi, J., Kimura, G., Lallemant, S., Screaton, E.J., Curewitz, D., Masago, H., Moe, K.T., and the Expedition 314/315/316 Scientists, Proceedings of the Integrated Ocean Drilling Program, 314/315/316: Washington, DC (Integrated Ocean Drilling Program Management International, Inc.). https://doi.org/10.2204/iodp.proc.314315316.124.20090
Expedition 319 Scientists, 2010. Expedition 319 summary. In Saffer, D., McNeill, L., Byrne, T., Araki, E., Toczko, S., Eguchi, N., Takahashi, K., and the Expedition 319 Scientists, Proceedings of the Integrated Ocean Drilling Program, 319: Tokyo (Integrated Ocean Drilling Program Management International, Inc.). https://doi.org/10.2204/iodp.proc.319.101.2010
Expedition 334 Scientists, 2012. Expedition 334 summary. In Vannucchi, P., Ujiie, K., Stroncik, N., Malinverno, A., and the Expedition 334 Scientists, Proceedings of the Integrated Ocean Drilling Program, 334: Tokyo (Integrated Ocean Drilling Program Management International, Inc.). https://doi.org/10.2204/iodp.proc.334.101.2012
Hall, R., 2002. Cenozoic geological and plate tectonic evolution of SE Asia and the SW Pacific: computer-based reconstructions, model and animations. Journal of Asian Earth Sciences, 20(4):353–431. https://doi.org/10.1016/S1367-9120(01)00069-4
Hall, R., Ali, J.R., Anderson, C.D., and Baker, S.J., 1995. Origin and motion history of the Philippine Sea plate. Tectonophysics, 251(1–4):229–250. https://doi.org/10.1016/0040-1951(95)00038-0
Hanamura, Y., and Ogawa, Y., 1993. Layer-parallel faults, duplexes, imbricate thrust and vein structures of the Miura Group: keys to understanding the Izu fore-arc sediment accretion to the Honshu fore arc. Island Arc, 2(3):126-141. https://doi.org/10.1111/j.1440-1738.1993.tb00081.x
Hayman, N.W., Byrne, T.B., McNeil, L.C., Kanagawa, K., Kanamatsu, T., Browne, C.M., Schleicher, A.M., and Huftile, G.J., 2012. Structural evolution of an inner accretionary wedge and forearc basin initiation, Nankai margin, Japan. Earth and Planetary Science Letters, 353–354:163–172. https://doi.org/10.1016/j.epsl.2012.07.040
Hirose, T., Ikari, M., Kanagawa, K., Kimura, G., Kinoshita, M., Kitajima, H., Saffer, D., Tobin, H., Yamaguchi, A., Eguchi, N., Maeda, L., Toczko, S., Bedford, J., Chiyonobu, S., Colson, T.A., Conin, M., Cornard, P.H., Dielforder, A., Doan, M.-L., Dutilleul, J., Faulkner, D.R., Fukuchi, R., Guérin, G., Hamada, Y., Hamahashi, M., Hong, W.-L., Ijiri, A., Jaeger, D., Jeppson, T., Jin, Z., John, B.E., Kitamura, M., Kopf, A., Masuda, H., Matsuoka, A., Moore, G.F., Otsubo, M., Regalla, C., Sakaguchi, A., Sample, J., Schleicher, A., Sone, H., Stanislowski, K., Strasser, M., Toki, T., Tsuji, T., Ujiie, K., Underwood, M.B., Yabe, S., Yamamoto, Y., Zhang, J., Sanada, Y., Kido, Y., Le Ber, E., and Saito, S., 2020. Expedition 358 methods. With contributions by T. Kanamatsu. In Tobin, H., Hirose, T., Ikari, M., Kanagawa, K., Kimura, G., Kinoshita, M., Kitajima, H., Saffer, D., Yamaguchi, A. Eguchi, N., Maeda, L., Toczko, S., and the Expedition 358 Scientists, NanTroSEIZE Plate Boundary Deep Riser 4: Nankai Seismogenic/Slow Slip Megathrust. Proceedings of the International Ocean Discovery Program, 358: College Station, TX (International Ocean Discovery Program). https://doi.org/10.14379/iodp.proc.358.102.2020
Ijiri, A., Iijima, K., Tsunogai, U., Ashi, J., and Inagaki, F., 2018. Clay mineral suites in submarine mud volcanoes in the Kumano forearc basin, Nankai Trough: constraints on the origin of mud volcano sediments. Geosciences, 8(6):220. https://doi.org/10.3390/geosciences8060220
Kimura, G., Hashimoto, Y., Kitamura, Y., Yamaguchi, A., and Koge, H., 2014. Middle Miocene swift migration of the TTT triple junction and rapid crustal growth in southwest Japan: a review. Tectonics, 33(7):1219–1238. https://doi.org/10.1002/2014TC003531
Kimura, G., Koge, H., and Tsuji, T., 2018. Punctuated growth of an accretionary prism and the onset of a seismogenic megathrust in the Nankai Trough. Progress in Earth and Planetary Science, 5(1):78. https://doi.org/10.1186/s40645-018-0234-1
Kimura, J.-I., Stern, R.J., and Yoshida, T., 2005. Reinitiation of subduction and magmatic responses in SW Japan during Neogene time. Geological Society of America Bulletin, 117(7–8):969–986. https://doi.org/10.1130/B25565.1
Kopf, A., Mora, G., Deyhle, A., Frape, S., and Hesse, R., 2003. Fluid geochemistry in the Japan Trench forearc (ODP Leg 186): a synthesis. In Suyehiro, K., Sacks, I.S., Acton, G.D., and Oda, M. (Eds.), Proceedings of the Ocean Drilling Program, Scientific Results, 186: College Station, TX (Ocean Drilling Program), 1–23. https://doi.org/10.2973/odp.proc.sr.186.117.2003
Maltman, A.J., Byrne, T., Karig, D.E., and Lallement, S., 1993. Deformation at the toe of an active accretionary prism: synopsis of results from ODP Leg 131, Nankai, SW Japan. Journal of Structural Geology, 15(8):949–964. https://doi.org/10.1016/0191-8141(93)90169-B
Martini, E., 1971. Standard Tertiary and Quaternary calcareous nannoplankton zonation. In Farinacci, A. (Ed.), Proceedings of the Second Planktonic Conference, Roma 1970: Rome (Edizioni Tecnoscienza), 2:739–785.
Moore, G.F., Asada, M., Kopf, A., Kodaira, S., and Morita, S., 2017. Evidence for widespread mud diapirs in norther Kumano Basin, Nankai Trough forearc basin (presented at the Japan Geosciences Union/American Geophysical Union Joint Meeting, Mukuhari, Japan, 20–25 May 2017). (Abstract SGL34-02) https://confit.atlas.jp/guide/event-img/jpguagu2017/SGL34-02/public/pdf?type=in
Moore, G.F., Boston, B.B., Strasser, M., Underwood, M.B., and Ratliff, R.A., 2015. Evolution of tectono-sedimentary systems in the Kumano Basin, Nankai Trough forearc. Marine and Petroleum Geology, 67:604–616. https://doi.org/10.1016/j.marpetgeo.2015.05.032
Morita, S., Ashi, J., Aoike, K., and Kuramoto, S., 2004. Evolution of Kumano basin and sources of clastic ejecta and pore fluid in Kumano mud volcanoes, Eastern Nankai Trough (presented at the International Symposium on Methane Hydrates and Fluid Flow in Upper Accretionary Prisms 2004, Kyoto, Japan, 9 March 2004). http://citeseerx.ist.psu.edu/viewdoc/download?doi=10.1.1.515.5431&rep=rep1&type=pdf
Okada, H., and Bukry, D., 1980. Supplementary modification and introduction of code numbers to the low-latitude coccolith biostratigraphic zonation (Bukry, 1973; 1975). Marine Micropaleontology, 5:321–325. https://doi.org/10.1016/0377-8398(80)90016-X
Oohashi, K., Lin, W., Wu, H.-Y., Yamaguchi, A., and Yamamoto, Y., 2017. Stress state in the Kumano Basin and in slope sediment determined from anelastic strain recovery: results from IODP Expedition 338 to the Nankai Trough. Geochemistry, Geophysics, Geosystems, 18(10):3608–3616. https://doi.org/10.1002/2017GC007137
Palmer, M.R., 2017. Boron cycling in subduction zones. Elements, 13(4):237–242. https://doi.org/10.2138/gselements.13.4.237
Pape, T., Geprägs, P., Hammerschmidt, S., Wintersteller, P., Wei, J., Fleischmann, T., Bohrmann, G., and Kopf, A.J., 2014. Hydrocarbon seepage and its sources at mud volcanoes of the Kumano forearc basin, Nankai Trough subduction zone. Geochemistry, Geophysics, Geosystems, 15(6):2180–2194. https://doi.org/10.1002/2013GC005057
Pickering, K.T., Underwood, M.B., Saito, S., Naruse, H., Kutterolf, S., Scudder, R., Park, J.-O., Moore, G.F., and Slagle, A., 2013. Depositional architecture, provenance, and tectonic/eustatic modulation of Miocene submarine fans in the Shikoku Basin: results from Nankai Trough Seismogenic Zone experiment. Geochemistry, Geophysics, Geosystems, 14(6):1722–1739. https://doi.org/10.1002/ggge.20107
Raffi, I., Backman, J., Fornaciari, E., Pälike, H., Rio, D., Lourens, L., and Hilgen, F., 2006. A review of calcareous nannofossil astrobiochronology encompassing the past 25 million years. Quaternary Science Reviews, 25(23–24):3113–3137. https://doi.org/10.1016/j.quascirev.2006.07.007
Ramirez, S.G., Gulick, S.P.S., and Hayman, N.W., 2015. Early sedimentation and deformation in the Kumano forearc basin linked with Nankai accretionary prism evolution, southwest Japan. Geochemistry, Geophysics, Geosystems, 16(5):1616–1633. https://doi.org/10.1002/2014GC005643
Sato, T., Chinyonobu, S., and Hodell, D.A., 2009. Data report: Quaternary calcareous nannofossil datums and biochronology in the North Atlantic Ocean, IODP Site U1308. In Channell, J.E.T., Kanamatsu, T., Sato, T., Stein, R., Alvarez Zarikian, C.A., Malone, M.J., and the Expedition 303/306 Scientists, Proceedings of the Integrated Ocean Drilling Program, 303/306: College Station, TX (Integrated Ocean Drilling Program Management International, Inc.). https://doi.org/10.2204/iodp.proc.303306.210.2009
Seno, T., and Maruyama, S., 1984. Paleogeographic reconstruction and origin of the Philippine Sea. Tectonophysics, 102(1–4):53–84. https://doi.org/10.1016/0040-1951(84)90008-8
Shipboard Scientific Party, 2001. Leg 190 summary. In Moore, G.F., Taira, A., Klaus, A., et al., Proceedings of the Ocean Drilling Program, Initial Reports, 190: College Station, TX (Ocean Drilling Program), 1–87. https://doi.org/10.2973/odp.proc.ir.190.101.2001
Strasser, M., Dugan, B., Kanagawa, K., Moore, G.F., Toczko, S., Maeda, L., Kido, Y., Moe, K.T., Sanada, Y., Esteban, L., Fabbri, O., Geersen, J., Hammerschmidt, S., Hayashi, H., Heirman, K., Hüpers, A., Jurado Rodriguez, M.J., Kameo, K., Kanamatsu, T., Kitajima, H., Masuda, H., Milliken, K., Mishra, R., Motoyama, I., Olcott, K., Oohashi, K., Pickering, K.T., Ramirez, S.G., Rashid, H., Sawyer, D., Schleicher, A., Shan, Y., Skarbek, R., Song, I., Takeshita, T., Toki, T., Tudge, J., Webb, S., Wilson, D.J., Wu, H.-Y., and Yamaguchi, A., 2014. Site C0002. In Strasser, M., Dugan, B., Kanagawa, K., Moore, G.F., Toczko, S., Maeda, L., and the Expedition 338 Scientists, Proceedings of the Integrated Ocean Drilling Program, 338: Yokohama (Integrated Ocean Drilling Program). https://doi.org/10.2204/iodp.proc.338.103.2014
Strasser, M., Moore, G.F., Kimura, G., Kitamura, Y., Kopf, A.J., Lallemant, S., Park, J.-O., Screaton, E.J., Su, X., Underwood, M.B., and Zhao, X., 2009. Origin and evolution of a splay fault in the Nankai accretionary wedge. Nature Geoscience, 2(9):648–652. https://doi.org/10.1038/ngeo609
Taira, A., 2001. Tectonic evolution of the Japanese island arc system. Annual Review of Earth and Planetary Sciences, 29(1):109–134. https://doi.org/10.1146/annurev.earth.29.1.109
Tobin, H., Hirose, T., Ikari, M., Kanagawa, K., Kimura, G., Kinoshita, M., Kitajima, H., Saffer, D., Yamaguchi, A., Eguchi, N., Maeda, L., Toczko, S., Bedford, J., Chiyonobu, S., Colson, T.A., Conin, M., Cornard, P.H., Dielforder, A., Doan, M.-L., Dutilleul, J., Faulkner, D.R., Fukuchi, R., Guérin, G., Hamada, Y., Hamahashi, M., Hong, W.-L., Ijiri, A., Jaeger, D., Jeppson, T., Jin, Z., John, B.E., Kitamura, M., Kopf, A., Masuda, H., Matsuoka, A., Moore, G.F., Otsubo, M., Regalla, C., Sakaguchi, A., Sample, J., Schleicher, A., Sone, H., Stanislowski, K., Strasser, M., Toki, T., Tsuji, T., Ujiie, K., Underwood, M.B., Yabe, S., Yamamoto, Y., Zhang, J., Sanada, Y., Kido, Y., Le Ber, E., and Saito, S., 2020a. Expedition 358 summary. With contributions by T. Kanamatsu. In Tobin, H., Hirose, T., Ikari, M., Kanagawa, K., Kimura, G., Kinoshita, M., Kitajima, H., Saffer, D., Yamaguchi, A. Eguchi, N., Maeda, L., Toczko, S., and the Expedition 358 Scientists, NanTroSEIZE Plate Boundary Deep Riser 4: Nankai Seismogenic/Slow Slip Megathrust. Proceedings of the International Ocean Discovery Program, 358: College Station, TX (International Ocean Discovery Program). https://doi.org/10.14379/iodp.proc.358.101.2020
Tobin, H., Hirose, T., Ikari, M., Kanagawa, K., Kimura, G., Kinoshita, M., Kitajima, H., Saffer, D., Yamaguchi, A. Eguchi, N., Maeda, L., Toczko, S., and the Expedition 358 Scientists, 2020b. Supplementary material, https://doi.org/10.14379/iodp.proc.358supp.2020. Supplement to Tobin, H., Hirose, T., Ikari, M., Kanagawa, K., Kimura, G., Kinoshita, M., Kitajima, H., Saffer, D., Yamaguchi, A. Eguchi, N., Maeda, L., Toczko, S., and the Expedition 358 Scientists, NanTroSEIZE Plate Boundary Deep Riser 4: Nankai Seismogenic/Slow Slip Megathrust. Proceedings of the International Ocean Discovery Program, 358: College Station, TX (International Ocean Discovery Program). https://doi.org/10.14379/iodp.proc.358.2020
Tobin, H., Hirose, T., Saffer, D., Toczko, S., Maeda, L., Kubo, Y., Boston, B., Broderick, A., Brown, K., Crespo-Blanc, A., Even, E., Fuchida, S., Fukuchi, R., Hammerschmidt, S., Henry, P., Josh, M., Jurado, M.J., Kitajima, H., Kitamura, M., Maia, A., Otsubo, M., Sample, J., Schleicher, A., Sone, H., Song, C., Valdez, R., Yamamoto, Y., Yang, K., Sanada, Y., Kido, Y., and Hamada, Y., 2015. Site C0002. In Tobin, H., Hirose, T., Saffer, D., Toczko, S., Maeda, L., Kubo, Y., and the Expedition 348 Scientists, Proceedings of the Integrated Ocean Drilling Program, 348: College Station, TX (Integrated Ocean Drilling Program). https://doi.org/10.2204/iodp.proc.348.103.2015
Torres, M.E., Cox, T., Hong, W.-L., McManus, J., Sample, J.C., Destrigneville, C., Gan, H.M., Gan, H.Y., and Moreau, J.W., 2015. Crustal fluid and ash alteration impacts on the biosphere of Shikoku Basin sediments, Nankai Trough, Japan. Geobiology, 13(6):562–580. https://doi.org/10.1111/gbi.12146
Tsuji, T., Ashi, J., Strasser, M., and Kimura, G., 2015. Identification of the static backstop and its influence on the evolution of the accretionary prism in the Nankai Trough. Earth and Planetary Science Letters, 431:15–25. https://doi.org/10.1016/j.epsl.2015.09.011
Tsunogai, U., Maegawa, K., Sato, S., Komatsu, D.D., Nakagawa, F., Toki, T., and Ashi, J., 2012. Coseismic massive methane release from a submarine mud volcano. Earth and Planetary Science Letters, 341–344:79–85. https://doi.org/10.1016/j.epsl.2012.06.004
Underwood, M., 2018. The origin of strata within the inner accretionary prism of Nankai Trough: evidence from clay mineral assemblages along the NanTroSEIZE transect. Island Arc, 27(3):e12252. https://doi.org/10.1111/iar.12252
Underwood, M.B., and Moore, G.F., 2012. Evolution of sedimentary environments in the subduction zone of southwest Japan: recent results from the NanTroSEIZE Kumano transect. In Busby, C., and Azor, A. (Eds.), Tectonics of Sedimentary Basins: Recent Advances: Cambridge, MA (Blackwell Publishing, Ltd.), 310–327. https://doi.org/10.1002/9781444347166.ch15
Yamamoto, Y., Lin, W., Oda, H., Byrne, T., and Yamamoto, Y., 2013. Stress states at the subduction input site, Nankai subduction zone, using anelastic strain recovery (ASR) data in the basement basalt and overlying sediments. Tectonophysics, 600:91–98. https://doi.org/10.1016/j.tecto.2013.01.028
You, C.-F., Chan, L.H., Spivack, A.J., and Gieskes, J.M., 1995. Lithium, boron, and their isotopes in sediments and pore waters of Ocean Drilling Program Site 808, Nankai Trough: implications for fluid expulsion in accretionary prisms. Geology, 23(1):37–40. https://doi.org/10.1130/0091-7613(1995)023<0037:LBATII>2.3.CO;2
1 Kimura, G., Hirose, T., Ikari, M., Kanagawa, K., Kinoshita, M., Kitajima, H., Saffer, D., Tobin, H., Yamaguchi, A., Eguchi, N., Maeda, L., Toczko, S., Bedford, J., Chiyonobu, S., Colson, T.A., Conin, M., Cornard, P.H., Dielforder, A., Doan, M.-L., Dutilleul, J., Faulkner, D.R., Fukuchi, R., Guérin, G., Hamada, Y., Hamahashi, M., Hong, W.-L., Ijiri, A., Jaeger, D., Jeppson, T., Jin, Z., John, B.E., Kitamura, M., Kopf, A., Masuda, H., Matsuoka, A., Moore, G.F., Otsubo, M., Regalla, C., Sakaguchi, A., Sample, J., Schleicher, A., Sone, H., Stanislowski, K., Strasser, M., Toki, T., Tsuji, T., Ujiie, K., Underwood, M.B., Yabe, S., Yamamoto, Y., Zhang, J., Sanada, Y., Kido, Y., Le Ber, E., and Saito, S., 2020. Site C0025. With contributions by T. Kanamatsu. In Tobin, H., Hirose, T., Ikari, M., Kanagawa, K., Kimura, G., Kinoshita, M., Kitajima, H., Saffer, D., Yamaguchi, A. Eguchi, N., Maeda, L., Toczko, S., and the Expedition 358 Scientists, NanTroSEIZE Plate Boundary Deep Riser 4: Nankai Seismogenic/Slow Slip Megathrust. Proceedings of the International Ocean Discovery Program, 358: College Station, TX (International Ocean Discovery Program). https://doi.org/10.14379/iodp.proc.358.105.2020
2 Expedition 358 Scientists' affiliations.
This work is distributed under the Creative Commons Attribution 4.0 International (CC BY 4.0) license. 