Betzler, C., Eberli, G.P., Alvarez Zarikian, C.A., and the Expedition 359 Scientists
Proceedings of the International Ocean Discovery Program Volume 359
publications.iodp.org
doi:10.14379/iodp.proc.359.110.2017

Site U14721
C. Betzler, G.P. Eberli, C.A. Alvarez Zarikian, M. Alonso-García, O.M. Bialik, C.L. Blättler, J.A. Guo, S. Haffen, S. Horozal, M. Inoue, L. Jovane, D. Kroon, L. Lanci, J.C. Laya, A. Ling Hui Mee, T. Lüdmann, M. Nakakuni, B.N. Nath, K. Niino, L.M. Petruny, S.D. Pratiwi, J.J.G. Reijmer, J. Reolid, A.L. Slagle, C.R. Sloss, X. Su, P.K. Swart, J.D. Wright, Z. Yao, and J.R. Young2
Keywords: International Ocean Discovery Program, IODP, JOIDES Resolution, Expedition 359, Site U1472, Maldives, Kardiva Channel, Goidhoo atoll, Indian Ocean paleoceanography, Oligocene, Miocene, Pliocene, Pleistocene, carbonate platform, carbonate platform drowning, celestine, dolomite, drift deposits, large benthic foraminifers, monsoon, sea level, sequence stratigraphy
MS 359-110: Published 4 May 2017
Background and objectives
Site U1472 (proposed Site MAL-06B) lies at 4°46.2653′N, 073°4.0111′E, at a water depth of 379.3 m in the middle of the southern transect (Figures F1, F2). It is located 9.2 km east of Site U1470 and 7.6 km west of Site U1471 in the southern branch of the Kardiva Channel, which connects the Inner Sea with the open Indian Ocean. The sediments of the Inner Sea are hemipelagic carbonates consisting of a mixture of components exported from the atolls and pelagic components (periplatform ooze). Site U1472 cores will therefore complement the record of the youngest paleoceanographic and sedimentological changes in the Maldives.
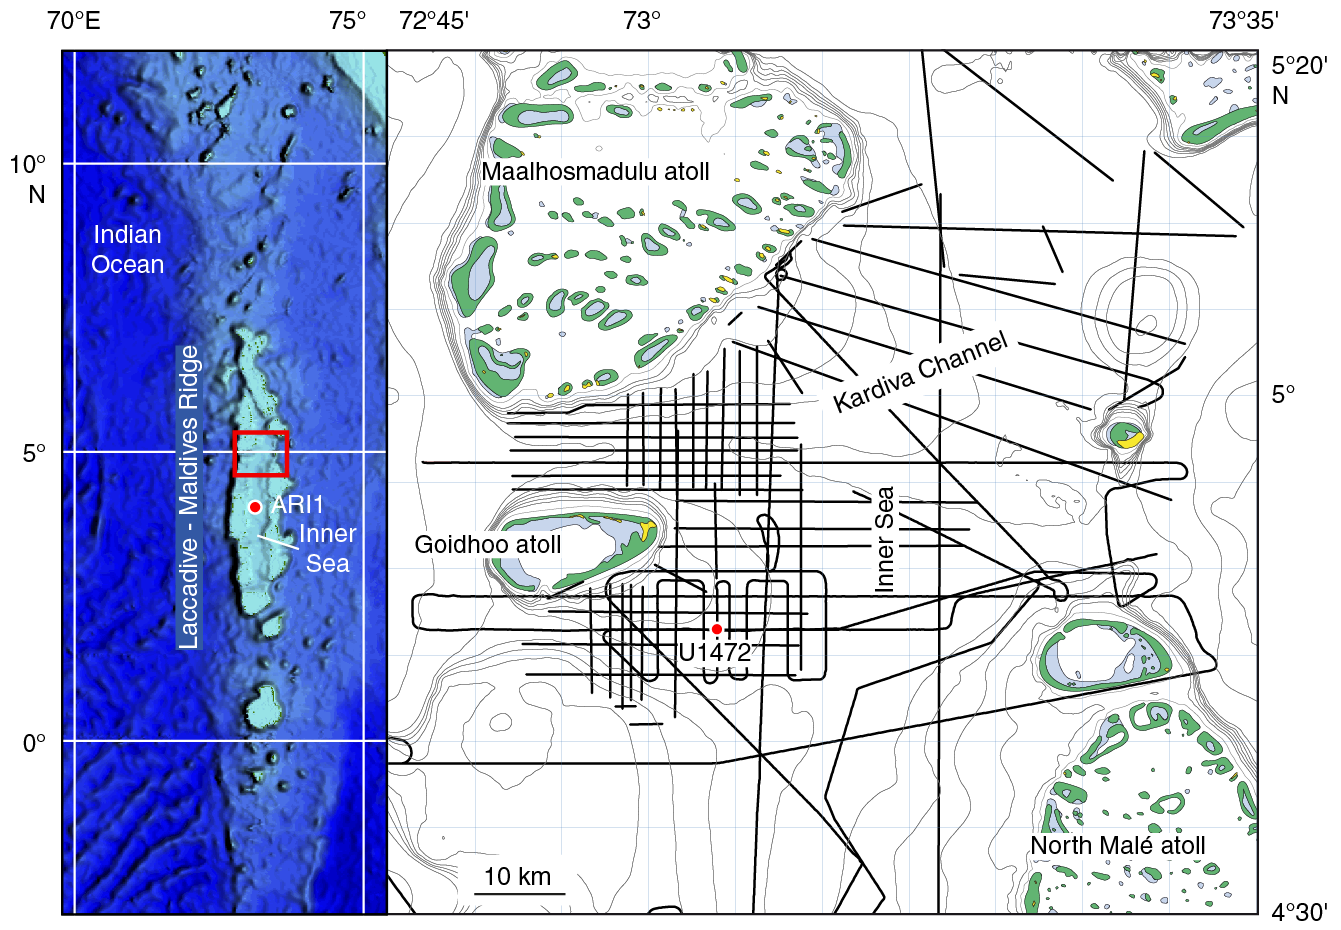
Figure F1. Location map of Site U1472.

Figure F2. Seismic section along the southern transect with Expedition 359 sites.
The site location was chosen based on an interpretation of seismic lines that show it lies on the apex of a Miocene–Pliocene shingled drift body that progrades to the east (Figure F2). The distal part of this drift was cored at Site U1471, where drift sequence (DS) DS1 and part of DS2 are of considerable thickness. At Site U1472, DS3–DS10 form the near-horizontal topsets of the prograding clinoforms within the drift. These clinoforms and the offlap pattern are reminiscent of geometries observed in prograding platform sequences (Belopolsky and Droxler, 2004a, 2004b). In DS3–DS6, these topsets contain wavy, laterally discontinuous reflections that represent either sand waves or deep-water coral bioherms.
The objectives for this site were (1) to constrain the ages of the drift depositional sequences; (2) to analyze the cyclostratigraphy of drift deposits, therefore reconstructing changes in the current regime and monsoon cyclicity; and (3) to retrieve the lithology of the wavy seismic facies to confirm their current-controlled deposition.
Operations
Site U1472
Hole U1472A
With limited time available because we needed to depart for Malé no later than 0200 h on Saturday 28 November 2015, we decided to move to Site U1472 and core one final advanced piston corer (APC) hole as deep as possible with the remaining expedition time. Site U1472 was originally a primary drill site for the expedition, but it was downgraded to alternate status as a result of a higher scientific priority to core at Site U1471.
An APC/extended core barrel (XCB) bottom-hole assembly (BHA) was made up as the ship moved 4.1 nmi in dynamic positioning mode to Site U1472. The drill string was run to the seafloor, and Hole U1472A was started at 0415 h. We cut and recovered Cores 1H–34F from 0 to 251.9 mbsf, recovering 233.75 m of core (93%) (Table T1; see Figure F1 in the Expedition 359 summary chapter [Betzler et al., 2017a]). None of the cores were oriented. The last core of Expedition 359 arrived on deck at 2015 h. The drill string was pulled up one last time, and all drilling equipment was secured. The seafloor-positioning beacon was released, but it did not come to the surface. Thrusters were raised, and at 0212 h on 28 November, we began the transit to Malé.
Table T1. Site U1472 core summary. Download table in .csv format. View PDF table.
Transit to Malé
The transit ended at 0718 h on 28 November 2015, and at 0720 h the pilot came on board. The anchor was ultimately dropped in the Malé anchorage at 0806 h. As part of the Republic of Maldives drilling clearance, the ship was required to check in at Malé. The two observers were discharged, and the agent took everyone’s passports ashore again to clear out of Maldivian waters. In addition, the Maldivian Minister of Fisheries and Agriculture came onboard for a meeting with the Co-Chief Scientists, who gave him a briefing on the expedition results. Passports were returned, and the pilot came aboard at 1430 h. At 1448 h on 28 November, the anchor was weighed, and at 1512 h, the pilot departed the ship, marking the beginning of the sea transit to Colombo, Sri Lanka.
Transit to Colombo
The transit to Colombo, Sri Lanka, was quick and uneventful. Shipboard clocks were advanced 30 min at 1400 h on 29 November 2015. Although the pilot was scheduled for 0700 h, it was not until 1013 h that the pilot actually boarded the ship. The ship entered the harbor, and the first line went ashore at the Unity Container Terminal berth at Colombo at 1100 h on 30 November, officially ending Expedition 359.
Lithostratigraphy
Site U1472 is the middle site in the southern transect and was drilled through a succession of drift and hemipelagic deposits (see Background and objectives). The site is comparable to the succession drilled at Site U1468 in the northern transect. Sites U1470 and U1471 were drilled to the west and east of this site, respectively. Results from the east–west transect will help reconstruct the characteristics of drift sequences from the proximal to distal parts of a carbonate platform and determine the physical and climatic forcing processes driving the evolution of carbonate drift deposition. The sequence is divided into four lithostratigraphic units based on changes in texture, components, degree of lithification, and color (Figure F3).
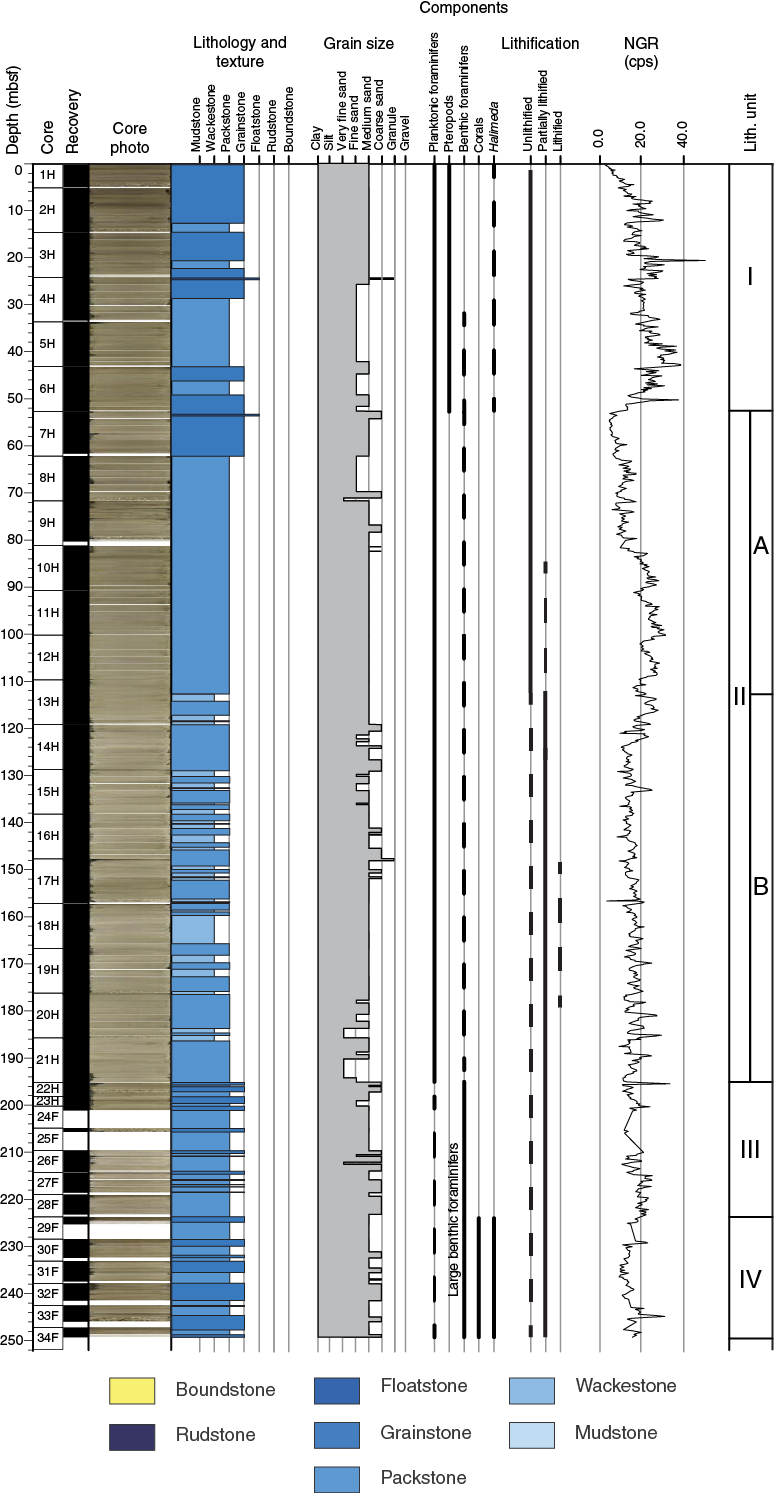
Figure F3. Lithostratigraphic summary, Site U1472.
Lithostratigraphic units
Unit I
Unit I consists of unlithified packstone and grainstone and mud-lean fine- to medium-grained grainstone with abundant fairly well preserved planktonic foraminifers (Figure F4) as the major skeletal component. The uppermost 2.6 m is dark medium-grained grayish brown unlithified grainstone that grades downhole to mud-lean unlithified packstone starting at 12.70 mbsf. Within the unlithified packstone, intercalations with a granular-grained floatstone texture occur with intraclasts up to 3 cm in size. These intraclasts occur at 4H-1, 14–24 cm (23.34–24.44 mbsf), and 4H-1, 34–45 cm (24.54–25.65 mbsf). Components include abundant planktonic foraminifers and well-preserved benthic foraminifers with common echinoderm spines, pteropods, sponge spicules (Figure F4A–F4B), calcareous nannofossils, whole gastropods and bivalves, and mollusk fragments. Intraclasts, fish teeth, otoliths, Halimeda fragments, pellets, and organic material are present. Some bioclasts have a yellow stain, which indicates reworking. Bioturbation is common to complete in this unit, often producing mottling.
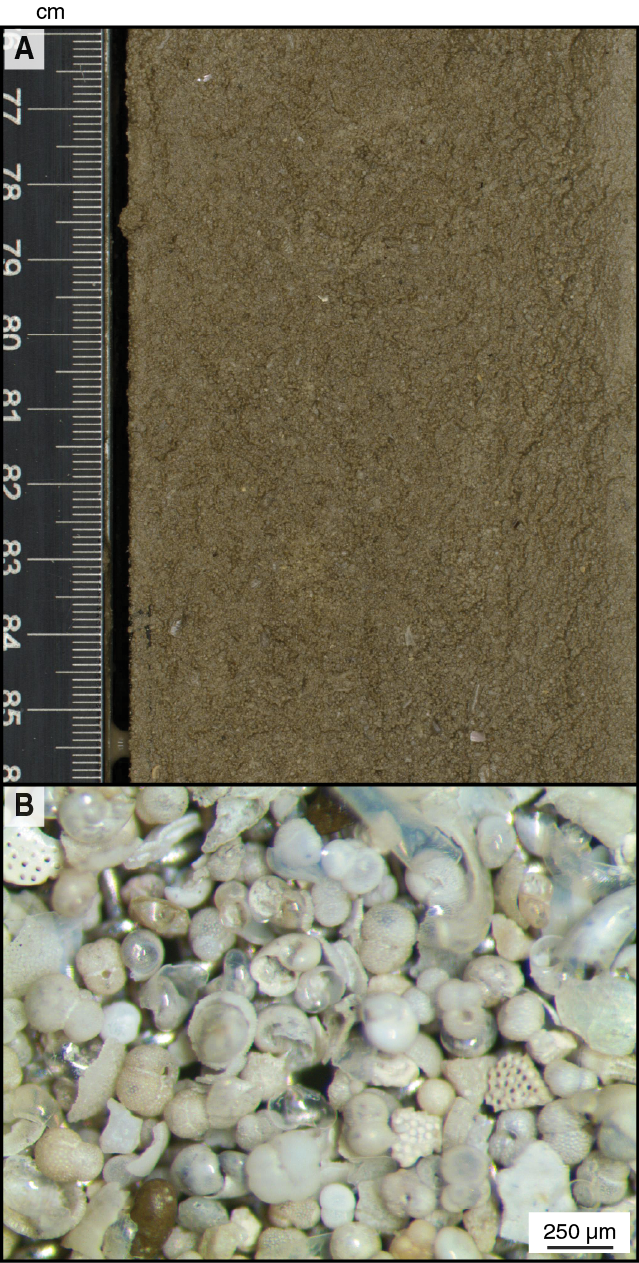
Figure F4. Components of Unit I.
Unit II
Unit II is divided into two subunits.
Subunit IIA
The Unit I/II boundary is marked by a textural change from a grainstone-dominated succession to a packstone-dominated succession. Although the top of Subunit IIA is medium-grained unlithified grainstone, the major part of this unit consists of medium- to coarse-grained light gray to white unlithified mud-lean packstone. An interval with a floatstone texture occurs intercalated in the unlithified grainstone at 7H-1, 38–85 cm (53.08–53.55 mbsf). Components include abundant planktonic foraminifers; common benthic foraminifers, mollusks, and echinoid fragments; and a few otoliths. Aggregate grains/intraclasts are abundant, and organic matter is present. A smear slide sample taken at 57.03 mbsf contains abundant calcareous nannofossils, aragonite needles, and calcite crystals. Apatite and organic matter are present, and dolomite rhombs are few. Bioclasts are overgrown with calcite.
Induration increases from Section 8H-6, 0 cm (69.7 mbsf) downhole, and distinct partially lithified coarser grained intervals dominate the succession from Section 10H-1, 0 cm (81.2 mbsf), downhole. Smear slide samples taken at 75.28 and 83.6 mbsf show an abundance of calcareous nannofossils and planktonic foraminifers. Aragonite needles are common, and dolomite rhombs, tunicates, and organic matter are present to rare. Most components show calcitic overgrowth.
Subunit IIB
A change to a packstone texture and interlayers with a wackestone texture together with an increase in lithification mark the Subunit IIA/IIB boundary. Subunit IIB is medium- to coarse-grained, light brownish gray to pale yellow and white, partially lithified to lithified planktonic foraminifer–rich wackestone and packstone. Components include abundant planktonic foraminifers, common benthic foraminifers and aggregate grains/intraclasts, and rare echinoid spines and shell fragments. Skeletal components have overgrowth, and skeletal assemblages are less diverse than those in Subunit IIA. Smear slide samples taken at 121.9 and 146.84 mbsf show an abundance of calcareous nannofossils, planktonic foraminifers, and calcite crystals. Benthic foraminifers and apatite are common. Tunicates, aragonite needles, and micritized grains are present. Bioclasts are severely overgrown with calcite crystals.
Unit III
The Unit II/III boundary is marked by a textural change to a succession dominated by a grainstone texture and the first occurrence of large benthic foraminifers. Unit III consists of partially lithified to lithified light grayish brown to light yellowish brown medium-grained planktonic foraminifer–rich grainstone and interlayered fine- to medium-grained packstone. Contacts are sharp and represent changes in color and texture. Planktonic foraminifers are abundant. Benthic foraminifers, aggregate grains/intraclasts, and organic matter are common. Large benthic foraminifers are few to present and include Amphistegina and Lepidocyclina. A smear slide sample taken at 216.9 mbsf contains abundant aragonite needles, as well as calcite crystals and micritized grains. Calcareous nannofossils are distinctly absent. Components have calcite overgrowth and are poorly preserved. Fine carbonate crystallites seen in the overlying unit are nearly absent and are replaced by large benthic foraminiferal assemblages typical of neritic environments. Foraminiferal skeletons have overgrowths, masking their original shape and indicating alteration due to diagenesis (Figure F5).
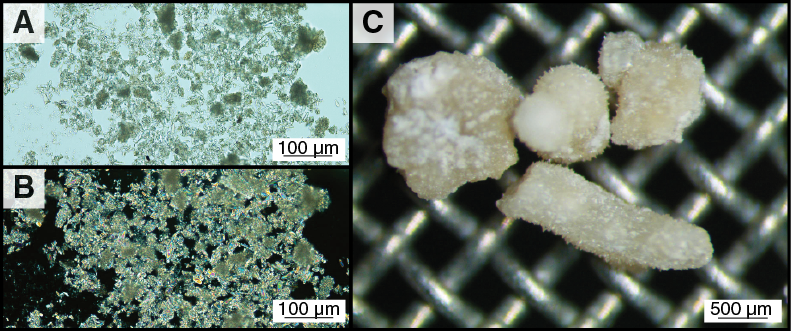
Figure F5. Components of Subunit IIB.
Unit IV
The Unit III/IV boundary is marked by a significant increase in the abundance of benthic foraminifers and in the diversity of skeletal components. Unit IV is characterized by medium- to coarse-grained partially lithified and unlithified planktonic foraminifer–rich grainstone and interlayered unlithified medium-grained packstone. Components include abundant planktonic foraminifers, benthic foraminifers, and aggregate grains/intraclasts. Large benthic foraminifers including Amphistegina, Lepidocyclina, and Miogypsina are common. Mollusk fragments, gastropods, lithoclasts, and echinoid fragments are present to common. Coral fragments, Halimeda plates, Chlamys, and red algae also occur at the top of this succession (29F-1, 52–91 cm).
Discussion
Unit I contains carbonate sand with well-preserved planktonic foraminifers as the dominant skeletal component. It also contains pteropods, otoliths, echinoid fragments, shell fragments, and other components (Figure F4) typical of a hemipelagic sedimentary environment. The facies of Unit I is similar to the top units of all the sequences drilled in this area. The occurrence of yellow-stained bioclasts and the presence of a solitary coral (Core 359-U1472A-4H; Figure F6) and a cold-water coral (Core 6H) indicate some reworking. The light gray to brownish gray color of the sediment may be a consequence of the high content in organic matter and iron in reduced form, in response to bottom water redox conditions. An interpretation of suboxic conditions is supported by higher natural gamma radiation (NGR) (Figure F3). Varying gray-brown color changes associated with a cyclic pattern of lightness (L*) and NGR may indicate cyclic changes in bottom water oxygenation conditions.
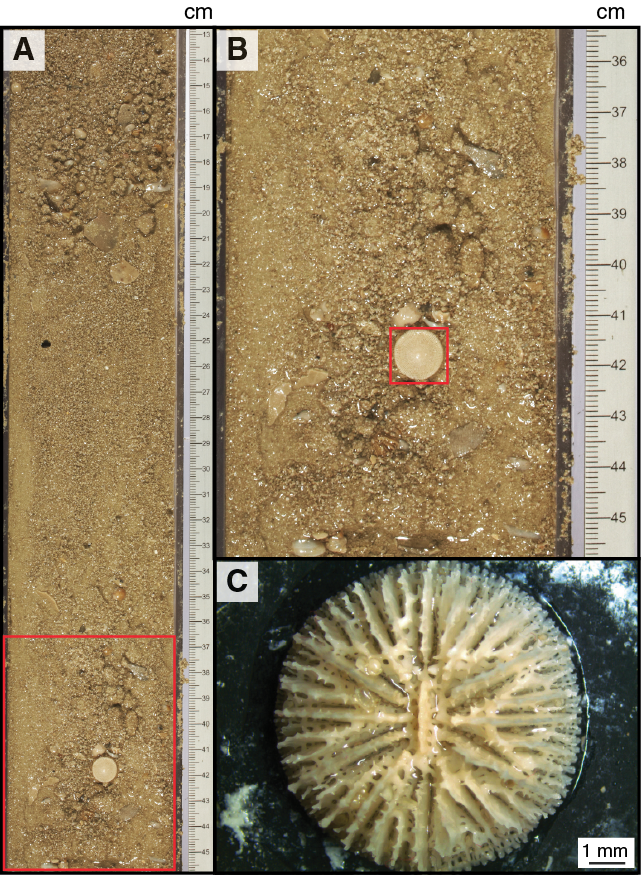
Figure F6. Unlithified floatstone and coral, Unit I.
Textural changes and degree of lithification are the primary criteria considered for marking the Unit I/II boundary. Unit I has a grainstone to packstone texture, and Unit II has a packstone to wackestone texture. Unit II has similar skeletal components to those in Unit I, but a distinct difference is the absence of pteropods. NGR values in Unit II are distinctly lower than those in Unit I (Figure F3). The top of Unit II contains large bioclasts and shells (Figure F7), indicating a phase of intensified bottom currents. Although the entire unit has similar components, Unit II is divided into two subunits on the basis of differences in texture, grain size, and degree of preservation of skeletal components. Subunit IIA has a predominantly uniform packstone texture, indicating relatively stable energy conditions prevalent during deposition. The occurrence of aggregate grains and an increased degree of cementation also document early marine diagenesis.
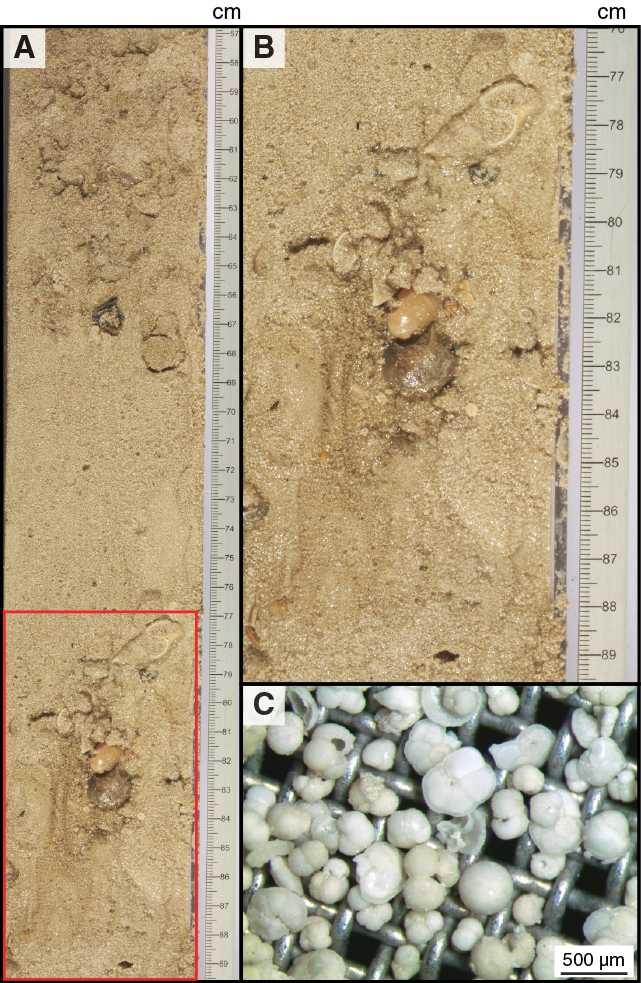
Figure F7. Components of Unit II.
Compared to Subunit IIA, Subunit IIB has variable texture alternating between packstone and wackestone with more coarse-grained intervals and increased lithification. The subunit has abundant calcitic needles (Figure F5), and the calcareous skeletons have overgrowths. The variable texture and grain size are similar to those observed in Unit II at Site U1468 and can be attributed to waxing and waning intervals of monsoon-induced currents/energy conditions at the seafloor and/or changes in sea level (Betzler et al., 2009; Lüdmann et al., 2013).
The transition from packstone to grainstone texture and the grain size change from predominantly medium- to coarse-grained sand define the top of Unit III (Figure F3). The textural, grain size, and biota assemblage changes collectively indicate that this unit represents a shallowing-upward succession, possibly due to sea level fall, and increased energy conditions leading to winnowing conditions.
Unit IV is marked by a transition to predominantly coarse-grained partially lithified grainstone. Texture, grain size, bioclast components and the inclined contacts of layers with coarse sand (Figure F8) document a high-energy condition typical for the top of the contourite fan drift sequence (e.g., Betzler et al., 2014). The occurrence of reef material along with large benthic foraminiferal species typical of inner to middle neritic environments (see Biostratigraphy) indicates that this succession represents material reworked from shallow-water environments and deposited at Site U1472 by prevalent strong currents. The fining-upward succession (Figure F8) within the unit indicates a reduction in current strength or may represent the sand wave type morphology registered at this depth in the seismic profile.
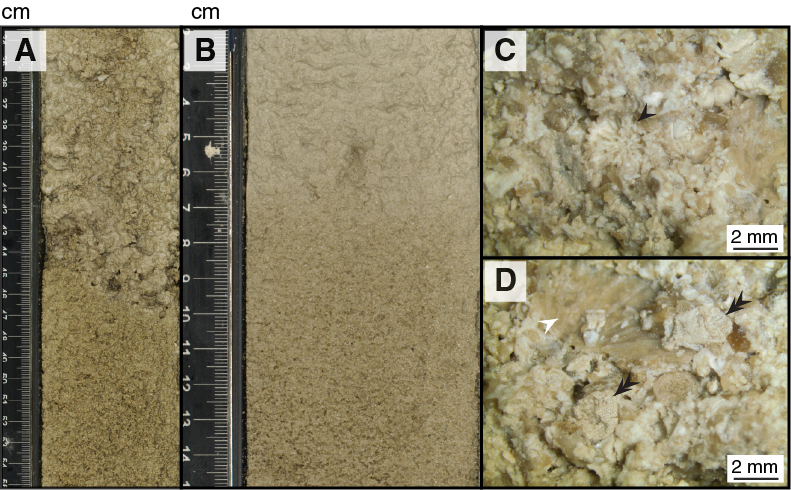
Figure F8. Components of Unit IV.
In summary, a 251.9 m hole was drilled at Site U1472, recovering a ~234 m long sequence dating back to the late Miocene (see Biostratigraphy) and evolving from a high-energy, shallow-marine environment (neritic) to a hemipelagic sedimentary system, recording changes in sea level and current regime likely driven by varying monsoonal strength. Hemipelagic components such as planktonic foraminifers are present throughout the sequence, but they are in varying states of preservation as a consequence of diagenesis.
Biostratigraphy
A ~233.75 m sequence was recovered at Site U1472. Calcareous microfossils are present throughout the sequence, with good preservation in the upper 100 m and poor to very poor preservation below. Several biostratigraphic events were identified, allowing for the construction of a reasonable biostratigraphic model for the site. Calcareous nannofossil biostratigraphy suggests a late Miocene age for the bottom of the sequence. Based on the absence of radiolarians at previous sites, we did not expect to find them at Site U1472, and core catcher samples were not studied for these microfossils.
Age model
The sequence of recognized events is summarized in Table T2 and plotted in Figures F9 and F10.
Table T2. Biostratigraphic events, Site U1472. Download table in .csv format.
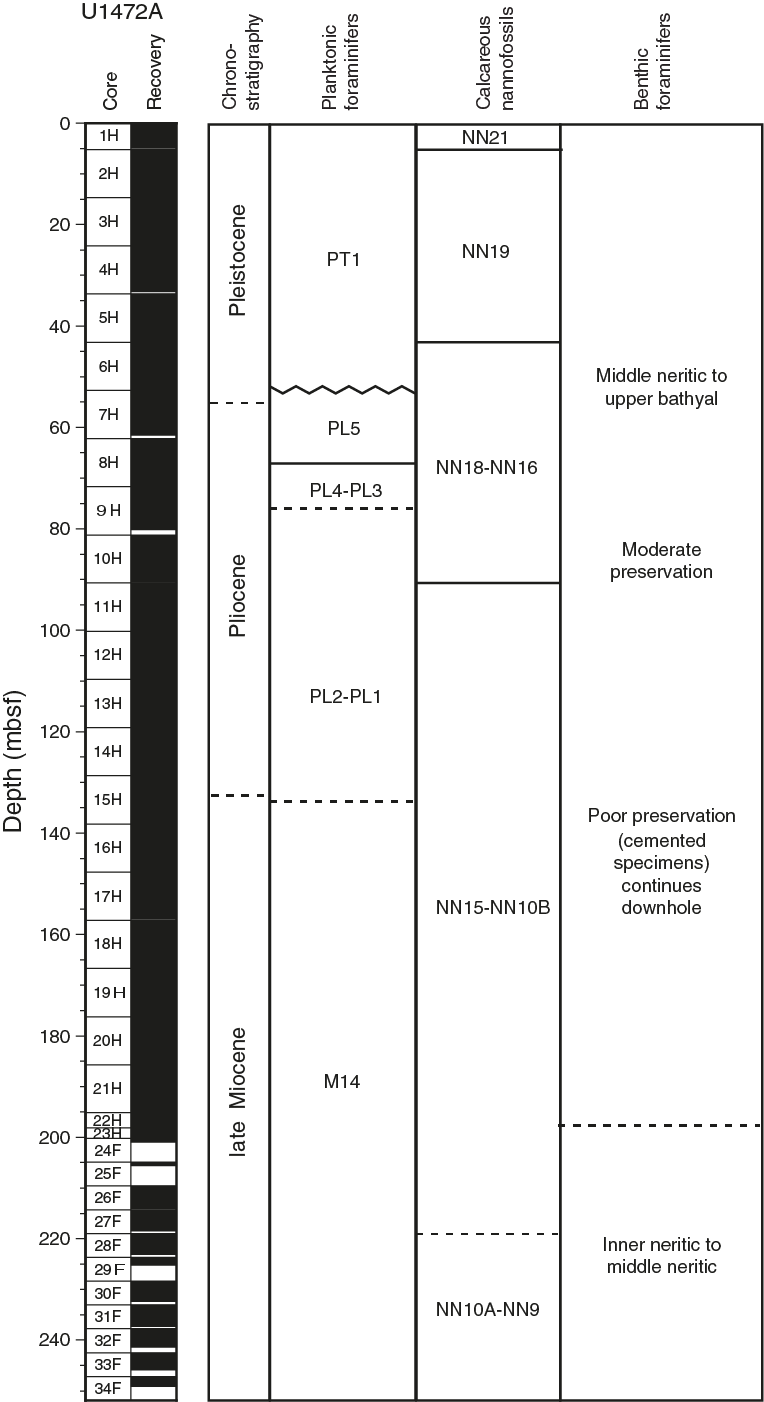
Figure F9. Biostratigraphic and paleoenvironmental summary, Site U1472.
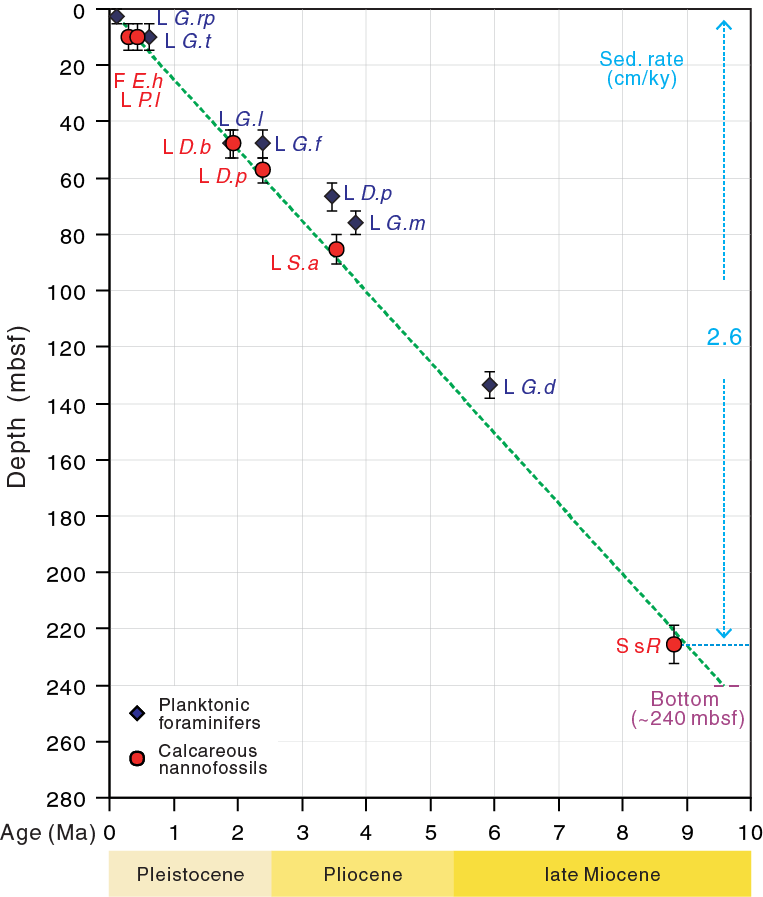
Figure F10. Age-depth plot, Site U1472.
Through the Quaternary and early Pliocene, there is a useful sequence of biostratigraphic events, and a fairly clear age model was established. As at other sites, planktonic foraminifers consistently indicate older ages and therefore indicate lower sedimentation rates than those suggested by calcareous nannofossils. A compromise regression line based on both groups gives a sedimentation rate of ~2.6 cm/ky (Figure F10). This sedimentation rate continues to the bottom of the hole.
Calcareous nannofossils
Calcareous nannofossils are abundant and well preserved in the first two cores of Hole U1472A (Table T3). In subsequent cores, nannofossil preservation deteriorates, becoming moderate to poor, and abundances decrease. Principal marker events (the first occurrence [FO] of Emiliania huxleyi and the last occurrences [LOs] of Pseudoemiliania lacunosa, Discoaster brouweri, and Discoaster pentaradiatus) were placed in the upper ~100 m through the LO of Sphenolithus abies (3.54 Ma), which occurs between Samples 359-U1472A-9H-CC and 10H-CC (Table T2). Below this depth, most samples have only rare nannofossils, and assemblages are dominated by very small (<3 µm) Reticulofenestra and S. abies. Virtually no discoaster specimens were observed below Sample 13H-CC; consequently, the LO of Discoaster quinqueramus, usually one of the most reliable events, could not be placed.
Table T3. Nannofossil range chart, Hole U1472A. Download table in .csv format.
In Samples 20H-CC to 27H-CC, coccoliths are frequent or common and dominated by small reticulofenestrids (<6 µm), clearly from the small Reticulofenestra interval or above (i.e., <8.8 Ma). Samples 27H-CC to 29H-CC are barren or have only very rare coccoliths. The basal part of the recovered sequence shows assemblages in a few samples (30H-CC, 32H-CC, and 34H-CC) that include a significant proportion of large Reticulofenestra specimens (6–9 µm), suggesting these assemblages are below the small Reticulofenestra event (Young, 1990; Rio et al., 1990) and are therefore older than 8.8 Ma (Hilgen et al., 2012). Hence, the base of the small Reticulofenestra event was placed between Samples 27H-CC and 30H-CC (Table T2).
Planktonic foraminifers
Planktonic foraminifers were examined in Hole U1472A core catcher samples (35 samples). Additionally, the mudline sample was also recovered and examined. Planktonic foraminifers show good preservation from the mudline to Sample 359-U1472A-12H-CC (109.8 mbsf), where foraminifers start to show calcite overgrowth. Planktonic foraminifers are abundant in all samples except for the bottom six (Samples 29H-CC to 34H-CC), which are characterized by high amounts of large benthic foraminifers.
Four Pleistocene bioevents were identified in Hole U1472A: the LO of Globigerinoides ruber pink (0.12 Ma) between the Hole U1472A mudline sample and Sample 1H-CC (2.6 mbsf), the LO of Globorotalia tosaensis (0.61 Ma) between Samples 1H-CC and 2H-CC (9.9 mbsf), the LO of Globigerinoides fistulosus (1.88 Ma) between Samples 5H-CC and 6H-CC (47.9 mbsf), and the LO of Globorotalia limbata (2.39 Ma) between Samples 5H-CC and 6H-CC (47.9 mbsf). Within the Pliocene, we identified the LO of Dentoglobigerina altispira (3.47 Ma) between Samples 7H-CC and 8H-CC (66.7 mbsf), the LO of Globorotalia margaritae (3.85 Ma) between Samples 8H-CC and 9H-CC (76 mbsf), and the LO of Globoquadrina dehiscens (5.92 Ma) between Samples 14H-CC and 15H-CC (133.6 mbsf) (Tables T2, T4). Constraints on this event are limited because only a few specimens of G. dehiscens were identified.
Table T4. Planktonic foraminifer range chart, Hole U1472A. Download table in .csv format.
Benthic foraminifers
Eleven core catcher samples were investigated for benthic foraminifers. Pleistocene benthic foraminifers are abundant, and preservation ranges from very good to good (Table T5). Pliocene to Pleistocene benthic foraminifers present include Cibicidina walli, Cibicidoides robertsonianus, Bolivina sp. (smooth flat), and Uvigerina proboscidea, indicating a middle neritic to upper bathyal depositional environment. The lithology shows a change in Sample 359-U1472A-15H-CC, where foraminifer-rich sediments partially lithified. Below Sample 20H-CC, the benthic foraminifer assemblage notably changes to one dominated by Amphistegina sp., Discogypsina sp., and fragments of large benthic foraminifers (Lepidocyclina sp.), which points to an inner neritic to middle neritic depositional environment.
Table T5. Benthic foraminifer range chart, Hole U1472A. Download table in .csv format.
Geochemistry
Interstitial water chemistry
A total of 25 interstitial water (IW) samples were obtained from Site U1472 by whole-round squeezing. Chloride and alkalinity titrations were performed, but no additional IW analyses were completed because of time constraints. Concentrations of all measured species are given in Table T6. Alkalinity concentrations decrease from 3.43 mM at the surface to 2.66 mM at the bottom (239 mbsf) of Hole U1472A (Figure F11). On the other hand, Cl– concentrations steadily increase from 559 to 573 mM throughout Hole U1472A with some variations. Similar to Cl–, salinity also increases from 35 at the surface to 36 at the bottom. The range of pH is 7.4 to 7.8.
Table T6. Interstitial water chemistry, Site U1472. Download table in .csv format.

Figure F11. IW Cl–, alkalinity, and hydrogen concentrations, Site U1472.
Bulk sediment geochemistry
X-ray diffraction
Sedimentary mineralogy was determined by X-ray diffraction (XRD) from squeeze cake samples for a total of 25 samples. In contrast to Sites U1467 and U1471, where aragonite decreases in the upper 100 mbsf, aragonite remains abundant at Site U1472 throughout the sampled interval, constituting 15% to 50% of the sediment (Figure F12; Table T7). One sample from 200.2 mbsf is even predominantly composed of aragonite (82.5%). High-Mg calcite (HMC) is present in the uppermost sample only at 2.63 mbsf, and dolomite is present up to 6% in pre-Pleistocene sediments. The remainder of the sediment is composed of low-Mg calcite (LMC).
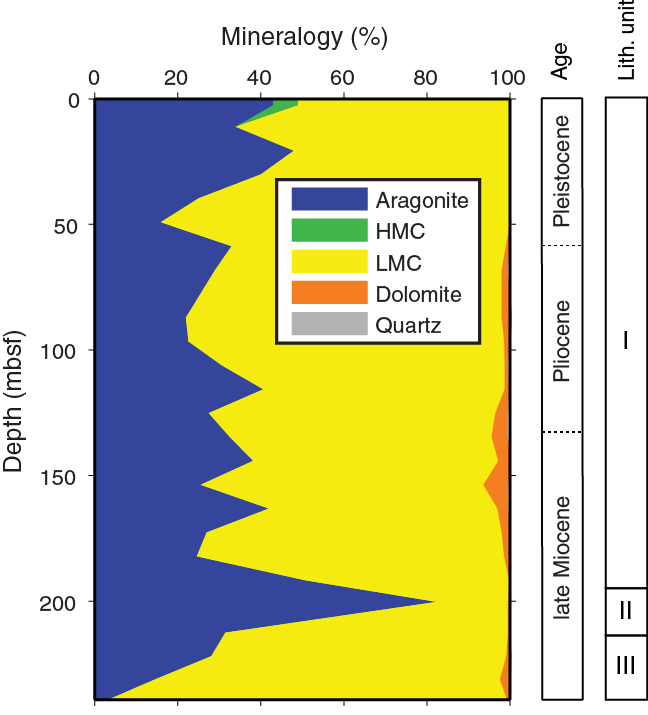
Figure F12. Relative concentrations of aragonite, HMC, LMC, dolomite, and quartz, Site U1472.
Table T7. XRD results, Site U1472. Download table in .csv format.
Volatile hydrocarbons
Headspace samples for the analysis of methane, ethene, ethane, propene, and propane were obtained from 34 sediment samples at Site U1472. Methane concentrations remain low between 1.51 and 2.59 ppmv (Figure F13; Table T8). No heavier hydrocarbons (C2+) were detected at this site.
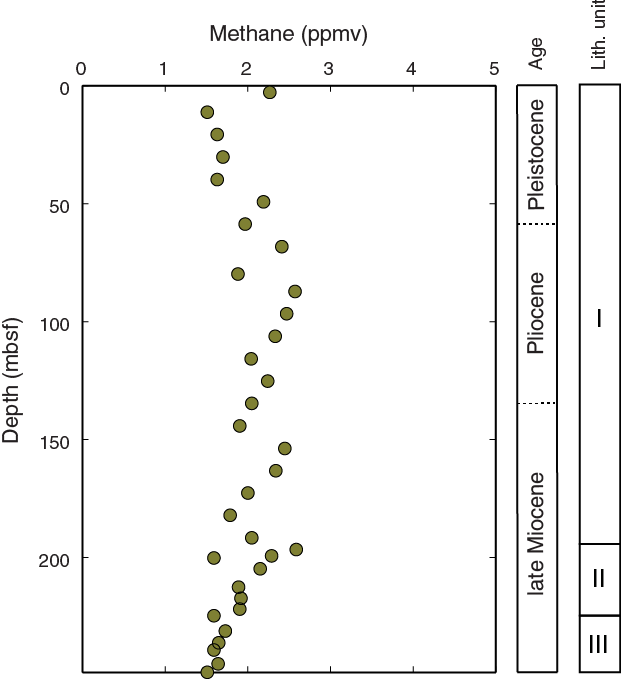
Figure F13. Methane concentrations in head space samples, Site U1472.
Table T8. Headspace hydrocarbons, Site U1472. Download table in .csv format.
Discussion
The slight increase in the concentration of Cl– at Site U1472 is higher than the increase observed at Site U1471 but not as strong as that found at Sites U1466 or U1468. This increases may be a relict signal of Last Glacial Maximum seawater (see Geochemistry in the Site U1467 chapter [Betzler et al., 2017b]) that has not yet diffused away. The constant alkalinity concentrations with depth indicate negligible rates of bacterial sulfate reduction relative to advection of seawater at Site U1472.
Neomorphism of aragonite to LMC does not appear to occur with the same intensity as at other Expedition 359 sites. The high abundance of aragonite even at 200 mbsf is unique to this site and might be related to the general lack of modern, active diagenesis inferred from constant pore fluid profiles. We lack data on the concentration of Sr2+ in IW samples that could indicate if carbonate neomorphism is currently occurring. The constant alkalinity at Site U1472 also suggests that the small amounts of dolomite present in the sediments are the result of previous episodes of alteration and are not actively forming in the modern sediment column. Carbonate diagenesis and dolomitization must have occurred in previous time intervals but unusually do not seem to have resulted in aragonite neomorphism to LMC.
Paleomagnetism
Natural remanent magnetization (NRM) was measured on 23 APC cores and 17 half-length APC (HLAPC) cores from Hole U1472A at 15 cm intervals using the superconducting rock magnetometer. Cores were subjected to stepwise alternating field (AF) demagnetization at 15 and 30 mT. The first and second sections of each core were generally skipped for efficiency and because they were generally affected by drill pipe contamination and thus rendered useless for paleomagnetic purposes (see Paleomagnetism in the Site U1467 chapter [Betzler et al., 2017b]). Results are summarized in Figure F14.
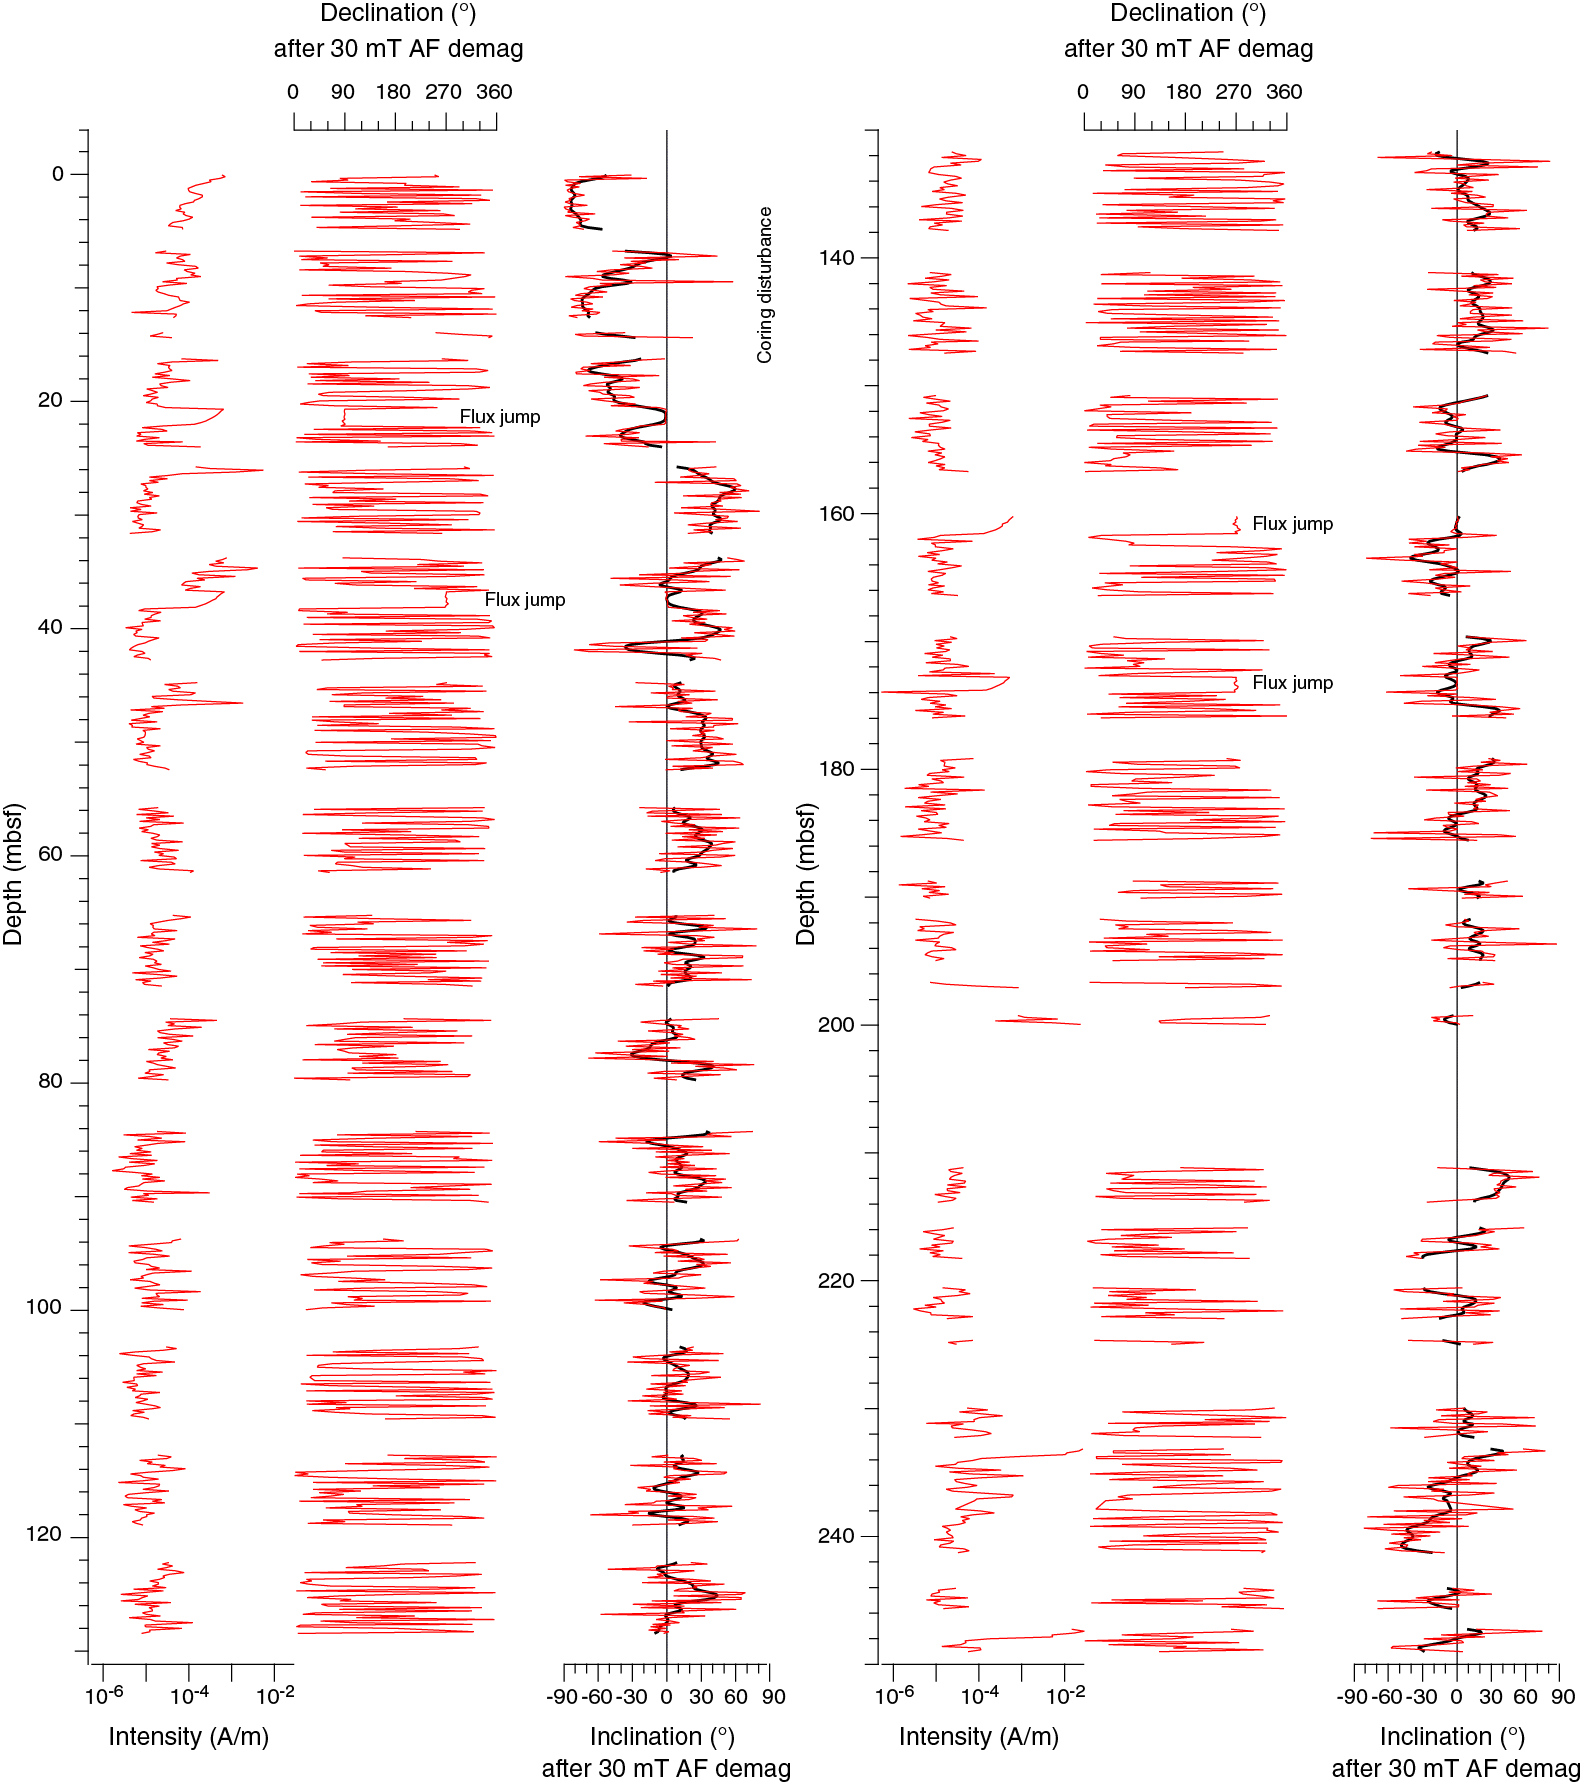
Figure F14. NRM intensity, declination, and inclination of APC and HLAPC cores, Hole U1472A.
Magnetization intensity after demagnetization at 30 mT and removing the high-intensity sections is rather low, averaging 2.34 × 10⁻⁵ A/m, and similar to that observed at previous sites in the same condition (same demagnetization steps and removal of high peaks). Occasional “flux jumps” in the y-axis superconducting quantum interference device (SQUID) sensor were observed at about 21, 37, 160, and 173 mbsf. Measurements from this site were not affected by the declination bias observed at previous sites.
Paleomagnetic results
Nearly vertical and negative inclinations were found in the upper 30 mbsf of Hole U1472A (Figure F14), which could be interpreted as a coring disturbance in these soft and water-trenched sediments. The rest of the inclination record is generally shallower but still shows erratic behavior that is not easily interpretable as a sequence of reversals.
The declination record, which is not oriented, is also scattered and difficult to interpret. An equal-area projection of the paleomagnetic directions from Hole U1472A shows, in fact, nearly uniformly dispersed directions (Figure F15).
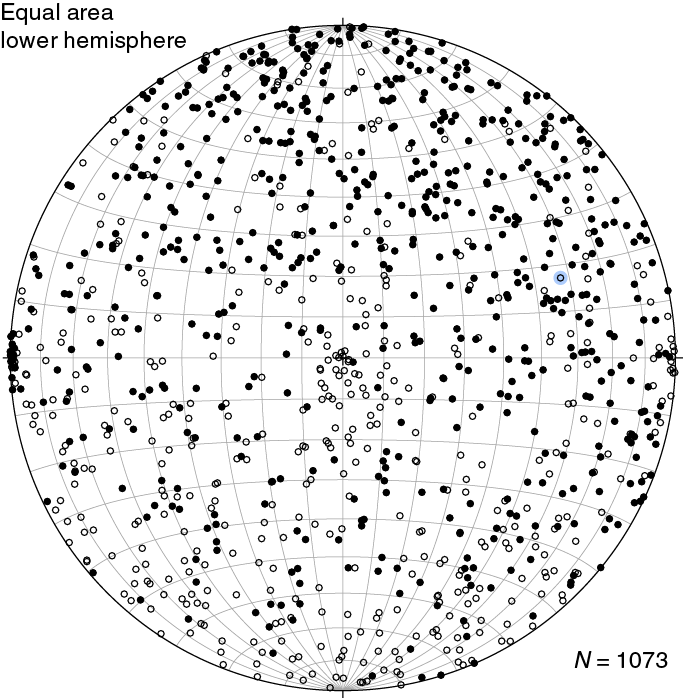
Figure F15. Paleomagnetic directions after AF demagnetization at 30 mT, Hole U1472A.
In principle, geomagnetic reversals can be deduced from nearly antipodal changes in declination and can be occasionally observed in Figure F14; however, the interpretation of these features did not give any reasonable results, suggesting that they are either a strongly incomplete record (i.e., not all reversals are recorded) or simply stochastic fluctuations.
Physical properties
NGR, magnetic susceptibility (MS; with the magnetic susceptibility loop [MSL] or WRMSL MS), gamma ray attenuation (GRA) bulk density, and P-wave velocity were measured on whole-round cores from Hole U1472A (0–252 mbsf). Magnetic susceptibility point (MSP or Section Half Multisensor Logger [SHMSL] MS) and color reflectance were performed on archive-half sections. P-wave velocity measurements were also conducted on working-half sections in the core liner. Porosity and density from moisture and density (MAD), thermal conductivity, and shear strength were not measured at this site. Based on variations of physical properties, especially NGR, three petrophysical (PP) units were distinguished (Figure F16). Unit 1, comprising two subunits, spans from the seafloor to ~124 mbsf. Unit 2 extends from ~124 to ~200 mbsf, and Unit 3 covers ~200 to 251.9 mbsf.
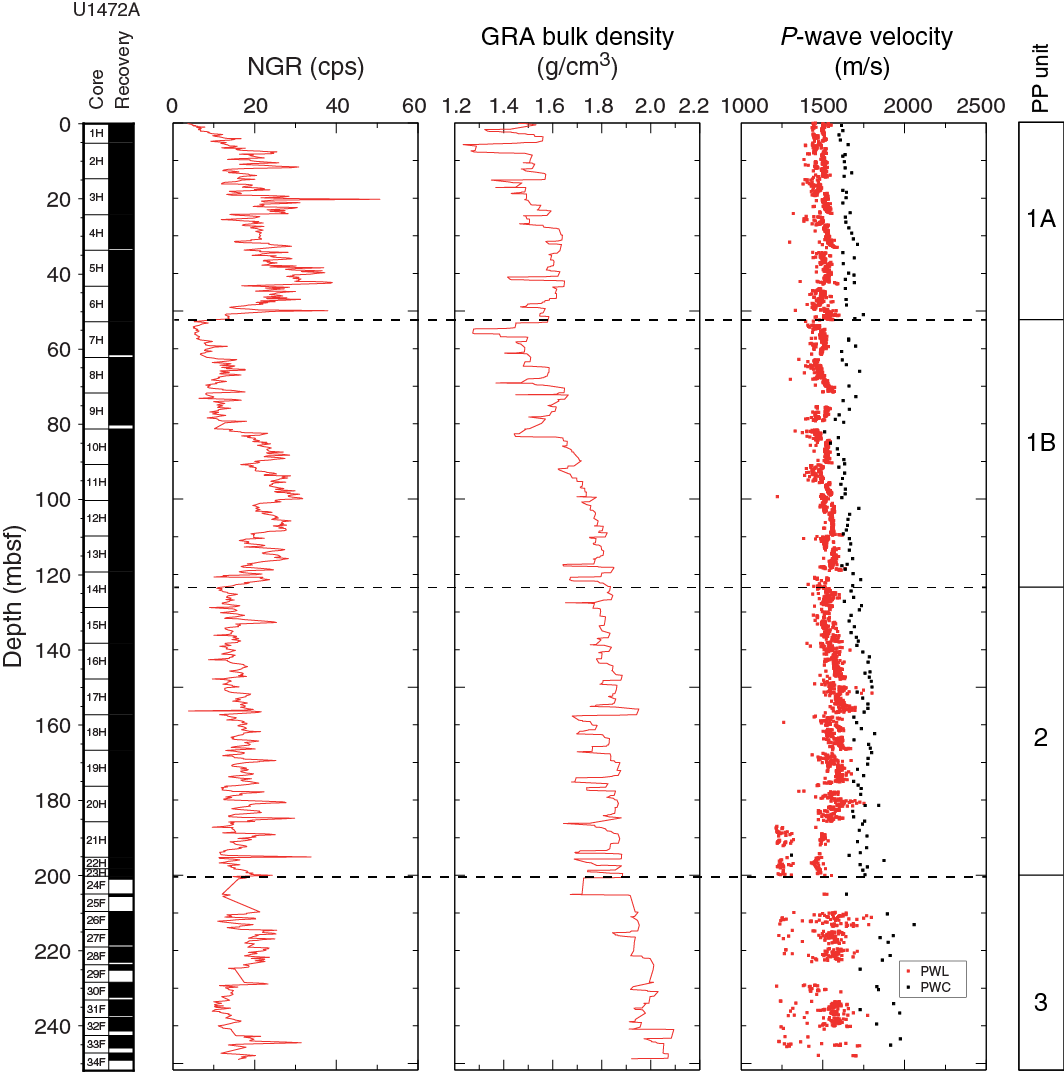
Figure F16. NGR, GRA bulk density, and P-wave velocity, Site U1472.
Natural gamma radiation
Petrophysical Unit 1 NGR values display large-scale fluctuations with some relatively small-scale excursions superimposed (Figure F16). Subunit 1A extends from ~0 to 52 mbsf and shows relatively high values that range from ~10 to 40 counts/s. NGR in the top of Subunit 1B shifts abruptly to lower values (<20 counts/s) at 52 mbsf but increases to 20 to 30 counts/s from 81 to 124 mbsf. Another decrease in NGR marks the top of Unit 2 at 124 mbsf, and variability increases downhole to the base of this unit. In Unit 3, NGR values exhibit relatively small-scale excursions and remain relatively low (<25 counts/s).
Density
GRA density measurements on whole-round cores generally increase downhole from ~1.4 to 2.1 g/cm3 (Figure F16). Unit 1 bulk density tracks NGR and is subdivided into Subunits 1A and 1B based on two increasing trends with depth. In Unit 2, bulk density remains relatively constant with an average of ~1.8 g/cm3 followed by another increase to 2.1 g/cm3 in Unit 3.
P-wave velocity
P-wave velocities were measured using the P-wave logger (PWL) on the WRMSL. PWL values are usually lower than velocities measured with the P-wave caliper (PWC), most likely due to high water content of the sediments. PWL measurements on whole-round cores roughly increase from ~1600 m/s at the seafloor to 1975 m/s at the bottom of Hole 1472A (Figure F16). In Unit 3, PWC values vary more than in Units 1 and 2. From the seafloor through most of Unit 2 (~190 mbsf), PWL values increase with a trend similar to that of the PWC values. PWL values in the lower portion of Unit 2 and throughout Unit 3 are offset to low values relative to PWC and display greater variability because of the poor coupling between the core and the core liner.
Color reflectance
In Unit 1, L* values generally increase downhole from 0 to 124 mbsf (Figure F17). Minor fluctuations on the order of 5–10 m are superimposed on this trend. Variability is reduced in Subunit 1B, reflecting more homogeneous sediment color in the unit. In Units 2 and 3, L* values decrease slightly, showing broader deviation. These two units are separated by an abrupt shift toward higher values at ~200 mbsf, but the base of Unit 3 returns to values encountered in the lower part of Unit 2.
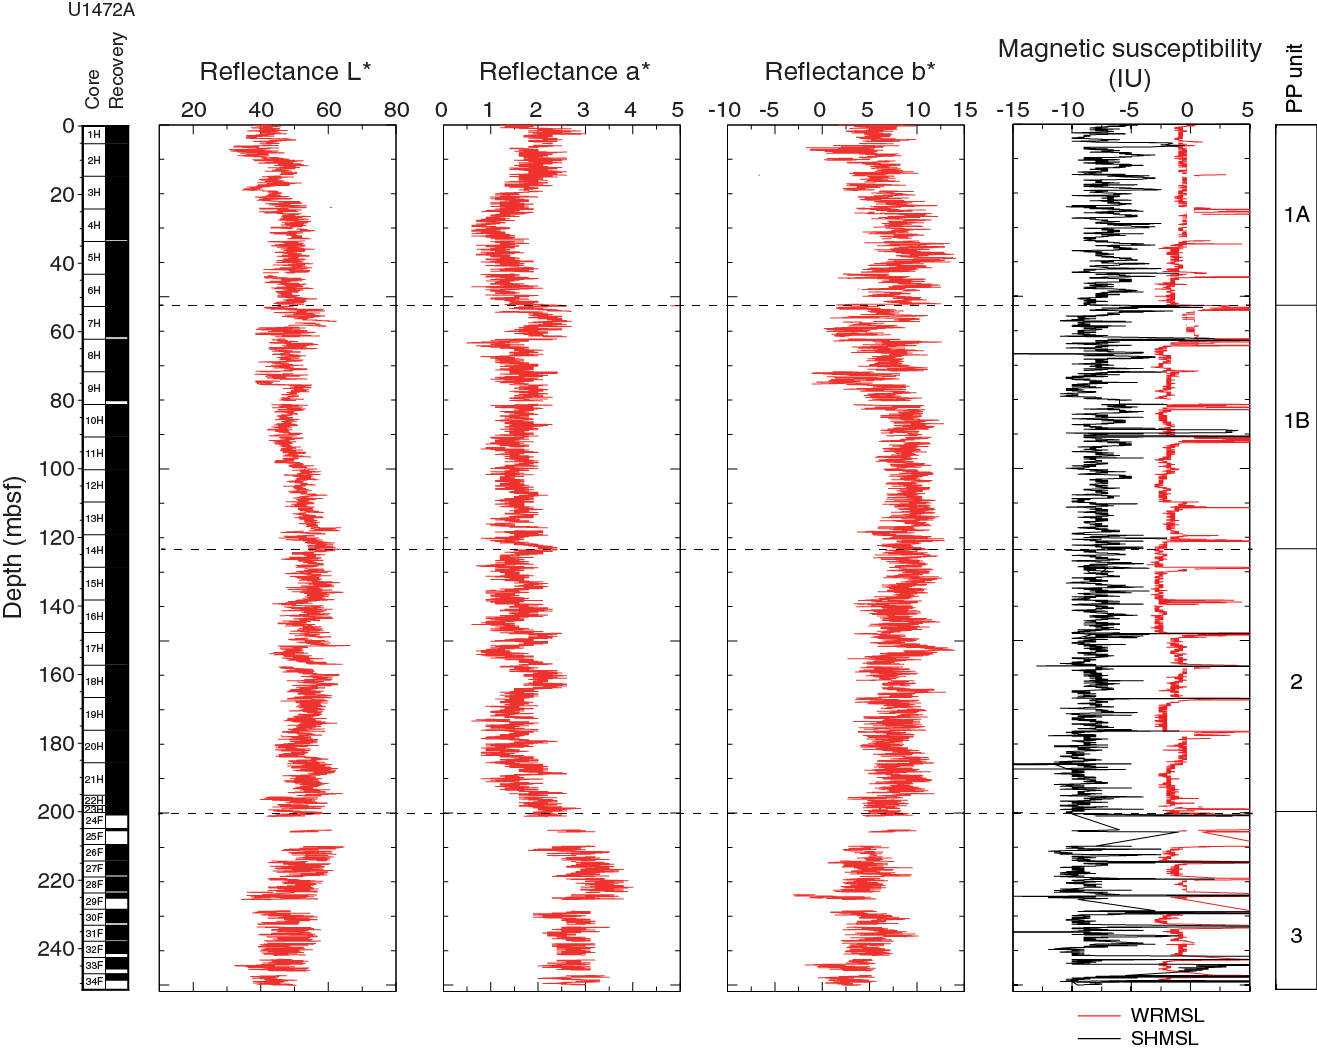
Figure F17. Color reflectance and magnetic susceptibility, Site U1472.
In Unit 1, a* values show a broad trend of first decreasing and then increasing between 0 and 60 mbsf. Below a sharp decrease at the top of Subunit 1B, values remain stable toward the ba=se of the subunit. In the lower portion of Unit 2 and into Unit 3, a* again displays a broad shift to higher values. b* mostly ranges from approximately –5 to 15 and shows an inverse relationship with a*.
Magnetic susceptibility
Magnetic susceptibility was measured on whole-round and split cores, recording contamination from the drilling process, probably rust from the drill string. Many of these contaminated values were manually removed from the raw data. However, this process was conservative, and some peaks with relatively high values remain. Most MSL values are very low (–2.5 to 0 IU), as are MSP values (–12 to –5 IU) (Figure F17). MSL and MSP values decrease slightly from the seafloor to the middle of Unit 2 (~150 mbsf), followed by some excursions in the lower portion of Unit 2 and the entire Unit 3.
Seismic stratigraphy
Site U1472 is located on the southern platform-basin transect between Sites U1470 and U1471. The subsurface stratigraphic packaging is comparable to northern transect Site U1468 but comprises an undisturbed succession of all drift sequences (DS1–DS10) (Figure F18). DS3–DS10 have lower sedimentation rates at this site than at basinal Site U1467 (Lüdmann et al., 2013). Because of time limitations at the end of the expedition, we only drilled about 252 mbsf into DS3.
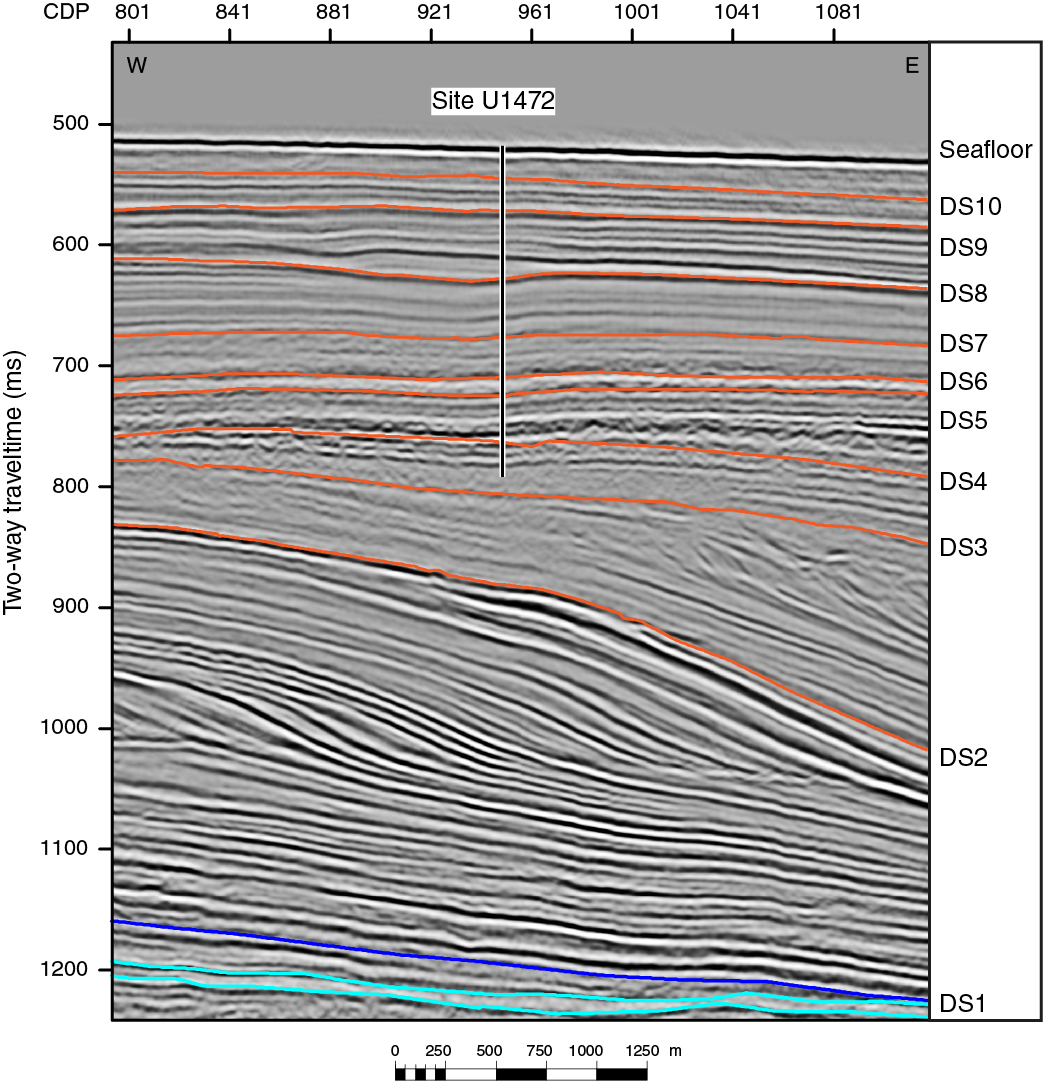
Figure F18. Seismic section across Site U1472 displaying DS1–DS10.
Time-depth conversion
Because of time restrictions, neither downhole logging nor a check shot survey was performed at this site. Because of the proximity of Sites U1472 and U1470, we used the check shots from Site U1470 as a reference to adapt the velocity model. Computed interval velocities are shown in Figure F19. Figure F20 shows the time-depth conversion, and Table T9 shows the depths of DS4–DS10.

Figure F19. Correlation of seismic and core data, Site U1472.
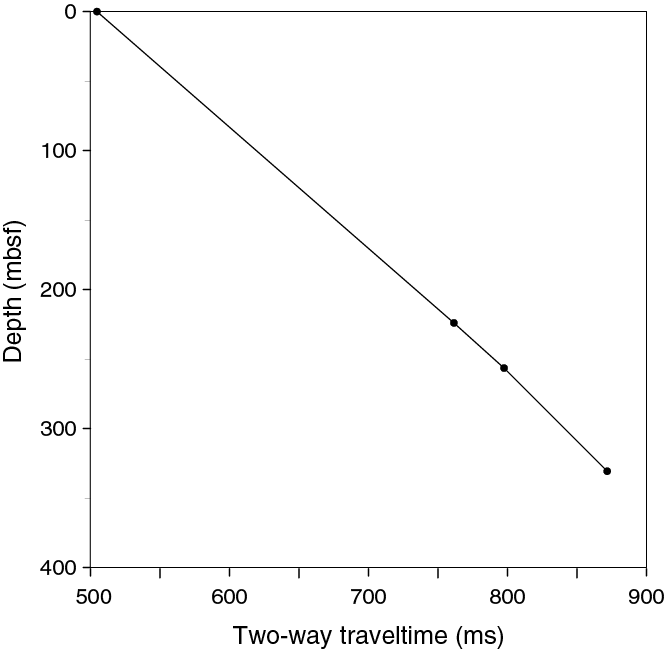
Figure F20. Time-depth conversion, Site U1472.
Table T9. DS boundaries, Site U1472. Download table in .csv format.
Seismic facies and geometries
DS7–DS10 are well-stratified, medium- to low-amplitude continuous reflections and are interpreted to be sheeted drifts. They pass basinward into elongated mounded separate drifts where they were drilled at Site U1467. DS3–DS6 show different facies and geometry. They are characterized by subparallel reflections of predominantly high amplitude. Toward the base of DS3, the reflections became chaotic and low in amplitude. DS5 and DS6 are sheet-like, whereas DS3 and DS4 have a divergent pattern and thicken basinward.
References
Belopolsky, A.V., and Droxler, A.W., 2004a. Seismic expressions and interpretation of carbonate sequences: the Maldives platform, equatorial Indian Ocean. AAPG Studies in Geology, 49. http://archives.datapages.com/data/specpubs/study49/images/st49.pdf
Belopolsky, A.V., and Droxler, A.W., 2004b. Seismic expressions of prograding carbonate bank margins: middle Miocene, Maldives, Indian Ocean. In Eberli, G.P., Masaferro, J.L., and Sarg, J.F. (Eds.), Seismic Imaging of Carbonate Reservoirs and Systems. AAPG Memoir, 81:267–290. http://archives.datapages.com/data/specpubs/memoir81/CHAPTER12/CHAPTER12.HTM
Betzler, C., Eberli, G.P., Alvarez Zarikian, C.A., Alonso-García, M., Bialik, O.M., Blättler, C.L., Guo, J.A., Haffen, S., Horozal, S., Inoue, M., Jovane, L., Kroon, D., Lanci, L., Laya, J.C., Ling Hui Mee, A., Lüdmann, T., Nakakuni, M., Nath, B.N., Niino, K., Petruny, L.M., Pratiwi, S.D., Reijmer, J., Reolid, J., Slagle, A.L., Sloss, C.R., Su, X., Swart, P.K., Wright, J.D., Yao, Z., and Young, J.R., 2017a. Expedition 359 summary. In Betzler, C., Eberli, G.P., Alvarez Zarikian, C.A., and the Expedition 359 Scientists, Maldives Monsoon and Sea Level. Proceedings of the International Ocean Discovery Program, 359: College Station, TX (International Ocean Discovery Program). http://dx.doi.org/10.14379/iodp.proc.359.101.2017
Betzler, C., Eberli, G.P., Alvarez Zarikian, C.A., Alonso-García, M., Bialik, O.M., Blättler, C.L., Guo, J.A., Haffen, S., Horozal, S., Inoue, M., Jovane, L., Kroon, D., Lanci, L., Laya, J.C., Ling Hui Mee, A., Lüdmann, T., Nakakuni, M., Nath, B.N., Niino, K., Petruny, L.M., Pratiwi, S.D., Reijmer, J.J.G., Reolid, J., Slagle, A.L., Sloss, C.R., Su, X., Swart, P.K., Wright, J.D., Yao, Z., and Young, J.R., 2017b. Site U1467. In Betzler, C., Eberli, G.P., Alvarez Zarikian, C.A., and the Expedition 359 Scientists, Maldives Monsoon and Sea Level. Proceedings of the International Ocean Discovery Program, 359: College Station, TX (International Ocean Discovery Program). http://dx.doi.org/10.14379/iodp.proc.359.105.2017
Betzler, C., Hübscher, C., Lindhorst, S., Reijmer, J.J.G., Römer, M., Droxler, A.W., Fürstenau, J., and Lüdmann, T., 2009. Monsoon-induced partial carbonate platform drowning (Maldives, Indian Ocean). Geology, 37(10):867–870. http://dx.doi.org/10.1130/G25702A.1
Betzler, C., Lindhorst, S., Eberli, G.P., Lüdmann, T., Möbius, J., Ludwig, J., Schutter, L., Wunsch, M., Reijmer, J.J.G., and Hübscher, C., 2014. Periplatform drift: the combined result of contour current and off-bank transport along carbonate platforms. Geology, 42(10):871–874. http://dx.doi.org/10.1130/G35900.1
Gradstein, F.M., Ogg, J.G., Schmitz, M.D., and Ogg, G.M. (Eds.), 2012. The Geological Time Scale 2012: Amsterdam (Elsevier).
Hilgen, F.J., Lourens, L.J., and Van Dam, J.A., 2012. The Neogene period. With contributions by A.G. Beu, A.F. Boyes, R.A. Cooper, W. Krijgsman, J.G. Ogg, W.E. Piller, and D.S. Wilson. In Gradstein, F.M., Ogg, J.G., Schmitz, M.D., and Ogg, G.M. (Eds.), The Geologic Time Scale: Oxford, United Kingdom (Elsevier), 923–978. http://dx.doi.org/10.1016/B978-0-444-59425-9.00029-9
Lourens, L., Hilgen, F., Shackleton, N.J., Laskar, J., and Wilson, D., 2004. The Neogene period. In Gradstein, F.M., Ogg, J.G., and Smith, A. (Eds.), A Geologic Time Scale 2004: Cambridge, United Kingdom (Cambridge University Press), 409–440. http://dx.doi.org/10.1017/CBO9780511536045.022
Lüdmann, T., Kalvelage, C., Betzler, C., Fürstenau, J., and Hübscher, C., 2013. The Maldives, a giant isolated carbonate platform dominated by bottom currents. Marine and Petroleum Geology, 43:326–340. http://dx.doi.org/10.1016/j.marpetgeo.2013.01.004
Raffi, I., Backman, J., Fornaciari, E., Pälike, H., Rio, D., Lourens, L., and Hilgen, F., 2006. A review of calcareous nannofossil astrobiochronology encompassing the past 25 million years. Quaternary Science Reviews, 25(23–24):3113–3137. http://dx.doi.org/10.1016/j.quascirev.2006.07.007
Rio, D., Fornaciari, E., and Raffi, I., 1990. Late Oligocene through early Pleistocene calcareous nannofossils from western equatorial Indian Ocean (Leg 115). In Duncan, R.A., Backman, J., Peterson, L.C., et al., Proceedings of the Ocean Drilling Program, Scientific Results, 115: College Station, TX (Ocean Drilling Program), 175–235. http://dx.doi.org/10.2973/odp.proc.sr.115.152.1990
Thompson, P.R., Bé, A.W.H., Duplessy, J.-C., and Shackleton, N.J., 1979. Disappearance of pink-pigmented Globigerinoides ruber at 120,000 yr BP in the Indian and Pacific Oceans. Nature, 280(5723):554–558. http://dx.doi.org/10.1038/280554a0
Wade, B.S., Pearson, P.N., Berggren, W.A., and Pälike, H., 2011. Review and revision of Cenozoic tropical planktonic foraminiferal biostratigraphy and calibration to the geomagnetic polarity and astronomical time scale. Earth-Science Reviews, 104(1–3):111–142. http://dx.doi.org/10.1016/j.earscirev.2010.09.003
Young, J.R., 1990. Size variation of Neogene Reticulofenestra coccoliths from Indian Ocean DSDP cores. Journal of Micropaleontology, 9:71–85. http://dx.doi.org/10.1144/jm.9.1.71
1 Betzler, C., Eberli, G.P., Alvarez Zarikian, C.A., Alonso-García, M., Bialik, O.M., Blättler, C.L., Guo, J.A., Haffen, S., Horozal, S., Inoue, M., Jovane, L., Kroon, D., Lanci, L., Laya, J.C., Ling Hui Mee, A., Lüdmann, T., Nakakuni, M., Nath, B.N., Niino, K., Petruny, L.M., Pratiwi, S.D., Reijmer, J.J.G., Reolid, J., Slagle, A.L., Sloss, C.R., Su, X., Swart, P.K., Wright, J.D., Yao, Z., and Young, J.R., 2017. Site U1472. In Betzler, C., Eberli, G.P., Alvarez Zarikian, C.A., and the Expedition 359 Scientists, Maldives Monsoon and Sea Level. Proceedings of the International Ocean Discovery Program, 359: College Station, TX (International Ocean Discovery Program). http://dx.doi.org/10.14379/iodp.proc.359.110.2017
2 Expedition 359 Scientists’ addresses.
This work is distributed under the Creative Commons Attribution 4.0 International (CC BY 4.0) license. 
- F1. Location map of Site U1472.
- F2. Seismic section along the southern transect with Expedition 359 sites.
- F3. Lithostratigraphic summary, Site U1472.
- F4. Components of Unit I.
- F5. Components of Subunit IIB.
- F6. Unlithified floatstone and coral, Unit I.
- F7. Components of Unit II.
- F8. Components of Unit IV.
- F9. Biostratigraphic and paleoenvironmental summary, Site U1472.
- F10. Age-depth plot, Site U1472.
- F11. IW Cl–, alkalinity, and hydrogen concentrations, Site U1472.
- F12. Relative concentrations of aragonite, HMC, LMC, dolomite, and quartz, Site U1472.
- F13. Methane concentrations in head space samples, Site U1472.
- F14. NRM intensity, declination, and inclination of APC and HLAPC cores, Hole U1472A.
- F15. Paleomagnetic directions after AF demagnetization at 30 mT, Hole U1472A.
- F16. NGR, GRA bulk density, and P-wave velocity, Site U1472.
- F17. Color reflectance and magnetic susceptibility, Site U1472.
- F18. Seismic section across Site U1472 displaying DS1–DS10.
- F19. Correlation of seismic and core data, Site U1472.
- F20. Time-depth conversion, Site U1472.
- T1. Site U1472 core summary.
- T2. Biostratigraphic events, Site U1472.
- T3. Nannofossil range chart, Hole U1472A.
- T4. Planktonic foraminifer range chart, Hole U1472A.
- T5. Benthic foraminifer range chart, Hole U1472A.
- T6. Interstitial water chemistry, Site U1472.
- T7. XRD results, Site U1472.
- T8. Headspace hydrocarbons, Site U1472.
- T9. DS boundaries, Site U1472.