Hall, I.R., Hemming, S.R., LeVay, L.J., and the Expedition 361 Scientists
Proceedings of the International Ocean Discovery Program Volume 361
publications.iodp.org
doi:10.14379/iodp.proc.361.103.2017
Site U14741
I.R. Hall, S.R. Hemming, L.J. LeVay, S. Barker, M.A. Berke, L. Brentegani, T. Caley, A. Cartagena-Sierra, C.D. Charles, J.J. Coenen, J.G. Crespin, A.M. Franzese, J. Gruetzner, X. Han, S.K.V. Hines, F.J. Jimenez Espejo, J. Just, A. Koutsodendris, K. Kubota, N. Lathika, R.D. Norris, T. Periera dos Santos, R. Robinson, J.M. Rolinson, M.H. Simon, D. Tangunan, J.J.L. van der Lubbe, M. Yamane, and H. Zhang2
Keywords: International Ocean Discovery Program, IODP, JOIDES Resolution, Expedition 361, Site U1474, Agulhas Current, Agulhas Leakage, Agulhas Plateau, Agulhas Retroflection, Agulhas Return Current, Agulhas Rings, Agulhas Undercurrent, Atlantic Meridional Overturning Circulation, boundary current, Cape Basin, Circumpolar Deep Water, Congo Air Boundary, Delagoa Bight, East Madagascar Current, human evolution, Indian Ocean, Indonesian Throughflow, interocean exchange, Intertropical Convergence Zone, Last Glacial Maximum, Limpopo River, Middle Pleistocene Transition, Miocene, Mozambique Channel, Natal Valley, North Atlantic Deep Water, ocean circulation, paleoceanography, paleoclimate, Pleistocene, Pliocene, salinity, southern Africa, Southern Ocean, Subantarctic Zone, Subtropical Front, Subtropical Gyre, thermohaline circulation, Warm Water Route, Western Boundary Current, Zambezi River
MS 361-103: Published 30 September 2017
Background and objectives
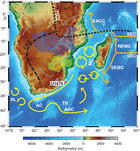
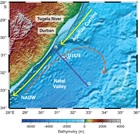
International Ocean Discovery Program (IODP) Site U1474 is located in the northernmost Natal Valley (31°13.00′S; 31°32.71′E) ~88 nmi south-southwest of Durban, South Africa (Figures F1, F2), at a water depth of 3045 m below sea level (mbsl).
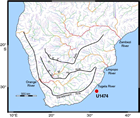
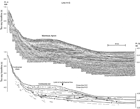
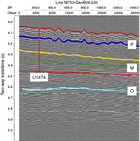
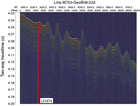
The northeast-southwest–trending Natal Valley is a sediment-filled basin between the coast of southeast Africa and the Mozambique Ridge (Figure F2). At its northern end, the shoaling valley passes into the extensive coastal plains of southern Mozambique (Dingle et al., 1978; Goodlad, 1986), whereas toward the south the deepening Natal Valley merges with the Transkei Basin deeper than 4500 mbsl. Terrigenous sediment supply into the Natal Valley is dominated by seasonal discharge from numerous short but fast-flowing rivers that characterize the drainage system of the Natal coast (e.g., the Tugela and Great Kei Rivers), as well as more distant contributions from the Limpopo River and possibly the Zambezi River (Figure F3). Surface sediment dispersal is strongly affected by the ~100 km wide Agulhas Current, flowing southward close to the continental shelf edge and transporting ~70 Sv at 32°S (Beal and Bryden, 1999; Bryden et al. 2005) with surface velocities up to 150 cm/s. At depth, the northward-flowing Agulhas Undercurrent (Beal and Bryden, 1997) hugs the continental slope, presently transporting North Atlantic Deep Water (NADW) within an interval extending to 2500 mbsl. The currents related to this northward flow have led to formation of a network of elongate, north-south–oriented “plastered” sediment drifts. Niemi et al. (2000) present seismic data from the region, which is very close to Site U1474. Three erosional unconformities/reflectors (P, M, and O) are recognized throughout the region, and their presence suggests intervals of major reorganization of bottom circulation patterns. Niemi et al. (2000) assigned tentative ages to these reflectors of early Pliocene (P), early middle Miocene (M), and Eocene/Oligocene boundary (O) (Figures F4, F5). Above Reflector O, major drift bodies can be seen in seismic data throughout Natal Valley. Site U1474 lies within a zone of parallel reflectors immediately upslope from an area of undulating topography and internal reflectors interpreted as contourite drift bodies (Figures F5, F6).
According to Lutjeharms (2006), the Agulhas Current can be considered to be fully constituted at ~26°S, around Ponta do Ouro, close to the border between Mozambique and South Africa. The northern section of the Agulhas Current system at Site U1474 is extraordinarily stable because of the steep, nearly rectilinear continental shelf that topographically steers the current flow southward (de Ruijter et al., 1999; Lutjeharms, 2006, 2007).
Several high-resolution orbital- to millennial-timescale records from marine sediment cores near Site U1474 (e.g., Ziegler et al., 2013; Simon et al., 2013, 2015a, 2015b) have provided multiproxy reconstruction of hydrographic variability within the main flow of the Agulhas Current as well as river discharge from the catchments of the Natal coast over the past 250 ky. In particular, Simon et al. (2013) have demonstrated (1) a strong connectivity between the upstream Agulhas Current hydrographic variability and the phasing of temperature, salinity, and planktonic foraminiferal–based Agulhas leakage changes in the Agulhas corridor and (2) changes in terrestrial hydroclimate related to regional precession-paced insolation changes, as well as the effects associated with high-latitude abrupt climate forcing (Simon et al., 2015b). The Simon et al. (2013) record can be plausibly linked to the influence of recirculation within the southwest Indian Ocean subgyre as predicted from physical oceanographic synthesis (e.g., Gordon, 1985; Stramma and Lutjeharms, 1997). When considered in combination with archaeological records, these records appear to provide evidence for links between climate and human settlement in South Africa during the Middle Stone Age (Ziegler et al., 2013).
Our primary objective was to recover a key Pliocene–Pleistocene sedimentary succession, including the early Pliocene warm period, mid-Pliocene expansion of the Northern Hemisphere ice sheets, and the mid-Pleistocene transition (MPT), formed under the influence of the upper reaches of the Agulhas Current. The site is ideally located to provide
- A reconstruction of Agulhas Current warm-water transports close to the start of the fully constituted Agulhas Current;
- An upstream record that may allow connections between Agulhas leakage and its headwater variability to be discerned;
- Evidence to understand the connections between southern African terrestrial climates and southeast Indian Ocean heat budgets, notably Agulhas Current warm-water transports and associated ocean-atmosphere heat and moisture transfer;
- A record of the vigor and hydrography of NADW (or its precursors) transported to the Circumpolar Deep Water and the southwest Indian Ocean; and
- An interstitial water profile of δ18O and chloride ion concentration that can enhance the understanding of temperature, salinity, and density of deep waters bathing Site U1474.
Site U1474 was occupied on 10 February 2016. Eight holes were drilled and cored using the advanced piston corer (APC) and half-length advanced piston corer (HLAPC) systems, achieving a depth of 254.1 m drilling depth below seafloor (DSF) in Hole U1474A. The total cored interval at Site U1474 was 896.4 m, and total recovery was 910.75 m (102%).
Operations
Port Louis port call
IODP Expedition 361 began at 1014 h (UTC + 4) on 30 January 2016 with the first line ashore at Quay A Mer Rouge in Port Louis, Mauritius. The IODP JOIDES Resolution Science Operator (JRSO) staff and chief scientists boarded the vessel at 1100 h, and the off-going science party departed at 1300 h. Port call activities started with the IODP staff crew change and crossover; off-going staff departed the vessel at 1500 h. The Siem crew crossover took place on 31 January, and the science party boarded the vessel that morning.
On 4 February, the vessel was made ready for the sea passage. The port call ended with last line away at 0736 h. With the assistance from two harbor tugs, the vessel left Port Louis. The pilot departed the vessel at 0808 h. The propeller speed was increased to 140 rpm, and the R/V JOIDES Resolution began the sea passage to the first site (U1474) of Expedition 361.
Transit to Site U1474
The original operations plan called for the ship to transit to proposed Site MZC-01C (Site U1476) to begin coring operations. However, the ship had not yet been cleared to operate within the Mozambique Exclusive Economic Zone (EEZ), and on 6 February 2016 the decision was made to go to proposed Site NV-02C (Site U1474), which is located within the South Africa EEZ. After a 1563 nmi transit from Port Louis averaging 11.3 kt, the vessel arrived at Site U1474 at 2330 h (UTC + 2 h) on 9 February. Given the location of Site U1474 within the Agulhas Current, surface current speeds were high throughout operations, averaging ~1.5 m/s.
Site U1474
Site U1474 consisted of 8 holes, ranging in depth from 3.1 to 254.1 m DSF (Table T1). Overall, 111 cores were recorded for the site. A total of 809.79 m of core over a 794.0 m interval was recovered using the APC system (102% core recovery). The HLAPC system was used to core a 102.4 m interval with 100.96 m of core recovered (99% core recovery). A total of 910.75 m of sediment was recovered from an 896.4 m interval at Site U1474 (102% core recovery). The total time spent at Site U1474 was 7.6 days.
Table T1. Site U1474 core summary. Download table in .csv format. View PDF table.
Hole U1474A
The drill string was run to a depth of 3025.2 mbsl. The top drive was picked up and the bit was placed at 3042.6 mbsl for the first APC core. The core barrel was retrieved completely full, missing the sediment/water interface at the seafloor. The bit was raised 7.9 m to 3034.7 mbsl for a second coring attempt. This also yielded a full core barrel. These two cores were later curated as Cores 361-U1474G-1H and 361-U1474H-1H. The bit was raised 5 m to 3029.7 mbsl for a third coring attempt at 1525 h. This core recovered a good mudline.
Cores 361-U1474A-1H through 27H were successfully recovered using nonmagnetic core barrels. After four partial strokes using the APC, the HLAPC was deployed for Cores 28F through 29F. After reaching the HLAPC refusal depth at 254.1 m DSF, the drill string was pulled out of the hole. The bit cleared the seafloor at 1040 h on 12 February, ending Hole U1474A.
A total of 27 APC cores were taken over a 244.9 m interval with a total recovery of 256.11 m of core (105% core recovery). Two HLAPC cores were retrieved over a 9.2 m interval with 8.72 m recovered (95%). Total core recovery for Hole U1474A was 104%.
Hole U1474B
The vessel was offset 20 m north of Hole U1474A, and coring in Hole U1474B started at 1320 h on 12 February. Cores 361-U1474B-1H through 16H penetrated to 147.3 m DSF and recovered 142.09 m of sediment (96% core recovery). One interstitial water whole-round sample was taken from each core section for high-resolution geochemistry. After reaching the total depth at 147.3 m DSF, the drill string was pulled out of the hole. The bit cleared the seafloor at 0835 h on 13 February.
Hole U1474C
The vessel was offset 20 m east of Hole U1474A, and coring in Hole U1474C started at 0935 h on 13 February. Core 361-U1474C-1H was recovered with 3.07 m of sediment. The stratigraphic correlation specialists determined that a longer first core was needed to span stratigraphic gaps, and Hole U1474C was terminated.
Hole U1474D
The ship maintained its position 20 m east of Hole U1474A, and coring started in Hole U1474D at 1100 h on 13 February. Hole U1474D was cored to 124.5 m DSF using the APC system. At 0215 h on 14 February, winds increased to 50 kt, gusting up to 58 kt, and combined with a ~2 kt surface current led to the dynamic positioning system operating at 100% capacity. The drill string was pulled out of the hole, and the bit cleared the seafloor at 0305 h on 14 February, ending Hole U1474D. The final depth of Hole U1474D was 124.5 m DSF. Cores 361-U1474D-1H through 14H were taken over a 124.5 m interval and recovered 126.04 m of sediment (101% core recovery).
Hole U1474E
The vessel drifted at 0.9 kt southward after ending Hole U1474D. At 1900 h on 14 February, the thrusters were raised to transit back to Site U1474. Hole U1474E was spudded 20 m east of Hole U1474A at 0725 h on 15 February. The hole was drilled without coring to 105.5 m DSF. Cores 361-U1474E-2H through 9H were recovered using the APC system to 172.0 m DSF. One drilled interval between 124.5 and 126.0 m DSF was used to aid in stratigraphic correlation. The HLAPC was deployed for Cores 10F through 19F. After recovering Core 19F, the drill string was pulled out of the hole. The bit cleared the seafloor at 0630 h on 16 February, ending Hole U1474E. The final depth of Hole U1474E was 219.0 m DSF.
Seven APC cores were taken over a 65.0 m interval with a total recovery of 67.93 m of core (105% core recovery). Ten HLAPC cores were retrieved over a 47.0 m interval with 46.51 m recovered (99% core recovery). Two drilled intervals over 107 m were logged. The total core recovery for Hole U1474E was 102%.
Hole U1474F
The vessel was offset 20 m south of Hole U1474A and Hole U1474F started at 0845 h on 16 February. Cores 361-U1474F-1H through 21H were retrieved using the APC system. After experiencing partial strokes while taking Cores 20H and 21H, the HLAPC system was deployed for Cores 22F through 24F. Following Core 24F, the stratigraphic correlation specialists requested a 2.0 m drilled interval (361-U1474F-251) to offset the coring gaps. Coring operations with the HLAPC continued through Core 33F, where APC refusal depth was reached at 238.4 m DSF. The drill string was pulled out of the hole, and the bit cleared the seafloor at 0400 h and cleared the rotary table at 0745 h on 18 February. The rig was then secured for transit. Permission to drill in the Mozambique EEZ had still not been received, so the decision was made to sail south. The vessel began the transit to proposed Site APT-01B (Site U1475) at 0948 h on 18 February, ending Hole U1474F and Site U1474.
A total of 21 APC cores were taken over a 190.2 m interval with a total recovery of 194.76 m of core (102% core recovery). Eleven HLAPC cores were retrieved over a 46.2 m interval with 45.73 m recovered (99% core recovery). One interval of 2.0 m was drilled without coring. A total of 240.49 m of sediment was recovered over a 236.4 m cored interval (102% core recovery) in Hole U1474F.
Holes U1474G and U1474H
Cores 361-U1474G-1H and 361-U1474H-1H were retrieved prior to the start of Hole U1474A. Core 361-U1474G-1H was shot ~13 m below the sediment/water interface and recovered 9.97 m of sediment. Core 361-U1474H-1H was shot 0.3 m below the sediment/water interface and recovered 9.82 m of sediment. Science leadership decided that the greatest scientific value of Core 361-U1474G-1H would come from leaving it on the vessel for training of future science parties.
Sedimentology
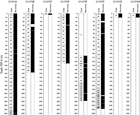
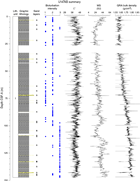
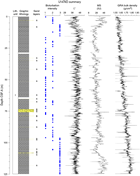
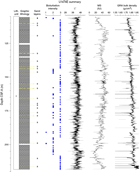
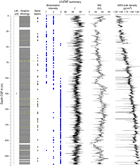
Drilling at Site U1474 recovered a ~910 m long sediment succession from eight holes (Figures F7, F8; also see Operations). Hole U1474A was cored to 254.07 m coring depth below seafloor (CSF-A), Hole U1474B to 147.33 m CSF-A, Hole U1474C to 3.07 m CSF-A, Hole U1474D to 124.82 m CSF-A, Hole U1474E from 105.5 to 218.45 m CSF-A, Hole U1474F to 238.33 m CSF-A, Hole U1474G to 9.97 m CSF-A, and Hole U1474H to 9.82 m CSF-A. Three intervals totaling 109.0 m were advanced without coring: two in Hole U1474E (0–105.5 and 124.5–126.0 m CSF-A) and one in Hole U1474F (204.3–206.3 m CSF-A). The APC system was used in all holes, whereas the HLAPC was used in the lower parts of Holes U1474A, U1474E, and U1474F. Visual description of all cores (except from Hole U1474H) was performed and recorded using the shipboard lithostratigraphic DESClogik program, which involves visual assessment of average grain size, sediment color, sedimentary structures, and bioturbation. Disturbances induced by drilling were also described. Lithologic characteristics were further determined using smear slide analyses, and a total of 680 shipboard samples were collected from the working halves of the cores for paleontological, physical property, paleomagnetic, and geochemical analyses (Table T2).
Table T2. Overview of shipboard sampling with number of samples taken, Holes U1474A–U1474F. Download table in .csv format.
Lithostratigraphic unit description
Unit I
- Intervals: 361-U1474A-1H-1, 0 cm, through 29H-CC, 45 cm; 361-U1474B-1H-1, 0 cm, through 16H-CC, 40 cm; 361-U1474C-1H-1, 0 cm, through 1H-CC, 34 cm; 361-U1474D-1H-1, 0 cm, through 14H-CC, 21 cm; 361-U1474E-2H-1, 0 cm, through 19F-CC, 30 cm; 361-U1474F-1H-1, 0 cm, through 33F-CC, 17 cm; 361-U1474H-1H-1, 0 cm, through 1H-CC, 19 cm.
- Depths: Hole U1474A = 0–254.07 m CSF-A; Hole U1474B = 0–147.3 m CSF-A; Hole U1474C = 0–3.07 m CSF-A; Hole U1474D = 0–124.82 m CSF-A; Hole U1474E = 105.5–218.45 m CSF-A; Hole U1474F = 0–238.33 m CSF-A; Hole U1474H = 0–9.82 m CSF-A.
- Age: Miocene to Holocene
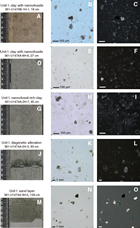
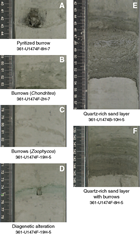
Unit I is composed of light yellowish brown (10YR 6/4) foraminifer-bearing clay with nannofossils in the uppermost 50–60 cm of the sequence (Figure F9). The rest of the sequence is characterized by light greenish gray (GLEY 1 7/10Y) to greenish gray (GLEY 1 5/10 to GLEY 1 6/10Y) foraminifer-bearing clay with nannofossils alternating with nannofossil-rich clay with or without foraminifers. The nannofossil-rich clay is more common in the deeper parts of the recovered section. Dark gray (GLEY 1 4/N) to dark greenish gray (GLEY 1 4/10Y) foraminifer-bearing fine sand layers are common (typically 1–3 per core) (Figures F9, F10). The thickness of these layers varies between 0.5 and 234 cm; most are between 3 and 5 cm. The layers consist mainly of foraminifers and angular quartz and are generally well sorted and normally graded. Moreover, they are most often marked by sharp erosive bottom contacts, and bioturbation is generally restricted to their uppermost parts. These layers are interpreted as turbidites, but occasional contourite deposits cannot be excluded. The unit is also characterized by abundant green to dark gray diffuse mottling, indicating prevalent bioturbation throughout (mainly burrows). The relative bioturbation intensity increases with depth (Figure F8). Subcentimeter- to centimeter-thick (0.2–1.0 cm) green layers are found regularly throughout the cores (Figure F10). These layers are predominantly composed of quartz and calcite, with moderate amounts of glauconite and pyrite according to X-ray diffraction (XRD) (Figure F11) and smear slide observations (Figure F9; Table T1).
Drilling disturbance
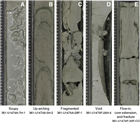
Different types of drilling disturbances were observed in the cores at Site U1474 (Figure F12). The first sections of most cores from Holes U1474A, U1474B, and U1474D are generally soupy, whereas the last sections of cores often present some fractures or flow-in disturbances. Upward-arching of sediment and voids were also occasionally observed.
Lithologies and composition
Smear slide observations show that terrigenous (59% ± 15%) and biogenic (41% ± 15%) materials are the principal components of the sediment at U1474 (Table T3). The biogenic fraction is dominated by nannofossils (27% ± 18% on average), foraminifers (12% ± 9%), and siliceous sponge spicules (<10%). Grain sizes of terrigenous materials are mainly clay (60% ± 27% on average), followed by sand (22% ± 26%) and silt (21% ± 11%). The mineralogy of the terrigenous component is dominated by clay minerals (31% ± 18% on average) and quartz (18% ± 18%), with presence of pyrite, glauconite, feldspar, and Fe oxides.
Table T3. Smear slide textures, compositions, and lithologic names, Holes U1474A-U1474F. Download table in .csv format.
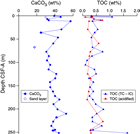
The average concentration of total biogenic carbonate in the sediment of Hole U1474A was estimated at ~39% based on smear slide descriptions (Table T3). This result is in agreement with geochemical analyses, which measured an average carbonate content of 37.5 wt% (range = 17–57 wt%) (Figure F13). The abundant fine sand layers observed throughout the sequence have lower carbonate contents (e.g., 17.6 wt% in Sample 361-U1474A-8H-4, 70–71 cm).
Dark gray foraminifer-bearing fine sand layers occur within Unit I in all holes. These layers are mainly composed of quartz (48%), followed by foraminifers (23%) and pyrite (8%). Pyrite (usually associated with burrows) is also present throughout Unit I. Thin green layers also occur at irregular intervals. These color bands may be associated with the presence of glauconite, as suggested by XRD analyses (Figure F11), although they may also be related to a slight degree of carbonate recrystallization, potentially reflecting siderite formation (Fe carbonate).
Structures
The only sedimentary structure occasionally observed is millimeter-thick laminations in the sand layers. Bioturbation is the only secondary sedimentary structure and is present throughout Unit I. The most common indicator of bioturbation is centimeter-scale diffuse mottling. Discrete ichnofossil burrows (Chondrites, Planolites, and Zoophycos) are commonly observed. Thin darker bands commonly surround burrows, and macroscopic pyritized burrows are also common. Bioturbation intensity ranges from slight to strong and increases with depth in all holes (Figure F8).
Color
The color of the sediment ranges from light yellowish brown (10YR 6/4) for the foraminifer-bearing clays in the uppermost 50–60 cm of the sequence to light greenish gray (GLEY 1 7/10Y) to greenish gray (GLEY 1 5/10 to GLEY 1 6/10Y) for the nannofossil-rich clay. The fine-sand layers are darker, such as dark gray (GLEY 1 4/N) and dark greenish gray (GLEY 1 4/10Y).
Discussion
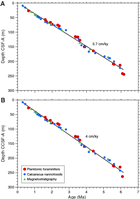
Sediment recovered from Site U1474 is mainly composed of terrigenous clay material that is probably transported by the main riverine/drainage systems of the Natal coast (Figure F3) (e.g., Ziegler et al., 2013; Simon et al., 2015b). The terrigenous components are mixed with hemipelagic sediments, mainly nannofossils and foraminifers. The generally low rates of sedimentation (3.7 cm/ky; see Age model) and the presence of thin sand layers are consistent with sediment supply from the distal part of the slope turbidite system of the northern Natal Valley. Considering the presence of contourites along the southeast African margin (Flemming, 1981; Ramsay, 1994; Faugères et al., 1999; Preu et al., 2011) and the location of Site U1474 on a plastered drift deposit, the sand layers found within Unit I could also be contourite structures. Presently there is a lack of commonly accepted criteria to distinguish between contourites and other deep-sea deposits such as fine-sand turbidites of mixed composition solely on the basis of lithological facies in cores and outcrop. (Rebesco et al., 2014).
Extensive bioturbation and diagenetic alteration of the Site U1474 sediment suggest an oxygen-rich deep-sea environment, which can be attributed to the presence of ventilated of deep-water masses (presently NADW) (Beal and Bryden, 1999; Arhan et al., 2003; Beal et al., 2006). The formation of glauconite in the sediment can be the product of smectite alteration as a result of slow accumulation rates of detrital material and redox potential (Skiba et al., 2014). Pyrite forms when bacterial processes couple organic carbon oxidation with the reduction of sulfate. This reaction creates sulfide that can in turn react with dissolved or mineral iron to produce pyrite (Canfield and Raiswell, 1992; Schoonen, 2004). The common presence of pyrite in Unit I suggests a high availability of Fe in the sediment, probably riverine transported, which would enhance early diagenesic processes at Site U1474. The amount of organic carbon in the sediment is very low (~0.5 wt%; see Geochemistry), and part of the organic matter could have been degraded during diagenesis. The compaction at Site U1474 increases with depth, as inferred by the increasing bulk density values with depth (Figures F8, F9; also see Physical properties). As such, the increase of bioturbation intensity could simply be a visual artifact caused by the compaction.
Physical properties
Physical property measurements were completed on whole-round sections and section halves from cores collected in Holes U1474A–U1474H. All whole-round sections were first logged prior to thermal equilibration at a sampling resolution of 2.5 cm using the Special Task Multisensor Logger (STMSL), generating a record of gamma ray attenuation (GRA) density and magnetic susceptibility (MS) that was used by the stratigraphic correlators for drilling decision-making. Following thermal equilibration (after temperature reached 19°C), the sections were logged, again at a sampling resolution of 2.5 cm, using the Whole-Round Multisensor Logger (WRMSL), generating P-wave velocity (VP) and a further set of GRA density and magnetic susceptibility data. Whole-round sections were then scanned with the Natural Gamma Radiation Logger (NGRL) at a sampling resolution of 10 cm. Finally, thermal conductivity measurements were performed on 21 cores from Holes U1474A and U1474B. The full-space needle probe was used, usually near the middle of Section 4.
Following core splitting, samples were taken for moisture and density (MAD) measurements from the working-half sections. The MAD (index) properties determined at Site U1474 include bulk density, dry density, grain density, porosity, void ratio, and water content. A total of 81 discrete samples for MAD measurements were collected from every other section in Hole U1474A as well as 3 samples from sandy layers in Hole U1474B. Spectral color reflectance and point magnetic susceptibility measurements were made on the archive-half sections using the Section Half Multisensor Logger (SHMSL). Sampling resolution ranged between 0.5 and 2 cm. Red, green, and blue (RGB) were measured on the Section Half Imaging Logger (SHIL).
Three downhole temperature measurements were taken in Hole U1474A, but these data proved unreliable due to the ship’s heave.
Magnetic susceptibility
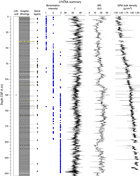
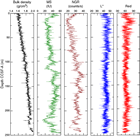
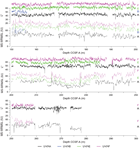
The magnetic susceptibility values from the whole-round core (WRMSL) analyses show variability between 11 and 67 instrument units (IU; ~10–5 SI) along Hole U1474A, with maximum values at the shallowest depths (Figure F14). Cyclic variations in magnetic susceptibility are observed along the entire hole, punctuated by two marked low magnetic susceptibility intervals at 100–109 and 201–210 m CSF-A with values of ~25 and ~15 IU, respectively. Larger magnetic susceptibility fluctuations can be recognized near the bottom of the hole, with a relative maximum peak at 244 m CSF-A. Point magnetic susceptibility (SHMSL) fluctuations closely track the whole-round core measurements but display higher absolute IU values.
In general, magnetic susceptibility values at this site are likely controlled by variations in the concentration of ferri- or paramagnetic particles present in the terrigenous sediment fraction.
Natural gamma radiation
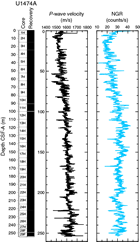
The changes in natural gamma radiation (NGR) represent the total variation in the activity of the radioactive elements uranium, thorium, and potassium. In Hole U1474A, NGR values range from 12 to 43 counts/s with an average of 29 counts/s (Figure F15). In the uppermost 12 m CSF-A, NGR decreases from 35 to 17 counts/s. From 12 to 116 m CSF-A, NGR values increase to 40 counts/s. This trend is likely due to sediment compaction as revealed by the gradual increase in P-wave velocity and bulk density in this interval (Figures F15, F16). From the maximum values at 116 m CSF-A, NGR decreases again to 30 counts/s at the base of Hole U1474A. Superimposed on the general trends are cyclic changes of typically ~10–15 counts/s, which are likely related to the variable amount of terrigenous vs. biogenic sediment components.
Thermal conductivity
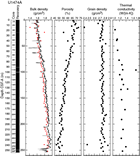
Overall, thermal conductivity values range from 1.1 to 1.7 W/(m·K) and follow a linear increase from the seafloor to 100 m CSF-A where a maximum is reached (Figure F16). Below 100 m CSF-A, thermal conductivity values fluctuate between 1.2 and 1.4 W/(m·K) to the bottom of the site.
Bulk density
Bulk density at Site U1474 was determined on whole-core sections using the STMSL and WRMSL (GRA density) and on discrete MAD samples. Changes in GRA and MAD bulk densities are well correlated throughout Hole U1474A (Figure F16). GRA bulk density values vary from 1.4 to 2 g/cm3, which are consistent with the mean MAD bulk density of 1.75 g/cm3. Densities generally increase downhole. The grain density is 2.75 g/cm3 on average and varies between 2.41 and 2.86 g/cm3.
Porosity
Porosities (Figure F16) decrease linearly downhole, with some dispersion likely due to lithologic controls, with relatively higher porosities (~72%) in the top of the sequence between 0 and 12.8 m CSF-A and ~50% porosity at the bottom (250 m CSF-A). This decreasing trend in porosity is likely the result of increasing sediment compaction with depth. Variations in bulk density also reflect the same compaction pattern.
Compressional wave velocity
The compressional P-wave velocity track data (Figure F15) were cleaned of outliers caused by section breaks. Velocities average 1550 m/s in the uppermost 5 m CSF-A of the site and drop to an average of ~1500 m/s between 5 and 8 m CSF-A. From 8 to 98 m CSF-A, velocities increase again from 1500 to 1630 m/s. From 98 m CSF-A to 200 m CSF-A, data exhibit lower variability (1600–1650 m/s) with some high-velocity excursions up to 1700 m/s. At 202 m CSF-A, P-wave velocities significantly drop to 1600 m/s before increasing again to 1700 m/s at the bottom of the hole. This trend is interrupted by another marked low-velocity zone between 246 and 250 m CSF-A, which may be related to drilling disturbance. In general, sandy layers exhibit significantly higher velocities compared to the surrounding finer grained sediment.
Diffuse reflectance spectrometry and digital color image
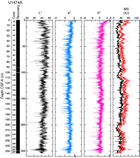
Spectral reflectance was measured on archive halves from Holes U1474A–U1474H using the SHMSL. In general, L* ranges from 30 to 50 and shows marked cyclic variability with a range of wavelengths throughout the record. These cycles are more pronounced below 110 m CSF-A (Figure F14). Color reflectance values for a* range between –1 and 5.5 and between –6 and 8 for b*. Higher frequency cycles and marked maxima in the reflectance values were observed in the mudline cores that correspond to the uppermost ~50 cm of lithostratigraphic Unit I (see Sedimentology). An abrupt step-like increase in a* values is observed at ~110 m CSF-A in Hole U1474A. A significant change in the character of L*, a*, and b* data occurring below 240 m CSF-A could be due to core drilling disturbances. The color reflectance variations are due to compositional changes (e.g., clay or nannofossil ooze concentration), but in the uppermost ~50 cm in Unit I of Hole U1474A, high a* and b* may be explained by redox reactions in a moving diagenetic window; in other words, perhaps the brown color is temporary and all the section would have looked like this interval when it was within the top 50 cm of sediment. Spectral reflectance data are very similar between holes.
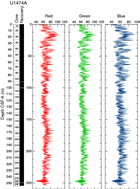
SHIL records of RGB color were taken from the moist surface of the archive halves of split cores. RGB data have average values of R = 66, G = 67, and B = 62 (Figure F17). RGB data occasionally show a marked artifact cyclic pattern along sections throughout the records due to track geometry during measurement and broadly correspond with the color reflectance L*.
Downhole temperature
In Hole U1474A, downhole temperature measurements were recorded for Cores 361-U1474A-4H, 7H, and 10H, but the results were compromised because of ship heave.
Summary
Despite the homogeneous lithology, the range of physical properties examined at Site U1474 show significant variations along the sediment column (Figure F18). Deeper than 12.8 m CCSF-A, estimated porosity values follow the expected decreasing trend to the bottom of the sequence, consistent with the influence of sediment compaction. Variations in GRA density also effectively reflect the inferred compaction pattern but also show some evidence for cyclicity. NGR and magnetic susceptibility markedly decrease from the top of the site to 10 m CCSF-A but then increase until 130 m CCSF-A. Below this depth they progressively decrease. This decreasing trend occurs in spite of further compaction, as revealed by bulk density, and thus likely reflects a decreasing abundance of clay minerals and magnetic minerals within the sediment relative to carbonates. Superimposed on the general trends are cyclic changes in NGR and color parameters, which are inferred to be related to the variable terrigenous versus biogenic sediment mixtures.
Micropaleontology
A 254 m thick sequence of recent to Miocene sediment was recovered at Site U1474. The sequence is biostratigraphically complete at the biozone level for planktonic foraminifers and calcareous nannofossils, although diatoms and radiolarians are present only in the mudline samples. The calcareous nannofossil assemblages show increasing fragmentation on Discoasteraceae and Ceratolithaceae and dissolution of the central area in placoliths downhole. The planktonic foraminifer fauna is commonly well preserved in the upper 200 m CSF-A of the section but then becomes dominated by fragments and dissolution-resistant forms deeper than 200 m CSF-A. Benthic foraminifers are present throughout the record in low abundance and are diverse. Preservation varies from moderate to well preserved. Siliceous fossils are composed almost exclusively of sponge spicules between 0 and 100 m CSF-A; below this depth siliceous fossils are not found.
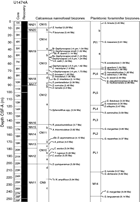
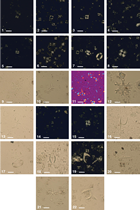
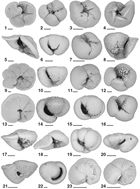
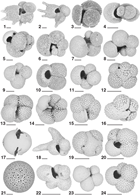
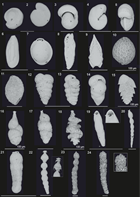
The calcareous nannofossil, planktonic foraminifer, and benthic foraminifer age assignments are in good agreement with each other and with the paleomagnetic time estimates. The integrated biostratigraphic zonation is shown in Figure F19 with calcareous nannofossils reported in Table T4 and planktonic foraminifer datums reported in Table T5. Calcareous nannofossil occurrences are presented in Table T6, planktonic foraminifer occurrences are shown in Table T7, and diatom occurrences are recorded in Table T8. Typical examples of calcareous nannofossil biozone markers are presented in Figure F20. Representative species of planktonic foraminifers in Site U1474 are shown in Figures F21 and F22. Benthic foraminifers are illustrated in Figure F23. The age-depth plot including the biochronology and magnetostratigraphic datums is discussed in Age model and is shown in Figure F41. The degree of reliability for each datum is based on distinct taxonomy, abundance, and consistency of occurrence through the identified range, ranging from 1 (>80% reliability) to 3 (< 50% reliability).
Table T4. Biostratigraphic datums for planktonic foraminifers, Hole U1474A. Download table in .csv format.
Table T5. Biostratigraphic datums for calcareous nannofossils, Hole U1474A. Download table in .csv format.
Table T6. Calcareous nannofossil occurrences, Hole U1474A. Download table in .csv format.
Table T7. Planktonic foraminifer occurrence and abundance based on examination of >150 µm fraction, Hole U1474A. Download table in .csv format.
Table T8. Diatom and other siliceous microfossil occurrences, Hole U1474A. Download table in .csv format.
Calcareous nannofossils
Calcareous nannofossil biostratigraphy is based on the analysis of the mudline sample, 29 core catcher samples, and 159 samples from selected intervals in the split-core sections in Hole U1474A. Two samples from the split-core Sections 361-U1474F-26F-3, 50 cm (209.8 m CSF-A), and 27F-3, 67 cm (214.6 m CSF-A) were analyzed for index markers in order to define the top of Biozone NN11 and Subzone CN9d. Nannofossils are abundant throughout the recovered sequence and show good to moderate preservation. A total of 61 late Miocene to recent species belonging to 25 genera are identified (for examples, see Figure F20). Assemblages are predominantly composed of tropical to subtropical taxa. However, temperate species such as Coccolithus pelagicus are found consistently in all the samples. Dissolution of the central area and/or overcalcification of rims for the smaller placoliths and caneoliths occur in the upper 43 m CSF-A, whereas fragmentation and overgrowth are common in the discoasters and large placolith species deeper than 74 m CSF-A to the bottom of the sequence. Etching is observed in some specimens of C. pelagicus, large gephyrocapsids, and reticulofenestrids. Reworked Paleocene to early Miocene species (Catinaster coalitus, Cyclicargolithus floridanus, Dictyococcites bisecta, Discoaster spp., Heliolithus kleinpellii, Reticulofenestra umbilica, Sphenolithus heteromorphus, and Scyphosphaera ventriosa) are found throughout Hole U1474A.
Calcareous nannofossil Biozones NN21 and CN15 (Late Pleistocene to recent) span from the mudline to Sample 361-U1474A-2H-3, 70 cm (9.1 m CSF-A), and are marked by the base occurrence of Emiliania huxleyi (<0.29 Ma). Scanning electron microscopy enabled us to confirm the identification of E. huxleyi, the presence of which can be uncertain under the light microscope. This interval consists of relatively high abundances of Florisphaera profunda and Gephyrocapsa oceanica. Nannofossil Biozone NN20 and Subzone CN14b are recognized on the continuous abundances of G. oceanica downcore and the absence of E. huxleyi and Pseudoemiliania lacunosa from Samples 2H-4, 70 cm (10.6 m CSF-A), through 2H-CC (14.65 m CSF-A). The top occurrence of P. lacunosa (0.44 Ma) in Sample 3H-1, 75 cm (15.65 m CSF-A), defines the top of Biozone NN19 and Subzone CN14a. The base of Subzone CN14a is represented by the top common occurrence of small Gephyrocapsa spp. (1.02 Ma) in Sample 5H-5, 75 cm (40.65 m CSF-A). The base reentrance of Gephyrocapsa spp. (>4 µm; 1.04 Ma) is also observed in Sample 5H-5, 75 cm, and marks the Subzone CN14a/CN13b boundary. This interval is also characterized by the dominance of Gephyrocapsa caribbeanica, whose relative abundance declines downcore compared to other species. The base common occurrence of Reticulofenestra asanoi (1.14 Ma) in Sample 6H-3, 75 cm (47.15 m CSF-A), is observed within Biozone NN19 and Subzone CN13b. Other bioevents recognized in these biozones are the top occurrence of Gephyrocapsa spp. (>5.5 µm; 1.24 Ma) and base of the acme of small Gephyrocapsa spp. (1.24 Ma) in Sample 6H-5, 75 cm (50.1 m CSF-A); the top occurrence of Helicosphaera sellii (1.34) in Sample 6H-CC (53.3 m CSF-A); and the base occurrence of Gephyrocapsa spp. (>5.5 µm; 1.62 Ma) and top occurrence of Calcidiscus macintyrei (1.6 Ma) in Sample 8H-2, 75 cm (64.7 m CSF-A). Sample 8H-5, 75 cm (69.1 m CSF-A), is assigned to Biozone NN19 or the top of Subzone CN13a based on the base occurrence of Gephyrocapsa (>4 µm; 1.73 Ma). The top occurrence of Discoaster brouweri (1.93 Ma) and Discoaster triradiatus (1.95 Ma) in Sample 9H-2, 75 cm (74.1 m CSF-A), assigns the sample to the Biozone NN19/NN18 or Subzone CN13a/CN12d boundary. The base common occurrence of D. triradiatus (2.14 Ma) in Sample 9H-4, 75 cm (77.1 m CSF-A), is in Biozone NN18 and Subzone CN12d. The Biozone NN18/NN17 or Subzone CN12d/CN12c boundary is identified in Sample 10H-4, 75 cm (86.65 m CSF-A), based on the top occurrence of Discoaster pentaradiatus (2.39 Ma), which is the earliest Pleistocene marker. Other species present in the Pleistocene sequence are Calciosolenia murrayi, Ceratolithus cristatus, Ceratolithus telesmus, Discosphaera tubifera, Hayaster perplexus, Helicosphaera carteri, Rhabdosphaera clavigera, and long-ranging taxa Calcidiscus leptoporus, Pontosphaera spp., Syracosphaera pulchra, Umbellosphaera irregularis, Umbellosphaera tenuis, Umbilicosphaera foliosa, and Umbilicosphaera sibogae.
The Pliocene/Pleistocene boundary at Site U1474 is defined by the top occurrence of Discoaster surculus (2.49 Ma) in Sample 10H-6, 50 cm (89.4 m CSF-A), which approximates the Biozone NN17/NN16 or Subzone CN12c/12b boundary and the top occurrence of Discoaster tamalis (2.8 Ma) in Sample 11H-2, 75 cm (93.15 m CSF-A), which defines the Subzone CN12b/12a boundary. Within Biozone NN16, the top occurrence of Sphenolithus spp. (3.54 Ma) in Sample 14H-4, 75 cm (124.6 m CSF-A), is in Subzone CN12a. The top occurrence of Reticulofenestra pseudoumbilicus (3.7 Ma) defines the top of Biozone NN15 and Subzone CN11b and is recorded in Sample 16H-5, 75 cm (145.1 m CSF-A). The top occurrence of Amaurolithus tricorniculatus (3.92 Ma), which is in Sample 17H-3, 75 cm (151.6 m CSF-A), defines the top of Biozone NN14. The base common occurrence of Discoaster asymmetricus (4.13 Ma) in Sample 18H-CC (167.16 m CSF-A) delineates the bottom of Biozone NN14 and Subzone CN11b. The top occurrence of Amaurolithus primus (4.5 Ma) in Sample 19H-4, 75 cm (172.2 m CSF-A), occurs in Biozone NN13 and marks the transition from Subzone CN11a to CN10c. Biozone NN12 and Subzone CN10b are defined by the top occurrence of Ceratolithus acutus (5.04 Ma), which is observed in Sample 20H-5, 75 cm (183.1 m CSF-A). The earliest Pliocene marker, the top occurrence of Triquetrorhabdulus rugosus (5.28 Ma), is found in Sample 21H-2, 75 cm (188.15 m CSF-A), and represents Biozone NN12 and Subzone CN10b. Among the marker species, the nannofossils identified in the Pliocene sequence are Amaurolithus delicatus, Ceratolithus armatus, Coronosphaera spp., Discoaster blackstockae, Discoaster calcaris, Discoaster challengeri, Discoaster pansus, Discoaster variabilis, Scyphosphaera globulata, Scyphosphaera pulcherrima, Sphenolithus abies, Umbilicosphaera rotula, and reworked species from the Paleocene and Miocene.
The Miocene Subzone CN10b/CN10a boundary is represented by the base occurrence of C. acutus (5.35 Ma) in Sample 21H-3, 75 cm (189.6 m CSF-A). The top occurrence of Discoaster quinqueramus (5.59 Ma) in Sample 22H-4, 70 cm (200.6 m CSF-A), defines the top of Biozone NN11 and Subzone CN9d. Toward the bottom of the sequence, the top common occurrence of Nicklithus amplificus (5.94 Ma) in Sample 25H-1, 75 cm (222.75 m CSF-A), determines the boundary between Subzones CN9d and CN9c.
Planktonic foraminifers
Planktonic foraminifers were examined in core catcher samples from Hole U1474A, supplemented with 10 cm3 samples taken from split core halves in this hole at a resolution of ~1 per section for a total of 160 samples. Intervals of core disturbance sometimes prevented sampling from parts of Hole U1474A. The samples from the section halves were dried before washing, greatly improving the quality of the resulting foraminifer residues compared to the rapidly processed core catcher samples. Planktonic foraminifers are present throughout the recovered sequence, and assemblages are typically diverse and characterized by a mixture of subtropical species, taxa from the subtropical convergence zone, and even some subpolar forms such as Neogloboquadrina pachyderma (sinistral). Examples of the major foraminifer taxa present at Site U1474 are illustrated in Figures F21 and F22. Foraminifer residues typically constitute 5%–10% of the total coarse sediment volume (>63 µm), although the coarse fraction falls notably to <1% of the total sediment in Core 361-U1474A-19H (~167 m CSF-A) and deeper to the bottom of the recovered sequence. Foraminifer preservation varies widely, from semi-glassy, translucent specimens in much of the Pleistocene sequence to samples dominated by chamber fragments, dissolution-resistant species, and benthic foraminifers in the Miocene sequence. Foraminifers typically have empty tests without overgrowths or recrystallization.
The Pleistocene Biozone Pt1 sequence (0–1.88 Ma) extends from the mudline to Sample 361-U1474A-8H-4, 70–72 cm (67.66 m CSF-A). Within Biozone Pt1, we recognize a series of datums, including the base occurrence of Globorotalia hirsuta in Sample 1H-3, 70–72 cm (3.71 m CSF-A), which we regard as unreliable given its shallow position relative to the associated calcareous nannofossil and paleomagnetic datum levels. We identified the top occurrence of Globorotalia tosaensis (0.61 Ma) in Sample 4H-3, 70–72 cm (28.11 m CSF-A), marking the Subzone Pt1a/Pt1b boundary, and the top occurrence of Neogloboquadrina acostaensis (1.58 Ma) in Sample 7H-4, 70–72 cm (58.11 m CSF-A). Globoturborotalita apertura has its top occurrence (1.64 Ma) in Sample 8H-2, 70–72 cm (64.76 m CSF-A). This species is found as shallow as Sample 7H-7, 70–72 cm (62.61 m CSF-A), as solitary individuals, and its top occurrence has some ambiguity in the sequence of datums at Site U1474. Finally, the base of Subzone Pt1a is marked by the top occurrence of Globigerinoides fistulosus (1.88 Ma) in Sample 8H-4, 70–72 cm (67.66 m CSF-A). Globigerinoides fistulosus is a regular component of assemblages as deep as Sample 13H-5, 70–72 cm (116.63 m CSF-A), but tends to be removed by dissolution; indeed, the top occurrence of G. fistulosus is recorded by a single chamber with the characteristic tubulospines in an otherwise partly dissolved and fragmented foraminifer assemblage.
Besides the biozone markers, the Biozone Pt1 sequence is characterized by a diverse tropical to warm subtropical foraminifer assemblage typically found in surface western boundary currents (Table T7). Typical species include Globorotalia inflata, Pulleniatina obliquiloculata, Globigerinoides ruber (both white and pink forms), Neogloboquadrina dutertrei, Globigerinoides sacculifer, Orbulina universa, Globigerinella siphonifera, Globorotalia truncatulinoides, and Globorotalia tumida. Also present are distinctive elements such as N. pachyderma (dextral), Globigerinella calida, Globigerina falconensis, Turborotalia quinqueloba, and heavily crusted forms of Globorotalia crassaformis and G. tosaensis.
The early Pleistocene is represented by Biozone PL6 and the uppermost part of Biozone PL5. The sequence of calibrated datums includes the base occurrence of G. truncatulinoides (1.93 Ma) in Sample 9H-2, 70–72 cm (74.11 m CSF-A), the top occurrence of Globigerinoides extremus (1.98 Ma) in the same sample, and the top occurrence of Globoturborotalita woodi (2.30 Ma) in Sample 9H-4, 70–72 cm (77.11 m CSF-A). The Biozone PL6/PL5 boundary is represented by the top occurrence of Globorotalia pseudomiocenica (2.39 Ma) in Sample 9H-6, 70–72 cm (80.11 m CSF-A), where G. pseudomiocenica co-occurs with the top occurrence of Globorotalia limbata and top occurrence of Globorotalia multicamerata (2.98 Ma). The top occurrences of G. pseudomiocenica and G. multicamerata are calibrated at 2.39 and 2.98 Ma, respectively, by Wade et al. (2011), suggesting that there may be a hiatus or reworking of these species. We regard the top occurrence of G. multicamerata as unreliable; not only is this datum event at variance with other biostratigraphic and magnetostratigraphic events, but it is also based on the rare and discontinuous occurrence of G. multicamerata, which is basically an eight-chambered variant of G. pseudomiocenica. The lower part of Biozone PL5, within the Pliocene, is marked by the base occurrence of G. fistulosus (3.33 Ma) in Sample 13H-5, 70–72 cm (116.63 m CSF-A), and the base occurrence of G. tosaensis (3.35 Ma) in Sample 13H-6, 70–72 cm (118.11 m CSF-A). Both the base occurrences of G. fistulosus and G. tosaensis datums are not particularly reliable because of only occasional occurrences near their origination points.
The biota of Biozone PL6 includes abundant G. ruber, G. inflata, and N. dutertrei accompanied by G. truncatulinoides, G. menardii, P. obliquiloculata, and N. acostaensis. Biozone PL5 has a similar biota with the addition of G. pseudomiocenica, G. multicamerata, and heavily crusted representatives of Globoconella sphericomiozea, G. crassaformis, and G. inflata. With relatively few exceptions, foraminifers are well preserved and common to abundant.
The middle Pliocene is indicated by Biozones PL4 and PL3. The transition between Biozones PL5 and PL4 is marked by the distinctive top occurrence of Dentoglobigerina altispira (3.47 Ma) in Sample 13H-6, 70–72 cm (118.11 m CSF-A). The transition between Biozones PL4 and PL3 is documented by the top occurrence of Sphaeroidinellopsis seminulina (3.59 Ma) in Sample 14H-CC (129.1 m CSF-A). Carbonate preservation as well as planktonic foraminifer abundance notably decreases between Sample 15H-3, 70–72 cm (132.63 m CSF-A), and the bottom of Hole U1474A. The co-occurrence of D. altispira and S. seminulina indicates that the sediment in Sample 13H-6, 70–72 cm, is older than 3.59 Ma.
The associated fauna in Biozone PL4 (Table T6) includes abundant Pulleniatina primalis and G. ruber along with common G. siphonifera, G. sacculifer, G. tumida, and Globigerina bulloides along with rare but consistent representation by D. altispira, G. pseudomiocenica, and G. sphericomiozea. The latter, along with Globoconella puncticulata and G. crassaformis oceanica, are typically heavily crusted and represent taxa typical of the subtropical convergence zone south of the Natal Valley. Biozone PL3 has a biota similar to that of Biozone PL4 with the addition of S. seminulina and the occasional presence of N. pachyderma (sinistral), also suggestive of incursions of cool-water fauna into an otherwise subtropical assemblage.
The boundary between Biozones PL3 and PL2 is represented by the top occurrence of Globorotalia margaritae (3.85 Ma) in Sample 17H-3, 74–76 cm (151.65 m CSF-A). Samples 17H-5, 70–72 cm, and 17H-6, 70–72 cm (154.63 and 155.7 m CSF-A), contain an unusual occurrence of G. tumida flexuosa, a species normally found in mid-Pleistocene sections, which might be evidence of reworked sediment. The top occurrence of P. primalis (3.66 Ma) was identified in Sample 10H-6, 70–72 cm (89.61 m CSF-A); this datum was found considerably shallower in the recovered sequence than expected, suggesting reworking or miscalibration of the datum.
The most abundant species in Biozone PL2 are G. extremus, G. sacculifer, and G. tumida along with N. acostaensis, G. woodi, and G. bulloides. Distinctive secondary elements include D. altispira, N. dutertrei, G. margaritae, S. seminulina, and Globoquadrina venezuelana. Species typical of the subtropical convergence are present in Biozone PL2, such as Globoconella conomiozea, G. puncticulata, and G. sphericomiozea. Preservation tends to fall off in Biozone PL2, with increasing fragmentation and reduction in the numbers of large specimens as well as an overall decrease in numbers of specimens.
The boundary between Biozones PL2 and PL1 occurs in Sample 18H-6, 70–72 cm (165.65 m CSF-A), with the top occurrence of Globoturborotalia nepenthes (4.37 Ma). The top occurrence of Globorotalia cibaoensis represents a discrete occurrence in Sample 24H-CC (221.97 m CSF-A), indicating the middle of Biozone PL1. The base of Biozone PL1 and top of late Miocene Biozone M14 occurs at the base occurrence of G. tumida (5.57 Ma) in Sample 23H-5, 70–72 cm (211.60 m CSF-A). In the Miocene, we find a quick succession of datums, including the top occurrence of Globoquadrina dehiscens (5.92 Ma) in Sample 23H-CC (214.9 m CSF-A) and the top occurrence of G. margaritae (6.08 Ma) in Sample 27H-3, 70–72 cm (243.37 m CSF-A). We also find Globorotalia paralenguaensis, with a calibrated top occurrence of 6.02 Ma (Gradstein et al., 2012), in Sample 27H-1, 70–72 cm (240.61 m CSF-A). Finally, the top occurrence of Globorotalia lenguaensis (6.14 Ma) occurs in Sample 28F-2, 70–72 cm (246.03 m CSF-A), marking the top of Miocene Biozone M13.
In addition to the biozone markers, the Miocene sequence is characterized by diverse tropical to warm subtropical foraminifer species that became extinct in the early Pliocene. Typical species include Globoturborotalia obliquus, Globoturborotalia decoraperta, Globorotalia plesiotumida, Globorotalia conomiozea, Globorotalia pliozea, G. venezuelana, and Sphaeroidinellopsis kochi. Planktonic foraminifer assemblages are almost entirely poorly preserved and sparse. Nonetheless, some of the small individuals can still be found with glassy tests, such as G. lenguaensis and G. paralenguaensis, as well as small specimens of Globorotalia pleisotumida and Globorotalia merotumida.
Siliceous microfossils
Diatoms, silicoflagellates, radiolarian fragments, phytoliths, and sponge spicules make up a minor component of mudline samples and exhibit good to poor preservation (Table T8). The diatom assemblage is characteristic of the modern Indian Ocean assemblage described in Schrader (1974), which includes Asterolampra marylandica, Asteromphalus arachne, Asteromphalus sp., Azpeitia africana, Azpeitia nodulifera, Hemidiscus cuneiformis, Nitzschia marina, Rhizosolenia bergonii, Thalassionema nitzschioides, Thalassiothrix longissima, and Triceratium cinnamomeum. Other taxa present are Bacteriastrum elongatum, Bacteriastrum furcatum, Diploneis bombus, Ethmodiscus rex fragments, Navicula sp., and Odontella sp. The silicoflagellate Dictyocha aculeata aculeata also helps support the modern age of this mudline assemblage. Additionally, the presence of Fragilariopsis kerguelensis, a Southern Ocean diatom, suggests some influence of northward bottom water transport at Site U1474. The trace presence of phytoliths suggests either freshwater input and/or wind transportation.
Siliceous microfossils in core catcher samples are almost exclusively sponge spicules, which are etch-pitted and exhibit poor preservation. Radiolarian fragments are present in trace amounts and exhibit poor preservation. Sponge spicules are rare to trace between 0 and 100 m CSF-A, below which spicules are no longer observed. Sediment deeper than 100 m CSF-A is barren of siliceous microfossils.
Benthic foraminifers
The occurrence of benthic foraminifers is based on the analysis of 23 core catchers and 6 samples from the working half of Core 361-U1474A-4H. The abundance of benthic foraminifers is generally low; however, the record is continuous throughout the hole. The paleoenvironmental implications presented below are based on the most common species and preservation state.
Characteristics
The relative occurrence of benthic foraminifers is small compared to planktonic foraminifers; however, species diversity is high. Preservation is good to moderate in Samples 361-U1474A-1H-CC through 21H-CC. Preservation is poor in Samples 22H-CC through 28H-CC. Suborders of Textulariina, Miliolina, Lagenina, and Rotaliina were found. Most common species documented in Figure F23 are Melonis affinis and Melonis barleeanum, Stilostomella spp., Uvigerina spp., Oridorsalis umbonatus, Fissurina sp., Kariella bradyi, Gyroidina sp., Globocassidulina subglobosa, Bolivinita quadrilatera, Cibicidoides spp., Nodosaria spp., Pleurostomella alternans, Pyrgo spp., Quinqueloculina spp. and Fursenkoina spp.
Paleoenvironment
The benthic assemblage indicates lower bathyal to upper abyssal (1000–3000 m) water depths throughout the record. Low-O2 and/or high–organic carbon input group species were found (Bolivina, Bulimina, Chilostomella, Fursenkoina, Globobulimina, Rutherfordoides, and Uvigerina). The abundance of Uvigerina spp. and other low-O2 indicator species is high in Sample 12H-CC, potentially indicating less-ventilated bottom water at that interval.
The low abundance of Bulimina spp. might suggest reduced organic matter flux despite low-O2 conditions. The continuous presence of Planulina wuellerstorfi, which is an indicator species of low to intermediate organic flux, supports this assumption.
In general, based on the evidence in the evaluated core catcher samples, there is no evidence of transported shallow-water (shelf) benthic foraminifers and no obvious sorting of foraminifers on test size and shape that may be indicative of gravity flows. The Stilostomella group of infaunally living, elongate, cylindrical foraminifers was present in samples up to Section 361-U1474A-4H-4 (29.6 m CSF-A). This group is known to have their greatest abundances in poorly ventilated, low-O2 environments and to have become globally extinct between 0.7 and 0.58 Ma. The last occurrence of this group in Hole U1474A fits well into this time frame, as the paleomagnetic results indicate the Brunhes/Matuyama Chron reversal at 0.78 Ma occurs in Section 4H-5 (31.4 m CSF-A).
Paleomagnetism
Discrete sample measurements
Discrete sediment samples (N = 76; Table T9) from Hole U1474A and two additional samples from the oxidized core top of Hole U1474C were initially analyzed for magnetic susceptibility and anisotropy of magnetic susceptibility (AMS). Subsequently, natural remanent magnetization (NRM), alternating field (AF) demagnetization, and isothermal remanent magnetization (IRM) acquisition experiments were performed.
Table T9. Analyzed discrete whole-round samples, Site U1474. Download table in .csv format.
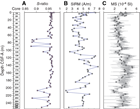
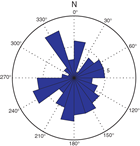
The volumetric magnetic susceptibility determinations on the discrete samples are in close agreement with the magnetic susceptibility measurements from passing the cores through the loop sensor (Figure F24C). AMS results for discrete samples are summarized in Table T10 and displayed in Figure F25. Eigenvalues associated with the maximum (τ1), intermediate (τ2), and minimum (τ3) magnetic susceptibility were calculated with the PmagPy application developed for Python (Tauxe et al., 2016). The eigenvalues, degree of anisotropy, foliation, and lineation indicate that the sediment bears depositional magnetic fabrics that are oblate with the vertical axes of minimum magnetic susceptibility (Figure F25A–F25C). Eigenvalues of minimum (τ3) magnetic susceptibility divert from the maximum and intermediate (τ1and τ2) eigenvalues with depth (Figure F25A). The minimum principal eigenvector (V3) shows steep inclinations below ~30 m CSF-A in Hole U1474A, which can probably be attributed to compaction of the sediment (Figure F25D). The declination of the maximum magnetic susceptibility (V1) corrected for core orientation might reflect the direction of bottom currents during sediment deposition and suggests that the bottom currents were highly variable over the last ~5 my (Figures F25, F26). However, shore-based analyses should be conducted to replicate the AMS experiments in a low-noise environment.
Table T10. Overview of AMS data, Site U1474. Download table in .csv format.
The S-ratio, a proxy for low- versus high-coercivity magnetic minerals, is very similar for all samples in Hole U1474A except for an interval between 70 and 82 m CSF-A (Cores 361-U1474A-8H through 10H; Figure F24A), and the magnetic inventory is mainly dominated by low-coercivity minerals, most likely magnetite. Saturation IRM (SIRM) is between 2 and 5 A/m for all samples (Figure F24B). The overall high SIRM values in Hole U1474A suggest that ferrimagnetic iron oxides are largely unaffected by reductive diagenesis. Below 110 m CSF-A, magnetic susceptibility and SIRM increase, indicating even slightly higher ferrimagnetic mineral contents.
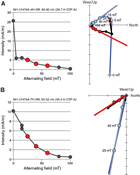
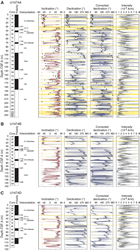
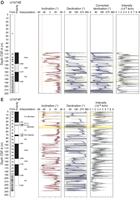
NRM inclinations are typically steep down (~90°) as a result of a magnetic overprint induced by the drill string. Figures F27A and F27B display the demagnetization behavior of two representative discrete samples. Drill string magnetization is generally removed after AF demagnetization of 25 mT. Subsequent demagnetization steps show a stable characteristic remanent magnetization (ChRM). Demagnetization data of discrete samples were further analyzed by principal component analyses (PCA), using the DAIE package (Sagnotti, 2013). The ChRM was computed using PCA for demagnetization steps between 25 and 60 mT and plotted together with the section-half data in Figure F28A. For the used steps, most of the samples have median angular deviations <20°, indicating stable ChRMs. The inclination for the uppermost samples is normal polarity, which is in agreement with the present-day inclination of –62.7° at the geographical location of Site U1474 (vertical dashed red lines in Figure F28), and further downcore signify zones of reversed and normal polarities.
Archive-half measurements
Archive halves of cores recovered from Holes U1474A–U1474H were measured using the shipboard pass-through magnetometer at 4 cm resolution. We only show downhole data for Holes U1474A, U1474B, and U1474D–U1474F (Figure F28) because Holes U1474C and U1474H only cover the uppermost meters of the sedimentary sequence and do not contain significant magnetostratigraphic information. Sediment cores were progressively demagnetized at 15 and 25 mT. No higher magnetic fields were applied because a secondary magnetization overprint imparted during drilling was sufficiently removed after the 25 mT step (cf. Figure F26). NRM intensities are on the order of 10–3 A/m (Figure F28). Core orientation data were acquired by the Icefield MI-5 core orientation tool for Holes U1474A (Cores 1H through 22H), U1474B (Cores 2H and 12H through 15H), U1474D (Cores 1H through 14H), and U1474E (Cores 2H, 3H, and 5H through 8H). For the remaining cores from these holes, orientation data were not properly recorded, probably due to damage to the Icefield MI-5 tool, possibly related to vibrations of the drill pipe by the strong currents at this site. As a consequence, no attempt was made to record the orientation of cores from Holes U1474F–U1474H. Where orientation data were available, the correction factor for the declination that was output by the Icefield MI-5 tool needed to be subtracted by 180° to provide true declinations of ~0° during the Brunhes Chron, recorded in the uppermost part of the holes. Corrected declinations with respect to core orientation are plotted in a separate panel (Figure F28). The declination records show downcore changes in individual cores that might be related to twisting of the liners during coring and/or core extraction.
In the upper ~30 m CSF-A, inclinations are close to the present-day inclination of –62.7° (Figure F28). Some core tops and ends are affected by fall-in and sucking of sediment, which often have steep negative inclinations that were not removed during AF demagnetization at 25 mT. Characteristic steep negative inclination combined with visual core descriptions of coring disturbance allowed the identification of these artifactual directional data (yellow horizontal bars in Figure F28). The cores contain frequent fine sand layers, probably related to downslope transport and/or winnowing. In cases where the layers are thicker than ~5 cm, they distort the directional record, which is attributed to the response function and effective sensor length (9 cm) of the z-component superconducting quantum interference device (Richter et al., 2007). Besides the mentioned disturbances, inclination data are of excellent quality and allowed clear distinctions of polarity zones that are linked to magnetic (sub)chrons. Additionally, the inclination record of Hole U1474A shows overall good agreement with the directional record of the discrete samples, which were taken from the middle, least disturbed part of the sediment cores (Figure F28A).
Magnetostratigraphy
The Brunhes/Matuyama (0.781 Ma) boundary is recorded in Hole U1474A. In Holes U1474B and U1474D–U1474F, it was not recovered due to coring gaps, and only estimates for the boundary can be given in Table T11 (Figure F28). Normal inclinations associated with the Jaramillo (C1r.1n; 1.072–0.988 Ma) and Olduvai (C2n; 1.945–1.778 Ma) Chrons are documented in Holes U1474A, U1474B, U1474D, and U1474F. The Olduvai interval is thicker in Hole U1474D compared to the other holes because of a thick (~1.7 m) sand interval that correlates to thinner layers in the other holes (Figure F25).
Table T11. Polarity zone boundaries, Site U1474. Download table in .csv format.
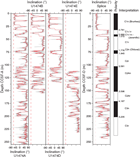
The Matuyama/Gauss polarity transition (2.581 Ma) was identified in the inclination records from all holes. Within the Gauss Chron, two intervals of reversed polarity were recorded in Holes U1474A, U1474B, and U1474F. Hole U1474D only covers the shallower interval, and Hole U1474E only covers the deeper polarity zone. These intervals probably correspond to the C2An.1r (Kaena; 3.116–3.032 Ma) and C2An.2r (Mammoth; 3.330–3.207 Ma) Subchrons (Figure F28). However, an in-depth evaluation of sedimentary features and paleomagnetic data will be required to verify this preliminary interpretation. The Gauss/Gilbert polarity transition (3.596 Ma) is apparent in Holes U1474A, U1474B, and U1474F. In Holes U1474A, U1474B, U1474E, and U1474F, the Gilbert Chron can further be divided into phases of reversed and normal polarity. In accordance with biostratigraphy, we assigned these intervals to the C2Ar (4.187–3.596 Ma), C3n (5.235–4.187 Ma), and C3r (6.033–5.235 Ma) Chrons. The lower boundary of the C3r (Gilbert) Chron was not identified. Figure F29 summarizes the polarity reversals on the CCSF-A depth scale and shows the spliced inclination record. The assignment of polarity chrons is supported by biostratigraphy (Figure F19). Based on polarity zones, accumulation rates are fairly constant at ~4 cm/ky over the last 3.5 my; previously, accumulation rates were slightly lower.
Stratigraphic correlation
Eight holes were drilled at Site U1474 using the APC and HLAPC systems to recover a complete section ranging from at least 5 Ma to present at the highest possible resolution. Strong surface currents and strong winds created difficult coring conditions. Because of resulting core disturbances as well as the sporadic occurrences of sandy layers (see Sedimentology), the stratigraphic quality of the cores varied considerably among holes. For example, the uppermost 1.5 m sections of most cores in Hole U1474A were soupy and generally unusable for stratigraphic purposes. Also, several APC cores taken near the bottom of the recovered sequence achieved only partial strokes and sucked in as much as 2 m of homogeneous sediment at their base (e.g., Cores 361-U1474A-21H and deeper). Finally, the sandy layers led to some instances of highly variable within-core distortion of the sedimentary sequence among holes due to differential recovery. Nevertheless, despite these adverse conditions, an unambiguously complete section was recovered from the mudline in Core 361-U1474F-1H to the base of Core 361-U1474E-14H at 212 m CCSF-A (see Stratigraphic correlation in the Expedition 361 methods chapter [Hall et al., 2017] for an explanation of depth scales). Ambiguous evidence exists for two (likely modest) coring gaps between Cores 361-U1474E-14H and 15H and between 15H and 16H because no alternate hole with which to overlap these core boundaries was drilled. Assuming that these gaps are small (<1 m), a complete succession extends to 237 m CCSF-A. A complete spliced sequence was constructed that comprised correlated sections of Holes U1474F (which provides the mudline anchor), U1474D, and U1474E and some intervals of Hole U1474A. These holes were used as the basis for the spliced sequence because the core quality was optimal and the shipboard sampling was minimal. Cores from Hole U1474B were placed on the CCSF-A depth scale but did not contribute to the splice because this hole was dedicated to whole-round interstitial water samples.
Compositing of holes
As a guide for drilling (to avoid coring gap alignment), sequences from all holes were composited in near-real-time using magnetic susceptibility data from the Special Task Multisensor Logger (see Physical properties in the Expedition 361 methods chapter [Hall et al., 2017] for details) measured at 2.5 cm resolution. In several instances, the drilling operations created somewhat unusual core lengths. For example, bad weather forced abandonment of Hole U1474D, and Hole U1474E coring resumed a few meters above the base of Hole U1474D. The first interval of Hole U1474E is officially composed of a 105 m long washed section. In other cases, drilling advanced several meters beyond recovery to avoid alignment of coring gaps among holes, and, by IODP convention, this also created short (~2 m) washed drilled intervals. Finally, the expanded and disturbed first section of many cores and the suck-in at the base of the cores with partial strokes led to persistent instances of apparently overlapping intervals between cores on both the CSF-A and the CCSF-A scales. Overlaps on the CSF-A scale are common for any sediment coring expedition, but overlaps on the CCSF-A scale are relatively unusual. Apparent overlapping intervals between cores were avoided in the construction of the splice (see below).
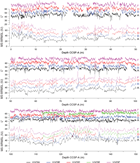
Final compositing in preparation for splice construction used a combination of magnetic susceptibility data from the STMSL, NGR (10 cm resolution), and spectral reflectance L* (1–2 cm resolution) (Figure F30). The relative depth offset of each core was determined by the optimized correlation of these three variables (Figure F31), with the top of Hole U1474F serving as the anchor (zero depth point). These depth offsets are reported in affine Table T12. For those cores that did not contribute to the shipboard splice, core depth offsets were determined by choosing stratigraphic tie points as close as possible to the top of each core. The variable within-core stretching of sequences implies that single depth offsets will result in inevitable misalignment of features that are clearly correlative among holes. Therefore, for those cores not in the splice the correlation of features is arbitrarily best near the top of the cores. This is an essential consideration for applying age data derived from paleomagnetism and paleontology, which were mainly derived from Hole U1474A, to the spliced intervals.
Table T12. Affine table, Site U1474. Download table in .csv format.
Construction of the splice
Once the composite depth scale was created, selected sequences from Holes U1474A and U1474D–U1474F were spliced together to create a complete and representative section (Figure F32). Detailed sedimentological logs were consulted in the process of splice construction to avoid inclusion of any obviously disturbed sections and/or sections with completely unique features (relative to the other holes). The end result is reported in the splice interval Table T13. The splice constitutes a continuous sequence with a total length of at least 212 m CCSF-D and, possibly, up to 237 m CCSF-D. Inspection of the spliced magnetic susceptibility, L*, and NGR records demonstrates that the splice-tie boundaries do not create gaps or repeated intervals within the spliced section. Below 212 m CCSF-D, coring gaps of unknown length prevent further robust extension of a continuous splice. In general, below 212 m CCSF-D the combination of (1) the possible presence of coring gaps, (2) the less-than-optimal core quality, and (3) the poor overall confidence in the stratigraphic ties supports this judgment. However, above this depth, confidence in the splice ties is high because of the rich structure of the magnetic susceptibility records.
Table T13. Splice interval table, Site U1474. Download table in .csv format.
Geochemistry
Chemical compositions of headspace gases, interstitial water, and bulk sediment were investigated at Site U1474. Sampling for shipboard analyses largely focused on Hole U1474A. A dedicated high-resolution interstitial water sampling campaign was conducted in Hole U1474B. Downhole profiles of interstitial water chemistry largely reflect postdepositional microbially mediated reactions driven by the relatively modest deposition of organic carbon. Sedimentary carbonate contents are nearly constant around 40 wt%, with the exception of low values within sandy layers and diagenetically altered burrow linings (Table T14).
Table T14. Carbonate, total organic carbon, and total nitrogen data, Holes U1474A and U1474F. Download table in .csv format.
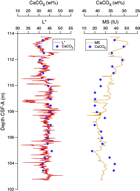
Interstitial water was squeezed from 5 cm whole rounds at ~3 m resolution from 0 to 23.35 m CSF-A in Holes U1474A and U1474B, ~9 m resolution between 23.35 and 204.39 m CSF-A in Hole U1474A, and one final sample at 230.57 m CSF-A, also in Hole U1474A. A total of 23 samples were collected from Hole U1474A, and 5 samples were collected from Hole U1474B for shipboard analysis of interstitial water chemistry (Table T15). An additional 90 interstitial water samples from Hole U1474B were collected for shore-based analysis of δ18O and Cl– to accomplish the objectives of the ancillary project letter (APL-845). Of all the interstitial water whole rounds taken, three samples from Hole U1474B were archived as part of the core rather than being squeezed because they were compromised (either by drilling disturbance or because they intersected intervals containing fine sandy sediment). No Rhizon samples were taken at Site U1474. Bulk sediment samples from Hole U1474A were measured for total organic carbon (TOC) and total inorganic carbon (TIC) content at ~9 m resolution. An additional 21 samples were selected from Cores 361-U1474F-12H and 13H and analyzed for TIC content as part of an effort to calibrate the Section Half Multisensor Logger (SHMSL) data to calcium carbonate content.
Table T15. Interstitial water geochemistry results, Holes U1474A and U1474B. Download table in .csv format.
Sedimentary hydrocarbon gases
Headspace gas samples were collected from each core in Hole U1474A, 28 samples in total. In all samples, CH4 was the dominant hydrocarbon and it remained near background concentrations throughout the 252 m of Hole U1474A. A slight decrease in concentrations occurs from ~3 ppm at the top of the core to 1.5 ppm at the base of the cored interval.
Interstitial water chemistry
Salinity, chlorinity, sodium, magnesium, and potassium
Salinity, chloride, and sodium at 35 and 554.349 and 479.7 mM, respectively, are near seawater values in the uppermost samples and decrease downhole (Figure F33). There is a slight chloride maximum at ~25 m CSF-A in Hole U1474A, likely the result of diffusion of higher salinity water from the Last Glacial Maximum (Adkins, 2002). Chloride measurements show some scatter, with one anomalously high but reproducible value in Sample 361-U1474A-10H-5, 145–150 cm (88.85 m CSF-A). Comparison of the chloride and magnetic susceptibility data suggests that some of this scatter could be associated with the presence of sandy layers, where chloride concentration decreases toward modern seawater values near the sand likely as a result of the associated higher porosity. Sodium, magnesium, and potassium concentrations show a slight peak in Hole U1474A at 7.7 m CSF-A and then decrease linearly with depth with little variability.
Alkalinity, phosphate, nitrate, and pH
Alkalinity in the uppermost sample (361-U1474B-1H-2, 140–145 cm) is 3.84 mM; deeper it increases to a maximum of 6.61 mM at 52.35 m CSF-A in Hole U1474A and then decreases through the rest of the hole to a minimum of 1.2 mM at 230.57 m CSF-A (Figure F34). The phosphate profile closely resembles the alkalinity profile. Phosphate concentrations are 2.6 µM in the first sample (1H-2, 140–145 cm), increase to 8.1 µM at 52.35 m CSF-A, and then decrease toward zero by 156.54 m CSF-A in Hole U1474A. The calibration range of phosphate standards was not optimal for such overall lower concentrations, resulting in poor constraint of the detection limit. The relationship between phosphate and alkalinity is likely related to the processes controlling the production and consumption of both alkalinity and PO43–. Respiration of organic matter, assuming a generic organic matter composition of (CH2O)106(NH3)16(H3PO4), produces both HCO3– (a major constituent of alkalinity) and PO43–. Production of alkalinity and PO43– appears to peak around 50 m CSF-A in Hole U1474A. Below this depth, alkalinity and PO43– decrease, likely due to the consumption of HCO3– and PO43– in authigenic mineral phases, including manganese carbonates and phosphate minerals (Gieskes, 1974). The downhole nitrate profile is significantly impacted by core disturbance and possible contamination from drilling fluid through the sand layers. Nitrate decreases from 14 to 5 µM between 3.96 and 21.653 CSF-A in Hole U1474A, typical of suboxic nitrate reduction by denitrifying bacteria (not shown). Below this interval, nitrate concentrations are high and variable, close to bottom water values, indicative of sample contamination. pH starts at 7.65 in the uppermost sample and reaches a maximum of 7.87 at 128.079 m CSF-A, and then decreases to 7.60 at the base of the section (230.57 m CSF-A) (Figure F34). This pH increase could be driven by anaerobic microbial respiration processes, which tend to add more alkalinity than dissolved inorganic carbon (DIC) to interstitial water. For seawater, increasing the ratio of alkalinity to DIC causes pH to increase.
Iron and manganese
The dissolved iron and manganese profiles are relatively similar, with maximum concentrations observed at 3.96 m CSF-A (Sample 361-U1474A-1H-3, 96–101 cm) that then decrease to near-zero values by ~100 m CSF-A (Figure F35). Both metals are redox sensitive and are released during microbially mediated reductive dissolution of the ferrous manganese oxyhydroxide coatings. High concentrations of dissolved Fe and Mn in the shallowest interstitial water samples collected suggest that the low-oxygen conditions required for reductive dissolution are reached within the upper ~3–4 m of the sediment column. Decreasing dissolved manganese concentration with depth reflects its combination with HCO3– and formation of manganese carbonate minerals (Calvert and Pedersen, 1994). The removal of dissolved iron likely reflects the formation of iron sulfides. Abundant black sulfide streaks are apparent on the surface of the cores throughout, likely as a result of accelerated sulfate reduction within the lining of burrows from bioturbating organisms.
Sulfate and barium
Sulfate concentrations are 27.3 mM in the first sample (361-U1474B-1H-2, 140–145 cm), near average seawater concentrations, and they decrease steadily in a concave-downward profile downhole to 2.71 mM at 230.57 m CSF-A (Figure F35). This is likely the result of microbial sulfate reduction, in which sulfate is used as an electron receptor in the anaerobic oxidation of organic matter:
53 SO42– + (CH2O)106(NH3)16(H3PO4) → 39 CO2 + 67 HCO3– + 16 NH4+ + 53 HS– + 39 H2O + HPO42–.
In sediment where sulfate reduction is rapid and intense, barite (BaSO4) will dissolve. At Site U1474, barium concentrations are below detection limits in all but two samples in the uppermost 60 m of Hole U1474A. Below 60 m CSF-A, barium increases with depth to a maximum concentration of 2.9 μM at 204.39 m CSF-A, implying no significant barite dissolution (Figure F35).
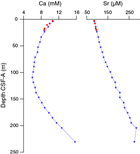
Calcium and strontium
The concentration of calcium in interstitial waters decreases from 10.669 mM, near typical seawater values, in the uppermost sediment to a minimum concentration of 6.0 mM at 109.42 m CSF-A in Hole U1474A and then increases to a maximum of 15.7 mM in the deepest sample (230.57 m CSF-A) (Figure F36). Removal of dissolved calcium is likely due to the precipitation of calcium carbonate in the upper 100 m of Hole U1474A as a result of the high alkalinity. Below ~100 m CSF-A, dissolution of calcium carbonate likely becomes favorable, possibly due to the small decrease in pH, which leads to the observed increase in dissolved calcium concentrations below ~100 m CSF-A. Strontium concentrations increase linearly with depth from 85 μM at the top of the hole (2.9 m CSF-A) to a maximum concentration of 284 μM at 204.39 m CSF-A (Figure F36).
Silicon, lithium, and boron
Silicon concentrations are highest (>450 μM) in the upper 71.35 m of Hole U1474A, with a maximum in concentration of 631 μM at 33.35 m CSF-A, below which values decrease gradually to 71.35 m CSF-A. Between 71.35 and 80.85 m CSF-A, silicon decreases rapidly by 200 μM. In the lower portion of the profile, silicon concentrations gradually decrease with depth to ~130 m CSF-A and then remain relatively stable around 177 ± 17 μM (Figure F37). This step-like change mid-hole suggests a change in lithology, either in clay mineralogy or biogenic silica contents, with a more important source of silicon present in the upper ~70 m CSF-A. The overall pattern of dissolved silicon in the interstitial water somewhat mimics the presence of siliceous microfossils, which are more abundant but still rare in the upper ~70 m CSF-A (see Micropaleontology).
The dissolved lithium profile displays structure with depth, with a minimum lithium concentration of 22.4 μM at 3.96 m CSF-A followed by an increase to 56.97 μM at 71.35 m CSF-A and a second decrease to 35 μM at 146.97 m CSF-A. Lithium increases yet again at the base of the hole to a maximum measured concentration of 60.41 μM in the deepest sample (230.57 m CSF-A) (Figure F37).
Boron concentrations generally decrease with depth in interstitial water but with more variability than any of the conservative cations. In the upper ~25 m CSF-A, boron concentrations are between 460 and 470 µM and then decrease steadily downhole to ~100 m CSF-A. Below this depth, boron concentrations hover around 330 ± 33 μM (Figure F37). We note that there is an offset of ~10% in the boron concentrations of samples from Hole U1474A relative to those in Hole U1474B in the upper ~25 m CSF-A, which is within the analytical precision of the boron concentration measurement. However, as all samples were collected, processed, and analyzed identically, it is difficult to ascribe this offset purely to an analytical artifact. Natural environmental variability in boron concentrations may also be partly responsible for the observed offset.
Bulk sediment geochemistry
Total organic carbon by difference versus direct measurement after acidification
Computing TOC by difference (i.e., subtraction of inorganic carbon [IC] measured by coulometry from total carbon [TC] measured on the elemental analyzer) when TC and IC are both large numbers results in small and variable estimates of TOC that are neither accurate nor precise. To evaluate this, we measured TOC on a subset of 15 samples after removing the IC fraction by acidification (see Geochemistry in the Expedition 361 methods chapter [Hall et al., 2017]). Comparison of the two measurements suggests that the difference method is generally acceptable, overall TOC concentrations are near our limits of measurement, and the variations may not be significant. The two high TOC measurements (>1 wt% at 2.5 and 251.62 m CSF-A) from the difference method are likely erroneous (Figure F38).
Calcium carbonate
Calcium carbonate weight percent (CaCO3 wt%) as measured by coulometry ranges between 17.6 and 57.3 wt%, with an average of ~38 wt% in Hole U1474A (Figure F38). There is no apparent trend of CaCO3 with depth and no discernible pattern of variability, though this may be due in part to low sampling resolution. Measurements were reproducible, with five samples from U1474A measured in duplicate (11.69, 36.06, 67.6, 218.19, and 246.22 m CSF-A), with an observed average difference for these replicates of ~0.5%.
Calcium carbonate compared to core physical properties
We sampled Cores 361-U1474F-12H and 13H at ~50 cm resolution to determine if calcium carbonate content can be calibrated to other physical properties, specifically magnetic susceptibility and L* (Figure F39). The magnetic susceptibility of a sample is its ability to be magnetized by an external magnetic field, which can be related to its bulk lithology. A sample with more calcium carbonate should have a lower magnetic susceptibility because it would have a lower relative amount of terrigenous material with ferromagnetic properties. Samples with more calcium carbonate should also be lighter in color because calcium carbonate is white, which would give them higher L* values. A weak negative correlation exists between magnetic susceptibility and carbonate, and a weak positive correlation exists between light reflectance and carbonate, suggesting that a calibration would not be reliable (Figure F40).
Age model
A 254 m sequence of late Miocene to recent sediment was recovered from Site U1474. The age model for this site is based on the biozonation of calcareous nannofossils and planktonic foraminifers and magnetostratigraphy. The biochronology was developed for Hole U1474A where the datums are identified at a typical spacing of 1.5 m (providing the minimum disturbance of the sediment). One sample per section within cores was taken in addition to standard samples from core catchers. The magnetostratigraphy is based on records from all holes, and all of the magnetic boundaries identified in Hole U1474A. Age estimates from biozones are shown in Tables T4 and T5 (geologic ages are shown on the Gradstein et al., 2012 [GTS2012] timescale). Magnetostratigraphic boundaries are shown in Table T11. The age-depth model is presented in Figure F41.
The age-depth relationship also reveals that inferred sedimentation rates are quite consistent throughout the recovered sequence, without identified hiatuses. An average sedimentation rate of 3.7 cm/ky with negligible variations is estimated based upon a linear fit to the combined data set on the CSF-A depth scale (r2= 0.98). Between 2.98 and 3.33 Ma, the absence of data points is due to the absence of marker events in planktonic foraminifers, calcareous nannofossils, and magnetostratigraphy. Minor inconsistencies between the microfossil groups at the bottom of the hole likely result from the extensive dissolution of calcareous fossils that lead to occasionally preserved occurrences of some marker species.
References
Adkins, J.F., McIntyre, K., and Schrag, D.P., 2002. The salinity, temperature, and δ18O of the glacial deep ocean. Science, 298(5599):1769–1773. http://dx.doi.org/10.1126/science.1076252
Arhan, M., Mercier, H., and Park, Y.-H., 2003. On the deep water circulation of the eastern South Atlantic Ocean. Deep-Sea Research, Part I, 50(7):889–916. http://dx.doi.org/10.1016/S0967-0637(03)00072-4
Beal, L.M., and Bryden, H.L., 1997. Observations of an Agulhas undercurrent. Deep Sea Research Part I: Oceanographic Research Papers, 44(9–10):1715–1724. http://dx.doi.org/10.1016/S0967-0637(97)00033-2
Beal, L.M., and Bryden, H.L., 1999. The velocity and vorticity structure of the Agulhas Current at 32°S. Journal of Geophysical Research: Oceans, 104(C3):5151–5176. http://dx.doi.org/10.1029/1998JC900056
Beal, L.M., Chereskin, T.K., Lenn, Y.D., and Elipot, S., 2006. The sources and mixing characteristics of the Agulhas Current. Journal of Physical Oceanography, 36(11):2060–2074. http://dx.doi.org/10.1175/JPO2964.1
Bryden, H.L., Beal, L.M., and Duncan, L.M., 2005. Structure and transport of the Agulhas Current and its temporal variability. Journal of Oceanography, 61(3):479–492. http://dx.doi.org/10.1007/s10872-005-0057-8
Calvert, S.E., and Pedersen, T.F., 1994. Sedimentary geochemistry of manganese: implications for the environment of formation of manganiferous black shales. Economic Geology, 91(1):36–47. http://dx.doi.org/10.2113/gsecongeo.91.1.36
Canfield, D.E., and Raiswell, R., 1992. Pyrite formation and fossil preservation. In Allison, P.A., and Briggs, D.E.G. (Eds.), Topics in Geobiology (Volume 9): Taphonomy: Releasing the Data from the Fossil Record: New York (Plenum Press), 337–387.
de Ruijter, W.P.M., Biastoch, A., Drijfhout, S.S., Lutjeharms, J.R.E., Matano, R.P., Picheven, T., van Leeuwen, P.J., and Weijer, W., 1999. Indian-Atlantic interocean exchange: dynamics, estimations and impact. Journal of Geophysical Research: Oceans, 104(C9):20885–20910. http://dx.doi.org/10.1029/1998JC900099
Dingle, R.V., Goodlad, S.W., and Martin, A.K., 1978. Bathymetry and stratigraphy of the northern Natal Valley (SW Indian Ocean): a preliminary account. Marine Geology, 28(1–2):89–106. http://dx.doi.org/10.1016/0025-3227(78)90099-3
Faugères, J.-C., Stow, D.A.V., Imbert, P., and Viana, A., 1999. Seismic features diagnostic of contourite drifts. Marine Geology, 162(1):1–38. http://dx.doi.org/10.1016/S0025-3227(99)00068-7
Flemming, B.W., 1981. Factors controlling shelf sediment dispersal along the southeast African continental margin. Marine Geology, 42(1–4):259–277. http://dx.doi.org/10.1016/0025-3227(81)90166-3
Gieskes, J.M., 1974. Interstitial water studies, Leg 25. In Simpson, E.S.W., Schlich, R., et al., Initial Reports of the Deep Sea Drilling Project, 25: Washington, DC (U.S. Government Printing Office), 361–394. http://dx.doi.org/10.2973/dsdp.proc.25.113.1974
Goodlad, S.W., 1986. Tectonic and sedimentary history of the mid-Natal Valley (SW Indian Ocean). Bulletin of Joint Geological Survey/University of Cape Town Marine Geoscience Unit, 15:625–630.
Gordon, A.L., 1985. Indian-Atlantic transfer of thermocline water at the Agulhas retroflection. Science, 227(4690):1030–1033. http://dx.doi.org/10.1126/science.227.4690.1030
Gradstein, F.M., Ogg, J.G., Schmitz, M.D., and Ogg, G.M. (Eds.), 2012. The Geological Time Scale 2012: Amsterdam (Elsevier).
Hall, I.R., Hemming, S.R., LeVay, L.J., Barker, S., Berke, M.A., Brentegani, L., Caley, T., Cartagena-Sierra, A., Charles, C.D., Coenen, J.J., Crespin, J.G., Franzese, A.M., Gruetzner, J., Han, X., Hines, S.K.V., Jimenez Espejo, F.J., Just, J., Koutsodendris, A., Kubota, K., Lathika, N., Norris, R.D., Periera dos Santos, T., Robinson, R., Rolinson, J.M., Simon, M.H., Tangunan, D., van der Lubbe, J.J.L., Yamane, M., and Zhang, H., 2017. Expedition 361 methods. In Hall, I.R., Hemming, S.R., LeVay, L.J., and the Expedition 361 Scientists, South African Climates (Agulhas LGM Density Profile). Proceedings of the International Ocean Discovery Program, 361: College Station, TX (International Ocean Discovery Program). http://dx.doi.org/10.14379/iodp.proc.361.102.2017
Lutjeharms, J.R.E., 2006. The Agulhas Current: Berlin (Springer-Verlag). http://dx.doi.org/10.1007/3-540-37212-1
Lutjeharms, J.R.E., 2007. Three decades of research on the greater Agulhas Current. Ocean Science, 3(1):129–147. http://dx.doi.org/10.5194/os-3-129-2007
Moore, A., Blenkinsop, T., and Cotterill, F., 2009. Southern African topography and erosion history: plumes or plate tectonics? Terra Nova, 21(4):310–315. http://dx.doi.org/10.1111/j.1365-3121.2009.00887.x
Niemi, T.M., Ben-Avraham, Z., Hartnady, C.J.H., and Reznikov, M., 2000. Post-Eocene seismic stratigraphy of the deep ocean basin adjacent to the southeast African continental margin: a record of geostrophic bottom current systems. Marine Geology, 162(2–4):237–258. http://dx.doi.org/10.1016/S0025-3227(99)00062-6
Preu, B., Spieß, V., Schwenk, T., and Schneider, R., 2011. Evidence for current-controlled sedimentation along the southern Mozambique continental margin since early Miocene times. Geo-Marine Letters, 31(5–6):427–435. http://dx.doi.org/10.1007/s00367-011-0238-y
Ramsay, P.J., 1994. Marine geology of the Sodwana Bay shelf, southeast Africa. Marine Geology, 120(3–4):225–247. http://dx.doi.org/10.1016/0025-3227(94)90060-4
Reason, C.J.C., Landman, W., and Tennant, W., 2006. Seasonal to decadal prediction of southern African climate and its links with variability of the Atlantic Ocean. Bulletin of the American Meteorological Society, 87(7):941–955. http://dx.doi.org/10.1175/BAMS-87-7-941
Rebesco, M., Hernàndez-Molina, F.J., Van Rooij, D., and Wåhlin, A., 2014. Contourites and associated sediments controlled by deep-water circulation processes: state-of-the-art and future considerations. Marine Geology, 361:111–154. http://dx.doi.org/10.1016/j.margeo.2014.03.011
Richter, C., Acton, G., Endris, C., and Radsted, M., 2007. Technical Note 34: Handbook for Shipboard Paleomagnetists. Ocean Drilling Program. http://dx.doi.org/10.2973/odp.tn.34.2007
Sagnotti, L., 2013. Demagnetization Analysis in Excel (DAIE). An open source workbook in Excel for viewing and analyzing demagnetization data from paleomagnetic discrete samples and U-channels. Annals of Geophysics , 56(1):D0114. http://dx.doi.org/10.4401/ag-6282
Schoonen, M.A.A., 2004. Mechanisms of sedimentary pyrite formation. In Amend, J.P., Edwards, K.J., and Lyons, T.W. (Eds.), Sulfur Biogeochemistry: Past and Present. Special Paper - Geological Society of America, 379:117–134. http://dx.doi.org/10.1130/0-8137-2379-5.117
Schrader, H.-J., 1974. Cenozoic marine planktonic diatom stratigraphy of the tropical Indian Ocean. In Fisher, R.L., Bunce, E.T., et al., Initial Reports of the Deep Sea Drilling Project, 24: Washington, DC (U.S. Government Printing Office), 887–967. http://dx.doi.org/10.2973/dsdp.proc.24.122.1974
Simon, M.H., Arthur, K.L, Hall, I.R, Peeters, F.J.C., Loveday, B.R., Barker, S., Ziegler, M., and Zahn, R., 2013. Millennial-scale Agulhas Current variability and its implications for salt-leakage through the Indian–Atlantic ocean gateway. Earth and Planetary Science Letters, 383:101–112. http://dx.doi.org/10.1016/j.epsl.2013.09.035
Simon, M.H., Gong, X., Hall, I.R., Ziegler, M., Barker, S., Knorr, G., van der Meer, M.T.J., Kasper, S., and Schouten, S., 2015a. Salt exchange in the Indian–Atlantic ocean gateway since the Last Glacial Maximum: a compensating effect between Agulhas Current changes and salinity variations? Paleoceanography, 30(10):1318–1327. http://dx.doi.org/10.1002/2015PA002842
Simon, M.H., Ziegler, M., Bosmans, J., Barker, S., Reason, C.J.C., and Hall, I.R., 2015b. Eastern South African hydroclimate over the past 270,000 years. Scientific Reports, 5:18153. http://dx.doi.org/10.1038/srep18153
Skiba, M., Maj-Szeliga, K., Szymański, W., and Błachowski, A., 2014. Weathering of glauconite in soils of temperate climate as exemplified by a Luvisol profile from Góra Puławska, Poland. Geoderma, 235–236:212–226. http://dx.doi.org/10.1016/j.geoderma.2014.07.013
Strahler, A.N., 1952. Hypsometric (area-altitude) analysis of erosional topography. Geological Society of America Bulletin, 63(11):1117–1142. http://dx.doi.org/10.1130/0016-7606(1952)63[1117:HAAOET]2.0.CO; 2
Stramma, L., and Lutjeharms, J.R.E., 1997. The flow field of the subtropical gyre of the South Indian Ocean. Journal of Geophysical Research: Oceans, 102(C3):5513–5530. http://dx.doi.org/10.1029/96JC03455
Tauxe, L., Shaar, R., Jonestrask, L., Swanson-Hysell, N.L., Minnett, R., Koppers, A.A.P., Constable, C.G., Jarboe, N., Gaastra, K., and Fairchild, L., 2016. PmagPy: software package for paleomagnetic data analysis and a bridge to the Magnetics Information Consortium (MagIC) database. Geochemistry, Geophysics, Geosystems, 17(6):2450–2463. http://dx.doi.org/10.1002/2016GC006307
Wade, B.S., Pearson, P.N., Berggren, W.A., and Pälike, H., 2011. Review and revision of Cenozoic tropical planktonic foraminiferal biostratigraphy and calibration to the geomagnetic polarity and astronomical time scale. Earth-Science Reviews, 104(1–3):111–142. http://dx.doi.org/10.1016/j.earscirev.2010.09.003
Ziegler, M., Simon, M.H., Hall, I.R., Barker, S., Stringer, C., and Zahn, R., 2013. Development of Middle Stone Age innovation linked to rapid climate change. Nature Communications, 4:1905. http://dx.doi.org/10.1038/ncomms2897
1 Hall, I.R., Hemming, S.R., LeVay, L.J., Barker, S., Berke, M.A., Brentegani, L., Caley, T., Cartagena-Sierra, A., Charles, C.D., Coenen, J.J., Crespin, J.G., Franzese, A.M., Gruetzner, J., Han, X., Hines, S.K.V., Jimenez Espejo, F.J., Just, J., Koutsodendris, A., Kubota, K., Lathika, N., Norris, R.D., Periera dos Santos, T., Robinson, R., Rolinson, J.M., Simon, M.H., Tangunan, D., van der Lubbe, J.J.L., Yamane, M., and Zhang, H., 2017. Site U1474. In Hall, I.R., Hemming, S.R., LeVay, L.J., and the Expedition 361 Scientists, South African Climates (Agulhas LGM Density Profile). Proceedings of the International Ocean Discovery Program, 361: College Station, TX (International Ocean Discovery Program). http://dx.doi.org/10.14379/iodp.proc.361.103.2017
2 Expedition 361 Scientists’ addresses.
This work is distributed under the Creative Commons Attribution 4.0 International (CC BY 4.0) license. 
- F1. Location map of Site U1474 with main surface currents in the southwest Indian Ocean.
- F2. Geomorphologic and oceanographic features near Site U1474.
- F3. Drainage system of southern Africa.
- F4. Precruise interpretation of seismic Line H–G near Site U1474.
- F5. Precruise interpretation of seismic Line M753-GeoB08-233 at Site U1474.
- F6. Parasound Line M753-GeoB08-233 showing parallel reflectors at Site U1474.
- F7. Core recovery, Holes U1474A–U1474H.
- F8. Lithostratigraphic summary with selected physical property and geochemical data.
- F9. Representative lithologies per interval.
- F10. Representative sedimentary structures and lithologic accessories, Site U1474.
- F11. XRD diffractogram of bulk powders from diagenetic alterated layers, Hole U1474A.
- F12. Sediment deformations and disturbances, Site U1474.
- F13. Comparison of CaCO3 from discrete samples and biogenic carbonate estimated in smear slides, Hole U1474A.
- F14. Color reflectance and magnetic susceptibility from WRMSL and SHMSL, Hole U1474A.
- F15. P-wave velocity and NGR, Hole U1474A.
- F16. Bulk density, porosity, grain density, and thermal conductivity, Hole U1474A.
- F17. SHIL RBG color data, Hole U1474A.
- F18. Spliced bulk density, WRMSL magnetic susceptibility, NGR, sediment L*, and red color band records, Site U1474.
- F19. Biochronology at Site U1474 with calcareous nannofossils and the locations of significant planktonic foraminifer events.
- F20. Calcareous nannofossils, Hole U1474A.
- F21. Planktonic foraminifers, Hole U1474A.
- F22. Planktonic foraminifers, Hole U1474A.
- F23. Most common benthic foraminifers, Hole U1474A.
- F24. S-ratio, SIRM, and magnetic susceptibility, Hole U1474A.
- F25. AMS results, Site U1474.
- F26. Rose diagram of declinations of maximum magnetic susceptibility corrected for core orientations plotted downhole.
- F27. Alternating field demagnetization of two representative samples from Hole U1474A.
- F28. Downhole paleomagnetic results, Site U1474.
- F29. Inclination summary, Site U1474.
- F30. Magnetic susceptibility and L* records, Site U1474.
- F31. Comparison of Site U1474 MS-WRMSL records on the CSF-A and CCSF-A depth scales.
- F32. Composite spliced record of MS-WRMSL, L*, and NGR, Site U1474.
- F33. Dissolved magnesium, potassium, sodium, and chloride profiles, Holes U1474A and U1474B.
- F34. Alkalinity, dissolved phosphate, and pH profiles, Holes U1474A and U1474B.
- F35. Dissolved iron, manganese, sulfate, and barium profiles, Holes U1474A and U1474B.
- F36. Dissolved calcium and strontium profiles, Holes U1474A and U1474B.
- F37. Dissolved silicon, lithium, and boron profiles, Holes U1474A and U1474B.
- F38. Calcium carbonate and TOC profiles, Hole U1474A.
- F39. Downhole calcium carbonate content and high-resolution MS and L*.
- F40. Calcium carbonate vs. MS and L*.
- F41. Age-depth relationships for Site U1474 based upon calcareous nannofossils, planktonic foraminifers, and magnetochron boundaries.
- T1. Site U1474 core summary.
- T2. Overview of shipboard sampling with number of samples taken, Holes U1474A–U1474F.
- T3. Smear slide textures, compositions, and lithologic names, Holes U1474A-U1474F.
- T4. Biostratigraphic datums for planktonic foraminifers, Hole U1474A.
- T5. Biostratigraphic datums for calcareous nannofossils, Hole U1474A.
- T6. Calcareous nannofossil occurrences, Hole U1474A.
- T7. Planktonic foraminifer occurrence and abundance based on examination of >150 µm fraction, Hole U1474A.
- T8. Diatom and other siliceous microfossil occurrences, Hole U1474A.
- T9. Analyzed discrete whole-round samples, Site U1474.
- T10. Overview of AMS data, Site U1474.
- T11. Polarity zone boundaries, Site U1474.
- T12. Affine table, Site U1474.
- T13. Splice interval table, Site U1474.
- T14. Carbonate, total organic carbon, and total nitrogen data, Holes U1474A and U1474F.
- T15. Interstitial water geochemistry results, Holes U1474A and U1474B.
