Hall, I.R., Hemming, S.R., LeVay, L.J., and the Expedition 361 Scientists
Proceedings of the International Ocean Discovery Program Volume 361
publications.iodp.org
doi:10.14379/iodp.proc.361.106.2017

Site U14771
I.R. Hall, S.R. Hemming, L.J. LeVay, S. Barker, M.A. Berke, L. Brentegani, T. Caley, A. Cartagena-Sierra, C.D. Charles, J.J. Coenen, J.G. Crespin, A.M. Franzese, J. Gruetzner, X. Han, S.K.V. Hines, F.J. Jimenez Espejo, J. Just, A. Koutsodendris, K. Kubota, N. Lathika, R.D. Norris, T. Periera dos Santos, R. Robinson, J.M. Rolinson, M.H. Simon, D. Tangunan, J.J.L. van der Lubbe, M. Yamane, and H. Zhang2
Keywords: International Ocean Discovery Program, IODP, JOIDES Resolution, Expedition 361, Site U1477, Agulhas Current, Agulhas Leakage, Agulhas Plateau, Agulhas Retroflection, Agulhas Return Current, Agulhas Rings, Agulhas Undercurrent, Atlantic Meridional Overturning Circulation, boundary current, Cape Basin, Circumpolar Deep Water, Congo Air Boundary, Delagoa Bight, East Madagascar Current, human evolution, Indian Ocean, Indonesian Throughflow, interocean exchange, Intertropical Convergence Zone, Last Glacial Maximum, Limpopo River, Middle Pleistocene Transition, Miocene, Mozambique Channel, Natal Valley, North Atlantic Deep Water, ocean circulation, paleoceanography, paleoclimate, Pleistocene, Pliocene, salinity, southern Africa, Southern Ocean, Subantarctic Zone, Subtropical Front, Subtropical Gyre, thermohaline circulation, Warm Water Route, Western Boundary Current, Zambezi River
MS 361-106: Published 30 September 2017
Background and objectives
Site U1477 is located in the western Mozambique Channel on the upper continental slope (19°21.29′S; 36°54.90′E), ~65 nmi east of the Zambezi River delta region, at a water depth of 429.2 m below sea level (mbsl) (Figures F1, F2).

Figure F1. Location map of Site U1477 with main surface currents in the southwest Indian Ocean.
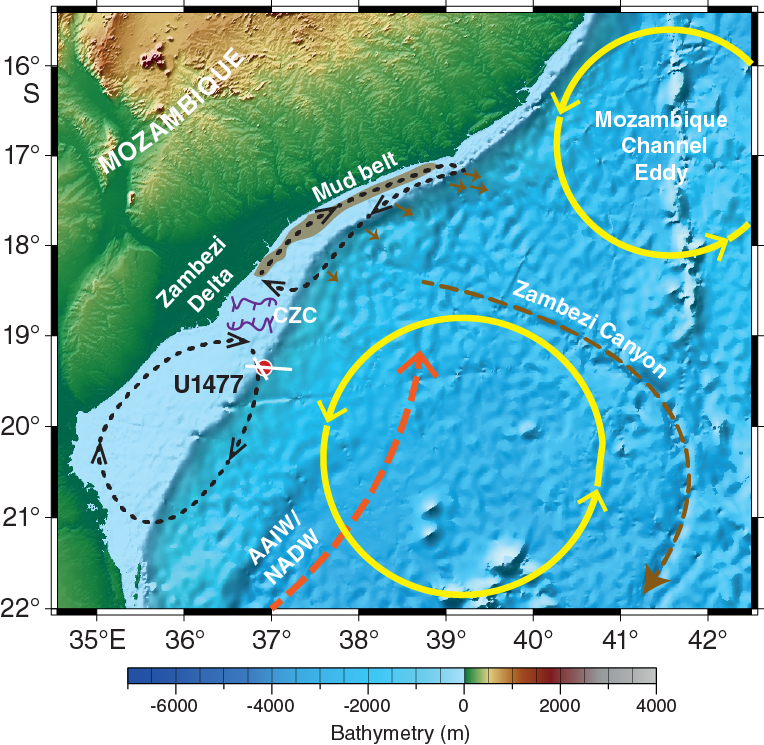
Figure F2. Geomorphologic and oceanographic features near Site U1477.
Site U1477 receives fluvial material exported from the Zambezi River basin catchment (Figures F1, F2), which is situated in the southernmost reach of the African monsoonal precipitation belt and drains multiple subbasins with differing basement lithologies, soils, and vegetation assemblages. Collectively, these subbasins span ~1.385 million km2, and the river itself extends over 2500 km. Originating in northern Zambia, the Zambezi River flows through eastern Angola, following the border between Zambia and Zimbabwe before flowing across Mozambique, where it enters the Mozambique Channel through an extensive delta system (Euroconsult Mott MacDonald, 2008). Annual precipitation across the Zambezi Catchment varies spatially with ~150 cm/y in the northern catchments, ~85 cm/y in the southern part, and 60–70 cm/y in the central part (Ronco et al., 2006). This spatial variability is controlled by the seasonal interplay of the Intertropical Convergence Zone (ITCZ) and the Congo Air Boundary (CAB), which collectively separates the Indian and Atlantic Ocean air masses (Figure F1), with the southwest monsoon and the southeast trade winds influencing the upper Zambezi River (i.e., upstream of Victoria Falls) and the northeast monsoon and the southeast trade winds affecting the middle and lower Zambezi River (Moore et al., 2008). Peak precipitation in the Zambezi River basin catchment occurs during the austral summer (December, January, February), when the ITCZ is located at its most southerly position.
The mean outflow of the Zambezi River is 3000 m3/s (Gammelsrød, 1992), and it transports an annual sediment load of ~51 Mm3, making it the largest single source of suspended sediment supply to the Mozambique margin (Walford et al., 2005). The Zambezi delta is located in a moderate indentation of the continental margin. At present, the southward water flow through the Mozambique Channel drives a counter-circulation loop on the shelf, leading to a coast-parallel flow that transports sediment toward the northern shelf area in a “mud belt” (Beiersdorf et al., 1980; Schulz et al., 2011; Siddorn et al., 2001) (Figure F2). To the north, this sediment passes over the shelf edge, as well as feeds the submarine Zambezi Canyon (Schulz et al., 2011). The river-borne sediment mixes with current-transported and biogenic material and is a major component of the extensive current-controlled sedimentary deposits that characterize the Mozambique margin. This system provides the potential to provide comprehensive proxy records that document regional oceanographic changes as well as changes in hydrological conditions of the African precipitation belt in southeastern Africa (e.g., Just et al., 2014; Schefuß et al., 2011; Schulz et al., 2011; Wang et al., 2013; Weldeab et al., 2013, 2014; van der Lubbe et al., 2014, 2015).
In contrast to the modern sedimentary routing, during the last glacial period when sea level was lower, downslope sediment transport occurred through the Zambezi paleochannel (Chinde-Zambezi paleochannel; Figure F2) located directly off the Zambezi delta. While active, the Zambezi paleochannel prograded toward the present-day shelf edge and incised the wide, subaerially exposed shelf, delivering sediment directly to the upper slope of the western Mozambique Channel (Beiersdorf et al., 1980; Schulz et al., 2011; van der Lubbe et al., 2014). The channelized sediment transport was drastically reduced as the Zambezi paleochannel was rapidly filled during the sea level rise of the last deglaciation, and sediment transport was diverted toward the northern shelf as the coastal current was established on the flooded shelf (van der Lubbe et al., 2014).
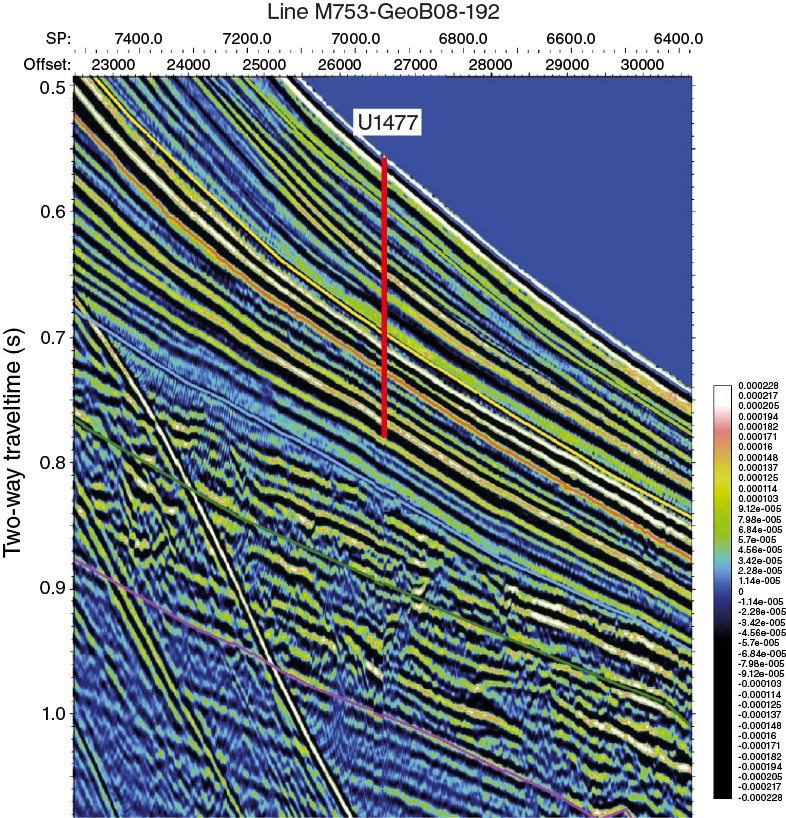
Site U1477 is situated on a contourite drift body deposited under the influence of the eddy-dominated water flow through the Mozambique Channel (Figures F3, F4, F5, F6, F7). The drift body displays packages of parallel and laterally continuous subseafloor reflectors (Figures F3, F5, F7). The site is located immediately southwest of the 6.51 m long marine sediment Core GeoB9307-3 (18°33.99ʹS, 37°22.89ʹE; 542 mbsl) (Schefuß et al., 2011). Core GeoB9307-3 is in an area of elevated deglacial and Holocene sedimentation. Accelerator mass spectrometry 14C dates indicate the age at the base of Core GeoB9307-3 is ~17 ky BP (before present). X-ray fluorescence downcore scans show large increases in elemental ratios that indicate sedimentary terrestrial contibutions. Large increases in concentrations of terrestrial plant–derived long-chain n-alkanes during Heinrich Stadial 1 and the Younger Dryas indicate enhanced terrestrial discharge by the Zambezi River and thus higher rainfall amounts in the catchment (Schefuß et al., 2011). The existing proxy records from Core GeoB9307-3 suggest the great potential of Site U1477 for paleoceanographic research at centennial timescales.
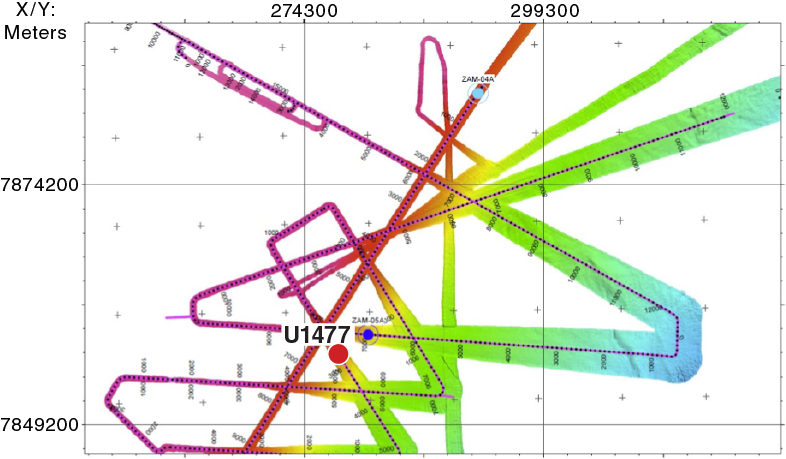
Figure F3. Multibeam bathymetry around Site U1477.
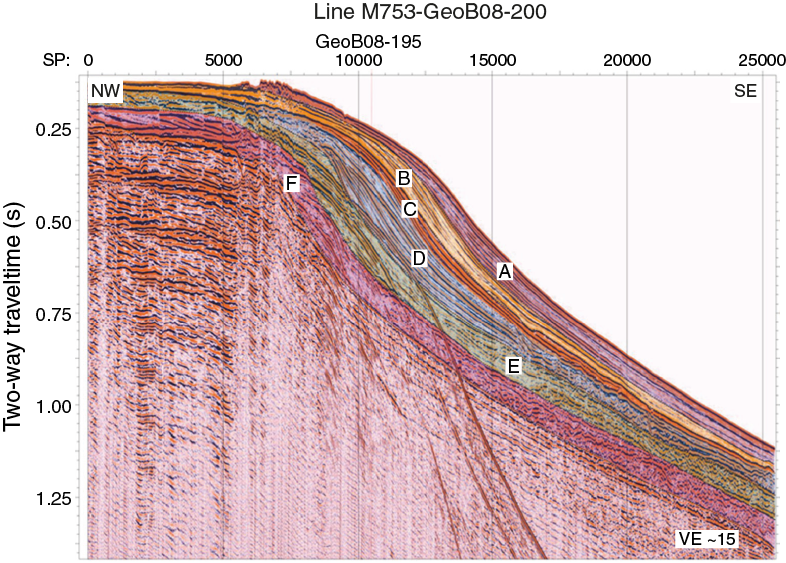
Figure F4. Seismic Line M753-GeoB08-200 at Site U1477.

Figure F5. Seismic Line M753-GeoB08-192 at Site U1477.
Figure F6. Detail of seismic Line M753-GeoB08-192 at Site U1477.
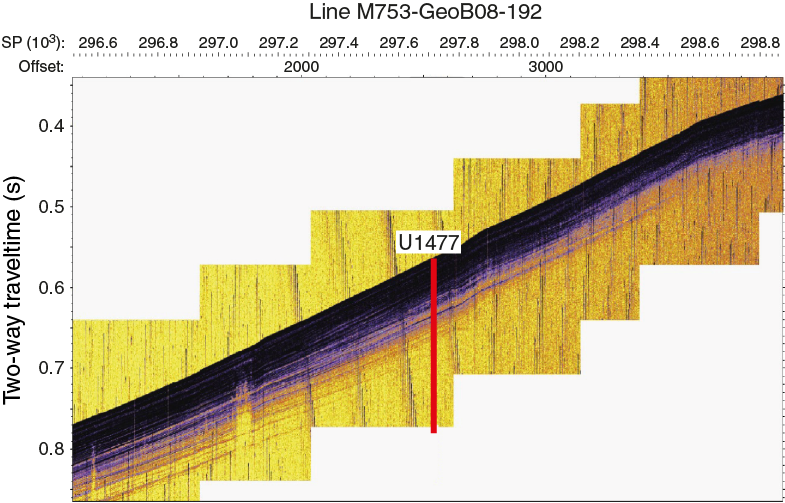
Figure F7. Parasound data along seismic Line M753-GeoB08-192 across Site U1477.
The Site U1477 precruise objectives were to
- Recover a complete and high-resolution sedimentary succession that spans the last 2 my, including the mid-Pleistocene transition (MPT), from the Mozambique margin close to the Zambezi River delta;
- Generate a high-resolution Pleistocene profile of southern African continental climate changes on orbital and suborbital timescales;
- Establish linking between southern African terrestrial climates and southwest Indian Ocean heat budgets, notably warm-water transports along the southeast African margin and associated ocean-atmosphere heat and moisture transfer;
- Examine the relationship between such climate variability and early human evolution; and
- Reconstruct upstream control on Agulhas leakage through headwater variability (Mozambique Current) during periods of orbitally modulated and suborbitally accelerated climate changes.
As detailed in subsequent sections, the actual sequence recovered featured greatly elevated accumulation rates and did not penetrate through the Late Pleistocene. Thus, the specific questions that will be addressed include the following: How did the rainfall patterns over southeast Africa evolve during the course of the last ice age cycle, notably in conjunction with monsoon dynamics, and migration of the ITCZ (Johnson et al., 2002; Schefuß et al., 2011; Trauth et al., 2009)? Did variable Agulhas Current warm-water transports contribute to and modulate the impacts of shifting air boundaries and rainfall patterns over southeast Africa and possibly offset these patterns from those over southwest Africa and the Namib (Dupont et al., 2005; 2011; Maslin et al. 2012)?
Site U1477 was occupied on 13 March 2016. Three holes were drilled and cored using the advanced piston corer (APC), half-length APC (HLAPC), and extended core barrel (XCB), achieving a depth of 181.2 m drilling depth below seafloor (DSF) in Hole U1477A. The total cored interval at Site U1477 was 474 m, and total recovery was 490.03 m (103%).
Operations
Transit to Site U1477
After a 350 nmi transit from Site U1476, the vessel arrived at proposed Site ZAM-05A (Site U1477) at 0942 h on 13 March 2016, and the thrusters were lowered at 1015 h.
Site U1477
Site U1477 consisted of 3 holes, ranging in depth from 119.4 to 181.2 m DSF (Table T1). Overall, 69 cores were recorded for the site. A total of 308.07 m of core over a 296.2 m interval was recovered using the APC system (104% core recovery). The HLAPC recovered 174.00 m of sediment over a 169.2 m interval (103% core recovery). The XCB was deployed for one core resulting in 7.96 m of sediment (97% core recovery). One interval was advanced without coring over 1.0 m. Overall, at total of 490.03 m of core was retrieved from a 474.0 m cored interval at Site U1477 (103% core recovery). The total time spent at Site U1477 was 1.9 days.
Table T1. Site U1477 core summary. Download table in .csv format. View PDF table.
Hole U1477A
The APC/XCB bottom-hole assembly (BHA) and drill string were deployed to 412.2 mbsl. The first two coring attempts resulted in water cores and, after lowering the bit a total of 15 m, Hole U1477A was spudded at 1535 h on 13 March 2016. Core 361-U1477A-1H recovered 7.52 m of sediment, and the water depth was calculated at 429.2 mbsl. The hole was cored to 102.5 m DSF (Cores 1H through 11H) using the APC system. After partial strokes with the APC on Cores 10H and 11H, the HLAPC was deployed, and piston coring continued to 173.0 m DSF (Cores 12F through 26F). The XCB was deployed for Core 27X (173.0–181.2 m DSF). Coring was terminated in Hole U1477A at a total depth of 181.2 m DSF. The drill string was removed from the hole, with the bit clearing the seafloor at 0615 h on 14 March, ending Hole U1477A. The total core recovery for Hole U1477A was 182.53 m over a 181.2 m cored interval (101%).
Hole U1477B
The vessel was offset 20 m north of Hole U1477A, and Hole U1477B was spudded at 0705 h on 14 March. The APC system was deployed for Cores 361-U1477B-1H through 12H (0–108.6 m DSF). After two partial strokes with the APC, the HLAPC was used for Cores 13F through 26F (108.6–174.4 m DSF). A total of 185.73 m of core was recovered over a 174.4 m cored interval in Hole U1477B (106%). The drill string was pulled from the hole, and the bit cleared the seafloor at 1910 h on 14 March, ending Hole U1477B.
Hole U1477C
The vessel was offset 20 m east of Hole U1477A, and Hole U1477C was spudded at 1950 h on 14 March with a 1.0 m drilled interval. The APC system was used for Cores 361-U1477C-2H through 10H. After partial stokes on Cores 9H and 10H, the HLAPC was deployed for Cores 11F through 17F. Coring was terminated at a total depth of 119.4 m DSF. One partial stroke was recorded while using the HLAPC (Core 12F). A total of 121.77 m of core was recovered from a 118.4 m cored interval (103%). The drill string was pulled from the hole, with the bit clearing the seafloor at 0415 h and the rotary table at 0555 h on 15 March. The rig floor was secured for transit at 0630 h, and the vessel was under way to Site U1478 at 0642 h, ending Site U1477.
Sedimentology
Drilling at Site U1477 recovered a total of ~490 m of sediment from three holes (Figures F8, F9; also see Operations). Hole U1477A was cored to 180.96 m coring depth below seafloor (CSF-A), Hole U1477B to 174.86 m CSF-A, and Hole U1477C to 119.35 m CSF-A. The APC system was applied in the uppermost ~100 m CSF-A of Hole U1477A, ~110 m CSF-A of Hole U1477B, and ~90 m CSF-A of Hole U1477C. The HLAPC was used in the lower parts of all holes, and the XCB was used for the deepest core in Hole U1477A (Core 361-U1477A-27X). One interval >1 m was advanced without coring in Hole U1477C (0–1.0 m CSF-A). A visual description of all cores was performed and recorded using the shipboard lithostratigraphic DESClogik program, which involves visual assessment of average grain size, sediment color, sedimentary structures, and bioturbation intensity. Disturbances induced by drilling and gas expansion were also described. Lithologic characteristics were further determined using smear slide analyses, and a total of 304 shipboard samples were collected from the working halves of the cores from Holes U1477A and U1477C for paleontological, physical property, paleomagnetic, and geochemical analyses (Table T2).
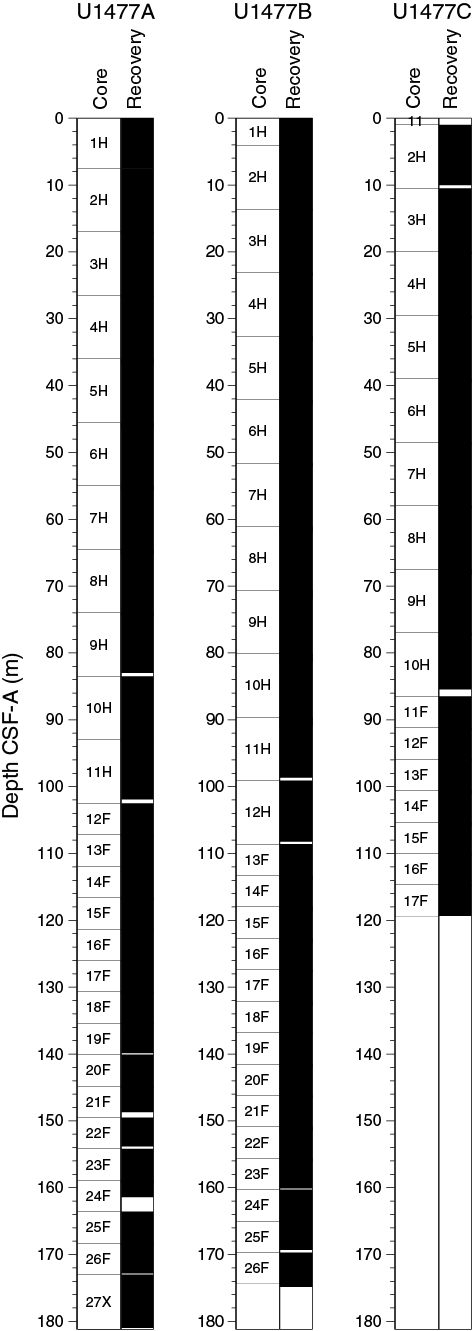
Figure F8. Core recovery, Holes U1477A–U1477C.
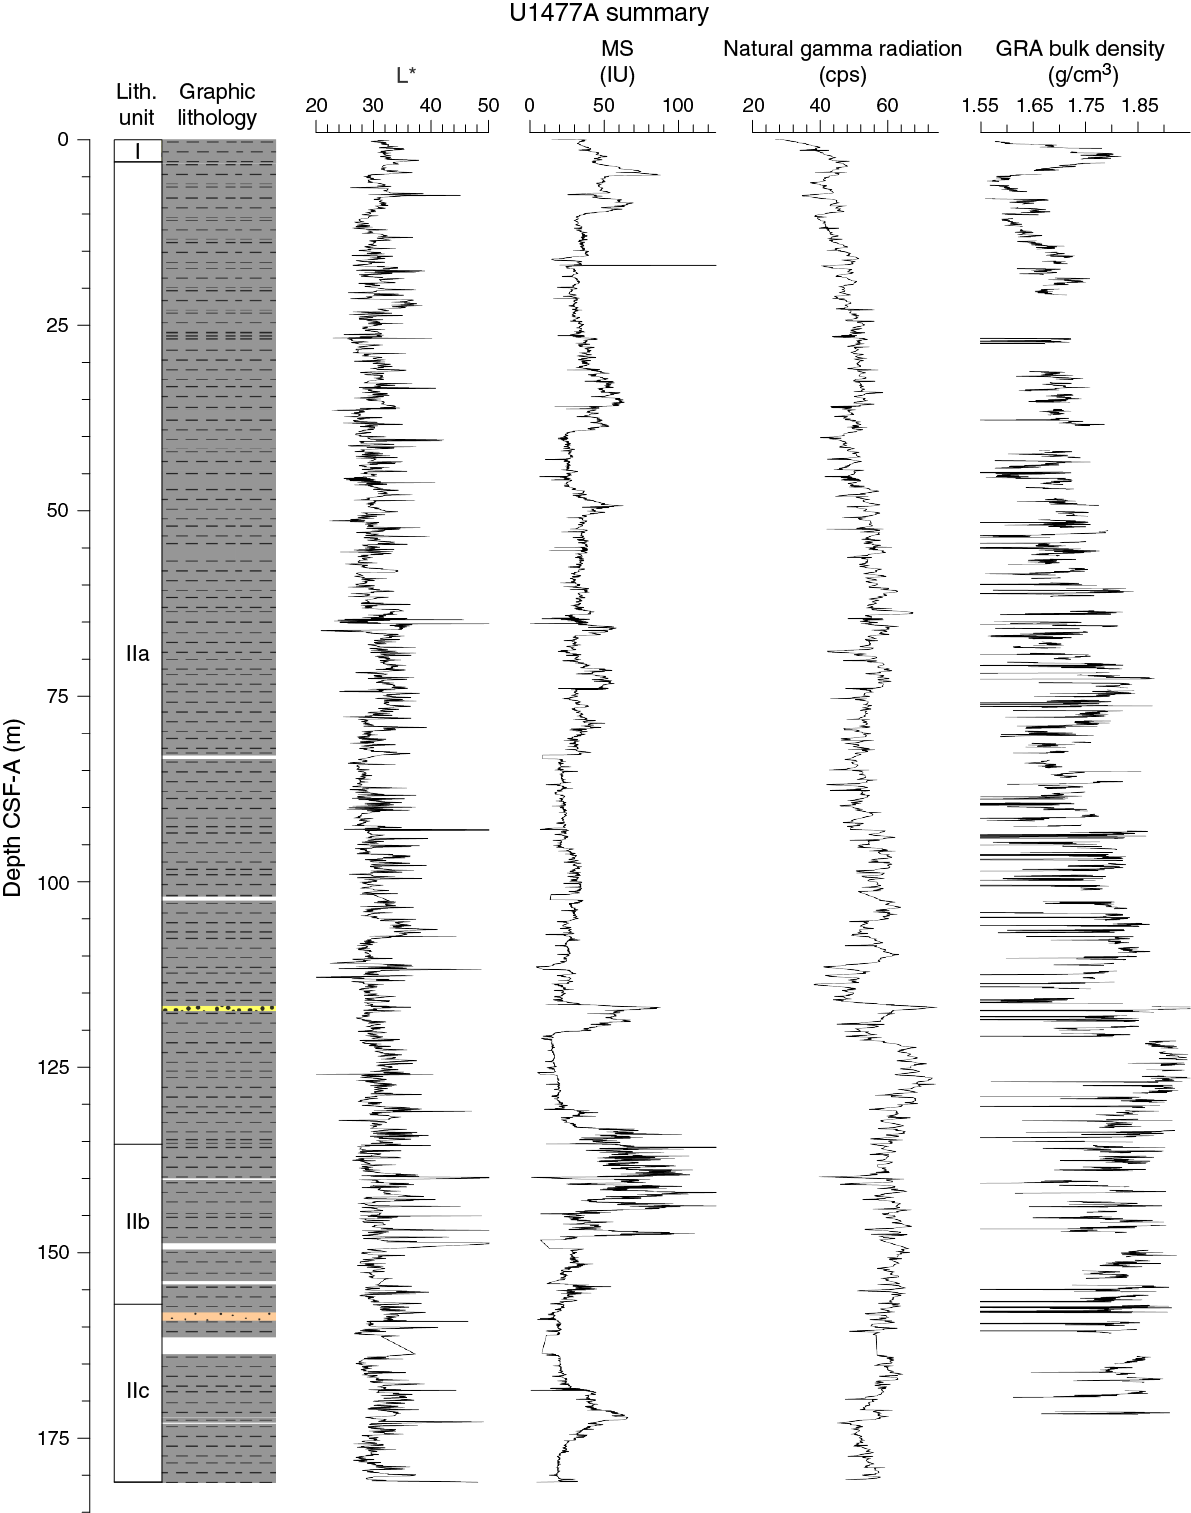
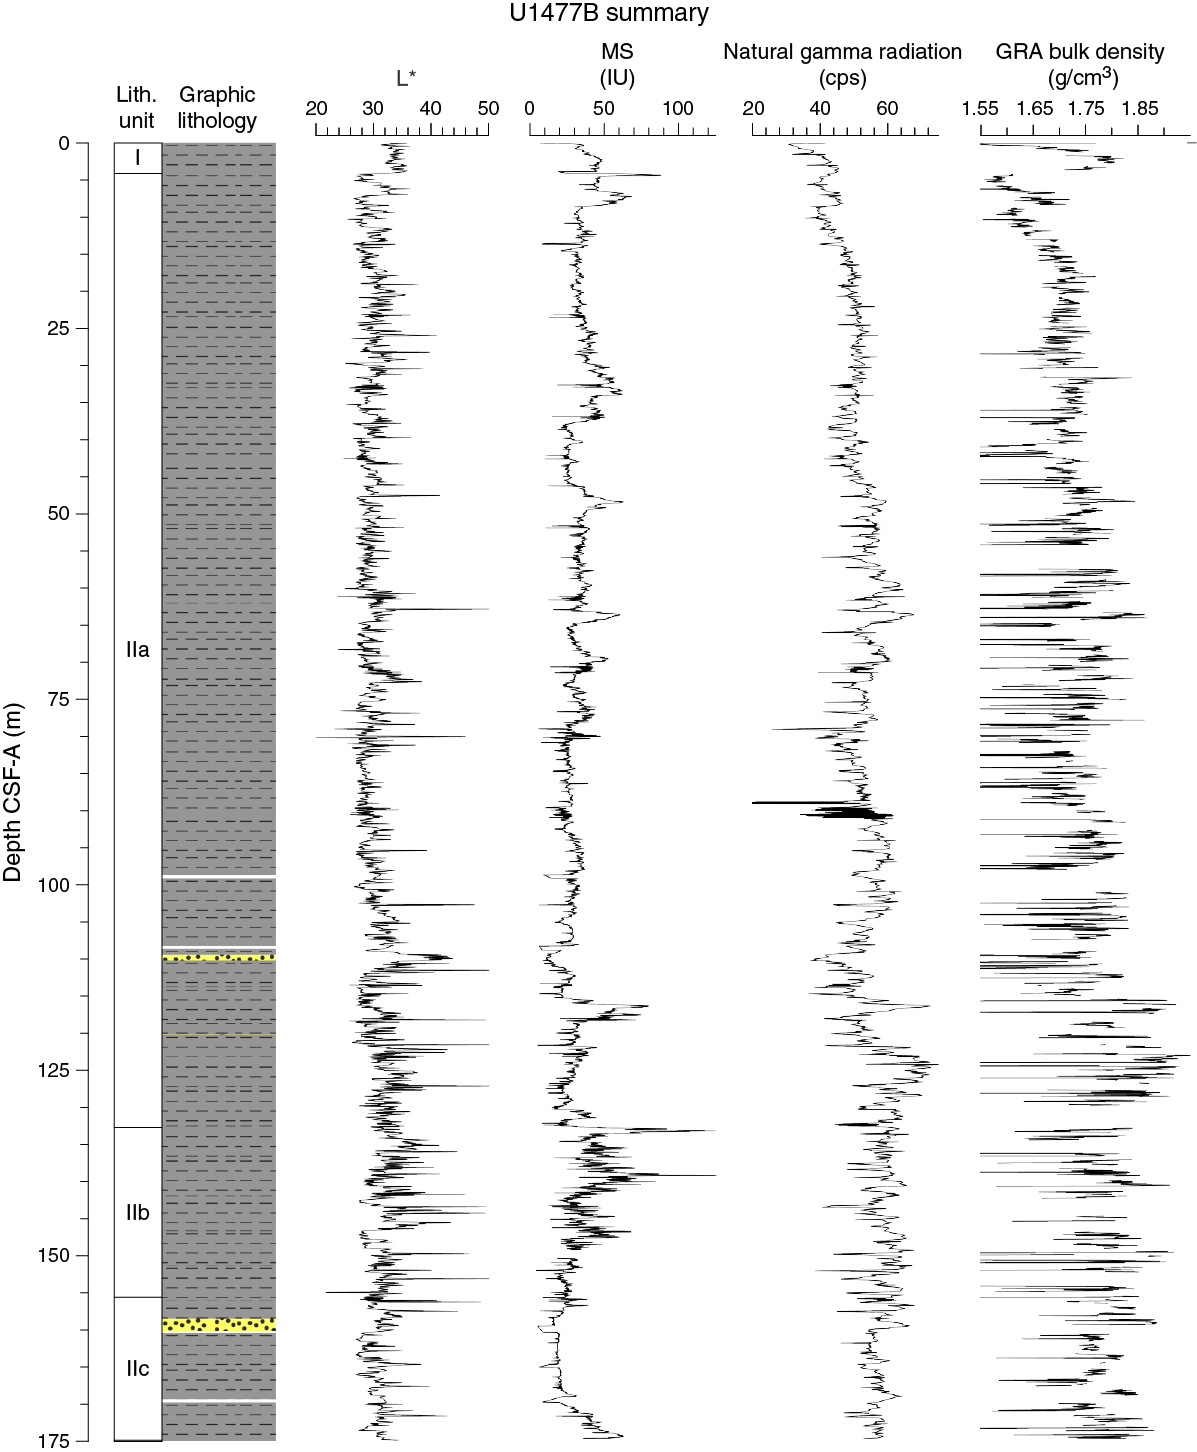
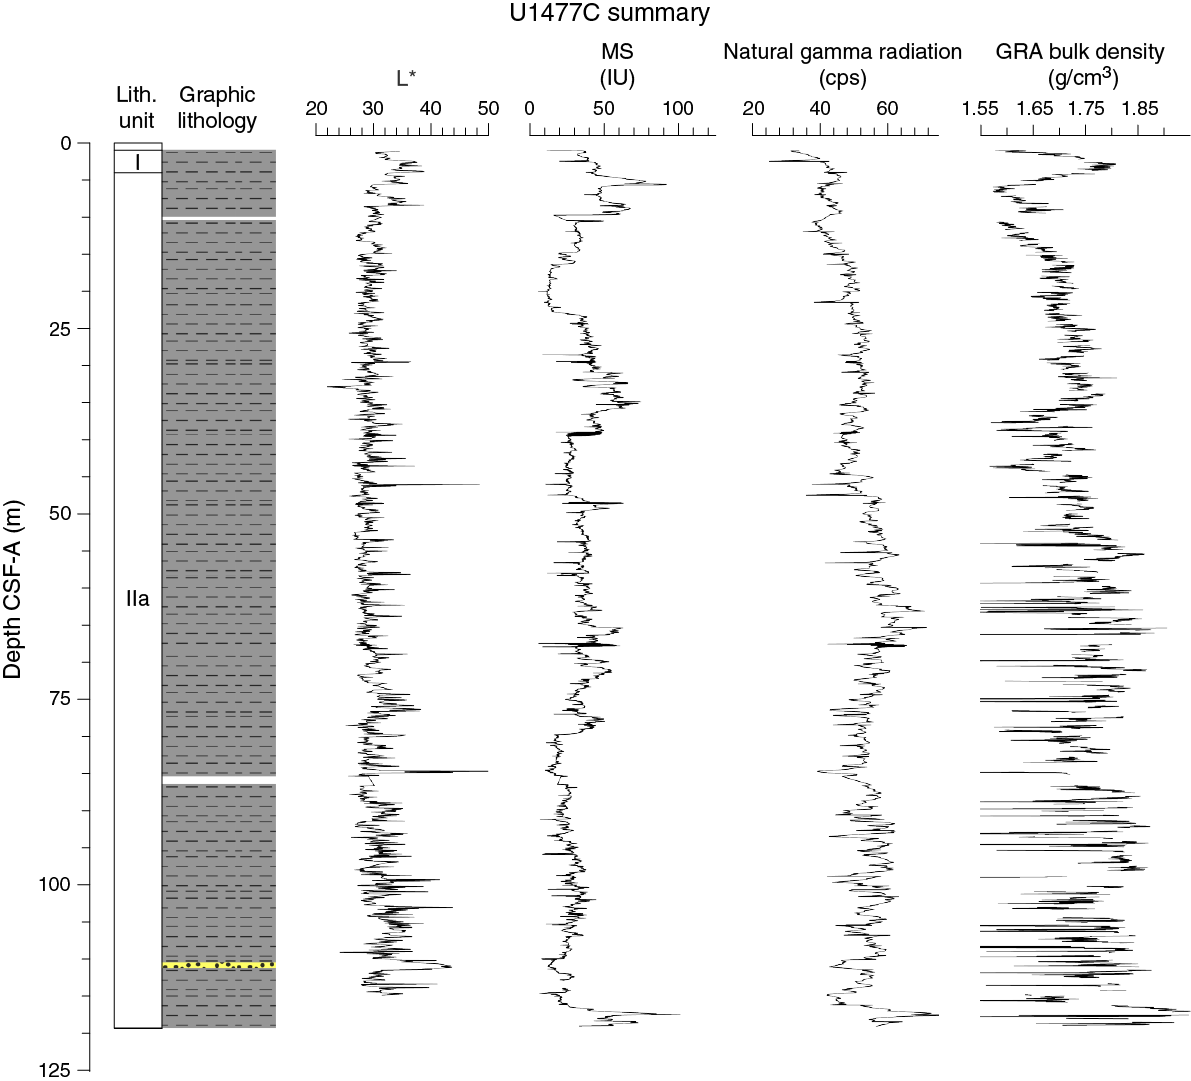
Figure F9. Lithostratigraphic summary with selected physical properties and geochemical data.
Table T2. Overview of shipboard sampling, Holes U1477A–U1477C. Download table in .csv format.
Lithostratigraphic unit description
Unit I
- Intervals: 361-U1477A-1H-1, 0 cm, through 1H-2, 144 cm; 361-U1477B-1H-1, 0 cm, through 1H-3, 87 cm; 361-U1477C-2H-1, 0 cm, through 2H-2, 150 cm
- Depths: Hole U1477A = 0–3.00 m CSF-A; Hole U1477B = 0–3.87 m CSF-A; Hole U1477C = 1.00–4.00 m CSF-A
- Age: Holocene
Unit I is composed of very dark gray (5Y 3/1) and dark gray (7.5YR 4/1) to dark greenish gray (GLEY 1 4/10Y; 10YR 3/1) sandy clay with foraminifers and nannofossils (Figure F10).

Figure F10. Representative lithologies per interval, Site U1477.
Unit II
Subunit IIa
- Intervals: 361-U1477A-1H-3, 0 cm, through 18F-CC, 17 cm; 361-U1477B-1H-CC, 0 cm, through 17F-CC, 32 cm; 361-U1477C-2H-3, 0 cm, through 17F-CC, 32 cm
- Depths: Hole U1477A = 3.00–135.62 m CSF-A; Hole U1477B = 3.87–132.71 cm CSF-A; Hole U1477C = 4.00–119.35 m CSF-A
- Age: Late Pleistocene to Holocene
Subunit IIa is composed of very dark gray (5Y 3/1; 10YR 3/1; GLEY I 3/N), dark greenish gray (GLEY 1 4/5GY), and occasionally olive-gray (5Y 5/3) silty clay, with intermittent occurrences of sand or light brown silt/clay layers (Figure F10).
Subunit IIb
- Intervals: 361-U1477A-19F-1, 0 cm, through 23F-2, 137 cm; 361-U1477B-18F-1, 0 cm, through 22F-CC, 10 cm.
- Depths: Hole U1477A = 135.4–156.94 m CSF-A; Hole U1477B = 132.1– 156.06 m CSF-A.
- Age: Late Pleistocene
Subunit IIb is characterized by very dark gray (5Y 3/1; 10YR 3/1; GLEY I 3/N) silty clay with frequent occurrences of sand or light brown silt/clay layers (Figure F10).
Subunit IIc
- Intervals: 361-U1477A-23F-3, 0 cm, through 27X-CC, 31 cm; 361-U1477B-23F-1, 0 cm through 26F-CC, 12 cm.
- Depths: Hole U1477A = 156.94–180.96 m CSF-A; Hole U1475B = 155.60–174.86 m CSF-A.
- Age: Late Pleistocene
Subunit IIc is composed of very dark gray (5Y 3/1; 10YR 3/1; GLEY I 3/N) silty clay with intermittent occurrences of sand or light brown silt/clay layers (Figure F10). Lithologic features resemble those of Subunit IIa.
Drilling disturbance
Cores from Site U1477 show severe drilling disturbances (fractures and fragmented intervals and voids) related to gas expansion. The uppermost centimeters of the first sections of some cores are soupy (Sections 361-U1477A-2H-1, 4H-1, 9H-1, 11H-1, and 16F-1; 361-U1477B-5H-1; and 361-U1477C-3H-1 and 6H-1); fractures are typically observed in the middle to bottom sections of most cores (Figure F11). “Biscuits” from drilling disturbance were observed in Core 361-U1477A-27X. Differences in lithologies in the uppermost <10 cm of the first core of Holes U1477B and U1477C in comparison to that in Hole U1477A may be attributed to drilling disturbances (fall-in). Specifically, dark gray silty clays, which are typical for Unit II, are present at the top of Holes U1477B and U1477C but not Hole U1477A. These clays in Hole U1477B show nannofossil assemblages that are similar to those described in core catchers from deeper intervals of Hole U1477A (see Micropaleontology), supporting the inference of potential contamination of the uppermost few centimeters of Holes U1477B and U1477C.

Figure F11. Sediment deformations and disturbances, Site U1477.
Lithologies and composition
Smear slide observations show that siliciclastic materials (87% ± 8% on average) are the principal component of the sediment at Site U1477 (Table T3; Figure F12). In Unit I, the sediment grain sizes consist of 28% (±15%) sand on average, 26% (±11%) silt, and 46% (±8%) clay. The sediment grain sizes consist of 11% (±5%) sand, 37% (±5%) silt, and 52% (±5%) clay in Subunit IIa and 8% (±2%) sand, 41% (±4%) silt, and 51% (±3%) clay in Subunit IIc. The quartz-rich sand layers in Subunit IIb consist of 75% sand, 13% silt, and 12% clay, whereas the aragonite-rich silt/clay layers in the same subunit consist of 6% (±1%) sand, 15% (±1%) silt, and 80% (±2%) clay.
Table T3. Smear slide textures, compositions, and lithologic names, Holes U1477A-U1477C. Download table in .csv format.
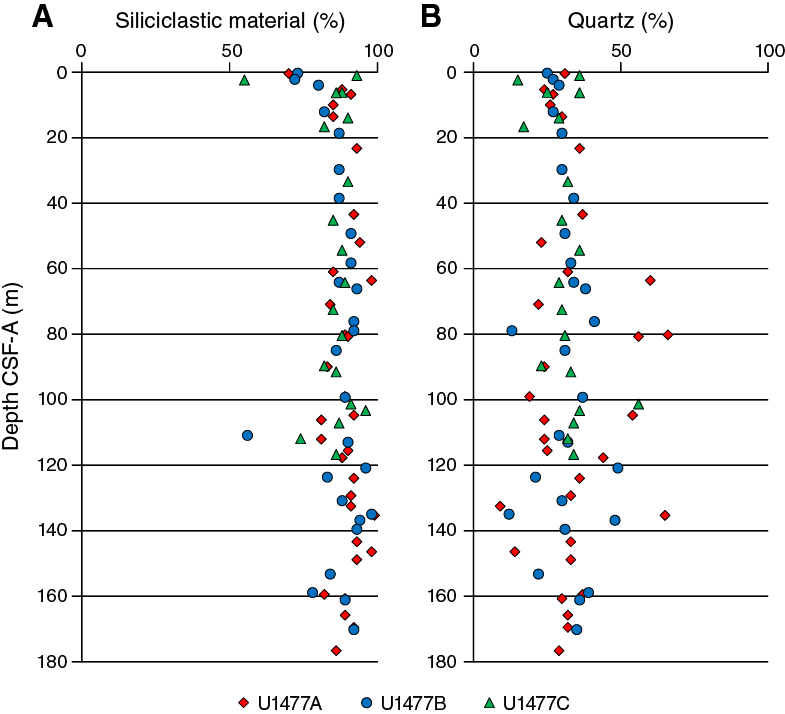
Figure F12. Relative percentages of major compositions of sediment determined by smear slide observation, Holes U1477A–U1477C.
The composition of the siliciclastic component is dominated by clay minerals (34% ± 15%) and quartz (32% ± 11% on average) in both units. Pyrite (7% ± 5% on average) and biotite (4% ± 2%) are also present throughout the cores. Trace amounts of zircon, hornblende, plagioclase, and dolomite were also regularly registered. These minerals are more abundant (1–6%) in medium sand–sized layers occasionally recorded in both units. The light brown silt/clay layers consist of 70% (±4%) carbonate fragments, in which needle-shaped crystals may likely be aragonite.
Biogenic materials represent only 8% ± 6% on average of the sediment. In Unit I, the biogenic fraction is larger (21% ± 11% on average) and is dominated by nannofossils (10% ± 6%) and foraminifers (8% ± 5%). In Unit II, the biogenic fraction is dominated by foraminifers (3% ± 2%) and nannofossils (2% ± 2%). The average abundance of total biogenic carbonate in the sediment in Hole U1477A was estimated at 4% ± 5% based on smear slides descriptions (Table T3). This result is in general agreement with geochemical analyses (see Geochemistry), which measured the average carbonate content at ~5 wt% (range = 1–22 wt%) (Figure F13).
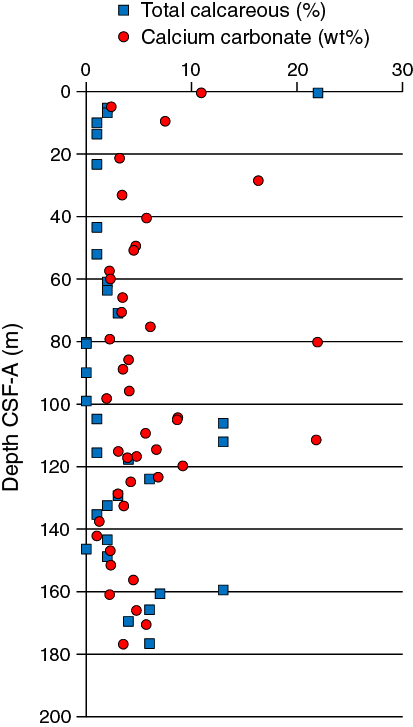
Figure F13. Comparison of CaCO3 from discrete samples and biogenic carbonate estimated in smear slides, Hole U1477A.
Structures
No primary sedimentary structures were observed. Visible secondary sedimentary structures, such as bioturbation, are rare. We note, however, that the very dark color of the sediment at Site U1477 may obscure sedimentary structures (e.g., bioturbation and diagenetic alterations).
Color
The color of the clayey sand in Unit I ranges between very dark gray (5Y 3/1; 10YR 3/1; GLEY I 3/N) and dark greenish gray (GLEY 1 4/10Y). The color of the silty clay in Subunit IIa ranges between dark gray (7.5YR 4/1; 10YR 4/1; GLEY 1 4/N) and dark greenish gray (GLEY 1 3/5GY) to very dark gray (5Y 3/1; 10YR 3/1). Finally, the silty clay in Subunits IIb and IIc is very dark gray (GLEY 1 3/N).
Discussion
Site U1477 is located in the western Mozambique Channel on the upper continental slope, off the Zambezi River, at a water depth of ~429 mbsl. The contourite drift body on which Site U1477 is located was deposited under influence of the eddy-dominated water flow through the Mozambique Channel (Lutjeharms, 2006). Site U1477 receives fluvial material from the Zambezi River, which has a mean outflow of ~3000 m3/s (Gammelsrød, 1992). The Zambezi Catchment area is in the southernmost reaches of the African monsoonal precipitation belt and drains multiple subbasins with differing basement lithologies, soils, and vegetation assemblages (e.g., Just et al., 2014; van der Lubbe et al., 2014).
The high proportion of siliciclastic material and the relatively increased amounts of organic matter (see Geochemistry) as well as high sedimentation rates of ~1 m/ky (see Age model) suggest enhanced deposition of Zambezi sediment at Site U1477. A change from sandy clay (Unit I) to silty clay (Unit II) sediment in all holes likely marks the Late Pleistocene/Holocene transition (see Age model) as inferred from correlation to published records from the area (van der Lubbe et al., 2014). This lithologic change can be attributed to the flooding of the Mozambique shelf as a result of sea level rise during the Holocene. A combination of high sea level and changes in oceanic currents during the Holocene can lead to the deposition of finer materials in the Mozambique shelf, whereas during times of low sea level the sediment largely bypasses the shelf and is delivered directly to the margin through the Zambezi paleochannel (van der Lubbe et al., 2014). The frequent occurrence of event layers consisting of quartz (sand/silt fraction) and biogenic carbonate fragments (clay fraction) in Subunit IIb can be attributed to river floods and/or storms enhancing current activity on the Mozambique shelf. These processes could trigger winnowing and downslope transport of coarse-grained sediment.
Physical properties
Physical property measurements were completed on whole-round sections and section halves from cores collected from Holes U1477A–U1477C. Gamma ray attenuation (GRA) density, magnetic susceptibility (MS), P-wave velocity (VP), and natural gamma radiation (NGR) measurements were made on all whole-round sections using the Special Task Multisensor Logger (STMSL), the Whole-Round Multisensor Logger (WRMSL), and the Natural Gamma Radiation Logger (NGRL). In all cases, STMSL resolution was set to 5 cm, WRMSL resolution was set to 2.5 cm, and NGRL resolution was set to 10 cm. All sections were first logged using the STMSL without waiting for thermal equilibration, generating a set of GRA density and magnetic susceptibility data that was used for stratigraphic correlation. Following thermal equilibration (after temperature reached 19°C), the sections were logged using the WRMSL, generating VP, GRA, and magnetic susceptibility data, and then logged using the NGRL.
Following core splitting, samples were taken for moisture and density (MAD) measurements from the working-half sections. The MAD (index) properties determined at Site U1477 include bulk density, dry density, grain density, porosity, void ratio, and water content. Three samples per core from the working-half sections of Holes U1477A were taken for MAD measurements. The samples (61 in total) were taken typically from Sections 2, 4, and 6 with few exceptions based on visual inspection. Spectral color reflectance and magnetic susceptibility were measured at a resolution of 8 cm on the archive-half sections using the Section Half Multisensor Logger (SHMSL). Red, green, and blue (RGB) were measured on the Section Half Imaging Logger (SHIL).
Diffuse reflectance spectrometry and digital color image
Spectral reflectance parameter L* ranges from 22 to 46 and shows a complex pattern (Figure F14). A poorly defined cyclic pattern is interrupted by abrupt variations. In the upper 64 m CSF-A, these sharp variations are represented by either increases or decreases in L* values and are between 25 and 40, but below this depth they are mainly associated with increases in L* with one exception at ~110 m CSF-A. The interval between ~64 and ~76 m CSF-A has high average L* values (30.6 ± 2.8).
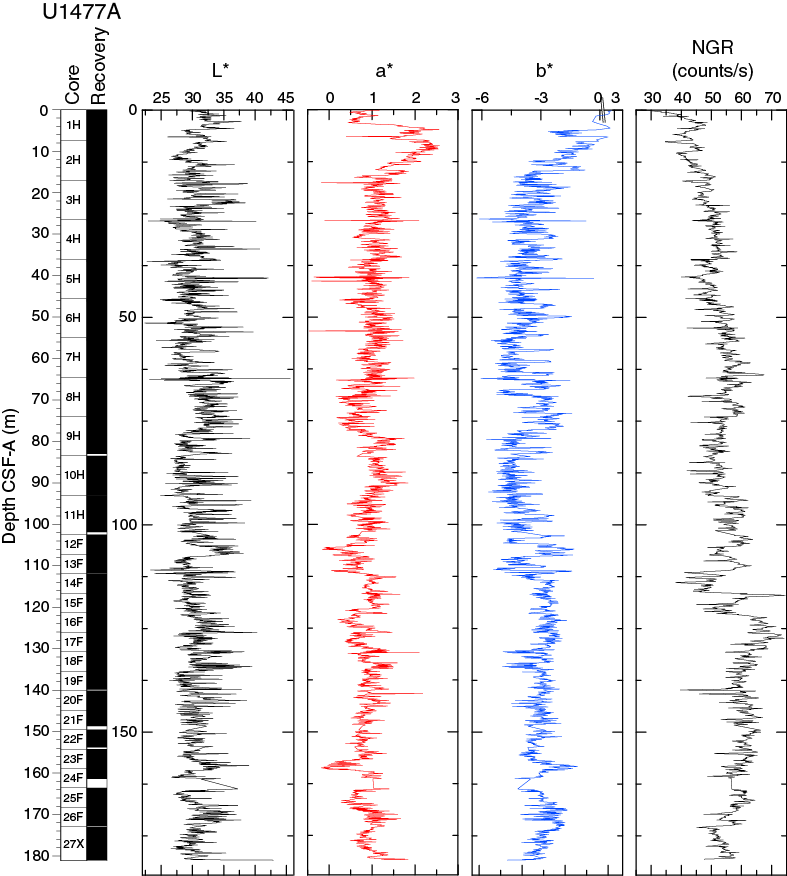
Figure F14. Color reflectance and NGR, Hole U1477A.
Spectral reflectance values for a* and b* are in general between 2.6 and –0.5 and between 2.6 and –6.3, respectively. Maxima in a* and b* values were observed in the mudline core, but a major difference between these reflectance parameters was observed in the upper sections, with maximum values for b* broadly corresponding to lithostratigraphic Unit I (see Sedimentology). On the other hand, maximum values for a* were observed between 5 and 9 m CSF-A, directly below Unit I. In general, a* and b* are poorly correlated, whereas b* shows a broad correspondence with L* values. The most systematic feature is a clear anticorrelation between a* and b* in several of the most prominent peaks along the sequence (e.g., 130, 133, and 158 m CSF-A) and an interval of relatively stable values between 120 and 155 m CSF-A. The color reflectance variations are due to compositional changes (e.g., organic matter versus clay mineral concentration/composition). Spectral reflectance data are very similar between holes. Deviations from good correspondence between holes are attributed to drilling disturbances.
SHIL records of RGB data were obtained from the moist surface of the archive halves of split cores. RGB data have average values of R = 31 ± 3.4, G = 31 ± 3.1, and B = 30 ± 2.7 (Figure F15). Data also show a complex pattern with high values in the mudline core, stable values interrupted by occasional abrupt variations between 9.5 and ~110 m CSF-A, and high-frequency variations in the lower part. There is some broad correlation with a* in the mudline core, but the data show a variable correlation with other spectral reflectance parameter along the entire sequence.
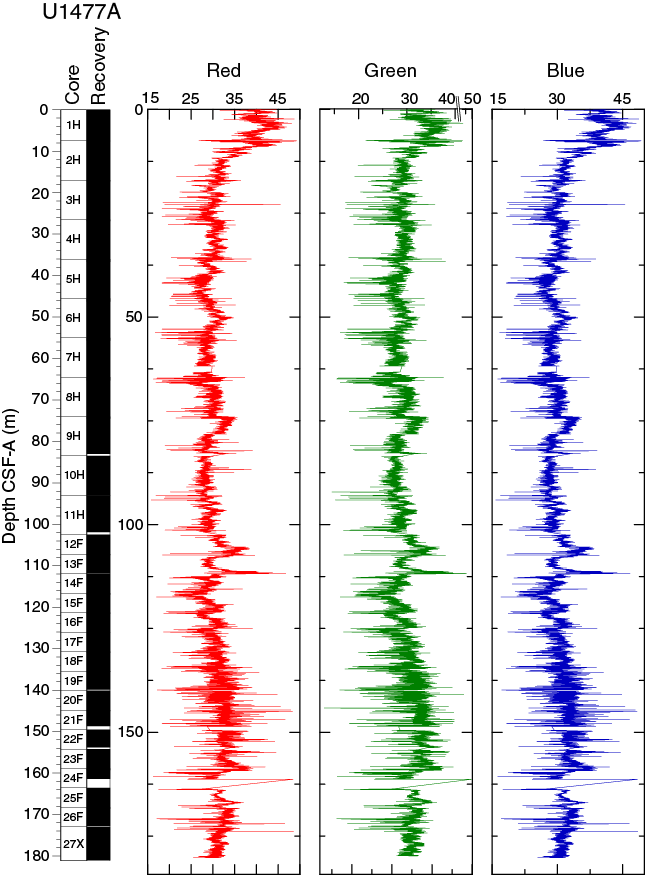
Figure F15. SHIL RGB color data, Hole U1477A.
Natural gamma radiation
In Hole U1477A, NGR (Figure F14) is 54 ± 7 counts/s on average. In the uppermost 64 m CSF-A, NGR increases from 30 to 67 counts/s. This gradual increase is interrupted by a zone with lower average values (41 counts/s) at 37–46 m CSF-A. Below 64 m CSF-A, NGR shows no clear trends and fluctuates around an average value of 56 ± 5 counts/s. A maximum of 74 counts/s occurs at 117 and ~127 m CSF-A, whereas a local minimum was observed at 114 m CSF-A. Spike-like excursions to lower NGR values (e.g., at 140 m CSF-A) may be due to voids caused by gas expansion.
Magnetic susceptibility
Whole-round core (WRMSL) measurements of magnetic susceptibility in Hole U1477A (Figure F16) have an average of 35.5 ± 14.9 instrument units (IU; ~10–5 SI). The low variability (~5–10 IU) background magnetic susceptibility decreases from 37 IU at the seafloor to 19 IU at the bottom of the hole. Superimposed on this trend are numerous 3–7 m intervals with significantly higher magnetic susceptibility values of up to 86 IU. A very prominent feature in the sequence is a zone of high magnetic susceptibility values between 133 and 144 m CSF-A. Within this zone, magnetic susceptibility averages 67.3 IU and exhibits high-amplitude variability ranging between 25 and 174 IU. It should be noted that the absolute values of the magnetic susceptibility measurements at Site U1477 may be biased to lower values for some intervals because of voids resulting from significant core expansion.
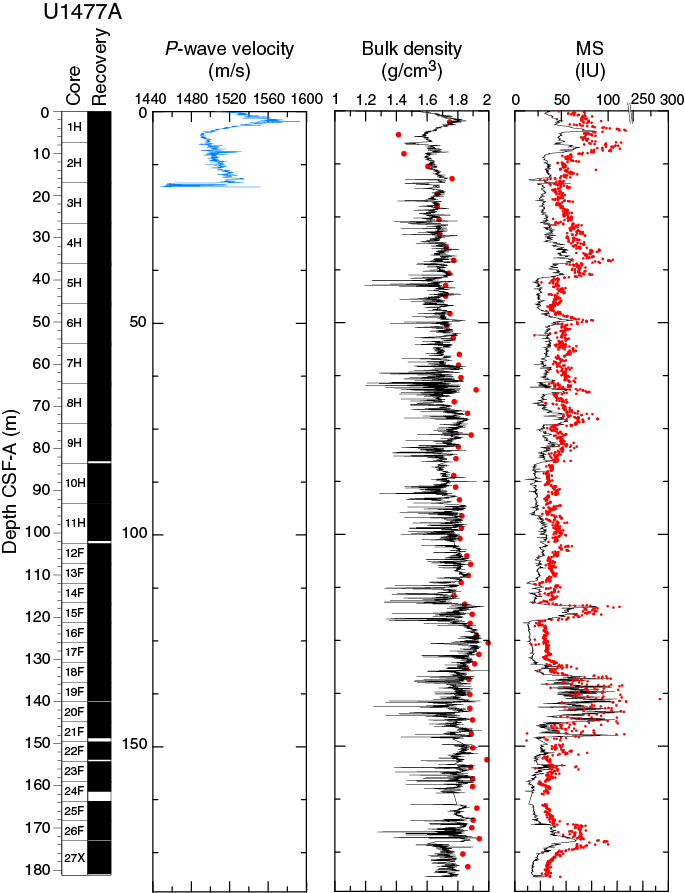
Figure F16. P-wave velocity, bulk density, and magnetic susceptibility, Hole U1477A.
Compressional wave velocity
P-wave velocities measured with the WRMSL (Figure F16) in Hole U1477A increase with a high gradient from 1520 m/s at the seafloor to 1593 m/s at 2.4 m CSF-A. This increase is followed by a sharp decrease to 1490 m/s at 5.6 m CSF-A. Below 5.6 m CSF-A, velocities exhibit a gradual increase to 1534 m/s at 16.9 m CSF-A. Below this depth, reliable P-wave data collection in all holes of Site U1477 was inhibited by strong signal attenuation caused by the high number of gas expansion voids so no values are included in the figure.
Moisture and density
Bulk density at Site U1477 was determined on whole-core sections using the STMSL and WRMSL (GRA density) and discrete MAD samples. Changes in GRA and MAD bulk densities are well correlated throughout Hole U1477A (Figure F16). GRA bulk density values vary from 1.13 to 2 g/cm3 and are consistent with an average MAD bulk density of 1.81 ± 0.1 g/cm3. Spike-like excursions to lower GRA bulk densities (e.g., at 64 m CSF-A) may be due to voids caused by gas expansion and the generally slightly higher values for discrete samples are likely also explained by the gas expansion voids. Grain densities vary between 2.10 and 3.17 g/cm3 with an average value of 2.77 ± 0.1 g/cm3 (Figure F17).
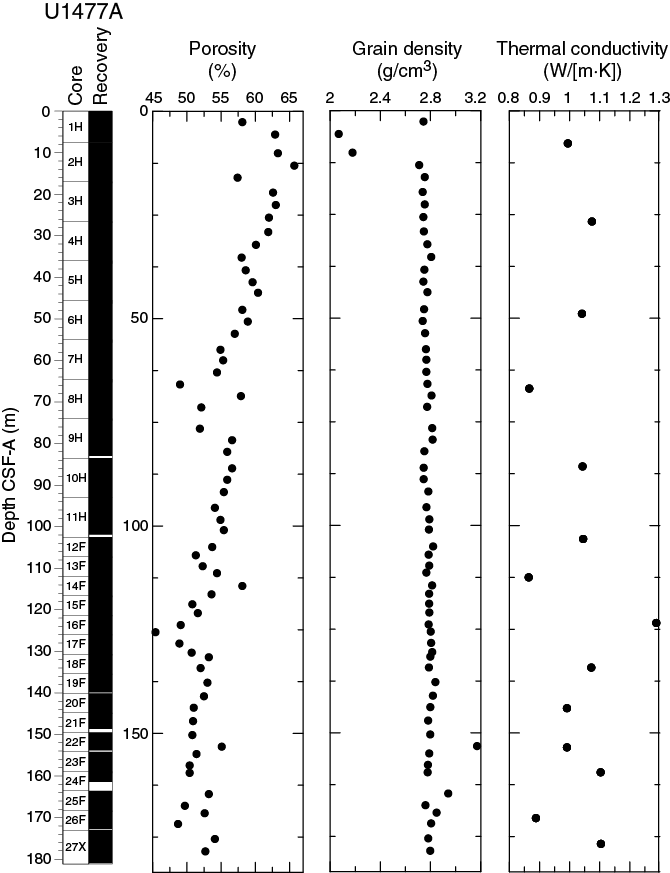
Figure F17. Porosity, grain density, and thermal conductivity, Hole U1477A.
Overall, the porosity profile (Figure F17) shows a decreasing downhole trend in Hole U1477A that is consistent with sediment compaction. Porosity values are low compared to Sites U1474–U1476, and range between 45.4% and 65.7%.
Thermal conductivity
Thermal conductivity measurements were performed on every other core in Holes U1477A and U1477B (Figure F17). The full-space needle probe was used, usually near the middle of one section. Overall, thermal conductivity values range between 0.86 and 1.29 W/(m·K), with an average value of 1.03 W/(m·K), but do not show an increase with depth as observed at previous sites.
Summary
Despite the homogeneous lithology, different physical parameters at Site U1477 show complex patterns of high-amplitude changes that are likely caused by climate-related variations in terrigenous sediment supply or current sorting effects. However, some spike-like excursions to lower values in NGR and GRA density data may be due to voids caused by gas expansion. Also, reliable P-wave data collection below 16.9 m CSF-A in all holes at Site U1477 was inhibited by strong signal attenuation caused by the frequent occurrence of gas expansion voids. The porosity profile at Site U1477 shows a decreasing trend downhole, and average porosities are significantly lower when compared to the sites (U1474–U1476 and U1479) in deeper water, suggesting a higher degree of sediment compaction.
Micropaleontology
Site U1477 spans approximately the last 200 ky of the Pleistocene. Analysis of calcareous nannofossils and planktonic foraminifers identifies two biostratigraphic datums—the abundance crossover of the nannofossils Gephyrocapsa caribbeanica to Emiliania huxleyi at ~90 ka and the top occurrence of planktonic foraminifer Globigerinoides ruber (pink) at ~120 ka. Diatoms were too sparse to yield a biostratigraphy. Calcareous nannofossils are generally well preserved in the clay-rich Hole U1477A, although abundance is typically low. Planktonic foraminifers are <1% of sediment particles in most samples, whereas calcareous nannofossils show abundances of <50 liths per field of view throughout the hole. The planktonic assemblage, which includes the regular occurrence of pteropods, is joined by benthic foraminifers, ostracods, sponge and gorgonian spicules, phytoliths, mollusks, echinoderm plates, and fish otoliths. Because of the high sedimentation rates (estimated as 1 m/ky) at this site, only core catcher samples were fully examined, for a total of 26 samples, with just a few additional samples examined from the split cores.
The biostratigraphy of Hole U1477A is shown in Figure F18 with microfossil datums reported in Tables T4 and T5. Calcareous nannofossil occurrences are presented in Table T6, and planktonic foraminifer occurrences are shown in Table T7. Typical examples of calcareous nannofossils at Site U1477 are presented in Figure F19. Representative species of planktonic and benthic foraminifers at Site U1477 are shown in Figure F20, and some examples of assemblages are illustrated in Figure F21. The age-depth plot including the biochronology and magnetostratigraphic datums is discussed in Age model and is shown in Figure F36.
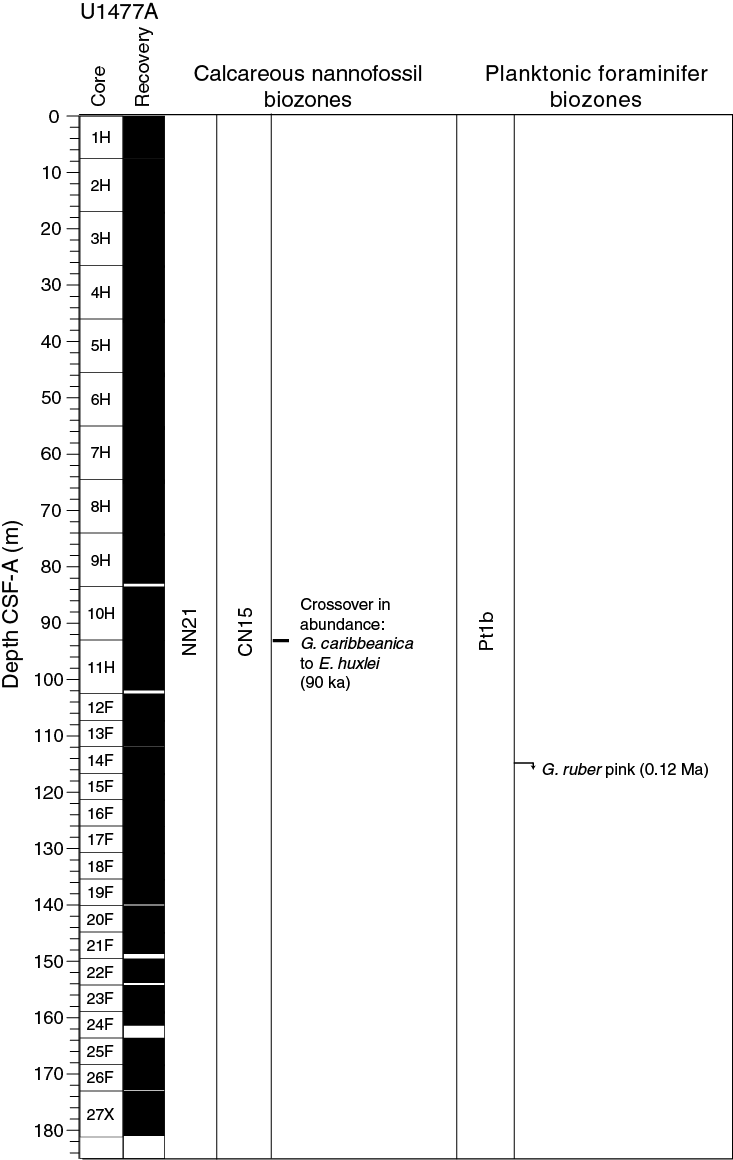
Figure F18. Biochronology at Site U1477 with significant planktonic foraminifer and calcareous nannofossil events.
Table T4. Biostratigraphic planktonic foraminifer datums, Site U1477. Download table in .csv format.
Table T5. Biostratigraphic calcareous nannofossil datums, Site U1477. Download table in .csv format.
Table T6. Calcareous nannofossil occurrence, Site U1477. Download table in .csv format.
Table T7. Planktonic foraminifer occurrence and abundance based on examination of the >150 µm fraction, Site U1477. Download table in .csv format.
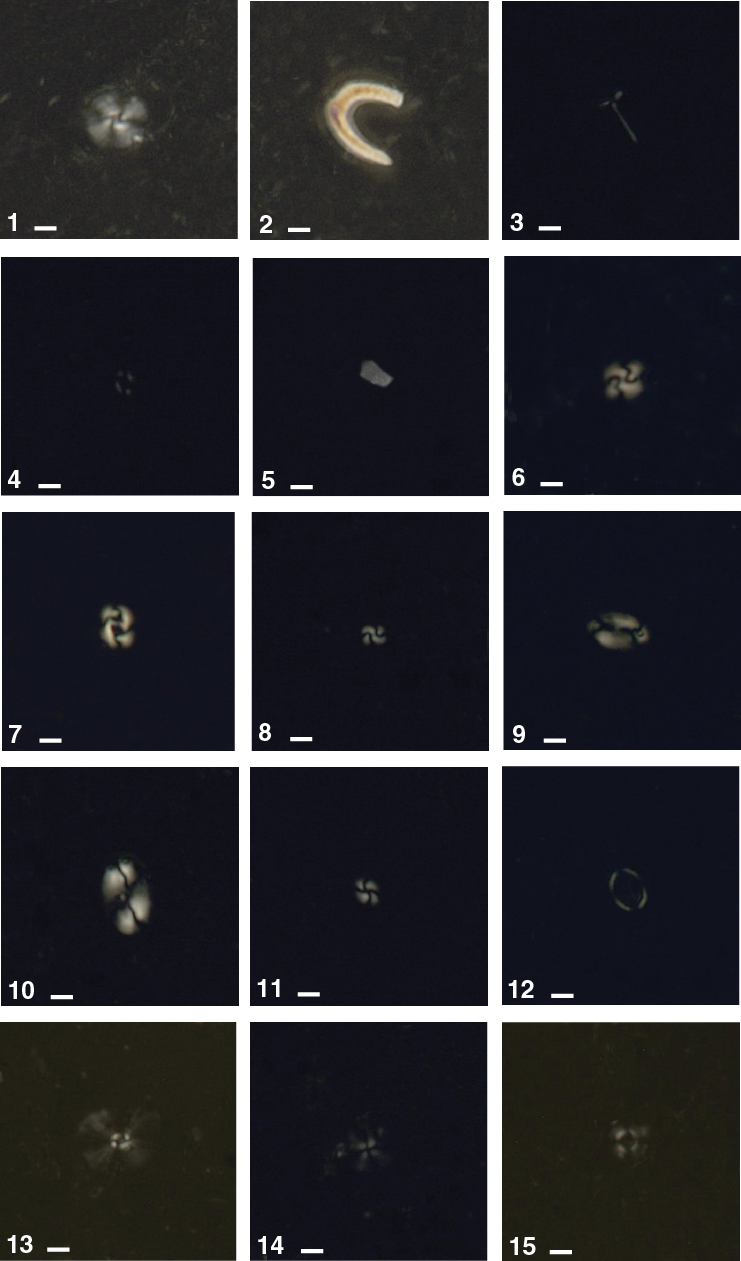
Figure F19. Calcareous nannofossils, Hole U1477A.
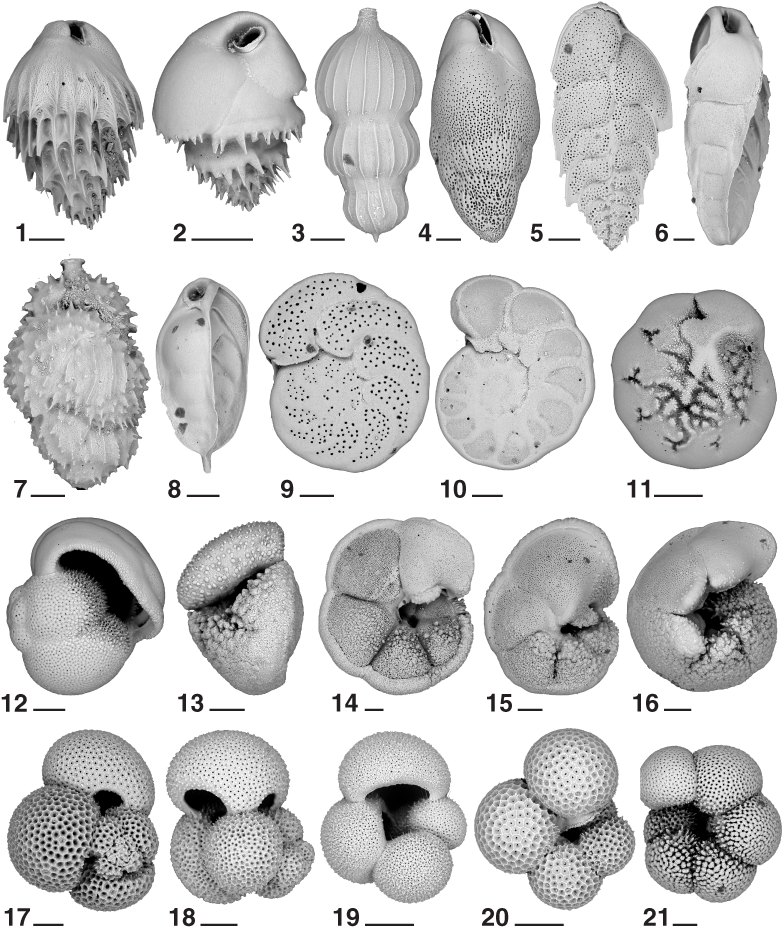
Figure F20. Benthic and planktonic foraminifers, Hole U1477A.
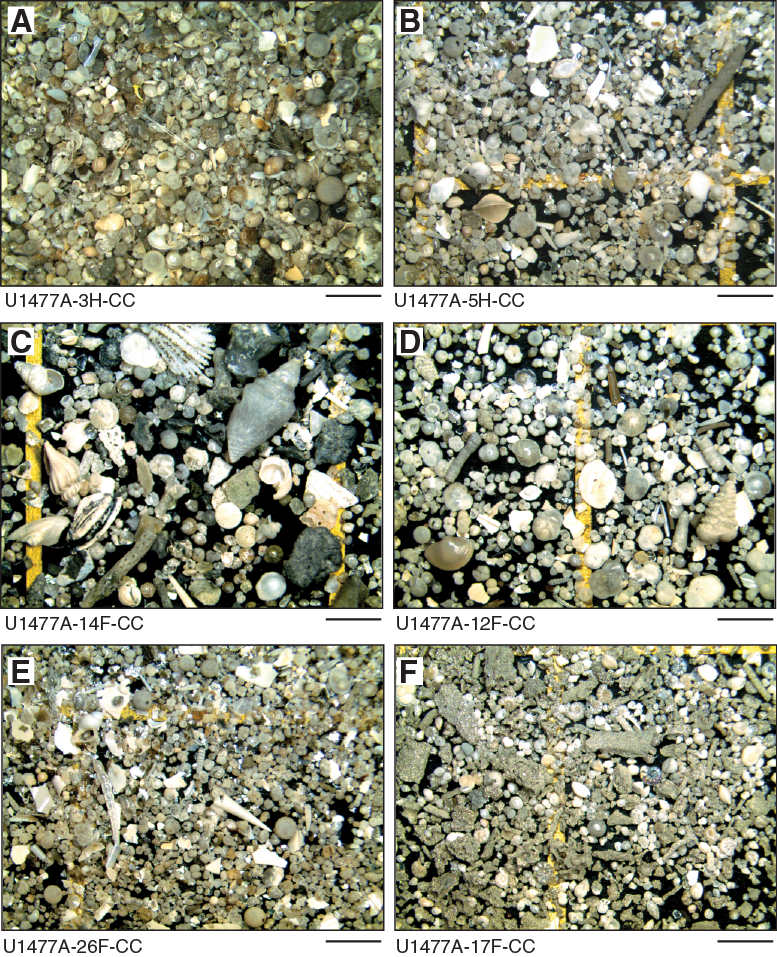
Figure F21. Representative assemblages of foraminifers and other sedimentary components, Site U1477.
Calcareous nannofossils
Calcareous nannofossils were analyzed in the mudline, 26 core catcher samples, and three selected intervals from the split-core sections in Hole U1477A. Group and individual abundances of discrete species were recorded from the core catcher and split-core section samples. Only one nannofossil datum event calibrated by Gradstein et al. (2012), the crossover in abundance of G. caribbeanica to E. huxleyi (~0.09 Ma) in Sample 361-U1477A-10H-CC (93.02 m CSF-A), was identified at Site U1477.
Relatively low abundances (<5% of sediment particles) were recorded in the upper part of the sequence (from the mudline to Sample 6H-CC; 55.68 m CSF-A). Abundances slightly increase in Sample 7H-CC (65.28 m CSF-A), reaching their maximum (>50% of sediment particles) in Samples 12F-CC (107.45 m CSF-A) and 13F-CC (111.85 m CSF-A). Between 116.95 and 126.08 m CSF-A (>0.12 Ma based on planktonic foraminifer datums), calcareous nannofossils are still quite common; however, they substantially decrease in abundance (<1% of sediment particles) between Samples 17F-CC (130.97 m CSF-A) and 22F-CC (153.79 m CSF-A). The species that characterize this interval are Florisphaera profunda, Gephyrocapsa oceanica, and small Gephyrocapsa spp. (<4 μm), which are valuable indicators of the nutricline depth (Flores et al., 2000). Finally, from Sample 23F-CC (159.29 m CSF-A) to the bottom of the hole at 180.96 m CSF-A, calcareous nannofossil abundances increase to between 5% and 50% of sediment particles.
Overall, the assemblages are characterized by relatively low species diversity and are dominated by cosmopolitan forms, such as E. huxleyi, G. oceanica, and small Gephyrocapsa (<4 μm) as well as by F. profunda and Gladiolithus flabellatus, two lower photic zone taxa. Rare to few specimens of Calcidiscus leptoporus, Helicosphaera carteri, Syracosphaera pulchra, small Reticulofenestra (<3 μm), Umbellosphaera irregularis, Umbellosphaera tenuis, and Umbilicosphaera sibogae are recorded in the samples. Rare occurrences of Helicosphaera hyalina, Helicosphaera wallichii, Pontosphaera japonica, Pontosphaera discopora, Rhabdosphaera clavigera, Discosphaera tubifera, Calsiosolenia murrayi, and Ceratolithus cristatus are also observed.
Planktonic foraminifers
Planktonic foraminifers were examined in core catcher samples in Hole U1477A and one core catcher sample in Hole U1477B for a total of 27 samples. Most samples were washed directly upon core recovery, a task that became increasingly difficult because of the compacted clay in the deeper parts of the hole. The core catchers from Cores 361-U1477A-24F (161.3 m CSF-A) through 27X (180.9 m CSF-A) and 361-U1477B-26F (174.8 m CSF-A) were dried completely before processing and soaked in a dilute borax solution—a procedure that made the samples much easier to process and likely resulted in an improvement in foraminifer quality in the washed sand fraction. Examples of the major foraminifer taxa present at Site U1477 are illustrated in Figures F20 and F21. Foraminifer residues (>63 µm) typically constitute from <1% to ~1% of the total sediment volume, with the highest abundance reached in Samples 361-U1477A-12F-CC (107.4 m CSF-A) and 13F-CC (111.8 m CSF-A). Foraminifer preservation is usually excellent, with the typical occurrence of semi-glassy, translucent specimens with empty chambers. However, some intervals also display moderate to poor preservation, commonly from infilling by pyrite, pyrite replacement, and extensive staining with iron oxides. Preservation in sand layers is particularly poor, with iron-stained foraminifers and benthic species (such as Ammonia falsobeccarii) transported in from shallower water.
The planktonic foraminifer assemblage is relatively invariant and is dominated by tropical Indian Ocean species such as G. ruber (white), Globigerinoides sacculifer, Globorotalia menardii, Neogloboquadrina dutertrei, and Globigerinella siphonifera. Globorotalia crassaformis, Orbulina universa, and Pulleniatina obliquiloculata are other typical elements, whereas Globigerinita glutinata, Globigerina bulloides, Globigerinella calida, Globigerinoides conglobatus, and Globorotalia tumida are rare but regularly occurring components. Species with more occasional occurrences include Globorotalia inflata, Neogloboquadrina pachyderma (dextral), Globorotalia hirsuta, Globigerinella obesa, Globigerina falconensis, and Globorotaloides hexagona. Finally, our single biostratigraphically useful species, G. ruber (pink), has its top occurrence in Samples 14F-CC (116.9 m CSF-A), positioning this sample at ~0.12 Ma. G. ruber (pink) was also found in Sample 361-U1477B-13F-CC (111.86 m CSF-A).
Siliceous microfossils
Diatoms, silicoflagellates, phytoliths, and sponge spicules make up a minor component of Hole U1477A samples and exhibit poor preservation in core catcher samples (Table T8). The mudline sample has moderate preservation and a mixed assemblage of marine, littoral, and freshwater diatoms. Other siliceous microfossils present in the mudline sample are phytoliths and sponge spicules. Marine diatoms represented in the mudline are taxa such as Azpeitia spp., Paralia sulcata, Triceratium favus, and Rhizosolenia bergonii. Also present are littoral taxa such as Cocconeis spp., Diploneis bombus, and Navicula spp. Terrestrial inputs are represented by the freshwater diatom, Aulacoseira spp., and other freshwater diatom fragments, along with the presence of phytoliths.
Table T8. Diatom and other siliceous microfossil occurrences, Site U1477. Download table in .csv format.
Core catcher samples contain trace amounts of siliceous microfossils that exhibit poor preservation. Several core catcher samples are barren of diatoms (Table T8); however, other siliceous microfossils such as sponge spicules and phytoliths are consistently present downcore. Marine diatoms were found along with indicators of terrestrial inputs in Samples 361-U1477A-10H-CC (93.07 m CSF-A), 11H-CC (101.88 m CSF-A), and 24F-CC (161.39 m CSF-A); however, the primary siliceous microfossil signal at this site is from sponge spicules, phytoliths, and littoral and freshwater diatoms. Datums for tropical diatoms were not observed at this site due to the high sedimentation rate.
Paleomagnetism
For Site U1477, sediment cores were recovered from Holes U1477A, U1477B, and U1477C with maximum penetration of 181.2, 174.4, and 119.4 m CSF-A, respectively. The Icefield MI-5 core orientation tool was used to measure orientations of sediment cores from Hole U1477A. However, this tool failed and the FlexIt tool was used for APC cores in Holes U1477B (Cores 1H through 12H) and U1477C (Cores 2H through 10H). Discrete samples were taken from Holes U1477A and U1477C for natural remanent magnetization (NRM) demagnetization, anisotropy of magnetic susceptibility (AMS), and isothermal remanent magnetization (IRM) acquisition experiments.
Discrete sample measurements
Bulk magnetic susceptibility reaches the highest values of ~600 × 10–6 SI at ~5 and ~10 m CSF-A in Holes U1477A and U1477C, respectively. Below it tends to vary between 100 and 250 × 10–6 SI with a maximum value of 500 × 10–6 SI between 130 and 140 m CSF-A. Trends in the volumetric magnetic susceptibility obtained from discrete samples aligns with the SHMSL magnetic susceptibility data (Figure F22; Table T9).
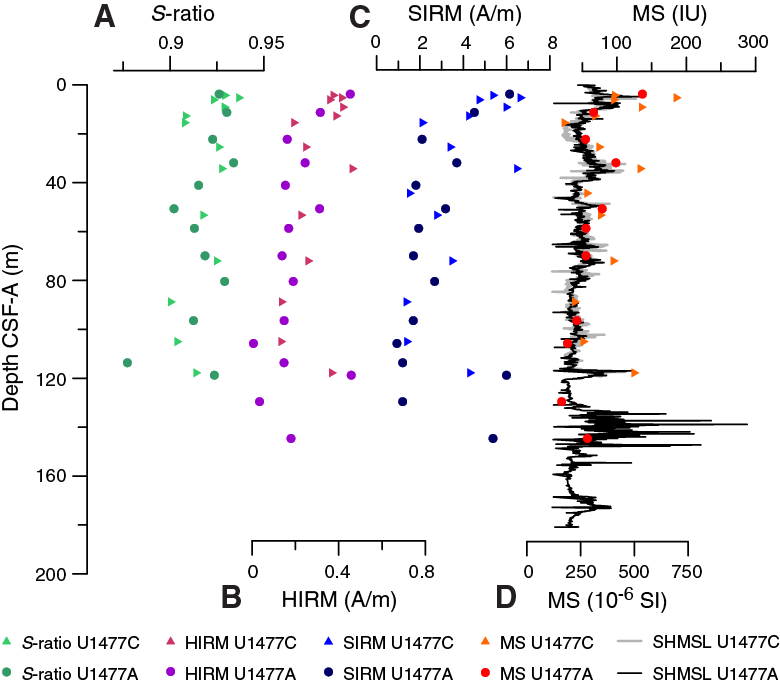
Figure F22. S-ratio, HIRM, SIRM, and magnetic susceptibility, Holes U1477A and U1477C.
Table T9. Volumetric bulk magnetic susceptibility and declination of maximum magnetic susceptibility eigenvalues of discrete samples, Site U1477. Download table in .csv format.
Because the Icefield MI-5 tool failed to work correctly in Hole U1477A, directional data could not be corrected for the orientation of cores retrieved in this hole; subsequent investigations found that the Icefield MI-5 tool had not operated correctly since Site U1476. However, the orientation angle that was obtained by the FlexIt tool was successfully applied to correct the directional data in Hole U1477B except for Core 361-U1477B-3H. The declinations of the eigenvalues of the maximum magnetic susceptibility (V1) were corrected for core orientation considering a modal declination of 0° for each of these cores (Table T10). Because of the relatively high magnetic susceptibility of the sediments at this site, the shipboard AMS data might be less affected by magnetic noise of the shipboard surroundings and therefore provide information on the magnetic fabric of the sediment related to the current direction at the time of sediment deposition. These preliminary AMS results indicate that the magnetic minerals are aligned in northern and southeastern directions (Table T9). These directions are consistent with current-induced sediment transport pathways from the Zambezi River and along the Mozambique margin.
Table T10. Analyzed discrete whole-round samples, Site U1477. Download table in .csv format.
Saturation IRM (SIRM) decreases from ~5 to ~1 A/m at ~16 m CSF-A (Figure F22). Further downcore, SIRM is relatively stable with a few elevated values coinciding with magnetic susceptibility peaks. Hard IRM (HIRM) shows the same trend as SIRM. S-ratios vary between 0.9 and 0.93, and the lowest values are generally associated with relatively low magnetic susceptibility.
Upon demagnetization of NRM most of the samples show stable directions (Figure F23A). However, Sample 361-U1477A-17F-3, 75–77 cm, from 129.75 m CSF-A shows acquisition of magnetization at right angles to the last demagnetization axes (arbitrary order of x, y, and z demagnetization axes) after the 40, 60, and 80 mT step (Figure F23B). This so-called gyroremanent magnetization is typical for the presence of greigite. The current sulfate–methane transition zone (SMTZ) was observed at ~16 m CSF-A (see Geochemistry). Sedimentary records from the Zambezi margin suggest that the SMTZ remains at approximately the same depth horizon as a result of the decrease in sediment accumulation rates after the flooding of the Mozambique shelf (März et al., 2008). This suggests that ample time is available in these sediments for associated early diagenetic processes, as dissolution and iron-sulfide (e.g., greigite) formation to overprint the magnetic mineralogy.
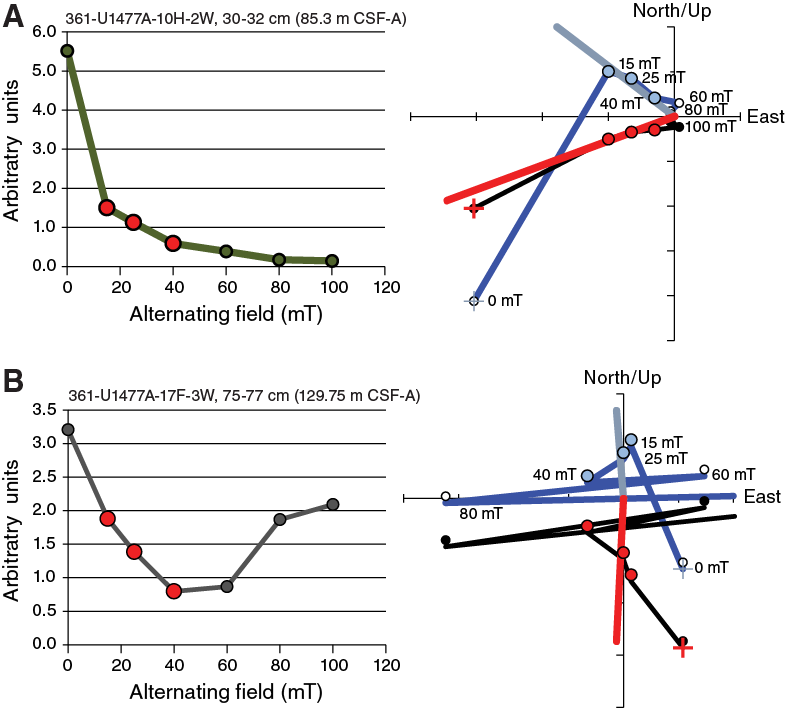
Figure F23. Alternating field demagnetization results from two samples from Hole U1477A.
Inclinations before demagnetization show steep downward (~80°) inclinations, as are typically observed for core drill string overprint. Characteristic remanent magnetizations were computed by performing principal component analyses (PCA) on incremental demagnetization steps, with median angular deviations <18°. All discrete samples show inclinations that are characteristic for normal polarity.
Archive-half measurements
Results from Core 361-U1477A-1H, which was demagnetized at 15, 20, and 25 mT, indicate that for most of the sections the coring overprint was successfully removed after the highest demagnetization step. Therefore, the remaining cores from Holes U1477A and U1477B as well as Cores 361-U1477C-2H through 6H were demagnetized at 25 mT, and inclinations average ~50° (Figure F24). Drilling disturbances and overprints have a notable effect on the inclination and declination data from the first and last section of each core. Additionally, inclination and declination data from sections that were retrieved by HLAPC are much noisier than those retrieved by APC.
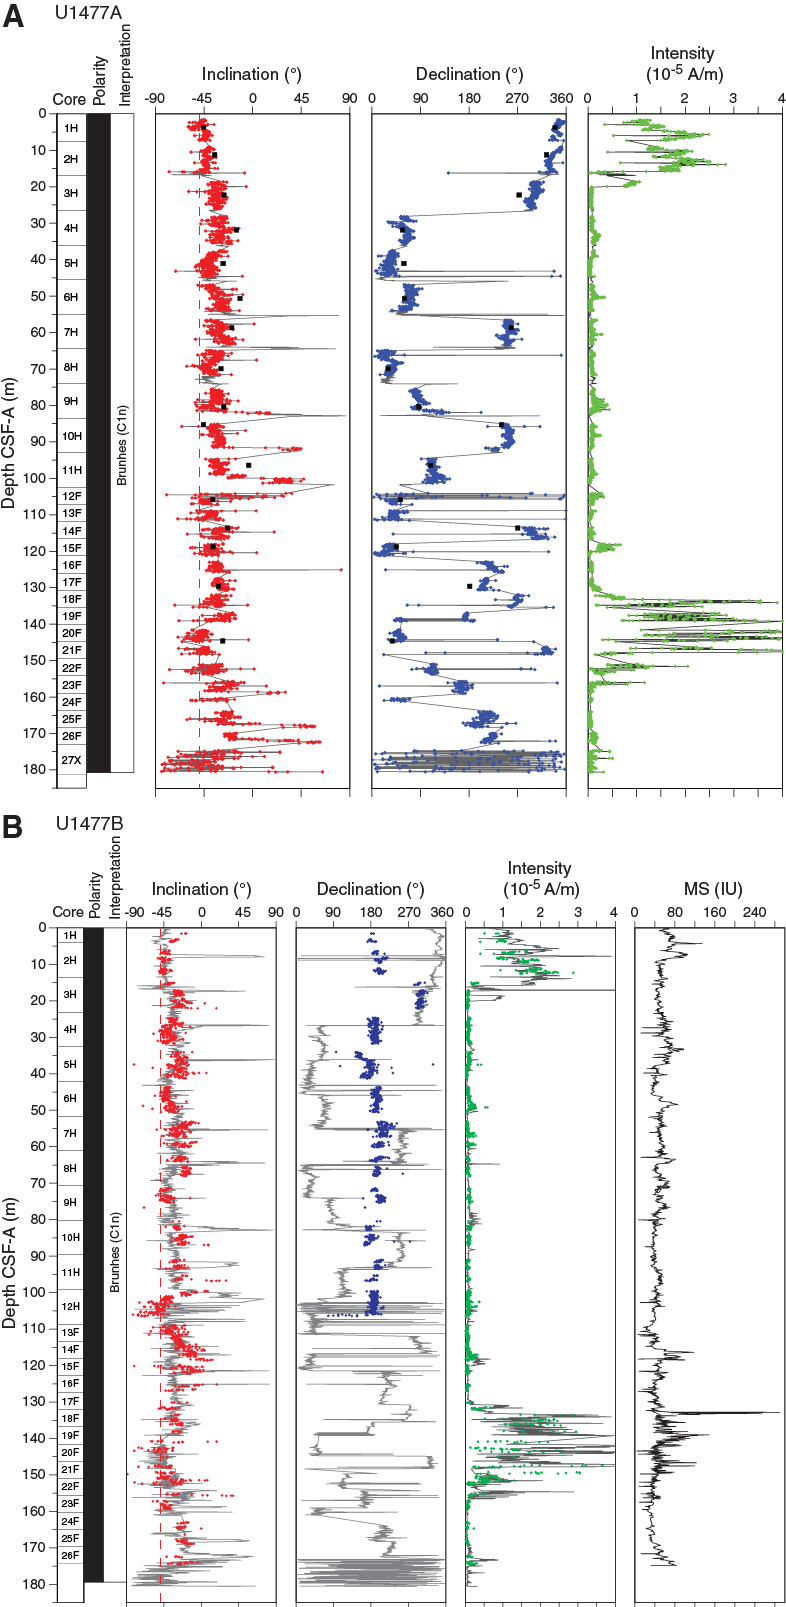
Figure F24. Downhole inclination, declination, and intensity after demagnetization at 25 mT, Site U1477.
Magnetostratigraphy
All recovered cores have inclinations of ~50°, similar to present-day inclination at Site U1477. No reversed intervals occur in the downhole inclination records, indicating that the sediments exclusively cover a part of the Brunhes normal polarity chron.
Stratigraphic correlation
Three holes were drilled at Site U1477 using the APC, HLAPC, and XCB systems and contain a reasonably complete section covering the last glacial cycle at extremely high resolution. Exceptionally high accumulation rates (~1 m/ky; see Age model) and accompanying high rates of organic carbon accumulation result in a high gas (CH4) content and consequently significant expansion of the cores upon decompression. This produced intervals of severe fracturing with many voids and substantial extension of individual core lengths. The nature of the sediment also led to relatively early refusal of the full-length APC barrel at ~80–90 m DSF (see Operations). This resulted in partial recovery of material and suspected flow-in of material in some cores around this depth in all holes (see Sedimentology). Furthermore, significant and apparently real differences between holes (reflected by various parameters including magnetic susceptibility, reflectance, and NGR compared on a meter scale) implies that construction of a continuous splice for the full length of the record is not possible and would be effectively meaningless, at least for the interval below ~85 m CCSF-A. Consequently, a continuous splice has been constructed only for the upper 85 m CCSF-A, with the deeper interval (downhole to ~195 m CCSF-A) being represented almost exclusively by Hole U1477B, which we consider the highest quality material. However, this choice, even for the uppermost 85 m CCSF-A, must be taken as subjective. Future investigations should consider differences between holes as potentially real and of possible significance to the broader inferences made from this site.
Irrespective of any real differences among holes on a meter scale, which prevents direct correlation across several intervals, there is clear correlation of several parameters across all three holes on a scale of 5–10 m, even on the CSF-A scale (Figure F25). This gives us confidence that the sediment at this site reflects representative environmental variations and can be used to make inferences about wider regional processes.
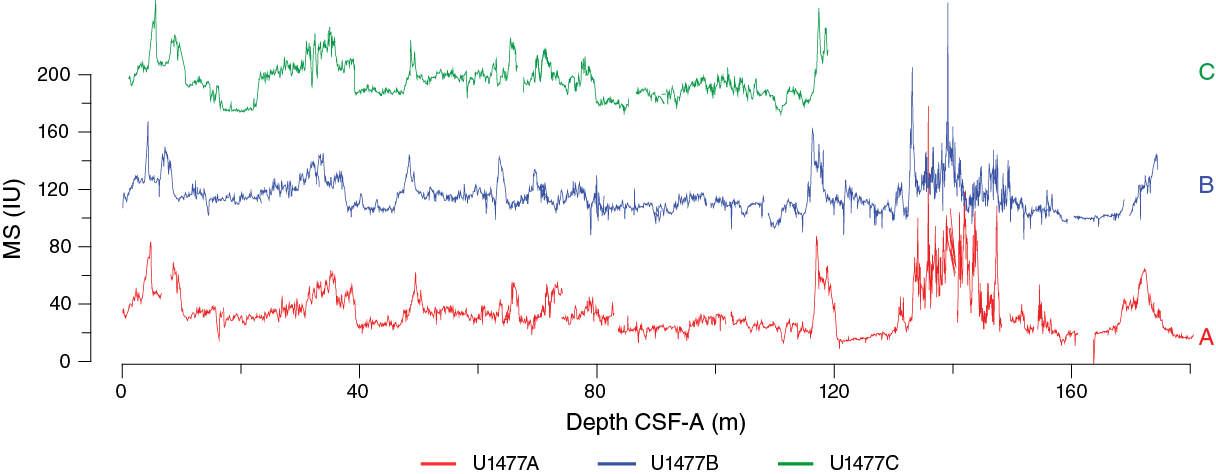
Figure F25. Magnetic susceptibility records on the CSF-A depth scale, Site U1477.
Compositing of holes
As a guide for drilling to avoid coring gap alignment where possible, sequences from all holes were composited in near-real-time using magnetic susceptibility data from the STMSL (see Physical properties in the Expedition 361 methods chapter [Hall et al., 2017] for details) measured at 5 cm resolution. After collection, compositing of holes was achieved using the whole-round magnetic susceptibility measurements almost exclusively—in this case from the STMSL—but results from the WRMSL were effectively identical and could have been used instead. Magnetic susceptibility was the preferred variable for stratigraphic ties because the gas expansion and fracturing led to especially noisy signals in other records (e.g., NGR and color reflectance). The relative depth offset of each core was determined by the optimized correlation of the magnetic susceptibility record (Figure F26), with the top of Hole U1477B serving as the mudline anchor. These depth offsets are reported in the affine Table T11.
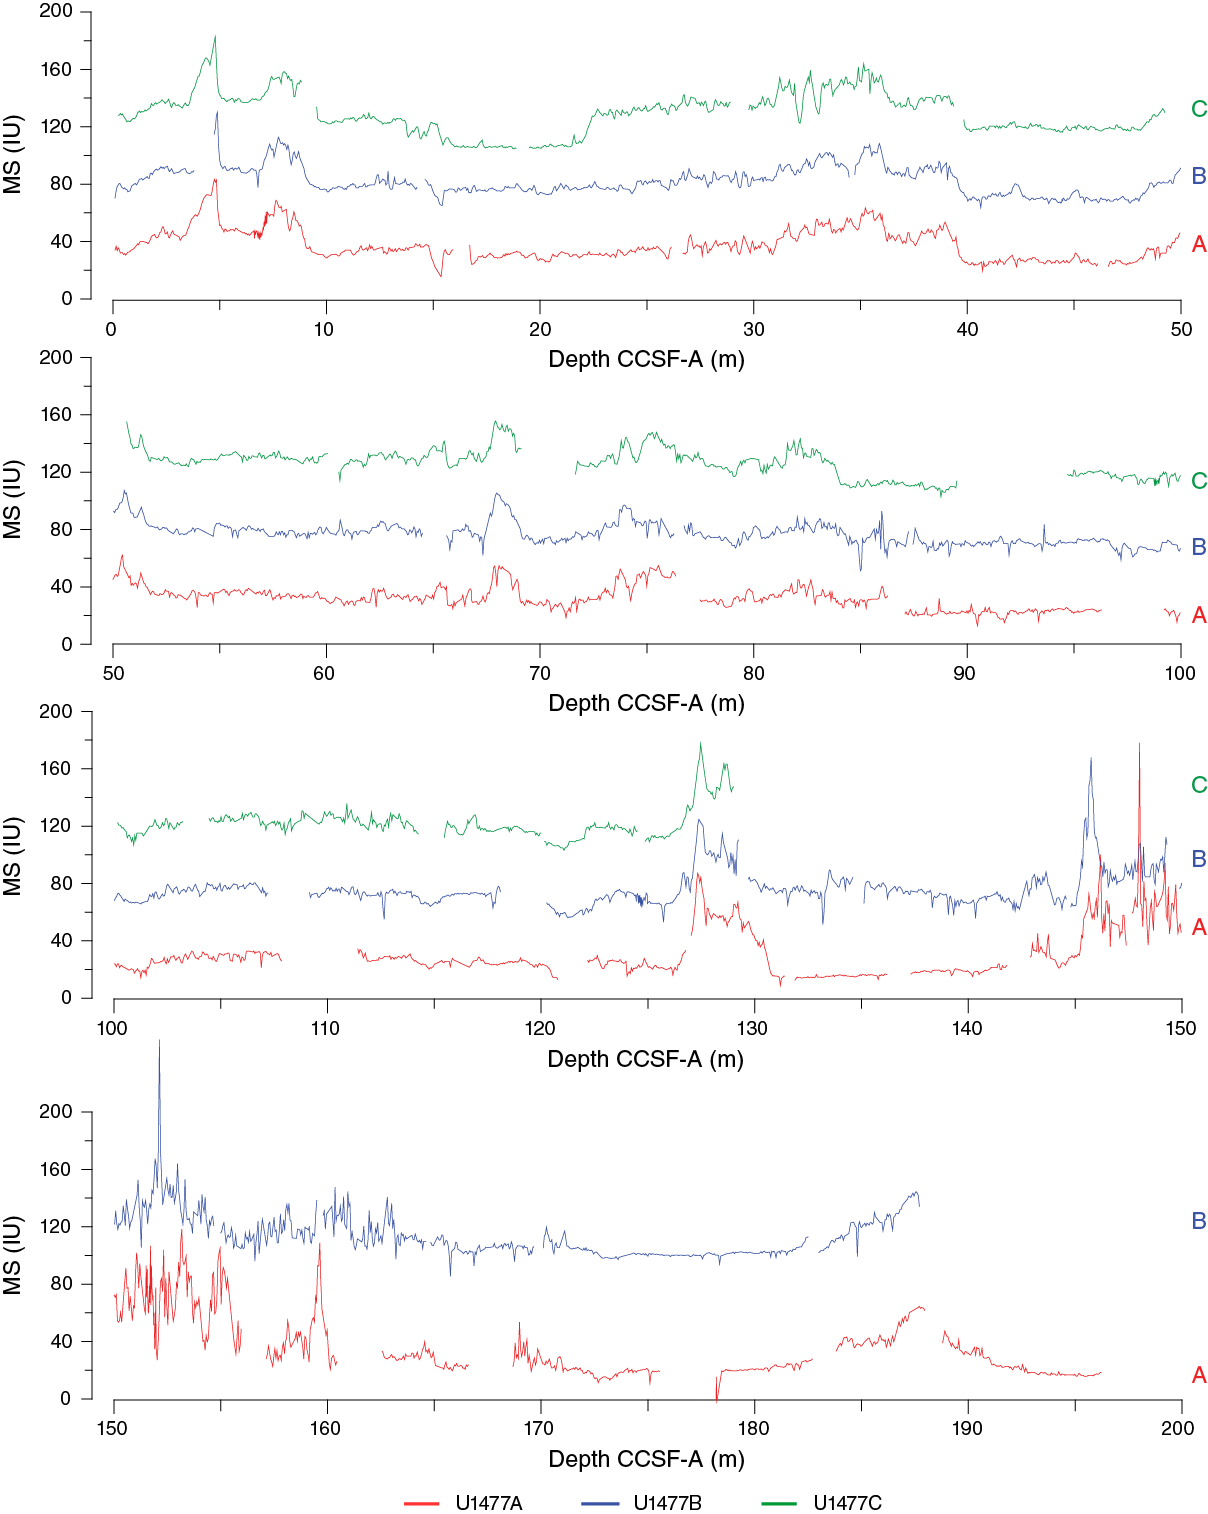
Figure F26. Magnetic susceptibility records on the CCSF-A depth scale, Site U1477.
Table T11. Affine table, Site U1477. Download table in .csv format.
Where a lack of distinct features prevented straightforward correlation between holes (notably below ~85 m CCSF-A) or where distinct differences between holes made correlation impossible, offsets (gaps) between cores were estimated by extrapolation of the growth factor from the core above. Typically this was ~10%, with some modest variation of this average growth rate to accommodate the few stratigraphic ties that could be made confidently (e.g., near the base of the recovered section).
Construction of the splice
Once the composite depth scale was created, select sequences from Holes U1477A–U1477C were spliced together to create a complete section downhole to ~85 m CCSF-A (Figure F27). Below this depth it was not possible to construct a continuous sequence, and distinct differences among holes (possibly exacerbated by problems associated with refusal of the APC) renders the exercise potentially meaningless. Consequently, the interval between ~85 and 195 m CCSF-A is represented in the splice almost exclusively by material from Hole U1477B (Table T12). Although it is not possible to precisely determine the width of gaps between cores within this interval, they have been estimated by assuming a relatively constant growth rate of ~10% throughout this section.
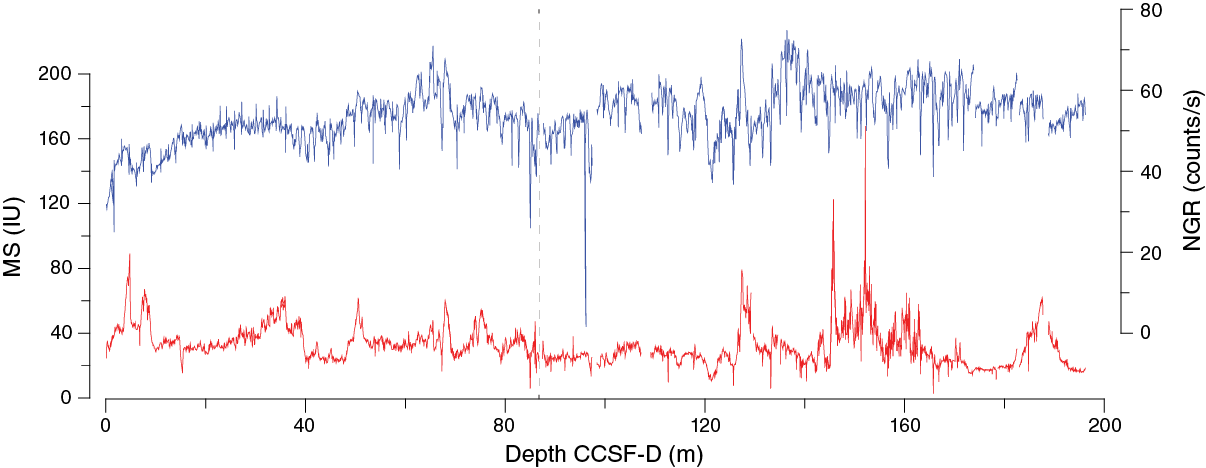
Figure F27. Composite spliced records of magnetic susceptibility and NGR, Site U1477.
Table T12. Splice interval table, Site U1477. Download table in .csv format.
Again, it should be stressed that any future study of material from this site needs to consider the differences among holes as potentially valuable illustrations of regional processes. Our particular choice of cores within all parts of the splice does not necessarily reflect the most representative of that interval.
Geochemistry
The chemical composition of headspace gases, interstitial waters, and bulk sediments were investigated at Site U1477. Sampling for shipboard analyses focused in Hole U1477A. Downhole profiles of interstitial water chemistry largely reflect postdepositional microbially mediated reactions driven by the rapid accumulation of organic carbon. Sedimentary carbonate contents range from 1 to 22 wt%, with an average of 5.5 wt%. Interstitial water profiles of redox-sensitive species indicate more intense diagenesis at this site than all the other sites, with anoxic conditions near the top of the core and complete sulfate reduction by ~16 m CSF-A (Figure F28).
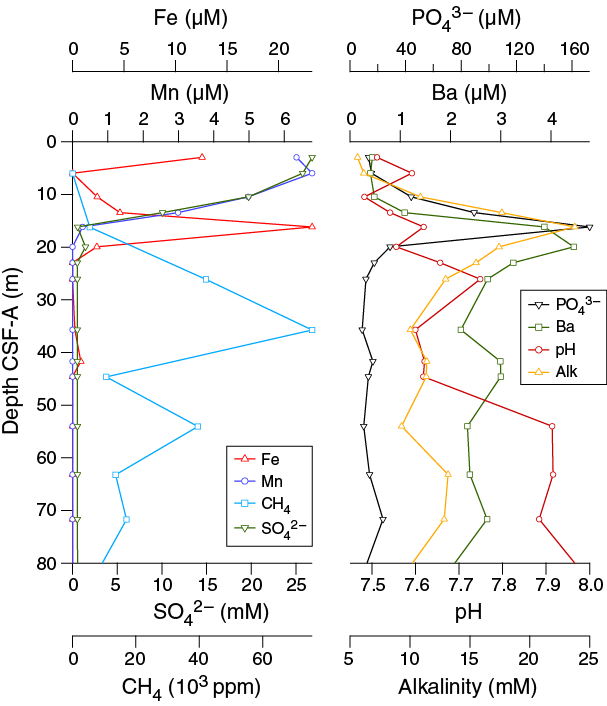
Figure F28. Concentration profiles that highlight microbial-driven reactions and redox cycling in the upper 80 m CSF-A, Hole U1477A.
Interstitial water was squeezed from 5 and 10 cm whole rounds at ~3 m resolution from 2.95 to 26.06 m CSF-A and ~9.5 m resolution between 24.06 and 172.03 m CSF-A in Hole U1477A. A total of 25 samples were collected from Hole U1477A for shipboard analysis of interstitial water chemistry. Bulk sediment in Hole U1477A was measured for total organic carbon (TOC) and total inorganic carbon (TIC) content in samples selected as representative of the lithology.
Sedimentary hydrocarbon gases
Headspace gas samples were collected from each core in Hole U1477A. A total of 20 samples were measured, with the uppermost 3 samples measured the following day because of instrument difficulties in the initial run. In all samples, CH4 is the primary hydrocarbon present, and only trace levels of ethene, ethane, and propene were detected. Methane concentrations increased from 29 ppmv at 6.0 m CSF-A to ~75,500 ppmv at 35.75 CSF-A in Core 361-U1477A-4H and then decreased for the remainder of the sampled cores (Figure F28). This is likely the result of bacterial methanogenesis (Barnes and Goldberg, 1976). Below ~100 m CSF-A, methane concentrations remain below ~10,000 ppmv.
Interstitial water chemistry
Salinity, chloride, sodium, magnesium, and potassium
Salinity, chloride, and sodium are relatively constant and near or slightly elevated above average seawater values in all samples from Hole U1477A (Figure F29). Average values (±1σ) are 552.7 ± 3.6 mM chloride and 467.8 ± 8.8 mM sodium. The downhole chloride profile displays a minor increase in the upper ~50 m CSF-A followed by a slight decrease further downhole. Magnesium and potassium concentrations decrease downhole from maximum values of 52.4 mM Mg and 11.3 mM K at 2.95 m CSF-A to minima of 37.7 mM Mg and 5.9 mM K near the bottom of Hole U1477A. The downhole potassium profile displays a monotonic decrease in concentration, whereas the magnesium profile displays more variability. The ~50% drawdown of potassium between the mudline and the bottom of Hole U1477A suggests significant uptake of potassium by clay minerals at depth.
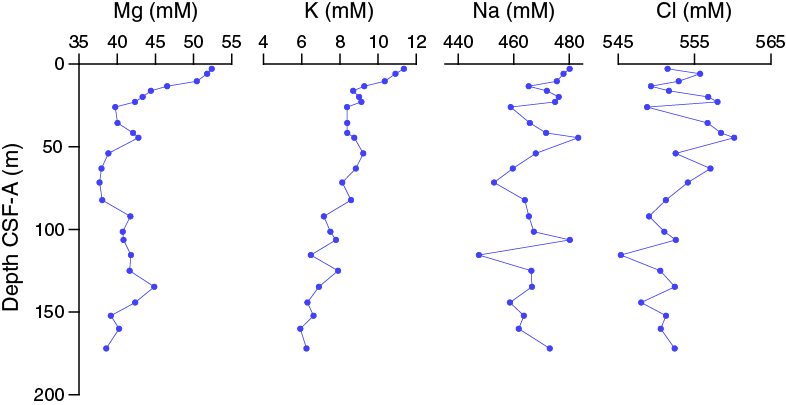
Figure F29. Dissolved magnesium, potassium, sodium, and chloride profiles, Hole U1477A.
Alkalinity, phosphate, and pH
Alkalinity is 5.6 mM at 2.95 m CSF-A, increases to a maximum of 23.8 mM at 16.16 m CSF-A, and remains relatively stable below ~26 m CSF-A with an average of 12.4 ± 2.0 mM in Hole U1477A (Figure F30). The downhole phosphate profile resembles the alkalinity profile, with concentrations increasing sharply from 13.4 µM at 2.95 m CSF-A to 172.6 µM at 16.16 m CSF-A and a relatively stable concentration of 15.3 ± 5.2 µM below ~26 m CSF-A. pH increases downhole from ~7.5 at 2.95 m CSF-A to ~8 at 82.24 m CSF-A and averages 7.83 ± 0.10 below ~54 m CSF-A.
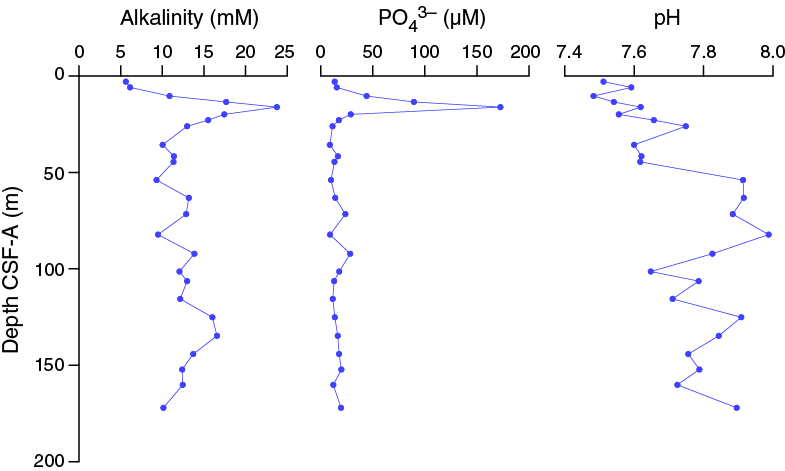
Figure F30. Alkalinity, dissolved phosphate, and pH profiles, Hole U1477A.
Iron and manganese
In Hole U1477A, the concentration of dissolved iron is 12.6 µM at 2.95 m CSF-A and decreases downhole except for an abrupt increase to 23.3 µM at 16.16 m CSF-A, which coincides with peaks in the downhole profiles of alkalinity and phosphate (Figures F28, F31). Below ~23 m CSF-A, the concentration of dissolved iron remains below the detection limit. Analytical issues with the iron standard calibration make it difficult to interpret measured values below 4.5 µM. However, the initial sample at 2.95 m CSF-A and two points that make up the maximum at 16.16 m CSF-A are within the calibrated range. The downhole dissolved manganese profile displays maximum concentrations 6.4 µM in the uppermost two samples at 2.95 m CSF-A and 6.8 µM at 5.95 m CSF-A before decreasing monotonically to below the detection limit at 19.95 m CSF-A. Decreasing dissolved manganese concentrations below the zone of dissolution in the uppermost ~6 m likely reflects its combination with HCO3– and formation of manganese carbonate minerals (Calvert and Pedersen, 1994). The downhole dissolved iron profile likely indicates that reductive dissolution of iron oxides is occurring around 16.16 m CSF-A and that precipitation of iron sulfide minerals removes the dissolved iron as it diffuses away from the zone of active reductive dissolution.
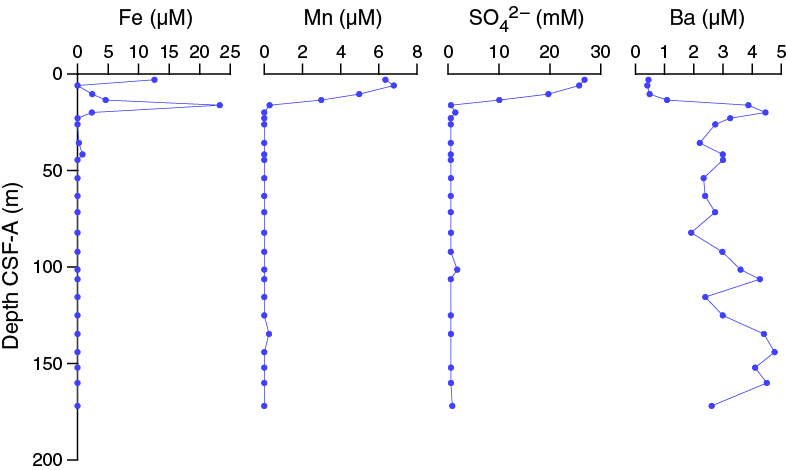
Figure F31. Dissolved iron, manganese, sulfate, and barium, Hole U1477A.
Sulfate and barium
Sulfate concentrations in Hole U1477A decrease rapidly downhole from a near-seawater concentration of 26.8 mM at 2.95 m CSF-A to below the detection limit at 16.16 m CSF-A (Figures F28, F31). This is likely the result of microbial sulfate reduction, in which sulfate is used as an electron receptor in the anaerobic oxidation of organic matter:
53 SO42– + (CH2O)106(NH3)16(H3PO4) → 39 CO2 + 67 HCO3– + 16 NH4+ + 53 HS– + 39 H2O + HPO42–.
At this site, the disappearance of sulfate in interstitial water coincides with the sharp increase in methane. This is the sulfate–methane transition zone and indicates that there is more microbial activity at this site than at previous sites, likely due to the significantly higher organic carbon accumulation rates. In sediment where sulfate reduction is rapid and intense, barite (BaSO4) will dissolve. In Hole U1477A, barium increases from minimum concentrations of <0.5 μM in the upper 10.45 m CSF-A to between ~2 and 5 μM below 16.16 m CSF-A, which is coincident with the abrupt decrease in sulfate. This indicates dissolution of barite.
Calcium and strontium
Concentrations of calcium in interstitial water in Hole U1477A rapidly decrease from a maximum of 10.2 mM at 2.95 m CSF-A to values around 4 mM at ~25m CSF-A before decreasing to a minimum of 3.6 mM at 82.24 m CSF-A. Calcium concentrations then show a slight increase to the bottom of the section (Figure F32). The downhole strontium profile roughly follows the pattern observed for calcium, with the highest concentration of 82.8 μM at 2.95 m CSF-A followed by decreasing concentrations to a minimum value of 56.3 μM at 82.24 m CSF-A and slightly increasing concentrations to the bottom of the section.

Figure F32. Dissolved calcium and strontium profiles, Hole U1477A.
Silicon, lithium, and boron
The downhole silicon profile in Hole U1477A displays increasing concentrations from 363.2 μM at 2.95 m CSF-A to a maximum concentration of 750.0 μM at 16.16 m CSF-A, which coincides with peaks in the downhole profiles of alkalinity, phosphate, and iron (Figure F33). Below 16.16 m CSF-A, silicon concentrations vary between 164.2 and 669.4 μM.
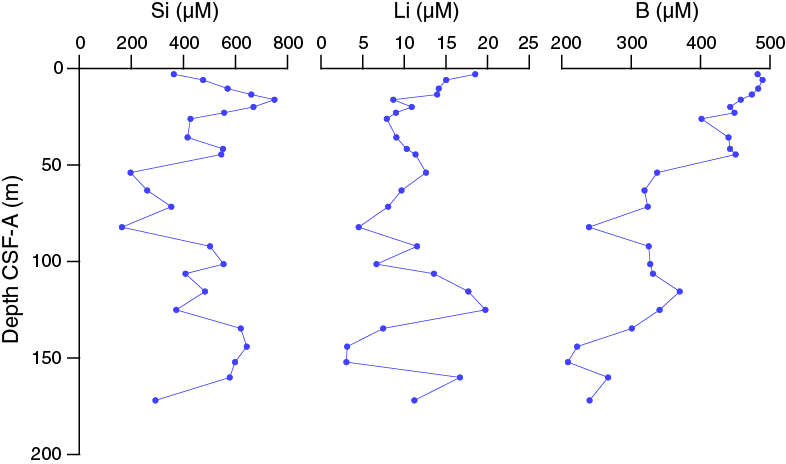
Figure F33. Dissolved silicon, lithium, and boron profiles, Hole U1477A.
The downhole lithium profile in Hole U1477A varies significantly. Lithium concentrations decrease with depth from 18.5 μM in the uppermost sample at 2.95 m CSF-A to a minimum concentration of 3.1 μM at 152.20 m CSF-A. The decreasing trend is interrupted by a broad peak with a maximum lithium concentration of 19.7 μM at 125.05 m CSF-A. Another peak occurs at the base of the section. Boron concentrations are noisy but decrease from >480 μM in the upper 10.45 m CSF-A to a minimum of 208.7 μM at 152.2 m CSF-A.
Bulk sediment geochemistry
Total organic carbon
Total organic carbon varies from 0.2 to 1.1 wt% with an average of 0.61 wt% for all samples measured (Figure F34). No systematic pattern relating organic carbon and carbonate or other lithologic properties such as magnetic susceptibility was observed.
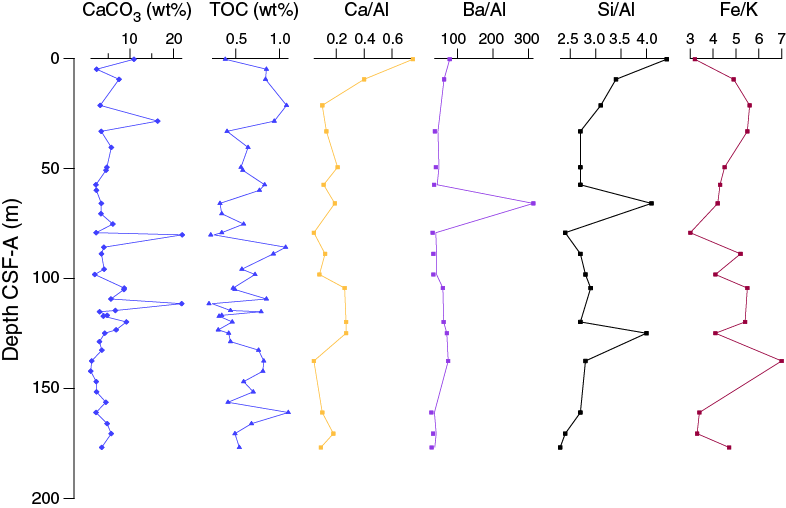
Figure F34. Calcium carbonate, TOC, and bulk sediment elemental ratios, Hole U1477A.
Calcium carbonate
Calcium carbonate contents range between 1 and 22 wt% with an average of 5.5 wt% at Site U1477 (Figure F34). Carbonate contents remain low for most of the core, with large spikes likely caused by preferential sampling of carbonate-rich shell-bearing intervals. No significant trend in carbonate content was observed at Site U1477.
Major and trace elements
Major and trace element concentrations were measured for 17 samples taken for calcium carbonate analyses from Hole U1477A (Table T13). Bulk sediment data for Site U1477 are in stark contrast to the previous sites, where biogenic calcium carbonate is a dominant sedimentary component. Bulk sediment concentrations of Al, Ti, and Fe are greater than those of average upper continental crust, whereas Ca, Sr, and Na concentrations are below average crustal values (Taylor and McLennan, 1985). Few elements show any significant correlation with aluminum oxide contents (Figure F35). Calcium oxide does display an inverse relationship with aluminum, and the low CaO concentrations imply that all or most of the calcium is present within carbonate minerals. Iron and magnesium oxides display weak positive correlations with aluminum oxide. This is almost certainly due to the extremely high abundance of biotite mica at this site (see Sedimentology). The abundant mica may also explain the average crustal K2O values in spite of the extremely low concentrations of CaO and Na2O. It is possible that Ca and Na were lost over many cycles of chemical weathering, whereas K was concentrated in the mica that was subsequently deposited at Site U1477. In addition, the abundance of platy mica significantly reduces porosity (see Physical properties), leaving little space for interstitial water and essentially removing Na contamination from dried pore fluid.
Table T13. Shipboard bulk sediment geochemistry data, Hole U1477A. Download table in .csv format.
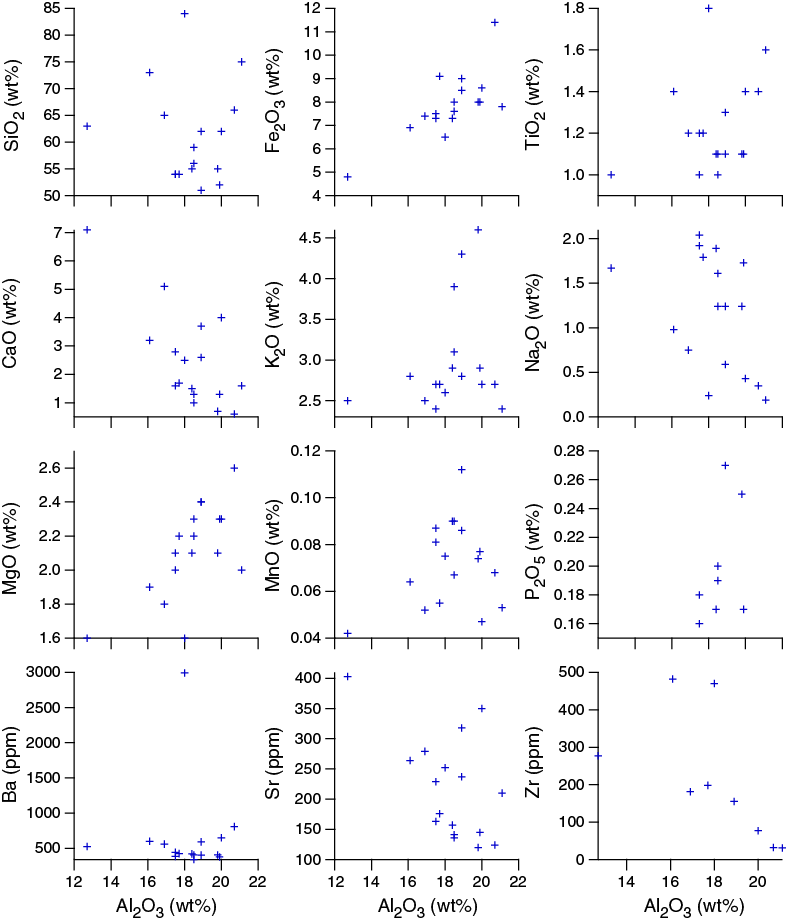
Figure F35. Sedimentary major and trace element concentrations vs. aluminum oxide content, Hole U1477A.
Downhole profiles of elemental ratios at Site U1477 reflect the dominance of lithogenic sediment (Figure F34). Ca/Al values are extremely low, with a maximum value of 0.75 in the uppermost sample (361-U1477A-1H-1, 40–41 cm). Below ~10 m CSF-A, Ca/Al values are even lower (0.15 ± 0.08) and generally follow carbonate content. Ba/Al values are also low and invariable with the exception of one outlier at 65.89 m CSF-A (Sample 8H-2, 113–114 cm). The Si/Al profile is also relatively flat with the exception of a decrease in the upper ~30 m CSF-A and two outliers at 65.89 and 124.88 m CSF-A. The decrease in Si/Al values in the upper 30 m CSF-A is also present in K/Al, Mg/Al, and Sr/Al profiles (not shown), coinciding with an increase in Fe/K and implying a change in sediment provenance or transport over this time interval. Below ~30 m CSF-A, there is variability in Fe/K values that is not present in Si/Al values and may indicate varying degrees of chemical weathering in the Zambezi Catchment.
Redox processes
The rapid accumulation of terrigenous sediment resulted in significant dilution of biogenic carbonate and high rates of microbial respiration at Site U1477. The resulting interstitial water and headspace gas concentrations show the consumption of oxidized species, including iron and manganese oxides and sulfate, and the production of methane during methanogenesis (Figure F28). The abrupt sulfate–methane transition at ~16 m CSF-A shows the immediate consumption of upward-diffusing methane in the presence of sulfate. This depth interval is marked by peaks in alkalinity and phosphate, two by-products of high rates of respiration, and peaks and barite and iron related to enhanced dissolution of barite and iron bearing minerals.
Age model
A total of 181 m of Late Pleistocene to Holocene sediment was recovered from Hole U1477A. The age model is based on the biochronology of calcareous nannofossils and planktonic foraminifers along with the correlation to the radiocarbon-dated age models of nearby piston Cores 64PE304-80 and GIK16160-3 (van der Lubbe et al., 2014) over the past 20 ky. These correlations were made based on the distinctive magnetic susceptibility profiles of all cores. Biostratigraphic sampling at Site U1477 included 27 core catcher samples from Hole U1477A. We report biostratigraphic events in Tables T4 and T5, and major age-depth trends are illustrated in Figure F36.
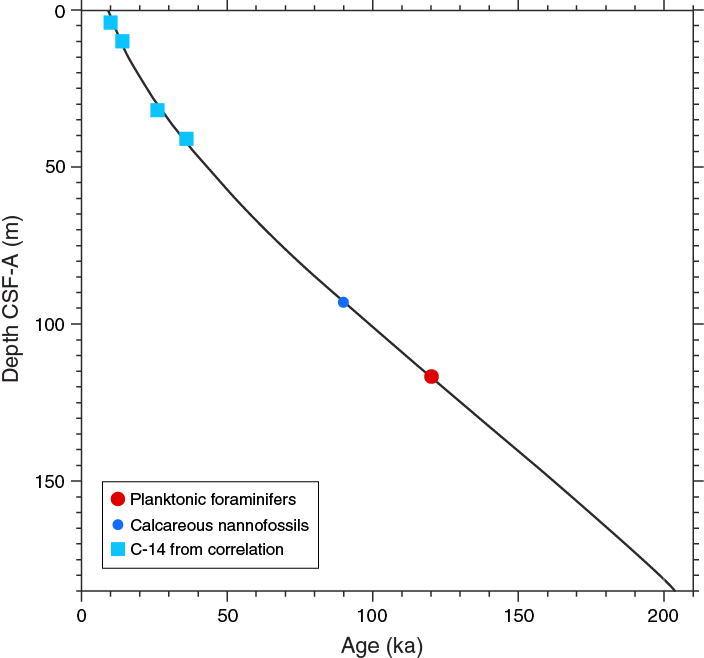
Figure F36. Age-depth relationships, Site U1477.
The age-depth model provides an estimate of ~0.2 Ma for the basal age of Site U1477. The correlation of the Site U1477 MS profile to the radiocarbon-dated age models of nearby piston cores suggests that sedimentation rates were greatest between ~30 and 40 ka (~30 m CSF-A in Hole U1477A) to the present (~1.5 m/ky), with slower rates (or even a hiatus) at the top of the record. The long-term average sedimentation rate before ~0.05–0.06 Ma (~50 m CSF-A in Hole U1477A) is ~83 cm/ky but is estimated by only two biostratigraphic datums. A third-order polynomial fit has an r 2 = 0.999 and extrapolates to a bottom age in Sample 361-U1477A-27X-CC (181 m CSF-A) of ~0.2 Ma.
References
Barnes, R.O., and Goldberg, E.D., 1976. Methane production and consumption in anoxic marine sediments. Geology, 4(5):297–300. http://dx.doi.org/10.1130/0091-7613(1976)4<297:MPACIA>2.0.CO;2
Beiersdorf, H., Kudrass, H.R., and von Stackelberg, U., 1980. Placer deposits of ilmenite and zircon on the Zambezi shelf. Geologisches Jahrbuch, Reihe D: Mineralogie, Petrographie, Geochemie, Lagerstaettenkunde, 36:5–85.
Calvert, S.E., and Pedersen, T.F., 1994. Sedimentary geochemistry of manganese; implications for the environment of formation of manganiferous black shales. Economic Geology, 91(1):36–47. http://dx.doi.org/10.2113/gsecongeo.91.1.36
Dupont, L.M., Caley, T., Kim, J.-H., Castañeda, I., Malaizé, B., and Giraudeau, J., 2011. Glacial–interglacial vegetation dynamics in south eastern Africa coupled to sea surface temperature variations in the Western Indian Ocean. Climate of the Past, 7(4):1209–1224. http://dx.doi.org/10.5194/cp-7-1209-2011
Dupont, L.M., Donner, B., Vidal, L., Pérez, E.M., and Wefer, G., 2005. Linking desert evolution and coastal upwelling: Pliocene climate change in Namibia. Geology, 33(6):461–464. http://dx.doi.org/10.1130/G21401.1
Euroconsult Mott MacDonald, 2008. Integrated Water Resources Management Strategy and Implementation Plan for the Zambezi River Basin: Lusaka, Zambia (SADC-WD/Zambezi River Authority). http://www.zambezicommission.org/downloads/Zambezi River Basin IWRM Strategy ZAMSTRAT.pdf
Flores, J.-A., Bárcena, M.A., and Sierro, F.J., 2000. Ocean-surface and wind dynamics in the Atlantic Ocean off Northwest Africa during the last 140,000 years. Palaeogeography, Palaeoclimatology, Palaeoecology, 161(3–4):459–478. http://dx.doi.org/10.1016/S0031-0182(00)00099-7
Gammelsrød, T., 1992. Variation in shrimp abundance on the Sofala Bank, Mozambique, and its relation to the Zambezi River runoff. Estuarine, Coastal and Shelf Science, 35(1):91–103. http://dx.doi.org/10.1016/S0272-7714(05)80058-7
Gradstein, F.M., Ogg, J.G., Schmitz, M.D., and Ogg, G.M. (Eds.), 2012. The Geological Time Scale 2012: Amsterdam (Elsevier).
Hall, I.R., Hemming, S.R., LeVay, L.J., Barker, S., Berke, M.A., Brentegani, L., Caley, T., Cartagena-Sierra, A., Charles, C.D., Coenen, J.J., Crespin, J.G., Franzese, A.M., Gruetzner, J., Han, X., Hines, S.K.V., Jimenez Espejo, F.J., Just, J., Koutsodendris, A., Kubota, K., Lathika, N., Norris, R.D., Periera dos Santos, T., Robinson, R., Rolinson, J.M., Simon, M.H., Tangunan, D., van der Lubbe, J.J.L., Yamane, M., and Zhang, H., 2017. Expedition 361 methods. In Hall, I.R., Hemming, S.R., LeVay, L.J., and the Expedition 361 Scientists, South African Climates (Agulhas LGM Density Profile). Proceedings of the International Ocean Discovery Program, 361: College Station, TX (International Ocean Discovery Program). http://dx.doi.org/10.14379/iodp.proc.361.102.2017
Johnson, T.C., Brown, E.T., McManus, J., Barry, S., Barker, P., and Gasse, F., 2002. A high-resolution paleoclimate record spanning the past 25,000 years in southern East Africa. Science, 296(5565):113–132. http://dx.doi.org/10.1126/science.1070057
Just, J., Schefuß, E., Kuhlmann, H., Stuut, J.-B.W., and Pätzold, J., 2014. Climate induced sub-basin source-area shifts of Zambezi River sediments over the past 17 ka. Palaeogeography, Palaeoclimatology, Palaeoecology, 410:190–199. http://dx.doi.org/10.1016/j.palaeo.2014.05.045
Lutjeharms, J.R.E., 2006. The Agulhas Current: Berlin (Springer-Verlag). http://dx.doi.org/10.1007/3-540-37212-1
März, C., Hoffmann, J., Bleil, U., de Lange, G.J., and Kasten, S., 2008. Diagenetic changes of magnetic and geochemical signals by anaerobic methane oxidation in sediments of the Zambezi deep-sea fan (SW Indian Ocean). Marine Geology, 255(3–4):118–130. http://dx.doi.org/10.1016/j.margeo.2008.05.013
Maslin, M.A., Pancost, R.D., Wilson, K.E., Lewis, J., and Trauth, M.H., 2012. Three and half million year history of moisture availability of south West Africa: evidence from ODP Site 1085 biomarker records. Palaeogeography, Palaeoclimatology, Palaeoecology, 317–318:41–47. http://dx.doi.org/10.1016/j.palaeo.2011.12.009
Moore, A.E., Cotterill, F.P.D., Main, M.P.L., and Williams, H.B., 2008. The Zambezi River. In Gupta, A. (Ed.), Large Rivers: Geomorphology and Management: Chichester, United Kingdom (John Wiley & Sons, Ltd.), 311–332. http://dx.doi.org/10.1002/9780470723722.ch15
Reason, C.J.C., Landman, W., and Tennant, W., 2006. Seasonal to decadal prediction of southern African climate and its links with variability of the Atlantic Ocean. Bulletin of the American Meteorological Society, 87(7):941–955. http://dx.doi.org/10.1175/BAMS-87-7-941
Ronco, P., Fasolato, G., and Di Silvio, G., 2006. The case of the Zambezi River in Mozambique: some investigations on solid transport phenomena downstream Cahora Bassa Dam. In Alves, E., Cardoso, A., Leal, J., and Ferreira, R. (Eds.), Proceedings of the International Conference on Fluvial Hydraulogy: Lisbon, Portugal (Taylor & Francis).
Schulz, H., Lückge, A., Emeis, K.-C., and Mackensen, A., 2011. Variability of Holocene to Late Pleistocene Zambezi riverine sedimentation at the upper continental slope off Mozambique, 15°–21°S. Marine Geology, 286(1–4):21–34. http://dx.doi.org/10.1016/j.margeo.2011.05.003
Schefuß, E., Kuhlmann, H., Mollenhauer, G., Prange, M., and Pätzold, J., 2011. Forcing of wet phases in southeast Africa over the past 17,000 years. Nature, 480(7378):509–512. http://dx.doi.org/10.1038/nature10685
Siddorn, J.R., Bowers, D.G., and Hoguane, A.M., 2001. Detecting the Zambezi River Plume using observed optical properties. Marine Pollution Bulletin, 42(10):942–950. http://dx.doi.org/10.1016/S0025-326X(01)00053-4
Taylor, R.S., and McLennan, S.M., 1985. The Continental Crust: Its Composition and Evolution: Oxford, United Kingdom (Blackwell Scientific Publications, Ltd.).
Trauth, M.H., Larrasoaña, J.C., and Mudelsee, M., 2009. Trends, rhythms and events in Plio–Pleistocene African climate. Quaternary Science Reviews, 28(5–6):399–411. http://dx.doi.org/10.1016/j.quascirev.2008.11.003
van der Lubbe, H.J.L., Frank, M., Tjallingii, R., and Schneider, R.R., 2016. Neodymium isotope constraints on provenance, dispersal, and climate-driven supply of Zambezi sediments along the Mozambique margin during the past ~45,000 years. Geochemistry, Geophysics, Geosystems, 17(1):181–198. http://dx.doi.org/10.1002/2015GC006080
van der Lubbe, H.J.L., Tjallingii, R., Prins, M.A., Brummer, G.-J.A., Jung, S.J.A., Kroon, D., and Schneider, R.R., 2014. Sedimentation patterns off the Zambezi River over the last 20,000 years. Marine Geology, 355:189–201. http://dx.doi.org/10.1016/j.margeo.2014.05.012
Walford, H.L., White, N.J., and Sydow, J.C., 2005. Solid sediment load history of the Zambezi Delta. Earth and Planetary Science Letters, 238(1–2):49–63. http://dx.doi.org/10.1016/j.epsl.2005.07.014
Wang, Y.V., Larsen, T., Leduc, G., Andersen, N., Blanz, T., and Schneider, R.R., 2013. What does leaf wax δD from a mixed C3/C4 vegetation region tell us? Geochimica et Cosmochimica Acta, 111:128–139. http://dx.doi.org/10.1016/j.gca.2012.10.016
Weldeab, S., Lea, D.W., Oberhänsli, H., and Schneider, R.R., 2014. Links between southwestern tropical Indian Ocean SST and precipitation over southeastern Africa over the last 17 kyr. Palaeogeography, Palaeoclimatology, Palaeoecology, 410:200–212. http://dx.doi.org/10.1016/j.palaeo.2014.06.001
Weldeab, S., Stuut, J.-B.W., Schneider, R.R., and Siebel, W., 2013. Holocene climate variability in the winter rainfall zone of South Africa. Climate of the Past, 9(5):2347–2364. http://dx.doi.org/10.5194/cp-9-2347-2013
1 Hall, I.R., Hemming, S.R., LeVay, L.J., Barker, S., Berke, M.A., Brentegani, L., Caley, T., Cartagena-Sierra, A., Charles, C.D., Coenen, J.J., Crespin, J.G., Franzese, A.M., Gruetzner, J., Han, X., Hines, S.K.V., Jimenez Espejo, F.J., Just, J., Koutsodendris, A., Kubota, K., Lathika, N., Norris, R.D., Periera dos Santos, T., Robinson, R., Rolinson, J.M., Simon, M.H., Tangunan, D., van der Lubbe, J.J.L., Yamane, M., and Zhang, H., 2017. Site U1477. In Hall, I.R., Hemming, S.R., LeVay, L.J., and the Expedition 361 Scientists, South African Climates (Agulhas LGM Density Profile). Proceedings of the International Ocean Discovery Program, 361: College Station, TX (International Ocean Discovery Program). http://dx.doi.org/10.14379/iodp.proc.361.106.2017
2 Expedition 361 Scientists’ addresses.
This work is distributed under the Creative Commons Attribution 4.0 International (CC BY 4.0) license.
- F1. Location map of Site U1477 with main surface currents in the southwest Indian Ocean.
- F2. Geomorphologic and oceanographic features near Site U1477.
- F3. Multibeam bathymetry around Site U1477.
- F4. Seismic Line M753-GeoB08-200 at Site U1477.
- F5. Seismic Line M753-GeoB08-192 at Site U1477.
- F6. Detail of seismic Line M753-GeoB08-192 at Site U1477.
- F7. Parasound data along seismic Line M753-GeoB08-192 across Site U1477.
- F8. Core recovery, Holes U1477A–U1477C.
- F9. Lithostratigraphic summary with selected physical properties and geochemical data.
- F10. Representative lithologies per interval, Site U1477.
- F11. Sediment deformations and disturbances, Site U1477.
- F12. Relative percentages of major compositions of sediment determined by smear slide observation, Holes U1477A–U1477C.
- F13. Comparison of CaCO3 from discrete samples and biogenic carbonate estimated in smear slides, Hole U1477A.
- F14. Color reflectance and NGR, Hole U1477A.
- F15. SHIL RGB color data, Hole U1477A.
- F16. P-wave velocity, bulk density, and magnetic susceptibility, Hole U1477A.
- F17. Porosity, grain density, and thermal conductivity, Hole U1477A.
- F18. Biochronology at Site U1477 with significant planktonic foraminifer and calcareous nannofossil events.
- F19. Calcareous nannofossils, Hole U1477A.
- F20. Benthic and planktonic foraminifers, Hole U1477A.
- F21. Representative assemblages of foraminifers and other sedimentary components, Site U1477.
- F22. S-ratio, HIRM, SIRM, and magnetic susceptibility, Holes U1477A and U1477C.
- F23. Alternating field demagnetization results from two samples from Hole U1477A.
- F24. Downhole inclination, declination, and intensity after demagnetization at 25 mT, Site U1477.
- F25. Magnetic susceptibility records on the CSF-A depth scale, Site U1477.
- F26. Magnetic susceptibility records on the CCSF-A depth scale, Site U1477.
- F27. Composite spliced records of magnetic susceptibility and NGR, Site U1477.
- F28. Concentration profiles that highlight microbial-driven reactions and redox cycling in the upper 80 m CSF-A, Hole U1477A.
- F29. Dissolved magnesium, potassium, sodium, and chloride profiles, Hole U1477A.
- F30. Alkalinity, dissolved phosphate, and pH profiles, Hole U1477A.
- F31. Dissolved iron, manganese, sulfate, and barium, Hole U1477A.
- F32. Dissolved calcium and strontium profiles, Hole U1477A.
- F33. Dissolved silicon, lithium, and boron profiles, Hole U1477A.
- F34. Calcium carbonate, TOC, and bulk sediment elemental ratios, Hole U1477A.
- F35. Sedimentary major and trace element concentrations vs. aluminum oxide content, Hole U1477A.
- F36. Age-depth relationships, Site U1477.
- T1. Site U1477 core summary.
- T2. Overview of shipboard sampling, Holes U1477A–U1477C.
- T3. Smear slide textures, compositions, and lithologic names, Holes U1477A-U1477C.
- T4. Biostratigraphic planktonic foraminifer datums, Site U1477.
- T5. Biostratigraphic calcareous nannofossil datums, Site U1477.
- T6. Calcareous nannofossil occurrence, Site U1477.
- T7. Planktonic foraminifer occurrence and abundance based on examination of the >150 µm fraction, Site U1477.
- T8. Diatom and other siliceous microfossil occurrences, Site U1477.
- T9. Volumetric bulk magnetic susceptibility and declination of maximum magnetic susceptibility eigenvalues of discrete samples, Site U1477.
- T10. Analyzed discrete whole-round samples, Site U1477.
- T11. Affine table, Site U1477.
- T12. Splice interval table, Site U1477.
- T13. Shipboard bulk sediment geochemistry data, Hole U1477A.