Hall, I.R., Hemming, S.R., LeVay, L.J., and the Expedition 361 Scientists
Proceedings of the International Ocean Discovery Program Volume 361
publications.iodp.org
doi:10.14379/iodp.proc.361.107.2017

Site U14781
I.R. Hall, S.R. Hemming, L.J. LeVay, S. Barker, M.A. Berke, L. Brentegani, T. Caley, A. Cartagena-Sierra, C.D. Charles, J.J. Coenen, J.G. Crespin, A.M. Franzese, J. Gruetzner, X. Han, S.K.V. Hines, F.J. Jimenez Espejo, J. Just, A. Koutsodendris, K. Kubota, N. Lathika, R.D. Norris, T. Periera dos Santos, R. Robinson, J.M. Rolinson, M.H. Simon, D. Tangunan, J.J.L. van der Lubbe, M. Yamane, and H. Zhang2
Keywords: International Ocean Discovery Program, IODP, JOIDES Resolution, Expedition 361, Site U1478, Agulhas Current, Agulhas Leakage, Agulhas Plateau, Agulhas Retroflection, Agulhas Return Current, Agulhas Rings, Agulhas Undercurrent, Atlantic Meridional Overturning Circulation, boundary current, Cape Basin, Circumpolar Deep Water, Congo Air Boundary, Delagoa Bight, East Madagascar Current, human evolution, Indian Ocean, Indonesian Throughflow, interocean exchange, Intertropical Convergence Zone, Last Glacial Maximum, Limpopo River, Middle Pleistocene Transition, Miocene, Mozambique Channel, Natal Valley, North Atlantic Deep Water, ocean circulation, paleoceanography, paleoclimate, Pleistocene, Pliocene, salinity, southern Africa, Southern Ocean, Subantarctic Zone, Subtropical Front, Subtropical Gyre, thermohaline circulation, Warm Water Route, Western Boundary Current, Zambezi River
MS 361-107: Published 30 September 2017
Background and objectives
Site U1478 is located in the northernmost Natal Valley, on the Inharrime Terrace (25°49.26′S; 34°46.14′E), ~75 nmi east of the Limpopo River (Figures F1, F2) at a water depth of 488 m below sea level (mbsl).
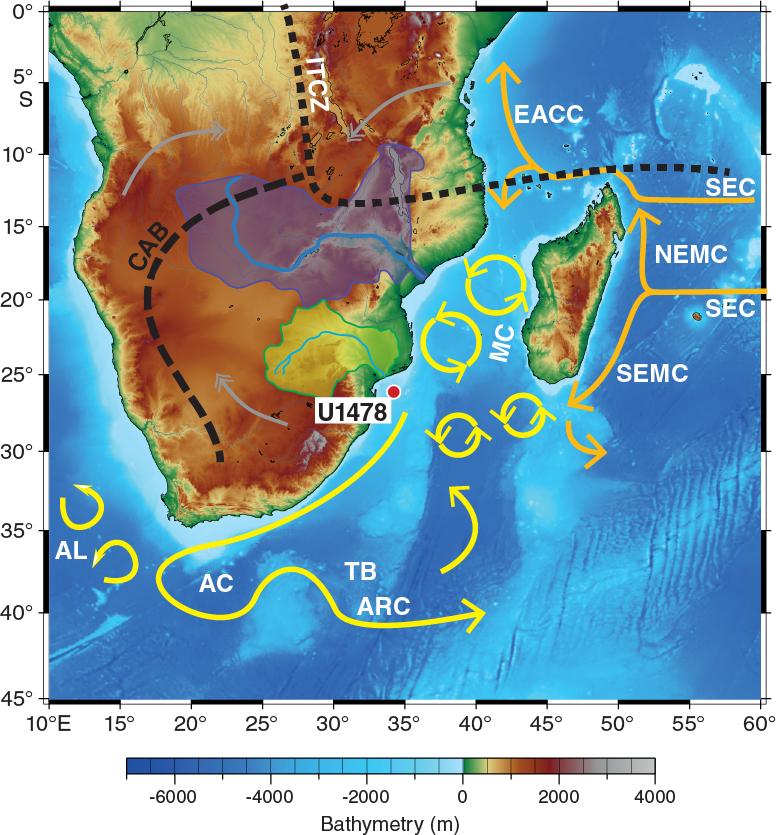
Figure F1. Location map of Site U1478 with main surface currents in the southwest Indian Ocean.
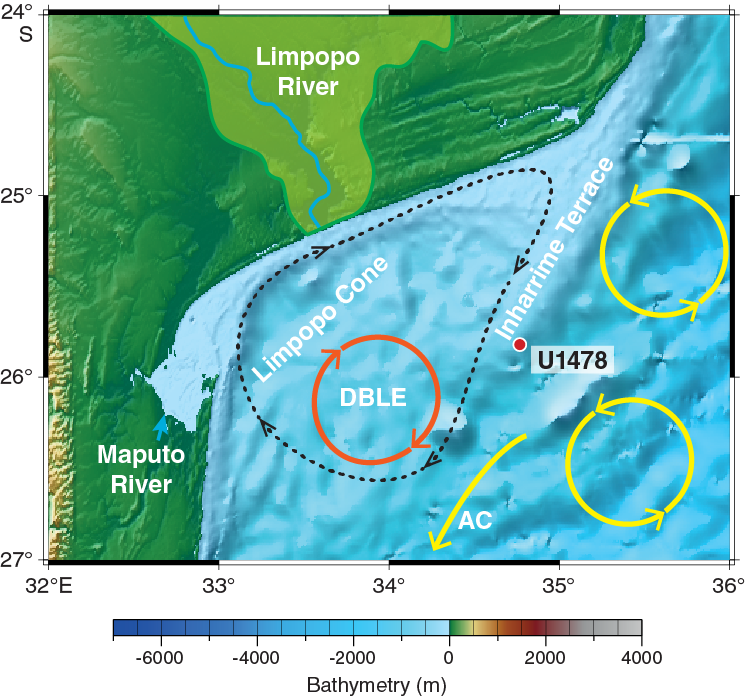
Figure F2. Geomorphologic and oceanographic features near Site U1478.
The region is characterized by a distinct indentation of the continental margin (Figure F2), named Delagoa Bight (Lamont et al., 2010), into which the Limpopo River, the second largest eastward-draining river in Africa, deposits sediment. Located just south of the Mozambique Channel, the Delagoa Bight is influenced by the southward-flowing waters that have traveled through the Mozambique Channel as well as those coming from the southern tip of Madagascar by way of the East Madagascar Current (Lutjeharms, 2006), the confluence of which forms the Agulhas Current (Figure F1). Various studies (e.g., Harris, 1972; Lutjeharms, 1976, 1981; Sætre and Jorge da Silva, 1984; Martin, 1981a, 1981b; Lutjeharms and Jorge da Silva, 1988; Lamont et al., 2010) demonstrate that the broad Inharrime Terrace (Figure F2) provides a suitable configuration for the formation of a topographically constrained mesoscale circulation, the Delagoa Bight lee eddy, forced by the rapid flow of water past the Bight. The Delagoa Bight lee eddy, typically centered around 26°S, 34°E (Lutjeharms and da Silva, 1988; Lutjeharms, 2006b; Lamont et al., 2010) (Figures F2, F3), can reach a diameter of ~180 km (Lutjeharms and da Silva, 1988) and involves transport of ~18 Sv (Lutjeharms, 2006). Whereas Lutjeharms and da Silva (1988) suggested that the Delagoa Bight lee eddy was a quasi-permanent feature, recent observations by Lamont et al. (2010) have shown it to be more transient. Cyclonic eddies typically drive upwelling cells that inject nutrients into the surface water and are consequently often associated with enhanced of oceanic primary productivity (McGillicuddy and Robinson, 1997). Hydrographic observations by Lutjeharms and da Silva (1988) demonstrated upwelling from as deep as 900 mbsl occurring in the center of the Delagoa Bight lee eddy. Increased phytoplankton biomass is found to be coincident with cooler water in the northeastern region of the Delagoa Bight (Barlow et al., 2008; Lamont et al., 2010) (Figure F3). Satellite-derived chlorophyll measurements suggest that hydrographic conditions are the primary control of the variations in phytoplankton biomass and primary production in the bight (Kyewalyanga et al., 2007).
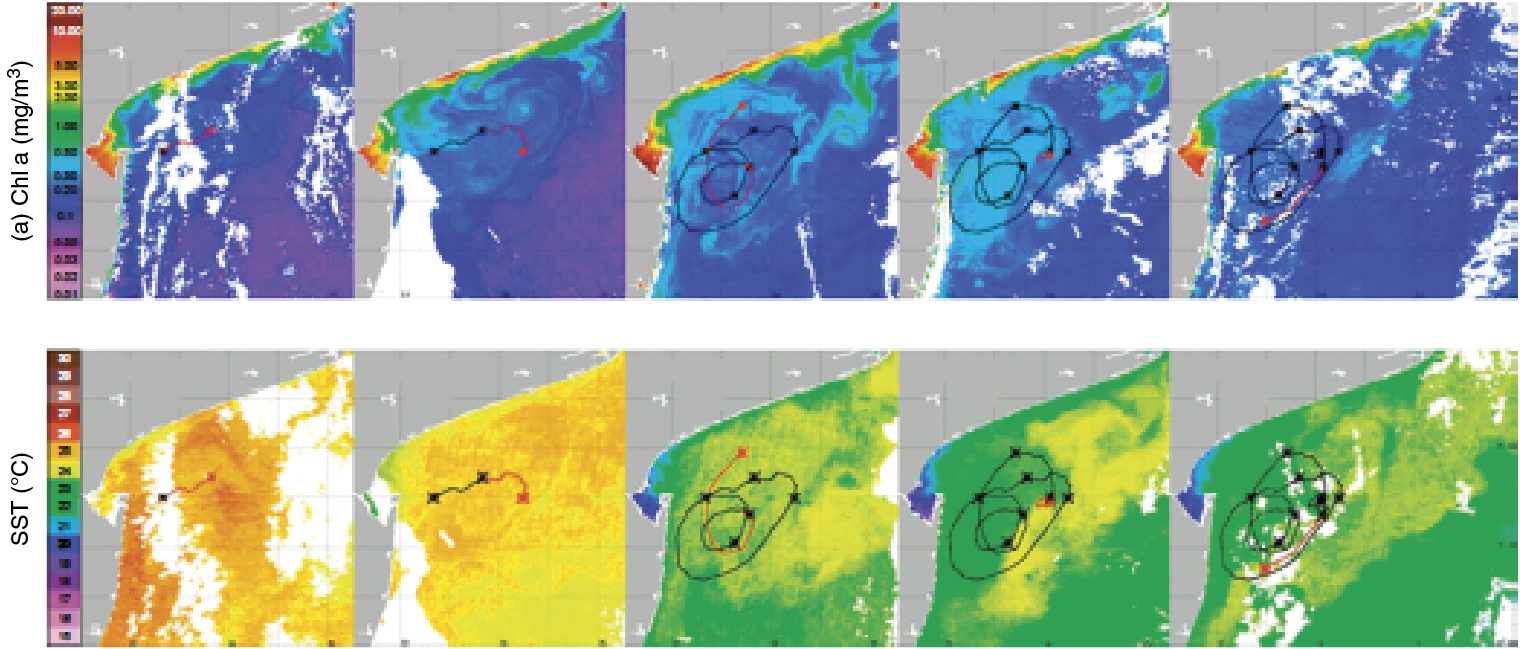
Figure F3. Selected maps of SeaWiFS chlorophyll-a concentration and NOAA AVHRR sea-surface temperature.
On the basis of seismo-acoustic data, the offshore physiographic characteristics of the Limpopo region have been divided into two major provinces (Figure F2): the Limpopo Cone and the Inharrime Terrace (Dingle et al., 1978; Martin, 1981b; Martin et al., 1982). The 300 km long Limpopo Cone extends south from the Limpopo River mouth (Martin, 1981b), and its upper reaches form a gently sloping terrace between 400 and 600 mbsl, with a shallow smooth-floored valley extending along its entire western side (Dingle et al., 1978). To the west, the Limpopo Cone merges with the continental slope off Maputo Bay, whereas in the east it combines with Inharrime Terrace, a curvilinear sedimentary feature composed of several mounded drift sequences that result from the interplay between the Mozambique Channel throughflow and the Delagoa Bight lee eddy (Preu et al., 2011).
Modern sedimentation on the Limpopo Cone and Inharrime Terrace is mainly controlled by the regional current regime. Martin (1981a) suggested the eastern slope of Inharrime Terrace is under the influence of the southward-flowing Mozambique Channel throughflow (newly formed Agulhas Current), and associated upwelling, which is strongest in the shallowest reaches of the terrace. In contrast, deposition on the western part of Inharrime Terrace and the Limpopo Cone is mainly controlled by the strong coastal countercurrent that is formed on the shelf off northern Natal and in Maputo Bay (Gründlingh, 1977) associated with the Delagoa Bight lee eddy. Sediment delivered by the Limpopo River (and Maputo River) is swept northeastward along the shelf, resulting in low modern accumulation rates at the central Limpopo Cone (Martin, 1981a, 1981b).
The Limpopo River catchment is considerably smaller than the neighboring Zambezi River catchment, spanning a little over 410,000 km2. The Limpopo River has as mean annual discharge of ~170 m3/s and delivers an annual sediment load of 33 Mt/y (Milliman and Meade, 1983) to Delagoa Bight. A larger portion of the catchment encompasses the low-lying eastern coastal plain, which comprises about two-thirds of the land area of the catchment, whereas the Waterberg Massif and Soutpansberg Mountains are the highest topographic features in the catchment (not shown). The catchment lies in the transition between tropical and subtropical climate, just south of the subtropical ridge between the southern Hadley and the Ferrel cell (Tyson and Preston-Whyte, 2000), and therefore climate varies spatially from relatively arid in the west, through temperate conditions in the central zones, to semi-arid environments in the east, with average annual precipitation ranging from 1400 mm in the mountains to 600 mm in the lowlands (Boroto, 2001). During most of the year, surface airflow is from the southwest Indian Ocean and is stronger during the austral summer months (November–March) when most rain falls. Vegetation is also varied and has been divided into five different phytogeographical provinces (Dupont et al., 2011). The suitability of the region to yield valuable evidence of how southern African climate and vegetation changed through the Pleistocene glacial–interglacial cycles has recently been demonstrated using marine sediment Core MD96-2048 retrieved from 660 mbsl on the upper continental slope 120 km south of the mouth of the Limpopo River (Figure F4) (Dupont et al., 2011). During interglacial intervals, the pollen evidence for vegetation of eastern South Africa and southern Mozambique is dominated by evergreen and deciduous forests species. In contrast, during glacial intervals pollen from open mountainous scrubland dominates the assemblage. These data suggest that mountainous Podocarpus forest and woodlands expanded during cool and humid intermediate periods associated with the influence of Southern Hemisphere summer insolation (at 30°S) on regional temperatures. A close correlation with the sea-surface temperature (SST) -stack from the same core (Caley et al., 2011) suggests strong coupling between the expansion–contractions of mountainous scrubland and cold–warm SST variability in the Agulhas Current.
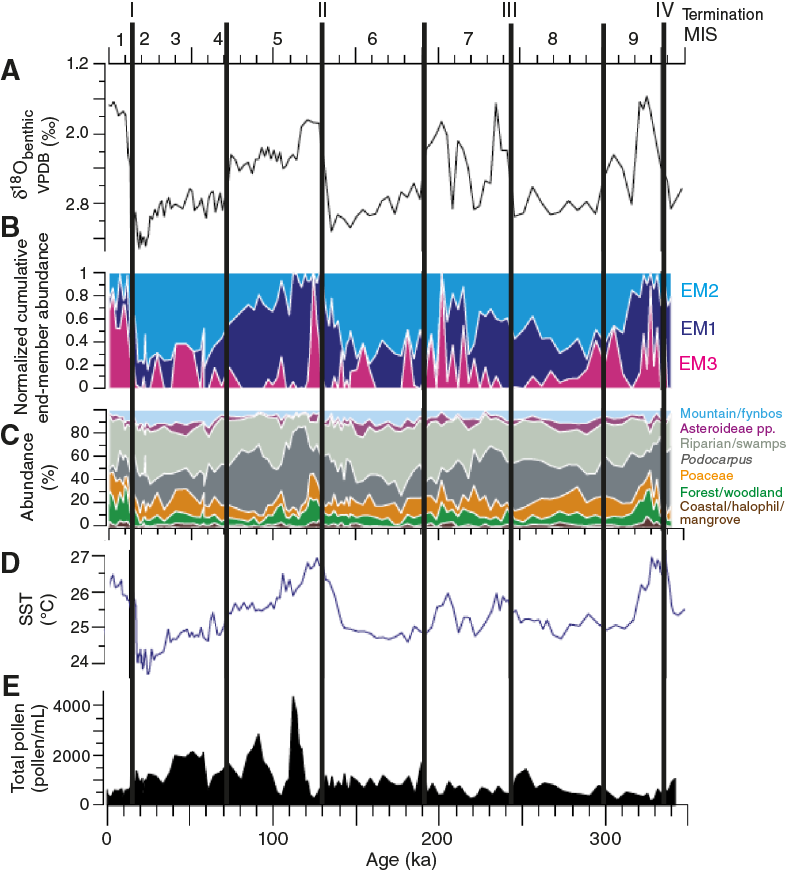
Figure F4. Multiproxy records from marine sediment Core MD96-2048.
The Site U1478 primary objectives are to:
- Recover a complete high-resolution sedimentary succession that spans the last 2 my, including the mid-Pleistocene transition, from the Mozambique margin close to the Limpopo River;
- Generate a high-resolution Pleistocene profile of southern African continental climate changes on orbital and suborbital timescales;
- Establish linking between southern African terrestrial climates and southwest Indian Ocean heat budgets, notably warm-water transports along the southeast African margin and associated ocean-atmosphere heat and moisture transfer;
- Examine the relationship between such climate variability and early human evolution; and
- Reconstruct upstream control on Agulhas leakage through headwater variability (Mozambique Current) during periods of orbitally modulated and suborbitally accelerated climate changes.
Specific questions that will be addressed include the following: Did the long-term climatic developments of the Pleistocene alter the atmospheric circulation and rainfall patterns over southeast Africa, inducing far-field responses to East African uplift, monsoon dynamics, and migration of the Intertropical Convergence Zone (ITCZ) (Johnson et al., 2011; Schefuß et al., 2011; Trauth et al., 2009)? Did variable Agulhas Current warm-water transports contribute to and modulate the impacts of shifting air boundaries and rainfall patterns over southeast Africa and possibly offset these patterns from those over southwest Africa and the Namib (Dupont et al., 2005, 2011; Maslin et al., 2012)?
The regional seismic-stratigraphic analysis of Preu et al. (2011), reporting Expedition 361 site survey data (Figures F5, F6, F7, F8) collected during R/V Meteor Cruises M63/1 in 2005 and M75/3, identifies four major reflectors within Inharrime Terrace. All of these reflectors represent regional unconformities or facies changes (Figure F5). Reflector L (blue; may have developed in the Pliocene as the result of full establishment of the Mozambique Current), Jimmy (yellow; may be associated with the development of the Mozambique Channel in the middle Miocene), Angus (red; late Oligocene/early Miocene hiatus), and McDuff (green; Cenomanian/Turonian boundary) were named and interpreted in previous studies by Dingle et al. (1978) and Martin (1981b). Distinct lateral variations in thickness and reflector spacing can be seen, in particular within the youngest unit. The mounded shape and internal reflector geometries clearly indicate a contourite origin. Also, in deeper units these characteristics are observed in conjunction with lateral depocenter shifts. Site U1478 is situated in the center of the most recent contourite drift body deposited under the influence of the eddy-dominated water flow through the Mozambique Channel. The drift body displays packages of parallel and laterally continuous subseafloor reflectors (Figures F7, F8).
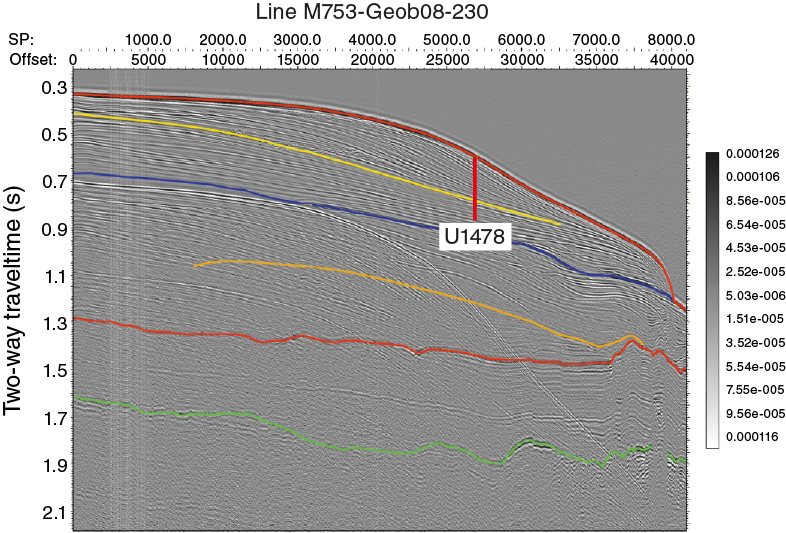
Figure F5. Seismic Line M753-Geob08-230 across Site U1478.
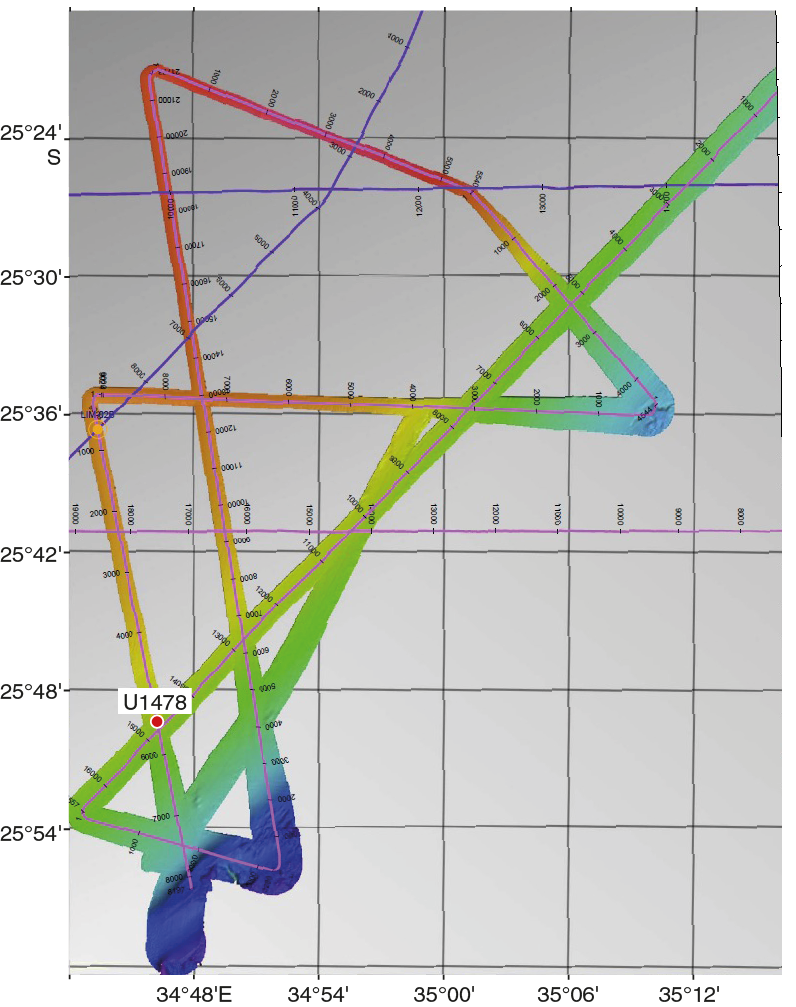
Figure F6. Seismic tracks and bathymetry at the Inharrime Terrace.
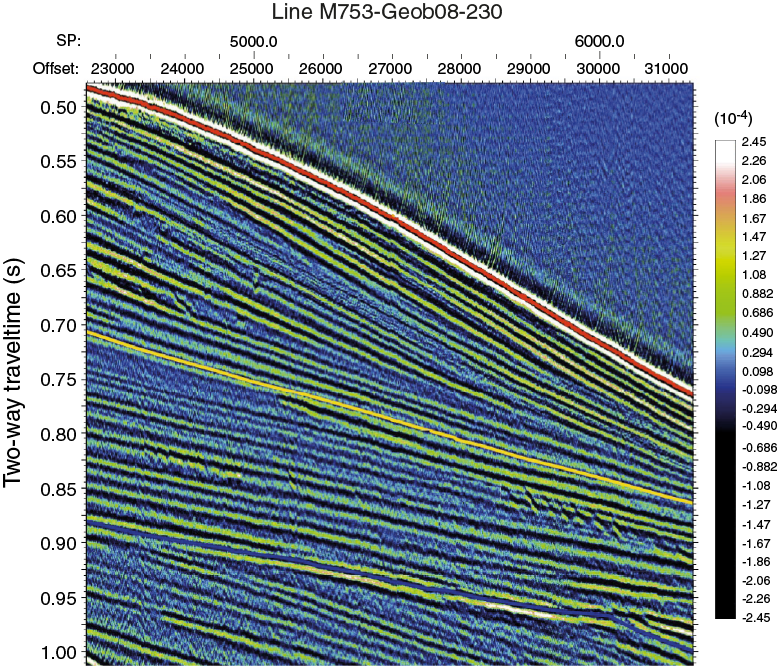
Figure F7. Seismic Line M753-Geob08-230 at Site U1478.
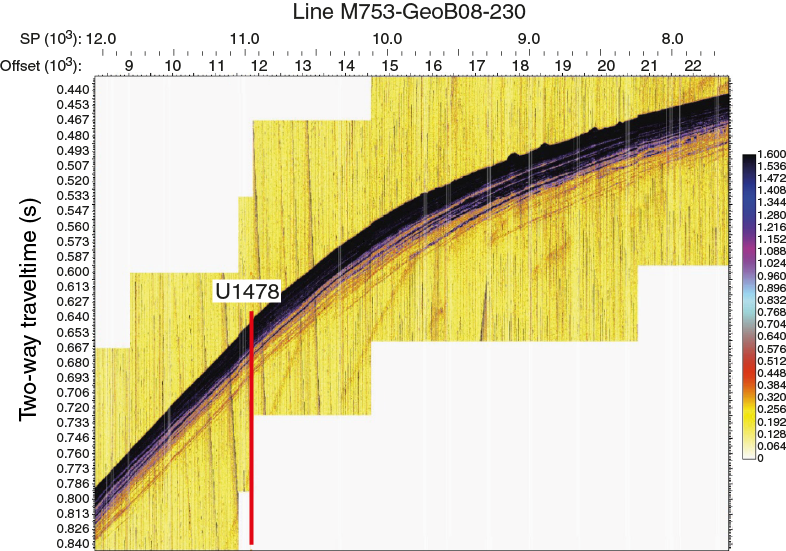
Figure F8. Parasound data for seismic Line M753-GeoB08-230 across Site U1478.
Site U1478 was occupied on 16 March 2016. Four holes were drilled and cored using the full-length advanced piston corer (APC), achieving a depth of 248.4 m drilling depth below seafloor (DSF) in Hole U1476A. The total cored interval at Site U1478 was 698.9 m, and total recovery was 708.66 m (101%).
Operations
Transit to Site U1478
After a 422 nmi transit from Site U1477, the vessel arrived at proposed Site LIM-01B (Site U1478) at 2215 h on 16 March 2016. The thrusters lowered at 2215 h, and a positioning beacon was deployed at 2315 h. The vessel stabilized over the site coordinates at 2324 h, starting the site and Hole U1478A.
Site U1478
Site U1478 consisted of 4 holes, ranging in depth from 216.0 to 248.4 m DSF (Table T1). Overall, 119 cores were recorded for the site. A total of 708.66 m of core over a 698.9 m interval was recovered using the APC system (101% core recovery). The HLAPC recovered 213.44 m of sediment over a 206.8 m interval (103% core recovery). Nine intervals were advanced without coring over 54.3 m. Overall, at total of 922.1 m of core was retrieved from a 905.7 m cored interval at Site U1478 (102% core recovery). The total time spent at Site U1478 was 2.7 days.
Table T1. Site U1478 core summary. Download table in .csv format. View PDF table.
Hole U1478A
An APC/extended core barrel bottom-hole assembly was made up, and the drill string was deployed to 484.3 mbsl. Hole U1478A was spudded at 0320 h on 17 March 2016. The APC system was used on Cores 361-U1478A-1H through 21H (0–196.7 m DSF). The half-length APC (HLAPC) was then deployed after significant overpull (70,000 lb) was recorded while removing Core 21H, and Cores 22F through 32F (196.7–248.4 m DSF) were retrieved.
The APC system was deployed 21 times over a 196.7 m interval, with a recovery of 202.22 m (102.8% recovery). The HLAPC was deployed 11 times over a 51.7 m interval, with a recovery of 54.74 m (105.9% recovery). A total of 256.96 m of sediment was recovered over a 248.4 m cored interval in Hole U1478A (103% recovery). The drill pipe was pulled from the hole and the bit cleared the seafloor at 1805 h on 17 March, ending Hole U1478A.
Hole U1478B
The vessel was offset 20 m north of Hole U1478A, and Hole U1478B was spudded at 1840 h on 17 March. Hole U1478B was drilled without recovery from 0 to 1.0 m DSF to ensure offset coring gaps between Holes U1478A and U1478B. The APC system was used on Cores 361-U1478B-2H through 19H (1.0–172.0 m DSF), and the HLAPC was deployed for Cores 20F and 21F (172.0–181.4 m DSF). The coring system was switched back to the APC for Core 22H, which recorded a partial stroke. The HLAPC was used for the remaining cores in Hole U1478B (Cores 23F through 34F). After reaching 247.3 m DSF, the drill string was pulled from the hole, and operations in Hole U1478B ended with the bit clearing the seafloor at 1015 h on 18 March.
The APC was used for a total of 19 cores over a cored interval of 180.5 m with a recovery of 180.31 m (100% recovery). The HLAPC was used for 14 cores over a 65.8 m interval with a recovery of 66.54 m (101% recovery). A total of 246.85 m of core was recovered over a 246.3 m cored interval at Hole U1478B with 100% core recovery. Each core section from 0 to 150 m CSF-A was sampled for interstitial water for postcruise research.
Hole U1478C
The vessel was moved 20 m east of Hole U1478A, and Hole U1478C was spudded at 1110 h on 18 March. The hole was washed down without recovery to 3.0 m DSF in order to offset coring gaps between holes for stratigraphic correlation. APC coring continued for Cores 361-U1478C-3H through 21H (3.0–178.5 m DSF). Interval 361-U1478C-202 was drilled without recovery from 164.5 to 169.0 m DSF. The HLAPC was deployed for Cores 21F through 38F (178.5–248.3 m DSF). Within the HLAPC cored section, three intervals were drilled without coring over a total of 4.0 m. After completing coring operations, the drill string was pulled from the hole, with the bit clearing the seafloor at 0219 h on 19 March.
The APC system was deployed for a total of 19 cores over an interval of 172.5 m with a recovery of 173.25 m (100% recovery). The HLAPC was deployed for 14 cores over a 65.8 m interval with a recovery of 69.07 m (105% recovery). A total of 238.3 m of core was recovered over a 248.3 m cored interval (102% recovery). There were a total of five intervals drilled without coring covering a total of 10 m.
Hole U1478D
The vessel was offset 20 m south of Hole U1478A, and Hole U1478D was spudded at 0310 h on 19 March. Core 361-U1478D-1H recovered 6.7 m of sediment, and the seafloor was estimated at 490.7 mbsl. Hole U1478D was drilled without recovery from 6.7 to 8.7 m DSF to offset coring gaps for stratigraphic correlation. The APC system was deployed for Cores 3H through 17H (8.7–151.2 m DSF). A center bit was installed, and the hole was drilled without recovery over 39.3 m (151.2–190.5 m DSF) to target gaps in the stratigraphy. The HLAPC was deployed for Cores 19F and 20F (190.5–199.9 m DSF). The drill string was then advanced without recovery 2.0 m and Cores 22F through 24F (201.9–211.3 m DSF) were retrieved.
The APC system was deployed for 16 cores over 149.2 m with a recovery of 152.88 m (102.5% recovery). The HLAPC system was deployed for 5 cores over a 23.5 m interval with 23.09 m recovered (98.3%). A total of 175.97 m of core was recovered over a 172.7 m cored section (102% core recovery). There were 3 intervals drilled without coring for covering a total of 43.3 m.
After completing coring operations in Hole U1478D, the drill string was pulled from the hole. The bit cleared the seafloor at 1350 h on 19 March and the rig floor at 1540 h. The rig floor was secured for transit, and the vessel began the transit to Site U1479 at 1630 h, ending Site U1478.
Sedimentology
Drilling at Site U1478 recovered a total of ~922 m of sediment from four holes (Figures F9, F10; also see Operations). Hole U1478A was cored to 248.64 m coring depth below seafloor (CSF-A), Hole U1478B to 247.01 m CSF-A, Hole U1478C to 248.55 m CSF-A, and Hole U1478D to 216.35 m CSF-A. The advanced piston corer (APC) system was applied in the uppermost ~190 m CSF-A in Hole U1478A, ~170 m CSF-A in Hole U1478B, ~180 m CSF-A in Hole U1478C, and ~150 m CSF-A in Hole U1478D. The HLAPC was used in the lower parts of all holes. Nine intervals of in total 54.4 m length were advanced without coring: one interval in Hole U1478B (0–1.0 m CSF-A), five intervals in Hole U1478C (1.5–3, 164.5–169, 187.9–188.9, 193.6 194.6, and 213.4–215.4 m CSF-A), and three intervals in Hole U1478D (6.7–8.7, 151.2–190.5, and 199.9–201.9 m CSF-A). Visual description of all cores was performed and recorded using the shipboard lithostratigraphic DESClogik program, which involves visual assessment of average grain size, sediment color, sedimentary structures, and bioturbation intensity. Drilling disturbances were also described. Lithologic characteristics were further determined using smear slide analyses, and a total of 493 shipboard samples were collected for paleontological, physical property, paleomagnetic, and geochemical analyses (Table T2).

Figure F9. Core recovery, Holes U1478A–U1478D.
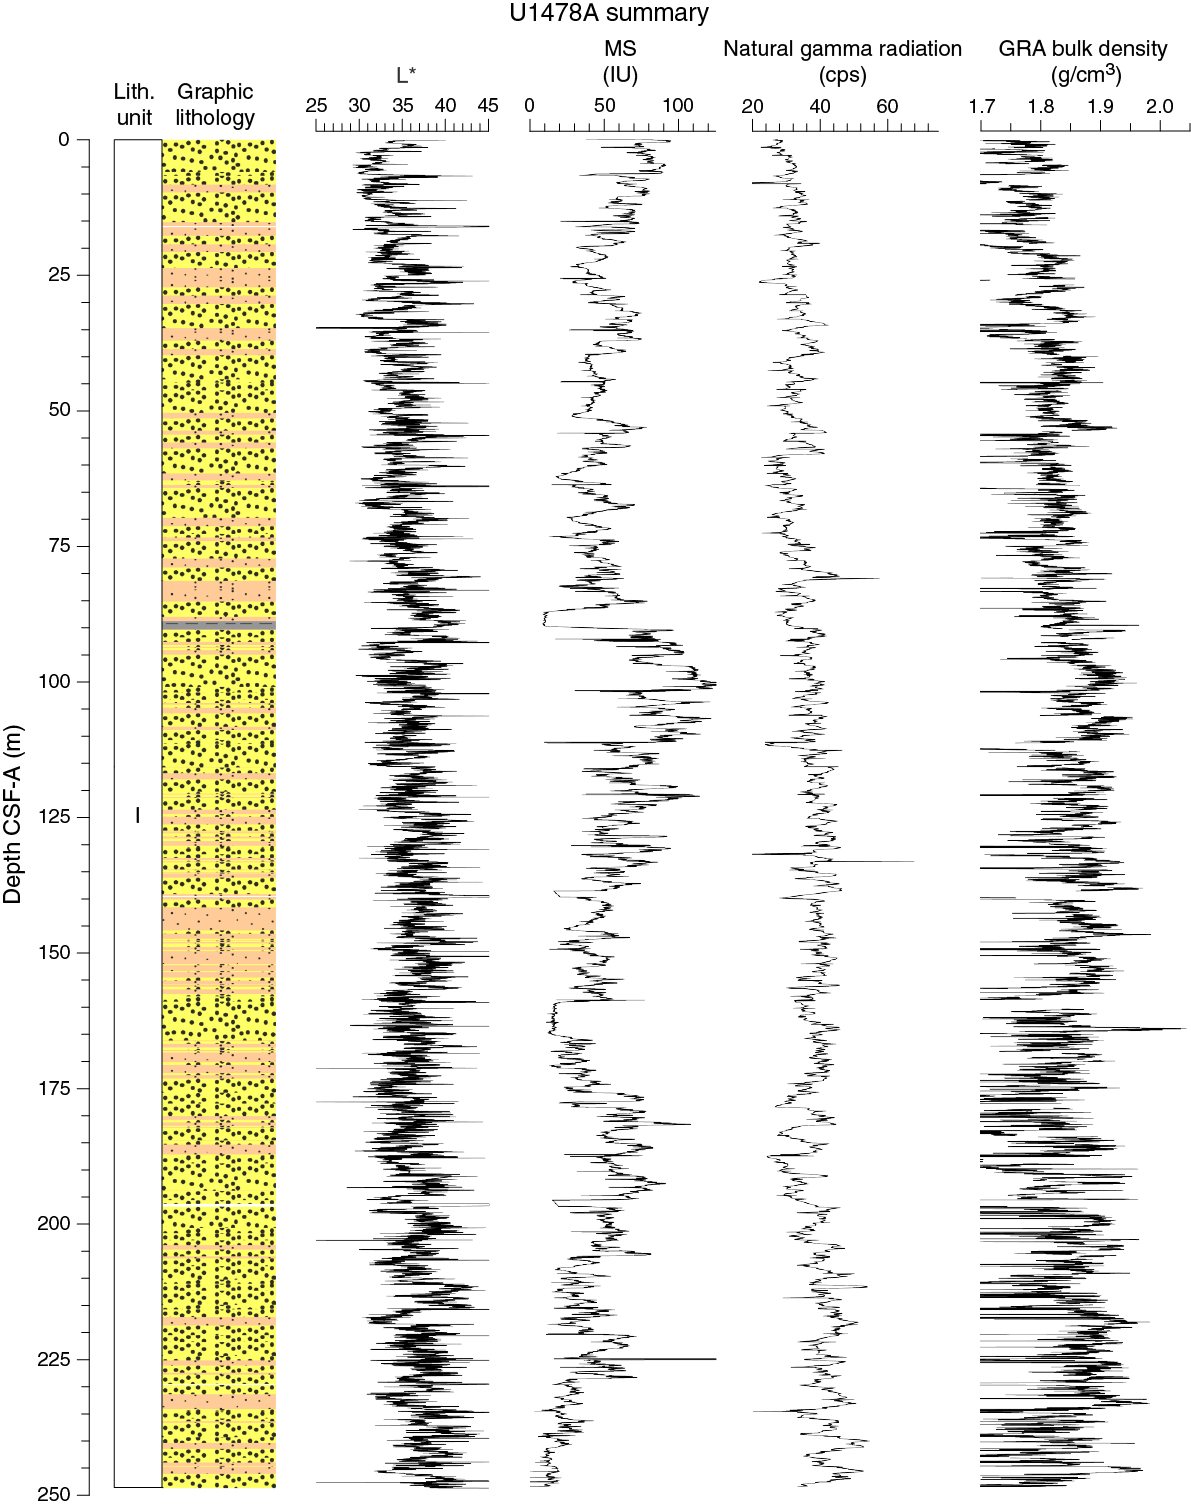
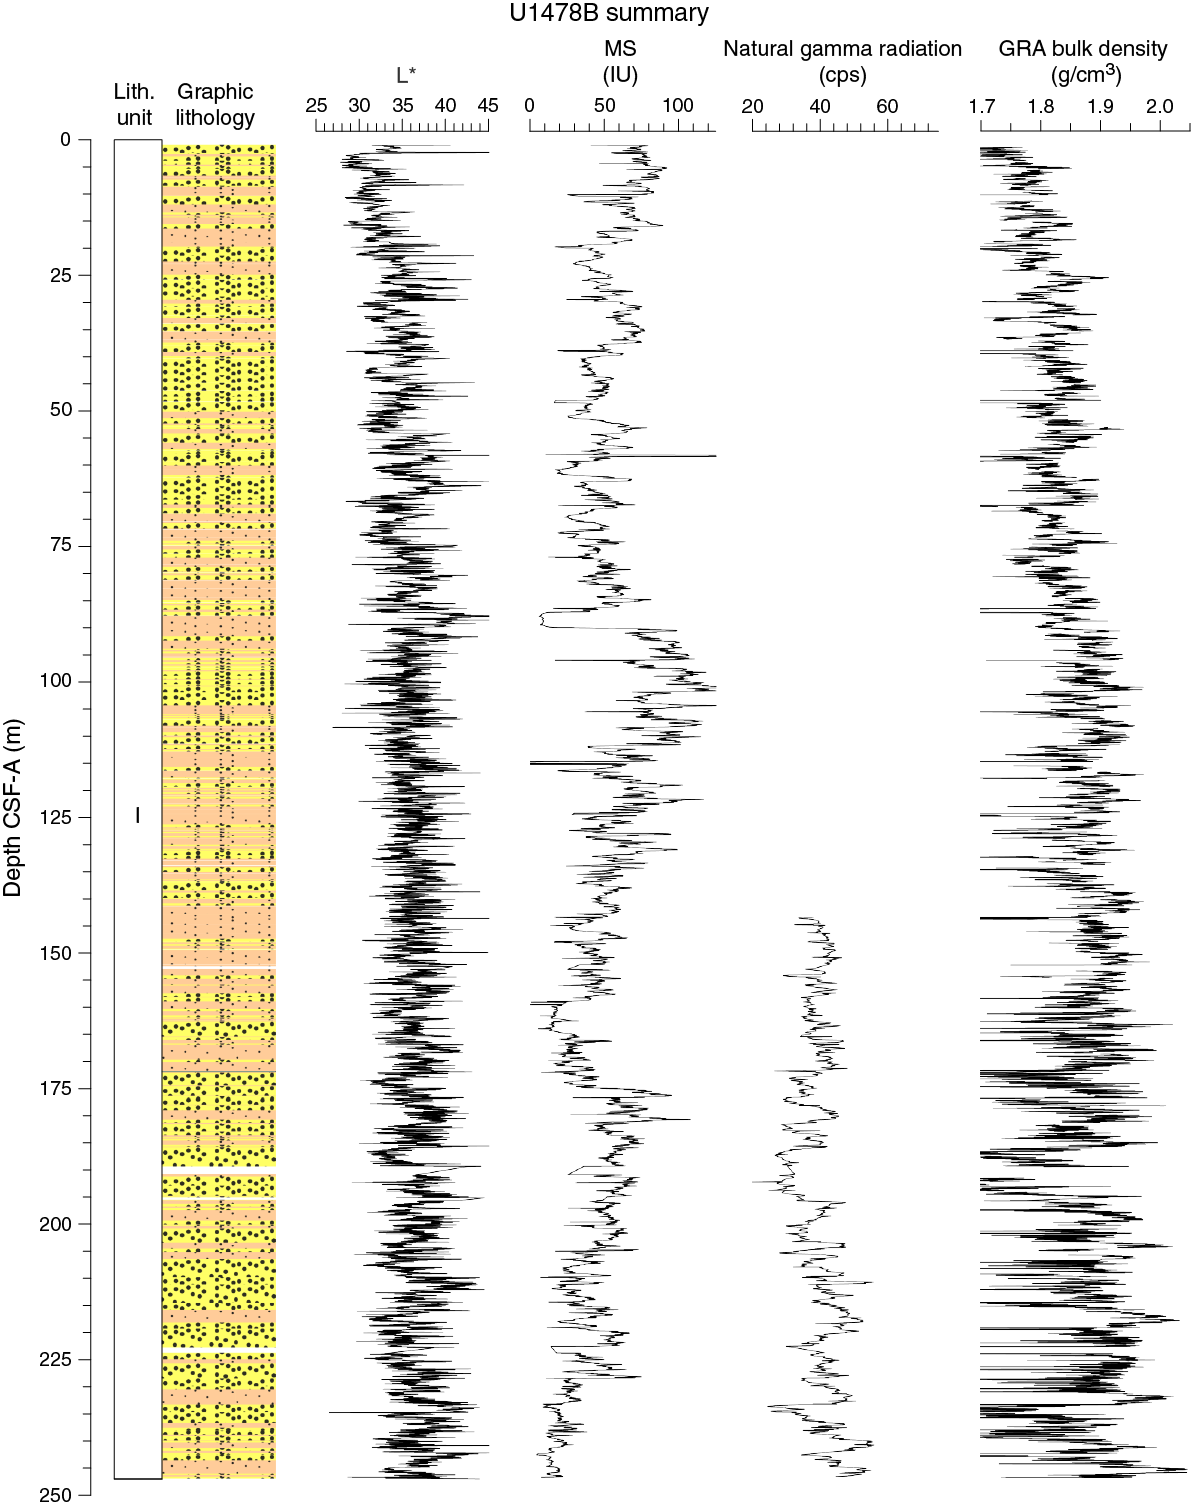

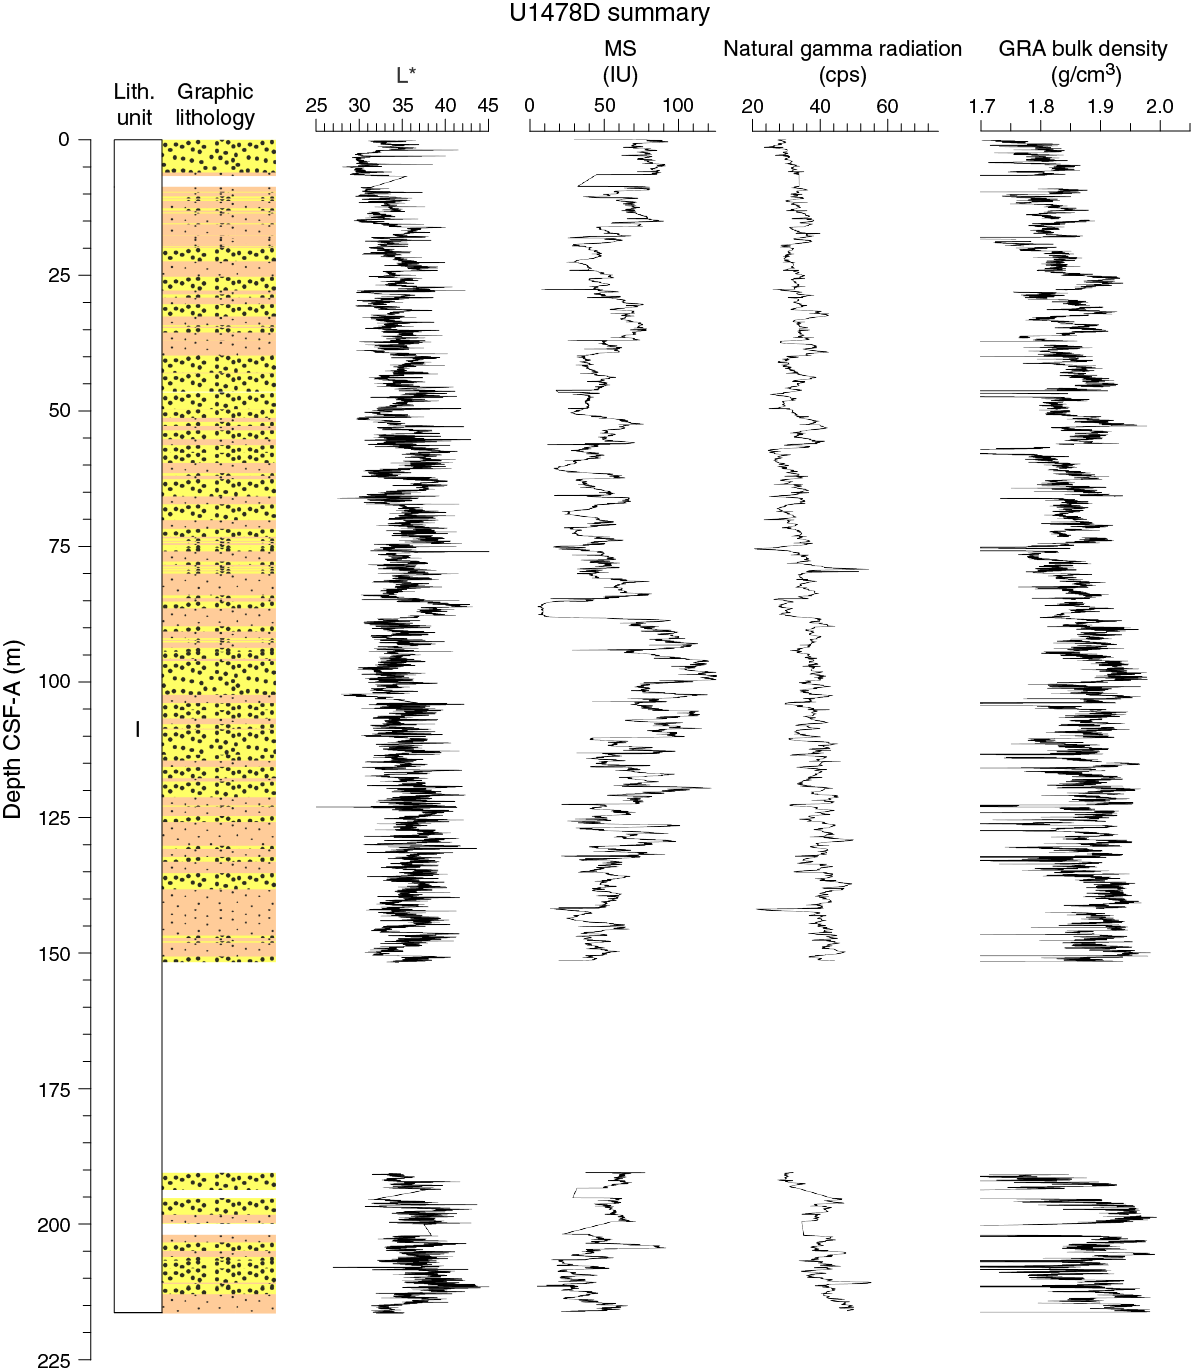
Figure F10. Lithostratigraphic summary with selected physical properties and geochemical data.
Table T2. Overview of shipboard sampling, Holes U1478A–U1478D. Download table in .csv format.
Lithostratigraphic unit description
Unit I
- Intervals: 361-U1478A-1H-1, 0 cm, through 32F-CC, 19 cm; 361-U1478B-1H-1, 0 cm, through 34F-CC, 31 cm; 361-U1478C-1H-1, 0 cm, through 38F-CC, 17 cm; 361-U1478D-1H-1, 0 cm, through 24F-CC, 22 cm
- Depths: Hole U1478A = 0–248.64 m CSF-A; Hole U1478B = 0–247.01m CSF-A; Hole U1478C = 0–248.55 m CSF-A; Hole U1478D = 0–216.35 m CSF-A
- Age: Pliocene to Holocene
Unit I is composed of dark olive-gray (5Y 3/2) and dark greenish gray (GLEY 1 4/10Y) to very dark greenish gray (GLEY 1 3/10Y) sand with foraminifers and nannofossils alternating with clayey or sandy silt with foraminifers and nannofossils (Figure F11).
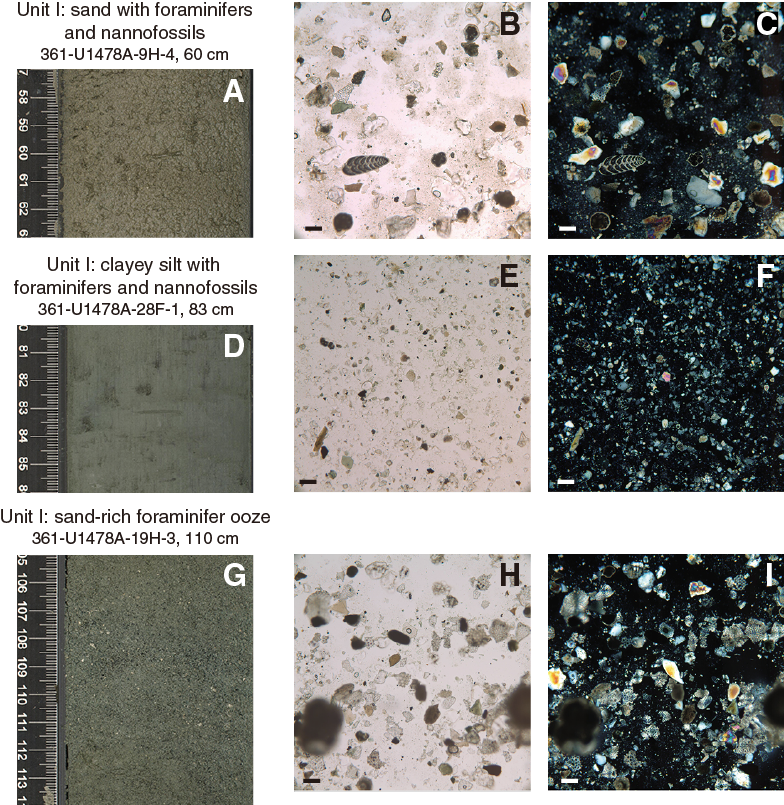
Figure F11. Representative lithologies per interval.
Drilling disturbance
The extent of drilling disturbances in the cores from Site U1478 is minor (Figure F12). Soupy intervals are limited to the uppermost sections of some cores, and flow-in disturbance, fragmented sediment, and voids were occasionally observed.
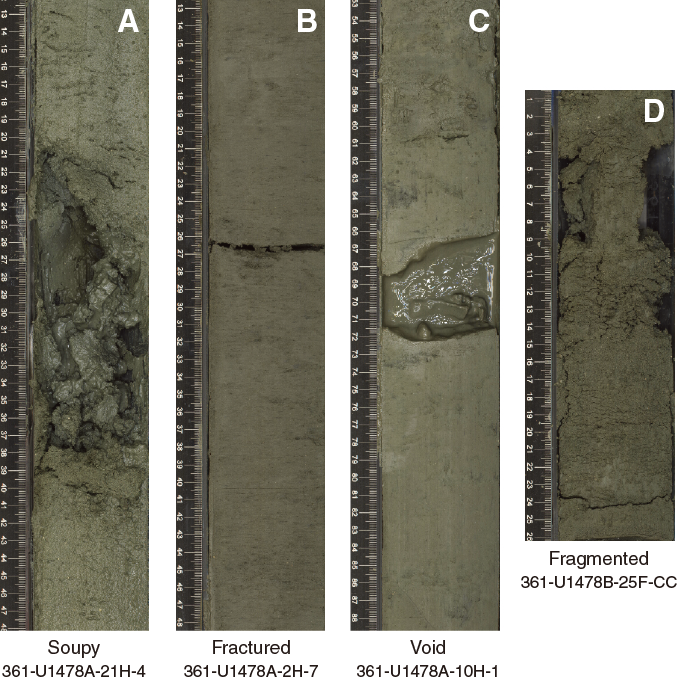
Figure F12. Sediment deformations and disturbance, Site U1478.
Lithologies and composition
Smear slide observations show that siliciclastic materials (62% ± 6% on average) are the principal component of the sediment at Site U1478 and the sand fraction is less than 50% (Table T3). Sediment grain sizes consist of 33% (±22%) sand on average, 39% (±14%) silt, and 28% (±9%) clay. The composition of the terrigenous component is dominated by quartz (32% ± 6% on average, Figure F13) and clay minerals (11% ± 5%), with common presence of pyrite. Trace amounts of dolomite, glauconite, hornblende, plagioclase, and zircon were also observed. The composition of the biogenic component is dominated by nannofossils (14% ± 6% of the bulk sediment on average) and foraminifers (13% ± 6% of the bulk sediment on average).
Table T3. Smear slide textures, compositions, and lithologic names, Holes U1478A-U1478D. Download table in .csv format.
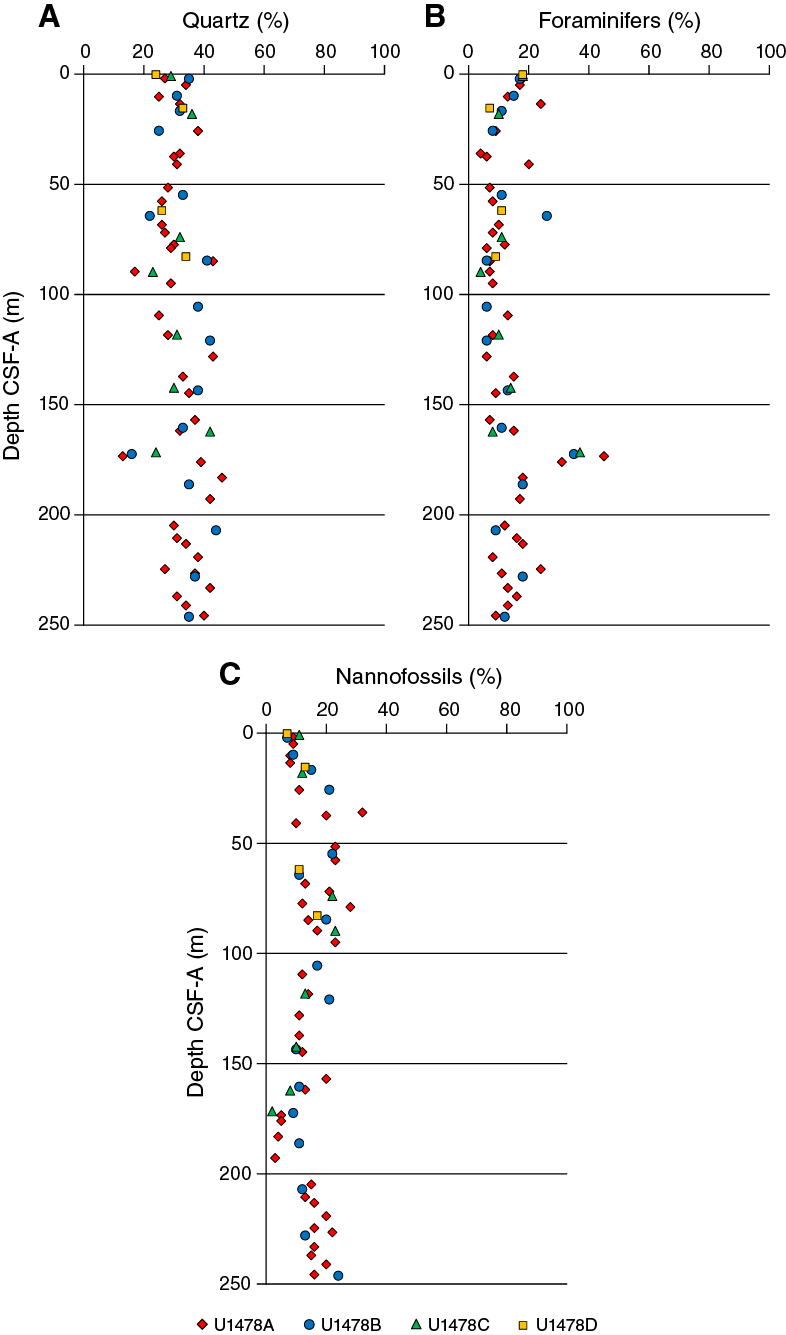
Figure F13. Major compositions of sediment determined by smear slide observation, Holes U1478A–U1478D.
The average abundance of total biogenic carbonate in the sediment in Hole U1478A was estimated to be ~36% ± 6% based on smear slide descriptions (Table T3). This result is in broad agreement with geochemical analyses (see Geochemistry) with an average of 28 wt% (range = 16–55 wt%) carbonate content (Figure F14).
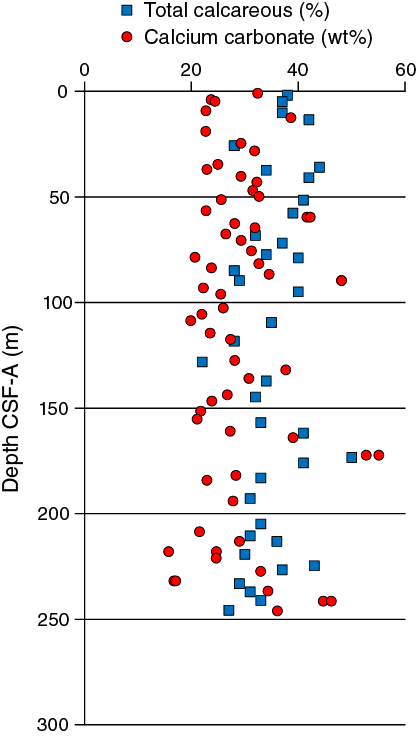
Figure F14. Comparison of CaCO3 from discrete samples and biogenic carbonate estimated in smear slides, Holes U1478A–U1487D.
An interval of sand-rich foraminifer ooze was observed at ~170–172 m CSF-A in Holes U1478A (19H-3, 110 cm), U1478B (19H-7, 50 cm), and U1478C (21H-1, 130 cm) (Figure F10). This interval is mainly composed of foraminifer shells and medium sand–sized quartz with common presence of medium sand–sized pyrite and glauconite (Figure F11).
Structures
No primary sedimentary structures were observed. Secondary sedimentary structures, such as bioturbation, are rare.
Color
The color of sand with foraminifers and nannofossils ranges from dark olive-gray (5Y 3/2) (uppermost ~3–6 m in all holes) to dark greenish gray (GLEY 1 4/10Y) and very dark greenish gray (GLEY 1 3/10Y). The color of clayey silt with foraminifers and nannofossils ranges from greenish gray (GLEY 1 5/5GY) to dark greenish gray (GLEY 1 4/10Y) and very dark greenish gray (GLEY 1 3/10Y). Finally, the sand-rich foraminifer ooze is greenish gray (GLEY 1 5/5GY).
Discussion
Site U1478 is located at 490 mbsl on Inharrime Terrace east of the Limpopo River. This area consists of a large triangle-shaped sedimentary body in the northwestern Natal Valley connected with the Limpopo River sediment cone, which has been built up since the late Miocene (Martin, 1981b). The lithologic alternation between clayey silt with nannofossils and foraminifers and sand with foraminifers and nannofossils observed at Site U1478 probably results from complex interactions between the water masses bathing Inharrime Terrace, sea level fluctuations, and fluvial discharges. Inharrime Terrace is composed of several major drift sequences that result from the interplay between the Mozambique Channel throughflow and the stationary Delagoa Bight lee eddy (Preu et al., 2011). This eddy is likely driven by the rapid flow of the adjacent water past the substantial promontory (Quartly and Srokosz, 2004; Lutjeharms, 2006). The flow of the eddy slows in the center, where suspended material settles (Martin, 1981b). The occurrence of sand-rich foraminifer ooze at ~170–172 m CSF-A in Holes U1478A–U1478C suggests the roll of winnowing and could be consistent with contourite deposition at Site U1478. Two intervals of low magnetic susceptibility at ~87–91 and 159–164 m CSF-A in all holes (see Physical properties) occur within Unit I. These intervals seem not to be related to any distinct lithologies because they occur across sandy, silty, and clay sediment.
Physical properties
Physical property measurements were completed on whole-round sections and section halves from cores collected from Holes U1478A–U1478D. Gamma ray attenuation (GRA) density, magnetic susceptibility (MS), P-wave velocity (VP), and natural gamma radiation (NGR) measurements were made on all whole-round sections using the Special Task Multisensor Logger (STMSL), the Whole-Round Multisensor Logger (WRMSL), and the Natural Gamma Radiation Logger (NGRL). Because of time constraints, the NGRL was not run on Cores 361-U1478B-1H through 16H, which were sampled every section for interstitial water whole rounds. In all cases, STMSL sampling resolution was set to 5 cm, WRMSL sampling resolution was set to 2.5 cm, and NGRL sampling resolution was set to 10 cm. All sections were first logged using the STMSL without waiting for thermal equilibration, generating a set of GRA density and MS data that was used for stratigraphic correlation. Following thermal equilibration (after temperature reached 19°C), the sections were logged using the WRMSL, generating VP and another set of GRA density and magnetic susceptibility data, and then logged using the NGRL.
Following core splitting, samples were taken for moisture and density (MAD) measurements from the working-half sections. Three samples per core from the working-half sections of Hole U1478A were taken for MAD measurements. The samples were taken typically from Sections 2, 4, and 6 with few exceptions based on visual inspection. The MAD (index) properties determined on 81 samples from Hole U1478A include bulk density, dry density, grain density, porosity, void ratio, and water content. Spectral color reflectance and MS were measured at a resolution of 4 cm on the archive-half sections using the Section Half Multisensor Logger (SHMSL). Red, green, and blue (RGB) were measured on the Section Half Imaging Logger (SHIL).
Diffuse reflectance spectrometry and digital color image
In general, spectral reflectance parameter L* ranges from 29 to 44 and shows cyclic variability throughout. These oscillations have a wavelength between 1 and 5 m. Along the entire Hole U1478A, a slight progressive increase in average L* values was observed ranging from 34 at the seafloor to 37 at the bottom of the hole (Figure F15). Color reflectance values for a* range in general between 1.8 and –1.3 and between 6 and –4 for b*.
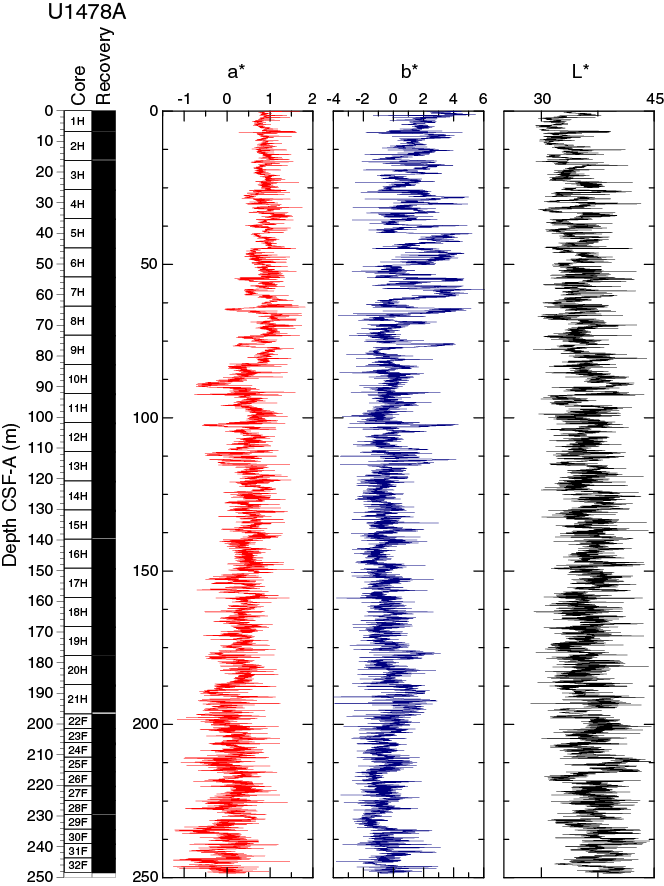
Figure F15. Color reflectance, Hole U1478A.
Maxima in a* and b* values were observed at ~63 and ~58 m CSF-A, respectively, and in general both show poor correlation with L* values. After a brief low in a*, at ~75 m CSF-A, average a* values decrease gradually from 1 at ~85 m CSF-A to 0 at the base of the sequence. Around the same depth level, the cyclic pattern for b* values change, with higher amplitudes in the upper part compared to the lower one. The color reflectance variations are likely due to compositional changes (e.g., carbonate versus clay mineral concentration). Spectral reflectance data are very similar between holes. Deviations may be due to drilling disturbances.
RGB values obtained from the SHIL were measured on the moist surface of the archive halves of split cores. RGB data have average values of R = 36 ± 5, G = 35 ± 5, and B = 30 ± 4 (Figure F16) and show a cyclic pattern, with higher amplitudes in the upper 95 m CSF-A. Below this depth, RGB measurements display a lower variability with two positive excursions at ~178 and ~187 m CSF-A and a marked decrease at ~190 m CSF-A. RGB data broadly correspond with color reflectance b*.
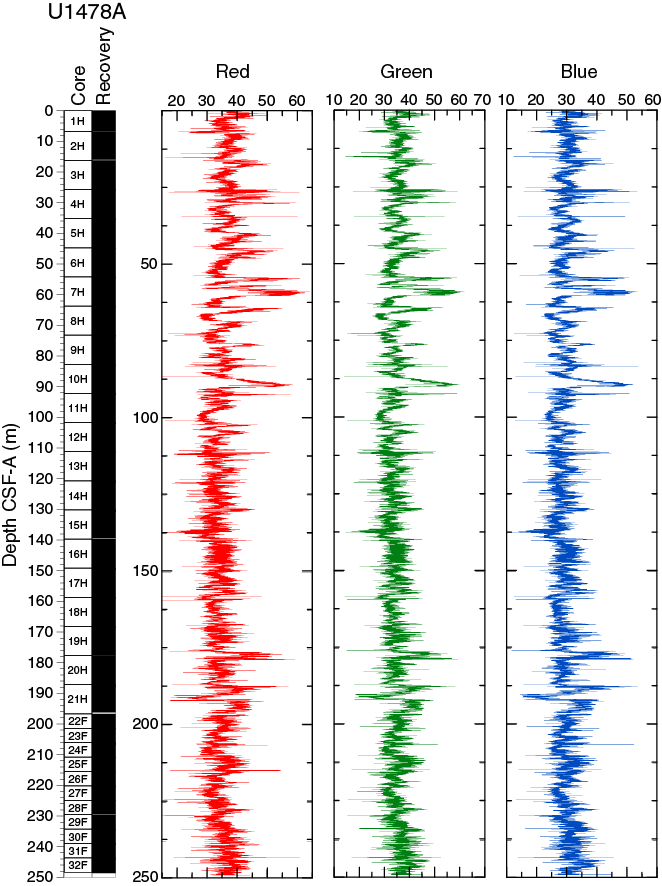
Figure F16. SHIL RGB color data, Hole U1478A.
Natural gamma radiation
In Hole U1478A, NGR average count rates increase downhole from 27 counts/s at the seafloor to 53 counts/s at the bottom of the hole (Figure F17). This gradual increase is interrupted by two zones at 57–74 and 174–195 m CSF-A, showing excursions to lower average values of 30 ± 3 and 34 ± 5 counts/s, respectively. A peak-like maximum NGR value of 58 counts/s occurs at 81 m CSF-A. Below 175 m CSF-A, cyclic changes in NGR display longer cycles (3–5 m) compared to the upper 175 m CSF-A, where wavelengths are typically 1–3 m. Moreover, an interval with higher (~15 counts/s) than average amplitude variability (~10 counts/s) occurs between 175 and 200 m CSF-A.
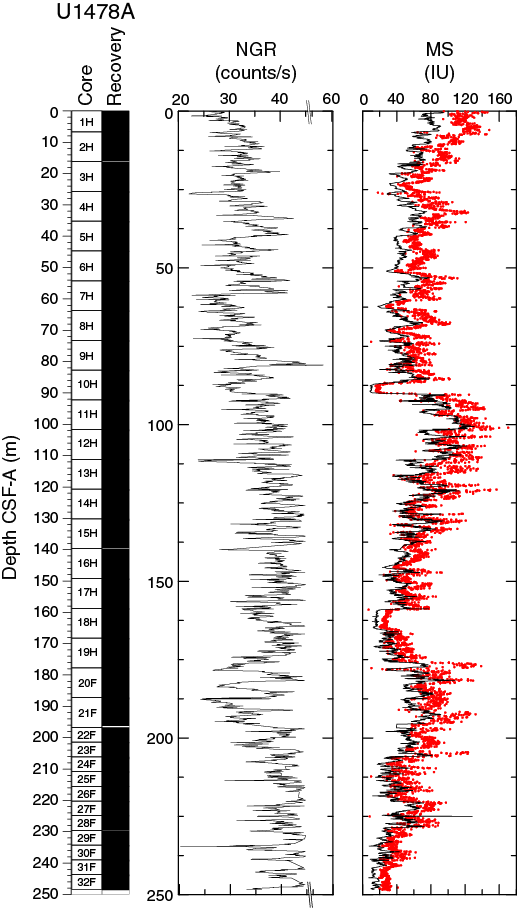
Figure F17. NGR and magnetic susceptibility, Hole U1478A.
Magnetic susceptibility
Whole-round core (WRMSL) measurements of MS in Hole U1478A (Figure F17) have an average of 51.2 ± 22.6 instrument units (IU; ~10–5 SI). In the upper 25 m CSF-A, magnetic susceptibility values show cyclic changes and a progressive decrease from 91 to 31 IU. From 25 to 89 m CSF-A, MS ranges between ~20 to ~70 IU and varies around an average of 50 IU. At 89 m CSF-A, this cyclic pattern is interrupted by a low-MS interval of ~3 m in which minimum values (<20 IU) are reached. Below 92 m CSF-A, MS increases again with a high gradient such that maximum MS values of 131 IU are reached only a few meters (103 m CSF-A) below the low-MS interval. From this point, MS decreases to ~159 m.
At 159 m CSF-A, another 5 m long low-MS (~15 IU) interval begins. From the bottom of this interval at 164 m CSF-A, MS shows a rapid increase to 90 IU at 180 m CSF-A followed again by a general decrease to the bottom of the hole.
Compressional wave velocity
P-wave velocity data measured with the WRMSL (Figure F18) was cleaned of outliers caused by section breaks. Velocities average 1550 ± 14 m/s in the uppermost 25 m CSF-A of Hole U1478A. At 25 m CSF-A, a step-like change is followed by an interval (25–90 m CSF-A) with higher and more variable velocities (1574 ± 21 m/s). From 90 to 130 m CSF-A velocities also fluctuate around an average of 1574 m/s but with significantly larger amplitude variations (1450–1650 m/s). Below 130 CSF-A, reliable P-wave data collection in all holes at Site U1478 was inhibited by strong signal attenuation caused by the high number of gas expansion voids so no data are shown on the figure.
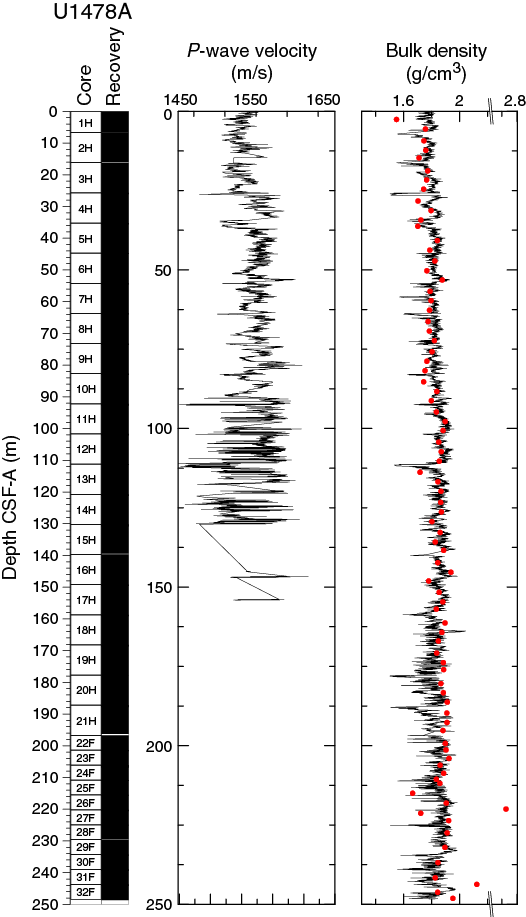
Figure F18. P-wave velocity and bulk density, Hole U1478A.
Moisture and density
Bulk density at Site U1478 was determined on whole-core sections using the STMSL and WRMSL (GRA) and on discrete MAD samples. Variations in GRA and MAD bulk densities are well correlated throughout Site U1478 (Figure F18). GRA bulk density values vary from 1.5 to 2 g/cm3 and are consistent with an average MAD bulk density of 1.84 ± 0.12 g/cm3. The spike-like excursions to lower GRA bulk density values may be due to small voids caused by gas expansion. The average grain density is 2.76 ± 0.01 g/cm3 and the values vary between 2.55 and 3.29 g/cm3 (Figure F19).
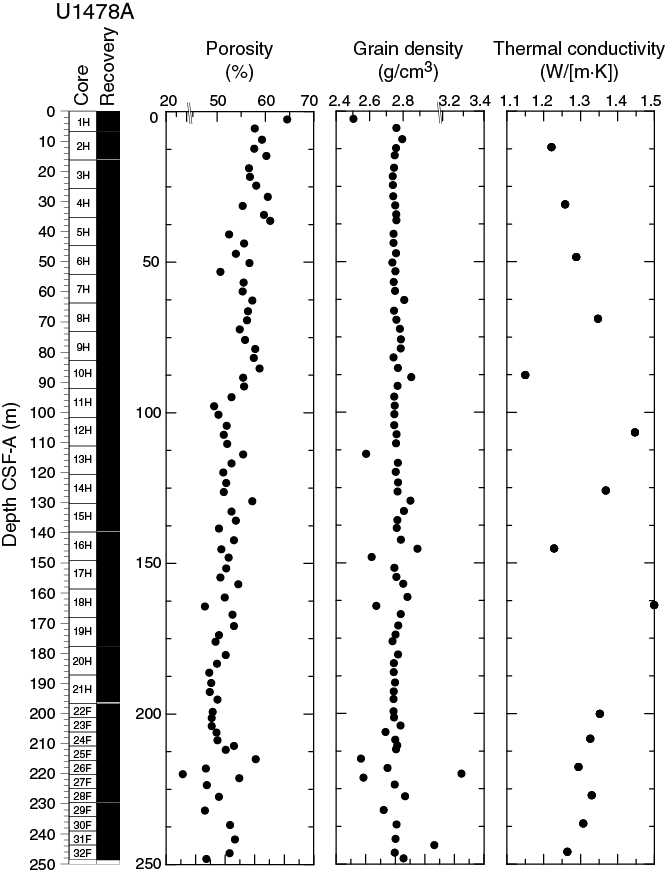
Figure F19. Porosity, grain density, and thermal conductivity, Hole U1478A.
Overall, the porosity profile shows a decreasing trend downward in Hole U1478A that is consistent with sediment compaction with variations along that trend likely due to variations in average grain size of the sediment particles. Porosity values are similar to those at Site U1477 and range between 44.0% and 64.5%.
Thermal conductivity
Thermal conductivity measurements were performed on every other core in Hole U1478A (Figure F19). The full-space needle probe was used, usually near the middle of one section. Overall, thermal conductivity values range between 1.15 and 1.49 W/(m·K), with an average value of 1.31 W/(m·K), but do not show a clear trend with depth as also observed at Site U1477.
Summary
Despite the fact that the lithology at Site U1478 is homogeneous and has been classified as one lithostratigraphic unit (see Sedimentology), the physical parameters measured at Site U1478 show a complex pattern of amplitude changes and trends. All high-resolution records derived by core logging (Figure F20) show cyclic changes that are likely related to the variable lithologic alternations between silt-rich and sand-rich intervals (see Sedimentology) and thus may reflect complex interactions between ocean circulation, sea level fluctuations, and fluvial discharges. Cyclic variability within the measured physical properties is pervasive throughout the sequence; however, the amplitude and wavelength of the cyclicity fluctuate along the records and between each different measured parameter. Also, changes in general trends do not correlate between parameters. Two zones of very low magnetic susceptibility values at 89–92 and 164–168 m CCSF-A may have been caused by sediment diagenesis as indicated by elevated iron and manganese concentrations in interstitial water (see Geochemistry). The porosity profile shows a decreasing trend downhole, and average porosities are similar to Site U1477 but are significantly lower when compared to the sites in deeper water (Sites U1474–U1476 and U1479), suggesting a higher degree of sediment compaction at the shallower sites.
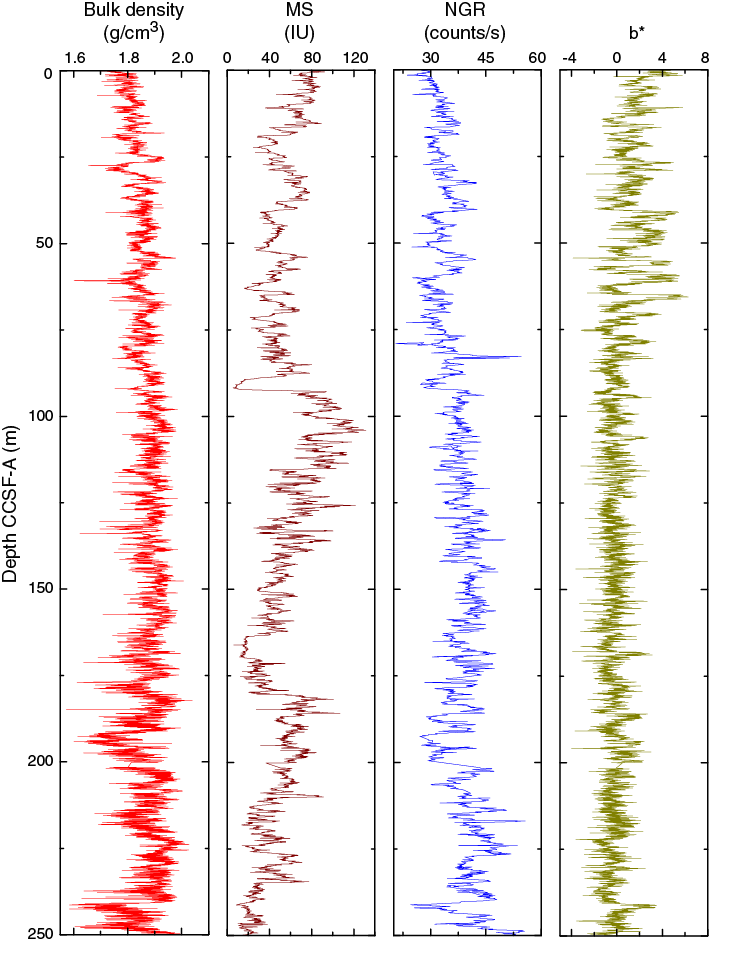
Figure F20. Spliced bulk density, WRMSL magnetic susceptibility, NGR, and b* color reflectance, Site U1478.
Micropaleontology
Site U1478 spans the Late Pleistocene to middle Pliocene with a bottom-hole age of ~3.9 Ma. Calcareous nannofossils, planktonic foraminifers, diatoms, and other siliceous remains were analyzed in the mudline, 32 core catcher samples, and selected split-core section samples (78 for calcareous nannofossils and 75 for foraminifers) from Hole U1478A. The sequence is biostratigraphically complete at the biozone level for planktonic foraminifers and calcareous nannofossils. The diatom record is limited to the mudline sample, whereas siliceous sponge spicules and phytoliths appear rarely in the core catcher samples. Calcareous microfossils are abundant and mostly well preserved throughout Site U1478 with the occurrence of tropical to subtropical species. Temperate species of calcareous nannofossils and planktonic foraminifers tend to appear from ~177.72 to 248.64 m CSF-A. The microfossil assemblage includes pteropods, benthic foraminifers, ostracods, sponge and gorgonian spicules, phytoliths, mollusks, coral fragments, and fish otoliths.
Calcareous biochronology and paleomagnetic age estimates show good agreement with each other, but some of the biostratigraphic markers from planktonic foraminifers show evidence of upward reworking of top appearance datums (see Planktonic foraminifers and Age model). Accordingly, the foraminifer datums characterized by rare abundances (a few specimens in a sample) and discontinuous appearances near their top occurrence were discounted. The evidence for reworking of planktonic foraminifers at Site U1478 is equivocal. Overall we are unsure how pervasive reworking is throughout the sequence, but it might be more common in the frequent sandy beds where foraminifer abundance is high (>20%). Split-core section samples for foraminifer identification were taken at regular intervals (typically 70–72 cm within a section), but by chance they mostly occurred in sand-rich horizons. In contrast, most nannofossil samples were taken from fine-grained sediments.
Biostratigraphy in Hole U1478A is shown in Figure F21 with microfossil datums reported in Tables T4 and T5. Calcareous nannofossil occurrences are presented in Table T6, and planktonic foraminifer occurrences are shown in Table T7. Typical examples of calcareous nannofossils at Site U1478 are presented in Figure F22. Representative species of planktonic and benthic foraminifers at Site U1478 are shown in Figures F23 and F24. The age-depth plot including the biochronology and magnetostratigraphic datums is discussed in Age model and is shown in Figure F39.
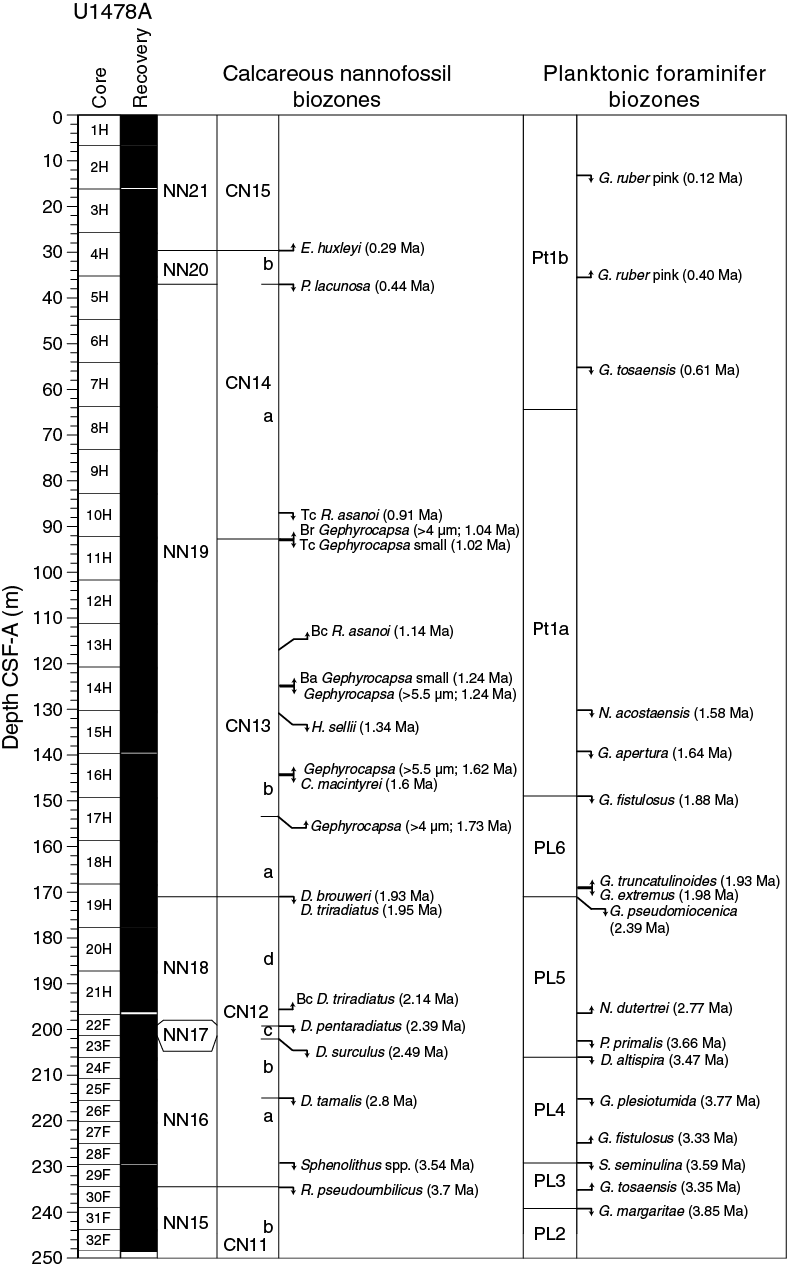
Figure F21. Biochronology in Hole U1478A with the locations of significant planktonic foraminifer and calcareous nannofossil events.
Table T4. Biostratigraphic planktonic foraminifer datums, Site U1478. Download table in .csv format.
Table T5. Biostratigraphic calcareous nannofossil datums, Site U1478. Download table in .csv format.
Table T6. Calcareous nannofossil occurrence, Site U1478. Download table in .csv format.
Table T7. Planktonic foraminifer occurrence and abundance based on examination of the >150 µm fraction, Site U1478. Download table in .csv format.
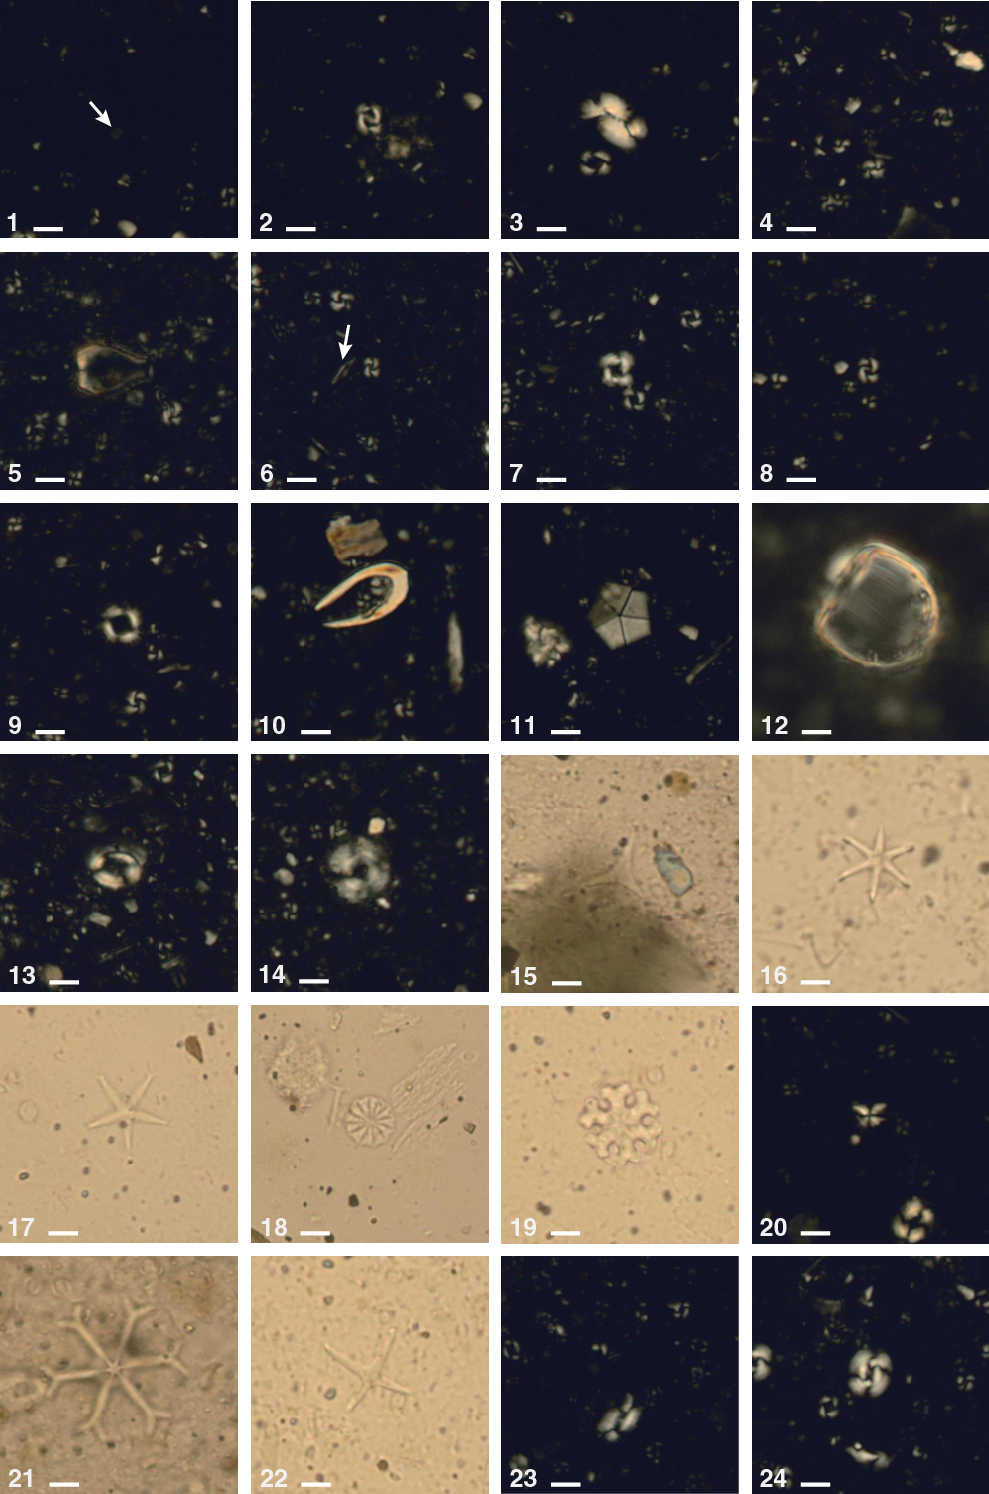
Figure F22. Calcareous nannofossils, Hole U1478A.

Figure F23. Representative assemblages of benthic foraminifers in Sample U1478A-31F-CC.
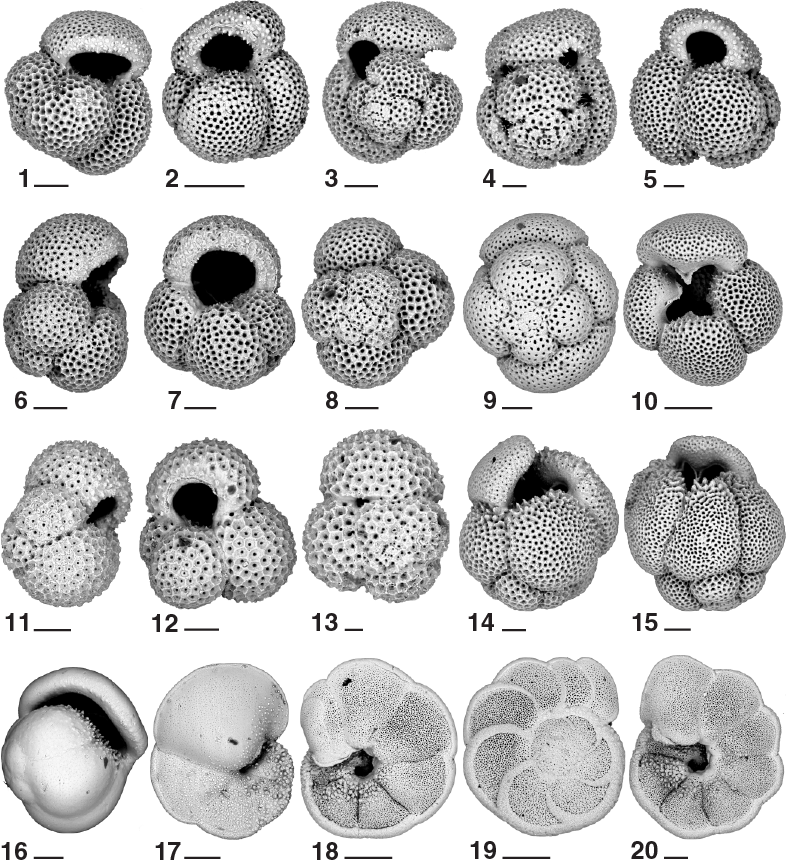
Figure F24. Representative assemblages of planktonic foraminifers, Hole U1478A.
Calcareous nannofossils
Calcareous nannofossil assemblages were analyzed in the mudline, 32 core catcher samples, and 78 split-core section samples from Hole U1478A. The split-core section samples, analyzed only for marker species abundances, were selected based on the likelihood of the marker occurrence and on the sediment appearance (i.e., texture and absence of bioturbation). Core catcher investigations focused instead on calcareous nannofossil abundances of discrete taxa. A total of 20 nannofossil datums calibrated by Lourens et al. (2004) and Gradstein et al. (2012) were identified, leading to the assigned age range from the Late Pleistocene to the middle Pliocene for the recovered sequence. Based on occurrence and abundance, nannofossil datums are considered reliable unless otherwise stated. Individuals of 48 tropical, subtropical, and temperate nannofossil species belonging to 20 genera were observed (for examples, see Figure F22). Calcareous nannofossil assemblages are mostly abundant (>50% of sediment particles) with occasional samples of lower percentages (10%–50% of sediment particles). Preservation is good, and reworking of species is low; however, specimens of the Discoaster taxa tend to show broken arms and fragmentation. The assemblage is characterized by the occurrence of coastal species such as Gephyrocapsa oceanica and Braarudosphaera bigelowii, whereas the temperate species Coccolithus pelagicus is first found in Sample 361-U1478A-19H-CC (177.72 m CSF-A) at ~2 Ma, and its occurrence continues downcore to the bottom of the sequence.
The coincident base of Biozones NN21 and CN15 is observed in Sample 4H-3, 70 cm (29.4 m CSF-A) with the base occurrence of Emiliania huxleyi (0.29 Ma). The classification of this species was determined by analyzing split-core samples from the top of Hole U1478A under the scanning electron microscope, which provides the appropriate magnification to reliably identify E. huxleyi. The top occurrence of Pseudoemiliania lacunosa (0.44 Ma) in Sample 5H-2, 30 cm (37 m CSF-A), defines the Biozone NN20/NN19 and Subzone CN14b/CN14a boundaries. Biozone NN19 and Subzone CN14a include the top common occurrence of Reticulofenestra asanoi (0.91 Ma) in Sample 10H-4, 75 cm (87.98 m CSF-A), and the top common occurrence of small Gephyrocapsa spp. (1.02 Ma) in Sample 11H-1, 75 cm (92.95 m CSF-A). The former datum has a lower quality score because its abundance is low prior to its top occurrence, fluctuating between 1 and 10 specimens per field of view. The Subzone CN14a/CN13b boundary is marked by the base reentrance of Gephyrocapsa spp. (>4 µm; 1.04 Ma) in Sample 11H-1, 75 cm (92.95 m CSF-A). Subzone CN13b contains the base common occurrence of R. asanoi (1.14 Ma) in Sample 13H-4, 35 cm (117.00 m CSF-A); the top occurrence of Gephyrocapsa spp. (>5.5 µm; 1.24 Ma) and the base acme of small Gephyrocapsa spp. (1.24 Ma) in Sample 14H-3, 145 cm (125.16 m CSF-A); the top occurrence of Helicosphaera sellii (1.34 Ma) in Sample 15H-1, 114 cm (131.34 m CSF-A); the top occurrence of Calcidiscus macintyrei (1.6 Ma) in Sample 16H-3, 135 cm (144.07 m CSF-A); and the base occurrence of Gephyrocapsa spp. (>5.5 µm; 1.62 Ma) in Sample 16H-4, 70 cm (145.20 m CSF-A). The Subzone CN13b/CN13a boundary is recognized in Sample 17H-4, 40 cm (153.97 m CSF-A), based on the bottom occurrence of Gephyrocapsa spp. (>4 µm; 1.73 Ma).
The Biozone NN19/NN18 and Subzone CN13a/CN12d boundaries are placed in Sample 19H-2, 91 cm (170.61 m CSF-A), where the top occurrence of Discoaster brouweri (1.93 Ma) occurs. The top occurrence of Discoaster triradiatus (1.95 Ma) is recorded in Sample 19H-2, 91 cm (170.61 m CSF-A), following its base common occurrence (2.14 Ma) in Sample 21H-6, 74 cm (195.44 m CSF-A), which both characterize Biozone NN18 and Subzone CN12d. Both occurrences of D. triradiatus are considered to be of low reliability due to the scarcity and irregular appearance of the datum. In particular, the base common occurrence of D. triradiatus is characterized by the presence of a few individuals within the sample. The tops of Biozone NN17 and Subzone CN12c are found in Sample 22F-2, 85 cm (199.05 m CSF-A), based on the top occurrence of Discoaster pentaradiatus (2.39 Ma). Minor reworking of this species was recorded in the upper part of the sequence, where the younger age-diagnostic taxon D. triradiatus is present. The Biozone NN17/N16 and Subzone CN12c/CN12b boundaries are defined by the top occurrence of Discoaster surculus (2.49 Ma) in Sample 22F-4, 55 cm (201.24 m CSF-A). The top occurrence of Discoaster tamalis (2.8 Ma) in Sample 25F-CC (215.70 m CSF-A) delineates the Subzone CN12b/CN12a boundary within Biozone NN16. The Pliocene/Pleistocene boundary is located between the top occurrences of D. surculus (2.49 Ma) and D. tamalis (2.8 Ma). The top occurrence of Sphenolithus spp. (3.54 Ma) in Sample 28F-CC (229.44 m CSF-A) marks the lower part Biozone NN16. The top occurrence of Reticulofenestra pseudoumbilicus in Sample 30F-1, 17 cm (234.47 m CSF-A), defines the transition to Biozone NN15 and Subzone CN11b, indicating that the associated sedimentary sequence in Hole U1478A is younger than 3.7 Ma. These last two datums are considered to be of lower reliability because of their irregular occurrence.
The Pliocene–Pleistocene record is also characterized by rare to common occurrences of long-ranging nannofossil taxa such as B. bigelowii, Calcidiscus leptoporus, Calciosolenia murrayi, C. pelagicus, Helicosphaera carteri, Helicosphaera spp., Pontosphaera spp., Rhabdosphaera clavigera, Scyphosphaera spp., Syracosphaera spp., Reticulofenestra spp. (<3 µm), Umbellosphaera spp., and Umbilicosphaera spp.
Planktonic foraminifers
Planktonic foraminifers define a complete sequence of Pliocene–Pleistocene datums between Subzone Pt1b and the base of Biozone PL3 and suggest the sedimentary sequence reaches at least 3.85 Ma and probably 4.1 Ma (see Age model). Planktonic foraminifer fauna is dominated by tropical to warm subtropical species, although there is a very small number of individuals representing species from the subtropical convergence throughout the sequence. Foraminifers are mostly well preserved in Hole U1478A, with the frequent occurrence of glassy and semitranslucent specimens throughout Hole U1478A. Still, some samples, particularly in the lower parts of Hole U1478A, show foraminifer fragmentation and pitting, as well as overgrowth by dolomite that results in only moderate preservation. There are also signs of low levels of reworking, with rare occurrences of marker species in shallower parts of the sequence than expected based upon the majority of other biostratigraphic datums. The abundance of sandy sediment at Site U1478 may account for some of this reworking because foraminifer sand could be produced by erosion and transportation of previously deposited materials. Reworking does not appear to be an overwhelming phenomenon because the sequence of biostratigraphic datums is generally in agreement with other Expedition 361 sites once we eliminate rare, discontinuous occurrences in defining the depths of biostratigraphic events.
Planktonic foraminifers were examined in core catcher samples from Hole U1478A and generally in alternating split-core sections. The core catcher samples were all washed upon recovery; this proved to be easier than at other Expedition 361 sites because of the frequent occurrence of foraminifer-rich sand in the core catchers, which disaggregated easily while being washed. The split-core section samples were dried completely before processing and soaked in a dilute borax solution, a procedure that made the samples easy to disaggregate and likely resulted in an improvement in foraminifer quality in the washed sand fraction over the core catcher samples. Examples of the major foraminifer taxa present at Site U1478 are illustrated in Figures F23 and F24. Stratigraphic ranges of species are shown in Table T7.
The Pleistocene Biozone Pt1 sequence (0–1.88 Ma) extends from the mudline to Sample 361-U1478A-16H-CC (149.60 m CSF-A). Globigerinoides ruber (pink) has its top occurrence (0.12 Ma) in Sample 2H-5, 70–72 cm (13.41 m CSF-A), whereas its bottom occurrence (0.4 Ma) is in Sample 4H-CC (35.56 m CSF-A). The base occurrence of Globigerinella calida has a calibrated age of 0.22 Ma. Although we have numerous typical specimens of this species with large, very loosely coiled shells, we found the taxon to range well below other foraminifer and nannofossil markers for the Pleistocene, as is also the case at other Expedition 361 sites. The top occurrence of Globorotalia tosaensis is in Sample 6H-CC (54.54 m CSF-A) and marks the Biozone Pt1a/Pt1b boundary at 0.61 Ma. Globorotalia tosaensis has regular occurrence in Hole U1478A, suggesting that it is a reliable biozone marker. We found the top occurrence of Neogloboquadrina acostaensis (1.58 Ma) in Sample 14H-CC (130.80 m CSF-A) and the top occurrence of Globoturborotalita apertura (1.64 Ma) in Sample 15H-CC (139.43 m CSF-A). However, individual G. apertura specimens occur well above this datum in Hole U1478A (as shallow as Sample 12H-1, 70–72 cm; 102.4 m CSF-A). Hence, our choice for the top occurrence of G. apertura is based on the last common occurrence of the marker species, and we consider occasional specimens above the datum-making occurrence to be reworked. The biozone marker for the base of Subzone Pt1a, the top occurrence of Globigerinoides fistulosus (1.88 Ma), occurs in Sample 16H-CC (149.60 m CSF-A). Globigerinoides fistulosus is typically represented by at least a few specimens in every sample within its range, suggesting that the base of Biozone Pt1 is a reliable datum in Hole U1478A. We found specimens we identified as cf. G. fistulosus in the middle of the range of G. fistulosus; these specimens typically have very elongate sac-like final chambers that are either drawn to a point or are surmounted by bumps and knobs that resemble nascent tubulospines. However, for the purposes of defining the top and base occurrences of G. fistulosus, we used only individuals with distinct tubulospines.
Biozone PL6 includes the base occurrence of G. truncatulinoides (1.93 Ma) in Sample 19H-1, 70–72 cm (168.91 m CSF-A); the top occurrence of Globigerinoides extremus (1.98 Ma) in Sample 18H-CC 168.43 m CSF-A); and the top occurrence of Pulleniatina primalis (Section 361-U1478A-23F-1; 202.11 m CSF-A). The calibrations of both G. truncatulinoides and G. extremus are out of their expected order given their identified stratigraphic occurrences; however, the base occurrence of G. truncatulinoides agrees with its astronomically identified first occurrence in the tropical Atlantic (2.03 Ma; Sexton and Norris, 2008) or its paleomagnetically calibrated base occurrence (2.10 Ma) at Ocean Drilling Program Site 763 (Eastern Indian Ocean) by Sinha and Singh (2008). The top occurrence of G. extremus, like that of G. apertura, is plagued by the rare occurrences of single individuals above the inferred extinction of the species; indeed we find the species consistently between Samples 11H-CC and 12H-CC (102.12–111.37 m CSFA), ~57 m above the datum we have established. The base of Biozone PL6 is marked by the top occurrence of Globorotalia pseudomiocenica (2.39 Ma) in Sample 19H-3, 70–72 cm (171.91 m CSF-A). The top occurrence of G. pseudomiocenica is marked by the abundant occurrence of large, typical representatives of this species in the sample recording its top appearance.
The Pleistocene foraminifer assemblage is dominated by G. ruber, Globigerinoides sacculifer, Globorotalia menardii, Globorotalia tumida, and Neogloboquadrina dutertrei. Other common species are Globorotalia crassaformis, Globorotalia truncatulinoides, Globigerinella siphonifera, Orbulina universa, Pulleniatina obliquiloculata, and Sphaeroidinella dehiscens. Minor elements of the Pleistocene biota include Globorotalia inflata, Neogloboquadrina pachyderma (dextral), Globigerina falconensis, Globigerina obesa, and Globigerinoides tenellus.
Biozone PL5 includes the base occurrence of N. dutertrei calibrated at 2.77 Ma (Sinha and Singh, 2008) in Sample 21H-CC (196.21 m CSF-A); the base occurrence of G. fistulosus (3.33 Ma) in Sample 27F-CC (225.05 m CSF-A); the base occurrence of G. tosaensis (3.35 Ma) in Sample 30F-1, 70–72 cm (235.01 m CSF-A); the top occurrence of Globorotalia plesiotumida (3.77 Ma) in Sample 25F-CC (215.67 m CSF-A); and the top occurrence of Dentoglobigerina altispira (3.47 Ma) in Sample 24F-1, 70–72 cm (206.81 m CSF-A). Specimens near the base appearance of G. tosaensis can be readily separated from their ancestor, G. crassaformis, by the addition of a fifth chamber in the final whorl of G. tosaensis, which changes the chamber arrangement and shape of the dorsal sutures. In contrast to the clearly defined base datum for G. tosaensis, that for the top occurrence of D. altispira is marked by rare occurrences and gaps in the range throughout the interval near the highest occurrence datum. There are also two rare outlier occurrences of D. altispira in Samples 18H-1, 70–72 cm (159.41 m CSF-A), and 19H-3, 70–72 cm (171.91 m CSF-A), the highest of which is 48 m above our identified datum level. The base of Biozone PL4 is approximated by the top occurrence of Sphaeroidinellopsis seminulina (3.59 Ma) in Sample 30F-3, 70–72 cm (237.93 m CSF-A). Samples throughout the range of S. seminulina include frequent occurrences of S. dehiscens. Because these two species differ mainly in the presence of a supplementary aperture in S. dehiscens, which is absent in S. seminulina, defining the base of Biozone PL4 requires considerable turning of specimens to identify the datum level. Hence, it is possible that we have failed to identify the top occurrence of S. seminulina if it is rare near its extinction datum. The base of Biozone PL3 is marked by the top occurrence of Globorotalia margaritae (3.85 Ma) in Sample 31F-1, 70–72 cm (239.71 m CSF-A). Like some other datums, we have placed the top occurrence of G. margaritae at the last common occurrence of the species, but we do find rare individuals (1–2 per sample) as shallow as Sample 29F-3, 70–72 cm (233.1 m CSF-A).
Pliocene biozones are represented by a tropical assemblage that includes G. pseudomiocenica, G. ruber, G. sacculifer G. extremus, G. menardii, Globigerinoides conglobatus, N. acostaensis, and Neogloboquadrina humerosa. Pulleniatina obliquiloculata, G. siphonifera, G. falconensis, and G. crassaformis are also consistent elements of the fauna.
Siliceous microfossils
Diatoms, phytoliths, and sponge spicules make up a minor component of Hole U1478A samples and exhibit poor preservation in core catcher samples (Table T8). The mudline sample has poor preservation and a mixed assemblage of marine and littoral diatoms. Other siliceous microfossils present in the mudline sample are phytoliths and sponge spicules. Marine diatoms represented in the mudline are taxa such as Paralia sulcata, Rhizosolenia spp., Triceratium cinnamomeum, and Thalassionema nitzschioides. Also present are littoral taxa such as Diploneis bombus. Terrestrial inputs are suggested by the presence of phytoliths.
Table T8. Diatom and other siliceous microfossil occurrences, Site U1478. Download table in .csv format.
Core catcher samples contain trace amounts of siliceous microfossils, which exhibit poor preservation. Phytoliths and sponge spicules occur in trace to rare abundances downcore, but Site U1478 core catcher samples are barren of diatoms (Table T8).
Paleomagnetism
Sediment cores were recovered from Holes U1478A–U1478C with maximum penetration depths of ~250 m CSF-A. Hole U1478D was cored from 6.7 to 151.2 and 190.5 to 216.0 m CSF-A. The orientations of Cores 361-U1478A-1H through 21H and 361-U1478B-2H through 22H were measured using the FlexIt core orientation tool. Core orientations in Holes U1478C and U1478D were not measured. Discrete samples were taken from Hole U1478A (Table T9) for natural remanent magnetization (NRM) demagnetization, anisotropy of magnetic susceptibility (AMS), and isothermal remanent magnetization (IRM) acquisition experiments.
Table T9. Analyzed discrete whole-round samples, Site U1478. Download table in .csv format.
Discrete sample measurements
Saturation IRM (SIRM) and hard IRM (HIRM) largely follow the downcore pattern of magnetic susceptibility (Table T10), indicating that they are directly responsive to ferrimagnetic mineral concentrations (Figure F25). S-ratios are mostly stable at 0.95 but show distinct minima indicating a strong depletion of low-coercivity minerals with respect to high-coercivity minerals, also signified by SIRM and susceptibility minima. A very distinct interval of low susceptibility at ~90 m CSF-A is located below the sulfate–methane transition zone, and another minimum at ~165 m CSF-A is located below a zone of elevated concentrations of dissolved Fe and Mn in interstitial water (see Geochemistry), suggesting that the magnetic mineral record is likely affected by early diagenetic processes. Out of 30 samples, only 17 samples provide reliable characteristic remanent magnetizations based on principal component analysis using the sDAIE workbook (Sagnotti, 2013). Inclination in the uppermost samples generally ranges from –50° to –44°, which is typical for the geographical location of Site U1478 during recent normal polarity (Figure F26). Inclination and declination data acquired from discrete samples are in agreement with high-resolution results from core halves (Figure F27).
Table T10. Volumetric bulk magnetic susceptibility of discrete samples, Site U1478. Download table in .csv format.
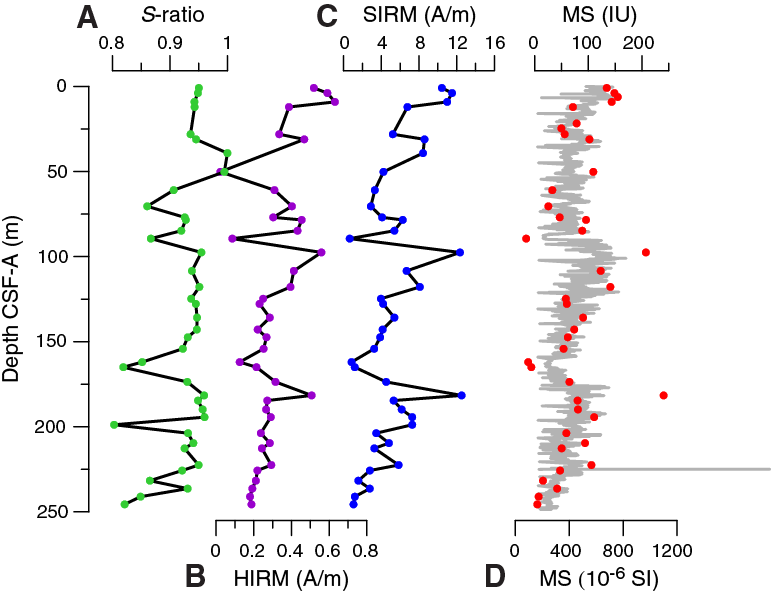
Figure F25. S-ratio, HIRM, SIRM, and magnetic susceptibility, Hole U1478A.
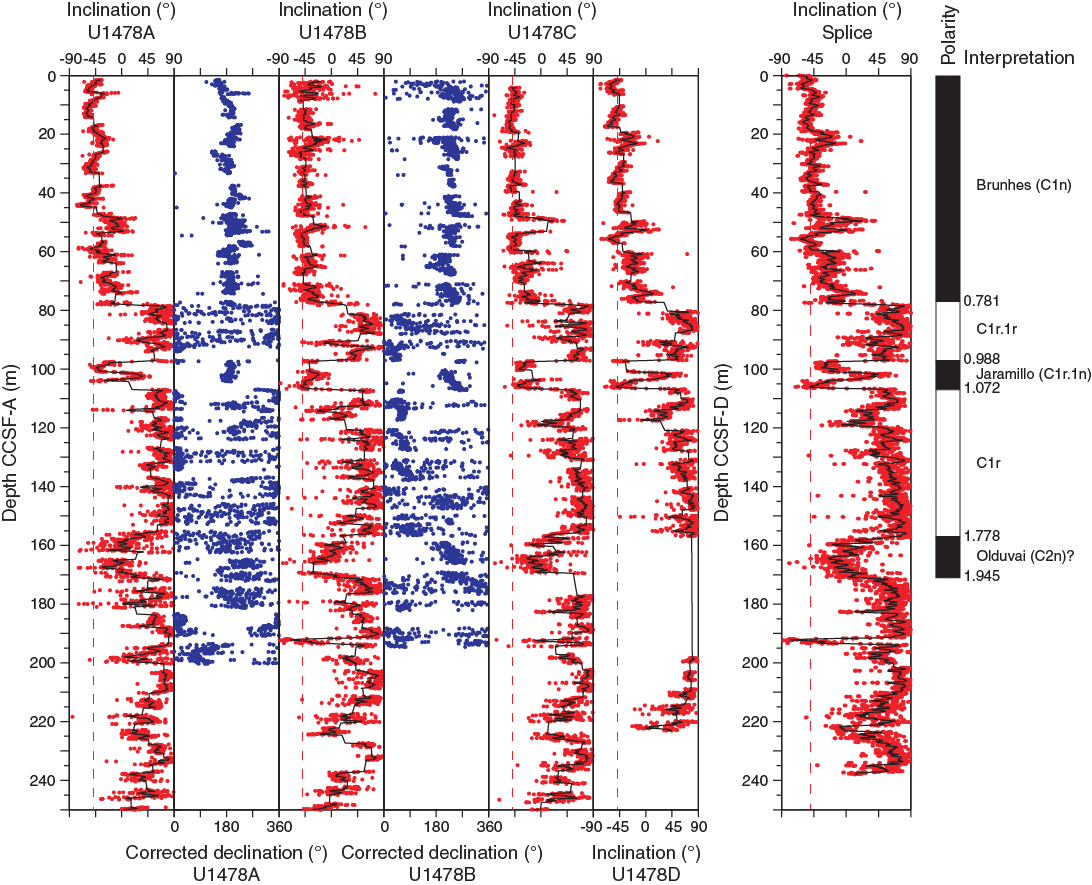
Figure F26. Inclination summary, Site U1478.
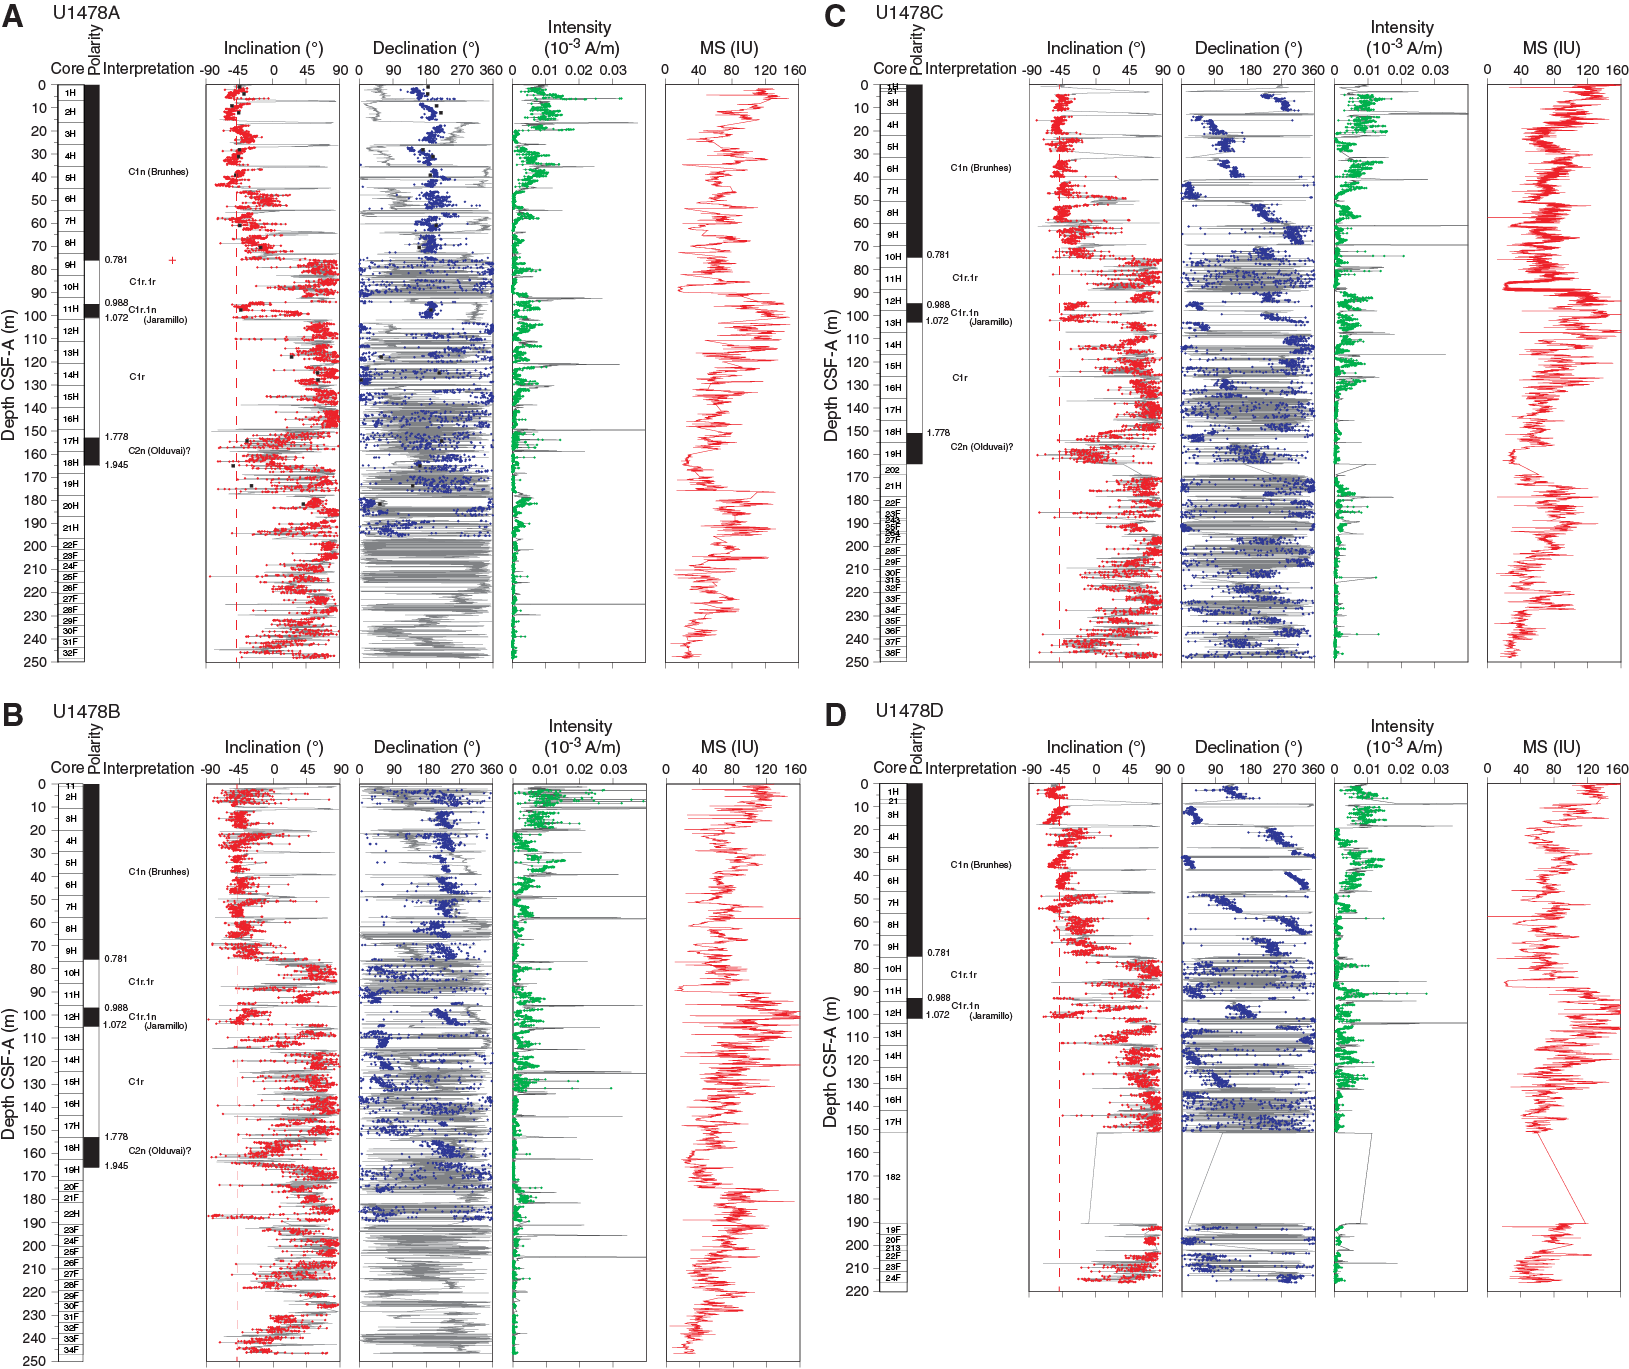
Figure F27. Downhole inclination, declination, intensity, and magnetic susceptibility, Site U1478.
Archive-half measurements
After 25 mT demagnetization, the core drill string overprint was largely removed, and directional data appear to be of good quality (Figure F27). Inclination and declination data indicate phases of stable normal or reversed polarity. However, the low-susceptibility intervals mentioned above are associated with modulation in the inclinations. Therefore, more detailed analyses are needed to separate the primary magnetic signal from an eventual early diagenetic overprint.
Magnetostratigraphy
Based on directional data, polarity zones are assigned to magnetic chrons (Table T11). The Brunhes/Matuyama polarity boundary and the Jaramillo normal polarity chron are identified in the inclination and corrected declination data from Holes U1478A–U1478D. Downcore, an extensive interval of normal polarity likely corresponds to the Olduvai normal polarity subchron, which is in agreement with nannofossil biostratigraphy. As mentioned above, a possible impact of diagenesis needs to be more carefully examined for this interval. Although biostratigraphy indicates that the sedimentary sequence spans the last ~4 my, the normal polarity associated with the Gauss Chron could not be identified in the shipboard downhole records.
Table T11. Polarity zone boundaries, Site U1478. Download table in .csv format.
Stratigraphic correlation
Four holes were drilled at Site U1478 using the APC and HLAPC. Generally good core quality and clear magnetic susceptibility signals resulted in robust and unambiguous stratigraphic ties. Consequently, we have high confidence that, with the exception of one probable gap at ~195 m CSF-A, these holes constitute a nearly complete section spanning the full length of the longest hole (244 m recovered in Hole U1478A). The objective of obtaining a complete section was aided by the fact that the magnetic susceptibility data from the STMSL and WRMSL (see Physical properties in the Expedition 361 methods chapter [Hall et al., 2017] for details) could be used for real-time correlation in Holes U1478B–U1478D; adjustments to the drilling depth were made in these holes for the purpose of avoiding potential core gap alignment. A targeted coring approach was employed for Hole U1478D to ensure a high-quality splice for the uppermost 150 m CSF-A and to bridge remaining gaps below 195 m CSF-A. The targets were developed on the basis of the stratigraphic ties in Holes U1478A–U1478C.
A continuous splice was constructed for the uppermost ~200 m CCSF-A, and a floating splice of another ~50 m of section is appended below the coring gap. In general, the clarity of the stratigraphic ties and the multiple cross-checks available from several variables gives us high confidence in the integrity of these two separate spliced sequences.
Compositing of holes
As a guide for drilling to avoid coring gap alignment where possible, sequences from all holes were composited in near-real-time using magnetic susceptibility data from both the STMSL and WRMSL, measured at 5 cm resolution. These instruments were run in parallel to maintain pace with the rapid collection of core material at shallow water depths. After collection, compositing of holes was achieved using the magnetic susceptibility measurements almost exclusively, and for this site, the STMSL and WRMSL magnetic susceptibility measurements are effectively interchangeable. Magnetic susceptibility was the preferred variable for stratigraphic ties because the signal was strong and distinctive throughout the recovered sedimentary sequence. However, the consistency of the stratigraphic ties was checked with color (RGB red) and NGR data. These variables provided particularly useful cross-checks in the intervals cored by HLAPC. The relative depth offset of each core was determined by the optimized correlation of the magnetic susceptibility record (Figure F28), with the top of Hole U1478D serving as the mudline anchor. These depth offsets are reported in the affine Table T12.
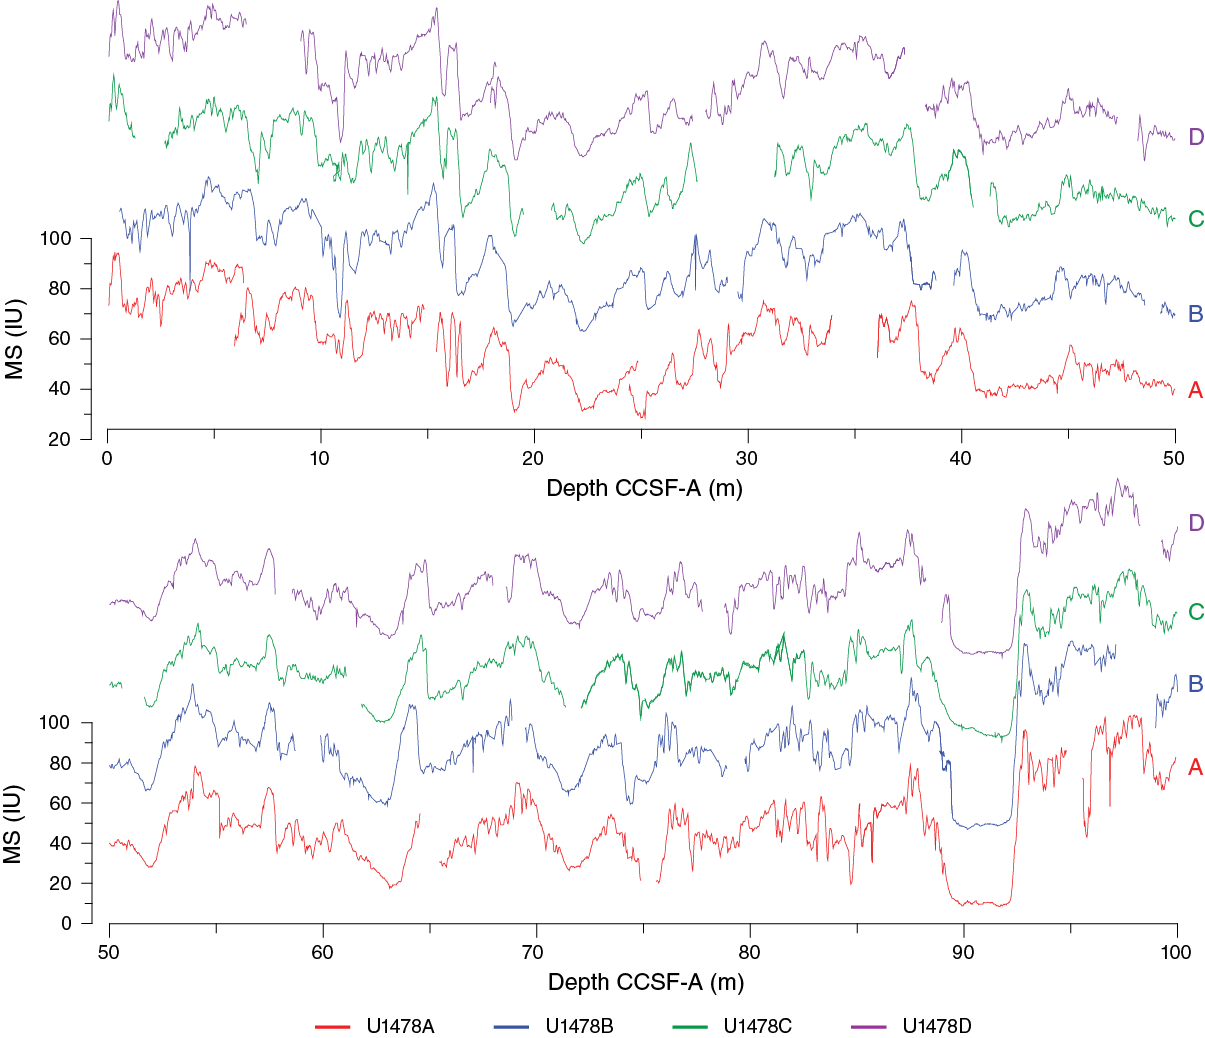
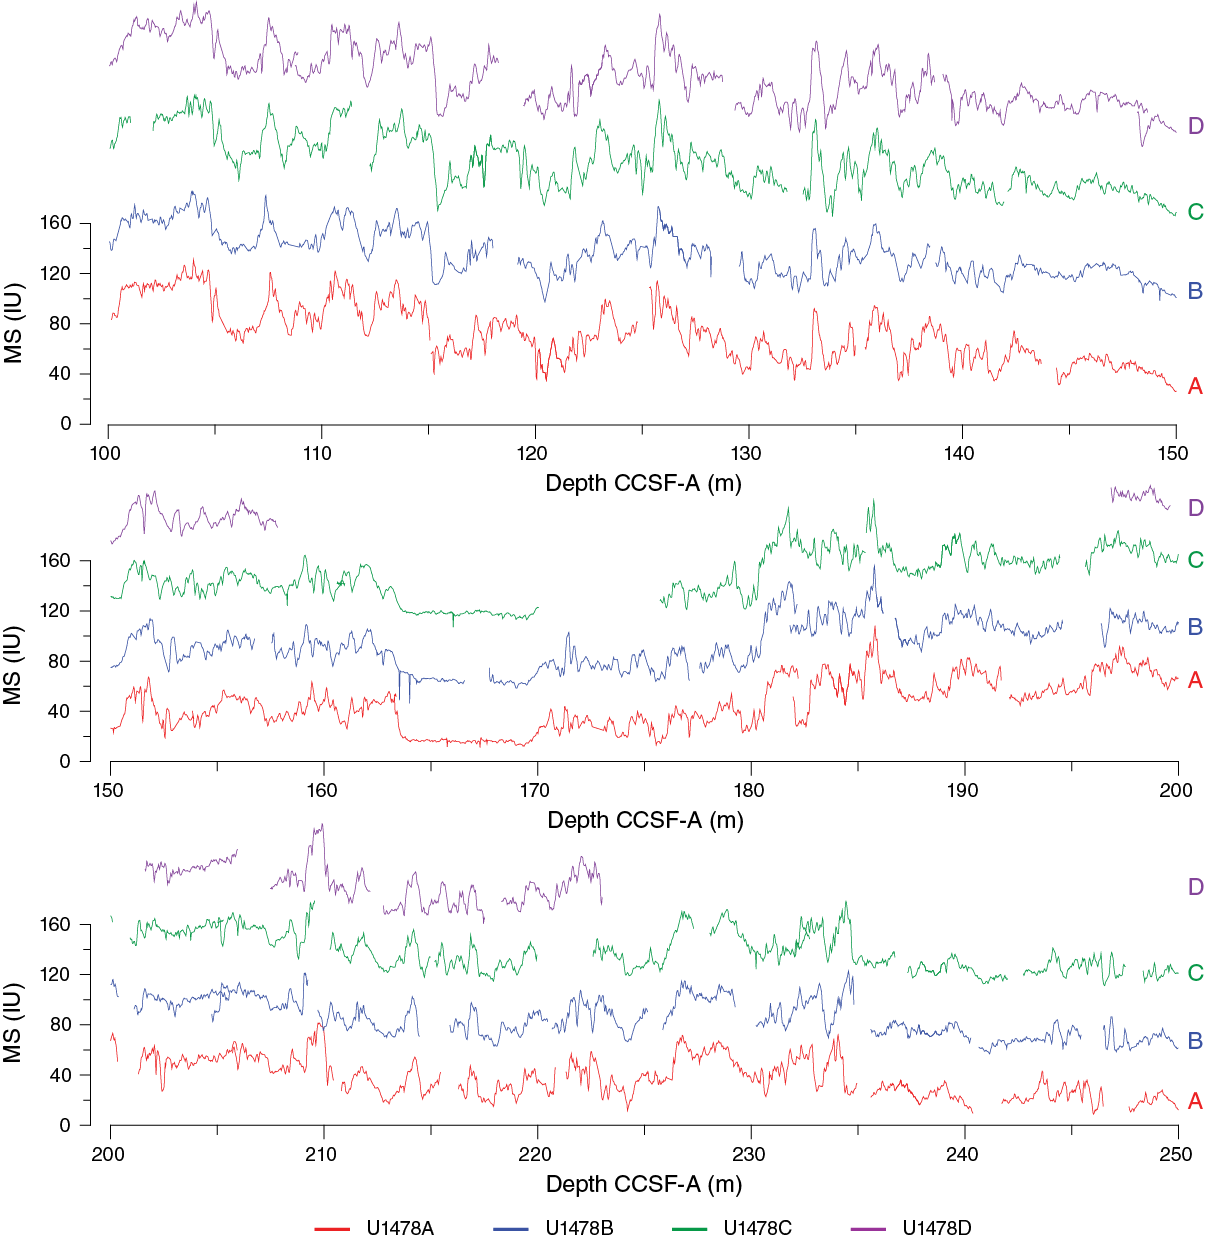
Figure F28. Magnetic susceptibility records, Site U1478.
Table T12. Affine table, Site U1478. Download table in .csv format.
A single apparent coring gap occurred at ~195 m CSF-A, despite multiple attempts to bridge this gap, presumably because some sedimentary layer at this depth impeded penetration of the piston corer (both APC and HLAPC). The extent of this gap could not be determined without downhole logging information, and therefore the CCSF-A depth scale below this gap is floating. However, for the affine table we have simply extrapolated the growth rates from the adjacent overlying cores at this gap interval.
In some cases, particularly in the lower portion of the sedimentary sequence, decompression led to appearance of variable stretching of the sedimentary sequence. However, in general, the average growth rate of the CCSF-A depth scale relative to the CSF-A depth scale in all holes was relatively modest (3%–5%) because of the relatively low water and volatile content of the sediment.
Construction of the splice
Once the composite depth scale was created, select sequences from Holes U1478A–U1478D were spliced together to create a complete section downhole to ~195 m CCSF-A (Figure F29; Table T13). Below this (core gap) depth, another continuous sequence could be developed to the base of Hole U1478A. For the uppermost 150 m CCSF-A, the spliced sequence relies principally on cores from Holes U1478C and U1478D because these cores were not sampled aboard the ship. The uppermost cores from Hole U1478B were placed on the composite depth scale but did not contribute to the splice because these cores were dedicated for high-resolution interstitial water sampling. However, cores from Hole U1478B below 150 m CSF-A were included in the splice because they were below the depth limit of the interstitial water sampling program. As with the compositing, splice ties were determined primarily on the basis of magnetic susceptibility data from the WRMSL. The other variables (RGB, reflectance, and NGR) were checked to ensure that the spliced sequence did not contain artificial jumps or repeated intervals.
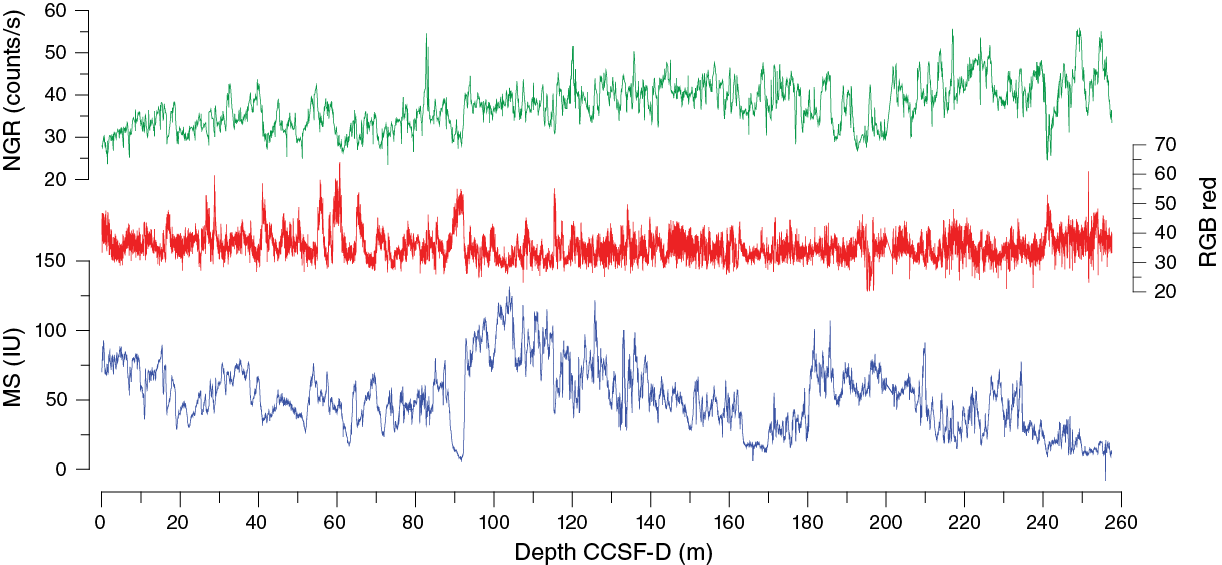
Figure F29. Composite spliced records of magnetic susceptibility, NGR, and RGB red values, Site U1478.
Table T13. Splice interval table, Site U1478. Download table in .csv format.
Geochemistry
The chemical composition of headspace gases, interstitial water, and bulk sediments were investigated at Site U1478. Sampling for shipboard analyses focused in Hole U1478A. Downhole profiles of interstitial water chemistry largely reflect postdepositional microbially mediated reactions driven by the accumulation of organic carbon (Figure F30). Sedimentary calcium carbonate contents range from 16 to 55 wt% with an average of 28 wt%. Interstitial water profiles of redox-sensitive species indicate more moderate to intense diagenesis at this site with anoxic conditions at 72.65 m CSF-A.
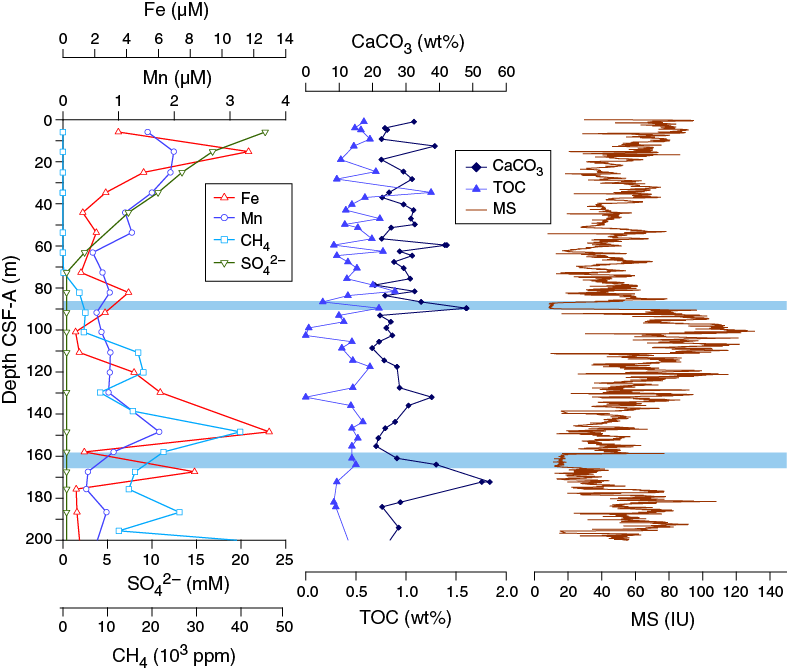
Figure F30. Concentration profiles, sedimentary carbonate TOC contents, and magnetic susceptibility, Hole U1478A.
Interstitial water was squeezed from 5 or 10 cm whole rounds at ~3 m resolution from 3.90 to 25.90 m CSF-A in Holes U1478A and U1478B and ~9.5 m resolution between 25.09 and 242.96 m CSF-A in Hole U1478A. A total of 25 samples from Hole U1478A and 10 samples from Hole U1478B were collected for shipboard analysis of interstitial water chemistry. An additional 96 interstitial water samples from Hole U1478B (16 cm × 5 cm whole rounds and 80 cm × 10 cm whole rounds) were collected for shore-based analysis of δ18O and Cl– to accomplish the objectives of the Ancillary Project Letter (APL-845) proposal. Bulk sediment in Hole U1478A was measured for total organic carbon (TOC) and total inorganic carbon (TIC) content and bulk elemental concentrations in samples selected as representative of the lithology.
Sedimentary hydrocarbon gases
Headspace gas samples were collected from each core in Hole U1478A. A total of 32 samples were measured. In all samples, CH4 was the primary hydrocarbon present, with low levels of ethene, ethane, and propene detected. Methane concentrations increase from 2 ppmv at 5.9 m CSF-A to 64,918 ppmv at 214.60 CSF-A in Core 361-U1478A-25F and decrease slightly below this depth (Figure F31). This is likely the result of bacterial methanogenesis (Barnes and Goldberg, 1976).
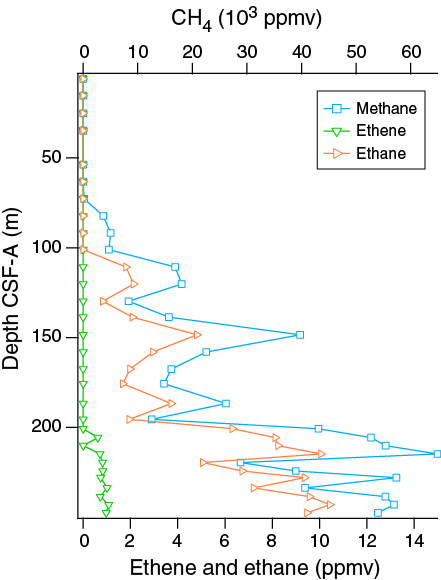
Figure F31. Headspace gas profiles, Hole U1478A.
Interstitial water chemistry
Salinity, chloride, sodium, magnesium, and potassium
Salinity, chloride, and sodium concentrations are relatively constant and near or slightly elevated above average seawater values in all samples from Hole U1478A (Figure F32). Average values (±1σ) are 557.8 ± 2.2 mM chloride and 482.6 ± 5.3 mM sodium. Downhole chloride concentrations are elevated at 13.40–72.65 and 167.47–200.64 m CSF-A, with slightly lower values in the interleaving depth interval. Magnesium and potassium concentrations decrease downhole from maximum values of 52.3 mM Mg and 11.3 mM K at 3.90 m CSF-A to minima of 36.5 mM Mg and 5.9 mM K near the bottom of Hole U1478A. Both profiles show slight curvature around 100 m CSF-A with near linear trends below this depth, suggesting that uptake into clays may be focused in this mid-depth interval.

Figure F32. Dissolved magnesium, potassium, sodium, and chloride profiles, Holes U1478A and U1478B.
Alkalinity, phosphate, and pH
Alkalinity is 6.7 mM at 3.90 m CSF-A and increases to a maximum of 9.80 mM at 16.40 m CSF-A. Phosphate concentrations are relatively high in the upper tens of meters, peaking at 17.3 µM at 6.90 m CSF-A. Phosphate decrease downhole to below detection limits at the base of the section (Figure F33). pH increases downhole from ~7.4 at 3.90 m CSF-A to a maximum of 8.1 at 224.19 m CSF-A.
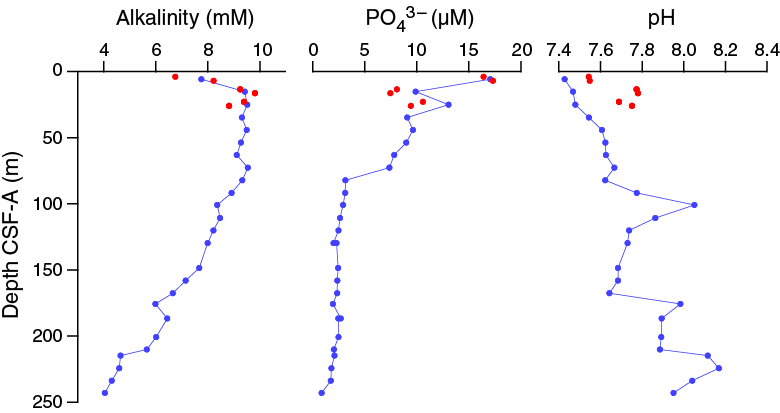
Figure F33. Alkalinity, dissolved phosphate, and pH profiles, Holes U1478A and U1478B.
Iron and manganese
In Hole U1478A, dissolved iron concentrations are 2.2 µM at 3.90 m CSF-A, increasing to 11.7 at 15.15 m CSF-A and then decreasing to relatively low values downhole. Two secondary peaks of 13.0 and 8.3 µM are present at 148.41 and 167.47 m CSF-A, respectively (Figures F30, F34). One measurement, of 39.9 µM, was outside of the calibration range, occurs at 63.15 m CSF and is considered an outlier. The downhole dissolved manganese profile nearly parallels the iron profile, with maxima of 2.0 µM at 15.15 and 148.41 m CSF-A; between these depths values are low (0.3–0.8 µM). The coincident peaks recorded in dissolved Fe and Mn at 148.41 m CSF-A indicate the presence of a redox front where Fe and Mn are being remobilized from their oxidized, solid phases.
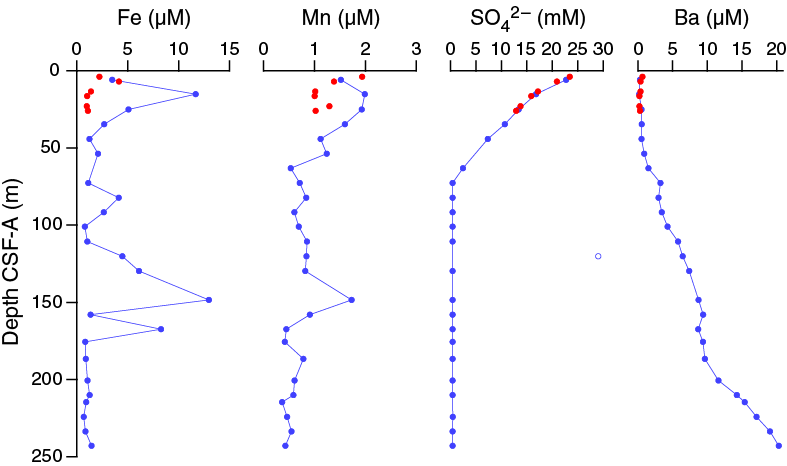
Figure F34. Dissolved iron, manganese, sulfate, and barium, Holes U1478A and U1478B.
Sulfate and barium
Sulfate concentrations in Hole U1478A decrease rapidly downhole from 23.4 mM at 3.90 m CSF-A to below the detection limit at 72.65 m CSF-A (Figure F34). This is the result of microbial sulfate reduction, in which sulfate is used as an electron receptor in the anaerobic oxidation of organic matter:
53 SO42– + (CH2O)106(NH3)16(H3PO4) → 39 CO2 + 67 HCO3– + 16 NH4+ + 53 HS– + 39 H2O + HPO42–.
The disappearance of sulfate in interstitial water coincides with the increase in methane from the detection limit to ~5 ppmv, which is indicative of the sulfate–methane transition zone and suggests extensive microbial activity in this sediment, similar to Site U1477, and likely due to the more rapid accumulation of organic carbon at these sites. In sediment where sulfate reduction is rapid and intense dissolution of barite (BaSO4) is also high. In Hole U1478A, barium increases from minimum concentrations of <1 μM in the upper 53.65 m CSF-A to ~20 μM at the base of Hole U1478A (Figures F30, F34). This trend is consistent with a steady dissolution of barite where the sediment is undersaturated with respect to barite caused by the absence of sulfate.
Calcium and strontium
Calcium concentrations in interstitial water in Hole U1478A decrease from a maximum of 8.6 mM at 3.90 m CSF-A to low values of 4.7–5.2 mM between 63.15 and 100.91 m CSF-A and again below 186.65 m CSF-A (Figure F35). In between the two low intervals, the elevated calcium values between 100.91 and 186.65 m CSF-A are approximately coincident with the increases in Fe and Mn concentrations, again potentially indicative of a lithologic change that enhanced dissolution, in this case, of calcite. The downhole strontium profile increases to a maximum concentration of 128.5 μM at 91.70 m CSF-A followed by a decrease to a relatively steady value of ~100 μM between 100.91 and 200.64 m CSF-A with a slight increase toward the bottom of the section.
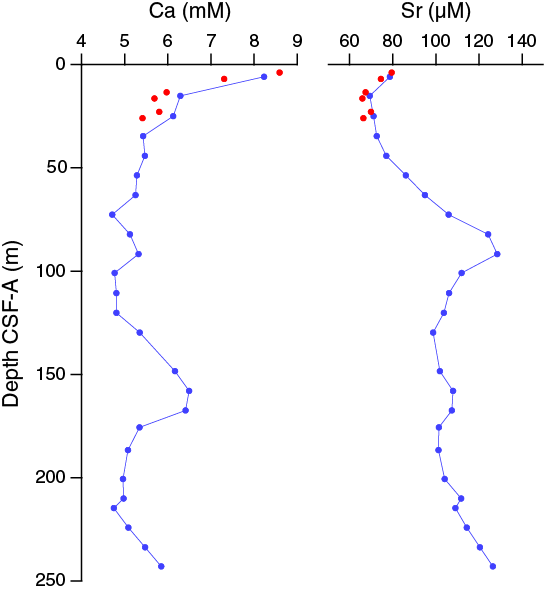
Figure F35. Dissolved calcium and strontium profiles, Holes U1478A and U1478B.
Silicon, lithium, and boron
The downhole silicon profile in Hole U1478A displays relatively high and steady concentrations around 500 μM in the upper ~91.70 m CSF-A, below which concentrations tend to decrease toward a minimum value of ~100 μM at the base of Hole U1478A (Figure F36). As with calcium, iron, and manganese, silicon also shows a distinct peak mid-section centered on 160 m CSF-A.
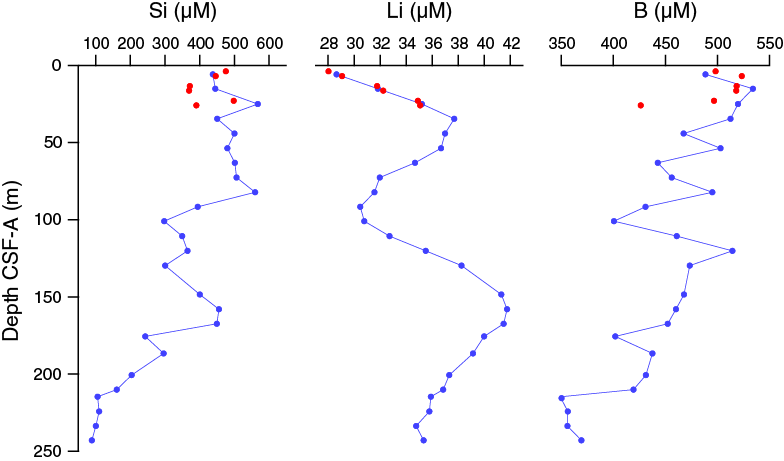
Figure F36. Dissolved silicon, lithium, and boron profiles, Holes U1478A and U1478B.
Lithium concentrations vary between 28 and 42 µM with two distinct peaks at ~40 and 160 m CSF-A. A maximum lithium concentration of 41.7 μM occurs at 157.63 m CSF-A. Boron concentrations are noisy but decrease from >500 μM in the upper 25 m CSF-A to a minimum of 348.9 μM at 214.71 m CSF-A.
Bulk sediment geochemistry
Total organic carbon
Total organic carbon varies from 0 to 1.25 wt% with an average of 0.45 wt% for all samples measured (Figure F30). No systematic pattern relating organic carbon to carbonate or other lithologic properties such as magnetic susceptibility is observed.
Calcium carbonate
Calcium carbonate content ranges between 16 and 55 wt% with an average of 28 wt% at Site U1478 (Figure F30). The large spikes in carbonate content may be due to preferential sampling of carbonate-rich shell-bearing intervals. No significant trend in carbonate content was observed at Site U1478.
Major and trace elements
Major and trace element concentrations were measured for 26 samples (Table T14). Concentrations are close to those of average upper continental crust (Taylor and McLennan, 1985), especially after normalizing for calcium carbonate dilution by dividing the measured concentrations by [100 – CaCO3 (wt%)]. Calcium and strontium are enriched by the presence of calcium carbonate. Titanium is also enriched above upper crustal values. Like Site U1477, few elements show any significant correlation with aluminum oxide content (Figure F37). Here, CaO and Sr concentrations are inversely correlated with Al2O3, and FeO concentrations are positively correlated with Al2O3.
Table T14. Shipboard bulk sediment geochemistry data, Hole U1478A. Download table in .csv format.
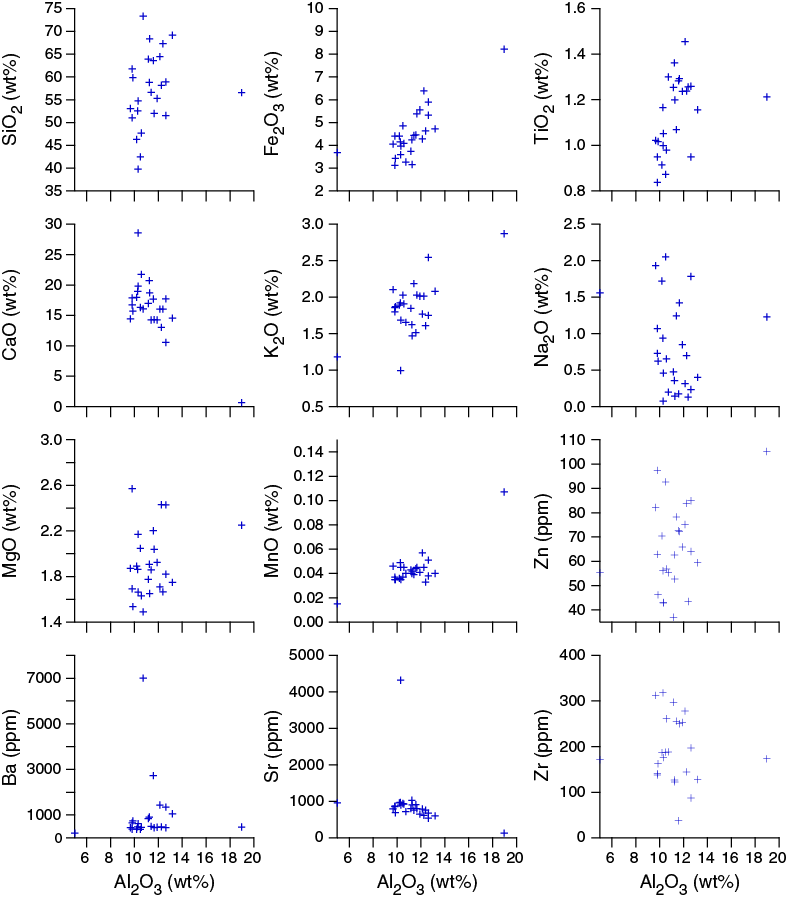
Figure F37. Sedimentary major and trace element concentrations versus aluminum oxide content, Hole U1478A.
Downhole, Ca/Al and Ba/Al profiles are almost constant, except for a few outliers, which is consistent with the lack of any downhole trend in carbonate content at Site U1478 (Figure F38). Downhole variations in Si/Al values generally mirror those of Fe/K, which may indicate changes in sediment provenance between more and less heavily weathered terranes. A broad relationship exists between CaCO3 and Fe/K and the magnetic susceptibility record for Hole U1478A.
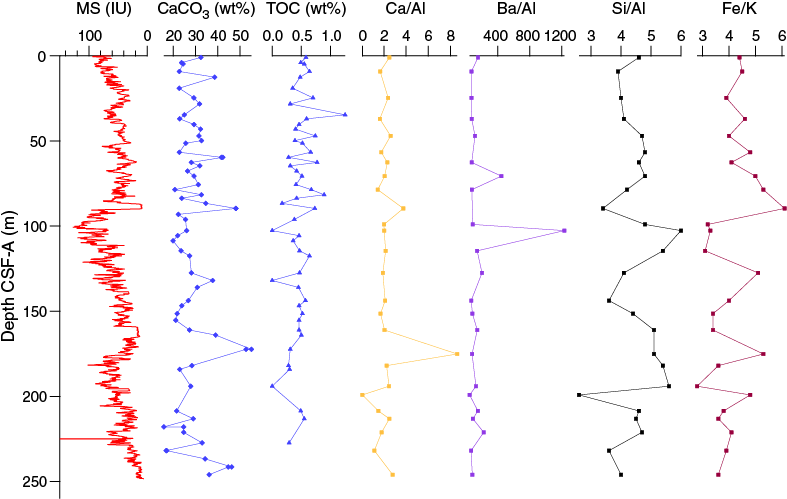
Figure F38. Calcium carbonate and TOC, magnetic susceptibility, and bulk sediment elemental ratios, Hole U1478A.
Paleoredox boundaries
Interstitial water iron and manganese data show a pair of secondary peaks centered around 85 and 150 m CSF-A in Hole U1478A. The peaks lie well below shallow subsurface depths (<10 m) where they typically occur due to dissolution of authigenic phases and subsequent reprecipitation and sit just above marked lows in magnetic susceptibility at ~88 and 160 m CSF-A (Figure F30). These peaks may reflect paleoredox boundaries, where oxidation of organic matter has resulted in the persistent production of dissolved iron and manganese. These boundaries may occur because of the rapid deposition of organic carbon, which has subsequently been consumed by respiration. They could also reflect significant fluctuations in the sedimentation (either rates or porosity/permeability) such that the redox boundary remained stationary for a period of time and then rapidly jumped higher in the section after a large depositional event. The low intervals in magnetic susceptibility that occur at the base of and between the iron peaks may reflect a distinct depositional phase that impeded the steady migration of the redox front upward, forcing the boundary to jump depths. No matter the cause of the deep iron and manganese peaks, it appears that the decreasing trend in magnetic susceptibility between 100 and 160 m CSF-A reflects the diagenetic loss of magnetic minerals rather than a substantial sedimentologic change (Figure F30; also see Paleomagnetism).
Age model
A total of 257 m of middle Pliocene to Late Pleistocene sediment was recovered from Hole U1478A. The age model is based on the biochronologies of calcareous nannofossils and planktonic foraminifers and magnetostratigraphy. Biostratigraphic sampling in Hole U1478A included 32 core catcher samples as well as 78 working-half samples for calcareous nannofossils and 75 samples for foraminifers. We report biostratigraphic events in Tables T4 and T5, magnetostratigraphic events in Table T11, and major age-depth trends in Figure F39.

Figure F39. Age-depth relationships based on planktonic foraminifers, calcareous nannofossils, and magnetostratigraphy from Hole U1478A.
The age-depth relationship is consistent with a sedimentation rate of 9.2 cm/ky in the upper 190 m CSF-A of Hole U1478A. All chronostratigraphic markers are in good agreement in the upper 110 m CSF-A. Below this depth, calcareous nannofossils suggest younger ages than foraminifers at equivalent depths, and paleomagnetic datums are more aligned with those of the calcareous nannofossils. From 120 m CSF-A to near the bottom of the recovered sequence, most planktonic foraminifer datums imply a lower and relatively constant sedimentation rate of ~5.3 cm/ky. In contrast, calcareous nannofossils, two of the planktonic foraminifer datums, and one paleomagnetic datum are in agreement with continued high sedimentation rates of 9.2 cm/ky downhole to ~195 m CSF-A (~2.15 Ma). The sedimentation rate falls to ~2.9 cm/ky from 195 m CSF-A to the bottom of the sequence. Both calcareous nannofossils and planktonic foraminifer datums, if extrapolated from the best-fit of data below 200 m CSF-A, suggest the bottom hole age is ~4.1 Ma.
Several intervals where the age-depth relationship may be used to imply higher sedimentation rates than those estimated above (Figure F39) are present in Hole U1478A. For instance, a step in the calcareous nannofossil datums from 95 to 117 m CSF-A (~1.05–1.15 Ma) may suggest a short-term increase in sedimentation rates to almost 22 cm/ky, and a longer step between 150 and 196 m CSF-A (~1.77–2.13 Ma) may indicate sedimentation rates as high as 12.5 cm/ky. However, these two intervals are observed within those sediment sections that were characterized by thick sandy beds. In addition, the 150–196 m increase in implied sedimentation rates from calcareous nannofossils corresponds to a large discrepancy in the locations of calibrated calcareous nannofossil and planktonic foraminifer datums. Indeed, some of the most problematic datums are the base common occurrence of D. triradiatus (2.14 Ma), the top occurrence of D. pentaradiatus (2.39 Ma), and the extinction of G. pseudomiocenica (2.39 Ma); these events, although of similar age, are separated by as much as 22 m of cored record. All these datums have been in close agreement at other Expedition 361 sites, making the present discrepancy in their stratigraphic positions within Hole U1478A somewhat puzzling. Discoaster pentaradiatus and G. pseudomiocenica events and other calcareous nannofossil datums are also very well marked by abundant occurrences and high reliability scores, suggesting that rarity or discontinuous occurrences is not likely to be the explanation for the discrepancies between the fossil groups. For these reasons we consider the variations in sedimentation rates from foraminifer and nannofossil datums are likely to reflect sedimentary processes rather than miscalibrations or undersampling of the record. Because nannofossils are abundant in all samples, we do not consider it likely that the discrepancy is due to significant removal of nannofossils by the sand bodies emplacement process. However, we do not have a clear hypothesis that might explain the apparent upward reworking of foraminifers, especially considering that the fossils that represent these datums are abundant in the samples. Perhaps ecological exclusion could be an explanation. In any case, we advise that this potential lithologic bias be considered when planning for sampling.
The lithology from which samples were collected could potentially have led to the difference in the biochronologies. Calcareous nannofossil slides were mainly prepared from the silty clay intervals focusing the investigation on missing markers and sediment characteristics (if applicable). Planktonic foraminifer samples were instead taken at regular depth horizons (typically 70–72 cm in a section) and, by chance, sampled primarily in sandy intervals. Despite the different sampling approach, the datum divergence between the two microfossil groups occurs when nannofossils were collected from both silty and sandy layers. The sandy sediment might expose both microfossil groups to, for example, reworking by bottom currents; however, calcareous nannofossils are still abundant in these layers and do not display a clear reworking signal. Also, the interpretation of hydrodynamic controls does not explain the convergence of the datums collected from different types of sediment.
It is plausible that some planktonic foraminifer datums may be miscalibrated. Sinha and Singh (2008) analyzed the foraminifer datums at Site 763, on the Exmouth Plateau, northwest Australia, a site characterized by partial magnetostratigraphy. Their calibration differs substantially from that of Gradstein et al. (2012). Merging calibrations of Sinha and Singh (2008) with the Gradstein et al. (2012) timescale reduces some of the mismatches between foraminifer and calcareous nannofossil datums. The most significant differences are found for the base occurrence of N. dutertrei, absent in the Gradstein et al. (2012) calibration, and top occurrences of both P. primalis and D. altispira, which differ by 0.82 and 0.42 my from the Gradstein et al. (2012) calibration, respectively. We caution against uncritical acceptance of the Sinha and Singh (2008) calibrations because, in our opinion, the paleomagnetic record is not as clear-cut as implied by the authors. However, we agree that the recalibration of some datums is necessary.
References
Barlow, R., Kyewalyanga, M., Sessions, H., van den Berg, M., and Morris, T., 2008. Phytoplankton pigments, functional types, and absorption properties in the Delagoa and Natal Bights of the Agulhas ecosystem. Estuarine, Coastal and Shelf Science, 80(2): 201–211. http://dx.doi.org/10.1016/j.ecss.2008.07.022
Barnes, R.O., and Goldberg, E.D., 1976. Methane production and consumption in anoxic marine sediments. Geology, 4(5): 297–300. http://dx.doi.org/10.1130/0091-7613(1976)4<297:MPACIA>2.0.CO;2
Boroto, R.A.J., 2001. Limpopo River: steps towards sustainable and integrated water resources management. In Schumann, A.H., Acreman, M.C., Davis, R., Marino, M.A., Rosbjerg, D., and Jun, X. (Eds.), Regional Management of Water Resources. Proceedings of the International Association of Hydrological Sciences, 268:33–40.
Caley, T., Kim, J.-H., Malaizé, B., Giraudeau, J., Laepple, T., Caillon, N., Charlier, K., Rebaubier, H., Rossingol, L., Castañeda, I.S., Schouten, S., and Sinninghe Damsté, J.S., 2011. High-latitude obliquity forcing drives the Agulhas leakage. Climate of the Past Discussions, 7(3): 2193–2215. http://dx.doi.org/10.5194/cpd-7-2193-2011
Dingle, R.V., Goodlad, S.W., and Martin, A.K., 1978. Bathymetry and stratigraphy of the northern Natal Valley (SW Indian Ocean): a preliminary account. Marine Geology, 28(1–2): 89–106. http://dx.doi.org/10.1016/0025-3227(78)90099-3
Dupont, L.M., Caley, T., Kim, J.-H., Castañeda, I., Malaizé, B., and Giraudeau, J., 2011. Glacial–interglacial vegetation dynamics in south eastern Africa coupled to sea surface temperature variations in the Western Indian Ocean. Climate of the Past, 7(4): 1209–1224. http://dx.doi.org/10.5194/cp-7-1209-2011
Dupont, L.M., Donner, B., Vidal, L., Pérez, E.M., and Wefer, G., 2005. Linking desert evolution and coastal upwelling: Pliocene climate change in Namibia. Geology, 33(6): 461–464. http://dx.doi.org/10.1130/G21401.1
Gradstein, F.M., Ogg, J.G., Schmitz, M.D., and Ogg, G.M. (Eds.), 2012. The Geological Time Scale 2012: Amsterdam (Elsevier).
Gründlingh, M.L., 1977. Drift observations from Nimbus VI satellite-tracked buoys in the southwestern Indian Ocean. Deep Sea Research, 24(10): 903–913. http://dx.doi.org/10.1016/0146-6291(77)90559-8
Hall, I.R., Hemming, S.R., LeVay, L.J., Barker, S., Berke, M.A., Brentegani, L., Caley, T., Cartagena-Sierra, A., Charles, C.D., Coenen, J.J., Crespin, J.G., Franzese, A.M., Gruetzner, J., Han, X., Hines, S.K.V., Jimenez Espejo, F.J., Just, J., Koutsodendris, A., Kubota, K., Lathika, N., Norris, R.D., Periera dos Santos, T., Robinson, R., Rolinson, J.M., Simon, M.H., Tangunan, D., van der Lubbe, J.J.L., Yamane, M., and Zhang, H., 2017. Expedition 361 methods. In Hall, I.R., Hemming, S.R., LeVay, L.J., and the Expedition 361 Scientists, South African Climates (Agulhas LGM Density Profile). Proceedings of the International Ocean Discovery Program, 361: College Station, TX (International Ocean Discovery Program). http://dx.doi.org/10.14379/iodp.proc.361.102.2017
Harris, T.F.W., 1972. Sources of the Agulhas Current in the spring of 1964. Deep Sea Research and Oceanographic Abstracts, 19(9): 633–650. http://dx.doi.org/10.1016/0011-7471(72)90091-5
Johnson, T.C., Brown, E.T., McManus, J., Barry, S., Barker, P., and Gasse, F., 2002. A high-resolution paleoclimate record spanning the past 25,000 years in southern East Africa. Science, 296(5565): 113–132. http://dx.doi.org/10.1126/science.1070057
Kyewalyanga, M.S., Naik, R., Hedge, S., Raman, M., Barlow, R., and Roberts, M., 2007. Phytoplankton biomass and primary production in Delagoa Bight Mozambique: application of remote sensing. Estuarine, Coastal and Shelf Science, 74(3): 429–436. http://dx.doi.org/10.1016/j.ecss.2007.04.027
Lamont, T., Roberts, M.J., Barlow, R.G., and van den Berg, M.A., 2010. Circulation patterns in the Delagoa Bight, Mozambique, and the influence of deep ocean eddies. African Journal of Marine Science, 32(3): 553–562. http://dx.doi.org/10.2989/1814232X.2010.538147
Lourens, L., Hilgen, F., Shackleton, N.J., Laskar, J., and Wilson, D., 2004. The Neogene period. In Gradstein, F.M., Ogg, J.G., and Smith, A. (Eds.), A Geologic Time Scale 2004: Cambridge, United Kingdom (Cambridge University Press), 409–440. http://dx.doi.org/10.1017/CBO9780511536045.022
Lutjeharms, J.R.E., 1976. The Agulhas Current system during the northeast monsoon season. Journal of Physical Oceanography, 6(5): 655–670. http://dx.doi.org/10.1175/1520-0485(1976)006<0665:TACSDT>2.0.CO;2
Lutjeharms, J.R.E., 1981. Features of the southern Agulhas Current circulation from satellite remote sensing. South African Journal of Science, 77:231–236. http://journals.co.za/content/sajsci/77/5/AJA00382353_1526
Lutjeharms, J.R.E., 2006a. The Agulhas Current: Berlin (Springer-Verlag). http://dx.doi.org/10.1007/3-540-37212-1
Lutjeharms, J.R.E., 2006b. The ocean environment off southeastern Africa: a review. South African Journal of Science, 102:419–426. http://reference.sabinet.co.za/webx/access/electronic_journals/sajsci/sajsci_v102_n9_a13.pdf
Lutjeharms, J.R.E., and da Silva, A.J., 1988. The Delagoa Bight eddy. Deep Sea Research, Part A: Oceanographic Research Papers, 35(4): 619–634. http://dx.doi.org/10.1016/0198-0149(88)90134-3
Martin, A.K., 1981a. Evolution of the Agulhas Current and its palaeo-ecological implications. South African Journal of Science, 77(12): 547–554. http://hdl.handle.net/10520/AJA00382353_1748
Martin, A.K., 1981b. The influence of the Agulhas Current on the physiographic development of the northernmost Natal Valley (S.W. Indian Ocean). Marine Geology, 39(3–4): 259–276. http://dx.doi.org/10.1016/0025-3227(81)90075-X
Maslin, M.A., Pancost, R.D., Wilson, K.E., Lewis, J., and Trauth, M.H., 2012. Three and half million year history of moisture availability of south West Africa: evidence from ODP Site 1085 biomarker records. Palaeogeography, Palaeoclimatology, Palaeoecology, 317–318:41–47. http://dx.doi.org/10.1016/j.palaeo.2011.12.009
McGillicuddy, D.J., Jr., and Robinson, A.R., 1997. Eddy-induced nutrient supply and new production in the Sargasso Sea. Deep Sea Research, Part I: Oceanographic Research Papers, 44(8): 1427–1450. http://dx.doi.org/10.1016/S0967-0637(97)00024-1
Milliman, J.D., and Meade, R.H., 1983. World-wide delivery of river sediment to the oceans. Journal of Geology, 91(1): 1–21. http://dx.doi.org/10.1086/628741
Preu, B., Spieß, V., Schwenk, T., and Schneider, R., 2011. Evidence for current-controlled sedimentation along the southern Mozambique continental margin since early Miocene times. Geo-Marine Letters, 31(5–6): 427–435. http://dx.doi.org/10.1007/s00367-011-0238-y
Quartly, G.D., and Srokosz, M.A., 2004. Eddies in the southern Mozambique Channel. Deep Sea Research Part II: Topical Studies in Oceanography, 51(1–3): 69–83. http://dx.doi.org/10.1016/j.dsr2.2003.03.001
Reason, C.J.C., Landman, W., and Tennant, W., 2006. Seasonal to decadal prediction of southern African climate and its links with variability of the Atlantic Ocean. Bulletin of the American Meteorological Society, 87(7): 941–955. http://dx.doi.org/10.1175/BAMS-87-7-941
Sætre, R., and Jorge da Silva, A., 1984. The circulation of the Mozambique Channel. Deep Sea Research, Part A: Oceanographic Research Papers, 31(5): 485–508. http://dx.doi.org/10.1016/0198-0149(84)90098-0
Sagnotti, L., 2013. Demagnetization Analysis in Excel (DAIE). An open source workbook in Excel for viewing and analyzing demagnetization data from paleomagnetic discrete samples and U-channels. Annals of Geophysics, 56(1). http://dx.doi.org/10.4401/ag-6282
Schefuß, E., Kuhlmann, H., Mollenhauer, G., Prange, M., and Pätzold, J., 2011. Forcing of wet phases in southeast Africa over the past 17,000 years. Nature, 480(7378): 509–512. http://dx.doi.org/10.1038/nature10685
Sexton, P.F., and Norris, R.D., 2008. Dispersal and biogeography of marine plankton: long-distance dispersal of the foraminifer Truncorotalia truncatulinoides. Geology, 36(11): 899–902. http://dx.doi.org/10.1130/G25232A.1
Sinha, D.K., and Singh, A.K., 2008. Late Neogene planktic foraminiferal biochronology of the ODP Site 763A, Exmouth Plateau, southeast Indian Ocean. Journal of Foraminiferal Research, 38(3): 251–270. http://dx.doi.org/10.2113/gsjfr.38.3.251
Trauth, M.H., Larrasoaña, J.C., and Mudelsee, M., 2009. Trends, rhythms and events in Plio–Pleistocene African climate. Quaternary Science Reviews, 28(5–6): 399–411. http://dx.doi.org/10.1016/j.quascirev.2008.11.003
Tyson, P.D., and Preston-Whyte, R.A., 2000. The Weather and Climate of Southern Africa: Cape Town, South Africa (Oxford University Press).
Taylor, R.S., and McLennan, S.M., 1985. The Continental Crust: Its Composition and Evolution: Oxford, United Kingdom (Blackwell Scientific Publications, Ltd.).
1 Hall, I.R., Hemming, S.R., LeVay, L.J., Barker, S., Berke, M.A., Brentegani, L., Caley, T., Cartagena-Sierra, A., Charles, C.D., Coenen, J.J., Crespin, J.G., Franzese, A.M., Gruetzner, J., Han, X., Hines, S.K.V., Jimenez Espejo, F.J., Just, J., Koutsodendris, A., Kubota, K., Lathika, N., Norris, R.D., Periera dos Santos, T., Robinson, R., Rolinson, J.M., Simon, M.H., Tangunan, D., van der Lubbe, J.J.L., Yamane, M., and Zhang, H., 2017. Site U1478. In Hall, I.R., Hemming, S.R., LeVay, L.J., and the Expedition 361 Scientists, South African Climates (Agulhas LGM Density Profile). Proceedings of the International Ocean Discovery Program, 361: College Station, TX (International Ocean Discovery Program). http://dx.doi.org/10.14379/iodp.proc.361.107.2017
2 Expedition 361 Scientists’ addresses.
This work is distributed under the Creative Commons Attribution 4.0 International (CC BY 4.0) license. 
- F1. Location map of Site U1478 with main surface currents in the southwest Indian Ocean.
- F2. Geomorphologic and oceanographic features near Site U1478.
- F3. Selected maps of SeaWiFS chlorophyll-a concentration and NOAA AVHRR sea-surface temperature.
- F4. Multiproxy records from marine sediment Core MD96-2048.
- F5. Seismic Line M753-Geob08-230 across Site U1478.
- F6. Seismic tracks and bathymetry at the Inharrime Terrace.
- F7. Seismic Line M753-Geob08-230 at Site U1478.
- F8. Parasound data for seismic Line M753-GeoB08-230 across Site U1478.
- F9. Core recovery, Holes U1478A–U1478D.
- F10. Lithostratigraphic summary with selected physical properties and geochemical data.
- F11. Representative lithologies per interval.
- F12. Sediment deformations and disturbance, Site U1478.
- F13. Major compositions of sediment determined by smear slide observation, Holes U1478A–U1478D.
- F14. Comparison of CaCO3 from discrete samples and biogenic carbonate estimated in smear slides, Holes U1478A–U1487D.
- F15. Color reflectance, Hole U1478A.
- F16. SHIL RGB color data, Hole U1478A.
- F17. NGR and magnetic susceptibility, Hole U1478A.
- F18. P-wave velocity and bulk density, Hole U1478A.
- F19. Porosity, grain density, and thermal conductivity, Hole U1478A.
- F20. Spliced bulk density, WRMSL magnetic susceptibility, NGR, and b* color reflectance, Site U1478.
- F21. Biochronology in Hole U1478A with the locations of significant planktonic foraminifer and calcareous nannofossil events.
- F22. Calcareous nannofossils, Hole U1478A.
- F23. Representative assemblages of benthic foraminifers in Sample U1478A-31F-CC.
- F24. Representative assemblages of planktonic foraminifers, Hole U1478A.
- F25. S-ratio, HIRM, SIRM, and magnetic susceptibility, Hole U1478A.
- F26. Inclination summary, Site U1478.
- F27. Downhole inclination, declination, intensity, and magnetic susceptibility, Site U1478.
- F28. Magnetic susceptibility records, Site U1478.
- F29. Composite spliced records of magnetic susceptibility, NGR, and RGB red values, Site U1478.
- F30. Concentration profiles, sedimentary carbonate TOC contents, and magnetic susceptibility, Hole U1478A.
- F31. Headspace gas profiles, Hole U1478A.
- F32. Dissolved magnesium, potassium, sodium, and chloride profiles, Holes U1478A and U1478B.
- F33. Alkalinity, dissolved phosphate, and pH profiles, Holes U1478A and U1478B.
- F34. Dissolved iron, manganese, sulfate, and barium, Holes U1478A and U1478B.
- F35. Dissolved calcium and strontium profiles, Holes U1478A and U1478B.
- F36. Dissolved silicon, lithium, and boron profiles, Holes U1478A and U1478B.
- F37. Sedimentary major and trace element concentrations versus aluminum oxide content, Hole U1478A.
- F38. Calcium carbonate and TOC, magnetic susceptibility, and bulk sediment elemental ratios, Hole U1478A.
- F39. Age-depth relationships based on planktonic foraminifers, calcareous nannofossils, and magnetostratigraphy from Hole U1478A.
- T1. Site U1478 core summary.
- T2. Overview of shipboard sampling, Holes U1478A–U1478D.
- T3. Smear slide textures, compositions, and lithologic names, Holes U1478A-U1478D.
- T4. Biostratigraphic planktonic foraminifer datums, Site U1478.
- T5. Biostratigraphic calcareous nannofossil datums, Site U1478.
- T6. Calcareous nannofossil occurrence, Site U1478.
- T7. Planktonic foraminifer occurrence and abundance based on examination of the >150 µm fraction, Site U1478.
- T8. Diatom and other siliceous microfossil occurrences, Site U1478.
- T9. Analyzed discrete whole-round samples, Site U1478.
- T10. Volumetric bulk magnetic susceptibility of discrete samples, Site U1478.
- T11. Polarity zone boundaries, Site U1478.
- T12. Affine table, Site U1478.
- T13. Splice interval table, Site U1478.
- T14. Shipboard bulk sediment geochemistry data, Hole U1478A.