Morgan, J., Gulick, S., Mellett, C.L., Green, S.L., and the Expedition 364 Scientists
Proceedings of the International Ocean Discovery Program Volume 364
publications.iodp.org
https://doi.org/10.14379/iodp.proc.364.106.2017

Site M0077: Upper Peak Ring1
S. Gulick, J. Morgan, C.L. Mellett, S.L. Green, T. Bralower, E. Chenot, G. Christeson, P. Claeys, C. Cockell, M.J.L. Coolen, L. Ferrière, C. Gebhardt, K. Goto, H. Jones, D. Kring, J. Lofi, C. Lowery, R. Ocampo-Torres, L. Perez-Cruz, A.E. Pickersgill, M. Poelchau, A. Rae, C. Rasmussen, M. Rebolledo-Vieyra, U. Riller, H. Sato, J. Smit, S. Tikoo, N. Tomioka, J. Urrutia-Fucugauchi, M. Whalen, A. Wittmann, K. Yamaguchi, L. Xiao, and W. Zylberman2
Keywords: International Ocean Discovery Program, IODP, International Continental Scientific Drilling Program, ICDP, L/B Myrtle, Mission Specific Platform, Expedition 364, Site M0077, Hole M0077A, Gulf of México, Yucatán shelf, Chicxulub, impact crater, crater modification, multi-ring basin, peak ring, uplifted continental crust, impact melt rock, planar deformation features, Cretaceous/Paleogene boundary, PETM, K-Pg boundary, Cretaceous-Paleogene mass extinction, shock metamorphism, carbon isotope excursions, hydrothermal, geomagnetic reversal, shatter cone, ejecta, suevite, granitoid, pelagic limestone, tsunamite
MS 364-106: Published 30 December 2017
Introduction
In Hole M0077A, the Upper Peak Ring interval is composed of suevite and impact melt rock between 617.33 and 747.02 meters below seafloor (mbsf) (Sections 40R-1, 109.4 cm, to 95R-3, 117 cm). The following sections detail the data and measurements from this package.
Operations
Coring continued in Hole M0077A on 27 and 28 April 2016. Cores 41R–58R were recovered, and all were high quality, maintaining core diameter with few breaks and high recovery. The total advance during this period was from 128.1 to 674.19 m drilling depth below seafloor (DSF).
At 0500 h on 29 April, after recovering Cores 59R and 60R, changes in drilling parameters were recorded and the pipe was tripped to assess the condition of the bottom-hole assembly (BHA) and drill string. Upon recovery, the bit was observed to be worn and was therefore changed, and running in commenced. Coring started at 2300 h, and Core 61R was recovered to deck by 2355 h.
On 30 April, due to a change in lithology, core runs were shortened to ~1.5 m on average and the coring rate was reduced to optimize recovery. By the end of the day, a total of 11 core runs (Cores 62R–72R) were completed, advancing the hole 15.75 m and reaching 699.09 m DSF. Average core recovery was 81%.
On 1 May, essential maintenance of the rig was carried out for the majority of the morning. Once complete, the core barrel was recovered to deck, and upon inspection, it was found that the core catcher contained a stub of core, probably left behind by the previous run (Core 72R). A decision was made to trip the pipe and then step down to standard PQ3 drill string, allowing the next phase of the downhole logging program to begin.
Setup for logging commenced, and the pipe was tripped to 507.00 m DSF, just below the depth of casing, to enable open-hole logging. Logging operations continued for the remainder of the day, and logging personnel were transferred to the platform from the supply boat, Linda F. Figure F26 and Table T4 (both in the Expedition 364 methods chapter [Gulick et al., 2017a]) summarize the detailed operations and acquisition parameters for each tool or tool string run (see Downhole logging in the Expedition 364 methods chapter [Gulick et al., 2017a]). The first tool run was between ~698 and 507 m wireline log depth below seafloor (WSF). Toward the end of the day, a second tool string was sent down the hole and run uphole from ~697 m WSF at very high resolution.
Downhole logging operations continued during the early hours of 2 May. While rigup for vertical seismic profile (VSP) operations was ongoing, marine mammal and protected species observations were carried out. Following technical issues with the depth encoder, the VSP tool was lowered to 696 m WSF and run uphole at high resolution. Marine mammal and protected species observation continued throughout and for a period after VSP operations. Upon completion of downhole logging operations, maintenance of the drill rig continued for the remainder of the day. The supply boat Linda F arrived, and logging personnel disembarked.
On 3 May, maintenance of the drill rig was completed and running in pipe began. The base of the hole was reached at 0325 h, and coring commenced. On recovery of Core 73R, fragments of the drill bit were found in the core liner, indicating that the bit had worn in places. The pipe was tripped to recover the BHA for inspection. Following discussion, the decision was made to case and cement the borehole and step down to a standard PQ3 size to improve coring efficiency. Casing of the hole started and continued through the remainder of the day. The total depth reached using oversized PQ3 size was 701.64 m DSF. During the day, the Linda F arrived to transfer supplies and personnel.
Running in casing continued until 0510 h on 4 May. The casing was set by pumping cement to the base of the hole and allowing up to 12 h for it to cure. To maximize operational time while the cement was curing, a wireline tool string comprising the natural gamma ray tool and acoustic imager was sent downhole to assess whether these data could be acquired through casing. Upon completion of the downhole logging exercise, the drill string was run into the hole in preparation for coring.
Running pipe continued until 0230 h on the morning of 5 May. Upon reaching the base of the hole, coring cement began, with a cement core being recovered at 0329 h. Coring continued throughout the day and was intermittently interrupted to carry out essential maintenance on the drill rig. Coring runs were kept short to maximize recovery in challenging lithologies. Seven cores were recovered, advancing the hole by 5.7 m. Core recovery was 100%, and quality was good. By midnight, the hole reached 707.34 m DSF.
On 6 May, coring continued with nine cores recovered. The recovery rate was an improvement on the previous day, and the quality of the core was noted to be very high. The hole was advanced by 21.35 m, reaching 728.69 m DSF.
Coring continued with rates continuing to increase as the lithology became more competent. The recovery and quality of the cores remained high. Core 95R was recovered at 1535 h on 7 May.
Lithology and computed tomography
Lithology
Upper Peak Ring interval lithologies are divided into Units 2 and 3 (Figure F1). Unit 2 is polymict breccia with impact melt rock fragments and is thus suevite. Unit 3 is impact melt rock with occasional (<25%) clasts. Units 2 and 3 are divided into Subunits 2A–2C, 3A, and 3B based on sedimentary features and matrix or groundmass characteristics (Figure F2). In terms of core disturbance, the suevite matrix is deteriorated in some intervals, but in general, core quality was excellent.
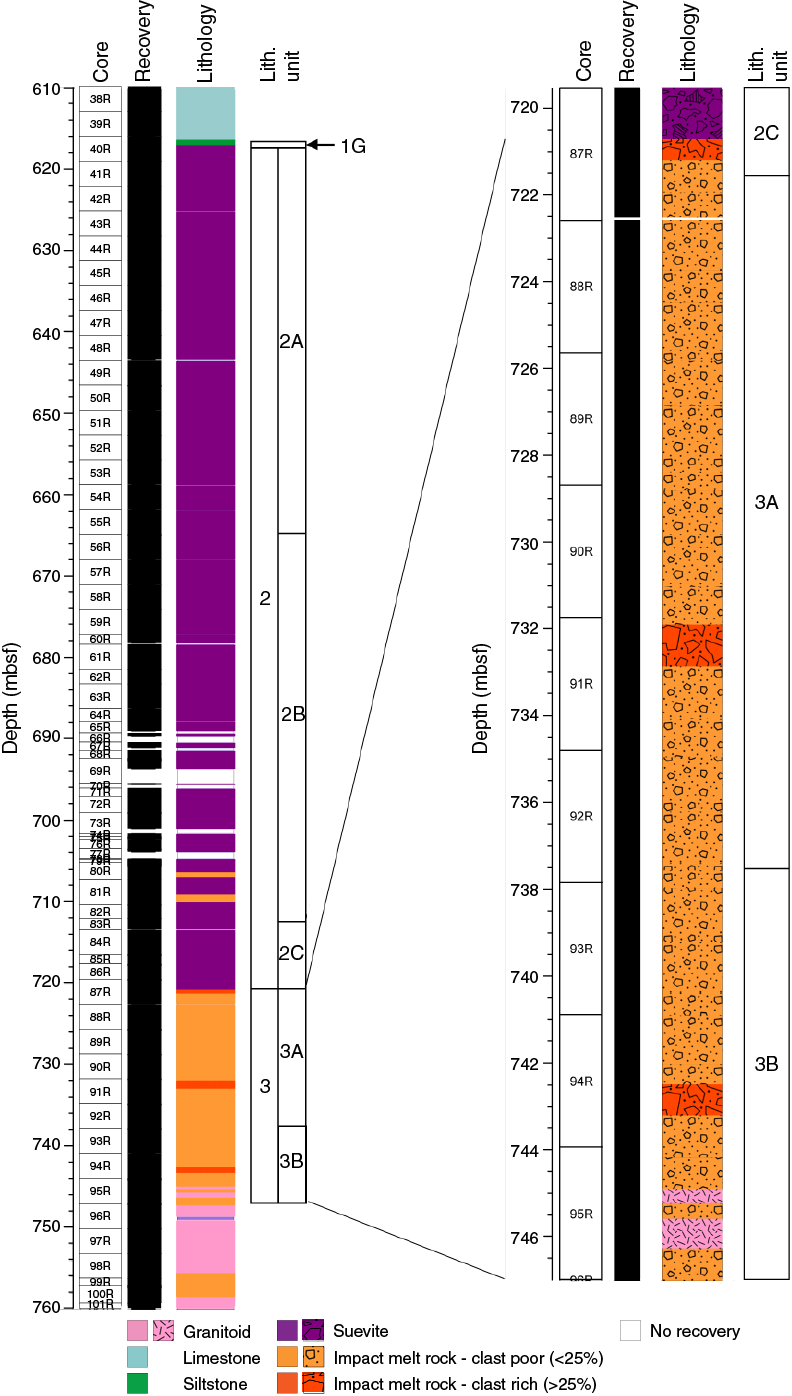
Figure F1. Lithostratigraphic summary.

Figure F2. Lithostratigraphic unit boundaries.
Unit 2
The upper surface of Unit 2 in the lithologic sequence is defined by the sharp stylolitized contact at the top of the cross-bedded suevite in Section 40R-1, 109.4 cm (617.33 mbsf) (Figure F2A). Unit 2 is an approximately 104 m thick suevite (interval 40R-1, 109.4 cm, to 87R-2, 90 cm; 617.33–721.62 mbsf) and is predominantly composed of various types of green to black impact melt rock clasts, as well as to a lesser degree lithic fragments, including Mesozoic sedimentary rocks and crystalline basement rocks. The maximum clast size, defined here as the long axis length (in centimeters) of the largest clast in each section, varies from 0.2 cm to more than 25 cm (Figure F3; Table T1). Overall, the unit has a fining-upward trend, although upward coarsening or grain size oscillations in maximum clast size are locally observable, especially in the upper part of Subunit 2A.
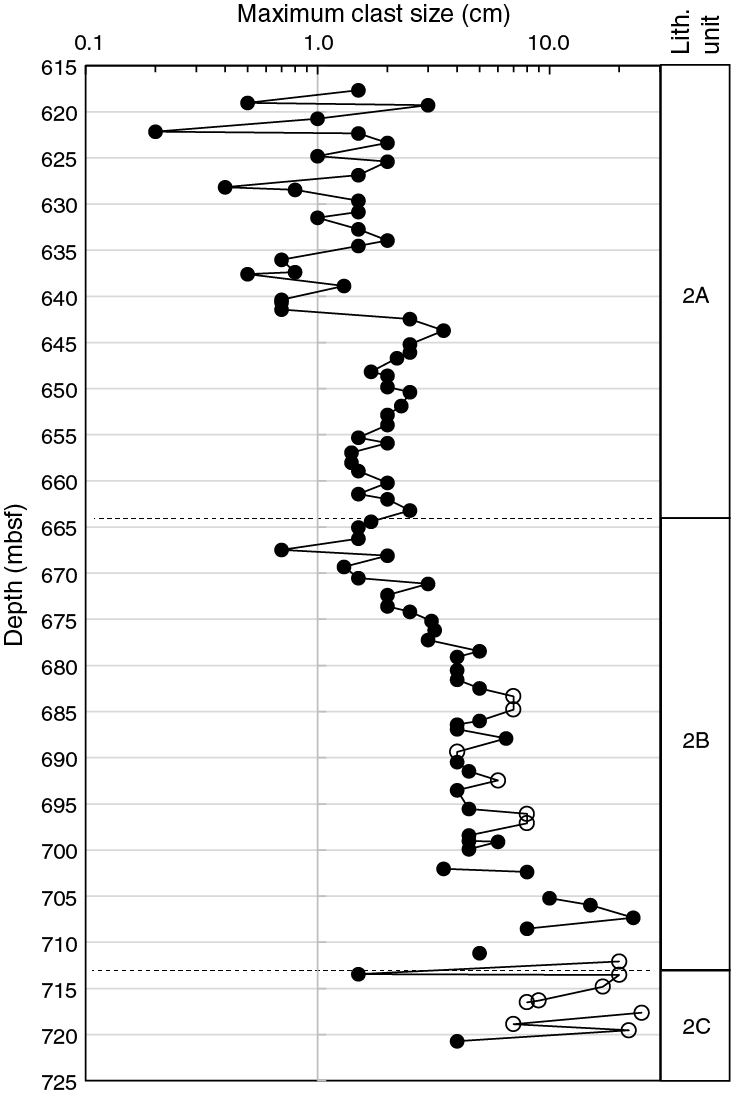
Figure F3. Maximum clast size for Unit 2.
Table T1. Maximum clast sizes. Download table in CSV format.
Subunit 2A
The suevite in Subunit 2A (interval 40R-1, 109.4 cm, to 55R-3, 11 cm; 617.33–664.52 mbsf) is relatively well sorted in the upper part of the subunit but poorly sorted in the lower part (Figure F4A). The matrix is gray, and the suevite is mostly matrix supported, although grain-supported features are also locally observed. Repeated upward-fining or upward-coarsening features are well developed in the uppermost 10 m. In Sections 40R-1 through 41R-2, there are 4 to 62 cm thick, upward-fining, rhythmic or cyclic packages where the suevite becomes more clay rich and stylolitized upward. Upward-fining and upward-coarsening packages occur locally throughout the subunit, but they do not have distinct bounding surfaces and upward-fining deposits are commonly coarse-tail graded. Cross-lamination is observed only in the uppermost 8 cm of Subunit 2A (Section 40R-1; Figure F5). Other sedimentary features are generally not evident in the subunit. Dark gray subvertical pipes or patches are observed between Sections 41R-1 and 49R-3, which locally show increased porosity. These pipes are interpreted as possible degassing or dewatering pipes. In Cores 53R and 54R, larger patches of orange-red matrix have replaced the midgray matrix. These patches are provisionally interpreted as hydrothermal alteration zones.
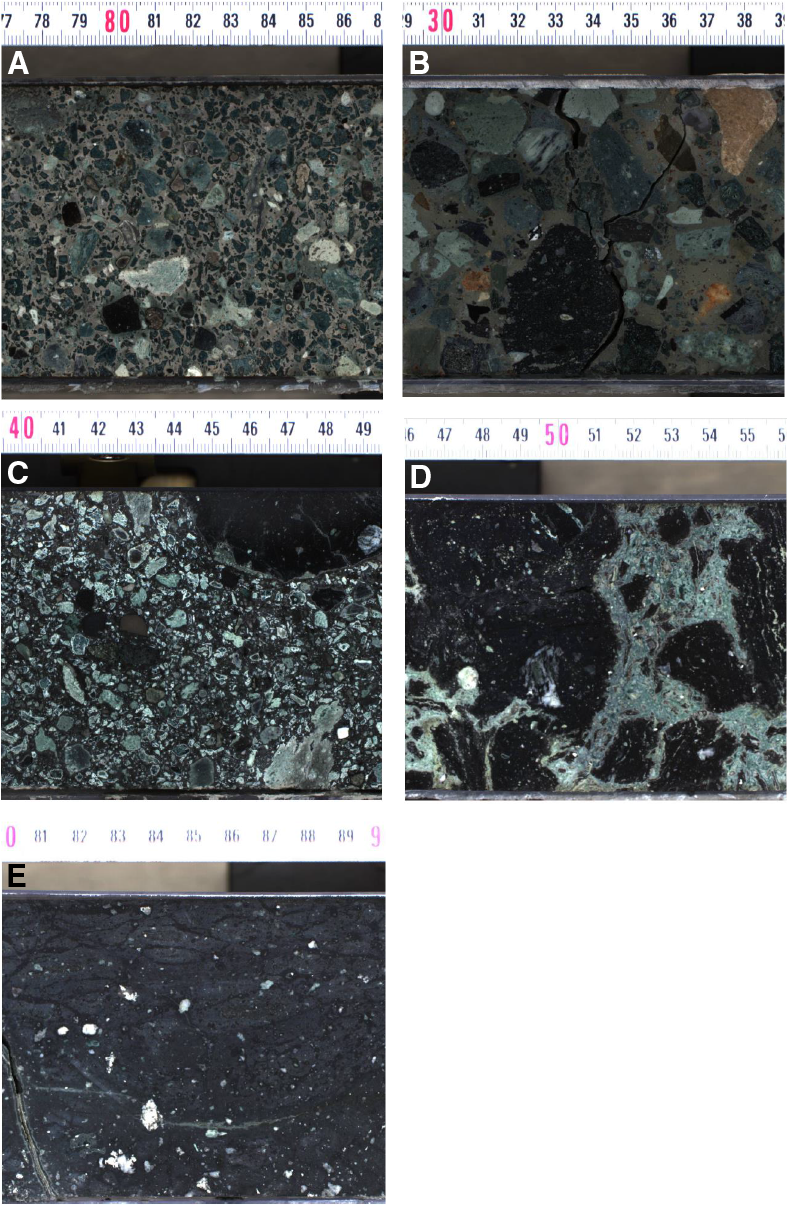
Figure F4. Lithostratigraphic subunits.
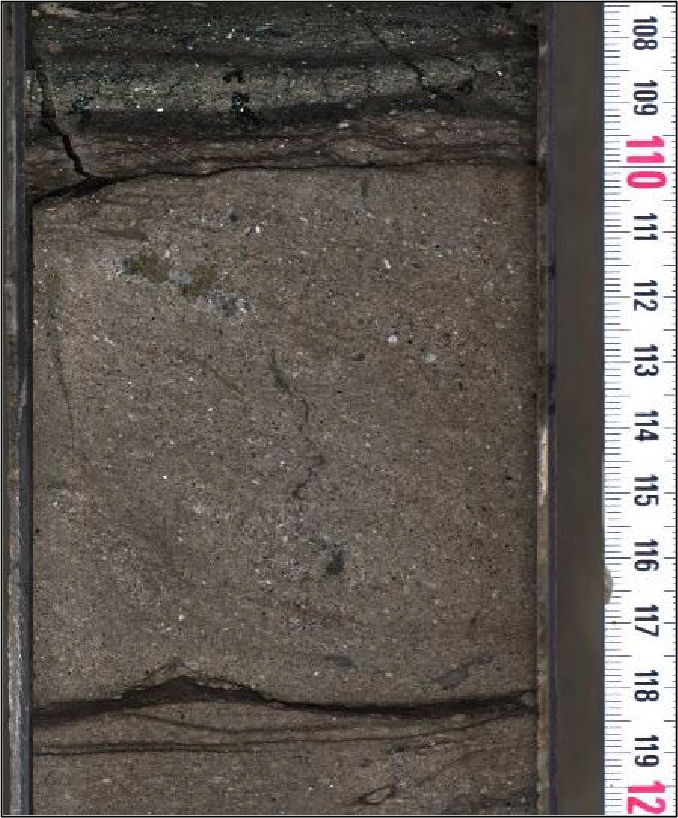
Figure F5. Cross-lamination in suevite at top of Subunit 2A.
Eleven thin sections of this subunit were prepared and show that the suevite is matrix-supported polymict breccia (Figure F6). The matrix is micritic carbonate, locally containing opaque minerals. Clasts include limestone, isolated fossils (such as foraminifers), and impact melt rock fragments with altered (green to brown clay minerals in plane-polarized light) glassy to microcrystalline textures. Many of the melt rock fragments have flow textures and are in some cases vesicular. Vesicles are either empty or filled with carbonate and/or matrix material. Within the micritic carbonate matrix and locally along the margins of clasts are pockets partially or entirely filled with sparry calcite (seen in two of the three thin sections available for this subunit, Samples 43R-3, 31–33 cm, and 46R-3, 25–26 cm). This infill may be related to the degassing or dewatering features seen in the upper portion of the section.
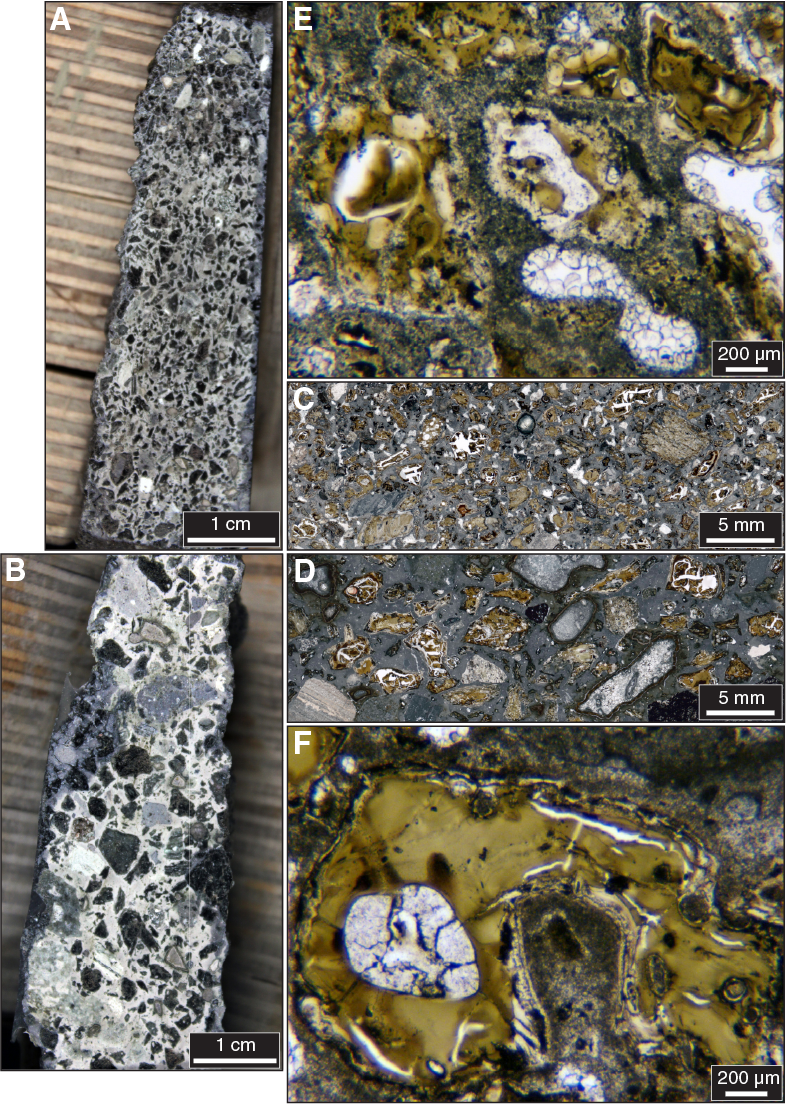
Figure F6. Suevite from Subunit 2A.
Elsewhere within the subunit (e.g., Samples 43R-3, 31–33 cm, 46R-3, 25–26 cm, and 50R-3, 122–124 cm), melt rock fragments contain relict mineral clasts (dominated by feldspar and quartz) and shocked lithic rock fragments or are themselves coated with an additional layer of melt rock. Lithic fragments with planar fractures, (decorated) planar deformation features, and resorbed margins are abundant; a few toasted quartz grains were noted. Silica glass is generally recrystallized and has a chert-like appearance. Type II ballen silica (Sample 50R-3, 122–124 cm) and Type V ballen silica (Sample 46R-3, 25–26 cm) were observed (see Ferrière et al., 2009, for definitions). Possible coesite was observed in a large silica-rich melt rock fragment (Sample 50R-3, 122–124 cm), but micro-Raman spectroscopy will be required for confirmation. The microcrystalline melt rock fragments often contain streamers of carbonate.
Subunit 2B
Subunit 2B (interval 55R-3, 11 cm, to 83R-1, 75 cm; 664.52–712.83 mbsf) (Figure F4B) is suevite that has the same matrix and clast composition as Subunit 2A but is devoid of major sedimentary features other than a general fining-upward succession with local decimeter-scale fining-upward packages. The upper surface is defined by an erosional contact at Section 55R-3, 11 cm (Figure F2B), which is the lowest erosional contact observed in Unit 2. Core recovery of the subunit was poor (~89%) compared to other subunits, possibly because of poor lithification of clast-supported intervals and/or concomitant alteration.
Clast sizes in the suevite increase with depth, locally exceeding 10 cm toward the bottom of the subunit (Figure F3). Two large clasts of impact melt rock were found in Section 80R-2 and 81R-2, reaching 60 and 90 cm in length, respectively. These clasts were logged as clast-poor, dark gray melt rocks with green margins at the contact with suevite. Local approximately centimeter-sized zones containing orange to red minerals and calcitic and sulfide mineralization are common in the cores and are interpreted as hydrothermal alteration features.
Seven thin sections of this subunit were prepared, including six suevite samples and one clast of impact melt rock (interval 82R-5, 0–15 cm). The matrix of the suevite is brown and made of very fine grained microcrystalline carbonate. A possible clay component will need to be confirmed with secondary electron microscopy. A large variety of clasts were observed, dominated by altered melt rock fragments that are green to brown in plane-polarized light, suggesting the presence of clay minerals, similar to Subunit 2A. Isolated mineral clasts (mainly quartz and feldspar) and lithic clasts also occur. Lithic clasts include a variety of more or less shocked rock fragments, mainly composed of quartz and feldspar, as well as micas and opaque minerals. Quartz grains are in some cases toasted and/or display several sets of (decorated) planar deformation features. Type IV ballen quartz was observed in Sample 55R-3, 75–77 cm. Other lithic clasts include fine-grained to coarser grained limestone, locally with fossils. In addition, a possible shale clast was reported in Sample 65R-1, 117–118 cm, as well as brecciated granite and mafic rock clasts in Sample 80R-2, 137–139 cm.
The sample of clast-poor impact melt rock (82R-5, 0–15 cm) has a fine-grained matrix made of tiny plagioclase laths and opaque minerals (magnetite and sulfides) in an altered (now clay-bearing) melt rock (Figure F7). The most abundant lithic fragments in the melt rock are granitoids. Quartz in these granitoids is shocked, showing up to three sets of planar deformation features, and can be toasted, whereas other grains are transformed to Type III ballen quartz. Shocked plagioclase with possible planar deformation features is also visible.
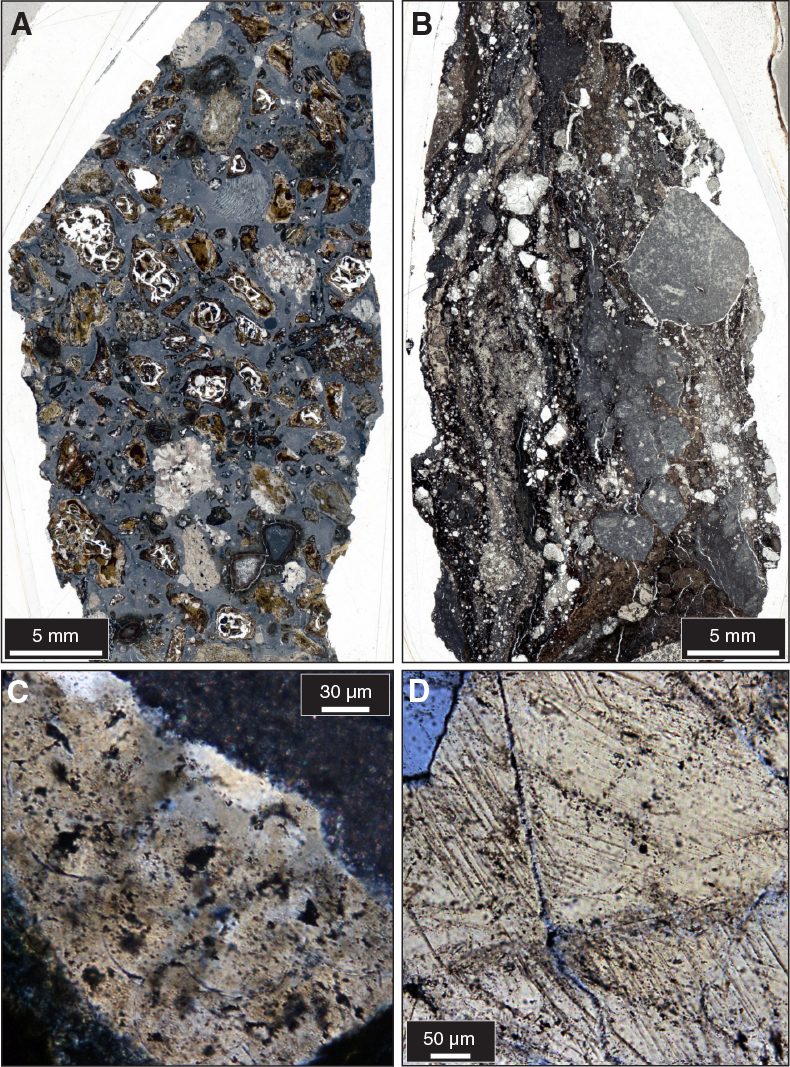
Figure F7. Suevite from Subunit 2B.
Subunit 2C
Subunit 2C (interval 83R-1, 75 cm, to 87R-2, 90 cm; 712.83–721.62 mbsf) is a ~9 m thick suevite. The upper surface is defined as the transition from Subunit 2B to suevite with very poorly sorted angular to subrounded clasts and a dark brown matrix that transitions to a bright green matrix with depth (Figures F2C, F4C). The suevite is mostly matrix supported but is locally clast supported. Impact melt rock clasts are typically black, gray, or green and frequently have a dark core surrounded by greenish rims. Flow textures are present together with local alteration in the melt rock clasts, preferentially occurring within the green melt rock. The melt rock clasts range in size from a few millimeters to >10 cm. The clasts have rounded or subangular shapes mainly in the upper part of the subunit. With depth, angular clasts become more common. Apart from melt rock clasts, carbonate and granite lithologies are present, with minor occurrences of gneiss, granodiorite, amphibolite, siltstone, and shale.
One thin section is available for this subunit (Sample 85R-2, 0–22 cm). The sample shows impact melt rock clasts with compositional variation between two melt rock types: one is dark, aphanitic, microcrystalline clast-bearing melt rock, and the other is vesicular, strongly altered melt rock rich in smectite. The suevite matrix was not sampled.
Unit 3
The second principal lithology of the Upper Peak Ring interval consists of a ~25 m thick succession of impact melt rocks (interval 87R-2, 90 cm, to 95R-3, 117 cm; 721.61–747.02 mbsf). It is dominantly clast-poor impact melt rock, but clast-rich intervals occur locally (Figure F1).
Subunit 3A
Subunit 3A is ~16 m thick (interval 87R-2, 90 cm, to 92R-3, 17 cm; 721.62–737.56 mbsf) and is characterized by a mixture of dark green and black clast-poor impact melt rocks (Figures F2D, F4D). The first occurrence of the dark green melt rock marks the top of the subunit. The green melt rock often forms a matrix with angular fragments of black melt rock. These black melt rock fragments commonly entrain various mineral fragments and <1 mm to ~1 cm lithic fragments and also can contain vesicles and flow lines. The green melt rock reacts to HCl and thus may be altered through hydrothermal processes. The green melt rock was also found to be intimately intermixed with black melt rock, forming multiple millimeter to centimeter thin schlieren of green material within the black melt rock.
Black impact melt rock also occurs in larger regions up to 0.5 m in size. These regions include centimeter- to decimeter-sized clasts of target material. The smaller clasts are partially resorbed and in some cases heavily shocked, making lithologic identification difficult. Larger clasts in the impact melt rock are composed of metamorphic and igneous target lithologies, including decimeter-sized clasts of granodiorite (Sample 91R-1, 44–68 cm) and gneiss (Sample 91R-1, 94–110 cm) and rare clasts of red sandstone (e.g., Sample 90R-3, 8–15 cm).
One thin section was available for this subunit (Sample 89R-3, 39–43 cm). The impact melt rock in this sample is variably altered, with some parts consisting of microcrystalline melt rock with tiny phenocryst laths in an aphanitic groundmass (with partly digested clasts and blebs of opaque minerals), green domains consisting of smectite (likely a secondary alteration product from a formerly glassy melt), zeolite, silica, and chloritoid/chlorite (Figure F8). Up to ~0.5 cm angular to subrounded clasts in the melt rock are variably assimilated, some with reaction coronas. A few silica clasts with ballen quartz occur, and one clast of quartz with decorated planar deformation features was noted.

Figure F8. Impact melt rock from Subunit 3A.
Subunit 3B
Subunit 3B occurs below the green schlieren-bearing black impact melt rock and is a ~9 m thick, black, coherent, clast-poor impact melt rock (interval 92R-3, 17 cm, to 95R-3, 117 cm; 737.56–747.02 mbsf). The contact occurs at the lowest occurrence of green schlieren (Figures F2E, F4E). Although the green schlieren are absent, the black melt rock still contains observable flow banding and vesicles. It also entrains a variety of mineral and lithic clasts. In some parts, the clasts are evenly distributed. Other areas contain clusters and subtle alignments of clasts. As in Subunit 3A, clasts are composed of metamorphic and igneous target lithologies, but Subunit 3B lacks visible clasts of sedimentary lithologies. Granitoid clasts dominate and increase in abundance toward the base of the subunit, reaching 42 cm in size before the base. Subunit 3B contains clasts of previously solidified impact melt rock that seem to have separated, and the gaps are filled with melt rock. The lower surface of this subunit is the top of the shocked granitoid target in Section 95R-3 at 747.02 mbsf (Figure F2F).
One thin section was available for this subunit (Sample 93R-3, 51–52 cm), revealing that this impact melt rock is composed of a fine-grained matrix made of tiny plagioclase laths and opaque minerals (magnetite) in a melt (now altered to clay minerals) (Figure F9). Mineral clasts including quartz, alkali-feldspar, and plagioclase occur, as well as partially assimilated mineral and rock (mainly granitoids) clasts and some melt rock fragments. Quartz grains display planar deformation features and are in some cases toasted. Plagioclase grains with possible planar deformation features were also noted.
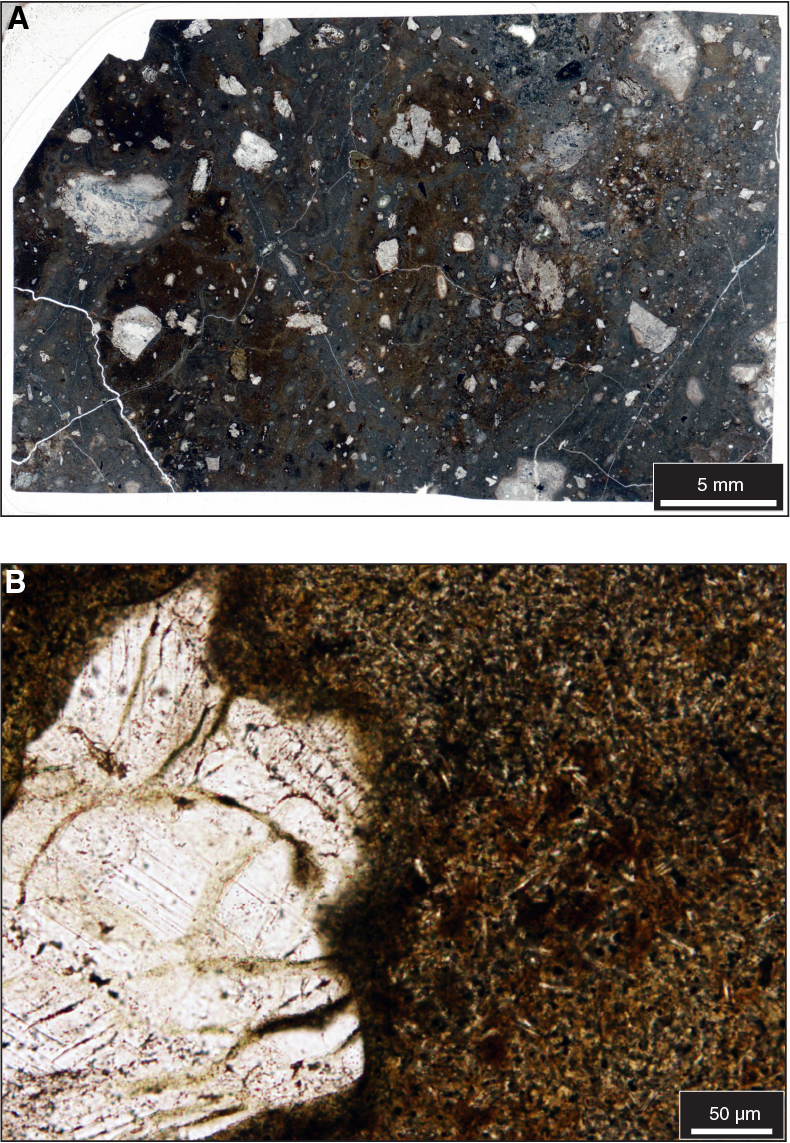
Figure F9. Impact melt rock from Subunit 3B.
Target lithologies
The target sedimentary lithologies that occur as clasts within the suevites and impact melt rocks of the Upper Peak Ring interval are carbonate, chert (which in many cases is visibly associated with and derived from carbonate), shale, sandstone, and red siltstone. Metamorphic lithologies that were logged are marble, gneiss, mylonite, and amphibolite. Igneous lithologies among the clasts are granite, granodiorite, diorite, and mafic clasts variously logged as gabbro, diabase, and dolerite. Carbonate and granite are the most abundant target lithologies. Anhydrite was not observed as a clast lithology. The red siltstone is the first occurrence seen in Chicxulub breccias, although it is a well-known unit within the Maya block based on the Petróleos Mexicanos (PEMEX) series of Yucatán boreholes (e.g., Claeys et al., 2003). The sedimentary, metamorphic, and igneous target lithologies are found at most depths in the Upper Peak Ring interval, although carbonate was not logged in the impact melt rock (Subunits 3A and 3B) and granitoids dominate the clast assemblage at the base of Subunit 3B.
Computed tomography facies analyses
Unit 2
Subunit 2A
Subunit 2A (617.33–664.52 mbsf; 618.54–665.72 m core composite depth below seafloor [CCSF-A]), described as suevite during visual core description, has an average computed tomography (CT) number of 1570.8 ± 119.4 (2σ). It is characterized in CT facies by a moderate CT number matrix and clasts of bright and dark CT number material (Figure F10A). In the upper core sections of this subunit, stylolites appear within the suevite as laminations of light gray material. Locally, rare occurrences of bright CT responses in subvertically oriented linear structures with high bulk density (ρb) and effective atomic number (Zeff) correlate with structures interpreted as dewatering or degassing pipes (e.g., 618.80 mbsf). Additionally, several bright CT responses without preferential orientation correlate with observations of sulfide minerals. A slight increase in clast size is observed downhole through the core, although this increase occurs through several fining- and coarsening-upward sequences. Furthermore, the proportion of high–CT number clasts increases with depth, whereas the relative proportion of low–CT number clasts decreases. With increasing depth, subvertically oriented, low–CT number planar structures were seen with low Zeff and low ρb (e.g., 620.30 mbsf). From ~650 mbsf downhole, many of the clasts have high–CT number rims. Zones of red minerals within the suevite matrix at ~658 mbsf are reflected by a relative increase in CT number, with marginal increases in both Zeff and ρb.

Figure F10. Representative CT scans of subunits.
The contact with Subunit 2B marks an abrupt change in clast size and variability:
- Subunit 2A has significantly fewer high–CT number, high–ρb clasts than Subunit 2B.
- Subunit 2A has generally smaller clasts than Subunit 2B.
Subunit 2B
Subunit 2B (664.52–712.83 mbsf; 665.72–713.81 m CCSF-A), described as suevite during visual core description, has an average CT number of 1711.6 ± 344.0 (2σ). The subunit is characterized by a moderate CT number matrix with variable clast size, sorting, and angularity and variably high and low CT numbers in clasts. Progressing downhole, the subunit gradually and continuously grows coarser (Figure F10B). Carbonate clasts are conspicuous due to their high CT numbers, high ρb, and high Zeff. Melt rock clasts have a moderate CT number, moderate ρb, and moderate Zeff, whereas crystalline basement clasts are highly variable. Rare mafic clasts were found, and they are distinct from the black melt rock clasts in CT because of their high Zeff and high ρb (e.g., 706.68 mbsf, where a mafic target rock clast is rimmed by impact melt rock). At 701.67 mbsf, suevite is truncated by a secondary material possessing very low ρb and high Zeff.
The contact to Subunit 2C marks a change in CT facies:
- The matrix of Subunit 2B has lower ρb than that of Subunit 2C.
- Most of the clasts in Subunit 2C have lower ρb than the matrix, but the majority of clasts in Subunit 2B have greater ρb than the matrix.
- The Zeff of the matrix abruptly increases.
Subunit 2C
Subunit 2C (712.83–721.62 mbsf; 713.81–722.98 m CCSF-A), described as suevite during visual core description, has an average CT number of 1919.4 ± 393.0 (2σ). The subunit is characterized by high–CT number matrix with angular low–CT number clasts (Figure F10C). There are local large clasts of varied materials (e.g., Section 84R-2); three such clasts were found. The first has a high CT number, high Zeff, and high ρb; the second has a moderate CT number, high ρb, and low Zeff; and the third has a low CT number, low ρb, and low Zeff. Melt rock clasts typically have low CT numbers relative to the matrix. An abrupt change in CT characteristics occurs at 715.60 mbsf, where the CT number of the matrix increases due to an increase in ρb. This change corresponds with a color change in the matrix from black to green. From this depth downhole, the subunit has far fewer small clasts and more common melt rock clasts that span the entire width of the core. An anomalously high-CT region occurs in the lowermost 30 cm of this subunit. This change in CT is primarily due to an abrupt change in the matrix Zeff and a lack of large clasts.
The contact with Subunit 3A marks a change in CT facies:
- The average CT number is comparatively high in Subunit 2C.
- Subunit 3A lacks angular clasts; instead, it has flow textures.
Unit 3
Subunit 3A
Subunit 3A (721.62–737.56 mbsf; 722.98–739.13 m CCSF-A), described as clast-poor impact melt rock during visual core description, has an average CT number of 1879.5 ± 277.9 (2σ). The subunit is characterized by an intermixture of high– and low–CT number materials and common angular clasts (Figure F10D). The high–CT number material, notable for its green appearance in visual core description, has high Zeff and slightly higher ρb in comparison with the second material, which is black upon visual inspection. Both materials contain local angular clasts with both high and low CT numbers.
The contact with Subunit 3B marks a drop in average CT number, reflected as drops in both Zeff and ρb, an increase in homogeneity, and the onset of a turtle-shell pattern in Subunit 3B.
Subunit 3B
Subunit 3B (737.56–747.02 mbsf; 739.13–748.90 m CCSF-A), described as clast-poor impact melt rock during visual core description, has an average CT number of 1803.7 ± 181.5 (2σ). The subunit is characterized by a turtle-shell pattern and local clasts of CT bright and dark material (Figure F10E). The turtle-shell pattern originates from rounded, low–CT number zones, between which veins of high–CT number material occurs. The CT brightness contrast between these zones occurs primarily due to ρb contrasts. The uppermost 1 m of Subunit 3B lacks the turtle-shell pattern. Within this subunit, three large clasts of material from Unit 4 (granitoids from the Lower Peak Ring interval) are present. Finally, at 744.68 mbsf, an unusual clast of CT-dark material within which several clasts can be seen possesses an aureole of CT-bright material, related primarily to high ρb.
The contact with Unit 4 is marked by an abrupt reduction in Zeff and an increase in ρb. The net effect upon CT number is minor; however, there is a distinct change in texture to a granular material without a matrix.
Biostratigraphy
The suevites in Cores 40R–85R were searched for unaltered limestone clasts with fossils. Selected clasts were polished on one surface, and photomicrographs were prepared. Some of the polished surfaces were stained with methylene blue to bring out details otherwise obscured by the lack of contrast between nannofossil-rich matrix and foraminifers. Washed residues from core catcher samples were prepared for further analysis under a reflected light microscope. Fossils in the suevite occur in two modes: enclosed in larger clasts or as individual fossils in the matrix. Fossils identified in the suevites span the full range of paleoenvironments known from the Cretaceous Yucatán Platform. These environments include Early Cretaceous shallow-water carbonates containing rudists and larger foraminifers through Late Cretaceous pelagic limestones containing planktic and benthic foraminifers.
Foraminifers
Washed residues were examined through the suevites in Cores 40R–85R, but no foraminifers were observed. Thin sections taken of limestone clasts yielded a number of planktic and benthic foraminifers, including a number of clasts of mid-Cretaceous (Cenomanian–Turonian) heterohelicids, whiteinellids, single-keeled planktic foraminifers (e.g., Rotalipora or Praeglobotruncana), and calcispheres (Samples 46R-3, 25–26 cm [637.61 mbsf], 50R-3, 123–124 [649.81 mbsf], and 55R-3, 75–77 cm [665.16 mbsf]) (Figure F11).
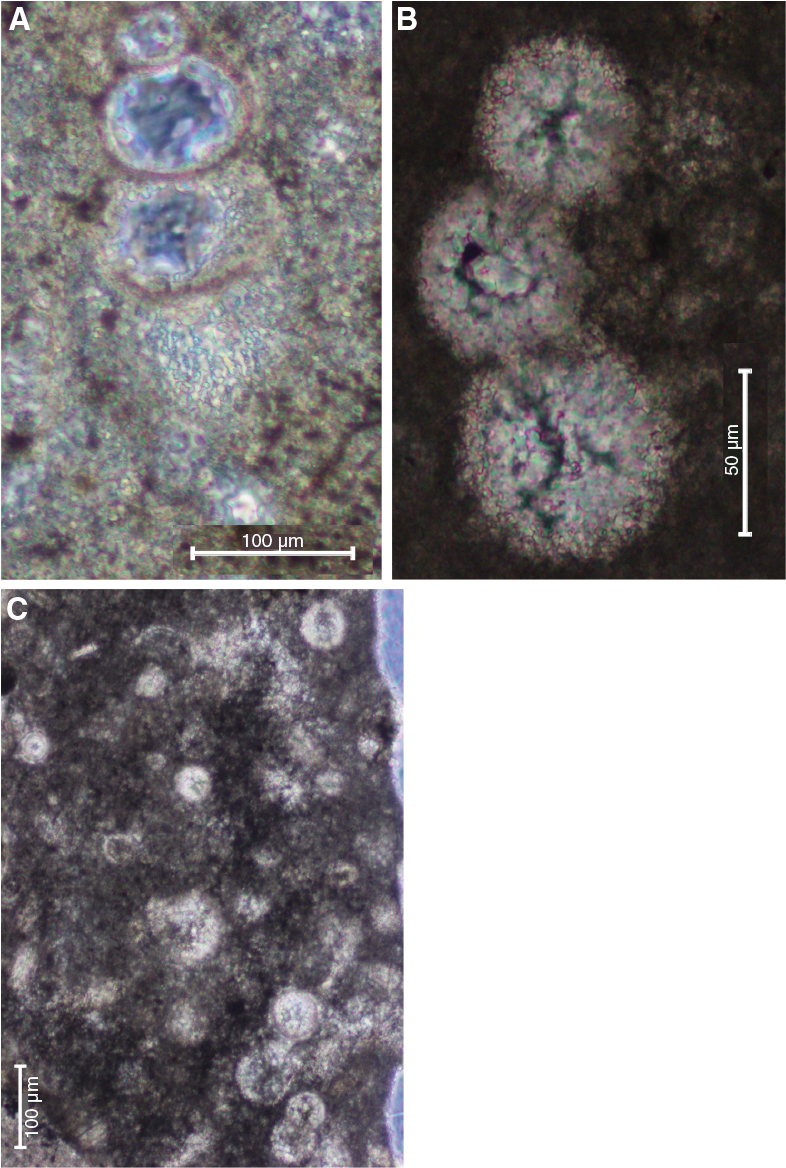
Figure F11. Cretaceous planktic foraminifers in limestone clasts.
Nannofossils
The interval from Sample 40R-3, 24–28 cm, to Sample 59R-3, 105–106 cm (619.27–677.22 mbsf), contains rare and moderately to poorly preserved Late Cretaceous nannofossils. Most of the species observed have long stratigraphic ranges and are not indicative of any well-defined stratigraphic interval. However, samples between Samples 40R-3, 24–28 cm, and 44R-3, 65–67 cm (619.27–631.49 mbsf) contain Aspidolithus parcus, Eiffellithus eximius, Lithraphidites quadratus, and Micula murus, which have well-defined ranges in the Late Cretaceous. Toward the bottom of the sampled interval within the suevites, nannofossils are often broken and heavily overgrown.
Macrofossils and larger foraminifers
The limestone clasts are highly variable in size and composition. Micro- and macrofossils are often remarkably well preserved downhole through Core 85R (Figure F12). In clasts, we observed fragments of numerous rudists (mostly radiolitids) (Figure F13), which are typical for Late Cretaceous rudist reefs and common in the Maastrichtian. Other macrofossils include gastropods and bivalves. Larger foraminifers include Omphalocyclus sp. and Orbitoides spp., which usually occur in between and in association with rudist patch reefs (Figure F14). In other clasts, large miliolids were observed (Figures F12, F14).
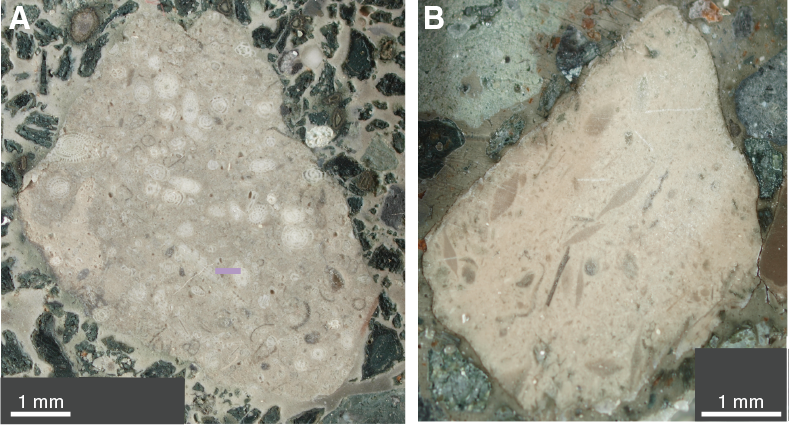
Figure F12. Clasts containing abundant larger benthic foraminifers.

Figure F13. Radiolitid rudist fragments.
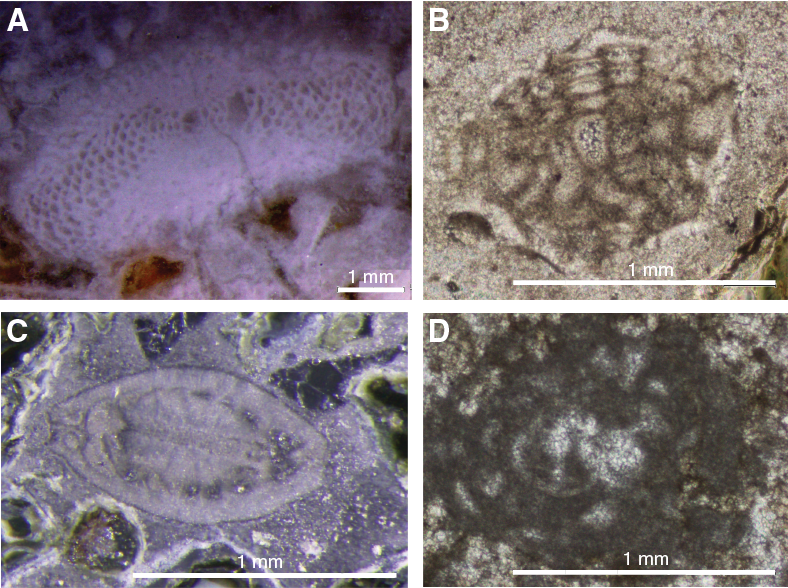
Figure F14. Large miliolids and larger benthics in clasts.
Paleomagnetism
Discrete sample measurements
Paleomagnetism measurements were conducted on 45 suevite samples and 6 impact melt rock samples collected from the Upper Peak Ring interval (Sections 40R-1, 109.4 cm, to 95R-3, 117 cm; 617.33–747.02 mbsf) at a frequency of ~1 sample per core. Natural remanent magnetization (NRM) was measured for all samples, as well as the residual moment following stepwise alternating field (AF) demagnetization (in 5 mT increments) up to maximum applied fields of 20 mT.
Remanent magnetization
The initial NRMs of the suevite samples range between ~8 × 10⁻⁹ and ~1 × 10⁻⁵ Am2 (for sample volumes of ~12.25 cm3) with an average value of ~2 × 10⁻⁶ Am2 (Figure F15B). These magnetization intensities are often ~3 to 4 orders of magnitude higher than the NRM values of the Post-Impact Sedimentary Rocks interval (see Paleomagnetism in the Site M0077: Post-Impact Sedimentary Rocks chapter [Gulick et al., 2017c]). Samples from the suevite within the upper portion of Subunit 2A exhibit the lowest NRM intensities (~8 × 10⁻⁹ Am2) but have relatively stable NRMs with ~80% of the initial signal left at AF 20 mT demagnetization (e.g., Sample 42R-2, 11 cm) (Figure F16A), indicating the presence of high-coercivity magnetic minerals. Suevite samples sourced from the lower portion of Subunit 2A and from all of Subunits 2B and 2C have somewhat higher initial NRM values but are less resistant to AF demagnetization, with ~50%–70% of the signal left at AF 20 mT demagnetization (e.g., Sample 50R-3, 7 cm) (Figure F16B). This comparison suggests that these deeper suevite samples have a greater population of low-coercivity (<20 mT) ferromagnetic grains than the shallower suevite samples (diffuse boundary within Subunit 2A), suggesting a correlation between high magnetization intensities and relatively high proportions of low-coercivity ferromagnetic grains. Throughout Unit 2, the residual magnetizations present after AF 20 mT demagnetization range between ~8 × 10⁻⁹ and ~7 × 10⁻⁶ Am2 with an average value of ~1 × 10⁻⁶ Am2.
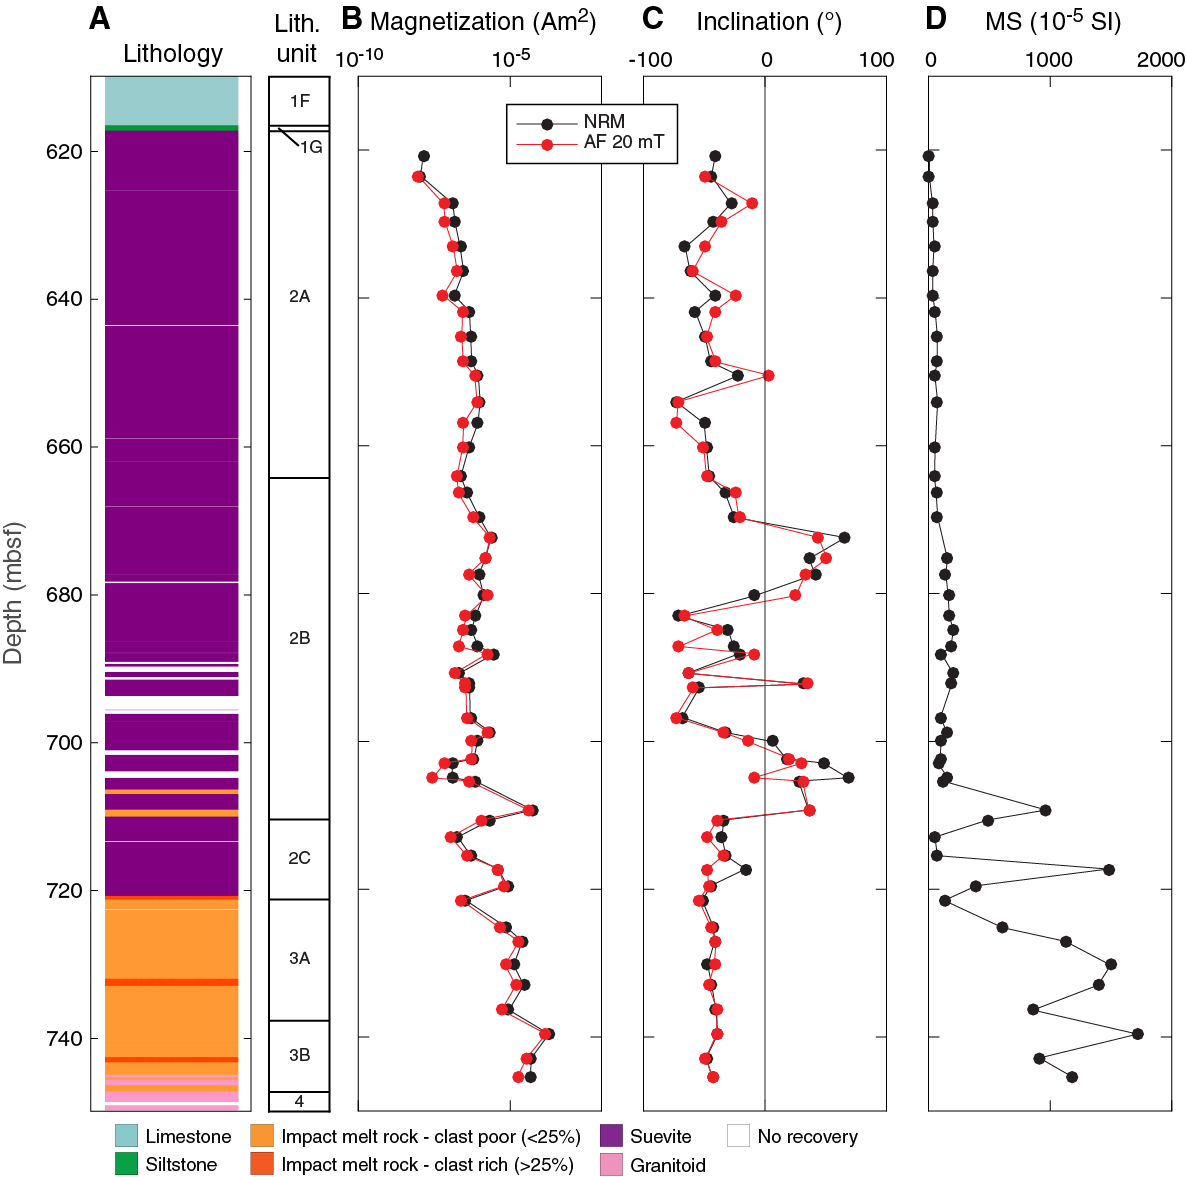
Figure F15. Magnetostratigraphic plots.
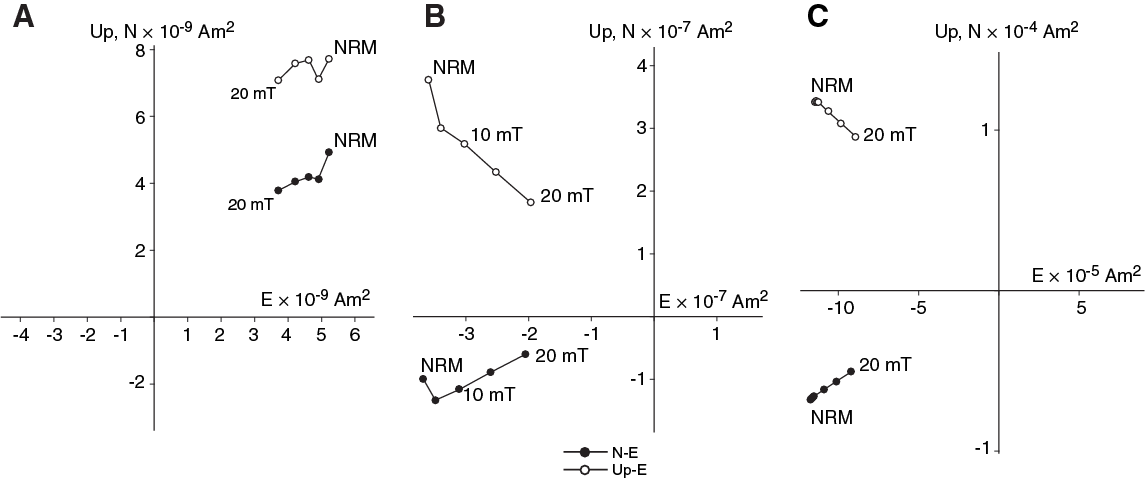
Figure F16. AF demagnetization of suevite and impact melt rock.
The six impact melt rock samples were taken from Cores 81R, 89R, 91R, 93R, 94R, and 95R, which are all from between ~708 and 747 mbsf. The upper sample is from an impact melt rock occurrence within Unit 2, whereas the remaining five samples are from an impact melt rock–dominated interval in Unit 3. Initial NRMs for these samples range from ~2 × 10⁻⁵ to ~2 × 10⁻⁴ Am2 with an average of ~6 × 10⁻⁵ Am2 (Figure F15B). This mean value is ~4 to 5 orders of magnitude higher than the mean NRM of the Post-Impact Sedimentary Rocks interval and ~1 order of magnitude higher than the overlying suevites (Unit 2). Notably, the impact melt rock samples have the highest NRM intensities observed across all lithologies present in the core, with values approaching the cryogenic magnetometer saturation threshold (i.e., the maximum magnetization that can be reliably measured: ~10–4 Am2). However, we were able to measure the highest intensity impact melt rock samples after changing the sensitivity range of the magnetometer (see Paleomagnetism in the Expedition 364 methods chapter [Gulick et al., 2017a]). After AF 20 mT demagnetization, the residual magnetizations in the impact melt rocks range between ~2 × 10⁻⁵ and ~2 × 10⁻⁴ Am2 with an average value of ~5 × 10⁻⁵ Am2. About 75% of the original NRM moment is left after the 20 mT demagnetization step, indicative of both low- and high-coercivity ferromagnetic grain populations in these samples.
The NRM data correlate well with multisensor core logger (MSCL) measurements that demonstrate that impact melt rock has the highest magnetic susceptibilities in the Upper Peak Ring interval. In particular, we observed a gradual increase in magnetic susceptibility values from the top of the suevite to the thickest interval of impact melt rock. The highest magnetic susceptibility values (~1.7 × 10⁻² SI) among the impact melt rock are present at ~740 mbsf, near the contact with the Lower Peak Ring interval (Figure F15D). This peak in magnetic susceptibility agrees well with our NRM measurements, which recorded a maximum value of 2 × 10⁻⁴ Am2 at the same depth (Sample 93R-2, 37 cm) (Figure F16C).
Magnetic polarity zones
The NRMs of most of the suevite samples have negative magnetic inclinations (i.e., reversed polarity) (Figure F15C) with an average value of –43°. The impact melt rock samples we measured all exhibit reversed polarity as well, with an average NRM inclination of –44°. These inclinations are indistinguishable from the –44° mean inclination previously obtained for reversely magnetized suevite and impact melt rock samples during prior investigations of these lithologies within the Chicxulub crater (Urrutia-Fucugauchi et al., 1994, 2004; Velasco-Villareal et al., 2011).
Three zones of normal polarity were observed within the suevite: Cores 57R–60R, 68R, and 73R–80R (~668–677, 691–693, and 699–706 mbsf, respectively). Samples from these normal polarity zones have an average NRM inclination of 38°, which is again nearly identical to previously reported values for Chicxulub suevite samples that exhibit normal polarity (Velasco-Villareal et al., 2011). The suevite and impact melt rock were likely formed and emplaced within minutes of the impact, which took place when the geomagnetic field exhibited reversed polarity (i.e., during Chron 29r). Therefore, we interpret the observed normal polarity zones to be the result of the effect of post-impact remagnetization event(s).
Geochemistry and mineralogy
Discrete bulk rock X-ray fluorescence, total carbon, and X-ray diffraction data on samples from Cores 40R–95R (617.33–747.02 mbsf) provide a picture of bulk chemistry and mineralogy for the Upper Peak Ring interval, which is composed of suevite and impact melt rock.
Major and trace elements and carbon and sulfur content
Major and minor elements
The major and minor element compositions of 50 samples from Cores 40R–95R (617.33–747.02 mbsf) are given in Table T2. Their depth profiles are plotted in Figures F17, F18, and F19. The relative error was 0.9% for SiO2, 1.7% for TiO2, 0.6% for Al2O3, 1.2% for MnO, 0.4% for FeO and CaO, and 0.2% for K2O. We attained poorer precision in our analyses of P2O5 (3.2%), MgO (3.3%), and Na2O (~5%).
Table T2. Major element compositions. Download table in CSV format.
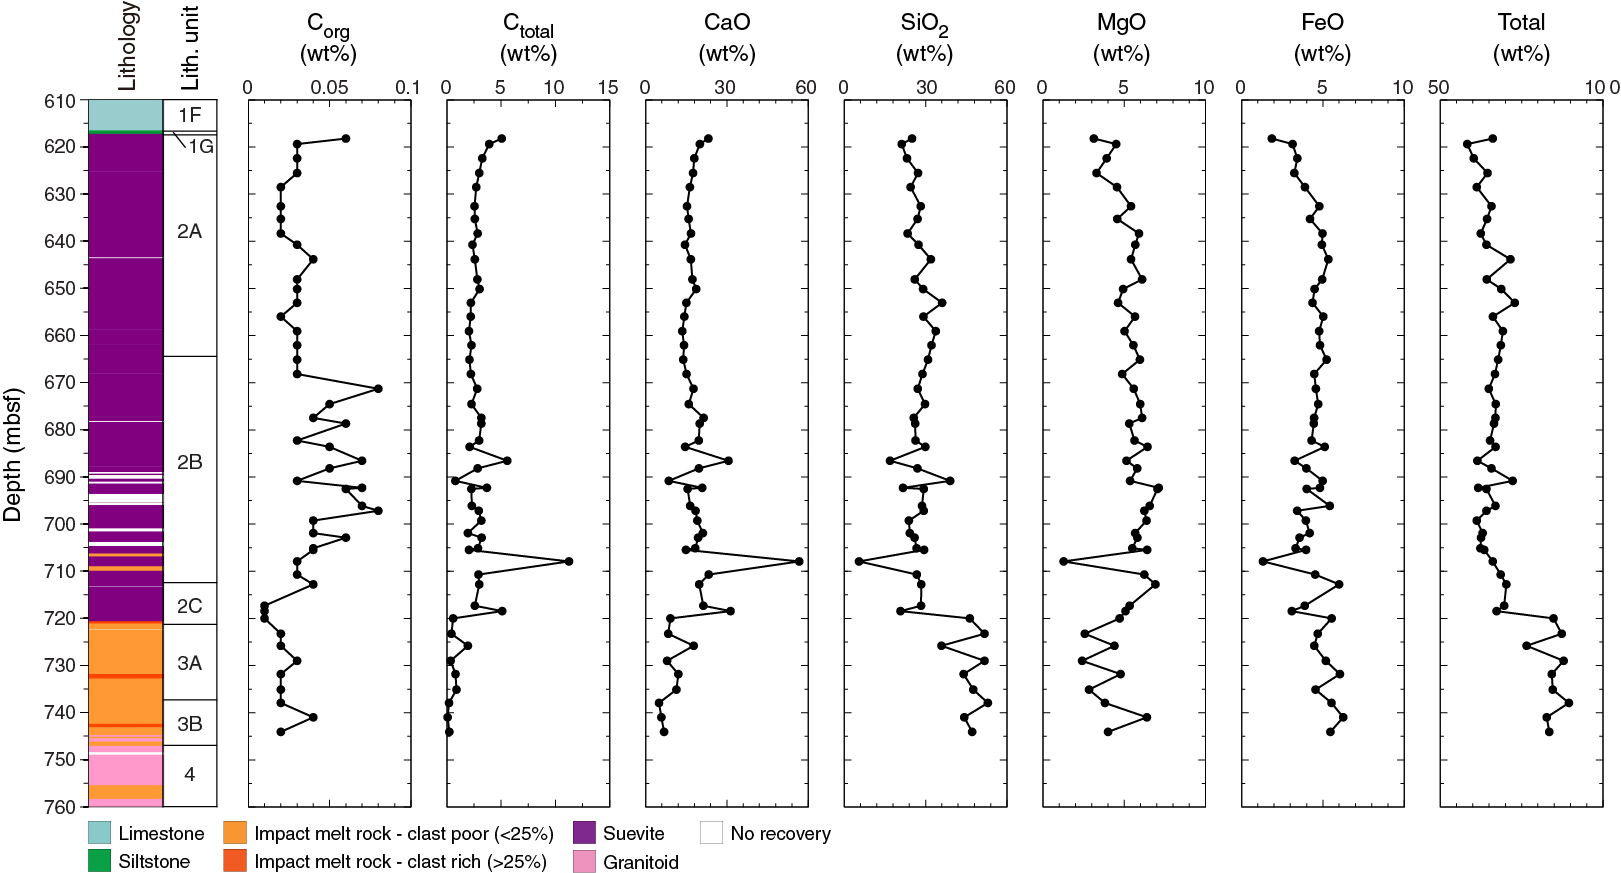
Figure F17. Major element compositions.

Figure F18. Minor element compositions.
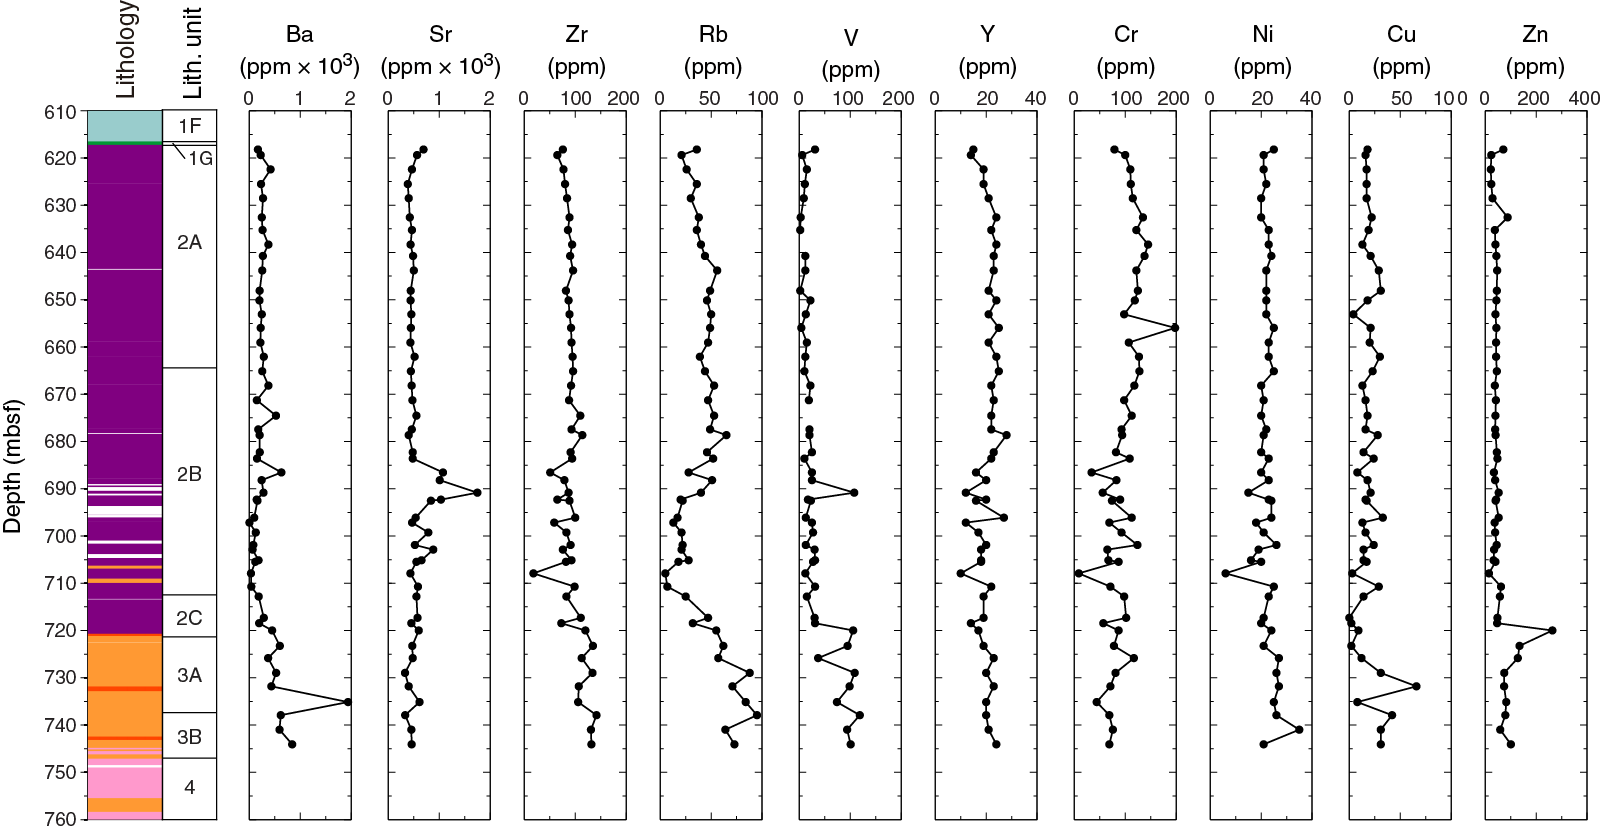
Figure F19. Trace element compositions.
These major and minor elements show pronounced variation with depth. For example, the SiO2 content varies from as low as 5.43 wt% to a maximum of 52.99 wt%. Chemical data suggest that the Upper Peak Ring interval consists of an upper portion of suevite to 683 mbsf that appears grossly homogeneous. In a lower portion of suevite from 683 to 719 mbsf, sample compositions show more scatter. For example, the standard deviation (σ) of the concentration of SiO2 is 7.0 wt% in the lower portion compared to 3.5 wt% in the portion above, for TiO2 σ is 0.12 wt% compared to 0.04 wt%, and for Al2O3 σ is 2.1 wt% compared to 0.8 wt% in the portion above, whereas the overall concentration trends appear grossly similar to those of the upper portion. The lowermost portion, which is dominated by impact melt rock, is chemically distinct with higher concentrations of SiO2, TiO2, Al2O3, FeO, and, notably, oxide totals that are on average 20 wt% higher than those of the suevite above. (Figures F17, F18).
The suevite (Subunit 2A) shows enrichment in Zr, Rb, Br, Al, Si, K, Ti, Sr, and Ba, with a depletion in Mn compared to the siltstone (Subunit 1G) above. In the suevite (Subunit 2A), Ca is relatively depleted compared to the units above, but still abundant.
Carbon and sulfur
The concentrations of total carbon (Ctotal), organic carbon (Corg), carbonate carbon (Ccarb), and sulfur in the 50 samples from Cores 40R–95R (617.33–747.02 mbsf) are given in Table T3, and the depth profiles of Corg, Ctotal, and sulfur are shown in Figure F20. The relative errors of our analyses are within 5.0% for Ctotal and Corg and 1.0% for S.
Table T3. Carbon and sulfur contents. Download table in CSV format.
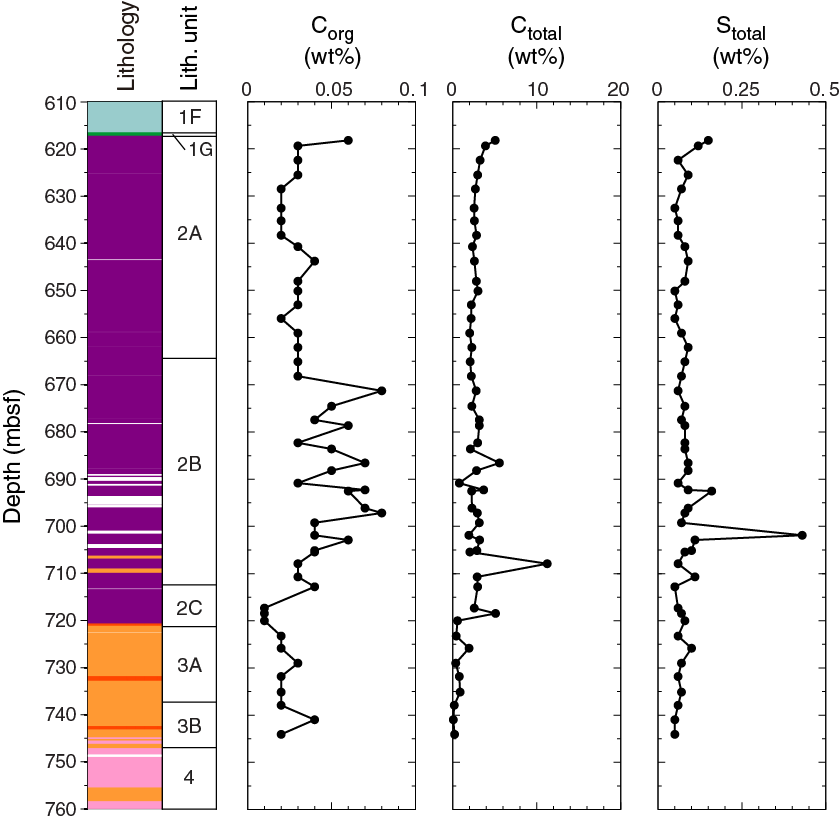
Figure F20. Carbon and sulfur contents.
Corg concentrations are generally very low with an average of 0.04 wt% (Figure F20). Minor excursions to concentrations as high as 0.08 wt% occur between 671.33 and 702.88 mbsf. Ccarb dominates the Ctotal contents and correlates with the CaO concentrations. There are two broad trends in the Ctotal concentration profile, showing a background average of 2–4 wt% Ctotal in the suevite section (617.33–719.99 mbsf) and a background average of <1 wt% in the impact melt rock section (719.99–747.02 mbsf). Three concentration peaks occur at sample depths of 686.56, 707.92, and 718.45 mbsf. The average sulfur concentration in this section is 0.08 wt%, with one notable excursion to 0.43 wt% at 701.89 mbsf.
Trace elements
Trace element compositions are shown in Table T4. Their depth profiles are plotted in Figure F19. Relative errors are 1.0% for Sr and S, 0.6% for Zr, and typically >5% for the other trace elements.
Table T4. Minor and trace element compositions.< Download table in CSV format.
In the upper portion from 619 to 683 mbsf, trace element concentrations are fairly homogeneous, with some, such as Zr, Rb, and Yb, showing gradual increases in concentration with depth (Figure F19). Similar to the major and minor element concentrations, trace element concentrations between 683 and 719 mbsf also show more scatter, which is especially pronounced in the depth profiles for Sr, Zr, Rb, Y, Ni, Cr, and Cu. In Unit 3 (impact melt rocks), Ba, Zr, Rb, V, and Zn concentrations are strongly enriched compared to the suevite subsections; the average concentrations of Ba and V in the impact melt rock are 709 and 93 ppm, respectively, compared to 221 and 20 ppm in the suevite above 719 mbsf.
Mineralogy
The composition of the bulk mineralogy of 50 samples from Cores 40R–95R (617.33–747.02 mbsf) is presented in Table T5, and their depth profiles are shown in Figure F21. For a general description of the different minerals present in this interval, refer to Table T5.
Table T5. Abundance of all minerals in the upper peak ring rocks. Download table in CSV format.
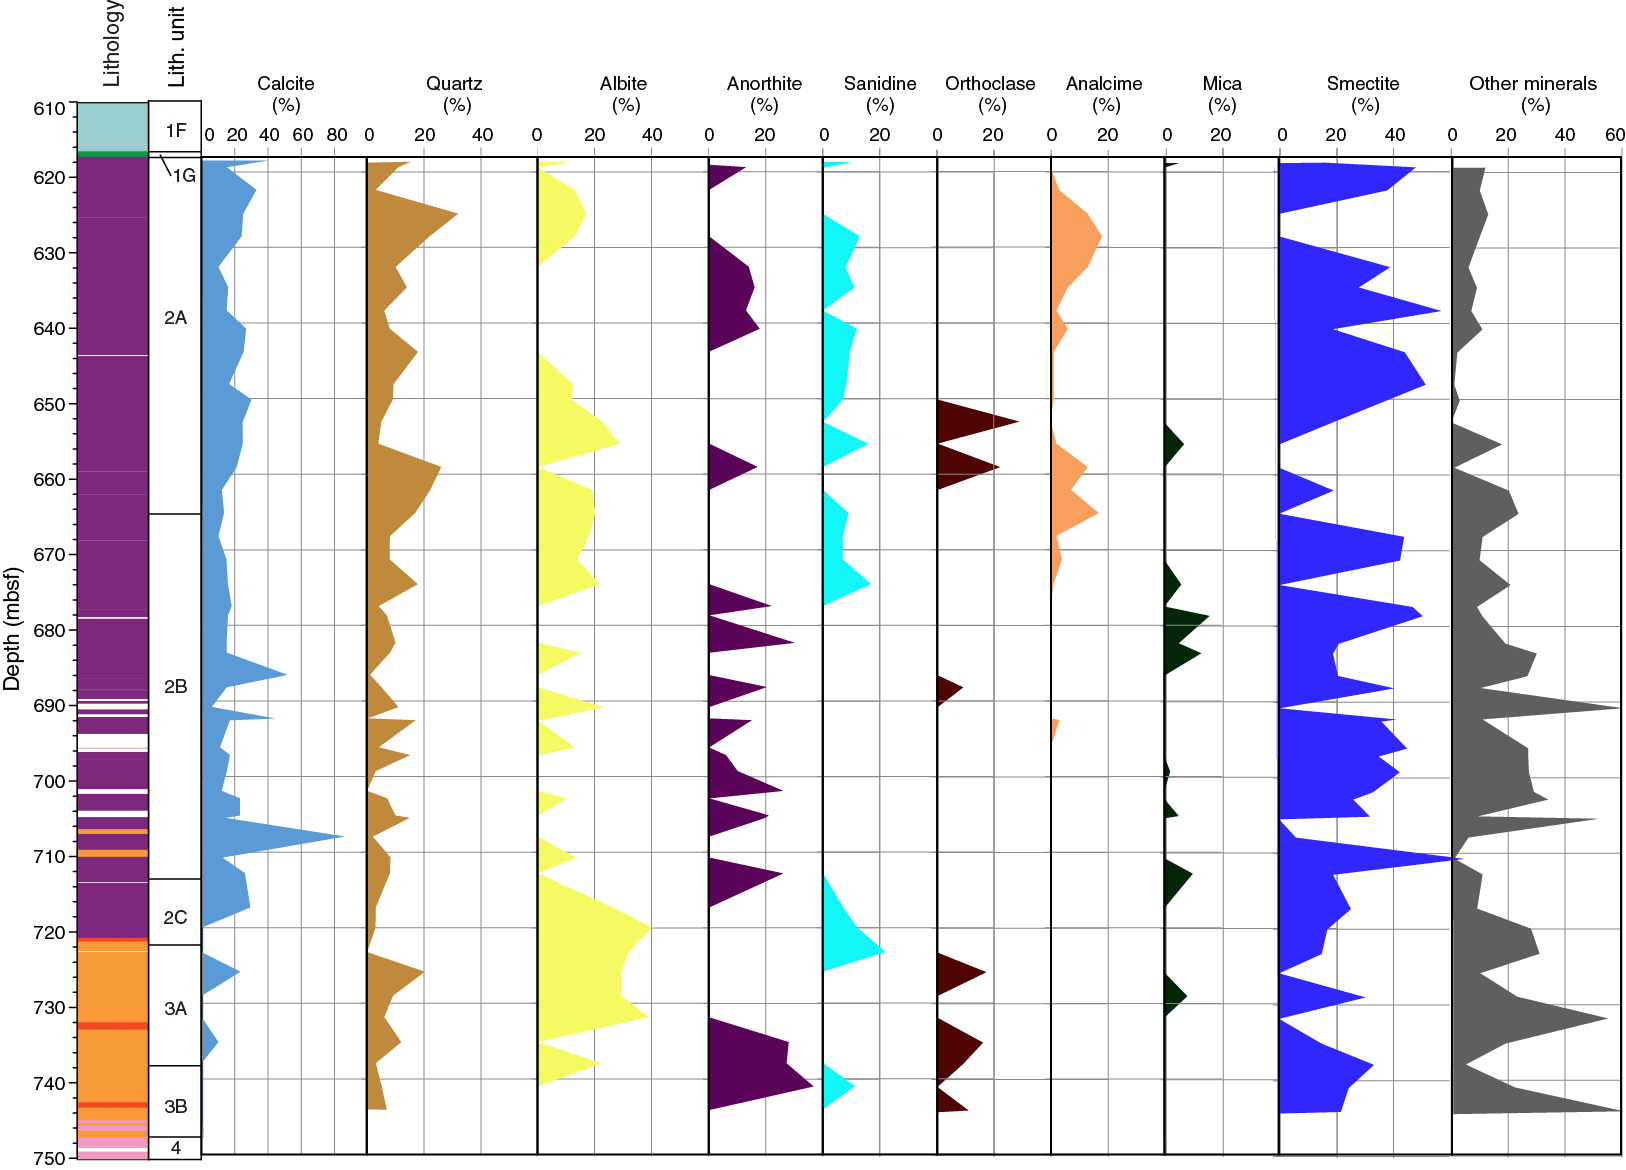
Figure F21. Bulk mineralogy.
The mineralogical assemblage can be divided into two intervals:
- In Core 40R through Section 85R-1 (617.33–717.31 mbsf; Subunits 2A–2C [suevite]), the mineralogical assemblage is mainly composed of calcite (average = 20%), quartz (average = 15%), and two main types of feldspar, anorthite, and albite (average = 15%), that are anticorrelated throughout the unit. Analcime and sanidine occur in abundances as high as ~20% from 619.39 to 674.54 mbsf. Orthoclase was detected in six samples (Figure F21). The clay fraction is mainly composed of smectite (saponite, nontronite, montmorillonite, and aerinite) and traces of mica (biotite, glauconite, and phlogopite), serpentine (chrysotile and antigorite), clinoptilolite, vermiculite, and kaolinite. Accessory minerals are highly variable and include oxides (cristobalite, tridymite, hematite, corundum, and portlandite), zeolites (stibilite, stellerite, heulandite, mordenite, and andesite), silicates (hastingsite, richterite, barrenite, stevensite, talc, beryl, hedenbergite, sodalite, diopside, almandine, ferrosilite, and clinoferrosilite), evaporites (gypsum, halite, and anhydrite), carbonates (siderite and manasseite), phosphates (brushite), pyroxenes (augite), volkovskite, and amphiboles (magnesiohornblende).
- In Core 87R through Section 95R-2 (719.54–744.88 mbsf; Subunits 3A and 3B [impact melt rock]), the mineralogical assemblage is mainly composed of albite and anorthite (average = 30%), as well as quartz (average = 10%). Here, calcite is almost completely absent in the samples. The clay fraction is dominated by smectite (average = 20% of saponite) and traces of mica (phlogopite and glauconite), chlorite (clinochlore), vermiculite, clinoptilolite, and serpentine (lizardite and antigorite). Accessory minerals are again highly variable, including feldspar (sanidine, orthoclase, bassanite, and nepheline), zeolite (microcline and andesine), silicates (talc, forsterite, sodalite, diopside, and ferrosilite), evaporite (gypsum), and oxides (corundum and magnetite). Of particular note is the occurrence of coesite, a high-pressure polymorph of quartz, in Core 87R at 719.99 mbsf, near the top of Unit 3 (impact melt rocks).
Physical properties
P-wave velocity
P-wave velocities from discrete sample measurements generally range from ~2700 to 4800 m/s (Figure F22). Velocities from 617 to 680 mbsf in the suevite are fairly uniform with a mean value of ~3150 m/s. Velocities are more variable in the suevite from 680 to 722 mbsf, ranging from ~2750 to 4100 m/s (with two higher values of 4450 and 5000 m/s), and increase to ~3700–4800 m/s (with two lower values of 2400 and 3400 m/s) in the impact melt rock section from 722 to 747 mbsf (Unit 3). P-wave velocities sharply decrease at the boundary from the overlying Post-Impact Sedimentary Rocks interval to the Upper Peak Ring interval (Subunit 2A), but there is no clear change in values between the Upper and Lower Peak Ring intervals (Subunit 3B–Unit 4). From ~617 to 710 mbsf, discrete sample P-wave velocities are consistently higher (by an average of ~300 m/s) but follow the general trend of the downhole sonic log and VSP. From ~710 to 747 mbsf (approximately equal to Subunits 2C–3B) and across the boundary into the Lower Peak Ring interval (Unit 4), there is a close match between the discrete P-wave measurements and the downhole sonic log. Where the downhole sonic log and VSP diverge, the discrete measurements more closely follow the sonic log.

Figure F22. Physical properties.
Porosity
Porosities decrease from ~35%–37% at the top of the Upper Peak Ring interval to 15%–25% at the base (Figure F22). Porosities gradually decrease from 35%–37% to 31%–35% in Subunit 2A, are variable between ~20% and 40% in Subunit 2B, and decrease to 15%–25% in Subunits 2C–3B where impact melt rocks were first observed. There is one porosity measurement of ~3% from a large clast at ~708 mbsf. In general, porosities are inversely correlated with velocities, with higher porosities occurring in zones of lower velocity. There are sharp changes in porosities across both the top and bottom boundaries of the interval, with lower porosities observed in the overlying Post-Impact Sedimentary Rocks interval and underlying Lower Peak Ring interval.
Density
Bulk densities increase from ~2.0–2.1 g/cm3 at the top of the Upper Peak Ring interval to 2.3–2.5 g/cm3 at the base (Figure F22). Bulk densities generally follow a positive relationship with velocities and an inverse relationship with porosities. Bulk densities vary from 2.0 to 2.15 g/cm3 in Subunit 2A, are variable from ~2.0 to 2.35 g/cm3 in Subunit 2B, and increase to 2.2–2.5 g/cm3 in Subunits 2C–3B, where impact melt rock was first observed. There is one bulk density measurement of 2.7 g/cm3 from a large clast at ~708 mbsf. Density sharply decreases across the boundary from the overlying Post-Impact Sedimentary Rocks interval to the Upper Peak Ring interval, but there is no clear change across the boundary to the underlying Lower Peak Ring interval. There is good correspondence between bulk densities measured on discrete samples and those measured with gamma ray attenuation using the MSCL, although more variation is observed in the MSCL values.
Thermal conductivity
Thermal conductivity values generally range from 1.4 to 1.85 W/(m·K), with a few lower and higher values (Figure F22). Thermal conductivity values decrease from ~1.5–1.6 to 1.4–1.5 W/(m·K) in Subunit 2A, vary from 1.2 to 1.85 W/(m·K) with a mean value of 1.56 W/(m·K) in Subunit 2B, and vary from 1.35 to 2.2 W/(m·K) with a mean value of 1.68 W/(m·K) in Subunits 2C–3B, where impact melt rock was first observed. There are sharp changes across the boundaries to the overlying Post-Impact Sedimentary Rocks interval and underlying Lower Peak Ring interval, with lower thermal conductivities observed in the Upper Peak Ring interval. Thermal conductivities follow a similar trend to P-wave velocities and bulk densities.
Resistivity
Resistivities increase from ~1.4 to 2.3 Ωm in Subunit 2A, have large variations from 0.5 to 5.2 Ωm in Subunits 2B–2C, and decrease to 0.4–3.4 Ωm in the impact melt rock section (Unit 3) (Figure F22). There are sharp increases to higher resistivities at the boundaries to the overlying Post-Impact Sedimentary Rocks interval and underlying Lower Peak Ring interval. MSCL resistivities are consistently higher but follow the same trend as those obtained in the downhole log (resistivity derived from the EM51 induction tool) in Subunits 2A–2B, but MSCL resistivities are lower than downhole log resistivities in Subunits 2C–3B where impact melt rock was observed. The cause for these differences remains to be determined.
Magnetic susceptibility
Magnetic susceptibility values measured by the MSCL increase from ~2 × 10⁻⁵ SI at the top of the interval to ~1000 × 10–5 to 2000 × 10–5 SI at the base (Figure F23). Values increase from ~2 × 10⁻⁵ SI at 617 mbsf to ~25 × 10–5 SI at 624 mbsf and to ~75 × 10–5 SI at the base of Subunit 2A. Values range from ~50 × 10–5 to 340 × 10–5 SI in Subunit 2B and are highly variable in Subunit 2C with values of ~20 × 10–5 to 2000 × 10–5 SI. The highest values were observed in the impact melt rock (Unit 3), where they increase from ~475 × 10–5 to 2000 × 10–5 SI. There is a decrease in magnetic susceptibility values at the top of the underlying Lower Peak Ring interval. Magnetic susceptibility values measured by the MSCL are consistently lower than those measured by the wireline downhole log but have a similar trend as a result of the difference in volume of investigation between the tools used (wireline measures a larger volume than the MSCL) (e.g., Dubuisson et al., 1995).
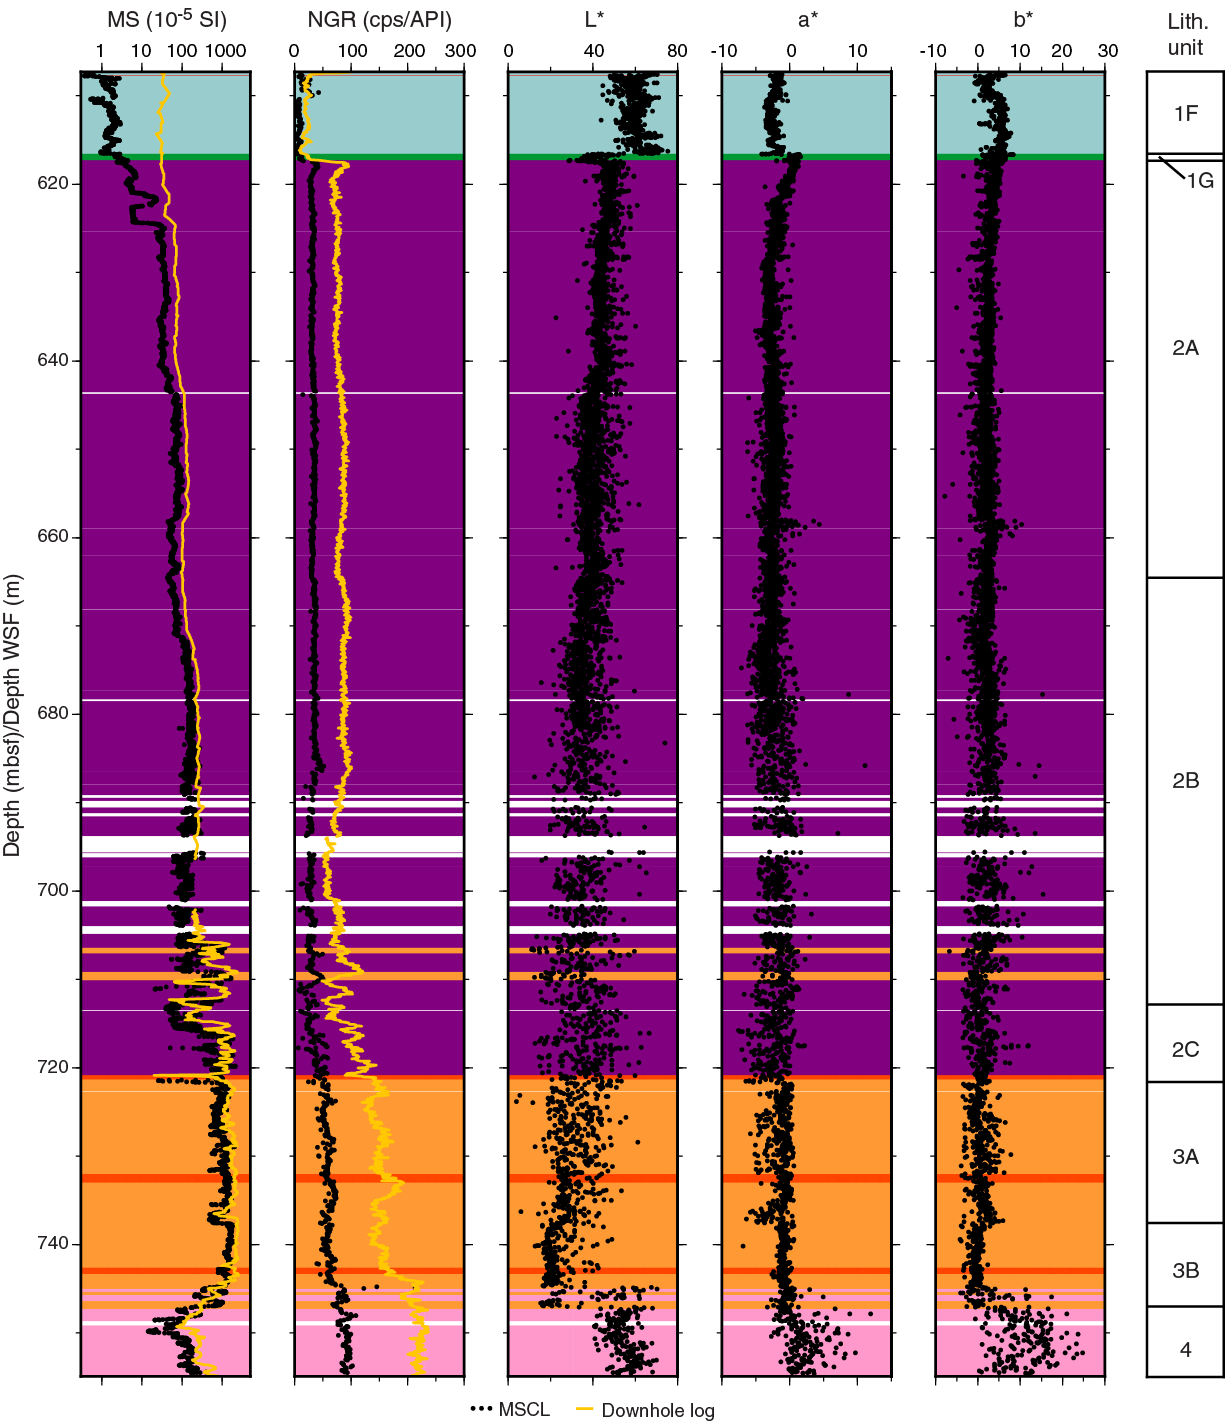
Figure F23. Magnetic susceptibility, NGR, and L*, a*, and b*.
Natural gamma radiation
NGR values range from ~26 to 42 counts/s from 617 to 685 mbsf with a mean value of 34 counts/s (Figure F23). Values are highly variable from 685 to 721 mbsf, with NGR values of ~3–60 counts/s. NGR values increase in the impact melt rock section (Unit 3) to ~40–70 counts/s, with a few values as high as 214 counts/s. There is a sharp increase in NGR values across the boundary from the overlying Post-Impact Sedimentary Rocks interval to the Upper Peak Ring interval and from the Upper Peak Ring interval to the underlying Lower Peak Ring interval. The trend of the NGR values measured by the MSCL in counts per second is in good agreement with the one from the wireline downhole log in API units.
Color reflectance
Color reflectance L* values steadily decrease throughout the Upper Peak Ring interval from a mean value of 34 at the top to 20 at the base (Figure F23). L* values are more variable from 682 to 745 mbsf than from 617 to 682 mbsf. Except for a small decrease in a* values from 617 to 621 mbsf, a* values are relatively constant, with a mean value of –2.1. There is no trend in b* values, which have a mean value of 2.0. There is a sharp decrease in L* and an increase in a* values at the boundary from the overlying Post-Impact Sedimentary Rocks interval to the Upper Peak Ring interval; L*, a*, and b* values increase and show more variability in the underlying Lower Peak Ring interval.
Downhole logging
Downhole logging measurements (617.33–747.02 mbsf; 617.45 to approximately 746.2 m WSF) were conducted during the Middle (from 697 m WSF to the pipe entrance at ~507 m WSF) and Lower B logging sessions (from 935 m WSF to the pipe entrance at ~701 m WSF) (Figure F24; see Figure F26 in the Expedition 364 methods chapter [Gulick et al., 2017a]). As a consequence, there is a small gap in the downhole data between ~701 and 697 m WSF where it was not possible to acquire open-hole downhole logs.
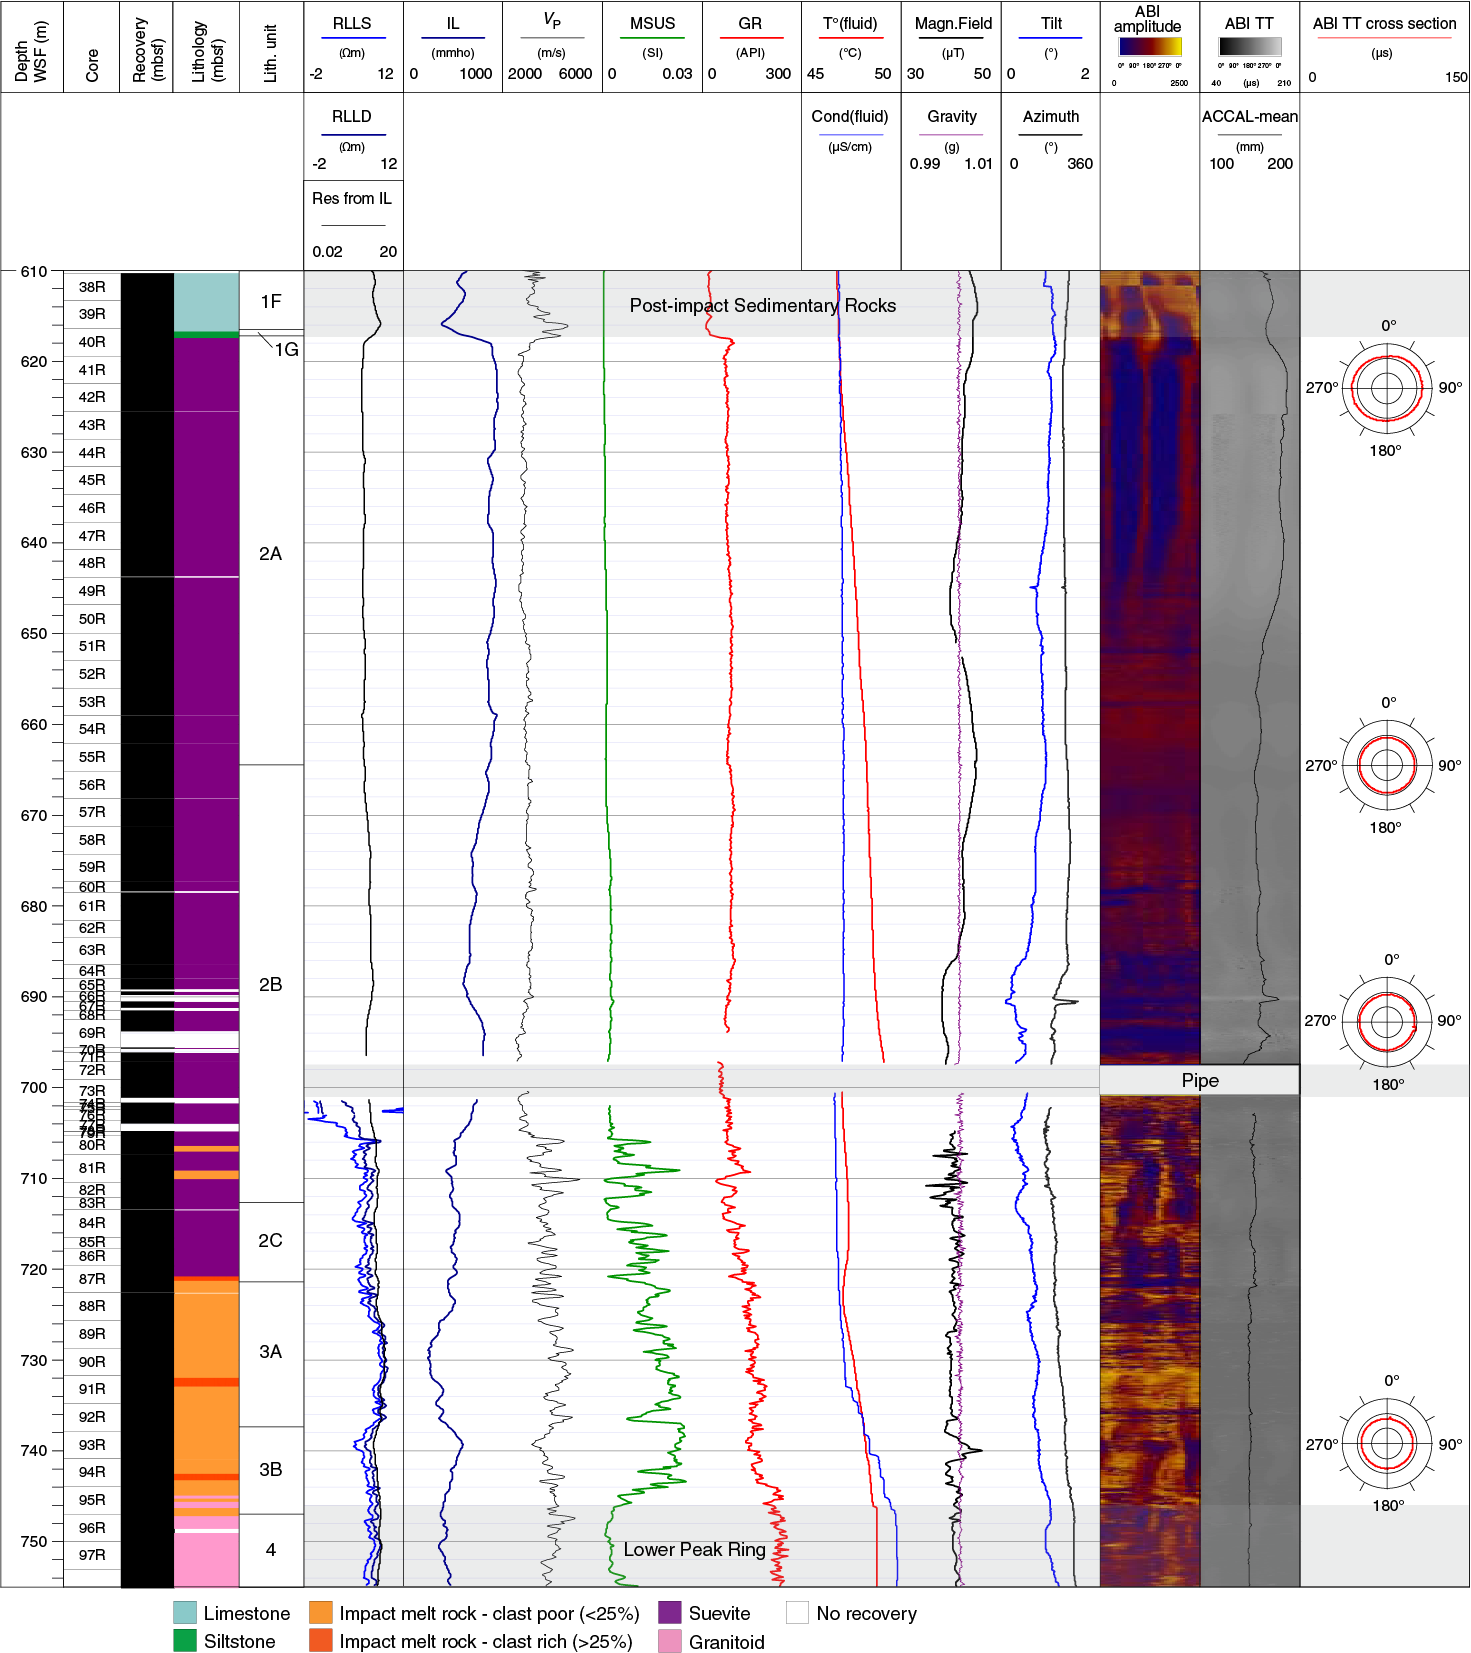
Figure F24. Wireline downhole log data.
Wireline logs
From ~616 to 746 m WSF, the hole was very stable, and borehole conditions were good. Wireline log data quality is good except for conductivity and magnetic susceptibility (EM51 tool) between 616 and ~697 m WSF due to a technical problem during the Middle logging session (see Downhole logging in the Expedition 364 methods chapter [Gulick et al., 2017a]). The acoustic borehole images (ABIs) are of lower quality between 616 and 644 m WSF due to decentralization of the tool. The downhole logs are in good agreement with the physical properties measurements performed on whole-round cores and discrete samples (see Physical properties). The gamma ray logs from the various tool strings and runs match well, and only a small number of minor postacquisition depth-shift adjustments (of less than 0.6 m) were required to align the various passes. The pipe entrance during the Lower B logging session was determined to be at 700.8 m WSF on the ABI. Between 697 and 701 m WSF, gamma ray values are lower than those recorded at greater depths as a result of attenuation of the signal through the pipe.
The boundary with the overlying Post-Impact Sedimentary Rocks interval is identified at ~617.45 m WSF on the ABIs (Figure F25A), at a depth where there are major changes in the wireline log properties; for example, there is a sharp downhole decrease in P-wave sonic velocities (from >4000 to <3000 m/s) and induction resistivity (from ~4 to 1.2 Ωm) and an increase in gamma ray (from 10 to >65 API) (Figure F24). This petrophysical boundary fits with the transition between Subunits 1G and 2B in Section 40R-1 (see Lithology).

Figure F25. Core-log integration.
In the Upper Peak Ring interval, wireline logs are characterized by a clear change in log pattern at ~705.5 m WSF (Figure F24). Above this depth, from ~616 to 705.5 m WSF, the logs show low variability (Figure F26). The induction resistivity log gives values ranging between ~1.1 and 1.6 Ωm with an average resistivity of 2.56 Ωm. Resistivity and sonic logs follow the same trend. Sonic P-wave velocities range between 2400 and 3400 m/s with an average of ~2900 m/s. Magnetic susceptibility is low, ranging between 33 × 10−5 and 260 × 10–5 SI. The gamma ray log shows low variability, with values ranging between 40 and 115 API with an average of 80 API. The borehole fluid temperature (T°fluid) increases progressively downhole from 46.9°C at the base of the post-impact formation to 47.3°C at ~705 m WSF. Borehole fluid conductivity (Condfluid) ranges between 80,000 and 83,000 µS/cm. A sharp step is observed between 698 and 701 m WSF in both the temperature and conductivity logs. This step is due to the fact that the borehole fluid logs above and below this interval were not acquired during the same logging sessions (see Downhole logging in the Expedition 364 methods chapter [Gulick et al., 2017a]). In both cases, the borehole fluids did not have time to equilibrate with the ambient formation. In addition, they did not reach the same degree of nonequilibrium. The borehole fluid temperature thus likely reflects a minimum value for the in situ temperature of the formation, whereas borehole conductivity is affected by the recent drilling operations and the presence of drill mud (Middle logging session) and seawater in the hole (Lower B logging session). From ~616 to 705.5 m WSF, the acoustic caliper logs show a relatively regular borehole shape with a slight enlargement between 616 and 644 m WSF, where the borehole shape is more elliptical.
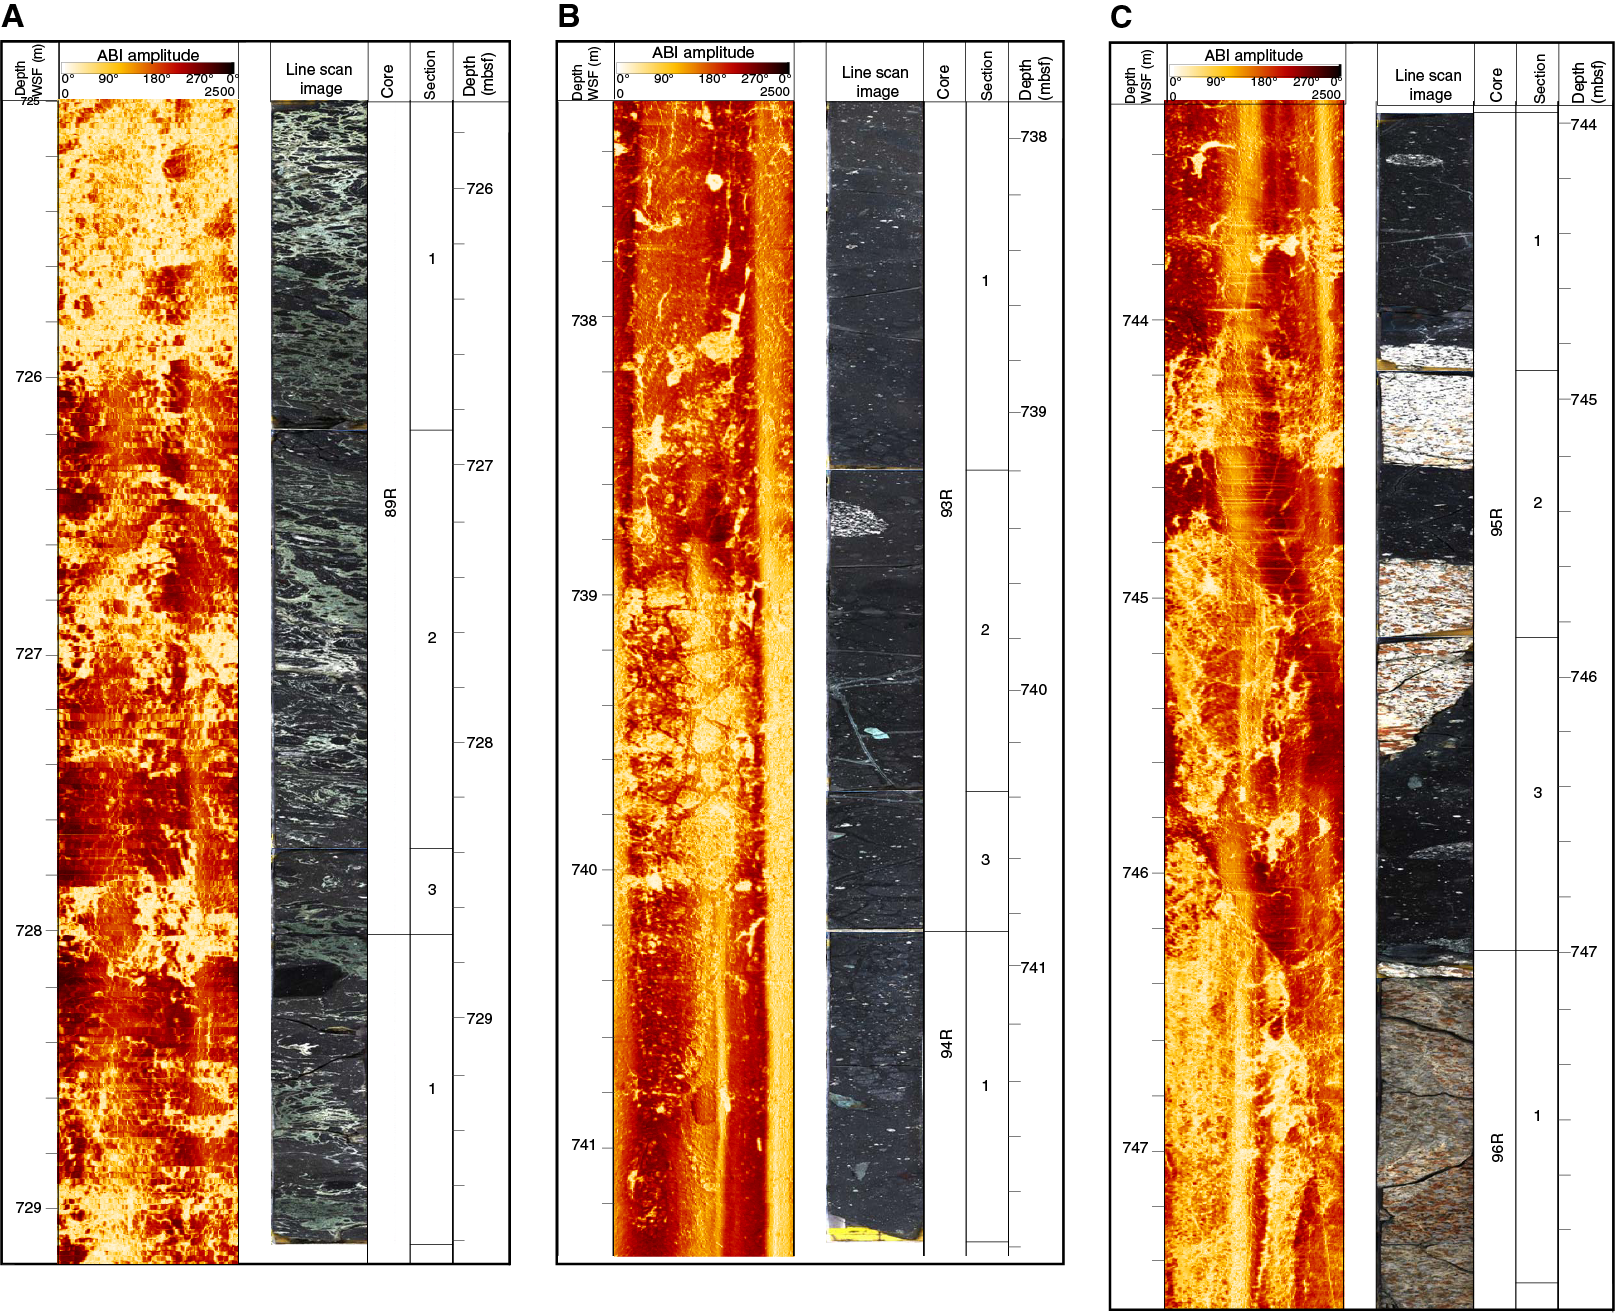
Figure F26. Core-log integration.
At ~705. 5 m WSF (Figure F24), sharp increases in sonic P-wave velocity and magnetic susceptibility are observed, along with a moderate increase in gamma ray and resistivity. This transition in the wireline log patterns is observed ~7 m above the transition between Subunits 2B and 2C, placed at 712.84 mbsf in Section 83R-1 (see Lithology).
From ~705.5 to ~747 m WSF, the wireline logs show a much higher variability compared to the logs above (Figure F24). Induction resistivity log values range between ~2.5 and 5.76 Ωm with an average resistivity of 3.60 Ωm. The induction resistivity and resistivity logs show the same trend. The shallow and deep readings of the resistivity tool (DLL3) have a higher vertical resolution and slightly lower resistivities than the induction tool (EM51). From 726 to 737 m WSF, where there is impact melt rock belonging to Subunit 3A (see Lithology), the three logs give almost the same resistivities. However, MSCL resistivity values measured on whole-round cores in this interval show lower resistivities in this zone (Figure F22), whereas they are consistently higher than those measured in the downhole log in the Upper Peak Ring material above. The origin of these differences still needs to be explained.
Resistivity and sonic logs are well correlated. Sonic P-wave velocities range between 2800 and 5200 m/s with an average of ~3900 m/s, ~1000 m/s higher than in the suevite above. Magnetic susceptibility is high, showing high variability at a meter scale, ranging between 200 × 10–5 and 3000 × 10–5 SI with an average of 1000 × 10–5 SI. Below ~710 m WSF, the gamma ray log shows more variability, increases downhole, and ranges between 32 and 260 API. The borehole fluid temperature (T°fluid) shows a progressive downhole increase from 47.35° to 48.63°C. Borehole fluid conductivity (Condfluid) ranges between 80,000 and 96,000 µS/cm. An increase in the borehole fluid conductivity slope is observed at ~734 m WSF.
Throughout the entire Upper Peak Ring interval, ABIs are low to good quality. Between 616 and 644 m WSF, the images were impacted by the elliptical shape of the borehole, as seen in the traveltime cross sections at ~623 m WSF (Figure F24). Below 644 m WSF, the ABIs are of good quality, although interpretation is not simple due to the complexity of the formation. The images correlate well with the core line scans; however, where some distinct features are visible, an offset of up to 70 cm is observed between the two data sets (Figures F25, F26). The general gradational change in clast size in the suevites is well identified, as are locally the impact melt rock, schlieren within the melt rock, and granitoid clasts in Subunits 3A and 3B (Figure F27) (see Lithology). Some planar contacts were also identified locally (e.g., impact melt rock/granitoid contact at ~744.5 m WSF in Figure F27C) with dipping boundaries appearing as sinusoides. The amplitude of the ABIs (lighter colors in Figure F24) increases below ~705 m WSF, which correlates with an increase in sonic P-wave velocity.
Vertical seismic profile
The three-component VSP collected from 620.0 to 745.0 m WSF was of somewhat lower quality than shallower VSP runs during Expedition 364, with a loss of high-frequency components below ~697 m WSF. The vertical component of the VSP (Figure F28) shows a broad spectrum waveform dominated by frequencies below 300 Hz, with the largest peak at 23 Hz and a second major peak at 62 Hz. First-arrival traveltimes were picked (Figure F26B), and then a moving window algorithm was used to find differential P-wave velocities with depth (Figure F26C). Recorded data are adversely affected by reverberations at ~655, 668, and 685 m WSF. The suevite region has an average velocity of 2970 ± 21 m/s and below 720 m WSF the average velocity increases to 4236 ± 11 m/s (see Figure F15 in the Expedition 364 summary chapter [Gulick et al., 2017b]).
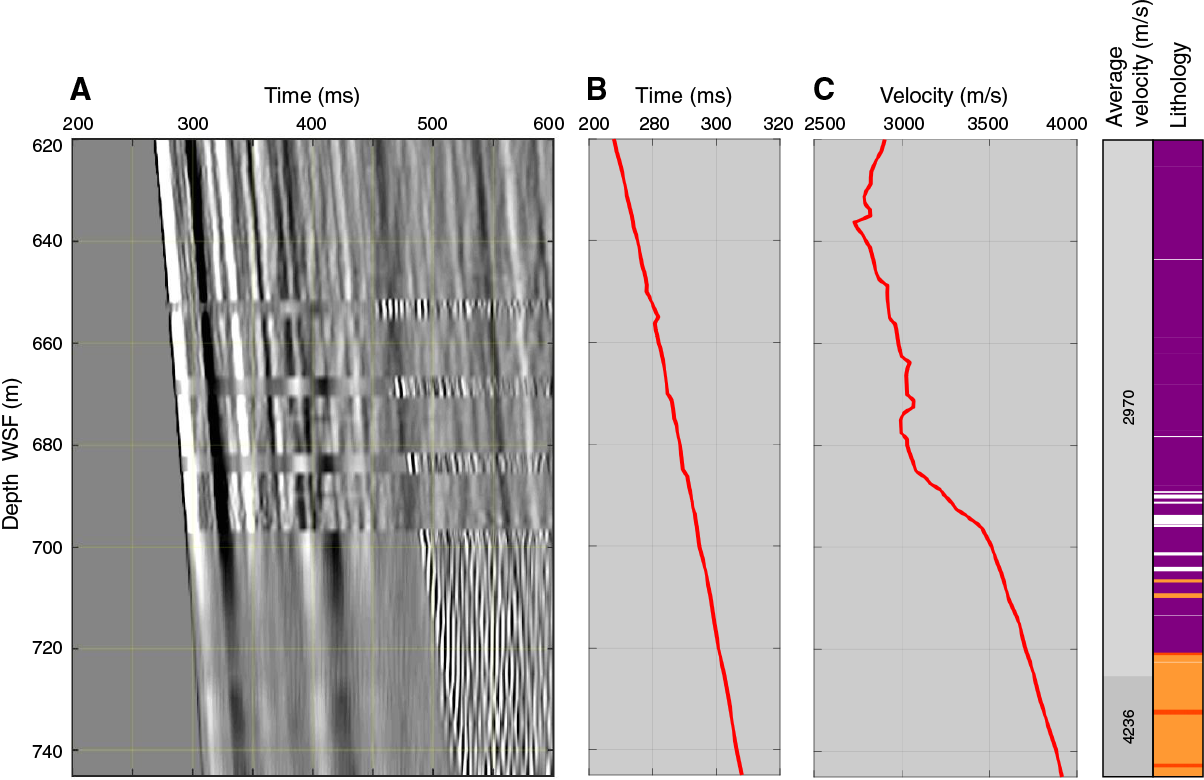
Figure F27. VSP vertical component.
Primary arrivals in the radial and azimuthal horizontal components are mostly coherent above 700 m WSF (Figure F28). Below 700 m WSF, the data quality is poor.

Figure F28. VSP horizontal component.
References
Claeys, P., Heuschkel, S., Lounejeva-Baturina, E., Sanchez-Rubio, G., and Stöffler, D., 2003. The suevite of drill hole Yucàtan 6 in the Chicxulub impact crater. Meteoritics & Planetary Science, 38(9):1299–1317. https://doi.org/10.1111/j.1945-5100.2003.tb00315.x
Dubuisson, G., Thibal, J., Barthès, V., Pocachard, J., and Pozzi, J.-P., 1995. Downhole magnetic logging in sediments during Leg 145: usefulness and magnetostratigraphic interpretation of the logs at Site 884. In Rea, D.K., Basov, I.A., Scholl, D.W., and Allan, J.F. (Eds.), Proceedings of the Ocean Drilling Program, Scientific Results, 145: College Station, TX (Ocean Drilling Program), 455–468. https://doi.org/10.2973/odp.proc.sr.145.135.1995
Ferrière, L., Koeberl, C., and Reimold, W.U., 2009. Characterization of ballen quartz and cristobalite in impact breccias: new observations and constraints on ballen formation. European Journal of Mineralogy, 21(1):203–217. https://doi.org/10.1127/0935-1221/2009/0021-1898
Gulick, S., Morgan, J., Mellett, C.L., Green, S.L., Bralower, T., Chenot, E., Christeson, G., Claeys, P., Cockell, C., Coolen, M.J.L., Ferrière, L., Gebhardt, C., Goto, K., Jones, H., Kring, D., Lofi, J., Lowery, C., Ocampo-Torres, R., Perez-Cruz, L., Pickersgill, A.E., Poelchau, M., Rae, A., Rasmussen, C., Rebdolledo-Vieyra, M., Riller, U., Sato, H., Smit, J., Tikoo, S., Tomioka, N., Urrutia Fucugauchi, J., Whalen, M., Wittmann, A., Yamagachi, K., Xiao, L., and Zylberman, W., 2017a. Expedition 364 methods. In Morgan, J., Gulick, S., Mellett, C.L., Green, S.L., and the Expedition 364 Scientists, Chicxulub: Drilling the K-Pg Impact Crater. Proceedings of the International Ocean Discovery Program, 364: College Station, TX (International Ocean Discovery Program). https://doi.org/10.14379/iodp.proc.364.102.2017
Gulick, S., Morgan, J., Mellett, C.L., Green, S.L., Bralower, T., Chenot, E., Christeson, G., Claeys, P., Cockell, C., Coolen, M.J.L., Ferrière, L., Gebhardt, C., Goto, K., Jones, H., Kring, D., Lofi, J., Lowery, C., Ocampo-Torres, R., Perez-Cruz, L., Pickersgill, A.E., Poelchau, M., Rae, A., Rasmussen, C., Rebdolledo-Vieyra, M., Riller, U., Sato, H., Smit, J., Tikoo, S., Tomioka, N., Urrutia Fucugauchi, J., Whalen, M., Wittmann, A., Yamagachi, K., Xiao, L., and Zylberman, W., 2017b. Expedition 364 summary. In Morgan, J., Gulick, S., Mellett, C.L., Green, S.L., and the Expedition 364 Scientists, Chicxulub: Drilling the K-Pg Impact Crater. Proceedings of the International Ocean Discovery Program, 364: College Station, TX (International Ocean Discovery Program). https://doi.org/10.14379/iodp.proc.364.101.2017
Gulick, S., Morgan, J., Mellett, C.L., Green, S.L., Bralower, T., Chenot, E., Christeson, G., Claeys, P., Cockell, C., Coolen, M.J.L., Ferrière, L., Gebhardt, C., Goto, K., Jones, H., Kring, D., Lofi, J., Lowery, C., Ocampo-Torres, R., Perez-Cruz, L., Pickersgill, A.E., Poelchau, M., Rae, A., Rasmussen, C., Rebdolledo-Vieyra, M., Riller, U., Sato, H., Smit, J., Tikoo, S., Tomioka, N., Urrutia Fucugauchi, J., Whalen, M., Wittmann, A., Yamagachi, K., Xiao, L., and Zylberman, W., 2017c. Site M0077: Post-Impact Sedimentary Rocks. In Morgan, J., Gulick, S., Mellett, C.L., Green, S.L., and the Expedition 364 Scientists, Chicxulub: Drilling the K-Pg Impact Crater. Proceedings of the International Ocean Discovery Program, 364: College Station, TX (International Ocean Discovery Program). https://doi.org/10.14379/iodp.proc.364.105.2017
Urrutia-Fucugauchi, J., Marin, L., and Sharpton, V.L., 1994. Reverse polarity magnetized melt rocks from the Cretaceous/Tertiary Chicxulub structure, Yucatan Peninsula, Mexico. Tectonophysics, 237(1–2):105–112. https://doi.org/10.1016/0040-1951(94)90161-9
Urrutia-Fucugauchi, J., Soler-Arechalde, A.M., Rebolledo-Vieyra, M., and Vera-Sanchez, P., 2004. Paleomagnetic and rock magnetic study of the Yaxcopoil-1 impact breccia sequence, Chicxulub impact crater (Mexico). Meteoritics & Planetary Science, 39(6):843–856. https://doi.org/10.1111/j.1945-5100.2004.tb00934.x
Velasco-Villareal, M., Urrutia-Fucugauchi, J., Rebolledo-Vieyra, M., and Perez-Cruz, L., 2011. Paleomagnetism of impact breccias from the Chicxulub crater—implications for ejecta emplacement and hydrothermal processes. Physics of the Earth and Planetary Interiors, 186(3–4):154–171. https://doi.org/10.1016/j.pepi.2011.04.003
1 Gulick, S., Morgan, J., Mellett, C.L., Green, S.L., Bralower, T., Chenot, E., Christeson, G., Claeys, P., Cockell, C., Coolen, M.J.L., Ferrière, L., Gebhardt, C., Goto, K., Jones, H., Kring, D., Lofi, J., Lowery, C., Ocampo-Torres, R., Perez-Cruz, L., Pickersgill, A.E., Poelchau, M., Rae, A., Rasmussen, C., Rebolledo-Vieyra, M., Riller, U., Sato, H., Smit, J., Tikoo, S., Tomioka, N., Urrutia- Fucugauchi, J., Whalen, M., Wittmann, A., Yamaguchi, K., Xiao, L., and Zylberman, W., 2017. Site M0077: Upper Peak Ring. In Morgan, J., Gulick, S., Mellett, C.L., Green, S.L., and the Expedition 364 Scientists, Chicxulub: Drilling the K-Pg Impact Crater. Proceedings of the International Ocean Discovery Program, 364: College Station, TX (International Ocean Discovery Program). https://doi.org/10.14379/iodp.proc.364.106.2017
2 Expedition 364 Scientists’ addresses.
This work is distributed under the Creative Commons Attribution 4.0 International (CC BY 4.0) license. 
- F1. Lithostratigraphic summary.
- F2. Lithostratigraphic unit boundaries.
- F3. Maximum clast size for Unit 2.
- F4. Lithostratigraphic subunits.
- F5. Cross-lamination in suevite at top of Subunit 2A.
- F6. Suevite from Subunit 2A.
- F7. Suevite from Subunit 2B.
- F8. Impact melt rock from Subunit 3A.
- F9. Impact melt rock from Subunit 3B.
- F10. Representative CT scans of subunits.
- F11. Cretaceous planktic foraminifers in limestone clasts.
- F12. Clasts containing abundant larger benthic foraminifers.
- F13. Radiolitid rudist fragments.
- F14. Large miliolids and larger benthics in clasts.
- F15. Magnetostratigraphic plots.
- F16. AF demagnetization of suevite and impact melt rock.
- F17. Major element compositions.
- F18. Minor element compositions.
- F19. Trace element compositions.
- F20. Carbon and sulfur contents.
- F21. Bulk mineralogy.
- F22. Physical properties.
- F23. Magnetic susceptibility, NGR, and L*, a*, and b*.
- F24. Wireline downhole log data.
- F25. Core-log integration.
- F26. Core-log integration.
- F27. VSP vertical component.
- F28. VSP horizontal component.