Morgan, J., Gulick, S., Mellett, C.L., Green, S.L., and the Expedition 364 Scientists
Proceedings of the International Ocean Discovery Program Volume 364
publications.iodp.org
https://doi.org/10.14379/iodp.proc.364.107.2017

Site M0077: Lower Peak Ring1
S. Gulick, J. Morgan, C.L. Mellett, S.L. Green, T. Bralower, E. Chenot, G. Christeson, P. Claeys, C. Cockell, M.J.L. Coolen, L. Ferrière, C. Gebhardt, K. Goto, H. Jones, D. Kring, J. Lofi, C. Lowery, R. Ocampo-Torres, L. Perez-Cruz, A.E. Pickersgill, M. Poelchau, A. Rae, C. Rasmussen, M. Rebolledo-Vieyra, U. Riller, H. Sato, J. Smit, S. Tikoo, N. Tomioka, J. Urrutia-Fucugauchi, M. Whalen, A. Wittmann, K. Yamaguchi, L. Xiao, and W. Zylberman2
Keywords: International Ocean Discovery Program, IODP, International Continental Scientific Drilling Program, ICDP, L/B Myrtle, Mission Specific Platform, Expedition 364, Site M0077, Hole M0077A, Gulf of México, Yucatán shelf, Chicxulub, impact crater, crater modification, multi-ring basin, peak ring, uplifted continental crust, impact melt rock, planar deformation features, Cretaceous/Paleogene boundary, PETM, K-Pg boundary, Cretaceous-Paleogene mass extinction, shock metamorphism, carbon isotope excursions, hydrothermal, geomagnetic reversal, shatter cone, ejecta, suevite, granitoid, pelagic limestone, tsunamite
MS 364-107: Published 30 December 2017
Introduction
From 747.02 meters below seafloor (mbsf) to the base of Hole M0077A at 1334.69 mbsf, granitoids intruded by pre-impact mafic and felsic dikes were recovered, interspersed with suevite and impact melt rock (Core 95R-3, 117 cm, through Core 303R at the base of hole). The following sections detail the data and measurements from this Lower Peak Ring interval.
Operations
Coring in Hole M0077A continued with Core 96R recovered at 1810 h on 7 May 2016. The recovery and quality of the cores remained high, and the hole was advanced 24.40 m to 753.09 m drilling depth below seafloor (DSF) by the end of 7 May.
Coring continued to progress on 8 May. In general, the recovery and quality of the cores remained high. The only exception was while drilling Core 99R, when the bit became blocked and, as a result, a short run was recovered. The core was blocked in the tube with many fractured pieces and was difficult to extract. Coring resumed with excellent recovery rates, and high-quality cores were collected. A total of 11 cores were collected to 783.59 m DSF.
The high-quality recovery continued on 9 May. While running Cores 117R and 119R, the bit became blocked, which again resulted in shortened core runs. All other cores were full 3.05 m runs, with a total of 28.35 m recovered from 11 cores.
Coring continued on the morning of 10 May. While drilling Core 123R, loss of circulation was noted at ~821 m DSF (~5% drilling fluid loss). As a result, Loss Circulation Material (LCM) was pumped down the hole, followed by drilling fluid, which resolved the issue, and coring resumed. Following several unsuccessful attempts to core, the drill string was tripped to recover a suspected worn bit. The bottom-hole assembly (BHA) was recovered at 1544 h. The bit was worn and was replaced. The pipe was then run back in, and coring recommenced at 2145 h.
Two cores of excellent quality and 100% recovery were recovered by 0340 h on 11 May. Several attempts were then made to core deeper, but the drill bit was not advancing within the hole. A decision was made to trip the drill string, commencing at 0850 h, to inspect the BHA. The BHA was recovered, and the bit was replaced. Pipe was run back into the hole, and coring recommenced at 2010 h. However, the core run was short because the bit blocked off due to a crumpled liner. As coring continued, the hole depth at midnight was 830.09 m DSF, an advance of 6.85 m from the previous day.
Coring initially progressed slowly and without interruption on 12 May. Four cores were recovered in the morning (by 1155 h), and three more were recovered during the afternoon. The cores continued to be high quality, and a 100% recovery rate was achieved. The day finished with the hole advanced 17.30 m to 847.54 m DSF.
On 13 May, coring continued. While recovering Core 136R, the barrel became blocked, and the run was recovered early. Despite steady torque and constant drilling fluid flow, no penetration was made on a further attempt to core, and it was concluded that the bit was worn. As a result, the majority of the morning and early afternoon was spent tripping out/in the hole and replacing the bit (0400–1230 h). Coring commenced at 1230 h with short (0.4–0.7 m) cores recovered initially. The final two cores of the day (140R and 141R) were recovered following full runs, measuring 3.10 m each. The hole depth at midnight was 859.54 m DSF.
At 0000 h on 14 May, a motor change on the rig was carried out during shift changeover, and coring recommenced at 0055 h. Coring continued steadily throughout the day, with a total of 11 cores advancing the hole 30.80 m. These cores were noted to be very high quality with 100% recovery. The hole depth at the end of the day was 890.34 m DSF.
On 15 May, coring continued with high-quality cores retrieved at a recovery rate of 100%. Rig maintenance (repair to a hydraulic hose) was required prior to the recovery of Core 156R at 0720 h. Once complete, coring recommenced at 0855 h and continued for the remainder of the day. At the end of the day, the hole reached 926.94 m DSF with a total of 14 cores (36.60 m) recovered.
Coring continued on 16 May. Changes in lithology slowed progress for short periods of time, and a loss circulation zone was encountered, causing a small delay in drilling as LCM was prepared and delivered downhole. However, due to the continued loss of drilling fluid, a higher ratio of water to mud was adopted to conserve the dry mud supply. Cores were again extremely high quality with 100% recovery and a steadily improving coring rate. By the end of the day, 14 cores were collected, totaling 36.60 m, and the hole depth was 963.54 m DSF.
The coring rate continued to increase throughout 17 May, with a total of 17 cores (51.85 m) recovered over the 24 h period, taking the hole depth to 1015.39 m DSF. Due to a continued loss of circulation relating to issues from the previous day, water and dilute mud were used to flush the drill cuttings.
On 18 May, coring continued without any stoppages. A total of 15 cores were collected (42.13 m), deepening the hole to 1057.52 m DSF. Toward the end of the day, issues were noted with the barrel failing to latch in. Once latched in and lowered to ~10 cm from the base of the hole, the pressure increased to an unworkable level (300–500 psi) and the torque remained low (less than 1000 psi). It was concluded that the bit was worn, and as a result, the majority of the late morning and early afternoon on 19 May was spent tripping pipe out of the hole. The bit was worn and was replaced, and coring recommenced at 1415 h, producing high-quality cores with 100% recovery. The day ended with the hole at 1075.92 m DSF following the retrieval of six cores measuring 18.40 m in total.
Coring continued uninterrupted on 20 May. Cores were excellent quality with 100% recovery. The day ended with the hole at 1121.64 m DSF, having drilled 45.72 m in total. Coring continued to progress without any maintenance stoppages on 21 May, ending the day with the hole at 1166.19 m DSF, having drilled 44.50 m.
Coring continued on 22 May with excellent quality cores of close to 100% recovery. The day ended with the hole at 1215.24 m DSF, having drilled 49.05 m (16 cores).
Coring continued uninterrupted on 23 May. Cores were excellent quality with 100% recovery. The day ended with the hole at 1255.54 m DSF, having advanced 40.30 m (13 cores).
Coring continued uninterrupted on 24 May. The 12 cores collected were consistently high quality, and the day ended with the hole at 1291.29 m DSF.
On 25 May, there were no operational issues, and coring proceeded continuously with the same high quality and recovery rates. The day ended with the hole at 1328.49 m DSF, having advanced 37.20 m. A total of 12 cores were recovered.
The final cores of Expedition 364 were collected on 26 May. The last two cores collected were again of excellent quality and 100% recovery. The total depth for Hole M0077A was 1334.69 m DSF at 0235 h, having advanced the hole by 6.20 m since midnight.
With the completion of coring on 26 May, the supply boat Linda F transferred the science party to Progreso, leaving the European Consortium for Ocean Research Drilling (ECORD) Science Operator (ESO) staff and Montco crew on board the L/B Myrtle. In preparation for downhole logging activities, the hole was flushed with water, and the pipe was pulled to ~940 m DSF below a zone of potential hole instability (where significant mud circulation loss was noted). Figure F26 and Table T4 (both in the Expedition 364 methods chapter [Gulick et al., 2017a]) summarize the operations and acquisition parameters for each tool or tool string run. Acquisition started from the bottom of the hole (1334.68 m DSF) to ~940 m DSF at 0740 h.
Downhole logging operations proceeded on 27 May with the acquisition of logs, including optical borehole images (OBIs), from ~1046 to ~940 m wireline log depth below seafloor (WSF). The elevated bottom hole temperature inhibited the OBI tool from working properly at depth. Following the tripping out of pipe, wireline operations recommenced at 0740 h. Centralized tools were not run across the interval in which the drilling fluid was lost (~940 m WSF) to avoid destabilizing the borehole wall. At ~850 m WSF, the borehole diameter had expanded beyond the size of the centralizers. The tool string was pulled back to the deck at 1612 h, and the centralizers were changed for larger ones. The tool string containing the acoustic borehole image (ABI) tool was sent downhole at 1840 h to image the ~850–700 m WSF interval, after which another tool string was deployed, reaching the bottom of the hole at 2350 h.
On 28 May, gamma ray and OBI logs were collected. The tool string arrived back at surface at 0630 h and rigup for vertical seismic profile (VSP) commenced. Marine mammal and protected species observations commenced in advance of VSP activities and continued throughout. The VSP tool was sent to 1325.0 m WSF, and data acquisition began at 0900 h. Acquisition was completed at 1340 h, and logging operations ended with rigdown completed at 1530 h. Once these final operational activities were complete, demobilization commenced at 1530 h and continued on 29 May.
On 30 May, the L/B Myrtle successfully jacked down, during which time all personnel were restricted to the uppermost deck in line with safety protocol. Following a short (approximately 3 h) transit, the L/B Myrtle arrived at the port of Progreso, and the remaining crew (Montco and ESO staff) disembarked, ending the offshore operational phase of Expedition 364.
Lithology and computed tomography
Lithology
Granitoids, pre-impact dikes, suevite, and impact melt rock
Hole M0077A was drilled through a long succession of mainly felsic basement rocks of granitoid composition from 747.02 mbsf (Section 95R-3, 117 cm) to the bottom of the hole (Figure F1). These rocks are petrographically characterized as coarse-grained granite to syenite hosting aplite and pegmatite dikes. Moreover, granitoid rocks are intruded by three types of subvolcanic dikes or dike swarms that are macroscopically classified as felsite, dacite, and diabase/dolerite. Granitoid rocks were pervasively deformed by the impact and host local bodies of suevite and impact melt rock. Furthermore, an approximately 100 m thick unit of suevite and impact melt rock with interspersed granitoids occurs at 1215–1316 mbsf (Sections 265R-2 through 298R-1).
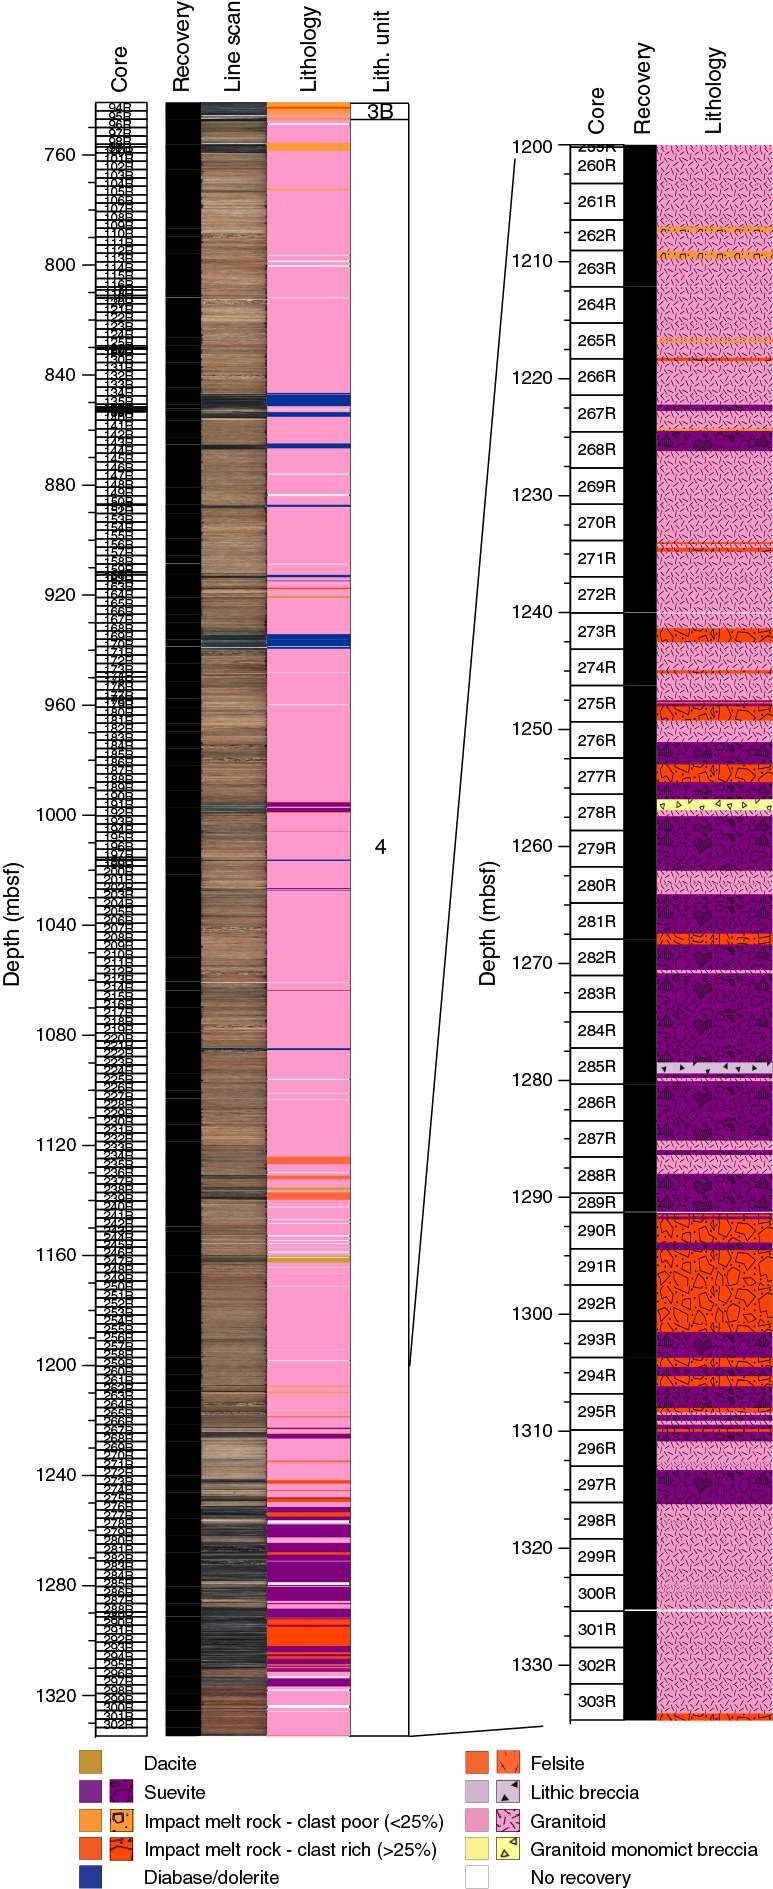
Figure F1. Lithostratigraphic summary.
Granitoids
The dominant basement lithology is macroscopically classified as a granitoid (Figure F2). Overall, the rock is coarse grained and consists of red to pink alkali-feldspar, white to light yellowish plagioclase, and gray to white quartz, with some biotite and, locally, accessory minerals, including sulfides and titanite.
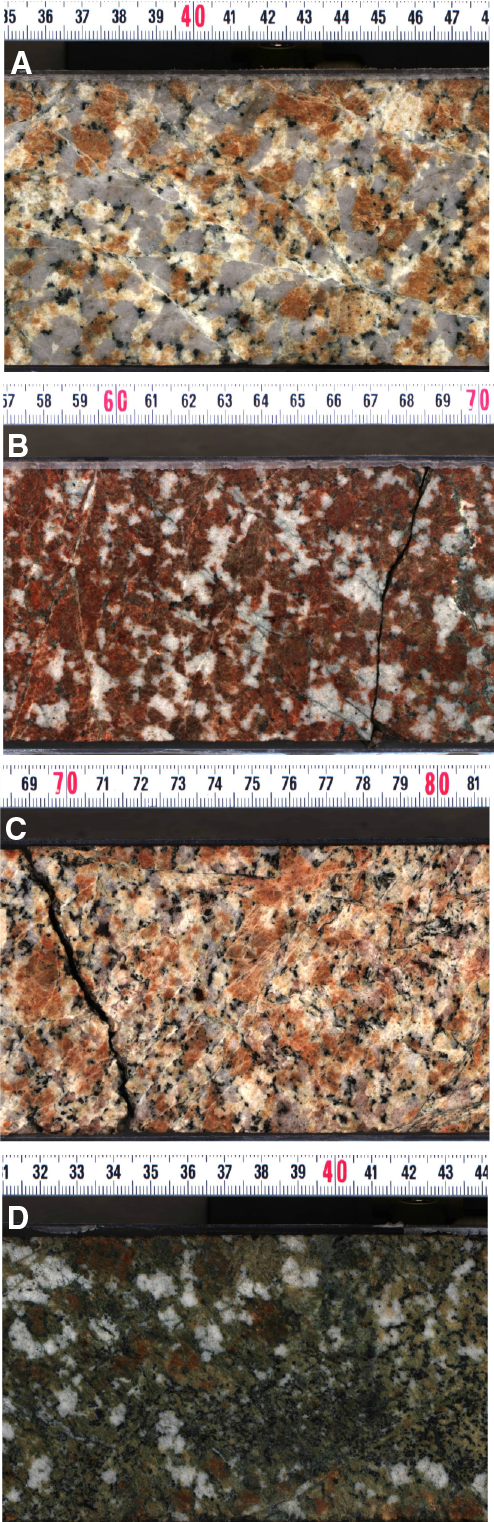
Figure F2. Petrographic variations of granitoids.
The contents of the three main mineral constituents (alkali-feldspar, plagioclase, and quartz) each vary between ~20% and 40%. Subeuhedral or euhedral alkali-feldspar typically dominates the composition, and locally plagioclase can be strongly reduced in abundance relative to alkali-feldspar. Grain sizes of these constituents generally vary from ~0.5 to ~3 cm, although alkali-feldspar can locally exceed the diameter of the drill core (~8 cm). Plagioclase and quartz are both anhedral and show color variations that may be related to hydrothermal alteration. Quartz was also observed to have macroscopically visible cleavage planes, which are assumed to be shock-induced planar fractures. Biotite is between 0.2 and 1 cm in size, and its content varies between 1% and 5%.
Granitoid commonly shows textural and compositional variations over a few tens of centimeters. Particularly, alkali-feldspar content and size can become more dominant relative to plagioclase. These granitoids are often dark red and locally more biotite rich, with white quartz up to 1 cm in size. Furthermore, local, diffuse aggregates of biotite-enriched zones occur in the granitoid and reach over 5 cm in size.
Alteration of granitoids is mostly observed near contact zones with faults, impact melt rock, suevite, and intrusive dikes. Granitoids here display color variations that could be caused by thermal or shock alteration or a combination of both. Feldspars often show discoloration to green or variable shades of yellow, orange, and red, whereas quartz may turn milk-white or rarely pale red. Mafic minerals locally appear midgray instead of black.
Numerous thin sections of the granitoids were analyzed. Alkali-feldspar generally shows perthitic exsolution and pervasive clouding. Symplectitic intergrowths between the alkali-feldspar and albite-rich margins of plagioclase decorate feldspar grain boundaries. Plagioclase commonly displays polysynthetic twinning that is locally kinked. Planar fractures and possible planar deformation features were noted in some of the plagioclase grains. Narrow spacing of plagioclase twin lamellae indicates an albite-rich composition. Zoning was observed and enhanced by clouding, and grains commonly display white albitic rims. Quartz in thin section is pervasively shocked; almost all grains contain several sets of planar deformation features, and many also show planar fractures and feather features. In rare cases, kink banding in quartz was also observed. Biotite is often kinked. Further accessory minerals observed in thin section include muscovite, zircon, apatite, sphene, epidote, calcite, and opaque minerals. Alteration of the granitoid is visible through saussuritization or sericitization of plagioclase, whereas biotite appears retrogressed to chlorite and magnetite. Epidote-zoisite mineralization was locally observed in mafic zones, as was the occurrence of muscovite. Euhedral calcite was often observed in veins and vugs.
See Geochemistry and mineralogy for preliminary chemical analyses of this lithology. Note also that preliminary results from X-ray fluorescence (XRF) analysis of several samples place this rock within the granite and syenite fields of the diagram for igneous rocks. Nomenclature for this lithology may therefore be subject to change.
Aplite and pegmatite
Aplite and pegmatite dikes were commonly observed within the granitic host rock (Figure F3) and commonly occur together. These dikes range in thickness from ~10 to 80 cm. Aplite is characterized by fine-grained zones of diffusely distributed feldspar minerals and ranges from orange to dark pink. Apart from alkali-feldspar, concentrations of other minerals vary. Plagioclase, quartz, and biotite are strongly reduced or absent. Pegmatite is composed of large alkali-feldspars (>3 cm; >60%), plagioclase (>2 cm; 20%–30%), quartz (2–4 cm; 30%–20%), and minor biotite (<3%). Graphic intergrowth between small quartz and large alkali-feldspar crystals is common. Submillimeter thin, straight, platy biotite is one of the more noticeable features. Contact boundaries between the dikes and the host granitic rock are commonly sharp and do not show metamorphism or alteration zones. No shipboard thin section billets were taken from these units.
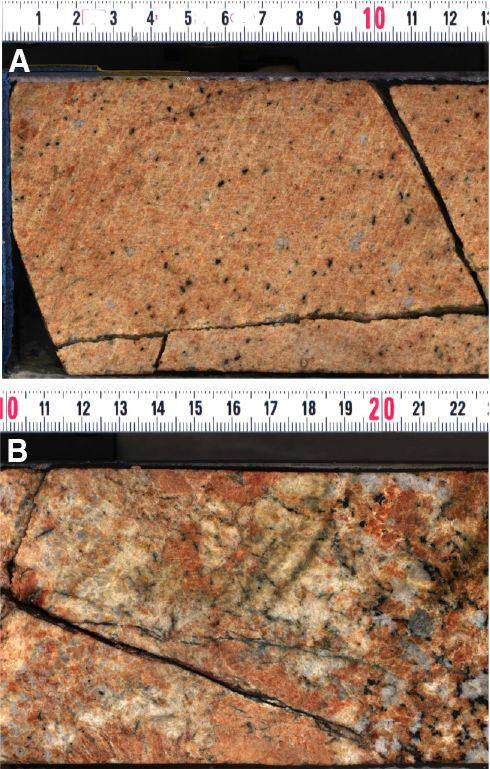
Figure F3. Dikes.
Dacite
Three grayish brown dikes were found within the granitoid rocks in Sections 164R-3, 238R-1, 238R-2, and 246R-3 through 247R-2 and were macroscopically described as dacites. These dacite dikes have a porphyritic texture with euhedral plagioclase phenocrysts as large as 3.5 cm, alkali-feldspar phenocrysts as large as 2 cm, and minor quartz and biotite (Figure F4). Alkali-feldspar locally displays reaction rims and may therefore be clasts derived from the granitoid country rock. The groundmass is medium-grained with plagioclase, alkali-feldspar, and amphibole. Dike thicknesses are between 0.6 and 2.7 m.
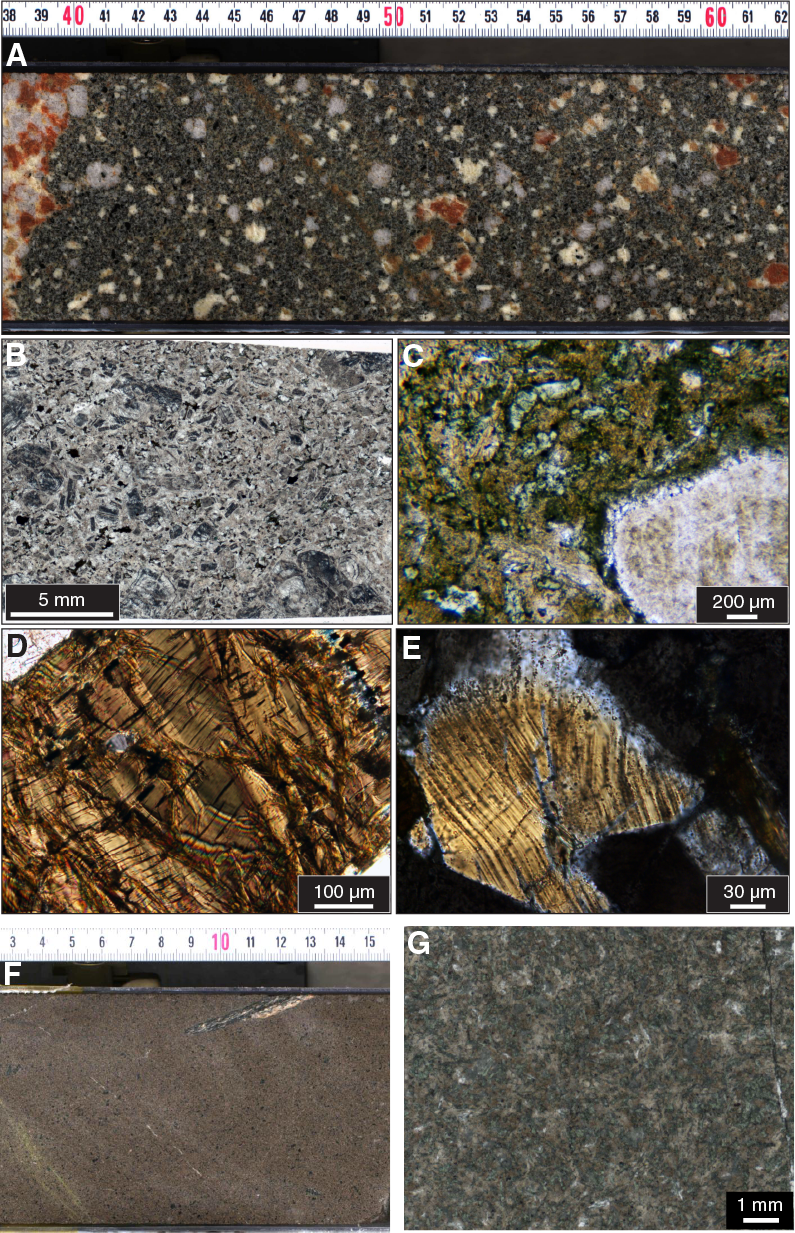
Figure F4. Dacite and felsite.
Petrographic investigation in thin section shows a tonalitic to dacitic microcrystalline rock with plagioclase, alkali-feldspar, quartz, biotite, magnetite, sphene, zircon, apatite, opaque minerals (possibly pyrite), and epidote-zoisite group minerals in the groundmass. Plagioclase forms phenocrysts with zoning that is visible by the level of saussuritization. Plagioclase twin planes are kinked, and feldspars are commonly clouded. Almost all quartz grains are shocked with planar fractures, planar deformation features, and feather features.
Note that preliminary results from XRF analysis (see Geochemistry and mineralogy) of one sample from Section 247R-1 place this rock within the trachyte/trachydacite field of the TAS diagram for volcanic rocks. Nomenclature for this lithology may therefore be subject to change.
Felsite
Three very fine grained, homogeneous, midbrown to gray dikes within the granitoid rocks in Sections 234R-2 through 235R-2, 236R-3 through 237R-1, and 238R-3 through 239R-2 were macroscopically described as felsites (Figure F4). Larger phenocrysts seen in the dacite are lacking here. Felsite dike thicknesses range from 1.5 to 2.5 m. Xenoliths occur and sometimes include the local granitic host rock but otherwise are deep-sourced gneiss or amphibolite that range in size from submillimeter to ~5 cm. Felsite has local white- or black-filled veins and rare quartz-filled vugs as large as 3 cm.
In thin section, felsites show acicular, 100 µm long feldspar crystals forming clusters in an ophitic texture that has an interstitial mafic phase that was altered to zoisite (with characteristic blue interference colors). Euhedral, ~100 µm long opaque mineral phases occur in the groundmass with more rare opaque phases as large as ~20 µm. Cloudy, poorly crystallized carbonate seems to replace an original component. Apatite also occurs as small prismatic crystals. Quartz occurs in vugs as large as 0.5 cm and exhibits at least one set of planar deformation features. Secondary, undeformed sparry calcite also occurs in vugs and possibly anhydrite.
Preliminary results from XRF analysis place one sample of this lithology from Section 239R-1 within the phonotephrite field of the TAS diagram for volcanic rocks. Nomenclature for this lithology may therefore be subject to change.
Diabase/dolerite and porphyritic diabase/dolerite
Several mafic dikes were observed in the upper portion of the granitoids and were macroscopically described as diabase/dolerite (Figure F5). They have two textures; the more common one is porphyritic, composed of a dark gray to black aphanitic groundmass containing characteristic ~1–10 mm needle-shaped white-green, partially altered plagioclase phenocrysts and 1 mm long mafic phenocrysts. The other consists of a dark gray to black aphanitic groundmass without plagioclase phenocrysts. The groundmass is composed of mafic and felsic mineral constituents and iron sulfide mineral phases. Rarely, there are granitic fragments within the matrix (on average less than 1 fragment per section) that appear partially digested. Dike thicknesses range from a few centimeters to 5 m.
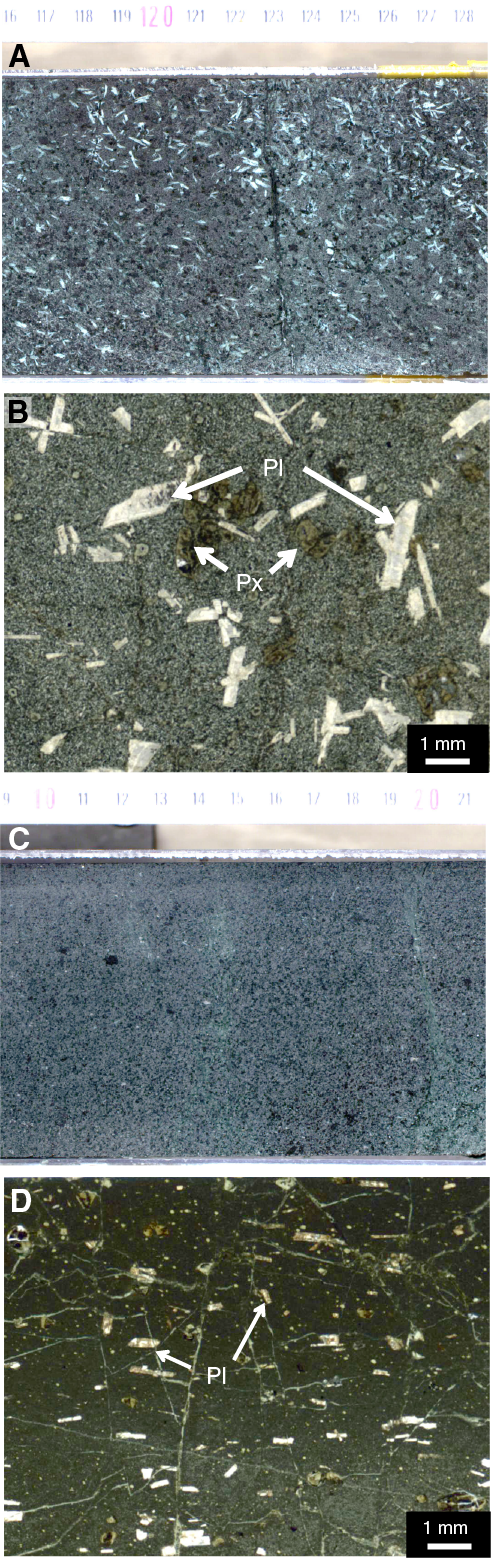
Figure F5. Diabase/dolerite.
In thin section, the diabase/dolerite shows a microcrystalline, mafic groundmass with large euhedral plagioclase laths and euhedral pyroxene. Pervasive alteration is visible where plagioclase is strongly altered to zeolites and phyllosilicates, and pyroxene is chloritized. Fractures are commonly filled with serpentine. Quartz and calcite occur in vugs and veins.
Note that preliminary results from XRF analyses of 10 samples of these units place this rock within the tephrite/basanite and foidite fields of the TAS diagram for volcanic rocks. Nomenclature for this lithology may therefore be subject to change.
Suevite and impact melt rock
An approximately 100 m thick unit of suevite and impact melt rock interspersed within the granitic sequence occurs from 1215 to 1316 mbsf (Cores 265R–298R), with suevite as the dominant lithology (Figures F6, F7). In Cores 277R–298R, suevite and impact melt rock form a nearly continuous, 58 m thick interval, with only a few decimeter- to meter-scale occurrences of granite, some of which may be clasts within the impact melt rock and suevite.
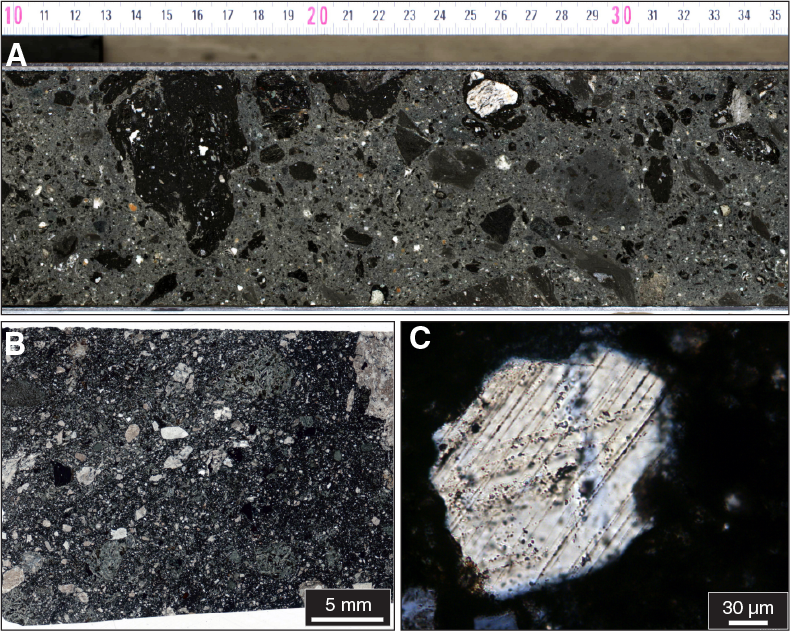
Figure F6. Suevite with black impact melt fragments and granite clasts.
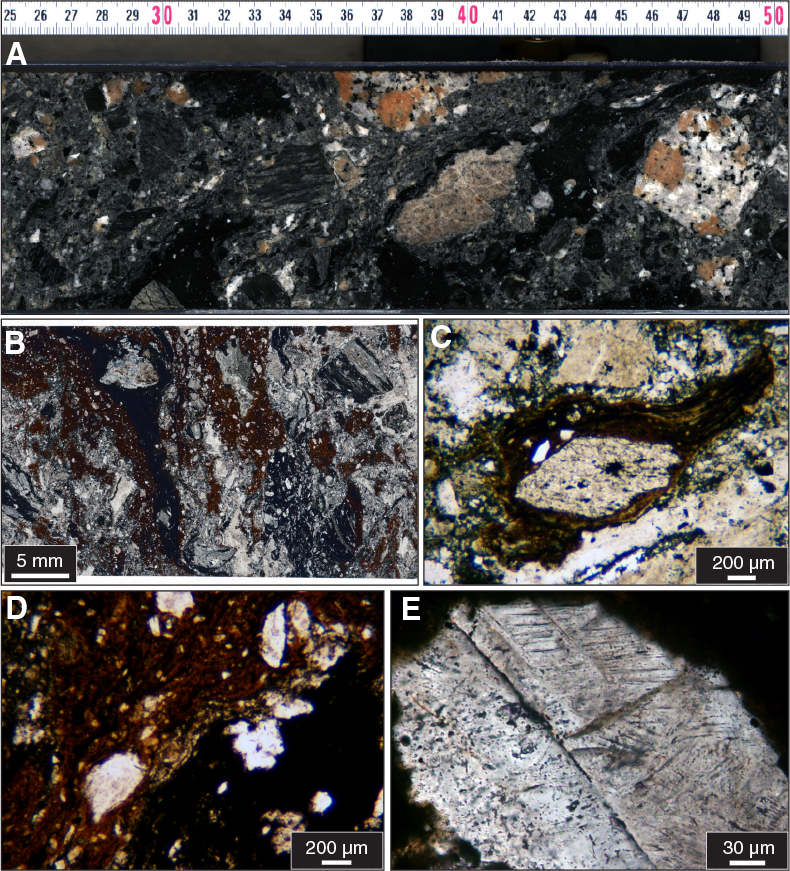
Figure F7. Suevite with black and reddish brown impact melt fragments and granitoids.
Flow banding occurs in both the impact melt rock and suevite. The clasts entrained in the units have angular to rounded shapes and consist of impact melt rock, granitic rock (including aplite), granodiorite, felsite, diabase/dolerite, another unidentified mafic lithology, gneiss, mylonite, schist, and quartzite. Unlike the overlying suevite and impact melt rock of Units 2 and 3, these rocks do not have visible carbonate clasts or clasts of other sedimentary rocks. In some intervals, the clast sizes are ≤5 cm, but clasts of 10 to 20 cm are common. The largest clast logged was 100 cm (a gneiss in Section 281R-2). Some clasts are mantled by impact melt rock. Other clasts are partially resorbed or digested within the melt rock.
The impact melt rock and suevite are locally altered. White and green veins were observed, and diffuse green mineralization is common. Dissolution vugs occur in both intervals and are in some cases partially filled with a green mineral. Sulfide (including pyrite), which is generally <1 mm in size but locally occurs in centimeter-scale clusters, is scattered throughout the interval. Mineralization appears to increase in intensity toward the base of the interval. Possible analcime crystals occur along an open fracture in Section 293R-1, and a purple mineral partially fills a 4 to 6 cm vug in that same section. Red and yellow mineralization is also present but less frequent than green mineralization.
In thin section, both suevite and impact melt rock are pervasively altered, making it difficult in some cases to clearly differentiate between them (i.e., the use of a scanning electron microscope is required to investigate the nature of the matrix). Different types of melt fragments occur in the suevite samples, from black to red, with flow texture, with or without vesicles, and with more or less nondigested rock and mineral fragments. In some cases, clasts are coated with a layer of melt rock. Some of the quartz grains contain several sets of decorated planar deformation features; feldspar is also shocked in places. Sparry carbonate typically fills some vugs, especially in impact melt rock.
Computed tomography facies
Granitoid
Granitoid rocks were found throughout the Lower Peak Ring interval from 746.99 mbsf to the bottom of the hole. The granitoid computed tomography (CT) facies has an average CT number of ~1900 and is characterized by a granular texture with white, light gray, dark gray, and black mineral grains. The granitoids generally have high CT density (ρb) and a low effective atomic number (Zeff). Most of the alkali-feldspar in the granitoids has concentric zonation in both Zeff and ρb (Figure F8). The granitoids are commonly deformed by shear fractures, cataclasites, and breccias. This deformation is expressed in the CT data by a reduction in the ρb and CT number of the material.
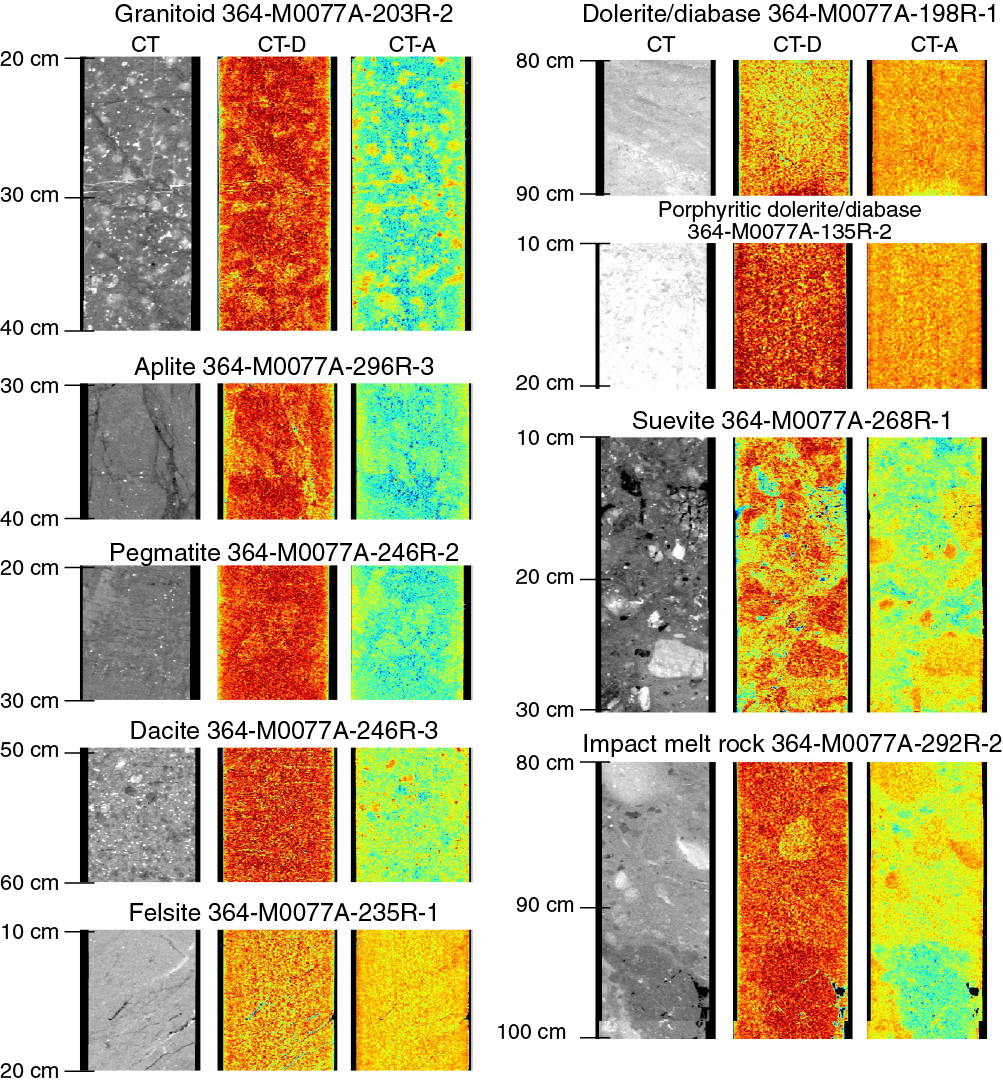
Figure F8. CT scans.
Aplite and pegmatite
Aplite and pegmatite dikes are found throughout the granitoids; these intervals have a slightly lower average CT number (~1800) than the granitoids overall and almost no high-CT and high-Zeff minerals. The ρb values of aplite and pegmatite are equal to that of the granitoids. The aplite and pegmatite intervals have a very homogeneous texture in CT, and distinguishing the two is difficult (Figure F8). In some cases, the difference in CT brightness between the different large crystals of the pegmatite was observed.
Felsite and dacite
The felsite and dacite units have distinctly different CT facies. The dacite units have an average CT number of ~2000 and are characterized by high ρb and high Zeff (greater than that of the granitoids). The large phenocrysts in the dacite were differentiated in the CT data; the large alkali-feldspar crystals have high CT numbers due to their high Zeff, whereas the plagioclase and quartz crystals have low CT numbers and Zeff. The groundmass of the rock is characterized by homogeneous high CT numbers (relative to the granitoids), with local CT bright spots (Figure F8).
The felsite units have an average CT number of ~2100, higher than that of the granitoids. The overall texture of the felsites is homogeneous with rare high–CT number minerals. The felsite has high Zeff and low ρb. The felsite locally contains large clasts of light or dark material.
Dolerite/diabase and porphyritic dolerite/diabase
Dolerite/diabase is characterized by very high CT numbers (~2400) and Zeff and high ρb (Figure F8). The porphyritic dolerite/diabase is distinguished from the dolerite/diabase by the presence of lower CT number lath-shaped crystals, corresponding to the plagioclase phenocrysts observed in visual core description. The dolerite/diabase is distinguished from felsite by its comparatively higher Zeff.
Suevite/impact melt rock
The suevite and impact melt rock intervals possess many similarities. Suevite has an average CT number of ~1800, and the impact melt rock has a slightly higher average CT number of ~1900. Overall, both have moderate ρb and Zeff values and a moderate CT number matrix in which clasts of various size, angularity, CT brightness, and texture were found. Locally, alignment of clasts parallel to flow textures in the matrix were observed (Figure F8).
The suevite and impact melt rock are distinguished based on their CT number and ρb values; the impact melt rock has slightly larger values than the suevite. Furthermore, the matrix of the impact melt rock is more homogeneous than that of the suevite.
Deformation
Pre-impact deformation
Granitoid rocks display ample evidence for pre-impact and impact-induced deformation. Pre-impact deformation is characterized by weak to moderately developed shape-preferred orientation (SPO) defined by feldspar, quartz, and biotite (Figure F9). Deformation under these conditions is evident by crystal-plastic flow of the rock-forming minerals. For example, petrographic investigation of thin sections shows that grain boundaries of alkali-feldspar and plagioclase migrated into neighboring grains, which led to the formation and rotation of subgrains (Figure F10). Similarly, quartz is dynamically recrystallized, shown by undulatory extinction, serrated grain boundaries, and subgrain formation. The grain-shape alignment therefore formed under amphibolite-facies metamorphic conditions. Postemplacement strain was imparted either during solidification of the magma or as a consequence of a mild regional tectonic overprint. Based on the evidence of postmagmatic viscous deformation, the Lower Peak Ring interval consists chiefly of metagranite. At localities where the SPO is well visible, macroscopic impact-induced planar structures are concordant to this fabric anisotropy (Figure F9).
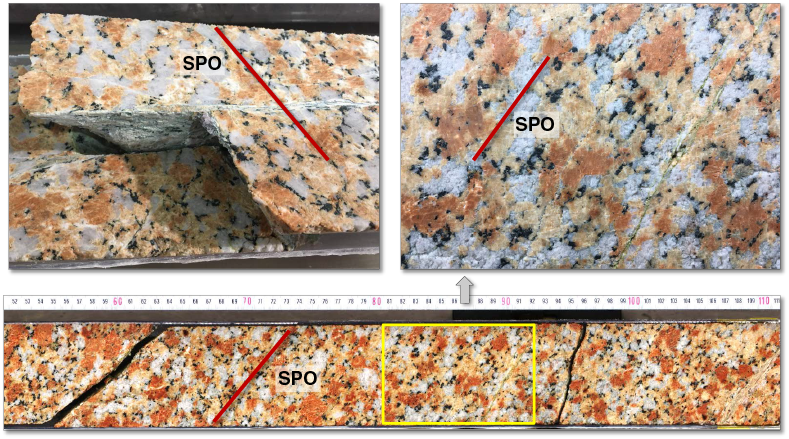
Figure F9. SPO of rock-forming minerals.
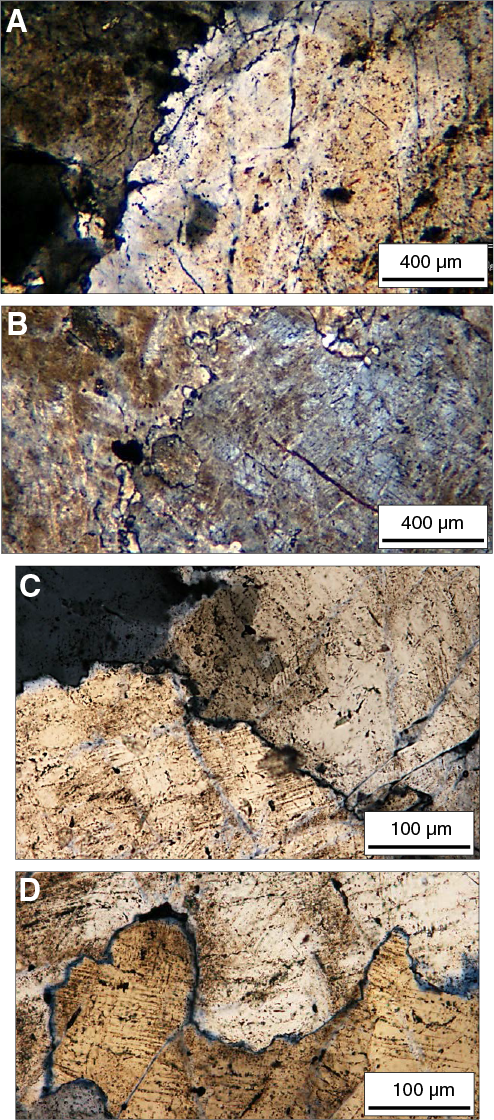
Figure F10. Microstructural characteristics of alkali-feldspar and quartz.
Impact-induced deformation: microscale observations
Impact-induced deformation of the granitoid rock is recognized on the microscopic (<1 cm), mesoscopic (1 cm to 1 m), and macroscopic (>1 m) scales. On the microscopic scale, granitoids show pervasive cataclastic deformation and shock-metamorphic features (Figure F11), including several sets (as many as four sets were observed) of planar deformation features, planar fractures, and feather features in quartz, plagioclase, and alkali-feldspar. Planar deformation features are far more abundant in quartz grains than in the feldspars. Planar fractures in plagioclase are evident by displaced and kinked twin lamellae. Planar fractures in alkali-feldspar are less apparent due to feldspar clouding and perthite exsolusion, collectively masking somewhat the impact-induced microstructure of this mineral phase. Feldspar fragments are often pulled apart, and interstitial space between fragments is either filled with comminuted quartz or secondary mineral phases, such as epidote-group minerals and mica. Intra- and intergranular fracturing and cataclastic deformation (Figures F11, F12) are seen in all granitoid rocks sampled to date for microscopic inspection, even in those that appear mesoscopically and macroscopically unstrained. Biotite flakes are kinked.

Figure F11. Impact-induced deformation and shock metamorphism.
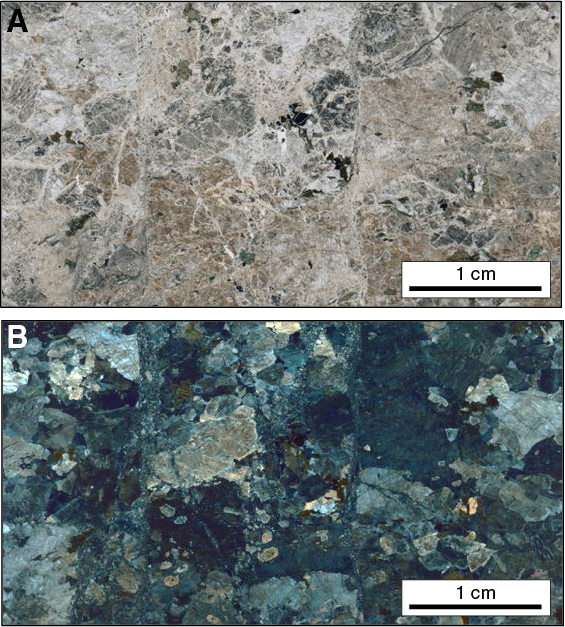
Figure F12. Pervasive grain-scale cataclastic deformation.
Impact-induced deformation: mesoscale observations
Mesoscopic evidence for shock-induced deformation occurs in the form of shatter cones in fine-grained igneous rocks, notably in aplite, amphibolite, and felsite (Figure F13). Impact-induced deformation structures on the mesoscopic scale in the granitoid rocks include distinct hairline fractures, brittle shear faults, foliated and crenulated mineral fabrics, cataclasite, and ultracataclasite (Figure F14). Collectively, the thickness and abundance of these structures was used to assess gradients in mesoscopic and macroscopic deformation (Figure F15). Zones of cataclasite and ultracataclasite range in thickness from less than a few millimeters up to a decimeter. Cataclasite is mostly white to pale green, whereas ultracataclasite generally displays a black matrix (Figure F14). Depending on the intensity of impact-induced deformation, both types of cataclasite form either thin, anastomosing, or convoluted zones (Figure F15). Displacement parallel to zone walls of cataclasite does not seem to be common.
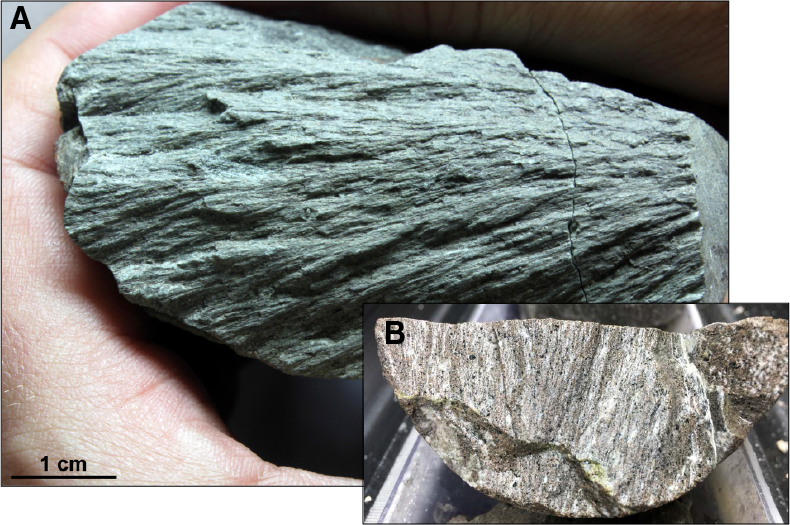
Figure F13. Shatter cone and felsite.

Figure F14. Mesoscopic impact-induced structures.
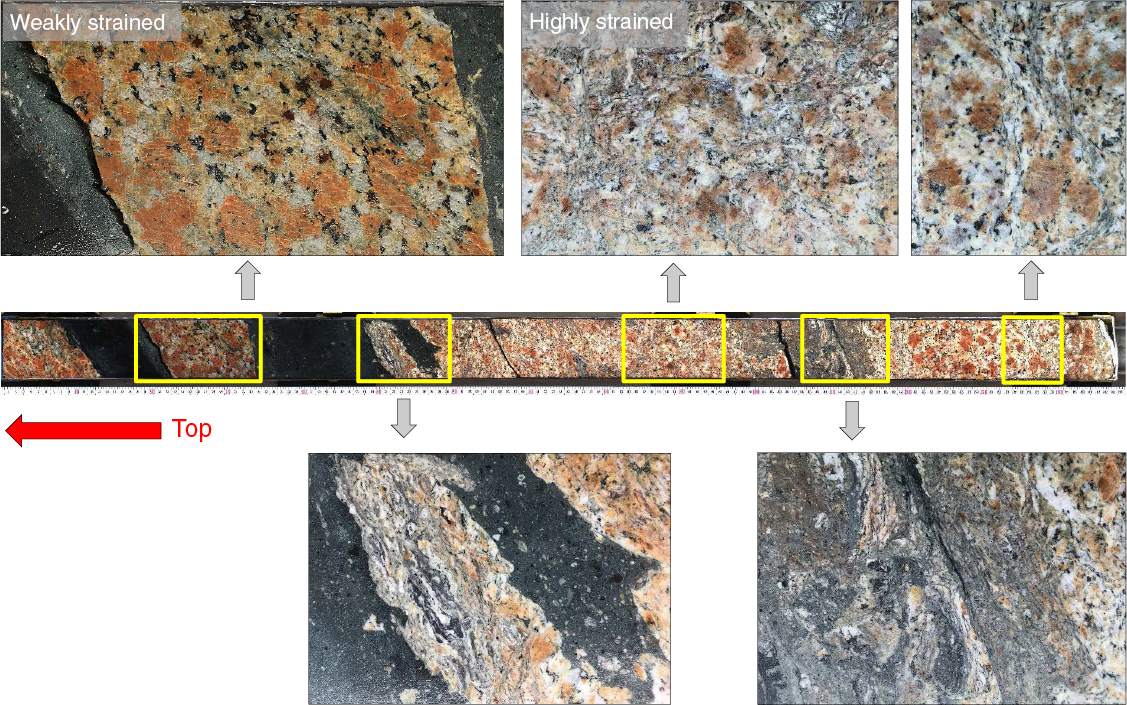
Figure F15. Mesoscopic to macroscopic strain gradient.
Brittle shear faults are ubiquitous in the metagranite. In contrast to seismically induced shear faults (Figure F16), the impact-induced faults encountered in the drill cores are devoid of mineral fibers and display fault-surface striations that are often several centimeters long. In places, fault surfaces display two differently oriented striations. Fault-striations are seen as ridges and grooves of strongly sheared host-rock material. The sense of displacement on the fault surfaces can be reliably discerned by the polarity of ridge truncations perpendicular to the striations. Displacement magnitudes on the shear faults may amount to several decimeters on a single fault (Figure F14).
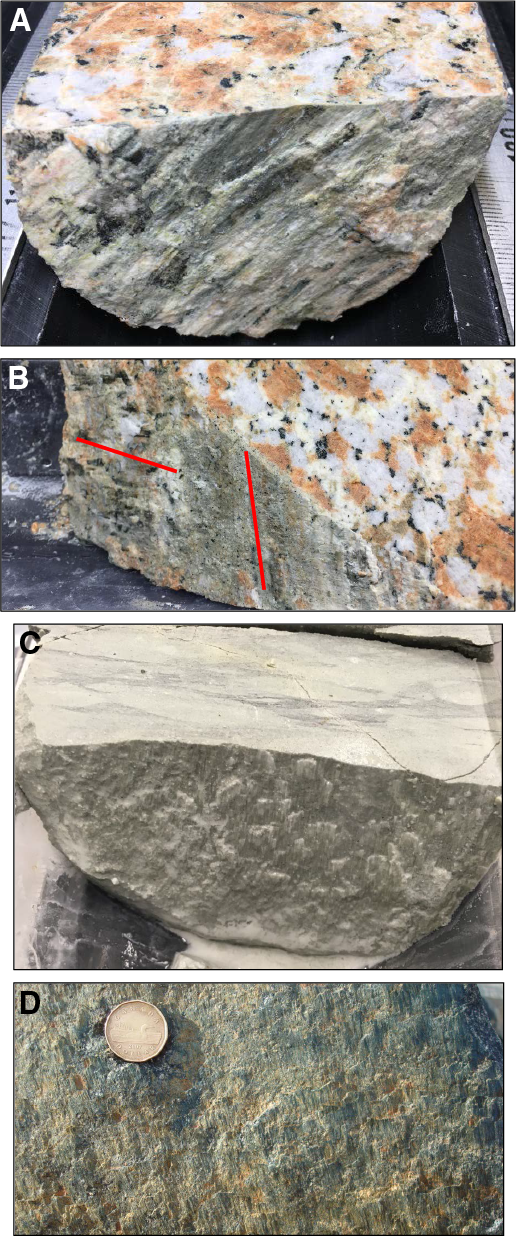
Figure F16. Shear faults.
Localized shearing may result in a strong SPO of comminuted material akin in appearance to mineral foliations caused by ductile deformation. Such zones of layered material may form mechanical anisotropies, which are prone to crenulation (Figure F14). Granitoids below Core 271R show ductile band structures that include shear bands, C-S fabrics (C = shear plane; S = foliation), and shear zones. The asymmetry of the band structures is evident where they displace layered material in the granitoid. The orientation and asymmetry of the band structures indicate a strong normal fault component resolved on these structures. This deformation is also evident in suevite and impact melt rock bodies below Core 272R. In these lithologies, however, band structures are less localized than they are in the granitoid and may form shear zones up to several centimeters wide (Figure F17). The highly drawn out and sigmoidal shapes of granitoid and impact melt rock clasts in suevite and impact melt rock attest to deformation during the solidification of the bodies.
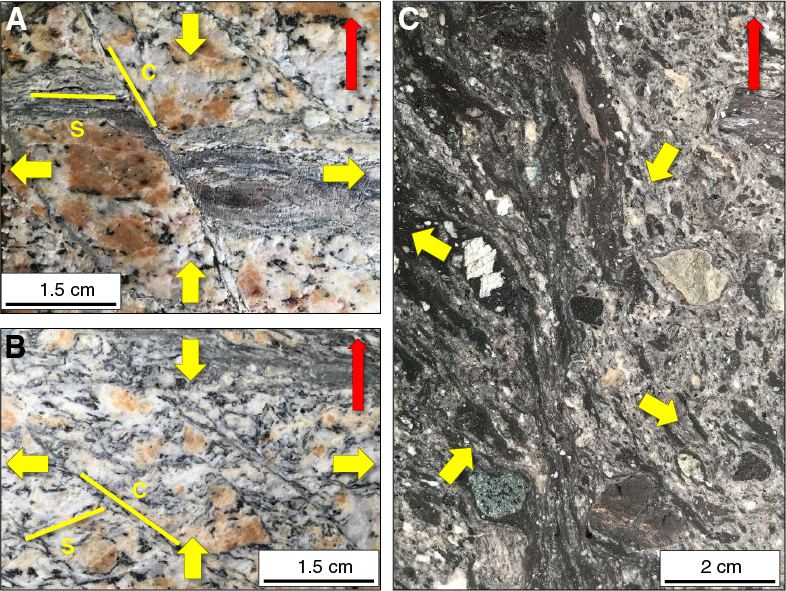
Figure F17. Ductile band structures.
Succession of deformation mechanisms
Structural overprinting criteria point to a relative age of impact-induced, mesoscopic planar structures. Zones of cataclasite seem to be consistently displaced or used by shear faults (Figure F18). Cataclasite bands in granitoid fragments contained in suevite are cut by the latter (Figure F19), and a striated granitoid fragment was found in impact melt rock. Moreover, suevite and impact melt rock were emplaced in zones of dilation caused by opening of shear faults. Collectively, these observations suggest that cataclastic deformation was followed by shear faulting, followed in turn by emplacement of suevite and impact melt rock into dilation zones. This succession of deformation mechanisms is underpinned by the fact that suevite and impact melt rock are devoid of cataclasite and shear faults. The observation that suevite and impact melt rock were not solid when they were affected by band structures accomplishing normal faulting suggests that the band structures formed largely after the shear faults. Open fractures hosting hydrothermal minerals (Figure F20) occurred after crater formation.

Figure F18. Truncation of cataclasite by shear faults.
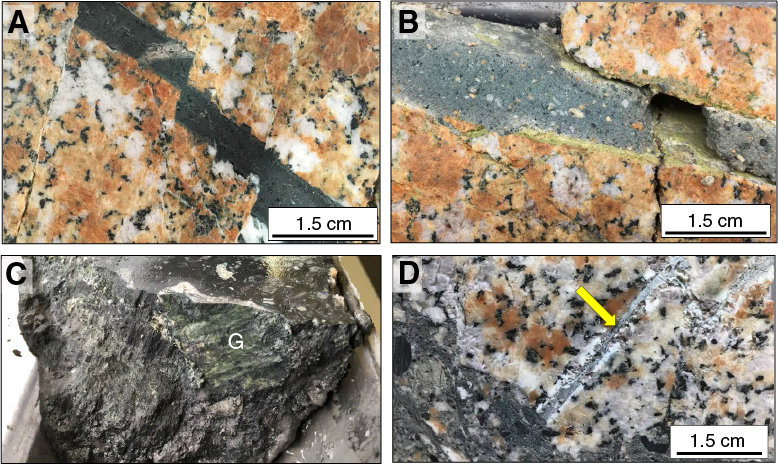
Figure F19. Diabase/dolerite veins, shear faults, cataclasite, and suevite.
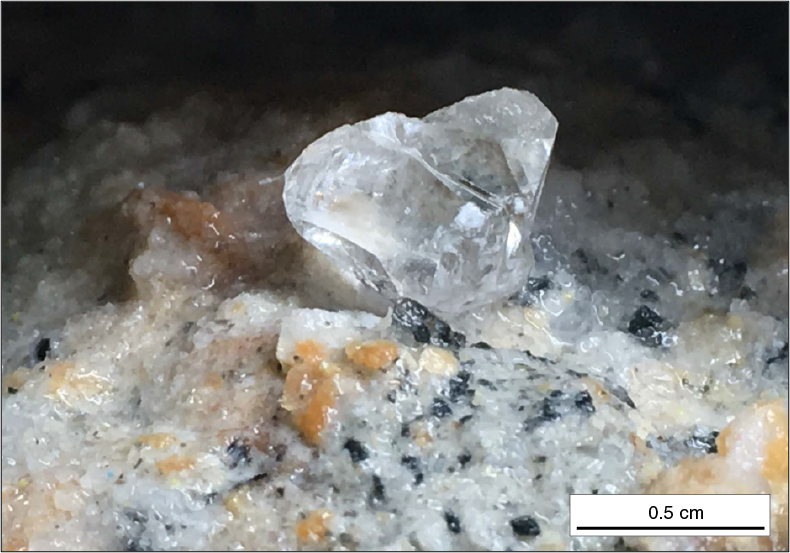
Figure F20. Open fracture with hydrothermal mineralization.
Preliminary fault-slip analysis
Aside from the late-stage shear band structures, brittle shear faults lend themselves excellently to fault-kinematic analysis in terms of principal strain axis orientations. For this purpose, the orientations of 602 shear faults, respective striations, slip-senses, and confidence of inferred slip senses were measured in the granitoids using a protractor. As an example of a fault-slip analysis, a limited set of fault-slip data was inverted to obtain an approximate orientation of principal strain axes. For this purpose, we used the numerical dynamic analysis assuming a friction angle of 30° (Figure F21). Note that the calculation of scientifically meaningful principal strain axes has to await full correction of orientation data in terms of geographic north. Nonetheless, the tentative results suggest that horizontal and moderately inclined shortening axes (E3 in the figure) may be expected from a proper fault-slip analysis.
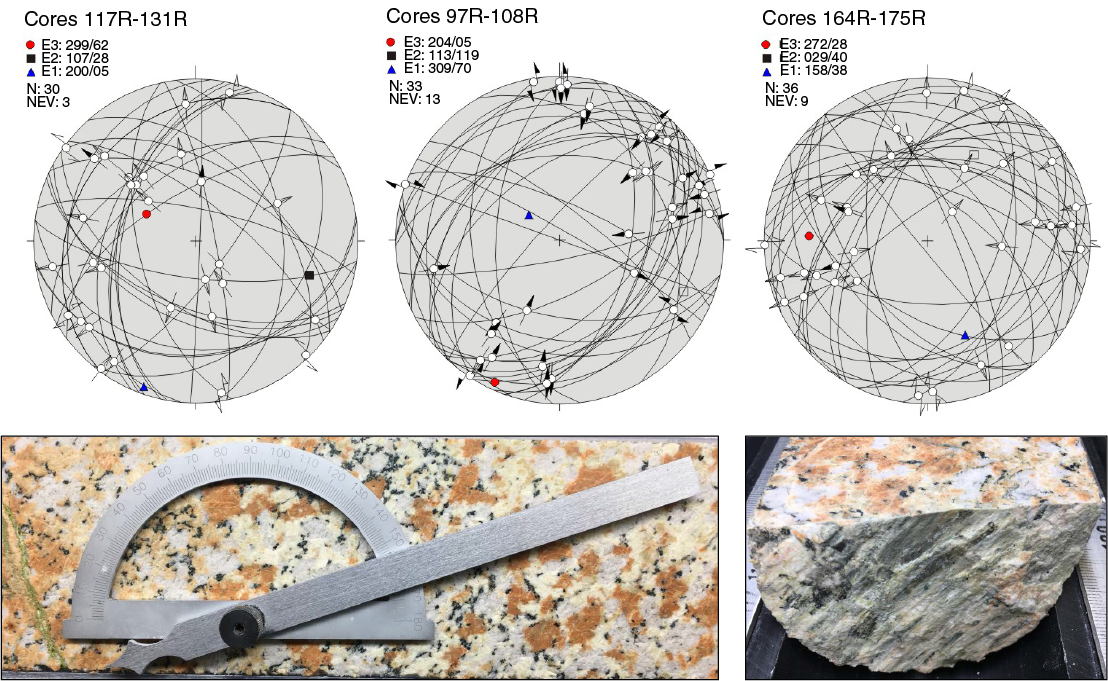
Figure F21. Fault-slip inversion.
Paleomagnetism
Discrete sample measurements
Paleomagnetism measurements were conducted on 195 samples collected from the Lower Peak Ring interval (Section 95R-3, 117 cm, through Core 303R; 747.02–1334.69 mbsf) at a frequency of ~1 sample per core. The samples include granitoids, pre-impact dikes, suevite, and impact melt rock. The natural remanent magnetization (NRM) was measured for all samples, as well as the residual moment following stepwise alternating field (AF) demagnetization (in 5 mT increments) up to maximum applied fields of 20 mT.
Remanent magnetization
The initial NRMs of granitoid samples range between ~3 × 10⁻⁸ and ~4 × 10⁻⁵ Am2 (for sample volumes of ~12.25 cm3), with an average of ~2 × 10⁻⁶ Am2. Two classes of demagnetization behavior were observed in the granitoids. The first class, which represents the majority of granitoid samples, shows a rapid decay curve with ~90% of the initial signal removed at AF 20 mT demagnetization (e.g., Sample 107R-2, 10.0–12.5 cm) (Figure F22A). The fact that up to ~80% of the initial signal is often lost at AF levels as low as 5 mT is suggestive of a very low coercivity overprint. The other class of demagnetization behavior is mostly observed in granitoids located near contacts with intrusions such as pre-impact dikes and impact melt rock (e.g., Sample 285R-2, 18.0–20.5 cm) (Figure F22B). This second class of granitoids exhibits a relatively stable NRM with ~70% of the initial signal left at AF 20 mT demagnetization, indicative of a greater population of high-coercivity (>20 mT) ferromagnetic grains within these rocks. The residual magnetizations present across all granitoids after AF 20 mT demagnetization range between ~1 × 10⁻⁸ and ~2 × 10⁻⁵ Am2 with an average value of ~7 × 10⁻⁷ Am2.
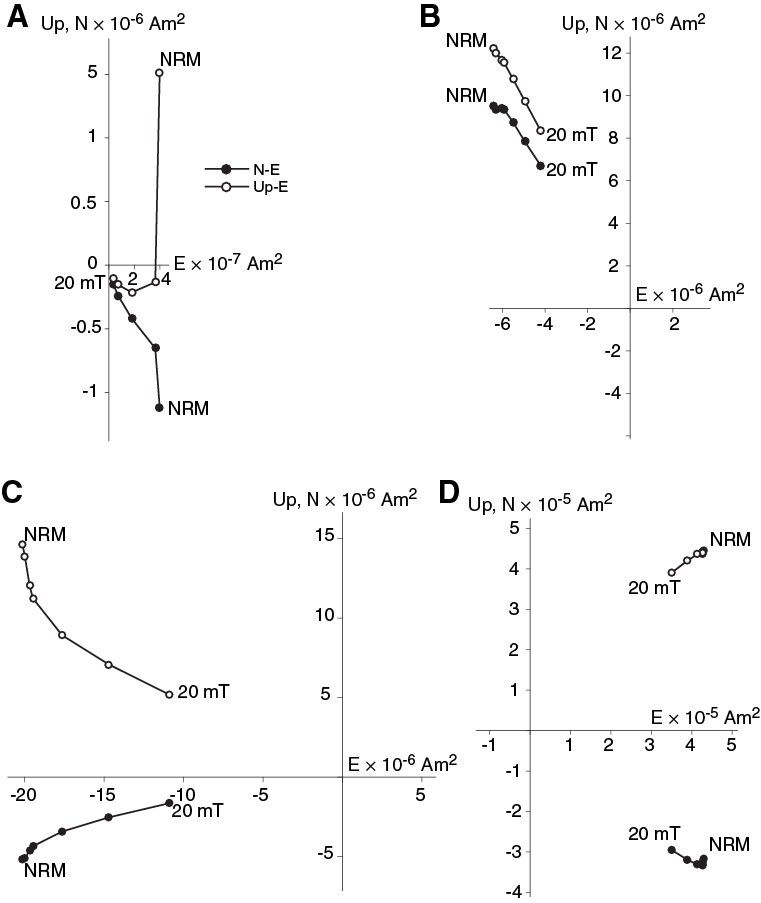
Figure F22. AF demagnetization behavior.
The four pre-impact dike samples measured during the Onshore Science Party (OSP) were collected from Cores 135R, 140R, 169R, and 170R, all between ~849 and 938 mbsf. The initial NRMs of these samples range from ~2 × 10⁻⁷ to ~3 × 10⁻⁵ Am2 with an average of ~1 × 10⁻⁵ Am2. This average magnetization intensity is about one order of magnitude higher than the NRM of the granitoids. After AF demagnetization to 20 mT, residual magnetizations in the pre-impact dikes range between ~2 × 10⁻⁷ and ~1 × 10⁻⁵ Am2 with an average value of ~7 × 10⁻⁶ Am2. About 50% of the original NRM moment is left at AF 20 mT demagnetization (e.g., Sample 107R-2, 120.0–122.5 cm) (Figure F22C).
The suevite and impact melt rock samples were mostly collected from near the bottom of the Hole M0077A cored interval (Cores 268R, 276R, 277R, 279R–284R, 286R–295R, and 297R, all between ~1225 and 1315 mbsf). The initial NRMs of these samples range from ~3 × 10⁻⁵ to ~2 × 10⁻⁴ Am2 with an average of ~1 × 10⁻⁴ Am2 (e.g., Sample 268R-1, 72.0–74.5 cm) (Figure F22D). This average value is two orders of magnitude higher than the NRM of the granitoids. After AF 20 mT demagnetization, residual magnetizations in the suevite and impact melt rock range between ~2 × 10⁻⁵ and ~2 × 10⁻⁴ Am2 with an average value of ~8 × 10⁻⁵ Am2. Approximately 80% of the original NRM moment is left at AF 20 mT demagnetization, indicating that these rocks are dominated by a high-coercivity ferromagnetic grain population.
The NRM data correlate well with multisensor core logger (MSCL) measurements, which demonstrate that the suevites and impact melt rocks have the highest magnetic susceptibilities in the Lower Peak Ring interval. The highest impact melt rock magnetic susceptibility values (~4 × 10⁻² SI, as observed in the MSCL data) are present at ~1250 mbsf (Figure F23). A paleomagnetic sample was not collected from this particular depth during the OSP. However, the sample with the highest NRM intensity (2 × 10⁻⁴ Am2 in Core 281R) was collected nearby at ~1265 mbsf.
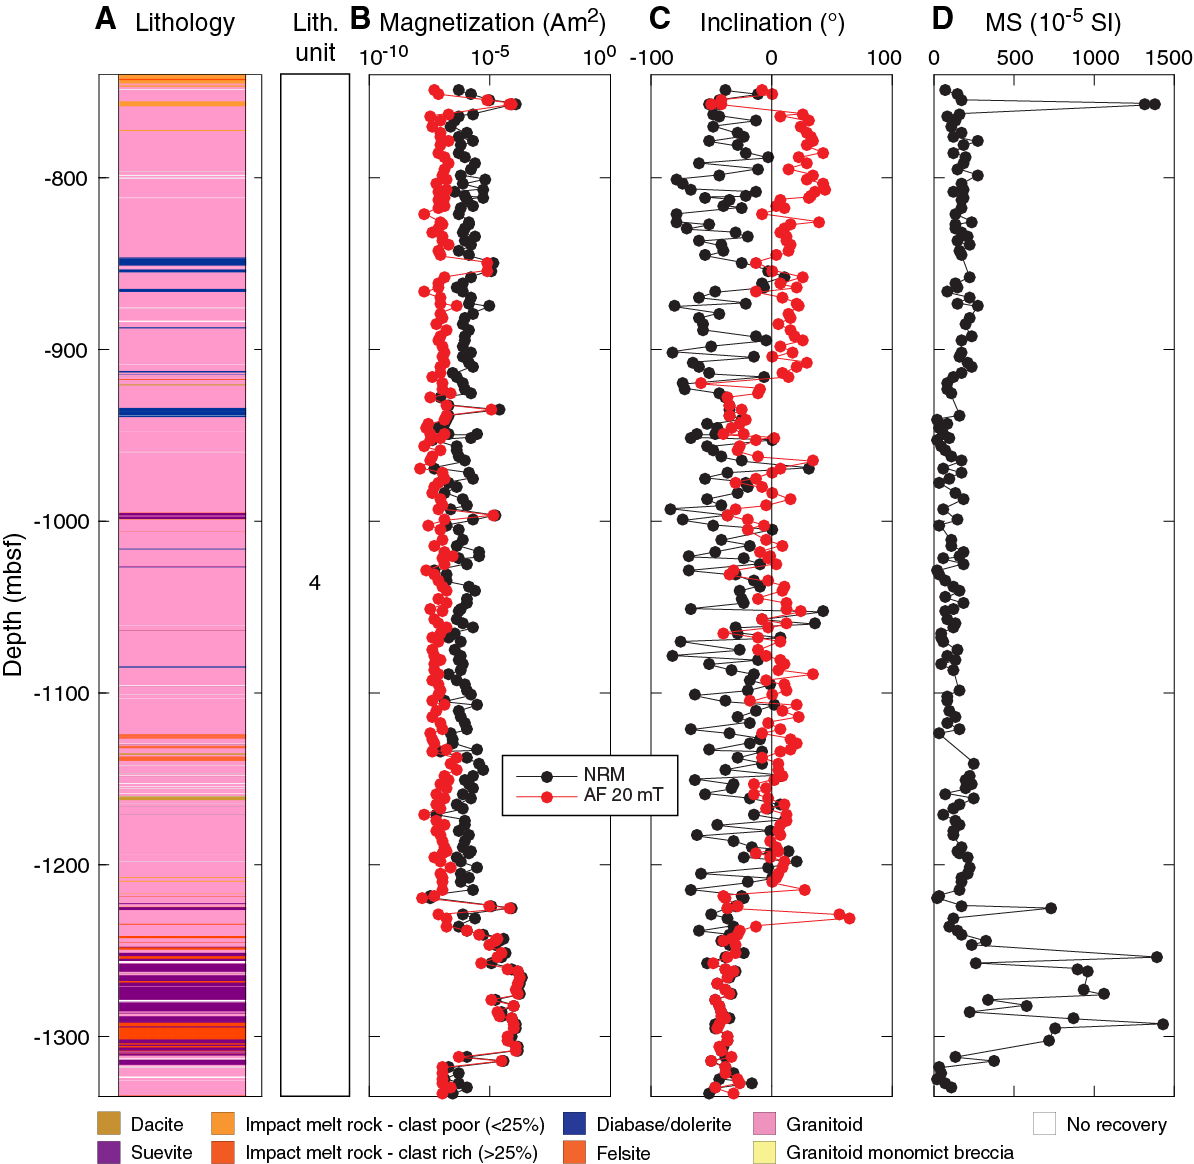
Figure F23. Magnetostratigraphic plots.
Inclination data
The NRMs of most samples (including granitoids, pre-impact dikes, suevites, and impact melt rocks) have negative magnetic inclinations (i.e., they exhibit reversed polarity) with an average value of –35° (Figure F23). However, a very small number of samples (14 samples; ~7% of the total measured samples for this section) exhibit normal polarity, with inclination values below 45°. Interestingly, after AF demagnetization to 20 mT, many granitoid samples (particularly those collected from above ~900 mbsf and between ~1050 and ~1200 mbsf) switch to normal polarity midexperiment. The NRMs of the pre-impact dikes have an average inclination of −25°. The NRMs of the granitoids have an average inclination of −34°. The suevite and impact melt rock samples all exhibit reversed polarity with an average NRM inclination of –38° and maintain negative inclination values after AF 20 mT demagnetization. Given the similarity of the measured NRM inclinations to the –44° mean inclination previously obtained for reversely magnetized suevite and impact melt rock samples during prior investigations of these lithologies within the Chicxulub crater (Urrutia-Fucugauchi et al., 1994, 2004; Velasco-Villareal et al., 2011), much of the Lower Peak Ring interval was likely (at minimum) partially remagnetized by mechanisms related to the impact.
Geochemistry and mineralogy
Discrete bulk XRF, total carbon, and X-ray diffraction data on Cores 96R–303R (747.02–1334.69 mbsf) provide a picture of the bulk chemistry and mineralogy for the Lower Peak Ring interval.
Major and trace elements and carbon and sulfur content
Major and minor elements
Major element compositions of the 194 samples from Cores 96R–303R (747.02–1334.69 mbsf) are presented in Table T1. Their depth profiles are shown in Figure F24. The relative error is 1.75% for SiO2, 1.83% for TiO2, 0.57% for Al2O3, 0.36% for K2O, 0.51% for FeO, 0.42% for CaO, 2.29% for P2O5, 2.65 for MgO, and 5.80 for Na2O.
Table T1. Major element compositions. Download table in CSV format.
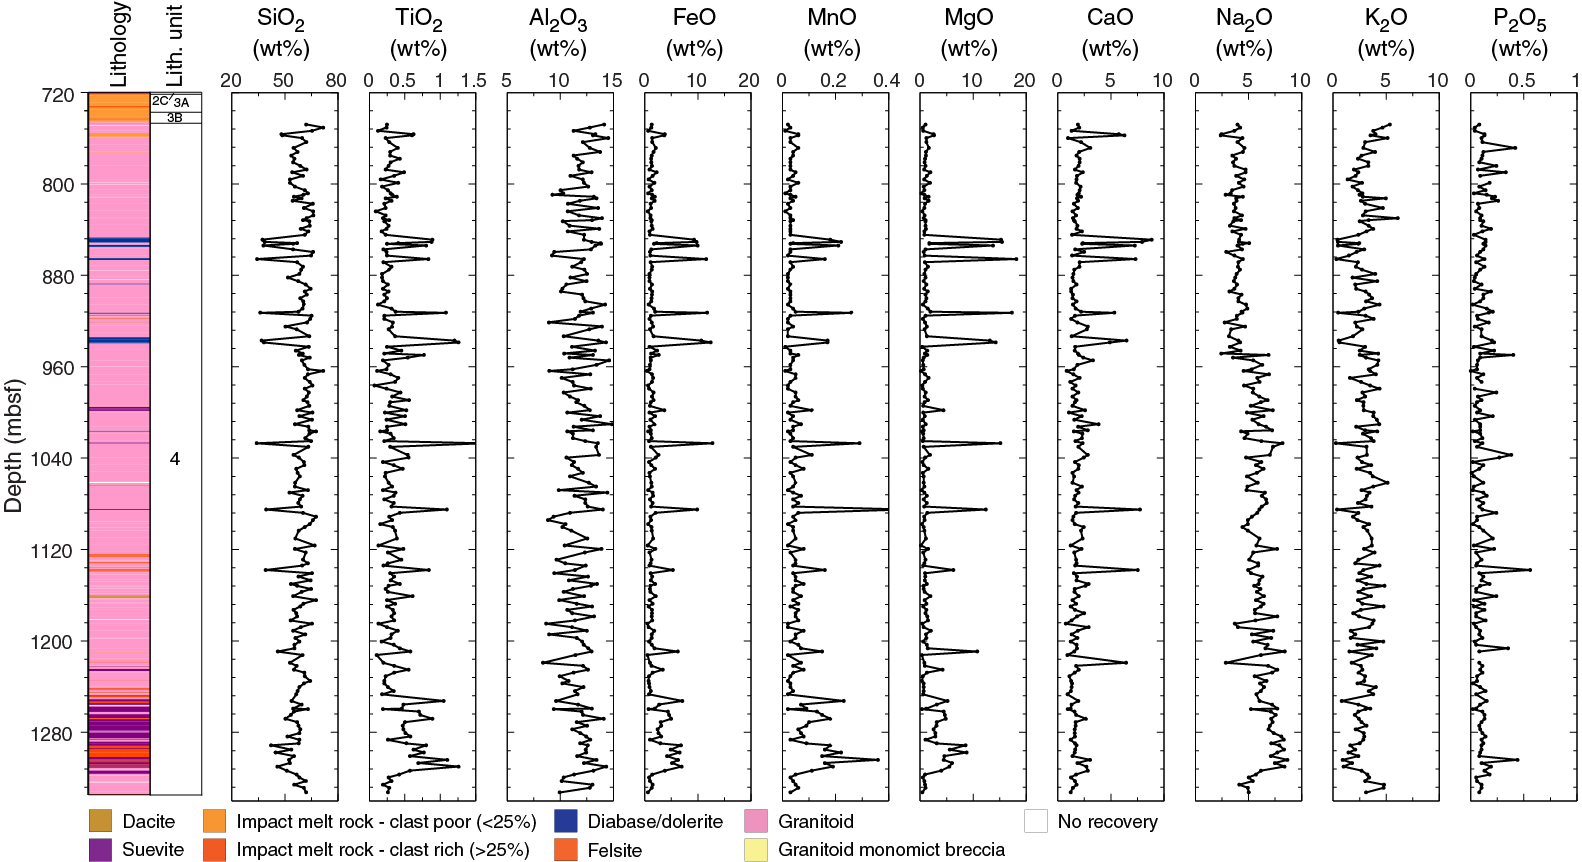
Figure F24. Major element compositions.
Total oxide contents (average ± 1σ = 84.93 ± 3.68 wt%) may reflect the presence of volatile components technically not detectable by XRF. The granitoid-dominated Lower Peak Ring interval contains some intercalations of pre-impact dikes, suevites, and impact melt rocks. Compared to the granitoids, the pre-impact dike lithologies (felsite, dacite, and diabase/dolerite) have much lower SiO2 and K2O contents than the granitic rocks, whereas MgO, FeO, CaO, MnO, and TiO2 are typically significantly enriched. A dacite sampled at 1160.9 mbsf exhibits a moderate enrichment in TiO2 and a moderate depletion in SiO2. Suevite and impact melt rock intercalations show variable compositions but tend to be relatively depleted in K2O and enriched in TiO2, FeO, MgO, and MnO compared to the granitoids (Figure F24). This figure also illustrates that Na2O concentrations from 948.39 and 1332.75 mbsf (average ± 1σ = 6.12 ± 1.12 wt%) are slightly higher than those between 748.89 to 948.39 mbsf (average ± 1σ = 3.92 ± 0.59 wt%).
Carbon and sulfur
Contents of total carbon (Ctotal), organic carbon (Corg), carbonate carbon (Ccarb), and sulfur (S) in the 194 samples from Cores 96R–303R (747.02–1334.69 mbsf) are presented in Table T2, and their depth profiles are shown in Figure F25. The relative error is within 2.0% for Ctotal and Corg and 0.7% for S.
Table T2. Carbon and sufur contents. Download table in CSV format.
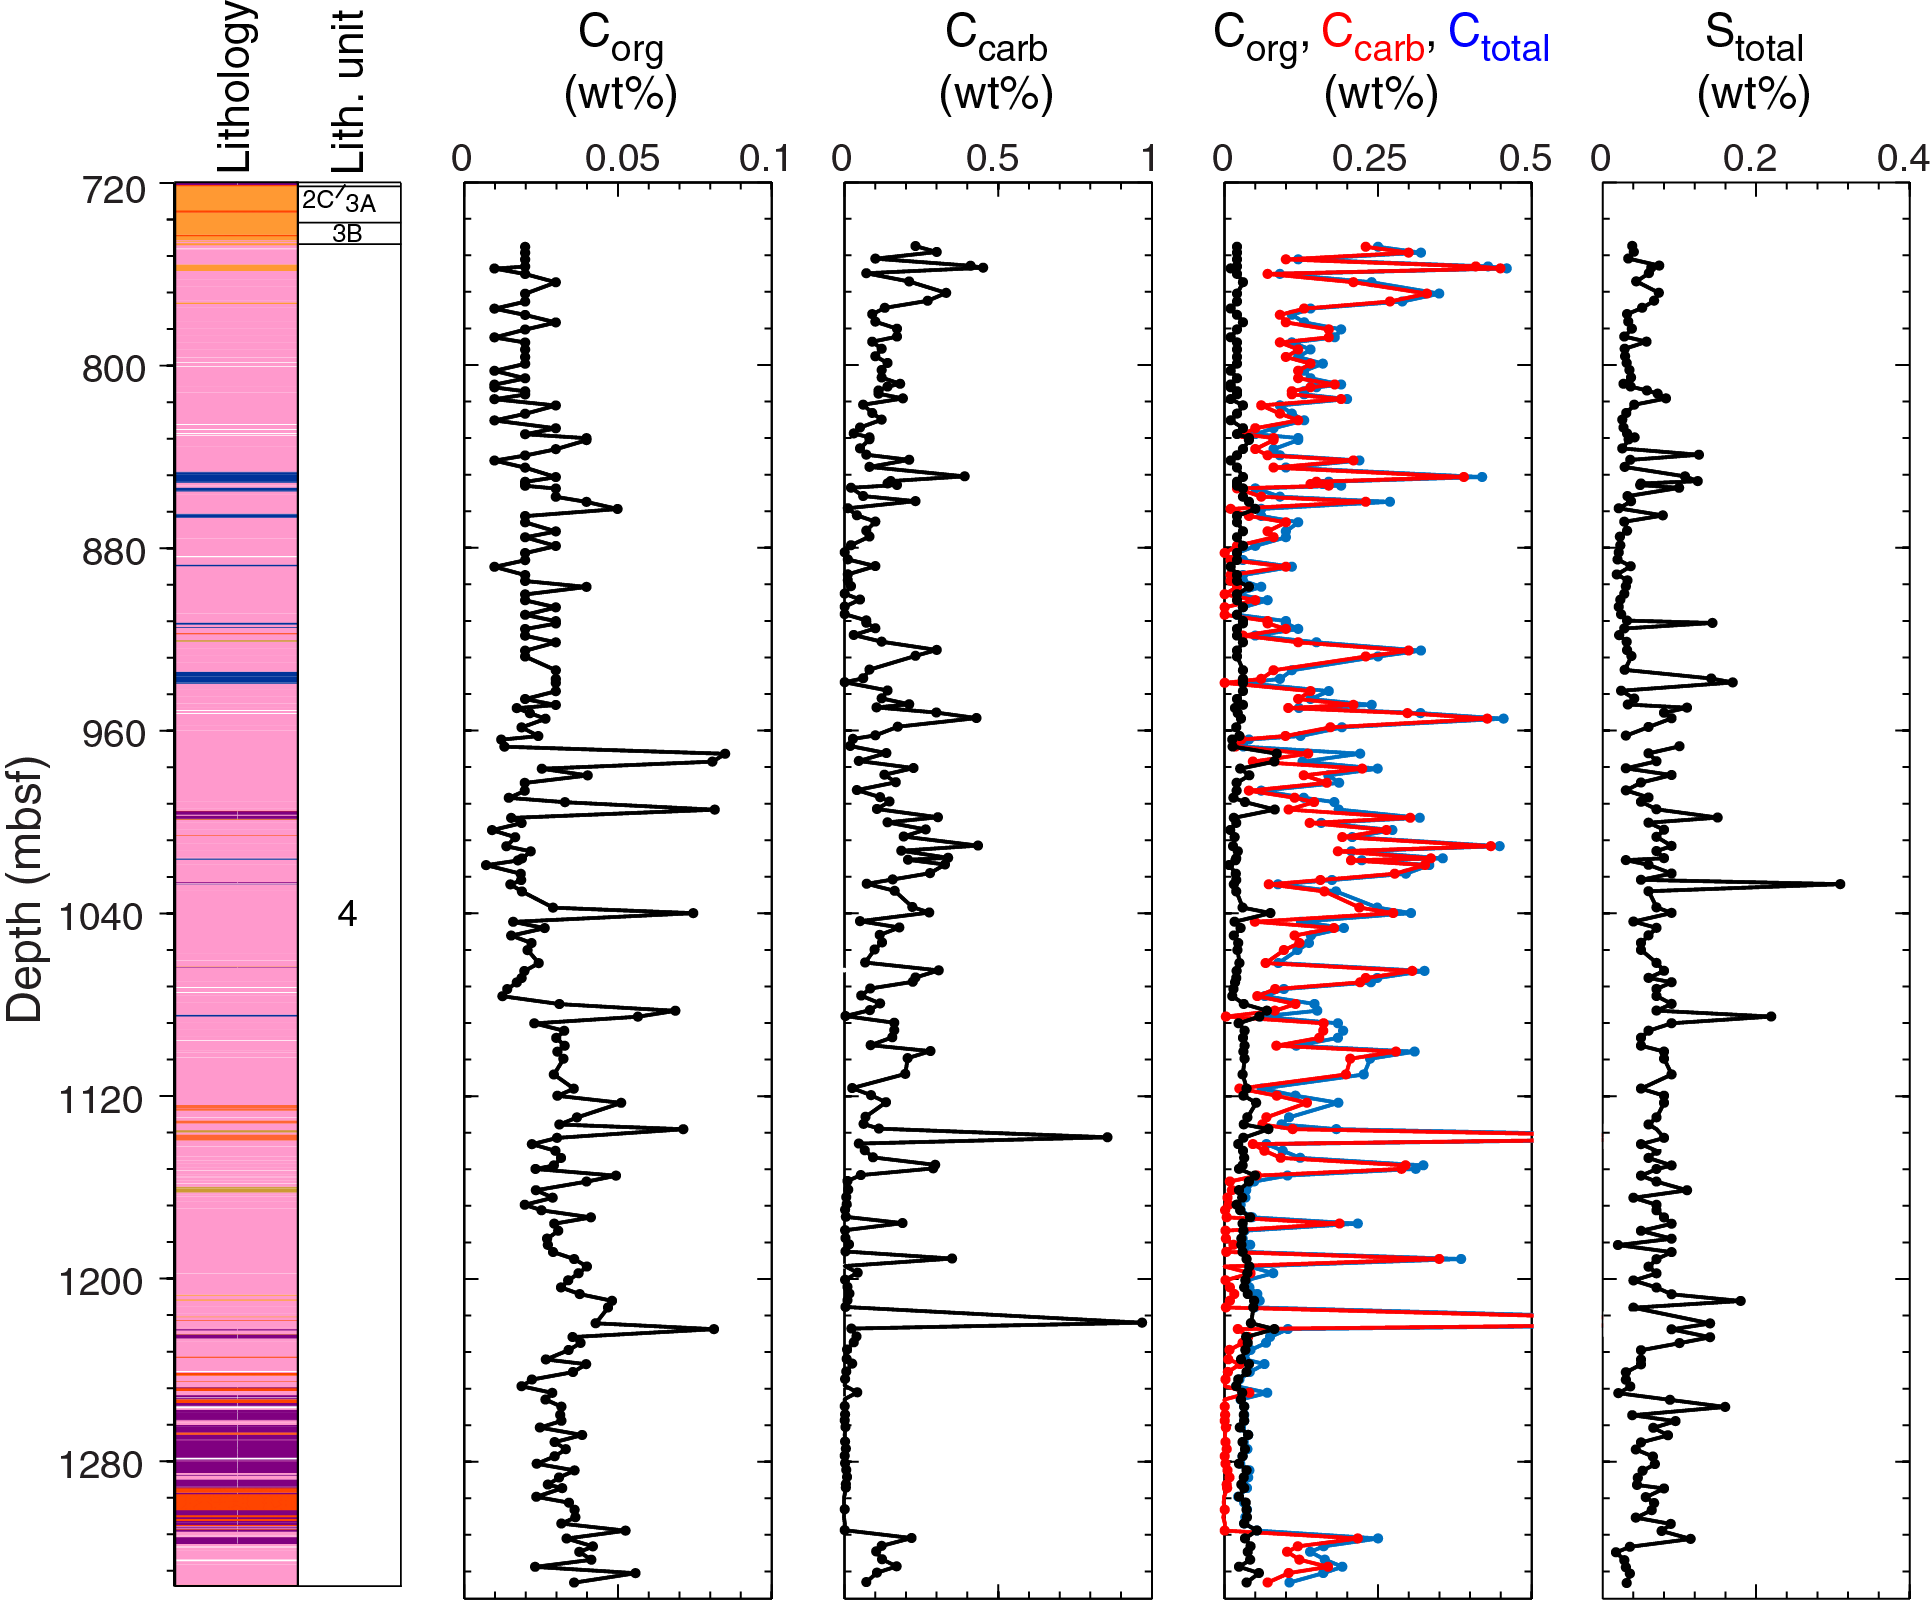
Figure F25. Carbon and sulfur contents.
Three samples in Core 215R through Section 217R-1 (1064.89–1070.03 mbsf) have high Corg concentrations (0.24 to ~0.33 wt%), whereas general background values are low (average = 0.03 wt%). The Ccarb content (average = 0.13 wt%) is higher than the Corg content in these three samples. Otherwise, Ccarb exhibits variable abundances that mostly do not correlate with obvious lithologic variations. However, the felsite sample at 1137.95 mbsf exhibits strong relative enrichment in Ccarb, and the package of granitoids, suevites, and impact melt rocks between 1157.12 and 1309.97 mbsf exhibits very low concentrations of Ccarb, with a few exceptions, compared to the granitoids above and below. The S content (average = 0.06 wt%) is very low, except for in diabase/dolerite samples that display concentration spikes; interestingly, the felsite sample (1137.95 mbsf) that otherwise shows some chemical affinities with the diabase/dolerite lithologies does not exhibit an enrichment in sulfur and neither does the sample of dacite at 1160.9 mbsf.
Trace elements
Trace element compositions of the 194 samples from Cores 96R–303R (747.02–1334.69 mbsf) are presented in Table T3, and their depth profiles are shown in Figures F26 and F27. The relative error is 1.1% for Sr, 0.7% for Zr, 0.3% for Rb, 4.7% for Ba and Cr, 3.6% for Cu, 5.3% for Nb, 2.1% for Ni, 1% for Pb, 2.5% for Y, and 0.6% for Zn. Other trace elements have standard errors estimated to be >10%.
Table T3. Minor and trace element compositions. Download table in CSV format.
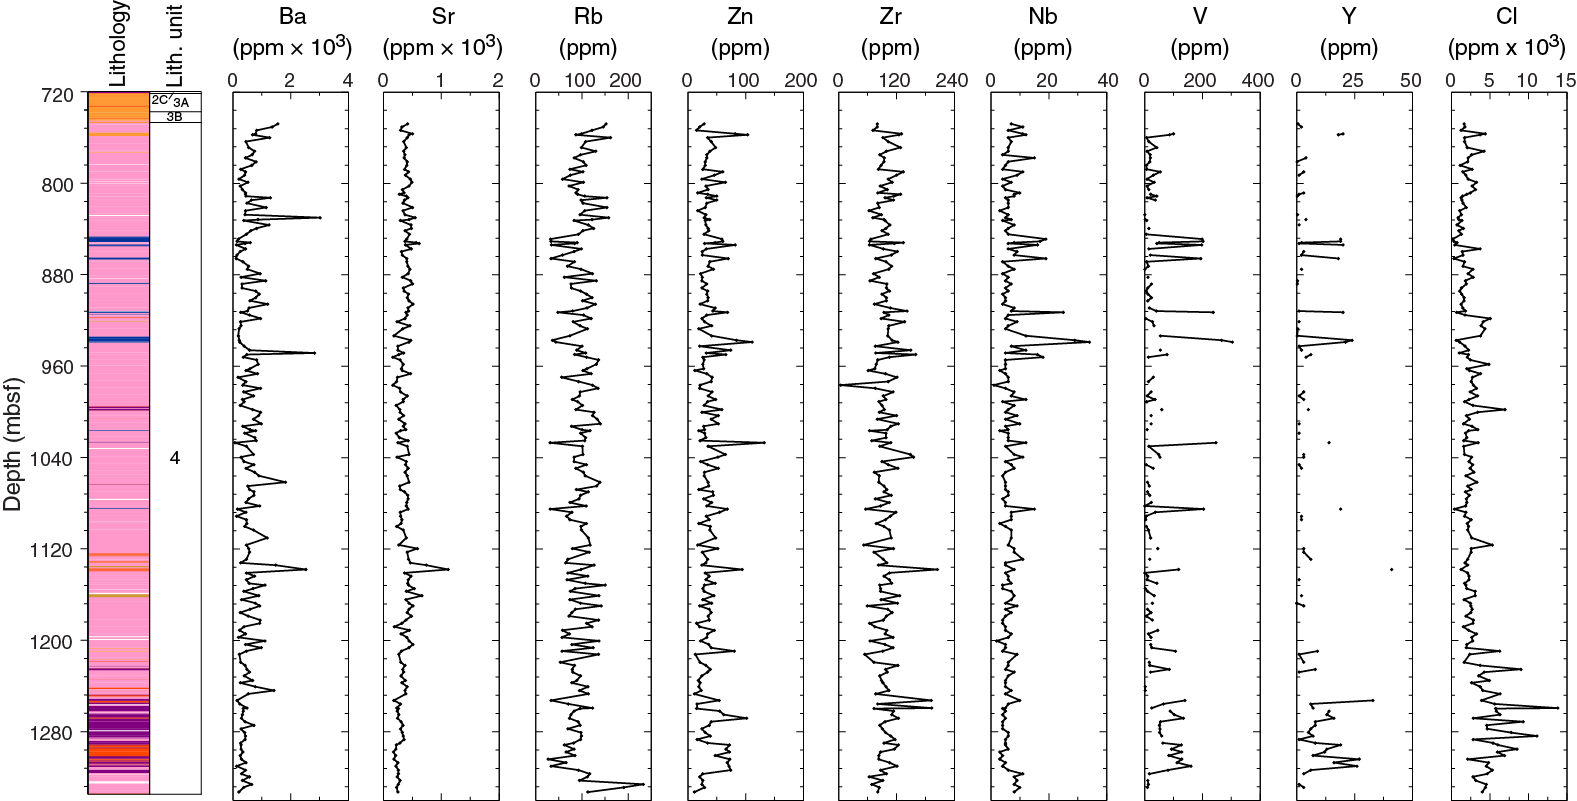
Figure F26. Trace element compositions.
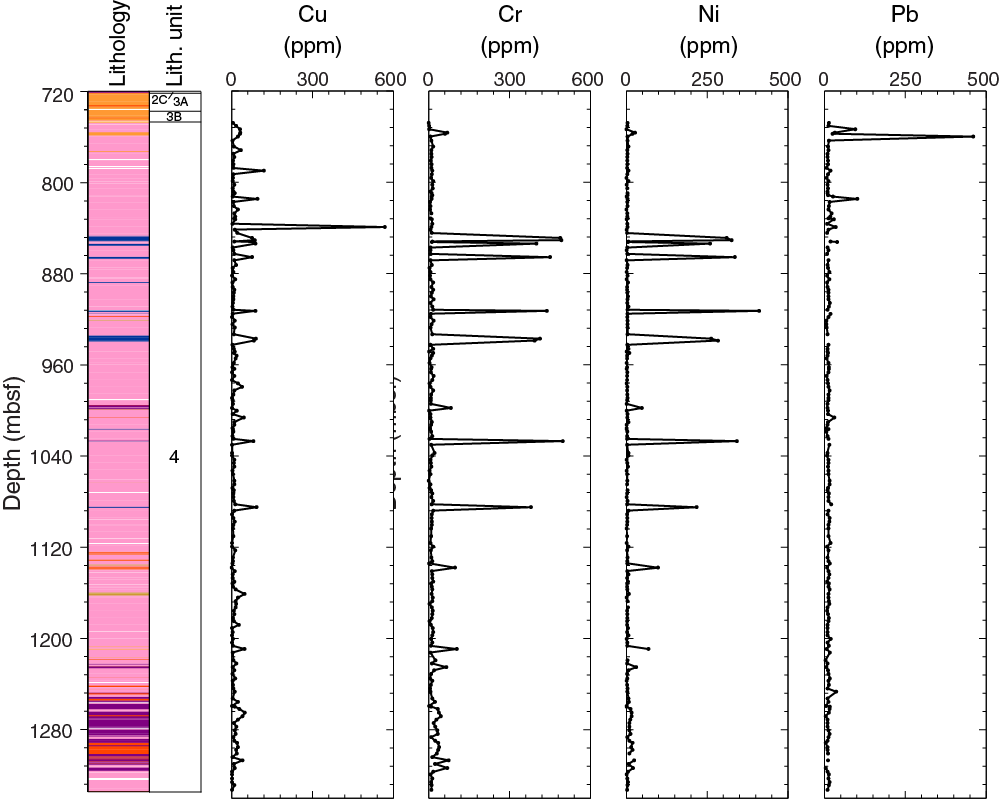
Figure F27. Trace element compositions.
Trace element concentrations exhibit little variation among the granitic samples, except for an excursion in Rb in two samples near the bottom of the package at 1325.89 and 1328.57 mbsf. Pre-impact dikes exhibit characteristic strong enrichments in Cr, Ni, Y, Cu, V, Y, Nb, and Zn compared to the granitic rocks. The felsite lithology among the pre-impact dikes was only sampled once at 1137.95 mbsf and exhibits similar concentration patterns to the diabase/dolerite lithology. However, it displays additional significant enrichments in Ba, Sr, and Zr, as well as a relatively higher concentration of Y and lower concentrations of V, Cr, and Ni. The dacite at 1160.9 mbsf indicates mostly similar trace element concentrations to its granitic host rocks, except for slight enrichments in Sr, V, and Cu. Suevite and impact melt rock concentrations are variable but appear relatively depleted in Ba and Sr and moderately enriched in Zn, Y, V, Cr, Ni, and Cu compared to the granitoids.
Mineralogy
The composition of the bulk mineralogy of 183 samples from Cores 96R–303R (747.02–1334.69 mbsf) is presented in Table T4, and their depth profiles are shown in Figure F28. For a general description of the different minerals present in the Lower Peak Ring interval, refer to Table T5.
Table T4. Percentage abundance data. Download table in CSV format.
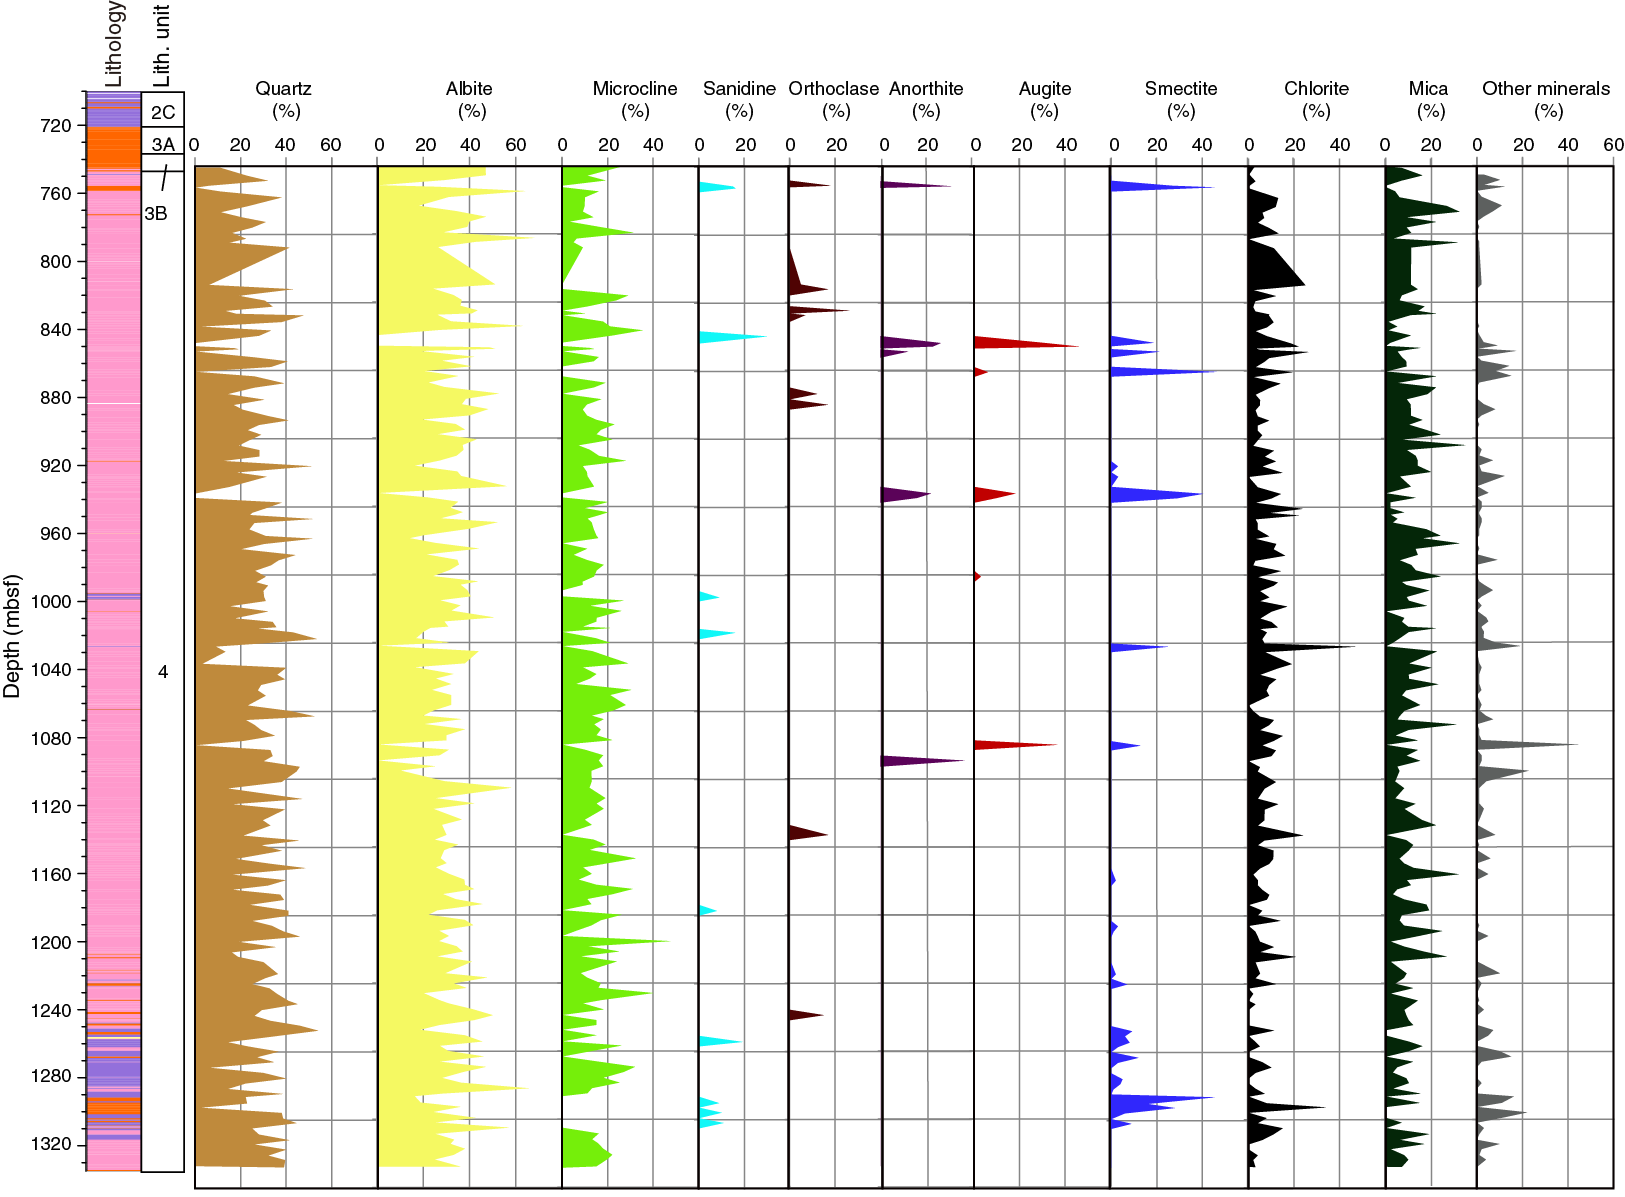
Figure F28. Bulk mineralogy.
Table T5. All minerals. Download table in CSV format.
The mineralogical assemblage at the top of the interval is mainly composed of albite (average = 40%), quartz (average = 30%), and microcline (average = 20%). The clay fraction is dominated by mica phyllosilicates (muscovite, biotite, phlogopite, illite, annite, fluorannite, lepidolite, paragonite, phengite, polylithionite, siderophyllite, and tainiolite) and chlorite (clinochlore, nimite, chamosite, and corrensite).
Accessory minerals are highly variable, including oxides (cristobalite, baddeleyite, ferrierite, magnesioferrite, magnetite, orthoferrosilite, pyrochroite, rutile, and stishovite), plagioclase (andesine), zeolite (analcime, chabazite, merlinoite, natrolite, stibilite, and ankerite), carbonate (calcite, dawsonite, dolomite, and rhodochrosite), evaporite (halite), silicates (clinoferrosilite, anorthoclase, bustamite, enstatite, ferrosilite, nepheline, pyrope, sodalite, talc, and zircon), pyroxene (clinopyroxene and orthopyroxene), halide (cryolite), sulfide (pentlandite), and amphibole. The clay fraction contains, in addition to mica and phyllosilicates, traces of smectite (aerinite, montmorillonite, and saponite), serpentine (clinochrysotile, lizardite, and brindleyite), chlorite (clinochlore, corrensite, and nimite), vermiculite, palygorskite, and kaolinite (halloysite).
Several samples of pre-impact dike and impact melt rock lithologies (Cores 99R, 100R, 135R, 140R, 144R, 170R, 171R, 203R, 222R, and 282R) have different mineral assemblages. In all of these samples, the clay fraction is mainly composed of smectite (saponite, montmorillonite, and aerinite) and often associated with chlorite (clinochlore and corrensite). The accessory minerals that make up these samples are mainly feldspar (sanidine, orthoclase, and anorthite) and pyroxene (augite). Moreover, quartz is absent or almost absent.
In Cores 290R–296R, which are composed of impact melt rocks, microcline disappears and smectite increases to up to 40%.
Of particular note is the possible occurrence of stishovite, a high-pressure polymorph of quartz, in felsite in Core 239R at 1137.95 mbsf.
Physical properties
P-wave velocity
P-wave velocities from discrete sample measurements in the Lower Peak Ring interval have a lot of variability but generally range from ~3500 to 5000 m/s (Figure F29). Values are variable between 747 and 849 mbsf, ranging from ~2500 to 5300 m/s, with a distinct peak of 6000 m/s at 849–851 mbsf, where a diabase/dolerite dike was described. P-wave velocities decrease from ~4500 to ~4000 m/s at 846–933 mbsf and have higher values of 4600–4800 m/s between 934 and 936 mbsf, where another diabase/dolerite dike was encountered. Below 936 mbsf, P-wave velocities are variable with values of ~2000 to ~5300 m/s and average ~4200 m/s.

Figure F29. P-wave velocity, porosity, density, thermal conductivity, and resistivity.
No clear change in values was observed across the boundary between the overlying Upper Peak Ring interval and the Lower Peak Ring interval. Discrete P-wave velocities follow the general trend of the downhole sonic log and VSP. Where the downhole sonic log and VSP diverge, the discrete measurements more closely follow the sonic log.
Porosity
Porosities are variable from 747 to 820 mbsf but generally decrease from >20% to ~8% (Figure F29). Porosities are fairly constant from 820 to 920 mbsf with a mean value of ~10% and are more variable from 920 to 1030 mbsf with values between 6% and 18% and four higher values of 20%–25%. From 1030 to 1220 mbsf, porosities are constant with a mean value of 8%–9% but show two sharp positive peaks: ~10%–17% at ~1116 mbsf and ~10%–13% at ~1130–1138 mbsf. Below 1220 mbsf, porosities are more variable and tend toward higher values, averaging 15% with a maximum value of >40%.
In general, porosities show an inverse correlation with velocities, with higher porosities coinciding with zones of lower velocity. A sharp change in porosities is observed across the boundary between the Upper Peak Ring and Lower Peak Ring intervals, with higher porosities observed in the Upper Peak Ring interval.
Density
Bulk densities are fairly constant between 747 and 1215 mbsf with a mean value of ~2.45 g/cm3 and are more variable below 1215 mbsf with values ranging from ~2.2 to 2.5 g/cm3 (Figure F29). Positive peaks are found at ~848–851 mbsf (~2.6–2.7 g/cm3) and ~933–937 mbsf (~2.5–2.6 g/cm3), and negative troughs are found at 997 mbsf (~2.3 g/cm3) and 1117 mbsf (~2.3 g/cm3).
No clear change in density is observed across the boundary with the overlying Upper Peak Ring interval. Bulk densities are generally positively correlated with velocities and inversely correlated with porosities. There is good correspondence between bulk densities measured on discrete samples and bulk densities measured with gamma ray attenuation using the MSCL, although more variation is observed in the latter.
Thermal conductivity
Thermal conductivity values are variable and generally range from 1.5 to 3.4 W/(m·K) (Figure F29). They are higher in the granitoids (mean value = 2.7 W/[m·K]) and lower in the diabase/dolerite dikes (mean value = 1.7 W/[m·K]).
A sharp change across the boundary between the Upper Peak Ring and Lower Peak Ring intervals is observed, with higher thermal conductivity values in the Lower Peak Ring interval.
Resistivity
Resistivities are variable from 747 to 1080 mbsf, ranging between 0.5 and 13 Ωm with a few values as high as 25 Ωm. Between 1080 and 1200 mbsf, resistivities are fairly constant with a mean of 4 Ωm, with some variability (1–13 Ωm) at ~1024–1038 mbsf (Figure F29). Below 1200 mbsf, resistivity is variable and ranges between 1.1 and 7.2 Ωm for the downhole logging measurements and between 0.4 and 11.3 Ωm for the MSCL measurements. One distinct negative peak in downhole logging resistivity is encountered at ~850 mbsf. This peak is not observed in the MSCL data and is likely an artifact from the presence of metal pieces in the borehole associated with drilling operations. MSCL resistivities are consistently lower but follow the same trend as resistivity measured by downhole logging (derived from the EM51 induction tool) from 745 to 1250 mbsf. However, the difference between MSCL and downhole log resistivities increases between 1250 and 1315 mbsf across the interval where suevites and impact melt rocks were observed. This observation is similar to the offset in resistivity values between core-based and borehole–based measurements in the suevites and impact melt rocks in the Upper Peak Ring interval; the cause for these differences remains to be determined. There is a sharp change across the boundary to the overlying Upper Peak Ring interval in the MSCL data with lower values in the Upper Peak Ring interval, but there is little change in the downhole logging resistivity values across this boundary.
Magnetic susceptibility
Magnetic susceptibility values are fairly constant at ~200 × 10–5 SI from 747 to 930 mbsf with one positive peak in an impact melt rock at ~755–758 mbsf (~1000 × 10–5 to 1400 × 10–5 SI) and additional peaks of 400 x 10–5 to 1200 × 10–5 SI at depths where diabase/dolerite were encountered: ~849–851, 854–855, ~865–866, ~887–888, and ~934–936 mbsf (Figure F30). From 936 to 1225 mbsf, magnetic susceptibility is highly variable, ranging from 10 × 10–5 to 1100 × 10–5 SI. Values increase from 100 × 10–5 SI at 1225 mbsf to 1600 × 10–5 SI at 1300 mbsf and decrease to values of 700 × 10–5 SI toward the base of the section.
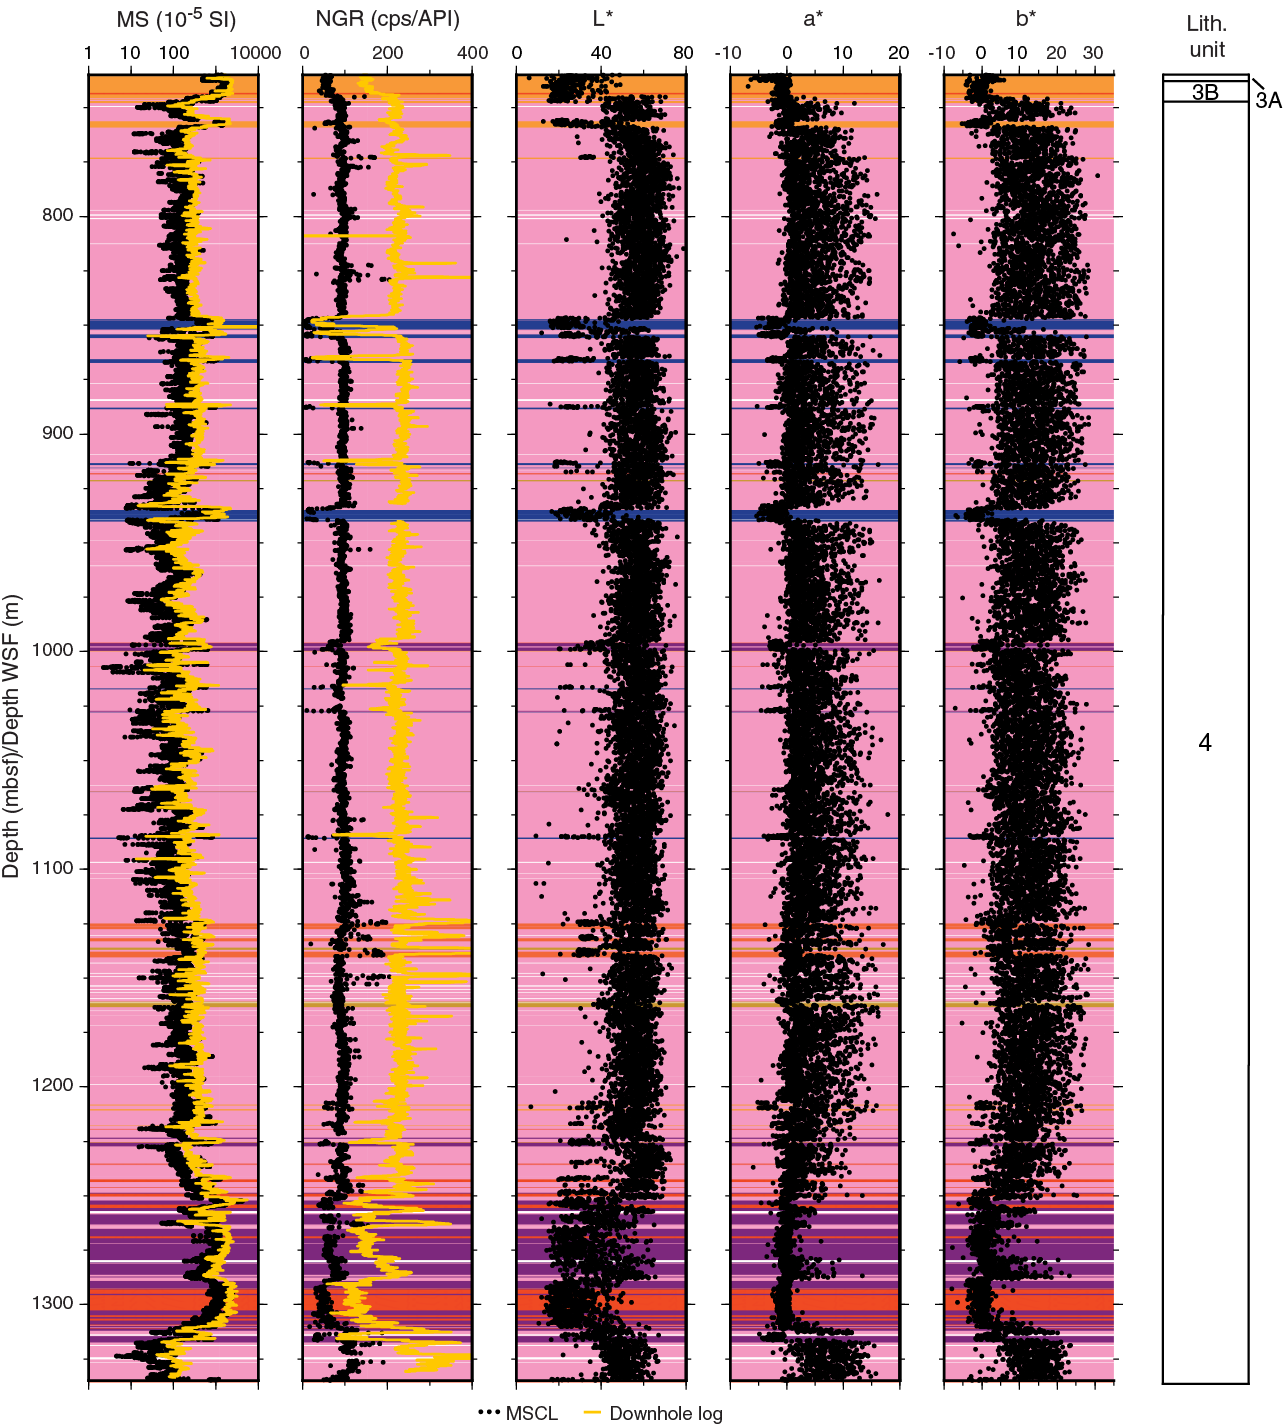
Figure F30. Magnetic susceptibility, NGR, and L*, a*, and b* values.
Magnetic susceptibility values measured by the MSCL are consistently lower but have a similar trend to those measured by the wireline downhole log. This offset is likely a result of the difference in volume of investigation between the tools used (wireline measures a larger volume than MSCL; e.g., Dubuisson et al., 1995). One distinct positive peak in downhole logging magnetic susceptibility is encountered at ~850 mbsf. This peak is not observed in the MSCL data. This peak is likely an artifact due to metal pieces that fell into the borehole during drilling operations because it occurs at the same depth where a high resistivity value is observed in the downhole wireline resistivity log.
Natural gamma radiation
Natural gamma radiation (NGR) values are fairly constant from 747 to 1250 mbsf with a mean value of ~93 counts/s. Distinct positive excursions of 132–205 counts/s were observed at several layers where impact melt rocks were encountered: ~772–773, ~776–778, ~822–823, and ~824–829 mbsf. Distinct negative excursions of 4–14 counts/s were observed at diabase/dolerite dikes: ~849–851, 854–855, ~865–866, ~887–888, ~934–936, ~933–940, ~1027, and ~1085 mbsf (Figure F30). Below 1250 mbsf, NGR values are more variable and range from ~17 to ~190 counts/s. NGR values slightly increase from the Upper Peak Ring interval to the Lower Peak Ring interval. The trend of the NGR values measured by the MSCL in counts per second is in good agreement with the one from the wireline downhole log in American Petroleum Institute (API) units.
Color reflectance
Color reflectance L* values are relatively constant with a mean value of 52 but have a rather large standard deviation of 12 (Figure F30). Similarly, a* values are 3.3 ± 3.7 and b* values are 10.7 ± 6.9. Several excursions with lower L* (<20), lower a* (–5), and lower b* values (–5) were observed at ~772–773, ~776–778, ~822–823, ~824–829, ~849–851, 854–855, ~865–866, ~887–888, ~934–936, ~933–940, ~1027, and ~1085 mbsf, where diabase/dolerite dikes were encountered. L*, a*, and b* values are generally higher and show more variability than those in the overlying Upper Peak Ring interval. This difference is likely caused by the coarse grain size and variability of color in the minerals within the granitoids.
Downhole logging
Downhole logging measurements in the Lower Peak Ring interval were conducted during the third logging session (see Downhole logging in the Expedition 364 methods chapter [Gulick et. al., 2017a]), from 1334 m WSF to the base of the Upper Peak Ring impact melt rock (base of Subunit 3B), found at 747.02 mbsf in Section 95R-3 (see Lithology) and at ~746.2 m WSF on the wireline ABIs (see Figure F26 in the Site M0077: Upper Peak Ring chapter [Gulick et al., 2017b]). Wireline logs were acquired in two steps (Lower A and Lower B) to avoid an interval of potential hole instability (where there was a loss in drilling fluid circulation) located at around 938 mbsf.
Wireline logs
From 746 to 1334 m WSF, the hole was very stable, and borehole conditions were excellent. Wireline log data quality is very good (Figure F31). The downhole logs are generally in good agreement with the physical properties measurements performed on whole-round cores and discrete samples (see Physical properties). The gamma ray logs from the various tool strings and runs match well. Postacquisition depth-shift adjustments to align the various passes were generally less than 50 cm, except for the standalone tools because they were lighter than the stacked tool strings. The pipe entrance at the end of the Lower A logging session was determined to be at 938.74 m WSF on the ABI. From 935.5 to 939.2 m WSF, only a few logs were acquired (from tools not needing centralization; see Downhole logging in the Expedition 364 methods chapter [Gulick et. al., 2017a]) to avoid destabilizing the hole at this depth with centralizers.
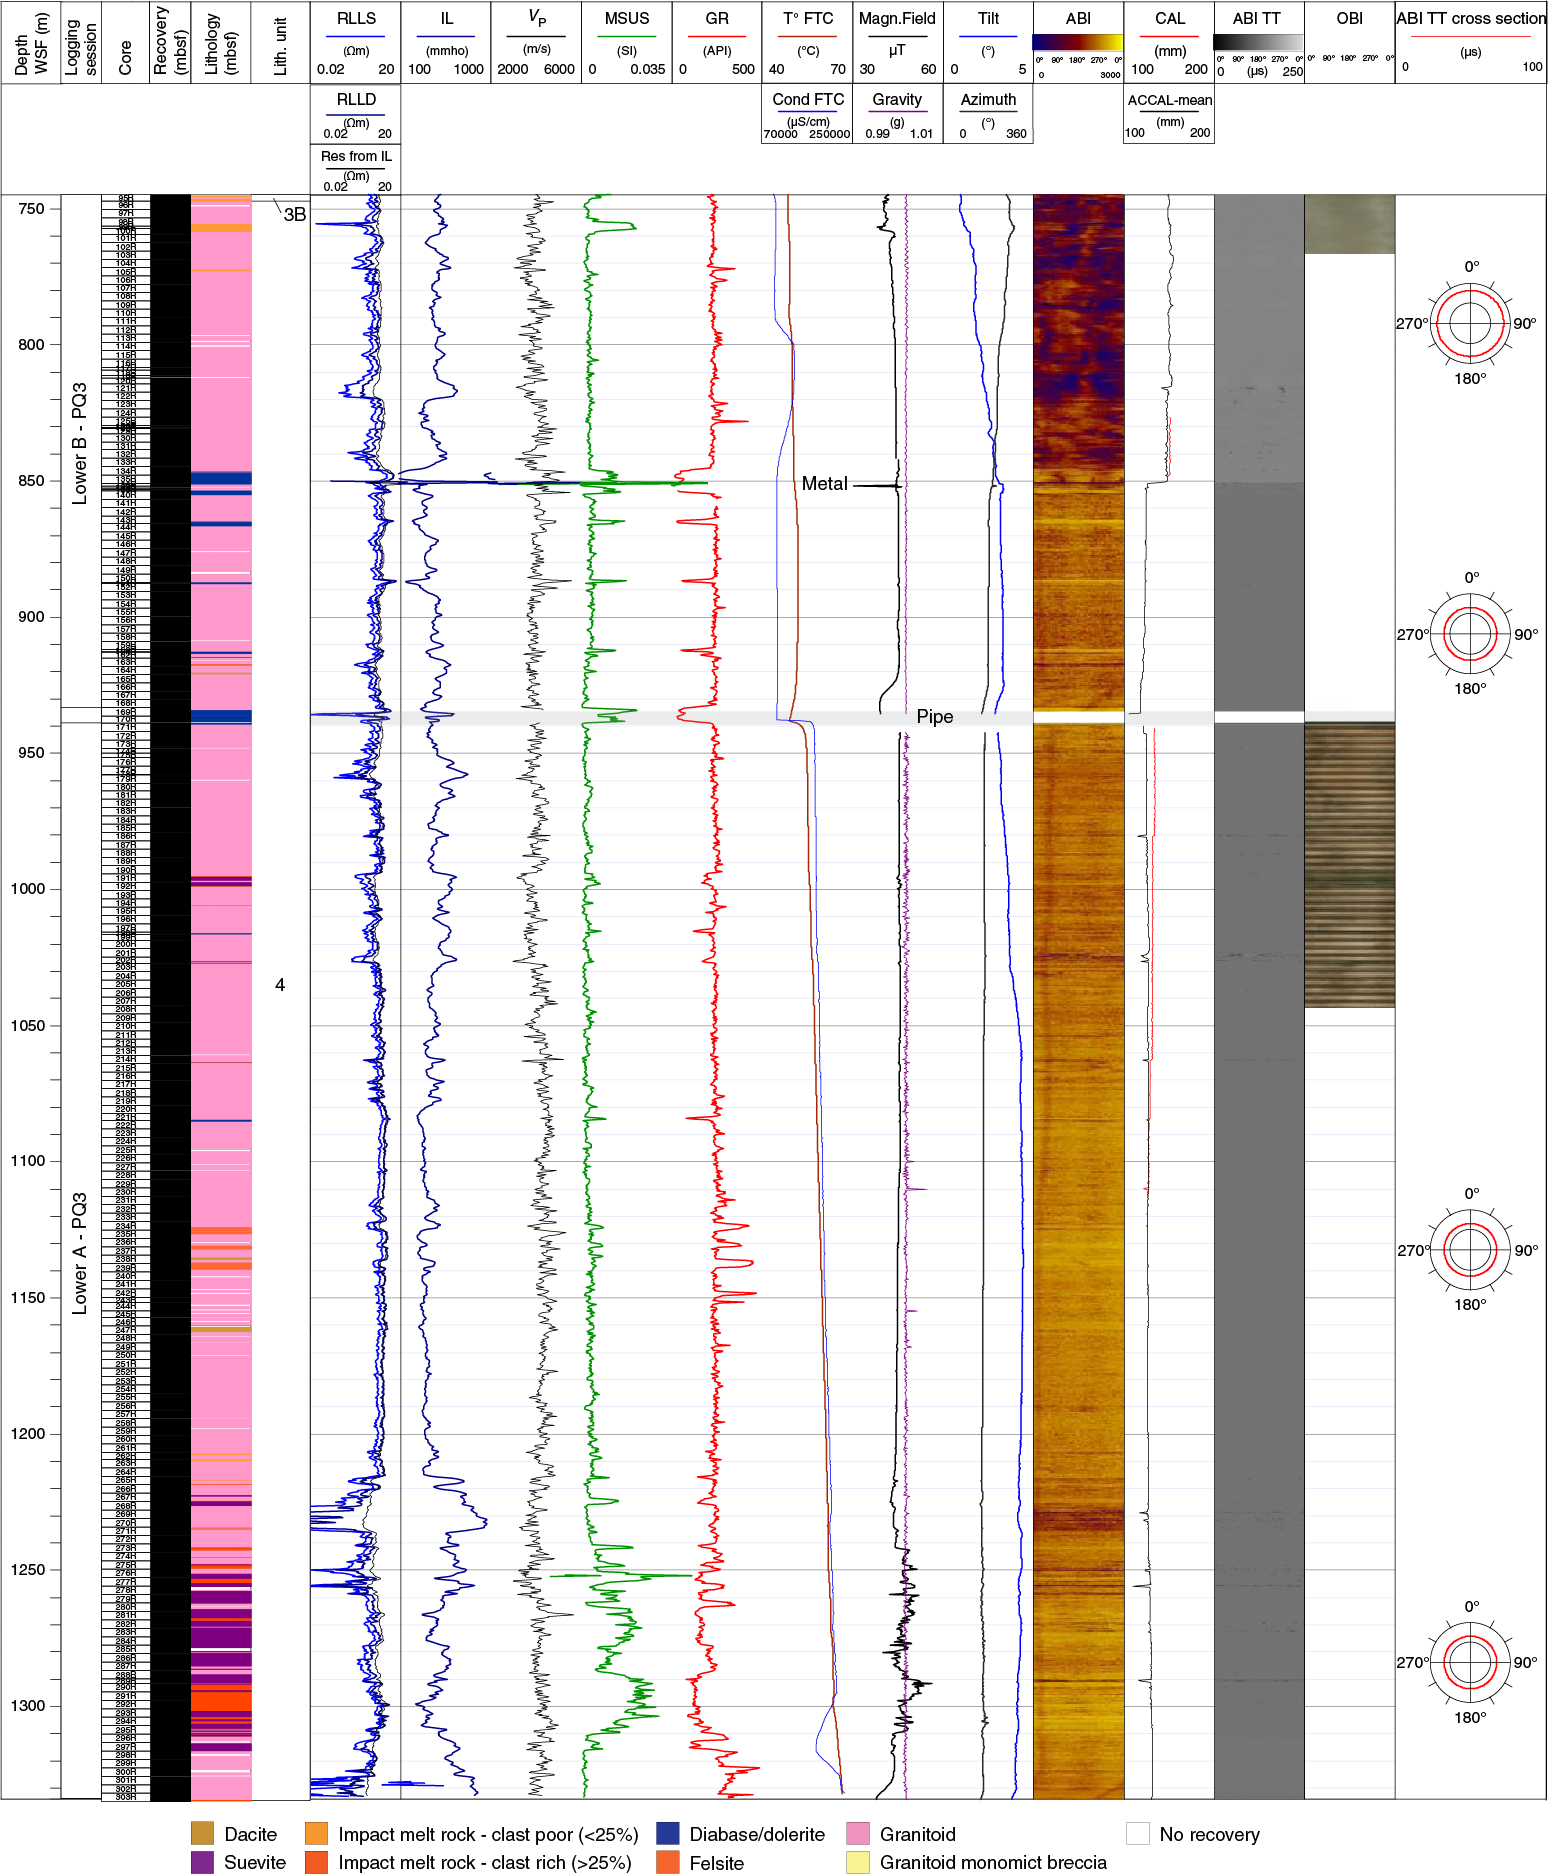
Figure F31. Wireline downhole log data.
The contact between the impact melt rock of the Upper Peak Ring (Unit 3) and Lower Peak Ring intervals (Unit 4; granitoids) is marked on the wireline logs by a sharp decrease in magnetic susceptibility (from 0.02 to 0.002 SI) and an increase in gamma ray from 150 to >190 API (see Figure F24 in the Site M0077: Upper Peak Ring chapter [Gulick et. al. 2017b]). In the Lower Peak Ring interval below, wireline logs are characterized by moderate to low variability. Resistivity logs (RLLS and RLLD) from the DLL3 tool and induction resistivity (RES from IL) from the EM51 tool show the same pattern, with average values of ~5 Ωm. The shallow resistivity reading is consistently lower than the deep reading (see Physical properties). Occasional negative readings in the RLLS log are related to the limitations of the DLL3 tool, which works less well in low-resistivity formations. RLLD resistivity values are either similar or slightly lower than induction resistivities (Res from IL). The intervals in which the RLLS, RLLD, and Res from IL logs are separated mostly occur at depth intervals in which faults are observed (e.g., 1225–1234 m WSF) (Figure F31). MSCL resistivity values follow the same trend as those measured in the downhole logs, except between 1250 and 1315 m WSF, where they diverge. The cause of these differences remains to be determined. At ~850 m WSF, a strong negative spike in induction resistivity was observed with a positive spike in magnetic susceptibility and a sharp change in borehole diameter (from ~147 mm above to 125 mm below). Because this anomaly was not observed in the MSCL resistivity and magnetic susceptibility data measured in whole-round cores, it is likely related to the presence of a piece of metal in the hole.
Resistivity and sonic logs are generally well correlated, as expected. Sonic P-wave velocities range between 2570 and 5900 m/s with an average of ~4100 m/s. Magnetic susceptibility is generally low (>0.002 SI) with increasing values >0.02 SI in the diabase/dolerite dikes and suevite intervals (e.g. 848, 935, 1252, and 1256–1311 m WSF) (Figure F31). These high–magnetic susceptibility intervals often correlate with incursions toward either low (<50 API) or high values (>400 API) in the gamma ray log. Gamma ray in the granitoid provides consistent values of ~250 API.
The borehole fluid temperature (T°fluid) increases downhole from 47° to 66.5°C at the base of the hole. Borehole fluid conductivity (Condfluid) ranges between 80,000 and 236,000 µS/cm. A step in both the borehole fluid temperature and conductivity profiles is observed at 938 m WSF, the depth at which drilling fluid circulation loss occurred during drilling operations. The borehole fluid measurements were acquired shortly after the drilling, so fluid parameter logs should only be used qualitatively.
The ABIs are of moderate to excellent quality (Figures F31, F32). The borehole shape was ideal for ABI imaging, being almost circular as shown by the traveltime cross sections at several depths. The acoustic caliper (ACCAL) recorded a mean diameter of around 125 mm below ~850 m WSF, close to the drill bit size. Above ~850 m WSF, the borehole is enlarged, reaching ~147 mm in diameter, and is slightly less regular.

Figure F32. Core-log integration data.
The ABI amplitude borehole images correlate well with the line-scan core data, although a small offset is observed between the two data sets (~0.6 m in Figure F32). Diabase/dolerite dikes and suevites generally appear as high-amplitude values (bright yellow) in the ABIs. The OBIs were acquired over two distinct intervals. Between 950 and 1040 m WSF, they are good quality and correlate well with the ABIs. An apparent ~3 m long cyclic-like change in color is observed, interpreted as resulting from a change in the LED intensity of the tool, which was run beyond its temperature limitation at this depth. From ~770 to 745 m WSF, no features were observed on the OBIs, possibly due to the presence of mudcake on the borehole wall that was not removed when the hole was flushed with seawater due to the borehole enlargement in this area.
Vertical seismic profile
The vertical component of the VSP collected from 745.0 to 1325.0 m WSF is of good quality, although the frequency content is lower (<40 Hz with a peak at 23 Hz) compared to data acquired in the shallower section of the hole (Figure F33). First-arrival traveltimes were picked, and then a moving-window algorithm was used to determine the change in P-wave velocity with depth. Higher velocity regions up to 4400 m/s can be seen between 725 and 850 m WSF and 1050 and 1150 m WSF. Conversely, lower velocities down to ~4100 m/s can be seen between 850 and 1050 m WSF and 1150 and 1250 m WSF. Tube waves can be seen propagating downward, but they are reflected and attenuated at ~930 m WSF. At this depth, the acoustic imager shows the presence of a large fracture.
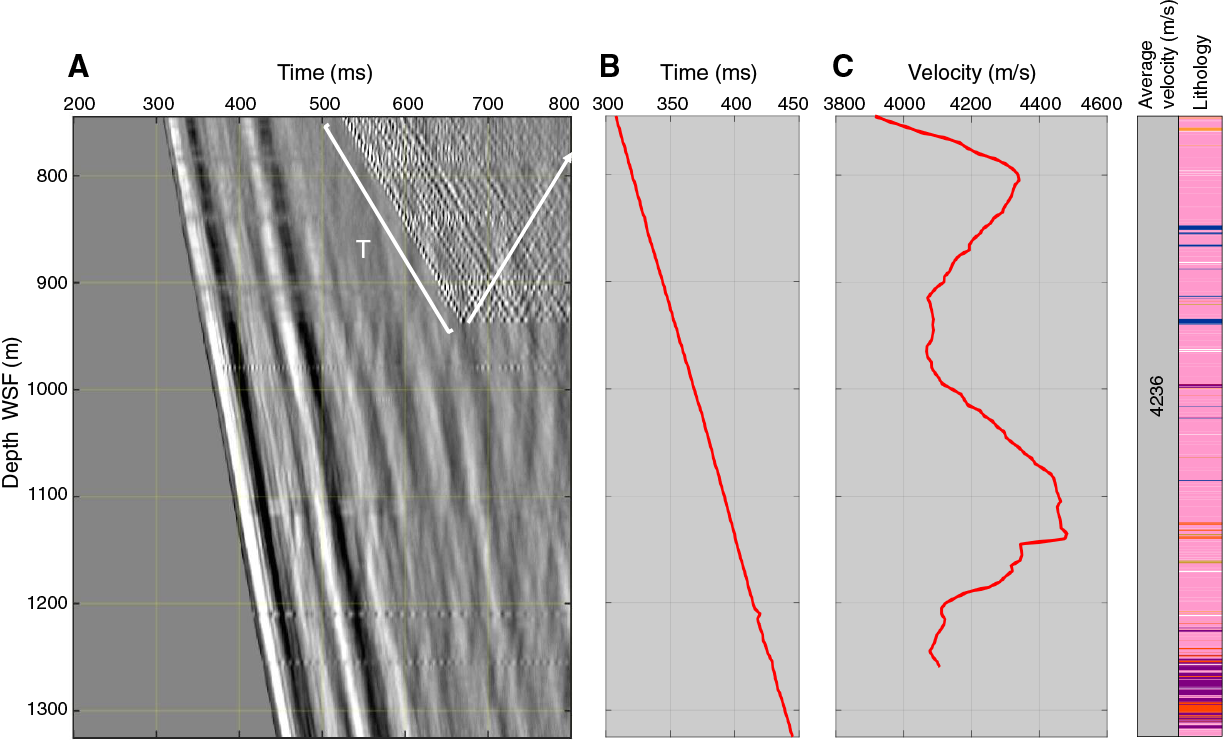
Figure F33. VSP vertical component.
The radial and azimuthal horizontal component data are relatively poor (Figure F34).
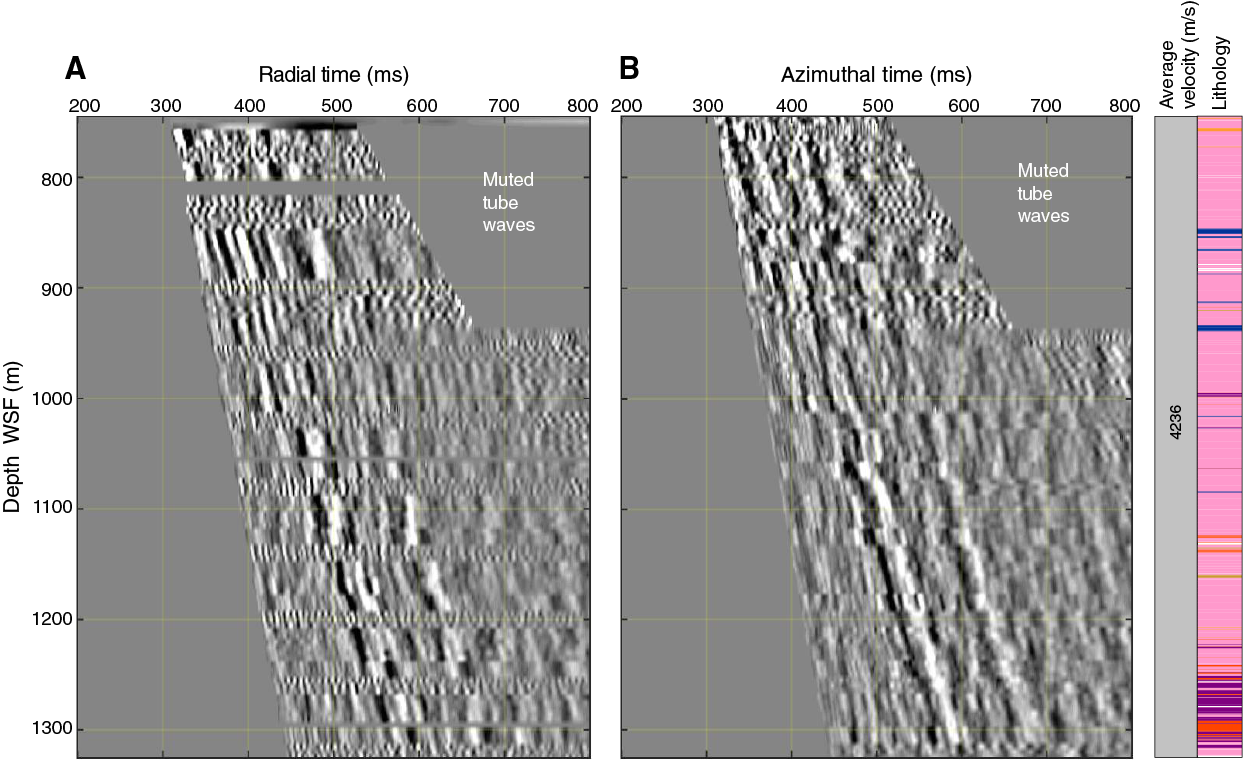
Figure F34. VSP horizontal.
References
Dubuisson, G., Thibal, J., Barthès, V., Pocachard, J., and Pozzi, J.-P., 1995. Downhole magnetic logging in sediments during Leg 145: usefulness and magnetostratigraphic interpretation of the logs at Site 884. In Rea, D.K., Basov, I.A., Scholl, D.W., and Allan, J.F. (Eds.), Proceedings of the Ocean Drilling Program, Scientific Results, 145: College Station, TX (Ocean Drilling Program), 455–468. https://doi.org/10.2973/odp.proc.sr.145.135.1995
Gulick, S., Morgan, J., Mellett, C.L., Green, S.L., Bralower, T., Chenot, E., Christeson, G., Claeys, P., Cockell, C., Coolen, M., Ferrière, L., Gebhardt, C., Goto, K., Jones, H., Kring, D., Lofi, J., Lowery, C., Ocampo-Torres, R., Perez-Cruz, L., Pickersgill, A.E., Poelchau, M., Rae, A., Rasmussen, C., Rebdolledo-Vieyra, M., Riller, U., Sato, H., Smit, J., Tikoo, S., Tomioka, N., Urrutia Fucugauchi, J., Whalen, M., Wittmann, A., Yamagachi, K., Xiao, L., and Zylberman, W., 2017a. Expedition 364 methods. In Morgan, J., Gulick, S., Mellett, C.L., Green, S.L., and the Expedition 364 Scientists, Chicxulub: Drilling the K-Pg Impact Crater. Proceedings of the International Ocean Discovery Program, 364: College Station, TX (International Ocean Discovery Program). https://doi.org/10.14379/iodp.proc.364.102.2017
Gulick, S., Morgan, J., Mellett, C.L., Green, S.L., Bralower, T., Chenot, E., Christeson, G., Claeys, P., Cockell, C., Coolen, M., Ferrière, L., Gebhardt, C., Goto, K., Jones, H., Kring, D., Lofi, J., Lowery, C., Ocampo-Torres, R., Perez-Cruz, L., Pickersgill, A.E., Poelchau, M., Rae, A., Rasmussen, C., Rebdolledo-Vieyra, M., Riller, U., Sato, H., Smit, J., Tikoo, S., Tomioka, N., Urrutia Fucugauchi, J., Whalen, M., Wittmann, A., Yamagachi, K., Xiao, L., and Zylberman, W., 2017b. Site M0077: Upper Peak Ring. In Morgan, J., Gulick, S., Mellett, C.L., Green, S.L., and the Expedition 364 Scientists, Chicxulub: Drilling the K-Pg Impact Crater. Proceedings of the International Ocean Discovery Program, 364: College Station, TX (International Ocean Discovery Program). https://doi.org/10.14379/iodp.proc.364.106.2017
Urrutia-Fucugauchi, J., Marin, L., and Sharpton, V.L., 1994. Reverse polarity magnetized melt rocks from the Cretaceous/Tertiary Chicxulub structure, Yucatan peninsula, Mexico. Tectonophysics, 237(1–2):105–112. https://doi.org/10.1016/0040-1951(94)90161-9
Urrutia-Fucugauchi, J., Soler-Arechalde, A.M., Rebolledo-Vieyra, M., and Vera-Sanchez, P., 2004. Paleomagnetic and rock magnetic study of the Yaxcopoil-1 impact breccia sequence, Chicxulub impact crater (Mexico). Meteoritics & Planetary Science, 39(6):843–856. https://doi.org/10.1111/j.1945-5100.2004.tb00934.x
Velasco-Villareal, M., Urrutia-Fucugauchi, J., Rebolledo-Vieyra, M., and Perez-Cruz, L., 2011. Paleomagnetism of impact breccias from the Chicxulub crater—implications for ejecta emplacement and hydrothermal processes. Physics of the Earth and Planetary Interiors, 186(3–4):154–171. https://doi.org/10.1016/j.pepi.2011.04.003
1 Gulick, S., Morgan, J., Mellett, C.L., Green, S.L., Bralower, T., Chenot, E., Christeson, G., Claeys, P., Cockell, C., Coolen, M.J.L., Ferrière, L., Gebhardt, C., Goto, K., Jones, H., Kring, D., Lofi, J., Lowery, C., Ocampo-Torres, R., Perez-Cruz, L., Pickersgill, A.E., Poelchau, M., Rae, A., Rasmussen, C., Rebolledo-Vieyra, M., Riller, U., Sato, H., Smit, J., Tikoo, S., Tomioka, N., Urrutia- Fucugauchi, J., Whalen, M., Wittmann, A., Yamaguchi, K., Xiao, L., and Zylberman, W., 2017. Site M0077: Lower Peak Ring. In Morgan, J., Gulick, S., Mellett, C.L., Green, S.L., and the Expedition 364 Scientists, Chicxulub: Drilling the K-Pg Impact Crater. Proceedings of the International Ocean Discovery Program, 364: College Station, TX (International Ocean Discovery Program). https://doi.org/10.14379/iodp.proc.364.107.2017
2 Expedition 364 Scientists’ addresses.
This work is distributed under the Creative Commons Attribution 4.0 International (CC BY 4.0) license. 
- Figure F1. Lithostratigraphic summary.
- Figure F2. Petrographic variations of granitoids.
- Figure F3. Dikes.
- Figure F4. Dacite and felsite.
- Figure F5. Diabase/dolerite.
- Figure F6. Suevite with black impact melt fragments and granite clasts.
- Figure F7. Suevite with black and reddish brown impact melt fragments and granitoids.
- Figure F8. CT scans.
- Figure F9. SPO of rock-forming minerals.
- Figure F10. Microstructural characteristics of alkali-feldspar and quartz.
- Figure F11. Impact-induced deformation and shock metamorphism.
- Figure F12. Pervasive grain-scale cataclastic deformation.
- Figure F13. Shatter cone and felsite.
- Figure F14. Mesoscopic impact-induced structures.
- Figure F15. Mesoscopic to macroscopic strain gradient.
- Figure F16. Shear faults.
- Figure F17. Ductile band structures.
- Figure F18. Truncation of cataclasite by shear faults.
- Figure F19. Diabase/dolerite veins, shear faults, cataclasite, and suevite.
- Figure F20. Open fracture with hydrothermal mineralization.
- Figure F21. Fault-slip inversion.
- Figure F22. AF demagnetization behavior.
- Figure F23. Magnetostratigraphic plots.
- Figure F24. Major element compositions.
- Figure F25. Carbon and sulfur contents.
- Figure F26. Trace element compositions.
- Figure F27. Trace element compositions.
- Figure F28. Bulk mineralogy.
- Figure F29. P-wave velocity, porosity, density, thermal conductivity, and resistivity.
- Figure F30. Magnetic susceptibility, NGR, and L*, a*, and b* values.
- Figure F31. Wireline downhole log data
- Figure F32. Core-log integration data.
- Figure F33. VSP vertical component.
- Figure F34. VSP horizontal.