Hobbs, R.W., Huber, B.T., Bogus, K.A., and the Expedition 369 Scientists
Proceedings of the International Ocean Discovery Program Volume 369
publications.iodp.org

https://doi.org/10.14379/iodp.proc.369.103.2019
Site U15121
B.T. Huber, R.W. Hobbs, K.A. Bogus, S.J. Batenburg, H.-J. Brumsack, R. do Monte Guerra, K.M. Edgar, T. Edvardsen, M.L. Garcia Tejada, D.L. Harry, T. Hasegawa, S.J. Haynes, T. Jiang, M.M. Jones, J. Kuroda, E.Y. Lee, Y.-X. Li, K.G. MacLeod, A. Maritati, M. Martinez, L.K. O’Connor, M.R. Petrizzo, T.M. Quan, C. Richter, L. Riquier, G.T. Tagliaro, C.C. Wainman, D.K. Watkins, L.T. White, E. Wolfgring, and Z. Xu2
Keywords: International Ocean Discovery Program, IODP, Expedition 369, JOIDES Resolution, Site U1512, Hot Cretaceous Greenhouse, oceanic anoxic events, Mentelle Basin, Naturaliste Plateau, Great Australian Bight, Gondwana breakup, Tasman Gateway, Indonesian Gateway, cyclostratigraphy, carbon isotope excursions, Paleocene/Eocene Thermal Maximum, Eocene greenhouse, Miocene, volcanic rifted margin, nonvolcanic rifted margin
MS 369-103: Published 25 May 2019
Background and objectives
International Ocean Discovery Program (IODP) Site U1512 (34°1.6406′S, 127°57.7605′E) lies in the Great Australian Bight at ~3100 m water depth on the continental slope. A nearby industry well (Jerboa-1) in the Eyre Subbasin on the continental shelf provides a stratigraphic tie along a seismic profile line (Figures F1, F2). The objective for coring Site U1512 was to obtain a continuous Upper Cretaceous record of marine black shales in the Great Australian Bight, including Oceanic Anoxic Event (OAE) 2, which straddles the Cenomanian/Turonian boundary interval. The Site U1512 sediment record will be compared with coeval Expedition 369 sequences cored in the Mentelle Basin to characterize the geochemical and biological responses to extreme global carbon cycle perturbations in different paleoceanographic settings at high southern latitudes.

Figure F1. Site U1512, Jerboa-1 commercial well, and Leg 182 site locations.

Figure F2. Seismic profile from Jerboa-1 to Site U1512.
During the Cretaceous, the Great Australian Bight was situated at the eastern tip of a partial seaway (the Australo-Antarctic Gulf [AAG]), with the Naturaliste Plateau in the open ocean at the western gateway that connected the AAG with the southern Indian Ocean. The breakup on the southern margin of Australia occurred at a very slow rate, and rifting is thought to have started in the Cenomanian to Turonian (Direen et al., 2011). Plate tectonic reconstructions corresponding to these early stages of rifting are poorly constrained and controversial (White et al., 2013). The early rift ~15 km thick post-Middle Jurassic sedimentary sequence that accumulated in the Great Australian Bight contains the largest continental margin deltaic sequence deposited during the Late Cretaceous greenhouse period (MacDonald et al., 2013). Accelerated subsidence in the late Albian and through the Cenomanian to Santonian led to the deposition of a thick sequence of marine shales (Totterdell et al., 2000). An overall transgressive phase of sedimentation in the early Paleogene was followed by the establishment of open marine carbonate shelf conditions from the early Eocene onward. The AAG eventually widened to create the Southern Ocean, with a switch to rapid spreading after 45 Ma (White et al., 2013).
Recovery of a mid-Cretaceous dredge sample with as much as 6.9% total organic carbon (TOC) from a location 10 km north-northwest of Site U1512 (fig. 2 in Totterdell and Mitchell, 2009) provided the impetus for coring Site U1512. The latest Cenomanian to earliest Turonian age of the material was based on organic-walled dinoflagellate cyst (dinocyst) assemblages that constitute a typical association for OAE 2 in both hemispheres (Marshall and Batten, 1988). Although we cored an additional 130 m below the original target depth, the Cenomanian/Turonian boundary interval was not reached. Despite this, studies of the ~700 m sequence of early Turonian to late Santonian marine claystone will provide new insights into the evolution of Late Cretaceous climate and oceanography in the region of the AAG.
Operations
Site U1512 consisted of a single hole (U1512A) that was cored with the rotary core barrel (RCB) system. The original plan was to advance to 570 m drilling depth below seafloor (DSF); however, it became apparent during coring operations that the Late Cretaceous sedimentary section was very expanded. Following revisions to coring depth estimates and safety panel approval, the hole was deepened to 700 m DSF. Coring operations and conditions were excellent. After coring operations were finished, one downhole logging run was completed with a modified triple combination (triple combo) tool string, measuring natural gamma radiation (NGR), density, resistivity, and velocity. Logging operations and conditions were also excellent.
Overall, 7.7 days (7–14 October 2017) were spent at Site U1512. A total of 73 RCB cores were recorded for the site (Table T1), penetrating to a total depth of 700.8 m DSF and recovering 631.86 m (90%).
Port call and transit to Site U1512
Expedition 369 officially began at 0754 h (UTC + 11 h) on 26 September 2017 with the first line ashore at Macquarie Wharf, Berth 4, Hobart (Australia). The ship cleared immigration and customs, and the Expedition 369 technical staff, Expedition Project Manager, and Co-Chief Scientists boarded the ship at 0930 h. The following morning (27 September), the rest of the science party boarded the ship. Throughout the port call, the science party received various introductions to the R/V JOIDES Resolution’s facilities and IODP policies and practices, as well as laboratory and shipboard safety inductions. The scientists also met with their respective laboratory specialists and began working in their laboratory groups in preparation for the expedition’s activities. Logistical operations during the port call included offloading science-related supplies and freight; properly disposing of hazardous material; loading fresh and frozen local food, marine gas oil, additional supplies, and freight; and installing a spare wireline logging cable. Public relations activities were conducted on 28 and 29 September. After securing for a transit in rough seas, the ship left Hobart with the last line released at 0710 h and began making its way to Site U1512. Because of heavy wind and swell, the ship’s average speed was 6.4 kt over the first 24 h of the transit, with speeds sometimes <5 kt. The weather and the ship’s speed improved throughout the remaining voyage. At 1815 h on 3 October, the vessel changed course to Portland, Victoria (Australia), for medical release of a crew member. A coast guard launch met the vessel in the harbor at 1245 h on 4 October. The crew member and manifest were transferred, and the ship renewed its sea voyage at 1300 h. After a 1425 nmi transit averaging 9.84 kt over the 144.75 h sea voyage, the ship arrived at Site U1512 at ~0500 h (UTC + 8 h) on 7 October. The thrusters were lowered and the dynamic positioning system was engaged, officially ending the sea voyage at 0530 h. The acoustic positioning beacon was deployed at 0610 h.
Hole U1512A
Hole U1512A (34°01.6406′S, 127°57.7605′E; 3071 m water depth) began on 7 October 2017. Nonmagnetic core barrels were used. The crew began deploying the RCB bottom-hole assembly at 0900 h. No significant operational problems occurred while running the drill string to just above the seafloor. The top drive was picked up, and a wiper pig was inserted into the drill string. The wiper pig was pumped through the drill string with 2.0 times the annular volume of the string to clean any rust or debris. Hole U1512A was started at 2120 h on 7 October, following two unsuccessful attempts to tag the seafloor. The water depth was determined to be 3070.87 m. Cores 1R and 2R were shortly on deck at 2240 and 2340 h, respectively. Core 1R recovered 0.66 m (7%), and 2R recovered 2.03 m (21%); both advanced from 9.6 to 19.2 m DSF. Recovery sharply increased in subsequent cores (mostly >90%). Mud sweeps (30 bbl) were pumped every second or third core starting with Core 17R. The original plan was to advance to 570 m DSF; however, it became apparent during coring operations that the Late Cretaceous sedimentary section was expanded. Following revisions to coring depth estimates and subsequent safety panel approval, the hole was deepened to 700 m DSF. RCB coring continued without incident through the recovery of Core 73R to 700.8 m DSF at 1915 h on 13 October, which completed coring operations at Site U1512.
At the conclusion of coring, we prepared for downhole logging. The rotary shifting tool (RST) was run in on the coring line to release the bit. The RST was run again to reposition the mechanical bit release (MBR) shifting sleeve back to the circulating position. After shifting the sleeve, the RST was pulled to the surface, and the sinker bars were removed at 2130 h. Prior to downhole logging, sepiolite mud weighted with barite was added to the borehole to stabilize the walls and prevent cave-ins. The top drive was set back, and the drill string was pulled up to logging depth (69.9 m DSF). A modified triple combo tool string (Quambo; 44.48 m long) was assembled with the following tools:
- Hostile Environment Natural Gamma Ray Sonde (HNGS),
- High-Resolution Laterolog Array (HRLA),
- Dipole Sonic Imager (DSI),
- Hostile Environment Litho-Density Sonde (HLDS) with source,
- Enhanced Digital Telemetry Cartridge (EDTC),
- Logging equipment head-Q tension (LEH-QT), and
- Centralizer for centralizing the DSI and HRLA.
In this modified tool string, the HNGS was moved to the bottom and the DSI was added from the Formation MicroScanner tool string. These instruments measured density, downhole sonic velocity, resistivity, and NGR while the EDTC transmitted data upstring to the ship.
The Quambo was deployed at 0435 h on 14 October. After the tool string exited the pipe, the active heave compensator was turned on. A downlog was performed from just above the seafloor to 698.4 m wireline depth below seafloor (WSF). The hole was then logged upward for a short calibration pass (~100 m), run back to the bottom, and logged upward to just below the end of the drill pipe, where the caliper was closed prior to reentering the drill pipe. Excellent borehole stability enabled logging of the full open borehole interval (69.9–698.4 m WSF). The tools were pulled from the hole and were back at the surface at 1130 h, and by 1345 h the equipment was rigged down. The drill string was then pulled out of the hole, clearing the seafloor at 1410 h. The acoustic beacon was recovered on deck at 1736 h. At 2255 h on 14 October, the end of the MBR cleared the rig floor. The rig floor was secured for transit at 2300 h, ending Hole U1512A and Site U1512.
Lithostratigraphy
Hole U1512A lithostratigraphic units and boundaries were defined by changes in lithology as identified by macroscopic core description, smear slide and thin section examination, X-ray diffraction (XRD), and handheld portable X-ray fluorescence (pXRF) analyses (Figure F3). The sedimentary sequence is divided into two main lithostratigraphic units: Unit I includes 10.06 m of calcareous ooze with sponge spicules, and Unit II contains at least 691.32 m of silty clay/silty claystone in which we observed 23 thin to medium beds of glauconitic and sideritic sandstone. Unit II is divided into Subunits IIa (silty clay) and IIb (silty claystone) based on the degree of lithification.
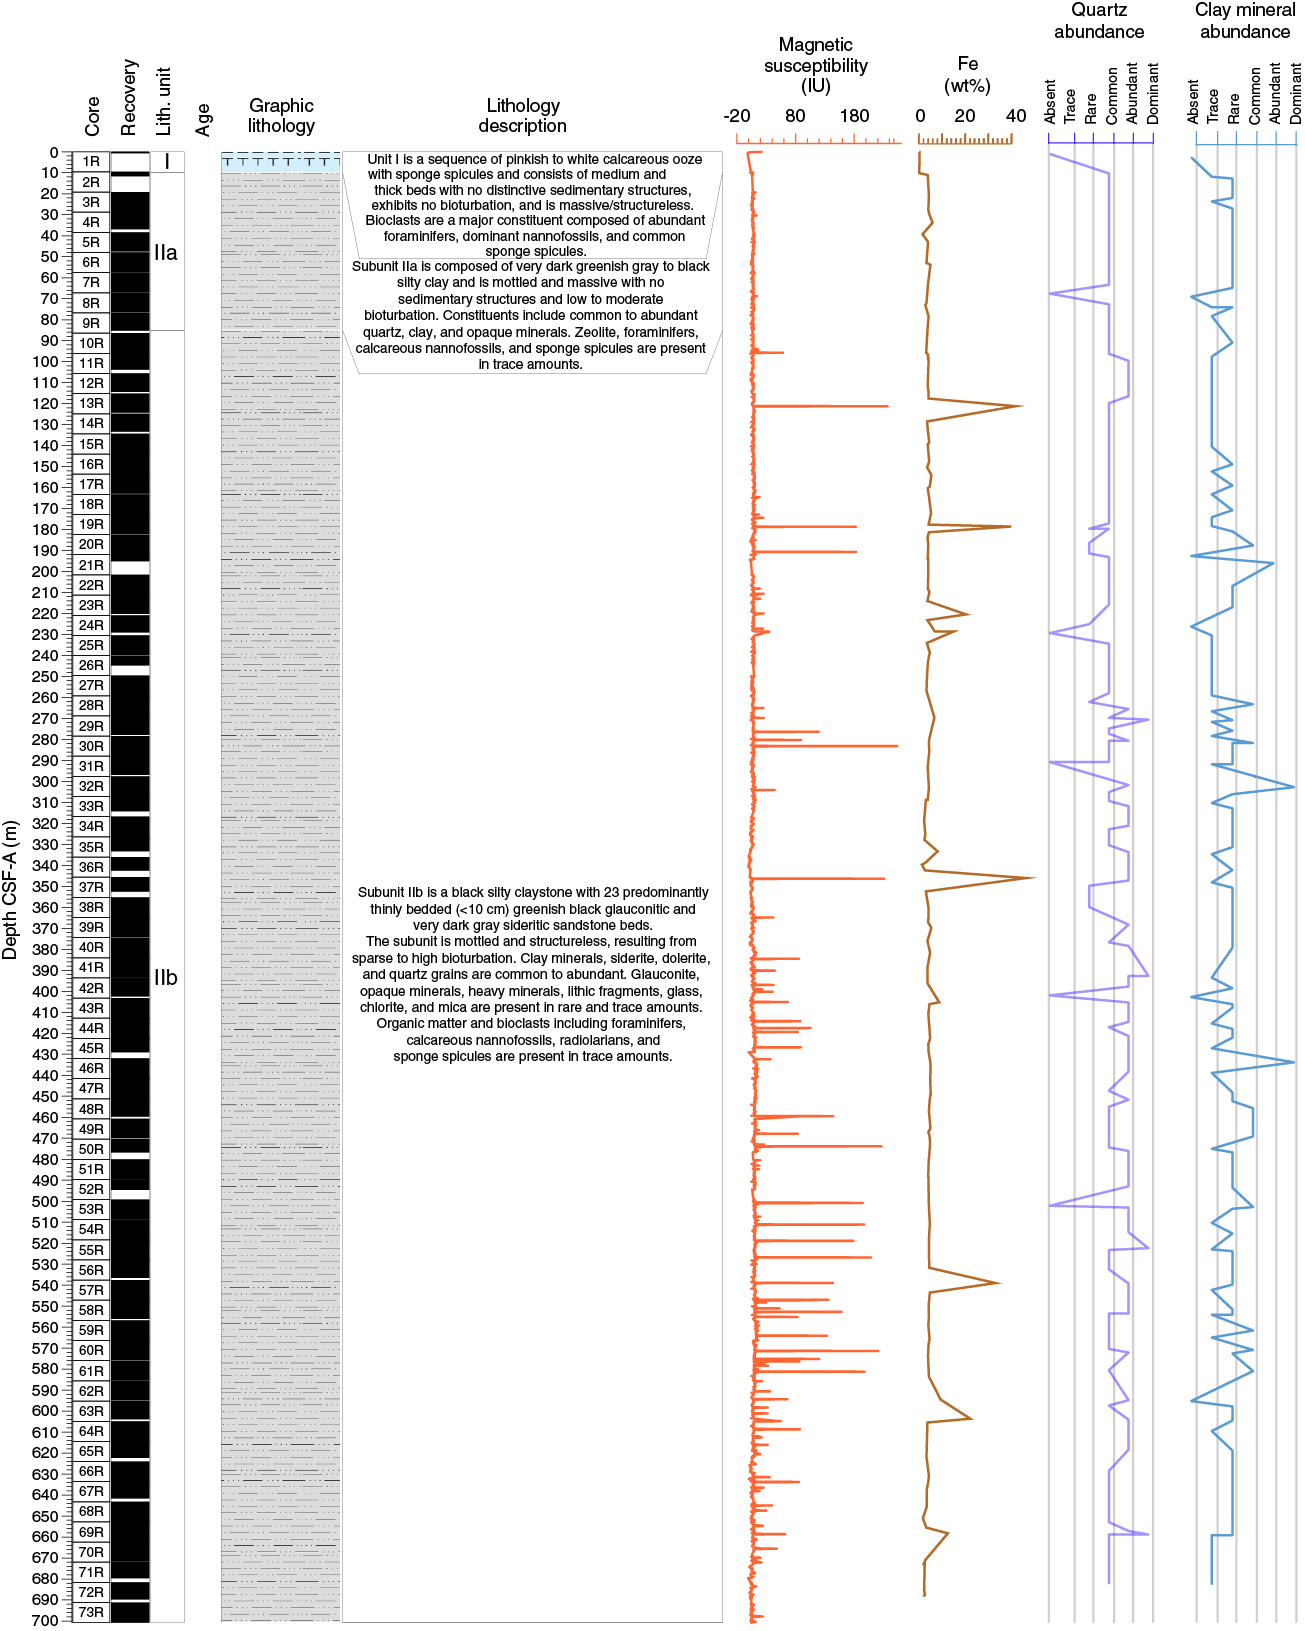
Figure F3. Lithostratigraphic summary.
Unit I
- Interval: 369-U1512A-1R-1, 0 cm (top of hole), to 2R-1, 46 cm
- Depth: 0–10.06 m core depth below seafloor, Method A (CSF-A)
- Age: Pleistocene
- Lithology: calcareous ooze with sponge spicules
- Drilling disturbance type and intensity: soupy; moderate to high
- Nature of top contact: seafloor
- Nature of bottom contact: sharp
Lithostratigraphic Unit I is a 10.06 m sequence of pinkish to white calcareous ooze with sponge spicules (Figure F4A). The unit consists of medium and thick beds that are massive and structureless. No distinctive sedimentary structures and no signs of bioturbation were observed. In smear slides, bioclasts are the major constituent and are composed of dominant calcareous nannofossils, abundant foraminifers, and common sponge spicules (Figure F5A). XRD-derived data show that the mineralogical composition of this unit is dominated by calcite (Figure F6A). This composition is consistent with carbonate content of >90 wt% (see Geochemistry).
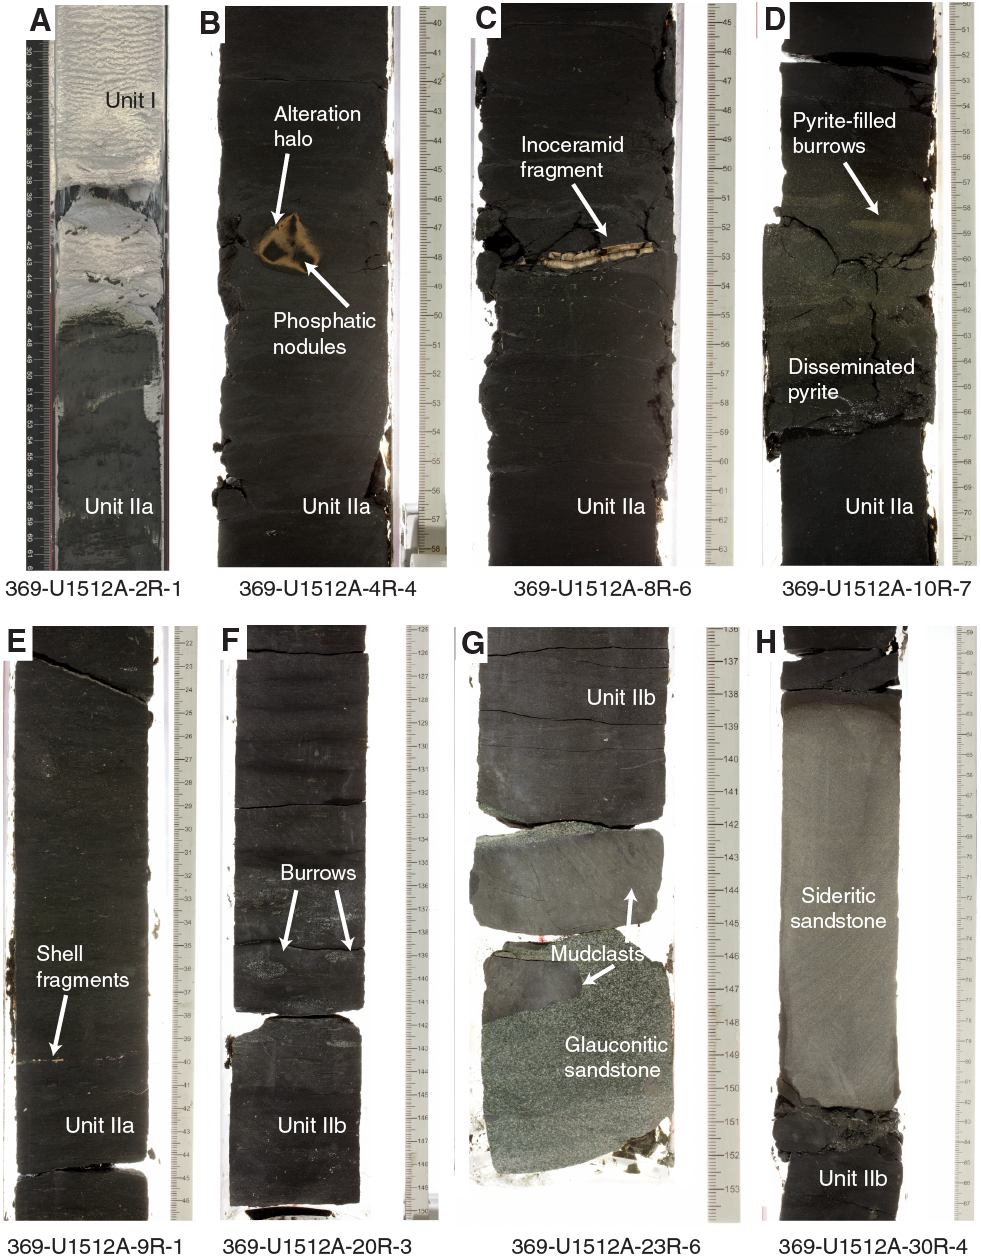
Figure F4. Representative lithologies.
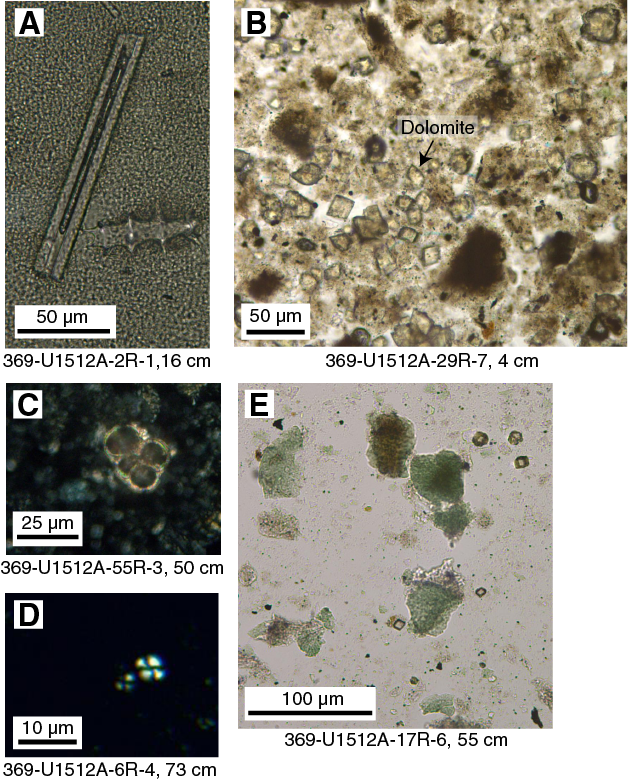
Figure F5. Sediment constituents.
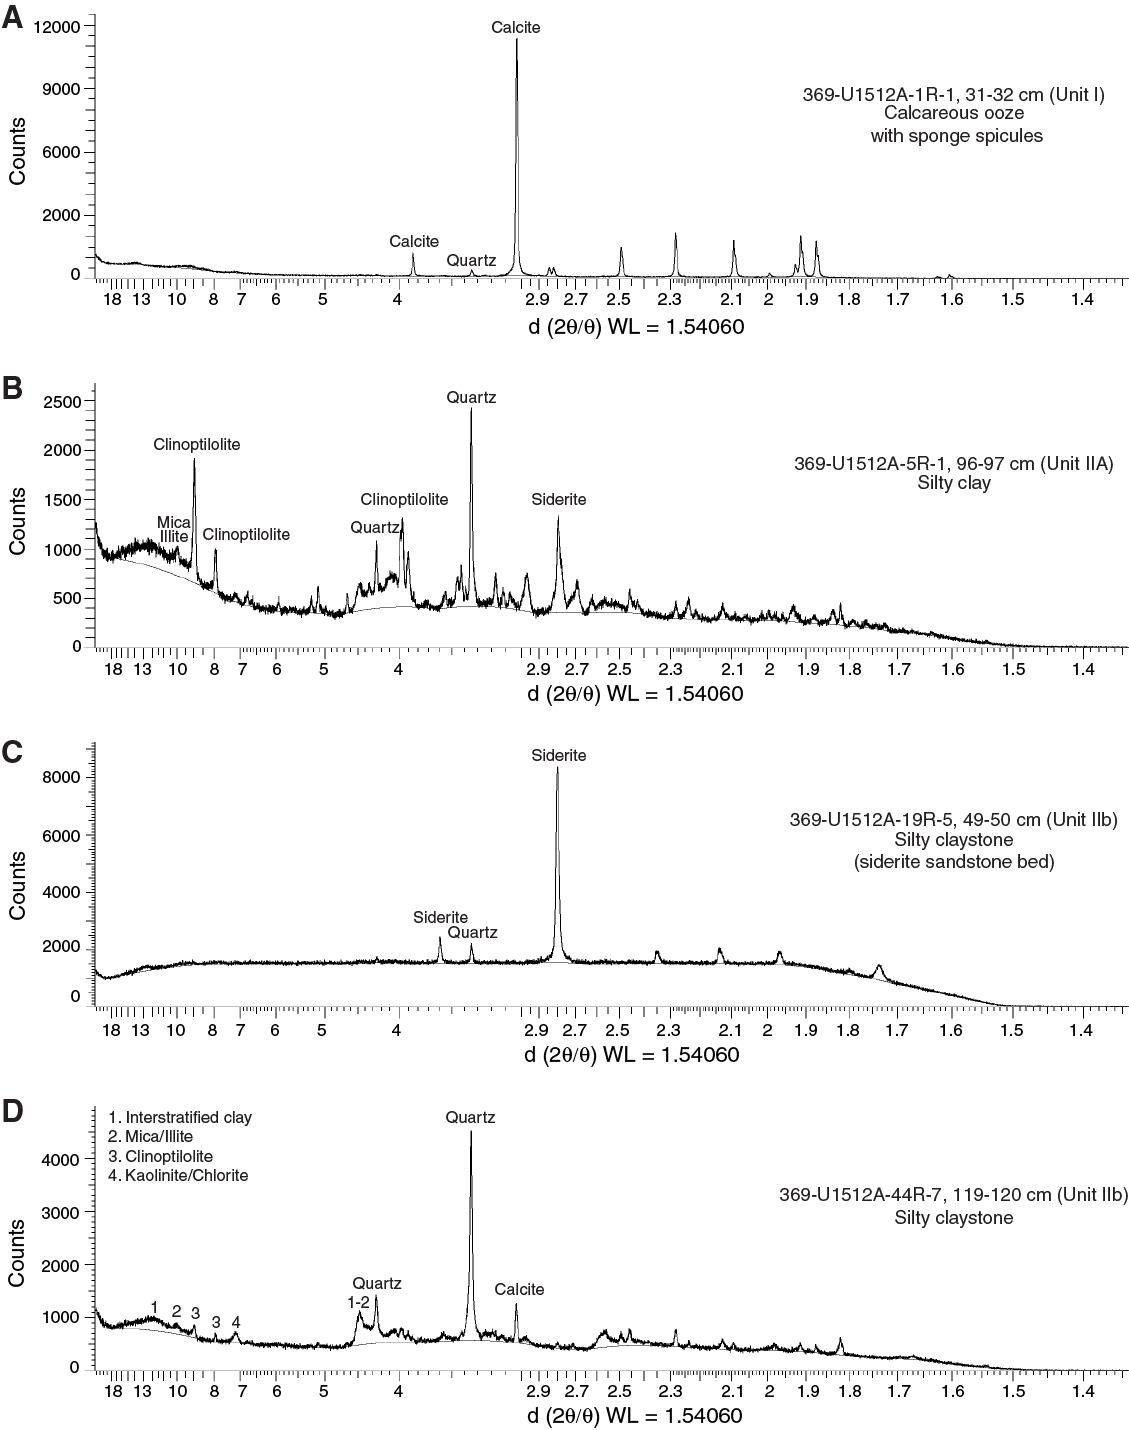
Figure F6. XRD results.
Unit II
- Interval: 369-U1512A-2R-1, 46 cm, to 73R-CC, 24 cm (bottom of hole [BOH])
- Depth: 10.06–701.38 m CSF-A
- Age: Santonian to Turonian
- Lithology: silty clay, silty claystone, silty claystone with nannofossils, calcareous claystone, calcareous silty claystone, calcareous sandy claystone, and glauconitic sandstone with siderite
- Drilling disturbance type and intensity: various (bowed, fractured, and biscuit); slight to destroyed
- Nature of top contact: sharp
- Nature of bottom contact: BOH
Lithostratigraphic Unit II is a 691.32 m thick sequence of very dark greenish gray and black silty clay that gradationally transitions into silty claystone in Section 369-U1512A-9R-CC. Beds of glauconitic clayey sandstone, glauconitic silty sandstone, glauconitic sandstone, silty sandstone with intraclasts, silty claystone with sand, and sideritic sandstones with varying amounts of silt and clay are present throughout the unit and are as thick as 32 cm. In Sections 70R-6 through 73R-CC (669.31–701.38 m CSF-A), a minor change in lithology occurs with the presence of calcareous claystone and calcareous sandy/silty claystone.
Subunit IIa
- Interval: 369-U1512A-2R-1, 46 cm, to 9R-CC, 29 cm
- Depth: 10.06–85.16 m CSF-A
- Age: late Santonian
- Lithology: silty clay
- Drilling disturbance type and intensity: bowed to biscuit; slight to severe
- Nature of top contact: sharp
- Nature of bottom contact: gradational
Lithostratigraphic Subunit IIa is composed of 75.10 m of very dark greenish gray to black silty clay (Figure F4B). The subunit is mottled and massive with no sedimentary structures because of low to moderate bioturbation. In Section 369-U1512A-8R-CC (76.11 m CSF-A), 2 cm long vertical burrows with calcite infill are present. Pyrite is present in Cores 8R and 9R as nodules and in a disseminated form in the silty clay. In Section 10R-7, burrows with pyrite infill are present (Figure F4C). Constituents present in smear slides include common to abundant quartz, clay, and opaque minerals (Figures F7, F8; see Site U1512 smear slides in Core descriptions). Zeolite, foraminifers, calcareous nannofossils (Figure F5D), and sponge spicules are present in trace amounts. Inoceramid fragments and alteration halos are common throughout the unit (Figure F4B, F4C, F4E). In thin section (Sample 5R-4, 0–2.8 cm), the silty clay exhibits poorly developed lamination. The sample is moderately sorted and is composed of common angular quartz grains and traces of feldspar, mica, and bioclasts in a clay-rich matrix (Figure F7A). For this subunit, XRD analyses reveal that the mineral assemblage is dominated by quartz and clinoptilolite (Figure F6B).
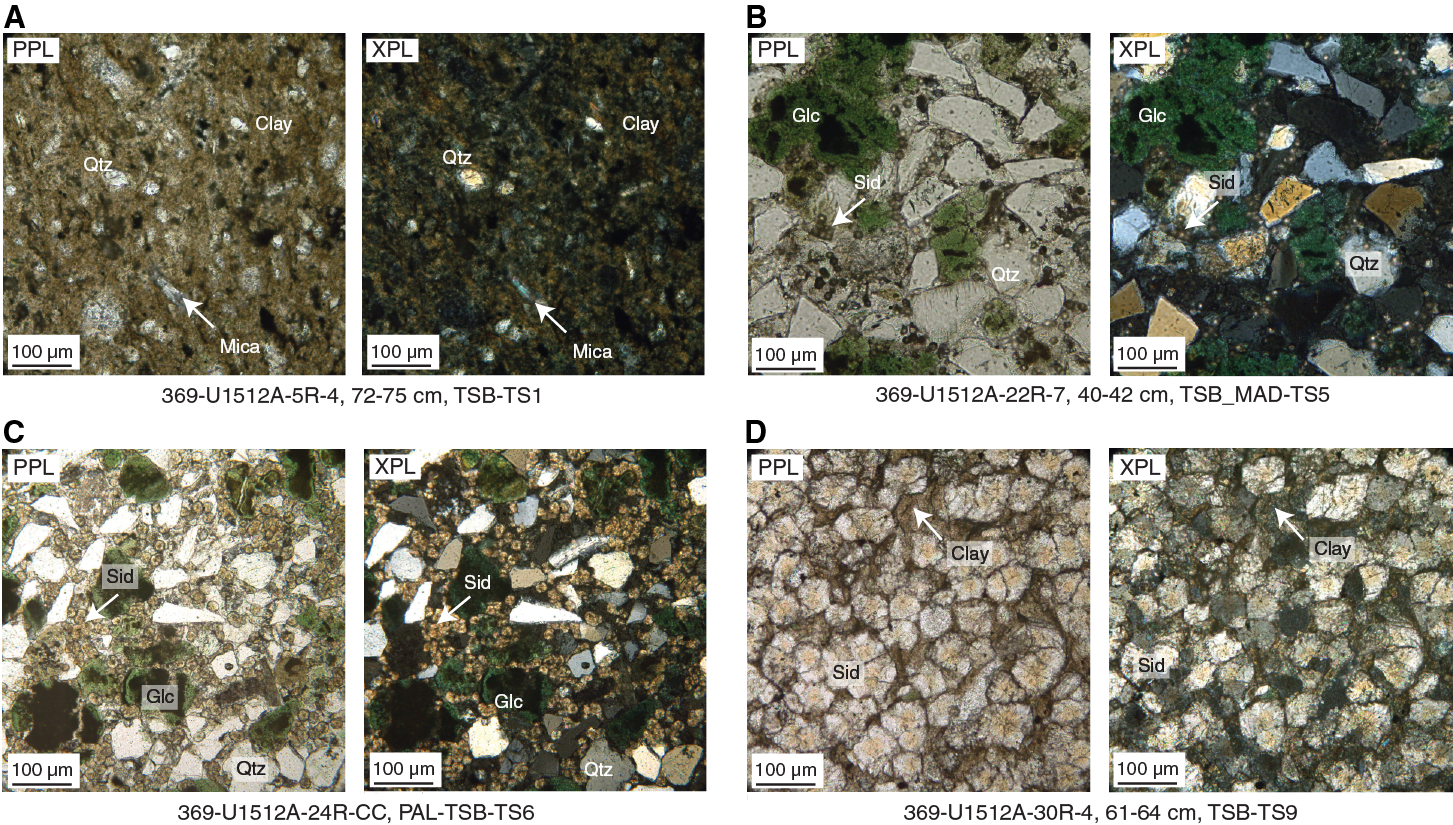
Figure F7. Representative lithology constituents.
Figure F8. Thin section modal analysis.
Subunit IIb
- Interval: 369-U1512A-10R-1, 0 cm, to 73R-CC, 24 cm (BOH)
- Depth: 86.40–701.38 m CSF-A
- Age: late Santonian to Turonian
- Lithology: silty claystone
- Drilling disturbance type and intensity: fractured to brecciated; slight to destroyed
- Nature of top contact: gradational
- Nature of bottom contact: BOH
Lithostratigraphic Subunit IIb is composed of at least 615.22 m of black silty claystone that contains 23 thinly bedded (<10 cm thick) greenish black glauconitic and very dark gray sideritic sandstone beds that do not appear to be cyclic (Figures F4G, F4H, F6C). Subunit IIb differs from Subunit IIa in that it is lithified. Subunit IIb also exhibits sparse and high bioturbation. Core 369-U1512A-68R contains thin to medium lamination (643.2–653.28 m CSF-A). Siderite nodules, shell fragments, pyrite, and alteration halos are common throughout the subunit. Vertical and horizontal burrows with glauconitic sandstone infill are common and occur at irregular intervals (Figure F4F). From Core 65R to Core 73R, nannofossil content increases markedly from 0%–4% to 4%–35%. Inclined bedding in Subunit IIb (Core 36R; ~340 m CSF-A) does not reflect regional structural dip; it is likely an artifact as a result of hole deviation during coring operations (see Downhole logging).
The sandstone beds in Subunit IIb are generally structureless and exhibit normal grading (Figure F4G, F4H; Table T2). However, two sandstone intervals are cross-bedded and/or laminated with sharp bases and gradational tops (Sections 369-U1512A-22R-7 [210.57–210.67 CSF-A] and 24R-6 [228.53–228.88 CSF-A]). Sideritic sandstone beds are associated with prominent peaks in the bulk density and magnetic susceptibility data (see Petrophysics). Table T2 presents the composition and texture of sandstone beds and laminae in Subunit IIb.
In smear slides, clay minerals, siderite, dolomite, and common to abundant quartz grains are present (Figure F5B; see Site U1512 smear slides in Core descriptions). Glauconite, opaque minerals (largely pyrite), heavy minerals, lithic fragments, glass, chlorite, and mica are present in trace and rare amounts (Figure F5E). Organic matter and bioclasts including foraminifers, calcareous nannofossils, radiolarians, and sponge spicules are present in trace amounts (Figure F5C).
In thin section, silty claystone is moderately sorted and contains common subangular quartz grains supported in a clay-rich matrix. Minerals present in trace amounts include glauconite and mica. Some samples show moderately developed lamination. Thin sectioned glauconitic sandstone beds are moderately sorted and are composed of abundant glauconite mica and common sand-sized quartz grains with trace amounts of muscovite, chlorite, siderite, and lithic fragments (Figure 7B). Organic matter and common opaque anhedral minerals are present in trace amounts. Sideritic sandstone beds in thin section are predominantly well sorted and are composed of dominant crystalline siderite, glauconite, and common clay with trace amounts of quartz grains and radiolarians (Figure F7C, F7D).
Whole-rock XRD analyses conducted on selected sediment samples confirm that the main mineral present in Subunit IIb is quartz. Other minerals present in this subunit include opal, chlorite/kaolinite, mica/illite, clay (montmorillonite/illite), and clinoptilolite (in a lower proportion than in Subunit IIa). Peaks in calcite were reported consistently in Cores 44R through 73R and suggest a trend toward more carbonate rich rocks downhole (Figure F6D).
Bulk-rock pXRF analyses (Table T3) reveal high concentrations of Fe (10%–46%) in sideritic sandstone beds (Figure F3). These beds also have notable concentrations of Ca and Mn. A close association between the presence of alteration halos and elements is associated with phosphate minerals (e.g., P, Ca, Sr, and Y).
Biostratigraphy and micropaleontology
Samples from all Hole U1512A core catchers were analyzed for calcareous nannofossils, planktonic foraminifers, and benthic foraminifers. In addition, samples from split core sections were also evaluated for calcareous nannofossil assemblages. Observations of other distinctive and potentially age-diagnostic or environmentally diagnostic microfossil groups, including organic-walled dinocysts, radiolarians, fish debris, and inoceramid prisms, were also made (Figure F9; Table T4). Calcareous nannofossil datums form the chronologic framework for Hole U1512A because they are most consistently present (Table T5). In contrast, planktonic foraminifers are rare but, where present, give ages consistent with those from calcareous nannofossils. Similarly, dinocyst taxa are present in Cores 369-U1512A-47R through 70R, and radiolarian taxa are present in Cores 1R through 63R. Both types of taxa provide additional age confirmation for Late Cretaceous sediments. The sedimentation rates for Santonian Zones CC17–CC16 and CC15 are 36 and 19 m/My, respectively. The interval from the middle Coniacian to middle Turonian, encompassing Zones CC14 and CC13, has an average sedimentation rate of 63 m/My. Sedimentation rates accelerated markedly in the lower to middle Turonian Zone CC12 to 272 m/My (Figure F10). This estimate does not correct for the hole deviation from vertical (see Petrophysics).
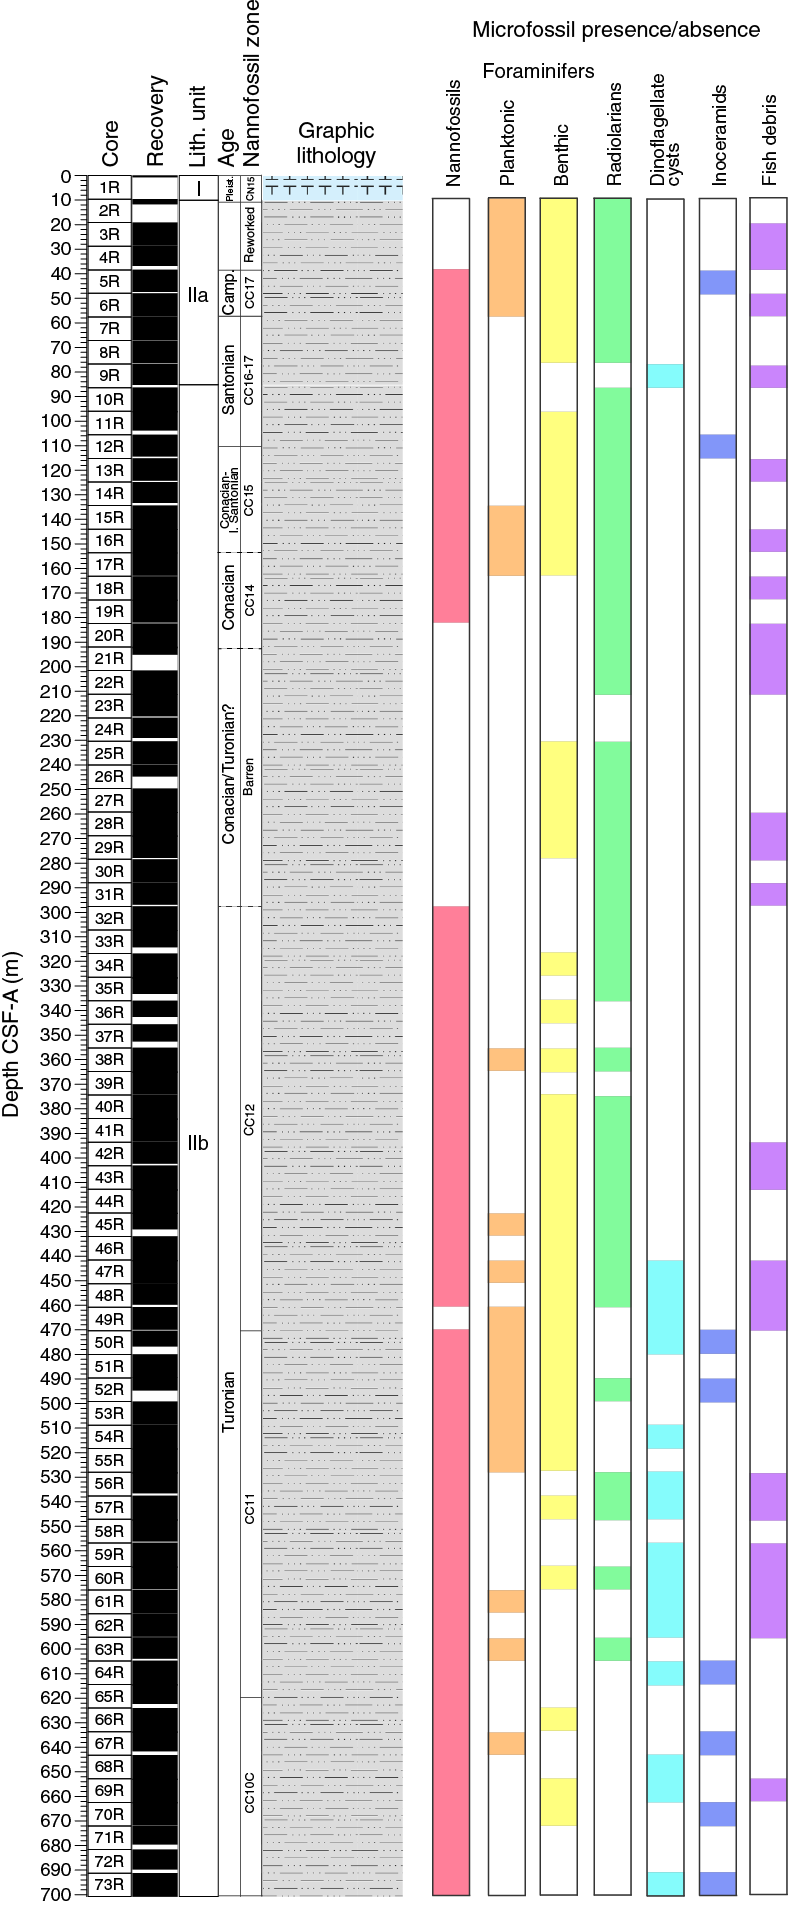
Figure F9. Selected microfossil group summary.
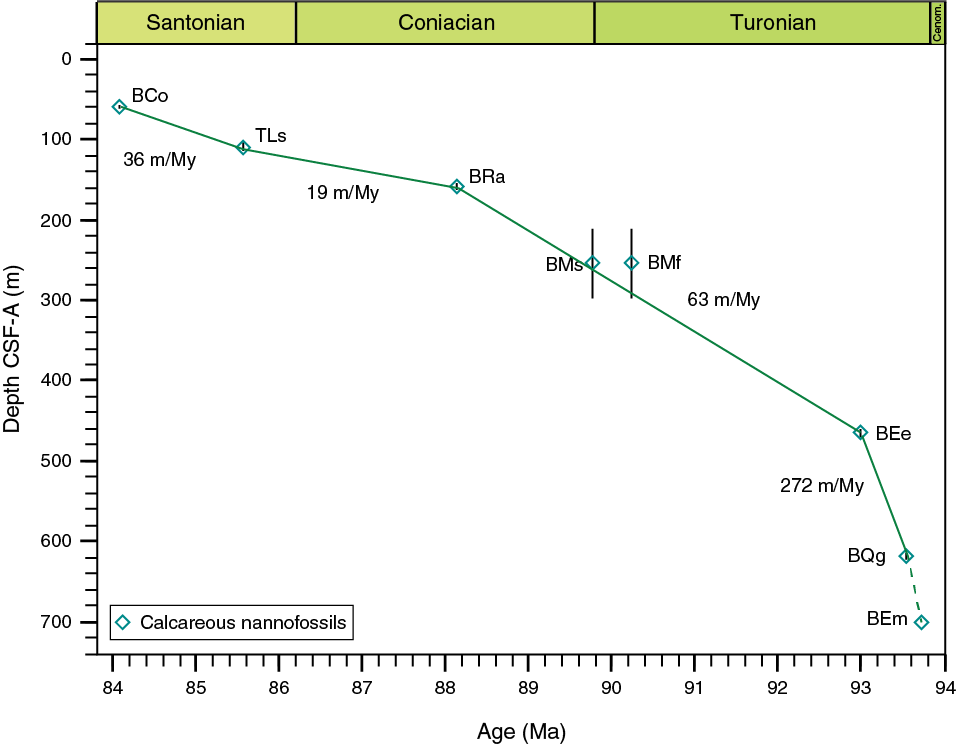
Figure F10. Age-depth plot and sedimentation accumulation rates.
Calcareous nannofossils
More than 90 samples were examined for calcareous nannofossils during shipboard investigation of the 701.4 m of sediments recovered from Hole U1512A. With the exception of the upper 1.12 m of upper Pleistocene foraminiferal nannofossil ooze, the recovered sediments consist of a continuous succession of Santonian to Turonian silty clay and silty claystone. Although neither abundant nor continuously preserved, calcareous nannofossils provide sufficient biostratigraphic control to characterize the age of the sediments (Table T5). The biostratigraphically important taxa identified are illustrated in Figure F11. Distribution of calcareous nannofossils is presented in Tables T4 and T6.
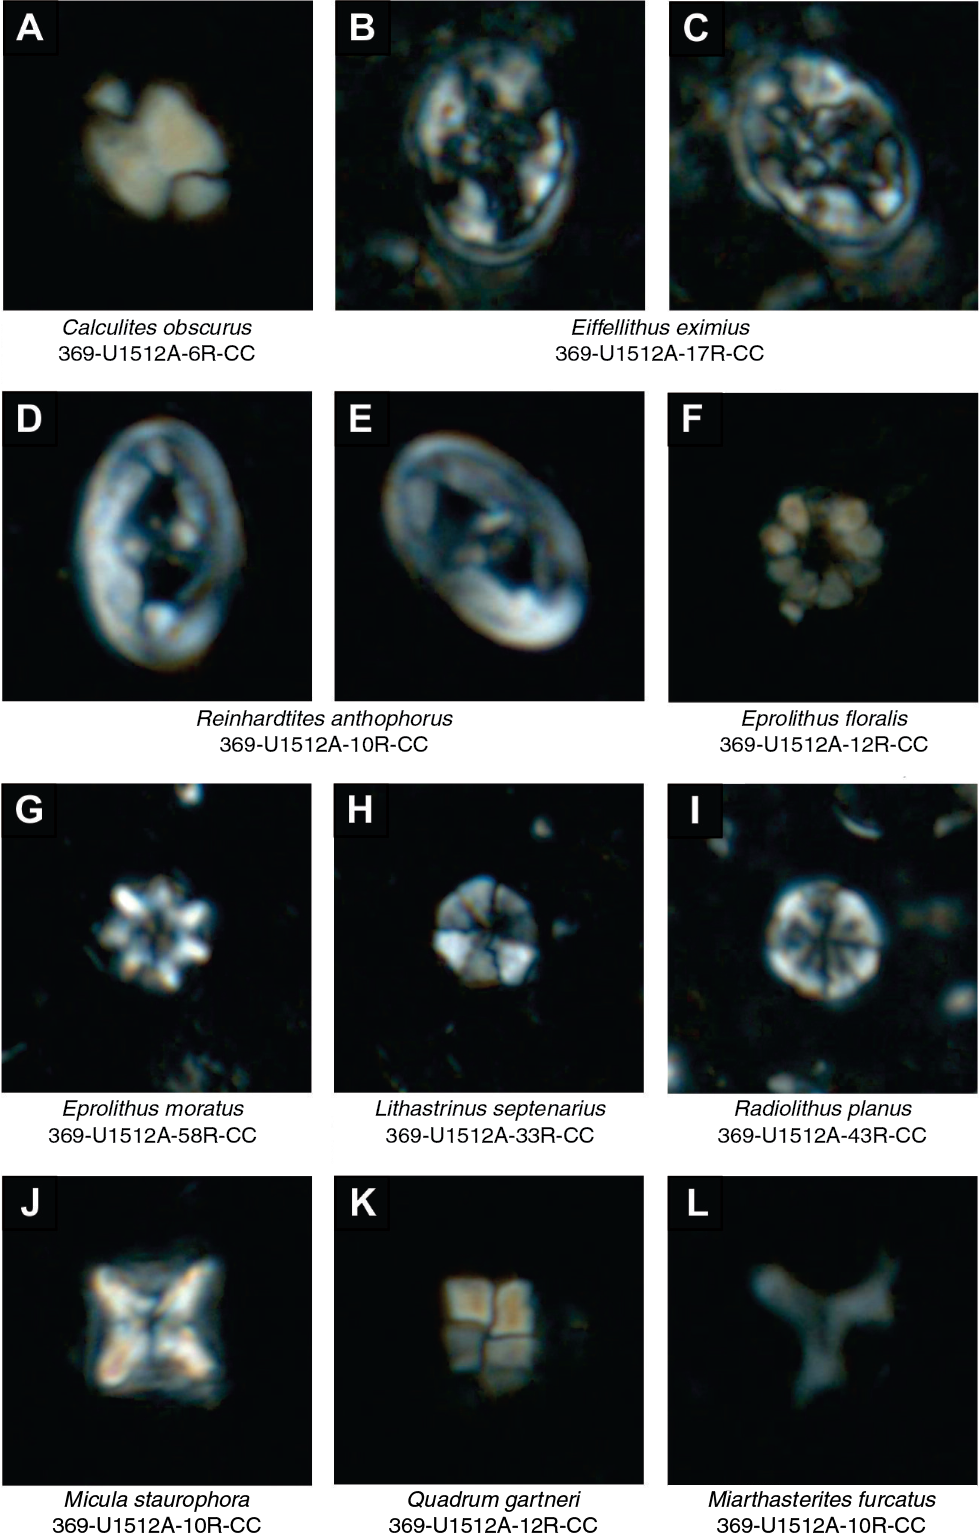
Figure F11. Selected calcareous nannofossil taxa.
A smear slide (Sample 369-U1512A-1R-1, 5 cm) taken from the upper part of lithostratigraphic Unit I (see Lithostratigraphy) contains very abundant Emiliania huxleyi, indicating the uppermost part of calcareous nannofossil Zone CN15. The numerical dominance of E. huxleyi over Gephyrocapsa caribbeanica (common) in this sample indicates an age of 0.07 Ma or younger. This interval lies above a sharp contact with grayish white foraminiferal nannofossil ooze from Sample 1R-1, 17 cm, to Sample 2R-1, 46 cm. The calcareous nannofossil assemblage from Sample 1R-CC contains both abundant E. huxleyi and very abundant G. caribbeanica but is dominated by the latter taxon, which indicates the older part of Zone CN15 and a possible age of 0.07–0.29 Ma. The presence of few Coccolithus braarudii, as opposed to Coccolithus pelagicus, in these late Pleistocene samples suggests sea-surface temperatures (SSTs) of 10°–20°C, which are compatible with modern SST values.
Lithostratigraphic Unit II consists of a thick (690.32 m) succession of silty clay and silty claystone from Section 369-U1512A-2R-1, 46 cm, to the base of the hole (Core 73R; 701.38 m CSF-A). This succession disconformably underlies Unit I with a sharp contact. The majority of the samples investigated from Unit II contain nannofossils (~75% [54 out of 72] of the core catchers are nannofossil bearing); however, nannofossils seldom constitute >1% of the sediment volume (few; see Calcareous nannofossils in the Expedition 369 methods chapter [Huber et al., 2019]) and are never a major rock-forming constituent in this succession. Although barren samples are scattered throughout the section, most are concentrated in two intervals at the top of the succession and in Sections 20R-CC through 30R-CC (192.37–287.84 m CSF-A).
Core catcher samples from intervals 369-U1512A-2R-CC, 30–35 cm, through 4R-CC, 27–32 cm, are barren of nannofossils. Samples from Cores 5R through 6R contain rare to few nannofossils with moderate to good preservation and include assemblages that increase in species richness from ~15 species in Sample 5R-3, 98–100 cm, to ~40 species in Sample 6R-CC, 29–34 cm. A single specimen of Calculites obscurus observed in Sample 6R-CC, 29–34 cm (57.32 m CSF-A), and the presence of Eprolithus floralis in this interval indicate the lower portion of Santonian Zone CC17, which is dated to ~83.7–84.3 Ma (Erba et al., 1995; Hardenbol et al., 1998).
Intervals 369-U1512A-7R-3, 71–73 cm, through 11R-CC, 7–12 cm, cannot be confidently assigned to a calcareous nannofossil zone. They are bracketed by the occurrence of C. obscurus in Sample 6R-CC, 29–34 cm, above and the last appearance datum (LAD) of Lithastrinus septenarius (an indicator for Zone CC15) in Sample 12R-CC, 14–19 cm, below. The taxon whose first appearance datum (FAD) separates Zones CC16 and CC17, C. obscurus, is a holococcolith that is very susceptible to destruction by dissolution. In addition, C. obscurus is very rare or absent in certain paleoceanographic settings, including epeiric seas such as the Western Interior Seaway of North America (Kita et al., 2017). As a result, its absence from samples in this interval may be biostratigraphic, paleoecologic, or diagenetic; therefore, Zones CC16 and CC17 cannot be separated reliably under these conditions. For this reason, this interval is assigned to the combined Zones CC16–CC17 that span the upper part of the Santonian.
Intervals 369-U1512A-12R-CC, 14–19 cm, through 16R-CC, 19–24 cm, contain L. septenarius, Reinhardtites anthophorus, Marthasterites furcatus, and Micula staurophora. This species association is diagnostic of Santonian Zone CC15. The interval from Sample 17R-CC, 0–6 cm, to Sample 19R-CC, 11–16 cm contains L. septenarius, M. furcatus, and M. staurophora but lacks R. anthophorus, indicating lowermost Coniacian Zone CC14. The underlying samples (Samples 20R-CC, 18–23 cm, to 30R-CC, 6–11 cm) are either barren or contain only single specimens of the most dissolution-resistant taxa. These latter samples (20R-CC, 18–23 cm, and 22R-CC, 33–38 cm) contain single specimens of M. staurophora that, in this stratigraphic framework, suggest Zone CC14; however, it is equally probable that these specimens are contaminants introduced during drilling or the slide preparation process. As a result, the assignment of these samples to Zone CC14 is questionable.
Calcareous nannofossils reappear below the barren interval (Sections 369-U1512A-20R-CC through 30R-CC) in Sample 31R-CC, 8–13 cm, with an assemblage that contains Eiffellithus eximius (sensu Verbeek of Huber et al., 2017), Eiffellithus perchnielseniae, and Quadrum gartneri but lacks M. furcatus and M. staurophora. This association is indicative of middle to upper Turonian Zone CC12. This zone, from Sample 31R-CC, 8–13 cm, to Sample 48R-CC, 46–48 cm (296.86–459.71 m CSF-A), is characterized by rare to few generally moderately preserved nannofossils with only a few barren intervals. The marker taxon Lucianorhabdus maleformis, which has a FAD similar to that of E. eximius (sensu Verbeek), is not present in this interval. Its absence may reflect paleoecological exclusion or diagenetic destruction of this species at Site U1512.
Section 369-U1512A-49R-CC through interval 64R-CC, 12–17 cm (459.71–614.83 m CSF-A), contains Quadrum intermedium, Q. gartneri, Eprolithus moratus, and Eiffellithus perchnielseniae but not Eiffellithus eximius (sensu Verbeek), indicating lower to middle Turonian Zone CC11. Calcareous nannofossils are few to rare in this interval, with moderate to good preservation. Notably, bedding in the recovered cores exhibits increasing apparent dip through this interval as a result of hole deviation from vertical (see the downhole logging discussion in Petrophysics), resulting in an artificially thicker succession in this zone.
Quadrum gartneri apparently disappears below Sample 369-U1512A-64R-CC, 12–17 cm, although Q. intermedium, Eprolithus moratus, and Eiffellithus perchnielseniae persist to the total depth of the hole (Sample 73R-CC, 19–24 cm). This stratigraphic interval between the FADs of E. moratus and Q. gartneri is designated as Subzone CC10c. The FAD of E. moratus is dated as 93.73 Ma (Gradstein et al., 2012), indicating that Subzone CC10c is entirely within the lower Turonian. Calcareous nannofossils are generally rare but exhibit moderate preservation throughout this interval in Hole U1512A.
Planktonic foraminifers
Hole U1512A core catcher samples were examined for planktonic foraminiferal biostratigraphy (Table T7). Several thousand particles (multiple picking trays) were scanned routinely for each sample. The majority of samples (54 out of 74) are barren of planktonic foraminifers. Where present, foraminifers are small (<150 µm), except in the Pleistocene (Samples 369-U1512A-1R-CC and 2R-CC).
An abundant, diverse, and well-preserved planktonic foraminiferal assemblage is present in Sample 369-U1512A-1R-CC, taken from calcareous ooze (lithostratigraphic Unit I). This sample is assigned to planktonic foraminiferal Subzone Pt1b based on the occurrence of Truncorotalia truncatulinoides and absence of Truncorotalia tosaensis. Samples 2R-CC to 6R-CC occur in Subunit IIa and contain only rare planktonic foraminifers, with preservation ranging from good to poor. Sample 2R-CC includes a latest Pliocene to early Pleistocene assemblage (planktonic foraminiferal Zone PL5 through Subzone Pt1a) based on the presence of T. tosaensis. Sample 3R-CC contains a mixed assemblage of Eocene/Oligocene and Cretaceous taxa, whereas Sample 4R-CC contains only a single poorly preserved biserial. From Sample 5R-CC downhole, samples consistently contain only small Late Cretaceous taxa. Selected planktonic foraminiferal taxa are illustrated in Figure F12 to document the preservation and taxonomy of Cretaceous taxa. The following samples are barren of planktonic foraminifers: 7R-CC to 14R-CC, 18R-CC to 44R-CC, 46R-CC, 48R-CC, 56R-CC to 60R-CC, 62R-CC, and 64R-CC to 73R-CC.
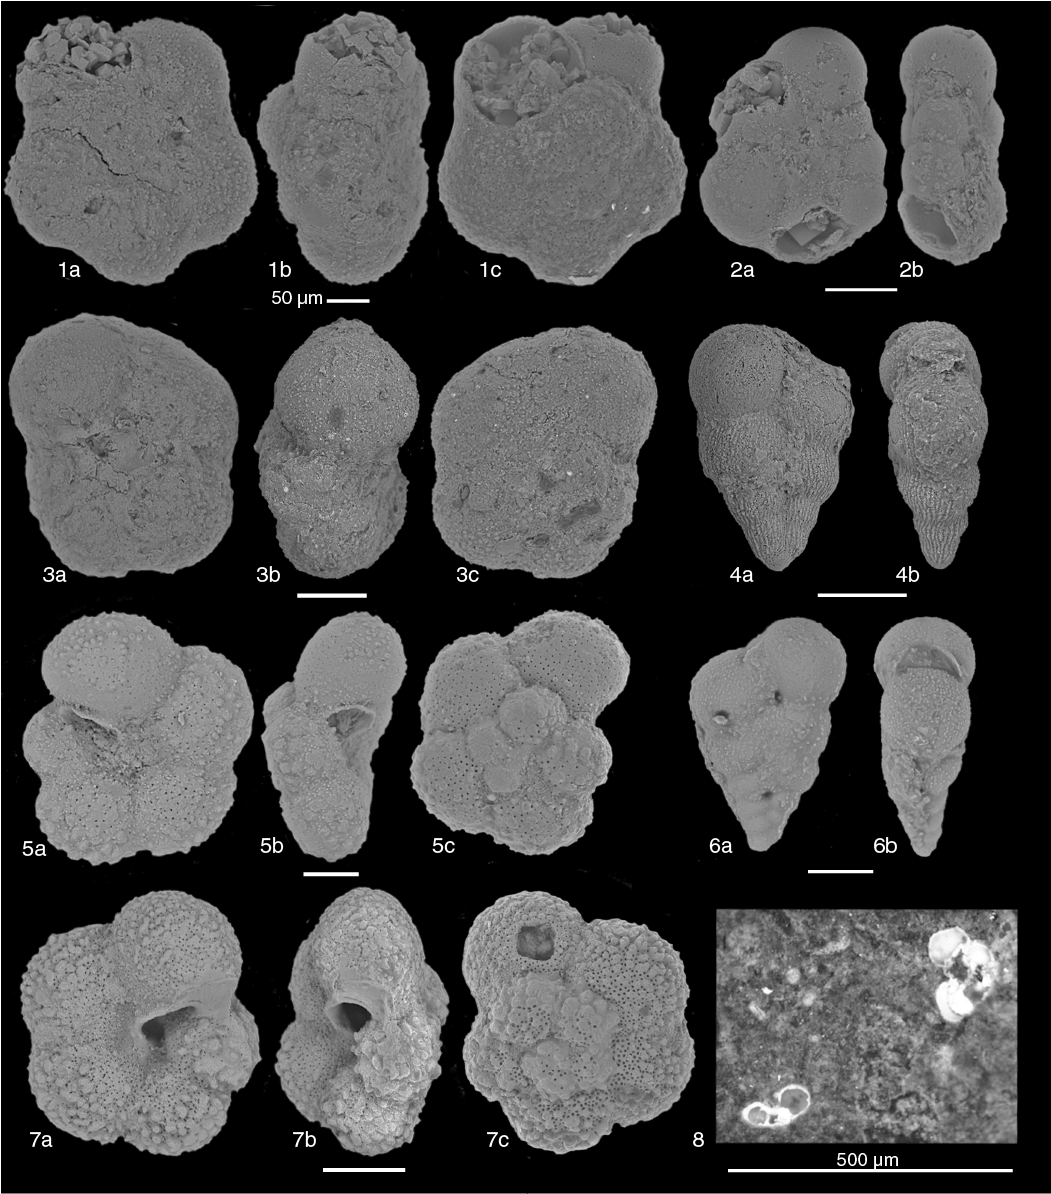
Figure F12. Selected planktonic foraminiferal taxa.
In Samples 369-U1512A-15R-CC to 17R-CC, only a few small and poorly preserved specimens were found in each sample and were assigned to Dicarinella canaliculata, Globigerinelloides bollii, Laeviheterohelix pulchra, Muricohedbergella crassa, Planoheterohelix globulosa, and Planoheterohelix planata (Figure F12). The overlapping ranges of these species indicate a Coniacian–Santonian age that is consistent with calcareous nannofossil zonal assignments.
In Samples 369-U1512A-45R-3, 21–25 cm; 45R-CC; 47R-CC; 49R-CC; 50R-CC; 55R-CC; 61R-CC; and 63R-CC, planktonic foraminifers are rare, and a few representatives of L. pulchra, Muricohedbergella delrioensis, Planoheterohelix globulosa, Praeglobotruncana stephani, Schackoina cenomana, Whiteinella baltica, and Whiteinella brittonensis were found (Figure F12). Preservation of planktonic foraminiferal tests is generally poor to moderate throughout, but tests show good preservation in Samples 50R-CC to 52R-CC. In particular, Sample 55R-CC yields abundant, small (45–100 µm), and well-preserved biserial and trochospiral planktonic foraminifers. In addition, Whiteinella paradubia and Whiteinella aumalensis are visible in cross-section in bulk rock from Sample 47R-CC (Figure F12). A Turonian age for the interval between Samples 45R-3, 21–25 cm, and 63R-CC is inferred according to the species occurrences; this age is in agreement with the calcareous nannofossil zonal assignments.
Benthic foraminifers
All core catcher samples were analyzed for benthic foraminifers except for Core 369-U1512A-1R. Although benthic foraminiferal abundance varies throughout the hole, it is typically higher than planktonic foraminiferal abundance. A total of 72 samples were processed and examined for benthic foraminifers; 44 samples contain low abundances of benthic foraminifers, and the remaining 28 samples are barren (Table T8).
The observed constituent taxa of the assemblages belong to the Textulariina, Lagenina, and Rotaliina suborders (following Armstrong and Brasier, 2005). The examined assemblages are largely composed of agglutinated species, with fewer occurrences of calcareous-walled species (Table T8; Figure F13). An exception is the sample from Sample 369-U1512A-55R-CC, which yields calcareous-walled and miliolid species. The observed assemblages are most commonly used to infer middle to lower bathyal environments. However, foraminiferal assemblages dominated by agglutinated taxa are also recorded from restricted or marginal (paleo)environments, such as shelf seas or marshes (e.g., Kaminski, 1987; Gradstein et al., 1994; Murray, 2006). No age-diagnostic taxa were observed.
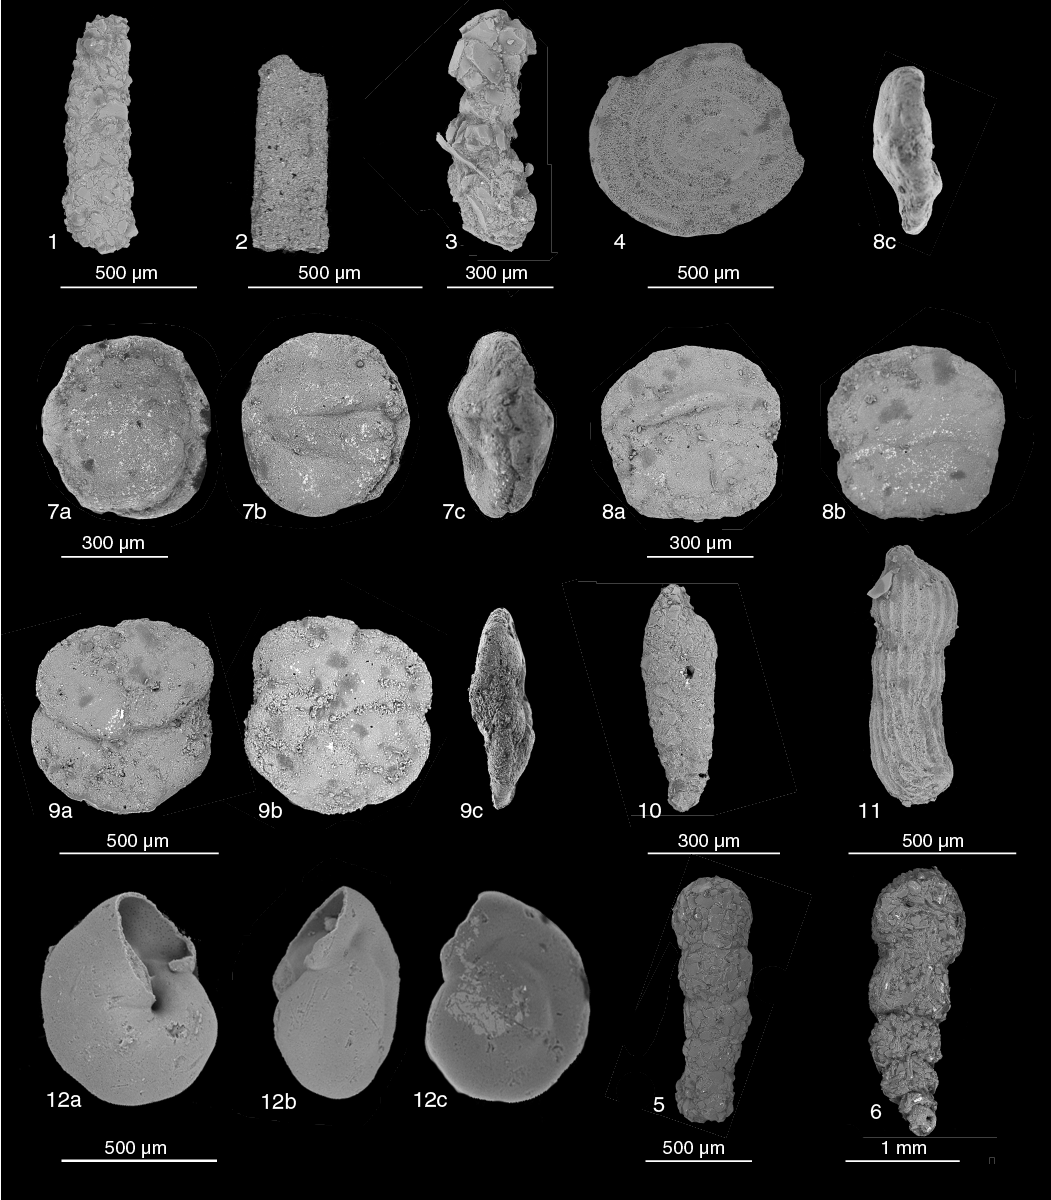
Figure F13. Selected benthic foraminiferal taxa.
Radiolarians
Hole U1512A core catcher samples were examined for radiolarians (Table T4). Radiolarians are abundant and moderately to well preserved in Samples 369-U1512-2R-CC and 3R-CC, but samples contain a mixture of Cretaceous and Neogene taxa, likely due to downhole contamination that caused mixing in the core catcher samples during drilling. Samples 4R-CC to 12R-CC yield moderately to poorly preserved assemblages of varying abundance. Radiolarians are rare and moderately preserved in Samples 13R-CC to 35R-CC, except for Samples 16R-CC and 29R-CC, in which they are highly abundant. In Samples 36R-CC to 48R-CC, radiolarians occur only sporadically in rare abundance and are thereafter absent from most cores to the bottom of the hole, except for rare occurrences in Samples 52R-CC, 56R-CC, 57R-CC, 60R-CC and 63R-CC. A selection of the observed Cretaceous species are illustrated and tentatively identified in Figure F14. The most age diagnostic of these, including Dictyomitra densicostatus, Protostichocapsa stocki, and Histiastrum aster, are described from sediments ranging from the Santonian to Campanian (O’Dogherty, 1994; Urquhart and Banner, 1994; Erbacher, 1998; Popova-Goll et al., 2005; Bragina et al., 2014).

Figure F14. Selected Cretaceous radiolarian taxa.
Dinoflagellate cysts
Dinocyst taxa were rarely found during routine scanning of the >45 µm sieve size fraction of samples from Hole U1512A. The youngest sample containing dinocysts is 369-U1512A-9R-CC (Figure F15, Specimen 1). Samples 10R-CC to 46R-CC are barren; however, dinocysts are present, albeit rare, in most samples from Cores 47R through 70R (Table T4). Taxa found at the site include Oligosphaeridium sp. (Figure F15, Specimens 1 and 8). The taxa observed are recorded in the Late Cretaceous, which is consistent with age determinations from calcareous nannofossil and planktonic foraminiferal analyses. In particular, the rare presence of Paleohystrichophora infusorioides in Samples 47R-CC to 70R-CC is coincident locally with calcareous nannofossil Zones CC11–CC13 (Powis and Patridge, 1980; Helby et al., 1987; Morgan et al., 2003; Blevin and Cathro, 2008), providing support for their Turonian age and some age information in samples where no calcareous plankton are preserved (e.g., Samples 57R-CC and 59R-CC). Unfortunately, the scarcity of dinocysts and lack of light photomicrographs made identification quite difficult for the most part.
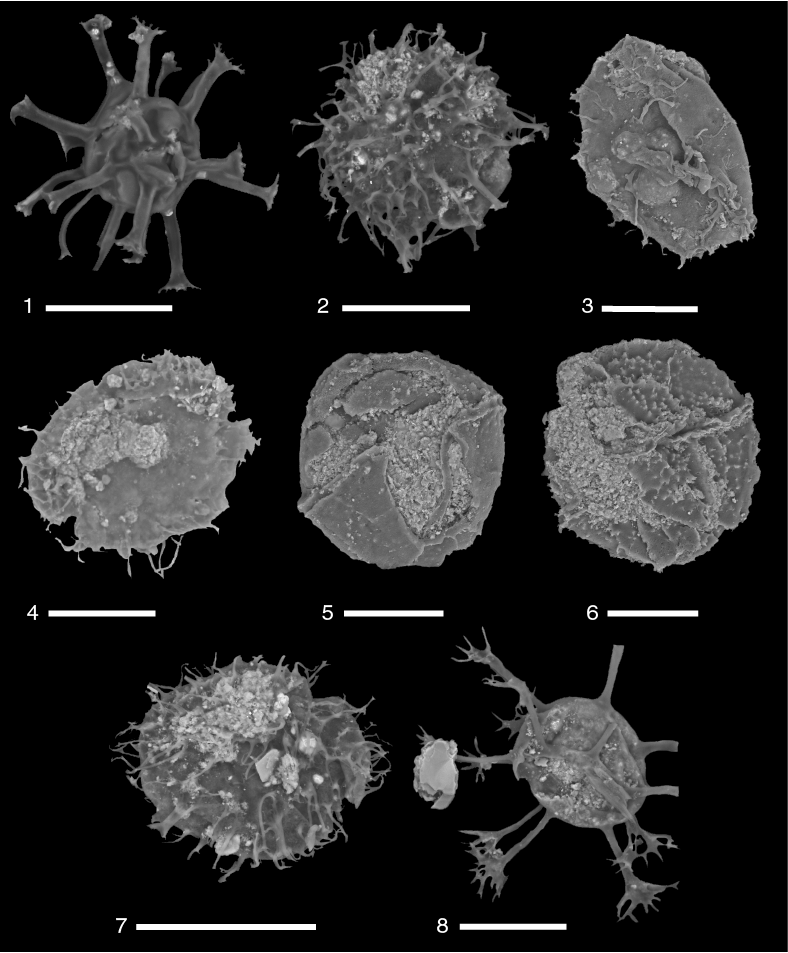
Figure F15. Selected Cretaceous dinocyst specimens.
Paleomagnetism
We measured the natural remanent magnetization (NRM) of all Hole U1512A archive-half sections (Cores 369-U1512A-1R through 73R) and 21 discrete samples collected from the working-half sections. The archive halves were subjected to either 10 and 20 mT alternating field (AF) demagnetization (Cores 1R through 5R) or 10, 20, and 30 mT AF demagnetization (Cores 6R through 73R) and measured with the pass-through superconducting rock magnetometer (SRM) at 5 cm intervals. Discrete samples were subjected to progressive AF demagnetization up to 80 mT using an in-line, automated AF demagnetizer and measured with the SRM to isolate the characteristic remanent magnetization (ChRM). To constrain the magnetic mineralogy, isothermal remanent magnetization (IRM) acquisition experiments of three discrete samples (10R-3, 79–81 cm; 10R-6, 53–55 cm; and 11R-2, 85–87 cm) were conducted.
Natural remanent magnetization of sedimentary cores
Downhole variations in the Hole U1512A paleomagnetic results are displayed in Figure F16. Because the cores were drilled with the RCB system, the magnetic declinations are expected to have a random distribution throughout Hole U1512A. NRM inclinations frequently point steeply downward, which is indicative of drilling-induced viscous overprints (e.g., Richter et al., 2007) that can generally be removed by AF demagnetization (Figures F16, F17, F18).
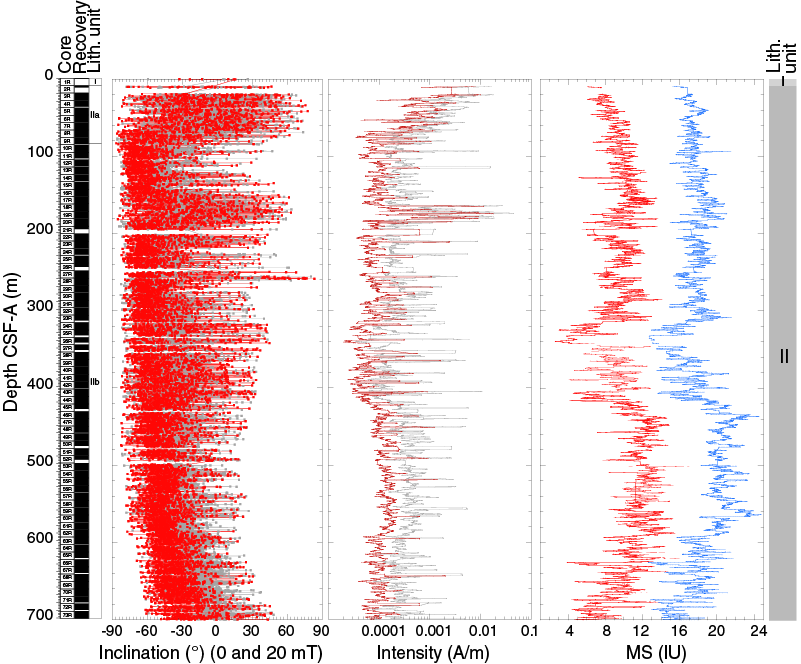
Figure F16. Paleomagnetic data.
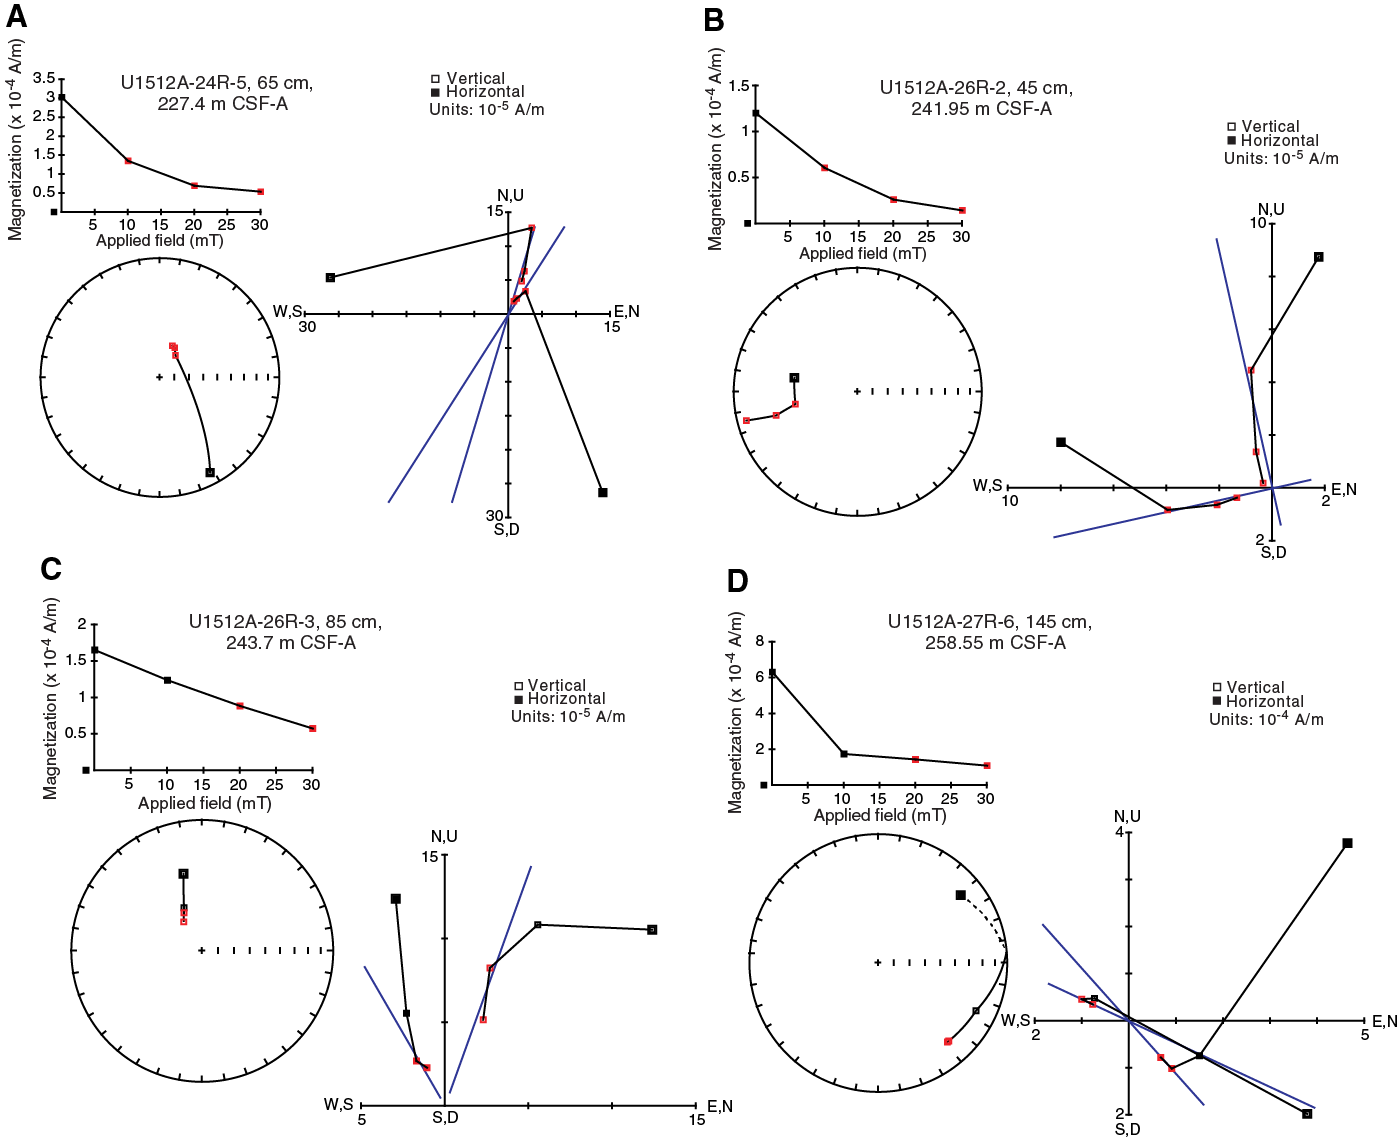
Figure F17. Vector endpoint diagrams for section halves.
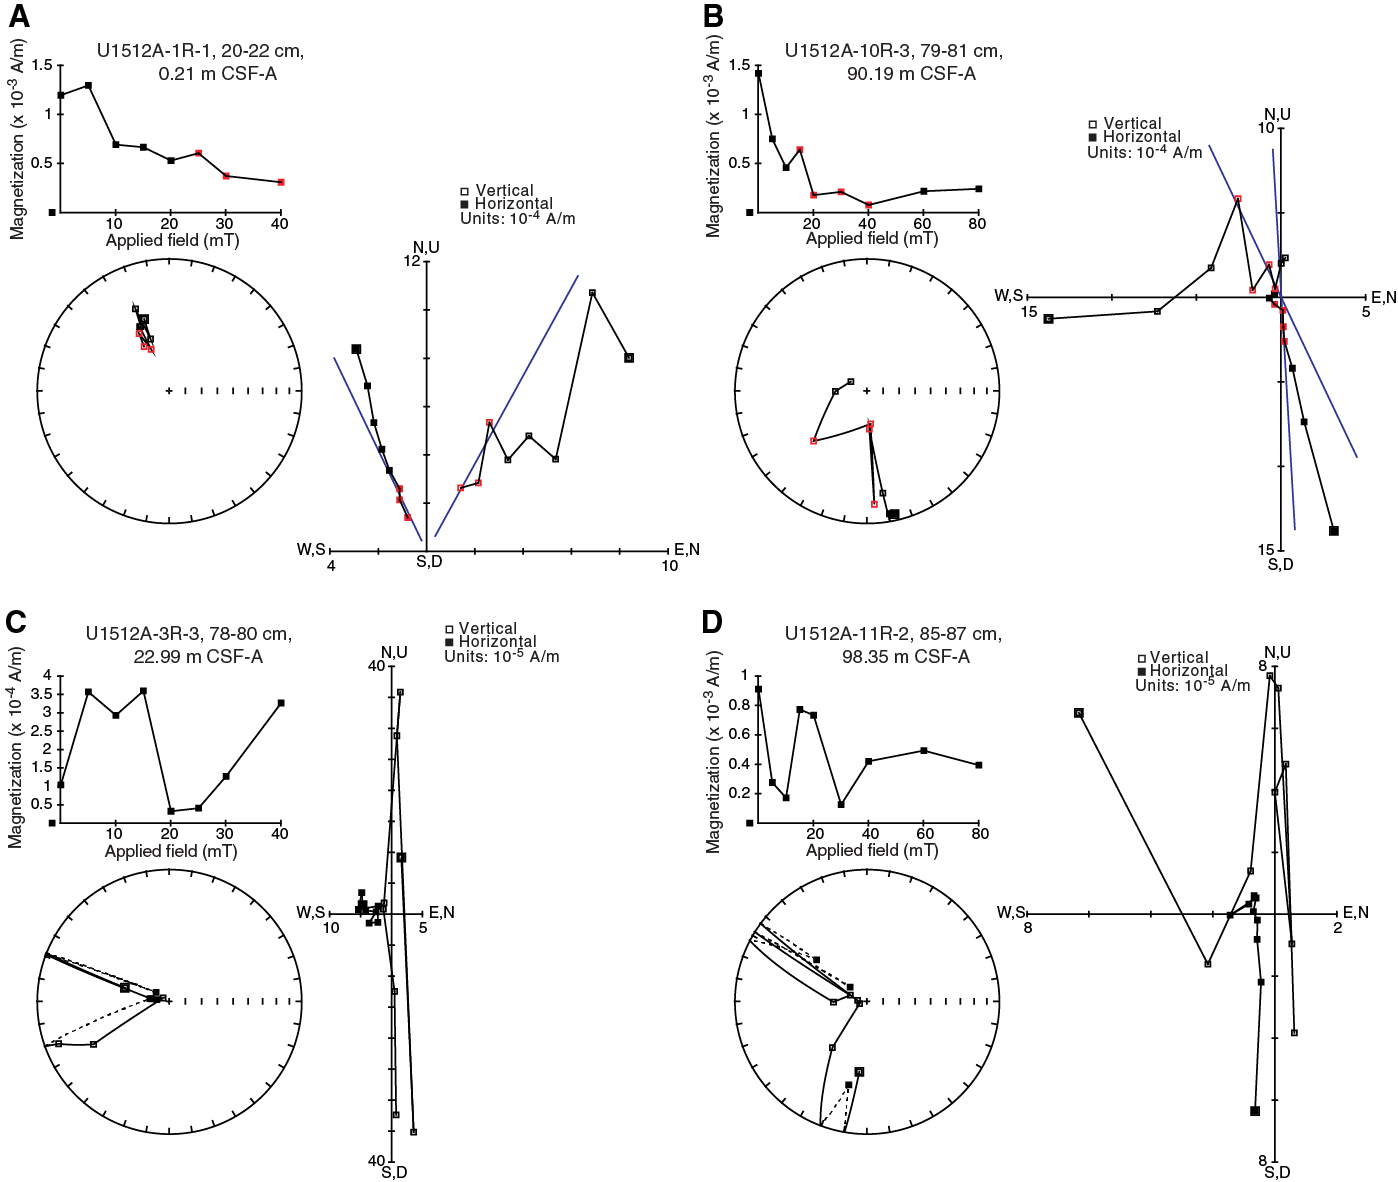
Figure F18. Vector endpoint diagrams for representative discrete samples.
The NRM intensity of Hole U1512A sedimentary cores varies from 1.5 × 10⁻⁵ to 7.8 × 10⁻² A/m with a mean of 5.5 × 10⁻⁴ A/m. Overall, high NRM intensity values were observed in the uppermost 50 m and between 170 and 190 m CSF-A (Figure F16). Downhole NRM intensity variations have a pattern that is generally consistent with that of whole-round low-field magnetic susceptibility (Figure F16; see Petrophysics), indicating an overall homogeneous lithology. Striking peaks occur in both NRM intensity and whole-round magnetic susceptibility.
In many cases, high NRM intensity corresponds to high magnetic susceptibility (Figure F16). However, the depths at which the spikes of the two parameters occur do not always correlate, suggesting more complicated magnetic phases at these depths. The magnetic susceptibility peaks typically occur in intervals where pyrite was observed (see Lithostratigraphy). Because pyrite is paramagnetic (Dunlop and Özdemir, 1997), it can contribute to magnetic susceptibility, but it cannot carry magnetic remanence.
Paleomagnetic demagnetization results
The archive halves of Cores 369-U1512A-1R through 5R were subjected to stepwise AF demagnetization up to 20 mT. Visual inspection of the demagnetization data indicates that the paleomagnetic data after the 20 mT demagnetization treatment appear largely similar to those after the 10 mT treatment. To effectively remove the viscous overprints from the recovered core sections, the remainder of the cores (6R through 73R) were subjected to progressive AF demagnetization up to 30 mT. The demagnetization results show that the drilling-induced magnetic overprint (e.g., Richter et al., 2007) can generally be removed by AF demagnetization at 10 or 20 mT, as indicated by a significant drop in magnetization intensity and a shift in inclinations toward negative values (Figure F16). In most cases, ChRMs can be defined from the paleomagnetic data acquired from the pass-through measurements. ChRMs can be determined by principal component analysis (Kirschvink, 1980) using only three demagnetization steps (Figure F17A, F17B) or two demagnetization steps (Figure F17C, F17D) that show a trajectory decaying toward the origin. Principal component analysis was performed using PufflinPlot (Lurcock and Wilson, 2012) and ZPlotit (http://paleomag.ucdavis.edu/software-Zplotit.html) software. In some cases, samples display either a rapid decrease in magnetic intensity and erratic directions upon demagnetization or resistance to AF demagnetization with >50% magnetic intensity remaining after the 30 mT AF demagnetization treatment. In these cases, the ChRMs cannot be isolated.
The remanent magnetization of 21 discrete samples from Hole U1512A was investigated using detailed stepwise AF demagnetization up to 80 mT. The calcareous ooze sample from lithostratigraphic Unit I displays a stable trajectory decaying toward the origin during stepwise demagnetization, defining a ChRM (Figure F18A). The remaining 20 discrete samples from Subunits IIa and IIb show that remanent magnetizations were largely cleaned by 40 mT, and ChRMs can be isolated from four samples (20.1, 29.41, 90.19, and 96.85 m CSF-A) (Figure F18B). The remaining 16 samples from Subunits IIa and IIb show an increase in magnetization at 10 mT or higher demagnetization steps (Figure F18C, F18D), and ChRMs cannot be defined from these samples.
IRM acquisition data of discrete samples show that they are generally saturated by 200 mT (Figure F19), indicating that the main magnetic carriers in these samples have low coercivity values.
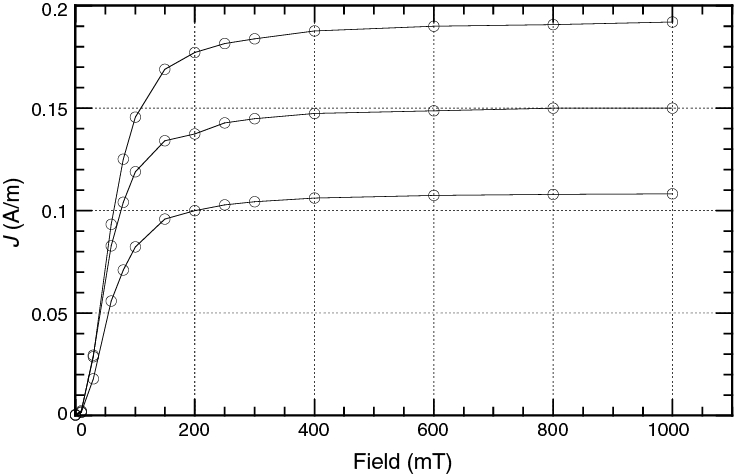
Figure F19. Discrete sample IRM acquisition.
Magnetostratigraphy
Because all cores from Hole U1512A were drilled with the RCB system, for both discrete sample and section-half measurements we used only the ChRM inclinations (not declination) to define magnetic polarity. We culled all results with maximum angular deviation angles >15° and eliminated remaining scattered data points. As shown in Figure F20, the ChRM inclinations are predominantly negative, ranging from around −70° to −20°, which indicates predominantly normal polarity because Site U1512 is located in the Southern Hemisphere. The uppermost ~80 m of the sedimentary succession displays overall noisy polarity signals because of the significant coring disturbance (biscuiting) introduced by the rotary coring process. Positive ChRM inclination values occur between 0 and 75, 175 and 190, and 256 and 259 m CSF-A. The intervals from 0 to 75 and 175 to 100 m CSF-A also exhibit sporadic or consecutive negative ChRM inclinations mixed with dominantly positive inclinations, making it impossible to assign magnetic polarity. The interval between 256 and 259 m CSF-A exhibits consistent downward-pointing paleomagnetic inclinations, defining a zone of reversed polarity (Figure F20). A significant deviation toward shallow inclinations is apparent in the lower 200 m of the section and is most likely related to the up to 27° deviation of the hole from the vertical (see Downhole logging), although effects from inclination shallowing cannot be ruled out.
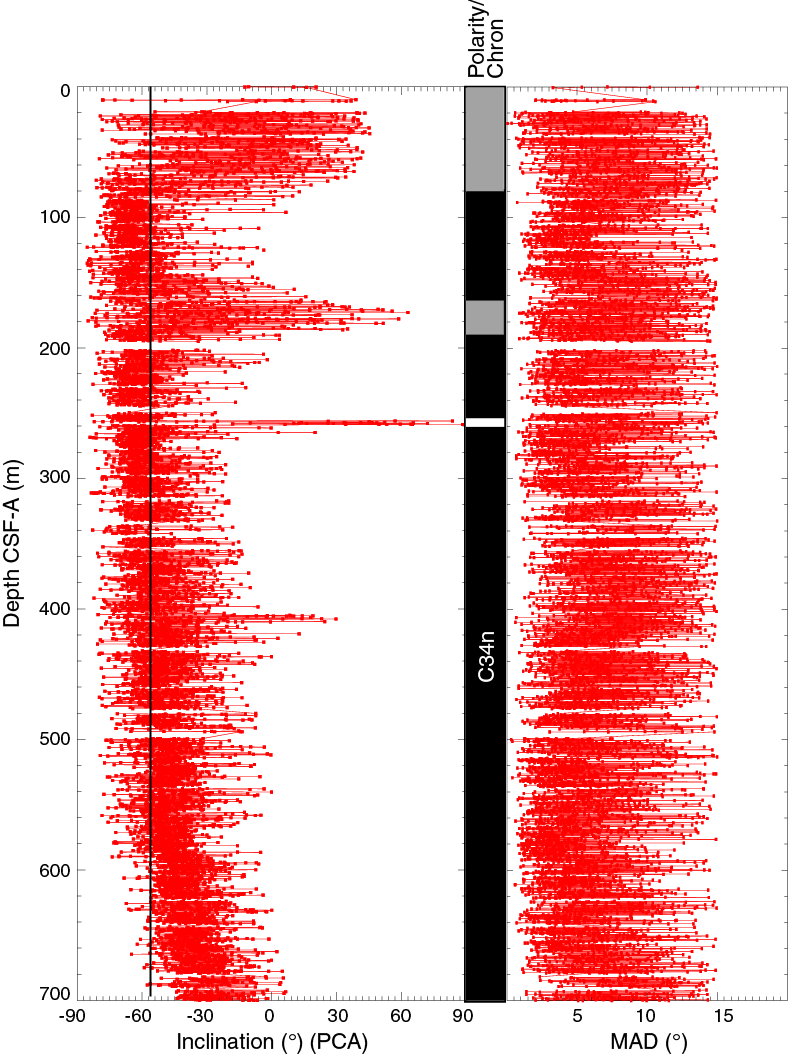
Figure F20. Magnetostratigraphic results.
Shipboard micropaleontological studies suggest that Core 360-U1512A-5R (38.4-47.4 m CSF-A) is Santonian and the base of Core 73R is early Turonian (see Biostratigraphy and micropaleontology). Therefore, the majority of the sedimentary cores (from 38.4 to 700 m CSF-A) were deposited during the latter part of the 41.5 My Cretaceous Normal Superchron (CNS) (Gradstein et al., 2012). The predominant occurrence of normal polarity values in Hole U1512A is consistent overall with the micropaleontological data and is proposed to represent Chron C34n (Ogg, 2012). The intervals of dominantly positive inclinations at 38.4–75, 175–190, and 256–259 m CSF-A may represent episodes of magnetic field excursions during Chron C34n. In particular, a reversed polarity interval is clearly defined between 256 and 259 m CSF-A and likely documents a brief magnetic field excursion in the uppermost segment of the CNS.
Petrophysics
Physical properties
Magnetic susceptibility, gamma ray attenuation (GRA) bulk density, NGR, thermal conductivity, P-wave caliper velocity, color reflectance, and moisture and density (MAD) were measured on whole rounds, split-core sections, and discrete samples from Hole U1512A. Recovery was near continuous in Hole U1512A (see Operations). Thus, very few gaps in physical properties data occur between seafloor and the bottom of the hole at 701 m CSF-A.
Natural gamma radiation
NGR measured on whole-round sections with the Natural Gamma Radiation Logger range from 10.0 to 49.2 counts/s with an average of 32.8 counts/s (Figure F21) after any anomalously low measurements (<10.0 counts/s) near core edges or gaps were removed. NGR data were deconvolved to extract K, U, and Th contents (Figure F22) using the Matlab scripts of De Vleeschouwer et al. (2017). U/Th ratios are typically ~0.2 and always <1, suggesting oxic conditions at the time of deposition, which is in agreement with the low TOC content measured throughout the hole (see Geochemistry). K/Th ratios decrease in the uppermost 100 m of the hole.
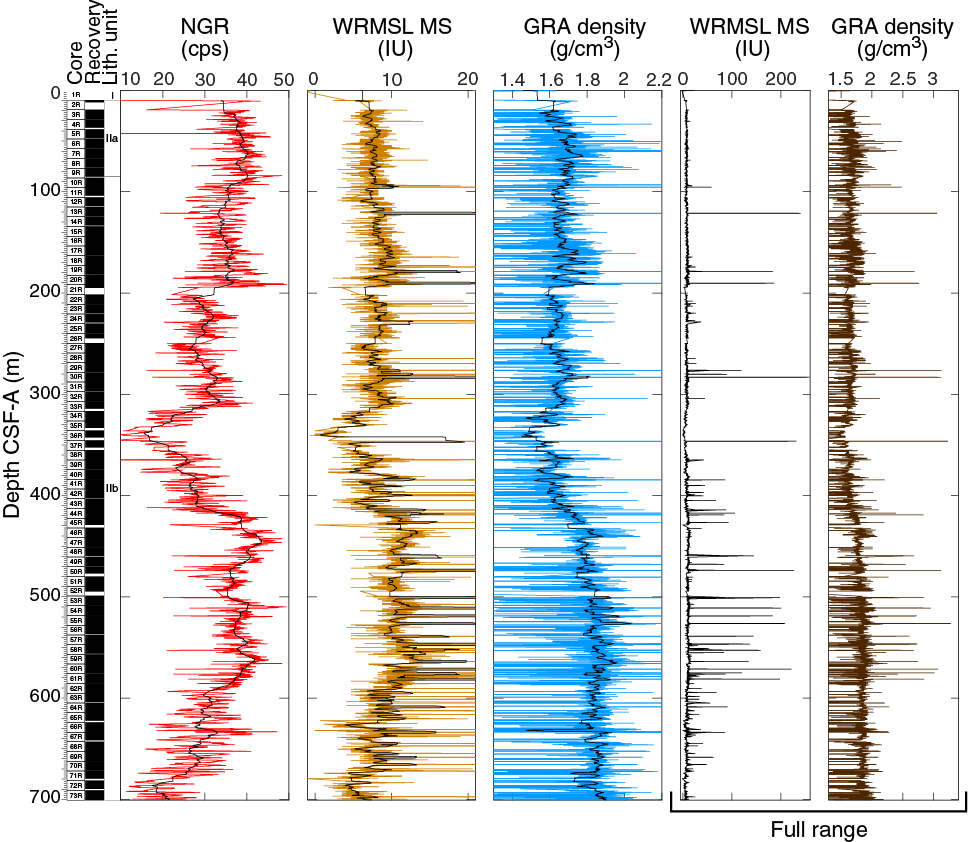
Figure F21. WRMSL physical properties.
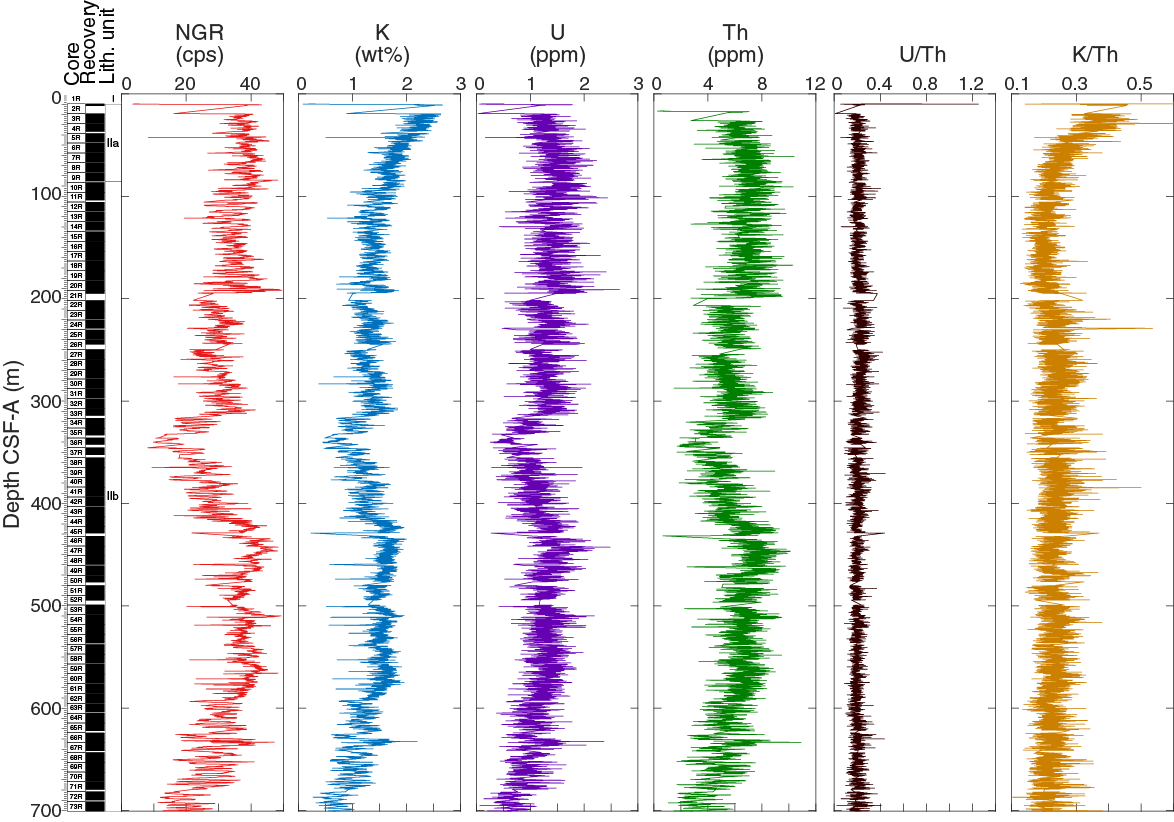
Figure F22. Downhole logging NGR.
The NGR signal most likely reflects variations in detrital content. NGR averages >30 counts/s from 22 to 194 m CSF-A (Figure F21) and from 420 to 590 m CSF-A. NGR reaches minimum values from 330 to 350 m CSF-A and from 675 m CSF-A to the bottom of the hole, where the mean NGR is <20 counts/s. High-amplitude cyclical fluctuations in NGR from 95 to 180 m CSF-A, from 290 to 420 m CSF-A, and from 595 to 701 m CSF-A (the bottom of the hole) range in thickness from 1.5 to 5 m.
Magnetic susceptibility
Magnetic susceptibility was measured on all whole-round sections on the Whole-Round Multisensor Logger (WRMSL), and point measurements were made on the Section Half Multisensor Logger (SHMSL). Downhole trends and values from both measurements are comparable. However, magnetic susceptibility measured with the SHMSL is noisier, and therefore this report refers to WRMSL measurements (Figures F21, F23). Magnetic susceptibility values range from −0.6 to 253.6 instrument units (IU) (Figure F21). The average value of magnetic susceptibility is 9.4 IU. Magnetic susceptibility in claystone and siltstone is typically <20 IU, whereas magnetic susceptibility in the thin to medium sideritic and glauconitic sandstone beds sharply increases to >100 IU (Figure F21).
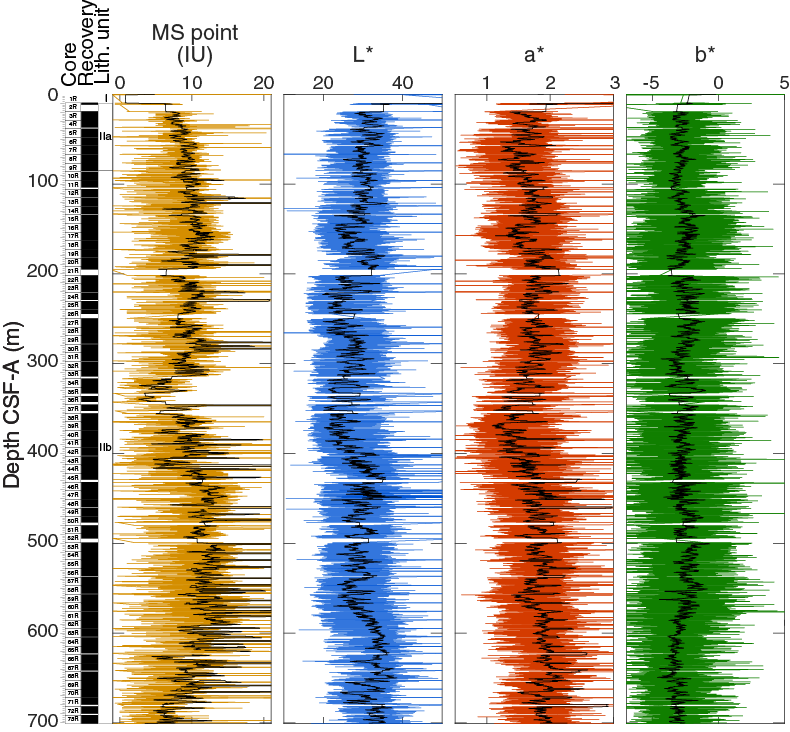
Figure F23. SHMSL physical properties.
From 22 to 310 m CSF-A, magnetic susceptibility cyclically fluctuates by a mean of ~8 IU on a scale of 3 to 5 m. On a large depth range (22–194 m CSF-A), downhole magnetic susceptibility and NGR trends differ (Figure F21). Over a shorter depth range (meters), however, magnetic susceptibility and NGR data consistently covary, and in the lower interval of the hole, magnetic susceptibility and NGR generally correlate at both scales. From 310 to 338 m CSF-A, magnetic susceptibility decreases from ~12 IU to the minimum value in the hole (−0.6 IU) but then increases to ~16 IU by 435 m CSF-A. Deeper than 580 m CSF-A, magnetic susceptibility decreases to ~4.5 IU.
GRA bulk density
GRA density values in siltstone and claystone do not exceed 2.2 g/cm3, although GRA density increases to 3.28 g/cm3 in siderite nodules and glauconitic sandstone (Figure F21). These high values are correlated with spikes in magnetic susceptibility. From 20 to 65 m CSF-A, average GRA density increases from 1.6 to 1.8 g/cm3. From 65 to 325 m CSF-A, GRA density stabilizes around a mean of 1.65 g/cm3. Below this, GRA density decreases to reach a minimum in the hole of 1.5 g/cm3 at 338 m CSF-A. Downhole, GRA density progressively increases to >1.8 g/cm3 by 515 m CSF-A and remains relatively constant to the bottom of the hole. Bulk density shows an overall correlation with NGR from 22 to 562 m CSF-A (Figure F21). Below 562 m CSF-A, GRA bulk density remains stable and NGR decreases with depth.
Color reflectance
High-resolution (2 cm) reflectance spectroscopy and colorimetry data such as reflectance (L*), red versus green (a*), and blue versus yellow (b*) from archive-half sections measured on the SHMSL display high noise levels (Figure F23). Because of the homogeneity of the lithology and color (gray to black), reflectance signals averaged over >10 m appear to not be correlated to magnetic susceptibility. Nonetheless, minimum values of mean L* and a* occur at ~330 m CSF-A, where NGR, magnetic susceptibility, and GRA bulk density also reach their minimum in the hole.
Bulk density, grain density, and porosity
Bulk density, grain density, and porosity were measured on two or three discrete samples taken from the dominant silty clay or claystone lithology of each core, using MAD measurements. Additional samples were taken as needed to characterize the nonrepresentative intervals of glauconitic and sideritic sandstones. Overall, bulk density in the silty clay and claystone intervals ranges from 1.54 to 2.37 g/cm3, and density in the sandstone beds ranges from 3.21 to 3.49 g/cm3 (Figure F24). Porosity in the silty clay and claystone units ranges from 28% to 65%, with most measurements between 40% and 48%. Porosity in the sideritic sandstone units ranges from 5% to 13% as calculated from MAD measurements (see Petrophysics in the Expedition 369 methods chapter [Huber et al., 2019]). Within the upper claystone lithostratigraphic Subunit IIa (10–85 m CSF-A) (see Lithostratigraphy), bulk density increases downhole from~1.62 to 1.91 g/cm3 and porosity and grain density decrease from 62% to 50% and from 3.33 to 2.81 g/cm3, respectively. Bulk and grain densities are relatively constant from 85 to ~300 m CSF-A in upper Subunit IIb, with mean values around 1.9 and 2.8 g/cm3, respectively. Between 300 and 430 m CSF-A, bulk and grain densities decrease slightly (~1.8 and 2.5 g/cm3, respectively). Deeper than 430 m CSF-A, grain density is nearly constant at ~2.8 g/cm3, similar to values in upper Subunit IIb. Bulk density increases steadily downhole from 400 m CSF-A (1.88 g/cm3) to the bottom of the hole (2.1 g/cm3). Porosity generally decreases from ~50% to ~35% deeper than ~85 m CSF-A. High-porosity intervals deviating from this downhole trend occur from 320 to 365 m CSF-A (as much as ~51%) and from 435 to 470 m CSF-A (48%). Occasional, very low porosity values at horizons with high grain density (e.g., 346.29 m CSF-A) correspond to ~1–15 cm thick sideritic and glauconitic sandstone interbeds within the silty claystone of Unit II.
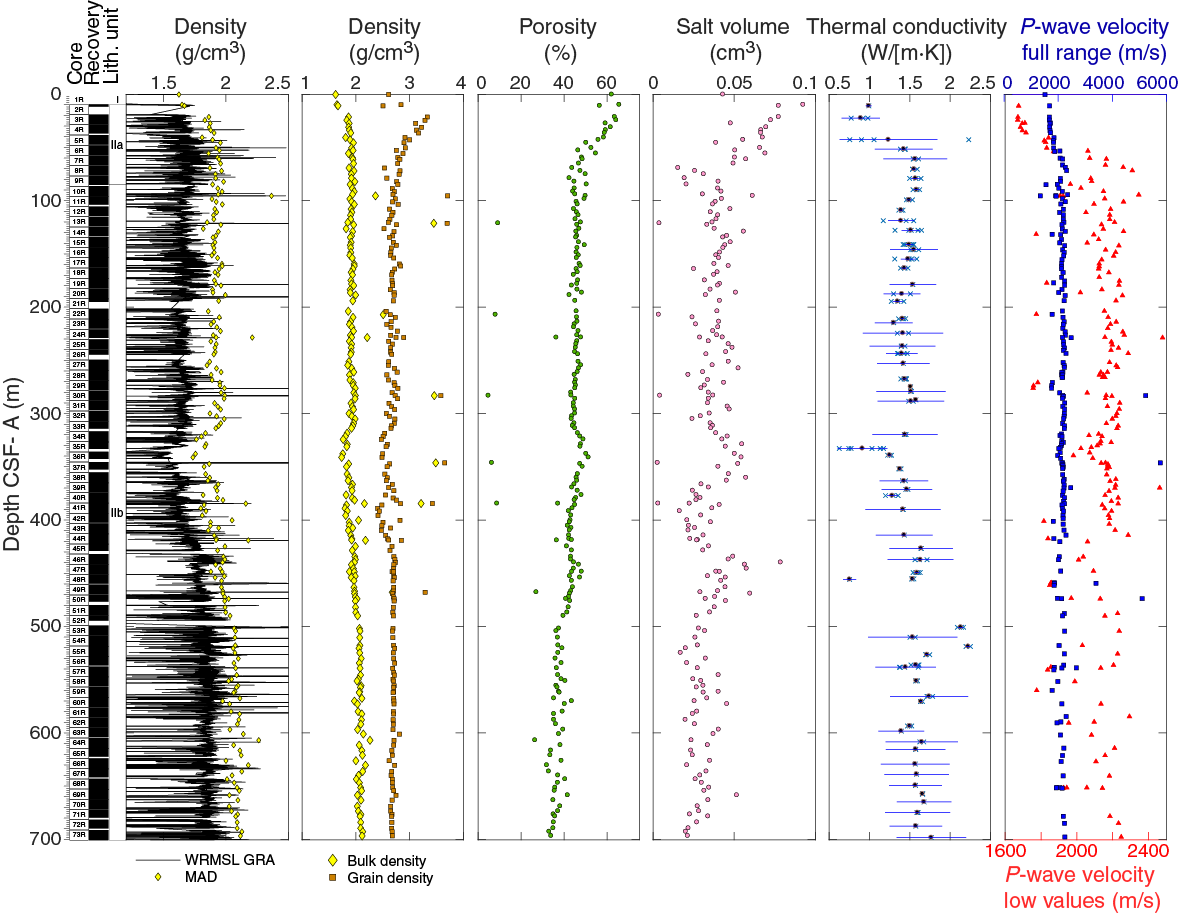
Figure F24. Density, porosity, thermal conductivity, and P-wave velocity.
Thermal conductivity
Thermal conductivity was measured on cores with good recovery, although null results were obtained from some sections. A needle probe was inserted into a whole-round section for measurement at 10.9 m CSF-A. Increased induration below this depth prevented this, so a needle embedded in an acrylic puck was used on the surface of working-half sections (see Petrophysics in the Expedition 369 methods chapter [Huber et al., 2019] for measurement details).
Overall, thermal conductivity increases with depth from 0.9 ± 0.2 W/(m∙K) (1σ) near the seafloor to 1.59 ± 0.03 W/(m∙K) at 63 m CSF-A (Figure F24). Thermal conductivity values are relatively uniform (1.45–1.55 W/[m∙K]) between 60 and 320 m CSF-A. Thermal conductivity decreases to a minimum of 0.9 ± 0.3 W/(m∙K) at 333 m CSF-A, which coincides with the interval where most physical parameters deviate from their average values. Thermal conductivity increases from 333 to 360 m CSF-A, reaching a nearly constant mean value of 1.55 W/(m∙K) from 360 m CSF-A to the bottom of the hole. In this interval, thermal conductivity values of >2 W/(m∙K) occasionally occur in sideritic and glauconitic sandstone interbeds at ~501 and 519 m CSF-A.
P-wave velocity
P-wave velocity was measured with the WRMSL on whole-round cores from the seafloor to 95 m CSF-A and with the Section Half Measurement Gantry P-wave caliper (PWC) on working-half sections or discrete samples from selected sections. Whole-round P-wave velocity was not measured below 95 m CSF-A because of scattered data and poor contact between the core material and liner. P-wave velocity in the silty clay of lithostratigraphic Subunit IIa (10–85 m CSF-A) increases with depth from 1509 to 2310 m/s (Figure F24) with a downhole velocity gradient of 11.2 m/s. P-wave velocity in the claystone and glauconitic sandstone of Subunit IIb deeper than 85 m CSF-A ranges from 1670 to 2346 m/s with a nearly constant average velocity of ~2200 m/s. However, P-wave velocity decreases by ~100 m/s from 325 to 365 m CSF-A in the same interval that porosity increases and bulk density, GRA bulk density, NGR, and magnetic susceptibility decrease (Figures F21, F24). The sideritic sandstone of Subunit IIb have higher P-wave velocity values from 3397 to 5774 m/s.
Downhole logging
After wireline logging operations were completed (see Operations) from 69.9 m DSF to the bottom of the hole, the preprocessed logs were sent to the Borehole Research Group at Lamont-Doherty Earth Observatory, where the logs were processed for wireline result depth matching. The processed logs were sent back to the ship during the expedition. One aspect of the processing involved shifting the wireline logs to a depth scale referenced to the seafloor, which was determined by the NGR step observed at ~3087.5 m wireline log depth below rig floor (WRF) during the Quambo run (see Operations). This depth differed from the seafloor depth determined by the drillers at 3081.7 m drilling depth below rig floor (DRF). The depth-shifting of logs, using the HNGS log from the main pass of the Quambo, generated the wireline log matched depth below seafloor scale (WMSF; see Petrophysics in the Expedition 369 methods chapter [Huber et al., 2019]). However, the seafloor exhibits very low NGR, adding uncertainty to its identification. An estimated ~12.0 m offset between core depth (CSF-A) and WMSF depth is based on the offset of NGR trends between the two records. In the following discussion, we refer to all cores on the WMSF depth scale, realizing that the match between the two depth scales is only approximate.
Furthermore, an inclinometer housed in the EDTC recorded nonvertical values for the borehole orientation deeper than ~210 m WMSF. Inclination increased to 27° approaching the base of the hole, indicating a progressive deviation from a vertical profile (Figure F25). Based on our calculations, the maximum offset between downhole distance and vertical depth does not exceed 13.0 m at the base of the borehole.
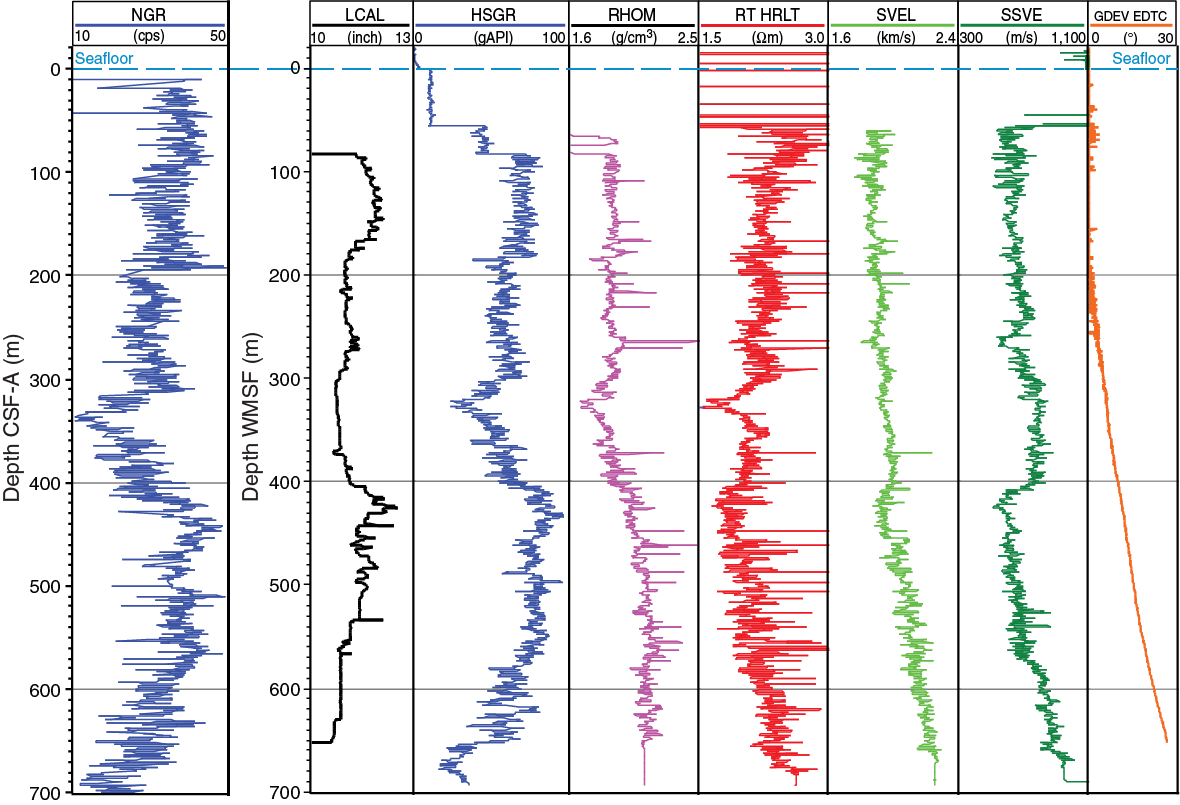
Figure F25. Whole-round core NGR and downhole logging results.
Natural gamma radiation
Downhole wireline logging in the borehole reveals two plateaus in NGR at 90–180 and 190–300 m WMSF, as well as trends to minima near 325 m WMSF (30 gAPI) and 670 m WMSF (20 gAPI) (Figure F25). Within these larger scale trends, shorter scale variation (<10 m) exists in the NGR data (10–20 gAPI) in multiple intervals.
The five-window spectroscopy of the HNGS tool also allowed determination of approximate U, Th, and K contents. K and Th contents mimic the NGR spectra, whereas U content shares similar but less pronounced trends in high and low values. Downhole logging median U (1.45 ppm), Th (9.87 ppm), and K (0.98%) contents are slightly different than those computed from the NGR data set generated on board using the methodology specified in De Vleeschouwer et al. (2017) but produce consistent trends (Figure F22).
Resistivity
Computed true resistivity (HRLT) is between 1.75 and 2.75 Ωm for the majority of the borehole, with a mean of 2.17 Ωm (Figure F25). However, resistivity decreases to a minimum of ~1.6 Ωm in a ~10 m thick interval near 325 m WMSF. Resistivity sporadically spikes to >3.0 Ωm in several depth intervals (i.e., 170–220 and 450–580 m WMSF), corresponding to thin beds of sideritized sandstone and high magnetic susceptibility within lithostratigraphic Subunit IIb (see Lithostratigraphy).
Sonic velocity
Sonic primary (P-wave) and shear wave velocities increase from ~1860 to ~2000 m/s and ~600 to ~800 m/s, respectively, from the top of the hole to 400 m WMSF. Primary sonic velocity decreases by ~100 m/s below ~410 m WMSF. A more pronounced decrease in shear velocity was observed below the same horizon (Figure F25). This decrease in velocity corresponds to a maximum in NGR and a minor increase in porosity (Figure F24), and the caliper on the wireline tool indicates a widening of the borehole by 1 inch. We therefore suspect that the decrease in sonic velocity in this interval reflects a more fractured or less indurated component of the formation. Both primary and shear wave velocities increase again from 425 m WMSF to the base of the logged interval (700.8 m DSF) by 250 and 400 m/s, respectively.
Small-scale variability (i.e., <10 m) and spikes in sonic velocity are superimposed on the general trends of the log (e.g., ~370 m WMSF). Notably, sonic tool string velocity measurements describe traveltimes in the z-direction (i.e., vertical) and will be systematically lower than PWC velocity measurements from half-round and saw-cut sections in the x/y-direction because of the anisotropy associated with flat-lying, fine-grained, and thinly bedded rock or fractures. Additionally, the deviation in the borehole’s inclination potentially led to an apparent increase in sonic velocity downhole if we assume that the cored dominant claystone lithology is anisotropic. However, the apparent trend in velocity and depth also corresponds with a gradual increase in density downhole (a nondirectional measurement), so it is possible that a mixture of several factors could explain the sonic velocity data.
Density
Downhole density values from the wireline logs plateau (average is ~1.90 g/cm3) from 70 to ~270 m WMSF. Below this interval, density decreases to a minimum of ~1.65 g/cm3 between 320 and 330 m WMSF. From this minimum, density increases downhole to 430 m WMSF, below which the signal plateaus around ~2.15 g/cm3 to the base of the logged interval. Sporadic density spikes of >2.25 g/cm3 occur through portions of the downhole log (e.g., 110–270 and 370–575 m WMSF), and many of these horizons also preserve resistivity and sonic velocity spikes, which correspond to thin sideritic and glauconitic sand beds (see Lithostratigraphy).
Geochemistry
The geochemistry program at Site U1512 was designed to characterize the composition of interstitial water and bulk sediment and to assess potential presence of volatile hydrocarbons for routine safety monitoring. Site U1512 was expected to recover Cenomanian to Turonian black shale and a complete OAE 2 sequence. Actual recovered sediment was predominantly consolidated Santonian to Turonian black silty claystone (see Lithostratigraphy and Biostratigraphy and micropaleontology).
Headspace hydrocarbon gases
A total of 73 headspace gas samples were taken for routine safety monitoring, typically from the top of the next core section after the interstitial water sample. Hydrocarbons were detected in 68 of these samples. No gas was detected in samples from Cores 369-U1512A-1R through 5R, and samples from Cores 6R through 9R had low concentrations of interstitial gas. Methane was the dominant gas detected (as much as 104,000 ppmv), with very minor ethane and occasional propane (as much as 653 and 148 ppmv, respectively) (Table T9; Figure F26). The predominance of methane over higher hydrocarbons indicates a biogenic source. From 303.27 to 467.66 m CSF-A (Cores 32R through 49R) the methane/ethane ratios were significantly higher than at other levels in the cores (Figure F26), reflecting biogenic methanogenesis. Deeper than ~473 m CSF-A (Core 50R), the methane/ethane ratio drops to “anomalous” values (Pimmel and Claypool, 2001), possibly indicating thermogenesis. However, given the low maturity of the samples (Table T10) (Totterdell and Mitchell, 2009), the gas in the lower part of the core was unlikely generated in situ. Possible butane and pentane peaks were observed in deeper cores (Core 60R and deeper) but were not quantified.
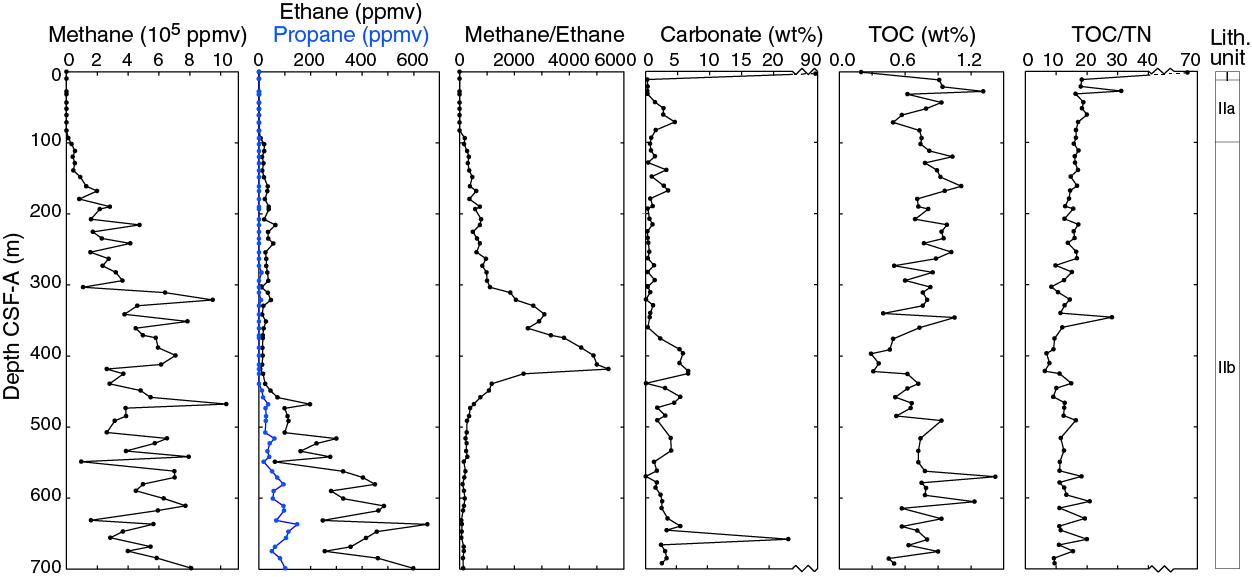
Figure F26. Headspace hydrocarbon gas, carbon, and TOC/TN.
Interstitial water analyses
For analysis of water chemistry, 46 interstitial water samples were taken from whole-round squeezing of sediment intervals from Hole U1512A. Ion chromatography was used to measure chloride (Cl−), bromide (Br−), and sodium (Na+); inductively coupled plasma–atomic emission spectroscopy (ICP-AES) was used to analyze barium (Ba), boron (B), lithium (Li), manganese (Mn), silicon (Si), calcium (Ca), potassium (K), manganese (Mg), sulfur (S), and strontium (Sr). All ICP-AES measurements were converted to molar concentrations, and we assumed all sulfur was present as sulfate (SO42−). Sulfate, Ca, Mg, and K were also measured by ion chromatography, but the ICP-AES concentration data were determined to be of higher quality (see Geochemistry in the Expedition 369 methods chapter [Huber et al., 2019]). Thus, ion chromatography concentrations are reported only in intervals where ICP-AES data were missing, and these values are noted with an asterisk in Table T11 and by open symbols in Figure F27. Ammonium (NH4+) was measured by spectrophotometry (Gieskes et al., 1991).
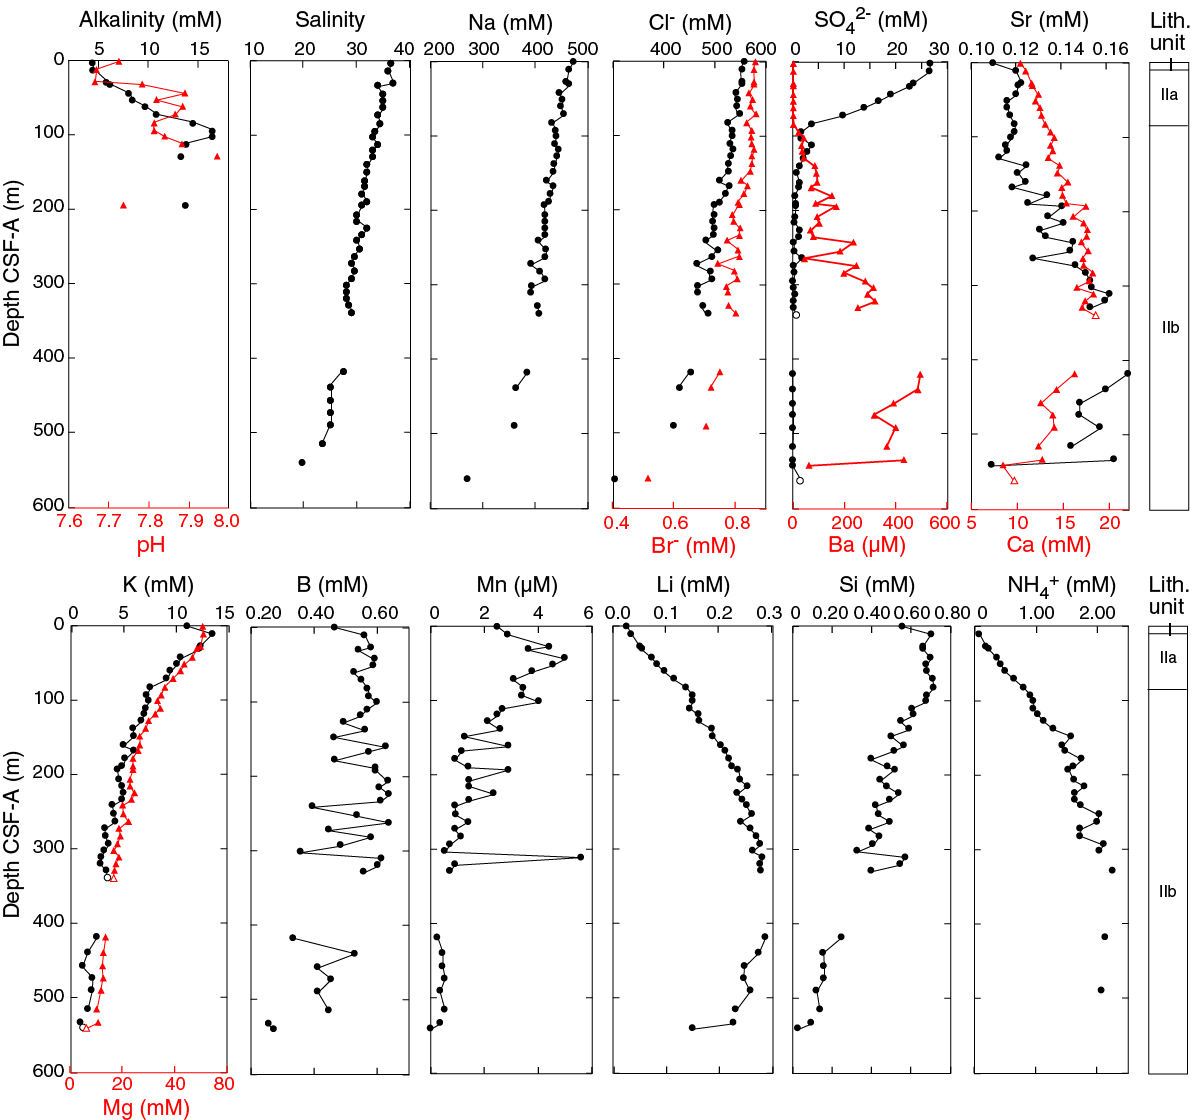
Figure F27. Interstitial water geochemistry.
The preliminary plan for whole-round sampling was one sample per core. However, because of increasing lithification of the sediment downhole, interstitial water yield was low for the majority of the cores deeper than Core 369-U1512A-12R (~110 m CSF-A). As a result, one interstitial water sample was taken per core from Cores 1R through 36R, followed by a short sampling hiatus for Cores 37R through 43R. Interstitial water sampling resumed for every other core from Cores 44R through 54R and one per core for Cores 55R through 57R and 59R. No samples were taken below Core 59R (~560 m CSF-A). The small volumes of interstitial water recovered from the majority samples meant that some analyses could not be performed for all samples; preference was given to ICP-AES and ion chromatography analyses due to the quantity of information generated using these techniques. The sample collected from Core 55R did not yield any water upon squeezing.
Salinity, pH, and alkalinity
The salinity of interstitial water samples generally decreases with depth to a low of 19.5 at ~540 m CSF-A (Core 369-U1512A-57R) in the deepest sample measured. This drawdown in salinity is due to two factors: (1) decrease in SO42−, Mg, and K concentrations and (2) the general decrease in Na+ and Cl− with depth. The 23% decrease in observed NaCl seems not to be associated with the presence of methane hydrates, even though methane levels are high throughout these cores. We suspect that low-salinity water may be present at greater depth.
Alkalinity and pH measurements were limited to the uppermost ~130 m because the small volumes of interstitial water obtained from deeper samples precluded measuring alkalinity and pH on those samples. Alkalinity increases from 4.40 mM at 0.56 m CSF-A to a high of 16.52 mM at 93.55 m CSF-A (Core 369-U1512A-10R) and then decreases slightly to 13.79 mM at 193.19 m CSF-A (Table T11; Figure F27). Measured pH values range from 7.67 to 7.97 and slightly increase downhole.
Sulfate and ammonium
Sulfate is rapidly depleted within the upper 93 m (Core 369-U1512A-10R) of the sedimentary column due to bacterial sulfate reduction and is accompanied by a synchronous NH4+ and alkalinity increase. Therefore, these profiles generally mirror each other, as observed in Hole U1512A (Table T11; Figure F27). Sulfate increases slightly to 3.88 mM at 119.49 m CSF-A but stays low for the rest of the sampled interval. The NH4+ concentration is below detection limit in the shallowest sample, steadily increases to 2.25 mM at 329.27 m CSF-A (Core 35R), and then stays high downhole to Core 59R (562.28 m CSF-A). Inferred sulfate reduction is also supported by the common occurrence of pyrite and other sulfide minerals in the sediment (see Lithostratigraphy) and by the decrease in pH in the upper part of the hole. Occasionally, low but detectable SO42− concentrations were found in samples from deeper than ~140 m CSF-A. These measurements could be due to a small contribution from ambient seawater present in nonvisible core fractures resulting from the rotary drilling process. Otherwise, the interstitial water is generally free of SO42− below the sulfate–methane transition zone (SMTZ) at ~100 m CSF-A.
Magnesium and potassium
Dissolved Mg and K concentrations exhibit steep changes with depth and reach their lowest values in the deepest core sampled for interstitial water (Core 369-U1512A-59R) (Table T11; Figure F27). Dissolved Mg concentration decreases gradually from 50 mM in Core 3R (27.60 m CSF-A) to 5 mM at 562.28 m CSF-A. Similarly, dissolved K concentration decreases from seawater value in the shallowest sample to <2 mM at the bottom of the sampled interval (562.28 m CSF-A). This coupled change in dissolved K and Mg concentrations possibly reflects alteration reactions of volcanic material within the sedimentary column or in basement rocks and the formation of clay minerals (e.g., Gieskes and Lawrence 1981). Differences in the dissolved Mg and K profiles with depth likely indicate multiple mechanisms for cation uptake were active in Hole U1512A. The associated potential release of Ca during alteration reactions (e.g., Bischoff and Dickson 1975) cannot be excluded, but the signal of this process, if occurring, is most likely obscured by carbonate diagenesis (see below).
Calcium and strontium
Dissolved Ca concentration increases with depth to 300 m CSF-A. This increase could result from alteration of volcanic material distributed throughout the core or carbonate diagenesis; the latter is more likely given that volcanic material was not identified during core description (see Lithostratigraphy). Sr concentration shows a similar pattern, though to a lesser degree. In contrast to the observed removal of Mg and K throughout the entire sampled interval, Ca and to a lesser extent Sr only exhibit decreasing concentrations deeper than 300 m CSF-A (Figure F27). This pattern suggests that carbonate dissolution/recrystallization may prevail below ~300 m CSF-A. The exclusion of Sr in recrystallized or newly formed carbonate minerals may explain the lack of a Sr decrease deeper in the hole (Voigt et al., 2015).
Chloride, bromide, sodium, and lithium
Interstitial water concentrations of Cl− and Br− covary. Cl− concentration generally decreases from 559 mM at 0.56 m CSF-A to 304 mM at 562.28 m CSF-A, and Br− concentration decreases from 0.87 mM at 0.56 m CSF-A to 0.52 mM at the base of the sampled interval (Table T11; Figure F27). Compared with seawater, the Br/Cl ratio steadily increases downhole from 1.55 × 10⁻³ in Core 369-U1512A-1R to 1.68 × 10⁻³ in Core 52R. The Na/Cl ratio remains essentially constant at this site. Li concentration increases from 0.03 mM at 0.56 m CSF-A to a maximum of 0.29 mM at 418.41 m CSF-A and then decreases slightly to 0.15 mM at 541.83 m CSF-A, a pattern that is possibly explained by the release of Li from clay minerals through interaction with NH4+, as reflected by the good correlation between these two parameters (r2 = 0.96).
Barium, boron, and silica
Ba concentration is strongly related to the presence or absence of SO42− in interstitial water (Torres et al., 1996). Low Ba concentrations are seen in the upper cores where SO42− is still present. Ba concentration starts to increase at the SMTZ (Cores 369-U1512A-9R and 10R) and reaches a maximum value of 496 µM in Core 44R (Table T11; Figure F27). The decrease in Ba below the SMTZ is attributed to contamination by ambient seawater during rotary drilling. Despite the great care taken during the cleaning of the whole-round samples taken for interstitial water analyses, contamination from drilling fluid in small fractures within the core samples could not always be recognized. We therefore regard the maximum values in the profile as the most reliable ones.
Dissolved Si generally decreases from a maximum of 0.70 mM at 11.48 m CSF-A to 0.03 mM at 541.83 m CSF-A, with a short positive excursion of 0.57–0.55 mM between 310.68 m CSF-B and 329.27 m CSF-A (Table T11; Figure F27). The high dissolved Si concentrations reflect the presence of biogenic opal-A in the sediment. The systematically lower concentrations deeper than Core 35R may be due to opal-A/CT transformation (Murray et al., 1992).
B concentrations range from 0.26 to 0.64 mM and are highly variant throughout the measured section, particularly between 241.35 and 439.31 m CSF-A (Table T11; Figure F27). Adsorption/desorption and alteration reactions within the sedimentary column are likely responsible for this concentration variation (Brumsack and Zuleger, 1992), although squeezing-pressure effects may play a role as well.
Manganese
Mn concentration slightly increases from 2.5 µM at 0.56 m CSF-A to 5.0 µM at 43.27 m CSF-A and then gradually decreases to 0 µM in Core 369-U1512A-57R (541.83 m CSF-A), the deepest sample measured with ICP-AES (Table T11; Figure F27). The high Mn concentration at 310.68 m CSF-A (5.6 µM) may be due to contamination. The Mn profile demonstrates the reducing character of the entire cored sedimentary sequence. Lower concentrations deeper than ~400 m CSF-A may indicate Mn incorporation into diagenetic carbonate minerals.
Bulk-sediment geochemistry
A total of 72 freeze-dried bulk-sediment samples were collected from Cores 369-U1512A-1R through 73R. Typically, the samples were taken as subsamples from the interstitial water squeeze cake; where no interstitial water sample was taken, a small sample was taken from the working-half section.
Excluding Core 369-U1512A-1R (a foraminifer-nannofossil ooze with 90.97% CaCO3), total inorganic carbon content varies from 0.00 to 2.68 wt% (Table T12; Figure F26), corresponding to 0.03%–22.29% CaCO3, assuming that the CaCO3 hosts all inorganic carbon. Again, with the exception of Core 1R, the total carbon content varies from 0.49 to 3.48 wt%. TOC ranges from 0.20 to 1.42 wt%, and total nitrogen (TN) ranges from 0.003 to 0.099 wt%. The TOC/TN ratio shows a weak stratigraphic trend; values toward the top of the claystone sequence range between 16 and 20 and then gradually decrease downhole to the minimum observed value (6.3) at 422.1 m CSF-A (Core 44R). The TOC/TN ratio then increases slightly and irregularly with depth to 16.37 at 490.96 m CSF-A (Core 52R).
The low carbonate percentages throughout the cored section are reflected in the very low contribution of calcareous nannofossil and foraminiferal components to the sediment. The higher carbonate content often observed deeper than 375.95 m CSF-A is likely due to the incorporation of inoceramid shell fragments common in many intervals (see Lithostratigraphy). Low organic carbon content of <1.5 wt% is inconsistent with previous work (Totterdell and Mitchell, 2009), which shows high TOC (<7 wt%) in the majority of sedimentary rocks dredged in this region. This difference may be due to the higher sedimentation rate at U1512 (see Biostratigraphy and micropaleontology), with terrigenous input diluting the organic content of marine origin. Gradual decrease of the TOC/TN ratio from the top of the dark gray clay sequence through 422.09 m CSF-A (Core 44R) is interpreted to be associated with biological methanogenesis, which is expected to be strongest through the low TOC/TN interval. The process may have decomposed N-containing terrestrial organic matter and released carbon as methane, leaving behind nitrogen as NH4+ in clay. The low TOC/TN ratios could also result from a change in the organic matter source from more terrestrial to more marine contributions, but this hypothesis is not supported by the source rock analysis (see below).
Organic matter source analysis
Source rock analysis was performed on eight samples with TOC contents of ~1.0%. Seven samples have a low nominal temperature (≤420°C) of the maximum rate of hydrocarbon yield (Tmax) (Table T10; Figure F28). However, the uppermost sample from Core 369-U1512A-3R has a Tmax of 432°C, which falls just within the oil window. Hydrogen index and oxygen index values are 21–52 and 49–61, respectively, indicating Type III kerogen on a van Krevelen-type diagram (Figure F28). These values indicate that variations in TOC/TN ratios likely are not controlled by changes in terrestrial input, a finding supporting the hypothesis that biological methanogenesis is the main factor producing the TOC/TN ratio.
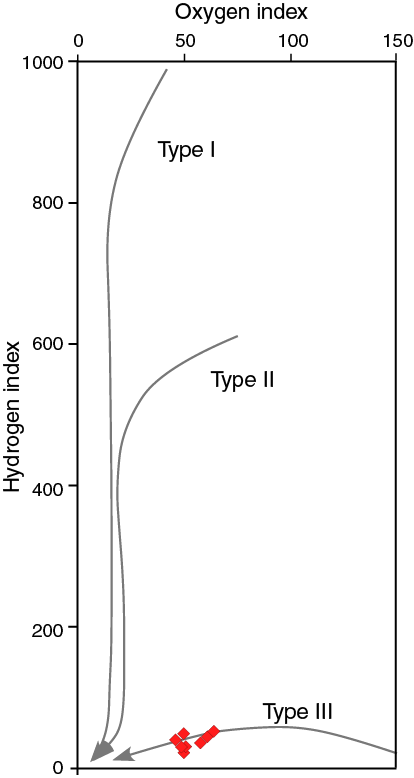
Figure F28. Source rock analysis.
Stratigraphic correlation
At Site U1512, one hole (U1512A) was cored with the RCB system (see Operations) with an overall recovery of 90%. Cores are visually remarkably uniform, but distinctive features that might be used for correlation are present in both NGR and magnetic susceptibility data. Observed variations include both large-scale trends in average values expressed over >10 m of section and apparently cyclic alternation of variable amplitude on shorter length scales (1–5 m thick) (Figure F29). In addition, there are distinct peaks in magnetic susceptibility that often correspond to thin (<20 cm) clastic layers (see Lithostratigraphy and Petrophysics). Matching sharp peaks within common trends on a ~50 m scale in NGR records from the cores and wireline logging in Hole U1512A permitted translation of the CSF-A scale to the WMSF scale (Figure F30; Table T13).
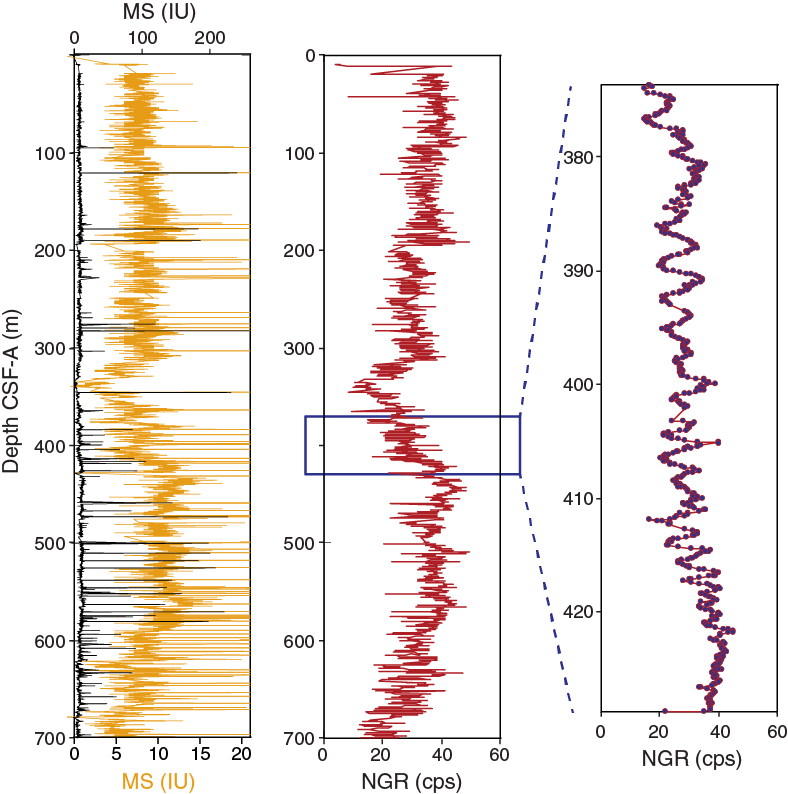
Figure F29. MS and NGR data used for stratigraphic correlation.
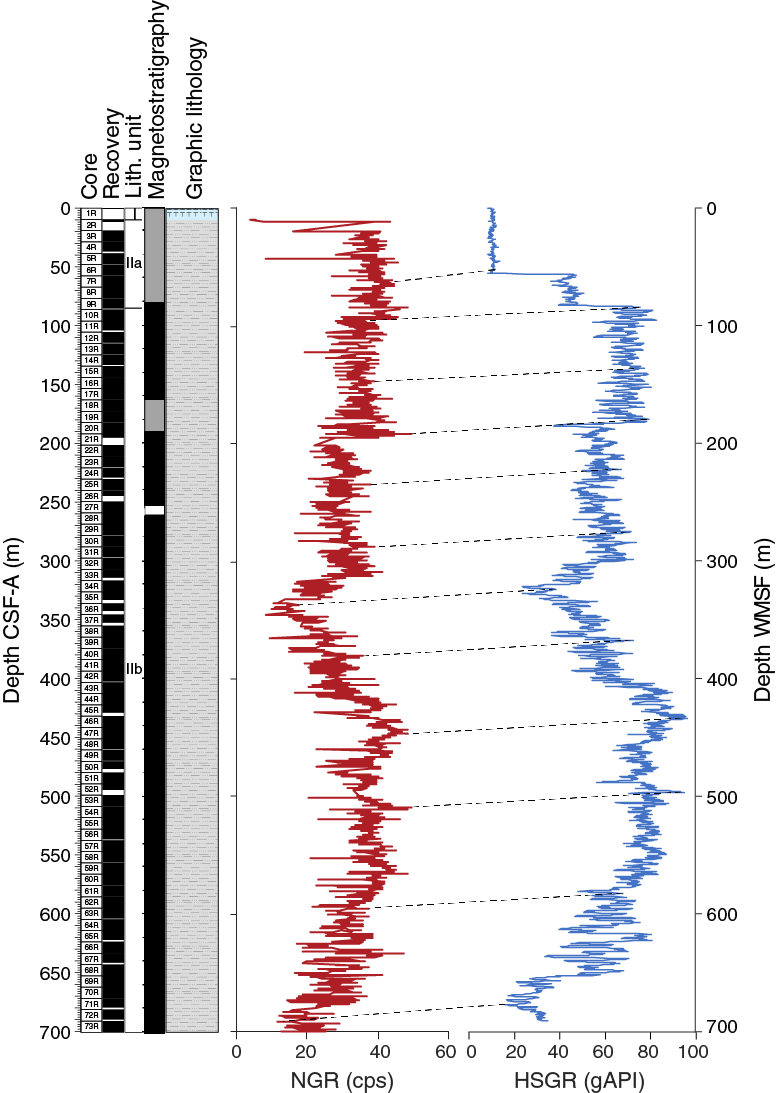
Figure F30. Correlation between core-based data and wireline log NGR data.
Data compiled from various laboratory groups provide a consistent impression of high rates of deposition of dark to very dark, homogeneous, fine-grained, terrigenous-dominated sediment during Chron C34N of the Turonian–Santonian. The sediment accumulation rate for Santonian-age cores is 36 m/My (nannofossil Zones CC17–CC16) and 19 m/My (Zone CC15), whereas the interval from the uppermost Coniacian to middle Turonian has an average sediment accumulation rate of 63 m/My. Sediment accumulation rates accelerated markedly in the lower to middle Turonian to 272 m/My (see Biostratigraphy and micropaleontology; Figure F31). Despite a lack of obvious lithologic variation, rhythmic variation in several physical property measurements is apparent on length scales ranging from meters to tens of meters (see Petrophysics). Trends in interstitial water chemistry show evidence for early diagenetic reactions, including carbonate dissolution, silica transition, and the presence of methane (see Geochemistry; Figure F31).

Figure F31. Age-depth relationship.
References
Armstrong, H.A., and Brasier, M.D., 2005. Microfossils (2nd edition): Oxford, United Kingdom (Blackwell Publishing).
Bischoff, J.L., and Dickson, F.W., 1975. Seawater-basalt interaction at 200°C and 500 bars: implications for origin of sea-floor heavy-metal deposits and regulation of seawater chemistry. Earth and Planetary Science Letters, 25(3):385–397. https://doi.org/10.1016/0012-821X(75)90257-5
Blevin, J., and Cathro, D., 2008. Australian Southern Margin Synthesis, Project GA707, Client Report to Geoscience Australia: Canberra, ACT (FrOG Tech Pty Ltd.). https://d28rz98at9flks.cloudfront.net/68892/68892.pdf
Bragina, L.G., Bragin, N.Y., Djerić, N., and Gajić, V., 2014. Late Cretaceous radiolarians and age of flyschoid sediments in the Struganik section (Western Serbia). Stratigraphy and Geological Correlation, 22(2):202–218. https://doi.org/10.1134/S086959381402004X
Brumsack, H.-J., and Zuleger, E., 1992. Boron and boron isotopes in pore waters from ODP Leg 127, Sea of Japan. Earth and Planetary Science Letters, 113(3):427–433. https://doi.org/10.1016/0012-821X(92)90143-J
De Vleeschouwer, D., Dunlea, A.G., Auer, G., Anderson, C.H., Brumsack, H., de Loach, A., Gurnis, M., et al., 2017. Quantifying K, U, and Th contents of marine sediments using shipboard natural gamma radiation spectra measured on DV JOIDES Resolution. Geochemistry, Geophysics, Geosystems, 18(3):1053–1064. https://doi.org/10.1002/2016GC006715
Direen, N.G., Stagg, H.M.J., Symonds, P.A., and Colwell, J.B., 2011. Dominant symmetry of a conjugate southern Australian and East Antarctic magma-poor rifted margin segment. Geochemistry, Geophysics, Geosystems, 12(2):Q02006. https://doi.org/10.1029/2010GC003306
Dunlop, D.J., and Özdemir, Ö., 1997. Cambridge Studies in Magnetism (Volume 3): Rock Magnetism: Fundamentals and Frontiers: Cambridge, United Kingdom (Cambridge University Press).
Erba, E., Premoli Silva, I., and Watkins, D.K., 1995. Cretaceous calcareous plankton biostratigraphy of Sites 872 through 879. In Haggerty, J.A., Premoli Silva, I., Rack, F., and McNutt, M.K. (Eds.), Proceedings of the Ocean Drilling Program, Scientific Results, 144: College Station, TX (Ocean Drilling Program), 157–169. https://doi.org/10.2973/odp.proc.sr.144.071.1995
Erbacher, J., 1998. Mid-Cretaceous radiolarians from the eastern equatorial Atlantic and their paleoceanography. In Mascle, J., Lohmann, G.P., and Moullade, M. (Eds.), Proceedings of the Ocean Drilling Program, Scientific Results, 159: College Station, TX (Ocean Drilling Program), 363–373. https://doi.org/10.2973/odp.proc.sr.159.037.1998
Gieskes, J.M., Gamo, T., and Brumsack, H., 1991. Technical Note 15: Chemical Methods for Interstitial Water Analysis Aboard JOIDES Resolution. Ocean Drilling Program. https://doi.org/10.2973/odp.tn.15.1991
Gieskes, J.M., and Lawrence, J.R., 1981. Alteration of volcanic matter in deep-sea sediments: evidence from the chemical composition of interstitial waters from deep sea drilling cores. Geochimica Cosmochimica Acta, 45(10):1687–1703. https://doi.org/10.1016/0016-7037(81)90004-1
Gradstein, F.M., Kaminski, M.A., Berggren, W.A., Kristiansen, I.L., and D’Iorio, M.A., 1994. Cenozoic biostratigraphy of the Central North Sea and Labrador Shelf. Micropaleontology, 40. https://doi.org/10.2307/1485906
Gradstein, F.M., Ogg, J.G., Schmitz, M.D., and Ogg, G.M. (Eds.), 2012. The Geological Time Scale 2012: Amsterdam (Elsevier).
Hardenbol, J., Thierry, J., Farley, M.B., Jacquin, T., de Graciansky, P.-C., and Vail, P.R., 1998. Mesozoic and Cenozoic sequence chronostratigraphic framework of European basins. In de Graciansky, P.-C., Hardenbol, J., Jacquin, T., and Vail, P.R. (Eds.), Mesozoic and Cenozoic Sequence Stratigraphy of European Basins. Special Publication - SEPM (Society for Sedimentary Geology), 60:3–13. http://archives.datapages.com/data/sepm_sp/SP60/Mesozoic_and_Cenozoic_Sequence_Chronostratigraphic.pdf
Helby, R.J., Morgan, R., and Partridge, A.D., 1987. A palynological zonation of the Australian Mesozoic. In Jell, P.A. (Ed.), Studies in Australian Mesozoic Palynology. Memoirs of the Association of Australasian Palaeontologists, 4:1–94.
Huber, B.T., Hobbs, R.W., Bogus, K.A., Batenburg, S.J., Brumsack, H.-J., do Monte Guerra, R., Edgar, K.M., Edvardsen, T., Garcia Tejada, M.L., Harry, D.L., Hasegawa, T., Haynes, S.J., Jiang, T., Jones, M.M., Kuroda, J., Lee, E.Y., Li, Y.-X., MacLeod, K.G., Maritati, A., Martinez, M., O'Connor, L.K., Petrizzo, M.R., Quan, T.M., Richter, C., Riquier, L., Tagliaro, G.T., Wainman, C.C., Watkins, D.K., White, L.T., Wolfgring, E., and Xu, Z., 2019. Expedition 369 methods. In Hobbs, R.W., Huber, B.T., Bogus, K.A., and the Expedition 369 Scientists, Australia Cretaceous Climate and Tectonics. Proceedings of the International Ocean Discovery Program, 369: College Station, TX (International Ocean Discovery Program). https://doi.org/10.14379/iodp.proc.369.102.2019
Huber, B.T., Petrizzo, M.R., Watkins, D.K., Haynes, S.J., and MacLeod, K.G., 2017. Correlation of Turonian continental margin and deep-sea sequences in the subtropical Indian Ocean sediments by integrated planktonic foraminiferal and calcareous nannofossil biostratigraphy. Newsletters on Stratigraphy, 50(2):141–185. https://doi.org/10.1127/nos/2017/0373
Kaminski, M.A., 1987. Cenozoic deep-water agglutinated foraminifera in the North Atlantic [Ph.D. thesis]. Woods Hole Oceanographic Institute/Massachussetts Institute of Technology. https://doi.org/10.1575/1912/4321
Kirschvink, J.L., 1980. The least-squares line and plane and the analysis of palaeomagnetic data. Geophysical Journal of the Royal Astronomical Society, 62(3):699–718. https://doi.org/10.1111/j.1365-246X.1980.tb02601.x
Kita, Z.A., Watkins, D.K., and Sageman, B.B., 2017. High-resolution calcareous nannofossil biostratigraphy of the Santonian/Campanian stage boundary, Western Interior Basin, USA. Cretaceous Research, 69:49–55. https://doi.org/10.1016/j.cretres.2016.08.015
Lurcock, P.C., and Wilson, G.S., 2012. PuffinPlot: a versatile, user-friendly program for paleomagnetic analysis. Geochemistry, Geophysics, Geosystems, 13(6):Q06Z45. https://doi.org/10.1029/2012GC004098
MacDonald, J.D., Holford, S.P., Green, P.F., Duddy, I.R., King, R.C., and Backé, G., 2013. Detrital zircon data reveal the origin of Australia’s largest delta system. Journal of the Geological Society, 170(1):3–6. https://doi.org/10.1144/jgs2012-093
Marshall, K.L., and Batten, D.J., 1988. Dinoflagellate cyst associations in Cenomanian–Turonian “black shale” sequences of northern Europe. Review of Palaeobotany and Palynology, 54(1–2):85–103. https://doi.org/10.1016/0034-6667(88)90006-1
Morgan, R., Rowett, A., and White, M.R., 2003. Biostratigraphy. Petroleum Geology of South Australia (Volume 5): Bight Basin: Adelaide, SA (Department of Primary Industries and Resources). http://minerals.dpc.sa.gov.au/__data/assets/pdf_file/0007/259981/pgsa5_chapter5.pdf
Murray, J.W., 2006. Ecology and Applications of Benthic Foraminifera: Cambridge, United Kingdom (Cambridge University Press).
Murray, R.W., Brumsack, H.J., von Breymann, M.T., Sturz, A.A., Dunbar, R.B., and Gieskes, J.M., 1992. Diagenetic reactions in deeply buried sediments of the Japan Sea: a synthesis of interstitial-water chemistry results from Legs 127 and 128. In Tamaki, K., Suyehiro, K., Allan, J., McWilliams, M., et al., Proceedings of the Ocean Drilling Program, Scientific Results, 127/128 (Part 2): College Station, TX (Ocean Drilling Program), 1261–1274. https://doi.org/10.2973/odp.proc.sr.127128-2.177.1992
O’Dogherty, L., 1994. Biochronology and paleontology of mid-Cretaceous radiolarians from Northern Apennines (Italy) and Betic Cordillera (Spain). Mémoires de Géologie (Lausanne), 21.
Ogg, J.G., 2012. Geomagnetic polarity time scale. In Gradstein, F.M., Ogg, J.G., Schmitz, M.D., and Ogg, G.M. (Eds.), The Geologic Time Scale 2012: Amsterdam (Elsevier), 85–113. https://doi.org/10.1016/B978-0-444-59425-9.00005-6
Pimmel, A., and Claypool, G., 2001. Technical Note 30: Introduction to Shipboard Organic Geochemistry on the JOIDES Resolution. Ocean Drilling Program. https://doi.org/10.2973/odp.tn.30.2001
Popova-Goll, I., Vishnevskaya, V., and Baumgartner, P.O., 2005. Upper Cretaceous (Santonian–Campanian) radiolarians from Voronesh Anticline, southwestern Russia. Micropaleontology, 51(1):1–37. https://doi.org/10.2113/51.1.1
Powis, G., and Partridge, A.D., 1980. Palynological analysis of Jerboa-1, Eyre Basin, Western Australia. Esso Australia Palaeontological Report 1980/15. In Huebner, P.U. (Comp.), Well Completion Report, Jerboa-1, Eyre Basin, Western Australia. Esso Australia Report: Western Australia Department of Minerals and Energy, S1615, App. 5 (unpublished).
Richter, C., Acton, G., Endris, C., and Radsted, M., 2007. Technical Note 34: Handbook for Shipboard Paleomagnetists. Ocean Drilling Program. https://doi.org/10.2973/odp.tn.34.2007
Torres, M.E., Brumsack, H.-J., Bohrmann, G., and Emeis, K.C., 1996. Barite fronts in continental margin sediments: a new look at barium remobilization in the zone of sulfate reduction and formation of heavy barites in diagenetic fronts. Chemical Geology, 127(1–3):125–139. https://doi.org/10.1016/0009-2541(95)00090-9
Totterdell, J.M., Blevin, J.E., Struckmeyer, H.I.M., Bradshaw, B.E., Colwell, J.B., and Kennard, J.M., 2000. A new stratigraphic framework for the Great Australian Bight: starting with a clean slate. APPEA Journal, 40:95–117.
Totterdell, J.M., and Mitchell, C.H. (Eds.), 2009. Bight Basin Geological Sampling and Seepage Survey: R/V Southern Surveyor Survey SS01/2007. Geoscience Australia, 2009/24. http://www.ga.gov.au/metadata-gateway/metadata/record/gcat_68689
Urquhart, E., and Banner, F.T., 1994. Biostratigraphy of the supra-ophiolite sediments of the Troodos Massif, Cyprus: the Cretaceous Perapedhi, Kannaviou, Moni and Kathikas formations. Geological Magazine, 131(04):499–518. https://doi.org/10.1017/S0016756800012127
Voigt, J., Hathorne, E.C., Frank, M., Vollstaedt, H., and Eisenhauer, A., 2015. Variability of carbonate diagenesis in equatorial Pacific sediments deduced from radiogenic and stable Sr isotopes. Geochimica et Cosmochimica Acta, 148:360–377. https://doi.org/10.1016/j.gca.2014.10.001
White, L.T., Gibson, G.M., and Lister, G.S., 2013. A reassessment of paleogeographic reconstructions of eastern Gondwana: bringing geology back into the equation. Gondwana Research, 24(3–4):984–998. https://doi.org/10.1016/j.gr.2013.06.009
Zijderveld, J.D.A., 1967. AC demagnetization of rocks: analysis of results. In Collinson, D.W., Creer, K.M., and Runcorn, S.K. (Eds.), Developments in Solid Earth Geophysics (Volume 3): Methods in Palaeomagnetism: Amsterdam (Elsevier), 254–286. https://doi.org/10.1016/B978-1-4832-2894-5.50049-5
1 Huber, B.T., Hobbs, R.W., Bogus, K.A., Batenburg, S.J., Brumsack, H.-J., do Monte Guerra, R., Edgar, K.M., Edvardsen, T., Garcia Tejada, M.L., Harry, D.L., Hasegawa, T., Haynes, S.J., Jiang, T., Jones, M.M., Kuroda, J., Lee, E.Y., Li, Y.-X., MacLeod, K.G., Maritati, A., Martinez, M., O’Connor, L.K., Petrizzo, M.R., Quan, T.M., Richter, C., Riquier, L., Tagliaro, G.T., Wainman, C.C., Watkins, D.K., White, L.T., Wolfgring, E., Xu, Z., 2019. Site U1512. In Hobbs, R.W., Huber, B.T., Bogus, K.A., and the Expedition 369 Scientists, Australia Cretaceous Climate and Tectonics. Proceedings of the International Ocean Discovery Program, 369: College Station, TX (International Ocean Discovery Program). https://doi.org/10.14379/iodp.proc.369.103.2019
2 Expedition 369 Scientists’ affiliations.
This work is distributed under the Creative Commons Attribution 4.0 International (CC BY 4.0) license. 
- F1. Site U1512, Jerboa-1 commercial well, and Leg 182 site locations.
- F2. Seismic profile from Jerboa-1 to Site U1512.
- F3. Lithostratigraphic summary.
- F4. Representative lithologies.
- F5. Sediment constituents.
- F6. XRD results.
- F7. Representative lithology constituents.
- F8. Thin section modal analysis.
- F9. Selected microfossil group summary.
- F10. Age-depth plot and sedimentation accumulation rates.
- F11. Selected calcareous nannofossil taxa.
- F12. Selected planktonic foraminiferal taxa.
- F13. Selected benthic foraminiferal taxa.
- F14. Selected Cretaceous radiolarian taxa.
- F15. Selected Cretaceous dinocyst specimens.
- F16. Paleomagnetic data.
- F17. Vector endpoint diagrams for section halves.
- F18. Vector endpoint diagrams for representative discrete samples.
- F19. Discrete sample IRM acquisition.
- F20. Magnetostratigraphic results.
- F21. WRMSL physical properties.
- F22. Downhole logging NGR.
- F23. SHMSL physical properties.
- F24. Density, porosity, thermal conductivity, and P-wave velocity.
- F25. Whole-round core NGR and downhole logging results.
- F26. Headspace hydrocarbon gas, carbon, and TOC/TN.
- F27. Interstitial water geochemistry.
- F28. Source rock analysis.
- F29. MS and NGR data used for stratigraphic correlation.
- F30. Correlation between core-based data and wireline log NGR data.
- F31. Age-depth relationship
- T1. Core summary.
- T2. Sandstone beds.
- T3. pXRF results.
- T4. Selected microfossil groups.
- T5. Calcareous nannofossil bioevents.
- T6. Calcareous nannofossils.
- T7. Planktonic foraminifers.
- T8. Benthic foraminifers.
- T9. Headspace gas data.
- T10. Source rock analysis data.
- T11. Interstitial water geochemistry.
- T12. Bulk sediment geochemistry.
- T13. Core-log correlation tie points.