Hobbs, R.W., Huber, B.T., Bogus, K.A., and the Expedition 369 Scientists
Proceedings of the International Ocean Discovery Program Volume 369
publications.iodp.org

https://doi.org/10.14379/iodp.proc.369.106.2019
Site U15151
B.T. Huber, R.W. Hobbs, K.A. Bogus, S.J. Batenburg, H.-J. Brumsack, R. do Monte Guerra, K.M. Edgar, T. Edvardsen, M.L. Garcia Tejada, D.L. Harry, T. Hasegawa, S.J. Haynes, T. Jiang, M.M. Jones, J. Kuroda, E.Y. Lee, Y.-X. Li, K.G. MacLeod, A. Maritati, M. Martinez, L.K. O’Connor, M.R. Petrizzo, T.M. Quan, C. Richter, L. Riquier, G.T. Tagliaro, C.C. Wainman, D.K. Watkins, L.T. White, E. Wolfgring, and Z. Xu2
Keywords: International Ocean Discovery Program, IODP, JOIDES Resolution, Expedition 369, Site U1515, Hot Cretaceous Greenhouse, oceanic anoxic events, Mentelle Basin, Naturaliste Plateau, Great Australian Bight, Gondwana breakup, Tasman Gateway, Indonesian Gateway, cyclostratigraphy, carbon isotope excursions, Paleocene/Eocene Thermal Maximum, Eocene greenhouse, Miocene, volcanic rifted margin, nonvolcanic rifted margin
MS 369-106: Published 25 May 2019
Background and objectives
International Ocean Discovery Program Site U1515 is the westernmost (33°16.1890′S, 114°19.3666′E; Figures F1, F2) and shallowest (~850 m water depth) site cored during Expedition 369, with the primary objective to provide evidence of the prebreakup rifting history in the region prior to the onset of the rifting episode that led to the final separation of the Greater India and Australia/Antarctica plates. The site location was chosen based on seismic evidence of dipping strata below the Valanginian unconformity mapped throughout the western margin of Australia and previously cored at Site U1513 in the western Mentelle Basin. The extrusive basalts that cover this unconformity in the western Mentelle Basin are not present at Site U1515.
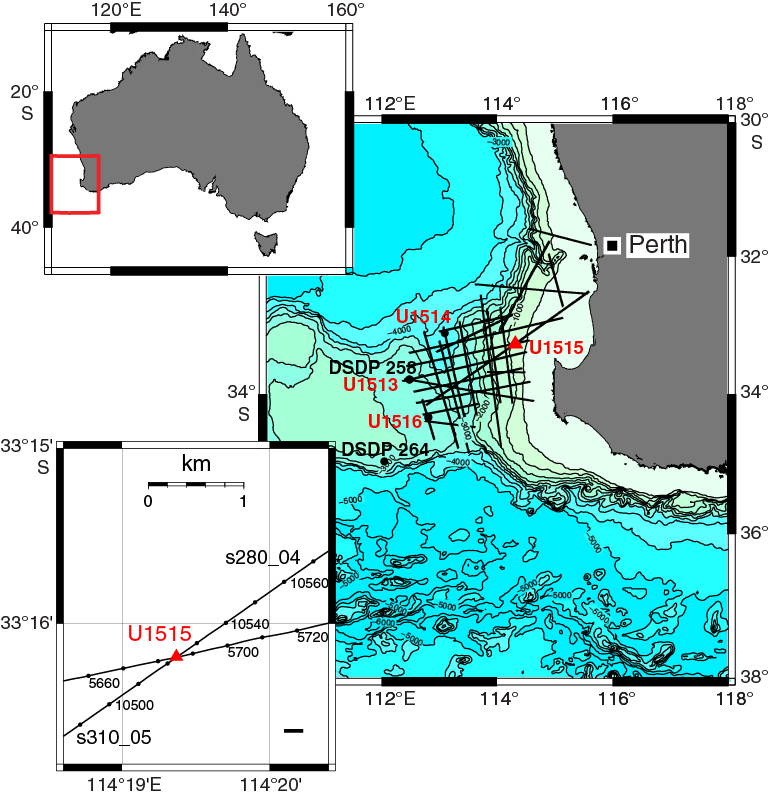
Figure F1. Site U1515 location.

Figure F2. Seismic Profile s310_05.
Structural interpretations suggest that basal deposits in the eastern Mentelle Basin are older (Permian? to Jurassic) than those in the western Mentelle Basin (Jurassic?) (Borissova et al., 2002). Coring at Site U1515 tests this interpretation by sampling sediments from the eastern Mentelle Basin for the first time. Cores recovered from this site will enable investigation of the tectonic and structural relationships with similar-aged rift basins along the western margin of Australia, in particular with the adjacent Perth Basin (Bradshaw et al., 2003) and potentially with rift structures in Antarctica (Maritati et al., 2016). Finally, the cored record will ascertain the provenance of early rift deposits (Jurassic?) and establish whether they were sourced from the Pinjarra orogen or from the Albany-Frazer province.
Operations
Operations at Site U1515 consisted of coring a single hole (U1515A) with the rotary core barrel (RCB) system to 517.1 m drilling depth below seafloor (DSF) (Table T1). The original plan for this site included coring in three holes and a full suite of wireline logging runs. However, hole conditions were generally poor, precluding logging, and core recovery was low, thus shortening the time spent at this site. Overall, 55 RCB cores were recovered, with 93.62 m recovered of the 517.1 m cored (18.1%). The total time at Site U1515 was 3.6 days (10–13 November 2017).
Transit to Site U1515
The ship arrived at the site at 0000 h (UTC + 11 h) on 10 November 2017, covering 62.5 nmi in 6.3 h at an average speed of 9.9 kt. The acoustic positioning beacon was deployed at 0046 h.
Hole U1515A
Preparations for coring in Hole U1515A (33°16.1890′S, 114°19.3666′E) began on 10 November 2017. Nonmagnetic core barrels were used throughout coring. The drill string was lowered starting at 0500 h, and Hole U1515A was started at 0650 h. The seafloor was tagged at 849.7 meters below sea level (mbsl). We began RCB coring, but recovery was low because of intermittent chert layers and unconsolidated sand. Cores 3R, 16R through 19R, 21R, 25R, 51R, and 52R had no recovery, and Cores 20R, 22R, 23R, 26R through 29R and 31R recovered <10 cm. Recovery for the other cores was generally <50%. Hole conditions were poor overall, and we experienced highly variable rates of penetration throughout. We recovered the final core (55R; 517.1 m DSF) at 0400 h on 13 November. The drill string was then brought back to the rig floor by 1350 h, officially ending Hole U1515A. After multiple attempts to release the acoustic beacon, it was abandoned. The rig floor was secured for transit, and the vessel was under way to Site U1516 at 1354 h.
Lithostratigraphy
Hole U1515A lithostratigraphic units (Figure F3) are defined by changes in lithology and sedimentary characteristics as identified by macroscopic core description (Figure F4), smear slide examination (Figures F5, F6; see Site U1515 smear slides in Core descriptions), thin section examination, and X-ray diffraction (XRD) data (Figure F7) and handheld portable X-ray fluorescence (pXRF) measurements (Table T2). The sedimentary sequence recovered at Site U1515 is divided into two lithostratigraphic units with several subunits. Because of the limited recovery (see Operations), the thickness of each unit is not specified. Instead, only the core interval where each unit is present is reported. Unit I is a sequence of light greenish gray calcareous ooze and calcareous chalk with sponge spicules, silicified limestone, chert, and sandstone. The age of sediments/rocks in Unit I range from the Pleistocene to the Upper Cretaceous (Campanian or Santonian). Unit II (age unknown) largely consists of a sequence of gray to black silty sand and sandstones with glauconite and silty sandstone and claystone with variable abundances of organic matter.

Figure F3. Lithostratigraphic summary.
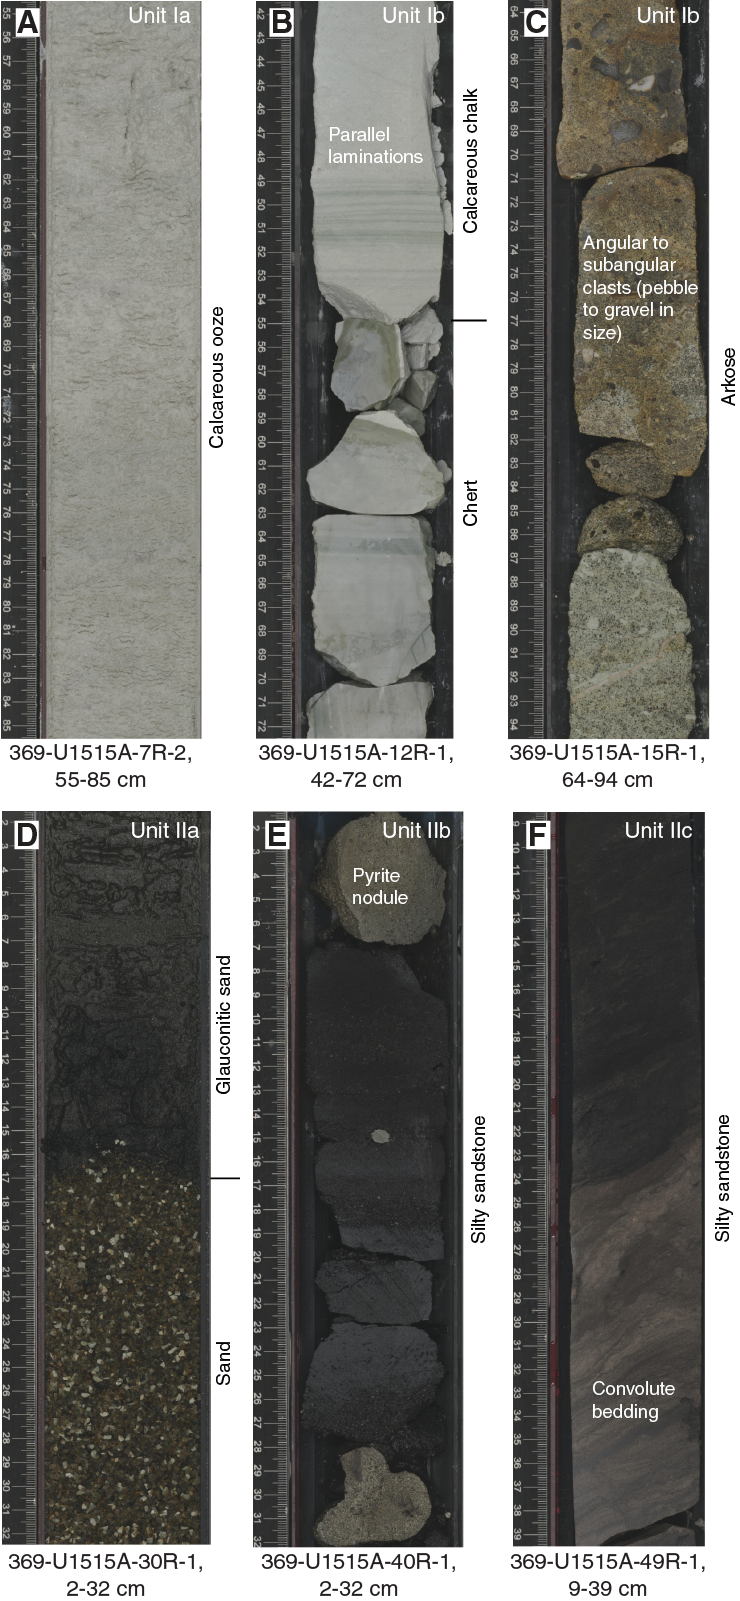
Figure F4. Primary lithologies and sedimentary features.
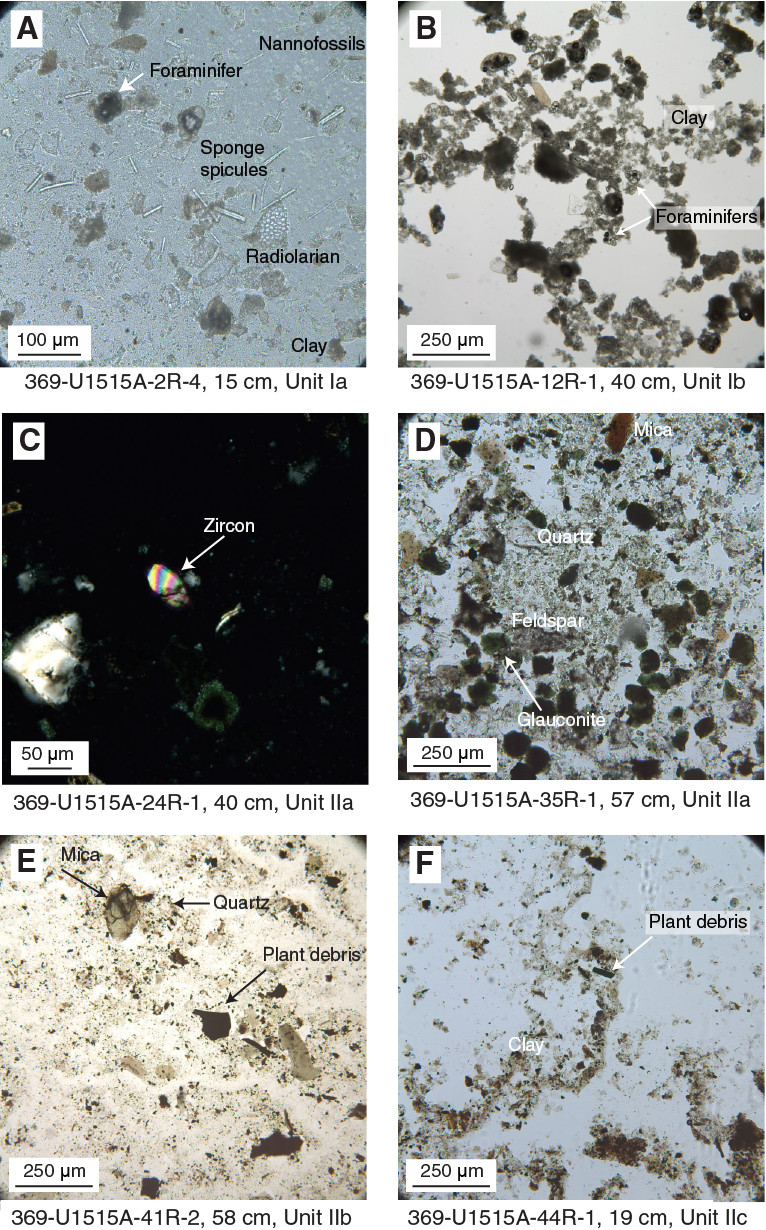
Figure F5. Sediment constituents.
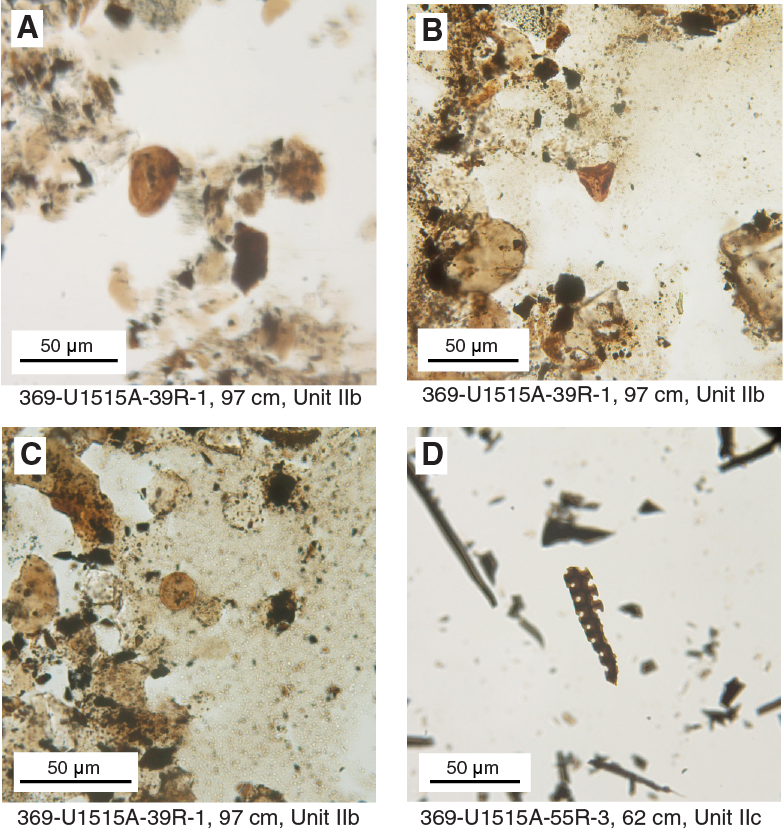
Figure F6. Characteristic plant debris and organic material.

Figure F7. XRD results.
Unit I
- Interval: 369-U1515A-1R-1, 0 cm, to 15R-1, 104 cm
- Depth: 0–128.84 m core depth below seafloor, Method A (CSF-A)
- Age: Pleistocene to upper Campanian or upper Santonian
- Lithology: calcareous ooze with sponge spicules, calcareous ooze, calcareous chalk, calcareous chalk with sponge spicules, silicified limestone, bioclastic limestone, sandy limestone, sandstone, arkose, and chert
- Drilling disturbance type and intensity: various (soupy, flowage, biscuited, fragmented, and brecciated); slight to destroyed
- Nature of top contact: seafloor
- Nature of bottom contact: unknown (core gap)
Lithostratigraphic Unit I consists of light greenish gray calcareous ooze with sponge spicules that grades downward to light greenish gray calcareous chalk with sponge spicules, white calcareous chalk, and light greenish gray chert with some intervals of silicified, bioclastic, and sandy limestone (Figures F3, F4A, F4B; see Site U1515 smear slides in Core descriptions). The base of this unit (interval 369-U1515A-15R-1, 40–104 cm; 128.2–128.84 m CSF-A) is characterized by sandstone (Figures F3, F4C). This unit is generally massive and structureless; however, some intervals in Sections 9R-1 and 9R-2 (75.70–78.17 m CSF-A) and Cores 12R through 15R (104.50–127.83 m CSF-A) exhibit thin parallel lamination. Cores 12R through 15R are brecciated by drilling disturbance.
Unit I is divided into Subunits Ia (calcareous ooze with sponge spicules) and Ib (calcareous chalk, chert, and sandstones) (Figures F3, F4A).
Subunit Ia
- Interval: 369-U1515A-1R-1, 0 cm, to 8R-CC, 9 cm
- Depth: 0–67.83 m CSF-A
- Age: Pleistocene to Pliocene or Miocene
- Lithology: calcareous ooze, and calcareous ooze with sponge spicules
- Drilling disturbance type and intensity: various (soupy, flowage); slight to moderate
- Nature of top contact: seafloor
- Nature of bottom contact: unknown (core gap)
Lithostratigraphic Subunit Ia consists of light greenish gray calcareous ooze and calcareous ooze with sponge spicules (Figure F4A). This unit is massive and structureless.
In smear slides, biogenic grains include common to dominant foraminifers, common to abundant nannofossils, and rare to common sponge spicules (Figure F5A; see Site U1515 smear slides in Core descriptions). Radiolarians and siliciclastics (quartz, clay, glauconite, and opaque minerals) are present in only trace or rare amounts.
XRD analyses confirm that calcite is the main mineral in this unit, a conclusion consistent with a calcium (Ca) content of >36 wt% measured by pXRF (Table T2) and a carbonate content of >80 wt% measured by coulometer (see Geochemistry).
Subunit Ib
- Interval: 369-U1515A-9R-1, 0 cm, to 15R-1, 104 cm
- Depth: 75.70–128.84 m CSF-A
- Age: Pliocene or Miocene to upper Campanian or upper Santonian
- Lithology: calcareous chalk with sponge spicules, calcareous chalk, calcareous chalk with clay, silicified limestone, bioclastic limestone, sandy limestone, sandstone, arkose, and chert
- Drilling disturbance type and intensity: various (soupy, biscuit, fragmented, and brecciated); slight to destroyed
- Nature of top contact: unknown (core gap)
- Nature of bottom contact: unknown (core gap)
Lithostratigraphic Subunit Ib consists of light greenish gray, greenish gray, and white calcareous chalk with sponge spicules, calcareous chalk, calcareous chalk with clay, silicified limestone, bioclastic limestone, sandy limestone, sandstone, arkose, and chert (Figures F4B). This unit is generally massive and structureless; however, some chert and calcareous chalk intervals have distinctive greenish laminations. In Cores 369-U1515A-10R and 12R, these laminations are a few millimeters thick. Bioturbation is absent. Compared with Subunit Ia, Subunit Ib is characterized by a marked increase in the lithification of the recovered material. In smear slides, biogenic grains are largely composed of calcareous foraminifers and nannofossils. Sponge spicules are common only in Core 9R. The basal part of this subunit is characterized by the occurrence of sandstones with angular to subangular clasts in Section 15R-1 (Figures F3, F4C). In thin section, the sandstone in Sample 15R-1, 73–75 cm (128.53 m CSF-A), is classified as arkose with poorly sorted glauconite with rounded grains. Constituents include plagioclase feldspar, lithic grains (siltstone and sandstone), quartz, and foraminifers bound by a calcite cement.
XRD analyses confirm that the mineral assemblage is dominated by calcite in the calcareous chalk and by calcite, opal, and quartz in chert (Figure F7A, F7B). Bulk-rock pXRF analyses (Table T2) confirm that Ca content is high in this subunit (>37 wt%), except for chert samples that have high silicon (Si) content (31–42 wt%).
Unit II
- Interval: 369-U1515A-24R, 0 cm, to 55R-CC, 14 cm (bottom of hole [BOH])
- Depth: 209.90–512.98 m CSF-A
- Age: unknown
- Lithology: silty sand with glauconite, glauconitic silty sand/sandstone, sandstone, silty sandstone, siltstone, silty claystone, quartzitic silty claystone with feldspar, claystone, pebbles, chert, carbonaceous sandstone, silty claystone and claystone, and coal
- Drilling disturbance type and intensity: various (soupy, biscuit, fractured, fragmented, and brecciated); absent to destroyed
- Nature of top contact: unknown (core gap)
- Nature of bottom contact: BOH
Lithostratigraphic Unit II is a sequence of gray, black, and greenish black silty sand with glauconite, glauconitic silty sand/sandstone, sandstone, silty sandstone, siltstone, silty claystone, quartzitic silty claystone with feldspar, pebbles, chert, carbonaceous sandstone, silty claystone and claystone, coal, and claystone with variable abundances of organic matter and quartz (Figures F3, F4D–F4F, F5C–F5F; see Site U1515 smear slides in Core descriptions). Unit II is divided into Subunits IIa (generally glauconitic sand and sandstone), IIb (generally sandstone with siltstone and claystone interbeds), and IIc (generally silty sandstone and claystone with coal and plant debris).
Subunit IIa
- Interval: 369-U1515A-24R, 0 cm, to 36R-CC, 8 cm
- Depth: 209.90–325.18 m CSF-A
- Age: unknown
- Lithology: glauconitic sand, sand, silty sand with glauconite, and glauconitic sandstone
- Drilling disturbance type and intensity: various (soupy, biscuit, fractured, and fragmented); none to severe
- Nature of top contact: unknown (core gap)
- Nature of bottom contact: unknown (core gap)
Lithostratigraphic Subunit IIa consists of black to greenish black glauconitic sand, sand, silty sand with glauconite, and glauconitic sandstone (Figures F3, F4D). Grain size varies from very fine to medium sand. This unit is generally massive and structureless with the exception of Core 369-U1515A-30R, which is moderately bioturbated. Disseminated pyrite grains are present in Cores 32R through 34R.
Smear slide observations show that glauconite and quartz are the dominant lithologic components in Subunit IIa. Other siliciclastic components include trace to common clay and mica (e.g., muscovite or biotite) with trace and rare amounts of feldspar and opaque minerals (Figure F4D, F4E). Pyrite content progressively increases in abundance downhole. Plant debris is also present in rare and trace amounts.
XRD analyses conducted on discrete samples confirm that quartz is the dominant mineral in this unit. Feldspar, mica/illite/glauconite, and kaolinite/chlorite are also present in smaller quantities (Figure F7C). Bulk-rock pXRF analyses (Table T2) reveal higher contents of aluminum (Al; 5.0–9.1 wt%), potassium (K; 1.8–3.9 wt%), titanium (Ti; 0.49–0.63 wt%), and iron (Fe; 6.5–12 wt%) in this subunit compared with Unit I.
Subunit IIb
- Interval: 369-U1515A-37R-1, 0 cm, to 41R-3, 78 cm
- Depth: 334.70–375.87 m CSF-A
- Age: unknown; possibly Early Jurassic (Pliensbachian) or younger
- Lithology: sandstone, silty sandstone, and sandstone with gravel with siltstone, silty claystone, and claystone interbeds
- Drilling disturbance type and intensity: various (fractured and fragmented); none to extensive
- Nature of top contact: unknown (core gap)
- Nature of bottom contact: unknown (core gap)
Lithostratigraphic Subunit IIb consists of alternations of very dark gray sandstone and silty sandstone with black claystone and dark greenish gray silty claystone (Figures F3, F4E). The subunit is generally massive and structureless; however, some intervals are characterized by the presence of rhythmic laminations. Silty sandstone intervals are fine grained and well sorted. In Core 369-U1515A-41R (373.18–375.87 m CSF-A), the silty sandstone intervals exhibit normal grading. Compared with Subunit IIa, Subunit IIb is characterized by an increase in the abundance of pyrite nodules and a decrease in the abundance of glauconitic grains. Nodules of siliciclastic material, cemented with calcite, are sporadically present throughout the subunit.
Smear slide observations confirm that clay minerals are the dominant lithologic components in claystone and silty claystone intervals. Quartz is the dominant component in the sandstone intervals. Other siliciclastic grains include rare to common feldspar and mica. Common to abundant opaque minerals, including common pyrite, are present throughout the unit. Plant debris is also more abundant (common) in this interval in comparison with Subunit IIa (Figure F5E; see Site U1515 smear slides in Core descriptions). In smear slide Sample 369-U1515A-39R-1, 97 cm (354.87 m CSF-A), spores from the genera Contignisporites and Gleicheniidites are present. Although not zonal markers in their own right, these genera are age diagnostic in Mesozoic strata in Australia, with first occurrences in the Early Jurassic (Pliensbachian; Helby et al., 1987). An algal cell from the genus Leiosphaeridia is also present in the same sample (Figure F6A–F6C).
XRD analyses confirm that the mineral assemblage is dominated by quartz, feldspar, and kaolinite. Mica/illite/glauconite and heulandite/clinoptitlolite are also present in smaller quantities (Figure F7D). Bulk-rock pXRF analyses (Table T2) indicate that Sample 369-U1515A-38R-1, 44–45 cm (344.74 m CSF-A), in this subunit contains 5.1 wt% sulfur (S), which is the maximum content of S in this hole.
Cores 369-U1515A-42R through 44R contain fragments/pebbles of chert and granite, which are uncommon among the terrigenous material in this subunit (Figure F3). Recovery was low in this interval (i.e., Cores 369-U1515A-42R through 44R) and the recovered pebbles are likely fall-in from cores above; because they are not considered in situ, they are not described in the designated units.
Subunit IIc
- Interval: 369-U1515A-44R-1, 0 cm, to 55R-CC, 14 cm
- Depth: 402.00–512.98 m CSF-A
- Age: unknown
- Lithology: silty sandstone and claystone with plant debris
- Drilling disturbance type and intensity: various (biscuit, fractured, fragmented, and brecciated); none to extensive
- Nature of top contact: unknown (core gap)
- Nature of bottom contact: BOH
Lithostratigraphic Subunit IIc consists of alternations of gray to very dark gray silty sandstone and very dark gray to black claystone with plant debris (possibly coalified) in several intervals (Figures F3, F4F). The top of the subunit corresponds to a decrease in porosity (see Petrophysics). Subunit IIc exhibits a range of sedimentary structures including wavy strata, parallel lamination, rhythmic lamination, convoluted bedding, and mottling. From Core 369-U1515A-44R (~400 m CSF-A) downhole, bedding is inclined, which may reflect the regional dip of this sedimentary sequence.
Bioturbation throughout the subunit is generally low to moderate. Wood fragments, leaf fragments, possible root remnants, and undifferentiated plant debris are present throughout the subunit (Figure F6D). Two coal beds are present in this subunit (45R-1, 0–4 cm; 47R-1, 38–41 cm). Compared with Subunit IIb, Subunit IIc is characterized by an increase in the abundance of plant debris and a decrease in the abundance of pyrite.
Smear slide observations confirm that plant debris is a dominant constituent in the claystone intervals. Quartz is dominant in siltstone and sandstone intervals. Other siliciclastic grains include rare to abundant feldspar and trace to rare mica. Trace to abundant opaque minerals are present throughout the unit.
Whole-rock XRD analyses confirm that the mineral assemblage is dominated by quartz, feldspar, and kaolinite (Figure F7E). Mica/illite/glauconite is also present in smaller quantities (Figure F7D). Bulk-rock pXRF analyses (Table T2) reveal that a Sample 369-U1515A-46R-2, 85–86 cm (423.44 m CSF-A), contains 1900 ppm manganese and 25 wt% Fe.
Biostratigraphy and micropaleontology
Where available, core catcher samples from Cores 369-U1515A-1R through 48R were analyzed for calcareous nannofossils, planktonic foraminifers, and benthic foraminifers (Tables T3, T4, T5). There was no recovery in Cores 16R through 20R, and Cores 49R through 55R were not analyzed based on the absence of calcareous microfossils from Core 20R downhole. The presence of planktonic and benthic foraminifers and calcareous nannofossils and observations of other distinctive and potentially age-diagnostic or environmentally diagnostic microfossil groups such as calcispheres, ostracods, radiolarians, fish and plant debris, sponge spicules, and inoceramid prisms are documented in Table T6.
Calcareous nannofossils
Calcareous nannofossils occur in the upper part of Hole U1515A (Cores 369-U1515A-1R through 15R), whereas the lower part (Cores 20R through 48R) is barren. Calcareous nannofossils were recovered and examined in 13 samples from Hole U1515A (Table T3).
Samples 369-U1515A-1R-CC, 13–18 cm, and 2R-CC, 13–18 cm, contain abundant, well-preserved calcareous nannofossil assemblages composed mainly of the Gephyrocapsa genus. The abundance of Gephyrocapsa ericsonii and Gephyrocapsa oceanica and the absence of Emiliania huxleyi and Pseudoemiliania lacunosa in this interval suggest upper Pleistocene Subzone CN14b. Ascidian spicules and both calcareous and siliceous sponge spicules are common.
Sediment was not recovered in Core 369-U1515A-3R. The calcareous nannofossil assemblage in Sample 4R-CC, 8–13 cm, is dominated by small Gephyrocapsa species. The few occurrences of Discoaster brouweri suggest lower Pleistocene Subzone CN12d; however, they could be reworked. This sediment is dominated by abundant carbonate debris, including anhedral fragments and subhedral carbonate crystals. Ascidian spicules are a common component.
Cores 369-U1515A-5R through 9R contain mixed calcareous nannofossil assemblages with few, poorly preserved specimens diluted with abundant ascidian spicules and carbonate particles. In Sample 5R-CC, 0–5 cm, the presence of common Reticulofenestra perplexa, a cold-water Miocene form, and warm-water Pliocene forms such as D. brouweri and Discoaster tamalis indicate mixing of taxa of different ages and different paleoecological tolerances. Because of this mixing, we gave the youngest possible assignment of upper Pliocene Subzone CN12a, and we consider the Miocene material to be reworked. Sample 6R-CC, 0–5 cm, contains the Southern Ocean species R. perplexa, which is common, mixed with warm-water Discoaster neohamatus, suggesting late Miocene Zones CN7–CN8, although this age is based solely on the range of D. neohamatus, which could be reworked. Samples from the core catchers of Cores 7R through 9R similarly contain warm-water discoasters and Sphenolithus abies with common to abundant R. perplexa. The co-occurrence of the few species observed in these assemblages (Table T3) suggests a middle to upper Miocene placement.
Sample 369-U1515A-10R-CC, 0–5 cm, contains a common, moderately preserved calcareous nannofossil assemblage that includes Cyclicargolithus floridanus, Dictyococcites bisectus, Helicosphaera euphratis, and Sphenolithus akropodus without Reticulofenestra umbilica or Sphenolithus distentus. This association indicates lower Oligocene Zone CP17.
Sample 369-U1515A-11R-CC, 7–12 cm, contains an upper Eocene assemblage from Subzone CP15b with common and moderately well preserved Isthmolithus recurvus, Ericsonia formosa, Reticulofenestra stavensis, and R. umbilica and rare Discoaster saipanensis. The presence of Cribrocentrum reticulatum and Chiasmolithus grandis without I. recurvus or Chiasmolithus solitus in Samples 13R-CC, 13–18 cm, and 14R-CC, 4–9 cm, indicates upper Eocene Subzone CP14b for this interval. The assemblage is dominated by C. floridanus, Zygrhablithus bijugatus, and R. umbilica.
Sample 369-U1515A-15R-CC, 0–7 cm, is composed of a common, moderately preserved assemblage that includes Eiffellithus eximius, Broinsonia parca constricta, Broinsonia parca parca, and Reinhardtites levis. Co-occurrence of E. eximius and R. levis suggests upper Campanian Zone CC22 (Hardenbol, et al., 1998). The presence of Biscutum coronum and the absence of Uniplanarius spp. from this sample indicate the austral affinities of the assemblage.
Planktonic foraminifers
Core catcher samples from Hole U1515A were analyzed for planktonic foraminiferal biostratigraphy; planktonic foraminiferal occurrences are presented in Table T4. Several thousand particles (multiple picking trays) were scanned for each sample. Planktonic foraminiferal assemblages span the Pleistocene through Upper Cretaceous. Assemblages are diverse in part because they typically contain material of different ages, making precise age determination difficult at this site. Preservation below the Pleistocene is typically moderate to poor, and planktonic foraminifers vary from abundant in the Neogene to rare or few in the Eocene and Upper Cretaceous. Samples 369-U1515A-12R-CC and 13R-CC are cherts and therefore were not investigated for foraminifers. Cores 3R, 16R through 19R, and 25R had no recovery. Samples 20R-CC to 24R-CC and 26R-CC to 48R-CC were barren of planktonic foraminifers. No samples were taken for paleontological analysis from Core 49R to the bottom of the hole.
Sample 369-U1515A-1R-CC is assigned to upper Pleistocene Subzone Pt1b based on the presence of Truncorotalia truncatulinoides and the absence of Truncorotalia tosaensis. The overlapping presence of T. truncatulinoides and T. tosaensis in Sample 2R-CC indicates lower Pleistocene Subzone Pt1a. Samples 4R-CC to 6R-CC are assigned to Pliocene Zones PL3–PL4 based on the presence of Sphaeroidinellopsis seminulina and Globorotalia plesiotumida. A large amount of late Miocene (Zone M14) material is reworked into these samples. Samples 7H-CC and 8R-CC contain a mix of late Miocene and early Pliocene material, but based on the overlapping occurrences of Globoconella sphericomiozea, Sphaeroidinellopsis kochi, G. plesiotumida, and Globoturborotalita nepenthes, these samples are assigned to Zones M13–PL1. Sample 9R-CC contains much reworked Miocene material but is most likely late Miocene (tentatively Zones M11–M12?) in age based on the presence of species such as Globigerina decoraperta, Pulleniatina primalis, and Paragloborotalia mayeri. Sample 10R-CC contains Globigerinoides primordius, Globigerina angustiumbilicata, and Globigerina ciperoensis, indicating a late Oligocene through early Miocene age (likely Zones O6–M1), although very rare younger components are also present (e.g., Globorotalia scitula). Sample 11R-CC contains very few specimens, but the overlapping ranges of Dentoglobigerina tripartita and Globigerinatheka index likely indicate upper Eocene Zones E14–E15. A single very poorly preserved Morozovelloides specimen is also present but is considered reworked. The presence of Subbotina angiporoides, G. index, Dentoglobigerina galavisi, and Subbotina senni in Sample 14R-CC indicates Zone E13. Sample 15R-CC is assigned to the long, upper Campanian through upper Santonian Globigerinelloides impensus Zone as defined at the Kerguelen Plateau (Petrizzo, 2001). This zone is defined on the presence of the nominate taxon and supported by the apparent absence of marginotruncanids.
Benthic foraminifers
Core catcher samples were analyzed for benthic foraminifers, which are present in most samples (Table T5). Abundant benthic foraminifers are recorded in four samples. Samples 369-U1515A-4R-CC, 11R-CC, and 15R-CC contain rare benthic foraminifers, and Samples 20R-CC to 24R-CC and 26R-CC to 48R-CC are barren.
In Sample 369-U1515A-1R-CC, miliolid foraminifers and Elphidium sp. together with Brizalina sp. and Cibicidoides spp. are recorded, indicating an outer neritic to upper bathyal paleowater depth. Samples 4R-CC, 8R-CC to 10R-CC, and 15R-CC are dominated by Cibicidoides spp. associated with nodosariids and few deep-water benthic foraminiferal taxa such as Osangularia sp. and Nuttallides sp. The occurrence of Tappanina sp. in Sample 9R-CC could indicate reworking; its highest occurrence is known from the Eocene. Sample 11R-CC features the occurrence of Eouvigerina sp. and Lenticulinella sp. The benthic foraminiferal record suggests a bathyal water depth for Samples 4R-CC to 15R-CC (van Morkhoven et al., 1986; Tjalsma and Lohmann, 1983).
Paleomagnetism
We measured the natural remanent magnetization (NRM) of most Hole U1515A archive-half sections (Cores 369-U1515A-1R through 55R) and 19 discrete samples collected from the working-half sections. The archive-half sections of Cores 13R and 47R were not measured because they contain only pebble-sized rock fragments or very short segments of rock that were likely rotated during coring, sectioning, or splitting. The archive-half sections were subjected to 5, 10, 15, and 20 mT alternating field (AF) demagnetization and measured with the pass-through superconducting rock magnetometer (SRM) at 5 cm intervals. Discrete samples were demagnetized at 5, 10, 15, 20, 30, 40, and 60 mT peak fields using the in-line automated degausser and measured with the SRM to isolate the characteristic remanent magnetization (ChRM) and to verify the reliability of the split-core measurements.
Natural remanent magnetization of sedimentary cores
Downhole variations in paleomagnetic results obtained in Hole U1515A are detailed in Figure F8. Recovery with the RCB system was generally low, with 18% overall recovery (see Operations). Sediment consists of two major lithostratigraphic units (see Lithostratigraphy). Lithostratigraphic Unit I (0–128.8 m CSF-A) is composed of mainly calcareous ooze, chalk, and limestone. Unit II (209.9 m CSF-A to BOH) is composed of claystone, silty sandstone, and sand.
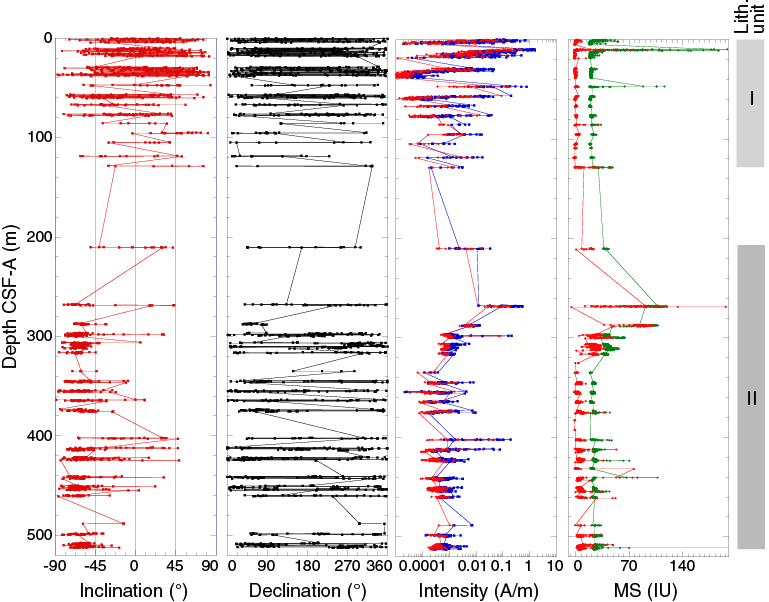
Figure F8. Paleomagnetic data.
The NRM of the majority of the Unit I cores shows upward- and downward-pointing moderate to low inclinations. Inclinations of most Unit I sedimentary cores show little change after AF demagnetization treatment, except for Core 369-U1515A-4R, which exhibits a shift toward negative values (Figure F8). The NRM of the majority of the Unit II sedimentary cores displays generally upward-pointing moderate to steep inclinations. Overall, the inclinations of the Unit II cores shift toward more negative values after AF demagnetization. NRM intensity of the Unit I sedimentary cores varies from 1.98 × 10⁻⁵ to 1.57 A/m, with a mean of 5.33 × 10⁻² A/m, and decreases downcore; intensity in the uppermost two cores (uppermost ~20 m) is >0.1 A/m. In the Unit II cores, NRM intensity ranges from 2.133 × 10⁻⁵ to 0.535 A/m with a mean of 9.85 × 10⁻³ A/m. NRM intensity in Unit II is mostly ~0.01 A/m, except for several short intervals at ~270, ~298, ~402, and ~412 m CSF-A that correspond to Cores 369-U1515A-30R, 33R, 44R, and 45R, respectively. These cores display significantly elevated intensity values.
The whole-round low-field magnetic susceptibility of the sedimentary cores from Hole U1515A (Figure F8; see Petrophysics) varies from ~3 to ~160 instrument units (IU). The downcore magnetic susceptibility variations generally reflect lithologic changes. Negative magnetic susceptibility mainly occurs in the uppermost ~80 m of lithostratigraphic Unit I, which is mainly composed of calcareous oozes, chalk, and limestone. Negative magnetic susceptibility sporadically occurs between ~330 and 430 m CSF-A in Unit II. The highest magnetic susceptibility occurs in the uppermost sections of Cores 369-U1515A-1R, 2R, and 6R and in Core 15R (~0–2, 9.6–11.0, 47–47.2, and 128.2–128.7 m CSF-A, respectively). Magnetic susceptibility in these intervals is mostly >40 IU.
Paleomagnetic demagnetization results
Available archive-half sections were subjected to stepwise AF demagnetization up to 20 mT, and the demagnetization results were visually inspected using the Laboratory Information Management System Information Viewer (LIVE) and the PuffinPlot (Lurcock and Wilson, 2012) and ZPlotit (http://paleomag.ucdavis.edu/software-Zplotit.html) software packages. In addition, 19 discrete samples were demagnetized stepwise up to 60 mT; principal component analysis (PCA; Kirschvink, 1980) was performed for these samples. Demagnetization data show that the drilling-induced magnetic overprint (e.g., Richter et al., 2007) can generally be removed by AF demagnetization at 5 or 10 mT, as indicated by a large drop in magnetic intensity (Figures F8, F9, F10) and significant changes in the demagnetization trajectories (Figures F9, F10). AF demagnetization up to 20 mT mostly resulted in a decrease in magnetic intensity by 73%. In many cases, ChRMs can be defined from the paleomagnetic data acquired from the pass-through measurements. ChRMs can be determined by PCA (Kirschvink, 1980) using either three or two demagnetization steps that display a vector trajectory decaying toward the origin. In some samples, magnetic intensity either gradually increases or rapidly decreases and/or shows erratic directions upon demagnetization. In these cases, ChRMs cannot be isolated.
NRM intensity in discrete samples is mostly 10−2 to 10−4 A/m. With one exception (Sample 369-U1515A-32R-2, 36–38 cm), these samples show unstable trajectories upon stepwise AF demagnetization (Figure F10), and ChRMs could not be resolved.
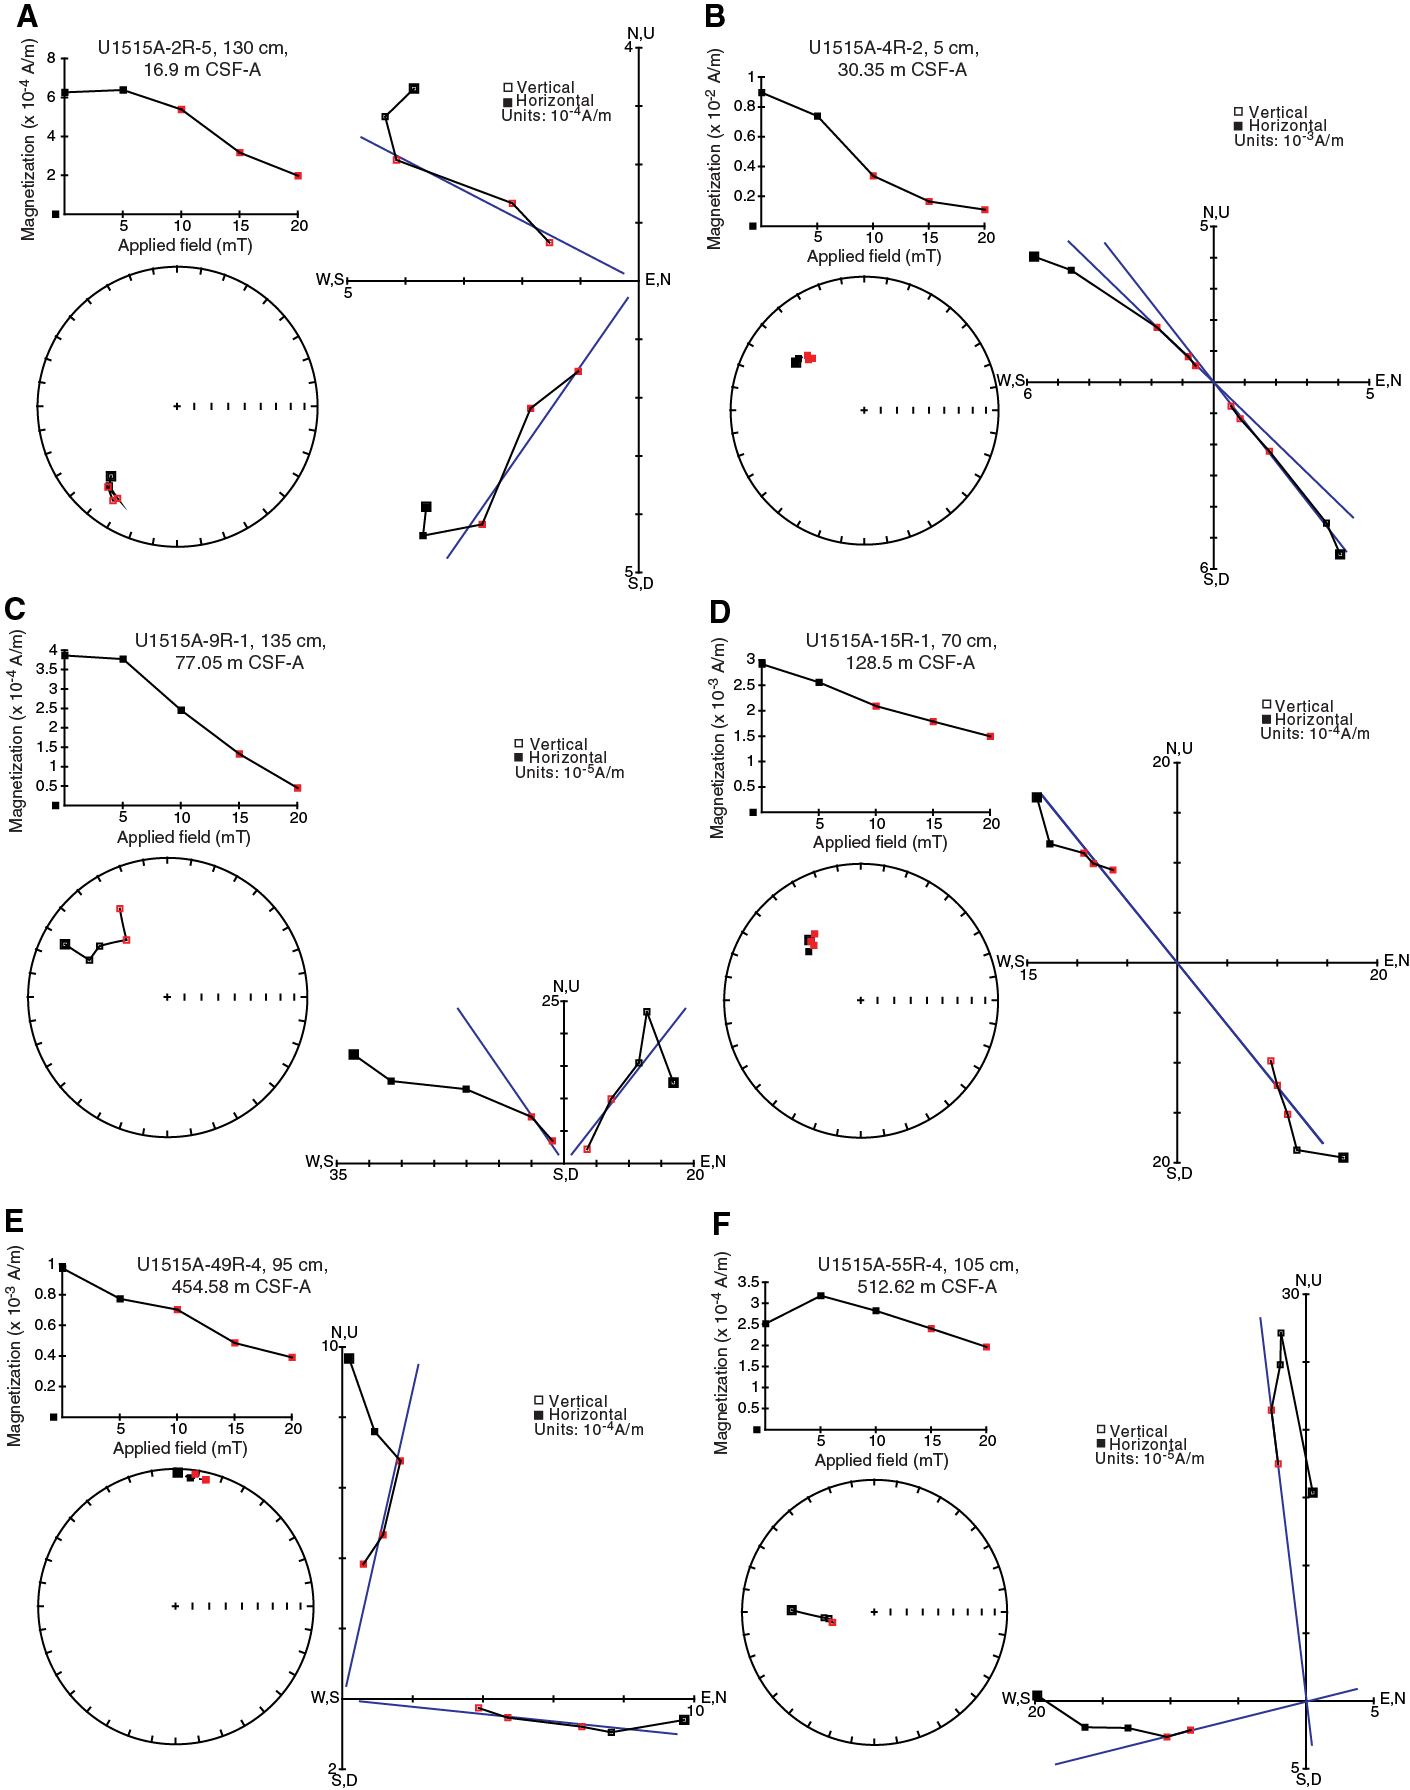
Figure F9. Vector endpoint diagrams for section halves.
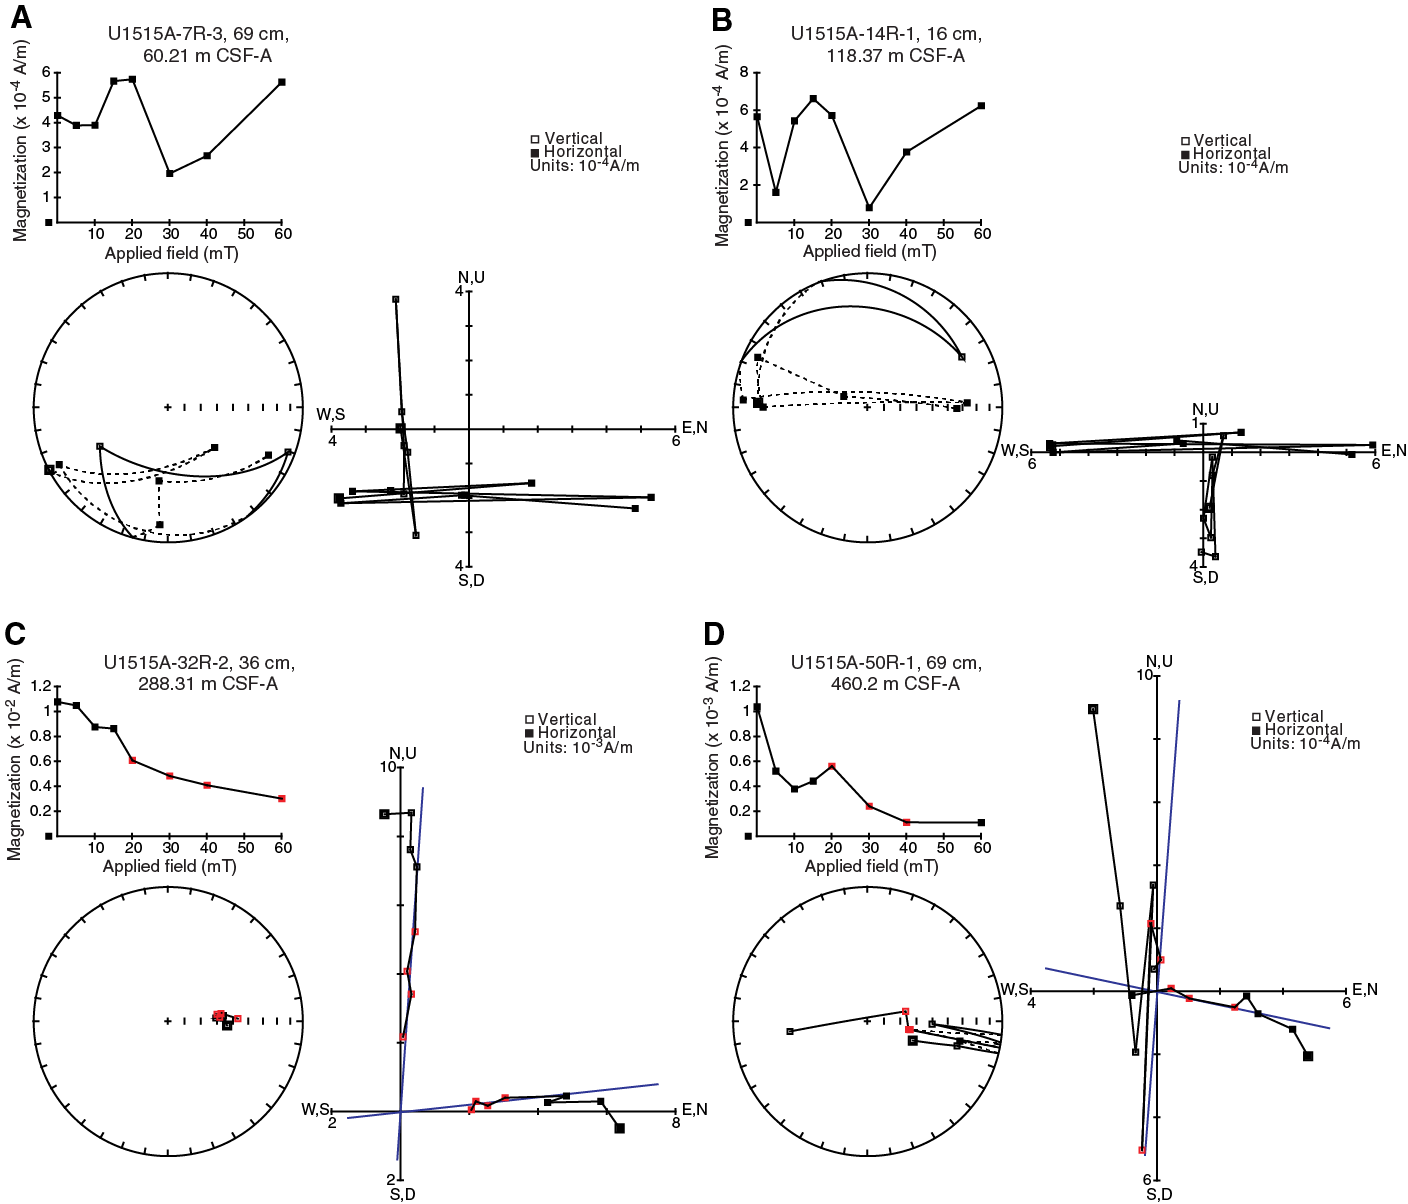
Figure F10. Vector endpoint diagrams for representative discrete samples.
Magnetostratigraphy and magnetic polarity
The interpretation of magnetic polarity in the horizontally unoriented RCB cores is based on the inclination record from the archive-half measurements after 20 mT AF demagnetization. The predominantly normal polarity chron between 0 and 13.4 m CSF-A correlates with Chron C1n (Brunhes Chron) and is constrained by the occurrence of T. truncatulinoides and the absence of T. tosaensis, indicating upper Pleistocene foraminifer Subzone Pt1b (see Biostratigraphy and micropaleontology). The reversed polarity interval between 13.4 and 15.3 m CSF-A correlates to Subchron C1r.1r followed by Subchrons C1r.1n (15.3–17.0 m CSF-A) and C1r.2r. These assignments are biostratigraphically constrained by the overlapping presence of T. truncatulinoides and T. tosaensis in the core catcher sample from Core 369-U1515A-2R, an observation indicative of lower Pleistocene Subzone Pt1a (Figure F11). Although the magnetic record is noisy and the core recovery is poor, intervals of predominantly normal and reversed polarity can be discerned in the remainder of the sections deeper than 20 m CSF-A (Figure F11). Correlation to the geomagnetic polarity timescale is not possible because of the poor core recovery and lack of biostratigraphic control.
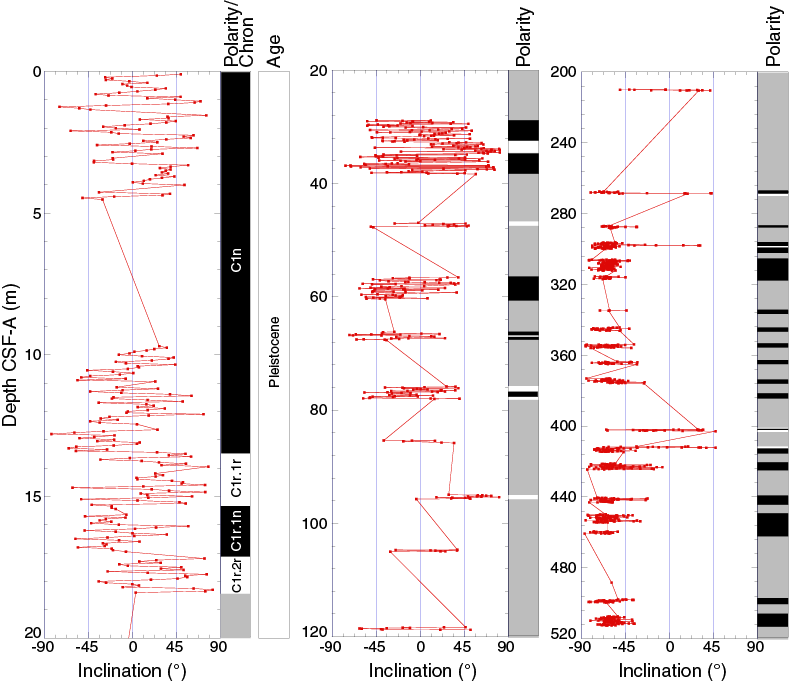
Figure F11. Magnetostratigraphic results.
Petrophysics
Physical properties
Physical properties data were collected from Hole U1515A. Core recovery was poor overall, particularly from ~130 to 270 m CSF-A, where almost no core was recovered (see Operations). Physical property data from this site are therefore sparse and discontinuous. Issues with borehole stability prevented downhole logging measurements from being collected at this site; therefore, no physical property data are available from intervals of no or low core recovery.
Natural gamma radiation
Natural gamma radiation (NGR) ranges from below the detection limit to 180 counts/s in Hole U1515A (Figure F8). From the top of the hole to 128 m CSF-A, NGR remains below 25 counts/s and decreases downhole to ~120 m CSF-A. This decrease is reflected in the deconvolved U content (De Vleeschouwer et al., 2017) but not the K and Th contents, which remain stable over this interval (Figure F9). The U/Th ratio is particularly high in the uppermost 18 m compared with other sections in the hole, likely because of higher U content (~2 ppm) with respect to relatively stable Th.
A major change in NGR occurs at 128 m CSF-A, increasing from below detection limit to 180 counts/s, the highest value recorded in this hole (Figure F12). This maximum value occurs at the top of the nonrecovery intervals (from ~129 to ~215 and ~215 to 268 m CSF-A).
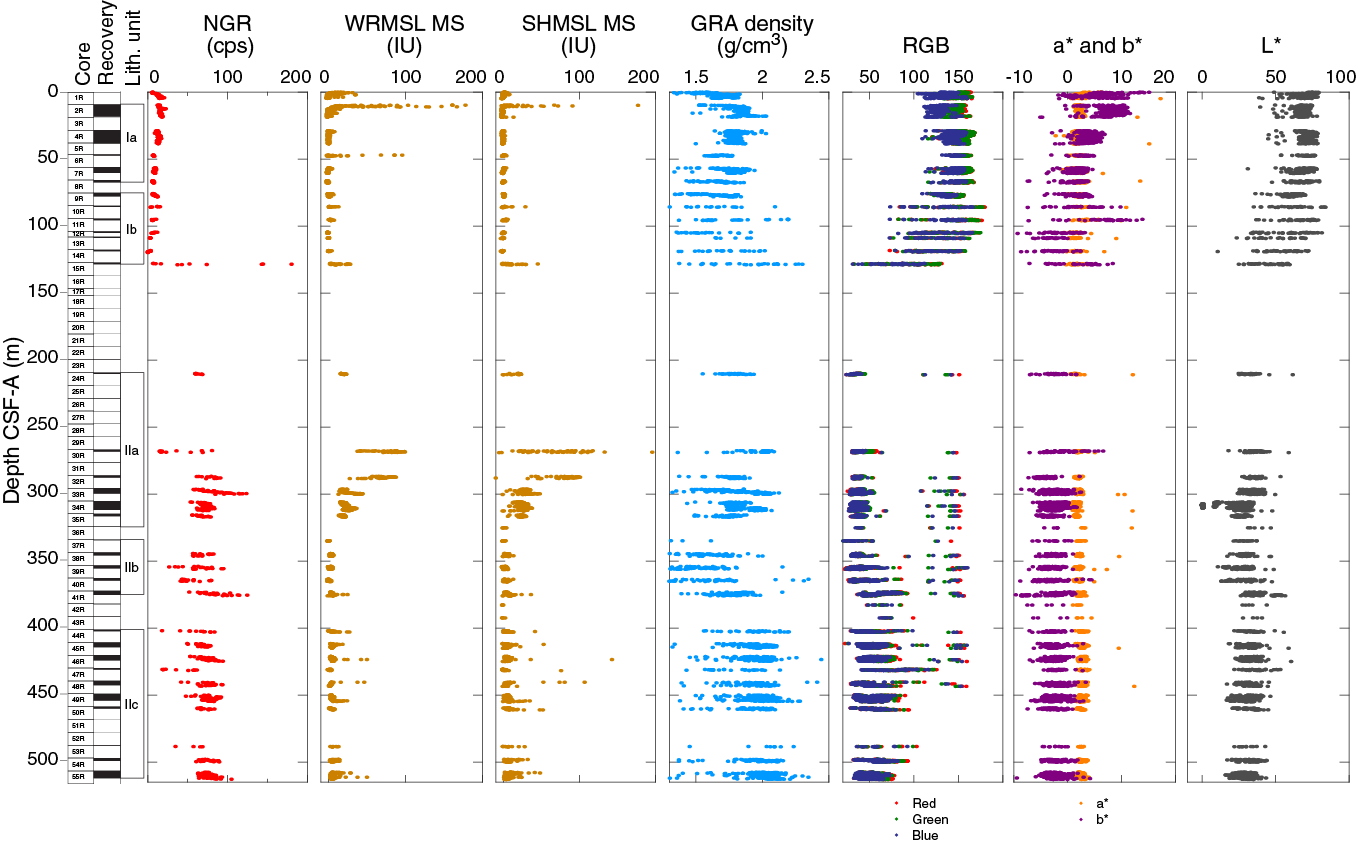
Figure F12. Physical properties.
Core recovery improved slightly from 268 m CSF-A to the base of the hole at 513 m CSF-A. Values of NGR over this interval are relatively stable at around 70 counts/s. The deconvolved U, Th, and K contents are broadly similar over this interval. However, from 344 to 373 m CSF-A, K content decreases and Th content increases (Figure F13), resulting in a significant increase in Th/K ratio over a ~40 m interval and corresponding to a transition in lithology across the unconformity at 364–373 m CSF-A (see Lithostratigraphy).

Figure F13. NGR data.
Magnetic susceptibility
Magnetic susceptibility was measured on all whole-round sections with the Whole-Round Multisensor Logger (WRMSL), and magnetic susceptibility point measurements were made on the archive-half sections with the Section Half Multisensor Logger (SHMSL). The magnetic susceptibility data from the WRMSL and SHMSL are comparable (Figure F11), although the sporadic measurements associated with poor core recovery make it difficult to see any apparent trends in the recorded data. WRMSL magnetic susceptibility values range from −3 to 178 IU. The uppermost ~130 m of the hole is generally characterized by magnetic susceptibility less than 30 IU, similar to that obtained in deeper sections of the hole, where magnetic susceptibility generally decreases from 270 to 342 m CSF-A and stabilizes at around 0 IU from ~330 to 513 m CSF-A. The only notable differences in magnetic susceptibility are seemingly sporadic high values (>50 IU) interspersed throughout the hole (e.g., at ~48 m CSF-A) and zones of higher magnetic susceptibility in the recovered sections from the middle of the core (e.g., at ~215 and ~270–320 m CSF-A). These zones generally correspond to glauconitic sandstone units (see Lithostratigraphy).
Gamma ray attenuation bulk density
Gamma ray attenuation (GRA) density was measured with the WRMSL. The data show significant variations in density in the same core sections, particularly for data collected deeper than 60 m CSF-A (Figures F12, F14). This variance may partly reflect a lithologic change from calcareous ooze to calcareous chalk and limestone (see Lithostratigraphy); however, it could equally be attributed to sparse recovery and lower apparent values associated with measuring GRA density on indurated sediments and sedimentary rocks. The WRMSL is calibrated for measuring advanced piston corer cores with sediment filling the core liner, not rock samples collected using the RCB system, which do not typically fill the core liner, thus resulting in lower apparent density. Excluding sparse outliers, the highest values in a given core section are deemed to be the most reliable. GRA density increases from ~1.5 to 1.8 g/cm3 between the seafloor and 20 m CSF-A but then decreases downhole from ~20 to ~120 m CSF-A. Few data were collected between ~130 and 270 m CSF-A. Density generally decreases from ~1.8 to 1.5 g/cm3 between ~270 and 375 m CSF-A. This trend is reversed and GRA density increases below ~375 m CSF-A and stabilizes at a density of 1.8–1.9 g/cm3 to the base of the hole (Figures F12, F14).
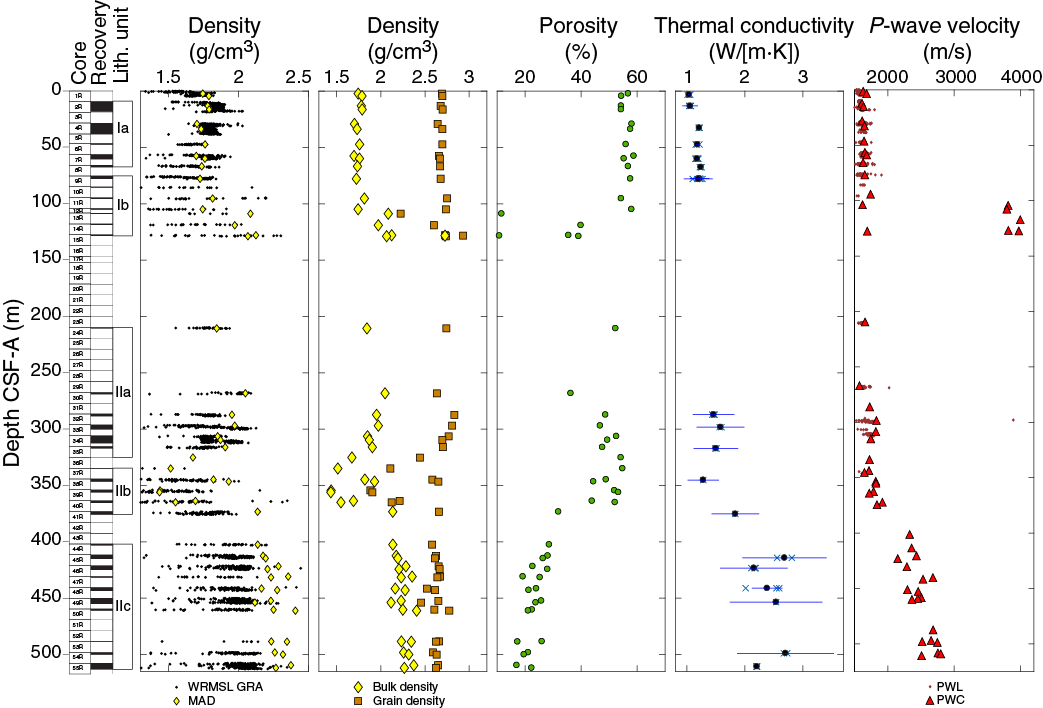
Figure F14. Density, porosity, thermal conductivity, and P-wave velocity.
Slightly higher density at ~270 m CSF-A corresponds to intervals of glauconitic sandstone, and slightly lower density occurs at ~290–315 m CSF-A, where sandstone and silty sandstone were recovered. The lower density between 340 and 380 m CSF-A corresponds to siltstone and claystone beds (Figures F12, F14; see Lithostratigraphy). However, the overall increase in density between Cores 369-U1515A-40R and 41R corresponds to the 364–373 m CSF-A unconformity surface and the transition from sandstone interbedded with siltstone and claystone (lithostratigraphic Subunit IIb) to silty sandstone and claystone with coal and plant debris (Subunit IIc) (see Lithostratigraphy).
Color reflectance
High-resolution (2.5 cm) reflectance spectroscopy and colorimetry (RSC) and RGB data such as reflectance (L*), red versus green (a*), and blue versus yellow (b*) from archive-half sections measured on the SHMSL display significant amounts of instrumental noise. RSC data are sparse and discontinuous between ~130 and 270 m CSF-A and RGB data are widely scattered across the hole; however, some general trends exist in RSC data. Between the seafloor and 68 m CSF-A, L* is relatively constant, and a* and b* decrease with depth (Figure F12). This interval corresponds to lithostratigraphic Subunit Ia, characterized by calcareous ooze with sponge spicules (see Lithostratigraphy). Below this interval, L*, a*, and b* are scattered; however, overall these parameters decrease downhole to ~130 m CSF-A, corresponding to lithostratigraphic Subunit Ib, which is characterized by calcareous chalk and cherts (see Lithostratigraphy). Core 369-U1515A-24R is the only core recovered from ~130 to ~270 m CSF-A, and its average RSC values are 33 (L*), 1.8 (a*), and −2.3 (b*). From ~270 m CSF-A to the bottom of the hole (513 m CSF-A), RSC values are relatively stable and constant.
Bulk density, grain density, and porosity
Bulk density, grain density, and porosity of cored material were measured on discrete samples, using moisture and density (MAD) measurements. Typically, one to two samples per core were taken for these measurements, depending on recovery. Care was taken to ensure that the samples were representative of the overall lithology. In general, MAD measurements can be divided into two zones: those collected between the seafloor and ~120 m CSF-A and those collected from ~270 m CSF-A to the base of the hole (Figure F14). Bulk density in the upper section increases with depth from ~1.40 to 2.15 g/cm3, with one outlying value of 2.75 g/cm3. Bulk density in the lower section decreases from 2.05 g/cm3 to a minimum of 1.40 g/cm3 between 270 and 355 m CSF-A and then increases from 1.40 to 2.40 g/cm3 from 355 m CSF-A to the base of the hole (Figure F14). Similar trends were observed in grain density, with minimum values around 355 m CSF-A. Porosity follows an inverse pattern to that of bulk density, with values of ~60% at the top of the hole decreasing to ~35%–40% at ~120 m CSF-A. In the lower section of the hole, porosity decreases from 50% to 20% below ~355 m CSF-A between lithostratigraphic Subunits IIb and IIc (Figure F14).
Thermal conductivity
The lowest thermal conductivity values of ~1.0–1.1 W/(m·K) occur in the uppermost 20 m of the hole and generally increase with depth (Figure F14). Between 32 and 78 m CSF-A, thermal conductivity increases from 1.15 to 1.25 W/(m·K). These values correspond to calcareous ooze in lithostratigraphic Subunit Ia (see Lithostratigraphy).
In the lower section of the hole, thermal conductivity continues to increase with depth, ranging from 1.3 to 1.6 W/(m·K) between ~280 and ~370 m CSF-A and increasing to 2.1–2.8 W/(m·K) deeper than ~410 m CSF-A. We cannot determine if this increase in thermal conductivity with depth is gradual or sharp because of poor core recovery through the transition interval. However, the deepest interval with highest thermal conductivity corresponds to silty sandstone and sandstone with organic matter in lithostratigraphic Subunit IIc recovered below the angular unconformity seen in the seismic profile (>364–373 m CSF-A) (Figure F2; see Lithostratigraphy).
P-wave velocity
P-wave velocity was measured on whole-round cores using the WRMSL P-wave logger (PWL) and on working-half sections and discrete samples using the Section Half Measurement Gantry P-wave caliper (PWC). Reported velocity is based on automatically picked first arrival times. One or two measurements per core were taken with the PWC, typically near the location where MAD samples were collected. Whole-round P-wave velocity was measured on all cores downhole to ~350 m CSF-A (Figure F14). However, the most reliable velocity values obtained using the WRMSL were those collected shallower than ~105 m CSF-A (Core 369-U1515A-12R) because the core liners were filled with material, ensuring good contact between the source, core, and receiver. Where both PWL and PWC measurements were taken, PWC velocity lies near the maximum PWL velocity, excluding sparse outliers.
P-wave velocity values can be separated into two intervals based on the downhole velocity gradient (Figure F14). The upper interval corresponds to soft or weakly indurated calcareous ooze, calcareous chalk, limestone, and arkose sandstone shallower than 355 m CSF-A. The upper interval has a relatively uniform velocity gradient of 0.6 m/s/m, with velocity ranging from ~1650 m/s at the seafloor to 1850 m/s at the bottom of this interval. P-wave velocity within the chert interval from 105 to 130 m CSF-A is ~3800 m/s. The second, lower interval corresponds with more strongly indurated siltstone and sandstone and extends from 355 m CSF-A to the bottom of the Hole at 525 m CSF-A. P-wave velocity in this interval increases downhole from 1850 to 2750 m/s, with a downhole velocity gradient of 5.4 m/s/m. Additionally, a distinct increase in P-wave velocity is noted between lithostratigraphic Subunits IIb and IIc.
Geochemistry
The geochemistry program at Site U1515 was designed to characterize the composition of interstitial water and solid sediments and to assess potential presence of volatile hydrocarbons. Samples discussed here are from Hole U1515A (0–512.98 m CSF-A), the only hole at this site.
Headspace hydrocarbon gases
A total of 38 headspace gas samples were taken for routine safety monitoring downhole to 508.7 m CSF-A (Table T7). Effectively, no gas was detected.
Interstitial water analyses
For analysis of water chemistry, 17 interstitial water samples were taken from whole-round squeezing of sediment intervals in Hole U1515A (Table T8; Figure F15). The small squeezing device was used to recover interstitial water from highly consolidated samples from deeper than 411 m CSF-A (Cores 369-U1515A-45R, 46R, and 48R). Ion chromatography was used to measure chloride (Cl−), sodium (Na), bromide (Br−), and SO42−, and inductively coupled plasma–optical emission spectrometry (ICP-OES) was used to analyze barium (Ba), boron (B), lithium (Li), manganese (Mn), silicon (Si), iron (Fe), calcium (Ca), phosphorus (P), potassium (K), magnesium (Mg), sulfur (S), and strontium (Sr). All ICP-OES measurements were converted to molar concentrations, and we assumed all sulfur was present as sulfate (SO42−). ICP-OES and ion chromatography SO42− data are essentially identical, supporting the assumption that SO42− is by far the dominant sulfur species in interstitial water at this site despite the smell of H2S in Cores 2R and 4R.
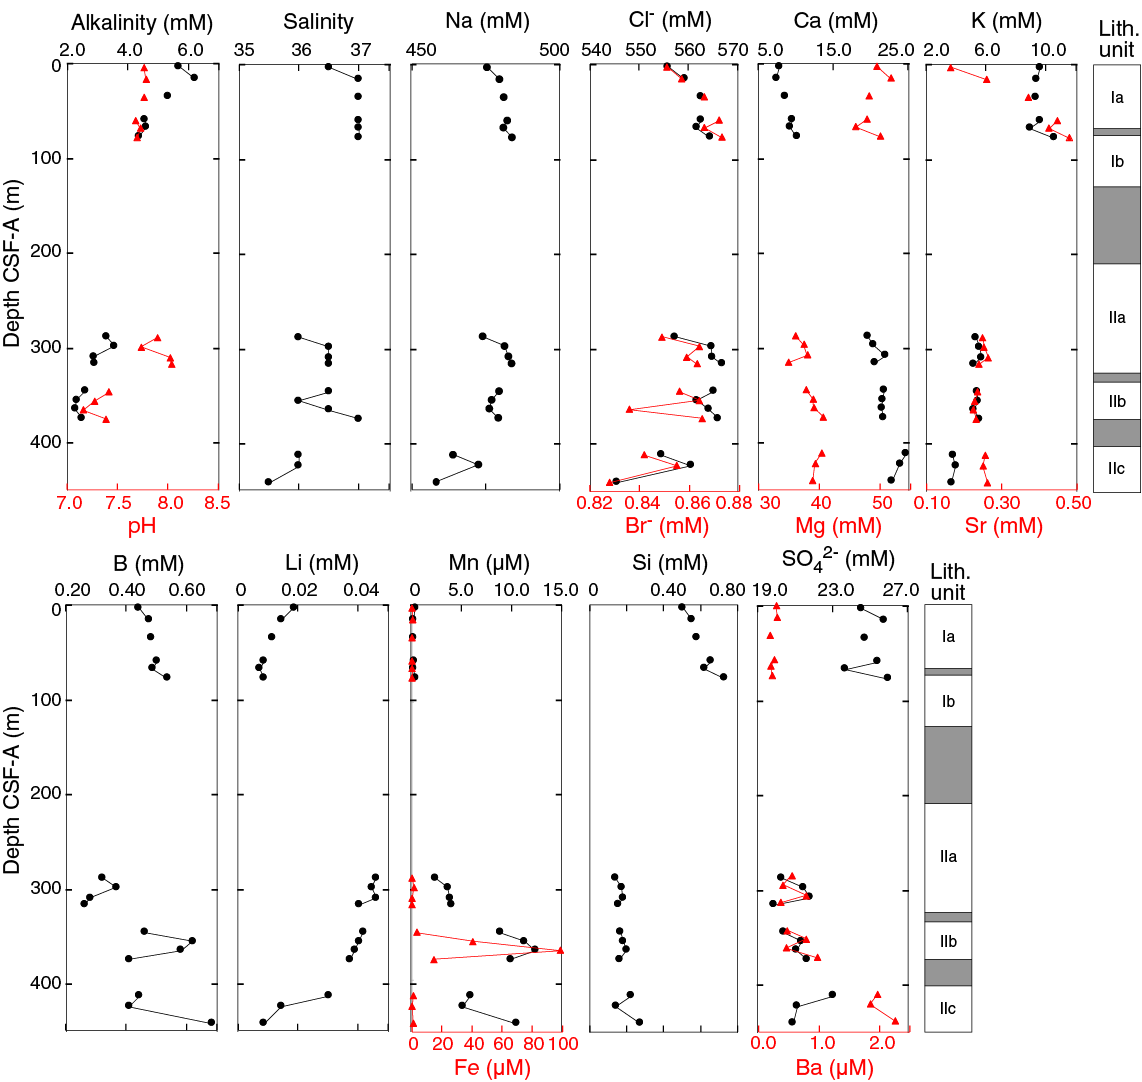
Figure F15. Interstitial water geochemistry.
The preliminary plan for whole-round sampling was one sample per full-length core where recovery allowed. Interstitial water samples were taken downhole to 441.6 m CSF-A (Core 369-U1515A-48R); interstitial water samples were not taken from Cores 10R through 31R, 36R, 37R, 42R–44R, and 47R because of low recovery. The small volumes of interstitial water extracted from some samples meant that some analyses could not be performed for many samples. Preference was given to ICP-OES and ion chromatography analyses due to the quantity of information determined by these techniques.
Because of low core recovery, interstitial water could only be analyzed in two depth intervals separated by a gap of ~211 m (77.1–287.84 m CSF-A). Furthermore, the four lowermost samples originate from below the unconformity separating Cretaceous from possibly Jurassic strata (see Lithostratigraphy). Therefore, consistent profiles allowing interpretation of processes reflected in concentration gradients could not be generated.
Salinity, pH, and alkalinity
The salinity of interstitial water samples ranges from 35.5 to 37.0 and does not change significantly downhole until 77.1 m CSF-A. Slightly greater variability was observed deeper than 287.8 m CSF-A (Table T8; Figure F15).
Alkalinity and pH measurements were limited to a maximum depth of 374.1 m CSF-A (Core 369-U1515A-48R). Alkalinity generally decreases from 6.21 mM at 15.5 m CSF-A (Core 2R) to 4.36 mM at 77.1 m CSF-A. Alkalinity is even lower (2.26–3.29 mM) in samples deeper than 287.84 m CSF-A (Table T8; Figure F15).
The pH values are relatively constant (7.69–7.79) in the upper 77.1 m of the hole and are more variable at greater depths (7.16–8.04). The lowest value is in Core 369-U1515A-40R (Table T8; Figure F15).
Sulfate and ammonium
SO42– is moderately depleted relative to seawater at shallower depths (24–26 mM between 2.96 and 77.10 m CSF-A), whereas slightly lower values are seen downhole (20–23 mM from 287.84 to 441.60 m CSF-A) (Table T8; Figure F15). The subtle decrease in SO42– concentration seems to indicate low rates of sulfate reduction, although the limited recovery makes it hard to determine whether this is a linear decrease with depth or something more complex. NH4+ concentration was generally not determined because metabolic activity seemed to be low. In samples where determination was attempted, most values were below the detection limit.
Magnesium and potassium
Mg concentration slightly decreases in the upper section of the hole (Cores 369-U1515A-2R through 9R) and is consistently lower (35–41 mM) below 287.8 m CSF-A (Table T8; Figure F15). K concentration is relatively constant (9–11 mM) in lithostratigraphic Subunits Ia and Ib and is significantly lower downhole. The changes in K and Mg may reflect alteration reactions of volcanic material likely present in the sediment record, but the decrease in both elements is less prominent than at other Expedition 369 sites. Roles played by reactions in the basement below the cored depth cannot be excluded at this site (e.g., Gieskes and Lawrence 1981), but the limited data hampers any further interpretation.
Calcium and strontium
Dissolved Ca concentration increases downhole in lithostratigraphic Subunits Ia and Ib and is significantly higher deeper than 287.84 m CSF-A, reaching a maximum of 25 mM at the top of lithostratigraphic Subunit IIc (412.73 m CSF-A; Core 369-U1515A-46R) (Table T8; Figure F15). The slight increase in Ca in the top layer may be related to carbonate diagenesis (see Bulk sediment geochemistry), whereas the increase at depth could be due to the release of Ca during volcanic material alteration reactions (e.g., Bischoff and Dickson, 1975). Dissolved Sr increases from 0.17 mM at 2.96 m CSF-A (Core 1R) to 0.48 mM at 77.1 m CSF-A (Core 9R) as a result of carbonate recrystallization. Sr concentration is essentially constant at ~0.25 mM deeper than 287.84 m CSF-A (Cores 32R through 48R), indicating that Sr distribution is governed by carbonate diagenesis in the shallow part of the core and that alteration reactions play a minor role at this site.
Chloride, bromide, sodium, and lithium
Interstitial water concentration profiles of Cl− and Br− are similar. Cl− concentration increases slightly from 556 to 564 mM at the top of the cored section (2.96–77.1 m CSF-A; Cores 369-U1515A-1R through 9R) and then generally decreases to 545 mM downhole from 287.84 m CSF-A to the bottom of the sampled material (Table T8; Figure F15). The Br− profile is similar to that of Cl−, increasing from 0.85 to 0.87 mM downhole from 2.96 to 77.10 m CSF-A and then decreasing to 0.83 mM at 441.60 m CSF-A (Core 48R) (Table T8; Figure F15). Both Br− and Cl– profiles roughly match that of salinity. The Br/Cl ratio is fairly constant at a seawater-like value throughout the cored section, indicating that organic matter degradation does not have a significant influence on Br− concentration.
Na concentration varies from 447 to 472 mM throughout the cored section (Table T8; Figure F15). The Na/Cl ratio averages ~0.85 and decreases slightly downhole, but the data are too limited to draw any firm conclusions from this observation.
Li concentration slightly decreases in the upper cored section (2.96–77.10 m CSF-A; Cores 369-U1515A-1R through 9R). Li concentration is significantly higher in the deeper cores (32R through 48R) (Table T8; Figure F15). The lack of data because of poor core recovery between 77.10 and 297.69 m CSF-A makes it difficult to determine why Li increases by >0.025 mM between lithostratigraphic Subunits Ib and IIa; therefore, meaningful interpretation of the Li profile is not possible.
Barium, boron, and silicon
Ba concentration is strongly related to the presence or absence of SO42− in interstitial water (Torres et al., 1996) (Table T8; Figure F15). SO42− concentration decreases with depth through the measured sections of Site U1515 and is reflected by a subtle increase in Ba with depth, exceeding 2.5 µM at the bottom of the cored section (412.73-441.60 m CSF-A; Cores 369-U1515A-45R through 48R) (Church and Wolgemuth, 1972).
Dissolved Si concentration gradually increases from 0.50 to 0.73 mM downhole from 2.96 to 77.1 m CSF-A (Cores 369-U1515A-1R through 9R), reflecting the presence of biogenic siliceous tests (Table T8; Figure F15). In comparison, Si concentration is constant (~0.18 mM) in lithostratigraphic Unit II (287.84–441.60 m CSF-A; Cores 32R through 48R). Generally, dissolved Si concentration seems to reflect the abundance of siliceous tests throughout the hole, although lower concentration at the bottom of the hole indicates that Unit II lies below the opal-A/CT transition (Murray et al., 1992).
B concentration increases gradually from a seawater-like value of 0.44 mM at 2.96 m CSF-A (Core 369-U1515A-1R) to 0.54 mM at 77.10 m CSF-A (Core 9R); this gradual increase possibly is related to desorption from clay minerals. In the deeper cores, highly variable concentrations (0.26–0.68 mM) are observed in lithostratigraphic Units II and III (Table T8; Figure F15). Adsorption/desorption and alteration reactions within the sedimentary column are likely responsible for this variability (Brumsack and Zuleger, 1992).
Manganese and iron
Mn concentration is low in lithostratigraphic Subunits Ia and Ib and higher in the deeper Unit II cores, with a maximum of 12.4 µM at 364.28 m CSF-A (Core 369-U1515A-40R) (Table T8; Figure F15). Fe concentration is barely above the detection limit at this site, except in Subunit IIb, where it reaches a maximum of 98.9 µM at 364.28 m CSF-A (Core 40R). This observation indicates that Unit II, particularly Subunit IIb, is likely more reducing than the shallower deposits.
Bulk sediment geochemistry
A total of 33 bulk sediment samples were collected downhole to ~511 m CSF-A (Core 369-U1515A-55R). For standard low-resolution analyses, these samples were taken from the interstitial water squeeze cake; when an interstitial water sample was not taken, a small sample was retrieved from the working-half section. More targeted samples were taken within intervals containing coaly layers (Cores 37R and 47R) (see Lithostratigraphy).
Bulk sediment at this site can be divided into three distinct intervals (Table T9; Figure F16). In lithostratigraphic Subunits Ia and Ib, carbonate content is very high (~80–90 wt%), but below this unit carbonate content drops to ~0 wt%. Total organic carbon (TOC) content of Subunits Ia, Ib, and IIa is 0–2.4 wt%, whereas Subunits IIb and IIc contain elevated TOC, with values as high as 46.2 wt%; these maximal values occur in samples that targeted coaly layers. Total nitrogen (TN) content shows a similar pattern to TOC, with low concentrations in Subunits Ia, Ib, and IIa (≤0.04 wt%) and higher concentrations in Subunits IIb and IIc (0.02–0.40 wt%). However, TN and TOC do not show a linear correlation. Samples with <1 wt% TOC generally have a TOC/TN ratio of ~30, but the ratio increases in sediment with higher TOC content, reaching 142 in carbon-rich material from Section 369-U1515A-37R-1.
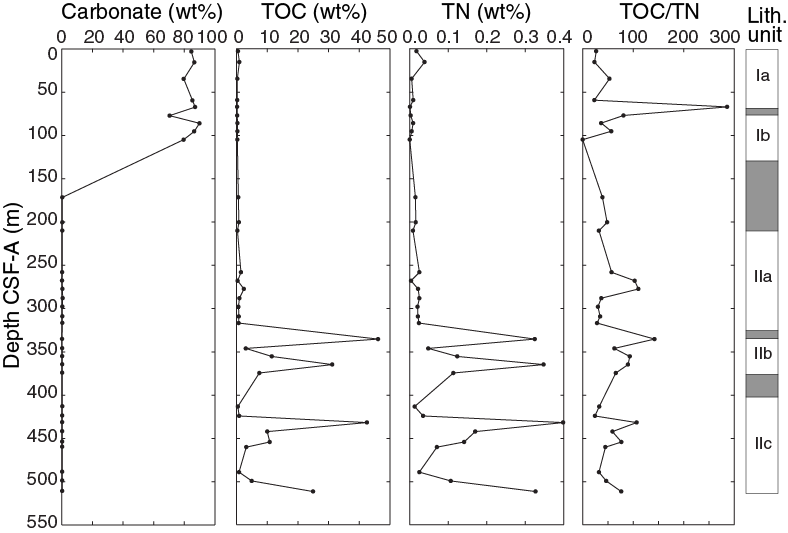
Figure F16. Carbon, nitrogen, and TOC/TN.
Organic matter source analysis
All samples with ≥0.8 wt% TOC were evaluated by source rock analysis. Samples from working-half sections (Cores 369-U1515A-37R, 47R, 49R, and deeper) were selectively taken from the black or dark brownish carbon-rich part of each core (Table T10; Figure F17). In total, 17 samples were analyzed.
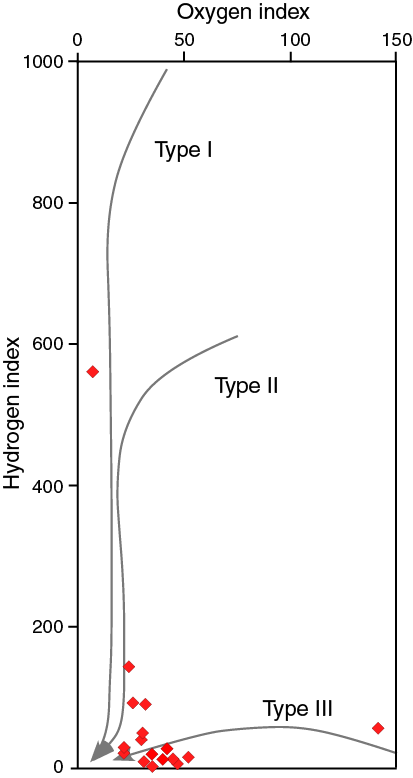
Figure F17. Source rock analysis.
TOC content was independently evaluated during source rock analysis based on the detection of pyrolyzed organic matter. Because this calculation employs a different analytical method than used for bulk sediment, these TOC values do not necessarily correspond to TOC values reported from bulk sediment analysis (see Bulk sediment geochemistry). To discriminate TOC content derived from regular bulk sediment analysis, we use TOCSRA for values evaluated during source rock analysis. Low (<0.8 wt%) TOCSRA analyses have a greater margin of error, potentially overestimating hydrogen index (HI) and oxygen index (OI) values. The nominal temperature of the maximum rate of hydrocarbon yield (Tmax) from these low-TOCSRA samples also varies greatly and thus cannot be reliably employed for estimating the thermal maturity of the organic matter.
Most of the studied samples have lower HI values (20–40 mg hydrocarbon [HC]/g TOC) and moderate OI values (20–40 mg CO2/g TOC), indicating Type III or IV kerogen of largely terrestrial origin or of highly degraded marine organic matter. Suboxic conditions (see Lithostratigraphy) and lower thermal maturity (see below) suggest that degraded Type I or II kerogen is unlikely. However, samples from Cores 369-U1515A-47R (~430 m CSF-A) through 50R (~460 m CSF-A) have different features. Core 47R has the highest TOCSRA content (44 wt%) and HI value (555 mg HC/g TOC), indicating Type I kerogen, likely from an algal source. Samples from Cores 48R through 50R have a higher HI value that does not exceed 150 mg HC/g TOC. The kerogen in these samples is still classified as Type III (Peters et al., 2005), but it is expected to be a mixture of terrestrial plants with a minor contribution of algae, which is also consistent with a higher abundance of plant debris (see Lithostratigraphy). Microscopic observation of algal cells in a sample from Core 39R (Figure F6) suggests that algal contribution may be a general feature through lithostratigraphic Subunits IIb and IIc. Tmax downhole from ~500 m CSF-A is ~430°C, indicating low to moderate thermal maturity at the base of the cored section.
Stratigraphic correlation
At Site U1515, one hole (U1515A) was cored with the RCB system to 512.98 m CSF-A with 18.1% recovery. Mixed ages for Cores 369-U1515A-1R through 15R and poor recovery from Core 5R to BOH severely limit stratigraphic inferences made from the recovered cores using shipboard data (Figure F18). Thus, we refer readers to Petrophysics, Lithostratigraphy, Biostratigraphy and micropaleontology, Geochemistry, and Paleomagnetism for specific observations.
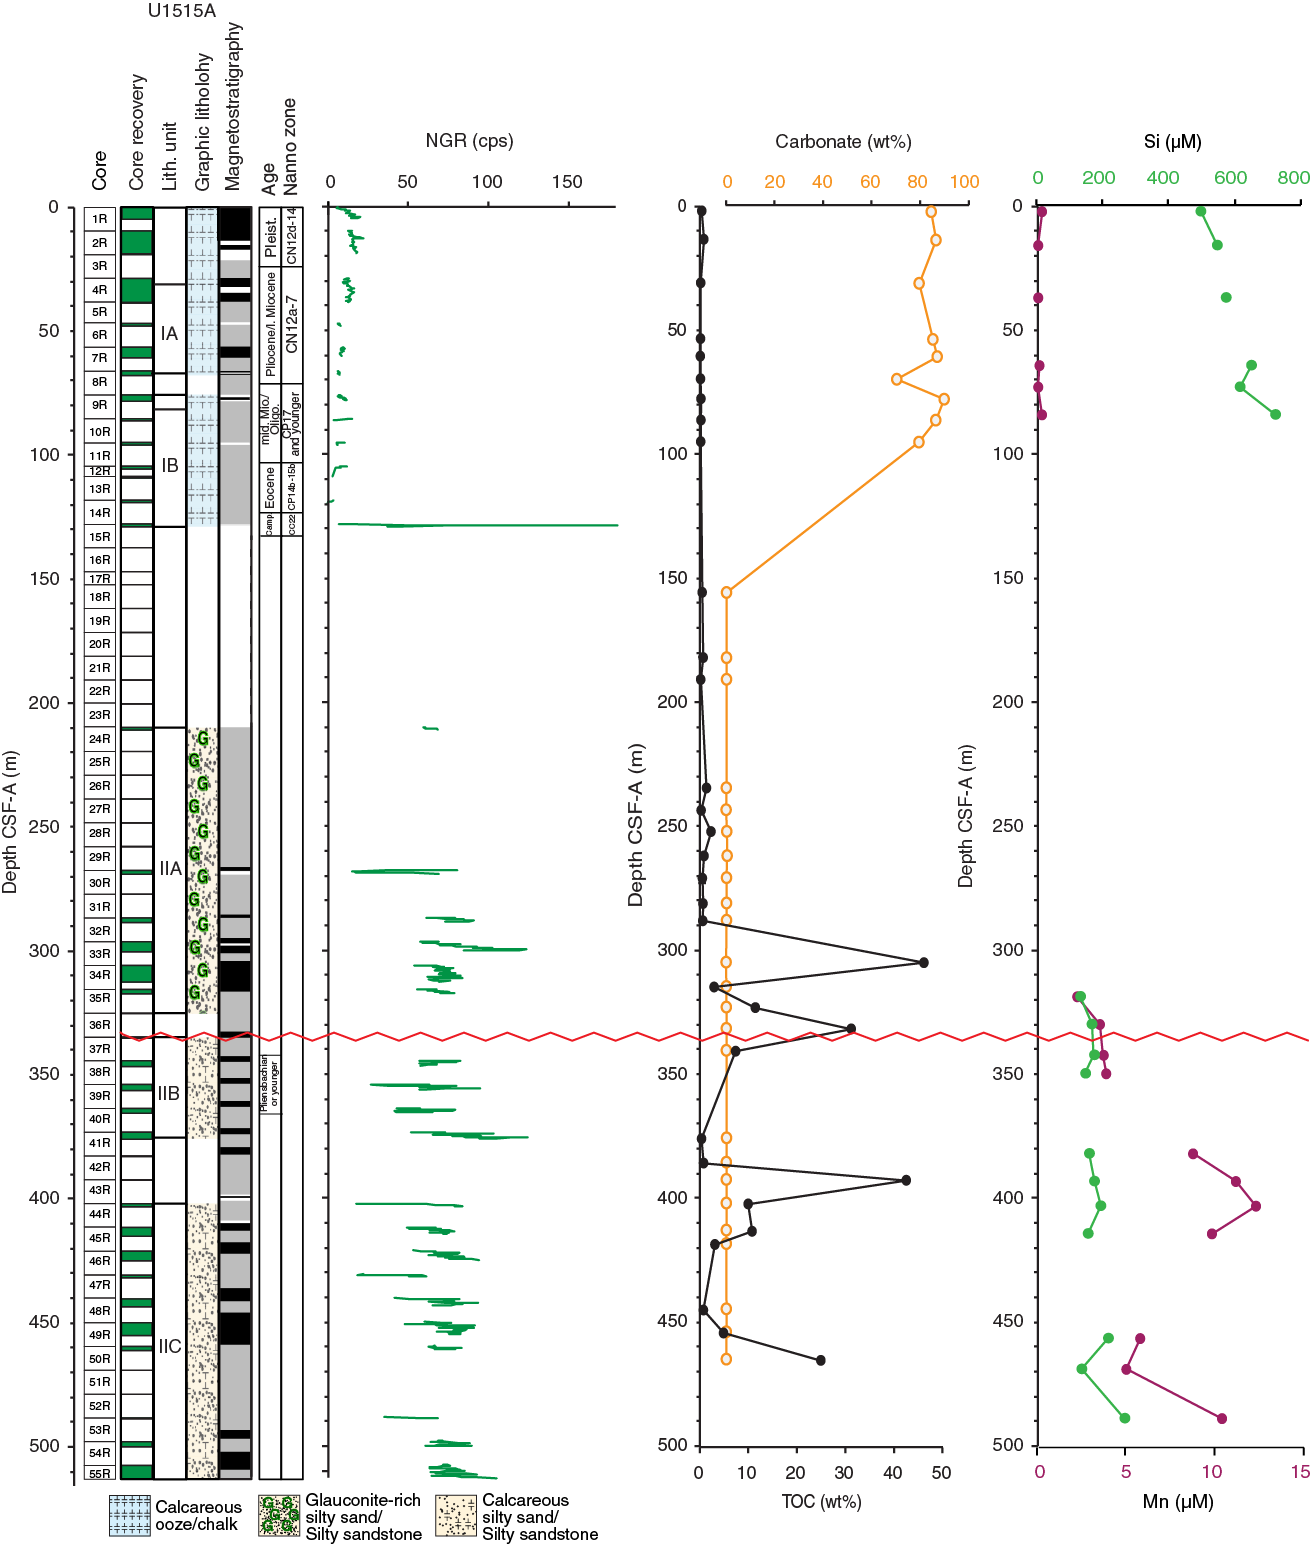
Figure F18. Site U1515 summary.
References
Bischoff, J.L., and Dickson, F.W., 1975. Seawater-basalt interaction at 200°C and 500 bars: implications for origin of sea-floor heavy-metal deposits and regulation of seawater chemistry. Earth and Planetary Science Letters, 25(3):385–397. https://doi.org/10.1016/0012-821X(75)90257-5
Borissova, I., 2002. Geological Framework of the Naturaliste Plateau. Geoscience Australia, 2002/20. http://www.ga.gov.au/metadata-gateway/metadata/record/40535/
Brumsack, H.-J., and Zuleger, E., 1992. Boron and boron isotopes in pore waters from ODP Leg 127, Sea of Japan. Earth and Planetary Science Letters, 113(3):427–433. https://doi.org/10.1016/0012-821X(92)90143-J
Church, T.M., and Wolgemuth, K., 1972. Marine barite saturation. Earth and Planetary Science Letters, 15(1):35–44. https://doi.org/10.1016/0012-821X(72)90026-X
De Vleeschouwer, D., Dunlea, A.G., Auer, G., Anderson, C.H., Brumsack, H., de Loach, A., Gurnis, M., et al., 2017. Quantifying K, U, and Th contents of marine sediments using shipboard natural gamma radiation spectra measured on DV JOIDES Resolution. Geochemistry, Geophysics, Geosystems, 18(3):1053–1064. https://doi.org/10.1002/2016GC006715
Gieskes, J.M., and Lawrence, J.R., 1981. Alteration of volcanic matter in deep-sea sediments: evidence from the chemical composition of interstitial waters from deep sea drilling cores. Geochimica Cosmochimica Acta, 45(10):1687–1703. https://doi.org/10.1016/0016-7037(81)90004-1
Hardenbol, J., Thierry, J., Farley, M.B., Jacquin, T., de Graciansky, P.-C., and Vail, P.R., 1998. Mesozoic and Cenozoic sequence chronostratigraphic framework of European basins. In de Graciansky, P.-C., Hardenbol, J., Jacquin, T., and Vail, P.R. (Eds.), Mesozoic and Cenozoic Sequence Stratigraphy of European Basins. Special Publication - SEPM (Society for Sedimentary Geology), 60:3–13. http://archives.datapages.com/data/sepm_sp/SP60/Mesozoic_and_Cenozoic_Sequence_Chronostratigraphic.pdf
Helby, R.J., Morgan, R., and Partridge, A.D., 1987. A palynological zonation of the Australian Mesozoic. In Jell, P.A. (Ed.), Studies in Australian Mesozoic Palynology. Memoir of the Association of Australasian Palaeontologists, 4.
Kirschvink, J.L., 1980. The least-squares line and plane and the analysis of palaeomagnetic data. Geophysical Journal of the Royal Astronomical Society, 62(3):699–718. https://doi.org/10.1111/j.1365-246X.1980.tb02601.x
Lurcock, P.C., and Wilson, G.S., 2012. PuffinPlot: a versatile, user-friendly program for paleomagnetic analysis. Geochemistry, Geophysics, Geosystems, 13(6):Q06Z45. https://doi.org/10.1029/2012GC004098
Maritati, A., Aitken, A.R.A., Young, D.A., Roberts, J.L., Blankenship, D.D., and Siegert, M.J., 2016. The tectonic development and erosion of the Knox Subglacial Sedimentary Basin, East Antarctica. Geophysical Research Letters, 43(20):10,728–10,737. https://doi.org/10.1002/2016GL071063
Murray, R.W., Brumsack, H.J., von Breymann, M.T., Sturz, A.A., Dunbar, R.B., and Gieskes, J.M., 1992. Diagenetic reactions in deeply buried sediments of the Japan Sea: a synthesis of interstitial-water chemistry results from Legs 127 and 128. In Tamaki, K., Suyehiro, K., Allan, J., McWilliams, M., et al., Proceedings of the Ocean Drilling Program, Scientific Results, 127/128 (Part 2): College Station, TX (Ocean Drilling Program), 1261–1274. https://doi.org/10.2973/odp.proc.sr.127128-2.177.1992
Peters, K.E., Walters, C.C., and Moldowan, J.M., 2004. The Biomarker Guide (Volume 2): Biomarkers and Isotopes in Petroleum Systems and Earth History: Cambridge, United Kingdom (Cambridge University Press). https://doi.org/10.1017/CBO9781107326040
Petrizzo, M.R., 2001. Late Cretaceous planktonic foraminifera from the Kerguelen Plateau (ODP Leg 183): new data to improve the Southern Oceans biozonation. Cretaceous Research, 22(6):829–855. https://doi.org/10.1006/cres.2001.0290
Richter, C., Acton, G., Endris, C., and Radsted, M., 2007. Technical Note 34: Handbook for Shipboard Paleomagnetists. Ocean Drilling Program. https://doi.org/10.2973/odp.tn.34.2007
Torres, M.E., Brumsack, H.-J., Bohrmann, G., and Emeis, K.C., 1996. Barite fronts in continental margin sediments: a new look at barium remobilization in the zone of sulfate reduction and formation of heavy barites in diagenetic fronts. Chemical Geology, 127(1–3):125–139. https://doi.org/10.1016/0009-2541(95)00090-9
van Morkhoven, F.P.C.M., Berggren, W.A., Edwards, A.S., and Oertli, H.J., 1986. Cenozoic cosmopolitan deep-water benthic foraminifera. Bulletin des Centres de Recherches Exploration-Production Elf-Aquitaine: Mémoire, 11.
Wade, B.S., Pearson, P.N., Berggren, W.A., and Pälike, H., 2011. Review and revision of Cenozoic tropical planktonic foraminiferal biostratigraphy and calibration to the geomagnetic polarity and astronomical time scale. Earth-Science Reviews, 104(1–3):111–142. https://doi.org/10.1016/j.earscirev.2010.09.003
Zijderveld, J.D.A., 1967. AC demagnetization of rocks: analysis of results. In Collinson, D.W., Creer, K.M., and Runcorn, S.K. (Eds.), Developments in Solid Earth Geophysics (Volume 3): Methods in Palaeomagnetism: Amsterdam (Elsevier), 254–286. https://doi.org/10.1016/B978-1-4832-2894-5.50049-5
1 Huber, B.T., Hobbs, R.W., Bogus, K.A., Batenburg, S.J., Brumsack, H.-J., do Monte Guerra, R., Edgar, K.M., Edvardsen, T., Garcia Tejada, M.L., Harry, D.L., Hasegawa, T., Haynes, S.J., Jiang, T., Jones, M.M., Kuroda, J., Lee, E.Y., Li, Y.-X., MacLeod, K.G., Maritati, A., Martinez, M., O’Connor, L.K., Petrizzo, M.R., Quan, T.M., Richter, C., Riquier, L., Tagliaro, G.T., Wainman, C.C., Watkins, D.K., White, L.T., Wolfgring, E., Xu, Z., 2019. Site U1515. In Hobbs, R.W., Huber, B.T., Bogus, K.A., and the Expedition 369 Scientists, Australia Cretaceous Climate and Tectonics. Proceedings of the International Ocean Discovery Program, 369: College Station, TX (International Ocean Discovery Program). https://doi.org/10.14379/iodp.proc.369.106.2019
2 Expedition 369 Scientists’ affiliations.
This work is distributed under the Creative Commons Attribution 4.0 International (CC BY 4.0) license. 
- F1. Site U1515 location.
- F2. Seismic Profile s310_05.
- F3. Lithostratigraphic summary.
- F4. Primary lithologies and sedimentary features.
- F5. Sediment constituents.
- F6. Characteristic plant debris and organic material.
- F7. XRD results.
- F8. Paleomagnetic data.
- F9. Vector endpoint diagrams for section halves.
- F10. Vector endpoint diagrams for representative discrete samples.
- F11. Magnetostratigraphic results.
- F12. Physical properties.
- F13. NGR data.
- F14. Density, porosity, thermal conductivity, and P-wave velocity.
- F15. Interstitial water geochemistry.
- F16. Carbon, nitrogen, and TOC/TN.
- F17. Source rock analysis.
- F18. Site U1515 summary
- T1. Core summary.
- T2. X-ray fluorescence results, Site U1515.
- T3. Calcareous nannofossil distribution, Hole U1515A.
- T4. Planktonic foraminifer distribution, Hole U1515A.
- T5. Benthic foraminifer distribution, Hole U1515A.
- T6. Presence and absence of selected microfossil groups and minerals identified in smear slides and the >45 µm sieve size fraction, Site U1515.
- T7. Gas element data, Site U1515.
- T8. Interstitial water geochemistry, Hole U1515A.
- T9. Bulk sediment geochemistry, Site U1515.
- T10. Source rock analysis data.