Sutherland, R., Dickens, G.R., Blum, P., and the Expedition 371 Scientists
Proceedings of the International Ocean Discovery Program Volume 371
publications.iodp.org
https://doi.org/10.14379/iodp.proc.371.103.2019

Site U15061
R. Sutherland, G.R. Dickens, P. Blum, C. Agnini, L. Alegret, G. Asatryan, J. Bhattacharya, A. Bordenave, L. Chang, J. Collot, M.J. Cramwinckel, E. Dallanave, M.K. Drake, S.J.G. Etienne, M. Giorgioni, M. Gurnis, D.T. Harper, H.-H.M. Huang, A.L. Keller, A.R. Lam, H. Li, H. Matsui, H.E.G. Morgans, C. Newsam, Y.-H. Park, K.M. Pascher, S.F. Pekar, D.E. Penman, S. Saito, W.R. Stratford, T. Westerhold, and X. Zhou2
Keywords: International Ocean Discovery Program, IODP, JOIDES Resolution, Expedition 371, Site U1506, Tasman Frontier, Zealandia, Reinga, Challenger, Eastern Australian Current, Lord Howe, Murihiku, New Caledonia, Norfolk, Northland, Pacific, Ring of Fire, Tasman, Taranaki, Tonga, Kermadec, Waka Nui, Wanganella, subduction, Early Eocene Climatic Optimum, EECO, Middle Eocene Climatic Optimum, MECO, biogenic bloom, stratigraphy, diagenesis, compaction, volcanism
MS 371-103: Published 2 February 2019
Background and objectives
International Ocean Discovery Program (IODP) Site U1506 (28.66°S, 161.74°E; 1505 m water depth) is located on northern Lord Howe Rise, ~290 km south of Deep Sea Drilling Project (DSDP) Sites 208 and 588 (Figure F1). Seismic reflection data image a regional unconformity that separates an upper seismic stratigraphic unit characterized by low-amplitude reflectors from an underlying unit with high-amplitude reflectors (Higgins et al., 2015; Sutherland et al., 2010). The unconformity (in some places more properly described as a disconformity) manifests as a continuous reverse polarity reflection over much of the area (Figure F2), and samples collected at Sites 208 and 588 have foraminiferal and nannofossil chalk of early Oligocene age overlying middle Eocene siliceous fossil–bearing chalk, radiolarite, and diatomite (Shipboard Scientific Party, 1973; Kennett et al., 1986).

Figure F1. Regional bathymetry and seismic reflection lines.
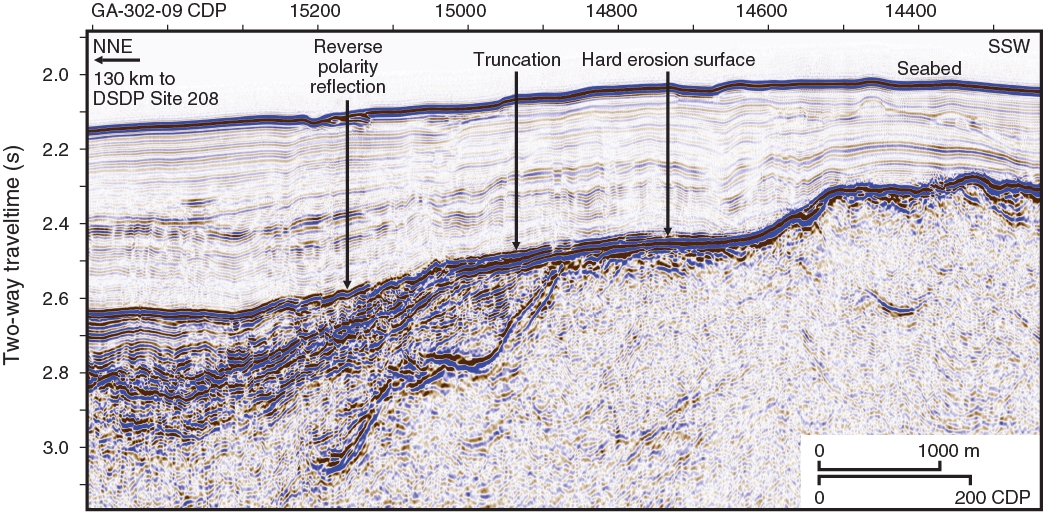
Figure F2. Representative seismic section from northern Lord Howe Rise.
The regional unconformity is interpreted to be locally associated with erosion of units beneath (Sutherland et al., 2010). Reflectors in the lower seismic unit are truncated in some places. In other places, however, usually near where the lower unit is truncated, the upper acoustically transparent seismic unit lies directly on flat surfaces characterized by high-amplitude, normal polarity seismic reflections (Figure F2). These surfaces are inferred from reflection amplitudes and apparent refraction velocities to be planed hard rock. Because such surfaces are found at similar depths across the region, they have been interpreted as a marker of past sea level, possibly cut by wave-base erosion (Sutherland et al., 2010). We hypothesized that these flat erosion surfaces were either cut during the Cretaceous rift–drift tectonic phase or during a later phase of Eocene–Oligocene uplift associated with Tonga-Kermadec subduction initiation.
The primary focus of IODP Expedition 371 was on Paleogene tectonics, and the objective at Site U1506 was to test the hypothesis that Lord Howe Rise was transiently uplifted during the Paleogene and has since subsided by ~1500 m. Site U1506 is located on the western flank of a broad bathymetric high (Figure F3), beneath which the unconformity is interpreted as a hard flat erosion surface. The drilling target, which was identified on seismic reflection data, is a small mounded feature that has ~100 m of relief above the regional unconformity surface (Figure F4). The mound has a normal polarity seismic reflection at its top but also contains internal reflections, including a gently dipping reverse polarity reflection. We hypothesized that it could be a Paleogene coral reef.

Figure F3. Local bathymetry and seismic reflection lines.
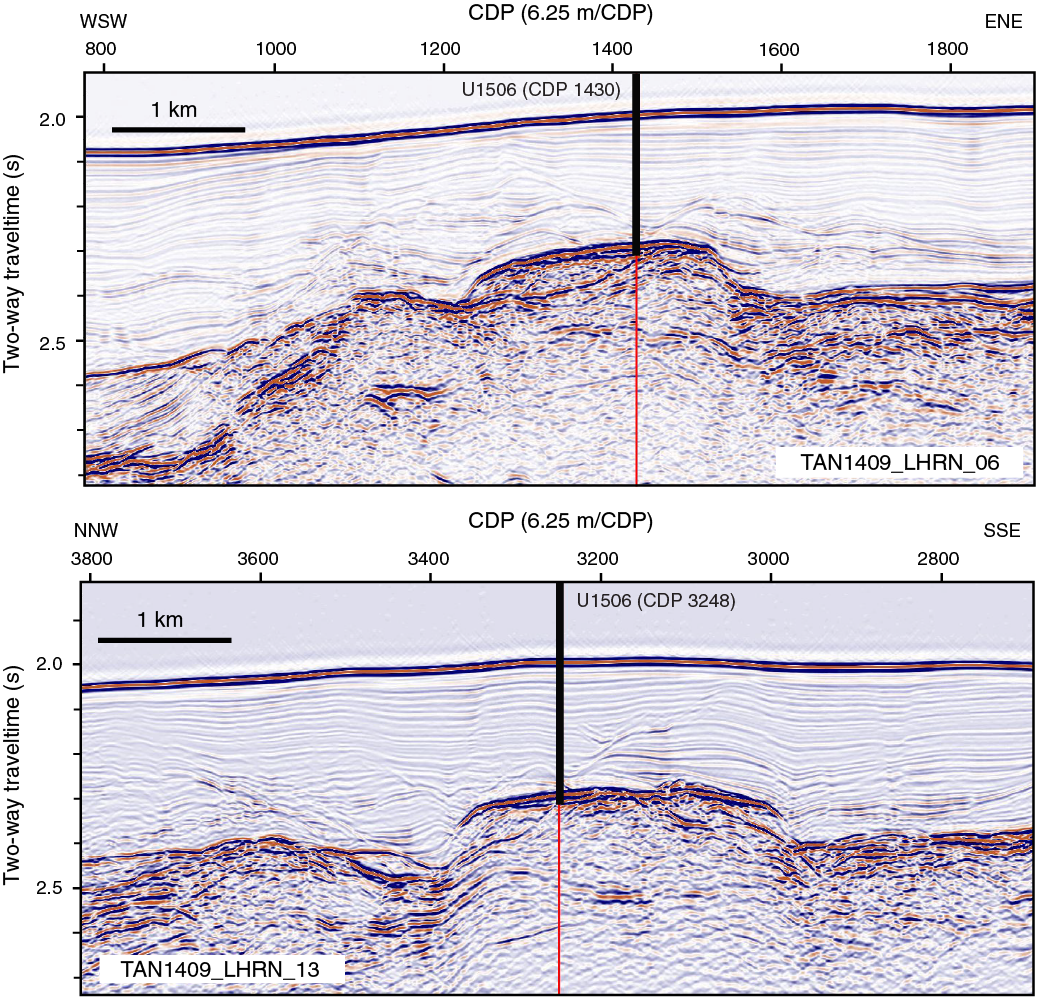
Figure F4. Seismic reflection lines.
A single rotary-drilled hole was planned with the primary objective to recover material from immediately above and below the unconformity (high-amplitude reflector) and from beneath it in the upper part of the mound. The primary goal was to constrain Paleogene vertical motions, but the geology of Lord Howe Rise is almost completely unknown, so any rock collected was likely to be of broad interest. Rotary drilling was chosen because consideration of the seismic reflection amplitude and seismic refraction velocity of 3.2–3.8 km/s suggested the material may be too hard for advanced piston corer or extended core barrel coring.
Operations
Port call
Expedition 371 started at 0812 h (all times are UTC + 10 h) on 27 July 2017 with the first line ashore at Wharf 10 in Townsville, Australia. The Co-Chief Scientists and IODP staff moved onto the ship and began port call activities, including meetings with the offgoing staff and discharging and receiving cargo.
The rest of the Expedition 371 scientists boarded the ship on the morning of 28 July and, after checking into their cabins, received various introductory presentations and laboratory safety tours. The Siem Offshore crew change was completed. Fresh food and other catering supplies were loaded on board. Three public ship tours were held. Toward the end of the day, we began loading 450 metric tons of marine gas oil, which was transported alongside by trucks and then pumped on board.
Fueling was finished at 0100 h on 29 July. We made progress on the subsea camera hydraulic system upgrade but were not able to complete it during this short port call. The Expedition 371 scientists received several presentations, including an introduction to the project science from the Co-Chief Scientists, an overview of education and outreach (E&O) plans from the two E&O Officers, and an introduction to the expedition work plan from the Expedition Project Manager (EPM). The Captain and other senior Siem Offshore personnel met with the scientists and provided ship safety information. The EPM then led the scientists on laboratory tours for an overview of scientific equipment, procedures, and work responsibilities. The passage plan for the expedition transits was completed, and arrangements were made with the agent and immigration for a departure at 0700 h on 30 July.
The ship left Townsville with the last line released at 0712 h on 30 July. The first fire and lifeboat safety drill was held for all aboard. The Co-Chief Scientists and EPM met with each laboratory team to discuss requirements, tasks, and issues, and the teams began to prepare for their work.
Site U1506
Hole location, water depth, and the number of cores recovered are listed in Table T1. All times are local ship time (UTC + 10 h).
Site U1506 was the first site occupied during Expedition 371. After an 1167 nmi transit from Townsville, Australia, the ship arrived at Site U1506 at 1912 h on 3 August 2017. The thrusters were lowered, and the dynamic positioning system was engaged. At 1948 h, the drill floor was cleared for operations, beginning Hole U1506A. At 2033 h, a seafloor positioning beacon was deployed.
The rotary core barrel (RCB) bottom-hole assembly was assembled and deployed. All drill string tubulars were strapped and drifted during the pipe trip. The top drive was picked up, and a wiper “pig” was pumped through the drill string to clean debris from the inside of the drill string prior to coring. The core barrel was deployed, and Hole U1506A was spudded at 0600 h on 4 August.
Seafloor depth was determined to be 1505.8 m drilling depth below rig floor (DRF) based on tagging it with the drill string, establishing a water depth of 1495 m. RCB coring proceeded at 9.5–9.7 m intervals through Core 28R (263.1 m drilling depth below seafloor [DSF]). Core 29R encountered the expected hard formation at ~265 m DSF. Cores were recovered in half intervals (4.5–5.0 m length) below this depth to minimize the risk of core loss due to jams in the bit or inner barrel. Average core recovery was 61% for the upper 28 cores and 79% for the lower 7 cores.
Coring ceased after Core 36R, which arrived on the rig floor at 1345 h on 5 August. Total recovery for the 306.1 m DSF drilled in Hole U1506A was 192.38 m (63%). A single 15 bbl mud sweep of high-viscosity gel mud was pumped during drilling in this hole. The drill string was retrieved, disassembled, and inspected; the acoustic beacon was recovered; and the rig floor was secured for transit, ending Hole U1506A operations at 1935 h. The time spent on Hole U1506A (and Site U1506) was 47.75 h or 2.0 days.
At 2000 h, we departed for Site U1507.
Lithostratigraphy
At Site U1506, ~265 m of Pleistocene–middle Eocene nannofossil ooze and chalk overlie ~40 m of volcanic rocks (Figure F1). The sedimentary sequence is designated lithostratigraphic Unit I and further divided into Subunits Ia, Ib, and Ic. The underlying interval of volcanic rock is designated lithostratigraphic Unit II (Figure F5; Table T2). Subunit Ia comprises ~258 m of fairly homogeneous white to light gray Pleistocene to middle Miocene nannofossil ooze and chalk with varying amounts of foraminifers. Subunit Ib consists of ~6 m of pale yellow upper Oligocene nannofossil chalk. Subunit Ic is ~30 cm of light greenish gray middle Eocene nannofossil chalk. Lithostratigraphic divisions are based on differences in lithology and sedimentological characteristics, as identified by macroscopic and microscopic (smear slide, thin section, and scanning electron microscope [SEM]) core descriptions (Figure F6) and aided by carbonate content and X-ray diffraction (XRD) analyses.
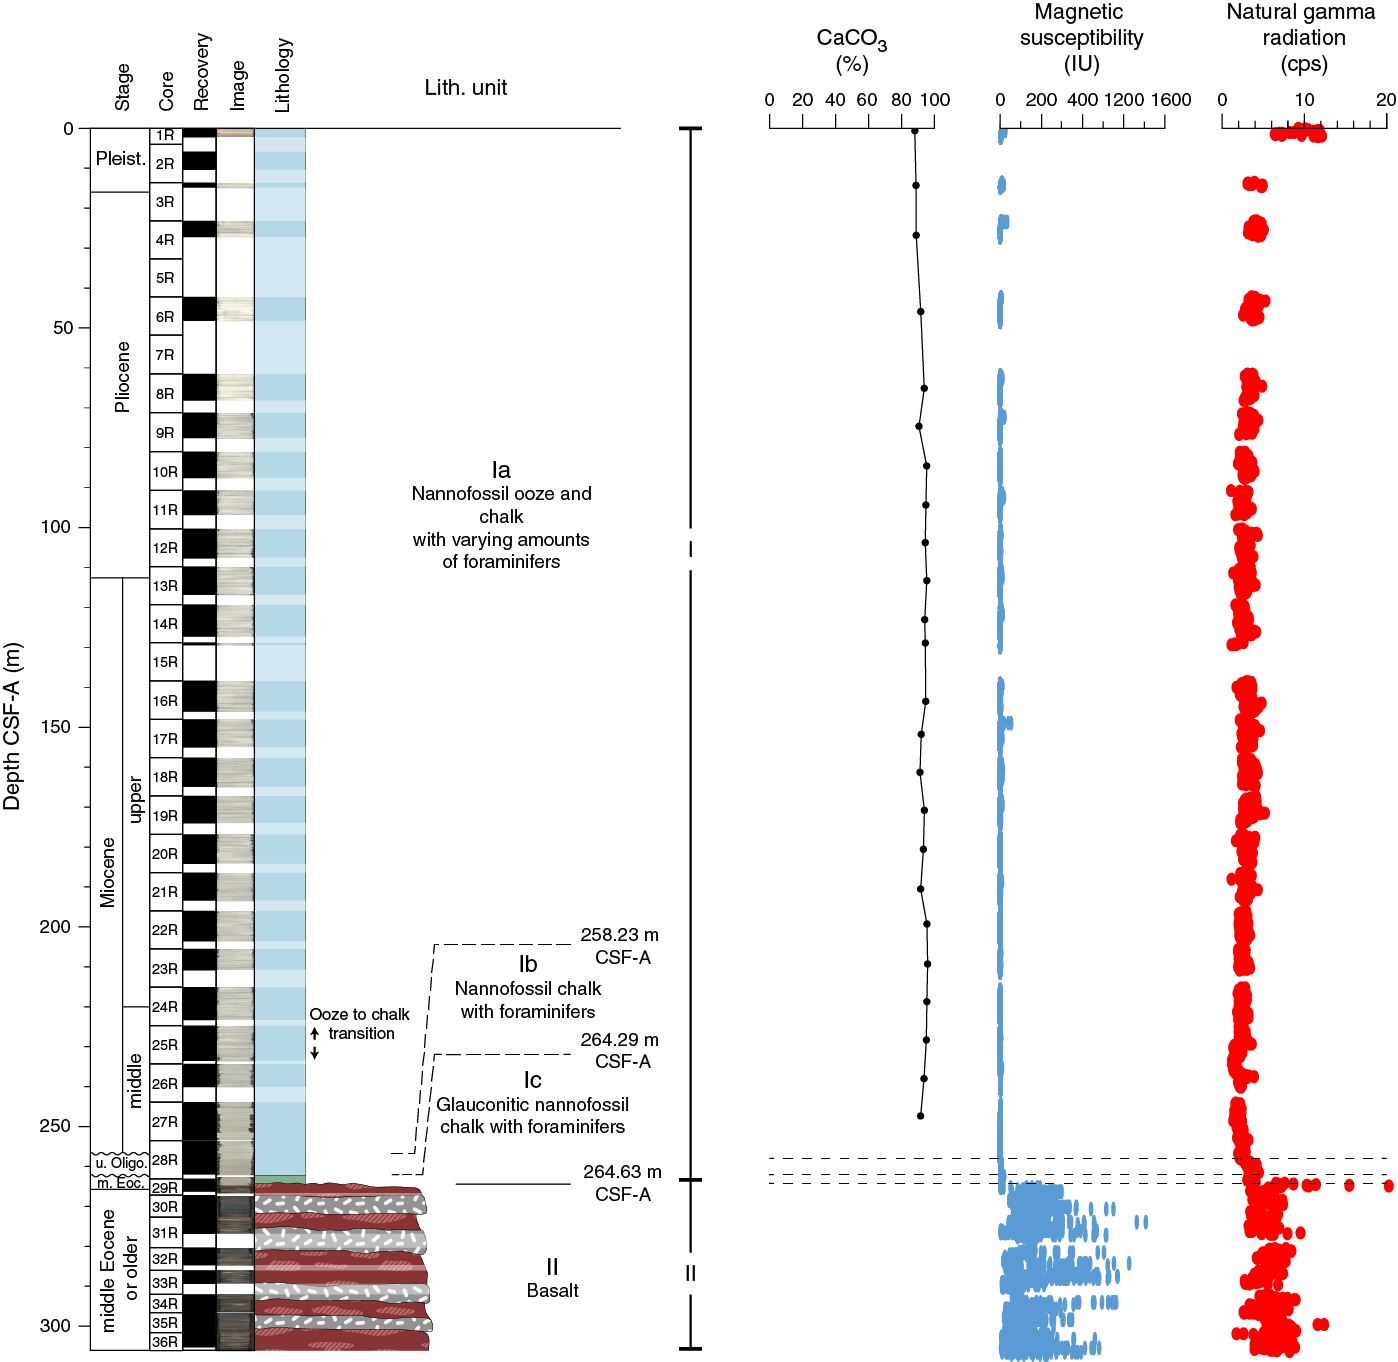
Figure F5. Lithostratigraphic summary.
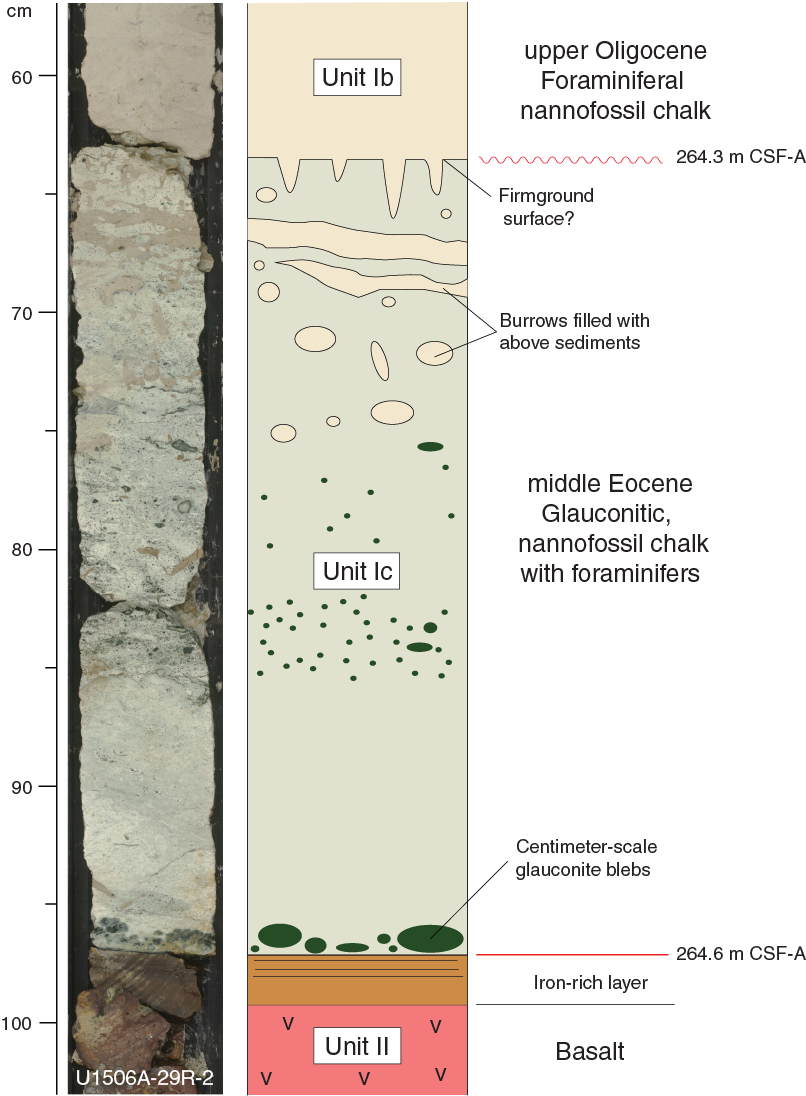
Figure F6. Subunit Ib/Ic and Unit I/II boundaries.
The Subunit Ia/Ib boundary is defined by a change in color from white (N 8.5) to pale yellow (2.5Y 8/2) nannofossil chalk in Section 371-U1506A-28R-4, which coincides with a biostratigraphic hiatus from the middle Miocene to upper Oligocene (see Biostratigraphy and paleoenvironment). The Subunit Ib/Ic boundary (Figure F6) is marked by the appearance of greenish gray glauconitic nannofossil chalk in Section 29R-2, 63 cm (264.29 m), also coinciding with a hiatus from the upper Oligocene to middle Eocene. The Unit I/II boundary is defined by a sharp contact between greenish gray glauconitic nannofossil chalk and altered amygdaloidal basalt in Section 29R, 97 cm (264.61 m).
Unit I
Unit I is a ~265 m thick sequence of Pleistocene–middle Miocene, upper Oligocene, and middle Eocene nannofossil ooze and chalk with foraminifers and is divided into three subunits (Ia, Ib, and Ic; Figures F5, F7, F8). Subunit Ib is differentiated from Subunit Ia by its pale yellow (2.5Y 8/2) color, and Subunit Ic is differentiated by the presence of glauconite. The subunit boundaries also coincide with stratigraphic hiatuses (see Biostratigraphy and paleoenvironment).
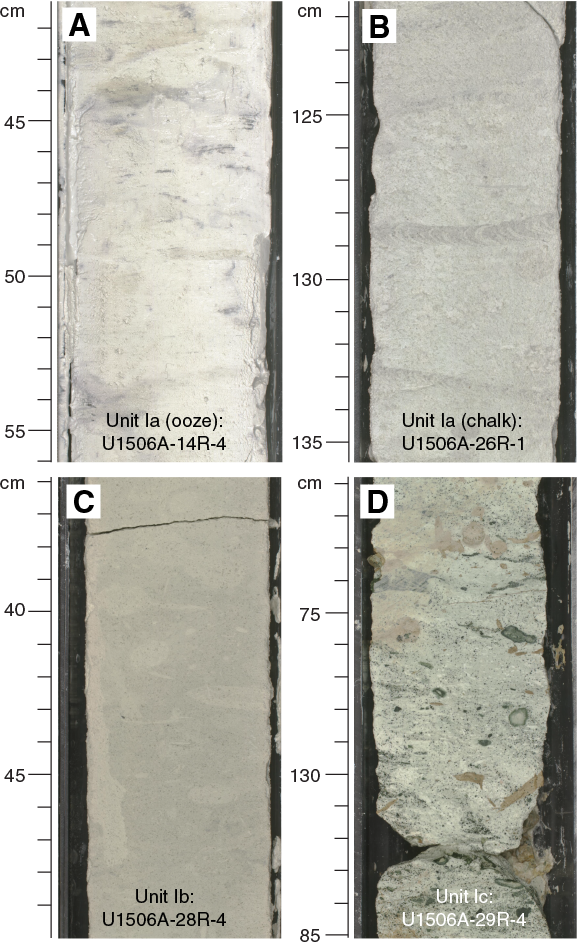
Figure F7. Common sedimentary lithologies, Unit I.
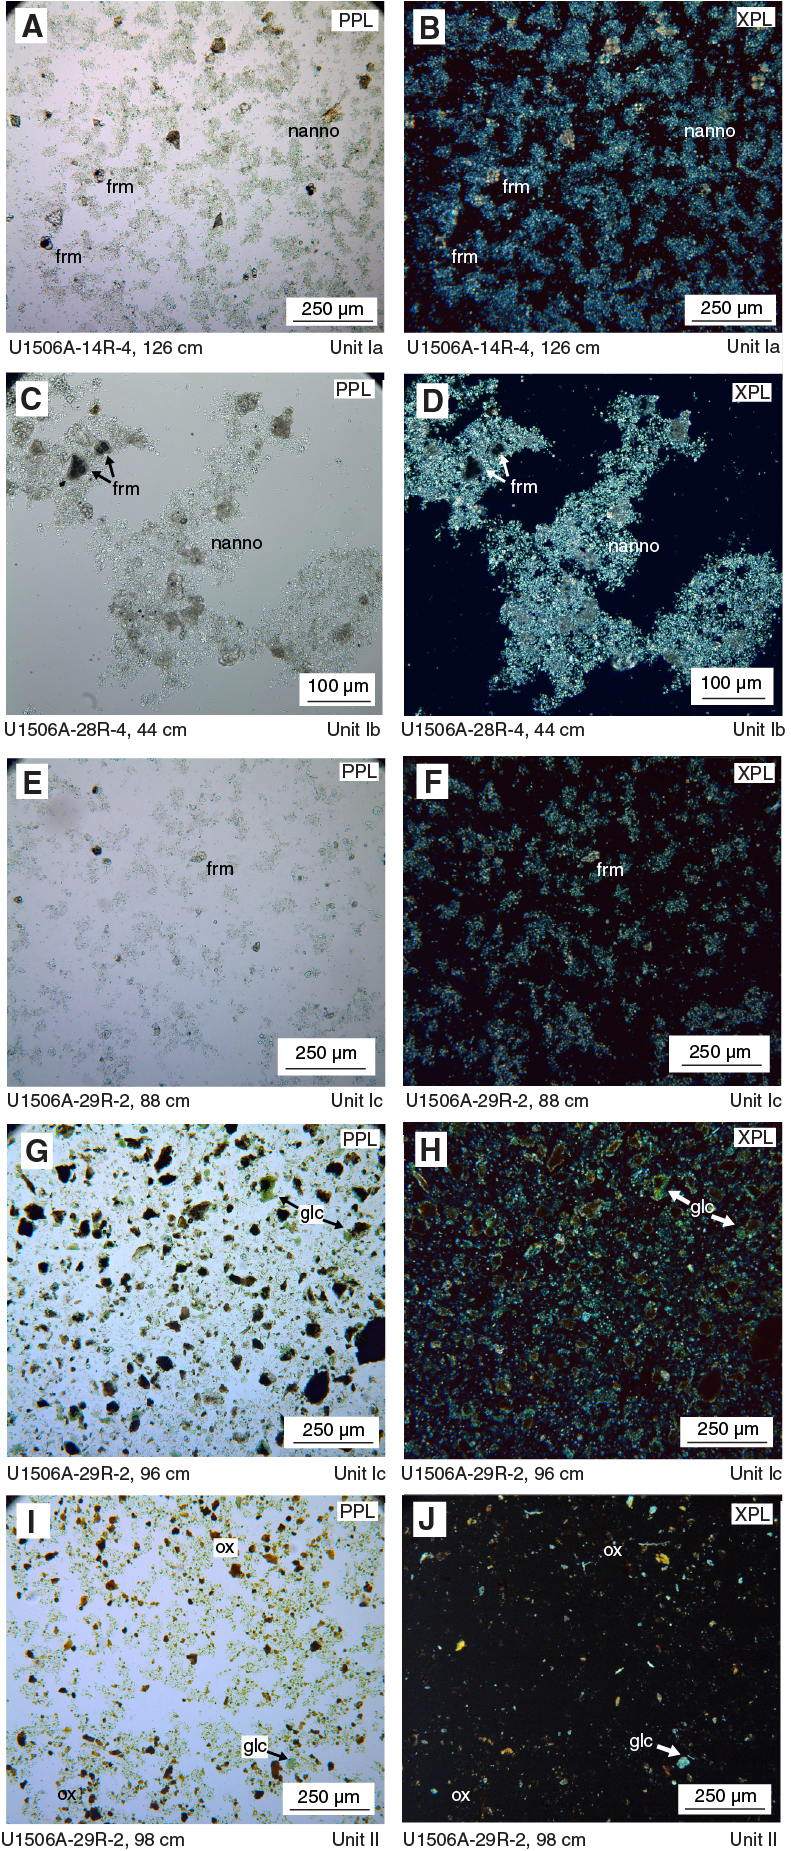
Figure F8. Common sedimentary lithologies.
Subunit Ia
Subunit Ia is ~258 m of homogeneous Pleistocene–middle Miocene white (predominantly N 8.5 and N 9) nannofossil ooze/chalk with foraminifers (Figures F7A, F8A, F9). Carbonate content ranges between 88% and 95% throughout the subunit (see Geochemistry). Faint decimeter-scale color banding between white (N 9) and grayish white (2.5Y 8/1) was observed in much of the subunit. Rare blebs of black opaque minerals are apparent throughout the subunit and were confirmed by XRD and SEM to be ~10 µm scale framboids consisting of ~1–3 µm scale pyrite crystals (Figure F10). In Section 371-U1506A-11R-1, a ~3 cm long pyritized burrow was observed.

Figure F9. Major biogenic and lithologic constituent abundances.
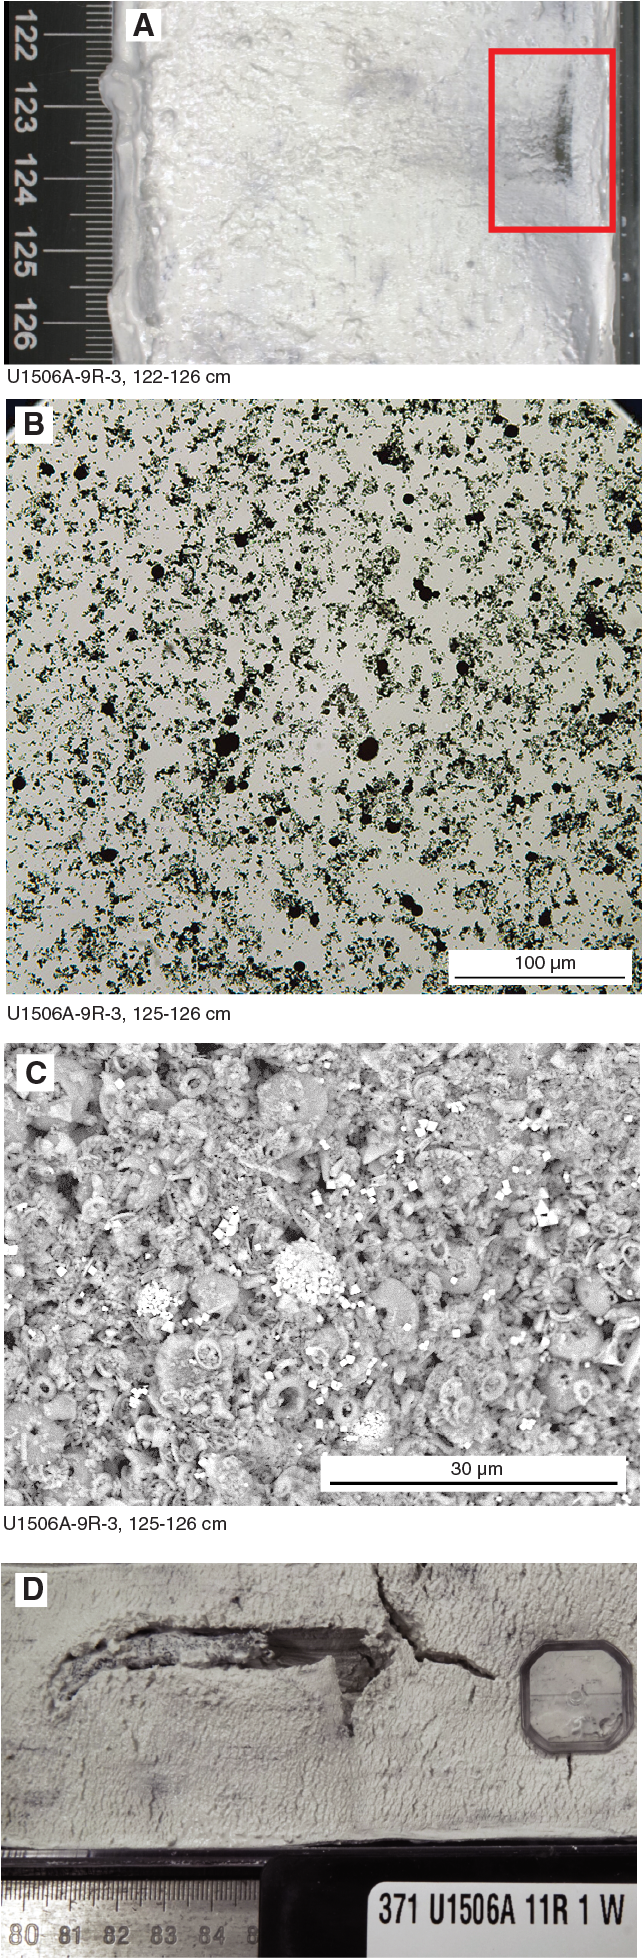
Figure F10. Pyritic elements.
The upper 48 m (Cores 1R through 6R) is variably soupy as a result of drilling disturbance. Cores 8R through 26R are variably slightly to moderately biscuited and fractured.
The ooze–chalk transition occurs over Cores 24R (ooze), 25R (described as ooze but decidedly firmer than the overlying cores and less firm than the underlying cores), and 26R (chalk). The RCB coring process was less destructive in the more lithified chalk of Cores 26R through 28R than in the overlying ooze. Finer structures and texture are better preserved in the chalk, including heavy bioturbation with slightly darker (10YR 8/1) Zoophycos, Planolites, Skolithos, and Chondrites burrows (Figure F7). These features are also present in much of the overlying ooze, wherein darker patches and blebs could represent burrows that were at least to some degree destroyed by the destructive nature of RCB coring in unconsolidated sediment.
Subunit Ib
Subunit Ib is ~6 m of pale yellow (2.5Y 8/2) to white (2.5Y 8/1) upper Oligocene nannofossil chalk with foraminifers (Figures F7C, F8C–F8D). The upper contact with Subunit Ia is marked by a color change from white gray (GLEY 1 8/N) to pale yellow (2.5Y 8/2) and a slight increase in magnetic susceptibility. This contact, which occurs in a 2 cm thick interval of mousse-like drilling disturbance, was incompletely recovered and apparently represents a hiatus from the upper Miocene to upper Oligocene (see Biostratigraphy and paleoenvironment and Age model and sedimentation rates). The entirety of Subunit Ib is moderately bioturbated with common Zoophycos and Planolites burrows (Figure F7C). Slight biscuiting and fracturing occurs in the lower half of the subunit (Sections 371-U1506A-29R-1 and 29R-2).
Subunit Ic
Subunit Ic is 34 cm of middle Eocene glauconitic nannofossil chalk with foraminifers (Figures F6, F7D, F8E–F8H). The upper contact with Subunit Ib, defined by the appearance of glauconite in smear slides and a coincident color change to light greenish gray (5GY 9/1; Figure F6), represents a hiatus from the upper Oligocene to middle Eocene (see Biostratigraphy and paleoenvironment and Age model and sedimentation rates). The 34 cm of Subunit Ic is broken into two large pieces resulting from drilling disturbance.
Subunit Ic is intensely bioturbated with burrows containing Oligocene nannofossil chalk from Subunit Ib in the upper 20 cm. The entire subunit contains abundant millimeter-scale speckles of dark green glauconite. Glauconite is concentrated in the bottom 2 cm of Subunit Ic and occurs as centimeter-scale blebs.
Unit II
Unit II is a ~40 m thick sequence of mafic crystalline volcanic rocks that exhibits a range of textures and mineralogy and includes varying amounts of carbonate as veins and void infills (Figures F11, F12, F13).
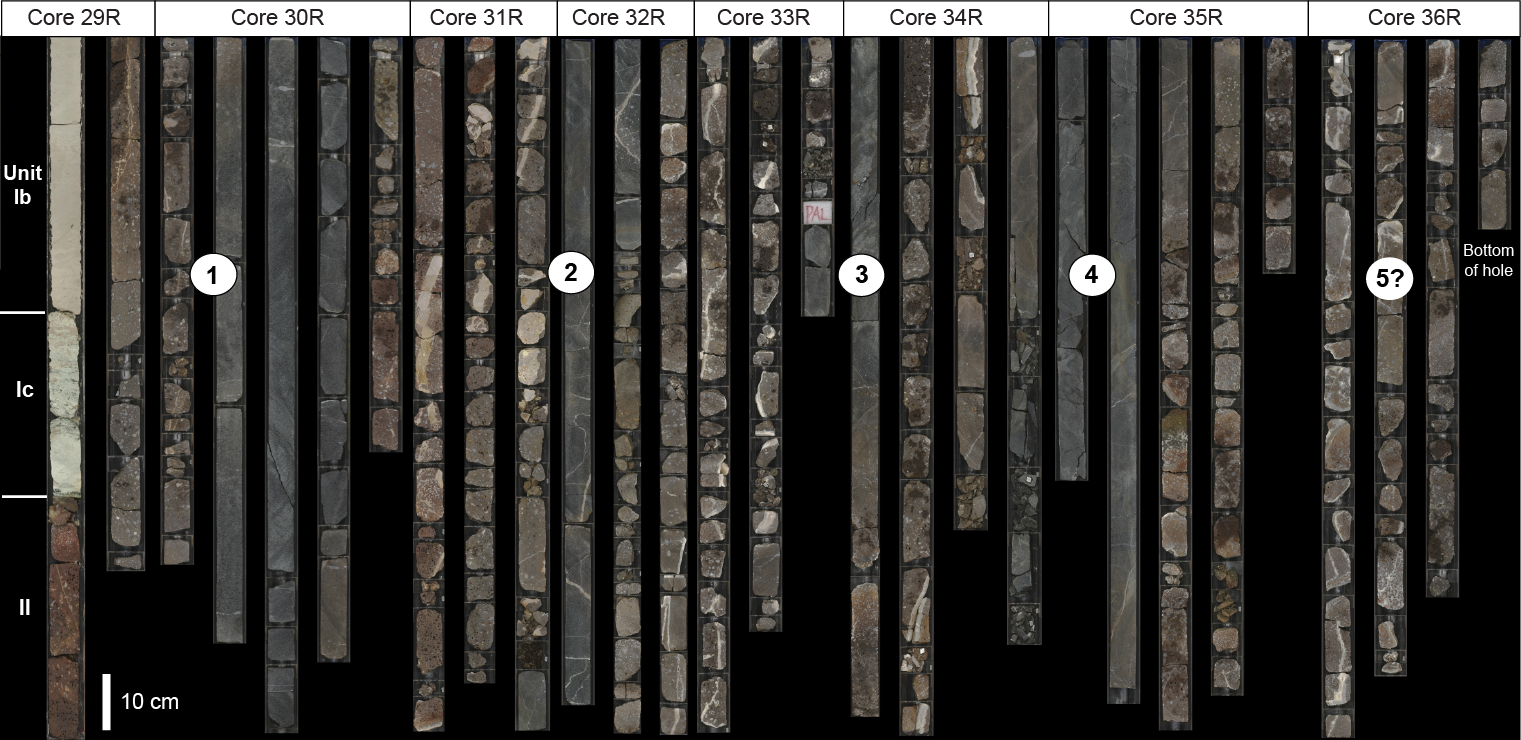
Figure F11. Alternating reddish brown microcrystalline amygdaloidal basalt and massive fine-grained dark gray basalt.
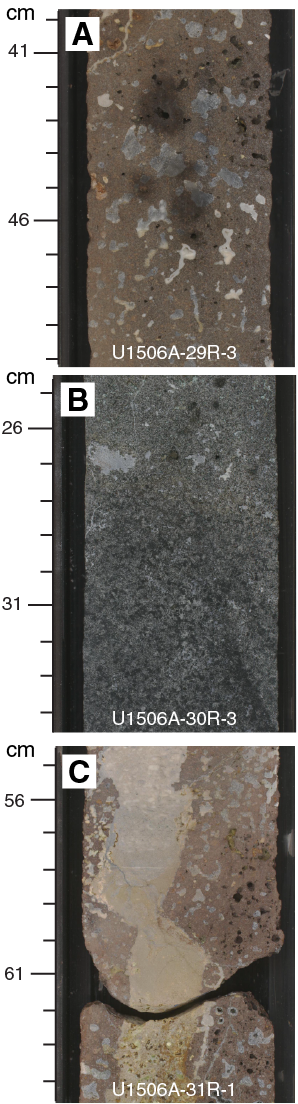
Figure F12. Representative crystalline rocks, section half images.
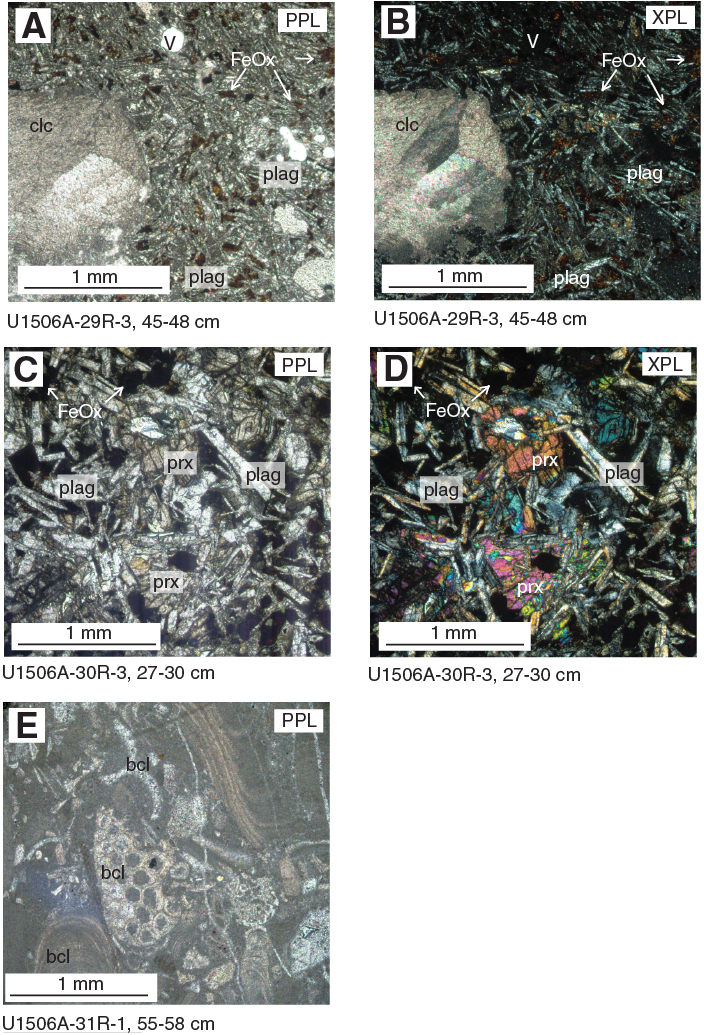
Figure F13. Representative crystalline rocks, photomicrographs.
The uppermost 2 cm of Unit II (interval 371-U1506A-29R-2, 97–99 cm; Figure F6) consists of a fine-grained, parallel-laminated, very dark grayish brown (2.5Y 3/2) layer separating the glauconitic nannofossil chalk of Subunit Ic from the crystalline volcanic rock that characterizes the rest of Unit II (Figure F11). Smear slide analysis indicates abundant iron oxides (hematite, limonite, and/or goethite), likely alteration products of the underlying basalt, and common glauconite (Figure F8I–F8J).
Below this thin dark brown layer, we identified two prominent textural facies of basaltic rock. Facies 1 consists of reddish brown (2.5YR 3/3 to 10R 4/2) amygdaloidal (bearing carbonate-filled vesicles) microcrystalline (grain size < 0.5 mm) basalt with abundant veins. Paired thin section and XRD analyses of the reddish brown facies (excluding calcite amygdules and veins) identified plagioclase as the dominant mineral, with common pyroxene (Figures F13, F14). Pyroxene crystals in this facies appear fractured and contain iron oxides and rarely a green mineral with colloform structure, possibly chlorite. Facies 2 consists of very dark gray (GLEY 1 3/N) nonvesicular fine-grained (grain size = 0.5–1 mm) basalt with fewer and thinner carbonate veins. Thin section and XRD analyses of Facies 2 again identified plagioclase as the dominant mineral, with common pyroxene and rare chlorite and iron oxides. The similar dominant mineralogy of the two facies suggests that the main difference between them is textural (grain size and degree of vesicularity/amygdularity) rather than compositional.
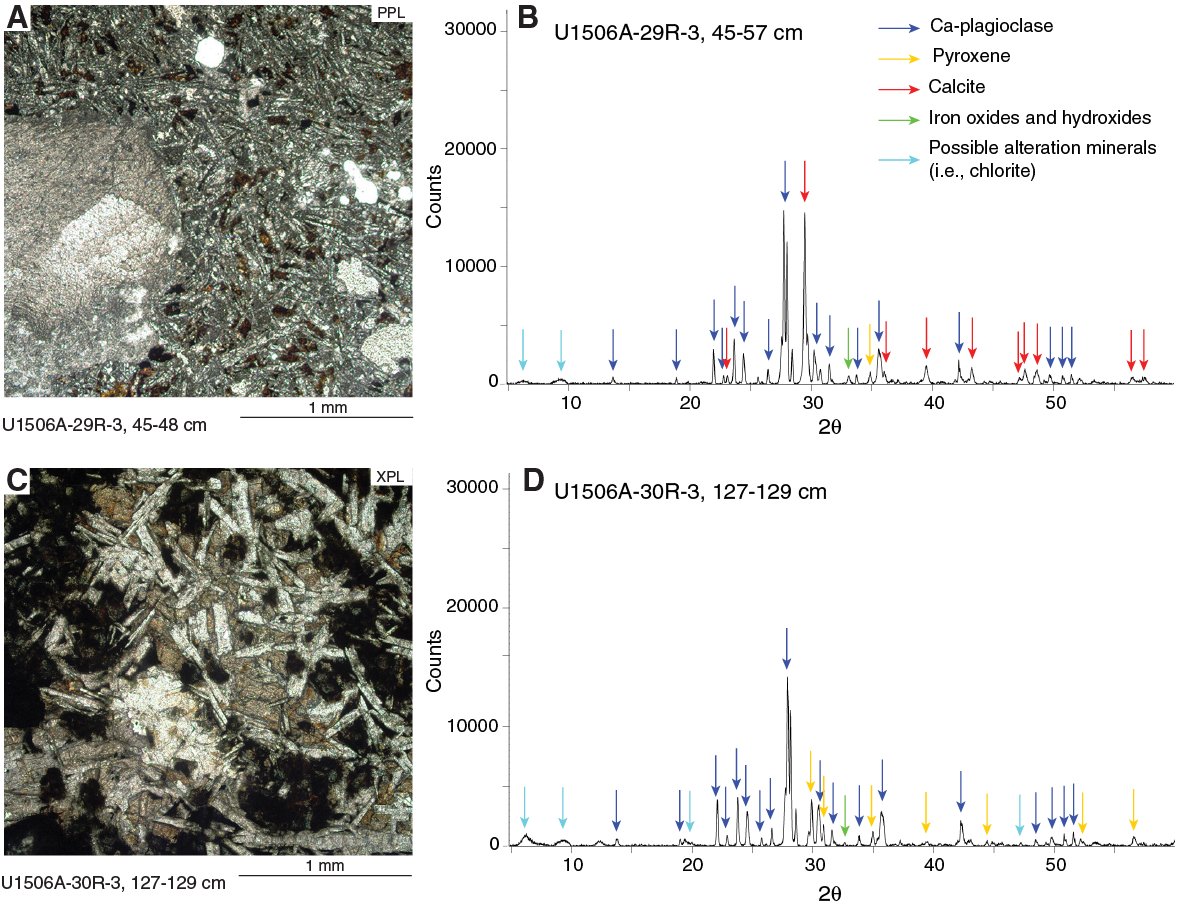
Figure F14. XRD results.
The two basalt facies alternate stratigraphically in ~10 m couplets, with each facies containing roughly equal thicknesses. Facies 1 is represented at 264.65–268.43, 272.99–276.67, 282.00–288.42, 292.81–295.90, and 299.35–305.65 m (Figure F11). Facies 2 is represented at 268.43–272.99, 276.73–282.20, 289.01–292.81, and 295.90–299.35 m. The superposition of the reddish brown facies in the uppermost interval and the subsequent alternation of these two facies throughout Unit II suggest that Facies 1 represents at least the top portion and potentially also the basal portion of an individual basalt emplacement or sequence, whereas the darker gray facies represents its central portion. This interpretation is supported by the higher degree of vesicularity (and subsequent amygdularity), smaller crystal size (suggesting a faster cooling rate), and greater degree of alteration and carbonate infilling that characterize the reddish brown facies. It is difficult to distinguish precisely the boundaries between the sequences because they are likely in the intervals of the reddish brown Facies 1 or may have been lost to core gaps. However, the occurrence of the dark gray facies (interpreted as the central portion of the sequence) allows for counting the individual sequences represented in Unit II. Four complete sequences (numbered 1–4 from top to bottom) and the upper reddish brown lithology of a fifth sequence were recovered (Figure F11).
Unit II contains abundant carbonate-filled veins and amygdules. Accessory mineral phases, possibly zeolites, were also observed. Although Facies 1 contains a significantly greater concentration of carbonate both as amygdules and veins than Facies 2, thin carbonate veins run through the entirety of Unit II (Figure F11). The most common carbonate veins are <1 mm thick, but a distinct set of veins are much larger (1–2 cm thick) and occur mostly in Facies 1 (Figure F12C). Most veins are composed primarily of large (generally up to the thickness of the veins) fibrous calcite crystals (Figure F13C–F13D. In some cases, however, voids are partially filled with micrite in the lower part and fibrous calcite in the upper part.
Several voids are filled with carbonate packstone composed of a micritic matrix (Figure F12C) that sometimes includes larger (up to several millimeters long) calcareous bioclasts (Figure F13E. Where micritic carbonate and large fibrous crystals co-occur, the micritic carbonate forms a flat-lying layer in the bottom of the vesicle. Bioclasts, recognized in thin section in a 2 cm thick subvertical micritic vein (interpreted as a neptunian dike) in Section 31R-1 (Figures F12C, F13E, include variably recrystallized fragments of bryozoans, red algae, brachiopods, foraminifers, and bivalves. This vein occurs in Facies 1 near the top of Sequence 2 or in the basal portion of Sequence 1 (Figure F11), is overlain by ~10 m of basalt (the central and upper portions of Sequence 1), and is underlain by ~30 m of basalt (Sequences 2–4). Calcareous nannofossils recovered from the micritic matrix of the infill of the dike yielded a maximum age of early Eocene (see Biostratigraphy and paleoenvironment). This age constraint, along with the middle Eocene age of Subunit Ic, informs the age of the basalt in Unit II. Certainly, Unit II is older than the overlying sediments of Subunit Ic and is thus middle Eocene or older. The neptunian dike (which is early Eocene or younger) occurs below the top sequence of basalt, ~10 m below the bottom of sedimentary Unit I. A straightforward interpretation of this stratigraphic relationship implies that the first basalt sequence is younger than the neptunian dike, constraining the age of the top basalt sequence to early or middle Eocene. However, we cannot rule out that the subvertical neptunian dike may be only a small part of a larger feature that crosscuts even the uppermost basalt and thus could be younger than the entirety of Unit II. In this case, the basalt may be middle Eocene or older.
Biostratigraphy and paleoenvironment
Calcareous nannofossil and planktic foraminifer biostratigraphic data at Site U1506 indicate a discontinuous early Eocene to Pleistocene age for the recovered sedimentary record (Table T3; Figure F15). Benthic foraminifer and ostracod assemblages indicate the site was located in lower bathyal water depths from the Oligocene to the Pleistocene, whereas Eocene assemblages indicate a shallowing of the depositional environment to upper bathyal water depths.
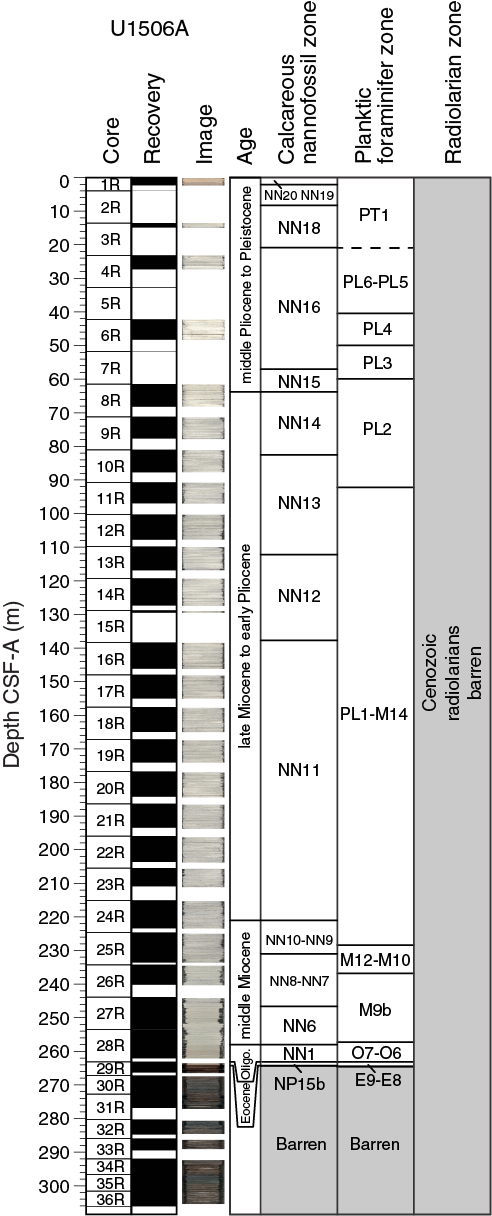
Figure F15. Microfossil biozonations.
Microfossil assemblages consist of moderate to moderately well preserved calcareous nannofossils, planktic and benthic foraminifers, and ostracods, indicating a depositional depth above the lysocline throughout the entirety of Hole U1506A (Figure F16). Rare heavily recrystallized radiolarians are found in Samples 9R-CC, 19R-CC, 23R-CC, 25R-CC, 27R-CC, and 28R-CC. This site is barren of other siliceous microfossils.
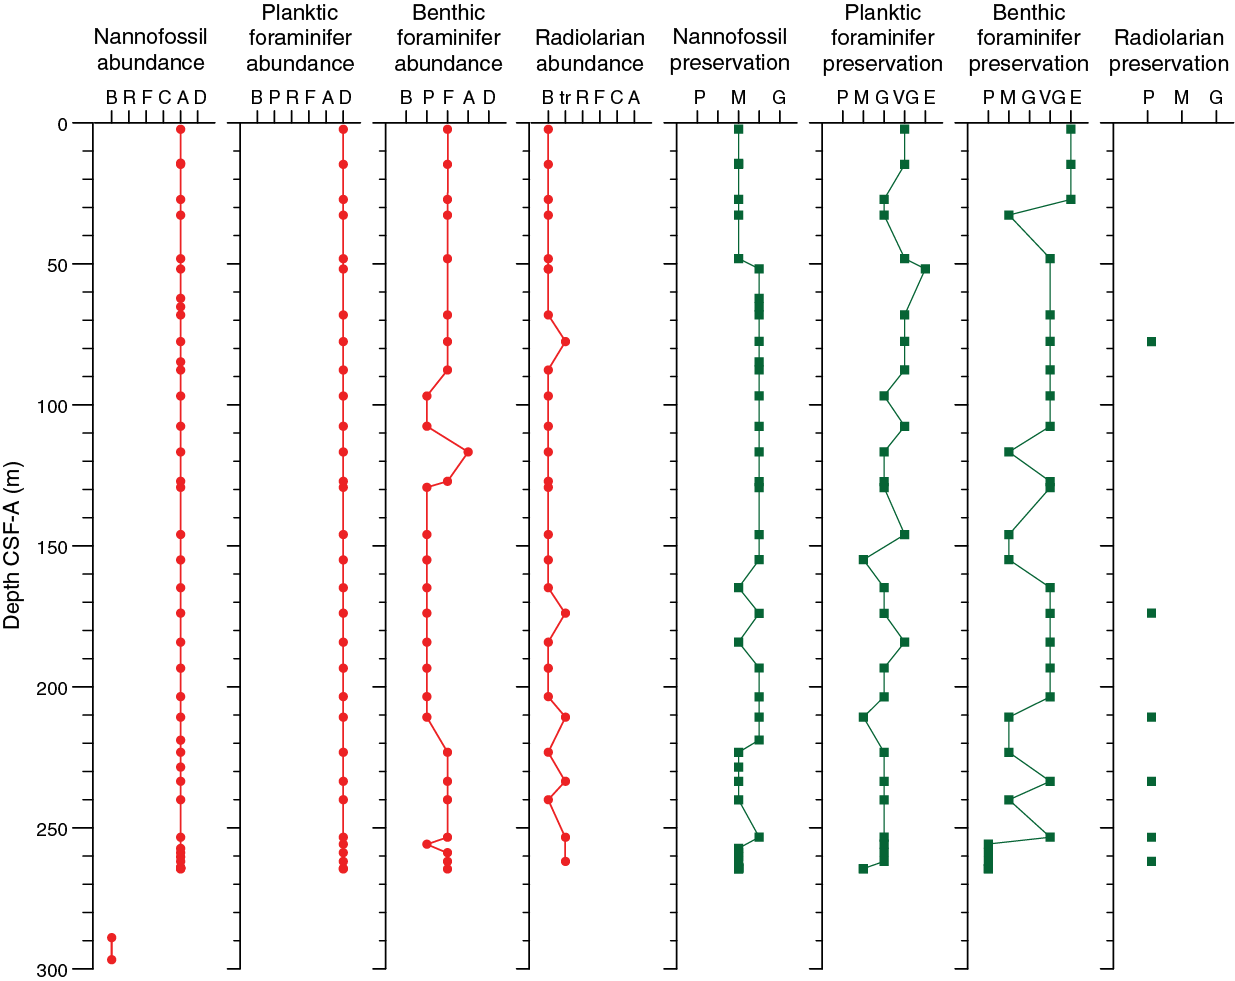
Figure F16. Microfossil abundance and preservation.
Biostratigraphic analysis of lithostratigraphic Subunits Ia (0–258.23 m) and Ib (258.23–264.29 m) reveals a Pleistocene to late Oligocene age that includes a middle Miocene to late Oligocene hiatus between Samples 27R-CC (nannofossil Zone NN6; planktic foraminifer Subzone M9b) and 28R-CC (nannofossil Zone NN1; planktic foraminifer Zones O6 and O7). Higher resolution sampling of Core 28R allowed the identification of a condensed interval between Samples 28R-3, 75 cm, and 28R-4, 75 cm, that accumulated over approximately 10 My. Subunit Ic (~264.29–264.63 m), a 34 cm thick interval consisting of highly bioturbated glauconite-rich nannofossil chalk, is of middle Eocene age (~45 Ma; nannofossil Zone NP15b). This age is based on nannofossil biostratigraphy and a benthic foraminifer datum and suggests erosion or nondeposition of sediments during the middle Eocene to the late Oligocene (~20 My). A sediment sample from a filled burrow in this subunit (Sample 29R-2, 70 cm) was dated as late Oligocene in age (nannofossil Zone NP25). Samples 33R-CC and 34R-CC were analyzed but were barren of microfossils. Core catcher samples from Cores 29R through 32R, 35R, and 36R were not analyzed for microfossils due to the hard volcanic rock recovered. However, one sample from the carbonate neptunian dike in the basalt (Sample 31R-2, 53–55 cm) was examined for calcareous nannofossils. Based on nannofossil assemblages, this interval is early Eocene or younger in age.
The benthic foraminifer and ostracod assemblages indicate a deep-water lower bathyal setting through the latest Oligocene to Pleistocene (Cores 1R through 28R). The middle Eocene benthic foraminiferal fauna is characteristic of an upper bathyal environment at about 500–1000 m, significantly shallower than the succeeding late Oligocene and younger intervals.
Calcareous nannofossils
Calcareous nannofossil biohorizons are primarily based on core catcher samples. Additional samples from working-half sections were used to refine ages for select intervals. Calcareous nannofossil distribution data are based on shipboard observations, focusing on species that are age diagnostic, and may not be fully representative of the full nannofossil assemblage (Table T4).
Calcareous nannofossils are abundant in Cores 371-U1506A-1R and 3R through 29R, and preservation ranges from moderate to moderately well preserved (Figure F16). Core 2R had zero recovery, and Cores 29R through 36R contain volcanic rocks.
The uppermost sample (1R-CC) can be recognized as nannofossil Zone NN20/NN21 due to the presence of medium-sized specimens of Gephyrocapsa spp. and the absence of Pseudoemiliania lacunosa. Samples 3R-1, 75 cm, and 3R-CC indicate a nannofossil assemblage from Zone NN18 of early Pleistocene age based on the presence of Discoaster brouweri and Helicosphaera sellii. The presence of Discoaster pentaradiatus and Discoaster tamalis in the next interval places Cores 4R through 7R in the late to middle Pliocene (Zone NN16), and the presence of Sphenolithus spp. in Sample 6R-CC supports this age. The top of Reticulofenestra pseudoumbilicus is the marker for the top of Zone NN15, identified in Sample 8R-1, 75 cm.
Cores 8R through 24R (65.25–218.85 m) represent an expanded early Pliocene to late Miocene interval with nannofossil zones predominantly based on species of Amaurolithus and Ceratolithus, although they were relatively rare in the samples analyzed. Additional low-resolution scans (63× magnification) were made to account for these taxa. The overgrown discoasters (ray tips and central area bosses) in the samples also made the placement of nannofossil zones in this interval difficult. Samples 8R-3, 75 cm, to 9R-CC indicate a late Pliocene age (Zone NN14) based on the appearance of Amaurolithus spp. The presence of Amaurolithus primus and Ceratolithus rugosus in Samples 10R-CC to 12R-CC indicates nannofossil Zone NN13. The absence of C. rugosus in Samples 13R-CC through 15R-CC suggests nannofossil Zone NN12, which spans the Pliocene/Miocene boundary. The subsequent interval to Sample 24R-3, 75 cm, represents nannofossil assemblages from Zone NN11 because Discoaster quinqueramus is present.
The middle Miocene is recorded in six samples: 24R-CC to 28R-3, 75 cm. Nannofossil Zone NN9 is identified by the presence of Discoaster hamatus and Discoaster neohamatus and the absence of D. pentaradiatus. Zone NN7 is identified by the presence of large Coccolithus miopelagicus specimens, whereas Zone NN6 is indicated by the presence of Cyclicargolithus floridanus and the frequent occurrence of Calcidiscus premacintyrei.
Calcareous nannofossils in Sample 28R-4, 75 cm, contain a late Oligocene assemblage with the presence of Zygrhablithus bijugatus and Dictyococcites bisectus (>10 µm). This assemblage indicates a hiatus of ~10 My and corresponds to a lithostratigraphic change from Subunit Ia to Ib. Sphenolithus ciperoensis is present in Sample 29R-2, 63 cm, the top of which is the nannofossil zonal marker for the top of Zone NP25.
A second hiatus of ~20 My exists between Samples 29R-2, 63 cm, and 29R-2, 70 cm. This hiatus coincides with a significant lithologic change between lithostratigraphic Subunits Ib and Ic. The nannofossil assemblage in Sample 29R-2, 70 cm, records a middle Eocene age, particularly because of the presence of Chiasmolithus gigas, which is also present in Sample 29R-2, 94 cm, and restricts this interval to Subzone NP15b (44.12–45.49 Ma). Burrows in Subunit Ic that contain pale yellow material yield a nannofossil assemblage of late Oligocene age, confirming that the material in the burrows originates from Subunit Ib.
Volcanic rocks were recovered from 306.1 m to the base of the hole. Smear slides of material recovered from Cores 33R and 34R were barren of nannofossils. Sample 31R-2, 53–55 cm, collected from a carbonate neptunian dike (see Lithostratigraphy), yielded rare calcareous nannofossils, including Reticulofenestra spp., Dictyococcites spp., and C. floridanus (Figure F17) Their presence suggests an early Eocene or younger age.
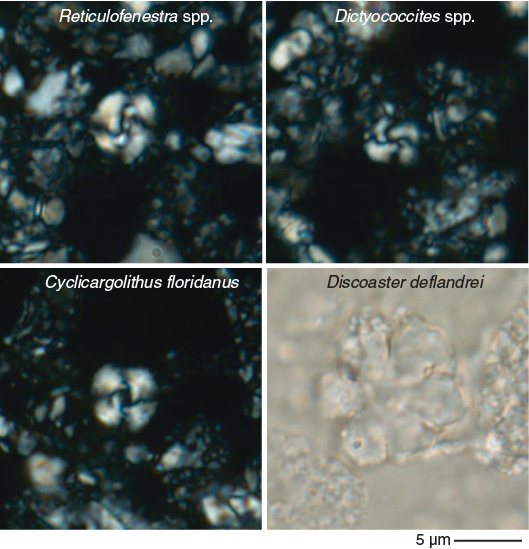
Figure F17. Early Eocene or younger calcareous nannofossils recovered from carbonate neptunian dike.
Planktic foraminifers
Core catchers and additional samples from working-half sections contain diverse and generally well preserved assemblages of planktic foraminifers from the Pleistocene to middle Eocene (Figures F16, F18). The stratigraphic distribution of planktic foraminifers is shown in Table T5.
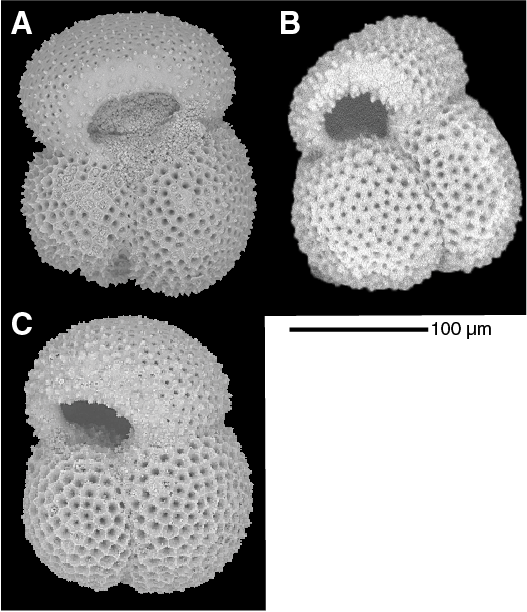
Figure F18. Preservation state of planktic foraminifers.
The uppermost interval from Samples 371-U1506A-1R-CC to 3R-CC (2.20–14.76 m) contains Globorotalia truncatulinoides, which is indicative of Pleistocene age. Samples 4R-CC to 10R-CC (27.16–87.57 m) contain diverse and well-preserved Pliocene assemblages, including the marker species Globoquadrina altispira, Sphaeroidinellopsis seminulina, and Hirsutella margaritae, which indicate planktic foraminifer Zones PL5 through PL2. The top of Globoturborotalita nepenthes between Samples 10R-CC and 11R-CC (87.57 and 96.80 m) marks the Zone PL2/PL1 boundary. Samples 11R-CC to 24R-CC (96.80–223.33 m) contain H. margaritae and Globorotalia cibaoensis, suggesting an age of late Miocene to early Pliocene. The rare occurrences of Globorotalia tumida and Sphaeroidinella dehiscens sensu lato hamper further differentiation of biozones.
The top of Paragloborotalia mayeri indicates the Subzone M13a/Zone M12 boundary and is located between Samples 24R-CC and 25R-CC (223.23 and 233.50 m). Samples 26R-CC to 28R-2, 74–76 cm (240.05–255.74 m), yield the middle Miocene Fohsella lineage (Fohsella fohsi fohsi, Fohsella fohsi lobata, and Fohsella robusta), indicating Subzone M9b. An upper Oligocene assemblage was recovered from Samples 28R-4, 72–73 cm, to 28R-CC (258.72–262.00 m) with the co-occurrence of Globigerinoides primordius and Catapsydrax dissimilis and the absence of Paragloborotalia kugleri and Paragloborotalia pseudokugleri, suggesting Zones O7 through O6. Globoquadrina dehiscens is present in Samples 26R-CC to 28R-CC (240.05–261.90 m), ranging from Subzone M9b to Zone O6. The range of G. dehiscens is different from the tropical planktic foraminiferal biostratigraphy of Wade et al. (2011), in which the species occurs from Zone M14 to the Subzone M1b/M1a boundary. This suggests diachroneity of the species’ bioevents in the south Pacific.
Samples 29R-2, 78–84 cm, and 29R-2, 88–91 cm (264.44 and 264.54 m, respectively), contain Acarinina bullbrooki, Acarinina primitiva, Globigerinatheka subconglobata, Morozovella crater, and the benthic foraminifer Elphidium hampdenense. Collectively, these species suggest an age of middle Eocene Zones E9 and E8. Below Sample 29R-2, 88–91 cm (264.54 m), planktic foraminifers are rare or absent, preventing zonal demarcation.
Benthic foraminifers
Benthic foraminifers were examined semiquantitatively in core catcher samples and in additional working-half sections from Cores 371-U1506A-28R and 29R (Table T6). This group is predominantly rare relative to total sediment particles in the >63 µm fraction of all studied samples. Thus, benthic foraminifers are present in samples from the earliest Pliocene and late Miocene and listed as few in the rest of the cores. Significant variations in benthic foraminifer preservation are recorded throughout, ranging from excellent in Cores 1R through 4R to poor in Cores 28R and 29R (Figures F16, F19). A total of 1545 specimens were picked, and 117 taxa were identified at Site U1506. All samples are strongly dominated by calcareous taxa, with agglutinated taxa making up a minor component of the assemblages.
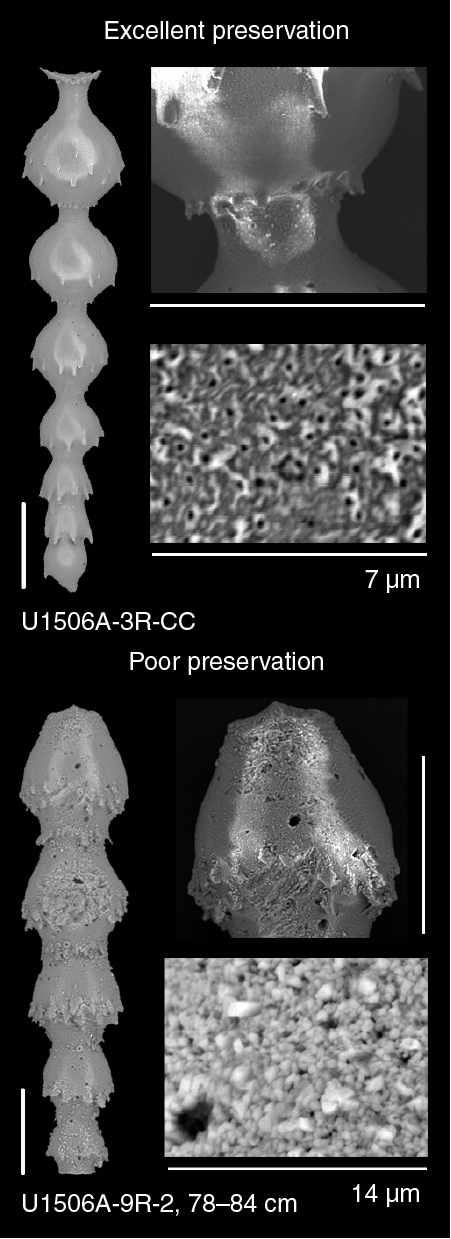
Figure F19. Two end-members of benthic foraminifer preservation states.
Pleistocene benthic foraminifer assemblages are dominated by infaunal morphogroups that indicate meso-eutrophic conditions at the seafloor. Lagenids, nodosariids, miliolids, and stilostomellids, as well as the species Planulina wuellerstorfi, Bolivina pusilla, Cibicidoides mundulus, Globocassidulina subglobosa, Epistominella vitrea, Nonion havanensis, Oridorsalis umbonatus, Sphaeroidina bulloides, and Uvigerina spp., are the most representative taxa.
Pliocene and Miocene benthic foraminifer assemblages, which have very good to moderate preservation, are also mostly dominated by infaunal taxa. These include nodosariids, lagenids, Pleurostomella spp., stilostomellids, Bolivina spp. (including B. pusilla), Bulimina spp. (incl. Bulimina forticostata), Fursenkoina spp., G. subglobosa, O. umbonatus, miliolids, and Spiroplectammina cubensis or Uvigerina spp. and indicate an abundant food supply to the seafloor. Some representative epifaunal taxa are Cibicides spp. (including Cibicides kullenbergi), Discorbinella bertheloti, and P. wuellerstorfi.
In terms of water paleodepth, the assemblages of Pleistocene to Miocene samples indicate deposition in the lower bathyal zone (van Morkhoven et al., 1986). This age is inferred from the common occurrence of lower bathyal and abyssal taxa (e.g., Alabamina creta, C. mundulus, E. vitrea, G. subglobosa, O. umbonatus, P. wuellerstorfi, Pyrgo murrhina, and Pullenia bulloides) and from the small number of taxa with an upper depth limit at 2000 m (van Morkhoven et al., 1986).
Two samples from Core 28R with poorly preserved Oligocene benthic foraminifers were examined. These samples contain abundant infaunal taxa such as Bulimina thanetensis, nodosariids, O. umbonatus, stilostomellids, Uvigerina peregrina, and Siphonina australis. Epifaunal taxa include Epistominella exigua and C. mundulus. Oligocene assemblages also indicate a lower bathyal paleodepth.
The taxonomic composition of the poorly preserved Eocene assemblages from Core 29R is significantly different from that of younger assemblages. They contain abundant Nuttallides truempyi, a species whose extinction marks the Eocene/Oligocene boundary. Other common taxa include E. hampdenense, Bulimina trinitatensis, Bulimina tuxpamensis, Cibicidoides eocaenus, Cibicidoides truncanus, Lenticulina spp., Oridorsalis spp. (including O. umbonatus), Pleurostomella spp., and stilostomellids. The occurrence of mixed infaunal and epifaunal morphogroups suggests mesotrophic conditions at the seafloor, and the assemblage composition indicates deposition in an upper bathyal environment. This paleodepth is significantly shallower than that inferred for the younger intervals at this site and is in agreement with the occurrence of abundant glauconite in Section 29R-2 (see Lithostratigraphy).
Ostracods
Ostracod fossil assemblages were investigated based on core catcher samples and additional working-half sections to interpret paleodepth through time. Ostracod preservation, abundance, assemblage composition, and paleodepth interpretation are summarized in Figure F20.
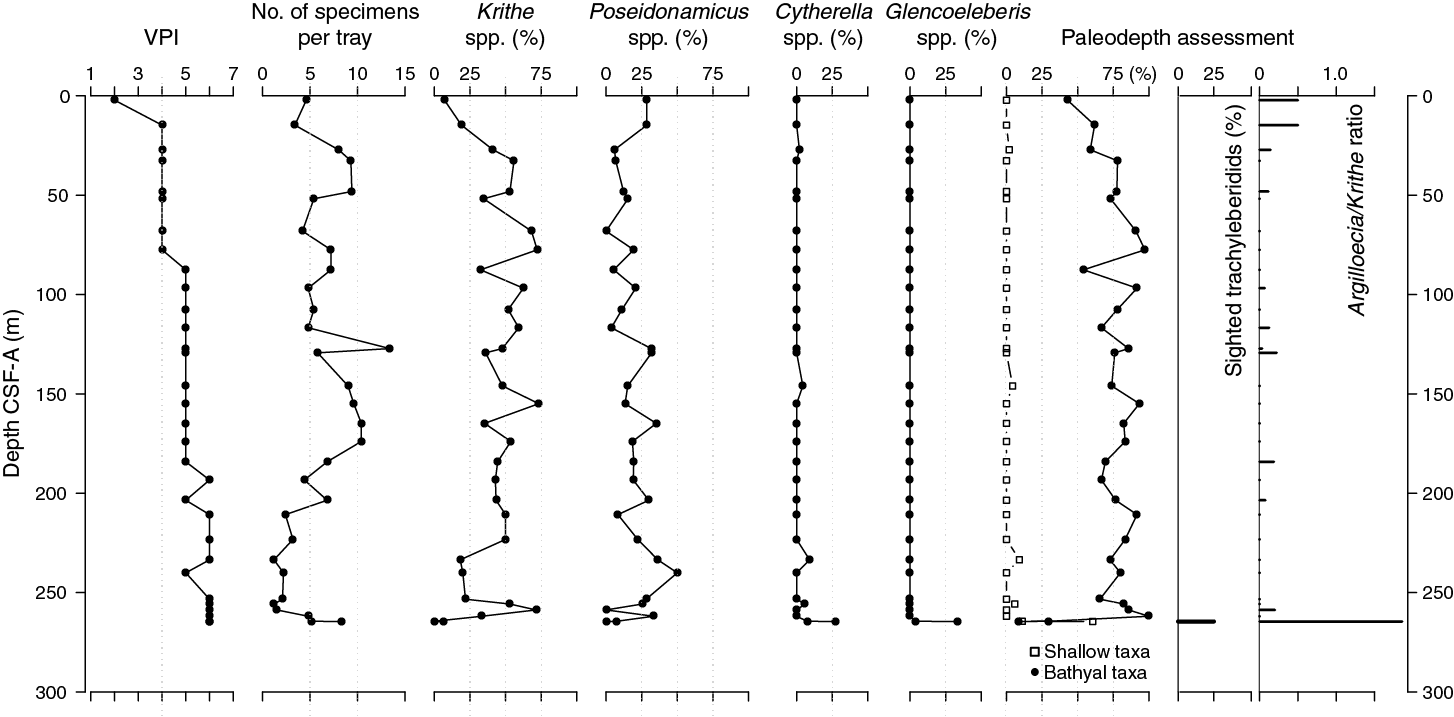
Figure F20. Ostracod preservation, abundance, and main assemblage composition.
Ostracod preservation is moderate overall. The visual preservation index (VPI) ranges from 1 to 7 (where 1 is excellent preservation and 7 is poor) and was used for preservation estimations (Dwyer et al., 1995). The fossils are relatively well preserved in the uppermost sections, where the VPI ranges from 2 to 5. Preservation gradually becomes poor in the lower sections, where the VPI ranges from 5 to 6.
In total, 1066 specimens were picked and 65 taxa were identified. The abundance data are standardized and presented as the number of specimens picked and identified per tray (Figure F20). Abundance ranges from 1 to 13 specimens. The most abundant intervals are Samples 371-U1506A-4R-CC to 22R-CC (27.16–203.52 m) and 29R-2, 88–91 cm (264.54 m). The least abundant interval is Samples 23R-CC to 28R-CC (210.76–261.90 m). The dominant genera are Krithe and Poseidonamicus. Other abundant genera include Bradleya, Cytheropteron, Cytherella, Glencoeleberis, and Argilloecia.
Paleodepth estimates are based on changes in (1) the percentages of taxa representing bathyal and shallow environments and (2) the percentage of sighted individuals belonging to the trachyleberidids (Figure F20). Estimates were made by applying the modern distribution range of extant species and by observing the presence/absence of ocular structures on individual specimens of trachyleberidids. Figure F21 elaborates the difference between blind and sighted trachyleberidids. In addition, the Argilloecia/Krithe ratio was included in the assessment because it is generally (but not absolutely) higher in shallow areas (Ayress, 1994). In Samples 1R-CC to 28R-CC (2.2–261.90 m), the dominance of the exclusively deep-water genus Poseidonamicus and the typical deep-sea genus Krithe indicate a >1000 m water depth (lower bathyal). In Sample 29R-2, 88–91 cm (264.54 m), a shallower setting (upper bathyal) is determined: the dominant assemblage components are replaced by shallow taxa, including Cytherella spp. and Glencoeleberis spp. The percentage of sighted trachyleberidids also increases to 25%. However, the occurrence of blind trachyleberidids and Krithe spp. indicates bathyal inputs. The paleodepth estimates based on ostracods agree overall with interpretations made from benthic foraminiferal assemblages.
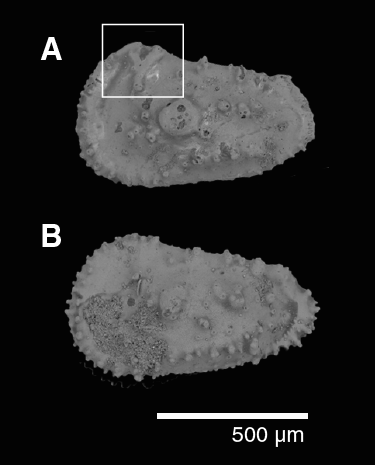
Figure F21. Trachyleberidis with and without ocular structure.
Radiolarians
Core catcher samples from Cores 371-U1506A-1R through 28R, 33R, and 34R were examined. Rare heavily recrystallized radiolarians were found in Samples 9R-CC, 19R-CC, 23R-CC, 25R-CC, and 27R-CC, which may very tentatively be of Mesozoic age, and in Sample 28R-CC, which may very tentatively be of Paleozoic age (Figure F22A. If these specimens do indeed belong to Mesozoic and Paleozoic affinities, the findings imply there was an exposed siliceous-rich source in the past. No other siliceous microfossils, such as diatoms, sponge spicules, or silicoflagellates, were found at this site.
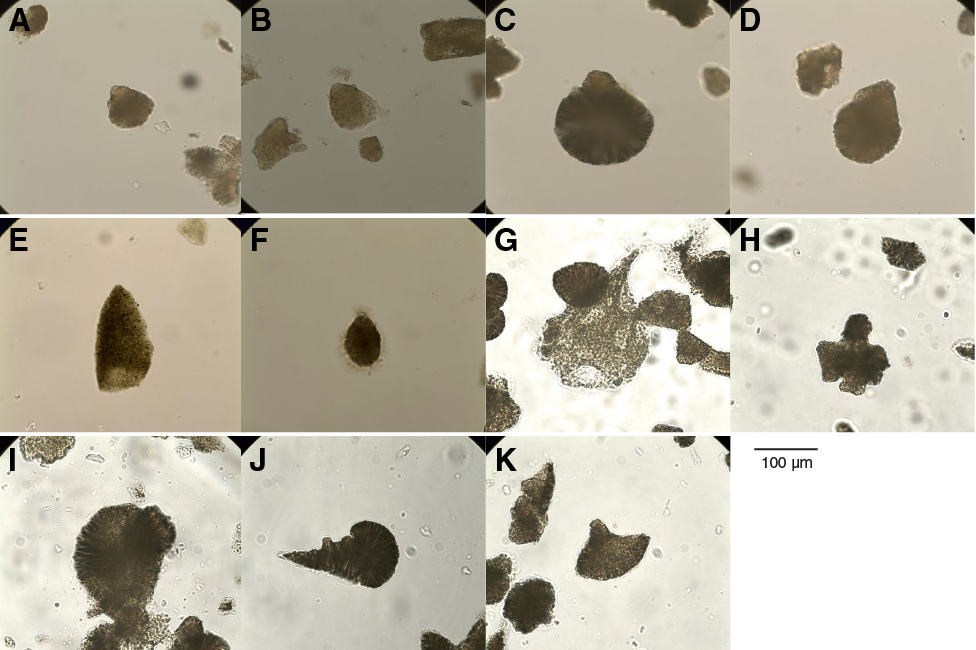
Figure F22. Radiolarians of tentative Mesozoic and Paleozoic affinities.
Palynology
A palynological reconnaissance study was carried out on core catcher samples from Cores 371-U1506A-24R, 26R, and 28R and an additional sample from the middle Eocene glauconite-rich layer in Section 29R-2. These samples yielded no palynomorphs.
Fossil content of Unit II
Thin section analysis of a neptunian dike in volcanic Unit II revealed a mixed assemblage of marine fossils, including red algae, charophyte and possible dacyclad green algae, bivalves, ostracods, foraminifers, few calcareous nannofossils, rare echinoderm spines, and rare recrystallized bryozoans (Figure F23). Recrystallization greatly restricted classification of the fossils. However, the fossil assemblage indicates the volcanic activity took place in or near a carbonate platform environment during or shortly after the early Eocene.
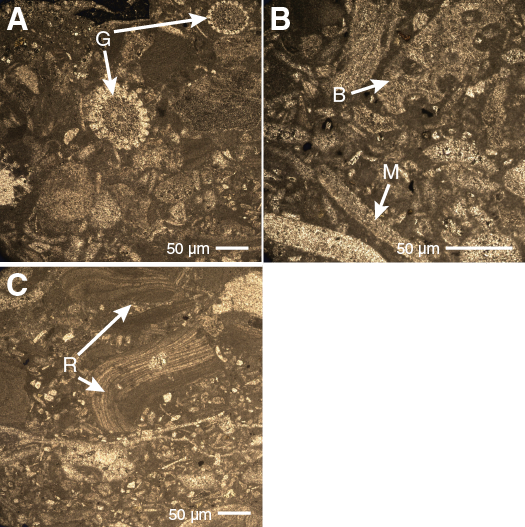
Figure F23. Macrofossils in carbonate neptunian dike.
Conclusions
Micropaleontological analysis of lithostratigraphic Subunits Ia (0–258.23 m) and Ib (258.23–264.29 m) reveals a Pleistocene to late Oligocene age at Site U1506 and deposition in a lower bathyal environment. This includes a middle Miocene to late Oligocene hiatus. Subunit Ic (~264.29–264.63 m) is of middle Eocene age (~45 Ma; Zone NP15b). It corresponds to a condensed interval and was deposited at a significantly shallower upper bathyal paleodepth. The age of this subunit implies a ~20 My hiatus (erosion or nondeposition of sediments) from the middle Eocene to late Oligocene. A mixed assemblage of marine fossils in a calcareous neptunian dike in volcanic Unit II reveals volcanic activity in or near a carbonate platform environment during or shortly after the early Eocene.
Paleomagnetism
Pass-through paleomagnetic measurement was performed on the archive-half sections of all cores recovered from Site U1506 (Cores 371-U1506A-1R through 36R) in an effort to establish a magnetic polarity stratigraphy. Additionally, 44 discrete samples were collected from working-half sections (Cores 1R through 28R).
Paleomagnetic results
Downhole paleomagnetic data show variable quality for different lithostratigraphic units (see Lithostratigraphy), which is shown by plotting the natural remanent magnetization (NRM) intensity, NRM inclination, and inclination after 20 mT alternating field (AF) demagnetization with respect to depth (Figure F24). In the nannofossil ooze interval in Unit I (Cores 371-U1506A-1R through 25R; 0–240 m), paleomagnetic directions were not stable, most likely because use of the RCB system disturbed the soft sediments significantly. The quality of the paleomagnetic data can be assessed further with histograms of inclination values (Figure F25). In the upper 240 m, values cluster around 0° with no bimodal (positive and negative) distribution of inclination. However, in the more lithified chalk interval in Unit I (Cores 27R through 29R; 240–270 m), consistently high or low paleomagnetic inclinations were obtained, indicating a series of normal and reversed polarity intervals (Figures F24, F26). The histogram of inclination values for the chalk interval is characterized by two relatively distinct peaks at approximately ±50°, the clustering of which increases after 20 mT AF cleaning (Figure F25B. The latter observation indicates that most of the viscous overprint can be removed after applying 20 mT AF demagnetization.
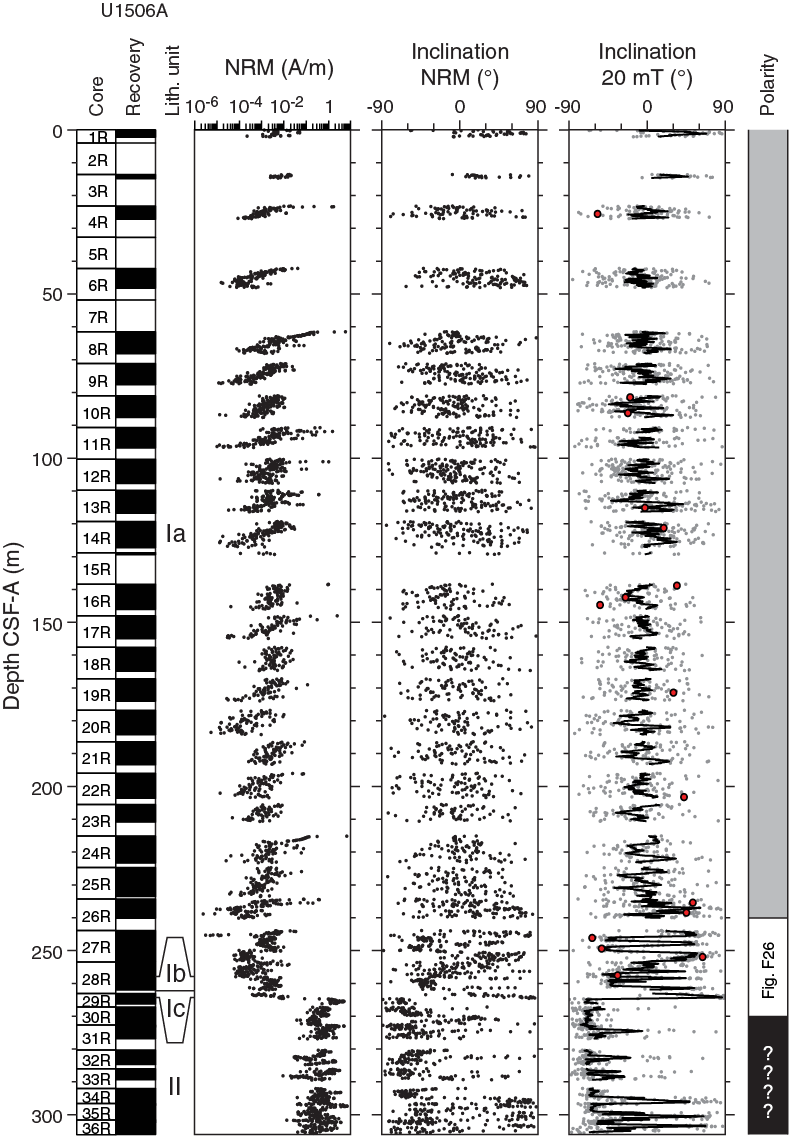
Figure F24. Pass-through paleomagnetic data.
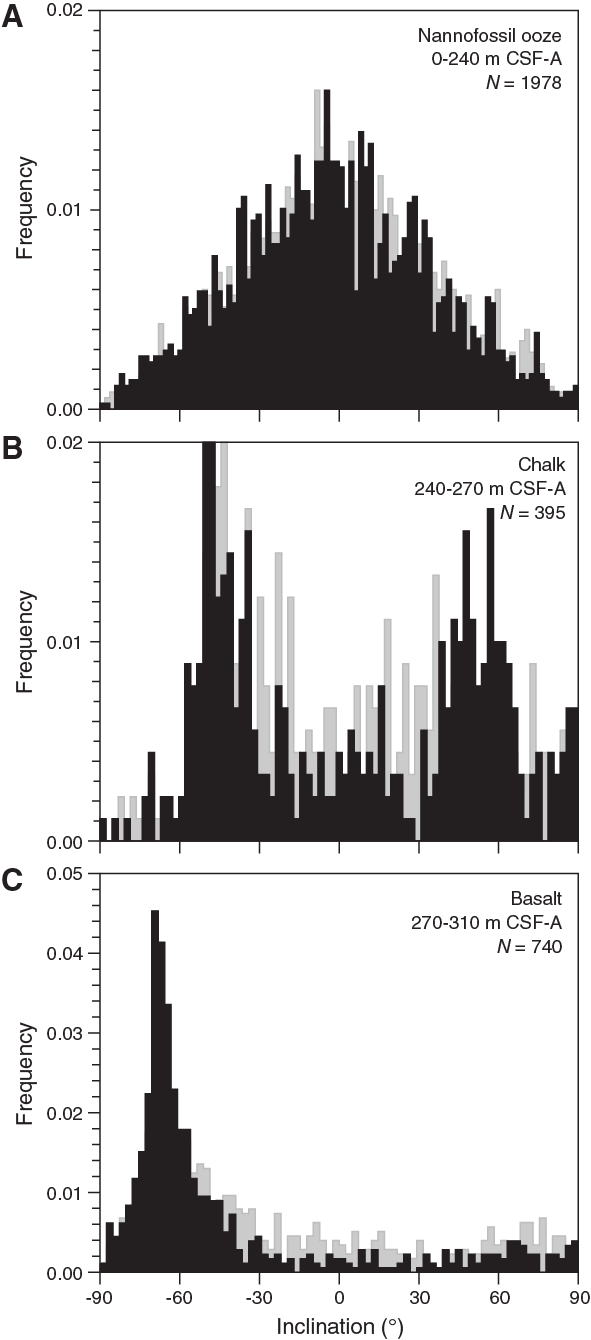
Figure F25. Inclination values.
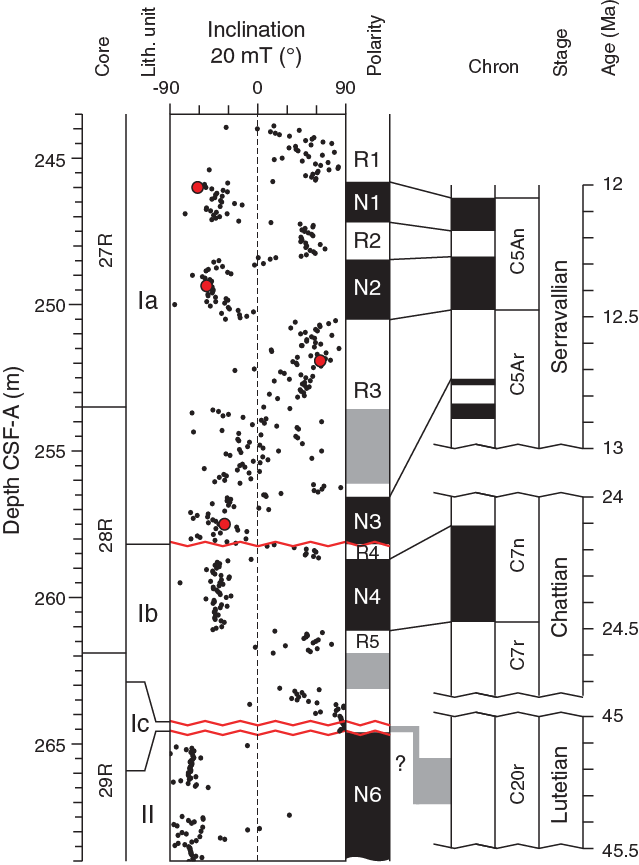
Figure F26. Paleomagnetic results for chalk interval.
The cores of Unit II basalt (Cores 29R through 36R; 270–310 m) yielded stable paleomagnetic signals after removing overprinting with 20 mT AF demagnetization (Figure F24). Most of the volcanic intervals show a steep negative inclination of the characteristic remanent magnetization (ChRM), indicating normal magnetic polarity (Figure F25C. However, parts of the volcanic interval were not affected by AF demagnetization at 20 mT and kept a positive inclination consistent with reversed polarity (Figure F24). Further analyses (e.g., thermal demagnetization) are required to properly investigate the paleomagnetic signal of the volcanic rocks.
Results from analyses of discrete samples from Site U1506 also show variable behavior largely related to the NRM intensity (Figure F27). After AF demagnetization, samples collected from the nannofossil ooze in Unit I are characterized by vector endpoints either poorly aligned or randomly distributed. However, some samples from this lithology are characterized by stable linear behavior with a ChRM direction isolated after AF demagnetization at 10 mT (Figure F27C). Discrete samples from the chalk interval in Unit I are also characterized by stable linear behavior with a ChRM direction isolated between 10 and 70 mT. In this stratigraphic interval, inclination values from principal component analysis (PCA) (Kirschvink, 1980) and pass-through inclination values after 20 mT AF demagnetization are highly consistent (Figure F26).

Figure F27. Vector endpoint demagnetization diagrams.
Magnetostratigraphy
Across the nannofossil ooze interval (0–240 m), no reliable shipboard magnetostratigraphy can be obtained because of the low NRM intensity. However, considering biostratigraphic constraints from the chalk interval between 240 and 270 m (see Biostratigraphy and paleoenvironment), the observed normal polarities N1 and N2 in Core 371-U1506A-27R can be correlated to Chrons C5An.1n and C5An.2n (Gradstein et al., 2012), respectively (Table T7). In Core 28R, the normal polarity N3 is possibly correlated to Chron C5Ar.1n, whereas normal polarity interval N4 can be correlated to Chron C7n.2n (Figure F26). Positive inclination reflecting reversed polarity was observed in Subunit Ic (Core 29R). Integration with biostratigraphic data allows us to assign this interval to Chron C20r. Most of the basalt (Cores 29R through 36R) has normal polarity, but the absence of other age constraints precludes magnetostratigraphic interpretation.
Petrophysics
Cores recovered from Hole U1506A were taken through the entire suite of physical properties measurements (see Petrophysics in the Expedition 371 methods chapter [Sutherland et al., 2019]), although neither wireline logs nor downhole temperature measurements were made. Primary differences seen in the measurements reflect the major change in lithology from calcareous sediment (lithostratigraphic Unit I) to underlying volcanic rocks (lithostratigraphic Unit II).
Lithostratigraphic Unit I exhibits small variations in magnetic susceptibility, color reflectance, and natural gamma radiation (NGR). In addition, measurable changes in sonic (P-wave) velocity and density are associated with the diagenetic change of ooze to chalk. A decrease in porosity occurs with depth, as is typical of carbonate ooze.
A large impedance contrast at 264 m is associated with a significant increase in both bulk density and P-wave velocity. This depth is the contact between sediment (Unit I) and volcanic rock (Unit II) and corresponds with the major reflection seen in the site survey multichannel seismic profiles at 2.29 s two-way traveltime (TWT). Variations in magnetic susceptibility, bulk density, and color reflectance below this major impedance contrast reflect the different basaltic rock facies in lithostratigraphic Unit II.
Density and porosity
Gamma ray attenuation (GRA) bulk density was measured on whole-round sections, whereas moisture and density (MAD) bulk density was determined on discrete samples (Figure F28). Bulk density varies between 1.6 and 1.8 g/cm3 in Cores 371-U1506A-1R and 28R (Unit I) and increases to 2.6–2.8 g/cm3 in Cores 30R through 36R (Unit II). From 150 m downhole, GRA progressively underestimates bulk density, a finding attributed to the progressive development of a gap between the core and core liner. MAD density values are considered more representative of true bulk density. In Unit I, grain density is approximately constant at 2.70 ± 0.03 g/cm3, consistent with the visual homogeneity of the carbonate ooze. Two outliers with grain density values of 2.84 and 2.90 g/cm3 (Samples 22R-3, 20 cm [199.20 m], and 24R-1, 44 cm [215.65 m]) were remeasured and the values reproduced; they show no obvious visual differences from adjacent sediment.
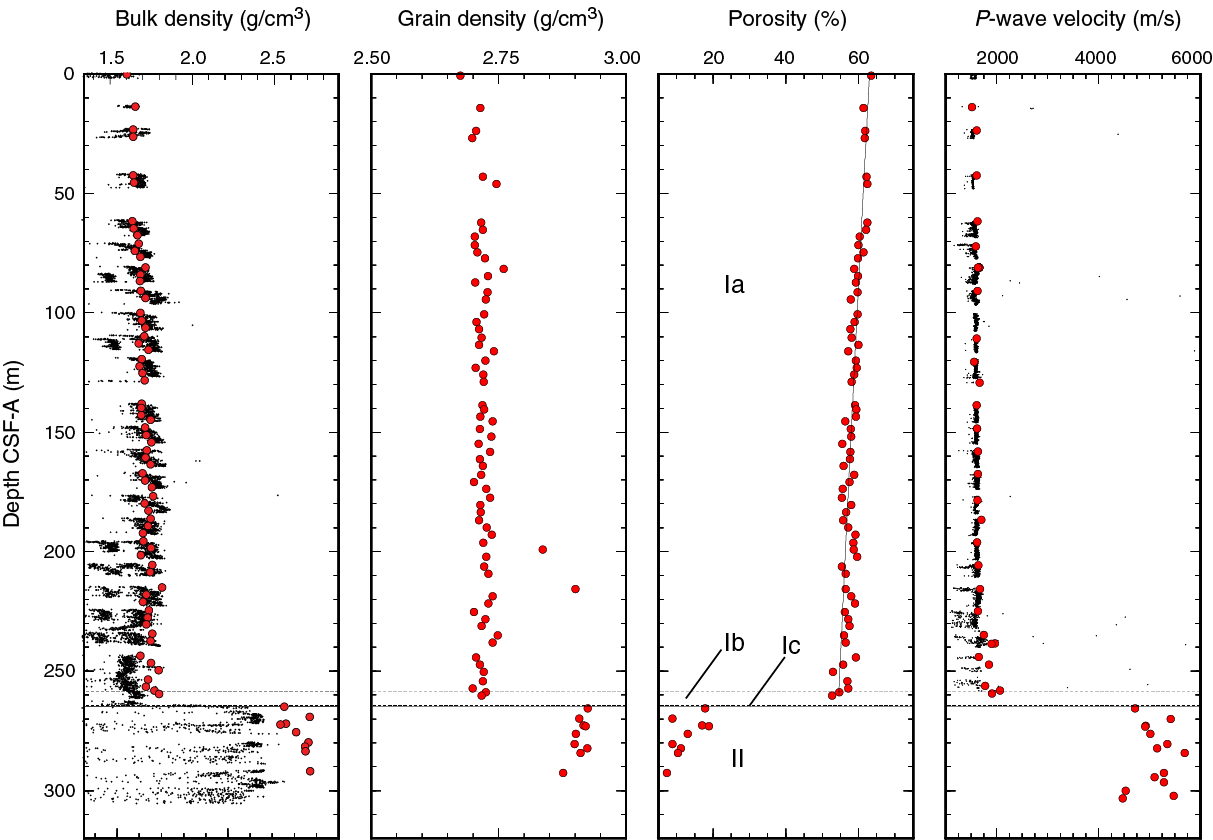
Figure F28. Bulk density, grain density, porosity, and P-wave velocity.
MAD-derived porosity values decrease from around 63% to 52% from the seafloor to the base of Unit I. A best-fitting curve of porosity (φ) decrease with depth (z) (i.e., φ = φoe−z/c) calculated for Unit l has φo = 62.1% ± 0.4% and c = 2377 ± 232 m (Figure F28), which is typical of calcareous ooze (Spinelli et al., 2004). Porosity values show higher variance in volcanic Unit ll but generally decrease to between 9% and 20%. The variance is attributed to lithology changes from mostly unaltered basalt to heavily weathered volcanic rocks with vesicles and amygdules.
P-wave velocity
P-wave velocity was measured on whole-round sections (P-wave logger [PWL]) and section halves (P-wave caliper [PWC] and P-wave bayonet [PWB]) (see Petrophysics in the Expedition 371 methods chapter [Sutherland et al., 2019]). PWL data are systematically lower than PWC and PWB values, and the discrepancy increases with depth in the ooze and chalk. This increase is partly attributed to the larger gap between the core and the liner in the deeper, firmer core sections. PWC and PWB P-wave velocity values are deemed more reliable. PWL measurements on whole-round sections were not possible on the volcanic rock in Unit II because the gaps between the core and the liner were substantial. PWC and PWB measurements were not successful in the first two cores of Unit I due to the fluid-like (“soupy”) material; however, three-component measurements were taken from 14 to 149 m (Cores 371-U1506A-3R through 14R, 16R, and 17R). At greater depths, lithification of the core increased to the point where the bayonets of the PWB cracked the sediment, making velocity values unreliable. Below Core 17R, only x-component caliper measurements were made in the sedimentary sequence. Three-component measurements were made on discrete rock samples taken from Cores 29R through 36R (Unit II).
PWC P-wave velocity values gradually increase with depth from ~1600 to ~2000 m/s in the sedimentary sequence (Figure F28). The upper 225 m of calcareous ooze has a low velocity gradient (~600 m/s/km; Cores 1R through 25R). Intermittently higher P-wave velocity values of ~2200 m/s occur in Cores 26R and 27R (234–253 m), suggesting a diagenetic transition of ooze to chalk. P-wave velocity values fluctuate by ~200 m/s in Cores 26R and 27R.
Volcanic rocks in Unit II have P-wave velocity values that range from 4400 to 6500 m/s. Velocity values >5600 m/s are characteristic of fine-grained gray basalt, and the lower range of velocity values is characteristic of reddish brown vesicular layers (Figure F28).
Magnetic susceptibility
Pass-through loop magnetic susceptibility (MSL) measurements were made on whole-round sections, and point magnetic susceptibility (MSP) measurements were made on all section halves (Figure F29). Magnetic susceptibility is low throughout the sedimentary section, −2 to 4 instrument units (IU) (Unit I), with a few local spikes up to 100 IU. In the volcanic rocks (Unit II), values range between ~0 and ~1500 IU with cyclic fluctuations (Figure F30) that correspond to dark gray basalt and reddish brown basalt sequences.
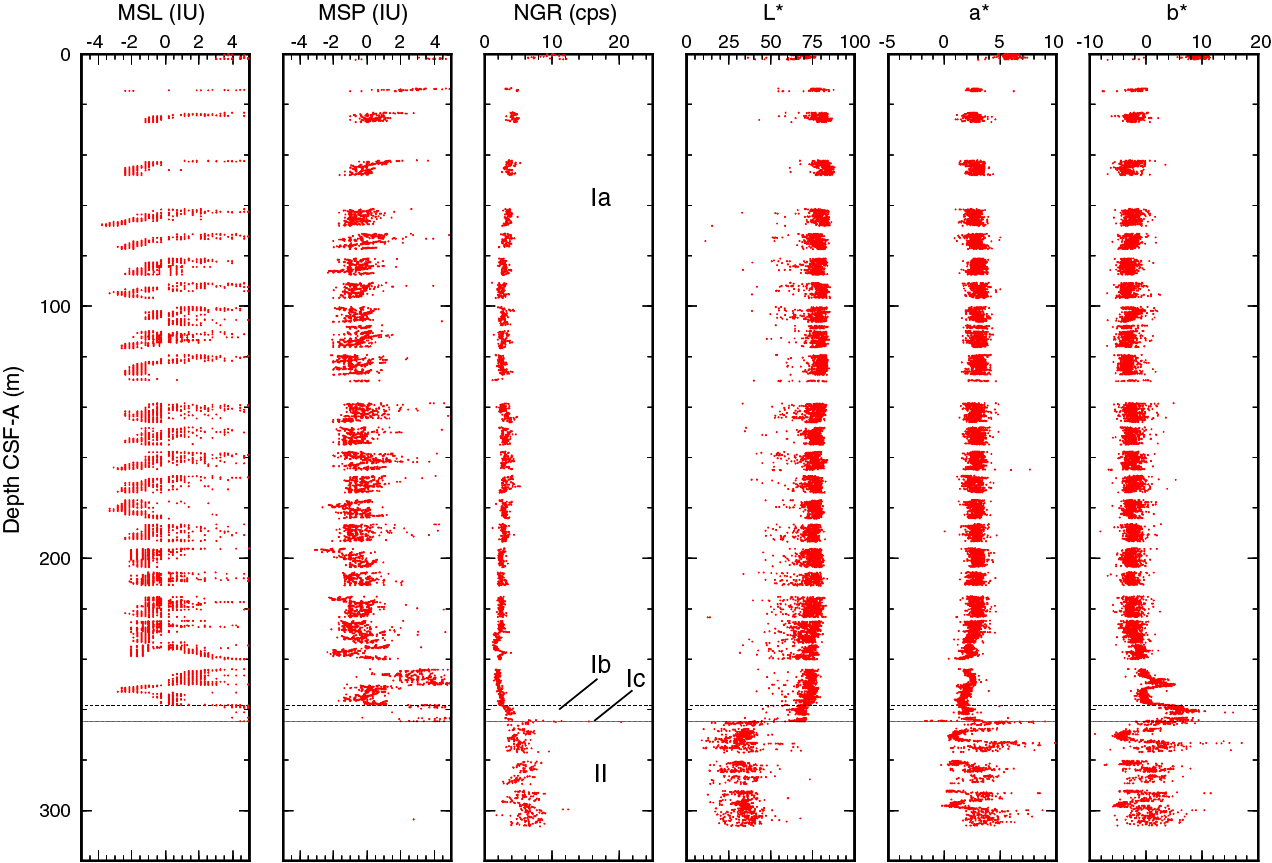
Figure F29. Magnetic susceptibility, NGR, and L*, a*, b*.
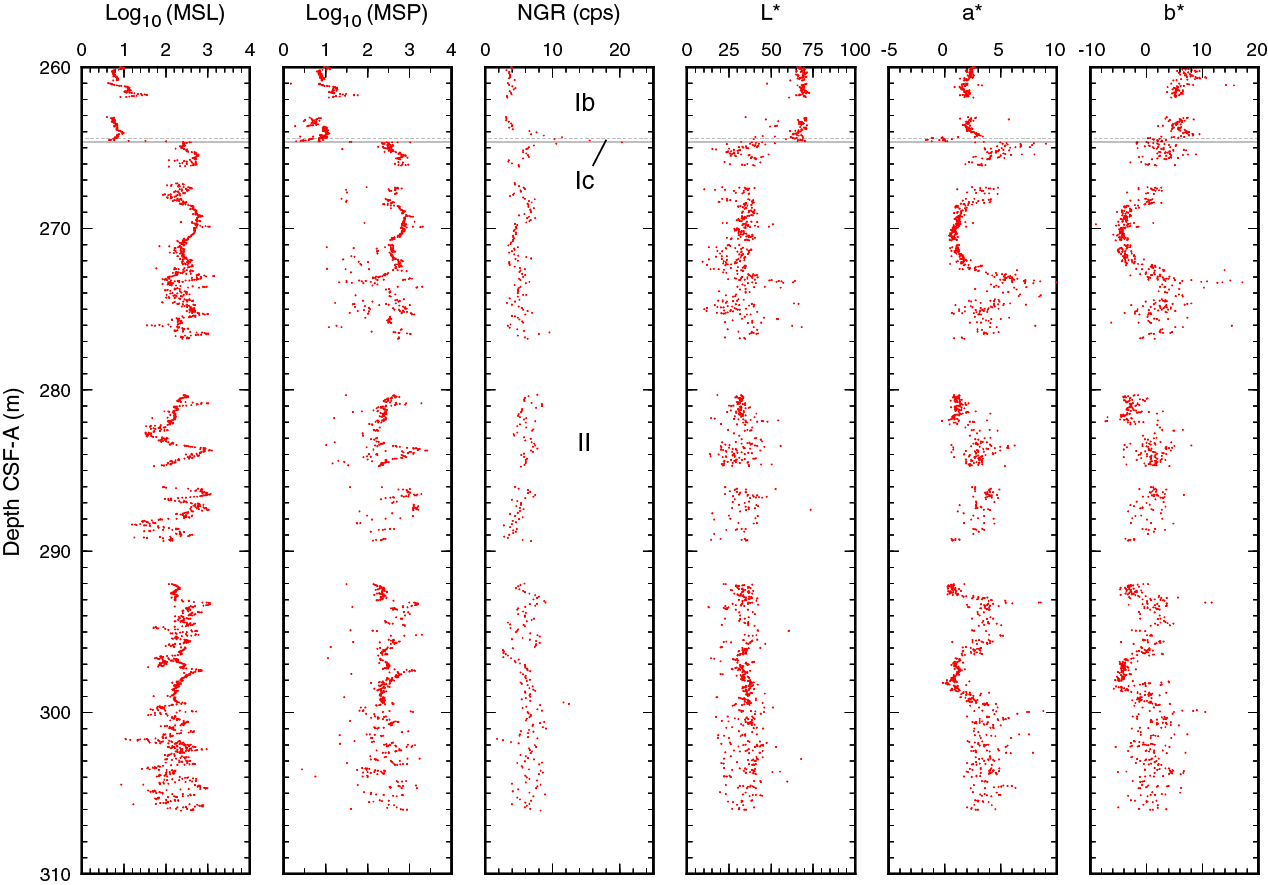
Figure F30. Magnetic susceptibility, NGR, and L*, a*, b*, Unit II.
Natural gamma radiation
NGR was measured on all whole-round sections (Figure F29). In the calcareous sediments in Unit I, NGR is low, decreasing downhole from ~8 to ~2 counts/s. NGR gradually increases with depth from ~2 to ~4 counts/s in Subunit Ib (Cores 371-U1506A-26R through 2R), with a sharp peak to ~25 counts/s over ~1 m near the sediment/rock interface in Subunit Ic (264.6 m; Unit I/II; Figure F30). The peak is associated with glauconitic nannofossil chalk with a thin layer of laminated brown mudstone at the unit interface (see Lithostratigraphy). NGR is variable between ~3 and ~9 counts/s in the volcanic rocks in Unit II and does not clearly correspond to lithologic variations in the volcanic sequence.
Thermal conductivity
Thermal conductivity was measured on cores of Unit I. The needle probe was used on whole-round sections from Cores 371-U1506A-1R through 25R, and the puck method was used on Cores 26R through 28R. Thermal conductivity data show a gradual and increasing trend with depth from 1.1 to 1.4 W/(m·K) over the uppermost ~250 m, consistent with expected values for calcareous ooze and chalk (Gallagher et al., 2017).
Sediment strength
Sediment strength was measured with both the automated vane shear and the penetrometer (Figure F31). To compare the two measurement types, unconfined shear strength can be estimated as one-half of unconfined compressive strength (see Petrophysics in the Expedition 371 methods chapter [Expedition 371 Scientists, 2019]). Strength generally increases with depth. Vane shear strength increases from ~18 kPa near the seafloor to ~40 kPa at 190 m. Compressive strength from penetrometer measurements is very low near the seafloor to ~72 m and then increases and becomes variable, ranging between ~60 and ~100 kPa to 186 m, where the sediments are too hard to penetrate with the tool.
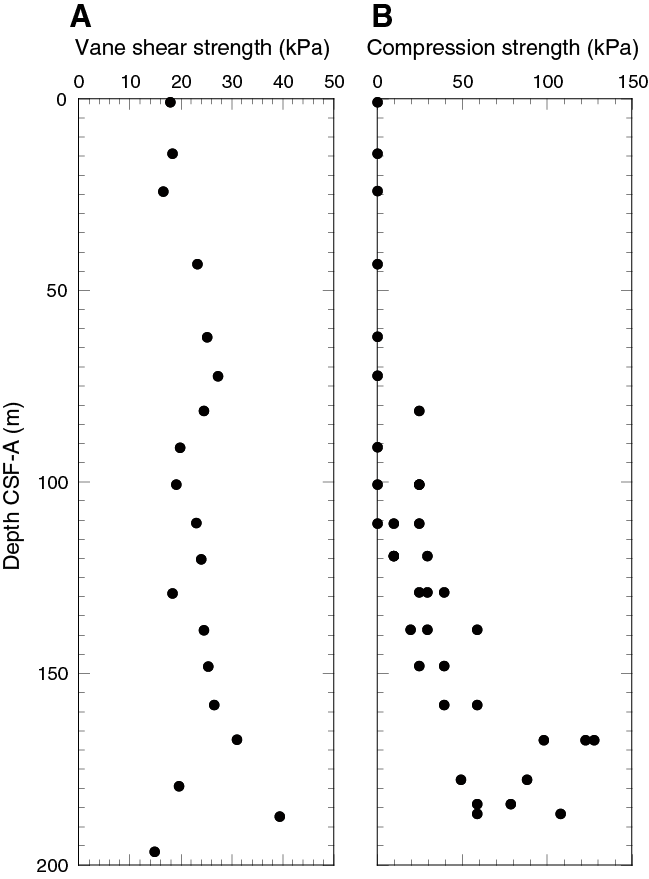
Figure F31. Shear strength.
Color spectrophotometry
In Unit I, reflectance L*, a*, and b* values are constant around ~75, ~2, and approximately −2, respectively (Figure F29). In Subunits Ib and Ic, reflectance b* values increase to ~5, reflecting a change to a yellowish color. In Unit II, reflectance a* and b* values exhibit cyclic changes ranging from ~0 to ~10 and from approximately −5 to ~10, respectively (Figure F30). The intervals of low a* and b* values correspond to intervals of dark gray basalt at 268.43–272.99, 276.73–282.2, 289.01–292.81, and 295.90–299.35 m (see Lithostratigraphy). L* values are constant at ~30 in Unit ll.
Geochemistry
The geochemistry program at Site U1506 was designed to characterize the composition of pore water and solid sediment and to assess the potential presence of volatile hydrocarbons. Site U1506 is located in an open-ocean setting well away from any continental inputs and where a relatively thin sediment package overlies basement rock. Accordingly, low primary productivity in overlying surface water and limited terrigenous input were expected to lead to a carbonate-rich lithology lean in organic components. Reactions representing organic decomposition and clay diagenesis should be minimal, but reactions with basement rock might strongly influence pore water chemistry.
Headspace hydrocarbon gases
A total of 35 headspace gas samples were taken for routine safety monitoring, typically from the top of the last section of every core. Hydrocarbon gases were consistently below the detection limit.
Interstitial water analyses
For analysis of water chemistry, a mudline sample was taken, representing water poured from inside the liner of Core 371-U1506A-1R, and 14 interstitial water (IW) samples were taken by whole-round squeezing of sediment intervals, with the deepest one at 260.9 m. The preliminary plan for whole-round sampling was one sample per core in the first three cores and then one sample every other core. However, because of low recovery and in one case a shattered liner, whole-round sampling was skipped for some samples.
Salinity, pH, and alkalinity
The salinity of IW samples is consistently 35.5. Alkalinity increases from 2.66 mM in the mudline sample to 2.94 mM at 47 m and then decreases downhole to 1.34 mM at 261 m, except for a local rise at 202 m (Table T8; Figure F32). pH generally decreases downhole from 7.76 to a minimum of 7.57, except for a local high of 7.71 at 125 m.
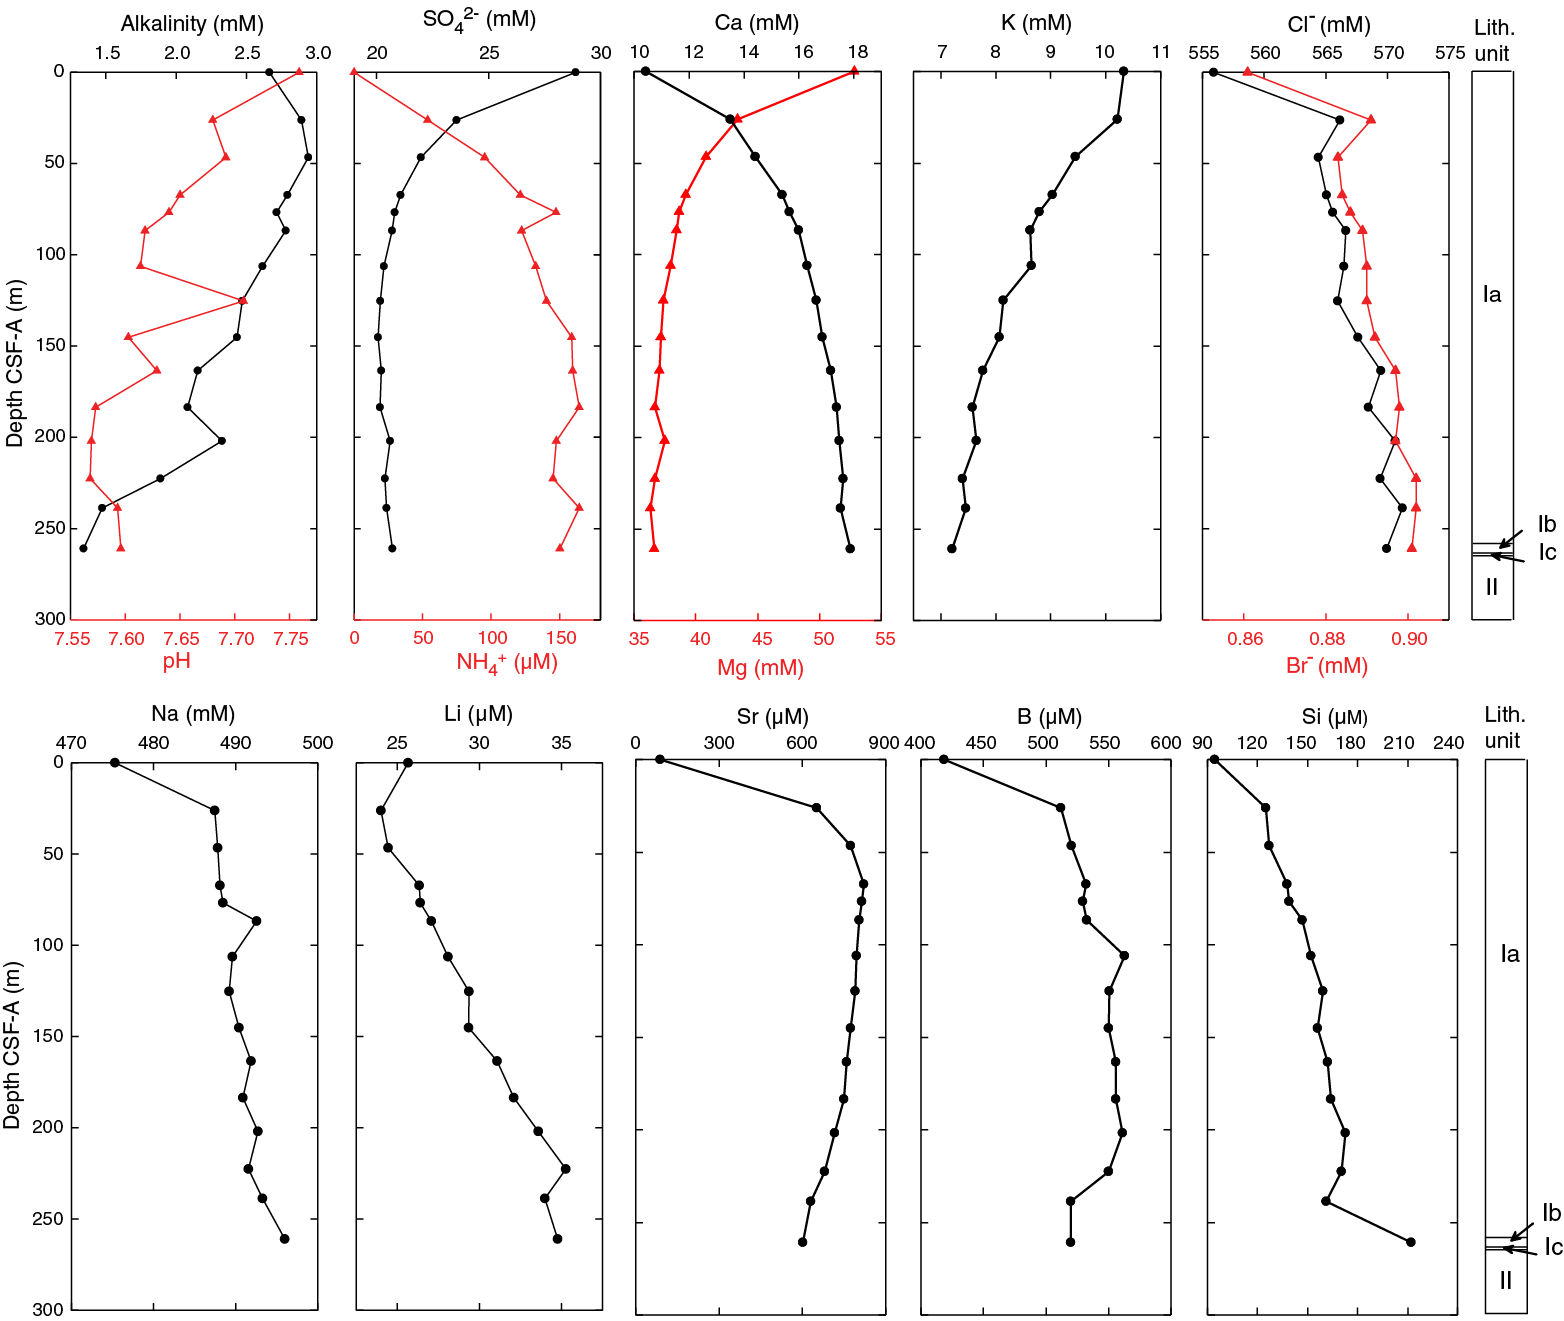
Figure F32. Alkalinity; pH; major, minor, and trace elements; and ion concentrations.
Sulfate and ammonium
The sulfate (SO42−) and ammonium (NH4+) profiles generally mirror each other in Hole U1506A (Table T8; Figure F32). SO42− concentration in the mudline sample is 28.9 mM, slightly higher than 28.6 mM for seawater with a salinity of 35.5 (Millero et al., 2008). Sulfate concentration decreases to 20.1 mM at 145 m and then increases slightly to 20.7 mM at 261 m. NH4+ concentration is 0 µM in the mudline sample, increases to 164.5 µM at 184 m, and then fluctuates between 145.3 and 164.5 µM from 184 to 261 m.
Calcium, magnesium, and potassium
The dissolved calcium (Ca) and magnesium (Mg) concentration profiles change in the opposite direction with different magnitude in Hole U1506A (Table T8; Figure F32). Ca concentration increases gradually from 10.4 mM in the mudline sample to 17.9 mM at 261 m, whereas Mg concentration decreases from 52.8 mM in the mudline sample to 36.7 mM at 261 m. Potassium (K) concentration decreases all the way down at a nearly constant rate from 10.3 mM in the mudline sample to 7.2 mM at 261 m (Table T8; Figure F32).
Chloride, bromide, sodium, and lithium
Pore water chloride (Cl−) and bromide (Br−) concentrations covary in Hole U1506A (Table T8; Figure F32). Cl− concentrations measured by titration and by ion chromatograph (IC) are similar, but the results from IC seem more consistent and are thus described below. Both Cl− and Br− increase dramatically between the first two samples, from 556 and 0.86 mM, respectively, at 0 m to 566 and 0.89 mM, respectively, at 26 m. Both ions decrease slightly in the third samples at 47 m and then increase gradually to 570 and 0.90 mM, respectively, at 261 m. The Na concentration profile is similar to those of Cl− and Br−, increases from 475 mM in the mudline sample to 487 mM at 26 m, and further increases to 496 mM at 261 m. The Li concentration profile is similar to Na, except that Li decreases slightly in the uppermost two samples. In general, dissolved Li concentration increases from 24.0 to 35.3 µM through the sedimentary column.
Strontium, boron, and silica
Both strontium (Sr) and boron (B) concentrations increase significantly from 0 to 26 m; Sr increases from 89 to 652 µM downhole, and B increases from 419 to 512 µM. Below 26 m, both elements show a more gradual increase followed by a slight decrease (Table T8; Figure F32). Dissolved silica (H4SiO4) increases abruptly from 94 to 125 µM between the uppermost two samples and increases again from 161 to 212 µM between the bottom two samples. Otherwise, this species increases gradually downhole.
Bulk sediment geochemistry
A total of 24 freeze-dried bulk sediment samples with a maximum volume of 5 cm3 were collected from Cores 371-U1506A-1R through 27R where recovery permitted. Typically, they were taken adjacent to MAD samples. No samples were analyzed for bulk sediment geochemistry from lithostratigraphic Subunit Ic or Unit II.
Total inorganic carbon (TIC) contents vary from 10.6 to 11.5 wt% in Hole U1506A (Table T9; Figure F33). Such values represent 88–96 wt% calcium carbonate (CaCO3), assuming that CaCO3 hosts all inorganic carbon. CaCO3 contents generally increase with depth over the uppermost 70 m so that the highest values are between 85 and 143 m and between 200 and 228 m. Total carbon (TC) contents vary from 10.8 to 12.2 wt%. As most carbon exists as CaCO3, downhole profiles of CaCO3 and TC closely mimic each other. Total organic carbon (TOC) contents are accordingly low, with values ranging between 0.1 and 0.4 wt% in the uppermost ~210 m and between 0.7 and 0.9 wt% from 219 to 247 m. Trace amounts of total nitrogen (TN) are present only in the uppermost two samples (0.65 and 14.32 m).

Figure F33. CaCO3, TC, TIC, TOC, and TN.
Discussion
Microbes can utilize a series of electron acceptors to decompose particulate organic carbon. After consumption of dissolved O2 and NO3− and labile metal oxides, the primary reaction involves dissolved SO42− (Froelich et al., 1979). This reaction, commonly called organoclastic sulfate reduction (OSR), can be expressed in a simple form:
2CH2O + SO42− → 2CO2 + S2− + 2H2O.
The reaction can also be expressed in an expanded form to include nutrients (Froelich et al., 1979):
(CH2O)106 (NH3)16 (H3PO4) + 53SO42− → 106CO2 + 16NH3 + 53S2− + H3PO4 + 106H2O.
Note that the reaction produces CO2, which will decrease pH.
The coupled profiles of sulfate and ammonium suggest modest OSR in the upper 150 m (Figure F32). The common occurrence of pyrite and other iron sulfide minerals in the sediment and low iron concentrations in the IW samples confirm the above suggestion. The decreasing trend of pH generally supports the inference of sulfate reduction in the upper part of the hole.
The abrupt increases in dissolved Sr, B, and H4SiO4 in the uppermost 26 m suggest dissolution of biogenic carbonate and silica (e.g., Gieskes et al., 1975; Gieskes, 1981; Park and Schlesinger, 2002). This inference might also be supported by the increase in dissolved Ca. However, because of the high CaCO3 contents of the sediment, dissolution should not have changed CaCO3% significantly and CaCO3% is not a good indicator for the degree of carbonate dissolution and recrystallization (e.g., figure 2-26 in Broecker and Peng, 1982).
Reactions with volcanic rocks underneath the sediment column and ion exchange with clay minerals in the sediment probably also affect pore water chemistry at Site U1506. Notably, Ca and Mg concentrations are still increasing and decreasing, respectively, at the bottom of Hole U1506A, which may reflect the release of Ca and consumption of Mg during alteration of basalt (e.g., Bischoff and Dickson, 1975; Gieskes and Lawrence, 1981). Uptake of K into clay minerals is also a common process (e.g., Gieskes and Lawrence, 1981). Certainly, altered basalt (with abundant calcite) and glauconite (typically potassium rich) was recovered at Site U1506.
The high carbonate percentages throughout lithostratigraphic Unit I reflect the large contribution of calcareous nannofossil and, secondarily, foraminiferal components to the sediment. This situation is similar to that of the present day, in which surface sediment on the Lord Howe Rise is dominantly nannofossil ooze (Burns, 1977; Nelson and Cooke, 2001). Low organic carbon contents of <1 wt% (and the limited presence of nitrogen) conform to the oligotrophic open-ocean setting of Site U1506 (Hedges and Keil, 1995).
Age model and sedimentation rates
We calculated linear sedimentation rates (LSRs) for Hole U1506A using paleomagnetic and biostratigraphic datums on the core depth below seafloor (CSF-A) depth scale (Table T3; Figure F34; see Biostratigraphy and paleoenvironment and Paleomagnetism). Calcareous nannofossils are present throughout lithostratigraphic Unit I (Subunits Ia–Ic) and were used to calculate sedimentation rates for the 0–10 Ma interval. Both calcareous nannofossil and paleomagnetic reversal datums were utilized for Unit I sediments >10 Ma.
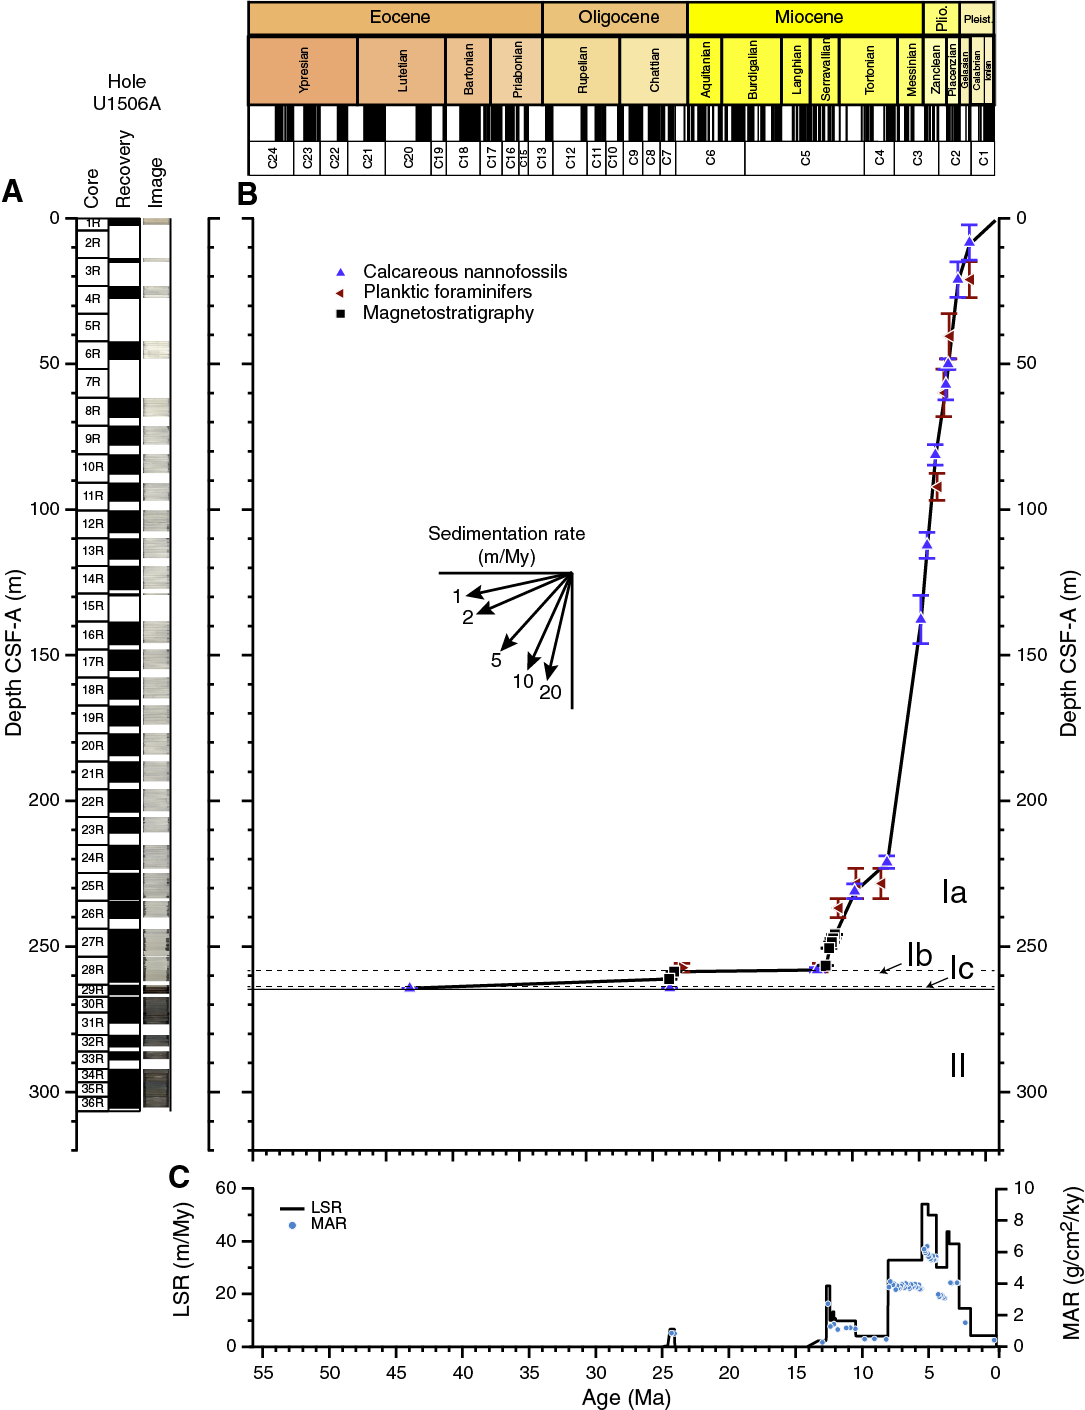
Figure F34. Sedimentation accumulation over time.
Subunits Ia and Ib are separated by a condensed interval of ~10 My. Below Subunit Ib, a condensed interval of ~20 My is present, separating the subunit from a thin drape of middle Eocene glauconitic nannofossil chalk (Subunit Ic). Below Subunit Ic, the mafic volcanic rocks in Unit II (age unknown) were observed. LSRs in the late Serravallian and early Tortonian vary between ~10 and 20 m/My and decrease in the late Tortonian and early Messinian to 5 m/My. Above the ooze–chalk transition in Subunit Ia, LSRs increase to an average of 40 m/My during the late Messinian to late Piacenzian (7–3 Ma) and drop thereafter to ~10 m/My in the early Pleistocene. This finding of increased LSR in the late Miocene to early Pliocene is consistent with previous observations from nearby DSDP Leg 90 sites (Kennett and von der Borch, 1986) and coincides with the late Miocene to early Pliocene “biogenic bloom” hypothesis, which suggests enhanced productivity in the Indian and Pacific Oceans from 9 to 3.5 Ma (Dickens and Owen, 1999).
References
Ayress, M.A., 1994. Cainozoic paleoceanographic and subsidence history of the eastern margin of the Tasman Basin based on Ostracoda. In Van der Lingen, G.J., Swanson, K.M., and Muir, R.J. (Eds.), Evolution of the Tasman Sea Basin: Proceedings of the Tasman Sea Conference. Rotterdam, The Netherlands (A.A. Balkema), 139–157.
Bischoff, J.L., and Dickson, F.W., 1975. Seawater-basalt interaction at 200°C and 500 bars: implications for origin of sea-floor heavy-metal deposits and regulation of seawater chemistry. Earth and Planetary Science Letters, 25(3):385–397. https://doi.org/10.1016/0012-821X(75)90257-5
Broecker, W.S., and Peng, T.-H., 1982. Tracers in the Sea: Palisades, NY (Eldigio Press).
Burns, D.A., 1977. Major features of oceanographic development of the southeast Indian and southwest Pacific Oceans interpreted from microfossil evidence. Marine Geology, 25(1–3):35–59. https://doi.org/10.1016/0025-3227(77)90046-9
Dickens, G.R., and Owen, R.M., 1999. The latest Miocene–early Pliocene biogenic bloom: a revised Indian Ocean perspective. Marine Geology, 161(1):75–91. https://doi.org/10.1016/S0025-3227(99)00057-2
Dwyer, G.S., Cronin, T.M., Baker, P.A., Raymo, M.E., Buzas, J.S., and Corrège, T., 1995. North Atlantic deepwater temperature change during late Pliocene and late Quaternary climatic cycles. Science, 270(5240):1347–1351. https://doi.org/10.1126/science.270.5240.1347
Froelich, P.N., Klinkhammer, G.P., Bender, M.L., Luedtke, N.A., Heath, G.R., Cullen, D., Dauphin, P., Hammond, D., Hartman, B., and Maynard, V., 1979. Early oxidation of organic matter in pelagic sediments of the eastern equatorial Atlantic: suboxic diagenesis. Geochimica et Cosmochimica Acta, 43(7):1075–1090. https://doi.org/10.1016/0016-7037(79)90095-4
Gallagher, S.J., Fulthorpe, C.S., Bogus, K., Auer, G., Baranwal, S., Castañeda, I.S., Christensen, B.A., De Vleeschouwer, D., Franco, D.R., Groeneveld, J., Gurnis, M., Haller, C., He, Y., Henderiks, J., Himmler, T., Ishiwa, T., Iwatani, H., Jatiningrum, R.S., Kominz, M.A., Korpanty, C.A., Lee, E.Y., Levin, E., Mamo, B.L., McGregor, H.V., McHugh, C.M., Petrick, B.F., Potts, D.C., Lari, A.R., Renema, W., Reuning, L., Takayanagi, H., and Zhang, W., 2017. Site U1462. In Gallagher, S.J., Fulthorpe, C.S., Bogus, K., and the Expedition 356 Scientists, Indonesian Throughflow. Proceedings of the International Ocean Discovery Program, 356: College Station, TX (International Ocean Discovery Program). https://doi.org/10.14379/iodp.proc.356.107.2017
Gieskes, J.M., 1981. Deep-sea drilling interstitial water studies: implications for chemical alteration of the oceanic crust, Layers I and II. In Warme, J.E., Douglas, R.G., and Winterer, E.L. (Eds.), The Deep Sea Drilling Project: A Decade of Progress. Special Publication - Society of Economic Paleontologists and Mineralogists, 32:149–167. http://archives.datapages.com/data/sepm_sp/SP32/Deep_Sea_Drilling_Interstitial_Water_Studies.html
Gieskes, J.M., Kastner, M., and Warner, T.B., 1975. Evidence for extensive diagenesis, Madagascar Basin, Deep Sea Drilling Site 245. Geochimica et Cosmochimica Acta, 39(10):1385–1393. https://dx.doi.org/10.1016/0016-7037(75)90117-9
Gieskes, J.M., and Lawrence, J.R., 1981. Alteration of volcanic matter in deep-sea sediments: evidence from the chemical composition of interstitial waters from deep sea drilling cores. Geochimica Cosmochimica Acta, 45(10):1687–1703. https://doi.org/10.1016/0016-7037(81)90004-1
Gradstein, F.M., Ogg, J.G., Schmitz, M.D., and Ogg, G.M. (Eds.), 2012. The Geological Time Scale 2012: Amsterdam (Elsevier).
Hedges, J.I., and Keil, R.G., 1995. Sedimentary organic matter preservation: an assessment and speculative synthesis. Marine Chemistry, 49(2–3):81–115. https://doi.org/10.1016/0304-4203(95)00008-F
Higgins, K., Hashimoto, T., Rollet, N., Colwell, J., Hackney, R., and Milligan, P., 2015. Structural analysis of extended Australian continental crust: Capel and Faust Basins, Lord Howe Rise. Geological Society Special Publications, 413(1):9–33. https://doi.org/10.1144/SP413.6
Kennett, J.P., and von der Borch, C.C., 1986. Southwest Pacific Cenozoic paleoceanography. In Kennett, J.P., von der Borch, C.C., et al., Initial Reports of the Deep Sea Drilling Project, 90: Washington, DC (U.S. Government Printing Office), 1493–1517. https://doi.org/10.2973/dsdp.proc.90.148.1986
Kennett, J.P., von der Borch, C., Baker, P.A., Barton, C.E., Boersma, A., Cauler, J.P., Dudley, W.C., Jr., Gardner, J.V., Jenkins, D.G., Lohman, W.H., Martini, E., Merrill, R.B., Morin, R., Nelson, C.S., Robert, C., Srinivisan, M.S., Stein, R., Takeuchi, A., and Murphy, M.G., 1985. Paleotectonic implications of increased late Eocene—early Oligocene volcanism from South Pacific DSDP Sites. Nature, 316(6028):507–511. https://doi.org/10.1038/316507a0
Kirschvink, J.L., 1980. The least-squares line and plane and the analysis of palaeomagnetic data. Geophysical Journal of the Royal Astronomical Society, 62(3):699–718. https://doi.org/10.1111/j.1365-246X.1980.tb02601.x
Millero, F.J., Feistel, R., Wright, D.G., and McDougall, T.J., 2008. The composition of Standard Seawater and the definition of the reference-composition salinity scale. Deep-Sea Research, Part I, 55(1):50–72. https://doi.org/10.1016/j.dsr.2007.10.001
Nelson, C.S., and Cooke, P.J., 2001. History of oceanic front development in the New Zealand sector of the Southern Ocean during the Cenozoic—a synthesis. New Zealand Journal of Geology and Geophysics, 44(4):535–553. https://doi.org/10.1080/00288306.2001.9514954
Park, H., and Schlesinger, W.H., 2002. Global biogeochemical cycle of boron. Global Biogeochemical Cycles, 16(4):20-1–20-11. https://doi.org/10.1029/2001GB001766
Shipboard Scientific Party, 1973. Site 206. With contributions by D. Burns and P.N. Webb. In Burns, R.E., Andrews, J.E., et al., Initial Reports of the Deep Sea Drilling Project, 21: Washington, DC (U.S. Government Printing Office), 103–195. https://doi.org/10.2973/dsdp.proc.21.106.1973
Spinelli, G.A., Giambalvo, E.R., and Fisher, A.T., 2004. Sediment permeability, distribution, and influence on fluxes in oceanic basement. In Davis, E.E., and Elderfield, H. (Eds.), Hydrogeology of the Oceanic Lithosphere: Cambridge, United Kingdom (Cambridge University Press), 151–188.
Sutherland, R., Collot, J., Lafoy, Y., Logan, G.A., Hackney, R., Stagpoole, V., Uruski, C., et al., 2010. Lithosphere delamination with foundering of lower crust and mantle caused permanent subsidence of New Caledonia Trough and transient uplift of Lord Howe Rise during Eocene and Oligocene initiation of Tonga-Kermadec subduction, western Pacific. Tectonics, 29(2). https://doi.org/10.1029/2009TC002476
Sutherland, R., Dickens, G.R., Blum, P., Agnini, C., Alegret, L., Asatryan, G., Bhattacharya, J., Bordenave, A., Chang, L., Collot, J., Cramwinckel, M.J., Dallanave, E., Drake, M.K., Etienne, S.J.G., Giorgioni, M., Gurnis, M., Harper, D.T., Huang, H.-H.M., Keller, A.L., Lam, A.R., Li, H., Matsui, H., Morgans, H.E.G., Newsam, C., Park, Y.-H., Pascher, K.M., Pekar, S.F., Penman, D.E., Saito, S., Stratford, W.R., Westerhold, T., and Zhou, X., 2019. Expedition 371 methods. In Sutherland, R., Dickens, G.R., Blum, P., and the Expedition 371 Scientists, Tasman Frontier Subduction Initiation and Paleogene Climate. Proceedings of the International Ocean Discovery Program, 371: College Station, TX (International Ocean Discovery Program). https://doi.org/10.14379/iodp.proc.371.102.2019
van Morkhoven, F.P.C.M., Berggren, W.A., Edwards, A.S., and Oertli, H.J., 1986. Cenozoic cosmopolitan deep-water benthic foraminifera. Bulletin des centres de recherches Exploration-production Elf-Aquitaine: Mémoire, 11.
Wade, B.S., Pearson, P.N., Berggren, W.A., and Pälike, H., 2011. Review and revision of Cenozoic tropical planktonic foraminiferal biostratigraphy and calibration to the geomagnetic polarity and astronomical time scale. Earth-Science Reviews, 104(1–3):111–142. https://doi.org/10.1016/j.earscirev.2010.09.003
Zijderveld, J.D.A., 1967. AC demagnetization of rocks: analysis of results. In Collinson, D.W., Creer, K.M., and Runcorn, S.K. (Eds.), Developments in Solid Earth Geophysics (Volume 3): Methods in Palaeomagnetism: Amsterdam (Elsevier), 254–286. https://doi.org/10.1016/B978-1-4832-2894-5.50049-5
1 Sutherland, R., Dickens, G.R., Blum, P., Agnini, C., Alegret, L., Asatryan, G., Bhattacharya, J., Bordenave, A., Chang, L., Collot, J., Cramwinckel, M.J., Dallanave, E., Drake, M.K., Etienne, S.J.G., Giorgioni, M., Gurnis, M., Harper, D.T., Huang, H.-H.M., Keller, A.L., Lam, A.R., Li, H., Matsui, H., Morgans, H.E.G., Newsam, C., Park, Y.-H., Pascher, K.M., Pekar, S.F., Penman, D.E., Saito, S., Stratford, W.R., Westerhold, T., Zhou, X., 2019. Site U1506. In Sutherland, R., Dickens, G.R., Blum, P., and the Expedition 371 Scientists, Tasman Frontier Subduction Initiation and Paleogene Climate. Proceedings of the International Ocean Discovery Program, 371: College Station, TX (International Ocean Discovery Program). https://doi.org/10.14379/iodp.proc.371.103.2019
2 Expedition 371 Scientists’ affiliations.
This work is distributed under the Creative Commons Attribution 4.0 International (CC BY 4.0) license. 
- F1. Regional bathymetry and seismic reflection lines.
- F2. Representative seismic section from northern Lord Howe Rise.
- F3. Local bathymetry and seismic reflection lines.
- F4. Seismic reflection lines.
- F5. Lithostratigraphic summary.
- F6. Subunit Ib/Ic and Unit I/II boundaries.
- F7. Common sedimentary lithologies, Unit I.
- F8. Common sedimentary lithologies.
- F9. Major biogenic and lithologic constituent abundances.
- F10. Pyritic elements.
- F11. Alternating reddish brown microcrystalline amygdaloidal basalt and massive fine-grained dark gray basalt.
- F12. Representative crystalline rocks, section half images.
- F13. Representative crystalline rocks, photomicrographs.
- F14. XRD results.
- F15. Microfossil biozonations.
- F16. Microfossil abundance and preservation.
- F17. Early Eocene or younger calcareous nannofossils recovered from carbonate neptunian dike.
- F18. Preservation state of planktic foraminifers.
- F19. Two end-members of benthic foraminifer preservation states.
- F20. Ostracod preservation, abundance, and main assemblage composition.
- F21. Trachyleberidis with and without ocular structure.
- F22. Radiolarians of tentative Mesozoic and Paleozoic affinities.
- F23. Macrofossils in carbonate neptunian dike.
- F24. Pass-through paleomagnetic data.
- F25. Inclination values.
- F26. Paleomagnetic results for chalk interval.
- F27. Vector endpoint demagnetization diagrams.
- F28. Bulk density, grain density, porosity, and P-wave velocity.
- F29. Magnetic susceptibility, NGR, and L*, a*, b*.
- F30. Magnetic susceptibility, NGR, and L*, a*, b*, Unit II.
- F31. Shear strength.
- F32. Alkalinity; pH; major, minor, and trace elements; and ion concentrations.
- F33. CaCO3, TC, TIC, TOC, and TN.
- F34. Sedimentation accumulation over time.
- T1. Core summary.
- T2. Lithostratigraphic units.
- T3. Microfossil datums and chrons used to construct age model.
- T4. Nannofossil distribution and abundance data.
- T5. Planktic foraminifer distribution and abundance.
- T6. Benthic foraminifer distribution and abundance.
- T7. Magnetostratigraphic tie points.
- T8. Interstitial water chemistry.
- T9. Bulk sediment geochemistry.