Wallace, L.M., Saffer, D.M., Barnes, P.M., Pecher, I.A., Petronotis, K.E., LeVay, L.J., and the Expedition 372/375 Scientists
Proceedings of the International Ocean Discovery Program Volume 372B/375
publications.iodp.org
https://doi.org/10.14379/iodp.proc.372B375.212.2025
Data report: paleomagnetic and rock magnetic observations from sediments and basalts collected at Expedition 375 Site U1526 on the Tūranganui Knoll, Hikurangi Plateau1
Katerina E. Petronotis2, Gary D. Acton2, and Christian Ohneiser3, 4
1 Petronotis, K.E., Acton, G.D., and Ohneiser, C., 2025. Data report: paleomagnetic and rock magnetic observations from sediments and basalts collected at Expedition 375 Site U1526 on the Tūranganui Knoll, Hikurangi Plateau. In Wallace, L.M., Saffer, D.M., Barnes, P.M., Pecher, I.A., Petronotis, K.E., LeVay, L.J., and the Expedition 372/375 Scientists, Hikurangi Subduction Margin Coring, Logging, and Observatories. Proceedings of the International Ocean Discovery Program, 372B/375: College Station, TX (International Ocean Discovery Program). https://doi.org/10.14379/iodp.proc.372B375.212.2025
2 International Ocean Discovery Program, Texas A&M University, USA. Correspondence author: kpetronotis@tamu.edu
3 Department of Geology, University of Otago, New Zealand.
4 Department of Geology, Faculty of Earth Sciences, Geography and Astronomy, University of Vienna, Austria.
Abstract
We measured the natural remanent magnetization (NRM) and rock magnetic properties of 57 sediment samples and 38 basalt samples from Tūranganui Knoll on the Hikurangi Plateau collected at Site U1526 during International Ocean Discovery Program Expedition 375. NRM was measured on all samples before and after either progressive alternating field or thermal demagnetization. Principal component analysis was conducted to provide estimates of the characteristic remanent magnetization direction. Rock magnetic observations include measurements on select samples of the bulk magnetic susceptibility, susceptibility versus heating for Curie temperature assessment, magnetic hysteresis, backfield for coercivity of remanence determinations, isothermal remanent magnetization, and first-order reversal curves.
1. Introduction
The primary objective of International Ocean Discovery Program (IODP) Expedition 375 was to characterize the Pacific plate sediments and rocks entering the Hikurangi subduction zone of New Zealand and to install seafloor observatories for long-term monitoring of subduction processes (Saffer et al., 2019). Characterization of the sediment and rock input is important for understanding the role lithology and fluids have in influencing the type of slip that occurs in subduction zones. The Hikurangi margin is characterized by frequent slow slip events (SSEs) that occur together with large tsunami-generating earthquakes. The SSEs appear to take up a substantial component of the plate motion between the Australian and Pacific plates (Wallace and Beavan, 2010; Wallace et al., 2016). Understanding the partitioning of this seismic slip is important for assessing seismic risk not only for the Hikurangi subduction zone but also for similar subduction zones such as those along the Japan Trench and Cascadia margin.
Our study focused on characterizing the magnetic properties of sediments and volcaniclastic and igneous rocks of the Hikurangi Plateau that are entering the subduction zone. These topographic highs, including subducting seamounts like the Tūranganui Knoll seamount, can affect how seismic slip is partitioned along the margin (Barker et al., 2018; Pedley et al., 2010). A second objective was to improve our understanding of the motion history of the Hikurangi Plateau by determining a paleomagnetic pole from the Late Cretaceous igneous and sedimentary units. Site U1526 on Tūranganui Knoll was chosen with those goals in mind (Figure F1). Unfortunately, our new paleomagnetic data agree with the initial assessment made during the expedition that much of the igneous section recovered is not suitable for estimating plate motion because it consists at least partly of what appear to be randomly oriented clasts rather than in situ volcanic flows (Wallace et al., 2019). Although some units may be in situ, they are insufficient in number and difficult to validate. Furthermore, the Late Cretaceous sedimentary section, which is only 1.5 m thick, is very weakly magnetized and insufficiently resolves the paleomagnetic inclination and hence the paleolatitude. The remaining ~28 m of the sedimentary section is too young (<5 Ma) to aid in resolving past motion of the plateau. This data report therefore focuses only on providing some basic rock magnetic and paleomagnetic characterization observations for a small suite of samples consisting of 38 basalt and 57 sediment samples from Site U1526.
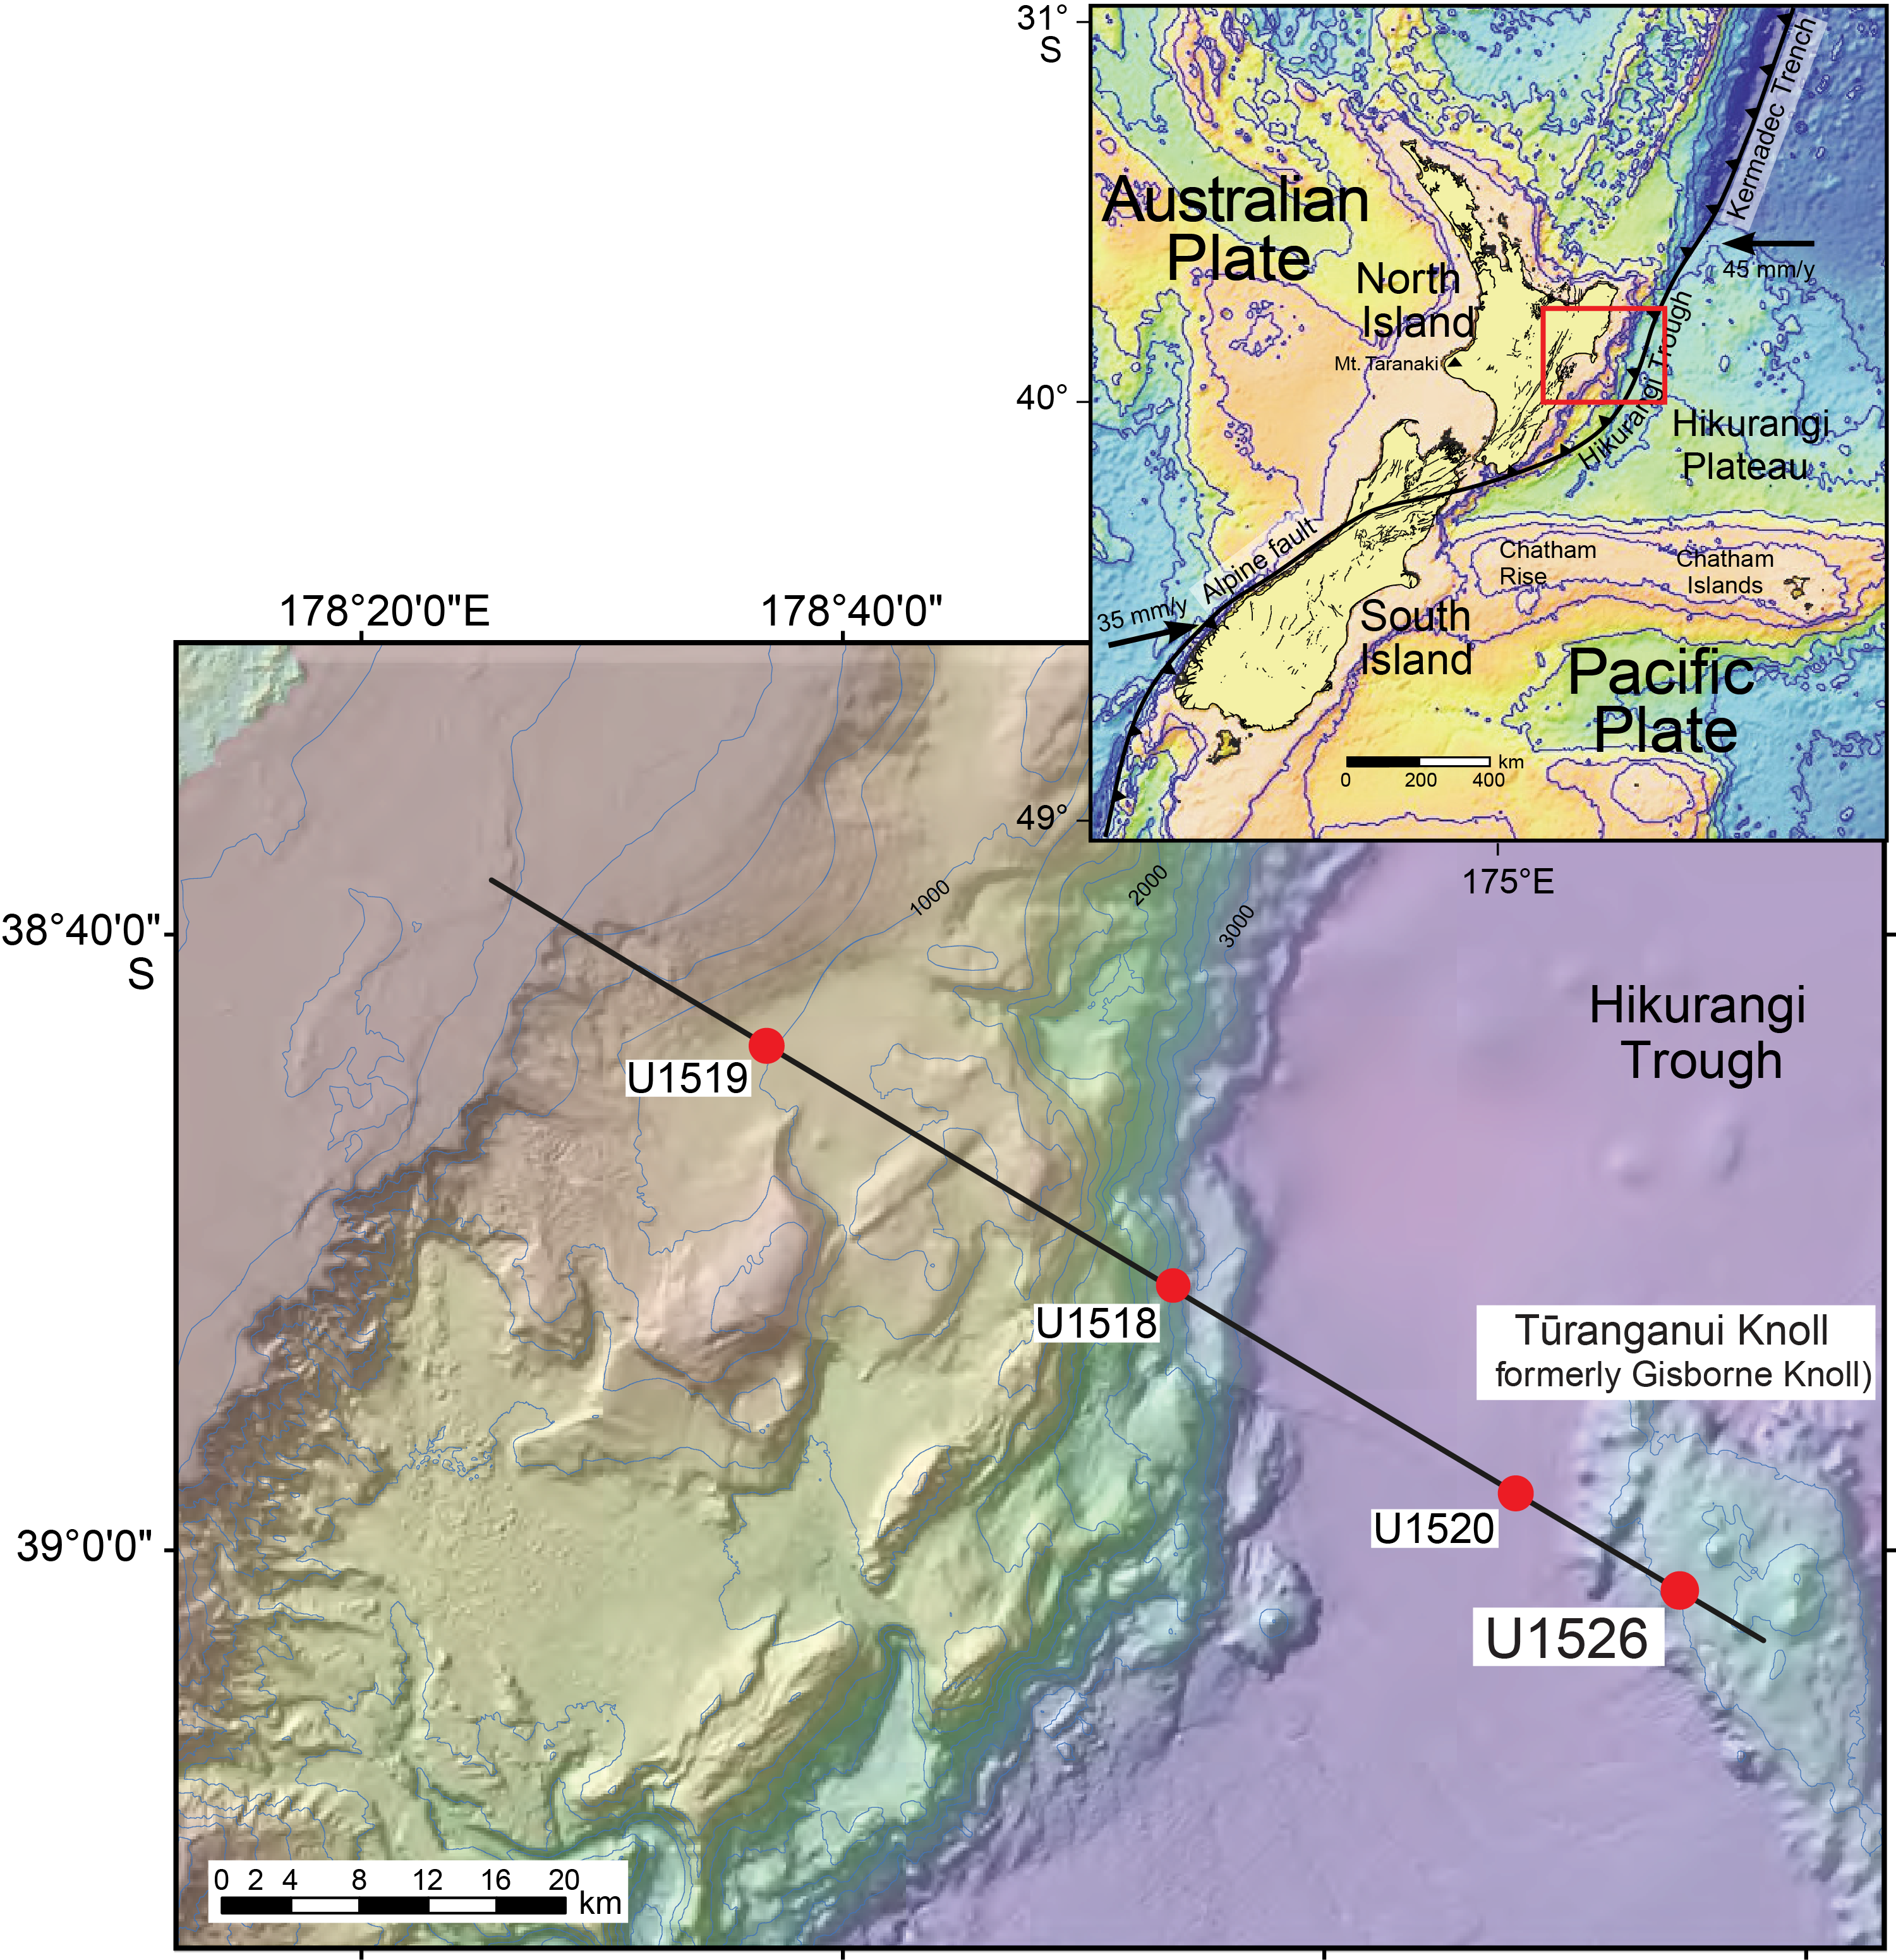
Figure F1. Transect of Expedition 375 sites.
2. Site U1526 lithostratigraphy
The stratigraphy recovered by coring at Site U1526 consists of a ~30 m thick sediment veneer that comprises Lithostratigraphic Unit I of Wallace et al. (2019). This is underlain by about 51 m of volcaniclastics and vesicular basalt that comprise Lithostratigraphic Unit II (Figure F2). The basaltic rocks are either thin in situ flows, large basalt clasts variably rotated during emplacement, or some combination of the two. These basaltic flows or large clasts have variable vesicularity and are separated from each other by intervals of volcaniclastic conglomerate with subrounded clasts of basalt intermixed with shell fragments. The uppermost volcaniclastics include volcaniclastic sandstone and conglomerate. These are overlain by a ~20 cm thick layer rich in manganese nodules that defines the top of Unit II. Shell fragments in the volcaniclastics include Late Cretaceous macrofossils (Wallace et al., 2019). Although the precise age of Tūranganui Knoll is unknown, the Late Cretaceous macrofossils indicate an age consistent with the main Hikurangi Plateau, which likely formed around 87–99 Ma (Davy et al., 2008; Hoernle et al., 2010).
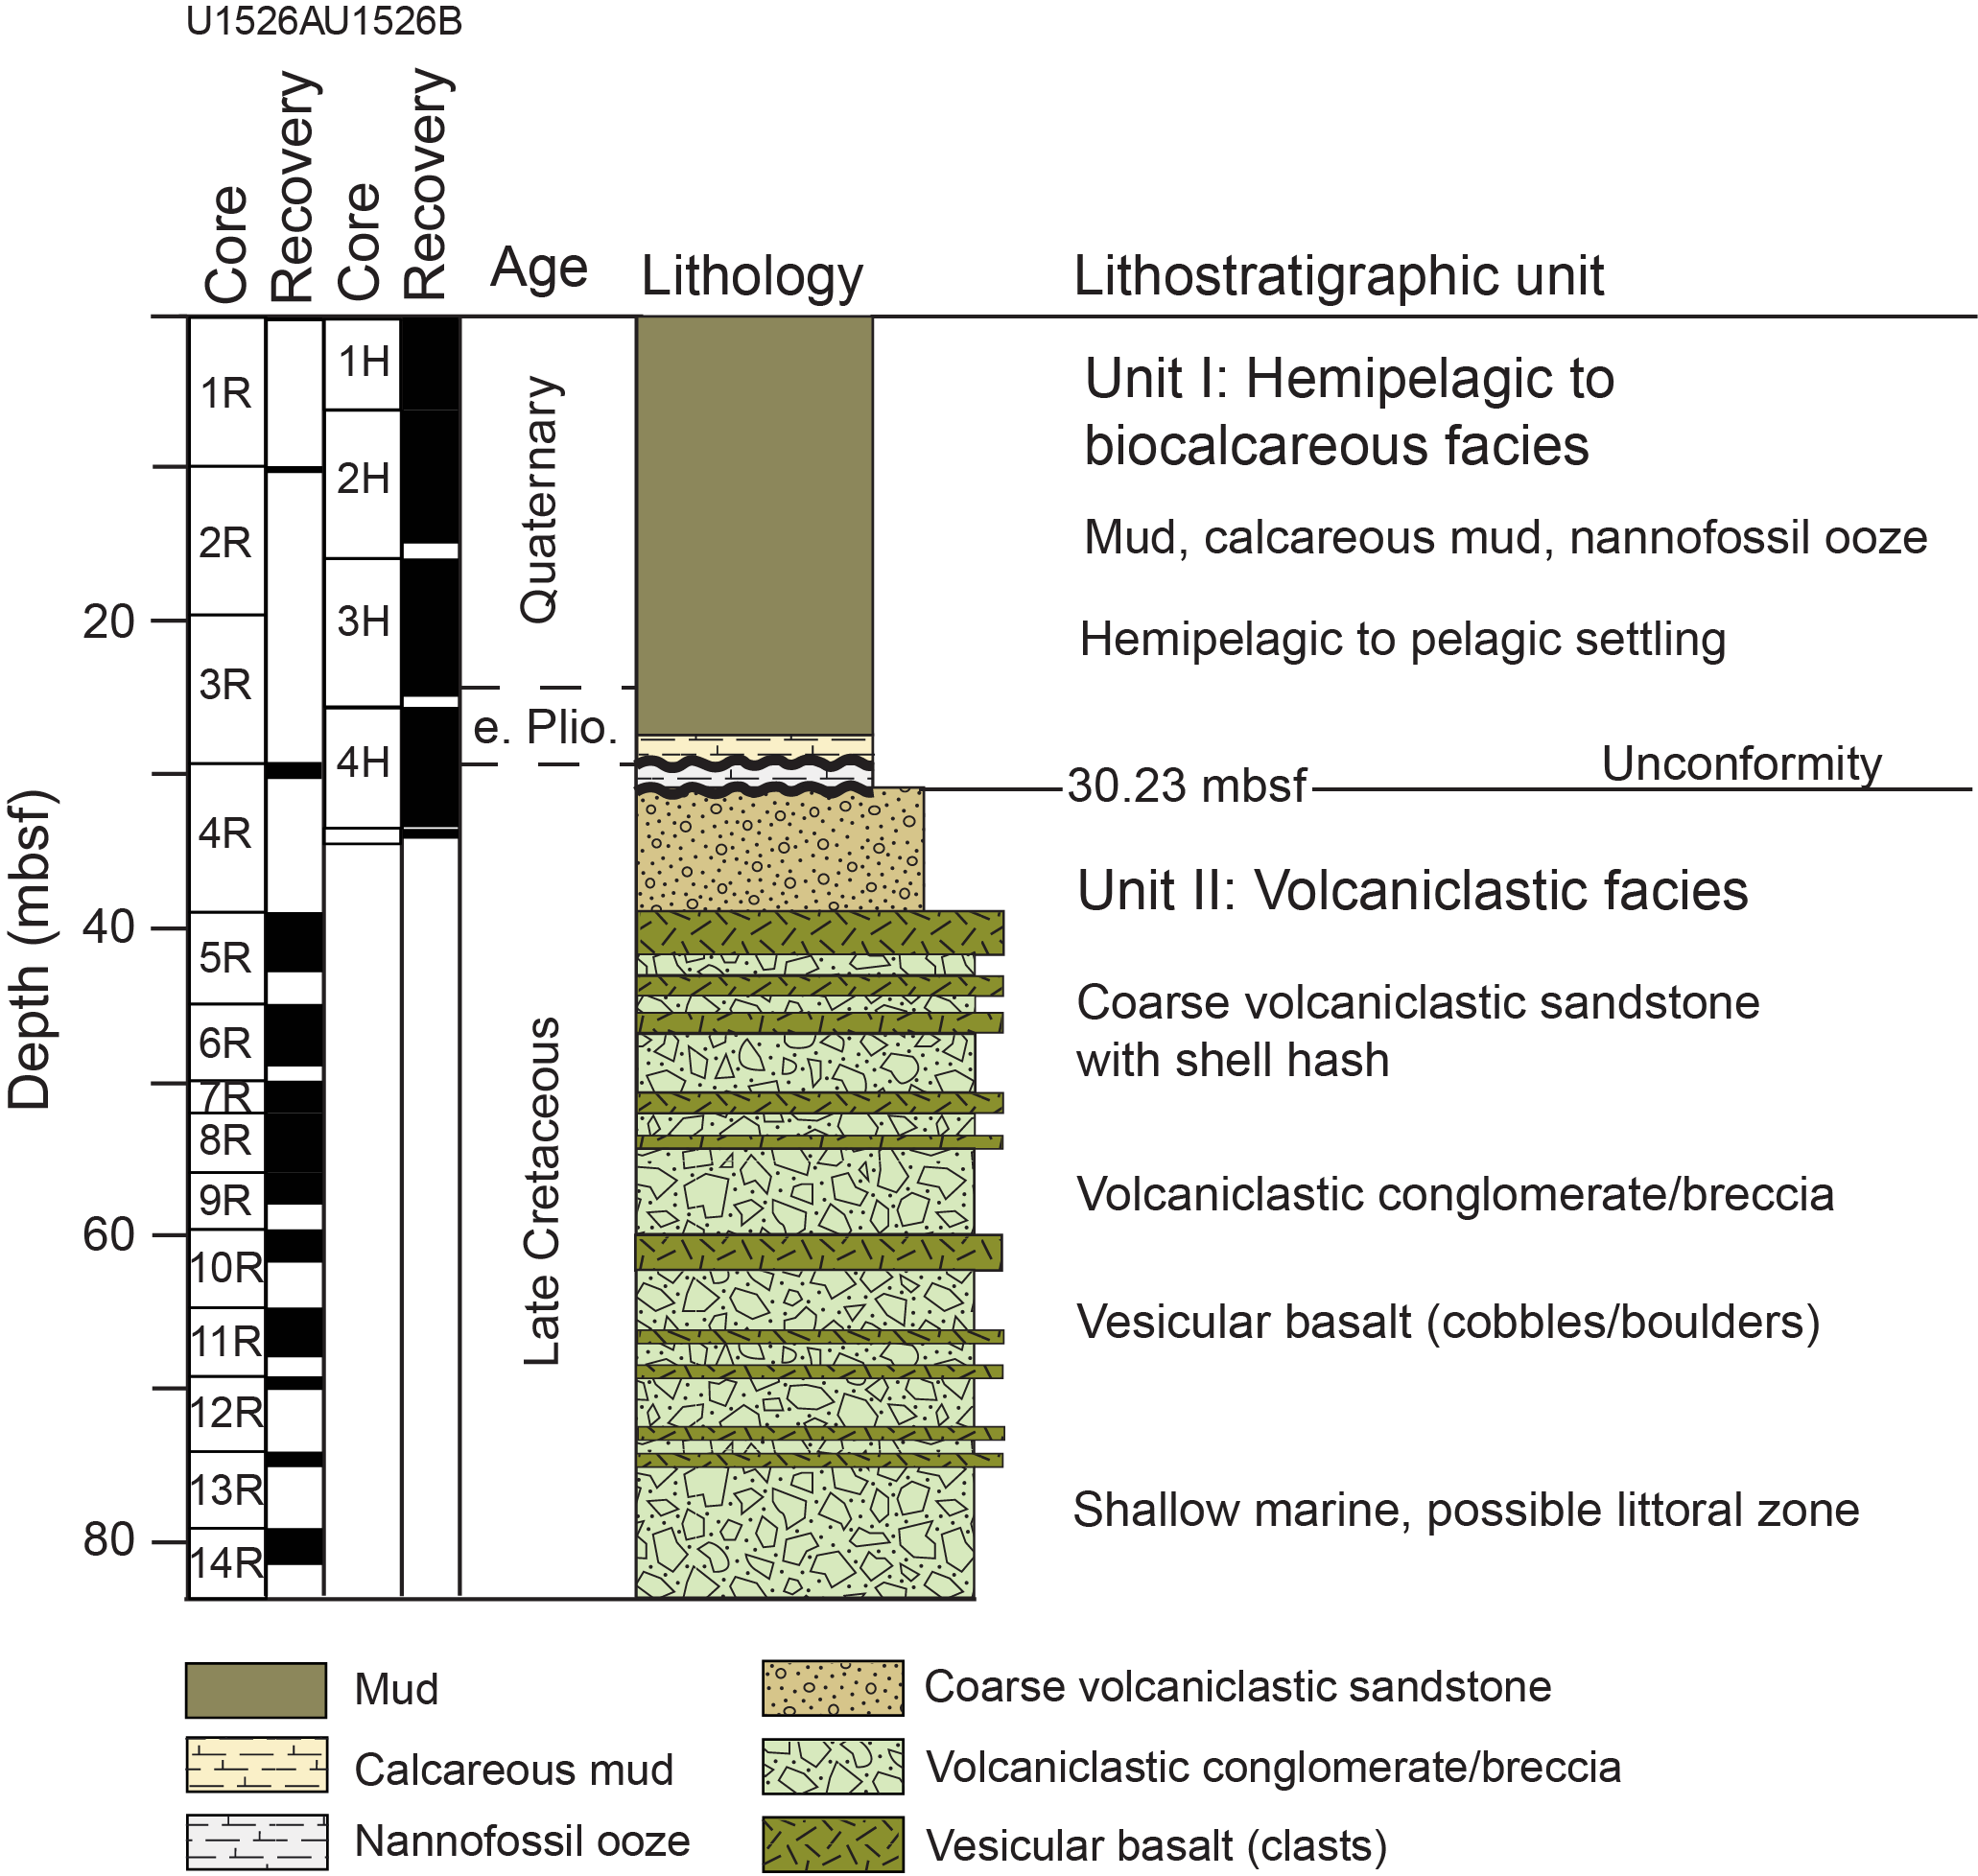
Figure F2. Lithostratigraphy.
The basal sediment of Unit I consists of a thin layer of nannofossil ooze spanning from 30.2 to 28.7 meters below seafloor (mbsf) that contains Late Cretaceous (Campanian–Maastrichtian) planktonic foraminifers, which constrain the age of the sediments to 66–74 Ma (Wallace et al., 2019). This is overlain by a light brown calcareous mud (28.7–26.9 mbsf) containing an early Pliocene biostratigraphic marker that constrains the age to >4.57 Ma and <5.3 Ma (Crundwell and Woodhouse, 2022). The remaining section (26.9–0 mbsf) consists of mud in various shades of gray and greenish gray. Based on the biostratigraphic model of Crundwell and Woodhouse (2022), the age of this muddy interval is early Pleistocene (<1.2 Ma) from ~26.9 to 17 mbsf, Middle Pleistocene from ~17 to 8 mbsf, Late Pleistocene from ~8 to 1 mbsf, and Holocene from ~1 mbsf to the mudline. Aside from the large hiatus separating the Late Cretaceous from the early Pliocene sediments and the early Pliocene from early Pleistocene sediments, there are at least four other significant hiatuses within the upper mud interval.
Recovery of the stratigraphic section was incomplete. Hole U1526A was cored with the rotary core barrel (RCB) system because the primary target was the igneous basement, which was recovered in Cores 375-U1526A-5R through 14R at 30.2–81.4 mbsf (Wallace et al., 2019). Recovery of the sedimentary section with RCB coring was quite poor, averaging just 8%, and recovery of the igneous section averaged 57%. During the last day of operations, Hole U1526B was cored with the advanced piston corer (APC)/extended core barrel (XCB) system to obtain a higher quality sediment section (Cores 375-U1526B-1H through 4H and 5X; 0–30.2 mbsf) with recovery averaging 94%.
3. Samples used in this study
We analyzed 38 basalt samples from Hole U1526A and 57 sediment samples from Hole U1526B. Of these, 12 samples were collected from the Late Cretaceous nannofossil ooze. The discrete basalt samples were collected as 8 cm3 cubes and sediment samples were collected in plastic cubes with an internal volume ~7 cm3 on JOIDES Resolution in 2018. An additional eight sediment samples were collected from the nannofossil ooze in 2020 at the Gulf Coast Repository at Texas A&M University (USA). The samples were analyzed in the paleomagnetism laboratories at the University of Hawai′i at Mānoa (USA) in 2019 and the University of Otago (New Zealand) in 2021 (see SAMPLES in Supplementary material for detailed sample information).
For the rock magnetic experiments that required small samples, we subsampled directly from the cubes. These samples were either small basalt chips taken from the cubes or a small amount of powdered sediment removed from the plastic sample holder. All hysteresis, backfield, isothermal remanent magnetization (IRM), and first order reversal curve (FORC) measurements were made on these same samples prior to any heating for the Curie temperature (CT) analyses.
4. Rock magnetism
We analyzed the magnetic properties of sediment and basalt samples through measurement of bulk magnetic susceptibility (MS), anisotropy of magnetic susceptibility (AMS), magnetic hysteresis, backfield, IRM, FORCs, and CT measurements.
4.1. Magnetic susceptibility
MS represents the ability of materials to become magnetized when subjected to magnetic fields, such as the Earth’s ambient field. We measured the MS of both sediment and basalt samples with a Geofyzika MiniKappa KLF-3 instrument at the University of Hawai′i. Two sets of measurements were made for each sample at magnetizing fields of 30 and 300 A/m, which allows the field dependence of MS to be assessed. We converted the raw meter values, which the meter provides in dimensionless SI volume for an assumed sample volume of 10 cm3, by multiplying by 10 and dividing by the sample volume, which was assumed to be 8 cm3 for igneous cube samples and 7 cm3 for sediment samples. MS data are available in MAGSUSC in Supplementary material.
To compare the discrete MS data with shipboard measurements, corrections must be applied to the shipboard MS data to convert them from raw meter values into dimensionless SI volume units. The shipboard data were collected on whole-round sections with a Bartington MS2C loop sensor (with a 98 mm coil diameter), which is part of the Whole-Round Multisensor Logger (WRMSL), and on the surface of split core sections with a Bartington MS2E probe sensor, which is part of the Section Half Multisensor Logger (SHMSL). Raw data from the WRMSL or SHMSL collected with the Bartington meters set to SI units are typically converted to dimensionless SI volume units by multiplying by 10−5, as recommended in the shipboard user guides (https://tamu-eas.atlassian.net/wiki/spaces/LMUG/overview). We apply an additional correction to the WRMSL data for RCB cores because of the smaller diameter of RCB cores relative to APC cores. For WRMSL data, the true value of MS is equal to the measured value multiplied by 10−5/KREL. KREL is the relative response of the instrument that depends on the core diameter (Bartington Instruments, 2011). The value of KREL is given by KREL = 3.45(d/D)3, where d is the core diameter and D is the coil diameter (D = 98 mm for the coil used on the WRMSL) (Bartington Instruments, 2011). IODP core diameter (d) varies from about 66 mm when the core fills the liner to about 55 mm for hard rock cores collected with the RCB system (Childress et al., 2024). Hence, KREL ≈ 1 for a core that fills the core liner, like APC cores, but KREL ≈ 0.54 for a core with a diameter of 55 mm, like RCB hard rock cores. If KREL is assumed to be 1, the MS would be underestimated by about a factor of two for hard rock cores. To avoid this bias, we correct the RCB WRMSL raw data by multiplying by 10−5/0.54. After correcting the raw meter values, susceptibilities from the discrete samples from this study are comparable with both the WRMSL and SHMSL shipboard susceptibility data (Figure F3). Susceptibilities for the Unit I sediments are about one to two orders of magnitude lower than for the Unit II igneous rocks.
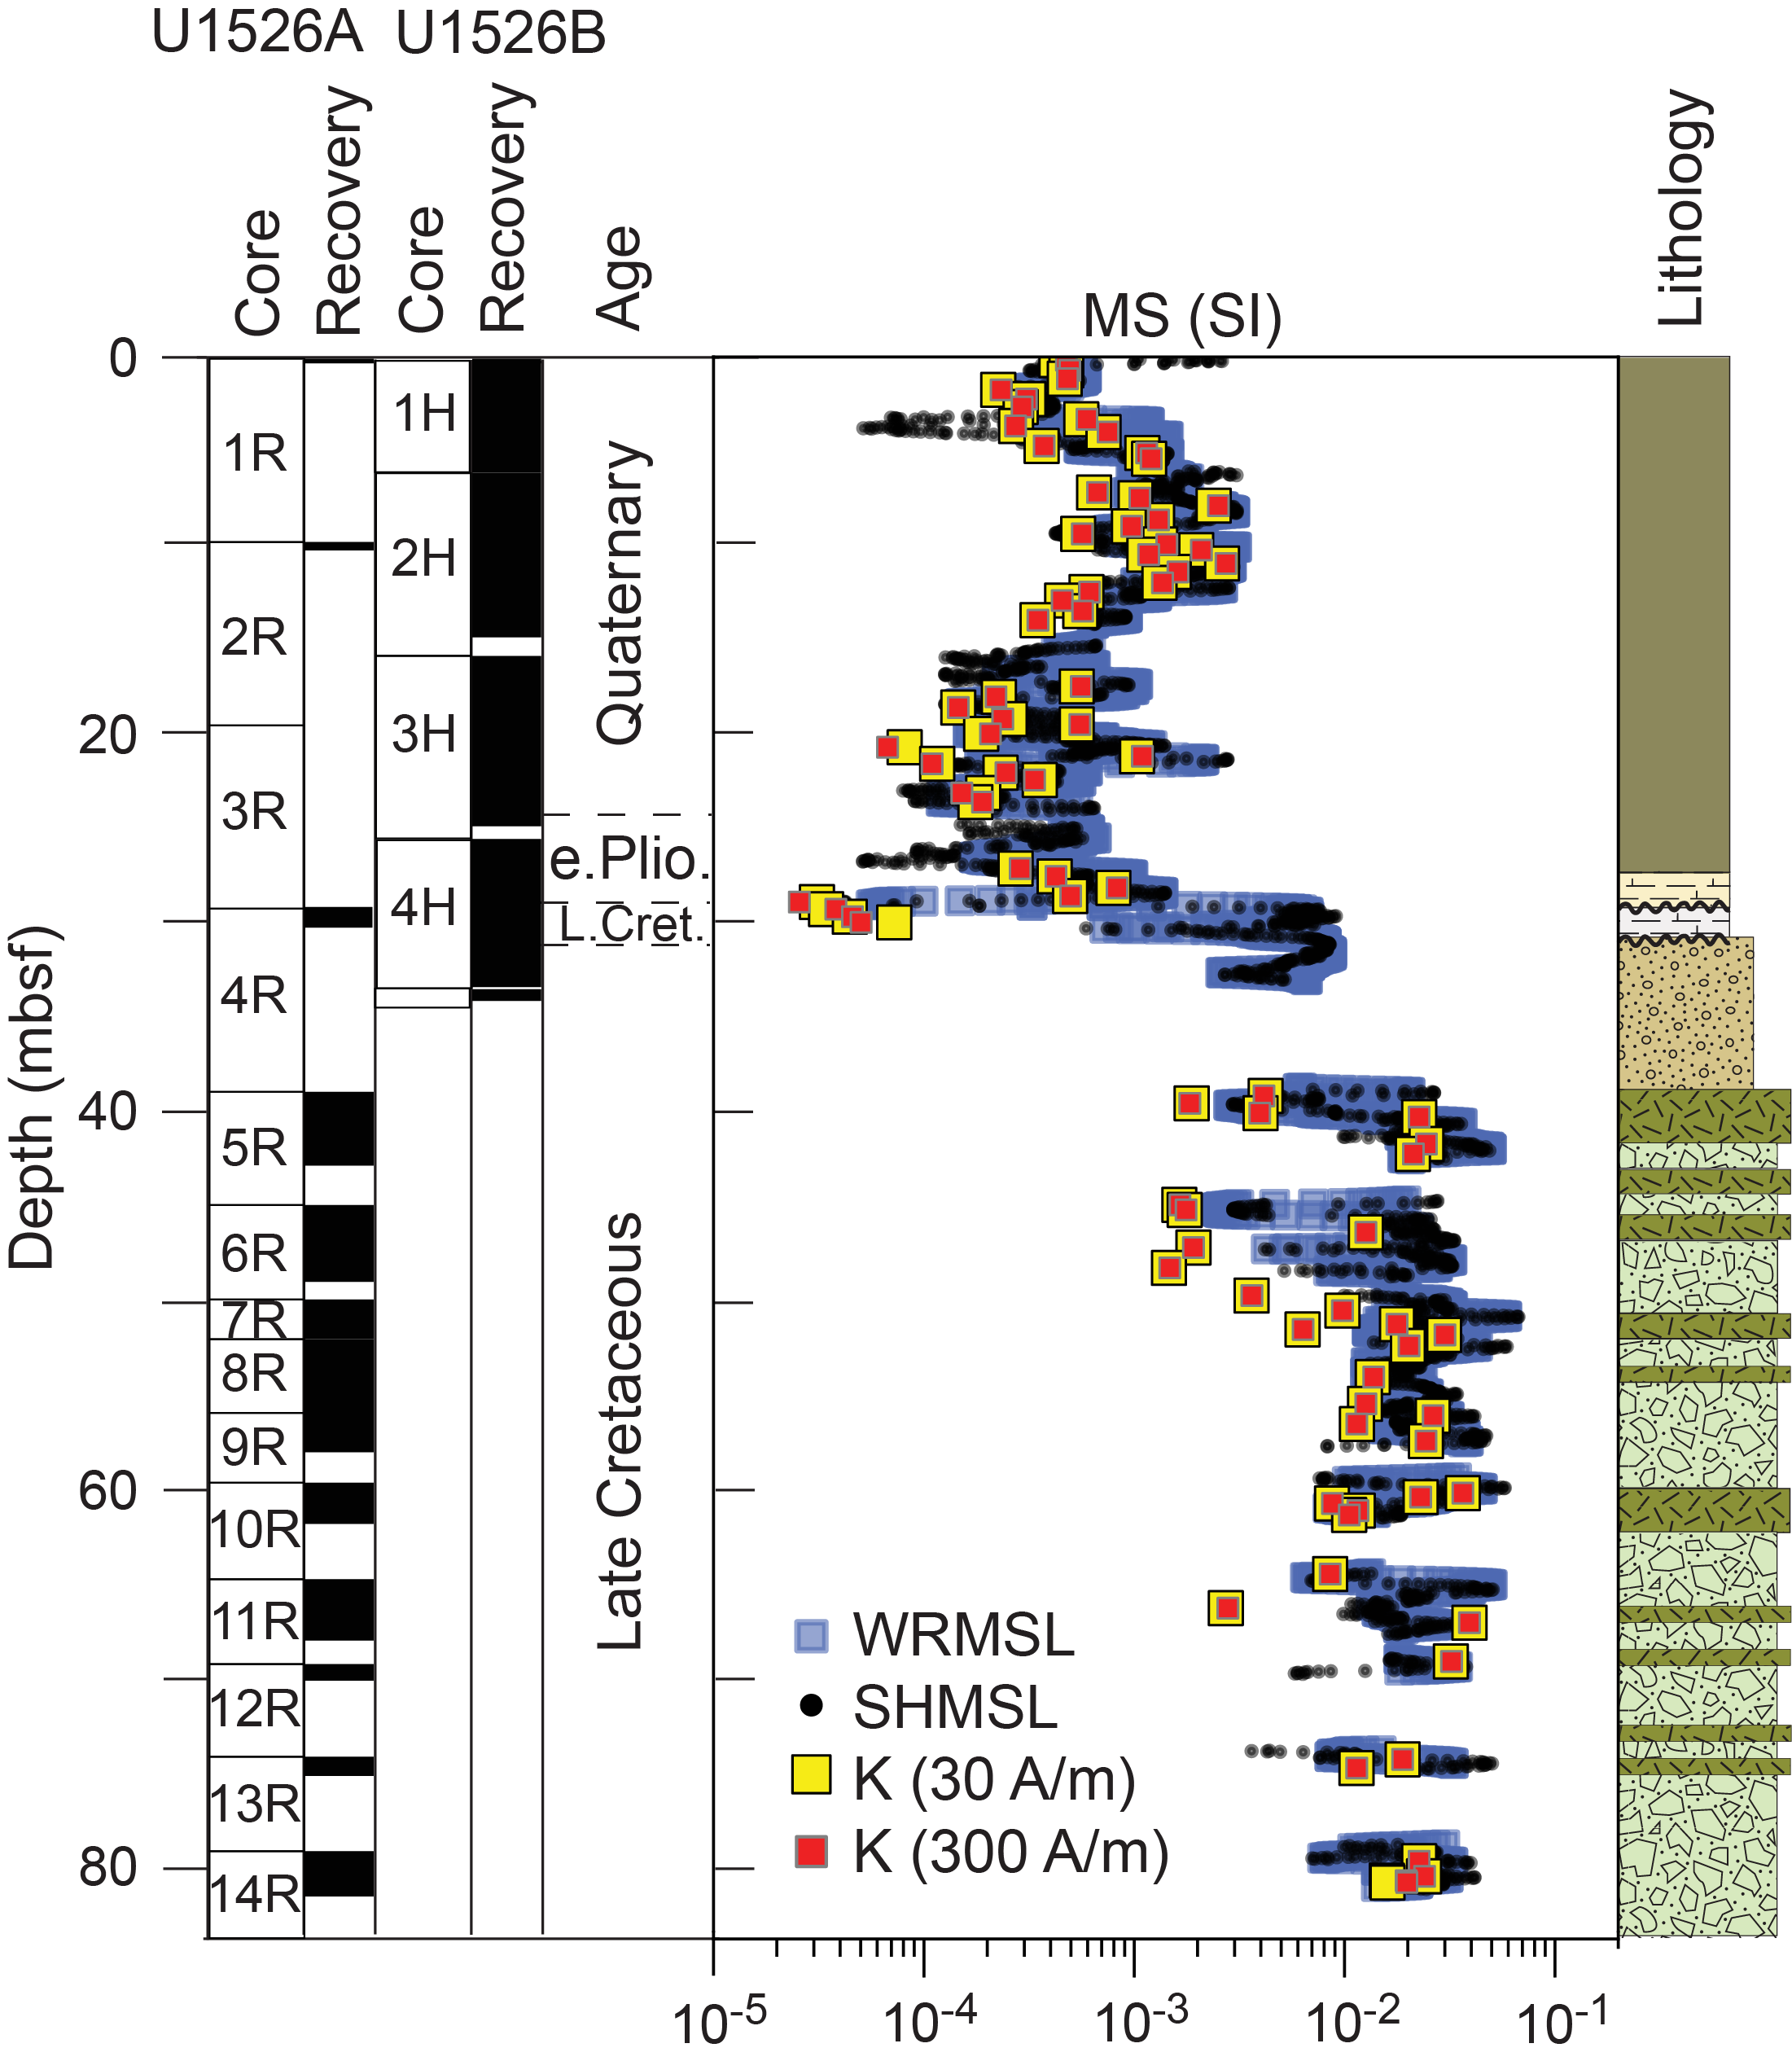
Figure F3. Bulk MS data.
MS values obtained in the different magnetizing fields differ by <2% for all discrete basalt samples except two (Figure F3). The two lowermost basalt samples from Core 375-U1526A-14R have values that differ by ~19%, which for oceanic volcanics indicates the presence of very titanium-rich titanomagnetite or titanomaghemite (Hrouda, 2002). Most discrete sediment samples have MS values that differ at the two magnetizing fields by <5%, 14 samples have values that differ by 5%–10.2%, and 4 samples have values that differ by 20.6%–43.8%. Although some of the difference for the sediments might be attributed to noise in measuring samples with very low MS, most of the difference is probably caused by real field dependence of MS caused by grain size variations and compositional variations of magnetic minerals. For example, titanomagnetite, hematite, and pyrrhotite all have field dependencies that vary based on composition (e.g., more titaniferous titanomagnetite has greater field dependence) and larger grain sizes are associated with greater field dependence (Hrouda, 2002).
4.2. Magnetic hysteresis and first-order reversal curves
Magnetic hysteresis properties, including those from backfield and IRM measurements and FORC diagrams, can be used to discriminate the coercivities of magnetic minerals, saturation magnetizations, magnetic grain sizes, and the interactions of different types and sizes of magnetic grains (e.g., Pike et al., 1999; Roberts et al., 2000; Acton et al., 2007a, 2007b). Hysteresis, backfield, IRM, and FORC measurements were conducted at the University of Hawai′i using a variable-field translation balance from MAG Instruments and at the University of Otago using a Princeton Measurements Corporation vibrating sample magnetometer (MicroMag 3900). We analyzed 1 nannofossil ooze sediment sample and 11 basalt samples at the University of Hawai′i and 2 nannofossil ooze sediment samples at the University of Otago. The samples used at the University of Hawai′i are described in Curie temperature. Examples of hysteresis loops obtained from basalt samples and one sediment sample are shown in Figure F4. The loops in this figure are not corrected for the high-field slope. They are left without the correction to show paramagnetic and diamagnetic behavior. However, the slope correction was computed and applied to the hysteresis data (see HYSTERESIS in Supplementary material for all data and plots).
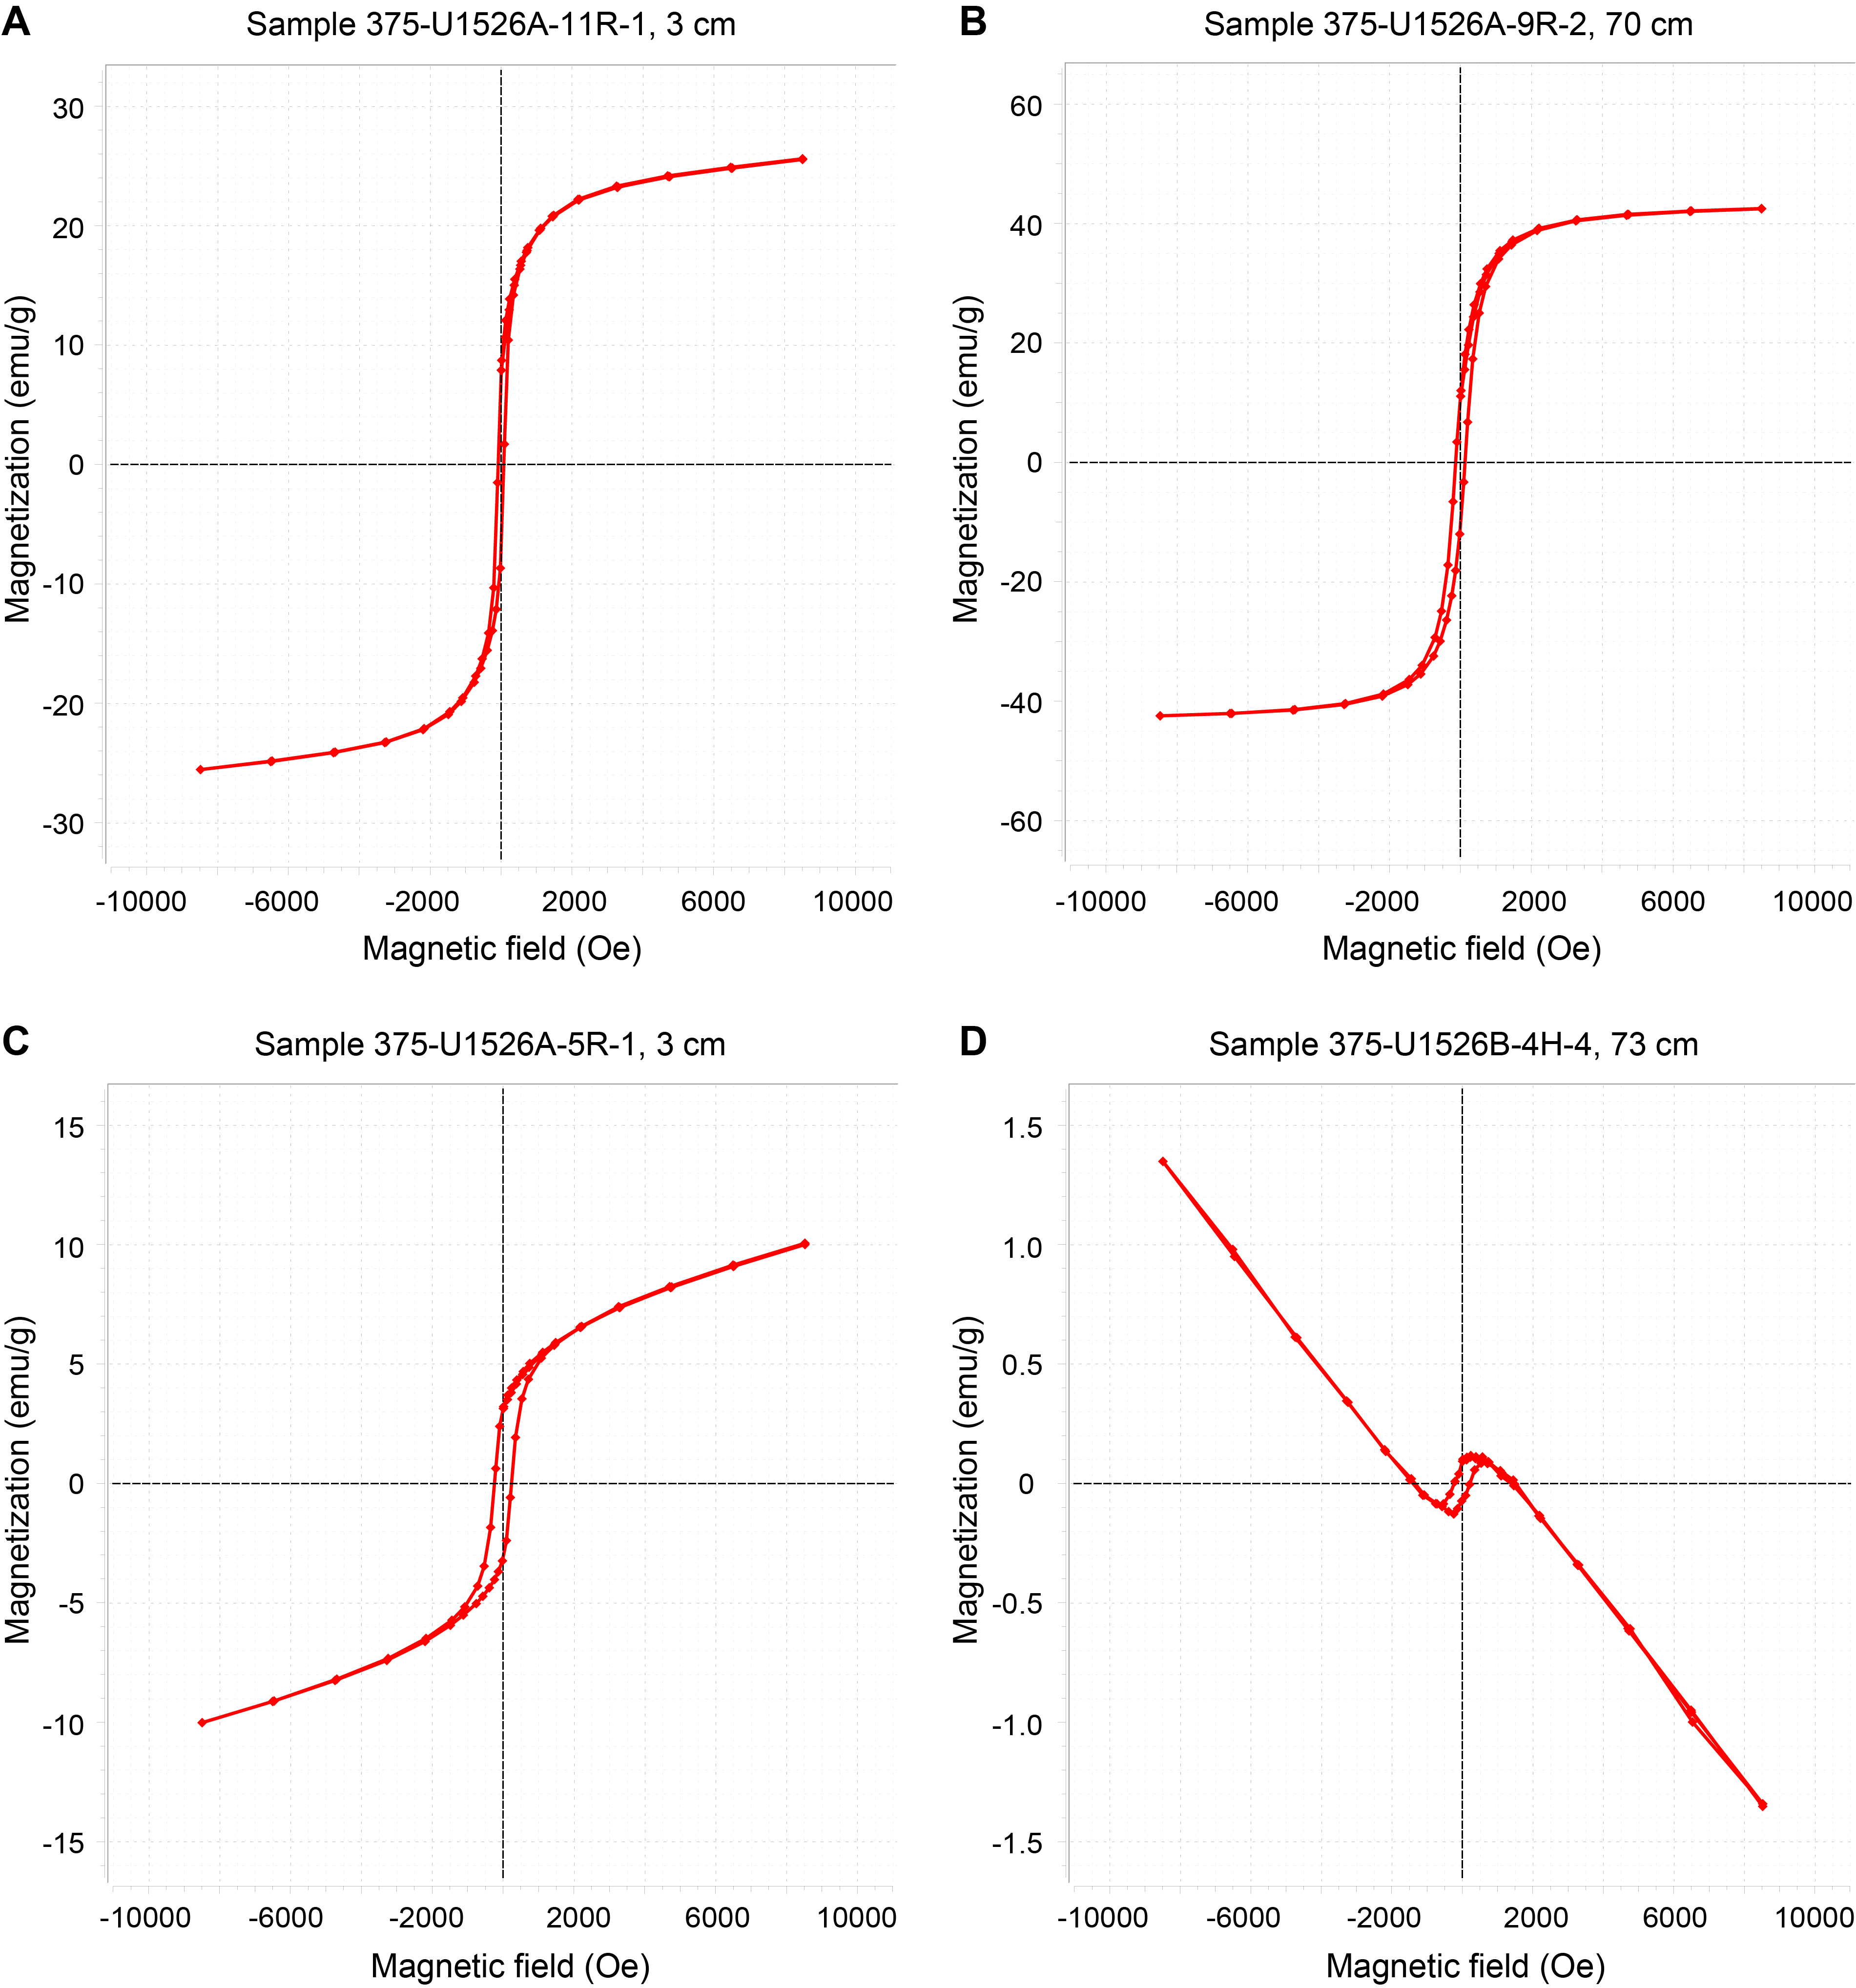
Figure F4. Magnetic hysteresis loops.
The basalt samples give fairly typical hysteresis loops for oceanic basalts (Figure F4A–F4C), with variations in the width of the loops reflecting variations in coercivity and different slopes reflecting different concentrations of paramagnetic minerals. The largest contrast in the loops is provided by the nannofossil ooze sample (Figure F4D), which is diamagnetic (due its high carbonate content and very low concentration of magnetic minerals) relative to the basalt samples, which all have a paramagnetic component.
The hysteresis and associated backfield measurements provide estimates of coercivity (Hc), coercivity of remanence (Hcr), the saturation remanent magnetization (Mr), saturation magnetization (Ms), and the ratios Hcr/Hc and Mr/Ms (see U1526-hysteresis-data-table.xlsx in HYSTERESIS in Supplementary material). Mr and Ms are relative values because the sample masses were only crudely estimated to be 20 mg. The coercivity ratio and magnetization ratio are plotted in a Day plot (Figure F5), which can be used to assess grain size variations in a general manner (Day et al., 1977). Site U1526 samples span from the region associated with single-domain (SD) grains well into the pseudosingle-domain (PSD) zone (Figure F5).
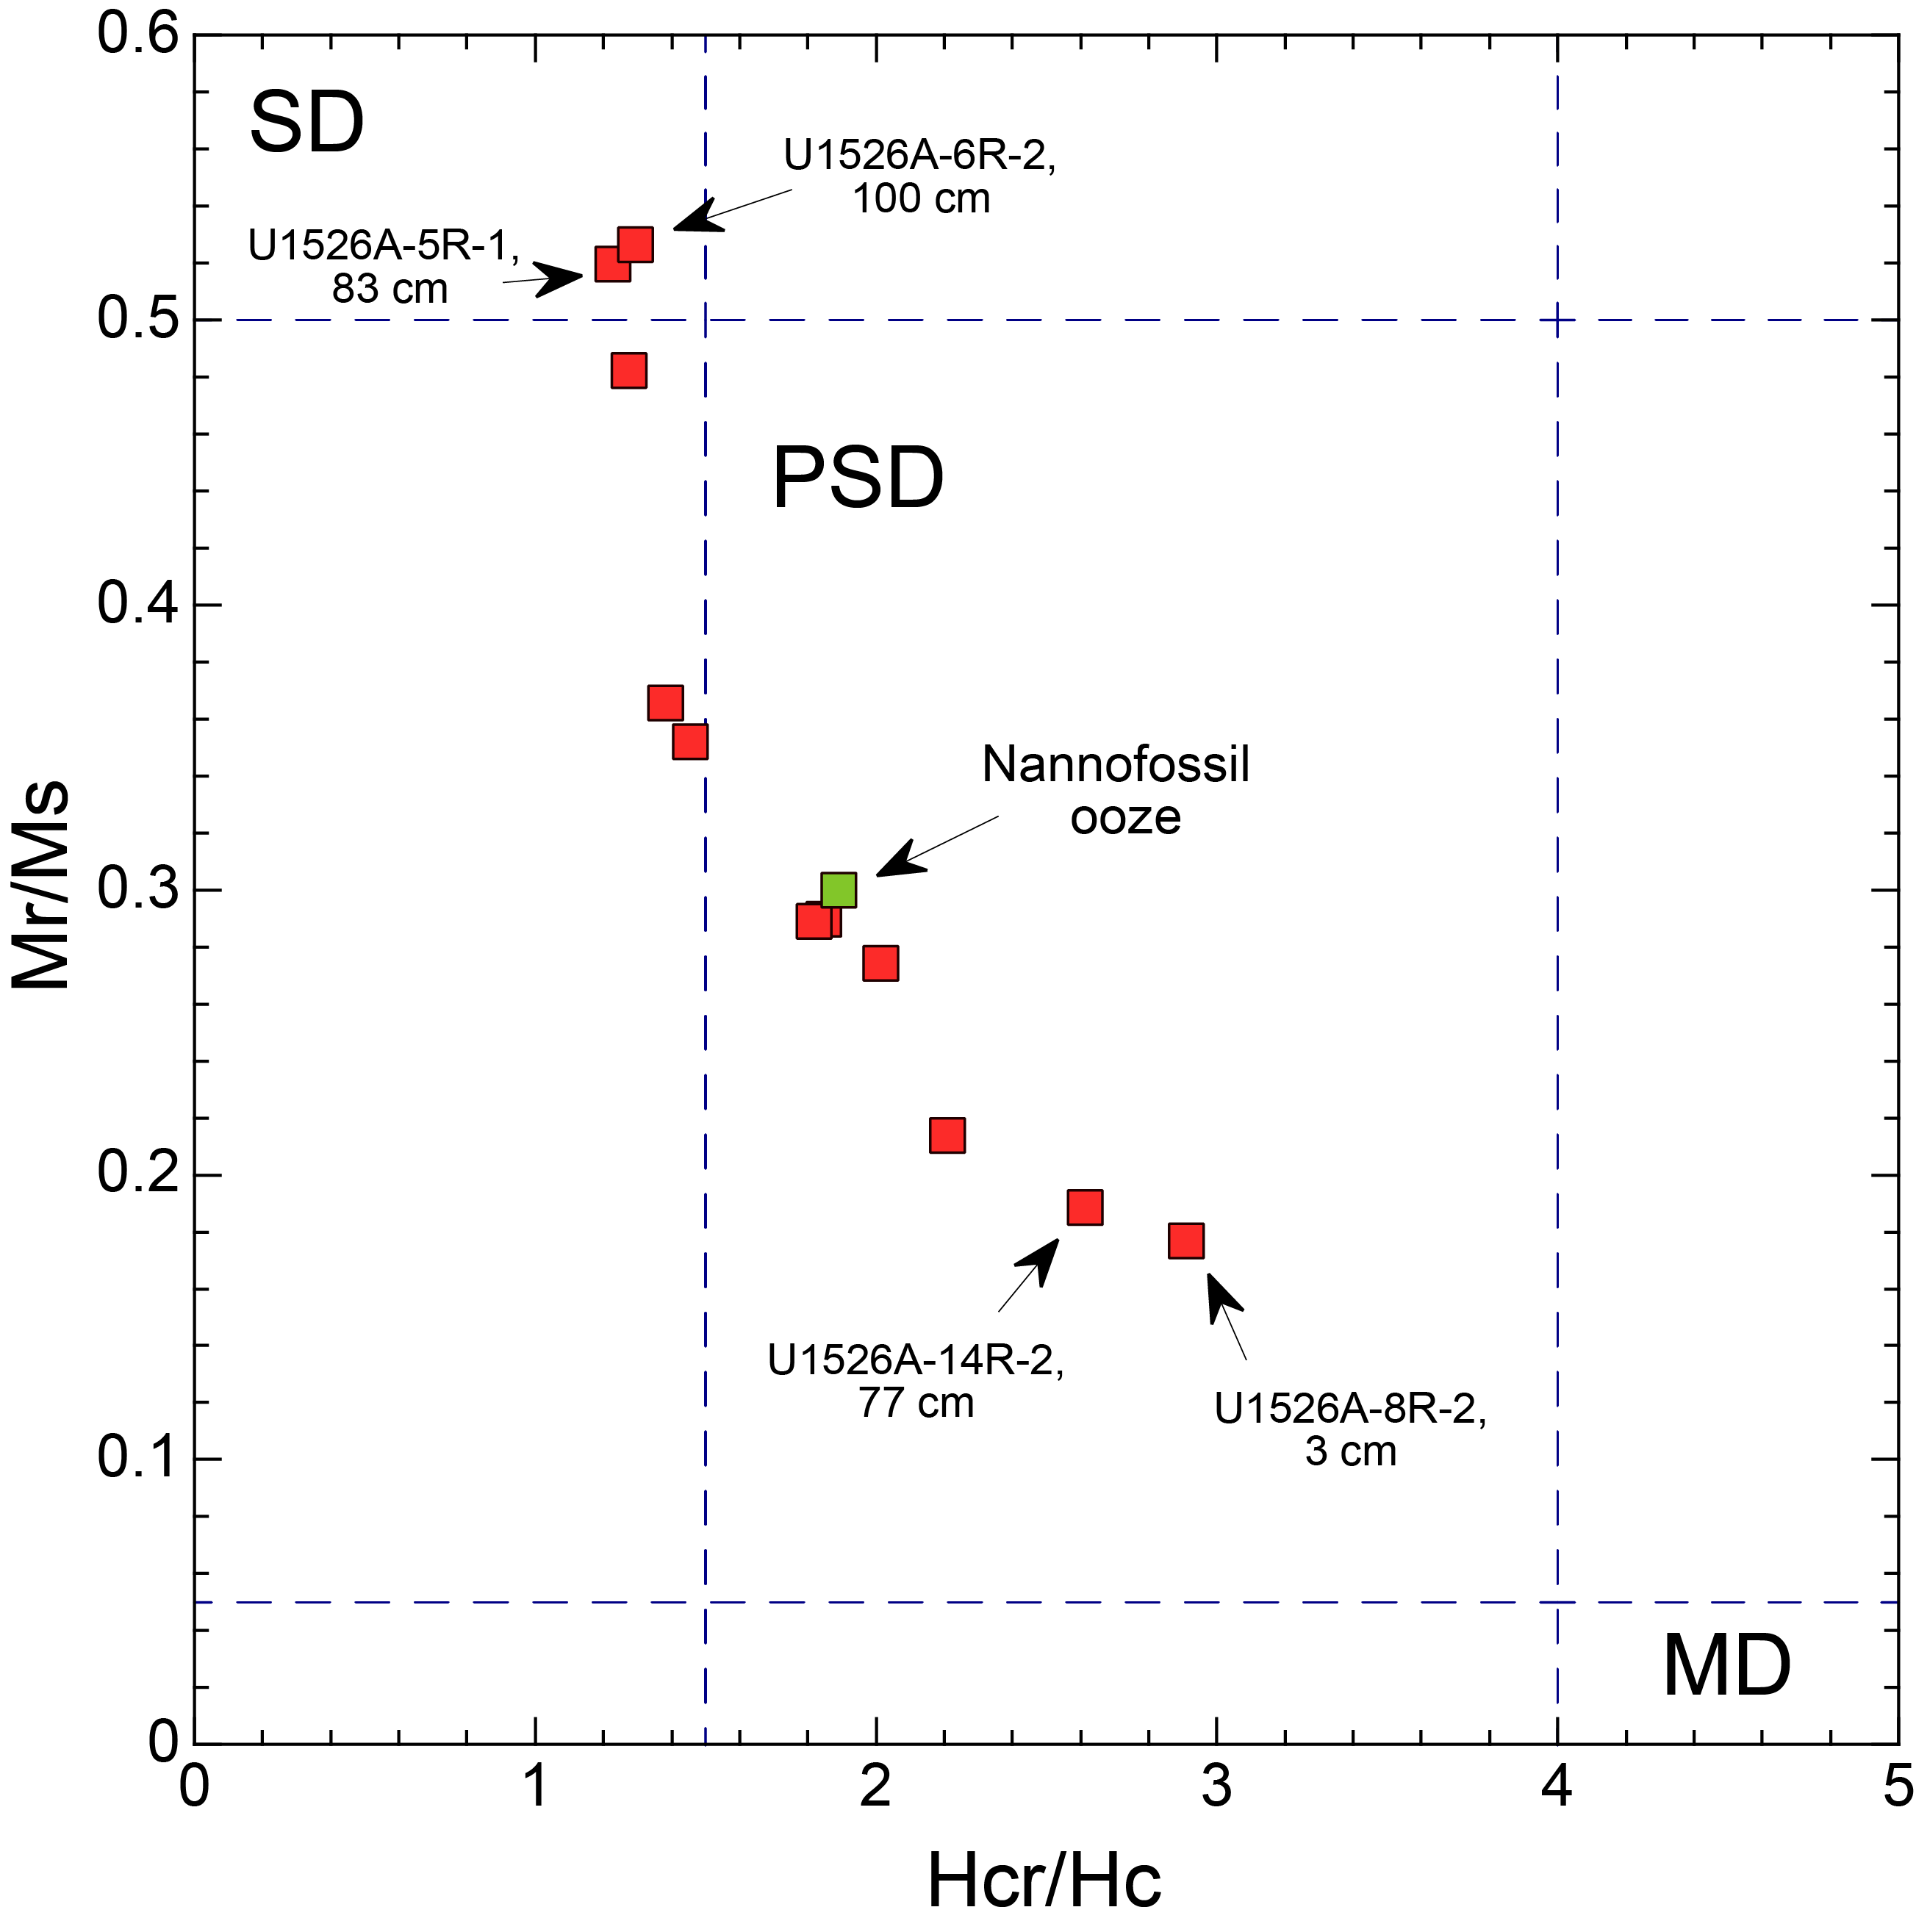
Figure F5. Coercivity and magnetization ratios.
FORC diagrams of basalt samples indicate the presence of moderate to low coercivity magnetic minerals with considerable interaction between grains and between domains in PSD and multidomain (MD) grains (Figure F6A, F6B; Samples 375-U1526A-9R-2, 70 cm, and 10R-1, 104 cm). The nannofossil ooze sample (Figure F6C; Sample 375-U1526B-4H-4, 84 cm) has similar coercivity distribution as the basalts but very little interaction between grains. This is not surprising given the low saturation magnetization and susceptibility that would indicate magnetic particles are much rarer (by about two orders of magnitude relative to the basalt) and dispersed based on the low level of interaction. The basalt FORCs were created with the FORCIT software (Acton et al., 2007a), which does not use a smoothing factor. Instead, it uses a Gaussian filter that was set to 40 mT. The sediment FORCs were processed using FORCinel with a simple smoothing factor of 8 (Harrison and Feinberg, 2008) (see FORCPLOT in Supplementary material).
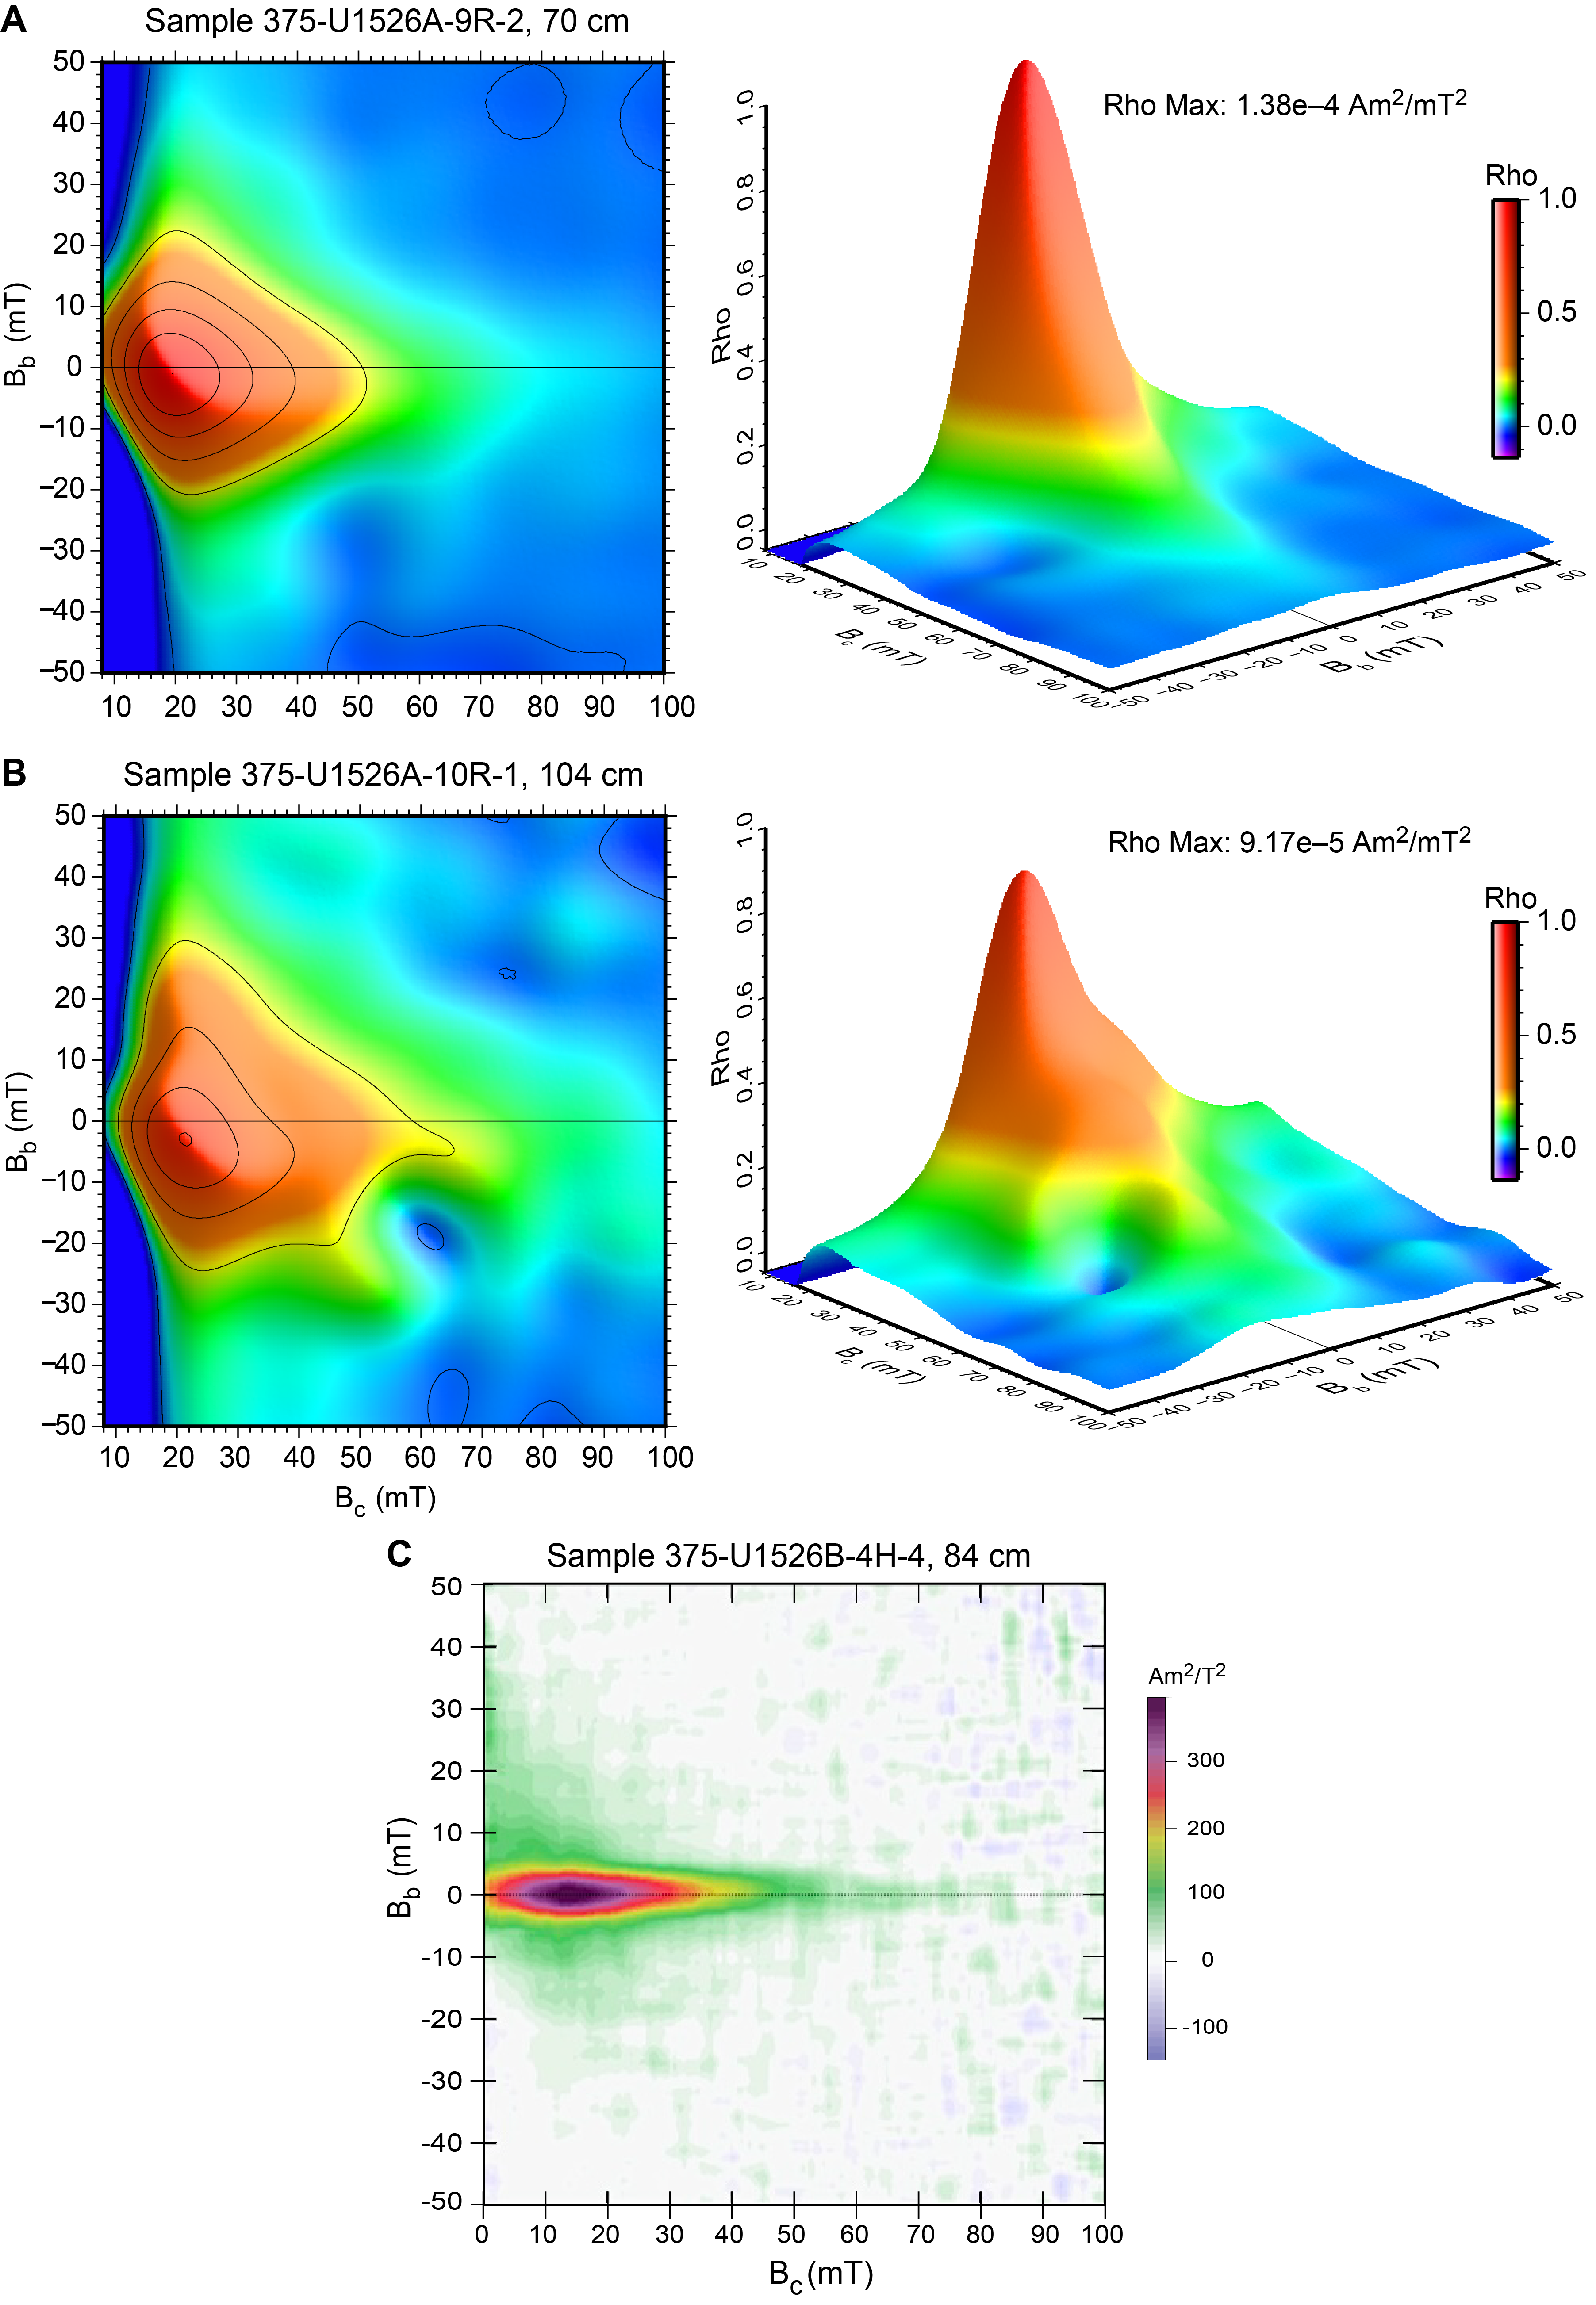
Figure F6. FORC diagrams.
Combining the FORC observations with those from the Day plot, both the basalt and nannofossil ooze have broadly similar coercivity distributions and have predominantly SD and PSD grain sizes, with at least some of the basalts possibly also having smaller contributions from MD grains. In the basalts, the magnetic grains are much more abundant and interact with each other or with themselves when PSD and possibly MD sized.
4.3. Curie temperature
The CT is the temperature above which materials lose their magnetic properties and become paramagnetic and can be used to determine what types of magnetic carriers are present. Common magnetic minerals encountered in seafloor sediments and volcanic rocks include magnetite, maghemite (a low-temperature oxidation byproduct of magnetite), and hematite, with CTs of 580°, ~645°, and 680°C, respectively (Dunlop and Özdemir, 1997). Both magnetite and maghemite are end-members of a range of titanomagnetites and titanomaghemites that occur commonly in oceanic basalts. CT decreases as titanium content increases in titanomagnetite and titanomaghemite. For example, moderate levels of titanium in either titanomagnetite or titanomaghemite can reduce the CT to around 300°–400°C (Dunlop and Özdemir, 1997).
Our CT observations are based on measuring the susceptibility of a sample as it was heated from room temperature to ~700°C and as it was cooled back down to room temperature. These measurements were conducted at the University of Hawai′i using a variable-field translation balance from MAG Instruments. We measured 1 sediment and 13 basalt samples. Measurements made at University of Hawai′i were only crudely mass normalized, with 20 mg being used as the estimated mass for all samples. In addition, background susceptibility is not subtracted, and therefore the susceptibility values in the data files and plots are relative values, which can be scaled to absolute values using the bulk susceptibility values given in the tables in MAGSUSC in Supplementary material. See CURIETEMP in Supplementary material for all data files and plots.
The basalt samples analyzed have heating curves that are consistent with mixtures of commonly observed magnetic minerals in oceanic basalts (magnetite, titanomagnetite, and titanomaghemite) being the main magnetic carriers (e.g., Herrero-Bervera et al., 2011; Krása et al., 2011). As evidenced by the sharp decreases in susceptibility at moderate temperatures, most samples have CTs that fall between 250° and 400°C (e.g., Figure F7A, F7B), with the lower CTs likely being associated with those samples that have more titanium-rich titanomagnetite and/or titanomaghemite. The lowest CT (~160°C) occurs in Sample 375-U1526A-14R-2, 77–79 cm (Figure F7E). This is also one of the two samples with a large field dependent susceptibility. Both observations are consistent with this sample containing very titanium-rich titanomagnetite or titanomaghemite.
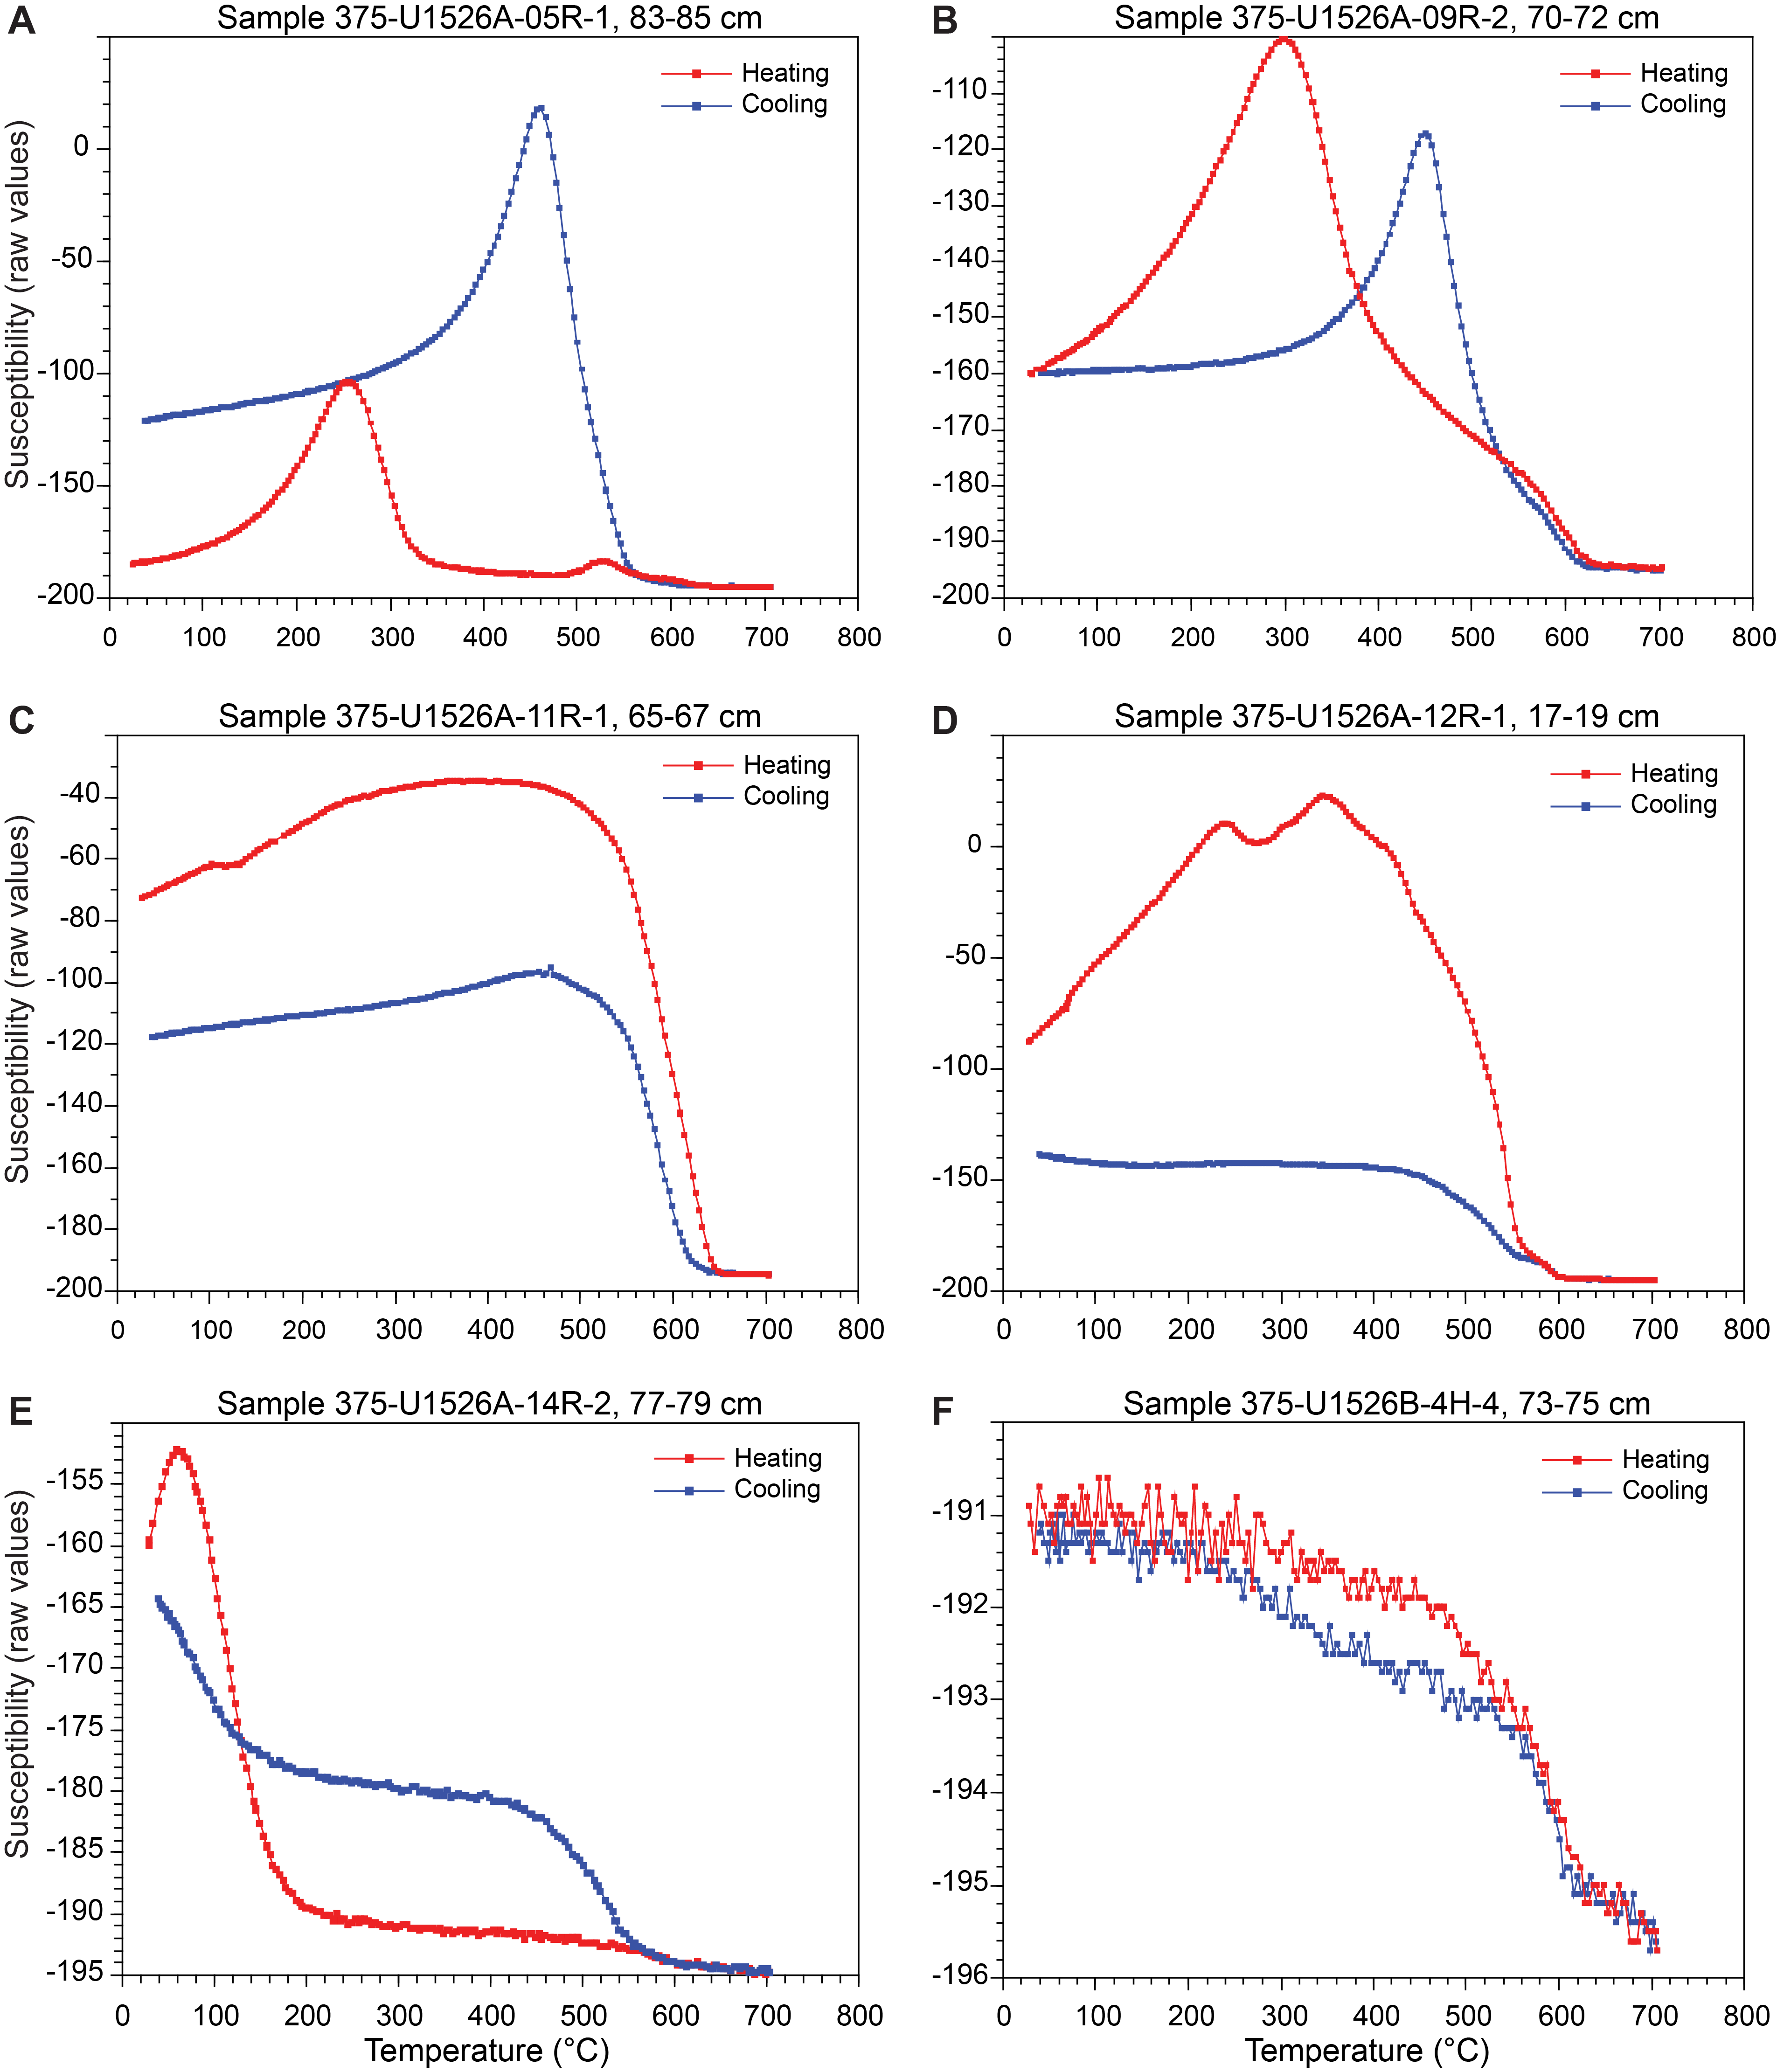
Figure F7. CT experiments.
Aside from the low to moderate CTs, several samples have a second CT of about 540° and 580°C (e.g., Samples 375-U1526A-5R-1, 83–85 cm, and 7R-2, 63–65 cm), which is indicative of magnetite or titanium-poor titanomagnetite (Figure F7A, F7D). The other half have either sharp decreases in susceptibility that occur beyond 580°C (e.g., Samples 8R-1, 3–5 cm; 10R-1, 104–106 cm; and 11R-1, 65–67 cm; Figure F7C) or more subdued decreases above 580°C (e.g., Samples 5R-1, 83–85 cm; 9R-2, 70–72 cm; and 12R-1, 17–19 cm; Figure F7A, F7B, F7D), both of which indicate the presence of a high coercivity mineral like maghemite or hematite.
5. Paleomagnetism
The natural remanent magnetization (NRM) of seafloor sediments and igneous rocks may contain information about plate motion, the behavior of Earth’s magnetic field, and the polarity of the field for use in magnetostratigraphic studies. Progressive demagnetization experiments can remove secondary overprints, resolve primary magnetization components, and help determine whether the NRM represents the ancient (paleomagnetic) field or a younger direction caused by alteration and remagnetization of the sediment or rock.
Our initial goal was to use the paleomagnetism of the Late Cretaceous sediments and igneous units to gain a better understanding of the paleogeography and motion of the Hikurangi Plateau. We therefore measured the NRM of basalt and sediment samples before and after progressive thermal or alternating field (AF) demagnetization and estimated the primary magnetization direction of each sample using principal component analysis (PCA) (Kirschvink, 1980).
5.1. Measurements
All basalt samples and all but eight sediment samples were measured at the University of Hawai′i on a 2G Enterprises 755 pass-through superconducting rock magnetometer with an in-line AF demagnetization unit. Sediment samples were subjected only to AF demagnetization. After the first day of AF measurements, it became apparent that we could not use the in-line demagnetization unit due to a faulty amplifier, which failed at AF fields of about 20 mT or higher. Instead, samples were AF demagnetized using a Molspin tumbler demagnetizer and then measured with the cryogenic magnetometer. Hence, for the first batch of sediment samples that were AF demagnetized up to 20 mT with the faulty in-line AF unit, we repeated the 20 mT step using the Molspin demagnetizer and then demagnetized in steps of 5 mT up to 50 mT, measuring the remanent magnetization on the 2G magnetometer after each step. Likewise, the remaining sediment samples were demagnetized at 5 mT steps from 0 to 50 mT using the Molspin demagnetizer for all demagnetization steps.
An additional eight sediment samples (all of them nannofossil ooze from Section 375-U1526B-4H-4) were measured at the University of Otago using a 2G Enterprises DC 760.5 pass-through superconducting rock magnetometer with an in-line demagnetization unit. Samples were demagnetized at 5 mT and then in 2.5 mT increments up to 45 mT.
We also downloaded the Site U1526 shipboard split core data for the nannofossil ooze. This consisted of measurements at 63 intervals (Wallace et al., 2019). Measurements were made every 2.5 cm between 28.82 and 30.54 mbsf after 0, 5, 10, 20, and 30 mT AF demagnetization.
We thermally demagnetized 29 basalt samples using a magnetic measurements thermal demagnetizer oven and measured the NRM after each step on the 2G magnetometer. AF demagnetization was done with steps of 50° between 100° and 200°C and steps of 30° up to 660°C in most cases. Eight basalt samples were subjected to AF demagnetization using 5 mT steps from 0 to 50 mT and then 10 mT steps up to 100 mT.
5.2. Data analysis
We calculated the preferred NRM directions using PCA. PCA lines were fit through the data requiring that at least 4 or 5 steps were used (3 steps for the shipboard data), with the fitting done in two ways: (1) the lines were not constrained to pass through the origin (referred to as the FREE option), and (2) the lines were anchored to the origin (ANC option). We also computed a stable endpoint (SEP) from a Fisherian average of the directions from the three highest demagnetization steps. The directions and PCA results are displayed for selected samples in orthogonal vector (modified Zijderveld) plots in Figures F8 and F9 for sediments and basalts, respectively. Orthogonal vector plots for all samples and data files with PCA results are available in DEMAGPCA in Supplementary material.
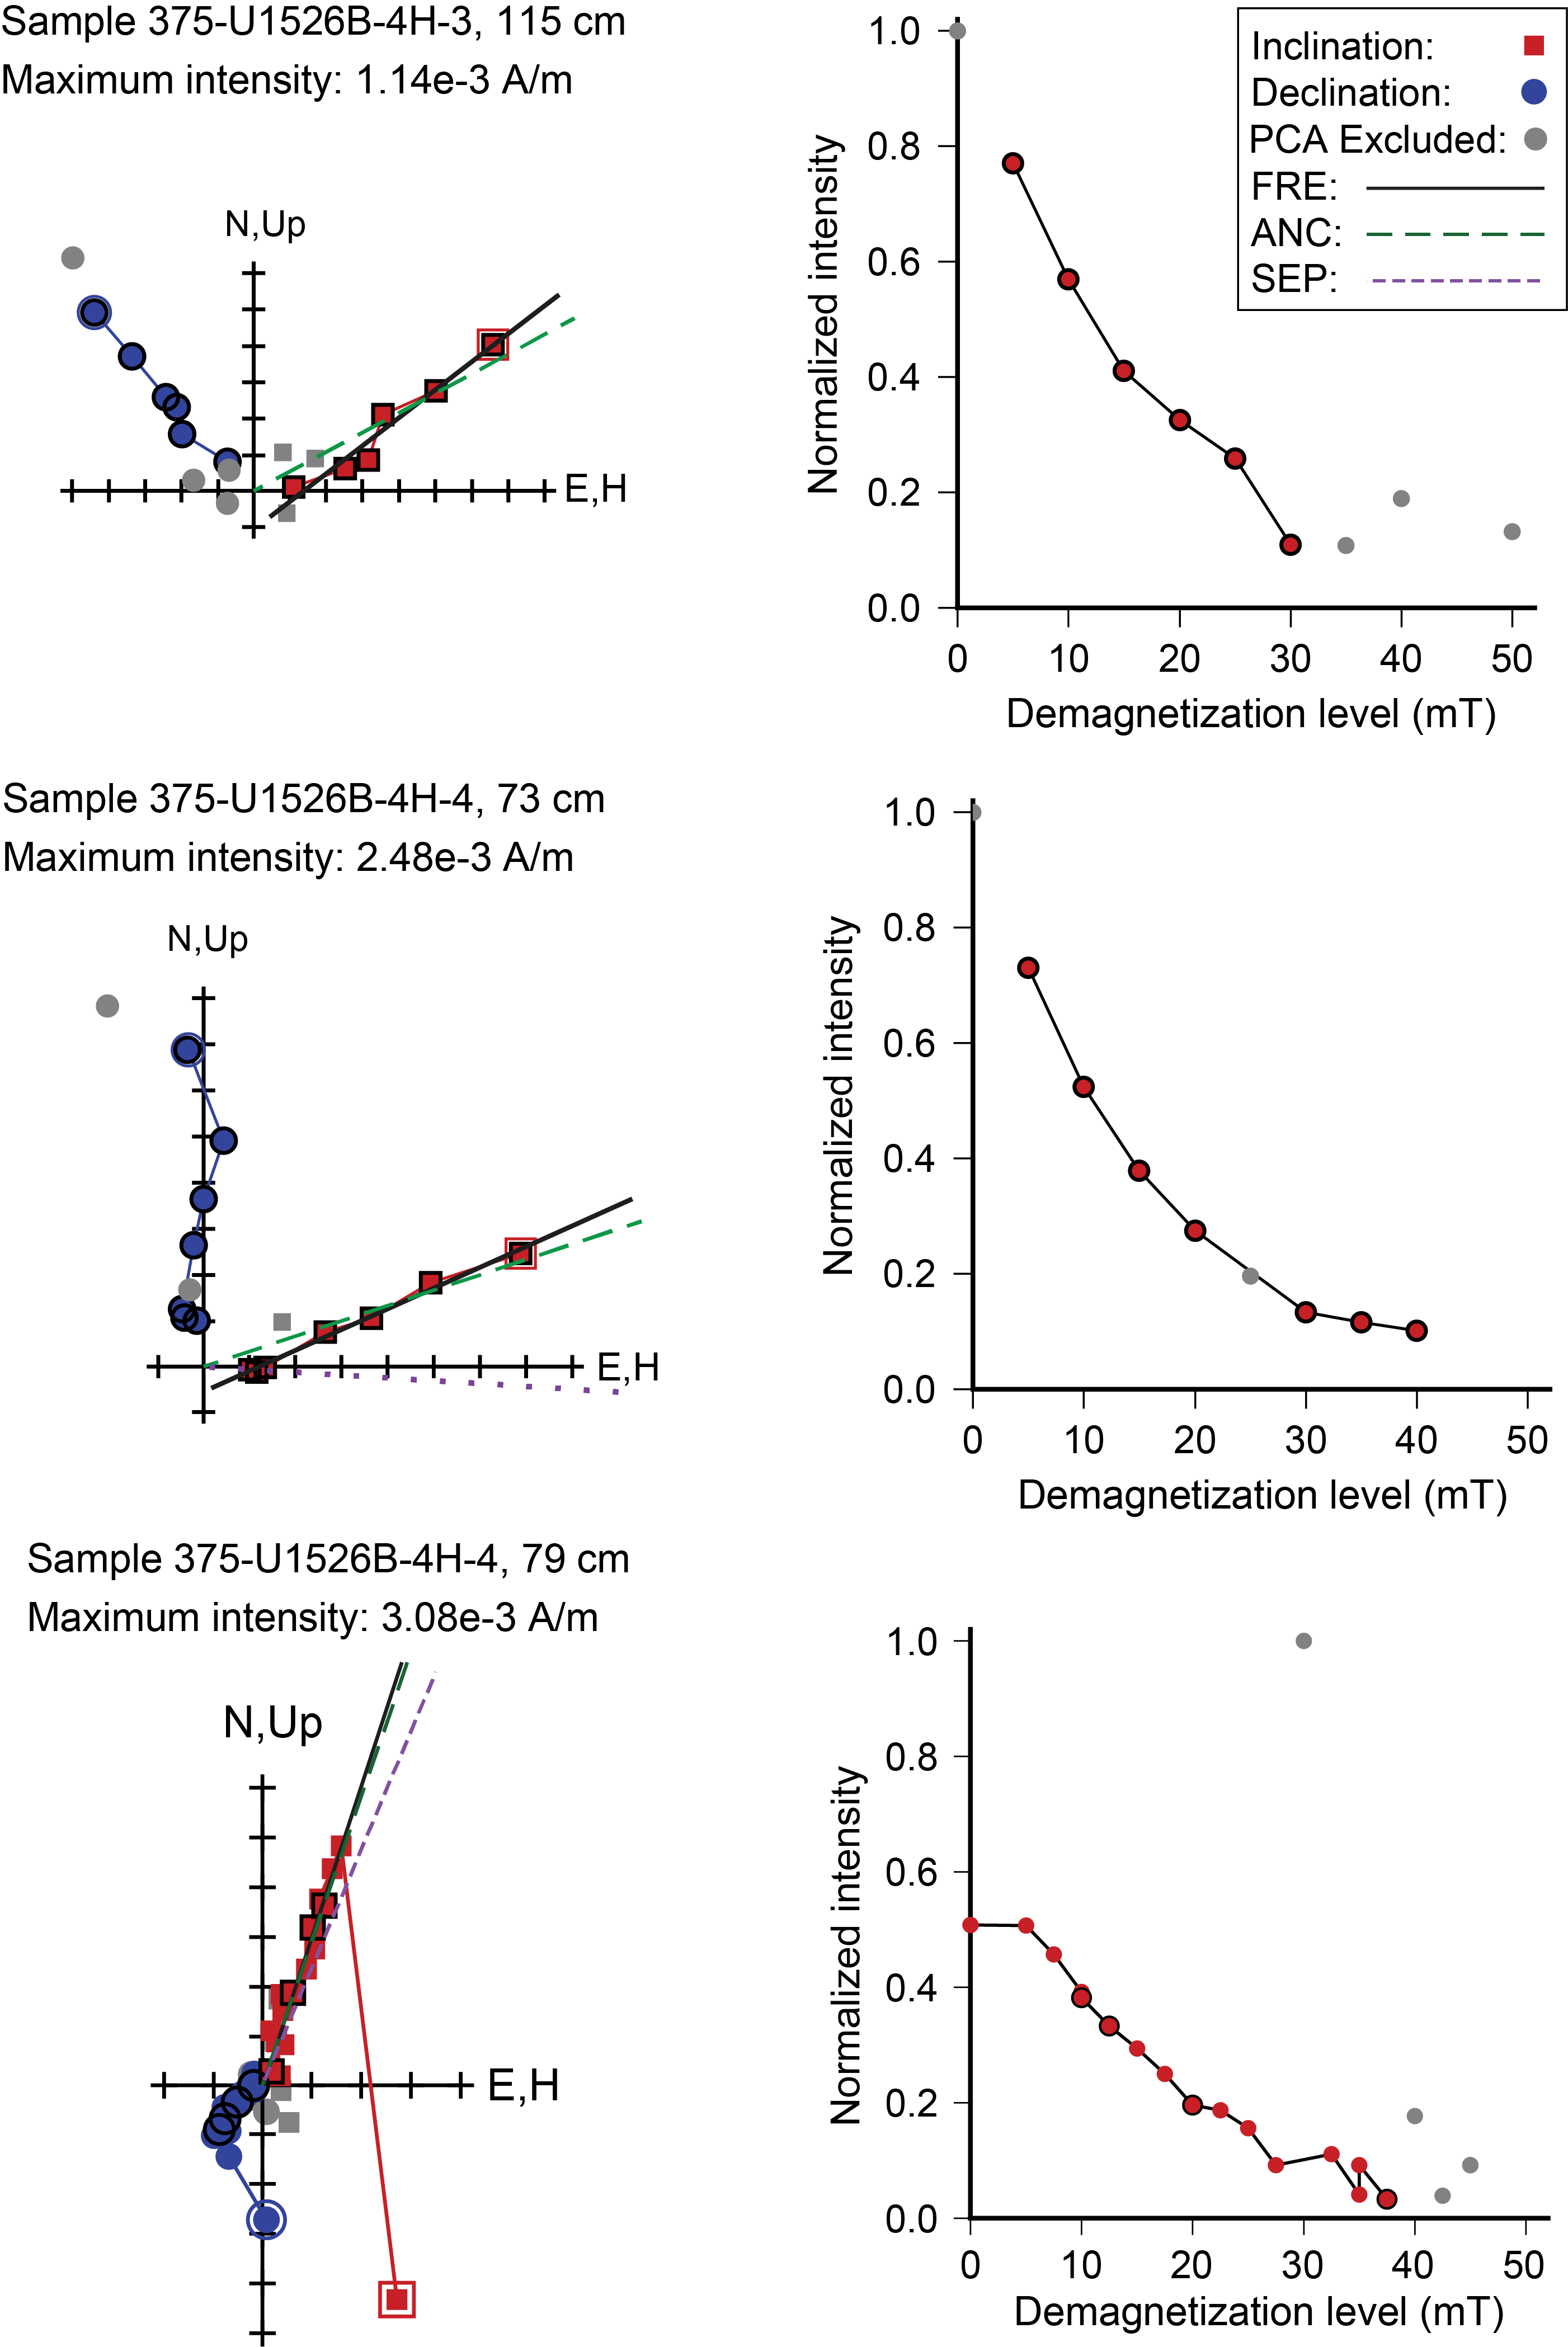
Figure F8. Modified Zijderveld plots, sediment.
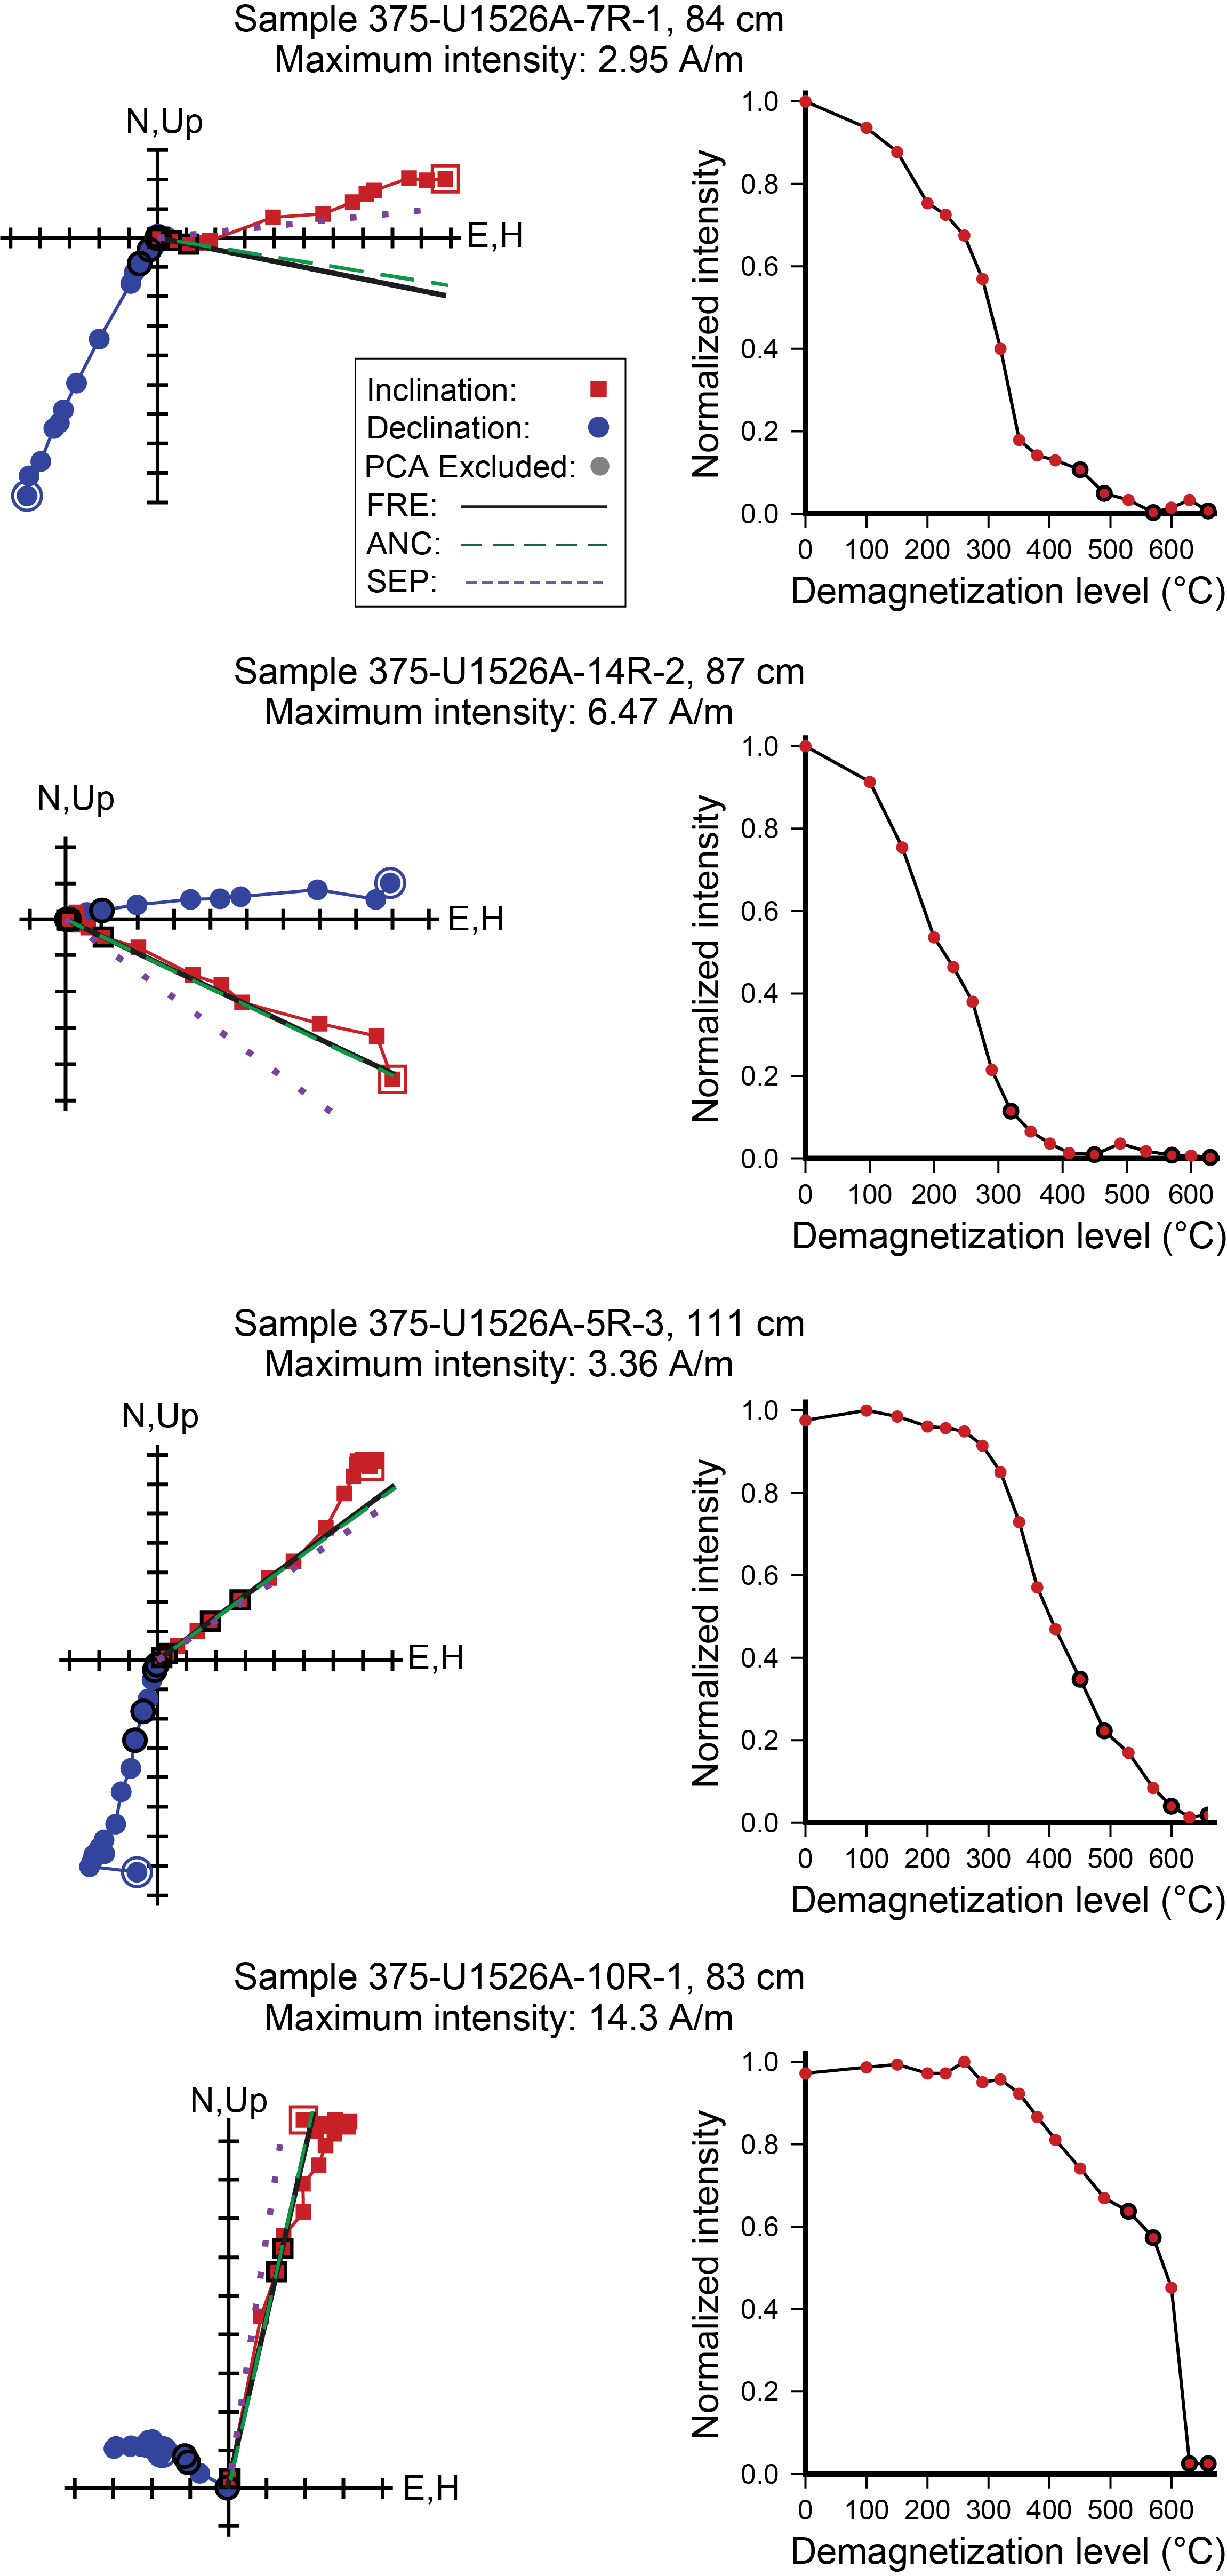
Figure F9. Modified Zijderveld plots, basalt.
The magnetic inclinations determined from PCA for the discrete samples on shore are generally comparable to the inclinations observed in the shipboard section-half and discrete sample data after demagnetization up to 20 mT or higher (Figure F10). The largest differences are typically associated with weakly magnetized sediments, which generally give noisy demagnetization paths in the orthogonal vector plots and likewise poorly constrained characteristic remanent magnetization (ChRM) directions.
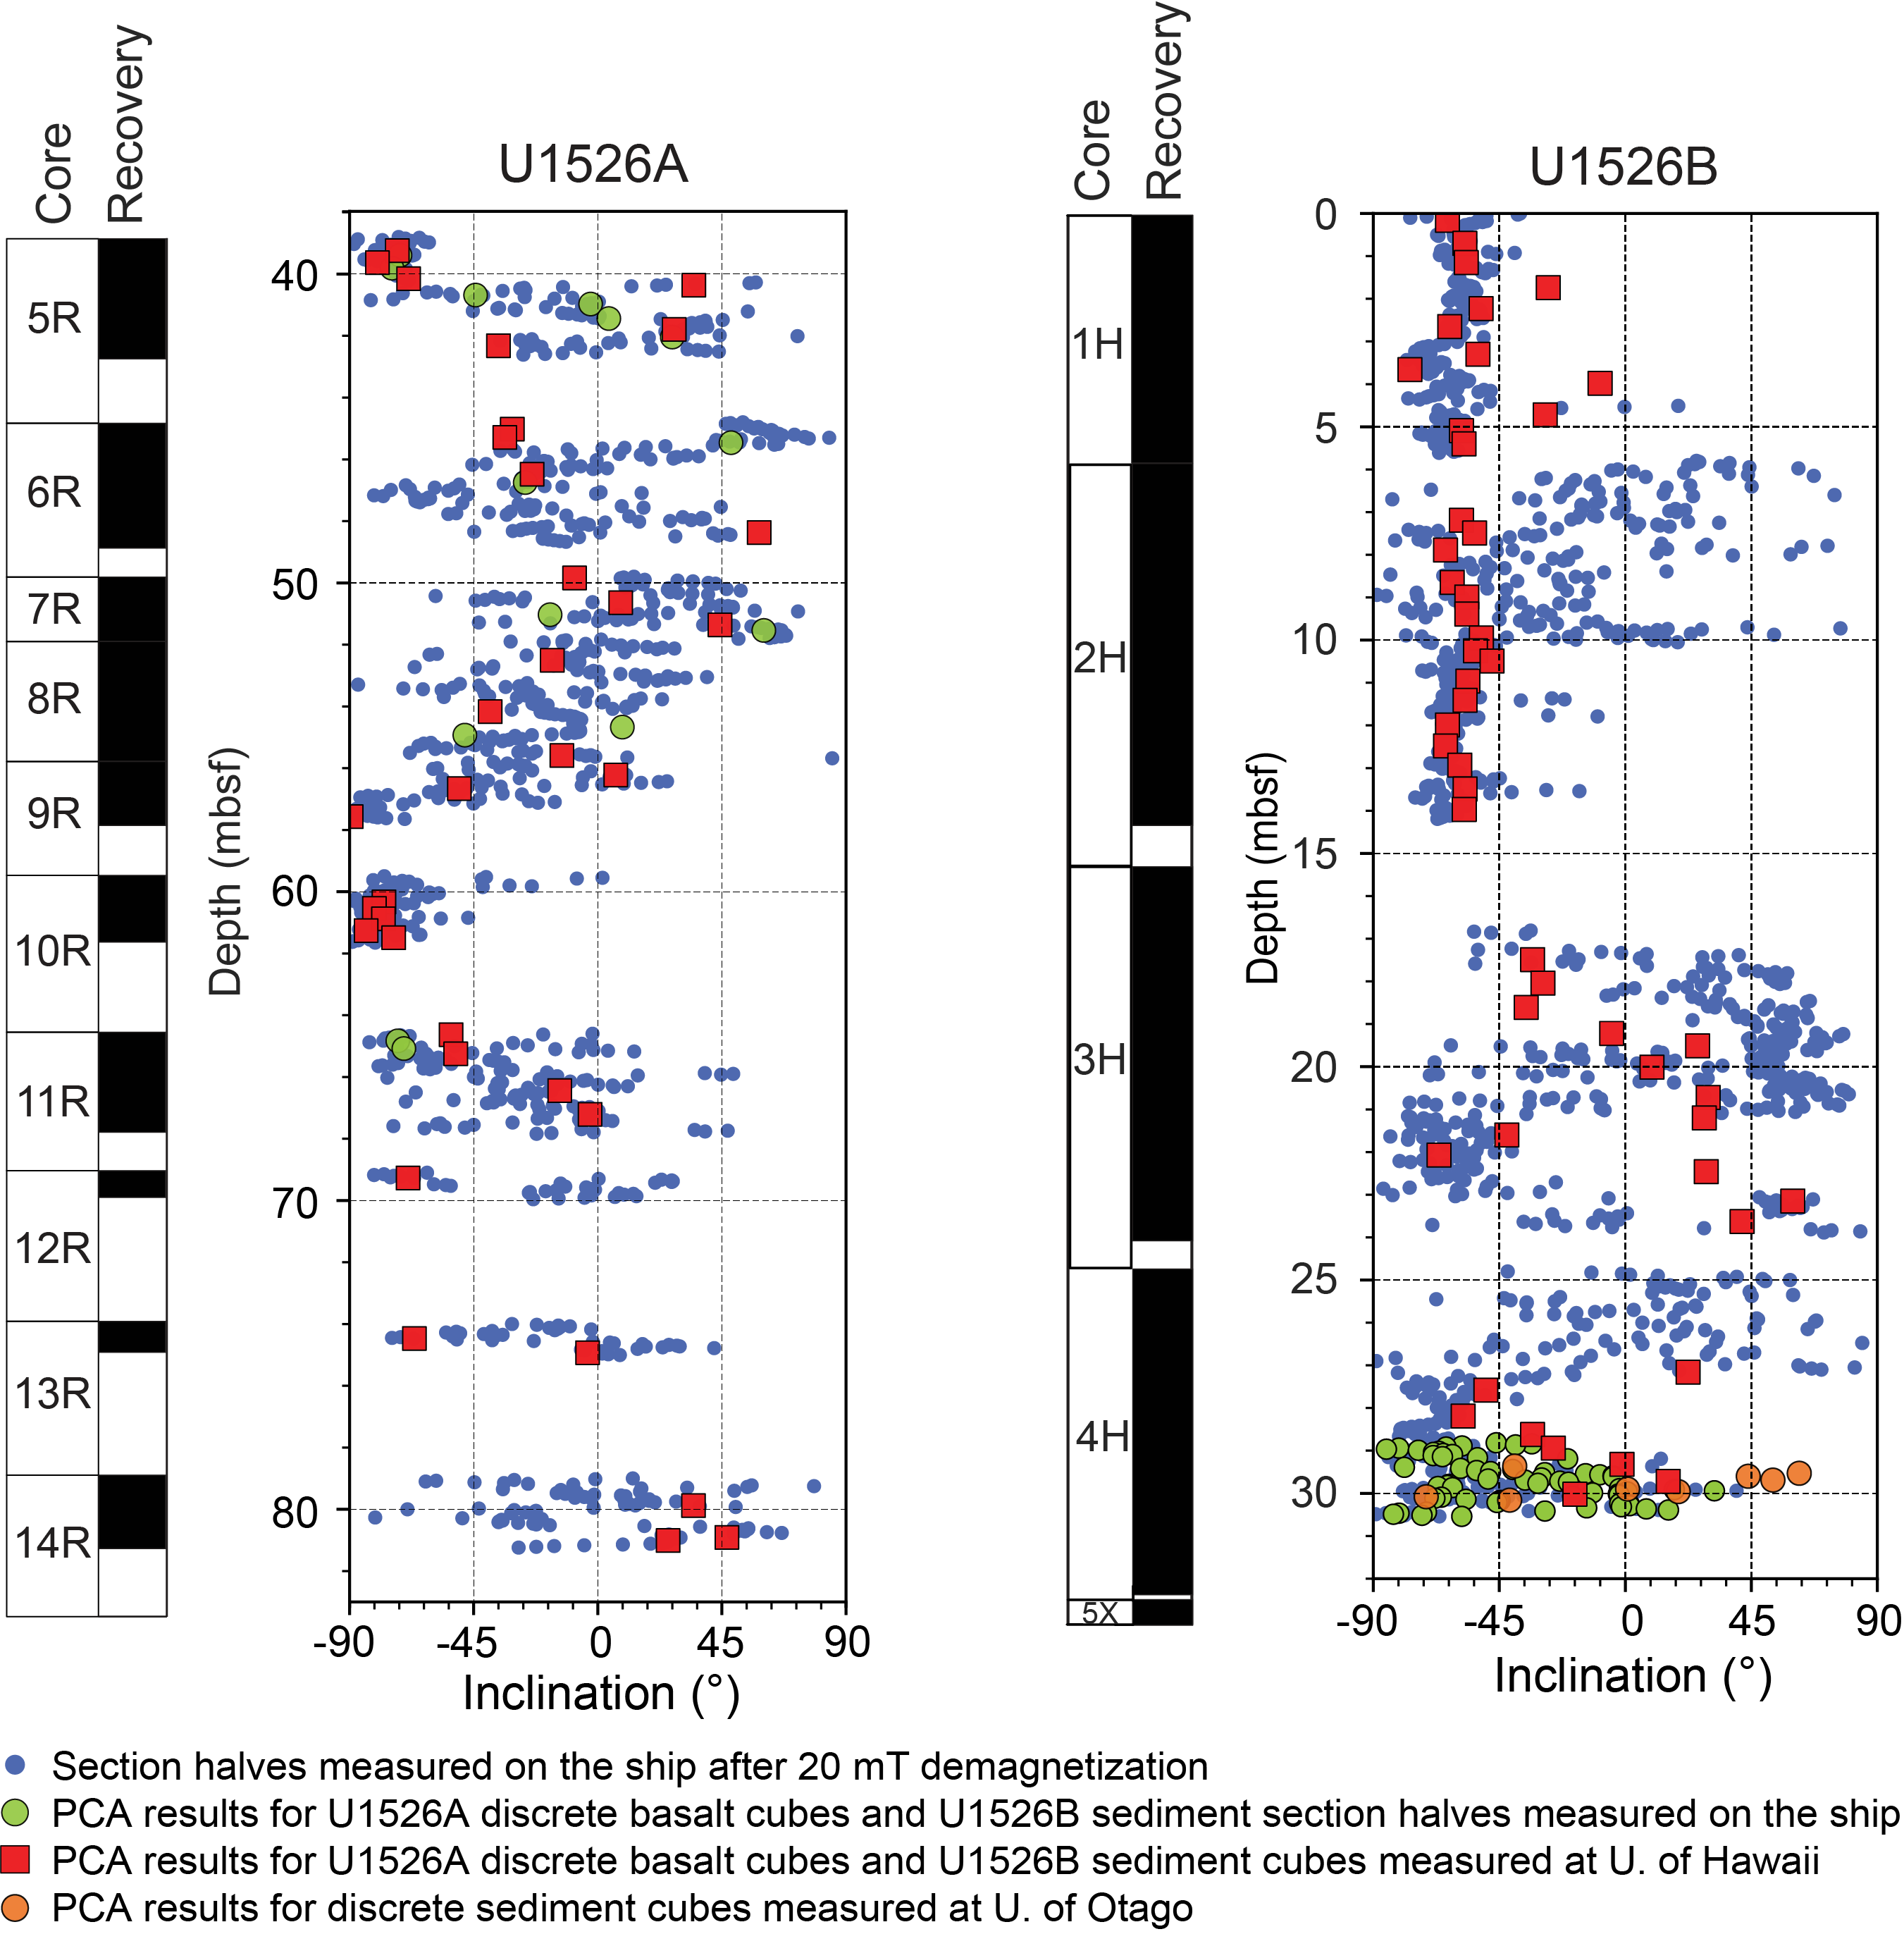
Figure F10. Inclinations.
5.3. Sediment results
A steep drilling overprint is typically removed by AF demagnetization in peak fields of 5 to 15 mT, with the remaining ChRM being weak. The origin of the ChRM is most likely a depositional magnetization, given that the sediments do not appear even moderately altered. Although the progressive demagnetization resolves the ChRM relatively well for some of the discrete samples, more generally as a sample is demagnetized its directions show a large amount of scatter because the magnetization is so weak. This is particularly true of the Late Cretaceous nannofossil ooze but also of some of the younger sediments.
Given that our research goals were focused on the older sediments, we only partially demagnetized the Pliocene and younger sediments above 28.7 mbsf. PCA analyses of these partially demagnetized samples are mostly poorly constrained, but the results that were obtained have quite consistent inclinations of about −60° above 15 mbsf (Figure F10). For Site U1526 at 39° south latitude, the expected geocentric axial dipole inclination for the past several million years would be about −68° when the field has normal polarity. The sediments above 15 mbsf therefore appear to be solely normal polarity. Between 15 and 24 mbsf, there appear to be two reversed polarity intervals separated by a normal polarity interval. Because hiatuses occur in the stratigraphic section, assigning those magnetozones to specific magnetochrons would be complicated. From 24 to ~27.5 mbsf, the inclinations are scattered nearly randomly between −90° and 90°. The core photos show that this interval sustained significant coring deformation (Wallace et al., 2019).
From 27.5 mbsf to the base of the nannofossil ooze at 30.2 mbsf, the shipboard section-half data have scattered inclinations that lie mostly between −30° and −80°, indicating the interval has normal polarity (Figure F10). The discrete cube samples are much more scattered and only a few of the samples had reasonably well constrained PCA directions. The scatter is attributed to the low magnetization of the sediments, which typically was <0.002 A/m. For example, the six more weakly magnetized nannofossil ooze samples measured at Otago University (NRMs < 0.002 A/m) yielded directions during demagnetization that were very scattered and no definitive PCA direction could be established, whereas the three samples with NRMs >0.002 A/m gave reasonably well resolved anchored PCA directions, even though these have inclinations that are highly inconsistent with each other (52.7°, −71.1°, and −41.3°) and are of dubious value. Probably the best estimate of the ChRM inclinations come from the section halves because the volume of sediment being measured is about 20 times greater than that of discrete samples, increasing the signal-to-noise ratio for the section-half measurements. Although the magnetic polarity of the nannofossil ooze can be ascertained (mainly from the PCA results for the section halves), neither the section-half nor discrete sample results are of high enough quality to warrant using them for paleolatitude determination.
5.4. Basalt results
The basalt samples have well-defined ChRMs, as evidenced by the univectorial nature of magnetization decay on vector demagnetization diagrams after removing low-unblocking temperature or low coercivity components most likely related to drilling, sampling, or handling the samples. PCA lines fit with the free option have MAD values <4° for all but one sample. The inclinations from this study are thus well constrained and they are also very consistent with those obtained during Expedition 375 from archive-half sections and discrete samples (Figure F10).
Despite being well resolved, the inclinations from discrete samples and section halves are dispersed from about 70° to −90°, suggesting the ChRMs are not solely from in situ lava flows extruded during stable geomagnetic polarity intervals. The expected (normal polarity) inclination for the Late Cretaceous at Site U1526 is about −70° to −75° (Acton and Gordon, 1991; Beaman et al., 2007). A couple clusters of steep inclinations do occur at 38.8–40.2 mbsf (Core 375-U1526A-5R) and 57.6–61.5 mbsf (Cores 9R–11R). These possibly represent a few in situ volcanic flows, but their setting cannot be confirmed given the general scatter of the data. The most likely interpretation is that the basalt samples are at least partly from clasts or boulders that have been transported from their original location as opposed to in situ flows, as was also suspected during Expedition 375 (see Lithostratigraphy and Paleomagnetism in Wallace et al., 2019).
6. Conclusions
We analyzed the magnetic properties and NRM of sediments and basalts recovered from Tūranganui Knoll on the Hikurangi Plateau during Expedition 375. The very low sedimentation rate and presence of several hiatuses makes it difficult to use the sediment paleoinclinations to construct a magnetostratigraphy at Site U1526. The relatively thin unit of Late Cretaceous sediments consisting of nannofossil ooze may retain a primary magnetization but the magnetization is extremely weak, making it difficult to resolve the characteristic inclination. The magnetic properties of the basalts indicate that they are very good paleomagnetic field recorders, but it is unlikely the paleomagnetic directions they record are from in situ volcanic flows. Instead, at least part of the volcanic section is comprised of clasts or boulders that have been transported from their original location. As a result, it is difficult to use the Late Cretaceous data to constraint the paleolatitude of the Hikurangi Plateau.
7. Data availability statement
The data collected for this study can be found in Supplementary material in this volume and at https://doi.org/10.5281/zenodo.14795970. All Expedition 375 shipboard data are available at https://web.iodp.tamu.edu/OVERVIEW.
8. Acknowledgments
This research used data and samples provided by IODP. Laboratory support was provided by a U.S. Science Support Program grant to K. Petronotis. Support for K. Petronotis and G. Acton was also provided by NSF Ocean Drilling Program grants OCE1326927 (IODP JOIDES Resolution Science Operator [JRSO]) and OCE2412279 (IODP Closeout). We thank the Expedition 375 scientists, the JRSO technical staff, and the Siem Offshore AS (now Sea1 Offshore AS) crew of JOIDES Resolution for making this complex expedition such a success. In particular, we thank Annika Greve for her considerable efforts in the shipboard paleomagnetism laboratory and Martin Crundwell, Claire Shepherd, and Adam Woodhouse for discussions on the age of the sediments. Finally, we thank Emilio Herrero-Bervera for providing access to the Paleomagnetic Laboratory at the University of Hawai′i and for his helpful discussions.
References
Acton, G.D., and Gordon, R.G., 1991. A 65 Ma palaeomagnetic pole for the Pacific plate from the skewness of magnetic anomalies 27r-31. Geophysical Journal International, 106(2):407–420. https://doi.org/10.1111/j.1365-246X.1991.tb03904.x
Acton, G., Roth, A., and Verosub, K.L., 2007a. Analyzing micromagnetic properties with FORCIT Software. Eos, Transactions American Geophysical Union, 88(21):230. https://doi.org/10.1029/2007EO210004
Acton, G., Yin, Q.-Z., Verosub, K.L., Jovane, L., Roth, A., Jacobsen, B., and Ebel, D.S., 2007b. Micromagnetic coercivity distributions and interactions in chondrules with implications for paleointensities of the early solar system. Journal of Geophysical Research: Solid Earth, 112(B3):1–19. https://doi.org/10.1029/2006JB004655
Barker, D.H.N., Henrys, S., Caratori Tontini, F., Barnes, P.M., Bassett, D., Todd, E., and Wallace, L., 2018. Geophysical constraints on the relationship between seamount subduction, slow slip, and tremor at the north Hikurangi subduction zone, New Zealand. Geophysical Research Letters, 45(23):12804–12813. https://doi.org/10.1029/2018GL08025
Bartington Instruments, L., 2011. Operation Manual for MS2 Magnetic Susceptibility System: Oxford, UK (Bartington Instruments, Ltd.). https://gmw.com/wp-content/uploads/2019/03/MS2-OM0408.pdf
Beaman, M., Sager, W.W., Acton, G.D., Lanci, L., and Pares, J., 2007. Improved Late Cretaceous and early Cenozoic Paleomagnetic apparent polar wander path for the Pacific plate. Earth and Planetary Science Letters, 262(1):1–20. https://doi.org/10.1016/j.epsl.2007.05.036
Childress, L.B., Acton, G.D., Percuoco, V.P., and Hastedt, M., 2024. The LILY database: linking lithology to IODP physical, chemical, and magnetic properties data. Geochemistry, Geophysics, Geosystems, 25(2):e2023GC011287. https://doi.org/10.1029/2023GC011287
Crundwell, M.P., and Woodhouse, A., 2022. Biostratigraphically constrained chronologies for Quaternary sequences from the Hikurangi margin of north-eastern Zealandia. New Zealand Journal of Geology and Geophysics, 67(3):364–384. https://doi.org/10.1080/00288306.2022.2101481
Davy, B., Hoernle, K., and Werner, R., 2008. Hikurangi Plateau: Crustal structure, rifted formation, and Gondwana subduction history. Geochemistry, Geophysics, Geosystems, 9(7):007004. https://doi.org/10.1029/2007GC001855
Day, R., Fuller, M., and Schmidt, V.A., 1977. Hysteresis properties of titanomagnetites: Grain-size and compositional dependence. Physics of the Earth and Planetary Interiors, 13(4):260–267.https://doi.org/10.1016/0031-9201(77)90108-X
Dunlop, D.J., and Özdemir, Ö., 1997. Rock Magnetism: Fundamentals and Frontiers: Cambridge, United Kingdom (Cambridge University Press). https://doi.org/10.1017/CBO9780511612794
Harrison, R.J., and Feinberg, J.M., 2008. FORCinel: an improved algorithm for calculating first-order reversal curve distributions using locally weighted regression smoothing. Geochemistry, Geophysics, Geosystems, 9(5). https://doi.org/10.1029/2008GC001987
Herrero-Bervera, E., Acton, G., Krása, D., Rodriguez, S., and Dekkers, M.J., 2011. Rock magnetic characterization through an intact sequence of oceanic crust, IODP Hole 1256D. In Petrovský, E., Ivers, D., Harinarayana, T., and Herrero-Bervera, E. (Eds.), IAGA Special Sopron Book Series (Volume 1): The Earth's Magnetic Interior. Dordrecht, Netherlands (Springer). https://doi.org/10.1007/978-94-007-0323-0_11
Hoernle, K., Hauff, F., van den Bogaard, P., Werner, R., Mortimer, N., Geldmacher, J., Garbe-Schönberg, D., and Davy, B., 2010. Age and geochemistry of volcanic rocks from the Hikurangi and Manihiki oceanic plateaus. Geochimica et Cosmochimica Acta, 74(24):7196–7219. https://doi.org/10.1016/j.gca.2010.09.030
Hrouda, F., 2002. Low-field variation of magnetic susceptibility and its effect on the anisotropy of magnetic susceptibility of rocks. Geophysical Journal International, 150(3):715–723.https://doi.org/10.1046/j.1365-246X.2002.01731.x
Kirschvink, J.L., 1980. The least-squares line and plane and the analysis of palaeomagnetic data. Geophysical Journal International, 62(3):699–718. https://doi.org/10.1111/j.1365-246X.1980.tb02601.x
Krása, D., Herrero-Bervera, E., Acton, G., and Rodriguez, S., 2011. Magnetic mineralogy of a complete oceanic crustal section (IODP Hole 1256D). In Petrovský, E., Ivers, D., Harinarayana, T., and Herrero-Bervera, E. (Eds.), The Earth's Magnetic Interior. IAGA Special Sopron Book Series, 1: 169–179. https://doi.org/10.1007/978-94-007-0323-0_12
Pedley, K.L., Barnes, P.M., Pettinga, J.R., and Lewis, K.B., 2010. Seafloor structural geomorphic evolution of the accretionary frontal wedge in response to seamount subduction, Poverty Indentation, New Zealand. Marine Geology, 270(1–4):119–138. https://doi.org/10.1016/j.margeo.2009.11.006
Petronotis, K.E., Acton, G.D., and Ohneiser, C., 2025. Supplementary material, https://doi.org/10.14379/iodp.proc.372B375.212supp.2025. In Petronotis, K.E., Acton, G.D., and Ohneiser, C., Data report: paleomagnetic and rock magnetic observations from sediments and basalts collected at Expedition 375 Site U1526 on the Tūranganui Knoll, Hikurangi Plateau. In Wallace, L.M., Saffer, D.M., Barnes, P.M., Pecher, I.A., Petronotis, K.E., LeVay, L.J., and the Expedition 372/375 Scientists, Hikurangi Subduction Margin Coring, Logging, and Observatories. Proceedings of the International Ocean Discovery Program, 372B/375: College Station, TX (International Ocean Discovery Program).
Pike, C.R., Roberts, A.P., and Verosub, K.L., 1999. Characterizing interactions in fine magnetic particle systems using first order reversal curves. Journal of Applied Physics, 85(9):6660–6667. https://doi.org/10.1063/1.370176
Roberts, A.P., Pike, C.R., and Verosub, K.L., 2000. First-order reversal curve diagrams: a new tool for characterizing the magnetic properties of natural samples. Journal of Geophysical Research: Solid Earth, 105(B12):28461–28475. https://doi.org/10.1029/2000JB900326
Saffer, D.M., Wallace, L.M., Barnes, P.M., Pecher, I.A., Petronotis, K.E., LeVay, L.J., Bell, R.E., Crundwell, M.P., Engelmann de Oliveira, C.H., Fagereng, A., Fulton, P.M., Greve, A., Harris, R.N., Hashimoto, Y., Hüpers, A., Ikari, M.J., Ito, Y., Kitajima, H., Kutterolf, S., Lee, H., Li, X., Luo, M., Malie, P.R., Meneghini, F., Morgan, J.K., Noda, A., Rabinowitz, H.S., Savage, H.M., Shepherd, C.L., Shreedharan, S., Solomon, E.A., Underwood, M.B., Wang, M., Woodhouse, A.D., Bourlange, S.M., Brunet, M.M.Y., Cardona, S., Clennell, M.B., Cook, A.E., Dugan, B., Elger, J., Gamboa, D., Georgiopoulou, A., Han, S., Heeschen, K.U., Hu, G., Kim, G.Y., Koge, H., Machado, K.S., McNamara, D.D., Moore, G.F., Mountjoy, J.J., Nole, M.A., Owari, S., Paganoni, M., Rose, P.S., Screaton, E.J., Shankar, U., Torres, M.E., Wang, X., and Wu, H.-Y., 2019. Expedition 372B/375 summary. In Wallace, L.M., Saffer, D.M., Barnes, P.M., Pecher, I.A., Petronotis, K.E., LeVay, L.J., and the Expedition 372/375 Scientists, Hikurangi Subduction Margin Coring, Logging, and Observatories. Proceedings of the International Ocean Discovery Program, 372B/375: College Station, TX (Proceedings of the International Ocean Discovery Program). https://doi.org/10.14379/iodp.proc.372B375.101.2019
Wallace, L.M., and Beavan, J., 2010. Diverse slow slip behavior at the Hikurangi subduction margin, New Zealand. Journal of Geophysical Research: Solid Earth, 115(B12):B12402. https://doi.org/10.1029/2010JB007717
Wallace, L.M., Saffer, D.M., Petronotis, K.E., Barnes, P.M., Bell, R.E., Crundwell, M.P., Engelmann de Oliveira, C.H., Fagereng, A., Fulton, P.M., Greve, A., Harris, R.N., Hashimoto, Y., Hüpers, A., Ikari, M.J., Ito, Y., Kitajima, H., Kutterolf, S., Lee, H., Li, X., Luo, M., Malie, P.R., Meneghini, F., Morgan, J.K., Noda, A., Rabinowitz, H.S., Savage, H.M., Shepherd, C.L., Shreedharan, S., Solomon, E.A., Underwood, M.B., Wang, M., and Woodhouse, A.D., 2019. Site U1526. In Wallace, L.M., Saffer, D.M., Barnes, P.M., Pecher, I.A., Petronotis, K.E., LeVay, L.J., and the Expedition 372/375 Scientists, Hikurangi Subduction Margin Coring, Logging, and Observatories. Proceedings of the International Ocean Discovery Program, 372B/375: College Station, TX (International Ocean Discovery Program). https://doi.org/10.14379/iodp.proc.372B375.106.2019
Wallace, L.M., Webb, S.C., Ito, Y., Mochizuki, K., Hino, R., Henrys, S., Schwartz, S.Y., and Sheehan, A.F., 2016. Slow slip near the trench at the Hikurangi subduction zone, New Zealand. Science, 352(6286):701–704. https://doi.org/10.1126/science.aaf2349