Wallace, L.M., Saffer, D.M., Barnes, P.M., Pecher, I.A., Petronotis, K.E., LeVay, L.J.,
and the Expedition 372/375 Scientists
Proceedings of the International Ocean Discovery Program Volume 372B/375
publications.iodp.org

https://doi.org/10.14379/iodp.proc.372B375.106.2019
Site U15261
L.M. Wallace, D.M. Saffer, K.E. Petronotis, P.M. Barnes, R.E. Bell, M.P. Crundwell, C.H. Engelmann de Oliveira, A. Fagereng, P.M. Fulton, A. Greve, R.N. Harris, Y. Hashimoto, A. Hüpers, M.J. Ikari, Y. Ito, H. Kitajima, S. Kutterolf, H. Lee, X. Li, M. Luo, P.R. Malie, F. Meneghini, J.K. Morgan, A. Noda, H.S. Rabinowitz, H.M. Savage, C.L. Shepherd, S. Shreedharan, E.A. Solomon, M.B. Underwood, M. Wang, and A.D. Woodhouse2
Keywords: International Ocean Discovery Program, IODP, JOIDES Resolution, Expedition 375, Site U1526, Hikurangi margin, slow slip events, Tūranganui Knoll, seamount, Hikurangi Plateau, subduction
MS 372B375-106: Published 5 May 2019
Background and objectives
Site U1526 (proposed Site HSM-08A) is located on the western flank of Tūranganui Knoll seamount in 2908 m water depth, east of Site U1520 in the Hikurangi Trough (Figures F1, F2). The primary objective of drilling at Site U1526 was to sample the thin sedimentary section (~30 m) and underlying volcaniclastics and/or igneous basement (see Figures F2, F3, both in the Expedition 372B/375 summary chapter [Saffer et al., 2019]). The seamount is elevated above the Hikurangi Plateau, a Cretaceous large igneous province (~118–96 Ma) currently subducting at the Hikurangi subduction zone. The age of the seamount is unknown; similar seamounts on the plateau are thought to have formed in the Late Cretaceous (~99–87 Ma; Hoernle et al., 2010), although earlier seamount formation during Hikurangi Plateau emplacement cannot be ruled out (e.g., Davy et al., 2008). Tūranganui Knoll and many other seamounts on the Hikurangi Plateau are guyot-like, with a flat-topped, steep-sided morphology suggestive of the erosion of an island volcano to sea level. Dredge samples from nearby seamounts have included sandstones, conglomerates, lavas, and volcaniclastic breccia, in some cases suggestive of shallow-water to subaerial depositional environments (Hoernle et al., 2010). Small volcanic cones on top of the seamount have a more pristine morphology (Figure F2) and may be more recent, perhaps as young as Pliocene (e.g., Timm et al., 2010).
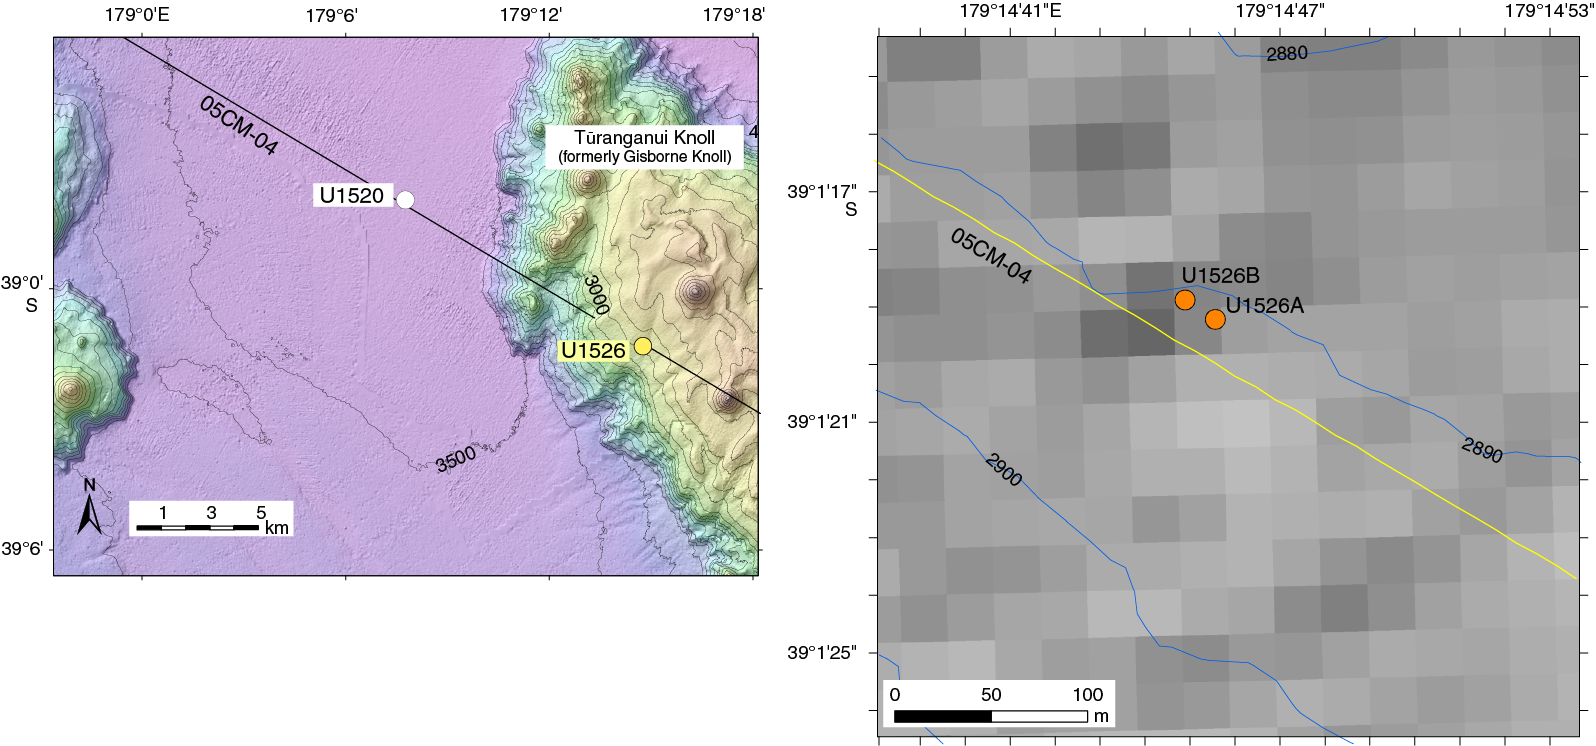
Figure F1. Bathymetry and location, Sites U1526 and U1520.

Figure F2. Seismic reflection image, Profile 05CM-04.
The scientific objective of coring was to characterize the seamount’s composition, physical properties, extent of alteration and hydration, and structure and hydrogeology prior to transport into the slow slip event (SSE) source region. Seismic imaging shows that subducted seamounts are present in the source region of shallow SSEs along the drilling transect (Bell et al., 2010; Barker et al., 2018) and may represent barriers to SSE propagation (Wallace et al., 2016). It is also possible that the subducted seamounts play a role in the location and rupture processes of historical tsunami earthquakes (Bell et al., 2014), as well as influence the location of tremor (Barker et al., 2018; Todd et al., 2018). Priorities for post-expedition analysis of cores include but are not limited to measurement of the mechanical, elastic, frictional, and hydrologic properties of the incoming sediment and basement along with detailed analyses of composition and alteration.
Operations
Transit to Site U1526
The vessel arrived at Site U1526 at 1700 h (UTC + 12 h) on 22 April 2018. Upon arrival, the thrusters were lowered, and the dynamic positioning (DP) system was engaged.
Hole U1526A
A rotary core barrel (RCB) bottom-hole assembly (BHA) was assembled, and the drill string was lowered to the seafloor. Hole U1526A (39°1.3203ʹS, 179°14.7594ʹE; 2890.1 meters below sea level [mbsl]; Table T1) was spudded at 0150 h on 23 April 2018. Cores 1R–14R advanced from 0 to 83.6 meters below seafloor (mbsf) and recovered 29.26 m (35% recovery). Nonmagnetic core barrels were used for all cores. At the completion of coring, the drill bit was partially raised from the seafloor, and the ship returned to nearby Site U1520.
Hole U1526B
On 2 May 2018, we returned to Site U1526 following an 8 h transit from Site U1520 in DP mode. The ship was offset 20 m west-northwest from Hole U1526A, and Hole U1526B (39°1.3146ʹS, 179°14.7481ʹE; 2888.4 mbsl) was spudded at 2015 h on 2 May. Advanced piston corer (APC) Cores 1H–4H and extended core barrel (XCB) Core 5X advanced from 0 to 33.5 mbsf and recovered 31.56 m (94% recovery). Nonmagnetic core barrels were used for all APC cores. The total time spent at Site U1526 was 2.88 days.
The R/V JOIDES Resolution started the transit to Auckland (New Zealand) at 1200 h on 3 May. International Ocean Discovery Program (IODP) Expedition 375 ended with the first line ashore at the Freyberg Wharf in Auckland, New Zealand, at 0652 h on 5 May.
Lithostratigraphy
We identified two lithostratigraphic units at Site U1526 (Figure F3). Unit I is a condensed section of fine-grained mixed siliciclastic-calcareous sediment grading downsection to biocalcareous sediment; Unit II is volcaniclastic. Unit II displays significant increases in magnetic susceptibility and natural gamma radiation (NGR) compared with the overlying carbonates (Figure F4).
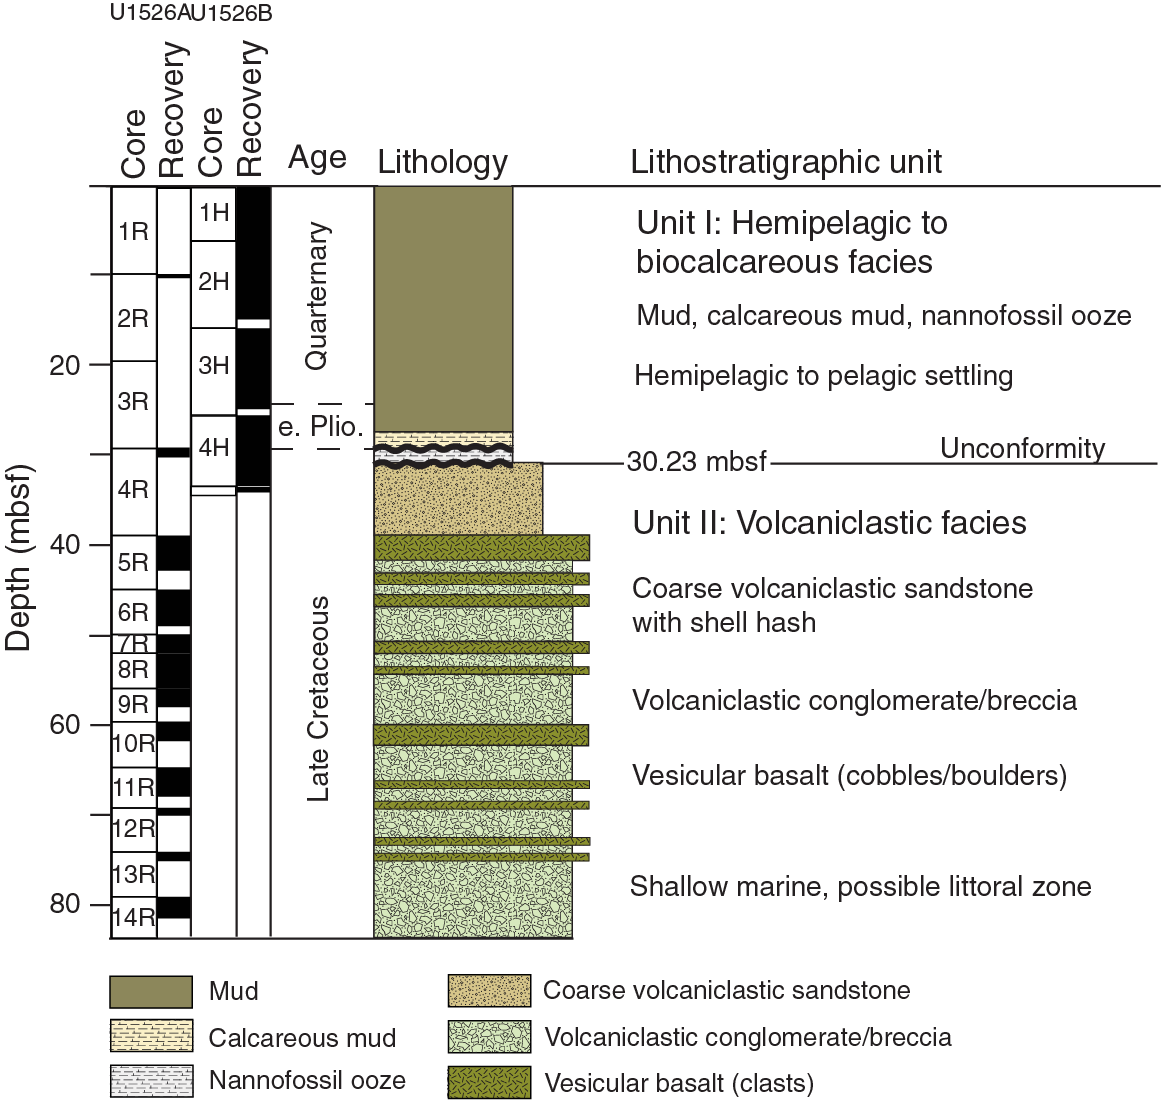
Figure F3. Lithostratigraphic summary.
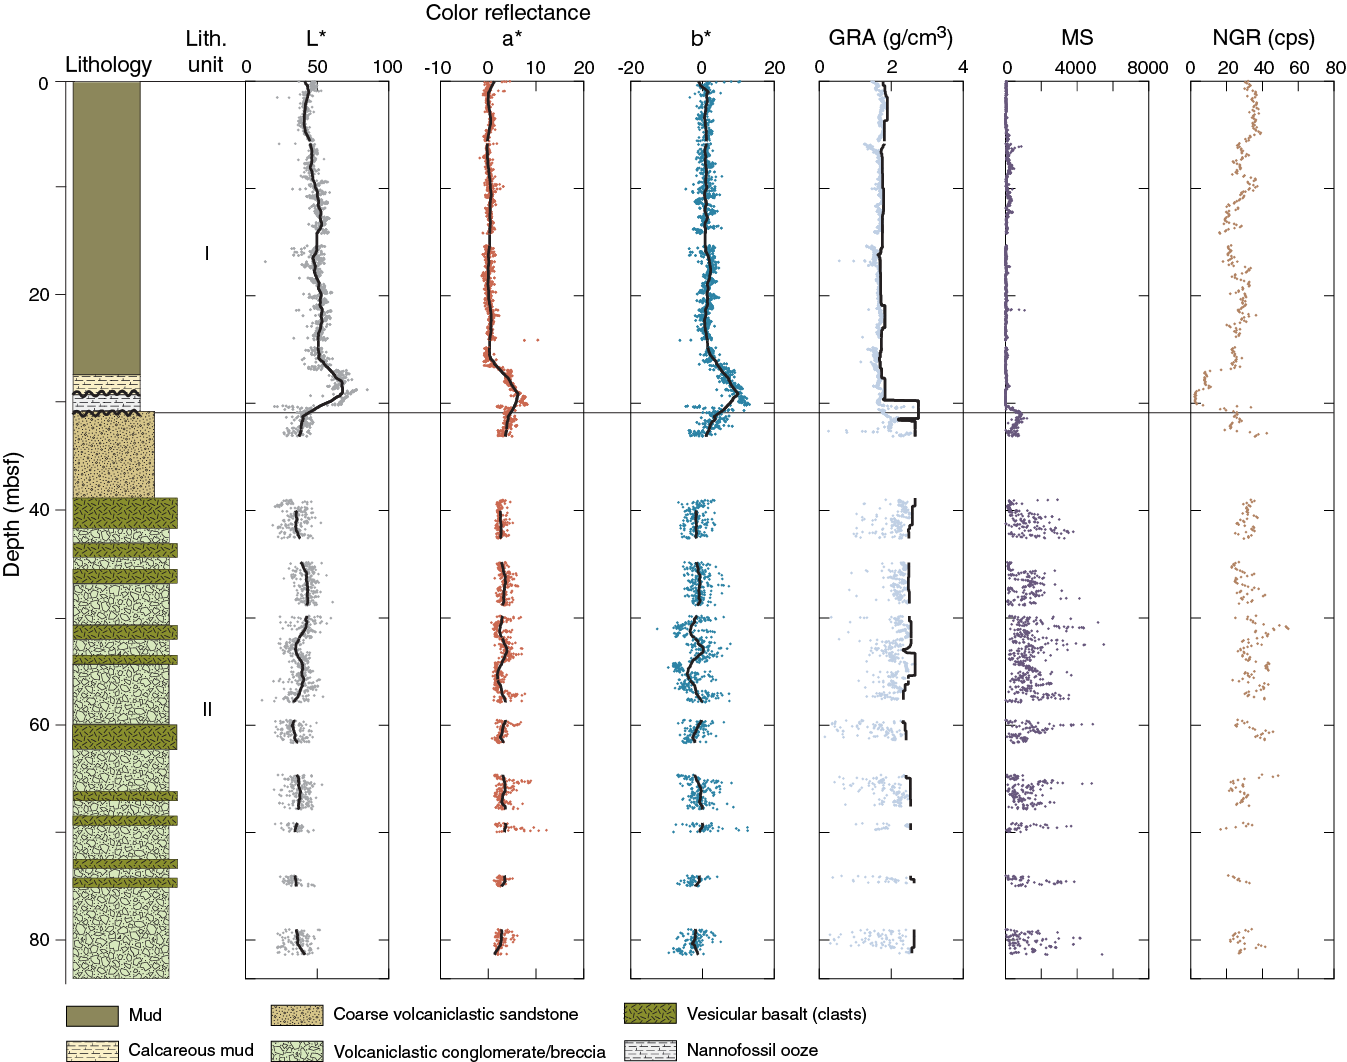
Figure F4. Color reflectance, bulk density, MS, and NGR.
Unit I
- Interval: 375-U1526B-1H-1, 0 cm, to 4H-4, 94 cm
- Thickness: 30.23 m
- Depth: 0–30.23 mbsf
- Age: Late Cretaceous to Holocene
- Lithology: mud, calcareous mud, and nannofossil ooze with foraminifers
Coring in Holes U1526A and U1526B started at the mudline. Because Hole U1526A was cored exclusively with the RCB system, recovery of soft sediment was limited (<20% recovery) and did not include the complete sedimentary cover sequence. APC coring in Hole U1526B (90%–100% recovery) recovered the same sediments observed in Hole U1526A plus some lithologies missed in the first hole. We report interval depths for Unit I using curated depths from Hole U1526B.
Unit I extends from 0 to 30.23 mbsf (interval 375-U1526B-1H-1, 0 cm, to 4H-4, 94 cm) (Table T2). The sediment changes downsection from mud (silty clay to clayey silt with nannofossils) to calcareous mud to nannofossil ooze (Figure F3). The depositional age ranges from Holocene to Late Cretaceous (see Biostratigraphy). Disseminated ash pod layers show abundant highly vesicular pumiceous clasts and common dense-blocky and cuspate glass shards as well as a phenocryst assemblage of feldspar, amphibole, and pyroxene. Normalized mineral abundances from bulk powder X-ray diffraction (XRD) are listed in Table T3 and plotted in Figure F5. These compositional data define a gradual increase in calcite downsection corresponding to a decrease in total clay minerals. Representative X-ray diffractograms are shown in Figure F6.
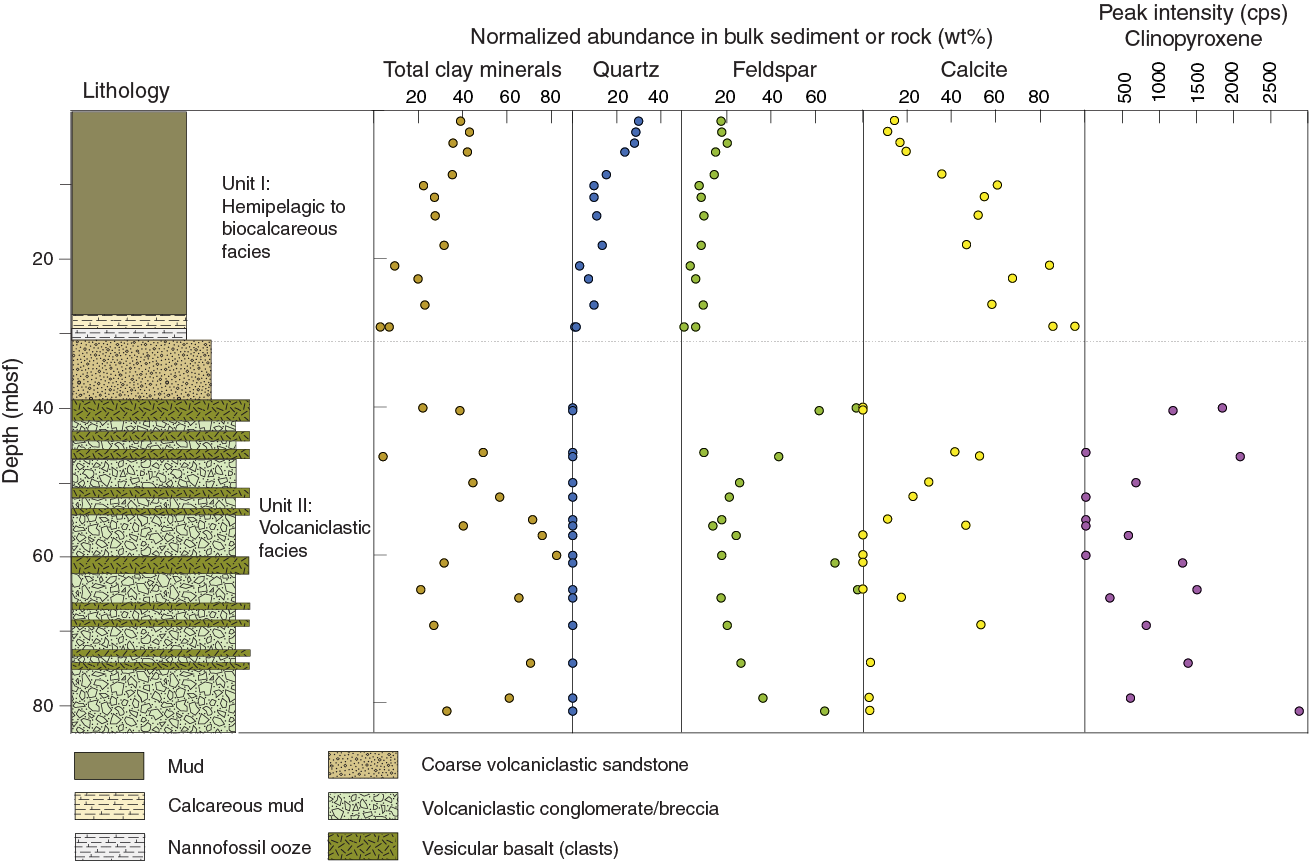
Figure F5. Bulk powder XRD results.
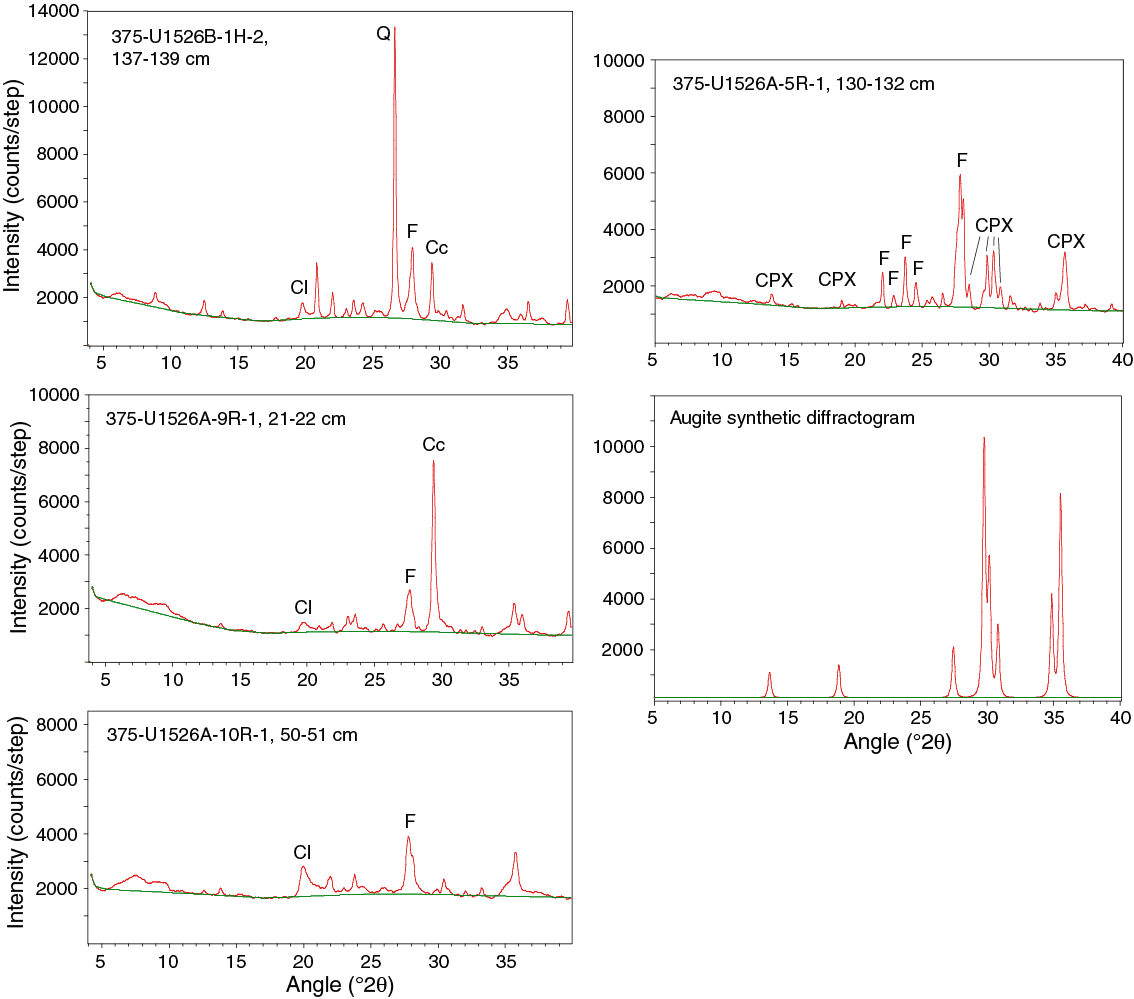
Figure F6. X-ray diffractograms for sediments and volcanic clasts.
From 0 to 26.91 mbsf (Figure F7) (interval 375-U1526B-1H-1, 0 cm, to 4H-2, 61 cm), the dominant lithology in Unit I is greenish gray mud (silty clay to clayey silt) with scattered layers of silt and volcanic ash. Smear slides indicate that the mud consists mainly of clay minerals and common feldspar, quartz, and volcanic grains (mainly transparent glass). Trace to common abundances of foraminifers, nannofossils, diatoms, radiolarians, and sponge spicules were observed as microfossil content. Silt layers are rich in foraminifers.
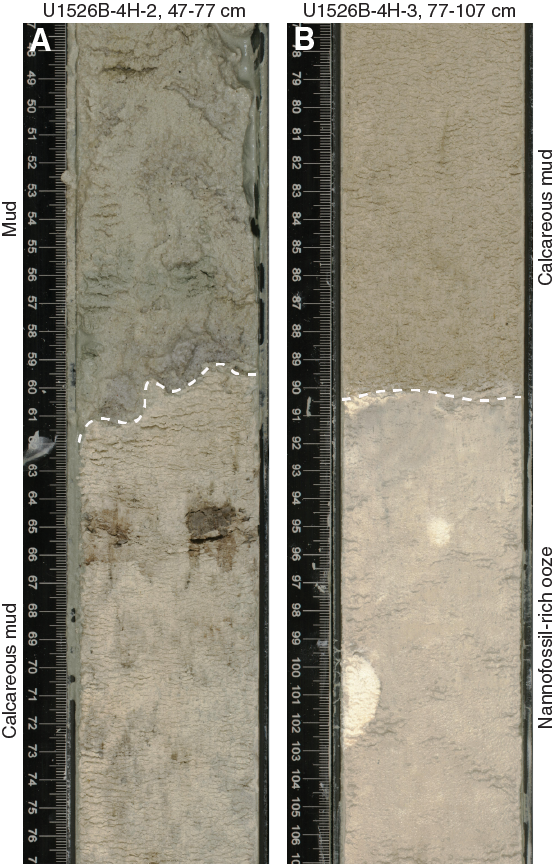
Figure F7. Contacts between lithologies, Unit I.
A sharp boundary at 26.91 mbsf (Section 375-U1526B-4H-2, 61 cm) separates the greenish gray mud from light brown calcareous mud (Figure F7). This change is associated with an increase in nannofossil content. The calcareous mud extends to 28.70 mbsf (Section 4H-3, 91 cm). We analyzed one sample of calcareous mud for carbonate content, and its value is 38.4 wt% (Table T3). Smear slides show that the calcareous mud is composed of quartz, feldspar, clay minerals, common volcanic grains (including transparent and colored glass), and abundant nannofossils. Larger bioclasts include abundant foraminifers and rare radiolarians, sponge spicules, and mollusks. Foraminifers from this lithology in Hole U1526B are mid- to early Pleistocene (0.62–2.17 Ma) in age, whereas the oldest fossils from this depth interval in Hole U1526A are early Pliocene (3.9–5.44 Ma) in age (see Biostratigraphy).
The lowermost lithology in Unit I is brownish white nannofossil ooze extending from 28.70 to 30.23 mbsf (Figure F8) (interval 375-U1526B-4H-3, 91 cm, to 4H-4, 94 cm). One sample of this lithology yields a carbonate content of 70 wt% (Table T3). Its boundary with the overlying calcareous mud is sharp and subhorizontal (Figure F7B). Foraminifers and nannofossils from the base of the nannofossil ooze are Late Cretaceous in age (see Biostratigraphy). If this age reflects the time of deposition of the entire ooze interval, then the contact with overlying calcareous mud is a significant unconformity.
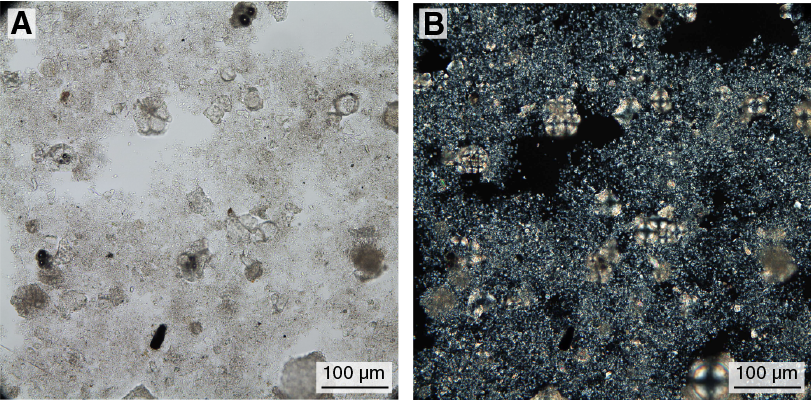
Figure F8. Nannofossil-rich ooze with foraminifers.
We interpret Unit I to be pelagic to hemipelagic in origin with very low sedimentation rates on the crest of the seamount. The decrease in carbonate content upsection could be a result of post-Cretaceous subsidence of the Tūranganui Knoll to a position closer to the lysocline. The cause of the sharp unconformity between nannofossil ooze (Late Cretaceous) and overlying calcareous mud (early Pliocene to early Pleistocene) is unclear.
Unit II
- Interval: 375-U1526B-4H-4, 94 cm, to 375-U1526A-14R-CC, 12 cm
- Thickness: 51.16 mbsf
- Depth: 30.23–81.39 mbsf
- Age: Late Cretaceous
- Lithology: coarse volcaniclastic sandstone and volcaniclastic conglomerate
Unit II extends from 30.23 to 81.39 mbsf (interval 375-U1526B-4H-4, 94 cm, to 375-U1526A-14R-CC, 12 cm) and is composed of volcaniclastic sandstone and conglomerate. Macrofossils in the volcaniclastic conglomerates indicate a Late Cretaceous age (see Biostratigraphy). Recovery was better in Cores 375-U1526B-4H (100%) and 5X (60%) than in Core 375-U1526A-4R (11%), so we use the curated depths in Hole U1526B to define the top depth of Unit II; the bottom depth is defined in Hole U1526A.
The Unit I/II boundary coincides with a 20 cm thick interval (375-U1526B-4H-4, 94–113 cm) rich in manganese concretions (Figures F7, F9). These concretions are underlain by coarse volcaniclastic sand (Figure F10A). The unconsolidated nature of this sand resulted in differential settling by size during core retrieval. Given the stark contrast in lithofacies across the unit boundary, the presence of the manganese crust, and the Cretaceous macrofossils in the volcaniclastic conglomerate, we interpret the contact to be an unconformity. The length of the hiatus represented by this unconformity will be refined as depositional ages of the nannofossil ooze above and the volcaniclastic facies below become clearer with future detailed studies.
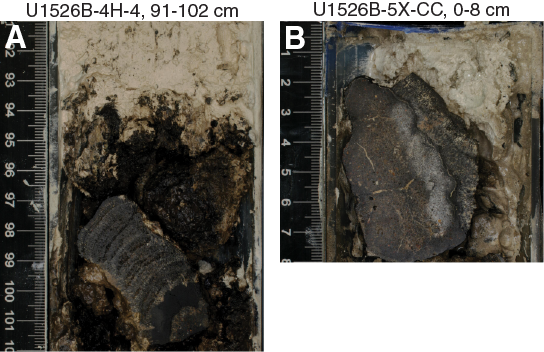
Figure F9. Manganese concretions, top of Unit II.

Figure F10. Volcaniclastic sandstone and conglomerate in Unit II.
The upper part of Unit II recovered in Hole U1526A (Core 4R) is reddish brown in color and ranges in grain size from coarse sand to granules (Figure F10). The lithified detritus includes a wide variety of rounded volcaniclasts composed of basalt and volcaniclastic sandstone. Concave shells of bivalves are also abundant. This sediment displays crude stratification, an organized clast-supported fabric, and moderate sorting. The intact shells and tabular clasts of basalt are aligned preferentially with their apparent long axes subparallel to cryptic bedding (Figure F11A). The rounded volcaniclasts include vesicular basalt and variably altered basalt with feldspar, pyroxene, olivine, and spinel. The uppermost parts of this deposit also contain rounded clasts of micritic limestone. Thin sections show that the primary clast-supported voids are filled by calcite cement (Figure F11). The majority of the basalt clasts retain their primary igneous textures, showing preserved plagioclase laths. One sample was analyzed for carbonate content, and its concentration is 68.4 wt% (Table T3). This high value is indicative of incorporation of bivalve shells and calcite cement into the specimen.
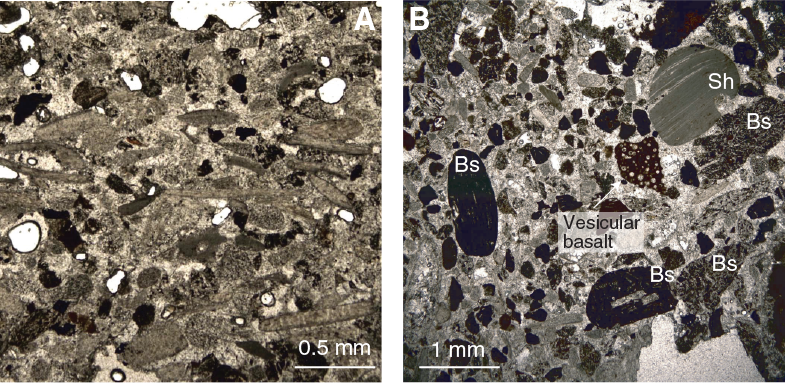
Figure F11. Volcaniclastic sandstone and conglomerate, Unit II.
Based on the rounding of clasts, stratification by size segregation, preferred grain orientation, clast-supported fabric, and hash of bivalve shells, we infer that the sediment was deposited in shallow water, possibly under the influence of wave action. The lack of silt- and clay-sized particles is also indicative of winnowing by currents and/or waves. This type of shallow-marine depositional environment is consistent with suggestions made by others for erosion of flat-topped seamounts on the Hikurangi Plateau close to or above sea level (e.g., Mortimer and Parkinson, 1996; Hoernle et al., 2010).
The sediment coarsens considerably downsection starting with Core 375-U1526A-5R (38.8 mbsf). Rounded to subangular clasts of variably altered basalt are mixed with a matrix of coarse sand (Figure F10). These conglomerates are clast supported. Bedding is crude but defined locally by interbeds of sandstone, fine-grained carbonate, and scattered laminae. The sandy intervals are also clast supported but poorly sorted. The larger sand clasts are rounded and variably altered with colors ranging from gray to reddish brown. The sand-sized matrix is typically cemented by calcite, palagonite, and clay minerals (Figure F11).
True dimensions of the largest basalt clasts are difficult to ascertain. We cannot rule out the possibility of some interlayering between lava flows and volcaniclastic debris, but we do not observe evidence of chilled margins or thermal reaction rims in the underlying finer grained sediments. In one interval (Figure F11), a thin layer of fossiliferous carbonate is mixed with compositionally diverse sand-sized clasts of well-rounded basalt and fills the space between two large clasts of basalt. Coralline algae from the matrix (Core 375-U1526A-6R) is Late Cretaceous in age and indicative of ~100–150 m water depths (see Biostratigraphy). Thin section observation of that contact material reveals no evidence for baking of the matrix. The thicker intervals of intact basalt measure 1–2 m, which is suggestive of boulders. The cobbles are also diverse in character, ranging from highly vesicular to dense and massive; some clasts retain glassy rims similar to pillow basalts, and others (e.g., Section 5R-1) show vesicle-enriched zones with elongated vesicles that are suggestive of flow structures (Figure F12). Alteration of the basalt clasts is also variable; the most-altered examples range from pale greenish gray to brown and reddish brown. Some altered clasts are coated with calcite cement, and many are thinly oxidized around their rims. In Core 12R, the material with intense red coloration is confined to cuttings, so we cannot determine the lithology’s thickness and geometry in situ. Mixing of variable clast sizes and compositions in a pile of fragmented basalt seems likely.
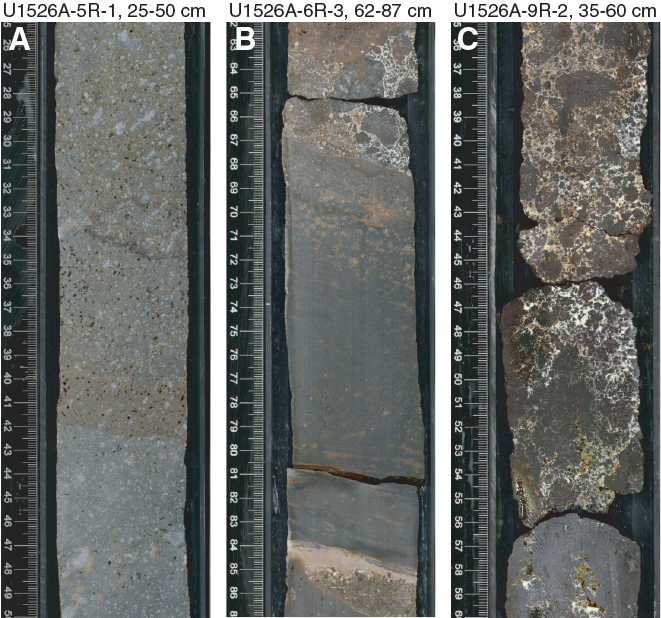
Figure F12. Basalt clasts, Unit II.
From visual core descriptions, we discern a crude downward decrease in basalt alteration throughout the unit. Where sandy matrix is lacking (e.g., interval 375-U1526A-6R-1, 87–101 cm), the cobbles and pebbles are tightly packed and cemented by pore-filling calcite, palagonite, clay minerals, and possibly fine-grained zeolite (Figure F11). Subhorizontal and locally steeper veins, generally filled with calcite, are also common, occurring both as diffuse veins and as fractures filled by mineral precipitates (see Structural geology). Bulk powder XRD results show highly variable concentrations of clay minerals, feldspar (plagioclase), and clinopyroxene along with scattered occurrences of phillipsite (Figure F5).
Thin sections verify that the basalt clasts typically contain plagioclase, olivine, and pyroxene phenocrysts; many clasts retain well-preserved plagioclase needles in the groundmass (Figure F13). Some examples display consistent alignment of crystals in the groundmass, suggestive of lava flows. One sample (interval 375-U1526A-9R-2, 33–35 cm) has monolithic fine-grained trachytic basalt clasts. Palagonite is common as an alteration product of basaltic glass. Thin section observations reveal no significant difference in the degree of microscopic alteration between intervals with green versus white cement. The white cement appears to be dominated by calcite, whereas the green cement is associated with palagonite rims and replacement by clay minerals.

Figure F13. Vesicular basalt and trachytic texture.
We interpret the cobble- to boulder-sized conglomerates to be products of basalt fragmentation and transport for short distances from outcrops in a shallow-marine environment. Fossils are indicative of water depths in the photic zone. The rounded clasts provide clear evidence of extensive abrasion prior to deposition. The variability of primary volcanic textures, oxidation rims (Figure F10), and red coloration indicate that at least some of the rounded clasts were subjected to subaerial exposure. The absence of silt and clay as a matrix and the prevalence of clast-supported rather than matrix-supported fabrics argue against emplacement by debris flows. The largest inferred diameters of the basalt boulders require considerable flow strength to exceed the threshold for motion. One likely interpretation for the transport mechanism is strong wave action in the littoral zone of a volcanic island.
Biostratigraphy
Planktonic foraminifers and calcareous nannofossils from core catcher samples and additional split-core samples from Holes U1526A and U1526B were examined to develop a shipboard biostratigraphic framework for Site U1526. Additionally, benthic foraminifers provided data on paleowater depths.
At Site U1526, we drilled two shallow sections of the Tūranganui Knoll seamount and recovered a discontinuous Holocene to Late Cretaceous sedimentary sequence comprising a number of hiatus-bounded sedimentary packages. High foraminiferal and nannofossil abundances with moderate to very good preservation were observed throughout the hemipelagic sedimentary cover (Unit I). Below this section in Lithostratigraphic Unit II, volcaniclastic coarse sandstones and conglomerates were barren of microfossils. However, macrofossils provided sufficient data to allow for broad biostratigraphic constraint and paleowater depth reconstruction.
Calcareous nannofossils
Calcareous nannofossil biostratigraphy at Site U1526 was established through the analysis of core catcher samples from Holes U1526A and U1526B. Nannofossils are common to abundant throughout the cored sequences and show moderate to good preservation. Minor reworking of older taxa was observed through the Pleistocene interval in both holes (Samples 375-U1526A-1R-CC, 0–5 cm, through 3R-1, 54–56 cm [0.0–19.94 mbsf], and Samples 375-U1526B-1H-CC, 0–10 cm, through 3H-CC, 19–26 cm [5.7–24.09 mbsf]). Biostratigraphic datums are given in Table T4, and the distribution of calcareous nannofossil taxa is shown in Table T5.
Hole U1526A
Sample 375-U1526A-1R-CC, 0–5 cm (0.0 mbsf), contains a nannofossil assemblage that includes Gephyrocapsa spp. and Pseudoemiliania lacunosa; however, Emiliania huxleyi was not observed under light microscopy. The top of Hole U1526A is therefore assigned a Middle Pleistocene age or older based on the last appearance datum (LAD) of P. lacunosa (0.44 Ma). The first appearance datum (FAD) of large Gephyrocapsa spp. (>5.5 µm) occurs in Sample 3R-1, 54–56 cm (19.94 mbsf), indicating lower Zone NN19 (1.62 Ma). Consequently, the interval between Samples 1R-CC, 0–5 cm, and 3R-1, 54–56 cm (0.0–19.94 mbsf), is assigned an early Pleistocene age or younger. Other taxa in the Pleistocene sequence include abundant to dominant Gephyrocapsa spp. (<3.5 µm) with few to common specimens of Calcidiscus leptoporus, Coccolithus pelagicus, Gephyrocapsa spp. (4–5.5 µm), Helicosphaera carteri, Helicosphaera hyalina, Pontosphaera discopora, Pontosphaera japonica, P. lacunosa, Pseudoemiliania ovata, Reticulofenestra asanoi, and Syracosphaera pulchra. Less common taxa include Calcidiscus macintyrei, Calcidiscus tropicus, Calciosolenia brasiliensis, Ceratolithus cristatus, Gephyrocapsa spp. (>5.5 µm), Helicosphaera sellii, Pontosphaera multipora, Reticulofenestra producta, Rhabdosphaera clavigera, Umbilicosphaera rotula, and Umbilicosphaera sibogae.
The co-occurrence of Amaurolithus delicatus (zonal marker with Amaurolithus tricorniculatus; LAD = 3.92 Ma; see Young, 1998) and Discoaster surculus (LAD = 2.49 Ma) in Sample 375-U1526A-3R-2, 14–16 cm (20.46 mbsf), suggests a hiatus between Samples 3R-1, 54–56 cm, and 3R-2, 14–16 cm (19.94–20.46 mbsf). This possible hiatus is consistent with a change in lithology from light greenish gray calcareous mud to brownish white nannofossil ooze (see Lithostratigraphy). The interval between Samples 3R-2, 14–16 cm, and 3R-CC, 0–5 cm (20.46–21.04 mbsf), is therefore assigned an age older than 3.92 Ma. Other taxa observed in this interval include C. leptoporus, C. tropicus, C. brasiliensis, C. pelagicus, Discoaster pentaradiatus, Discoaster variabilis, Helicosphaera intermedia, P. discopora, P. japonica, Reticulofenestra perplexa, R. producta, R. clavigera, Scyphosphaera ventriosa, S. pulchra, and U. rotula.
An abrupt lithologic change occurs between Samples 375-U1526A-3R-CC, 0–5 cm, and 4R-1, 0 cm (21.04–29.1 mbsf), with a shift to volcaniclastic sediments (Unit II; see Lithostratigraphy). Nannofossils are not present in the sample examined from the upper portion of Unit II (Sample 4R-CC, 0–3 cm [30.16 mbsf]), and no further samples were examined in Hole U1526A.
Hole U1526B
Similar to the shallowest sample from Hole U1526A, Sample 375-U1526B-1H-CC, 0–10 cm (5.70 mbsf), contains a nannofossil assemblage that includes Gephyrocapsa spp. and P. lacunosa. However, E. huxleyi was not observed under light microscopy. Consequently, a Middle Pleistocene age or older is assigned to the top of Hole U1526B based on the LAD of P. lacunosa (0.44 Ma). The FAD of medium Gephyrocapsa spp. (4–5.5 µm) occurs in Sample 2H-CC, 0–7 cm (14.30 mbsf), indicating lower Zone NN19 (1.73 Ma). Sample 3H-CC, 19–26 cm (24.09 mbsf), contains an assemblage that is consistent with an early Pleistocene age. Other taxa in the Pleistocene sequence include abundant to dominant Gephyrocapsa spp. (<3.5 µm) and P. ovata with few to common specimens of C. leptoporus, C. pelagicus, H. carteri, H. hyalina, H. sellii, P. discopora, P. japonica, P. multipora, P. lacunosa, and R. clavigera. Less common taxa include C. tropicus, C. brasiliensis, C. cristatus, Reticulofenestra haqii, S. pulchra, U. rotula, and U. sibogae.
An abrupt lithologic change occurs between Samples 375-U1526B-3H-CC, 19–26 cm, and 4H-4, 91–93 cm (24.09–30.19 mbsf) (see Lithostratigraphy). Sample 4H-4, 91–93 cm (30.19 mbsf), contains a Late Cretaceous nannofossil assemblage that includes Arkhangelskiella cymbiformis, Kamptnerius magnificus, Nephrolithus frequens, and Prediscosphaera spinosa.
Foraminifers
Planktonic and benthic foraminifers were examined from core catcher samples and split-core samples from Holes U1526A and U1526B (Figure F14). Biostratigraphic datums are given in Table T4, the distribution of planktonic foraminifer taxa is given in Table T6, and planktonic foraminifer abundances and indications of oceanicity (qualitative measure of the extent to which the paleoenvironment recorded by the faunal assemblage represents open ocean conditions relative to a nearshore-influenced environment) and paleowater depths are given in Table T7 and shown in Figure F14. Absolute ages assigned to biostratigraphic datums follow those listed in Table T4 in the Expedition 372B/375 methods chapter (Wallace et al., 2019).
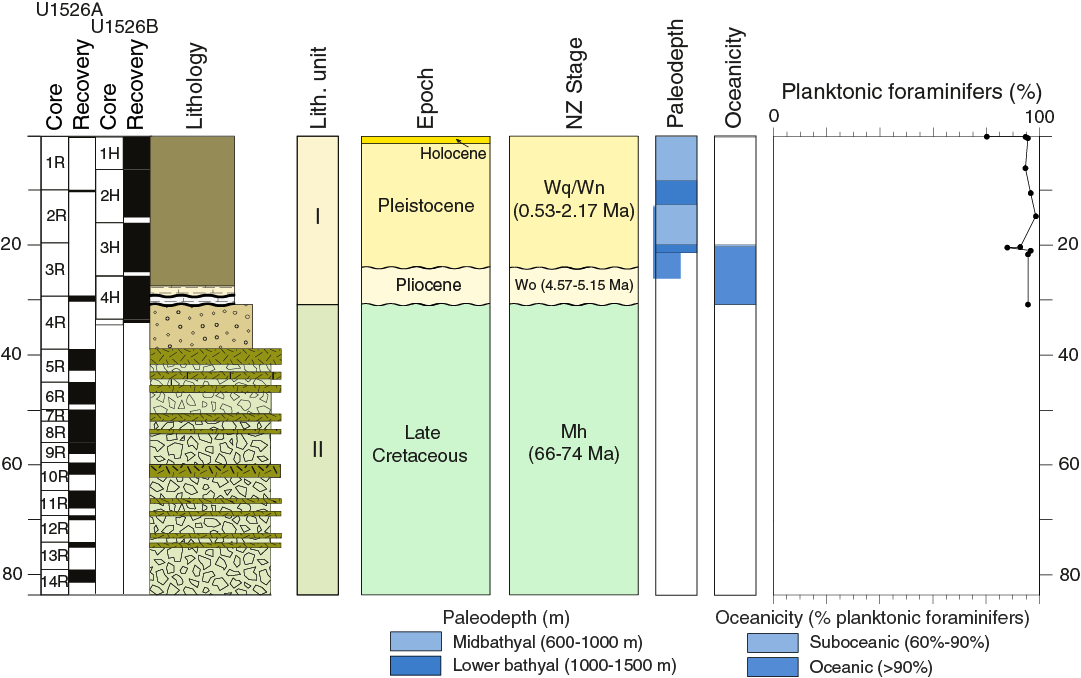
Figure F14. Lithostratigraphy, foraminifer abundance, and oceanicity.
All samples yielded well-preserved, diverse foraminifer assemblages dominated by planktonic foraminifers, which are the primary sedimentary constituent. Echinoid spines, radiolarians, and ostracods are also present in some samples but are rare compared with foraminifers.
Hole U1526A
Samples 375-U1526A-1R-CC, 0–5 cm, through 3R-1, 54–56 cm (0.0–19.94 mbsf), are assigned a Holocene to Middle Pleistocene age (Haweran to Castlecliffian; 0–0.63 Ma) based on the abundance of predominantly dextral coiled populations of Truncorotalia truncatulinoides and the presence of Hirsutella hirsuta in Sample 3R-1, 54–56 cm (19.94 mbsf) (see Biostratigraphy in the Expedition 372B/375 methods chapter [Wallace et al., 2019]). The identification of Holocene strata in Hole U1526B (see below) indicates a sedimentary hiatus between the Holocene and Middle Pleistocene. This age is supported by the presence of a typical Pleistocene assemblage composed of Globoconella inflata, Globigerina bulloides, Globigerinita glutinata, Neogloboquadrina incompta, Truncorotalia crassacarina, Truncorotalia crassula, Tr. (cf.) crassula, and Turborotalita quinqueloba. A sedimentary hiatus is also inferred to be present below Sample 3R-1, 54–56 cm (19.94 mbsf), wherein the Pleistocene lies unconformably over early Pliocene strata.
Samples 375-U1526A-3R-2, 14–16 cm, through 3R-CC, 0–5 cm (20.46–21.04 mbsf), are assigned to the early Pliocene (early Opoitian) based on abundant–common populations of Globoconella pliozea (3.9–5.44 Ma) and Globoconella puncticulata (younger than 5.33 Ma). This age is consistent with the background assemblage that is composed of Globoconella conomiozea s.l., Globoconella mons, Globoconella puncticuloides, Truncorotalia crassaformis, and Truncorotalia juanai.
Samples from the underlying volcaniclastic conglomerate (Unit II) are barren of microfossils, but macrofossils, including disarticulated prisms of calcite from inoceramid shells, and encrusting coralline algae on the surfaces of subrounded volcanic clasts support a Cretaceous age and shallow-water environment.
Hole U1526B
Samples 375-U1526B-1H-1, 0 cm, through 1H-1, 6–8 cm (0–0.06 mbsf), are assigned to the Holocene (Haweran; younger than 0.011 Ma) based on the presence of common sinistral Tr. truncatulinoides (younger than 0.53 Ma) and Hirsutella hirsuta (younger than 0.011 Ma) and the absence of Tr. crassacarina (younger than 0.05 Ma). Below these samples, a hiatus is inferred at the base of the Holocene at ~0.15 mbsf based on the faunas present in the underlying core catcher sample and a distinct lithologic change (see Lithostratigraphy). Samples 1H-CC, 0–10 cm, through 2H-CC, 0–7 cm (5.7–14.3 mbsf), are Middle Pleistocene (Castlecliffian; 0.53–0.62 Ma) based on the abundance of predominantly dextral coiled populations of Tr. truncatulinoides. Sample 3H-CC, 19–26 cm (24.09 mbsf), is Middle to early Pleistocene (Castlecliffian to Nukumaruan; 0.62–2.17 Ma) based on a decrease in the abundance of Tr. truncatulinoides. A Holocene to Pleistocene age for the upper part of Lithostratigraphic Unit I is supported by the presence of Beella digitata, Gc. inflata, Gg. bulloides, Gt. glutinata, Nq. incompta, Tr. crassula, Tr. (cf.) crassula, and Tb. quinqueloba. Early Pliocene sediments identified in Hole U1526A are inferred to be present in Hole U1526B; however, these sediments were not sampled for shipboard analysis.
Planktonic foraminifers present in Sample 375-U1526B-4H-4, 91–93 cm (30.19 mbsf), represent a well-preserved Campanian–Maastrichtian fauna constrained by the common occurrence of Globotruncana aegyptiaca (~66–74 Ma) as well as the Late Cretaceous faunal association of Globotruncana bulloides, Planoheterohelix globulosa, and Rugoglobigerina rugosa.
Paleowater depths
Benthic foraminifers present in Holes U1526A and U1526B through Unit I are indicative of mid- to lower bathyal water depths throughout the Holocene to Pleistocene succession (Figure F14) based on the faunal association of Eggerella bradyi, Sigmoilopsis schlumbergeri, and Planulina wuellerstorfi. This water depth conforms with planktonic foraminifer abundances (88%–97%) that indicate an oceanic to suboceanic setting. Early Pliocene samples indicate a lower bathyal depositional environment based on the presence of P. wuellerstorfi and Cibicides robertsonianus in an oceanic setting designated by planktonic foraminifer abundance (96%–97%). Late Cretaceous faunas are also dominated by planktonic foraminifer abundances (96%) consistent with an open oceanic setting.
Macroinvertebrate faunas in Unit II provide a tentative lower paleodepth limit in the upper photic zone (100–150 mbsl [J.C. Braga, pers. comm., 2018]) based on the presence of the Late Cretaceous coralline algae Sporolithon in Samples 375-U1526A-6R-3, 84–85 cm (49.33 mbsf), and 6R-CC, 14–17 cm (48.81 mbsf). However, these samples are interpreted to be ex situ and are likely sourced from upslope.
Paleomagnetism
Paleomagnetic investigations at Site U1526 focused on understanding the remanence intensity values and demagnetization behavior of volcaniclastic material recovered below 30.2 mbsf. We further aimed to provide constraints on the emplacement temperatures of this material and to investigate the possibility that in situ lava flow(s) are present. We also aimed to provide a preliminary magnetostratigraphy for the sedimentary cover sequence recovered in Hole U1526B.
Natural remanent magnetization (NRM) of archive halves was measured prior to and following stepwise alternating field (AF) demagnetization in 5–10 mT increments up to a peak field of 30 mT (Hole U1526B) or 40 mT (Hole U1526A). Archive halves were measured with a spacing of 2.5 cm. The superconducting rock magnetometer (SRM) has a response curve with a half-width of ~4 cm (see Paleomagnetism in the Expedition 372B/375 methods chapter [Wallace et al., 2019]), which limits the clast size that can be successfully resolved based on the SRM data. We thus collected 14 discrete samples from individual clasts/basalts in the volcaniclastic sequences of Lithostratigraphic Unit II (see Lithostratigraphy) to better resolve the remanence directions from individual clasts, their alteration and/or oxidation state, and their emplacement temperatures. Discrete samples were subjected to thermal demagnetization and measured in steps of 50°, 100°, 150°, 200°, 300°, and 400°C. Characteristic remanent magnetization directions were calculated using principal component analysis (Kirschvink, 1980).
Hole U1526B
Figure F15 displays the remanence declination and inclination records prior to and following demagnetization to a peak field of 20 mT and the half-core magnetic susceptibility measured using the Section Half Multisensor Logger (SHMSL) (see Physical properties). Background remanence intensity prior to demagnetization ranges from ~5 × 10⁻³ to 0.5 A/m.
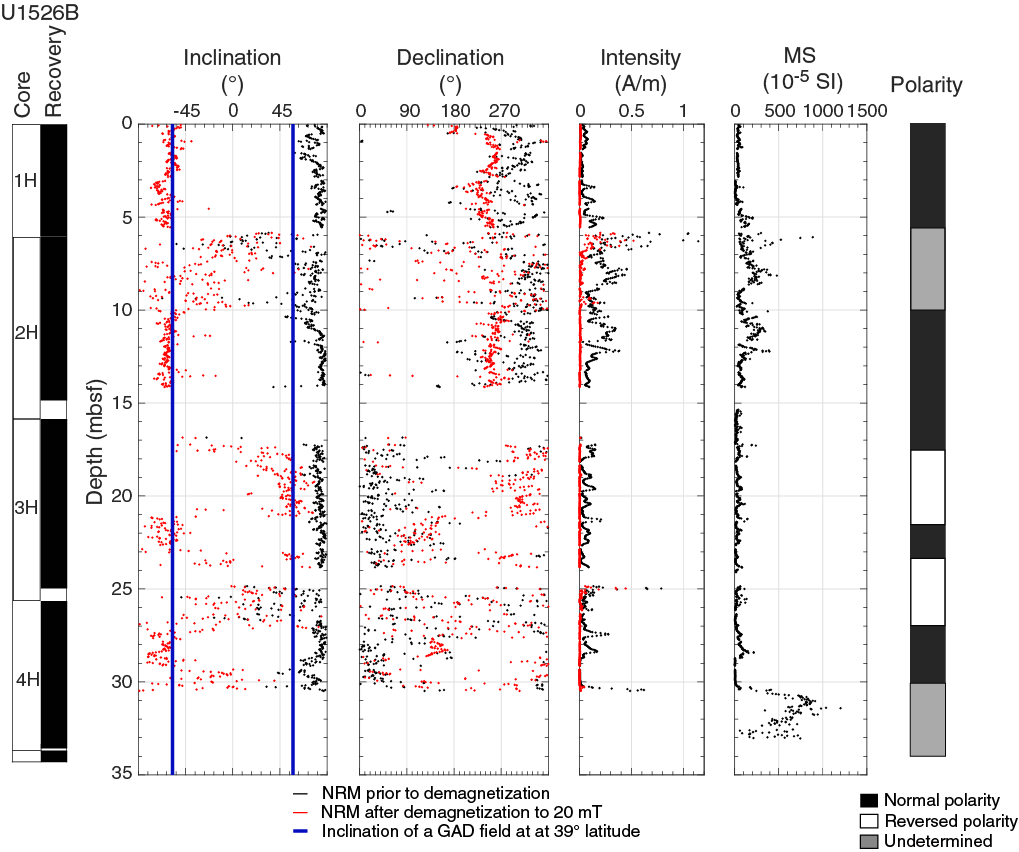
Figure F15. Magnetic inclination, declination, intensity, and MS, Hole U1526B.
Prior to demagnetization all measured sections are affected by a pervasive drilling overprint that manifests in steep positive inclination readings. This overprint was usually removed at the 10 or 20 mT demagnetization level. With the exception of 5–10 mbsf, the inclination records show a well-defined pattern with multiple switches from negative (normal polarity) to positive (reversed polarity) inclinations with sharp (maximum length of 10 cm) transitions. Preliminary biostratigraphic datums suggest the 30 m section spans from the Holocene at the seafloor to Late Cretaceous (74 Ma or younger) at 30 mbsf. Further refinement post-expedition may enable a correlation of individual polarity horizons with the geomagnetic polarity timescale (GPTS) of Gradstein et al. (2012).
Hole U1526A
Archive-half measurements
Figure F16 displays the remanence declination and inclination records prior to and following demagnetization to a peak field of 20 mT and archive half magnetic susceptibility. Core sections that contain calcareous mud and nannofossil ooze in Lithostratigraphic Unit I were severely damaged during the drilling process, and the remanence directions measured are unlikely to represent a depositional remanence. The shell-rich volcaniclastics of Section 375-U1526A-3R-1 are dissected into 2–5 cm long subhorizontal biscuits, and the declination records are thus not representative. The remanence inclinations range from −84.6° to −23.2° and average −61.35° ± 17.3°. The magnetic remanence intensity of the volcaniclastic deposits in Unit II varies in phase with the magnetic susceptibility values downhole. Mafic clasts usually exhibit peaks in remanence intensity and susceptibility and sudden changes in the remanence direction (Figure F17). NRM intensity values for Lithostratigraphic Unit II range from ~0.2 to 13 A/m. Because of the high mafic clast abundance it is difficult to estimate the remanence intensity of calcareous or sandy matrix and pore-filling cements. Visual inspection of the demagnetization trajectories in vector component diagrams shows simple single component remanences with variable median destructive fields between 5 and 30 mT.
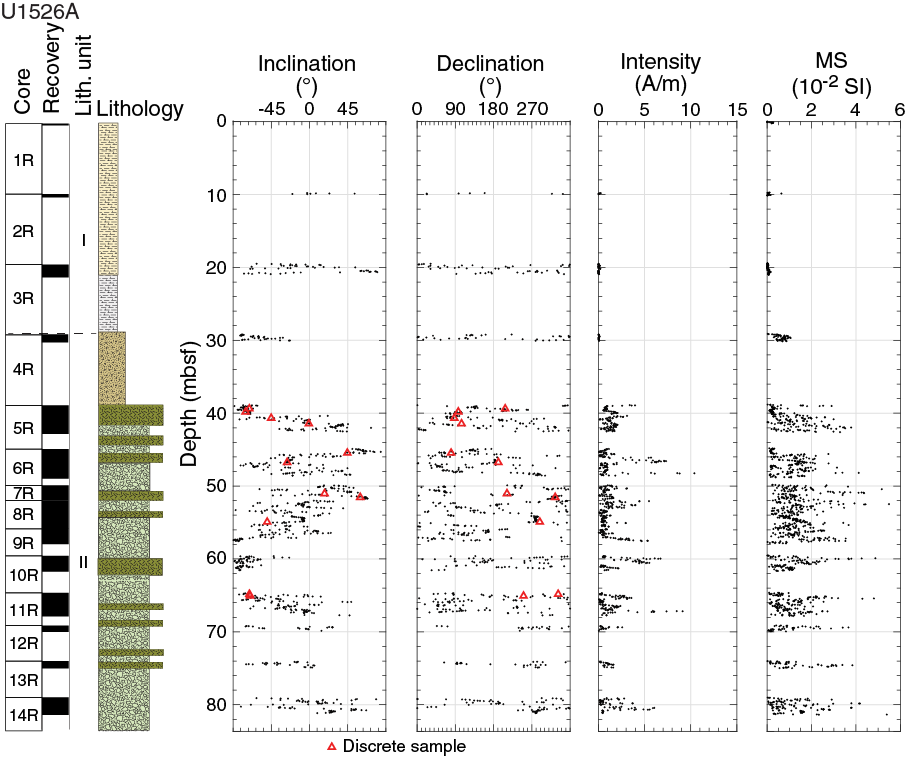
Figure F16. Magnetic inclination, declination, intensity, and MS, Hole U1526A.
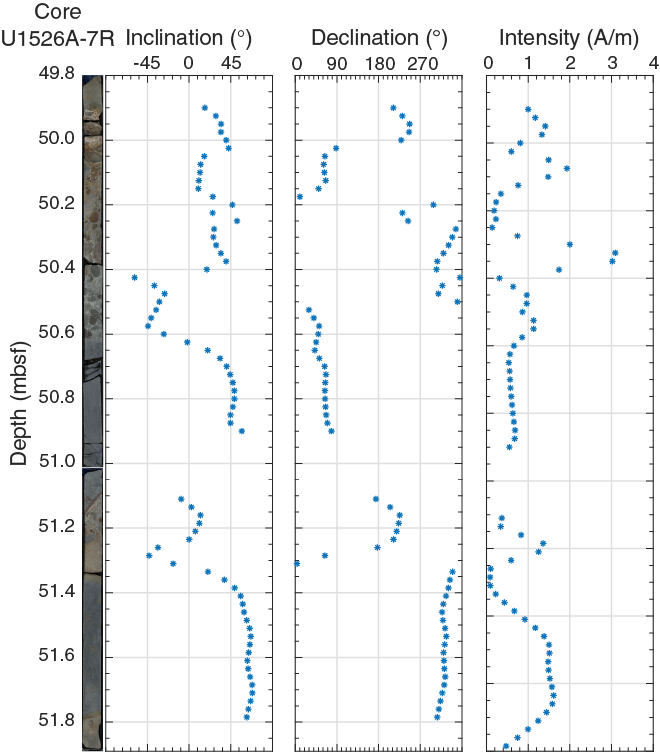
Figure F17. Inclination, declination, and intensity, volcaniclastic clasts.
The inclination records measured on both archive halves and discrete specimens between 40.8 and 57.25 mbsf and below 65 mbsf exhibit significant scatter (Figure F16). However, each individual clast appears to carry a consistent declination and inclination (Figure F17). The results from additional thermal demagnetization experiments on discrete samples are consistent with the results from archive-half measurements. We interpret this scatter to be analogous to a positive conglomerate test (Butler, 2004) implying that in this depth range the clasts were likely emplaced at ambient (“cold”) temperature. Furthermore, the magnetic remanence carriers have not experienced significant alteration since emplacement, which would have resulted in the growth of a chemical remanent magnetization overprint with a direction that is consistent across matrix and clasts. These observations are consistent with lithostratigraphic interpretations.
The identification of in situ lava flows, if present, is difficult because of incomplete core recovery, fracturing, and the absence of clear indicators such as chilled margins or baked contacts (see Lithostratigraphy). As a quick identification mechanism, we compare the inclination measurements of basaltic clasts that are 30 cm or more in length that are not surrounded by a bordering sedimentary matrix. We identified an interval between 57.2 and 64.8 mbsf (Sections 375-U1526A-9R-2, 10R-1, 10R-2, 10R-CC, and 11R-1) in which basalts that are 20 cm or longer have NRM directions with steep and negative inclinations (Figure F18). The (arithmetic) means calculated for each individual segment range from −83.7° ± 3.2° to −74.21° ± 2.6°, which compare well with inclinations measured on a ~1.5 m long and mostly intact piece of basalt in Section 5R-1 (38.8–40.27 mbsf; mean = −74.3° ± 5.4°). The results from a thermal demagnetization experiment conducted on a reddish sample below the lower end of a basalt in Section 11R-1 has an inclination that is consistent with the overlying basaltic rock, which could be a result of contact heating and/or alteration in a normal polarity field. Based on these paleomagnetic observations, we cannot rule out that in situ lava flows may be present in the sequence. Shore-based studies may shed further light on these observations.
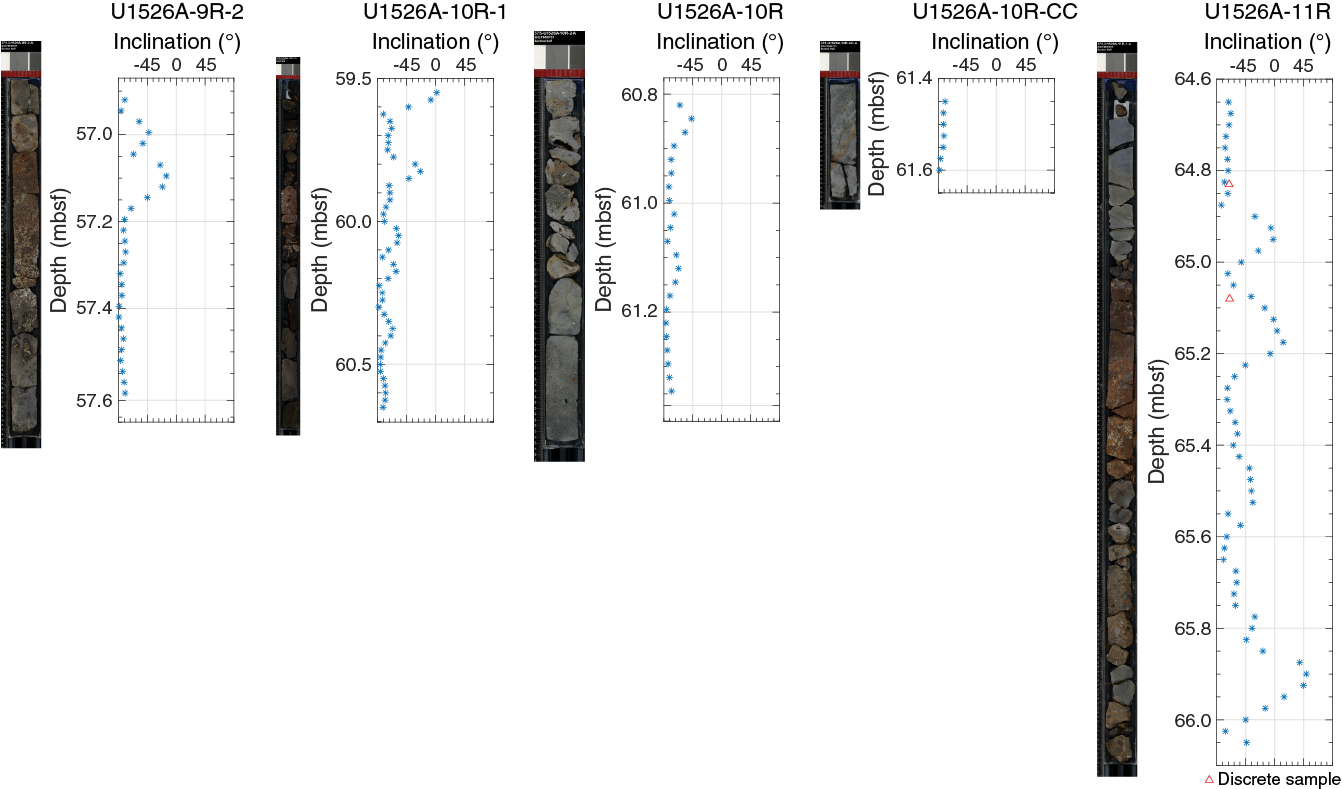
Figure F18. Inclination, basalt sections.
Discrete samples
Figure F19 displays representative vector component and NRM intensity versus temperature plots for a discrete sample from a basaltic clast and for a sample collected from a reddish and visibly deformed clast in Section 375-U1526A-11R-1 (see Figure F18 for location), both of which were subjected to thermal demagnetization. NRM intensity values rage from 2 to 5 A/m. All samples collected from basalt clasts show high-quality demagnetization behavior, and few samples have a small, probably thermoviscous overprint in the blocking temperature (TB) range 0°–200°C. Samples from the basaltic clast predominantly demagnetize in the blocking temperature range 200°–350°C, whereas the sample from the reddish clast in Section 11R-1 retained ~70% of its NRM intensity following demagnetization to 400°C.
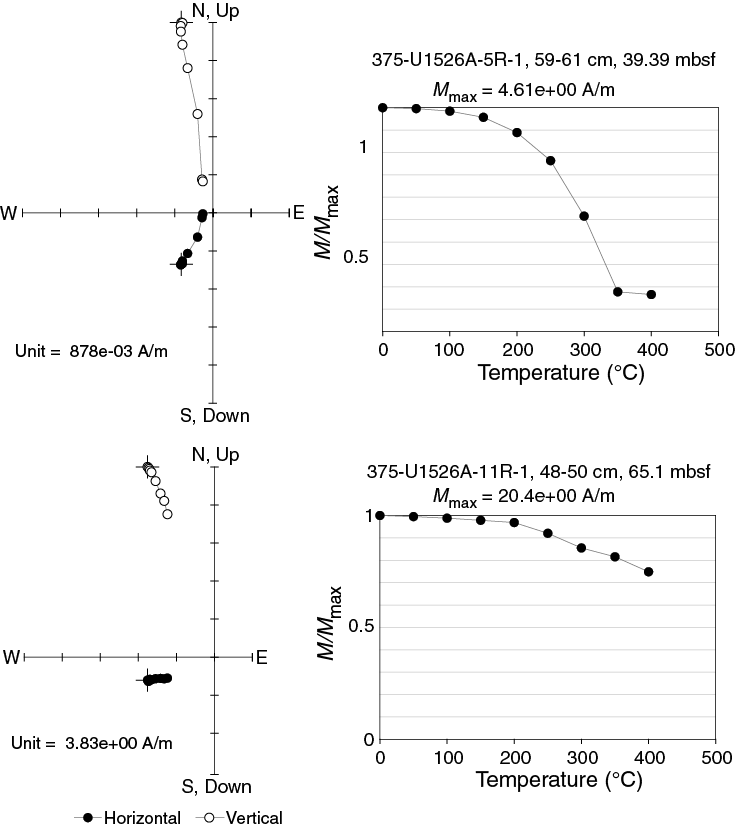
Figure F19. Vector components and NRM intensity, thermal demagnetization.
Structural geology
Site U1526 sampled a suite of heterogeneous volcaniclastic deposits and basalts overlain by ~30 m of pelagic sediments (see Lithostratigraphy). Brecciated volcaniclasts are scattered throughout the drilled interval. Fractures and veins are the most common structural features encountered at this site and were observed in both clasts and matrix. Both filled fractures and diffuse veins occur in Lithostratigraphic Unit II, similar to structures described at Site U1520.
We defined two distinct structural domains at this site. Domain 1 contains fine-grained, flat-lying sediments with no veins. Domain 2 shows varying degrees of cementation and veining and coincides with Lithostratigraphic Unit II (volcaniclastic facies) (Figure F20). Hole U1526A was cored from 0 to 83.6 mbsf and Hole U1526B was cored from 0 to 33.11 mbsf. Because of drilling disturbance in pelagic sediments in the upper 30 m of Hole U1526A, structural measurements in Lithostratigraphic Unit I are recorded only in cores from Hole U1526B.

Figure F20. Dip angles of structures.
Types of structures observed
Two types of veins were observed at Site U1526: (1) filled, opening-mode fractures with distinct sharp edges and (2) zones of cementation that have diffuse boundaries and occur over centimeter-scale intervals. For Vein Type 2 (diffuse vein), the term “vein” denotes a tabular zone that differs texturally and compositionally from the surrounding rock and is inferred to have formed after deposition of the surrounding sediments but did not necessarily require a fracture to form. Diffuse veins are common in the volcaniclastic sediments at Site U1520, but only two were recorded at Site U1526. Rare open fractures (two) and faults (one) were also described at Site U1526.
Domain 1: undeformed fine-grained calcareous mudstone
The upper 30.23 m consists of undeformed pelagic sediment (Sections 375-U1526B-1H-1 through 4H-4; 0–30.23 mbsf). Beds in Domain 1 are poorly resolved but are gently dipping to nearly horizontal where visible (Figure F20).
Domain 2: volcaniclastic deposits and basalts with veins
From 30.23 to 83.6 mbsf, cores consist of heterogeneous volcaniclastic sediments and basalt fragments (Sections 375-U1526A-3R-2 through 14R-2) that exhibit varying degrees of alteration, cementation, and mineralization (see Lithostratigraphy; Figure F21B–F21H). Veins occur from approximately ~39 mbsf to the bottom of the hole but are essentially absent in the shell-rich, poorly lithified volcaniclastics at the very top of Domain 2 (30.23–39 mbsf). Vein dip angles vary from subhorizontal to subvertical and exhibit no systematic variation with depth (Figure F20).
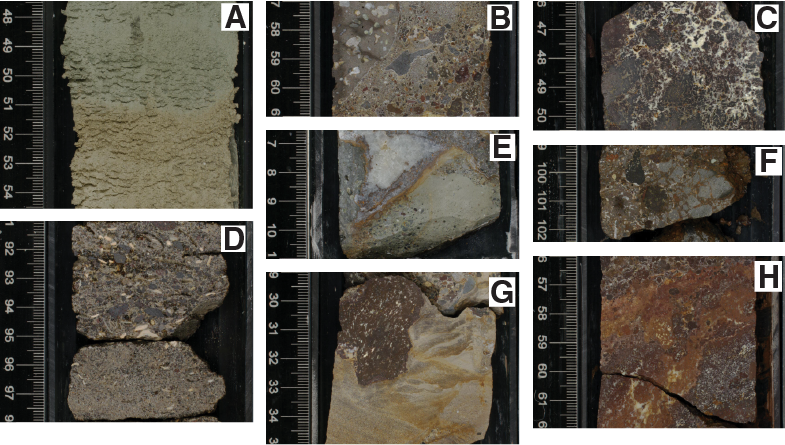
Figure F21. Bedding, matrix, and clast relationships, Hole U1526A.
The degree of cementation and lithification in Domain 2 generally increases with depth (Figure F21B–F21H). Subtle grain size variations may locally indicate poorly defined apparent bedding (Figure F21D, F21E), but no distinct planar bedding surfaces could be measured. Several silty horizons exhibit laminations and cross-bedding (Figure F21D), but it is unclear if these horizons represent lithic clasts or in situ matrix. Evidence for fragmentation and shear is recorded by brecciated clasts (Figure F21C) locally preserving jigsaw textures (Figure F21F) and rare planar fabrics in altered clasts (Figure F21H).
Veins occur throughout the volcaniclastic units below ~39 mbsf (middle of Section 375-U1526A-5R-1). Diffuse veins are defined by bands of interstitial cement in the volcaniclastic matrix (Figure F22A). Fracture veins occur both in the volcaniclastic matrix and in clasts, and these veins locally traverse clast/matrix boundaries (Figure F22B–F22E). The fracture veins are commonly <1 mm thick, anastomosing (Figure F22D), and filled by white-gray calcite. Thicker, wavy veins with a blocky internal structure were also observed, locally merging with open pore spaces lined with calcite. Circumgranular veins are common over several intervals, indicating a tendency for mineral precipitation along clast edges (Figures F21B, F22D). Thick, brown veins with micritic or clastic fill occur at 67.6–67.8 mbsf (Sections 11R-2 and 11R-CC) and appear to predate calcite-filled veins that also occur in this zone (Figure F22E).
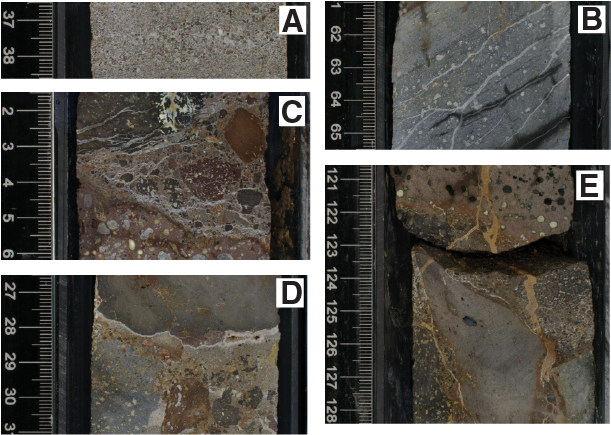
Figure F22. Representative veins in Domain 2, Hole U1526A.
Drilling disturbance
Drilling disturbance, mostly in the form of upward-arching beds, was severe in Domain 1 in Hole U1526A but minimal in Hole U1526B because of the change from RCB to APC coring. Domain 2 was disturbed by local slight to moderate biscuiting. Differential biscuit rotation affects our ability to orient deformation structures in a geographical reference frame.
Summary and discussion
The cores recovered at Site U1526 are largely undeformed. Fractures and veins are the only postdepositional structures of note. No deformation structures are preserved in Domain 1, which is characterized by subhorizontal beds. Fractures and veins occur throughout Domain 2 in the volcaniclastics and basalts.
Geochemistry
Inorganic geochemistry
The main objective of the inorganic geochemistry program at Site U1526 was to identify diagenetic reactions and potential fluid flow. A total of 11 routine pore water whole-round (WR) samples (10 cm long) were collected from APC cores in Hole U1526B and squeezed for shipboard and shore-based pore water chemical analyses. WR samples were collected on the catwalk at a frequency of four samples in Core 375-U1526B-1H, three samples in Core 2H, and two samples per core in Cores 3H and 4H.
All WR samples were thoroughly cleaned in an effort to remove drilling fluid contamination and then pressed in titanium squeezers at gauge forces to a maximum of 30,000 lb. The volume of recovered pore water varied with lithology and depth and ranged between 15 and 58 mL.
The major and minor element concentrations are listed in Tables T8 and T9, respectively. Their depth profiles are shown in Figures F23, F24, and F25. The geochemical profiles at Site U1526 reflect the combined effects of early organic matter diagenesis and carbonate and silicate mineral diagenesis. The concentrations of major elements at the top of Unit I are similar to seawater composition, and only the most reactive solutes show significant alteration relative to bottom water. However, a sharp gradient occurs in the profiles of many solutes approaching the volcaniclastic sediments in Unit II to a modified fluid composition that is similar to that of the volcaniclastic unit at Site U1520. Below, we provide a general description of the pore water chemical profiles and evidence for fluid–rock reactions.
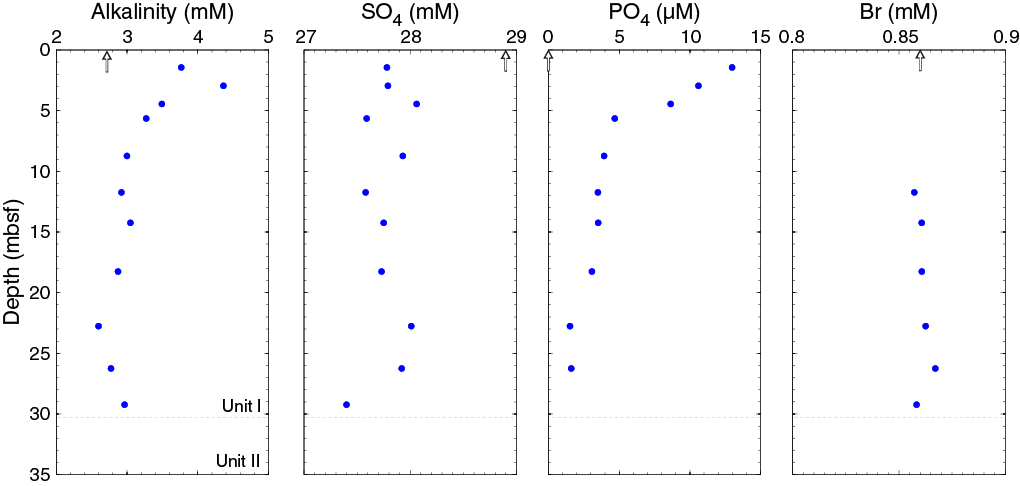
Figure F23. Alkalinity, sulfate, phosphate, and bromide.
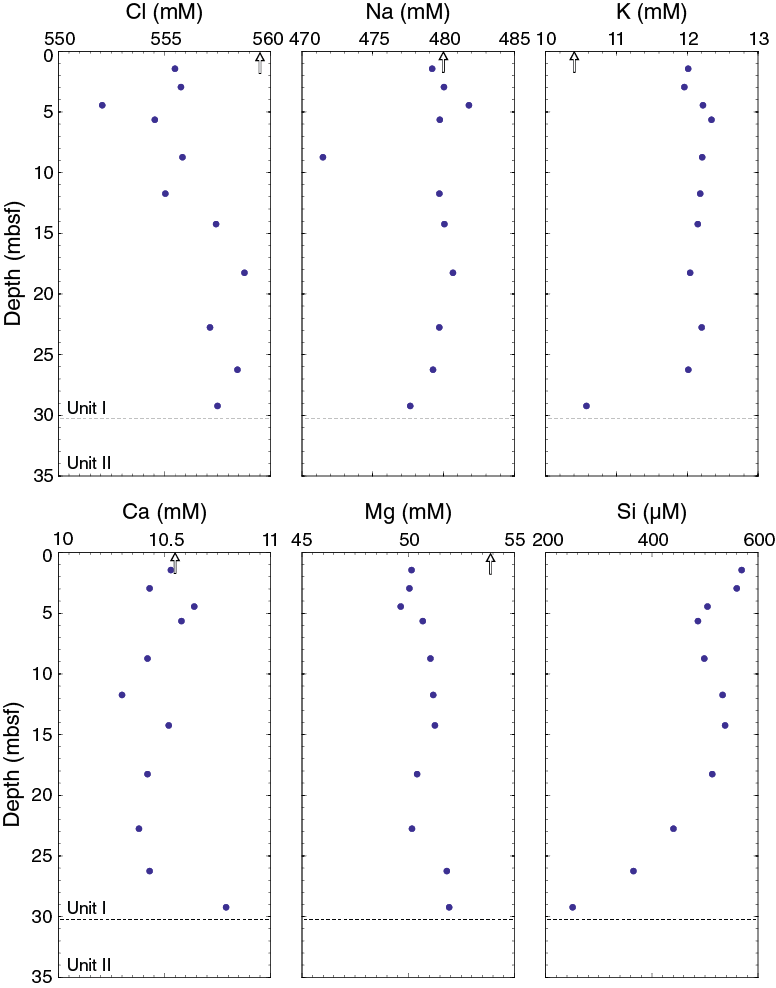
Figure F24. Chloride, sodium, potassium, calcium, magnesium, and silica.
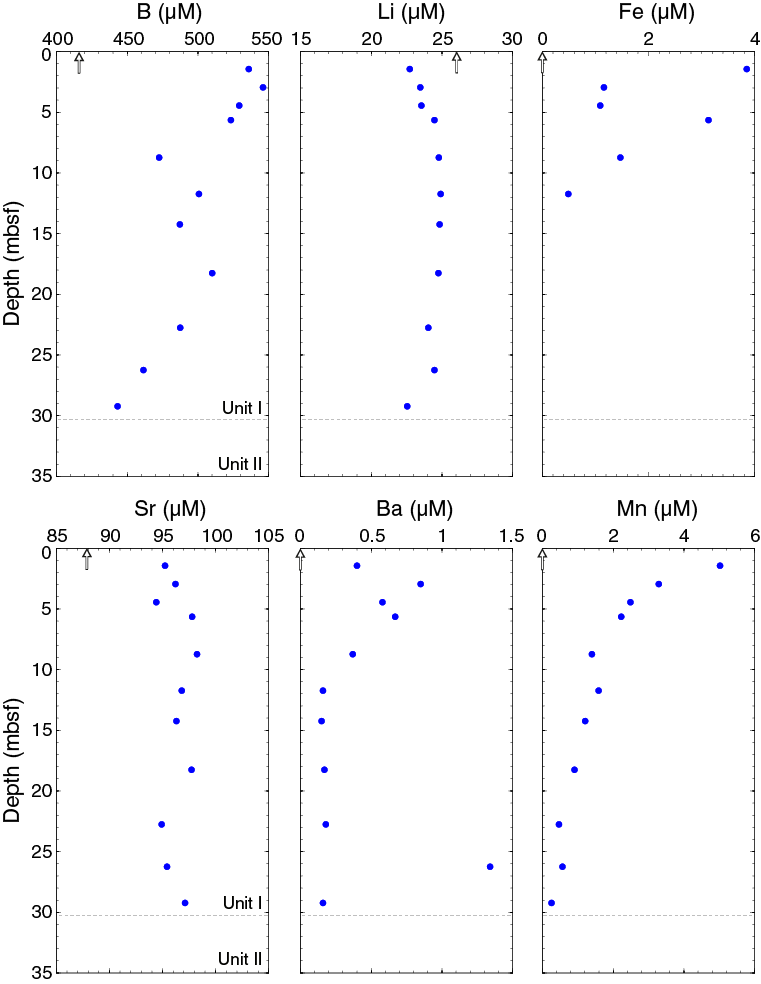
Figure F25. Boron, lithium, iron, strontium, barium, and manganese.
Organic matter diagenesis
Sulfate concentrations at the top of Unit I are lower than modern seawater value and are relatively constant, ranging from 27.4 to 28 mM (Figure F23). Alkalinity concentrations increase from the seafloor to a peak value of 4.36 mM at 2.95 mbsf, decrease to 3.27 mM at 5.65 mbsf, and remain relatively constant deeper than 5.65 mbsf to the base of Unit I. Phosphate concentrations decrease sharply from 13 µM at 1.45 mbsf to 4.7 µM at 5.6 mbsf and then decrease more gradually to the base of Unit I. The shape of the Mn concentration profile is concave downward with concentrations decreasing from 5.02 µM at 1.45 mbsf to 0.9 µM at 18.3 mbsf (Figure F25). Dissolved Fe concentrations range from 0.49 to 3.85 µM in the upper ~12 m of the sediment column and are below the detection limit deeper than ~12 mbsf.
Collectively, these solute profiles reflect the oxidation of particulate organic carbon through Mn reduction, Fe reduction, and SO4 reduction. The Mn reduction equation is
The sulfate reduction equation is
Some of the alkalinity produced through these metabolic reactions is sequestered in authigenic carbonates in the upper portion of Unit I.
Carbonate and silicate mineral diagenesis
Dissolved strontium concentrations are higher than modern seawater and are relatively constant with depth, ranging from 95 to 98 µM (Figure F25). The slight enrichment in Sr concentrations likely reflects recrystallization of biogenic carbonate in Unit I. Magnesium concentrations are less than seawater and relatively constant, ranging from 49 to 53 mM (Figure F24). Some of the depletion in Mg likely reflects recrystallization of biogenic carbonate to a higher Mg calcite. However, the Mg profile is also affected by silicate mineral diagenesis in Unit I. Dissolved silica concentrations are elevated with respect to seawater in the upper portion of Unit I, ranging from 487 to 569 µM in the upper 18 m of the sediment column and then decreasing to 251 µM at 29 mbsf (Figure F24). In the interval of elevated Si concentrations, boron concentrations range from 472 to 546 µM and then decrease to the base of Unit I. The elevated Si and B concentrations along with the lower than seawater Mg concentrations suggest minor silicate mineral diagenesis in the upper portion of the sediment column and the formation of authigenic aluminosilicate minerals.
A sharp decrease in potassium and silica concentrations, a moderate decrease in boron concentrations, and a sharp increase in calcium concentrations occur at the base of Unit I (Figures F24, F25). The sharp changes in these concentration profiles reflect a modified fluid composition in Unit II (volcaniclastic facies) owing to different and more mature fluid–rock reactions. Extrapolating the gradients to the Unit I/II boundary indicates that the fluid in the volcaniclastic sediments has a composition similar to that of volcaniclastic Unit V at Site U1520 (see Geochemistry in the Site U1520 chapter [Barnes et al., 2019]). Given that the sediments comprising Unit I at Site U1526 were deposited between the Holocene and 5.33 Ma (see Biostratigraphy), we would expect the concentrations of solutes in Unit II to establish a diffusional gradient to the top of Unit I over this long time period rather than the sharp gradients observed at the base of Unit I. The reason for the sharp gradients observed in the solute profiles will be explored further post-expedition.
We note that pore water lithium concentrations at the top of Unit I are ~3 µM lower than modern seawater value. These analyses were conducted at the very end of the expedition, and Li concentrations will be remeasured post-expedition to verify the shipboard values.
Organic geochemistry
Gas analyses
Headspace samples were taken from each sediment core to monitor for the presence and abundance of C1–C3 hydrocarbons as part of the standard safety protocol (Pimmel and Claypool, 2001). A total of 13 headspace gas samples were analyzed by gas chromatography (see Geochemistry in the Expedition 372B/375 methods chapter [Wallace et al., 2019]), and no methane, ethane, propane, ethene, or propene were detected (Table T10).
Bulk sediment analysis
The main objective of bulk sediment analysis was to provide measurements of the quantity and quality of organic matter and calcium carbonate contents. A total of 19 bulk sediment samples were collected at Site U1526 (Table T11) for elemental analysis by coulometric and carbon-hydrogen-nitrogen-sulfur measurements to determine inorganic carbon, calcium carbonate, total carbon (TC), total nitrogen (TN), and organic carbon contents (weight percent).
Calcium carbonate (CaCO3) in Lithostratigraphic Unit I (0–30.2 mbsf), which consists of fine-grained mixed to biocalcareous sediment, exhibits a large degree of scatter (ranging from 1.26 to 69.99 wt%). The CaCO3 profile mimics the depth profiles of TC (ranging from 0.03 to 8.82 wt%) and inorganic C (ranging from 0.04 to 8.40 wt%). Calcium carbonate content increases with depth and reaches its highest value of 69.99 wt% at 21 mbsf, corresponding to a nannofossil-rich ooze. In Lithostratigraphic Unit II (30.2–81.39 mbsf), which is composed of coarse volcaniclastic sandstone and volcaniclastic conglomerate, CaCO3 contents also exhibit a large degree of scatter, ranging from 0.25 to 68.30 wt%. The highest value (68.30 wt%; Sample 375-U1526A-4R-1, 6–7 cm) is indicative of bivalve shells and calcite cement (Figure F26).
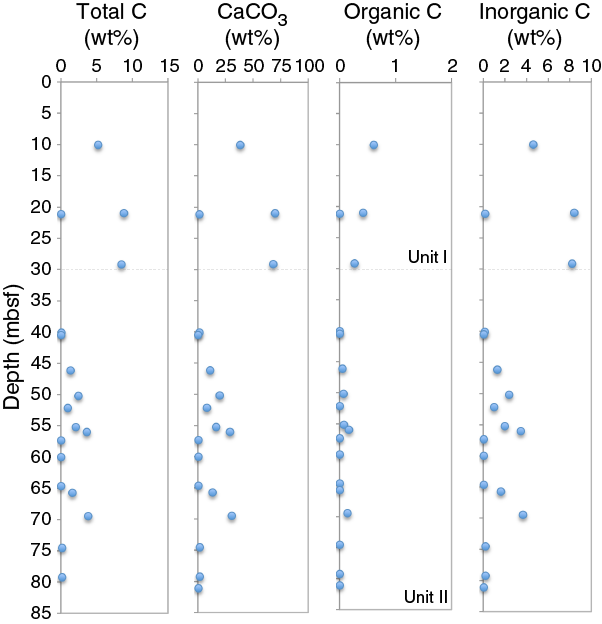
Figure F26. TC, CaCO3, organic carbon, and inorganic carbon.
Organic C values, calculated as the difference between TC and carbonate C content (see Geochemistry in the Expedition 372B/375 methods chapter [Wallace et al., 2019]), are low in Lithostratigraphic Units I and II (ranging from 0.00 to 0.61 wt%). The highest values are shallower than 21 mbsf and correspond to calcareous mud. The ratio of organic C to TN (C/N) can provide information on organic material provenance. Terrestrial organic matter typically has a C/N ratio of ~20, whereas marine organic matter, which is more proteinaceous, is characterized by a C/N ratio of ~5–8 (Pimmel and Claypool, 2001). TN is below the detection limit deeper than 21 mbsf. C/N ratios shallower than 21 mbsf range from 20.89 (possibly due to a terrestrial influence of organic matter) to 191 and reflect low TN values.
Physical properties
Density and porosity
Gamma ray attenuation (GRA) bulk density was determined on WR cores, and moisture and density (MAD) bulk density, grain density, and porosity were determined on discrete samples from Site U1526 working halves (see Physical properties in the Expedition 372B/375 methods chapter [Wallace et al., 2019]). No MAD measurements were conducted for Hole U1526B. Between the seafloor and ~21 mbsf in Hole U1526A, GRA bulk density ranges from ~1.3 to 1.5 g/cm3 and then increases rapidly to ~2.8 g/cm3 at ~40 mbsf (Figures F27, F28). From 40 to 82 mbsf, the majority of GRA bulk density values range between 2 and 2.5 g/cm3 with large scatter because of the irregular diameter of the recovered RCB cores and heterogeneity in lithology. After correction for the RCB core diameter, GRA bulk density ranges from 2.3 to 3 g/cm3 (Figure F28). In Hole U1526B, GRA bulk density increases from 1.5 g/cm3 to slightly above 1.8 g/cm3 in the uppermost 2 m and then decreases slightly with depth and remains constant at 1.5–1.6 g/cm3 between 6 and 24 mbsf. GRA bulk density shifts to lower values of 1.4–1.5 g/cm3 at 25 mbsf and then increases significantly over the lowermost 8 m of Hole U1526B, reaching values as high as ~2.8 g/cm3 at 30 mbsf.
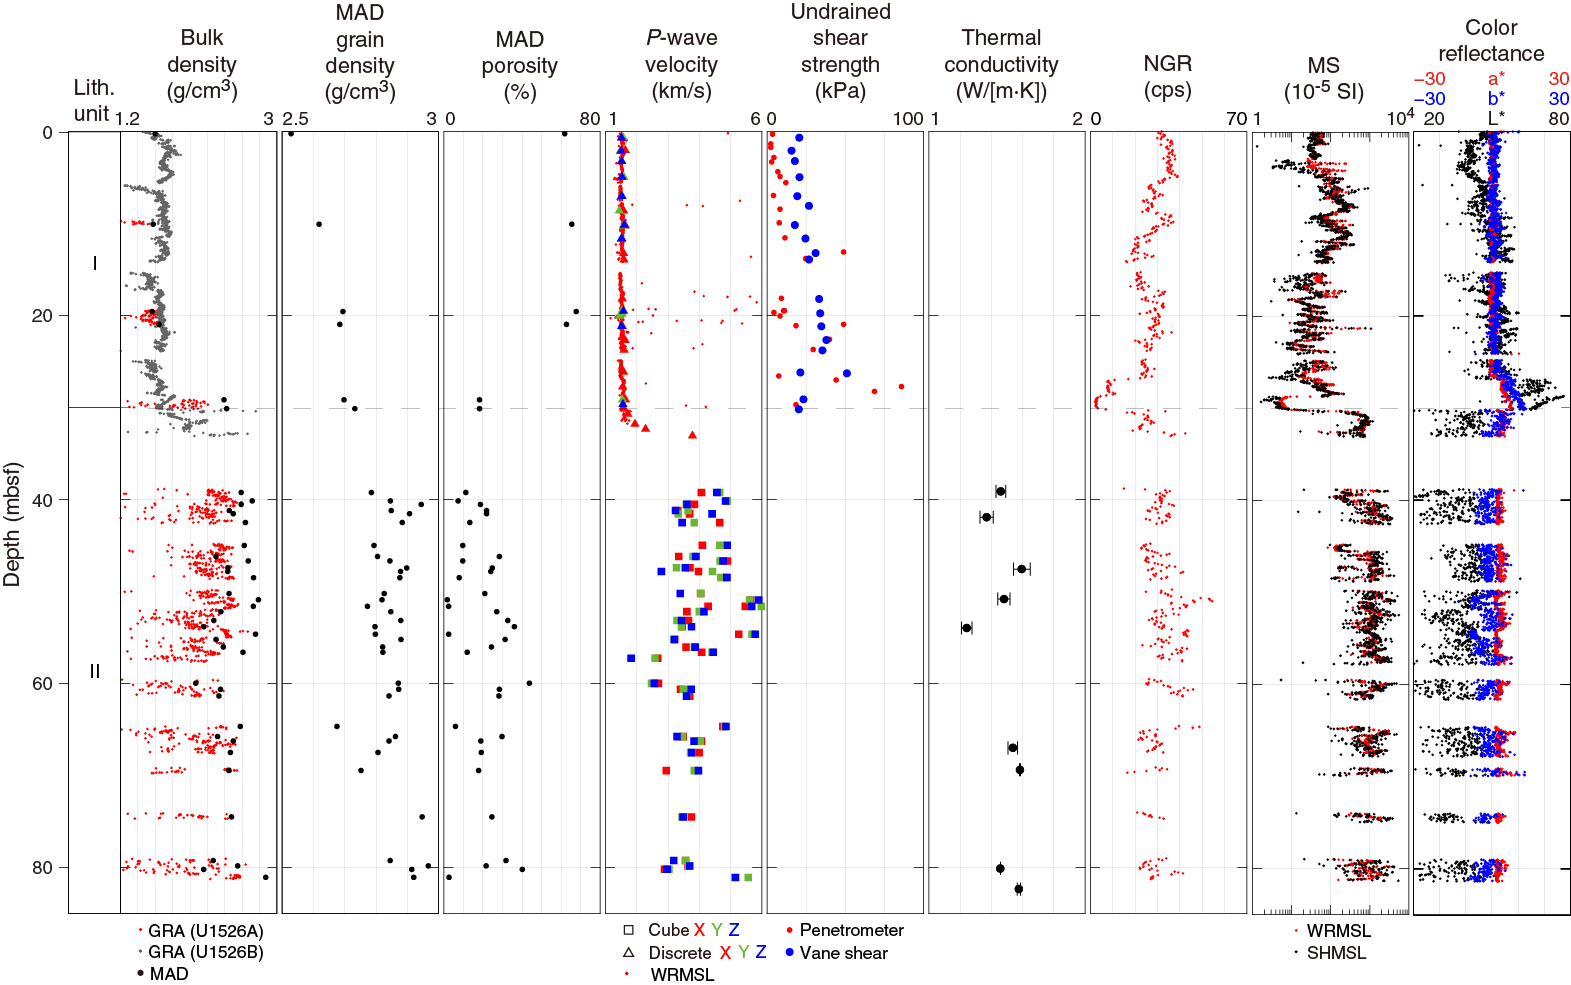
Figure F27. Physical properties.

Figure F28. Core diameter and GRA and MAD bulk density.
MAD bulk density is 1.6 g/cm3 between the seafloor and 21 mbsf. MAD bulk density increases to 2.4 g/cm3 at ~30 mbsf in the clastic material of Core 375-U1526A-4R (Figure F27). Between 39 mbsf and the bottom of Hole U1526A, MAD bulk density exhibits large scatter, ranging between 2.1 and 2.9 g/cm3 with an average of 2.5 g/cm3 and no discernible downhole trend. Grain density increases steadily from 2.5 g/cm3 at <1 mbsf to values as high as 2.9 g/cm3 at 40 mbsf and remains mostly constant between 40 and 69 mbsf, averaging 2.85 g/cm3. Grain density values are as high as 3.0 g/cm3 at the bottom of Hole U1526A from 75 to 81 mbsf.
Between the seafloor and 21 mbsf (in Lithostratigraphic Unit I) in Hole U1526A, porosity is 62%–68%. Porosity decreases abruptly to 18% at ~30 mbsf. From 39 mbsf to the bottom of Hole U1526A (in Unit II), porosity exhibits large scatter and ranges from 2% to 44%, averaging 20% with no significant downhole trend (Figure F27). In general, low bulk density, low grain density, and high porosity correspond to the shallow fine-grained sediment cover in Unit I, whereas high bulk density, high grain density, and low porosity values in Unit II are associated with the appearance of larger clasts of basalt. The large scatter in Unit II is due to the differences between the clastic material and the low-porosity basalt, as well as large variations in the size of vesicles in the basalt.
P-wave velocity
Compressional wave (P-wave) velocity was measured on WR cores, working halves, and discrete cubes. The discrete cubes were also used for MAD measurements. In Lithostratigraphic Unit I where the main lithologies are calcareous mud and nannofossil-rich ooze, P-wave velocity ranges from 1450 to 1570 m/s (Figure F27). In Unit II, the lithology is volcaniclastic conglomerate with basalt clasts and P-wave velocity ranges from 1700 to ~6000 m/s with significant scatter because of the heterogeneous nature of the conglomerate. Both horizontal anisotropy (αI) and vertical anisotropy (αT) range mostly between −0.2 and 0.2 (Figure F29; Table T12).
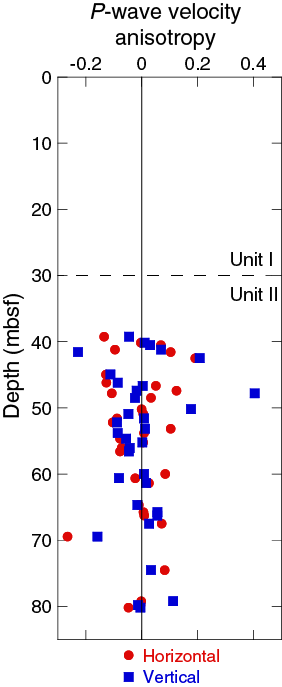
Figure F29. P-wave velocity anisotropy.
Shear strength
Shear strength measurements were conducted on the working halves of sediment cores from 0 to 30 mbsf in Holes U1526A and U1526B using the Giesa automated vane shear (AVS) and a pocket penetrometer. Undrained shear strength increases with depth from 0 to ~100 kPa between 0 and 30 mbsf.
Thermal conductivity
Thermal conductivity measurements were conducted on working halves from Lithostratigraphic Unit II in Hole U1526A using the half-space probe (see Physical properties in the Expedition 372B/375 methods chapter [Wallace et al., 2019]). No thermal conductivity measurements were conducted in Unit I because of poor recovery in Hole U1526A and limited time to process cores from Hole U1526B. In most cases, three measurements were made at each position. The plotted value represents the mean of the three measurements, and the horizontal bar shows the standard deviation. Although a sample of three does not represent an accurate measure of the standard deviation, this value can be used to assess the relative scatter in the measurements. From 39 to 82 mbsf, nine thermal conductivity measurements were made. Thermal conductivity values vary between 1.2 and 1.6 W/(m·K) with a mean value of 1.5 W/(m·K) (Figure F27).
Natural gamma radiation
NGR values in Lithostratigraphic Unit I mostly range between 20 and 40 counts/s, except for lower values of 2–8 counts/s between 27 and 30 mbsf corresponding to nannofossil-rich ooze (see Lithostratigraphy). NGR values in Unit II increase from about 29 counts/s at the top of the unit to about 50 counts/s at about 50 mbsf and then gradually decrease to 27 counts/s at the bottom of the cored interval (Figure F27).
The NGR spectra were used to estimate 40K, 232Th, and 238U concentrations using the algorithm of De Vleeschouwer et al. (2017) (Figure F30). K, Th, and U concentrations generally mimic patterns observed in the NGR data. Mean values of 40K, 232Th, and 238U through Unit I are 1.4 wt%, 3.2 ppm, and 1.3 ppm, respectively. In Unit II, mean values of 40K, 232Th, and 238U are 1.8 wt%, 2.8 ppm, and 0.8 ppm, respectively. These generally low values likely reflect the low concentration of clay throughout the cored intervals (see Lithostratigraphy).
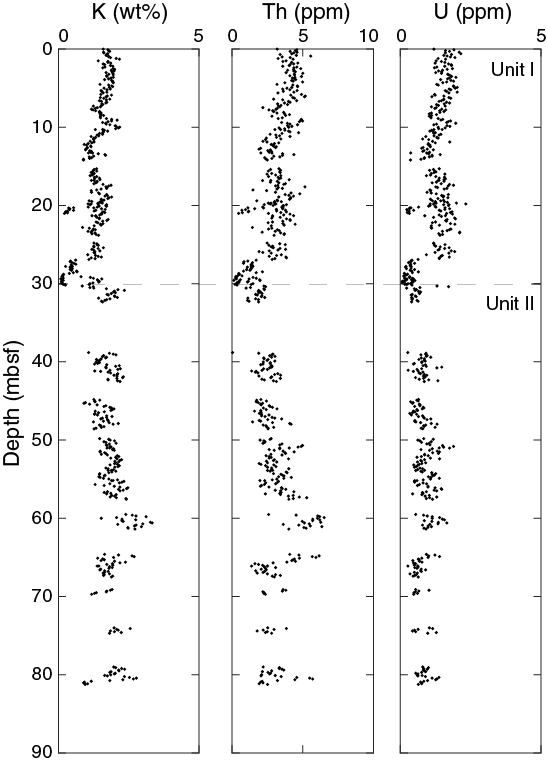
Figure F30. K, Th, and U.
Magnetic susceptibility
Magnetic susceptibility mostly ranges from 10 × 10−5 to 200 × 10−5 SI in Lithostratigraphic Unit I shallower than ~30 mbsf. Deeper than ~30 mbsf, magnetic susceptibility ranges from ~100 × 10−5 to 3000 × 10−5 SI with an average of ~1400 × 10−5 SI (Figure F27).
Reflectance spectroscopy and colorimetry
Color reflectance data were measured on archive halves from Site U1526 and are reported as L*, a*, and b* values (Figure F27). L* decreases from 50 at the seafloor to 40 at 5 mbsf and then increases to 50 at ~10 mbsf. It remains constant between 10 and 27 mbsf and then increases to 60–80 between 27 and 30 mbsf. Deeper than 30 mbsf, L* shows large scatter, ranging from 20 to 65. From the seafloor to 27 mbsf, a* and b* values are mostly constant with average values of 0; a* increases to a maximum value of 8 and b* increases to a maximum value of 10 between 27 and 30 mbsf. Deeper than 30 mbsf, both a* and b* are relatively constant with average values of ~4 and −1.2, respectively.
Core-seismic integration
In this section, we integrate core-based observations and measurements with seismic reflection profiles from Site U1526. No borehole logging data exist at this site; the site was not drilled with logging while drilling during IODP Expedition 372, and no wireline logging was undertaken during Expedition 375.
Seismic-well ties
RCB coring was undertaken to 83.6 mbsf in Hole U1526A, and the seafloor was identified at 2890.1 mbsl. APC and XCB coring were completed to 31.5 mbsf in Hole U1526B where the seafloor was identified at 2888.4 mbsl. Because no logging data were acquired in either hole, velocity and density information from laboratory measurements on cores were used to tie the lithologic information from cores to the seismic sections.
The available seismic data at Site U1526 include Seismic Line 05CM-04 on which Sites U1518, U1519, and U1520 are also located and a low-fold (48-channel) section acquired on the R/V Tangaroa. Site U1526 is located near Seismic Line 05CM-04 at common depth point (CDP) 7144 and lies 110 m from Cross-Line TAN1114-03. Figure F31 compares pre-expedition seismic velocity estimates produced for the depth migration of Seismic Line 05CM-04 and a full waveform inversion (FWI) (see Core-log-seismic integration in the Expedition 372B/375 methods chapter [Wallace et al., 2019]). We conducted continuous velocity measurement only on WR sediment cores, whereas discrete P-wave velocity measurements using a bayonet (PWB) and caliper (PWC) system were made on split cores and discrete samples, respectively, throughout Holes U1526A and U1526B (Figures F27, F31A; see Physical properties). P-wave velocity measurements in the pelagic sediments (see Lithostratigraphy) in the upper 29 m of Hole U1526A were restricted to Core 3R, where values of 1451, 1527, 1576 and 2475 m/s were recorded (see Physical properties). In Hole U1526B, 90%–100% core recovery was achieved in the same unit, which extended to 30.2 mbsf. P-wave velocity increases from about 1500 m/s close to the seafloor to about 1530 m/s at 30 mbsf (see Physical properties). In Hole U1526A below 29 mbsf, P-wave velocity values measured in the laboratory show a wide variation between 2034 and 5162 m/s with a mean value of 3805 m/s. This mean velocity is considerably higher than predictions made by the prestack depth migration (PSDM) (Barker et al., 2018) and FWI velocity models (Figure F31A).
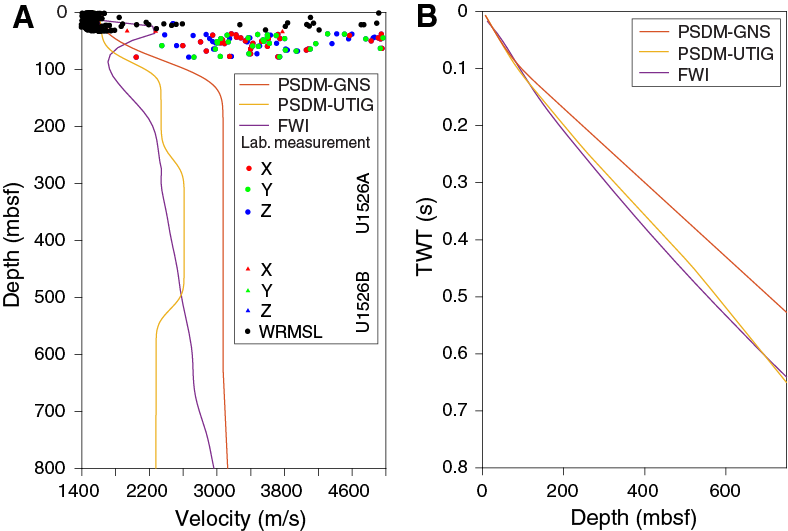
Figure F31. PSDM, FWI, and laboratory P-wave velocity data.
In the absence of continuous velocity and density data, we built a lithologic model and populated it with velocity and density information from laboratory measurements to create a synthetic seismic trace to tie the core and seismic data (see Core-log-seismic integration in the Expedition 372B/375 methods chapter [Wallace et al., 2019]). Holes U1526A and U1526B are divided into two lithostratigraphic units (see Lithostratigraphy). Unit I in Hole U1526B (0–30.2 mbsf) consists of hemipelagic mud, calcareous mud, and nannofossil-rich pelagic ooze. Unit II (30.2–82 mbsf) comprises coarse-grained cemented volcaniclastic sandstone, large (tens of centimeters) blocks of vesicular basalt, and cemented volcaniclastic conglomerate. Seismic Line 05CM-04 shows a high-amplitude, normal polarity reflection at 40 ms two-way traveltime (TWT) below seafloor at Site U1526 (Figure F32). If the normal polarity reflection at 40 ms TWT below seafloor corresponds to the Lithostratigraphic Unit I/II boundary at 30.2 mbsf in Hole U1526B, it would require an interval velocity of 1510 m/s for Unit I. This value is in good agreement with the Hole U1526B laboratory measurements.

Figure F32. Lithostratigraphic and seismic units and synthetic seismic trace.
Below ~30 mbsf, significant scatter in the laboratory P-wave velocity measurements reflects the mixed assemblage of low-velocity (<3000 m/s) volcaniclastic conglomerate with large (tens of centimeters) blocks of vesicular basalt and cemented volcaniclastic conglomerate intervals having higher velocity values of >5000 m/s. To produce a synthetic seismic trace, we constructed a velocity model with an interval velocity of 1510 m/s in Unit I and 3805 m/s in Unit II, corresponding to the mean velocity measured on Hole U1526A core samples (Velocity Model 1, Figure F32A; see Physical properties).
Figure F32B shows the synthetic seismic trace that is produced from Velocity Model 1 and MAD measurements (see Physical properties). There is a good match between a high-amplitude reflection trough at 30 mbsf (blue phase in Figure F32B) and the observed velocity and density increase across the contact between nannofossil-rich ooze and volcaniclastic sandstone. Velocity Model 1 is the simplest model that provides a partial match to the real data and honors laboratory P-wave velocity measurements. We recognize, however, that other more complex models could provide a better match below 30 mbsf. We use the synthetic seismic trace to tie core and seismic data in Holes U1526A and U1526B.
Seismic units and comparison with core data
Two seismic reflection units are identified in the upper sequence of Tūranganui Knoll at Site U1526 (Figure F33).
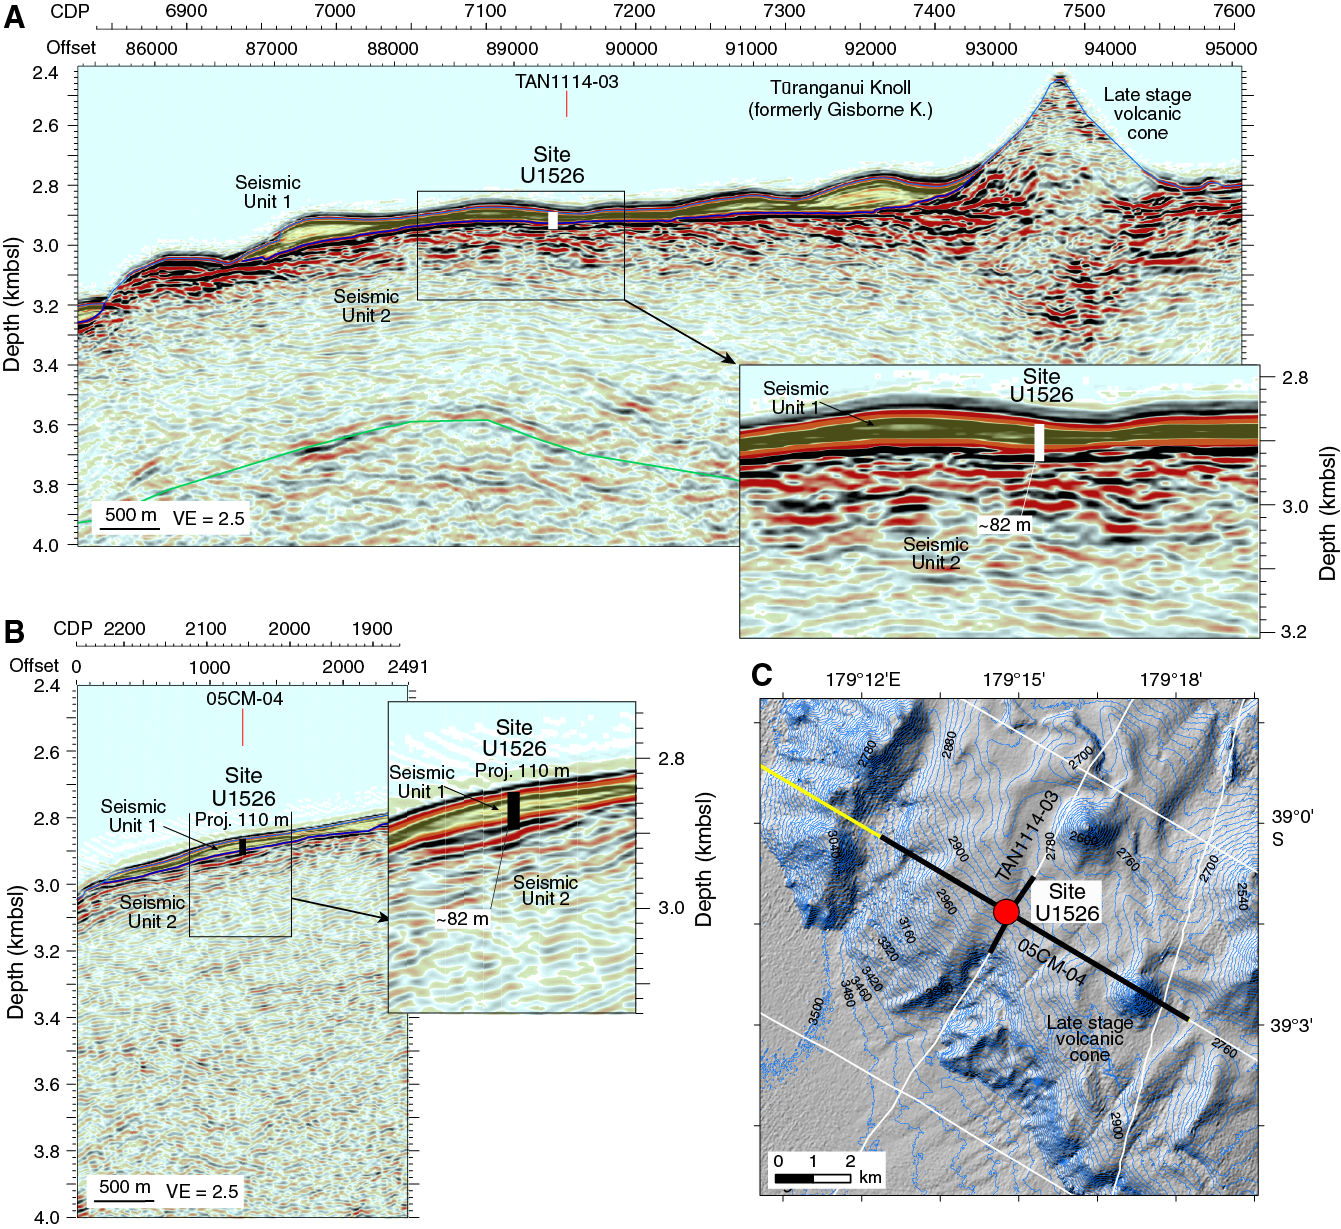
Figure F33. Seismic units, Line 05CM-04 and Cross-Line TAN1114-03.
Seismic Unit 1 (0–30 mbsf)
Seismic Unit 1 is represented by a weakly reflective interval that is ~30 m thick at Site U1526. Away from the site, a striking feature of the unit is its lateral variation in thickness and distinctive “pinch and swell” geometry (Figure F33). The unit reaches ~105 m thickness 2.5 km east of Site U1526 on Line 05CM-04. Elsewhere on other seismic profiles crossing the seamount, the unit locally exceeds 140 m thickness and includes unconformity-bounded intervals. The overall geometry of the unit and its internal unconformities would be consistent with sediment deposition under the influence of bottom currents. The apparent moat-like depressions around volcanic cones imaged in seismic sections and on multibeam bathymetric data provide supporting evidence for this interpretation.
Coring in Hole U1526B recovered a nearly complete sequence representing Seismic Unit 1, which corresponds to Lithostratigraphic Unit I (see Lithostratigraphy) (Figure F32). Lithostratigraphic Unit I (0–30.2 mbsf) comprises hemipelagic mud, light greenish gray calcareous mud, and brownish white nannofossil-rich ooze, and biostratigraphic ages range from Pleistocene to Cretaceous (see Biostratigraphy). Carbonate contents increase gradually downsection. Laboratory physical properties measurements reveal that the bulk density for cores in Hole U1526B ranges from about 1.5 g/cm3 close to the seafloor to about 1.8 g/cm3 at 30 mbsf (Figure F34).

Figure F34. Physical properties and seismic data.
Seismic Unit 2 (30–82 mbsf)
Seismic Unit 2 represents the lower 44 m drilled in Hole U1526A but extends a considerable depth below the drilling depth (Figure F33). The upper part of the unit is strongly reflective, comprising planar to irregular, discontinuous, high-amplitude reflections that vary locally from horizontal to gently (~10°–20°) dipping. The high-amplitude reflections extend to about 250 mbsf, beneath which the unit becomes more weakly reflective. Based on our preferred velocity model at Site U1526 (Figure F32), the drilled interval of Seismic Unit 2 is represented by a single seismic wavelet (Figure F35). Drilling operations planned using the PSDM of Line 05CM-04 (Barker et al., 2018) had anticipated that drilling to 82 m would allow irregular and locally dipping reflections beneath a high-amplitude, reversed polarity reflection to be cored, but these reflections were apparently not reached. The contact between Seismic Units 1 and 2 is approximately planar and at least locally appears to be an angular unconformity.

Figure F35. Seismic Line 05CM-04, depth converted and PSDM-GNS model.
Seismic Unit 2 corresponds to Lithostratigraphic Unit II (see Lithostratigraphy), which comprises coarse volcaniclastic sandstone to conglomerate composed of large, subrounded to subangular pebbles and boulders of variably altered to fresh basalt embedded in a matrix of cemented coarse-grained volcaniclastic sand. Although the lower part of the sequence includes intervals of relatively fresh basalt, it is not clear if they represent in situ flows or boulders of transported material (see Lithostratigraphy and Paleomagnetism). As with the P-wave velocity data, density values in Lithostratigraphic Unit II (~2.2–2.9 g/cm3) are considerably higher than in Unit I (~1.5–1.8 g/cm3) (Figure F34). The increase in density and velocity from Unit I to Unit II results in the high-amplitude normal polarity reflection observed in seismic reflection data (Figure F32).
References
Barker, D.H.N., Henrys, S., Caratori Tontini, F., Barnes, P. M., Bassett, D., Todd, E., and Wallace, L., 2018. Geophysical constraints on the relationship between seamount subduction, slow slip and tremor at the north Hikurangi subduction zone, New Zealand. Geophysical Research Letters, 45(23):12804–12813. https://doi.org/10.1029/2018GL080259
Barnes, P.M., Wallace, L.M., Saffer, D.M., Pecher, I.A., Petronotis, K.E., LeVay, L.J., Bell, R.E., Crundwell, M.P., Engelmann de Oliveira, C.H., Fagereng, A., Fulton, P.M., Greve, A., Harris, R.N., Hashimoto, Y., Hüpers, A., Ikari, M.J., Ito, Y., Kitajima, H., Kutterolf, S., Lee, H., Li, X., Luo, M., Malie, P.R., Meneghini, F., Morgan, J.K., Noda, A., Rabinowitz, H.S., Savage, H.M., Shepherd, C.L., Shreedharan, S., Solomon, E.A., Underwood, M.B., Wang, M., Woodhouse, A.D., Bourlange, S.M., Brunet, M.M.Y., Cardona, S., Clennell, M.B., Cook, A.E., Dugan, B., Elger, J., Gamboa, D., Georgiopoulou, A., Han, S., Heeschen, K.U., Hu, G., Kim, G.Y., Koge, H., Machado, K.S., McNamara, D.D., Moore, G.F., Mountjoy, J.J., Nole, M.A., Owari, S., Paganoni, M., Rose, P.S., Screaton, E.J., Shankar, U., Torres, M.E., Wang, X., and Wu, H.-Y., 2019. Site U1520. In Wallace, L.M., Saffer, D.M., Barnes, P.M., Pecher, I.A., Petronotis, K.E., LeVay, L.J., and the Expedition 372/375 Scientists, Hikurangi Subduction Margin Coring, Logging, and Observatories. Proceedings of the International Ocean Discovery Program, 372B/375: College Station, TX (International Ocean Discovery Program). https://doi.org/10.14379/iodp.proc.372B375.105.2019
Bell, R., Holden, C., Power, W., Wang, X., and Downes, G., 2014. Hikurangi margin tsunami earthquake generated by slow seismic rupture over a subducted seamount. Earth and Planetary Science Letters, 397:1–9. https://doi.org/10.1016/j.epsl.2014.04.005
Bell, R., Sutherland, R., Barker, D.H.N., Henrys, S., Bannister, S., Wallace, L., and Beavan, J., 2010. Seismic reflection character of the Hikurangi subduction interface, New Zealand, in the region of repeated Gisborne slow slip events. Geophysical Journal International, 180(1):34–48. https://doi.org/10.1111/j.1365-246X.2009.04401.x
Butler, R.F., 2004. Paleomagnetism: Magnetic Domains to Geologic Terranes (electronic edition). https://www.geo.arizona.edu/Paleomag/
Davy, B., Hoernle, K., and Werner, R., 2008. Hikurangi Plateau: crustal structure, rifted formation, and Gondwana subduction history. Geochemistry, Geophysics, Geosystems, 9(7):Q07004. https://doi.org/10.1029/2007GC001855
De Vleeschouwer, D., Dunlea, A.G., Auer, G., Anderson, C.H., Brumsack, H., de Loach, A., Gurnis, M., et al., 2017. Quantifying K, U, and Th contents of marine sediments using shipboard natural gamma radiation spectra measured on DV JOIDES Resolution. Geochemistry, Geophysics, Geosystems, 18(3):1053–1064. https://doi.org/10.1002/2016GC006715
Gradstein, F.M., Ogg, J.G., Schmitz, M.D., and Ogg, G.M. (Eds.), 2012. The Geological Time Scale 2012: Amsterdam (Elsevier). https://doi.org/10.1016/C2011-1-08249-8
Hoernle, K., Hauff, F., van den Bogaard, P., Werner, R., Mortimer, N., Geldmacher, J., Garbe-Schönberg, D., and Davy, B., 2010. Age and geochemistry of volcanic rocks from the Hikurangi and Manihiki oceanic plateaus. Geochimica et Cosmochimica Acta, 74(24):7196–7219. https://doi.org/10.1016/j.gca.2010.09.030
Kirschvink, J.L., 1980. The least-squares line and plane and the analysis of palaeomagnetic data. Geophysical Journal of the Royal Astronomical Society, 62(3):699–718. https://doi.org/10.1111/j.1365-246X.1980.tb02601.x
Mortimer, N. and Parkinson, D., 1998. Hikurangi Plateau: a Cretaceous large igneous province in the southwest Pacific Ocean. Journal of Geophysical Research: Solid Earth, 101(B1):687–696. https://doi.org/10.1029/95JB03037
Pimmel, A., and Claypool, G., 2001. Technical Note 30: Introduction to Shipboard Organic Geochemistry on the JOIDES Resolution. Ocean Drilling Program. https://doi.org/10.2973/odp.tn.30.2001
Timm, C., Hoernle, K., Werner, R., Hauff, F., van den Bogaard, P., White, J., Mortimer, N., and Garbe-Schönberg, D., 2010. Temporal and geochemical evolution of the Cenozoic intraplate volcanism of Zealandia. Earth-Science Reviews, 98(1–2):38–64. https://doi.org/10.1016/j.earscirev.2009.10.002
Todd, E.K., Schwartz, S.Y., Mochizuki, K., Wallace, L.M., Sheehan, A.F., Webb, S.C., Williams, C.A., et al., 2018. Earthquakes and tremor linked to seamount subduction during shallow slow slip at the Hikurangi margin, New Zealand. Journal of Geophysical Research: Solid Earth, 123(8):6769–6783. https://doi.org/10.1029/2018JB016136
Saffer, D.M., Wallace, L.M., Barnes, P.M., Pecher, I.A., Petronotis, K.E., LeVay, L.J., Bell, R.E., Crundwell, M.P., Engelmann de Oliveira, C.H., Fagereng, A., Fulton, P.M., Greve, A., Harris, R.N., Hashimoto, Y., Hüpers, A., Ikari, M.J., Ito, Y., Kitajima, H., Kutterolf, S., Lee, H., Li, X., Luo, M., Malie, P.R., Meneghini, F., Morgan, J.K., Noda, A., Rabinowitz, H.S., Savage, H.M., Shepherd, C.L., Shreedharan, S., Solomon, E.A., Underwood, M.B., Wang, M., Woodhouse, A.D., Bourlange, S.M., Brunet, M.M.Y., Cardona, S., Clennell, M.B., Cook, A.E., Dugan, B., Elger, J., Gamboa, D., Georgiopoulou, A., Han, S., Heeschen, K.U., Hu, G., Kim, G.Y., Koge, H., Machado, K.S., McNamara, D.D., Moore, G.F., Mountjoy, J.J., Nole, M.A., Owari, S., Paganoni, M., Rose, P.S., Screaton, E.J., Shankar, U., Torres, M.E., Wang, X., and Wu, H.-Y., 2019. Expedition 372B/375 summary. In Wallace, L.M., Saffer, D.M., Barnes, P.M., Pecher, I.A., Petronotis, K.E., LeVay, L.J., and the Expedition 372/375 Scientists, Hikurangi Subduction Margin Coring, Logging, and Observatories. Proceedings of the International Ocean Discovery Program, 372B/375: College Station, TX (International Ocean Discovery Program). https://doi.org/10.14379/iodp.proc.372B375.101.2019
Wallace, L.M., Saffer, D.M., Barnes, P.M., Pecher, I.A., Petronotis, K.E., LeVay, L.J., Bell, R.E., Crundwell, M.P., Engelmann de Oliveira, C.H., Fagereng, A., Fulton, P.M., Greve, A., Harris, R.N., Hashimoto, Y., Hüpers, A., Ikari, M.J., Ito, Y., Kitajima, H., Kutterolf, S., Lee, H., Li, X., Luo, M., Malie, P.R., Meneghini, F., Morgan, J.K., Noda, A., Rabinowitz, H.S., Savage, H.M., Shepherd, C.L., Shreedharan, S., Solomon, E.A., Underwood, M.B., Wang, M., Woodhouse, A.D., Bourlange, S.M., Brunet, M.M.Y., Cardona, S., Clennell, M.B., Cook, A.E., Dugan, B., Elger, J., Gamboa, D., Georgiopoulou, A., Han, S., Heeschen, K.U., Hu, G., Kim, G.Y., Koge, H., Machado, K.S., McNamara, D.D., Moore, G.F., Mountjoy, J.J., Nole, M.A., Owari, S., Paganoni, M., Rose, P.S., Screaton, E.J., Shankar, U., Torres, M.E., Wang, X., and Wu, H.-Y., 2019. Expedition 372B/375 methods. In Wallace, L.M., Saffer, D.M., Barnes, P.M., Pecher, I.A., Petronotis, K.E., LeVay, L.J., and the Expedition 372/375 Scientists, Hikurangi Subduction Margin Coring, Logging, and Observatories. Proceedings of the International Ocean Discovery Program, 372B/375: College Station, TX (International Ocean Discovery Program). https://doi.org/10.14379/iodp.proc.372B375.102.2019
Wallace, L.M., Webb, S.C., Ito, Y., Mochizuki, K., Hino, R., Henrys, S., Schwartz, S.Y., and Sheehan, A.F., 2016. Slow slip near the trench at the Hikurangi subduction zone, New Zealand. Science, 352(6286):701–704. https://doi.org/10.1126/science.aaf2349
Young, J.R., 1998. Neogene. In Bown, P.R. (Ed.), Calcareous Nannofossil Biostratigraphy: Dordrecht, The Netherlands (Kluwer Academic Publishing), 225–265.
1 Wallace, L.M., Saffer, D.M., Petronotis, K.E., Barnes, P.M., Bell, R.E., Crundwell, M.P., Engelmann de Oliveira, C.H., Fagereng, A., Fulton, P.M., Greve, A., Harris, R.N., Hashimoto, Y., Hüpers, A., Ikari, M.J., Ito, Y., Kitajima, H., Kutterolf, S., Lee, H., Li, X., Luo, M., Malie, P.R., Meneghini, F., Morgan, J.K., Noda, A., Rabinowitz, H.S., Savage, H.M., Shepherd, C.L., Shreedharan, S., Solomon, E.A., Underwood, M.B., Wang, M., and Woodhouse, A.D., 2019. Site U1526. In Wallace, L.M., Saffer, D.M., Barnes, P.M., Pecher, I.A., Petronotis, K.E., LeVay, L.J., and the Expedition 372/375 Scientists, Hikurangi Subduction Margin Coring, Logging, and Observatories. Proceedings of the International Ocean Discovery Program, 372B/375: College Station, TX (International Ocean Discovery Program). https://doi.org/10.14379/iodp.proc.372B375.106.2019
2 Expedition 372B/375 Scientists’ affiliations.
This work is distributed under the Creative Commons Attribution 4.0 International (CC BY 4.0) license. 