Gohl, K., Wellner, J.S., Klaus, A., and the Expedition 379 Scientists
Proceedings of the International Ocean Discovery Program Volume 379
publications.iodp.org

https://doi.org/10.14379/iodp.proc.379.103.2021
Site U15321
J.S. Wellner, K. Gohl, A. Klaus, T. Bauersachs, S.M. Bohaty, M. Courtillat, E.A. Cowan, M.A. De Lira Mota, M.S.R. Esteves, J.M. Fegyveresi, T. Frederichs, L. Gao, A.R. Halberstadt, C.-D. Hillenbrand, K. Horikawa, M. Iwai, J.-H. Kim, T.M. King, J.P. Klages, S. Passchier, M.L. Penkrot, J.G. Prebble, W. Rahaman, B.T.I. Reinardy, J. Renaudie, D.E. Robinson, R.P. Scherer, C.S. Siddoway, L. Wu, and M. Yamane2
Keywords: International Ocean Discovery Program, IODP, JOIDES Resolution, Expedition 379, Amundsen Sea West Antarctic Ice Sheet History, Site U1532, Amundsen Sea Embayment, Pine Island Glacier, Thwaites Glacier, Marie Byrd Land, paleoclimate, paleo–ice sheet, marine ice sheet, continental rise, deep-sea sediments, sediment drift, contourite, ocean-bottom current, seismic stratigraphy, ice-rafted debris, glacial–interglacial cyclicity, core X-ray, headspace gas, contamination tracer
MS 379-103: Published 23 February 2021
Site summary
Background
Site U1532 (Proposed Site ASRE-08A) is located on the western upper flank of a large sediment drift (Resolution Drift) on the continental rise 270 km north of the Amundsen Sea Embayment shelf edge (Figure F1; see Figure F1 in the Expedition 379 summary chapter [Gohl et al., 2021b]). This drill site was chosen as the first International Ocean Discovery Program (IODP) Expedition 379 site upon arriving at the Amundsen Sea because the sea ice distribution did not allow drilling at any of the other primary or alternate sites at the beginning of the expedition. The Resolution Drift belongs to a system of five parallel sediment drifts on this rise that are characterized by gentle western and steep eastern flanks. Sediment drifts are commonly formed by deposition of suspended sediments transported by ocean-bottom contour currents. Deep-sea channels originating at the foot of the continental slope and reaching far into the abyssal plain separate the sediment drifts in the Amundsen Sea. Sedimentary material is transported downslope through these channels via turbidity currents, slumps, and other gravity-driven processes that supply a large portion of the detritus deposited in the drifts (Nitsche et al., 2000; Dowdeswell et al., 2006). Sedimentation rates of drift deposits along the Antarctic margin have been observed to be extremely high, which makes them high-priority drill targets for obtaining continuous paleoceanographic and paleo–ice sheet records of high temporal resolution (e.g., Uenzelmann-Neben and Gohl, 2012). Stratigraphic interpretations of seismic lines across the sediment drifts of the Amundsen Sea (e.g., Nitsche et al., 2000; Scheuer et al., 2006; Uenzelmann-Neben and Gohl, 2012, 2014) are so far only constrained by long-distance correlation to drilled records of drift deposits on the Antarctic Peninsula rise (Ocean Drilling Program [ODP] Leg 178; e.g., Acton et al., 2002), but they suggest equally high sedimentation rates for the Pleistocene, Pliocene, and upper Miocene.
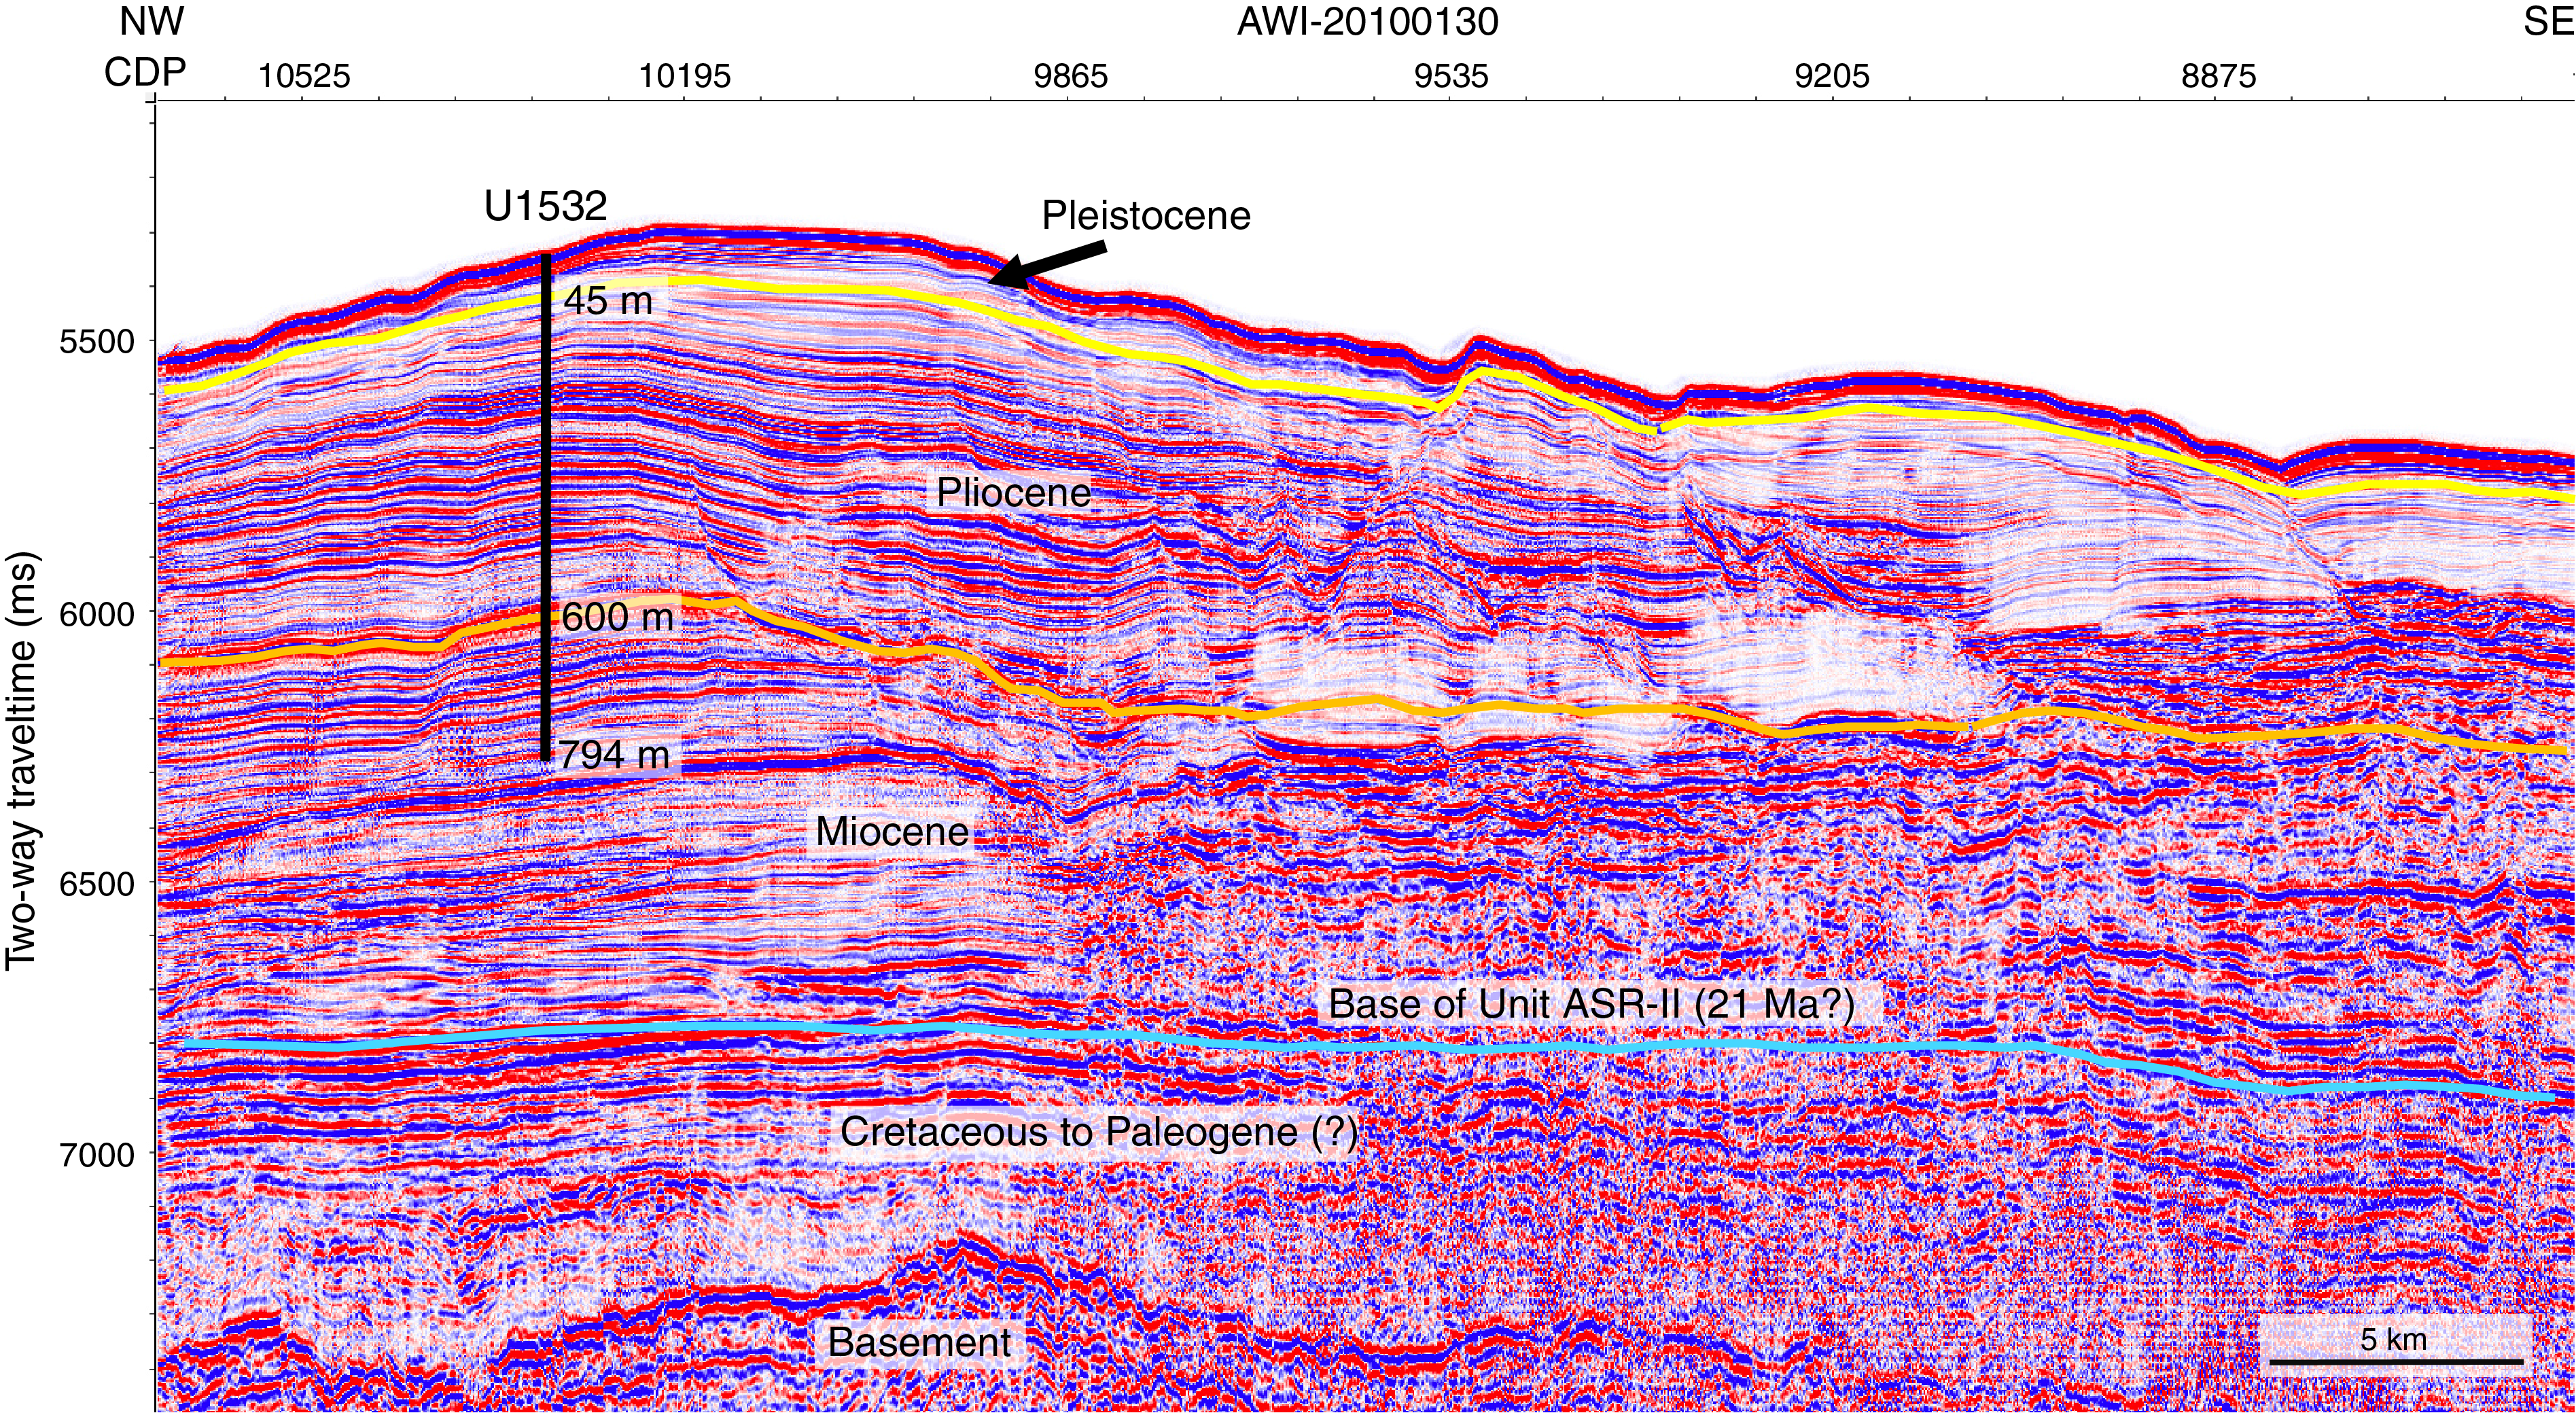
Figure F1. Site U1532 on Seismic Line AWI-20100130.
At Site U1532, seven holes (U1532A–U1532G) were drilled in a water depth of 3962 m (Figure F2). The deepest hole (U1532G) was drilled to 794 m. Overall core recovery was 90%. Although sea ice was not a problem for the R/V JOIDES Resolution at this site, frequent approaches of icebergs of various sizes from large tabular icebergs to smaller fragments and growlers forced numerous drilling pauses, resulting in an unusually large number of holes at Site U1532. Holes U1532E and U1532F were nothing more than unsuccessful attempts to start coring at depth before being forced to avoid another iceberg approach.
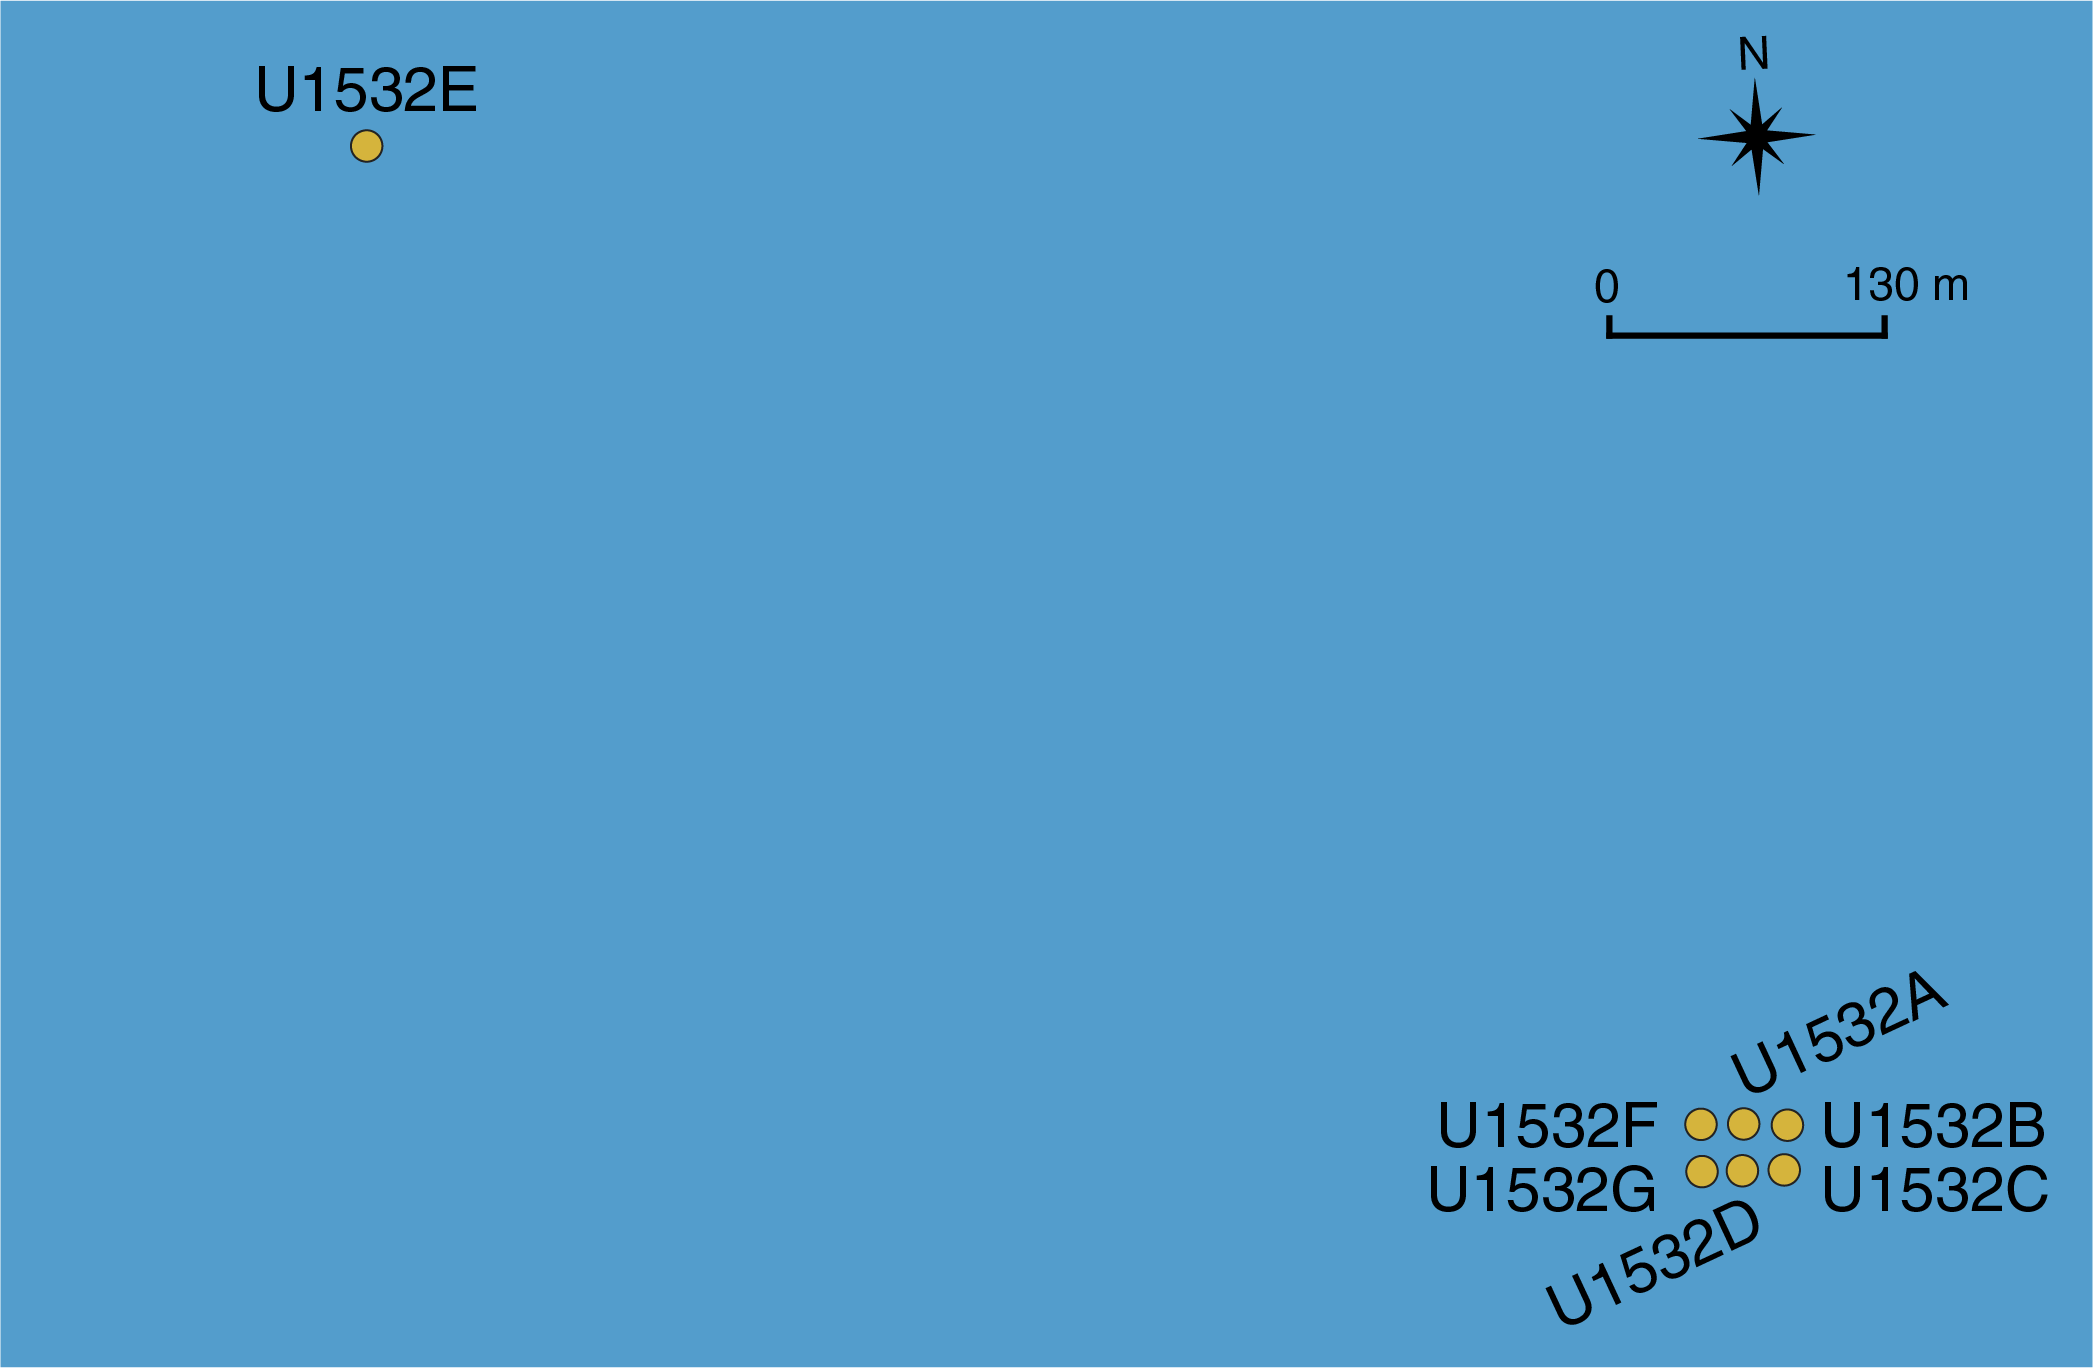
Figure F2. Distribution of Holes U1532A–U1532G.
Lithostratigraphy
Deposits recovered at Site U1532 include silty clay with dispersed sand and gravel and variable biogenic content from five holes down to a recovered core depth of 787.4 m. Six lithofacies were identified based on visual characteristics of the sediments combined with information from smear slides and thin sections. Whole-core X-radiographs aided in observations of sedimentary structures, clast occurrence, and drilling disturbance. The dominant lithofacies assemblages are planar thinly laminated silty clay with episodic occurrences of massive and bioturbated silty clay typically <1.5 m thick. Dispersed sand grains, granules, and occasionally pebbles were observed throughout but appear mainly concentrated in the massive and bioturbated facies. Minor lithofacies include foraminifer-rich and biosilica-rich mud to ooze.
We identified one lithostratigraphic unit with three subunits, IA (0–92.6 m; recent–Pliocene), IB (92.6–400.6 m; Pliocene), and IC (401.0–787.4 m; Pliocene–Miocene) based on changes in facies assemblages. The sediments are largely unconsolidated in the upper 150 m and become more consolidated below this depth. Intervals of carbonate-cemented laminae and very thin beds of coarse siltstone and sandstone are present below 400 m.
Biostratigraphy
In the upper part of the section recovered at Site U1532 (i.e., from 0 to 92 m; Lithostratigraphic Subunit IA), sufficient microfossils for biostratigraphic age assignment were only present in the upper ~10 m, providing an age of middle Pleistocene to recent (0–0.60 Ma). Based on diatom and radiolarian biostratigraphy, the interval between ~92 and 156 m is assigned a mid-to-late Pliocene age of 3.2–3.8 Ma, and the interval between ~156 and 224 m is assigned an early Pliocene age of 3.8–4.4 Ma. The absence of microfossils or only trace occurrences of highly fragmented and/or recrystallized siliceous microfossils in samples below ~224 m in Hole U1532G precluded shipboard biostratigraphic age determination at most levels. Exceptions include short intervals with poorly preserved but identifiable diatoms in the intervals between ~224 and 332 m (early Pliocene; younger than 4.7 Ma) and between ~332 and 510 m (early Pliocene to near the Miocene/Pliocene boundary; younger than 5.5 Ma).
Some light green, biosilica-rich intervals coincide with higher concentrations of coarse sands and gravels, inferred to be ice-rafted debris (IRD), and are generally bioturbated. Some stratigraphic intervals contain little or no identifiable diatom debris despite possessing low magnetic susceptibility and gamma ray attenuation (GRA) bulk density and a greenish color, which are characteristics typical of diatomaceous units. The lack of diatoms in these intervals is inferred to reflect, at least in part, diagenetic loss of diatoms and other siliceous microfossils. Organic microfossils occur throughout the Site U1532 sequence. A possibly in situ dinoflagellate cyst (dinocyst) assemblage of very low diversity and low abundance is present throughout the section, but it is most persistent below 591.77 m. Although calcareous microfossils, including foraminifers, calcareous nannofossils, and ostracods, are generally absent from Site U1532, they do occur in several thin intervals in the Pleistocene section.
Paleomagnetism
The interpreted magnetic polarity at Site U1532 was correlated to the Gradstein et al. (2012) geological timescale (GTS2012). The resulting key paleomagnetic data were then integrated with biostratigraphic data to produce an age model.
For Hole U1532A, a reliable shipboard magnetostratigraphy consisting of four normal and four reversed polarity intervals was obtained. The Brunhes–Matuyama polarity transition (0.781 Ma), the termination and beginning of the Olduvai Subchron (1.778 and 1.945 Ma, respectively), the Matuyama–Gauss polarity transition (2.581 Ma), the termination and beginning of the Kaena Subchron (C2An.1r; 3.032 and 3.116 Ma, respectively), and the termination and beginning of the Mammoth Subchron (C2An.2r; 3.207 and 3.330 Ma, respectively) were identified. Paleomagnetic measurements in Hole U1532B identified the beginning of the Mammoth Subchron (C2An.2r; 3.330 Ma) and the Gauss–Gilbert polarity transition (3.596 Ma). Paleomagnetic measurements in Hole U1532C identified the termination of the Nunivak Subchron (C3n.2n; 4.493 Ma) but no clear Cochiti Subchron (C3n.1n; 4.187–4.300 Ma). Natural remanent magnetization (NRM) measurements in Hole U1532G identified the beginning of the Nunivak Subchron (C3n.2n; 4.631 Ma), the termination and beginning of the Sidufjall Subchron (C3n.3n; 4.799 and 4.896 Ma, respectively), and the termination and beginning of the Thvera Subchron (C3n.4n; 4.997 and 5.235 Ma, respectively). Reversed magnetic polarity continues to the bottom of Hole U1532G, and the beginning of Chron C3r (6.033 Ma) was not observed. Therefore, the oldest sediments recovered at Site U1532 are interpreted to be of late Miocene age.
Geochemistry
At Site U1532, 65 interstitial water samples were collected and measured for salinity, alkalinity, pH, major ions (sodium [Na], potassium [K], calcium [Ca], magnesium [Mg], chloride [Cl], and sulfate [SO4]), nutrients (ammonium [NH4] and phosphate [PO4]), silica (H4Si[OH]4), and trace elements (strontium [Sr], lithium [Li], iron [Fe], manganese [Mn], boron [B], and barium [Ba]). Drilling fluid contamination was detected in a few interstitial water samples taken from extended core barrel (XCB) cores. Higher abundances of perfluorocarbon tracer (PFT) in these samples are in line with this observation. The sulfate downhole profile shows a sharp linear decrease from ~28 mM near the surface to ~2.3 mM at ~664 m; however, sulfate did not reach zero at this site, indicating a low sulfate reduction rate. The Ca and Sr profiles show an overall increasing trend, whereas the K and Mg profiles display the reverse trend. Silica concentrations are relatively high from 8.5 to 238 m, coinciding with intervals where a higher abundance of diatoms was observed. In situ partial dissolution of diatoms through reaction with the interstitial water likely resulted in higher pore water silica concentrations.
Calcium carbonate (CaCO3) occurs only in low concentrations in the sediments of Lithostratigraphic Subunit IA; discrete maxima in CaCO3 content observed in the upper section of Subunit IA are linked to layers rich in calcareous foraminifer tests. Subunit IB is characterized by a general increase in CaCO3 content downhole. Total organic carbon (TOC) content is generally low at Site U1532 but displays a small stepwise increase from Subunit IA to Subunit IC. Total nitrogen (TN) is generally low throughout all subunits. Total sulfur values decrease throughout Subunit IA and stay generally low throughout Subunit IB. Total sulfur increases downhole in the uppermost section of Subunit IC (to ~533 m). Thereafter, total sulfur values decline again and shift to particularly low values below ~670 m. This shift in total sulfur values is associated with a near depletion of interstitial water sulfate concentrations that may limit sulfate reduction and the formation of iron sulfides at greater depth.
Headspace gas samples to monitor for the presence and abundance of C1–C3 hydrocarbons revealed that methane occurs in only very low concentrations throughout the uppermost ~650 m of cored sediments. At ~667 m, methane concentrations increase rapidly, exceeding 5000 ppmv below ~713 m and reaching a maximum concentration of 9517 ppmv at ~771 m. The increase of methane at ~667 m coincides with a pronounced minimum in sulfate concentration, suggesting that methane may be of biogenic origin at Site U1532.
Physical properties
Collected physical property data include magnetic susceptibility, natural gamma radiation (NGR), GRA bulk density, discrete moisture and density (MAD), P-wave velocity, thermal conductivity, in situ formation temperature (advanced piston corer temperature tool [APCT-3]), and spectral color reflectance. Whole-round magnetic susceptibility trends follow those observed in GRA bulk density and NGR, likely indicating changes in terrigenous sediment content. Magnetic susceptibility data were used as a primary tool for correlating cores from adjacent holes. Measured whole-round magnetic susceptibility ranges between 8 × 10⁻⁵ and 241 × 10−5 SI. Average magnetic susceptibility values increase downhole from ~80 × 10−5 to ~120 × 10−5 SI at ~93 m, which corresponds to the Lithostratigraphic Subunit IA/IB boundary. Measured NGR ranges between 19 and 112 counts/s with an overall average of 69 counts/s. Average NGR values increase downhole from ~43 counts/s at the mudline to ~75 counts/s at ~93 m, which corresponds to the Subunit IA/IB boundary. Below ~93 m, magnetic susceptibility and NGR vary cyclically between ~15 × 10−5 and ~100 × 10−5 SI and between ~30 and 80 counts/s, respectively. In the upper 65 m, bulk density increases downhole from ~1.5 to ~1.8 g/cm3 followed by a more gradual increase to ~2.1 g/cm3, reflecting increasing compaction. Intervals of lower magnetic susceptibility, NGR, and GRA bulk density correspond to greenish gray intervals in Subunits IB and IC. Sediment porosity decreases downhole from 77% at the seafloor to 58% at 30 m and decreases further with depth to 33% at the bottom of Hole U1532G, reflecting the downward compaction trend of marine sediments. P-wave velocity increases with depth from ~1460 m/s at the seafloor to ~2090 m/s at the base of Hole U1532G. No major changes in P-wave velocity were observed across the lithostratigraphic subunit boundaries. Thermal conductivity increases with depth from ~1 W/(m·K) at the seafloor to ~1.8 W/(m·K) at ~390 m, corresponding to a downhole increase in dry bulk density and decrease in porosity because of compaction. Formation temperature measurements from 34 to 150 m in Hole U1532A were used to estimate a geothermal gradient of ~54˚C/km.
Operations
We conducted operations in seven holes at Site U1532 (Tables T1, T2, T3, T4, T5, T6). Coring occurred in five holes that collectively recovered core from the seafloor to 787.41 m (Holes U1532A–U1532D and U1532G) with an overall recovery of 90%. Two holes penetrated substantially into the seafloor but had to be abandoned before coring could start because of approaching ice (Holes U1532E and U1532F). We spent a total of 23.7 days at Site U1532. Drifting icebergs caused multiple interruptions that resulted in nearly half of this time (11.46 days) spent waiting for ice to clear the area or on operations not originally planned (pipe trips, reentries, or repeated drilled intervals). The frequency of interruptions due to drifting icebergs, as well as significant variations in their speed and direction, proved problematic. In Hole U1532G, deployment of a free-fall reentry system shortly after starting to drill into the seafloor (Figure F3) allowed us to core to 787 m.

Figure F3. Free-fall reentry system.
Unless otherwise noted, all depths presented in this volume are core depths below seafloor calculated as core depth below seafloor, Method A (CSF-A), and are reported as “m.” All times in this report are in ship local time (UTC – 3 h). In this section, we also document the start of the expedition in Punta Arenas, Chile, and the transit to Site U1532.
Punta Arenas port call and transit to Site U1532
Expedition 379, Amundsen Sea West Antarctic Ice Sheet History, was planned to start on 18 January 2019. However, the ship arrived a few days early (15 January) after the long transit from Hong Kong. This time, 15–16 January, was used to load the special fuel required for the cold-weather conditions in the Antarctic at the Cabo Negro Oil Terminal. The ship departed Cabo Negro, Chile, at 1206 h on 16 January and was at anchorage off Punta Arenas at 1438 h on 16 January. The ship left anchorage at 0548 h on 17 January and after a very short transit arrived at Prat Terminal 2, Punta Arenas, at 0730 h. The rest of the day was spent loading and installing a critical piece of drilling hardware (repaired j-connector) and loading a few other supplies that were available. The expedition officially started at 0800 h on 18 January with the Co-Chief Scientists and JOIDES Resolution Science Operator (JRSO) staff boarding the ship. The JRSO staff conducted their crossover with the departing staff, who left later in the afternoon. Other port call activities included a Port State Inspection and loading of 60 tons of drilling mud, a flat of drilling equipment, food and other catering supplies, and various JRSO and ship stores. The JRSO technical staff started with preparations to assemble and install the new X-ray system for acquiring images of core sections.
The expedition scientists boarded the ship on the morning of 19 January. After getting settled in their rooms, the scientists were introduced to life on board JOIDES Resolution, general laboratory safety, and information technology resources and services. Other port call activities included loading the final drilling hardware, securing all items for departure, and continued assembly and testing of an alternate satellite communication system because our normal system was not expected to work effectively in our area of operations.
On 20 January, the science party met to discuss the primary science objectives of the expedition and participated in the Captain’s introduction and safety meeting. The Co-Chief Scientists, Operations Superintendent, Ice Observers, JRSO Assistant Director, JRSO Manager of Information Technology, and Expedition Project Manager met to determine shipboard procedures for ice and weather data to be used for science operational planning. We also loaded fresh and frozen food and secured equipment for departure. The JRSO technical staff continued with final installation and testing of the X-ray system.
On 21 January, other than securing equipment for departure, we waited for the arrival of our additional backup satellite communications systems (required to maintain essential communications), a backup wireline logging tool (Versatile Seismic Imager [VSI]), and heaters for the life raft release system (required under the polar code for us to sail). In addition, the Captain was evaluating the weather to determine the optimum timing and route for departing Punta Arenas.
The backup wireline logging tool (VSI) and the essential backup satellite communications systems were received on 22 January. Installation of the backup communications systems began immediately while waiting for the heaters for the life raft release system, which were scheduled to arrive the following day.
At 0730 h on 23 January, we departed the dock and moved offshore to anchorage to make way for the RVIB Nathaniel B. Palmer. While at anchorage, we received the last remaining supplies necessary to sail, were cleared by immigration, and departed for the Amundsen Sea at 1418 h on 23 January. Because of significant weather and seas to the west, we took the eastern route through the Strait of Magellan. The total transit from Punta Arenas to the first proposed site (ASRE-09A) was ~1800 nmi. The pilot departed the ship at 2024 h on 23 January shortly after we exited the Strait of Magellan into the South Atlantic. Late in the day on 24 January, we departed the Atlantic Ocean via the Le Maire Strait (the passage between the Argentine portion of Tierra del Fuego and Isla de los Estados), entered the Southern Ocean, and started heading southwest toward the Amundsen Sea.
At the start of our transit, ice and weather data indicated that none of the continental shelf sites and only a few of the continental rise sites could be occupied, and forecasts led us to aim for Proposed Site ASRE-09A. During our transit, evolving data and forecasts, along with science priorities, led us to change our first site to Proposed Site ASRE-08A, which is ~33 nmi east of Proposed Site ASRE-09A. After a transit of 1770 nmi over 7.3 days at an average speed of 10.1 nmi/h, we arrived at Site U1532 at 2100 h on 30 January.
Site U1532
Hole U1532A
After we arrived at Site U1532 at 2100 h on 30 January 2019, we lowered the thrusters, switched to dynamic positioning mode at 2145 h, and began drill floor operations (Table T1). After assembling the outer core barrel and spacing out the inner core barrel, we started assembling and lowering the bottom-hole assembly (BHA) to the seafloor. On 31 January, we finished assembling the remaining drill collars and spent the first half of the day lowering the drill string to the seafloor (including verifying the internal diameter clearance and length of each piece of the drill string). At 1200 h on 31 January, we installed the top drive and pumped two pigs down through the drill string to clean the inside of the drill pipe before coring. After adjusting the bit to 3968.6 m below the rig floor, we installed the advanced piston corer (APC) core orientation tool, lowered the APC core barrel, and started coring in Hole U1532A at 1650 h on 31 January.
Core 1H recovered 5.63 m, resulting in a seafloor depth of 3961.5 m below sea level. Cores 1H–11H penetrated from 0 to 100.6 m and recovered 103.04 m (102%). All APC cores were oriented, and formation temperature measurements were made with the APCT-3 coring shoe while taking Cores 4H (34.0 m), 7H (62.6 m), and 10H (91.1 m). After recovering Core 11H, we had to stop coring at 0645 h on 1 February because of a combination of approaching ice and increasing difficulty observing ice caused by fog, snow, and a slight swell. We raised the bit up to 50 m below the seafloor with the intention of resuming coring in Hole U1532A after conditions improved. Instead, we were forced to pull the bit out of the hole at 0930 h on 1 February, raise the bit 100 m above the seafloor, and spend until 0015 h on 2 February adjusting our position as required to maintain a safe distance from ice. Although we had a free-fall funnel (FFF) readied for deployment, we did not deploy it given the balance between the time it would take to deploy the FFF and reenter it compared to the time it would take to redrill to 100 m in a new hole and resume coring from there.
Hole U1532B
After the drill floor was cleared to resume operations, we offset the ship 20 m east of Hole U1532A and started drilling in Hole U1532B at 0125 h on 2 February 2019 (Table T2). We drilled from the seafloor to 93.1 m without coring, recovered the XCB core barrel with center bit, and started APC coring. The first core from Hole U1532B (2H) arrived on the rig floor at 0415 h on 2 February. While we were taking the next core (3H), we had to pause coring again because of approaching ice. We raised the bit up to 50.5 m and waited for the ice to clear from 0800 to 1515 h on 2 February. We then resumed APC coring, and Core 4H (112.1–121.6 m; with a formation temperature measurement) arrived on deck at 1800 h. Before it was laid out on the rig floor, approaching ice forced us to stop coring again. We raised the bit back up to 50.5 m and waited from 1830 until 2215 h on 2 February before being able to lower the bit back to the bottom of the hole and resume coring at 2300 h.
We continued APC coring and recovered Cores 5H–9H (121.6–169.1 m; with a formation temperature measurement on Core 7H). After recovering Core 9H, approaching ice forced us to pause coring again at 0600 h on 3 February, and the bit was raised back up to 50.5 m below the seafloor. We were able to resume operations at 0900 h, so we lowered the bit back to 169.1 m and resumed coring. Core 10H was a partial stroke with the lowermost core liner deformed and a crack extending up the entire core liner. Core 10H recovered 6.48 m, so we advanced the bit 6.5 m and switched to half-length APC (HLAPC) coring. After Core 11F (175.6–180.3 m) was recovered, approaching ice once again forced us to pause coring at 1315 h on 3 February, and we had to raise the bit back up to 50.5 m. Unfortunately, the ice kept converging on our location, so we eventually had to pull the bit completely out of the hole at 1715 h on 3 February. Once again, we decided not to deploy a FFF and opted instead to drill down to 180 m in the next hole and resume coring from that depth. We spent the rest of 3 February positioning the ship to avoid the drifting ice. Overall, Hole U1532B was drilled without coring from the seafloor to 93.1 m. APC/HLAPC coring penetrated 87.2 m (93.1–180.3 m) and recovered 91.9 m (105%).
Hole U1532C
At 0000 h on 4 February 2019, we were able to resume operations. The ship was offset 20 m south of Hole U1532B, and at 0035 h we started drilling into the seafloor for Hole U1532C (Table T3). We drilled without coring from the seafloor to 178.3 m by 0415 h. After retrieving the core barrel with the center bit used during drilling, we started HLAPC coring. Core 2F (178.3–183.0 m) arrived on deck at 0630 h. This core was positioned to overlap with the deepest core from Hole U1532B (11F; 175.6–180.3 m). Cores 2F–11F (178.3–225.3 m) were recovered, but approaching ice forced us to pause coring at ~1630 h on 4 February. The barrel for Core 12F had already been deployed and had to be recovered before we raised the bit up to 61.9 m below the seafloor. We received the approval to resume operations at 1900 h on 4 February, so we lowered the bit back down to the bottom of the hole and resumed HLAPC coring. After Cores 12F–18F penetrated from 225.3 to 258.2 m, we switched to the XCB system. Cores 19X–22X penetrated from 258.2 to 291.0 m (10.18 m recovered; 31%), after which Cores 20X and 21X only recovered 6 cm. At 1445 h on 5 February, as Core 22X arrived at the rig floor, approaching ice forced us to pause coring and raise the bit to 50.5 m below the seafloor. We were able to resume operations at 1715 h on 5 February. After lowering the bit back down to the bottom of the hole, we took Cores 23X and 24X (291.0–310.1 m; 18.05 m recovered; 95%).
Just as Core 24X arrived on the rig floor at 2355 h on 5 February, we had to stop coring again and raise the bit back up to 50.5 m because of approaching ice. At 0530 h on 6 February, we resumed operations and started lowering the bit back to the bottom of the hole. The bit encountered a bridge at 172.5 m, so we deployed an XCB core barrel with a center bit to drill through it and then washed the bit down to the bottom of the hole at 310.1 m. We circulated 25 bbl of mud to clean cuttings out of the hole and retrieved the center bit to resume XCB coring. Just as we were about to drop the XCB barrel to start coring, approaching ice put operations back on hold. This time, however, we kept the bit near the bottom of the hole. At 1545 h on 6 February, the ice moved away and we resumed XCB coring. After Cores 25X–33X penetrated from 310.1 to 392.3 m, approaching ice and diminishing visibility due to snow forced us to pause coring, and Core 33X was pulled after only penetrating 5.5 m. At this point, we decided to abandon further XCB coring and switch to rotary core barrel (RCB) coring because
- Penetrating deeply at this site was a primary objective and required RCB coring,
- RCB coring may result in better quality core at the existing hole depths, and
- We wanted to take advantage of the time spent waiting for ice and environmental conditions to improve.
We started recovering the drill string at 1315 h on 7 February, and the bit cleared the seafloor at 1520 h. Overall, Hole U1532C was drilled without coring from the seafloor to 178.3 m and then HLAPC/XCB coring penetrated 214.0 m (178.3–392.3 m) and recovered 179.6 m (84%). We did not consider deploying a FFF in Hole U1532C and opted to start a new hole instead because it would provide better chances of being able to core deeply with the RCB system. Hole U1532C had been drilled/cored with an 11⁷⁄₁₆ inch bit, and we were in the hole for nearly 4.5 days; both factors contributed to an oversized uppermost top of the hole. Reusing this hole would have hampered our ability to core deeply with the smaller diameter RCB bit (9⅞ inches).
Hole U1532D
We finished recovering the drill string, and the APC/XCB BHA with the bit arrived back on the rig floor at 0045 h on 8 February 2019. After laying out the APC/XCB-specific parts of the BHA (seal bore and nonmagnetic drill collars), the drill crew started putting together the RCB BHA. Some extra time was required to fix a couple of issues identified by the routine verification of the drill collar interior diameter and core barrel space out within the BHA. From 0700 to 1430 h on 8 February, we lowered the bit until it was 21.5 m above the seafloor. We then installed the top drive, deployed a center bit, and adjusted the drill string to prepare for starting Hole U1532D (Table T4). We planned to start RCB coring at ~362 m to overlap with the deepest cores from Hole U1532C. Unfortunately, we had to pause operations at 1545 h on 8 February because of approaching ice. We maneuvered the ship to avoid the ice until it cleared the area. We were finally able to start drilling into the seafloor at 2142 h on 8 February. We drilled without coring until we reached 247.2 m at 0730 h on 9 February. Unfortunately, approaching ice forced us to raise the bit to 55.5 m below the seafloor. The rig floor was cleared to resume operations at 1530 h on 9 February, and we lowered the bit back down to the bottom of the hole. At 1715 h, we dropped an RCB core barrel with a center bit and resumed drilling from 247.2 m. At 2300 h on 9 February, the bit had reached 362.7 m, and we started to recover the center bit to prepare for RCB coring.
We deployed an RCB core barrel at 0000 h on 10 February and started RCB coring in Hole U1532D. After Cores 2R and 3R penetrated from 362.7 to 381.9 m, at 0415 h on 10 February approaching ice forced us to raise the bit back up to just below seafloor. The ice kept converging, so we had to pull the bit completely out of Hole U1532D at 0605 h on 10 February. We did not have sufficient time to deploy a FFF before having to pull out of the hole. Overall, Hole U1532D was drilled without coring from the seafloor to 362.7 m and RCB coring penetrated 19.2 m (362.7–381.9 m) and recovered 17.42 m (91%).
Holes U1532E and U1532F
Instead of waiting for the ice to pass and allow us to resume operations, we decided to move ~0.4 nmi northwest along the seismic reflection profile and start a new hole. After waiting until 1145 h for ice to clear the area, we started drilling without coring in Hole U1532E, and the bit reached 101.6 m at 1445 h on 10 February (Table T5). Increasing winds, snow, and swell made it difficult to visually track smaller pieces of ice, which do not show clearly on radar. This combined with larger ice in the area made us pause operations and raise the bit to just below the seafloor (48.6 m). Unfortunately, at 1830 h on 10 February approaching ice forced us to pull the bit completely out of Hole U1532E; because we had not penetrated significantly and the ice was converging on our position quickly, we did not choose to deploy a FFF. We raised the bit up to 105 m above the seafloor to wait for the ice to move out of the area. We took advantage of this downtime to conduct routine servicing of the drill line (slip and cut). We moved back near the location of Holes U1532A–U1532D and started drilling without coring in Hole U1532F at 2315 h on 10 February (Table T5). We planned to start RCB coring at ~378 m, just above the maximum coring depth in Hole U1532D. We drilled without coring from the seafloor to 105.1 m, where we had to stop to fix a hydraulic hose in the top drive (0230–0430 h on 11 February). When the bit reached 321.4 m (1630 h on 11 February), approaching ice forced us to stop drilling, recover the RCB core barrel with a center bit, and raise the bit back up to just below the seafloor (45.5 m). Again, the ice was converging on our position too quickly to deploy a FFF. We pulled the bit out of the seafloor at 1921 h on 11 February and waited for ice to clear the area with the bit just above the seafloor.
Hole U1532G
At 0900 h on 12 February 2019, we decided that because of the frequency of ice interruptions, a reentry system more substantial than a FFF would be required for the multiple reentries needed to core deeply. We recovered the drill string, and the bit arrived back on the rig floor at 1845 h on 12 February (Table T6). While the drill string was being recovered, we started preparing the parts of a free-fall reentry system (casing shoe, one joint of casing, mud skirt, the outer structural parts of the hydraulic release tool, and FFF cone). As soon as the bit was back on board, we spent the rest of the day assembling the reentry system in the center of the moonpool beneath the rig floor.
We completed assembling the free-fall reentry system at 0115 h on 13 February and then started lowering the RCB drilling assembly through the middle of the reentry system and to the seafloor. After starting Hole U1532G at 0920 h and penetrating to 51.9 m, we dropped the reentry system at 1100 h on 13 February. We continued drilling without coring to 161.5 m but had to pause operations from 1730 to 1815 h because of approaching ice. After spending ~1 h clearing ice from the wireline seal (blowout preventer) in the top drive, we resumed drilling. When the bit reached 171.2 m at 1945 h on 13 February, approaching ice forced us to pause operations again and raise the bit back to 54 m below the seafloor.
At 0345 h on 14 February, we had to pull completely out of Hole U1532G. At 0700 h on 14 February, we adjusted the bit depth for reentry, deployed the subsea camera system, and reentered Hole U1532G at 1005 h. We recovered the camera system and started lowering the drill string. When the bit reached 201.5 m at 1345 h, we had to raise the bit back up to 45.5 m below seafloor because of approaching ice. After the rig floor was cleared to resume operations at 1630 h on 14 February, we lowered the bit back down to the bottom of the hole and resumed drilling without coring.
At 0345 h on 15 February, we reached the depth where we wanted to start coring (372.3 m). After clearing ice from the wireline seal in the top drive and sinker bars, we recovered the core barrel with the attached center bit and started RCB coring. Once Core 3R arrived on deck, approaching ice forced us to pause operations at 1100 h on 15 February. We resumed coring at 1330 h on 15 February. After Core 14R (487.5–497.1 m) arrived on the rig floor at 1315 h on 16 February, approaching ice forced us to stop coring. We raised the bit up to 65 m below the seafloor and waited for ice to clear the area. We resumed operations at 1845 h on 17 February, and we lowered the bit from 65.0 m to 467.5 m and resumed RCB coring at 2130 h on 17 February. We then had nearly 40 h of uninterrupted coring. Cores 15R–34R penetrated from 497.1 to 688.6 m and recovered 170.51 m (89%).
After Core 34R arrived at 1445 h on 19 February, we had to stop coring because of approaching ice. At 1915 h on 19 February, we were able to resume coring, and Cores 35R through 37R penetrated another 28.7 m (688.6–717.3 m; 24.73 m recovered; 86%). As soon as we finished cutting Core 37R at 0045 h on 20 February, we had to raise the bit up to 54.5 m below seafloor because of approaching ice. We were finally able to retrieve Core 37R at 0420 h on 20 February.
At ~0655 h on 20 February, we were cleared to resume coring, and we started lowering the bit back down the hole. After we installed the top drive, the bit encountered some resistance at 567.5 m, so we rotated and circulated back to 709.2 m. At that depth, we had to drop a center bit to redrill the final ~8 m to the bottom of the hole (709.2–717.3 m). After we circulated 25 bbl of mud to clean the cuttings out of the hole, at 1315 h on 20 February approaching ice forced us to raise the bit back up to 64.5 m below the seafloor. We continued waiting on ice to clear the area until 0230 h on 21 February, when approaching ice forced us to pull the bit completely out of Hole U1532G so that we could offset the ship. At 0630 h on 21 February, we deployed the camera system in anticipation of being able to reenter Hole U1532G. After adjusting the bit depth for reentry at 0845 h, we surveyed the seafloor around Hole U1532G and then began attempts to reenter the hole. The FFF of the reentry system (with ~14 m of casing below) was not visible; it had settled substantially into the seafloor. After numerous attempts, we were finally able to reenter at 1225 h on 21 February. After the camera system was recovered, we started lowering the bit back down to the bottom of the hole. At 1615 h, the bit encountered some resistance at 620.5 m, so we installed the top drive (so we could circulate and rotate), dropped a core barrel, and reamed back down to the bottom of the hole (717.3 m). We recovered the core barrel (Core 38G; 0.47 m recovered) at 2125 h on 21 February and resumed RCB coring. Cores 39R–45R then penetrated from 717.3 to 779.9 m. Approaching ice forced us to stop cutting Core 45R after penetrating only 5.1 m. At 1315 h on 22 February, we raised the bit up to 754.5 m and recovered Core 45R. We resumed operations at 1615 h, lowered the bit back to the bottom of the hole, and started coring at 1700 h. After Cores 46R and 47R were recovered (779.9–787.41 m), we had to pause operations again at 2245 h on 22 February because of approaching ice and raise the bit up to 64.5 m below the seafloor. We continued waiting on the ice to clear the area until 0545 h on 23 February, when the approaching ice forced us to pull the bit out of the hole. At 0630 h, we decided to stop further operations in Hole U1532G and started to recover the drill string. The bit arrived back on the rig floor at 1335 h, and the rig floor was secured for transit at 1455 h on 23 February. Before we could get under way, we had to maneuver the ship away from the ice to raise the thrusters. We started our transit to Site U1533 (Proposed Site ASRE-09A) at 1618 h on 23 February.
Overall, Hole U1532G was drilled without coring from the seafloor to 372.3 m and then cored with the RCB system from 372.3 to 794.0 m, recovering 366.41 m (87%).
Lithostratigraphy
Site U1532 recovered silty clay with dispersed sand and gravel and variable biogenic content from five holes down to a core depth of 787 m. The sequence is divided into three lithostratigraphic subunits, IA, IB, and IC, based on changes in facies assemblages. The sediments are largely unconsolidated in the upper 150 m and become increasingly more consolidated below this depth. Intervals of carbonate-cemented laminae and very thin beds of coarse siltstone and sandstone are present below 400 m. Figure F4 shows a lithologic summary of the five holes that were cored at Site U1532. Correlation between holes is presented in Stratigraphic correlation.
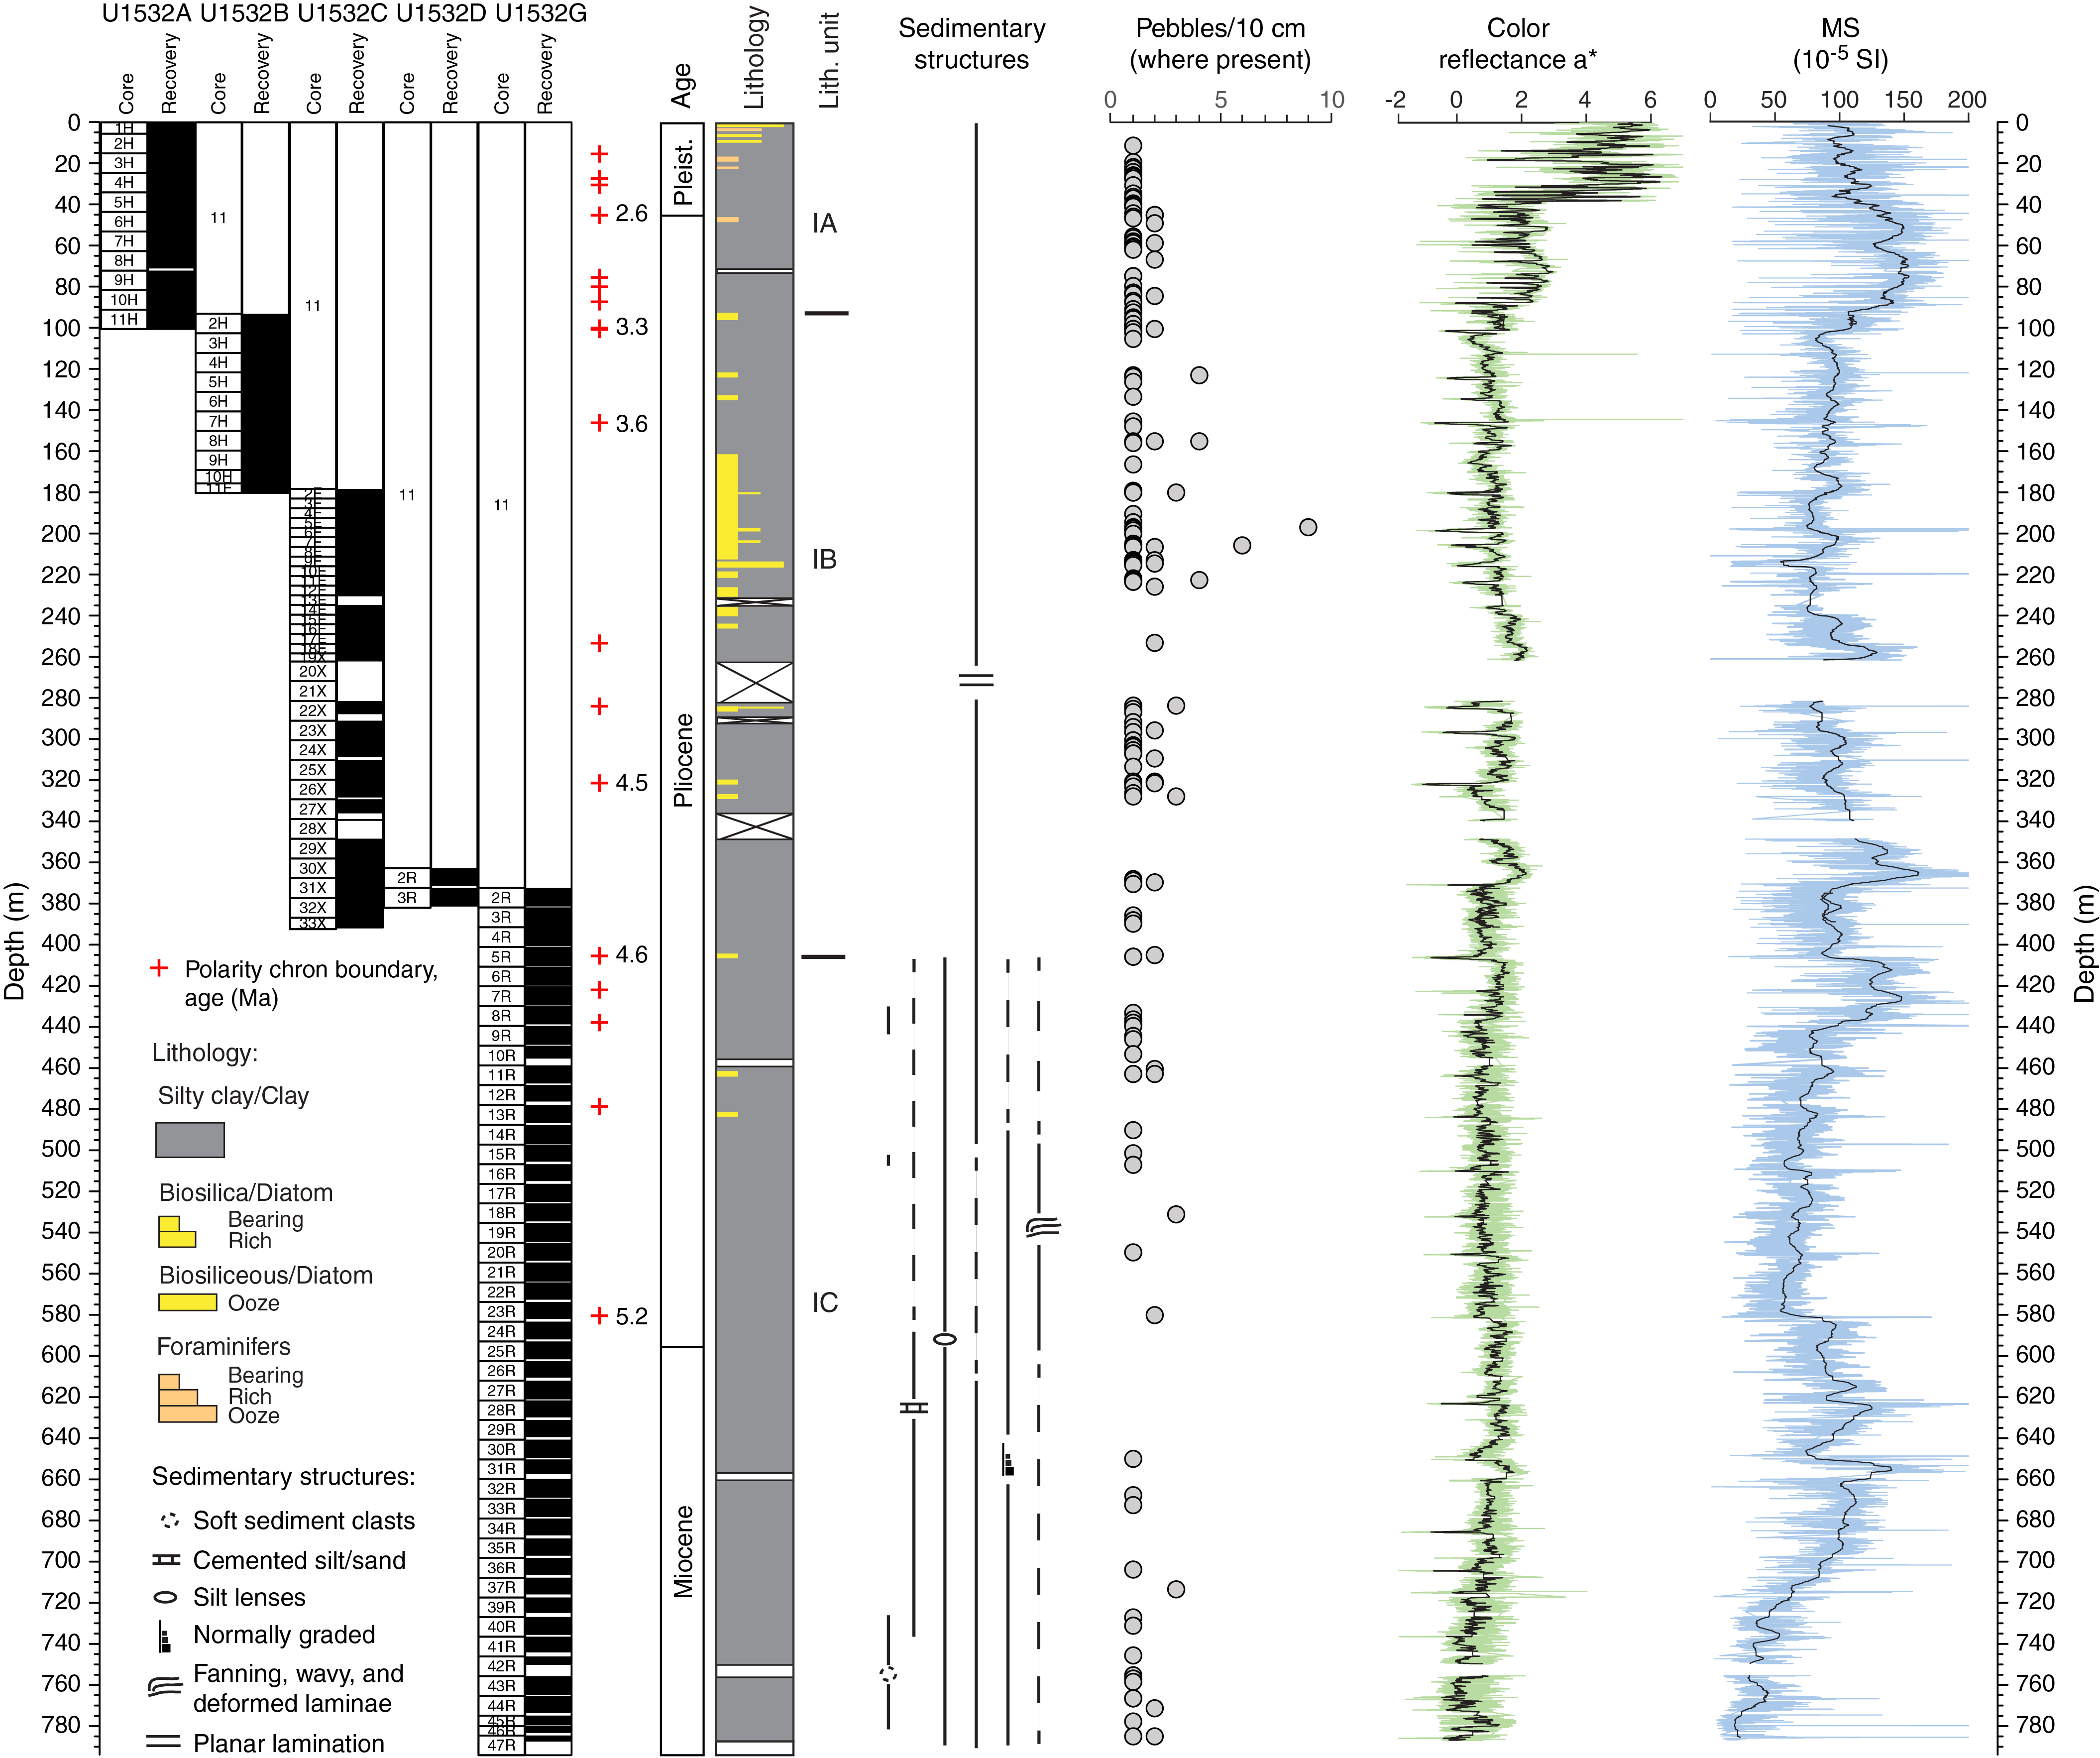
Figure F4. Composite lithostratigraphic summary.
Six lithofacies were identified based on visual characteristics of the sediments combined with information from smear slides and thin sections. Whole-core X-radiographs aided in observations of sedimentary structures, clast occurrence, and drilling disturbance. The dominant lithofacies assemblages are planar, thinly laminated silty clay with episodic occurrences of massive and bioturbated silty clay <1.5 m thick. Dispersed sand grains, granules, and occasionally pebbles were observed throughout but appear mainly concentrated in the massive and bioturbated facies. Minor lithofacies include foraminifer-rich and biosilica-rich mud to ooze. Detailed descriptions of the six facies, including primary lithologies, abundance of marine microfossils, and occurrence in lithostratigraphic subunits, are given in Table T7. Example photographs of each facies are shown in Figure F5.
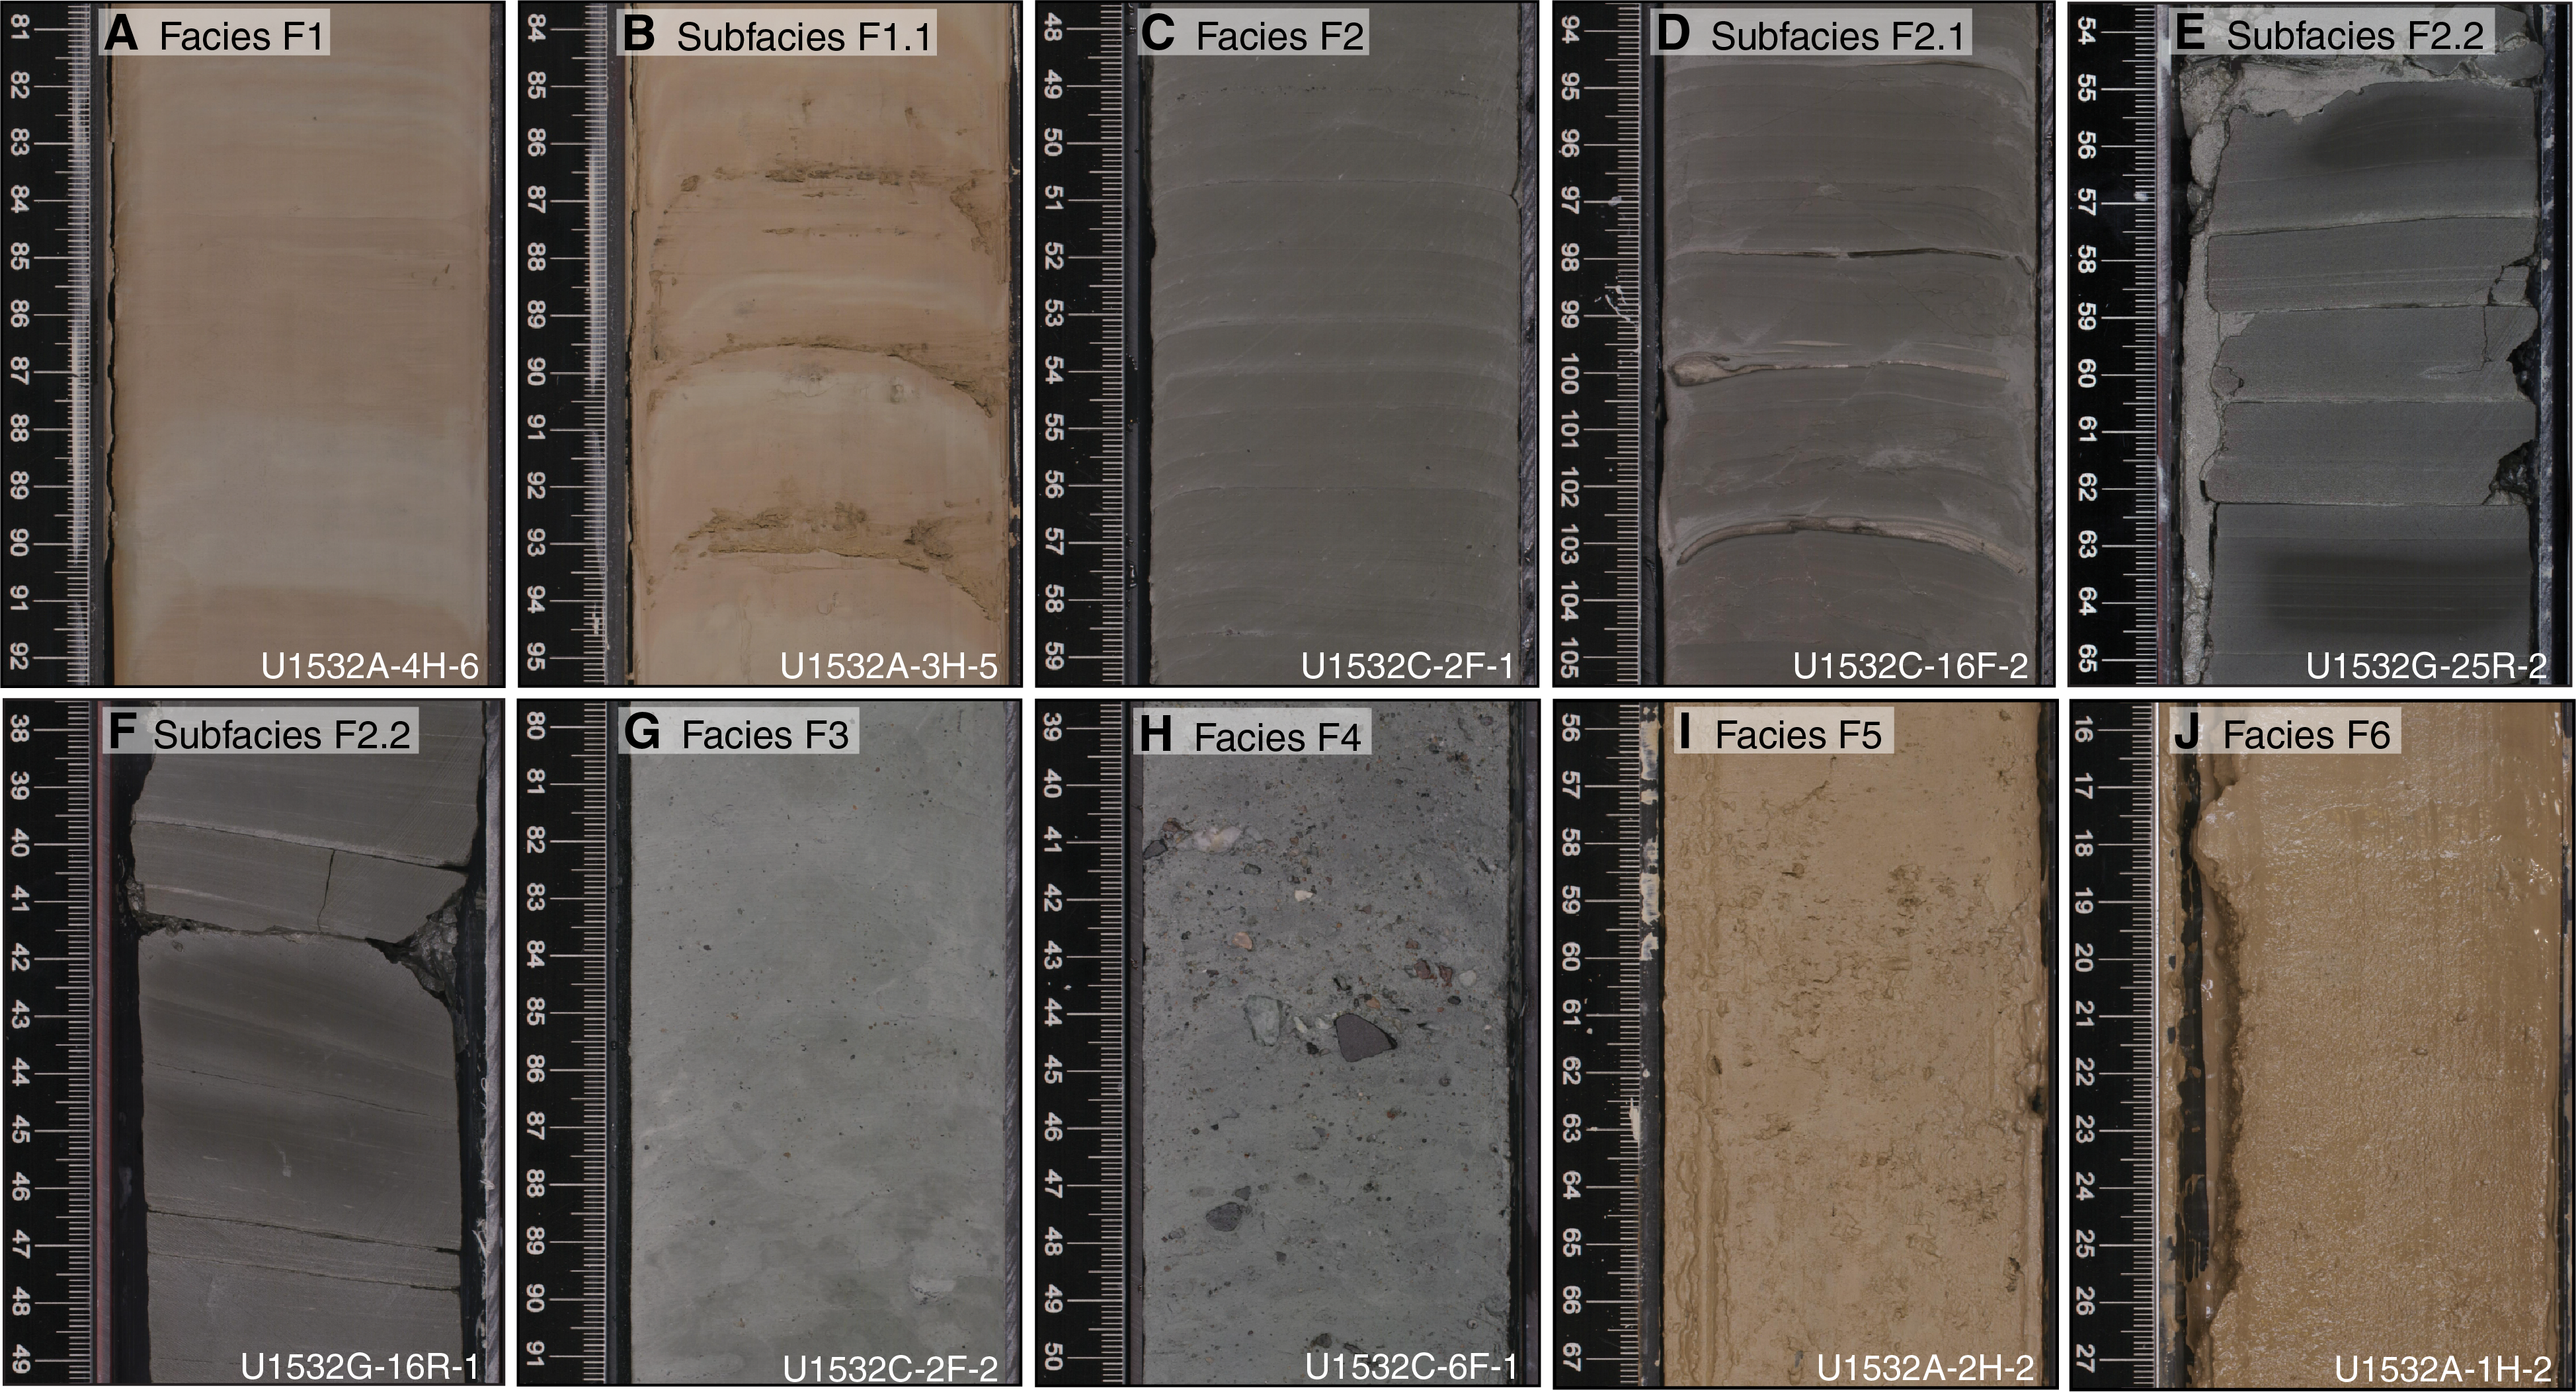
Figure F5. Facies and subfacies.
Core recovery and quality
Hole U1532A recovered core from 0 to 100.87 m, Hole U1532B from 93.10 to 180.62 m, Hole U1532C from 178.30 to 391.82 m, Hole U1532D from 362.70 to 381.23 m, and Hole U1532G from 372.3 to 787.41 m. APC and HLAPC coring were performed from 0 to 258.42 m in Holes U1532A–U1532C, XCB coring from 258.20 to 391.82 m in Hole U1532C, and RCB coring from 362.7 to 381.9 m in Hole U1532D and throughout Hole U1532G. Overall core recovery was 90%, but drilling disturbance was evident in some intervals. Core material was slightly to highly disturbed and soupy in the upper 9 m recovered in Hole U1532A, but cores were generally of high quality between 9 and 149 m in Holes U1532A and U1532B, and disturbance was generally limited to some bowed laminae (Figure F6A). Fall-in was present in the top parts of most cores (Section 1; example in Figure F6B). Suck-in or flow-in (Figure F6C) affected the lower parts of some cores between 149 and 262 m in Holes U1532B and U1532C. Cores were slightly to moderately biscuited throughout Holes U1532C, U1532D, and U1532G because of the XCB and RCB drilling systems (Figure F6D), although some discrete intervals were highly disturbed by drilling.
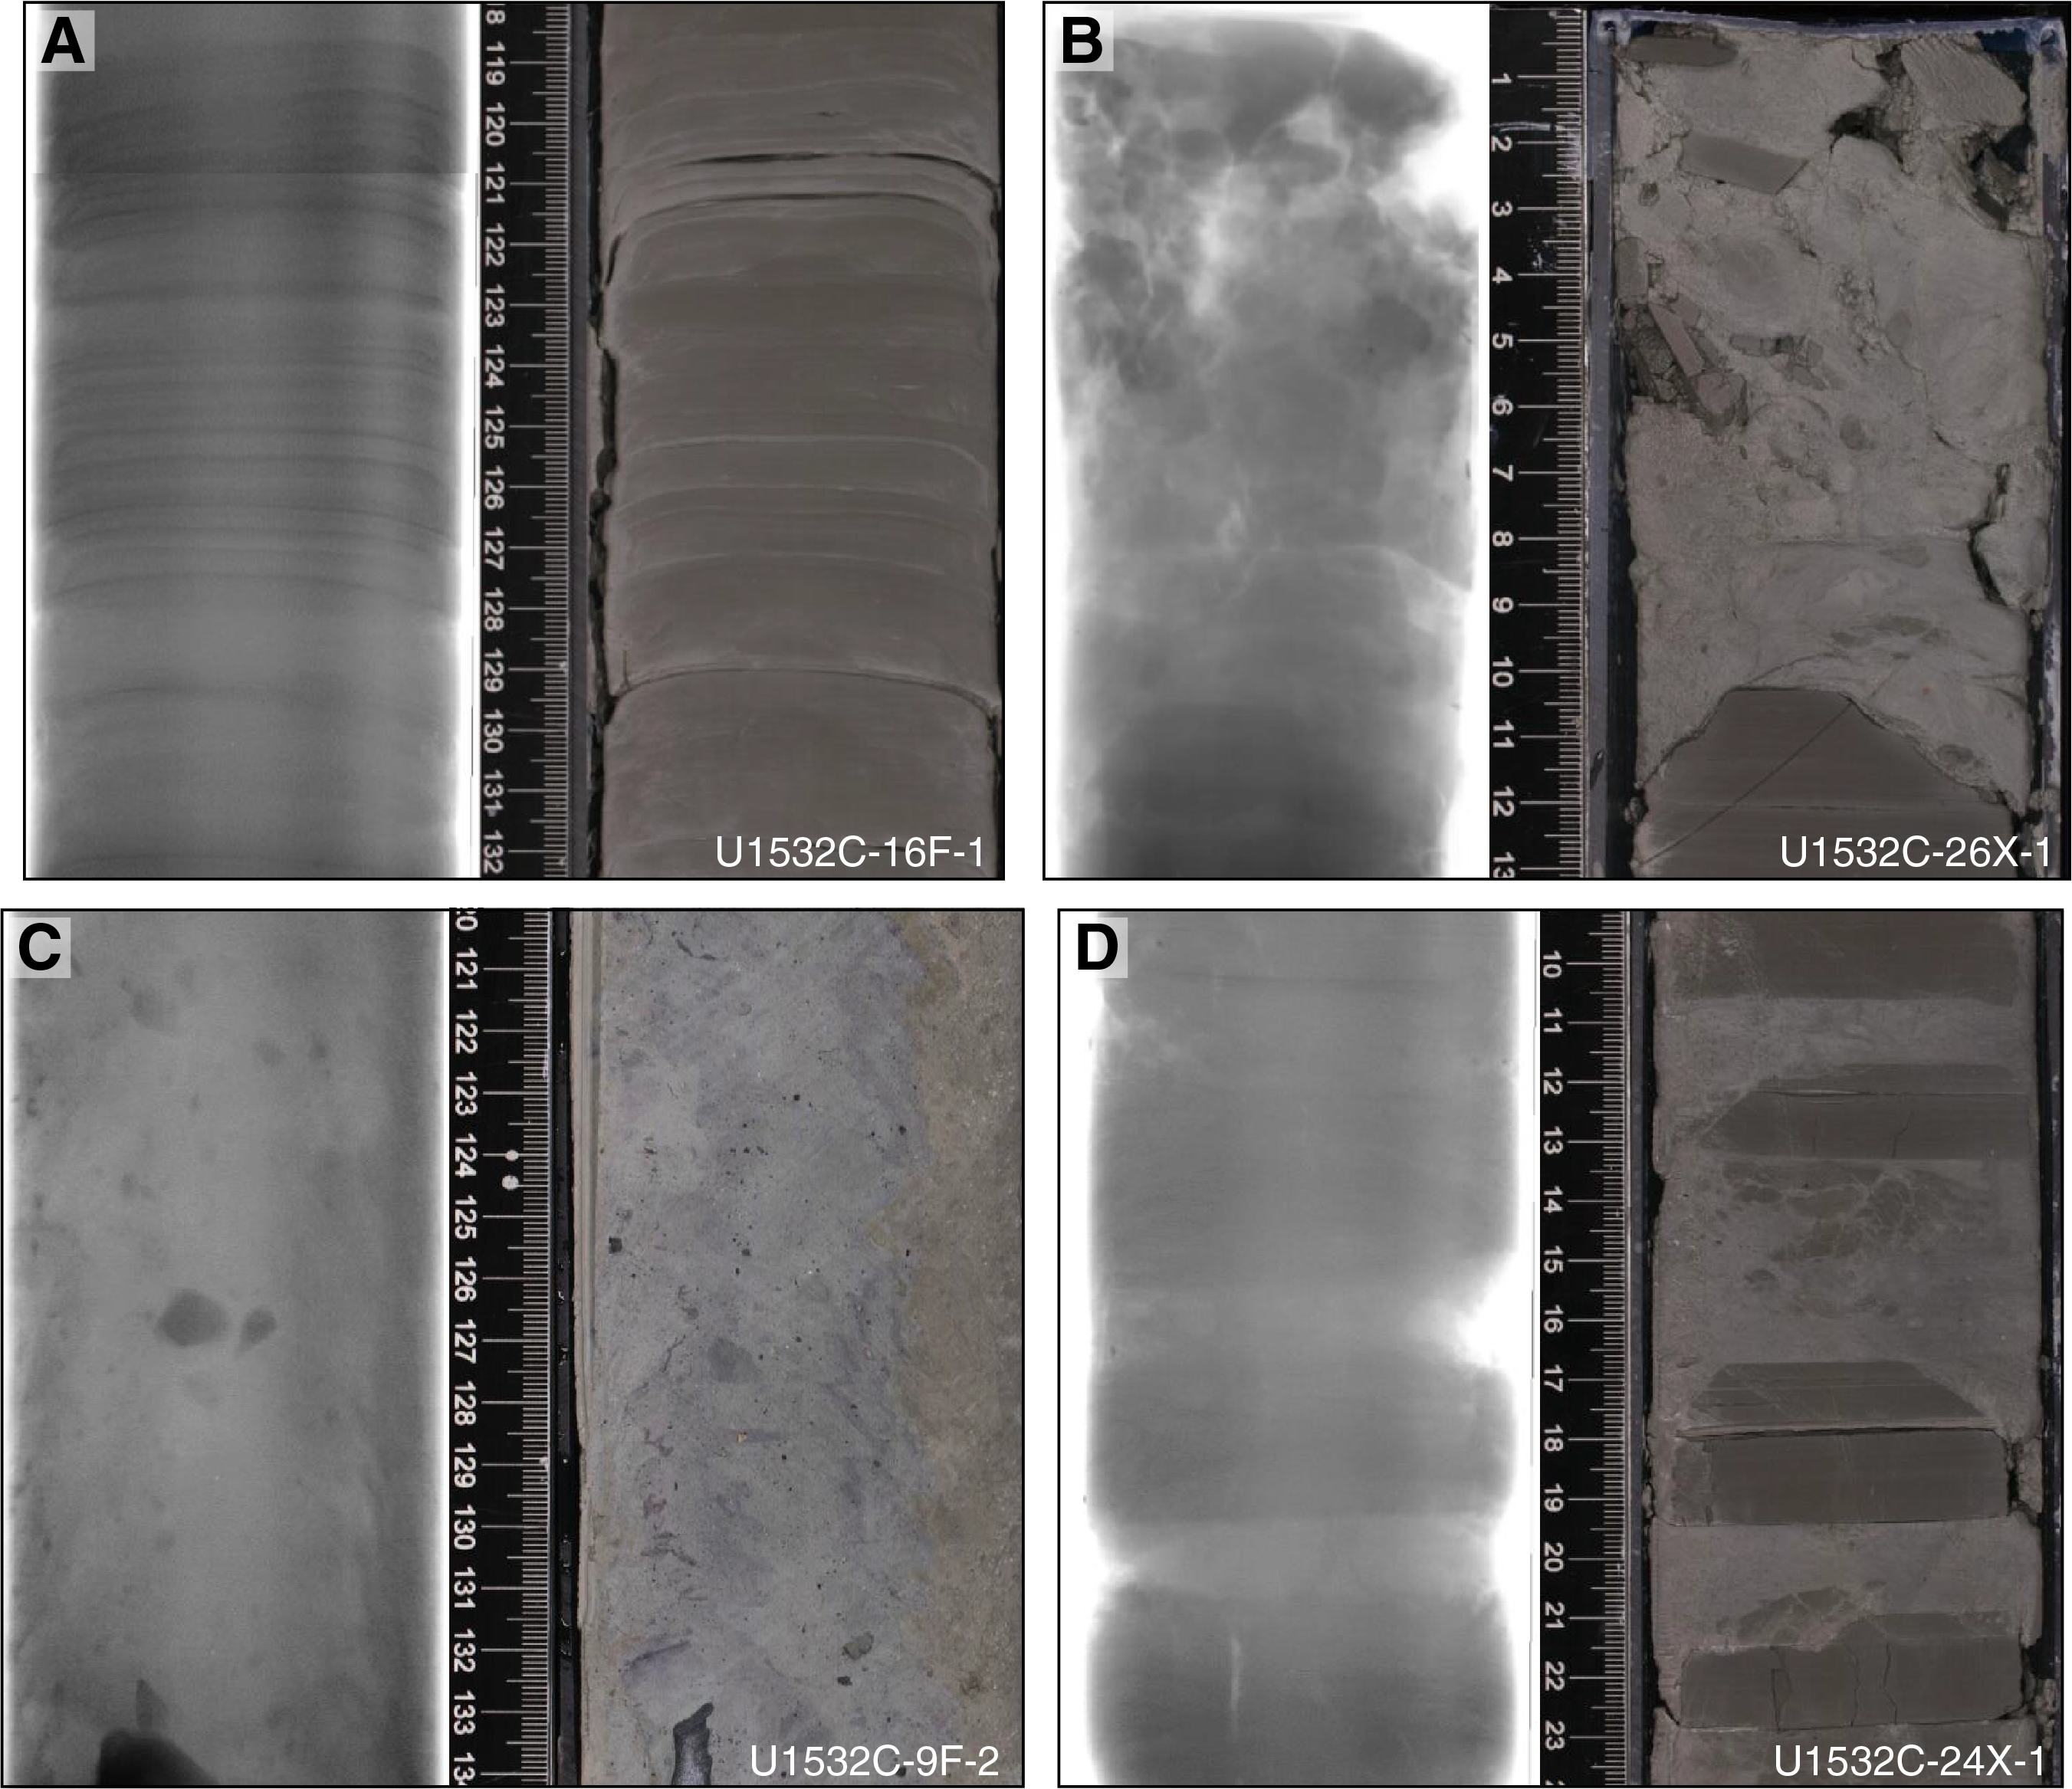
Figure F6. Drilling disturbance examples.
Cores from 0 to 150 m were split using a wire. However, deeper sections were more consolidated and required the use of a saw for splitting. This latter method provided a clear cross-section view of the sediments and structures present, enabling clasts on the split surface to be counted and identified.
Facies description
The most common facies at Site U1532 are F1 and F2, which comprise color-banded silty clay to clay and thinly laminated silty clay to clay, respectively (Table T7; Figure F5A, F5C). Faint to thin silt laminae and dispersed coarse sand and granules occur within both facies. The color banding in Facies F1 consists of centimeter- to decimeter-scale alternations from brown to gray with relatively sharp boundaries (Figure F5A). Moderate bioturbation of the contact between brown and gray silty clay is common. Facies F1 includes Subfacies F1.1, which is identified by color-banded silty clay to clay with laminae and very thin beds of (sandy) silt (Figure F5B) and traces of sponge spicules and diatom fragments.
The dominant color in Facies F2 is brown to dark (greenish) gray (Figure F5C). Bioturbation is slight to none. Facies F2 includes Subfacies F2.1 and F2.2. Subfacies F2.1 is identified by silty clay to clay with laminae to very thin beds of light gray to dark gray silt(stone) to sand(stone) (Figure F5D) and traces of sponge spicules and diatom fragments. Subfacies F2.1 laminae are quartz rich and may contain traces of vitric grains. Boundaries are characterized by sharp lower contacts and irregular or bioturbated upper contacts. Subfacies F2.2 is characterized by laminae of silty clay to clay that occur in a variety of forms, including normally graded (Figures F5E, F7B), fanned (Figure F5F), lenticular, deformed, or wavy. In Hole U1532G, sediments of Subfacies F2.2 are occasionally cemented with carbonate. These sediments consist of <1 cm thick (sandy) silty layers and mostly biscuited, <6 cm thick sandstones and were observed in situ between Cores 379-U1532G-6R and 40R.
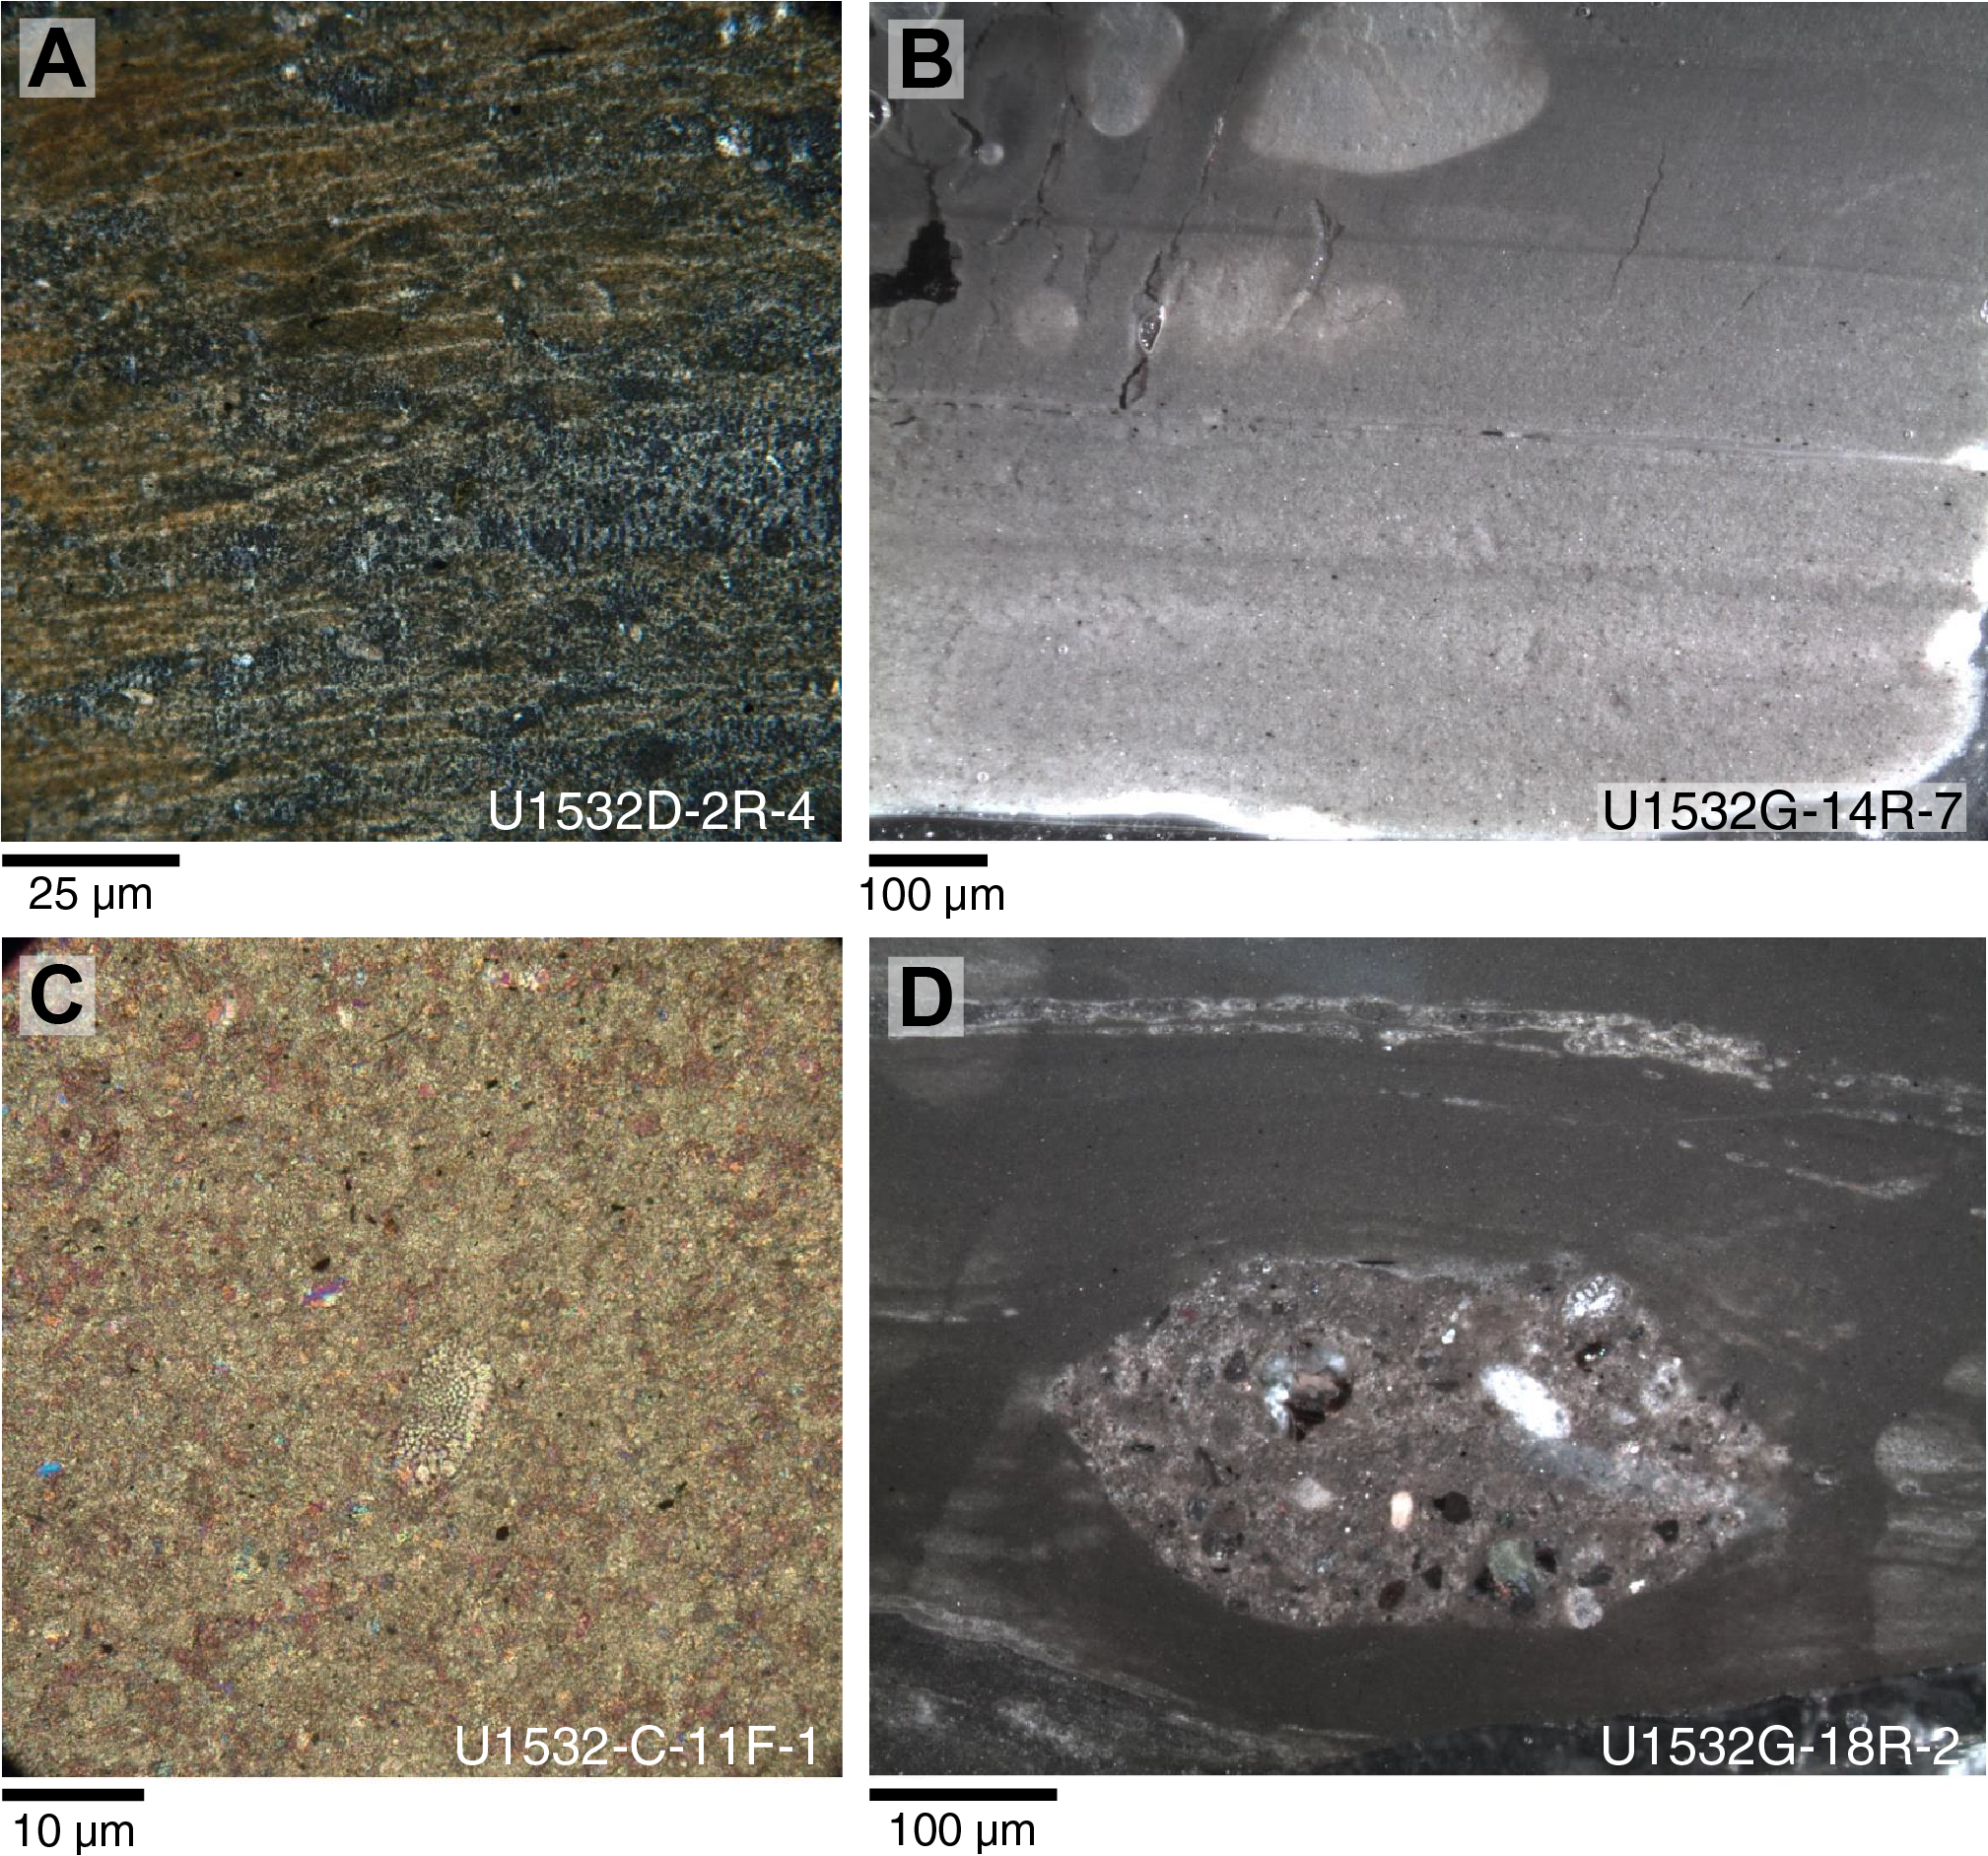
Figure F7. Thin section examples.
Facies F3 is light gray to dark greenish gray massive to bioturbated (sandy) silt to (silty) clay (Table T7; Figure F5G). At a microscale, thin, clay-rich, discontinuous, and/or bifurcating laminations possibly related to bioturbation are present (Figure F7A). The occurrence of Facies F3 correlates with lower a* color reflectance values (Figure F4). Coarse sand and granules are present in this facies and sometimes increase toward the top and transition into Facies F4. Facies F4 is barren to biosilica-rich greenish gray to dark gray sandy mud with dispersed clasts to clast-poor muddy diamict (Table T7; Figure F5H). Clast concentrations in Facies F4 are noticeably greater than in Facies F3 (Figure F5G, F5H). Facies F5 and F6 are characterized by abundant biogenic material. Brown to greenish gray biosilica-rich mud to biosiliceous ooze primarily consisting of diatoms and sponge spicules makes up Facies F5 (Table T7; Figure F5I). Facies F6 consists of light brown to brown foraminifer-bearing to foraminifer-rich mud that occurs in the upper 50 m of Hole U1532A (Table T7; Figure F5J). Facies F6 sediments occasionally contain nannofossils.
Lithostratigraphic units
Based on the facies associations, one lithostratigraphic unit with three subunits (IA, IB, and IC) was identified (Figure F4; Table T7).
Unit I
Subunit IA
Lithostratigraphic Subunit IA is composed of Facies F1 and F2, alternating with Subfacies F1.1 and interbedding with Facies F3, F5, and F6 (Figures F8A, F9A). Biogenic Facies F5 and F6 are present near the upper part of Subunit IA. Facies cyclicity at the decimeter to meter scale is apparent and occurs in the magnetic susceptibility (Figure F9A) and a* color reflectance data (Figure F4). The lowest magnetic susceptibility values occur in Facies F5 and F3, which contain biogenic components in variable concentrations, whereas the color-banded and laminated silty clays of Facies F1 and F2 are characterized by generally higher but variable magnetic susceptibility (Figure F9A). A common facies association consists of Subfacies F1.1 and Facies F3, and the transition from Subfacies F1.1 to Facies F3 is often characterized by a moderately bioturbated gradational contact (Figure F8A).
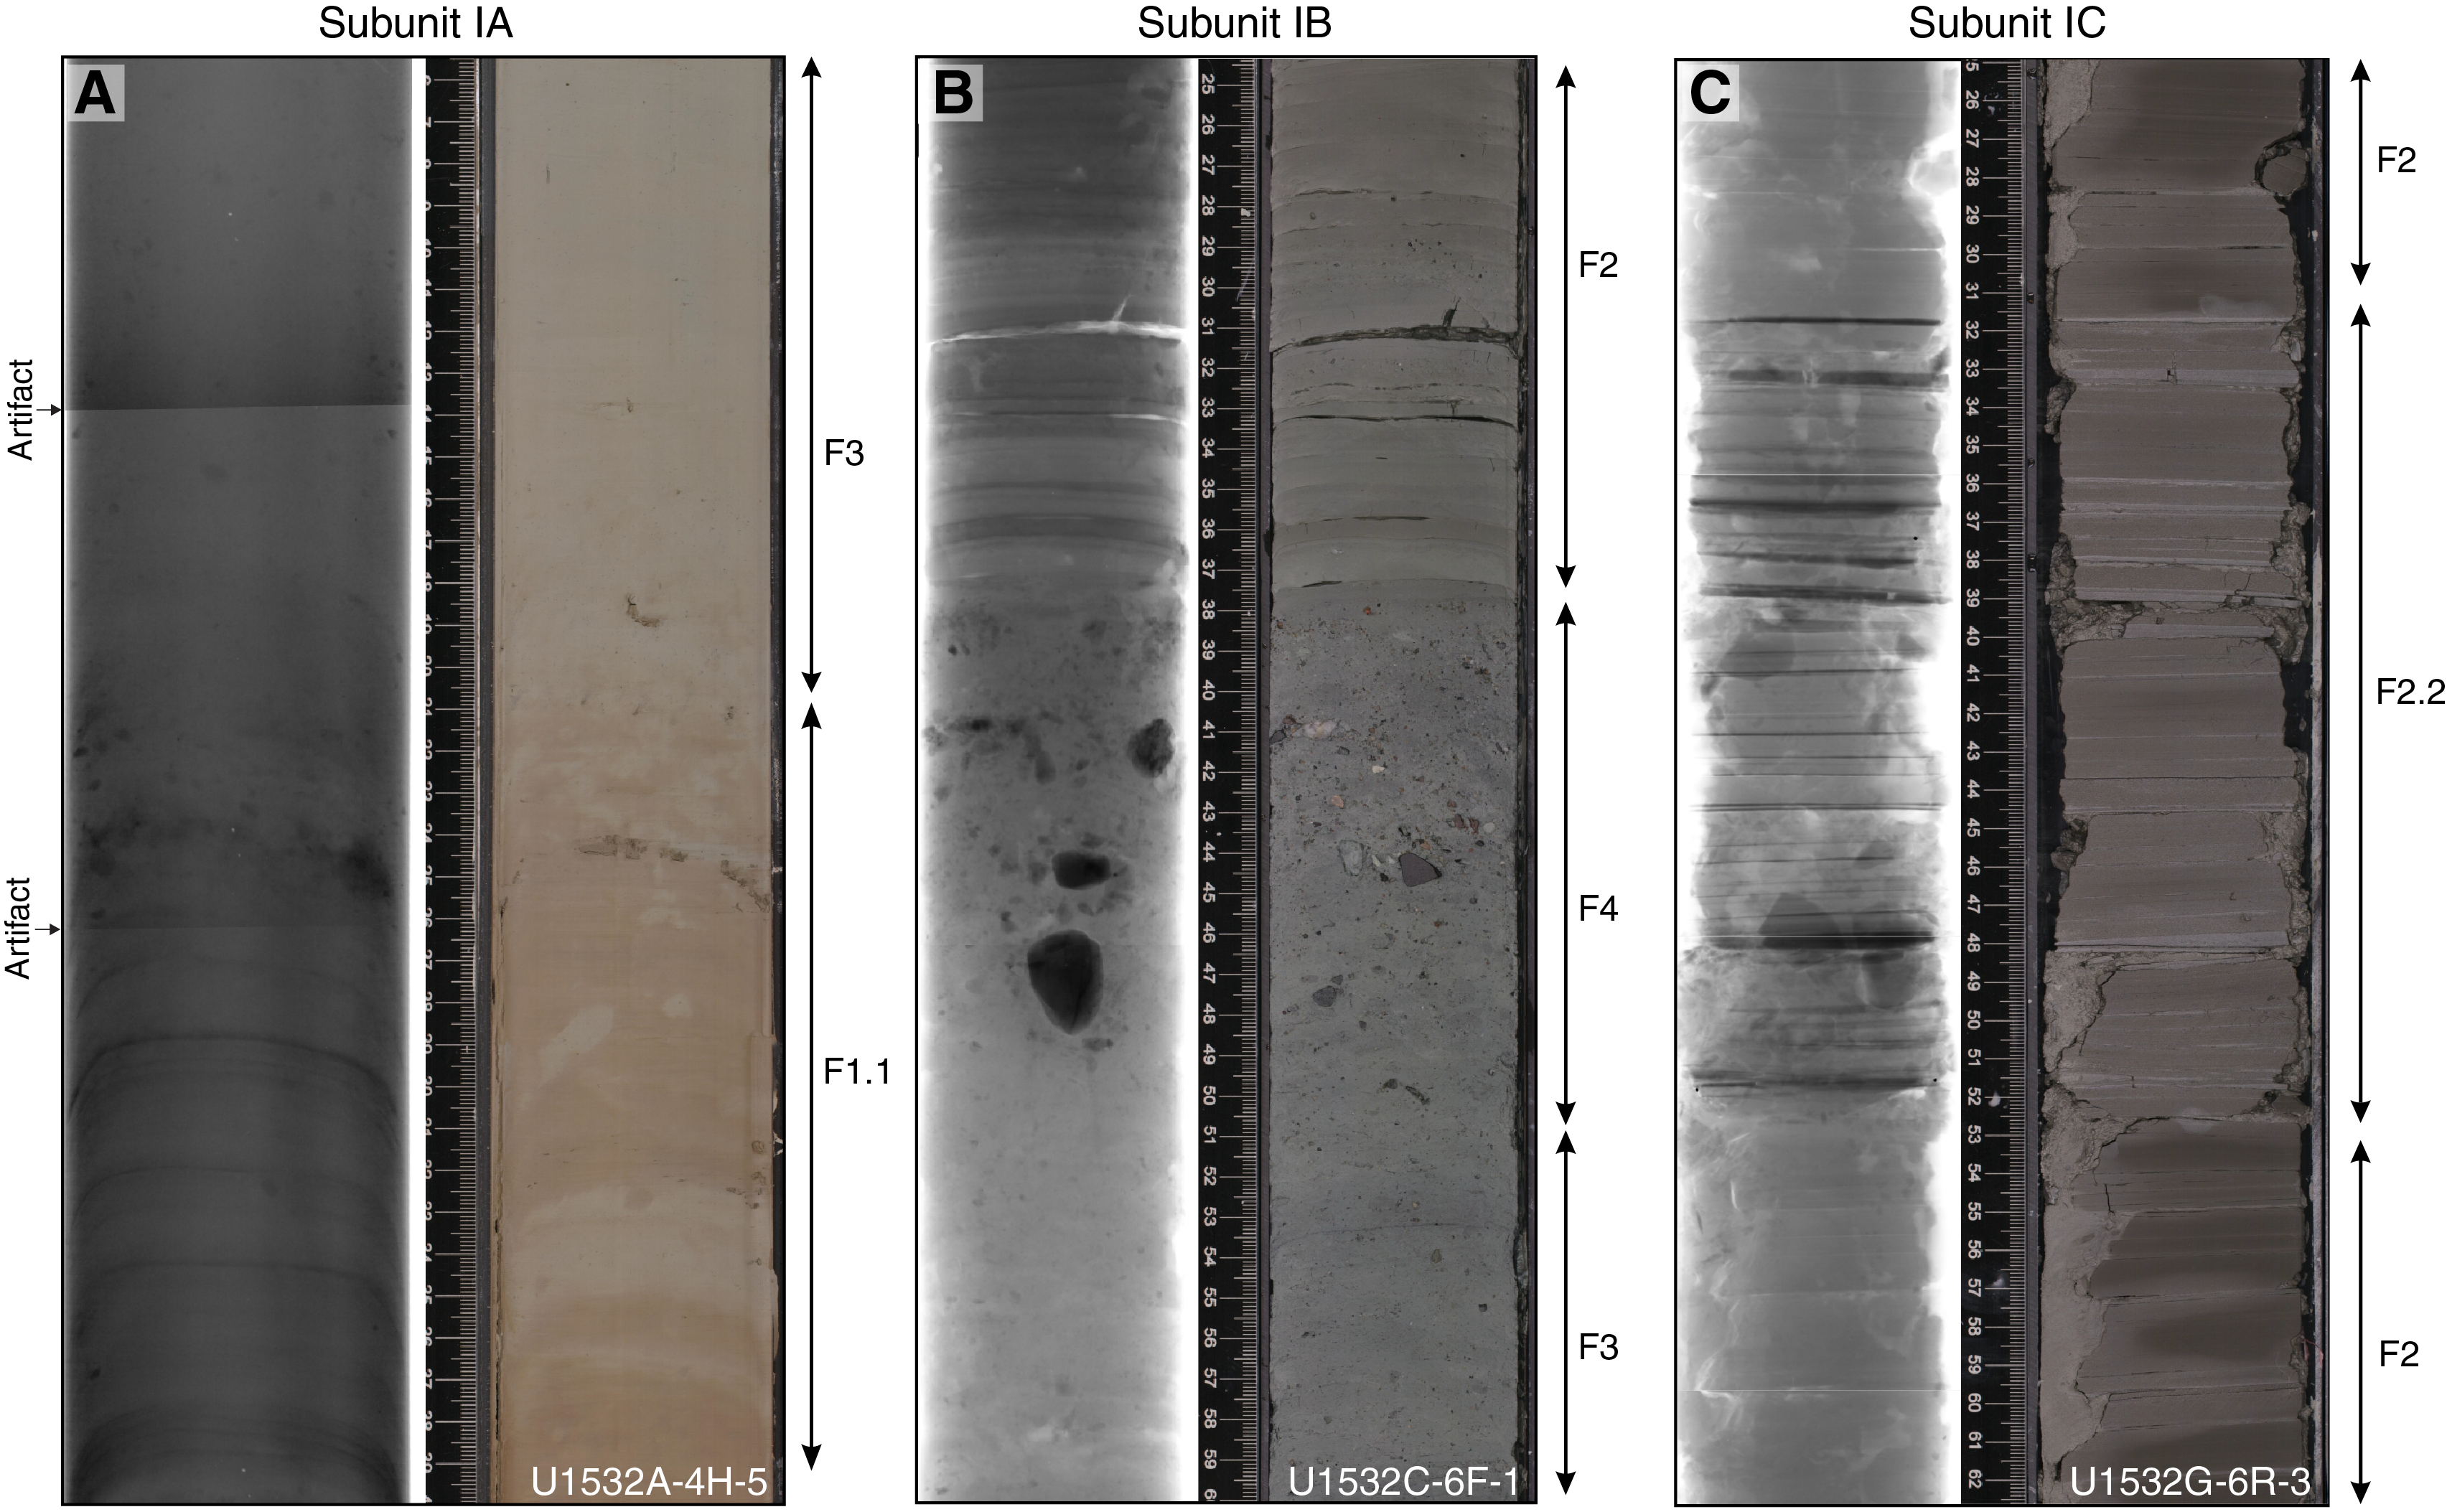
Figure F8. Representative facies associations.
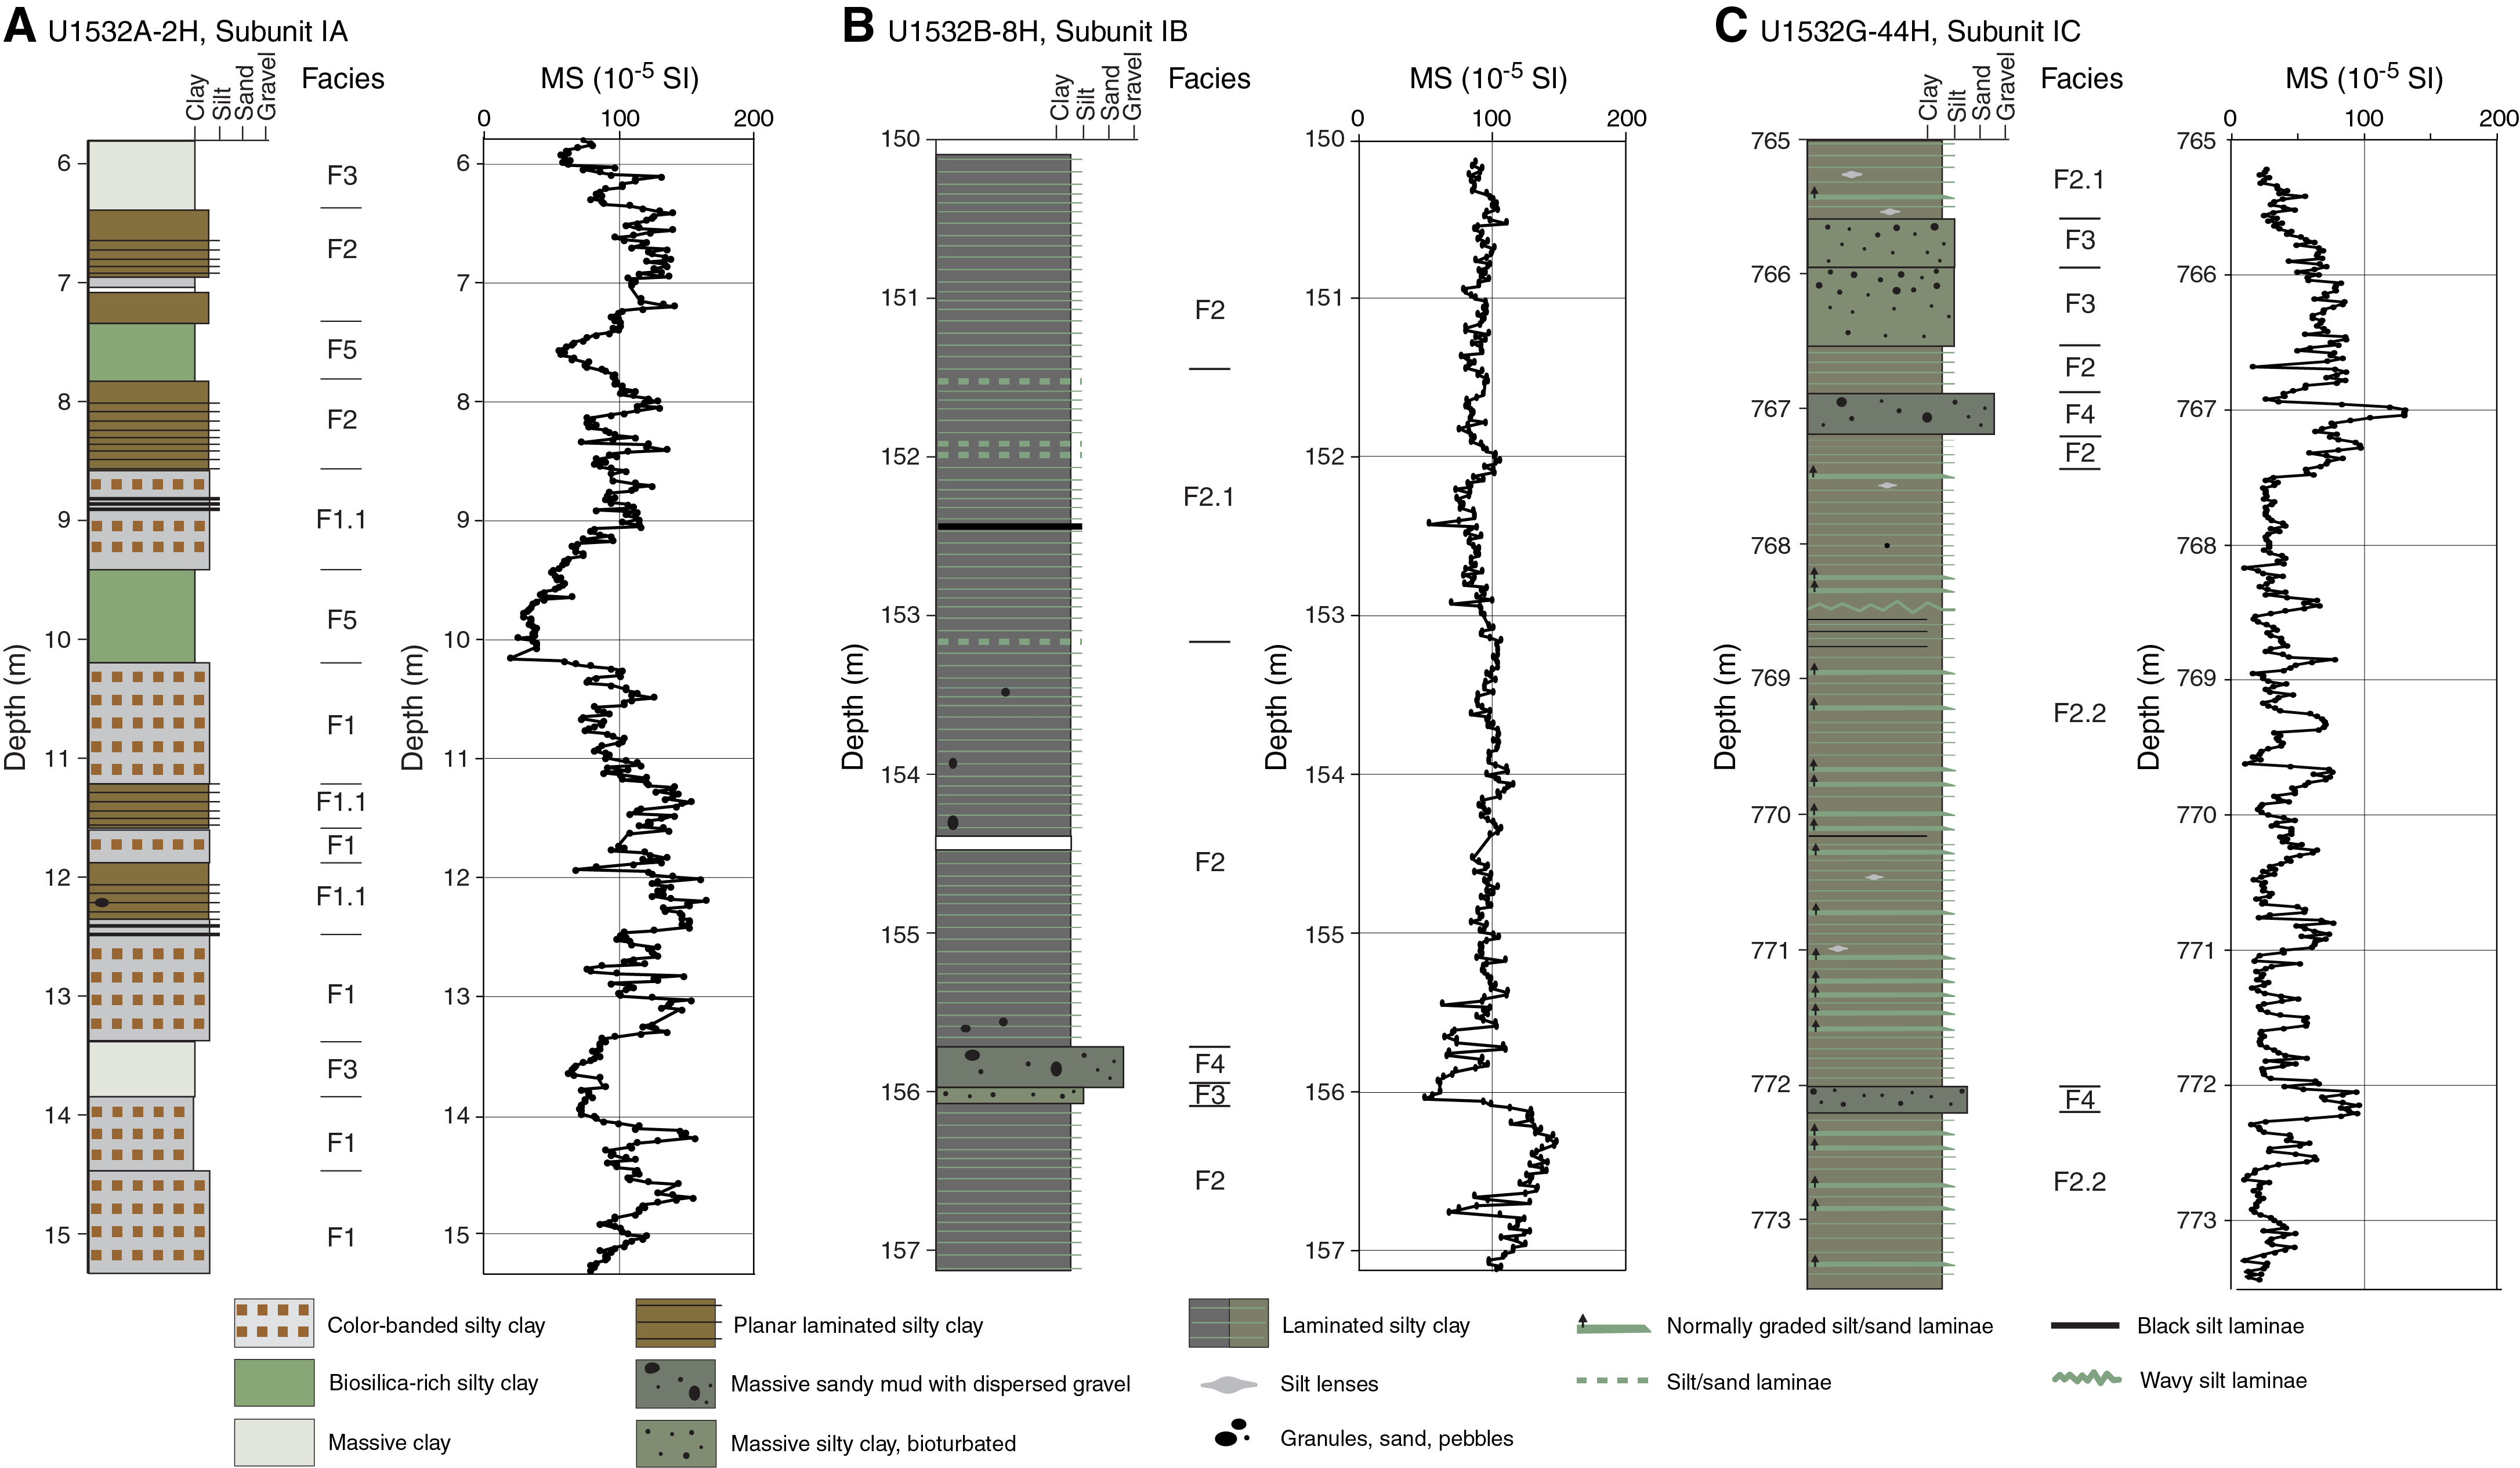
Figure F9. Facies associations, Subunits IA–IC.
Color reflectance measurements show a distinct color change in this subunit at ~40 m from more red-yellow hues above to more green-blue hues below (see a* reflectance in Figure F4), which is also apparent in the visual core descriptions (VCDs) and high-resolution digital images. This gradual color change is not associated with any obvious change in lithology. Another color change from olive-brown to dark gray is gradual and occurs from about 75 to 92.6 m (see a* reflectance in Figure F4).
The boundary between Lithostratigraphic Subunits IA and IB at 92.6 m is defined by the lowermost occurrence of Facies F1.
Subunit IB
- Intervals: 379-U1532A-11H-2, 7 cm, to 11H-CC, 28 cm; 379-U1532B-2H-1, 0 cm, to 11F-CC, 16 cm; 379-U1532C-2F, 0 cm, to 33X-CC, 16 cm; 379-U1532D-2R-1, 0 cm, to 3R-CC, 12 cm; 379-U1532G-2R-1, 0 cm, to 4R-CC, 17 cm
- Depths: Hole U1532A = 92.6–100.8 m; Hole U1532B = 93.1–180.6 m; Hole U1532C = 178.3–391.8 m; Hole U1532D = 362.7–381.2 m; Hole U1532G = 372.3–400.6 m
- Age: Pliocene
The top of Lithostratigraphic Subunit IB at 92.6 m coincides with the uppermost occurrence of black laminae or lenses with a larger biosiliceous component in Facies F2 of Subunit IB only. In Subunit IB, Facies F2 and Subfacies F2.1 are dominant and interbedded with Facies F3, F4, and F5 (Figures F8B, F9B; Table T7). Facies F2 (including Subfacies F2.1 and F2.2) ranges in thickness from 0.4 to 42 m and is usually thicker than the greenish gray interbeds of Facies F3 and F4, which combined vary in thickness from 0.1 to 1.5 m. Usually only Facies F3 was observed, but coarse sand and clast abundance can increase upsection to form Facies F4, which has a sharp upper boundary with the overlying laminated silty clays of Facies F2 (Figures F8B, F9B). Although the visual boundaries between Facies F4 and F2 in the sequence are sharp, higher abundances of both coarse-fraction and biosiliceous microfossil contents sometimes found in Facies F4 were observed directly above the boundary in the lowermost tens of centimeters of Facies F2 (Figure F8B). Facies changes appear to correspond with changes in magnetic susceptibility (Figure F9B; see Physical properties). For example, the lowest values occur in Facies F5, F4, and F3, which contain varying amounts of biogenic components that in Subunit IB are exclusively siliceous. Laminated facies (F2 and Subfacies F2.1) appear to have higher and variable magnetic susceptibility values, probably a result of their terrigenous content. Facies F3, F4, and F5 can also be distinguished from the laminated facies by their lower a* color reflectance values. Smear slide observations record an overall increase of biosiliceous material below the lithostratigraphic boundary at 92.6 m and continuing down to 330 m (Figure F4). In the lower part of Subunit IB (below 330 m), however, microfossil-bearing sediments are rare.
Subunit IC
Lithostratigraphic Subunit IC consists of Facies F2, including Subfacies F2.2, interbedded with Facies F3 and F4 (Figures F8C, F9C). Biogenic material is generally absent below 485 m. Interbeds of Facies F3 and F4 occur more frequently than in Subunits IA or IB (Figure F9C) and are more variable in thickness, ranging from 6 to 109 cm. Subunit IC includes all occurrences of soft-sediment clasts (Figure F7D), carbonate-cemented beds of silt(stone) and sand(stone), normally graded silt laminae or thin beds, and laminae of variable forms, including fanning, deformed, lenticular, or wavy. These sedimentary features of Subfacies F2.2 occur in distinct intervals in Subunit IC. Normally graded silt to clay and silt lenses are present throughout (Figures F4, F7B, F9C). The carbonate-cemented laminae and beds found in Subunit IC appear as high-density bands in X-radiographs (Figure F8C). In contrast to facies associations in Subunits IA and IB, magnetic susceptibility does not decrease in Facies F3 and F4.
Thin sections
Thirteen thin sections (TS) were made of discrete samples from consolidated sediments from Facies F2, Subfacies F2.2, and Facies F3 in Holes U1532C, U1532D, and U1532G to examine sediment microstructures and composition (Table T8; Figure F7). Six thin sections from Facies F2 and Subfacies F2.2 (TS07, TS11, TS12, TS13, TS17a, and TS17b) targeted sedimentary structures including thin clay-rich laminations, faulted laminations, discontinuous laminations, soft-sediment clasts, and normally graded silt to clay intervals (Figure F7B, F7D; Table T8). Six thin sections from Facies F3 (TS08a, TS08b, TS10a, TS10b, TS15, and TS16) sampled black pyritized biogenic debris and burrows with pyritized coatings resulting from bioturbation. Thin sections from Facies F3 also sampled soft-sediment clasts, dropstones, and clay-rich bifurcating laminations that are possibly related to bioturbation (Figure F7A; Table T8). One thin section sample (TS09) was taken from a carbonate concretion that was generally massive but contained fragments of diatoms (Figure F7C).
Petrology
Pebble abundance was generally low throughout Lithostratigraphic Subunit IA, in the lower part of Subunit IB, and throughout Subunit IC (Figure F4). In Facies F3 and F4 from 120 to 230 m, pebble abundance increases; the greatest concentration of pebbles occurs toward the top of Facies F3 and in Facies F4. Pebbles are generally subrounded to subangular (Figure F10).
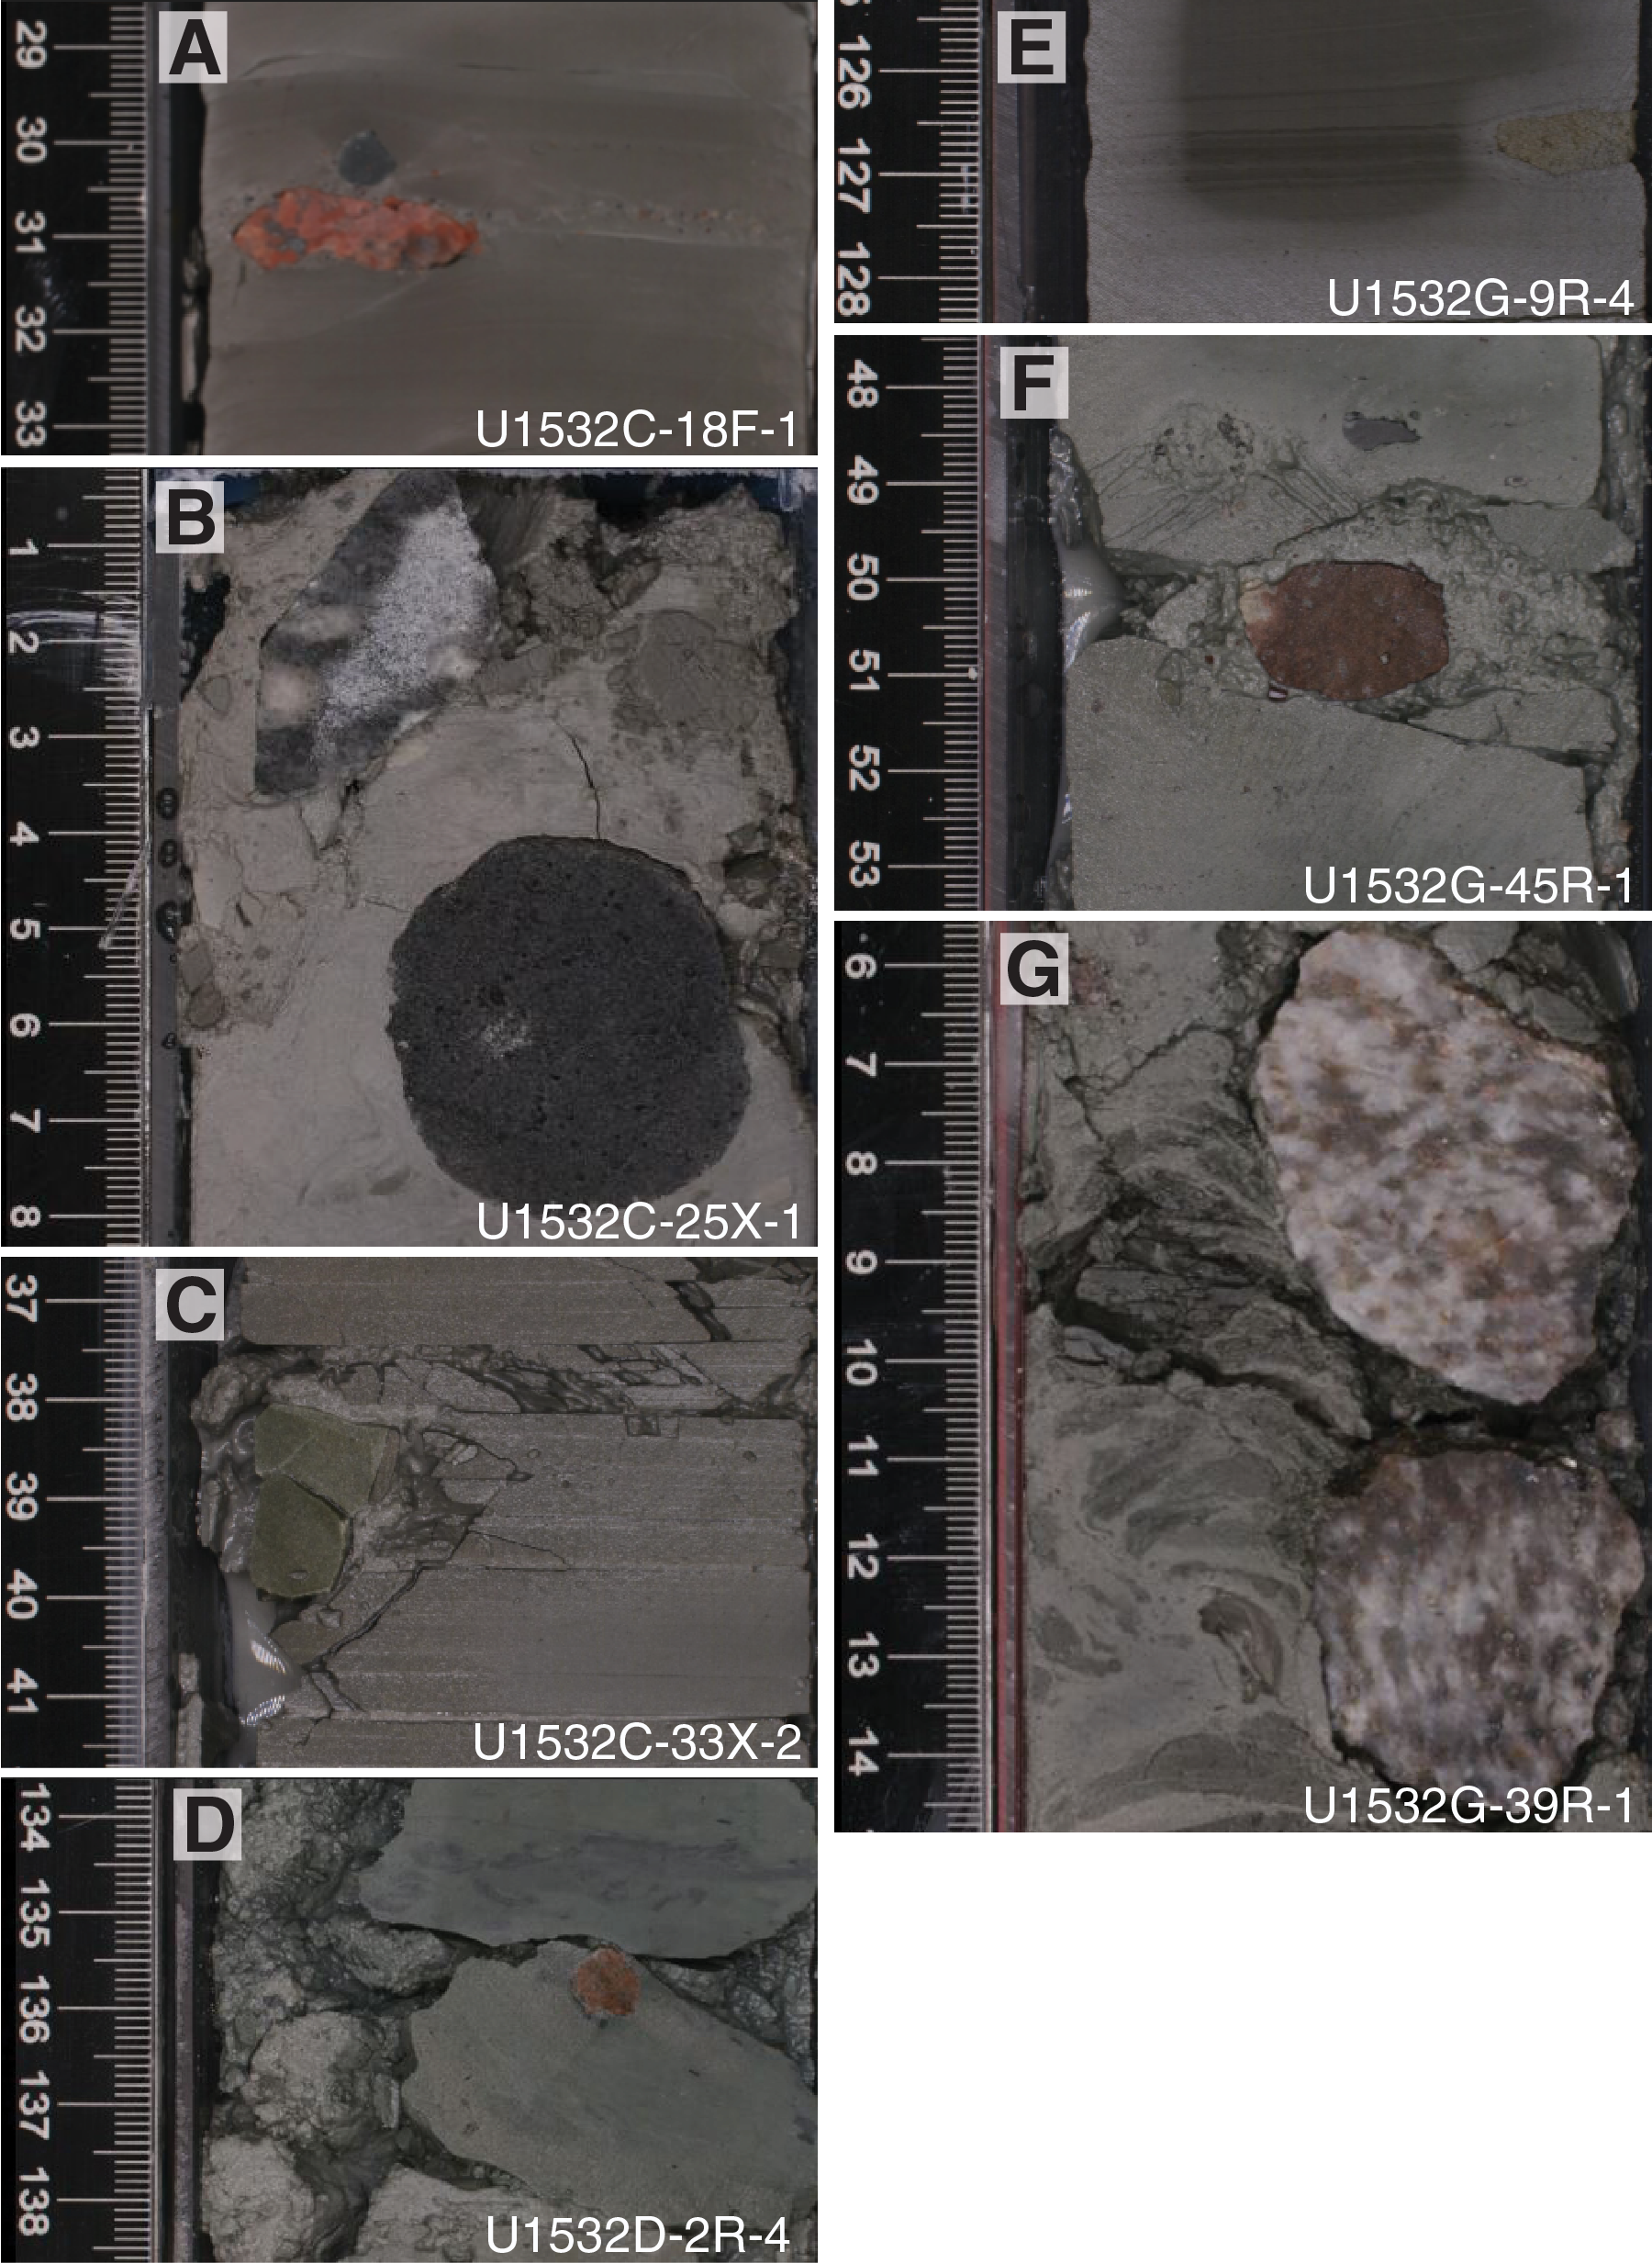
Figure F10. Clasts.
The main lithologies of pebble-sized clasts and mineral grains were determined from direct observation of cut core faces of the archive halves and from identification of mineral and lithic grains (coarse silt to granule size) obtained from sieved residues of core catcher samples taken for shipboard micropaleontological investigations from every core section (see Biostratigraphy).
Individual pebbles with a long axis >0.7 mm generally occur in the cores as isolated clasts. In Holes U1532A–U1532C, only six pebbles with a long axis >1 cm were directly observed on the split-core surface or in core catcher sample residues. Fifteen pebbles and three cobbles were observed on cut faces of archive halves from Hole U1532G. A majority of pebbles are plutonic, and K-feldspar granites are the most common clasts (Figure F10). Some of the larger pebbles occur near core tops within a short interval of presumed fall-in material (Figure F10B, F10G). Sedimentary rock types were rarely found in cores as in situ pebbles (Figure F10C, F10E).
Counts were obtained from the cut faces of the archive halves of four cores (379-U1532B-8H-4, 379-U1532C-6F-1, 379-U1532C-7F-4, and Ghost Core 379-U1532G-38G) and the residue of washed, sieved material from one core catcher section that remained after preparation for micropaleontology (Section 379-U1532G-30R-CC) (Figure F11). In addition, one study portion consisted of a “scrape” of coarse granules from a slightly disturbed, “bulged” core surface (Sample 379-U1532B-5H-1, 86–90 cm). The mounded material had to be removed prior to scanning by the Section Half Imaging Logger (SHIL) and would otherwise have been discarded.
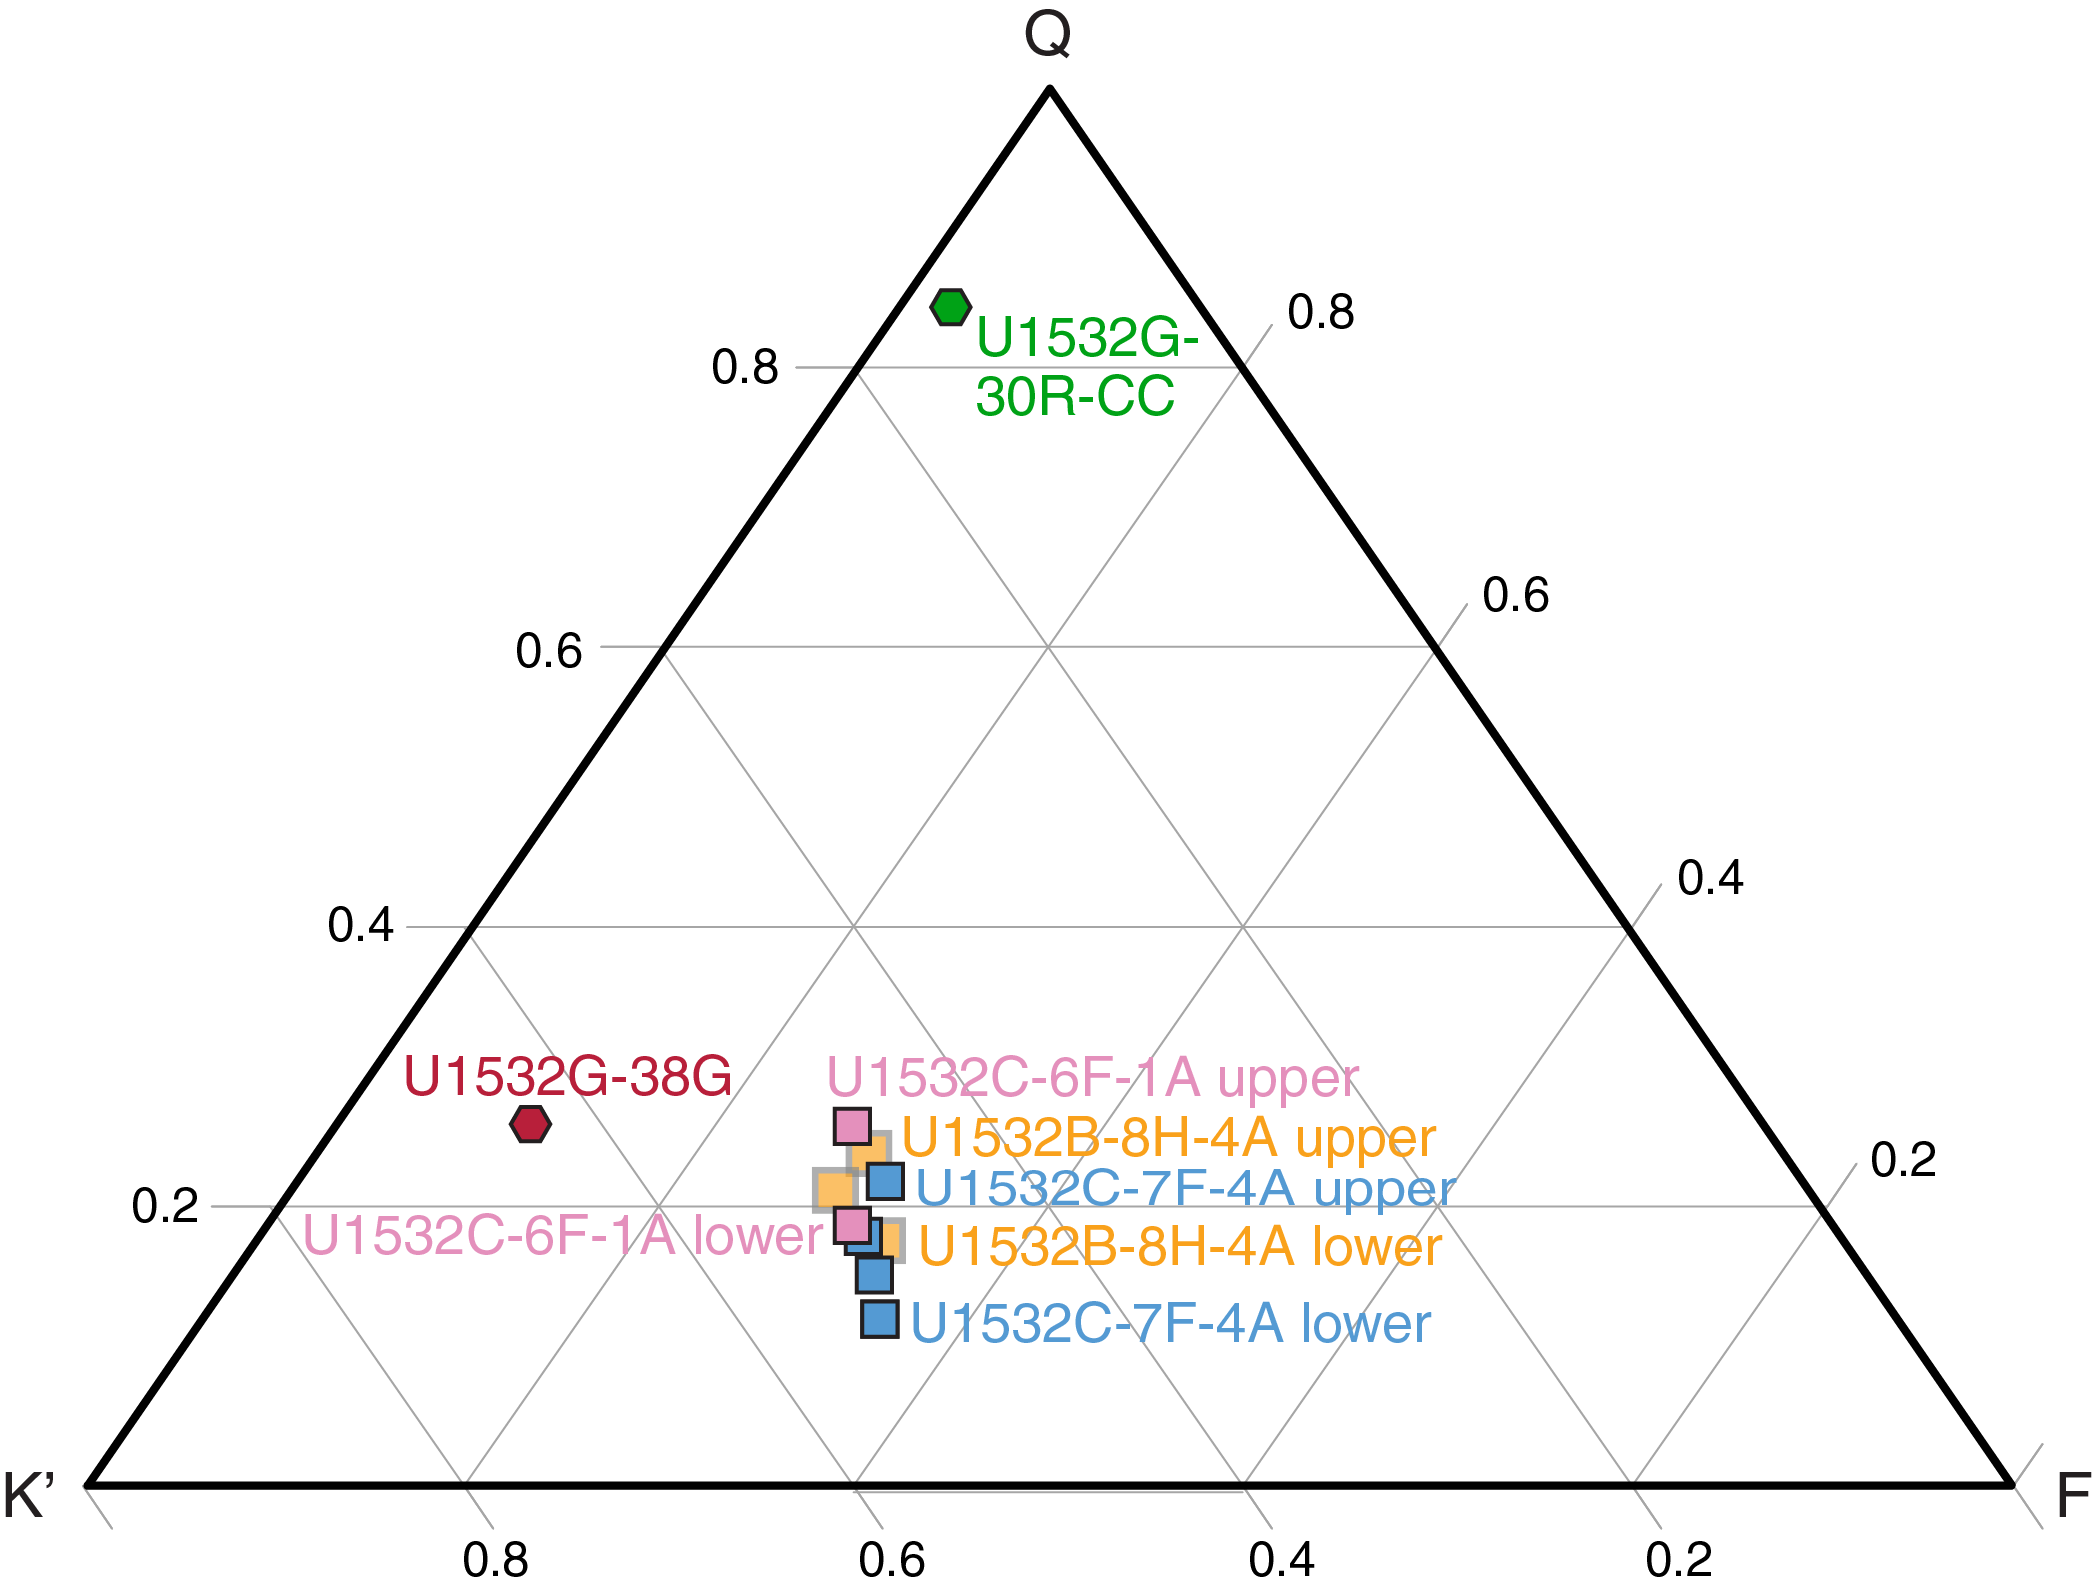
Figure F11. Adapted QKF ternary diagram.
The main lithologies/mineral types of coarse silt– to granule-sized grains are, in order of decreasing abundance, polycrystalline quartz, K-feldspar, granite, biotite, and diorite. Among the polycrystalline grains, K-feldspar-biotite granite, biotite-bearing leucogranite, and quartz are abundant. Polycrystalline quartz varieties include transparent, milky, and gray quartz, and quartz sometimes bears epidote. The proportions of lithic types were determined for the clast-rich intervals of Facies F3 and F4 by identifying lithic type and counting ~250 grains of 0.5 to 1.5 mm (long axis) in five representative intervals. A total of 1443 grains were counted (Table T9). The coarse silt, sand grains, and granules with a long axis <1.5 mm are angular to subangular.
The rock and mineral types identified are similar to those found in sparse rock exposures bordering the Amundsen Sea Embayment and in coastal central Marie Byrd Land (Leat et al., 1993; Pankhurst et al., 1993; Mukasa and Dalziel, 2000; Kipf et al., 2012; Riley et al., 2017). The presence of olivine and vitric grains (trace) in smear slides is possible evidence of volcano-sourced detritus originating in the glacier catchments of western Ellsworth Land (Rowley et al., 1990; Hole and LeMasurier, 1994) or eastern, central, or western Marie Byrd Land (LeMasurier et al., 1994; Wilch et al., 1999; Wilch and McIntosh, 2002, 2007; Handler et al., 2003; LeMasurier, 2013). A more distant provenance of the coarse-grained portion is possible (cf. Roy et al. 2007; Williams et al., 2010), provided that sources rich in igneous quartz, K-feldspar, and muscovite are present in the source region.
Clay mineralogy
Diffractograms obtained by X-ray diffraction (XRD) of the clay fraction (<2 µm) were investigated following the method of Petschick et al. (1996) for characterizing the provenance of fine-grained detritus. The chemistry of the clay mineral illite was evaluated by calculating the height ratios of its peaks at 5 and 10 Å. According to Esquevin (1969), illites with 5 Å/10 Å values >0.4 have a muscovitic (i.e., Al rich) composition, whereas illites with 5 Å/10 Å values <0.15 have a biotitic (i.e., Fe and Mg rich) composition.
The clay mineral assemblages at Site U1532 consist of illite, chlorite, kaolinite, and smectite; the former two minerals are the most abundant (Figure F12). Illite and chlorite are typical for physical weathering of crystalline or metamorphic rocks on land; illite is preferably derived from felsic source rocks, and chlorite is predominantly derived from low-grade metamorphic and basic rocks. Kaolinite and smectite result from chemical weathering, requiring humid climatic conditions, and kaolinite is predominantly formed by weathering of felsic rocks (often granites) under a (sub)tropical climate. Smectite can also form by submarine weathering of volcanic detritus and possibly by ice-lava interaction as a result of subglacial volcanism.
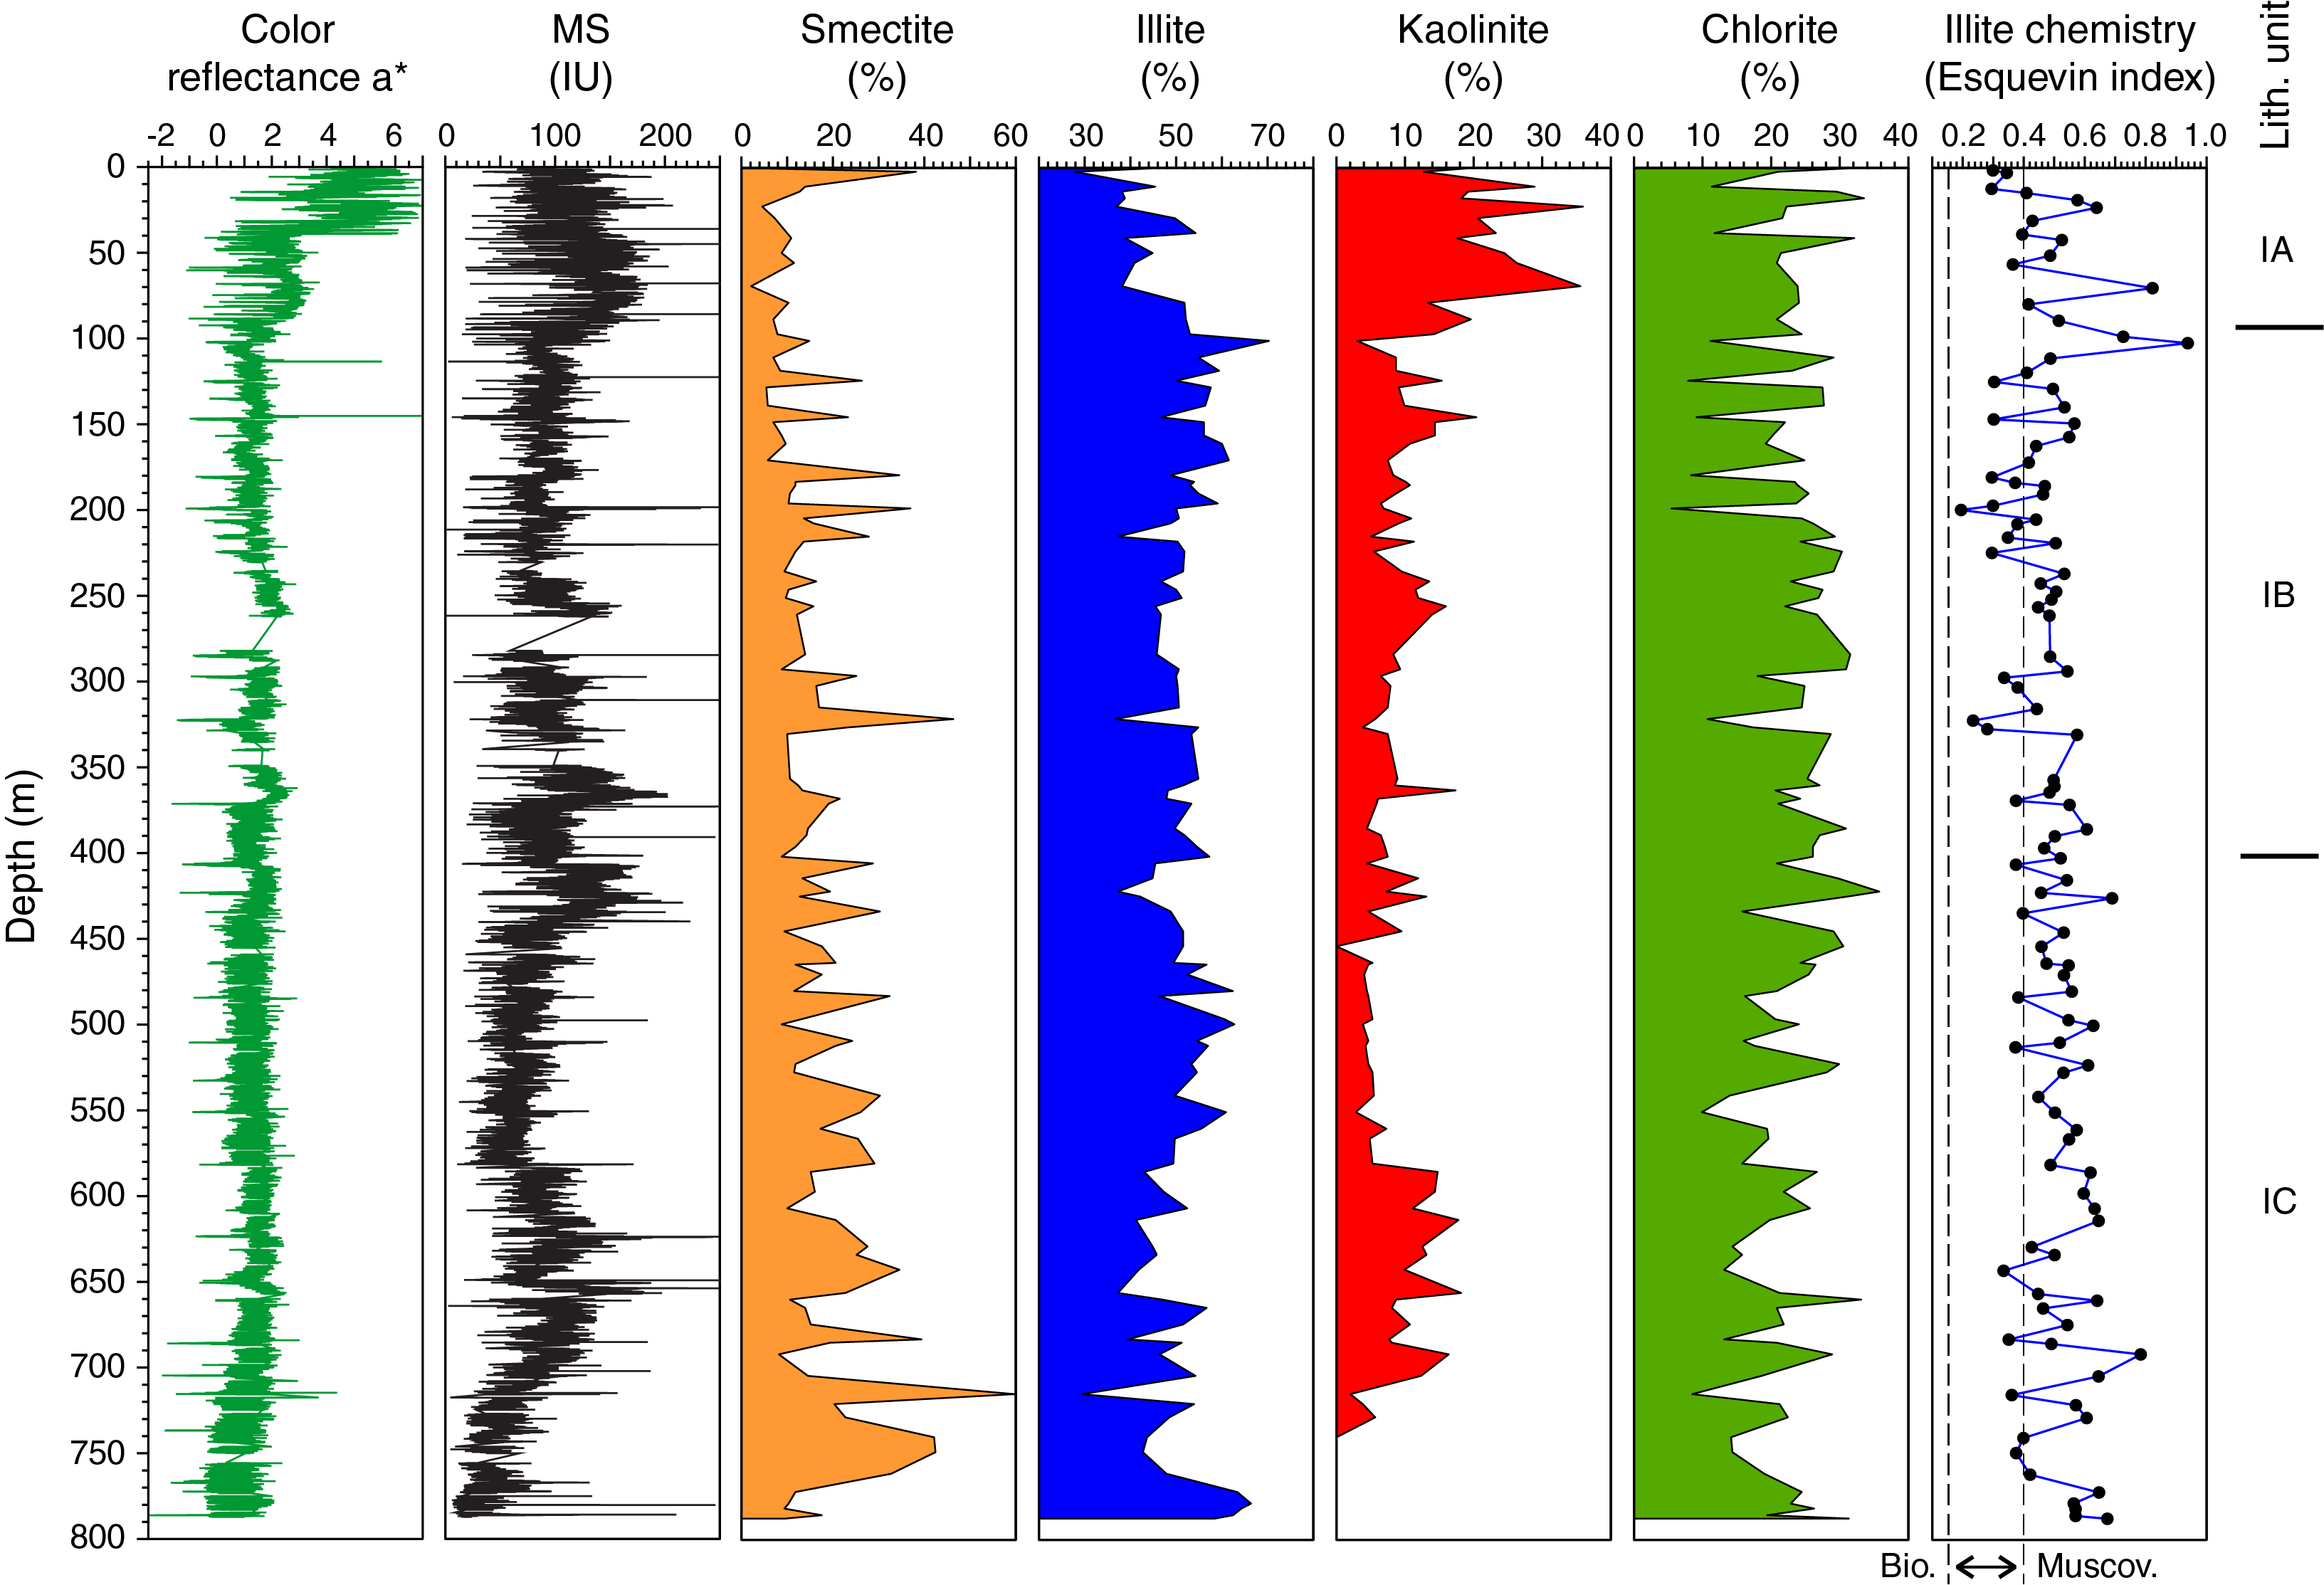
Figure F12. Clay mineralogy.
Illite and chlorite in sediments at Site U1532 are probably mainly derived from glacially eroded granitic and gneissic rocks and mafic volcanics from the Amundsen Sea hinterland (Ehrmann et al., 2011). The often relatively high kaolinite content points to a supply of reworked kaolinite-bearing detritus from the Amundsen Sea Embayment shelf and its hinterland that originates from unknown source(s) of pre-Oligocene sedimentary strata (Hillenbrand et al., 2003; Ehrmann et al., 2011). Smectite delivery has been attributed to the supply of fine-grained detritus from volcanic source rocks cropping out elsewhere in the Amundsen Sea hinterland (Hillenbrand et al., 2003; Ehrmann et al., 2011).
At Site U1532, average kaolinite contents in Lithostratigraphic Subunit IA (above 92.6 m) are higher than in underlying Subunit IB and correspond to high values in magnetic susceptibility and elevated a* color reflectance values. Kaolinite contents are also elevated between 580 and 730 m in Subunit IC and correspond to higher magnetic susceptibility. No distinct kaolinite peaks were detected below 730 m (Figure F12). Chlorite contents show clear fluctuations with no major general trends in Subunits IA and IB and a minor downcore decrease below ~550 m in Subunit IC. Illite contents are lower in Subunit IA than in underlying Subunits IB and IC, and the illite chemistry is predominantly muscovitic throughout most of the cores, especially in Subunit IA. Smectite contents display distinct maxima toward the top of Subunit IA and in Facies 3, 4, and 5 of Subunits IA, IB, and IC. Below 323 m in Subunits IB and IC, smectite occasionally reaches additional maxima in sediments of other facies. The smectite maxima coincide with minima in chlorite contents and often with minima in kaolinite contents. Anticorrelations between smectite and kaolinite contents were previously reported from late Quaternary sedimentary sequences from the Amundsen Sea continental slope and rise. They were interpreted as a result of enhanced supply of kaolinite-bearing terrigenous detritus to the margin during glacial times when grounded ice had advanced across the Amundsen Sea shelf (Hillenbrand et al., 2002, 2009).
An unidentified mineral, possibly the zeolite analcime, shows very weak peaks in diffractograms taken from samples below 235 m (from Sample 379-U1532C-14F-1, 129–131 cm, downward). The peaks become increasingly pronounced with depth. The mineral shows prominent broad peaks at ~5.64 Å in several samples taken from below 541 m in Hole U1532G (Sample 379-U1532G-19R-5, 26–28 cm), for example at 683 m (Sample 34R-3, 110–112 cm).
Interpretation
The sedimentary environment at this distal drift location is dominated by fine-grained terrigenous sediments (Facies F1 and F2) probably initially supplied by sediment gravity flows sourced from the Amundsen Sea continental shelf (e.g., Hillenbrand et al., 2002, 2009; Konfirst et al., 2012) and contour currents transporting suspended material from sources farther west, which is indicated by the asymmetric shape of the drifts with a gentle western and a steep eastern flank (Uenzelmann-Neben and Gohl, 2012).
The facies assemblage in Lithostratigraphic Subunit IA can be interpreted to be alternations between dominant downslope transport and contour current deposition (Facies F1 and F2) and Facies F3, F5, and F6 that represent pelagic sedimentation during times with reduced annual sea ice cover. Biogenic Facies F5 and F6 are often bioturbated, suggesting higher marine productivity and reduced sea ice extent. Warmer conditions than today are suggested by the occasional presence of nannofossils in Facies F6. In Subunit IB, greenish gray Facies F3 and F4 probably represent periods of hemipelagic deposition with ice rafting, whereas the planar, laminated silty clays of Facies F2 and Subfacies F2.1 represent deposition from bottom currents. This interpretation is supported by the fine grain sizes and thin laminations in Facies F2. Throughout Subunits IA–IC, the discrete coarser and thicker laminae to thin beds of silt to sand observed in Subfacies F1.1 and F2.1, as well as normally graded laminae (Subfacies F2.2; Figure F7B), may represent distal turbidites. In Subunit IC, silt lenses and fanning and wavy laminae may be associated with deposition during times of enhanced bottom-current vigor and suspended sediment supply. The absence of bioturbation and microfossils in many intervals of Subunit IC suggests either a high sedimentation rate of terrigenous detritus with dilution of biogenic material, low productivity of siliceous and calcareous planktonic organisms, or biogenic silica and carbonate diagenesis.
The coarse fraction primarily found in Facies F3 and F4 was delivered by ice rafting. Preliminary identification of pebbles and granules (Figures F10, F11) suggests that they could have originated from bedrock in the Amundsen Sea Embayment (Leat et al., 1993; Kipf et al., 2012; Spiegel et al., 2016; Riley et al., 2017) or Marie Byrd Land Province, more broadly (Pankhurst et al., 1998; Mukasa and Dalziel, 2000; Brown et al., 2016; Siddoway, submitted). More distant sources resulting from iceberg transport within the Antarctic Circumpolar Current (e.g., Williams et al., 2010) are also possible. Variations in abundance of IRD may be related to the changes in the intensity of ice rafting from glaciers draining into the Amundsen Sea Embayment and reaching the drill site (e.g., Hillenbrand et al., 2009) or changes in contour-current speed causing winnowing of fine-grained particles and accumulation of coarse-grained detritus (Figure F13).
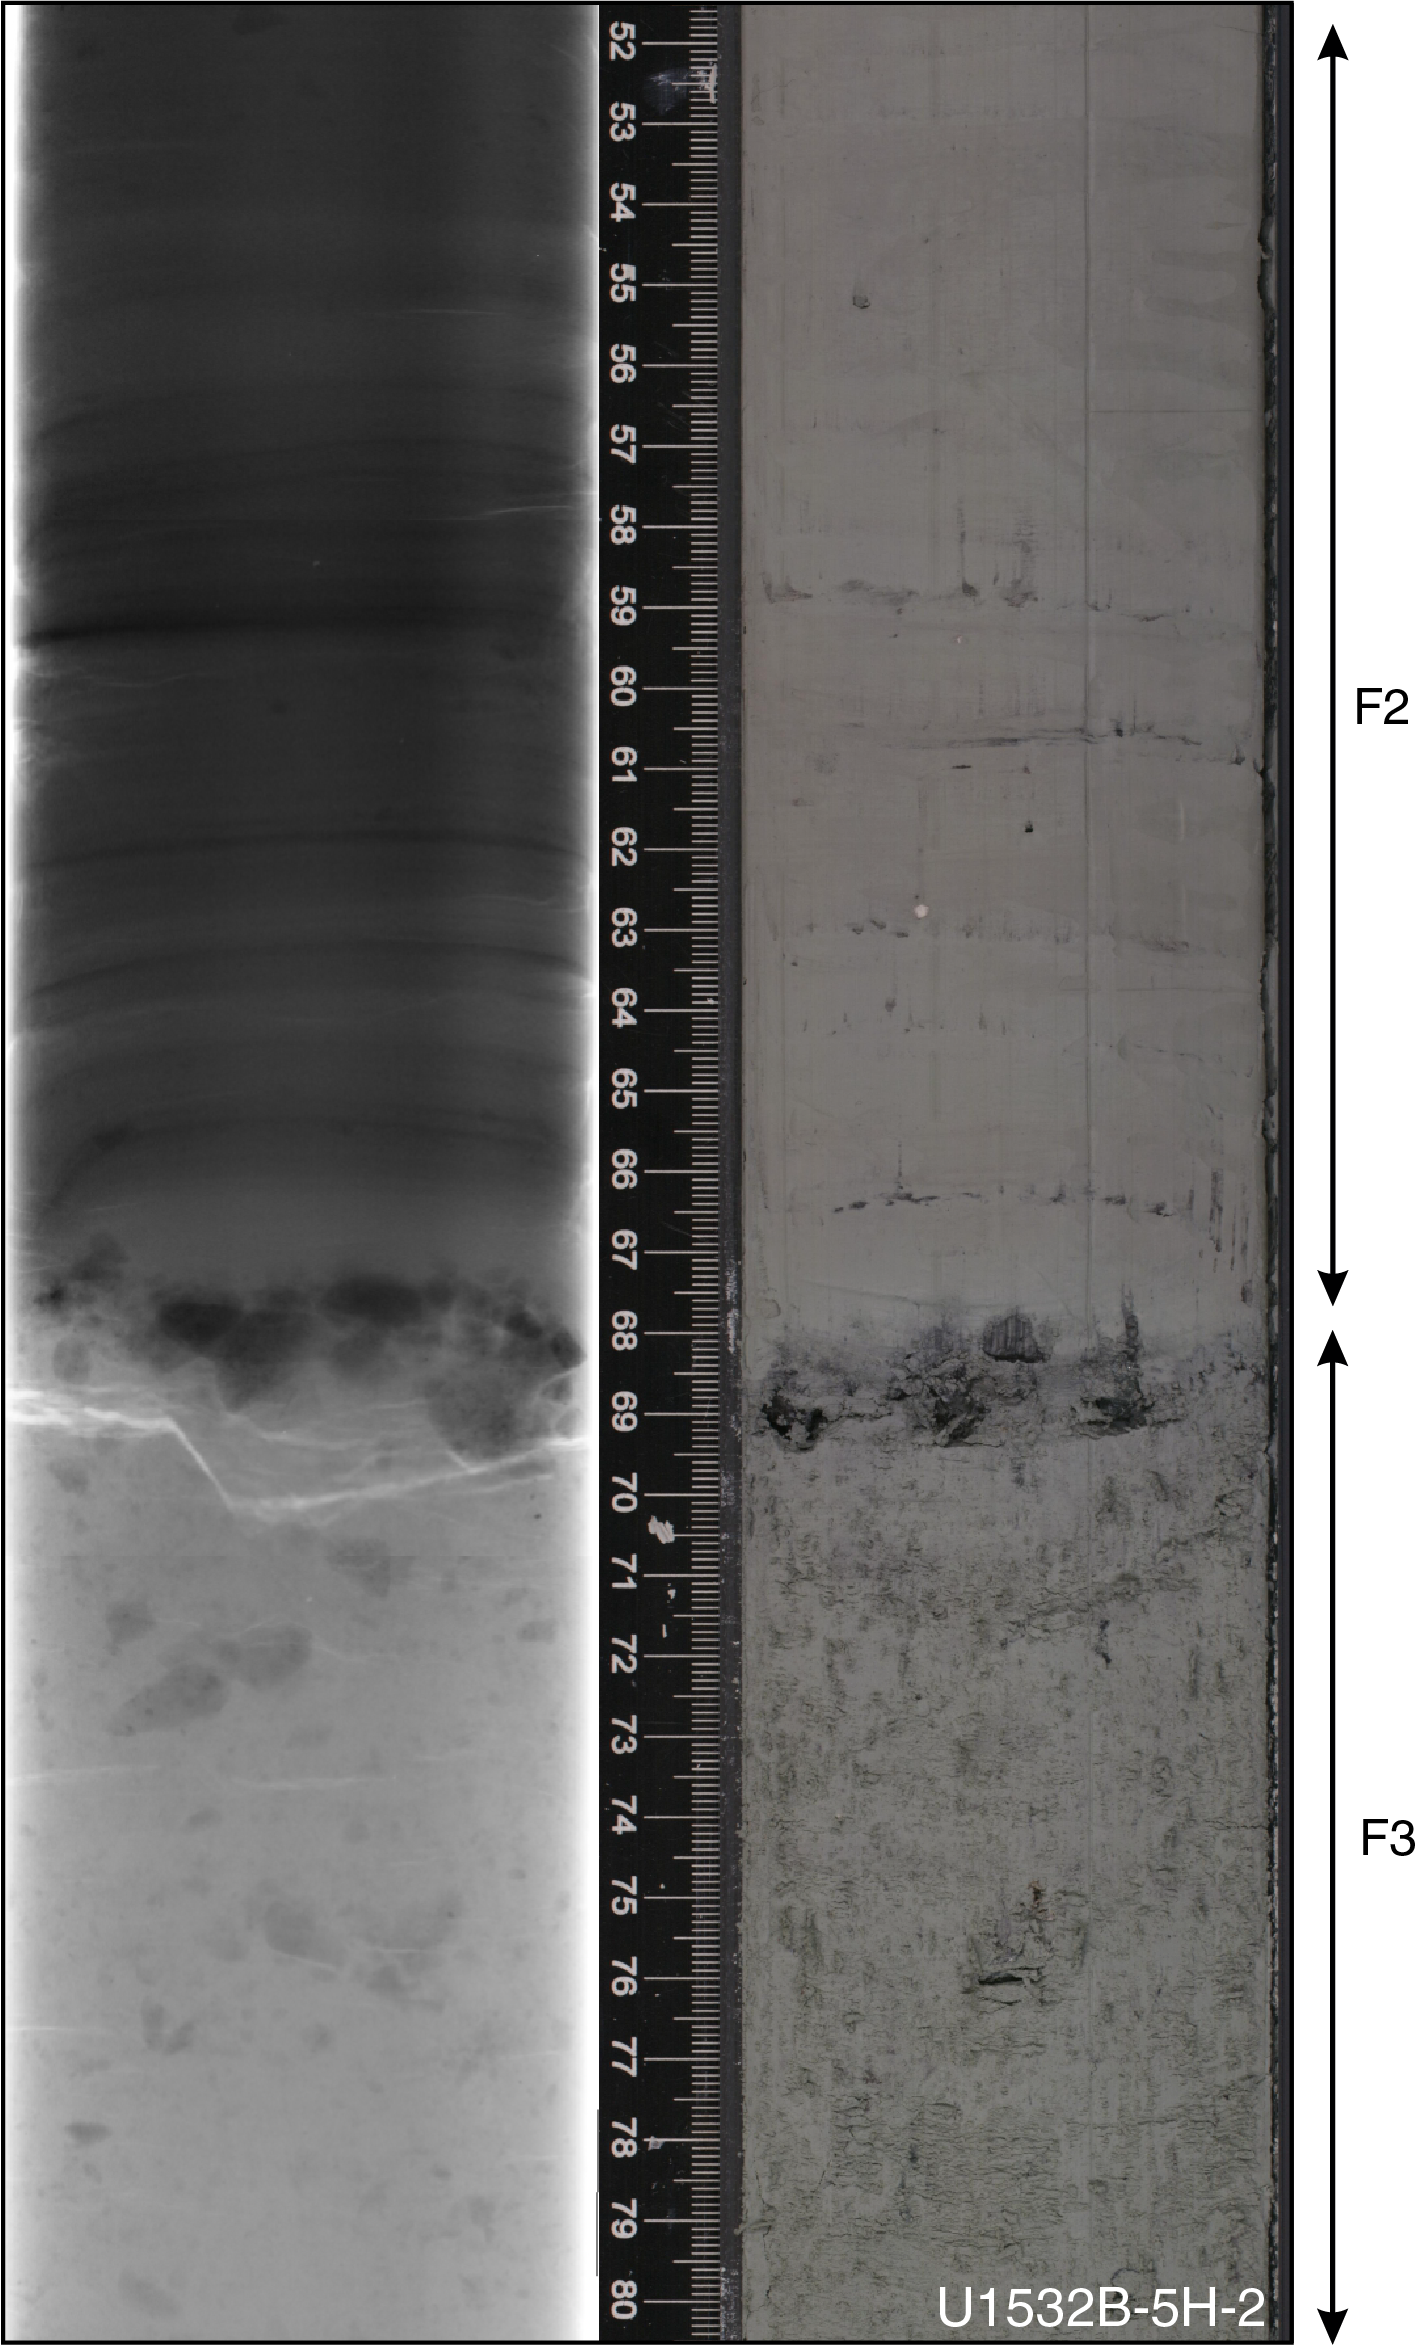
Figure F13. Possible lag deposit.
Biostratigraphy
Samples from core catchers and additional samples from split-core sections from Holes U1532A–U1532G were examined to determine the abundance and assemblage composition of diatoms, silicoflagellates, radiolarians, calcareous nannofossils, foraminifers, ostracods, and palynomorphs. The occurrence and abundance data for the main microfossil groups are summarized in Figure F14. The dominant lithology of the sediments recovered at Site U1532 is microfossil-poor laminated silty mud (see Lithostratigraphy). However, microfossil-bearing or microfossil-rich horizons were noted in Holes U1532A–U1532C and in the upper part of Hole U1532G.
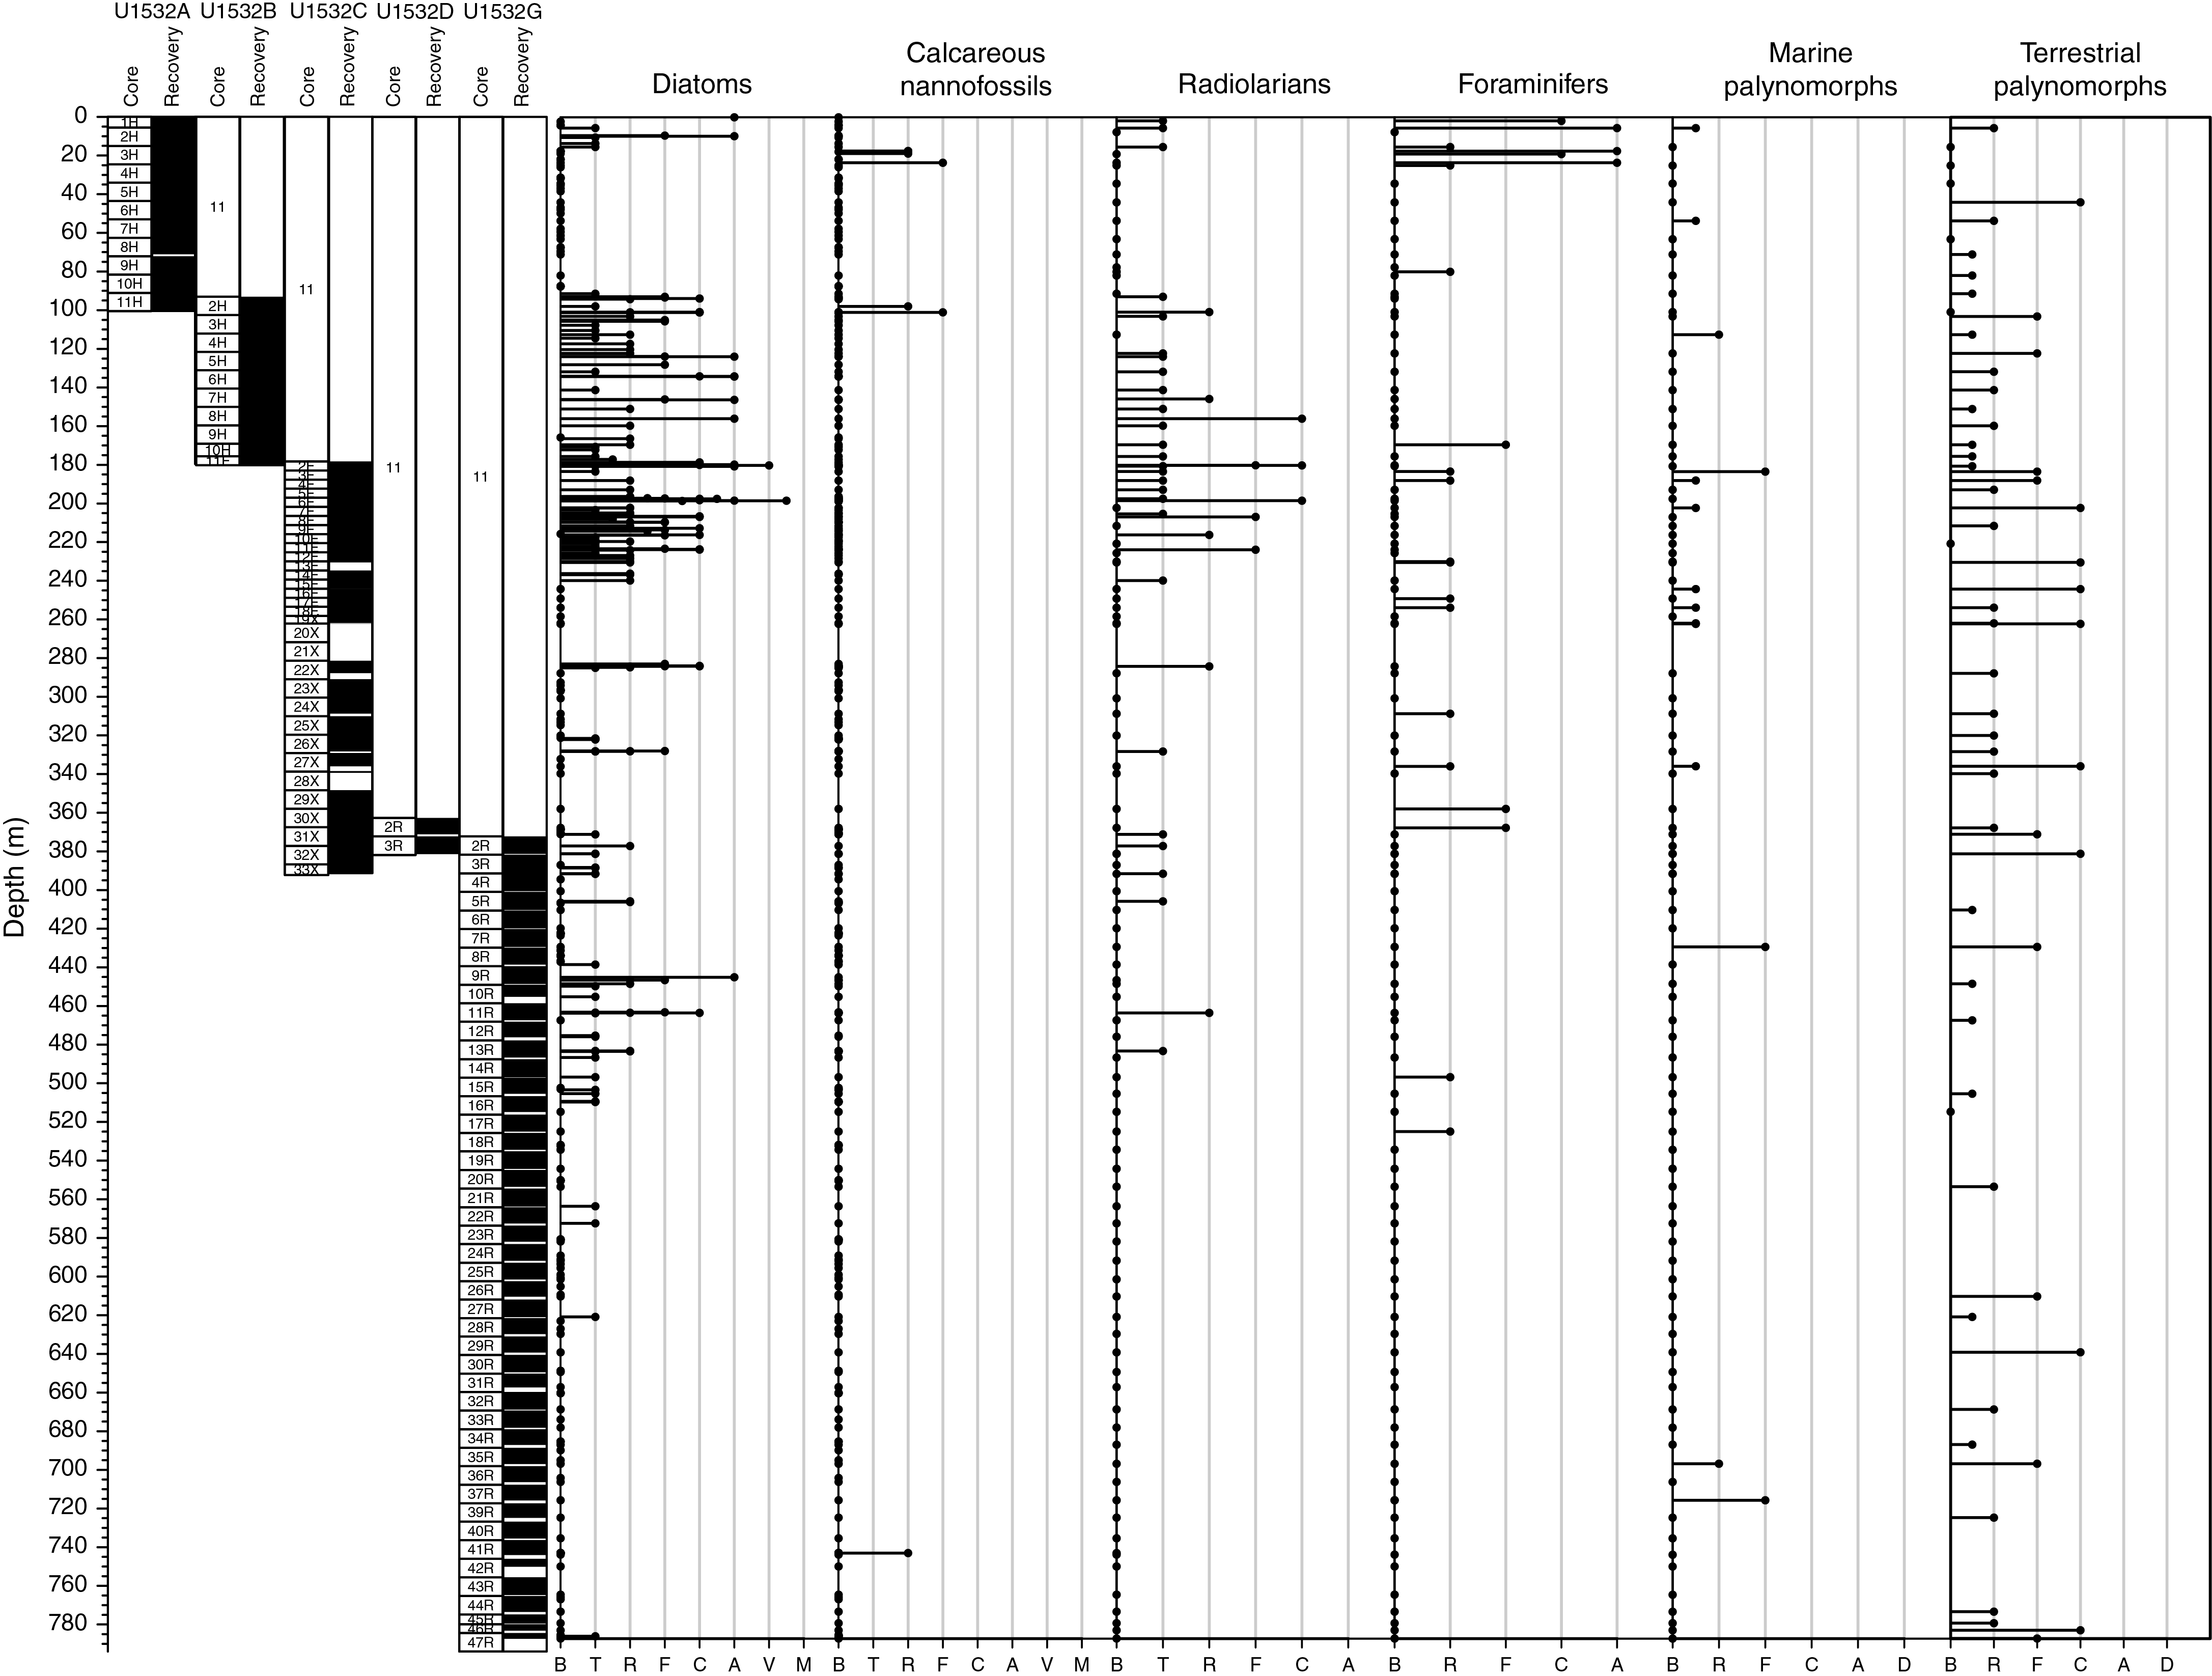
Figure F14. Relative abundance of microfossils.
In the upper part of the section recovered at Site U1532, sufficient microfossils for biostratigraphic age assignment were only present in the upper ~10 m, providing an age of middle Pleistocene to recent (0.6–0 Ma). Below this level, the abundance and preservation of microfossils varies greatly, but a relatively high abundance of siliceous microfossils was noted between ~92 and 224 m. Diatoms and radiolarians provide the primary biostratigraphic age control below ~92 m (Table T10) with supporting age information, where possible, from foraminifers, silicoflagellates, and organic-walled dinocysts. Based on diatom and radiolarian biostratigraphy, the interval between ~92 and 156 m is assigned a mid- to late Pliocene age of 3.2–3.8 Ma and the interval between ~156 and 224 m is assigned an early Pliocene age of 3.8–4.4 Ma. Trace occurrences of highly fragmented siliceous fossils in samples below ~224 m in Hole U1532G make biostratigraphic age determination difficult. However, the occurrence of poorly preserved but identifiable diatoms Rhizosolenia costata and Thalassiosira inura indicates that the interval between ~224 and 332 m is <4.7 Ma (early Pliocene), and sediments between ~332 and 510 m are younger than 5.5 Ma based on the occurrence of T. inura, which is present at 509.46 m. This lowest occurrence of T. inura may reflect the diagenetic loss of diatoms below this level rather than a chronostratigraphic first occurrence.
Independently calibrated biostratigraphic datums (Table T10) combined with magnetostratigraphic data (Table T15) for the Site U1532 sequence are integrated in an age-depth model in Chronostratigraphy (Figure F22).
Calcareous microfossils including foraminifers, calcareous nannofossils, and ostracods occur in thin Pleistocene intervals in Hole U1532A, generally in the absence of biosiliceous material. The absence of biogenic silica in the Pleistocene suggests lower primary productivity than in the Holocene in conjunction with strong seafloor dissolution of biogenic silica (based on comparison with the mudline sample obtained in Hole U1532A). Fossil-poor or barren intervals of silty clay are preliminarily interpreted to reflect very high terrigenous input during but likely not limited to times of glacial advance. Some light green biosilica-rich intervals coincide with higher concentrations of coarse sands and gravels inferred to be IRD and are generally bioturbated. The high concentration of commingled diatomaceous debris in these intervals suggests slower sediment accumulation rates than the laminated, unfossiliferous muds. Other targeted intervals are of lower density than the mudstones, have a greenish color, and have evidence of bioturbation but lack identifiable biosilica, which we infer at least in part to reflect diagenetic loss of diatoms.
Organic microfossils occur throughout the Site U1532 sequence. A possibly in situ dinocyst assemblage of very low diversity and low abundance is present throughout the section but is most persistent in Hole U1532G below 591.77 m. Dinocysts reworked from Paleogene sediments are also present throughout the section in similar concentrations to the possibly in situ assemblage. Terrestrial palynomorphs of Cretaceous to Paleogene age are also present throughout the section and are common in some samples between 188.04 and 381.18 m and below 591.77 m.
Diatoms
Microscopic analysis of diatoms was carried out on samples from 358 unique depths at Site U1532. To establish diatom biostratigraphic age constraints of recovered cores, smear slides were prepared from all core catcher samples from Holes U1532A–U1532G. Selected core catcher samples were also sieved at 10 and 20 µm to concentrate diatoms. Additional toothpick samples were collected from whole-round section ends on the catwalk and from selected intervals of the split cores. During split-core sampling, units with low bulk density (whole-round core section GRA bulk density measurements on the Whole-Round Multisensor Logger [WRMSL]) were specifically targeted. All diatom datums and their hole/core depths identified at Site U1532 are listed in Table T10, and an occurrence chart of key (biostratigraphically useful) diatom species is provided in Table T11.
Hole U1532A
The mudline water sample from Core 379-U1532A-1H contains a typical modern Southern Ocean diatom assemblage without any notable reworked taxa in the muddy matrix. Moderate dissolution is evident in the mudline diatoms. Below this surface sample, most samples examined from Hole U1532A are barren of diatoms or contain only trace occurrences, which is consistent with either moderate to relatively low diatom productivity in the region or strong seafloor dissolution of biogenic silica or a combination of the two factors. Hole U1532A samples containing sufficient abundances of diatoms for biostratigraphic analysis are restricted to discrete intervals of Section 2H-3 (8.59–10.08 m) and Core 11H (91.1–100.6 m). Sample 2H-3, 120 cm (9.79 m), is assigned to the latest Pleistocene Thalassiosira lentiginosa Zone (0–0.6 Ma), and samples from Core 11H are assigned to the Pliocene Fragilariopsis interfrigidaria Zone (3.2–3.8 Ma).
Hole U1532B
Diatoms were observed in most samples examined from Hole U1532B, although the abundance and preservation of diatoms varies greatly from sample to sample. Based on the occurrence of F. interfrigidaria and the absence of Thalassiosira vulnifica, the interval between Samples 379-U1532B-2H-1, 19 cm, and 8H-5, 3–5 cm (93.29–156.1 m), was assigned to the F. interfrigidaria Zone (3.2–3.8 Ma). The interval between Samples 8H-CC and 11H-CC (159.66–180.62 m) contains Fragilariopsis barronii and Fragilariopsis praeinterfrigidaria in the absence of F. interfrigidaria and was therefore assigned to the F. barronii Zone (3.8–4.4 Ma).
Hole U1532C
In Hole U1532C, samples from Cores 379-U1532C-2F through 14F (178.3–239.4 m) contain sufficient diatoms for biostratigraphic analysis. The occurrence of F. barronii in the absence of F. interfrigidaria in Sample 11F-3, 40 cm (224.02 m), allows the interval between Samples 2F-2, 90 cm, and 11F-3, 40 cm (180.70–224.02 m), to also be assigned to the F. barronii Zone (3.8–4.4 Ma). Samples below Sample 14F-CC (239.78–239.83 m) are generally barren of diatoms except for trace occurrences in samples from Cores 22X (281.4–291.0 m), 26X (319.7–329.2 m), and 31X–33X (367.6–392.3 m). The trace occurrence of highly fragmented diatoms in these samples makes it difficult to determine the biostratigraphic age. However, the occurrence of R. costata in Sample 26X-CC (328.26–328.31 m) provides an age constraint of <4.7 Ma (early Pliocene) for the lowermost section of Hole U1533C. The occurrence of T. inura in this lower interval characterized by poor siliceous microfossil preservation supports this interpretation. In addition to the age assessment provided by calibrated diatom first and last occurrences, Pliocene ages are supported qualitatively by comparison between the overall diatom community structure seen at Site U1532 with Pliocene-age diatom assemblages noted in other drill cores, such as those from Leg 178 Site 1095 (Winter and Iwai, 2002; Bart and Iwai, 2012).
Holes U1532D–U1532F
Two cores were obtained from Hole U1532D: 379-U1532D-2R and 3R (362.7–381.9 m). However, these samples contain only trace occurrences of diatoms that are not age diagnostic, similar to the overlapping interval of Hole U1532C. No cores were obtained from Holes U1532E or U1532F.
Hole U1532G
Hole U1532G was drilled without coring to 372.3 m and then cored to 787.41 m. We analyzed all core catcher samples from Cores 379-U1532G-2R (372.3–381.28 m) through 47R (784.4–787.41 m) and samples from all bioturbated intervals, which are interpreted as interglacial sediments. Below Core 24R (~590 m), thin, centimeter-scale calcareous cemented horizons were observed in discrete intervals (see Lithostratigraphy). We applied a standard acid cleaning process to selected samples from these horizons to attempt detection of diatom remains. These samples are barren or contain only trace pyritized occurrences of diatoms.
With the exception of rare occurrences in Section 379-U1532G-5R-4 (406 m), samples from Cores 2R–9R (372.3–445 m) are nearly or completely barren of diatoms, and only a few samples contain very rare highly fragmented diatoms or indeterminate traces of pyritized centric diatoms (Table T11).
A single occurrence of a rich diatom assemblage in Hole U1532G was noted in a soft-sediment clast from Sample 379-U1532G-9R-4, 127 cm (445.1 m). Distinct from the diatom-poor matrix that surrounds it, this clast contains abundant and well-preserved diatoms. Although displaced from its point of origin, potentially by ice rafting from the continental shelf, the clast contains an early Pliocene diatom assemblage assigned to the T. inura Zone and is considered approximately contemporaneous with the host sediment. The presence of F. praeinterfrigidaria and absence of Thalassiosira complicata in this clast suggests an age of 5.1–5.3 Ma.
Despite poor preservation, T. inura is recognized in several samples between Samples 379-U1532G-11R-4, 30 cm (463.41 m), and 16R-3, 13 cm (509.46 m), allowing us to assign this interval to the T. inura Zone (4.4–5.5 Ma; Iwai et al., 2002). Although the T. inura specimens observed in the lowermost sample at 509.46 m include only the central hyaline area as a residual following strong silica dissolution, taxonomic assignment is still possible. Below this occurrence to the bottom of the hole (787.41 m), diatoms are effectively absent, though trace occurrences of pyritized diatom fragments are noted sporadically in a few samples.
Reworking of siliceous microfossils
Although no notable reworked fossils were seen in the mudline, Miocene diatoms such as Denticulopsis dimorpha, Denticulopsis ovata, and Denticulopsis simonsenii were noted sporadically in the Pliocene–Pleistocene sediments at Site U1532 and are considered reworked fossils. The ebridians Pseudoammodochium sphericum and Pseudoammodochium lingii and Paleogene diatoms such as Pyxilla reticulata and Hemiaulus spp. were also observed, rarely, in samples from the Pliocene section of Site U1532, though not in Pleistocene sediments. As noted above, although technically reworked, the displaced diatomaceous clast in Sample 379-U1532G-9R-4, 127 cm (445.1 m), is interpreted to reflect approximately contemporaneous deposition. The occurrence of reworked diatoms at Site U1532 has not impaired or constrained biostratigraphic age determination.
Dissolution of siliceous microfossils
The absence of biogenic silica in the Pleistocene sediments of Hole U1532A suggests relatively low regional primary productivity leading to dissolution in the water column or at the seafloor. In the Pliocene section of Holes U1532B and U1532C, greenish gray bioturbated muds (see Lithostratigraphy) corresponding to low bulk density and low magnetic susceptibility generally contain more biosiliceous material in comparison to the laminated silty clay intervals. Sampling at ~10–20 cm spacing and smear slide analysis were performed on one such bioturbated interval between Samples 379-U1532C-22X-2, 102 cm (283.93 m), and 22X-3, 56 cm (284.97 m). All samples were taken from a greenish gray massive mud interval where coarse sands and gravels inferred to be IRD increase uphole and are in highest concentration at the top of the interval. Diatom abundance and species diversity also increase uphole through the interval. In contrast, diatoms are completely absent from samples taken from a similar low-density greenish gray massive mud in Section 23X-4 (296.40–296.95 m) and other similar intervals to the bottom of Hole U1532G. We infer that the absence of diatoms in these intervals at least in part reflects diagenetic loss of diatoms, which is typical of deep burial of biosilica.
Calcareous nannofossils
Most foraminifer-rich intervals examined in Hole U1532A (see Foraminifers and ostracods), which were limited to the Pleistocene, contain rare to common coccoliths representing a very low diversity assemblage. Rare nannofossils were noted in diatom smear slides between 16.30 and 17.10 m and at 18.80 m. Nannofossils are of frequent abundance in a foraminifer-rich layer at 23.54 m. With one exception, no calcareous nannofossils were noted in the remainder of diatom smear slides from Holes U1532A–U1532G, including intervals where foraminifers were successfully extracted by sieving.
An assemblage of poorly preserved nannofossils including Reticulofenestra spp., Cyclicargolithus spp., and a questionable Calcidiscus specimen, heavily overgrown discoasters, likely Discoaster deflandrei, and other calcareous microfossils including two very small planktonic foraminifers was noted in a smear slide from Sample 379-U1532G-41R-5, 76 cm. Multiple smear slides were prepared at that level and above and below, but subsequent smear slides did not produce more nannofossils, indicating that the occurrence likely represents a very small displaced sediment clast. The nannofossils are tentatively assigned a late Oligocene to early Miocene age that likely reflects reworking or ice rafting of a small volume of older sediment rather than contemporaneous deposition. Contamination is ruled out by the species composition representing a typical late Paleogene–early Neogene assemblage from the Southern Ocean and the lack of nannofossils throughout the Site U1532 sequence (with the exception of the Pleistocene). Onshore consultation with Denise Kulhanek of IODP regarding these fossils is gratefully acknowledged.
Radiolarians
Most samples examined from Holes U1532A–U1532G are barren of radiolarians or only contain non–age diagnostic trace occurrences except for a few samples containing assemblages with frequent to common radiolarians (Table T12). The uppermost of these was Sample 379-U1532A-11H-CC (100.82 m), which contains Helotholus vema (2.4–4.59 Ma) and was thus assigned to the Upsilon Zone. Sample 379-U1532B-8H-5, 3–5 cm (155.99 m), also contains Larcopyle polyacantha titan (last appearance datum [LAD] at 3.48 Ma) and thus is assigned to the lower subzone of the Upsilon Zone (3.48–4.59 Ma). Similarly, Samples 379-U1532B-11F-4, 39 cm (180.19 m), 379-U1532C-2F-2, 31–33 cm (180.11 m), and 379-U1532C-6F-1, 134–136 cm (198.44 m), also contain fragments of Lampromitra coronata (LAD at 3.72 Ma). The lowermost sample from Hole U1532C that contains a datable radiolarian assemblage was taken at 223.84 m (Sample 379-U1532C-11F-3, 22–23 cm) and was also assigned to the Upsilon Zone (<4.59 Ma).
Samples from Holes U1532D and U1532G are barren of radiolarians except for a sample taken in the bioturbated greenish facies of Section 379-U1532G-11R-4 (Sample 11R-4, 44–45 cm; 463.55 m), which yielded broken fragments of radiolarians. Some of these fragments could be identified to species typical of late Miocene–Pliocene assemblages (e.g., Cycladophora pliocenica and Larcopyle weddelium). A sample taken in a deeper bioturbated green facies of Section 13R-4 (Sample 13R-4, 95–96 cm; 483.28 m) contains only a few unidentifiable fragments. The other similar facies deeper in Hole U1532G are barren of radiolarians based on smear slides from split cores and on sieved material from the one core catcher containing such a facies (Sample 30R-CC; 649.41 m).
All radiolarian assemblages observed are preserved as primary opal-A but are mostly preserved as broken specimens. No recognizably reworked specimens were observed.
In the lower part of Hole U1532G (below Sample 44R-CC; ~773 mbsf), slides prepared for radiolarians show trace amounts of diatom and possible radiolarian fragments altered from opal-A to opal-CT along with occasional pyritized fragments of diatoms.
Palynology
Marine palynomorphs are rare in most samples examined from Site U1532 (Table T13). A possibly in situ, very low diversity assemblage consisting principally of Brigantedinium spp. and Selenopemphix spp. was noted throughout the site, but it appears most consistently below 591.8 m (Table T13). Neither of these genera have biostratigraphic utility in these Pliocene–Pleistocene sediments.
Some reworked Paleogene dinocysts were identified at Site U1532, principally Enneadocysta spp. (Table T13). Reworked dinocysts are present in similar abundance to possibly in situ forms. Potentially in situ dinocysts are slightly more frequent in the lower part of Hole U1532G (below Core 26R; ~591.77 m), although they remain rare throughout the recovered successions.
Most samples contain rare to common reworked Paleogene pollen (Table T13), and a few samples contain abundant and diverse pollen assemblages, including Late Cretaceous forms.
Palynofacies analysis revealed a consistent high concentration of palynodebris (black and brown phytoclasts) throughout all holes at Site U1532, making up an average of ~81% of the palynological assemblage.
Foraminifers and ostracods
A total of 90 core catcher and 17 discrete samples from section halves from Site U1532 were investigated for foraminifers. Planktonic foraminifers are absent in most samples, but rare to frequent occurrences were noted sporadically throughout the Site U1532 sequence. Only one species, Neogloboquadrina pachyderma (sinistral coiling), was noted other than an occurrence of uncertain identification noted in a smear slide from 743.13 m (see below). Three horizons with abundant N. pachyderma were observed in the upper part of Hole U1532A (Table T14).
Only three intervals in Hole U1532A were found to contain benthic foraminifers with high abundance and high diversity: Samples 379-U1532A-1H-2, 38–40 cm (1.88 m), 3H-2, 91–93 cm (17.5 m), and 3H-6, 95–97 cm (23.54 m). The benthic assemblage in these three samples is similar and is dominated by Nuttalides umbonifera, Epistominella exigua, Cibicides grossepunctatus, Pullenia salisbury, and Textularia antarctica (Figure F15). The preservation of benthic foraminifers in these samples ranges from moderate to good.

Figure F15. Foraminifers and ostracods.
A single, well-preserved specimen of an ostracod, Henryhowella caligo, was found in the interval containing foraminifers at 1.98 m (Sample 379-U1532A-1H-2, 38–40 cm). This species is reported exclusively from the Southern Ocean in waters deeper than 1570 m (Moriaki et al., 2009), which is consistent with the occurrence at Site U1532 (3962 m).
Two very small planktonic foraminifer specimens that could not be identified to the species level were noted in a smear slide containing calcareous nannofossils in Sample 379-U1532G-41R-5, 76 cm (743.13 m) (see Calcareous nannofossils for discussion of this likely reworked occurrence). Sediment processed from this interval contained no foraminifers, including the fine sieved fraction.
Paleomagnetism
Pass-through paleomagnetic measurements were performed on all archive halves from Site U1532. Determination of magnetic polarity stratigraphy was based only on inclination data after 20 mT demagnetization (Figure F16). Intervals that were assigned a “high” drilling disturbance (i.e., described as fall-in, flow-in, or suck-in) in the course of core description (see Lithostratigraphy) were systematically excluded from paleomagnetic interpretation. A total of 159 discrete samples were taken from the least-disturbed intervals of the working halves. Discrete samples were subjected to stepwise alternating field (AF) demagnetization to integrate with and verify pass-through paleomagnetic data. Anisotropy of magnetic susceptibility (AMS) was measured for all discrete samples to study the magnetic fabric. The stepwise acquisition of isothermal remanent magnetization (IRM) up to a peak field of 1 T was determined for a subset of six representative samples to investigate rock magnetic characteristics (e.g., grain size, mineralogy, and concentration of magnetic particles).
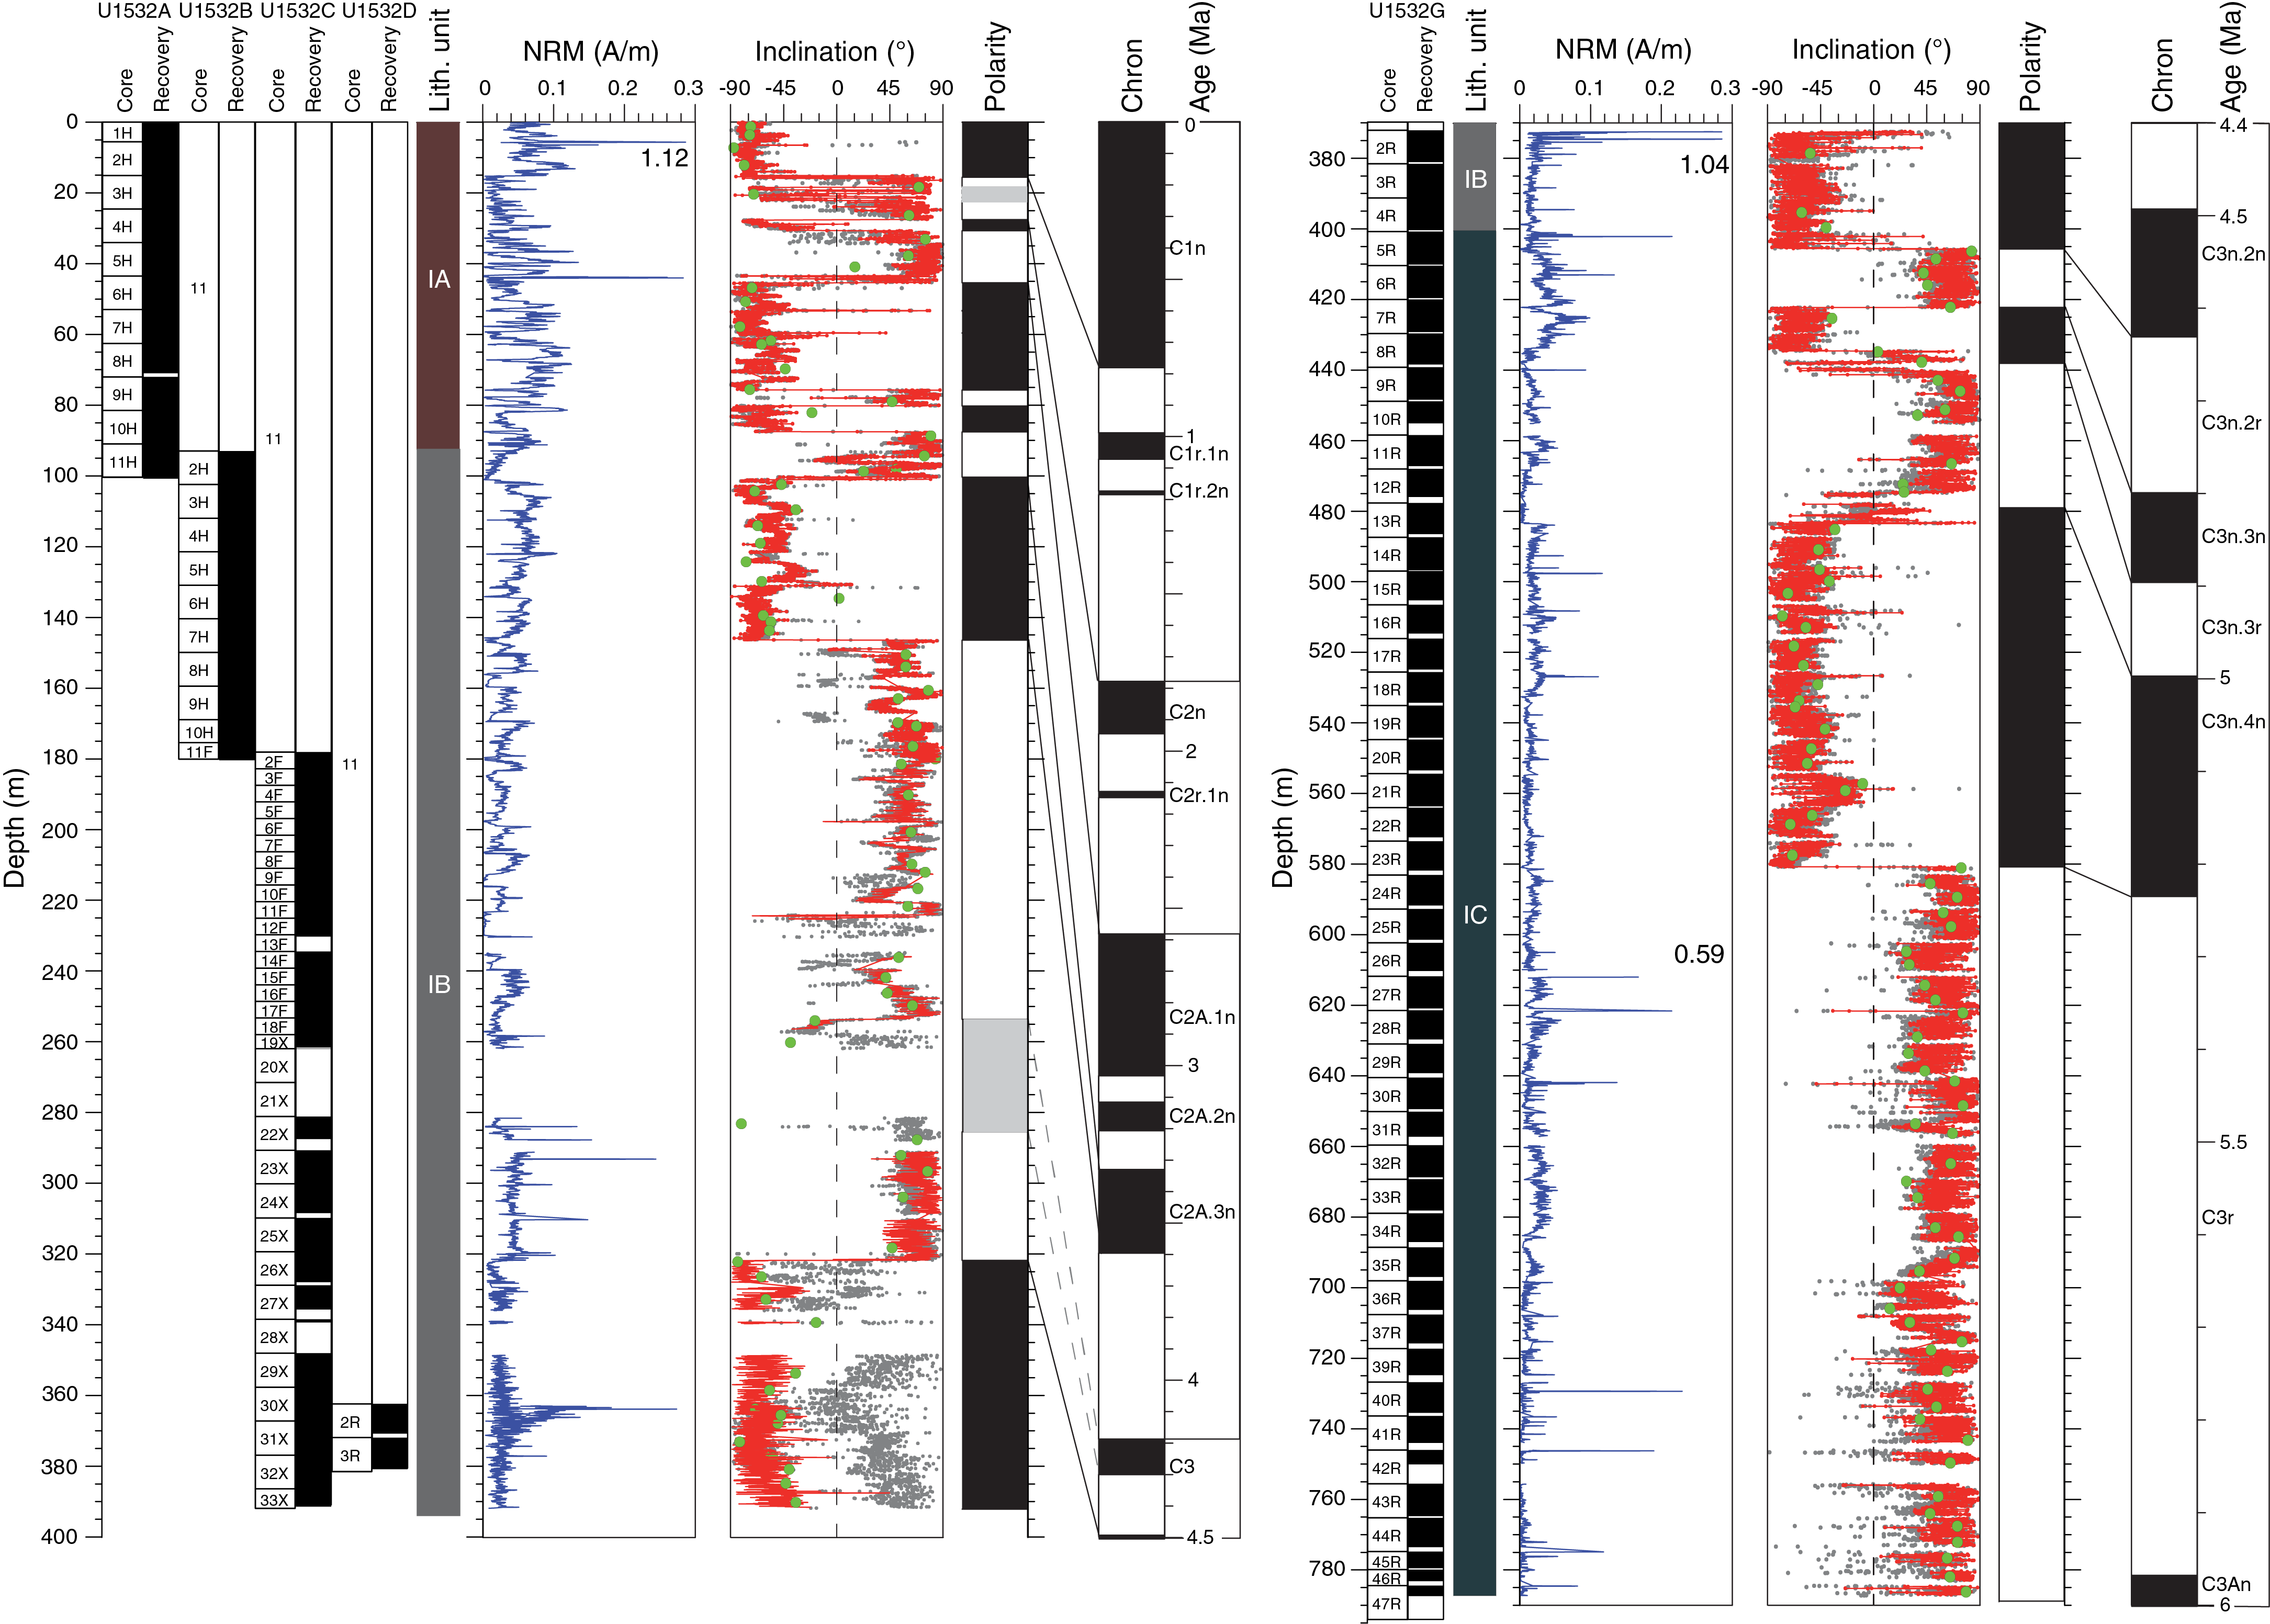
Figure F16. Paleomagnetic data.
Results from paleomagnetic measurements of archive halves
Paleomagnetic data of archive halves from Hole U1532A, including NRM intensity and inclination, show overall good to reasonable quality for all recovered lithologies. For Hole U1532A (Figure F16), NRM intensity is moderate to high (~10−2 to 10−1 A/m). Although it is usually less than 0.15 A/m, a peak value of ~1.12 A/m occurs at the middle of Section 379-U1532A-2H-1 due to the presence of rock fragments with high magnetic susceptibility. NRM intensity is variable with changes on the meter scale as well as the submeter scale. NRM inclination before AF cleaning exhibits several intervals of positive and negative values documenting several polarity changes (Figure F16). This pattern is persistent at the 20 mT demagnetization level, indicating a stable magnetic record. Cores 1H and 2H (0–15.1 m) are characterized by negative inclinations (i.e., normal polarity). From this interval to the top of Core 6H at 45.3 m, inclination data are mainly positive (i.e., reversed polarity) but show a series of reversals (Figure F16). Down to Core 10H (87.5 m), inclinations are mostly negative, but there is an intercalated interval of positive values in Core 9H. Below 87.5 m, inclinations are positive down to the bottom of Hole U1532A. NRM data as well as those at the 20 mT demagnetization level show clear bimodal clustering (Figure F17) close to the inclination value of ~79° expected for a geocentric axial dipole (GAD) for a site latitude of ~68.6°S. In summary, the paleomagnetic properties of the sediments recovered from Hole U1532A provide a reliable record of the geomagnetic field.
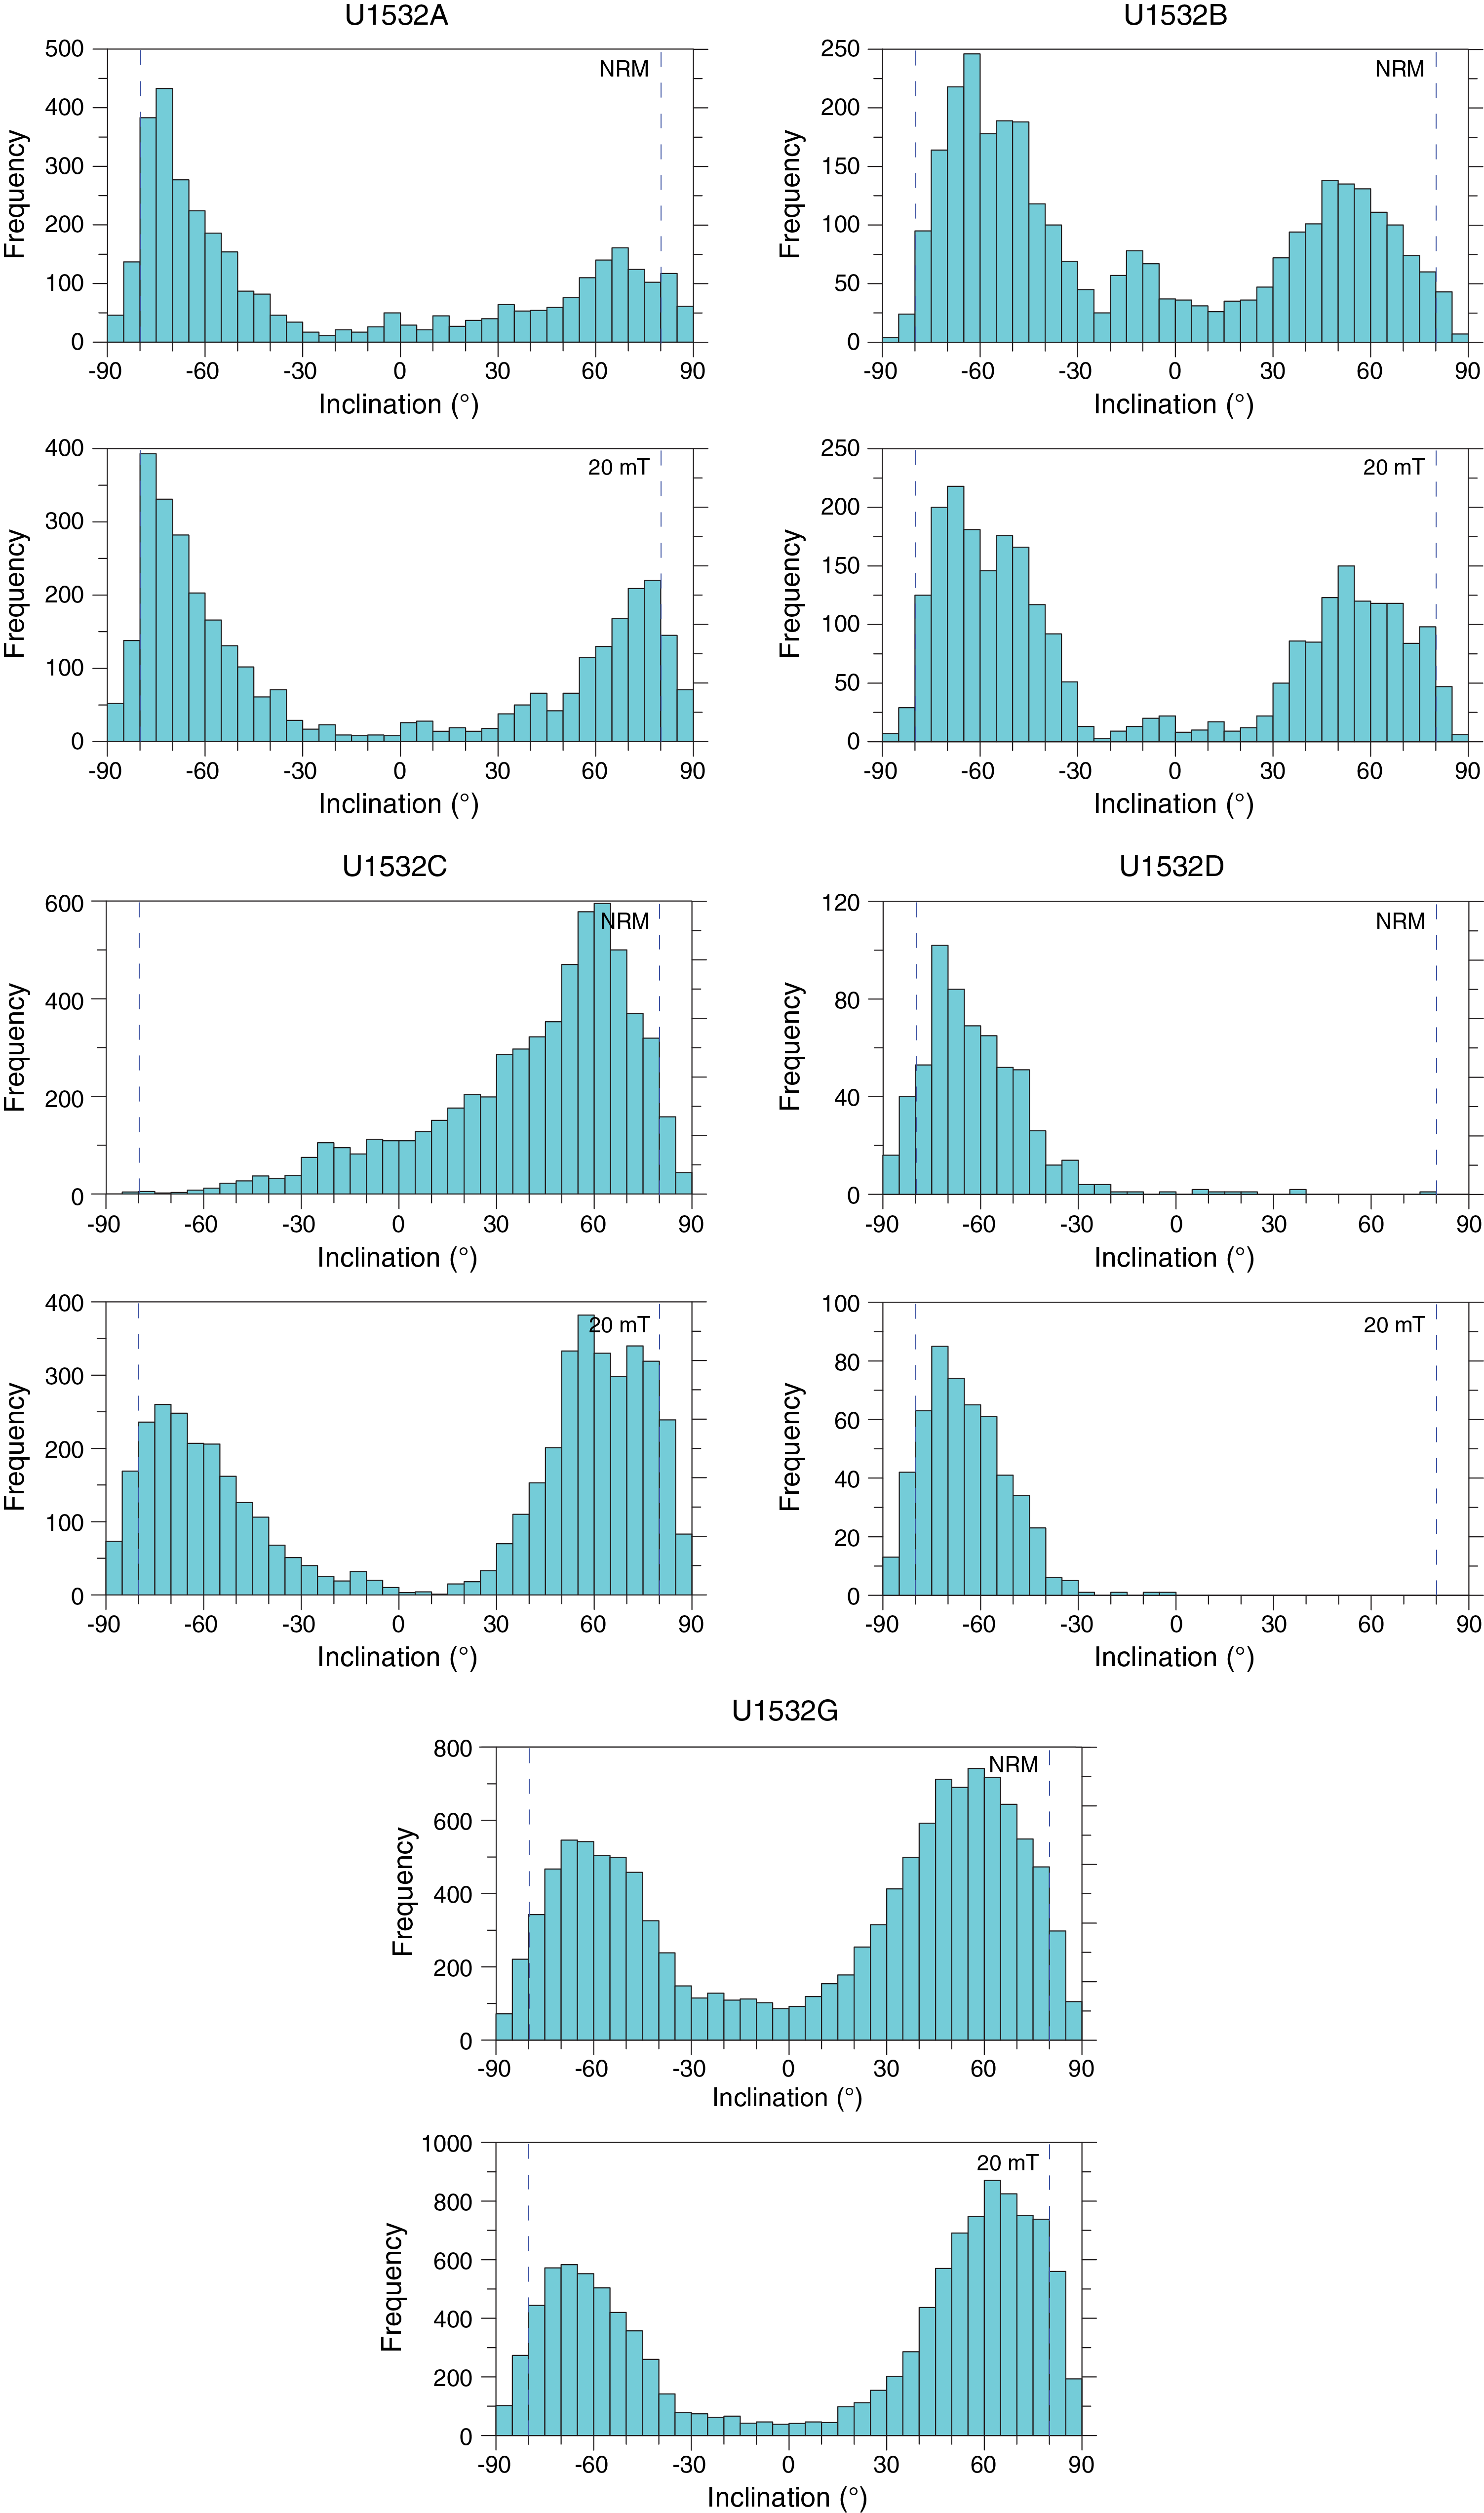
Figure F17. Inclinations.
For Hole U1532B, NRM intensity is moderate to high and ranges from ~10−2 to 10−1 A/m except for a few intervals where it decreases to ~10−3 A/m (Figure F16). AF demagnetization revealed positive inclination values (reversed polarity) in the upper part of Hole U1532B from 93 to 101 m followed by an interval of negative inclination (normal polarity) from 101 to 147 m. Farther downcore, we found positive inclination values to the bottom of Hole U1532B (Figure F16). NRM data as well as those at the 20 mT demagnetization level show clear bimodal clustering (Figure F17) close to the GAD inclination value of ~79° at site latitude. In summary, the paleomagnetic properties of the sediments recovered from Hole U1532B provide a reliable record of the geomagnetic field.
NRM intensity for Hole U1532C is usually moderate and ~10−2 A/m but peaks to 0.244 A/m at the top of Core 379-U1532C-2F, in the middle of Core 22X, and at the tops of Cores 23X and 25X (Figure F16). Only the latter instance coincides with the occurrence of an IRD hard rock clast. Positive inclination values found at the bottom of Hole U1532B continue in Hole U1532C downcore to the bottom of Core 17F. At ~253 m (Core 18F), a transition to normal polarity occurs. Most of the deeper part of Core 18F as well as Cores 19X and 22X were excluded from further interpretation because of severe coring and drilling disturbance. Cores 20X and 21X did not recover any sediments. Thus, the interval between ~256 and ~291 m is difficult to interpret, although we assume that a transition from normal to reversed polarity must have occurred in this interval but is not documented. At ~291 m at the top of Core 23X, inclination values are again positive. At 322 m, a transition from reversed to normal polarity is recorded. Normal polarity continues down to the bottom of Hole U1532C. A viscous remanent magnetization or IRM drilling-induced overprint of reversed polarity was observed for all XCB cores. The distribution of NRM inclinations shows a strong bias to shallow or even positive values as a consequence of this reversed polarity overprint (Figure F17). After AF demagnetization (at 5–10 mT), the typical bimodal distribution of inclination values returns to close to the expected GAD inclination (Figure F17). Thus, we infer that the XCB cores also provide a reliable paleomagnetic signal. The drilling-induced vertical overprint was not observed for any of the Site U1532 APC cores.
The two RCB cores recovered from Hole U1532D show normal polarity (Figure F16). Core 379-U1532D-2R exhibits moderate to high NRM intensities between ~10−2 and ~10−1 A/m that generally decrease downhole; intensities remain at those low values throughout Core 3R except for a peak value of 0.27 A/m at 363.73 m. Inclination values cluster close to the GAD value for this location (Figure F17).
NRM intensity for Hole U1532G is moderate and ranges from ~10−3 to ~10−2 A/m. NRM demagnetization at the 20 mT level reveals five polarity transitions between ~406 and ~581 m (Figure F16). The oldest magnetic polarity reversal (in Core 379-U1532G-23R) is preliminarily attributed to the beginning of the Thvera Subchron (C3n.4n; 5.235 Ma). Reversed magnetic polarity continues down to the deepest core recovered from Hole U1532G. The magnetic polarity transitions appear to be relatively sharp at ~406, 422, and 581 m (in Cores 5R, 7R, and 23R, respectively), whereas at ~438 and ~479 m (in Cores 8R and 12R, respectively) the transitions exhibit a more gradual character with oscillating polarities. Toward the bottom of Hole U1532G, the scatter in inclination data increases, which is probably due to the decreased NRM intensity and the increase of drilling disturbance. The maximum of the inclination distribution plots at a value that is a bit shallower than the GAD value for the site location (Figure F17).
Discrete sample measurements
After visual inspection and principal component analysis (PCA; Kirshvink, 1980), linear characteristic remanent magnetization components of NRM demagnetization data were isolated from 157 of 159 (99%) discrete samples. The majority of discrete samples show excellent AF demagnetization behavior with mostly straight vector endpoint data pointing toward the origin of the demagnetization diagrams after demagnetization at the 10–20 mT level. Two examples are shown in Figure F18. The good paleomagnetic behavior of the discrete samples confirms the reliability of the pass-through paleomagnetic results and provides confidence in our magnetostratigraphic interpretations.
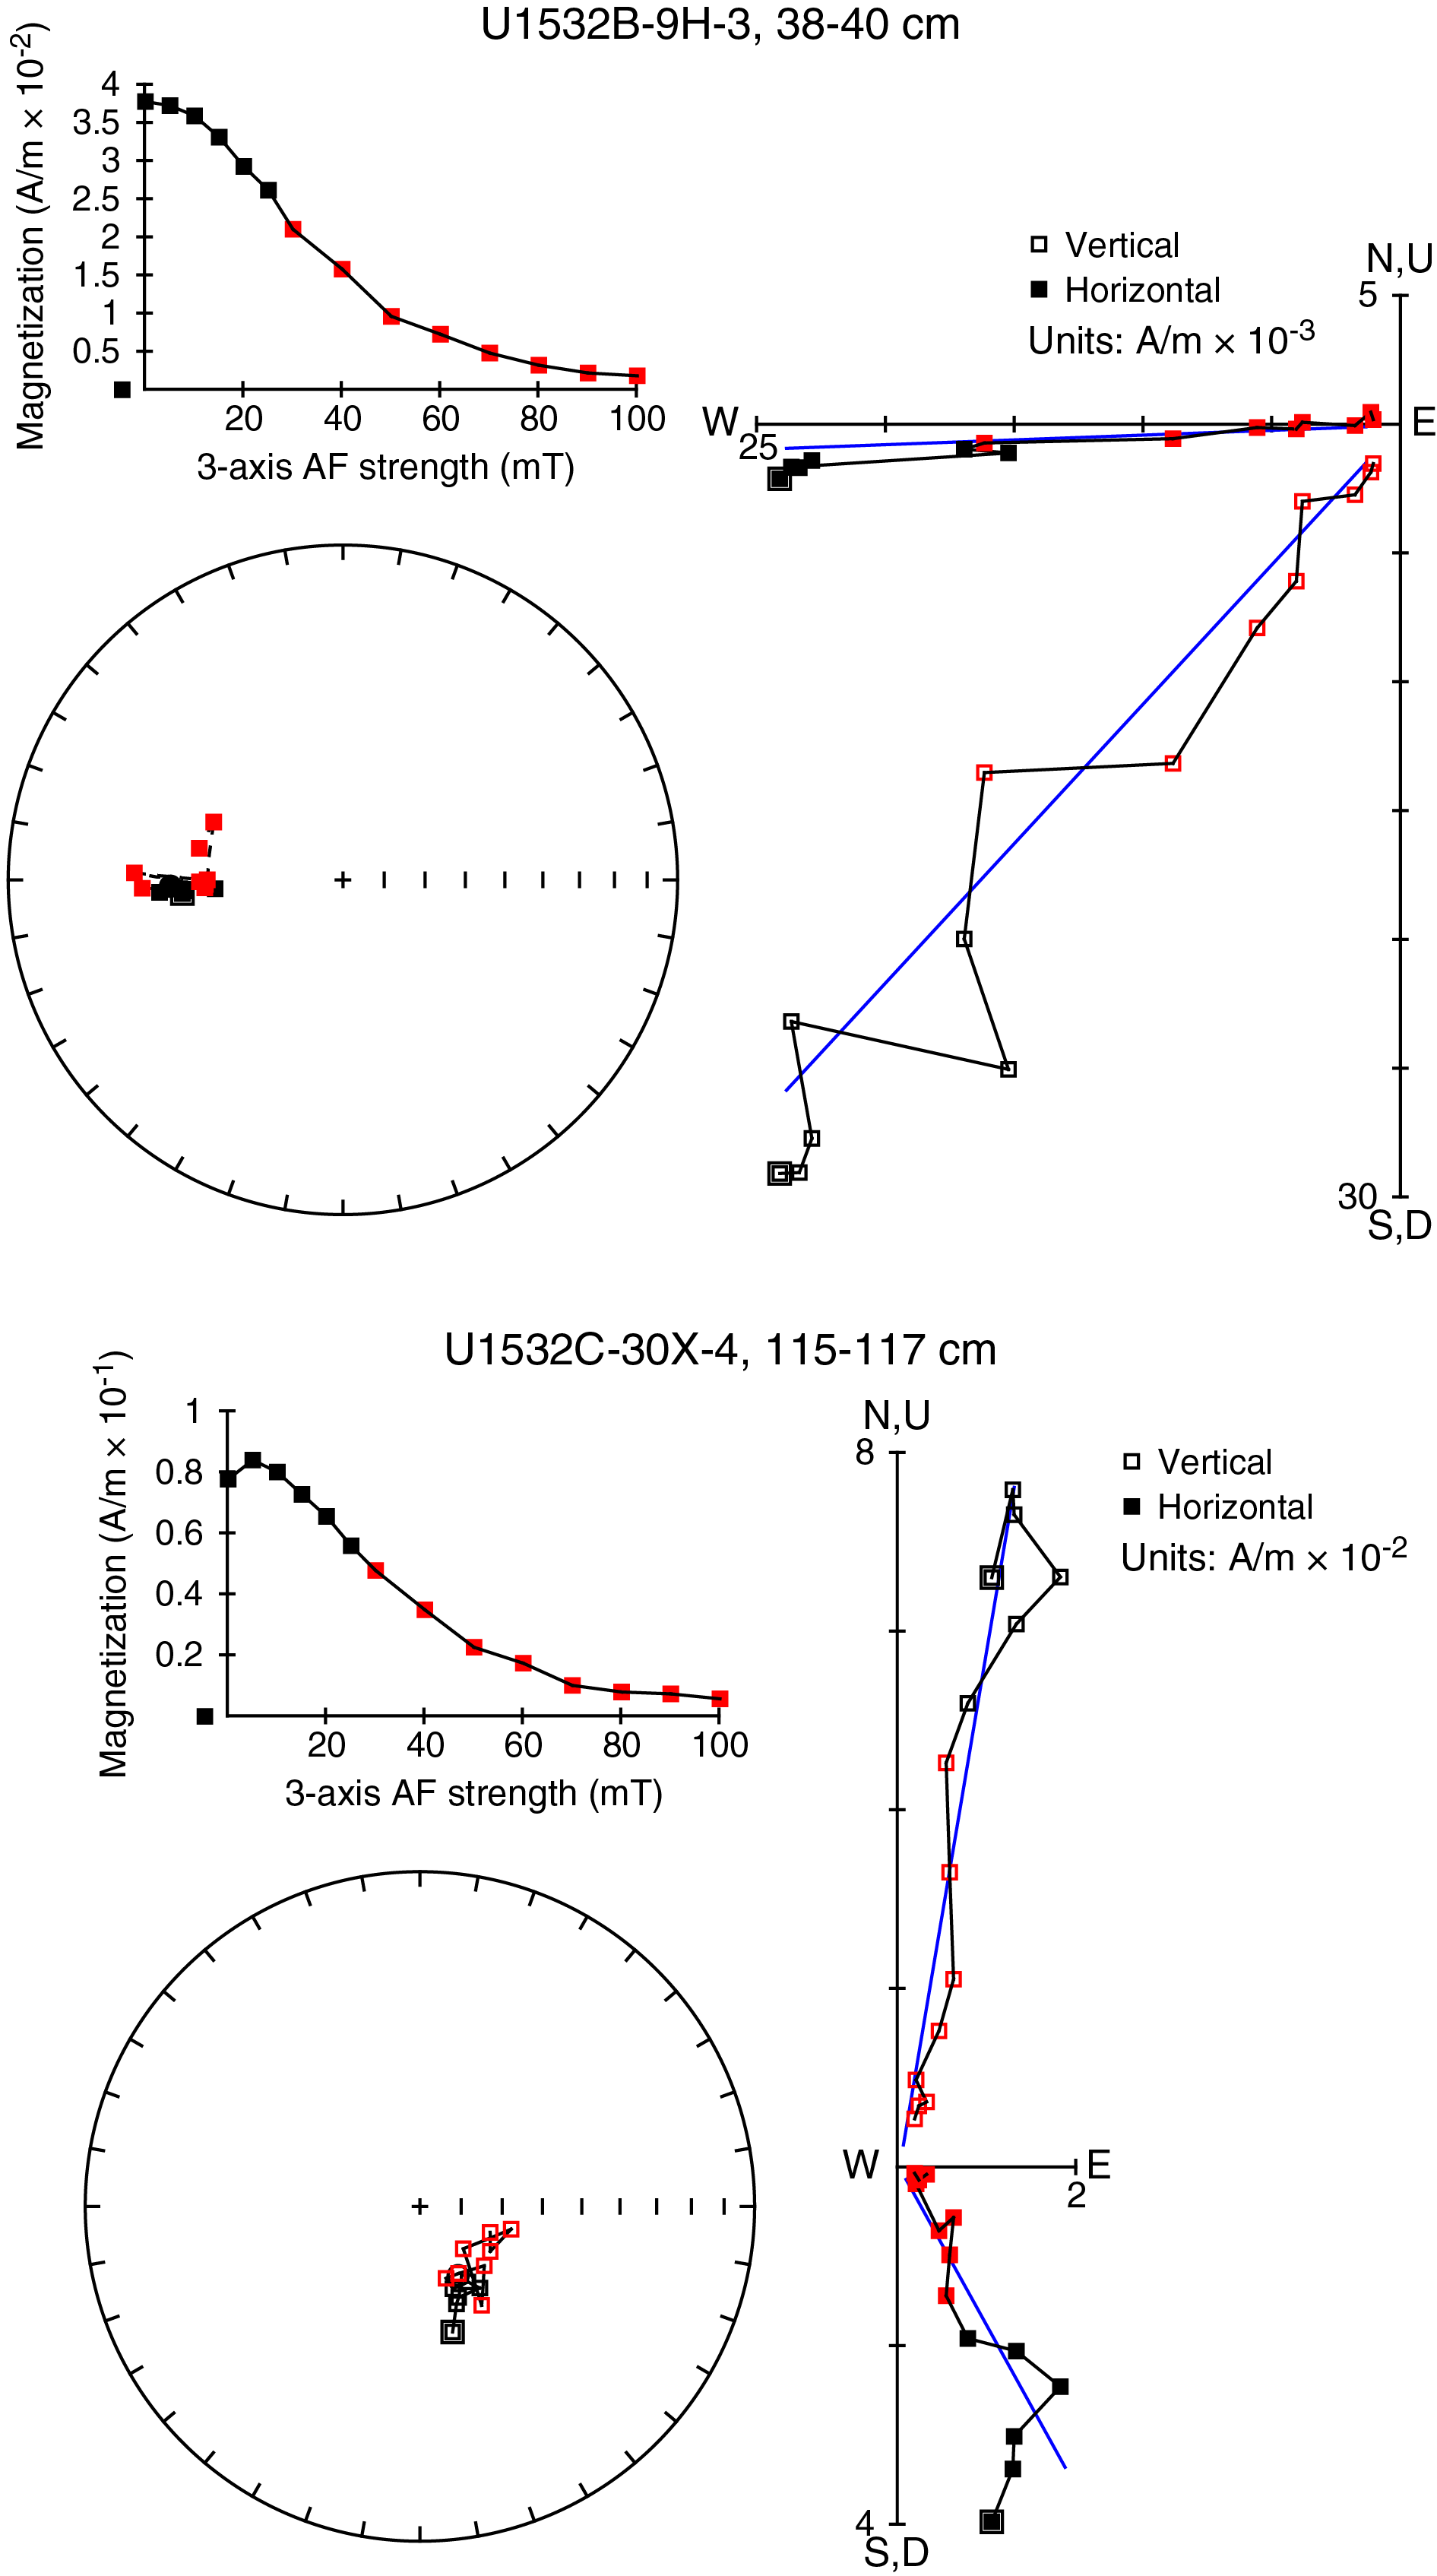
Figure F18. Demagnetization and NRM.
Anisotropy of magnetic susceptibility
AMS was measured on all 159 discrete samples from Site U1532. Samples from Holes U1532A–U1532D were collected by pushing 7 cm3 plastic cubes into the soft sediment. For Hole U1532G, 8 cm3 samples were cut with a rock saw with two parallel blades. AMS is highly variable with a clear trend from weak anisotropies in the upper part of Hole U1532A (lowest P = κmax/κmin = 1.02) to strong anisotropies in the deeper holes (highest P = 1.33).
For APC and HLAPC cores from Holes U1532A and U1532B, κmax shows a clear orientation toward the x-axis of the specimens coordinate system (see Figure F14 in the Expedition 379 methods chapter [Gohl et al., 2021a]).
In samples from Hole U1532C HLAPC and XCB cores (beginning with Core 379-U1532C-19X), the clustering of the preferred orientation of κmax is less pronounced.
For Holes U1532D and U1532G, both cored by the RCB system, κmax is arbitrarily distributed in the horizontal (x–y) plane (see Figure F14 in the Expedition 379 methods chapter [Gohl et al., 2021a]).
The κmin axis of the AMS ellipsoids of almost all samples is oriented roughly perpendicular to the horizontal plane, indicating a clear oblate magnetic fabric of the sediments (Figure F19), which is typically observed for sedimentary rocks deposited in an undisturbed environment and not affected by any significant syn- or postdepositional process other than magnetic ordering. Therefore, directional data obtained from paleomagnetic measurements on the same samples are supposed to be reliable.

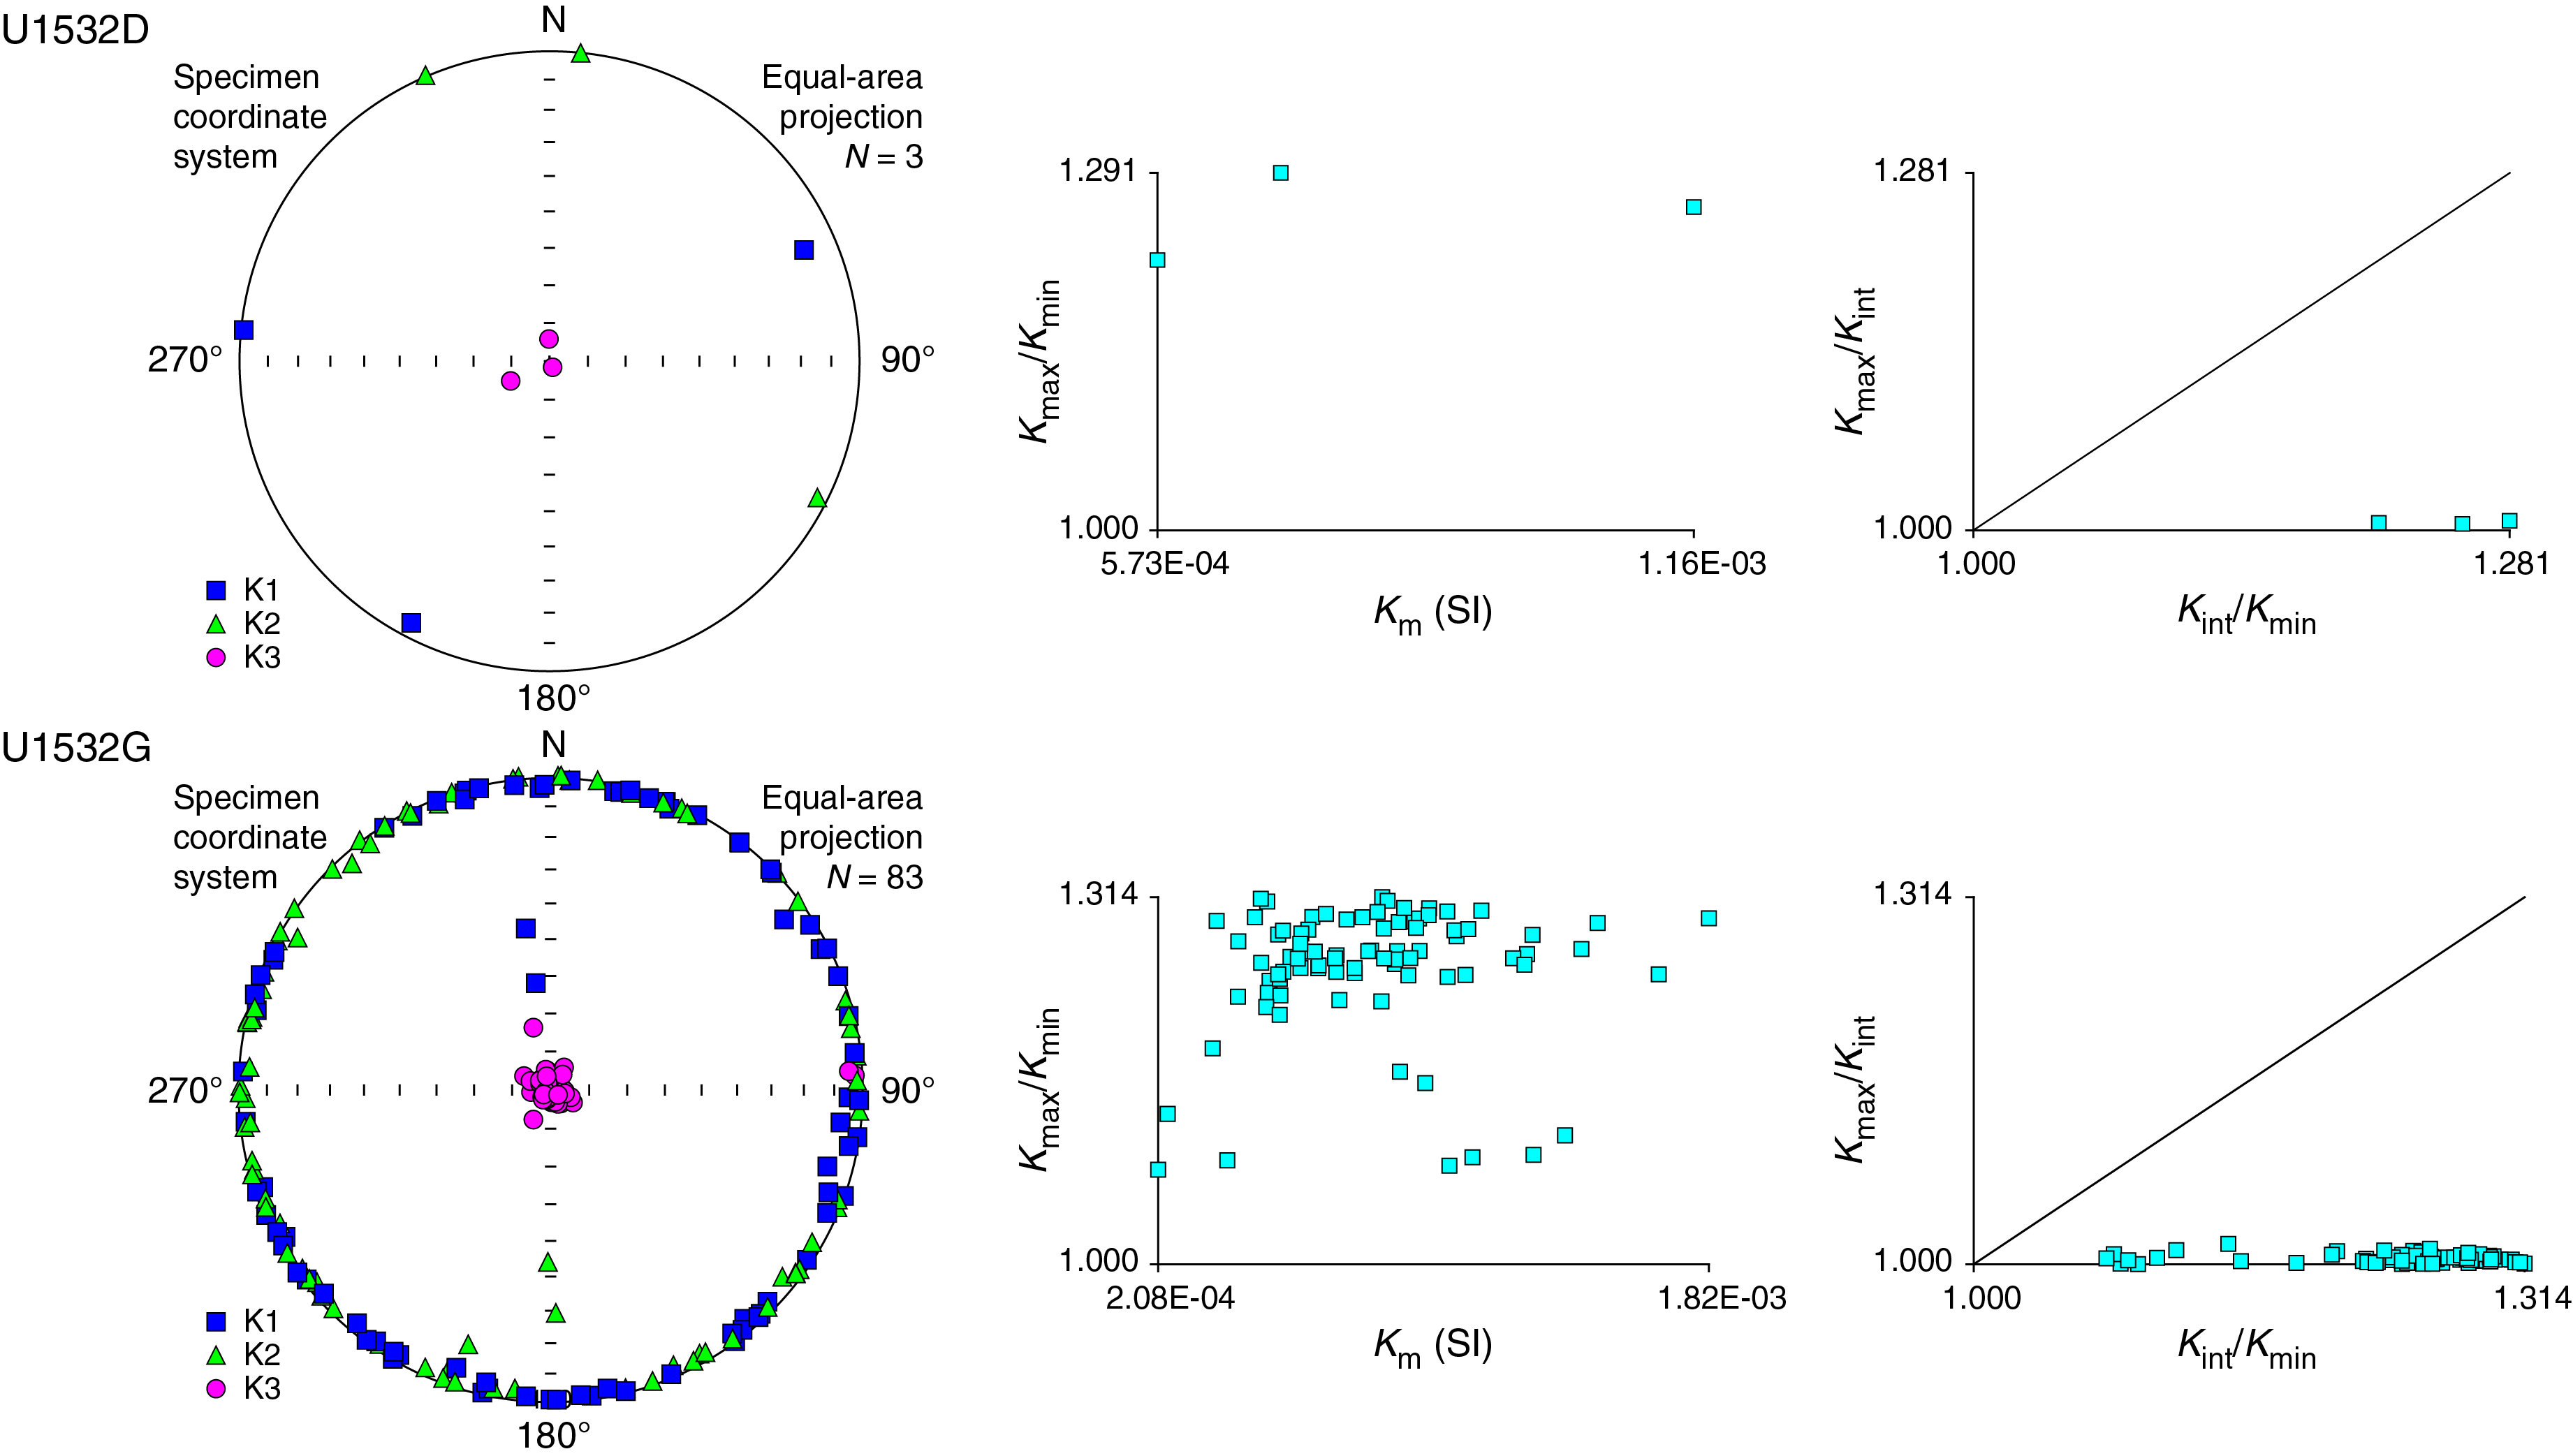
Figure F19. AMS data.
Isothermal remanent magnetization
The IRM acquisition curves for the discrete samples demonstrate steep slopes at low magnetic fields (Figure F20). Saturation IRM is reached at direct current (DC) fields of 0.2 to 0.4 T, suggesting mostly (titano)magnetites/-maghemites are the main carriers of magnetic remanence. Samples from depths shallower than Section 379-U1532B-5H-6 reached magnetic saturation at higher DC fields than those from sections recovered from greater depths, indicating that smaller magnetic particle sizes and/or a second, magnetically more stable mineral phase occurs mainly in the upper part of Hole U1532B (Figure F20).
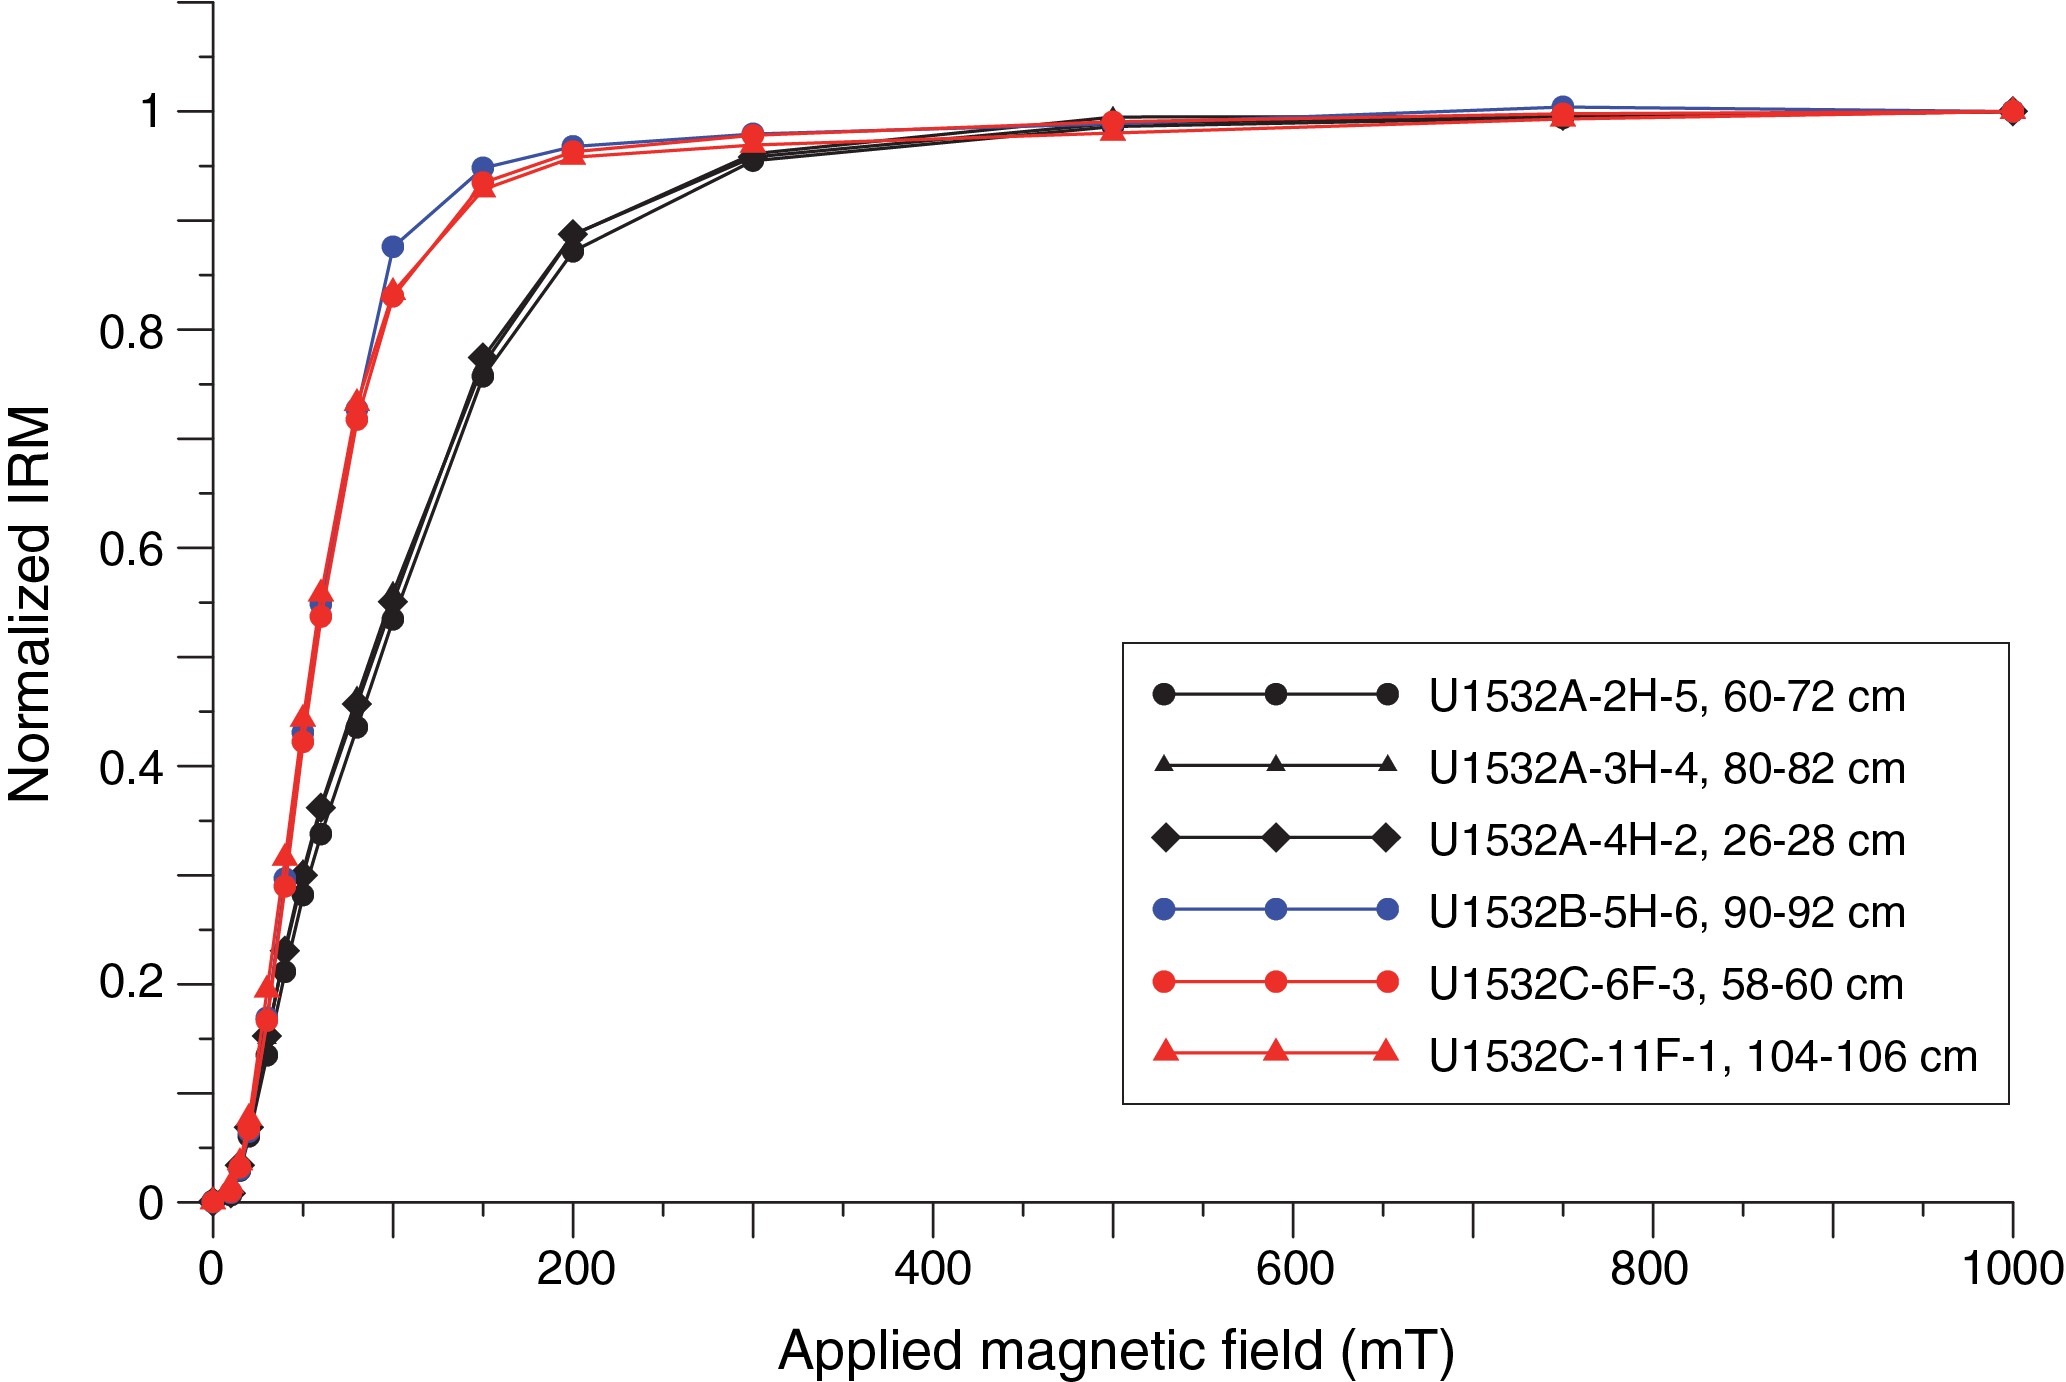
Figure F20. Normalized IRM versus applied DC field.
Orientation tool data
The Icefield MI-5 orientation tool was deployed while taking all APC cores from Holes U1532A and U1532B except for Core 379-U1532B-10H (Table T15). Although the corrected declination values exhibit a moderate bias to westerly directions, they cluster around the expected value of 0° (Figure F21). Therefore, we conclude that the orientation data are generally reliable. Still, we did not use the correction for shipboard interpretation during Expedition 379 but intend to apply it during further onshore data processing.
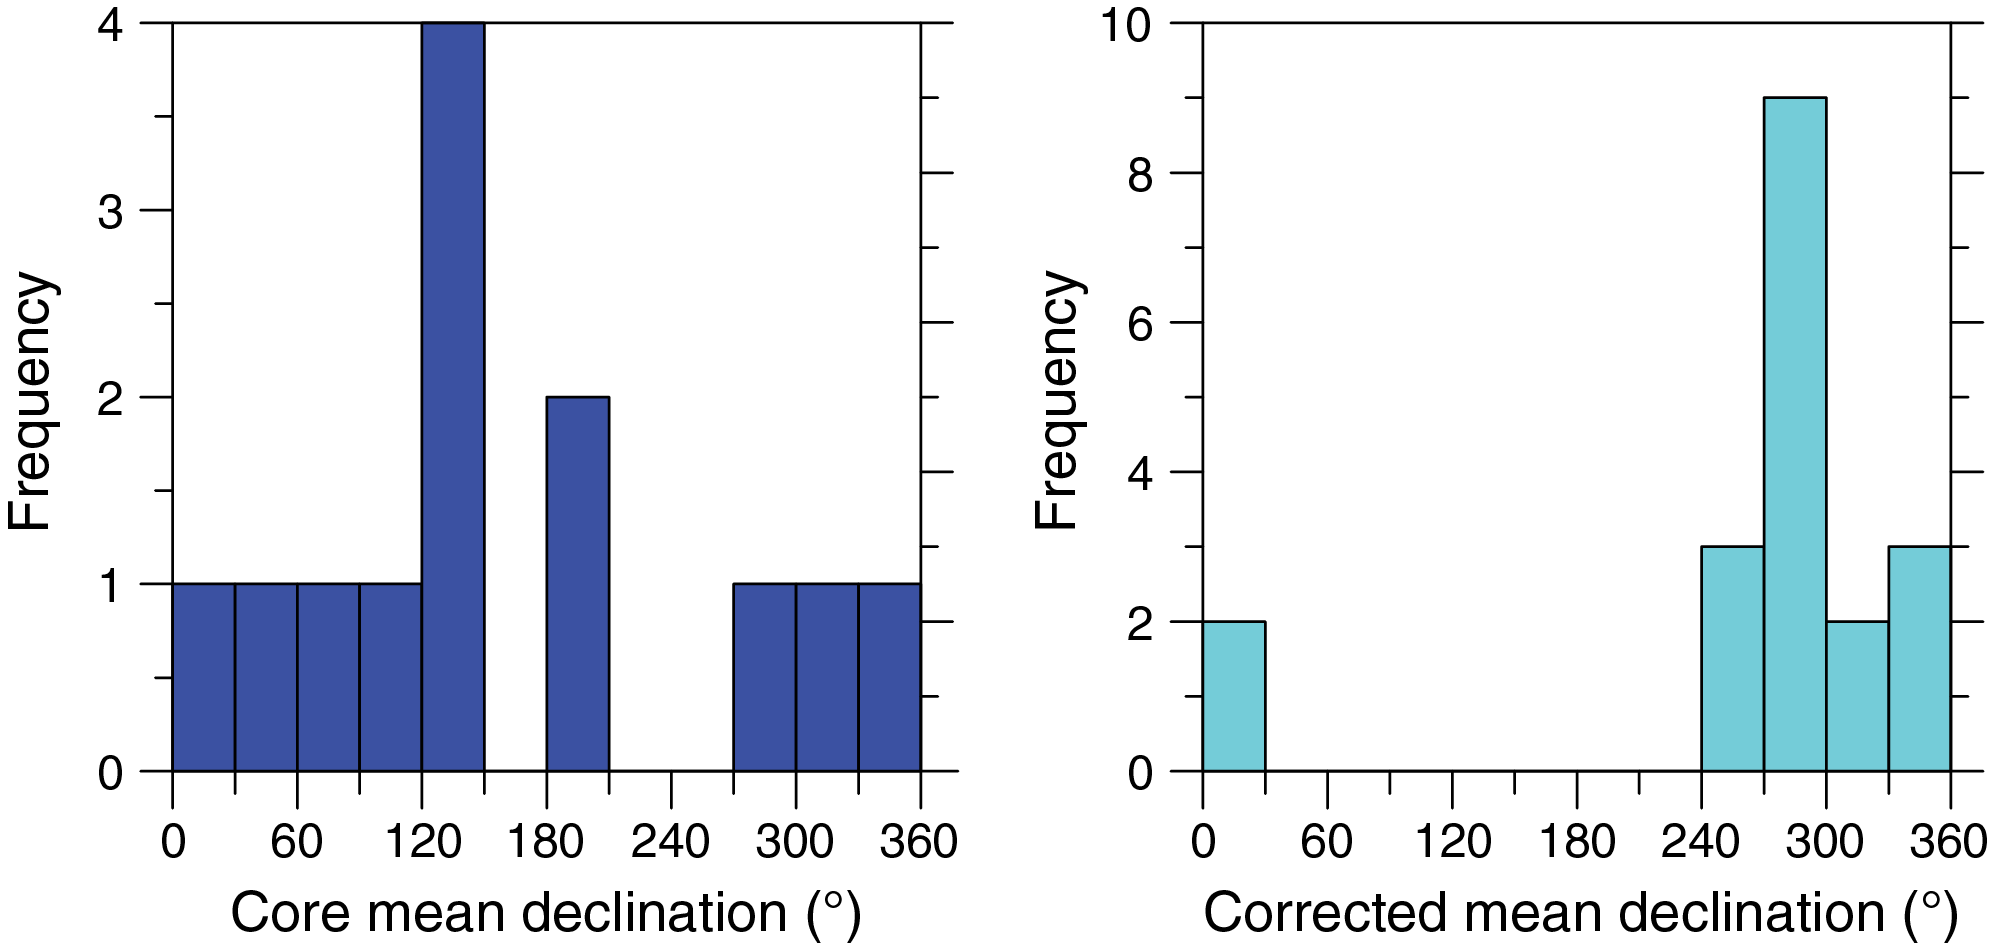
Figure F21. Declinations.
Magnetostratigraphy
The interpreted magnetic polarity at Site U1532 (Figure F16) was correlated to the GTS2012. The resulting key paleomagnetic age data (Table T16) were then integrated with biostratigraphic data to produce the age model presented in Chronostratigraphy.
For Hole U1532A, a reliable shipboard magnetostratigraphy was obtained that consisted of four normal and four reversed polarity intervals. Only the interval of high, frequently oscillating inclination data in Core 379-U1532A-3H (18.5–20.9 m) was not assigned to any magnetic polarity subchron, but it probably reflects the Jaramillo (C1r.1n; 0.988–1.072 Ma) and Cobb Mountain (C1r.2n; 1.173–1.185 Ma) Subchrons. The Brunhes–Matuyama polarity transition (0.781 Ma), the termination and beginning of the Olduvai Subchron (C2n; 1.778 and 1.945 Ma, respectively), the Matuyama–Gauss polarity transition (2.581 Ma), the termination and beginning of the Kaena Subchron (C2An.1r; 3.032 and 3.116 Ma, respectively), and the termination and beginning of the Mammoth Subchron (C2An.2r; 3.207 and 3.330 Ma, respectively) were identified.
Paleomagnetic measurements for Hole U1532B identified the beginning of the Mammoth Subchron (C2An.2r; 3.330 Ma) and the Gauss–Gilbert polarity transition (3.596 Ma). These data give reliable confirmation of the biostratigraphic dating for Hole U1532B and confirm the relatively high sedimentation rates during the late Pliocene.
Paleomagnetic measurements for Hole U1532C identified the termination of the Nunivak Subchron (C3n.2n; 4.493 Ma) but no clear Cochiti Subchron (C3n.1n; 4.187–4.300 Ma). Despite this uncertainty, sedimentation rates are estimated to be high for the early Pliocene as well.
Archive-half data from the two Hole U1532D cores show normal polarity at the 20 mT demagnetization level, indicating that the bottom of Hole U1532D must be younger than the beginning of the Nunivak Subchron (C3n.2n; 4.631 Ma).
NRM measurements for Hole U1532G identified the beginning of the Nunivak Subchron (C3n.2n; 4.631 Ma), the termination and beginning of the Sidufjall Subchron (C3n.3n; 4.799 and 4.896 Ma, respectively), and the termination and beginning of the Thvera Subchron (C3n.4n; 4.997 and 5.235 Ma, respectively). Reversed magnetic polarity continues down to the bottom of Hole U1532G, and the beginning of Chron C3r (6.033 Ma) was not recorded. Therefore, the oldest sediments recovered at Site U1532 are presumably of latest Miocene age.
The results from discrete sample demagnetization generally confirm the findings from the archive-half measurements (see green dots in Figure F16).
Chronostratigraphy
Based on shipboard analyses of Holes U1532A–U1532G, an age-depth model for the Site U1532 sequence (Figure F22) was constructed using biostratigraphic age datums (Table T10) to constrain correlation of magnetostratigraphic polarity zones to the GTS2012 (see Table T5 in the Expedition 379 methods chapter [Gohl et al., 2021a]. This preliminary age-depth model will be refined with further postcruise biostratigraphic and magnetostratigraphic work, and age control will likely be improved by application of additional age-dating techniques. Ultimately, high-resolution cyclostratigraphic analysis of physical property, lithostratigraphy, and geochemistry data may be possible.
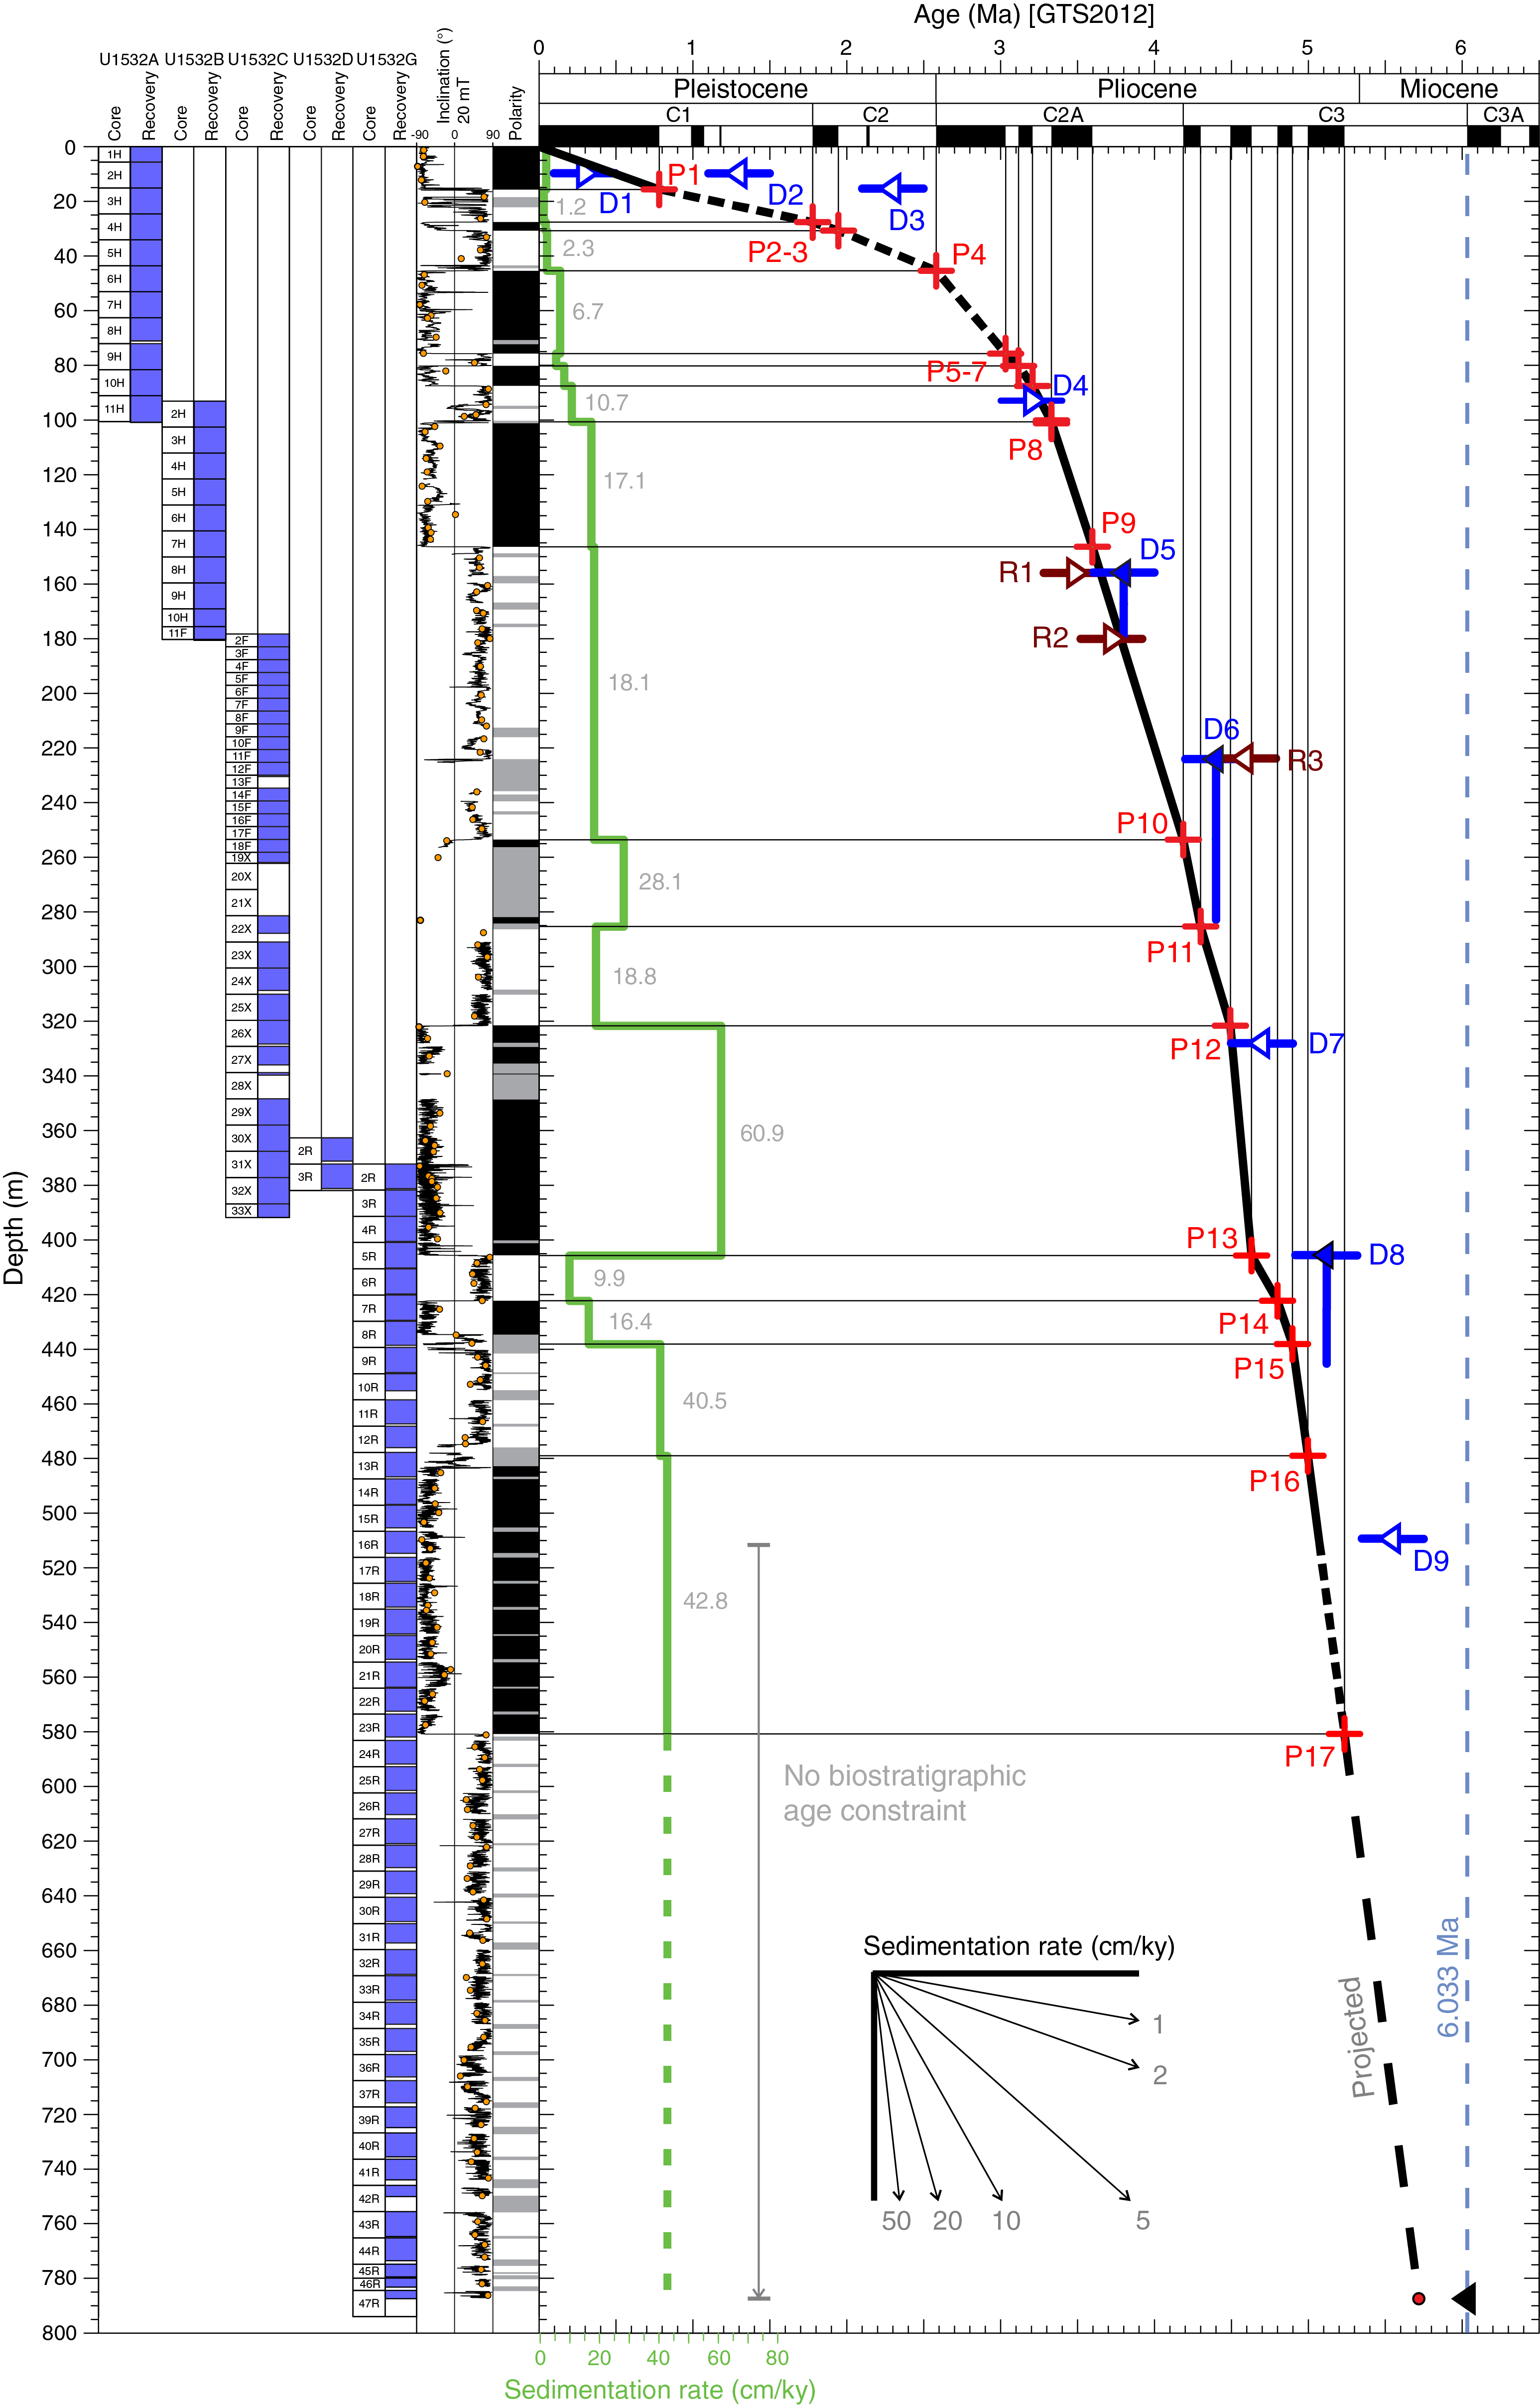
Figure F22. Age-depth model.
The magnetostratigraphic polarity zones identified in shipboard analysis of Site U1532 (Table T16) are, for the most part, clearly defined in the high-resolution inclination data generated from cryogenic magnetometer analysis of archive halves. These inclination directions are confirmed by analysis of regularly spaced (~1–5 m) discrete working-half samples and allow designation of well-defined polarity zones (see Paleomagnetism). Uncertainty in the polarity sequence and reversal boundaries is primarily confined to the ~256–290 m interval and is due to limited or disturbed core recovery in this interval.
Biostratigraphic age control for Site U1532 is based on diatom and radiolarian datums (Table T10). Using these biostratigraphic age control points, interpreted correlation of magnetostratigraphic polarity reversals identified at Site U1532 (Table T16) to the GTS2012 is relatively unambiguous. The interval between 0 and ~45 m is assigned a Pleistocene age, and the interval between ~45 and 787 m is assigned a latest Pliocene to latest Miocene age.
Because of an absence of siliceous microfossils, there is no biostratigraphic age control between ~10 and 92 m and from ~509 m to the bottom of recovery in Hole U1532G (~787 m). In the upper interval with no biostratigraphic age control (~10–92 m), the polarity pattern is clear and correlation to the Pleistocene to late Pliocene interval of the GTS2012 is unambiguous. The lowest biostratigraphic age constraint in the Site U1532 sequence at ~509 m is based on diatom biostratigraphy (Table T10); a diatom assemblage indicates a latest Miocene to early Pliocene age older than 5.55 Ma. The polarity sequence between ~509 and 787 m, however, is also well defined. Assuming no hiatuses in the lowermost section of the sequence, the reversed polarity interval between ~581 and 787 m is correlated to Subchron C3r. Given this correlation, the base of Hole U1532G is younger than 6.033 Ma (constrained by the top of Subchron C3An.1n). Projection of sedimentation rates calculated for Subchron C3n.4n between ~479 and 581 m (42.8 cm/ky) indicates an approximate age of 5.7 Ma for the base of the drilled sequence at Site U1532.
Linear sedimentation rates calculated between magnetostratigraphic age control points (Table T17; green line in Figure F22) show a significant downcore increase in sedimentation rates, which average ~2 cm/ky in the Pleistocene and ~24 cm/ky in the latest Miocene to early Pliocene section. The highest sedimentation rates documented, ~61 cm/ky, are recognized between ~322 and 406 m in Subchron C3n.2n (4.493–4.631 Ma). The lowest sedimentation rates in the Pliocene section (~10 cm/ky) were calculated between ~406 and 422 m in Subchron C3n.2r (4.631–4.799 Ma) and may indicate a transient decrease in sediment flux to the site or the presence of a short hiatus within this interval. A hiatus is not required, however. A similar decrease in sedimentation rate is inferred for a correlative interval at Leg 178 Site 1095 (Antarctic Peninsula drifts; Acton et al., 2002). This finding, if borne out by shore-based analyses, may indicate a regional decrease in terrigenous sediment flux from the Antarctic continent between 4.631 and 4.799 Ma.
Geochemistry and microbiology
Inorganic geochemistry
We collected 31 APC whole-round samples (5–10 cm in length), 8 HLAPC whole-round samples (10 cm in length), and 11 XCB whole-round samples (10 cm in length) on the catwalk at a frequency of 1–3 samples per core from the start of Hole U1532A through Section 379-U1532C-33X-2. We also collected 15 RCB whole-round samples (15–30 cm length) at a frequency of 1 sample every three cores from Hole U1532G. The volume of extracted interstitial water varied with depth from a maximum of 32 mL down to 6 mL. Aliquots of interstitial water samples were used for shipboard analyses, and the remaining water was subsampled for postcruise analyses (see Geochemistry and microbiology in the Expedition 379 methods chapter [Gohl et al., 2021a]). The chemical composition of the interstitial water samples is listed in Table T18.
Salinity, chloride, and sodium
The downhole profiles of salinity, Cl, and Na at Site U1532 are shown in Figure F23. Salinity has a constant value of 35.0 from the seafloor to ~324 m. Below this depth, salinity decreases and stays at about 34.0 throughout Hole U1532C and the upper section of Hole U1532G. From 578 m in Hole U1352G, salinity decreases with depth to ~32.0 at ~720 m.
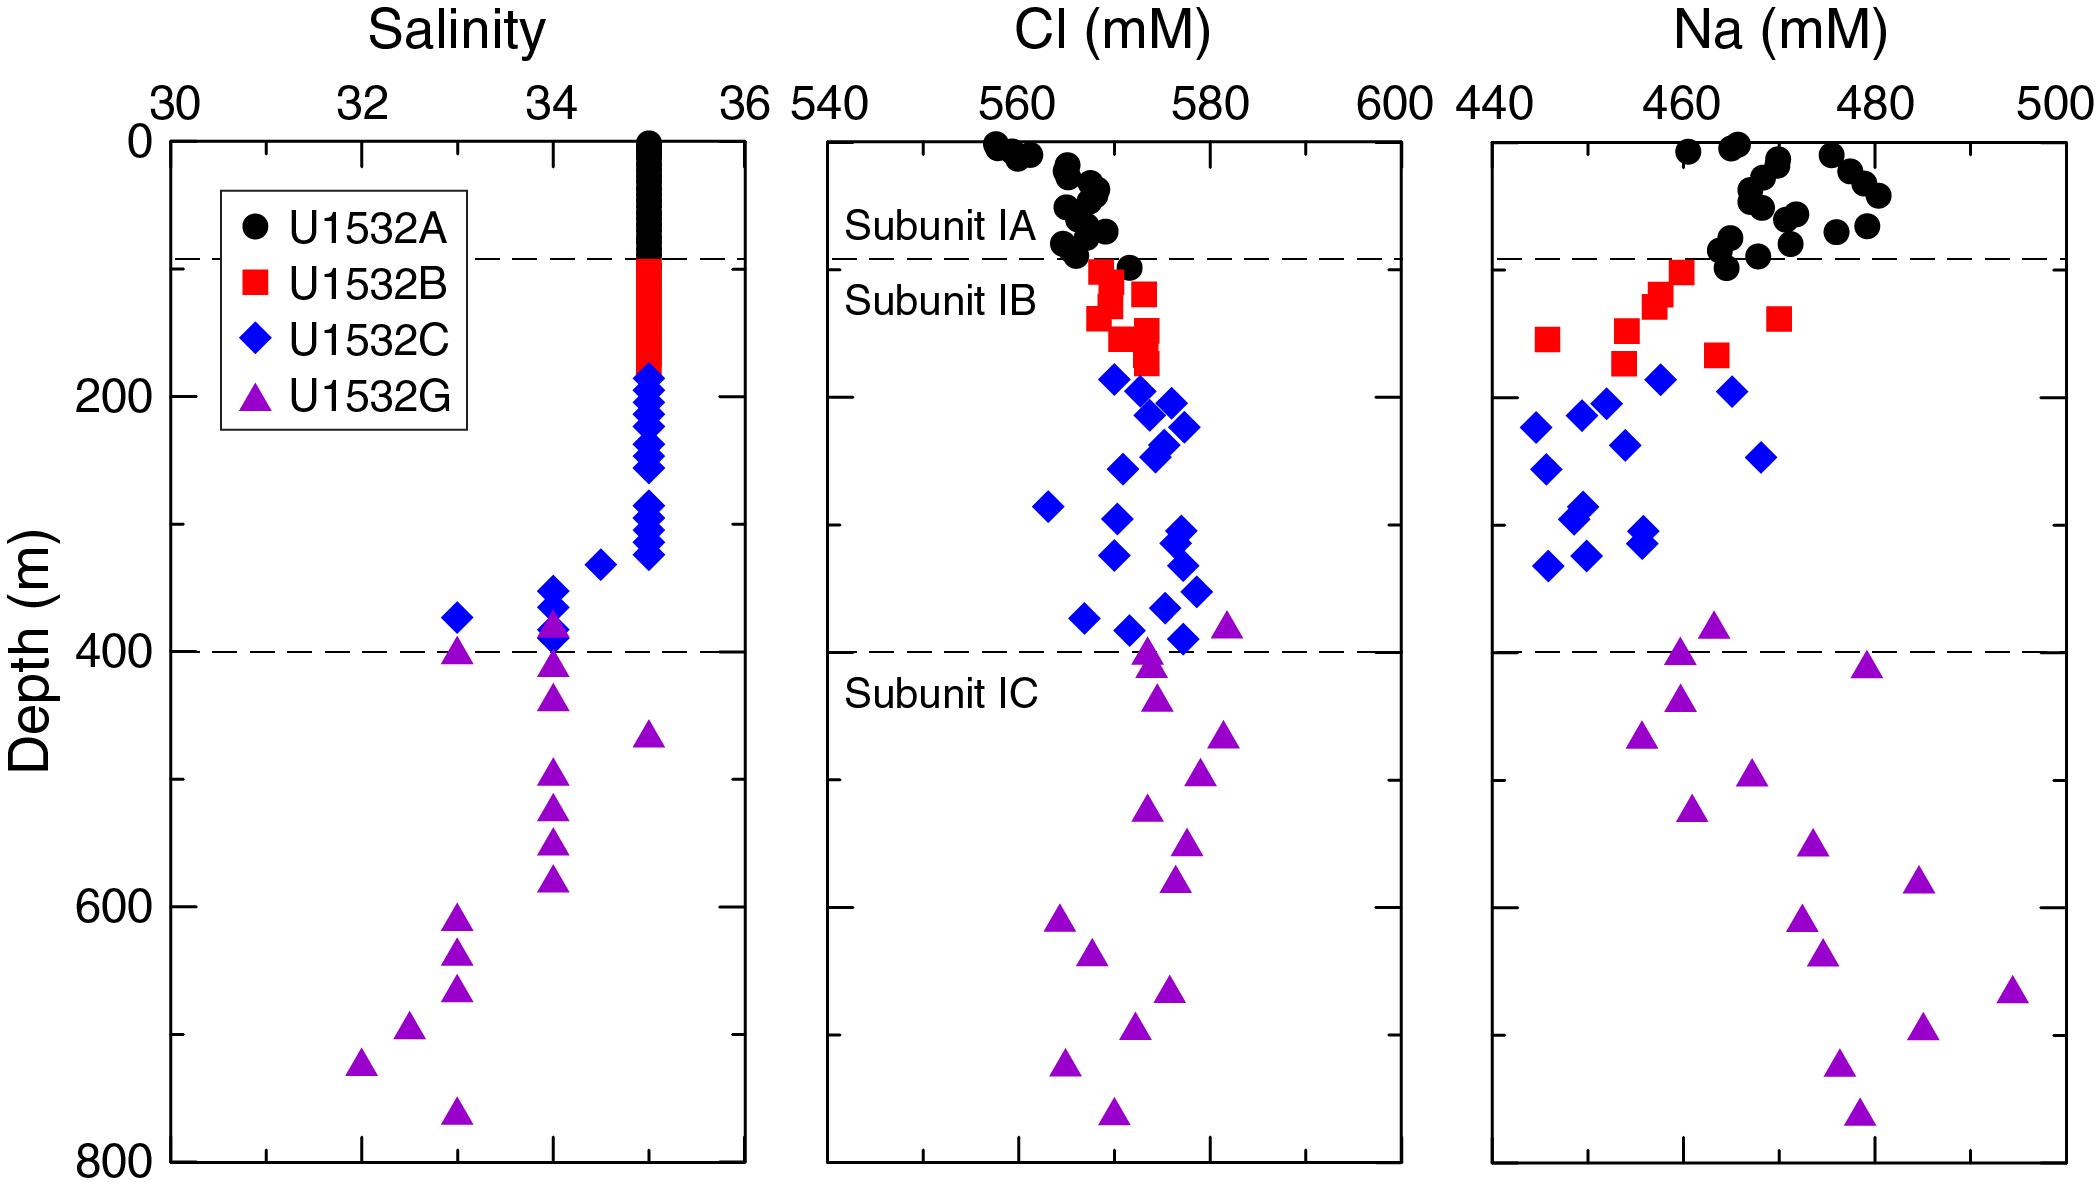
Figure F23. Interstitial water salinity, Cl, and Na.
Cl concentration at Site U1532 ranges between 558 and 582 mM. The elevated Cl concentrations in the lower part of the cored section are possibly due to hydration reactions during clay formation. Cl concentrations increase steadily with depth and reach a maximum value of ~582 mM below ~380 m, whereas they display a decreasing trend with depth below 465 m in Hole U1532G. A low Cl concentration was observed around 608 m in Hole U1352G, which coincides with observed carbonate nodules at this depth (see Lithostratigraphy).
Contamination by drilling fluid in several interstitial water samples from XCB cores is evident from Cl and sulfate (SO4) concentrations. The interstitial water sample from Section 379-U1532C-22X-3 has lower Cl and higher sulfate concentrations than those from Section 18F-2 (Figures F23, F24). The same pattern is seen in data from Sections 23X-3, 24X-3, 25X-3, and 26X-2, suggesting that drilling fluid contamination occurred in these samples (Figures F23, F24). This observation is in agreement with generally higher abundances of PFT found in the interior of a majority of these cores (see Microbiology). The increase in contamination coincides with a switch from HLAPC to XCB coring. The latter coring system generally results in increased core disturbances, including fracturing and biscuiting of sediments and injection of drilling fluid and/or mud slurries, that provide possible pathways for contamination.
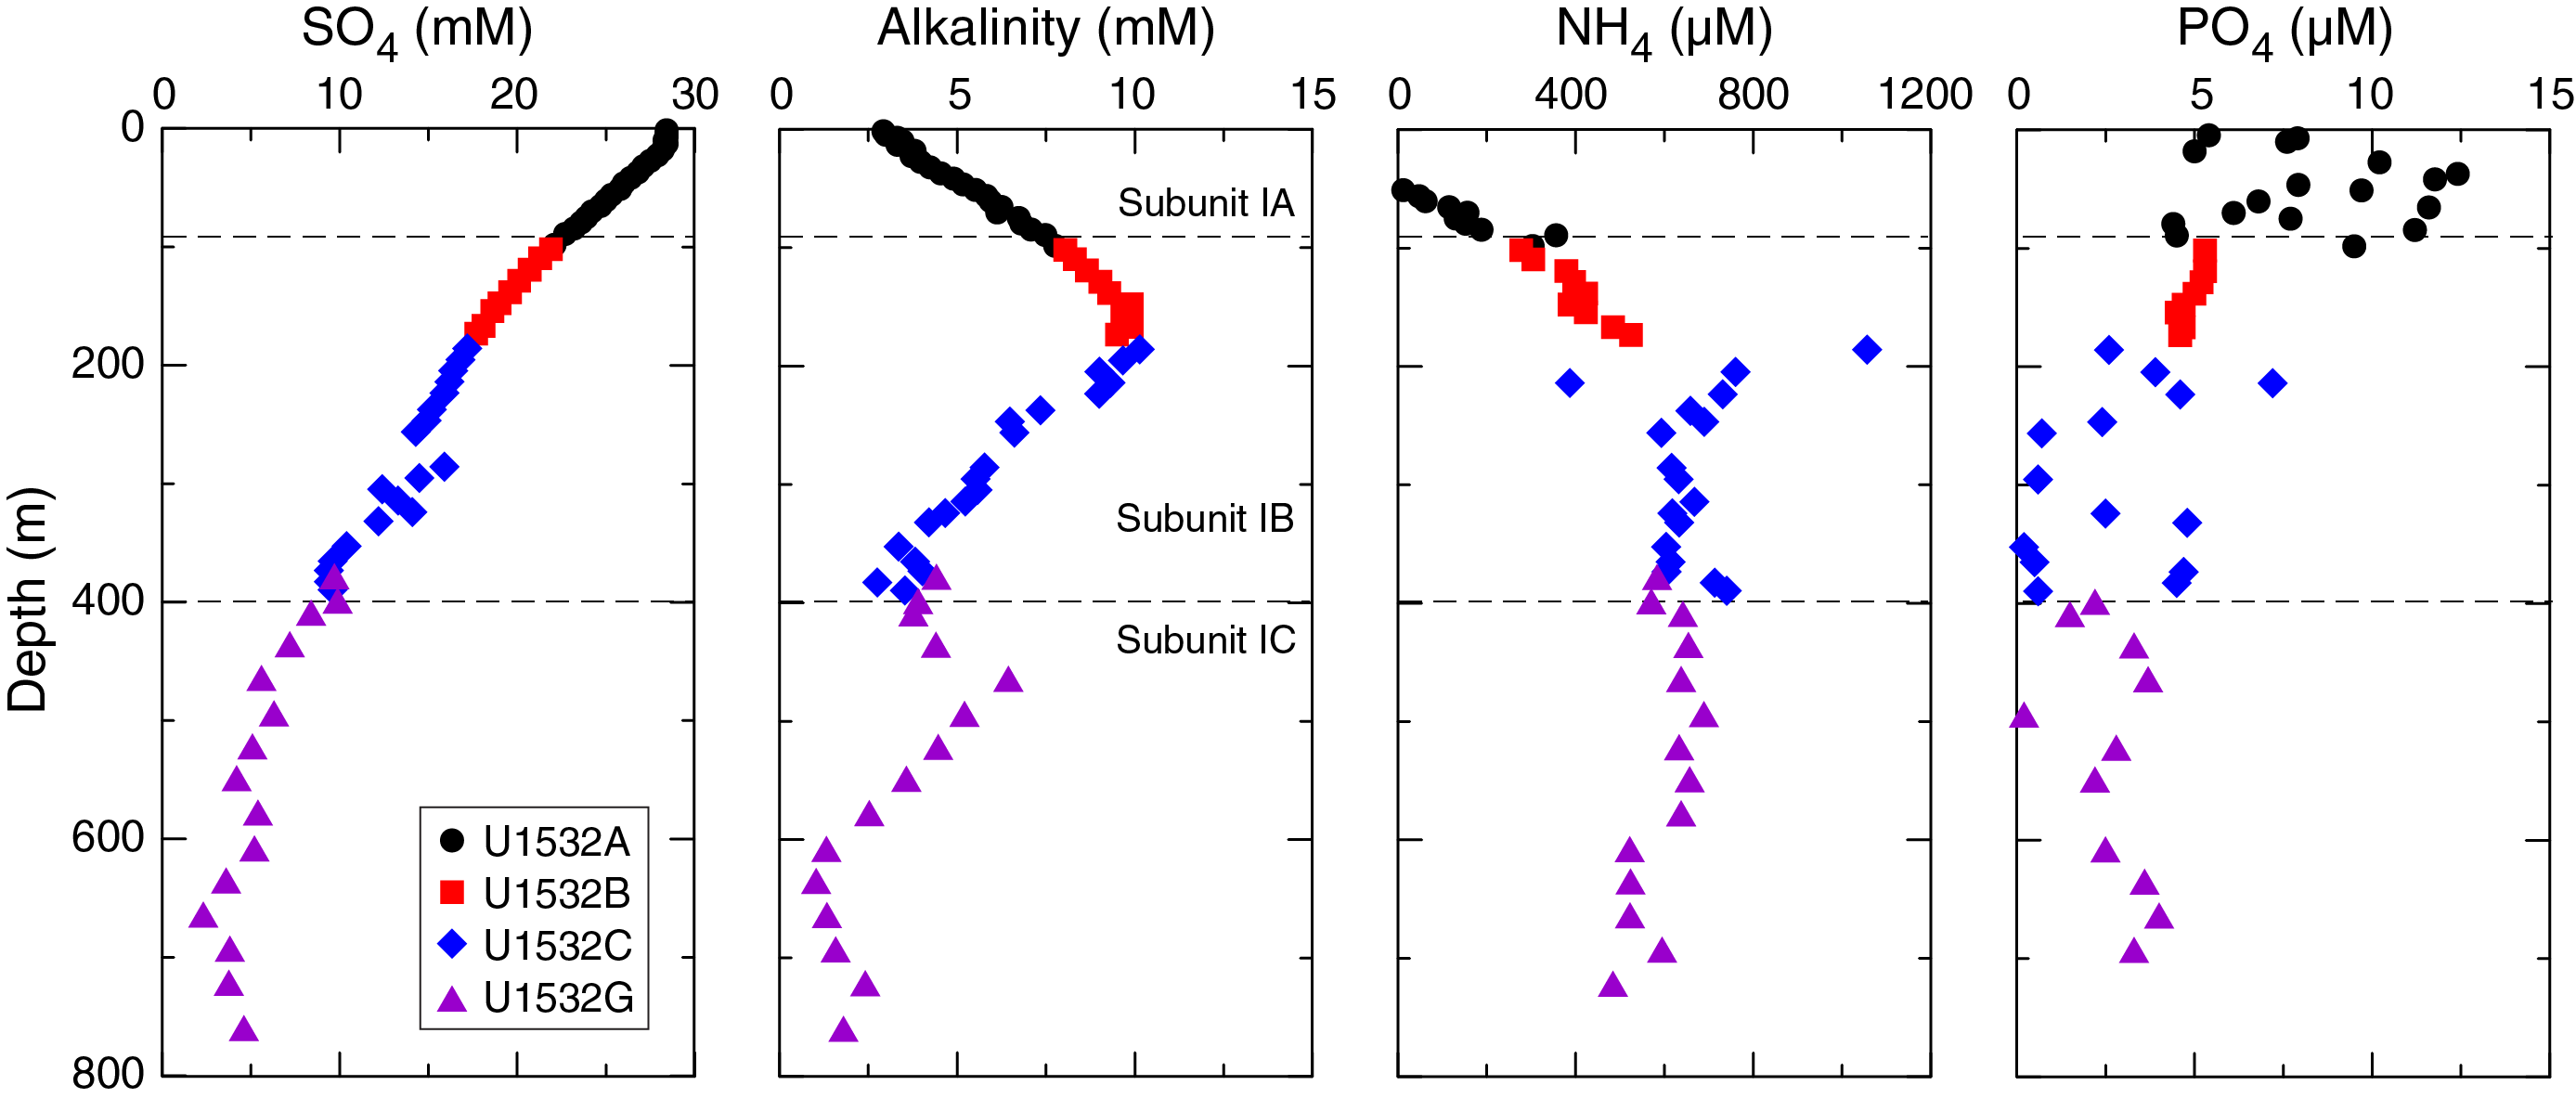
Figure F24. Interstitial water sulfate, alkalinity, ammonium, and phosphate.
Na concentration ranges between 445 and 494 mM throughout Site U1532. It increases to ~486 mM at ~40 m and then decreases gradually with depth to a minimum concentration at ~330 m. Below 400 m, Na concentrations display an overall increasing trend, which is opposite to that of Cl concentrations.
Sulfate, alkalinity, ammonium, and phosphate
Between 1.5 and ~20 m, sulfate concentrations in Hole U1532A have a constant value of 28.3 mM ± 0.2 mM, which is similar to that of modern seawater (~27.3 mM). Below ~20 m, sulfate decreases continuously with depth and reaches a minimum value (~2.3 mM) at ~664 m (Figure F24). Thereafter, it increases slightly with depth. These results indicate that the sulfate consumption rate is extremely low at this site, which might reflect low biogeochemical activity at Site U1532. The low TOC content of the sediment (<0.4 wt%; see Bulk sediment analysis) probably is responsible for the slow sulfate consumption this site. The low concentration of methane (<30 ppmv) over most of the cored section supports the interpretation of low microbial activity (see Hydrocarbon analysis). However, methane concentration below 670 m, where sulfate concentration has the lowest value at Site U1352, sharply increases (see Hydrocarbon analysis).
Alkalinity increases linearly with depth from 1.5 m to a maximum (~10 mM) at ~186 m, below which it decreases with depth to the base of Hole U1532C (389.6 m; Figure F24). It increases from 2.8 mM at 382 m to 6.4 mM at 464 m and afterward decreases with depth. Alkalinity has a minimum value (~1.0 mM) at 635 m. Alkalinity usually increases due to biogeochemical reactions, whereas it decreases when carbonate precipitation occurs (Teichert et al., 2009). Because sulfate reduction is the dominant biogeochemical process at Site U1532 and occurrences of carbonate nodules or carbonate-cemented silt/sand are often observed below 400 m (see Lithostratigraphy), the alkalinity changes can be explained by sulfate reduction and carbonate precipitation processes, which both vary with depth.
Dissolved ammonium (NH4) was not detected in interstitial water samples from 1.5 to 47 m in Hole U1532A. It was first detected at 51 m and thereafter increases sharply to 186 m to the maximum concentration (~1.0 mM). The highest ammonium concentration coincides with the maximum in alkalinity (Figure F24). Increasing ammonium concentrations are usually associated with organic matter degradation by sulfate reduction processes. After the peak in ammonium concentration, values remain between 600 and 700 μM down to 578 m (Figure F24). Ammonium concentration does not exceed 600 μM from 600 to 760 m. Carbonate nodules or carbonate-cemented siltstone/sand were observed in this interval (see Lithostratigraphy).
Dissolved phosphate (PO4) has low concentrations (<15 μM) throughout the cored section. Phosphate concentration is relatively high in the uppermost 100 m but does not display any discernible downhole trend (Figure F24).
Calcium, magnesium, and potassium
Ca concentrations show a linear increase from ~11 mM at 1.5 m to ~31 mM at 365 m. From that depth to the bottom of Hole U1532G, it varies within a narrow range from ~27 to 30 mM with an average of 28.5 mM (Figure F25), which is approximately 2.5 times higher than that of the modern seawater value. A slight decrease in Ca concentrations at ~600 m coincides with an interval with observed carbonate nodules (see Lithostratigraphy). On the contrary, K concentrations show a continuous decrease from a value of ~12 mM at 1.5 m to 2.0 mM at 365 m, after which values remain relatively constant (Figure F25).
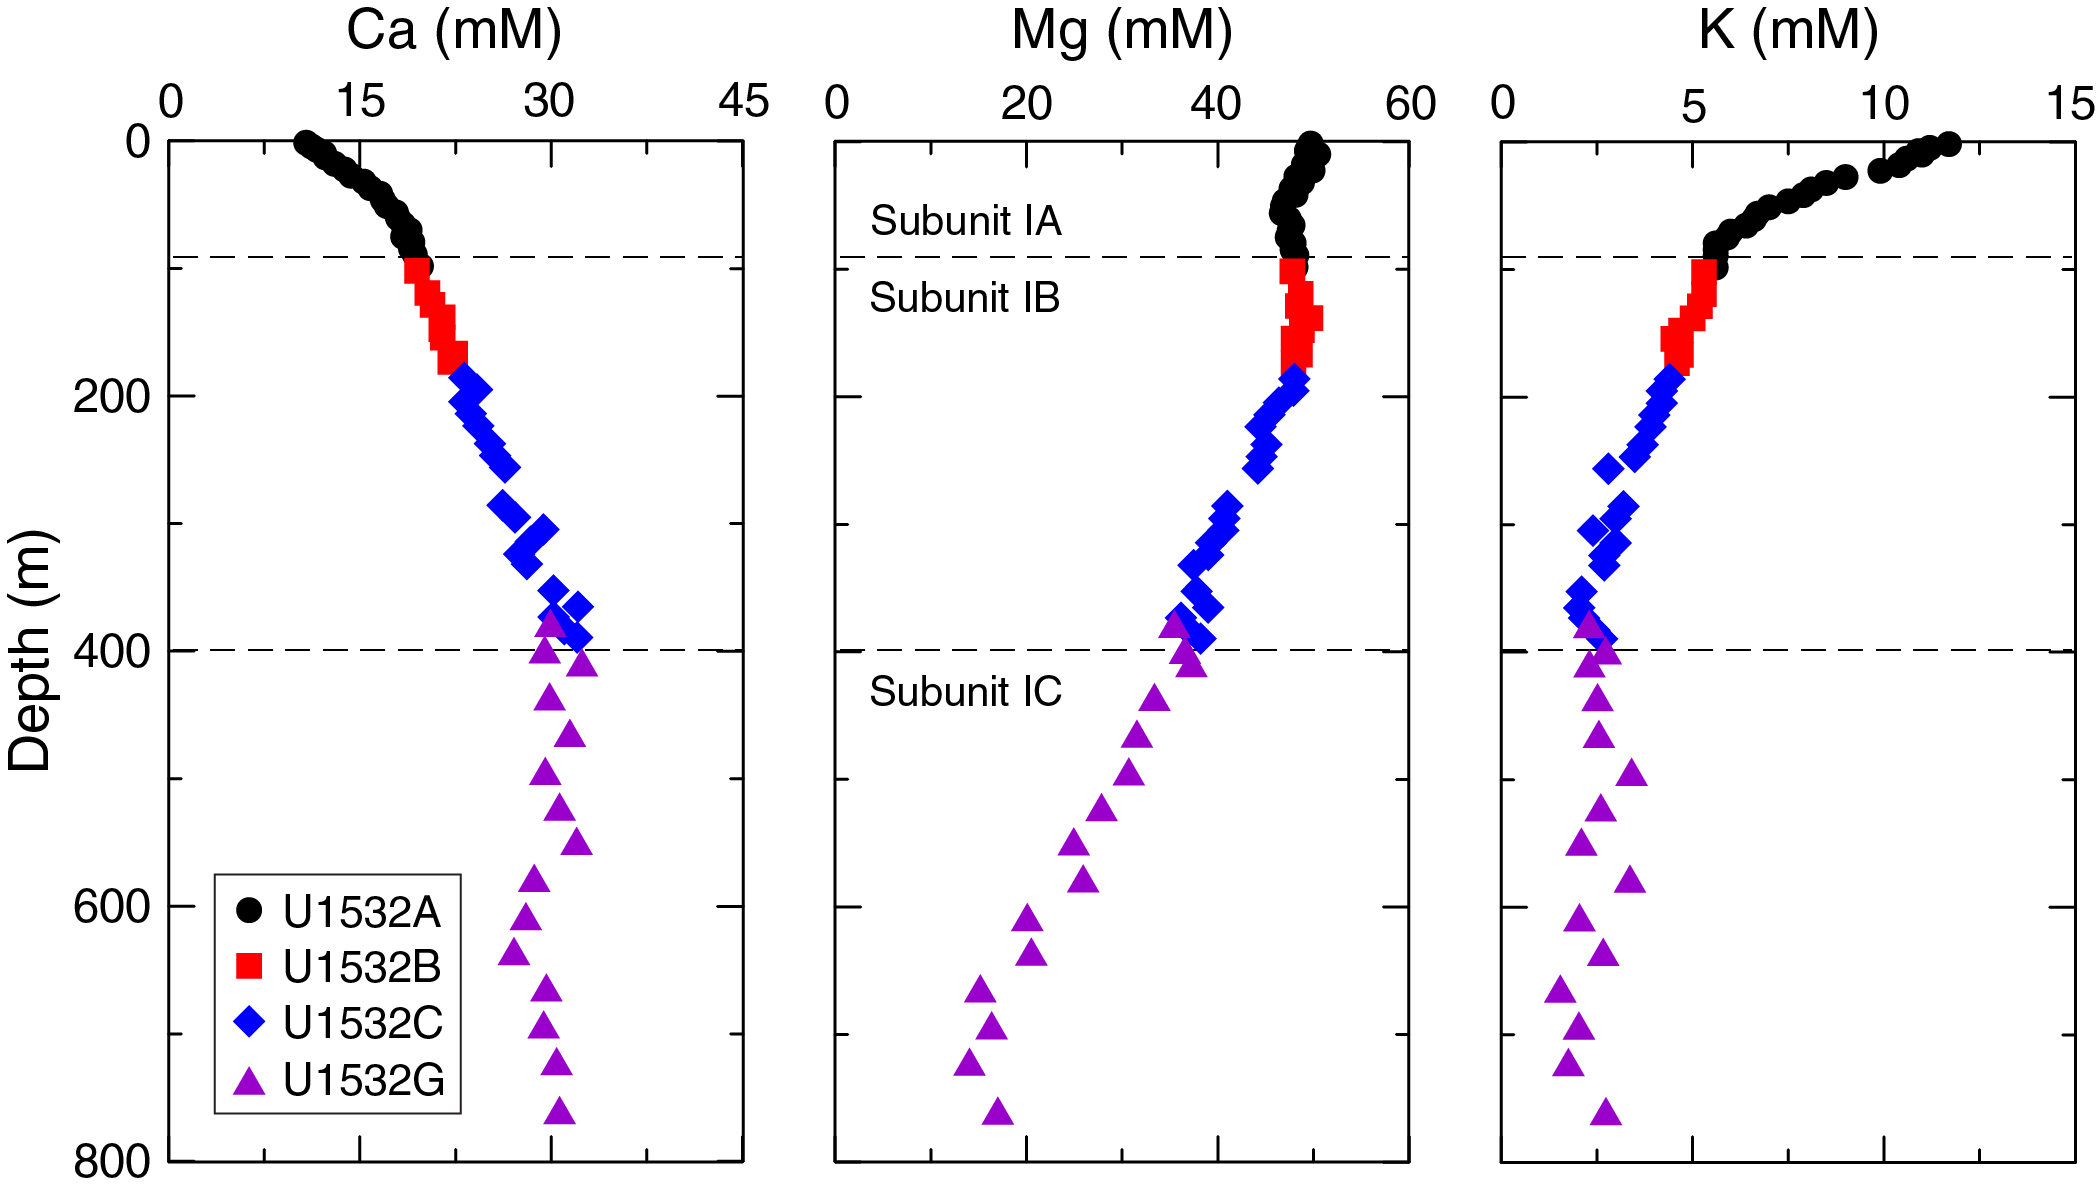
Figure F25. Interstitial water Ca, Mg, and K.
Mg slightly decreases with depth from the modern seawater value (~52 mM) at 1.5 m to 47 mM at 56 m and then becomes stable within a narrow range (47–48 mM) to 200 m. Mg concentration then shows a steady decrease below 200 m and reaches as low as 15 mM at 664 m (Figure F25). Below 670 m, Mg concentrations are relatively constant (~16 mM). The Ca increase and the K and Mg decrease with depth are potentially caused by either clay formation or diffusional communication with a deeper fluid.
Sr, Li, Mn, Fe, B, Ba, and silica
The downcore profiles of strontium (Sr,) lithium (Li), manganese (Mn), iron (Fe), boron (B), barium (Ba), and silica (H4Si[OH]4) are shown in Figure F26. Sr concentrations increase from 87 μM at 1.5 m to 124 μM at 66 m and become relatively stable within a narrow range from 117 to 123 μM to 174 m. Below 185 m, Sr concentrations increase to 400 m and become stable within a narrow range from 191 to 204 μM at 494 m. They again show an increasing trend from 214 μM at 522 m to 324 μM at 664 m. Below 693 m, Sr concentrations decrease rapidly with depth, but values are still three times higher than that of modern seawater (~82 μM). Such increases in interstitial water Sr have been related to fluid-rock reaction with volcaniclastic materials (e.g., Gieskes et al., 1990; Torres et al., 2004; Teichert et al., 2005). Hence, the observed increasing Sr trend at Site U1532 may be related to alteration of volcanic rocks or ashes. Shore-based Sr isotope ratios may help to identify various reactions/sources that are responsible for the observed downcore profile of Sr concentration.
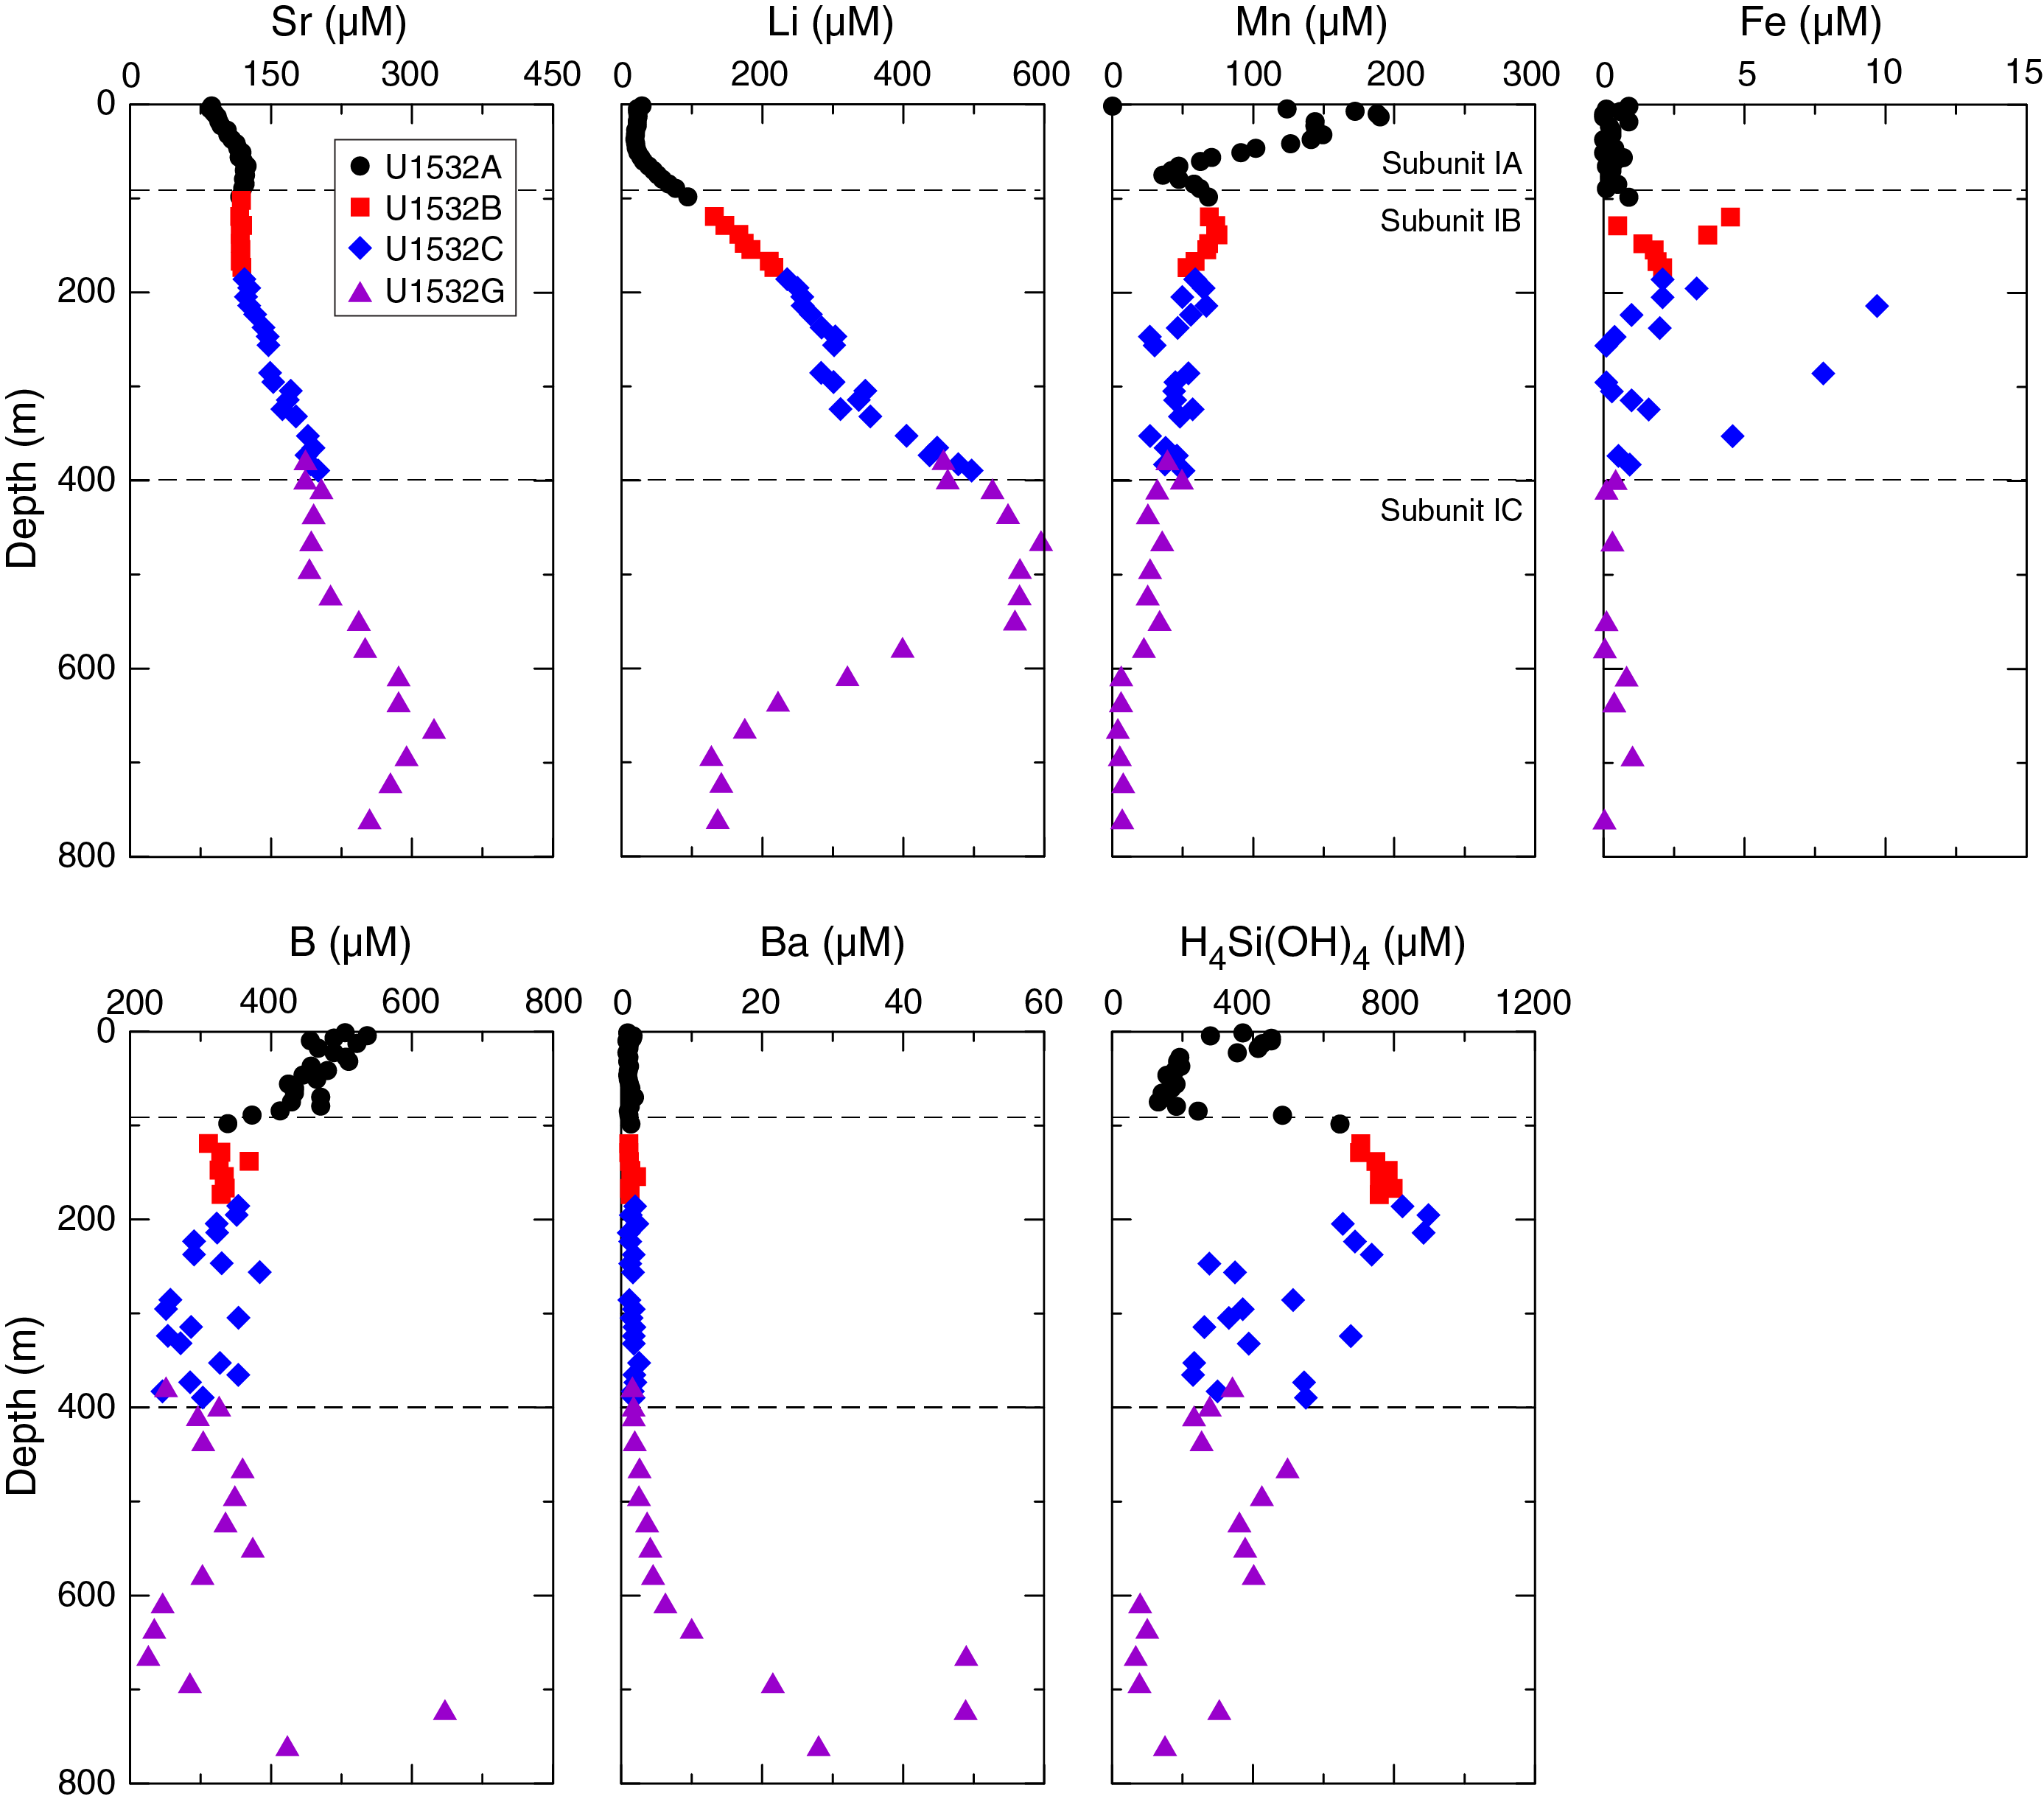
Figure F26. Interstitial water Sr, Li, Mn, Fe, B, Ba, and silica.
Li concentrations decrease from 29 μM at 1.50 m to 19 μM at 37 m, which is slightly lower than the modern seawater concentration (~21 μM). Below 41 m, Li concentrations sharply increase with depth and reach a maximum value of 595 μM at 464 m. Li concentrations decrease from 565 μM at 493 m to 175 μM at 664 m, and then they are relatively constant in the deepest three samples (128–142 μM).
Mn concentrations increase rapidly from 0.1 μM at 1.50 m to 190 μM at 13 m and have a relatively constant value of 143 μM to 38 m. They sharply decrease from 126 μM at 42 m to 36 μM at 75 m and then slightly increase again from 47 μM at 80 m to 75 μM at 138 m. Below this depth, Mn concentrations show a slight decrease down to 578 m. Mn concentrations drop to 6 μM at ~608 m and remain within a narrow range (4–8 μM) to the base of the cored section. These lowest Mn concentrations coincide with elevated methane concentrations (see Hydrocarbon analysis).
Fe concentrations are generally low (<10 µM) throughout the cored section at Site U1532 but have slightly higher values from 102 to 300 m. The Mn concentrations show a sharp decrease, whereas sulfate and Fe concentrations remain constant from 1.5 to 13 m, indicating that Mn reduction may be the dominant biogeochemical reaction that drives organic matter degradation in this interval, which is in contrast to the sulfate and Fe reduction reactions seen in the uppermost 1.5 m. Because sulfate reduction is so extremely low below 20 m, Mn reduction overlaps with sulfate reduction from 20 to 578 m, resulting in high Mn concentrations throughout Site U1532.
B concentrations show an overall decreasing trend with depth from 536 µM at 4.5 m to 339 µM at 98 m. They show a narrow range of 250–385 μM between 102 and 578 m. Below 721 m, B concentrations increase rapidly, reaching a maximum at 647 μM.
Ba concentrations are relatively low and constant with depth, ranging from 0.8 to 2.6 µM between 1.5 and 494 m. Ba concentrations increase steadily from 522 to 634 m and then rapidly increase to 49 µM around 664 m. Below this depth, Ba concentrations exceed 22 µM, coinciding with low sulfate concentrations. The observed Ba enrichment could be due to barite (BaSO4) dissolution. When sulfate is depleted, barite in sediment starts dissolving, causing high Ba concentrations in interstitial water (Brumsack and Gieskes, 1983; Solomon and Kastner, 2012).
Silica concentration shows five distinct zones with depth. The first is from 1.5 to 75 m, where silica concentration decreases with depth. The second is from 85 to 238 m and has the highest silica concentrations (700–900 µM). This high silica zone coincides with intervals with high diatom abundances (see Biostratigraphy). Diagenesis of these diatoms by reacting with the interstitial water is the likely cause of the higher silica concentrations. The third zone ranges from 247 to 436 m, where silica concentrations are quite variable but trend lower with depth. Silica concentration in the fourth zone increases rapidly at ~464 m, ranging from 361 to 498 μM. In the lowermost zone (608–760 m), silica drops dramatically to very low values ranging from 68 to 150 μM; a single exception is 305 μM at 722 m. The decreasing trend in silica concentration at the base of the section may be caused by opal diagenesis, which is common with burial beneath >600 m. Opal-A to opal-CT transition was indeed observed in Core 379-U1352G-45R (see Biostratigraphy).
Organic geochemistry
Hydrocarbon analysis
Headspace gas samples were taken from each core from Site U1532 to monitor for the presence and abundance of C1–C3 hydrocarbons as part of the standard IODP safety protocol (Pimmel and Claypool, 2001). A total of 83 headspace gas samples were analyzed by gas chromatography (GC) (see Geochemistry and microbiology in the Expedition 379 methods chapter [Gohl et al., 2021a]). The obtained methane concentrations are corrected for the background signal, which was determined to be ~2 ppmv based on the analysis of multiple instrumental blanks. Methane occurs in only very low concentrations throughout Holes U1532A–U1532C and on average amounts to ~6 ppmv (Figure F27; Table T19). Between ~60 and ~223 m, however, methane concentrations are slightly higher, varying from 11 to 27 ppmv. At ~667 m, methane concentrations start to increase rapidly and generally exceed 5000 ppmv below ~713 m. The maximum methane concentration of 9517 ppmv occurs at ~771 m. Ethane was first detected at ~696 m and is present continuously in low concentrations (<3 ppmv) below ~722 m. Propene is present (1.9 ppmv) at ~786 m in the deepest sediment core collected at Site U1532.

Figure F27. Light hydrocarbons and methane/ethane ratios.
The increase of methane at ~667 m coincides with a pronounced minimum in sulfate concentration (see Inorganic geochemistry), suggesting that methane at Site U1532 might have a biogenic origin. This possibility is also supported by the generally high methane/ethane ratios of 2288–4302 (Figure F27; Table T19), which are well above the <100 ratio expected for hydrocarbons of strictly thermogenic origin (Claypool and Kvenvolden, 1983). Although the presence of ethane at greater depth is commonly attributed to the thermal cracking of heavier hydrocarbons, in situ production of ethane by microorganisms has been demonstrated previously in deep marine sediments (Hinrichs et al., 2006) and may also occur at Site U1532. The light hydrocarbons detected at Site U1532 may thus be primarily of biological origin and derive from the degradation of sedimentary organic matter with only little evidence of contributions of hydrocarbons generated by thermal maturation processes at greater depth.
Bulk sediment analysis
A total of 176 sediment samples were collected for the analysis of bulk geochemical properties (Table T20). CaCO3 occurs in generally low concentrations in sediments from Lithostratigraphic Subunit IA (see Lithostratigraphy), varying from 0.03 to 0.56 wt% (Figure F28) except for three discrete horizons with CaCO3 content up to ~11 wt%. These horizons coincide with abundant calcareous foraminifer tests (see Biostratigraphy).
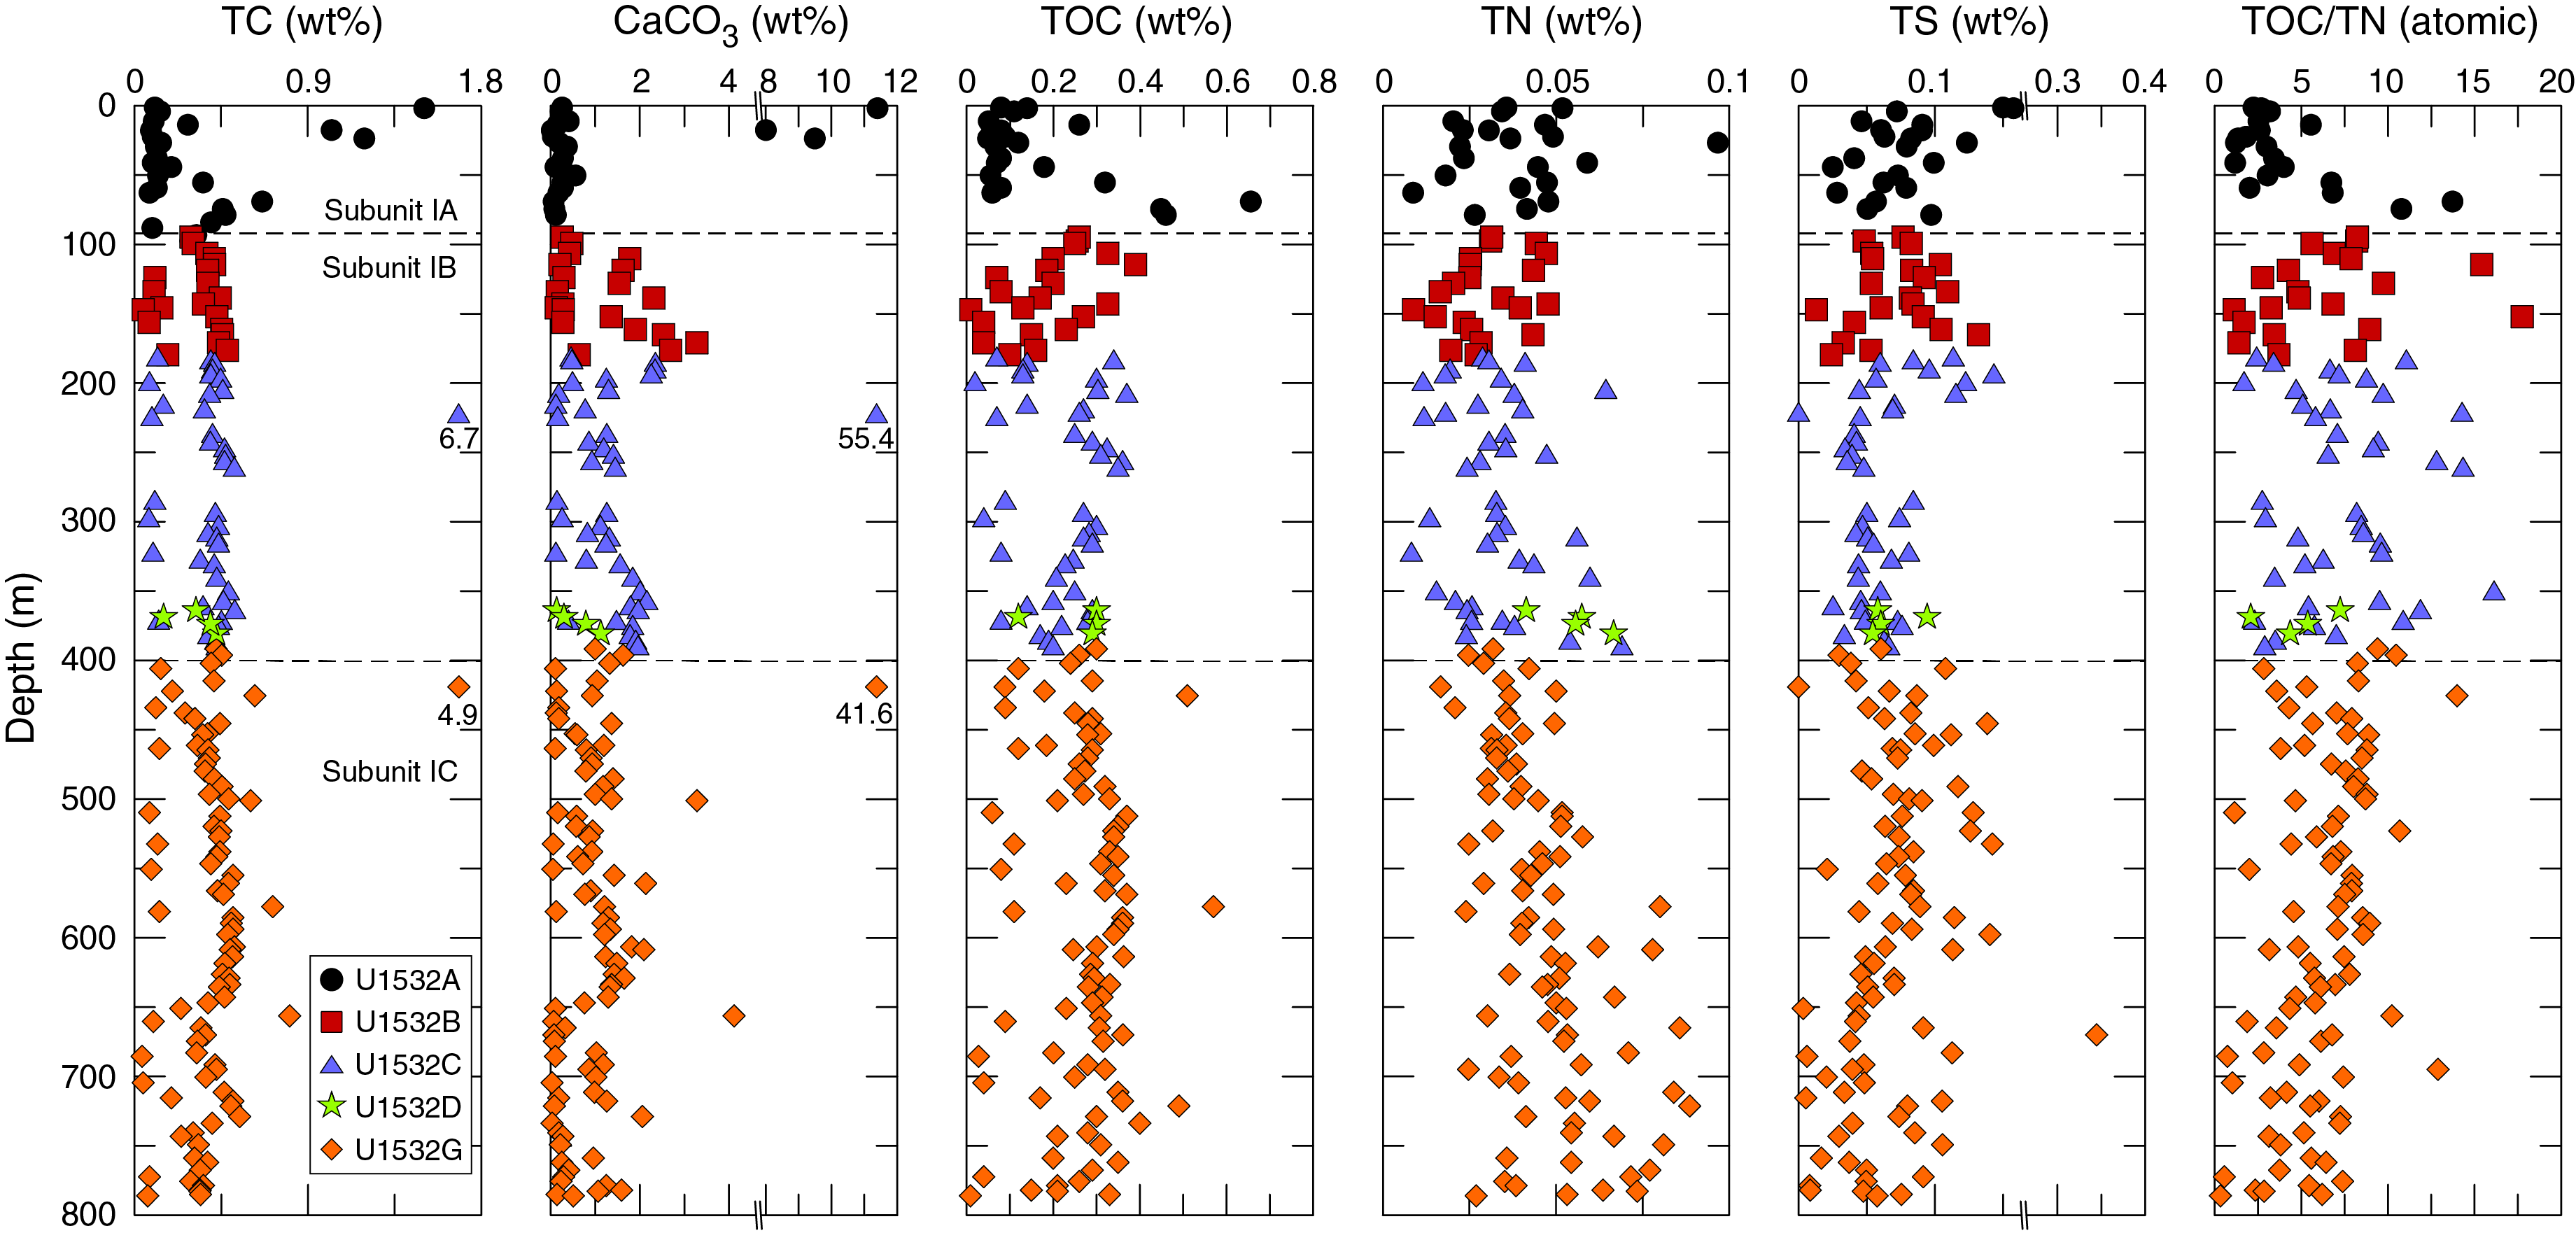
Figure F28. Carbon, nitrogen, sulfur, and TOC/TN.
Lithostratigraphic Subunit IB is characterized by a general increase in CaCO3 content with values ranging from 0.08 to 3.28 wt%. High contents of CaCO3 in this subunit are usually associated with the well-laminated gray muds of Facies F2, whereas low contents were observed in the biosiliceous and bioturbated green muds representing Facies F3 (see Lithostratigraphy). The low CaCO3 content in Subunit IB may be related to the partial dissolution of diatom frustules and hence the more acidic conditions in these intervals (see Inorganic geochemistry). A distinct maximum in CaCO3 of 55.40 wt% observed at ~220 m is associated with the presence of a carbonate concretion (see Lithostratigraphy).
TOC is generally low at Site U1532 but displays a stepwise increase in average values from Lithostratigraphic Subunit IA to Subunit IC (Figure F28; Table T20) ranging from 0.01 to 0.66 wt% (mean = 0.18 ± 0.17 wt%) in Subunit IA. The highest values average 0.49 ± 0.11 wt% between ~69 and ~84 m. TOC in Subunit IA shows a high correlation with total carbon (TC), indicating that TOC is the principal constituent of the TC pool. In Subunit IB, TOC varies from 0.01 to 0.37 wt% (mean = 0.21 ± 0.09 wt%). TOC slightly increases in Subunit IC and ranges from 0.03 to 0.57 wt% (mean = 0.27 ± 0.11 wt%).
TN is generally low throughout all subunits and ranges from 0.01 to 0.1 wt% (mean = 0.04 ± 0.02 wt%). It decreases from the top of Lithostratigraphic Subunit IA to the upper part of Subunit IB, below which it remains constant. A trend toward increasing TN was observed in Subunit IC with depth. TN at the base of Subunit IC, therefore, equals or exceeds that found at the top of the cored sequence. The ratio of TOC to TN in sediment sequences is commonly used to infer information on the origin of organic matter (Meyers, 1997). TOC/TN ratios in phytoplankton usually range from 4 to 8 and are close to the Redfield ratio, reflecting the high protein content of algal tissue. Terrestrial plants, in contrast, express TOC/TN ratios of 20 or higher. Because TOC/TN ratios at Site U1532 usually range from 1 to 10 (Figure F28; Table T20), the majority of the organic matter is presumably of aquatic origin. It should be pointed out, however, that a larger fraction of the investigated sediments has TOC/TN ratios lower than those commonly observed in algal biomass. This may point to significant contributions of inorganic nitrogen to the TN pool. Low TOC/TN ratios have also been reported from other organic-lean deep-sea sediments and explained by a larger loading of ammonia bound to clay particles (Müller et al., 1977), which may also be expected at Site U1532.
Total sulfur values decrease from 0.15 to 0.06 wt% throughout Lithostratigraphic Subunit IA and stay generally low (0.06 ± 0.02 wt%) throughout Subunit IB (Figure F28; Table T20). Total sulfur increases in the uppermost section of Subunit IC (until ~533 m) and yields values up to 0.14 wt%. Thereafter, total sulfur declines again and shows a shift to particularly low values below ~670 m. This shift in total sulfur is associated with a near depletion of sulfate in the interstitial water, which may limit sulfate reduction and consequently the formation of iron sulfides at Site U1532.
Microbiology
Contamination testing
To determine the degree of contamination of sediments through the coring process, samples for the analysis of PFT were collected from all cores that were chosen for microbiological studies. The PFT used here was perfluoromethylcyclohexane (PMCH). The general sampling strategy consisted of sampling the exterior adjacent to the core liner and the center of the core. PMCH was detected in all exterior and in some interior core samples, but concentrations varied over several orders of magnitude between cores and drilling systems (Figure F29; Table T21). PMCH was only measured in the first three cores obtained by APC coring because this coring method is considered to yield mostly intact cores with little drilling disturbance. Indeed, measured PMCH concentrations in the exterior of these three cores were considerably below the target concentration of the tracer in the drilling fluid. Moreover, PMCH was absent from the interior of Cores 379-U1532A-2H and 3H and only present close to the detection limit in Core 1H. APC coring thus resulted in cores of high quality for microbiological analysis and no or only little potential contamination of sediments with microbial cells derived from the seawater-based drilling fluid.
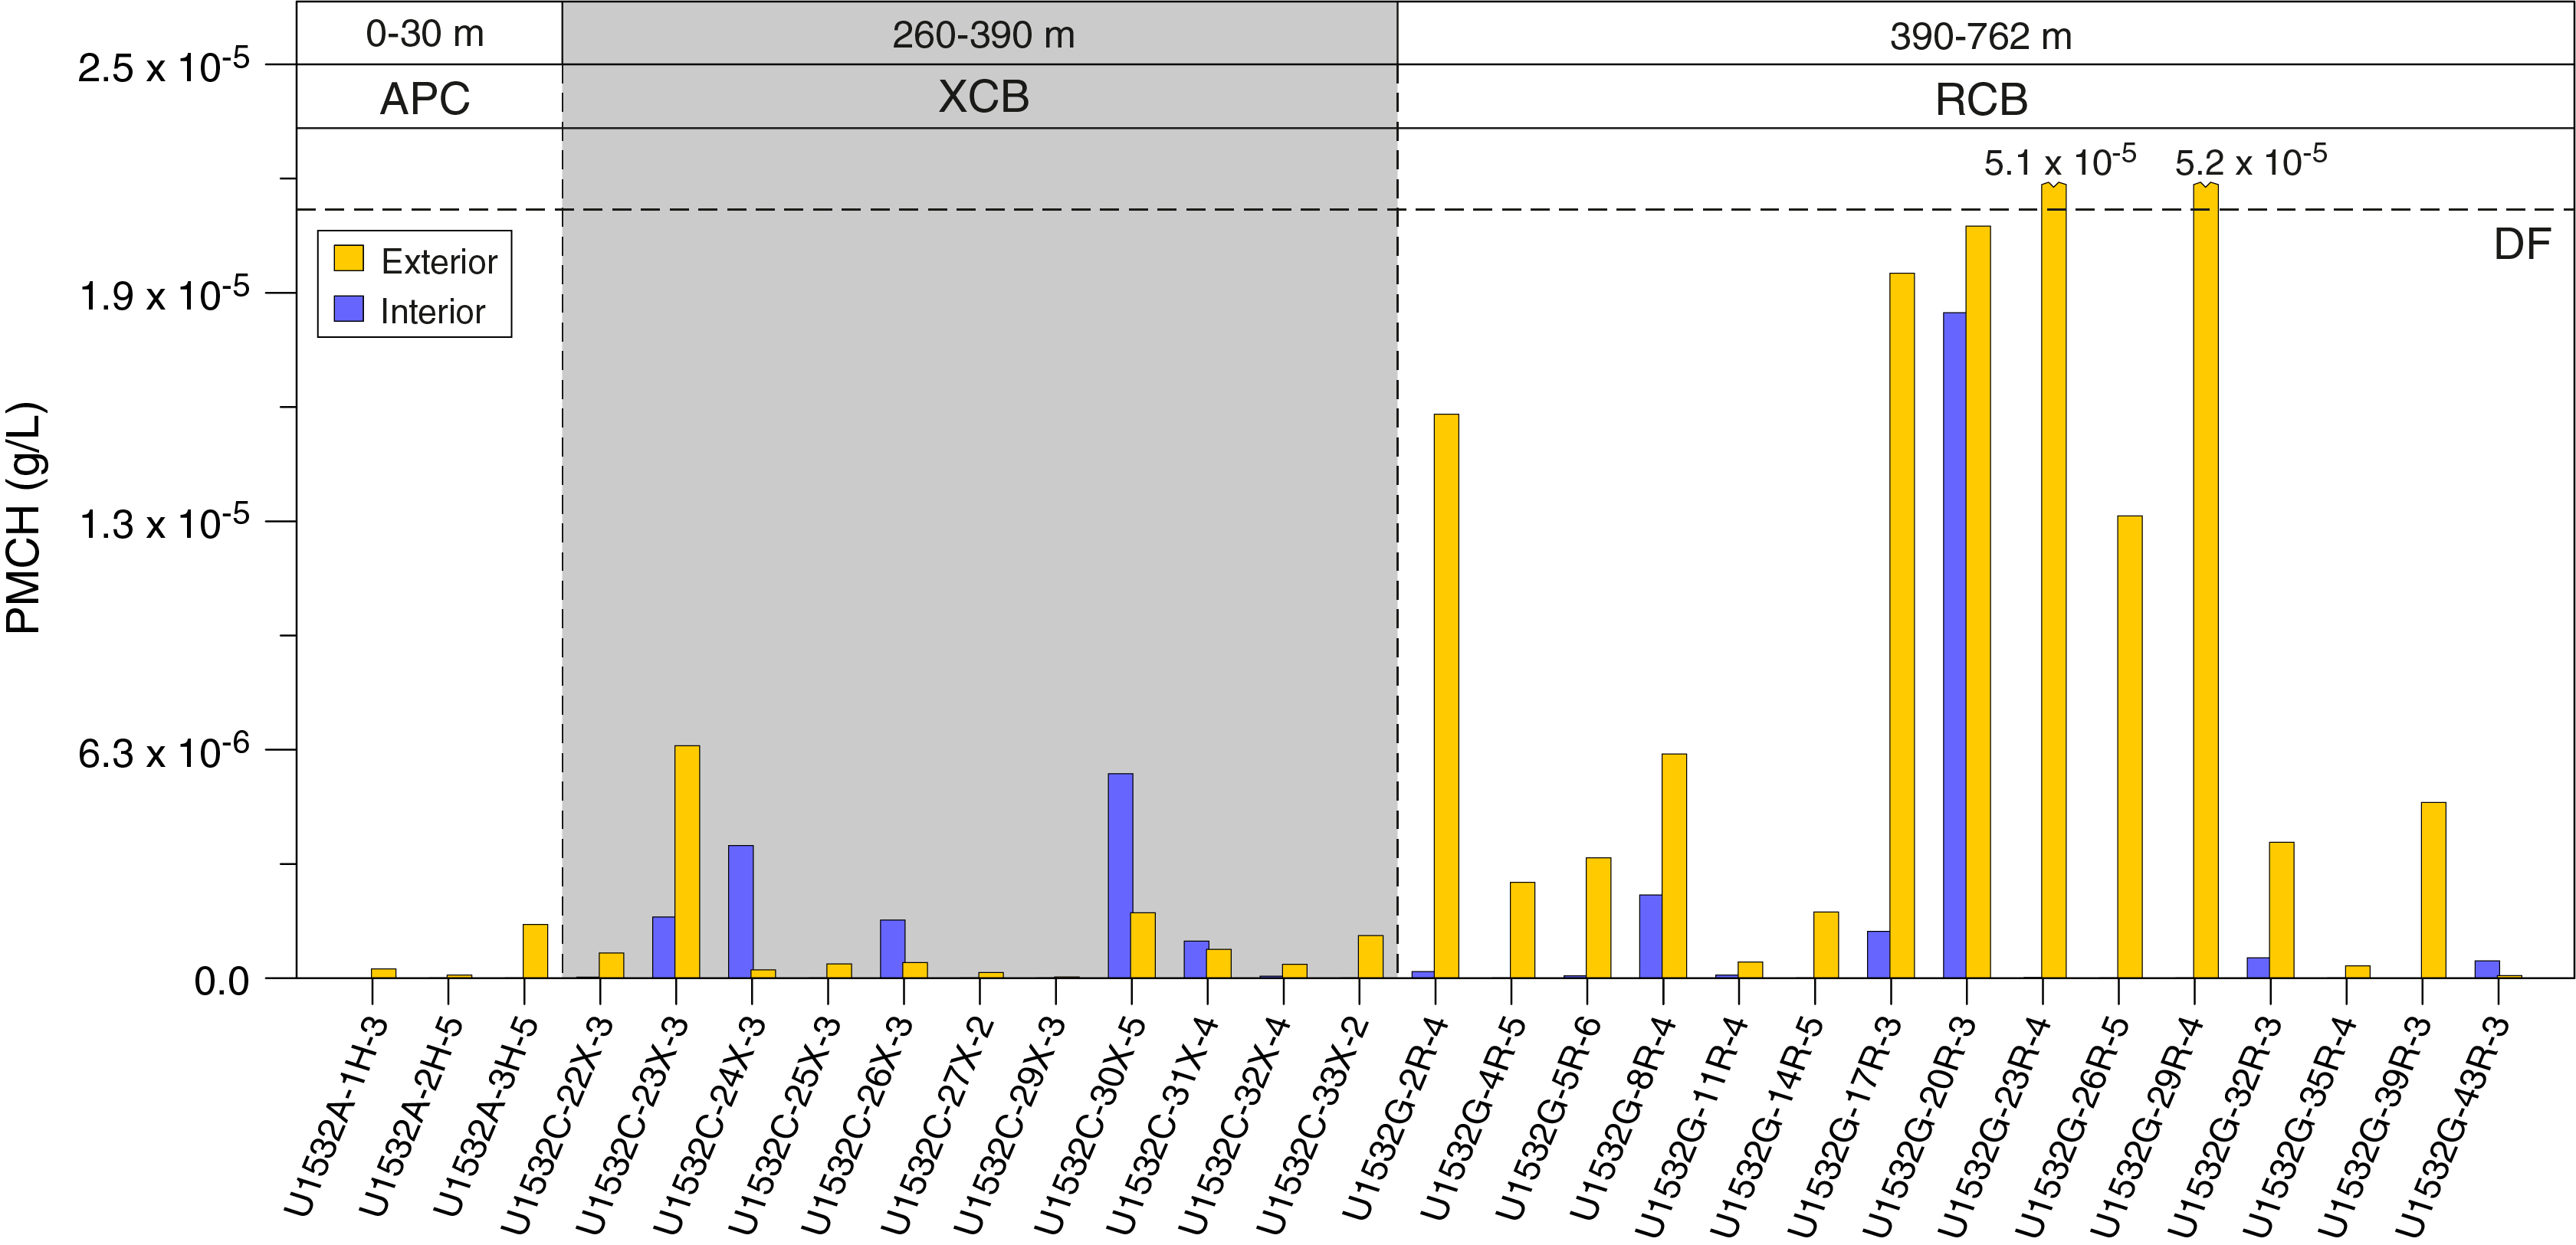
Figure F29. Concentration of PMCH.
Cores recovered using XCB drilling generally contained low concentrations of PMCH in their exterior except for Core 379-U1532C-23X, in which elevated concentrations were observed. Cores 23X, 24X, 26X, 30X, and 31X also showed increased PMCH concentrations in the interior of the core that exceeded those observed in the exterior of Cores 24X, 26X, 30X, and 31X. These cores are thus considered unsuitable for microbiological studies. Tracer concentrations thus provide evidence for a greater intensity of core disturbances in the XCB cores compared to APC cores, which may also explain the increased scatter in interstitial water data observed in this interval (see Inorganic geochemistry).
Cores retrieved using the RCB system generally showed the highest concentrations of PMCH. Particularly high concentrations of PMCH were found in the exterior of Cores 379-U1532G-2R, 17R, 20R, 23R, 26R, and 29R, in which PMCH concentrations occurred at a similar magnitude to that observed in the drilling fluid/mud. RCB coring thus seems to lead to larger drilling disturbances and injection of drilling mud between sediment and rock biscuits. The considerable increase in tracer concentrations in the exterior of most RCB cores is, therefore, likely linked to the greater loading of drilling fluid/mud spiked with PMCH. Despite the generally high contamination of the core exteriors, most cores showed only little to moderate contamination in the core interior. Core 20R is an exception in this respect because the tracer contamination in its center almost equals that of the core surface. Cores 8R, 17R, and 32R also showed signs of increased contamination in their interior based on the presence of elevated PMCH concentrations and are likely not fit for future microbiological analysis. However, most interiors of the RCB cores presented only little tracer contamination, indicating that the inner sediment structure stayed intact and offered few pathways for contamination. This may suggest that the majority of sediments recovered from the central part of the RCB cores may allow the study of microbial communities and abundances despite the generally more destructive nature of RCB coring. However, the degree of contamination associated with RCB coring is highly variable, stressing the importance of conducting tracer tests along with microbiological sampling as a quality control.
Physical properties
The shipboard physical properties measured at Site U1532 included nondestructive whole-round measurements of GRA bulk density, magnetic susceptibility and P-wave velocity with the WRMSL, and NGR on core sections from Holes U1532A–U1532D and U1532G. These measurements were made on all recovered sections with the exception of specific P-wave velocity measurements that were suspended for any sections with incompletely filled liners (Section 379-U1532B-12F-1 and all XCB and RCB cores). Thermal conductivity measurements were also made with a needle probe on whole-round soft-sediment cores and later with a puck probe on the working half of split cores with more consolidated sediments. After splitting the core sections, discrete samples were taken from suitable working halves for MAD measurements. Discrete P-wave velocity measurements were made with the Section Half Measurement Gantry (SHMG) on core section working halves. Archive halves were measured with the Section Half Multisensor Logger (SHMSL) for magnetic susceptibility and color reflectance. Whole-round physical property data were also used for hole-to-hole stratigraphic correlation (see Stratigraphic correlation).
Magnetic susceptibility
Magnetic susceptibility was measured on all whole-round sections with a pass-through “loop” sensor on the WRMSL and on split sections with a “point” sensor on the SHMSL, and WRMSL data was postprocessed to account for edge effects (see “Physical properties” in the Expedition 379 methods chapter [Gohl et al., 2021a]). Both instruments measured magnetic susceptibility at 2 cm intervals. Measured whole-round magnetic susceptibility values range from 8 × 10⁻⁵ to 241 × 10−5 SI with an overall average of 78 × 10−5 SI and a 1σ standard deviation of 29 × 10−5 SI. Average magnetic susceptibility values increase downcore from ~80 × 10−5 to ~120 × 10−5 SI to 93 m (Figure F30), where a decrease in magnetic susceptibility values coincides with the start of Lithostratigraphic Subunit IB. Below 93 m, there are cyclical downcore variations between ~15 × 10−5 and ~100 × 10−5 SI. A decrease in whole-round magnetic susceptibility values (of approximately 20 × 10−5 SI) at 258 m corresponds to the transition from APC to XCB and RCB coring. Both XCB and RCB coring return cores with a smaller internal sediment diameter than APC coring, resulting in a slight negative bias and lower measurement values. Below ~650 m, a decreasing trend toward the bottom of the hole was observed in magnetic susceptibility values. Whole-round magnetic susceptibility trends follow those observed in GRA bulk density and NGR, likely indicating changes in terrigenous sediment input (Figure F30). Point magnetic susceptibility measurements show the same trends as the whole-round magnetic susceptibility measurements but have slightly higher absolute values (Figure F31). In the upper to middle part of Subunit IB (above ~300 m), greenish gray biosilica-bearing to biosilica-rich muds accompanied by a steep downcore increase followed by decrease and then gradual increase in magnetic susceptibility were periodically observed (Figure F32). In greenish gray clay layers with dispersed clasts observed in the bottom part of Subunit IB (below ~300 m) and throughout Subunit IC, steep initial increases in magnetic susceptibility were not as prevalent (Figure F32).
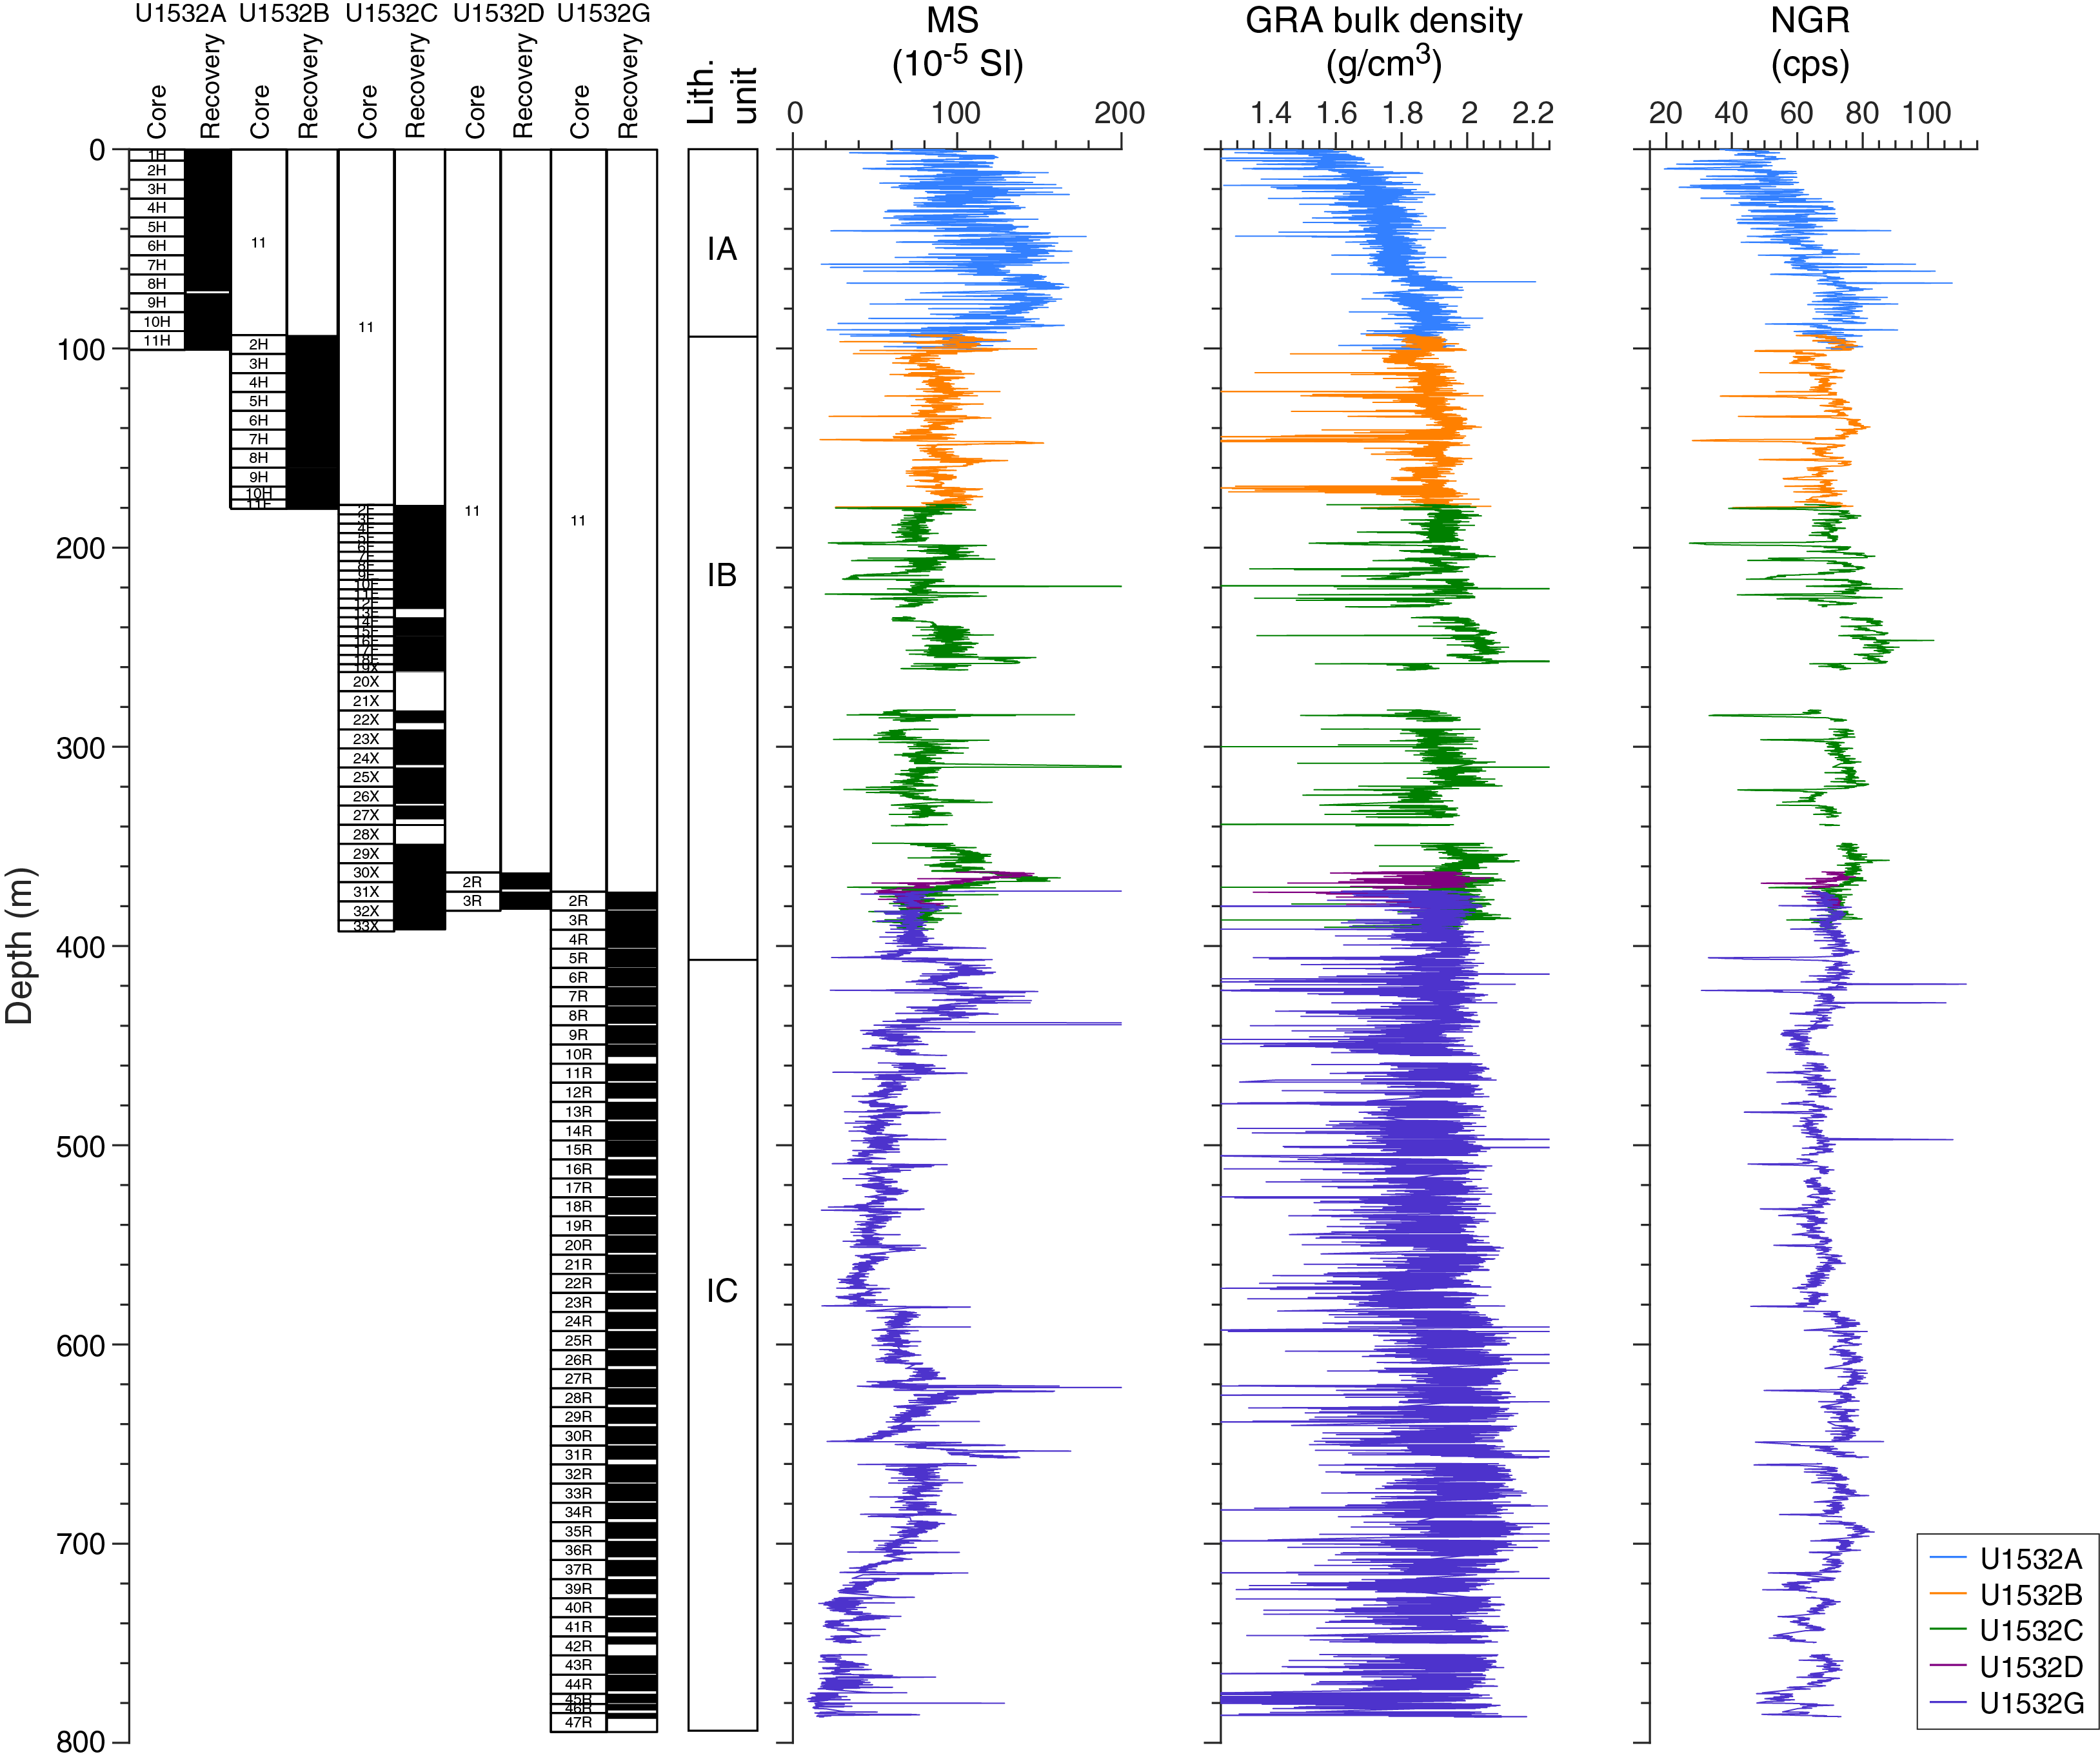
Figure F30. Whole-round physical properties.
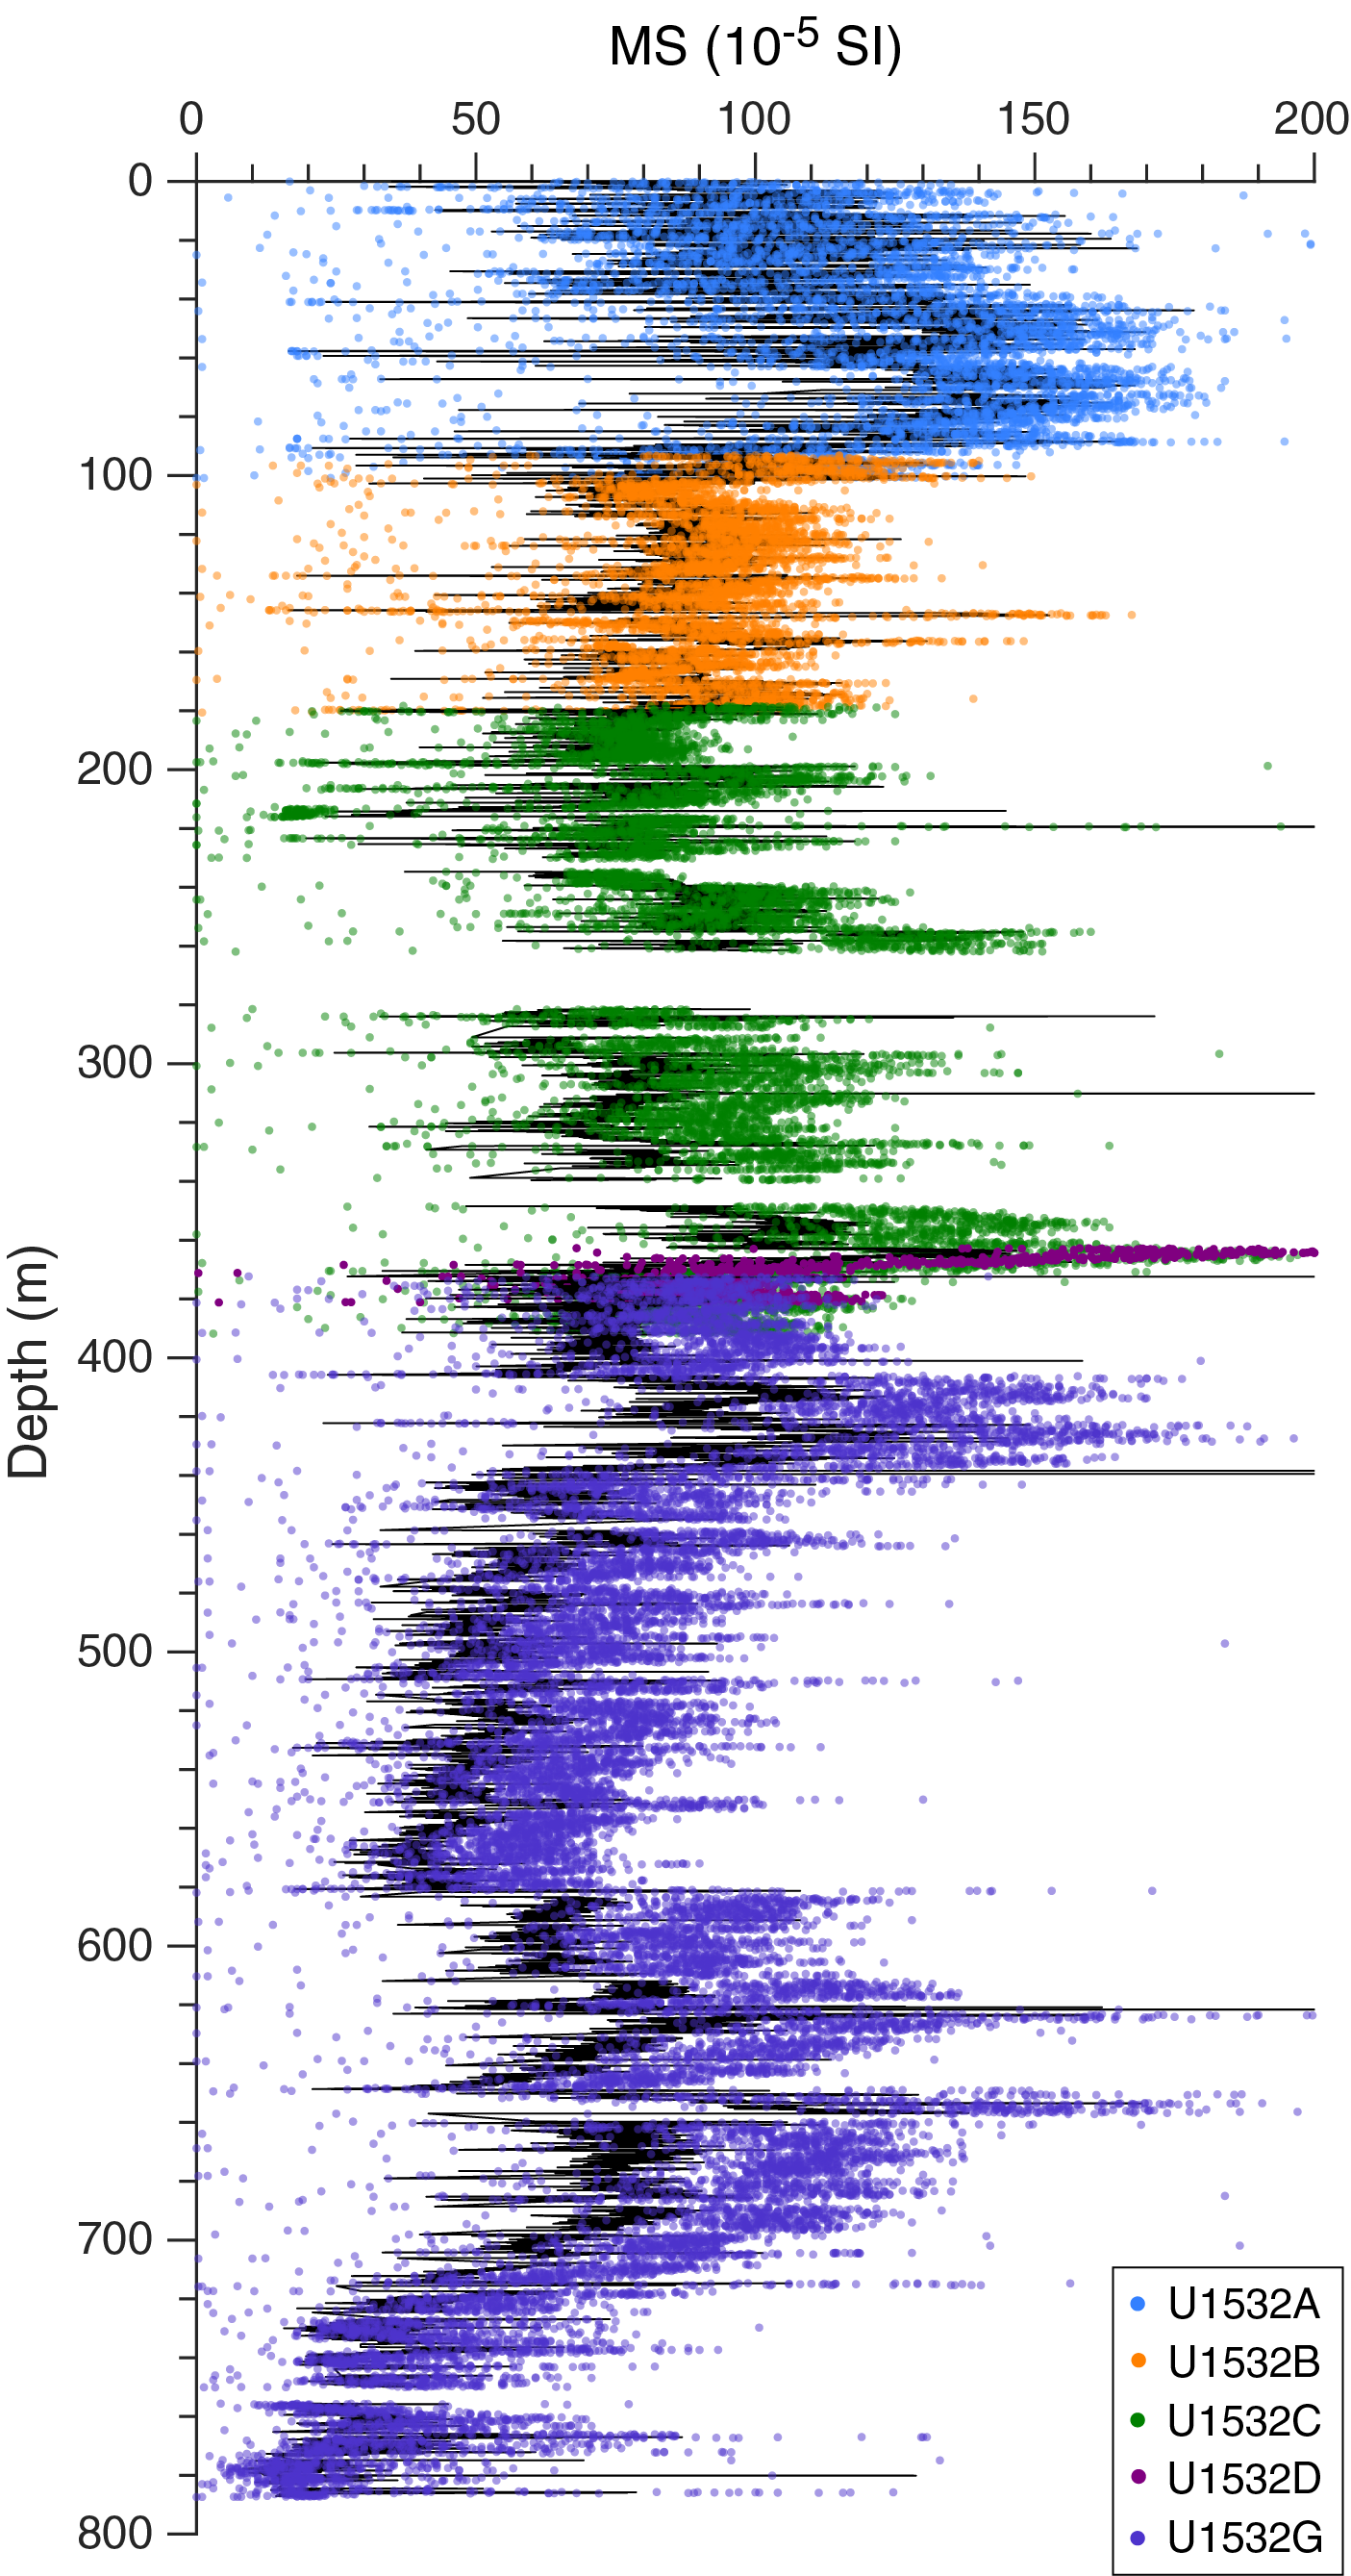
Figure F31. WRMSL and point SHMSL MS.
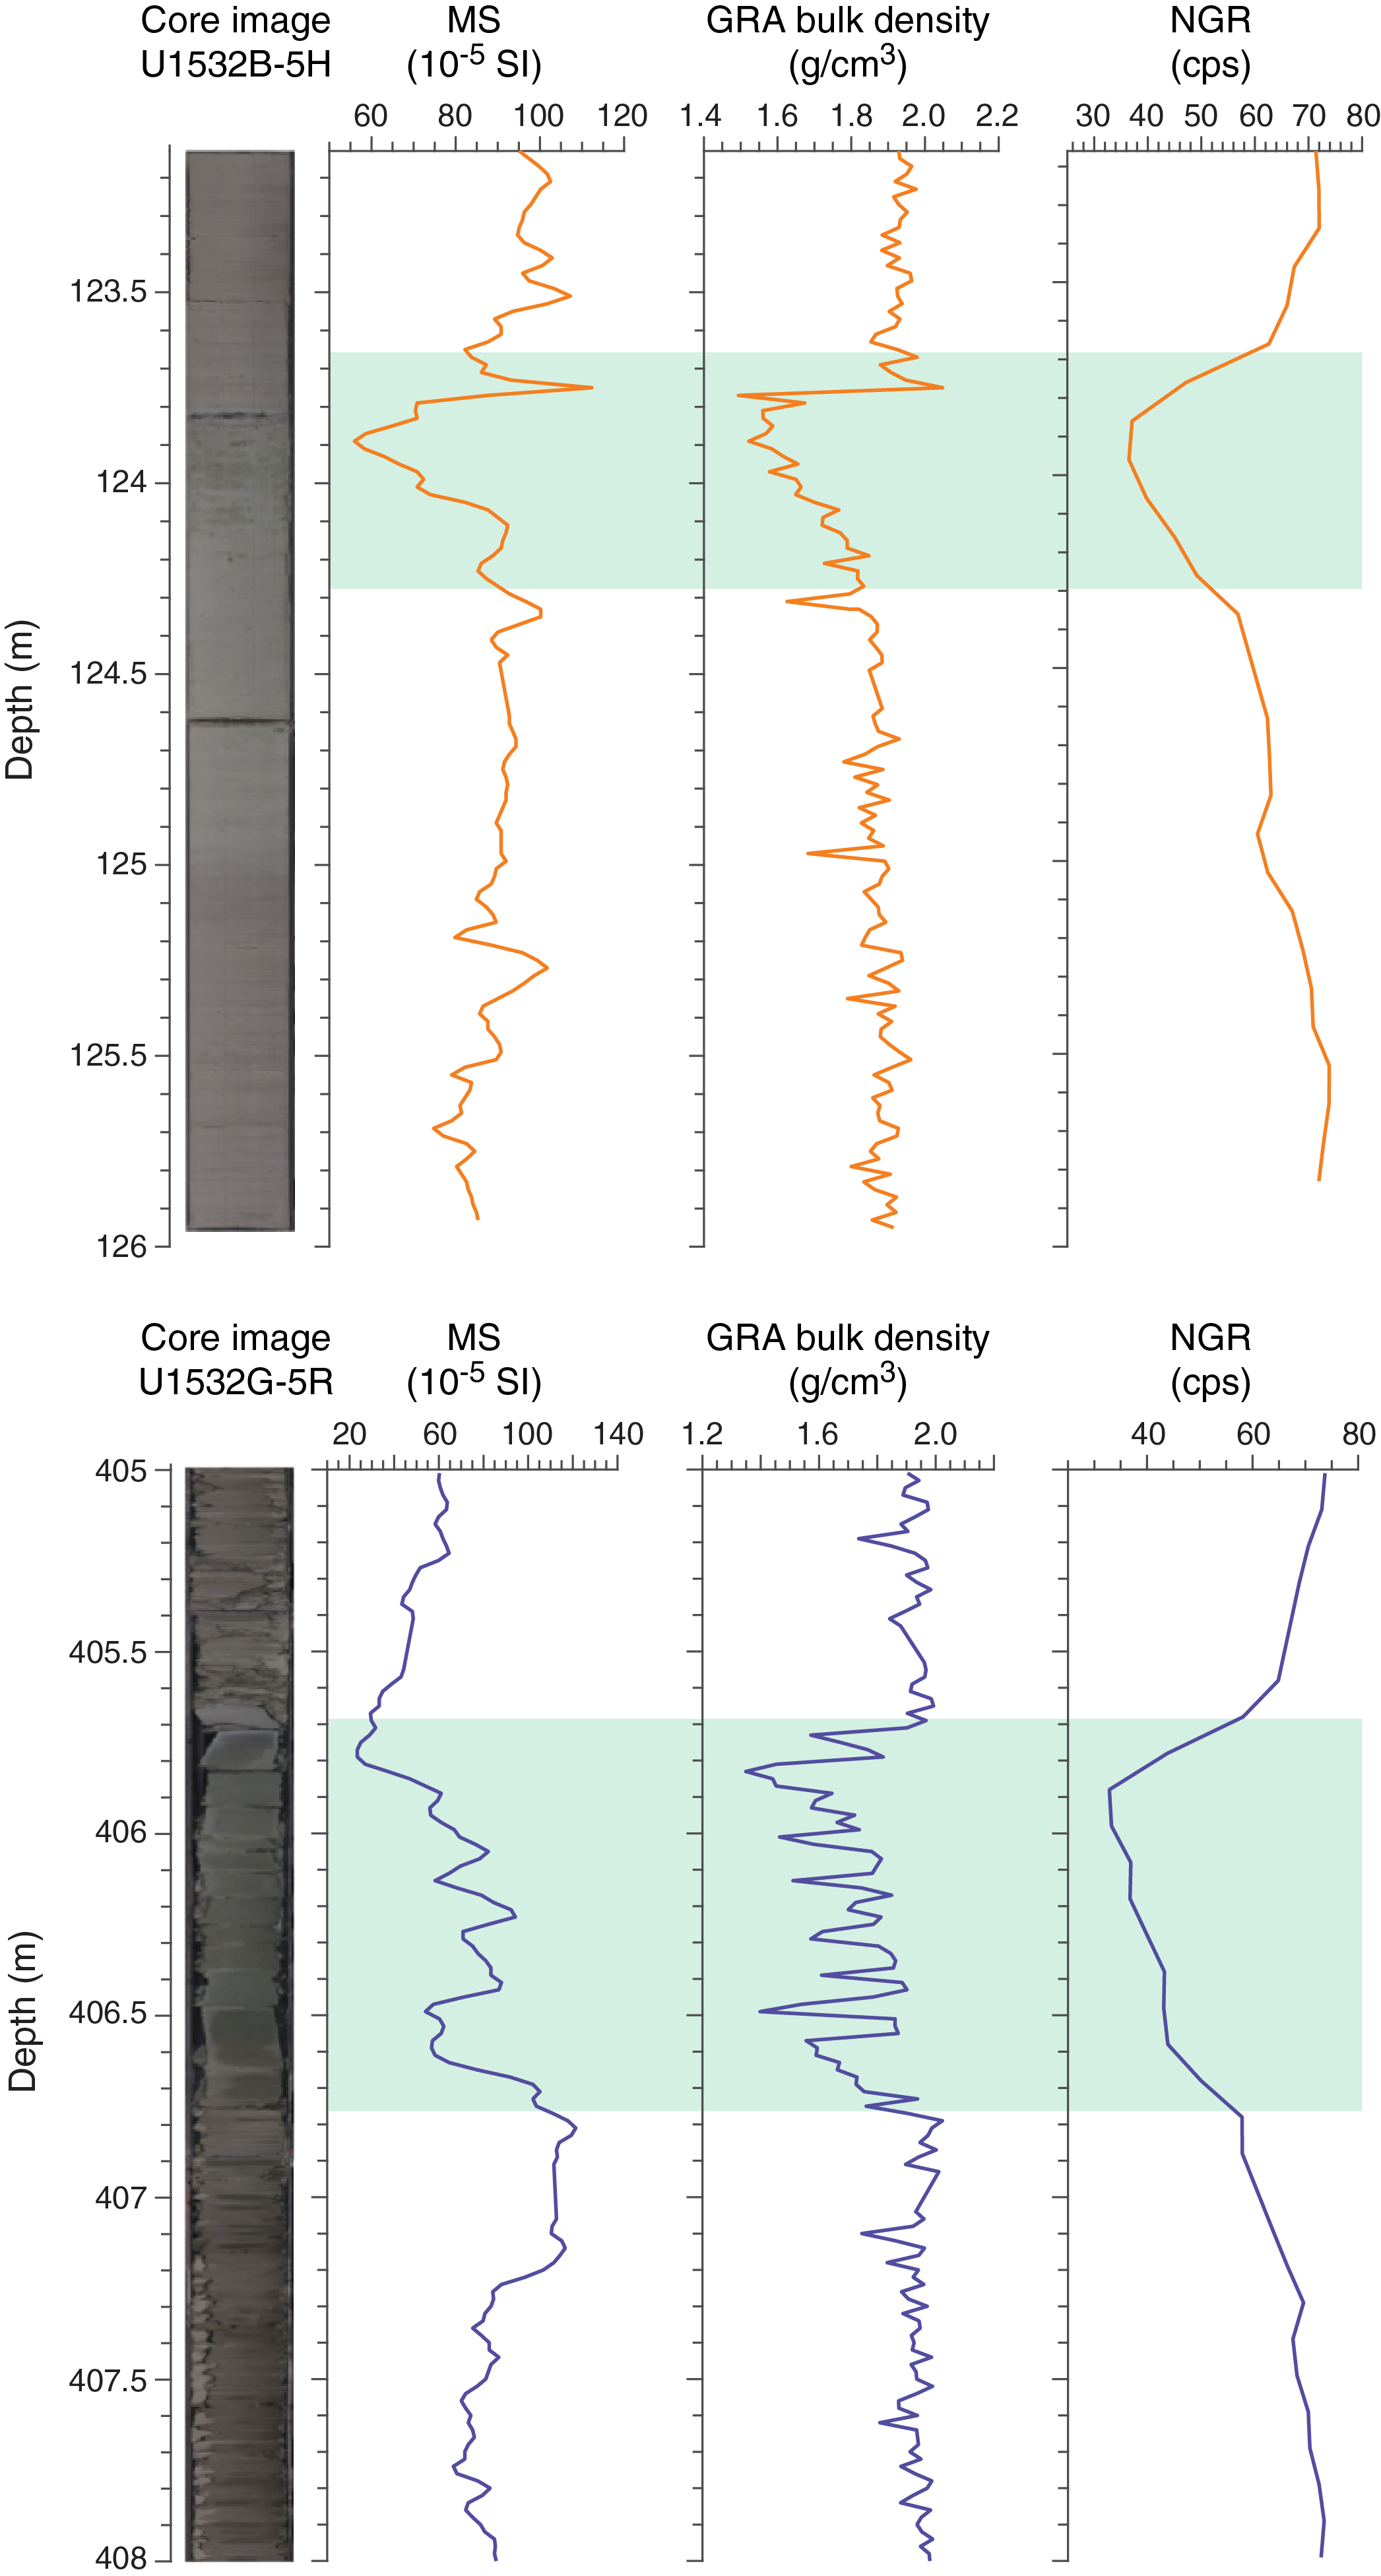
Figure F32. MS, GRA bulk density, and NGR.
Mass-normalized magnetic susceptibility (cm3/g) was calculated for the WRMSL magnetic susceptibility data using the GRA bulk density to help reduce biases that may reflect variability in parameters such as sediment compaction, porosity, and recovered core diameter (Walczak et al., 2015). Prior to normalization, both magnetic susceptibility and GRA bulk density were interpolated to 2 cm intervals and smoothed with a 4.5 cm Gaussian filter to accommodate the response function of the WRMSL magnetic susceptibility loop. This mass-normalized magnetic susceptibility may better represent more accurate sediment magnetic susceptibility measurements (Figure F33). General trends in the mass-normalized magnetic susceptibility agree with those observed in the raw data.
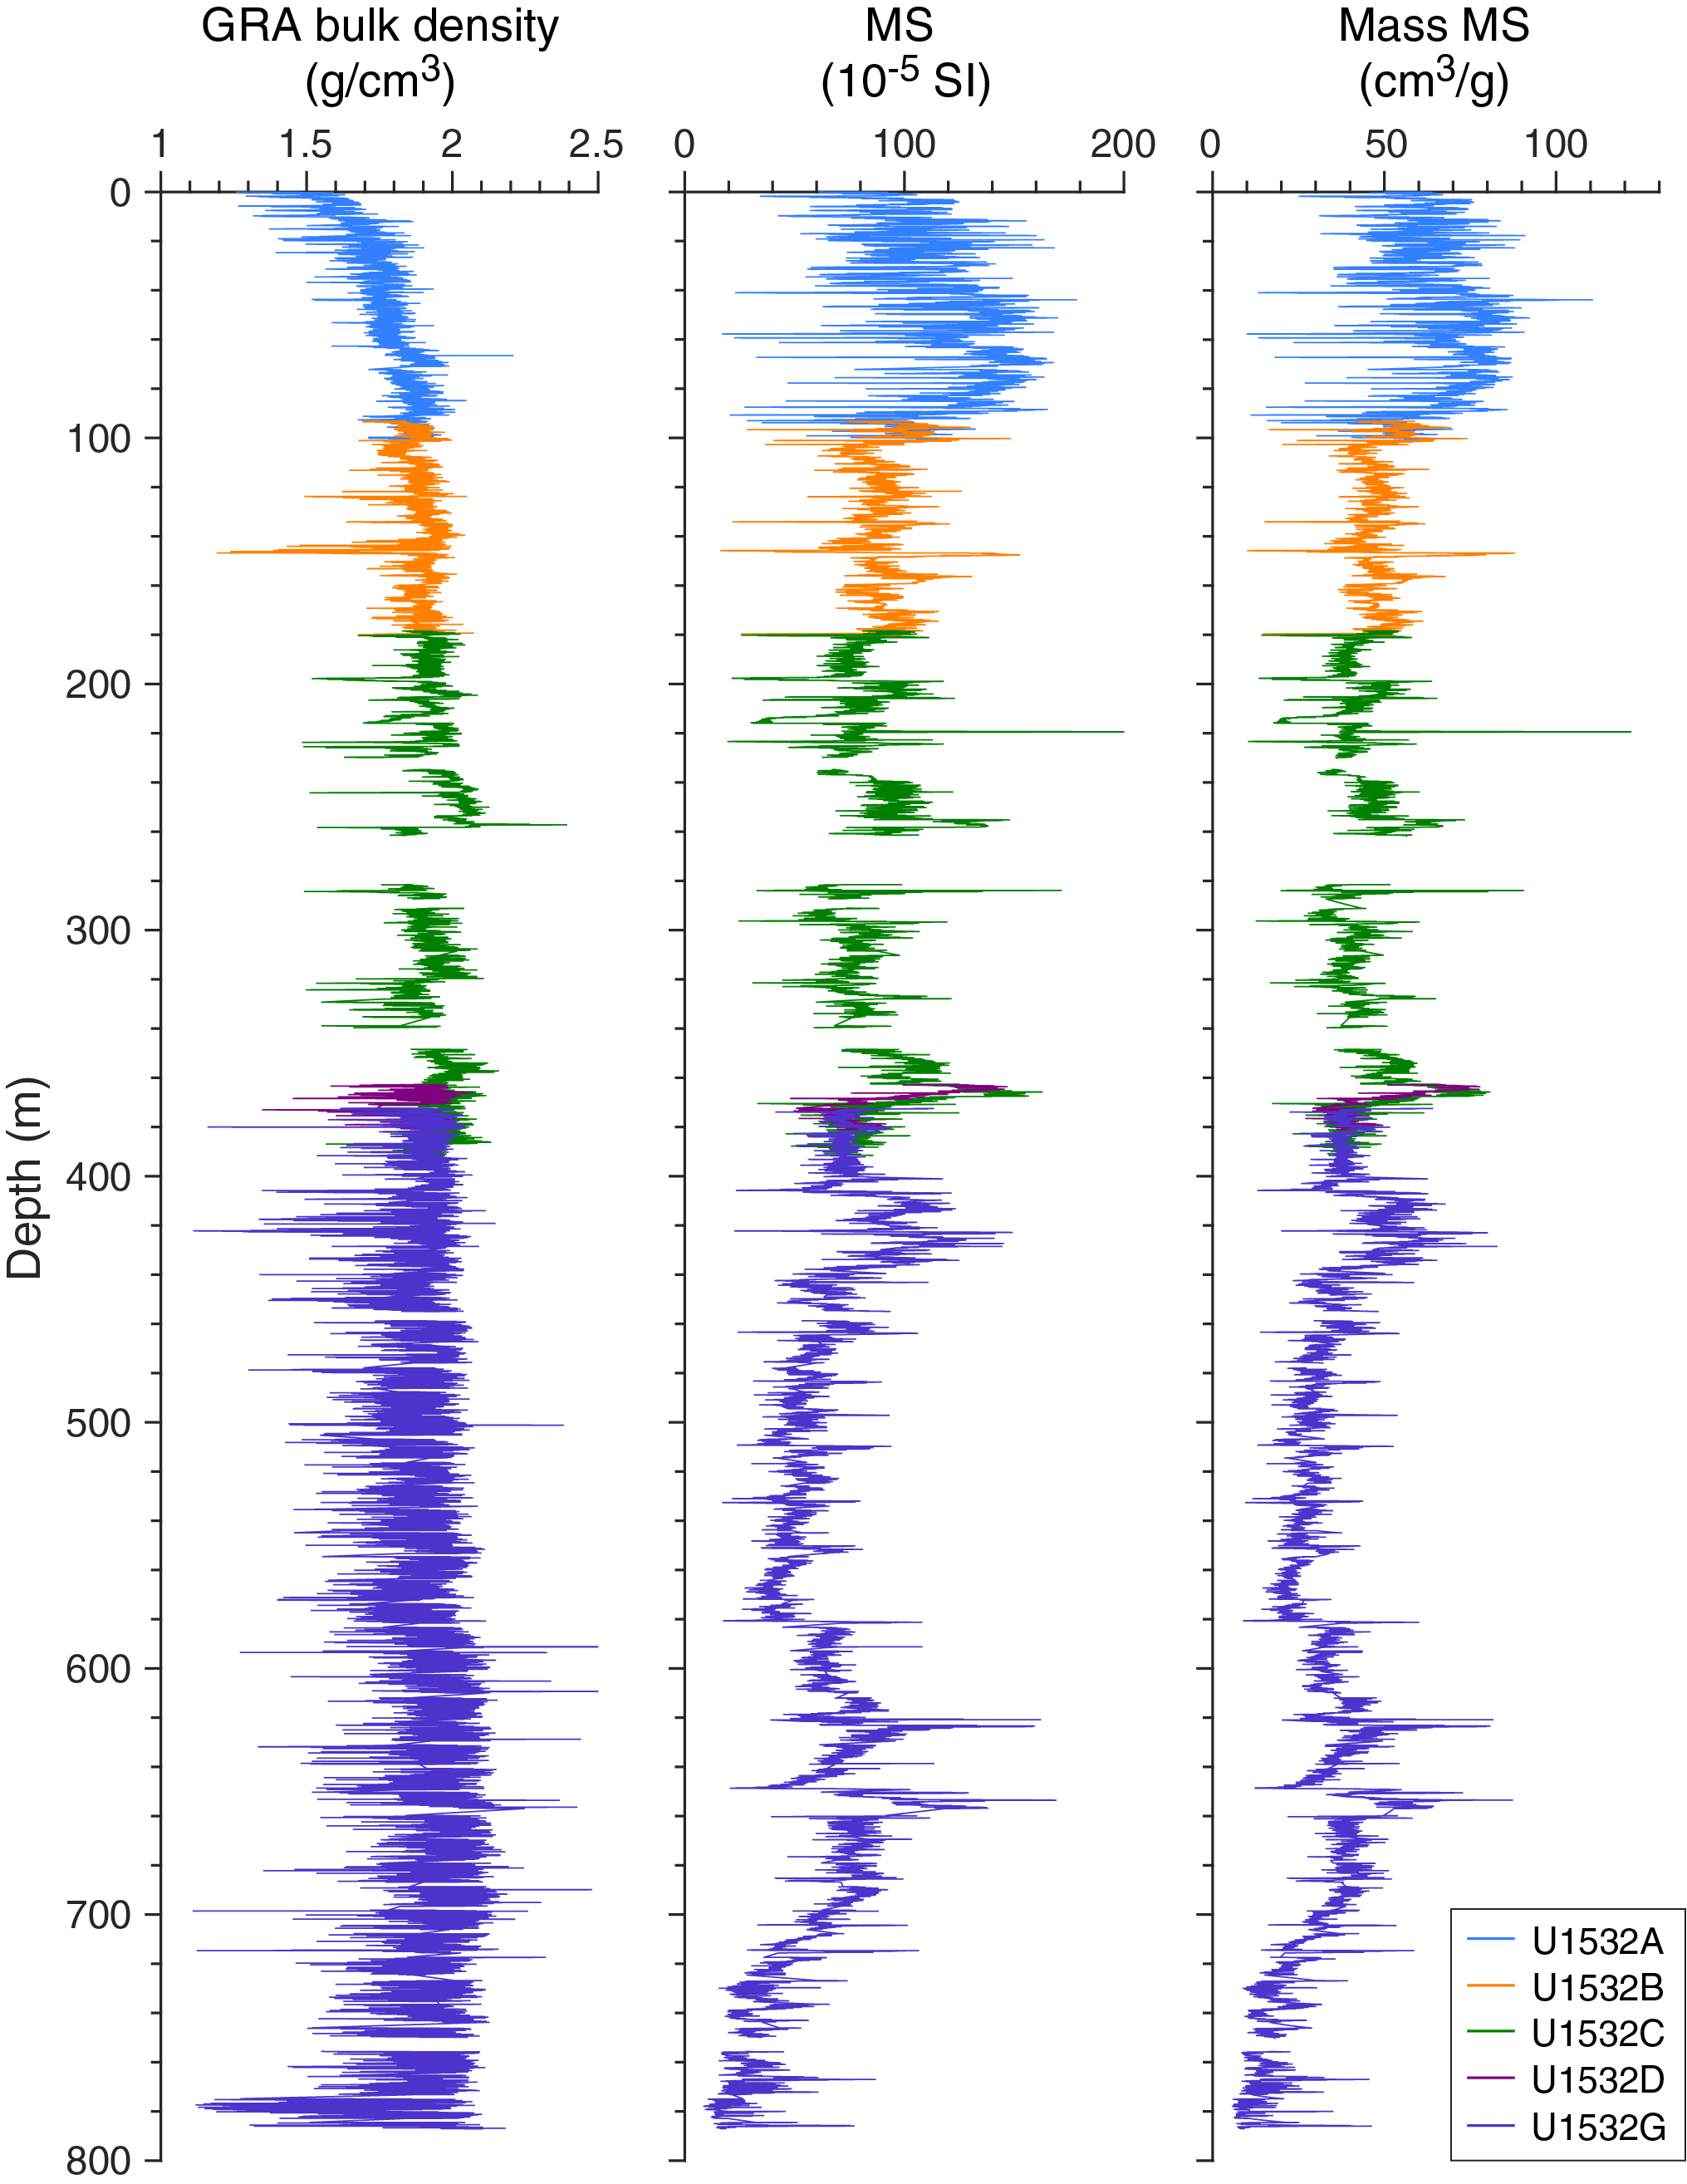
Figure F33. Mass-normalization of WRMSL MS data using GRA bulk density.
Natural gamma radiation
NGR was measured on all whole-round core sections at 10 cm intervals, and data were postprocessed to account for edge effects (see Physical properties in the Expedition 379 methods chapter [Gohl et al., 2021a]). Measured NGR values range from 19 to 112 counts/s with an overall average of 69 counts/s and a 1σ standard deviation of 9 counts/s (Figure F30). Average NGR values increase downcore from ~43 to ~75 counts/s to 93 m and the transition from Lithostratigraphic Subunit IA to Subunit IB (Figure F30). Below 93 m, cyclical downcore variations between ~30 and ~80 counts/s are evident. NGR trends follow those observed in magnetic susceptibility and GRA bulk density, likely indicating changes in terrigenous sediment input. A stepwise decrease in NGR counts was observed at 258 m and is associated with the transition from APC to XCB coring. XCB and RCB coring recovers core with a smaller diameter than APC coring, which results in a decrease in raw NGR counts. In Subunits IB and IC, greenish gray layers accompanied by a downcore decrease followed by a gradual increase in NGR were periodically seen (Figure F32).
As with WRMSL magnetic susceptibility, mass-normalized NGR is calculated using the GRA bulk density to help reduce biases that may reflect variability in parameters such as sediment compaction, porosity, and recovered core diameter (Walczak et al., 2015). Prior to normalization, both NGR and GRA bulk density were interpolated to 10 cm intervals and smoothed with a 20 cm Gaussian filter to accommodate the response function of the WRMSL magnetic susceptibility loop. In addition, raw NGR data (counts/s) were first volumetrically normalized by the effective volume in the NGR detection window (655 cm3) before mass normalization by GRA bulk density (g/cm3). Resultant mass-normalized NGR data (counts/s/g) may better represent more accurate sediment NGR measurements (Figure F34). General trends in the mass-normalized NGR agree with those observed in the raw data.
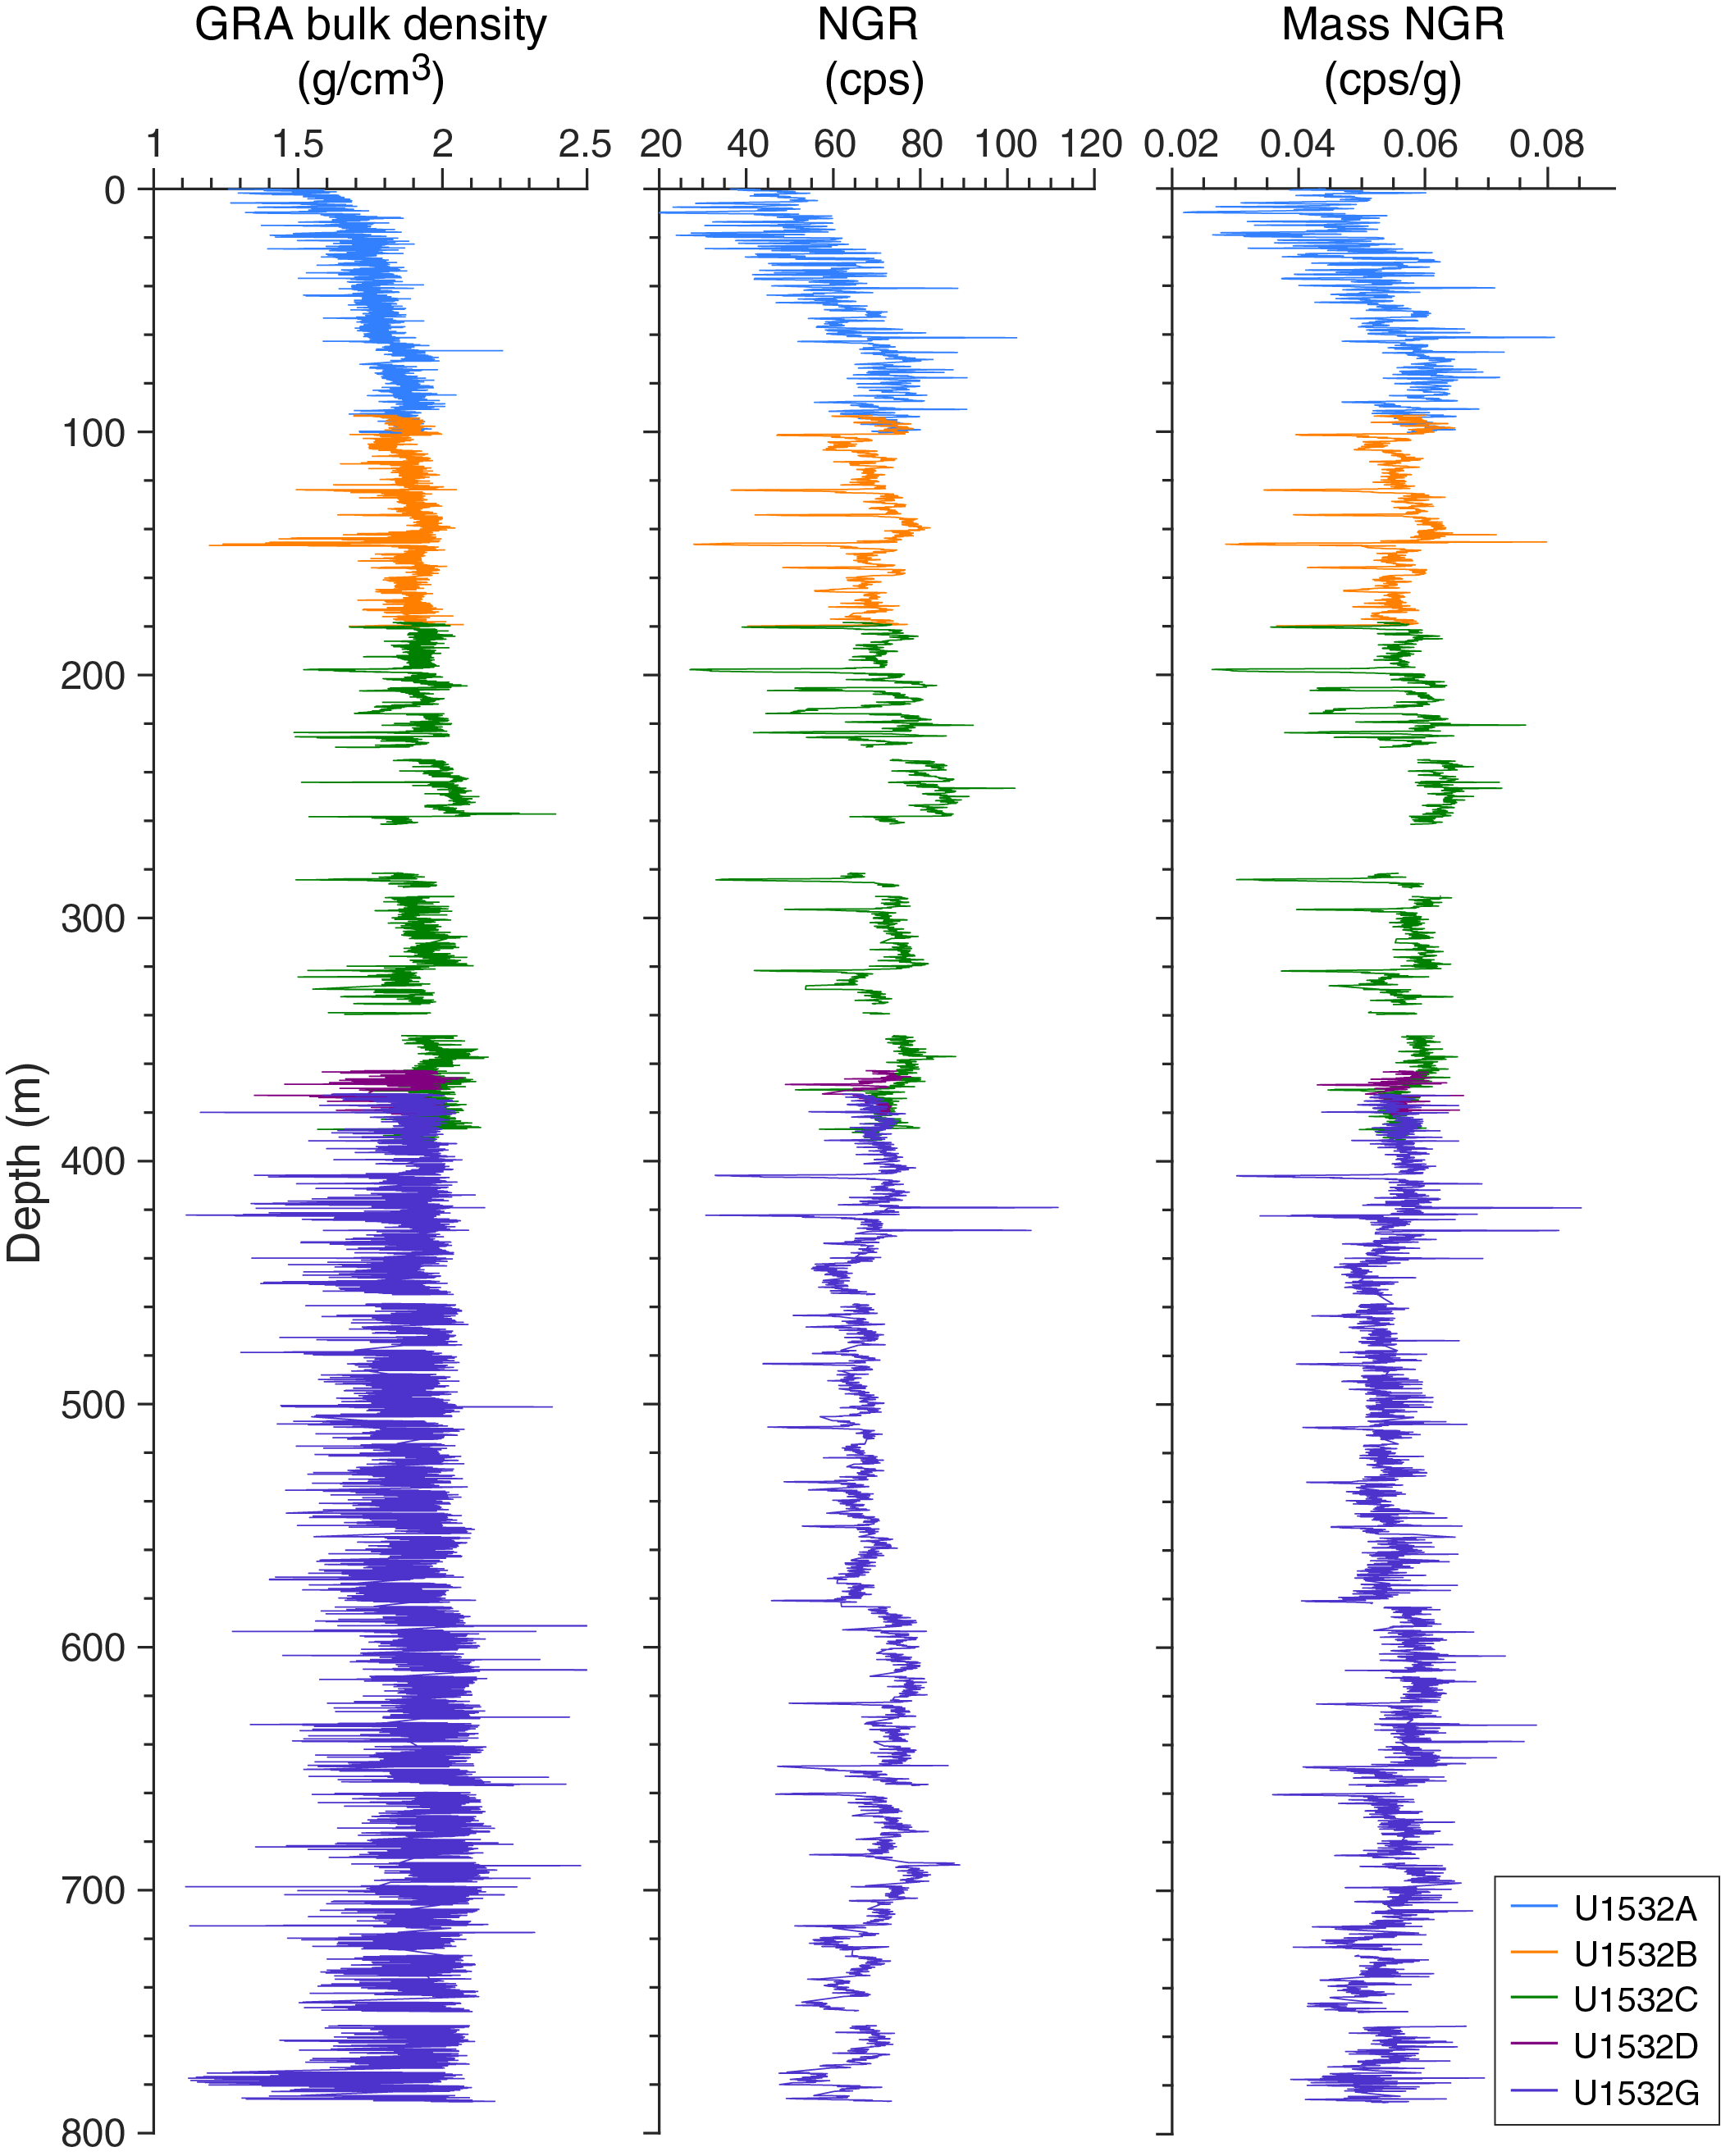
Figure F34. Mass-normalization of whole-round NGR data using GRA bulk density.
GRA bulk density
GRA bulk density was measured on whole-round sections using the WRMSL at 2 cm intervals with a 3 s integration time (see Physical properties in the Expedition 379 methods chapter [Gohl et al., 2021a]). Measured GRA bulk density values range from 1.1 to 2.5 g/cm3 with an overall average of 1.9 g/cm3 and a 1σ standard deviation of 0.12 g/cm3. The GRA bulk density record shows a rapid increase in average values from ~1.5 to ~1.8 g/cm3 for the uppermost ~65 m in Hole U1532A. The initial trend is followed by a more gradual density increase (from ~1.8 to ~2.1 g/cm3) to the termination of Hole U1532G at 787 m (Figure F30). The overall increase in GRA bulk density with depth at this site reflects the increasing compaction of sediment with depth. Smaller scale variability denotes changes in sediment lithology and correlates well with NGR and magnetic susceptibility variability. General trends in GRA bulk density follow those observed in magnetic susceptibility and NGR, likely indicating changes in terrigenous sediment input. An abrupt decrease in GRA bulk density was observed at 258 m at the transition from APC to XCB coring (Figure F30). This transition to lower density measurements reflects the smaller volume of the XCB cores. Noise in GRA bulk density increases with RCB coring in Holes U1532D and U1532G, likely due to smaller core volume, coring disturbance, and decreased core recovery. The MAD bulk density data collected on discrete samples from the split cores provide more accurate bulk densities in the XCB- and RCB-cored intervals (see Moisture and density; Figure F35). In Lithostratigraphic Subunits IB and IC, greenish gray layers accompanied by a decrease in GRA bulk density are periodically seen (Figure F32).
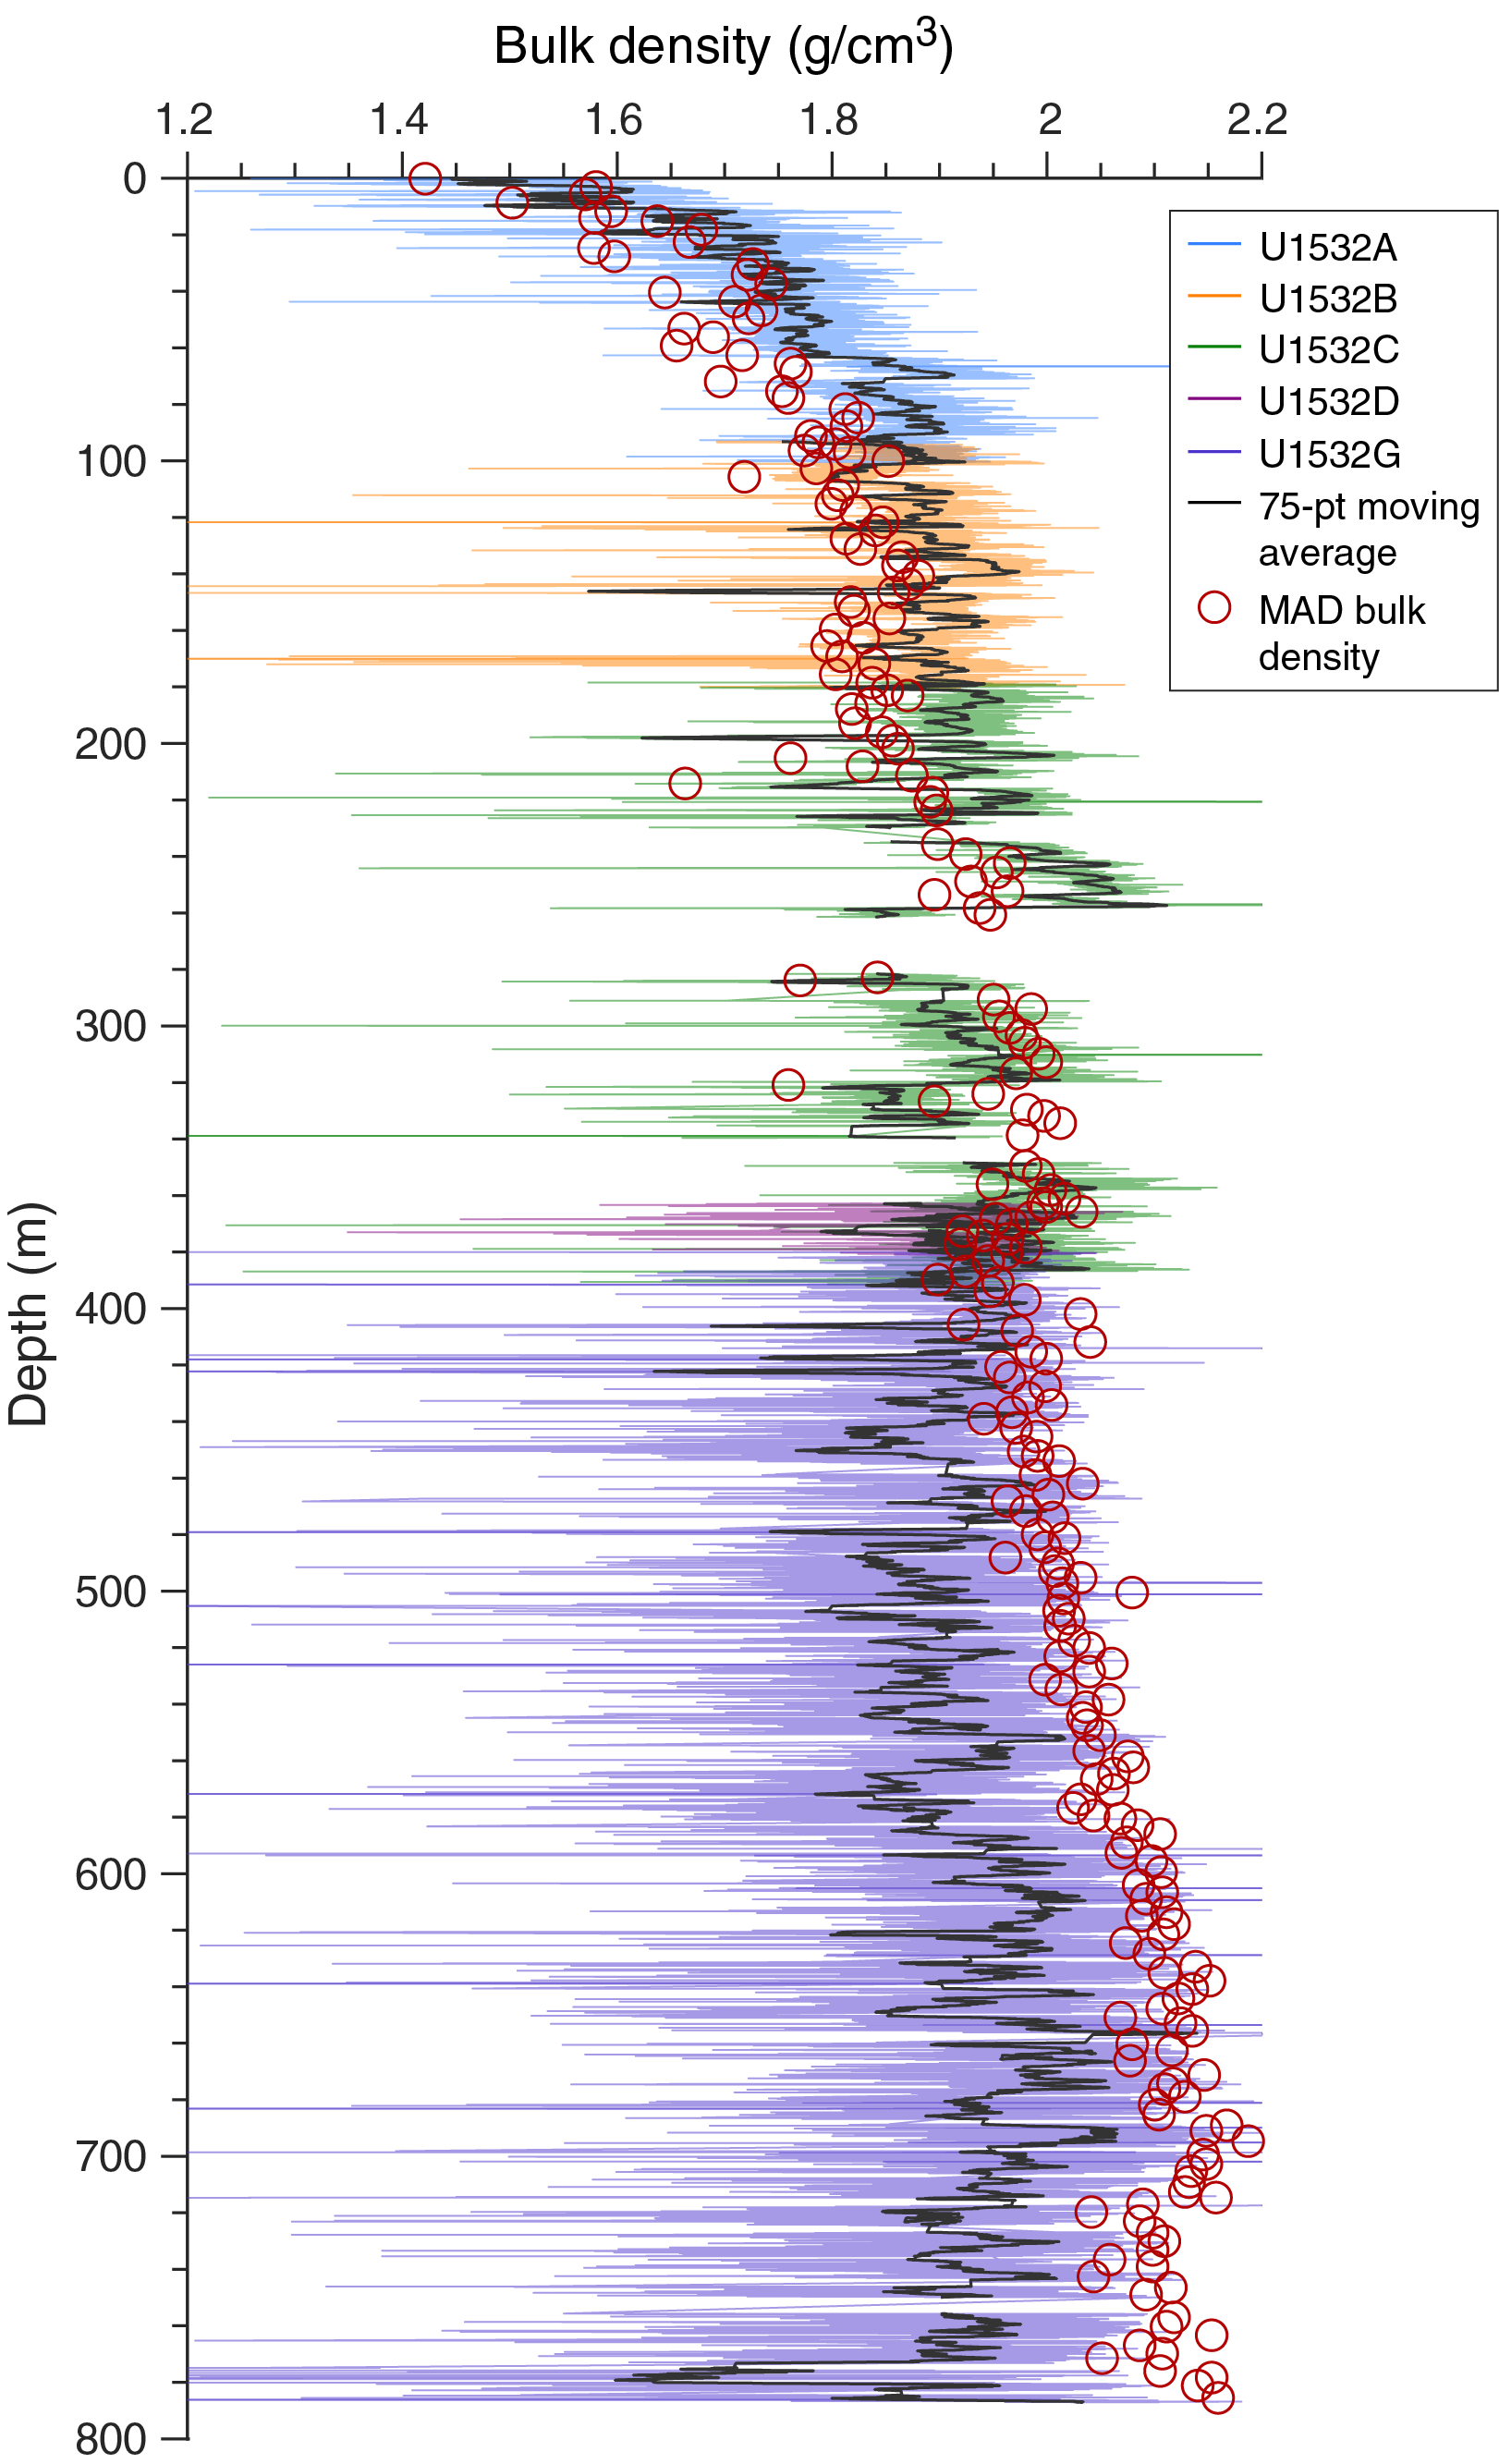
Figure F35. WRMSL GRA bulk density and discrete sample MAD.
Moisture and density
MAD bulk density values were calculated from mass and volume measurements made on discrete samples collected from the working half of split cores (see Physical properties in the Expedition 379 methods chapter [Gohl et al., 2021a]). In total, 248 discrete samples were analyzed. Bulk densities range from 1.4 to 2.2 g/cm3. MAD bulk densities increase quickly from 1.4 g/cm3 at the seafloor to 1.8 g/cm3 at 66 m, which corresponds to a decrease in porosity (Figure F36). From 66 m to the bottom of the hole, the rate of increase is slower, and densities range from 1.8 to 2.2 g/cm3 at 787 m. Some MAD bulk densities that are lower than the overall trend correspond with increases in biogenic material (see Lithostratigraphy and Biostratigraphy). MAD bulk density values correspond well with GRA bulk density to 258 m. Below that depth, GRA bulk density values trend lower than MAD values because of reduced sediment diameter in XCB and RCB cores (Figure F35).
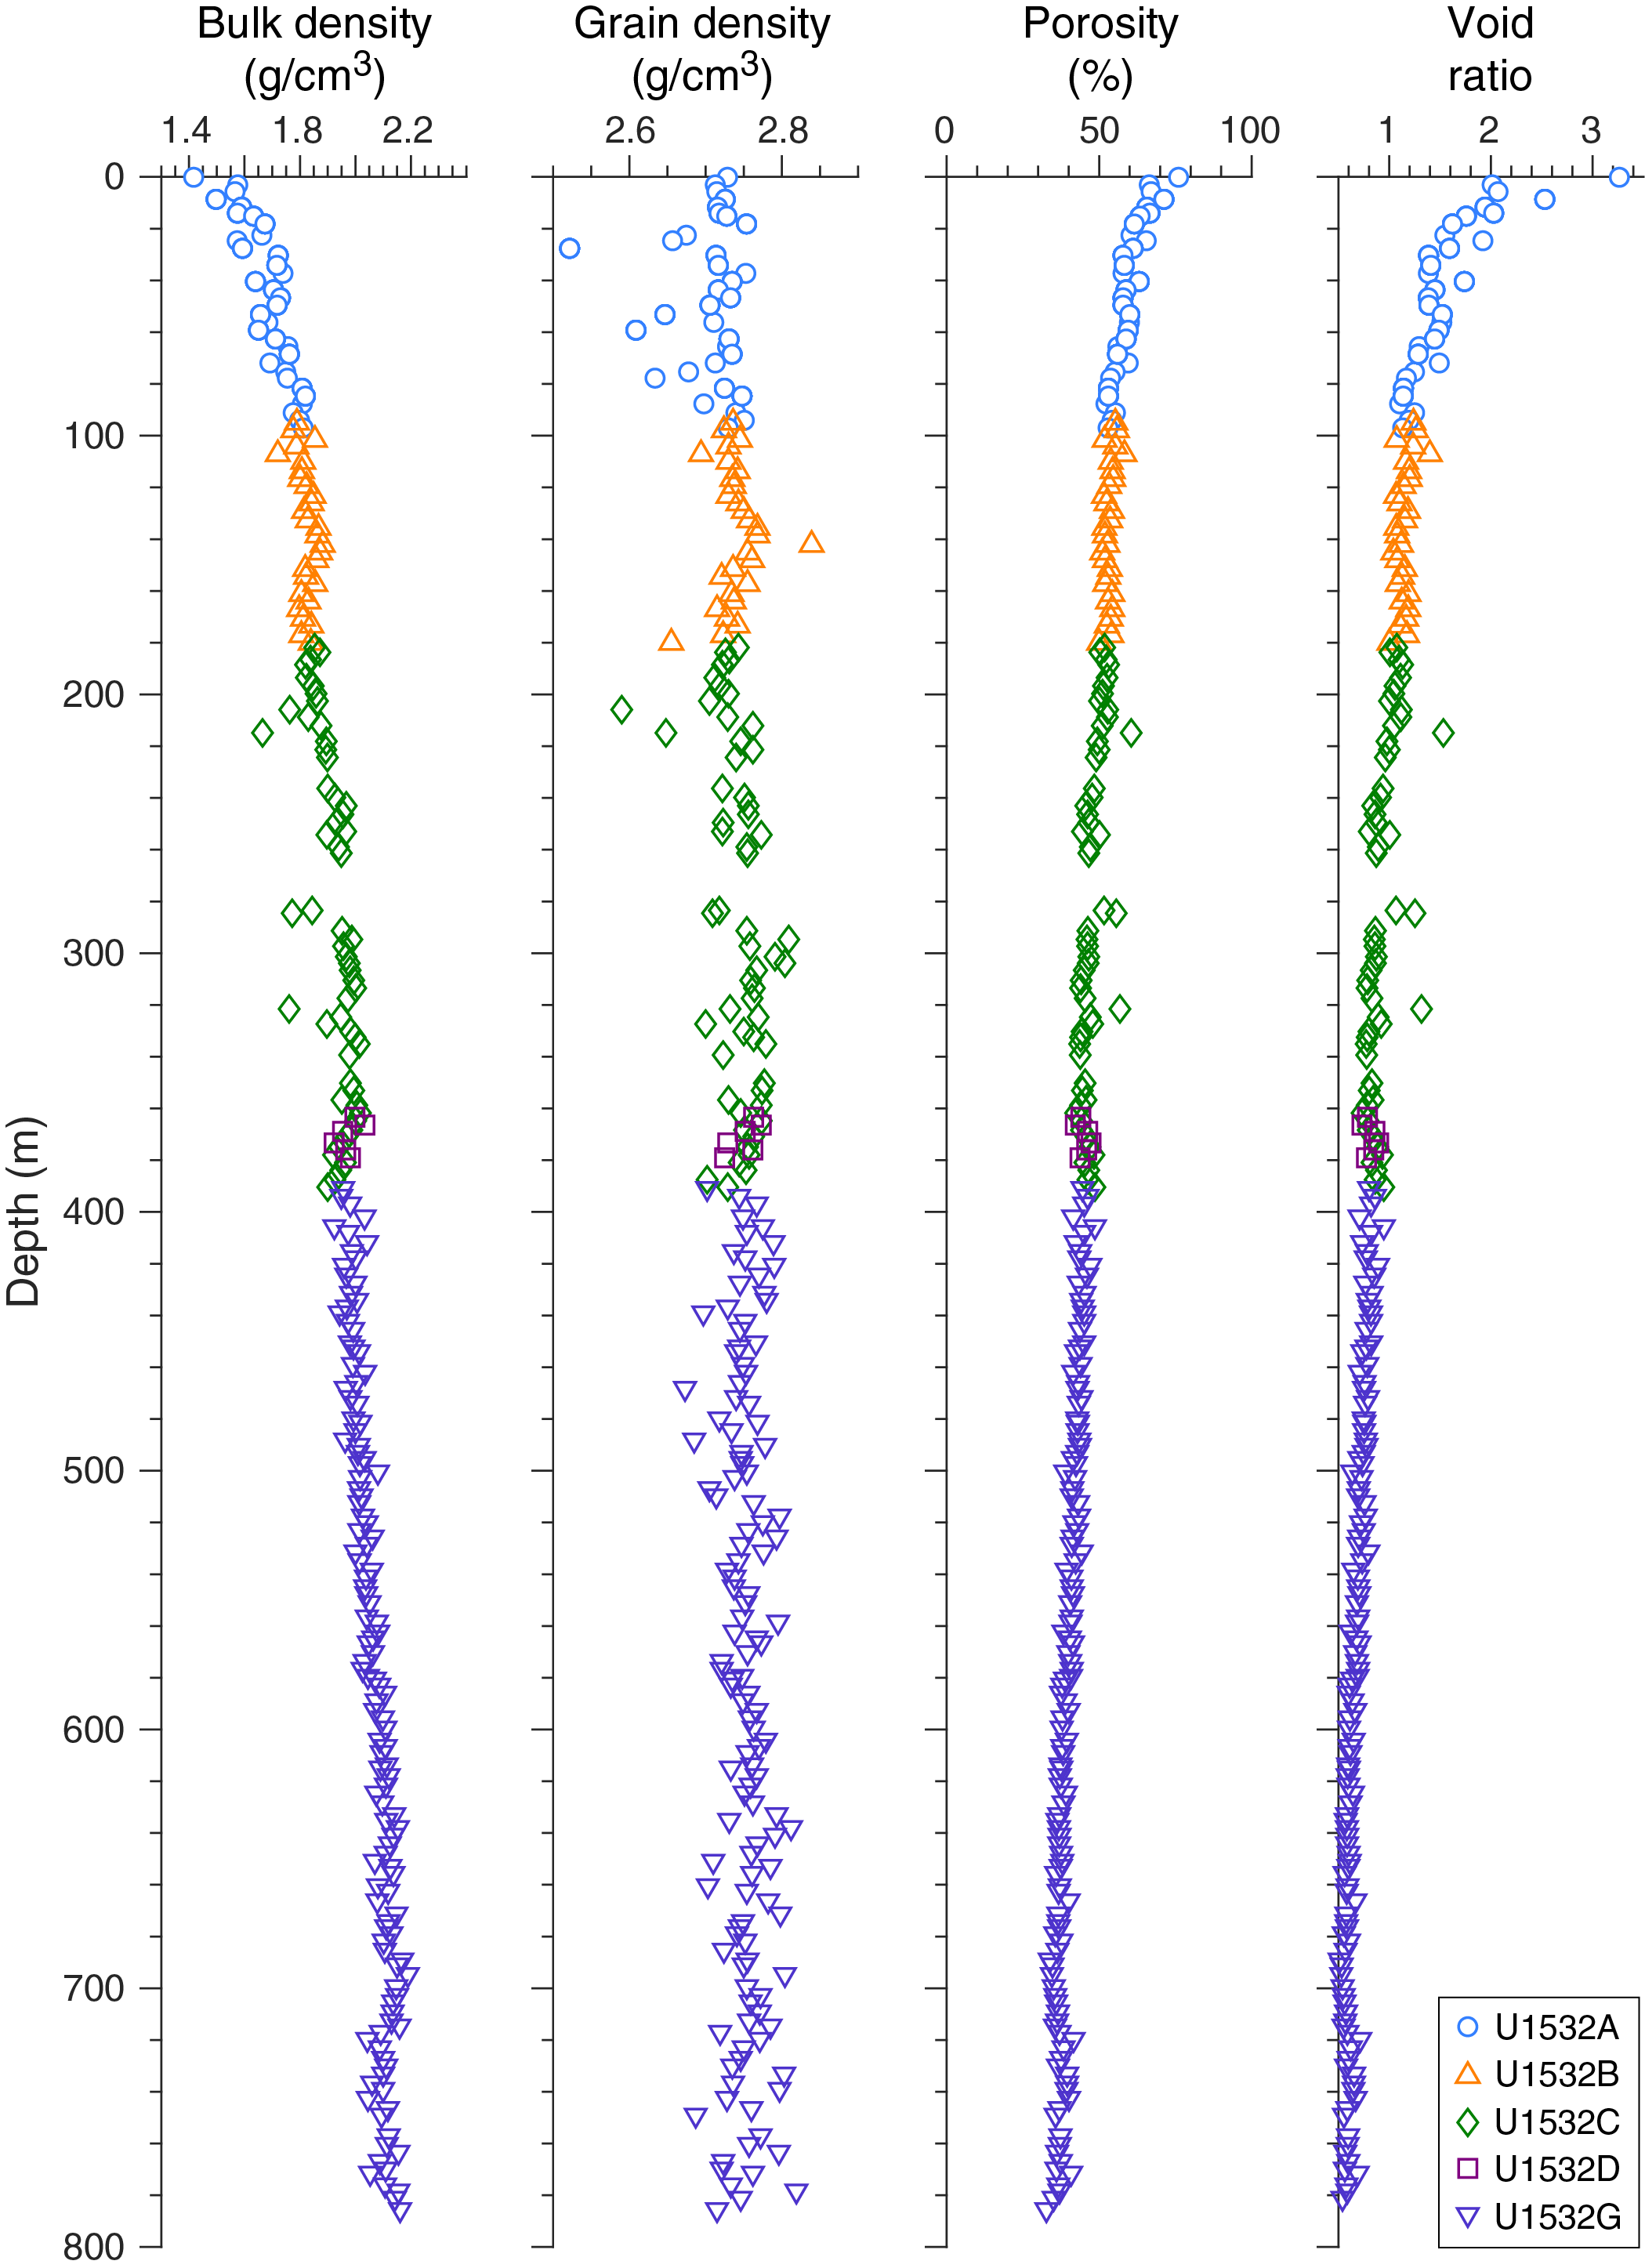
Figure F36. MAD data.
Measured grain density values are generally constant with depth, ranging from 2.5 to 2.8 g/cm3 (Figure F36). There was additional variability in grain density in the upper 100 m, where some MAD samples required additional drying time due to water retention from clays (see Physical properties in the Expedition 379 methods chapter [Gohl et al., 2021a]). Sediment porosity shows a rapidly decreasing trend from 77% to 58% with depth from the seafloor to ~31 m. This is followed by a more gradual decrease from 60% to 33% with depth to the termination of Hole U1532G at 787 m (Figure F36). Similar trends to porosity are also observed in the void ratio. These data show clear compaction trends that are consistent with marine clay-rich sediments (Busch, 1989).
P-wave velocity
P-wave velocity was measured on the WRMSL P-wave logger (PWL) for Holes U1532A–U1532C to 258 m at a resolution of 2 cm. Reliable measurements with the WRMSL were not available at deeper depths due to the presence of void space between the core material and core liner caused by the decrease in core diameter associated with XCB and/or RCB coring in Holes U1432C–U1532G. PWL velocities were also not measured for APC Section 379-U1532C-12F-1 due to incomplete filling of the core liner. PWL velocities increase with depth, ranging from ~1460 m/s at the seafloor to ~1670 m/s at 258 m (Figure F37).
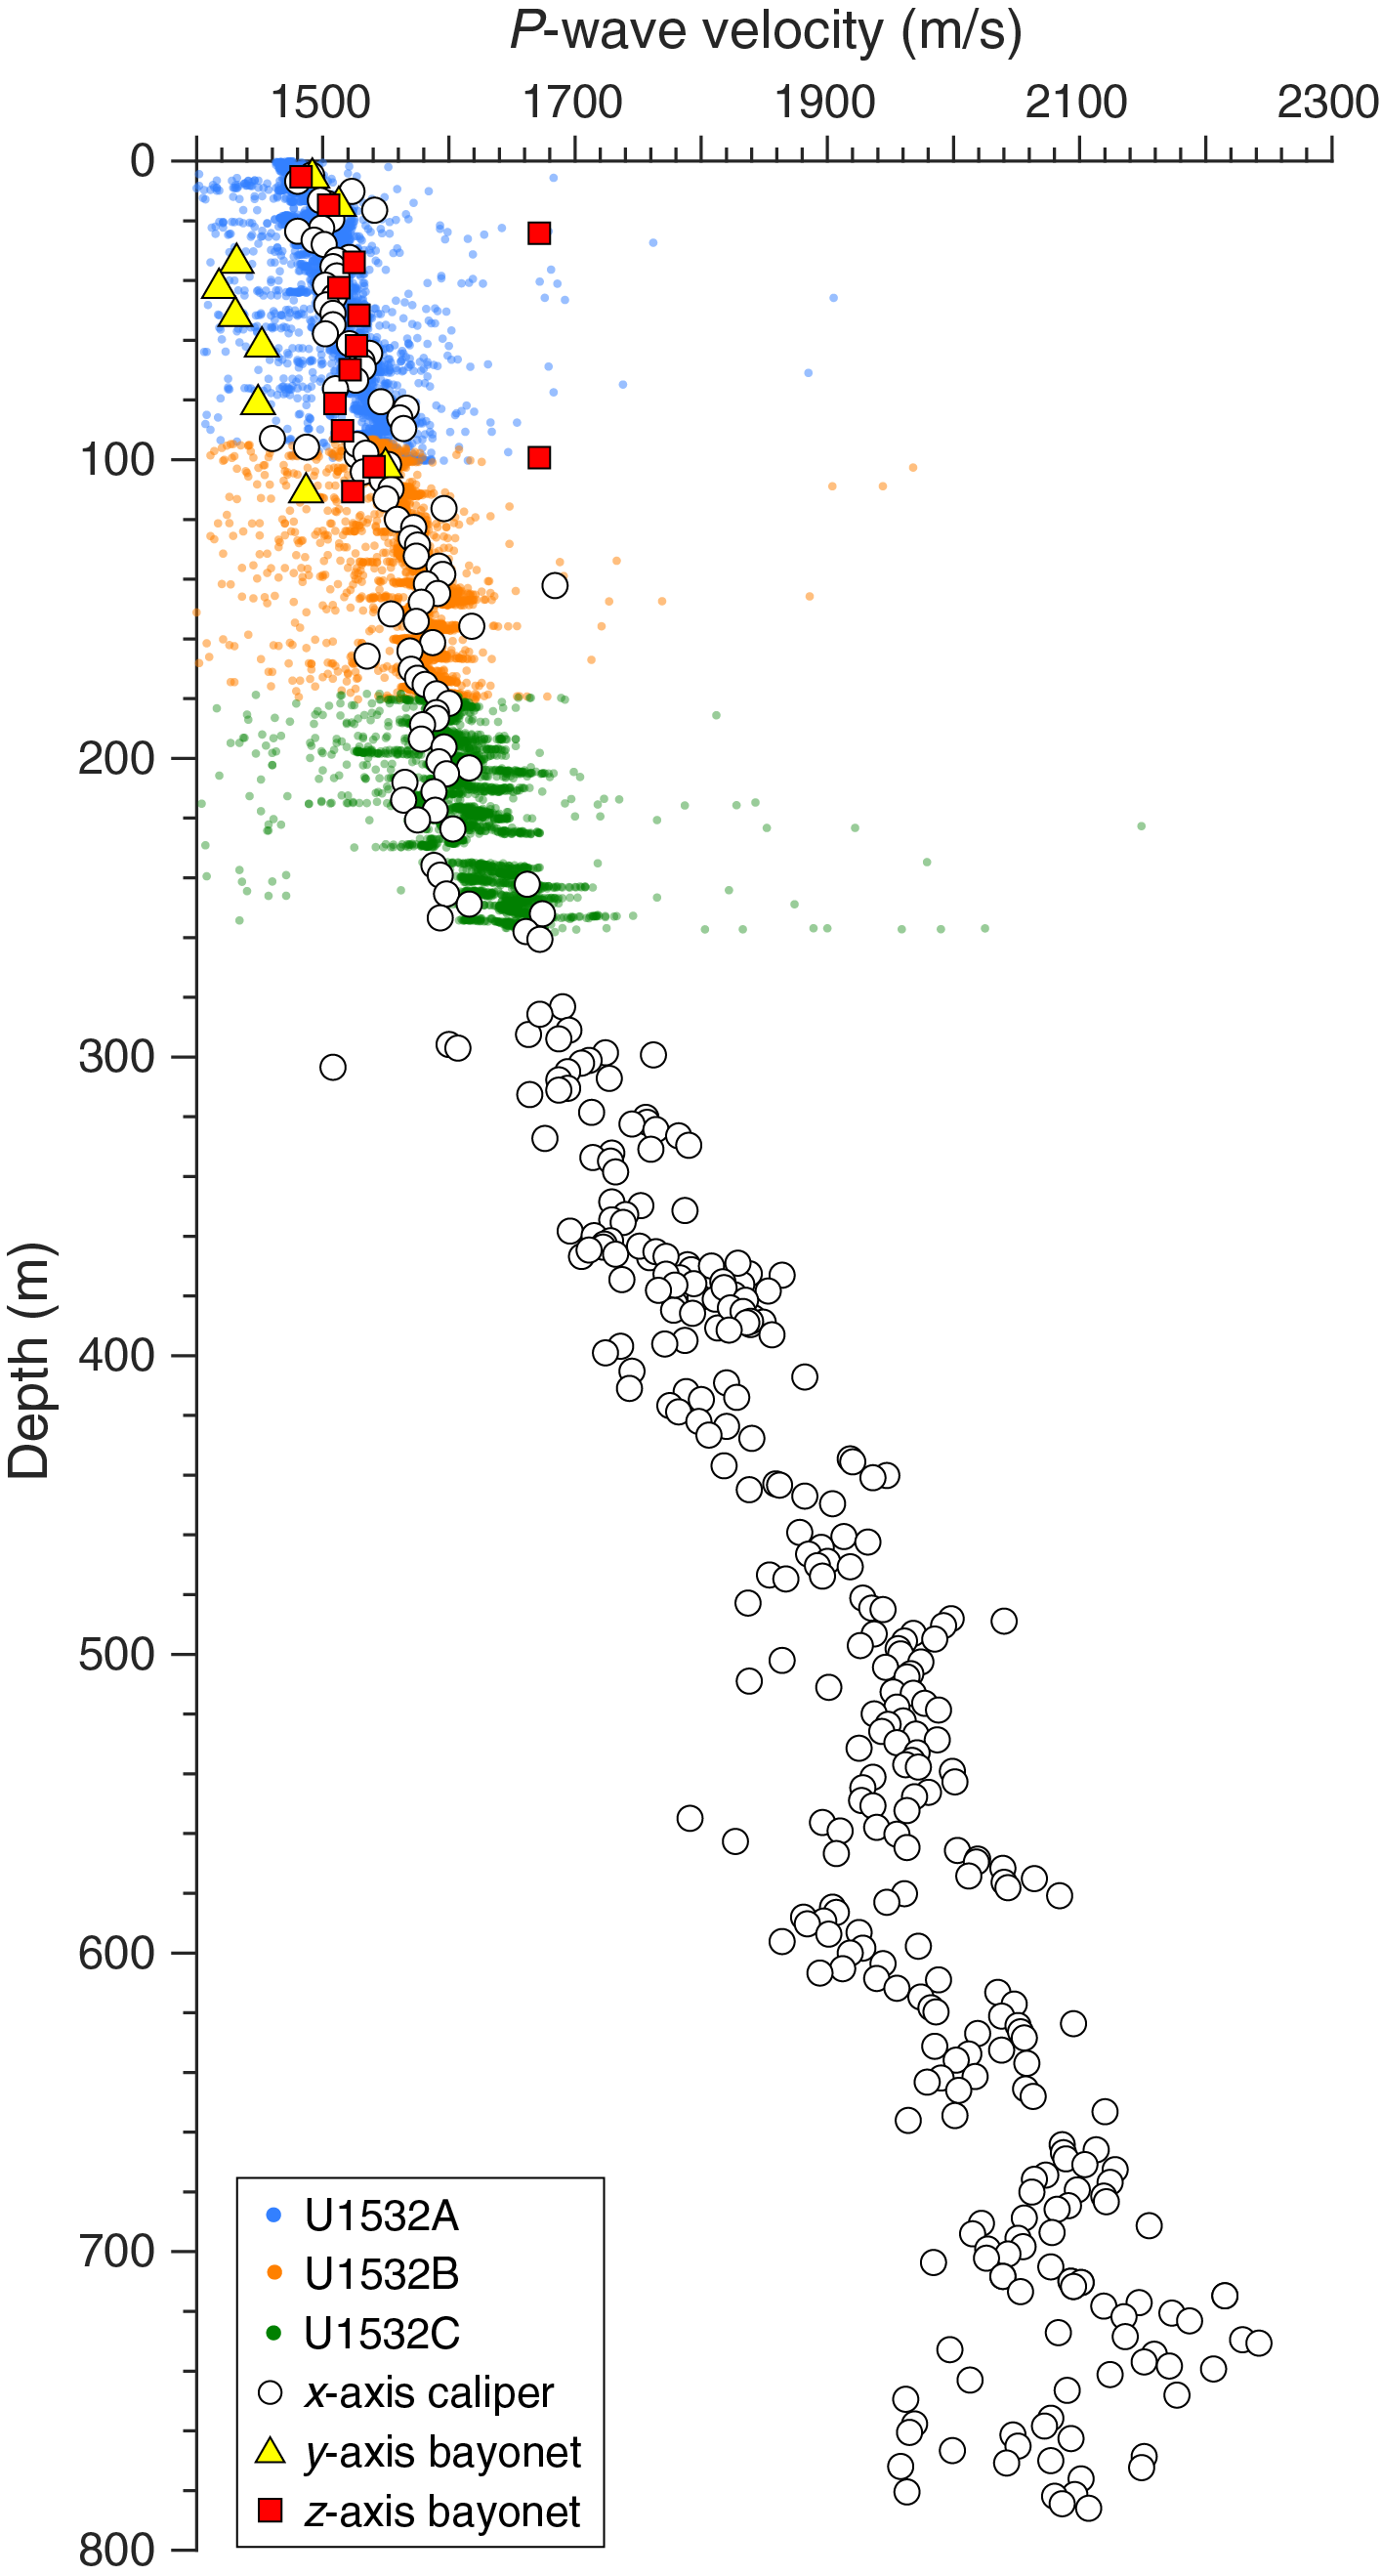
Figure F37. P-wave velocity.
Discrete P-wave velocity measurements were made on the SHMG (see Physical properties in the Expedition 379 methods chapter [Gohl et al., 2021a]) in the dominant lithology for the core interval. P-wave caliper (PWC) measurements track well with the PWL measurements for the upper 258 m and show a gradual increase with depth. PWC velocities continue to increase with depth as consolidation increases to an average velocity of ~2090 m/s at 787 m (Figure F37). A slight increase in PWC velocities compared to the general downcore trend was observed between 370 and 393 m. Below 400 m, variability in P-wave velocity increases, correlating with the presence of cemented silt and sand in Lithostratigraphic Subunit IC. P-wave velocity measurements made on the y- and z-axis with the P-wave bayonets (PWBs) range from 1253 to 1549 m/s in the y-direction and 1482 to 1671 m/s in the z-direction and increase with depth, although with greater variability than the PWC. PWB measurements were only collected until the sediment became too compacted for adequate penetration by the PWBs (111 m). PWC and PWB measurement values were automatically picked by the native SHMG instrument software when possible and manually picked only when the automatic algorithm encountered increased noise. No major changes in P-wave velocity were observed across lithostratigraphic unit boundaries.
Thermal conductivity
Thermal conductivity measurements were made once per core where possible on core sections collected from Holes U1532A–U1532G (see Physical properties in the Expedition 379 methods chapter [Gohl et al., 2021a]). A needle probe was used for all measurements on recovered whole-round cores down to 258 m. Below this depth, a half-puck contact probe was used on split working halves because the core sediments became too consolidated and compacted for proper needle probe insertion. Thermal conductivity measurements were not possible on all collected cores due to poor core quality or probe contact. For cores recovered by XCB or RCB coring, there were frequently no internal portions of the core sections long enough for full contact coverage of the half-puck probe. Consequently, only a single adequate measurement was possible below 400 m. As a first approximation, thermal conductivity in fine-grained sediments represents a combination of the conductivity of both the sediment grains and interstitial water. It is therefore dependent on both porosity and lithology. Because the thermal conductivity of typical sediment-forming minerals is higher than water, thermal conductivity is expected to increase with increasing dry bulk density. Overall, thermal conductivity values increase with depth from ~1 W/(m·K) at the seafloor to ~1.7 W/(m·K) at 392 m, corresponding to a downcore increase in dry bulk density and decreased porosity from compaction (Figure F38). The single measurement below 400 m displays a thermal conductivity of 1.6 W/(m·K); however, this measurement was made on a biosilica-rich facies (F3). Compared to the other thermal conductivity measurements typically taken in terrigenous silty clay facies (F2), this lower value may be due to lithologic differences.

Figure F38. Thermal conductivity.
Color reflectance
Spectral color reflectance was measured on archive halves from all core sections using the SHMSL (see Physical properties in the Expedition 379 methods chapter [Gohl et al., 2021a]). In general, L* values range from 50 to 20 with a general decrease downcore. a* and b* display color reflectance values that range between −2 to 7 and −6 to 14, respectively (Figure F39). They both show stepwise decreases at 38 and 93 m. The decrease in a* and b* at 93 m corresponds to a transition from Lithostratigraphic Subunit IA to Subunit IB. Below 93 m, a* shows cyclic variations ranging from approximately −1.5 to 2 and is associated with compositional changes (e.g., more biogenic versus terrigenous). An increase in a* values at 401 m corresponds to the top of Subunit IC.
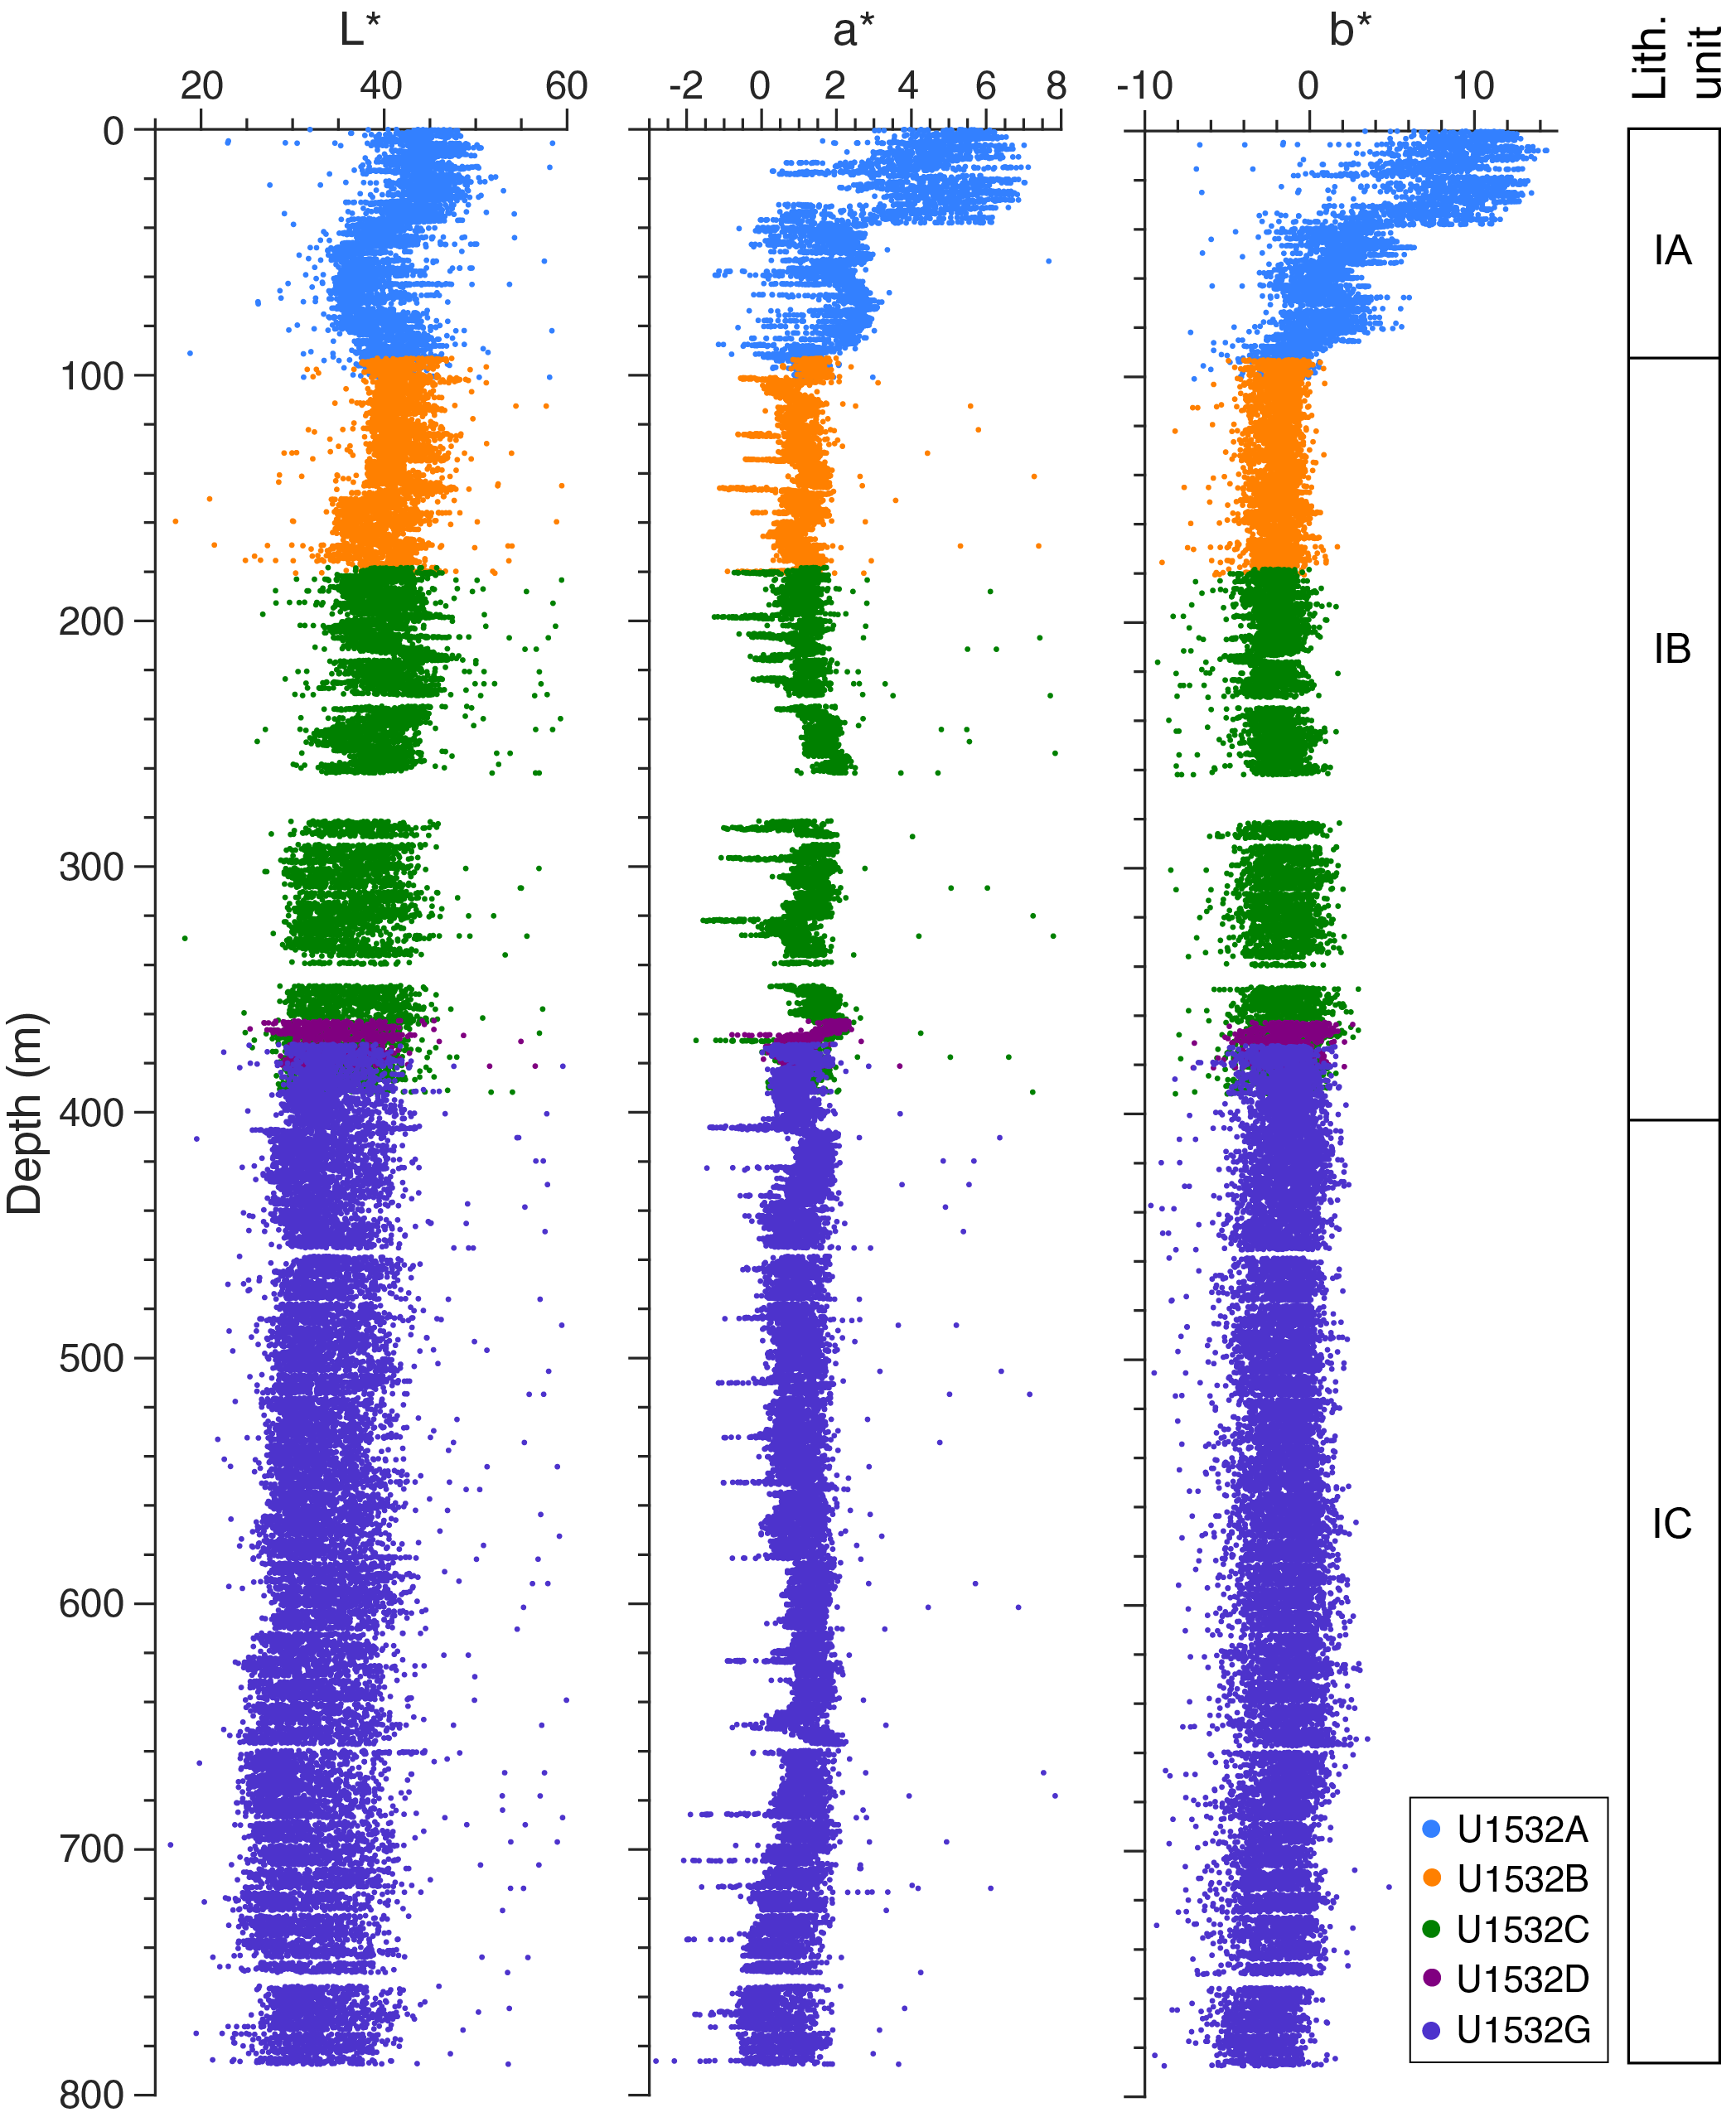
Figure F39. SHMSL color reflectance.
Geothermal gradient and heat flux
Formation temperature measurements were conducted using the APCT-3 during coring in Holes U1532A and U1532B. Three temperature measurements were taken in Hole U1532A on Cores 379-U1532A-4H (34.0 m), 7H (62.6 m), and 10H (91.1 m), and two were taken in Hole U1532B on Cores 379-U1532B-4H (121.6 m) and 7H (150.0 m) (Figure F40). A geothermal gradient (dT/dz) of ~54°C/km is estimated for the total measured depth interval of 34.0–150.0 m at Site U1532, where T is temperature at depth z. Assuming a thermal conductivity (k) for the site of 1.113 (adjusted for porosity and temperature after Dziadek et al., 2019), this gradient equates to an overall geothermal heat flux (G) of 60.1 mW/m2, where
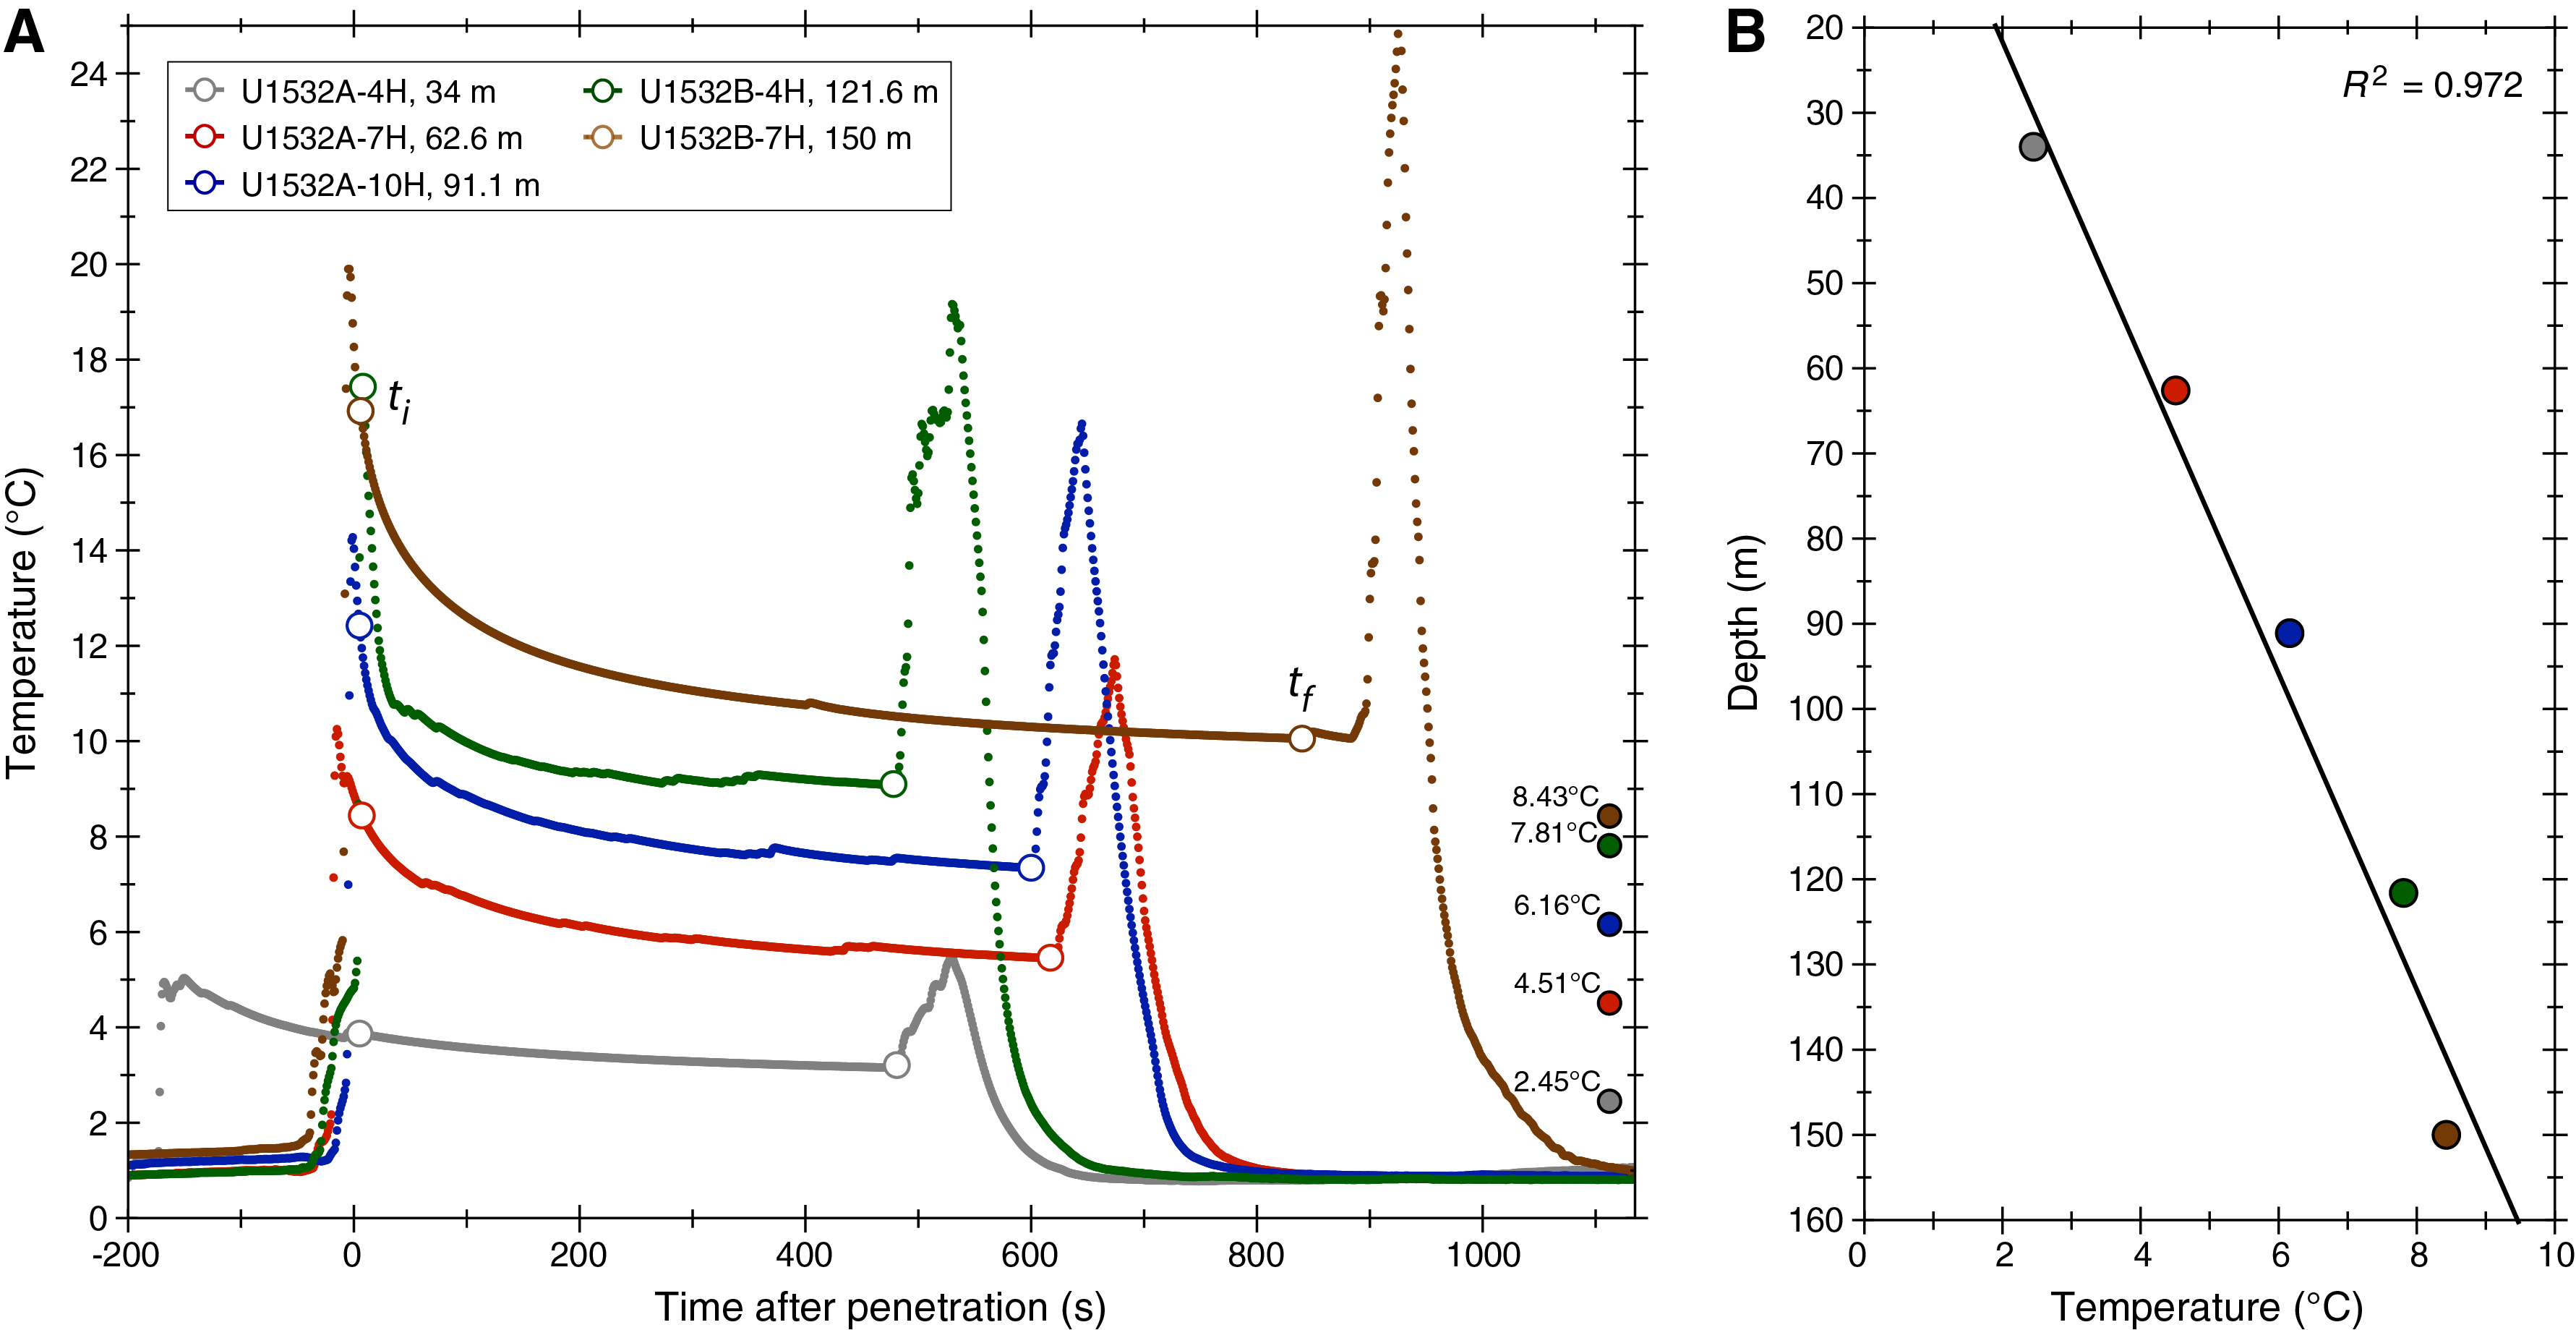
Figure F40. Formation temperature data and calculated equilibrium temperatures.
Stratigraphic correlation
Magnetic susceptibility data, core lithofacies descriptions from split core sections, and X-radiograph images collected from Holes U1532A–U1532D and U1532G were used to establish stratigraphic correlations and determine overlap between cored intervals at Site U1532. Tie points between holes were selected from magnetic susceptibility measured with the WRMSL (see Physical properties in the Expedition 379 methods chapter [Gohl et al., 2021a]) and supported by distinct lithologic features visible in split core sections and X-radiograph images. However, the offset between holes is not absolute because variations in sediment expansion and compression prevent some features from being present at equivalent offset depths across holes.
To correlate Hole U1532A to U1532B, a tie point was created from Section 379-U1532A-11H-5, 26 cm (97.24 m), to Section 379-U1532B-2H-3, 51 cm (96.62 m), based on a distinct magnetic susceptibility minimum related to a prominent silt layer that is apparent in both holes in the split core sections (Figure F41) and X-radiographs. Based on this correlation, Hole U1532B is offset −0.62 m from Hole U1532A.

Figure F41. Correlation of WRMSL MS, Holes U1532A and U1532B.
The correlation between Holes U1532B and U1532C was also established by both magnetic susceptibility data and distinct lithologic features. A distinct interval of Facies F3 and F4 (i.e., bioturbated and biosilica-bearing to biosilica-rich mud with clasts; see Lithostratigraphy) was observed, and the top of Facies F4 at Section 379-U1532B-11F-3, 94 cm (179.55 m), coincides with a distinct magnetic susceptibility minimum (Figure F42). The same interval was observed in Hole U1532C, with the top of the magnetic susceptibility minimum at Section 379-U1532C-2F-2, 22 cm (180.02 m), corresponding to Section 379-U1532B-11F-3, 94 cm (179.55 m). Based on this correlation, Hole U1532C is offset +0.47 m from Hole U1532B.
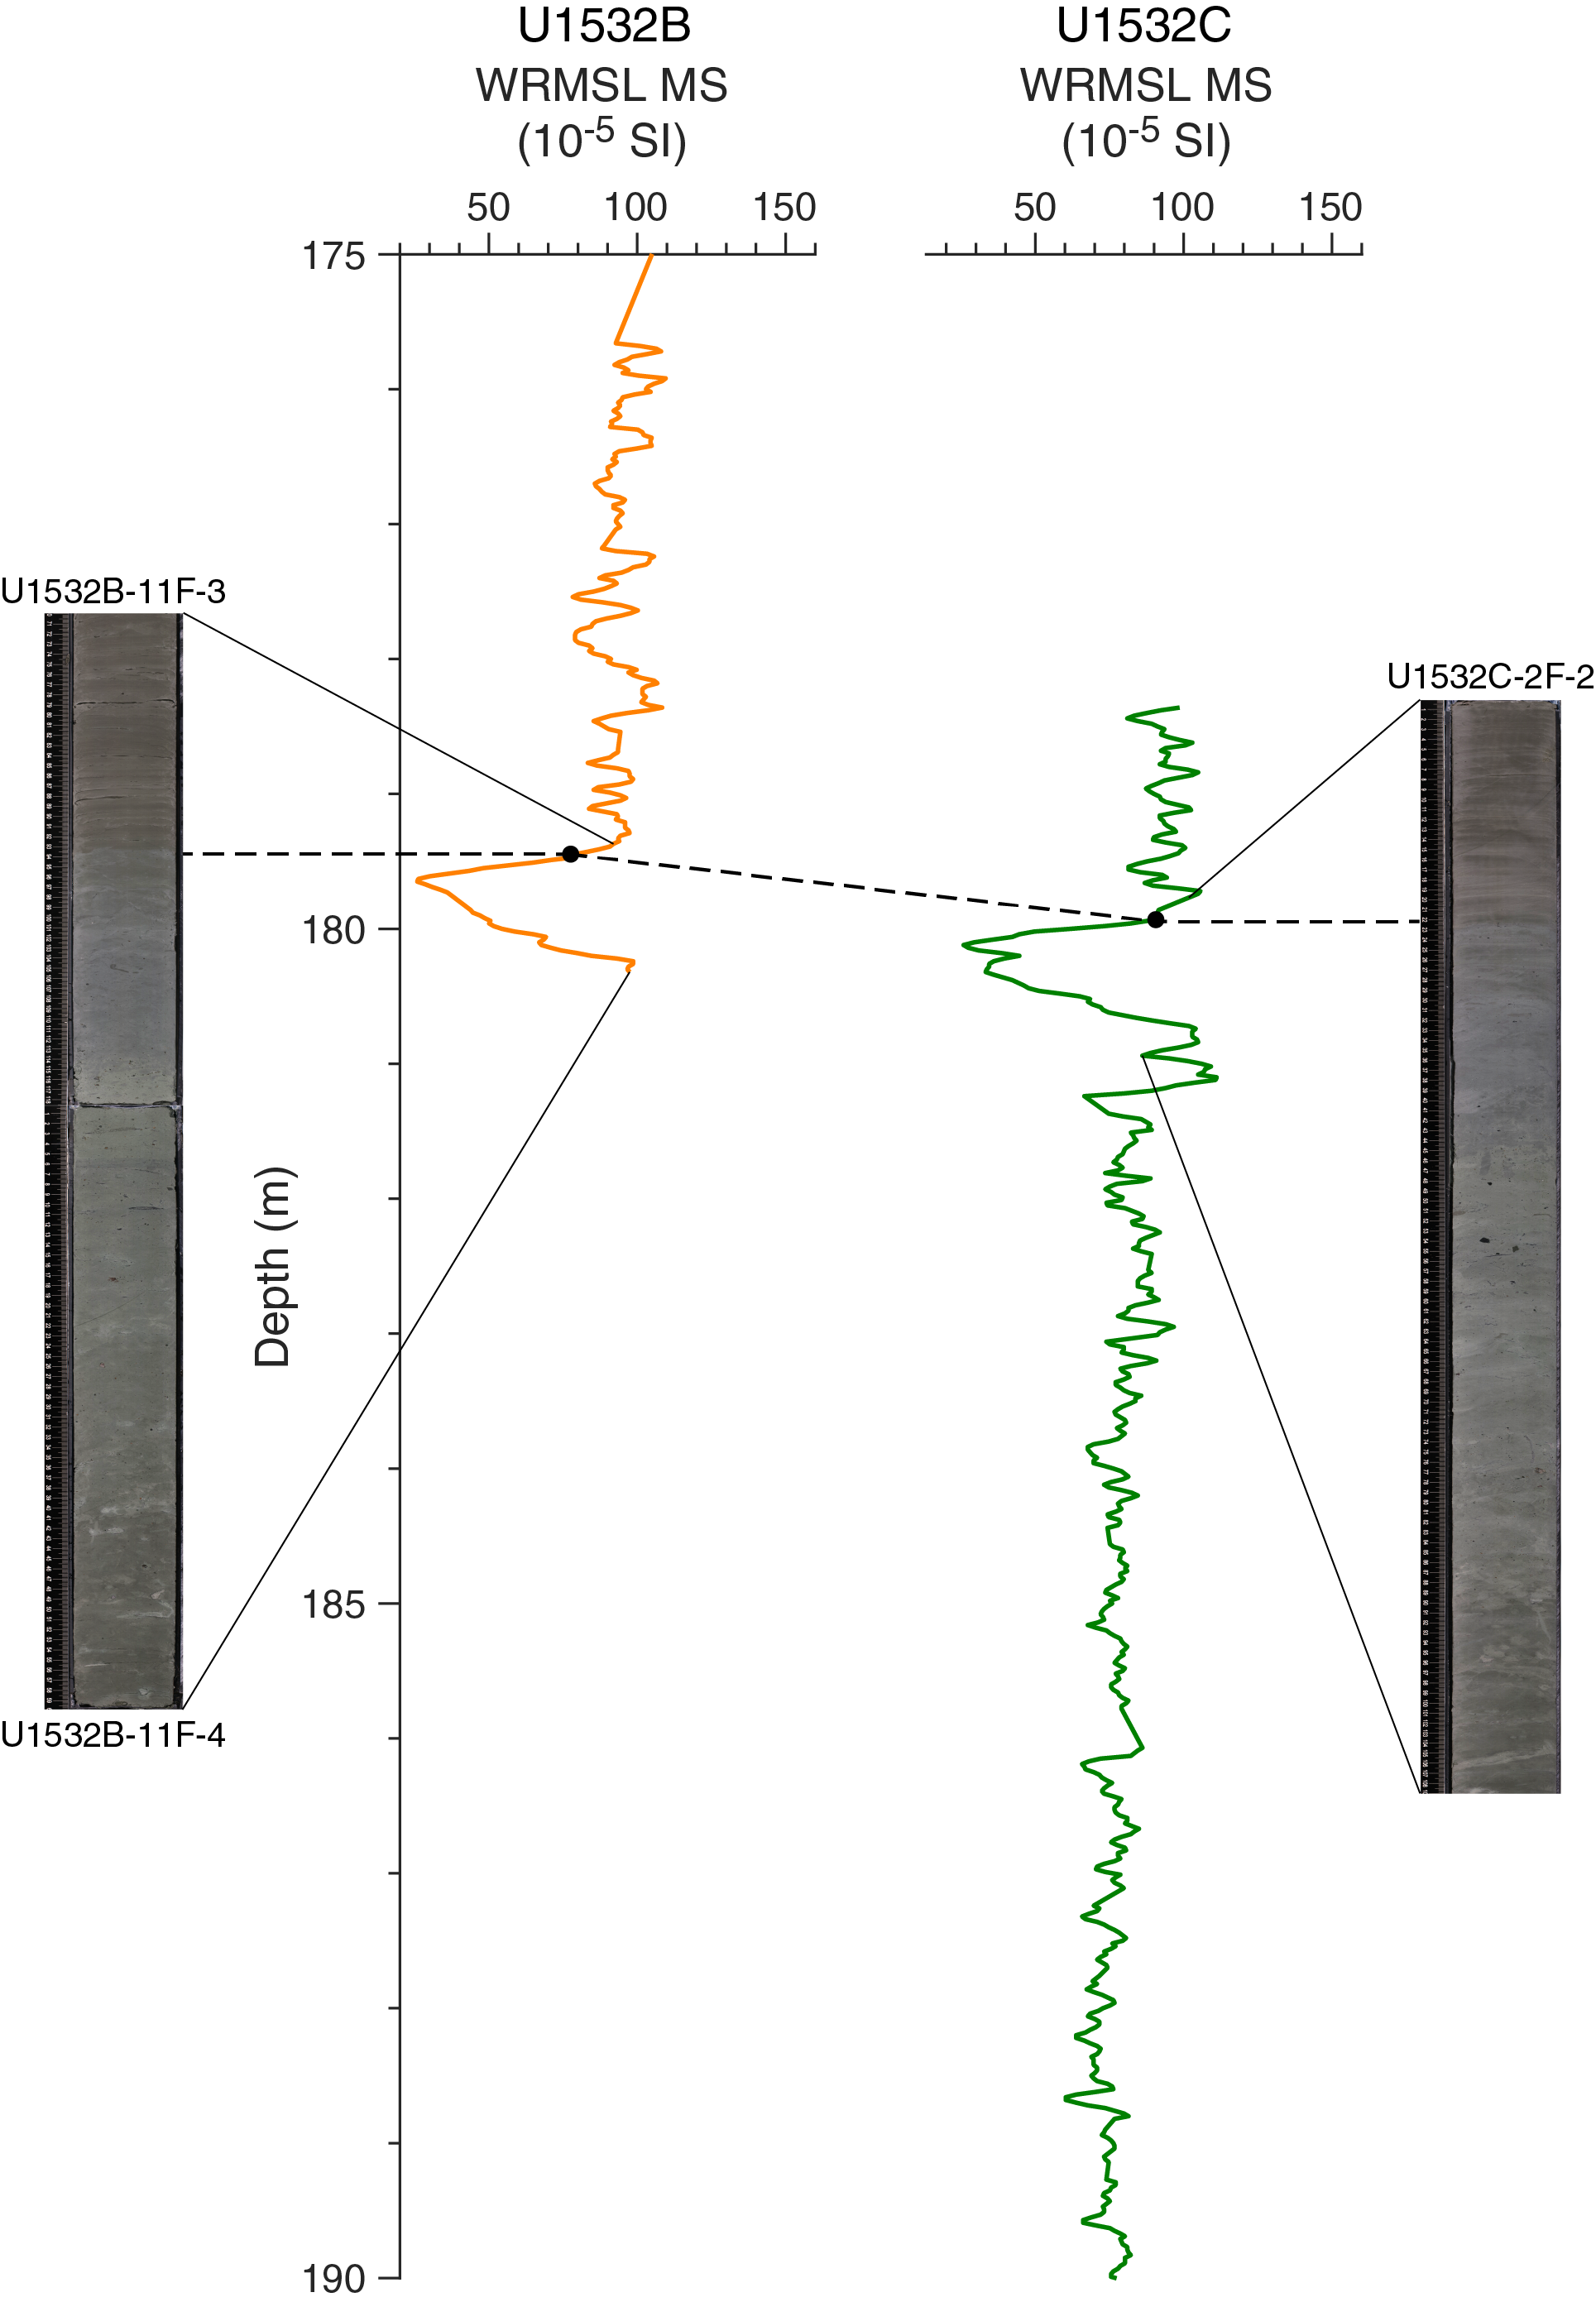
Figure F42. Correlation of WRMSL MS, Holes U1532B and U1532C.
Hole U1532C was correlated to Hole U1532D based on a prominent upward increase in magnetic susceptibility at the transition from Facies F4 to Facies F2 (Figure F43). A tie point was created at this transition at Sections 379-U1532C-31X-2, 137 cm (370.47 m), and 379-U1532D-2R-4, 116 cm (368.35 m). Based on this correlation, Hole U1532D is offset −2.12 m from Hole U1532C. All of Hole U1532D overlaps with Hole U1532C.
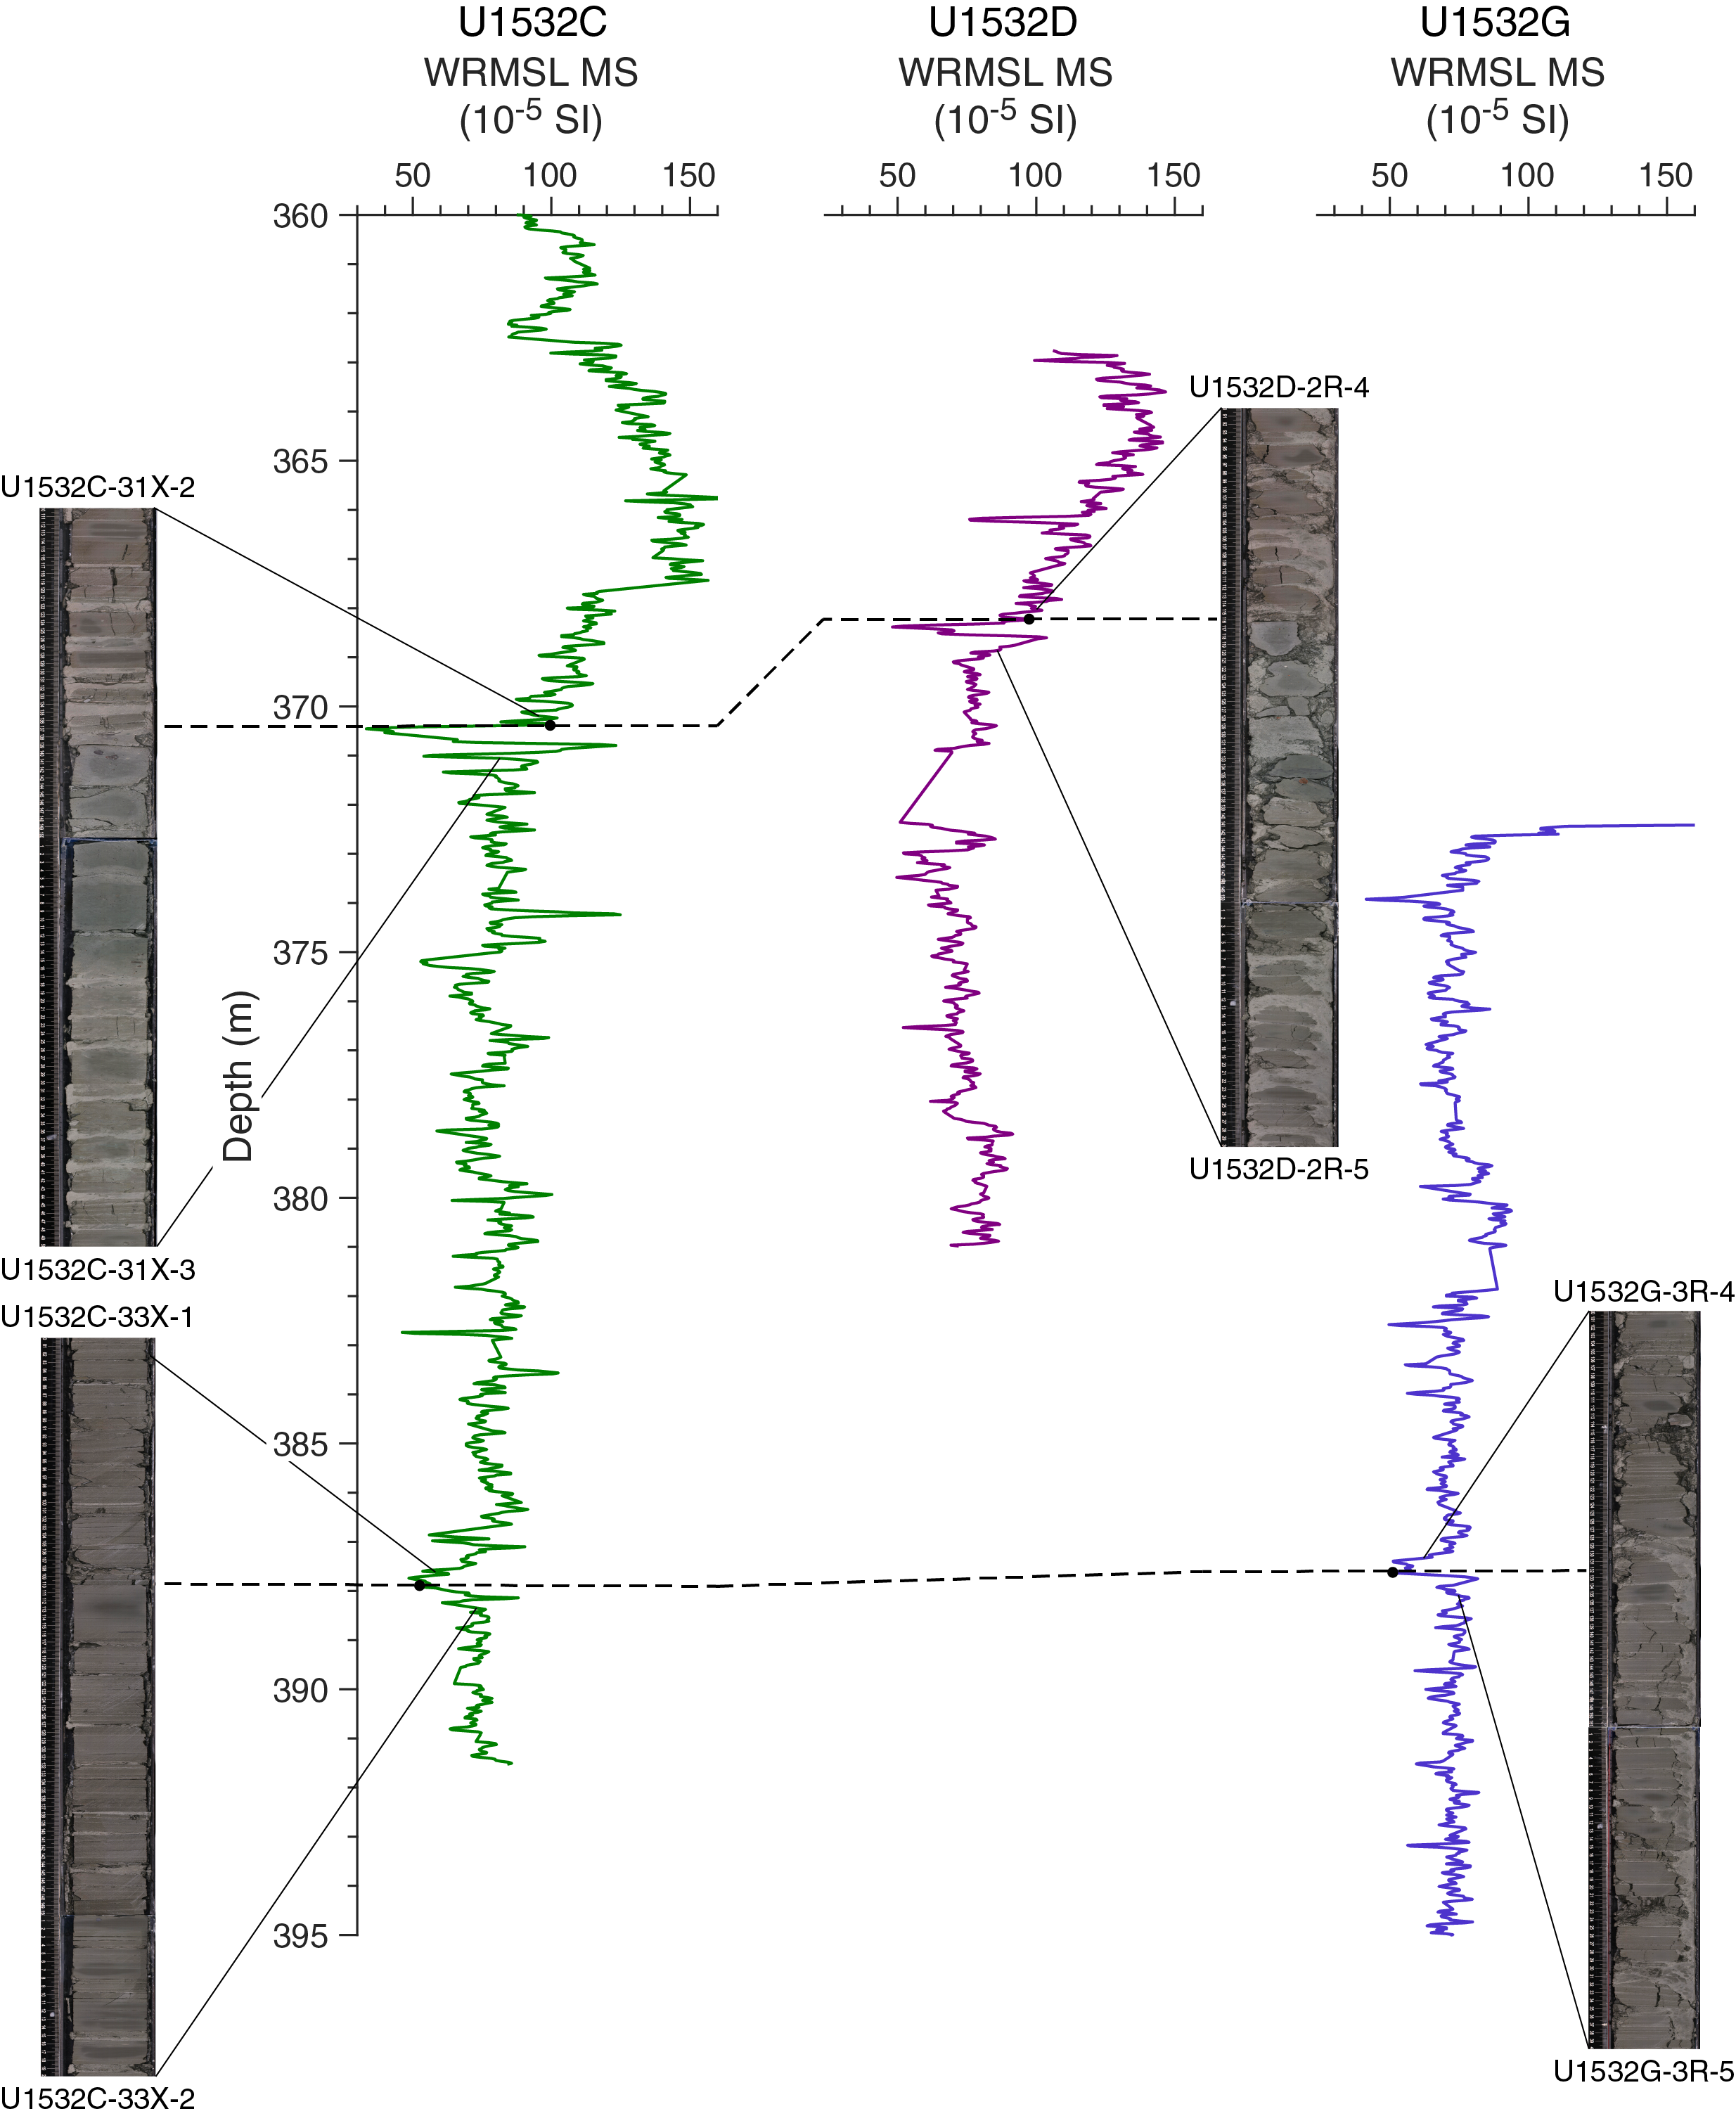
Figure F43. Correlation of WRMSL MS, Holes U1532C, U1532D, and U1532G.
Hole U1532G is correlated to Hole U1532C rather than Hole U1532D because of the short length of Hole U1532D. This correlation is established using a distinct magnetic susceptibility minimum with tie points at Sections 379-U1532C-33X-1, 110 cm (387.90 m), and 379-U1532G-3R-4, 132 cm (387.63 m) (Figure F43), resulting in an offset of +0.27 m between Holes U1532G and U1532C. Although a strong facies correlation between Holes U1532C and U1532G is not available because of core disturbance and relatively homogeneous facies in the region of overlap between the two holes, fragments of a distinctive rock type were observed in both Holes U1532C and U1532G just below the tie point (See Lithostratigraphy; Figure F10C). All tie points are summarized in Table T22.
References
Acton, G.D., Guyodo, Y., and Brachfeld, S.A., 2002. Magnetostratigraphy of sediment drifts on the continental rise of West Antarctica (ODP Leg 178, Sites 1095, 1096, and 1101). In Barker, P.F., Camerlenghi, A., Acton, G.D., and Ramsay, A.T.S. (Eds.), Proceedings of the Ocean Drilling Program, Scientific Results, 178: College Station, TX (Ocean Drilling Program), 1–61. https://doi.org/10.2973/odp.proc.sr.178.235.2002
Bart, P.J., and Iwai, M., 2012. The overdeepening hypothesis: how erosional modification of the marine-scape during the early Pliocene altered glacial dynamics on the Antarctic Peninsula’s Pacific margin. Palaeogeography, Palaeoclimatology, Palaeoecology, 335–336:42–51. https://doi.org/10.1016/j.palaeo.2011.06.010
Brown, C.R., Yakymchuk, C., Brown, M., Fanning, C.M., Korhonen, F.J., Piccoli, P.M., and Siddoway, C.S., 2016. From source to sink: petrogenesis of Cretaceous anatectic granites from the Fosdick migmatite–granite complex, West Antarctica. Journal of Petrology, 57(7):1241–1278. https://doi.org/10.1093/petrology/egw039
Brumsack, H.J., and Gieskes, J.M., 1983. Interstitial water trace-metal chemistry of laminated sediments from the Gulf of California, Mexico. Marine Chemistry, 14(1):89–106. https://doi.org/10.1016/0304-4203(83)90072-5
Busch, W.H., 1989. Patterns of sediment compaction at Ocean Drilling Program Sites 645, 646, and 647, Baffin Bay and Labrador Sea. In Srivastava, S.P., Arthur, M.A., Clement, B., et al., Proceedings of the Ocean Drilling Program, Scientific Results, 105: College Station, TX (Ocean Drilling Program), 781–790. https://doi.org/10.2973/odp.proc.sr.105.143.1989
Claypool, G.E., and Kvenvolden, K.A., 1983. Methane and other hydrocarbon gases in marine sediment. Annual Review of Earth and Planetary Sciences, 11(1):299–327. https://doi.org/10.1146/annurev.ea.11.050183.001503
Dowdeswell, J.A., Evans, J., Ó Cofaigh, C., and Anderson, J.B., 2006. Morphology and sedimentary processes on the continental slope off Pine Island Bay, Amundsen Sea, West Antarctica. Geological Society of America Bulletin, 118(5–6):606–619. https://doi.org/10.1130/B25791.1
Dziadek, R., Gohl, K., Kaul, N., and the Science Team of Expedition PS104, 2019. Elevated geothermal surface heat flow in the Amundsen Sea Embayment, West Antarctica. Earth and Planetary Science Letters, 506:530–539. https://doi.org/10.1016/j.epsl.2018.11.003
Ehrmann, W., Hillenbrand, C.-D., Smith, J.A., Graham, A.G.C., Kuhn, G., and Larter, R.D., 2011. Provenance changes between recent and glacial-time sediments in the Amundsen Sea Embayment, West Antarctica: clay mineral assemblage evidence. Antarctic Science, 23(5):471–486. https://doi.org/10.1017/S0954102011000320
Esquevin, J., 1969. Influence de la composition chimique des illites sur le cristallinité. Bulletin du Centre de recherches de Pau, 3:147–154.
Gieskes, J.M., Blanc, G., Vrolijk, P., Elderfield, H., and Barnes, R., 1990. Interstitial water chemistry—major constituents. In Moore, J.C., Mascle, A., et al., Proceedings of the Ocean Drilling Program, Scientific Results, 110: College Station, TX (Ocean Drilling Program), 155–178. https://doi.org/10.2973/odp.proc.sr.110.170.1990
Gohl, K., Wellner, J.S., Klaus, A., Bauersachs, T., Bohaty, S.M., Courtillat, M., Cowan, E.A., De Lira Mota, M.A., Esteves, M.S.R., Fegyveresi, J.M., Frederichs, T., Gao, L., Halberstadt, A.R., Hillenbrand, C.-D., Horikawa, K., Iwai, M., Kim, J.-H., King, T.M., Klages, J.P., Passchier, S., Penkrot, M.L., Prebble, J.G., Rahaman, W., Reinardy, B.T.I., Renaudie, J., Robinson, D.E., Scherer, R.P., Siddoway, C.S., Wu, L., and Yamane, M., 2021a. Expedition 379 methods. In Gohl, K., Wellner, J.S., Klaus, A., and the Expedition 379 Scientists, Amundsen Sea West Antarctic Ice Sheet History. Proceedings of the International Ocean Discovery Program, 379: College Station, TX (International Ocean Discovery Program). https://doi.org/10.14379/iodp.proc.379.102.2021
Gohl, K., Wellner, J.S., Klaus, A., Bauersachs, T., Bohaty, S.M., Courtillat, M., Cowan, E.A., De Lira Mota, M.A., Esteves, M.S.R., Fegyveresi, J.M., Frederichs, T., Gao, L., Halberstadt, A.R., Hillenbrand, C.-D., Horikawa, K., Iwai, M., Kim, J.-H., King, T.M., Klages, J.P., Passchier, S., Penkrot, M.L., Prebble, J.G., Rahaman, W., Reinardy, B.T.I., Renaudie, J., Robinson, D.E., Scherer, R.P., Siddoway, C.S., Wu, L., and Yamane, M., 2021b. Expedition 379 summary. In Gohl, K., Wellner, J.S., Klaus, A., and the Expedition 379 Scientists, Amundsen Sea West Antarctic Ice Sheet History. Proceedings of the International Ocean Discovery Program, 379: College Station, TX (International Ocean Discovery Program). https://doi.org/10.14379/iodp.proc.379.101.2021
Gradstein, F.M., Ogg, J.G., Schmitz, M.D., and Ogg, G.M. (Eds.), 2012. The Geological Time Scale 2012: Amsterdam (Elsevier). https://doi.org/10.1016/C2011-1-08249-8
Handler, M.R., Wysoczanski, R.J., and Gamble, J.A., 2003. Proterozoic lithosphere in Marie Byrd Land, West Antarctica: Re–Os systematics of spinel peridotite xenoliths. Chemical Geology, 196(1–4):131–145. https://doi.org/10.1016/S0009-2541(02)00410-2
Hillenbrand, C.-D., Fütterer, D.K., Grobe, H., and Frederichs, T., 2002. No evidence for a Pleistocene collapse of the West Antarctic Ice Sheet from continental margin sediments recovered in the Amundsen Sea. Geo-Marine Letters, 22(2):51–59. https://doi.org/10.1007/s00367-002-0097-7
Hillenbrand, C.-D., Grobe, H., Diekmann, B., Kuhn, G., and Fütterer, D.K., 2003. Distribution of clay minerals and proxies for productivity in surface sediments of the Bellingshausen and Amundsen seas (West Antarctica)—relation to modern environmental conditions. Marine Geology, 193(3–4):253–271. https://doi.org/10.1016/S0025-3227(02)00659-X
Hillenbrand, C.-D., Kuhn, G., and Frederichs, T., 2009. Record of a mid-Pleistocene depositional anomaly in West Antarctic continental margin sediments: an indicator for ice-sheet collapse? Quaternary Science Reviews, 28(13–14):1147–1159. https://doi.org/10.1016/j.quascirev.2008.12.010
Hinrichs, K.-U., Hayes, J.M., Bach, W., Spivack, A.J., Hmelo, L.R., Holm, N.G., Johnson, C.G., and Sylva, S.P., 2006. Biological formation of ethane and propane in the deep marine subsurface. Proceedings of the National Academy of Science of the United States of America, 103(40):14684–14689. http://dx.doi.org/10.1073/pnas.0606535103
Hole, M.J., and LeMasurier, W.E., 1994. Tectonic controls on the geochemical compositions of Cenozoic mafic alkaline volcanic rocks from West Antarctica. Contributions to Mineralogy and Petrology, 117(2):187–202. https://doi.org/10.1007/BF00286842
Iwai, M., Acton, G.D., Lazarus, D., Osterman, L.E., and Williams, T., 2002. Magnetobiochronologic synthesis of ODP Leg 178 rise sediments from the Pacific sector of the Southern Ocean: Sites 1095, 1096, and 1101. In Barker, P.F., Camerlenghi, A., Acton, G.D., and Ramsay, A.T.S. (Eds.), Proceedings of the Ocean Drilling Program, Scientific Results, 178: College Station, TX (Ocean Drilling Program), 1–40. https://doi.org/10.2973/odp.proc.sr.178.236.2002
Kipf, A., Mortimer, N., Werner, R., Gohl, K., Van Den Bogaard, P., Hauff, F., and Hoernle, K., 2012. Granitoids and dykes of the Pine Island Bay region, West Antarctica. Antarctic Science, 24(5):473–484. https://doi.org/10.1017/S0954102012000259
Kirschvink, J.L., 1980. The least-squares line and plane and the analysis of palaeomagnetic data. Geophysical Journal of the Royal Astronomical Society, 62(3):699–718. https://doi.org/10.1111/j.1365-246X.1980.tb02601.x
Konfirst, M.A., Scherer, R.P., Hillenbrand, C.-D., and Kuhn, G., 2012. A marine diatom record from the Amundsen Sea—insights into oceanographic and climatic response to the Mid-Pleistocene Transition in the West Antarctic sector of the Southern Ocean. Marine Micropaleontology, 92–93:40–51. https://doi.org/10.1016/j.marmicro.2012.05.001
Leat, P.T., Storey, B.C., and Pankhurst, R.J., 1993. Geochemistry of Palaeozoic–Mesozoic Pacific rim orogenic magmatism, Thurston Island area, West Antarctica. Antarctic Science, 5(3):281–296. https://doi.org/10.1017/S0954102093000380
LeMasurier, W., 2013. Shield volcanoes of Marie Byrd Land, West Antarctic rift: oceanic island similarities, continental signature, and tectonic controls. Bulletin of Volcanology, 75(6):726. https://doi.org/10.1007/s00445-013-0726-1
LeMasurier, W.E., Harwood, D.M., and Rex, D.C., 1994. Geology of Mount Murphy Volcano: an 8-m.y. history of interaction between a rift volcano and the West Antarctic ice sheet. Geological Society of America Bulletin, 106(2):265–280. https://doi.org/10.1130/0016-7606(1994)106<0265:GOMMVA>2.3.CO;2
Lurcock, P.C., and Wilson, G.S., 2012. PuffinPlot: a versatile, user-friendly program for paleomagnetic analysis. Geochemistry, Geophysics, Geosystems, 13(6):Q06Z45. https://doi.org/10.1029/2012GC004098
Meyers, P.A., 1997. Organic geochemical proxies of paleoceanographic, paleolimnologic, and paleoclimatic processes. Organic Geochemistry, 27(5–6):213–250. https://doi.org/10.1016/S0146-6380(97)00049-1
Moriaki, Y., Cronin, T.M., Hunt, G., and Hodell, D.A., 2009. Deep-sea ostracods from the South Atlantic sector of the Southern Ocean during the last 370,000 years. Journal of Paleontology, 83(6):914–930. https://doi.org/10.1666/08-149.1
Mukasa, S.B., and Dalziel, I.W.D., 2000. Marie Byrd Land, West Antarctica: evolution of Gondwana’s Pacific margin constrained by zircon U-Pb geochronology and feldspar common-Pb isotopic compositions. Geological Society of America Bulletin, 112(4):611–627. https://doi.org/10.1130/0016-7606(2000)112<611:MBLWAE>2.0.CO;2
Müller, P.J., 1977. C/N ratios in Pacific deep-sea sediments: effect of inorganic ammonium and organic nitrogen compounds sorbed by clays. Geochimica et Cosmochimica Acta, 41(6):765–776. https://doi.org/10.1016/0016-7037(77)90047-3
Nitsche, F.O., Cunningham, A.P., Larter, R.D., and Gohl, K., 2000. Geometry and development of glacial continental margin depositional systems in the Bellingshausen Sea. Marine Geology, 162(2–4):277–302. https://doi.org/10.1016/S0025-3227(99)00074-2
Pankhurst, R.J., Millar, I.L., Grunow, A.M., and Storey, B.C., 1993. The pre‐Cenozoic magmatic history of the Thurston Island Crustal Block, west Antarctica. Journal of Geophysical Research: Solid Earth, 98(B7):11835–11849. https://doi.org/10.1029/93JB01157
Pankhurst, R.J., Weaver, S.D., Bradshaw, J.D., Storey, B.C., and Ireland, T.R., 1998. Geochronology and geochemistry of pre‐Jurassic superterranes in Marie Byrd Land, Antarctica. Journal of Geophysical Research: Solid Earth, 103(B2):2529–2547. https://doi.org/10.1029/97JB02605
Petschick, R., Kuhn, G., and Gingele, F., 1996. Clay mineral distribution in surface sediments of the South Atlantic: sources, transport, and relation to oceanography. Marine Geology, 130(3–4):203–229. https://doi.org/10.1016/0025-3227(95)00148-4
Pimmel, A., and Claypool, G., 2001. Technical Note 30: Introduction to Shipboard Organic Geochemistry on the JOIDES Resolution. Ocean Drilling Program. https://doi.org/10.2973/odp.tn.30.2001
Riley, T.R., Flowerdew, M.J., Pankhurst, R.J., Leat, P.T., Millar, I.L., Fanning, C.M., and Whitehouse, M.J., 2017. A revised geochronology of Thurston Island, West Antarctica, and correlations along the proto-Pacific margin of Gondwana. Antarctic Science, 29(1):47–60. https://doi.org/10.1017/S0954102016000341
Rowley, P.D., Thompson, J.W., Smellie, J.L., Laudon, T.S., La Prade, K.E., and LeMasurier, W.E., 1990. Alexander Island, Palmer Island, and Ellsworth Land. In LeMasurier, W.E., Thomson, J.W., Baker, P.E., Kyle, P.R., Rowley, P.D., and Smellie, J.L. (Eds.), Antarctic Research Series (Volume 48): Volcanoes of the Antarctic Plate and Southern Oceans: Washington, DC (American Geophysical Union), 256–301.
Roy, M., van de Flierdt, T., Hemming, S.R., and Goldstein, S.L., 2007. 40Ar/39Ar ages of hornblende grains and bulk Sm/Nd isotopes of circum-Antarctic glacio-marine sediments: implications for sediment provenance in the Southern Ocean. Chemical Geology, 244(3–4):507–519. https://doi.org/10.1016/j.chemgeo.2007.07.017
Scheuer, C., Gohl, K., Larter, R.D., Rebesco, M., and Udintsev, G., 2006. Variability in Cenozoic sedimentation along the continental rise of the Bellingshausen Sea, West Antarctica. Marine Geology, 277(3–4):279–298. https://doi.org/10.1016/j.margeo.2005.12.007
Siddoway, C., submitted. Geology of West Antarctica. In Kleinschmidt, G. (Ed.), Geology of the Antarctic Continent: Stuttgart, Germany (Gebrüder Borntraeger Verlagsbuchhandlung).
Solomon, E.A., and Kastner, M., 2012. Progressive barite dissolution in the Costa Rica forearc—implications for global fluxes of Ba to the volcanic arc and mantle. Geochimica et Cosmochimica Acta, 83:110–124. https://doi.org/10.1016/j.gca.2011.12.021
Spiegel, C., Lindow, J., Kamp, P.J.J., Meisel, O., Mukasa, S., Lisker, F., Kuhn, G., and Gohl, K., 2016. Tectonomorphic evolution of Marie Byrd Land—implications for Cenozoic rifting activity and onset of West Antarctic glaciation. Global and Planetary Change, 145:98–115. https://doi.org/10.1016/j.gloplacha.2016.08.013
Teichert, B.M.A., Gussone, N., and Torres, M.E., 2009. Controls on calcium isotope fractionation in sedimentary porewaters. Earth and Planetary Science Letters, 279(3–4):373–382. https://doi.org/10.1016/j.epsl.2009.01.011
Teichert, B.M.A., Torres, M.E., Bohrmann, G., and Eisenhauer, A., 2005. Fluid sources, fluid pathways and diagenetic reactions across an accretionary prism revealed by Sr and B geochemistry. Earth and Planetary Science Letters, 239(1–2):106–121. https://doi.org/10.1016/j.epsl.2005.08.002
Torres, M.E., Teichert, B.M.A., Tréhu, A.M., Borowski, W., and Tomaru, H., 2004. Relationship of pore water freshening to accretionary processes in the Cascadia margin: fluid sources and gas hydrate abundance. Geophysical Research Letters, 31:L22305. https://doi.org/10.1029/2004GL021219
Uenzelmann-Neben, G., and Gohl, K., 2012. Amundsen Sea sediment drifts: archives of modifications in oceanographic and climatic conditions. Marine Geology, 299–302:51–62. https://doi.org/10.1016/j.margeo.2011.12.007
Uenzelmann-Neben, G., and Gohl, K., 2014. Early glaciation already during the early Miocene in the Amundsen Sea, Southern Pacific: indications from the distribution of sedimentary sequences. Global and Planetary Change, 120:92–104. https://doi.org/10.1016/j.gloplacha.2014.06.004
Walczak, M.H., Mix, A.C., Willse, T., Slagle, A., Stoner, J.S., Jaeger, J., Gulick, S., LeVay, L., Kioka, A., and the IODP Expedition 341 Scientific Party, 2015. Correction of non-intrusive drill core physical properties data for variability in recovered sediment volume. Geophysical Journal International, 202(2):1317–1323. https://doi.org/10.1093/gji/ggv204
Wilch, T.I., and McIntosh, W.C., 2002. Lithofacies analysis and 40Ar/39Ar geochronology of ice–volcano interactions at Mt. Murphy and the Crary Mountains, Marie Byrd Land, Antarctica. In Smellie, J.L. (Ed.), Volcano–Ice Interaction on Earth and Mars, Geological Society Special Publications, 202:237–253. https://doi.org/10.1144/GSL.SP.2002.202.01.12
Wilch, T.I., and McIntosh, W.C., 2007. Miocene–Pliocene ice-volcano interactions at monogenetic volcanoes near Hobbs Coast, Marie Byrd Land. In Cooper, A., and Raymond, C. (Eds.), Antarctica: A Keystone in a Changing World: U.S. Geological Survey and The National Academies (USA) Open-File Report 2007-1047. https://doi.org/10.3133/ofr20071047SRP074
Wilch, T.I., McIntosh, W.C., and Dunbar, N.W., 1999. Late Quaternary volcanic activity in Marie Byrd Land: potential 40Ar/39Ar-dated time horizons in West Antarctic ice and marine cores. Geological Society of America Bulletin, 111(10):1563–1580. https://doi.org/10.1130/0016-7606(1999)111<1563:LQVAIM>2.3.CO;2
Williams, T., van de Flierdt, T., Hemming, S.R., Chung, E., Roy, M., and Goldstein, S.L., 2010. Evidence for iceberg armadas from East Antarctica in the Southern Ocean during the late Miocene and early Pliocene. Earth and Planetary Science Letters, 290(3–4):351–361. https://doi.org/10.1016/j.epsl.2009.12.031
Winter, D., and Iwai, M., 2002. Data report: Neogene diatom biostratigraphy, Antarctic Peninsula Pacific margin, ODP Leg 178 rise sites. In Barker, P.F., Camerlenghi, A., Acton, G.D., and Ramsay, A.T.S. (Eds.), Proceedings of the Ocean Drilling Program, Scientific Results, 178: College Station, TX (Ocean Drilling Program), 1–25. https://doi.org/10.2973/odp.proc.sr.178.230.2002
Zijderveld, J.D.A., 1967. AC demagnetization of rocks: analysis of results. In Col linson, D.W., Creer, K.M., and Runcorn, S.K. (Eds.), Developments in Solid Earth Geophysics (Volume 3): Methods in Palaeomagnetism: Amsterdam (Elsevier), 254–286. https://doi.org/10.1016/B978-1-4832-2894-5.50049-5
1 Wellner, J.S., Gohl, K., Klaus, A., Bauersachs, T., Bohaty, S.M., Courtillat, M., Cowan, E.A., De Lira Mota, M.A., Esteves, M.S.R., Fegyveresi, J.M., Frederichs, T., Gao, L., Halberstadt, A.R., Hillenbrand, C.-D., Horikawa, K., Iwai, M., Kim, J.-H., King, T.M., Klages, J.P., Passchier, S., Penkrot, M.L., Prebble, J.G., Rahaman, W., Reinardy, B.T.I., Renaudie, J., Robinson, D.E., Scherer, R.P., Siddoway, C.S., Wu, L., and Yamane, M., 2021. Site U1532. In Gohl, K., Wellner, J.S., Klaus, A., and the Expedition 379 Scientists, Amundsen Sea West Antarctic Ice Sheet History. Proceedings of the International Ocean Discovery Program, 379: College Station, TX (International Ocean Discovery Program). https://doi.org/10.14379/iodp.proc.379.103.2021
2 Expedition 379 Scientists’ affiliations.
This work is distributed under the Creative Commons Attribution 4.0 International (CC BY 4.0) license. 