Weber, M.E., Raymo, M.E., Peck, V.L., Williams, T., and the Expedition 382 Scientists
Proceedings of the International Ocean Discovery Program Volume 382
publications.iodp.org

https://doi.org/10.14379/iodp.proc.382.103.2021
Site U15341
V.L. Peck, M.E. Weber, M.E. Raymo, T. Williams, L.H. Armbrecht, I. Bailey, S.A. Brachfeld, F.G. Cardillo, Z. Du, G. Fauth, M. García, A. Glüder, M.E. Guitard, M. Gutjahr, S.R. Hemming, I. Hernández-Almeida, F.S. Hoem, J.-H. Hwang, M. Iizuka, Y. Kato, B. Kenlee, Y.M. Martos, S. O'Connell, L.F. Pérez, B.T. Reilly, T.A. Ronge, O. Seki, L. Tauxe, S. Tripathi, J.P. Warnock, and X. Zheng2
Keywords: International Ocean Discovery Program, IODP, JOIDES Resolution, Expedition 382, Iceberg Alley and Subantarctic Ice and Ocean Dynamics, Site U1534, Subantarctic Front, Scotia Sea, Weddell Sea, contourites, Antarctic Circumpolar Current, Southern Hemisphere westerly winds, paleoceanography, paleoclimatology, mid-Pleistocene transition, Pliocene, interglacial climate, marine isotope stage, MIS 5, MIS 11
MS 382-103: Published 20 May 2021
Background and objectives
International Ocean Discovery Program (IODP) Site U1534 (proposed Site SFSD-03A) is located at 53°11.38′S, 58°45.65′W in 605 m of water. The site is situated on the northern flank of an east–west trending trough on the continental shelf ~660 km east of the Strait of Magellan at Common Depth Point 10005 on Seismic Reflection Profile SGFI93. Site U1534 is the first of a pair of sites. The second site (U1535; proposed Site SFSD-02A), which is 8 km east of Site U1534, targeted a more expanded sequence of the upper unit of the drift, reaching 120 meters below seafloor (mbsf).
The primary objective at Site U1534 was to recover a continuous ~300 m sedimentary section from a contourite drift where the crest is currently being deposited beneath the Subantarctic Front in 600 m of water. The drift is bathed with Antarctic Intermediate Water (AAIW) as it begins its northward penetration into the Atlantic Ocean. The principal scientific motivation to core this drift is to better understand the role of AAIW in climate change on millennial, glacial–interglacial, and longer term timescales.
The Atlantic Meridional Overturning Circulation (AMOC) plays a fundamental role in regulating Earth's climate (Buckley and Marshall, 2016). Past reductions in the strength of this overturning circulation have been associated with dramatic cooling in the Northern Hemisphere (Bond et al., 1993). A recent trend of cooling in the subpolar Atlantic Ocean and warming in the Gulf Stream region is indicative of weakening of the AMOC (Caesar et al., 2018). General circulation models are typically biased toward a stable AMOC and unable to replicate observed sensitivity of the AMOC to climate forcing (Liu et al., 2017). This bias in AMOC stability within models suggests that certain parameters are inaccurately represented, compromising our ability to predict future AMOC change. One element of the AMOC that remains poorly understood is the role of AAIW.
AAIW is one of the primary water masses characterizing the northward-flowing upper limb of the AMOC. Counterbalancing the southward flow of North Atlantic Deep Water, AAIW currently penetrates as far as 20°N in the North Atlantic Ocean. Today, AAIW is primarily formed in the southeast Pacific and southwest Atlantic Oceans. AAIW and its precursor, Subantarctic Mode Water, are advected eastward through the Drake Passage along the Subantarctic Front. This injection of cold, low-salinity Pacific water into the South Atlantic Ocean is commonly referred to as the "cold water route" (Speich et al., 2001). Variability in the connectivity between the Pacific and Atlantic Oceans via this cold water route may modify the physical properties of AAIW forming in the southwest Atlantic Ocean, in turn affecting the heat and salinity budget of the AMOC. Despite a recent surge in research effort (e.g., Voigt et al., 2016; Roberts et al., 2017; McClymont et al., 2016), a consensus on the role of AAIW in AMOC variability has not been reached. Proxy records from Sites U1534 and U1535 will provide the first constraints on past variability in end-member physical and geochemical properties of AAIW as it enters the upper limb of the AMOC.
Site U1534, located at the thickest part of the contourite drift, targeted the highest sediment accumulation rates to optimize the temporal resolution of subsequent reconstructions. Four laterally offset sedimentary units indicate that the drift was deposited under an evolving bottom current regime (Koenitz et al., 2008). Seismic interpretation of drift deposits throughout the Scotia Sea area suggests that a suite of drift deposits began forming beneath the Antarctic Circumpolar Current (ACC) in the early Miocene and that unconformity-bounded sedimentary units represent deposition under different oceanographic circulation regimes (Pérez et al., 2015). To test hypotheses about the conditions under which units beneath the Subantarctic Front were deposited, a key objective at Site U1534 was to core all three of the reflectors and determine the ages of these unconformities. Furthermore, confirming whether these reflectors are synchronous with their proposed counterparts in the Scotia Sea will enable a regional reconstruction of the oceanographic evolution of the ACC in this sector of the Southern Ocean.
Operations
The first core of Expedition 382 was taken in Hole U1534A at 1145 h local time on 29 March 2019 at 605.1 meters below sea level (mbsl). We used the advanced piston corer (APC) system to take Cores 382-U1534A-1H through 14H (to 115.7 mbsf), drilled 1 m through a hard layer, and switched to half-length APC (HLAPC) coring for Cores 16F–44F (to 256.7 mbsf) (Table T1). After encountering another hard layer at 255.5 mbsf, we switched to extended core barrel (XCB) coring to pass below the layer and take Cores 46X and 47X, which completed coring in this hole. Overall, Cores 1H–47X penetrated from the seafloor to 266.3 mbsf and recovered 271.7 m (102%).
Hole U1534B was started at 2300 h on 31 March. Core 382-U1534B-1H recovered 1.5 m of sediment, but the core liner shattered and no clear mudline was observed, so we ended the hole.
Hole U1534C was started at 1606 h on 1 April. Cores 382-U1534C-1H through 19H penetrated from the seafloor (606.3 mbsl) to 168.0 mbsf and recovered 159.6 m (95%). Core 19H recovered 0.71 m, and its core liner shattered, indicating that we had reached the limit of full-length piston coring, so we decided to end the hole.
Hole U1534D was started at 0330 h on 2 April. The purpose of this hole was to fill a stratigraphic gap and provide more material for sampling in the upper part of the stratigraphy. Cores 382-U1534D-1H through 3H penetrated from the seafloor to 28.5 mbsf and recovered 29.6 m (104%).
From 0515 to 0930 h, we transited 4 nmi east to Hole U1535A in dynamic positioning mode so that we did not have to raise the drill string back to the ship.
Lithostratigraphy
Four holes were cored at Site U1534. Hole U1534A was cored to a total depth of 266.3 mbsf. In Hole U1534B, the liner of the first core shattered upon penetration, so the hole reached a total depth of only 1.51 mbsf. Hole U1534C was successfully cored to 159.21 mbsf. Hole U1534D reached a total depth of 28.5 mbsf. Three lithostratigraphic units were identified based on sediment composition in smear slides and visual core description. Bioturbation is present throughout, but no distinct trace fossils were identified.
Most cores are relatively undisturbed. The most common drilling disturbances are mushy to soupy intervals in the top section of several cores. The dominant lithologic sequences in Holes U1534A and U1534C are greenish gray silty clays interbedded with clayey silts and clay layers. The most common biogenic components (sponge spicules and diatoms) are generally between 10% and 25% of the sediment.
In Holes U1534A and U1534C, a prominent pale green carbonate-rich layer with abundant nannofossils and foraminifers was identified between 37 and 42 mbsf (Core 382-U1534A-5H) (Figure F1).
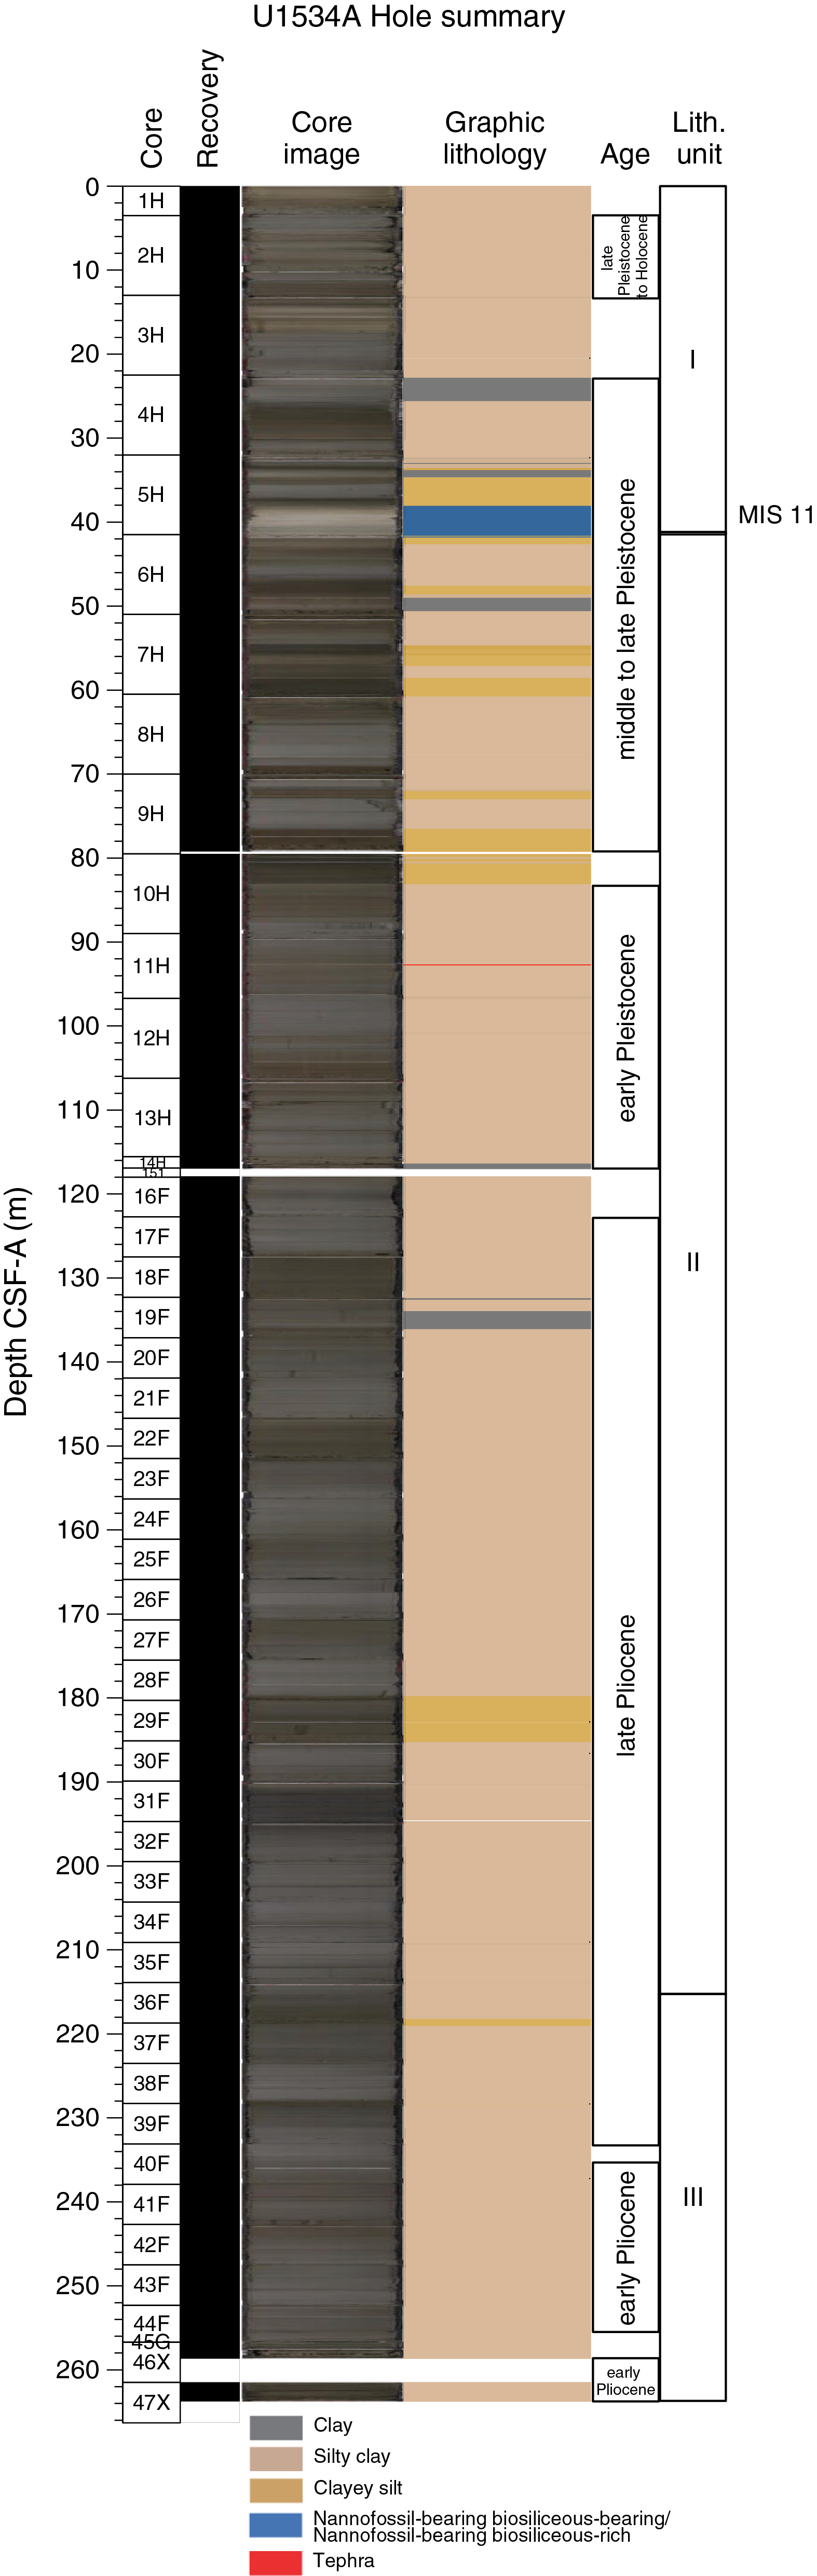
Figure F1. Visual core description.
Several well-preserved macrofossils were found throughout the cores, including solitary corals (Cores 382-U1534A-2H and 3H; Figure F2), gastropods (Core 6H; Figure F3), and several mollusk shell fragments and a shell (e.g., Core 3H; Figure F4).
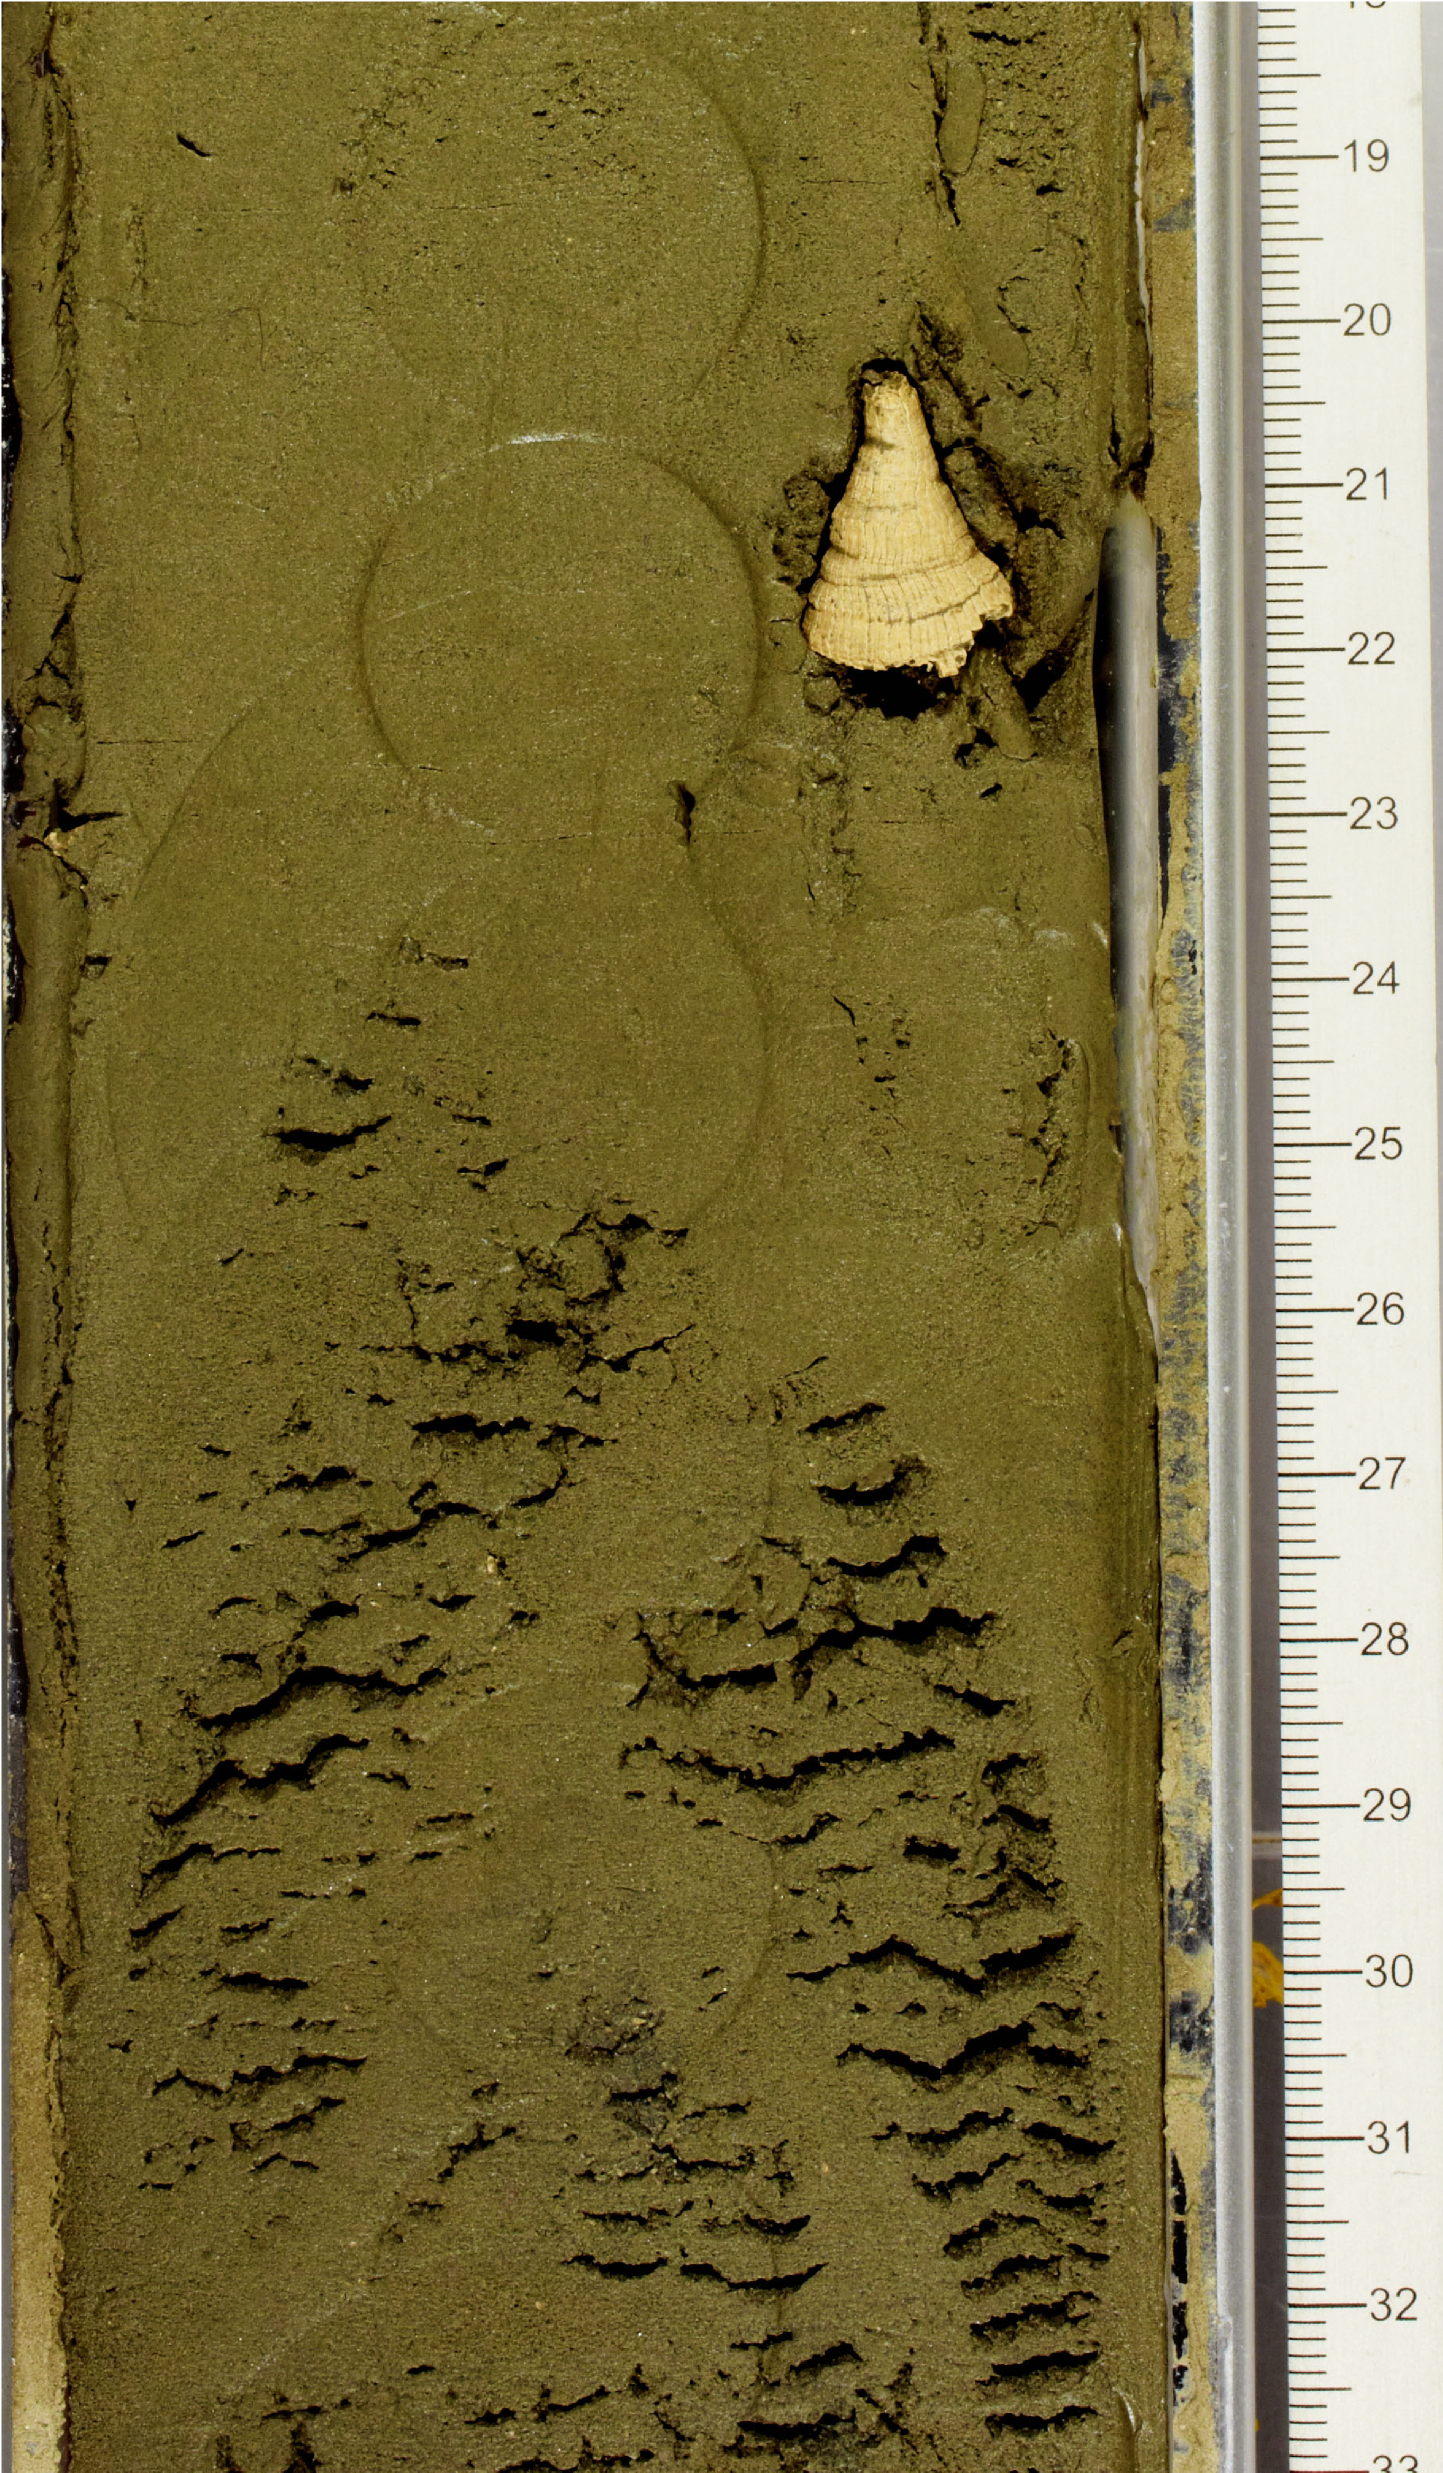
Figure F2. Solitary cold-water coral.
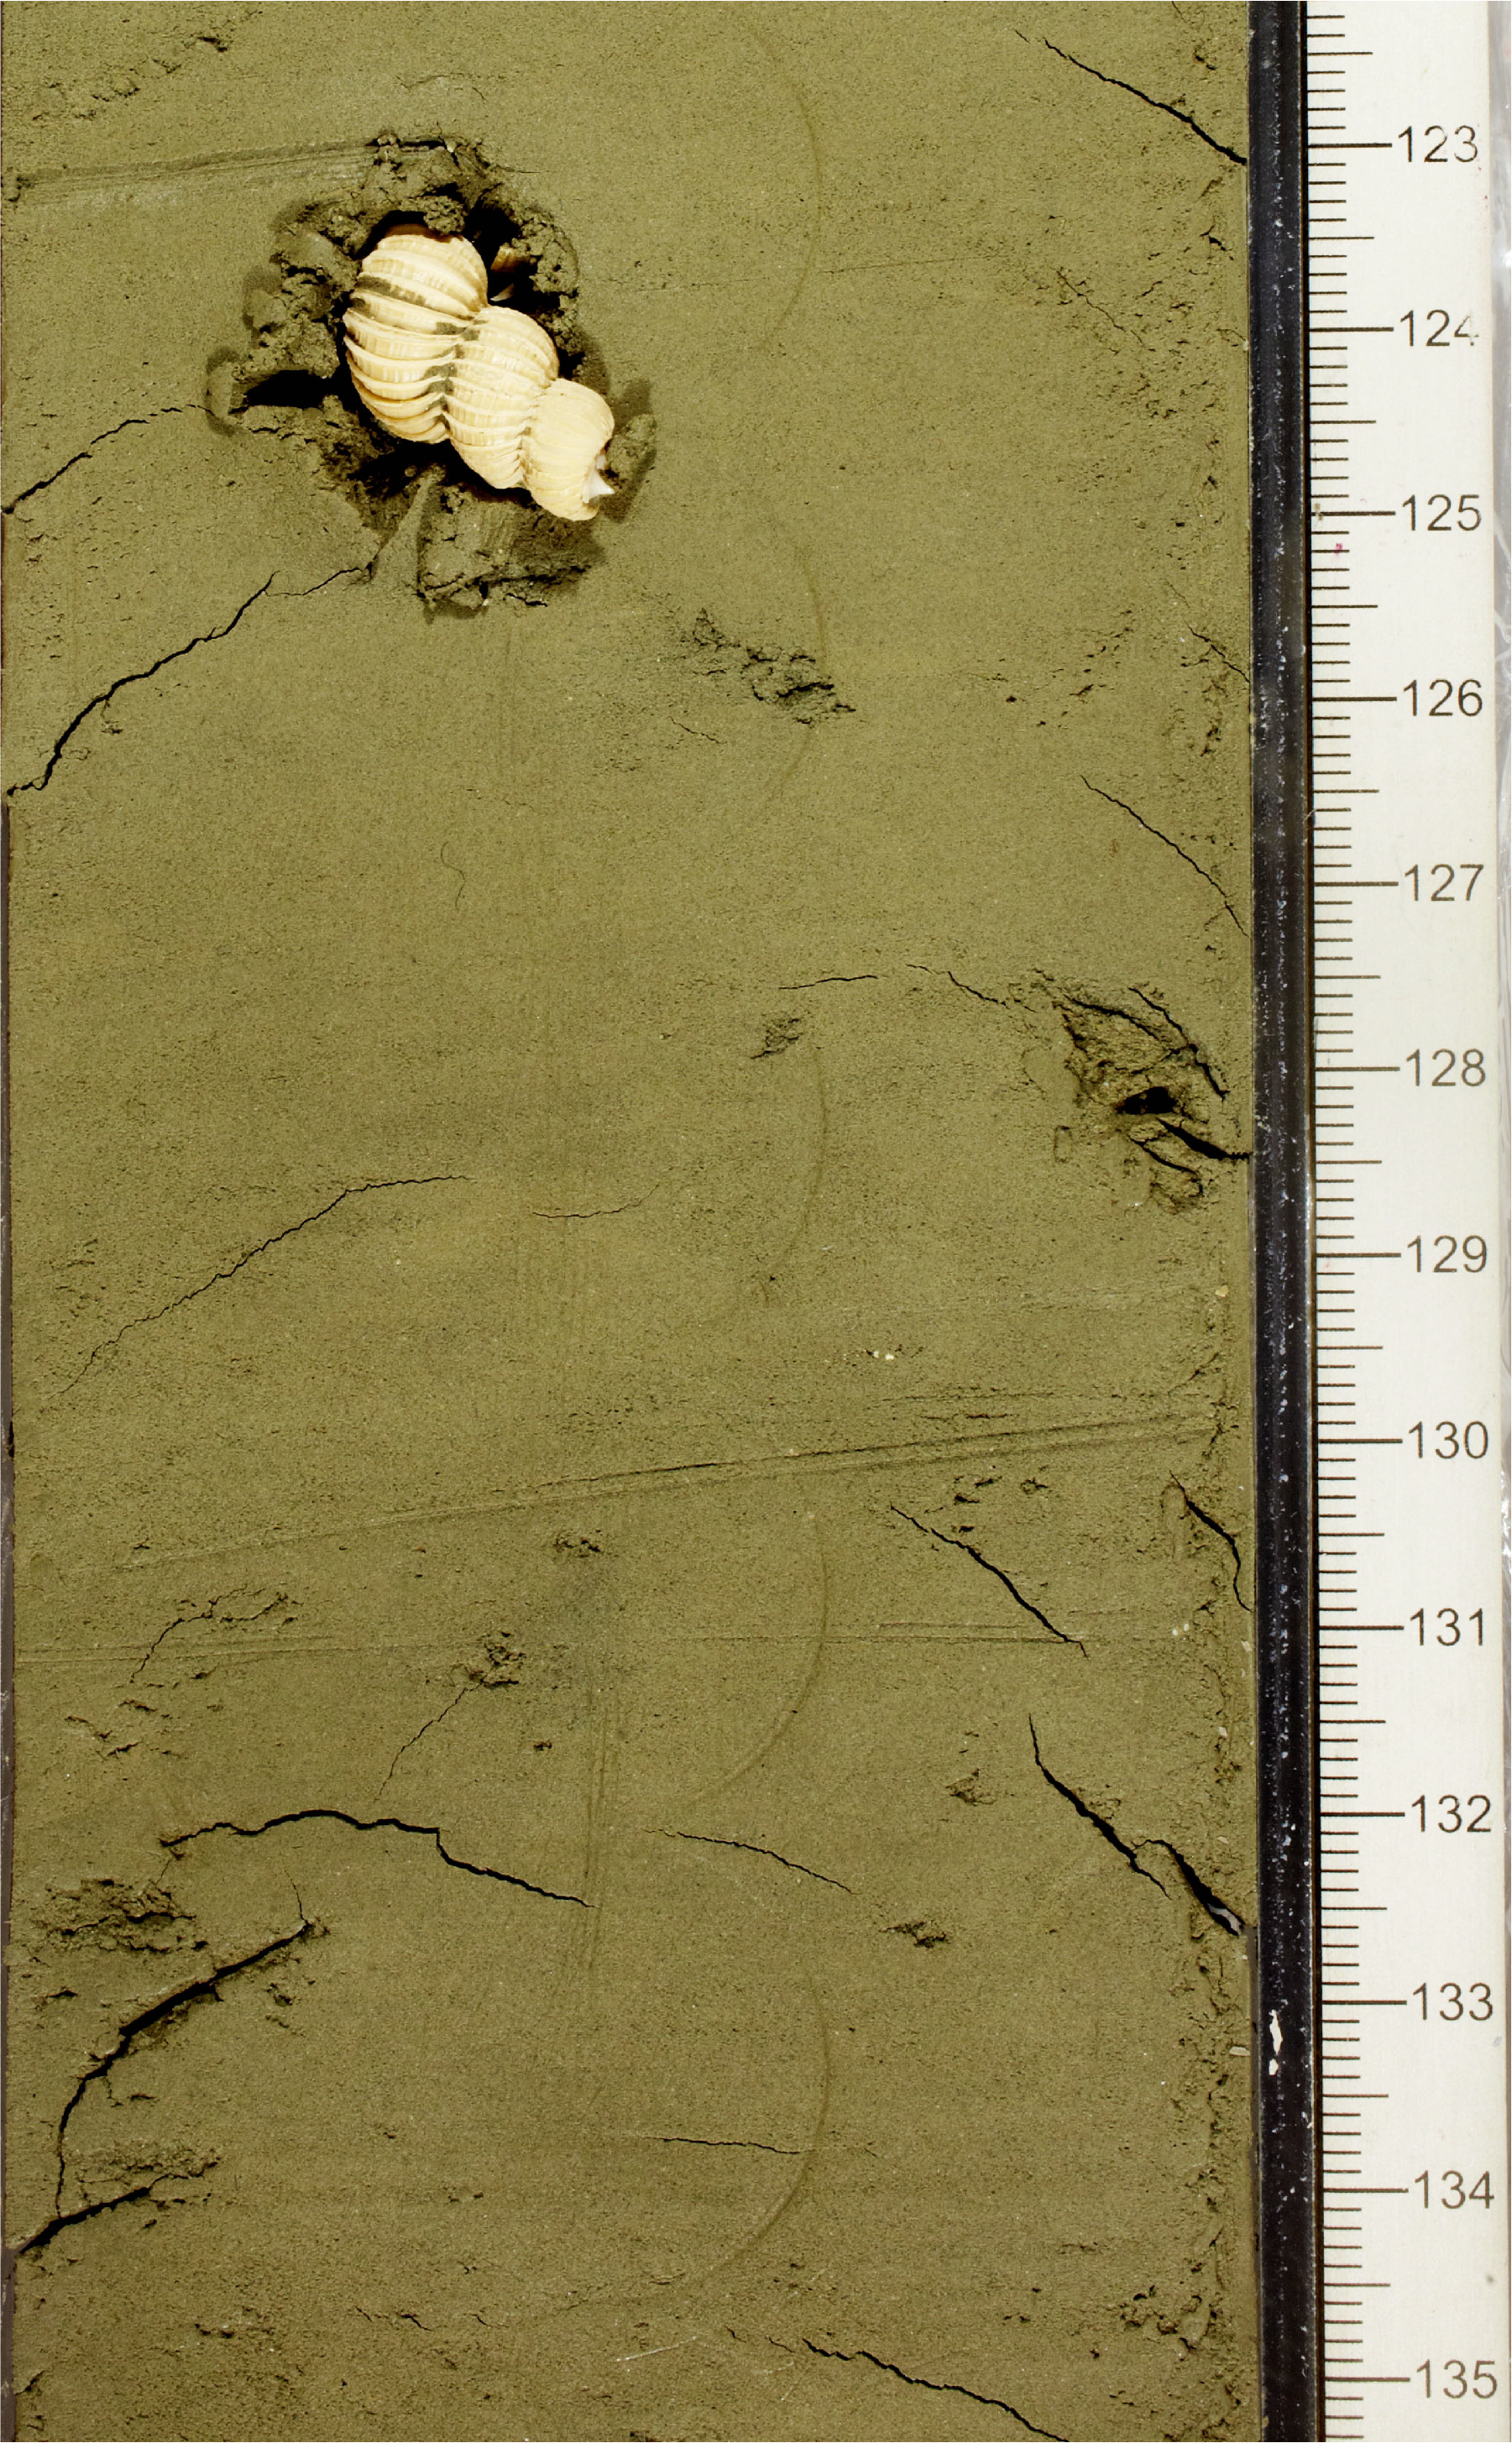
Figure F3. Well-preserved gastropod shell.
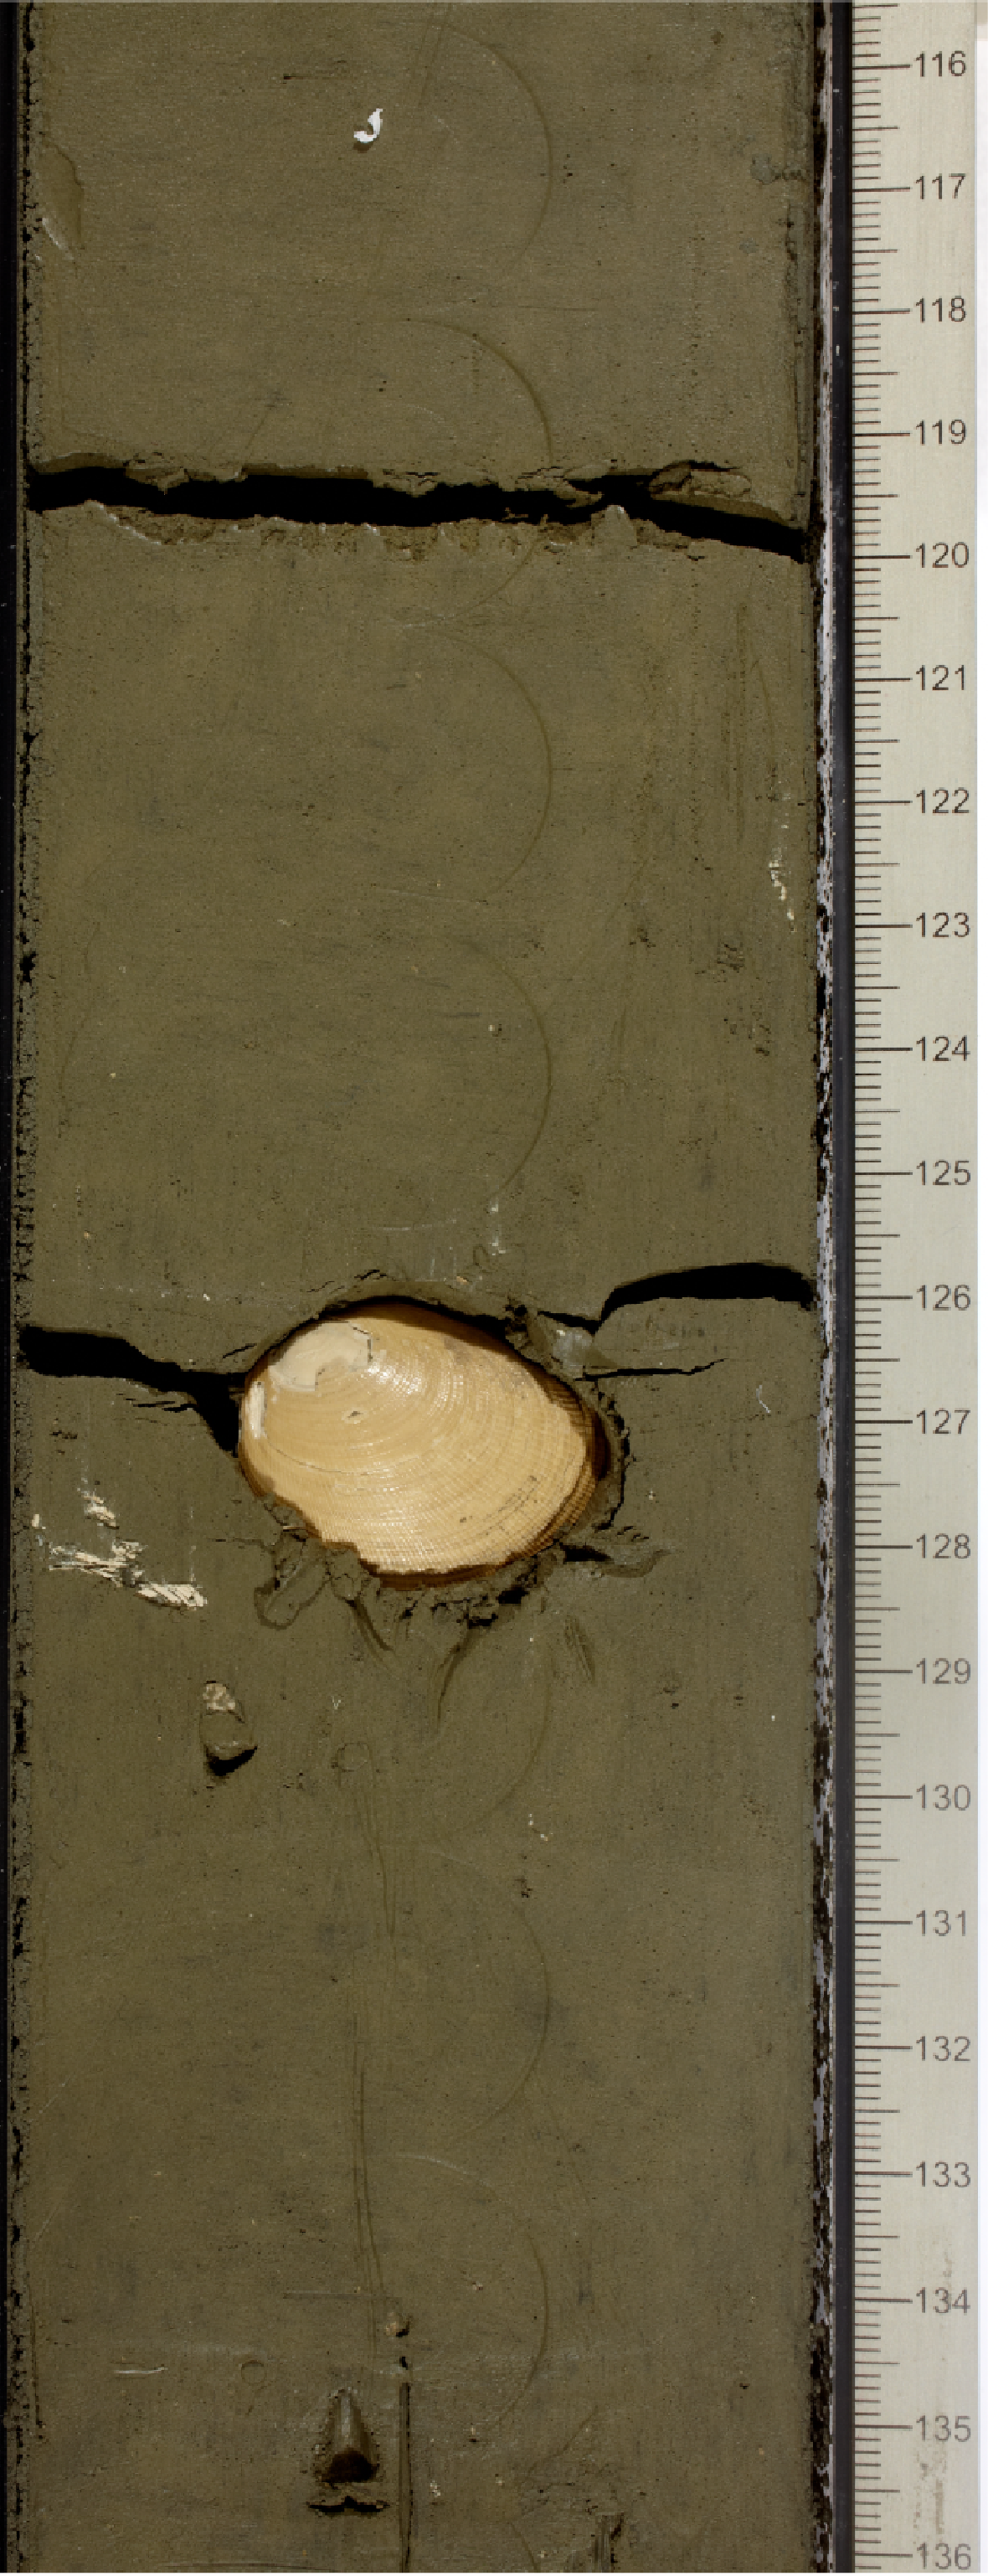
Figure F4. Well-preserved mollusk shell.
Unit descriptions
Unit I
- Intervals: 382-U1534A-1H-1, 0 cm, through 5H-CC; 382-U1534B-1H-1, 0 cm, through 1H-CC; 382-U1534C-1H-1, 0 cm, through 5H-CC; 382-U1534D-1H-1, 0 cm, through 3H-CC
- Depths: Hole U1534A = 0–41.75 mbsf; Hole U1534B = 0 to >1.51 mbsf (base of unit not recovered); Hole U1534C = 0–44.01 mbsf; Hole U1534D = 0–28.5 mbsf
- Age: Holocene–mid-Pleistocene
Lithostratigraphic Unit I comprises interbedded foraminifer-bearing dark and very dark greenish gray (10Y 4/1 and 10Y 3/1) biosilica-rich silty clays. As estimated from smear slides, the terrigenous fraction is composed of >50% quartz and <25% feldspar and accessory opaque minerals. Sieved samples (see Biostratigraphy) show varying contributions of fine sand that are largely composed of dark green, well-rounded glauconite grains throughout this unit. The biogenic fraction consists of >50% biosilica (diatoms and spicules).
Three carbonate-bearing to carbonate-rich intervals were identified. The first interval, the uppermost 2 m in Holes U1534A–U1534C, is olive to very dark grayish olive (5Y 4/3 to 5GY 3/2) biosiliceous silty clay that contains 25% foraminifers and nannofossils and represents the Holocene. The second carbonate-bearing interval, which likely represents Marine Isotope Stage (MIS) 5e, is greenish gray to dark greenish gray (10Y 6/1 to 5GY 4/2) biosiliceous silty clay containing 30% nannofossils and foraminifers. This interval was recovered in Sections 382-U1534A-2H-5, 2H-6, and 2H-CC; 382-U1534C-3H-2; and 382-U1534D-2H-4. The third carbonate-rich interval is a 5 m thick light gray (10Y 7/1) layer that was preliminarily identified as MIS 11 and occurs in Sections 382-U1534A-5H-5 through 5H-CC and 382-U1534C-5H-2 through 5H-5). In both Holes U1534A and U1534C, the upper and lower boundaries of this foraminifer- and nannofossil-rich biosiliceous ooze were marked by a gradual and partially bioturbated transition from and to the over- and underlying biosiliceous silty clays. The classification of this interval as ooze was determined from smear slide analyses (Figure F5) where the terrigenous to biogenic ratio was found to be 40:60. Quartz, glauconite, and opaque minerals are the main component of the terrigenous fraction, as identified from smear slide analyses. Foraminifers and nannofossils are common, yet the main components of the biogenic fraction, as determined by smear slide analysis, are diatoms and sponge spicules. The base of this interval defines the base of Lithostratigraphic Unit I.
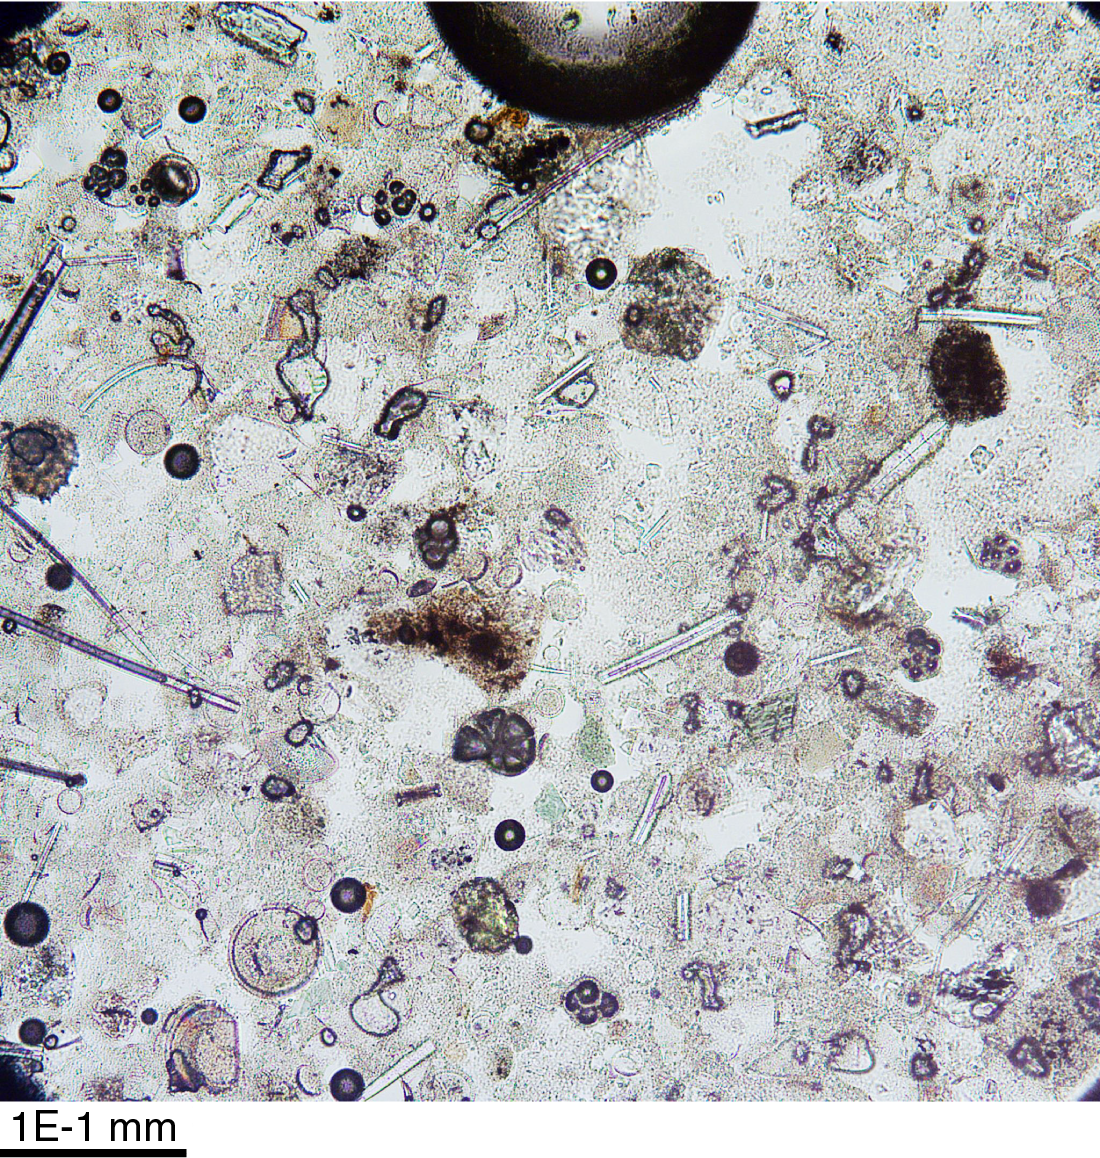
Figure F5. Foraminifer- and nannofossil-rich biosiliceous ooze.
Unit I also contains several well-preserved macrofossils, such as corals (Cores 382-U1534A-2H and 3H; Figure F2), gastropods (Core 6H; Figure F3), and a bivalve shell (Section 382-U1534D-2H-5, 125–129 cm; Figure F4), as well as several shell fragments (e.g., Core 382-U1534A-3H). Although present, dropstones are rare and could only be visually identified when on the split surface of the archive or working half (Sections 382-U1534A-4H-1 through 4H-6, 6H-3 through 6H-4, 8H-1 through 8H-6, and 19F-1 and 382-U1534C-1H-4, 4H-5, 7H-CC, 9H-5, 14H-1, and 15H-4). A few additional dropstones were observed in the X-radiographs.
Unit II
- Intervals: 382-U1534A-6H through 35F-CC; 382-U1534C-6H through 19H-CC
- Depths: Hole U1534A = 41.75–214.13 mbsf; Hole U1534C = 44.3–159.21 mbsf
- Age: middle Pleistocene–late Pliocene
Lithostratigraphic Unit II is dominated by biosilica-bearing to biosilica-rich silty clay that is dominantly dark greenish gray and very dark greenish gray (10Y 4/1 and 10Y 3/1). At more than 50%, quartz is the dominant mineral of the terrigenous fraction. Smear slide analyses also show rare to common feldspar minerals in most core samples, as well as accessory minerals of mica, glauconite, and opaques (probably pyrite). Several sharp boundaries between clay-rich and siltier layers are present, but graded bedding was not observed. A 10 cm thick carbonaceous, light gray tephra layer was observed in Section 382-U1534A-11H-3.
Bioturbation is present throughout; it consists of mottling and millimeter-wide, silt-filled, and pyritized burrows. Thick burrows were recovered in both holes around 150–151 mbsf (Sections 382-U1534A-22F-4 and 22F-CC and Core 382-U1534C-18H) (Figure F6). X-ray diffraction analysis of the lithified burrows shows a composition of quartz, high Mg-calcite, and feldspar.
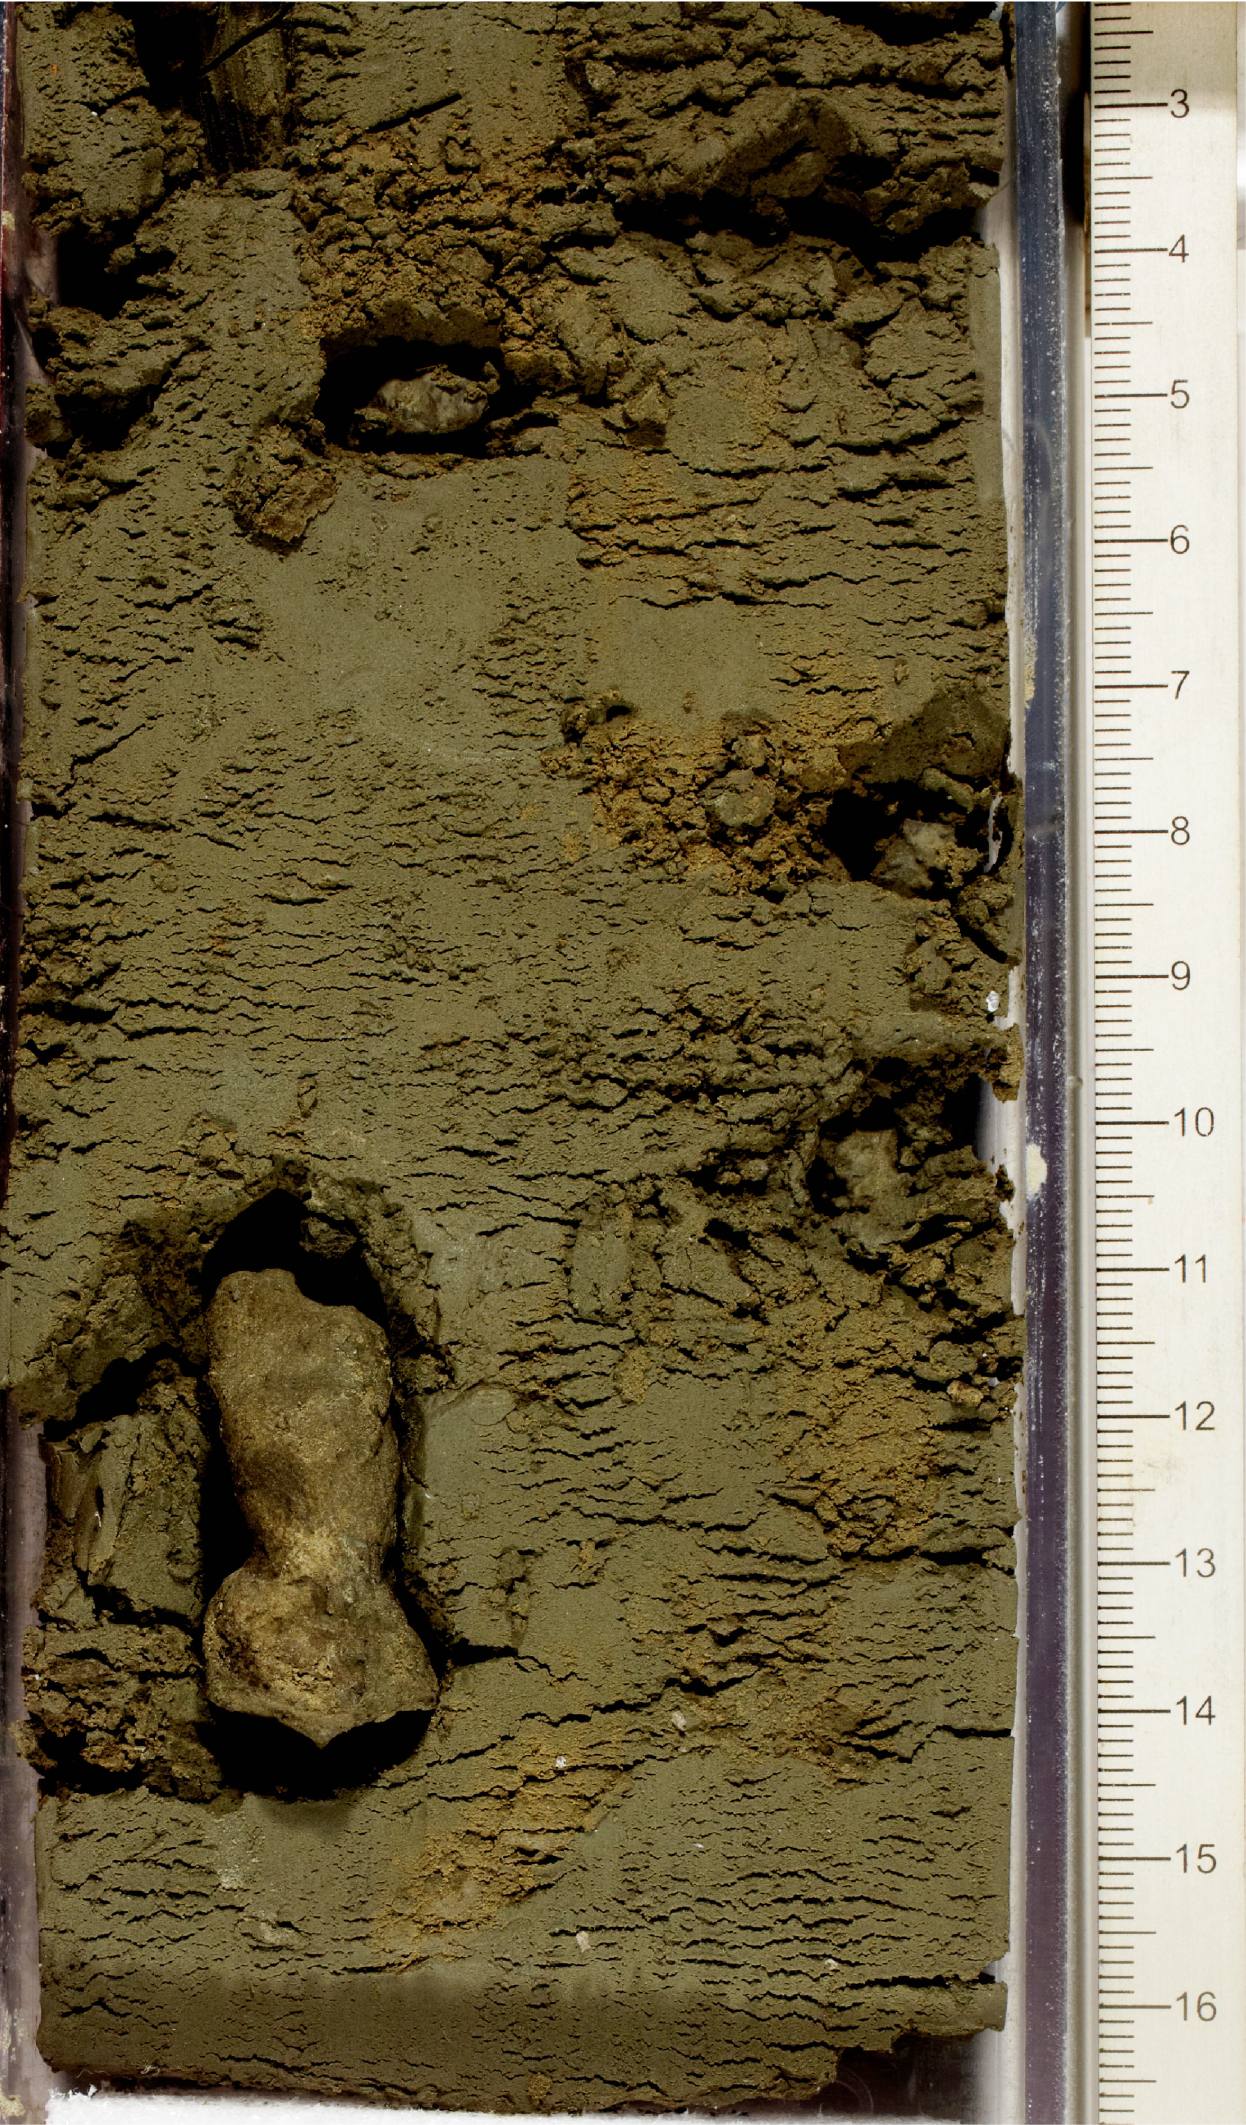
Figure F6. Part of lithified burrow.
Unit III
Lithostratigraphic Unit III consists of dark greenish gray (5GY 4/1 and 10Y 4/1) to very dark greenish gray (10Y 3/1) biosilica-bearing silty clay. This interval is distinguished by the reappearance of foraminifers, although in low amounts between 2% and 10%.
A dark brown, coarse-structured dolomitized rock fragment was found at the top of Core 382-U1534A-8H-1. The fragment showed a slight reaction to the treatment with HCl; hence, it was classified as dolomitized. However, because of its position of the top of the core, it might be classified as fall-in.
X-radiographs
For Site U1534, X-ray images were taken from whole-round sections as the first measurement in the physical properties workflow. The system was set to work with a voltage of 90 kV and a current of 1.0 mA. A total of 20 images were taken and stacked for each 12 cm long section of core, allowing an overlap of 3 cm between them. Exposure time for each image was 400 ms. A 1.5 m long core section thus provided 13 stacked images. A total of 3595 images were taken from Holes U1534A–U1534D. Archive-half sections from Holes U1534A and U1534C were used in sections where the liner was damaged and the whole-round sections could not fit into the X-Ray Imager. Images were automatically preprocessed with the Processing Utility, checked for quality control, and saved together with the raw images for further processing. Image quality was low when core liners were cracked or stressed, and several artifacts due to the calibration and/or the presence of dirt in the machine can be seen in the lower sections.
Radiographs from Site U1534 show some distinct textures (Figure F7), including millimeter-scale laminations (mostly parallel but also cross-laminations in some cases), faint centimeter-scale bands of alternating higher and lower values, millimeter- to centimeter-scale dropstones, fossil traces, and different types of fossils (shells and corals). X-ray images were used to identify macrofossils to sample for dating.
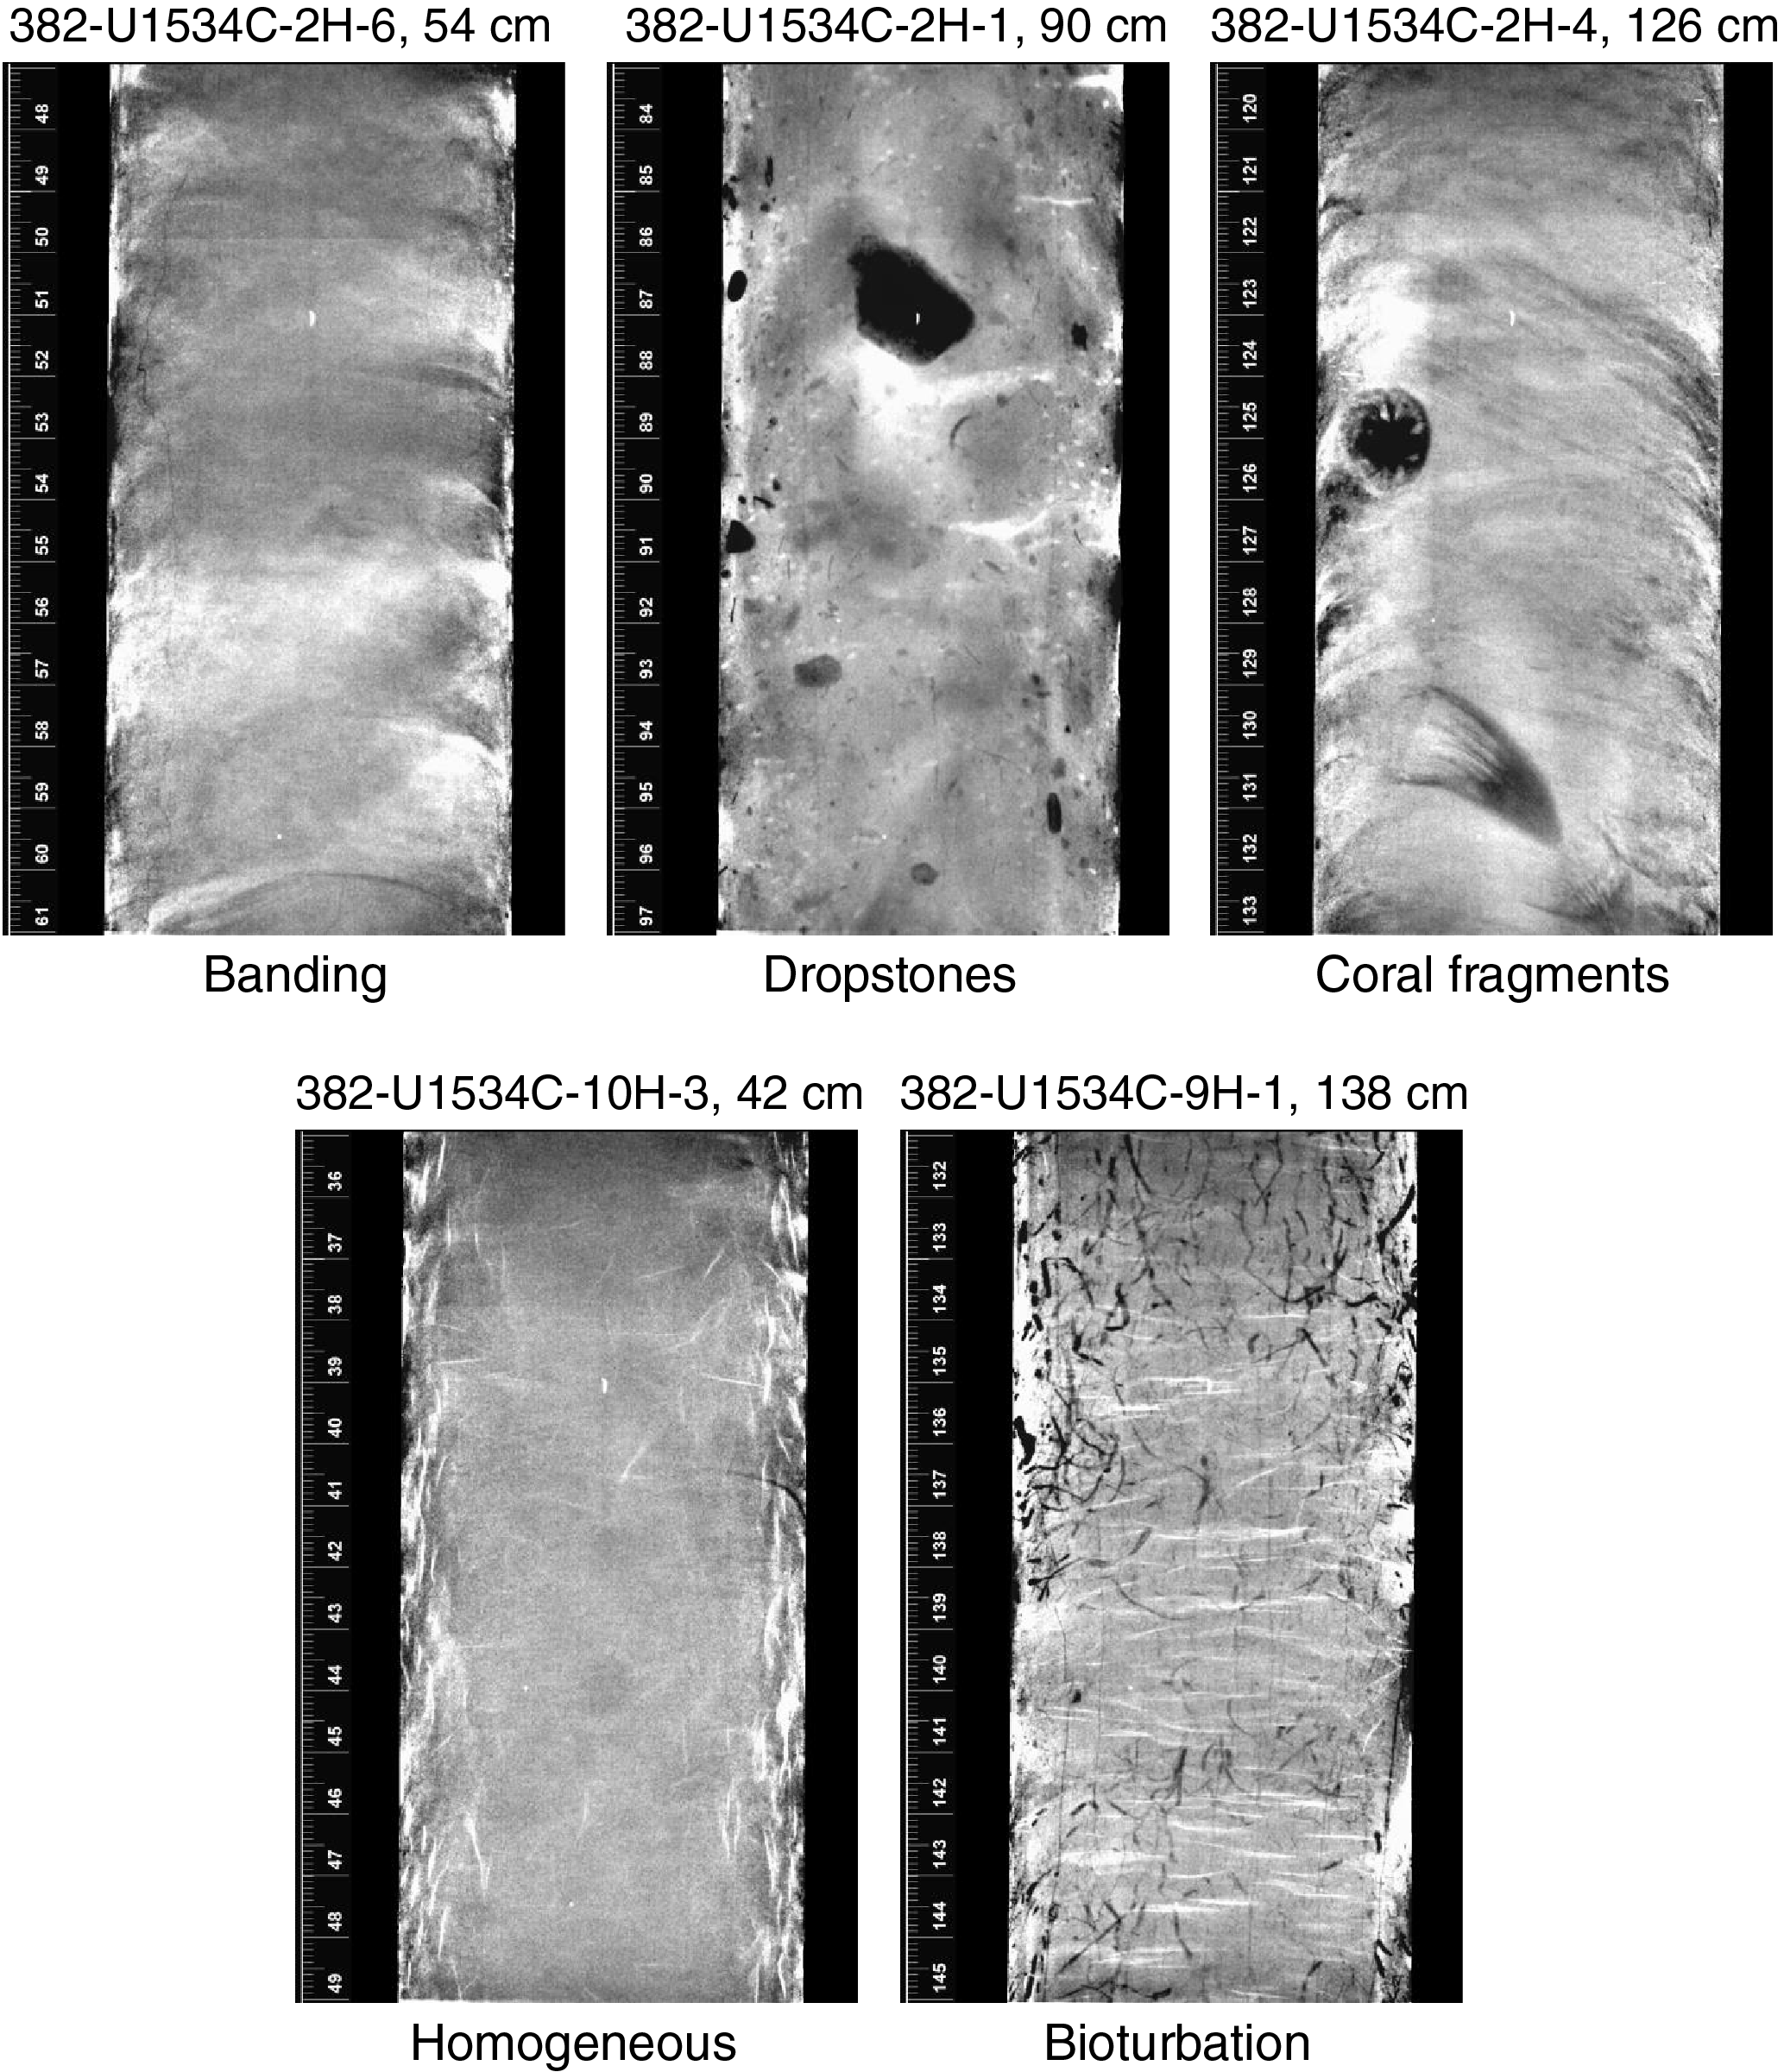
Figure F7. X-radiographs.
Biostratigraphy
Silty clays and clayey silts generally containing siliceous and organic-walled microfossils were recovered from Hole U1534A. Core catcher samples from Cores 382-U1534A-1H through 47X were analyzed for diatoms, radiolarians, foraminifers, and palynomorphs. In addition, selected samples from the archive halves of Cores 6H–12H were analyzed for diatoms, and samples from the archive and working halves of Cores 22F–42F were analyzed for diatoms and radiolarians. The following site description is focused on biostratigraphically significant taxa (i.e., presence/absence and first occurrence [FO]/last occurrence [LO] events). Results from the ship-based age model are presented in Figure F8 and Tables T2 and T3.
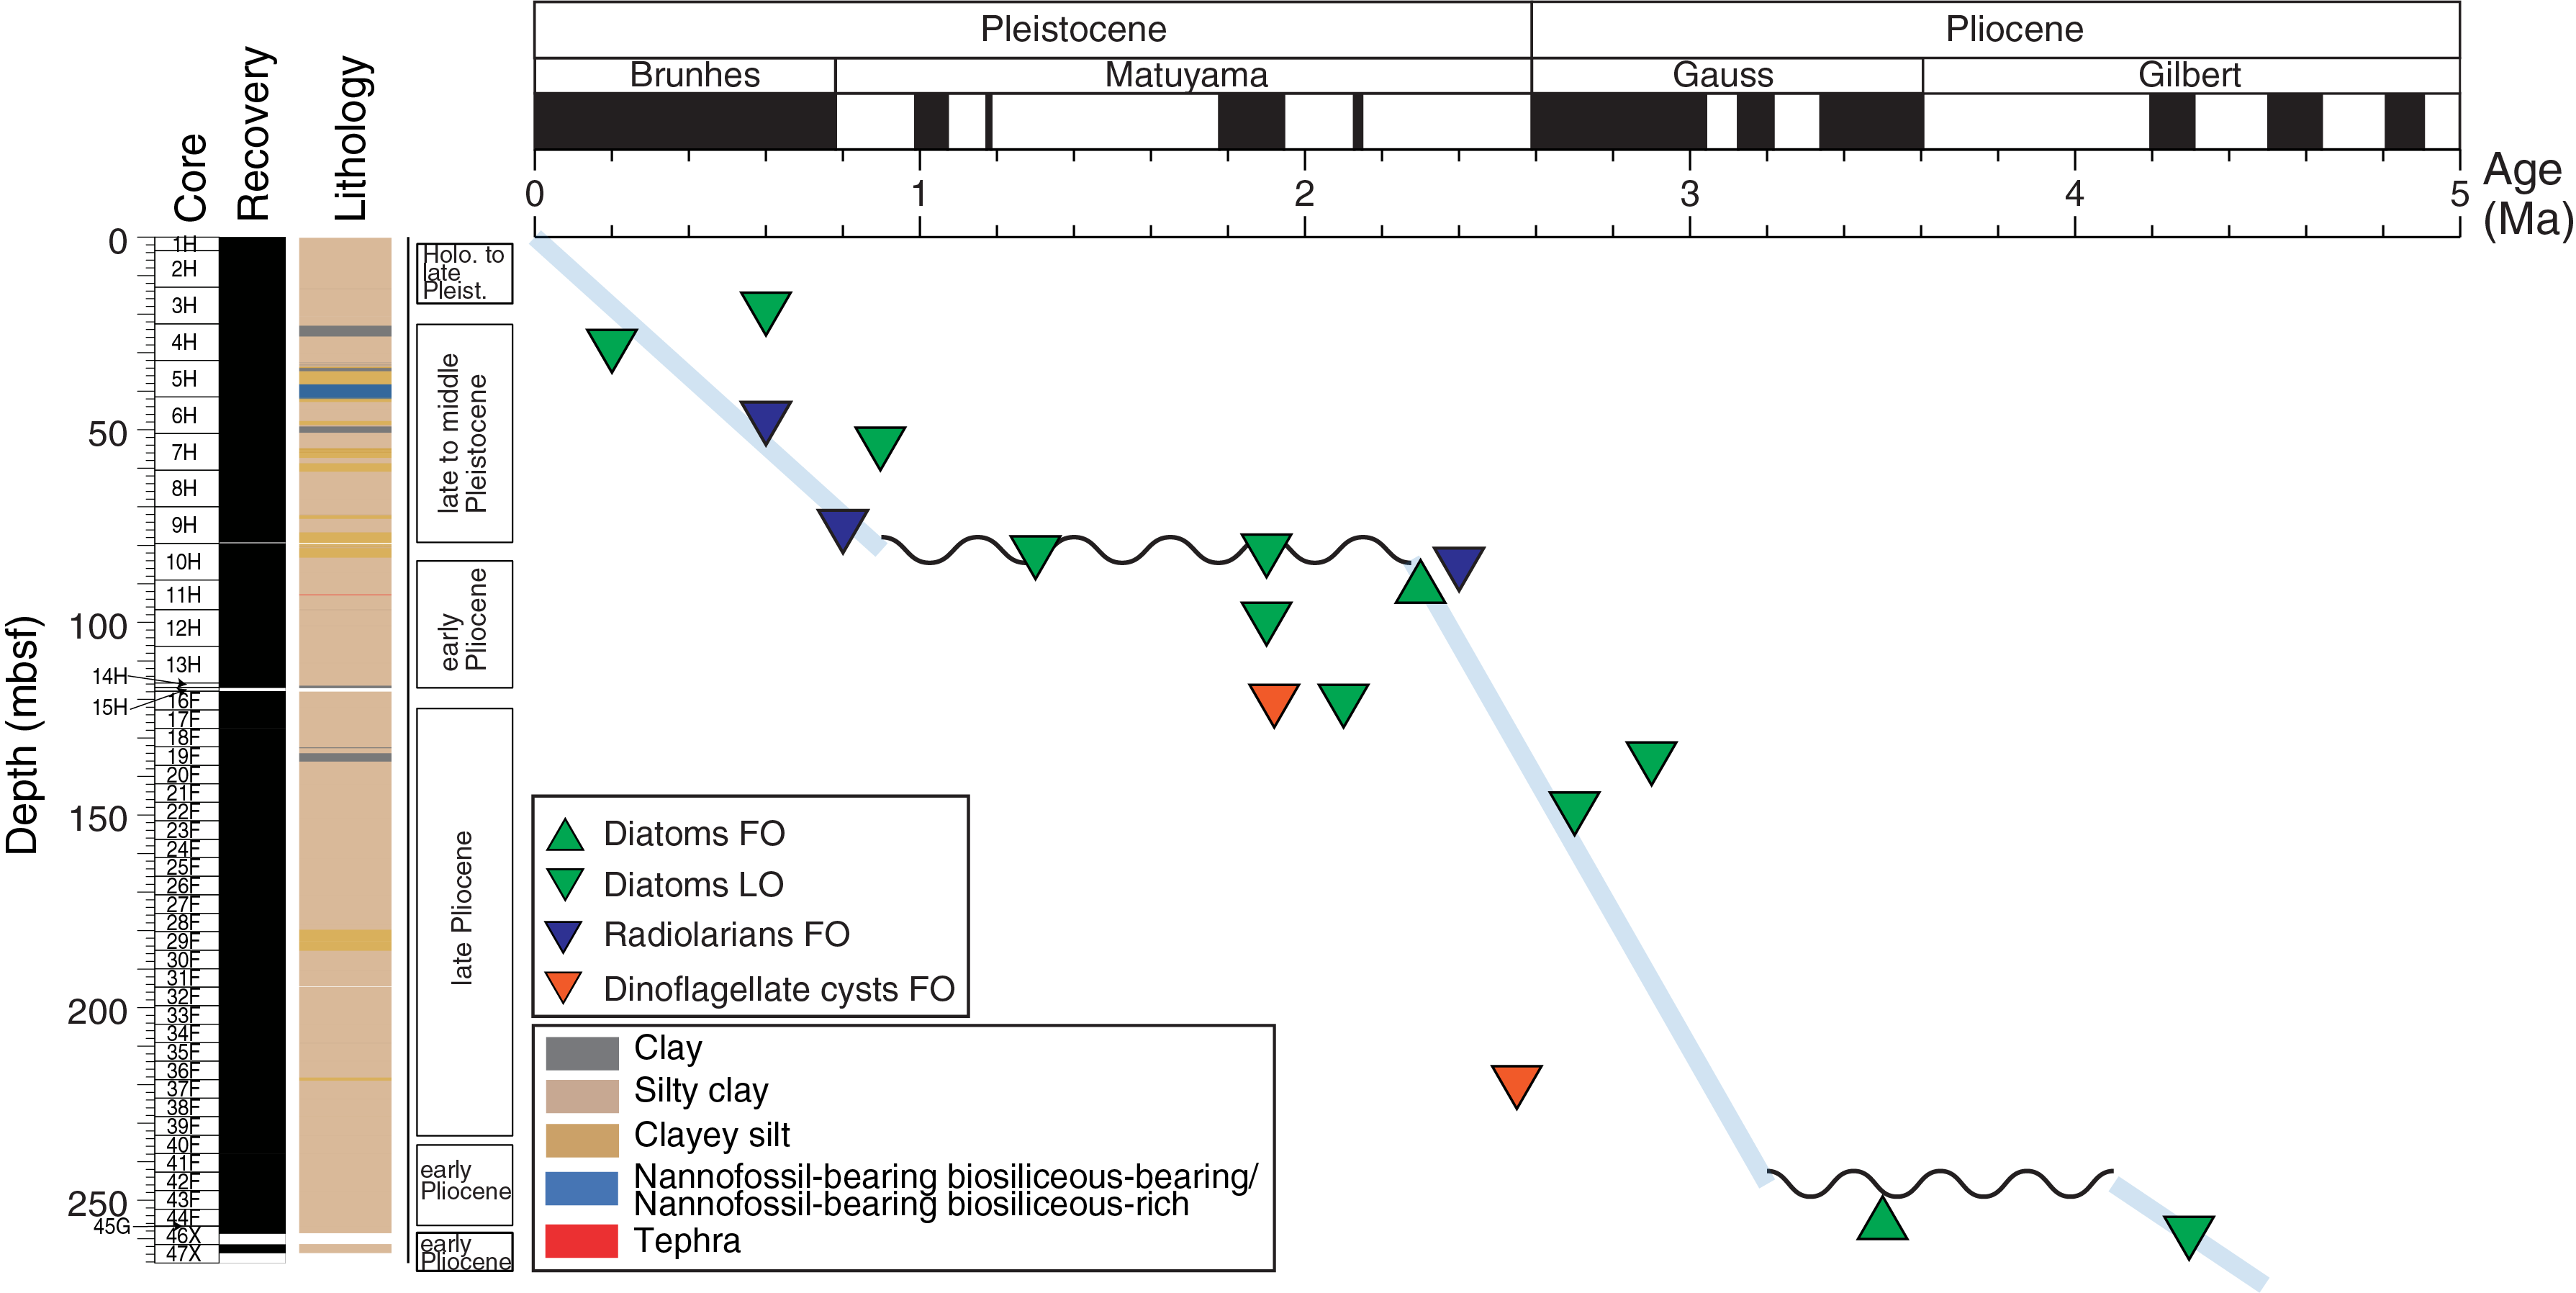
Figure F8. Biostratigraphic age-depth plot.
Siliceous microfossils
Diatoms
Although abundance and preservation (fragmentation and dissolution) are variable throughout the analyzed sections, diatoms occur in all core catcher samples except Samples 382-U1534A-33F-CC and 45G-CC, which are barren of diatoms. Silicoflagellates, ebridians, and sponge spicules are present with the diatoms but are not considered in this analysis. Diatoms are present at trace to abundant levels depending on the sample. Diatom dissolution and fragmentation varies from low to high.
The diatom assemblage in Samples 382-U1534A-1H-CC to 2H-CC is present in rare abundances and represents the Holocene to Pleistocene. These samples are dominated by Fragilariopsis kerguelensis (FO = 2.3 Ma), Paralia sulcata, and Hyalodiscus spp. Trace abundances of Porosira pseudodenticulata (FO = 2.3 Ma) and Thalassiosira eccentrica were also noted. Samples 3H-CC to 9H-CC contain a late to middle Pleistocene assemblage. These samples are similar to the assemblage found in the first two cores, with the additions of Actinocyclus ingens (LO = 0.6 Ma), Chaetoceros resting spores, Shionodiscus oestrupii (FO = 5.5 Ma), Thalassionema nitzschioides, and Thalassiosira lentiginosa (FO = 4.0 Ma). Other species are present occasionally in these samples (Table T4).
The diatom assemblage in Samples 382-U1534A-10H-3, 75 cm, to 39F-CC notably lacks F. kerguelensis compared to the samples above. Instead, this assemblage contains Fragilariopsis barronii (FO = 4.4 Ma; LO = 1.3 Ma) and Fragilariopsis weaveri (FO = 3.5 Ma; LO = 2.7 Ma). Thalassiosira torokina (FO = 9–9.5 Ma; LO = 1.9 Ma) is present in Samples 10H-3, 75 cm, to 14H-CC. The diatom assemblage in Samples 10H-3, 75 cm, to 39F-CC represents the late Pliocene–early Pleistocene. Thalassiosira inura (FO = 5.6 Ma; LO = 2.0–1.8 Ma) is first seen in Sample 12H-3, 75 cm, and is generally present in the remaining samples to Sample 39F-CC. Chaetoceros resting spores, P. sulcata, S. oestrupii, and T. nitzschioides are present in the majority of these samples. Numerous other diatom species are present in occasional samples throughout this interval (Table T4). Samples 16H-CC to 39F-CC represent the late Pliocene.
Samples 382-U1534A-40F-2, 75 cm, to 43F-CC lack F. barronii, F. weaveri, and T. inura. However, Chaetoceros resting spores, P. sulcata, S. oestrupii, and T. nitzschioides continue to be present in this interval. Thalassiosira kolbei (FO = 4.1 Ma; LO = 1.9 Ma) is a prominent biostratigraphic marker in these samples. This assemblage dates to the early Pliocene. Sample 43F-CC notably contains Thalassiosira nativa (FO = 10 Ma; LO = 4.8 Ma), which is restricted to the early Pliocene and late Miocene. Other taxa occurrences are noted in Table T4.
The two lowest analyzed depths (Samples 382-U1534A-46X-CC and 47X-CC) lack T. kolbei. These samples contain the biostratigraphic markers Fragilariopsis cylindrica (FO = 7.7 Ma; LO = 4.3 Ma), Fragilariopsis fossilis (FO = 8.7 Ma; LO = 2.8–3.5 Ma), and Proboscia barboi (FO = ~13 Ma; LO = 1.8 Ma). The common diatoms Chaetoceros resting spores, P. sulcata, S. oestrupii, and T. nitzschioides remain in these samples. Shionodiscus praeoestrupii is found exclusively in Sample 47X-CC. The two deepest cores collected in Hole U1534A represent the earliest Pliocene. All other diatom taxa observed in this interval are documented in Table T4.
Radiolarians
All core catcher samples from Samples 382-U1534A-1H-CC to 20F-CC were analyzed for radiolarians, and every second core catcher sample was analyzed between Samples 21F-CC and 47X-CC (because they are half cores).
Radiolarians generally occur in high abundances throughout Hole U1534A. The uppermost sample (382-U1534A-1H-CC) contains very few radiolarians, and they are often broken. Preservation is moderate to good in Samples 2H-CC to 31F-CC, and radiolarians are abundant to rare. Samples 33F-CC to 38F-2, 75–76 cm, contain poorly preserved radiolarians in rare abundance. Preservation is moderate, and frequent to abundant radiolarian concentration was observed in Samples 39F-CC to 45G-CC. Sample 46X-CC is almost barren of radiolarians, which are poorly preserved and often recrystallized, whereas Sample 47X-CC contains abundant radiolarians with good preservation.
Samples 382-U1534A-1H-CC to 5H-CC are assigned tentatively to the Omega Zone (0–0.4 Ma) based on the absence of the species Stylatractus universus. However, this species is rare in the Southern Ocean, and this event is not well identified without close sampling (Lazarus, 1992). Sample 6H-CC corresponds to the Psi Zone (0.8–0.4 Ma) based on the presence of the species Antarctissa cylindrica. The base of this zone is defined by the LO of Pterocanium trilobum in Sample 9H-CC, which marks the top of the Chi Zone (1.85–0.8 Ma). Cycladophora davisiana davisiana is present in the same sample, indicating ages younger than 2.6 Ma. The presence of Helotholus vema and Desmospyris spongiosa in Sample 10H-CC marks the upper boundary of the Upsilon Zone (2.4–4.5 Ma). The absence of Cycladophora pliocenica and Eucyrtidium calvertense above that sample indicates that the Phi Zone (2.4–1.88 Ma) is not present in this core, and thus a hiatus of approximately 1–1.6 Ma is inferred.
Below Sample 382-U1534A-10H-CC to the bottom of the hole (Sample 47X-CC), the Upsilon Zone is indicated based on the intermittent presence of H. vema (LO = 2.4 Ma; FO = 4.59 Ma) in addition to other species typical of this zone, such as E. calvertense, Eucyrtidium pseudoinflatum, C. pliocenica, Cycladophora humerus, D. spongiosa, and Dendrospyris megalocephalis. These species have very wide stratigraphic occurrences, and thus it is not possible to constrain ages more tightly. The presence of Larcopyle polyacantha titan in Sample 30F-CC indicates ages older than 3.48 Ma. However, only one individual was identified, so this datum is uncertain. In the absence of H. vema or any other species with occurrence restricted to the Upsilon Zone between Samples 33F-CC and 39F-CC, the next best age estimate for these samples is given by the occurrence of Lychnocanium grande in Sample 41F-CC (LO = 4.2–4.5 Ma; Florindo et al., 2013). Radiolarian occurrences are documented in Table T5.
Calcareous microfossils
Foraminifers
Core catcher Samples 382-U1534A-1H-CC to 20F-CC were analyzed for foraminifers, and every second core catcher was analyzed between Samples 21F-CC and 45G-CC. Preservation is typically medium to high, although specimens associated with high abundances of pyrite are often yellow in color. Fragmentation is typically medium to high.
Infaunal Uvigerina bifurcata is the most persistent benthic foraminifer; it is frequent to common in Samples 382-U1534A-1H-CC to 6H-CC and rare to trace in Samples 7H-CC to 9H-CC. Melonis spp., Fursenkoina fusiformis, Nonionella spp., Oridorsalis umbonatus, and Cassidulina subglobosa are rare to common in Samples 1H-CC to 7H-CC. Samples 10H-CC to 45G-CC are on the whole barren of calcareous foraminifers, although notable exceptions include rare Cibicides spp. in Samples 13H-CC and 24F-CC and rare Uvigerina and Bulimina spp. in Sample 33F-CC.
Planktonic foraminifer abundance varies from rare to abundant in Samples 382-U1534A-1H-CC to 6H-CC. Neogloboquadrina pachyderma sinistral is a persistent species where planktonic foraminifers are present. The highest abundance and diversity of planktonic foraminifers occurs in Samples 2H-CC and 5H-CC. The species identified include Globigerina inflata, Globigerina bulloides, Neogloboquadrina dutertrei, Neogloboquadrina pachyderma incompta, N. pachyderma sinistral, and Globoturborotalia spp. These observations are consistent with these intervals being from MISs 5e and 11, respectively.
The foraminifers identified in these samples are consistent with the age estimates suggested by the siliceous microfossil biostratigraphy but do not add any further refinement to the dating of these holes.
Fish teeth and squid beaks were observed in at least one fifth of the samples examined for foraminifers.
Pyritized burrows and pyrite infills in foraminifer chambers were commonly observed in sieved residues. Because of the risk of pyrite oxidation in split cores leading to carbonate dissolution (Osterman et al., 2001; Dunkley Jones and Bown, 2007), 20 cm3 quarter-round samples were collected every 20 cm from Holes U1534C and U1534D. Samples were initially frozen. Once the splice for Site U1534 was determined, all samples in the splice were sieved at 63 µm. All other samples were freeze-dried on board. The working halves from Site U1534 were heat sealed to keep them airtight to inhibit oxidation in storage.
Palynology
A total of 22 core catcher samples from Hole U1534A were processed and analyzed for palynological content (dinoflagellate cysts [dinocysts], pollen, and spores). Palynological assemblage data with semiquantitative estimates of palynofacies and dinocyst species are accessible in Table T6 and in the Laboratory Information Management System (LIMS) database under code "PALY." All samples yielded well-preserved marine and terrestrial palynomorphs. Generally, the dominant palynomorph association is composed of the heterotrophic dinocyst genera Brigantedinium spp., Selenopemphix spp., and Protoperidinium spp., whereas various trilete spores, mainly reworked, are the most abundant sporomorphs. Most of the dinocysts and acritarchs identified are long ranging, and nearly all cores analyzed contain some reworked specimens. In the time frame of the recovered material, only Samples 382-U1534A-16H-CC and 37F-CC have species with constrained datums useful for biostratigraphic interpretation: Selenopemphix dionaeacysta (LO = 1.92 Ma) and Invertocysta tabulata (LO = 2.55 Ma), respectively. Dating these samples to the early Pleistocene/late Pliocene offers supportive age control to the other microfossil groups sampled at a higher resolution (Figure F8).
All samples analyzed to date contain palynofacies other than dinocysts and sporomorphs. Acritarchs, foraminifer test linings, copepod remains, fungal spores, black and brown phytoclasts, and amorphous organic matter are commonly recorded throughout Hole U1534A. Specific occurrences are documented in Table T6.
Marine sedimentary ancient DNA
Ancient DNA
Samples for ancient DNA (aDNA) were collected from Holes U1534C and U1534D. Sampling from Hole U1534C followed the previously outlined Hole U1534B sampling methodology because coring Hole U1534B was unsuccessful and only recovered a damaged core unsuitable for aDNA analysis. For Hole U1534C, aDNA samples were collected from the mudline, the top and bottom of Core 382-U1534C-1H, the bottom of each section (1–4) of Core 1H, the bottom of every second section (2, 4, and 6) of Cores 2H–5H, and the bottom of Core 10H. An air control (empty tube) was collected after sampling Cores 1H, 4H, and 10H, and a drilling fluid control with perfluorocarbon tracer was also retained (12 mL).
Core 382-U1534D-1H aDNA samples were collected at closely spaced intervals: at 0, 5, 10, and 20 cm and then every 20 cm in Section 1H-1 to capture the Holocene; at 20, 70, and 120 cm in Sections 1H-2 through 1H-6; and at 25 cm in Section 1H-7. Air and drilling fluid controls were also collected. All samples will be analyzed at the special facilities of the Australian Centre for Ancient DNA (ACAD), Adelaide (see Biostratigraphy in the Expedition 382 methods chapter [Weber et al., 2021]).
In addition, subsamples from the three core catcher samples (382-U1534C-1H-CC, 2H-CC, and 3H-CC) that were sieved (>63, >20, and <20 µm) under clean conditions were retained and stored at −80°C to check for the sources of sedimentary aDNA at ACAD (see Biostratigraphy in the Expedition 382 methods chapter [Weber et al., 2021]). Microfossils (diatoms) in these samples reflect those in Samples 382-U1534A-1H-CC, 2H-CC, and 3H-CC.
Contamination control
Inner and outer sediment samples for chemical tracer testing (perfluoromethyl decaline [PFMD]) were collected at the same depths as aDNA samples for Hole U1534C and at 69–70 cm in each section from Hole U1534D. Samples were stored at 4°C and analyzed approximately 3 days after collection. For Hole U1534D, PFMD was detected in one sample (382-U1534D-1H-1, 69–70 cm). The sample from the outer portion of the core had a concentration of 1.597 ng/mL (indicating PFMD delivery to this sample), and the sample from the inner portion of the core had a concentration of 0.749 ng/mL (indicating potential contamination of the core center and thus the aDNA sample). The potentially contaminated sample will either be excluded from downstream analyses or evaluated with caution.
Summary
Diatom, radiolarian, foraminifer, and palynomorph biostratigraphic results are consistent for the majority of samples from Hole U1534A. These analyses showed 17 biostratigraphic events (Table T3). Based on these events, we estimate sedimentation rates of ~90 m/My in Samples 382-U1534A-1H-CC to 9H-CC; ~120 m/My in Samples 10H-3, 75 cm, to 40F-2, 75 cm; and ~70 m/My from Sample 41F-2, 75 cm, to the base of the hole. These approximate sedimentation rates, as well as suggested hiatuses between Samples 9H-CC and 10H-3, 75 cm, and between Samples 40F-2, 75 cm, and 41F-2, 75 cm, are illustrated in Figure F8. Estimated sedimentation rate changes may indicate variations in past ocean current strength and paleoproductivity. Our analysis suggests that the time periods between ~0 and 0.9 Ma, between ~2.4 and 3.2 Ma, and between 4.1 and 4.7 Ma are covered by the sediments acquired at this site. Reworking was noted in the palynomorph analysis. In intervals of poor fossil preservation, transport prior to deposition in the contourite is possible.
Paleomagnetism
Paleomagnetic measurements were made on 313 APC and HLAPC core sections from Holes U1534A (N = 201), U1534B (N = 1), and U1534C (N = 111) to investigate the natural remanent magnetization (NRM). Cores 382-U1534A-1H through 14H and 382-U1534C-1H through 19H were oriented using data from the Icefield MI-5 core orientation tool (Table T7; see Paleomagnetism in the Expedition 382 methods chapter [Weber et al., 2021]). No archive-half measurements were made on core catcher samples or XCB cores (382-U1534A-46X and 47X) because visual inspection of coring deformation indicated highly disturbed sedimentary fabric. No archive-half measurements were made on Hole U1534D cores because of time limitations and because the three recovered cores (382-U1534D-1H, 2H, and 3H) could be confidently correlated with recovered sediments in the other holes (see Stratigraphic correlation). All archive-half measurements were made on the initial magnetization and the magnetization following peak alternating field (AF) demagnetization at 10 and 15 mT. Initially, cores were also demagnetized using a peak AF of 20 mT and measured (Cores 382-U1534A-1H through 10H); however, because the drill string overprint typically appears to be removed by 10 mT, we stopped using this step in the interest of time.
A total of 297 discrete cube samples were taken from the working halves, with roughly one sample taken per section from APC and HLAPC cores recovered in Hole U1534A (avoiding visually disturbed intervals) and a limited number of samples taken from Hole U1534C cores to cover gaps in the uppermost 6 m of Hole U1534A (Core 382-U1534C-1H) and an interval with shattered core liners in Hole U1534A (Cores 382-U1534C-8H through 10H). The NRM of a subset of the discrete cube samples was investigated using the AGICO JR-6A spinner magnetometer to measure the initial magnetization and after demagnetization at peak AF steps of 10, 20, 30, 40, 50, and 60 mT. Some samples appeared to acquire a remanent magnetization above the 30 mT peak AF. Accordingly, a modified AF demagnetization protocol was used in further investigations to mitigate the impact of any gyroremanent magnetization (GRM) (see Paleomagnetism in the Expedition 382 methods chapter [Weber et al., 2021]; Stephenson, 1993). The NRM of the remaining discrete samples was investigated using the superconducting rock magnetometer (SRM) to measure the initial magnetization and after demagnetization at peak AF steps of 5, 10, 15, and 20 mT.
During the Icefield MI-5 tool data analysis and azimuthal orientation of measured declinations, we discovered a programming error in the SRM software. The negative sign was missing from the Y superconducting quantum interference device (SQUID) calibration constant for all archive halves measured from Day 1 of the expedition through 0737 h UTC on 4 April 2019. This error affects all cores from Holes U1534A and U1534C. All measured declinations (Dmeas) from the affected cores must be adjusted (Dadj) as follows:
This correction was applied to the data presented in this chapter. However, the LIMS database archives the primary measurement data and contains the faulty declinations for all affected core sections.
The anisotropy of magnetic susceptibility (AMS) of a subset of the discrete cube samples was investigated using the AGICO KLY 4S Kappabridge, focusing on 42–85 mbsf in Hole U1534A (Cores 382-U1534A-6H through 10H). Our goals were as follows:
- Assess whether cores with damaged liners have AMS fabrics suggestive of coring-induced disturbance.
- Assess whether a zone of noisy, possibly reversed polarity (70–130 mbsf; Cores 382-U1534A-9H through 18H and 382-U1534C-9H through 14H) is associated with coring-induced disturbance.
- Determine whether AMS can be used to narrow the location of the Pliocene–Pleistocene hiatus via an abrupt, large amplitude change in the degree of anisotropy (i.e., a change in sediment compaction that would manifest in AMS).
Natural remanent magnetization
Icefield MI-5 tool orientation results
Three Icefield MI-5 tools were deployed during the collection of full-length APC cores (Table T7). Tool 2052 was used for Cores 382-U1534A-1H through 10H. Tool 2007 was used for Cores 11H–14H. Tool 2043 was used for Cores 382-U1534C-1H through 19H. Each tool consists of three orthogonal fluxgate magnetometers that measure the x, y, and z components of the ambient geomagnetic field and the ambient temperature immediately prior to firing the core barrel. The magnetic tool face (MTF) is colinear with the double line scored on the core liner. The orientation of the MTF with respect to the geomagnetic pole is calculated from the x, y, and z intensities measured by the tool. In principle, the conversion of measured declinations in the sediment core to true declination (Dtrue) is given by
- Dmeas = measured declination in the sediment core,
- MTF = deviation of the tool face from magnetic north (or south), and
- Damb = present-day ambient geomagnetic field declination, which is approximately 4° at Site U1534 (see Table T6 in the Expedition 382 methods chapter [Weber et al., 2021]).
For Site U1534 archive halves, this correction was modified to account for the adjusted declinations:
In practice, the three Icefield MI-5 tools yielded inconsistent results. Dtrue values for Site U1534 are shown in Figure F9. In Holes U1534A and U1534C, each core forms a cluster of Dtrue values that can be viewed as secular variation around the long-term mean direction, scatter due to coring disturbance/measurement noise, and/or twisting of the core barrel upon recovery. However, the orientation of the mean direction differs between Holes U1534A and U1534C, and neither mean direction is close to the expected long-term mean of 0°, which is the predicted value for a geocentric axial dipole (GAD). We examined the Icefield MI-5 tool output data from Core 382-U1534A-1H, which recorded positive values for the x intensity and negative values for the y intensity. However, the instrument reported a positive MTF value (38°) when +x and −y should yield a negative MTF value (−38°). The three Icefield MI-5 tools were tested to diagnose this issue as the expedition progressed. Ultimately, we did not arrive at a solution that would allow the Icefield MI-5 data to be used for orientation (See Paleomagnetism in the Expedition 382 methods chapter [Weber et al., 2021]).
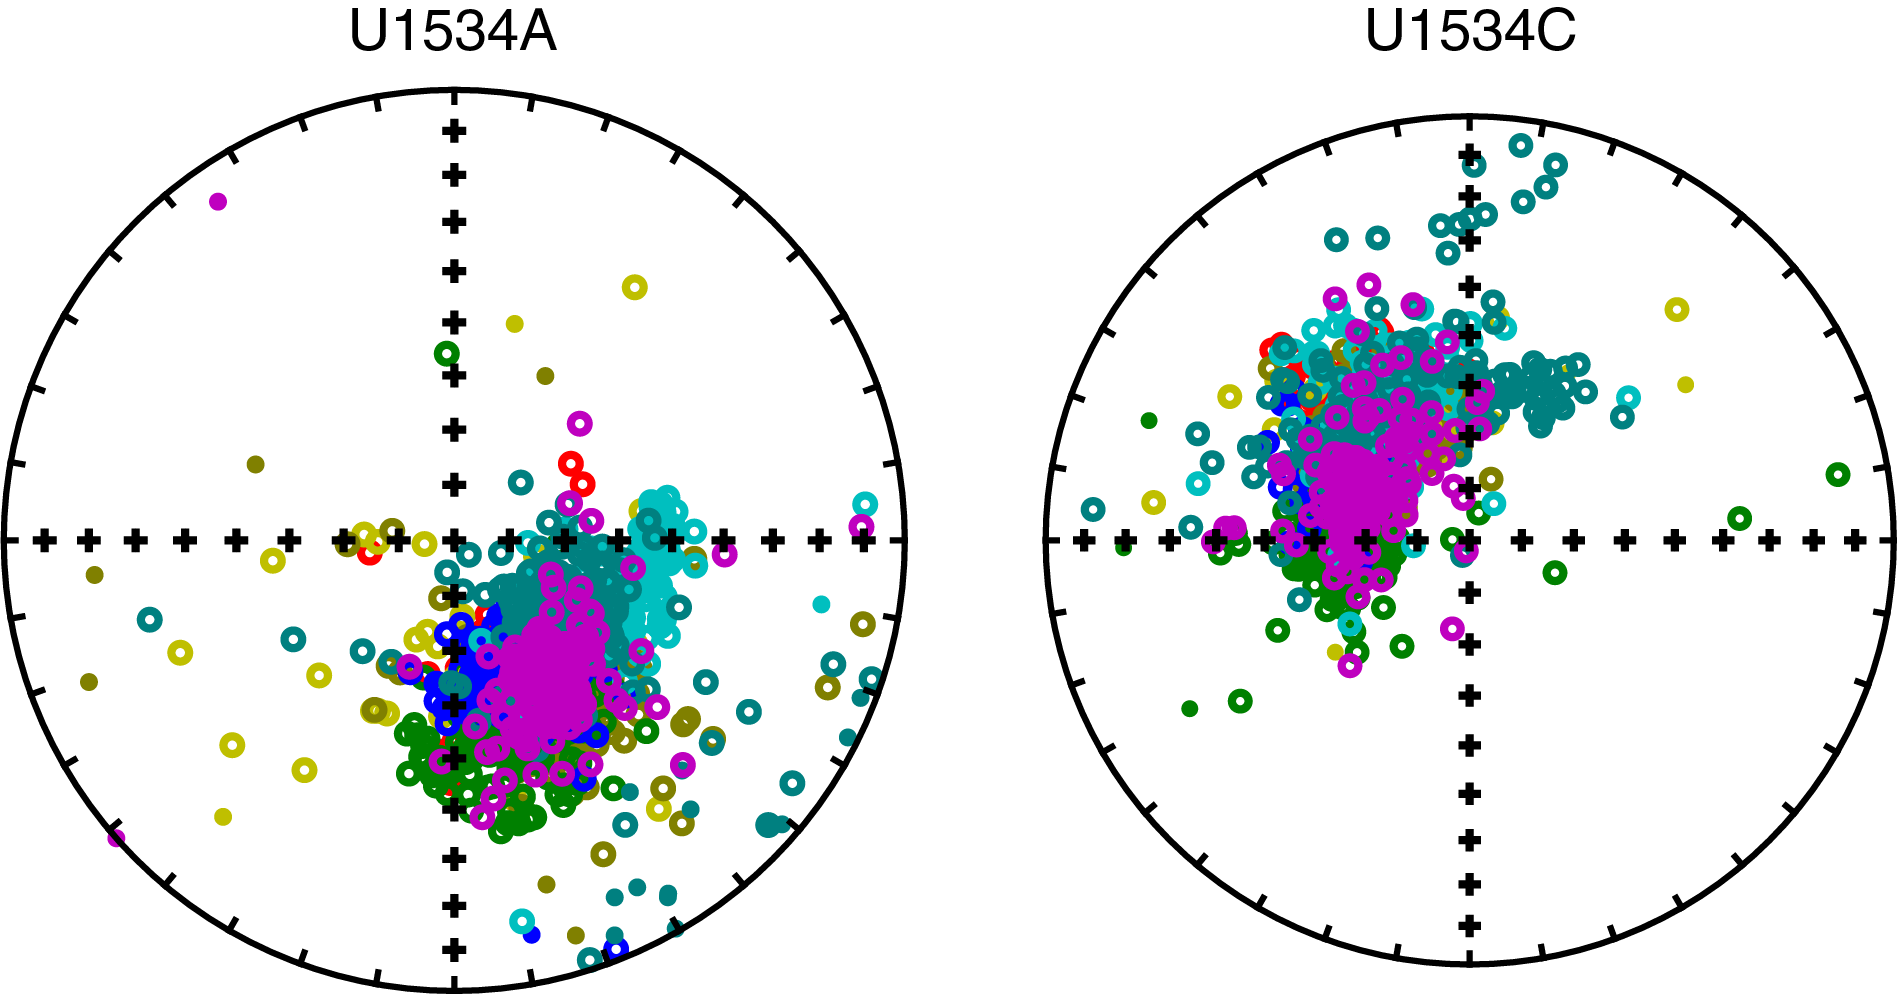
Figure F9. Orientation of adjusted declinations.
Stratigraphic archive-half results
Site U1534 archive halves were initially AF demagnetized at 0 (NRM step), 10, 15, and 20 mT (Cores 382-U1534A-1H through 10H) to determine the peak field necessary to identify and remove the drilling overprint. The drilling overprint was observed in a positive downward direction and was generally removed at the 10 mT step, as determined from vector endpoint diagrams (Figure F10). We discontinued the 20 mT demagnetization step after Core 10H.
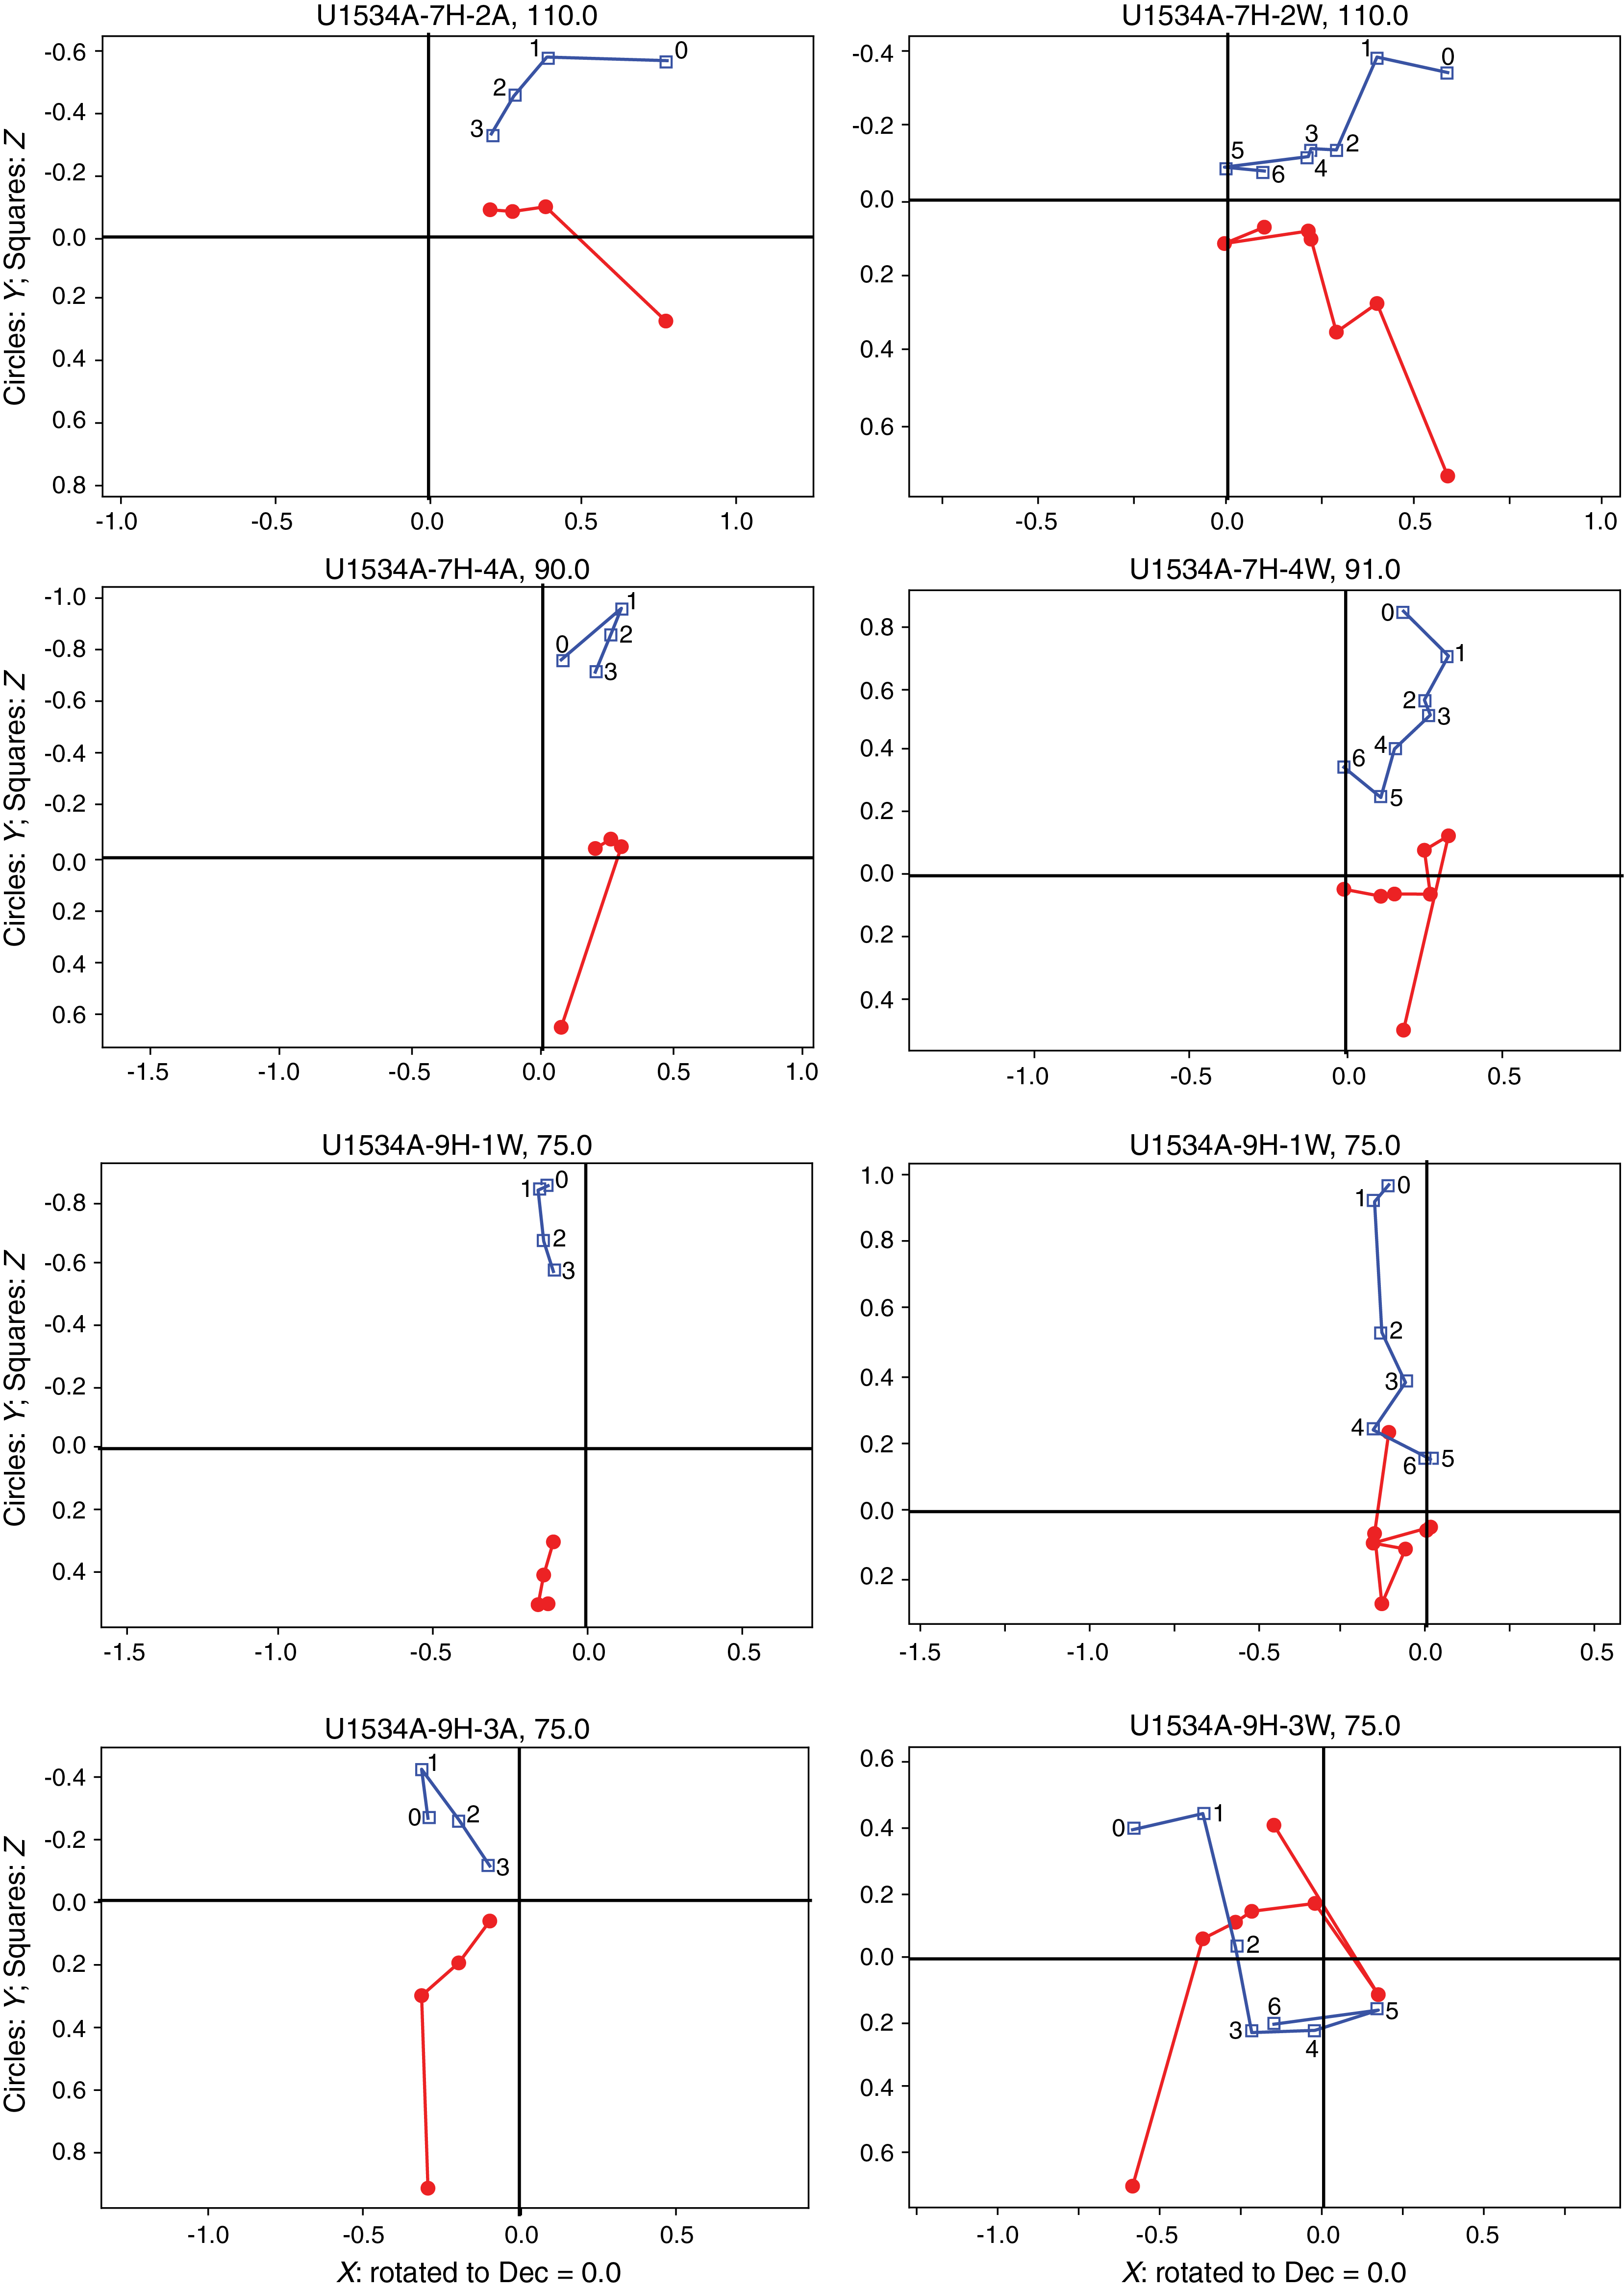
Figure F10. Vector endpoint diagrams.
The preliminary magnetostratigraphic interpretations are based on the inclination and declination from the 15 mT AF demagnetization step. These data were filtered as follows:
- We deleted all measurements within 5 cm of the section ends to remove the edge effect inherent in all pass-through measurement systems such as the SRM.
- We deleted all measurements in the upper 50 cm of Section 1 of all cores because they are the most susceptible to the accumulation of fall-in material during coring. Additionally, the strong vertical drilling overprint in these intervals often appeared to be more difficult to remove.
- We deleted all data from all intervals containing the "high" drilling disturbance intensity code entered during core description (see Lithostratigraphy) to remove data in intervals affected by coring-induced disturbance such as fall-in and flow-in.
- We inspected core photographs and X-radiographs in intervals with suspect directions to assess whether the directions coincided with dropstones or large shells beneath the core surface, turbidites, tephra layers, or other lithologic features.
After removing the drilling overprint, inclination values are predominantly negative (Figures F11, F12, F13). Intervals of shallow inclinations and positive inclinations were observed. In some cases, these intervals correspond to lithologic features such as silt layers that may define the base of a turbidite, dropstones or shells in the sediment, or possibly core flow-in. Intervals with positive inclinations are often narrow with poorly defined transitions between negative and positive intervals. An exception is near the base of Cores 382-U1534A-41F and 43F, which have transitions in both declination and inclination and likely are recordings of geomagnetic reversals.
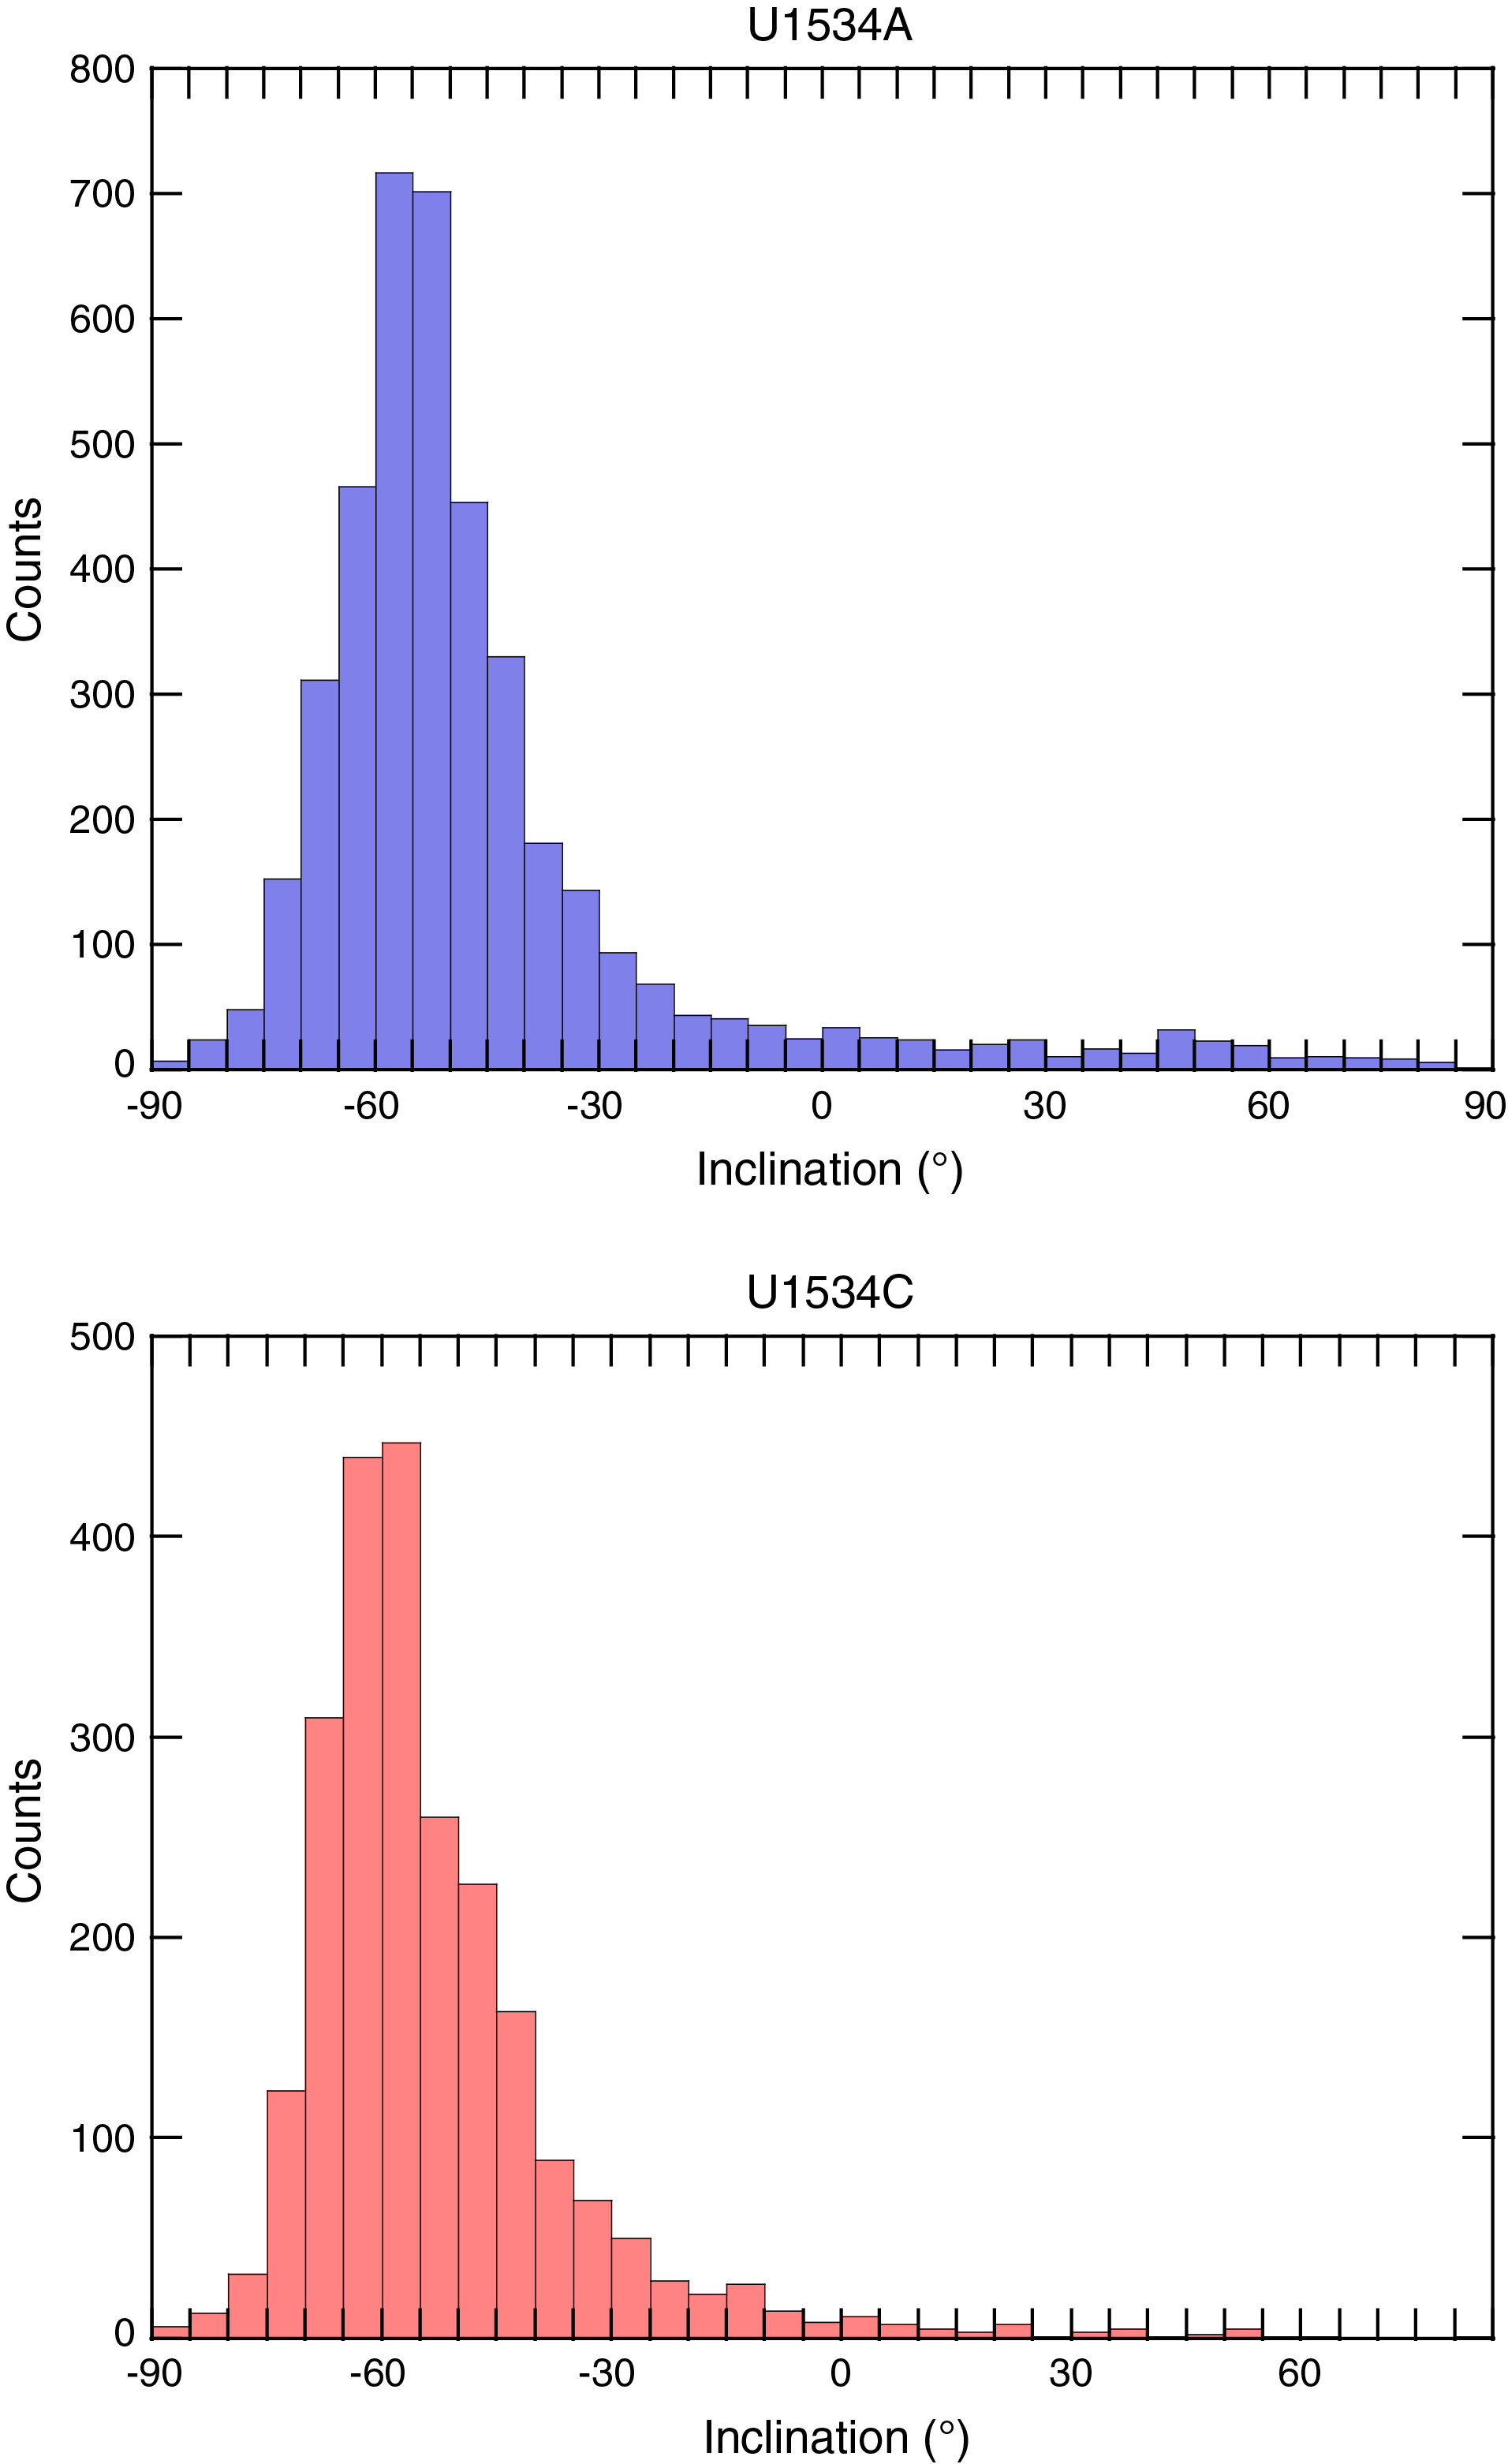
Figure F11. Inclination values.
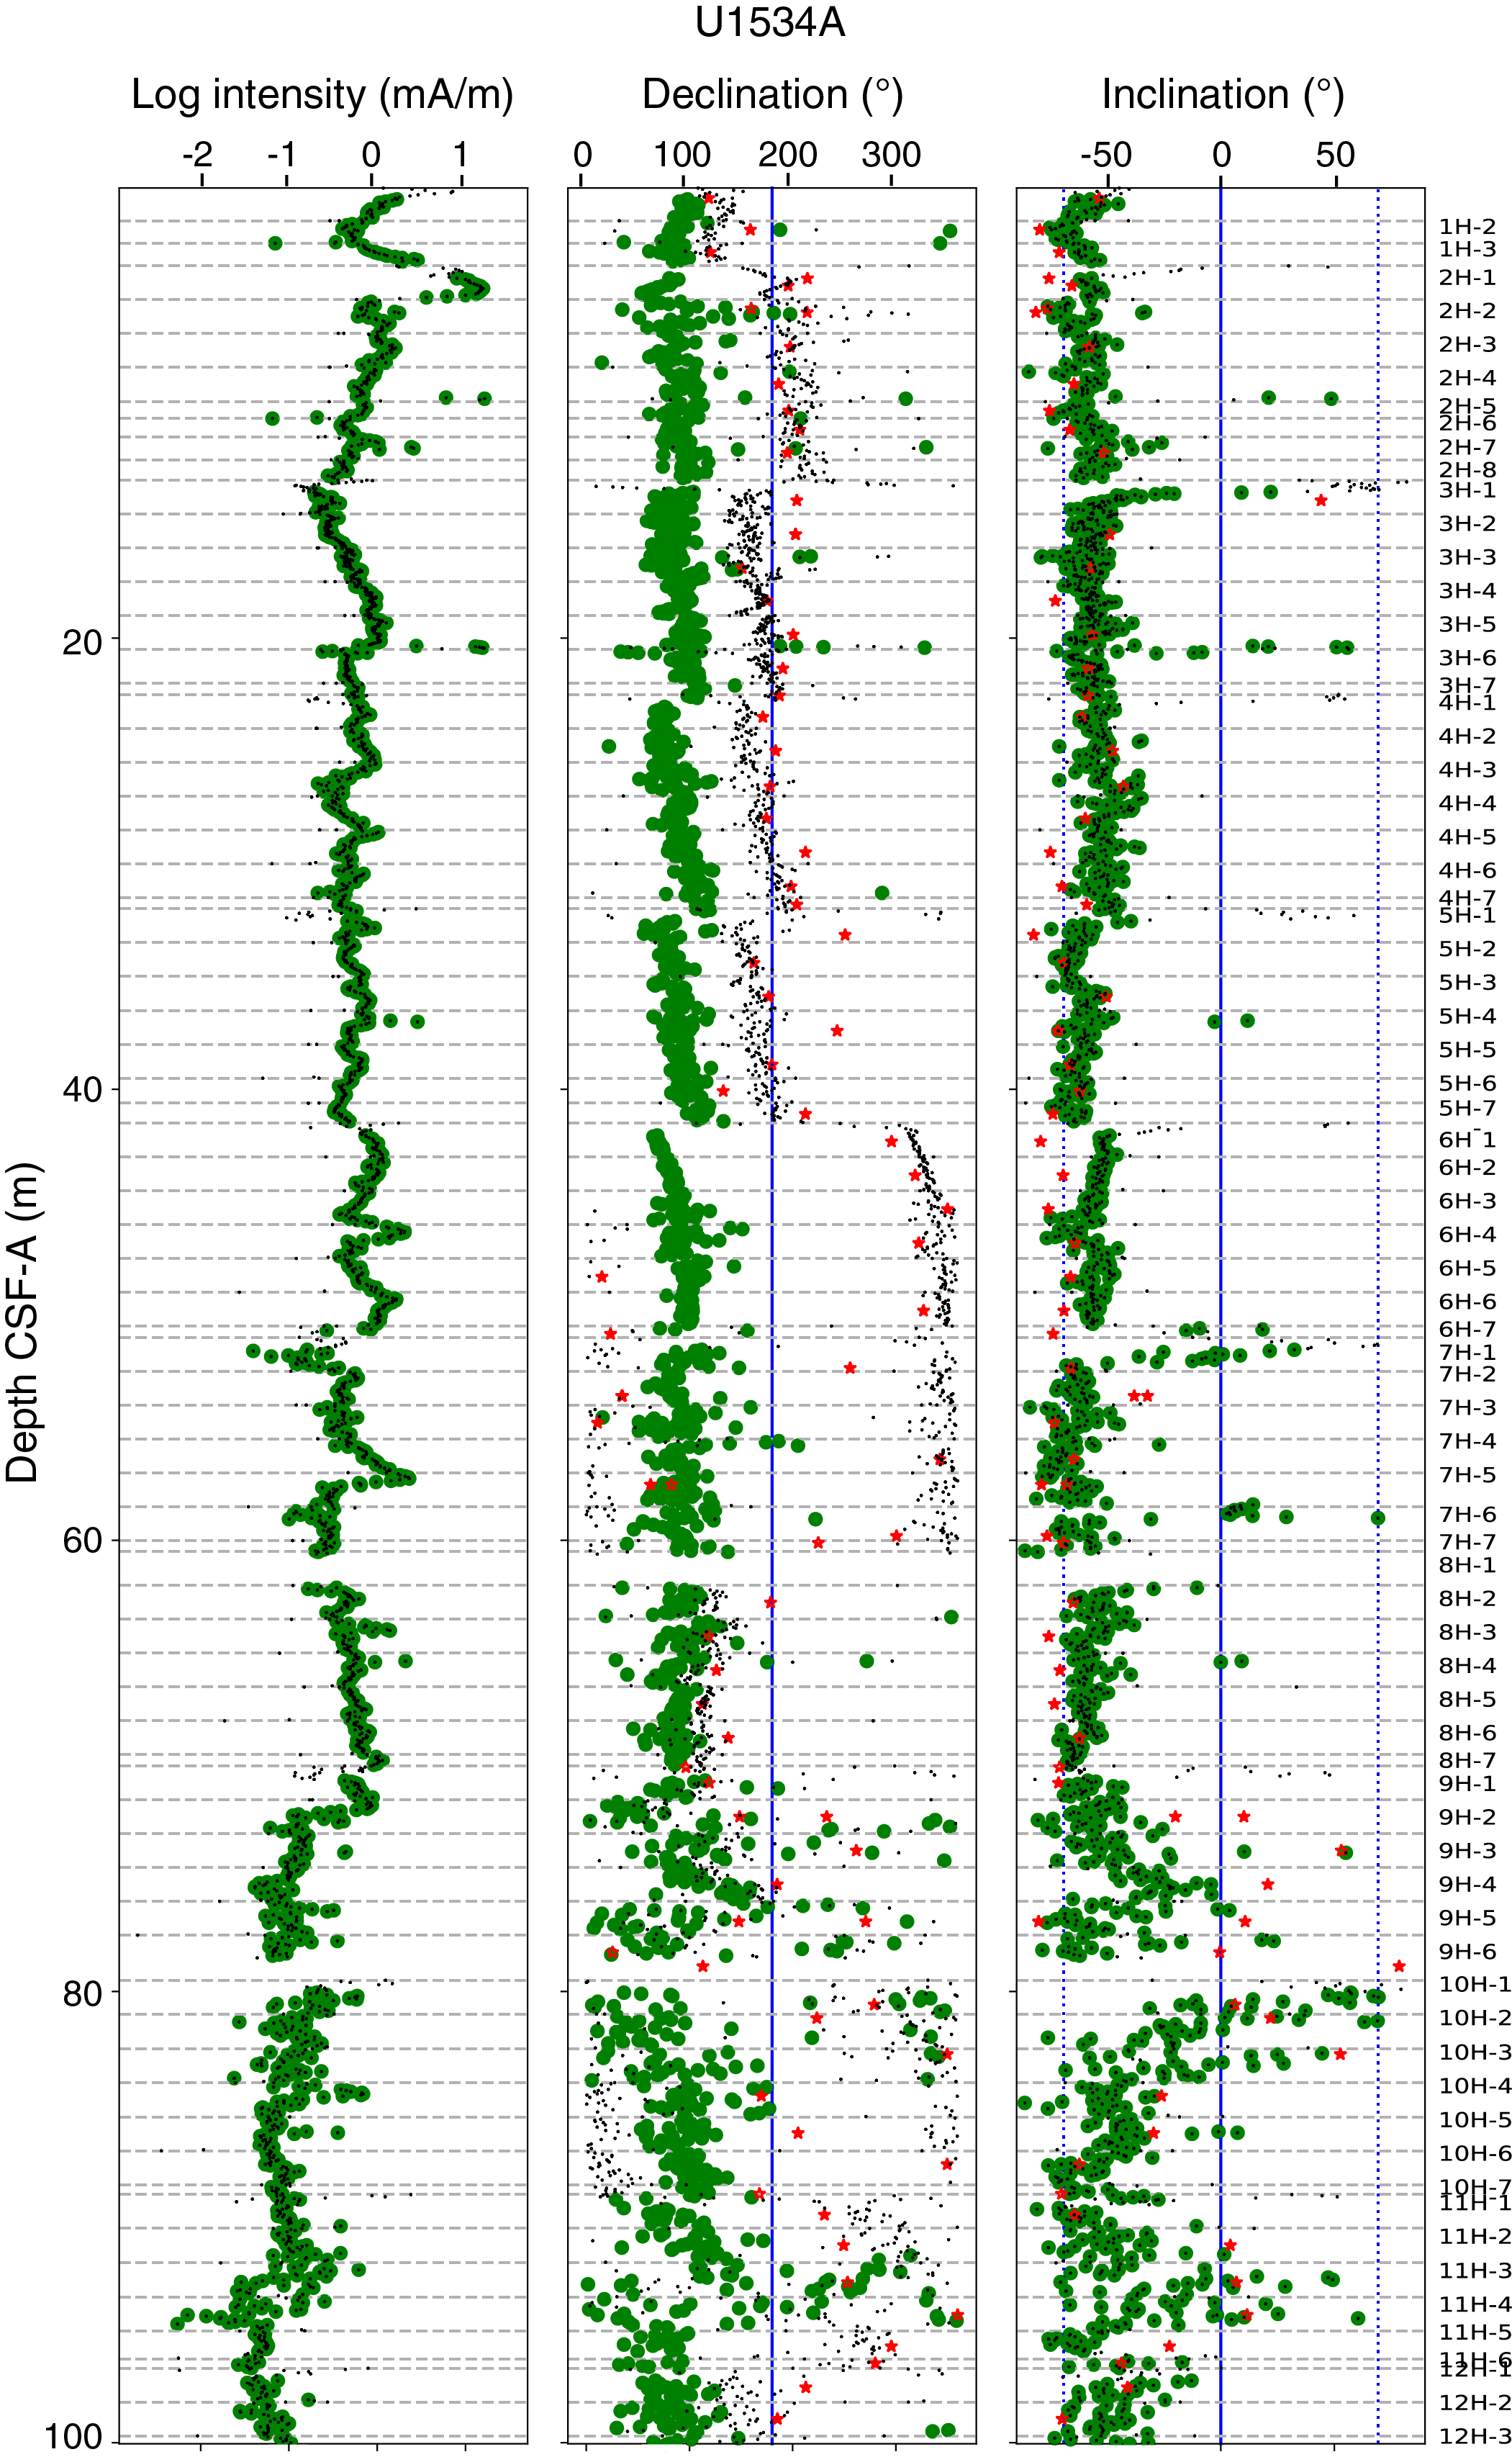
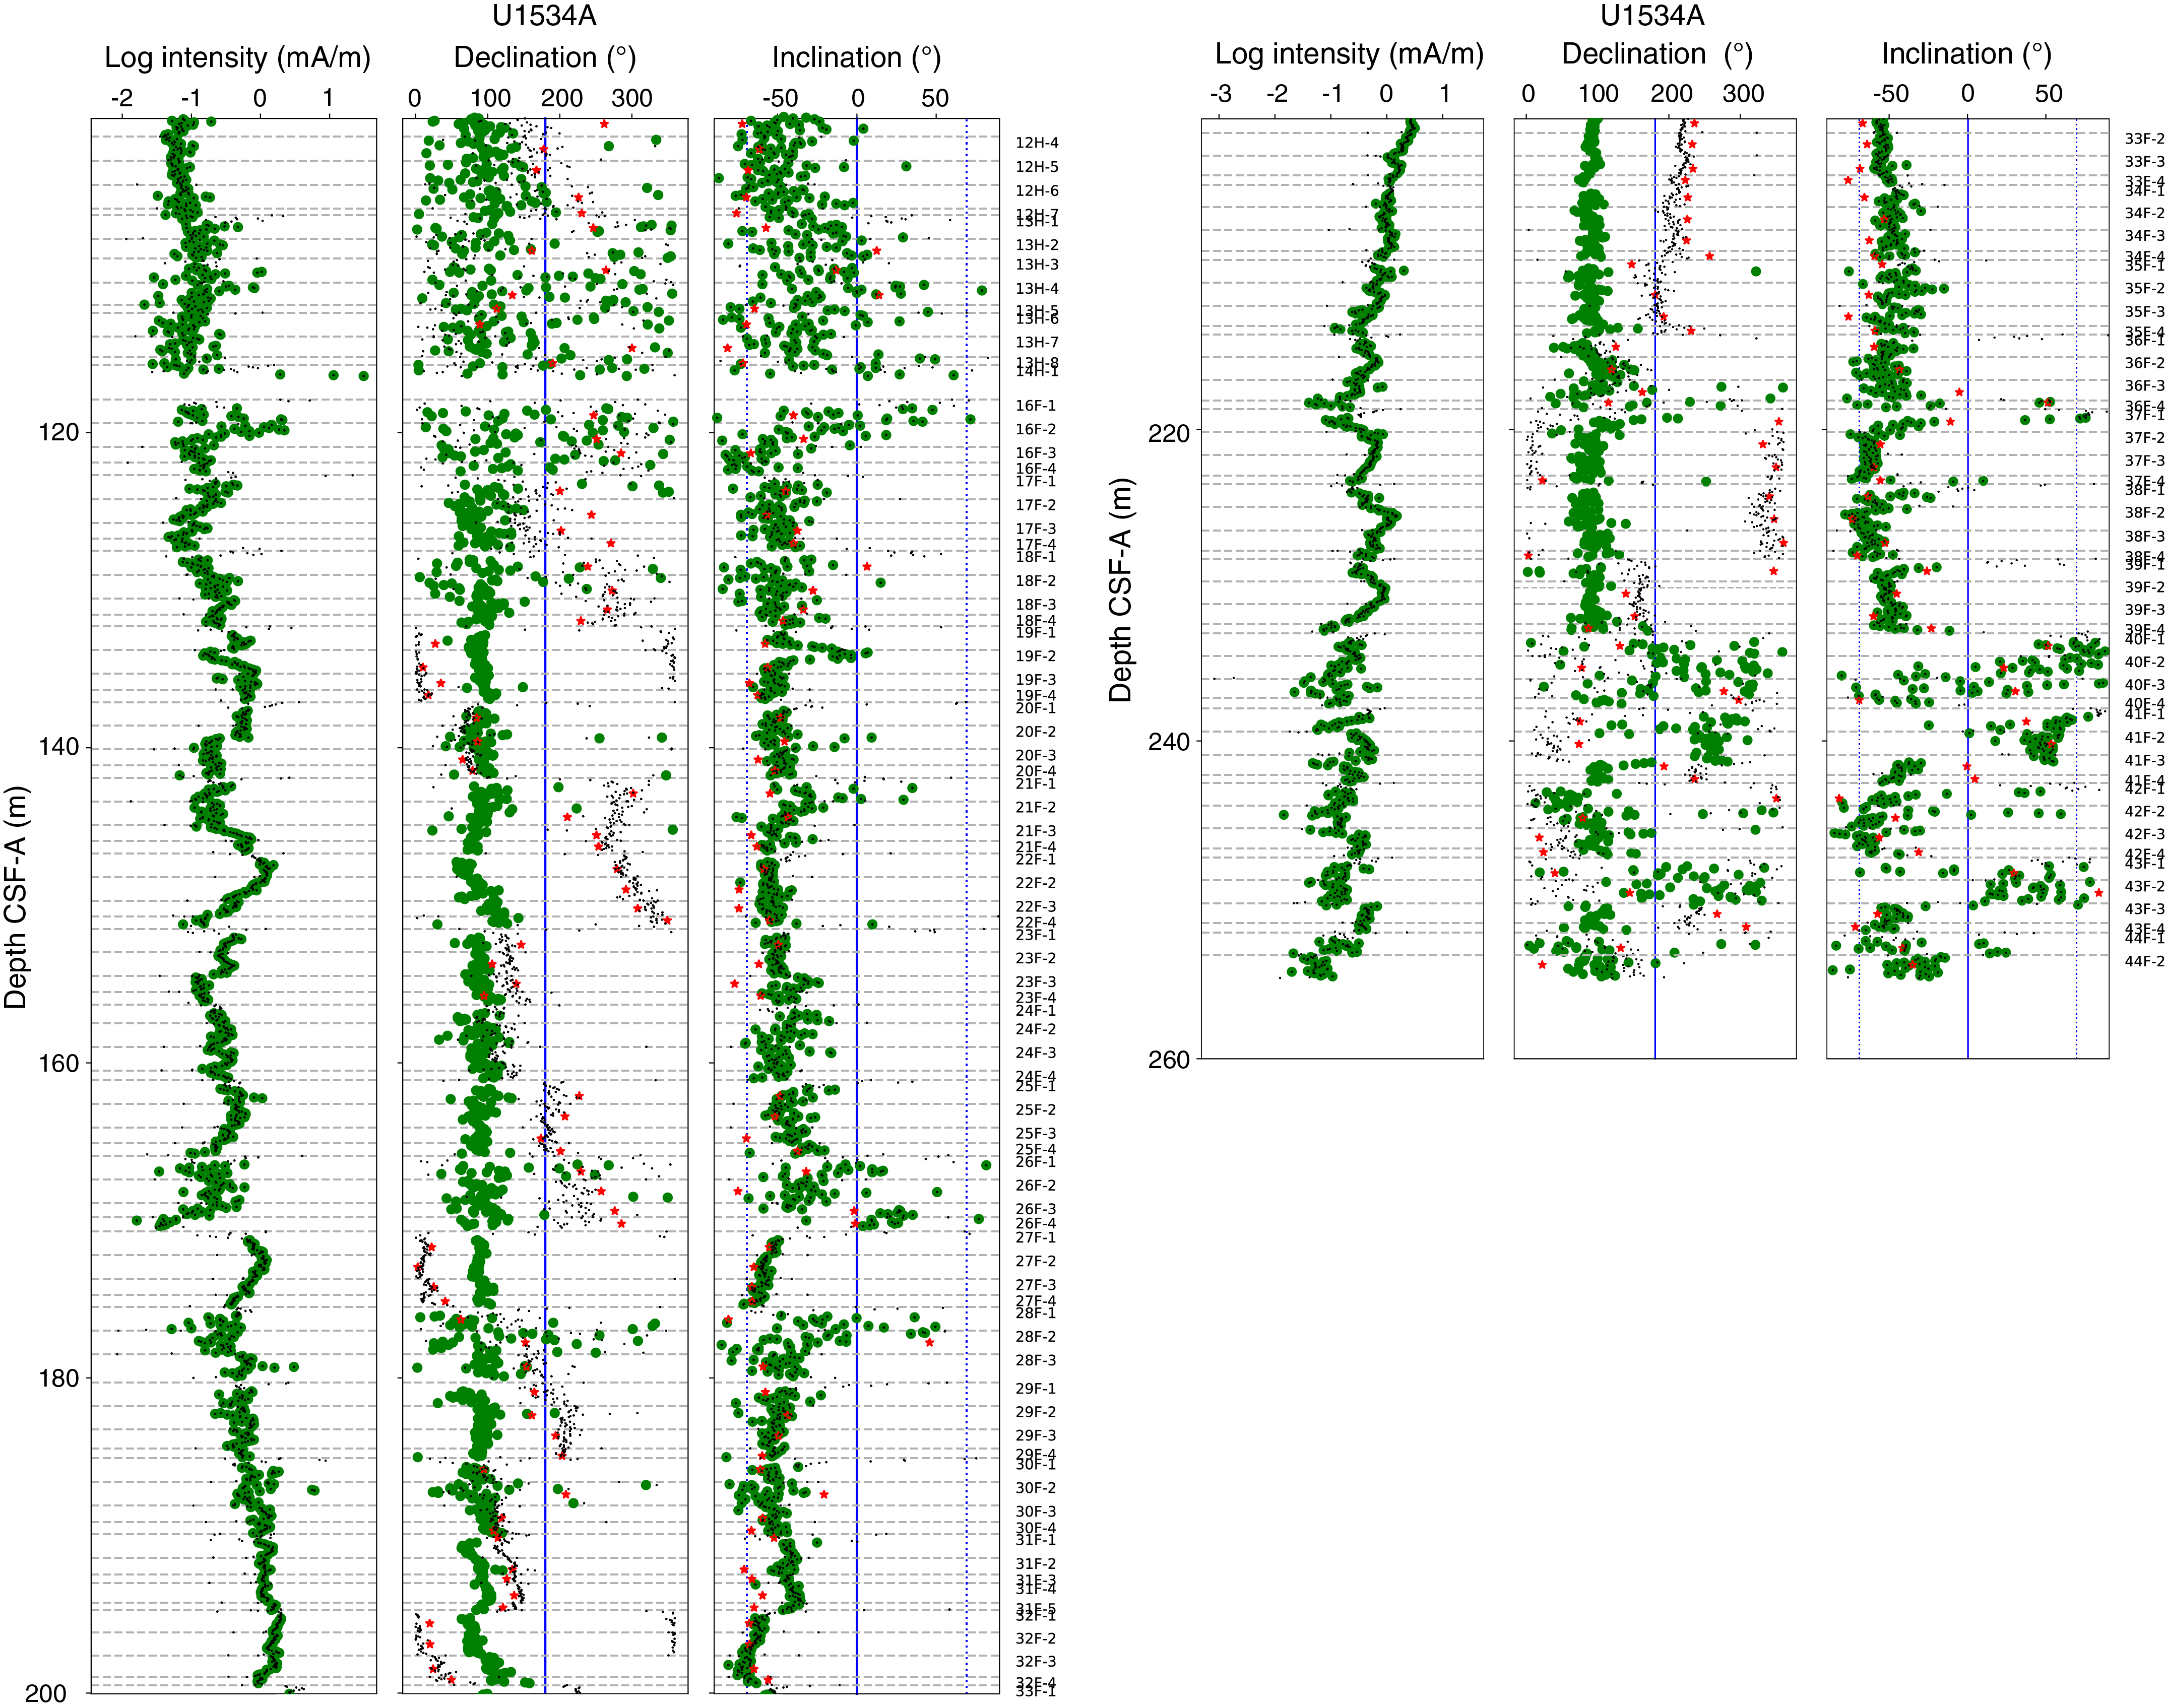
Figure F12. Intensity of remanence, declination, and inclination, Hole U1534A.
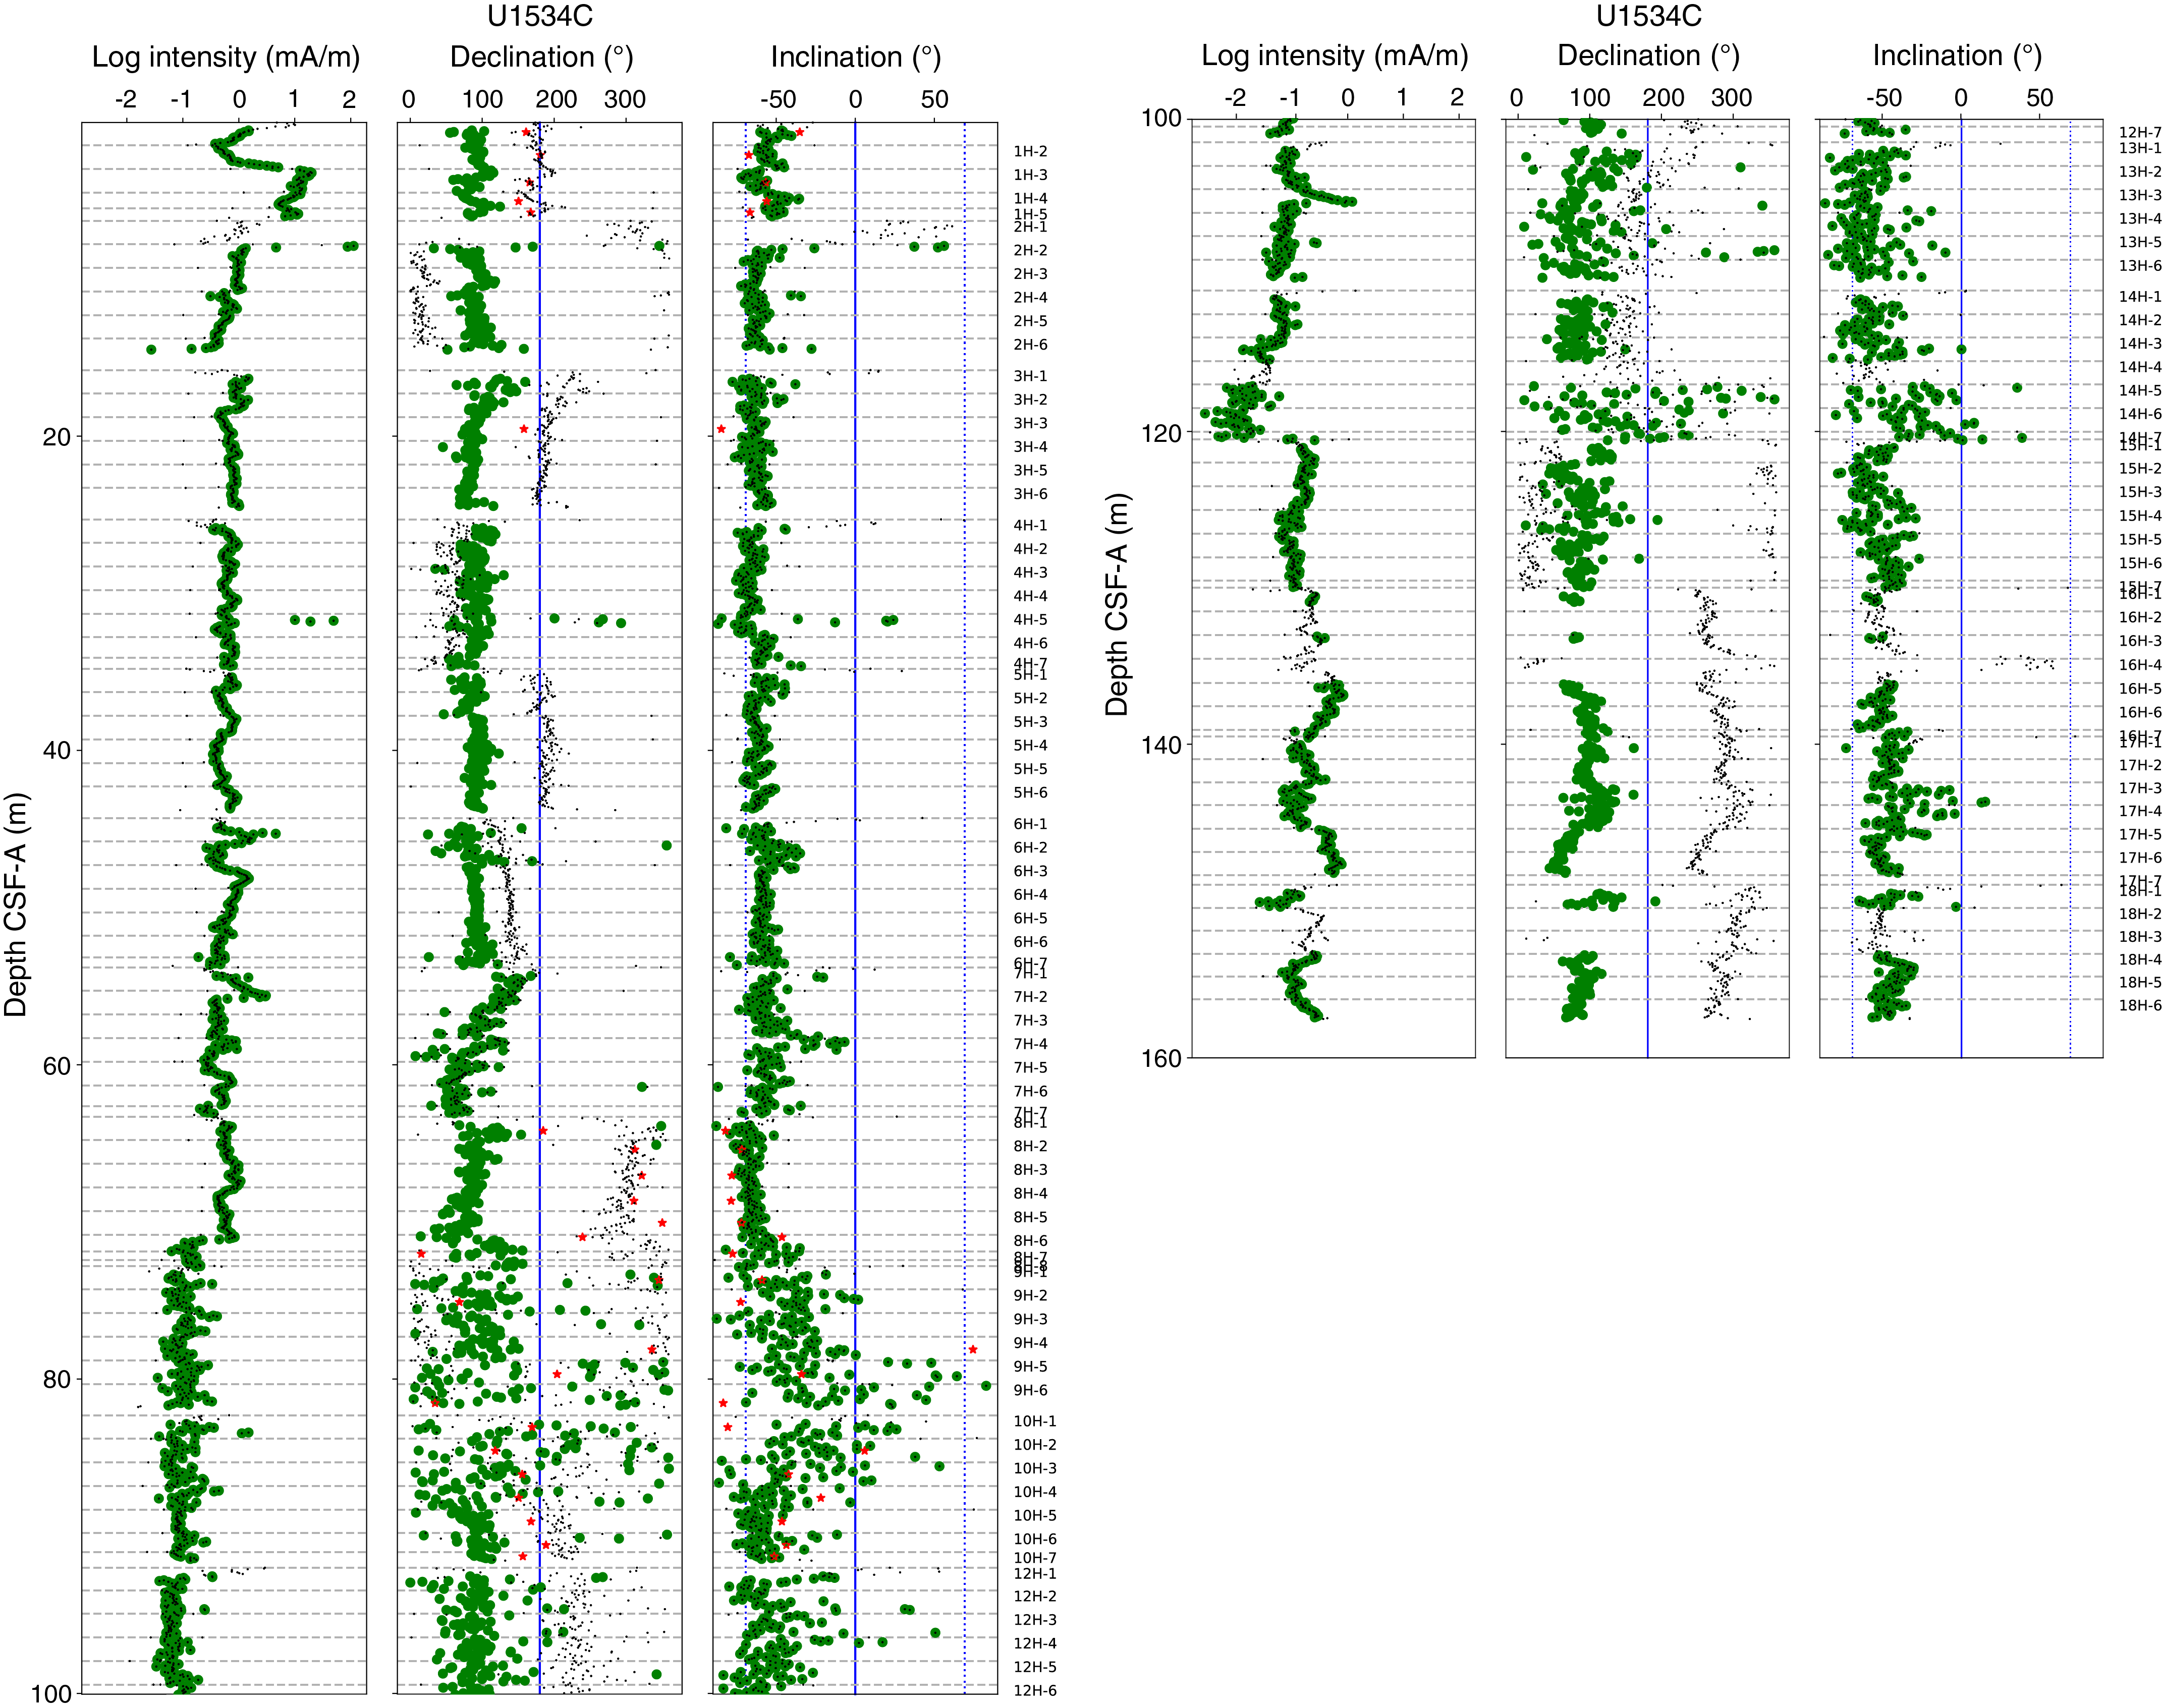
Figure F13. Intensity of remanence, declination, and inclination, Hole U1534C.
A subset of the oriented cubes from the Site U1534 working halves were AF demagnetized and analyzed on the AGICO JR-6A spinner magnetometer to assess the demagnetization behavior at higher peak AF levels. We observed the acquisition of magnetic remanence at AF fields (above ~30 mT) along orthogonal planes to the last applied AF. This is diagnostic of the acquisition of a GRM, which can have an undesirable complicating influence on NRM measurements. The strong smells of H2S gas and hydrocarbons emitted by numerous core sections, the sharp decline in magnetic susceptibility (MS) near the top of the hole, and the GRM observation indicate magnetic mineral diagenesis, including the dissolution of ferrimagnetic iron oxide minerals and growth of authigenic ferrimagnetic minerals. We suspect greigite (Fe3S4), a ferrimagnetic authigenic iron sulfide, is present, which has implications for the detrital or chemical origin and age of the characteristic remanent magnetization (syn- or postdepositional). Following this observation on the first four cube samples investigated, subsequent measurements that used a peak AF above 20 mT used a modified protocol to mitigate the impact of the GRMs.
Magnetic polarity stratigraphy
Steep negative inclinations at the latitude of Site U1534 indicate normal polarity. We observed normal polarity extending from 0 mbsf to at least 74.45 mbsf in Hole U1534A and from 0 to 73.2 mbsf in Hole U1534C (Zone N1; Figure F14; Table T8). Directly below the base of the N1 normal polarity zone, we are unable to confidently determine polarity because directions become more scattered in both holes. Although it is tempting to assign reversed polarity to an interval including positive inclinations in both Holes U1534A and U1534C around 80 mbsf, we did not observe a clear polarity transition or stable reversed directions around this time. We did not observe a clear Matuyama–Brunhes reversal or any interval of well-defined reversed polarity in the middle to late Pleistocene interval as defined by biostratigraphic datums.
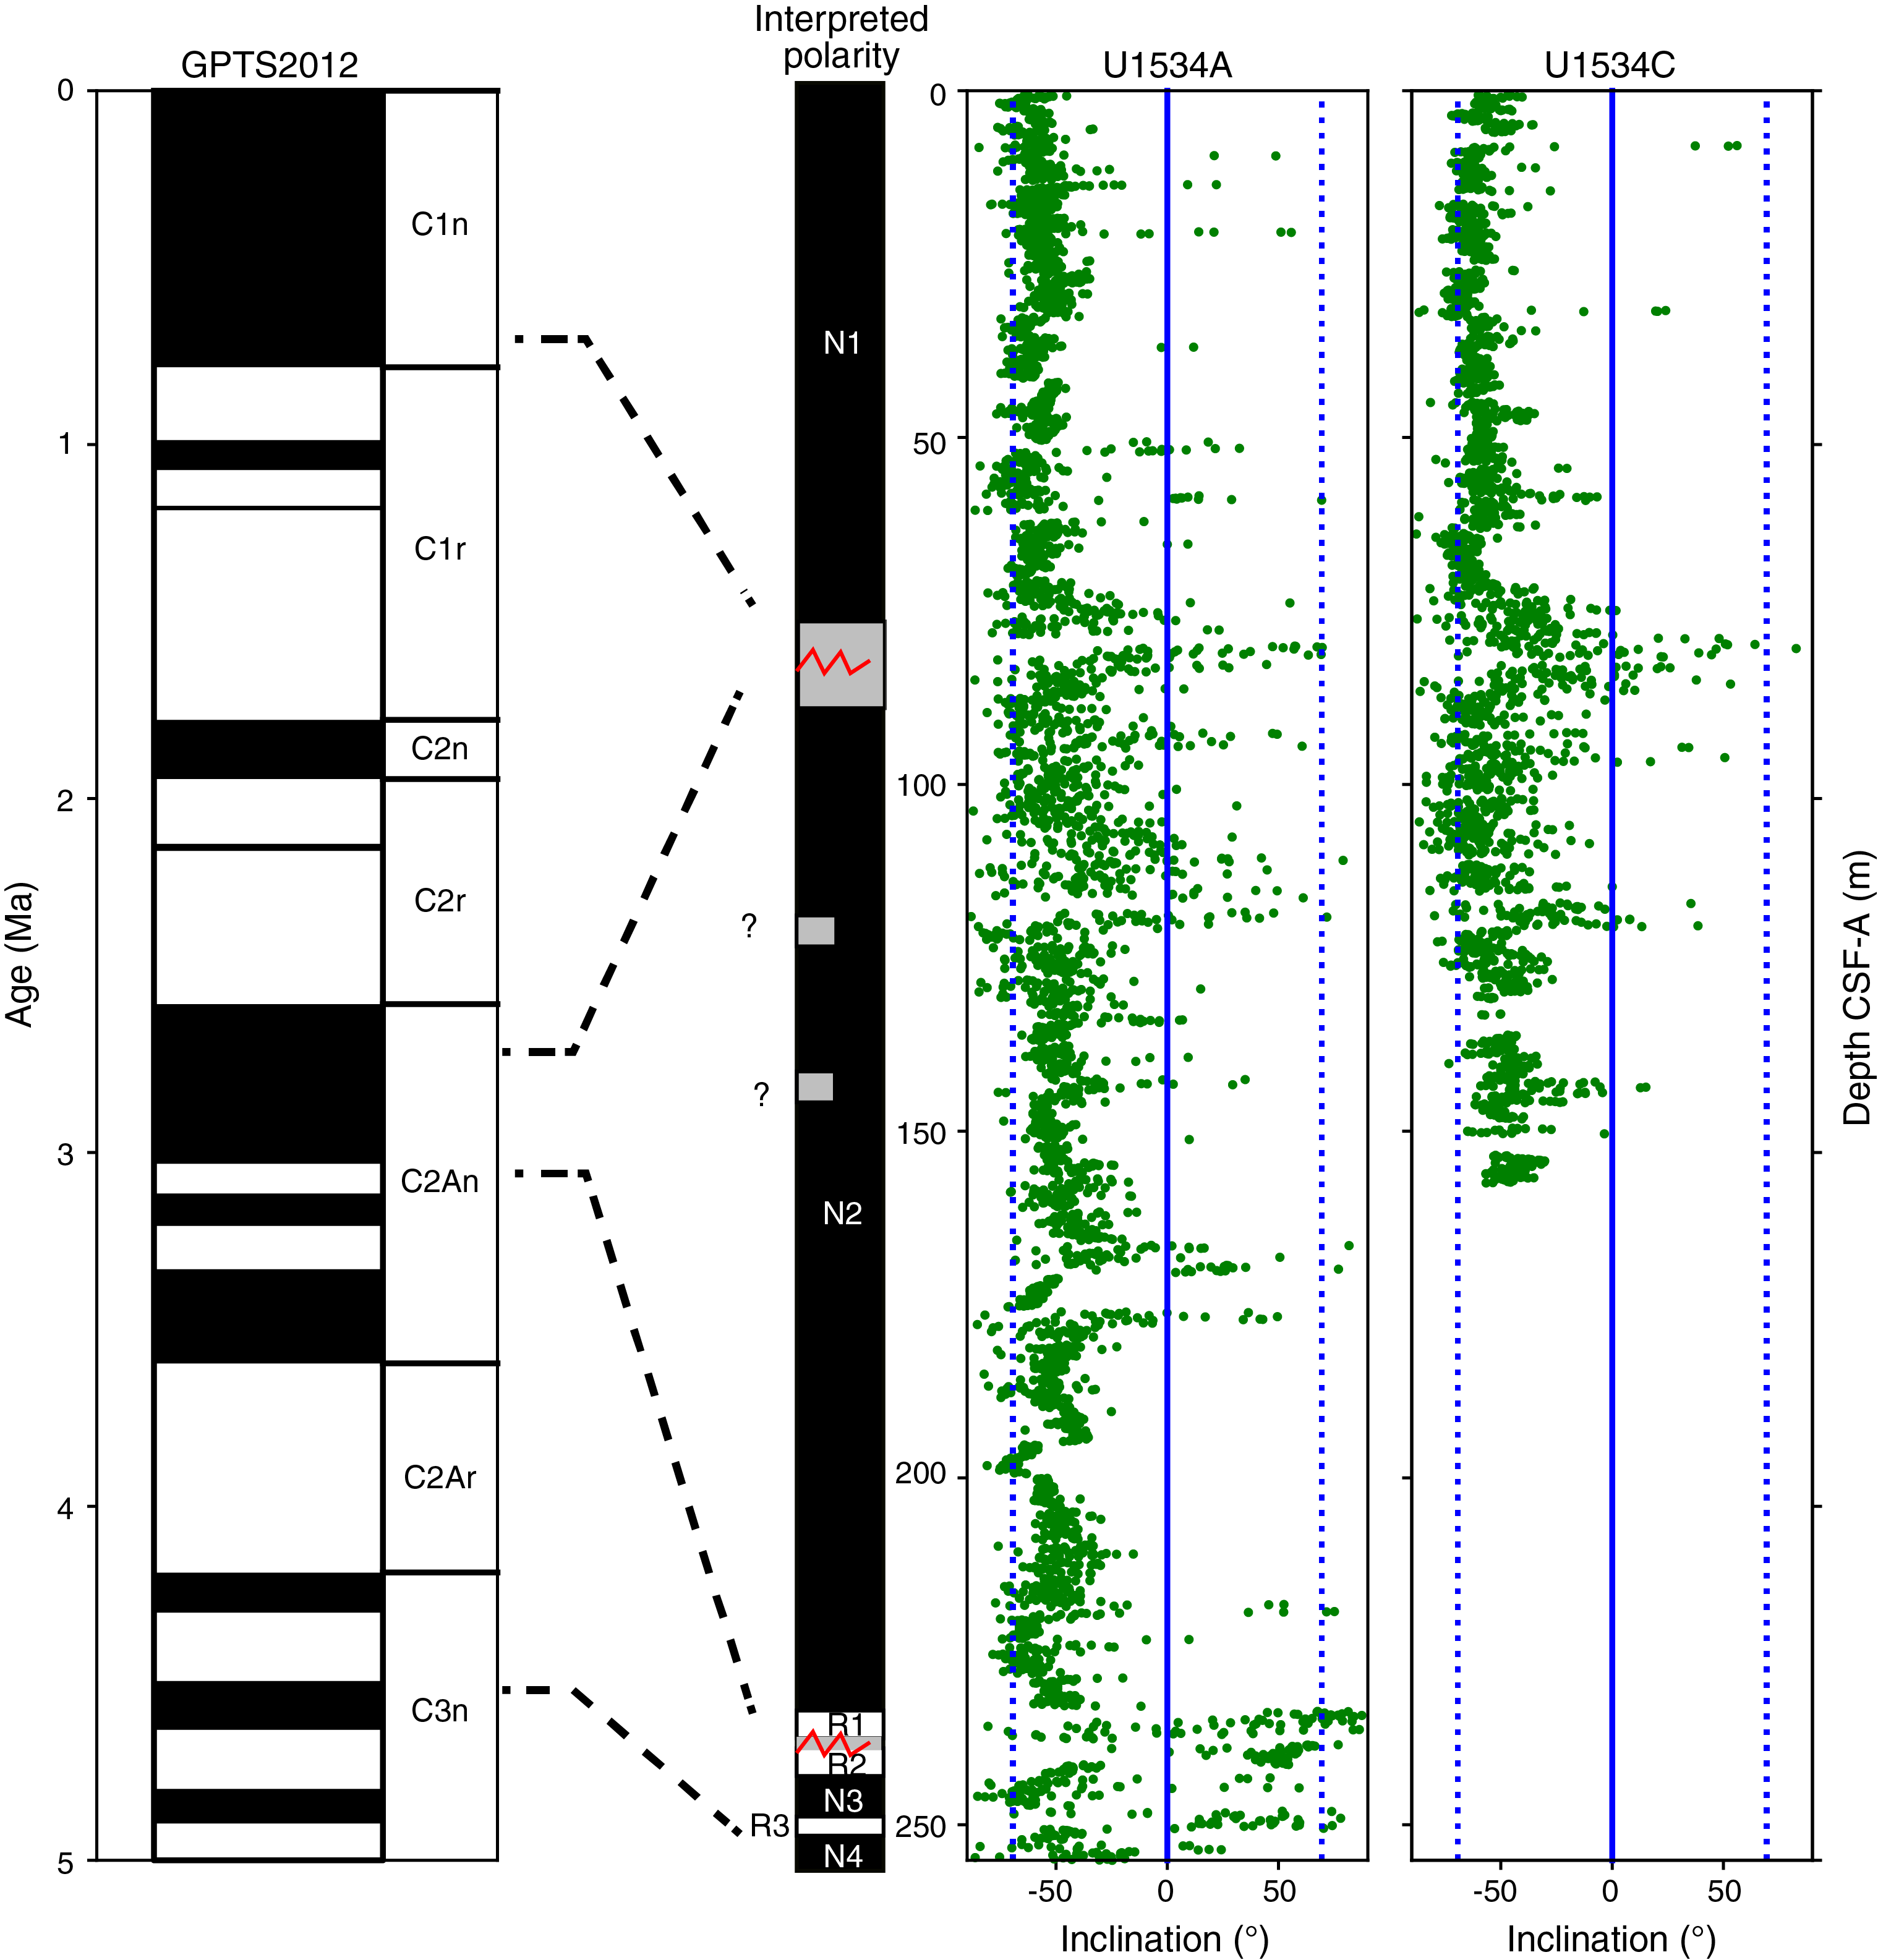
Figure F14. Preliminary magnetostratigraphy.
From 94.84 to 232.9 mbsf in Hole U1534A and from 97.04 mbsf to the base of recovery in Hole U1534C, we observed mostly negative inclinations, indicating an extended interval of normal polarity (Zone N2). Directions are typically more scattered in Holes U1534A and U1534C to around 120 mbsf and better defined below that depth. A few intervals contain positive inclinations; however, it is difficult to assess at this stage whether these inclinations represent brief intervals of reversed polarity or anomalous directions associated with coring disturbance, gas expansion, or dropstones. Upon closer investigation, we generally found that these intervals did not appear consistent with a well-defined reversed polarity based on reproducibility between the two holes, 180° declination changes associated with inclination changes, or lithologic descriptions. Additional work is likely required to fully assess these intervals. Biostratigraphic datums suggest a potential hiatus between Sections 382-U1534A-9H-CC (0.6–2.3 Ma) and 10H-2 (2.4–4.5 Ma) (see Biostratigraphy). Within this framework, we interpret Zones N1 and N2 to likely represent intervals of the Brunhes (C1n) and Gauss (C2An) Chrons, respectively, merged together by the biostratigraphically defined Pleistocene–Pliocene hiatus.
Steep positive inclinations overlying steep negative inclinations with about 180° declination changes are found in Cores 382-U1534A-40F, 41F, and 43F, indicating that transitions from normal to reversed polarity occurred in each of these cores. The polarity transitions are clearly defined and abrupt in Cores 41F and 43F and less well defined with more scattered directions in Core 40F. Cores 39F, 42F, and 44F are interpreted to represent normal polarity only. Biostratigraphic datums place Section 40F-CC (~2.2–4 Ma) in a wide range centered on the late Pliocene and Sections 41F-CC (~4.2–4.5 Ma) and 43F-CC (~4.8–5.5 Ma) around the early Pliocene. This placement suggests that these alternations between reversed and normal polarity likely capture reversals of subchron boundaries from the Gauss Chron (C2An) in Core 40F and from the Gilbert Chron (C3n) in Cores 41F and 43F. We interpret the reversed interval in Core 40F to be the Kaena Subchron (C2An.1r); however, because of incomplete recovery and at least one suggested hiatus during this interval, tighter chronostratigraphic constraints are needed to assign the polarity transitions in Cores 41F and 43F to specific reversals.
Anisotropy of magnetic susceptibility
AMS was analyzed on a subset of 30 oriented discrete samples ("Japanese" cubes) spanning Sections 382-U1534A-6H-1 through 10H-4 (42.32–84.63 mbsf). Only 4 of the 30 cubes displayed isotropic behavior with nearly equal intensities of the maximum (K1), intermediate (K2), and minimum (K3) susceptibility components (Figure F15). The remainder of the samples show varying degrees of anisotropy, and the majority of samples plot in the oblate field of a Flinn diagram (Figure F16).
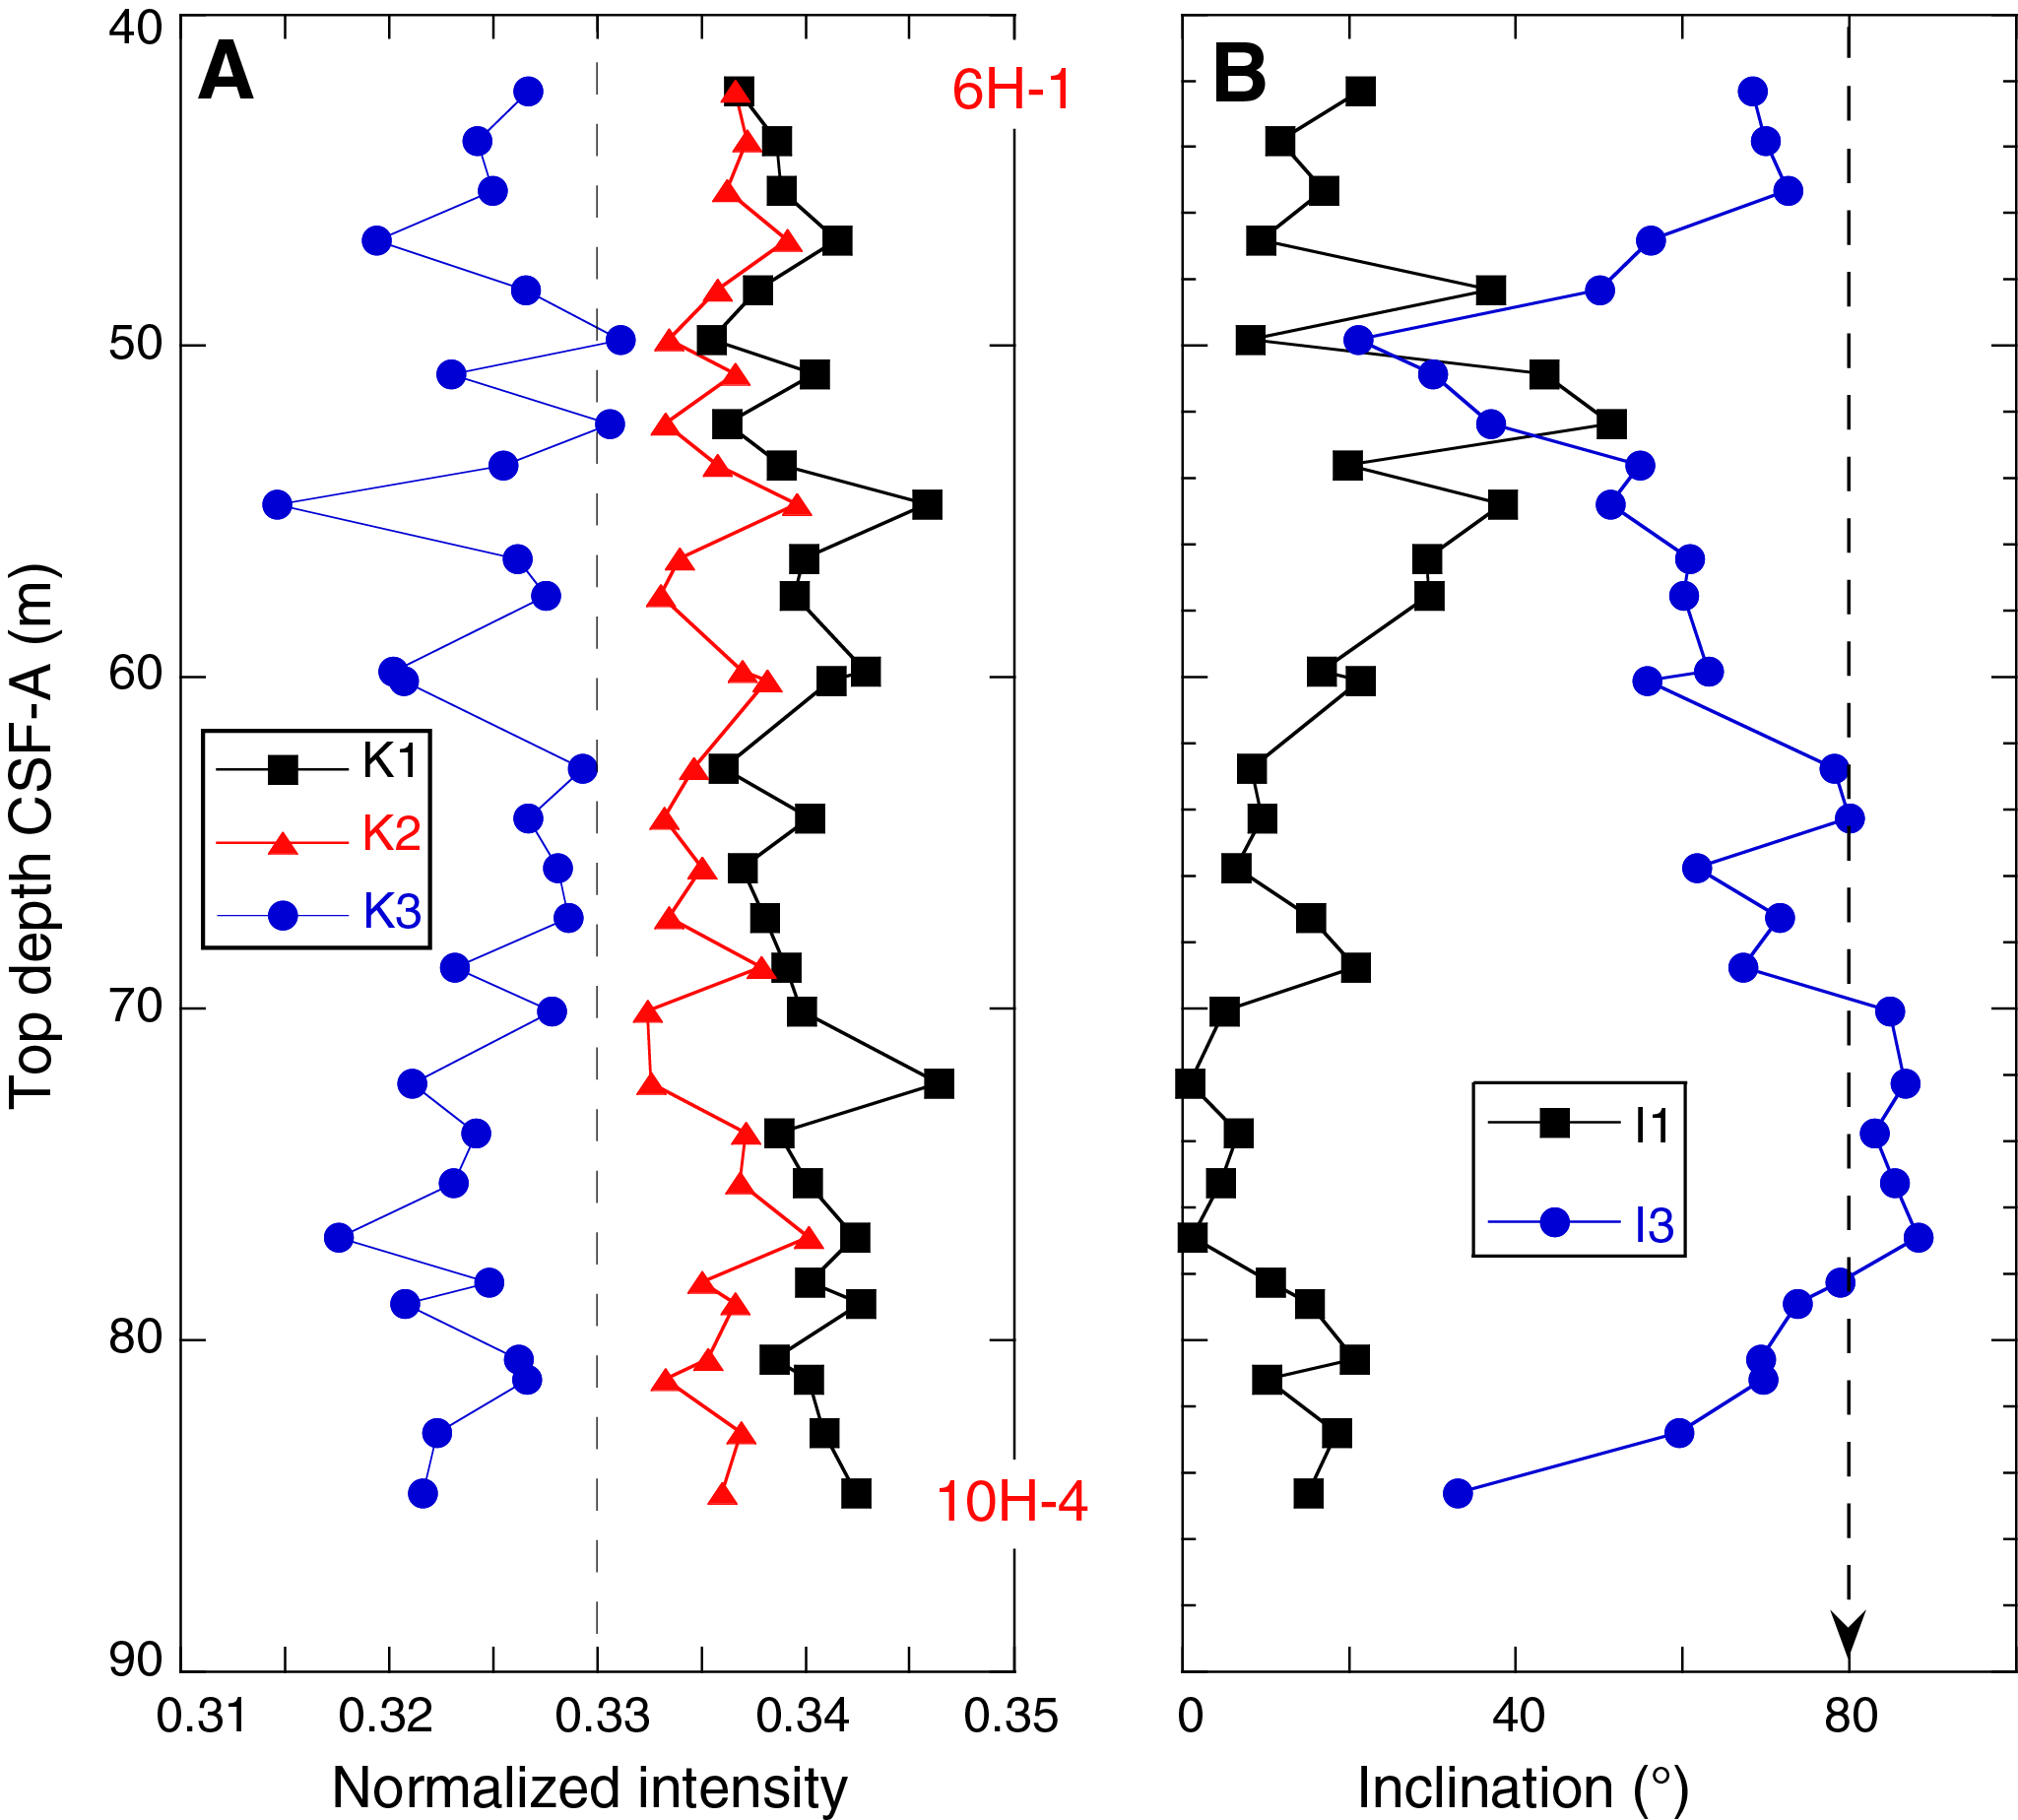
Figure F15. Intensities and inclinations of susceptibility axes.
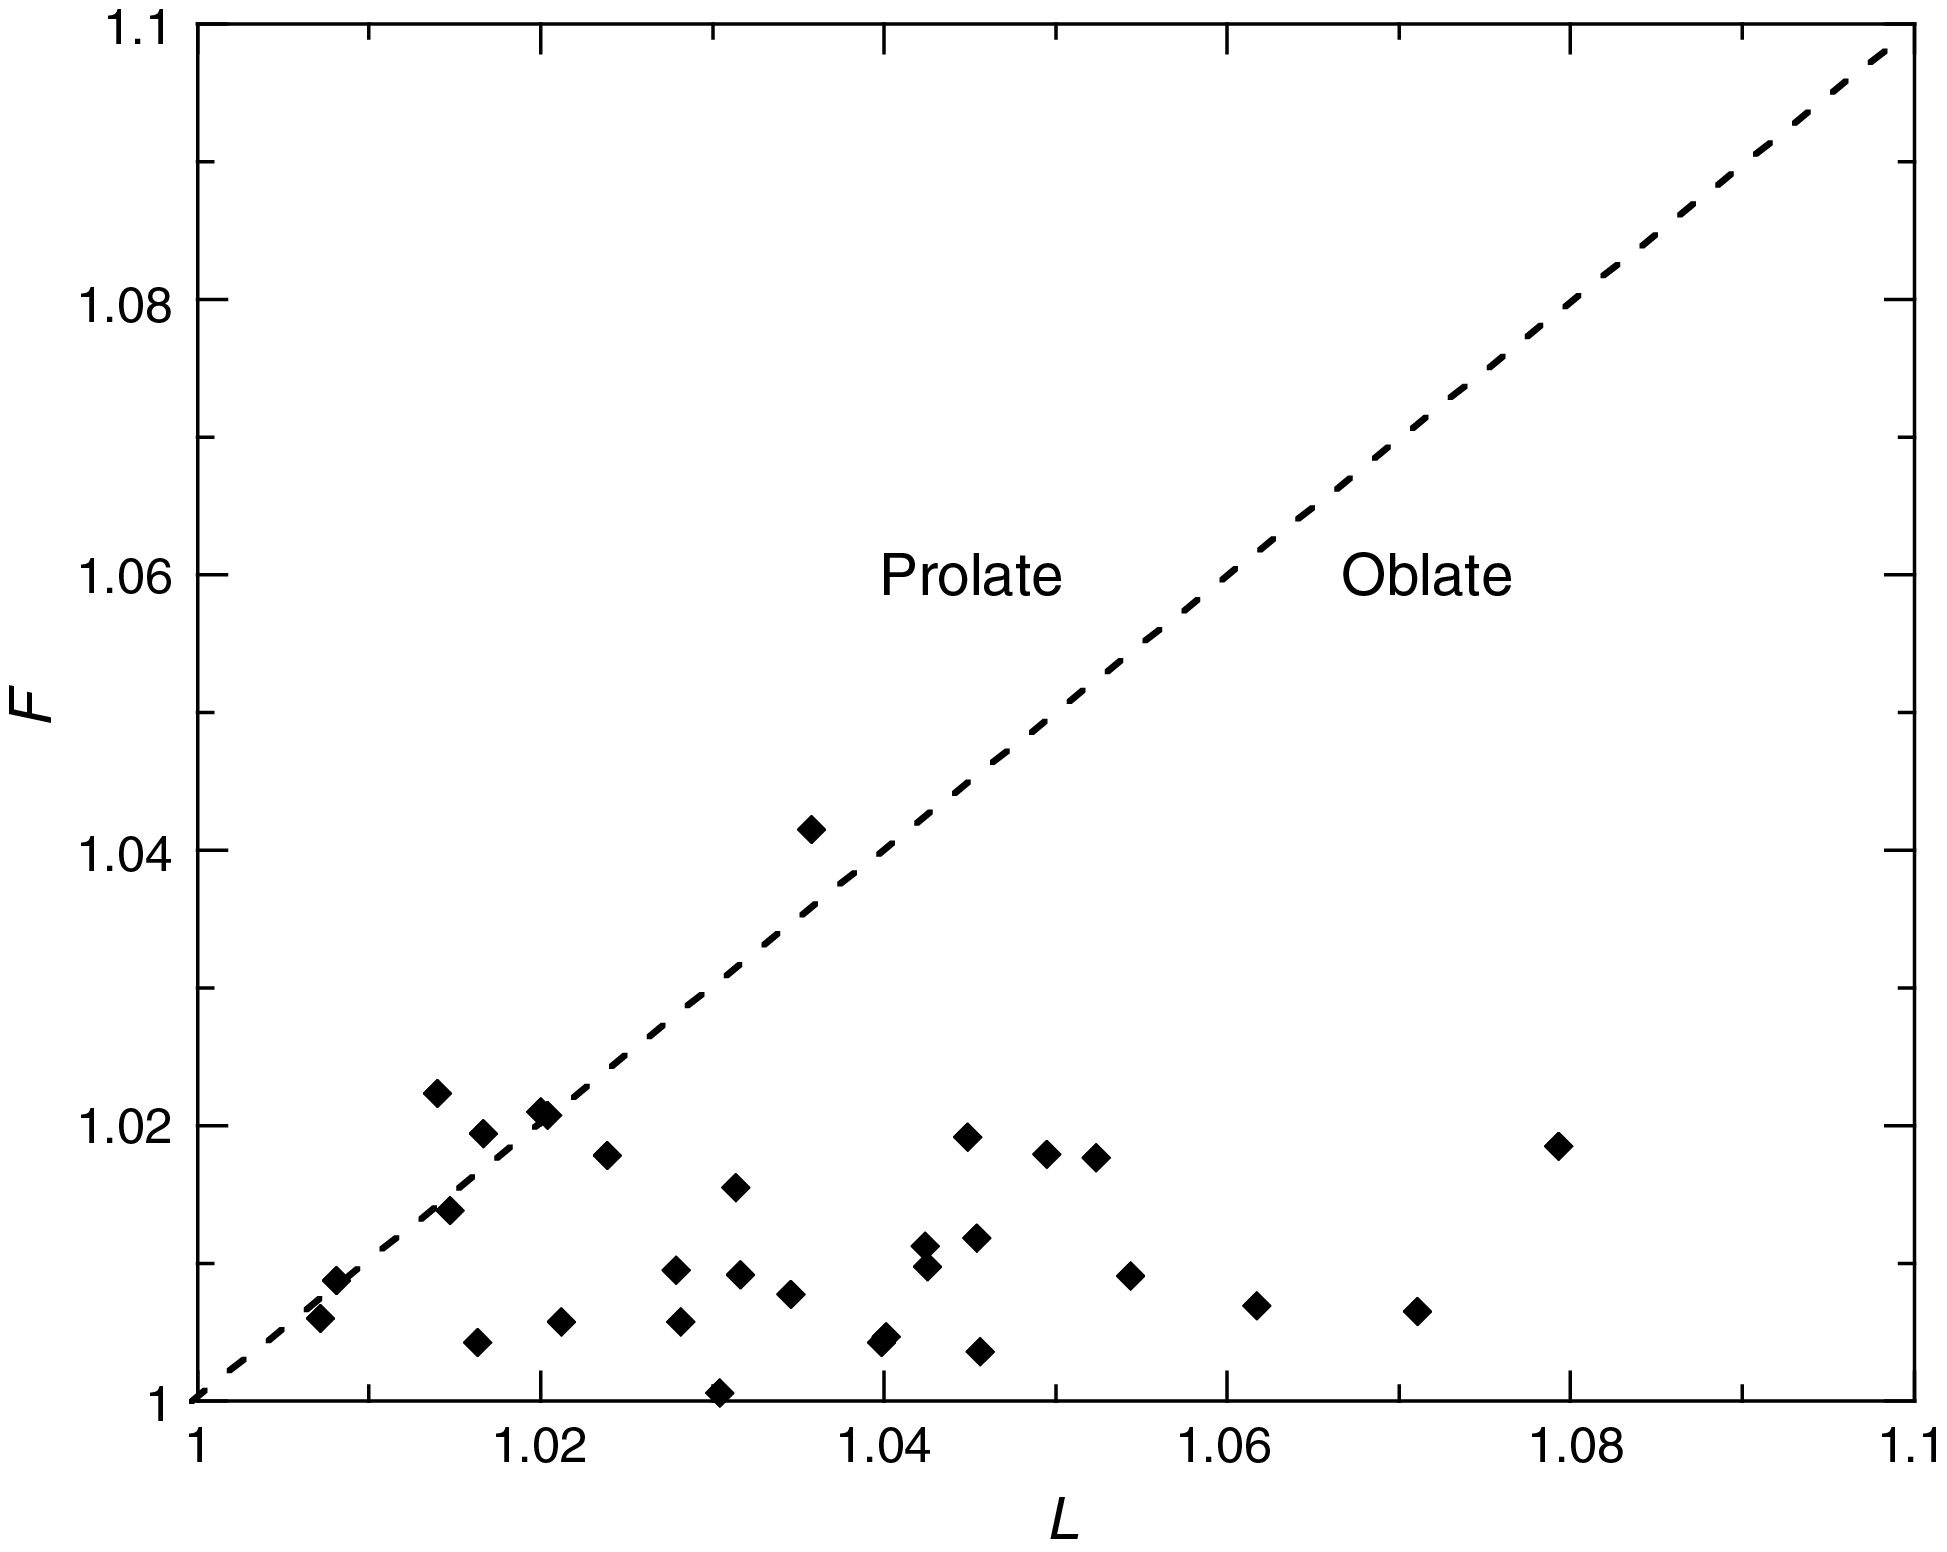
Figure F16. Simple classification of sedimentary fabric.
A "normal" sedimentary fabric, defined as one produced by gravitational settling of particles only, is characterized by a near vertical inclination of the minimum susceptibility axis (I3), with the maximum (I1) and intermediate (I2) susceptibility axes randomly oriented within the bedding plane. In contrast, I1 oriented vertically is an indicator of disturbance by core stretching (Thouveny et al., 2000; Széréméta et al., 2004). We did not observe core stretching in our Hole U1534A pilot samples. We observed normal sedimentary fabrics in seven samples, including those from Core 382-U1534A-9H, whose liner was shattered upon recovery. We note that the descriptor "shattered" was used to describe a wide range of physical changes in the core liner upon recovery and includes cores for which observations include small cracks with no separation of plastic across the crack (e.g., Core 9H), large cracks or breakage of the liner that allowed loss of sediment, and total implosion of the liner. Therefore, the descriptor "shattered" does not summarily disqualify a core from paleomagnetic analysis. AMS results suggest that data from a core containing only small cracks in the liner may still be viable for paleomagnetic work. Cores were evaluated on a case-by-case basis.
Variations in and deviations from a normal sedimentary fabric in unconsolidated sediment that are relevant to Site U1534 include current alignment of ferrimagnetic particles (Ellwood and Ledbetter, 1979; Kissel et al., 1997, 1998), deposition on a nonhorizontal surface, and subsequent rolling of grains downhill, slumping, or deposition in turbidity currents (Tarling and Hrouda, 1993; Schwehr and Tauxe, 2003). We note that the orientation of I3 is steep but off vertical in 19 of the 26 samples analyzed (Figure F15). Possible explanations include downslope transport on the drift, which is expected to be north–south on the continental slope, or an expression of the ACC, which flows west–east at present but possibly southwest–northeast in the past when the South Polar Front was located northward of its present position. Azimuthal orientation of the cores is necessary to explore these hypotheses further and will be the subject of postcruise work.
Finally, we hypothesized that the Pliocene–Pleistocene hiatus indicated in the biostratigraphic data between Sections 382-U1534A-9H-CC and 10H-2 would manifest as a large-amplitude change in the degree of anisotropy, with more sediment compaction generating higher anisotropy below the hiatus (Schwehr et al., 2006). However, we did not observe such a change. If the hiatus represents nondeposition rather than erosion and removal of previously deposited sediment, then the deeper sediments in the study area may not have experienced the degree of compaction we anticipated. We also note that the AMS measurements stopped at Section 10H-4 because of an increasing degree of ship roll and concerns for the safety of the KLY 4S Kappabridge, which cannot be used while it is strapped to a metal pole during rough seas. The postulated change in AMS properties may reside in Sections 10H-5 or 10H-6.
Geochemistry
Volatile hydrocarbons
Headspace gas analyses were performed at a resolution of one sample per full-length core (9.6 m advance) or one sample every other core for half-length cores (4.8 m advance) throughout Hole U1534A (Cores 382-U1534A-1H through 47X) as part of the routine environmental protection and safety monitoring program. Methane (CH4) is the dominant hydrocarbon, although ethane is also present in low concentrations. Methane concentrations are low (4–637 parts per million by volume [ppmv]) in the upper 30 m but increase downhole, with variable concentrations generally ranging from 5,700 to 72,000 ppmv from 40 to 262 mbsf (Figure F17; Table T9). Ethane (C2H6) concentrations remain low (<2 ppmv) in the upper 40 m and increase to as high as 15 ppmv from 50 to 230 mbsf (Figure F17). The methane/ethane ratio is correspondingly high (5,740–10,180) from 5 to 100 mbsf and then decreases downhole to 3,000 at 260 mbsf (Figure F17). Data are reported in Table T9.
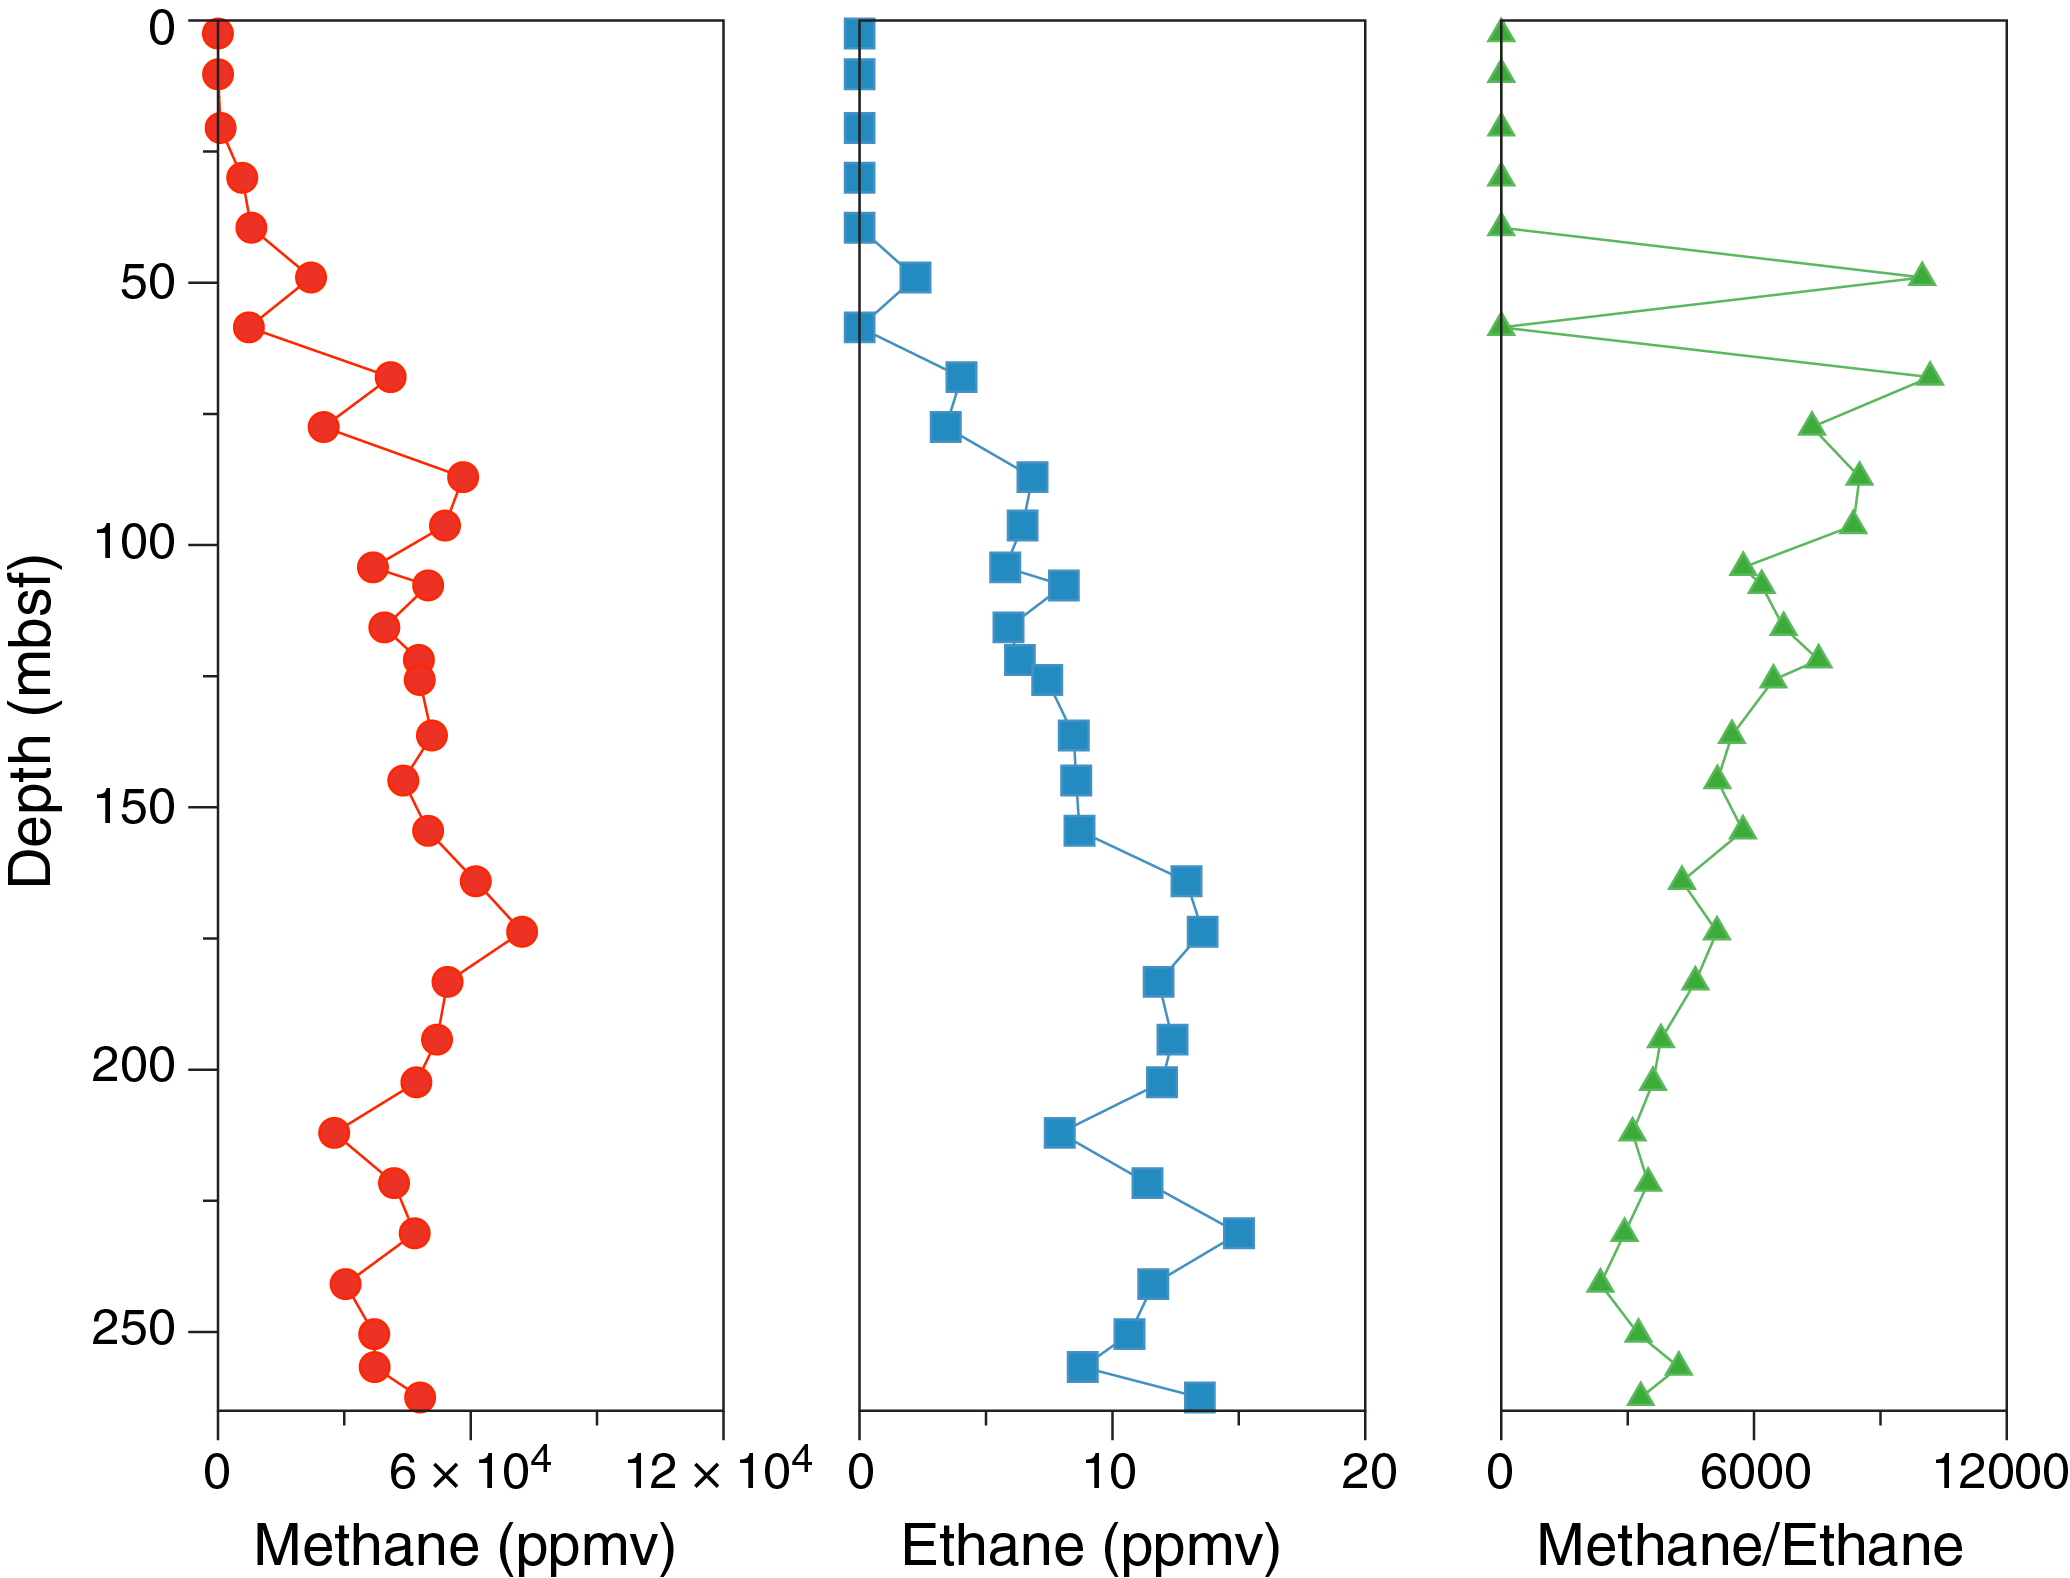
Figure F17. Methane, ethane, and methane/ethane ratio.
Interstitial water chemistry
A total of 17 interstitial water (IW) samples were squeezed from 5 cm whole-round samples (10 cm from the lowermost sample) from 2.45 to 235.9 mbsf (Core 382-U1534A-40F). IW was recovered in sufficient quantities (>25 mL) throughout. Filtered samples were analyzed for all envisioned shipboard analyses, and additional aliquots were set aside for further trace metal analyses at the Helmholtz Centre for Ocean Research Kiel (Germany). IW properties are presented in Figures F18 and F19 and Table T10.
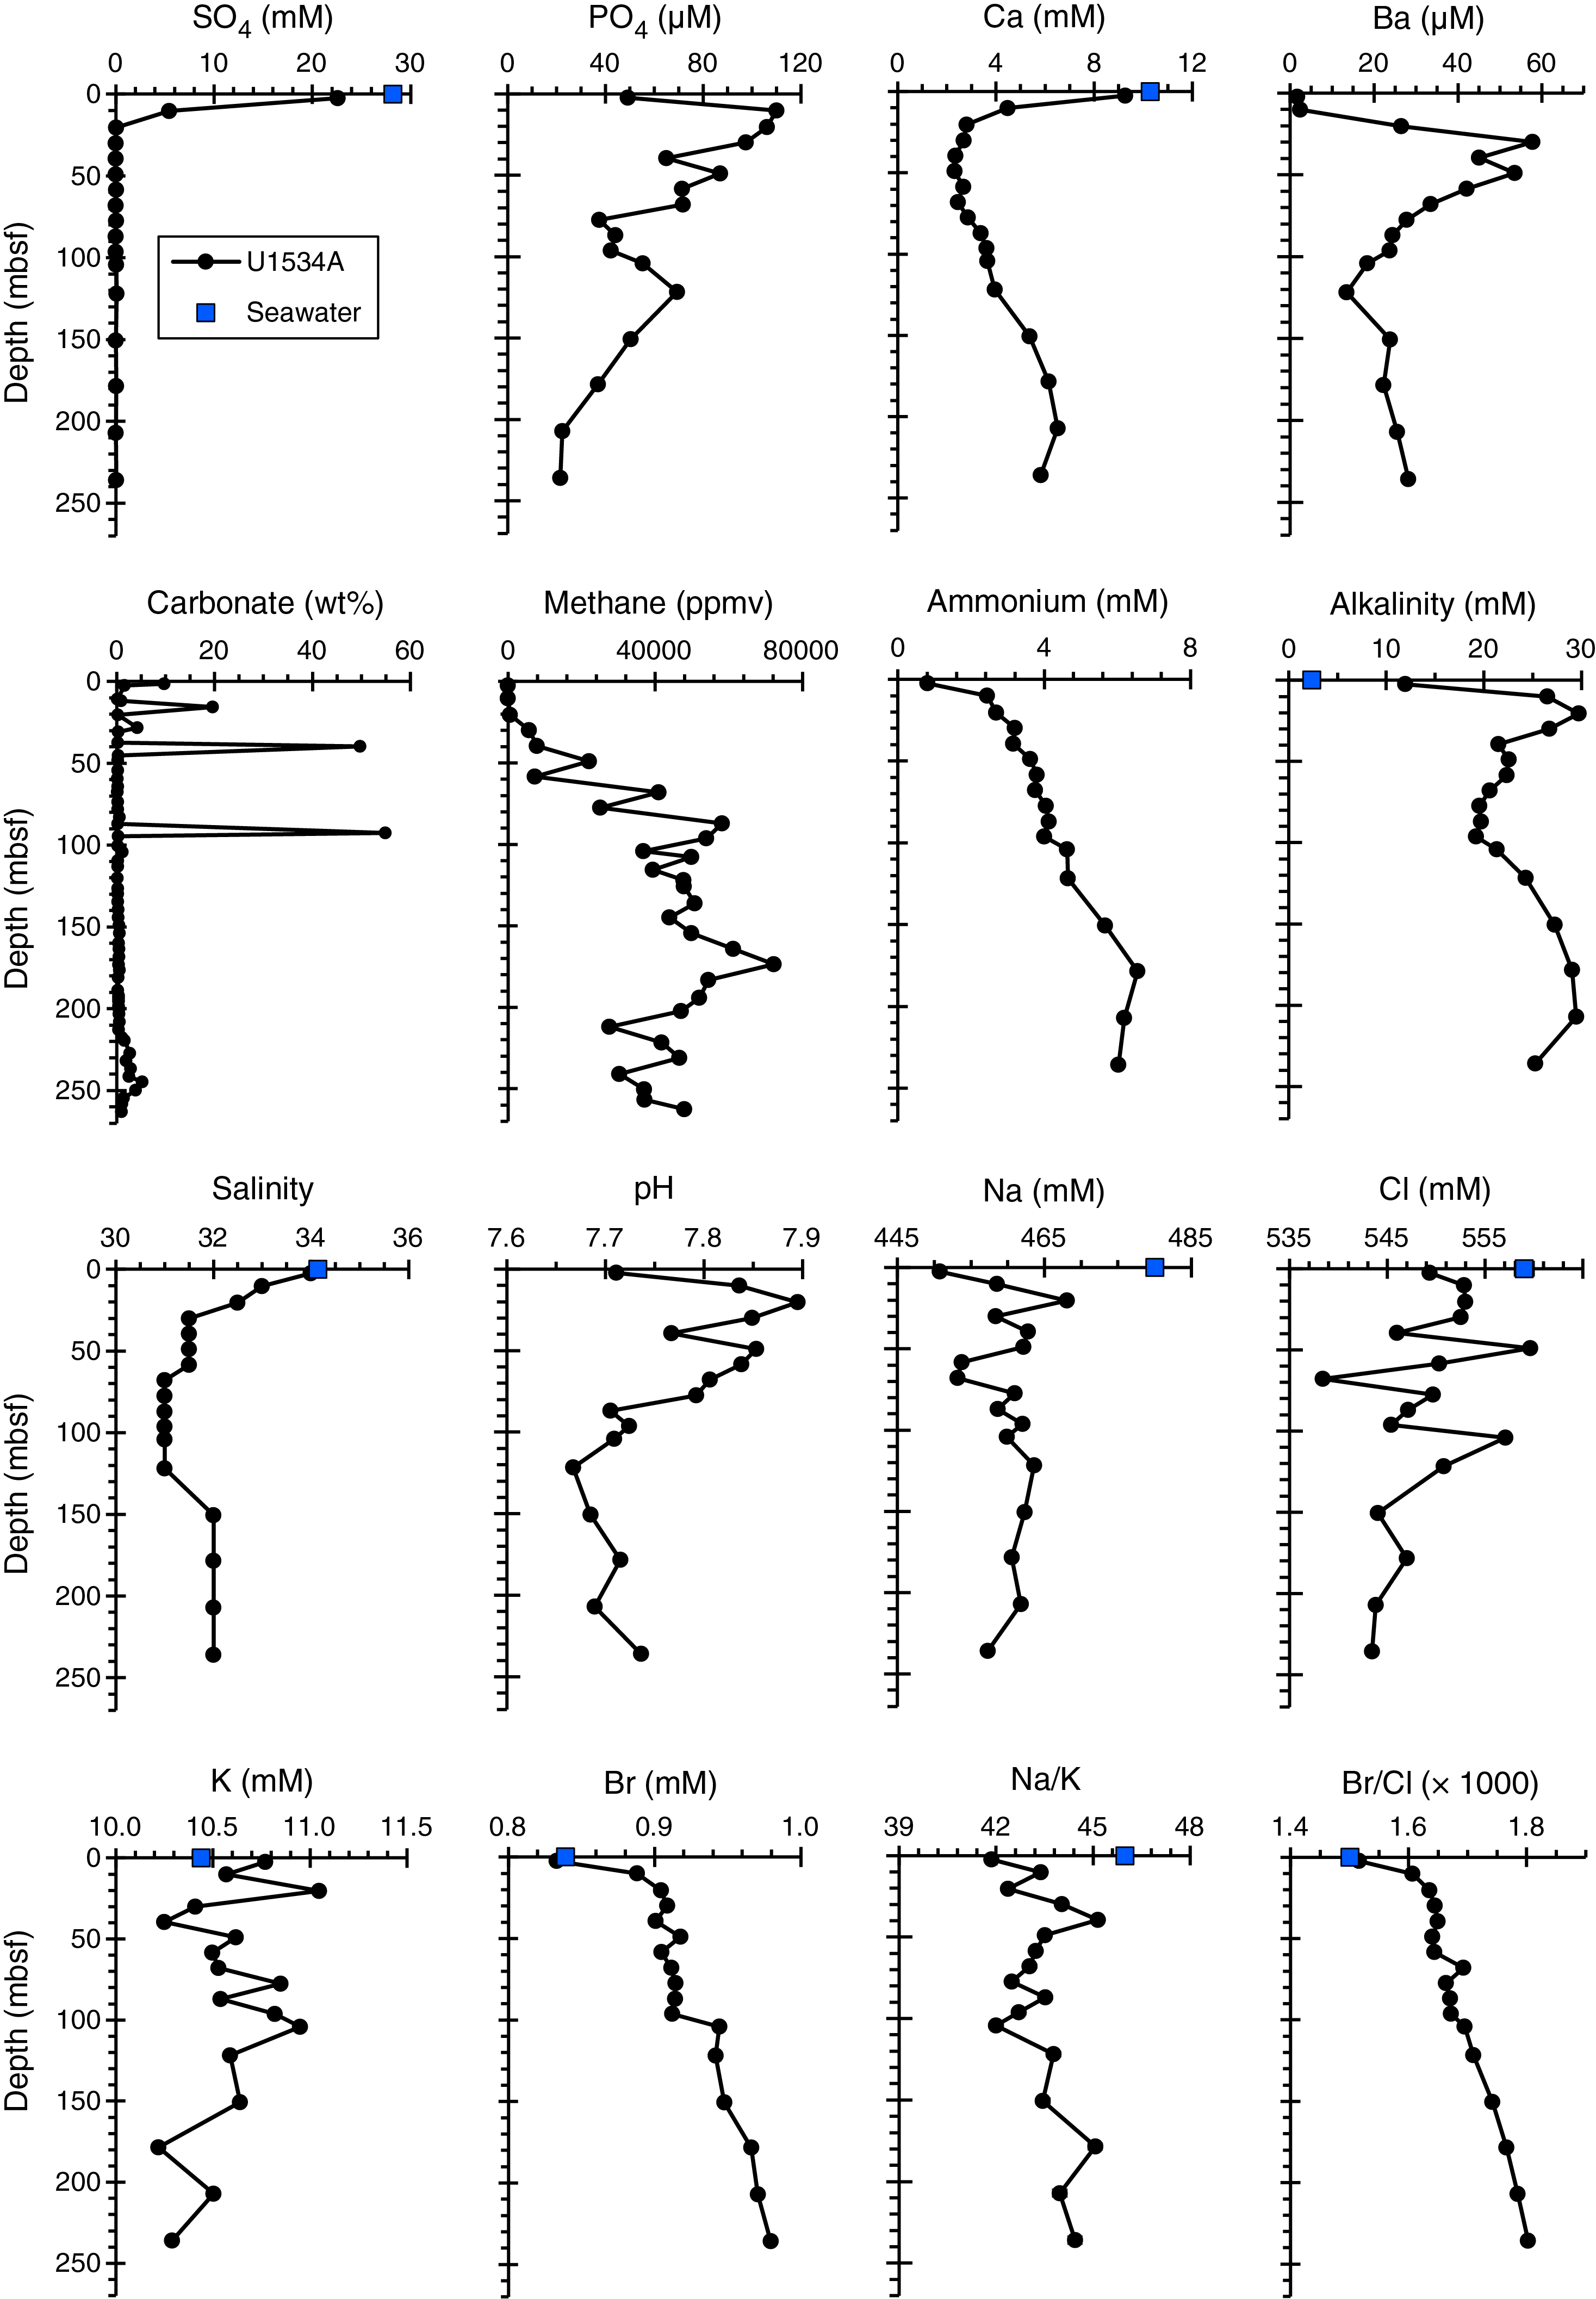
Figure F18. IW properties.
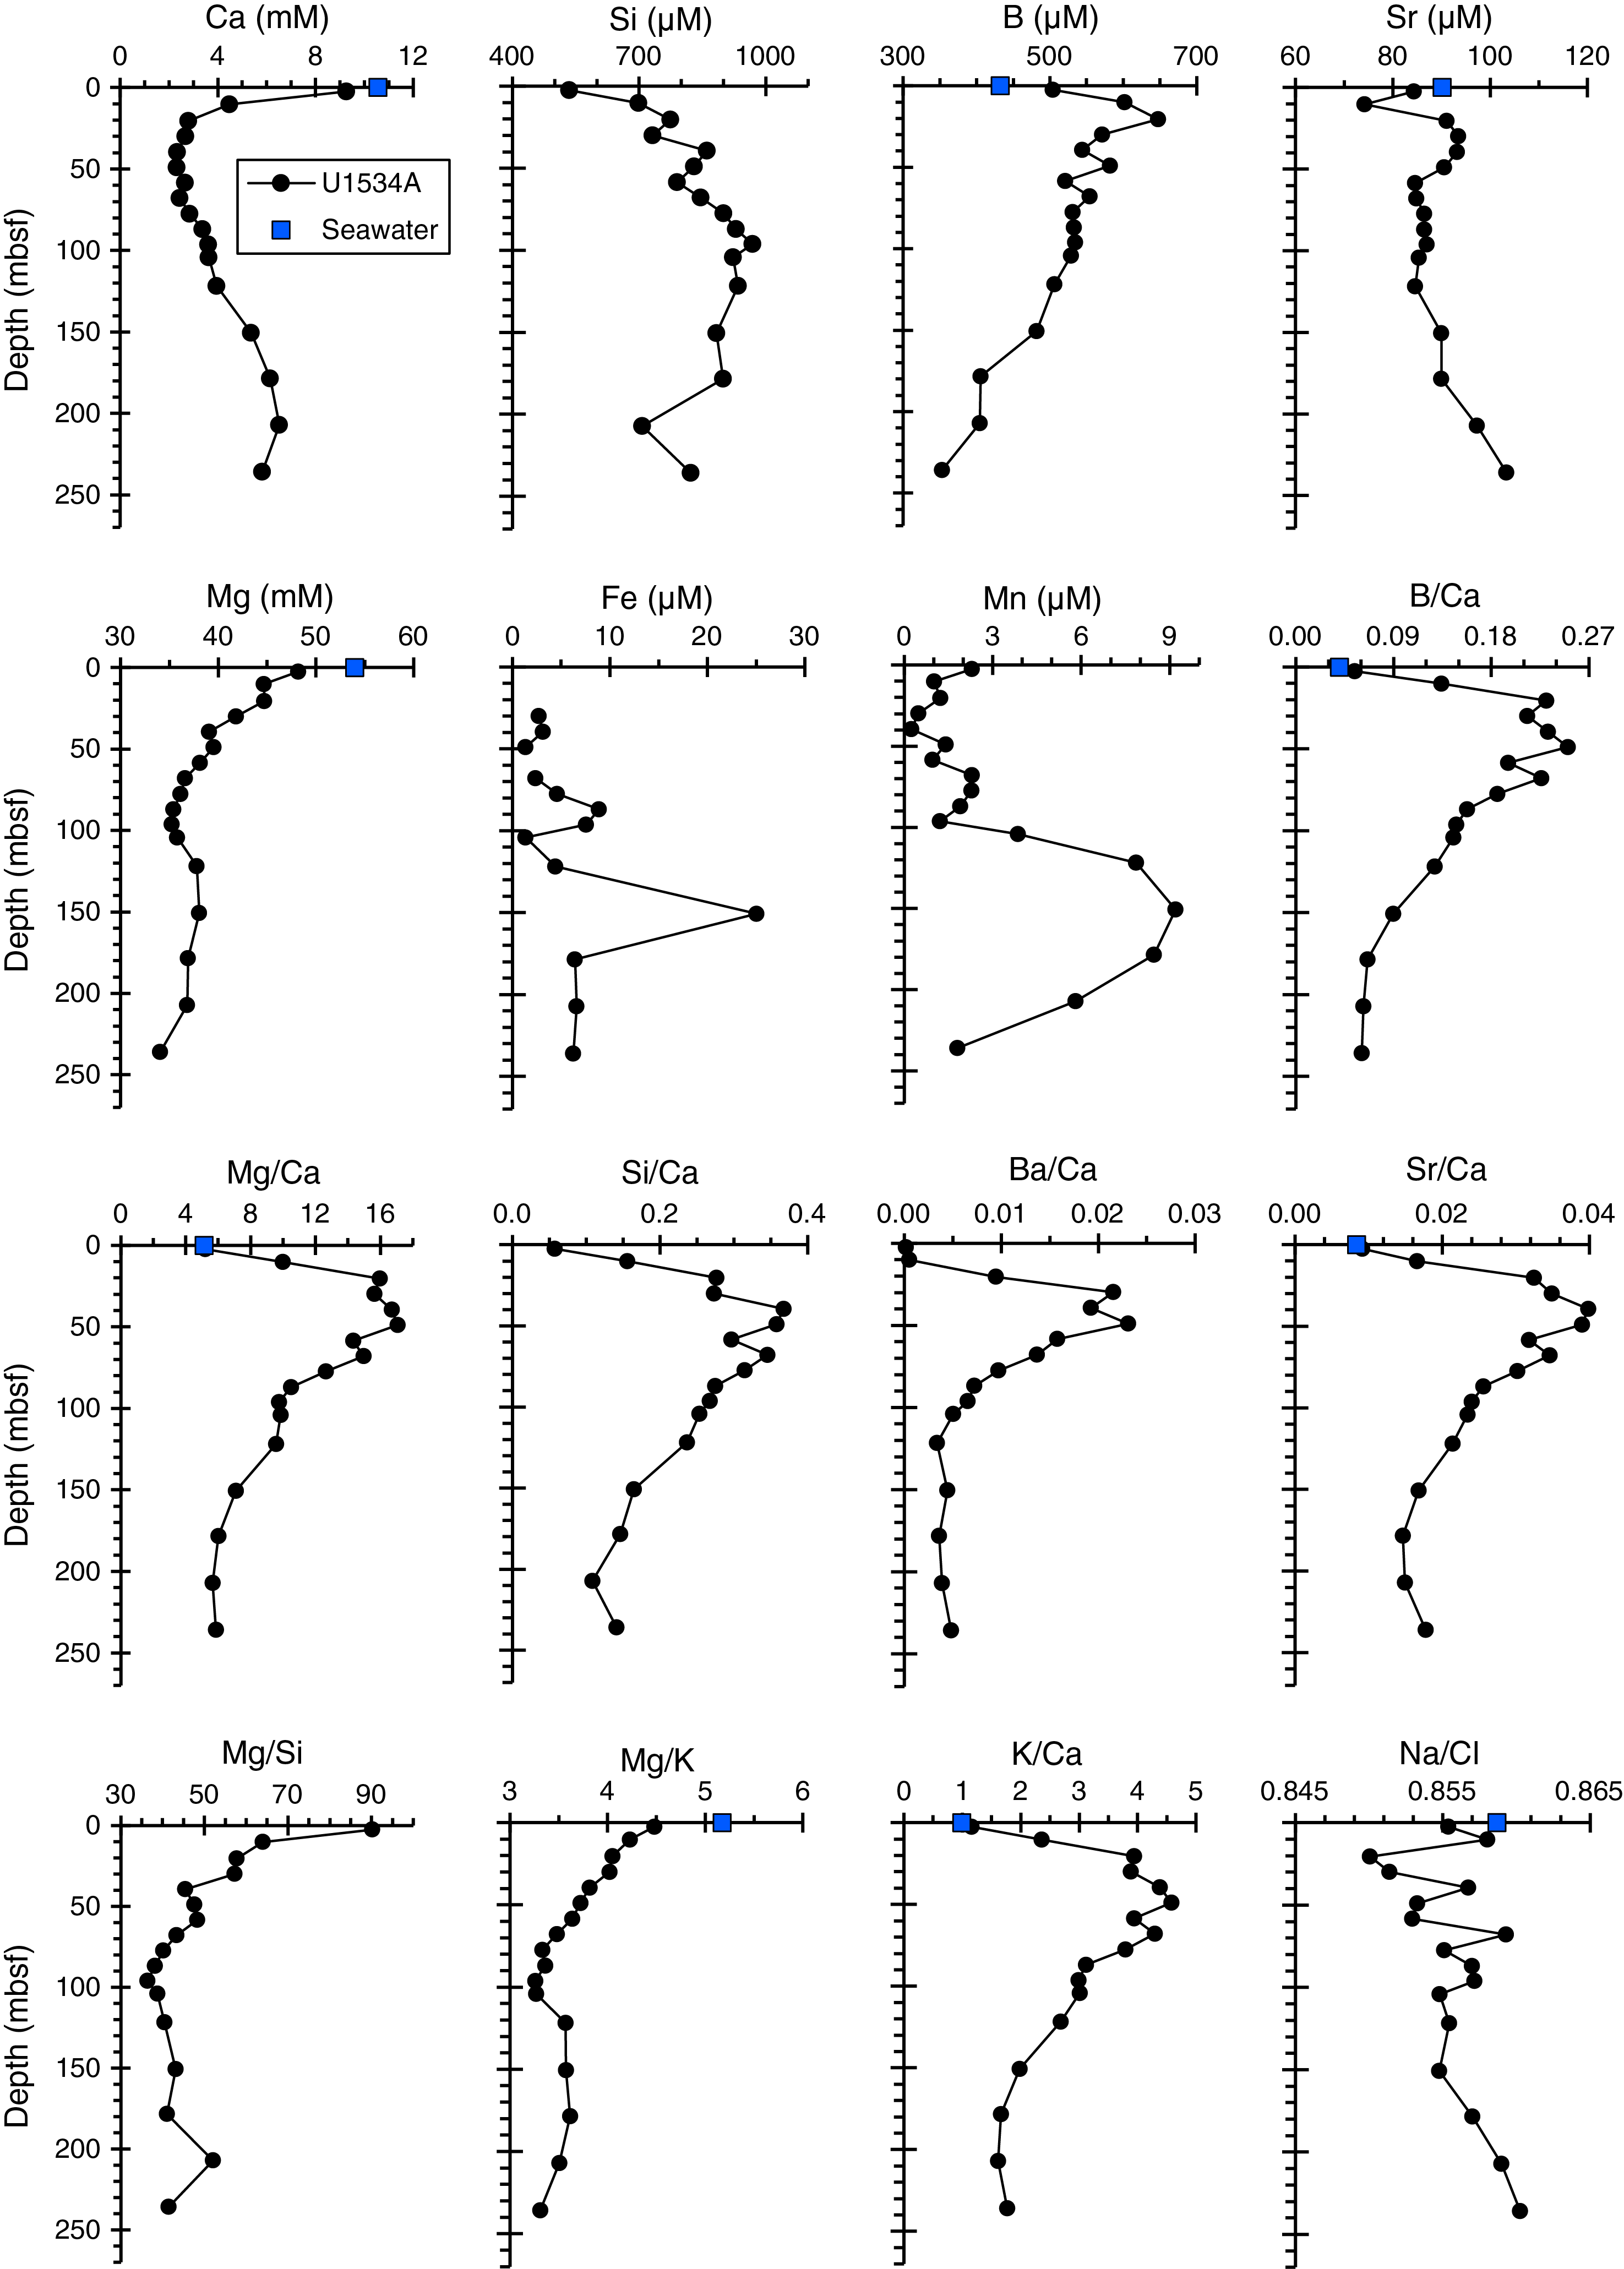
Figure F19. IW properties.
Salinity, sulfate, manganese, iron, alkalinity, and ammonium
IW salinity decreases from values matching ambient seawater (i.e., 34.13 at the nearest conductivity-temperature-depth [CTD] seawater sampling station according to the Global Ocean Data Analysis Project Version 2 [GLODAPv2] database [61.7°W, 53.3°S; 508 m water depth] [Olsen et al., 2016; Key et al., 2015]) to an IW salinity minimum (31.0) between 68 and 122 mbsf. Salinity slightly increases below this horizon but does not get higher than 32.0. Sulfate concentrations in the uppermost IW sample are slightly lower than ambient bottom water levels (22.6 mM as opposed to ~28 mM). Concentrations rapidly drop to levels close to the detection limit at 20.5 mbsf and remain depleted throughout the lower part of the core (SO4 = 0.042 ± 0.049 mM; n = 15). The sulfate–methane transition zone (SMTZ) is clearly identifiable because methane and ammonium concentrations steadily increase at levels where sulfate concentrations fall to close to zero. This interval also yields the highest alkalinity values (29.7 mM). Manganese concentrations in the upper 100 m are depleted (Mn < 3 µM), and they increase deeper than 100 mbsf. A somewhat similar picture emerges for IW Fe concentrations, which are below 10 µM for almost all sampled depths but include one elevated concentration found at 150 mbsf. Ammonium levels increase steadily with depth, reaching the highest concentrations at 180 mbsf (6.55 mM), approximately following the trends seen in methane concentrations (Figure F18). Ammonium and sulfate profiles are consistent with pronounced reducing conditions deeper than ~20–30 mbsf.
Chloride, bromide, sodium, potassium, pH, and phosphate
Chloride, potassium, and sodium concentrations display conservative behavior in Site U1534 sediment IW and have concentrations close to seawater (Figure F18) that largely show no resolvable downhole variations. Bromide concentrations in turn increase with depth; this increase becomes clearer in IW Br/Cl trends that also increase with depth (Figure F18). Such systematics in IW Br/Cl have been ascribed to microbially mediated organic matter degradation in the sediment releasing organically bound Br to IW (Berg and Solomon, 2016). None of the observed dominantly diagenetic trends in IW chemical properties vary with carbonate concentrations (Figure F18). pH is lower than average seawater (pH = 7.97; GLODAPv2 database [Olsen et al., 2016; Key et al., 2015]) and varies between 7.67 and 7.9 in the sampled interval. Phosphate concentrations are highest at 10 mbsf and then decrease steadily downhole. Two levels of pronounced phosphate depletion were observed at ~40 and 87 mbsf (Figure F18). The lowest phosphate concentrations are recorded in the lowermost part of the IW profile.
Calcium, magnesium, boron, silicon, barium, and other major and trace elements
Calcium concentrations in IW decrease most markedly in the sedimentary level above the SMTZ (i.e., in the upper 30 m) to a minimum of 2.3 mM at ~50 mbsf (Figure F19). Deeper Ca concentrations remain low and only gradually increase again deeper than ~80 mbsf to maximum concentrations of 6.5 mM at 207 mbsf. They then decrease again deeper in the hole. Calcium is preferentially precipitated in the zone of highest IW alkalinity, leading to pronounced positive excursions of Mg/Ca, Si/Ca, Ba/Ca, and Sr/Ca (Figure F19). This pattern is likely governed by authigenic carbonate formation below the SMTZ (Nöthen and Kasten, 2011). However, this hypothetical authigenic carbonate does not lead to obviously elevated sedimentary carbonate contents, which are very low in most parts of the sampled section at Site U1534 except for a few spikes (Figure F18).
Magnesium concentrations decrease more gradually with depth (Figure F19). The strongest gradient was observed in the upper 100 m, where magnesium decreases to a minimum of 35.25 mM at 96 mbsf. It recovers to somewhat higher concentrations at ~120 mbsf and remains at ~38 mM for most of the deeper sedimentary section. Boron in turn shows the strongest enrichment above the SMTZ (maximum of 647 µM at 20 mbsf). Deeper boron concentrations first decrease unsteadily but clearly decrease throughout the covered interval to a minimum of 353 µM at 236 mbsf (Figure F19).
Barium concentrations show the strongest enrichment directly below the SMTZ, peaking between 30 and 50 mbsf (maximum Ba of 57.8 µM at 30 mbsf). The strongest Ba enrichment was also observed in the sedimentary level corresponding to the highest alkalinity and pH (Figure F18). Such Ba enrichments were reported in earlier studies and are attributed to barite dissolution below sedimentary SMTZs (Torres et al., 1996; Dickens, 2001; Riedinger et al., 2006). The zone of highest Ba enrichment also corresponds to the level with the most pronounced Ca precipitation and highest Mg/Ca. Concentrations then drop markedly to a minimum of 13.4 µM at 122 mbsf and slightly increase again deeper in the hole (Figure F19).
Strontium shows a shallow concentration minimum at 10 mbsf then increases, remains at concentrations close to ambient seawater between 30 and 50 mbsf, and decreases before gradually increasing again downcore to the highest observed Sr concentrations at 235 mbsf (103 µM). Silicon is increasingly enriched in IW over the upper 100 m and then remains stable at ~900 mM to ~180 mbsf, shows one excursion to lower concentrations at 207 mbsf, and slightly increases again at the lowest covered depth. Lithium concentrations are below the inductively coupled plasma–atomic emission spectroscopy (ICP-AES) detection limit in the uppermost 90 m.
Bulk sediment geochemistry
Carbon, nitrogen, and carbonate
Discrete sediment samples (N = 60) from all major lithostratigraphic units identified in Hole U1534A were analyzed for total carbon (TC), total nitrogen (TN), and total inorganic carbon. Total organic carbon (TOC) and calcium carbonate (CaCO3) contents were subsequently calculated (Table T11). TOC contents range from 0.2 to 1.5 wt% (Figure F20) with slightly lower contents (<0.8 wt%) in the upper 80 m. The TOC/TN ratio is mostly around 10 with some small excursions to higher and lower values, suggesting sedimentary organic carbon mainly originates from marine organisms such as phytoplankton. Two sampled depths have higher TOC/TN, suggesting larger quantities of admixed terrestrial organic material. CaCO3 contents range between 0.2 and 54 wt% in Hole U1534A but mostly are <1 wt% (Figure F20). Significantly higher values (~50 wt%) were occasionally measured in the upper part of the sequences (0–100 mbsf) in intervals that probably correspond to interglacial conditions. These sections also have lower natural gamma radiation (NGR) and MS (see Physical properties). CaCO3 contents are also relatively high (~9 wt%) from 220 to 250 mbsf.
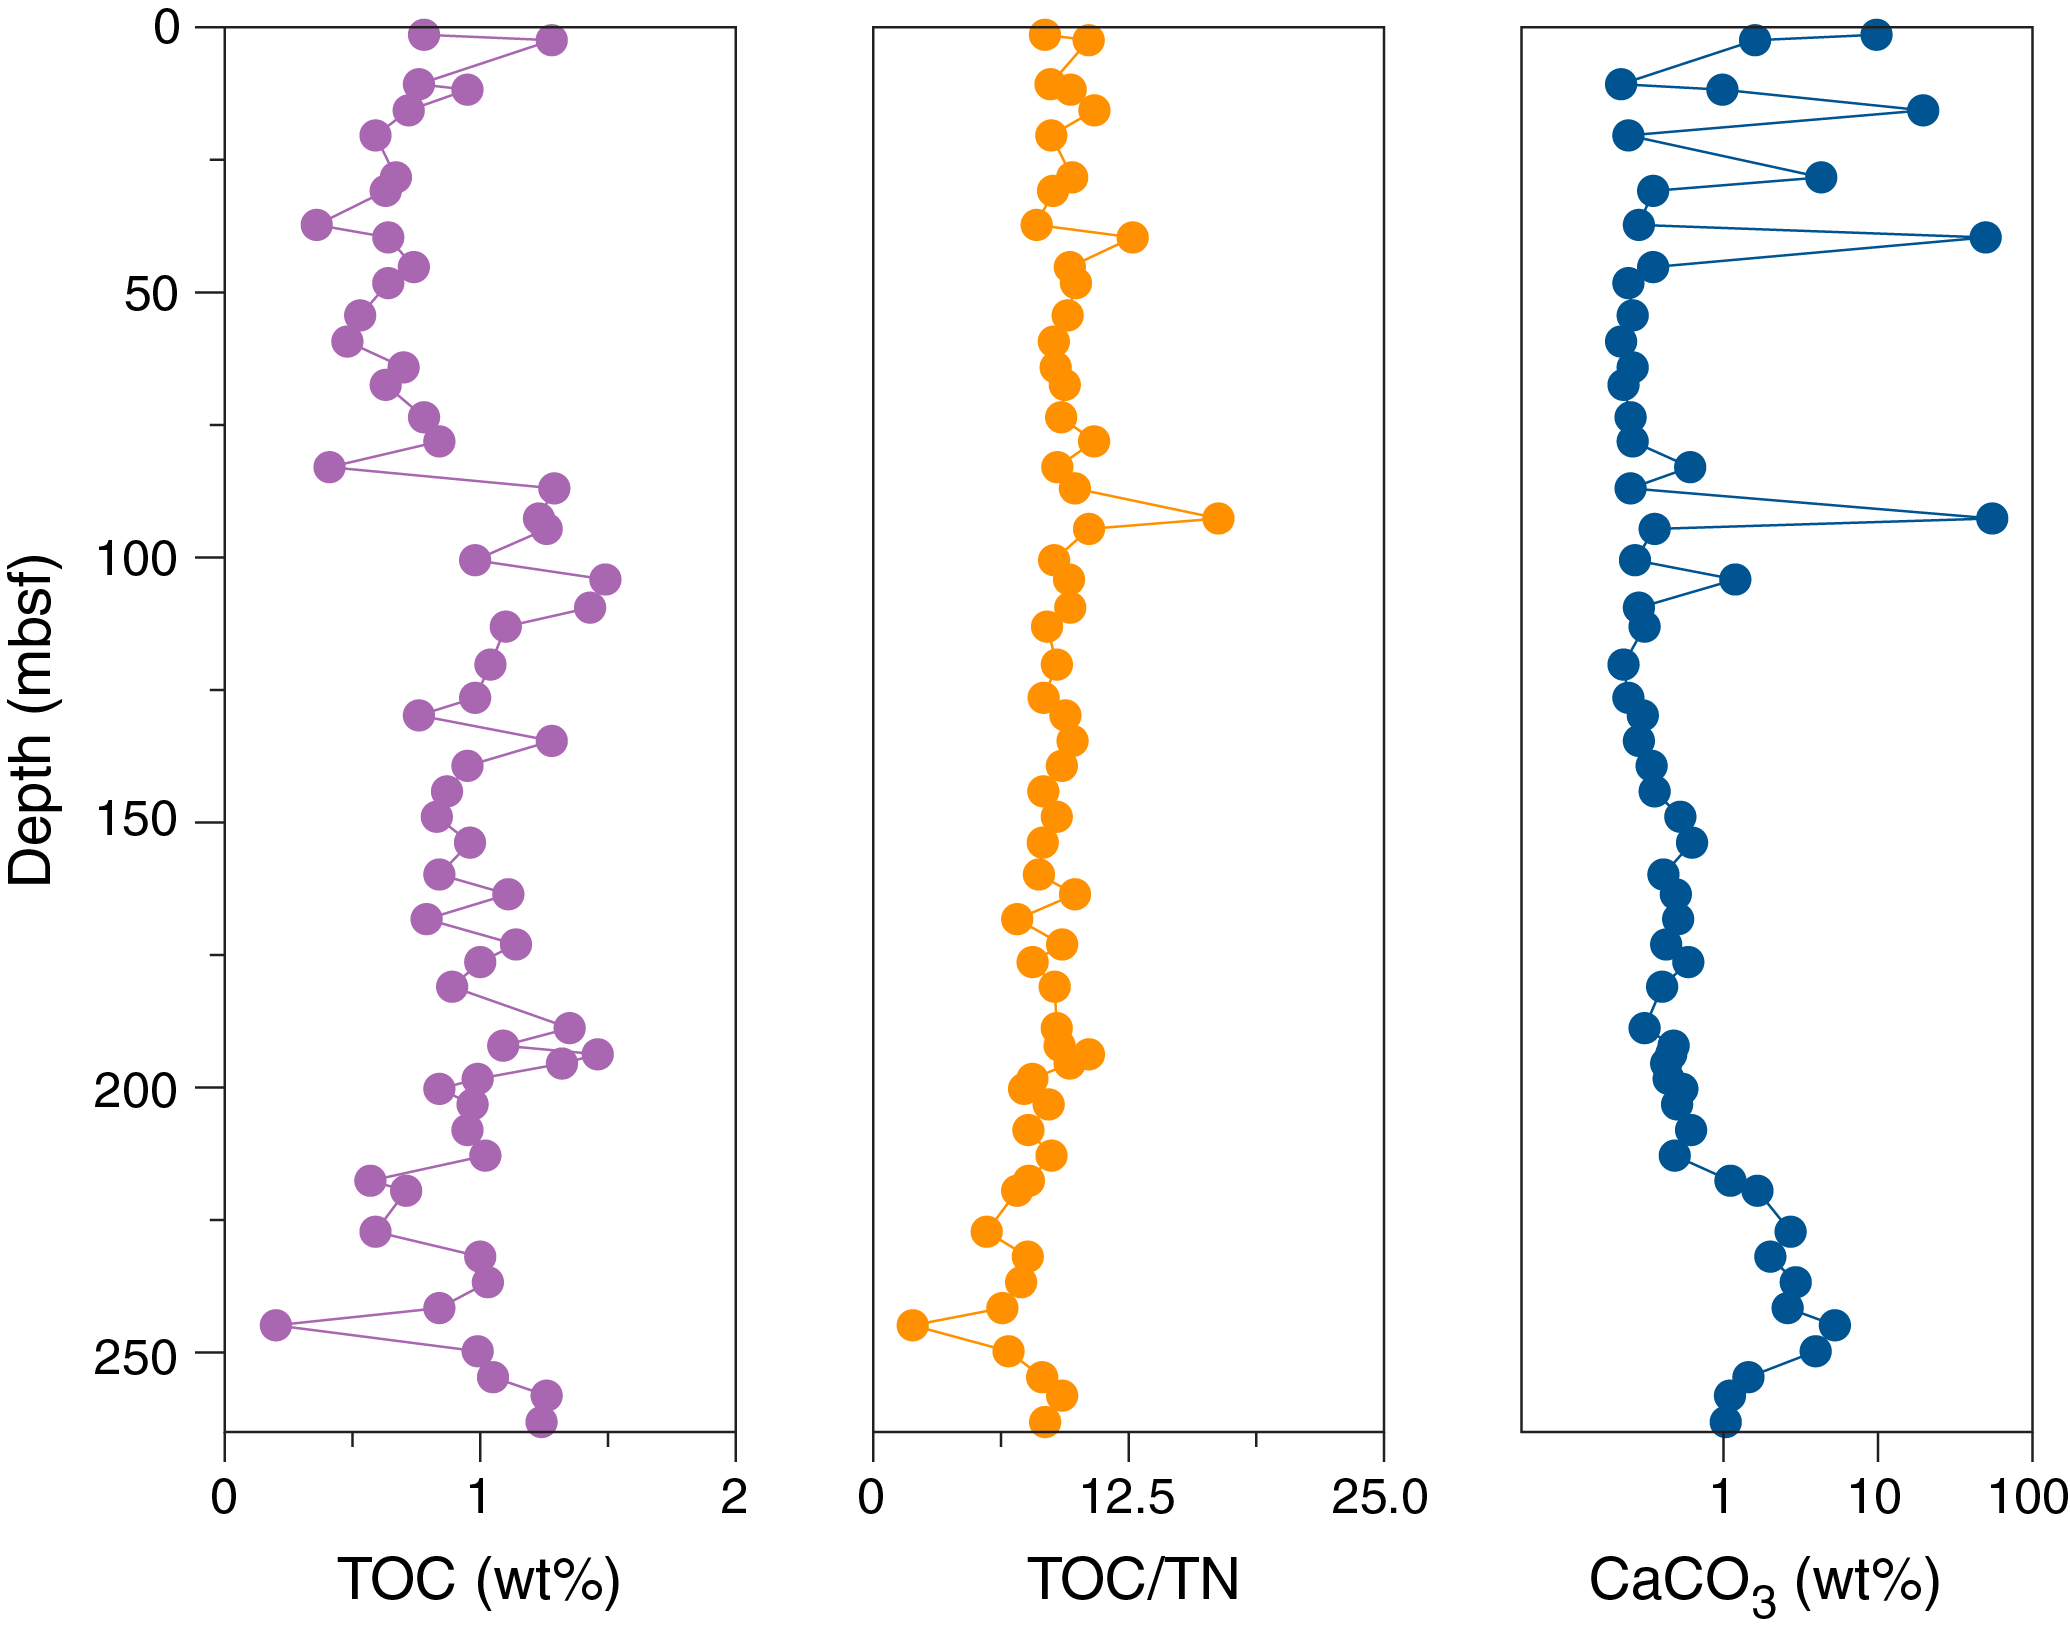
Figure F20. Bulk sediment TOC, TOC/TN ratio, and CaCO3.
Inorganic bulk sediment geochemistry
A total of 23 sediment samples were analyzed over 241 m of core. Results display highly consistent geochemical trends and strikingly constant compositions over most parts of the record. A selection of key elements and ratios are displayed in Figures F21 and F22. The full suite of results is presented in Table T12. Most geochemical variability was observed between 20 and 104 mbsf and was evident from the occurrence of two carbonate layers that lead to distinctly lower Al, Si, Ti, Na, K, Fe, Mn, La, Zr, and Cr concentrations in this interval. Among the presented major and trace elemental ratios in Figure F22, La/Zr seems to display the most clearly resolvable elemental trends in the upper 104 m, which could be controlled by provenance changes or grain size sorting effects and deserves further investigation. The SMTZ at 20 mbsf has no obvious expression in any elemental signal presented in Figures F21 and F22. An excursion to lower dissolved IW phosphate concentrations may be related to a positive bulk sedimentary phosphorous excursion at 92 mbsf (Figures F18, F21) that is located at the second carbonate layer. Together with elevated Mg, this peak in particulate phosphorous at 92 mbsf suggests the presence of authigenic carbonate fluorapatite along with high-Mg calcite or dolomite.
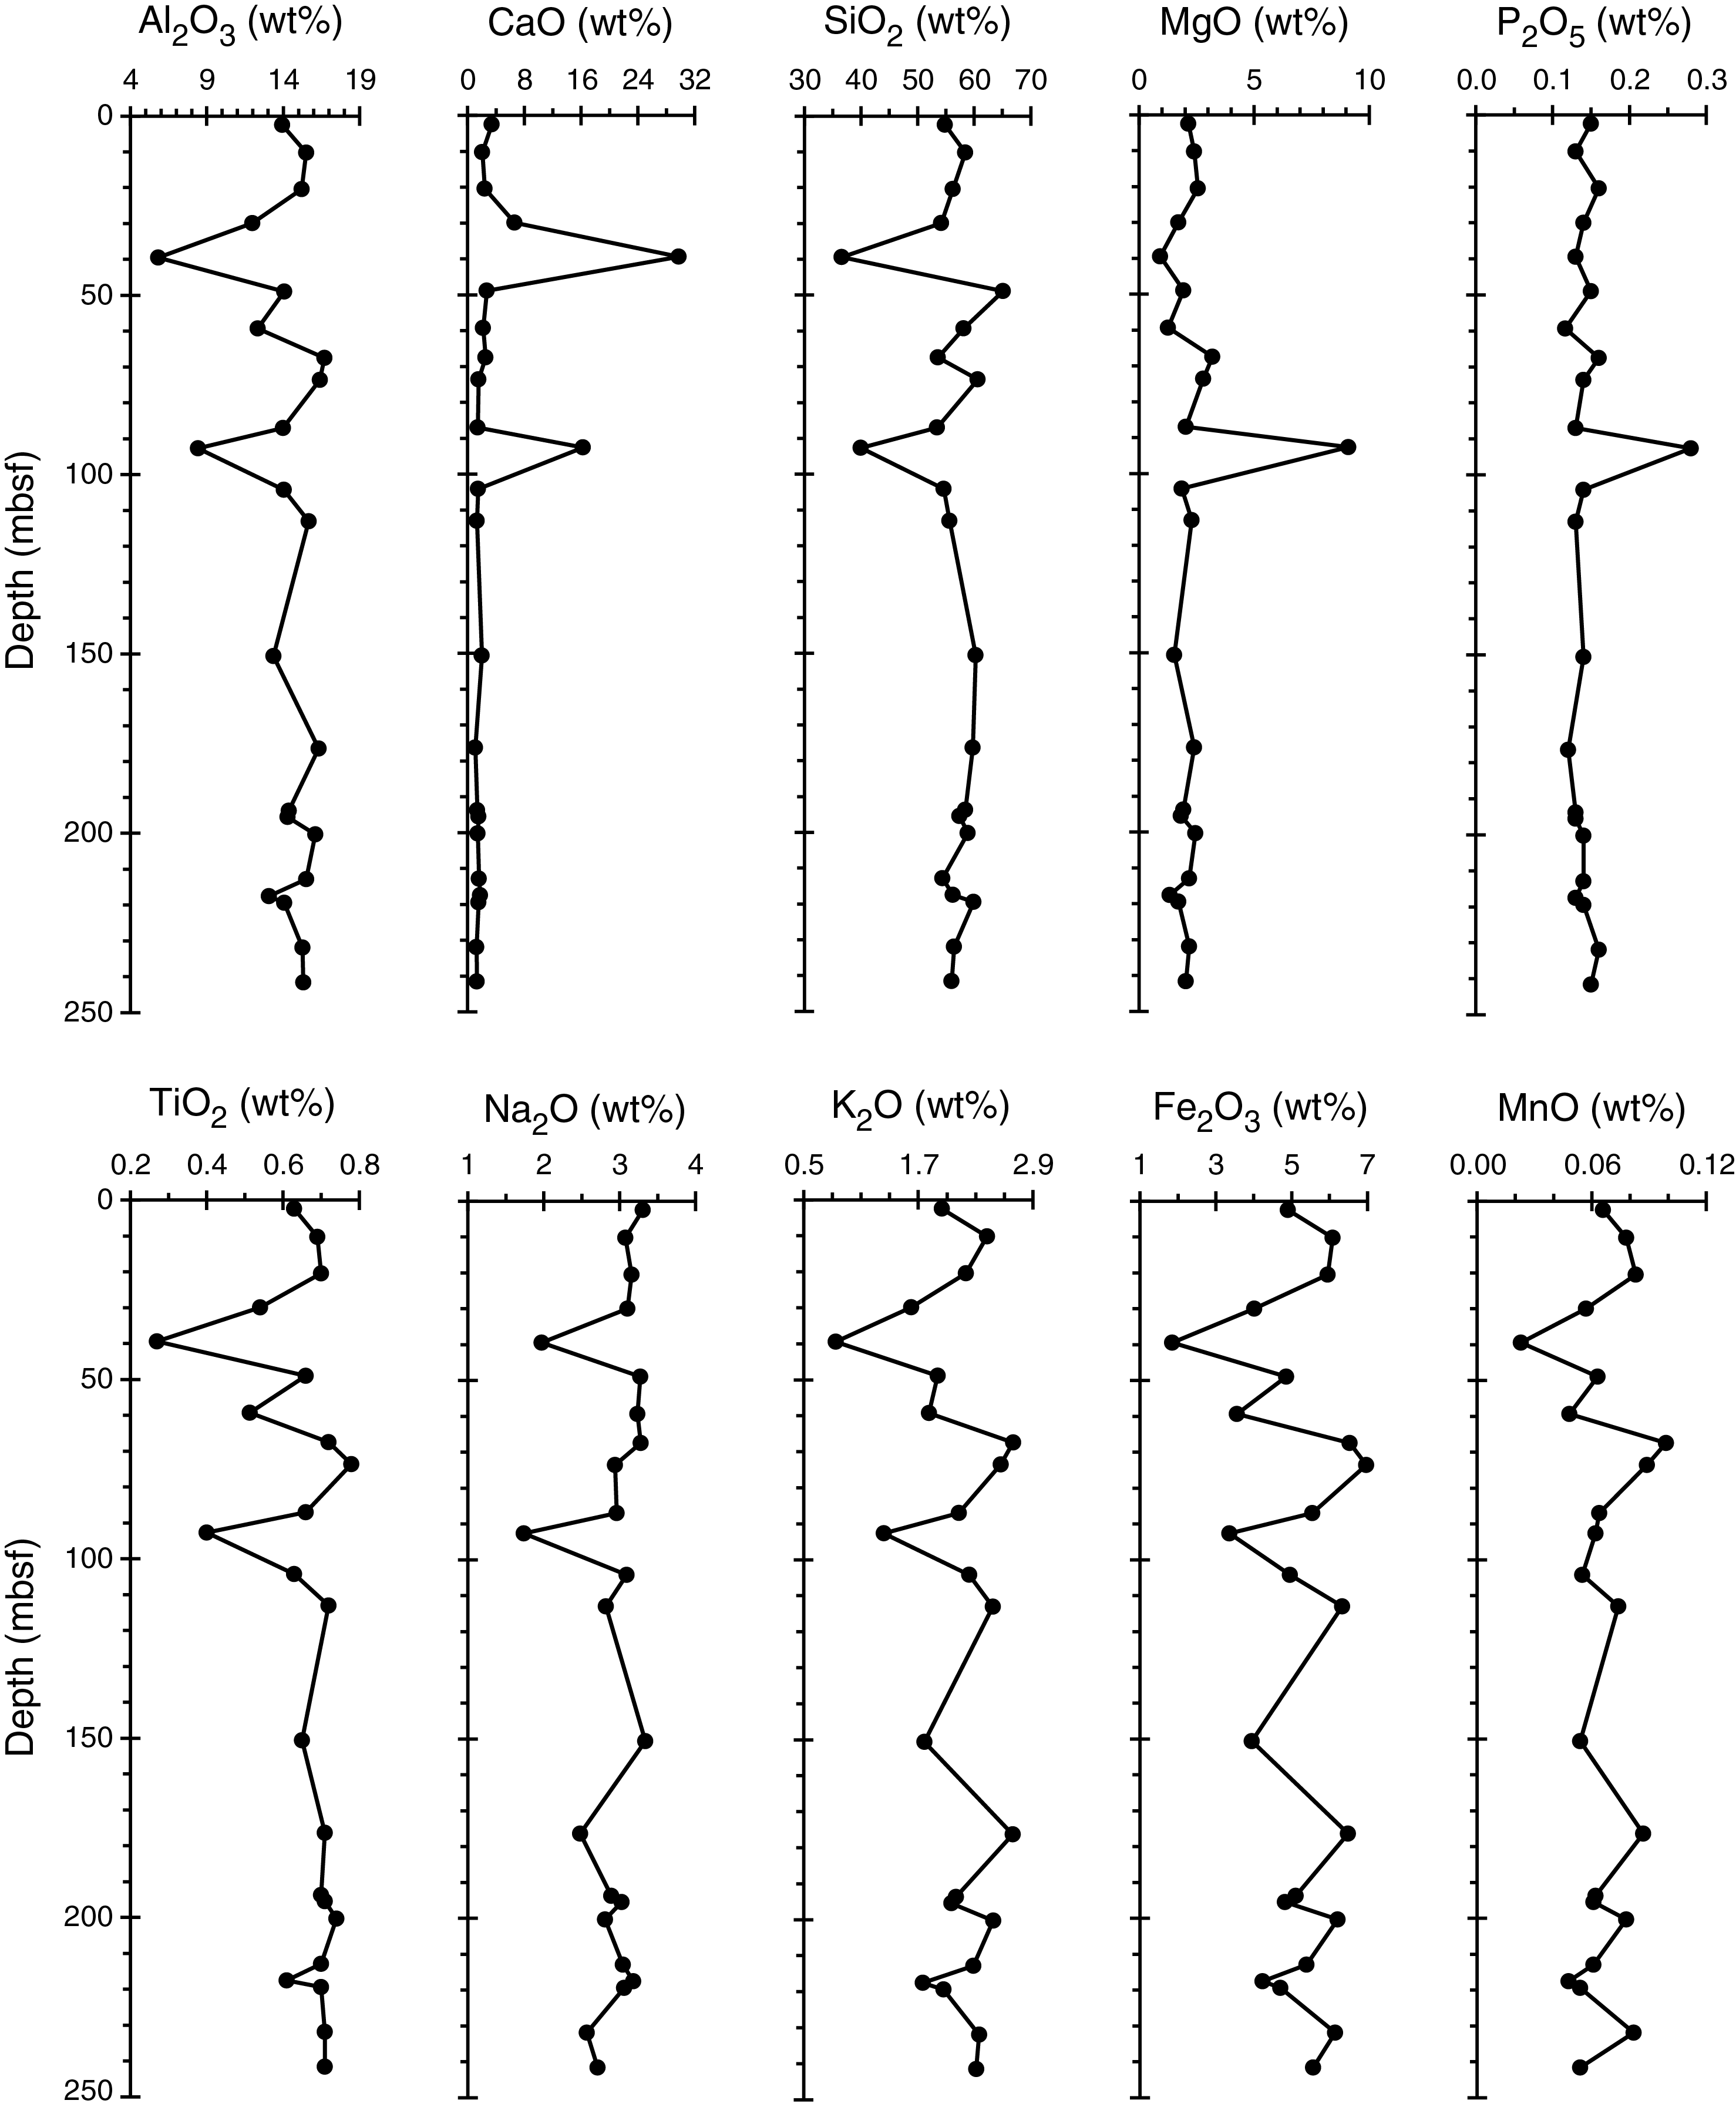
Figure F21. Bulk sediment major element compositions.
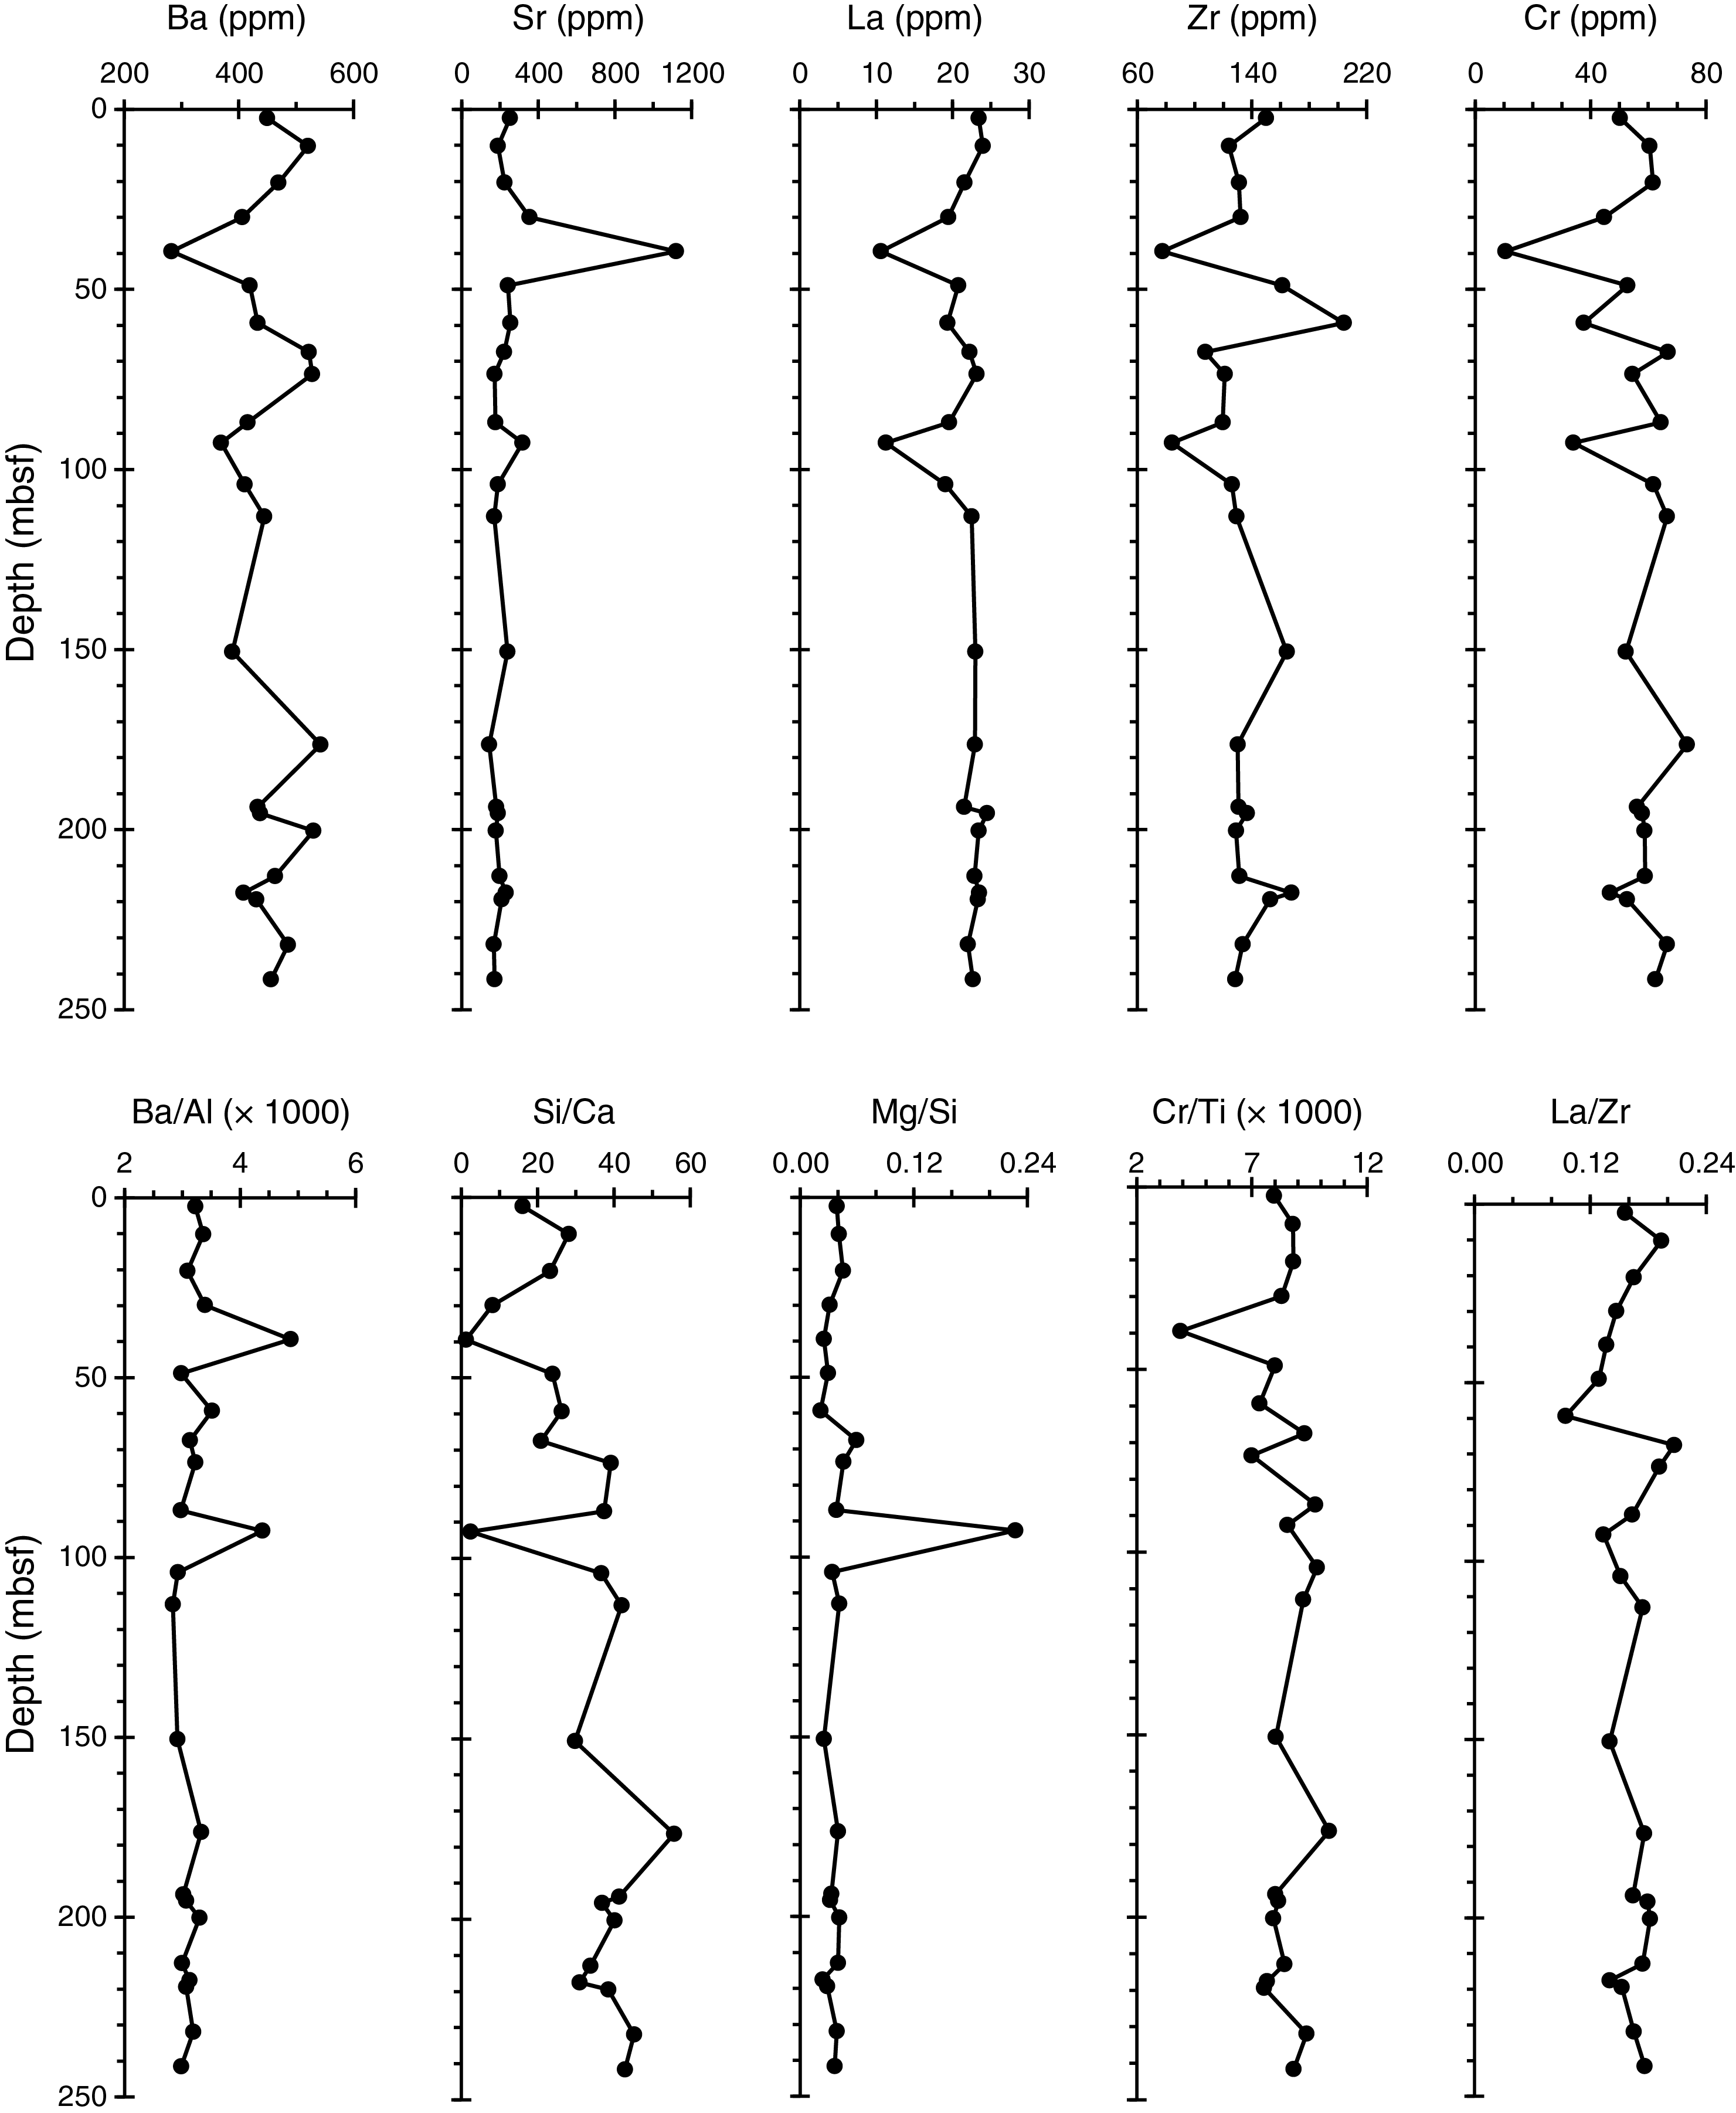
Figure F22. Sediment trace element compositions and elemental ratios.
Summary
Headspace gas analyses, IW chemistry, and bulk sediment geochemistry measurements were performed in Hole U1534A. Headspace gases show low methane and ethane concentrations in the upper 30 m of the hole; these concentrations increase downhole, reaching as high as 72,000 ppmv for methane and 15 ppmv for ethane. IW analyses delineate the presence of an SMTZ between 10 and 20 mbsf. The highest alkalinity values are seen directly below the SMTZ. Ammonium concentrations keep increasing downcore. Elevated barium concentrations follow the trends seen in alkalinity, and the highest dissolved Ba occurs below the SMTZ. TOC, TN, and CaCO3 contents range from 0.2 to 1.5 wt% throughout the hole. The TOC/TN ratios suggest marine-derived organic matter. Sporadic high CaCO3 contents were observed in the upper part of the sequence and are further characterized by lower MS and NGR values. Inorganic bulk sediment analyses equally reflect the largely terrigenous character of the sediments at Site U1534, and only two interspersed layers have elevated Ca indicative of carbonate and respective changes in all elemental concentrations and ratios. The most pronounced variability in sediment composition was observed in the upper 110 m, and invariant geochemical properties where found from 110 to 242 mbsf. The SMTZ at 20 mbsf has no direct expression in sedimentary elemental concentrations or ratios.
Physical properties
High-resolution physical property measurements were made on all cores and most core catchers from Holes U1534A–U1534D to provide basic information on sediment composition and variability. The Whole-Round Multisensor Logger (WRMSL) measured gamma ray attenuation (GRA) bulk density, MS, and compressional wave velocity (on the P-wave logger [PWL]) at 2.5 cm intervals. On whole-round cores, we also measured NGR at 10 cm intervals and thermal conductivity at one measurement per core. P-wave caliper (PWC) velocity was acquired in at least three sections per core, and more where possible, for Hole U1534A. On archive halves, point magnetic susceptibility (MSP) and color reflectance were measured mostly at 2.5 cm increments using the Section Half Multisensor Logger (SHMSL) and digital color imaging was completed with the Section Half Imaging Logger (SHIL). Additionally, we took discrete samples from Hole U1534A for moisture and density (MAD) measurements (1–3 samples per core; ideally samples that represent the sections and different sediment nature) to determine water content, wet bulk density, dry bulk density, porosity, and grain density.
Whole-Round Multisensor Logger measurements
Results from WRMSL measurements for Holes U1534A and U1534C are compiled in Figures F23 and F24. We measured high-resolution data for all cores and the majority of the core catchers. For Hole U1534A, cores rested for about 4 h before measurement to adjust to room temperature (~20°). For Sections 382-U1534C-1H-1 through 10H-2 and for stratigraphic correlation purposes, the WRMSL was run twice; the first time was as soon as the cores came into the laboratory, and the second time was after the cores had equilibrated to ambient temperature. Data presented in the figures include anomalies, such as unrealistic density and velocity measurements (e.g., density < 1.05 g/cm3 and velocity < 1800 m/s), caused by the effect of internal cracks (created by core expansion in the laboratory) in the core on the velocity and density measurements.
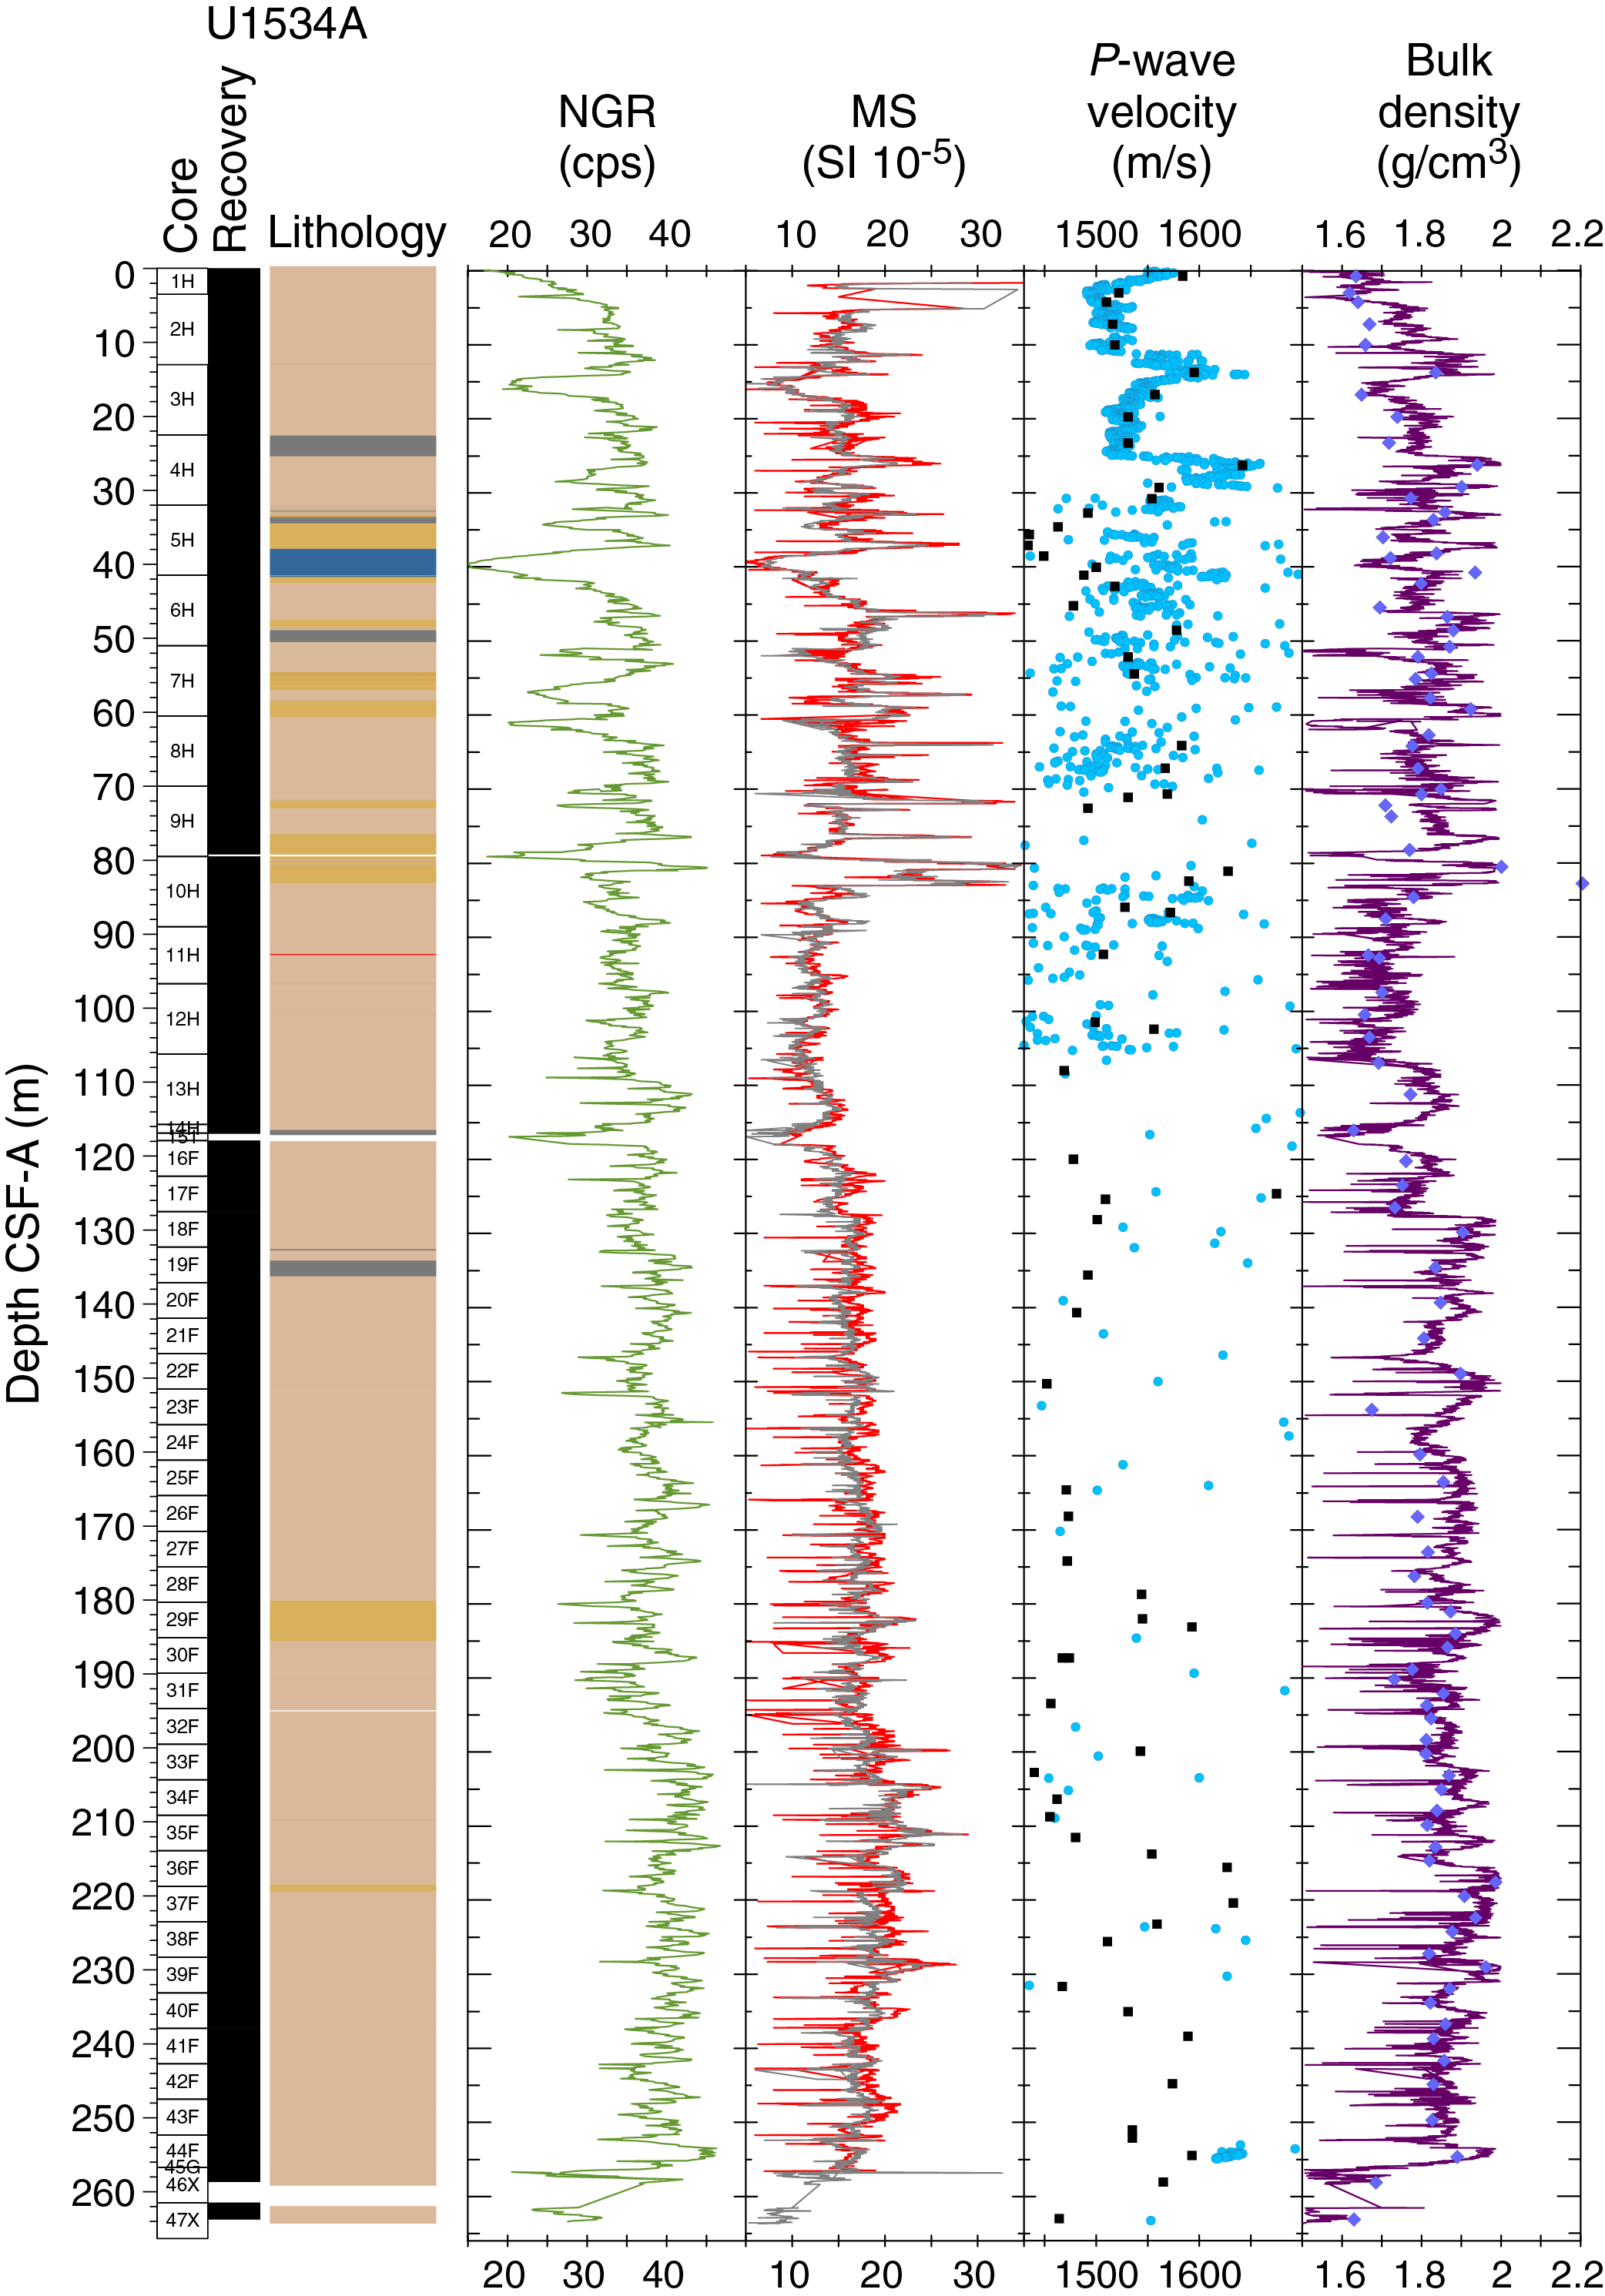
Figure F23. Physical properties, Hole U1534A.
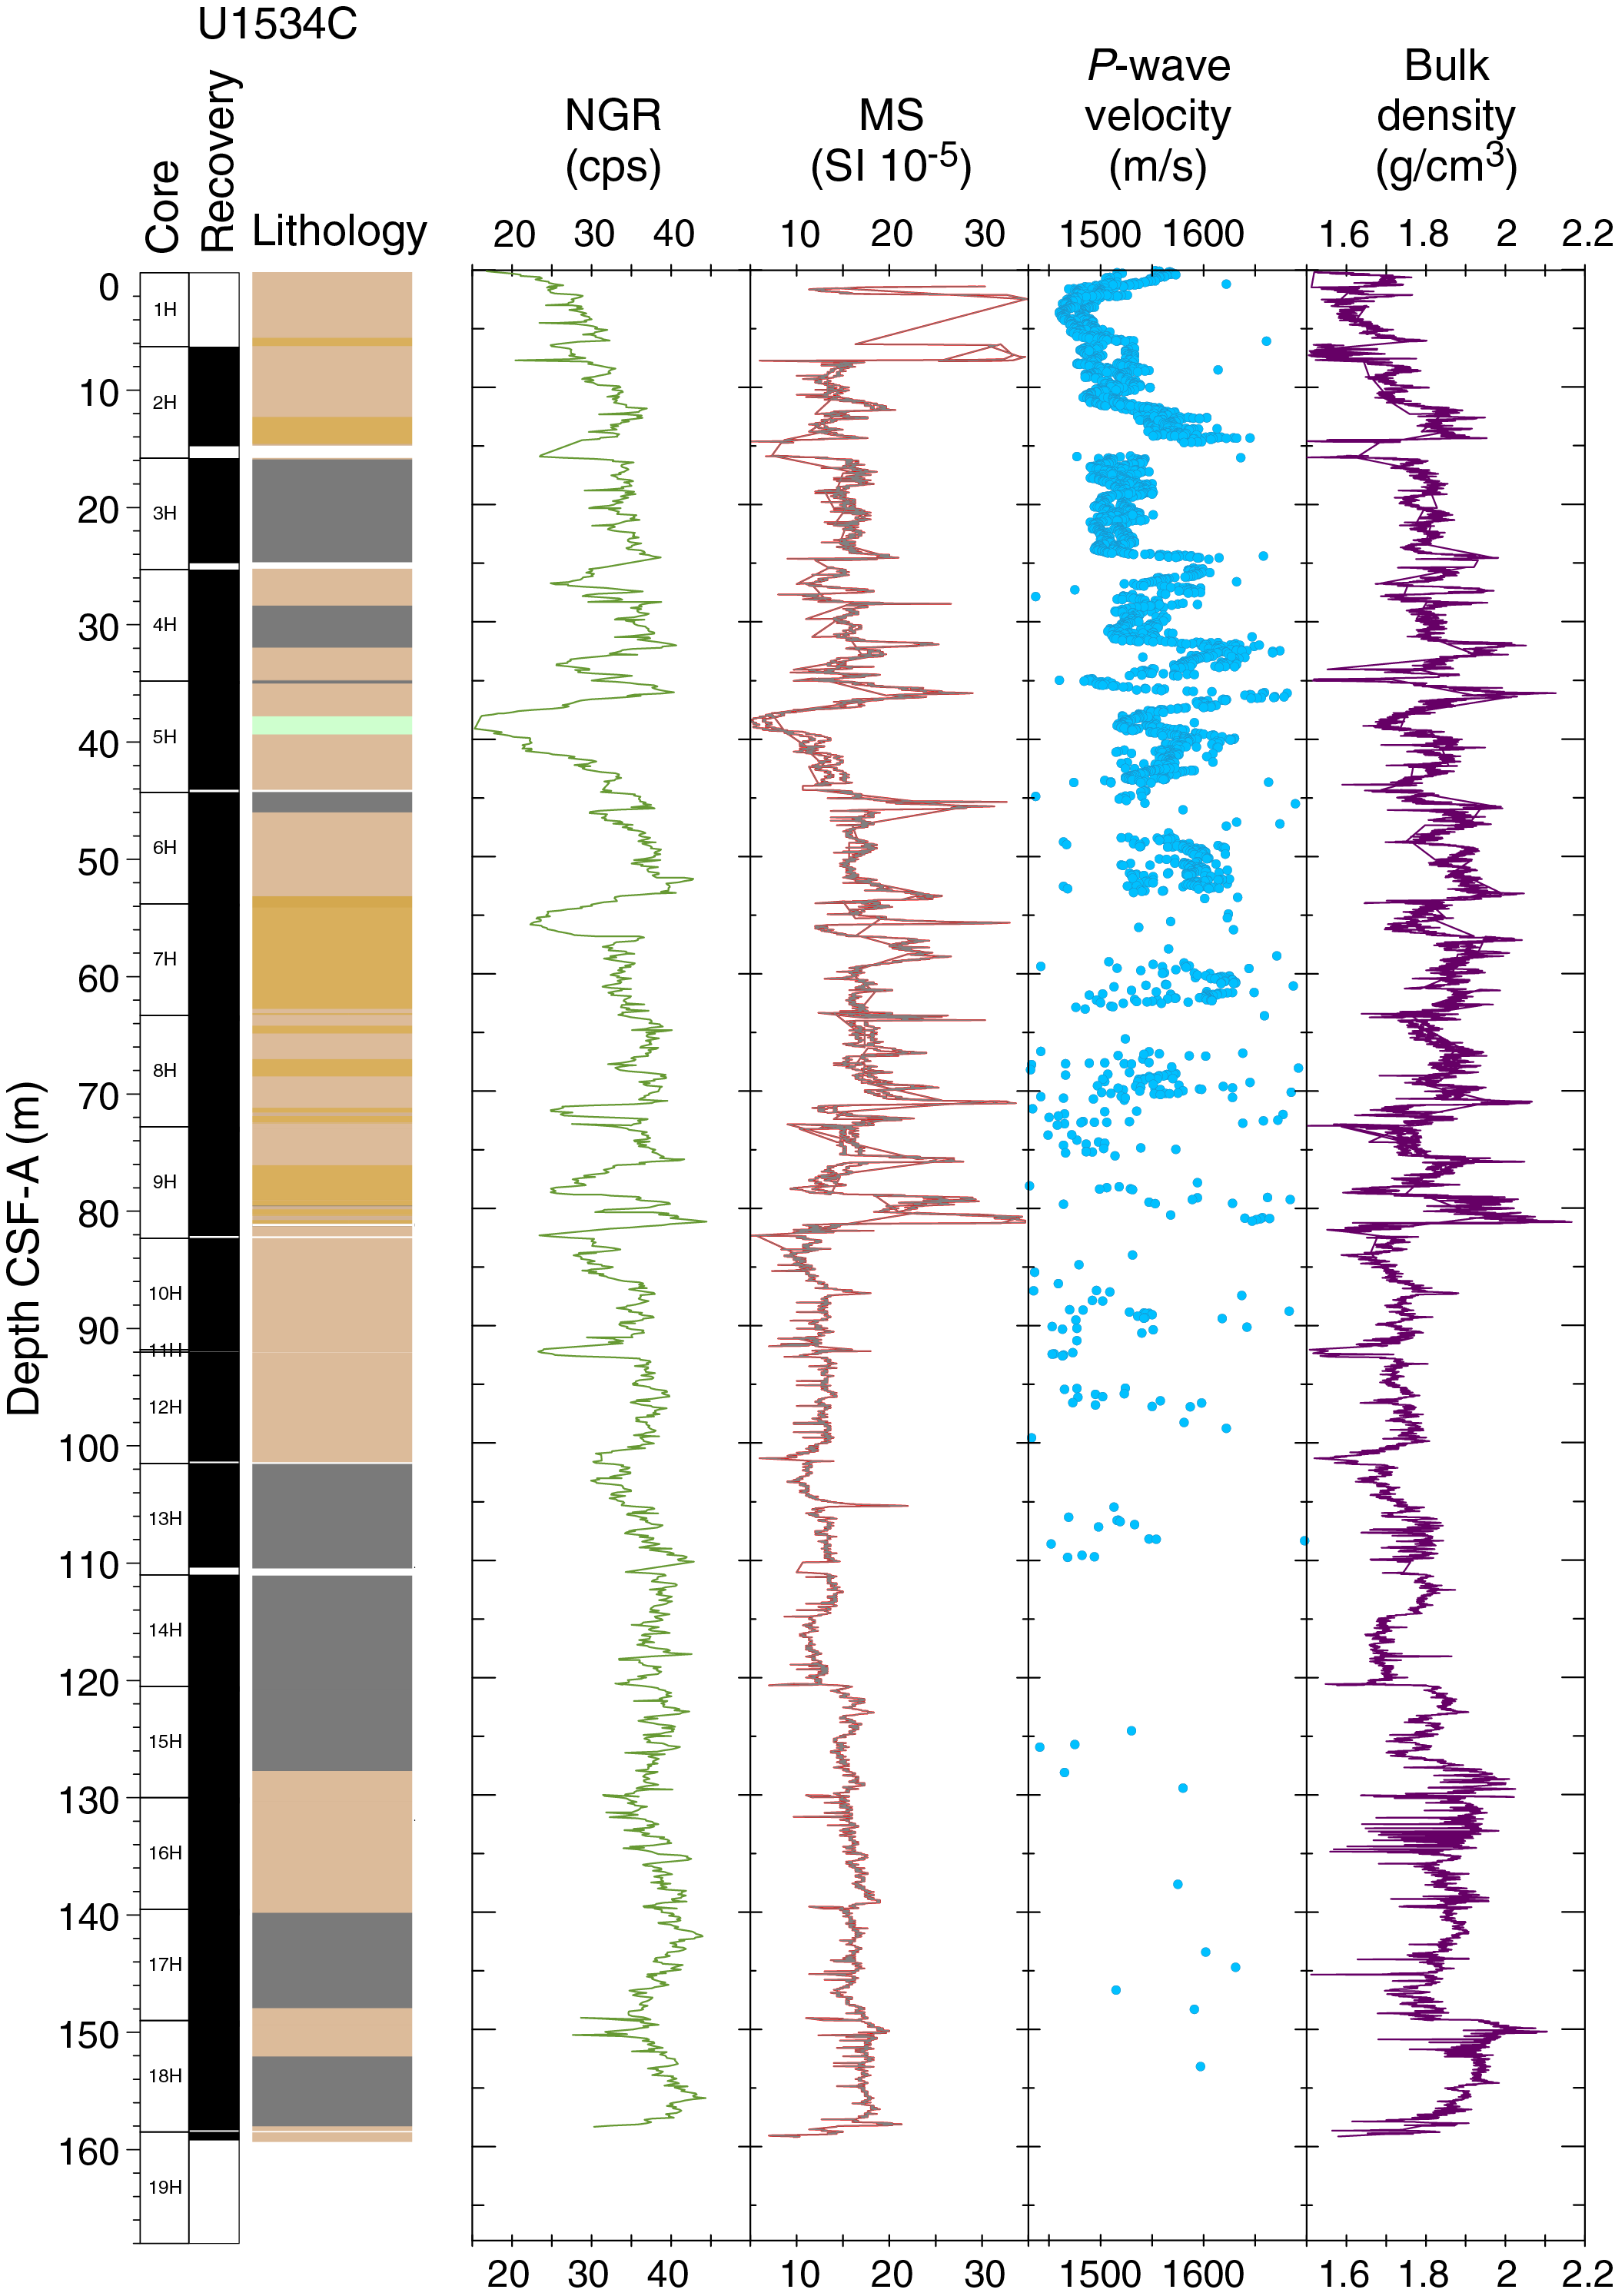
Figure F24. Physical properties, Hole U1534C.
Gamma ray attenuation bulk density
Wet bulk density values range from 1.5 to 2.2 g/cm3 and have a mean value of 1.8 g/cm3. The lowest GRA density values are found in Section 382-U1534A-10H-3 through Core 12H (79.5–106 mbsf), whereas the highest GRA density values are located in the upper sections of Core 10H and from Core 22F downhole. (Figures F23, F24). A generally positive linear relationship is found between GRA density values and NGR counts as well as between GRA density values and MS (Figure F25).
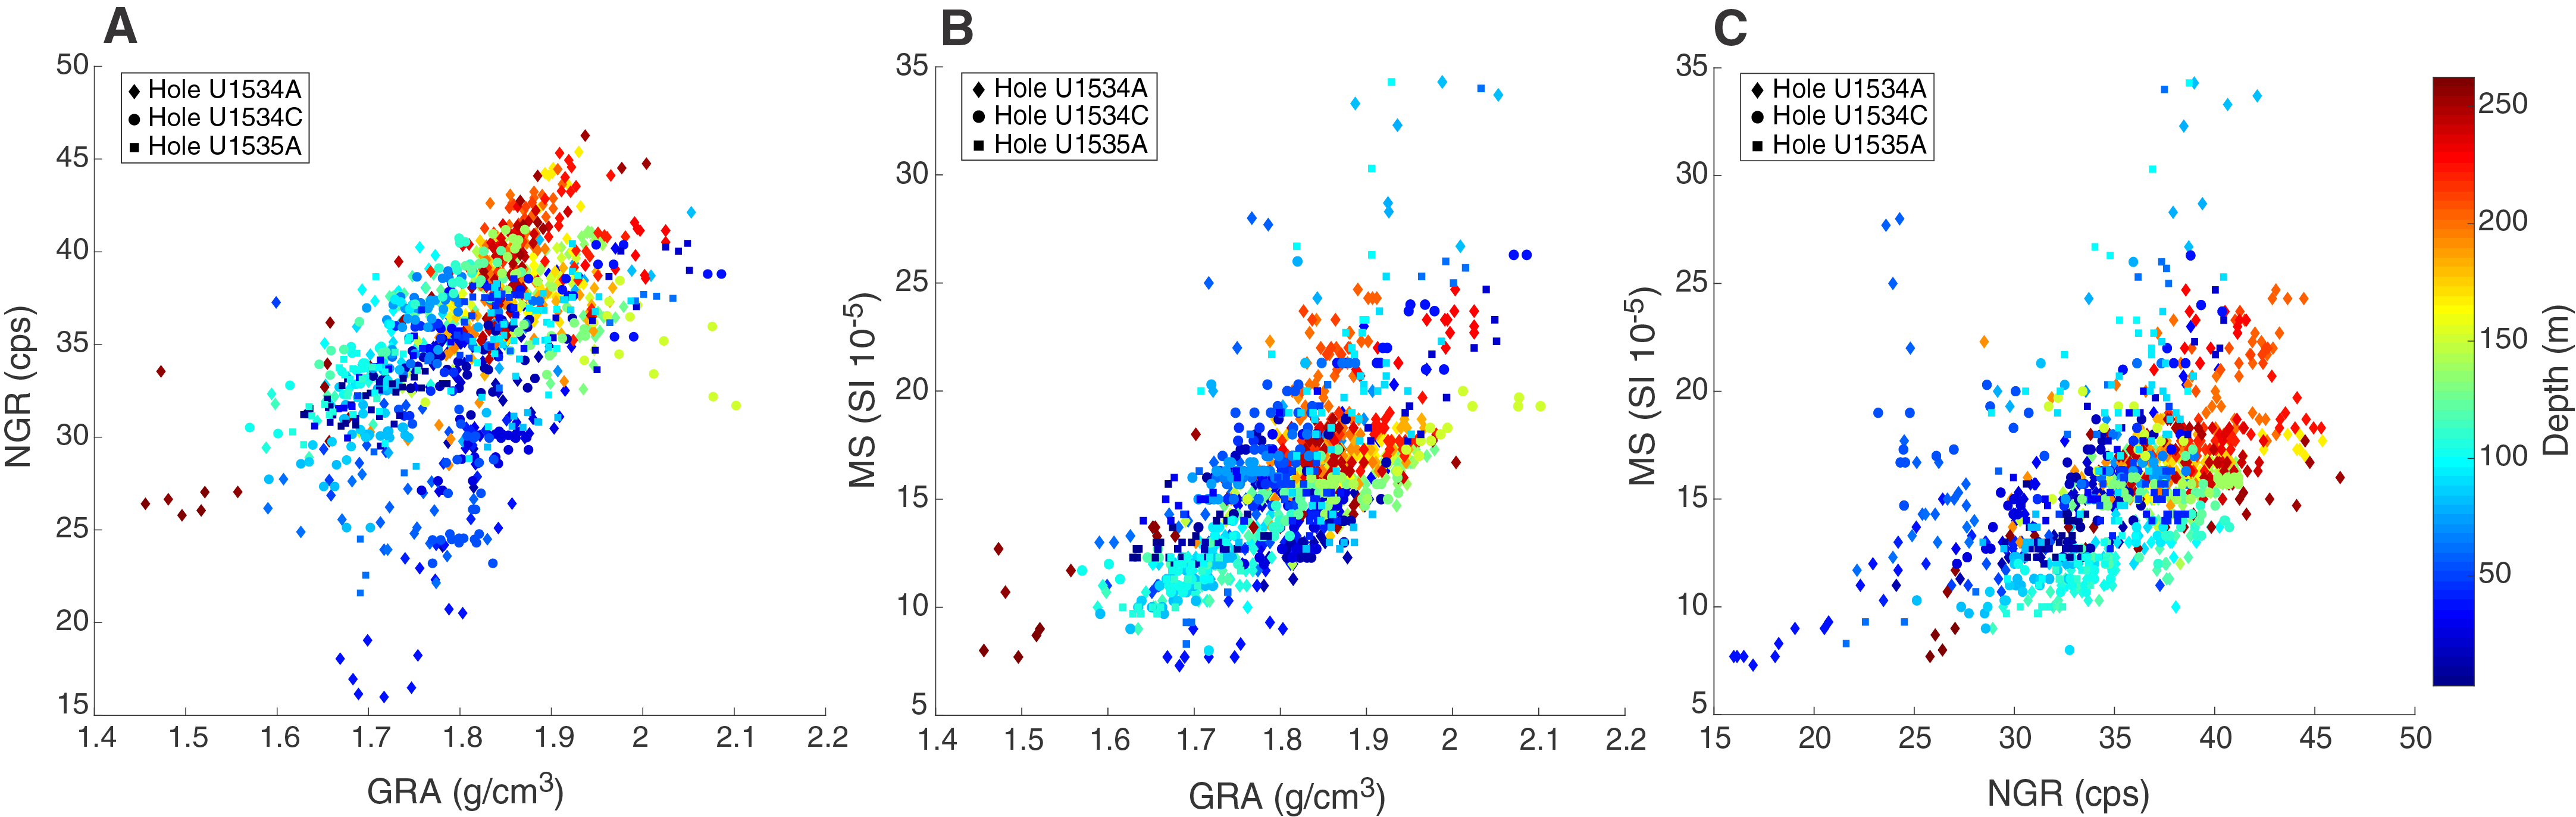
Figure F25. NGR, GRA, and MS, Sites U1534 and U1535.
Magnetic susceptibility
MS values range from 6 × 10⁻⁵ to 46 × 10−5 SI through most of the cores from Site U1534, with the exception of the uppermost 6–7 m of the holes, which recorded more elevated values as high as 128 × 10−5 SI (note that figure axes are cropped at 35 × 10−5 SI to optimize resolution for the majority of the record). Down to the hiatus associated with Reflector B (~83 mbsf; Section 382-U1534A-10H-3), MS exhibits variability with an amplitude of ~10 × 10−5 to 20 × 10−5 SI that likely reflects glacial–interglacial cyclicity. A prominent minimum in MS measured in Core 5H is associated the carbonate-rich interval interpreted to be MIS 11 (see Chronostratigraphy). The interval associated with the hiatus at Reflector B (~83 mbsf; Section 10H-3) corresponds to a positive anomaly in MS. Below the hiatus, maximum MS values do not exceed 29 × 10−5 SI; in addition, the amplitude of MS variability decreases and the cycles appear to become shorter in length. Generally, we observe a positive linear correlation in the variability of all the physical properties determined with the WRMSL when color-coded against depth. A general linear increase is found for MS and NGR with depth (Figure F25).
P-wave velocity
Realistic P-wave velocities measured on the PWL range from 1400 to 1700 m/s. Velocity measurements are generally meaningful for the uppermost cores (through Core 382-U1534A-4H), but the measurements for deeper cores often do not yield valid velocity values because of expansion in the sediments after they were taken out of in situ conditions. Expansion can be seen as cracks in the X-radiograph images, and it continued over a few hours as the cores equilibrated to room temperature. After Section 382-U1534C-10H-2, we decided to measure P-wave velocities with the WRMSL as soon as possible after the cores arrived to lessen the effects of expansion.
Natural gamma radiation
At Site U1534, NGR values vary between 15 and 47 counts/s. Cyclic variability in tune with the MS record suggests that NGR is sensitive to glacial–interglacial cycles in Cores 382-U1534A-1H through 10H, and MIS 11 was identified from a prominent minimum value in Core 5H. As with the MS record, the amplitude of NGR variability decreases below the hiatus at ~83 mbsf (Section 10H-3) (Figures F23, F24).
Thermal conductivity
Thermal conductivity varies between 0.89 and 1.8 W/(m·K) in Holes U1534A and U1534C (Figure F26). A clear positive trend with depth occurs through Core 382-U1534A-7H (60.5 mbsf), and then an abrupt decrease below Core 7H with lower though variable values is maintained until the bottom of the hole. The average thermal conductivity observed is 1.8 W/(m·K), with no clear dependence on sediment facies. The lowest values were measured in Cores 12H and 13H (96–116 mbsf) where tephra layers were found (see Lithostratigraphy). The highest values occur in Core 7H. Thermal conductivity measurements were combined with borehole temperatures for heat flow estimates (see Downhole measurements).
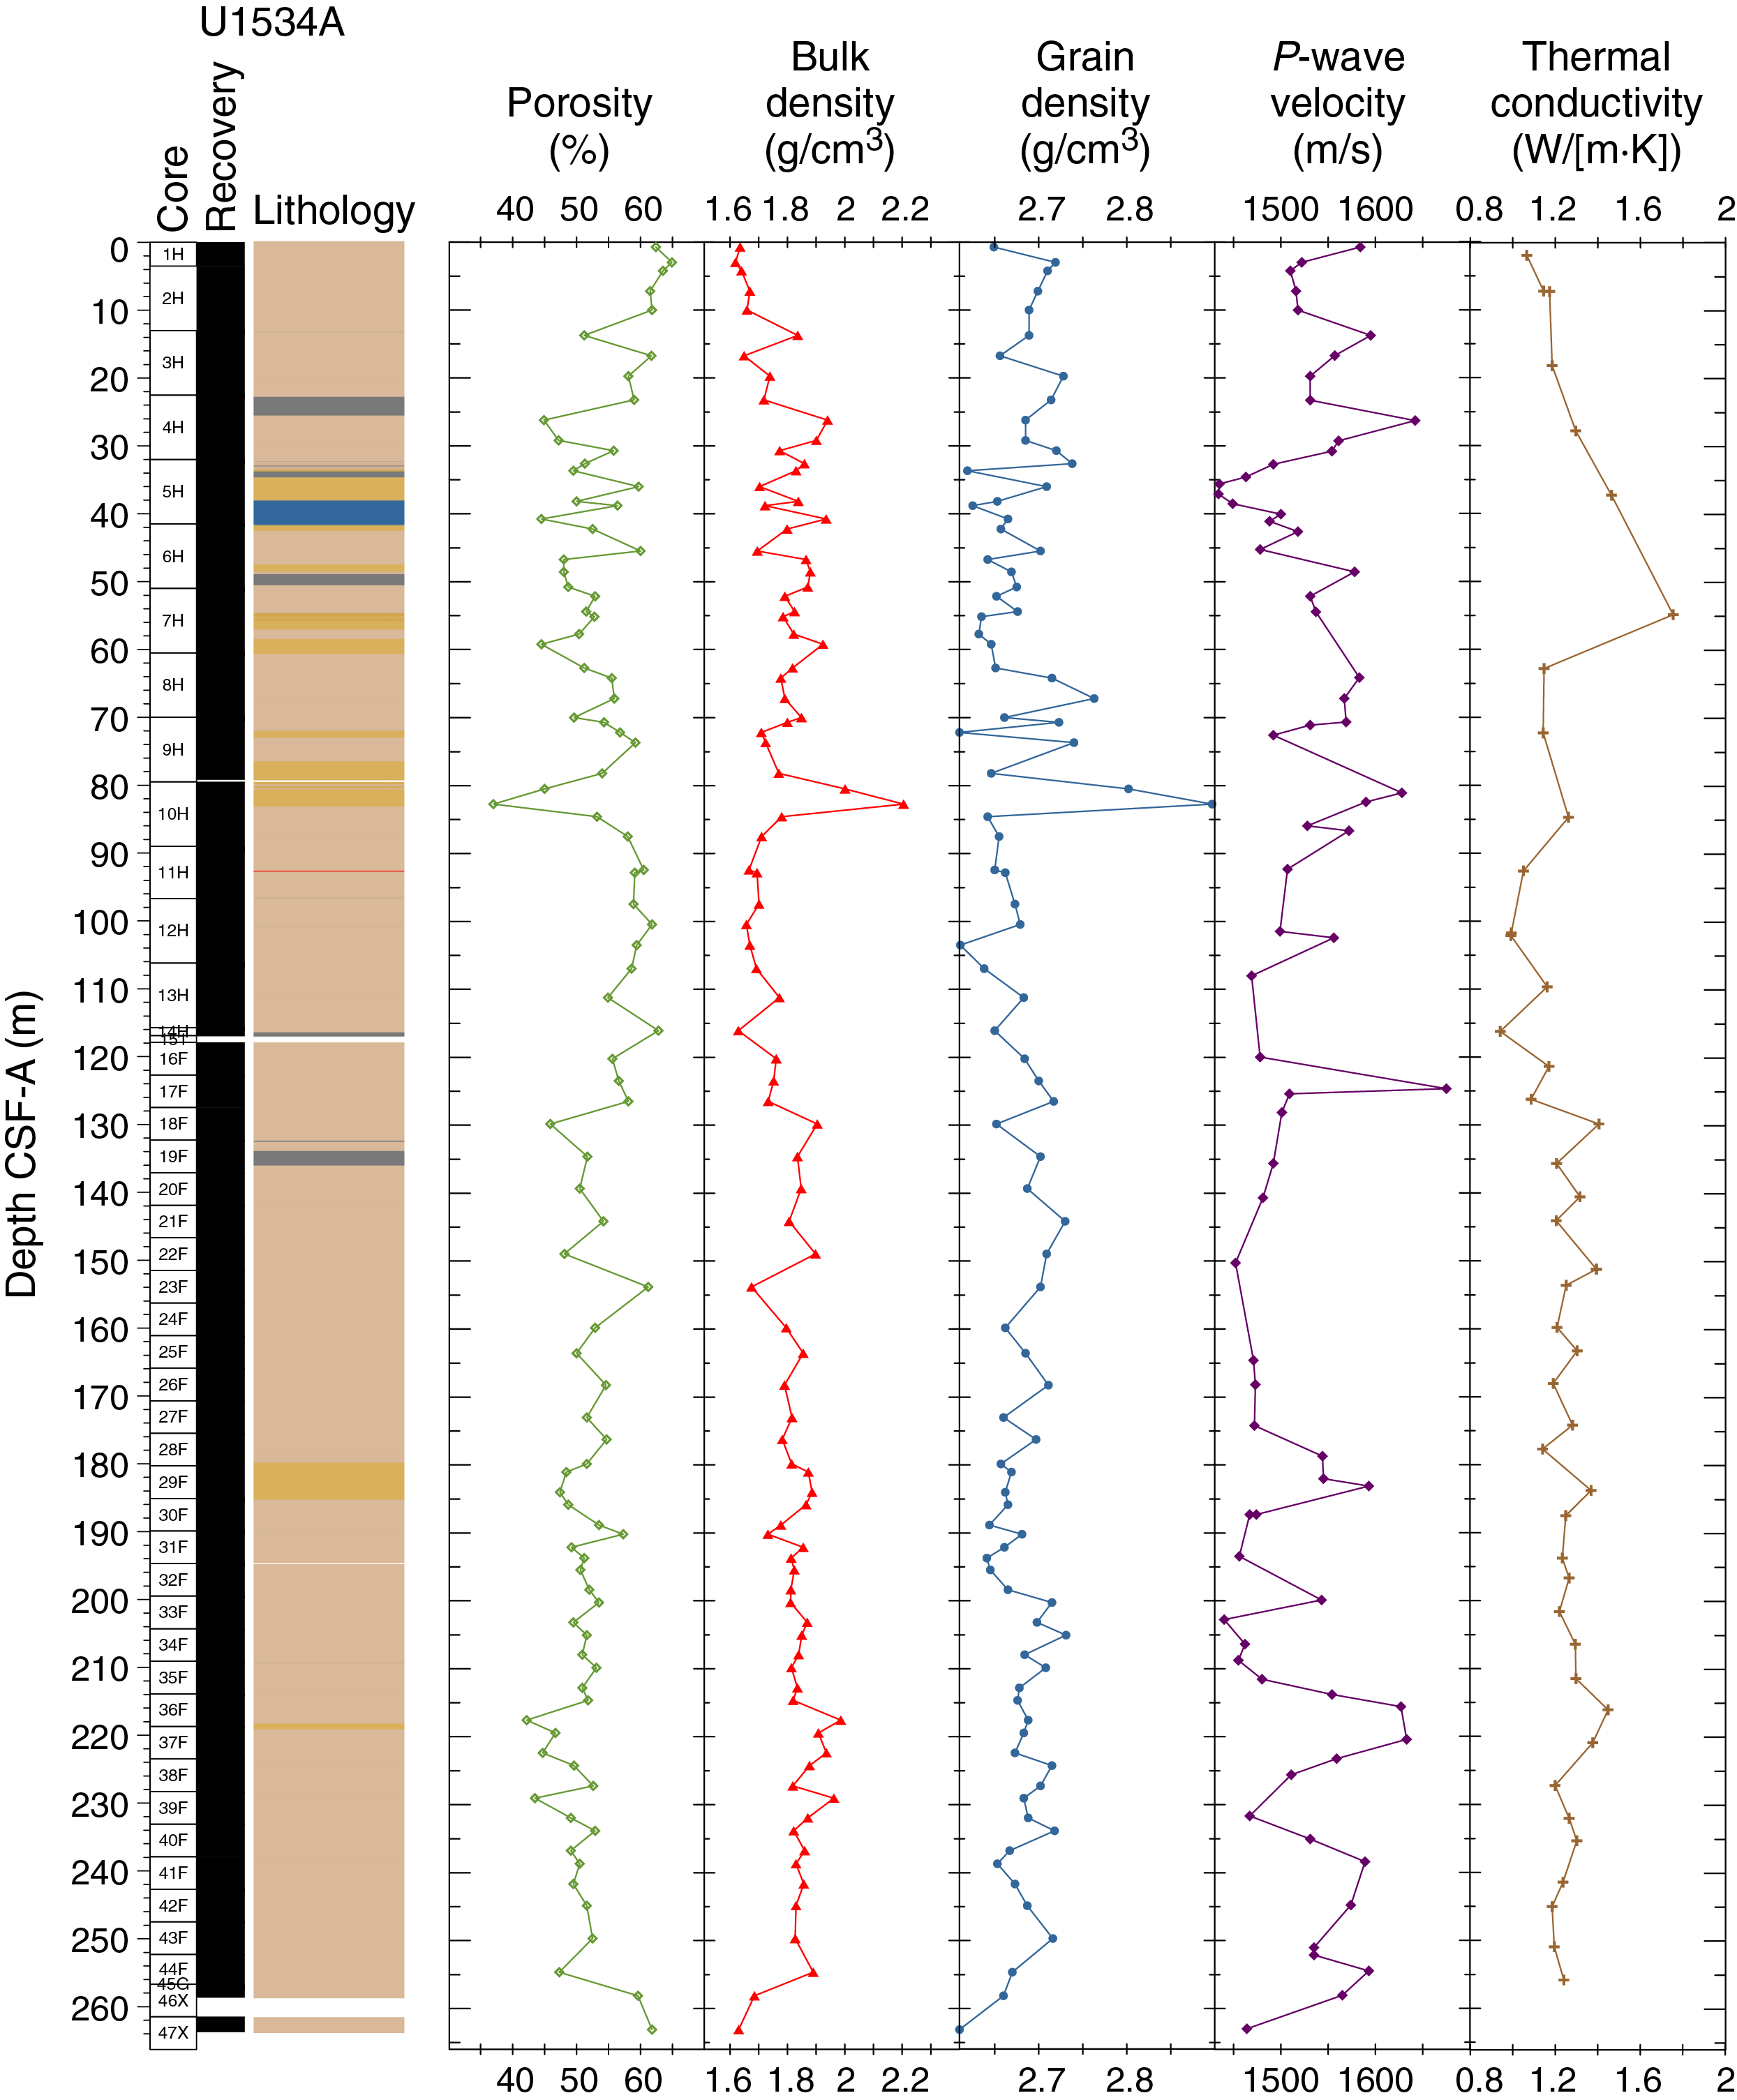
Figure F26. MAD results.
Point magnetic susceptibility
MSP measurements were performed on archive halves. Results agree with the WRMSL MS data (Figures F23, F24). MSP measurements were mostly acquired at 2.5 cm, the same resolution as the WRMSL, except for a few cores in Hole U1534C where the resolution was reduced to 5 cm to speed up the workflow. Improvements in the operation of the instrument allowed us to increase the measurement resolution back to 2.5 cm to match the WRMSL data. In some cases, higher variability is observed with this instrument because of the smaller integration volume of the sensor (~1 cm depth interval; 1σ) compared to the loop sensor (~18 cm depth interval; 1σ) used on the WRMSL (Weber et al., 1997).
Discrete compressional wave velocity
P-wave velocities measured on working halves with the caliper are believed to be more robust than the P-wave data yielded by the WRMSL, which are much more scattered below Core 382-U1534A-4H (Figure F23). We measured one discrete point in at least three sections per core where possible. Measurements were extremely difficult to obtain in some cores, assumably because of poor contact between the sensors, the liner, and the sediments. We used acid-buffered distilled water on some occasions to achieve a better coupling of the sensors to the sediment. High-amplitude variability in P-wave velocity data is seen in Core 5H and between Cores 35F and 39F (209–233 m/s). The highest realistic values (~1630 m/s) are in Cores 4H, 17H, 36F, and 37F, and the lowest values (~1320–1420 m/s) are in Cores 9H, 16H, 18H, and 36F (Figure F23). No caliper measurements were run for Hole U1534C.
Moisture and density
Water content, porosity, and wet and dry bulk densities are interdependent. Bulk density measurements were taken for Hole U1534A. Bulk density values were calculated from moisture and volume measurements made on discrete samples taken from the working halves (see Physical properties in the Expedition 382 methods chapter [Weber et al., 2021]). The sample resolution in each core varied depending on lithology, recovery, and quality, and at least three samples per APC core were recovered. A total of 95 samples were taken for MAD measurements.
MAD density values correspond well to GRA bulk density values measured on the WRMSL for Hole U1534A (Figures F23, F26). Bulk density typically varies between 1.6 and 1.9 g/cm3. An anomalously high bulk density of 2.2 g/cm3 is recorded at 83 mbsf; it corresponds to the positive anomalies in NGR and MS associated with the hiatus at Reflector B. Below the hiatus at ~83 mbsf, bulk density values vary between ~1.6 and 2.0 g/cm3.
Grain density typically varies between 2.60 and 2.75 g/cm3 through Hole U1534A (Figure F26). An anomalously high grain density value (2.9 g/cm3) occurs at ~83 mbsf along with positive anomalies in bulk density, NGR, and MS associated with the hiatus at Reflector B.
Porosity (percent of pore space of the wet sediment volume) is included in the suite of MAD measurements and indicates a general downhole decrease in volume percent. Discrete porosity values range from ~65% near the top of Hole U1534A to ~50% near the bottom of the hole (Figure F26). A porosity minimum of <40% is associated with the hiatus at ~83 mbsf.
Color reflectance
L*a*b* color reflectance measurements describe coordinates in a spherical system with 16.8 million possible variations (for details, see Weber, 1998; Blum, 1997). Color reflectance shows noisy cyclic variability of all three color components downcore. The L* axis measures the black–white color component and is known as the lightness or gray value. It can be a reliable tracer for the content of biogenic carbonate in marine sediment (Weber, 1998). At Site U1534, L* varies between 30 and 48. Cores 382-U1534A-5H and 382-U1534C-4H (~40 mbsf; inferred to be MIS 11) exhibit the highest L* values (Figures F27, F28). The amplitude of L* variability is greater above the hiatus at ~83 mbsf than below it. The hiatus itself in Section 382-U1534A-10H-3 is associated with the lowest L* values recorded at this site.
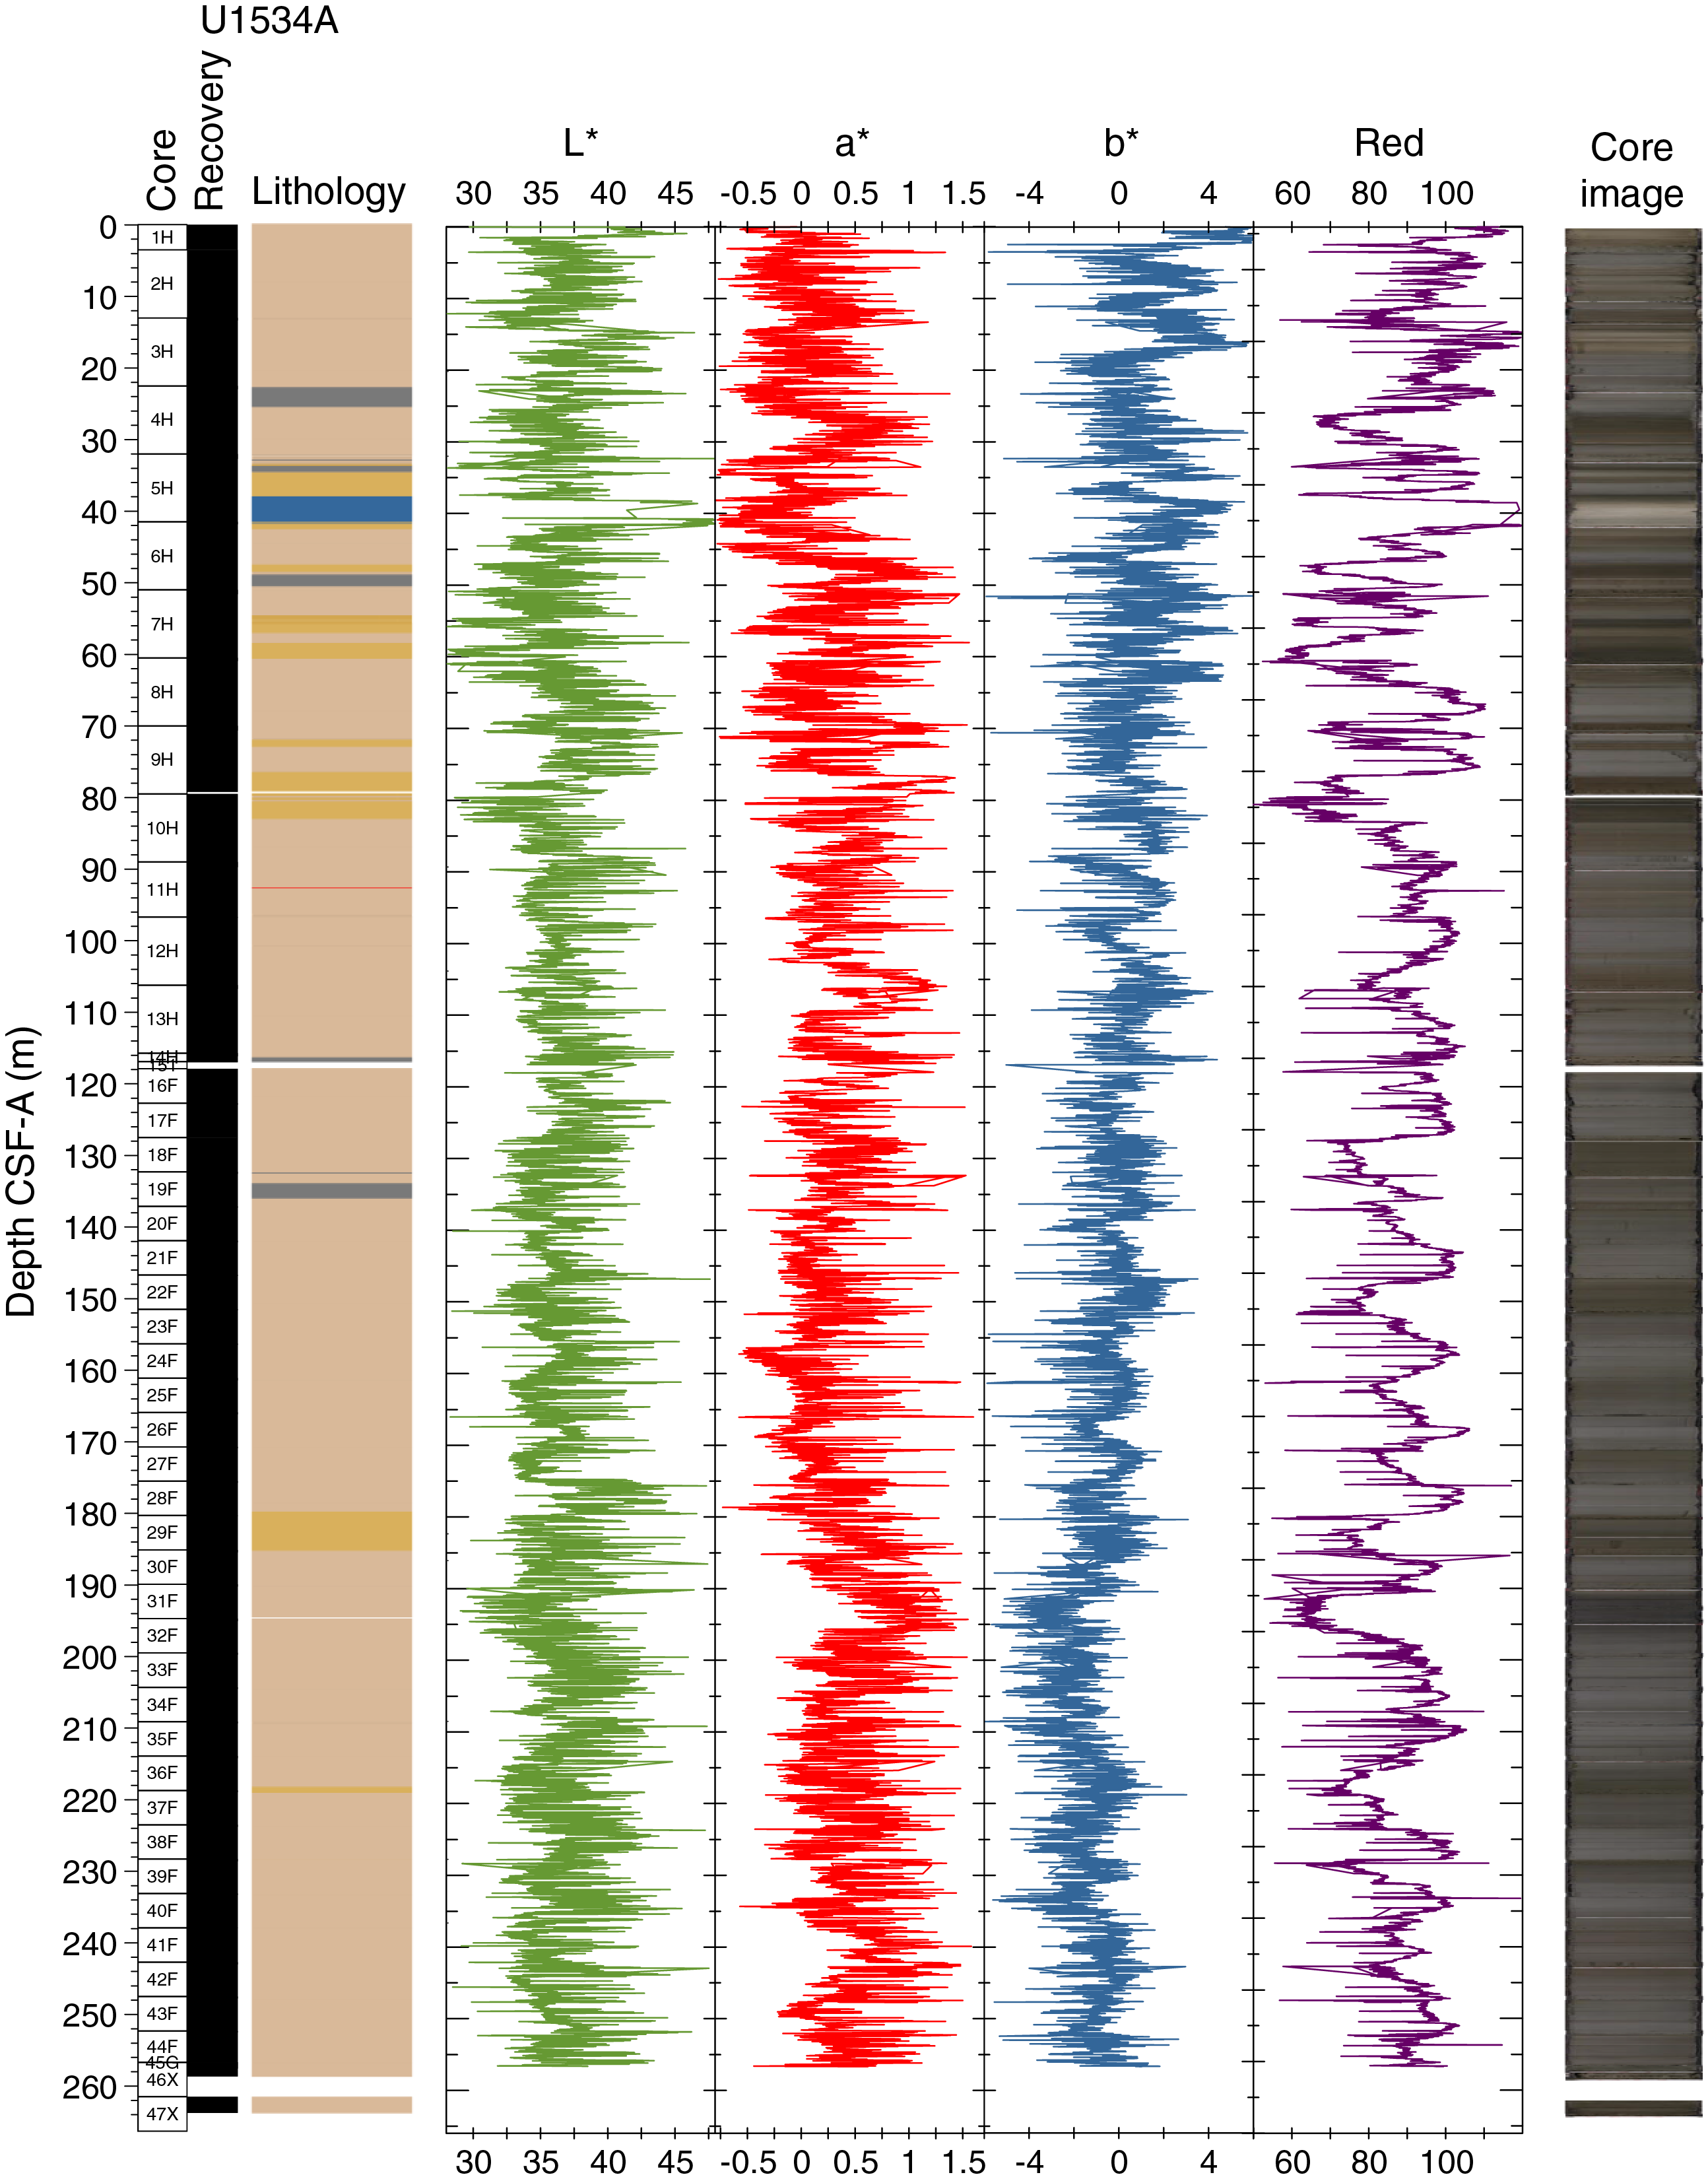
Figure F27. Color reflectance, Hole U1534A.
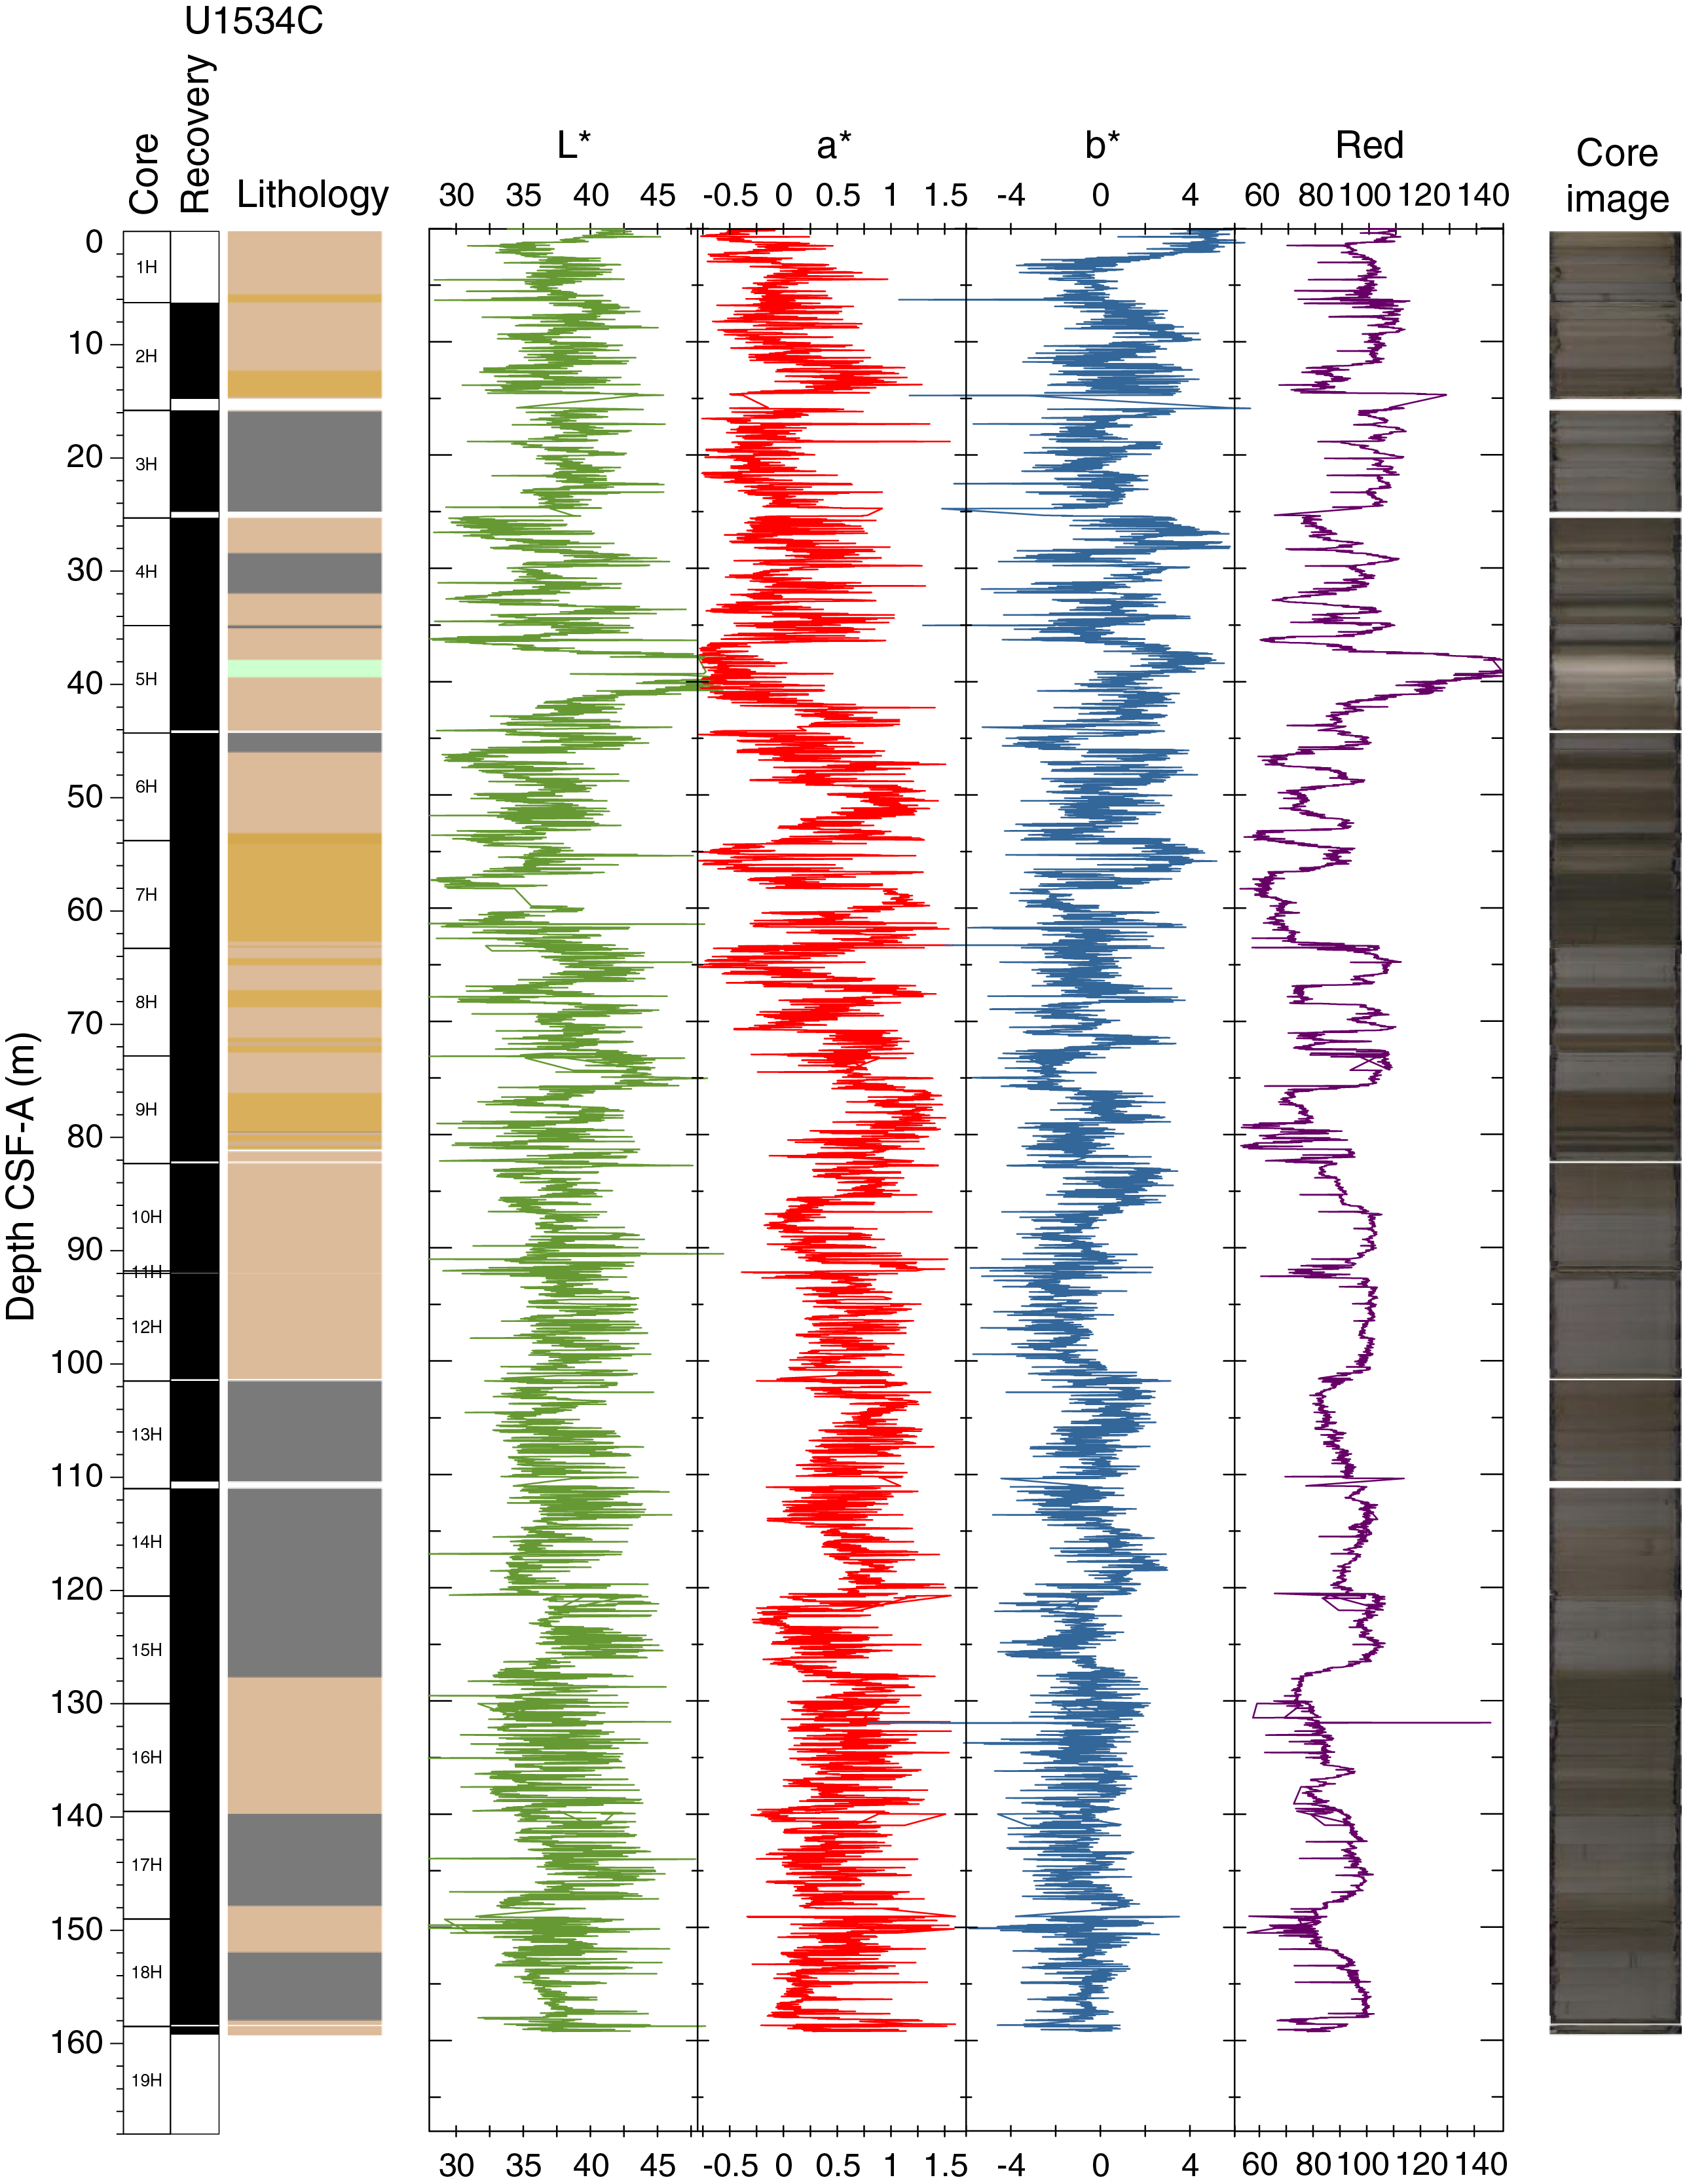
Figure F28. Color reflectance, Hole U1534C.
The a* axis is the green–red component and is often used as an indicator of changing redox conditions in the sediments, but in these sediments a* may be influenced by the relative content of glauconite in the sediments. For Holes U1534A and U1534C, a* values show distinct cyclic variations downcore with values between −0.5 and 1.5. a* exhibits enhanced amplitude variability, and lower minimum values are observed above the hiatus at ~83 mbsf. A minimum in a* is associated with the pale green carbonate-rich sediments of MIS 11 at ~40 mbsf.
The b* axis is the yellow–blue component, and it shows a cyclical variation along an overall decreasing trend downhole. b* is commonly used as a proxy for biogenic opal content (Sprenk et al., 2013) because high biogenic opal tends to make the sediment appear more yellow. Thus, the overall downhole decreasing trend in b* at Site U1534 may be interpreted to reflect a decrease in biogenic opal with depth. The highest b* values are found in Cores 382-U1534A-1H and 3H.
Physical properties and relationship with facies
In general, the sediments at Site U1534 are composed of silty clay and clayey silt. Much of the sequence is described as biosiliceous-bearing silty clay with abundant diatoms and sponge spicules. The majority of the samples measured have carbonate concentrations <1%; however, there are layers rich in foraminifers and nannofossils where carbonate composes as much as 50% of the sediment (e.g., the pale green interval in Core 382-U1534A-5H interpreted to be MIS 11). Layers with high percent CaCO3 (MISs 5e and 11) are associated with prominent minima in NGR, GRA bulk density, and MS. Some tephra layers were identified, and smear slides and sieved samples have abundant volcanic glass shards; however, it does not appear that they are clearly identifiable with physical property measurements. Additionally, abundant glauconite was found in the cores, and variations in the abundance of glauconite may influence the color/light measurements. It is most likely that the physical properties, at least in the mid–late Pleistocene, responded to variations in the proportion of biogenic and terrigenous content.
Two notable stepwise decreases in MS intensity and variability occur with depth. The first decrease occurs at ~7 mbsf in all Site U1534 holes and is likely due to magnetic mineral diagenesis including dissolution of iron oxide ferromagnetic minerals during early burial (see Paleomagnetism). The second stepwise decrease in MS intensity and variability occurs in Core 382-U1534A-10H coincident with a 1.8 My hiatus associated with Reflector B (see Chronostratigraphy). The muted cyclic variability in MS, NGR, and GRA density below ~83 mbsf may reflect the less pronounced variability of late Pliocene climate cycles.
Core disturbances and data quality
Core recovery was typically 100% except when we encountered a hard layer around 118 mbsf. This layer was correlated with a prominent reflector in Seismic Unit 2A. Although the core barrel was advanced, Core 382-U1534A-15H had no recovery. Overall, data quality and recovery were good at this site except for the PWL measurements that were affected by cracks that originated from core expansion, especially in cores recovered deeper than Cores 382-U1534A-4H and 382-U1534C-4H. In addition, because of the use of double liners to fix imperfections or cracks in many of the recovered cores, we were not able to X-ray image all cores. Similarly, WRMSL measurements were not possible in a few of the cores.
Summary
Physical property data were acquired on all cores from Site U1534 using the WRMSL for GRA wet bulk density, MS, and P-wave velocity (PWL). We also measured NGR in all sections longer than 50 cm and acquired X-ray images on cores without significant cracks. Thermal conductivity was acquired in one section per core. The SHMSL was used to measure MSP and color reflectance using the L*a*b* color system, and the red-green-blue (RGB) color of the sediments was measured with digital color imaging (SHIL). In addition, we determined P-wave velocities at discrete points on working halves and measured discrete samples for MAD of wet bulk density, dry bulk density, and grain density on Hole U1534A cores. The sensors worked correctly, and the data are of good quality except for those from the PWL, which present a great number of spikes due to the gaps created in the core during thermal expansion as the core equilibrated with laboratory temperature.
Silty clay, clay, and silt dominate the lithology at Site U1534. Glacial–interglacial variations in physical property signals are observed through the mid–late Pleistocene interval above ~83 mbsf. Of note, MIS 11 at ~40 mbsf exhibits prominent minima in NGR, MS, P-wave velocity, and a* values and a maximum in L* values. The hiatus associated with Reflector B at ~83 mbsf is recognized by positive anomalies in MS, NGR, bulk density, and grain density. In the late Pliocene sediments below ~83 mbsf, the amplitude of variability in physical property signals typically decreases.
Stratigraphic correlation
Four holes were drilled at Site U1534 using the APC, HLAPC, and XCB coring systems. The goals for these sites were to recover a complete sedimentary section to reconstruct Pliocene–Pleistocene oceanography and climate and to test previously published seismic stratigraphic inferences about the ages of three reflector horizons (Koenitz et al., 2008). Mudlines were achieved for Holes U1534A and U1534C (Hole U1534B failed) but not for Hole U1534D. The time available only permitted the recovery of three APC cores from Hole U1534D.
Whole-round cores from Holes U1534A and U1534C were analyzed for their physical properties using the WRMSL (for MS, GRA density, and P-wave velocity) and gamma ray track (for NGR intensity) and subsequently the SHMSL (for MS and color reflectance) once they were split into working and archive halves (see Physical properties; also see Physical properties in the Expedition 382 methods chapter [Weber et al., 2021] for details). Whole rounds from Core 382-U1534D-1H were not measured for their physical properties because they were split for aDNA sampling immediately upon collection to avoid modern-day DNA contamination. In addition to aDNA sampling, the three Hole U1534D cores were used to bridge coring gaps between Cores 382-U1534A-1H and 4H. To do so, we used the MS of the archive halves determined using the SHMSL MSP sensor.
Correlation between holes
To avoid coring gap alignment, sequences from all holes were examined in near–real time using whole-round MS and GRA density data measured at a 2.5 cm resolution with the WRMSL. Because of time constraints, it was not possible to conduct triple APC coring at Site U1534 (except for three Hole U1534D cores).
Core disturbances and other sporadic difficulties with coring meant that the stratigraphic quality of the sedimentary sequence recovered varied among holes. In general, we avoided including disturbed cores in our primary splice. Several APC cores taken near the bottom of their applicable range at these two sites achieved only partial strokes, and several instances of shattered core liners occurred. Despite these adverse conditions, we were nevertheless able to generate unambiguous affine ties from the mudline in Core 382-U1534C-1H to the base of Core 5H at ~46 m core composite depth below seafloor, Method A (CCSF-A), using sediment MS and GRA density data (Figure F29) (see Stratigraphic correlation in the Expedition 382 methods chapter [Weber et al., 2021] for an explanation of depth scales). Below ~46 m CCSF-A, the affine ties between several of the cores used to connect depths in Holes U1534A and U1534C are uncertain (see quality comments in Table T13) because in some instances the core gap is almost exactly lined up between the two holes. In some cases, it may be possible to improve the ties with postcruise efforts, for instance, using X-ray fluorescence core scanning elemental data. If all these ties could be confirmed, a near-complete succession could be established to ~152 m CCSF-A. Below ~152 m CCSF-A, no second hole exists to bridge potential stratigraphic gaps between Hole U1534A cores.
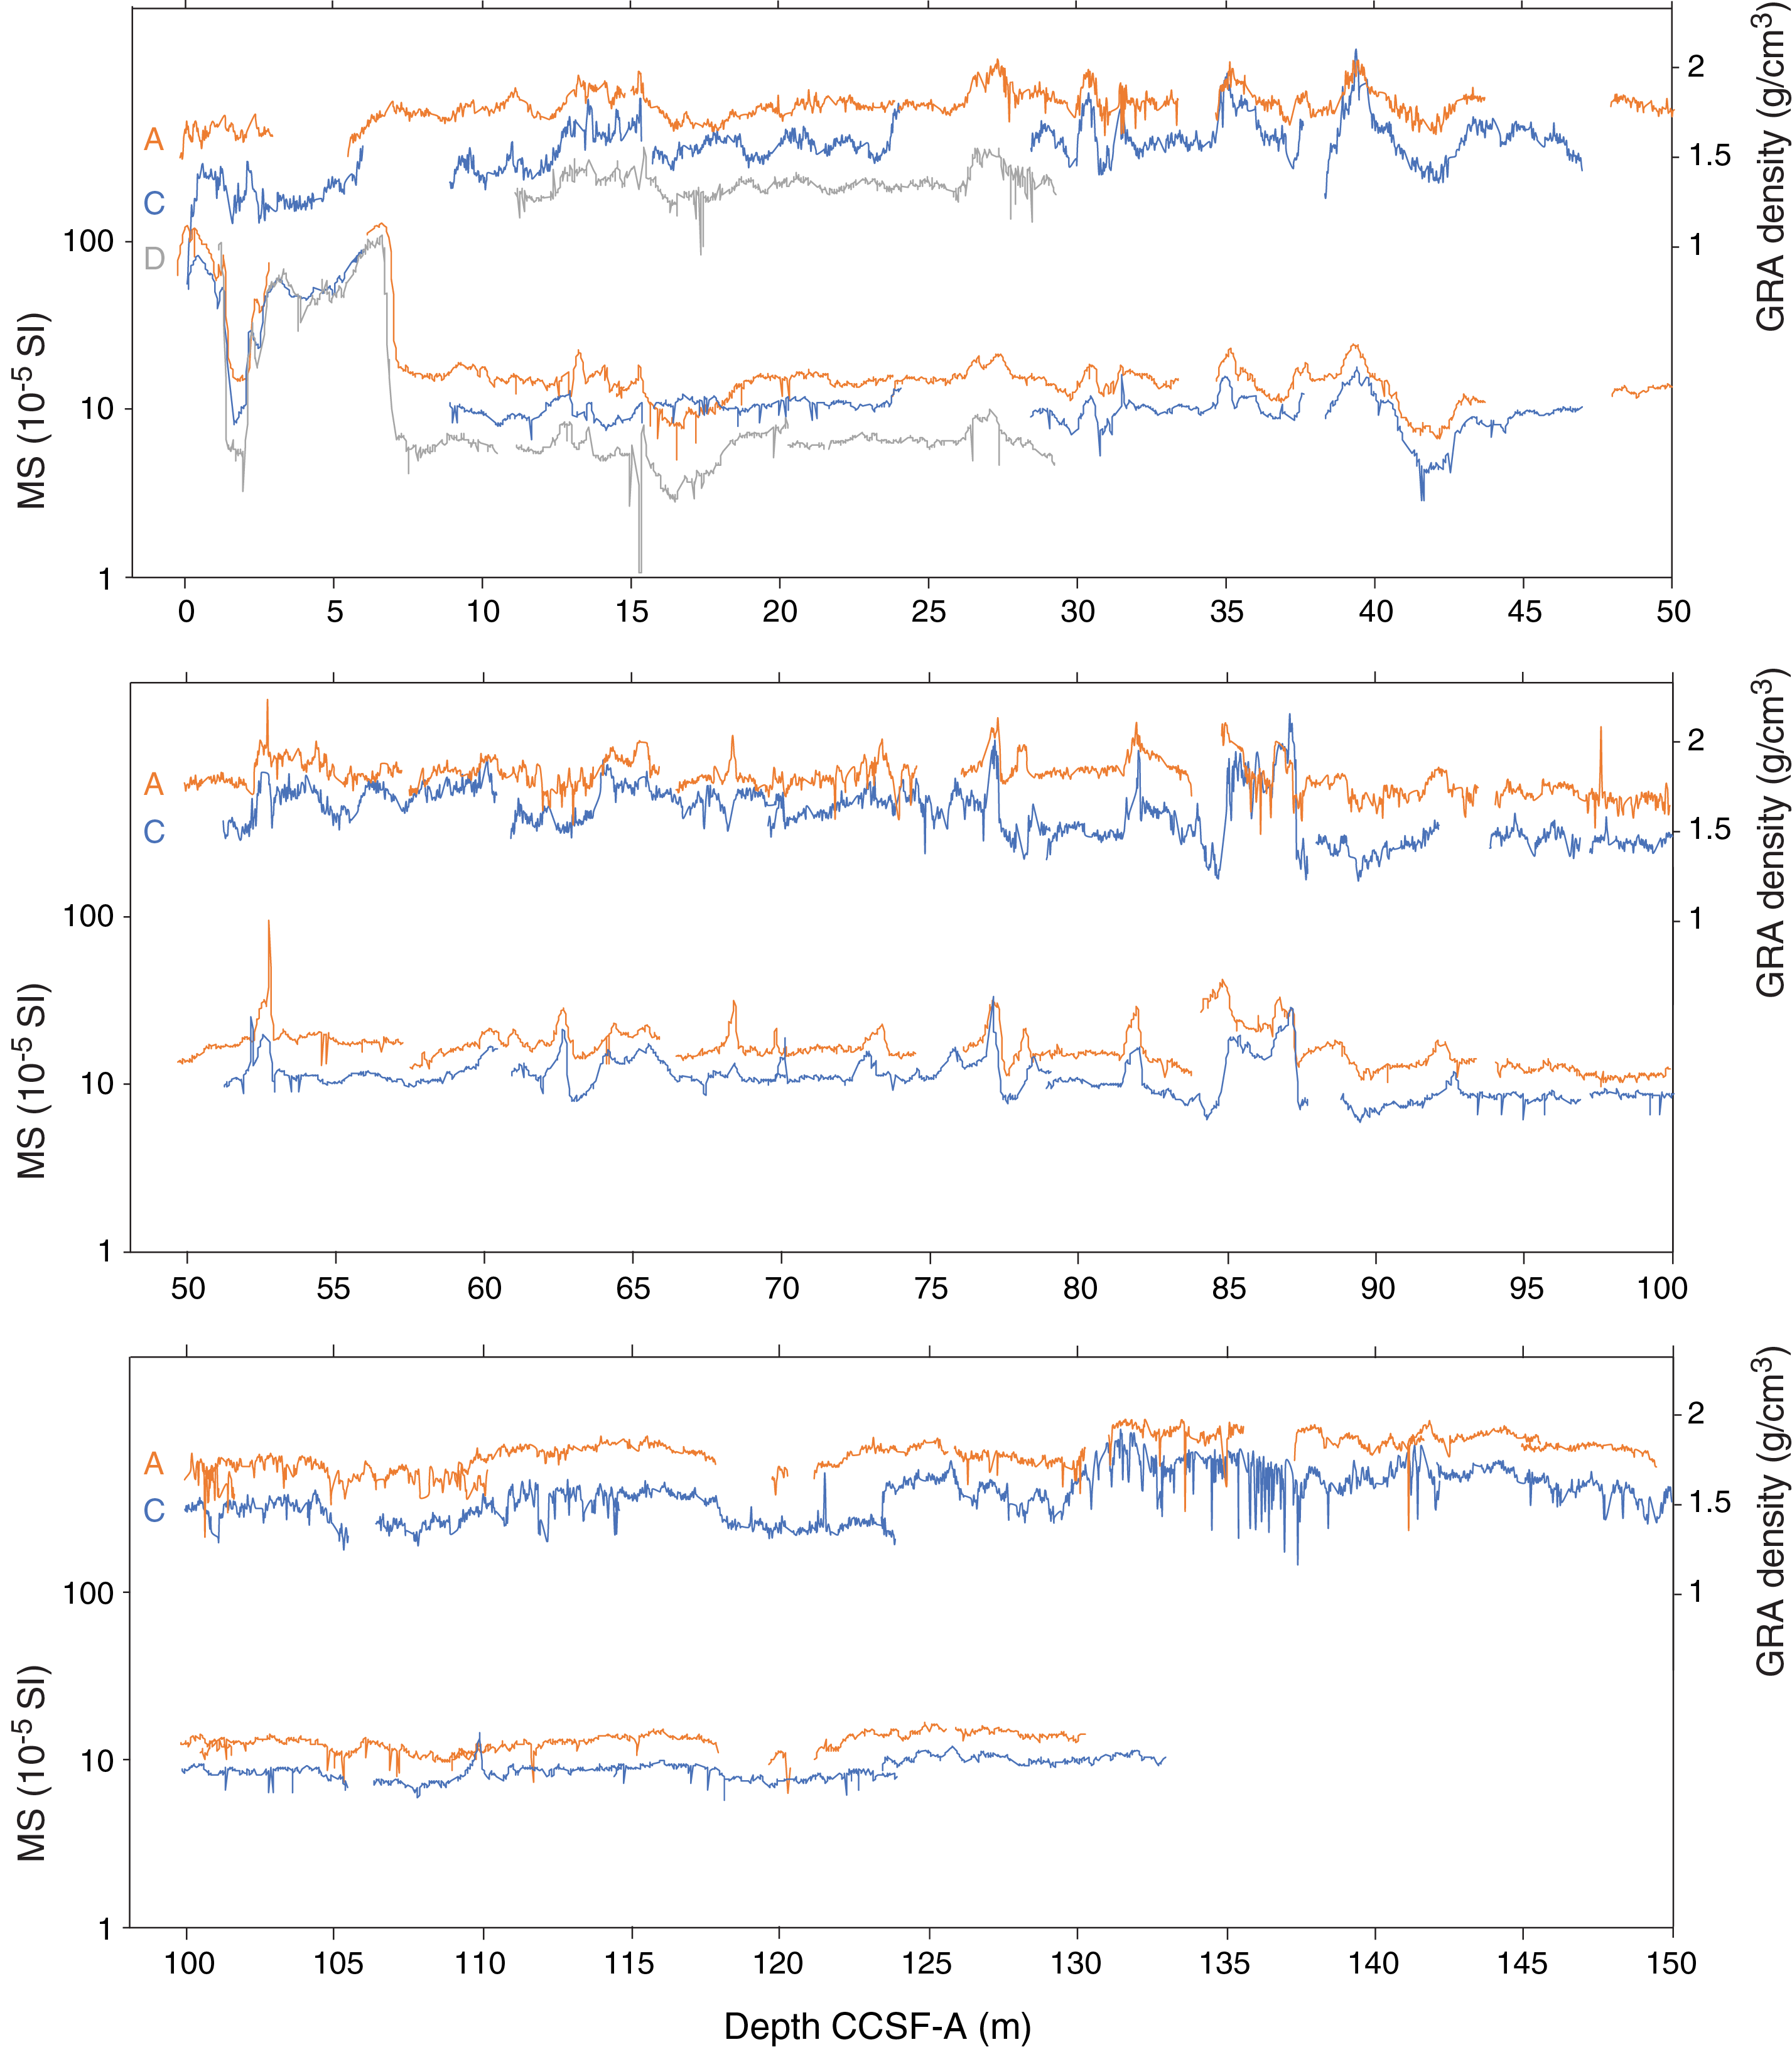
Figure F29. GRA density and MS.
The top of Hole U1534C (which preserved a mudline) served as the anchor (zero depth point) for the generation of the CCSF-A depth scale at this site, and the relative depth offset of each core from this reference was determined by establishing affine ties between cores from all three holes recovered based on the optimized correlation of WRMSL-derived MS and GRA density data (Figure F29). These depth offsets (or affine ties) are reported in affine Table T13. The variable in-core stretching of sequences implies that single depth offsets will result in inevitable misalignment of features that can otherwise confidently be correlated between holes. This misalignment is an essential consideration if one is to apply age data based on shipboard micropaleontology, nearly all of which were derived from Hole U1534A, to the spliced intervals from other holes.
Construction of the splice
Once the composite depth scale was created, selected sequences from Holes U1534A, U1534C, and U1534D were spliced together to create the most complete and representative section possible (Figure F30). In addition, we strove to include as much of Hole U1534C in the primary splice as possible because it was concurrently sampled shipboard to reduce the possibility of losing foraminifer shells to dissolution. Detailed sedimentological logs were consulted in the process of splice construction to avoid the inclusion of any obviously disturbed sections and/or sections with unique features (relative to the other holes). The end result is reported in Table T14.
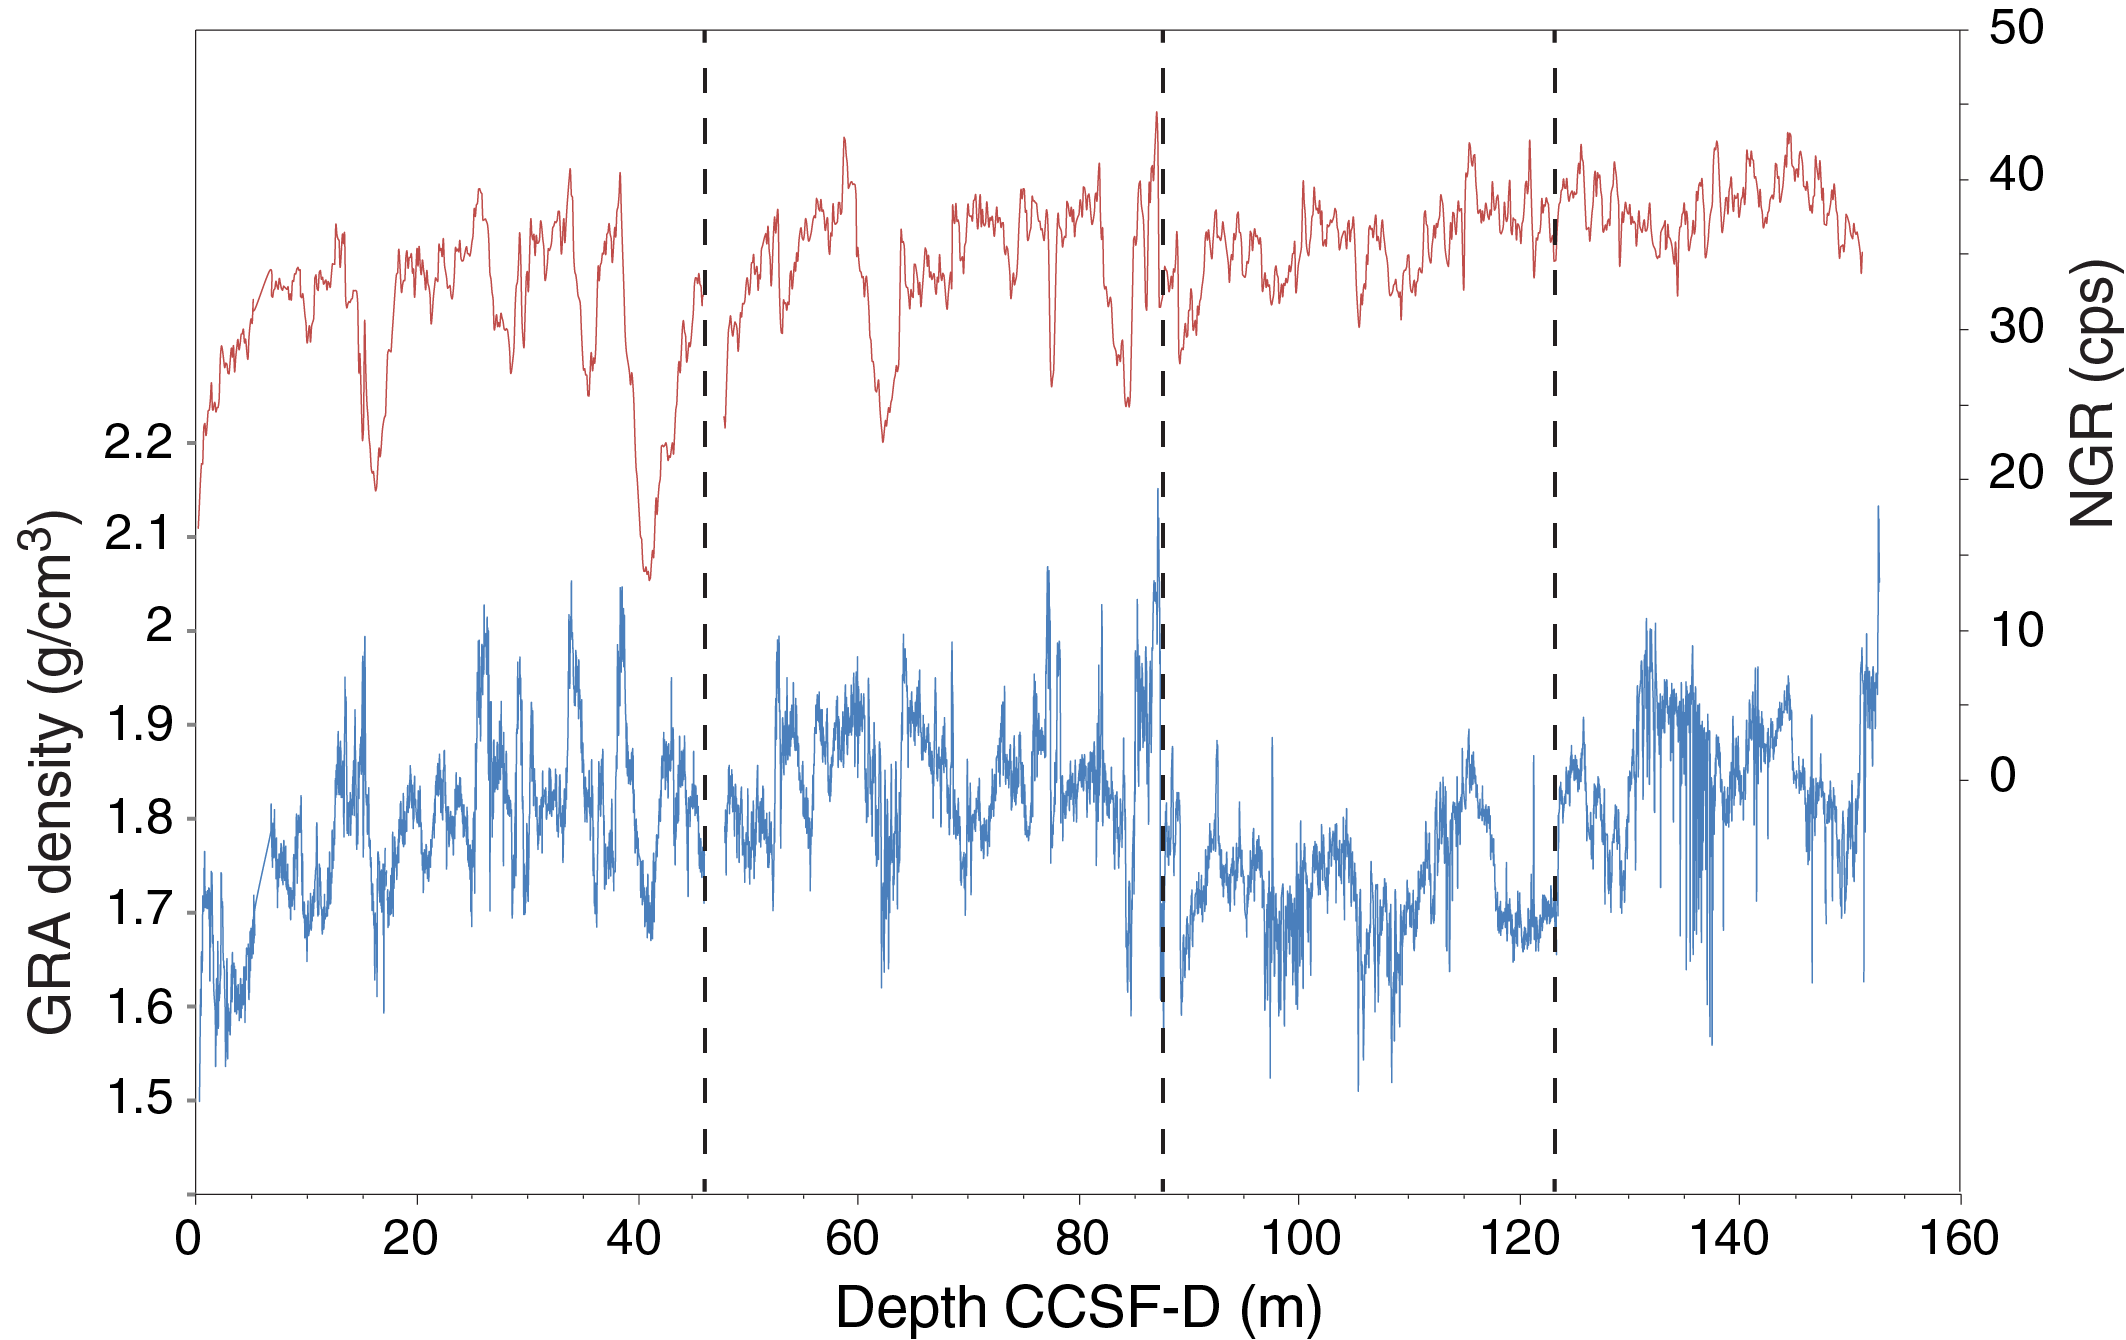
Figure F30. Spliced record of GRA density and NGR intensity.
The splice constitutes a continuous sequence with a total length of ~46 m core composite depth below seafloor, Method D (CCSF-D), and possibly a near-continuous sequence to ~152 m CCSF-D. It is dominantly composed of correlated sections from Holes U1534C (~68% of the splice), U1534A (25% of the splice), and U1534D (8% of the splice). Inspection of the spliced MS, GRA, L*, and NGR records demonstrates that the splice tie boundaries do not create gaps or repeated intervals in this sequence. Below 152 m CCSF-A, coring gaps of unknown length in Hole U1534A prevent further extension of a continuous splice. Cores 382-U1534A-22F through 44F are therefore appended with their cored respective depths/offsets to the primary splice.
Chronostratigraphy
Age models for Sites U1534 and U1535
A 266 m sequence of Pliocene–Pleistocene sediment was recovered from Site U1534, and a 117 m sequence was recovered from Site U1535. Because of their close proximity to each other, age models for these sites were developed in concert and are discussed together here. Based on the seismic stratigraphy, it was known that Site U1535 should have an expanded section above Reflector B relative to Site U1534. The age models for these sites (Figures F31, F32) are based on a combination of the biozonation of diatoms and radiolarians from core catcher samples (and occasionally from discrete toothpick sampling of the cores) in Holes U1534A and U1535A and magnetostratigraphy from Holes U1534A, U1534C, and U1535A. Summaries of the biostratigraphic markers used for their construction are presented in Tables T2 and T3 and in Tables T2 and T3 in the Site U1535 chapter (Peck et al., 2021) (geologic ages are from the geologic timescale [GTS2012; Gradstein et al., 2012]). Summaries of the magnetic polarity stratigraphies used are presented in Table T8 and in Table T7 in the Site U1535 chapter (Peck et al., 2021).
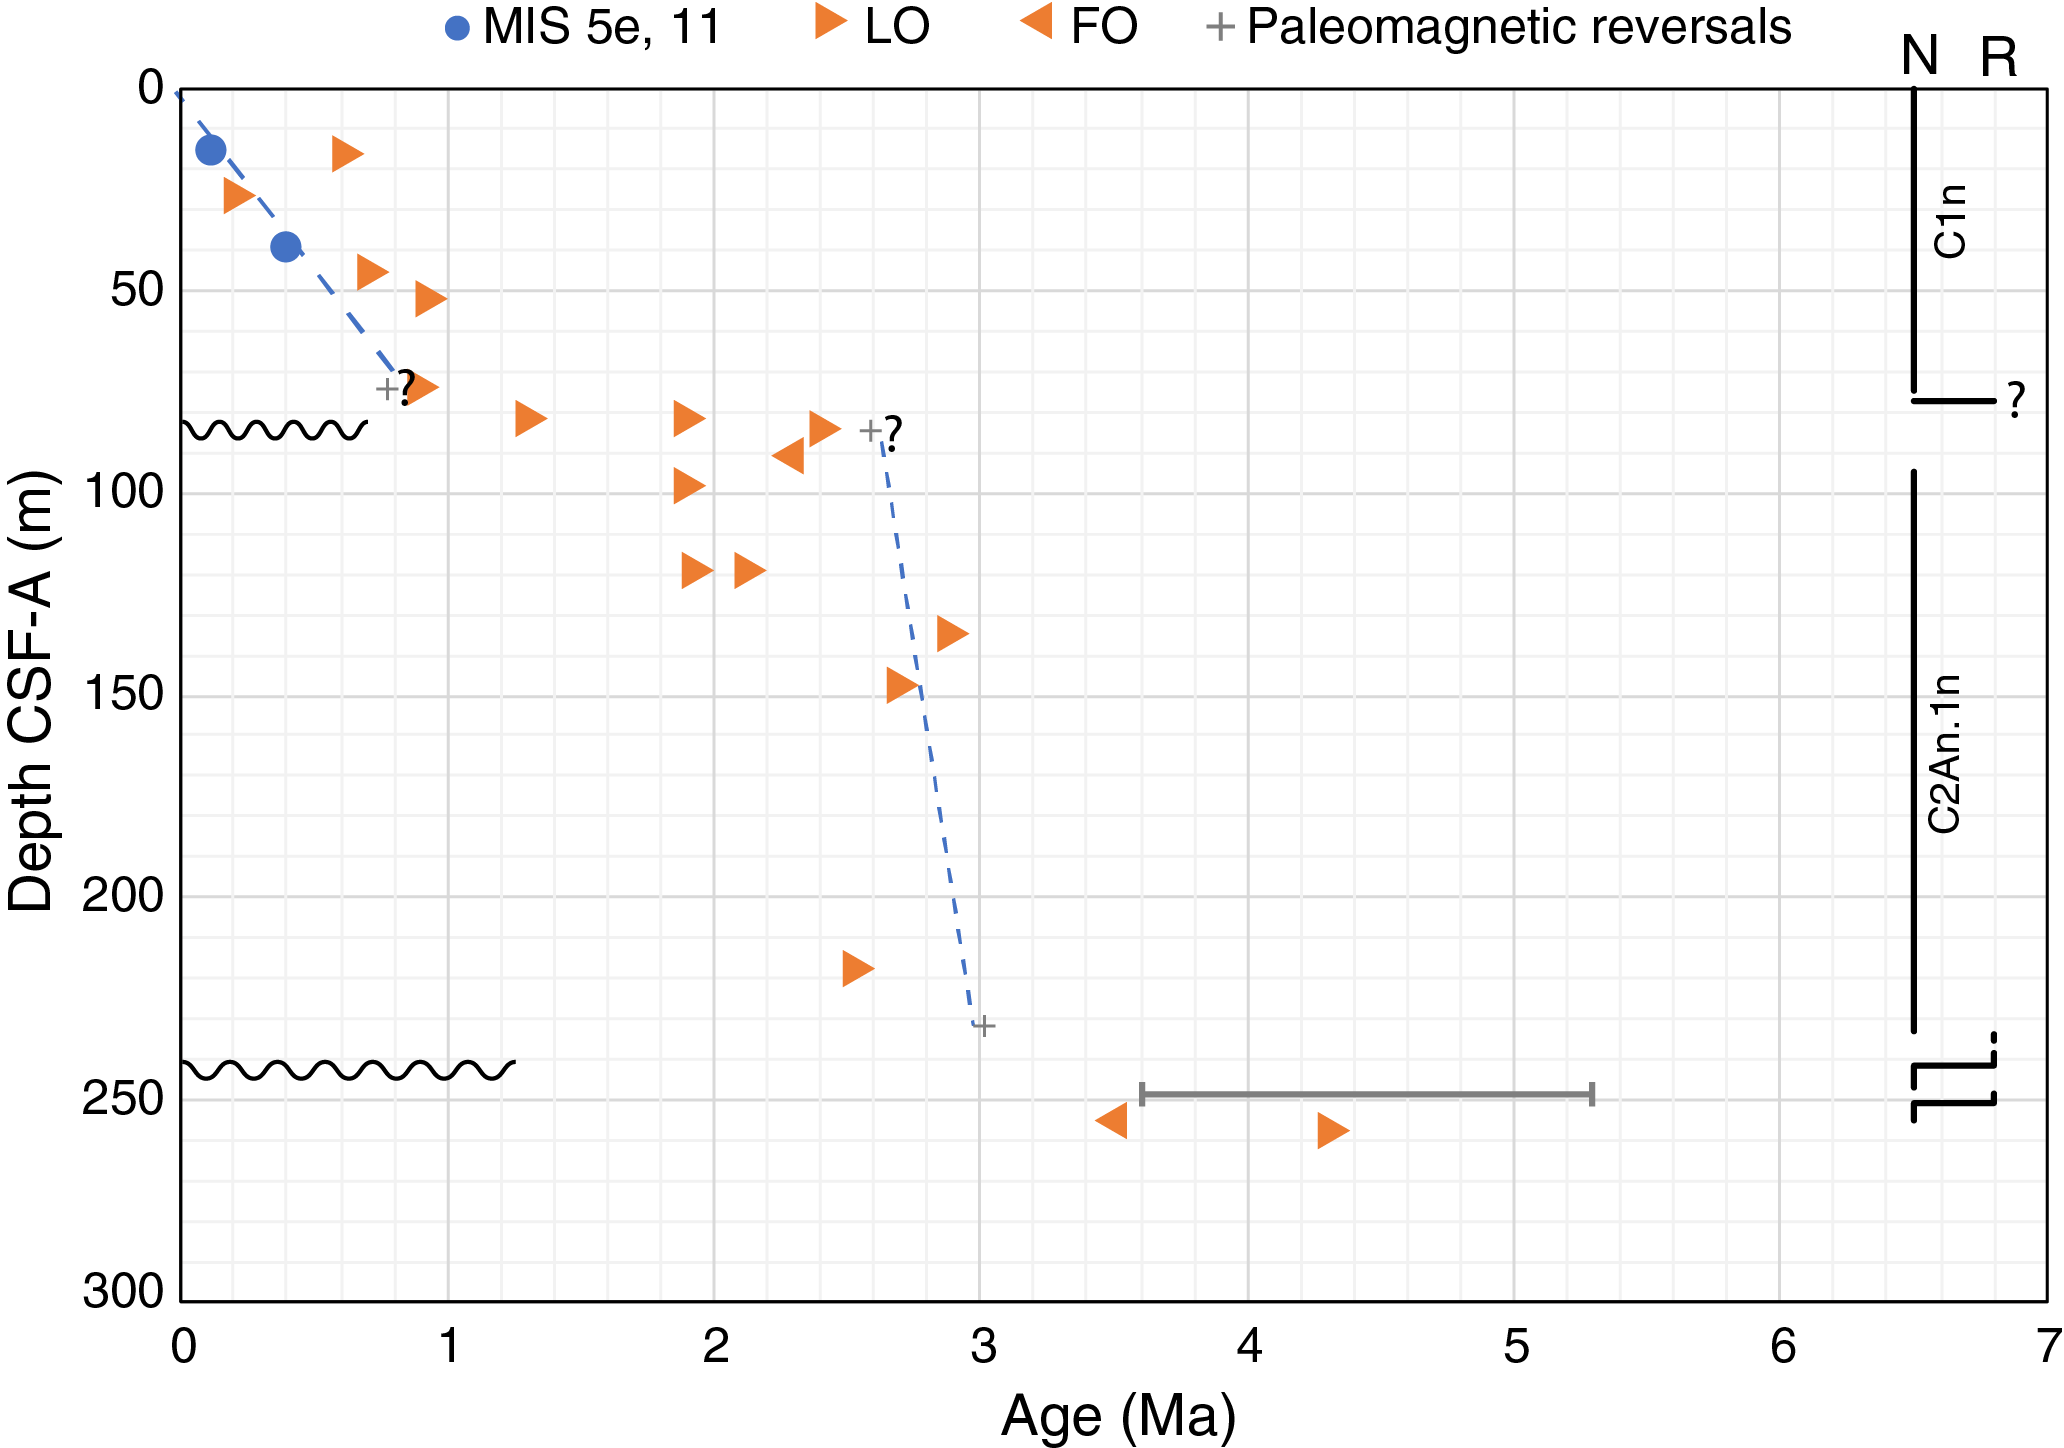
Figure F31. Age-depth plot, Site U1534.
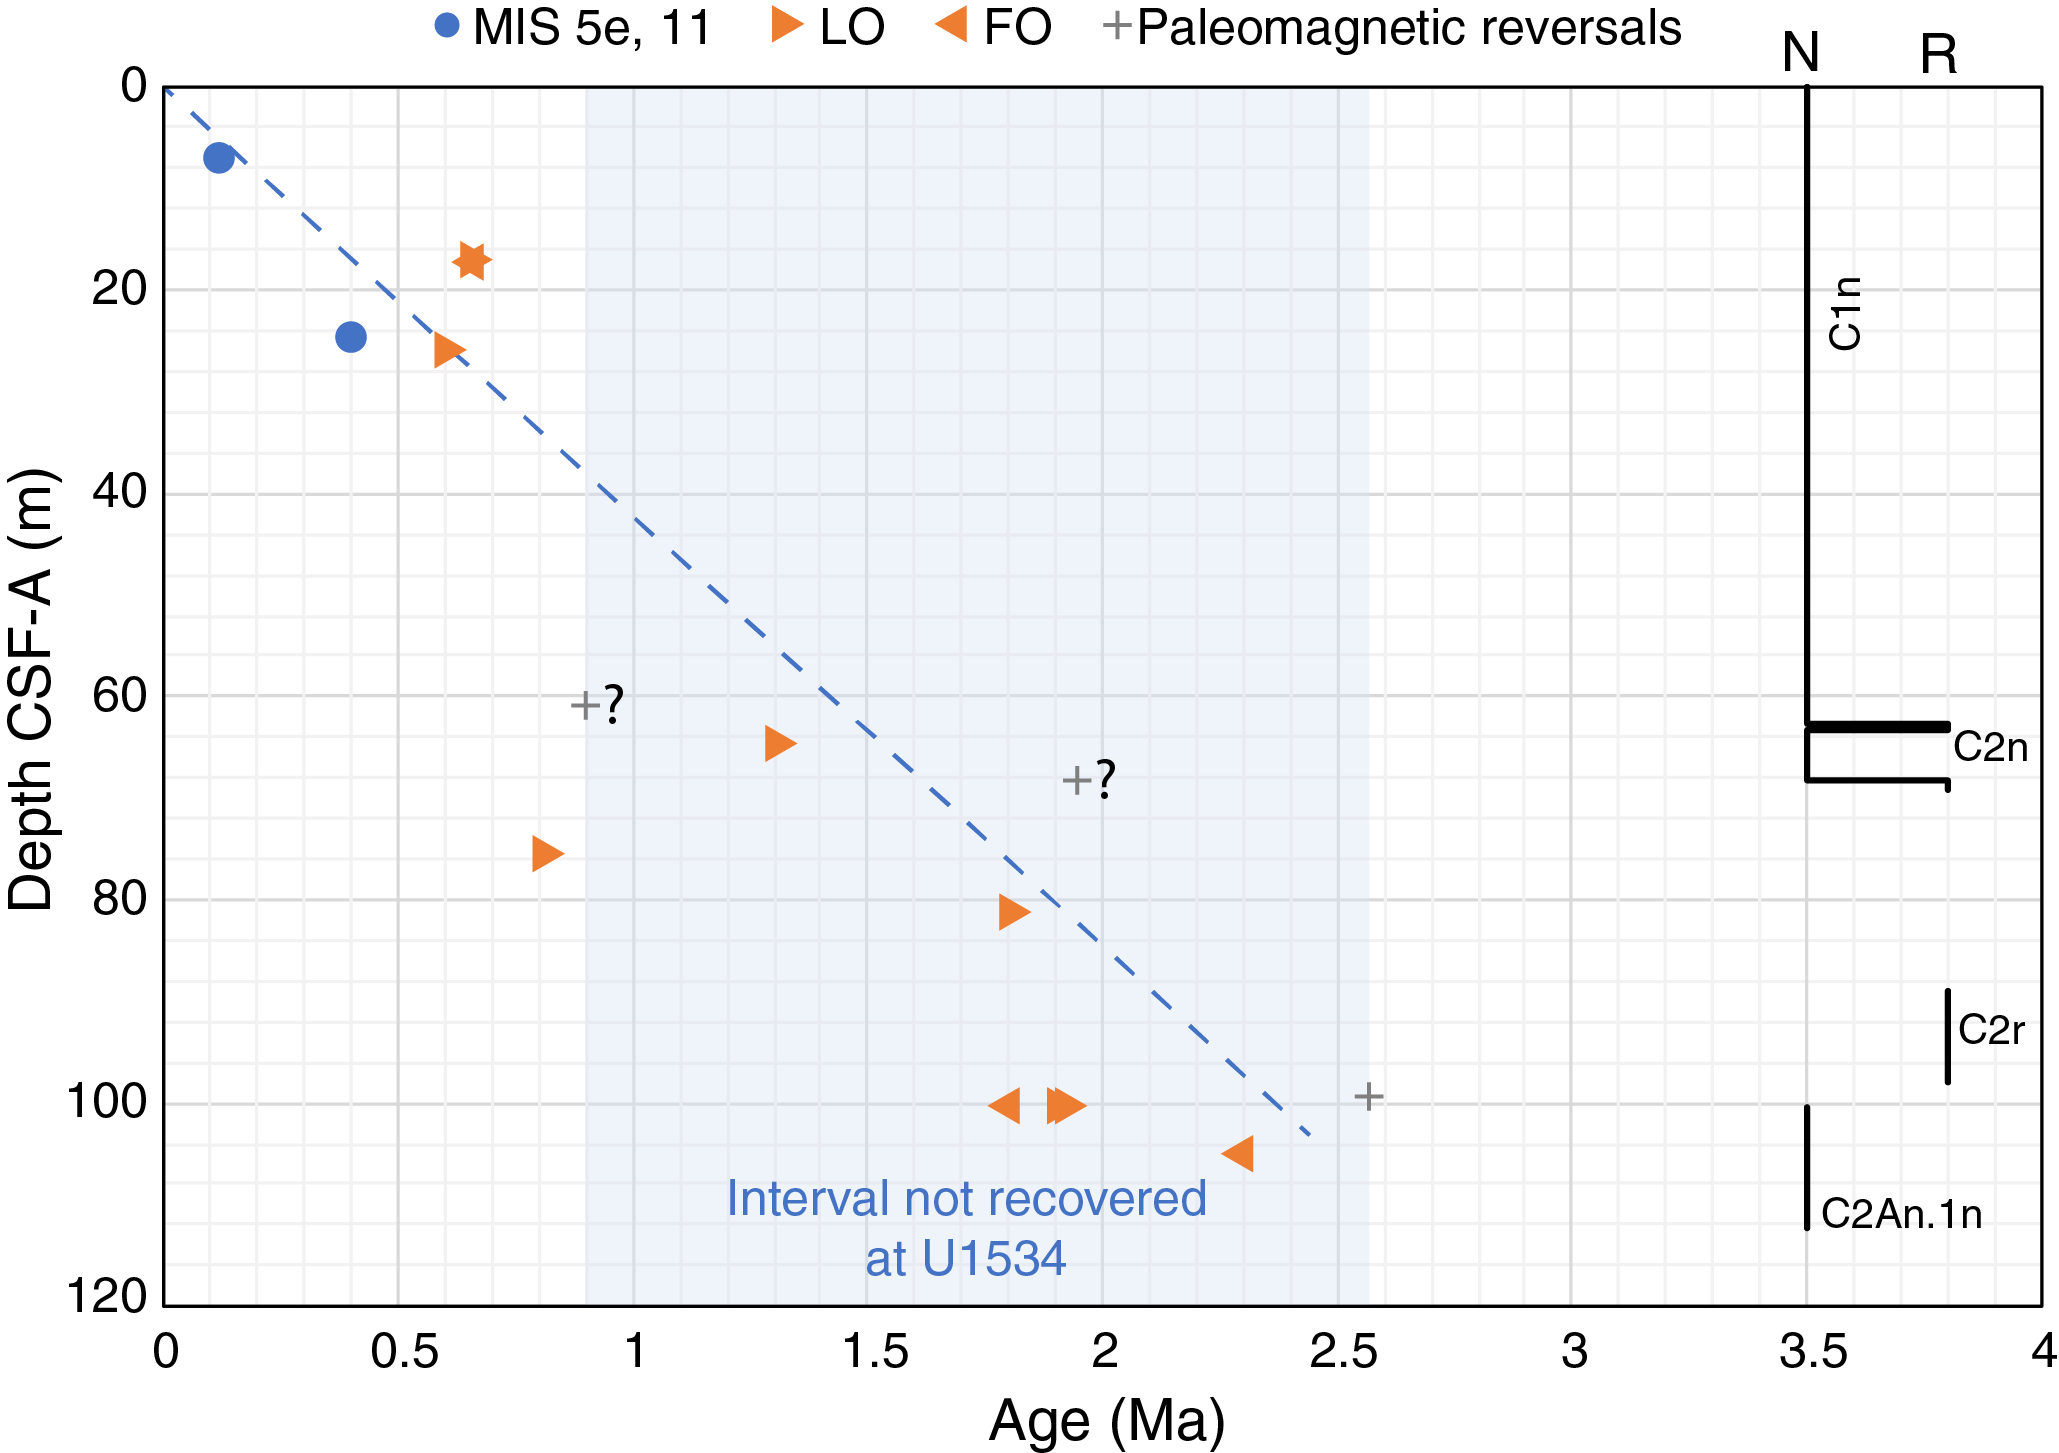
Figure F32. Age-depth plot, Site U1535.
Biostratigraphy was essential for guiding our interpretation of the magnetic polarity stratigraphies for Sites U1534 and U1535. Paleomagnetic measurements reveal that the upper ~230 m of Holes U1534A and U1534C is characterized by two polarity zones (N1 and N2) separated by a ~20 m interval of undeterminable polarity (e.g., 74.45–94.84 mbsf in Hole U1534A) (see Figure F14). Biostratigraphic data indicate that the interval of undeterminable polarity corresponds to a hiatus separating late Pliocene (Zone N2) and mid-Pleistocene (Zone N1) sediments, which are consistent with sediments deposited during the normal late Gauss Chron (C2An.1n; 2.58–3.03 Ma) and normal Brunhes Chron (C1n; 0–0.78 Ma), respectively, and the absence of reversed polarity zones that dominate the Matuyama Chron (C1r–C2r; 0.78–2.58 Ma). The top of the Gauss Chron (2.58 Ma) provides a youngest age constraint for Zone N2 sediments immediately beneath the hiatus, and the base of the Brunhes Chron (0.78 Ma) provides the oldest age constraint for the Zone N1 sediments above the hiatus. Assuming a faithful record of Earth's magnetic field, persistent normal polarity would suggest an age no older than 3.03 Ma at the base of Zone N2 (~233 mbsf).
Three intervals of reversed polarity were found in Hole U1534A spanning 233.8–235.6 (Zone R1), 238.7–241.4 (Zone R2), and 248.7–250.7 mbsf (Zone R3). To satisfy the biostratigraphy and paleomagnetic stratigraphy, a hiatus is invoked between 238 and 243 mbsf. The upper reversed interval (Zone R1) above the hiatus likely corresponds to the Kaena Subchron (C2An.1r; 3.03–3.12 Ma). Below the hiatus, the N4-R3-N3-R2 succession likely captures a series of transitions that characterize the short-duration subchrons found in the middle to late Gilbert Chron (C2Ar–C3n; 3.60–5.24 Ma). Sedimentation rates for the mid–late Pleistocene sediments above Reflector B are estimated to be on the order of 10 cm/ky. The late Pliocene sedimentation rates implied by this age model would be at least 35–40 cm/ky.
The biostratigraphy and paleomagnetic stratigraphy for Site U1535 are compromised because only one hole was cored at this site. In addition, intervals of core disturbance or abrupt lithologic transitions that may represent hiatuses complicate interpretation, although biostratigraphy does not suggest that sedimentation was interrupted by any prominent hiatuses. Sediments immediately above Reflector B at Site U1535 are likely early Matuyama (C2r) in age and may be as old as 2.58 Ma. A1.8 My hiatus associated with Reflector B is implied at Site U1534, whereas continuous or near-continuous sedimentation is inferred across Reflector B at Site U1535. Assuming a constant accumulation rate, this age model for Site U1535 suggests sedimentation rates on the order of 5 cm/ky throughout the Pleistocene, although the magnetostratigraphy suggests that the middle to late Pleistocene section likely includes either large changes in accumulation rates and/or brief hiatuses.
Several tephra layers were noted in the lithologic descriptions, and volcanic glass was frequently noted in smear slides and sieved samples. Additionally, some intervals (particularly interglacials in the late Pleistocene) have relatively high carbonate contents; for instance, what we infer to be MISs 11 (~400 ka; e.g., Sections 382-U1534C-5H-3 through 5H-5) and 5e (~125 ka; e.g., Sections 382-U1534D-2H-4 and 2H-5) and others bear carbonate-rich ash layers. There is therefore potential scope for refining the shipboard age model presented here with oxygen isotope stratigraphies, a strontium isotope stratigraphy, tephrastratigraphy of glass shard chemistry, and 40Ar/39Ar dating of tephras.
Downhole measurements
Downhole temperature and heat flow
Advanced piston corer temperature tool (APCT-3) downhole temperature measurements were made on Cores 382-U1534A-4H, 6H, 10H, and 13H. The two shallower measurements did not yield reliable results and were repeated on Cores 382-U1534C-4H and 7H. The seafloor temperature was determined to be 4.7°C based on APCT-3 data taken while the tool was held at the mudline for 5 min during each run (Figure F33). The obtained temperatures range from 6.5°C at 34.8 m drilling depth below seafloor (DSF) to 9.5°C at 115.7 m DSF (Table T15; Figures F33, F34), consistent with an approximately linear temperature increase with depth (Figure F34) and a geothermal gradient of 40°C/km.
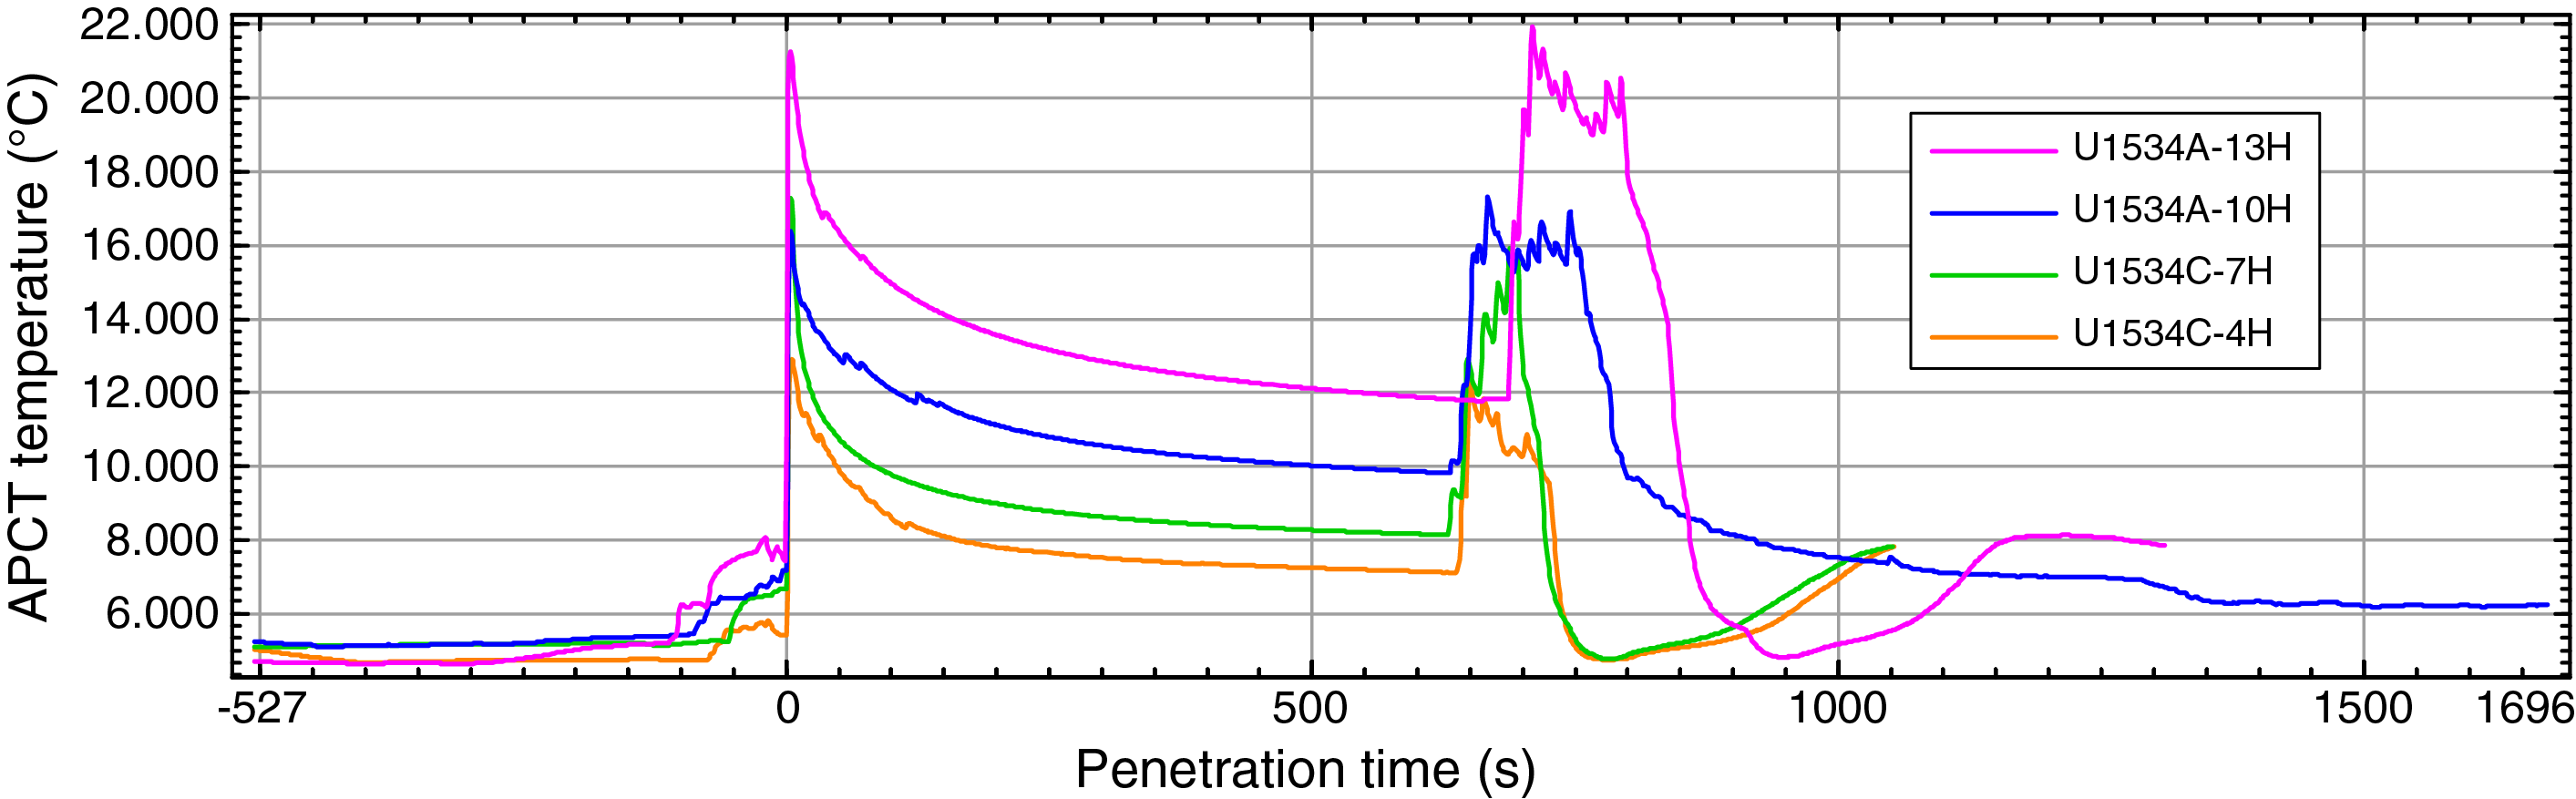
Figure F33. APCT-3 temperature-time series.
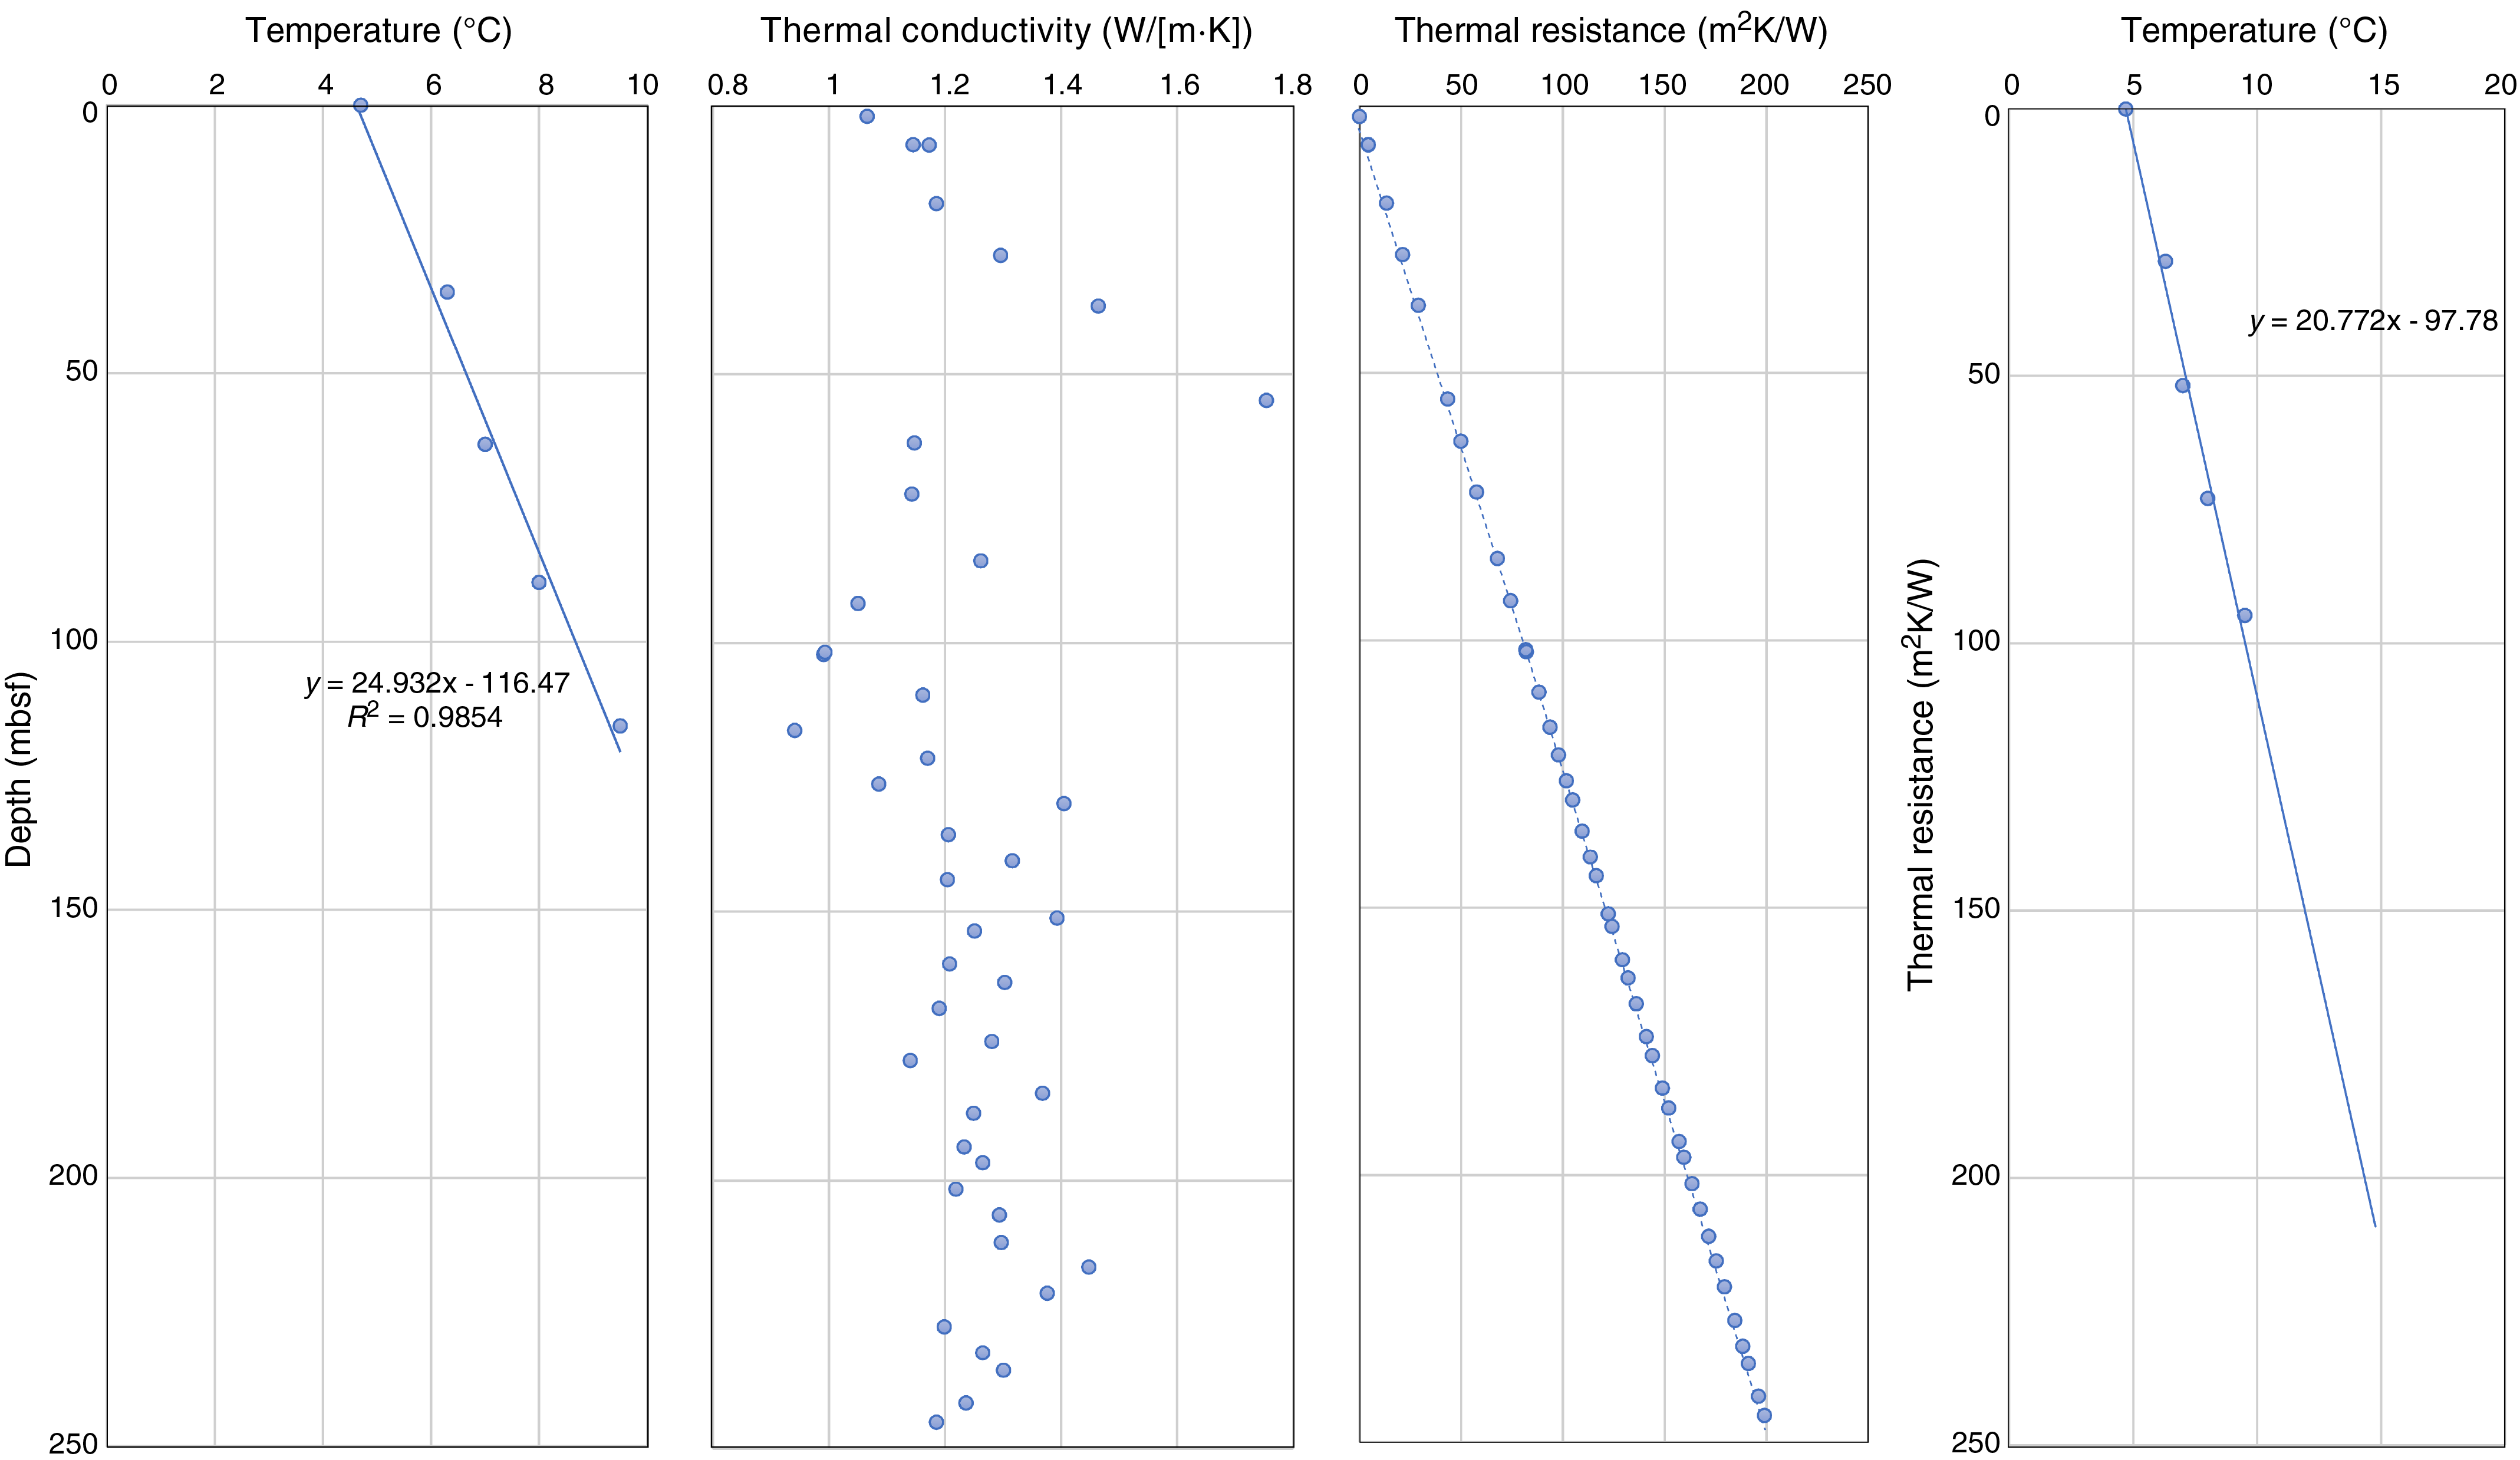
Figure F34. Heat flow calculation.
Thermal conductivity under in situ conditions was estimated from laboratory-determined thermal conductivity from Hole U1534A using the method of Hyndman et al. (1974) (see Physical properties in the Expedition 382 methods chapter [Weber et al., 2021]). The calculated in situ values are within 2% of the measured laboratory values. Thermal resistance was calculated by integrating the inverse of the in situ thermal conductivity over depth. A heat flow of 48 mW/m2 was obtained from the linear fit between temperature and thermal resistance following the method of Pribnow et al. (2000).
Core-log-seismic integration
Physical properties measured on cores from Site U1534 and multichannel seismic data from the region were integrated to identify the lithostratigraphy associated with each of the seismic stratigraphic units.
Physical properties and relationship with seismic interpretation
Seismic reflection profiles from the sediment drift identify four seismic stratigraphic units, which are designated Units 1A, 1B, 2A, and 2B from bottom to top following Koenitz et al. (2008). These units are identified by three stratigraphic horizons that represent marked changes in the seismic record and the physical properties measured on the cores (Figures F35, F36). Assignment of depths to the seismic record was achieved using a velocity model based on the discrete P-wave velocity (PWC) measurements.
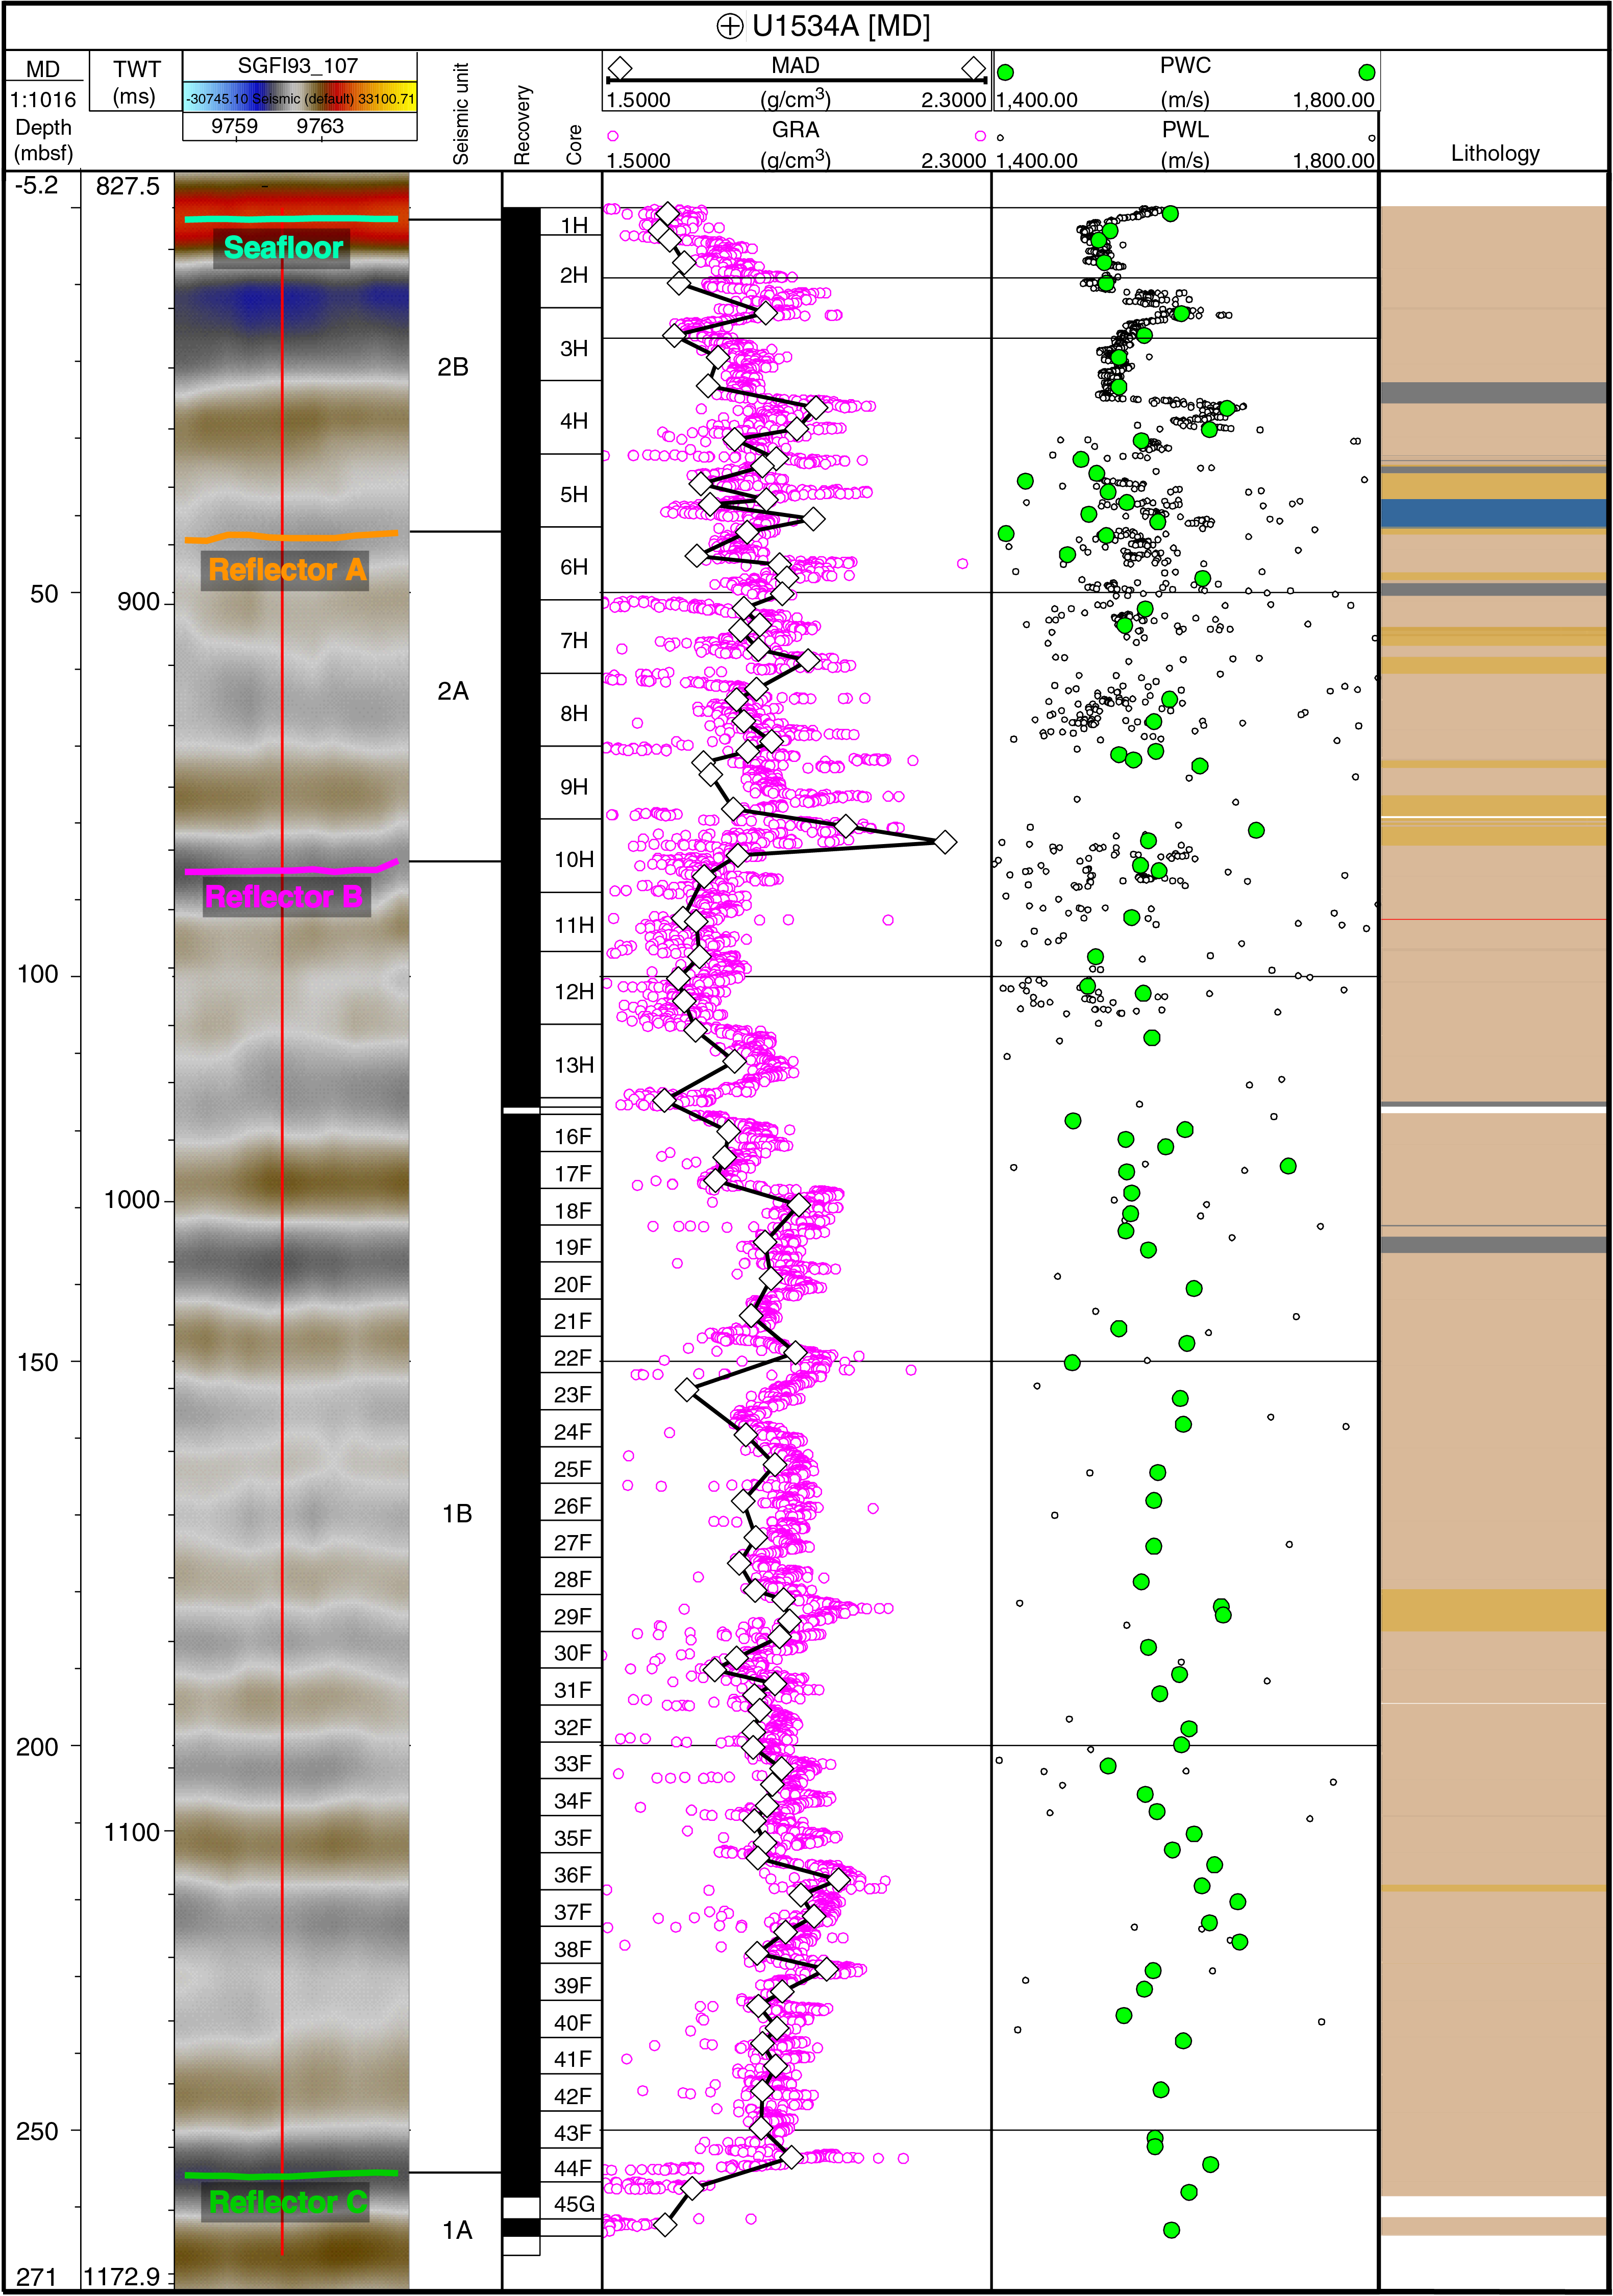
Figure F35. Physical properties with seismic reflectors.
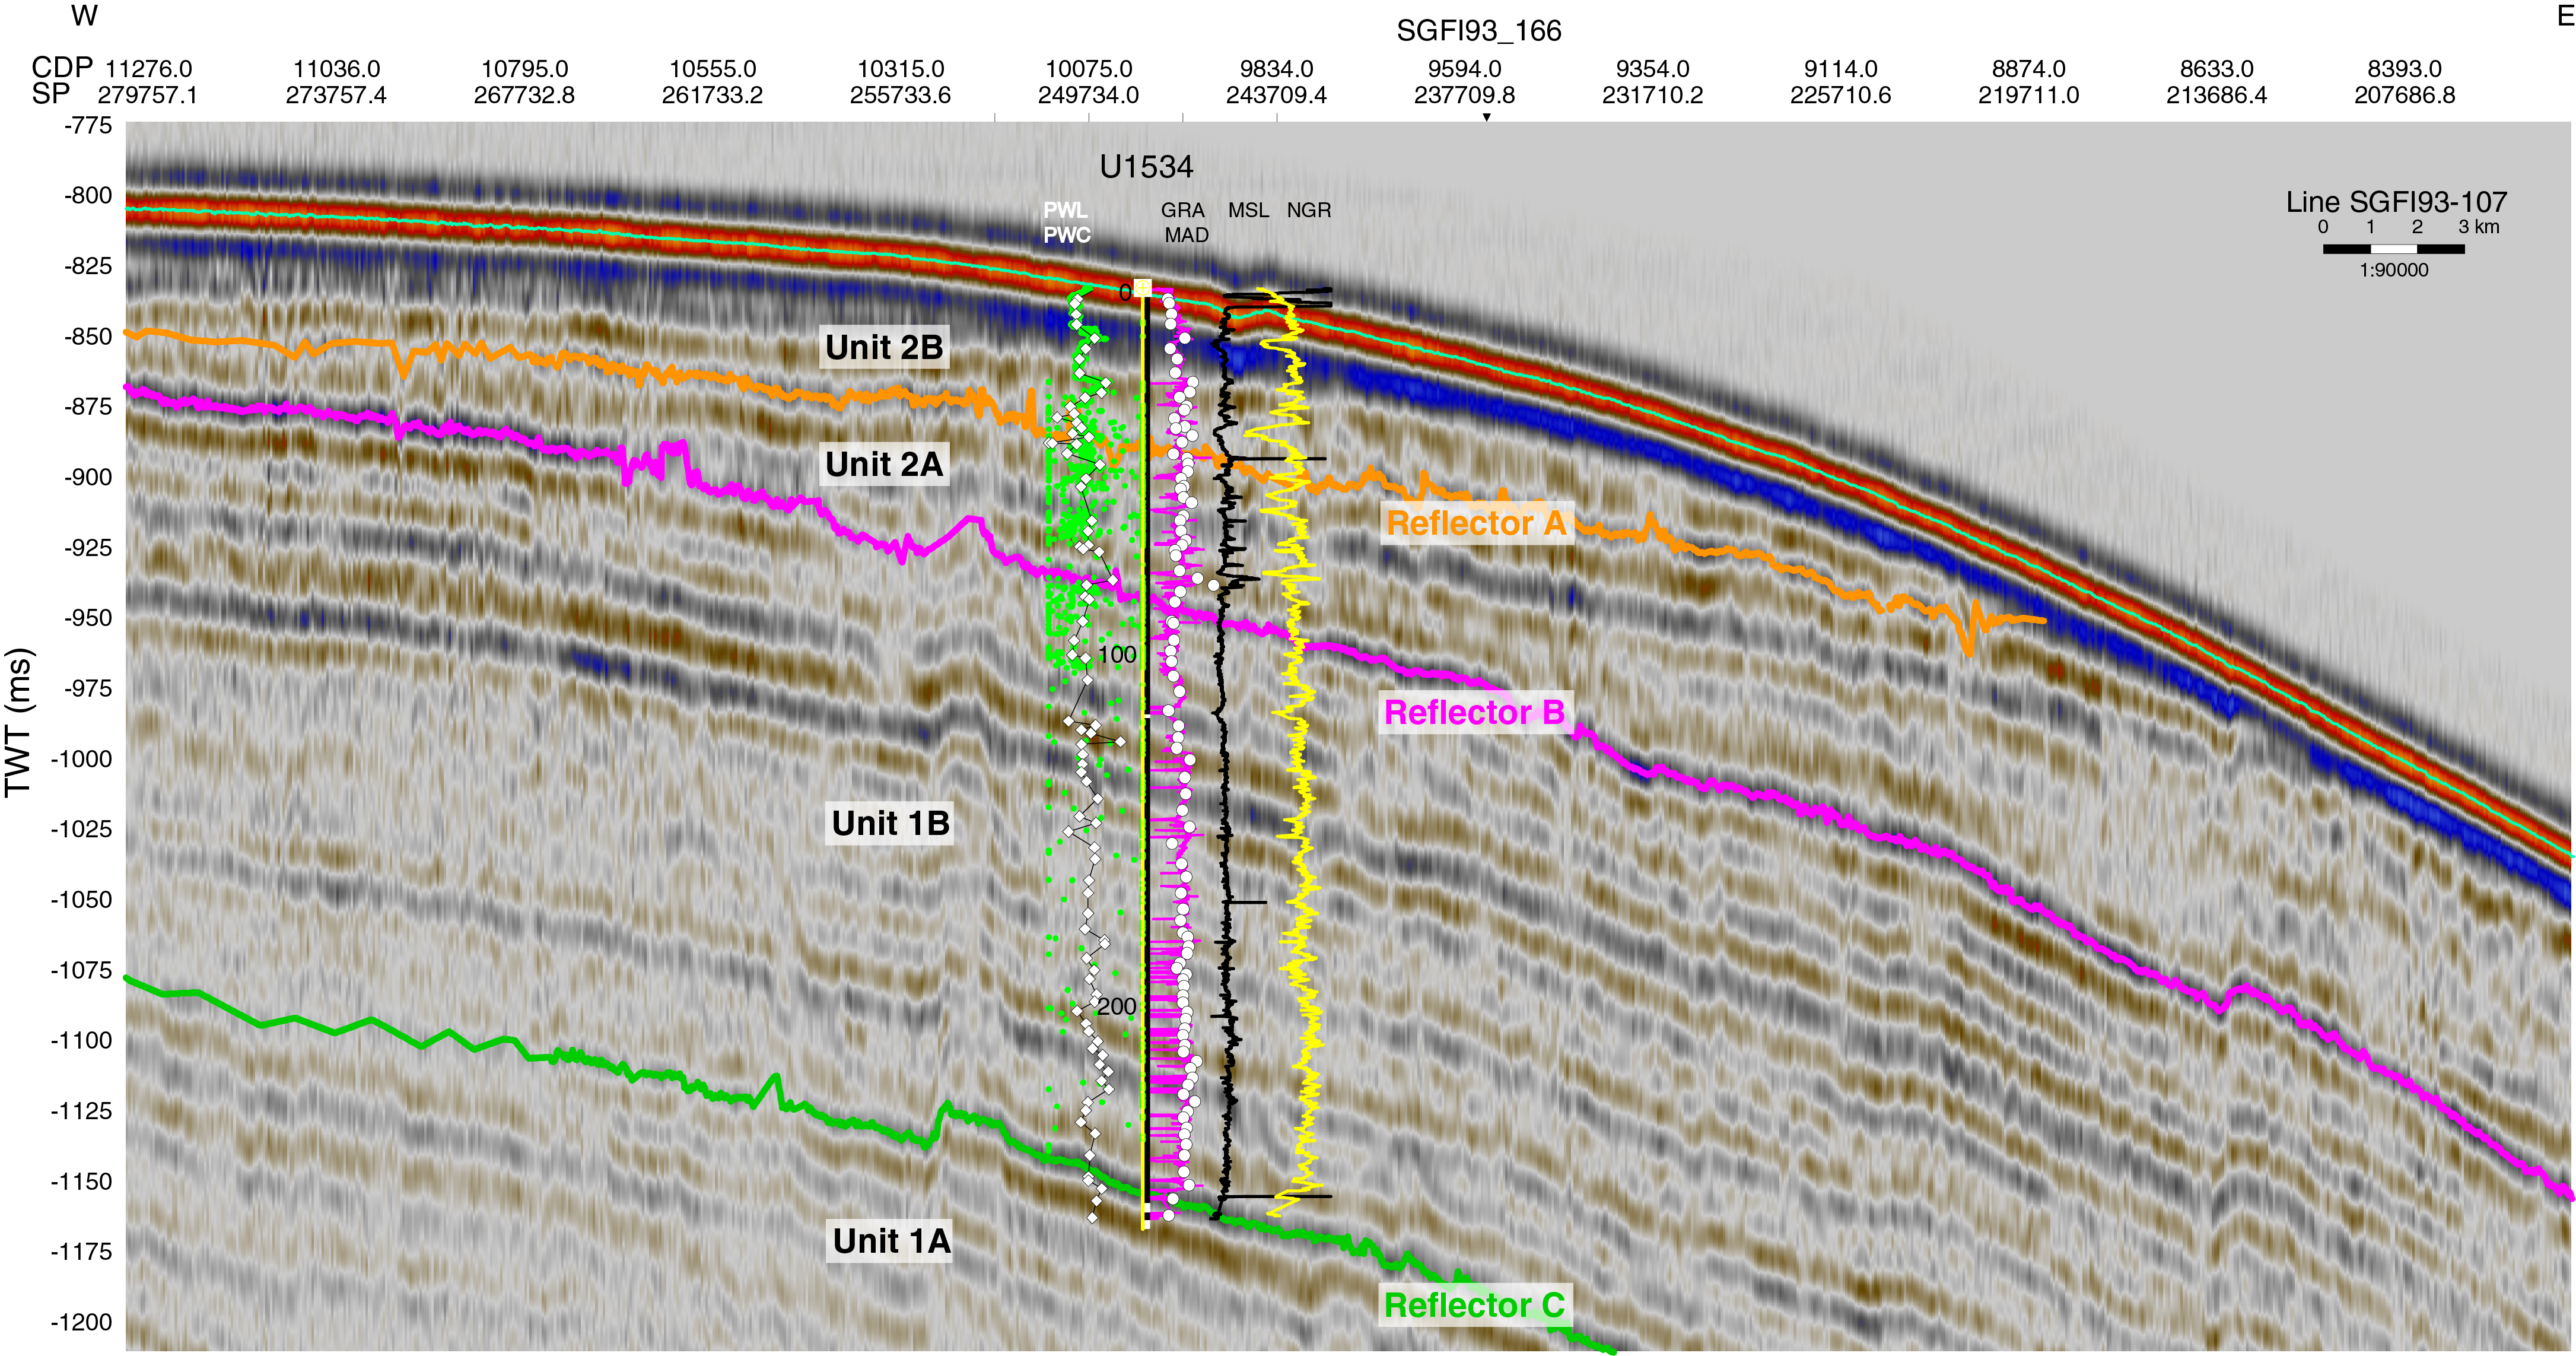
Figure F36. Seismic profile and physical properties.
At Site U1534, the lowermost recovered unit (1A) is characterized by relatively low values of MSP, loop magnetic susceptibility (MSL), NGR, GRA density, and wet bulk density (MAD) compared to Unit 1B, whereas discrete P-wave (PWC) data are slightly higher in Unit 1B than in Unit 1A. The seismic reflectors of Unit 1A pinch out to the west, and the top of the unit, which corresponds to Reflector C, is located at 1154 ms two-way traveltime (TWT) and 256 mbsf in Cores 382-U1534A-44F through 45G. Reflector C is marked by anomalies in the MSL, MSP, NGR, and GRA density signals and a high PWC value. Unit 1B is characterized by relatively uniform MSL, MSP, PWC, NGR, and GRA values. The discontinuity at the top of Unit 1B, which corresponds to Reflector B, is identified at 939 ms TWT or 83.5 mbsf in Core 10H. It is characterized by positive anomalies in MSL and GRA density values. In Unit 2A, MSL, MSP, NGR, and GRA density exhibit higher amplitude variability than in Unit 1B. The horizon at the top of Unit 2A, which corresponds to Reflector A, is placed at 888 ms TWT or 42.9 mbsf between Cores 5H and 6H; this level correlates with a marked minima in MSL, MSP, and NGR. These negative anomalies in MS and density correspond to an interval of high biogenic carbonate content interpreted to represent MIS 11. High-amplitude variability in MSL, MSP, NGR, and GRA density comparable to Unit 2A is observed in Unit 2B.
References
Berg, R.D., and Solomon, E.A., 2016. Geochemical constraints on the distribution and rates of debromination in the deep subseafloor biosphere. Geochimica et Cosmochimica Acta, 174:30–41. https://doi.org/10.1016/j.gca.2015.11.003
Blum, P., 1997. Technical Note 26: Physical Properties Handbook—A Guide to the Shipboard Measurement of Physical Properties of Deep-Sea Cores. Ocean Drilling Program. https://doi.org/10.2973/odp.tn.26.1997
Bond, G., Broecker, W., Johnsen, S., McManus, J., Labeyrie, L., Jouzel, J., and Bonani, G., 1993. Correlations between climate records from North Atlantic sediments and Greenland ice. Nature, 365(6442):143–147. https://doi.org/10.1038/365143a0
Buckley, M.W., and Marshall, J., 2016. Observations, inferences, and mechanisms of the Atlantic Meridional Overturning Circulation: a review. Reviews of Geophysics, 54(1):5–63. https://doi.org/10.1002/2015RG000493
Caesar, L., Rahmstorf, S., Robinson, A., Feulner, G., and Saba, V., 2018. Observed fingerprint of a weakening Atlantic Ocean overturning circulation. Nature, 556(7700):191–196. https://doi.org/10.1038/s41586-018-0006-5
Dickens, G.R., 2001. Sulfate profiles and barium fronts in sediment on the Blake Ridge: present and past methane fluxes through a large gas hydrate reservoir. Geochimica et Cosmochimica Acta, 65(4):529–543. https://doi.org/10.1016/S0016-7037(00)00556-1
Dunkley Jones, T., and Bown, P.R., 2007. Post-sampling dissolution and the consistency of nannofossil diversity measures: a case study from freshly cored sediments of coastal Tanzania. Marine Micropaleontology, 62(4):254–268. https://doi.org/10.1016/j.marmicro.2006.09.001
Ellwood, B.B., and Ledbetter, M.T., 1979. Paleocurrent indicators in deep-sea sediment. Science, 203(4387):837–839. https://doi.org/10.1126/science.203.4387.1335
Florindo, F., Farmer, R.K., Harwood, D.M., Cody, R.D., Levy, R., Bohaty, S.M., Carter, L., and Winkler, A., 2013. Paleomagnetism and biostratigraphy of sediments from Southern Ocean ODP Site 744 (southern Kerguelen Plateau): implications for early-to-middle Miocene climate in Antarctica. Global and Planetary Change, 110(C):434–454. https://doi.org/10.1016/j.gloplacha.2013.05.004
Gradstein, F.M., Ogg, J.G., Schmitz, M.D., and Ogg, G.M. (Eds.), 2012. The Geological Time Scale 2012: Amsterdam (Elsevier). https://doi.org/10.1016/C2011-1-08249-8
Hyndman, R.D., Erickson, A.J., and Von Herzen, R.P., 1974. Geothermal measurements on DSDP Leg 26. In Davies, T.A., Luyendyk, B.P., et al., Initial Reports of the Deep Sea Drilling Project, 26: Washington, DC (U.S. Govt. Printing Office), 451–463. https://doi.org/10.2973/dsdp.proc.26.113.1974
Key, R.M., Olsen, A., van Heuven, S., Lauvset, S.K., Velo, A., Lin, X., Schirnick, C., et al., 2015. Global Ocean Data Analysis Project, Version 2 (GLODAPv2), ORNL/CDIAC-162, ND-P093. Oak Ridge, Tennessee (US Department of Energy). https://doi.org/10.3334/CDIAC/OTG.NDP093_GLODAPv2
Kissel, C., Laj., C., Lehman, B., Labyrie, L., and Bout-Roumazeilles, V., 1997. Changes in the strength of the Iceland-Scotland Overflow Water in the last 200,000 years: evidence from magnetic anisotropy analysis of Core SU90-33. Earth and Planetary Science Letters, 152(1–4):25–36. https://doi.org/10.1016/S0012-821X(97)00146-5
Kissel, C., Laj., C., Mazaud, A., and Dokken, T., 1998. Magnetic anisotropy and environmental changes in two sedimentary cores from the Norwegian Sea and the North Atlantic. Earth and Planetary Science Letters, 164(3–4):617–626. https://doi.org/10.1016/S0040-1951(98)00223-6
Koenitz, D., White, N., McCave, I.N., and Hobbs, R., 2008. Internal structure of a contourite drift generated by the Antarctic Circumpolar Current. Geochemistry, Geophysics, Geosystems, 9(6):Q06012. https://doi.org/10.1029/2007GC001799
Lazarus, D., 1992. Antarctic Neogene radiolarians from the Kerguelen Plateau, Legs 119 and 120. In Wise, S.W., Jr., Schlich, R., et al., Proceedings of the Ocean Drilling Program, Scientific Results, 120: College Station, TX (Ocean Drilling Program), 785–809. https://doi.org/10.2973/odp.proc.sr.120.192.1992
Liu, W., Xie, S.-P., Liu, Z., and Zhu, J., 2017. Overlooked possibility of a collapsed Atlantic Meridional Overturning Circulation in warming climate. Science Advances, 3(1):e1601666. https://doi.org/10.1126/sciadv.1601666
McClymont, E.L., Elmore, A.C., Kender, S., Leng, M.J., Greaves, M., and Elderfield, H., 2016. Pliocene–Pleistocene evolution of sea surface and intermediate water temperatures from the southwest Pacific. Paleoceanography and Paleoclimatology, 31:895–913. https://doi.org/10.1002/2016pa002954
Nöthen, K., and Kasten, S., 2011. Reconstructing changes in seep activity by means of pore water and solid phase Sr/Ca and Mg/Ca ratios in pockmark sediments of the Northern Congo Fan. Marine Geology, 287(1–4):1–13. https://doi.org/10.1016/j.margeo.2011.06.008
Olsen, A., Key, R.M., van Heuven, S., Lauvset, S.K., Velo, A., Lin, X., Schirnick, C., et al., 2016. The Global Ocean Data Analysis Project version 2 (GLODAPv2) – an internally consistent data product for the world ocean. Earth System Science Data, 8:2907–323. https://doi.org/10.5194/essd-8-297-2016
Osterman, L.E., Poore, R.Z., and Barron, J., 2001. Climate variability of the Holocene, Site 1098, Palmer Deep, Antarctica. In Barker, P.F., Camerlenghi, A., Acton, G.D., and Ramsay, A.T.S. (Eds.), Proceedings of the Ocean Drilling Program, Scientific Results, 178: College Station, TX (Ocean Drilling Program), 1–45. https://doi.org/10.2973/odp.proc.sr.178.203.2001
Peck, V.L., Weber, M.E., Raymo, M.E., Williams, T., Armbrecht, L.H., Bailey, I., Brachfeld, S.A., Cardillo, F.G., Du, Z., Fauth, G., García, M., Glüder, A., Guitard, M.E., Gutjahr, M., Hemming, S.R., Hernández-Almeida, I., Hoem, F.S., Hwang, J.-H., Iizuka, M., Kato, Y., Kenlee, B., Martos, Y.M., O'Connell, S., Pérez, L.F., Reilly, B.T., Ronge, T.A., Seki, O., Tauxe, L., Tripathi, S., Warnock, J.P., and Zheng, X., 2021. Site U1535. In Weber, M.E., Raymo, M.E., Peck, V.L., Williams, T., and the Expedition 382 Scientists, Iceberg Alley and Subantarctic Ice and Ocean Dynamics. Proceedings of the International Ocean Discovery Program, 382: College Station, TX (International Ocean Discovery Program). https://doi.org/10.14379/iodp.proc.382.104.2021
Pérez, L.F., Hernández-Molina, F.J., Esteban, F.D., Tassone, A., Piola, A.R., Maldonado, A., Preu, B., Violante, R.A., and Lodolo, E., 2015. Erosional and depositional contourite features at the transition between the western Scotia Sea and southern South Atlantic Ocean: links with regional water-mass circulation since the middle Miocene. Geo-Marine Letters, 35(4):271–288. https://doi.org/10.1007/s00367-015-0406-6
Pribnow, D., Kinoshita, M., and Stein, C., 2000. Thermal Data Collection and Heat Flow Recalculations for Ocean Drilling Program Legs 101–180: Hanover, Germany (Institute for Joint Geoscientific Research, Institut für Geowissenschaftliche Gemeinschaftsaufgaben [GGA]). http://www-odp.tamu.edu/publications/heatflow/ODPReprt.pdf
Riedinger, N., Kasten, S., Gröger, J., Franke, C., and Pfeifer, K., 2006. Active and buried authigenic barite fronts in sediments from the Eastern Cape Basin. Earth and Planetary Science Letters, 241(3–4):876–887. https://doi.org/10.1016/j.epsl.2005.10.032
Roberts, J., McCave, I.N., McClymont, E.L., Kender, S., Hillenbrand, C.D., Matano, R., Hodell, D.A., and Peck, V.L., 2017. Deglacial changes in flow and frontal structure through the Drake Passage. Earth and Planetary Science Letters, 474:397–408. https://doi.org/10.1016/j.epsl.2017.07.004
Schwehr, K., and Tauxe, L., 2003. Characterization of soft-sediment deformation: detection of cryptoslumps using magnetic methods. Geology, 31(3):203–206. https://doi.org/10.1130/0091-7613(2003)031<0203:COSSDD>2.0.CO;2
Schwehr, K., Tauxe, L., Driscoll, N., and Lee, H., 2006. Detecting compaction disequilibrium with anisotropy of magnetic susceptibility. Geochemistry, Geophysics, Geosystems, 7(11):Q11002. https://doi.org/10.1029/2006GC001378
Speich, S., Blanke, B., and Madec, G., 2001. Warm and cold water routes of an O.G.C.M. thermohaline conveyor belt. Geophysical Research Letters, 28(2):311–314. https://doi.org/10.1029/2000GL011748
Sprenk, D., Weber, M.E., Kuhn, G., Rosén, P., Frank, M., Molina-Kescher, M., Liebetrau, V., and Röhling, H.-G., 2013. Southern Ocean bioproductivity during the last glacial cycle—new decadal-scale insight from the Scotia Sea. Geological Society Special Publication, 381(1):245–261. https://doi.org/10.1144/SP381.17
Stephenson, A., 1993. Three-axis static alternating field demagnetization of rocks and the identification of natural remanent magnetization, gyroremanent magnetization, and anisotropy. Journal of Geophysical Research: Solid Earth, 98(B1):373–381. https://doi.org/10.1029/92JB01849
Széréméta, N., Bassinot, F., Balut, Y., Labeyrie, L., and Pagel, M., 2004. Oversampling of sedimentary series collected by giant piston corer: evidence and corrections based on 3.5 kHz chirp profiles. Paleoceanography and Paleoclimatology, 19(1): PA1005. https://doi.org/10.1029/2002PA000795
Tarling, D.H., and Hrouda, F., 1993. The Magnetic Anisotropy of Rocks: London (Chapman and Hall).
Thouveny, N., Moreno, E., Delanghe, D., Candon, L., Lancelot, Y., and Shackleton, N.J., 2000. Rock magnetic detection of distal ice-rafted debris: clue for the identification of Heinrich layers on the Portuguese margin. Earth and Planetary Science Letters, 180(1–2):61–75. https://doi.org/10.1016/S0012-821X(00)00155-2
Torres, M.E., Brumsack, H.-J., Bohrmann, G., and Emeis, K.C., 1996. Barite fronts in continental margin sediments: a new look at barium remobilization in the zone of sulfate reduction and formation of heavy barites in diagenetic fronts. Chemical Geology, 127(1–3):125–139. https://doi.org/10.1016/0009-2541(95)00090-9
Voigt, I., Chiessi, C.M., Piola, A.R., and Henrich, R., 2016. Holocene changes in Antarctic Intermediate Water flow strength in the Southwest Atlantic. Palaeogeography, Palaeoclimatology, Palaeoecology, 463:60–67. https://doi.org/10.1016/j.palaeo.2016.09.018
Weber, M.E., 1998. Estimation of biogenic carbonate and opal by continuous non-destructive measurements in deep-sea sediments: application to the eastern equatorial Pacific. Deep-Sea Research, Part I: Oceanographic Research Papers, 45(11):1955–1975. https://doi.org/10.1016/S0967-0637(98)00028-4
Weber, M.E., Niessen, F., Kuhn, G., and Wiedicke, M., 1997. Calibration and application of marine sedimentary physical properties using a multi-sensor core logger. Marine Geology, 136(3–4):151–172. http://dx.doi.org/10.1016/S0025-3227(96)00071-0
Weber, M.E., Raymo, M.E., Peck, V.L., Williams, T., Armbrecht, L.H., Bailey, I., Brachfeld, S.A., Cardillo, F.G., Du, Z., Fauth, G., García, M., Glüder, A., Guitard, M.E., Gutjahr, M., Hemming, S.R., Hernández-Almeida, I., Hoem, F.S., Hwang, J.-H., Iizuka, M., Kato, Y., Kenlee, B., Martos, Y.M., O'Connell, S., Pérez, L.F., Reilly, B.T., Ronge, T.A., Seki, O., Tauxe, L., Tripathi, S., Warnock, J.P., and Zheng, X., 2021. Expedition 382 methods. In Weber, M.E., Raymo, M.E., Peck, V.L., Williams, T., and the Expedition 382 Scientists, Iceberg Alley and Subantarctic Ice and Ocean Dynamics. Proceedings of the International Ocean Discovery Program, 382: College Station, TX (International Ocean Discovery Program). https://doi.org/10.14379/iodp.proc.382.102.2021
1 Peck, V.L., Weber, M.E., Raymo, M.E., Williams, T., Armbrecht, L.H., Bailey, I., Brachfeld, S.A., Cardillo, F.G., Du, Z., Fauth, G., García, M., Glüder, A., Guitard, M.E., Gutjahr, M., Hemming, S.R., Hernández-Almeida, I., Hoem, F.S., Hwang, J.-H., Iizuka, M., Kato, Y., Kenlee, B., Martos, Y.M., O'Connell, S., Pérez, L.F., Reilly, B.T., Ronge, T.A., Seki, O., Tauxe, L., Tripathi, S., Warnock, J.P., and Zheng, X., 2021. Site U1534. In Weber, M.E., Raymo, M.E., Peck, V.L., Williams, T., and the Expedition 382 Scientists, Iceberg Alley and Subantarctic Ice and Ocean Dynamics. Proceedings of the International Ocean Discovery Program, 382: College Station, TX (International Ocean Discovery Program). https://doi.org/10.14379/iodp.proc.382.103.2021
2 Expedition 382 Scientists' affiliations.
This work is distributed under the Creative Commons Attribution 4.0 International (CC BY 4.0) license. 