Lamy, F., Winckler, G., Alvarez Zarikian, C.A., and the Expedition 383 Scientists
Proceedings of the International Ocean Discovery Program Volume 383
publications.iodp.org

https://doi.org/10.14379/iodp.proc.383.105.2021
Site U15411
G. Winckler, F. Lamy, C.A. Alvarez Zarikian, H.W. Arz, C. Basak, A. Brombacher, O.M. Esper, J.R. Farmer, J. Gottschalk, L.C. Herbert, S. Iwasaki, V.J. Lawson, L. Lembke-Jene, L. Lo, E. Malinverno, E. Michel, J.L. Middleton, S. Moretti, C.M. Moy, A.C. Ravelo, C.R. Riesselman, M. Saavedra-Pellitero, I. Seo, R.K. Singh, R.A. Smith, A.L. Souza, J.S. Stoner, I.M. Venancio, S. Wan, X. Zhao, and N. Foucher McColl2
Keywords: International Ocean Discovery Program, IODP, JOIDES Resolution, Expedition 383, Dynamics of the Pacific Antarctic Circumpolar Current, Site U1541, Southern Ocean, South Pacific, Chilean margin, paleoceanography, Antarctic Circumpolar Current, oceanic fronts, Circumpolar Deep Water, Antarctic Intermediate Water, marine carbon cycle, dust, biological productivity, iron fertilization, southern westerly winds, Patagonian ice sheet, West Antarctic ice sheet
MS 383-105: Published 18 July 2021
Background and objectives
Site U1541 (Proposed Site CSP-1A) is located in the central South Pacific at 54°12.756′S, 125°25.540′W, ~1830 nmi west of the Strait of Magellan, at 3604 m water depth (Figure F1A). The site sits on the western flank of the southernmost East Pacific Rise (EPR), ~50 nmi north of the Eltanin-Tharp Fracture Zone and ~160 nmi from the modern seafloor spreading axis. Site U1541 is underlain by oceanic crust formed at the EPR between ~6 and 8 Ma (Eagles, 2006), and assuming overall constant seafloor half-spreading rates of ~4.5 cm/y (Pitman and Heirtzler, 1966), the plate tectonic backtrack path moves the site eastward. This translates to an early Pliocene position ~100 nmi closer to the crest of the EPR at a water depth several hundred meters shallower than the modern value of 3604 m. At a smaller scale, the site is located in a NNE–SSW oriented trough, ~4 nmi wide, that parallels the orientation of the EPR. The adjacent ridges rise to ~3400 m water depth southeast of the site and to ~3500 m water depth northwest of the site (Figure F1B).
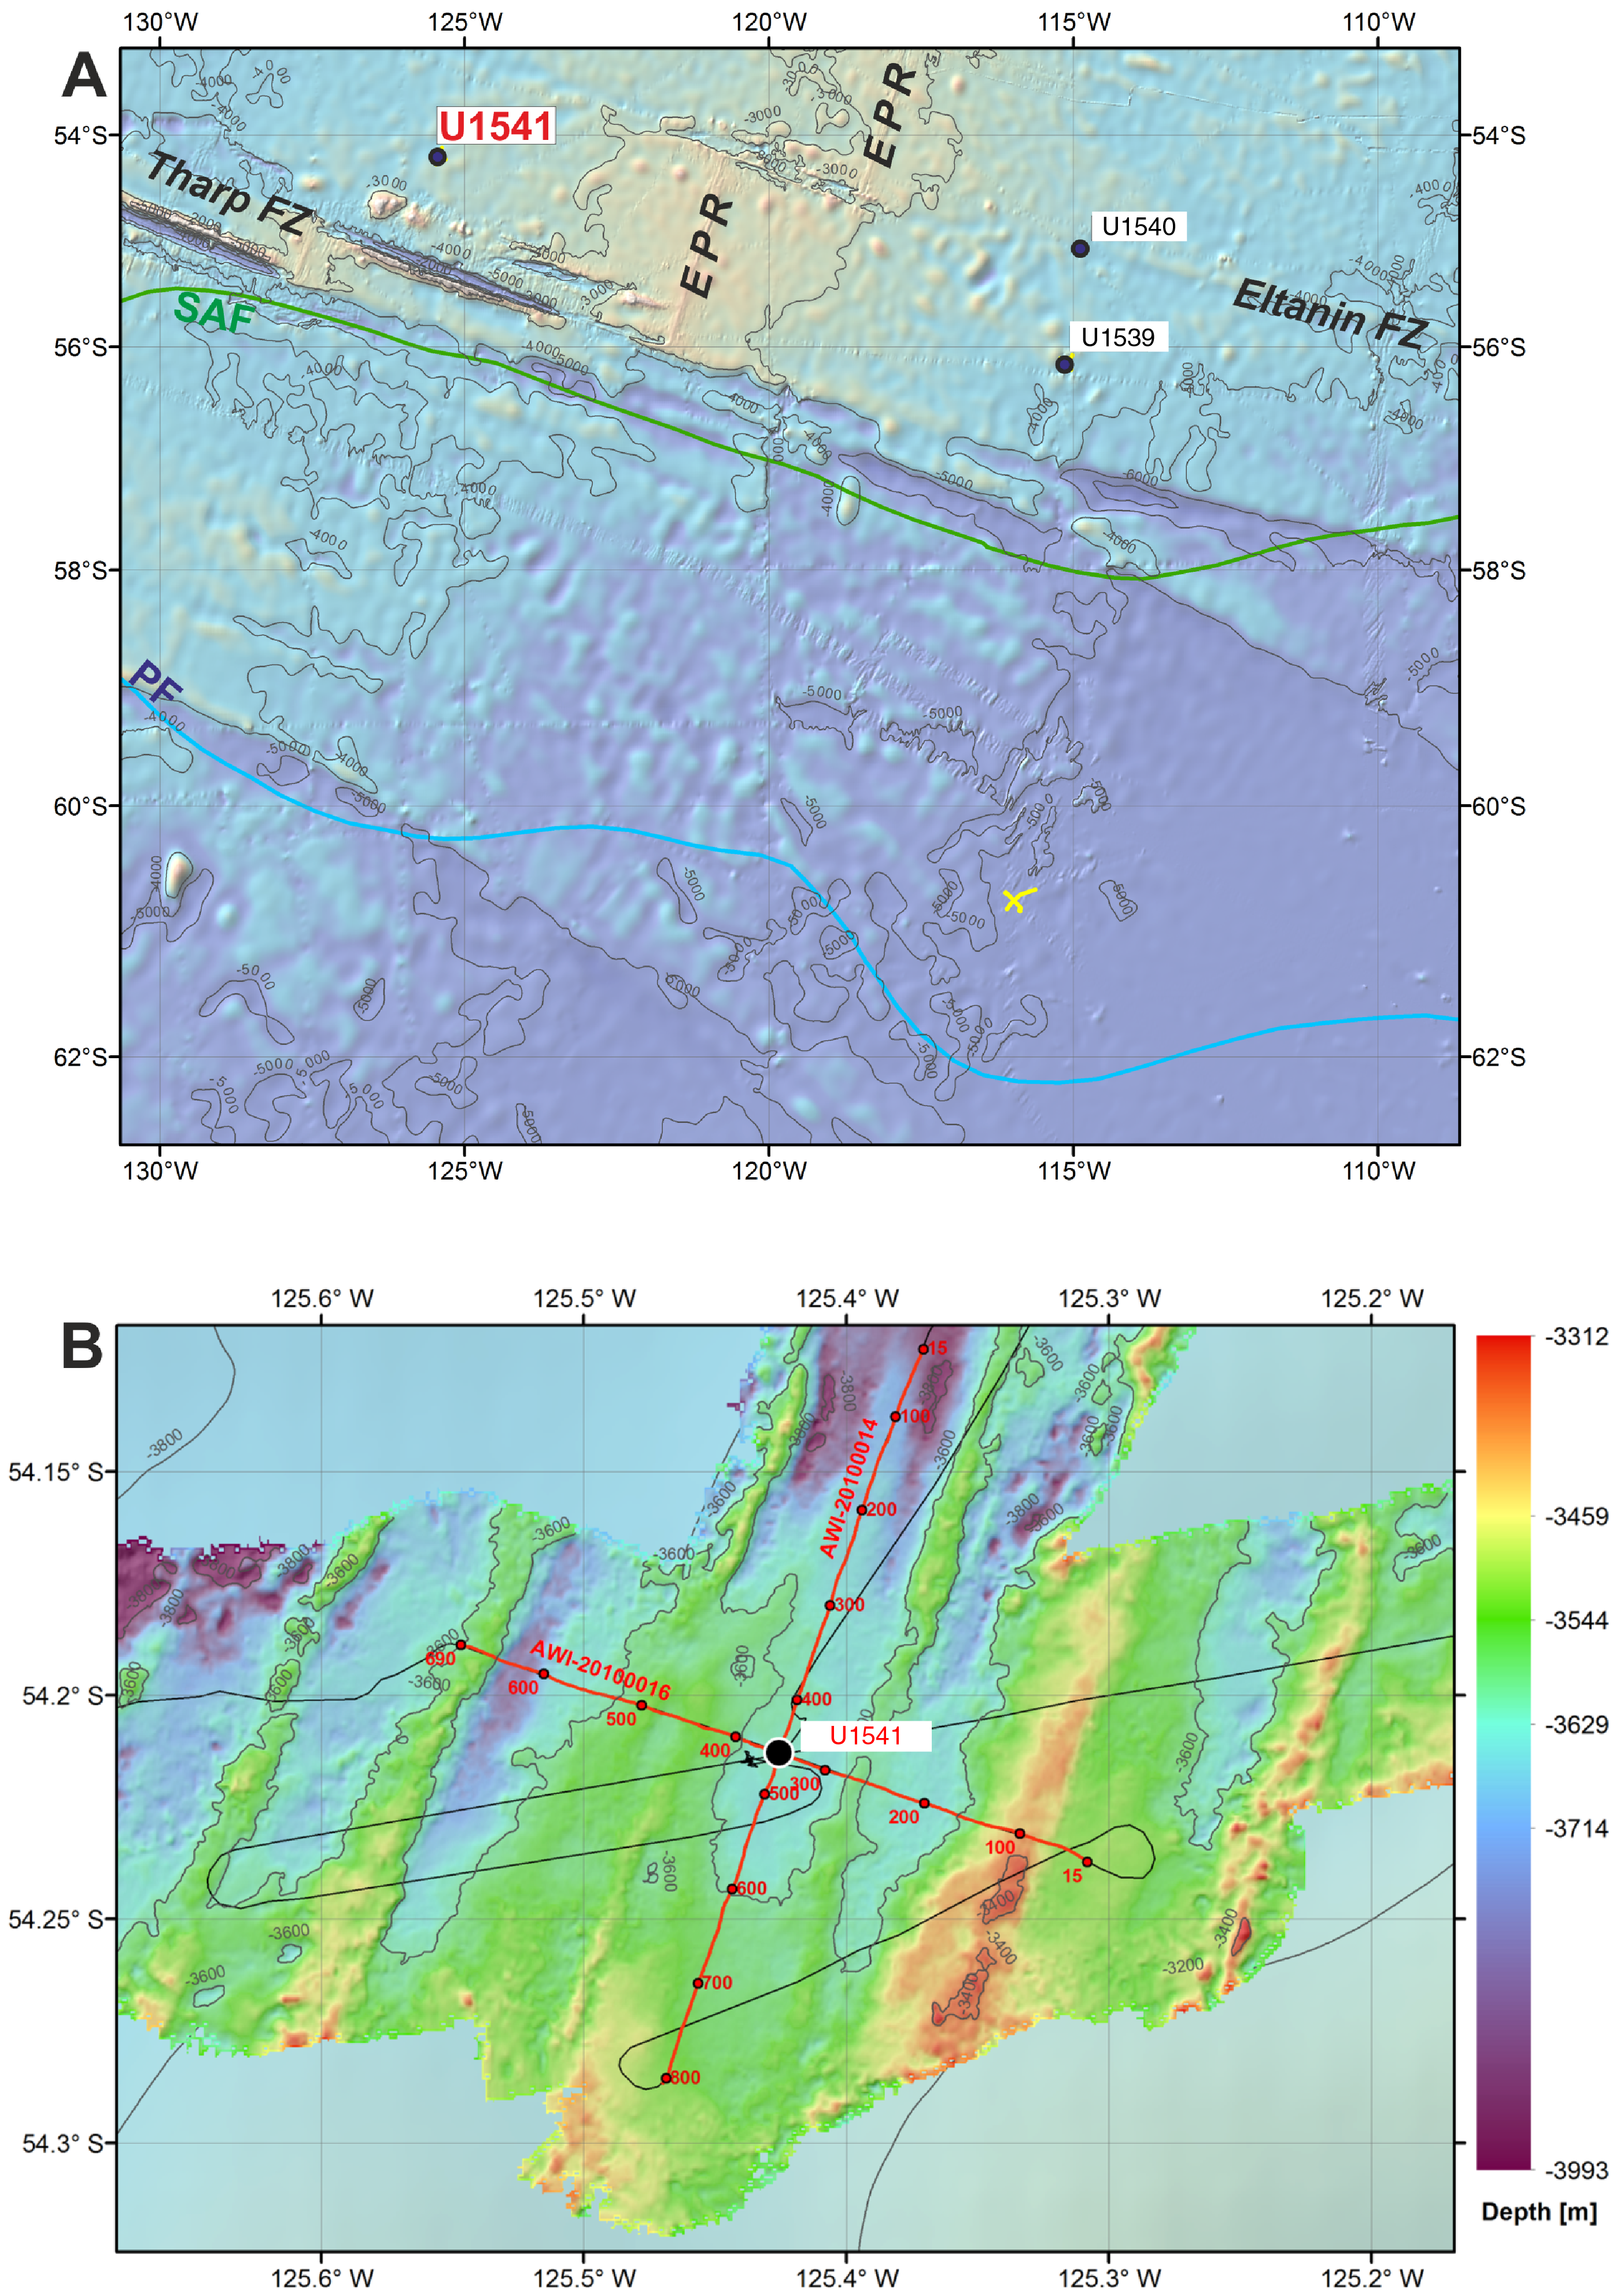
Figure F1. Oceanographic and bathymetric setting.
Site U1541 is located on Multichannel Seismic (MCS) Line AWI-201000014 at the intersection with Line AWI-2010000016 (Figure F2A) (Gersonde, 2011). The seismic cross-lines indicate ~180 m thick sediments above oceanic basement. Sediments are mostly well stratified and have flat-lying, slightly irregular reflectors. Low to moderately reflecting layers become stronger below ~120–140 m sediment depth. Sediment echo sound (Parasound) profiles (Gersonde, 2011) reveal moderate penetration (~80 m) and distinct layering (Figure F2B), suggesting a succession of fine-grained soft sediments with varying lithologic composition.
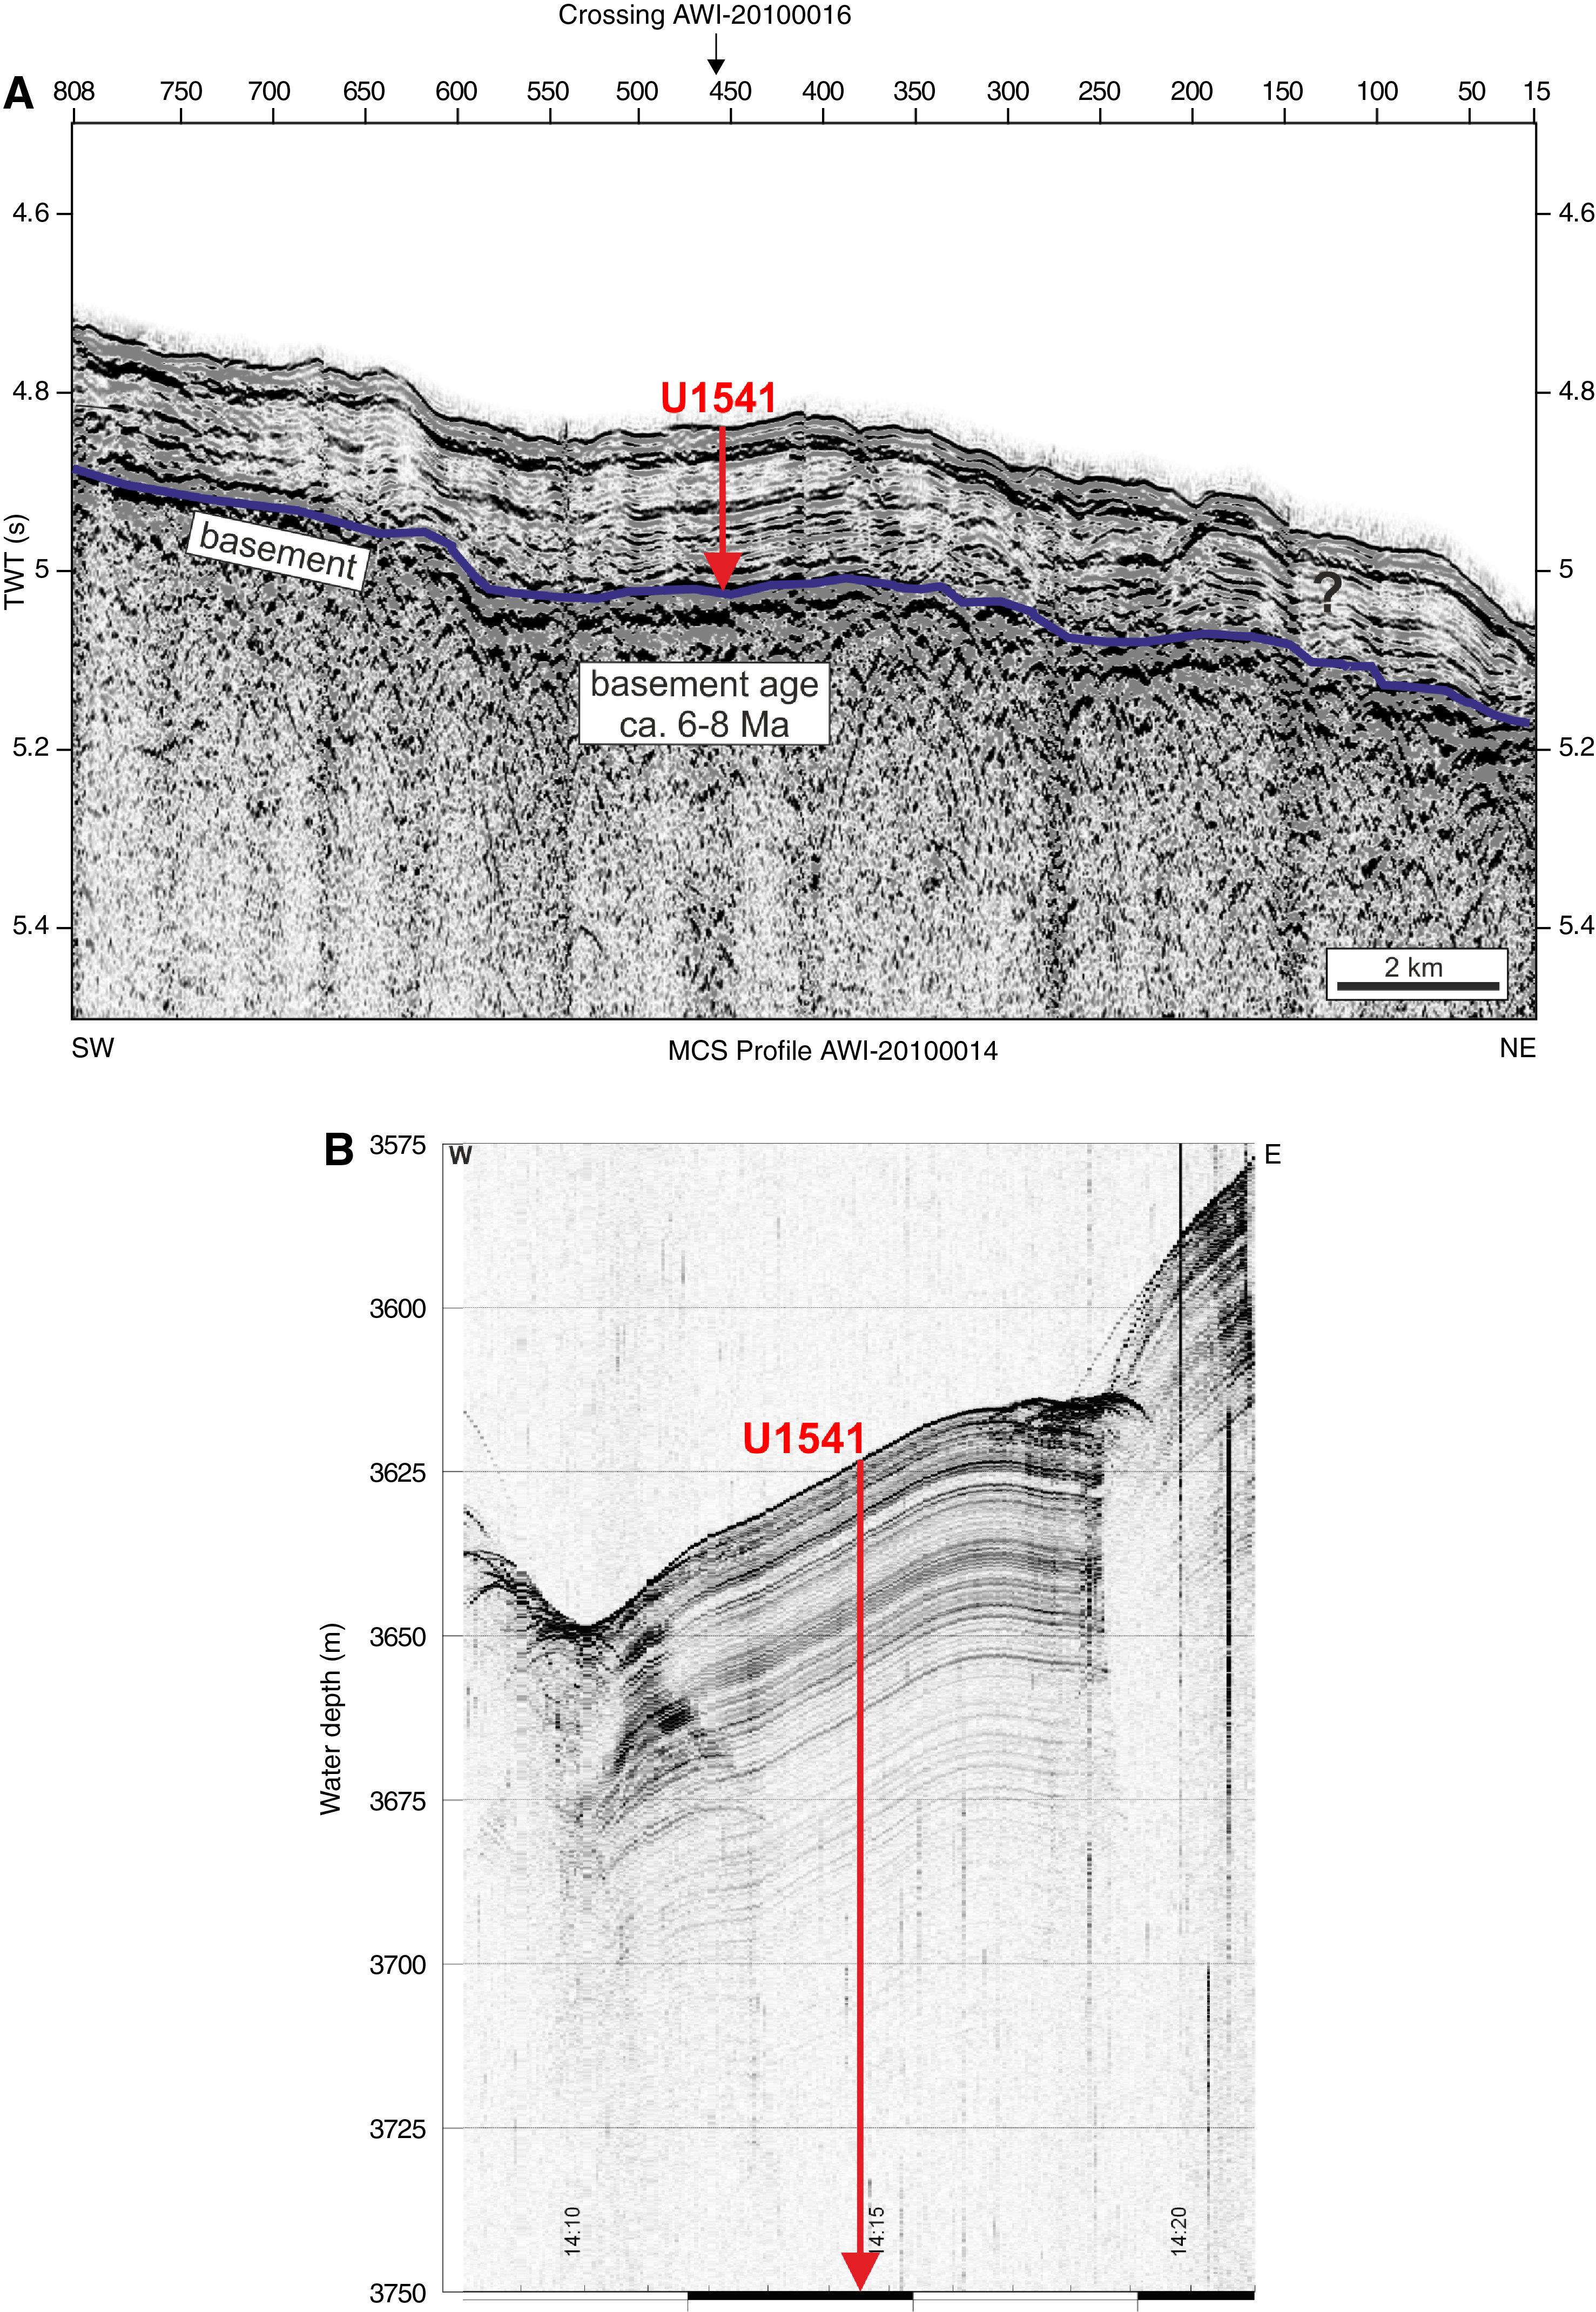
Figure F2. MCS and Parasound profiles.
A ~14 m long gravity core (PS75/059-2) that covers the past ~475 ky close to Site U1541 primarily contains calcareous ooze with some more diatom-rich intervals (~50–95 wt% CaCO3, ~5–25 wt% opal, and ~5–40 wt% siliciclastics). Sedimentation rates calculated over the length of Core PS75/059-2 average ~3 cm/ky, and maxima reach ~6 cm/ky between 390 and 420 ka (Marine Isotope Stage 11) (Ullermann et al., 2016).
Site U1541 lies in the pathway of the Subantarctic Antarctic Circumpolar Current (ACC), ~100 nmi north of the modern mean position of the Subantarctic Front (SAF). In this ACC sector, the associated fronts are strongly steered by the topography of seafloor spreading systems (Udintsev and Eltanin-Tharp Fracture Zone systems).
Sea-surface temperatures (SSTs) seasonally vary between ~3°C (July–September) and ~7°C (January–March). The area is located west of the main Antarctic Intermediate and Mode Water formation regions in the Southeast Pacific. The water depth of 3604.2 m places Site U1541 within Lower Circumpolar Deep Water (LCDW) (Figure F3).
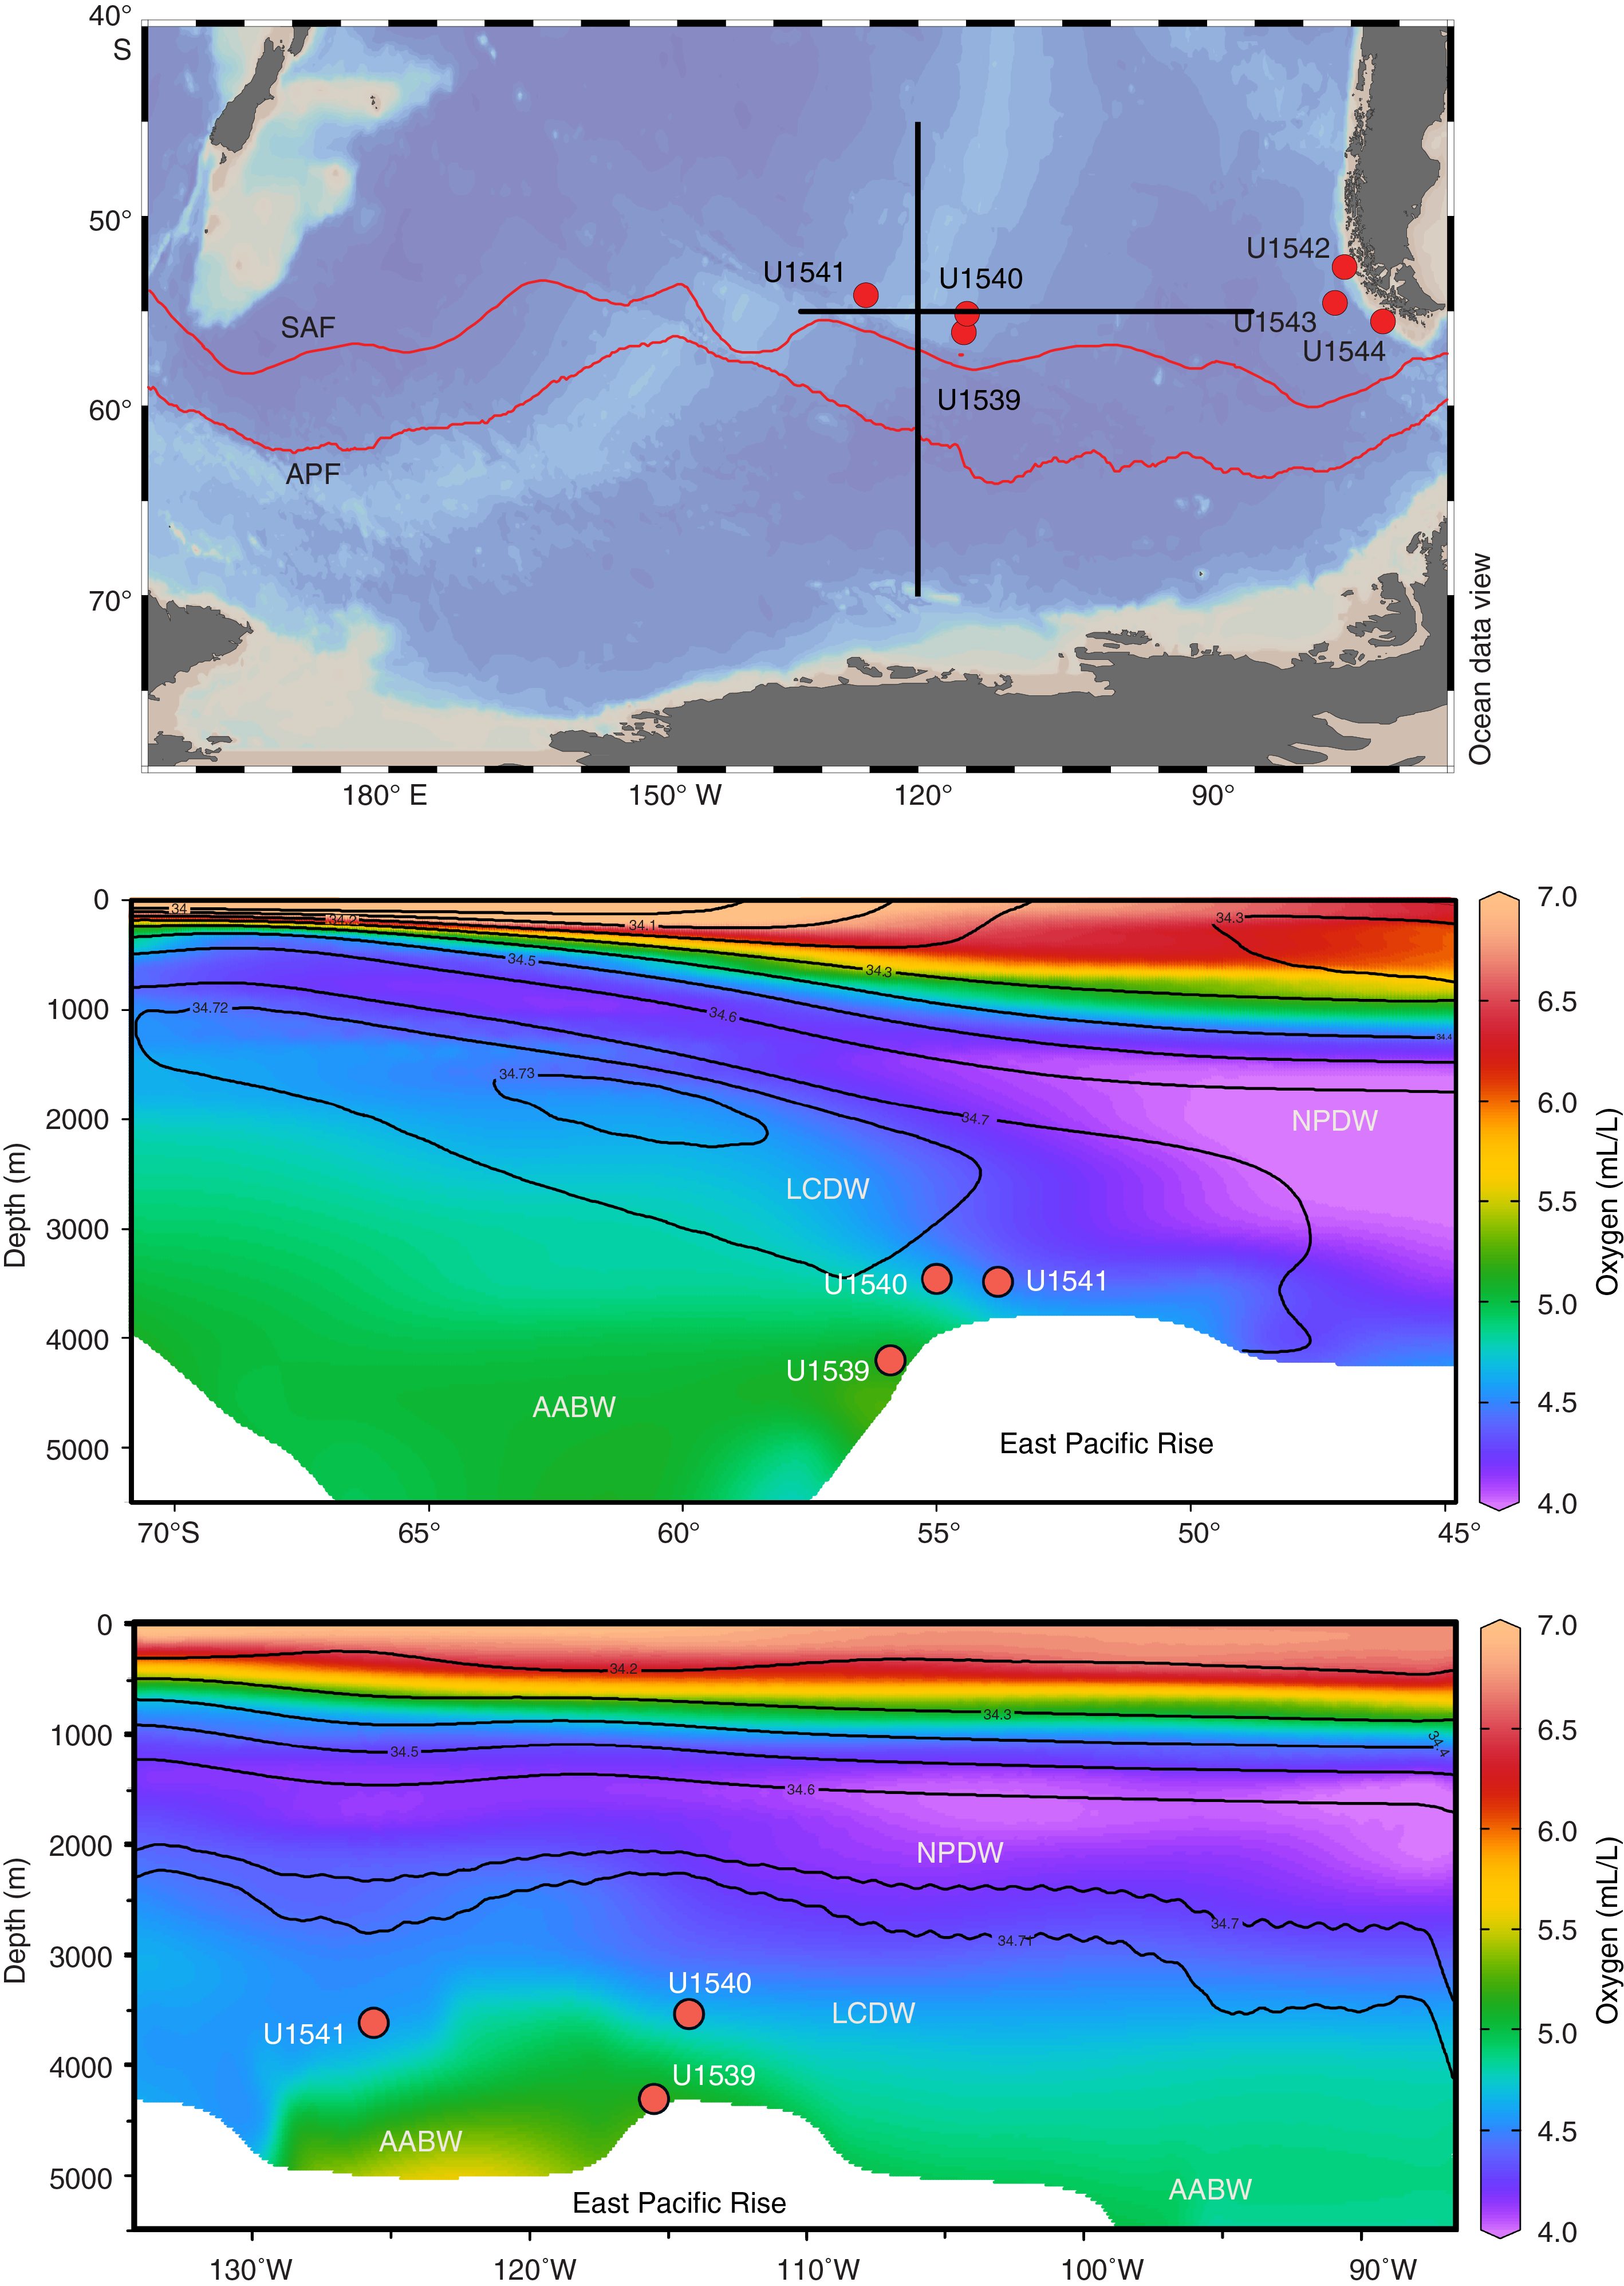
Figure F3. Modern salinity and oxygen distribution.
Scientific objectives
The main objectives at Site U1541 were to
- Recover a moderate resolution Subantarctic Miocene–Quaternary sediment record close to the SAF;
- Fully document the stratigraphy of calcareous and, subordinately, siliceous oozes, allowing for a wide range of paleoceanographic reconstructions;
- Reconstruct high-amplitude Subantarctic SSTs based on multiple proxies;
- Investigate long-term changes in dust input;
- Provide a record of LCDW and potential influence of glacial Antarctic Bottom Water (AABW);
- Reconstruct productivity (biogenic silica versus carbonate), nutrient distribution, and dust-productivity coupling; and
- Recover a potential far-field record of West Antarctic Ice Sheet variability.
Operations
Three holes were cored at Site U1541 using the full-length advanced piston corer (APC) system. Hole U1541A was cored to 9.5 m core depth below seafloor, Method A (CSF-A) (9.67 m recovered; 101.8%). Hole U1541B was cored to 138.5 m CSF-A (129.27 m recovered; 93.3%). Hole U1541C was cored to 118.1 m CSF-A (100.37 m recovered; 85%) (Table T1).
Transit to Site U1541
During the transit to Site U1541, rough weather systems moved in and caused high seas at the site location. Therefore, upon reaching the site coordinates at ~2300 h on 15 June 2019, the vessel continued at reduced speed on a 245°SW weather avoidance course for another ~100 nmi past the site. At 2105 h on 16 June, the sea state had sufficiently calmed to turn the ship around and head back. We completed the transit and arrived at Site U1541 at 0736 h on 17 June. We lowered the thrusters, and the vessel was placed over the site coordinates and on dynamic positioning mode by 0820 h. Soon after, the drill crew started to build the APC/extended core barrel (XCB) bottom-hole assembly and to lower the drill pipe to the seafloor.
Site U1541
Hole U1541A
By 1815 h, the drill bit had been lowered to 3597 meters below rig floor (mbrf), 5 m above the seafloor depth calculated from the precision depth recorder reading. Core 383-U1541A-1H was attempted, but it came up empty. Three more attempts followed with the bit at 3602, 3607, and finally 3617 mbrf before we successfully recovered any sediment. Hole U1541A was finally spudded at 2330 h on 17 June 2019. Core 1H recovered 9.5 m of sediment, indicating a missed mudline, and the hole was terminated at that point. The time spent in Hole U1541A was 15.75 h.
Hole U1541B
The bit was raised to 3612.0 mbrf, and Hole U1541B was spudded at 0055 h on 18 June 2019. Based on the recovery in Core 383-U1541B-1H, the seafloor was calculated at 3614.4 mbrf (or 3603.7 meters below sea level [mbsl]). Coring continued without incident until a partial stroke was recorded on Core 15H. When the core was recovered, the advanced piston corer temperature (APCT-3) tool cutting shoe showed damage; therefore, the driller pulled back the following APC core barrel before it arrived at the bottom. An XCB core barrel was dropped to attempt Core 16X. After drilling for 45 min and advancing only 0.5 m, the barrel was pulled back on board. Core 16X retrieved three large pebble-sized basalt pieces (2–5 cm in diameter) in the core catcher. The bit was pulled out of the hole, clearing the seafloor at 0100 h and ending Hole U1541B.
A total of 16 cores were taken in Hole U1541B. The APC system was used for 15 of these, reaching 138.0 m CSF-A before APC refusal and recovering 129.3 m (94%). The XCB system was used for one core, advancing 0.5 m and recovering 0.06 m of basalt (12%). The APCT-3 tool was used on Cores 383-U1541B-4H, 7H, 11H, and 15H. Misfires were recorded on Cores 1H, 4H, and 6H, and a partial stroke was registered on Core 15H. A total of 25 h were spent in Hole U1541B.
Hole U1541C
The vessel was offset 20 m east of Hole U1541B, the bit was raised to 3608.0 mbrf, and Hole U1541C was spudded at 0325 h on 19 June 2019. The full-length APC system was used to core the hole to 118.1 m CSF-A (Cores 383-U1541C-1H through 13H) before coring was terminated at 1805 h on 19 June to allow the vessel to evade approaching heavy weather.
The bit was pulled to the surface, clearing the rotary table at 0140 h on 20 June. The drill collars were laid out and the rig floor was secured for transit at 0204 h on 20 June, ending Hole U1541C and Site U1541. A total of 13 APC cores were taken over a 118.1 m interval with a recovery of 100.4 m (85%). Formation temperature measurements were not taken.
At 0236 h on 20 June, the vessel began a transit northeast of Site U1541 to avoid heavy weather headed toward the operational area. By midnight on 23 June, the vessel had traveled 772 nmi.
Sedimentology
Site U1541 is located north of the SAF at 54°12.76′S, 125°25.54′W, at approximately 3604 m water depth 160 nmi west of the EPR mid-ocean ridge and 370 nmi west of Site U1540. The basement age at Site U1541 is estimated at between 6 and 8 Ma. Site U1541 completes a set of three pelagic sites drilled in the open-ocean central South Pacific during Expedition 383 (Sites U1539–U1541) and will be used to reconstruct physical, chemical, and biological changes in the Pacific Southern Ocean from the Miocene to present. Site U1541 is particularly well suited to address the long-term evolution of past changes in the ACC and the southern high-latitude carbon cycle along with their climate implications.
The three holes (U1541A–U1541C) occupied at Site U1541 provide the basis for a composite ~146 m thick sedimentary sequence containing Holocene to Miocene sediments (see Stratigraphic correlation). Hole U1541B recovered the deepest sediments at 138.5 m CSF-A, but it was abandoned after APC refusal and when subsequent XCB drilling (Core 383-U1541B-16X) retrieved only three large pebble-sized rock fragments. Relatively high seas during drilling operations occasionally caused APC misfires, which led to incomplete strokes of the piston corer (see Operations) and caused fall-in and suck-in coring disturbances at the top and base of sediment cores, respectively (e.g., Core 383-U1541B-4H). The identification and classification of sediments disturbed by drilling operations is outlined in Sedimentology in the Expedition 383 methods chapter (Winckler et al., 2021a) and is largely based on disturbance described by Jutzeler et al. (2014). Severe drilling-disturbed sediments were classified as mixed biogenic oozes in the visual core descriptions (VCDs) and hole summaries (Figure F4), and examples are found in Sections 383-U1541B-4H-1 through 4H-7, 6H-1, and 383-U1541C-12H-1. Despite these difficulties, the composite stratigraphy developed from Holes U1541A–U1541C provide a near-complete and continuous sedimentary sequence from the Miocene to Holocene (see Biostratigraphy and Stratigraphic correlation).

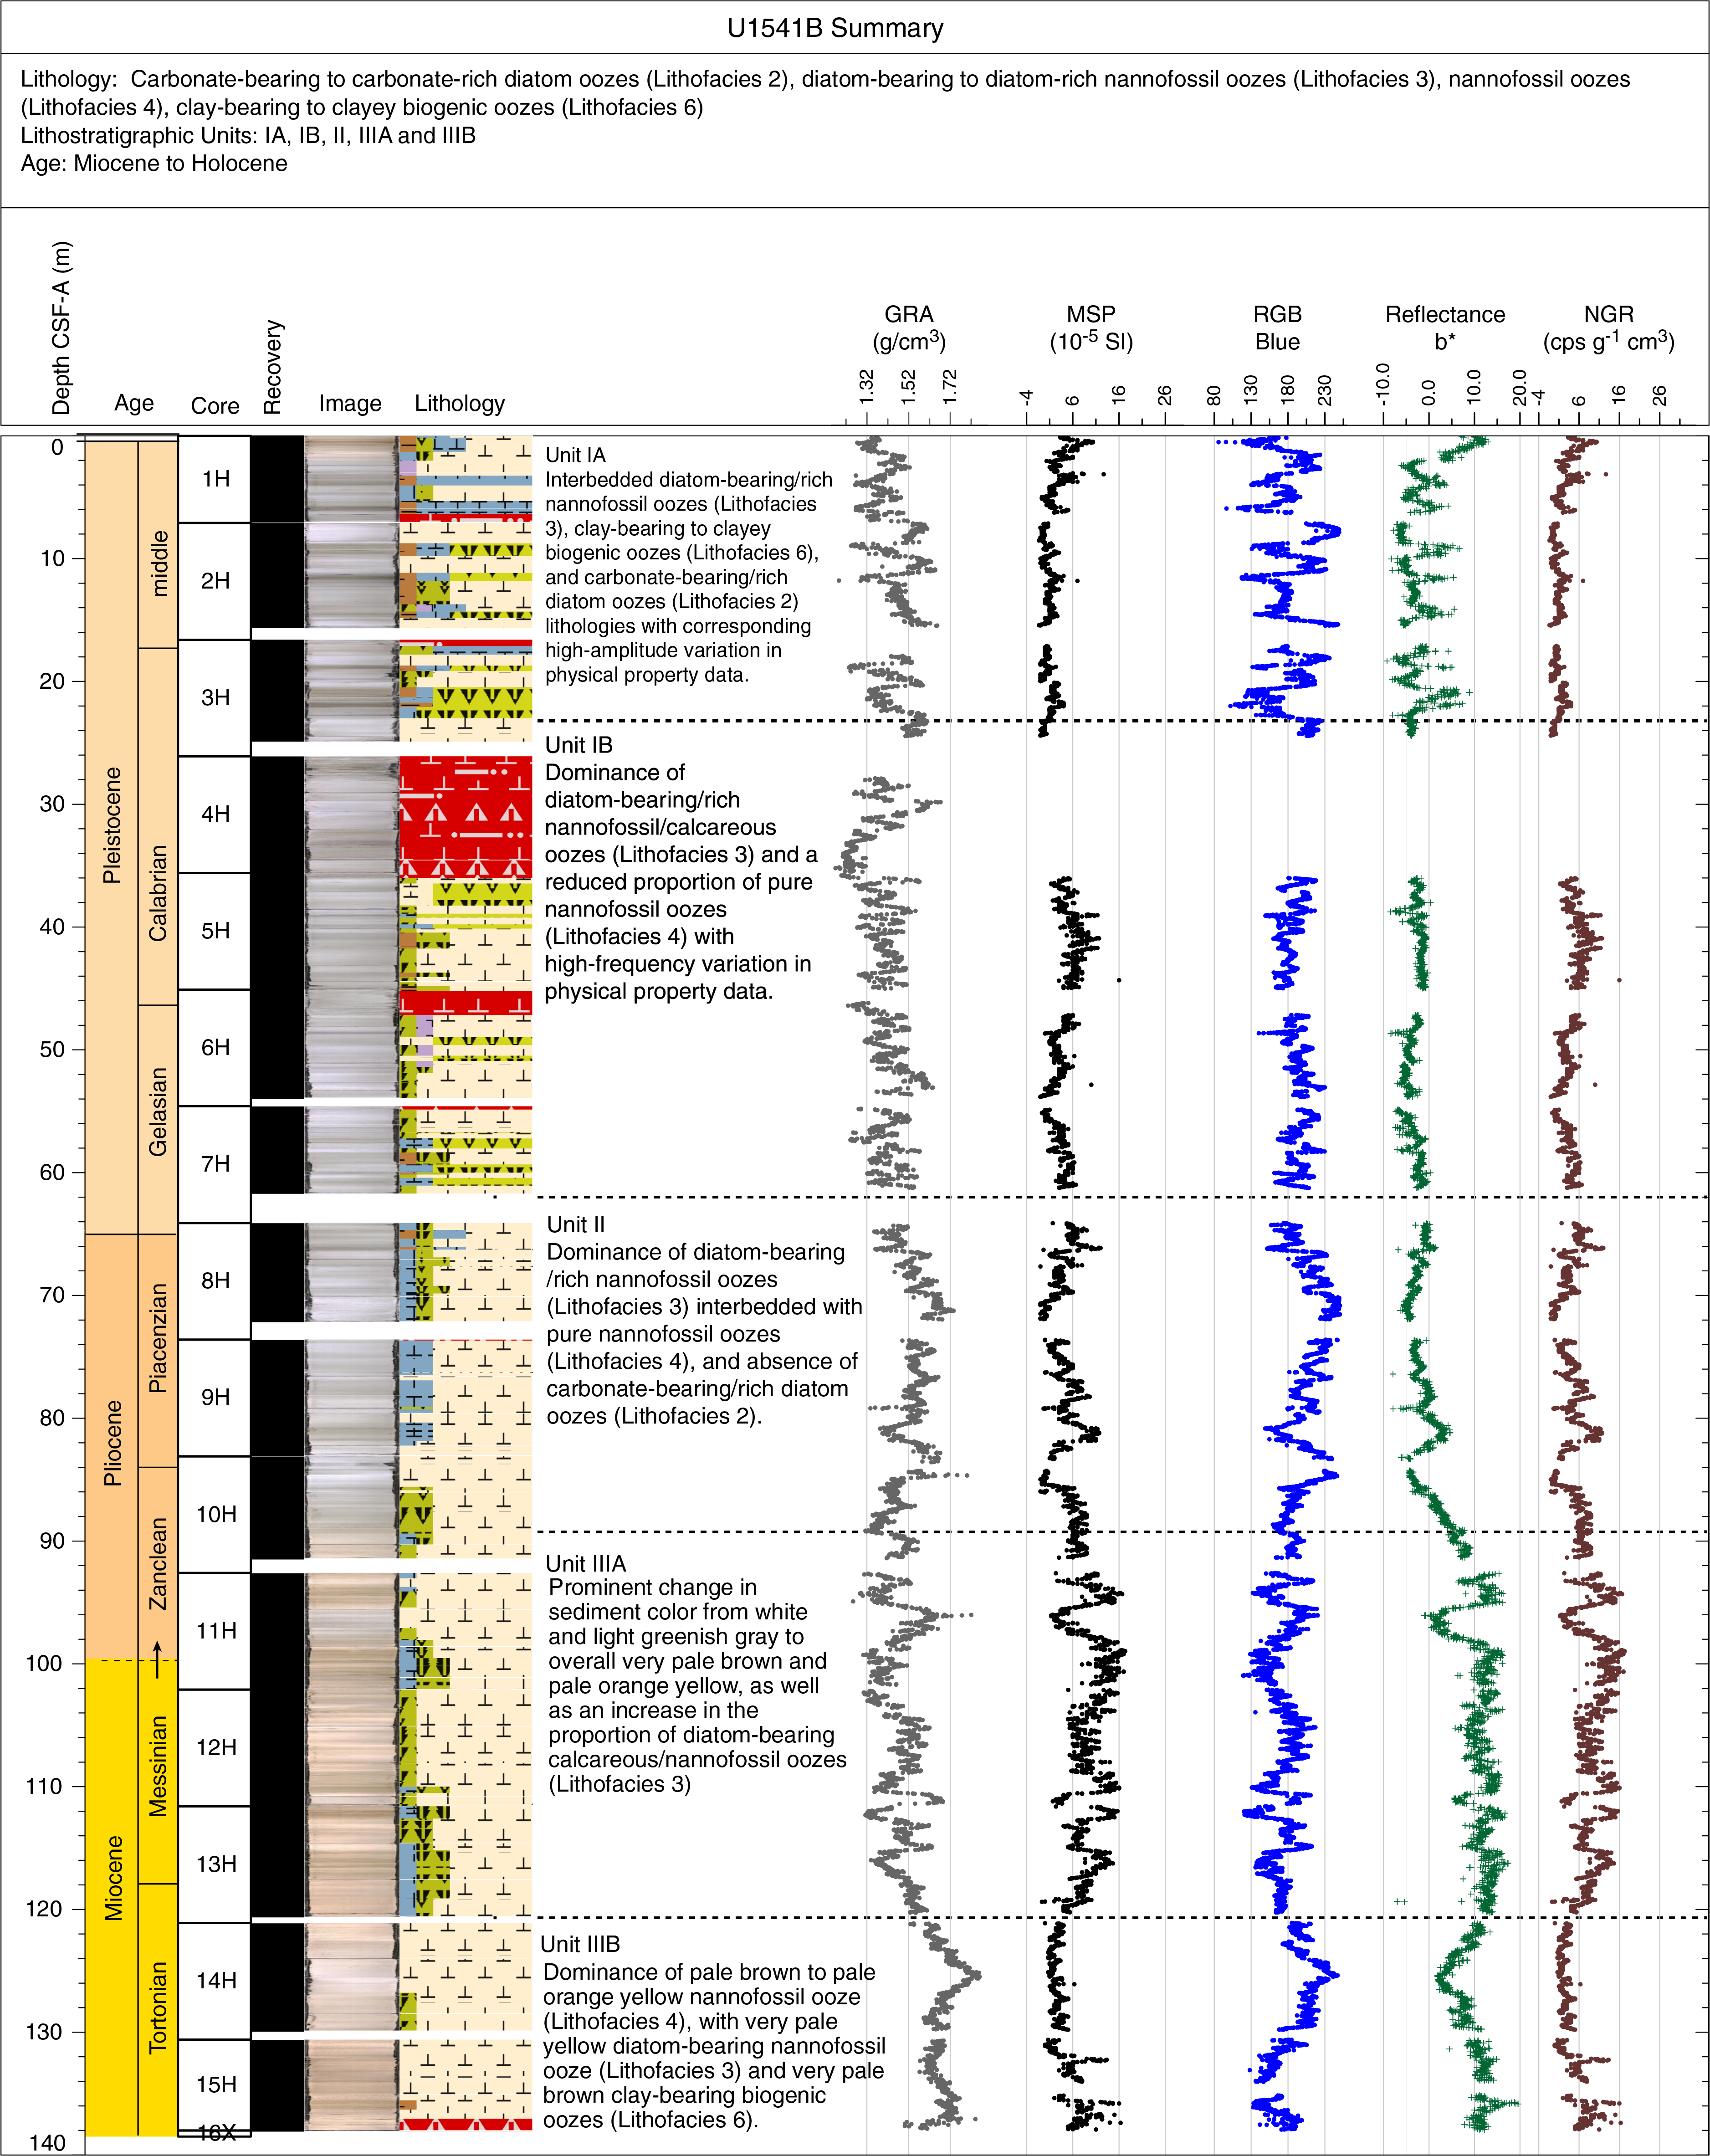

Figure F4. Hole summaries.
Lithofacies description
Four lithofacies were identified at Site U1541 (Table T2). The numbering of the facies is based on all facies documented for Expedition 383, but only lithofacies documented at Site U1541 are described and discussed here. All lithofacies defined at Site U1541 (Lithofacies 2, 3, 4, and 6) can be represented in a ternary diagram with diatom ooze, nannofossil ooze, and clay as end-members (Figure F5). Beds of carbonate-bearing to carbonate-rich diatom ooze (Lithofacies 2) (Figure F6) and clay-bearing and clayey biogenic ooze (Lithofacies 6) compose a minor proportion of the sedimentary sequence at Site U1541 (about 8% and 9%, respectively). Site U1541 sediments are dominated by diatom-bearing to diatom-rich calcareous or nannofossil ooze (Lithofacies 3; 55%) (Figure F7) and essentially pure nannofossil ooze with no major modifying or accessory components (Lithofacies 4; 28%) (Figure F8).
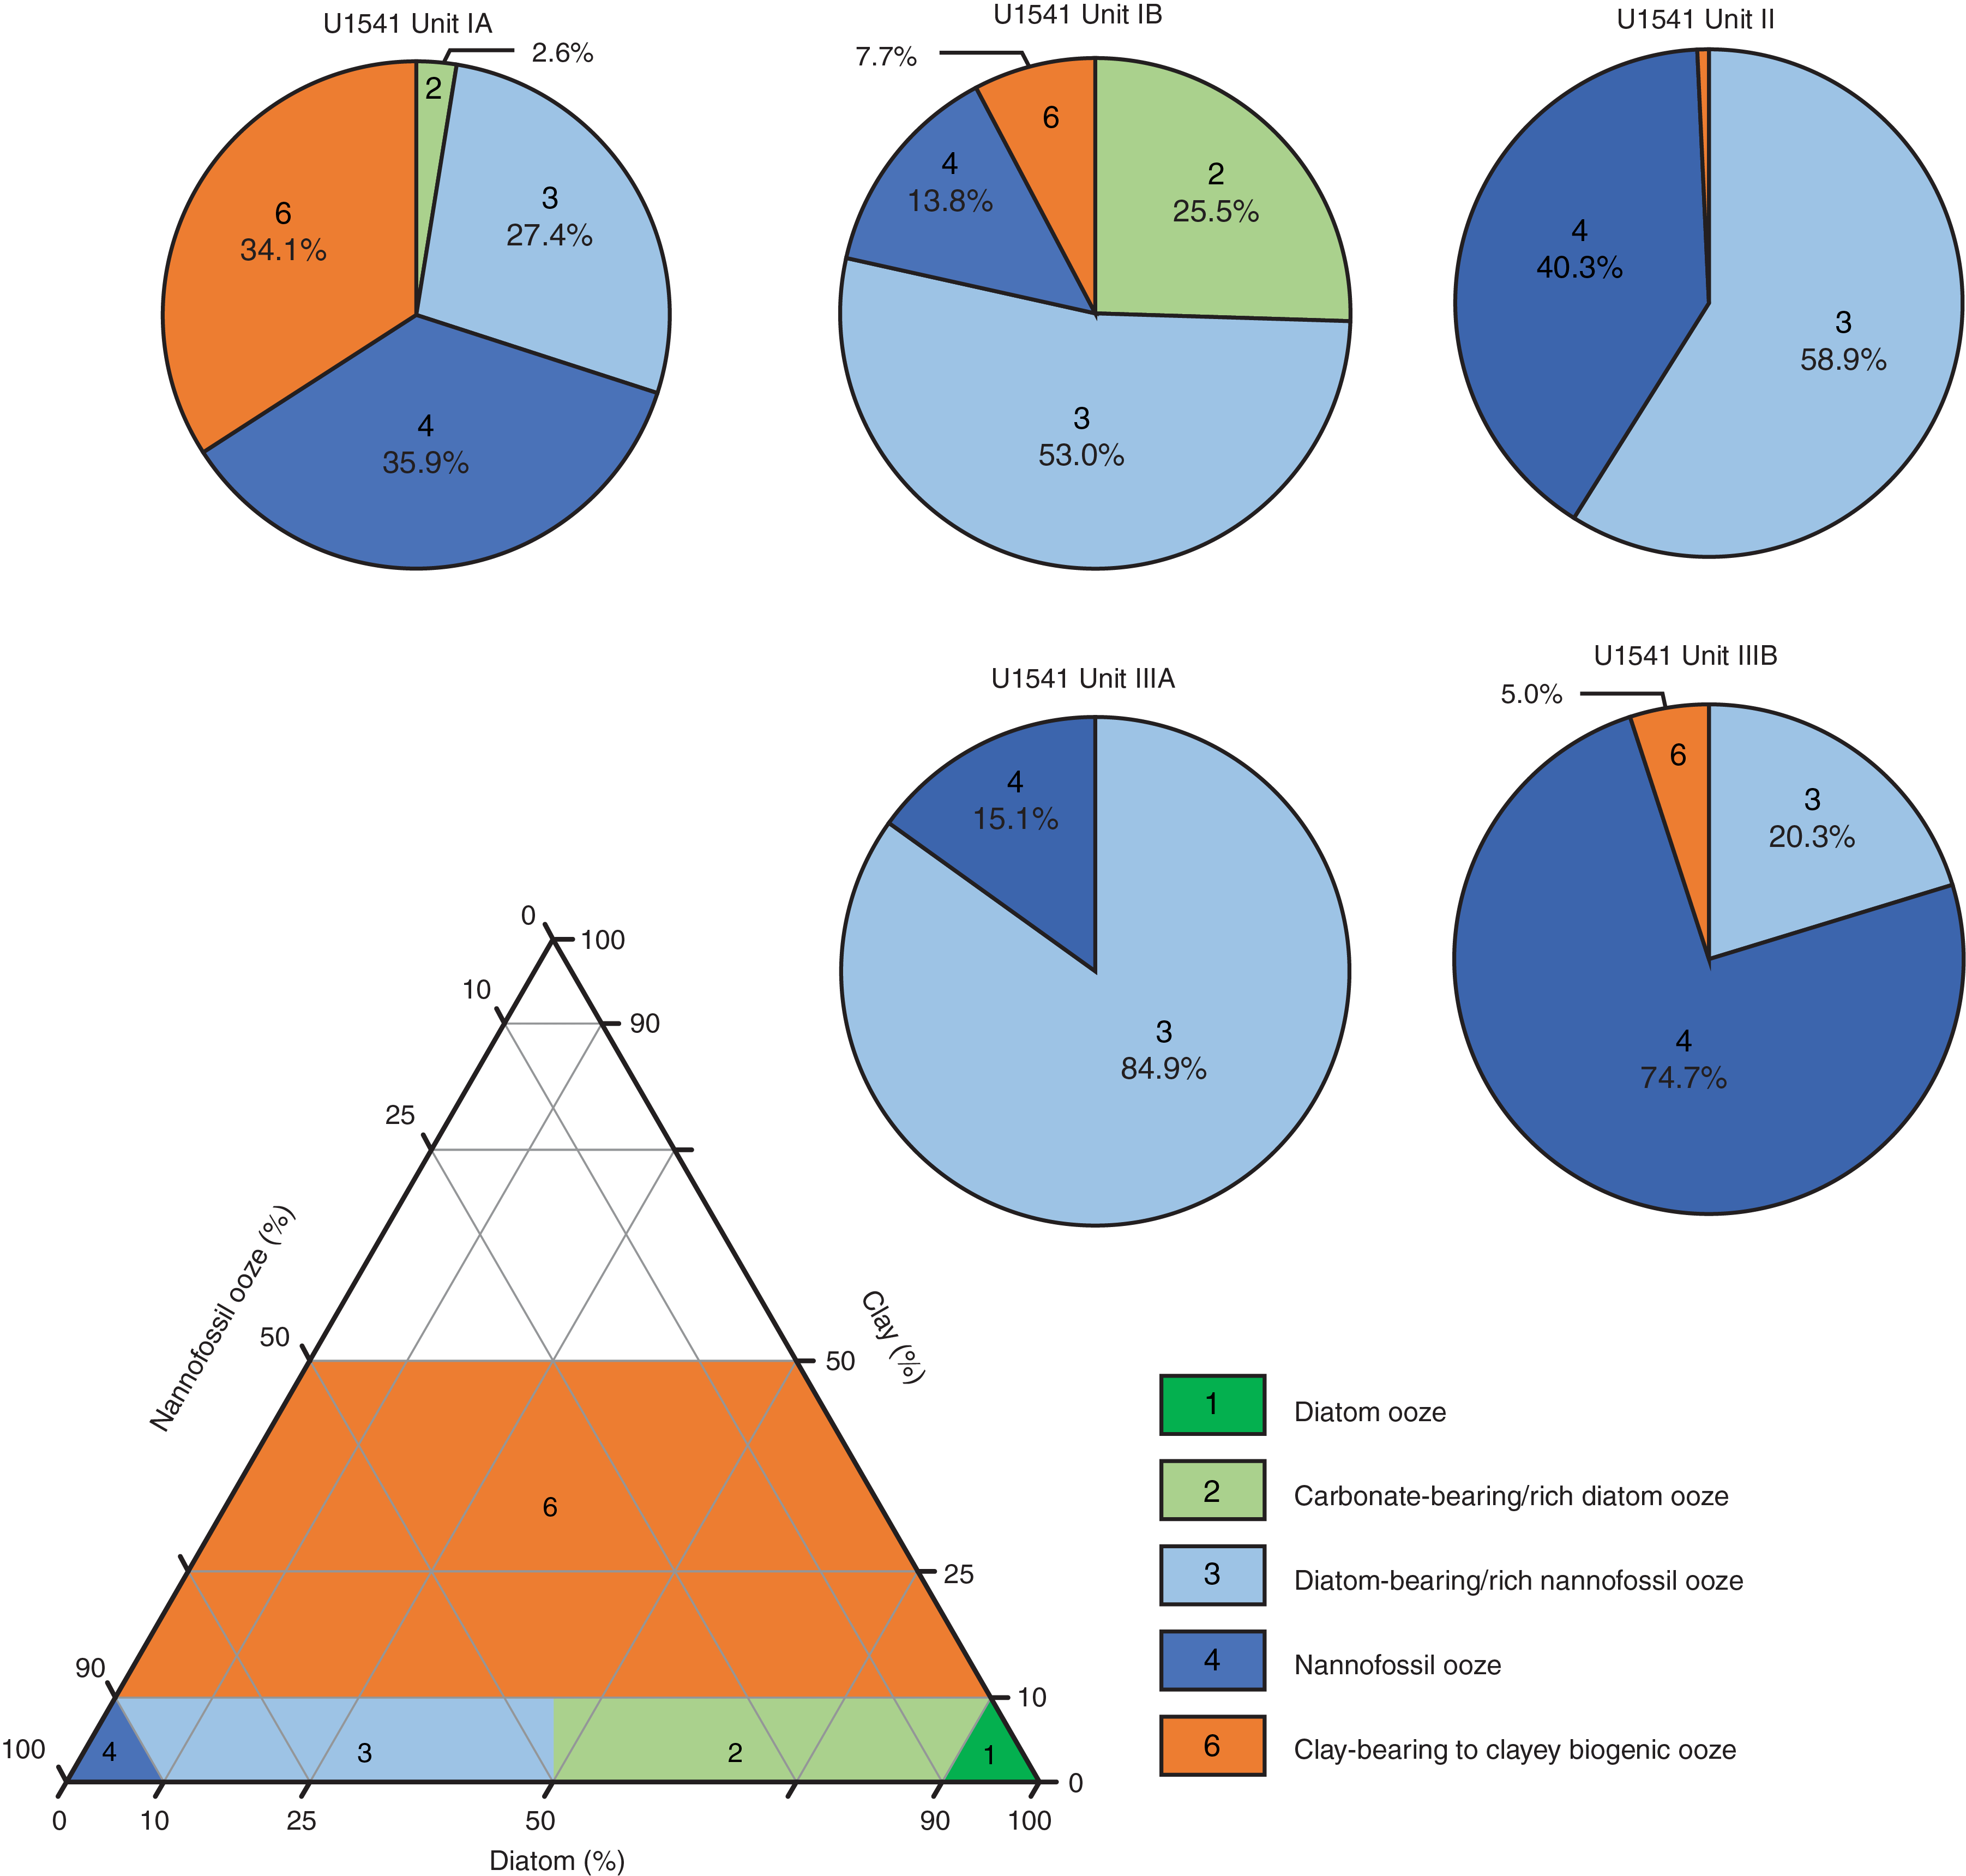
Figure F5. Primary lithologies.
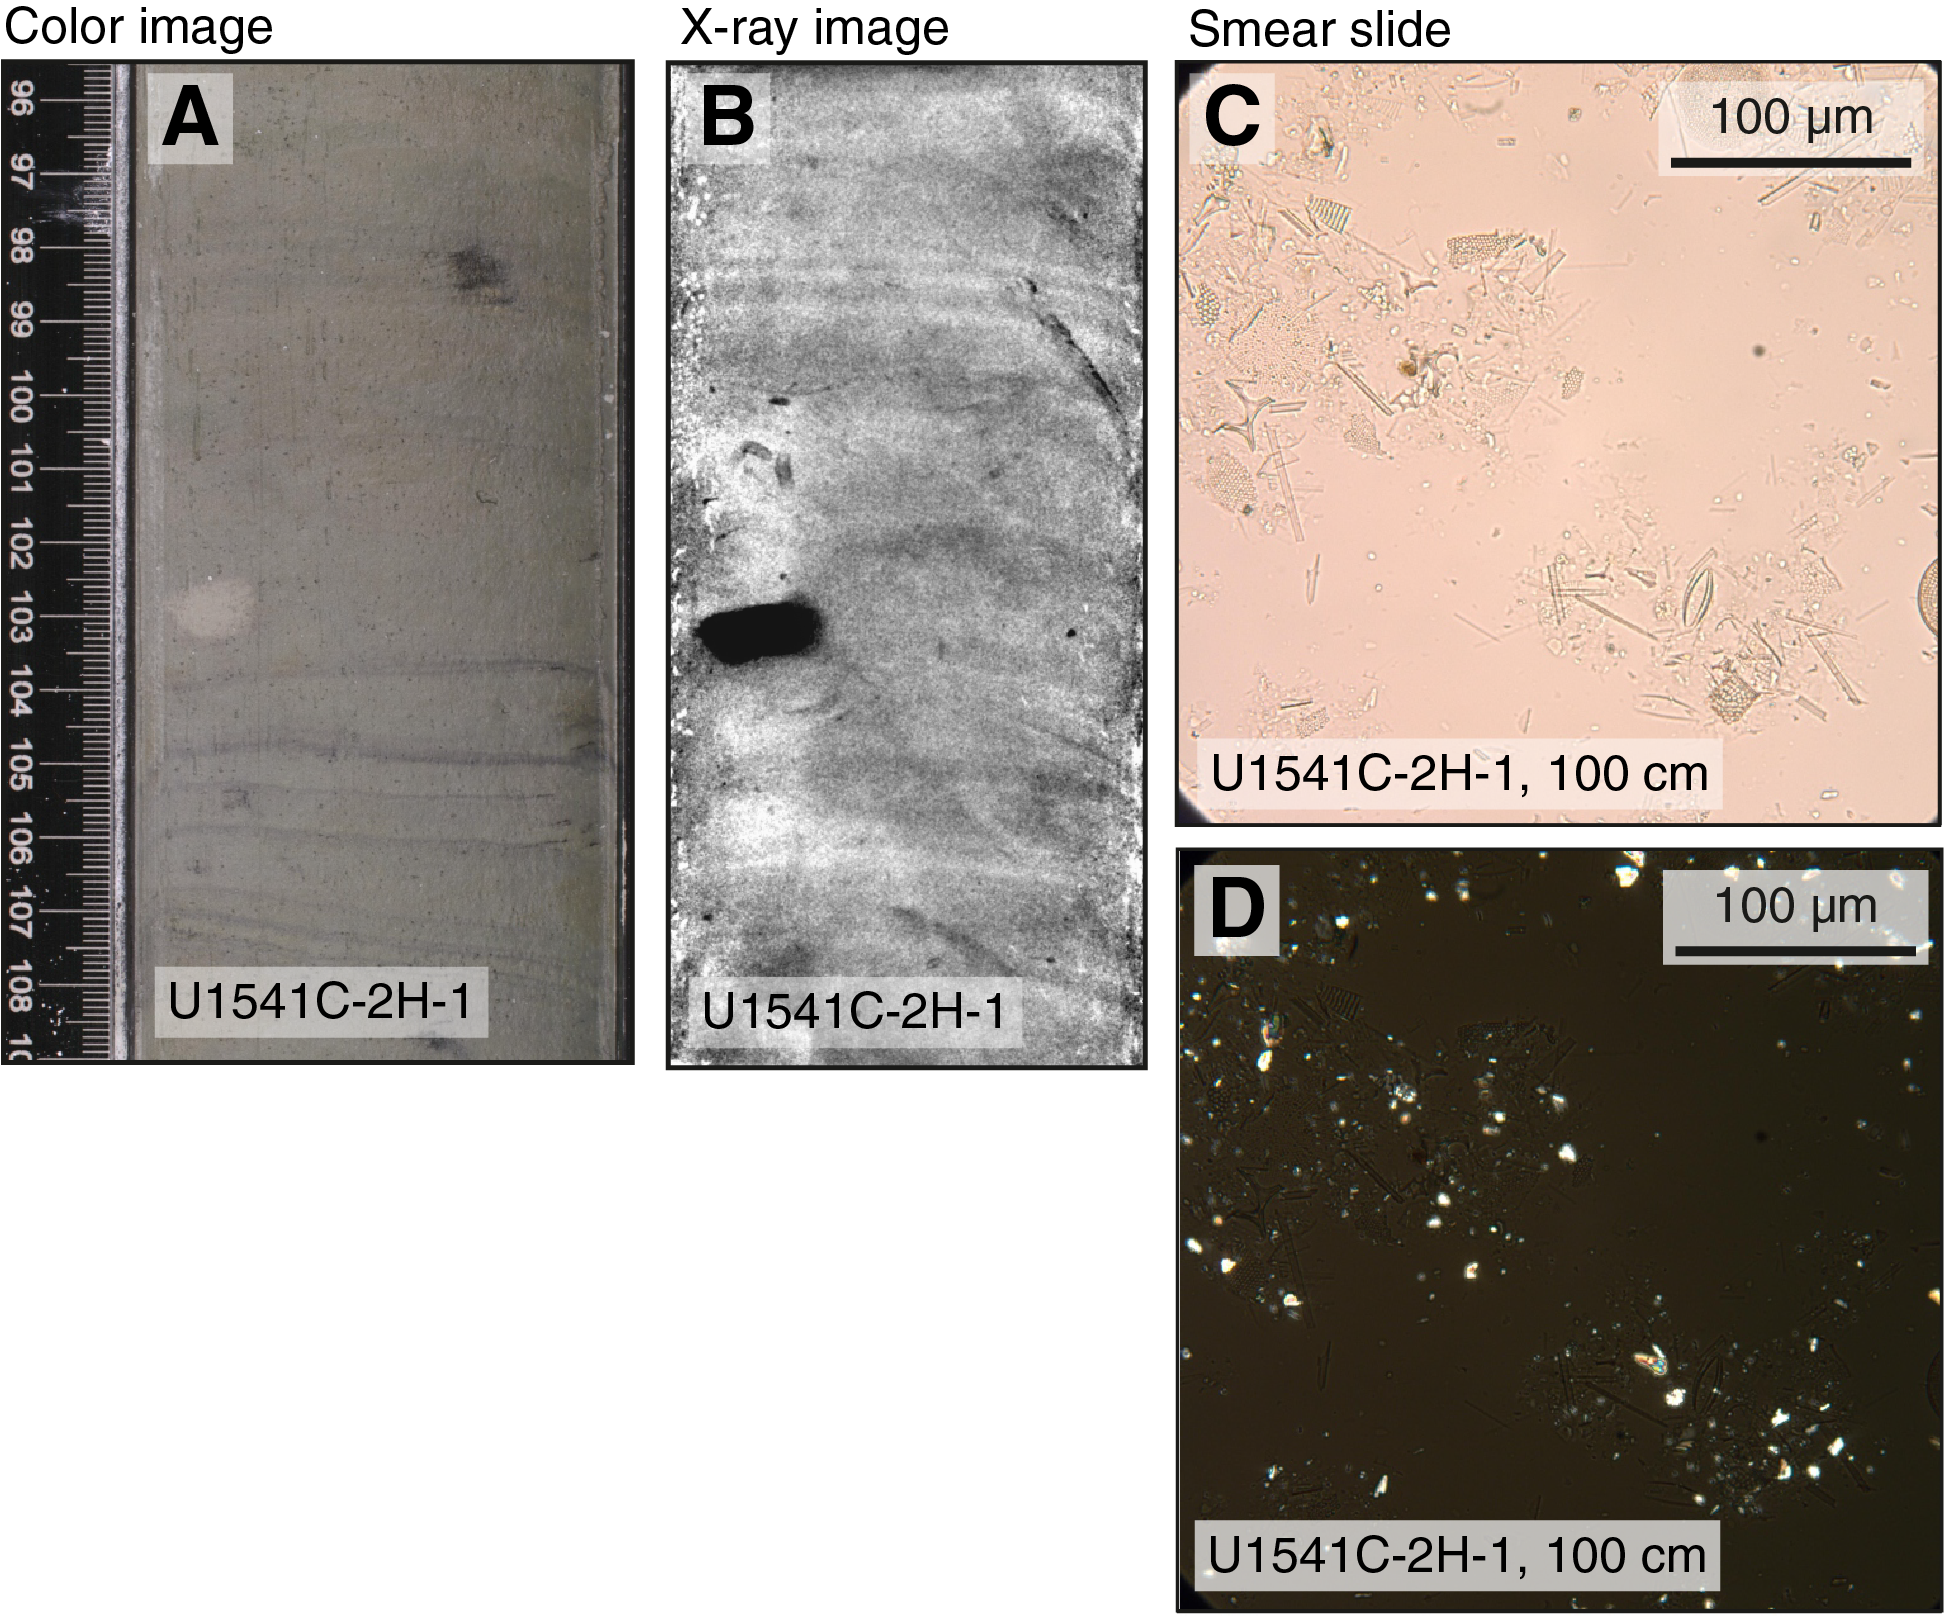
Figure F6. Mineral properties of Lithofacies 2.
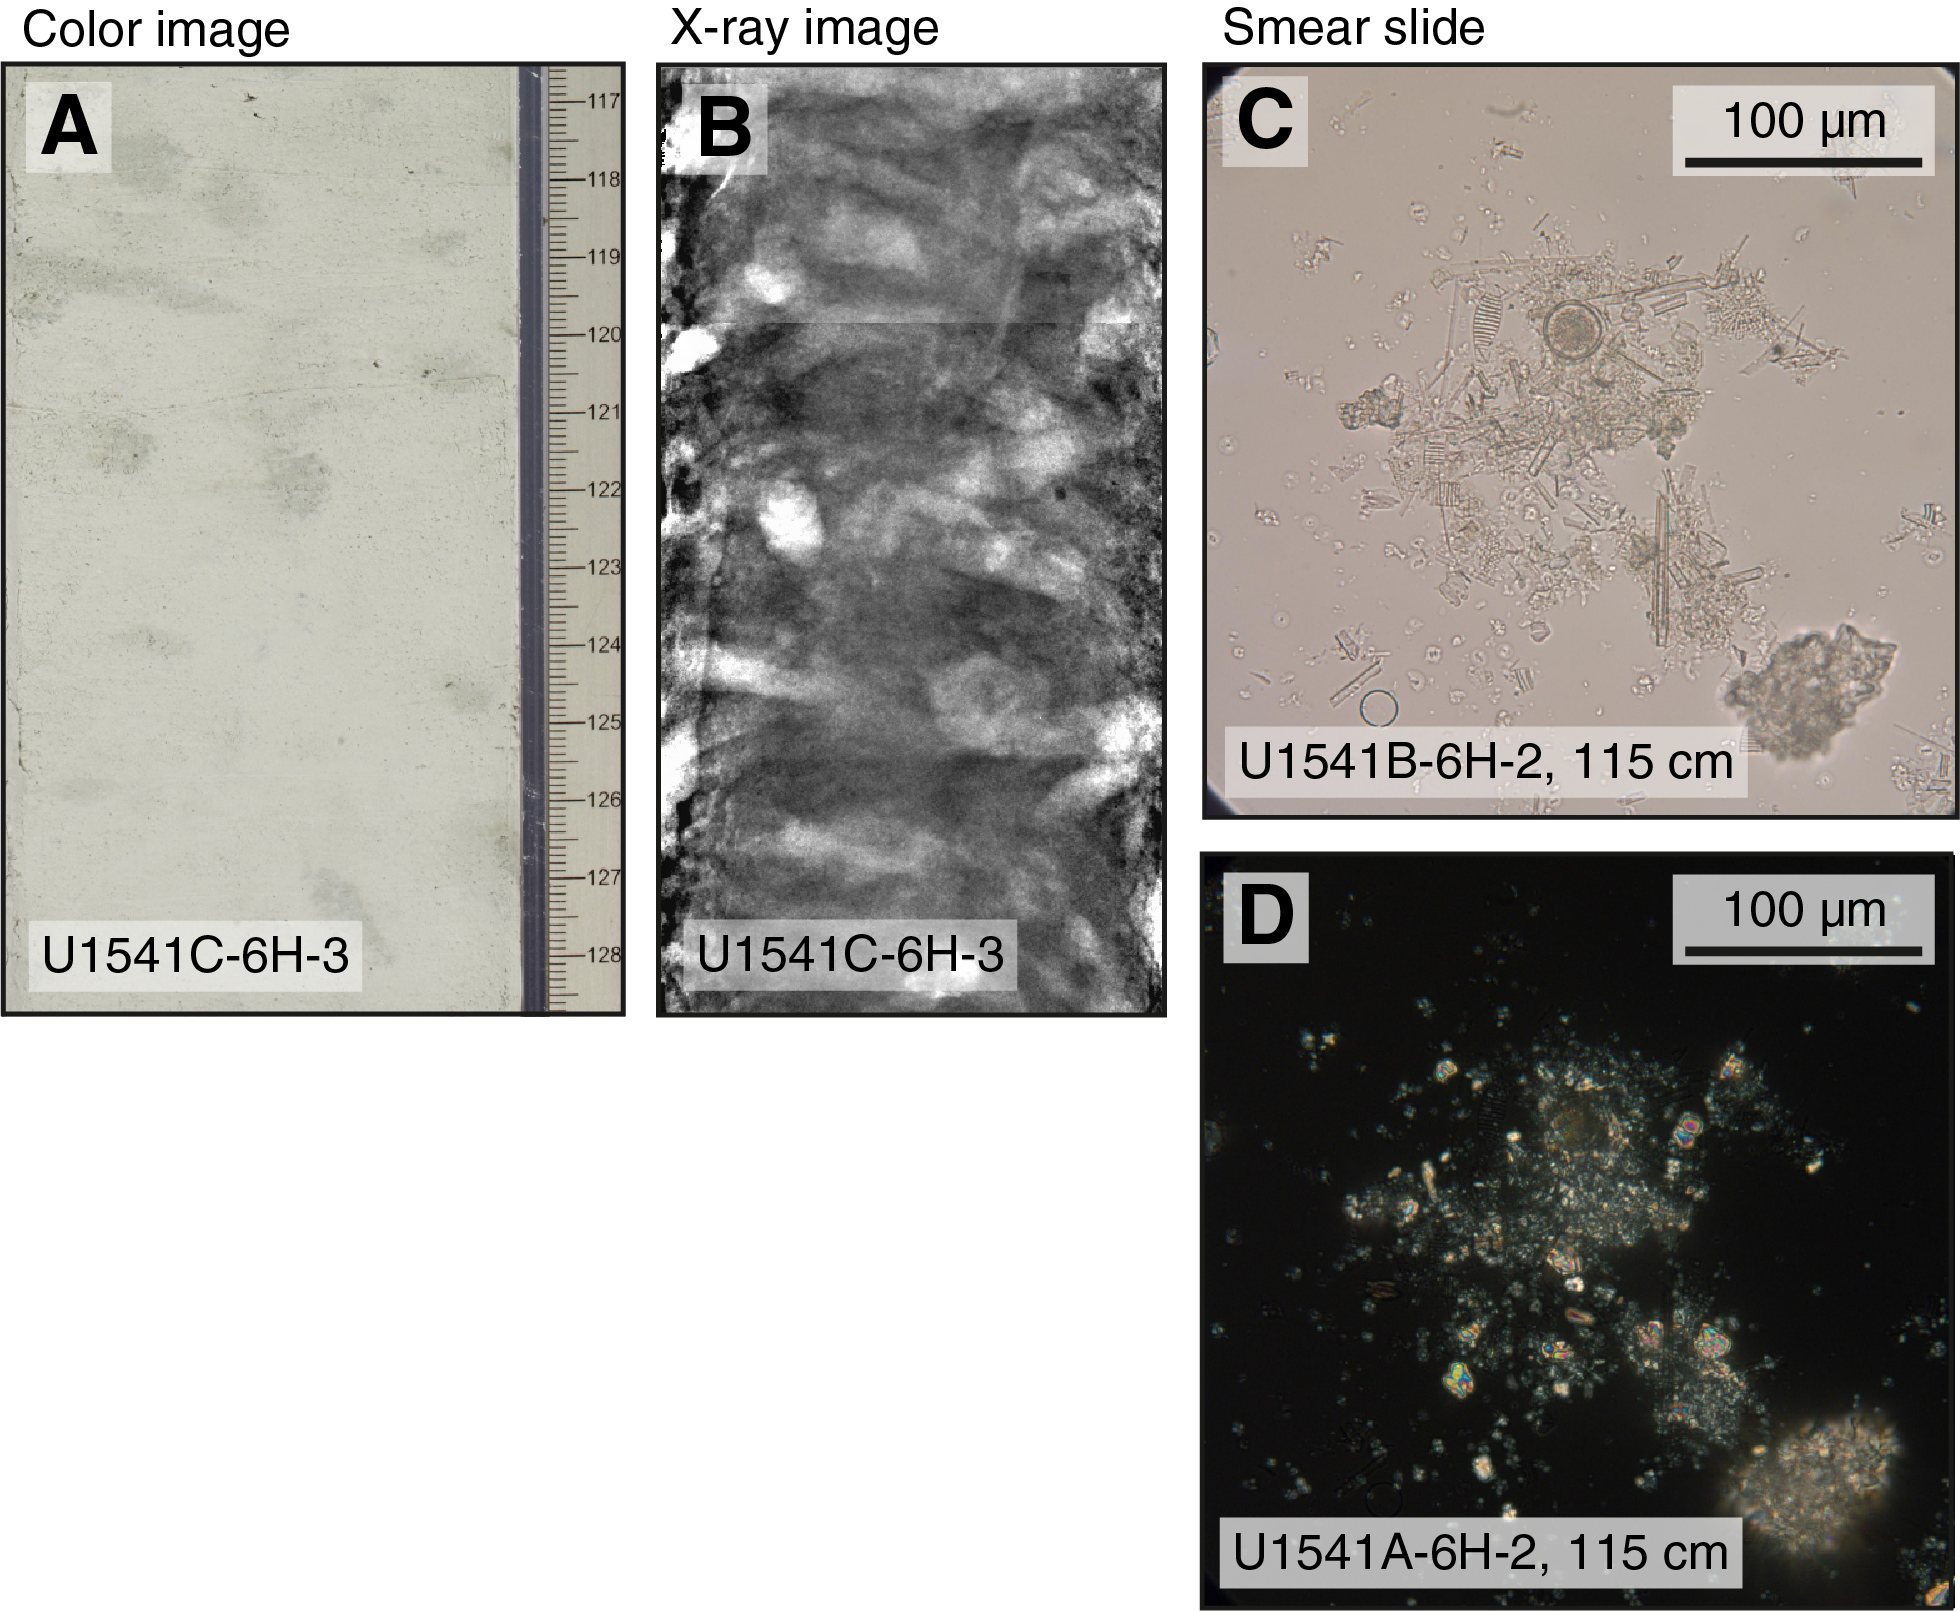
Figure F7. Mineral properties of Lithofacies 3.
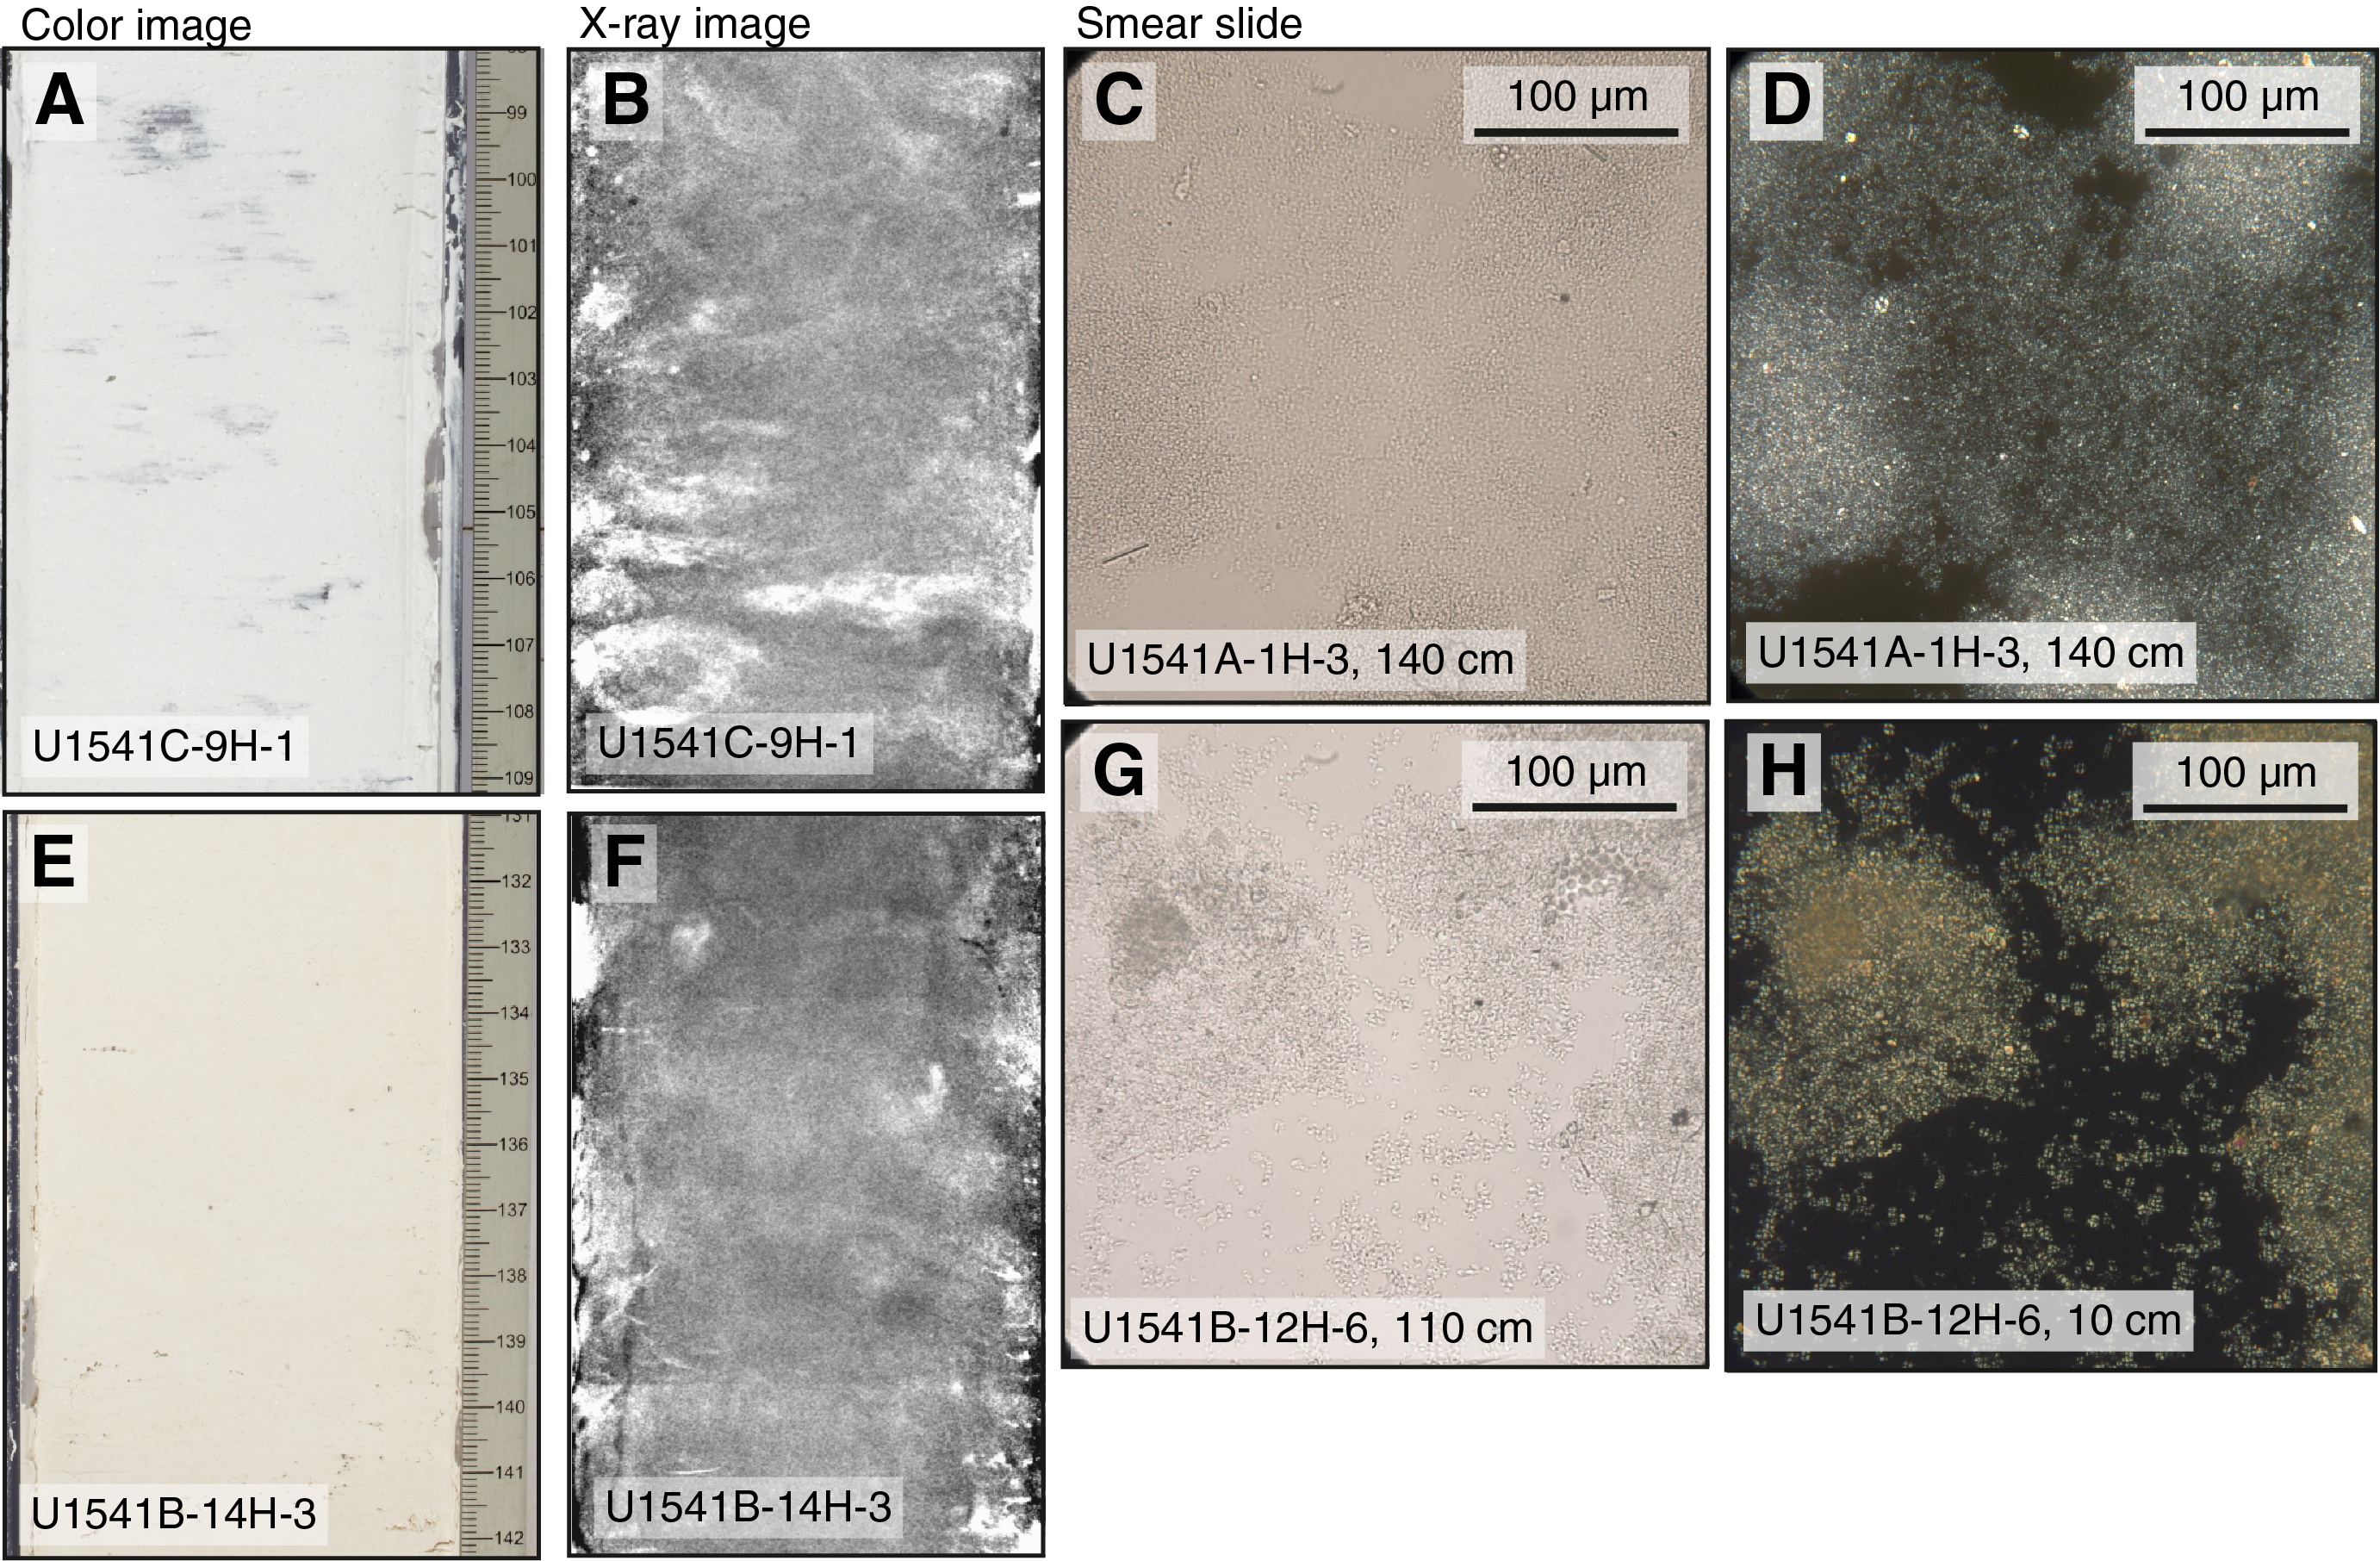
Figure F8. Mineral properties of Lithofacies 4.
Lithofacies 2
Lithofacies 2 is light greenish gray (10GY 7/1) to gray (N 6/) carbonate-bearing to carbonate-rich diatom ooze (Figure F6) that exhibits moderate to heavy bioturbation and may show wavy and/or discontinuous centimeter-scale bedding. Minor modifying components (10%–49%) are calcareous in nature and include nannofossils, foraminifers, and calcareous debris (mostly fragmented foraminiferal shells). Accessory components (<10%) include radiolarians, silicoflagellates, and sponge spicules. Dropstones >0.5 mm, distinct millimeter- to centimeter-scale diatom mats, and distinct color mottling are associated with this lithofacies. Bed thicknesses commonly range from 0.2 to 1.4 m.
Lithofacies 3
Lithofacies 3 is light greenish/blueish gray (10G 7/1 and 5B 7/1) and very pale yellow to pale orange yellow (2.5Y 9/2 to 10YR 9.5/2) diatom- and carbonate-bearing to diatom-rich nannofossil ooze (Figure F7) that appears with a variety of minor and accessory components. The carbonate modifier of this lithofacies is often composed of calcareous debris mostly derived from fragmented foraminifers. The more common biosiliceous modifier is composed of diatoms with rare occurrences of radiolarians, silicoflagellates, and sponge spicules. This facies appears moderately to heavily bioturbated (see Bioturbation) and is sometimes mottled with darker grayish patches due to burrow infills and diagenetic overprints (e.g., the precipitation of iron sulfides). X-ray images reveal only minor abundances of dropstones. The bed thickness of this lithofacies varies from 0.1 to 15 m in the Site U1541 sediment record.
Lithofacies 4
Lithofacies 4 is characterized by nannofossil ooze that is heavily bioturbated (see Bioturbation) and often has a massive appearance. Its color ranges from white (N 9/) and very light gray (N 7/) to very pale brown (10YR 8/2) and pale orange yellow (10YR 9.5/2) (Figure F8). It is characterized by only rare occurrences of carbonate (foraminifers) and various biosiliceous components. Mottled patches of darker grayish colors due to diagenetic iron sulfide overprints can be found in this lithofacies. The pale orange yellow variety of nannofossil oozes may show an increased abundance of Fe oxides and is dominated by two large coccolithophorid species, Reticulofenestra pseudoumbilicus and Coccolithus pelagicus. Dropstones are absent in this lithofacies. The bed thickness of Lithofacies 4 at Site U1541 varies from 0.2 to 6 m.
Lithofacies 6
Lithofacies 6 is clay-bearing to clayey biogenic ooze. It is characterized by a light greenish gray color (10Y 7/1, 10Y 6/1, or 5GY 7/1), is moderately to heavily bioturbated (see Bioturbation), and contains more than 10% clay-sized lithogenic components. The major lithology consists of biogenic components and may be dominated by diatoms or nannofossils. X-ray diffraction (XRD) analyses suggest a variable contribution of clay minerals and quartz to the clay-sized lithogenic fraction (see X-ray diffraction clay mineralogy). Accessory components (<10%) include radiolarians, silicoflagellates, and sponge spicules. X-radiographs indicate that dropstones can be present in this lithofacies in similar abundance to Lithofacies 2 and 3. The thickness of this lithofacies in the sedimentary record varies from 0.4 to 2 m.
Lithostratigraphic units
Based on the frequency and occurrence of the four lithofacies observed at Site U1541, the sedimentary sequence is divided into three lithostratigraphic units, and the youngest and oldest units are each divided into two subunits, A and B. The criteria used to define unit boundaries are discussed below and highlighted in Figure F9. Key unit characteristics, including depths within the Site U1541 sedimentary sequence and corresponding ages according to the preliminary shipboard age model, are also discussed below.
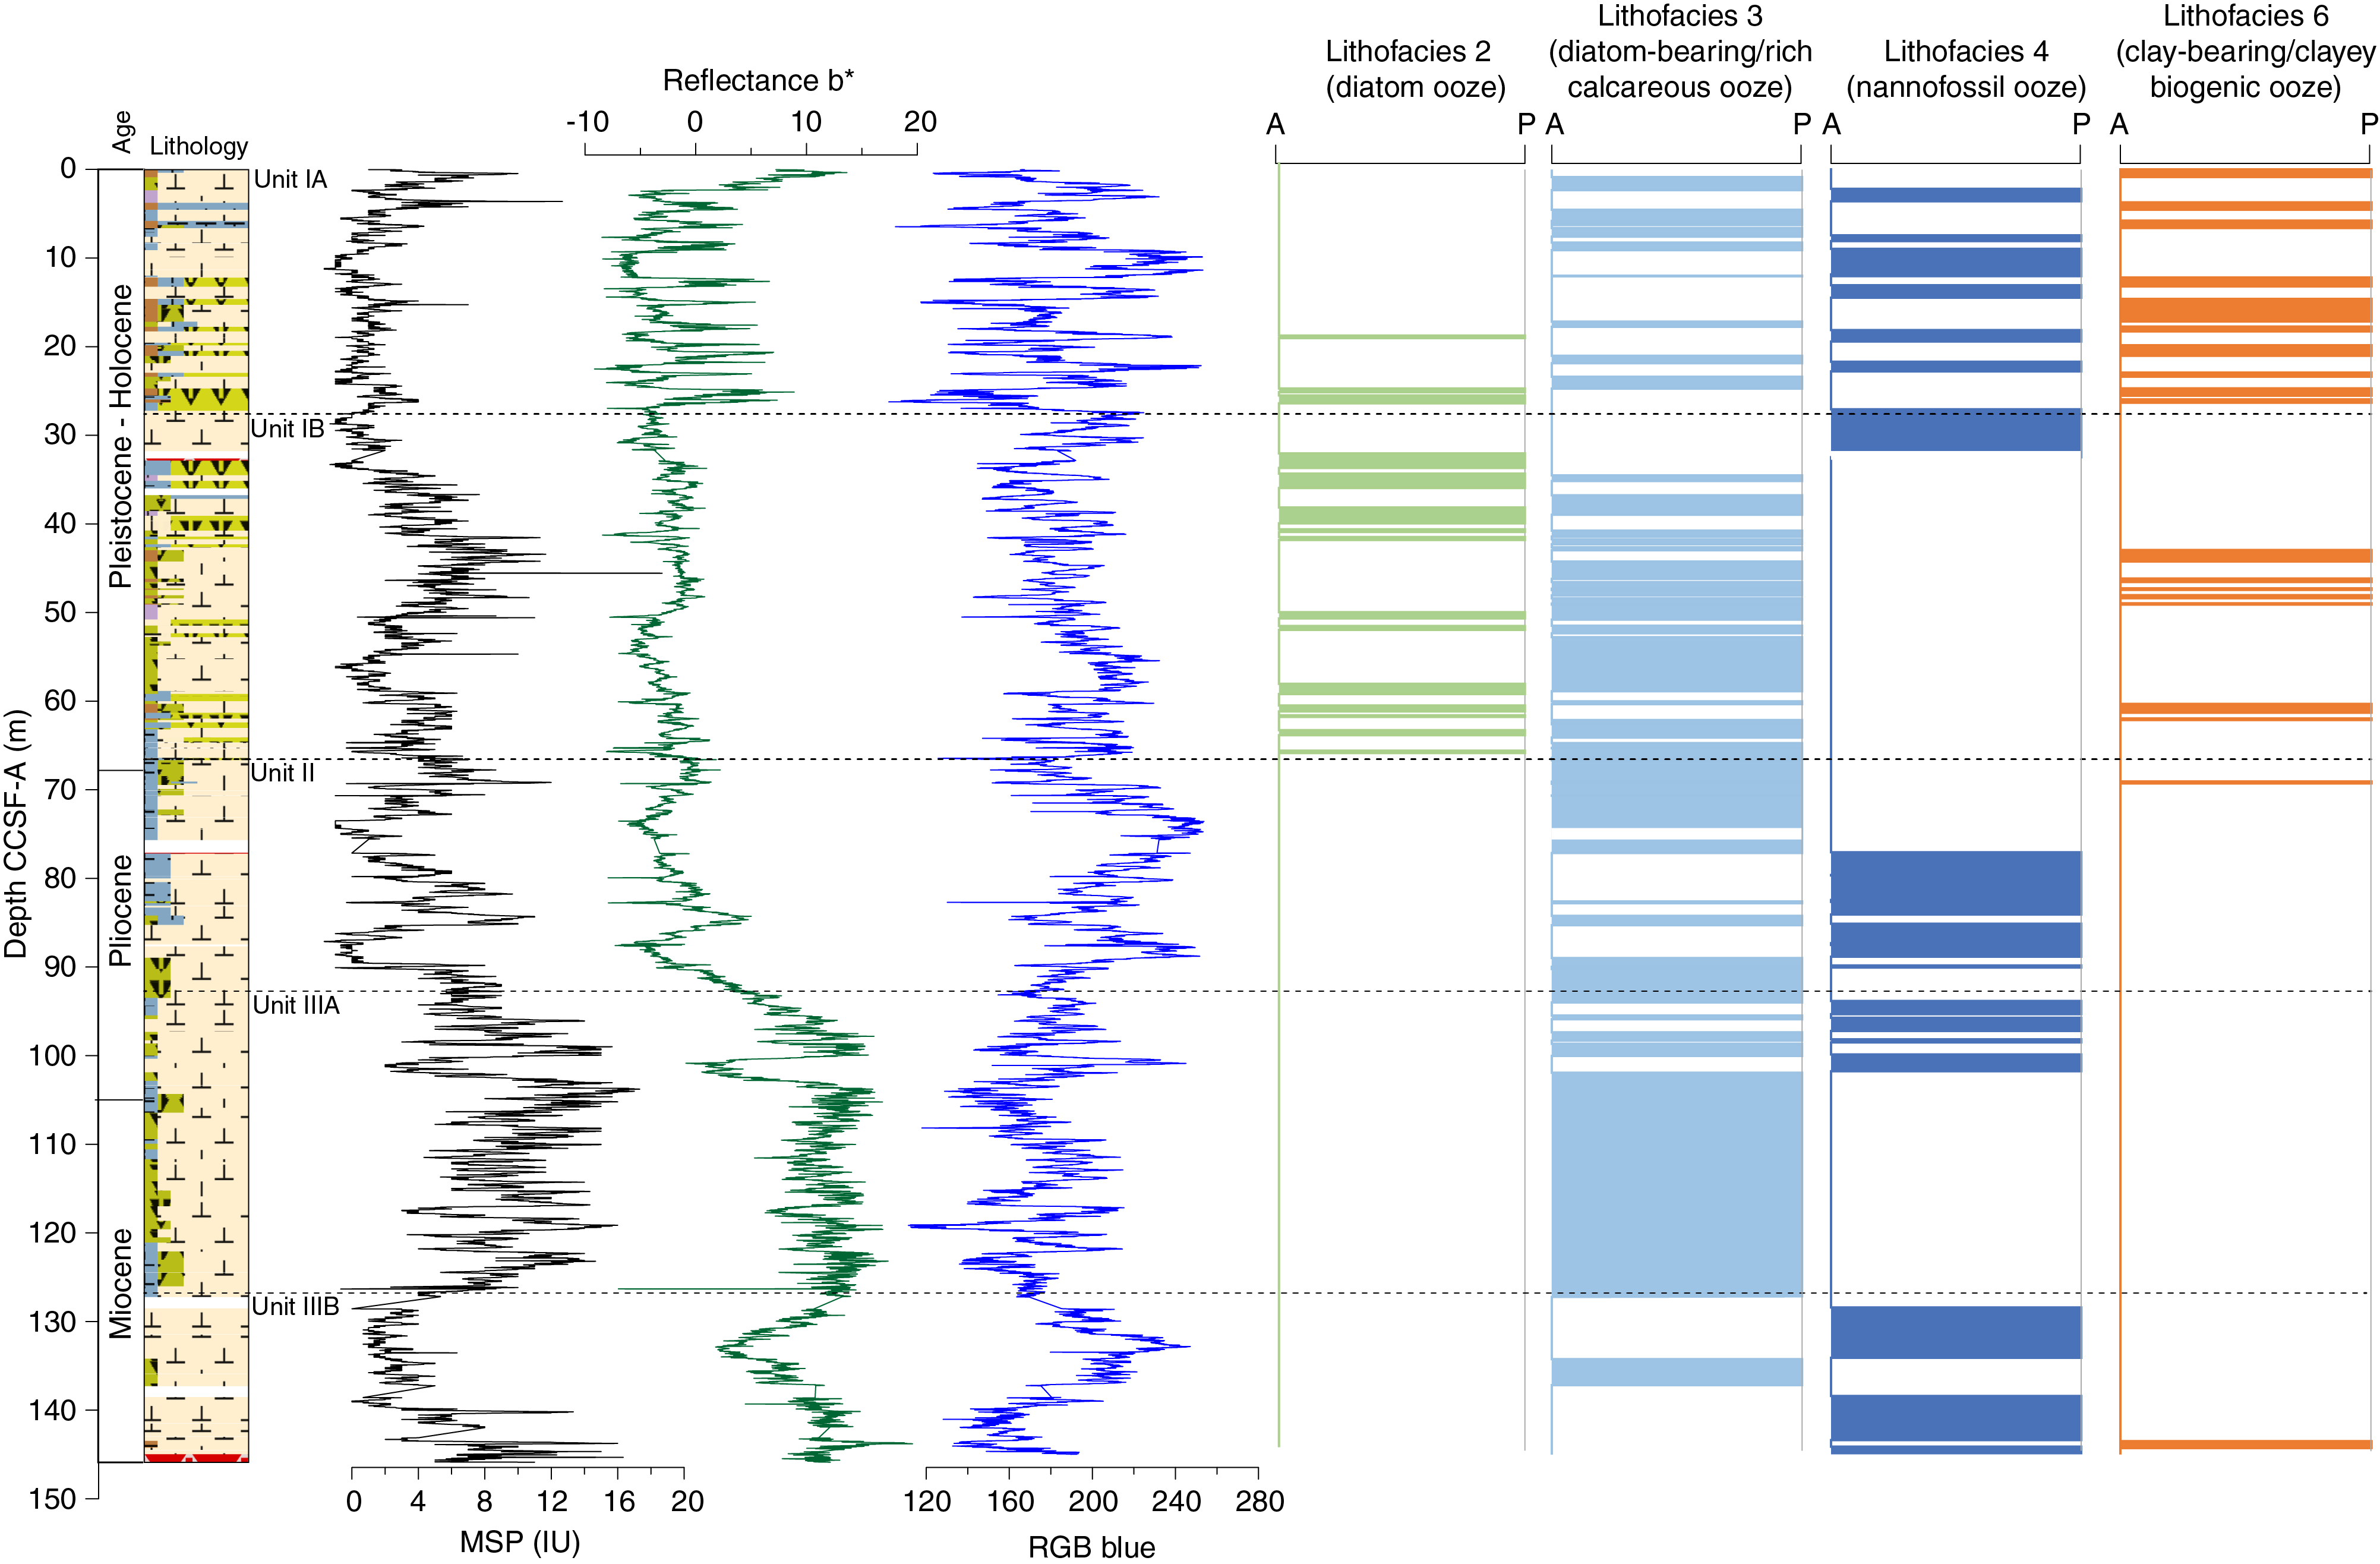
Figure F9. Primary lithostratigraphic variations.
Unit I
Subunit IA
- Intervals: 383-U1541A-1H-1, 0 cm, to 1H-CC, 14 cm; 383-U1541B-1H-1, 0 cm, to 3H-6, 12 cm; 383-U1541C-1H-1, 0 cm, to 4H-4, 7 cm
- Depths: Hole U1541A = 0–9.67 m CSF-A, Hole U1541B = 0–23.12 m CSF-A, Hole U1541C = 0–27.69 m CSF-A, Site U1541 composite section = 0–27.34 m core composite depth below seafloor, Method A (CCSF-A)
- Thickness: 27.34 m
- Age: Calabrian and middle Pleistocene to Holocene (younger than 0.98 Ma)
- Lithology: diatom-bearing to diatom-rich nannofossil oozes, clay-bearing to clayey biogenic oozes, carbonate-bearing to carbonate-rich diatom oozes
Lithostratigraphic Subunit IA spans the upper 27.34 m of Site U1541 and consists of interbedded light greenish gray diatom-bearing and diatom-rich nannofossil oozes (Lithofacies 3; 27.4% of the total unit thickness), white nannofossil oozes (Lithofacies 4; 35.9%), and light greenish gray to greenish gray clay-bearing to clayey biogenic oozes (Lithofacies 6; 34.1%). Carbonate-bearing or carbonate-rich diatom oozes (Lithofacies 2) only occur sporadically (2.6%). Sediments are moderately to heavily bioturbated, and lithologic transitions are gradational.
Subunit IB
- Intervals: 383-U1541B-3H-6, 12 cm, to 7H-CC, 40 cm; 383-U1541C-4H-4, 7 cm, to 8H-4, 106 cm
- Depths: Hole U1541B = 23.12–61.7 m CSF-A, Hole U1541C = 27.69–66.66 m CSF-A, Site U1541 composite section = 27.34–66.65 m CCSF-A
- Thickness: 39.31 m
- Age: Gelasian and Calabrian (Pleistocene) (~0.98 to ~2.58 Ma)
- Lithology: (diatom-bearing/rich) nannofossil oozes, (carbonate-bearing/rich) diatom oozes, clay-bearing to clayey biogenic oozes
Lithostratigraphic Subunit IB spans 27.34–66.65 m CCSF-A and exhibits a dominance of diatom-bearing and diatom-rich nannofossil/calcareous oozes (Lithofacies 3; 53.0% of the total unit thickness) and a reduced proportion of pure nannofossil oozes (Lithofacies 4; 13.8%). At the same time, the proportion of light greenish gray to greenish gray carbonate-bearing and carbonate-rich diatom oozes (Lithofacies 2) increases to 25.5% and clay-bearing or clayey biogenic oozes (Lithofacies 6) become less abundant (7.7%). Sediments are moderately to heavily bioturbated, and in the case of pure nannofossil oozes, they can have a massive and homogeneous appearance. Lithologic transitions are generally gradational.
A reduced occurrence of pure nannofossil ooze (Lithofacies 4) demarcates this unit from Subunit IA above (Figure F9). Subunit IB lithologies do not exhibit a dynamic range of lithologic variation and are more muted in appearance than in Subunit IA. This observation is reinforced by the low-amplitude variations in b* and red-green-blue color space (RGB) blue intensity in Subunit IB (Figure F4) (see Integrating physical property measurements with lithofacies observations).
Unit II
- Intervals: 383-U1541B-8H-1, 0 cm, to 10H-5, 37 cm; 383-U1541C-8H-6, 106 cm, to 11H-1, 63 cm
- Depths: Hole U1541B = 61.07–89.39 m CSF-A, Hole U1541C = 66.66–90.23 m CSF-A, Site U1541 composite section = 66.65–93.5 m CCSF-A
- Thickness: 26.85 m
- Age: Zanclean and Piacenzian (Pliocene) (~2.58 to ~4.2 Ma)
- Lithology: (diatom-bearing/rich) nannofossil ooze
Lithostratigraphic Unit II spans from 66.65 to 93.5 m CCSF-A and consists almost entirely of light greenish gray diatom-bearing or diatom-rich nannofossil ooze (Lithofacies 3; 58.9% of the total unit thickness) interbedded with white almost pure nannofossil ooze (Lithofacies 4; 40.3%). Sediments are heavily bioturbated to homogeneous and have a mottled appearance. Transitions between the lithologies are gradational. Carbonate-bearing and carbonate-rich diatom oozes are absent in this unit, and clay-bearing to clayey biogenic oozes (Lithofacies 6) only appear rarely (0.7%).
The downhole disappearance of diatom oozes as a dominant lithology marks the onset of Unit II at 66.65 m CCSF-A (Figure F9). This unit boundary also coincides with the start of a gradual shift of mean gamma ray attenuation (GRA) bulk density and RGB blue intensity to higher values (Figure F4).
Unit III
Subunit IIIA
- Intervals: 383-U1541B-10H-5, 37 cm, to 13H-CC, 30 cm; 383-U1541C-11H-1, 63 cm, to 13H-CC, 25 cm
- Depths: Hole U1541B = 89.39–120.56 m CSF-A, Hole U1541C = 95.64–118.4 m CSF-A, Site U1541 composite section = 93.5–127.51 m CCSF-A
- Thickness: 28.64 m
- Age: Messinian and Zanclean (Miocene and Pliocene) (~4.2 to ~7.2 Ma)
- Lithology: (diatom-bearing/rich) nannofossil oozes
Lithostratigraphic Subunit IIIA ranges from 93.5 to 127.51 m CCSF-A and consists entirely of very pale brown to pale orange yellow diatom-bearing calcareous/nannofossil oozes (Lithofacies 3; 84.9% of the total unit thickness) and white pure nannofossil oozes (Lithofacies 4; 15.1%). Sediments are generally heavily bioturbated and mottled by burrows, and lithologic transitions are gradational.
Subunit IIIA is distinguished from Unit II by a prominent change in sediment color from white and light greenish gray to overall very pale brown and pale orange yellow, as well as an increase in the proportion of diatom-bearing calcareous/nannofossil oozes from 58.9% to 84.9% (Lithofacies 3) (Figure F9). The unit boundary is also characterized by a change in b* color reflectance values and magnetic susceptibility (MS) (see Integrating physical property measurements with lithofacies observations).
Subunit IIIB
- Intervals 383-U1541B-14H-1, 0 cm, to 15H-5, 136 cm
- Depths: Hole U1541B = 121.1–137.98 m CSF-A, Site U1541 composite section = 128.55–145.93 m CCSF-A
- Thickness: 17.38 m
- Age: Tortonian and Messinian (Miocene) (~7.2 to ~8.5 Ma)
- Lithology: nannofossil ooze with varying minor biogenic and siliciclastic components
Lithostratigraphic Subunit IIIB spans from 128.55 to 145.93 m CCSF-A and consists of dominantly pale brown to pale orange yellow nannofossil ooze with foraminifers (Lithofacies 4; 74.7% of the total unit thickness) with contributions from very pale yellow diatom-bearing nannofossil ooze with foraminifers (Lithofacies 3; 20.3%) and very pale brown clay-bearing biogenic oozes (Lithofacies 6; 5%). These oozes have a massive and homogeneous appearance and are heavily bioturbated and mottled by large burrows.
Subunit IIIB is distinguished from Subunit IIIA by the absence of diatoms and other biosiliceous components and a marked dominance of nearly pure nannofossil ooze (Lithofacies 4) (Figure F9). In contrast to Subunit IIIA, nannofossil ooze lithofacies comprise 74.7% of the sedimentary sequence in Subunit IIIB, which is a significant increase compared to 15% in Subunit IIIA. Here, the nannofossil assemblage is composed predominantly of two large coccolithophorid species, R. pseudoumbilicus and C. pelagicus (see Biostratigraphy).
Complementary analyses
Petrology
Dark, glassy rock fragments of various sizes and irregular shapes were observed on the split surfaces of the section halves and in X-ray photographs in Sections 383-U1541B-15H-5 and 15H-CC (Figure F10). Photomicrographs of thin sections obtained from these fragments reveal phenocrysts of olivine, pyroxene, and tabular elongate plagioclase in a vitric matrix. The rock fragments are further covered by palagonite consisting of iron (hydr)oxides and clays. These observations indicate that the rock fragments at the base of Hole U1541B are volcanic glass.
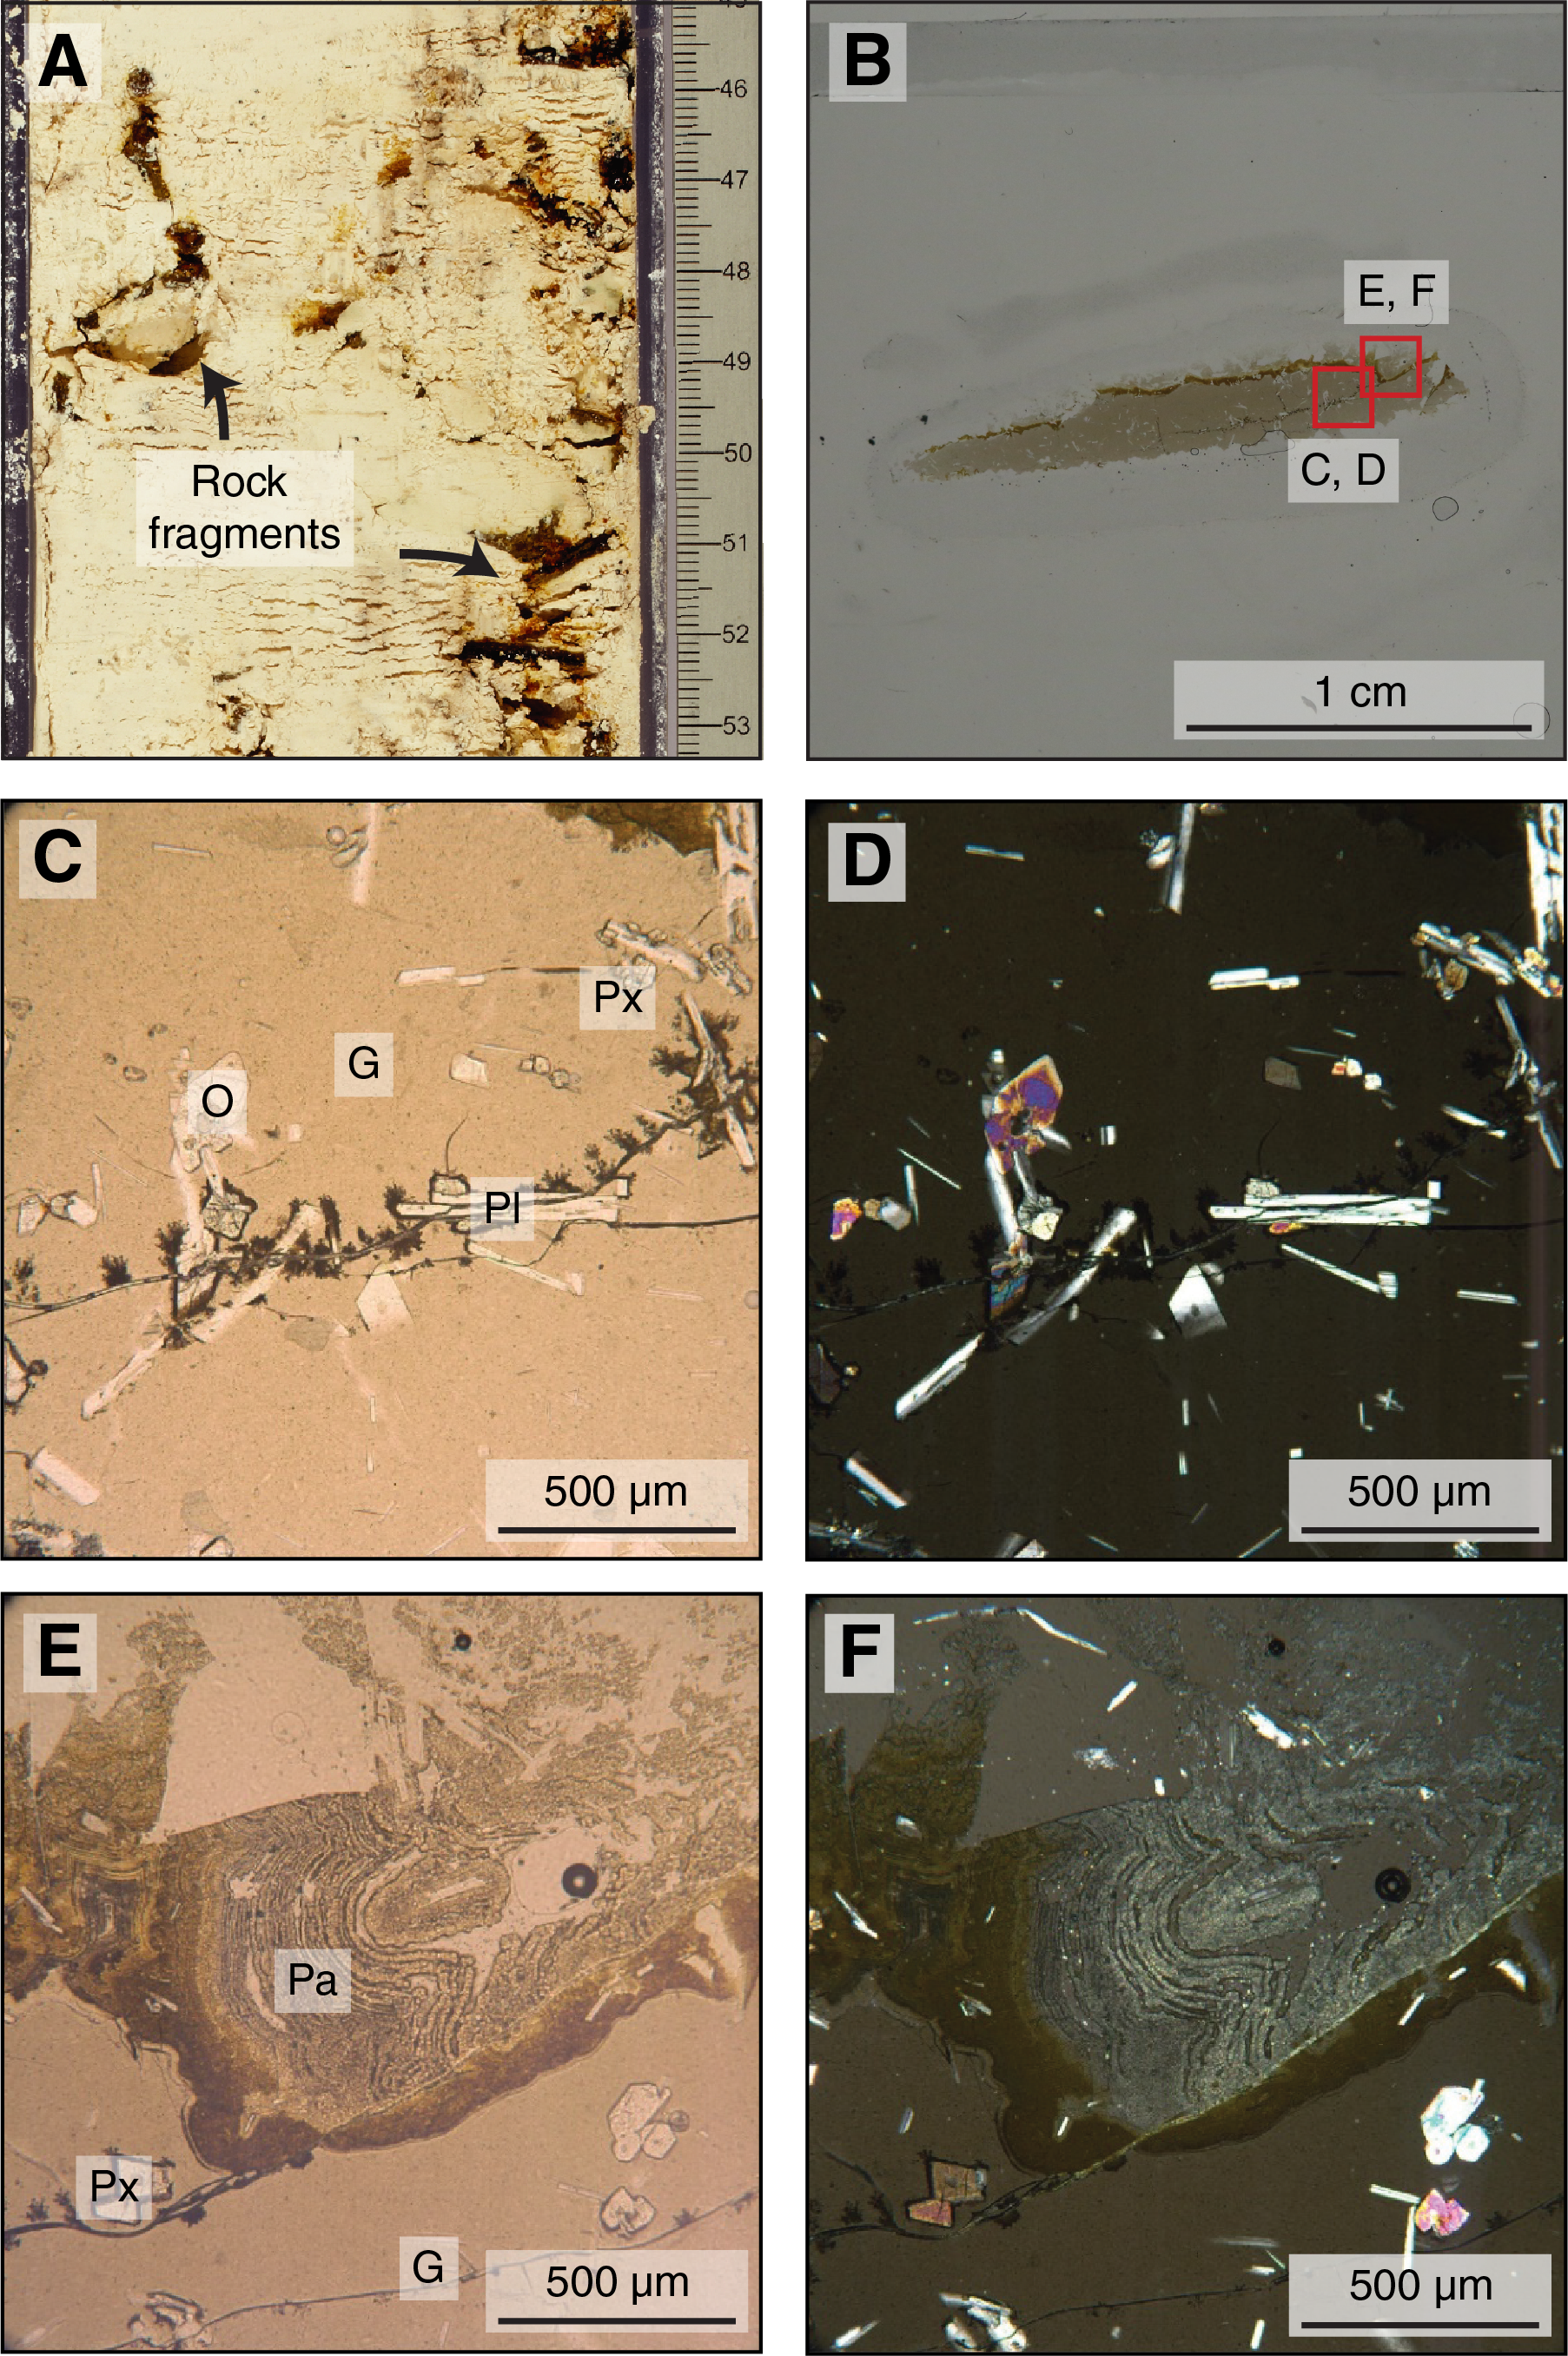
Figure F10. Weathered glass shards.
Three pieces of large pebble-sized rocks (2–5 cm in diameter) were recovered in Section 383-U1541B-16X-CC. These very dark bluish (5PB 3/1) rocks are irregular and rounded in shape and have a weathered exterior. Crosscut surfaces reveal a ~0.5 mm thick vesicular chilled margin (Figure F11). Thin section observations indicate that microphenocrysts of pyroxene and acicular plagioclase with twinning in a fine-grained aphanitic matrix are present. The microphenocrysts show partial intergrowth. The matrix is vesicular and highly altered to brownish material, possibly iron (hydr)oxides. These observations point to the recovery of pillow basalt in Section 16X-CC. The presence of basalt rock and volcanic glass fragments at the base of Hole U1541B suggest the complete recovery of the sedimentary sequence above the basement rock.
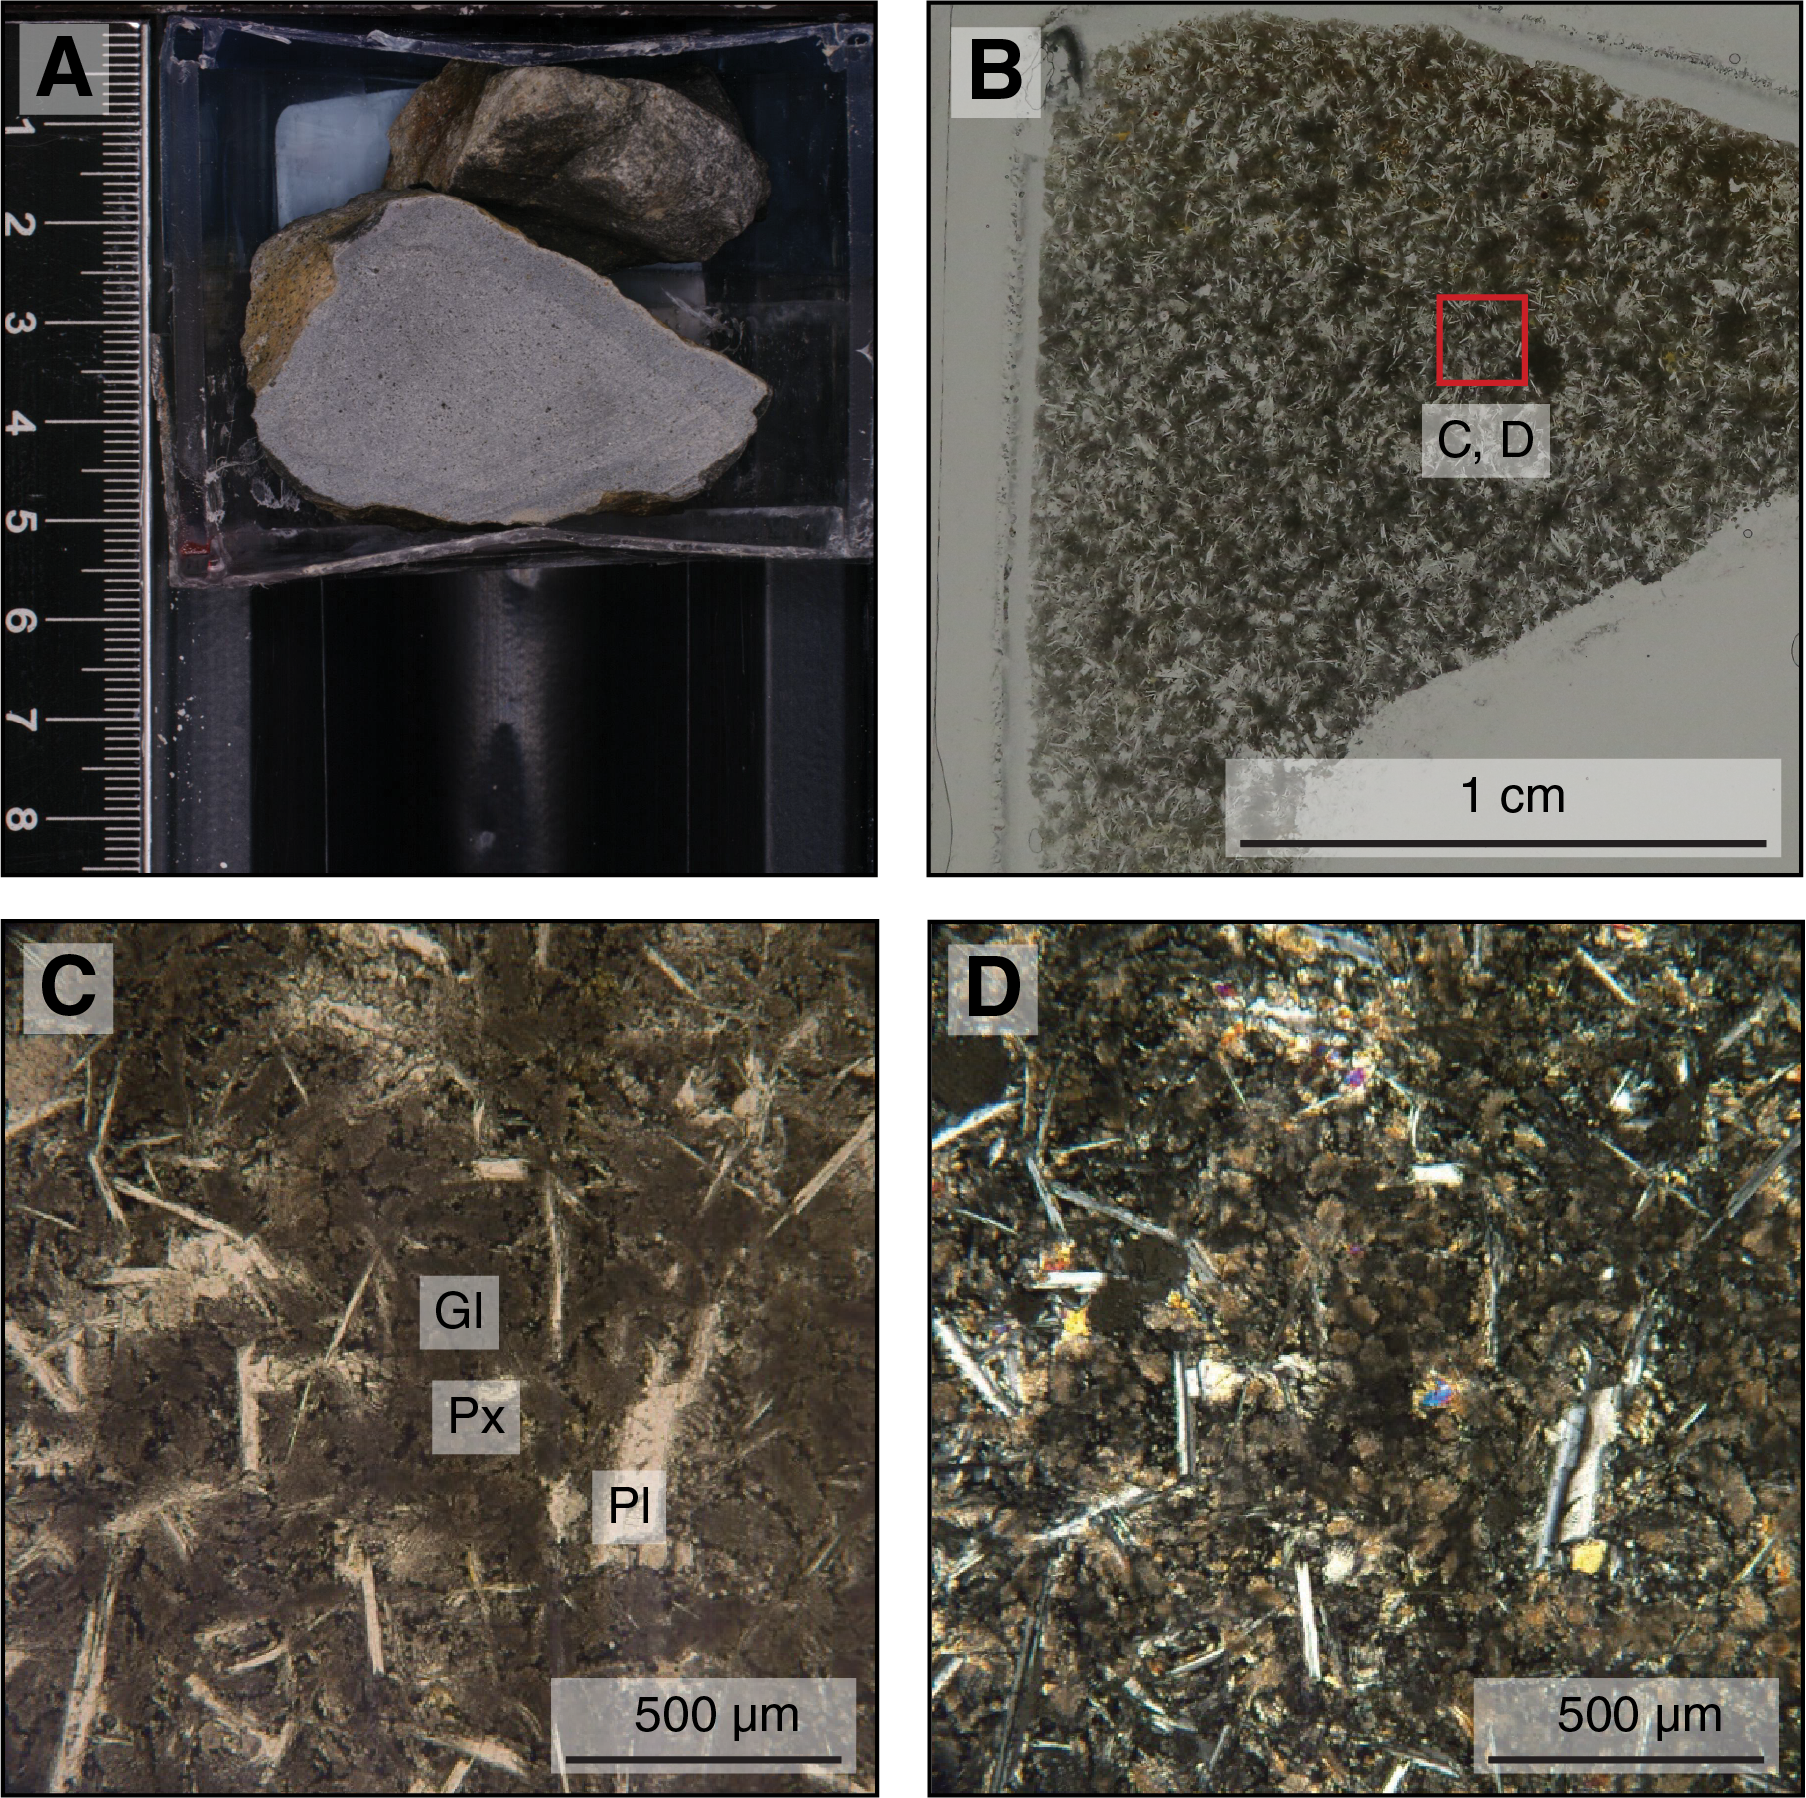
Figure F11. Rock samples.
X-ray diffraction clay mineralogy
XRD analyses were performed on 15 powdered samples obtained from Holes U1541A and U1541B to identify the mineralogy and composition of the lithogenic fraction of sediments at this site. The X-ray diffractograms reveal characteristic patterns within the individual lithostratigraphic units identified at this site.
Subunit IA shows clear peaks of detrital minerals such as quartz, feldspar (plagioclase), and phyllosilicates including illite, chlorite, kaolinite, and smectite (Figure F12). Samples obtained from Subunit IB often show a wide peak between 18° and 30°2θ that is associated with amorphous biogenic silica. X-ray diffractograms of samples obtained from Units II and III often reveal four characteristic calcite peaks at 26.6, 29.5, 36.1, and 39.5°2θ. Although the samples were double treated with acetic acid and agitated for 18 h (see Sedimentology in the Expedition 383 methods chapter [Winckler et al., 2021a]), a significant fraction of the carbonate phase remained undissolved and hence dominates the X-ray diffractograms. Additionally, samples from Units II and III show a narrow peak at 3.57 Å (24.9°2θ) that overlaps with kaolinite [002]. The amplitude of this peak is not diminished upon heating to 550°C, suggesting the presence of a well-structured crystalline mineral whose identity cannot be further characterized.
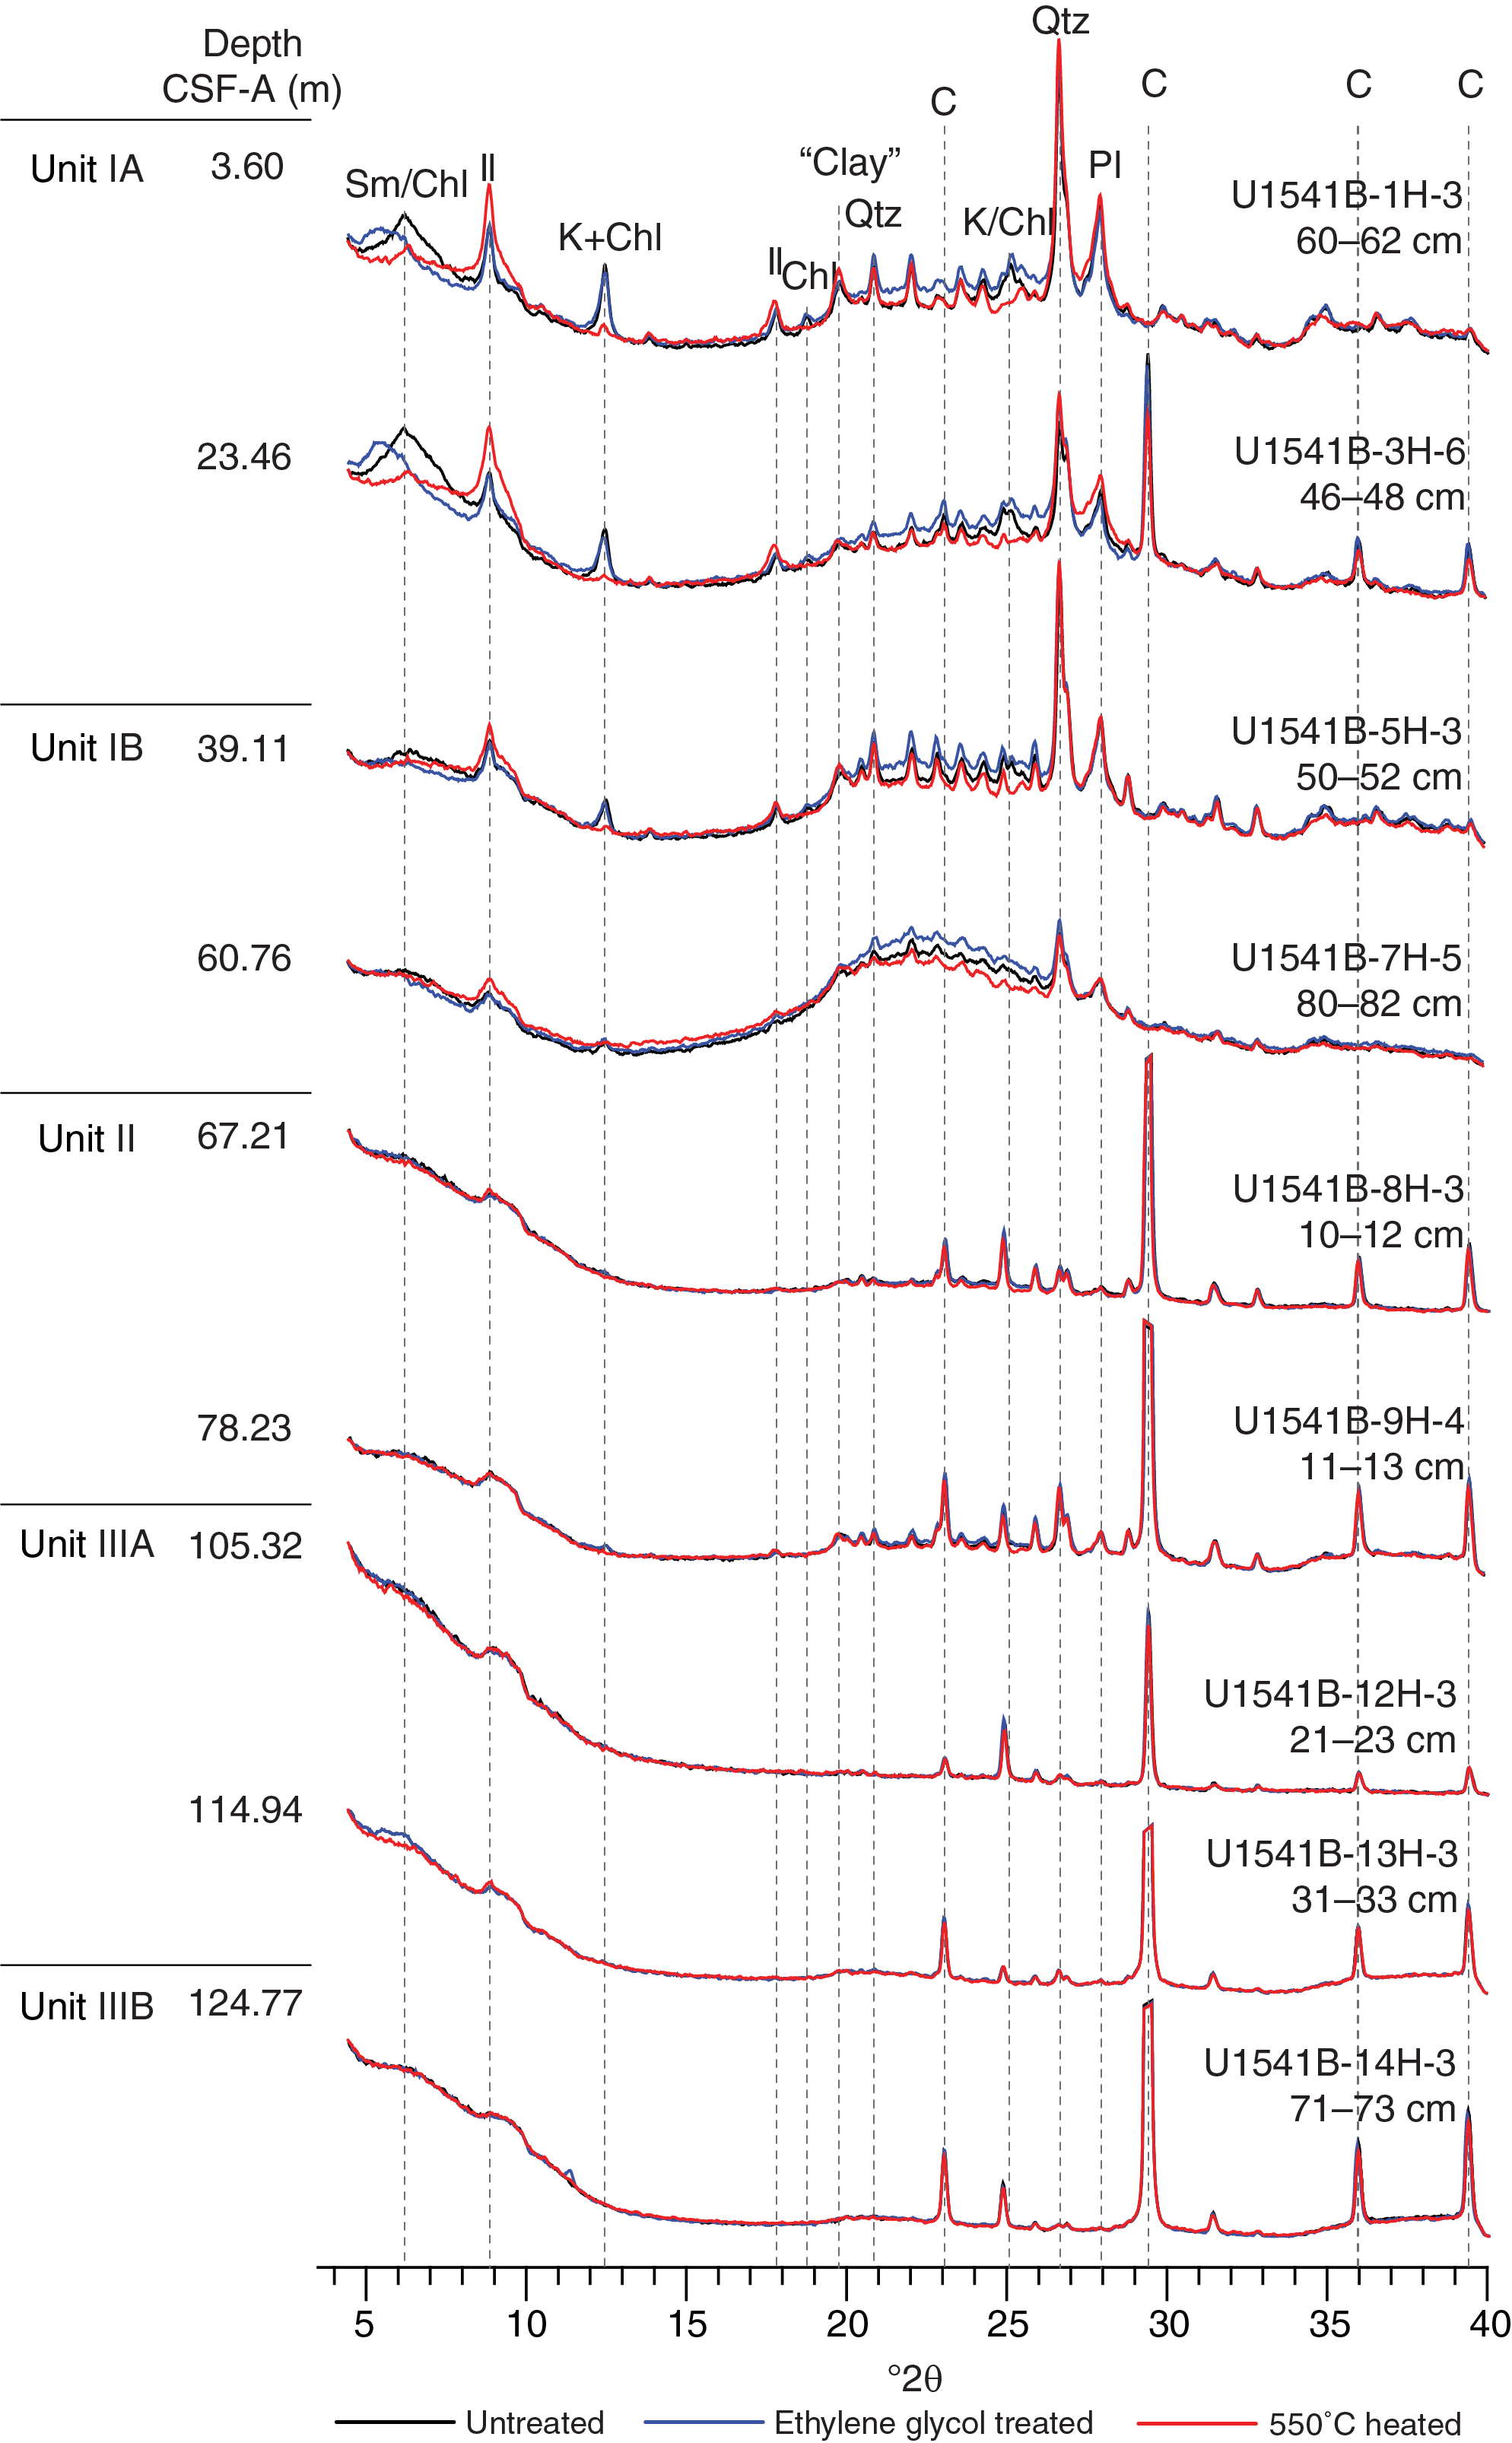
Figure F12. X-ray diffractograms.
Bioturbation
Sediments at Site U1541 are moderately to heavily affected by bioturbation. Macroscopic evidence for the effects of postdepositional sediment mixing by deep-penetrating organisms at Site U1541 mostly comes from burrows observed at lithologic transitions with distinct color changes, which likely reach into the preserved “transitional layer” of the sediment column at the time of deposition (Tiers III and IV after Wetzel and Uchman, 2012) (Figure F13). Evidence for strong bioturbation in the homogenized bioturbation mixed layer at the time of sediment deposition (Tiers I and II after Wetzel and Uchman, 2012) was interpreted from X-radiographs. Classified in most cases as heavy bioturbation, all Site U1541 cores show various overlapping bioturbation patterns and activity of various benthic communities during different times of deposition. Traces of Chondrites, Paleophycus, Planolites, Skolithos, Thalassinoides, and Zoophycos (Gage and Tyler, 1991) can be distinguished from the X-ray images. The vertical extent of (postdepositional) sediment displacement (i.e., the bioturbation depth) is 10 cm on average and in some cases reaches as much as 40 cm.
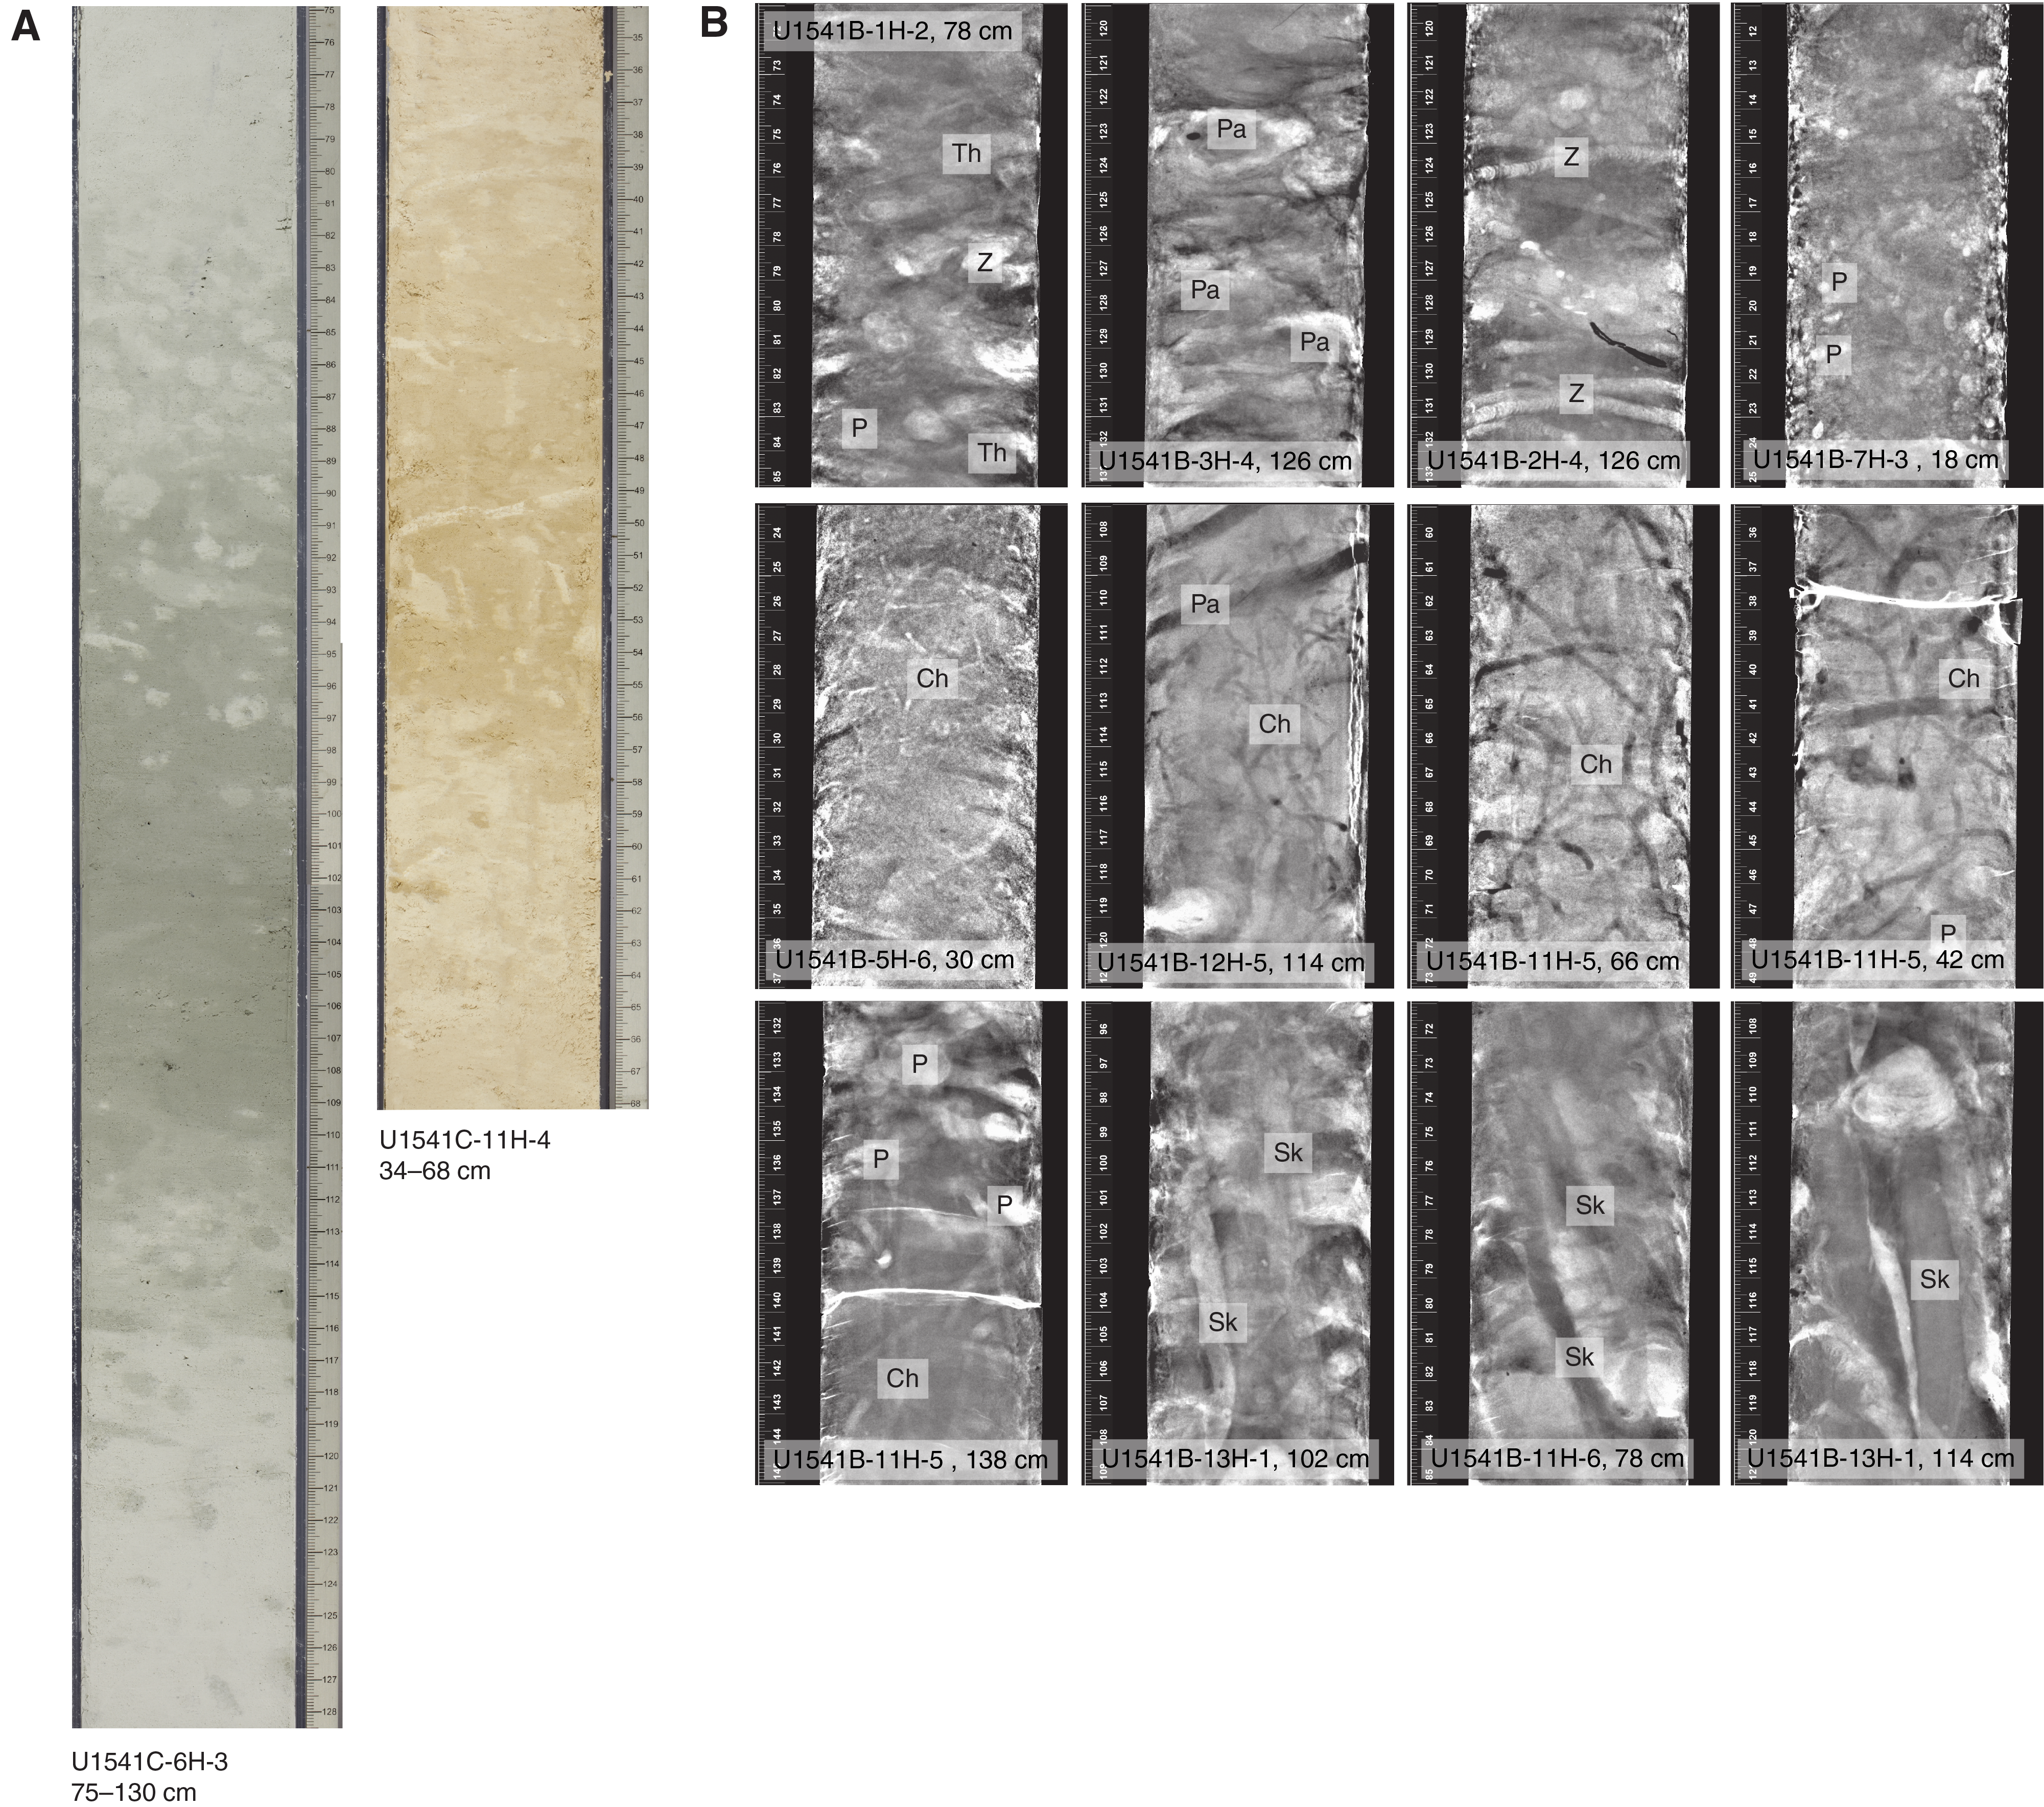
Figure F13. Bioturbation.
Integrating physical property measurements with lithofacies observations
The distribution of Site U1541 lithologies was compared to downcore physical property measurements including GRA bulk density, MS, natural gamma radiation (NGR), RGB blue intensity, and color reflectance b* (see Physical Properties in the Expedition 383 methods chapter [Winckler et al., 2021a]) to identify relationships between lithology and measured downcore data. Five intervals display the diversity of sediment types at Site U1541 (Figure F14):
- Subunit IA, Cores 383-U1541B-2H and 3H (7–25 m CSF-A);
- Subunit IB, Cores 383-U1541B-6H and 7H (45–62 m CSF-A);
- Unit II, Cores 383-U1541B-8H and 9H (64–83 m CSF-A);
- Subunit IIIA, Cores 383-U1541B-12H and 13H (102–120 m CSF-A); and
- Subunit IIIB, Cores 383-U1541B-14H and 15H (121.1–138 m CSF-A).
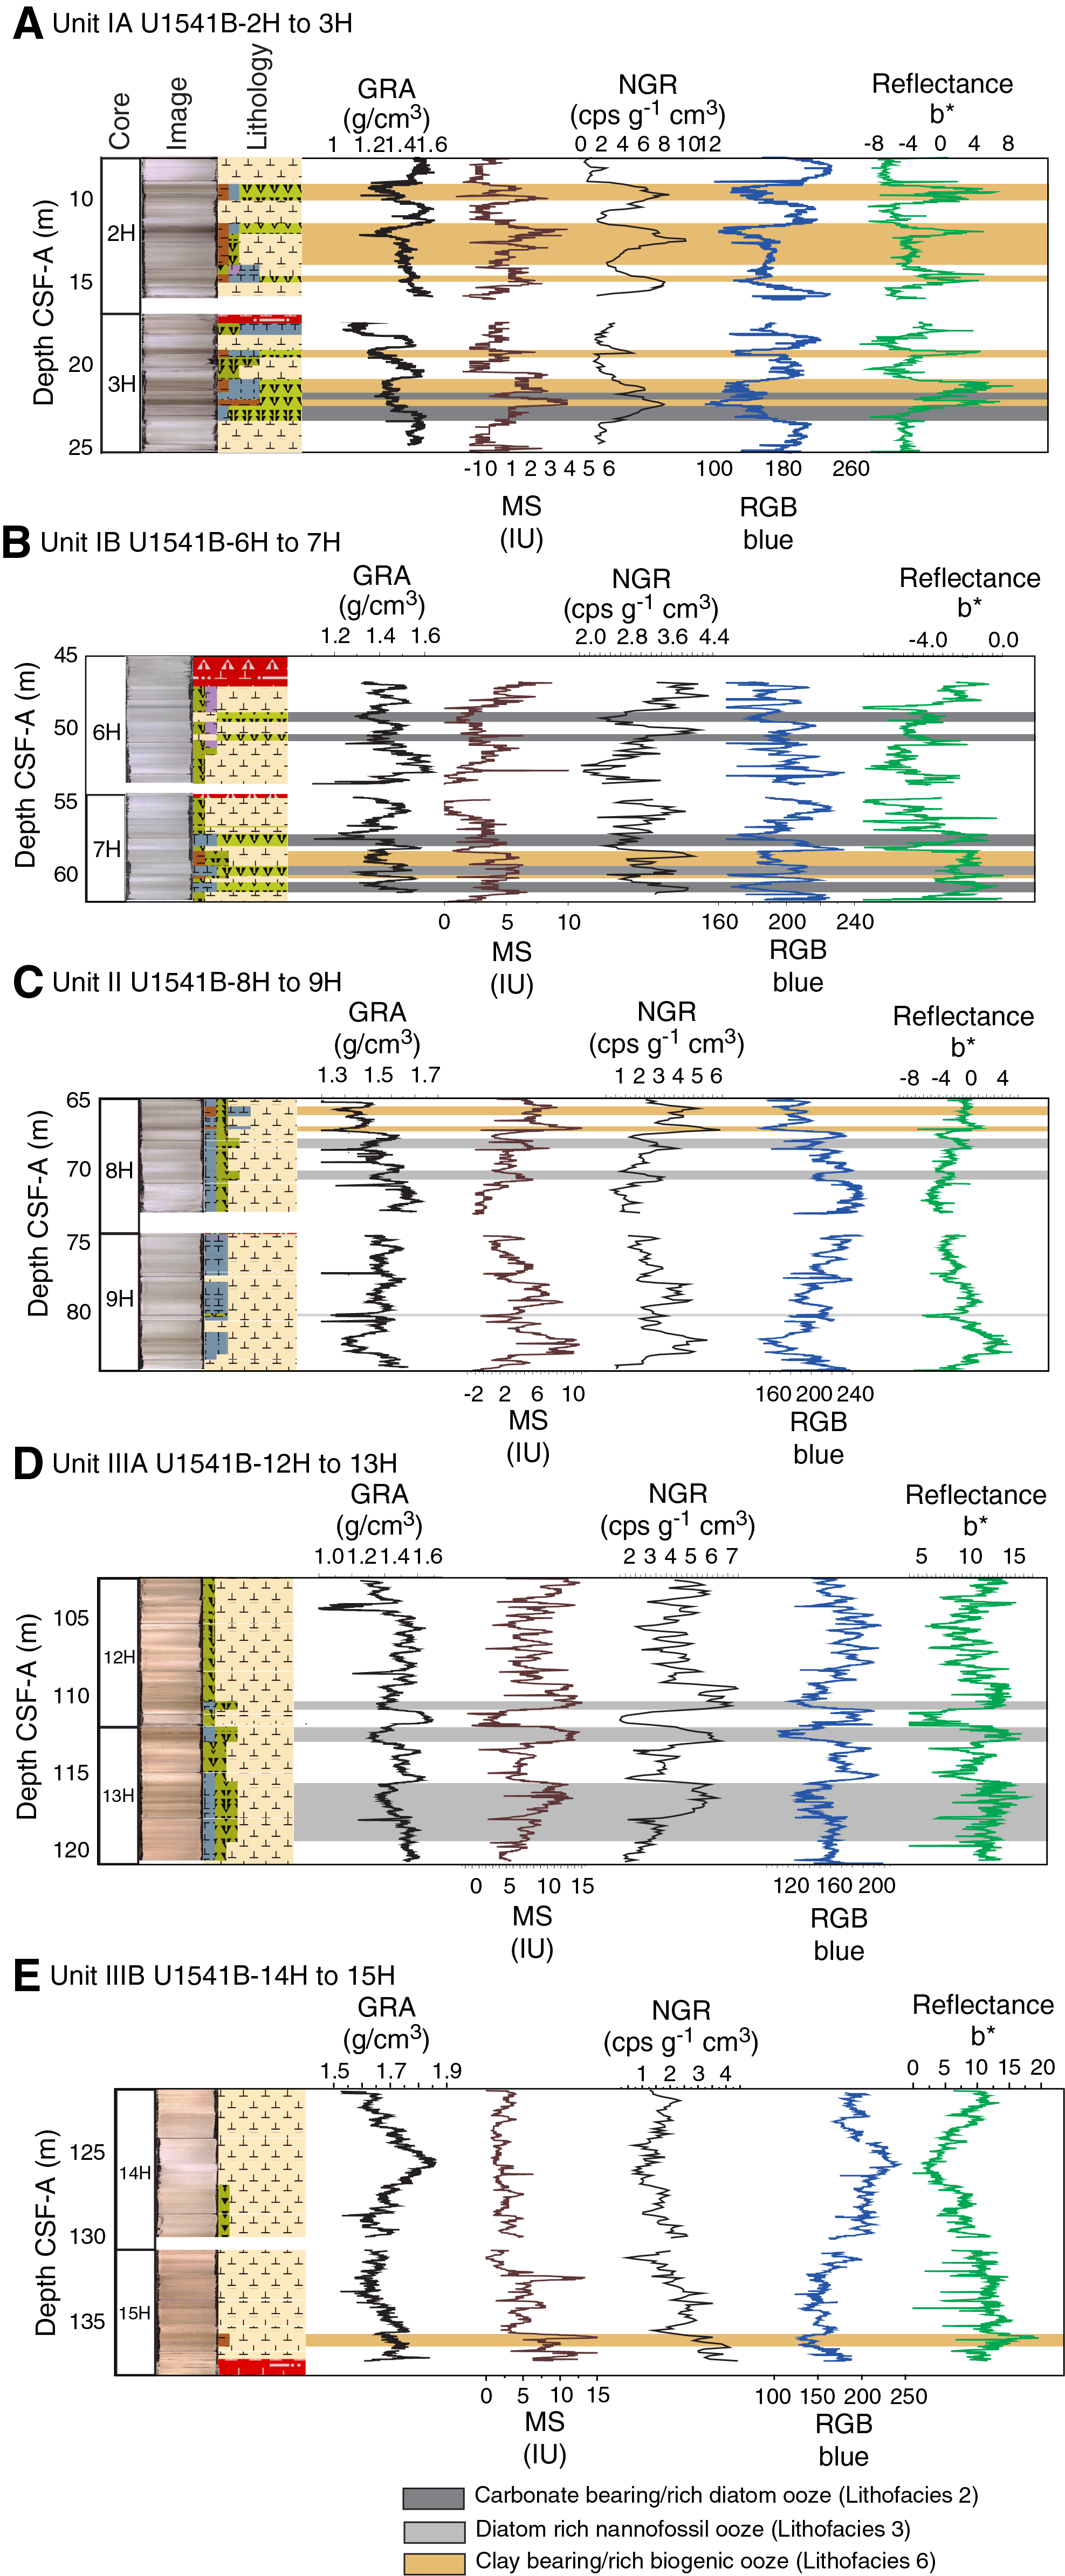
Figure F14. Physical properties.
Changes in physical properties in each lithostratigraphic unit are closely coupled to the lithofacies. In Subunit IA, generally lower GRA bulk density, lower RGB blue intensity, and higher b* values coincide with carbonate-bearing diatom oozes (Lithofacies 2) and clay-bearing biogenic oozes (Lithofacies 6). In contrast, nannofossil oozes (Lithofacies 4) show higher GRA bulk density, higher RGB blue intensity, and lower b* values. Additionally, Lithofacies 6 is associated with higher NGR and magnetic susceptibility in Subunit IA. Similar features occur in Subunit IB.
GRA bulk density values and RGB blue intensity values are generally high in Unit II, whereas b* values are generally low (Figures F4, F14). This reflects the dominance of white and light greenish gray nannofossil oozes (Lithofacies 3 and 4) and the absence of carbonate-bearing to carbonate-rich diatom oozes (Lithofacies 2). Occasional intervals of diatom-rich nannofossil oozes show opposite trends in GRA bulk density values (i.e., a decrease), RGB blue intensity values (i.e., a decrease) and b* values (i.e., an increase).
Nannofossils oozes from Subunit IIIA are characterized by high GRA bulk density values, similar to Unit II, but due to their distinct coloration (very pale brown and pale orange yellow) they show much lower RGB blue intensity values than those found in Unit II (Figure F14). Notable oscillations in GRA bulk density, magnetic susceptibility, NGR, and RGB blue intensity in this subunit are associated with variations between diatom-bearing and diatom-rich nannofossils/calcareous oozes. Because diatom lithologies effectively disappear in Subunit IIIB, it shows higher and less variable GRA bulk density values and RGB blue intensity values, whereas b* values can reach even lower values in Subunit IIIB compared to Subunit IIIA.
Overall, downcore changes in physical properties and spectrophotometric parameters capture alternations between lithofacies and lithologies at Site U1541 (Figure F14), similar to observations at Sites U1539 and U1540. This similarity is emphasized by significant positive correlations (r2 > 0.77) between bulk sedimentary carbonate weight percentages and color reflectance L* intensity values, as well as RGB blue values, in Subunits IA–IIIA at Site 1541 (Figure F15). The insensitivity of carbonate percentage changes to variations in RGB blue intensity in Subunit IIIB, however, suggests that close to the basement at Site U1541, processes other than primary lithology control sediment color. These processes may be related to an increased abundance of authigenic Fe (hydr)oxides identified through smear slide analyses.
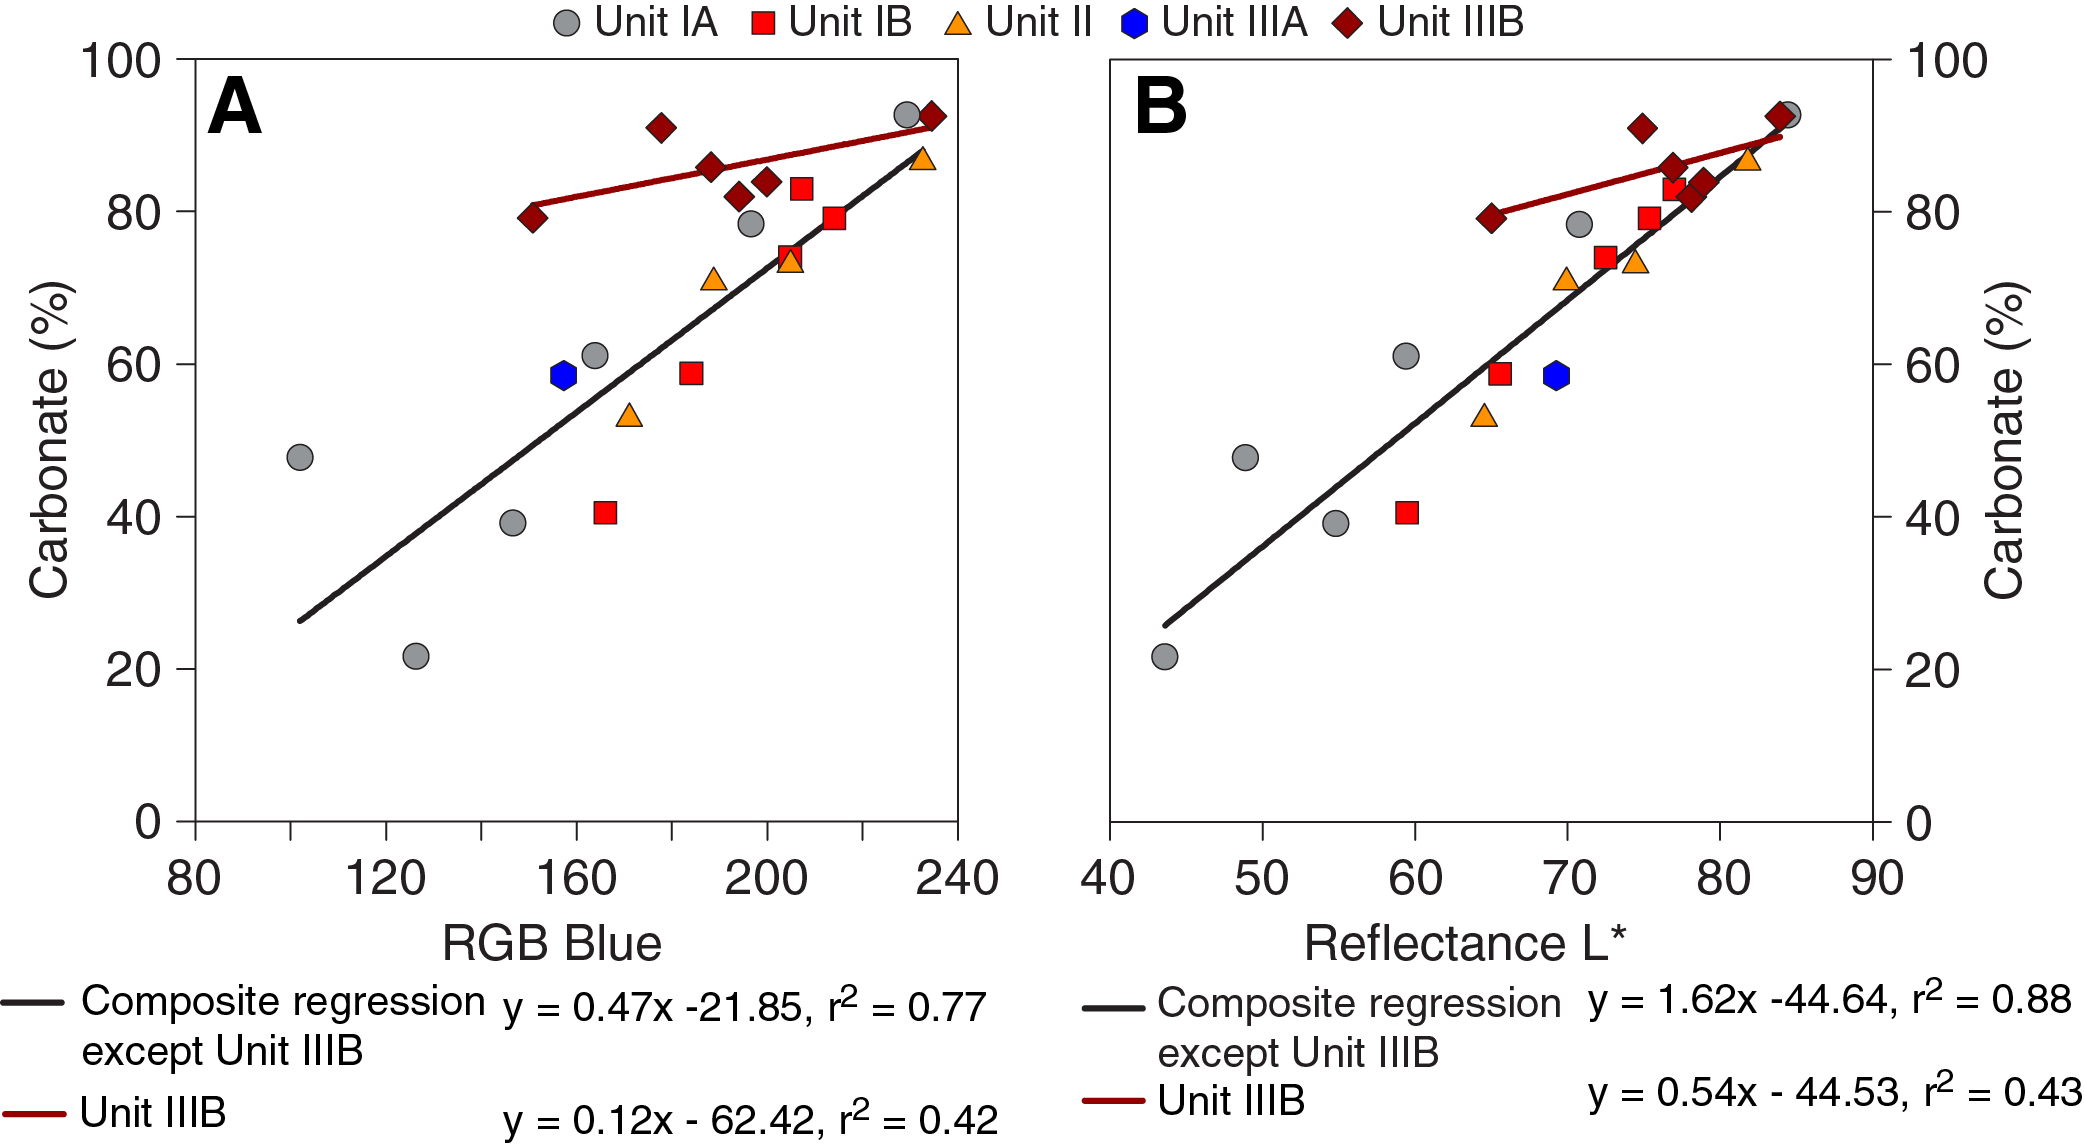
Figure F15. Bulk sedimentary carbonate content, RGB blue, and L*.
Summary and preliminary site interpretation
The sedimentary sequence at Site U1541 reveals marked and recurrent changes in biosiliceous and calcareous lithologies in the upper half of the core, whereas calcareous lithologies largely dominate the Pliocene/Miocene aged lower half of the core (Figures F4, F5). Recurrent alternations between (clay-bearing) biosiliceous and calcareous sediments in Subunits IA and IB (<66.65 m CCSF-A) broadly reflect glacial–interglacial changes in the export and preservation of opal and carbonate and/or the corrosiveness of bottom waters at this site. The prevalence of calcareous sediments may thus reflect increased carbonate export production and enhanced carbonate preservation at depth during interglacial climates, whereas biosiliceous lithologies suggest enhanced opal export production and/or reduced carbonate preservation at depth during glacial intervals (Figure F9). The change in the frequency and thickness of opal- versus carbonate-dominated sediments at the Subunit IA/IB boundary implies a transition in the pacing and duration of glacial versus interglacial periods around 1 Ma based on the Site U1541 preliminary shipboard age model (Figure F9) (see Biostratigraphy). This bears resemblance to lithologic changes at the Subunit IA/IB boundary observed at Site U1540 (see Sedimentology in the Site U1540 chapter [Winckler et al., 2021b]). The absence of diatom oozes in Unit II at Site U1541 (Figure F9) implies a warmer climate that is dominated by pelagic carbonate deposition, likely reflecting Pliocene conditions (see Biostratigraphy). Significantly in Unit II, sedimentation rates are ~1.3 cm/ky below ~80 m CCSF-A (~3 Ma).
The color change of carbonate-dominated lithologies at Site U1541 from white/light greenish gray to very pale brown/pale orange yellow may be due to an increased presence of Fe (hydr)oxides, possibly reflecting the proximity to basement and/or climate-related processes. The high carbonate content of Subunit IIIA and near-complete carbonate dominance in Subunit IIIB implies exceptional warmth in the Miocene–Pliocene central South Pacific region. SST reconstructions from Site U1541 sediments can thus provide important context on high-latitude Southern Hemisphere warmth over the past 8.5 My.
Average sedimentation rates based on biostratigraphy at Site U1541 above ~3 Ma are ~2.7 cm/ky on average and thus lower than at the two other pelagic central South Pacific sites drilled during Expedition 383 (Sites U1539 and U1540; see Biostratigraphy). With a sedimentary sequence of about 145 m CCSF-A recovered, Site U1541 sediments extend further back in time than those at Sites U1539 and U1540. Although some minor drilling gaps occur throughout the record and suck-in from contact with volcanic basement is evident at the base between 145.0 and 145.93 m CCSF-A in Hole U1541B, Site U1541 provides a near-continuous sedimentary sequence reaching back to the middle and late Miocene (~8.5 Ma). Therefore, Site U1541 may be best suited for reconstructing changes in key components of the Southern Ocean system on orbital to tectonic timescales. These components include the mean state of ACC strength and position, the latitudinal position and strength of the Southern Hemisphere westerly winds, aeolian dust supply, upwelling intensity, and the position of Southern Ocean fronts, as well as feedbacks and interactions between them. Site U1541 will thus provide a crucial Miocene-to-present perspective on the evolution of the ACC system and its climate impact and will complement higher resolution paleoclimate reconstructions based on Sites U1539 and U1540 that cover the period from the Pliocene to present.
Biostratigraphy
Core catcher samples from Site U1541 were analyzed for siliceous (diatoms, radiolarians, and silicoflagellates) and calcareous (nannofossils, foraminifers, and ostracods) microfossils. Calcareous nannofossils, planktonic and benthic foraminifers, diatoms, and silicoflagellates were also analyzed in the mudline and working-half toothpick samples. All microfossil groups of interest, diatoms, radiolarians, silicoflagellates, calcareous nannofossils, foraminifers, and ostracods, are present at Site U1541 and their abundance varies throughout the sequence. The preservation of diatoms is moderate overall. Radiolarians are generally very well preserved except for a few samples. Silicoflagellates are rare to barren throughout the core except for four samples in which they were common to abundant. Calcareous nannofossils are present throughout the sequence, and they are common to dominant in all but two of the examined samples. Planktonic and benthic foraminifers and ostracods present good to moderate preservation in the upper part of Hole U1541B and moderate preservation in the lowermost core catcher samples.
The age model at Site U1541 is mainly based on biostratigraphic analysis of Hole U1541B; additional samples from Hole U1541C were analyzed for diatoms and nannofossils. Split-core samples were taken from both holes to refine the stratigraphy in the lower half of the site. In total, 118 biostratigraphic constraints were documented, including events identified in both holes, that indicate an estimated age older than 7.95 Ma at the bottom of the sequence. The integrated biostratigraphy of diatoms, radiolarians, calcareous nannofossils, and planktonic foraminifers showed no major hiatuses at Site U1541, suggesting a continuous sequence of late Miocene–Holocene sediments with average sedimentation rates of ~1.7 cm/ky. Diatom, calcareous nannofossil, planktonic foraminifer, and radiolarian biozonations are shown in Figure F16. The microfossil datums recognized at this site are summarized in Table T3 and presented as an age-depth plot in Figure F17. Abundances of the different microfossil groups in Hole U1541B are shown in Figures F18 and F19.
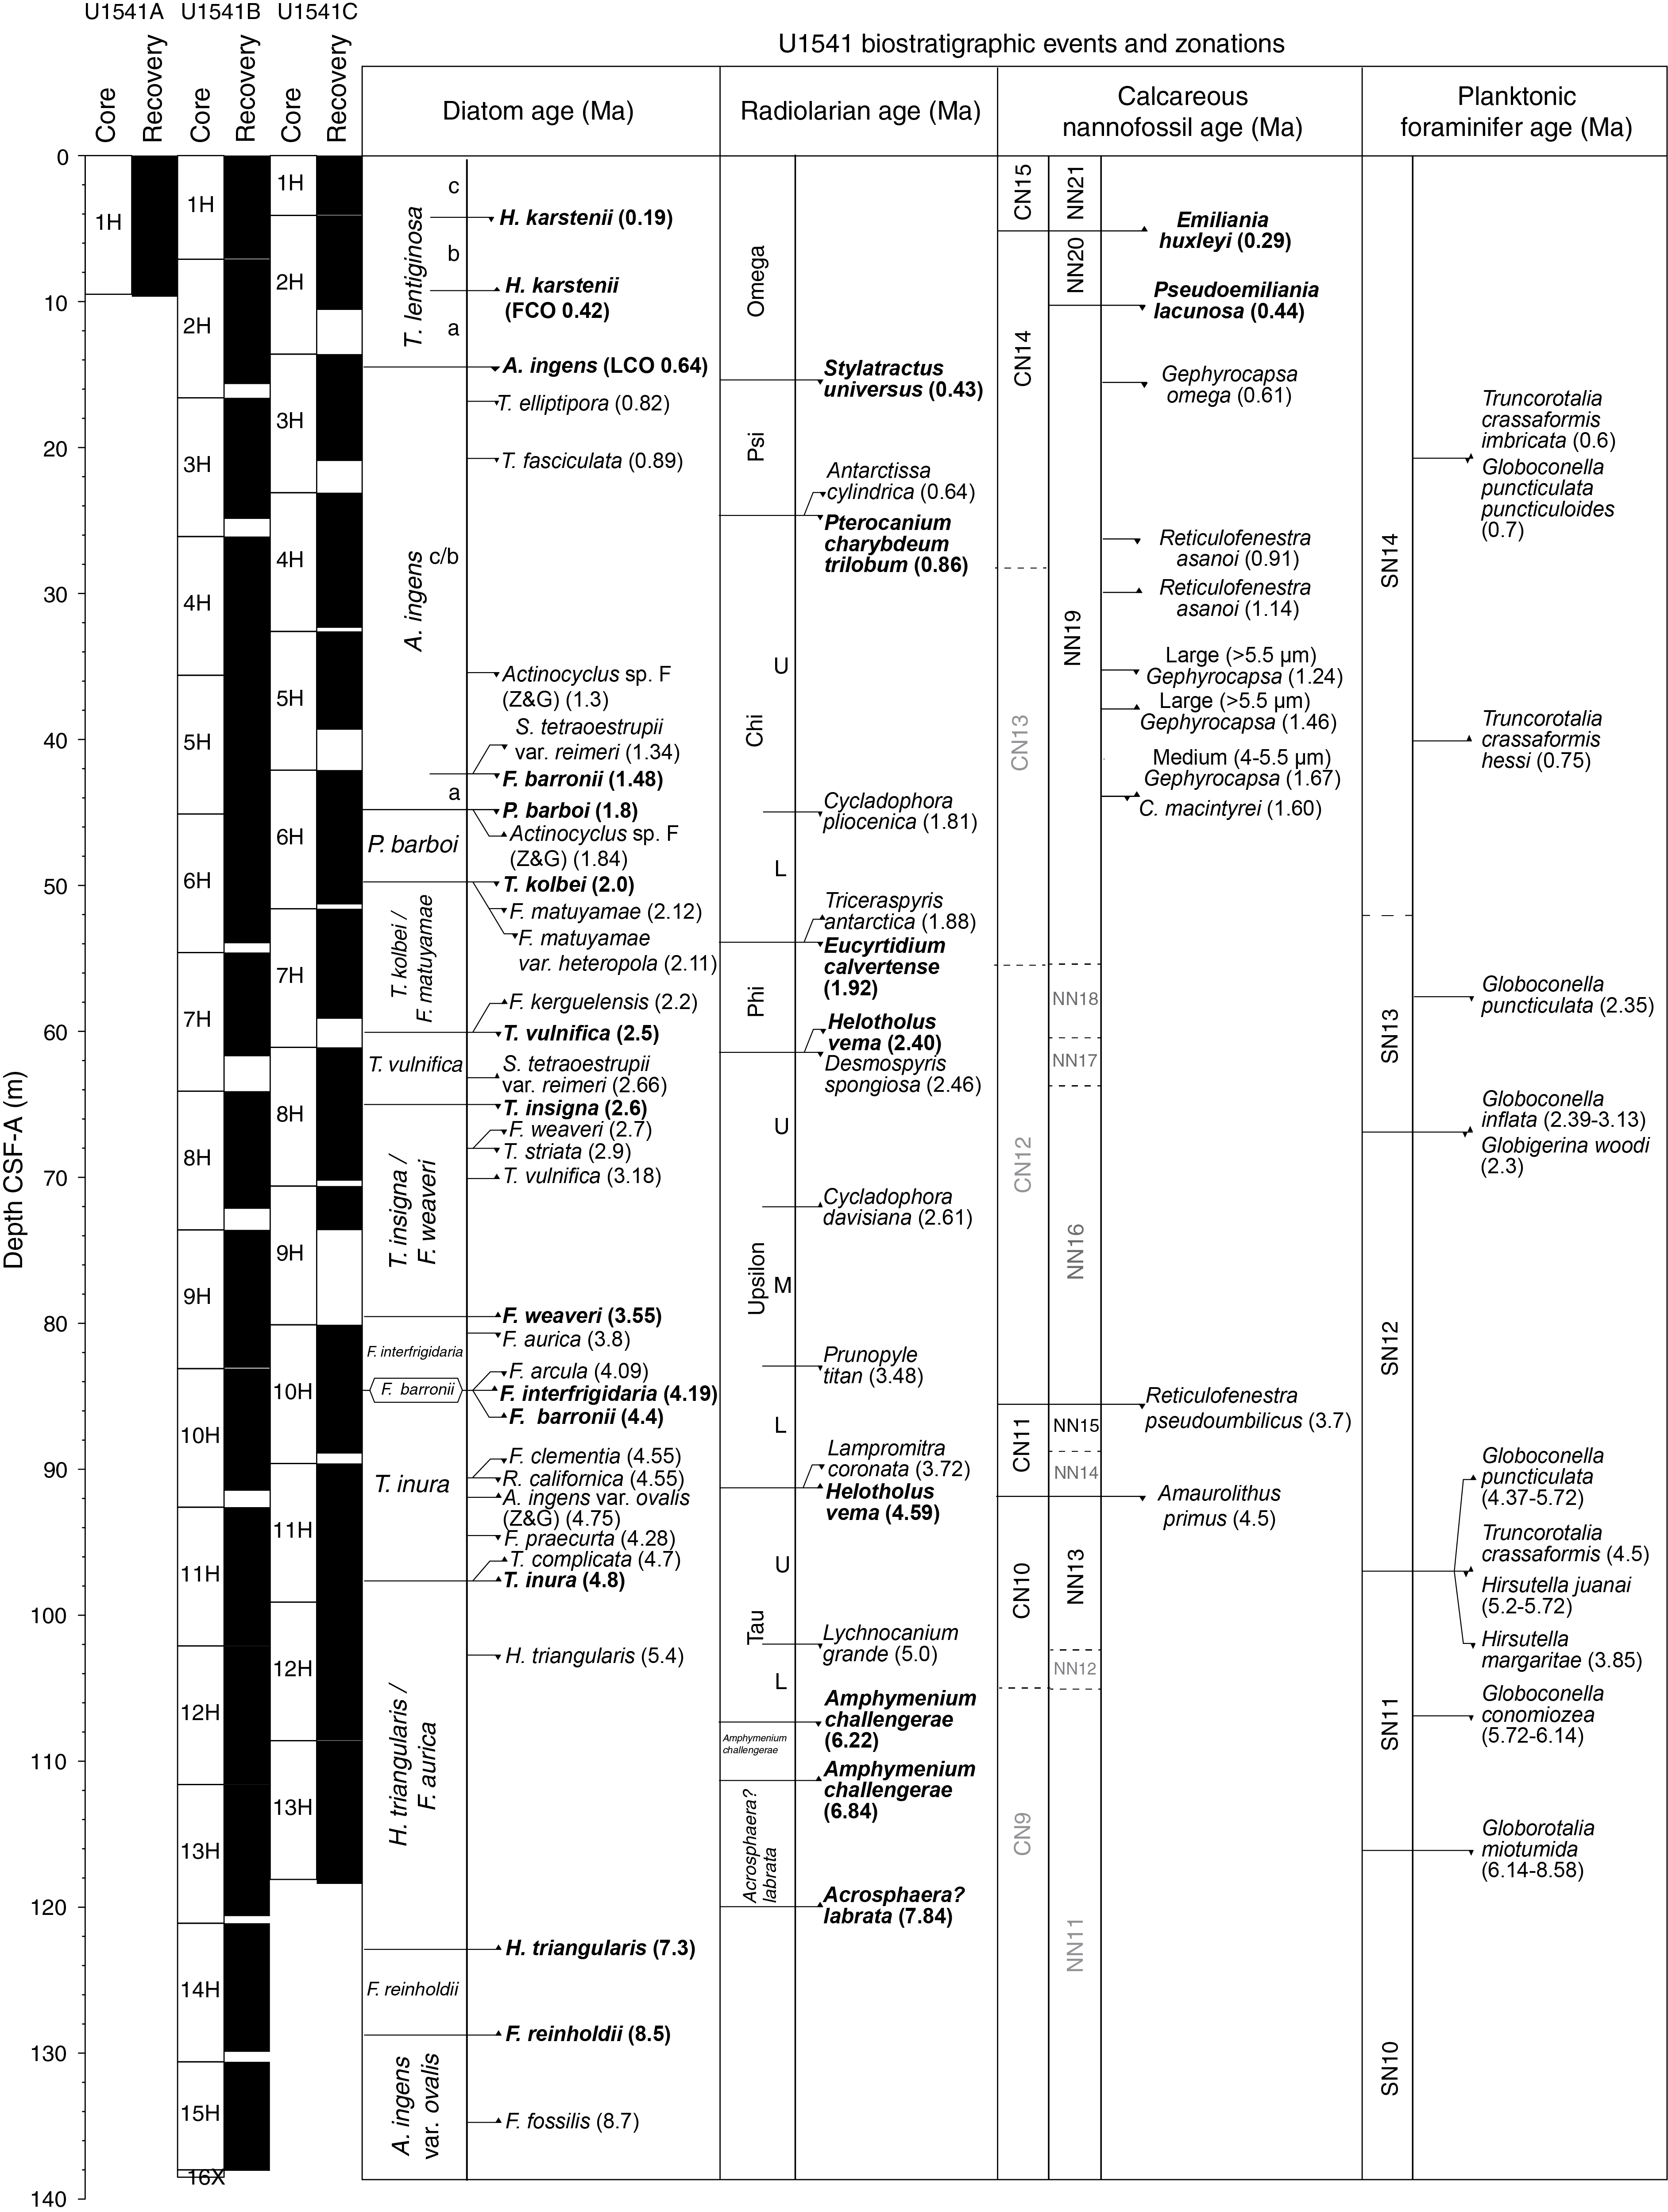
Figure F16. Zonations and biostratigraphic events.
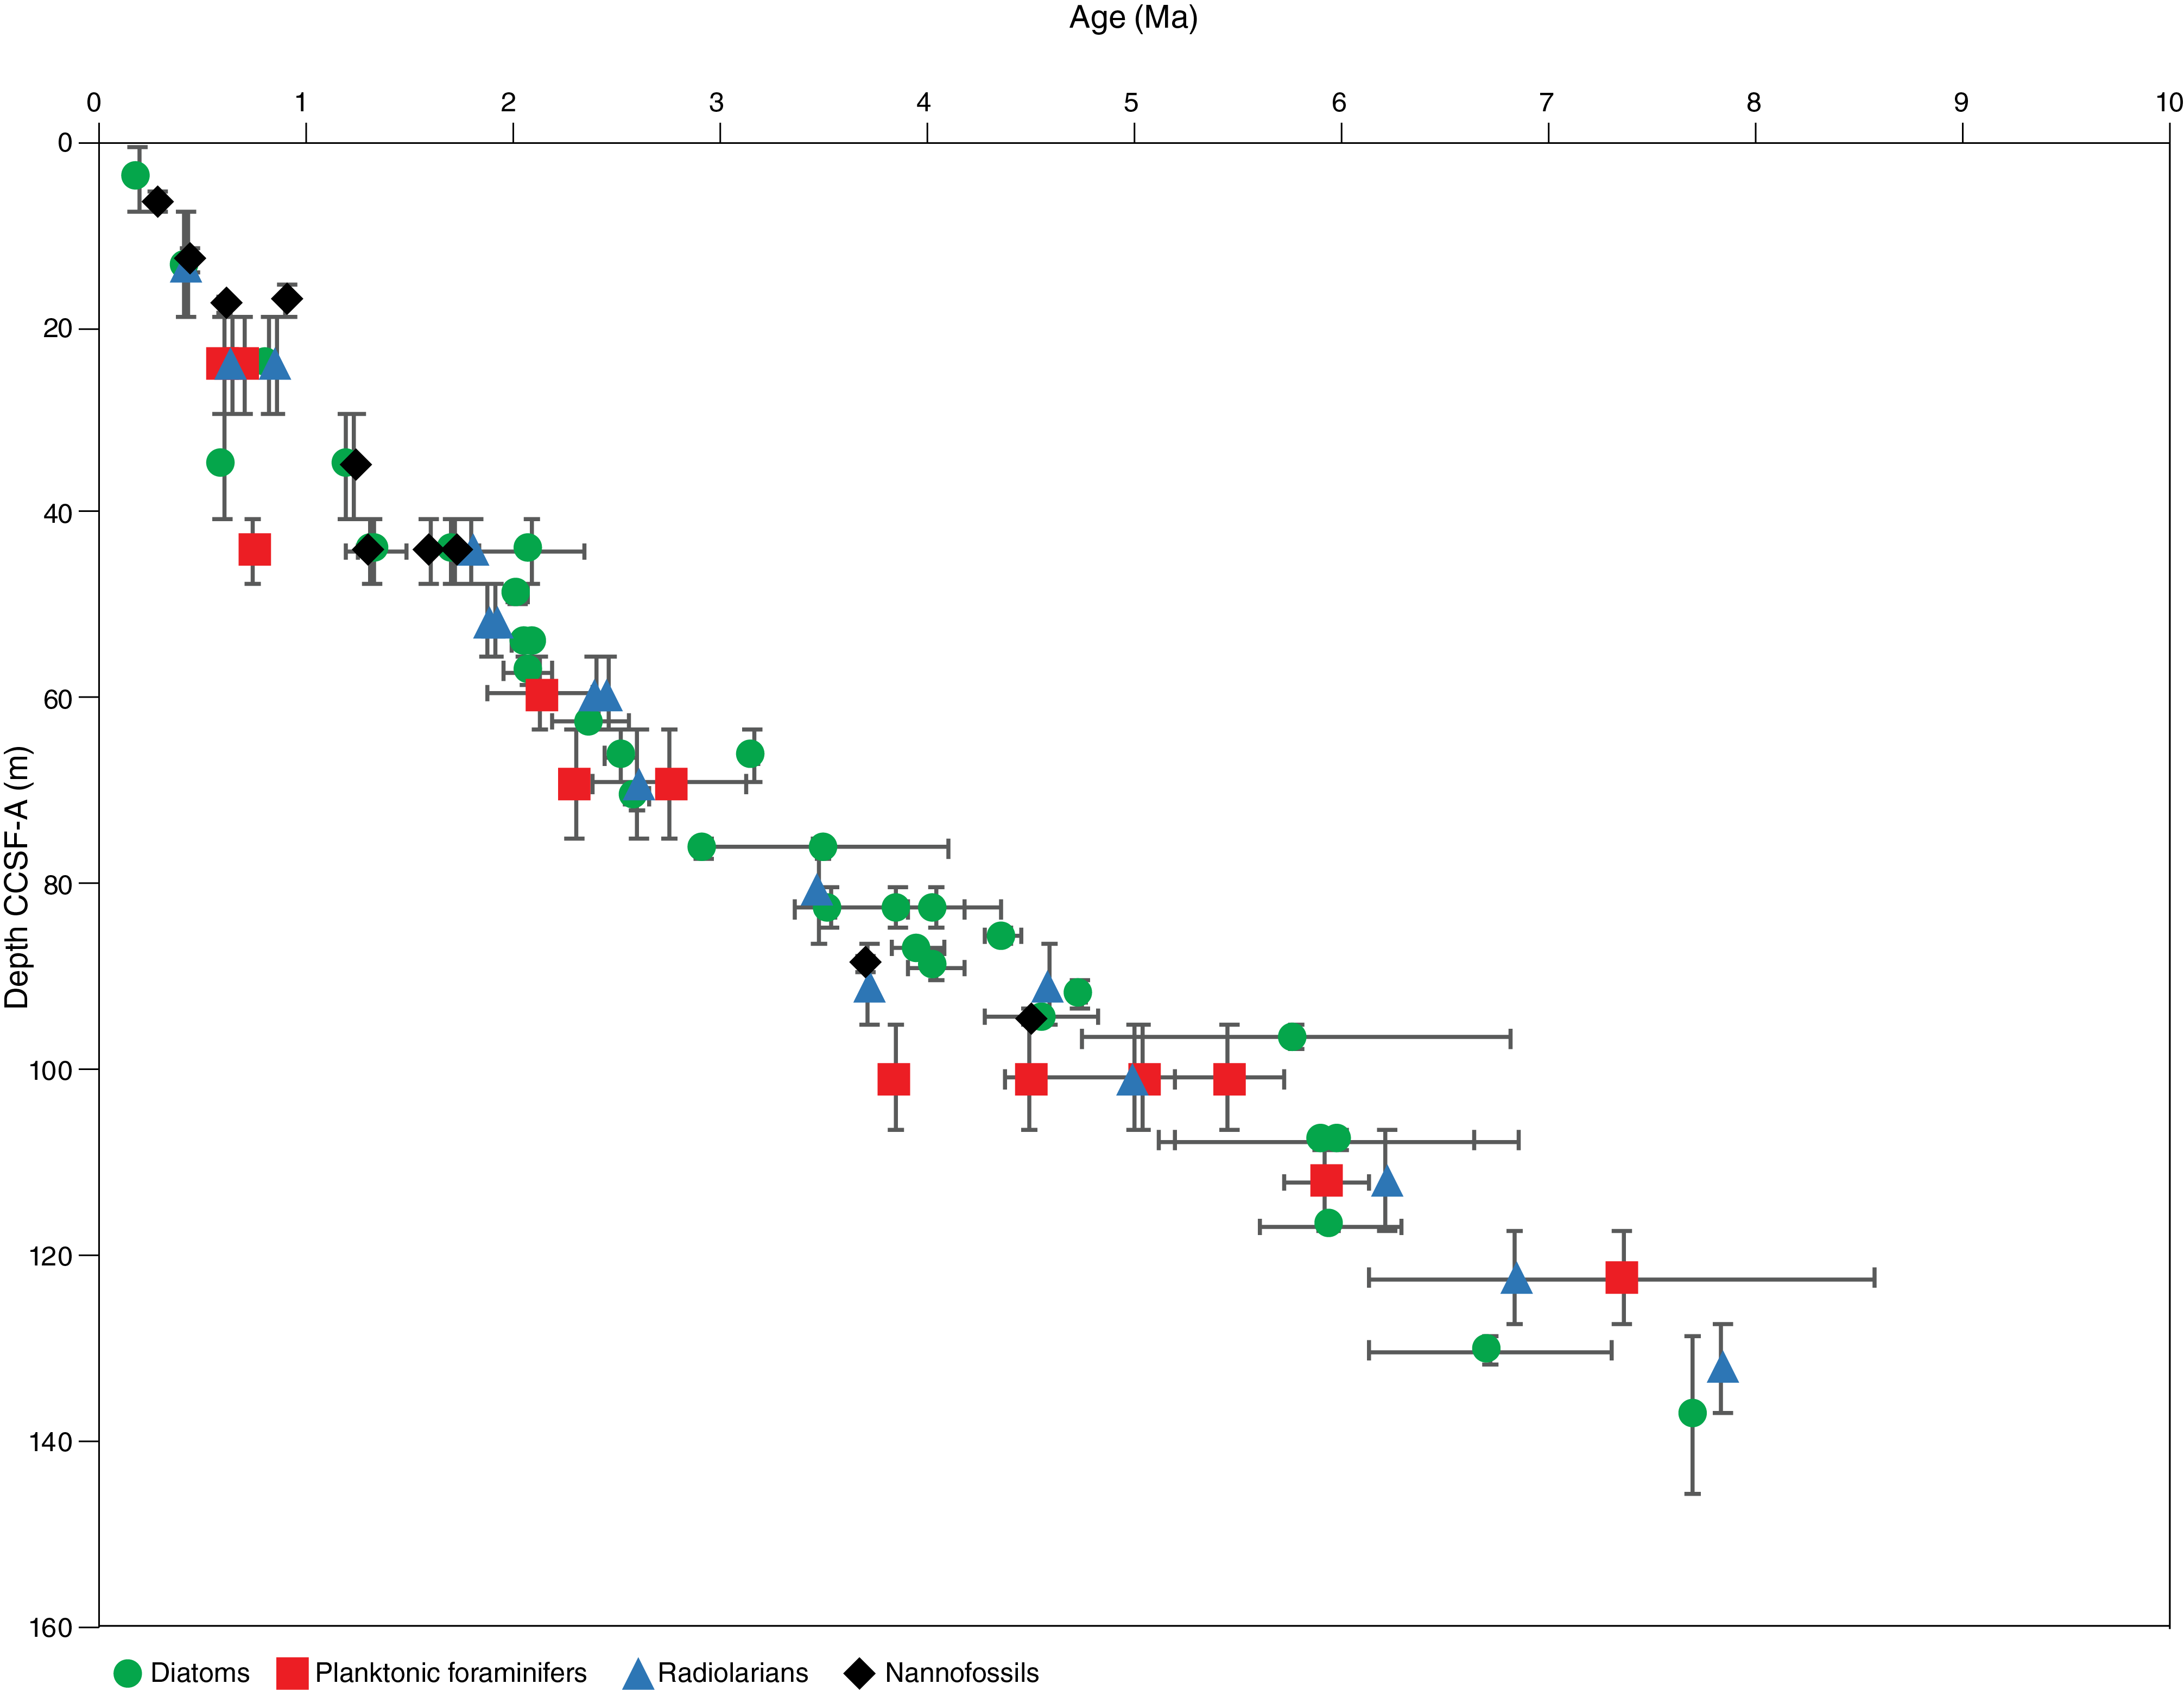
Figure F17. Age-depth plot.

Figure F18. Siliceous and calcareous microfossils.
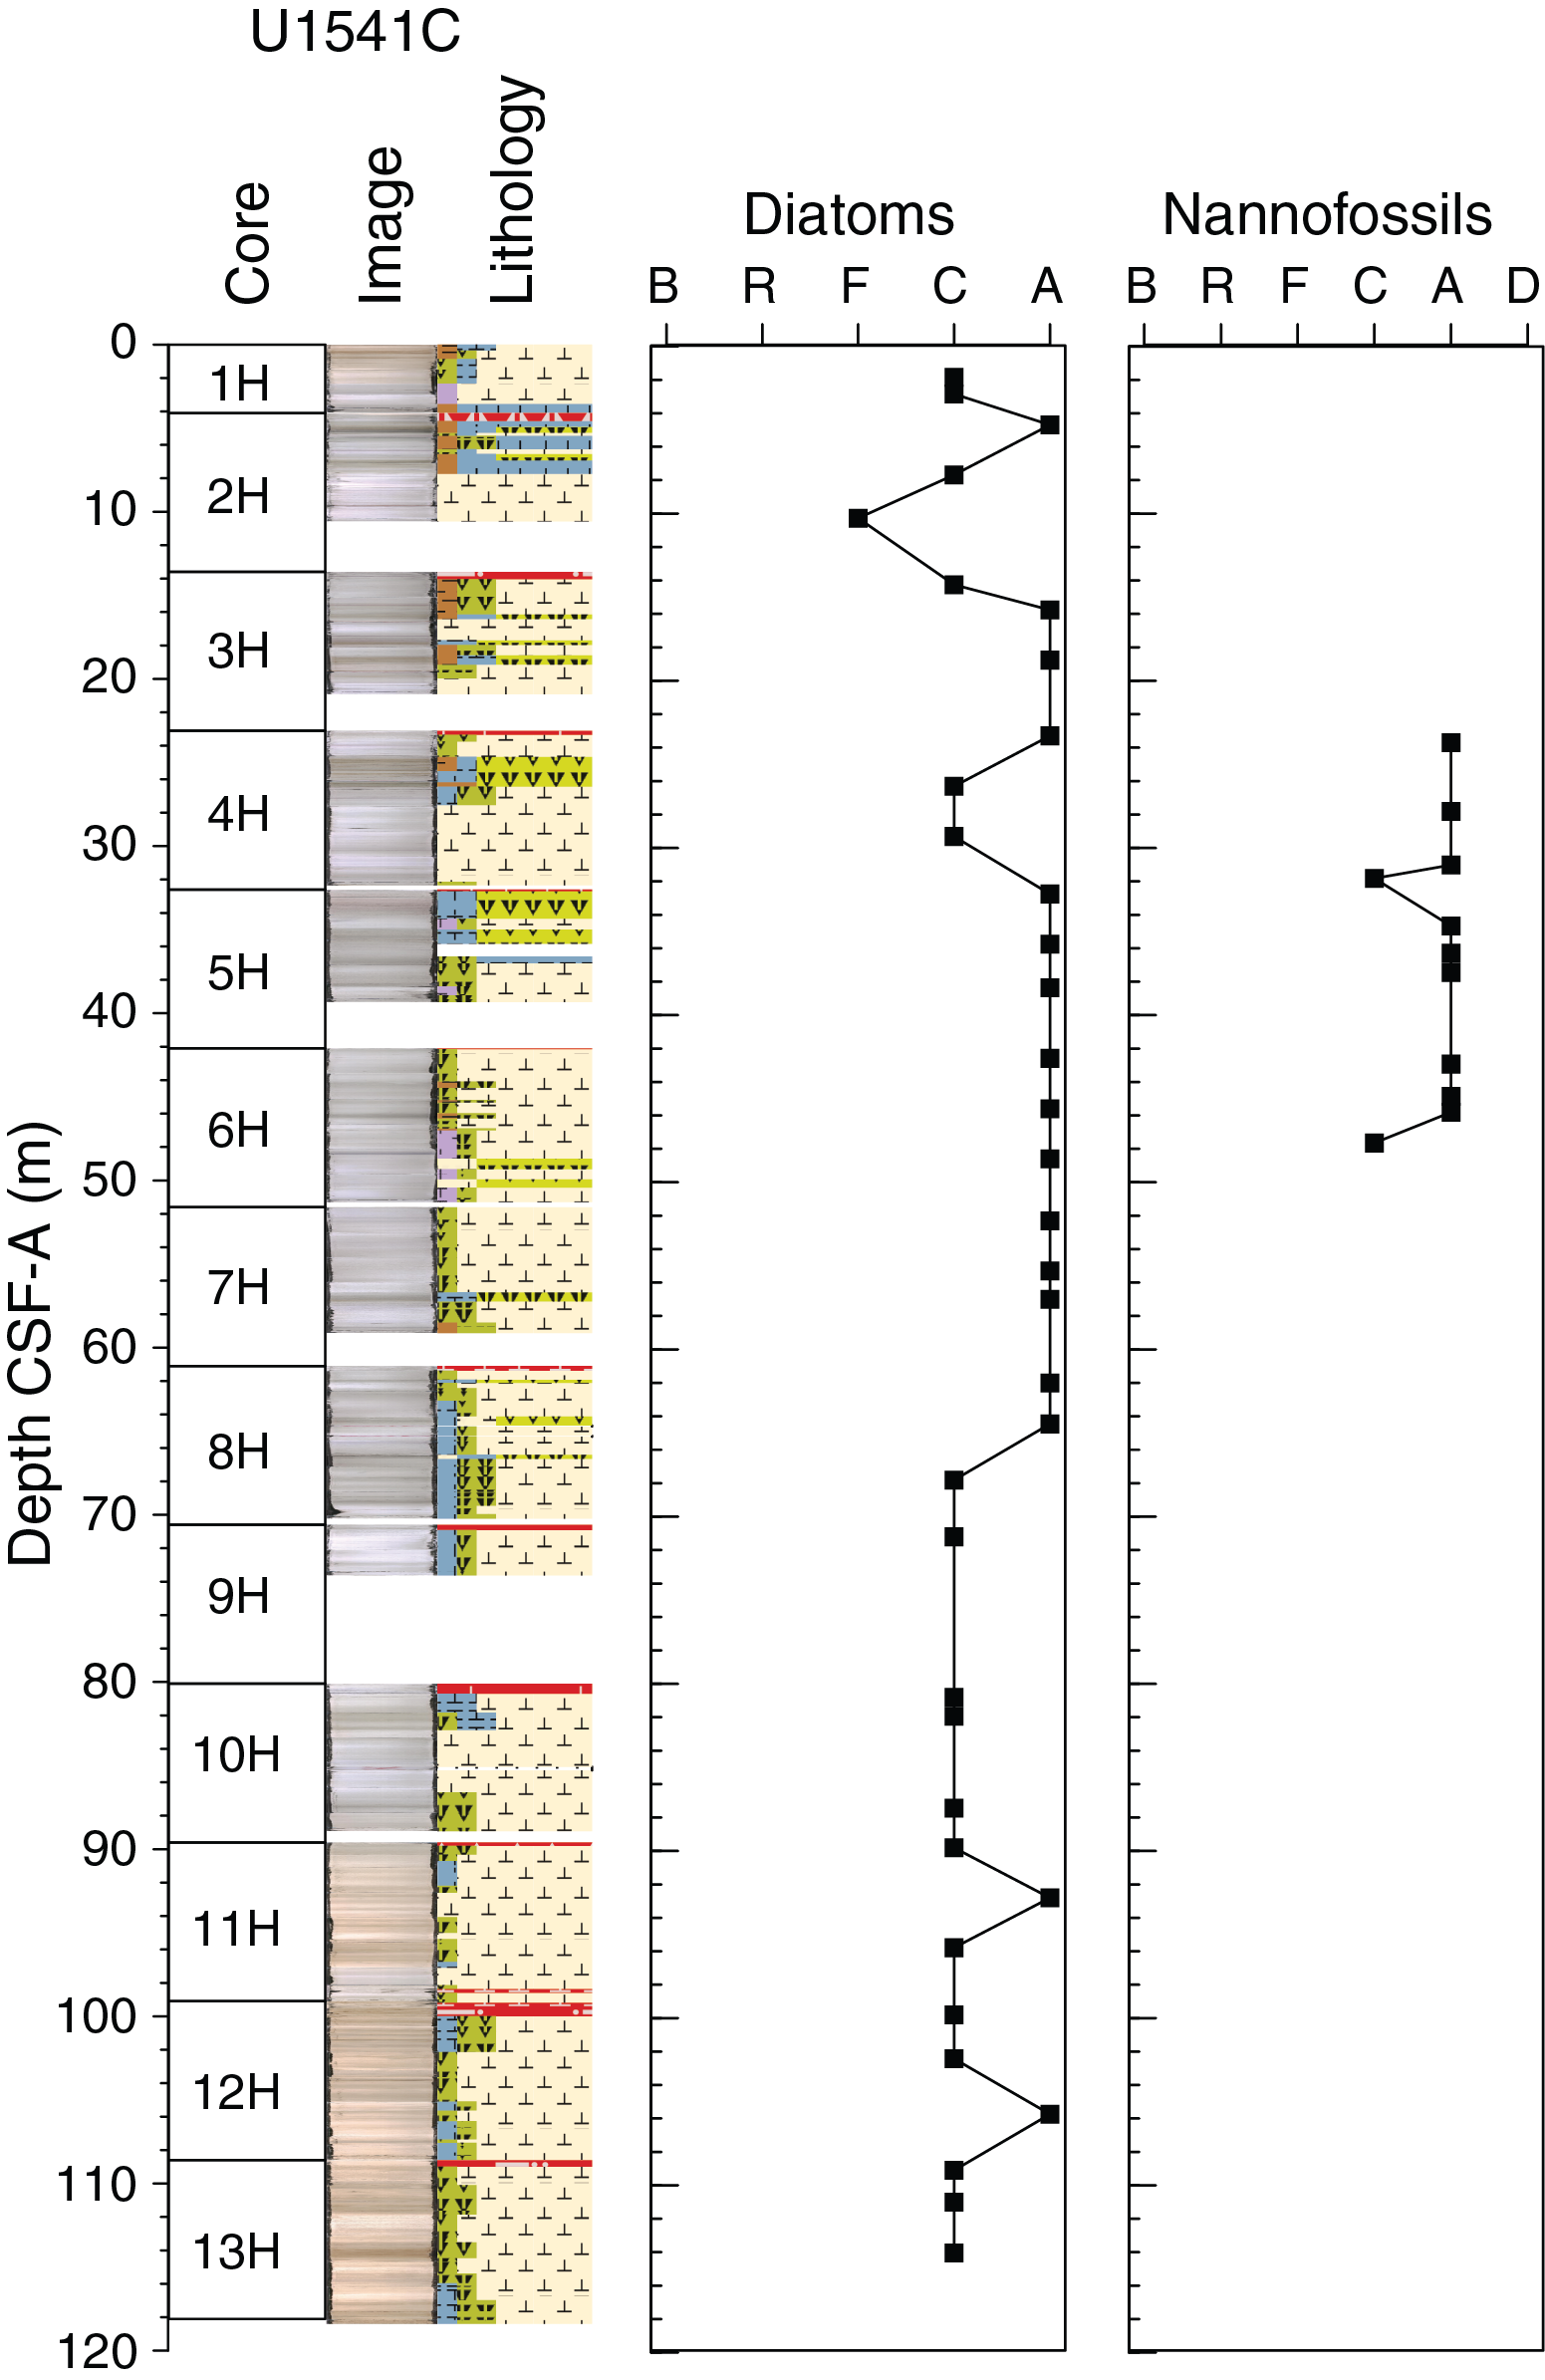
Figure F19. Diatoms and nannofossils.
Diatoms
Diatom biostratigraphy at Site U1541 is based on the analysis of 79 smear slides from 1 mudline, 15 core catcher, and 27 working-half toothpick samples taken from Hole U1541B and 36 working-half 1 cm3 cylinder samples taken from Hole U1541C. Diatoms are common to abundant and assemblages are diverse in most samples examined (Figures F18, F19; Table T4); however, exceptions occur in nannofossil ooze samples where diatoms are diluted to abundances of few to barren (see Biostratigraphy in the Expedition 383 methods chapter [Winckler et al., 2021a] for fossil group abundance definitions). Samples with diatom abundances of few or less include 383-U1541B-1H-CC; 8H-CC; 9H-3, 50 cm; 9H-CC; 11H-1, 80 cm; 11H-3, 80 cm; 15H-1, 50 cm; 15H-CC; and 383-U1541C-2H-5, 59–60 cm. The nannofossil ooze in Samples 383-U1541B-15H-1, 50 cm, and 15H-5, 50 cm, is barren of diatoms. Preservation is moderate, and most samples exhibit low to moderate fragmentation and moderate dissolution.
The diatom assemblage compositions in both Site U1541 holes are internally consistent, and the Pliocene–recent sequence is also in good agreement with Site U1540. The diatom succession appears to record continuous accumulation from recent to the late Miocene following the Pliocene–Pleistocene diatom zonation of Zielinski and Gersonde (2002) and the Miocene zonation of Censarek and Gersonde (2002), with bottom ages approaching 8.7 Ma for Hole U1541B and older than 5.3 Ma for Hole U1541C (Table T4; Figure F16). In both holes, abundant to few occurrences of Thalassiothrix antarctica in the Pleistocene to early Pliocene decline to few to rare occurrences in the early Pliocene to late Miocene.
Pleistocene diatom zones
The Pleistocene sequence in the upper part of Holes U1541B (above Sample 383-U1541B-8H-2, 70 cm) and U1541C (above Sample 383-U1541C-8H-1, 90–91 cm) in the Thalassiosira lentiginosa Partial Range Zone is characterized by common to few Fragilariopsis kerguelensis and T. lentiginosa and few to rare Eucampia antarctica. The boundary between Subzones C and B, marked by the last occurrence (LO) of Hemidiscus karstenii, was identified in both holes in Samples 383-U1541B-1H-CC (7.00–7.06 m CSF-A) and 383-U1541C-2H-1, 59–60 cm (4.69–4.70 m CSF-A). Subzones B and A of the T. lentiginosa Zone, divided by the first Quaternary common occurrence of H. karstenii, are undifferentiated in Hole U1541B, but the boundary was identified in Hole U1541C based on the presence of H. karstenii in Sample 383-U1541C-2H-3, 59–60 cm (7.68–7.69 m CSF-A), and its absence in Sample 2H-5, 59–60 cm (10.27–10.28 m CSF-A). The boundary between the T. lentiginosa Zone and the Actinocyclus ingens Partial Range Zone is placed at the last common occurrence (LCO) of A. ingens at few or greater numbers, as observed in Samples 383-U1541B-2H-CC (15.59–15.65 m CSF-A) and 383-U1541C-3H-1, 65–66 cm (14.25–14.26 m CSF-A). In the Pleistocene sequences of both holes, A. ingens occurs in common to few abundance. In the A. ingens Zone, Thalassiosira elliptipora is present in Samples 383-U1541B-3H-CC (24.83–24.89 m CSF-A) and 4H-CC (35.67–35.68 m CSF-A) and discontinuously present in Samples 383-U1541C-3H-2, 65–66 cm (15.76–15.77 m CSF-A), through 5H-3, 15–16 cm (35.75–35.76 m CSF-A). Although Zielinski and Gersonde (2002) used the first abundant occurrence (FAO) of T. elliptipora as the boundary between Subzones C and B in the A. ingens Zone, the species is rare in most samples in which it occurs and has a peak abundance of few. For this reason, the two subzones have not been differentiated in the Site U1541 shipboard biostratigraphy and instead are combined into Subzone C/B in Figure F16. The LO of Thalassiosira fasciculata is identified in Sample 383-U1541C-4H-1, 19–20 cm (23.29–23.30 m CSF-A), but the datum is not clearly detected in Hole U1541B. The boundary between A. ingens Subzones B and A is defined by the LO of Fragilariopsis barronii and Shionodiscus tetraoestrupii var. reimeri in Samples 383-U1541B-5H-CC (45.14–45.20 m CSF-A) and 383-U1541C-6H-1, 48–49 cm (42.58–42.59 m CSF-A). The transition from the A. ingens Zone to the Proboscia barboi Partial Range Zone is constrained by the LO of P. barboi in Samples 383-U1541B-5H-CC (45.14–45.20 m CSF-A) and 383-U1541C-6H-3, 48–49 cm (45.60–45.61 m CSF-A). Following the scheme of Zielinski and Gersonde (2002), the transition from the P. barboi Partial Range Zone to the Thalassiosira kolbei/Fragilariopsis matuyamae Concurrent Range Zone is marked by the LO of T. kolbei in Samples 383-U1541B-6H-2, 140 cm (48.01 m CSF-A), and 383-U1541C-7H-1, 70–71 cm (52.30–52.31 m CSF-A). The zone is further constrained by the LOs of F. matuyamae and F. matuyamae var. heteropola in Samples 383-U1541B-6H-CC (53.90–53.96 m CSF-A) and 383-U1541C-7H-1, 70–71 cm (52.30–52.31 m CSF-A). Long, slender varieties of Thalassionema nitzschioides are common to abundant in the P. barboi Zone and the upper portion of the T. kolbei/F. matuyamae Zone, and the LO of F. kerguelensis was noted in Samples 383-U1541B-6H-CC (53.90–53.96 m CSF-A) and 383-U1541C-7H-4, 90–91 cm (57.00–57.01 m CSF-A). The transition from the T. kolbei/F. matuyamae Zone to the Thalassiosira vulnifica Partial Range Zone is constrained by the LO of T. vulnifica. In Hole U1541B, the species was identified in only a single sample (383-U1541B-7H-CC; 61.54–61.70 m CSF-A), and it is absent from the samples above and below. In Hole U1541C, T. vulnifica is present in three consecutive samples, and the LO was identified in Sample 383-U1541C-8H-1, 90–91 cm (62.00–62.01 m CSF-A). The T. vulnifica Partial Range Zone, which has an age between 2.5 and 2.6 Ma, marks the transition from the early Pleistocene to the late Pliocene. Notably, the LO of Fragilariopsis interfrigidaria, which is usually found in the T. vulnifica Zone, is poorly defined at Site U1541 and was observed much deeper in the section than predicted from its regional last appearance datum (LAD) (Cody et al., 2008; Zielinski and Gersonde, 2002). This discrepancy may be ecological but may also reflect plasticity of taxonomic concepts within the Fragilariopsis praeinterfrigidaria lineage (Riesselman, 2012), of which diverse morphologies were observed in the Pliocene interval of Hole U1541B.
Pliocene diatom zones
The Pliocene sequence in the middle part of Holes U1541B (Samples 383-U1541B-8H-2, 70 cm, to 12H-1, 50 cm) and U1541C (Samples 383-U1541C-8H-1, 90–91 cm, through 11H-5, 20–21 cm) is characterized by common to rare F. barronii, Hemidiscus cuneiformis, and diverse T. nitzschioides varieties, and by few to rare A. ingens, indicating a warmer marine environment than that recorded during the Pleistocene. The LO of Thalassiosira inura is not well defined in Hole U1541B but was clearly observed in Sample 383-U1541C-8H-1, 90–91 cm (62.00–62.01 m CSF-A). The transition from the T. vulnifica Zone to the Thalassiosira insigna/Fragilariopsis weaveri Concurrent Range Zone is constrained by the LO of T. insigna in Samples 383-U1541B-8H-2, 70 cm (66.30 m CSF-A), and 383-U1541C-8H-5, 70–71 cm (67.81–67.82 m CSF-A). Below, the base of the zone is marked by the first occurrence (FO) of F. weaveri in Samples 383-U1541B-9H-3, 50 cm (77.10 m CSF-A), and 383-U1541C-9H-1, 60–61 cm (71.20–71.21 m CSF-A). In this zone, the LO of Thalassiosira complicata is clearly defined only in Sample 383-U1541C-8H-5, 70–71 cm (67.81–67.82 m CSF-A), whereas the LO of Thalassiosira striata was found in Samples 383-U1541B-9H-1, 50 cm (74.10 m CSF-A), and 383-U1541C-9H-1, 60 cm (71.20–71.21 m CSF-A), and the LO of Fragilariopsis aurica was identified in Samples 383-U1541B-9H-6, 50 cm (81.61 m CSF-A), and 383-U1541C-10H-3, 10–11 cm (81.93–81.94 m CSF-A). Below, the F. interfrigidaria Partial Range Zone is constrained at the top by the FO of F. weaveri (described above) and at the bottom by the FO of F. interfrigidaria in Samples 383-U1541B-10H-1, 50 cm (83.60 m CSF-A), and 383-U1541C-10H-6, 110–111 cm (87.43–87.44 m CSF-A). Within this zone, the LO of Fragilariopsis arcula is in Samples 383-U1541B-10H-1, 50 cm (83.60 m CSF-A), and 383-U1541C-10H-6, 110–111 cm (87.43–87.44 m CSF-A). Below the F. interfrigidaria Zone, the top of the F. barronii Partial Range Zone should be constrained by the FO of F. interfrigidaria (described above), and the bottom of the zone should be constrained by the FO of F. barronii. However, these two events were found in the same samples in both holes (383-U1541B-10H-1, 50 cm [83.60 cm CSF-A], and 383-U1541C-10H-6, 110–111 cm [87.43–87.44 m CSF-A]) (Tables T3, T4). Based on the complete sequence of magnetic reversals recovered at Site U1541 (see Paleomagnetism), we interpret this co-occurrence of datums not as a hiatus but instead as an indication that the sedimentary sequence containing the F. barronii Zone is very condensed at Site U1541, and we expect the zonal boundaries to be refined by higher resolution postcruise characterization. Below the F. barronii Zone, the boundary at the base of the T. inura Partial Range Zone is constrained by the FO of T. inura in Sample 383-U1541C-11H-5, 20–21 cm (95.78–95.79 m CSF-A), but it is not clearly defined in Hole U1541B. Within the T. inura Zone, the LO of Fragilariopsis cylindrica was noted in Samples 383-U1541B-11H-5, 80 cm (99.41 m CSF-A), and 383-U1541C-11H-3, 20–21 cm (92.80–92.81 m CSF-A), whereas the LO of Fragilariopsis clementia was found only in Sample 383-U1541C-11H-3, 20–21 cm (92.80–92.81 m CSF-A). The LO of A. ingens var. A sensu Harwood and Matuyama (1992) was also noted in this zone in Samples 383-U1541B-11H-5, 80 cm (99.41 m CSF-A), and 383-U1541C-11H-1, 20–21 cm (89.80–89.81 m CSF-A), and coincides with the LCO of Azpeitia nodulifer. A. ingens var. A persists through the base of both holes, sometimes co-occurring with specimens tabulated as A. ingens var. ovalis sensu Gersonde (1990) (Table T4), which have an oval valve outline but are otherwise very similar in appearance. Noting the ongoing taxonomic debate regarding differentiation of A. ingens var. A sensu Harwood and Maruyama (1992), A. ingens var. ovalis sensu Gersonde (1990), and Hemidiscus ovalis sensu Harwood and Maruyama (1992), we have lumped all morphologies into a single category for biostratigraphic purposes and applied the datum age of Cody et al. (2008) for A. ingens var. ovalis. The LO of Denticulopsis hustedtii also occurs in the T. inura Zone in Sample 383-U1541C-11H-1, 20–21 (89.80–89.81 m CSF-A). Finally, in the T. inura Zone, the core catcher from Core 383-U1541B-10H contains a distinct assemblage relative to all other samples examined that has diverse morphologies (both established species and unidentified variants) in the genera Azpeitia, Coscinodiscus, and Thalassionema.
Miocene diatom zones
The upper Miocene sequence in the lower part of Holes U1541B (below Sample 12H-4, 50 cm) and U1541C (below Sample 12H-1, 70–71 cm) is characterized by common to rare A. ingens, T. nitzschioides (long, thin varieties), and T. nitzschioides var. parva and by few to rare H. cuneiformis and Proboscia sp., suggesting Miocene water temperatures that were even warmer than those in the Pliocene. The persistent presence of Denticulopsis dimorpha was noted in both holes from the base of the sequence to the lower Pliocene. The transition from the T. inura Zone above into the Hemidiscus triangularus/F. aurica Zone below is constrained by the FO of H. triangularus in Sample 383-U1541B-12H-1, 50 cm (102.60 m CSF-A). The diatom assemblage in the lowermost sample analyzed from Hole U1541C, 13H-4, 90–91 cm (114.04–114.05 m CSF-A), still includes trace occurrences of H. triangularus, which constrains the bottom age of Hole U1541C to younger than 7.3 Ma. The zone is further characterized by the co-occurrence of few to rare Thalassiosira convexa var. aspinosa and F. praeinterfrigidaria. The bottom of the zone is constrained by the FO of H. triangularus in Sample 383-U1541B-14H-1, 50 (121.60 m CSF-A). Below the H. triangularus/F. aurica Zone, the upper boundary of the Fragilariopsis reinholdii Partial Range Zone of Censarek and Gersonde (2002) is defined by the FO of H. triangularus (described above), and the base is defined by the FO of F. reinholdii in Sample 383-U1541B-14H-5, 50 cm (127.51 m CSF-A), near the bottom of the recovered sequence. Given the longstanding uncertainty in the community (e.g., Frenguelli, 1949; Schrader, 1973; Suto and Uramoto, 2015) regarding the species concepts differentiating F. reinholdii from the related taxon F. fossilis, the LO of which is in Sample 383-U1541B-15H-1, 50 cm (131.10 m CSF-A), we note that the placement of this zone boundary is tentative and will likely be updated through postcruise refinement. The final zone, the A. ingens var. ovalis Partial Range Zone, sits below the F. reinholdii Zone. The top of the zone is defined by the FO of F. reinholdii (described above), and the base, marked by the FO of A. ingens var. ovalis, probably lies below the lowermost sample recovered from Hole U1541B. Although diatom abundance decreases as calcareous nannofossils become dominant toward the bottom of the hole, the lowermost sample recovered from Hole U1541B contains trace occurrences of A. ingens var. A. sensu Harwood and Maruyama, which we infer to be conspecific with A. ingens var. ovalis sensu Gersonde (see Pliocene diatom zones).
Radiolarians
Core catcher samples from Hole U1541B were analyzed for the occurrence of radiolarians (383-U1541B-1H-CC through 15H-CC [7.00–138.04 m CSF-A]). Radiolarians are abundant and generally well preserved in Site U1541 sediments (Figure F18; Table T5) except for Samples 1H-CC (7.00–7.06 m CSF-A) and 8H-CC (72.09–72.15 m CSF-A), which contain few radiolarians, and Sample 15H-CC (137.98–138.04 m CSF-A), in which radiolarians are absent. Recognized radiolarian biostratigraphic events are shown alongside diatoms, calcareous nannofossils, and planktonic foraminifers in Table T3.
Sample 383-U1541B-1H-CC (7.00–7.06 m CSF-A) is correlative to the Omega Zone based on the radiolarian assemblage and the absence of Stylatractus universus. The boundary between the Omega Zone and the underlying Psi Zone was identified by the presence of S. universus (0.43 Ma) in Sample 2H-CC (15.59–15.65 m CSF-A). The last appearance of Pterocanium charybdeum trilobum (0.86 Ma) is in Sample 3H-CC (24.83–24.89 m CSF-A). The good preservation and frequent occurrence of P. charybdeum trilobum in Sample 3H-CC defined its placement at the top of the Chi Zone (24.83–24.89 m CSF-A). The LAD of Antarctissa cylindrica (0.64 Ma), which falls in the Psi Zone, was also identified in Sample 3H-CC.
The following interval, down to 45.20 m CSF-A (Sample 383-U1541B-5H-CC), was assigned to the upper Chi Zone by the presence of Cycladophora pliocenica. In this sample, Helotholus vema is diagnostic of the Upsilon Zone. The common occurrence with Triceraspyris antarctica and absence of Eucyrtidium calvertense implies a Pleistocene age in the Chi Zone and reworking of H. vema. The lower Chi Zone and the top of the Phi Zone occur in Sample 6H-CC (53.90–53.96 m CSF-A), where Triceraspyris antarctica and E. calvertense were recognized. The Upsilon Zone, whose top is defined by the LAD of H. vema (2.40 Ma), was encountered in Hole U1541B in Sample 7H-CC (61.64–61.70 m CSF-A). The LO of Desmospyris spongiosa and occurrence of Cycladophora davisiana in Sample 7H-CC place this sample in the upper Upsilon Zone. The middle/upper boundary of the Upsilon Zone is defined by the first appearance datum (FAD) of C. davisiana in Sample 8H-CC (72.09–72.15 m CSF-A). The lower/middle part of the Upsilon Zone occurs from this sample through Sample 9H-CC (82.98–83.04 m CSF-A), where the LO of Prunopyle titan was recognized. The LO of Lampromitra coronata, which falls in the lower Upsilon Subzone, occurs in Sample 10H-CC.
The top of the Tau Zone was placed in Sample 383-U1541B-10H-CC (91.41–91.47 m CSF-A) by the first appearance of H. vema. The FAD of H. vema was challenging to assign at Site U1541 because of its co-occurrence with Helotholus haysi, a species very similar to H. vema, and a drop in abundance below 82.98 m CSF-A. For this report, the FO of H. vema was defined as the first appearance of specimens with six regularly radial beams. The LCO of Lychnocanium grande was recognized in Sample 11H-CC (102.03–102.09 m CSF-A). Above this sample, only single specimens of L. grande were observed, and the FO was noted well above the LCO. At Site U1541, the LCO of L. grande (5 Ma) is consistent with the diatom biostratigraphy, which suggests an age of 5–5.3 Ma.
The Amphymenium challengerae Zone was assigned in Sample 383-U1541B-12H-CC (111.54–111.60 m CSF-A) by the presence of A. challengerae, which has a short range from 6.22 to 6.84 Ma. This species was not found below this interval; therefore, this sample represents the total range of A. challengerae at Site U1541 and the base of the A. challengerae Zone. The deepest sample from Hole U1541B (15H-CC; 129.85–129.91 m CSF-A) is older than 7.84 Ma based on the absence of Acrosphaera labrata (FAD at 7.84 Ma), which is in good agreement with the diatom age estimate (younger than 7.9 Ma) for the same sample.
Silicoflagellates
Silicoflagellates were analyzed from 1 mudline, 15 core catcher, and 13 split-core samples from Hole U1541B. Silicoflagellates are rare to barren throughout the core except for four samples in which they are common to abundant (Table T6; Figure F18). The silicoflagellate assemblage at Site U1541 consists of nine species: Dictyocha stapedia, Dictyocha aculeata, Dictyocha perlaevis, Dictyocha brevispina, Dictyocha concavata, Stephanocha speculum, Stephanocha boliviensis, Octactis sp., and Bachmannocena diodon (Figure F20). D. stapedia and D. aculeata are the dominant species in the mudline sample but are otherwise sporadic. S. speculum is present in all samples and has a large morphological variability, including specimens with long and short corner spines, specimens with variable apical ring features (S. speculum var. monospicata, S. speculum var. bispicata, S. speculum var. coronata, and S. speculum var. pseudofibula), specimens with different numbers of basal ring sides (S. speculum var. pentagona and S. speculum var. octonaria), and a large (≥30 µm) variety similar to the S. speculum Group B described by Tsutsui et al. (2009) from water samples. A peculiar assemblage dominated by the pentagonal variety of S. speculum showing coronatid ornamentation occurs in Sample 383-U1541B-9H-CC (82.98–83.04 m CSF-A). Octactis sp. is present in Samples 4H-CC through 6H-CC (35.67–53.96 m CSF-A).
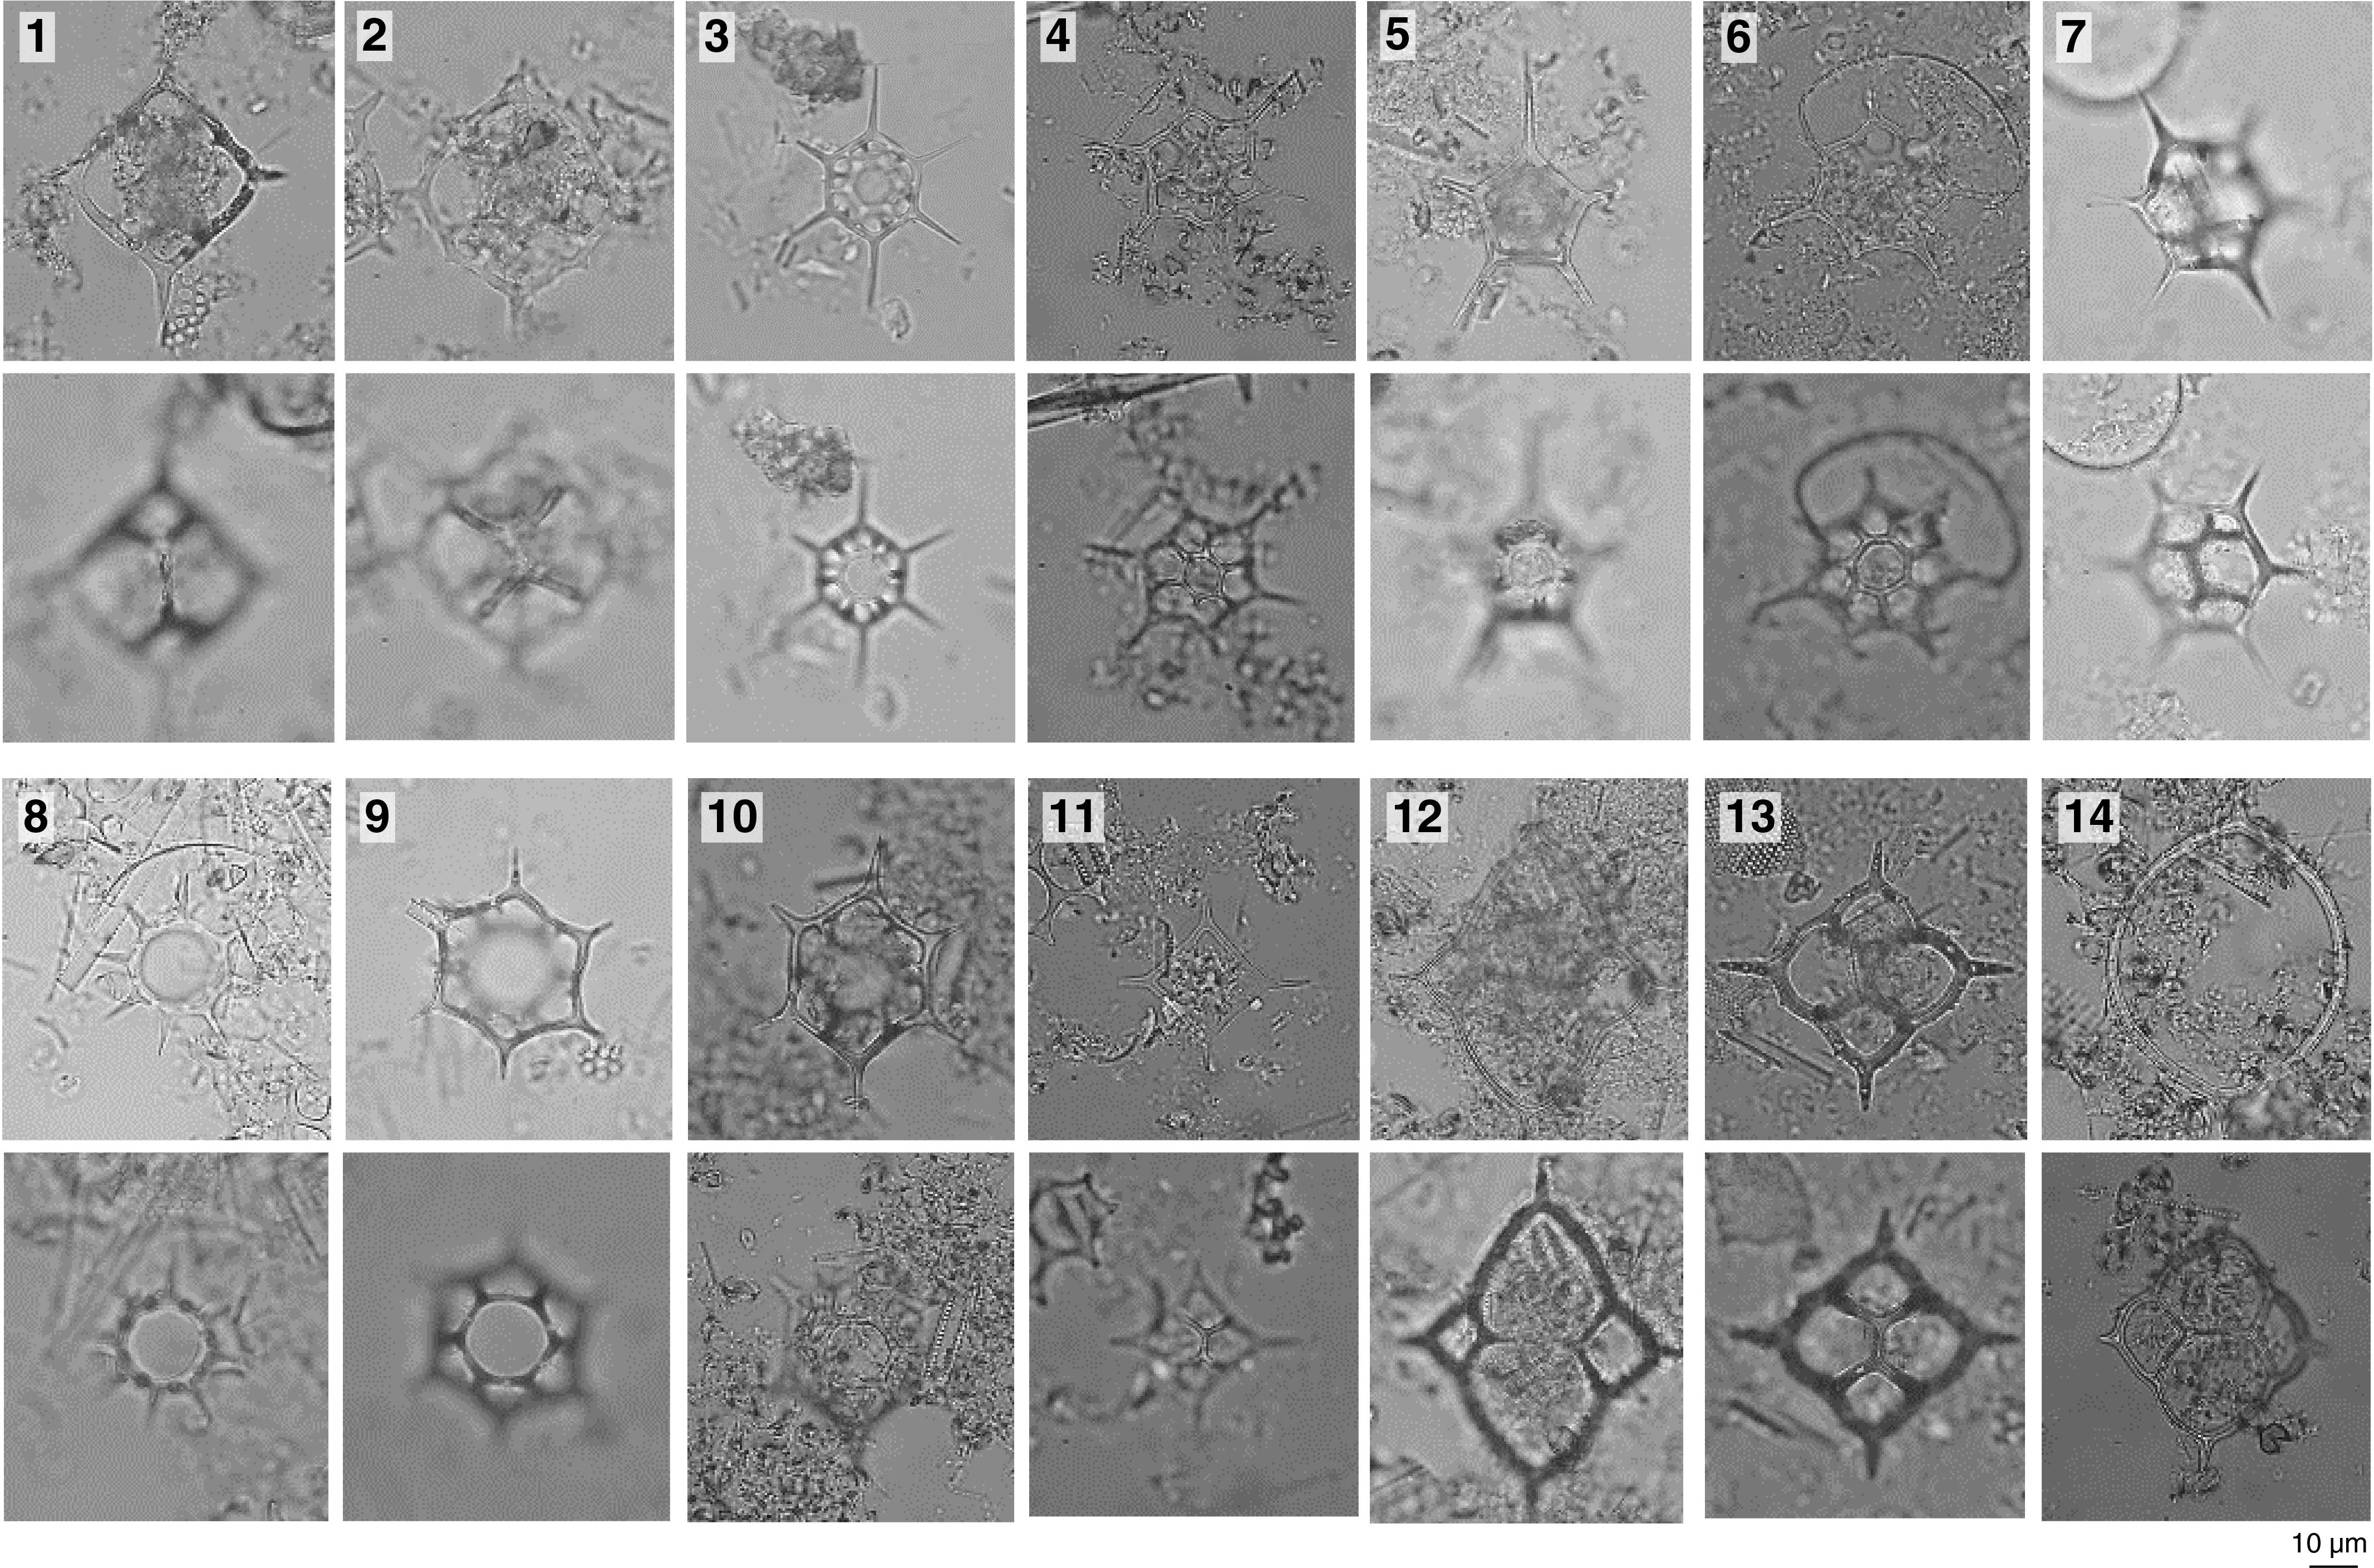
Figure F20. Silicoflagellates.
The D. speculum A Zone, developed for the Southern Ocean (Ciesielski 1975) and spanning the middle–late Pleistocene, was recognized from the top of the core through Sample 383-U1541B-9H-CC (82.98–83.04 m CSF-A). The presence of S. boliviensis in Sample 10H-CC (91.41–91.47 m CSF-A) indicates the top of the S. boliviensis Zone, and the common abundance of B. diodon from Sample 13H-CC (120.55–120.61 m CSF-A) downhole indicates the B. diodon Zone, which spans the late Miocene. However, the Dictyocha aspera var. pygmea and Dictyocha pseudofibula Zones in between the two zones mentioned above were not recognized. This was possibly due to the rare occurrences of silicoflagellates, although one single specimen of D. pseudofibula was recovered in Sample 13H-5, 50 cm (118.09 m CSF-A).
Calcareous nannofossils
Calcareous nannofossil biostratigraphy is based on the analysis of 47 samples: 1 mudline, 15 core catcher, and 20 split-core samples from Hole U1541B and 11 split-core samples from Hole U1541C (23.7–47.65 m CSF-A). In general, nannofossils are present throughout the sequence with variable abundance (Table T7; Figures F18, F19); they are common to dominant in most of the studied samples and have minimum abundances of few to rare only in Samples 383-U1541B-1H-3, 93 cm (3.92 m CSF-A), and 11H-CC (102.03–102.09 m CSF-A). Although the preservation of calcareous nannofossils varies, it is moderate to good in the majority of the samples.
The nannofossil assemblage at Site U1541 consists of 31 groups/taxa, including Emiliania huxleyi, Gephyrocapsa margerelii/muellerae, Gephyrocapsa caribbeanica, Gephyrocapsa oceanica, Gephyrocapsa spp. (small <4 µm, medium, and large >5.5 µm), Gephyrocapsa omega, Pseudoemiliania lacunosa, Reticulofenestra (<3, 3–5, 5–7, and >7 µm), Reticulofenestra asanoi, R. pseudoumbilicus, Reticulofenestra perplexa, Dictyoccocites spp., C. pelagicus, Calcidiscus leptoporus, Calcidiscus macintyrei, Helicosphaera carteri, Helicosphaera sellii, Pontosphaera multipora, Rhabdosphaera clavigera, Syracosphaera spp. (including Syracosphaera pulchra), Scyphosphaera spp., Discoaster spp., Discoaster variabilis, Amaurolithus primus, and Amaurolithus delicatus. Reworked specimens including Dictyoccocites spp. and Reticulofenestra spp. were found throughout the cores (Table T7; Figure F21).
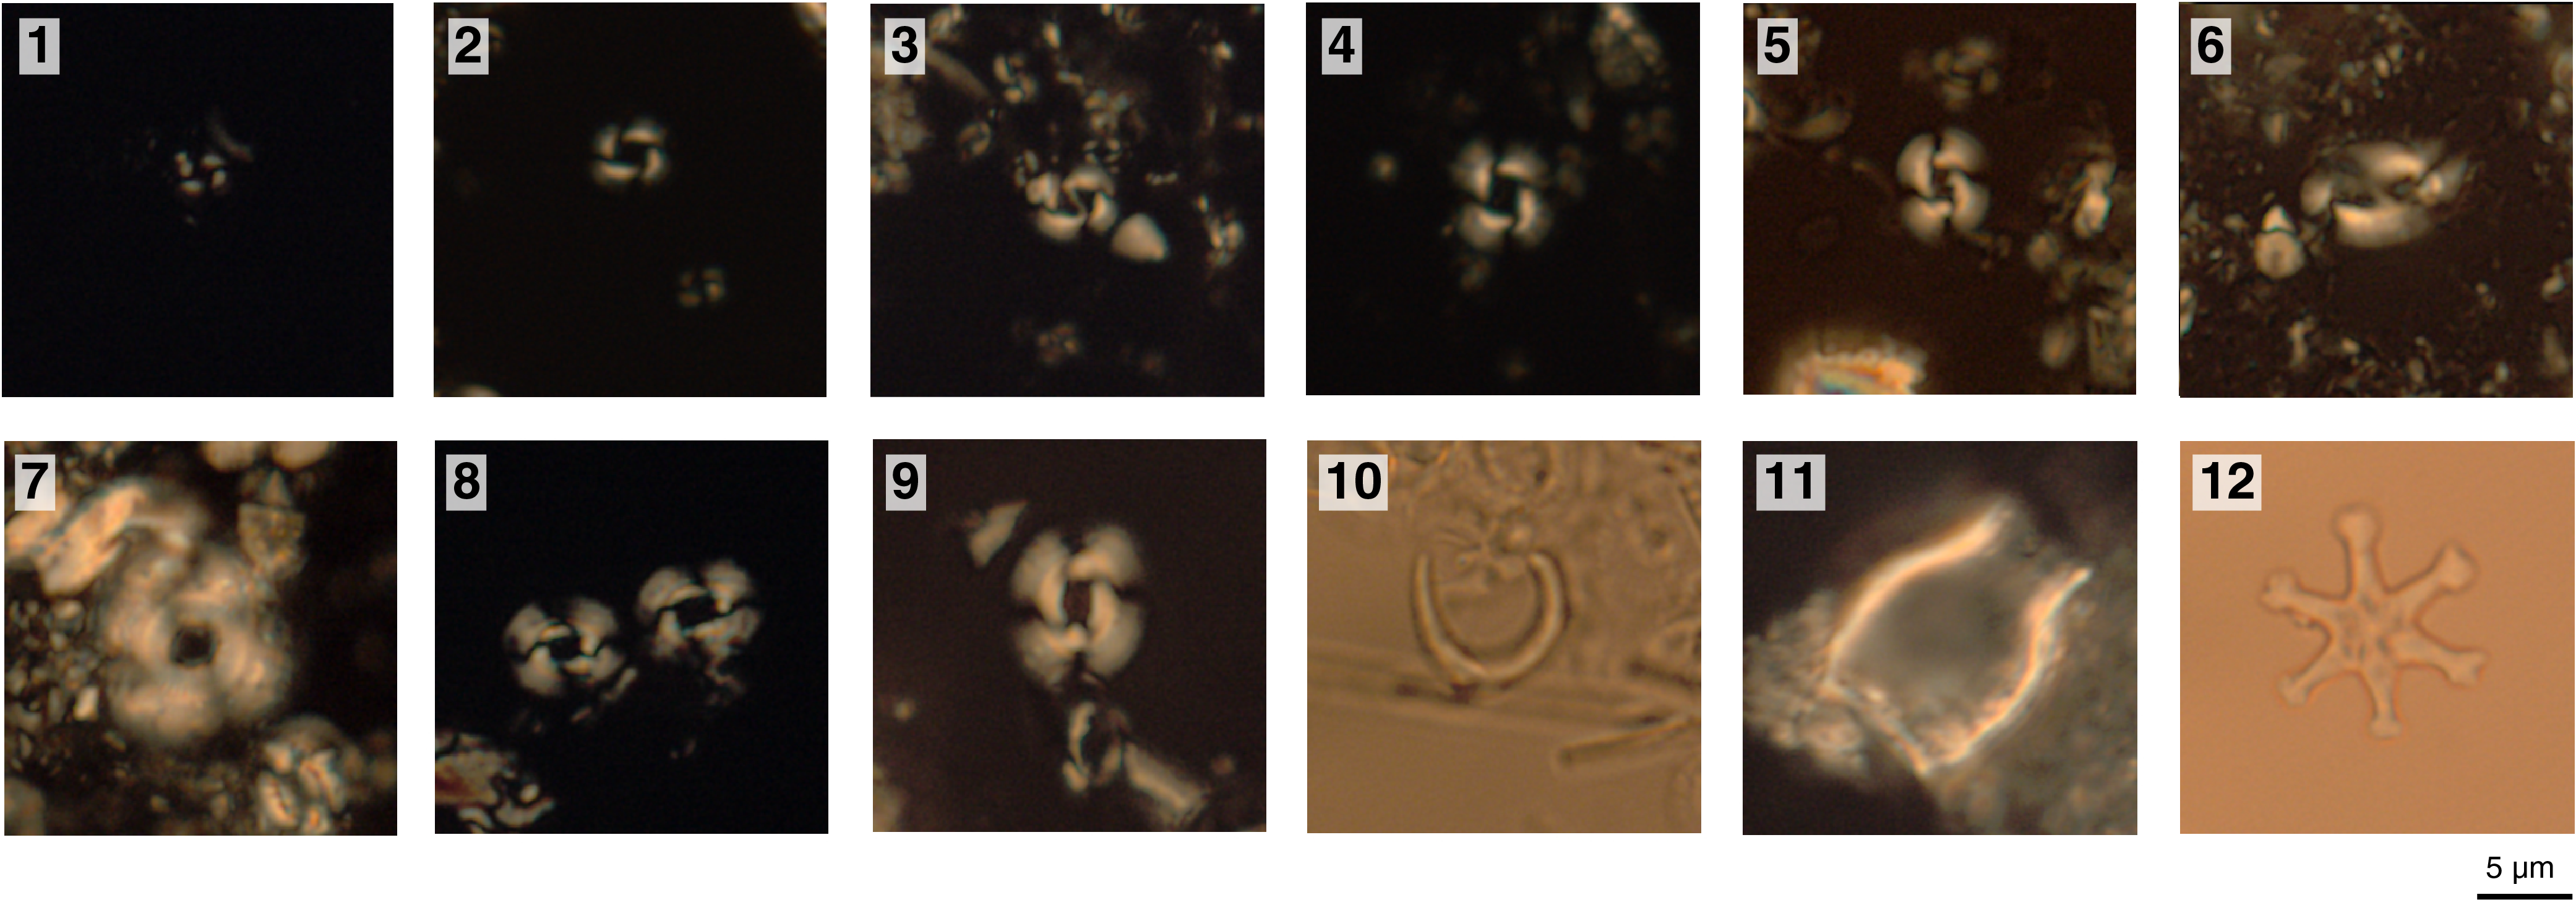
Figure F21. Calcareous nannofossils.
In total, 12 biostratigraphic events were observed at Site U1541. Nannofossil Zones CN15/NN21 through CN11a/NN13 were recognized (Figure F16) based on the following events:
- The FO of E. huxleyi (Sample 383-U1541B-1H-4, 53 cm; 5.01–5.06 m CSF-A);
- The LO of P. lacunosa (Sample 2H-3, 114 cm; 10.50 m CSF-A);
- The LO of G. omega (Sample 2H-5, 100 cm; 13.23 m CSF-A);
- The LO of R. asanoi (Sample 3H-6, 80 cm [23.79 m CSF-A]; refined in Sample 383-U1541C-4H-4, 20 cm [27.82 m CSF-A]);
- The first common occurrence (FCO) of R. asanoi (Sample 383-U1541B-3H-CC [24.83–24.89 m CSF-A]; refined in Sample 383-U1541C-4H-6, 40 cm [31.02 m CSF-A]);
- The LO of Gephyrocapsa spp. (>5.5 µm) large (Sample 383-U1541B-4H-CC [35.67–35.73 m CSF-A]; refined in Sample 383-U1541C-5H-2, 57 cm [34.67 m CSF-A])
- The FO of Gephyrocapsa spp. (>5.5 µm) large (Sample 383-U1541B-5H-2, 60 cm [37.70 m CSF-A]; refined in Sample 383-U1541C-5H-4, 35 cm [37.45 m CSF-A]);
- The FO of Gephyrocapsa spp. (4–5.5 µm) medium (Sample 383-U1541B-5H-5, 66 cm [42.27 m CSF-A]; refined in Sample 383-U1541C-6H-2, 125 cm [44.86 m CSF-A]);
- The LO of R. pseudoumbilicus (Sample 383-U1541B-10H-2, 90 cm; 85.50 m CSF-A); and
- The LO of A. primus (Sample 383-U1541B-10H-CC cm; 91.41–91.47 m CSF-A).
The presence of H. sellii in Sample 383-U1541B-5H-CC (45.14–45.20 m CSF-A) is not considered a true LO because this species rarely occurs in the core; Helicosphaera is usually rare throughout the core, possibly due to ecological forcing. The LO of C. macintyrei (Sample 383-U1541B-5H-CC [45.14–45.20 m CSF-A]; refined in Sample 383-U1541C-6H-3, 69 cm [45.81 m CSF-A]) occurs below the FO of Gephyrocapsa spp. (4–5.5 µm) medium in Holes U1541B and U1541C, although its LO is slightly younger, which is also possibly due to ecological forcing.
No calcareous nannofossil markers were found deeper than Sample U1541B-10H-CC. Several specimens of Discoaster were occasionally observed between Samples 10H-3, 80 cm (86.90 m CSF-A), and 15H-CC (137.98–138.04 m CSF-A), but they could not be identified at the species level due to their poor preservation and therefore did not provide any additional age constraint. We noted large changes in the size of Reticulofenestra coccoliths, from <3 to >10 µm, especially in the cores below Sample 5H-CC (45.14–45.2 m CSF-A) (Figure F22).
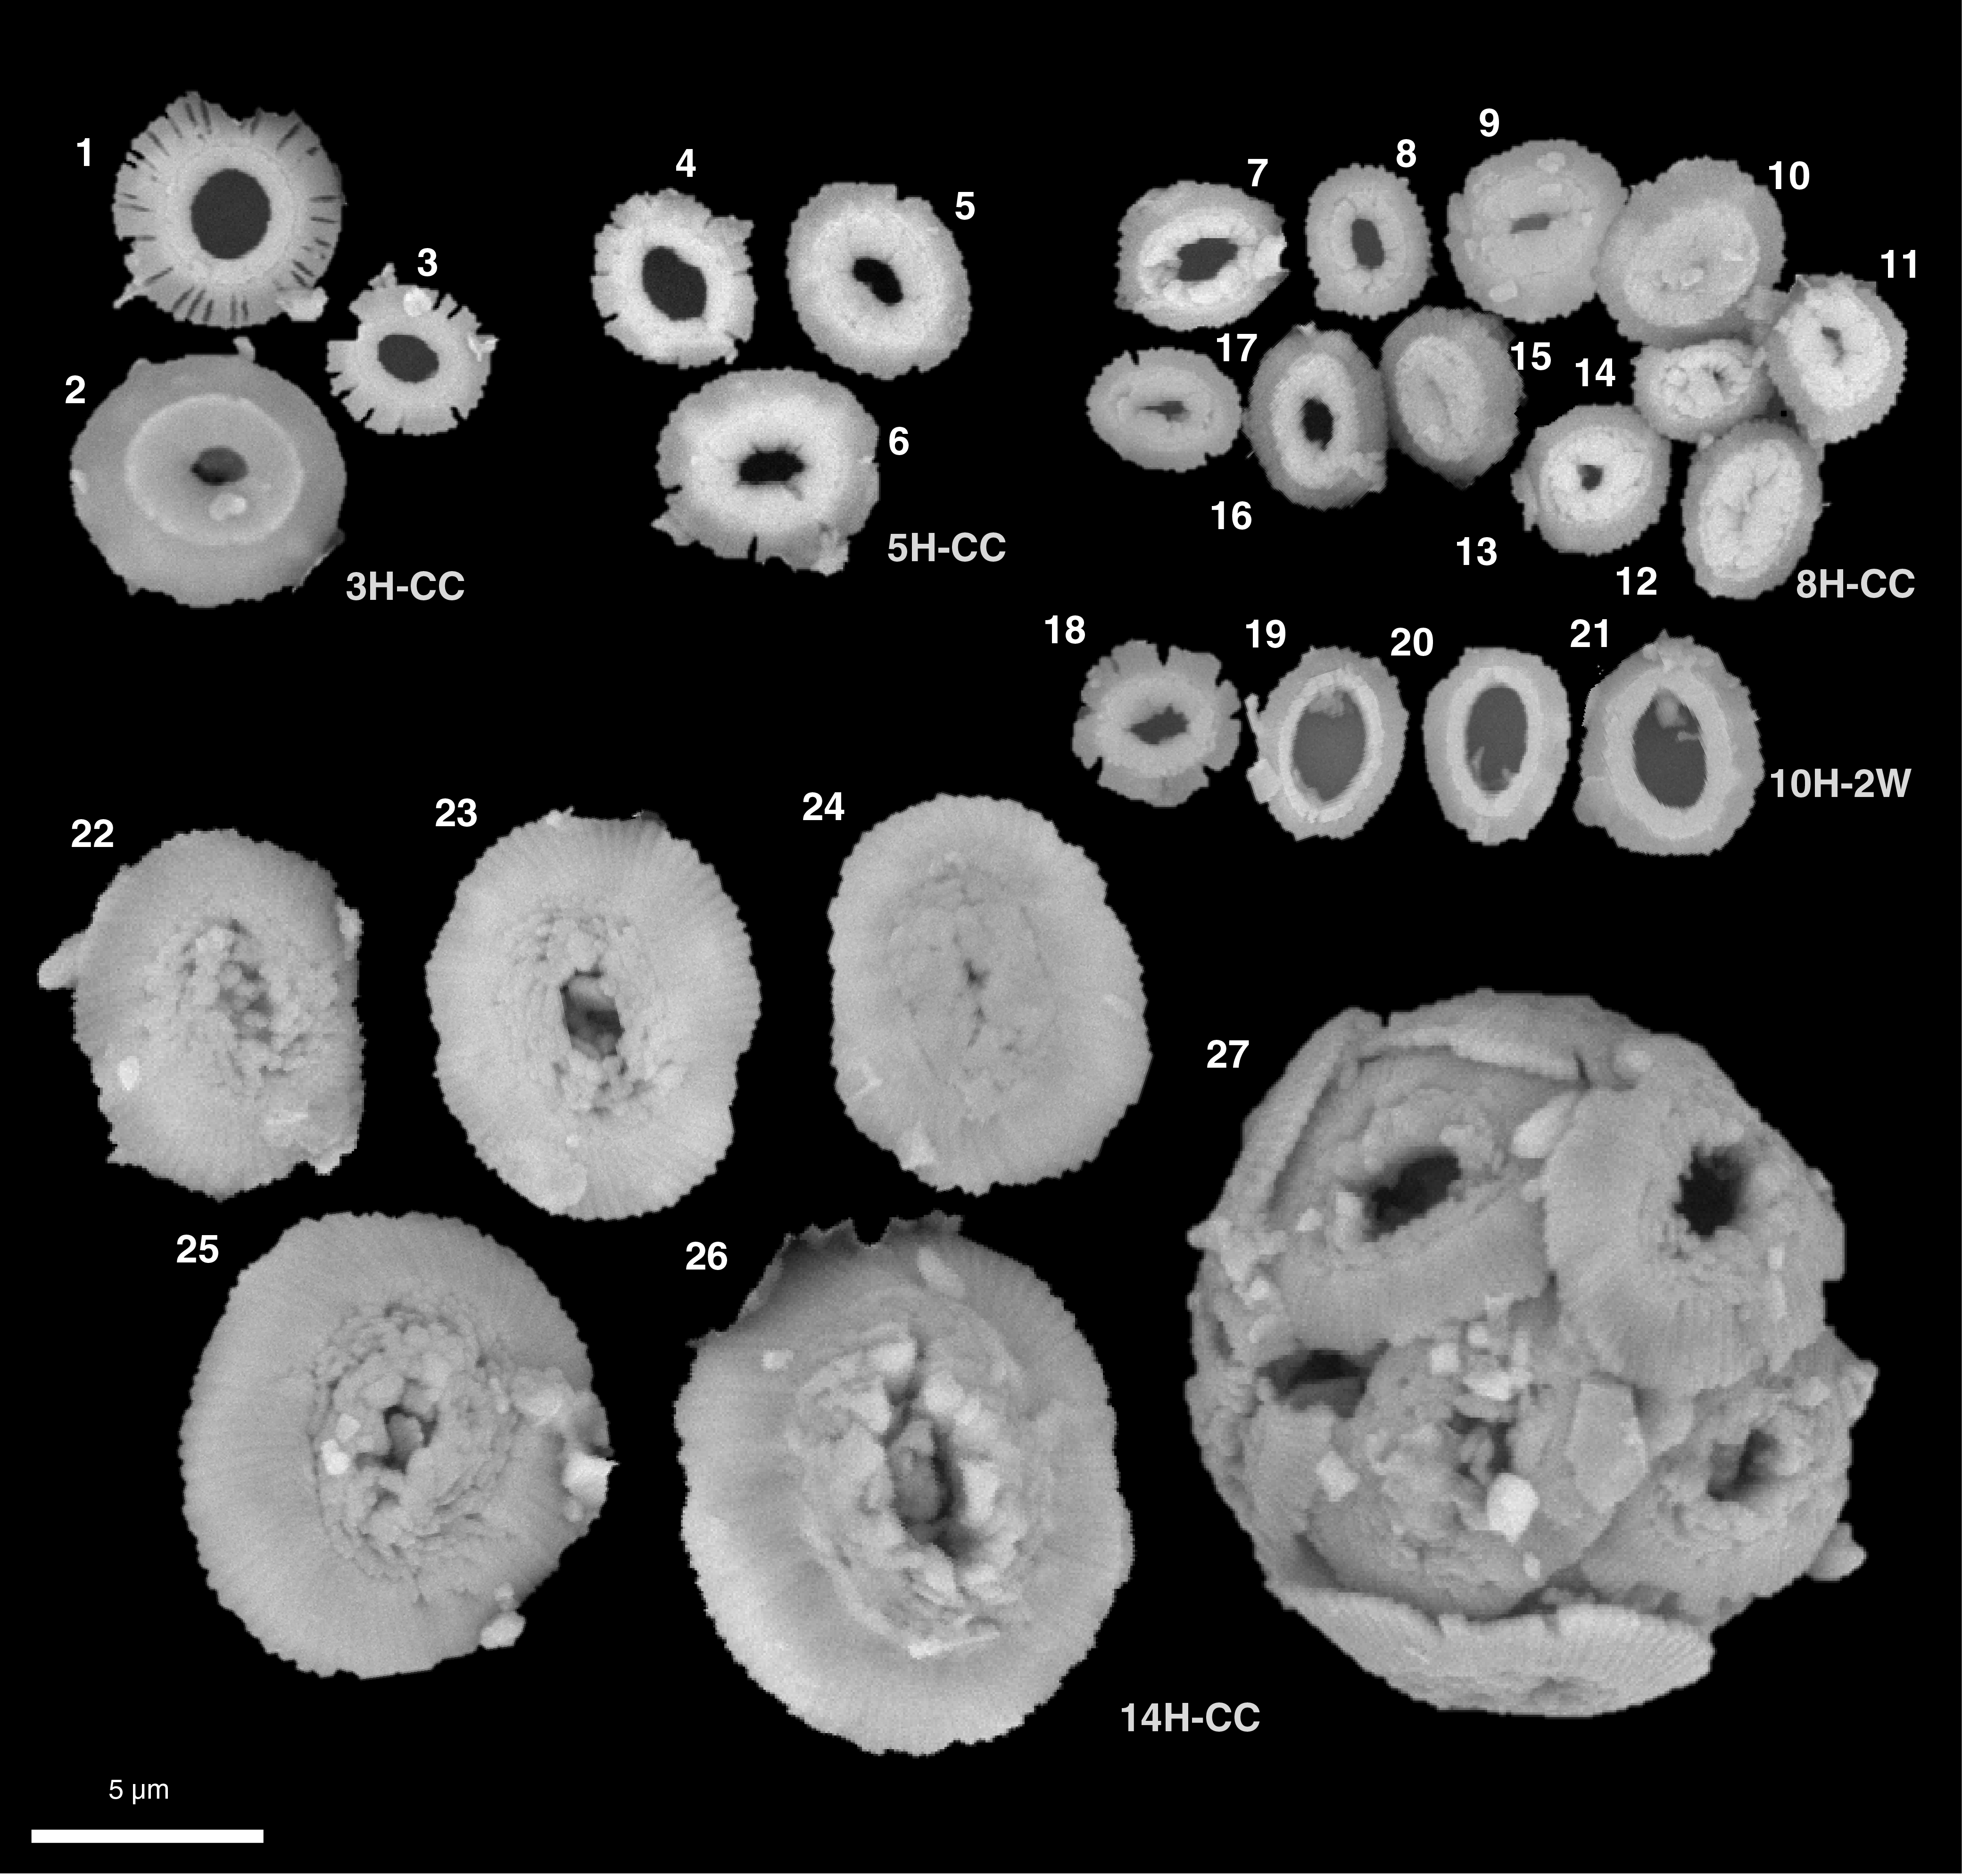
Figure F22. SEM images.
Foraminifers
Planktonic foraminifers
Core catcher samples from all 14 cores from Hole U1541B and 1 working-half sample from Hole U1541C were analyzed for planktonic foraminifers (Table T8). Planktonic foraminifers are abundant throughout Hole U1541B and make up >50% of the coarse fraction residue in most samples (Figure F18). Abundance is lower (5%–25%) only in Samples 383-U1541B-11H-CC and 13H-CC. Preservation is generally moderate to good in Hole U1541B but poor in Sample 11H-CC. Many encrusted forms of Neogloboquadrina pachyderma, Globoconella inflata, Globoconella puncticulata puncticuloides, and Truncorotalia crassaformis were found, which may influence stable isotope or trace element analyses (Jonkers et al., 2012; Steinhardt et al., 2015).
Assemblages are characterized by mainly high-latitude and some temperate species. N. pachyderma (sinistral) dominates the assemblage in Samples 383-U1541B-1H-CC through 7H-CC (7.00–61.70 m CSF-A), and Globigerina bulloides is present throughout the sequence. T. crassaformis, Truncorotalia crassaformis hessi, Truncorotalia crassaformis ronda, Truncorotalia crassaformis imbricata, Globoconella conomiozea, Globoconella pliozea, G. puncticulata, G. puncticulata puncticuloides, G. inflata, and Hirsutella juanai occur regularly in their respective age ranges. Rarer species include Turborotalita quinqueloba, Globigerinita glutinata, Globigerina woodi, Orbulina universa, Neogloboquadrina incompta, Neogloboquadrina dutertrei, Truncorotalia truncatulinoides, Truncorotalia crassula, Globorotalia miotumida, Hirsutella hirsuta, Hirsutella margaritae, and Hirsutella scitula. Examples of major foraminiferal taxa found at Site U1541 are shown in Figures F23 and F24.
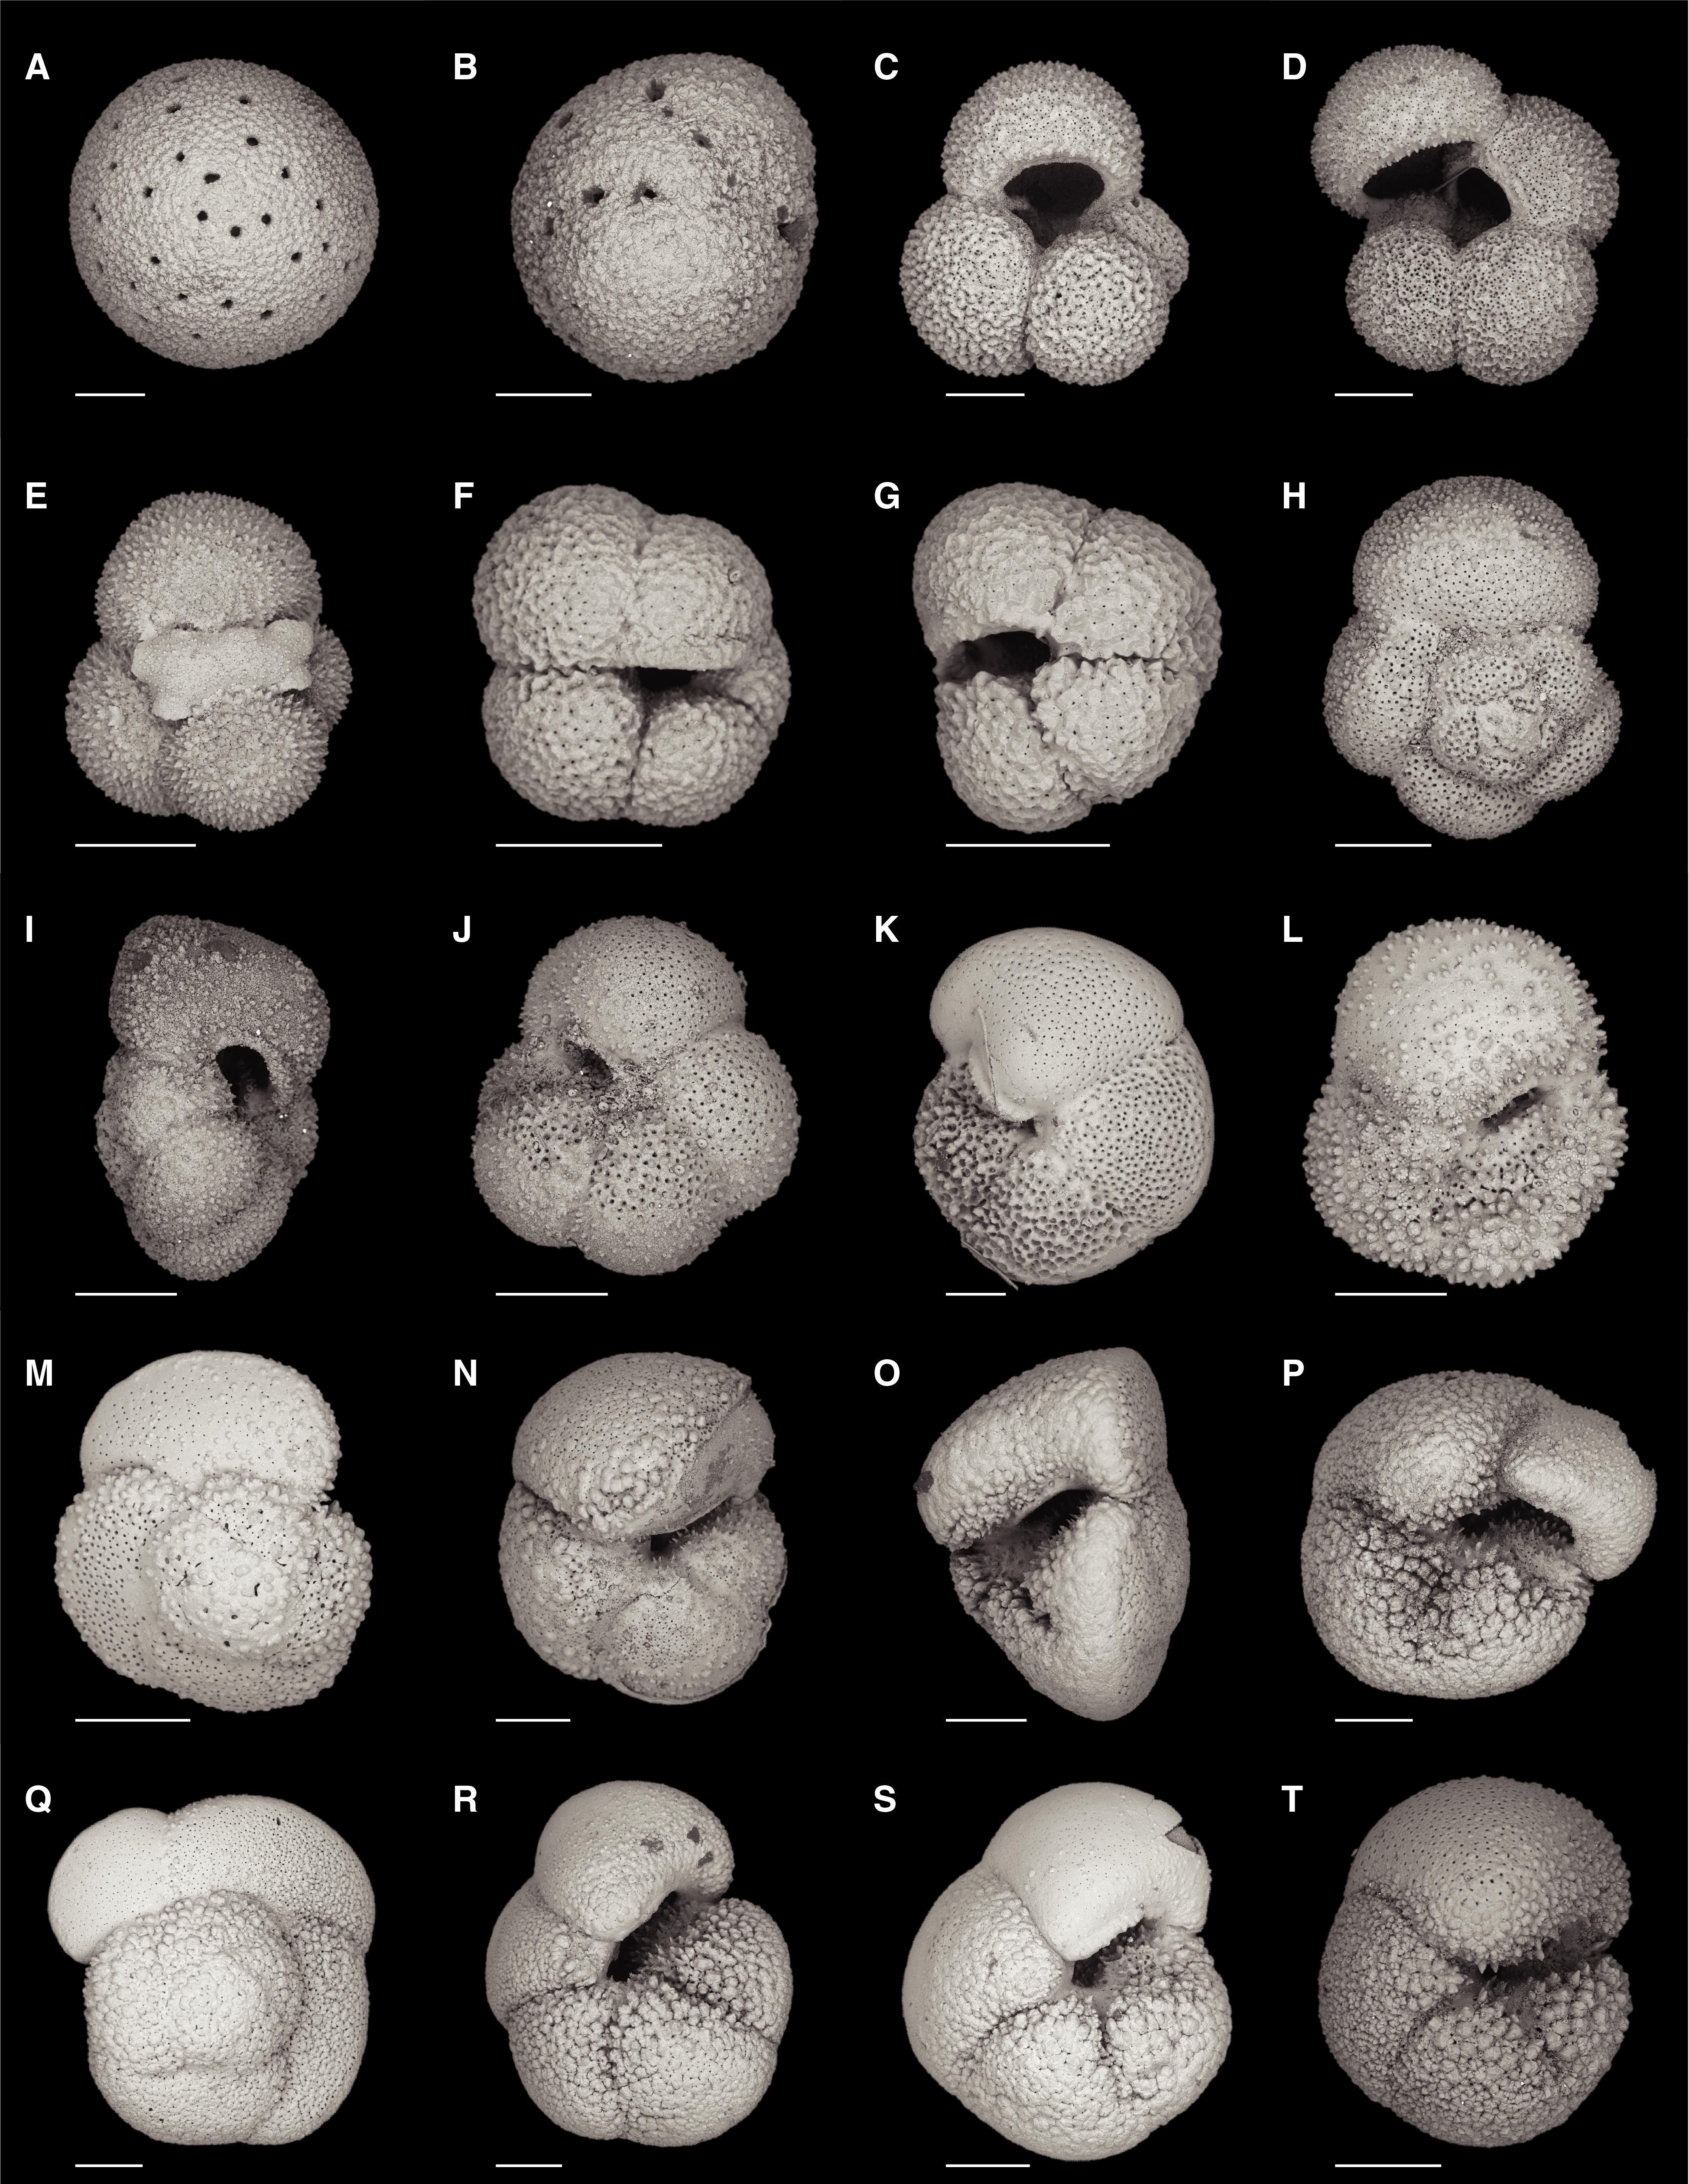
Figure F23. Common planktonic foraminifers.

Figure F24. Common planktonic foraminifers.
Eleven biomarkers species are present in Site U1541 planktonic foraminifer assemblages: G. inflata, T. crassaformis hessi, T. truncatulinoides, G. conomiozea, G. miotumida, Globoconella sphericomiozea, H. hirsuta, H. juanai, G. woodi, G. puncticulata, and H. margaritae. The uppermost part of Hole U1541B is late Pleistocene in age based on the presence of T. crassaformis imbricata (0.6 Ma; Bylinskaya, 2004) in Samples 383-U1541B-1H-CC and 2H-CC (7.00–15.65 m CSF-A) and T. hessi (~0.75 Ma; Gradstein et al., 2012) in Samples 1H-CC through 4H-CC (7.00–35.73 m CSF-A). G. inflata was observed between Samples 1H-CC and 7H-CC (7.00–61.70 m CSF-A), and G. puncticulata puncticuloides is abundant in Samples 3H-CC through 10H-CC (22.84–91.47 m CSF-A), which dates this interval to between 0.7 and 2.39–3.13 Ma (Hornibrook, 1981; Hornibrook and Jenkins, 1994; Wei, 1994; Scott et al., 2007). T. truncatulinoides was found only in Sample 1H-CC (7.00–7.06 m CSF-A), indicating Zone SN14 of Jenkins (1993). T. crassaformis ronda, another subspecies of T. crassaformis, was found sporadically in Samples 5H-CC through 10H-CC (45.14–91.47 m CSF-A), indicating that this interval comprises the upper Quaternary (~0.6 Ma) to mid-lower Pliocene (Bylinskaya, 2004). G. woodi was present at low abundance in most samples between Samples 8H-CC and 14H-CC (72.09–129.91 m CSF-A), indicating an age older than 2.3 Ma, but it was absent in Samples 10H-CC and 12H-CC, which suggests that it occurs only sporadically in the higher latitudes and its first occurrence at Site U1541 might not match the global LAD. G. puncticulata is present in Samples 7H-CC through 10H-CC (61.64–91.47 m CSF-A), indicating ages older than 1.88–2.39 Ma for this interval (Wei, 1994). Sporadic specimens of H. margaritae in Samples 14H-CC and 383-U1541C-11H-6 indicate that these samples are older than 3.85 Ma. G. conomiozea was observed only in Sample 383-U1541B-12H-CC (111.54–111.60 m CSF-A), indicating an age between 5.72–6.14 and 6.14–8.58 Ma (Wei, 1994). H. juanai occurs in Samples 11H-CC through 14H-CC (102.03–129.91 m CSF-A); thus, this interval can be associated with ages between 5.20–5.72 and 9.7 Ma (Chaisson and Pearson, 1997; Wade et al., 2011). G. miotumida occurs only in the bottommost samples from Hole U1541B (13H-CC and 14H-CC), indicating that the base of the recovered sequence is older than 6.14–8.58 Ma (Wei, 1994; Kennett and Srinivasan, 1983). Planktonic foraminiferal age estimates are consistent with radiolarian, diatom, and nannofossil ages.
Benthic foraminifers
Benthic foraminifers were examined in core catcher samples from Hole U1541B (15 samples). Samples with an average volume of ~20 cm3 were processed from all core catchers to obtain quantitative estimates of benthic foraminiferal distribution patterns downhole. The mudline samples recovered from Holes U1541B and U1541C were also examined, although mudline assemblage data were not systematically collected. To assess assemblage composition and variability, ~100 specimens from the >125 µm fraction were picked and transferred to slides for identification and counting. The presence and distribution of benthic foraminifers was additionally checked in the 125–63 µm fraction to ensure that assemblages in the >125 µm fraction were representative and that small species such as phytodetritus feeders or small infaunal taxa were not overlooked.
Benthic foraminifers are more abundant at Site U1541 than at Sites U1539 and U1540, and their abundance is few or greater in all but five samples examined (Figure F18). They are well preserved in the upper part of the sequence and moderately to poorly preserved in the lower part (Figures F18, F19; Table T9).
In total, 79 benthic foraminifer taxa were identified at this site. Table T9 and Figure F25 summarize the downcore distribution of benthic foraminifers in core catcher samples from Hole U1541B. Figure F26 illustrates characteristic taxa found at this site in addition to taxa from Sites U1539 and U1540.
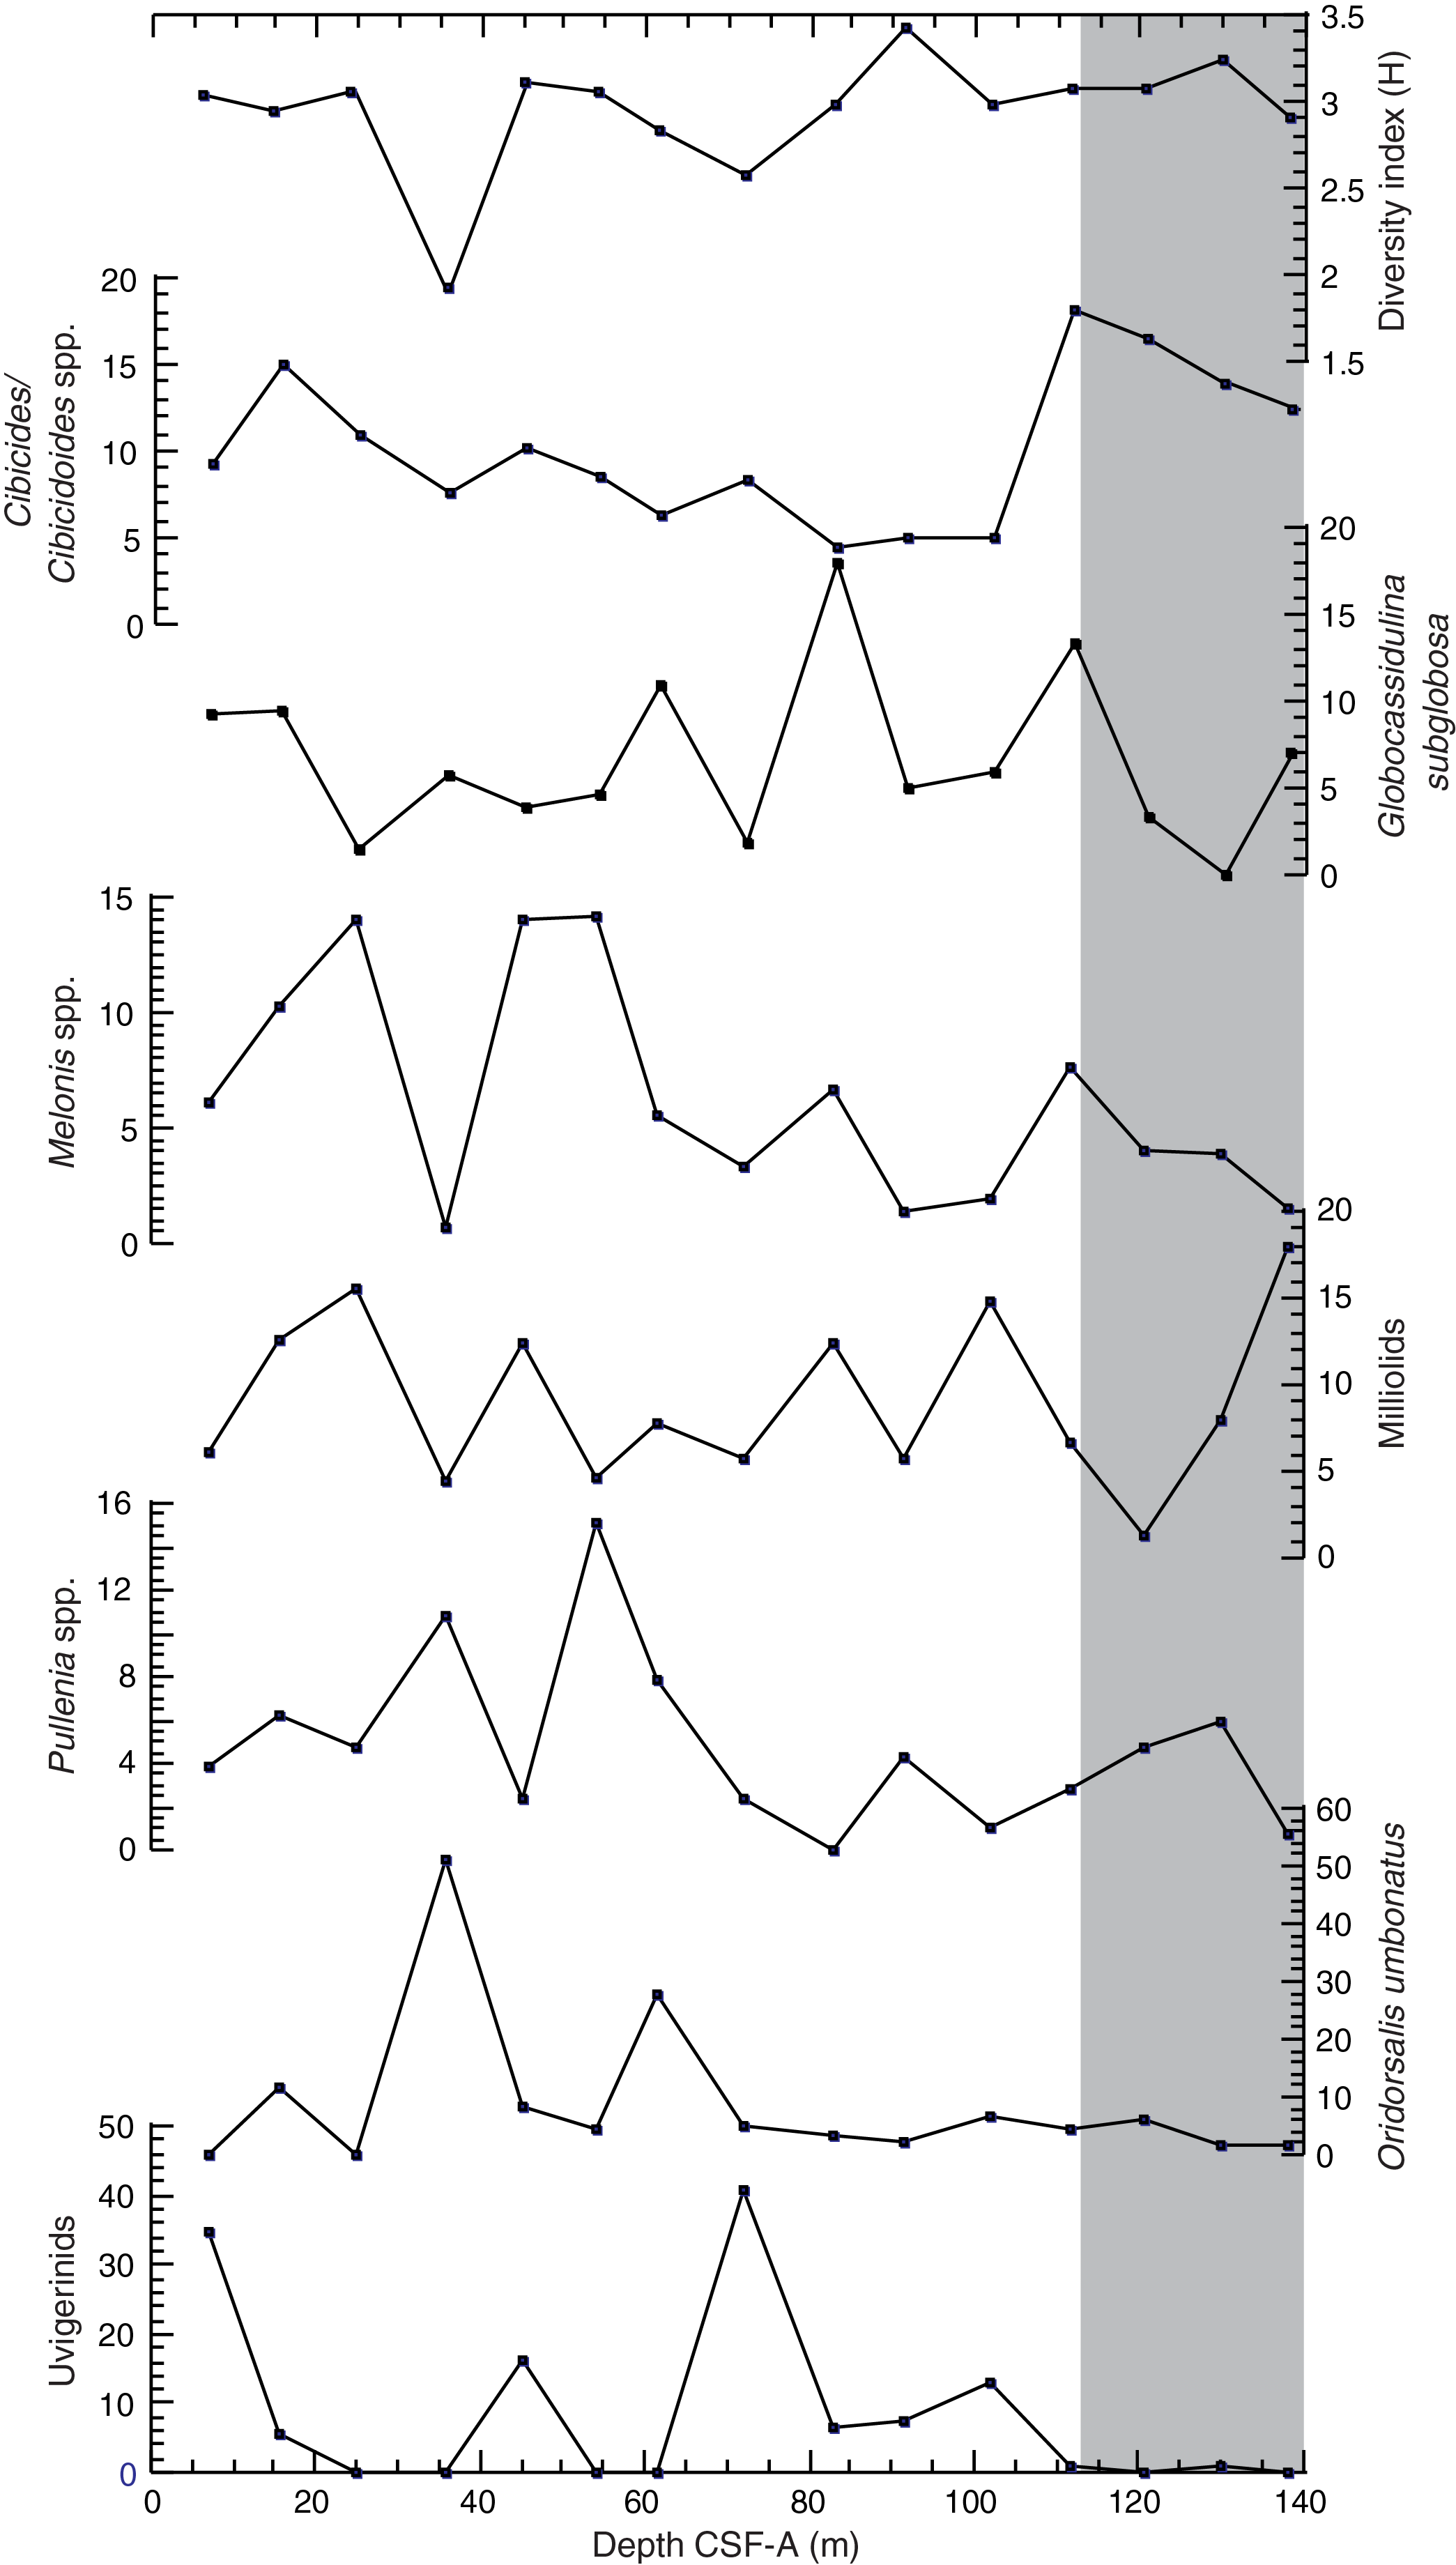
Figure F25. Species diversity index and abundance of dominant genus/species.
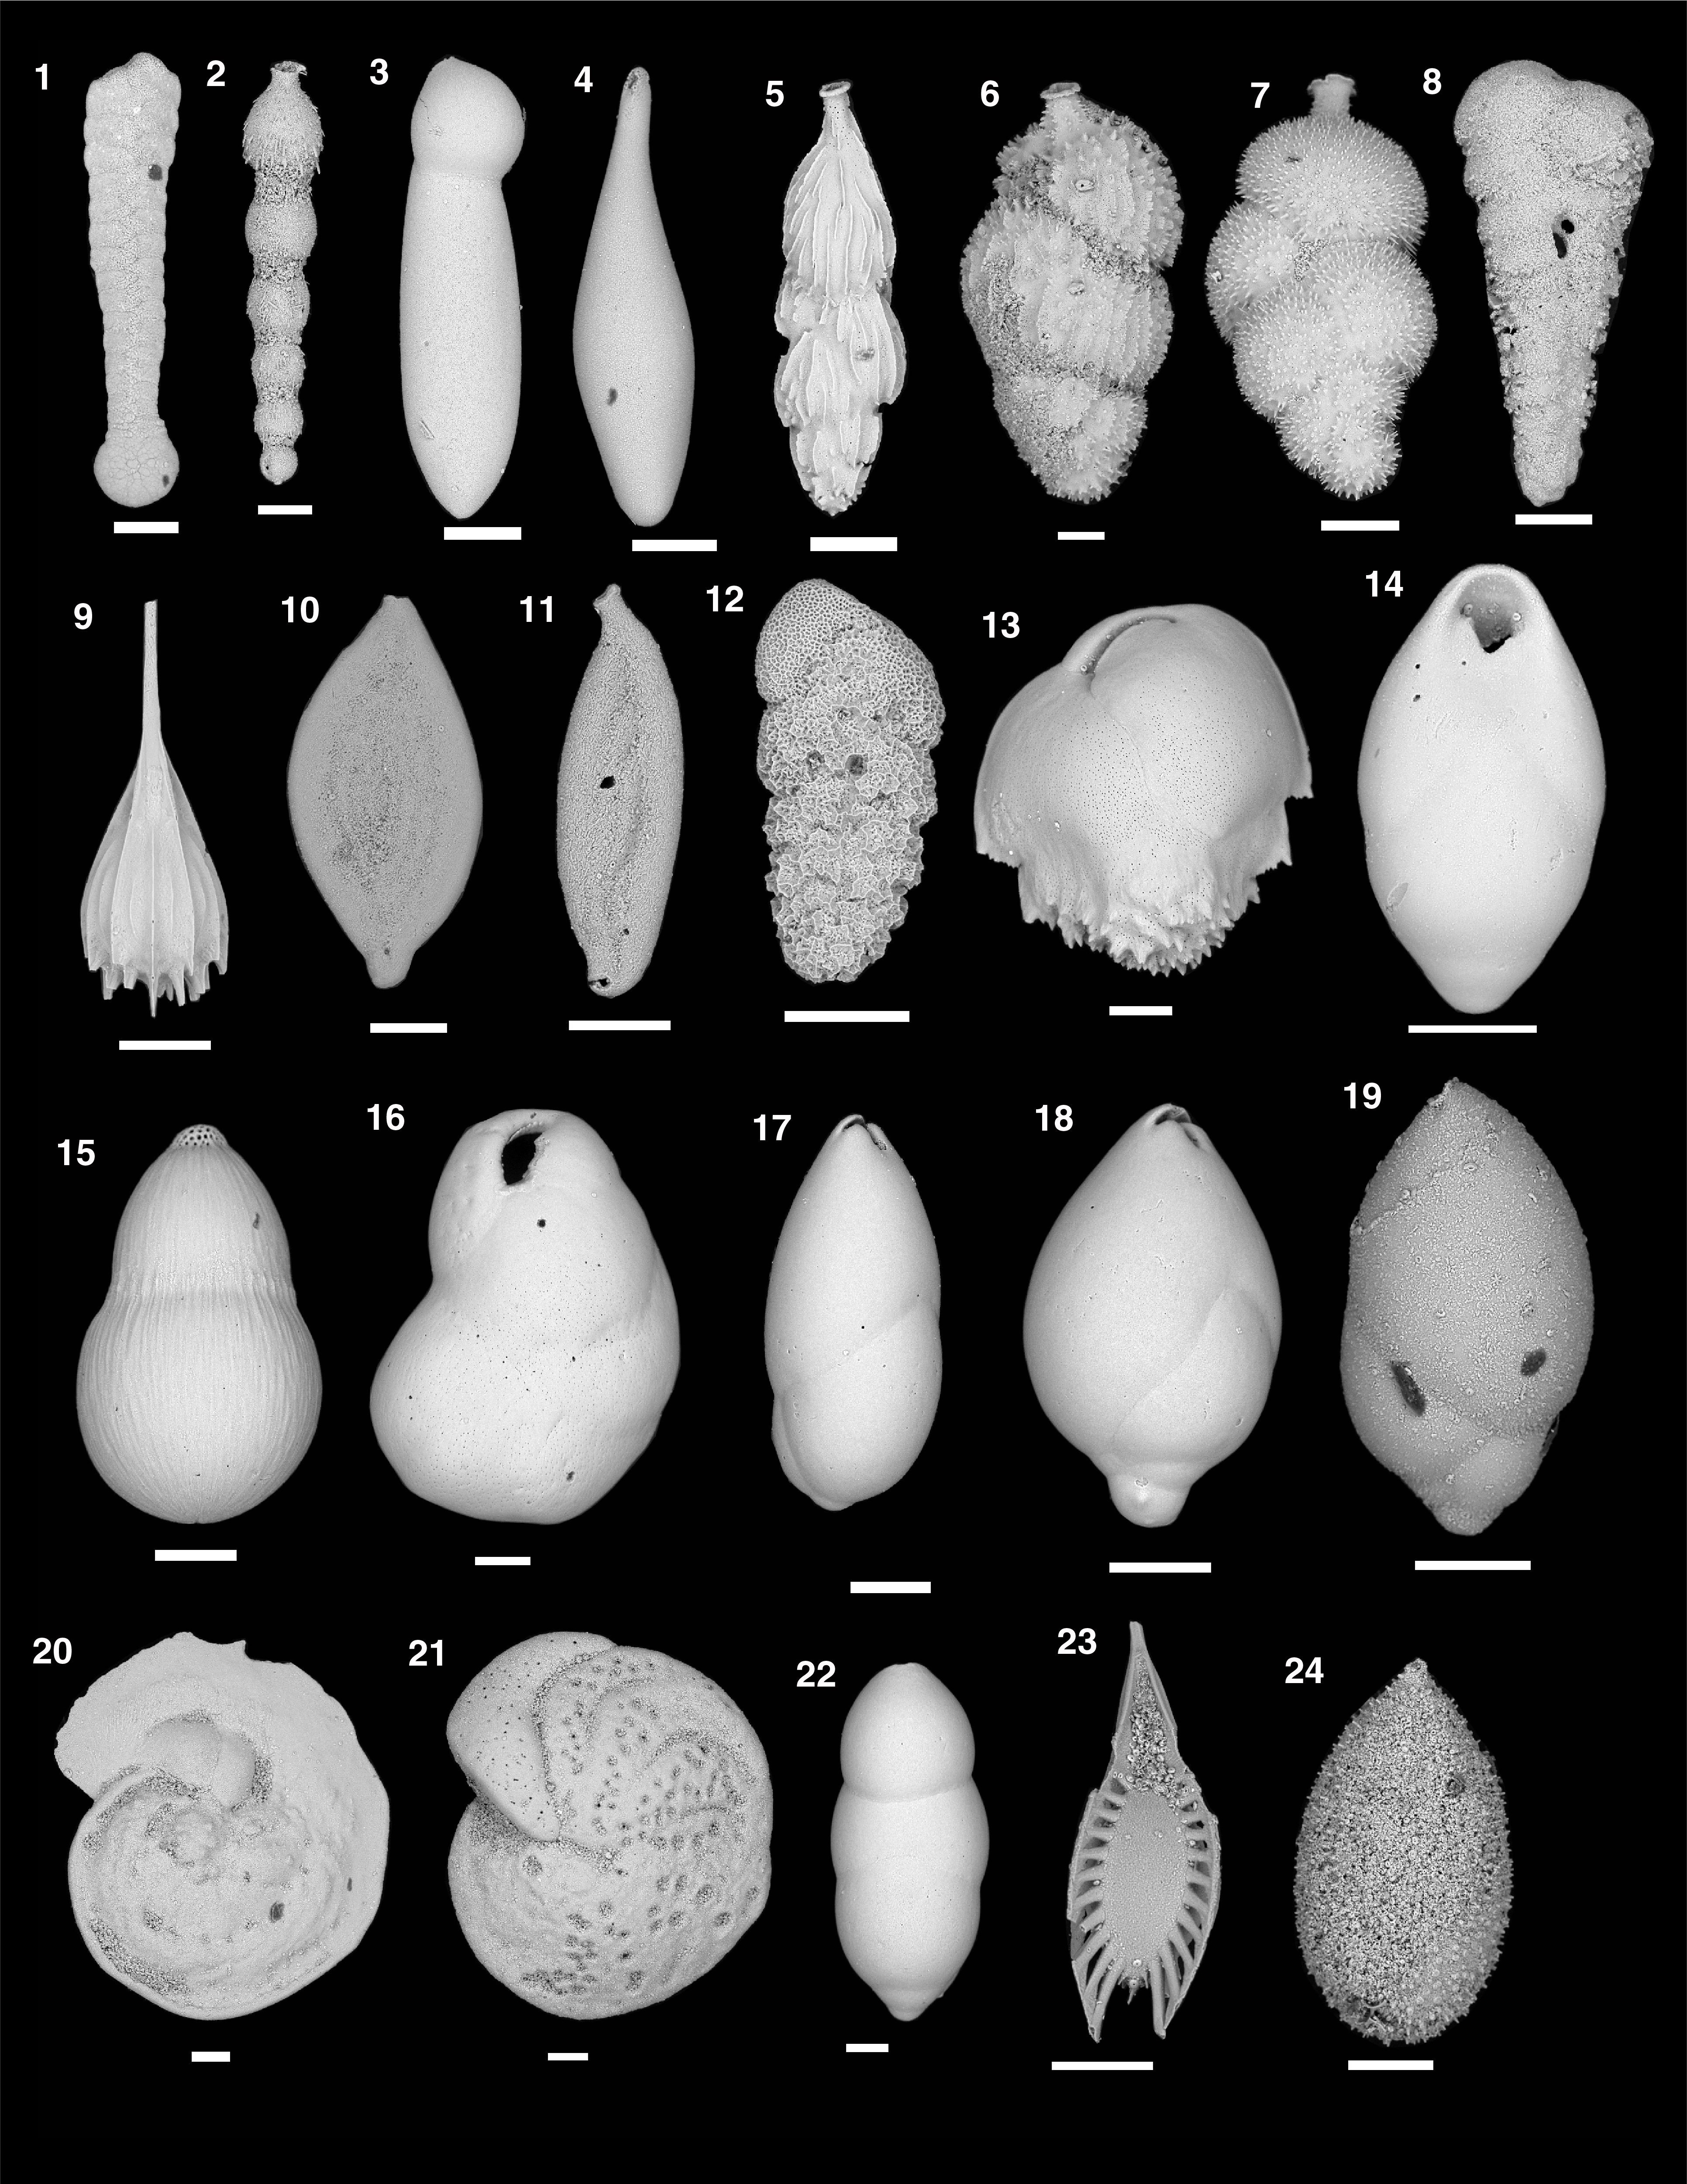
Figure F26. Benthic foraminifers.
The overall assemblage composition indicates lower bathyal to abyssal paleodepth throughout the late Miocene to Holocene, and the site has remained above the carbonate compensation depth. Species commonly recorded throughout the sequence include the calcareous species Globocassidulina subglobosa, Melonis barleeanum, Nuttallides umbonifera, Oridorsalis umbonatus, and Pullenia bulloides. The Uvigerina species is dominant in Samples 383-U1541B-1H-CC, 5H-CC, and 8H-CC and present in small amounts in a few more samples. Cibicides/Cibicidoides species mainly comprising Cibicidoides mundulus, Cibicidoides lobatulus, and Cibicides wuellerstorfi are present in lesser amounts and show a decreasing trend between Samples 2H-CC and 11H-CC. The abundance of this species, mainly C. wuellerstorfi, increases in Sample 12H-CC, and this species remains abundant thereafter along with N. umbonifera, suggesting well-oxygenated deep water with strong currents and high seasonality (Singh and Gupta, 2004). Below ~90 m CSF-A, the diversity of benthic foraminifers reaches a maximum and remains high downcore. None of the species mentioned above are abundant, and N. umbonifera, a species indicative of corrosive bottom water (Singh and Gupta, 2010; Bremer and Lohmann, 1982), increases. These conditions suggest the presence of warm corrosive bottom water at Site U1541 below ~90 m CSF-A. Above this depth, the abundance of Uvigerina suggests higher surface productivity (Das et al., 2018; Schönfeld, 2006; Singh and Gupta, 2004) and abundances of O. umbonatus, Melonis spp., and Pullenia spp. suggest intermediate to high flux of organic matter and low-oxygen conditions (Corliss, 1985; Singh and Gupta, 2004; Fontanier et al., 2005; Verma et al., 2013). The abundance of G. subglobosa is associated with enhanced flow of AABW (Corliss, 1979; Singh and Gupta, 2004, 2010; Singh et al., 2012).
Downcore changes in assemblage composition at Site U1541 suggest changes in paleoenvironmental conditions that may be linked to distinct phases of glacial–interglacial and major global paleoclimatic changes. However, the analyzed sample resolution is not sufficiently high to capture glacial–interglacial cyclicity or definitively identify climate events. Postcruise work will explore these intervals of change, including species diversity minima at ~36 and ~70 m CSF-A (Figure F25), which may represent cool intervals, and the high species diversity peak at ~91 m CSF, which may be associated with global warmth (Singh and Gupta, 2005; Singh et al., 2012; Gupta et al., 2013).
The mudline samples from Holes U1541B and U1541C were soaked in rose bengal and ethanol solution and gently washed to preserve fragile, agglutinated foraminifer specimens with extremely low fossilization potential. The mudline samples from Holes U1541B and U1541C have stained agglutinated and calcareous benthic foraminifers, suggesting that both mudlines collected modern sediment–water interfaces. Although relative species abundance was not tabulated, the mudline samples from this site have diverse assemblages and contain stained specimens of the common and rare agglutinated species such as Cribostromoides subglobosus, Paratrochammina challengeri, Rhabdammina spp., Reophax sp., Rhizammina sp., Siphotextularia sp., and Ammobaculites sp. Calcareous taxa are also very diverse and include Astrononion stelligerum, C. mundulus, Dentalina spp., Eggerella bradyi, Epistominella exigua, Fursenkoina complanata, Fursenkoina bradyi, Fissurina spp., G. subglobosa, Lenticulina convergens, M. barleeanum, Nonion sp., Pullenia quinqueloba, O. umbonatus, Quinqueloculina venusta, Quinqueloculina oblonga, and Triloculina tricarinata. A few additional species were found unstained. One intact stained bilvalve was also found in the mudline sample from Hole U1541C. The mudline samples from both holes are dominated by unstained planktonic foraminifers and radiolarians. Photomicrographs of mudline benthic foraminifer and bivalve specimens are presented in Figure F27.
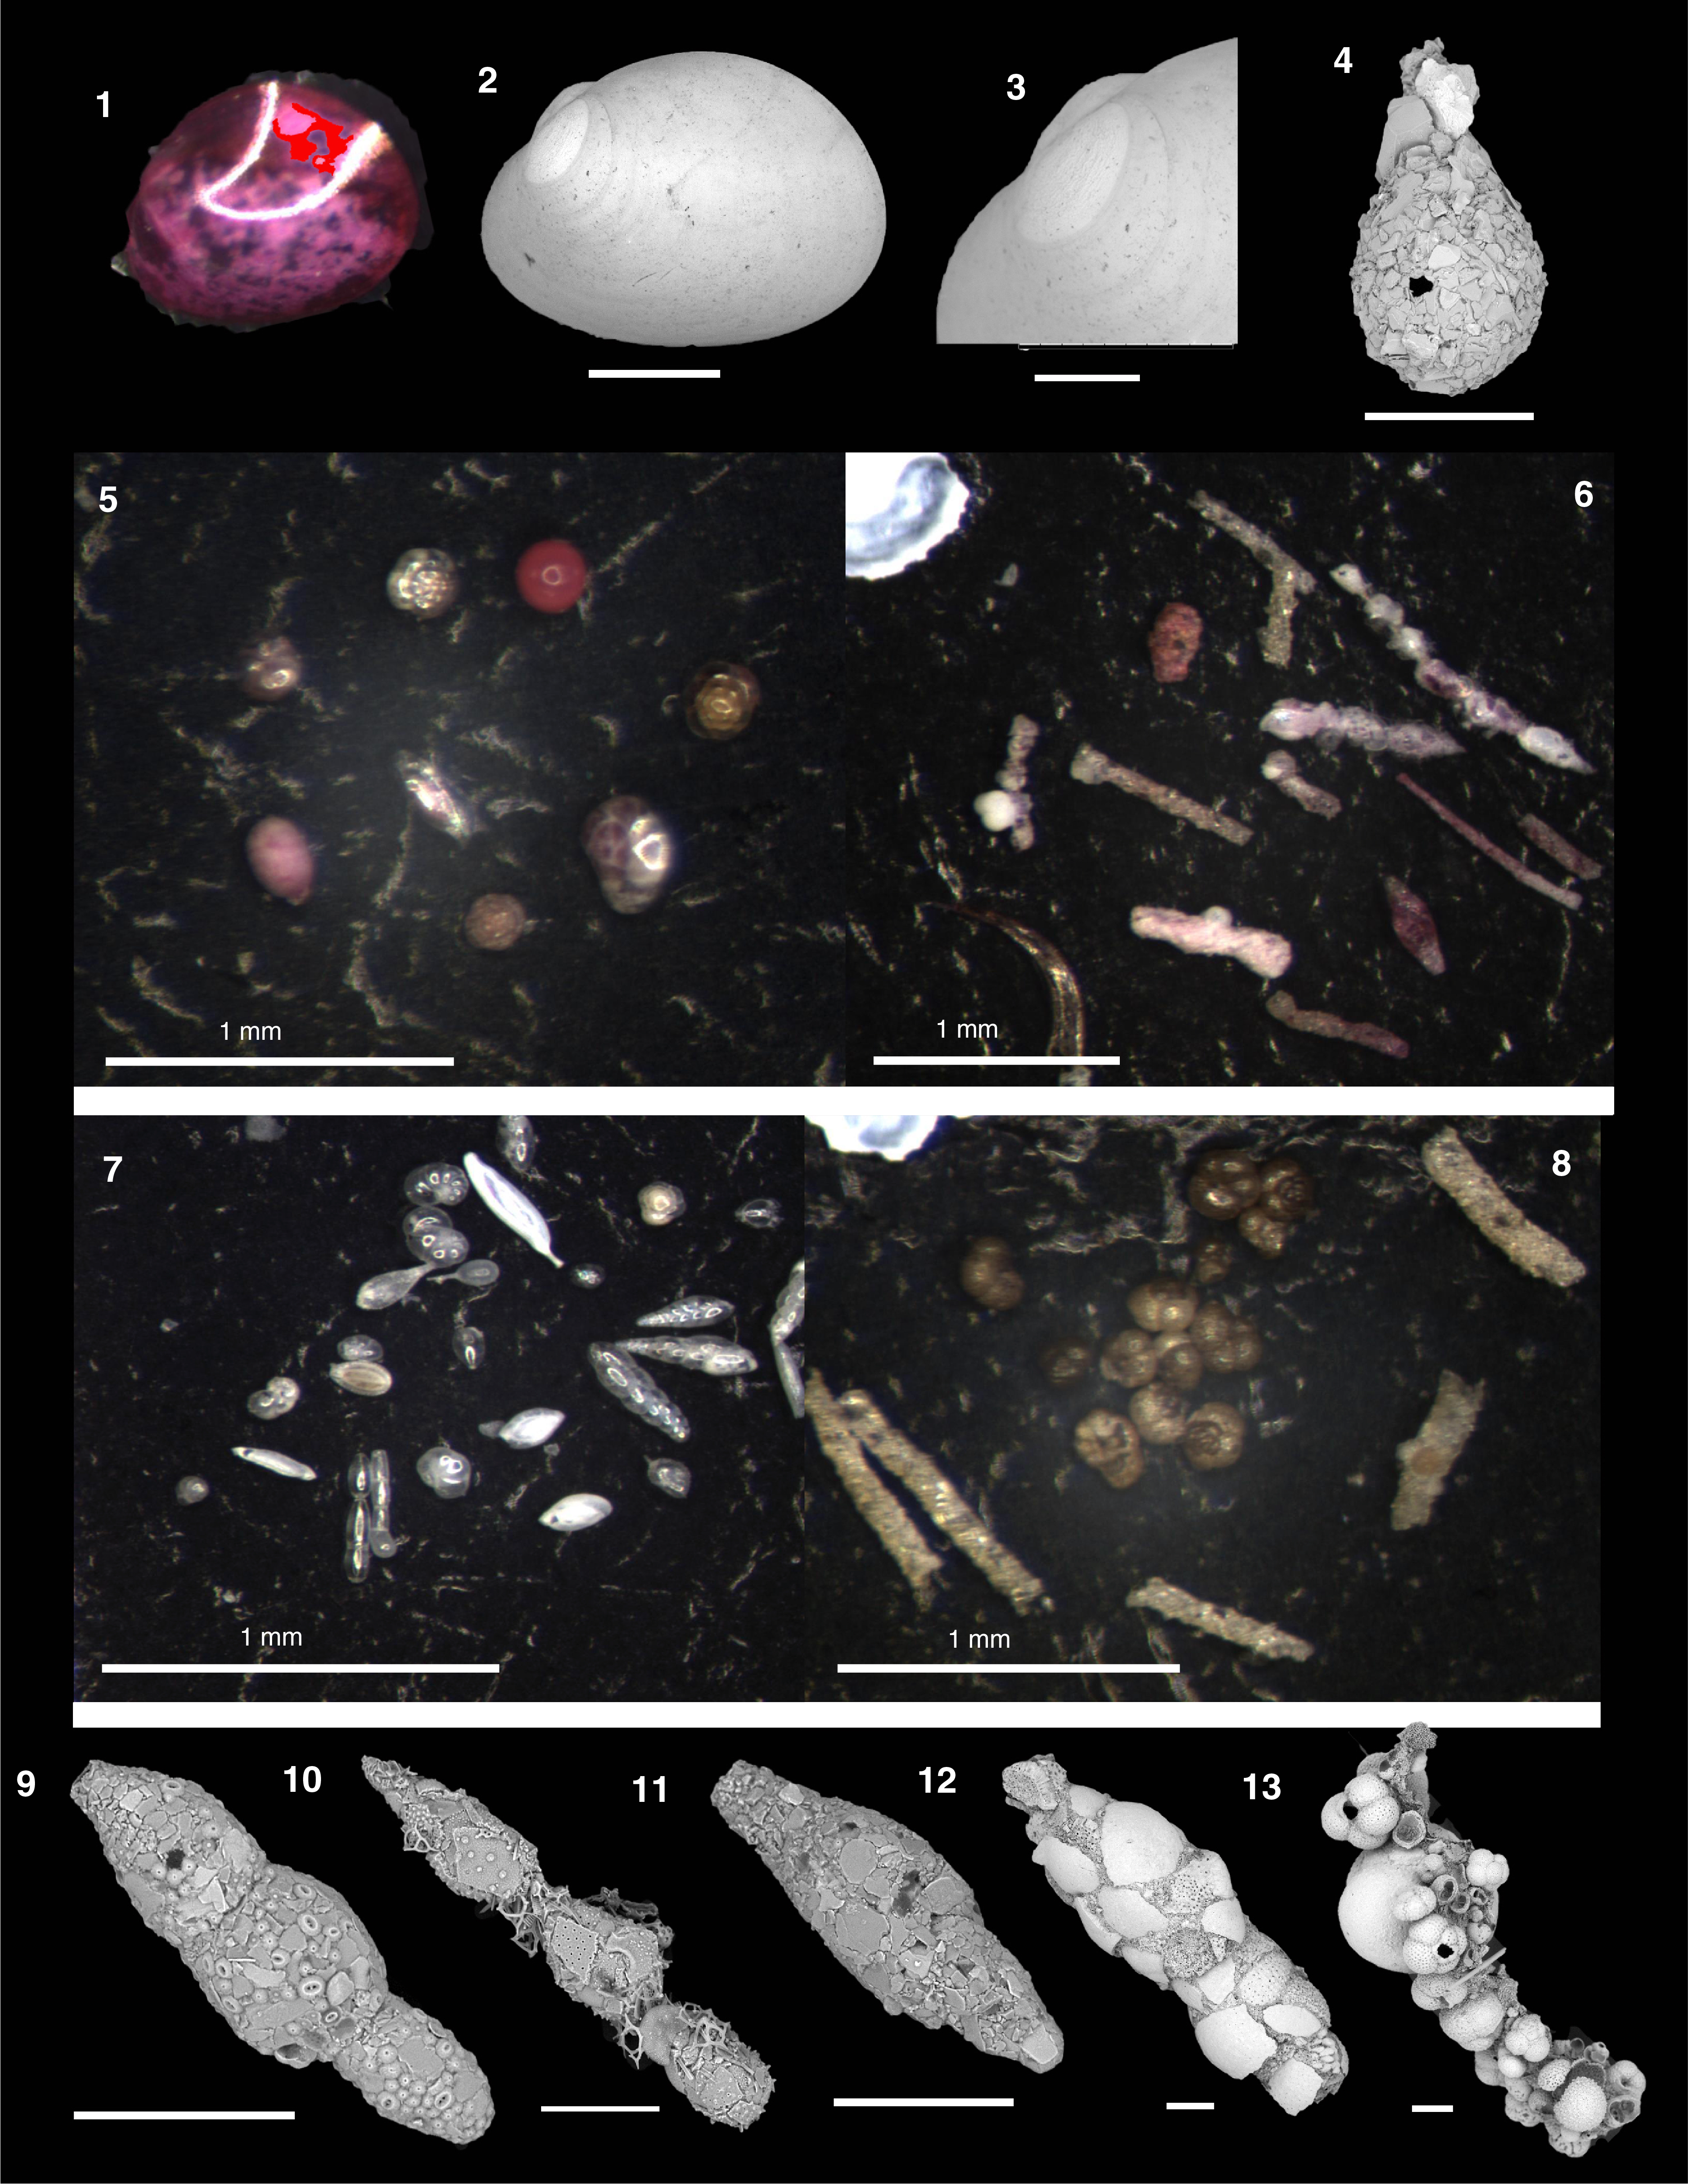
Figure F27. Agglutinated and calcareous benthic foraminifers and bivalves.
Ostracods
Core catcher samples from Holes U1541A (1H-CC) and U1541B (1H-CC through 15H-CC) were also examined for the presence of ostracods. All ostracods present in the >125 mm sand fraction were picked, counted, and identified to the genus level. Their abundance ranges between rare (1 valve) and abundant (>50 valves), although two samples (383-U1541B-6H-CC and 13H-CC) were barren (Figure F18). Valves and carapaces are moderately to well preserved. The highest ostracod abundance was observed in Samples 383-U1541A-1H-CC and 383-U1541B-9H-CC. The assemblage is dominated by Krithe and Henryhowella and includes Poseidonamicus, Pelecocythere, Legitimocythere, Pennyella, Bradleya, and Ambocythere in lower concentrations. The taxa indicate lower bathyal to abyssal depths and varying bottom water ventilation (Alvarez Zarikian et al., 2009, Alvarez Zarikian, 2015; Stepanova and Lyle, 2014; Whatley et al., 1986; Yasuhara et al., 2013). Table T10 summarizes the downcore distribution of ostracods present in core catcher samples from Site U1541.
Paleomagnetism
The natural remanent magnetization (NRM) of archive-half core sections from Site U1541 was measured and remeasured after alternating field (AF) demagnetization at 2 cm increments. Peak AFs were restricted to a maximum of 20 mT for all sections recovered using the APC system with standard full, nonmagnetic core barrels (see Operations). In general, the number of demagnetization steps and the peak AF used reflect the severity of the drill string and natural overprints, the desire to use low peak fields to preserve the magnetization for future shore-based studies, and the need to maintain core flow through the laboratory. See Table T11 for a list of AF demagnetization steps employed for each section. To maintain core flow, sections completely affected by drilling disturbance, as noted by the lithostratigraphic and/or paleomagnetic groups, were not measured. Data associated with intervals affected by obvious drilling deformation or measurement error were culled prior to uploading or during data processing.
The NRM intensities of cores recovered from Holes U1541A–U1541C range from 10−1 to 10−6 A/m (Figure F28). After demagnetization at a peak AF of 20 mT, the intensities are more constrained, although the pattern is complex and reflects the concentration of magnetic minerals (lithology), the polarity, and the drill string overprint. In general, reversed polarity intervals (positive inclinations) that are relatively strongly magnetized (0–5 m; below 30 m CCSF-A) show a significant drop (~50%) in intensity after a peak AF of 20 mT, whereas normal polarity intervals (negative inclination) that are relatively strongly magnetized show a much smaller decrease in intensity. This reflects the orientation of the drill string–induced overprint that is oriented down (−z) or positive (Richter et al., 2007) relative to the NRM’s polarity. As a result, reversed (positive) polarities show a large decrease in intensity as the drill string overprint is removed, whereas removal of the overprint from normal (negative) polarities gives rise to an initial increase in intensity before the primary magnetization begins to be demagnetized. The amplitude of the intensity decline relative to the NRM intensity after peak AF demagnetization is termed ∆ (for details, see Paleomagnetism in the Site U1540 chapter [Winckler et al., 2021b]):
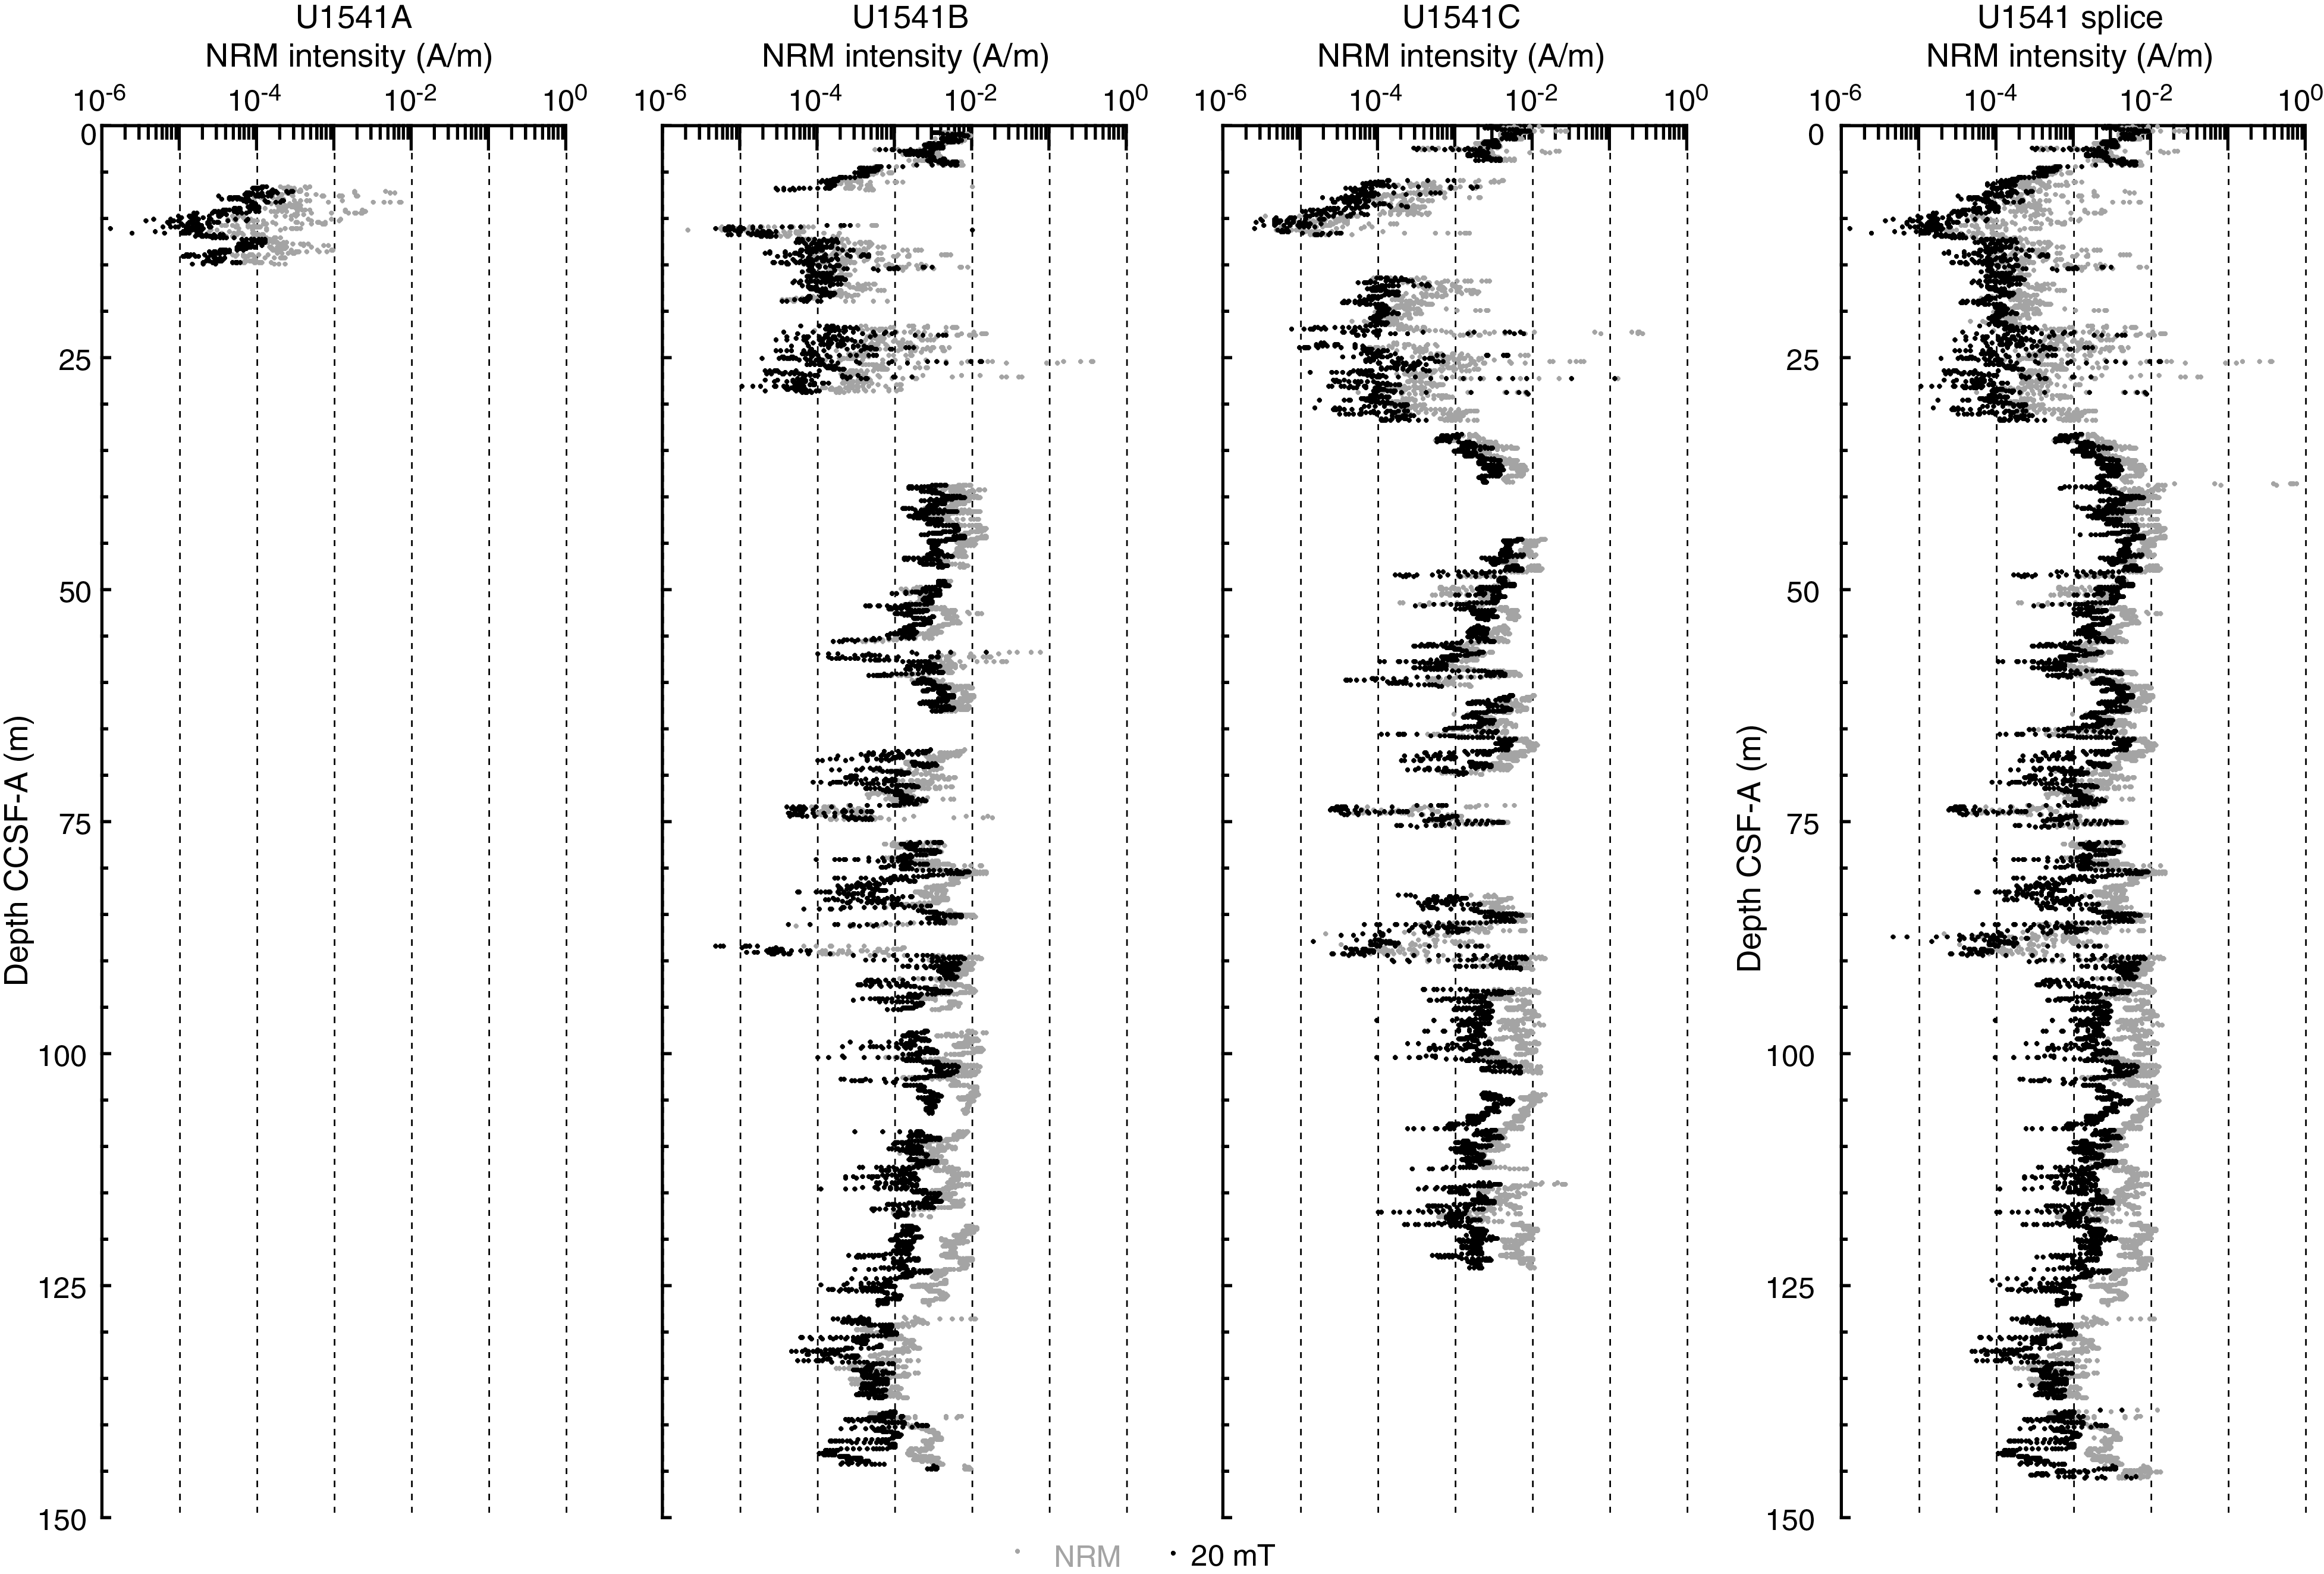
Figure F28. NRM intensity.
The ∆ parameter provides an initial measure of the quality of the NRM relative to the overprint that can be used to provide guidance on the reliability of the paleomagnetic record. At Site U1541, the ∆ parameter suggests that by 20 mT peak AF demagnetization, outside of a few intervals that will be discussed below, most of the drill string magnetic overprint has been removed. Low intensity intervals (5–30 m CCSF-A) (Figure F28), in contrast, show a large and variable (noisy) intensity decrease after demagnetization that reflects a lower coercivity magnetization combined with a low signal to noise ratio NRM giving rise to poorly resolved directions and even polarity (Figure F29).
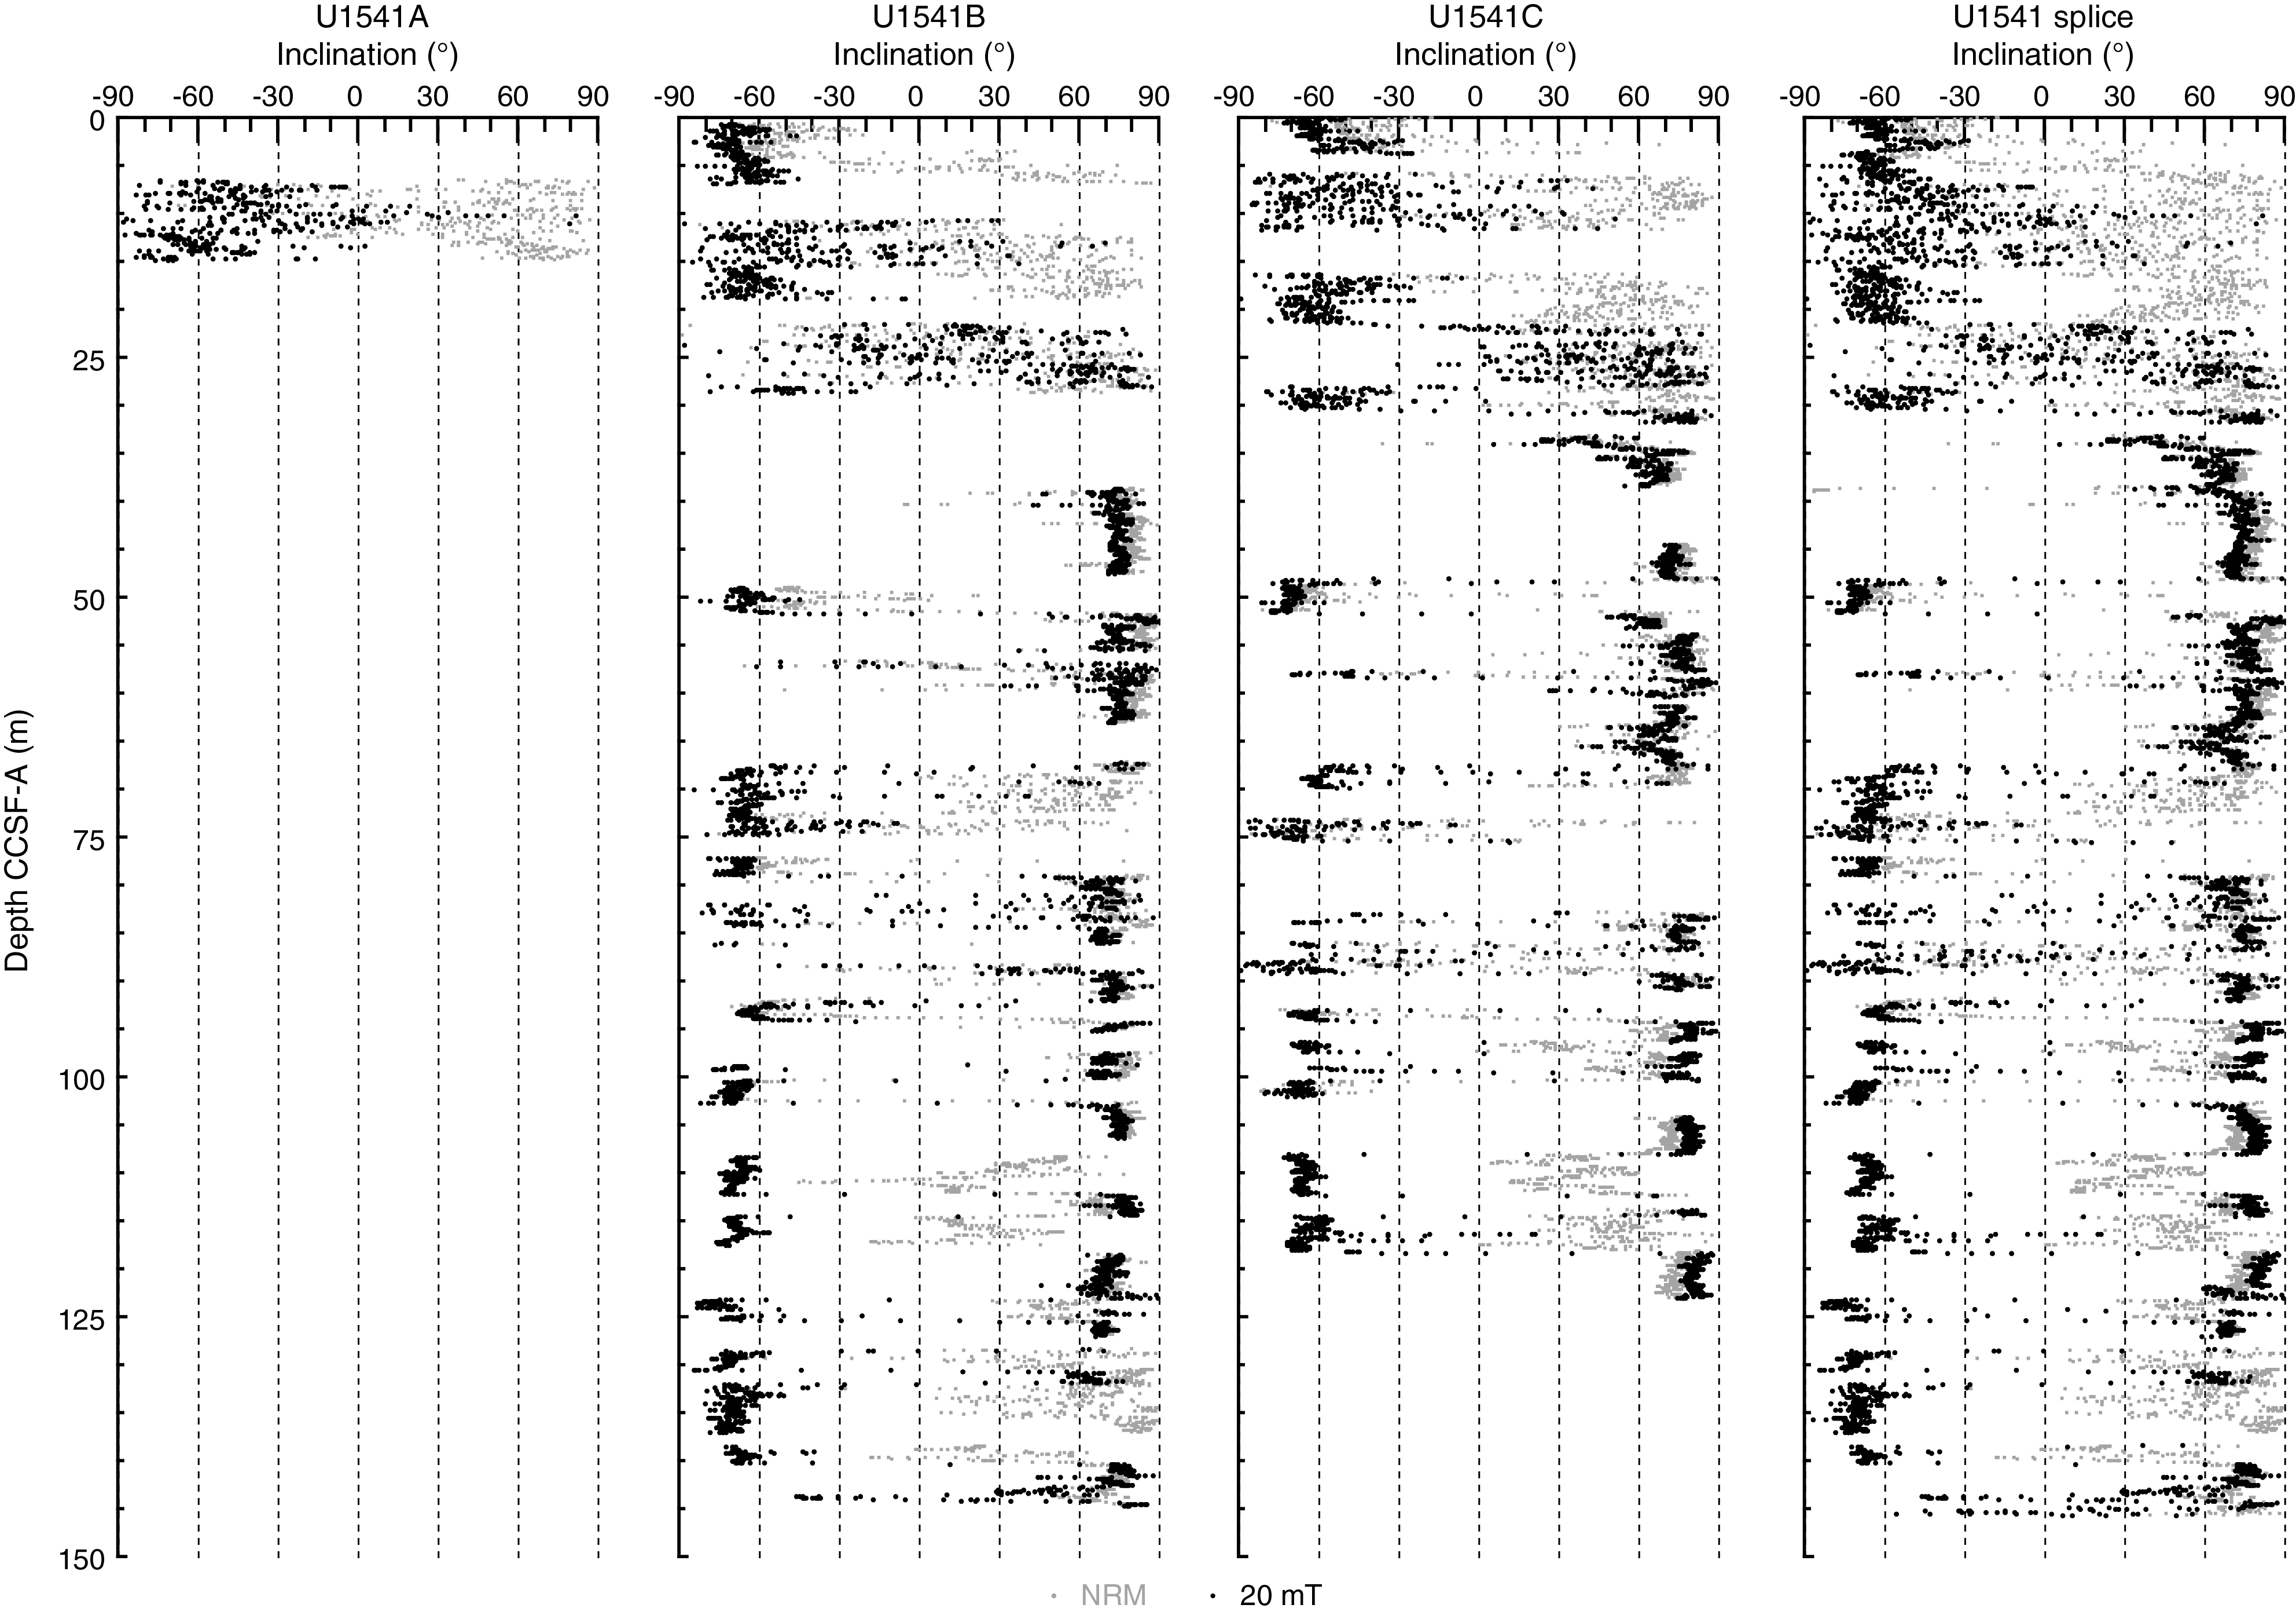
Figure F29. Inclination.
Downhole NRM intensity records from Holes U1541A–U1541C are comparable (Figure F28). NRM intensities from the uppermost sediments are relatively high (10−2 to ~10−3 A/m), but they quickly decrease by around two orders of magnitude over the upper 10 m CCSF-A. This may be attributed to redox conditions because sulfate is rapidly decreasing (see Geochemistry), although the existence of thick carbonate oozes also likely contributes (see Sedimentology). The NRM is characterized by very low intensity (10−4 to 10−5 A/m) from ~5 to ~30 m CCSF-A. Below this interval, NRM intensities are higher and vary between 10−2 and 10−4 A/m (Figure F28). Overall, the downhole intensity pattern generally follows physical properties such as magnetic susceptibility (see Sedimentology), suggesting that NRM intensity is largely controlled by the lithology with a diagenetic overprint.
Figure F29 shows inclination for Holes U1541A–U1541C before and after AF demagnetization at 20 mT. Inclinations capture a series of apparent polarity reversals that are consistent between Holes U1541B and U1541C where they overlap and together provide a long and almost continuous (see Stratigraphic correlation) record of polarity change over the past 8 My (Figures F30, F31). As stated above, polarity is less clearly observed in the upper part of the record (above 30 m CCSF-A) and is particularly problematic between 8–15 and 23–27 m CCSF-A, intervals characterized by exceedingly low signal to noise ratios. Despite these complications, the Matuyama/Brunhes and upper and lower Jaramillo polarity boundaries that define the upper part of the Matuyama Chron (C1r.1r and.1n) are observed (Figures F29, F30). Most reversal boundaries from the Olduvai Chron (C2n) to Chron C4r.1n (8.254 Ma) are generally well defined, and their positions in each hole are shown in Table T12 and Figure F30. The record of inclination and intensity after 20 mT peak AF demagnetization for the splice composite record allows polarity interpretations and correlation to the geomagnetic polarity timescale (GPTS) (Cande and Kent, 1995). Only the boundaries associated with the reversed polarity intervals of the Gauss Chron (C2An) (Kaena and Mountain) and the short normal polarity Subchron C3BR.2n that spans 7.454–7.485 Ma are not clearly recognized over the 0–8.5 Ma interval. Figure F31 illustrates the shipboard age model for Site U1541 based on correlation to the GPTS on 2012 geologic timescale (GTS2012) chronology (Hilgen et al., 2012). Shore-based studies will refine these correlations and facilitate development of relative paleointensity as the next step in magnetic stratigraphy.
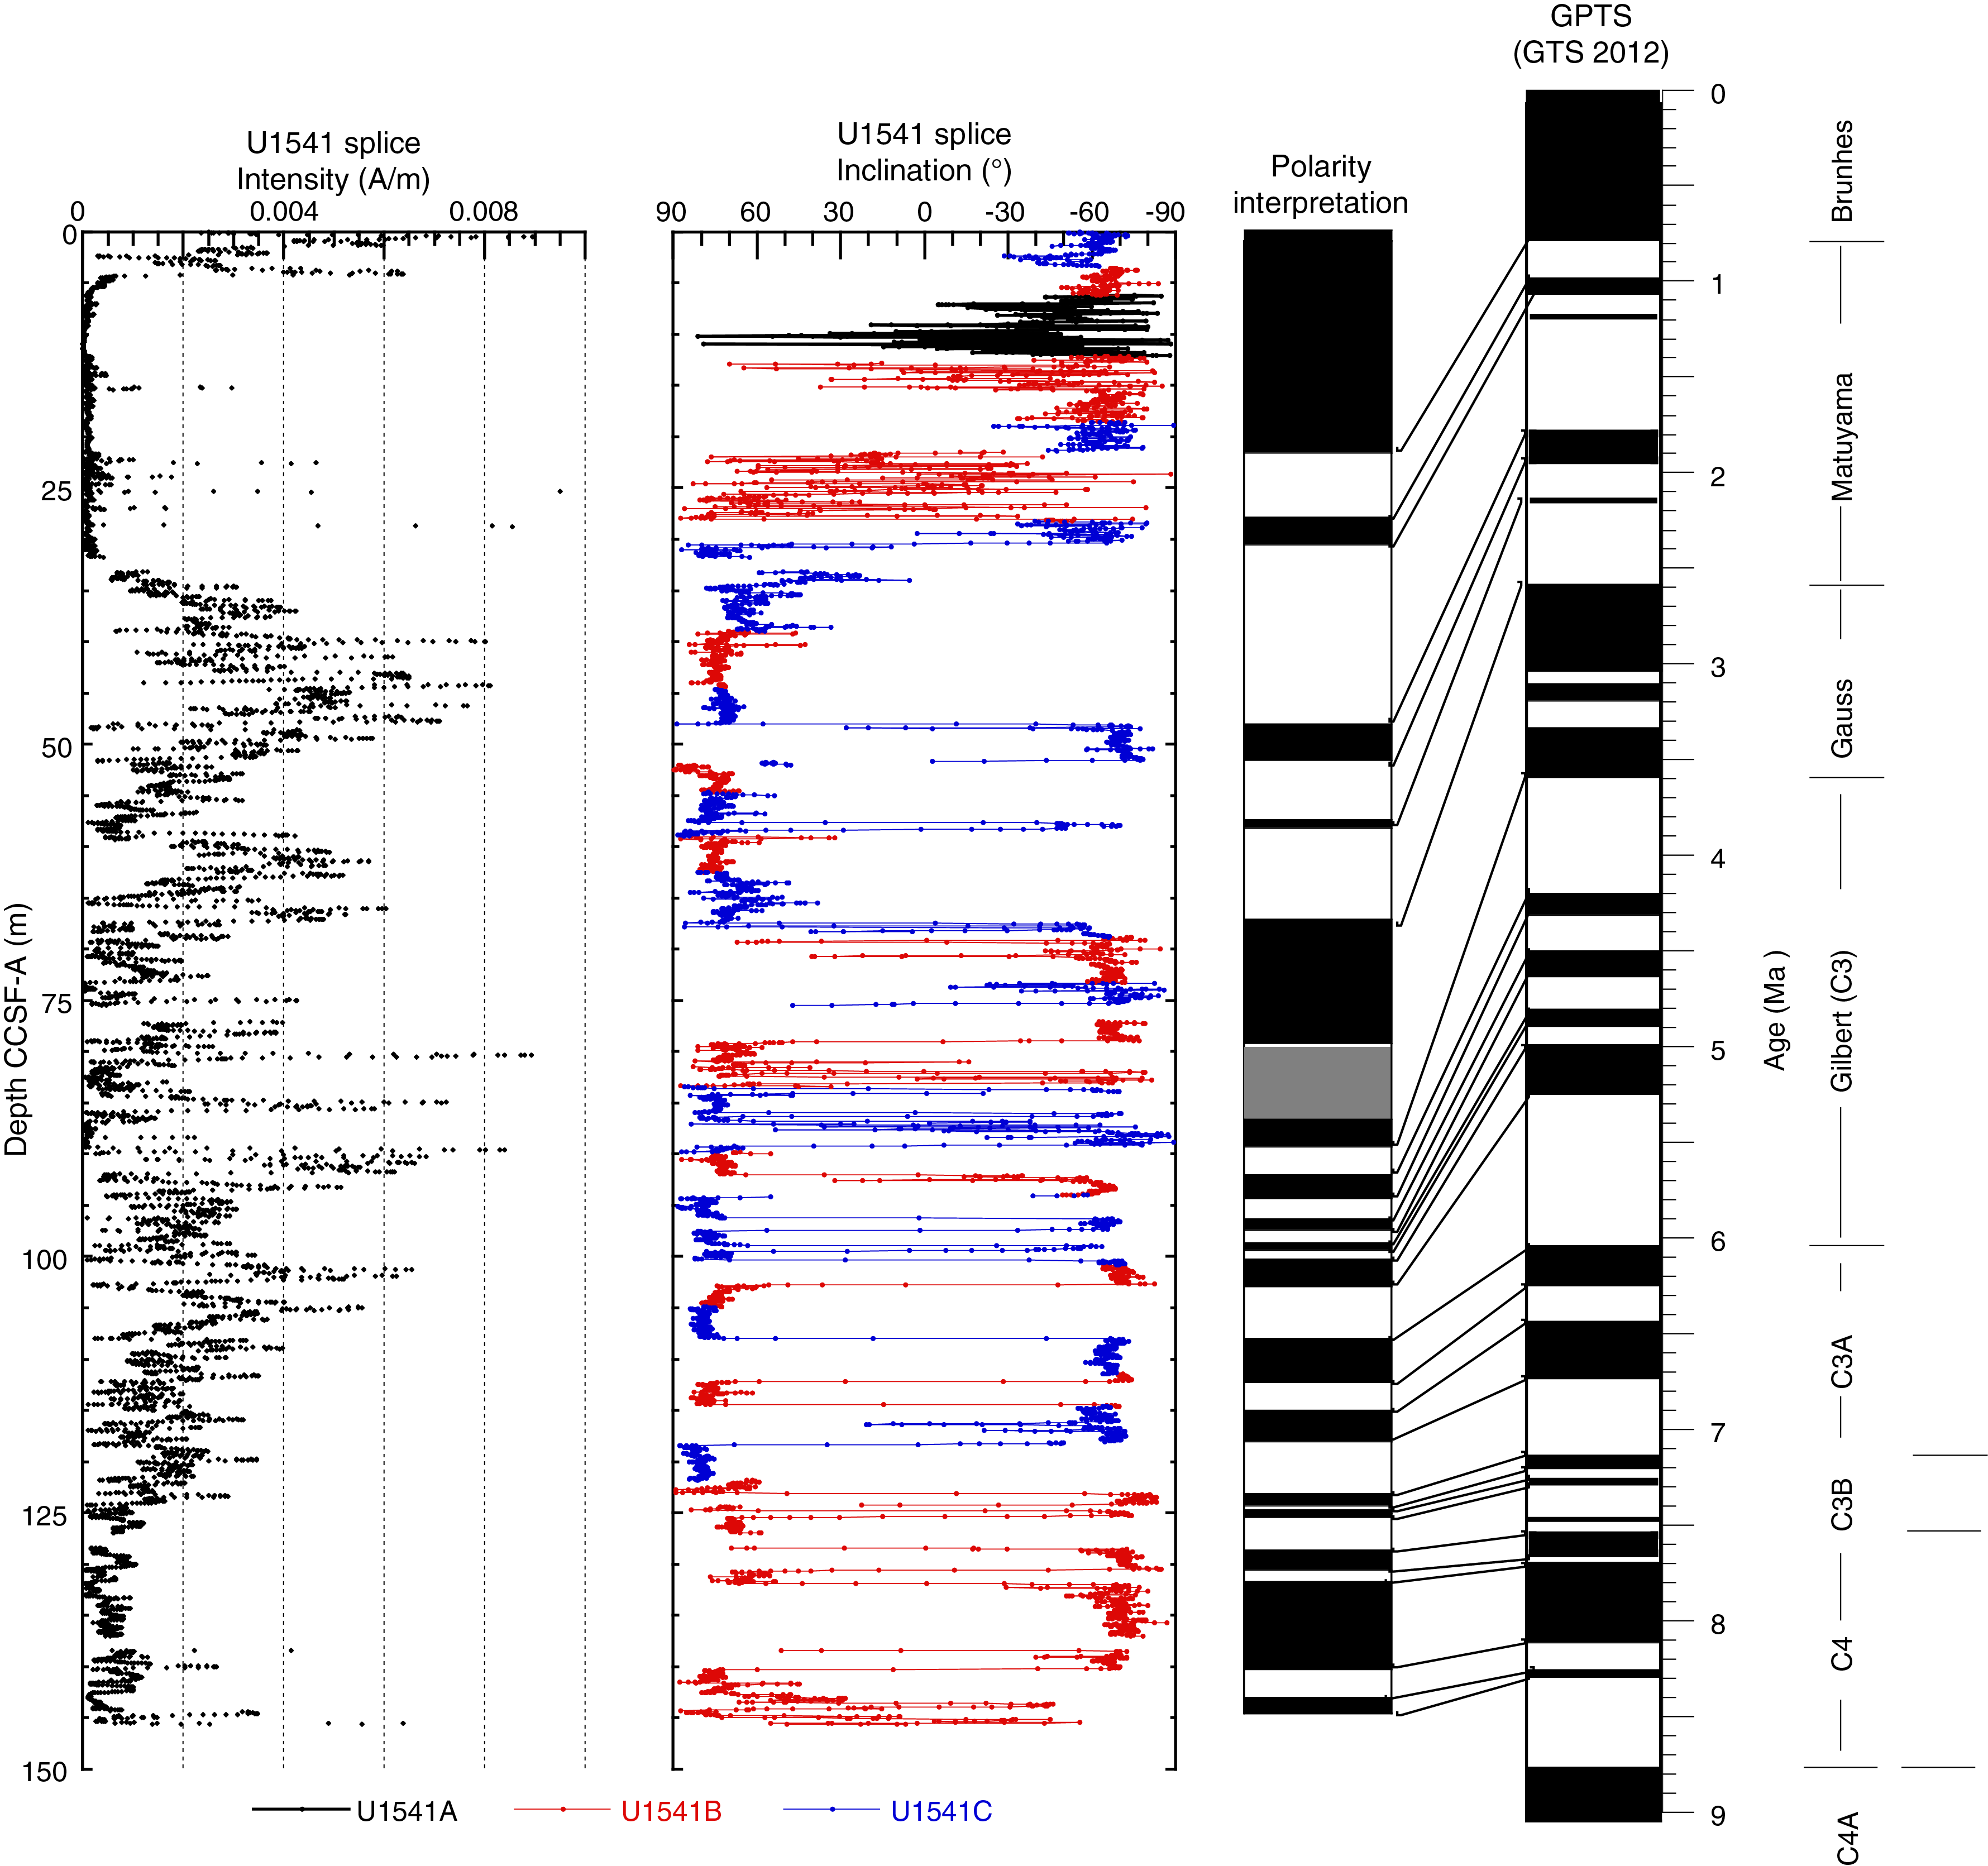
Figure F30. NRM intensity and inclination.
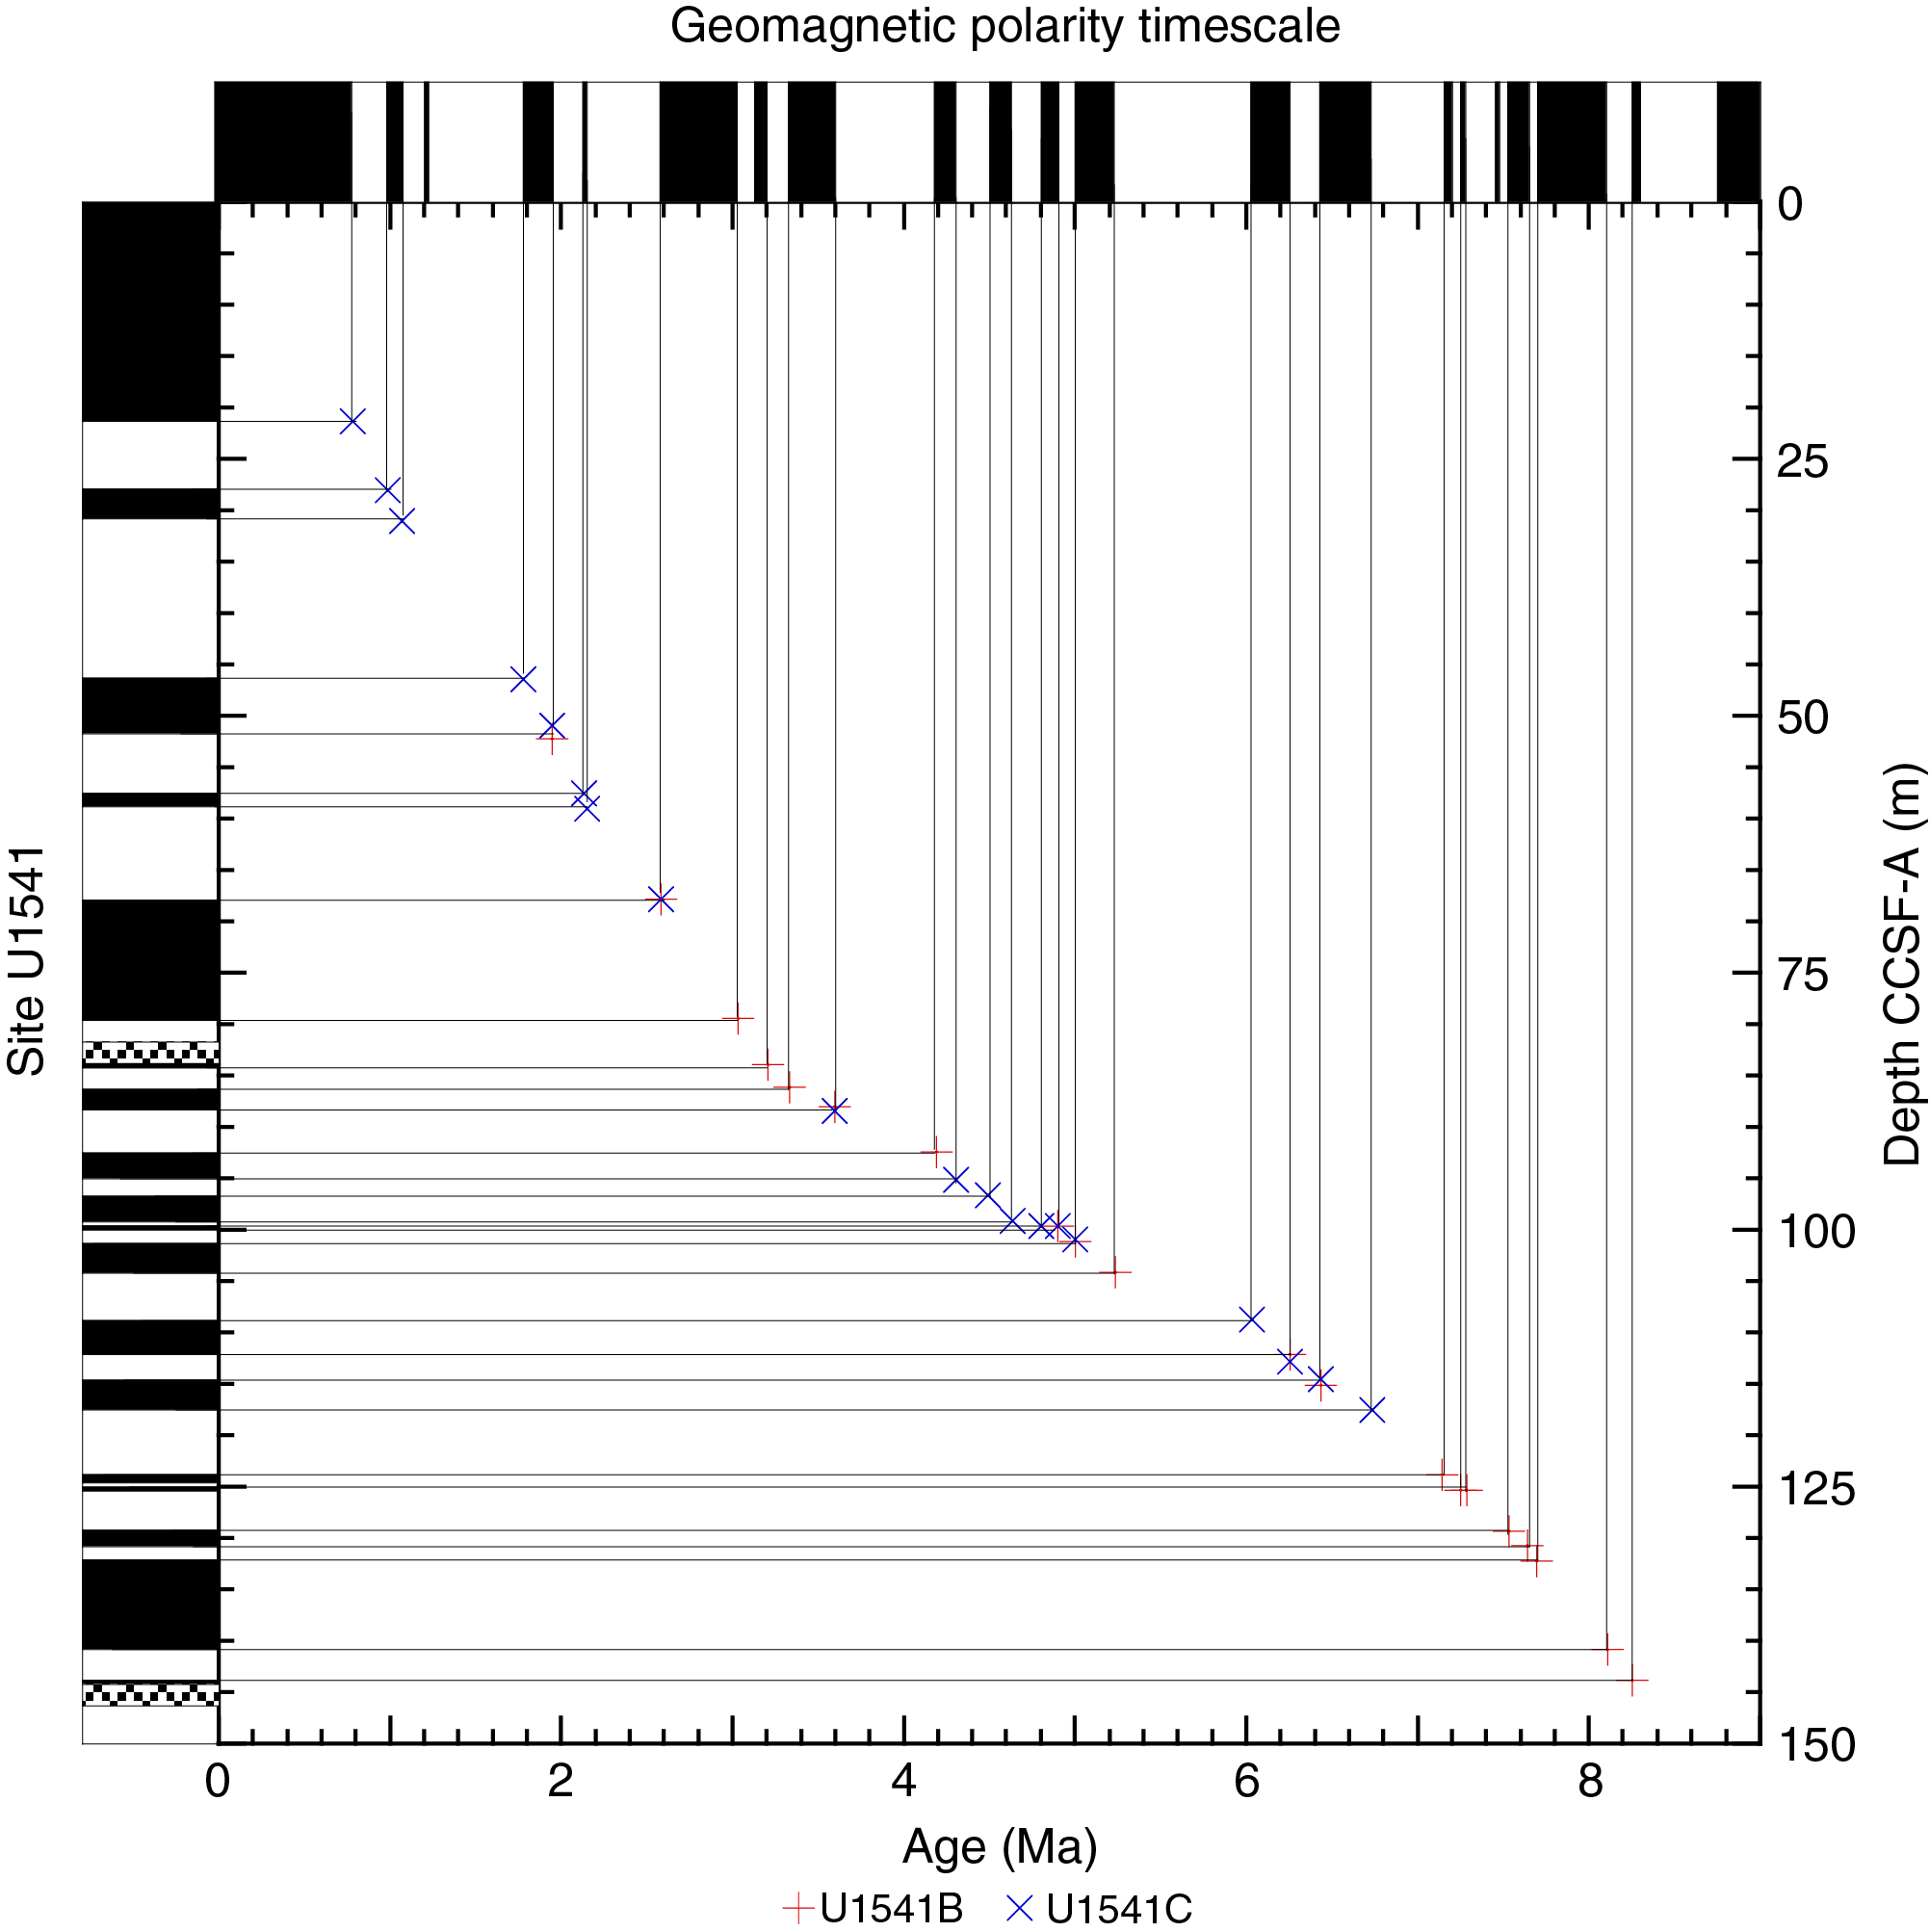
Figure F31. Age-depth relationship.
Geochemistry
Sediment gas sampling
Routine safety hydrocarbon measurements were collected at Site U1541 in headspace gastight vials at a resolution of approximately one 5 cm3 sample per core for Hole U1541A (5.98 m CSF-A) and Cores 383-U1541B-1H through 15H (5.97–136.6 m CSF-A) (see Geochemistry in the Expedition 383 methods chapter [Winckler et al., 2021a]). Methane concentrations are low at this site overall, averaging 2.86 ppmv and never exceeding 3.47 ppmv (Figure F32; see U1541-T1.xlxs in GEOCHEM in Supplementary material). Ethane and propane remain below detection limit throughout the entire hole.
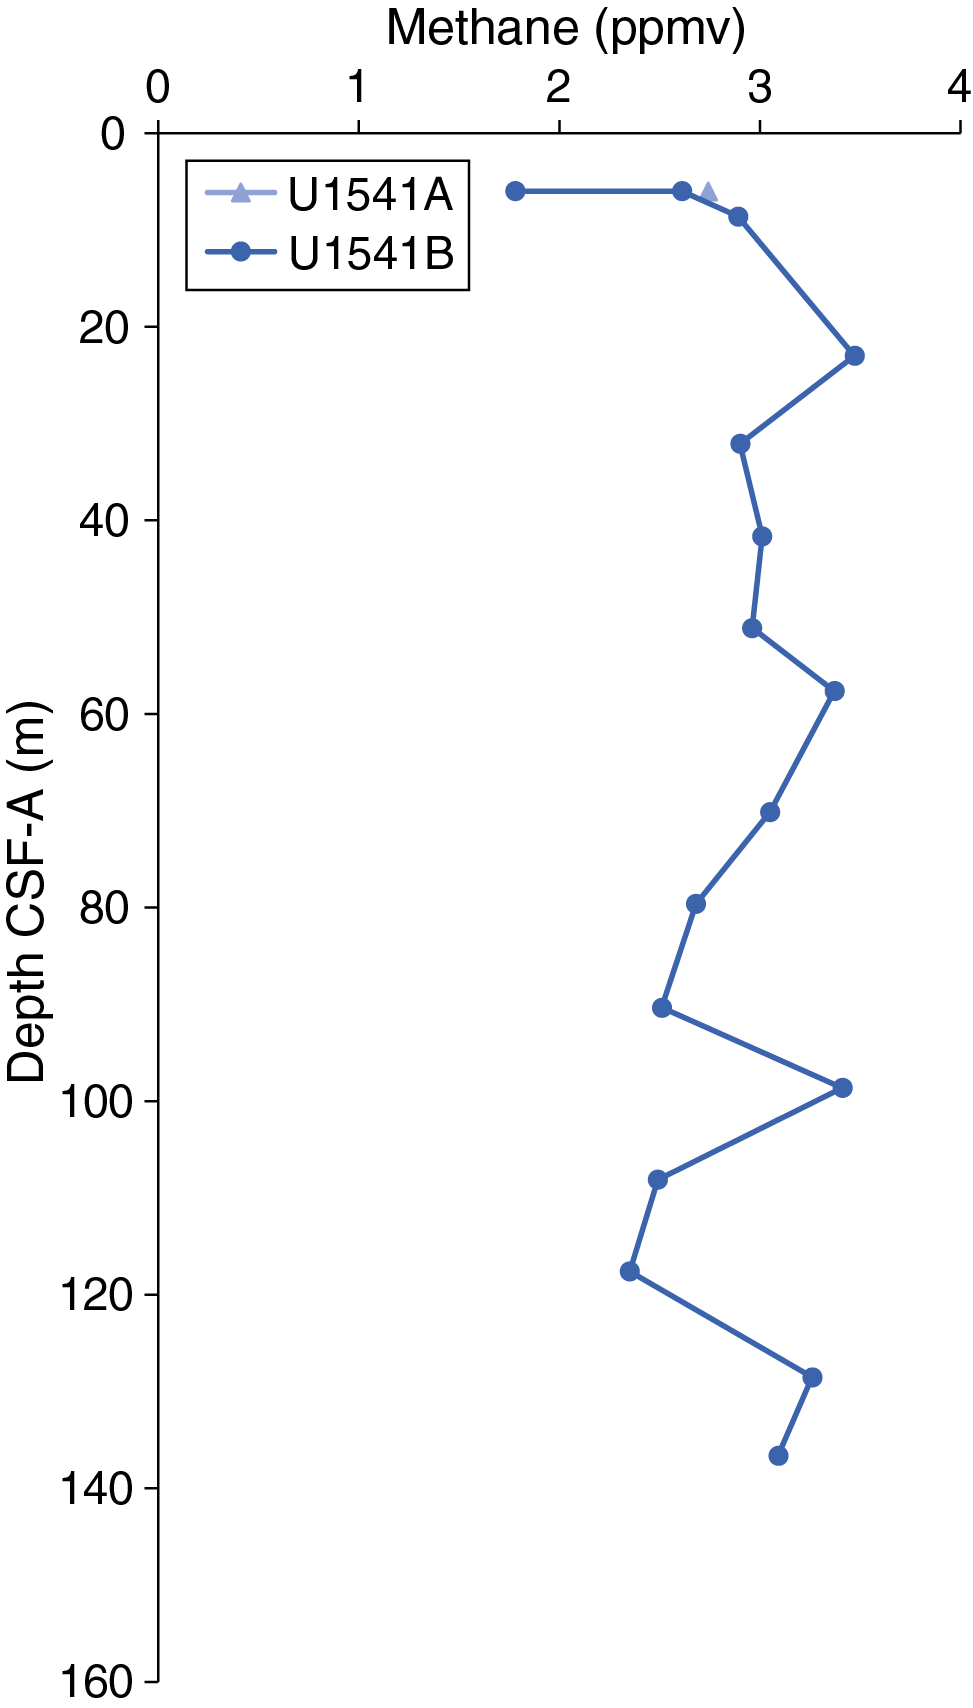
Figure F32. Headspace methane concentrations.
Interstitial water chemistry
At Site U1541, 37 whole rounds were collected for interstitial water samples from Holes U1541B and U1541C at a resolution of three per core from 0 to 120 m CSF-A and two per core from 120 to the bottom of the hole. Because of drilling disturbance in the upper part of the core, the interstitial water sampling strategy could not be followed as planned; only one interstitial water whole round was collected from the second core, and no whole rounds were collected from the third. A mudline sample collected from Hole U1541B was allowed to settle for several hours and was subsequently filtered through a 0.45 µm syringe-tip filter. Filtered mudline water was subjected to all standard shipboard chemistry. We squeezed whole rounds and subsampled for interstitial water according to the methods described in Geochemistry in the Expedition 383 methods chapter (Winckler et al., 2021a).
Alkalinity and pH
Alkalinity remains fairly constant around a mean value of 2.8 ± 0.5 (±1σ) mM to ~90 m CSF-A (Figure F33; see U1541-T2.xlxs in GEOCHEM in Supplementary material). Starting at 90.27 m CSF-A, alkalinity values show a decreasing trend to the bottom of the core at 136.55 m CSF-A. In the uppermost 32.03 m, pH values stay close to 8 (Figure F33). Between ~40 and 90 m CSF-A, pH values show higher variability. They decrease from 7.9 to 7.7 between ~82 and ~95 m CSF-A, and they remain stable around 7.8 thereafter.
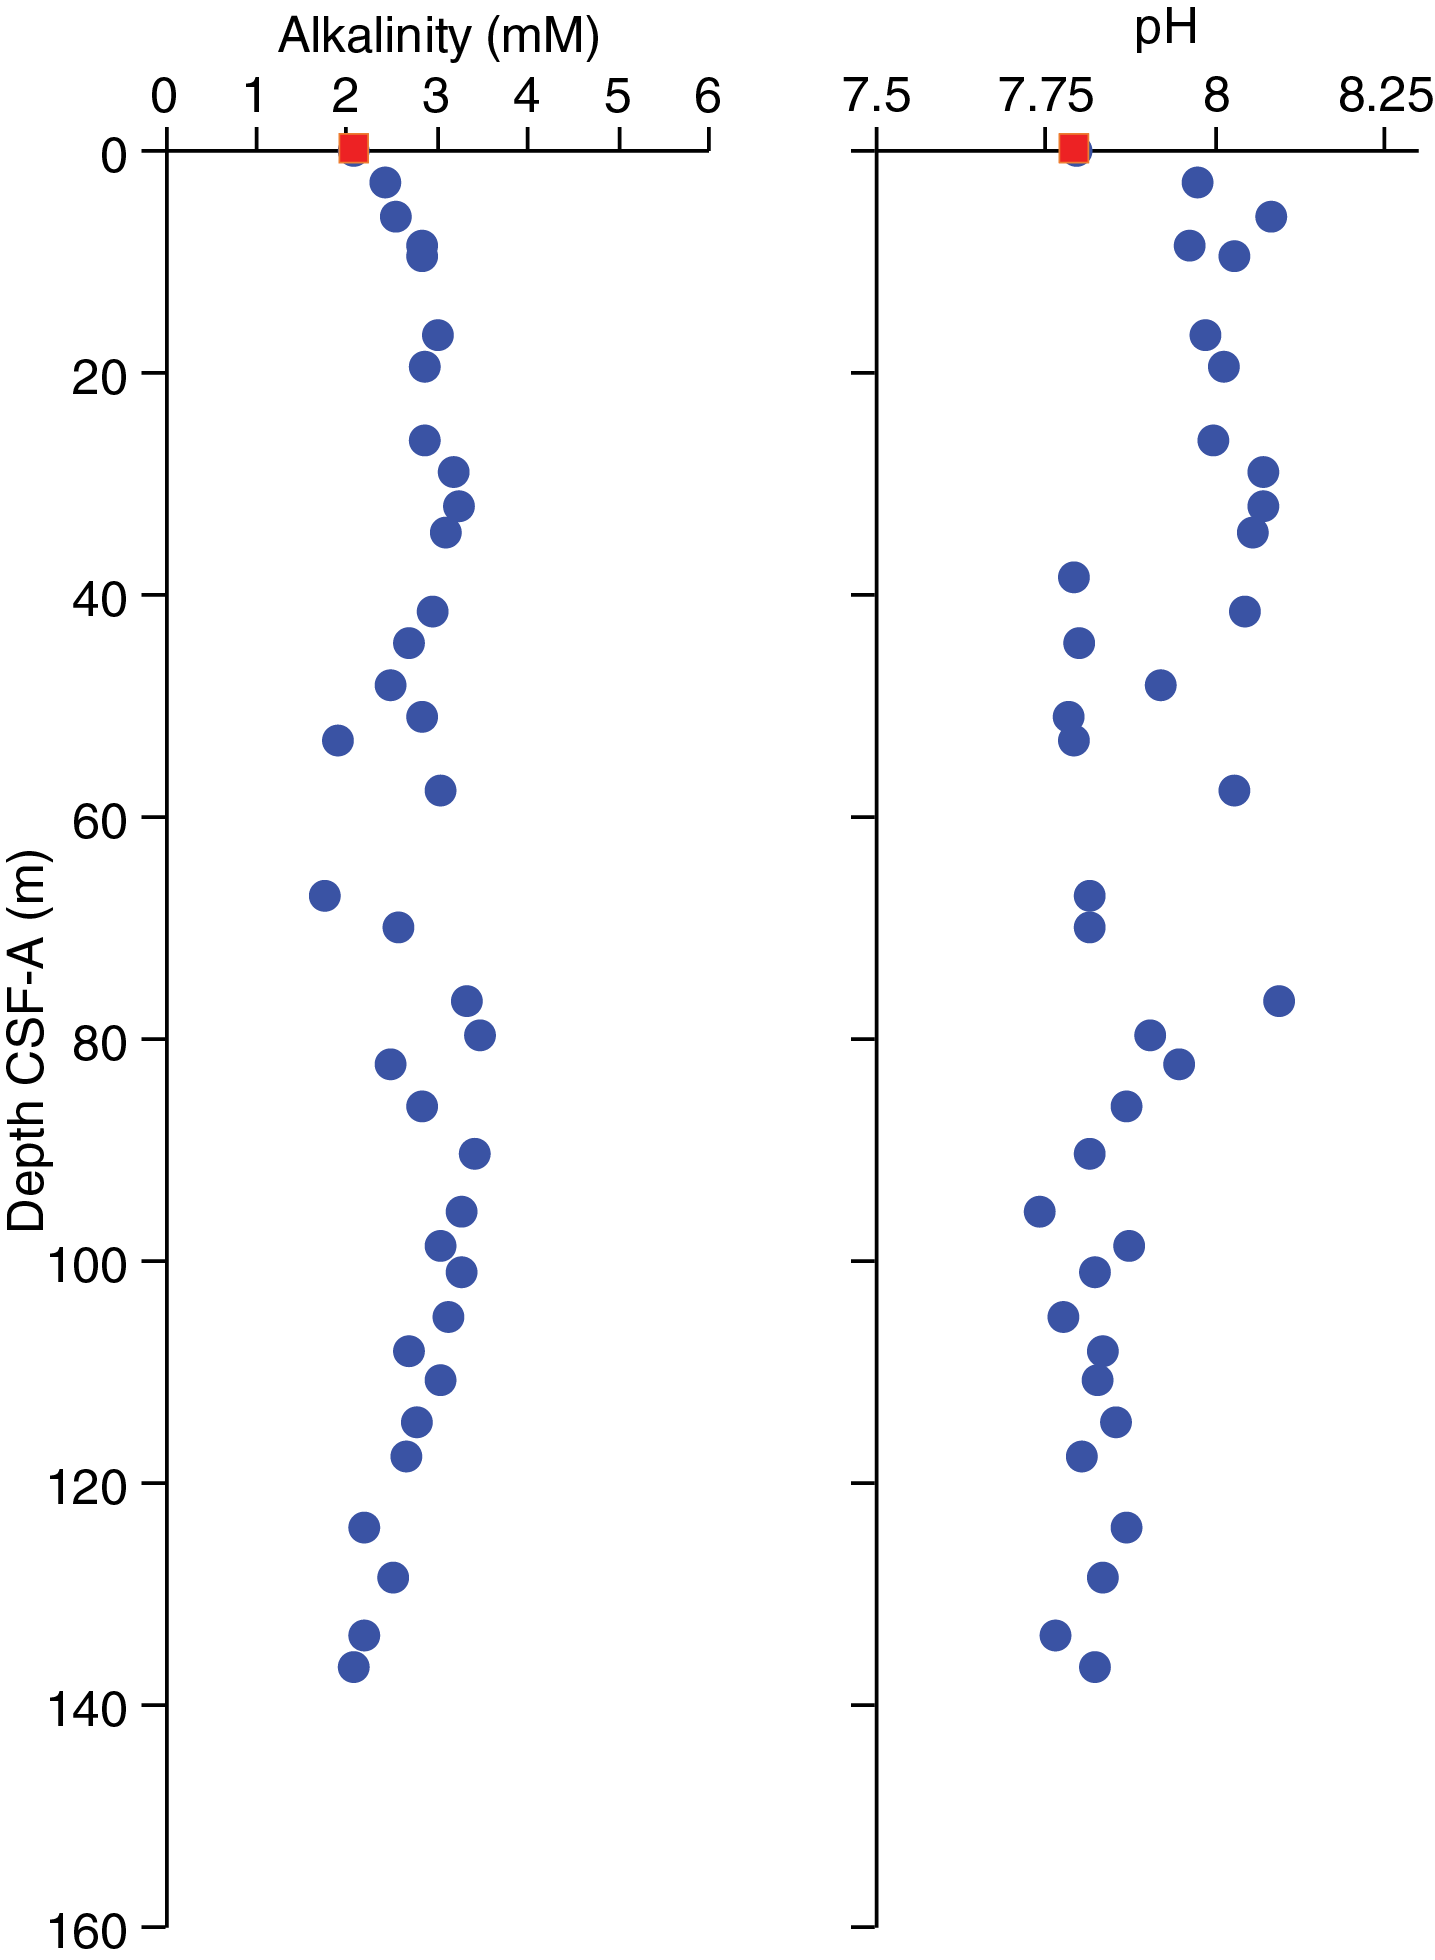
Figure F33. Interstitial water alkalinity and pH.
Salinity, chlorinity, sodium, and magnesium
Salinity for all interstitial water samples is constant at 35 throughout the core. Downhole chlorinity values do not show any prominent trends and have an average value around 563 ± 7 mM (Figure F34). Sodium (Na) concentrations show little variability downhole. The mean Na value is ~462 ± 6 mM. Magnesium (Mg) concentrations remain unchanged with depth with a mean value of 51.3 ± 0.5 mM (Figure F34).

Figure F34. Interstitial water chloride, sodium, and magnesium.
Iron, manganese, and lithium
Above 38.55 m CSF-A, dissolved iron (Fe) concentrations are largely below detection limit in the interstitial water (Figure F35). Between 38.55 and 90.27 m CSF-A, Fe is present in the interstitial water with significant scatter, ranging from below detection limit to a maximum concentration of 6.9 µM. Below 90.27 m CSF-A, aqueous Fe decreases in the interstitial water to below detection limit, possibly due to rapid scavenging by abundant Fe oxides at the bottom of the core. Manganese (Mn) concentrations increase sharply from below detection limit in the mudline sample to a local maximum of 14.2 µM at 36.55 m CSF-A (Figure F35). Mn concentrations drop again to 2.5 µM at 79.56 m CSF-A before slowly rising to 10.2 µM at 95.55 m CSF-A. At 110.79 m CSF-A, Mn is depleted from the interstitial water to 0.3 µM in the bottommost sample, similar to the behavior of Fe in this interval. Dissolved lithium (Li) displays a nearly constant interstitial water concentration of 23.8 ± 3.3 µM with slight increase below 76.55 m CSF-A (Figure F35). This slight increase in Li at depth could be due to influence of hydrothermal fluid.
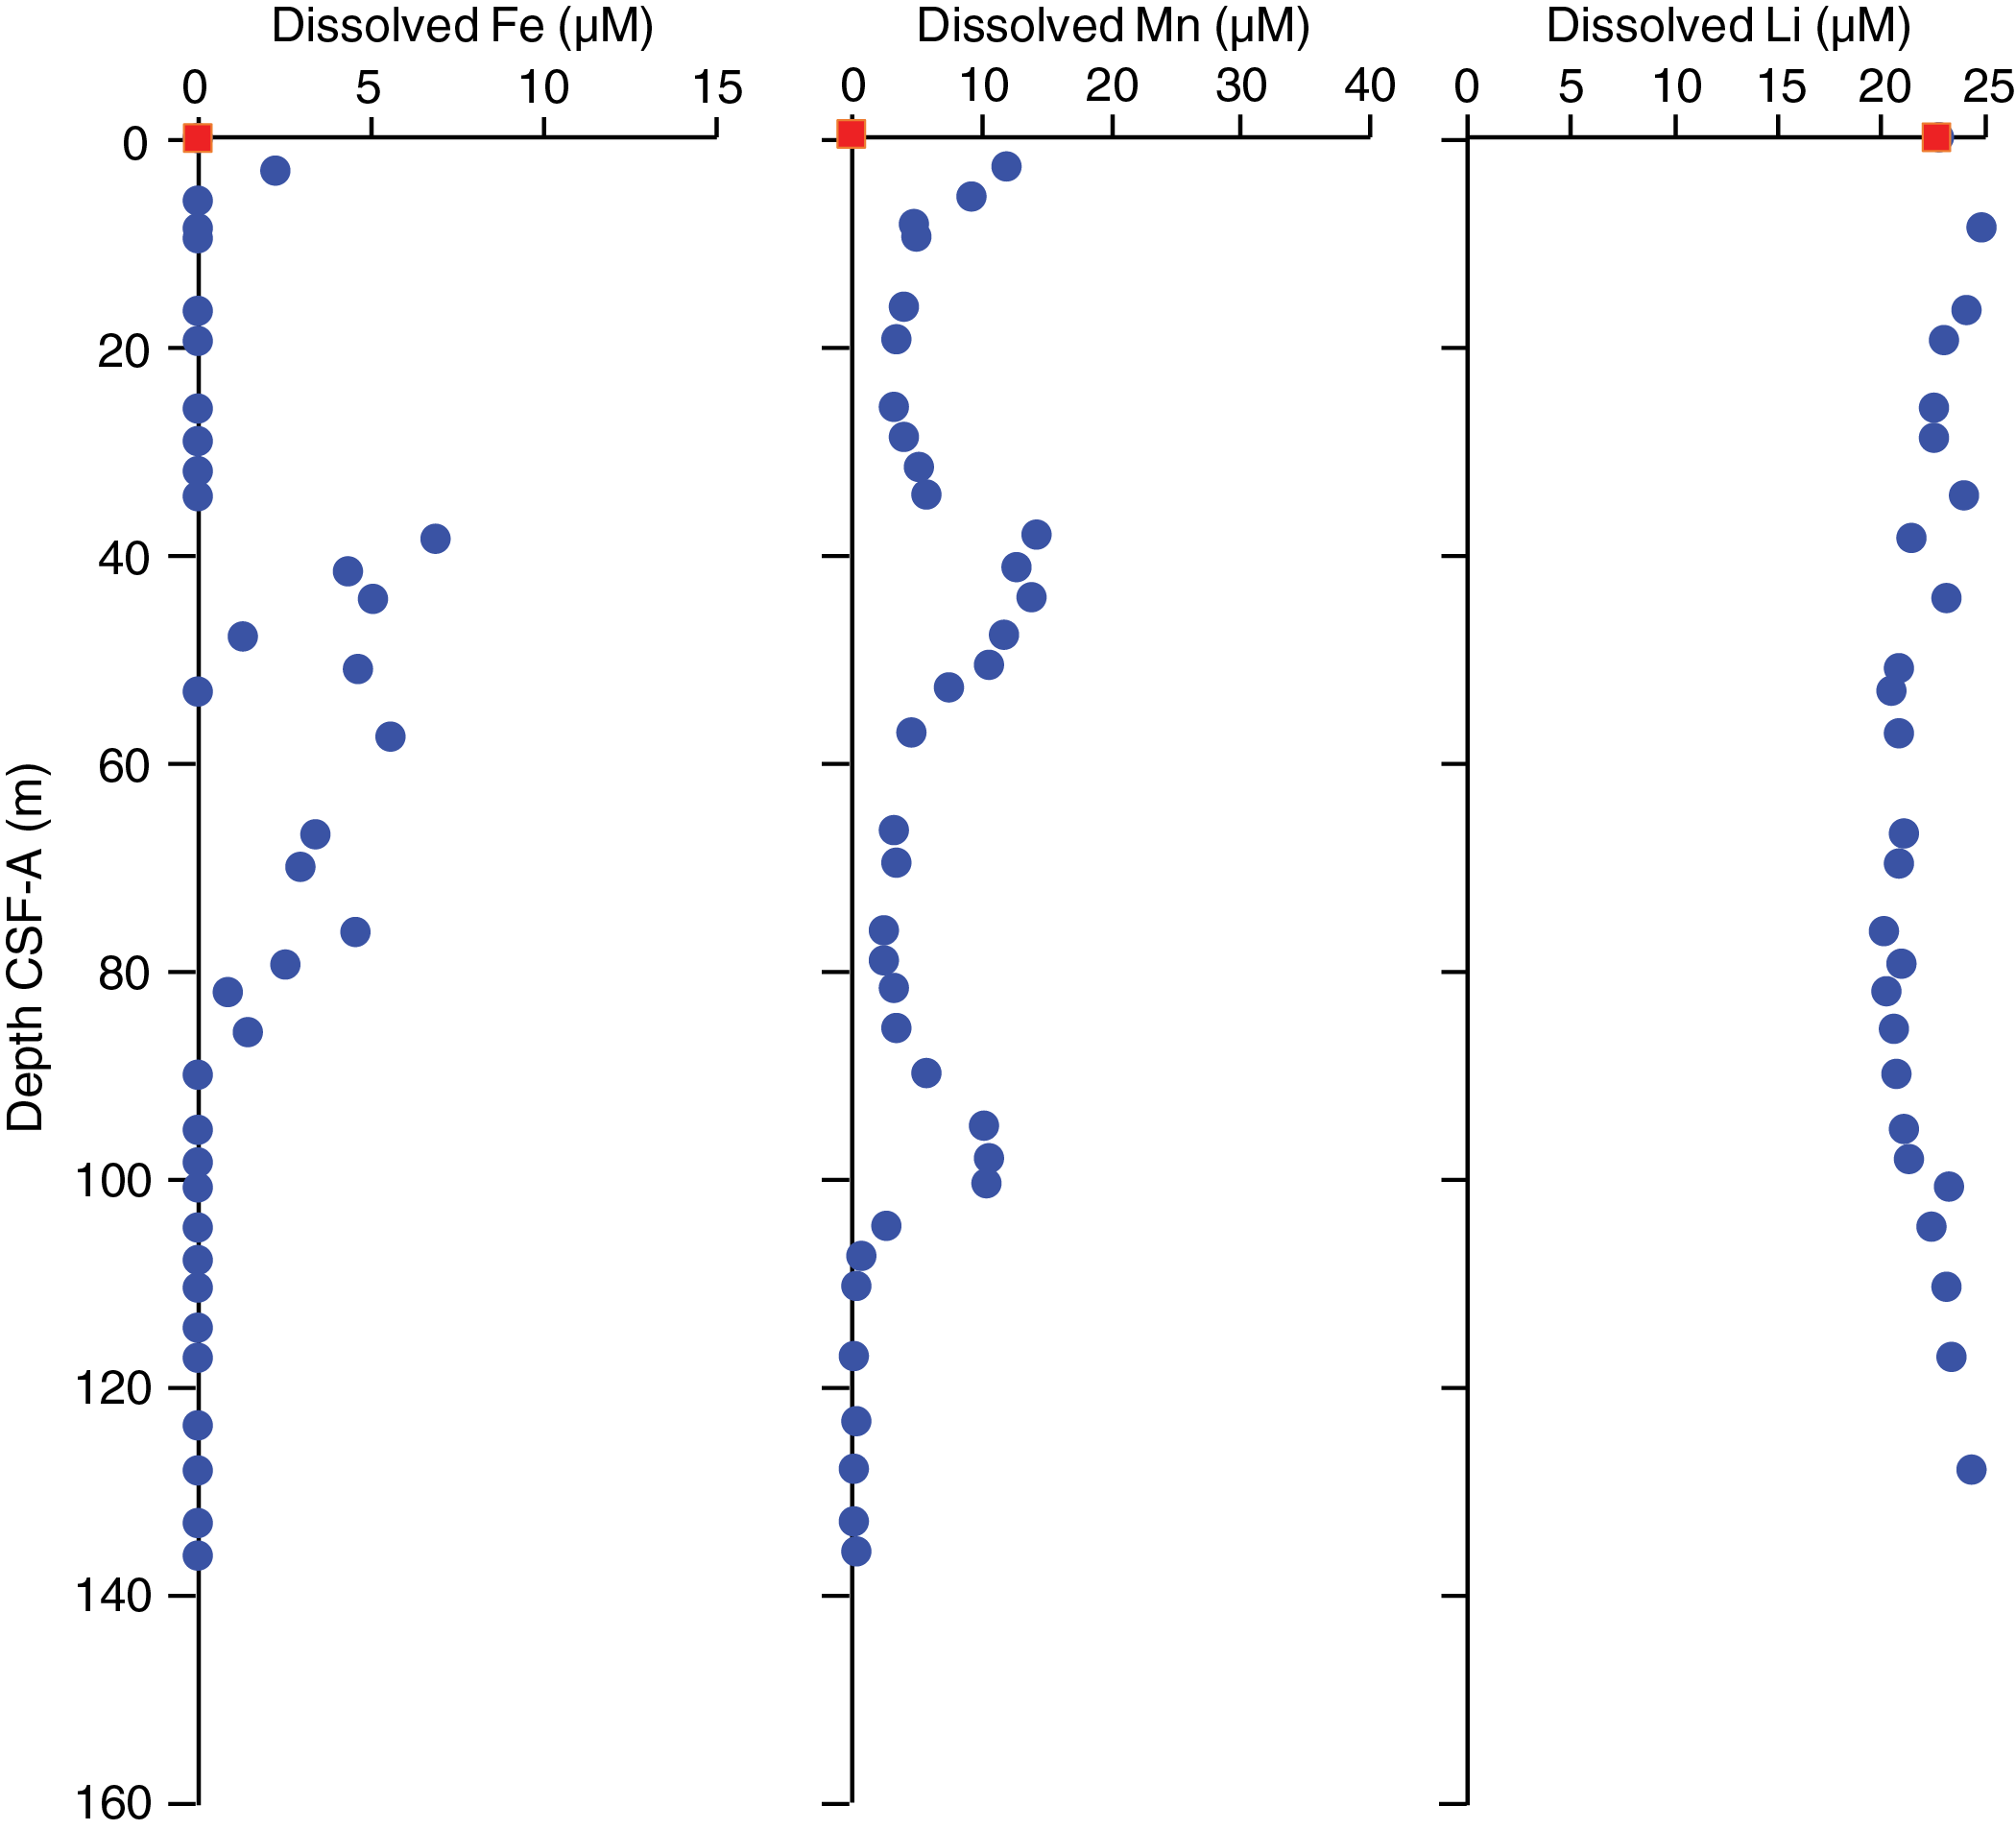
Figure F35. Interstitial water iron, manganese, and lithium.
Calcium, bromide, strontium, and silicon
Calcium (Ca) and bromide (Br−) concentrations remain fairly constant throughout the record, varying around averages of 10.7 ± 0.4 mM and 0.87 ± 0.01 mM, respectively (Figure F36). Strontium (Sr) increases almost linearly from a surface value of 87.1 µM to a maximum of 156 µM at 82.22 m CSF-A (Figure F36). Below this depth, Sr becomes progressively depleted in the interstitial water to a concentration of 92.1 µM in the bottommost sample (136.55 m CSF-A) (Figure F36). Dissolved silicon (Si) is low in the mudline water (246 µM) and relatively higher in the interstitial water down to 90.27 m CSF-A and has an average concentration of 757 ± 44 µM over this interval (Figure F36). Between 90 and 124 m CSF-A, interstitial water Si concentrations decrease gradually to 573 µM. In the lowermost four samples below 120 m CSF-A, Si exhibits a more rapid decrease to a minimum of 336 µM.

Figure F36. Interstitial water calcium, bromide, strontium, and silicon.
Phosphate, sulfate, and ammonium
Phosphate (PO43−) concentrations decrease gradually with depth from an average of 10.7 ± 1.1 µM in the uppermost ~30 m to 8.4 ± 0.4 µM in the lowermost ~30 m CSF-A (Figure F37). Sulfate (SO42−) concentrations are generally constant downhole with an average of 28.2 ± 0.4 mM and no prominent trends with depth despite some variability between 27 and 29 mM (Figure F37). Ammonium (NH4+) concentrations increase over the upper part of the core from below detection limit in the mudline sample to 95.6 µM at 49.06 m CSF-A (Figure F37). Below this depth, NH4+ decreases to a minimum of 5.5 µM at 133.55 m CSF-A. The increase in NH4+ in the upper layers of sediment could be related to NH4+ accumulation in interstitial water due to organic matter remineralization. The decreasing trend at depth might suggest presence of anaerobic oxidation of NH4+, perhaps through interactions with hydrothermal material and/or basalt.
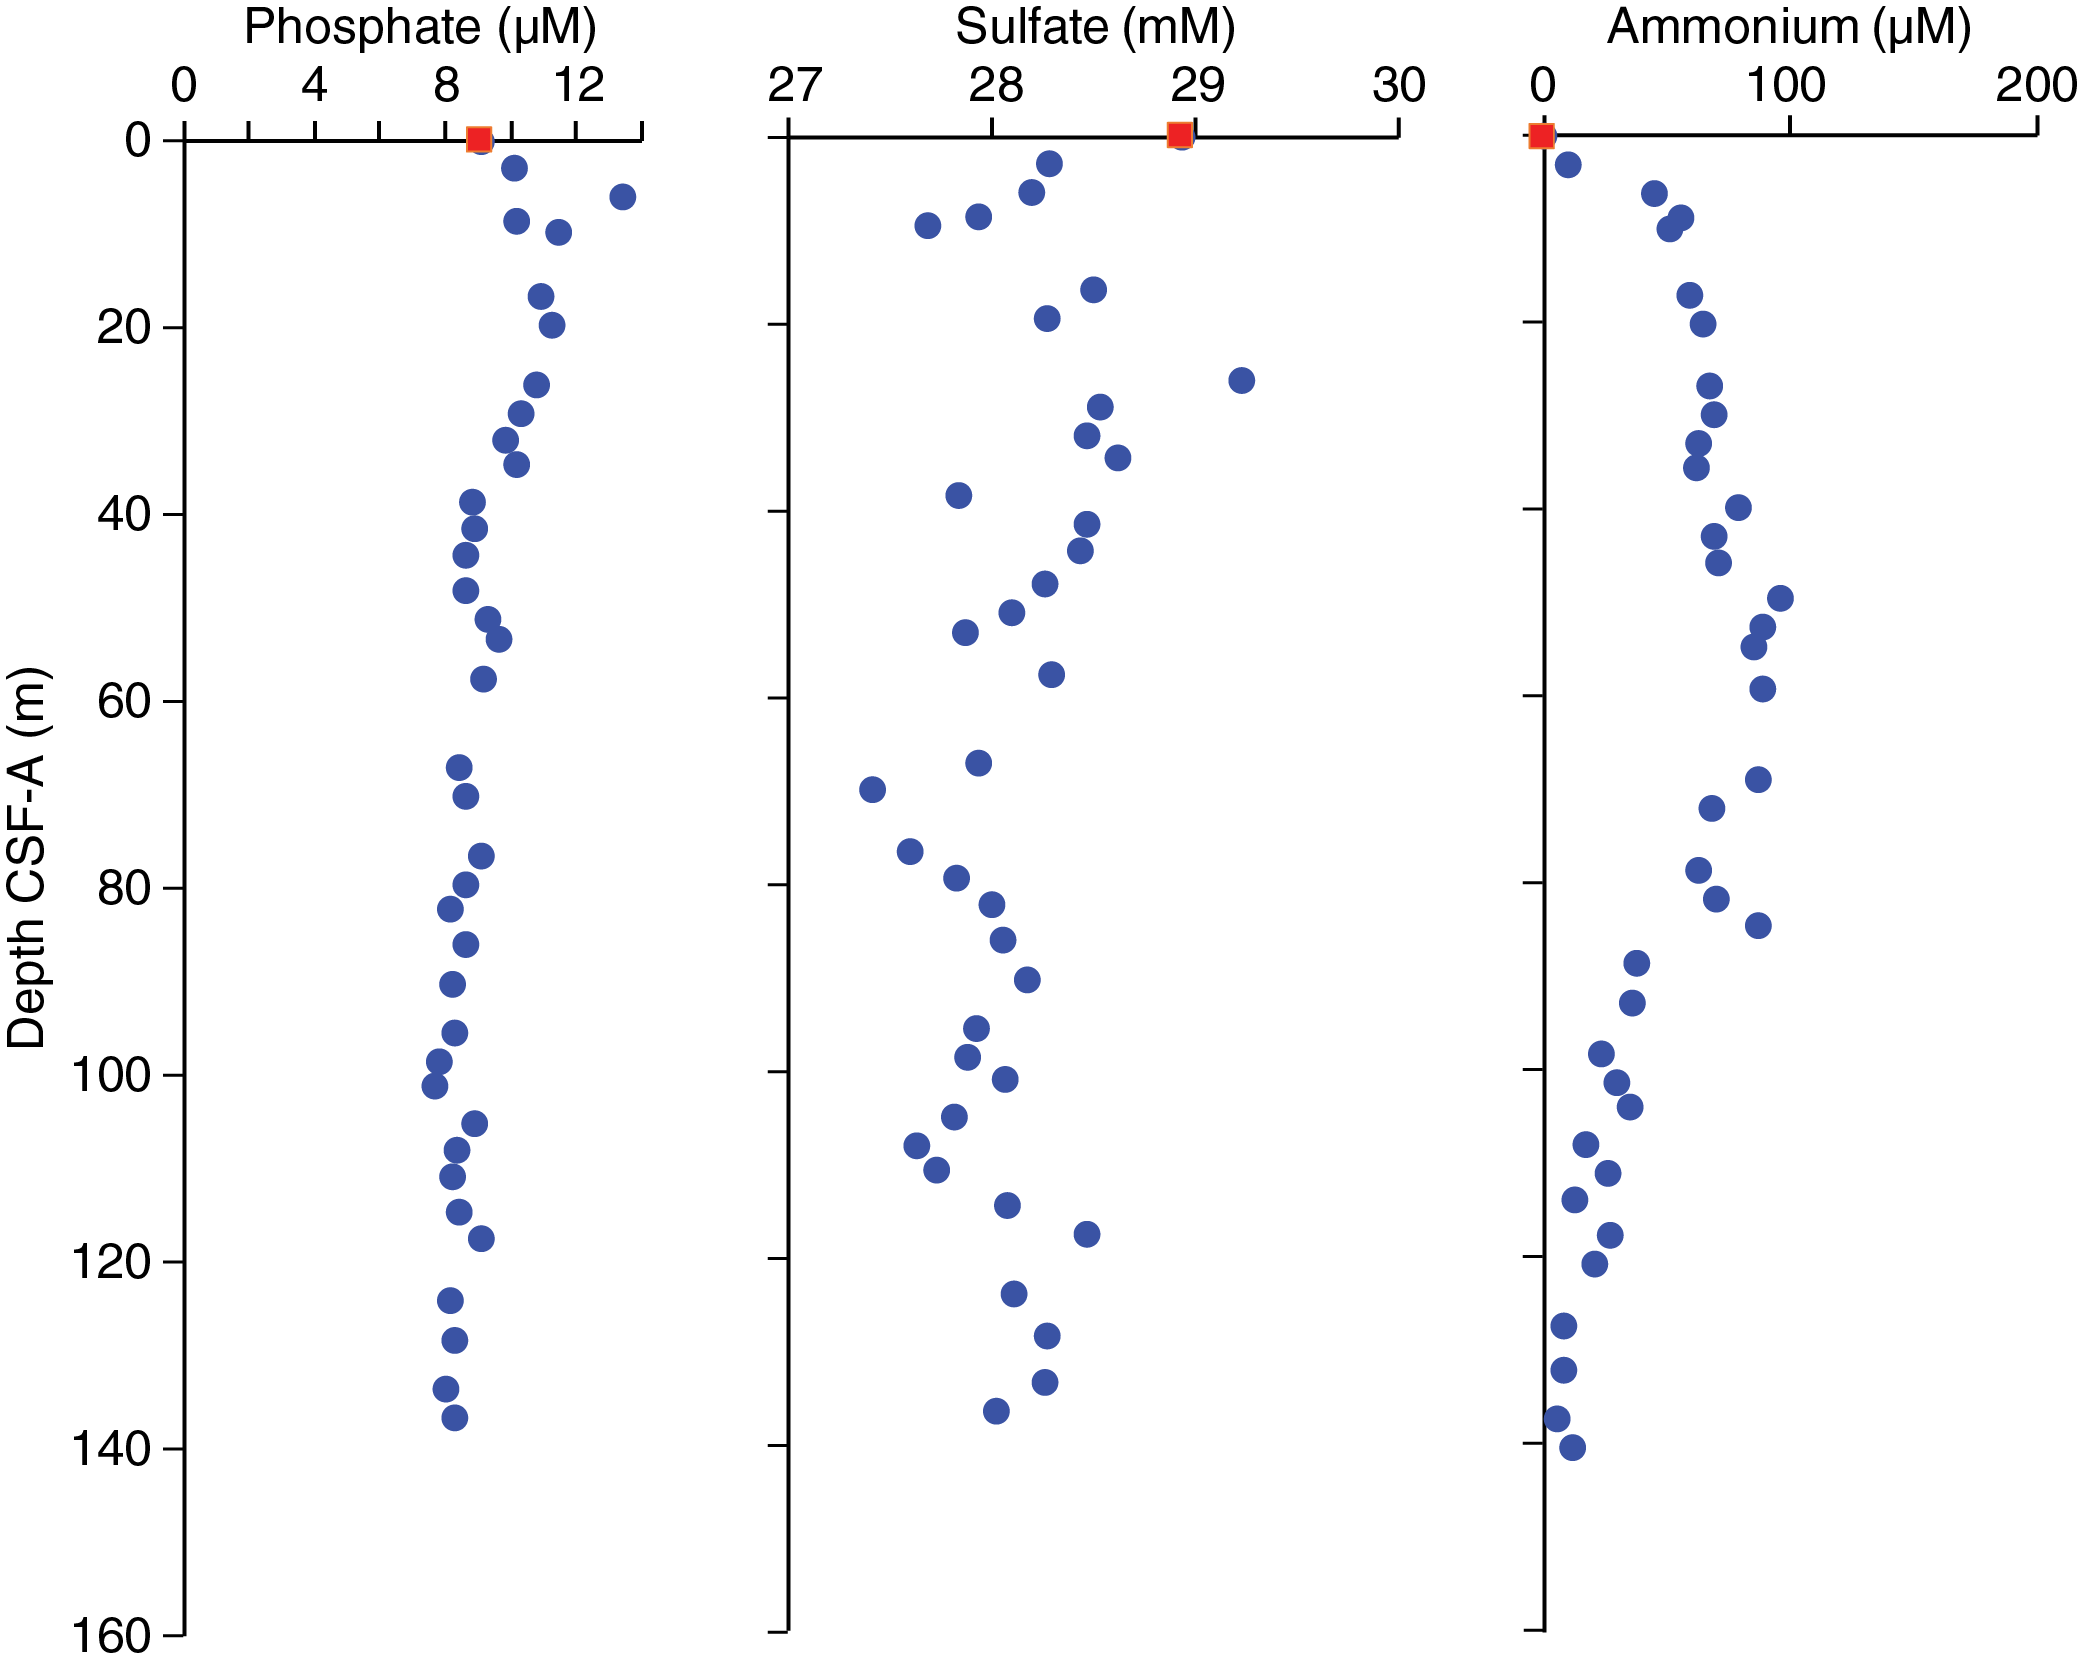
Figure F37. Interstitial water phosphate, sulfate, and ammonium.
Potassium, boron, and barium
Dissolved potassium (K) is generally constant in the interstitial water with depth and has an average concentration of 11.0 ± 0.4 mM (Figure F38). Boron concentrations exhibit a slight increase in the uppermost sediment, from 403 µM in the mudline sample to 448 µM at 16.56 m CSF-A, below which depth concentrations remain constant around an average of 428 ± 8 µM (Figure F38). Barium (Ba) concentrations are low in the interstitial water and between 0.13 and 0.55 µM throughout the record, with the exception of four higher values of 0.75 µM at 5.92 m CSF-A, 1.29 µM at 67.05 m CSF-A, 0.93 µM at 90.27 m CSF-A, and 0.83 µM at 124 m CSF-A (Figure F38).
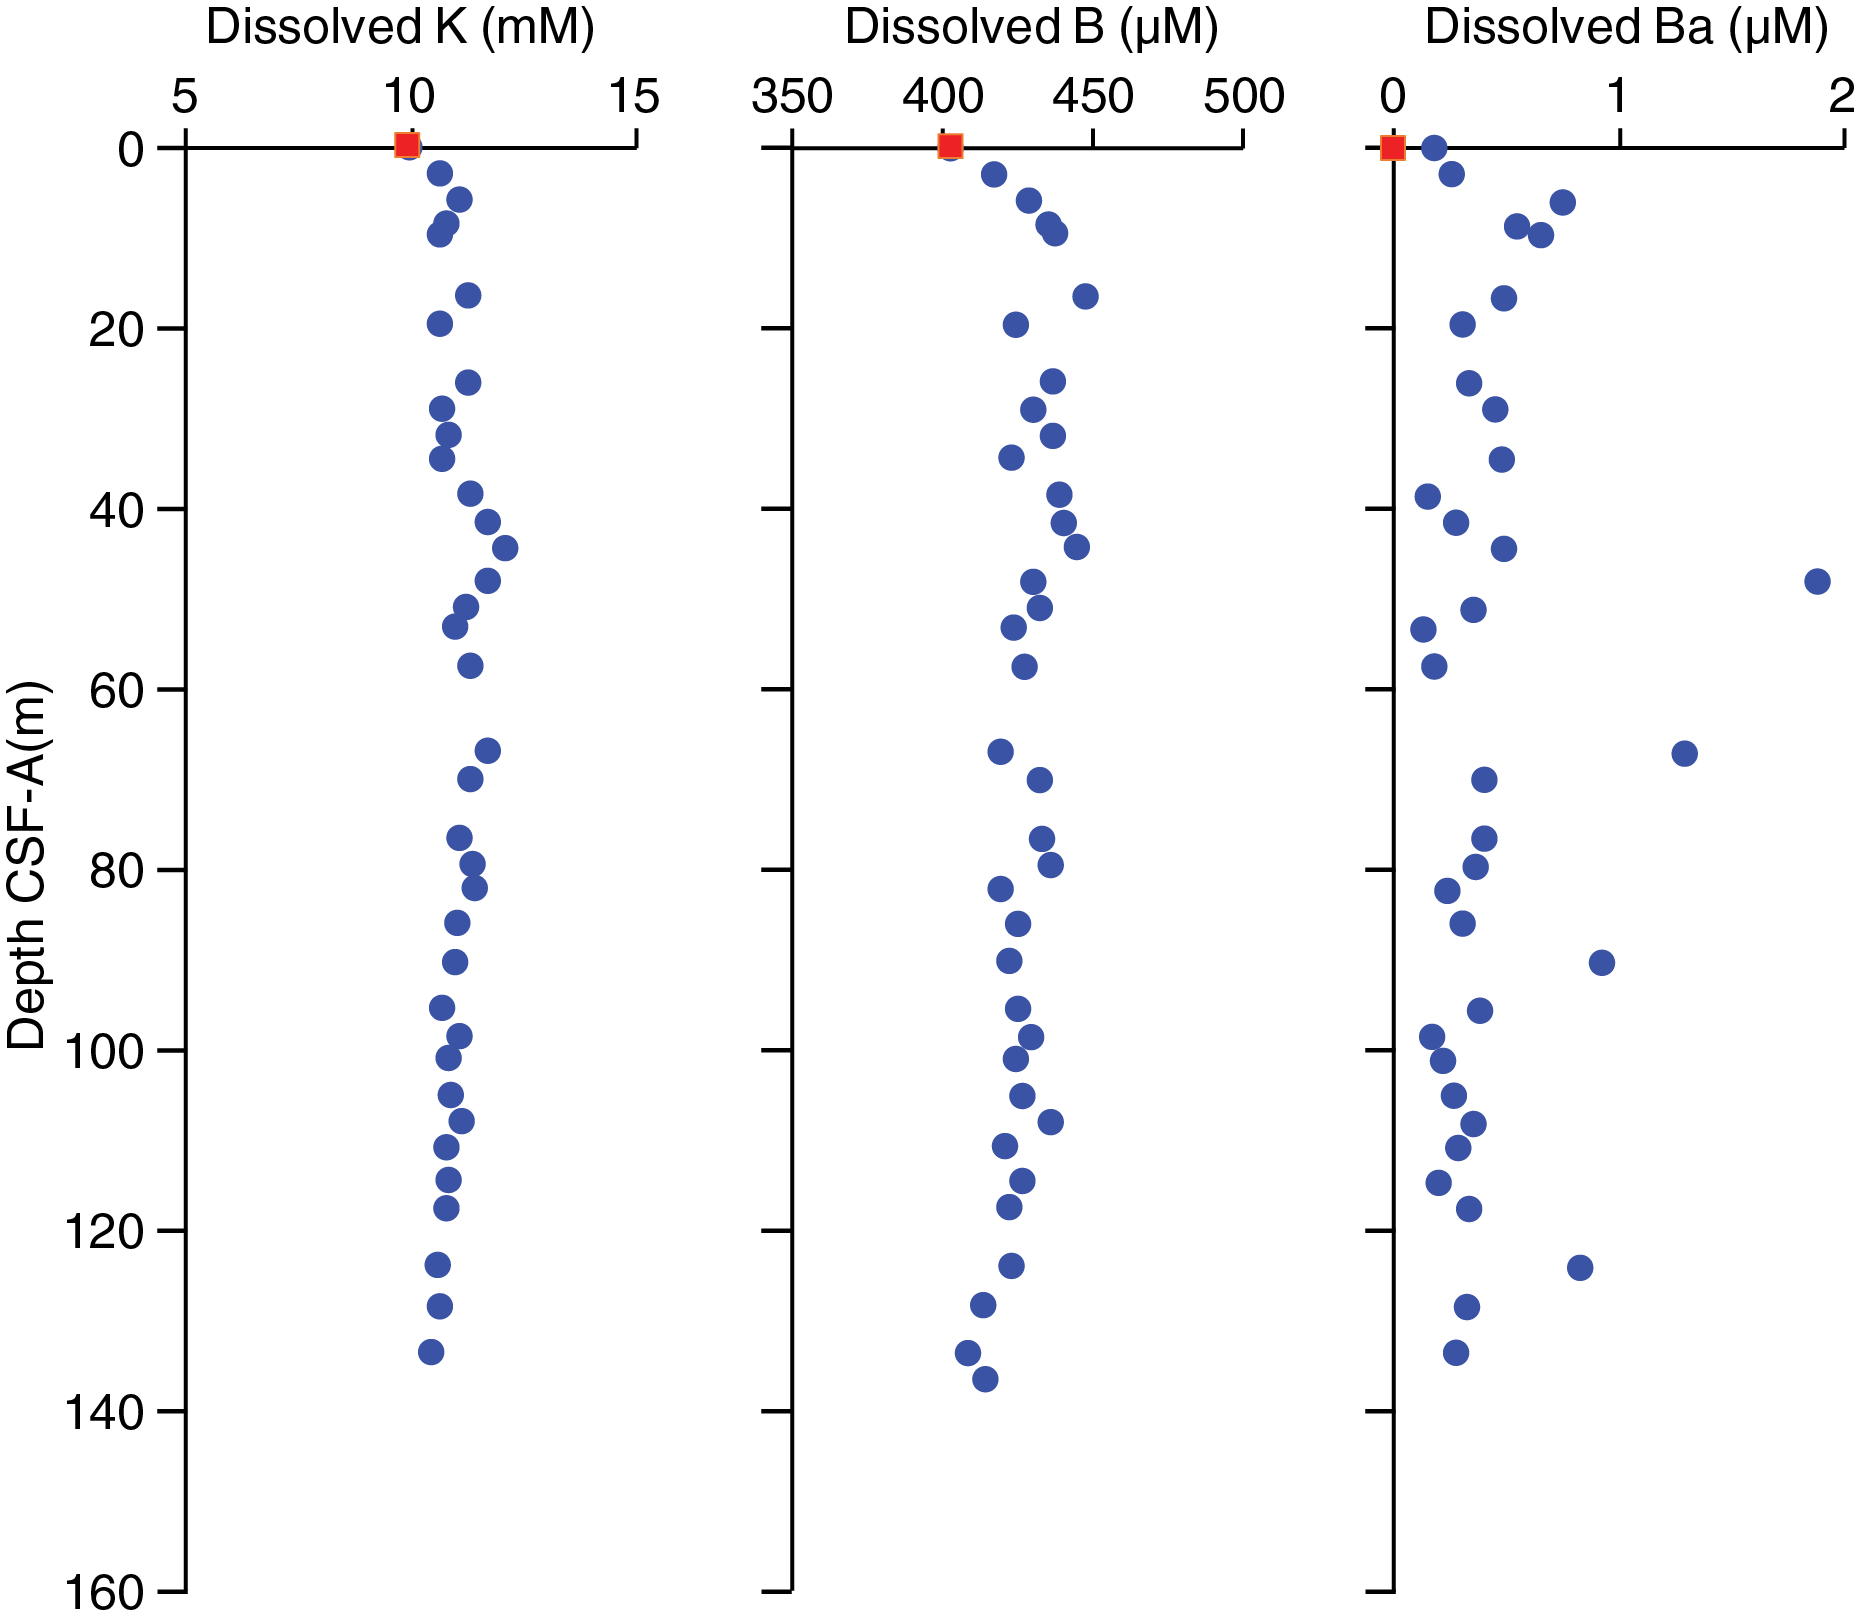
Figure F38. Interstitial water potassium, boron, and barium.
Bulk sediment
Calcium carbonate
Calcium carbonate (CaCO3) concentration measurements for Hole U1541B were obtained with a resolution of three samples per core except for Cores 383-U1541B-2H, 3H, 6H, and 7H, from which two samples per core were taken instead. For Hole U1541A, three CaCO3 samples were obtained from the one recovered core. The composite CaCO3 record of Holes U1541A and U1541B has a mean value of 68.6 wt% and a downhole variability ranging from 21.6 wt% at 1.1 m CSF-A to 92.7 wt% at 5.19 m CSF-A in Hole U1541A (Figure F39; see U1541-T3.xlxs in GEOCHEM in Supplementary material). CaCO3 measurements show a strong correlation with blue color intensity and color reflectance (L*) measurements (see Sedimentology).

Figure F39. CaCO3, TOC:TN, TN, and TOC.
Major and trace elements
A total of 16 samples taken for CaCO3 analyses from Holes U1541A and U1541B were also analyzed for major and minor element concentrations using inductively coupled plasma–atomic emission spectroscopy (ICP-AES) (see U1541-T4.xlxs in GEOCHEM in Supplementary material). Elemental oxides (namely MgO, K2O, Fe2O3, SiO2, and TiO2) show a strong positive correlation with a near zero intercept when plotted against aluminum oxides (Al2O3) (Figure F40). This correlation could indicate the presence of micaceous/clay minerals. In contrast, plots of Al2O3 versus MnO and P2O5 do not show any well-defined relation. Mn is a redox sensitive element and is also removed as carbonate minerals precipitate (Calvert and Pedersen, 1994). Precipitation of Mn carbonate might explain the lack of correlation between MnO and Al2O3. CaO shows a positive correlation against Al2O3.
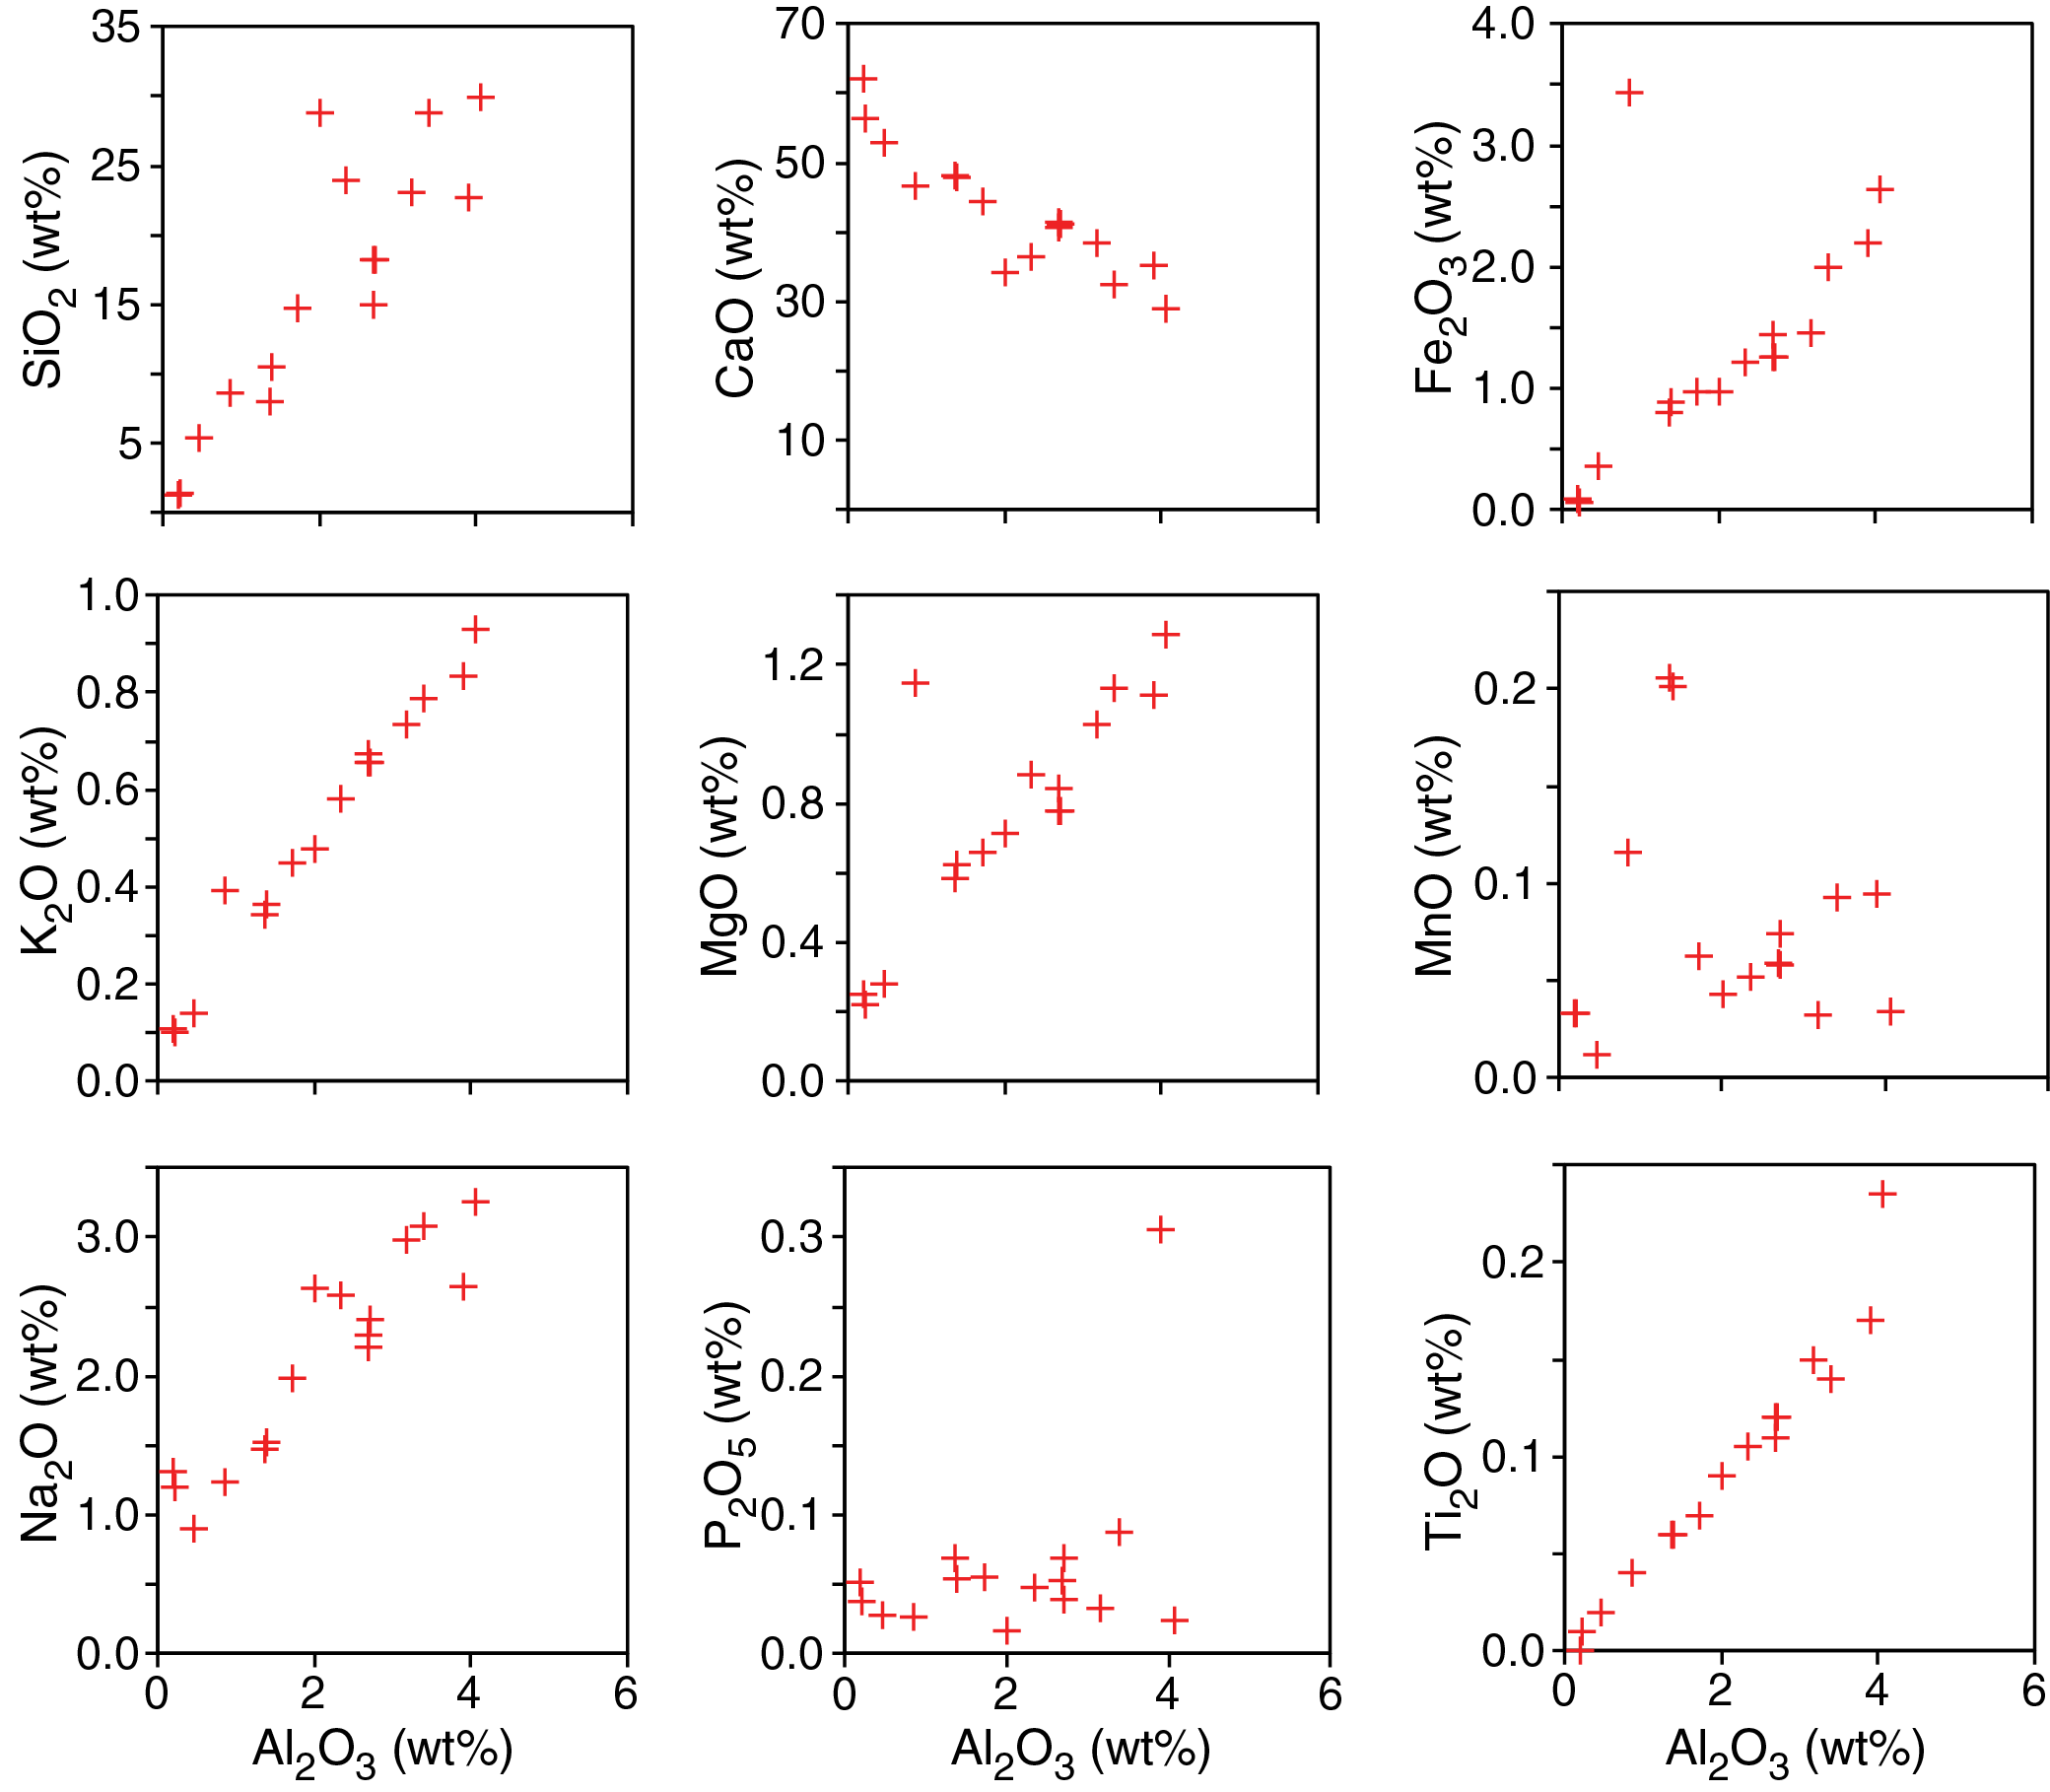
Figure F40. Bulk sediment elemental oxides vs. aluminum oxide.
Below 100 m CSF-A, measured Al, K, Fe, Ba, Mg, titanium (Ti), zinc (Zn), and zircon (Zr) in bulk sediment decrease in concentration in relation to their concentration values in the shallower sediments (Figure F41). Mn concentrations, however, show an abrupt increase between ~98 and 124 m CSF-A and a maximum of 1595 ppm at ~105 m CSF-A. The Mn concentration profile above 100 m CSF-A remains relatively constant at ~ 405 ppm. Most measured elements show an increase in the bottom sample at 135.85 m CSF-A (Figure F41), possibly indicating the influence of hydrothermal alteration or basaltic basement interactions on sediment composition. Downhole Sr and Ca concentrations show a strong similarity (Figure F41). Bulk sediment Ca primarily represents biogenic CaCO3; hence, covariation of Sr and Ca can be attributed to incorporation of Sr in biogenic CaCO3.
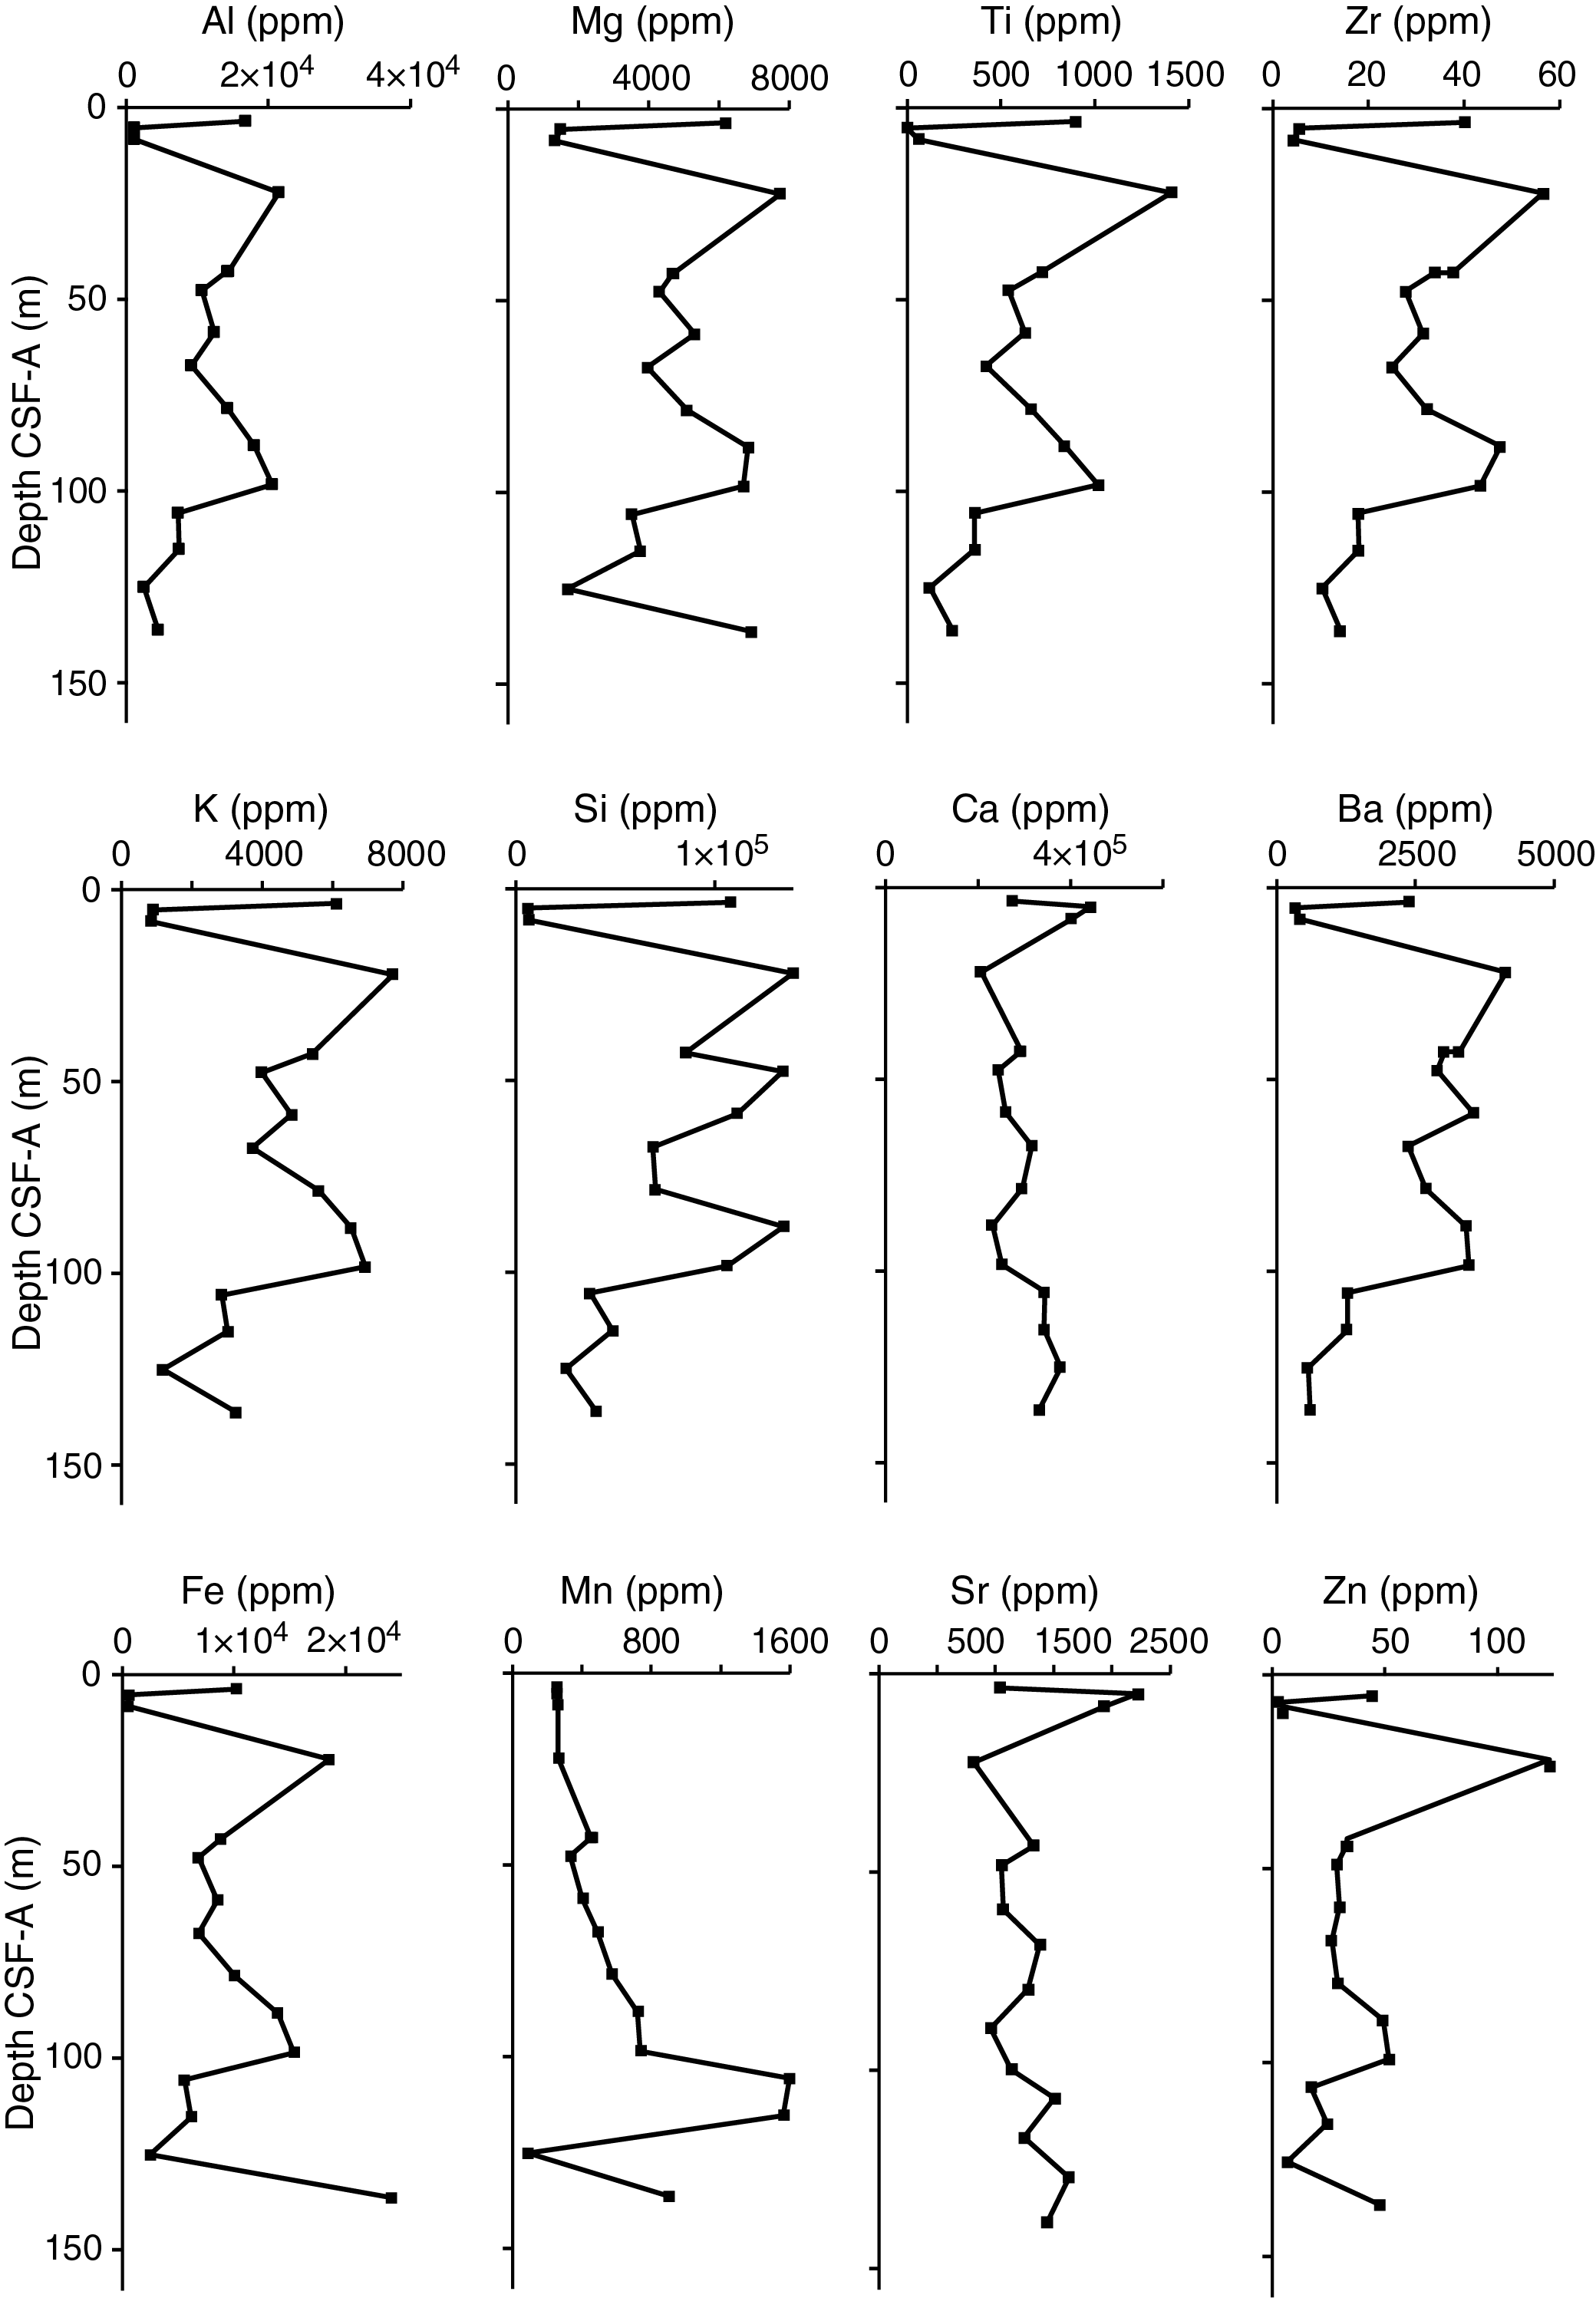
Figure F41. Bulk sediment major and minor element concentrations.
Organic carbon
All samples analyzed for CaCO3 were additionally subsampled for total carbon (TC) analysis. Total organic carbon (TOC) estimates were obtained by measuring the TC and subtracting the contribution of inorganic CaCO3 (see Sedimentary inorganic and organic carbon, nitrogen, and carbonate content in the Expedition 383 methods chapter [Winckler et al., 2021a]). The composite TOC record of Holes U1541A and U1541B shows a mean of 0.4 wt% and downhole variability ranging from 0.2 to 0.8 wt% (Figure F39; see U1541-T3.xlxs in GEOCHEM in Supplementary material). Considering the low mean TOC of 0.4 wt% at Site U1541, the relatively high standard deviation of internal standards (see Geochemistry in the Expedition 383 methods chapter [Winckler et al., 2021a]) produces high percent error in TOC measurements. Further shore-based analyses are required to refine these findings. The TOC record shows little correlation to the CaCO3 record (r2 = 0.11) downhole.
Total nitrogen
Samples were measured for total nitrogen (TN) simultaneously with TC. It was assumed that all the nitrogen detected in the sediment was organic in origin. The composite TN record of Holes U1541A and U1541B has a mean of 0.015 wt% and shows downhole variability ranging from 0.001 to 0.057 wt% (Figure F39; see U1541-T3.xlxs in GEOCHEM in Supplementary material). The net amplitude of TN variability and overall TN concentration decrease slightly downhole. The upper portion of the core between 0.7 and 81.71 m CSF-A has a mean TN value of 0.016 ± 0.009 wt%. The lower portion of the core from 84.45 to 137.00 m CSF-A has a mean TN value of 0.01 ± 0.004 wt%. These small values likely fall below the accurate detection limit of the instrument, given the relatively high standard deviation of internal standards (see Geochemistry in the Expedition 383 methods chapter [Winckler et al., 2021a]), and should therefore be interpreted with caution until shore-based analyses are collected. Therefore, the error associated with these low concentration measurements is too high for interpretation.
Organic carbon to organic nitrogen ratios
The ratio of TOC to TN from the composite record of Holes U1541A and U1541B has a mean value of 53 and shows downhole variability ranging from 7.5 to 630.8 (Figure F39; see U1541-T3.xlxs in GEOCHEM in Supplementary material). The maximum TOC:TN value coincides with a TN of 0.001 wt%, which falls below the detection limit of the elemental analyzer. This sample was run in duplicate to test results, and the difference in TOC:TN ratio between duplicates was 5.7. Excluding this peak, mean TOC:TN downhole is 38.1, which suggests that organic matter throughout Site U1541 derives from terrestrial sources (Meyers, 1994, 1997). Only one TOC:TN value of 7.5 falls within the range of algal-derived organic matter at 1.1 m CSF-A. All analyses should be interpreted with caution, however, because of the low TN detected at Site U1541.
Summary
The interstitial water composition is marked by an increase in alkalinity and pH in the upper ~5–8 m. This could have been caused by anaerobic organic matter oxidation through reduction of Mn oxides, Fe oxides, or SO42− (Soetaert et al., 2007), which might also explain the peak in dissolved Mn concentration at the surface. Decreasing trends in alkalinity and pH values below ~80 m CSF-A indicate the presence of chemical reactions that are supported in a hydrothermal setting (German and Von Damm, 2003). Fe concentrations are below detection limit deeper than 86.05 m CSF-A and could suggest precipitation of authigenic Fe or adsorption onto existing Fe oxides. Mn concentrations also show near zero values below 105.05 m CSF-A, indicating possible precipitation of Fe-Mn oxides/hydroxides or adsorption of Mn to Fe-oxides; scenarios consistent with Fe-Mn-rich hydrothermal fluid interacts with overlying seawater. The slight increase in Li concentration in the bottom sample might also indicate influence of hydrothermal fluid because hydrothermal input is one of the primary sources of Li to the oceanic Li budget. Should hydrothermal fluid dominate the interstitial water chemistry, we would expect high Si in the deeper part of the record. In contrast, Si concentrations tend to decrease in the bottom sections of the record, indicating that clay mineralogy or diagenetic reactions might have played a bigger role in shaping the interstitial water Si concentration profile. Given that the site is close to a hydrothermal ridge and the basement rock has been identified as basalt, interstitial water chemistry at depth (e.g., >80 m CSF-A) might represent some vestigial product of seawater-hydrothermal fluid-basalt interaction.
CaCO3 content is relatively high at this site. It never falls below 21.6 wt% and has a downhole average content of 68.6 wt%. TOC does not exceed 0.8 wt% and shows no clear correlation with CaCO3 content. TN is very low at this site, never exceeding 0.06 wt%, and low concentrations yield poor reproducibility of samples due to instrumental detection limits. The ratio of TOC:TN ranges between 7.5 and 126.4, with the exception of one major peak at 630.7. Therefore, mean values suggest a predominance of terrestrial input to the organic component of the sediment. However, the very high values (excluding the peak of TOC:TN at 70.5 m CSF-A) of the TOC:TN ratios are likely related to the extremely low values and poor reproducibility of TN measurements.
The bulk sediment elemental composition shows a marked increase in the contents of all metals toward the bottom of Hole U1541B at 135.85 m CSF-A, indicating interaction between basement rocks with the sediment. Oxide contents of Mg, K, Fe, Si, and Ti co-vary strongly with Al oxides, suggesting that these elements are present primarily in clay minerals. High coherency between downhole Ca and Sr concentrations suggest that Sr is incorporated in biogenic CaCO3.
Physical properties
Shipboard physical properties measured at Site U1541 comprise nondestructive whole-round measurements of GRA bulk density, magnetic susceptibility (MS), P-wave velocity using the Whole-Round Multisensor Logger (WRMSL) and NGR measurements on core sections from Holes U1541A–U1541C. Additional physical property data collected include thermal conductivity using a needle probe on whole-round core sections from Holes U1541B and U1541C. To support stratigraphic correlation and optimize drilling depths at subsequent holes to cover coring gaps, MS and GRA data were acquired while drilling Holes U1541A–U1541C before temperature equilibration using the Special Task Multisensor Logger (STMSL) at a 3 cm resolution with a 1 s GRA acquisition time and one MS measurement. The STMSL data were stored in the International Ocean Discovery Program Laboratory Information Management System (LIMS), but further use is discouraged because the more complete WRMSL and Section Half Multisensor Logger (SHMSL) data from all core sections also are available in LIMS. WRMSL measurements were carried out on all recovered sections, including sections with incompletely filled liners or partially water-filled sections. WRMSL data were processed to indicate measurements that were not representative of the sediment characteristics (see Physical Properties in the Expedition 383 methods chapter [Winckler et al., 2021a]). A number of discrete X-ray fluorescence (XRF) measurements were done on selected cores from Holes U1541B and U1541C.
After splitting the core sections, discrete samples were taken from the working halves representative of the defined lithostratigraphic units for moisture and density (MAD) measurements to determine porosity and bulk, dry, and grain density from Holes U1541A and U1541B. Discrete compressional wave velocity measurements were conducted on at least one working half of each core using the P-wave caliper (PWC) contact probe system on the Section Half Measurement Gantry (SHMG). Archive halves were measured with the SHMSL for MS and color reflectance (see Sedimentology).
Physical property data were used for hole-to-hole stratigraphic correlation and splicing (see Stratigraphic correlation). In line with the pelagic lithology at Site U1541, multiple physical property parameters display long-term cyclic changes and variability throughout the recovered strata. They generally correlate well with the alternating lithologies at Site U1541 over both short (e.g., less than a meter) and longer (e.g., several to tens of meters) timescales.
Magnetic susceptibility
Both whole-round measurements on the WRMSL and discrete point measurements on the SHMSL were used to characterize MS at Site U1541 (Figure F42). Both methods yielded a similar range of values and similar downhole variability. Values range from −2 to 18.5 IU (see Physical properties in the Expedition 383 methods chapter [Winckler et al., 2021a] for details on instrument units [IU; ~10−5 SI]) for the WRMSL and from −1 to 17 IU for the SHMSL. High values of >30 IU are attributed to individual outsized clasts or dropstones and are not representative of the overall sediment composition. At the top of some cores, high MS values are associated with identified dropstones that likely fell from the sides of the hole and accumulated at the bottom during the drilling process and thus were sampled at the top of these cores (e.g., Sections 383-U1541B-4H-1, 6H-1, and 7H-1). These sections, considered artifacts from the drilling, were removed from the spliced record in Figure F42. MS is higher at 34–54, 59–72, 77.2–85.3, and 89.6–127.5 m CCSF-A and below 140.7 m CCSF-A. The highest values in the MS record correspond to Lithostratigraphic Subunit IIIA. The increase of susceptibility values is observed at the transition from Subunit IIIB to Subunit IIIA at 127.51 m CCSF-A and corresponds to a transition from nannofossil ooze (Lithofacies 4) to diatom-rich nannofossil ooze (Lithofacies 3) (Figure F42) (see Sedimentology). This period of high susceptibility values extends to 89.65 m CCSF-A in Unit II, and the decrease corresponds to a transition from Lithofacies 3 to Lithofacies 4. Transitions in MS on depth scales of a few meters to tens of meters correspond generally to lithofacies changes. Diatom ooze (Lithofacies 2) or diatom-rich nannofossil ooze (Lithofacies 3) are associated with higher susceptibility values, and diatom-bearing and pure nannofossil ooze (Lithofacies 3 and 4, respectively) are typically associated with lower susceptibility values. This might indicate that increased diatom presence is generally associated with enhanced clay or ice-rafted debris transport to the site. Two notable exceptions are observed, one in the Lithofacies 4 portion of Core 383-U1541B-9H, representing the later part of the warm Pliocene where high susceptibility is associated with carbonate-bearing nannofossil ooze, and the other near the bottom of the site where high susceptibility is associated with nannofossil ooze (Lithofacies 4) and clay-bearing biogenic ooze (Lithofacies 6).
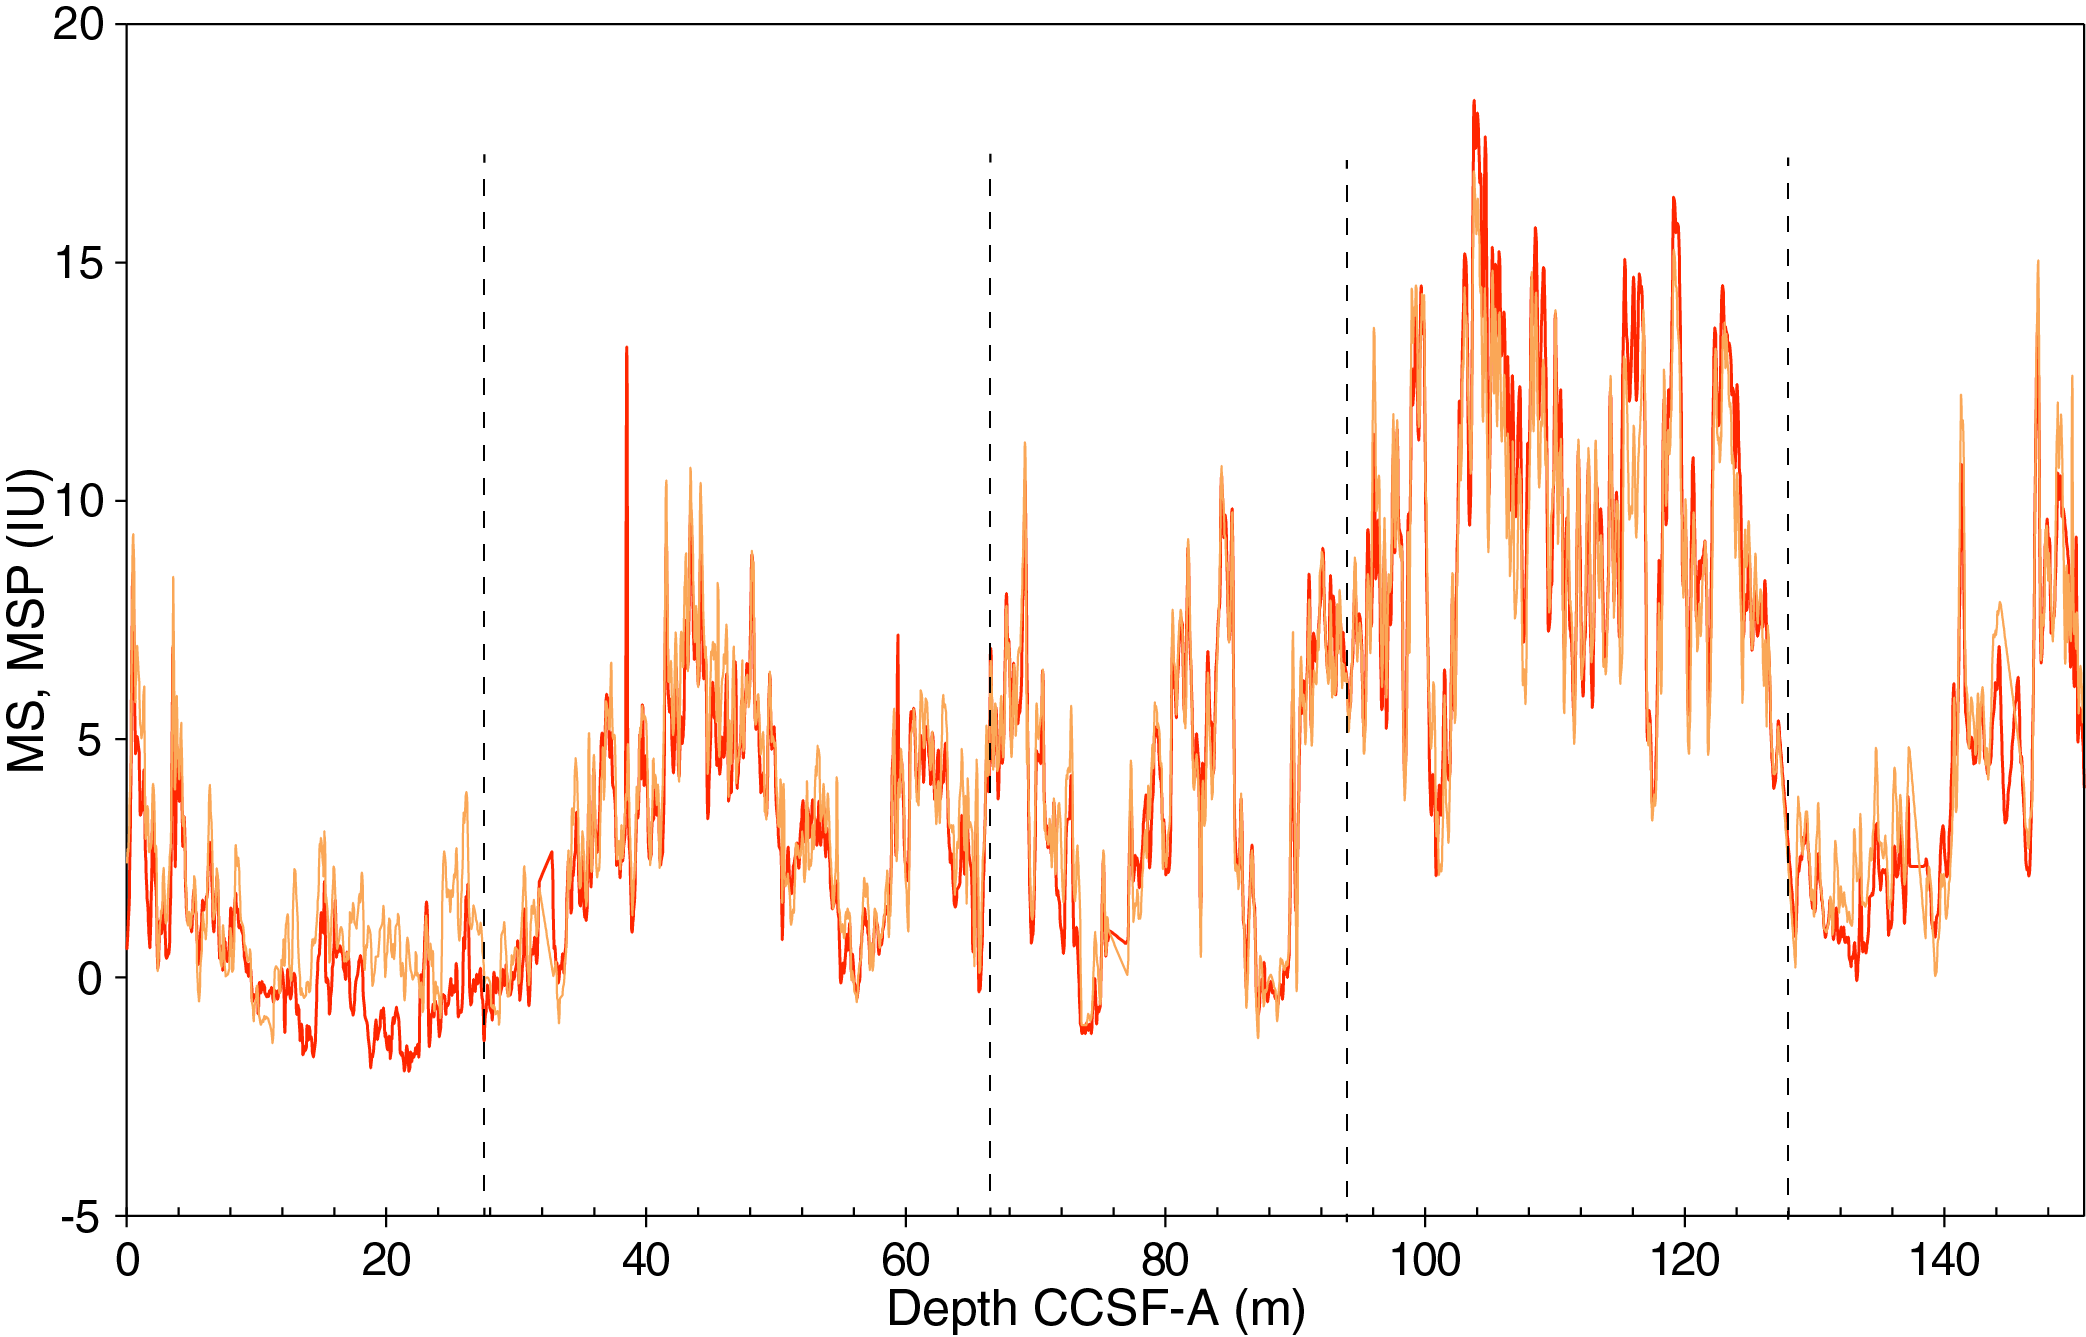
Figure F42. Splice data: magnetic susceptibility.
Natural gamma radiation
NGR density-normalized measurements show downhole variations between about 4 and 35 counts/s, and the highest values are from the uppermost 10 m (Figure F43). NGR variations match well with MS variations except for one NGR peak at 88.7 m CCSF-A that coincides with a MS minimum (Figure F44).
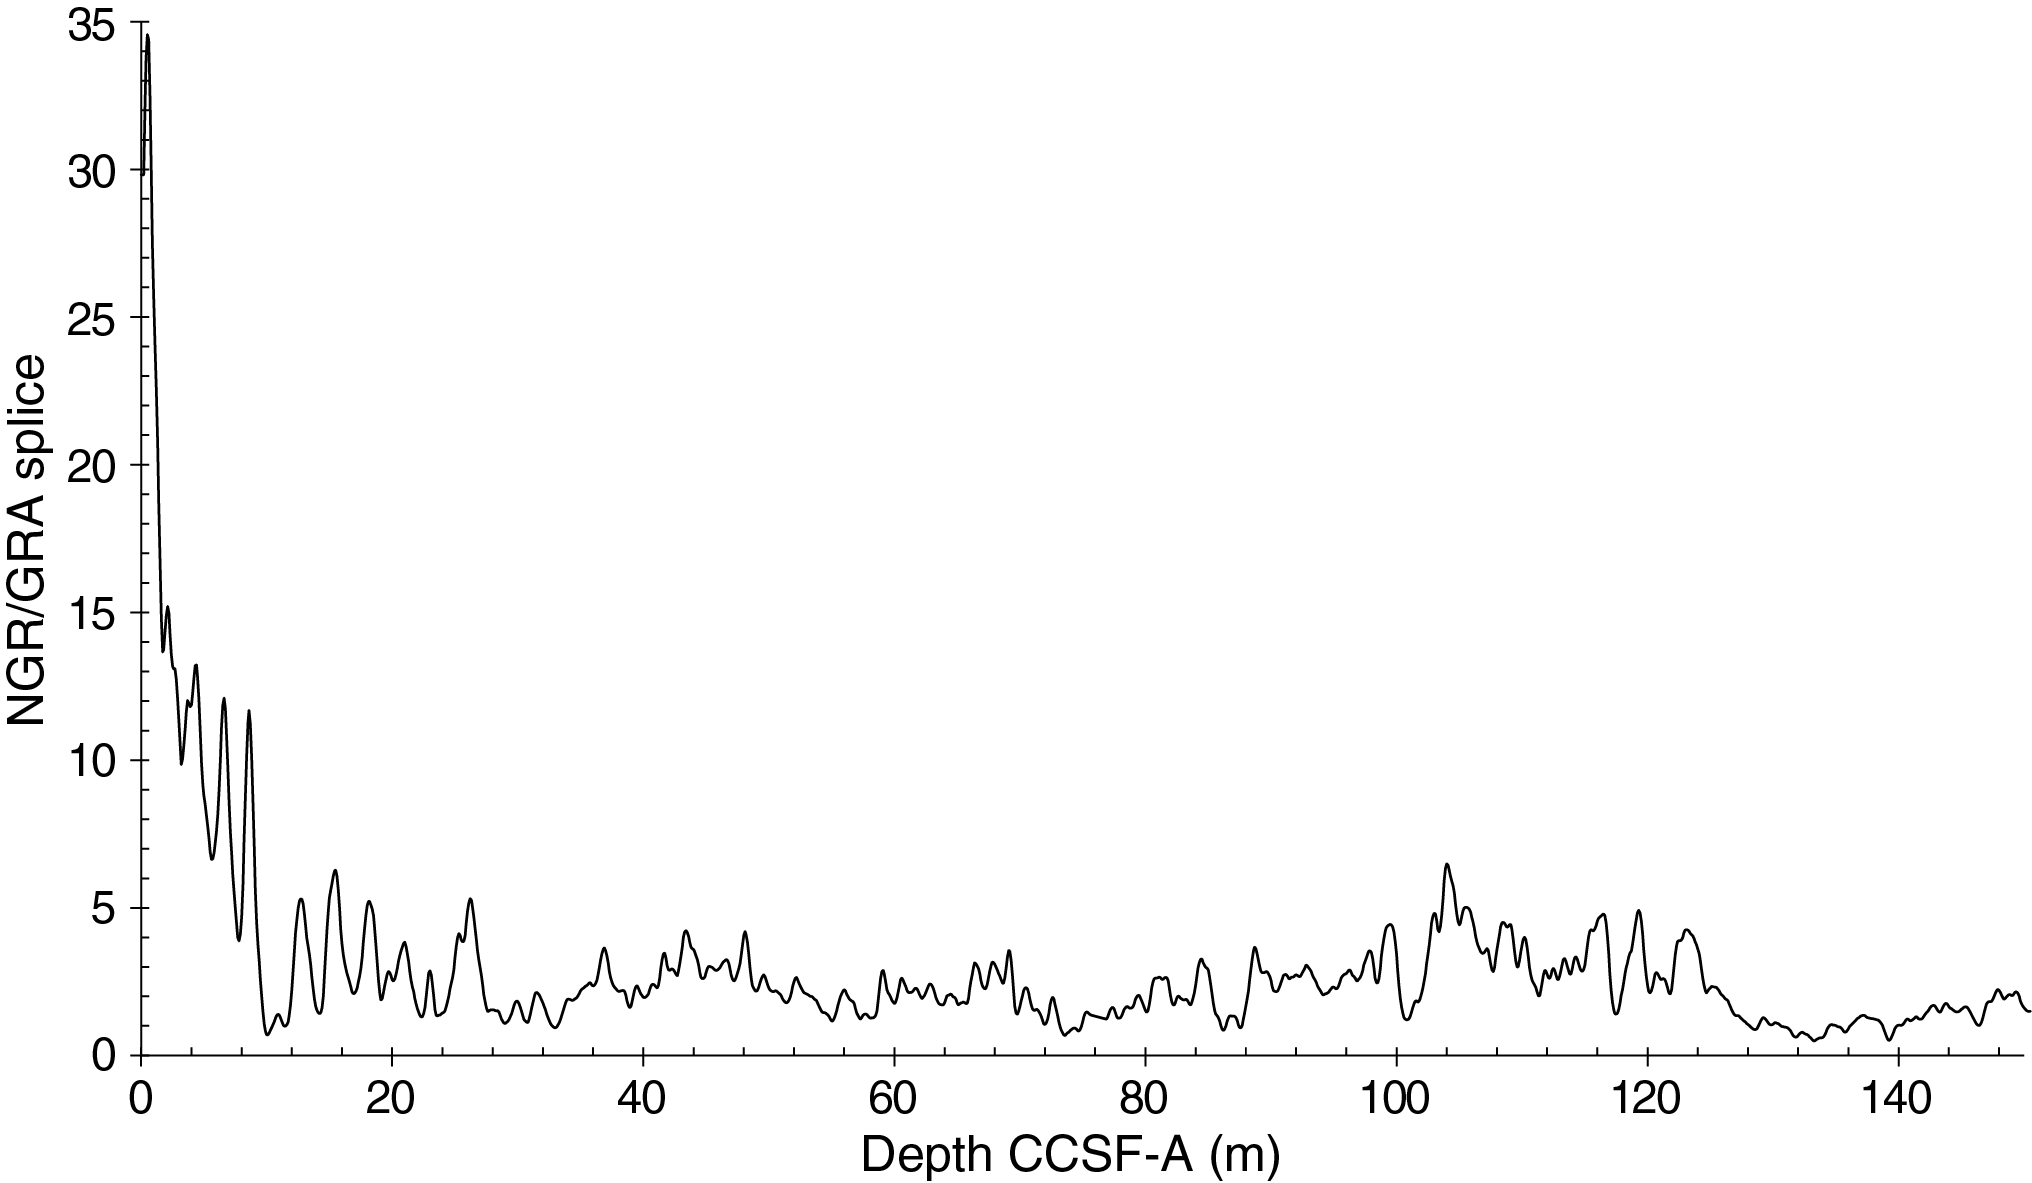
Figure F43. Splice data: density-normalized NGR-derived bulk density.
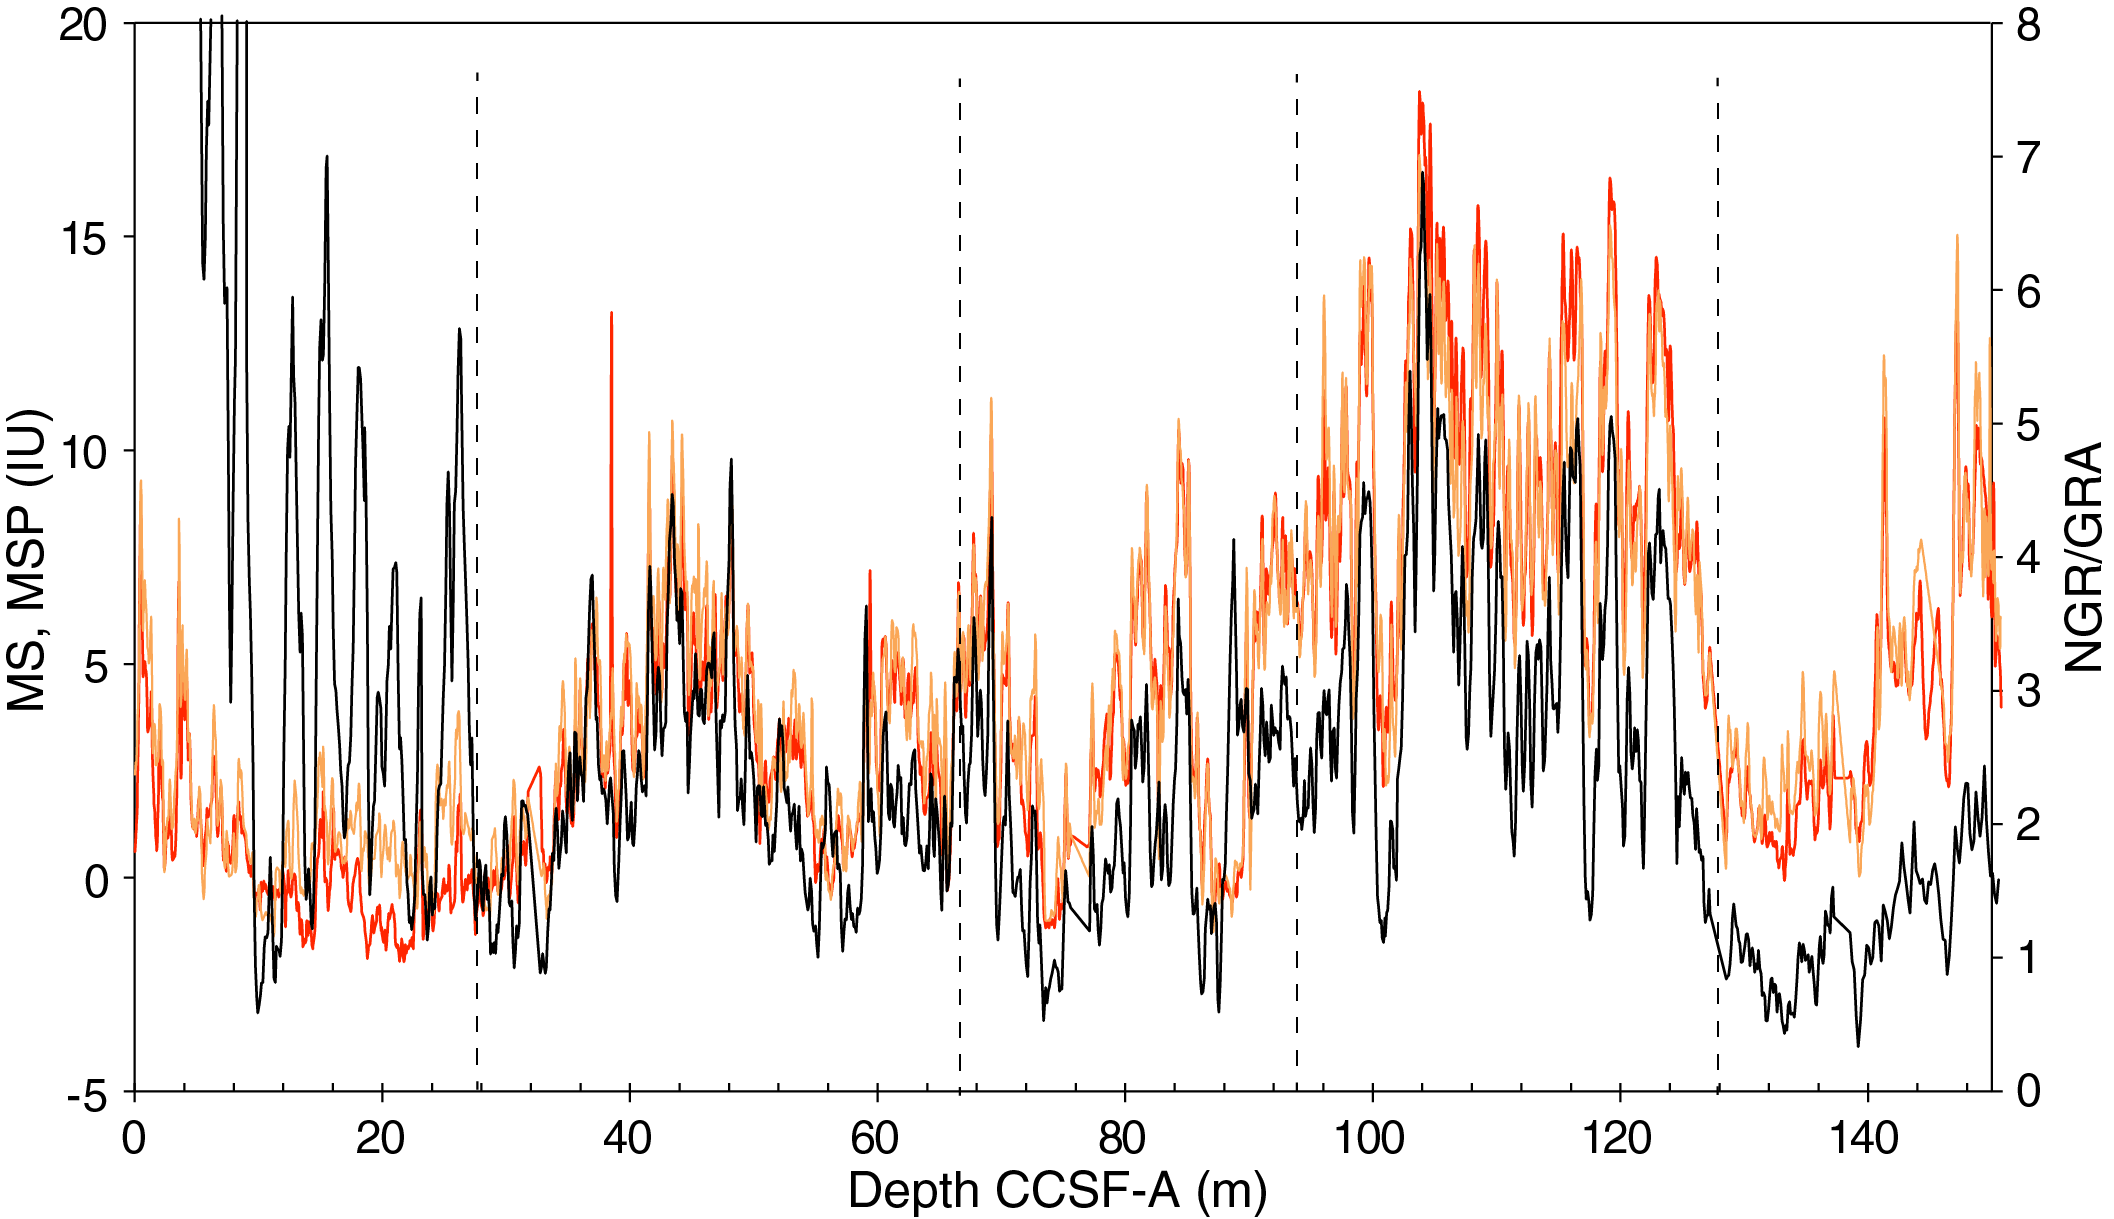
Figure F44. Splice data: density-normalized NGR and magnetic susceptibility.
In addition, we deconvolved Site U1541 NGR counts into low-resolution (semi)quantitative concentrations for the elements K, Th, and U (Figure F45), following the methods of Dunlea et al. (2013) and De Vleeschouwer et al. (2017). All three elements follow similar patterns, exhibit clear cyclic peaks, and correlate well with MS values. Although U and Th show less pronounced peaks than K because of their lower concentrations and maximum attainable resolution in the NGR data, they may provide initial information about sedimentation regime changes and sediment redox conditions (e.g., Jacobel et al., 2017). Higher total NGR counts, as well as the individual elemental data, which most likely indicate higher contents of siliciclastic material (primarily clay minerals), correlate with maxima in MS. The peak at 88.7 m CCSF-A described above corresponds to a peak in U that does not show up in Th or K of the NGR deconvolved records. The U peak at Site U1541 appears to match a U peak observed at Site U1540 (210.9 m CCSF-A) and likely represents a peak in authigenic U.
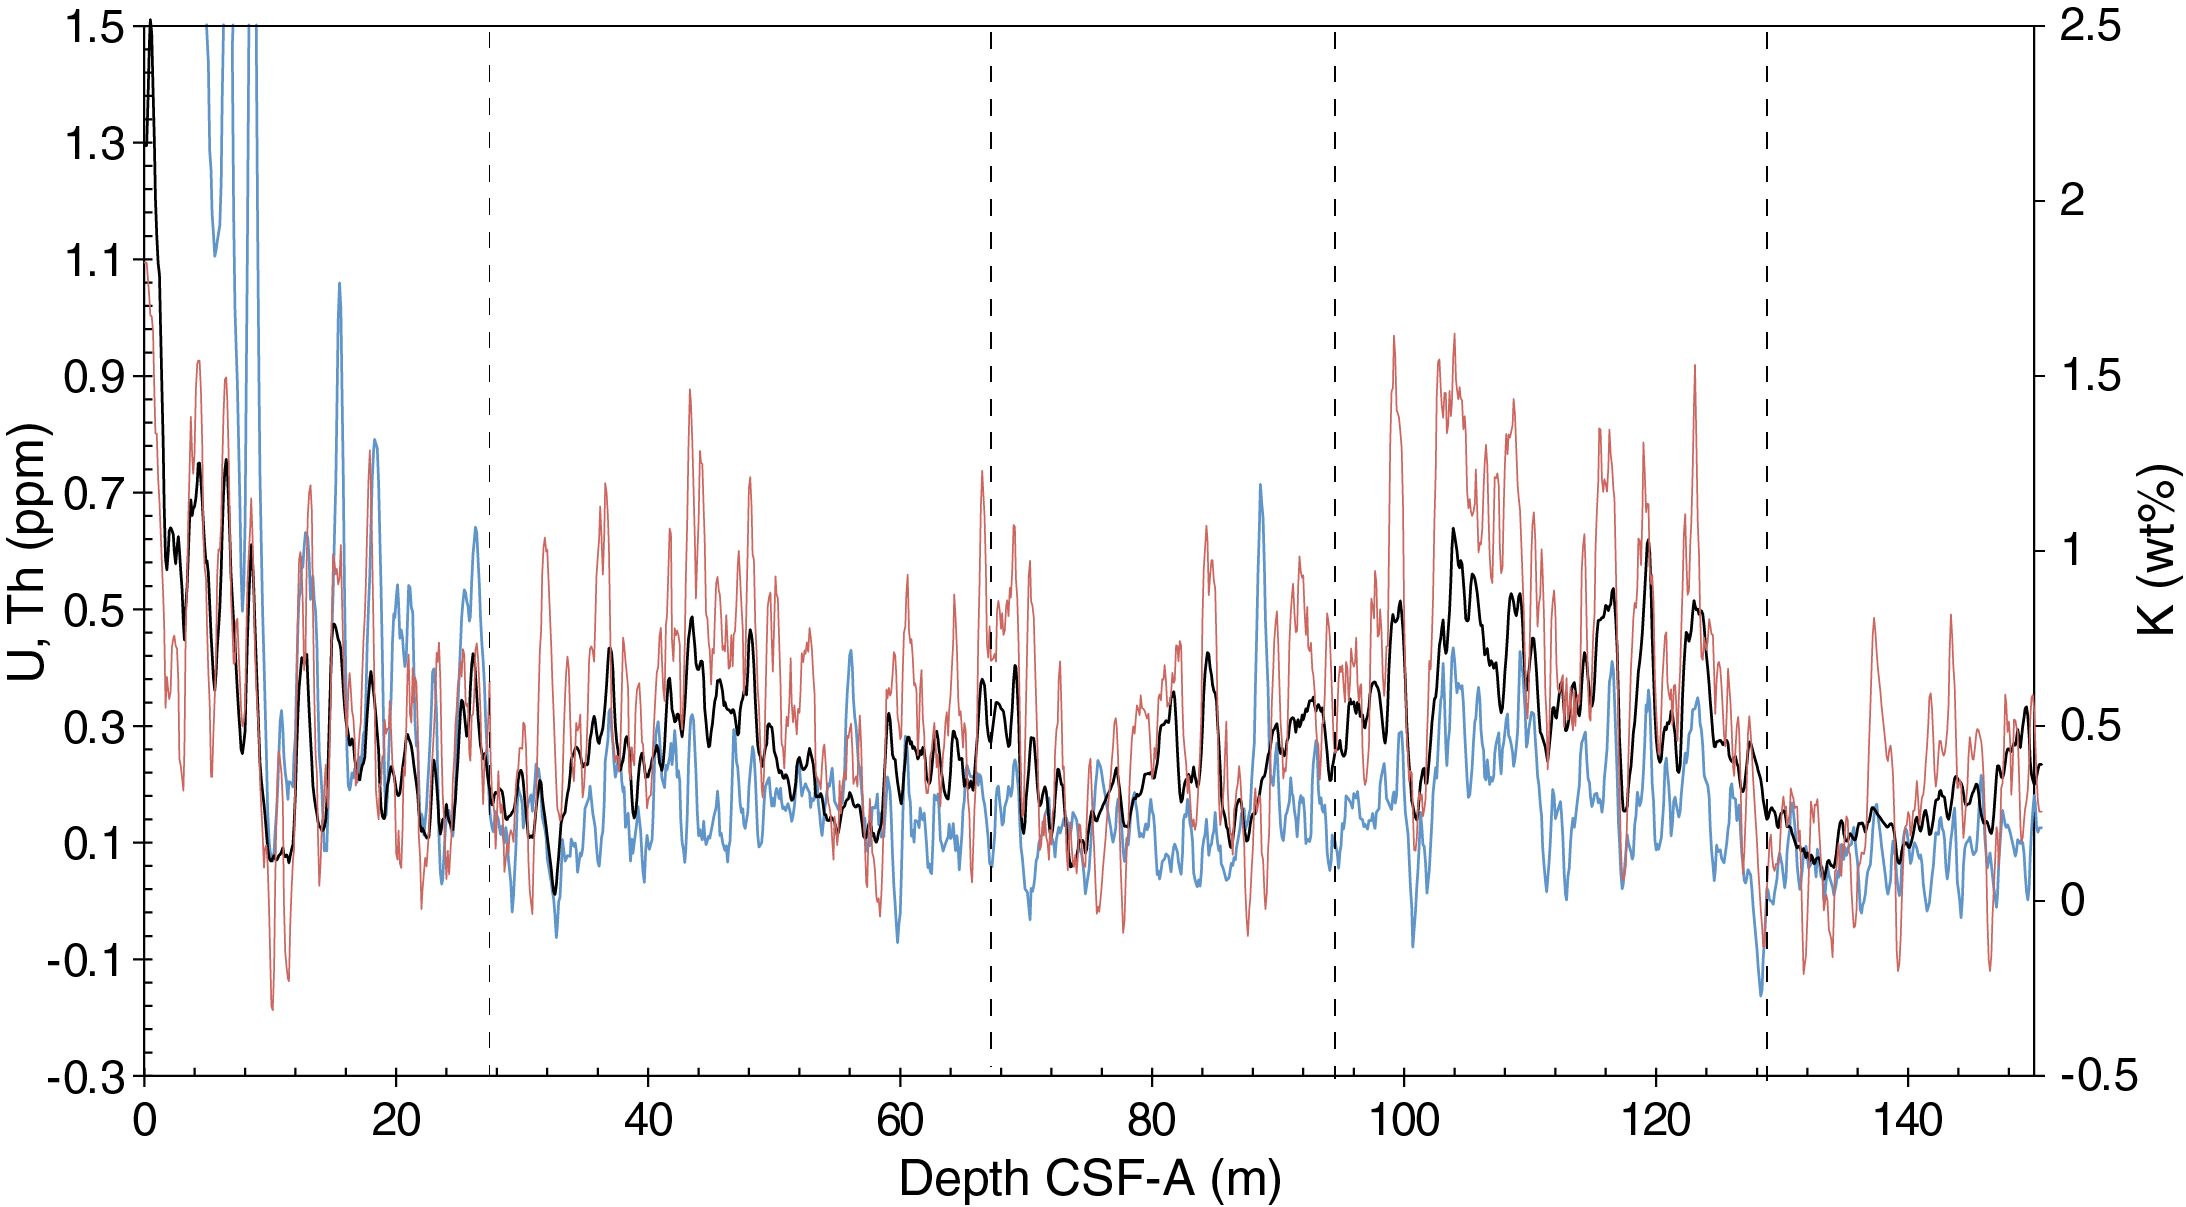
Figure F45. Splice data: K, U, and Th.
Measurements with a portable XRF spectrometer were performed on selected cores from Hole U1541C (Figure F46). K analyses are in good agreement with NGR-derived K concentrations and show similar variability, except in the upper part of the record where NGR indicates high values that might not be representative of K concentrations.
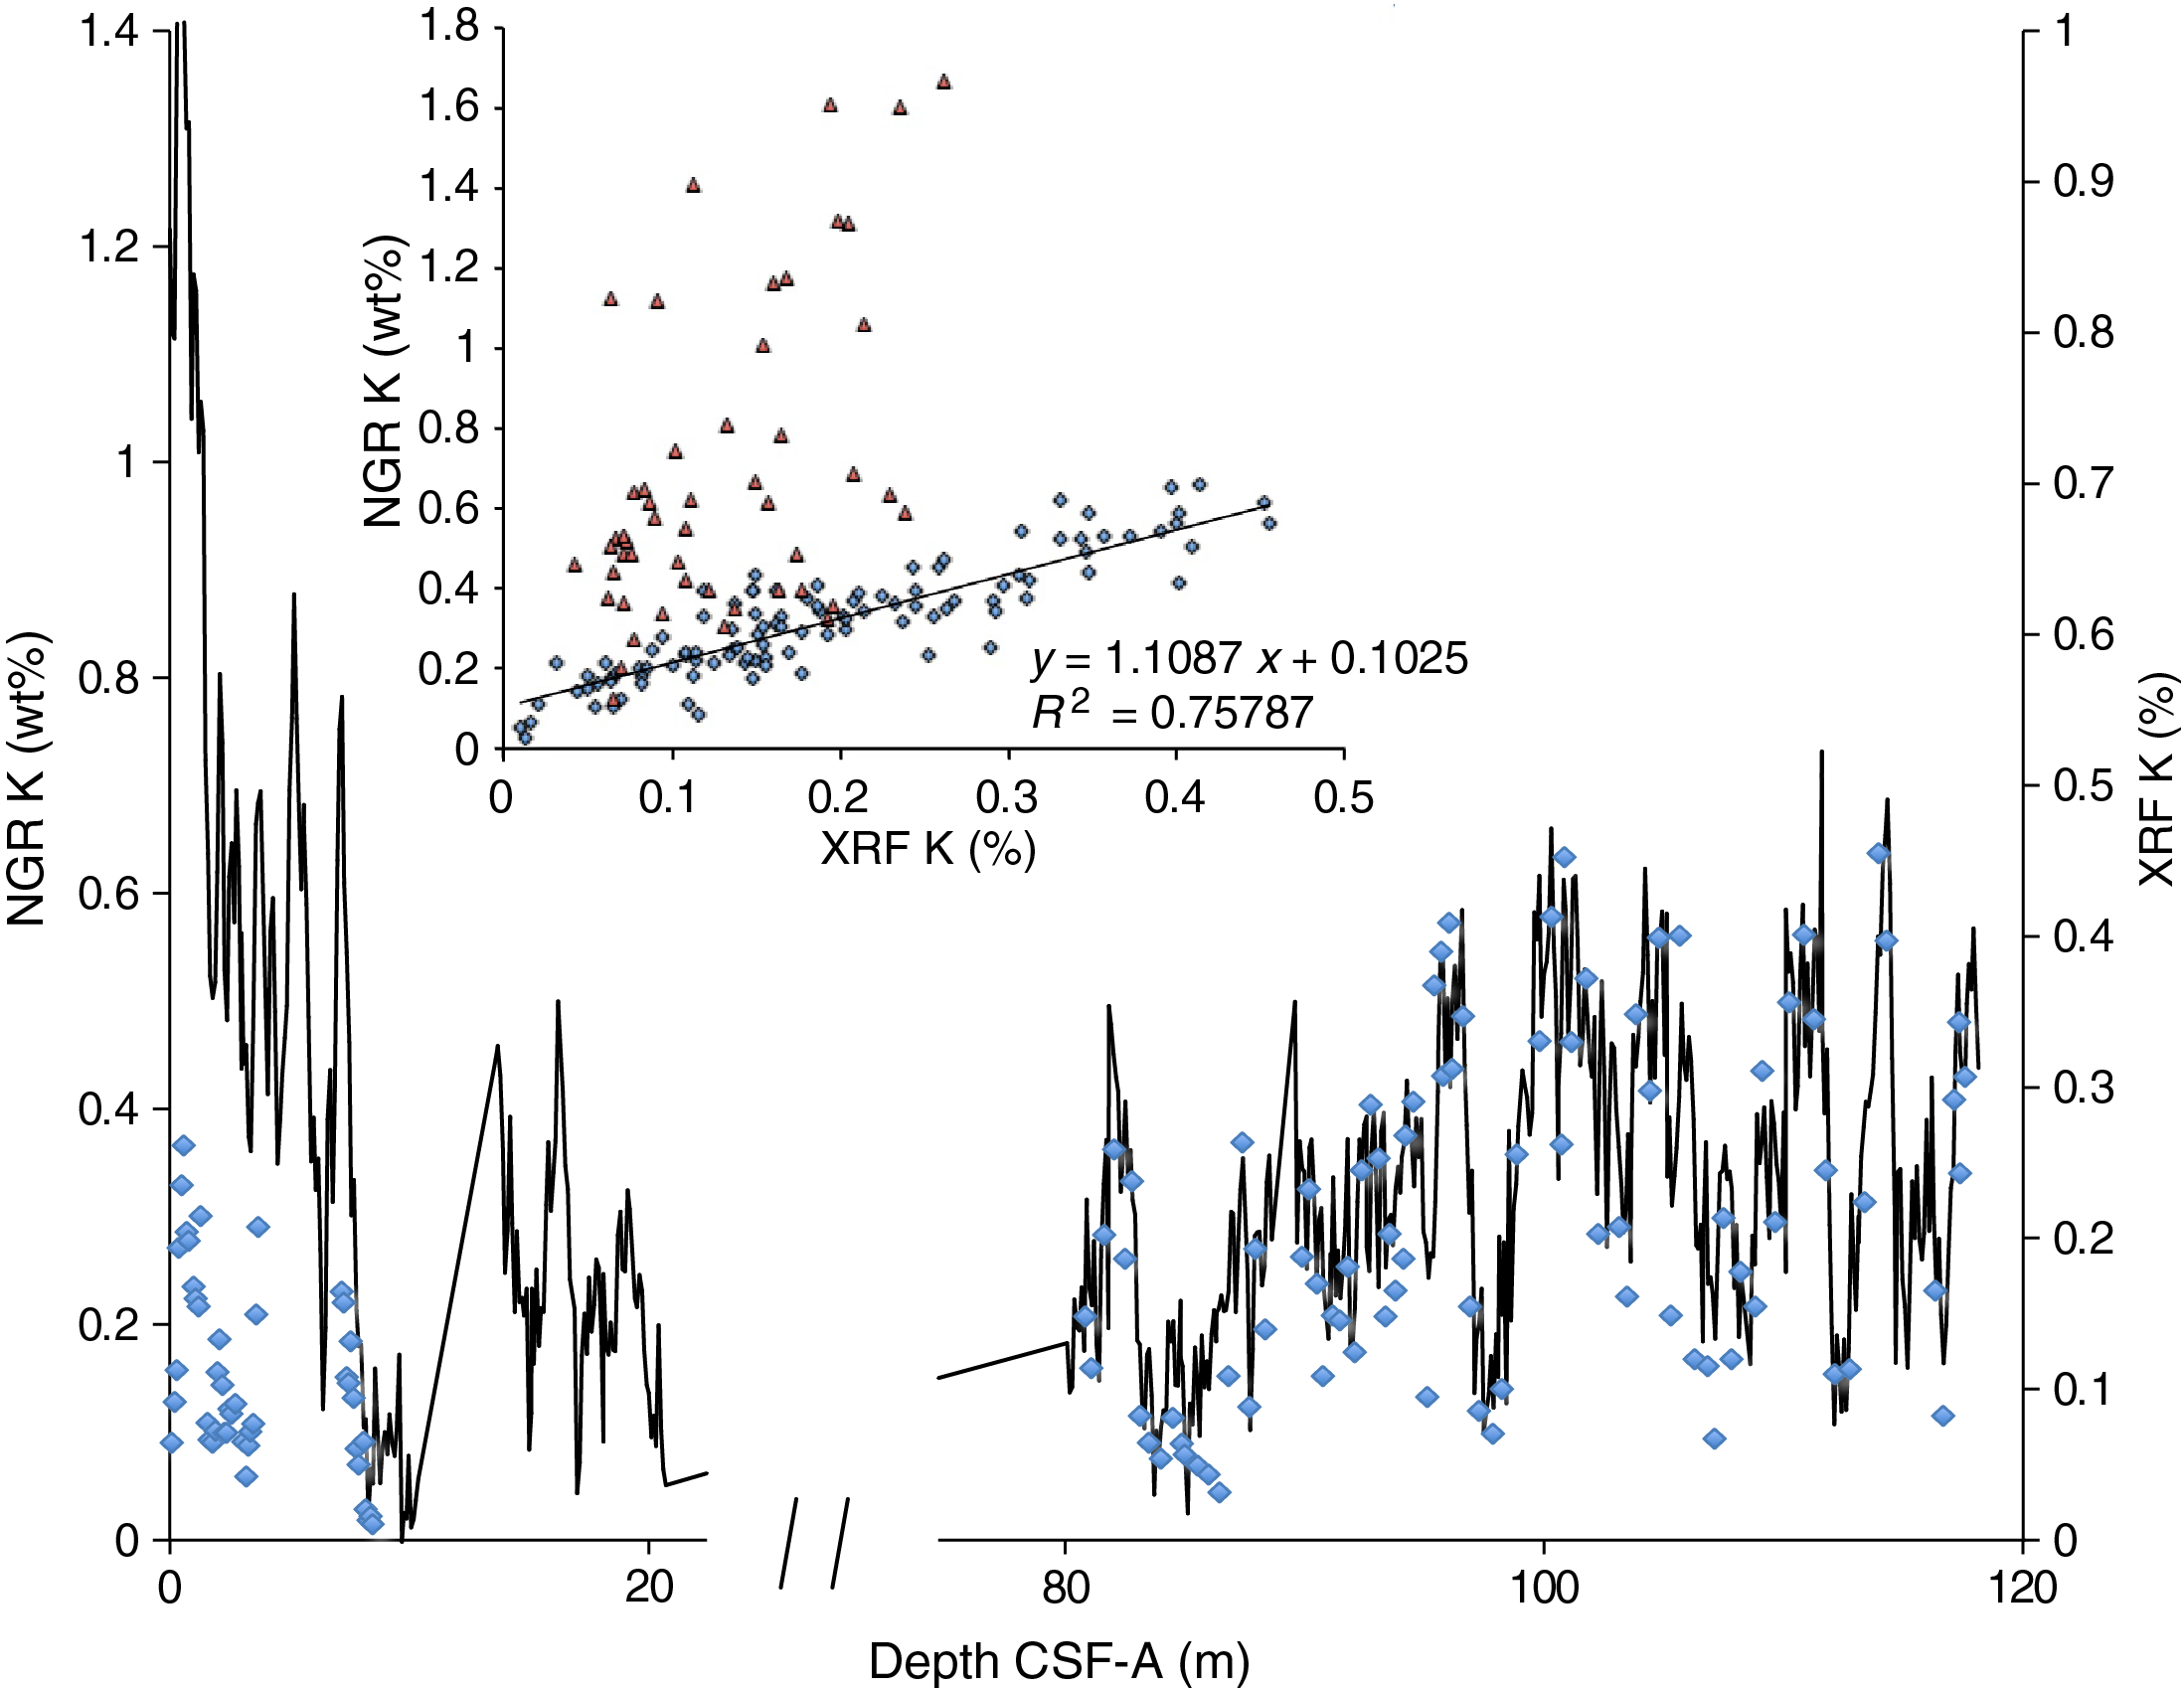
Figure F46. Potassium.
Bulk density, grain density, and porosity
We used GRA measurements at 2 cm spacing and discrete MAD values (44 samples) to evaluate changes in bulk density at Site U1541. GRA bulk density values throughout Holes U1541A and U1541C vary from 1.2 to ~1.85 g/cm3, and discrete MAD values range from 1.27 to 1.78 g/cm3 (Figure F47). Bulk density calculated from discrete MAD samples correlates well with the GRA and displays similar downhole trends in Holes U1541A and U1541C, leading to a high correlation coefficient of r2 = 0.94 between both methods across all encountered lithofacies (Figure F47). The highest GRA values (1.55–1.86 g/cm3) occur in the lowermost Miocene Subunit IIIB and are higher than the GRA values measured at Sites U1539 and U1540, where these older sediments were not recovered. Subunit IIIB and the central part of Unit II, which mainly correspond to Lithofacies 4, represent higher density values and lower-frequency changes than Unit I and Subunit IIIA, where the relative fraction of diatom and nannofossil content alternates. Where the diatom content varies most, in Lithofacies 2 and 3, GRA undergoes large and rapid variations. In Subunits IA and IB, large-amplitude GRA variations are linked to the alternation of diatom ooze (Lithofacies 2) during glacial periods and to diatom-bearing nannofossil oozes (Lithofacies 3) during interglacial periods. Although the GRA record displays changes over several meters in Subunit IA and the top part of Subunit IB, higher frequencies (~1 m) are seen in the GRA record in Subunit IB and in the lowermost meters of Unit II, probably corresponding to the 40 ka world of the early Pleistocene. GRA results strongly correlate with the carbonate content (r2 = 0.81) from Unit I through Subunit IIIA. Including Subunit IIIB, the correlation coefficient decreases to 0.77 because of higher GRA values for similar high carbonate content. In Subunit IIIA and through most of Unit II, GRA and MS are highly anticorrelated (Figure F48). This was also observed in the Pliocene interval at Site U1540. Diatoms are present in these units but are less abundant, resulting in lower amplitude variability in GRA. Probably the lower accumulation of ice-rafted debris and dropstones in those units removes the correlated presence of some MS and GRA peaks as seen in Unit I.
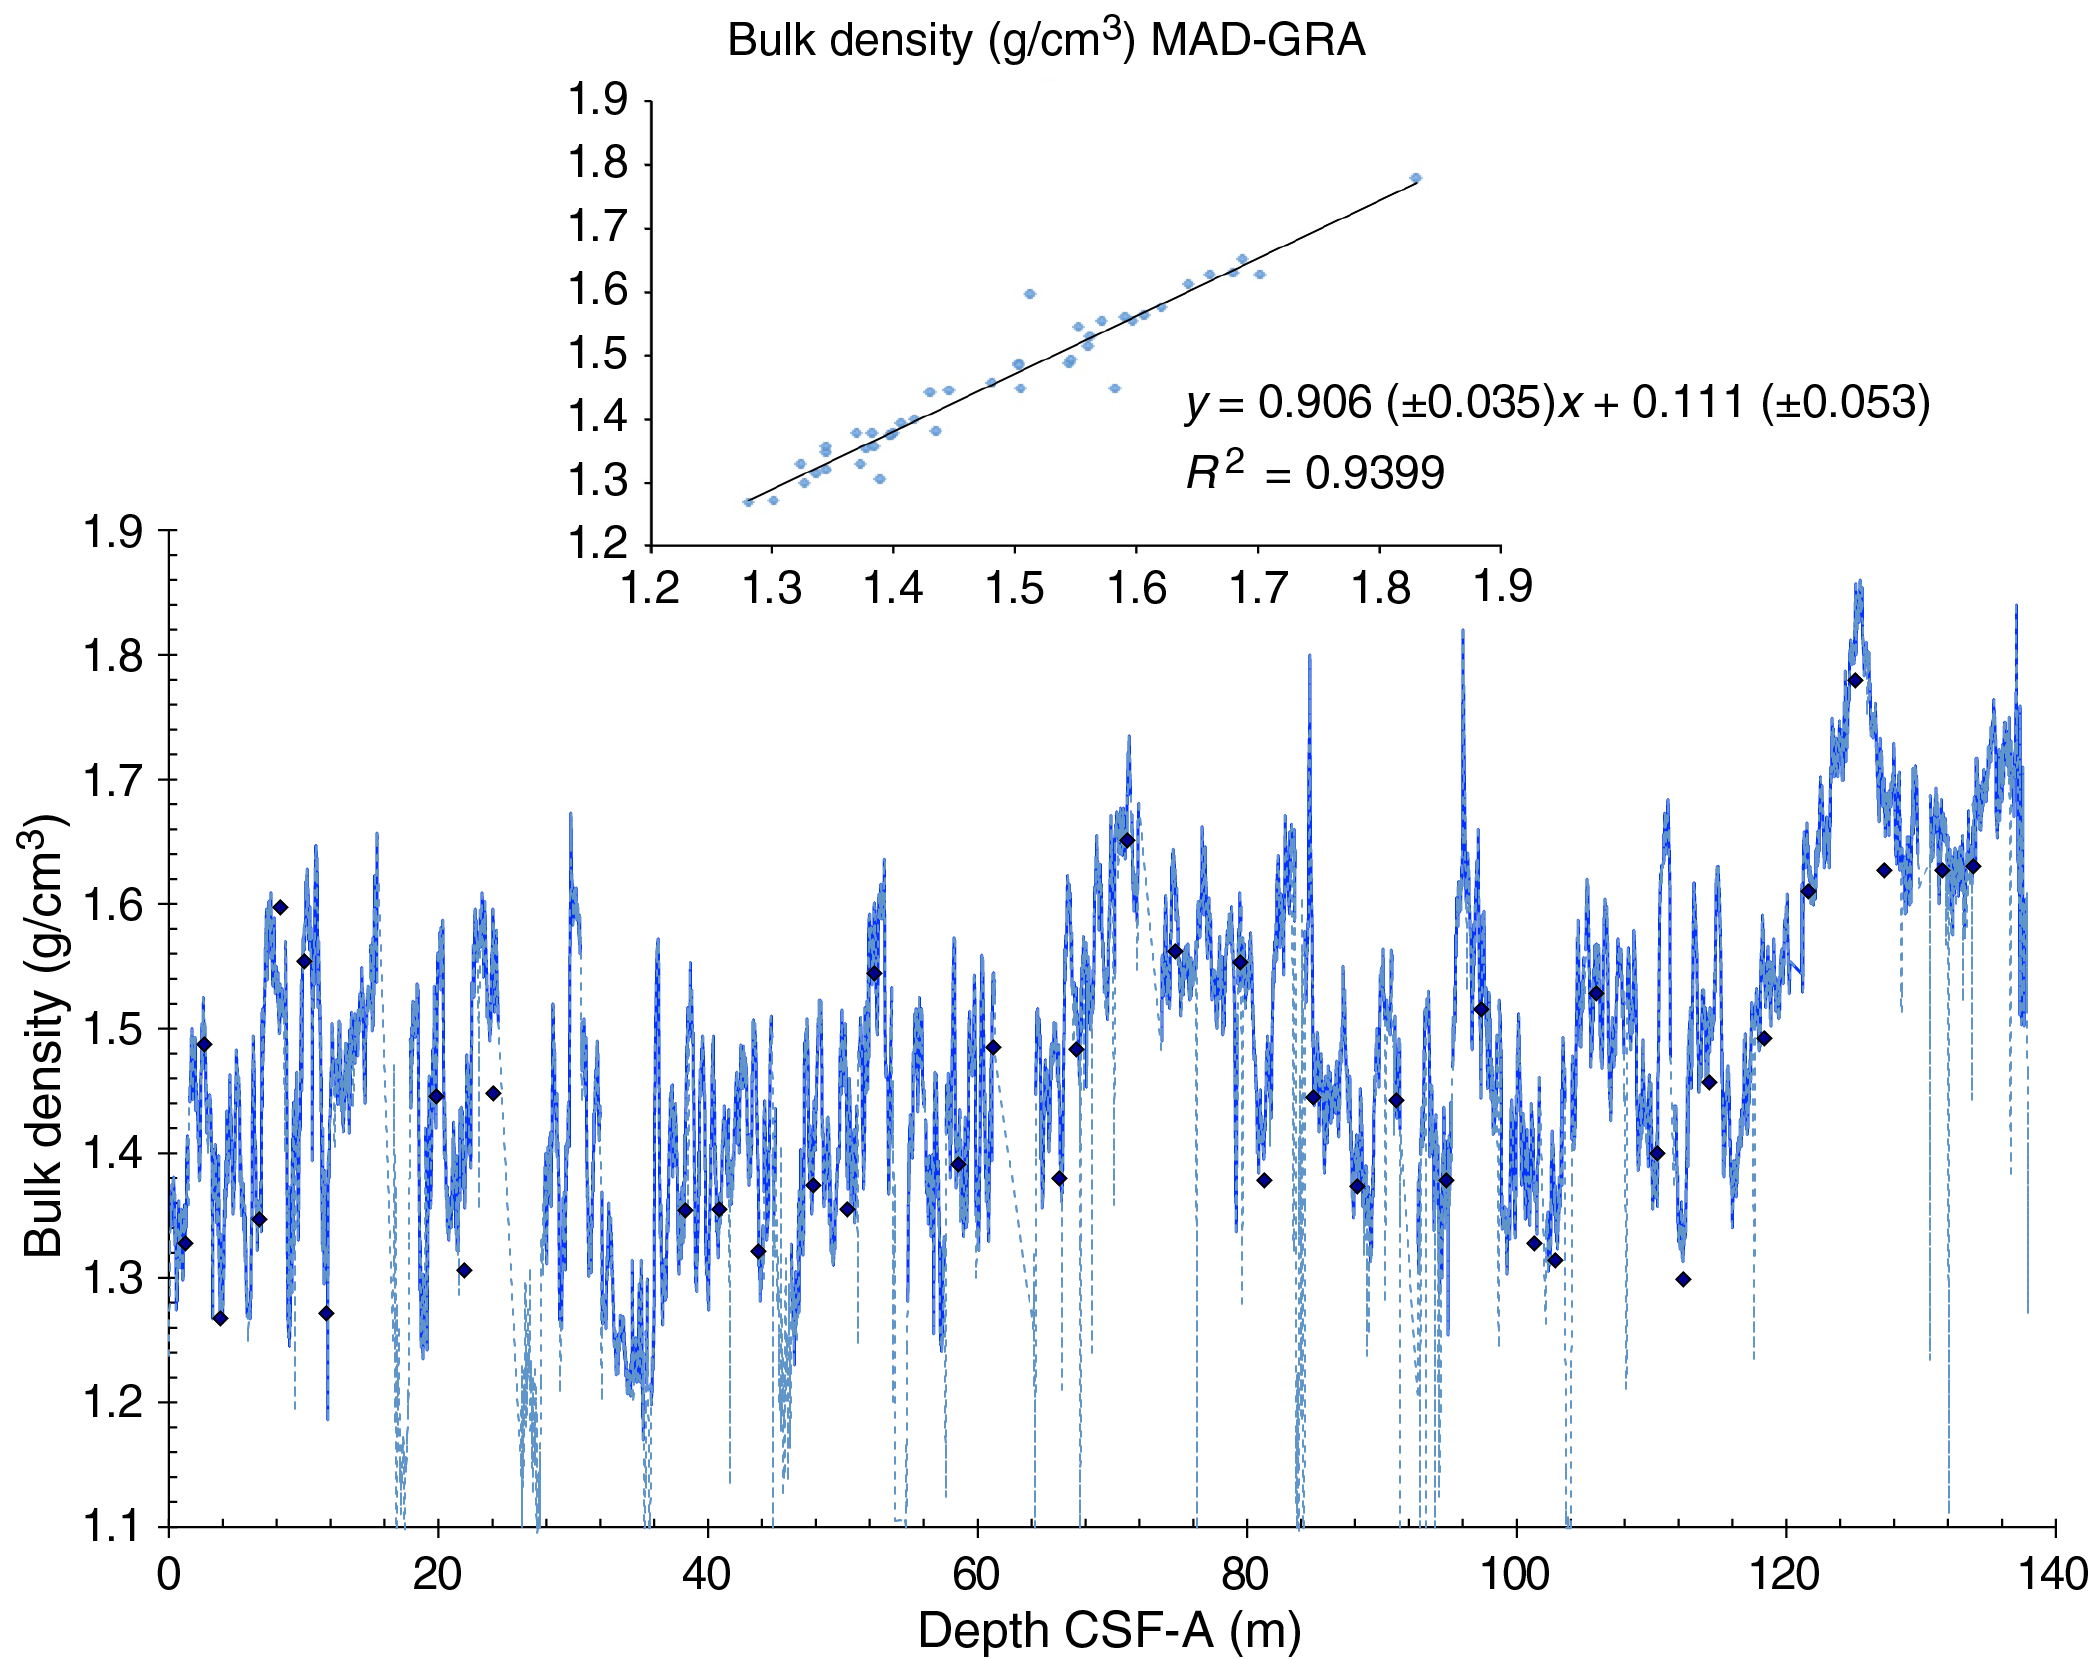
Figure F47. GRA bulk density raw.

Figure F48. Splice data: GRA bulk density and magnetic susceptibility.
In addition to bulk density, MAD measurements provide estimates of dry density, grain density, porosity, water content, void ratio, and several other properties, which co-vary downhole. Bulk density and porosity are anticorrelated. Intervals of high porosity and water content and low grain density correspond to diatom-rich oozes (Lithofacies 2 and 3). Intervals of low porosity and high density correspond to carbonate-bearing to carbonate-dominated lithologies (Lithofacies 3, 4, and 6). Water content varies from 38% to 68% throughout the site, except for the lowest 30 m, where values are ≤40%.
Compressional P-wave velocity
P-wave measurements from the WRMSL indicate moderate variations from 1485 to 1555 m/s (Figure F49). The measurements carried out using the PWC on working halves vary from 1475 to 1565 m/s, indicating a higher range of velocity values than the measurements made on the whole-round sections, but a linear relationship is observed between the whole- and half-core analyses with a r2 correlation coefficient of 0.674 (Figure F49). The difference between the PWC and the WRMSL measurements is within 20 m/s, which is lower than the indicated reproducibility for the caliper, which is ± 40 m/s (Figure F49). Clear oscillations and cycles like those occurring in other physical properties are observed within the three holes: shorter term variations in Unit I and longer term variations in Units II and III. The relationship between P-wave velocity and GRA changes throughout the site (Figure F50). In Lithofacies 4 (pure nannofossil ooze), P-wave velocity is linked to density, as in Subunit IIIB, except for the diatom-bearing interval at 136.5 m CCSF-A (129.5 m CSF-A) in Hole U1541B. The relationship between GRA and P-wave velocity changes throughout the core from a positive to negative correlation. P-wave velocity varies with diatom content, and higher velocities correspond to higher diatom content. When diatoms are absent or at a constant percent content in nannofossil ooze, then P-wave velocity varies with density.
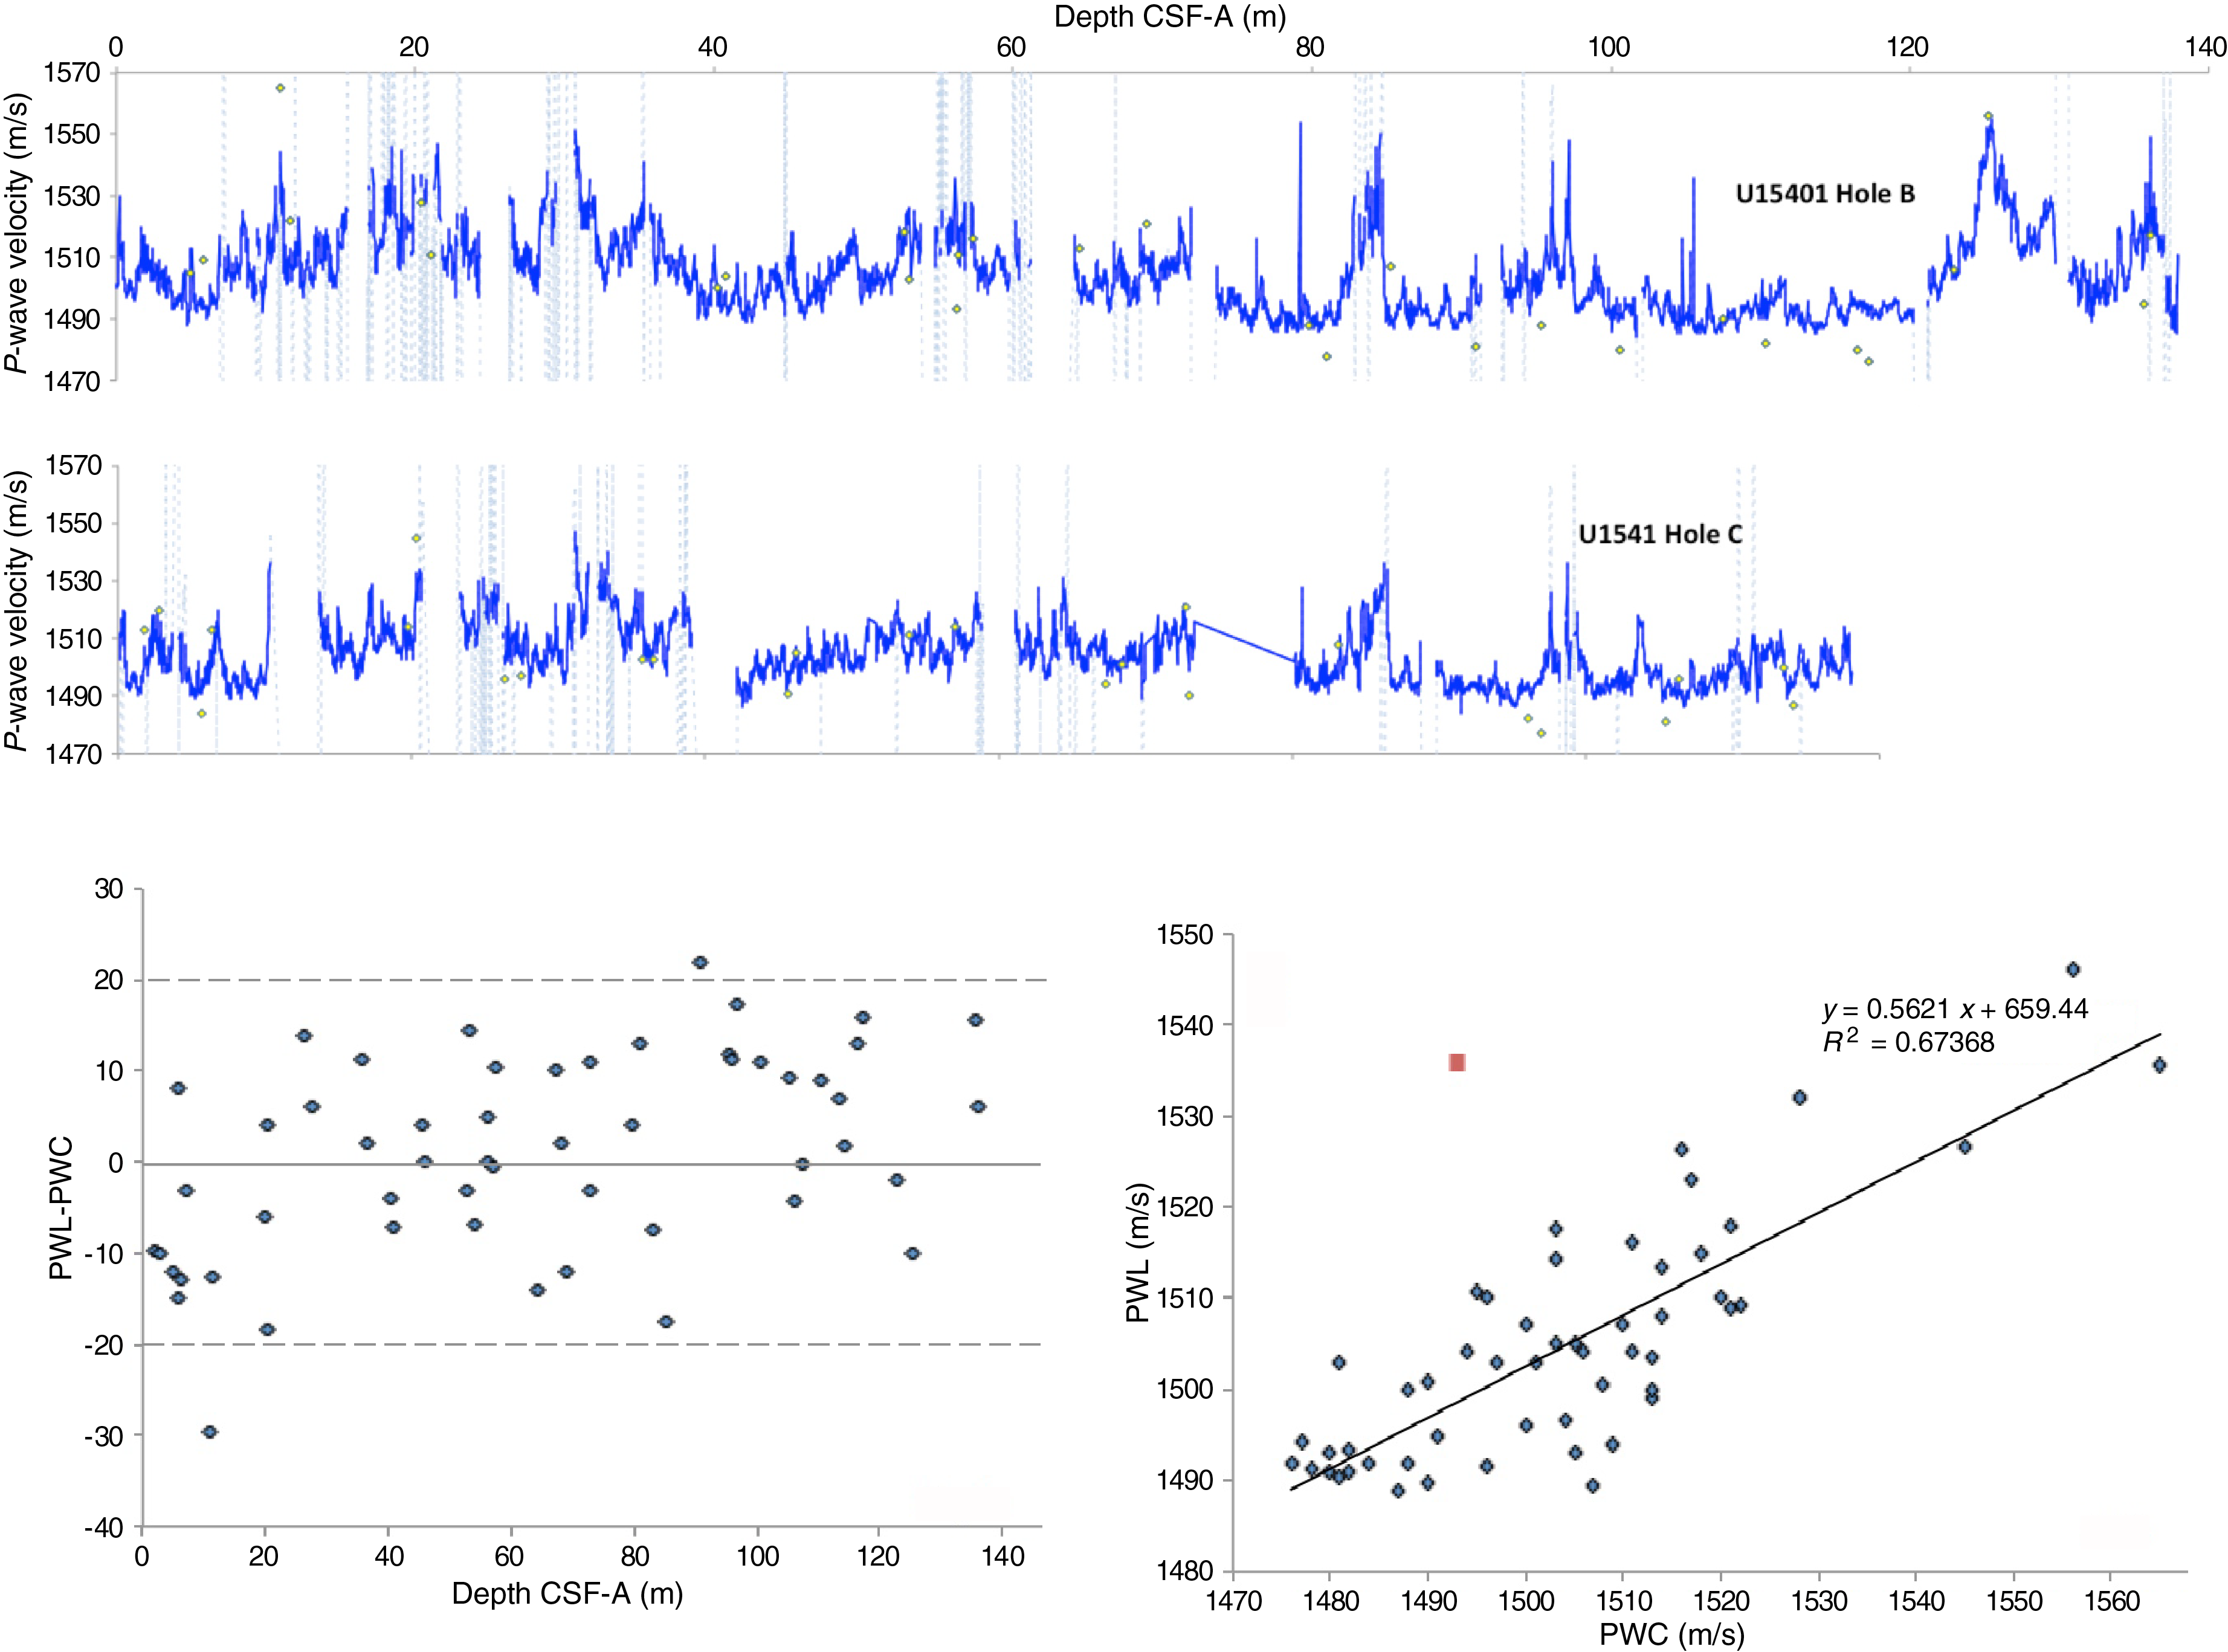
Figure F49. P-wave velocity.
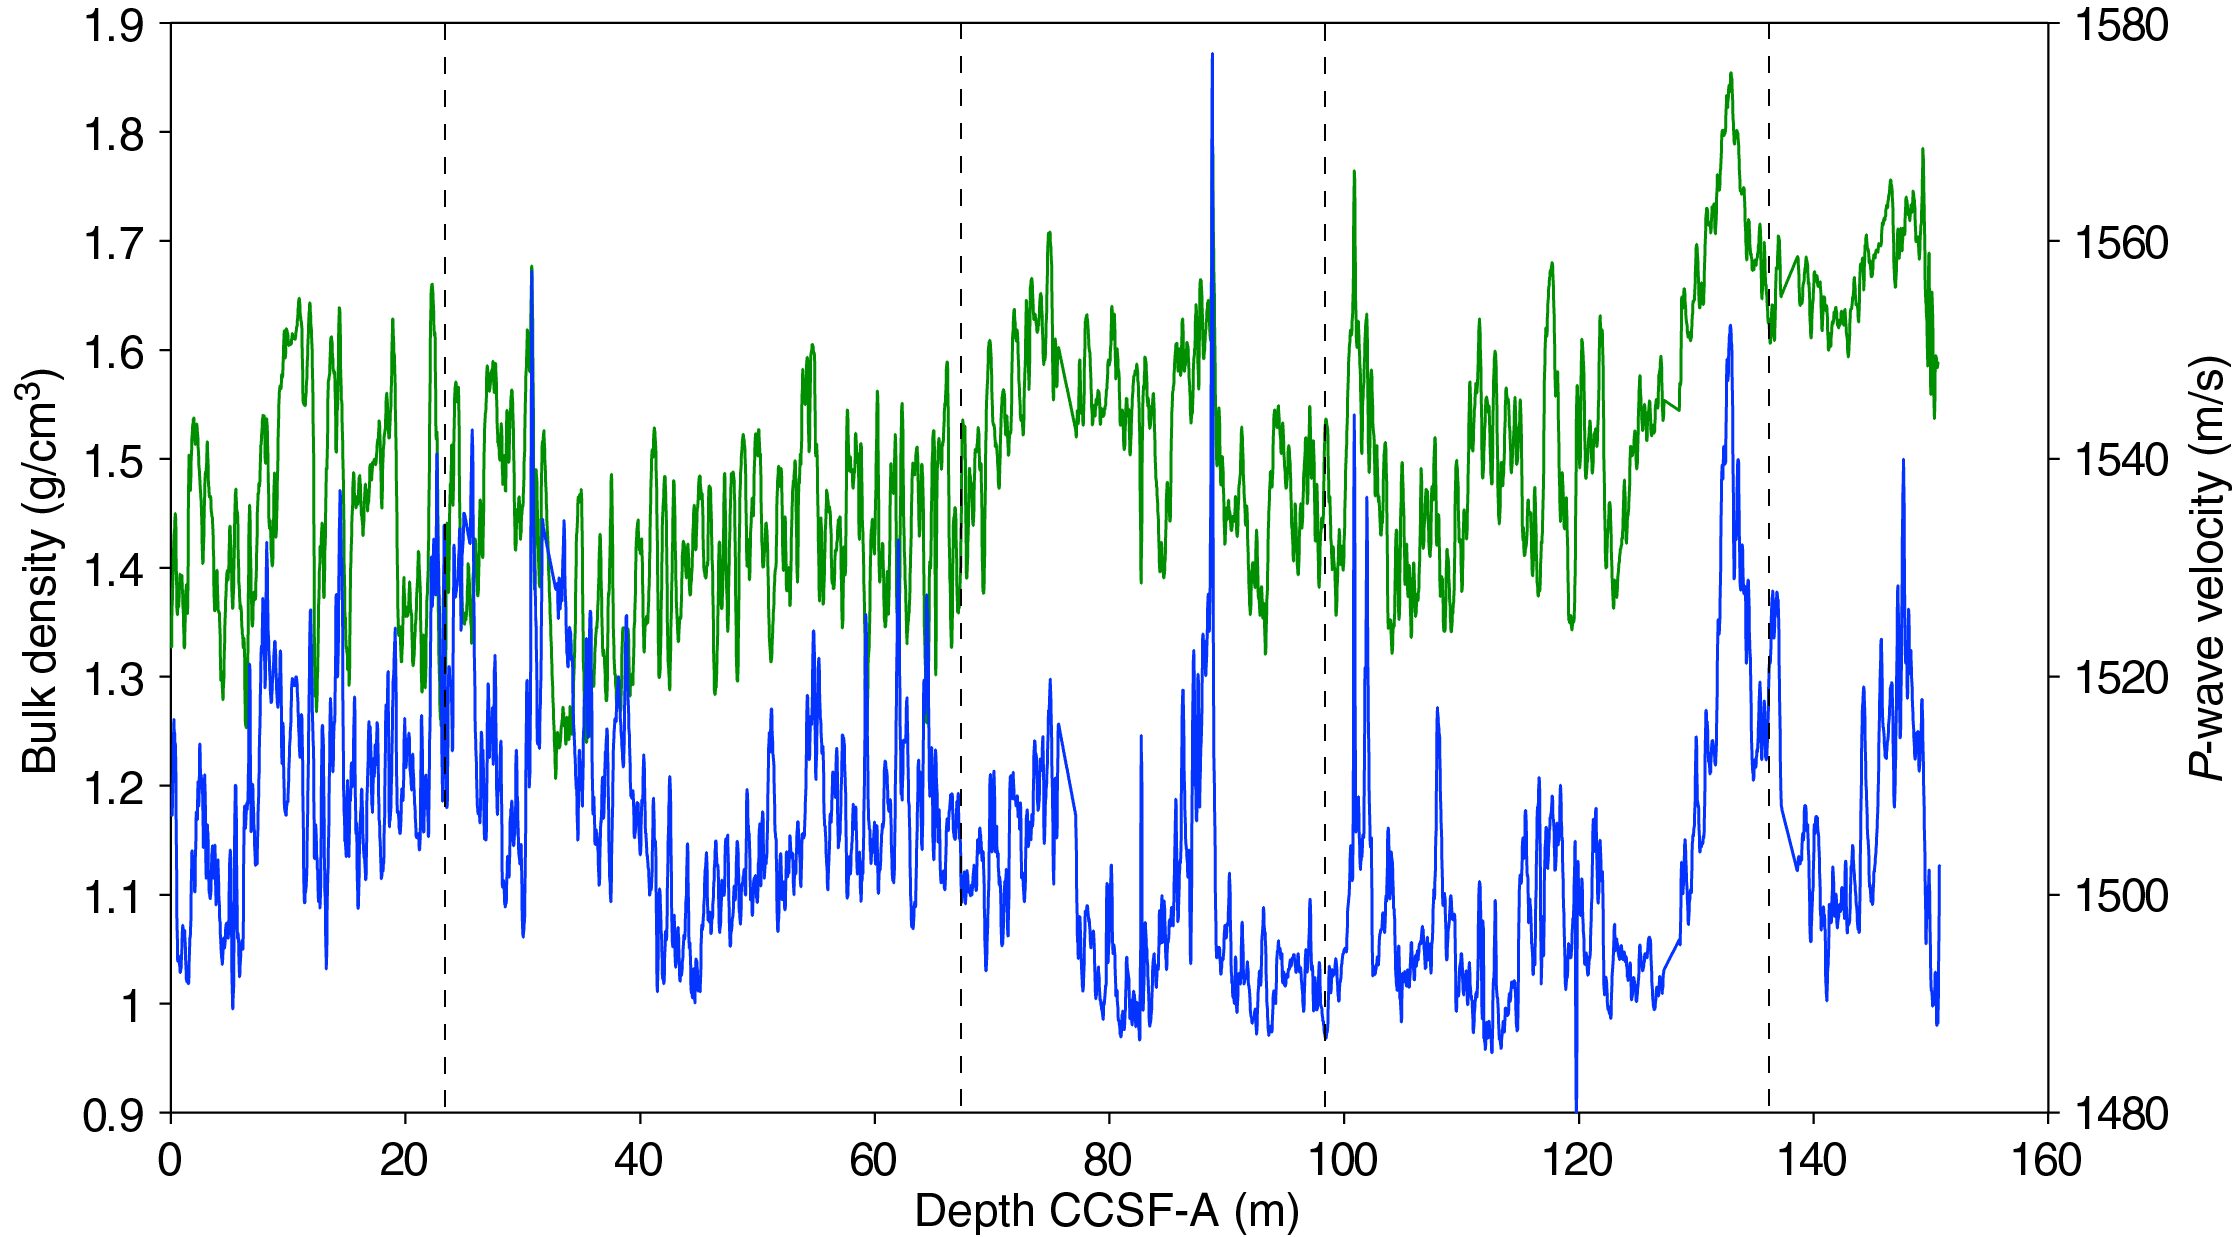
Figure F50. Splice data: GRA bulk density and P-wave velocity.
Thermal conductivity
Thermal conductivity was measured on all cores from Holes U1541A–U1541C with mostly two measurements, sometimes one, per core (Figure F51). A low value of 0.5 W was used for the needle probe. Measurements were carried out using the needle probe on the whole-round sections. For each depth, three replicates were measured. At six depths, one of the duplicate measurements failed (not plotted). The standard deviation was >5% at another five depths. Thus, the remaining 44 measurements should be reliable.
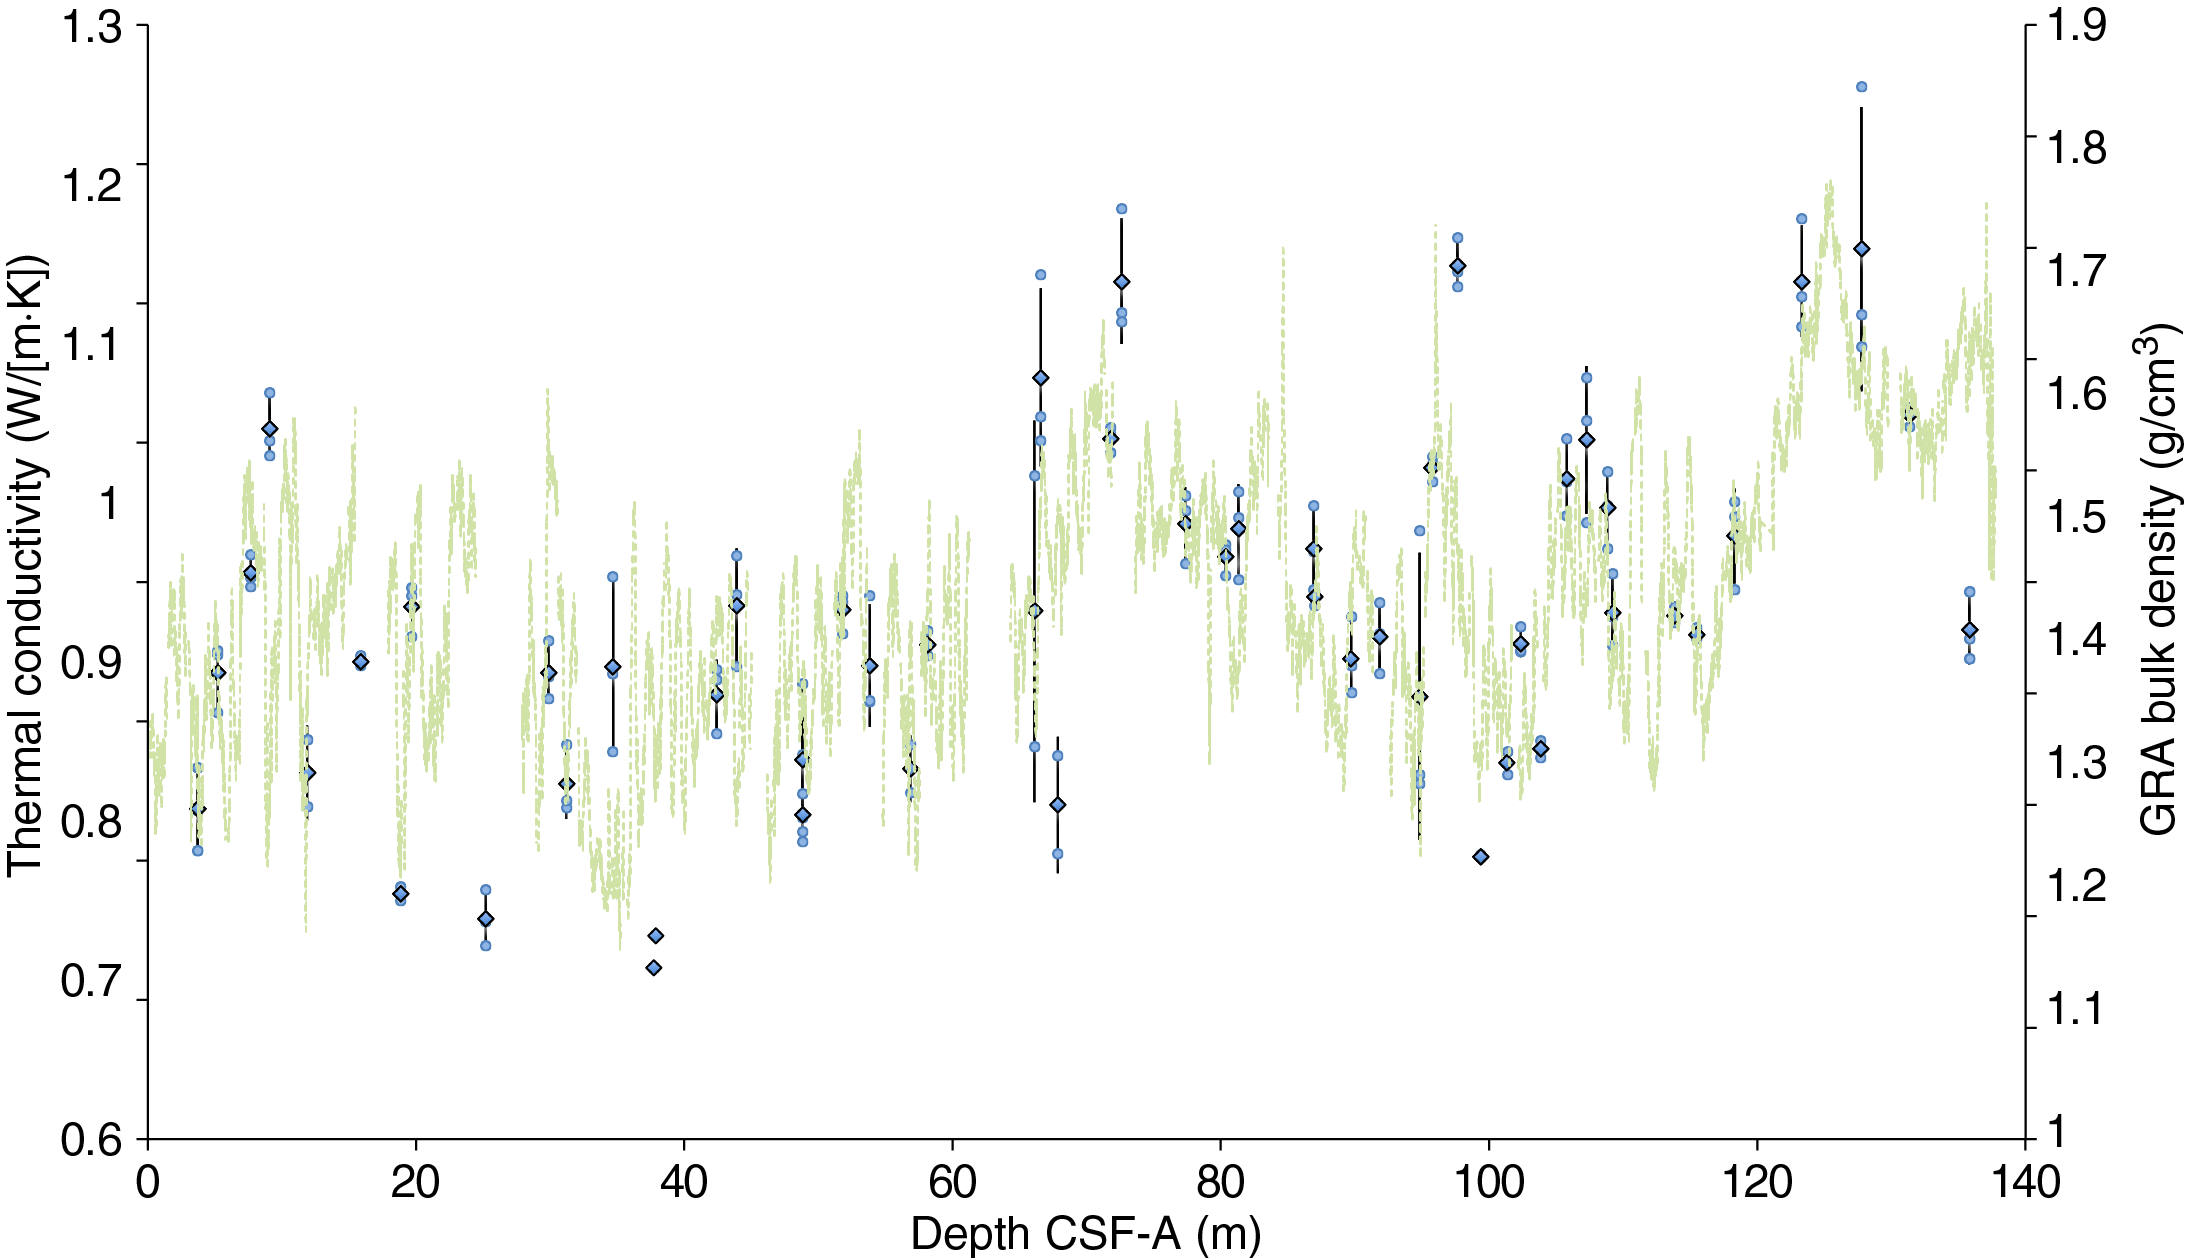
Figure F51. Thermal conductivity.
Across all holes at Site U1541, thermal conductivity ranges from ~0.72 to 1.24 W/(m·K) with a mean value of 0.978 W/(m·K). In general, diatom-rich oozes (Lithofacies 2; Subunits IA and IB) are characterized by low thermal conductivity and carbonate facies (Lithofacies 3 and 4) are characterized by higher thermal conductivity. The mean thermal conductivity is 0.907 W/(m·K) for Unit I, which alternates between Lithofacies 2 and 3, and 1.033 W/(m·K) for Units II and III (>70 m CSF-A) (Figure F51), which are dominated by Lithofacies 3 and 4. This highest thermal conductivity occurs in Unit II and Subunit IIIB where Lithofacies 4 dominates. Thermal conductivity mean values may indicate that thermal conductivity follows a pattern similar to GRA, with high values (>1.21 W/[m·K]) corresponding to the GRA values >1.6g/cm3 (Figure F51).
Summary
Data acquired from whole-round measurements for Site U1541 are generally in good agreement with those from split-core measurements (Figures F42, F47, F49). GRA and WRMSL P-wave logger data indicate shorter term variations in Unit I and at the top of Unit II, and the shortest term variations at the top of Unit II and in Unit IB are probably linked to the 40 ka world of the early Pleistocene. MS has both high amplitude and large timescale variability all the record. Higher GRA values in Unit II and Subunit IIIB correspond to a higher fraction of carbonate/nannofossils compared to diatoms, whereas higher values of MS and NGR in Subunit IIIA are likely linked to higher terrigenous content.
Downhole changes in physical property characteristics overall are in good agreement with the defined lithofacies based on sedimentologic characteristics but show different relationships with one another than at the two previous sites (U1539 and U1540) in intervals of low diatom content.
Downhole measurements
In situ temperature and heat flow
We carried out four downhole formation temperature measurements in Hole U1541B using the APCT-3 tool (Table T13). The calculated in situ formation temperatures increase with depth from 2.51°C at 35.6 m CSF-A to 4.37°C at 138.0 m CSF-A (Figure F52). The scatter is relatively small; however, the number of measurements carried out was smaller than planned due to the need to optimize drilling time ahead of deteriorating weather conditions. Average bottom water temperature was calculated as 1.624°C, and the recorded minima were 1.588°C (Table T13), measured as the APCT-3 core cutting shoe was placed at the mudline for ~5 min. The mud pumps were then switched off before lowering the tool to target depth. Thus, temperature values represent the average of the means of the four APCT-3 time series at mudline level and should be regarded as approximations of true bottom water temperature. True bottom water temperature values are about 0.5°C higher than at the previous Sites U1539 and U1540 and consistently slightly warmer by about 0.5°C than the bottom water temperature measured with a conductivity-temperature-depth rosette system during Cruise PS75 at locations nearby to the drilled sites. The temperatures remain broadly within the expected temperature range based on World Ocean Atlas 2009 data from the location of Site U1541 (Gersonde, 2011; Locarnini et al., 2010).
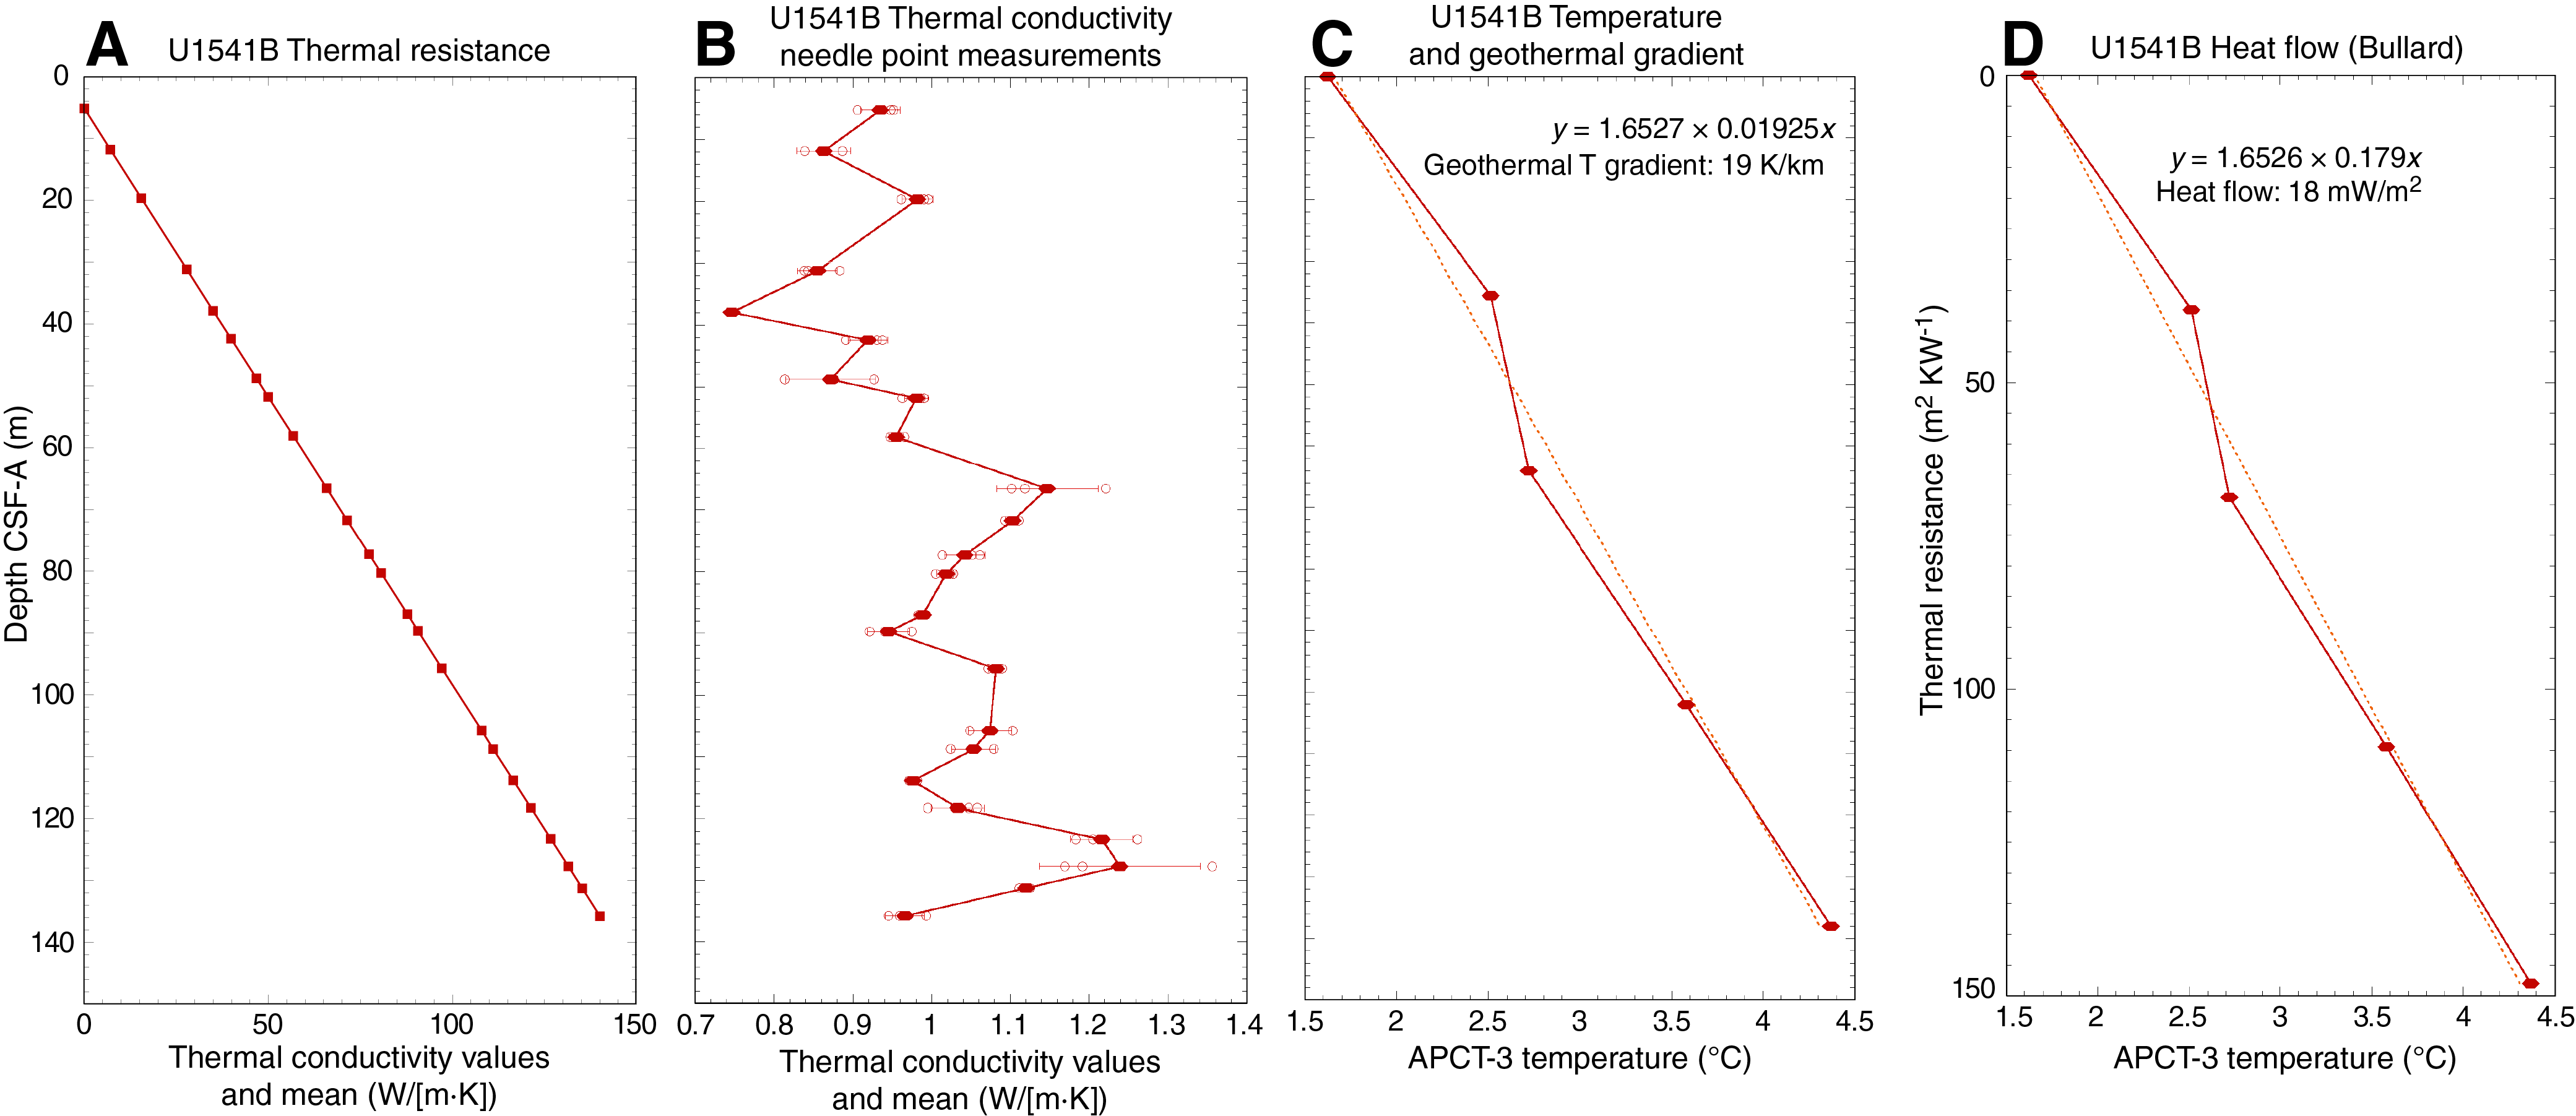
Figure F52. Heat flow calculations.
Thermal conductivity under in situ conditions was estimated from laboratory-determined thermal conductivity using established methods (Pribnow et al., 2000; Hyndman et al., 1974) (see Physical properties in the Expedition 383 methods chapter [Winckler et al., 2021a]). Thermal resistance was calculated by cumulatively adding the inverse of the in situ thermal conductivity values over depth intervals downhole (Figure F52). A calculated heat flow of 18 mW/m2 for Hole U1541B was obtained from the slope of the linear fit of in situ temperature and thermal resistance (Figure F52; cf. Pribnow et al., 2000). These values from Site U1541 west of the EPR are comparable to results calculated for Site U1540 (11–19 mW/m2) from a similar water depth east of the EPR and only nominally higher than the values for Site U1539 (11–14 mW/m2) from around 600 m deeper. These values indicate a fairly uniform subsurface crustal and sedimentary environment. Comparable low values between 10 and 50 mW/m2 were observed in previous studies (Hensen et al., 2019), although heat flow data density in the subpolar South Pacific south of 40°S is among the lowest for any oceanic region globally and exhibits high lateral gradients, implying a potential for laterally heterogeneous fluid flow and hydrothermal systems along and within the transform fault zone system near our sites (Hensen et al., 2019).
The geothermal gradient (gT) for Site U1541 is estimated at ~18 K/km within the total measured depth interval based on a linear fit of temperature versus depth. Reported results were calculated based on a mean thermal conductivity of 0.93 W/(m·K), a core water depth of 3614 m, a sediment density of 1.80 g/cm, a bottom water temperature of 1.62°C, and a laboratory temperature of 18°C. Calculations for heat flow, resistivity, and geothermal gradient were checked for potential bias due to varying assumptions about the bottom water temperature, but reported results remain the same for various assumptions of bottom water temperature changes within a degree Celsius or less.
Stratigraphic correlation
Correlations between holes at Site U1541 were accomplished using Correlator software (version 3.0). Tie points were established mostly using the blue channel extracted from the SHMSL data (RGB blue) (Figure F53), but in many cases a combination of measurements was used (Table T14). We constructed a splice from 0 to 127.254 m CCSF-A using Holes U1541A–U1541C (Table T15; Figures F53, F54, F55); however, because some cores were disturbed or short and could not be used, the splice contains two gaps (Figure F53), as detailed below. Because Hole U1541B was drilled deeper than the other holes, the last two cores in Hole U1541B were appended to the bottom of the splice.
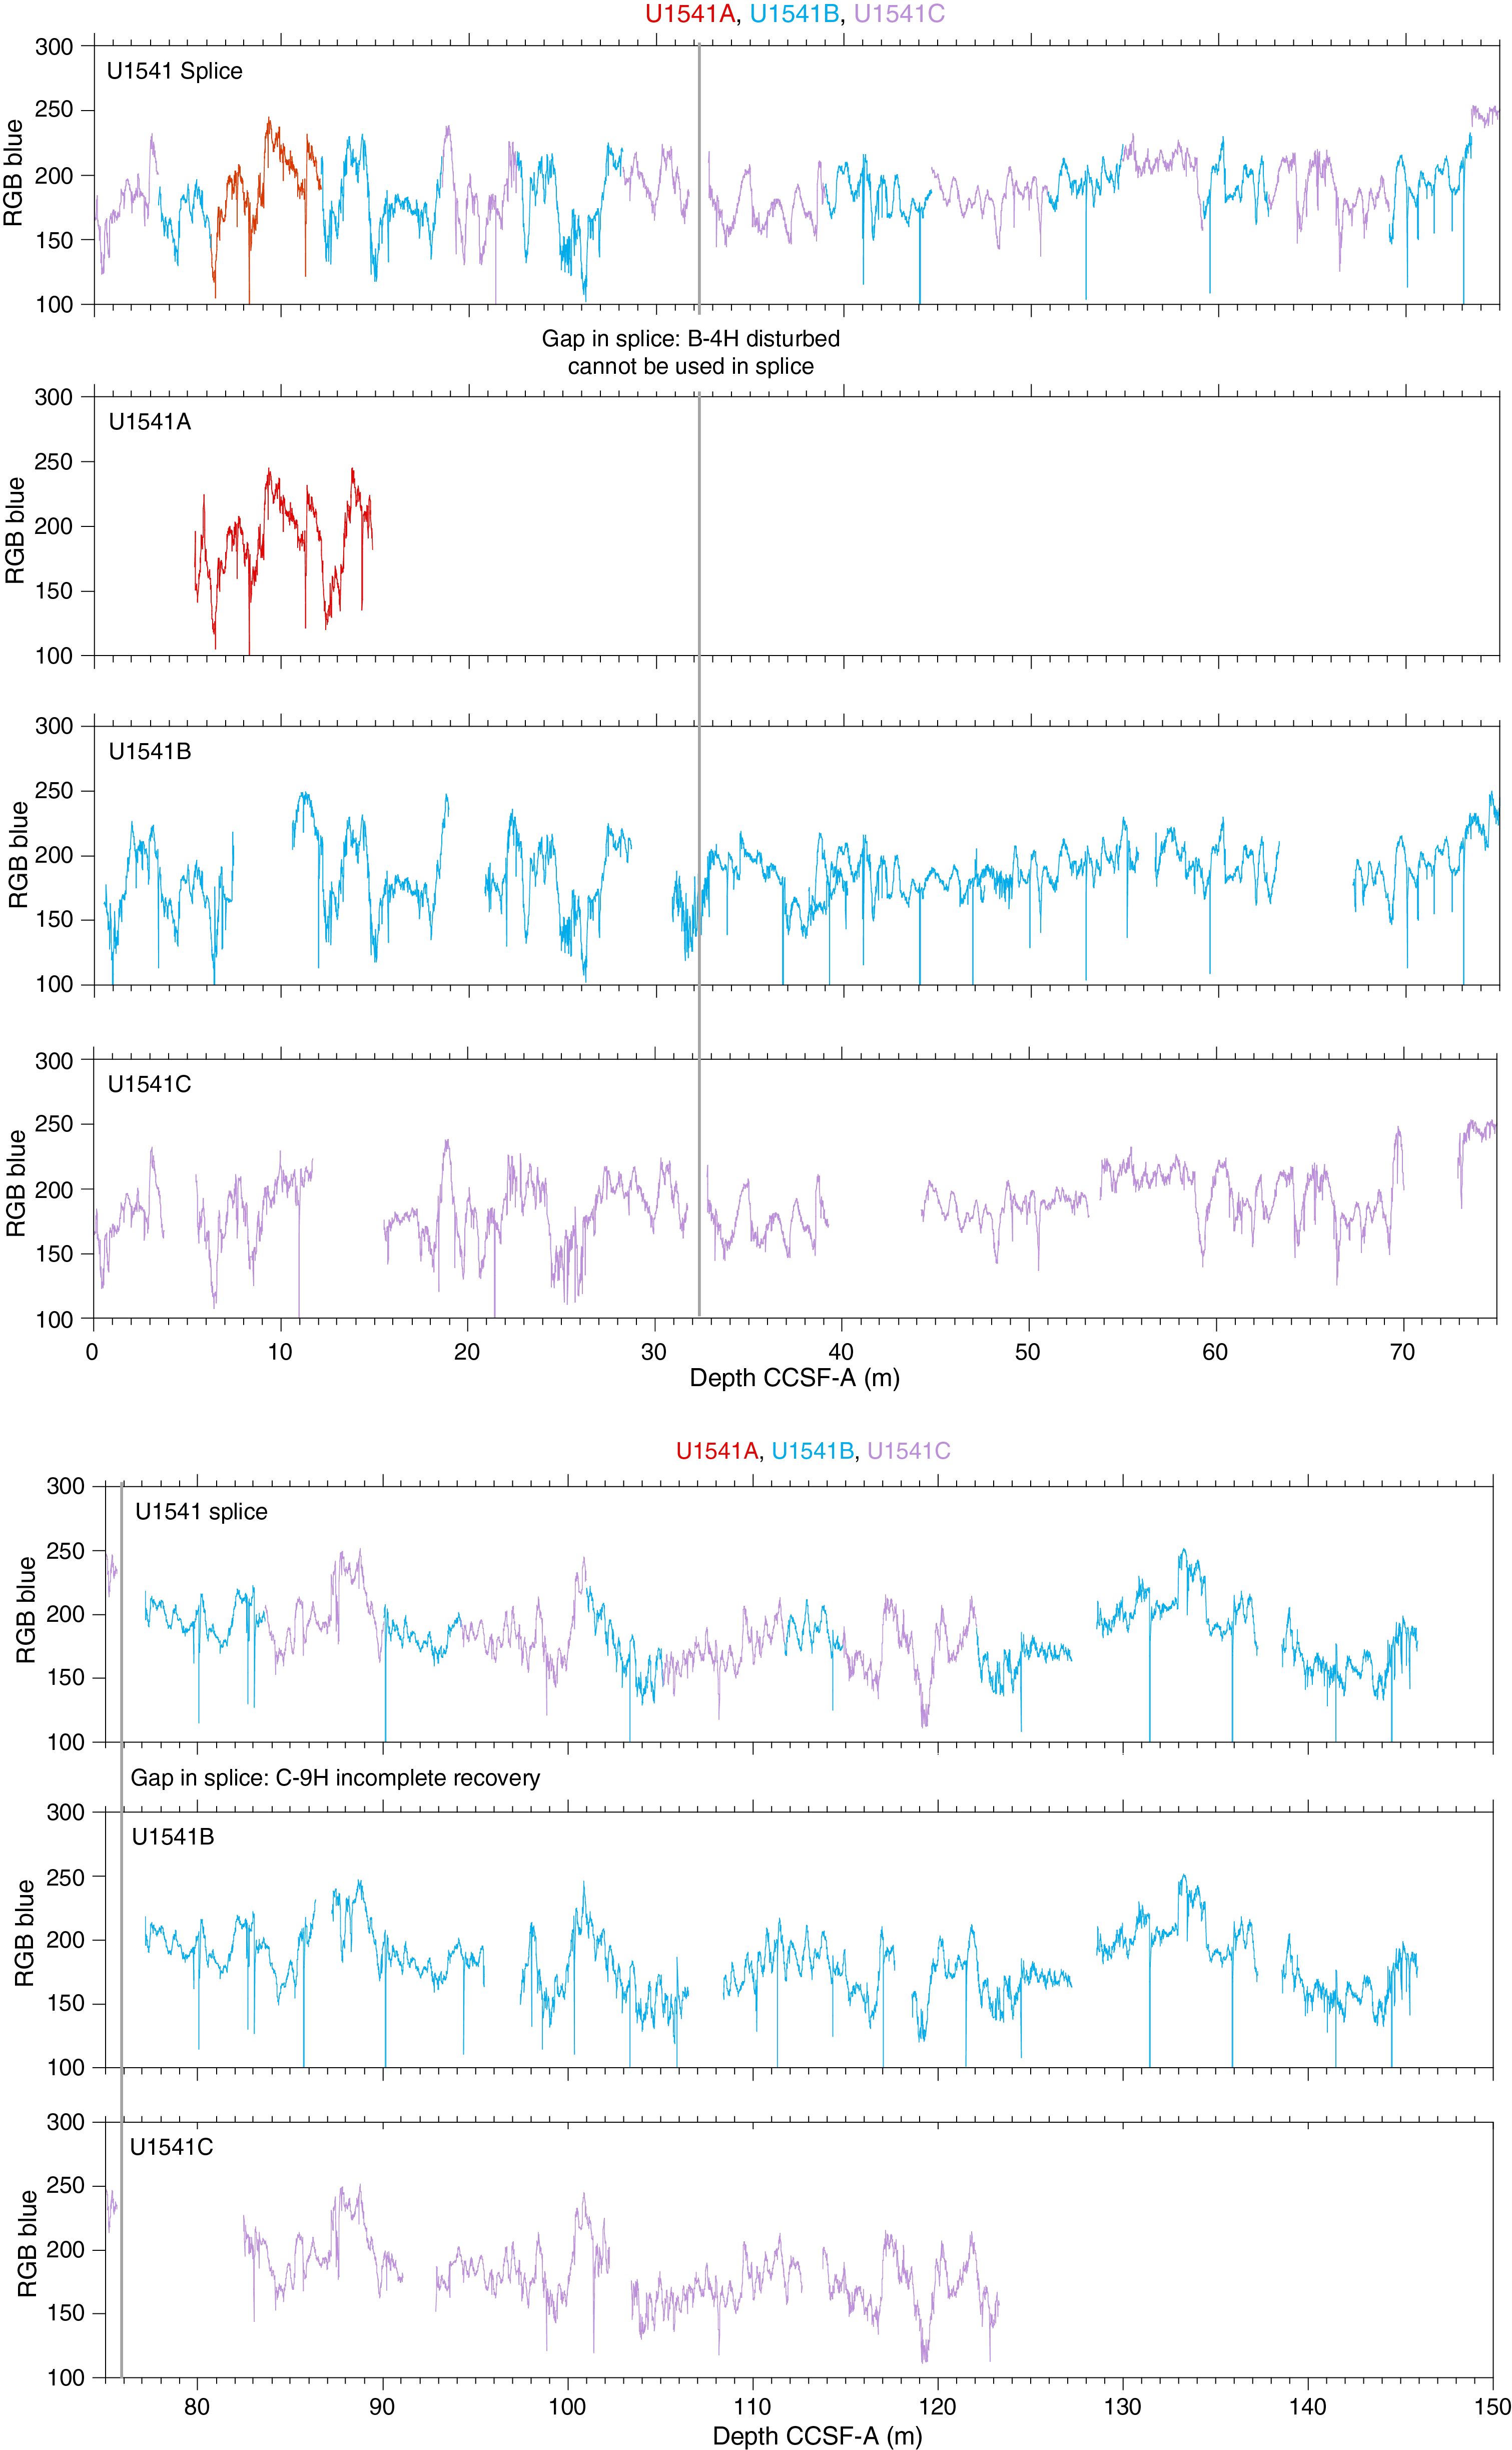
Figure F53. RGB blue.

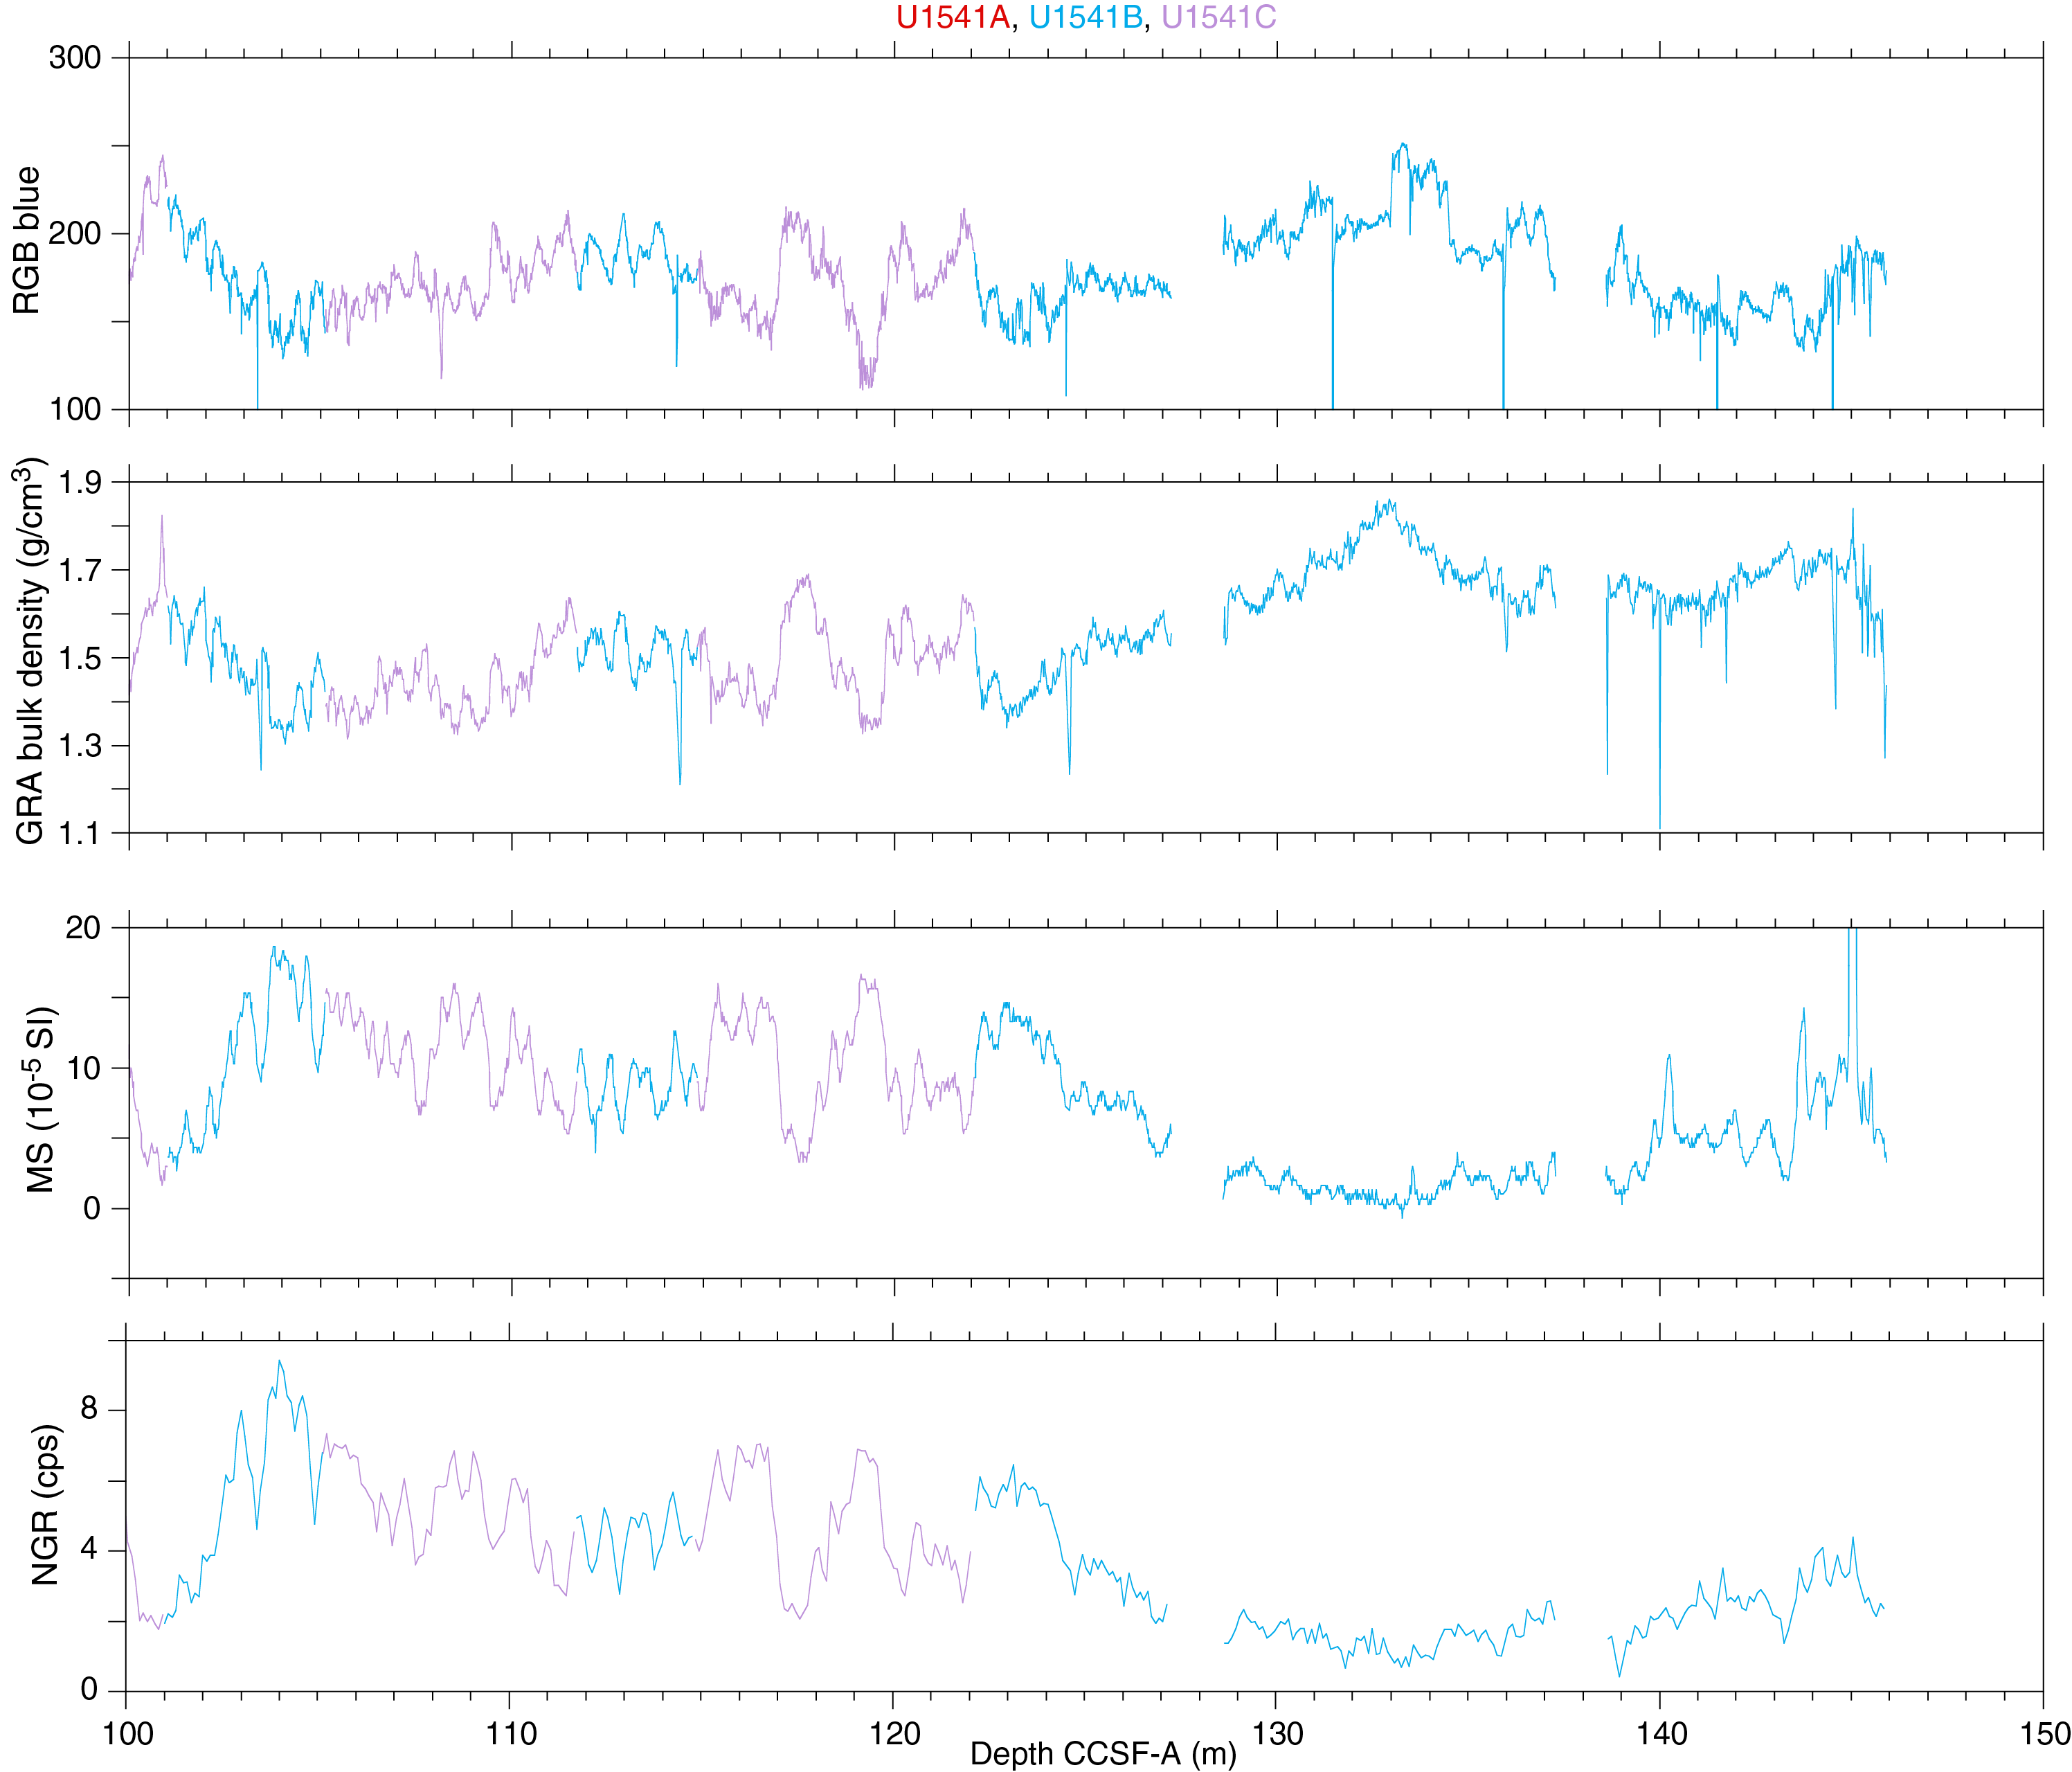
Figure F54. Splice data: RGB blue, GRA, MS, and NGR.
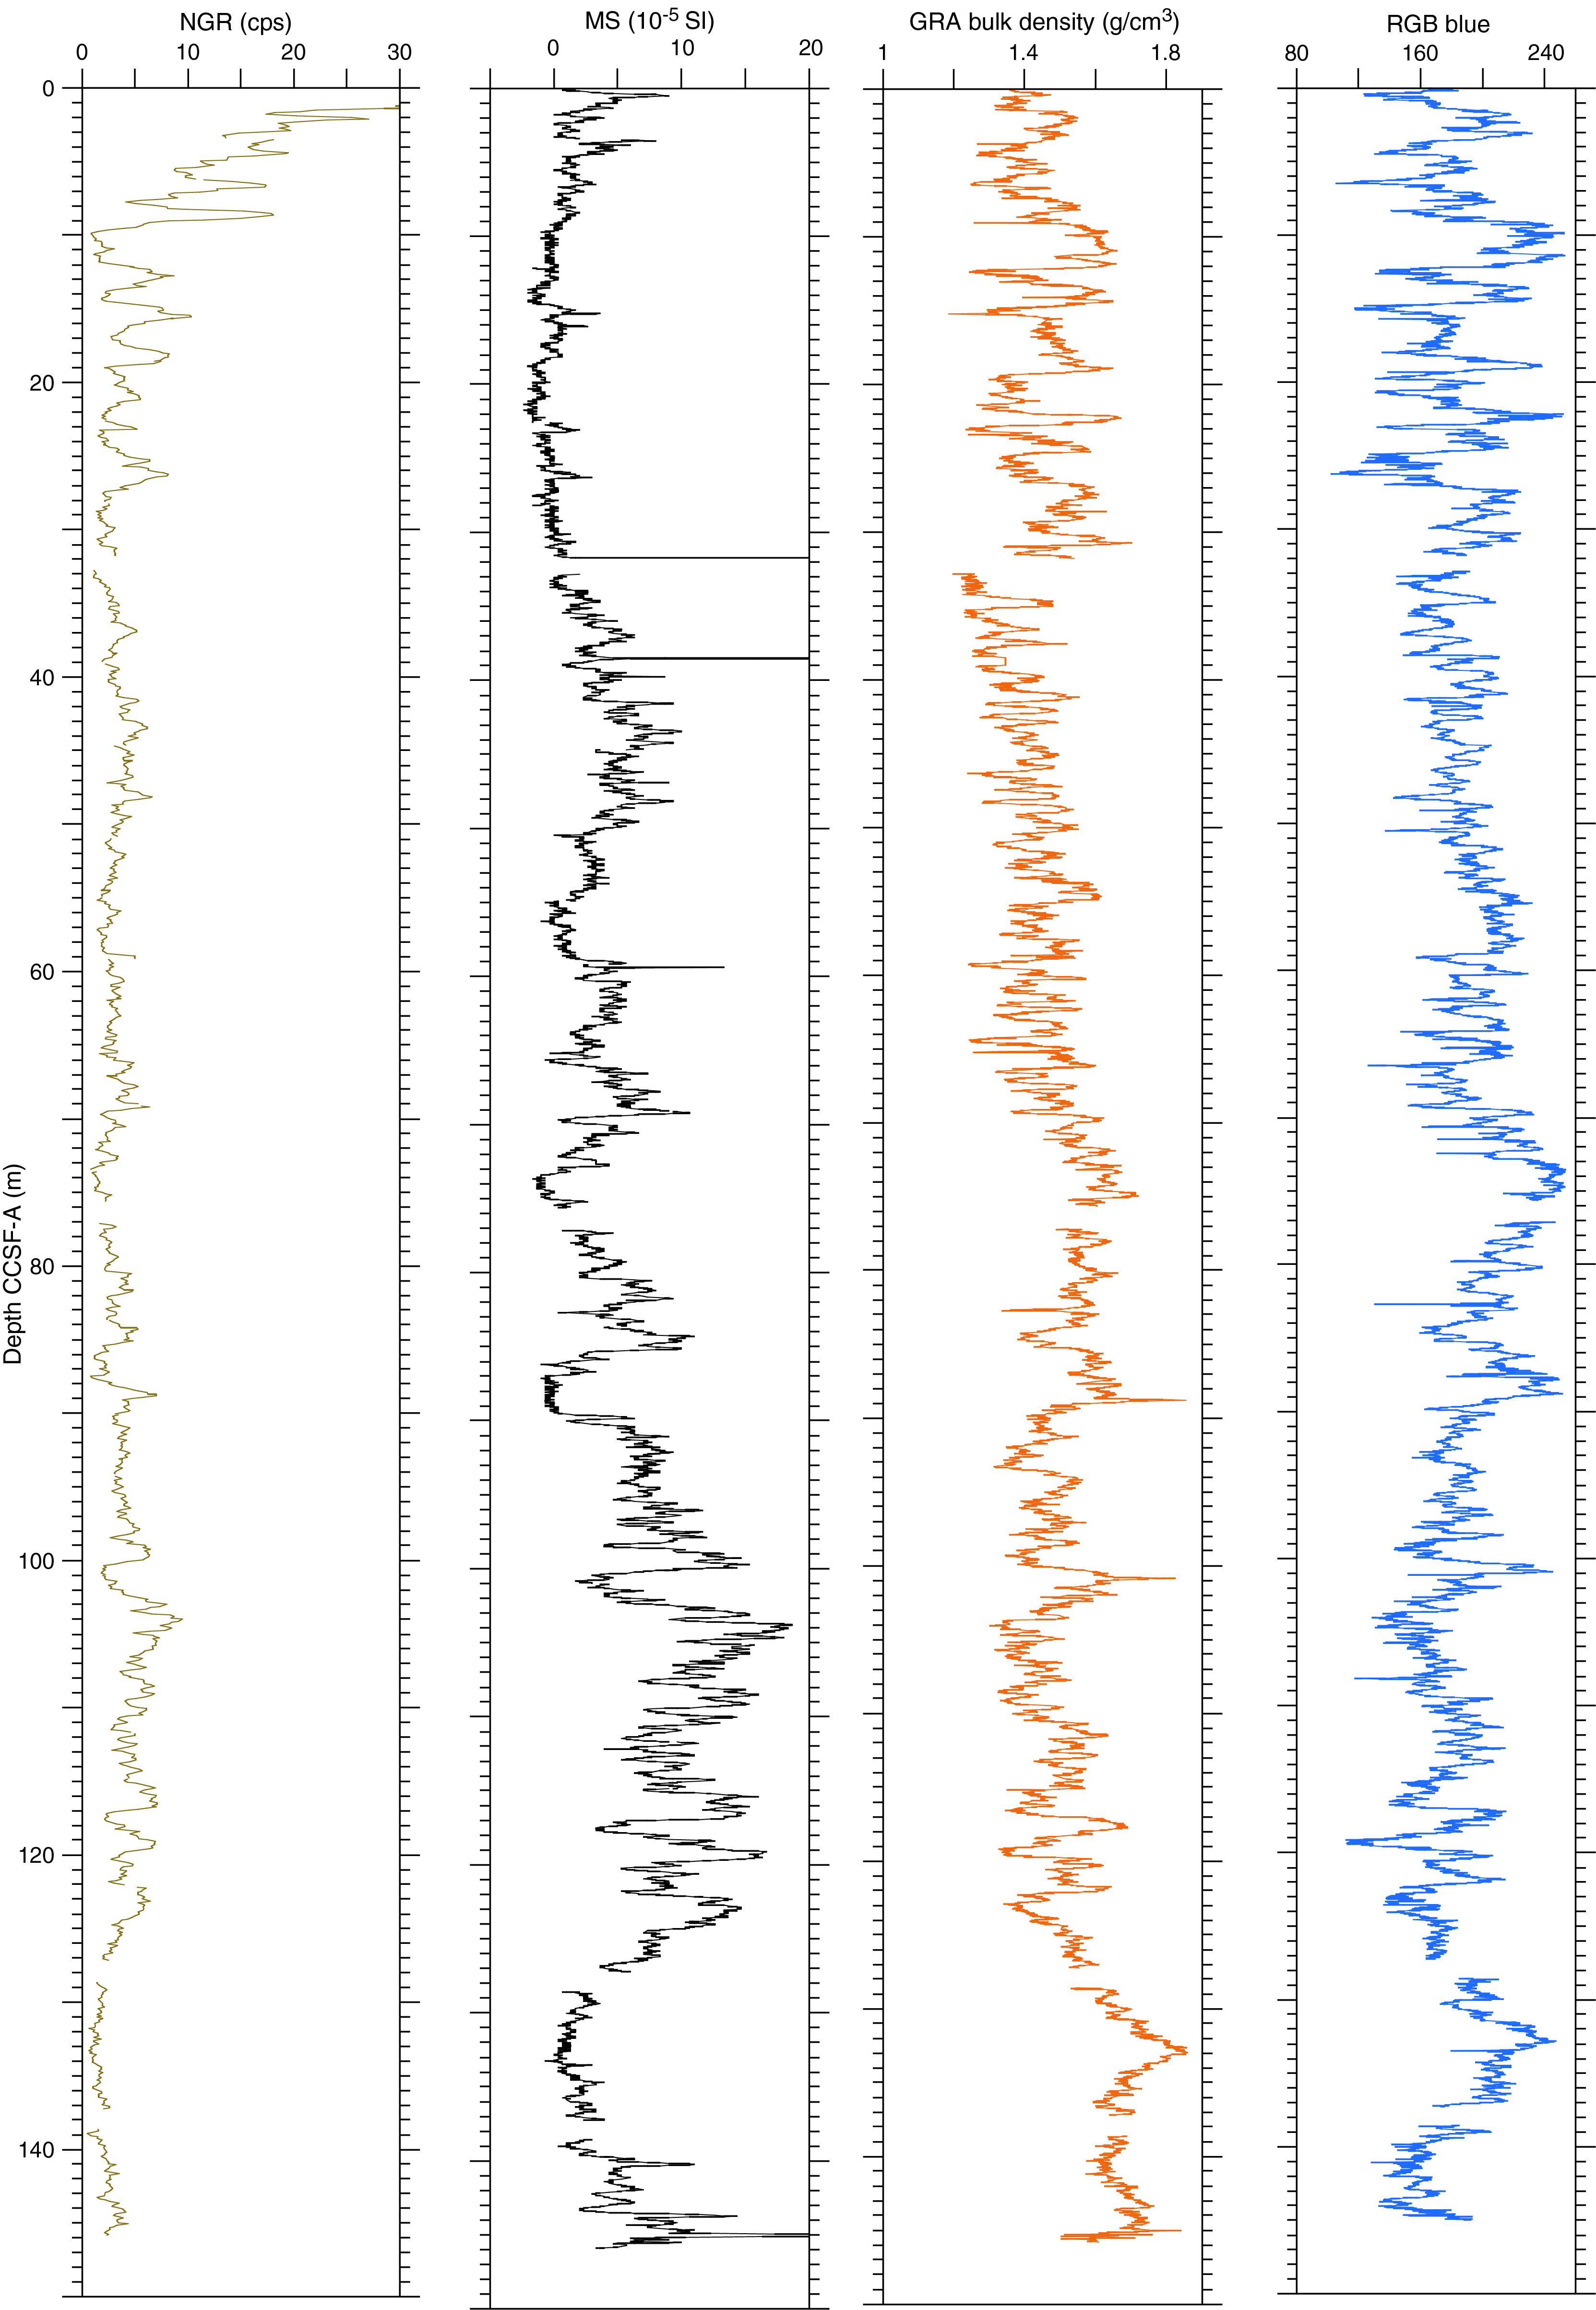
Figure F55. Cleaned splice data: RGB blue, GRA, MS, and NGR.
The CCSF-A scale is anchored to the mudline of Core 383-U1541C-1H, which is assigned the depth of 0 m CCSF-A. From this anchor, we worked downhole using Correlator to establish a composite stratigraphy on a core-by-core basis. Interstitial water sampling and shipboard measurement sampling were done on Cores 383-U1541A-1H; 383-U1541B-1H, 2H, and 4H–15H; and 383-U1541C-2H through 4H. Thus, our general approach was to avoid using material from these cores. However, because of poor recovery or coring disturbance in a few intervals, we had to piece together the splice using all three holes, sometimes using cores that had been used for shipboard sampling. We mainly used Hole U1541C as the backbone of the splice and filled gaps between cores and avoided any disturbed intervals by including cores from Holes U1541A and U1541B in the splice. Finally, we adjusted splice tie points to avoid intersection with paleomagnetic reversals so that reversals occur within splice intervals.
The upper portion of the splice is continuous with no gaps from 0 to 31.78 m CCSF-A. At that depth, because Core 383-U1541B-4H was highly disturbed, it was not used in the splice; instead, Core 383-U1541C-5H was appended to the splice by setting the affine offset using an offset consistent with an increasing cumulative affine offset of 0.5 m CCSF-A per core. Below this first gap, the splice is continuous from 32.75 m CCSF-A to the bottom of Core 383-U1541C-9H at 75.67 m CCSF-A. At that depth, because Core 383-U1541C-9H was short (only 3.02 m recovered), it was clear that it did not cover the entire gap between Cores 383-U1541B-8H and 9H, and we had to append Core 383-U1541B-9H to the bottom of Core 383-U1541C-9H by setting the affine offset using an offset consistent with an increasing cumulative affine offset of 0.5 m CCSF-A per core. Below 77.12 m CCSF-A, the splice is continuous to 127.25 CCSF-A, which is the bottom of Core 383-U1541B-13H. At that depth, because drilling at Hole U1541C was terminated due to weather, Cores 383-U1541B-14H and 15H were appended to the splice using an increasing cumulative offset of 0.5 m CCSF-A per core.
The cumulative offset between the CSF-A and CCSF-A depth scales is nearly linear for Holes U1541B and U1541C (Figure F56A). The growth factor averages 8.6% but varies from 0% to 49% because of ship heave and misfired APC cores. The average growth factor of 8.6% is consistent with what is expected for sediments that expand because of release of overburden but have minimal gas expansion due to low concentrations of methane and other gases (see Geochemistry). There are small changes in the growth factor, and therefore in the cumulative offset with depth (Figure F56B), because of core disturbance due to bad weather conditions and misfired APC coring in a few instances, particularly in the upper 80 m. The CSF-A depth for the top of each core is set to the drilling depth below seafloor (DSF), which is based on the position of the drill string below the seafloor. However, the process of correlation moved each core top depth to a position on the CCSF-A scale that may not represent variable sediment compaction and expansion. Calculation of mass accumulation rates based on the CCSF-A scale should account for differential expansion by dividing apparent depth intervals by the appropriate growth factor.
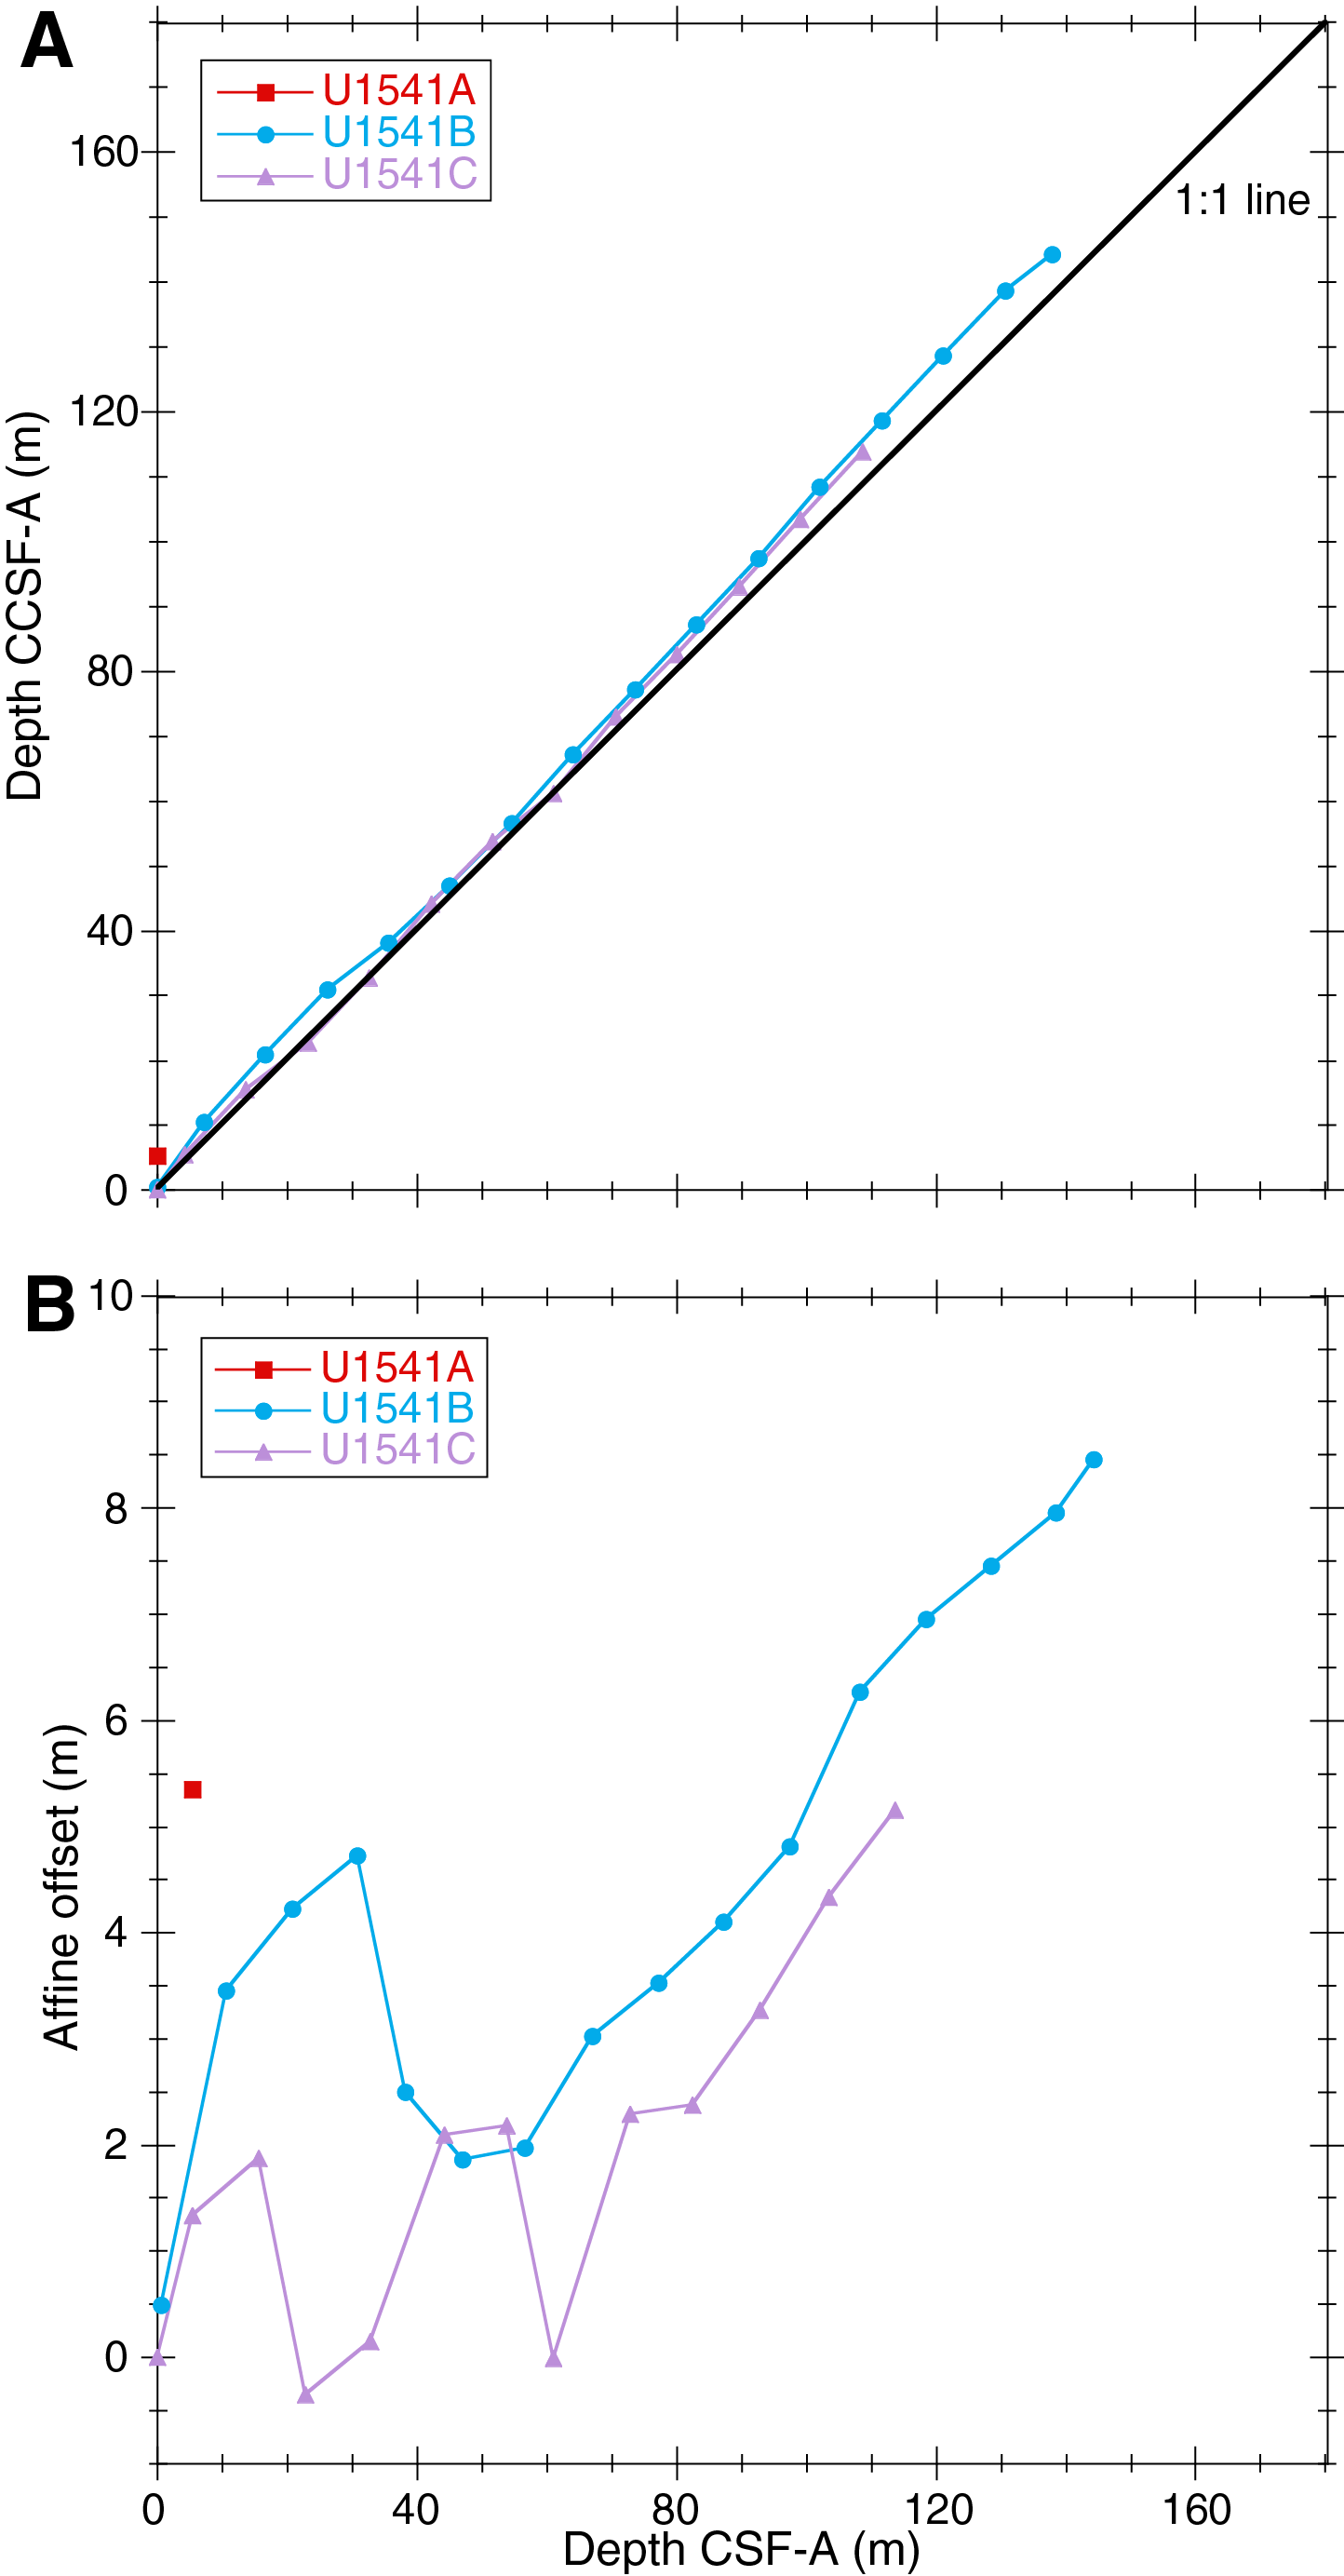
Figure F56. Core depth, composite depth scales, and the growth of cumulative depth offset.
References
Alvarez Zarikian, C.A., Stepanova, A.Y., and Grützner, J., 2009. Glacial–interglacial variability in deep sea ostracod assemblage composition at IODP Site U1314 in the subpolar North Atlantic. Marine Geology, 258(1–4):69–87. https://doi.org/
Alvarez Zarikian, C.A., 2015. Cenozoic bathyal and abyssal ostracods beneath the South Pacific Gyre (IODP Expedition 329 Sites U1367, U1368 and U1370). Palaeogeography, Palaeoclimatology, Palaeoecology, 419:115–142. https://doi.org/
Bremer, M.L., and Lohmann, G.P., 1982. Evidence for primary control of the distribution of certain Atlantic Ocean benthic foraminifera by degree of carbonate saturation. Deep-Sea Research, Part A: Oceanographic Research Papers, 29(8):987–998. https://doi.org/
Bylinskaya, M.E., 2004. Range and stratigraphic significance of the Globorotalia crassaformis plexus. Journal of Iberian Geology, 31(1):51–63.
Calvert, S.E., and Pedersen, T.F., 1994. Sedimentary geochemistry of manganese; implications for the environment of formation of manganiferous black shales. Economic Geology, 91(1):36–47. http://dx.doi.org/
Cande, S.C., and Kent, D.V., 1995. Revised calibration of the geomagnetic polarity timescale for the Late Cretaceous and Cenozoic. Journal of Geophysical Research: Solid Earth, 100(B4):6093–6095. https://doi.org/
Censarek, B., and Gersonde, R., 2002. Miocene diatom biostratigraphy at ODP Sites 689, 690, 1088, 1092 (Atlantic sector of the Southern Ocean). Marine Micropaleontology, 45(3–4):309–356. https://doi.org/
Chaisson, W.P., and Pearson, P.N., 1997. Planktonic foraminifer biostratigraphy at Site 925: middle Miocene–Pleistocene. In Shackleton, N.J., Curry, W.B., Richter, C., and Bralower, T.J. (Eds.), Proceedings of the Ocean Drilling Program, Scientific Results, 154: College Station, TX (Ocean Drilling Program), 3–31. http://dx.doi.org/
Ciesielski, P.F., 1975. Biostratigraphy and paleoecology of Neogene and Oligocene silicoflagellates from cores recovered during Antarctic Leg 28, Deep Sea Drilling Project. In Hayes, D.E., Frakes, L.A., et al., Initial Reports of the Deep Sea Drilling Project, 28: Washington, DC (U.S. Government Printing Office), 625–691. https://doi.org/
Cody, R.D., Levy, R.H., Harwood, D.M., and Sadler, P.M., 2008. Thinking outside the zone: high-resolution quantitative diatom biochronology for the Antarctic Neogene. Palaeogeography, Palaeoclimatology, Palaeoecology, 260(1–2):92–121. https://doi.org/
Corliss, B.H., 1979. Quaternary Antarctic bottom-water history: deep sea benthonic foraminiferal evidence from the southeast Indian Ocean. Quaternary Research, 12(2):271–289. https://doi.org/
Corliss, B.H., 1985. Microhabitats of benthic foraminifera within deep-sea sediments. Nature, 314(6010):435–438. https://doi.org/
Das, M., Singh, R.K., Vats, N., Holbourn, A., Mishra, S., Farooq, S.H., and Pandey, D.K., 2018. Changes in the distribution of Uvigernidae species over the past 775 kyr: implications for the paleoceanographic evolution of the Japan Sea. Palaeogeography, Palaeoclimatology, Palaeoecology, 507:201–213. https://doi.org/
De Vleeschouwer, D., Dunlea, A.G., Auer, G., Anderson, C.H., Brumsack, H., de Loach, A., Gurnis, M., et al., 2017. Quantifying K, U, and Th contents of marine sediments using shipboard natural gamma radiation spectra measured on DV JOIDES Resolution. Geochemistry, Geophysics, Geosystems, 18(3):1053–1064. https://doi.org/
Dunlea, A.G., Murray, R.W., Harris, R.N., Vasiliev, M.A., Evans, H., Spivack, A.J., and D’Hondt, S., 2013. Assessment and use of NGR instrumentation on the JOIDES Resolution to quantify U, Th, and K concentrations in marine sediment. Scientific Drilling, 15:57–63. https://doi.org/
Eagles, G., 2006. Deviations from an ideal thermal subsidence surface in the southern Pacific Ocean. Terra Antarctica Reports, 12:109–118.
Fontanier, C., Jorissen, F.J., Chaillou, G., Anschutz, P., Grémare, A., and Griveaud, C., 2005. Live foraminiferal faunas from a 2800 m deep lower canyon station from the Bay of Biscay: faunal response to focusing of refractory organic matter. Deep-Sea Research, Part I: Oceanographic Research Papers, 52(7):1189–1227. https://doi.org/
Frenguelli, J., 1949. Diatomeas fósiles de los yacimientos chilenos de Tiltil y Mejillones. Darwiniana, 9(1):97–157. https://www.jstor.org/
Gage, J.D., and Tyler, P.A., 1991. Deep-Sea Biology: A Natural History of Organisms at the Deep-Sea Floor. Cambridge, UK (Cambridge University Press) https://doi.org/
German, C.R., and Von Damm, K.L., 2003. Hydrothermal processes. Treatise on Geochemistry, 6:181–222. https://doi.org/
Gersonde, R., 1990. Taxonomy and morphostructure of Neogene diatoms from the Southern Ocean, ODP Leg 113. In Barker, P.F., Kennett, J.P., et al., Proceedings of the Ocean Drilling Program, Scientific Results, 113: College Station, TX (Ocean Drilling Program), 791–802. https://doi.org/
Gersonde, R., 2011. The Expedition of the Research Vessel “Polarstern” to the Polar South Pacific Sea in 2009/2010 (ANT-XXVI/2 - BIPOMAC). Berichte zur Polar und Meeresforschung, 632. http://epic.awi.de/
Gradstein, F.M., Ogg, J.G., Schmitz, M.D., and Ogg, G.M. (Eds.), 2012. The Geological Time Scale 2012: Amsterdam (Elsevier). https://doi.org/
Gupta, A.K., Singh, R.K., and Verma, S., 2013. Deep-sea palaeoceanographic evolution of the eastern Indian Ocean during the late Oligocene–Pleistocene: species diversity trends in benthic foraminifera. Current Science, 104(7):904–910. http://www.currentscience.ac.in/
Harwood, D.M., and Maruyama, T., 1992. Middle Eocene to Pleistocene diatom biostratigraphy of Southern Ocean sediments from the Kerguelen Plateau, Leg 120. In Wise, S.W., Jr., Schlich, R., et al., Proceedings of the Ocean Drilling Program, Scientific Results, 120: College Station, TX (Ocean Drilling Program), 683–733. https://doi.org/
Hensen, C., Duarte, J.C., Vannucchi, P., Mazzini, A., Lever, M.A., Terrinha, P., Géli, L., Henry, P., et al., 2019. Marine transform faults and fracture zones: a joint perspective integrating seismicity, fluid flow and life. Frontiers in Earth Science, 7:39. https://doi.org/
Hilgen, F.J., Lourens, L.J., and Van Dam, J.A., 2012. The Neogene period. With contributions by A.G. Beu, A.F. Boyes, R.A. Cooper, W. Krijgsman, J.G. Ogg, W.E. Piller, and D.S. Wilson. In Gradstein, F.M., Ogg, J.G., Schmitz, M.D., and Ogg, G.M. (Eds.), The Geologic Time Scale: Oxford, United Kingdom (Elsevier), 923–978. https://doi.org/
Hornibrook, N.d.B., 1981. Globorotalia (planktic Foraminiferida) in the late Pliocene and early Pleistocene of New Zealand. New Zealand Journal of Geology and Geophysics, 24(2):263–292. https://doi.org/
Hornibrook, N.d.B., and Jenkins, D.G., 1994. DSDP 594, Chatham Rise, New Zealand—late Neogene planktonic foraminiferal biostratigraphy revisited. Journal of Micropalaeontology, 13(2):93–101. https://doi.org/
Hyndman, R.D., Erickson, A.J., and Von Herzen, R.P., 1974. Geothermal measurements on DSDP Leg 26. In Davies, T.A., Luyendyk, B.P., et al., Initial Reports of the Deep Sea Drilling Project, 26: Washington, DC (U.S. Govt. Printing Office), 451–463. https://doi.org/
Jacobel, A.W., McManus, J.F., Anderson, R.F., and Winckler, G., 2017. Repeated storage of respired carbon in the equatorial Pacific Ocean over the last three glacial cycles. Nature Communications, 8:1727. https://doi.org/
Jenkins, D.G., 1993. Cenozoic southern mid- and high-latitude biostratigraphy and chronostratigraphy based on planktonic foraminifera. In Kennett, J.P., and Warnke, D.A. (Eds.), The Antarctic Paleoenvironment: A Perspective on Global Change: Part Two. Antarctic Research Series, 60:125–144. https://agupubs.onlinelibrary.wiley.com/
Jonkers, L., De Nooijer, L.J., Reichart, G.-J., Zahn, R., and Brummer, G.-J.A., 2012. Encrustation and trace element composition of Neogloboquadrina dutertrei assessed from single chamber analyses - implications for paleotemperature estimates. Biogeosciences, 9(11):4851–4860. https://doi.org/
Jutzeler, M., White, J.D.L., Talling, P.J., McCanta, M., Morgan, S., Le Friant, A., and Ishizuka, O., 2014. Coring disturbances in IODP piston cores with implications for offshore record of volcanic events and the Missoula megafloods. Geochemistry, Geophysics, Geosystems, 15(9):3572–3590. https://doi.org/
Kennett, J.P., and Srinivasan, M.S., 1983. Neogene Planktonic Foraminifera: A Phylogenetic Atlas: Stroudsburg, PA (Hutchinson Ross).
Lamy, F., Winckler, G., Alvarez Zarikian, C.A., and the Expedition 383 Scientists, 2021. Supplementary material, https://doi.org/
Locarnini, R.A., Mishonov, A.V., Antonov, J.I., Boyer, T.P., Garcia, H.E., Baranova, O.K., Zweng, M.M., and Johnson, D.R., 2010. World Ocean Atlas 2009 (Volume 1): Temperature. In Levitus, S. (Ed.), NOAA Atlas NESDIS 68: Washington, DC (U.S. Government Printing Office). ftp://ftp.nodc.noaa.gov/
Meyers, P.A., 1994. Preservation of elemental and isotopic source identification of sedimentary organic matter. Chemical Geology, 114(3–4):289–302. https://doi.org/
Meyers, P.A., 1997. Organic geochemical proxies of paleoceanographic, paleolimnologic, and paleoclimatic processes. Organic Geochemistry, 27(5–6):213–250. https://doi.org/
Pitman, W.C., and Heirtzler, J.R., 1966. Magnetic anomalies over the Pacific-Antarctic Ridge. Science, 154(3753):1164–1171. https://doi.org/
Pribnow, D., Kinoshita, M., and Stein, C., 2000. Thermal Data Collection and Heat Flow Recalculations for Ocean Drilling Program Legs 101–180: Hanover, Germany (Institute for Joint Geoscientific Research, Institut für Geowissenschaftliche Gemeinschaftsaufgaben [GGA]). http://www-odp.tamu.edu/
Richter, C., Acton, G., Endris, C., and Radsted, M., 2007. Technical Note 34: Handbook for Shipboard Paleomagnetists. Ocean Drilling Program. https://doi.org/
Riesselman, C.R., 2012. Fragilariopsis tigris sp. nov., a new late Pliocene Antarctic continental shelf diatom with biostratigraphic promise. Micropaleontology, 58(4):367–376. https://www.jstor.org/
Schönfeld, J., 2006. Taxonomy and distribution of the Uvigerina peregrina plexus in the tropical to northeastern Atlantic. Journal of Foraminiferal Research, 36(4):355–367. https://doi.org/
Schrader, H.-J., 1973. Cenozoic diatoms from the northeast Pacific, Leg 18. In Kulm, L.D., von Huene, R., et al., Initial Reports of the Deep Sea Drilling Project, 18: Washington, DC (U.S. Government Printing Office), 673–797. https://doi.org/
Scott, G.H., Kennett, J.P., Wilson, K.J., and Hayward, B.W., 2007. Globorotalia puncticulata: population divergence, dispersal and extinction related to Pliocene–Quaternary water masses. Marine Micropaleontology, 62(4):235–253. https://doi.org/
Singh, R.K. and Gupta, A.K., 2004. Late Oligocene–Miocene paleoceanographic evolution of the southeastern Indian Ocean: evidence from deep-sea benthic foraminifera (ODP Site 757). Marine Micropaleontology, 51(1–2):153–170. https://doi.org/
Singh, R.K., and Gupta, A.K., 2010. Deep-sea benthic foraminiferal changes in the eastern Indian Ocean (ODP Hole 757B): their links to deep Indonesian (Pacific) flow and high latitude glaciation during the Neogene. Episodes, 33(2):74–82.
Singh, R.K., and Gupta, A.K., 2005. Systematic decline in benthic foraminiferal species diversity linked to productivity increases over the last 26 Ma in the Indian Ocean. Journal of Foraminiferal Research, 35(3):219–227. http://dx.doi.org/
Singh, R.K., Gupta, A.K., and Das M., 2012. Paleoceanographic significance of deep-sea benthic foraminiferal species diversity at southeastern Indian Ocean Hole 752A during the Neogene. Palaeogeography, Palaeoclimatology, Palaeoecology, 361–362:94–103. https://doi.org/
Soetaert, K., Hofmann, A.F., Middelburg, J.J., Meysman, F.J.R., and Greenwood, J., 2007. The effect of biogeochemical processes on pH. Marine Chemistry, 106(1–2):380–401. (Reprint) http://dx.doi.org/
Steinhardt, J., de Nooijer, L.L., Brummer, G.-J., and Reichart, G.-J., 2015. Profiling planktonic foraminiferal crust formation. Geochemistry, Geophysics, Geosystems, 16(7):2409–2430. https://doi.org/
Stepanova, A., and Lyle, M., 2014. Deep-sea ostracoda from the eastern equatorial Pacific (ODP Site 1238) over the last 460 ka. Marine Micropaleontology, 111:100–107. https://doi.org/
Suto, I., and Uramoto, G.-I., 2015. Data report: diatom biostratigraphy of IODP Site U1371 in the South Pacific Ocean. In D’Hondt, S., Inagaki, F., Alvarez Zarikian, C.A., and the Expedition 329 Scientists, Proceedings of the Integrated Ocean Drilling Program, 329: Tokyo (Integrated Ocean Drilling Program Management International, Inc.). https://doi.org/
Tsutsui, H., Takahashi, K., Nishida, N., and Nishiwaki, S., 2009. Intraspecific morphological variation with biometry of Distephanus speculum (Silicoflagellata). Marine Micropaleontology, 72(3–4):239–250. https://doi.org/
Ullermann, J., Lamy, F., Ninnemann, U., Lembke-Jene, L., Gersonde, R., and Tiedemann, R., 2016. Pacific-Atlantic Circumpolar Deep Water coupling during the last 500 ka. Paleoceanography and Paleoclimatology, 31(6):639–650. https://doi.org/
Verma, S., Gupta, A.K., and Singh, R.K., 2013. Variations in deep-sea benthic foraminifera at ODP Hole 756B, southeastern Indian Ocean: evidence for changes in deep ocean circulation. Palaeogeography, Palaeoclimatology, Palaeoecology, 376:172–183. https://doi.org/
Wade, B.S., Pearson, P.N., Berggren, W.A., and Pälike, H., 2011. Review and revision of Cenozoic tropical planktonic foraminiferal biostratigraphy and calibration to the geomagnetic polarity and astronomical time scale. Earth-Science Reviews, 104(1–3):111–142. https://doi.org/
Wei, K.-Y., 1994. Stratophenetic tracing of phylogeny using SIMCA pattern recognition technique: a case study of the late Neogene planktonic foraminifera Globoconella clade. Paleobiology, 20(1):52–65. https://doi.org/
Wetzel, A., and Uchman, A., 2012. Hemipelagic and pelagic basin plains. In Knaust, D., and Bromley, R.G. (Eds.), Developments in Sedimentology (Volume 64): Trace Fossils as Indicators of Sedimentary Environments: Amsterdam (Elsevier), 673–701. https://doi.org/
Whatley, R.C., Downing, S.E., Kesler, K., and Harlow, C.J., 1986. The ostracod genus Poseidonamicus from the Cainozoic of D.S.D.P. sites in the S.W. Pacific. Revista Española de Micropaleontology, 18:387–400.
Winckler, G., Lamy, F., Alvarez Zarikian, C.A., Arz, H.W., Basak, C., Brombacher, A., Esper, O.M., Farmer, J.R., Gottschalk, J., Herbert, L.C., Iwasaki, S., Lawson, V.J., Lembke-Jene, L., Lo, L., Malinverno, E., Michel, E., Middleton, J.L., Moretti, S., Moy, C.M., Ravelo, A.C., Riesselman, C.R., Saavedra-Pellitero, M., Seo, I., Singh, R.K., Smith, R.A., Souza, A.L., Stoner, J.S., Venancio, I.M., Wan, S., Zhao, X., and Foucher McColl, N., 2021a. Expedition 383 methods. In Lamy, F., Winckler, G., Alvarez Zarikian, C.A., and the Expedition 383 Scientists, Dynamics of the Pacific Antarctic Circumpolar Current. Proceedings of the International Ocean Discovery Program, 383: College Station, TX (International Ocean Discovery Program). https://doi.org/
Winckler, G., Lamy, F., Alvarez Zarikian, C.A., Arz, H.W., Basak, C., Brombacher, A., Esper, O.M., Farmer, J.R., Gottschalk, J., Herbert, L.C., Iwasaki, S., Lawson, V.J., Lembke-Jene, L., Lo, L., Malinverno, E., Michel, E., Middleton, J.L., Moretti, S., Moy, C.M., Ravelo, A.C., Riesselman, C.R., Saavedra-Pellitero, M., Seo, I., Singh, R.K., Smith, R.A., Souza, A.L., Stoner, J.S., Venancio, I.M., Wan, S., Zhao, X., and Foucher McColl, N., 2021b. Site U1540. In Lamy, F., Winckler, G., Alvarez Zarikian, C.A., and the Expedition 383 Scientists, Dynamics of the Pacific Antarctic Circumpolar Current. Proceedings of the International Ocean Discovery Program, 383: College Station, TX (International Ocean Discovery Program). https://doi.org/
Yasuhara, M., Hunt, G., Okahashi, H., and Brandão, S.N., 2013. The ‘Oxycythereis’ problem: taxonomy and paleobiogeography of deep-sea ostracod genera Pennyella and Rugocythereis. Palaeontology, 56(5):1045–1080. https:/doi.org/
Zielinski, U., and Gersonde, R., 2002. Plio–Pleistocene diatom biostratigraphy from ODP Leg 177, Atlantic sector of the Southern Ocean. Marine Micropaleontology, 45(3–4):225–268. https://doi.org/
1 Winckler, G., Lamy, F., Alvarez Zarikian, C.A., Arz, H.W., Basak, C., Brombacher, A., Esper, O.M., Farmer, J.R., Gottschalk, J., Herbert, L.C., Iwasaki, S., Lawson, V.J., Lembke-Jene, L., Lo, L., Malinverno, E., Michel, E., Middleton, J.L., Moretti, S., Moy, C.M., Ravelo, A.C., Riesselman, C.R., Saavedra-Pellitero, M., Seo, I., Singh, R.K., Smith, R.A., Souza, A.L., Stoner, J.S., Venancio, I.M., Wan, S., Zhao, X., and Foucher McColl, N., 2021. Site U1541. In Lamy, F., Winckler, G., Alvarez Zarikian, C.A., and the Expedition 383 Scientists, Dynamics of the Pacific Antarctic Circumpolar Current. Proceedings of the International Ocean Discovery Program, 383: College Station, TX (International Ocean Discovery Program). https://doi.org/10.14379/iodp.proc.383.105.2021
2 Expedition 383 Scientists’ affiliations.
This work is distributed under the Creative Commons Attribution 4.0 International (CC BY 4.0) license. 