Lamy, F., Winckler, G., Alvarez Zarikian, C.A., and the Expedition 383 Scientists
Proceedings of the International Ocean Discovery Program Volume 383
publications.iodp.org

https://doi.org/10.14379/iodp.proc.383.107.2021
Site U15431
F. Lamy, G. Winckler, C.A. Alvarez Zarikian, H.W. Arz, C. Basak, A. Brombacher, O.M. Esper, J.R. Farmer, J. Gottschalk, L.C. Herbert, S. Iwasaki, V.J. Lawson, L. Lembke-Jene, L. Lo, E. Malinverno, E. Michel, J.L. Middleton, S. Moretti, C.M. Moy, A.C. Ravelo, C.R. Riesselman, M. Saavedra-Pellitero, I. Seo, R.K. Singh, R.A. Smith, A.L. Souza, J.S. Stoner, I.M. Venancio, S. Wan, X. Zhao, and N. Foucher McColl2
Keywords: International Ocean Discovery Program, IODP, JOIDES Resolution, Expedition 383, Dynamics of the Pacific Antarctic Circumpolar Current, Site U1543, Southern Ocean, South Pacific, Chilean margin, paleoceanography, Antarctic Circumpolar Current, oceanic fronts, Circumpolar Deep Water, Antarctic Intermediate Water, marine carbon cycle, dust, biological productivity, iron fertilization, southern westerly winds, Patagonian ice sheet, West Antarctic ice sheet
MS 383-107: Published 18 July 2021
Background and objectives
Site U1543 is located in the eastern South Pacific at 54°35.06ʹS, 76°40.59ʹW, ~110 nmi west of the Chilean coast and ~120 nmi south-southwest of Site U1542 at ~3860 m water depth (Figure F1). The site is situated west of the Chile Trench on a topographically elevated ridge ~300 m above the trench axis (~4200 m water depth) (Figure F2A). The basement at this location is oceanic crust older than ~20 Ma (Eagles, 2006).
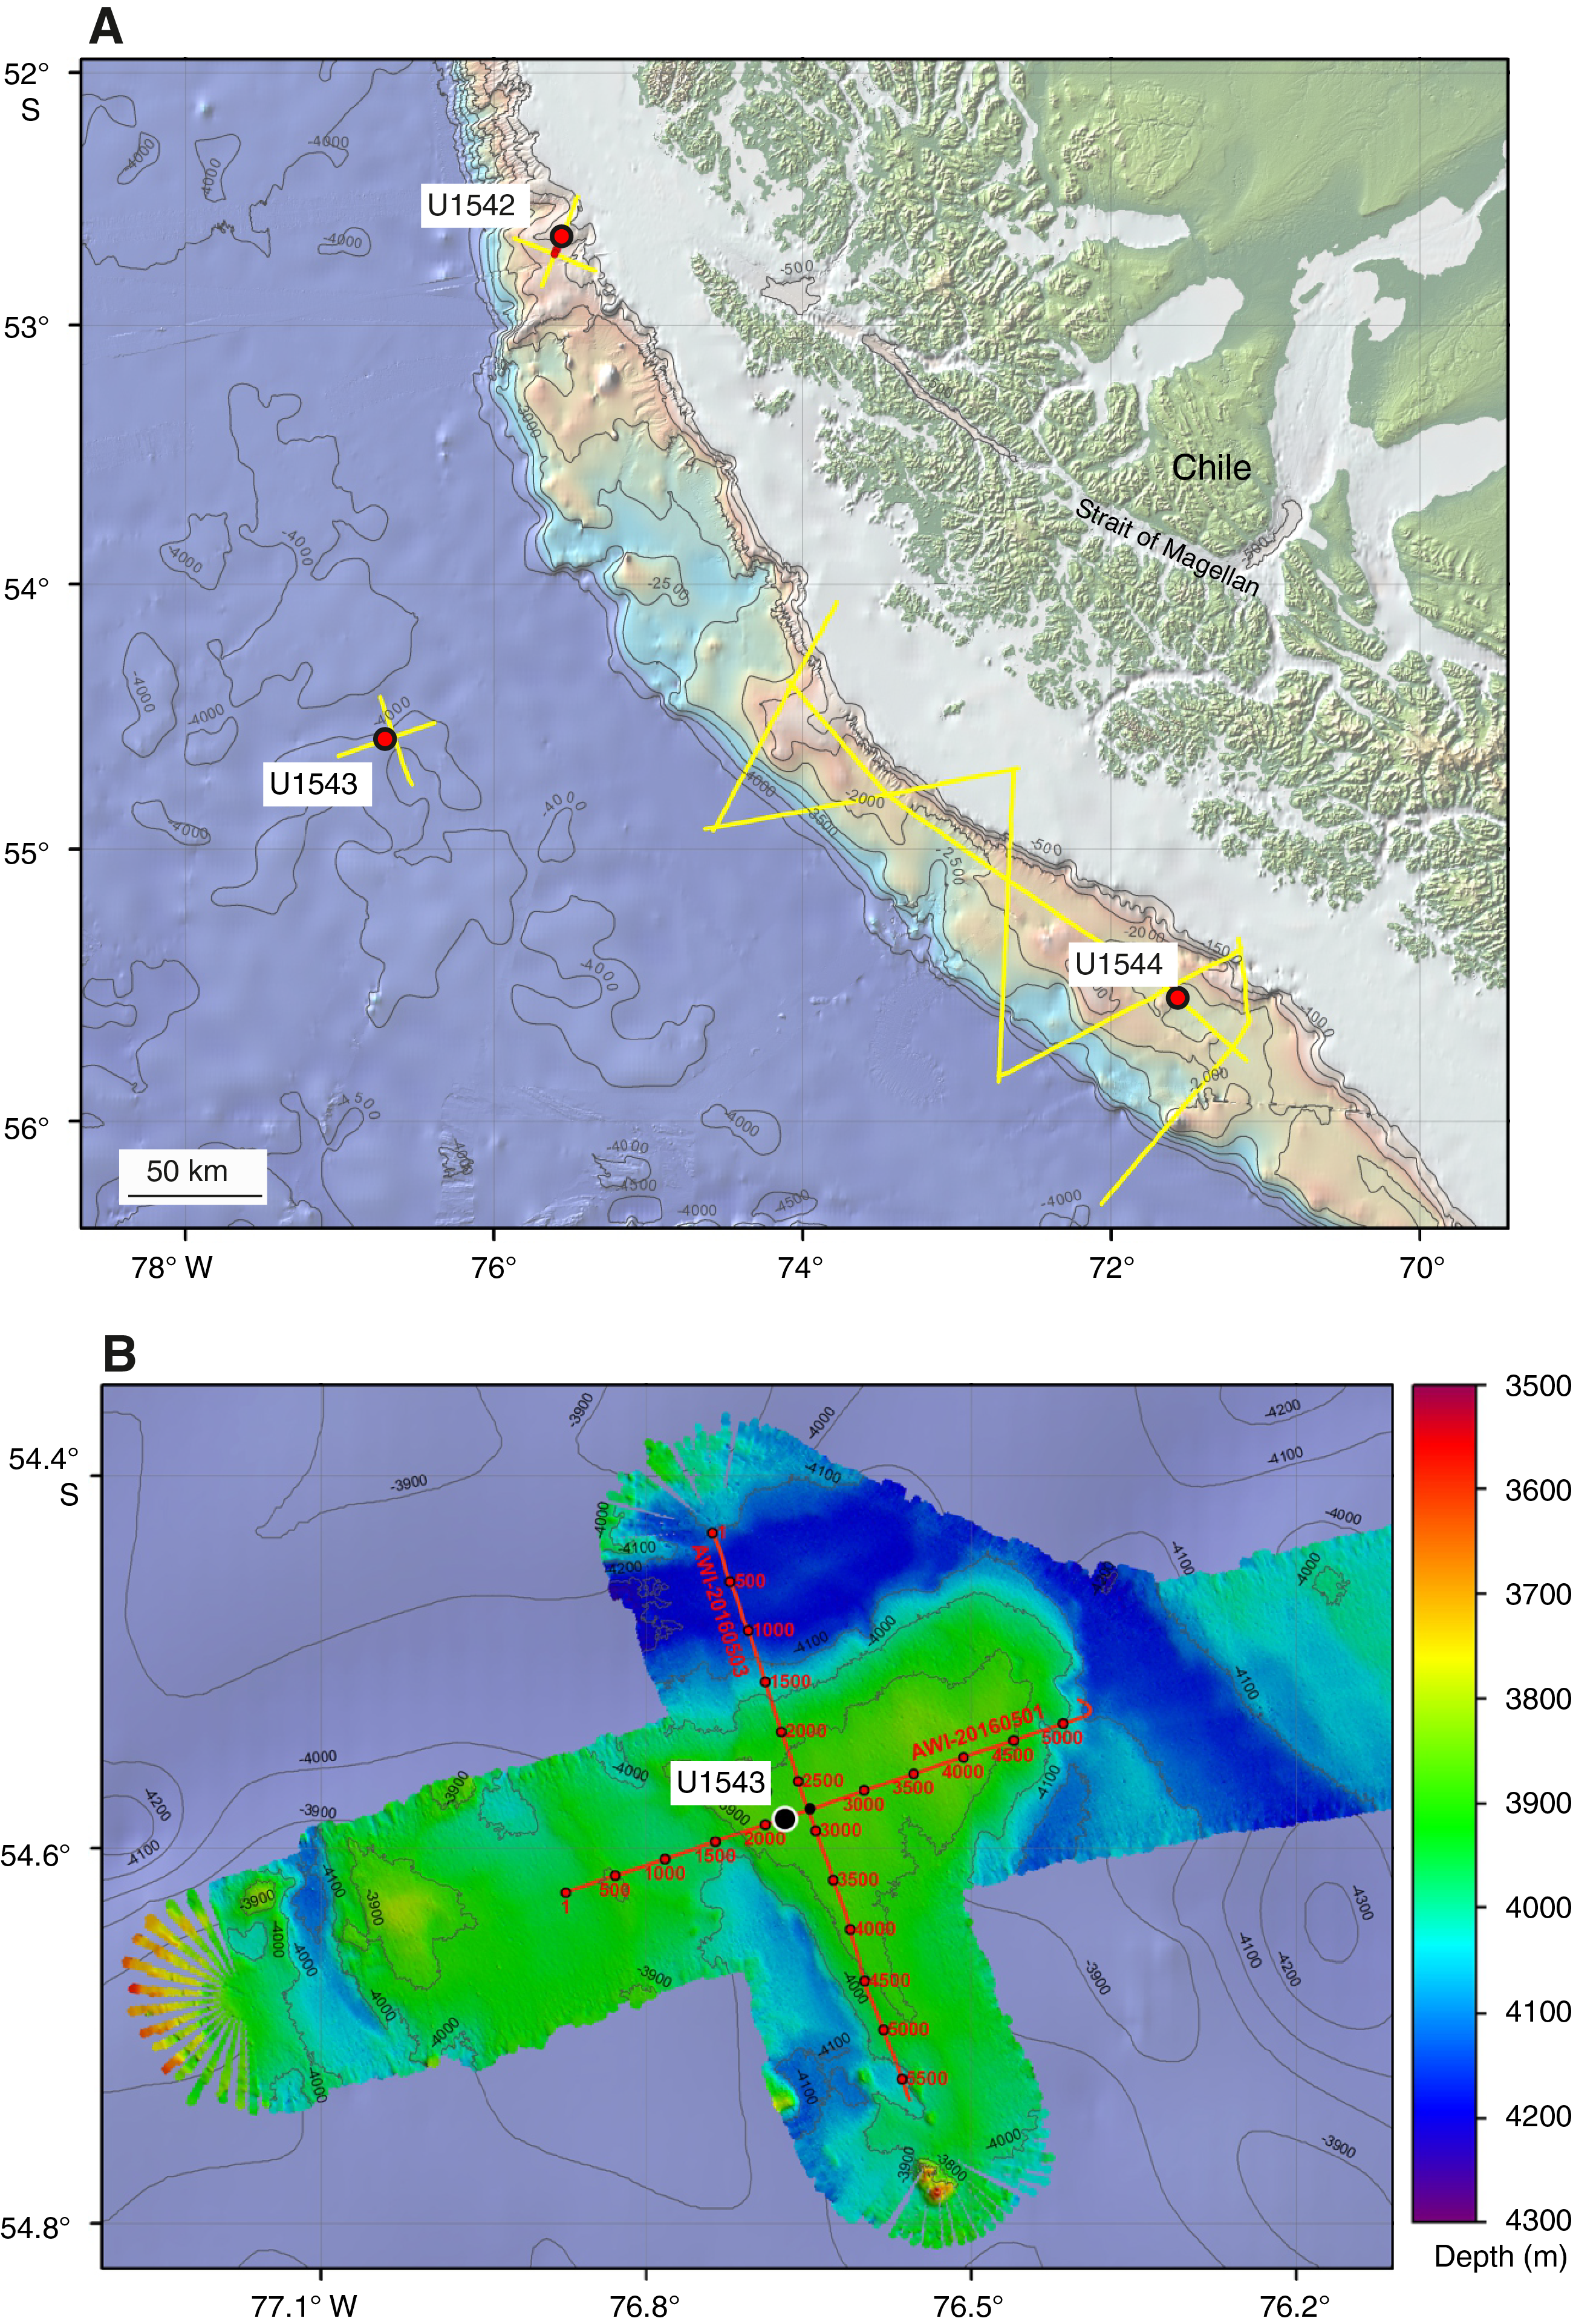
Figure F1. Oceanographic and bathymetric setting.

Figure F2. MCS and Parasound profiles.
Site U1543 lies at the intersection of two seismic lines and has a sediment thickness of 600–700 m. Site U1543 lies ~1 nmi southwest of the intersection between Multichannel Seismic (MCS) Lines AWI-20160501 and AWI-20160503 (Figure F2A) (Lamy, 2016). Sediments are mostly well stratified and have only slightly irregular reflectors. Sediment cover is drape-type and entirely covers the underlying basement morphology (Figure F2A). Sediment echo sound (Parasound) profiles (Lamy, 2016) reveal moderate penetration (~70 m) and distinct layering (Figure F2B), suggesting a succession of fine-grained sediments with varying lithologic composition.
Site U1543 is located at the offshore reach of the southward-flowing Cape Horn Current (CHC), a northern branch of the Antarctic Circumpolar Current (ACC) that continues toward the Drake Passage and provides a major fraction of the present-day northern Drake Passage transport (Well and Roether, 2003). Satellite-tracked surface drifters reveal that after crossing the East Pacific Rise (EPR), Subantarctic surface water of the ACC is transported northeastward across the Southeast Pacific toward the Chilean coast at ~45°S/75°W (Figures F3, F4). Here, presently only a minor part of ACC water is deflected northward into the Humboldt Current System, whereas the major fraction is deviated southward toward the Drake Passage. The CHC thus transports a significant amount of northern ACC water toward the Drake Passage in a narrow, ~100–150 km belt along the coast (Chaigneau and Pizarro, 2005) (Figures F3, F4). Modern surface current velocities within the CHC reach >35 cm/s at the continental margin (Site U1542) but decrease offshore toward Site 1543 (Boisvert, 1969; Chaigneau and Pizarro, 2005).
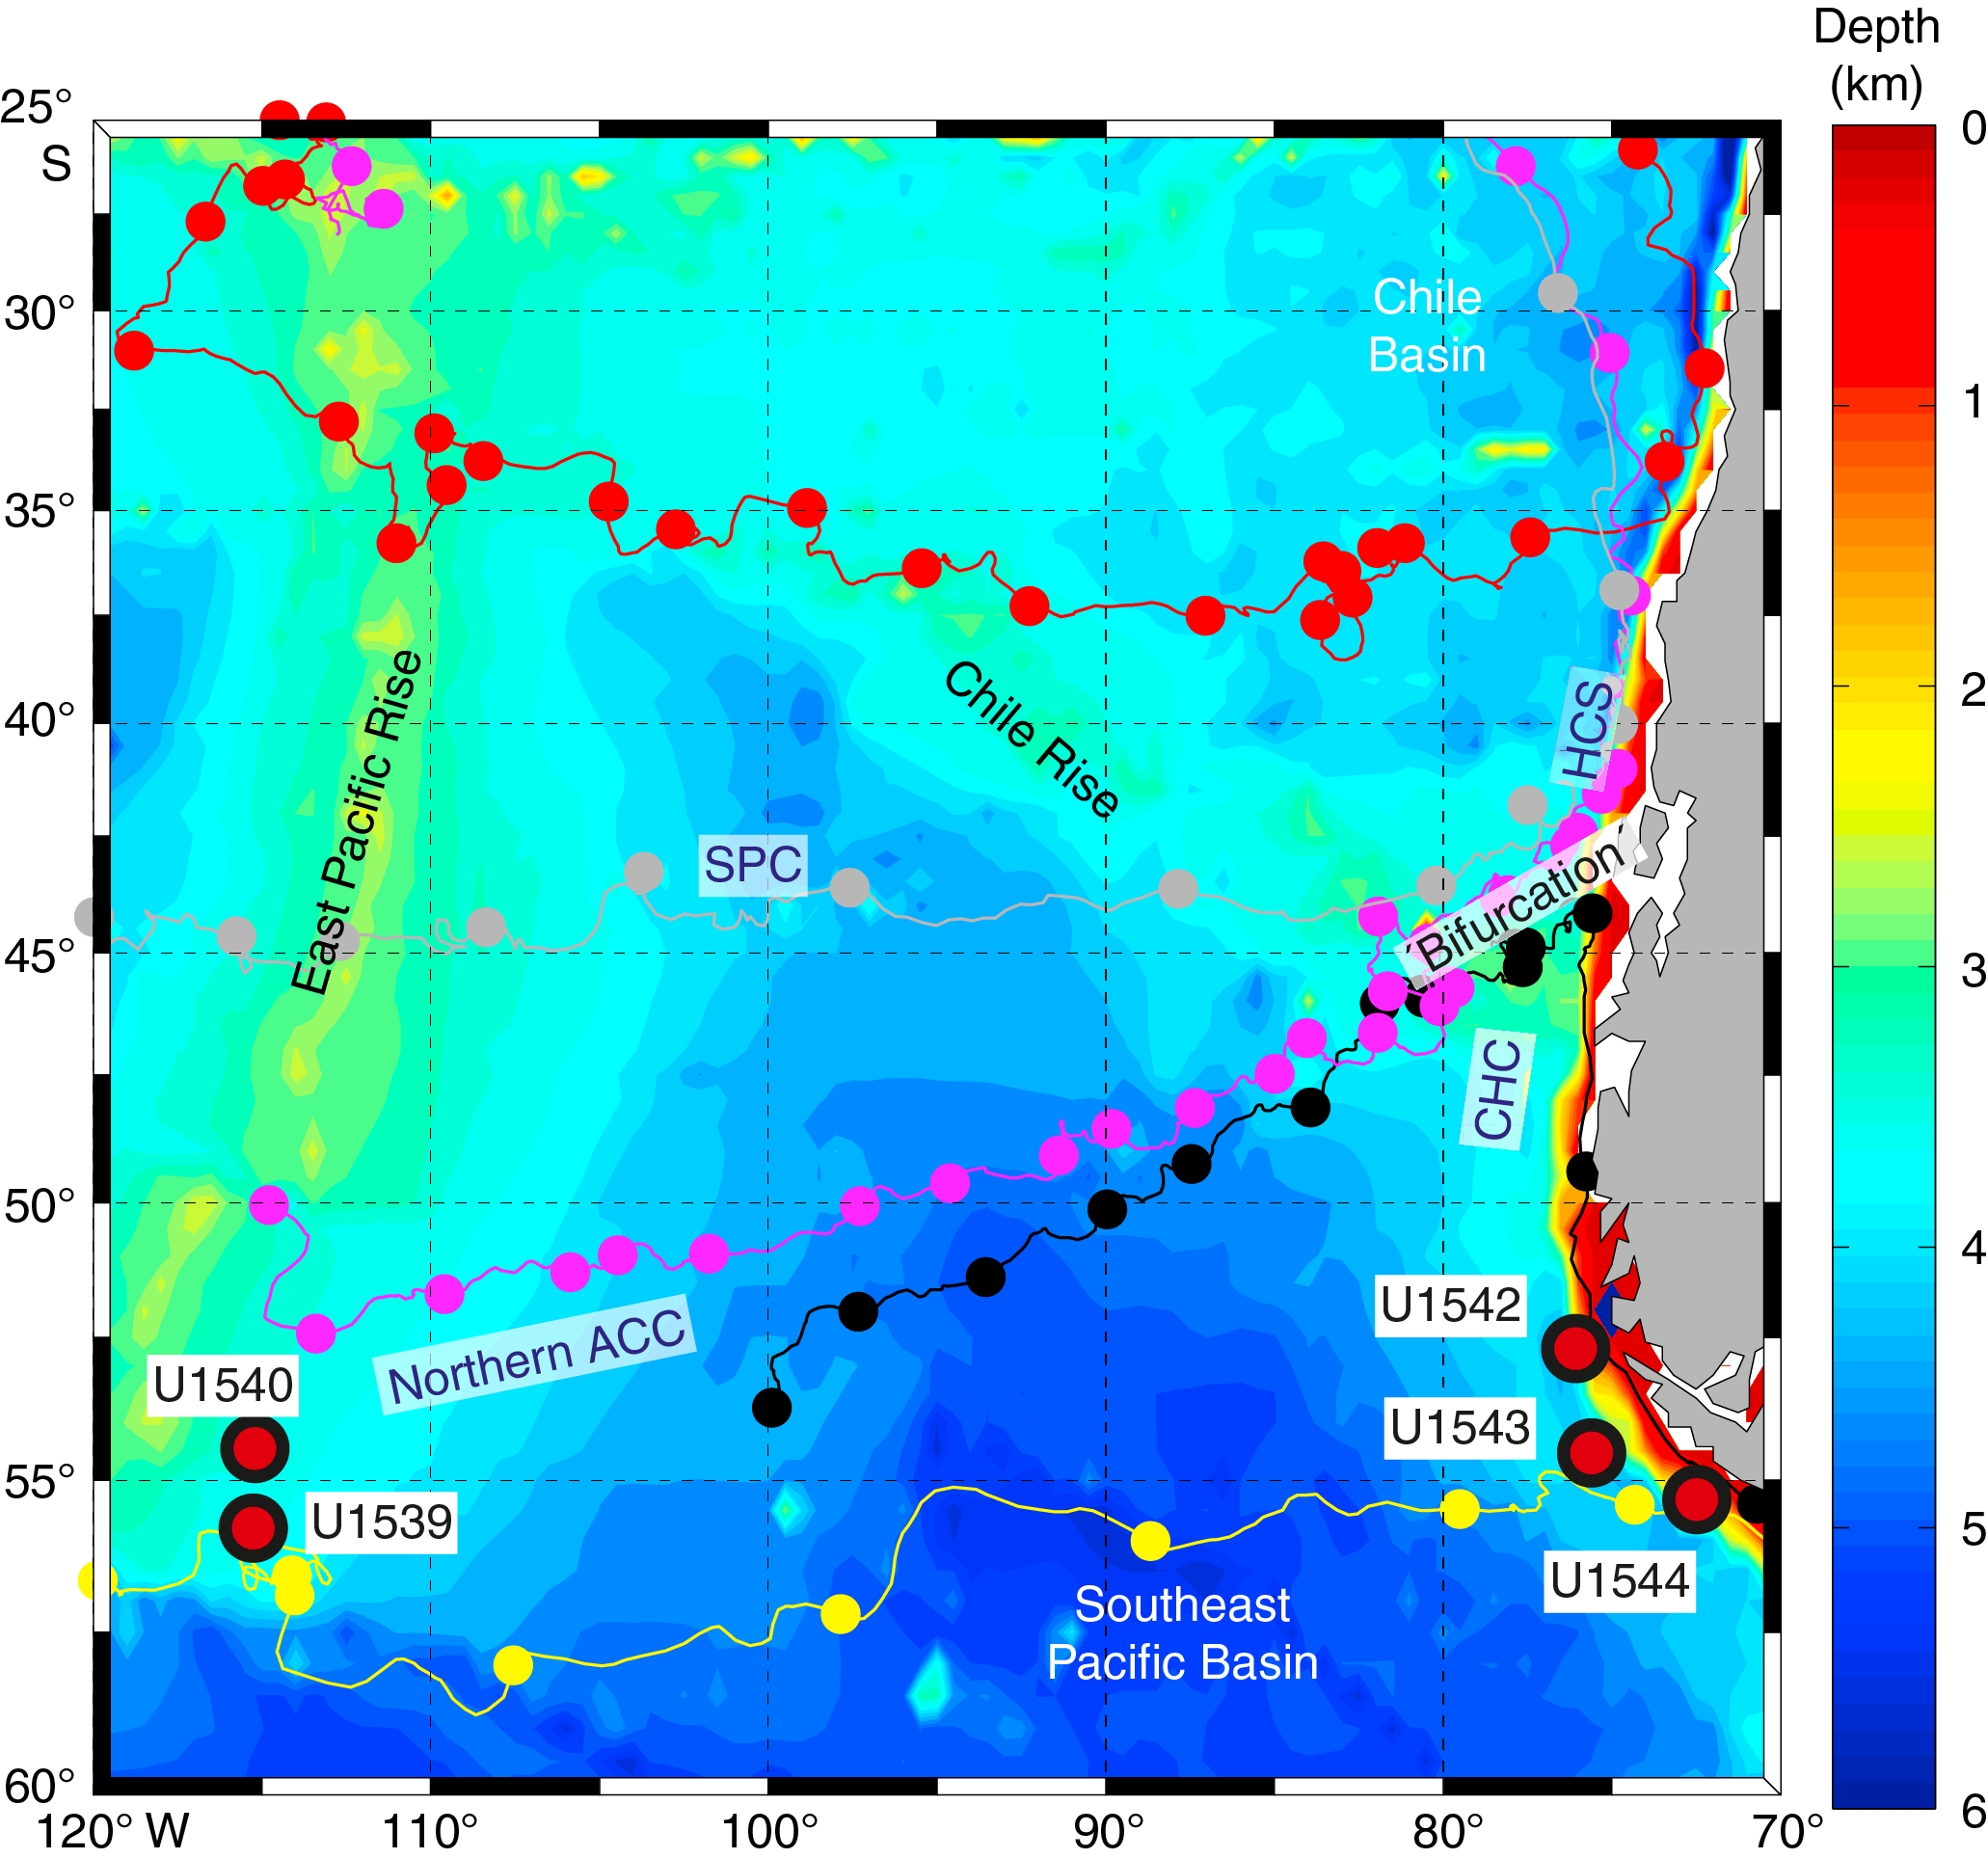
Figure F3. Surface circulation.
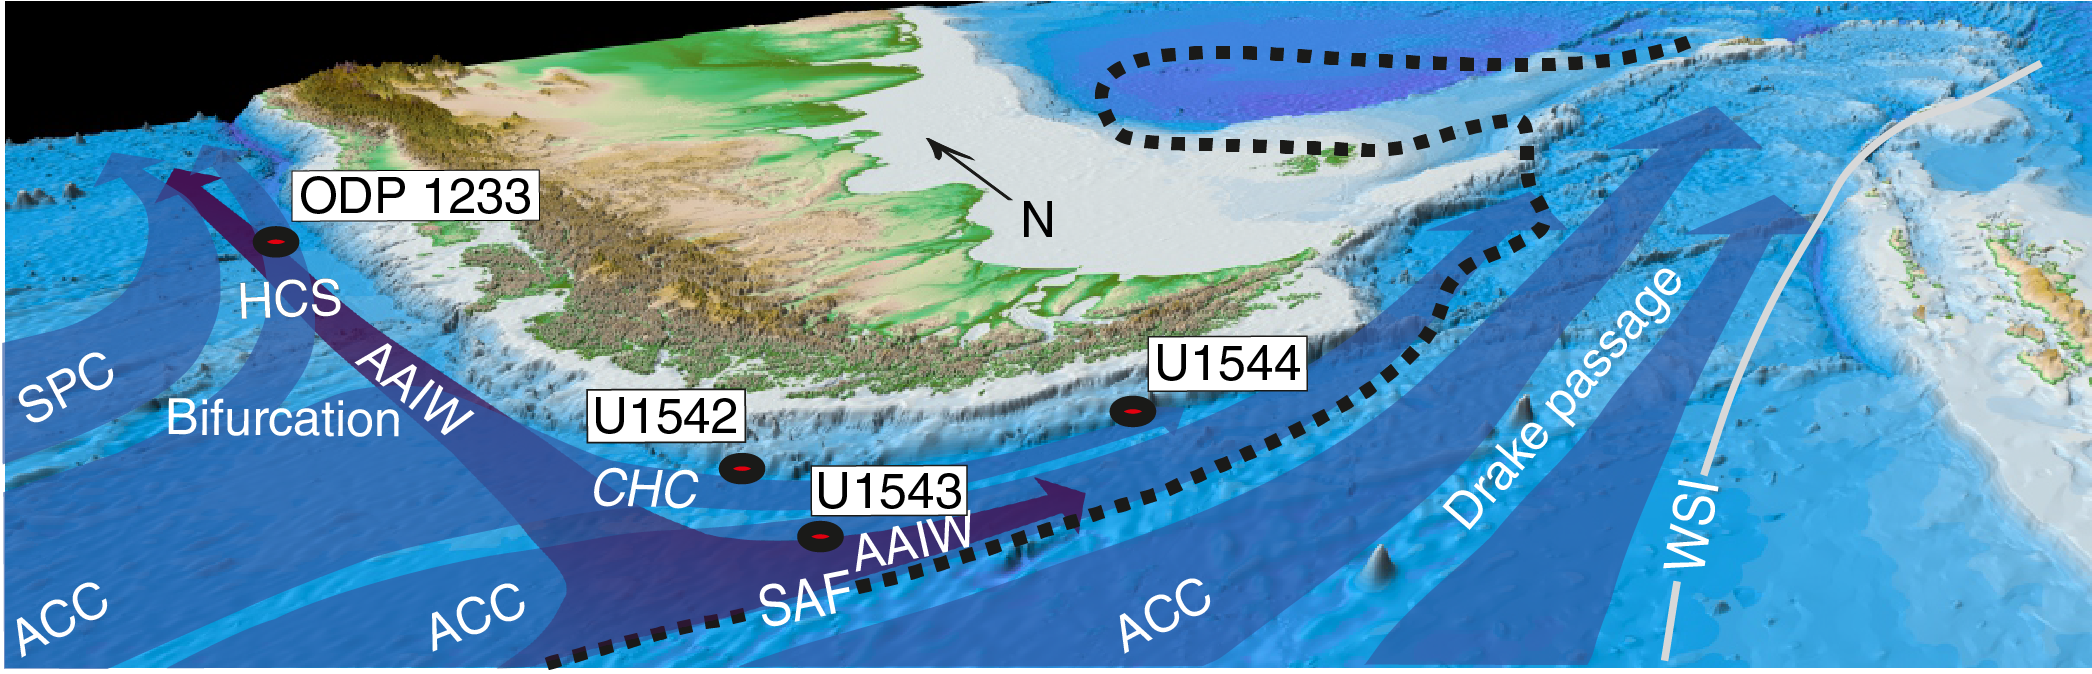
Figure F4. Major surface and intermediate water circulation.
Site U1543 is presently located at the lower limit of Lower Circumpolar Deep Water and might have been affected by Antarctic Bottom Water (AABW) in the past (Figure F5). The site is located ~4° latitude north of the present Subantarctic Front. Modern mean annual sea-surface temperature (SST) in this area is ~8.5°C, and the seasonal range is ~±3°C.
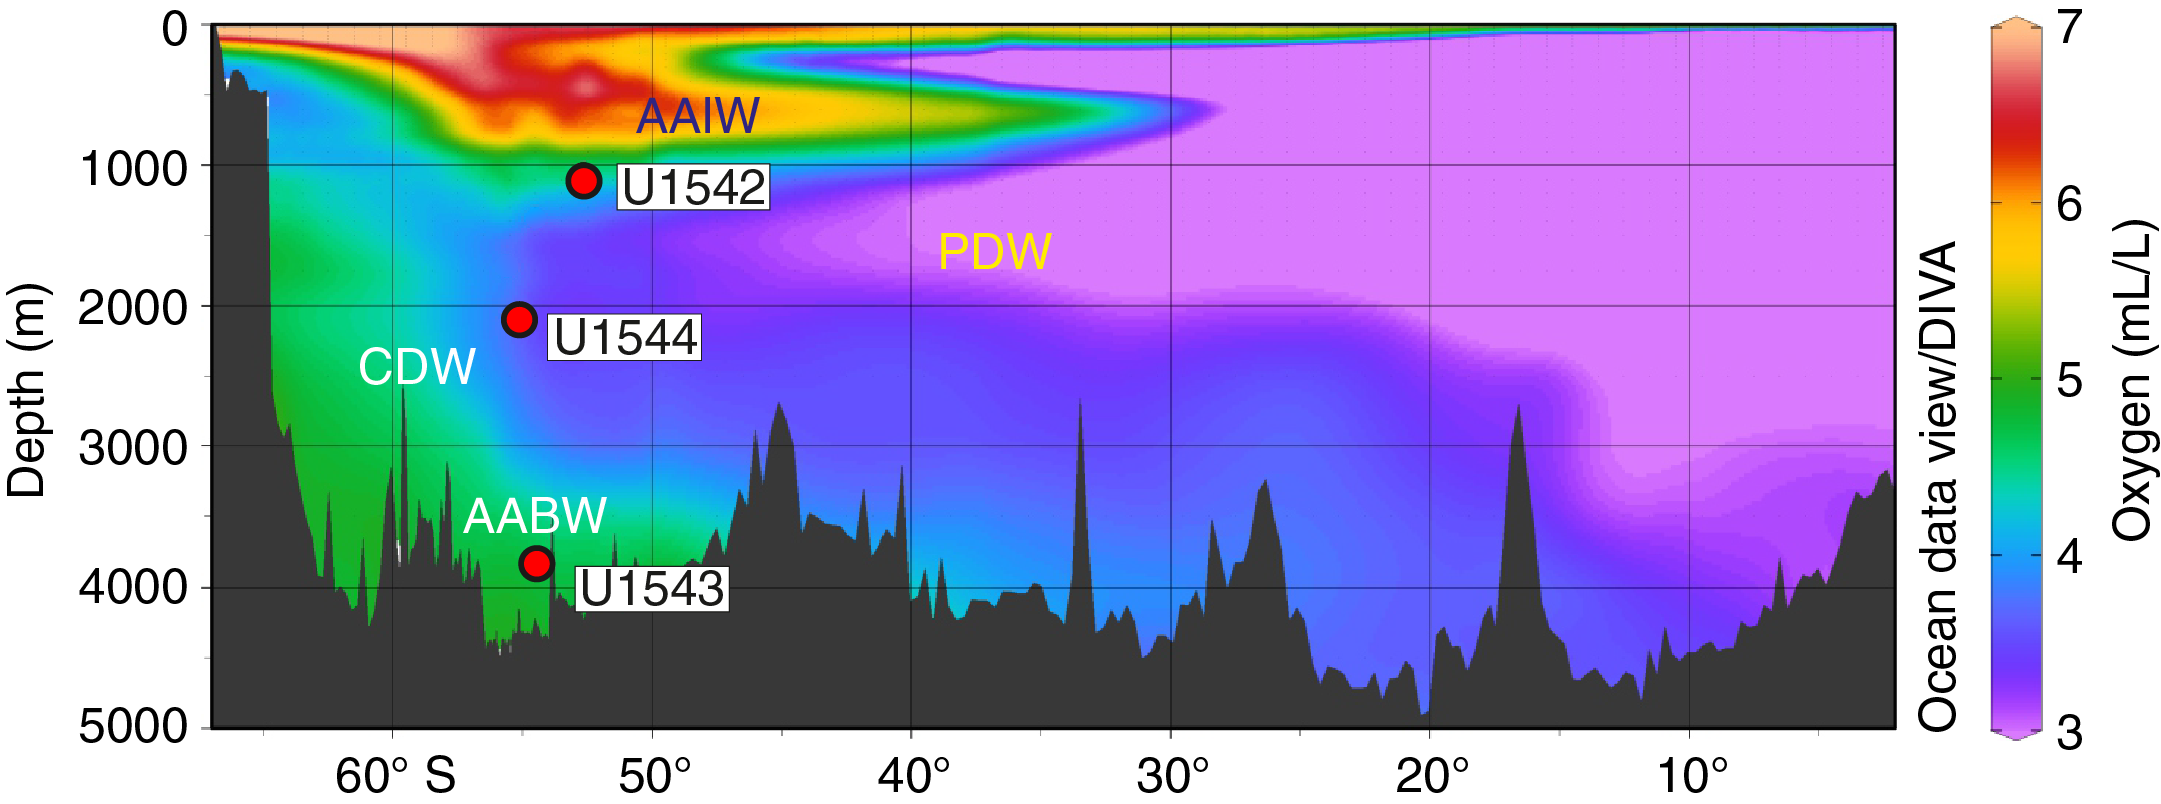
Figure F5. Modern oxygen distribution.
Precruise site survey Cores PS97/112-1 and PS97/114-1 (~14 and ~22 m long, respectively; Lamy, 2016), from the intersection of the seismic lines, provide sediment records reaching back to ~475 ka that indicate average sedimentation rates of ~5 cm/ky. Core scanner and bulk sediment data from Core PS97/114-1 indicate strong fluctuations in carbonate versus siliciclastic sediment components. High CaCO3 values are found during interglacials (as high as 50% in Marine Isotope Stage [MIS] 5 and 95% in MIS 11). Glacial sediments are dominated by clay, and CaCO3 contents are below 1 wt%.
Scientific objectives
The main objectives at Site U1543 were to
- Recover a late Miocene to recent undisturbed, continuous sediment record with medium to high sedimentation rates;
- Reconstruct the strength of the CHC (Subantarctic ACC) before entering the Drake Passage;
- Investigate AABW, Circumpolar Deep Water, and Pacific Deep Water mass properties;
- Investigate changes in continental paleoclimate; and
- Recover a potential near-field record of Patagonian ice sheet variability over the past several million years.
Operations
Two holes were cored at Site U1543 using the full-length advanced piston corer (APC) system. Hole U1543A was cored to 339.6 m core depth below seafloor, Method A (CSF-A) (350.62 m recovered; 103%), and Hole U1543B was cored to 283.1 m CSF-A (294.97 m recovered; 104.2%).
Transit to Site U1543
The R/V JOIDES Resolution made the 119 nmi voyage to Site U1543 in 10.5 h, averaging 11.3 kt. The thrusters were lowered, and the ship was moved to dynamic positioning control over the site coordinates at 1717 h on 8 July 2019. A water depth reading using the precision depth recorder set the preliminary seafloor depth at 3877.4 meters below rig floor (mbrf) for Hole U1543A. The operations plan for Site U1543 initially proposed three holes to 400 m CSF-A. Because of time lost to weather, this plan was modified to coring only two holes to APC refusal.
Site U1543
Hole U1543A
Hole U1543A was spudded at 0325 h on 9 July 2019, and coring with the full-length APC system continued to 339.6 m CSF-A. Coring was terminated after 90,000 lb of overpull was needed to retrieve Core 383-U1543A-36H. The drill string was pulled out of the hole, clearing the seafloor at 1830 h on 11 July. Overall, 36 cores were taken with 103% recovery.
Nonmagnetic core barrels were used on all cores. The core orientation tool was used for most cores, except for 383-U1543A-8H, 14H, 16H, 17H, 24H–29H, and 32H–36H. Formation temperature measurements were taken with the advanced piston corer temperature (APCT-3) tool for Cores 4H, 7H, 10H, 13H, 16H, and 19H. Partial strokes were recorded on Cores 32H–36H. The total time spent in Hole U1543A was 73.2 h (3.05 days).
Hole U1543B
The vessel was offset 20 m east of Hole U1543A, and Hole U1543B was spudded at 2010 h on 11 July 2019. The seafloor depth was calculated at 2876.4 mbrf (3865.3 meters below sea level [mbsl]) based on the recovery from Core 383-U1543B-1H. Hole U1543B was cored entirely with the APC system, and two drilled intervals were used to cover coring gaps between Holes U1543A and U1543B. The first drilled interval (1.9 m) followed Core 1H, and the second drilled interval (1.5 m) followed Core 23H. The bit was retrieved to the surface, clearing the seafloor at 1800 h on 13 July 2019 and the rotary table at 0045 h on 14 July. The rig floor was secured for transit at 0110 h, and JOIDES Resolution began transiting to Site U1544.
A total of 31 cores were taken over a 283.1 m interval in Hole U1543B. A total of 294.97 m was recovered (104.2% recovery). Two intervals were drilled without recovery for a total of 3.4 m. Nonmagnetic core barrels were used with all cores, and the core orientation tool was not used. Partial strokes were recorded on Cores 383-U1543B-31H through 33H. The liners of Cores 3H, 14H, 20H, 21H, 25H, and 31H–33H shattered on the catwalk after holes were drilled to release formation gas. Coring summaries for Holes U1543A and U1543B are shown in Table T1.
Sedimentology
Sediment cores from Holes U1543A and U1543B were retrieved from a drape-type sediment sequence on an elevated ridge in the eastern South Pacific. They present a continuous sedimentary record spanning the late Miocene to Holocene. Site U1543 sediments mostly consist of siliciclastic material and contain a significant proportion of biogenic sediments as intercalated beds or as a minor or major modifier of the dominant siliciclastic lithology. Sea conditions were favorable throughout the drilling operations at this site, with calm seas and low wave activity, which led to minor occurrences of core disturbances (i.e., fall-in at core tops). Intervals of uparching beds and/or suck-in at the bottom of cores were commonly observed below 275 m core composite depth below seafloor, Method A (CCSF-A), and may result from stiffer clay sediments at these depths. The identification and classification of sediments disturbed by drilling operations is described in Sedimentology in the Expedition 383 methods chapter (Winckler et al., 2021) and is largely based on Jutzeler et al. (2014). Severe drilling-disturbed sediments were classified as mixed siliciclastic sediments in the visual core descriptions (VCDs) and hole summaries (Figure F6). Examples can be found in Sections 383-U1543A-8H-1 and 8H-2, 383-U1543B-6H-1 and 6H-2, and 383-U1543B-31H-5 through 31H-CC. Sediments at Site U1543 become not only significantly stiffer with increasing sediment depth, they also show early signs of diagenesis and brittle deformation (e.g., microfaulting, microfracturing, and cracks). These more indurated/consolidated sediments required core splitting using a saw rather than wire-splitting downcore from Cores 383-U1543A-21H (>204.2 m CSF-A) and 383-U1543B-14H (>105.7 m CSF-A). Secondary precipitation of light brown carbonates was also identified below 275 m CCSF-A.
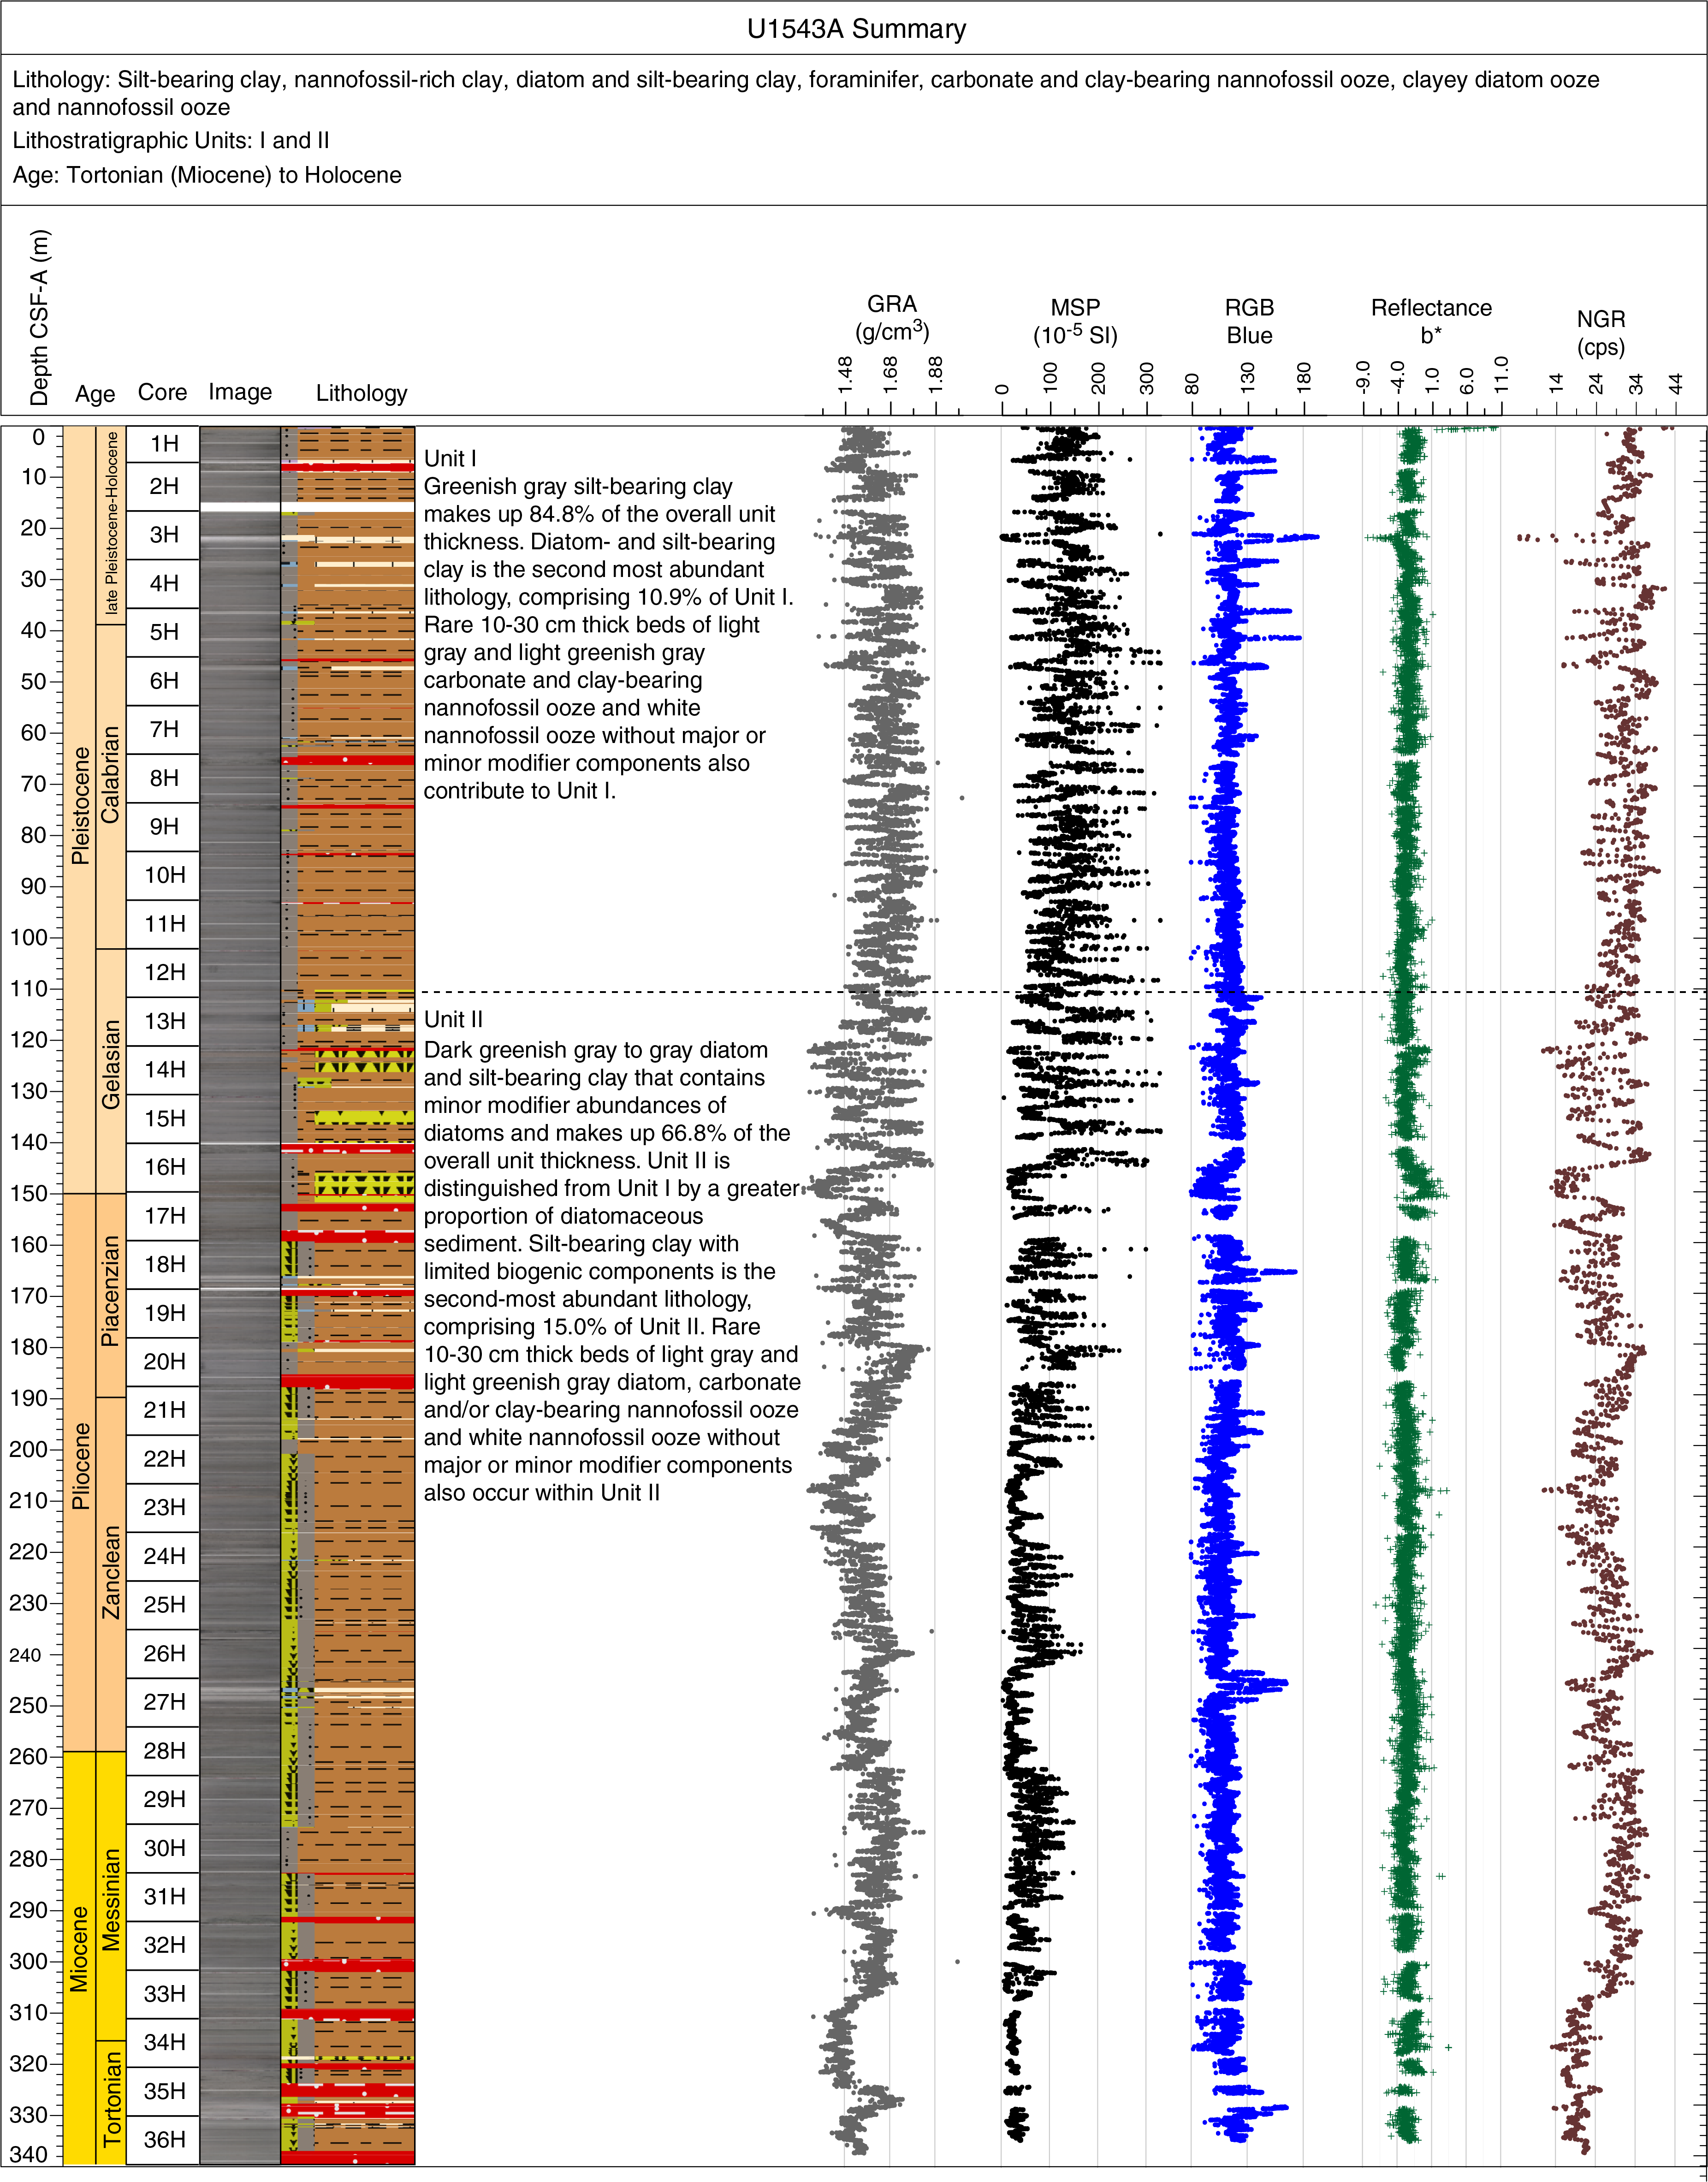

Figure F6. Hole summaries.
Lithofacies description
The five lithofacies identified at Site U1543 comprise siliciclastic and biogenic end-members and mixing lithologies between them (Table T2). They can be represented in a ternary diagram with carbonates, diatoms, and combined clay and silt as the main components (Figure F7). The numbering of the facies is based on the cumulative lithofacies documented for all Expedition 383 sites, but only lithofacies documented and introduced at Site U1543 are described and discussed here.
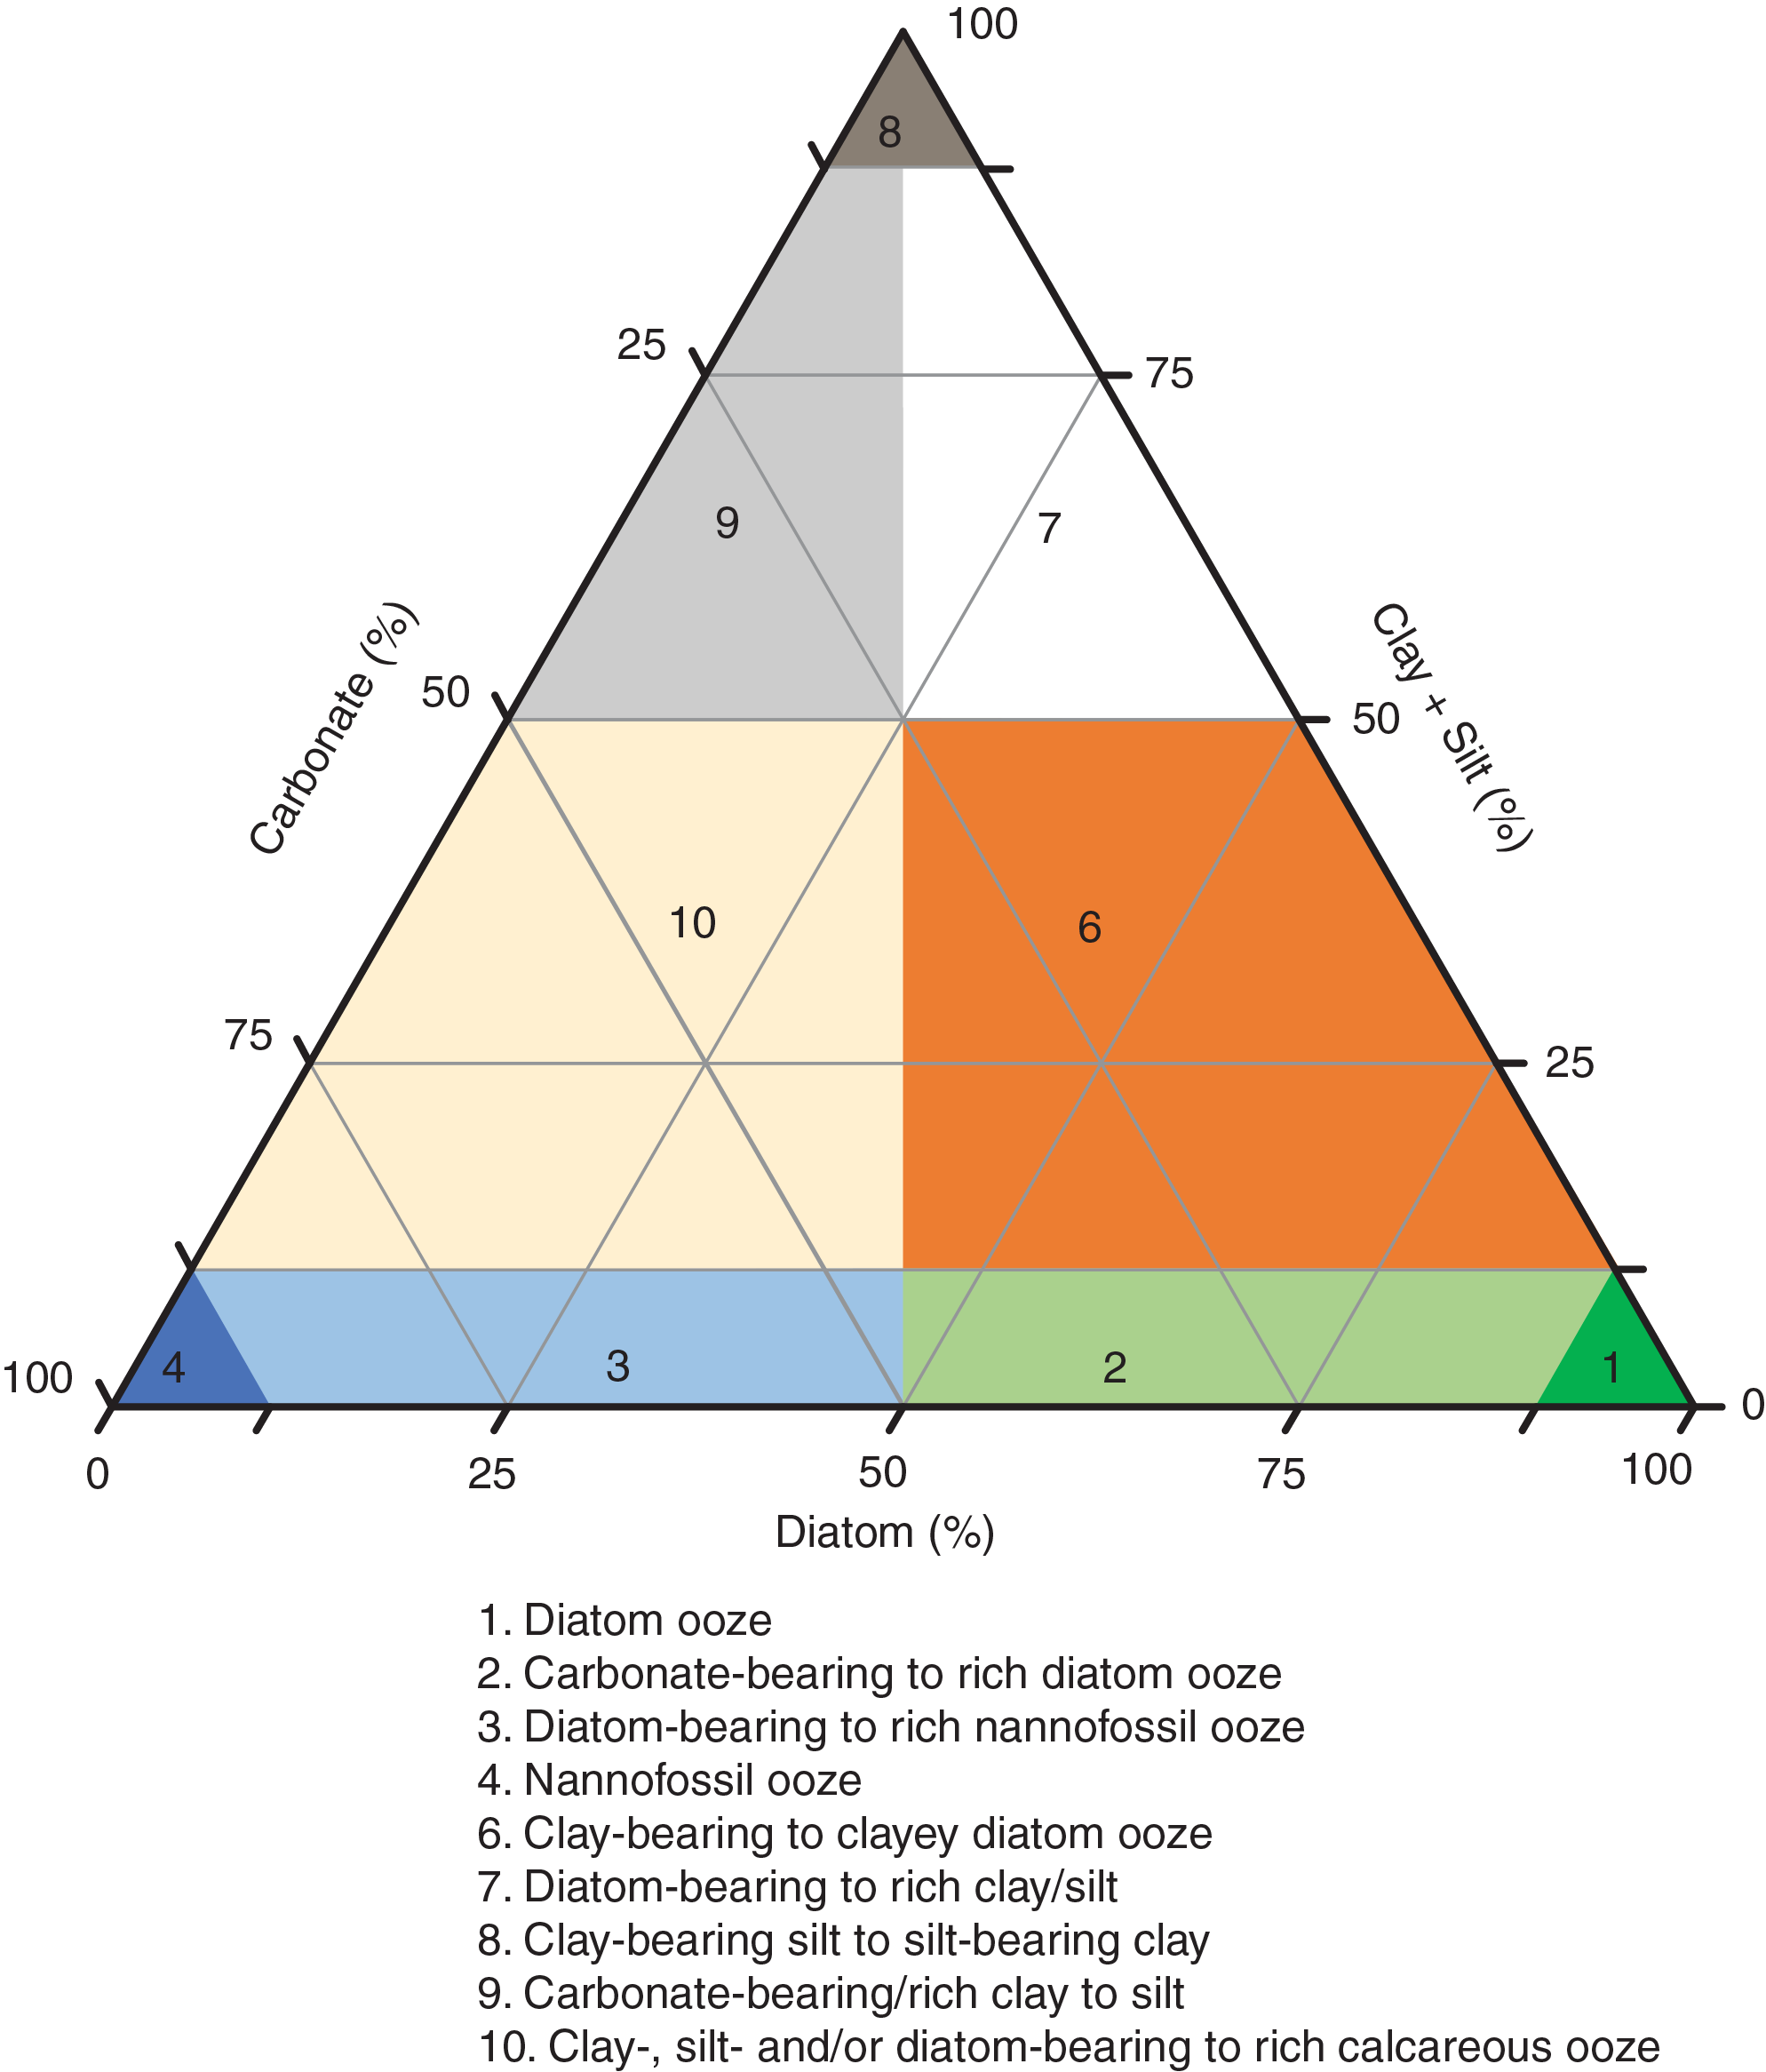
Figure F7. Primary lithologies.
Sediments from Lithofacies 4 and 10 are composed of calcareous ooze (i.e., nannofossils and foraminifers) (Figure F7). Lithofacies 4 consists of nearly pure calcareous ooze (Figure F8), and Lithofacies 10 contains minor or major biosiliceous and siliciclastic modifiers (Figure F9). Lithofacies 6, 7, and 8 are dominant lithologies at Site U1543. Lithofacies 6 and 7 transition from clay-bearing or clayey diatom ooze (Lithofacies 6) (Figure F10) to diatom-bearing/rich clay/silt (Lithofacies 7) (Figure F11), whereas Lithofacies 8 it silt-bearing clay to clay-bearing silt without any biosiliceous components (Lithofacies 8) (Figure F12).
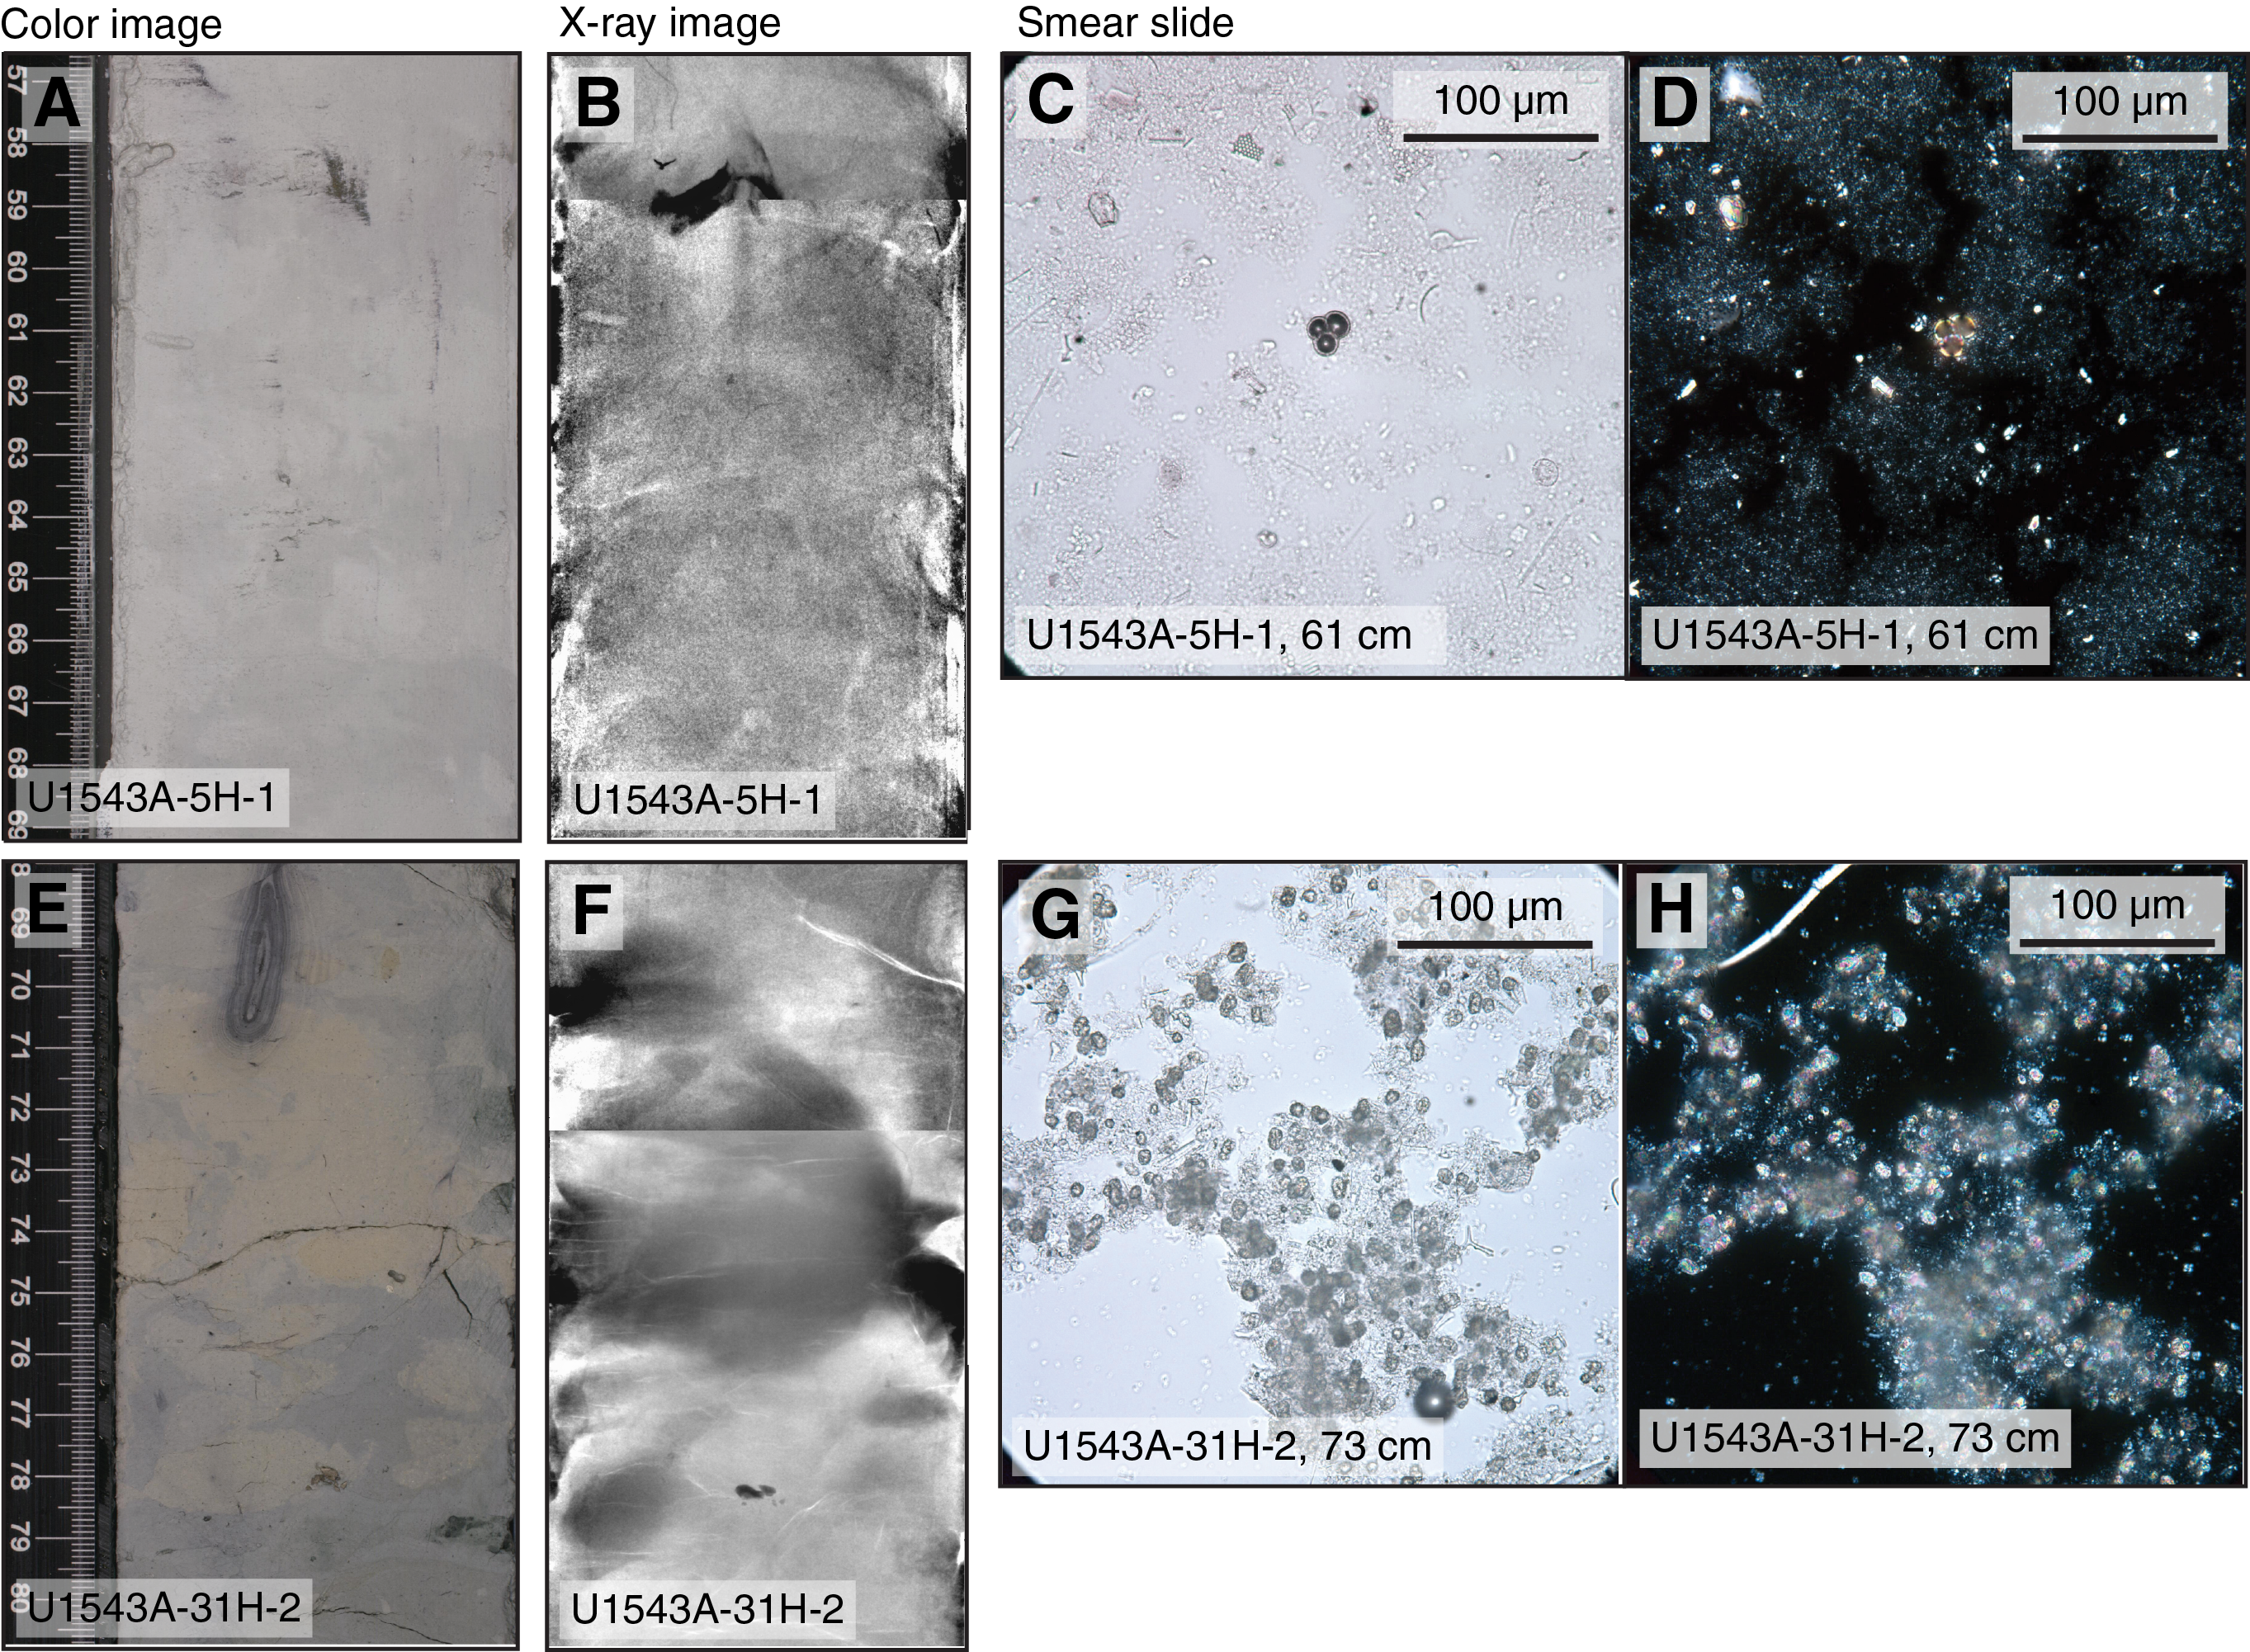
Figure F8. Mineral properties of Lithofacies 4.
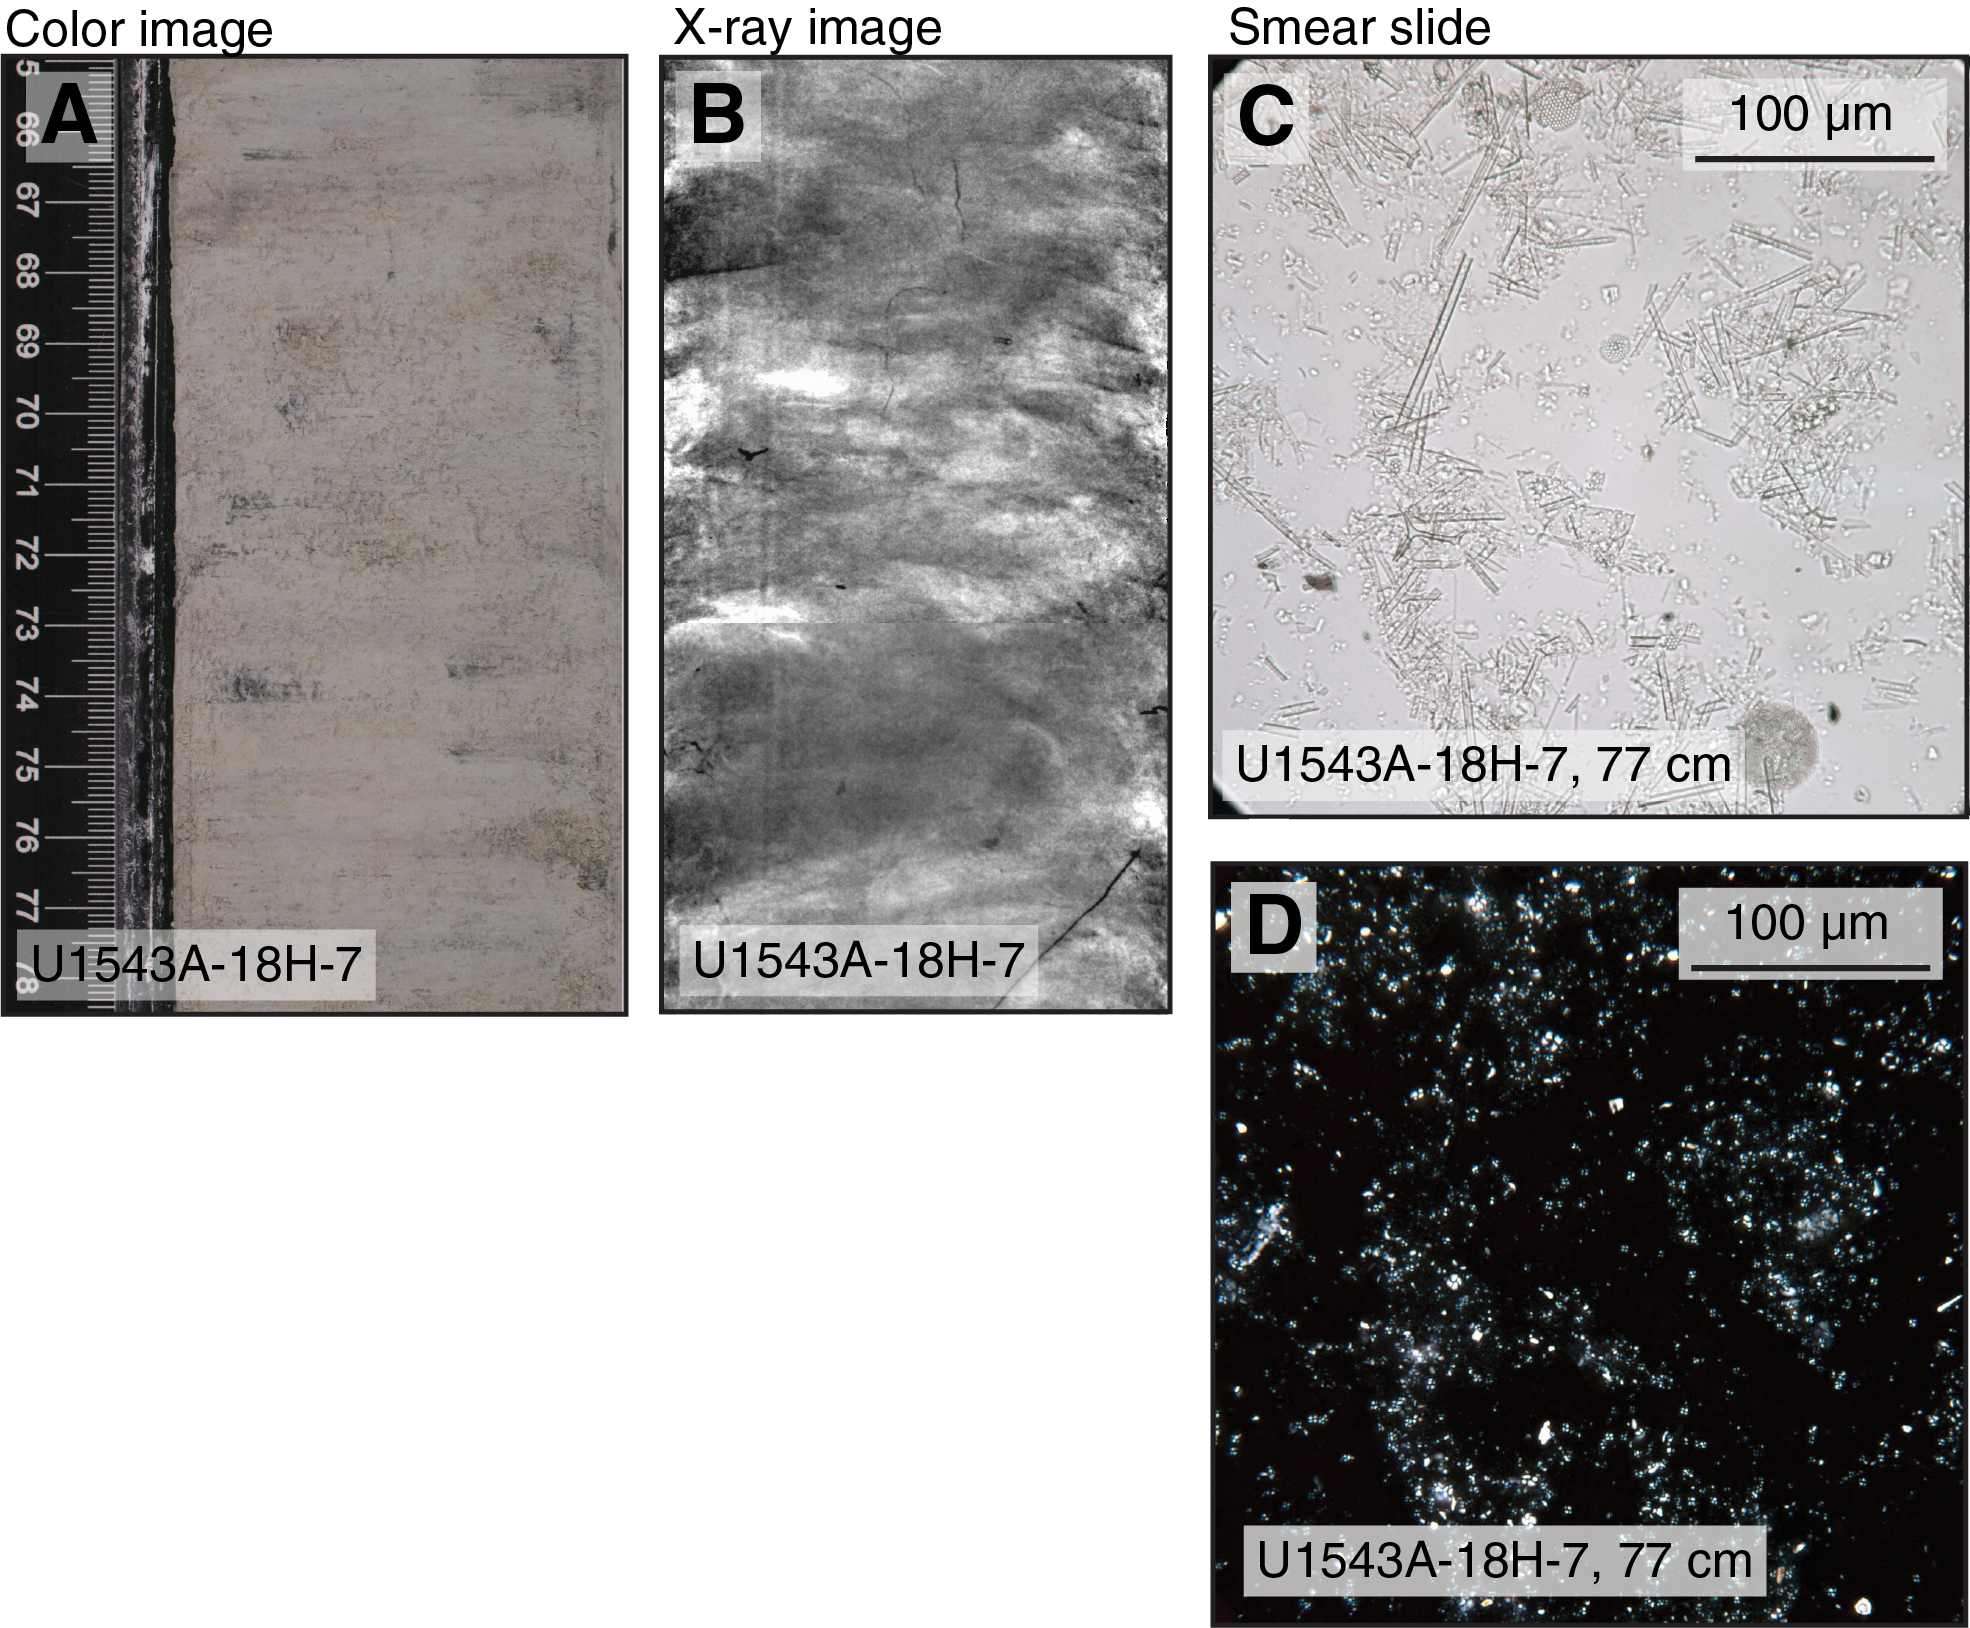
Figure F9. Mineral properties of Lithofacies 10.
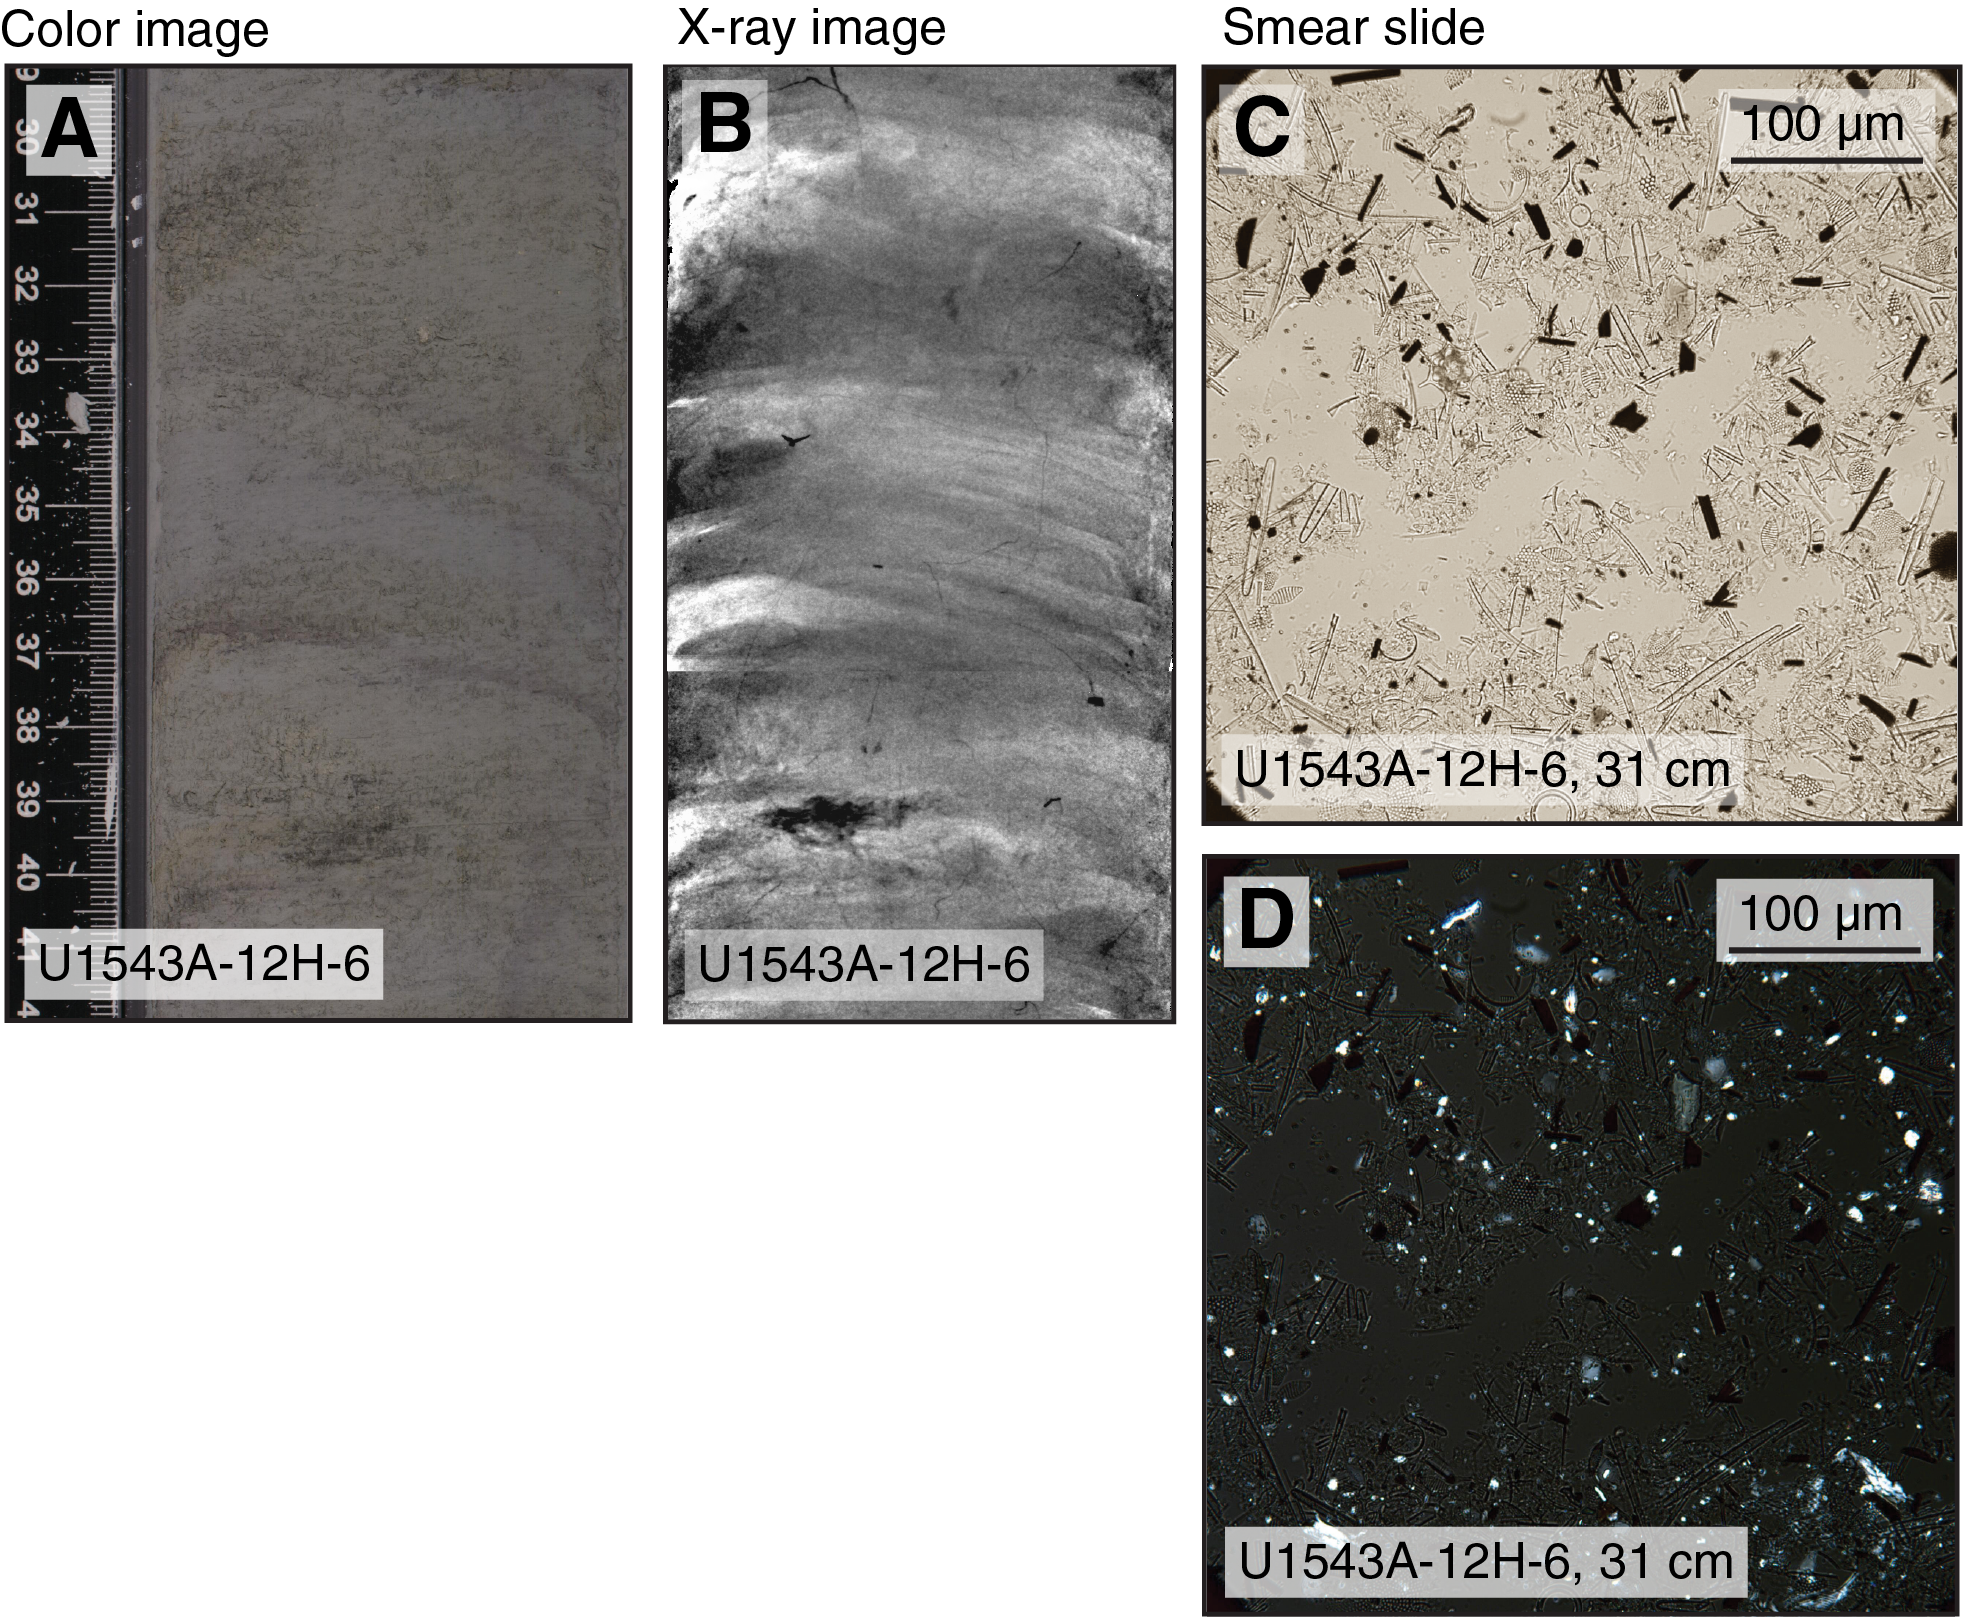
Figure F10. Mineral properties of Lithofacies 6.
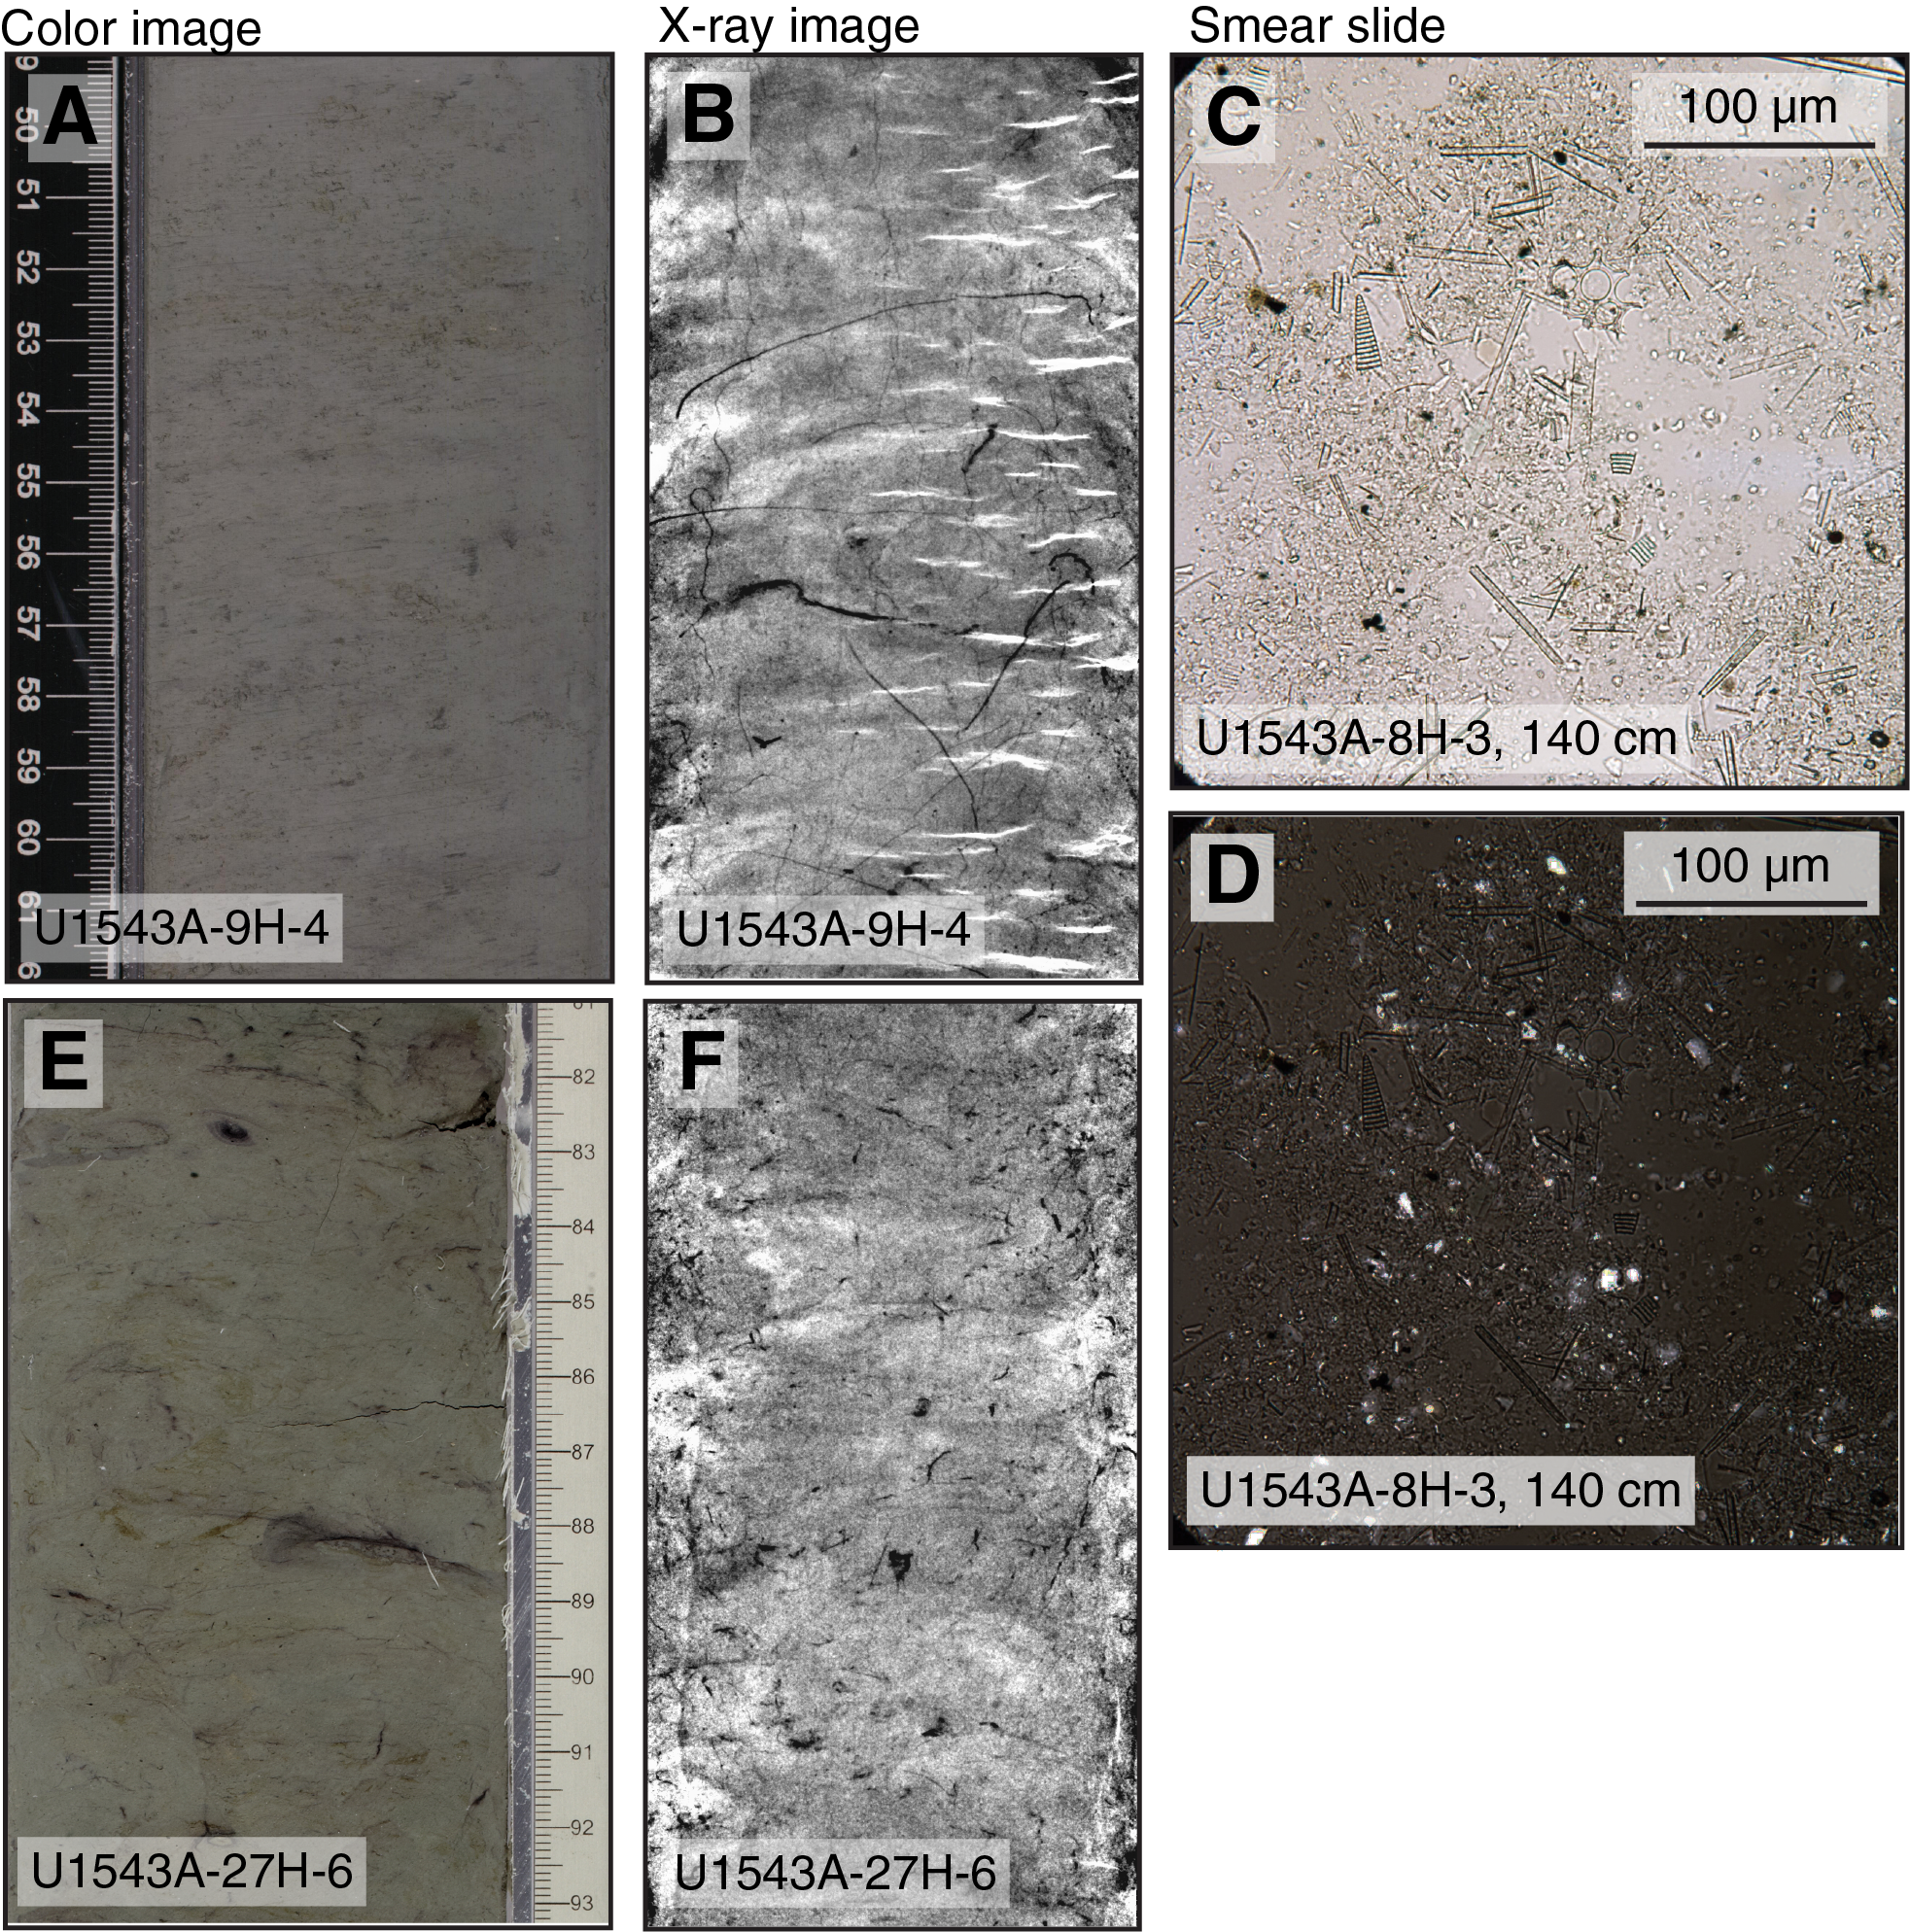
Figure F11. Mineral properties of Lithofacies 7.
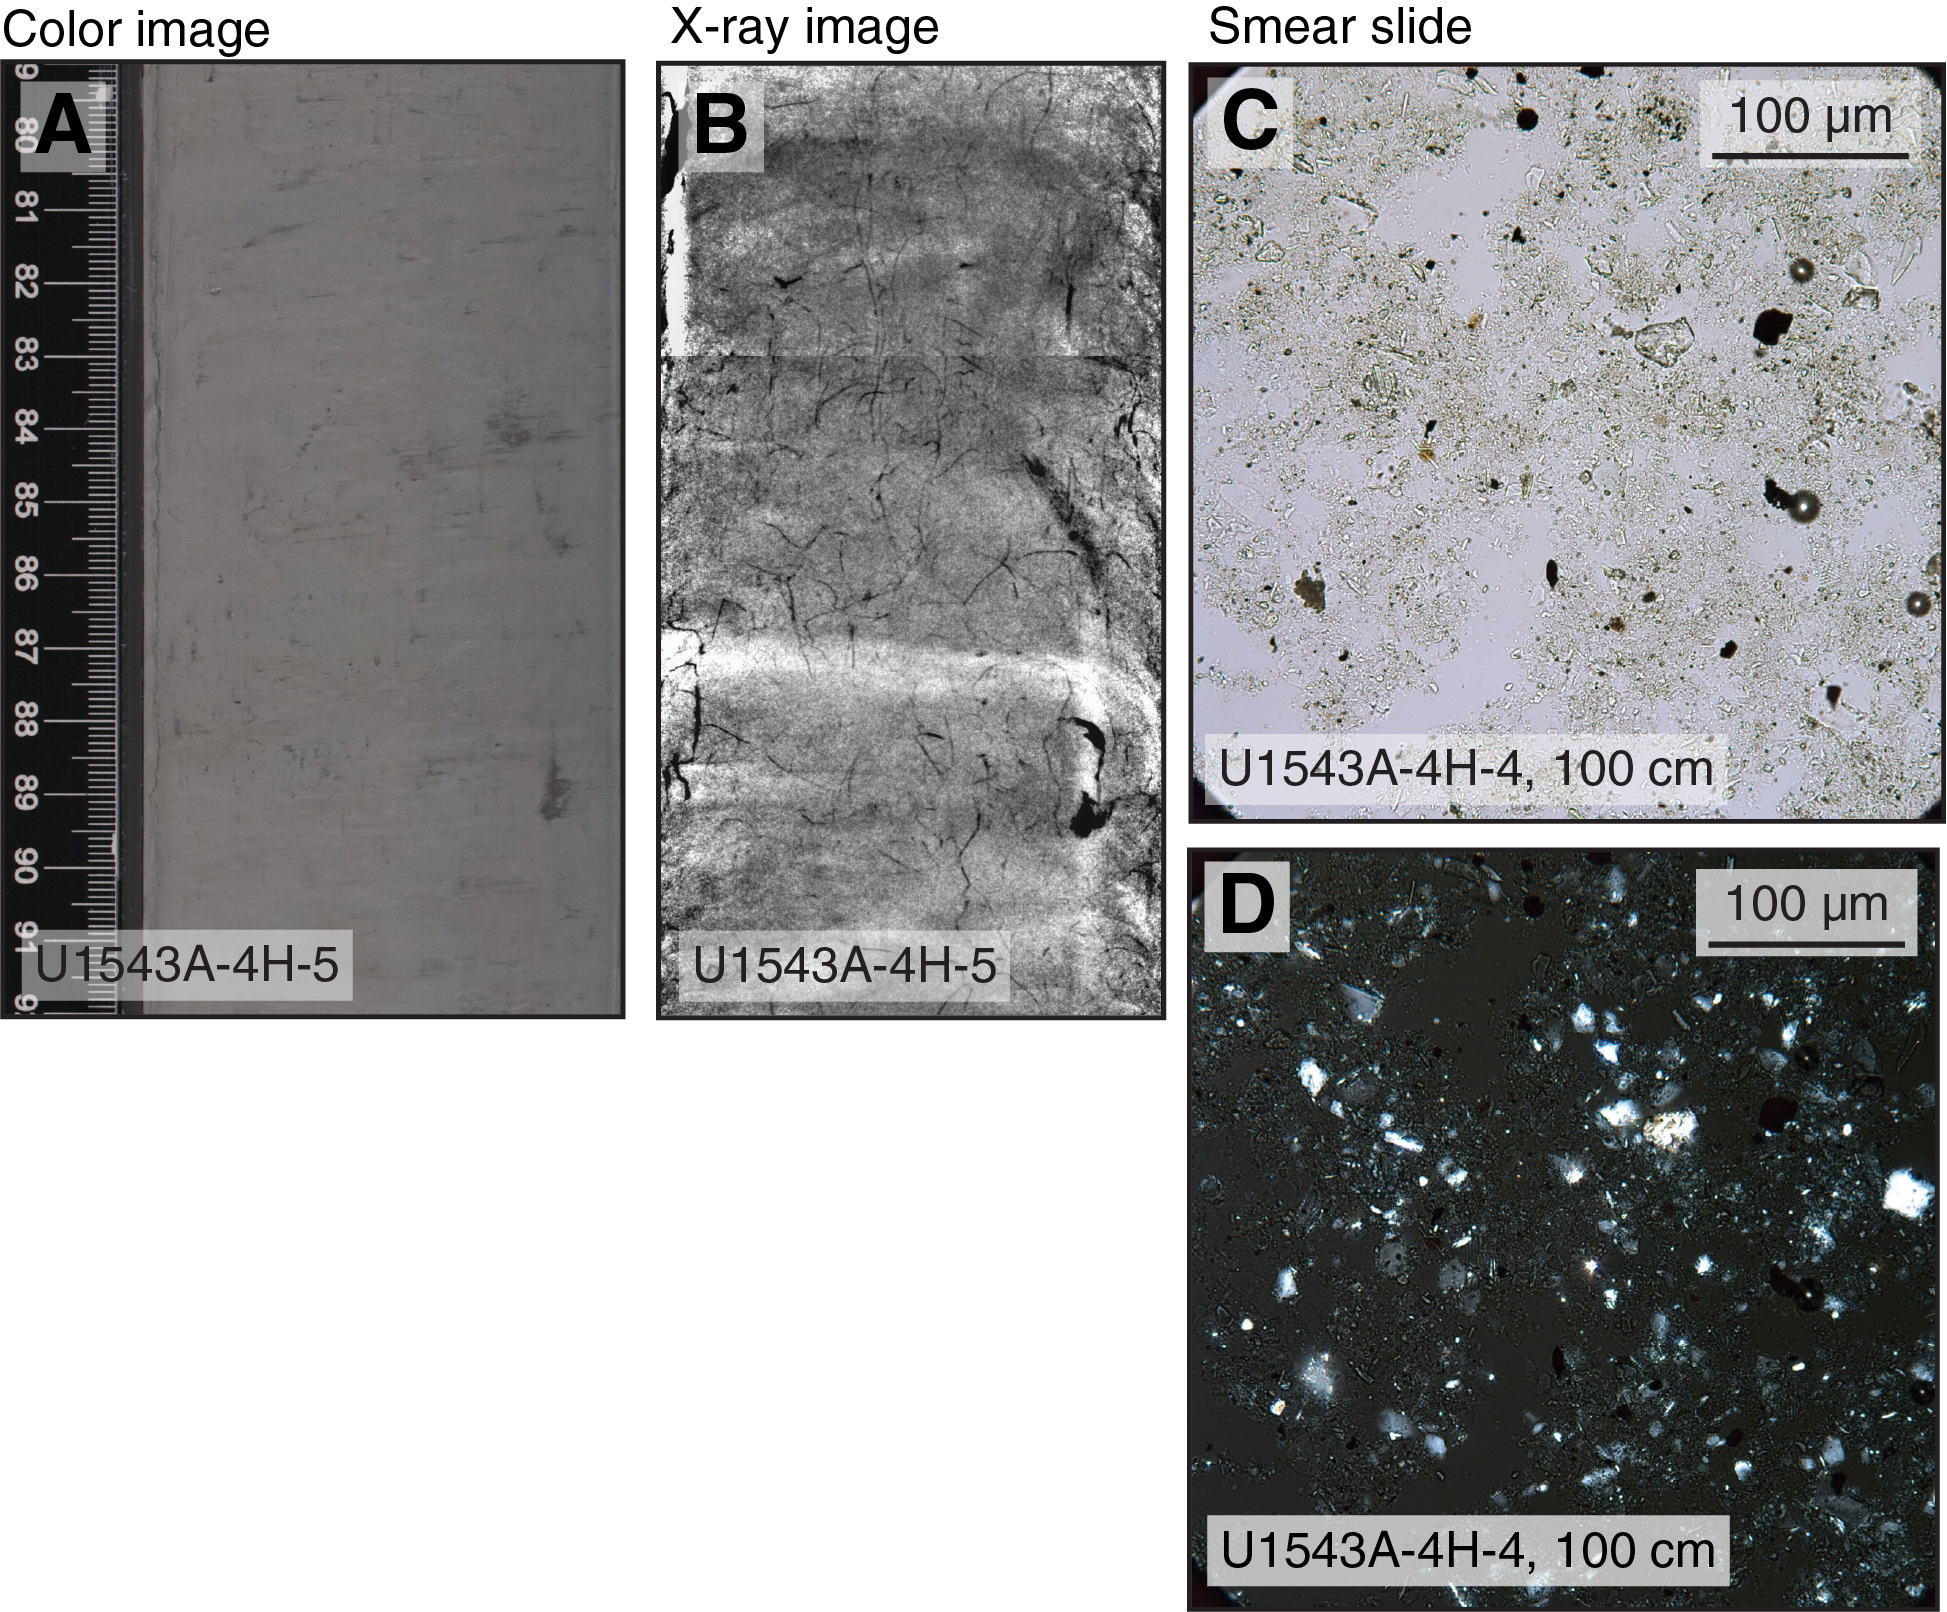
Figure F12. Mineral properties of Lithofacies 8.
Lithofacies 4
Lithofacies 4 is nannofossil ooze that is heavily bioturbated and often has a massive appearance (Figure F8). Its color ranges from white (N 9/) to greenish gray (10Y 6/1). It is characterized by only rare occurrences of carbonates (i.e., foraminifers) and traces of biosiliceous and siliciclastic components. Mottled patches of darker grayish colors due to diagenetic iron sulfide overprints and larger burrows can be found in this lithofacies. The bed thickness of Lithofacies 4 varies from 0.1 to 1.1 m and is found in Sections 383-U1543A-3H-4 and 5H-1. Lithofacies 4 shows a gradual transition to Lithofacies 10. Below 275 m CCSF-A, secondary carbonate precipitates may occur in this lithofacies.
Lithofacies 10
Lithofacies 10 is light gray (N 8/1) to light greenish gray to greenish gray (10Y 7/1 to 10Y 5/1) nannofossil ooze that contains a significant proportion of siliciclastic material (mainly clay and silt), diatoms, and foraminifers. It mostly appears in the form of a moderately to heavily bioturbated diatom- and clay-bearing nannofossil ooze in the sedimentary sequence of Site U1543 (Figure F9). The bed thickness of Lithofacies 10 varies from 0.1 to 0.65 m. Examples of this lithofacies are found in Sections 383-U1543A-16H-2, 18H-7, 24H-4, and 29H-5.
Lithofacies 6
Lithofacies 6 is silt-bearing and clay-bearing/clayey diatom ooze. It is greenish gray to dark greenish gray (10Y 6/1 and 5GY 5/1 to 5GY 4/1), is slightly or moderately bioturbated, and contains clay and silt as a minor or major modifier (Figure F10). X-ray diffraction (XRD) analyses suggest a variable contribution of clay minerals and quartz to the clay-sized lithogenic fraction (see X-ray diffraction clay mineralogy). Accessory components may include radiolarians, silicoflagellates, and sponge spicules. The thickness of this lithofacies in the sedimentary record varies from 0.1 to 1.5 m, and it is found in Sections 383-U1543A-12H-6, 15H-3, and 18H-4.
Lithofacies 7
Lithofacies 7 is composed of diatom-bearing to diatom-rich clay to silt (Figure F11). It is greenish gray (10Y 5/1) to dark greenish gray (10Y 4/1) and moderately bioturbated. According to X-radiographies, dropstones occur in traces in this lithofacies; dropstones were identified in the upper part of the sedimentary sequence at Site U1543 but are absent farther downcore. This lithofacies becomes significantly stiffer with increasing core depth, indicating signs of lithification and strong diagenetic coloring. The bed thickness of Lithofacies 7 varies from 0.1 to 6.5 m, and representative examples are found in Sections 383-U1543B-17H-2 and 17H-3 and 383-U1543A-20H-3, 20H-4, and 24H-3 through 24H-6.
Lithofacies 8
Lithofacies 8 is gray (N 5/0) to dark greenish gray (5GY 4/1) silt-bearing clay to clay-bearing silt largely barren of biogenic components (Figure F12). This lithofacies is slightly to moderately bioturbated and often contains dark greenish gray (10Y 4/1) millimeter-scale stiff clay layers. It is mottled because of diagenetic overprints (for instance, black spots and patches of iron sulfides are frequent). Centimeter-scale burrows are common. The thickness of this lithofacies in the sedimentary record varies from 0.1 to 5 m, and representative examples are found in Sections 383-U1543A-4H-4, 4H-5, and 22H-3 and 383-U1543B-13H-1 through 13H-6.
Lithostratigraphic units
The Site U1543 sedimentary sequence comprises two lithostratigraphic units (Figure F13). Key unit characteristics, including depths within the Site U1543 sedimentary sequence and corresponding ages according to the preliminary shipboard age model, are described below.
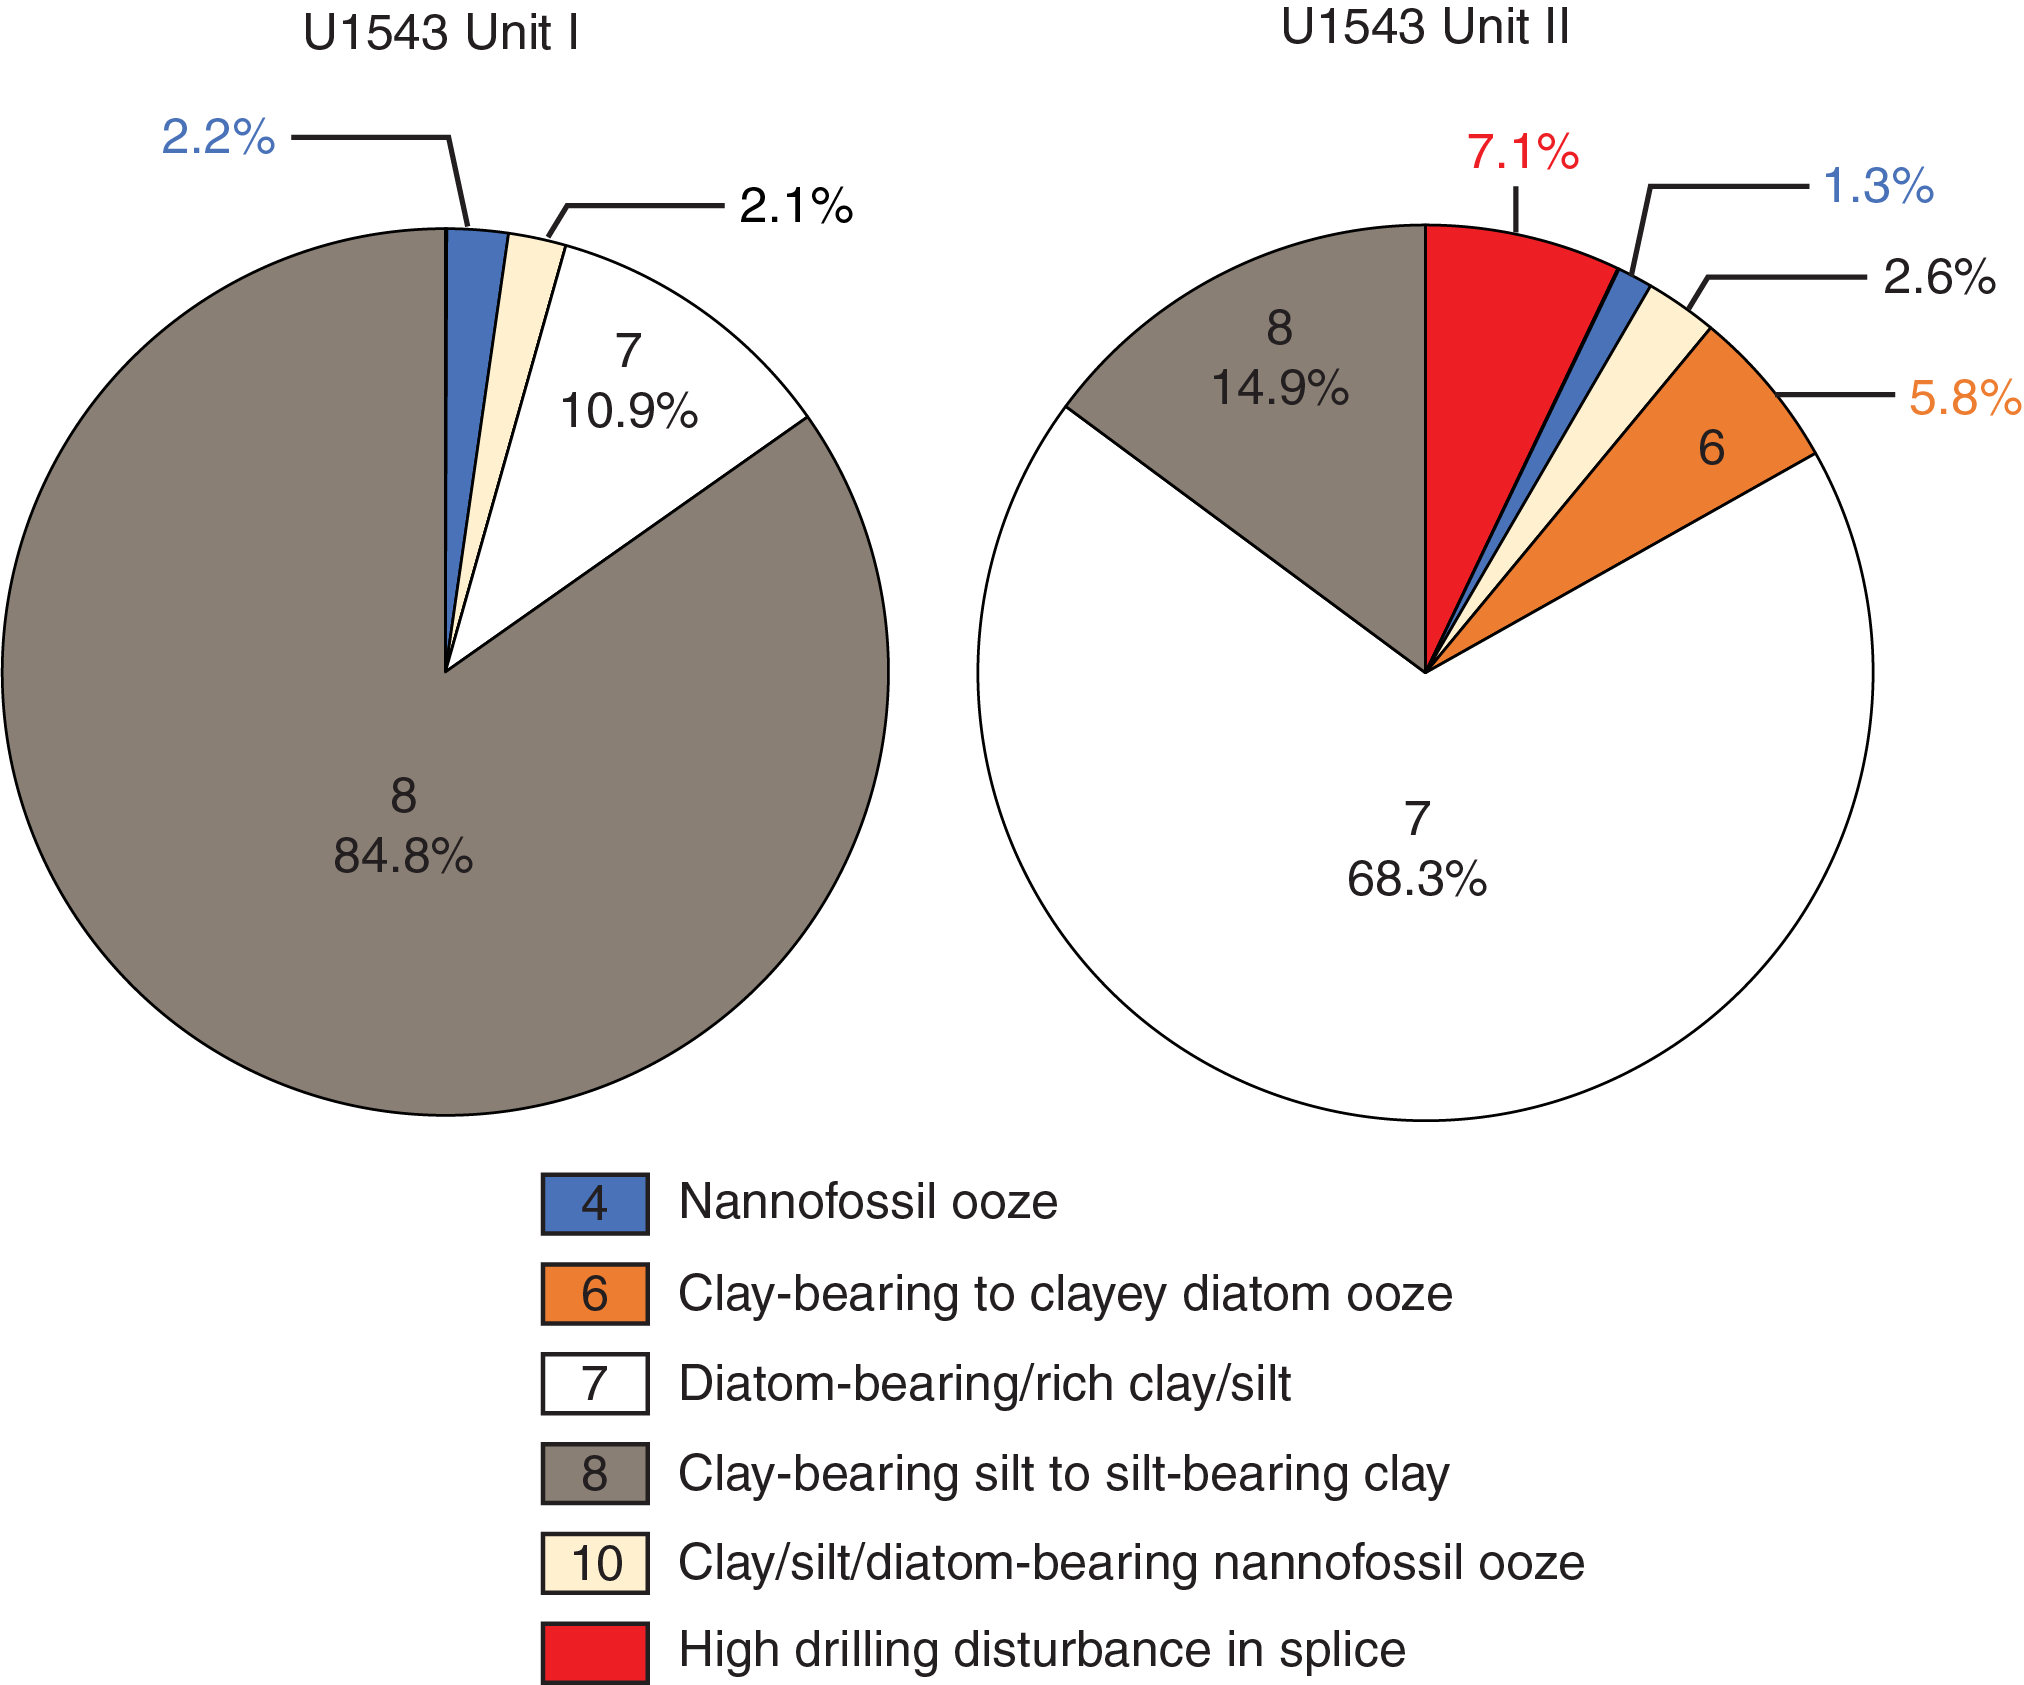
Figure F13. Relative contribution of lithofacies.
Unit I
- Intervals: 383-U1543A-1H-1, 0 cm, to 12H-6, 28 cm; 383-U1543B-1H-1, 0 cm, to 14H-2, 0 cm
- Depths: Hole U1543A = 0–109.9 m CSF-A, Hole U1543B = 0–107.2 m CSF-A, Site U1543 composite section = 0–115.5 m CCSF-A
- Thickness: 115 m
- Age: Gelasian (Pleistocene) to Holocene (younger than 2.58 Ma)
- Lithology: silt-bearing clay; nannofossil-rich clay; diatom- and silt-bearing clay; foraminifer-, carbonate-, and clay-bearing nannofossil ooze; and nannofossil ooze
Lithostratigraphic Unit I spans the upper 115 m of the Site U1543 sedimentary sequence, largely consists of greenish gray silt-bearing clay (Lithofacies 8) (Figure F14), and makes up 84.8% of the overall unit thickness (Figure F13). Diatom- and silt-bearing clay (Lithofacies 7) is the second most abundant lithology (10.9%). Rare 10–30 cm thick beds of light gray and light greenish gray carbonate and clay-bearing nannofossil ooze (Lithofacies 10; 2.1%) and white nannofossil ooze without major or minor modifier components (Lithofacies 4; 2.2%) also contribute to Unit I. Bioturbation ranges from moderate to heavy. Dropstones are rarely observed in the split sediment core surface and infrequently visible in X-ray images.
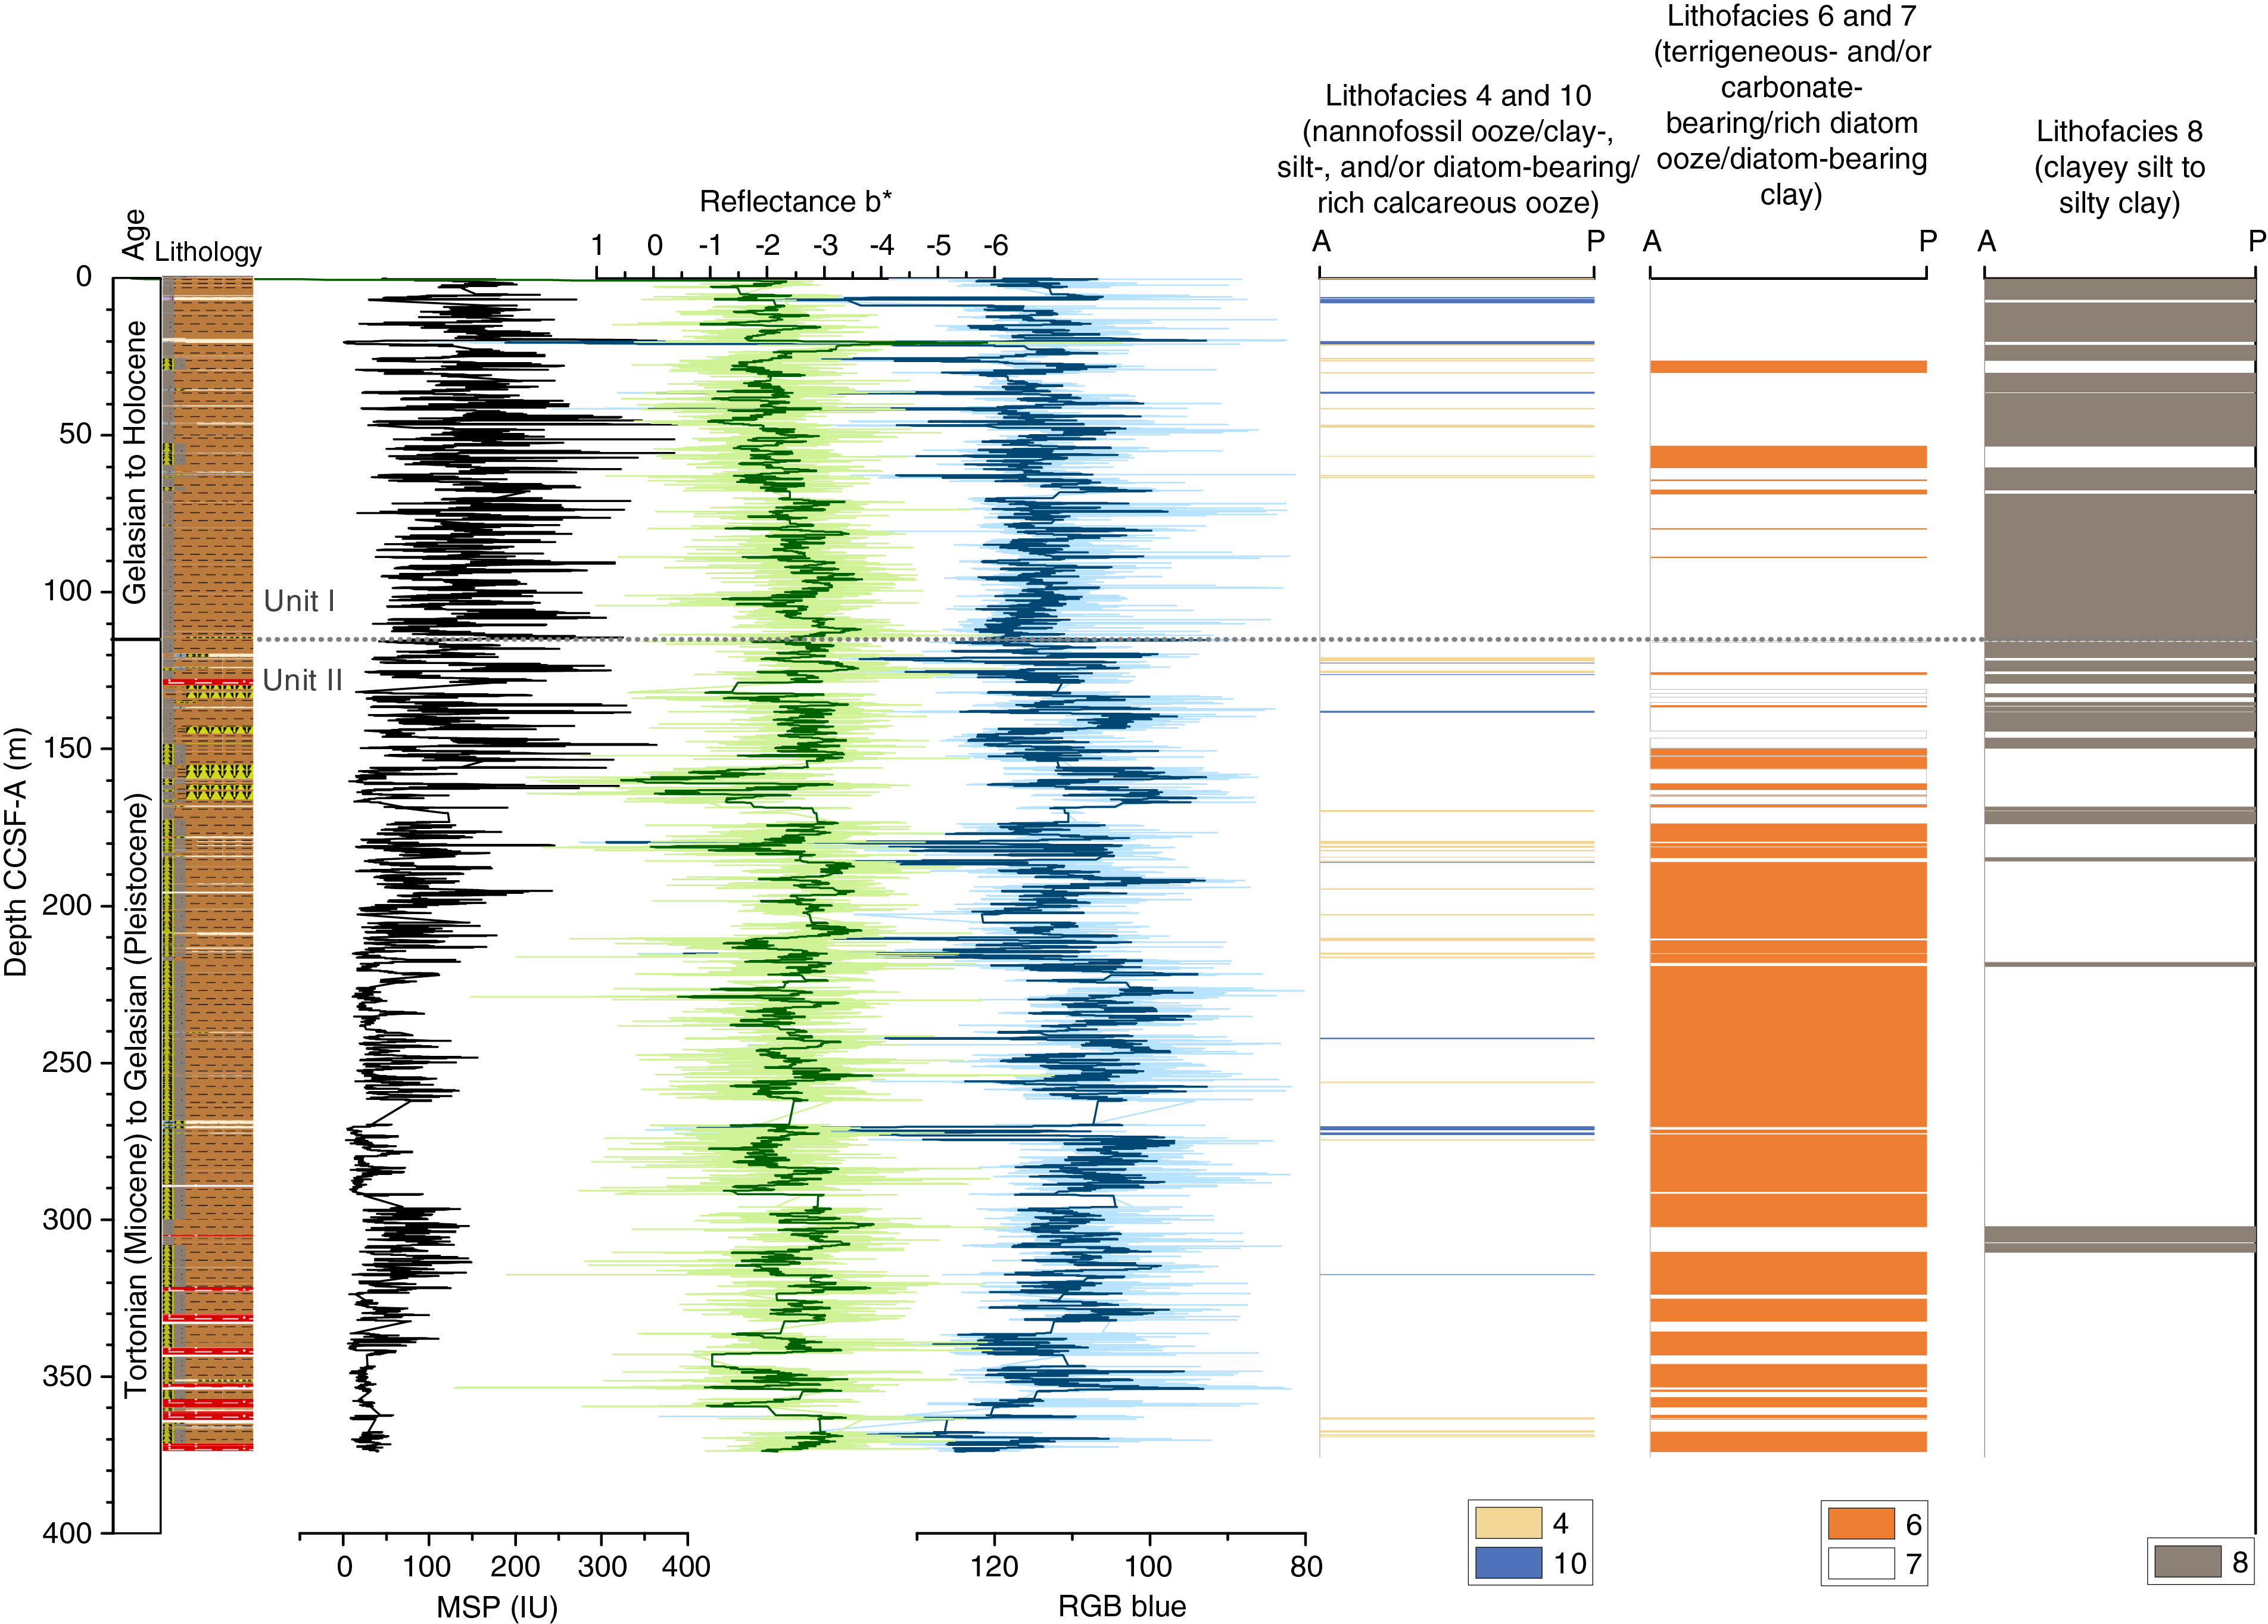
Figure F14. Primary lithostratigraphic variations.
Unit II
- Intervals: 383-U1543A-12H-6, 28 cm, to 36H-CC, 19 cm; 383-U1543B-14H-2, 0 cm, to 33H-CC, 19 cm
- Depths: Hole U1543A = 109.9–339.28 m CSF-A, Hole U1543B = 107.2–286.82 m CSF-A, Site U1543 composite section = 115.5–376.5 m CCSF-A
- Thickness: 261 m
- Age: Tortonian (Miocene) to Gelasian (Pleistocene) (~8 to ~2.58 Ma)
- Lithology: diatom- and silt-bearing clay; diatom ooze; clayey diatom ooze; and foraminifer-, carbonate-, and clay-bearing nannofossil ooze
Lithostratigraphic Unit II spans the lower 261 m of the Site U1543 sedimentary sequence and largely consists of dark greenish gray to gray diatom- and silt-bearing clay (Lithofacies 7) that contains minor modifier abundances of diatoms (Figure F6) and makes up 66.8% of the overall unit thickness (Figure F13). Unit II is distinguished from Unit I by a greater proportion of diatomaceous sediment, and the first occurrence of distinct beds of diatom ooze and diatom-bearing lithologies determines the boundary between Units I and II (Figure F14). Silt-bearing clay with limited biogenic components (Lithofacies 8) is the second most abundant lithology (15.0%). Rare 10–30 cm thick beds of light gray and light greenish gray diatom-, carbonate-, and/or clay-bearing nannofossil ooze (Lithofacies 10; 2.8%) and white nannofossil ooze without major or minor modifier components (Lithofacies 4; 1.7%) also occur in Unit II (Figure F13). One exception is a massive ~1 m thick bed of carbonate- and diatom-bearing nannofossil ooze (Lithofacies 10) in Core 383-U1543A-27H-2. Bioturbation ranges from moderate to heavy, and dropstones are neither observed in the split sediment core surface nor visible in X-ray images because of strong diagenetic overprinting. Unit II cores show intervals of high drilling disturbance related to fall-in and strong suck-in with associated plastic to brittle deformation of the more consolidated sediment (Figure F15). These disturbed intervals represent a moderate fraction (7.1%) of the spliced Site U1543 sedimentary sequence in Unit II.
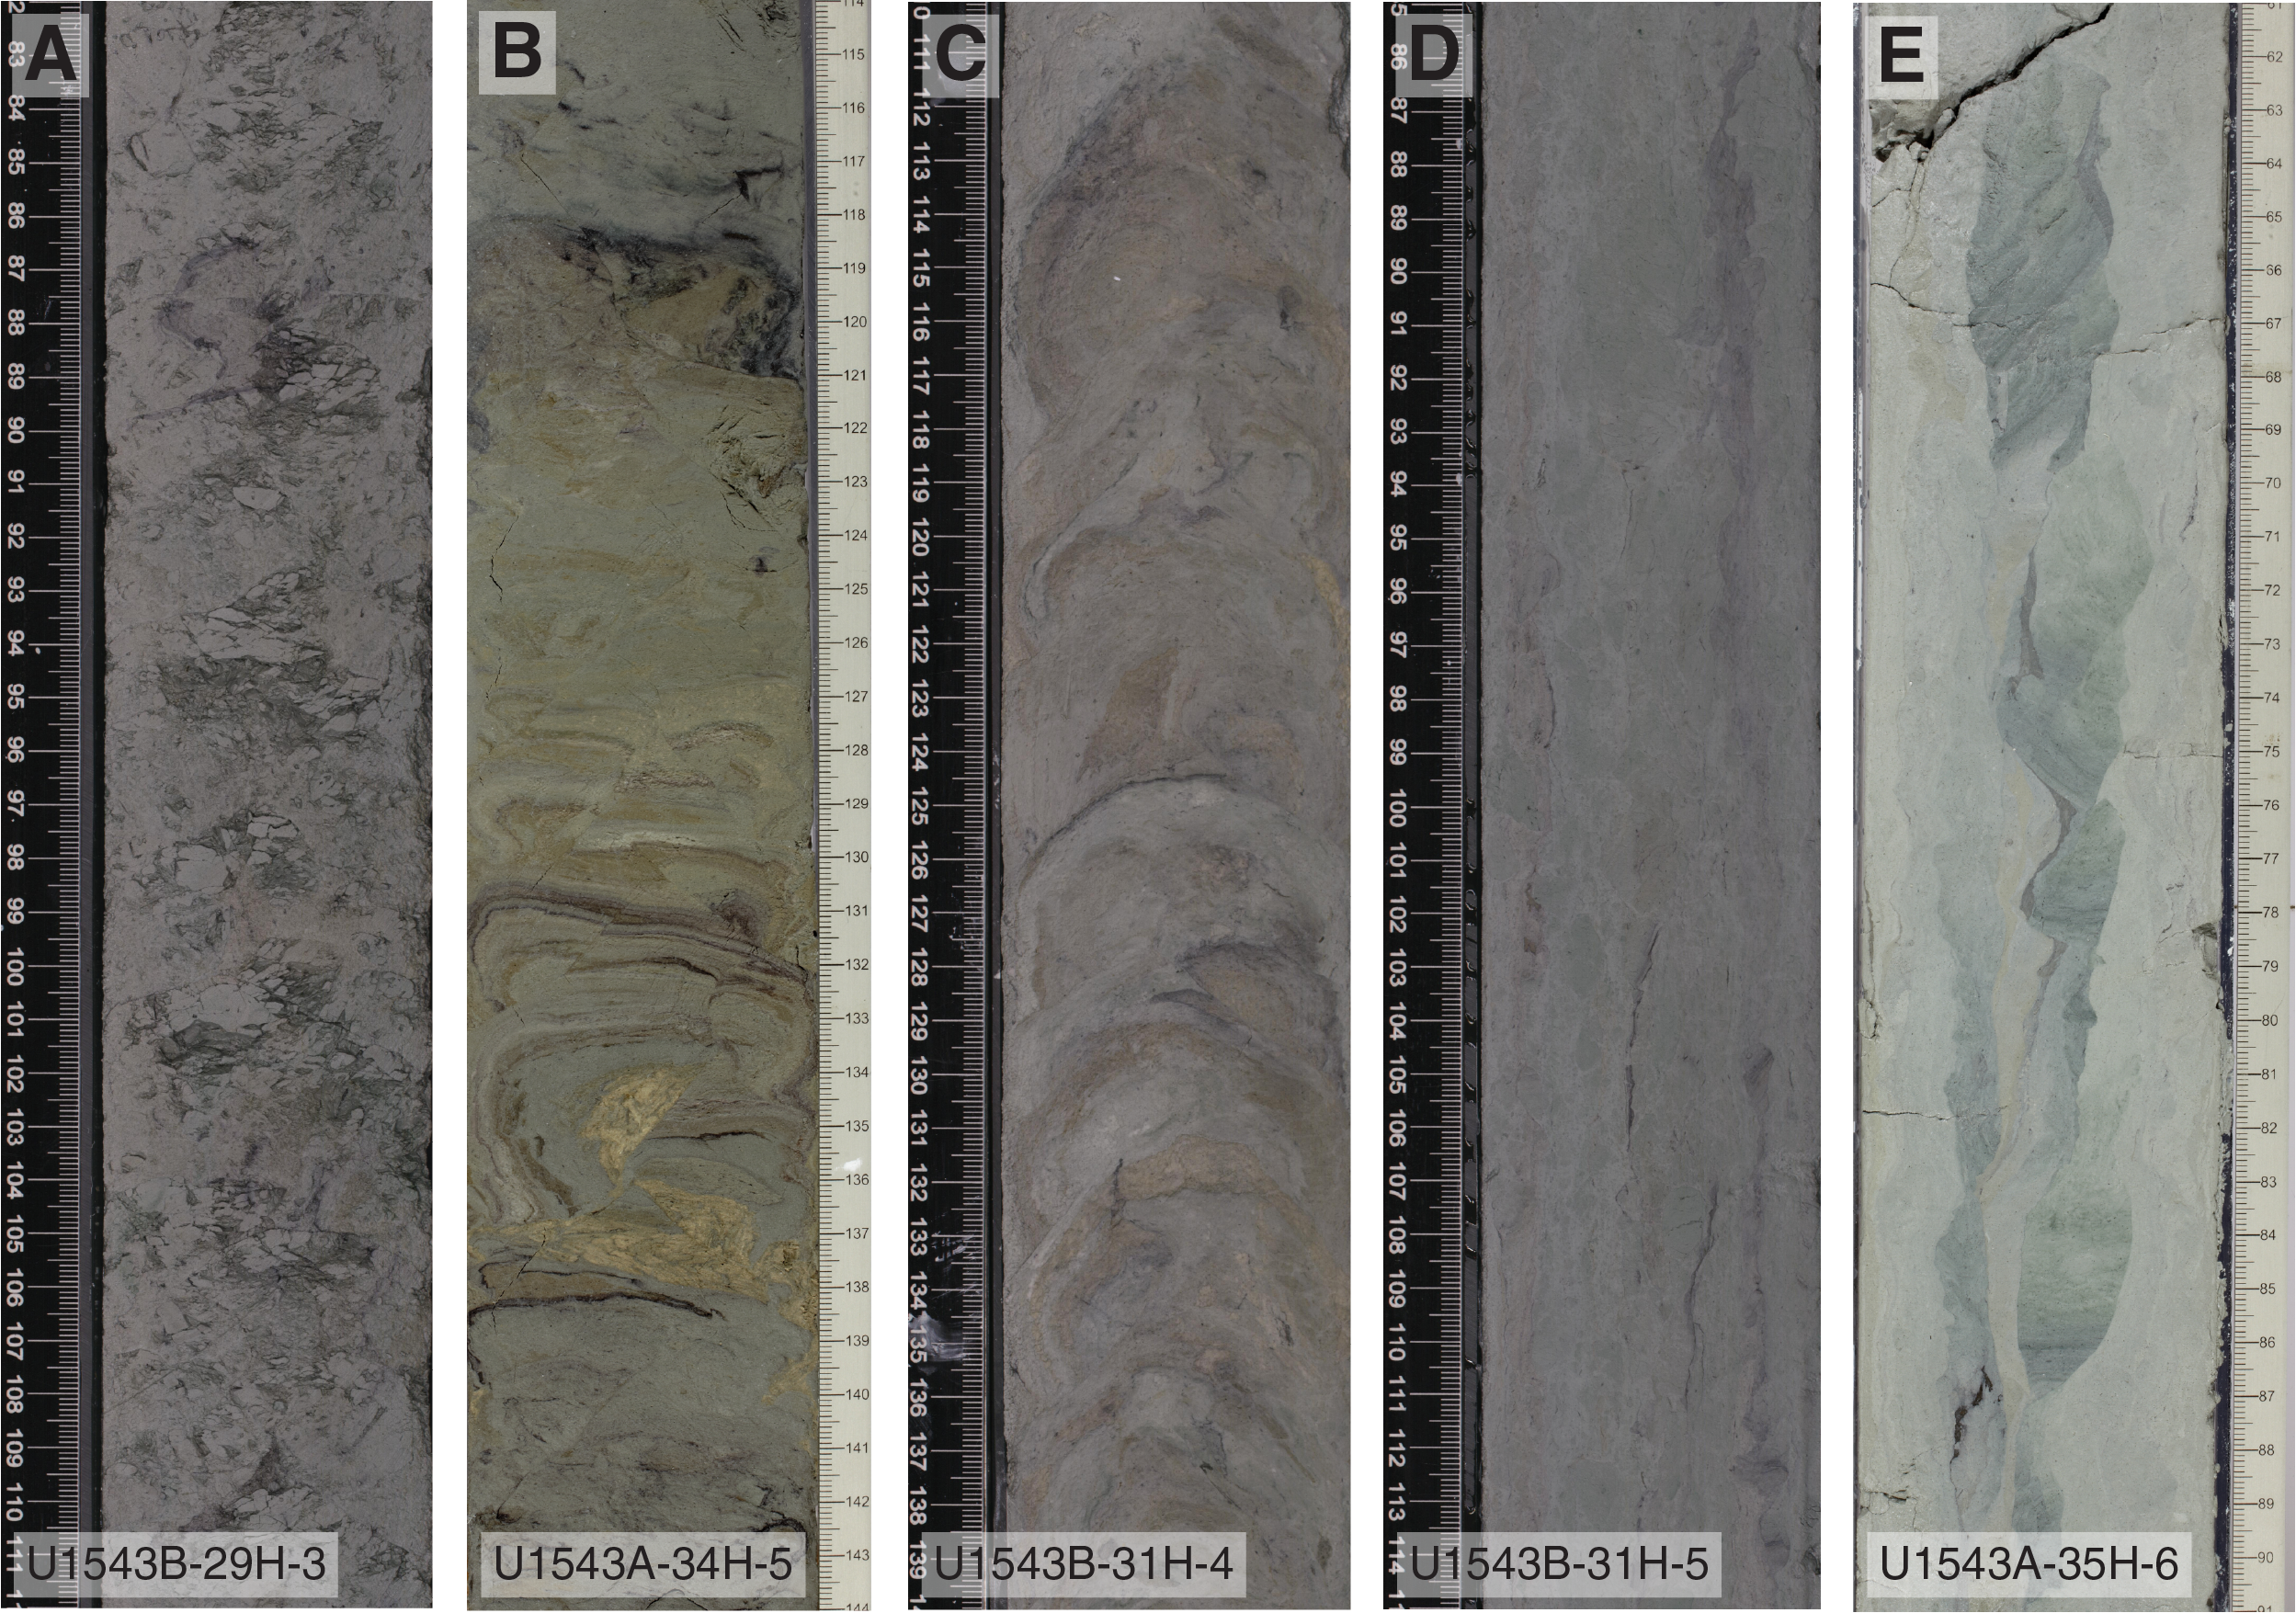
Figure F15. Deformational features.
Complementary analyses
X-ray diffraction clay mineralogy
XRD analyses were performed on 37 samples obtained from Hole U1543A to identify the mineralogy and composition of the clay fraction of sediments at this site. All results shown here are from untreated samples (see details in Sedimentology in the Expedition 383 methods chapter [Winckler et al., 2021]). The clay fraction consists of detrital minerals such as quartz, feldspar (plagioclase), and phyllosilicates including illite, chlorite, and smectite (Figure F16) and shows no detectable authigenic mineral phases. Peak intensity values are generally lower in Unit I than in Unit II, indicating the presence of poorly structured material in Unit I. Because the amorphous biogenic siliceous material is more abundant in Unit II than in Unit I, the weak intensity values in Unit I can be attributed to the presence of poorly structured mineral phases such as the first-order weathering products of primary minerals and/or altered volcanic material. The causes of higher crystallinity of Unit II clays, whether depositional or diagenetic processes, are not clear and need further examination.
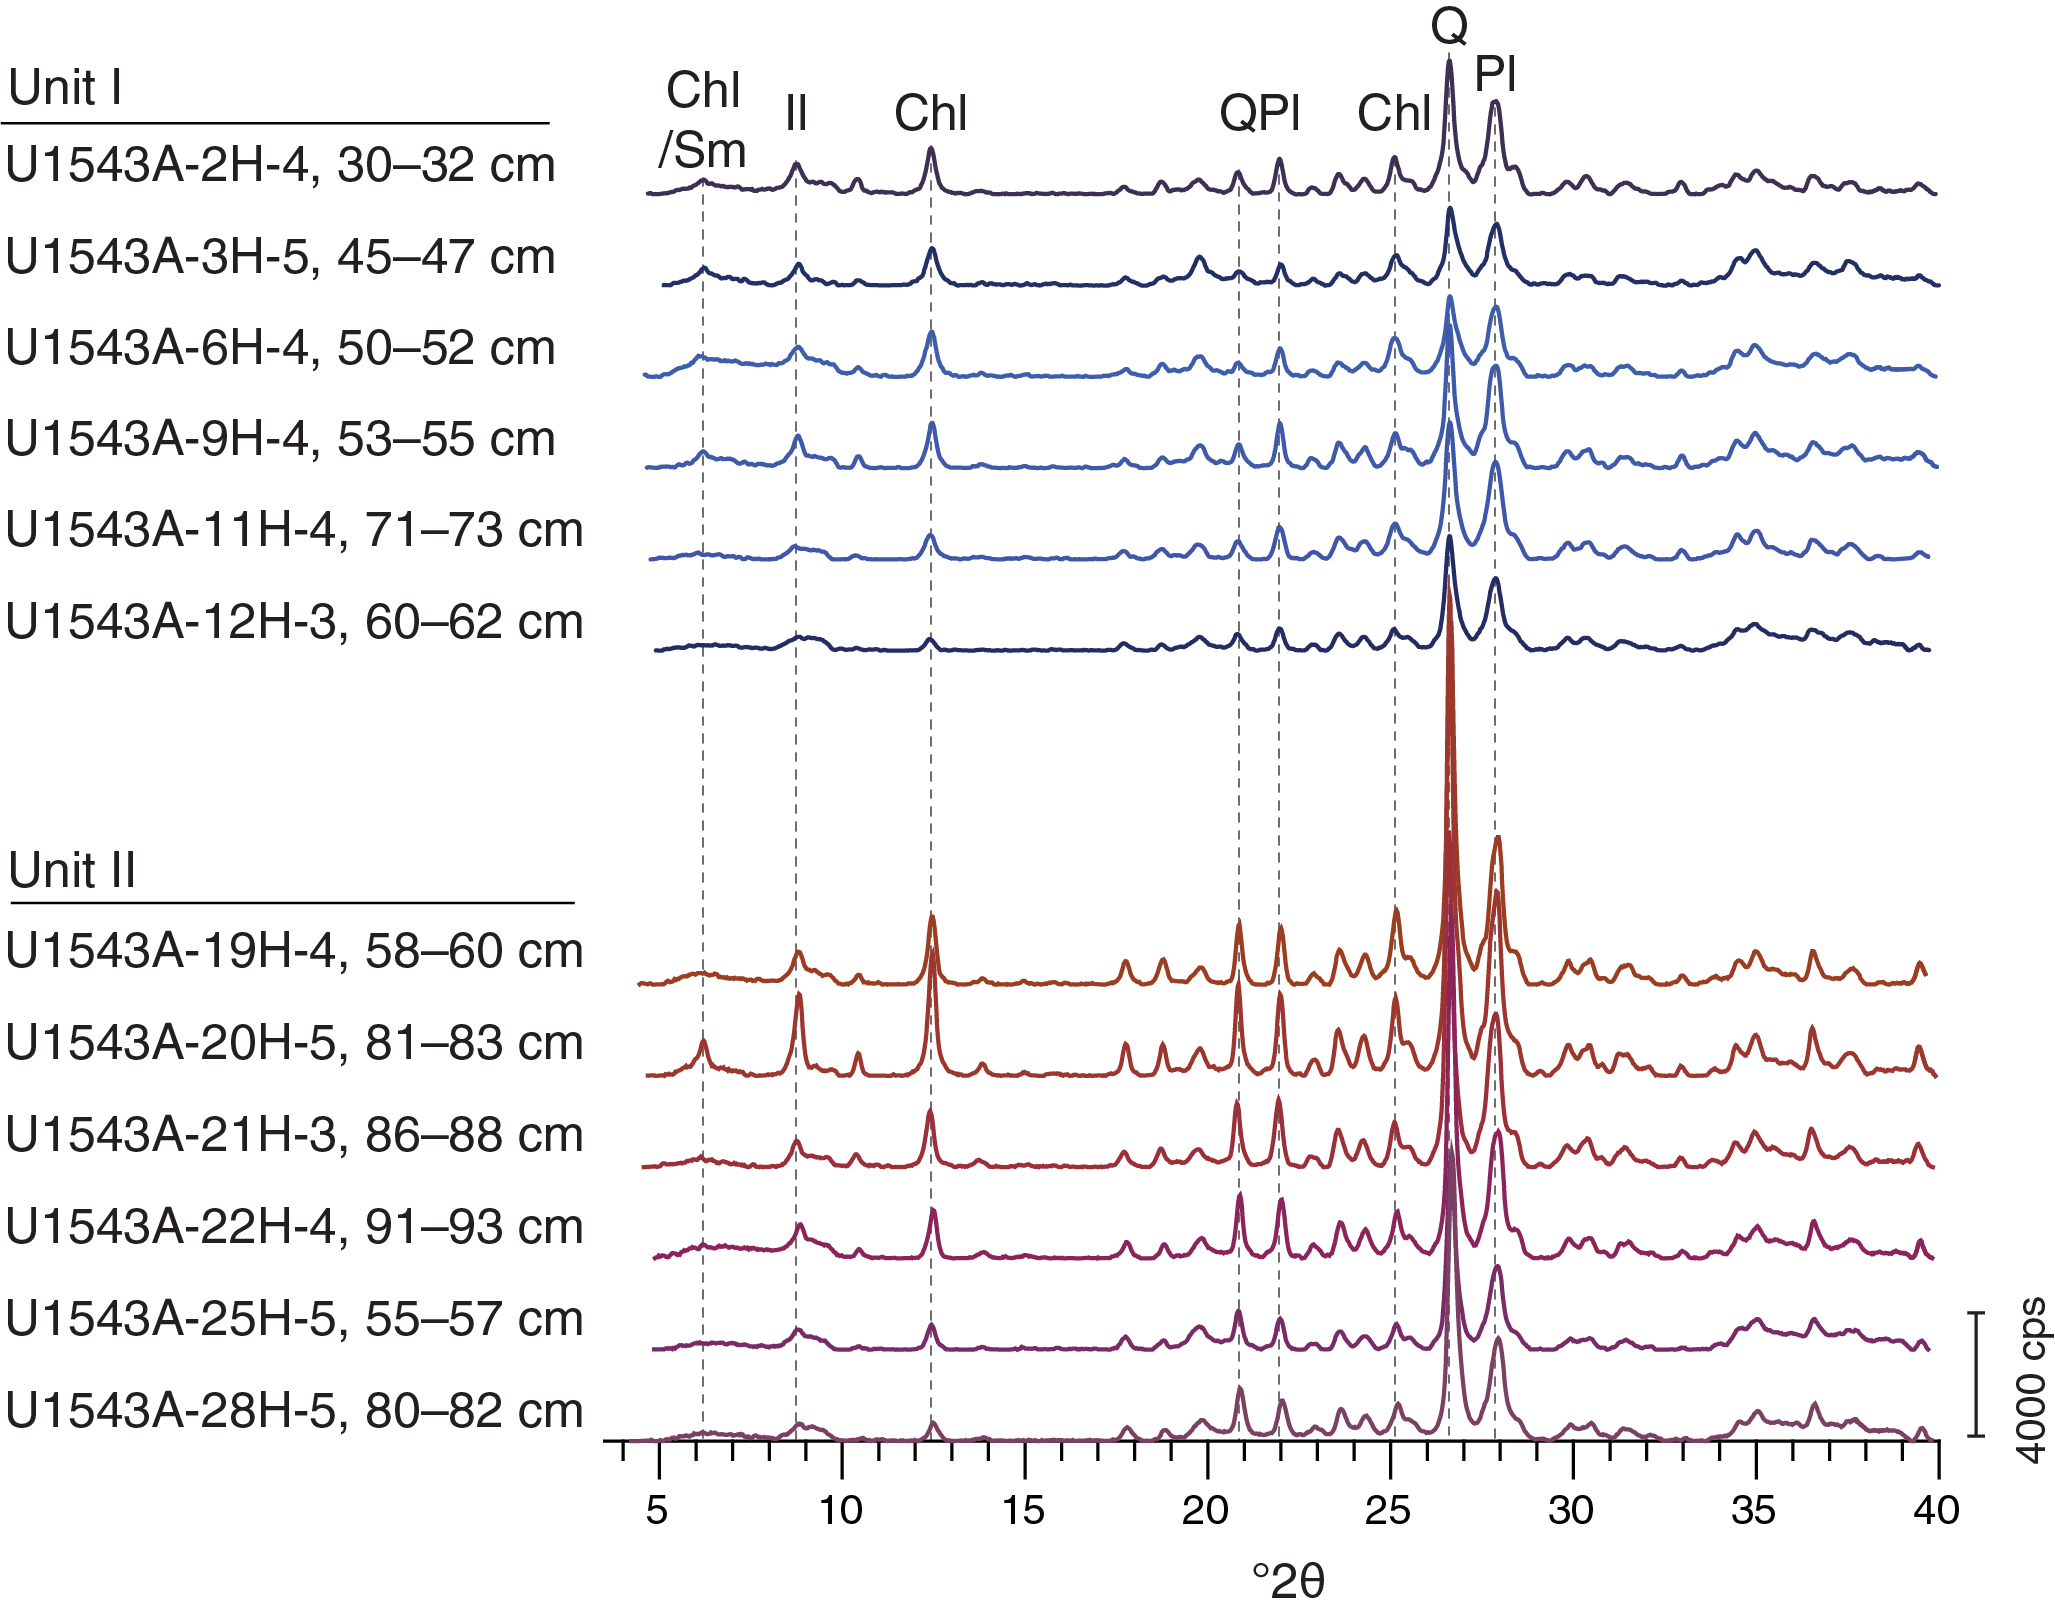
Figure F16. Representative samples of lithostratigraphic units.
Integrating physical property measurements with lithofacies observations
The distribution of Site U1543 lithologies was compared to downcore physical property measurements including gamma ray attenuation (GRA) bulk density, natural gamma radiation (NGR), magnetic susceptibility (MS), red-green-blue color space (RGB) blue intensity, and color reflectance b* (see Physical properties in the Expedition 383 methods chapter [Winckler et al., 2021]) to identify principal relationships between lithologic observations and the physical properties of the sediment (Figure F17). Intervals dominated by silt-bearing or silt- and diatom-bearing clay (Lithofacies 7 and 8), which are the most dominant lithofacies at Site U1543, are generally characterized by higher GRA bulk density values, higher MS, and higher NGR intensity (Figure F16). Cyclic minor to moderate changes in physical properties observed in these sediments were difficult to distinguish during visual core description and likely relate to minor changes in the relative contribution of diatoms to the dominating siliciclastic clay and silt component. In contrast, intervals dominated by nannofossil ooze (Lithofacies 4 and 10) are generally characterized by lower GRA bulk density values, lower MS, lower NGR intensity, and higher RGB blue intensity values, as observed at previous Expedition 383 sites. In addition, intervals dominated by silt-bearing and/or clay-bearing/clayey diatom ooze (Lithofacies 6) show lower GRA bulk density, lower MS, lower NGR intensity, and higher color reflectance b* (Figure F17).
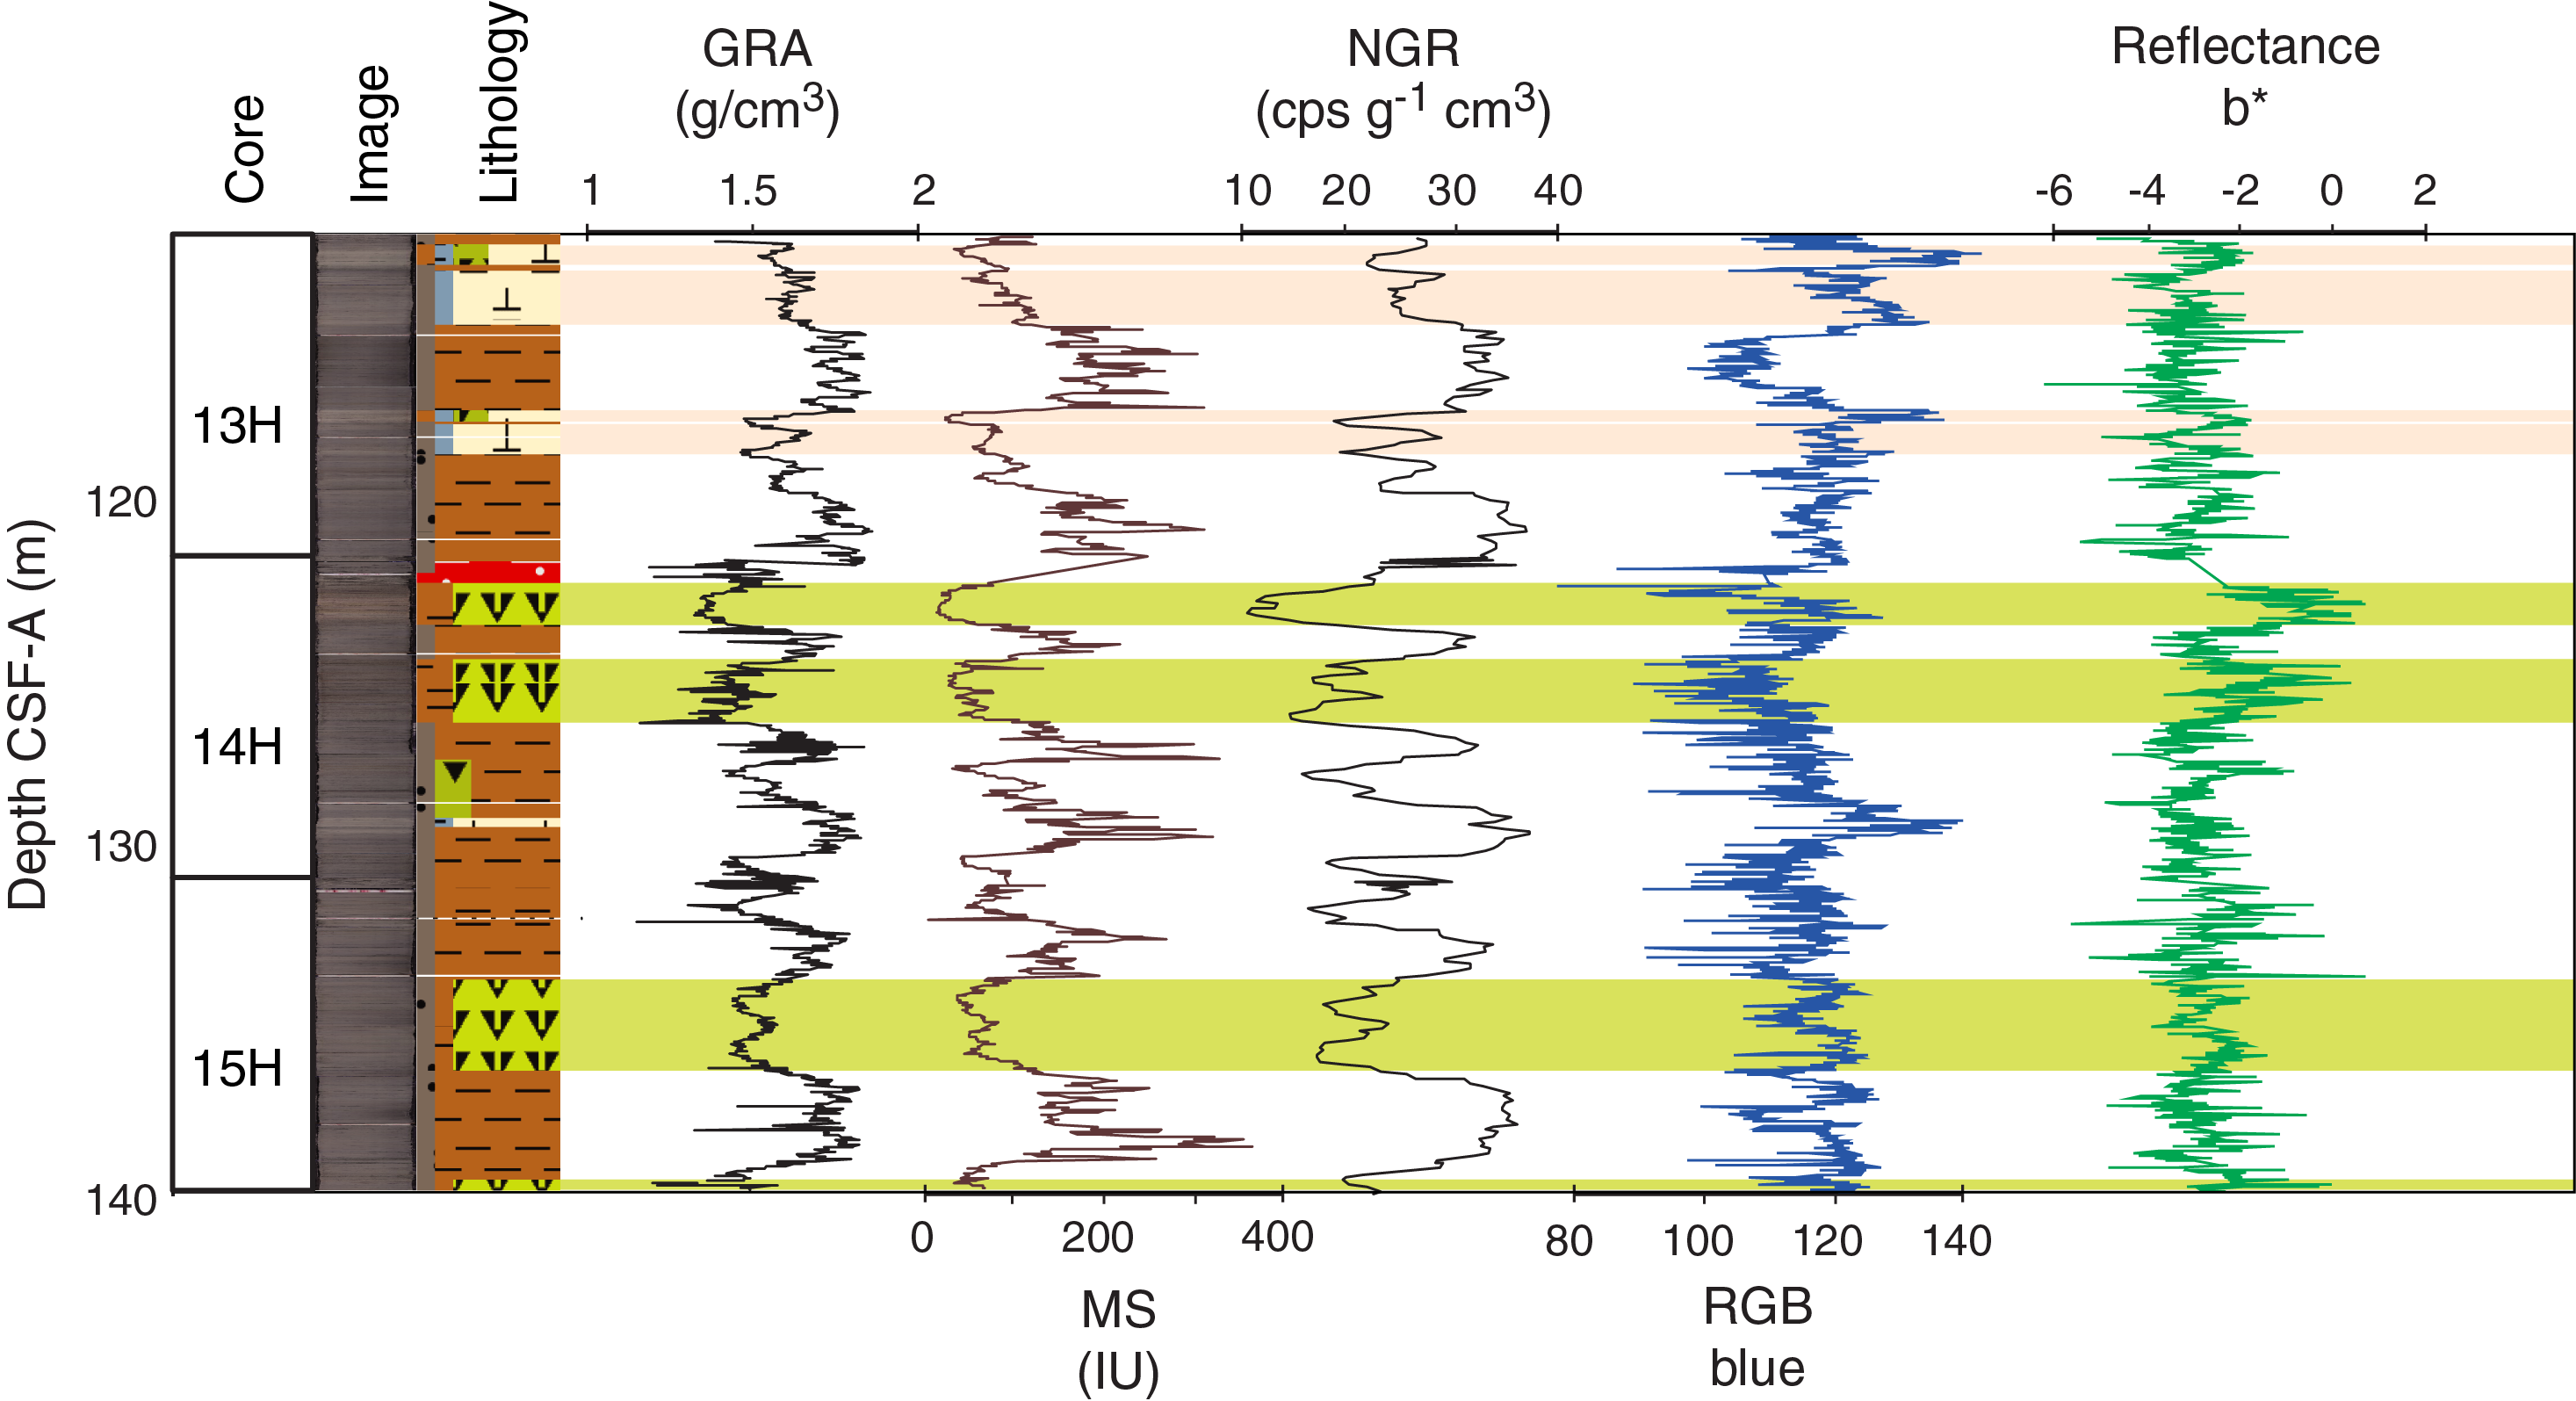
Figure F17. Major lithology and physical properties.
Relationships between lithology and physical properties in each lithostratigraphic unit at Site U1543 are further illustrated by a comparison of RGB blue and color reflectance L* with bulk sedimentary carbonate content (in weight percent) measurements (Figure F18). For low sedimentary carbonate weight percentages (<10 wt%), the carbonate content is generally poorly correlated with RGB blue and L* in both units. On the other hand, for higher carbonate contents (>10 wt%), changes in RGB blue and L* are correlated to variations in the carbonate content in both units. These observations illustrate that variations in the physical properties and color of sediments at Site U1543 are a major function of the carbonate content, but only above a certain carbonate weight percentage threshold. Below this threshold, changes in sediment color are likely related to other compositional changes such as terrigenous versus biogenic silica content or diagenetic coloring.

Figure F18. Bulk sedimentary carbonate content, RGB blue, and L*.
Summary and preliminary site interpretation
The Site U1543 sedimentary sequence is characterized by an abundance of clay- and silt-rich siliciclastic sediments that are interbedded with nannofossil- or diatom-dominant biogenic sediments. Lithostratigraphic Unit I (0–155 m CCSF-A) largely consists of silty clay with occasional beds of nannofossil ooze (Figures F6, F14). Nannofossil ooze beds are clearly characterized by positive excursions in L* and RGB blue intensity that are coincident with reductions in MS and NGR. The upper ~50 m of this unit exhibits high-amplitude variations in RGB blue intensity and NGR that are related to the alternation of dark gray silty clay (Lithofacies 8) and light gray to white nannofossil ooze (Lithofacies 10 and 4). The lower ~100 m exhibits similar variations, but the amplitude is reduced. Relative to Unit I, Unit II contains sediments with a greater abundance of diatoms as a minor component or as a major lithology. Prominent beds of silt- and clay-bearing and clayey diatom ooze between 115 and 162 m CCSF-A coincide with higher b* values (Figure F14). Below 162 m CCSF-A, the sequence largely contains diatom- and silt-bearing clay and b* does not exhibit any significant variations, which makes it difficult to estimate changes in diatom abundance based on color properties alone. Occasional nannofossil ooze beds in Unit II are characterized by similar excursions in RGB blue intensity, L*, MS, and NGR, as in Unit I.
Site U1543 is located west of the Chilean continental margin (and the Chile Trench) on a topographically elevated ridge at a water depth of 3864 m that supports, at least episodically, carbonate deposition and preservation relative to the surrounding abyssal plain. The close proximity of Site U1543 to southern South America results in siliciclastic-dominated sediments transported through fine-grained traction by the ACC and/or other regional bottom currents, ice-rafting, and suspension fall-out from sediment plumes originating from expanded glaciers terminating close to the modern continental shelf break when sea level was lower and plumes originating from fluvial systems along the Chilean margin. Future sediment and organic matter provenance studies can deconvolve these processes.
Overall, the undisturbed, continuous sediment record with medium to high sedimentation rates extending into the Miocene recovered at Site U1543 is exceptional and is an important eastern end-member locality to the Expedition 383 central South Pacific sites that can be used to evaluate past oceanographic and climate changes from the late Miocene to the present. The observed variations in lithology and physical properties are at least in part driven by glacial–interglacial climate changes that consistently impact the delivery and the nature of sediment deposited at Site U1543. The longer term evolution of these depositional processes recorded at Site U1543 will illuminate the multimillion year history of Patagonian ice sheet growth and retreat, ACC transport, and the underlying climatic conditions in which these processes evolved.
Biostratigraphy
Core catcher and split-core samples from Site U1543 were analyzed for siliceous (diatoms, radiolarians, and silicoflagellates) and calcareous (nannofossils, foraminifers, and ostracods) microfossils. Calcareous nannofossils, benthic foraminifers, and diatoms were also analyzed in the mudline sample. Microfossil occurrence and abundance varies throughout the Site U1543 sequence. Diatoms are few to abundant throughout the succession and are often common to abundant; they show moderate to high fragmentation and moderate dissolution. Radiolarians are common to abundant in all analyzed samples. Silicoflagellates are absent to few but are locally common. Calcareous nannofossil abundance varies widely across the analyzed samples. Planktonic foraminifers are rare in most samples but occasionally common to abundant in the upper 200 m of Hole U1543A. Benthic foraminifers are generally absent to rare throughout the record and occur at a higher abundance only during intervals interpreted to represent periods of warmth. Ostracods were only observed in the lower part of Hole U1543A.
The biostratigraphy at Site U1543 is based on Hole U1543A. A ~339.54 m thick sediment succession was recovered in Hole U1543A that represents a complete sequence from the upper Miocene to present. In total, 56 biostratigraphic events were recognized that indicate an estimated age of 7.3–8.5 Ma at the bottom of the hole, with an average sedimentation rate of ~4.7 cm/ky. Diatoms and radiolarians provide several well-constrained age-diagnostic events throughout the whole sequence. The integrated diatom, radiolarian, calcareous nannofossil, and planktonic foraminifer biozonations are shown in Figure F19. The microfossil datums recognized at this site are summarized in Table T3 and presented in Figure F20 as an age-depth plot including all of the biostratigraphic datums and the estimated sedimentation rate. Abundances of the different microfossil groups in Hole U1543A are presented in Figure F21.
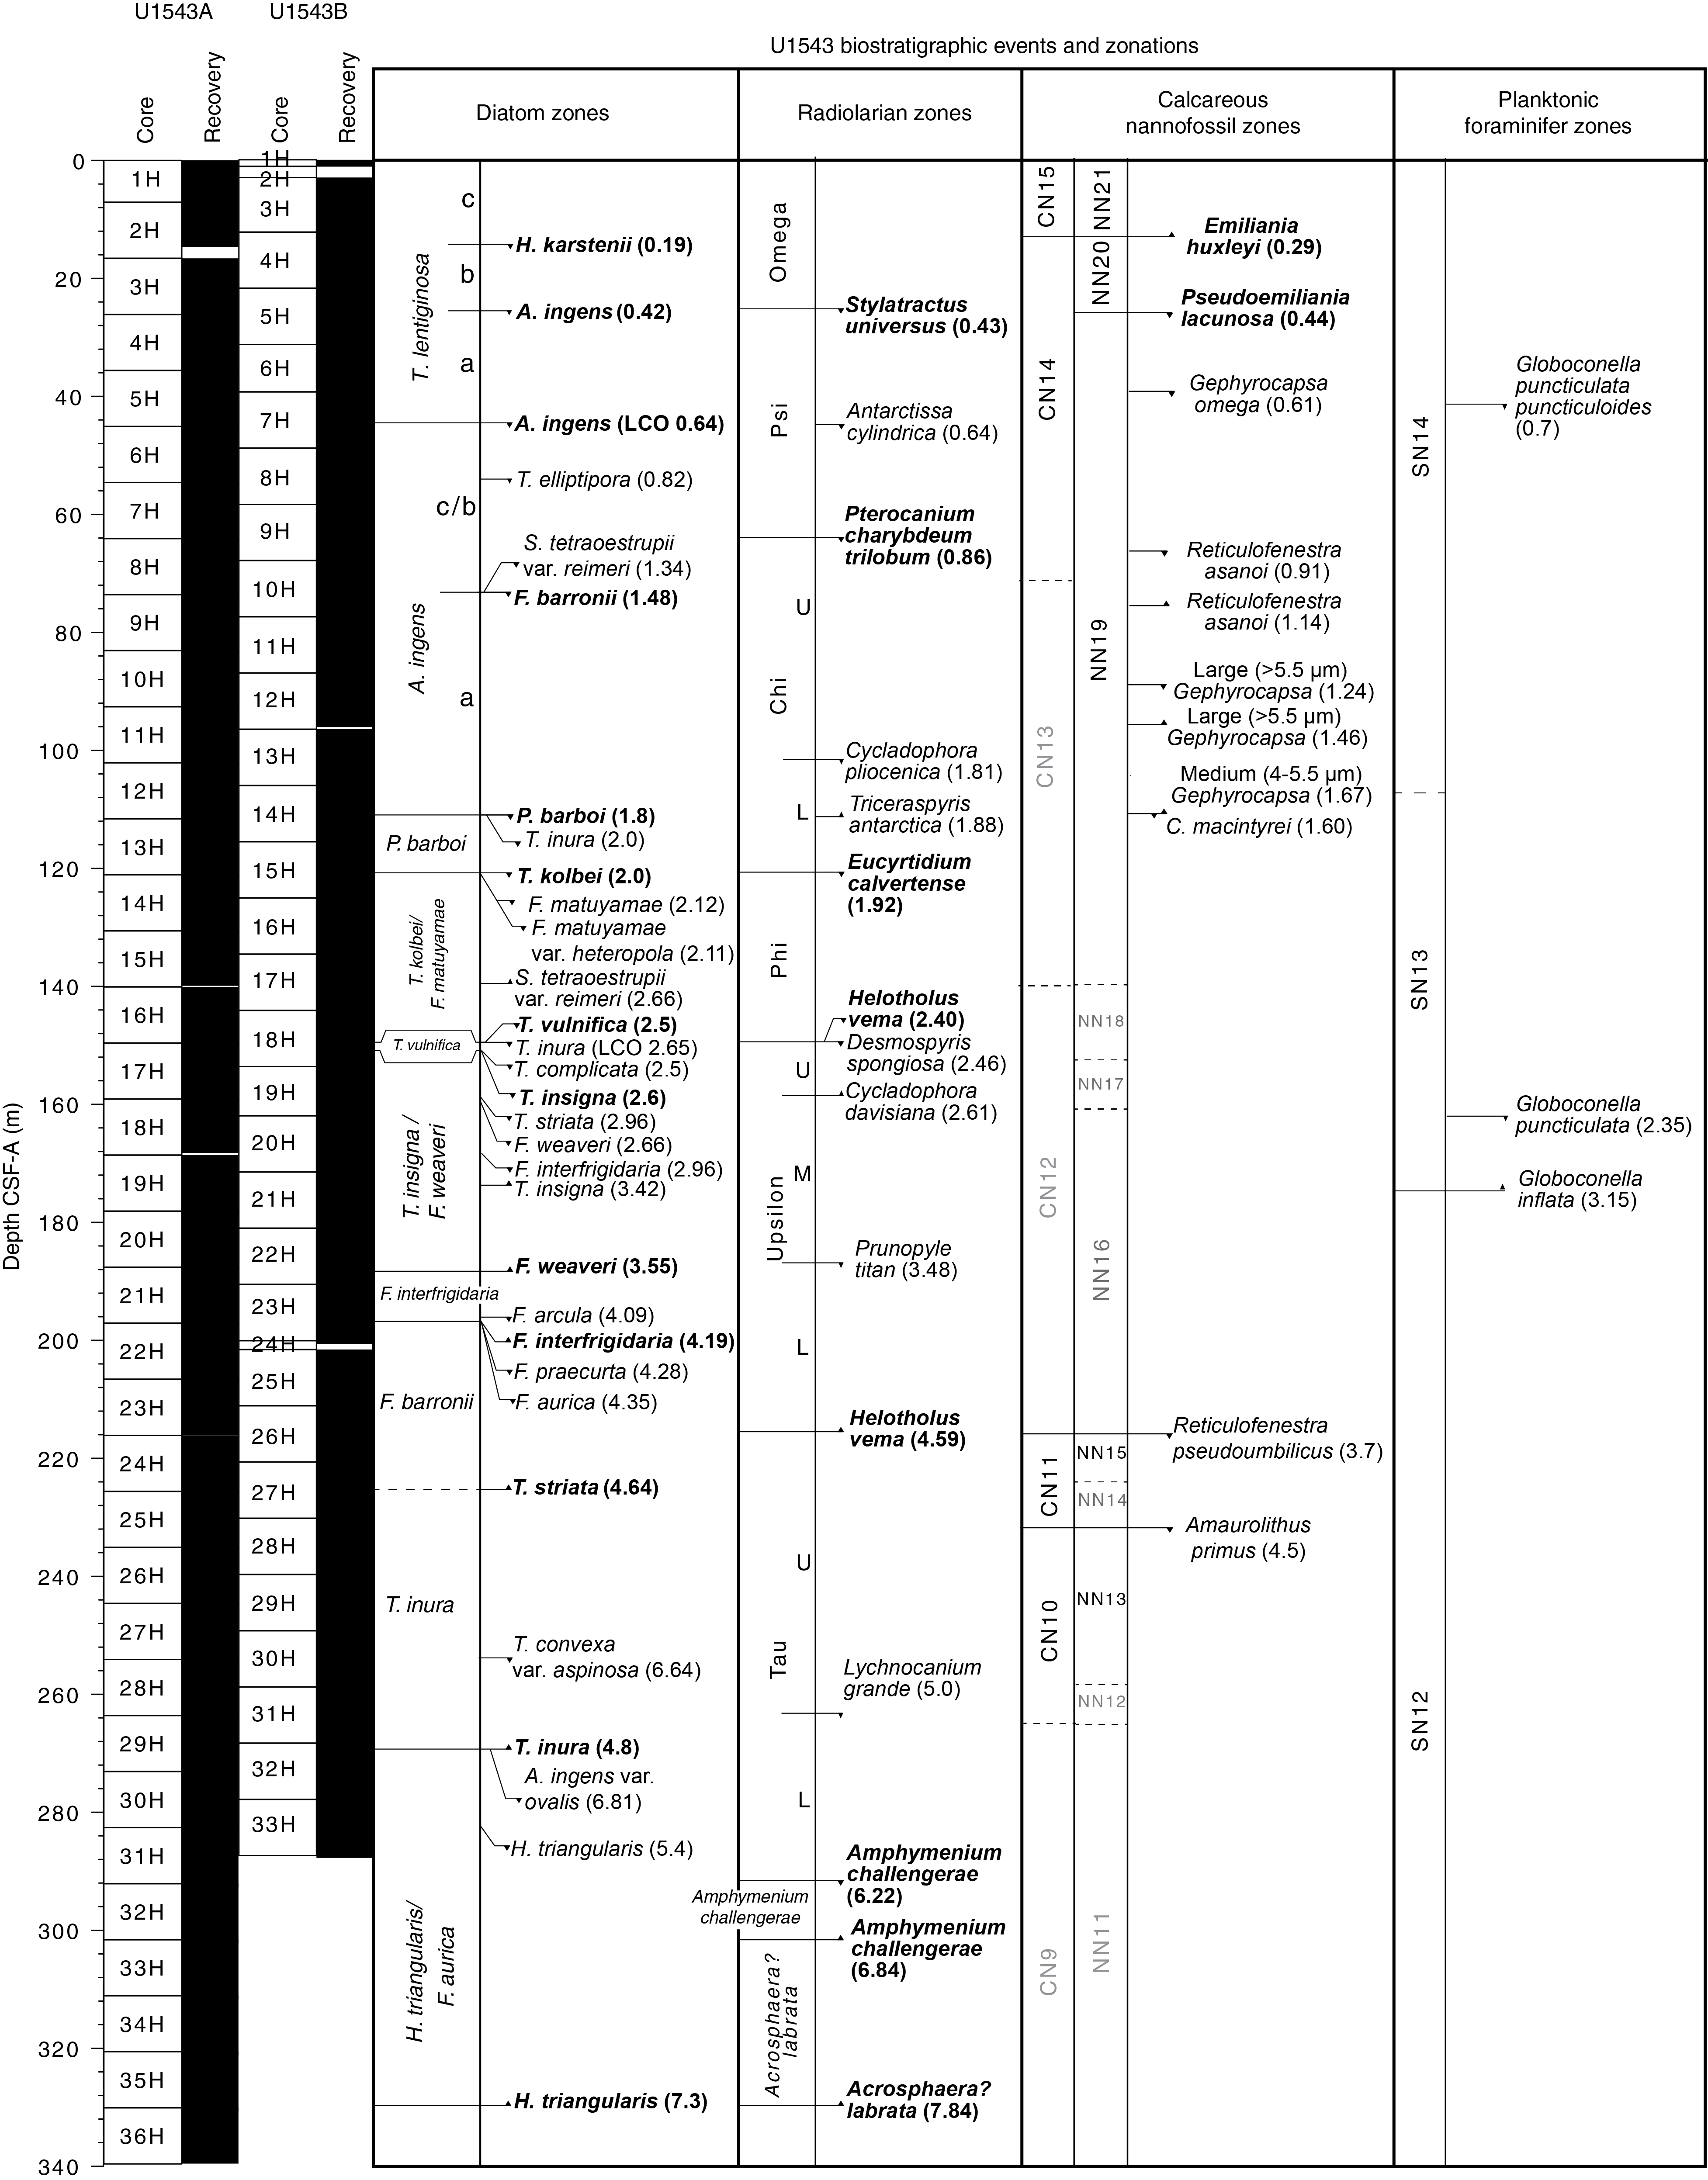
Figure F19. Zonations and biostratigraphic events.
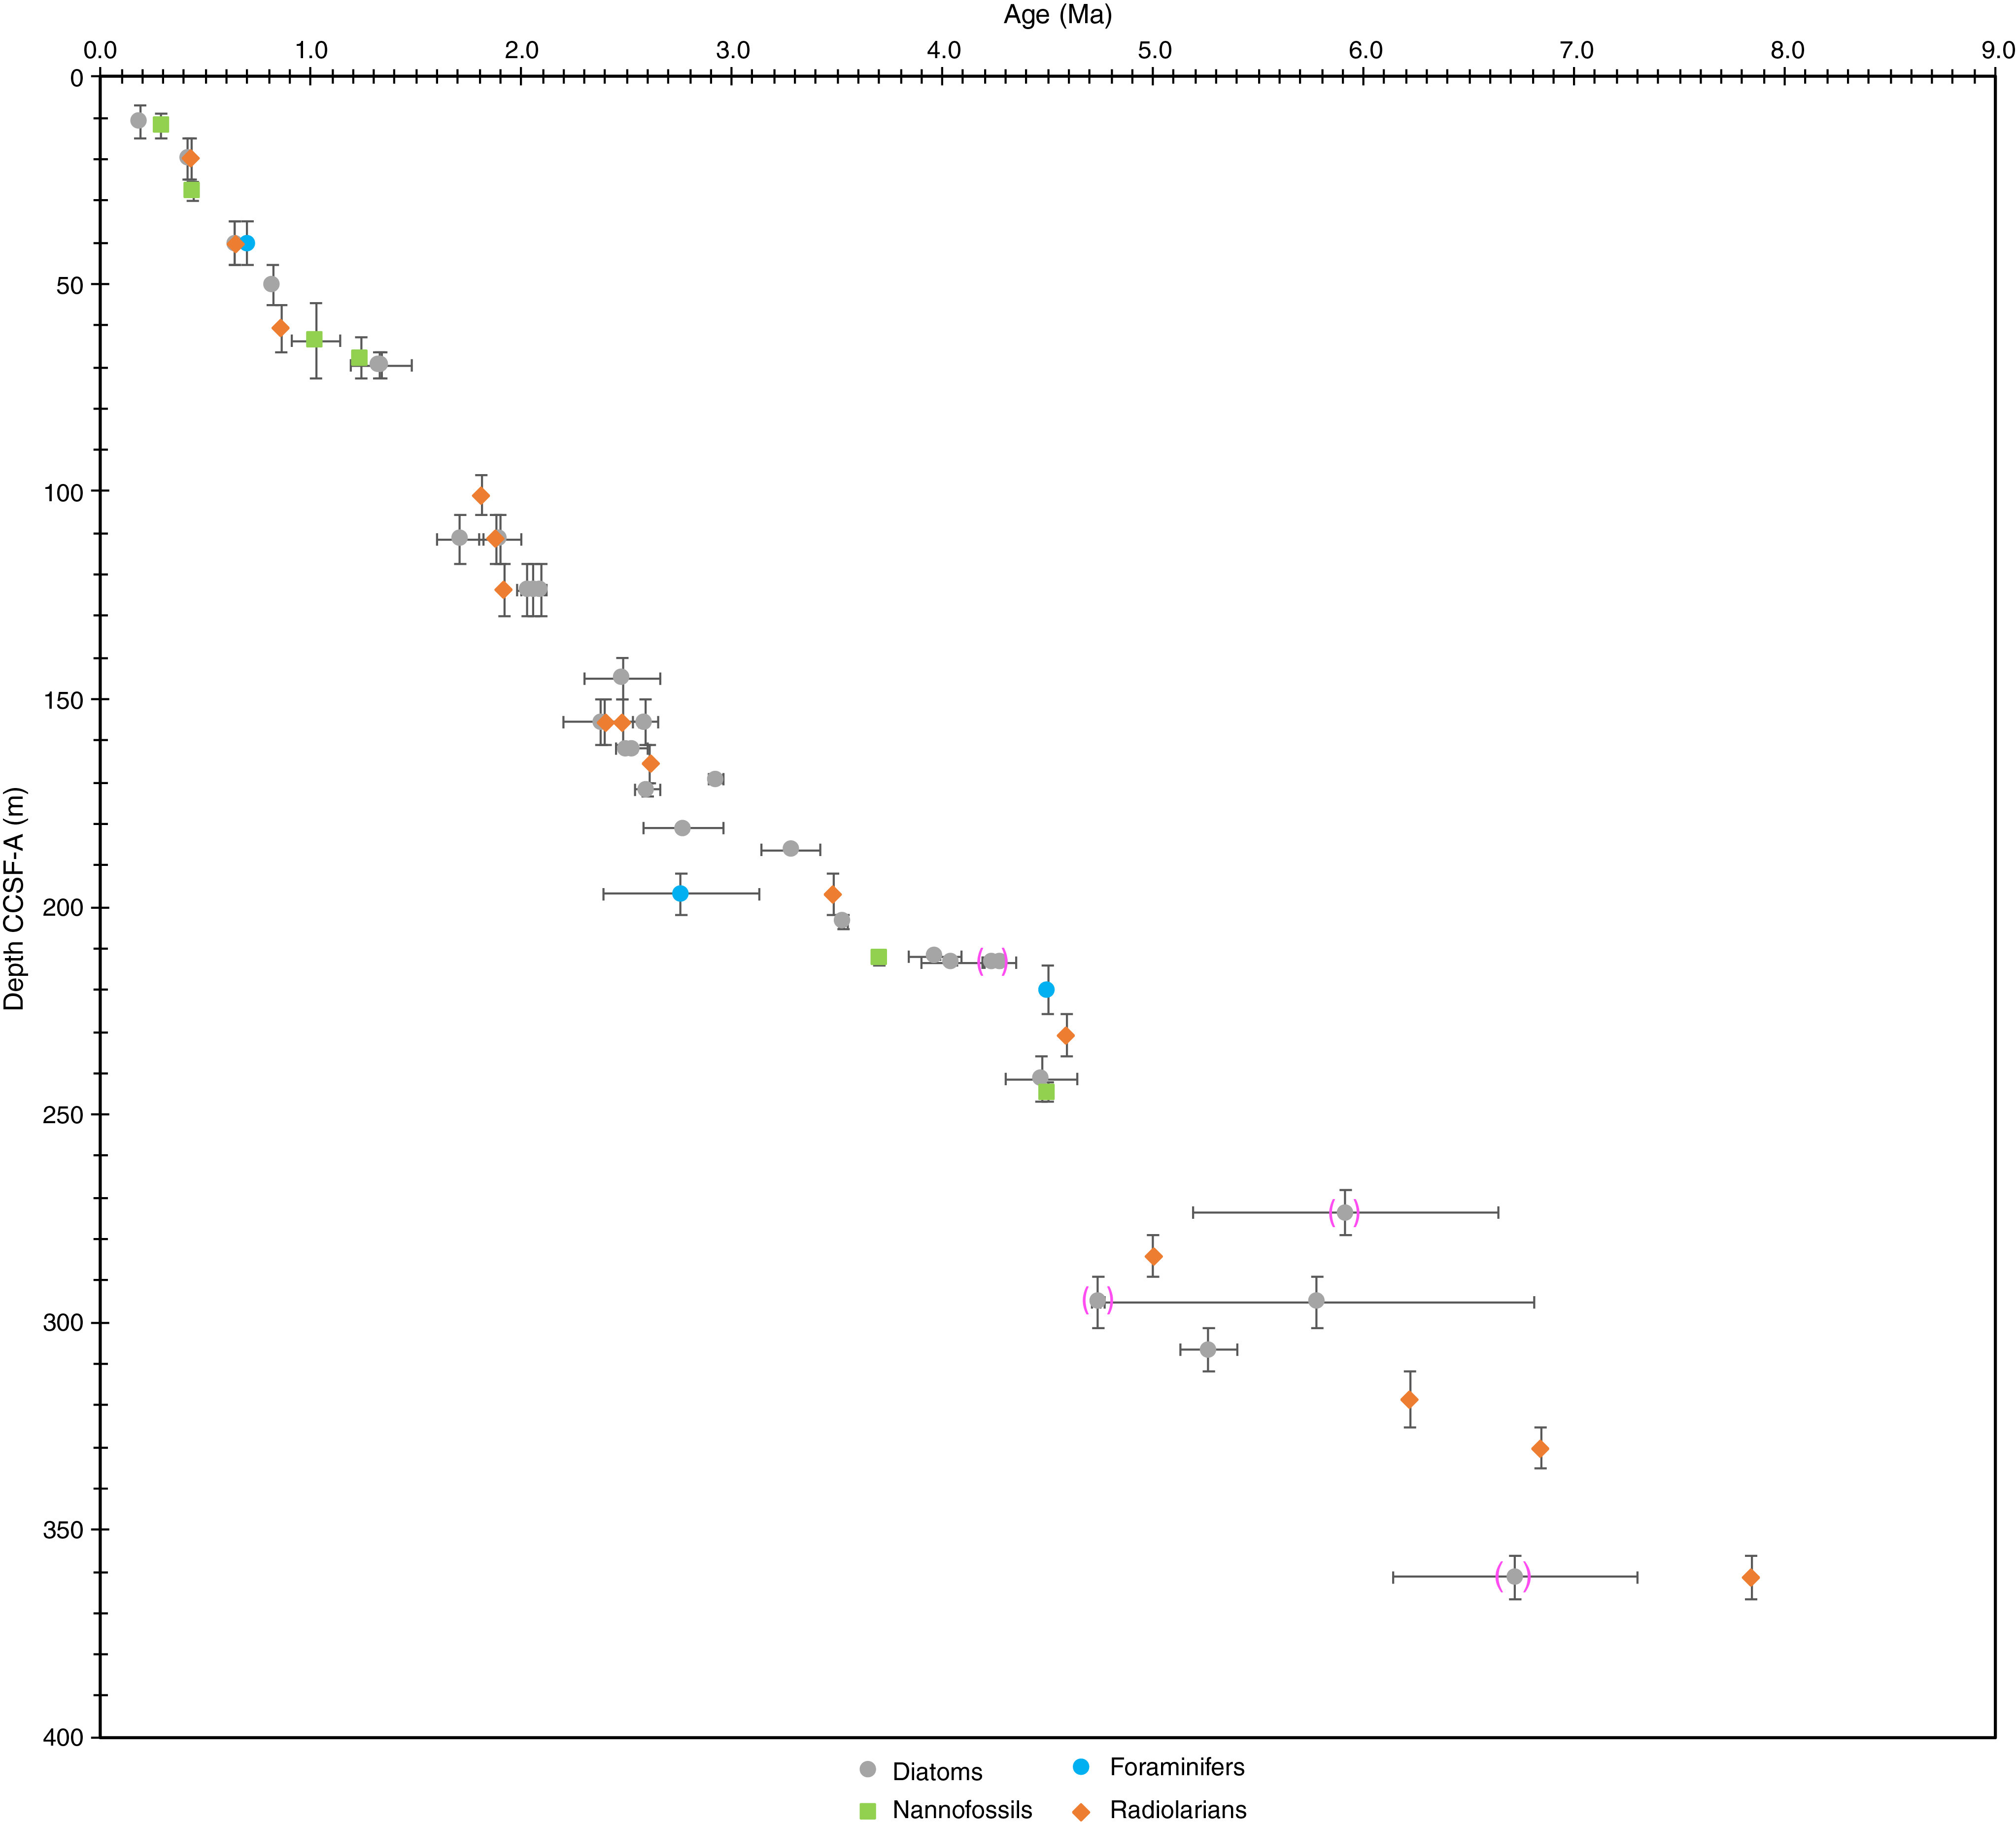
Figure F20. Age-depth plot.
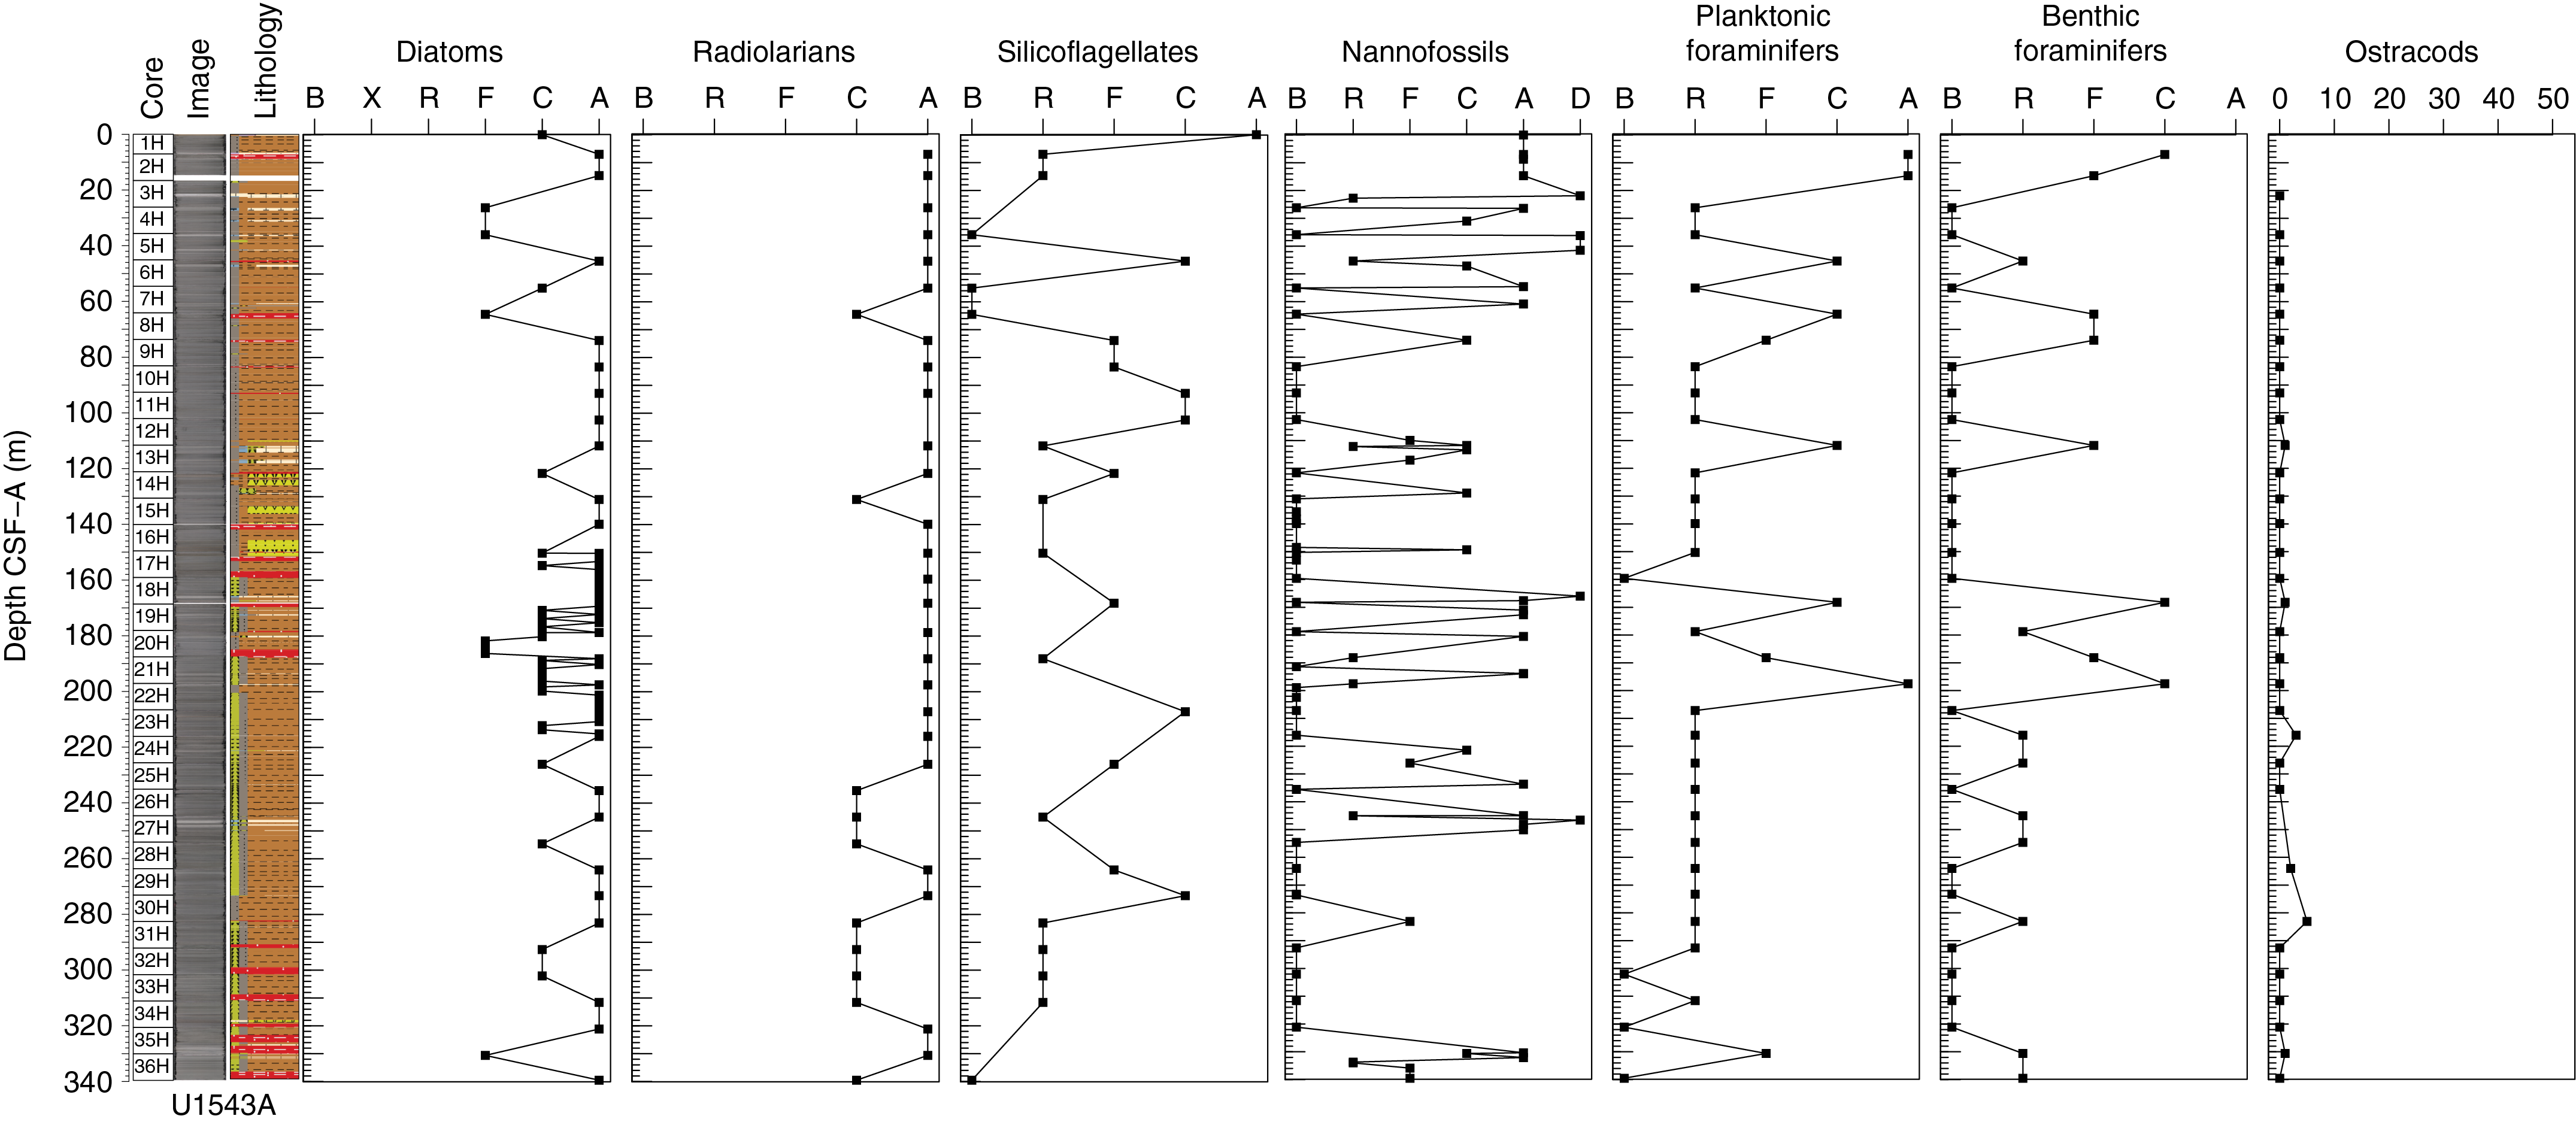
Figure F21. Siliceous and calcareous microfossils.
Diatoms
Diatom biostratigraphy at Site U1543 is based on the analysis of 79 smear slides from 1 mudline, 36 core catcher, and 42 split-core toothpick samples from Hole U1543A. Diatoms are common to abundant, and assemblages are diverse in most samples examined (Table T4) except for samples exhibiting the overwhelming presence of Thalassionema nitzschioides frustules. Such Thalassionema acme were noted especially in the upper Pliocene between Samples 383-U1543A-17H-2, 70 cm (151.76 m CSF-A), and 18H-6, 70 cm (166.65 m CSF-A), and in the lower Pliocene between Samples 22H-3, 120 cm, and 22H-5, 120 cm (201.25–204.20 m CSF-A), and between Samples 23H-6, 120 cm, and 30H-CC (215.17–283.04 m CSF-A), probably indicating times of warmer than present SSTs. Preservation is moderate, and most samples exhibit low to moderate fragmentation and moderate dissolution. However, a sequence of moderate to high dissolution and moderate to high fragmentation with common to few diatom abundances between Samples 20H-1, 70 cm, and 20H-6, 70 cm (178.80–186.27 m CSF-A), is characterized by a low abundance to absence of warm water indicator species like Hemidiscus cuneiformis, T. nitzschioides, and Shionodiscus oestrupii (Esper and Gersonde, 2014) and may be related to the Pliocene glaciation event during MIS M2 (~3.3 My before present). In addition to the same open-ocean species commonly encountered during examination of Sites U1539–U1541, few to rare occurrences of several Coscinodiscus species (Coscinodiscus marginatus, Coscinodiscus occulus-iridis, and Coscinodiscus radiatus) and common to rare occurrences of the neritic taxon Stephanopyxis were noted at Site U1543.
The diatom assemblage compositions in Hole U1543A are internally consistent and in good agreement with the upper Miocene–recent diatom sequence at Site U1541. The diatom succession appears to record continuous accumulation from the late Miocene to recent and follows the Miocene zonation of Censarek and Gersonde (2002) and the Pliocene–Pleistocene diatom zonation of Zielinski and Gersonde (2002), with a bottom age between 7.3 and 8.5 Ma (Table T3; Figure F19).
Pleistocene diatom zones
The Pleistocene sequence in the upper part of Hole U1543A (above Sample 383-U1543A-16H-CC [150.23–150.29 m CSF-A]), in the Thalassiosira lentiginosa Partial Range Zone, is characterized by abundant to few Fragilariopsis kerguelensis and T. lentiginosa and common to rare Chaetoceros resting spores. The boundary between Subzones C and B, marked by the last occurrence (LO) of Hemidiscus karstenii, was identified in Sample 2H-CC (14.65–14.71 m CSF-A). Subzones B and A of the T. lentiginosa Zone could not be differentiated by the first Quaternary common occurrence of H. karstenii, so the subzone boundary was instead placed at the LO of Actinocyclus ingens in Sample 3H-CC (26.19–26.25 m CSF-A). The boundary between the T. lentiginosa Zone and the A. ingens Partial Range Zone was placed at the last common occurrence (LCO) of A. ingens at few or greater numbers in Sample 4H-CC (35.87–35.93 m CSF-A). In the Pleistocene sequences, A. ingens is common to rare. In the A. ingens Zone, Thalassiosira elliptipora is present in Samples 6H-CC (55.06–55.12 m CSF-A) and 7H-CC (64.48–64.54 m CSF-A); the latter sample probably constrains the boundary between Subzones C and B in the A. ingens Zone. The boundary between A. ingens Subzones B and A is defined by the LOs of Fragilariopsis barronii and Shionodiscus tetraoestrupii var. reimeri in Sample 8H-CC (73.86–73.92 m CSF-A). The transition from the A. ingens Zone to the Proboscia barboi Partial Range Zone is constrained by the LO of P. barboi in Sample 12H-CC (111.72–111.78 m CSF-A). Following the scheme of Zielinski and Gersonde (2002), the transition from the P. barboi Partial Range Zone to the Thalassiosira kolbei/Fragilariopsis matuyamae Concurrent Range Zone is marked by the LO of T. kolbei in Sample 13H-CC (121.61–121.67 m CSF-A). The zone is further constrained by the LOs of F. matuyamae and F. matuyamae var. heteropola in Sample 13H-CC (121.61–121.67 m CSF-A). Long, slender varieties of T. nitzschioides are common to abundant in the P. barboi Zone and the upper portion of the T. kolbei/F. matuyamae Zone, and the LO of F. kerguelensis was noted in Sample 13H-CC (121.61–121.67 m CSF-A). The transition from the T. kolbei/F. matuyamae Zone to the Thalassiosira vulnifica Partial Range Zone is constrained by the LO of T. vulnifica. In Hole U1543A, the species was noted in only a single sample: 16H-CC (150.23–150.29 m CSF-A). The T. vulnifica Partial Range Zone, with an age between 2.5 and 2.6 Ma, marks the transition from the early Pleistocene to the late Pliocene. Notably, the LO of Fragilariopsis interfrigidaria, which is usually found in the T. vulnifica Zone, is poorly defined at Site U1543 and was observed much deeper in the section than predicted from its regional last appearance datum (LAD) (Cody et al., 2008; Zielinski and Gersonde, 2002).
Pliocene diatom zones
The Pliocene sequence in the middle part of Hole U1543A (Samples 383-U1543A-17H-1, 70 cm [150.30 m CSF-A], through 28H-CC [264.00–264.06 m CSF-A]) is characterized by abundant to common occurrences of multiple T. nitzschioides varieties and common to rare H. cuneiformis and A. ingens, indicating a warmer marine environment than that recorded during the Pleistocene. The LO of Thalassiosira inura is well defined in Sample 16H-CC (150.23–150.29 m CSF-A). The transition from the T. vulnifica Zone to the Thalassiosira insigna/Fragilariopsis weaveri Concurrent Range Zone is constrained by the LO of T. insigna in Sample 17H-1, 70 cm (150.30 m CSF-A). Below, the base of the zone is marked by the first occurrence (FO) of F. weaveri in Sample 20H-CC (188.12–188.18 m CSF-A). In this zone, the LOs of Thalassiosira complicata and Thalassiosira striata are clearly identified in Sample 17H-1, 70 cm (150.30 m CSF-A). Below, the F. interfrigidaria Partial Range Zone is constrained at the top by the FO of F. weaveri, described above, and at the bottom by the FO of F. interfrigidaria in Sample 21H-6, 120 cm (196.20 m CSF-A). At the bottom of the zone, the LO of F. arcula was found in Sample 21H-6, 120 cm (196.20 m CSF-A). Below the F. interfrigidaria Zone, the top of the F. barronii Partial Range Zone is constrained by the FO of F. interfrigidaria, described above. Because of the sparse occurrence of F. barronii in Hole U1543A, this marker could not be used to define the bottom of the F. barronii Zone. Instead, our working zonation uses the FO of T. striata, identified in Sample 23H-CC (216.01–216.07 m CSF-A), to constrain the bottom of the zone at Site U1543, pending further study. We note that the species is described as having an FAD close to the FO of F. barronii (Harwood and Maruyama, 1992); its FO is synchronous with the FO of F. barronii in Hole U1540D, the two events are occur in close proximity in Hole U1541A, and the higher abundance of T. striata compared to F. barronii at this site may merit the rezonation of this interval. Additionally, the bottom of the zone might be further constrained by the FO of Azpeitia harwoodii in Sample 23H-6, 120 cm (215.17 m CSF-A), as reported from Ocean Drilling Program (ODP) Hole 1138A, Kerguelen Plateau, with an age range of 4.2–3.7 Ma (Bohaty et al., 2003). The top of the zone is further characterized by common to few Azpeitia nodulifera and A. harwoodii, which have coinciding LOs in Sample 22H-1, 120 cm (198.30 m CSF-A). Below the F. barronii Zone, the base of the T. inura Partial Range Zone is constrained by the FO of T. inura in Sample 28H-CC (264.00–264.06 m CSF-A). In this zone, the LO of Thalassiosira convexa var. aspinosa was noted in Sample 27H-CC (254.62–254.68 m CSF-A).
Miocene diatom zones
The upper Miocene sequence in the lower part of Hole U1543A (below Sample 383-U1543A-28H-CC, [264.00–264.06 m CSF-A]) is characterized by common to rare T. nitzschioides (long, thin varieties) and T. nitzschioides var. parva and few to rare A. ingens and H. cuneiformis. The top of the zone is constrained by the FO of T. inura described above. The LO of Hemidiscus triangularus is noted in the upper part of the zone in Sample 30H-CC (283.04–283.10 m CSF-A). The zone is further characterized by the LO of A. nodulifera in Sample 29H-CC (273.23–273.29 m CSF-A), the LO of A. ingens var. A (Harwood and Matuyama) in Sample 30H-CC, 19–25 cm (283.04–283.10 m CSF-A), and few to rare co-occurrences of T. convexa var. aspinosa and Fragilariopsis praeinterfrigidaria. The bottom of the zone is defined by the FO of H. triangularus in Sample 34H-CC (321.10–321.16 m CSF-A), which coincides with the FO of T. convexa var. aspinosa. Below the H. triangularus/Fragilariopsis aurica Zone, the upper boundary of the Fragilariopsis reinholdii Partial Range Zone of Censarek and Gersonde (2002) is defined by the FO of H. triangularus described above, and Fragilariopsis arcula, F. aurica, and Fragilariopsis praecurta coincide in the zone. The bottom of the zone was not recovered in Hole U1543A.
Radiolarians
Core catcher samples from Cores 383-U1543A-1H through 36H were processed and analyzed for radiolarian abundance and preservation. Radiolarians are well preserved and abundant in the upper ~226.04 m (Samples 1H-CC through 24H-CC; 7.00–226.10 m CSF-A) except for Samples 7H-CC (64.48–64.54 m CSF-A) and 14H-CC (130.97–131.03 m CSF-A), where they are common and moderately preserved. In Samples 25H-CC through 27H-CC (235.51–254.68 m CSF-A), 30H-CC through 33H-CC (283.04–311.62 m CSF-A), and 36H-CC (339.48–339.54 m CSF-A), radiolarian preservation decreases significantly. Radiolarians are common, and preservation varies between moderate and poor in this interval. Samples 28H-CC and 29H-CC (264.00–273.29 m CSF-A) and 34H-CC and 35H-CC (321.10–330.63 m CSF-A) contain abundant and well-preserved radiolarians. A radiolarian distribution chart is shown in Table T5. Recognized radiolarian biostratigraphic events are shown alongside diatoms, calcareous nannofossils, and planktonic foraminifers in Table T3.
In Hole U1543A, 15 radiolarian events were recognized and used for dating the drilled sequence. The top of the Psi Zone was recognized in Sample 383-U1543A-3H-CC (26.19–26.25 m CSF-A) by the LO of Stylatractus universus, indicating an age older than 0.43 Ma. Samples above this interval belong to the Omega Zone. The following interval, to Sample 5H-CC (45.35–45.41 m CSF-A), where the LO of Antarctissa cylindrica is documented, was assigned to the remaining part of the Psi Zone. The boundary between the Psi Zone and the underlying Chi Zone was identified in Sample 7H-CC (64.48–64.54 m CSF-A) by the presence of Pterocanium charybdeum trilobum.
The LO of Cycladophora pliocenica, which divides the Chi Zone into two subzones, was recognized in Sample 383-U1543A-11H-CC (102.40–102.46 m CSF-A). The FO of Triceraspyris antarctica in Sample 12H-CC (111.72–111.78 m CSF-A) marks the remaining part of the Chi Zone. The Phi Zone, whose top is defined by the LAD of Eucyrtidium calvertense, was encountered in Sample 13H-CC (121.61–121.67 m CSF-A).
The boundary between the Phi and Upsilon Zones was identified in Sample 383-U1543A-16H-CC (150.23–150.29 m CSF-A) by the LO of Helotholus vema. The LO of Desmospyris spongiosa, which occurs near the top of the Upsilon Zone, was also encountered in Sample 16H-CC. The upper/middle Upsilon Zone boundary was placed at ~159.55 m CSF-A by the FO of Cycladophora davisiana in Sample 17H-CC (159.55–159.61 m CSF-A). The lower/middle part of the Upsilon Zone occurs below this depth, extending to Sample 20H-CC (188.12–188.18 m CSF-A), where the LO of Prunopyle titan was identified. The LO of Lampromitra coronata, which falls in the lower Upsilon Subzone, was not seen in this interval.
The FO of H. vema in Sample 383-U1543A-23H-CC (216.01–216.07 m CSF-A) allowed us to assign this sample to the top of the Tau Zone. At Site U1543, Lychnocanium grande occurs less commonly in Samples 22H-CC through 27H-CC (207.15–254.68 m CSF-A). Therefore, the boundary between the upper and lower part of the Tau Zone was placed at Sample 28H-CC (264.00–264.04 m CSF-A), where the LCO of L. grande was recognized. A late Miocene radiolarian assemblage was found in the lower part of Site U1543 between 302.04 and 339.54 m CSF-A. The Amphymenium challengerae Zone was placed between Samples 31H-CC (292.56–292.62 m CSF-A) and 32H-CC (302.04–302.10 m CSF-A) based on the total range of A. challengerae. The FO of A. challengerae places the boundary between the A. challengerae Zone and Acrosphaera? labrata Zone at ~302.04 m CSF-A. The base of the A.? labrata Zone was assigned in Sample 35H-CC (330.57–330.63 m CSF-A) based on the FO of A.? labrata. No radiolarian events were found in Sample 36H-CC (339.48–339.54 m CSF-A).
Silicoflagellates
Silicoflagellates were analyzed from 1 mudline and 28 core catcher samples from Hole U1543A. Silicoflagellates are few to barren throughout the core, except for six samples in which they are common to abundant (Figure F21; Table T6).
The silicoflagellate assemblage at Site U1543 consists of 11 species: Dictyocha stapedia, Dictyocha aculeata, Dictyocha perlaevis, Dictyocha brevispina, Dictyochia aspera, Stephanocha speculum, Stephanocha boliviensis, Octactis sp., Bachmannocena circulus, Bachmannocena diodon, and Bachmannocena quadrangula (Figure F22).
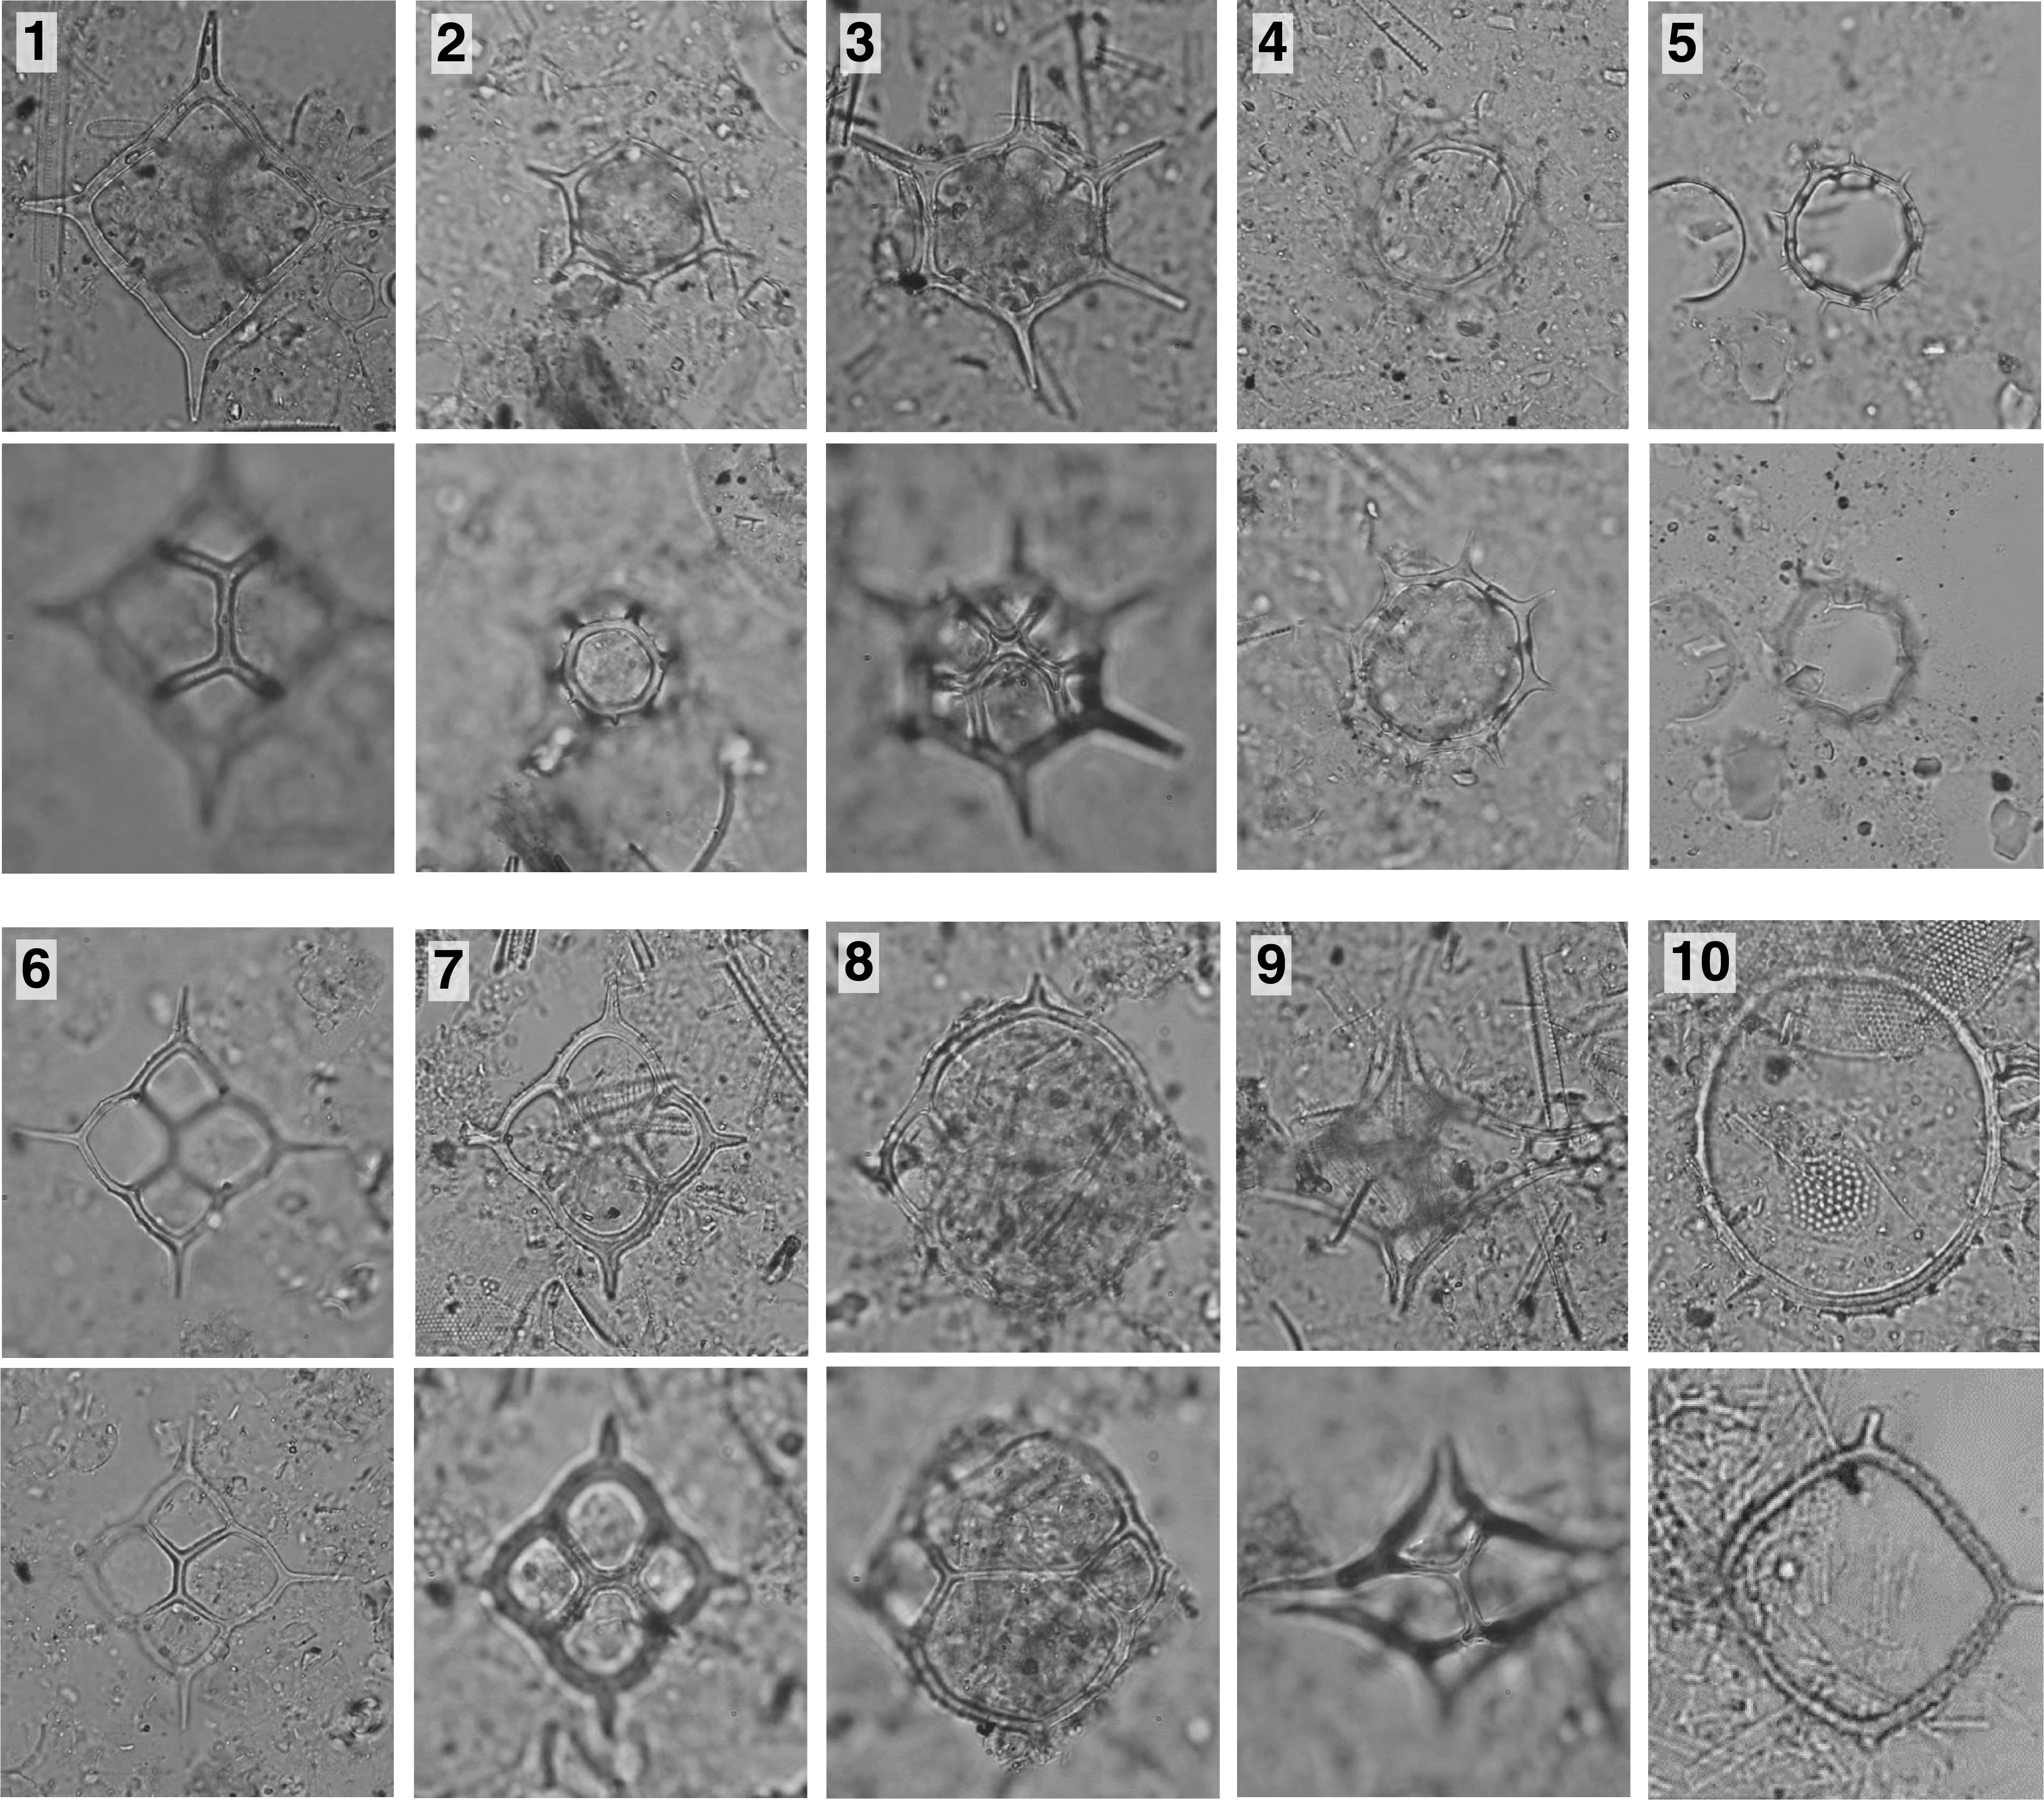
Figure F22. Silicoflagellates.
D. aculeata occurs sporadically in the upper eight core catcher samples, and D. stapedia occurs irregularly in samples throughout the entire succession. S. speculum is present throughout the succession and shows some morphological variability, including specimens with long and short corner spines, specimens with variable apical ring features (S. speculum var. monospicata, S. speculum var. bispicata, S. speculum var. coronata, and S. speculum var. pseudofibula), specimens with different numbers of basal ring sides (S. speculum var. pentagona and S. speculum var. septenaria), and a large (≥30 µm) variety similar to the S. speculum Group B described by Tsutsui et al. (2009) from water samples.
Octactis spp. is present in Samples 383-U1543A-10H-CC through 12H-CC (92.83–111.78 m CSF-A), and S. boliviensis is present in Samples 18H-CC through 30H-CC (168.18–283.10 m CSF-A).
The S. speculum A Zone, developed for the Southern Ocean (Ciesielski, 1975) and spanning the middle–late Pleistocene, was recognized from the top of the core to Sample 383-U1543A-18H-CC (Dictyochia aspera; 168.18–168.24 m CSF-A) and is followed by the middle–upper Pliocene S. boliviensis Zone. The lower zones are not well defined, and the presence of B. circulus probably indicates the middle Miocene B. circulus Zone.
Calcareous nannofossils
Calcareous nannofossil biostratigraphy is based on the analysis of 79 samples: 1 mudline, 36 core catcher, and 42 split-core samples from Hole U1543A (0–339.54 m CSF-A). Nannofossil abundance varies throughout the sequence, and several intervals are barren (Figure F21; Table T7). In general, the preservation of calcareous nannofossils varies from poor to moderate, but it is occasionally good in the nannofossil oozes (e.g., Samples 383-U1543A-3H-4, 90 cm; 5H-5, 5 cm; 18H-6, 6 cm; and 27H-2, 57 cm).
The nannofossil assemblage at Site U1543 consists of 29 groups/taxa, including Emiliania huxleyi, Gephyrocapsa margerelii/muellerae, Gephyrocapsa caribbeanica, Gephyrocapsa oceanica, Gephyrocapsa spp. (<4 µm, closed >4 µm, medium, and large), Pseudoemiliania lacunosa, Reticulofenestra (<3, 3–5, and 5–7 µm), Reticulofenestra asanoi, Reticulofenestra pseudoumbilicus, Dictyoccocites spp., Coccolithus pelagicus, Calcidiscus leptoporus, Calcidiscus macintyrei, Helicosphaera carteri, Helicosphaera sellii, Pontosphaera spp. (including Pontosphaera japonica), Syracosphaera spp. (including Syracosphaera pulchra), Scyphosphaera spp., Rhabdosphaera clavigera, Discoaster spp. (including Discoaster variabilis), and Amaurolithus primus/delicatus. Key taxa are illustrated in Figure F23.
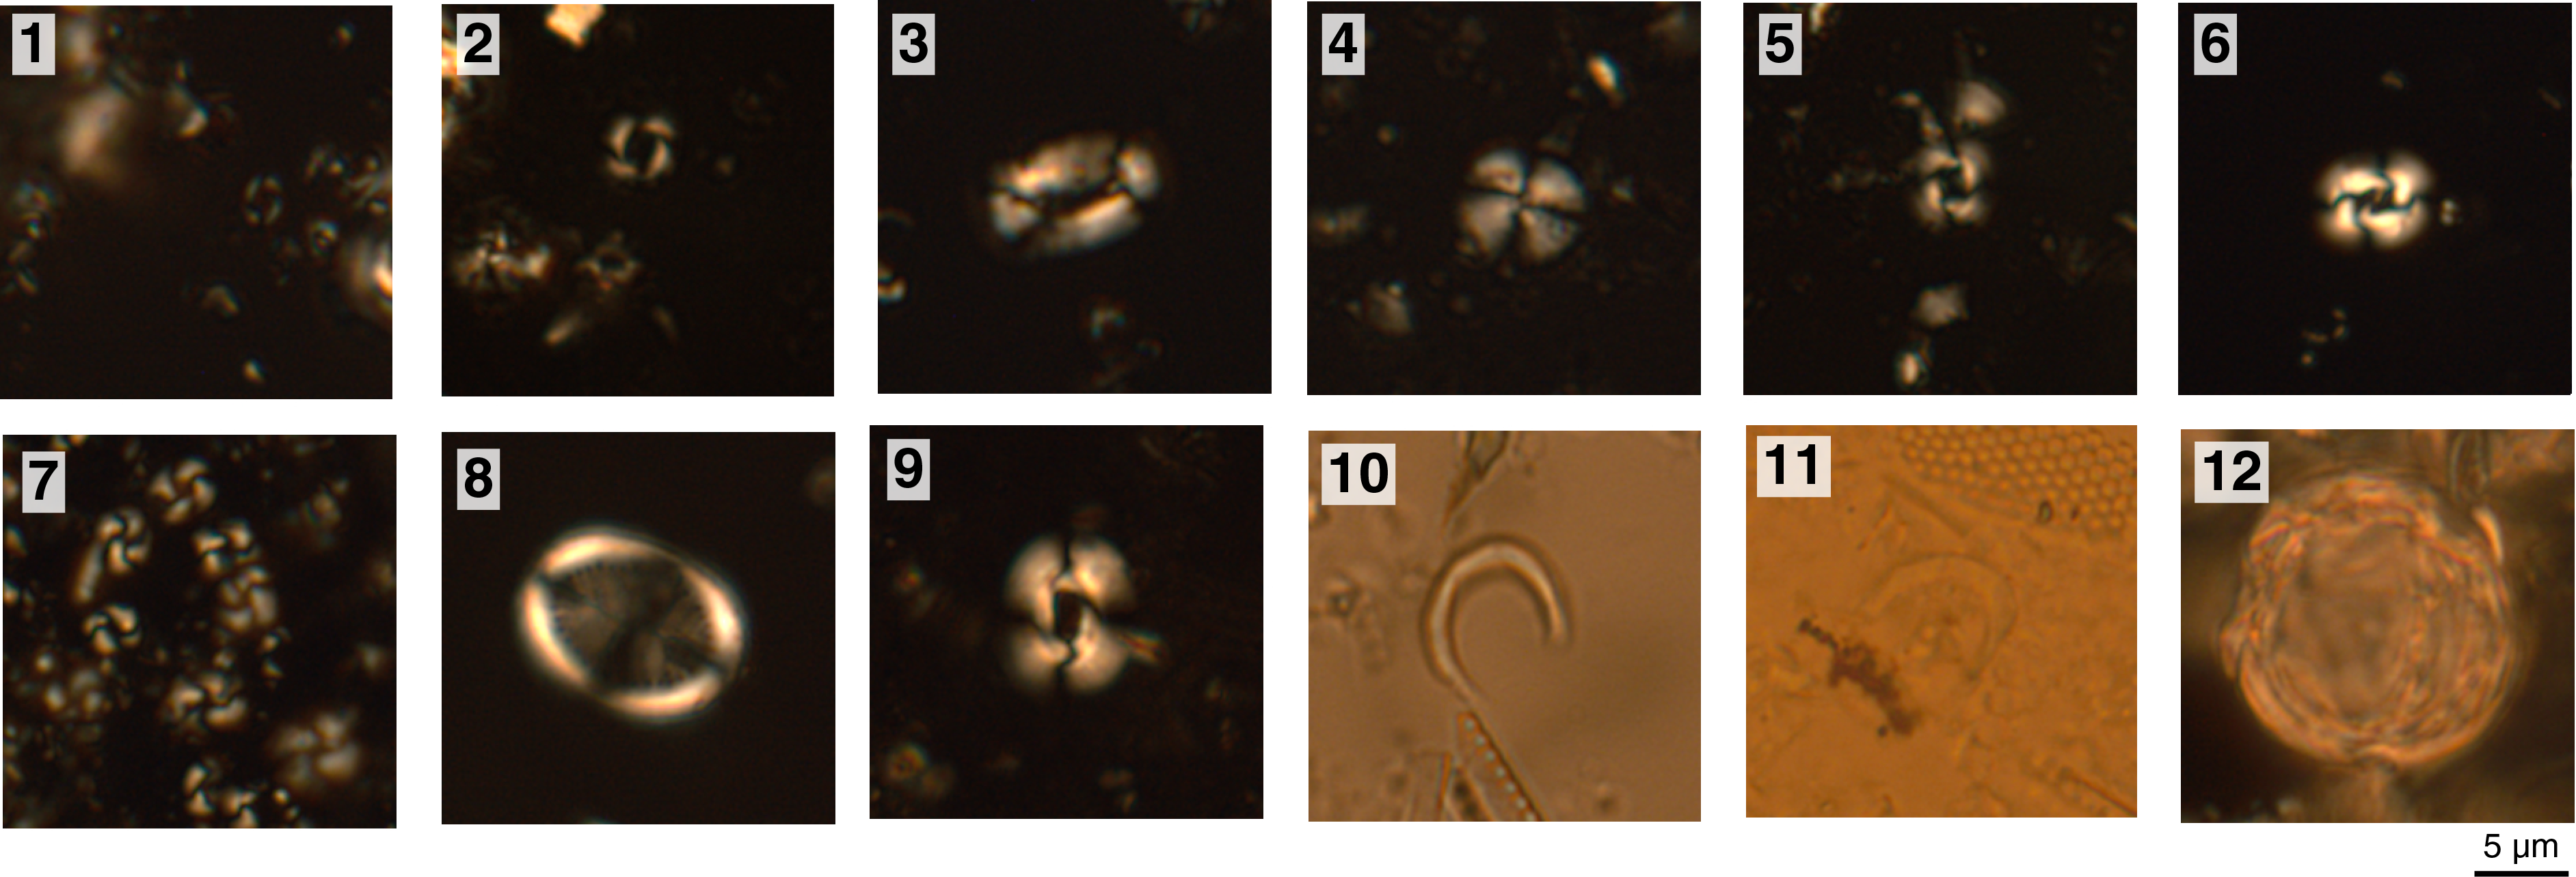
Figure F23. Calcareous nannofossils.
In total, five biostratigraphic events were observed at Site U1543. Nannofossil Zones CN15/NN21 through CN10/NN13 were recognized (Figure F19) based on the FO of E. huxleyi (Sample 383-U1543A-2H-CC; 14.65–14.71 m CSF-A), the LO of P. lacunosa (Sample 4H-4, 50 cm; 30.99 m CSF-A), the LO of Gephyrocapsa spp. (>5.5 µm) large (Sample 8H-CC; 73.86–73.92 m CSF-A), the LO of R. pseudoumbilicus (Sample 21H-CC; 197.52–197.58 m CSF-A), and the LO of A. primus/delicatus (Sample 24H-CC; 226.04–226.10 m CSF-A).
Although R. asanoi is present at Site U1543, it was not possible to constrain the LO and FO for this species because of barren intervals. Therefore, only the R. asanoi range of occurrence (between Samples 383-U1543A-6H-7, 49 cm, and 8H-CC [54.61–73.92 m CSF-A]) was considered here (Table T3). The sporadic presence of H. sellii (Sample 21H-5, 41 cm; 193.9 m CSF-A) and C. macintyrei (between Samples 27H-2, 57 cm, and 27H-4, 110 cm [246.62–250.13 m CSF-A]) were not considered here as bioevents because of the discontinuous occurrence of these species in the sediment sequence.
Foraminifers
Planktonic foraminifers
All 36 core catcher samples from Hole U1543A were analyzed for planktonic foraminifers (Table T8). The abundance of planktonic foraminifers is generally very low (<1%), and several samples in Hole U1543A are barren. Planktonic foraminifers are abundant in only three of the analyzed samples (383-U1543A-1H-CC [7.00–7.06 m CSF-A], 2H-CC [14.65–14.71 m CSF-A], and 21H-CC [197.52–197.58]) (Figure F21), which likely represent warm periods. Planktonic foraminifer preservation is generally moderate in Hole U1543A.
In samples where planktonic foraminifer abundance is higher than 5% of the total coarse fraction residue, the assemblage is characterized by both high-latitude and temperate species. Neogloboquadrina pachyderma (sinistral) dominates the assemblages to 111.78 m CSF-A. Globigerina bulloides is present throughout the sequence in Hole U1543A. Other species that occur in low abundances are Truncorotalia crassaformis, Truncorotalia truncatulinoides, Globoconella puncticulata, Globoconella puncticulata puncticuloides, Globoconella inflata, Globoconella pliozea, Globoconella sphericomiozea, Globoconella conomiozea, Globoturborotalita woodi, Turborotalita quinqueloba, Globigerinita glutinata, Orbulina universa, Neogloboquadrina incompta, Neogloboquadrina dutertrei, Hirsutella scitula, and Beella digitata. Key foraminiferal taxa found at Site U1543 are shown in Figures F24 and F25.
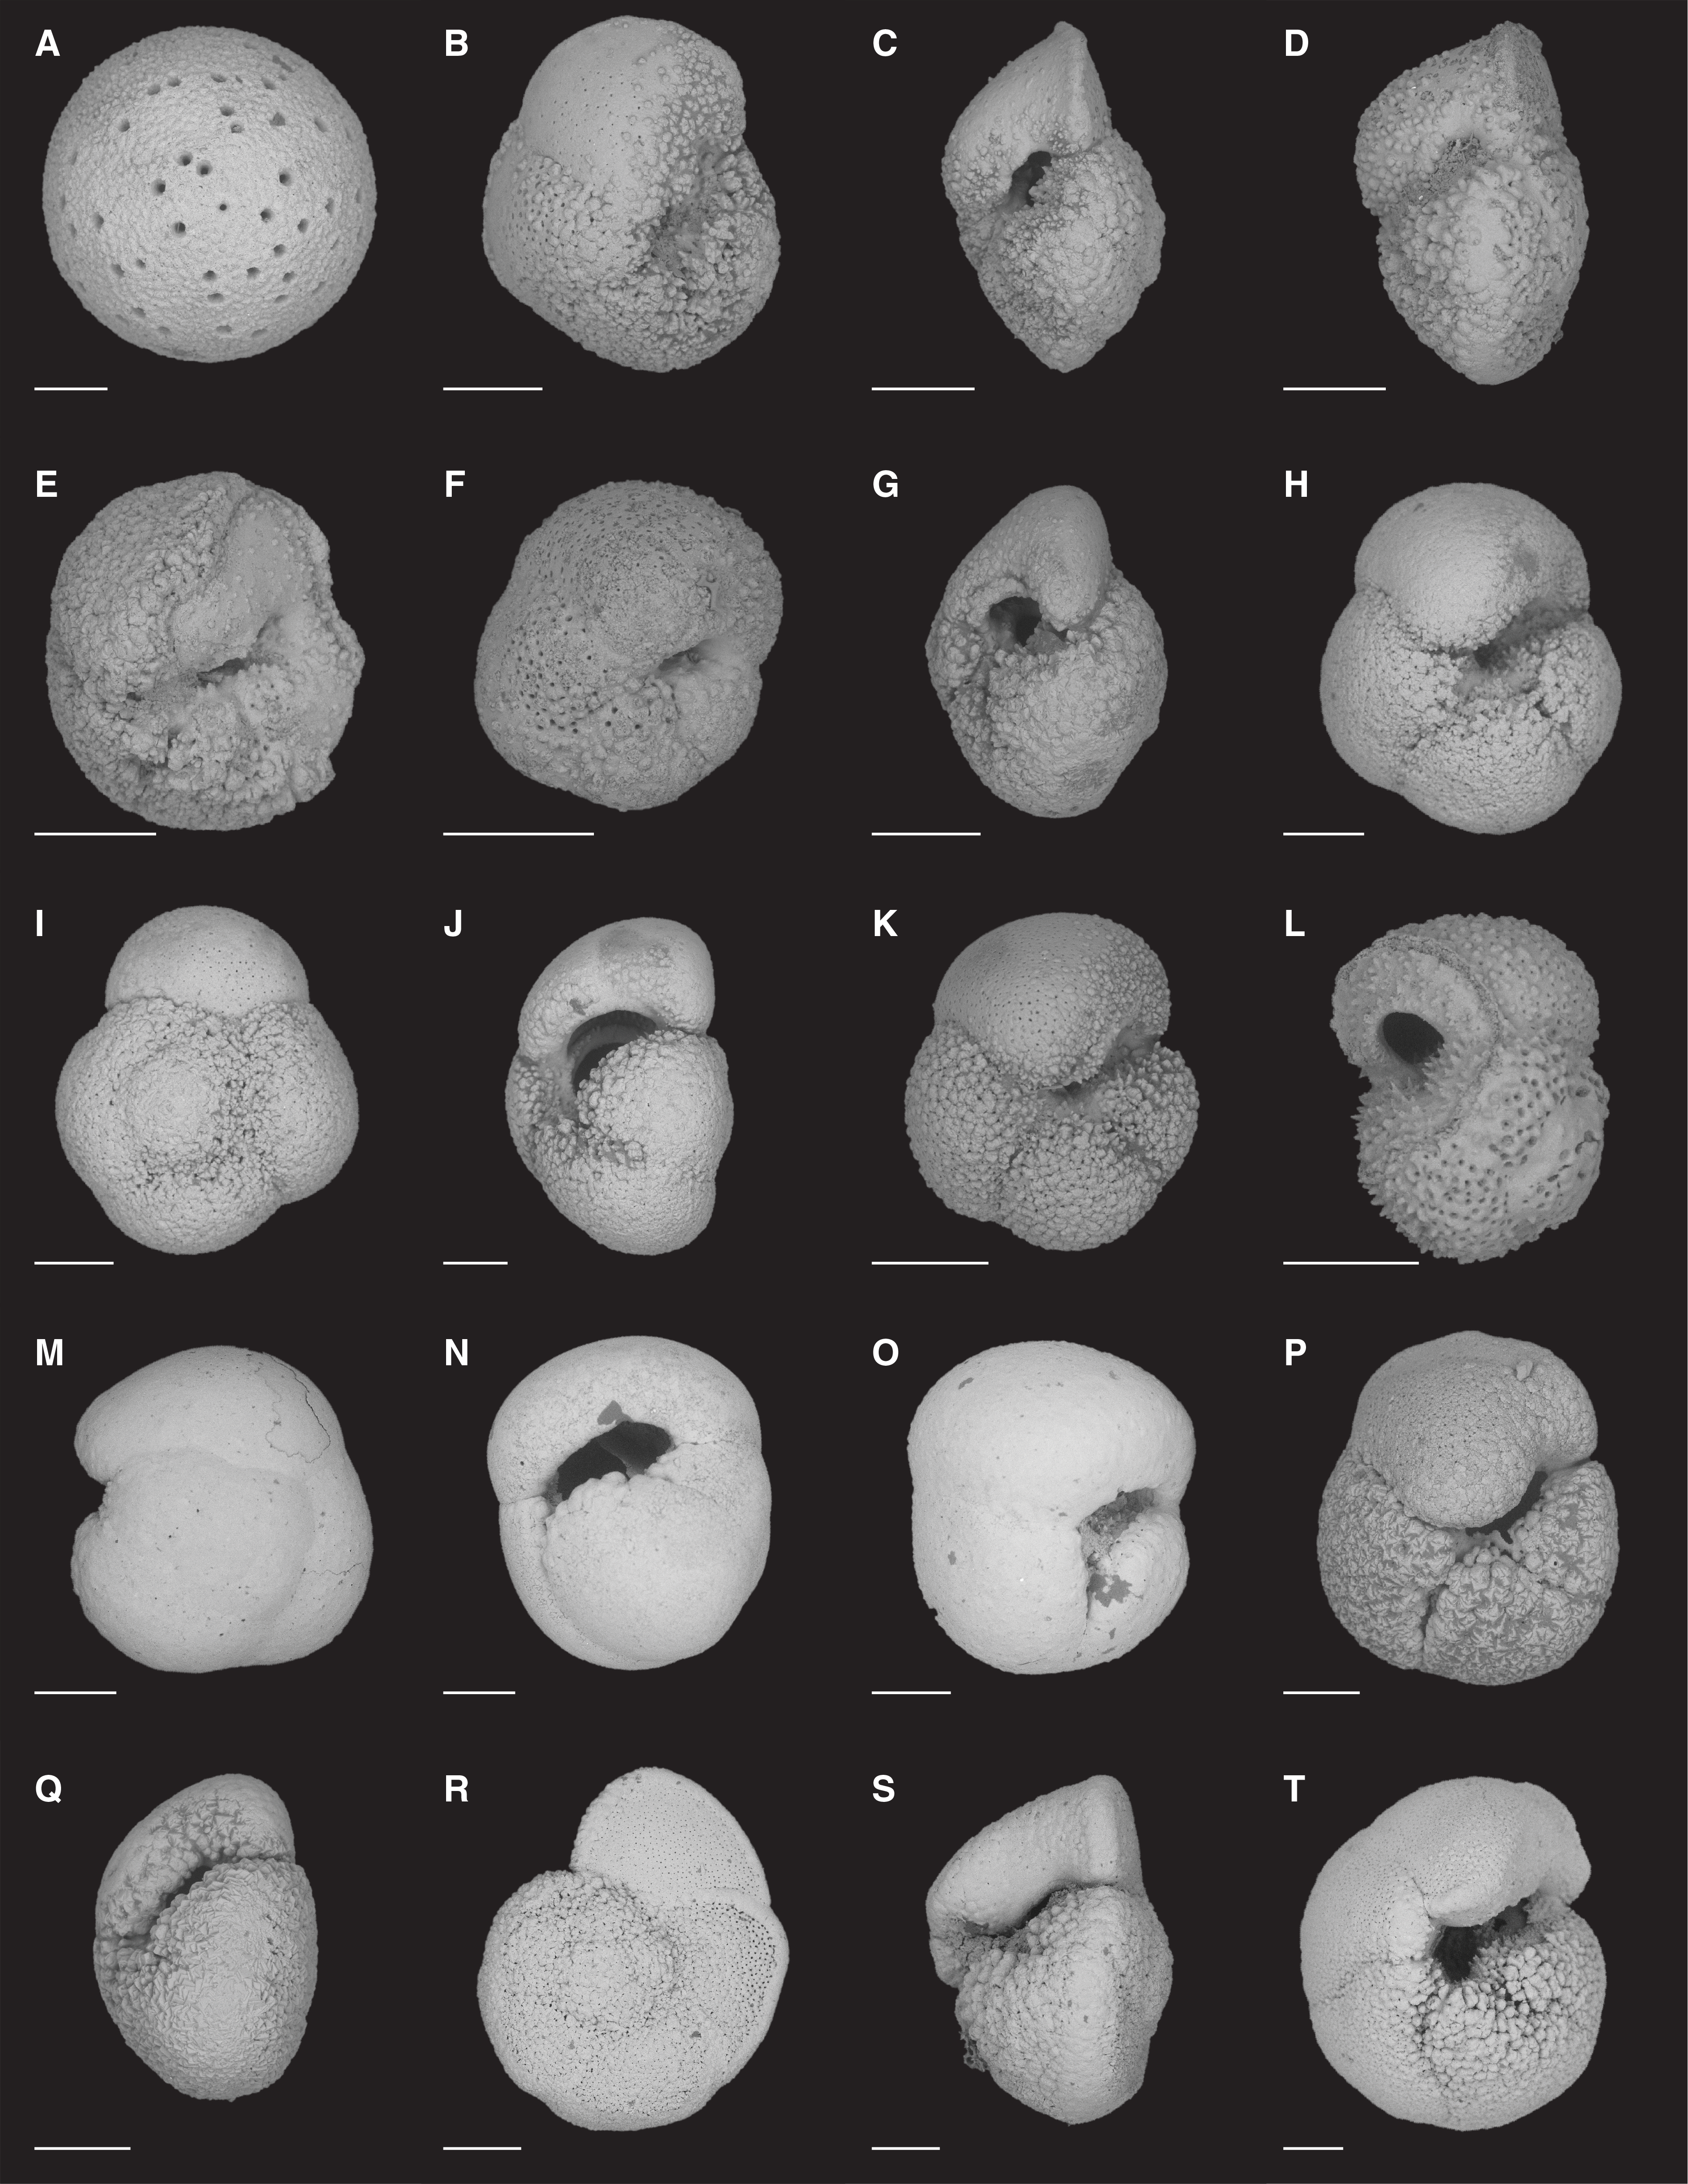
Figure F24. Planktonic foraminifers.
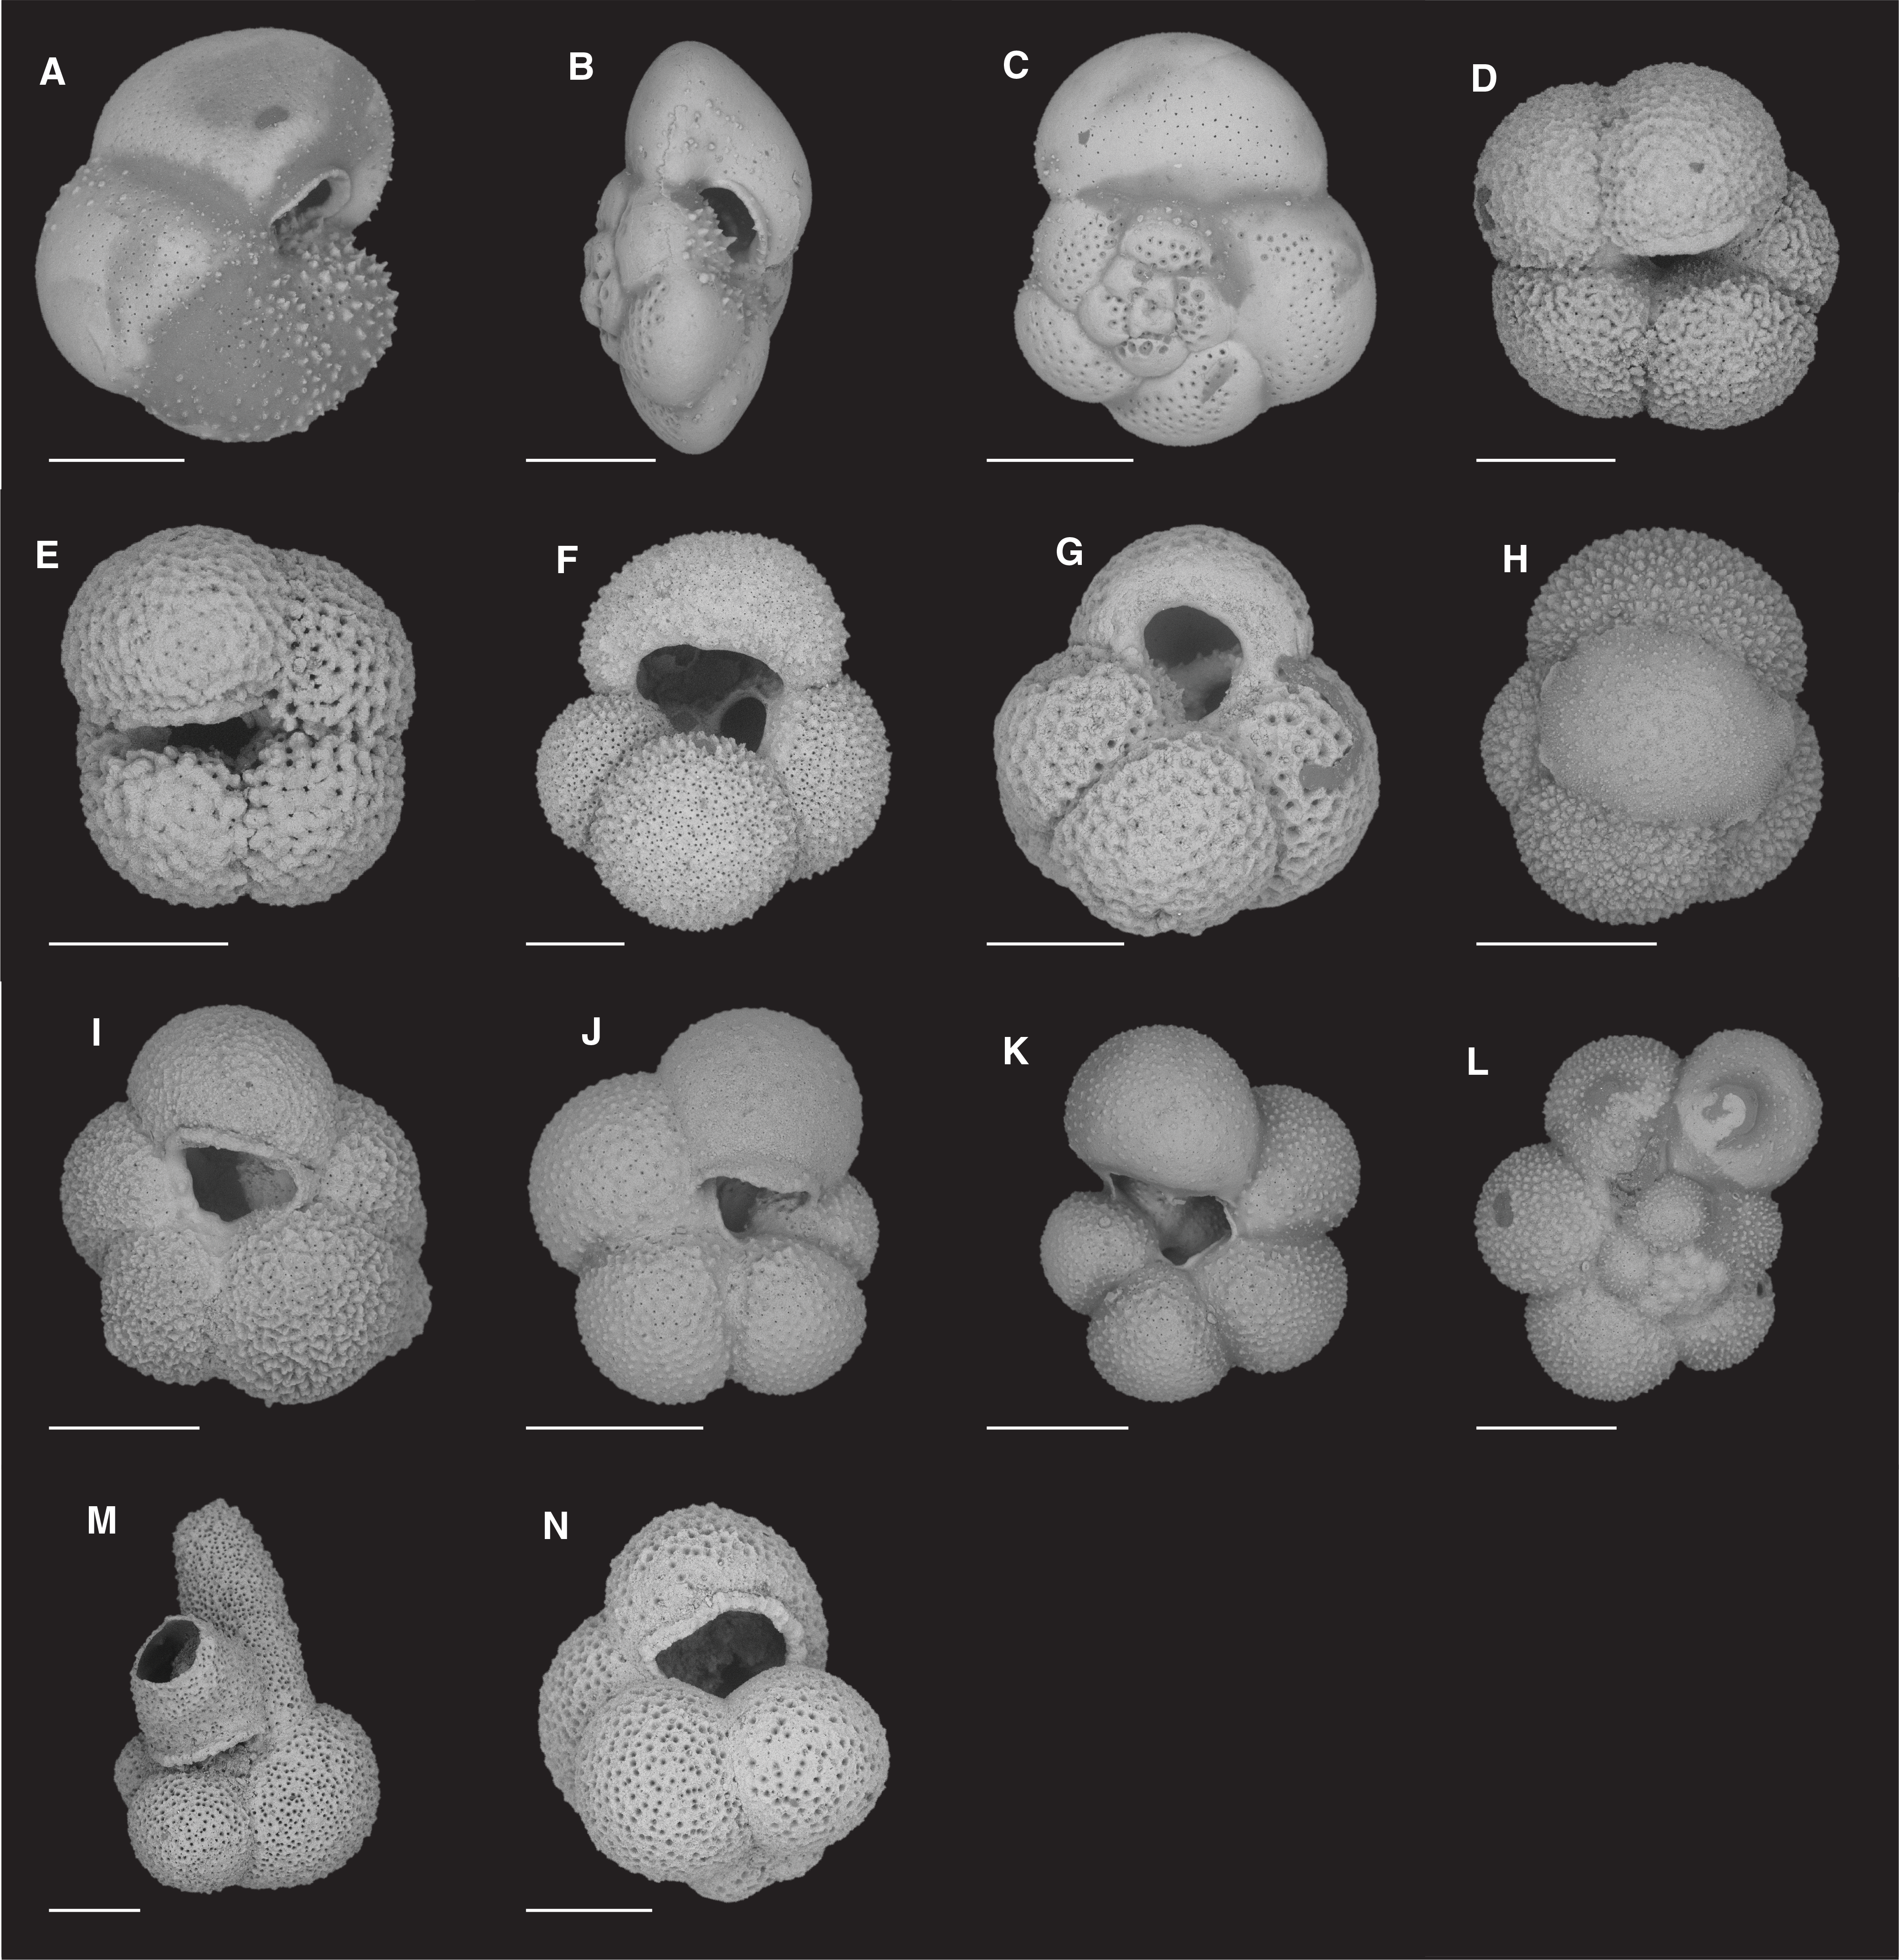
Figure F25. Planktonic foraminifers.
Several biomarker species are present in the Site U1543 planktonic foraminiferal assemblages: Globoconella calida, G. inflata, G. puncticulata, G. puncticulata puncticuloides, G. sphericomiozea, G. woodi, T. crassaformis, G. pliozea, and T. truncatulinoides. Because of infrequent occurrences of all marker species observed at this site, large uncertainties exist concerning the depth of the FOs and LOs. One specimen of G. calida was found in Sample 383-U1543A-2H-CC (14.65–14.71 m CSF-A), tentatively dating this sample to <0.22 Ma. T. truncatulinoides was found only in Sample 1H-CC (7.00–7.06 m CSF-A), which indicates Zone SN14 of Jenkins (1993). G. inflata was not observed in Samples 19H-CC through 36H-CC (178.73–339.54 m CSF-A), which may indicate that this interval is older than 3.13 Ma. G. puncticulata puncticuloides is discontinuously present in samples between Samples 5H-CC and 28H-CC (45.35–264.06 m CSF-A), indicating that ages in this interval range from ~0.7 to 5.72 Ma (Hornibrook, 1981; Hornibrook and Jenkins, 1994; Wei, 1994; Scott et al., 2007). G. puncticulata was observed in Samples 18H-CC through 21H-CC (168.18–197.58 m CSF-A). G. conomiozea and G. pliozea were only observed in Sample 30H-CC (283.04–283.10 m CSF-A), which suggests that the age of this sample is ~5.72 Ma. G. sphericomiozea is only present in Sample 27H-CC (254.62–254.68), which indicates an age older than 4.37 Ma. G. woodi was observed in Samples 18H-CC (168.18–168.23 m CSF-A), 20H-CC (188.12–188.18 m CSF-A), and 21H-CC (197.52–197.58 m CSF-A), indicating that these samples are older than 2.3 Ma. T. crassaformis is present in the majority of core catchers between Samples 1H-CC and 21H-CC (7.00–197.58 m CSF-A), suggesting that this entire interval is younger than 4.5 Ma.
Benthic foraminifers
Benthic foraminifers were examined in core catcher samples from Hole U1543A (36 samples) and U1543B (2 samples). Samples with an average volume of ~20 cm3 were processed from all core catchers to obtain quantitative estimates of benthic foraminiferal distribution patterns downhole. The mudline samples recovered from Holes U1543A and U1543B were also examined, although systematic assemblage data were not collected. To assess assemblage composition and variability, ~100 specimens from the >125 µm fraction were picked and transferred to slides for identification and counting. The presence and distribution of benthic foraminifers was additionally checked in the 125–63 µm fraction to ensure that assemblages in the >125 µm fraction are representative and that small species such as phytodetritus feeders or small infaunal taxa were not overlooked.
The benthic foraminifer abundance at this site is variable, ranging from common (3 samples) to barren (21 samples); preservation is moderate in most samples where benthic foraminifers are found (Figure F21; Table T9). In samples where specimens are rare, the assemblage is dominated by agglutinated species like Martinottiella communis. Most samples have a significant proportion of clay and silt fractions. Hence, the residue after washing over 63 µm sieves was small.
In total, 60 benthic foraminiferal taxa were identified at this site. Table T9 summarizes the downcore distribution of benthic foraminifers in core catcher samples from Holes U1543A and U1543B. The characteristic taxa found at this site were also found at central South Pacific Sites U1539–U1541 and Chilean margin Site U1542.
The overall assemblage composition indicates lower bathyal to abyssal paleodepths throughout the sequence and a fluctuating carbonate compensation depth. Species commonly recorded throughout the sequence include the calcareous species Cibicides/Cibicidoides spp., Epistominella exigua, Globocassidulina subglobosa, Melonis barleeanum, Nuttallides umbonifera, Oridorsalis umbonatus, and Uvigerina hispida and the agglutinated species M. communis. Cibicides/Cibicidoides spp. were found in all samples that are not barren except Sample 383-U1543A-12H-CC (111.72–111.78 m CSF-A). O. umbonatus is also abundant in all samples where benthic foraminifers are found except Samples 7H-CC (64.48–64.54 m CSF-A) and 27H-CC (254.62–254.68 m CSF-A). Downhole changes in assemblage composition at Site U1543 may be linked to environmental change such as glacial–interglacial phases. The overall benthic foraminifer assemblages in Samples 1H-CC (7.00–7.06 m CSF-A), 2H-CC (14.65–14.71 m CSF-A), 5H-CC (45.35–45.41 m CSF-A), 18H-CC (168.18–168.24 m CSF-A), 21H-CC (197.52–197.58 m CSF-A), and 35H-CC (330.57–330.63 m CSF-A) suggest warm conditions. Fish teeth are very common in all samples below Sample 21H-CC (197.52–197.58 m CSF-A) and sporadic in samples above that depth.
Ostracods
All 36 core catcher samples from Hole U1543A were analyzed for ostracods. Sample volume averaged ~20 cm3, and all ostracods present were picked and counted from the >125 µm fraction to obtain quantitative estimates of their temporal distribution. Ostracods were observed in only six samples below 110 m CSF-A in very low abundance (<5 valves per sample) (Figure F21). The taxa consist of Henryhowella, Krithe, Polycope, and Pseudobosquetina. Table T10 shows their distribution in Hole U1543A.
Paleomagnetism
The natural remanent magnetization (NRM) of archive-half core sections from Site U1543 was measured and then remeasured after alternating field (AF) demagnetization at 2 cm increments. In general, the number of demagnetization steps was selected based on the following factors: the desire for more steps to study the magnetization(s), the severity of the drill string and natural overprints that hopefully can be removed to recover the natural remanence, the desire to use low peak fields to preserve the magnetization for future shore-based studies, and the need to maintain core flow through the laboratory. For Hole U1543A, three (5, 10, and 15 mT) AF demagnetization steps were performed for the upper 35 m (through Core 383-U1543A-4H) to examine the drill string overprint and our ability to remove it. To keep up with core flow, the 5 mT step was removed and only the 10 and 15 mT steps were used for the rest of Hole U1543A. Based on these results and to further speed up core processing, a single 15 mT peak AF demagnetization step was employed for Hole U1543B. Data associated with intervals affected by obvious drilling deformation or measurement error were culled prior to uploading or during data processing.
The intensities before and after demagnetization for the upper 140 m of core recovered from Hole U1543A (Figure F26) are generally quite strong, varying around the 10–1 to 10–2 A/m range. A few discrete intervals have values as low as 10–4 A/m and are generally associated with MS lows. Between 140 and 240 m CSF-A, intensities are slightly lower on average, falling in the 10−2 A/m and below range. Below 240 m CSF-A, intensities are more variable and values in the 10–3 to 10–4 A/m range are much more common. Compared with previous sites, there is little difference in intensity before and after demagnetization at a peak AF of 15 mT, suggesting a finer magnetic mineralogy with a higher coercivity that is less susceptible to the drill string overprint. This is consistent with the results of AF demagnetization to a peak AF of 80 mT on cube samples of both the NRM and anhysteretic remanent magnetization from both sites. Overall, the downhole intensity pattern generally follows physical properties such as MS, suggesting that NRM intensity is largely controlled by lithology.

Figure F26. NRM intensities.
Figure F27 shows inclination for Holes U1543A and U1543B before and after AF demagnetization at 15 mT. Inclinations capture a series of apparent polarity reversals, either directly observed or inferred from polarity changes between cores, that when observed in a section are generally well defined and reproduced many times. Their positions in each hole are summarized in Table T11, and Figure F28 shows their positions in Hole U1543A. All polarity boundaries from the Matuyama/Brunhes at 0.781 Ma though Chron C3Br.2r at 7.285 Ma, 31 polarity reversals in total, are either directly observed or closely constrained and correlated to the geomagnetic polarity timescale (GPTS) (Cande and Kent, 1995; Hilgen et al., 2012) (Table T11). Reversed and normal polarity associated with the base of Chron C3B and the upper part of Chron C4 (older than 7.432 Ma) are observed, but the boundaries are not constrained in the deepest cores in Hole U1543A. Shore-based studies will refine correlations to the GPTS and facilitate development of relative paleointensity as the next steps in magnetic stratigraphy at Site U1543.

Figure F27. Inclination before and after 15 mT peak alternating field demagnetization.
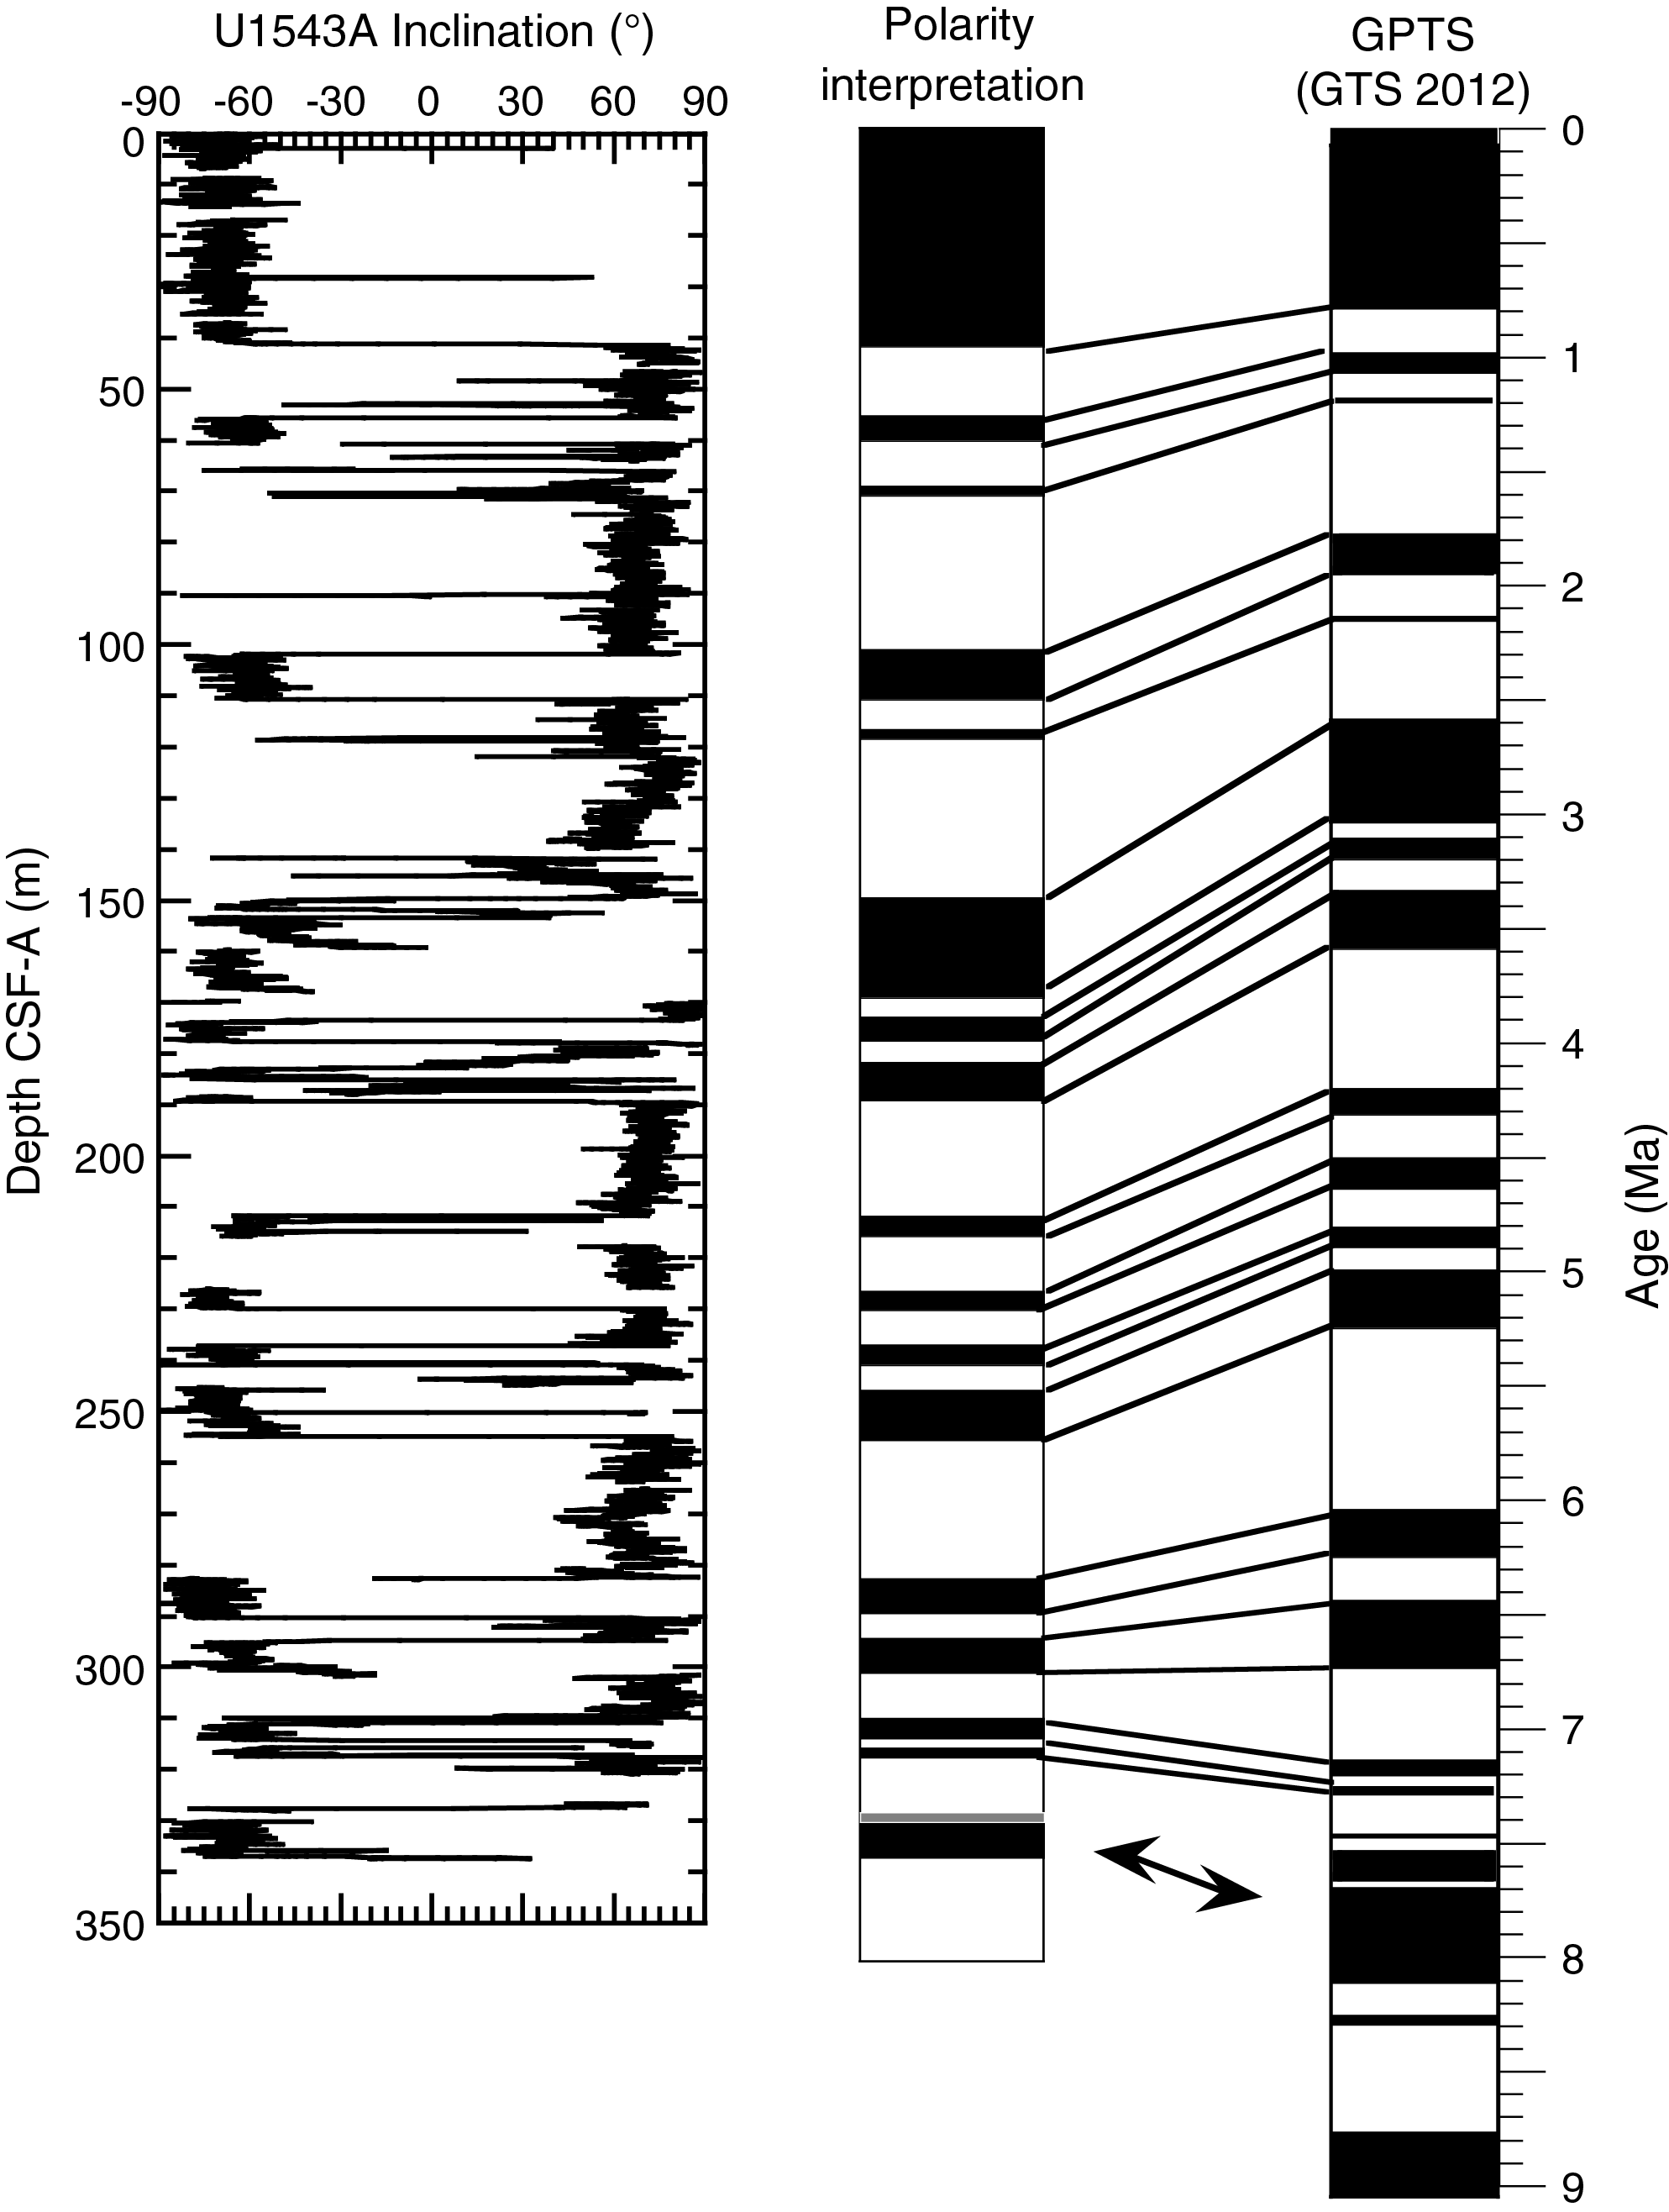
Figure F28. Inclination after 15 mT peak alternating field demagnetization.
Geochemistry
Sediment gas sampling
Routine safety hydrocarbon measurements were collected at Site U1543 in headspace gastight vials at a resolution of approximately one 5 cm3 sample per core from 5.99 to 337.63 m CSF-A for Hole U1543A (see Geochemistry in the Expedition 383 methods chapter [Winckler et al., 2021]). One sample from Core 383-U1543A-14H was spilled in the laboratory; therefore, a headspace measurement was not analyzed between 120.64 and 137.92 m CSF-A. Methane concentrations remain very low at this site, ranging from a minimum of 4 ppmv to a maximum of 17 ppmv (Figure F29; see U1543-T1.xls in GEOCHEM in Supplementary material). Propene occurs at a low concentration of 0.5 ppm at 280.67 m CSF-A, and concentrations of ethene, ethane, and propane remain below detection limit.
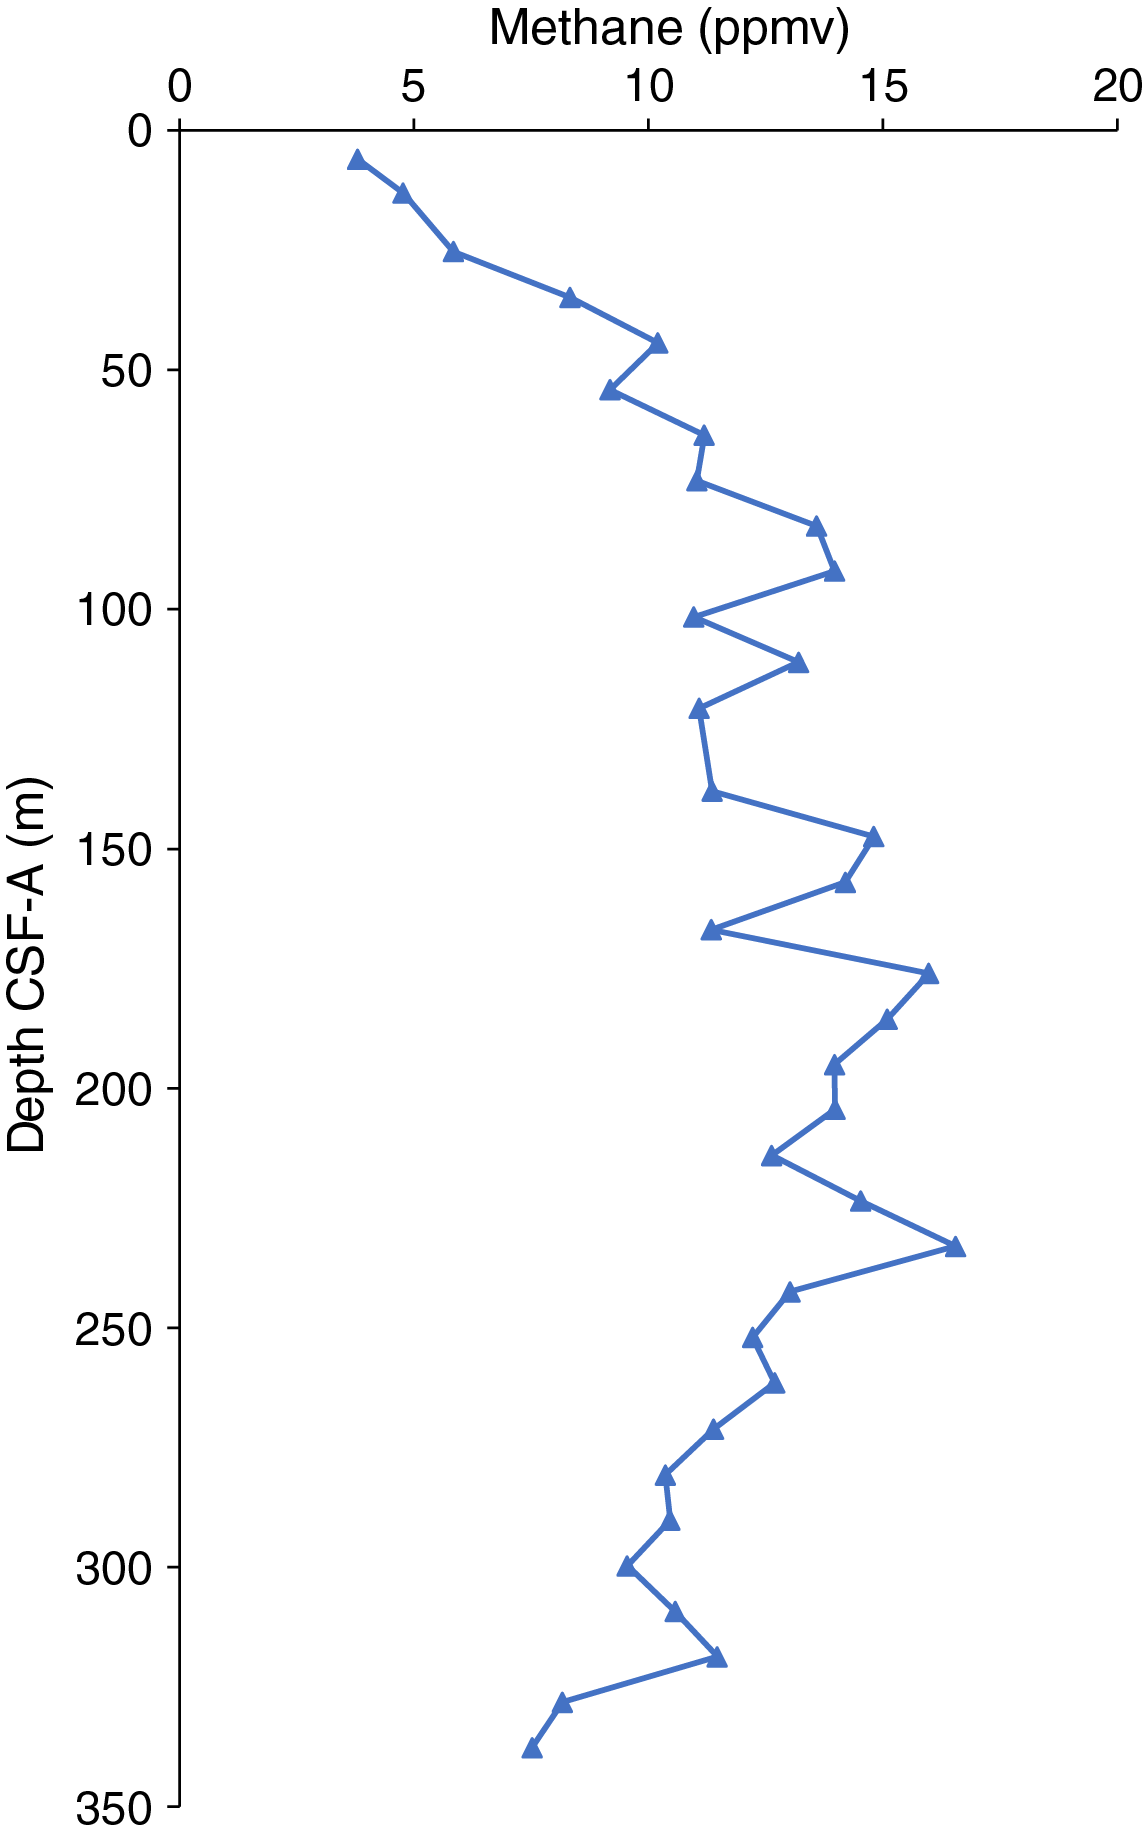
Figure F29. Headspace methane concentrations.
Interstitial water chemistry
At Site U1543, 67 whole rounds were collected for interstitial water samples from Hole U1543A at a resolution of one per section for the first two cores, three per core to 120 m CSF-A, two per core from 120 to 150 m CSF-A, and one per core from 150 m CSF-A to the bottom of the hole. A mudline sample collected from Hole U1543A was allowed to settle for several hours and subsequently filtered through a 0.45 µm syringe-tip filter. Filtered mudline water was subjected to all standard shipboard chemistry analyses. We squeezed whole rounds and subsampled for interstitial water according to the methods described in Geochemistry in the Expedition 383 methods chapter (Winckler et al., 2021).
Alkalinity and pH
Alkalinity increases from a mudline value of 2.2 mM to a maximum of 9.8 mM at 95.54 m CSF-A (Figure F30; see U1543-T3.xls in GEOCHEM in Supplementary material). This increase is likely due to anaerobic organic matter mineralization, which produces bicarbonate (Soetaert et al., 2007). Below this peak to the bottom of the core, alkalinity decreases to 4.1 mM in the bottommost sample. The decrease in alkalinity could be caused by the reoxidation of sulfide and ammonia, possibly mediated by microbes, because these reactions cause a net decrease in both alkalinity and pH (Soetaert et al., 2007). pH values increase from 7.88 at the mudline to a maximum of 8.36 at 105.06 m CSF-A and then gradually decrease to 8.05 at the bottom of the core (Figure F30). Alkalinity trends are similar to pH trends because the former primarily controls the latter.
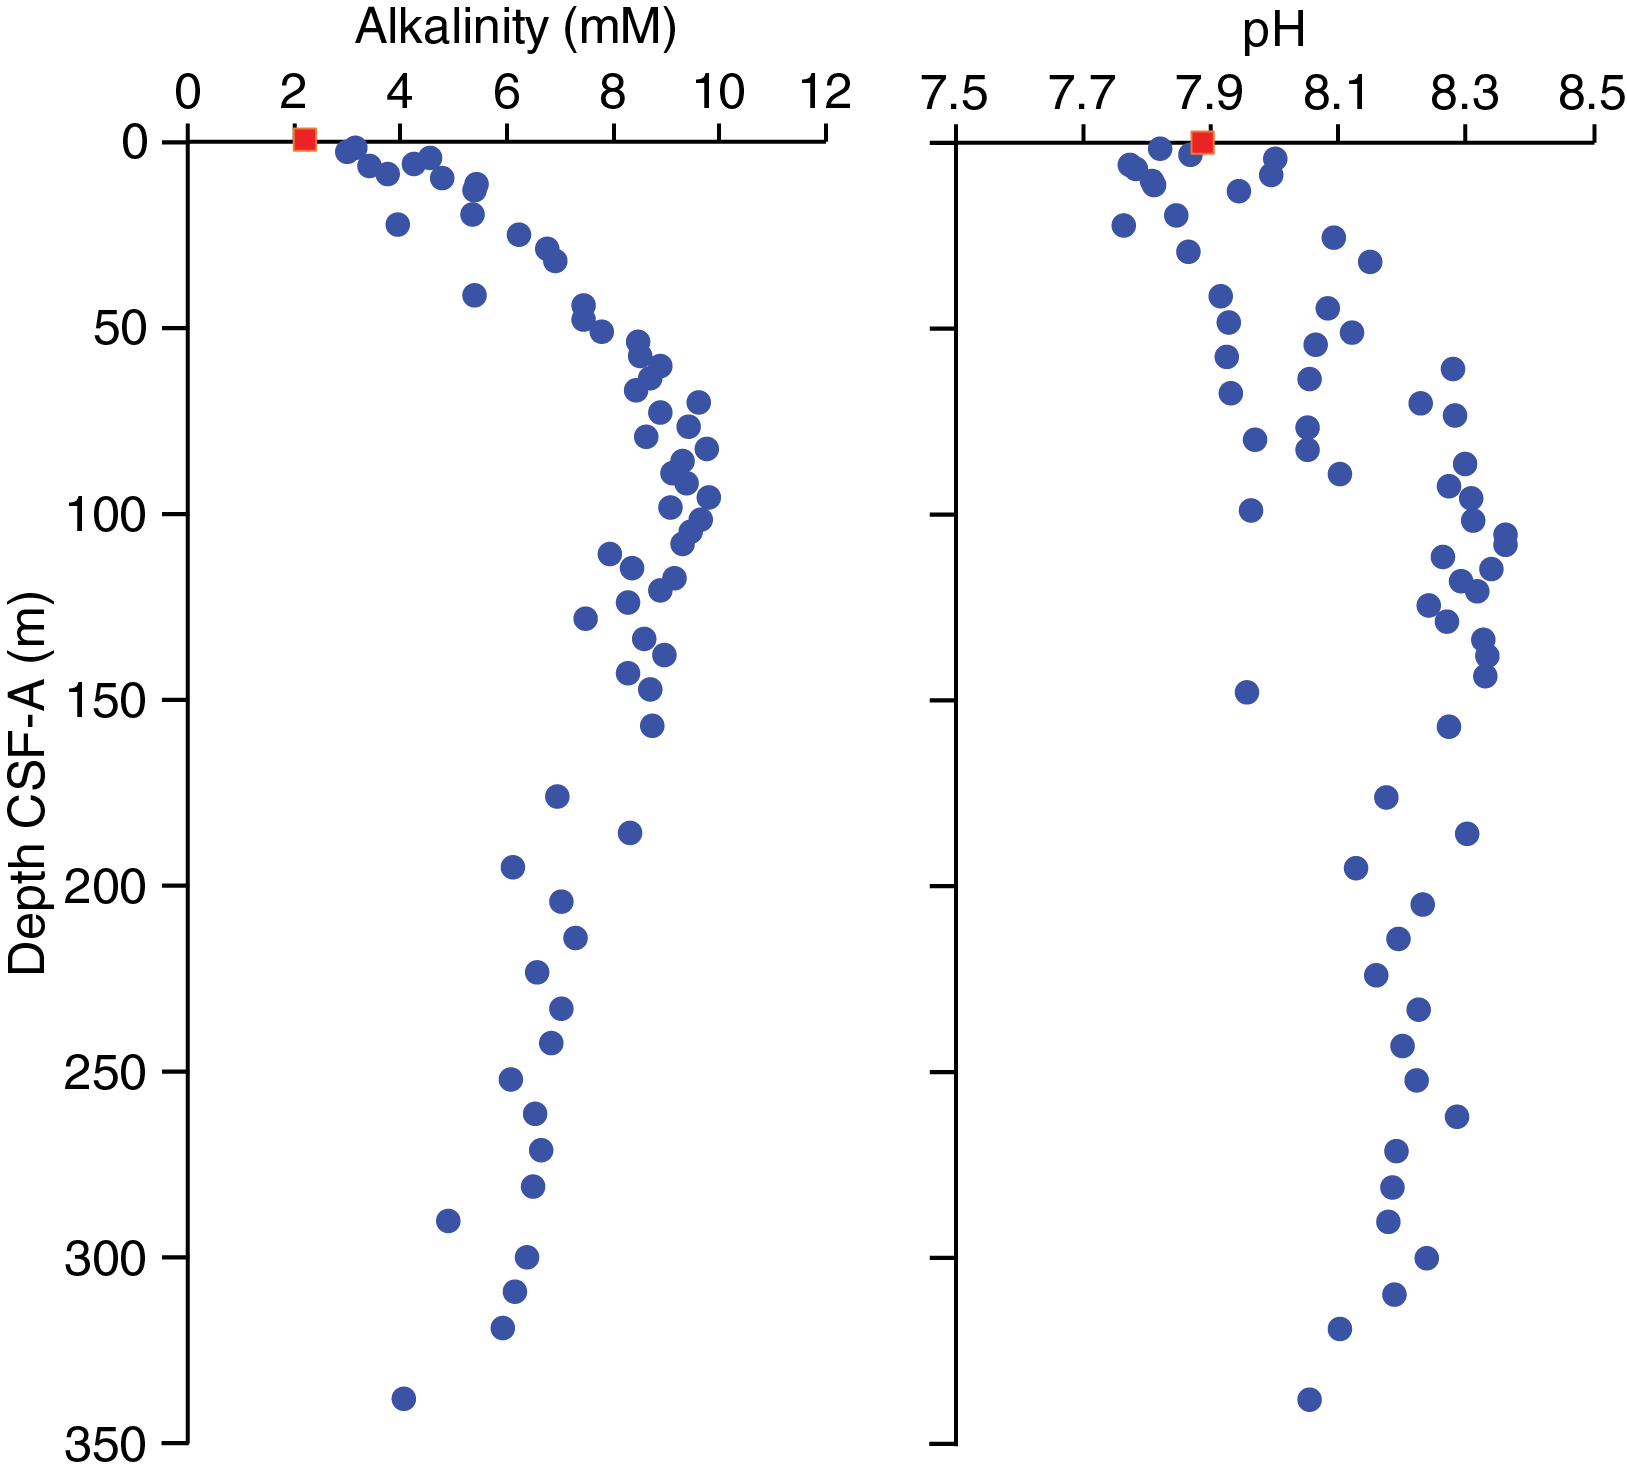
Figure F30. Interstitial water alkalinity and pH.
Salinity, chlorinity, and sodium
Salinity for all interstitial water samples is constant at 35 throughout the core. Chlorinity concentrations increase from the mudline value of 552 to 562 mM at 41.4 m CSF-A (Figure F31; see U1543-T2.xls in GEOCHEM in Supplementary material). Below this depth, chlorinity decreases to an average value of 555 ± 1 (±1σ) mM between ~150 and ~300 m CSF-A. Between 309.17 m CSF-A and the bottom of the core, chlorinity increases slightly to ~562 mM. Overall downhole sodium (Na) concentrations do not exhibit any specific trend but show some scatter around a mean value of ~476 ± 7 mM (Figure F31).

Figure F31. Interstitial water chloride and sodium.
Ammonium, phosphate, and sulfate
Ammonium (NH4+) concentrations increase from below detection limit in the mudline sample to a maximum of 860 µM at 110.99 m CSF-A (excluding a few samples that appear to be outliers) (Figure F32). Below this depth, NH4+ decreases in the interstitial water to 523 µM in the bottommost sample. The convex shape of the profile suggests the production of NH4+ in the upper sediment layers, likely through organic matter remineralization, and removal from the interstitial water in the deep sediment, possibly through anaerobic oxidation processes.
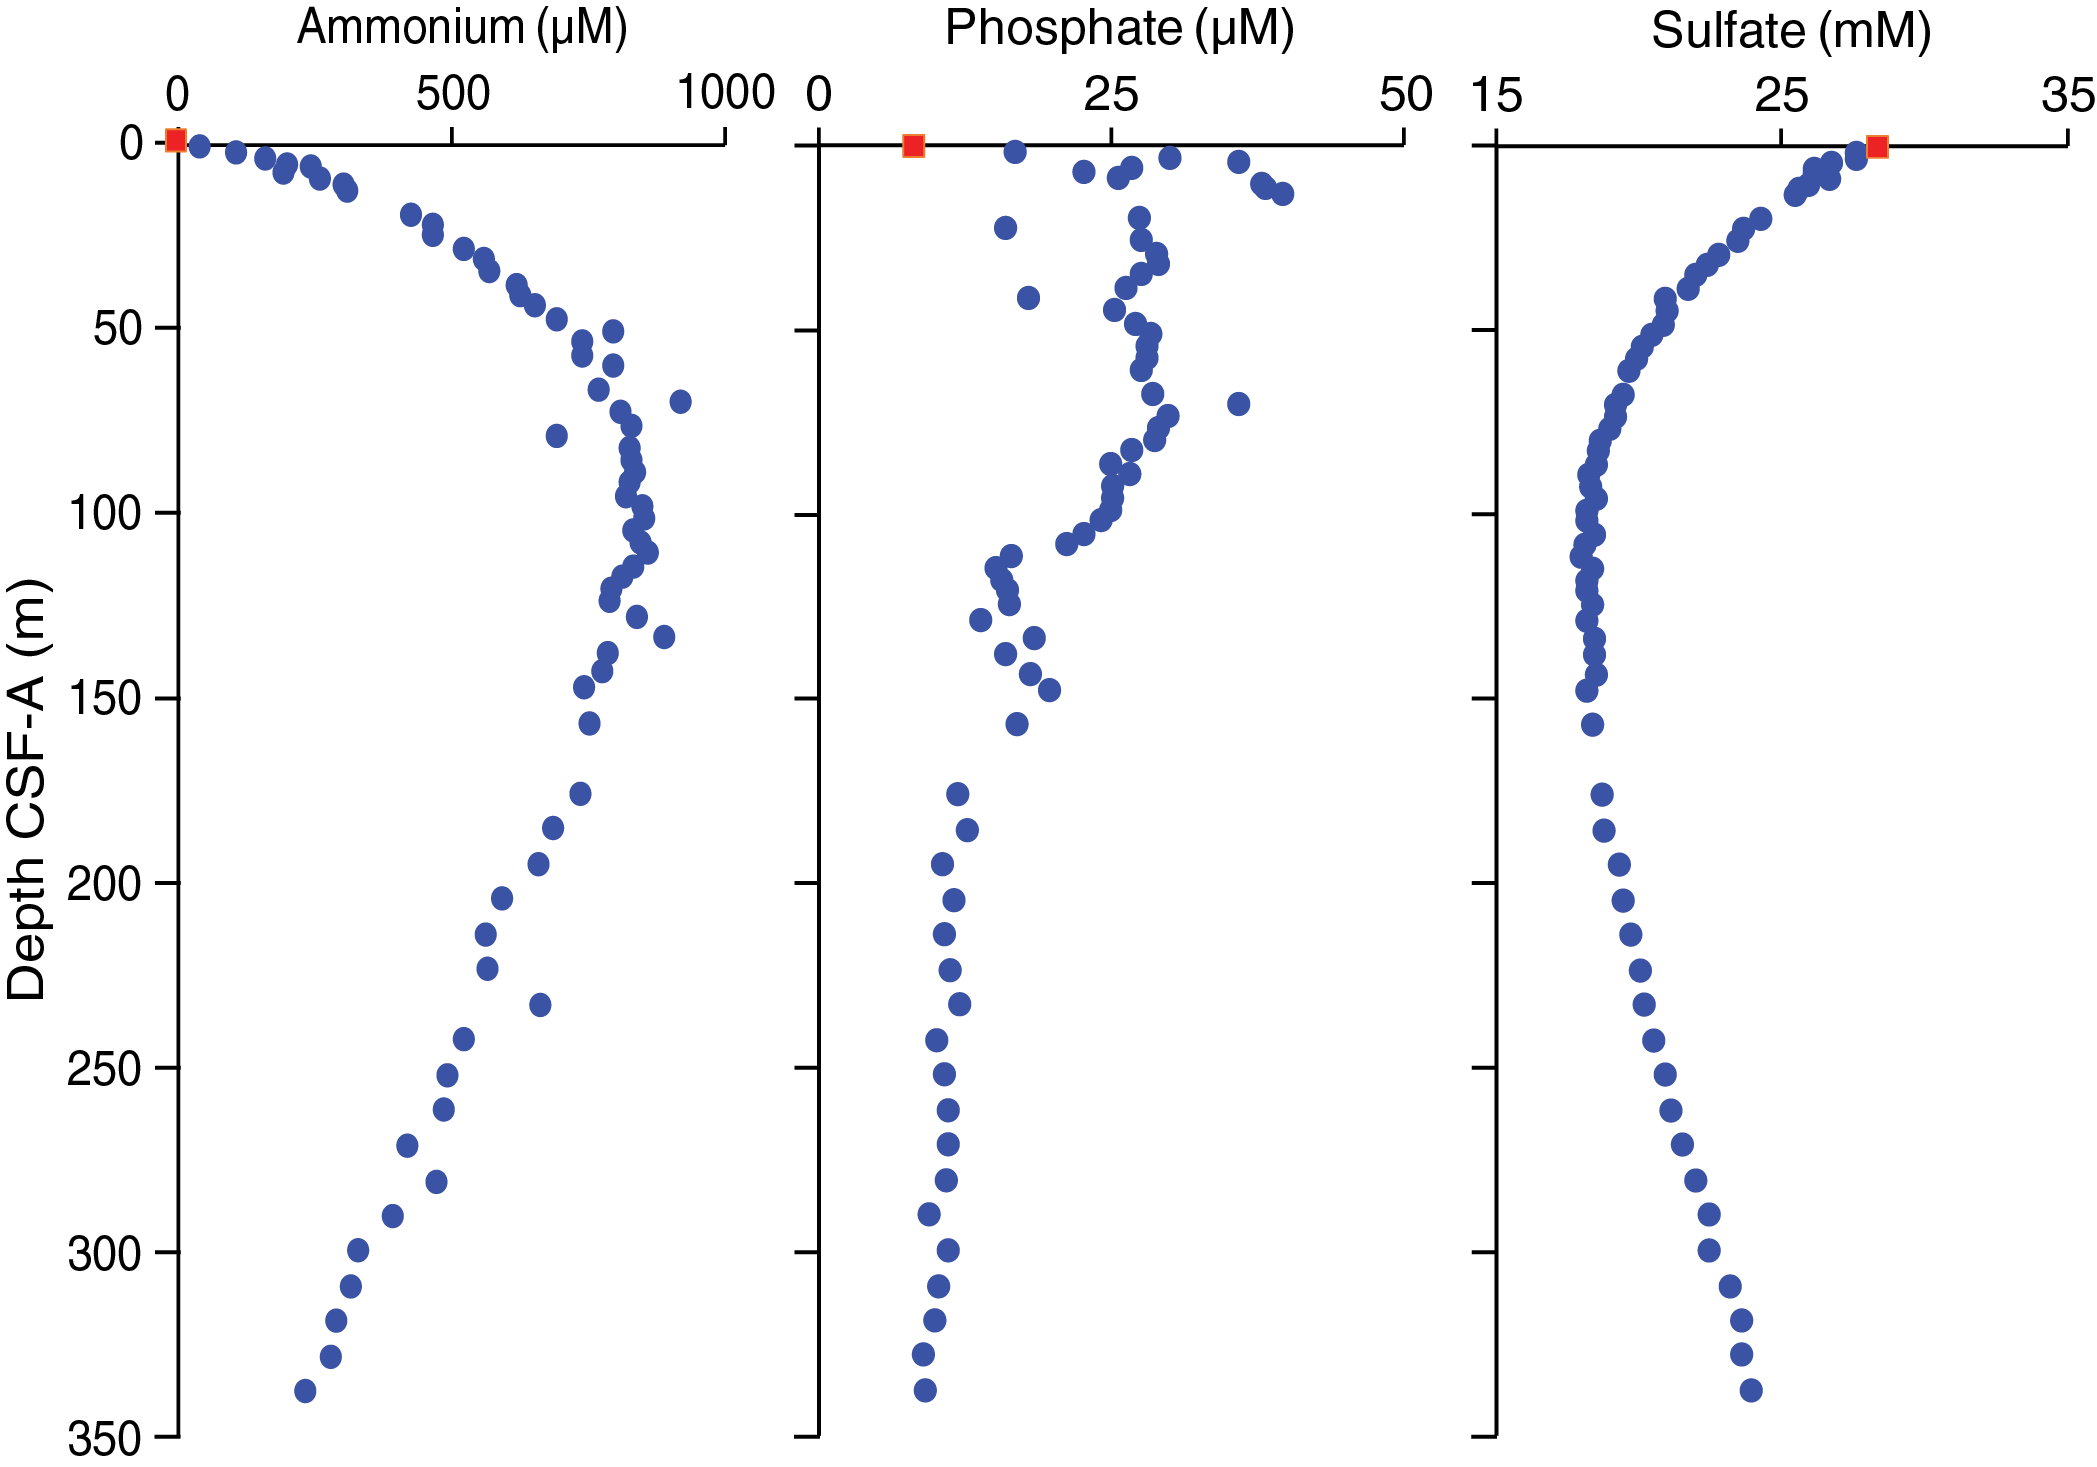
Figure F32. Interstitial water ammonium, phosphate, and sulfate.
Immediately below the sediment surface, phosphate (PO43–) concentrations increase from 8.3 µM at the surface to a maximum of 39.8 µM at 13.05 m CSF-A (Figure F32). This subsurface peak in PO43– might be related to organic matter degradation. Below this shallow peak, PO43– concentrations exhibit a generally decreasing trend. The bottom sample has a concentration of 10.1 µM.
Sulfate (SO42–) concentrations decrease from 28.4 mM at the mudline to a minimum of 17.9 mM at 110.99 m CSF-A (Figure F32). Below this depth, SO42– concentrations increase to 23.9 mM in the bottommost sample. This profile suggests removal of SO42– from the interstitial water, likely due to SO42– reduction down to ~100 m CSF-A, and a source of SO42– at depth, possibly related to sulfur oxidation or dissolution of SO42–-bearing minerals.
Calcium, strontium, and magnesium
Calcium (Ca) concentrations show a decreasing trend from ~10 mM at the mudline to 7.1 mM at 44.33 m CSF-A (Figure F33). Below this depth, Ca concentrations remain fairly constant to 156.89 m CSF-A with an average value of 7.3 ± 0.3 mM. A decrease in Ca below the surface could indicate precipitation of authigenic calcium carbonate (CaCO3) (supported by a decrease in interstitial water magnesium [Mg]). The remaining downhole Ca concentrations exhibit a gradually increasing trend. This increase in Ca concentrations with depth may reflect diffusive transport of Ca across a concentration gradient created by dissolution of CaCO3 near the bottom of the hole.
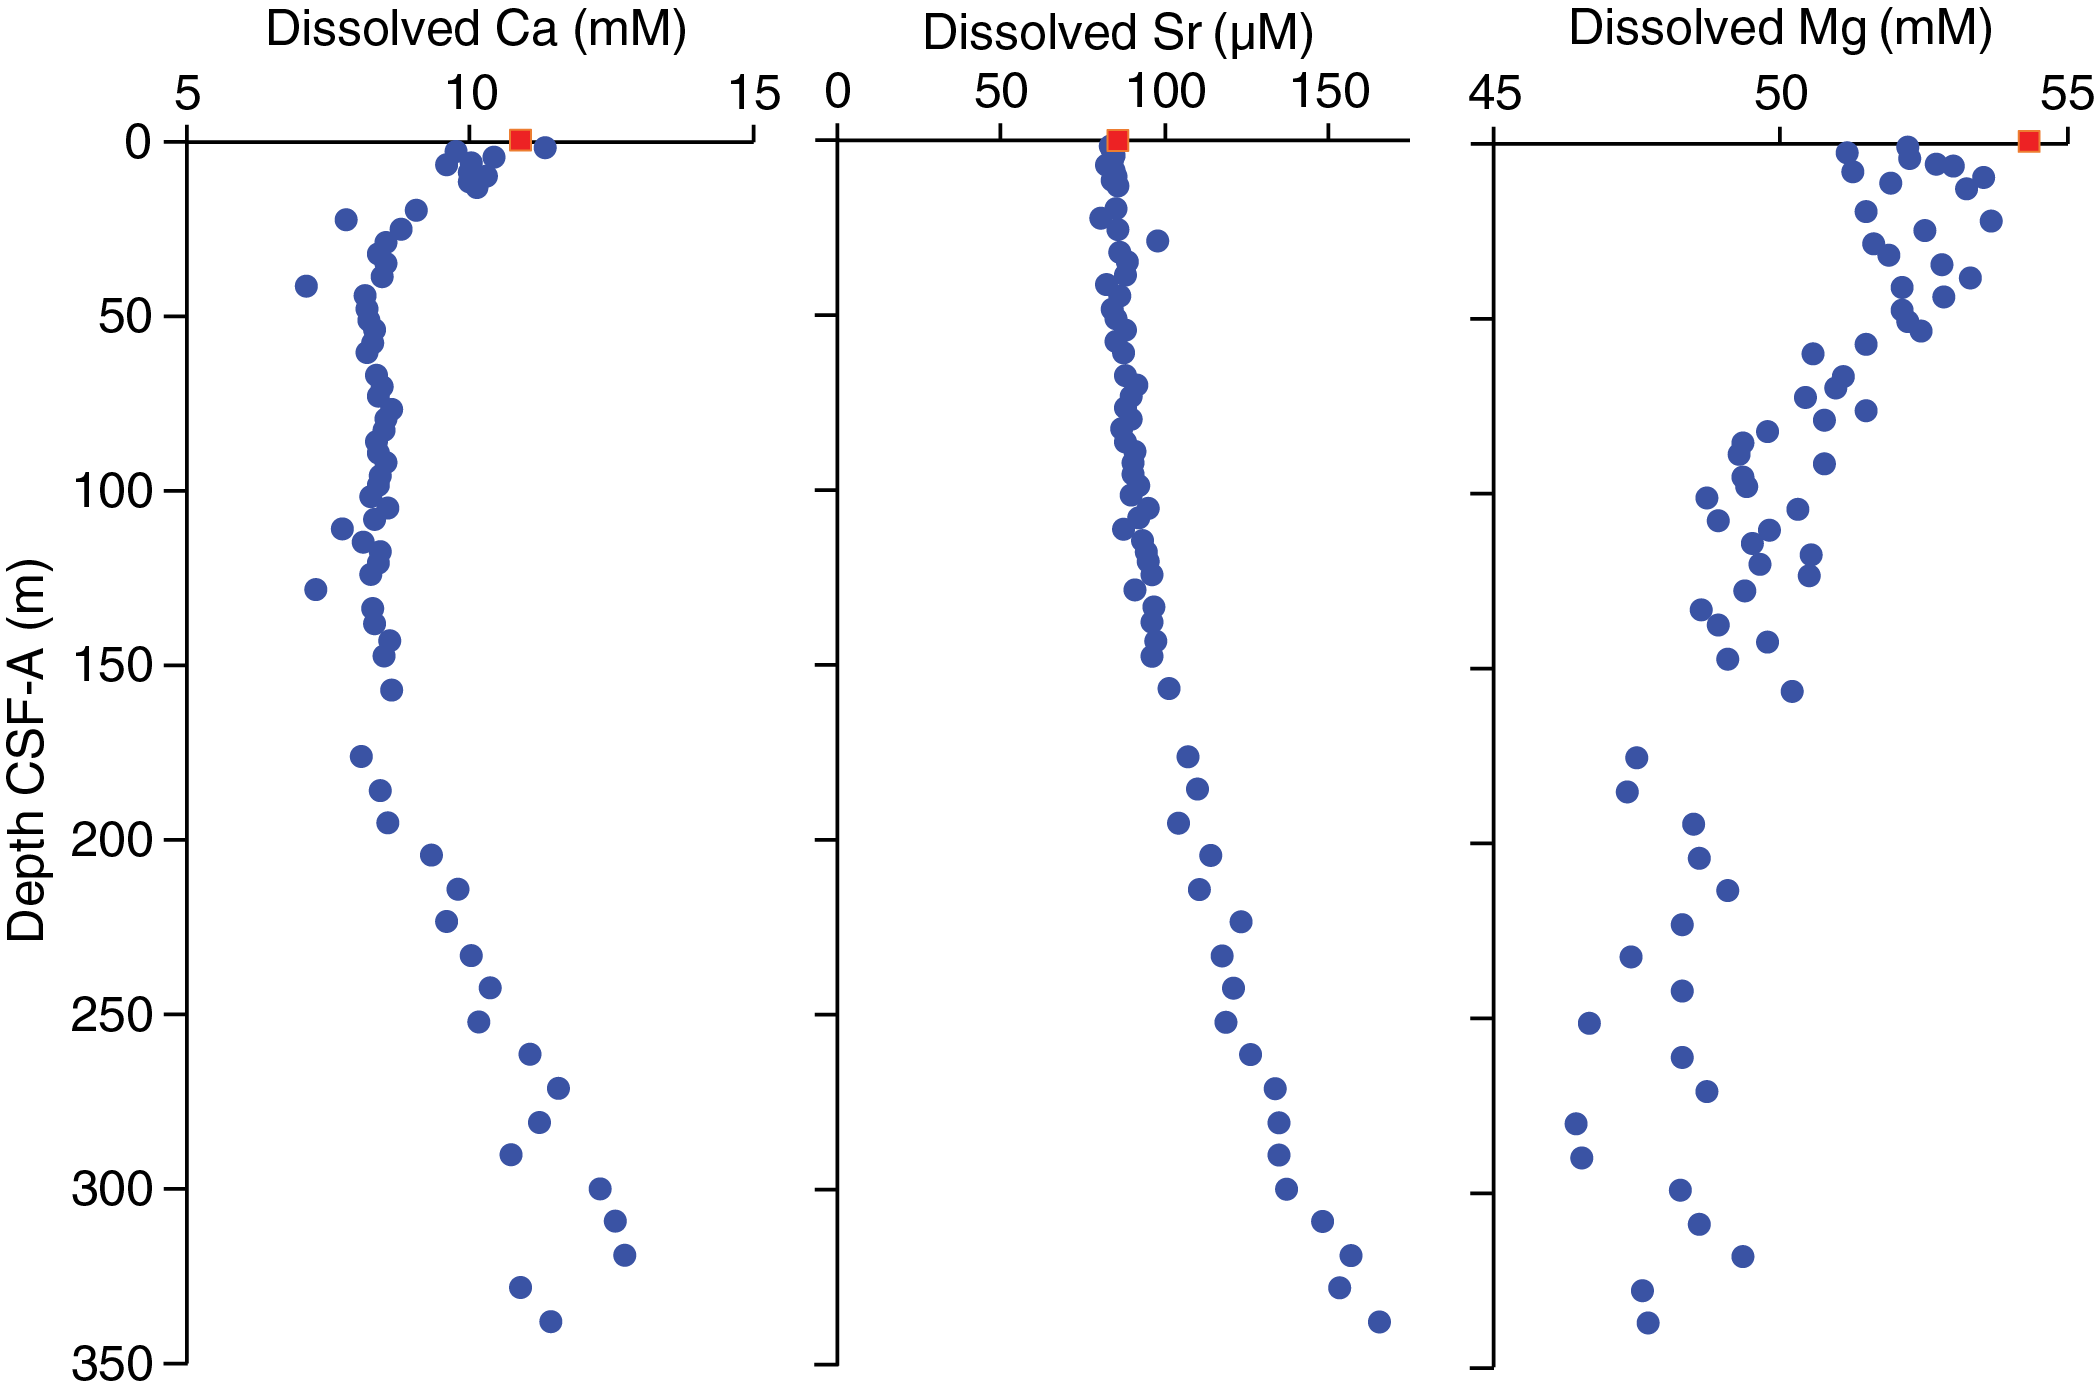
Figure F33. Interstitial water calcium, strontium, and magnesium.
Starting at the surface, strontium (Sr) concentrations remain roughly constant to ~142 m CSF-A with an average value of 88.5 ± 4.5 mM (Figure F33). From this depth to the bottom of the hole, Sr concentrations gradually increase, reaching 165.4 mM at 337.58 m CSF-A. Sr concentrations in the interstitial water generally follow dissolved Ca concentrations due to incorporation of Sr into CaCO3. Although this is true for the sediment intervals deeper than ~150 m CSF-A, the shallow part of the record indicates that interstitial water Sr and Ca are not controlled by the same processes (e.g., CaCO3 precipitation).
Throughout the hole, Mg concentrations show much scatter and a general decreasing trend toward lower values in the deeper part of the hole (Figure F33). In the uppermost ~152 m, the concentration gradient is higher than in the lower part of the hole. This change in concentration gradients with depth could be related to Mg-bearing CaCO3 precipitation and dissolution in the sediment column.
Iron, manganese, and lithium
Dissolved iron (Fe) concentrations show much scatter throughout the depth of the hole; however, the overall trends are well developed (Figure F34). A prominent peak is observed immediately below the surface before aqueous Fe is consistently removed to reach values below detection limit at 95.54 m CSF-A. Below this minimum, Fe concentrations increase to 9.9 µM at 194.95 m CSF-A before decreasing to below detection limit at 280.63 m CSF-A. Microorganisms use Fe as a terminal electron acceptor in organic matter remineralization. Thus, microbial dissimilatory Fe reduction can explain the subsurface peak in Fe. Subsequent removal of aqueous Fe below this peak is possibly due to Fe-sulfide precipitation.
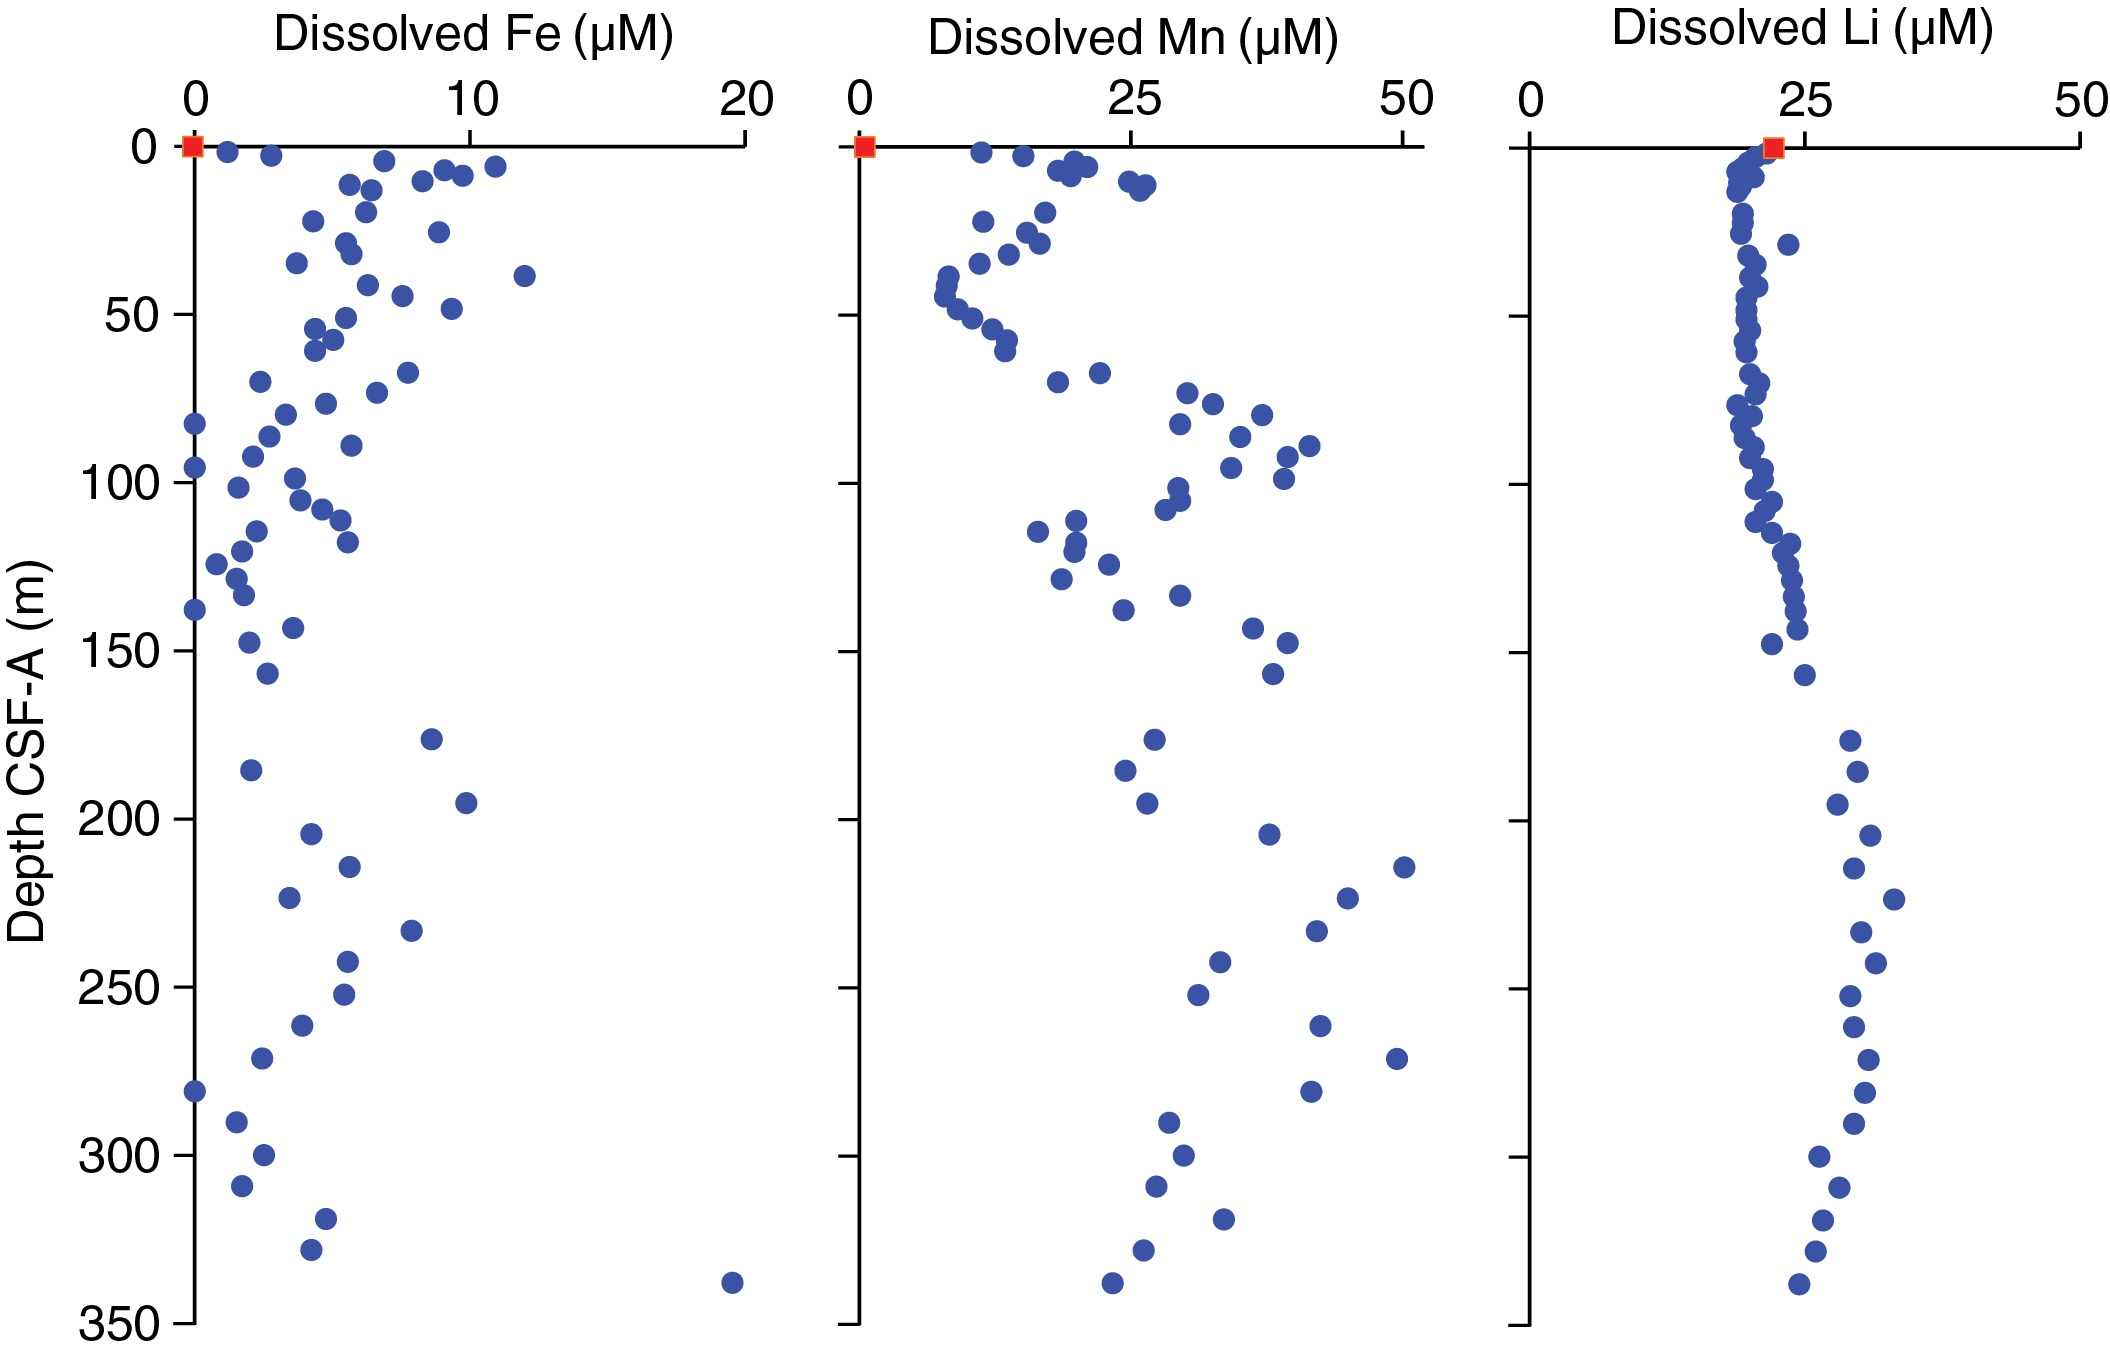
Figure F34. Interstitial water iron, manganese, and lithium.
Downhole manganese (Mn) concentrations show multiple maxima and minima. Prominent maxima occur immediately below the surface at ~89.06 and ~147.38 m CSF-A (Figure F34). Notable minima occur at ~41.4 and ~147.38 m CSF-A. Because Mn is also an important electron acceptor in organic matter remineralization, the subsurface peak observed in dissolved Mn can be attributed to organic carbon oxidation. Some of the reduced Mn is likely to diffuse downhole, where it might precipitate as Mn-carbonates. Deeper peaks in Mn concentrations may be related to variation in organic carbon content and/or the content and solubility of Mn-bearing minerals.
Dissolved lithium (Li) displays constant concentrations below the mudline (22.3 µM) to ~108 m CSF-A with an average value of 20.2 ± 1.0 µM (Figure F34). Below this depth, concentrations increase to 30.15 µM at ~232 m CSF-A before decreasing to the bottom of the hole to 24.6 µM at 337.58 m CSF-A.
Silicon, barium, potassium, and bromide
Silicon (Si) is low in the mudline water (141 µM) and exhibits a general increase to 761 µM at 38.47 m CSF-A (Figure F35). Below this depth, Si increases at a slower rate, reaching ~1000 µM in the bottommost sample. Data points that deviate from the overall trend (e.g., at 175.95 and 156.89 m CSF-A) may be outliers. Relatively high Si concentrations in interstitial water with respect to bottom water could be attributed to dissolution of silica from the solid phase.
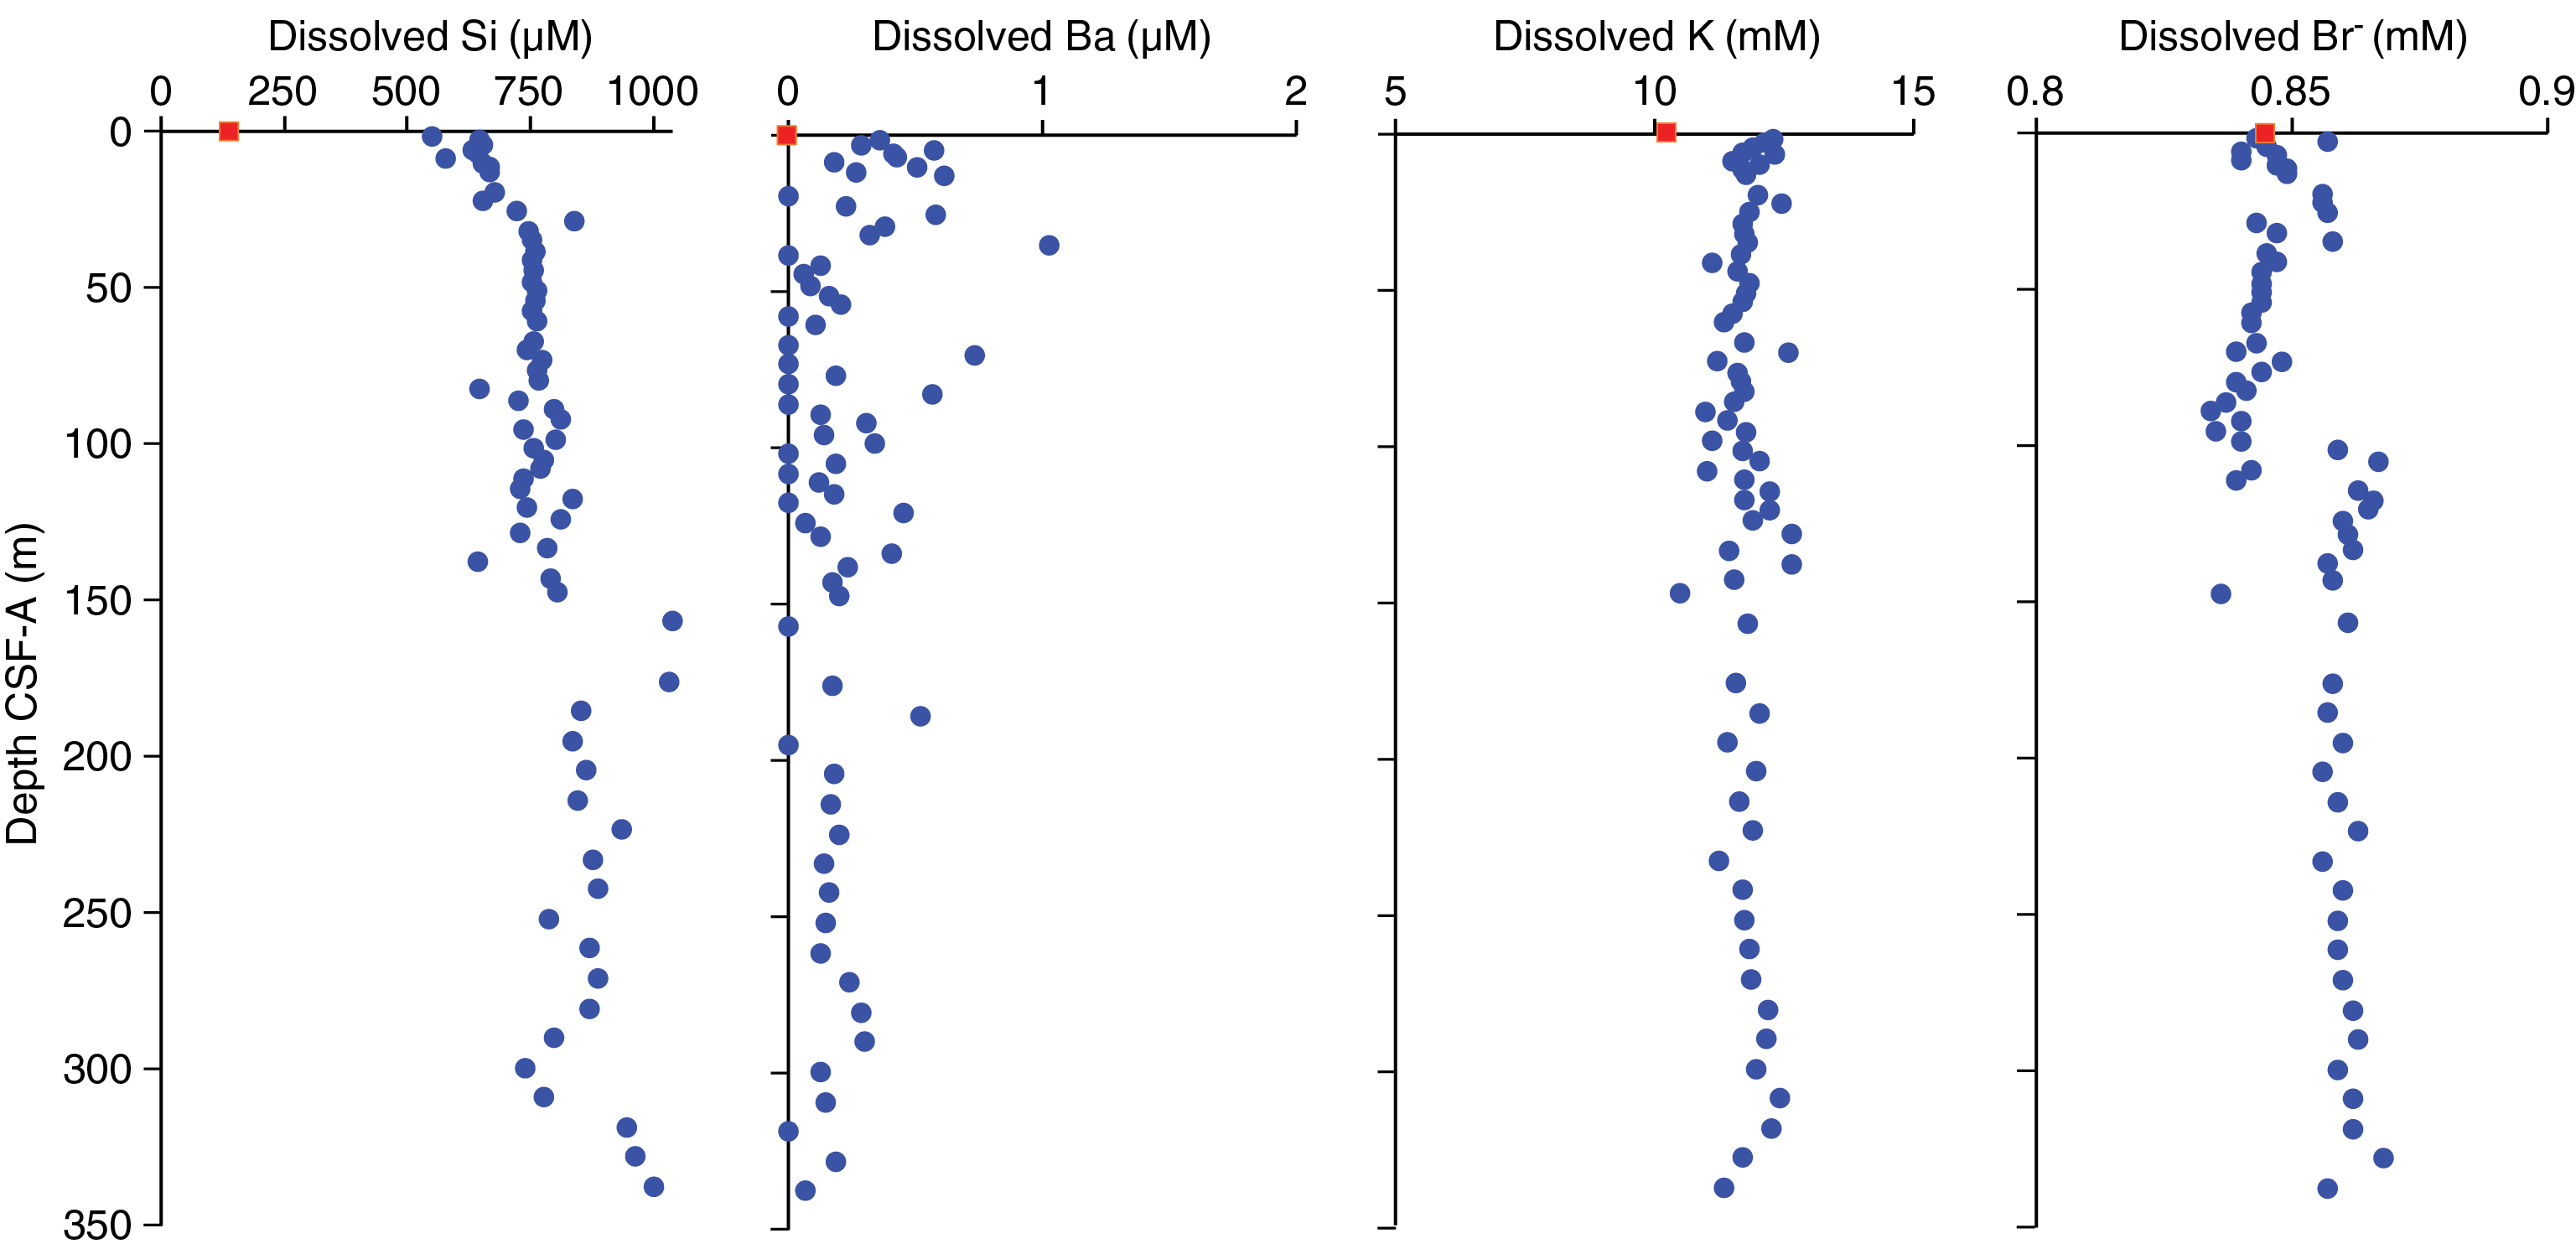
Figure F35. Interstitial water silicon, barium, potassium, and bromide.
Barium (Ba) concentrations are generally low throughout the core and have slightly higher values and greater variability above ~150 m CSF-A (Figure F35). The maximum concentration is 1.0 µM at 34.84 m CSF-A. The low aqueous Ba concentrations may be controlled by the precipitation of barite (BaSO4). Potassium (K) displays a vertical profile with constant concentrations averaging 11.8 ± 0.4 mM (Figure F35).
The profile of interstitial water bromide (Br–) displays a roughly vertical shape with a distinct break at ~115 m CSF-A; above this depth the average concentration is 0.85 ± 0.001 mM, and the average concentration below is 0.86 ± 0.006 mM (Figure F35). Because Br– is generally conservative in the sediment and primarily enters through diffusion across the sediment–water interface, the change in concentration at ~115 m CSF-A could be related to a change in sedimentation rate or sediment permeability.
Bulk sediment
Calcium carbonate
CaCO3 concentration measurements were obtained with a resolution of two samples per core for Hole U1543A with the exception of Cores 383-U1543A-1H, 12H–15H, and 27H, from which three samples were taken. Additionally, only one sample was taken from Core 35H. Mean CaCO3 content at this site is low (9.7 wt%); however, the record is highly variable, with several peaks fluctuating between a minimum of 0.1 wt% and a maximum of 86.8 wt% (Figure F36; see U1543-T4.xls in GEOCHEM in Supplementary material). A linear correlation between CaCO3 concentrations and RGB blue and color reflectance L* data is observed at this site for samples above 1 wt% (see Sedimentology).
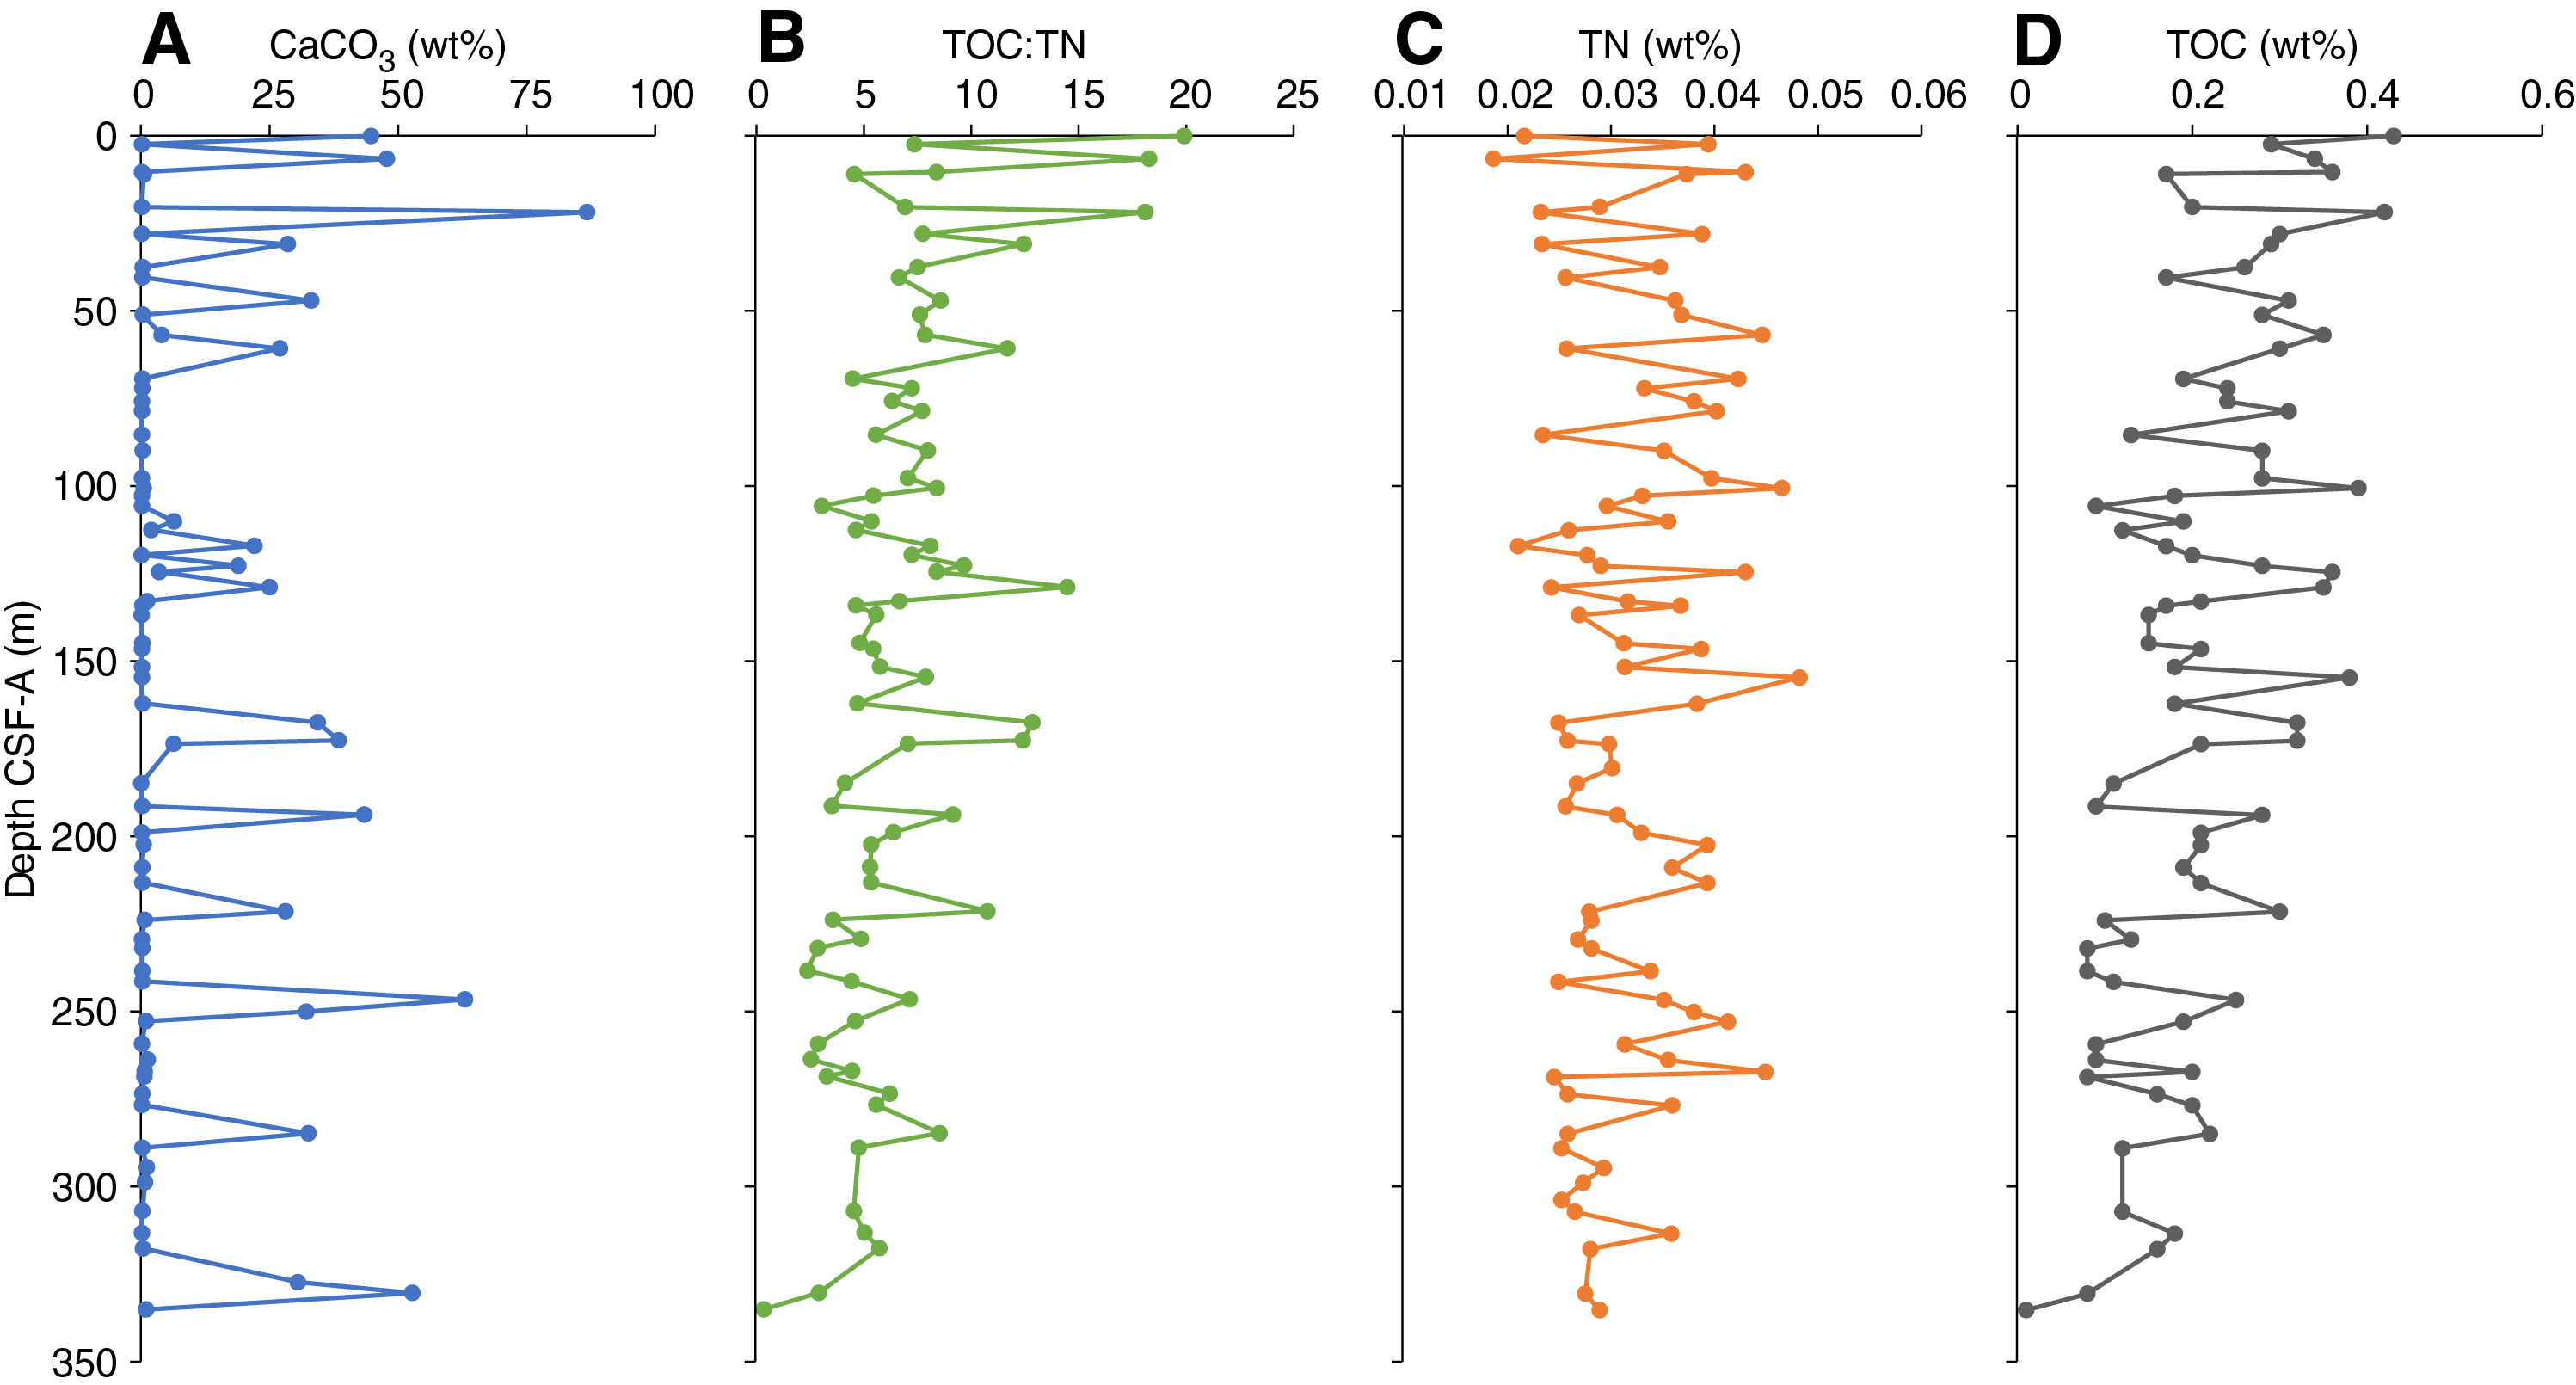
Figure F36. CaCO3, TOC:TN, TN, and TOC.
Major and trace elements
A total of 37 samples taken for CaCO3 analyses from Hole U1543A were also analyzed for major and minor element concentrations using inductively coupled plasma–atomic emission spectroscopy (ICP-AES). Elemental oxides (namely MgO, K2O, Fe2O3, and TiO2) show a strong positive correlation with a near zero intercept when plotted against aluminum oxides (Al2O3) (Figure F37; see U1543-T5.xls in GEOCHEM in Supplementary material). This correlation could indicate the presence of micaceous/clay minerals. Other oxides such as SiO2 do not exhibit any well-defined pattern when plotted against Al2O3 (Figure F37), possibly because of dilution of lithogenic material by siliceous biogenic material (the presence of clay-bearing to clayey diatom ooze has been reported at this site). Plots of Al2O3 versus MnO, CaO, and P2O5 do not show any well-defined relation. Manganese is a redox sensitive element and is also removed as CaCO3 minerals precipitate (Calvert and Pedersen, 1994). Precipitation and dissolution of Mn CaCO3 might explain the lack of correlation between MnO, CaO, and Al2O3.
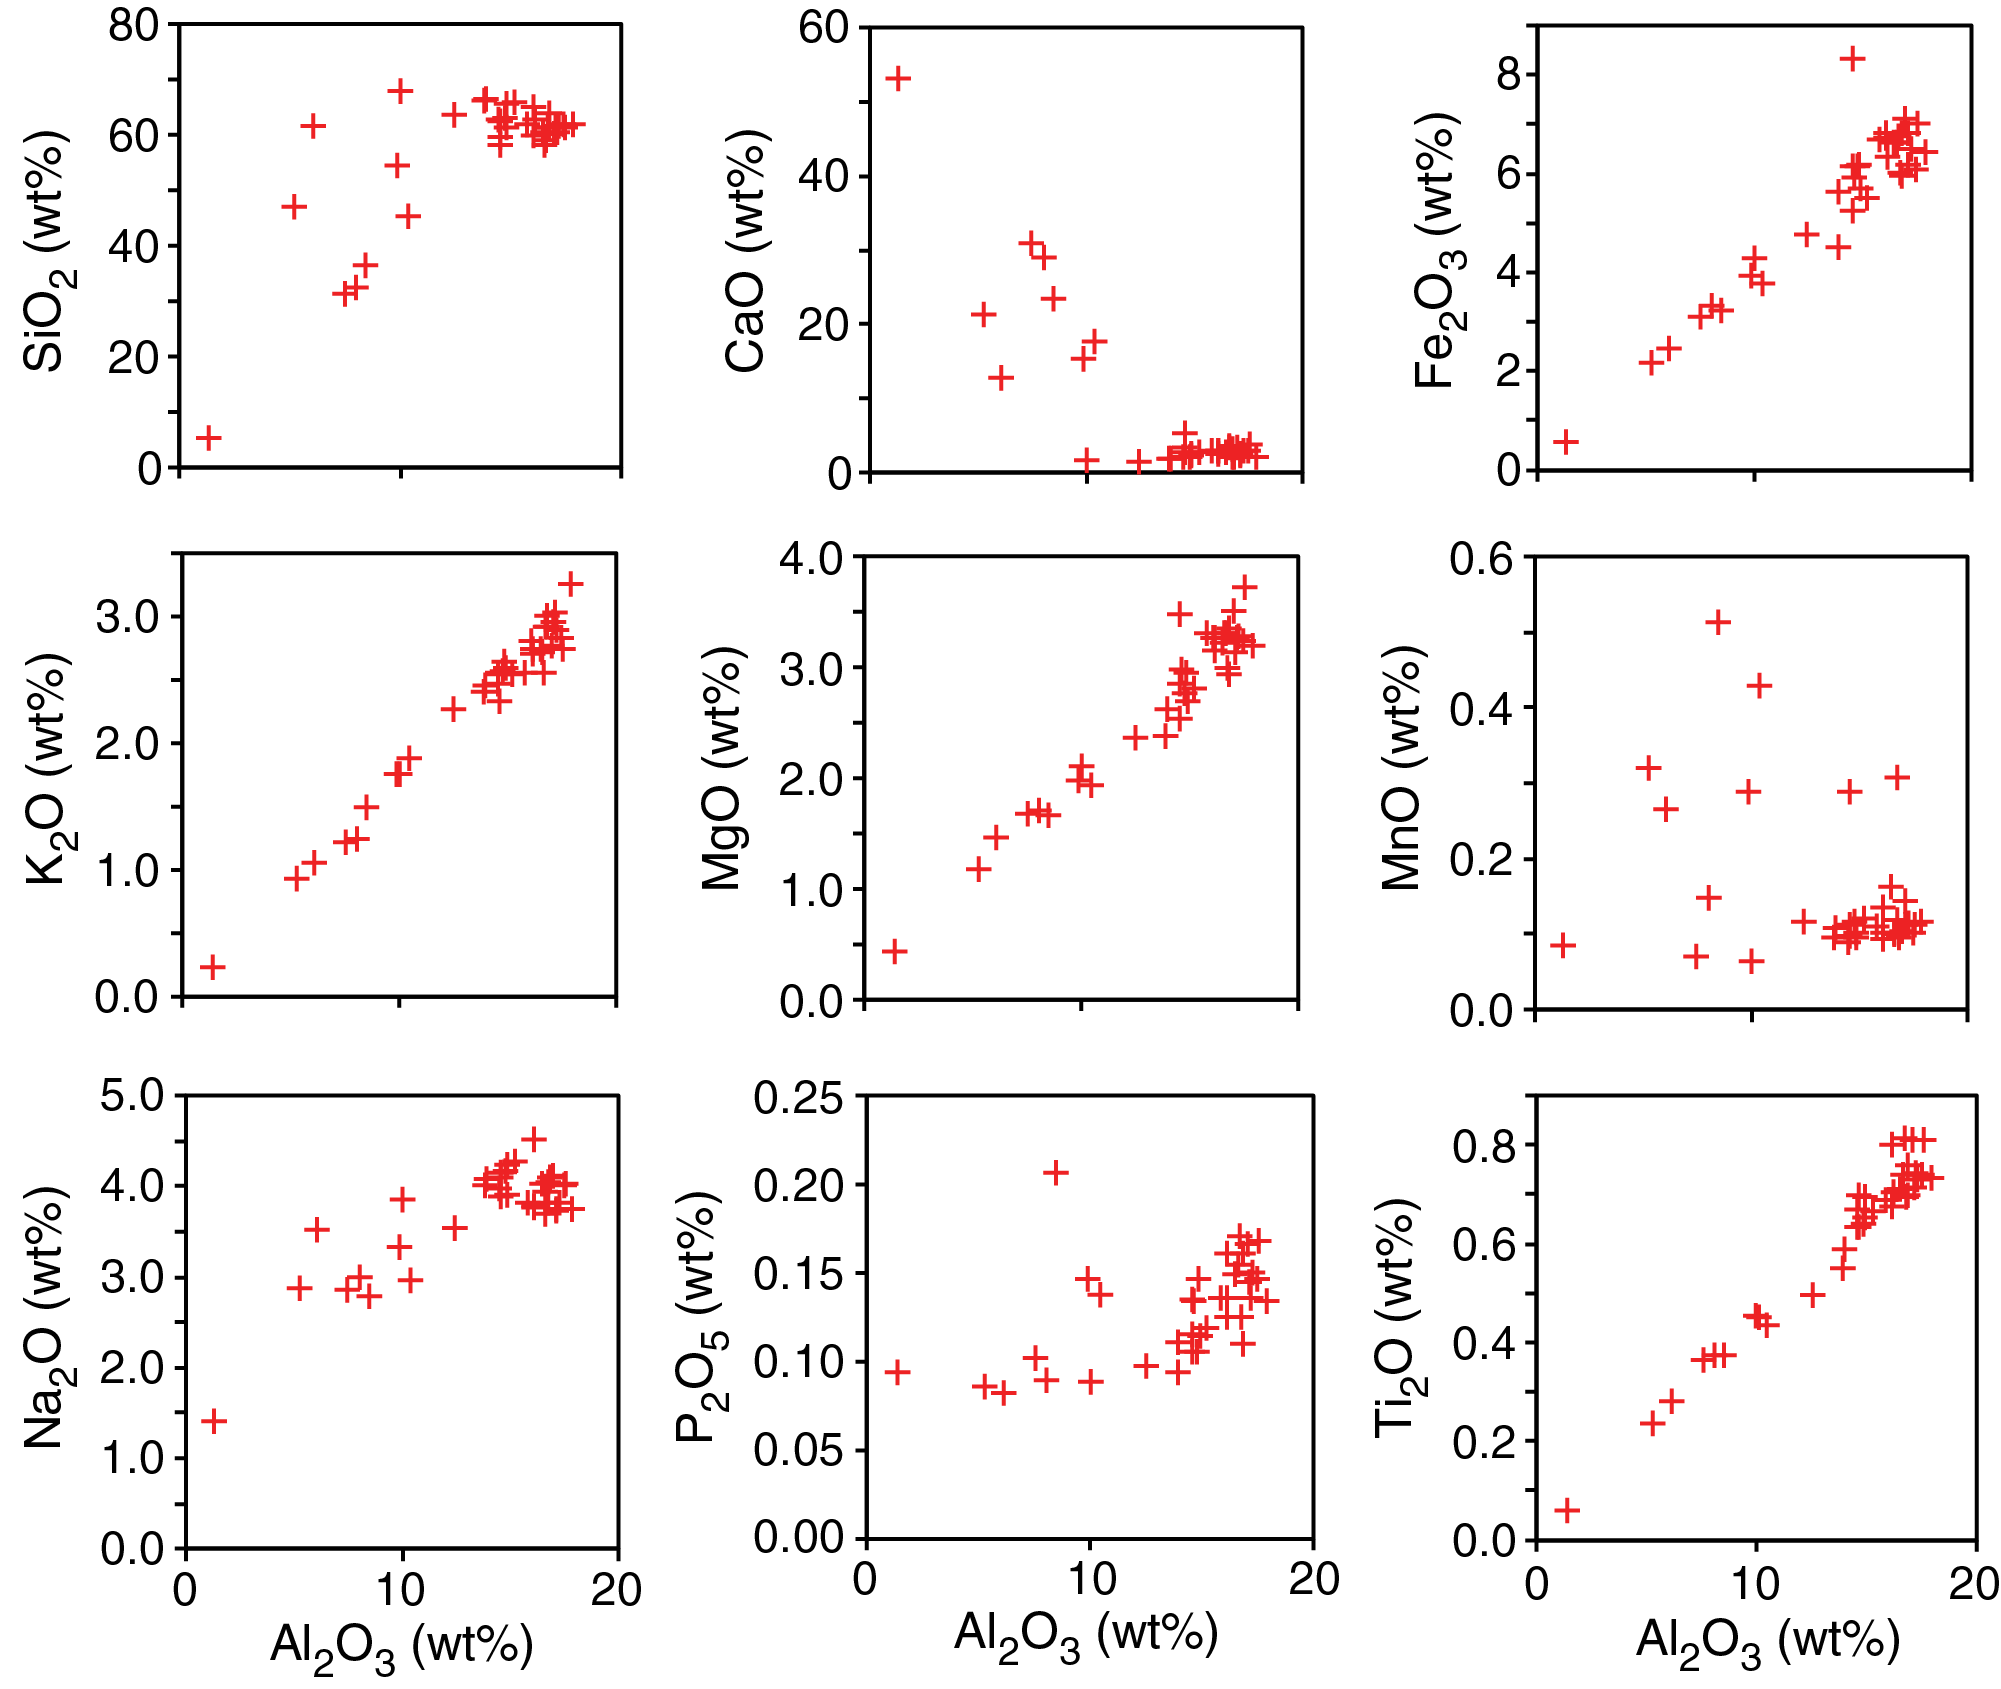
Figure F37. Bulk sediment elemental oxides vs. aluminum oxide.
The majority of measured major and trace elements (e.g., Al, Mg, titanium [Ti], K, Si, Ca, Fe, Mn, and Sr) show a generally constant concentration with depth with fluctuations at 21.84 m CSF-A and between 100 and 200 m CSF-A (Figure F38). Peaks in Fe and Mn occur between 100 and 200 m CSF-A; however, the patterns of change in these two redox-sensitive elements are generally anticorrelated. This might indicate a more efficient removal process of one versus the other. Additional measured elements such as K, Al, Mg, Ti, and Si also show changes in concentrations between 100 and 200 m CSF-A. Aqueous concentrations from a similar depth range suggest that mechanisms related to variation in organic carbon content remineralization and/or solubility of different mineral phases might be responsible for the observed changes in major and trace elements in the solid phase.
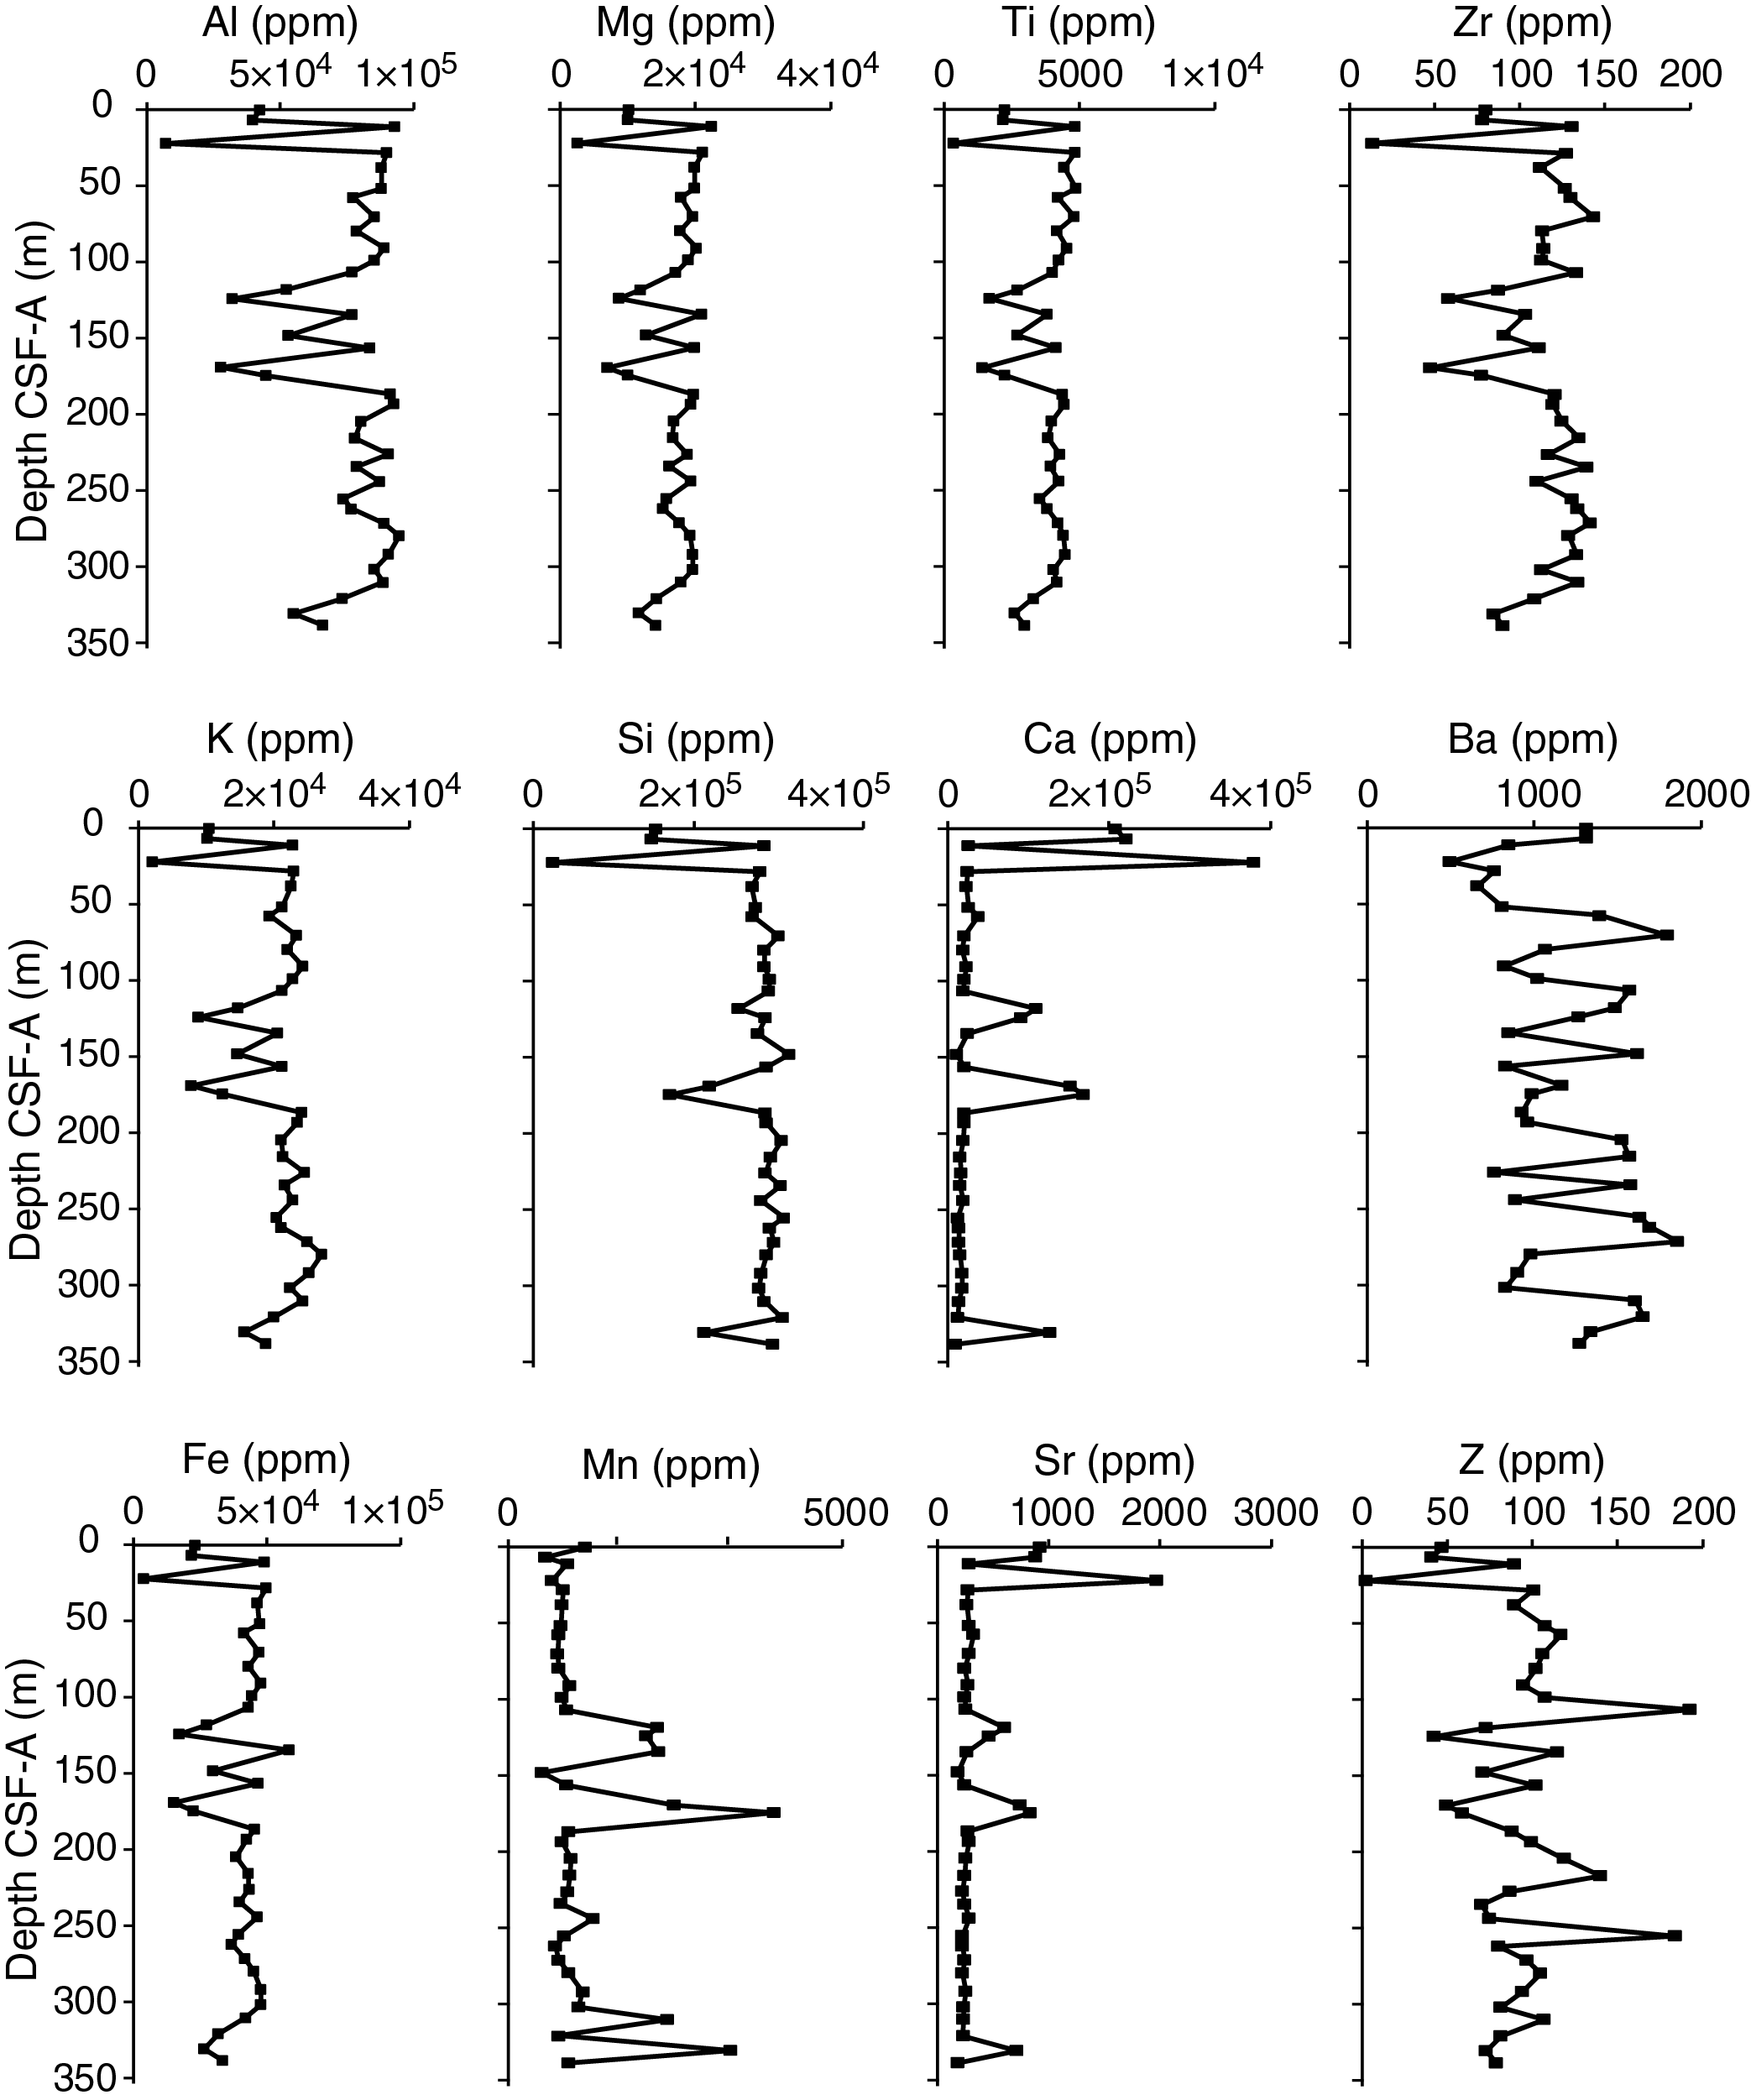
Figure F38. Bulk sediment major and minor element concentrations.
Organic carbon
All samples analyzed for CaCO3 were additionally subsampled for total carbon (TC) analysis. Total organic carbon (TOC) estimates were obtained by measuring the TC and subtracting the contribution of inorganic CaCO3 (see Geochemistry in the Expedition 383 methods chapter [Winckler et al., 2021]). TOC at Hole U1543A has a mean of 0.21 wt% (Figure F36; see U1543-T4.xls in GEOCHEM in Supplementary material). Additionally, four samples fall below detection limit of the carbon-hydrogen-nitrogen-sulfur (CHNS) analyzer. Because of the relatively large standard deviations associated with TC analyses (see Geochemistry in the Expedition 383 methods chapter [Winckler et al., 2021]), low average TOC values throughout Site U1543 likely have a high percent error, and further shore-based analyses are required to test shipboard findings. TOC broadly decreases downhole. It has a maximum concentration of 0.43 wt% in the uppermost portion of the core at 0.09 m CSF-A and a minimum of 0.01 wt% at the base of the core at 335.12 m CSF-A. Generally, the TOC record shows little correlation to the CaCO3 record (r2 = 0.2).
Total nitrogen
Samples were measured for total nitrogen (TN) simultaneously with TC. It was assumed that all the nitrogen detected in the sediment was organic in origin. TN for Hole U1543A has a mean of 0.03 ± 0.007 wt% (Figure F36; see U1543-T4.xls in GEOCHEM in Supplementary material). No clear trends were observed in the TN data; however, a maximum TN of 0.05 wt% occurs at 154.61 m CSF-A and a minimum TN of 0.02 wt% occurs at 6.64 m CSF-A. These small values likely fall below the detection limit of the instrument and should therefore be interpreted with caution until shore-based analyses are collected.
Organic carbon to organic nitrogen ratios
The ratio of TOC to TN from Hole U1543A has a mean value of 6.88 and ranges from a minimum ratio of 0.35 in the lowermost sample at 335.12 m CSF-A to a maximum ratio of 19.9 in the uppermost sample at 0.09 m CSF-A (Figure F36; see U1543-T4.xls in GEOCHEM in Supplementary material). TOC:TN values progressively decrease and become less variable from the top of the core to the bottom. This trend mirrors that observed in TOC, and low TN values limit the use of the TOC:TN proxy at this site. Mean TOC:TN suggests that organic matter primarily derives from marine algae rather than terrestrial material, although these data should be interpreted cautiously given the low TN values (Meyers et al., 1994).
Summary
Close to the sediment–water interface where oxygen is available, aerobic respiration is the primary mechanism of organic matter remineralization; however, as oxygen is depleted, nitrate, Mn, Fe, SO42–, and methane serve as terminal electron acceptors in organic carbon oxidation. Biologically mediated anaerobic oxidation of organic matter is evidenced in the interstitial water by the presence of reduced Fe and Mn, high alkalinity and pH, and high NH4+ concentrations. Farther downcore, interstitial water chemistry may be additionally impacted by oxidative processes either deep in the core or below the cored depth with upward diffusion. This is supported by decreases in NH4+ and increases in SO42– with depth. The deeper parts of the core show evidence of carbonate dissolution as well as interplay of dissolution and precipitation of Fe- and Mn-bearing minerals.
CaCO3 content at this site is generally low but has intermittent peaks downhole, fluctuating between a minimum of 0.1 wt% and a maximum of 86.8 wt%. A linear correlation between CaCO3 concentrations and RGB blue and color reflectance L* data is observed at this site for samples above 1 wt%. The maximum TOC content is 0.43 wt%, and TN is very low, never exceeding 0.05 wt%. The ratio of TOC:TN ranges between 0.34 and 19.91, suggesting a predominance of marine derived organic matter. However, TOC:TN ratios closely mirror the TOC record, and TN values are likely too low to effectively apply TOC:TN to sediments from Hole U1543A.
Bulk sediment data indicate the presence of micaceous/clay minerals along with a substantial amount of biogenic silica. Downcore bulk sediment for most measured elements is relatively constant, with fluctuations observed between 100–200 m CSF-A. These variations are most likely controlled by mechanisms related to variation in organic carbon content remineralization and/or solubility of different mineral phases.
Physical properties
Shipboard physical properties measured at Site U1543 comprise nondestructive whole-round measurements of GRA bulk density, MS, and P-wave velocity using the Whole-Round Multisensor Logger (WRMSL) and NGR measurements on core sections from Holes U1543A and U1543B. Additional physical property data collected for Site U1543 include thermal conductivity using a needle probe on whole-round core sections from Holes U1543A and U1543B. To support stratigraphic correlation and optimize drilling depths at subsequent holes to cover coring gaps, MS and GRA data were acquired while drilling Hole U1543B before temperature equilibration using the Special Task Multisensor Logger (STMSL) at a 3 cm resolution (see Physical Properties in the Expedition 383 methods chapter [Winckler et al., 2021]). These data were stored in the International Ocean Discovery Program Laboratory Information Management System (LIMS) but are not further evaluated and reported here; further use is discouraged because WRMSL and Section Half Multisensor Logger (SHMSL) data from all core sections are available in LIMS. Measurements were carried out on all recovered sections, including sections with incompletely filled liners or partially water-filled sections. WRMSL data were processed to flag measurements that were not representative of the sediment characteristics (see Physical Properties in the Expedition 383 methods chapter [Winckler et al., 2021]).
After splitting the core sections, discrete samples were taken from the working halves with representative lithostratigraphic units for moisture and density (MAD) measurements to determine porosity and bulk, dry, and grain density from Hole U1543A. Discrete compressional wave velocity measurements were conducted on at least one working half from each core using the P-wave caliper (PWC) contact probe system on the Section Half Measurement Gantry (SHMG) for Holes U1543A and U1543B. Archive halves were measured with the SHMSL for MS and color reflectance (see Sedimentology).
Physical property data were used for hole-to-hole stratigraphic correlation and splicing (see Stratigraphic correlation). The physical properties of Site U1543 indicate high frequency variability (i.e., within ≤1 m core intervals) throughout all the records, as well as long-term trends.
Magnetic susceptibility
Both whole-round measurements on the WRMSL and discrete point measurements on the SHMSL were used to characterize MS at Site U1543 (Figure F39). Both methods yielded a similar range of values and downhole variability. Values from the WRMSL MS loop (MSL) range from 3 to 301 instrument units (IU), and values from the SHMSL point MS sensor range from 3 to 353 IU (see Physical properties in the Expedition 383 methods chapter [Winckler et al., 2021] for details on instrument units [~10–5 SI]).
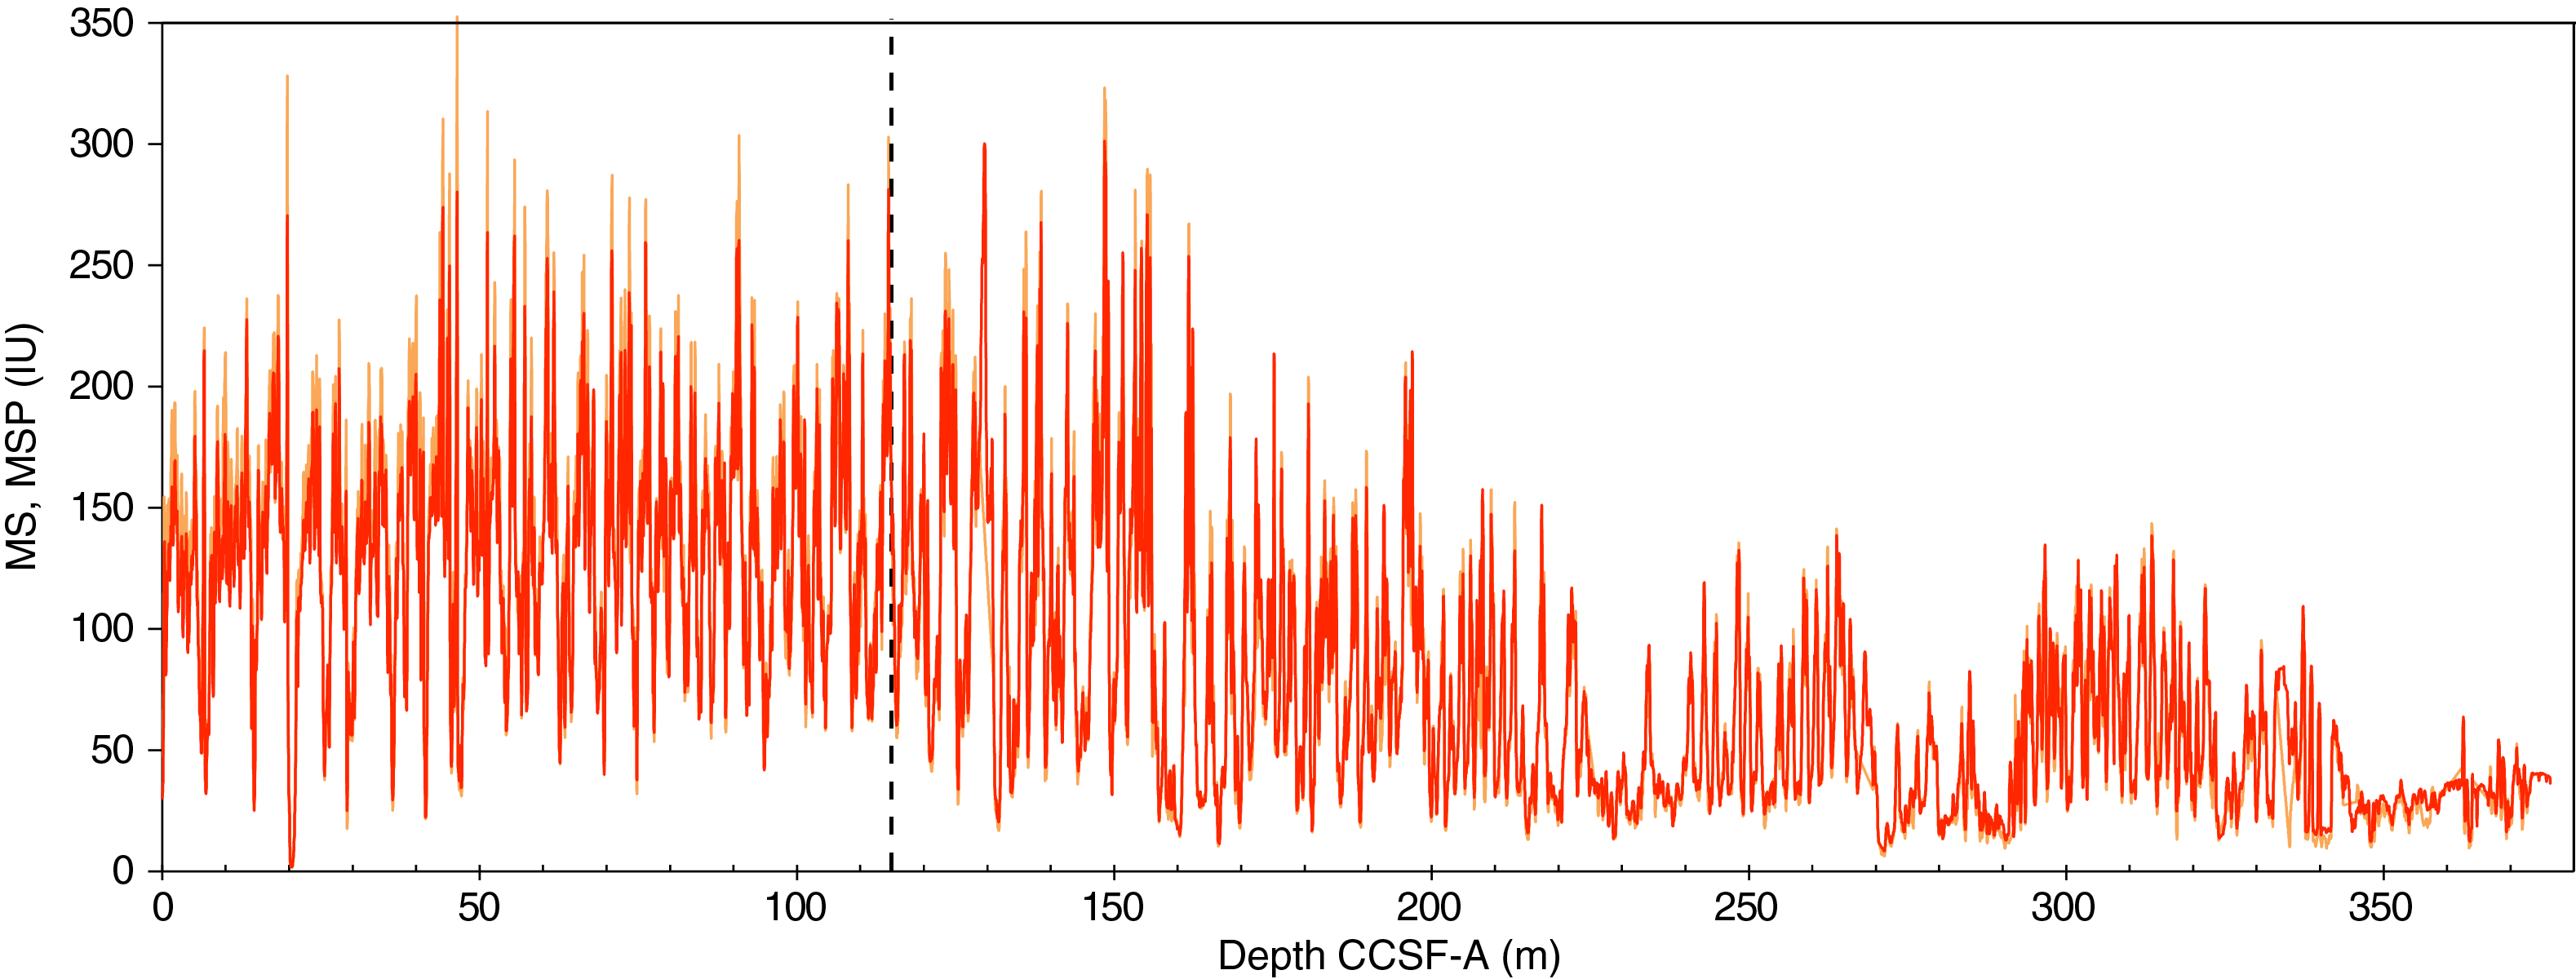
Figure F39. Splice data: WRMSL MS and SHMSL MSP.
MS shows high frequency variability (≤1 m) and a long-term trend along the whole record. The amplitudes of MSL variations increase toward the top at Site U1543 in two steps, first around 197 m CCSF-A, when high values start to exceed 200 IU, roughly coinciding with the beginning of the Northern Hemisphere Glaciation, and secondly at ~162 m CCSF-A, roughly corresponding to the presumed Pliocene–Pleistocene transition (see Biostratigraphy and Paleomagnetism for age assignment). In contrast, periods of low MS are encountered below ~200 m CCSF-A, in particular from 270.2 to 290 m CCSF-A (Figures F39, F40) and from 345 m CCSF-A to the bottom of the hole.
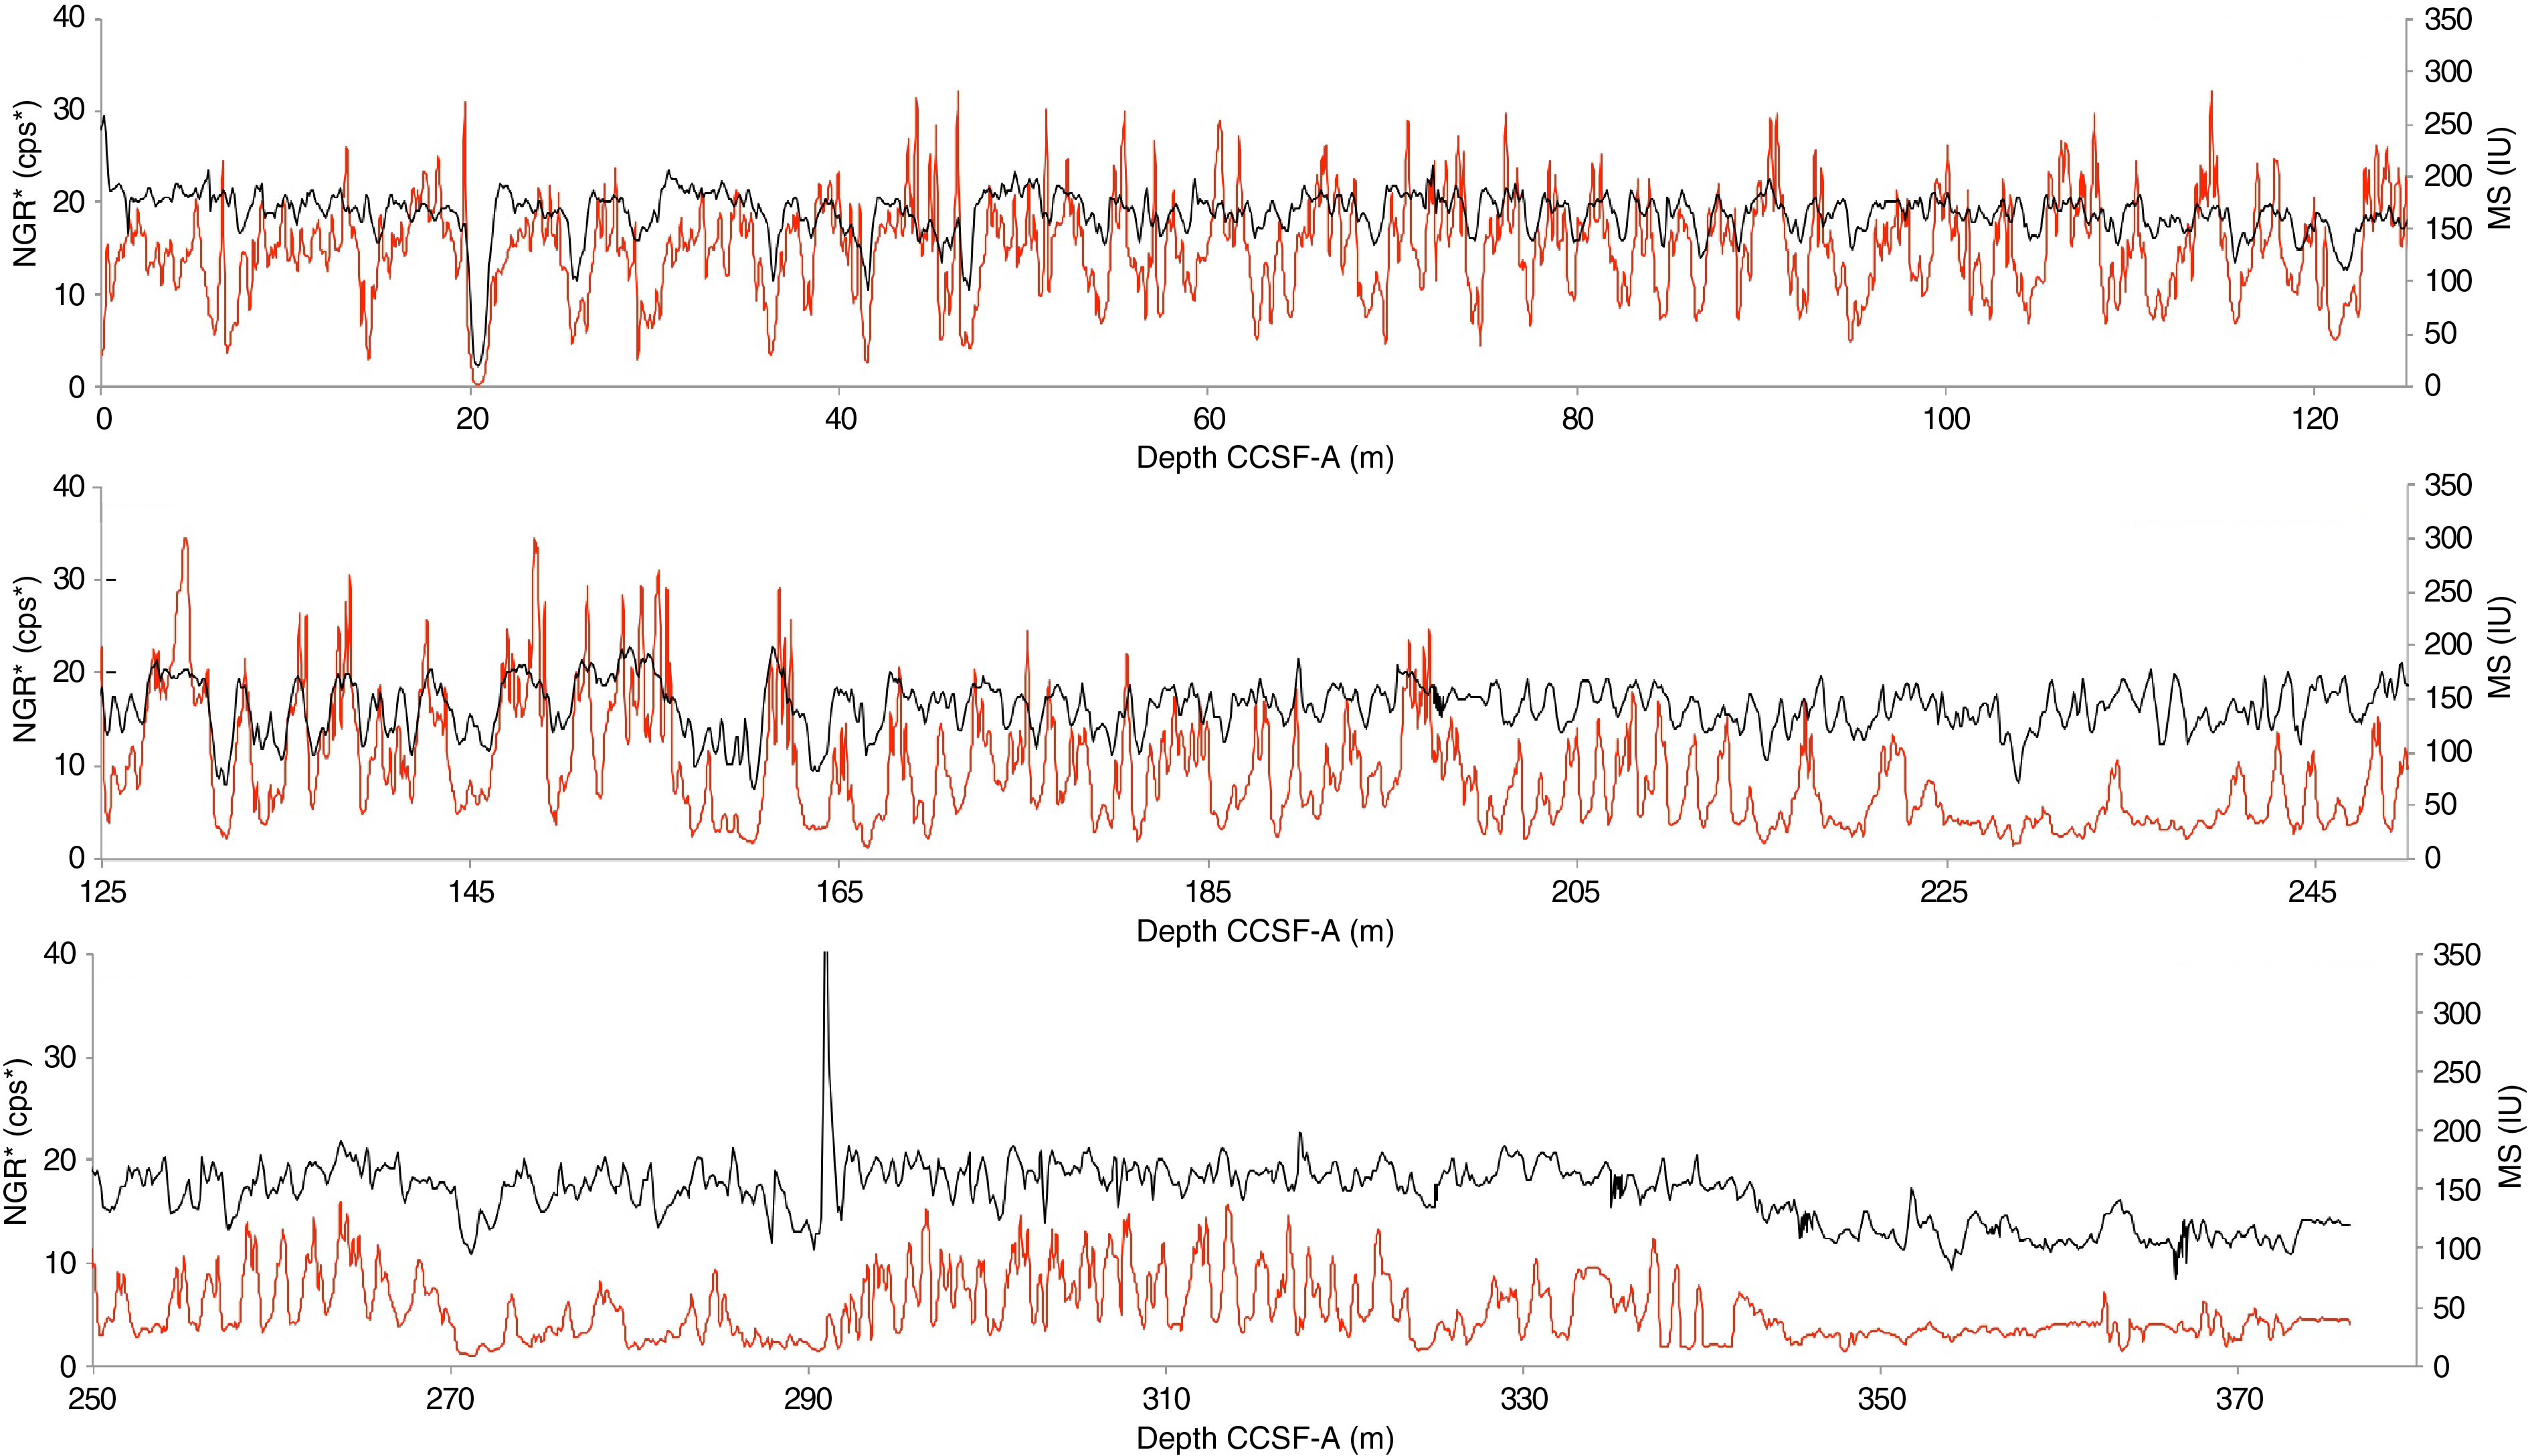
Figure F40. Splice data: WRMSL MS and NGR.
The interval of highest amplitude variations at 162–130 m CCSF-A corresponds to an alternation of silt-bearing clay and clayey diatom ooze (see Sedimentology). Above this depth, the amplitude of variations is slightly lower, and values rarely decrease below 50 IU, with minimum intervals decreasing to ~47 m CCSF-A, at about the Brunhes/Matuyama boundary (see Paleomagnetism; Figures F39, F40). Lithofacies 4 and 6, which correspond to dominant biogenic components (i.e., nannofossil or diatom ooze), correlate with low susceptibility intervals. However, a number of low susceptibility intervals are not reflected in lithofacies changes, and thus probably correspond to more subtle changes between clay, silt, and biogenic components (see Sedimentology).
Natural gamma radiation
NGR density-normalized (NGR*) measurements show downhole variations ranging from 3 to 43 counts per second (cps*) with median values of ~20 cps* (Figure F40). Site U1543 NGR* variations match well with MS variations except for few peaks (e.g., at 290 m CCSF-A) in contrast to Site U1542, where anticorrelation of NGR* and MS was linked to alternations of silt (and/or sand) and clay.
We deconvolved the Site U1543 NGR* counts into low-resolution (semi)quantitative concentrations for the elements K, Th, and U following the methods of Dunlea et al. (2013) and De Vleeschouwer et al. (2017). The Th concentrations were high enough (0.4–9 ppm) to use Th to normalize K and U records (Figure F41). A peak appears at 264 m CSF-A (290 m CCSF-A) in Hole U1543B (Figure F40). In Sample 383-U1543B-31H-5, 60 cm, U concentrations rise to ~8 ppm from ~1.5 ppm. This U peak occurs in the middle of an unusual 20 cm long section of sediment in which recrystallized calcite was detected (Figure F41) (see Sedimentology).
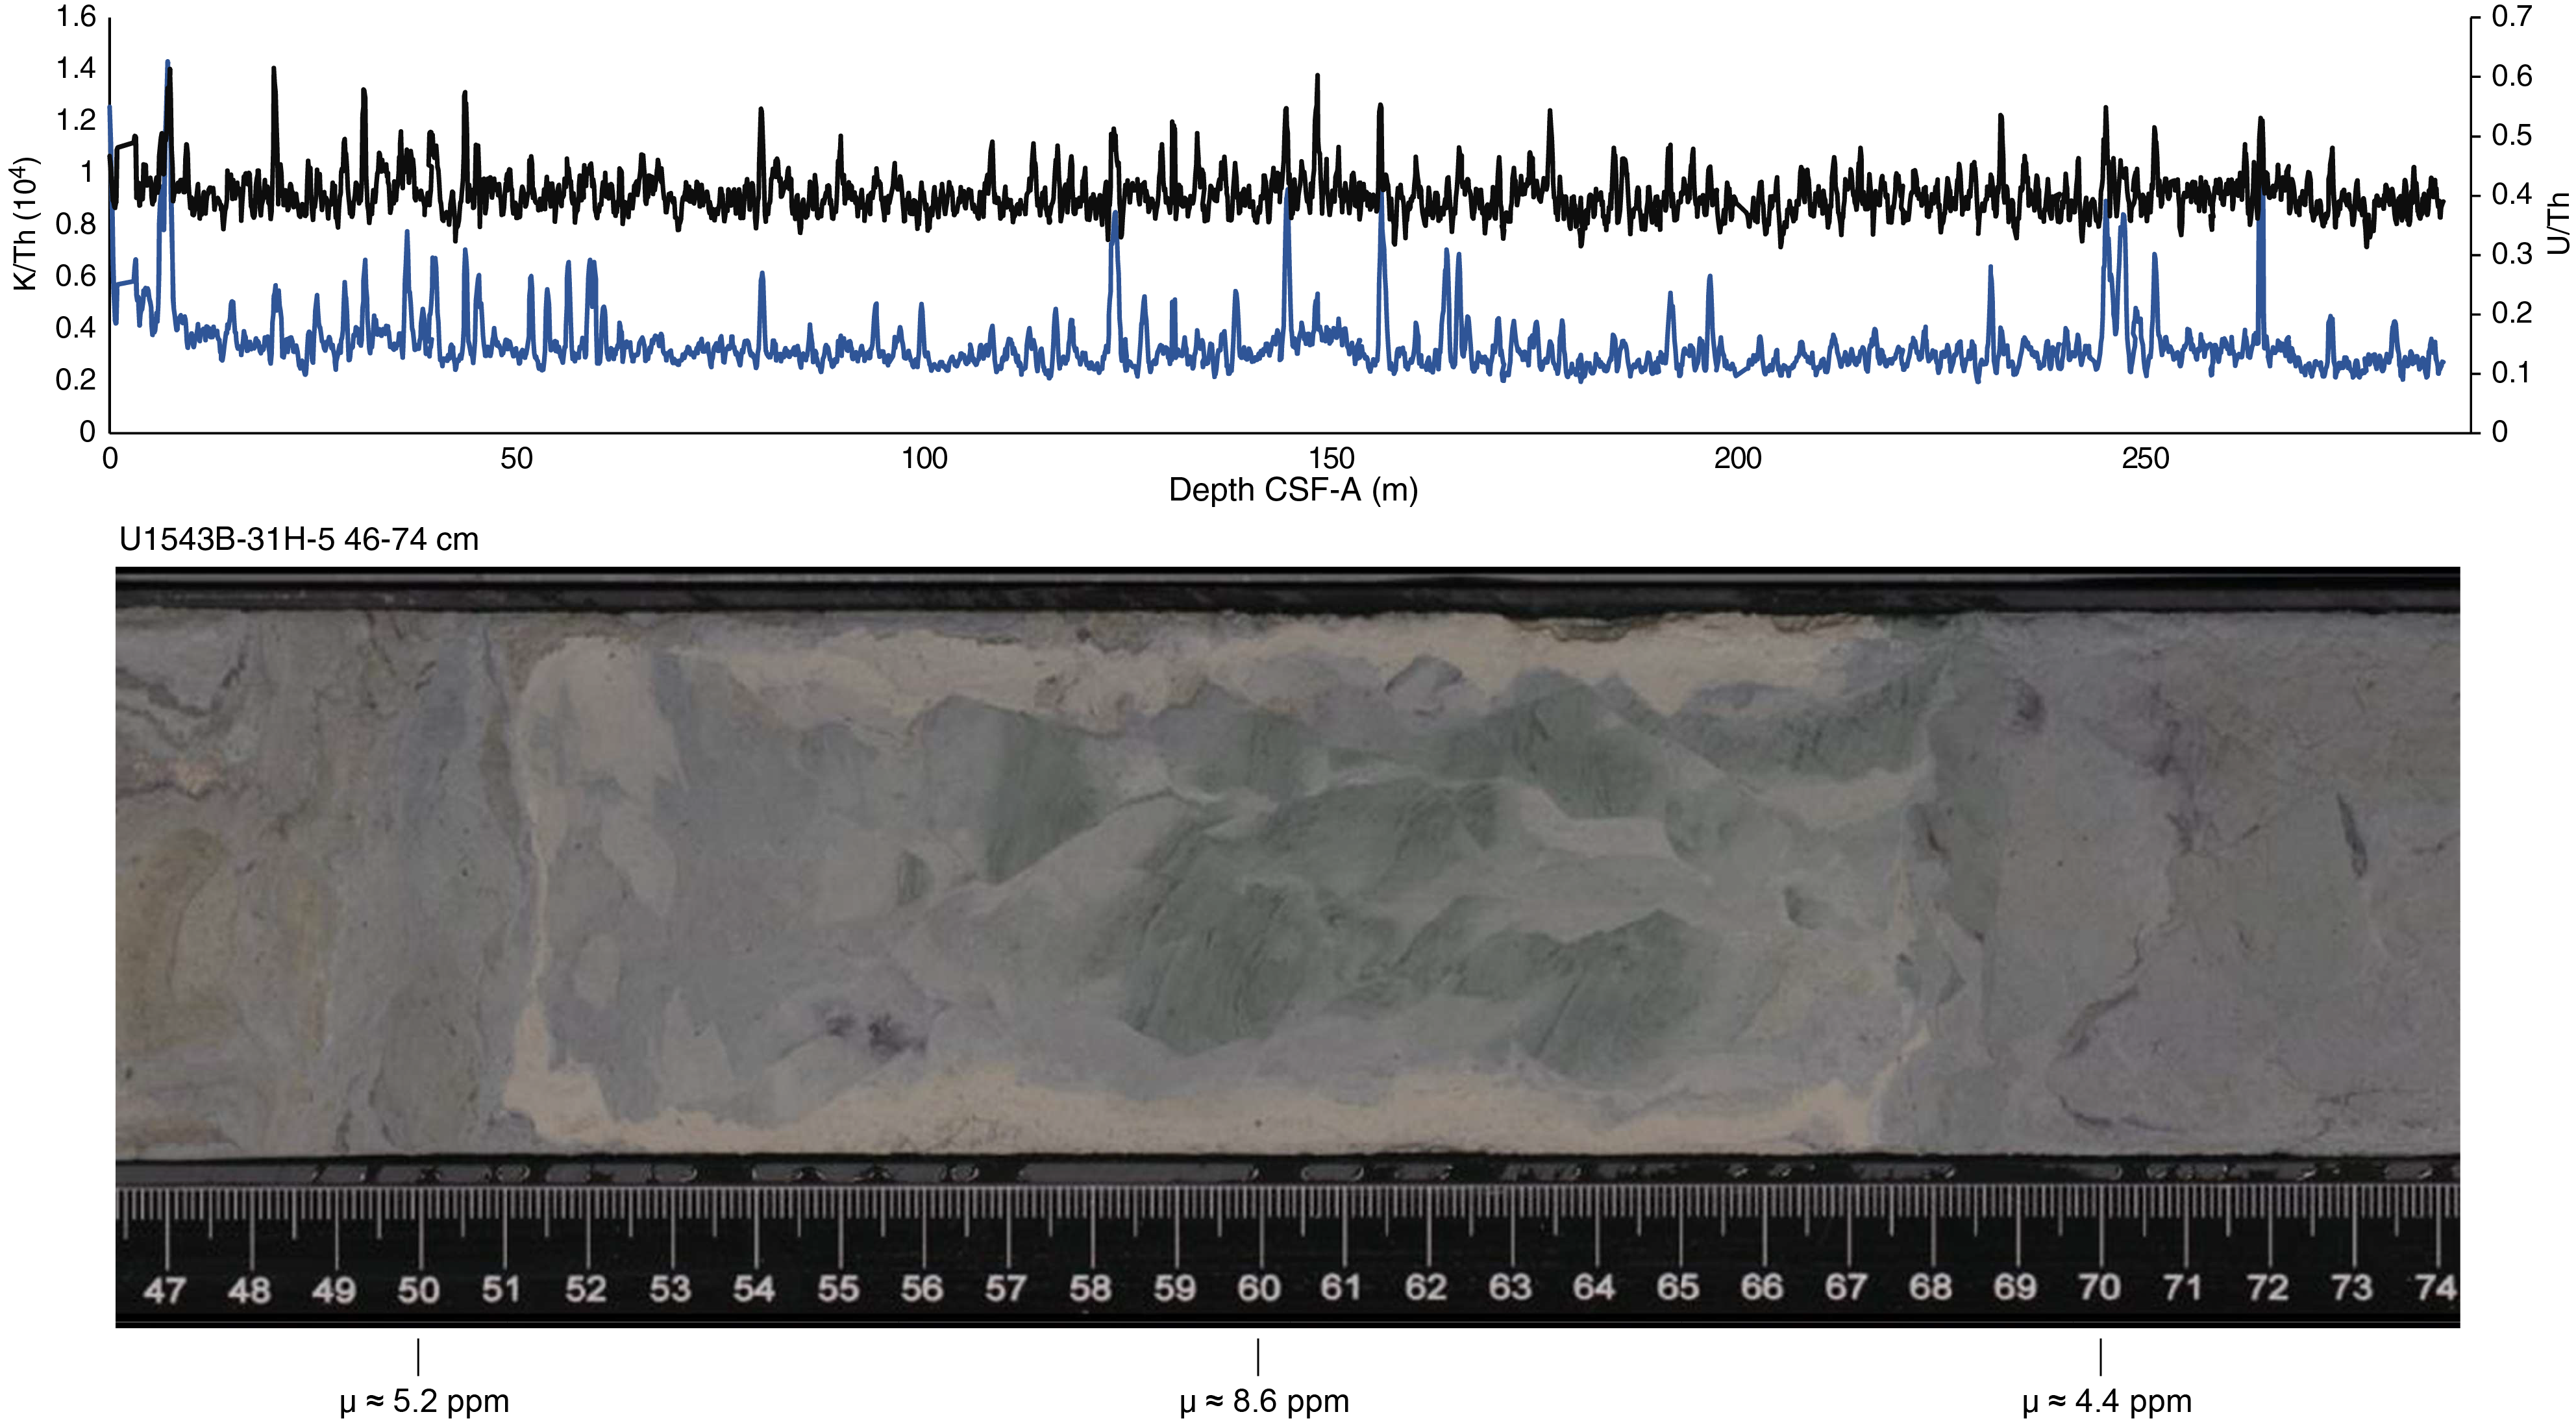
Figure F41. U/Th and K/Th.
Variability in Th may affect U/Th variations, particularly because U concentrations are slightly lower (0.21–8.6 ppm) and less variable (except for the peak at 290 m CCSF-A). To check for this effect, U and Th records were normalized for comparison (Figure F42); for both records the mean was subtracted and divided by half the full range and offset by +1 to avoid negative numbers. U peaks at 240, 256, 257, and 270 m CCSF-A, and all peaks occur within nannofossil oozes. The multiple U peaks between 270 and 277 m CCSF-A occur at a depth where nannofossil ooze alternates with diatom and silt-bearing clay.
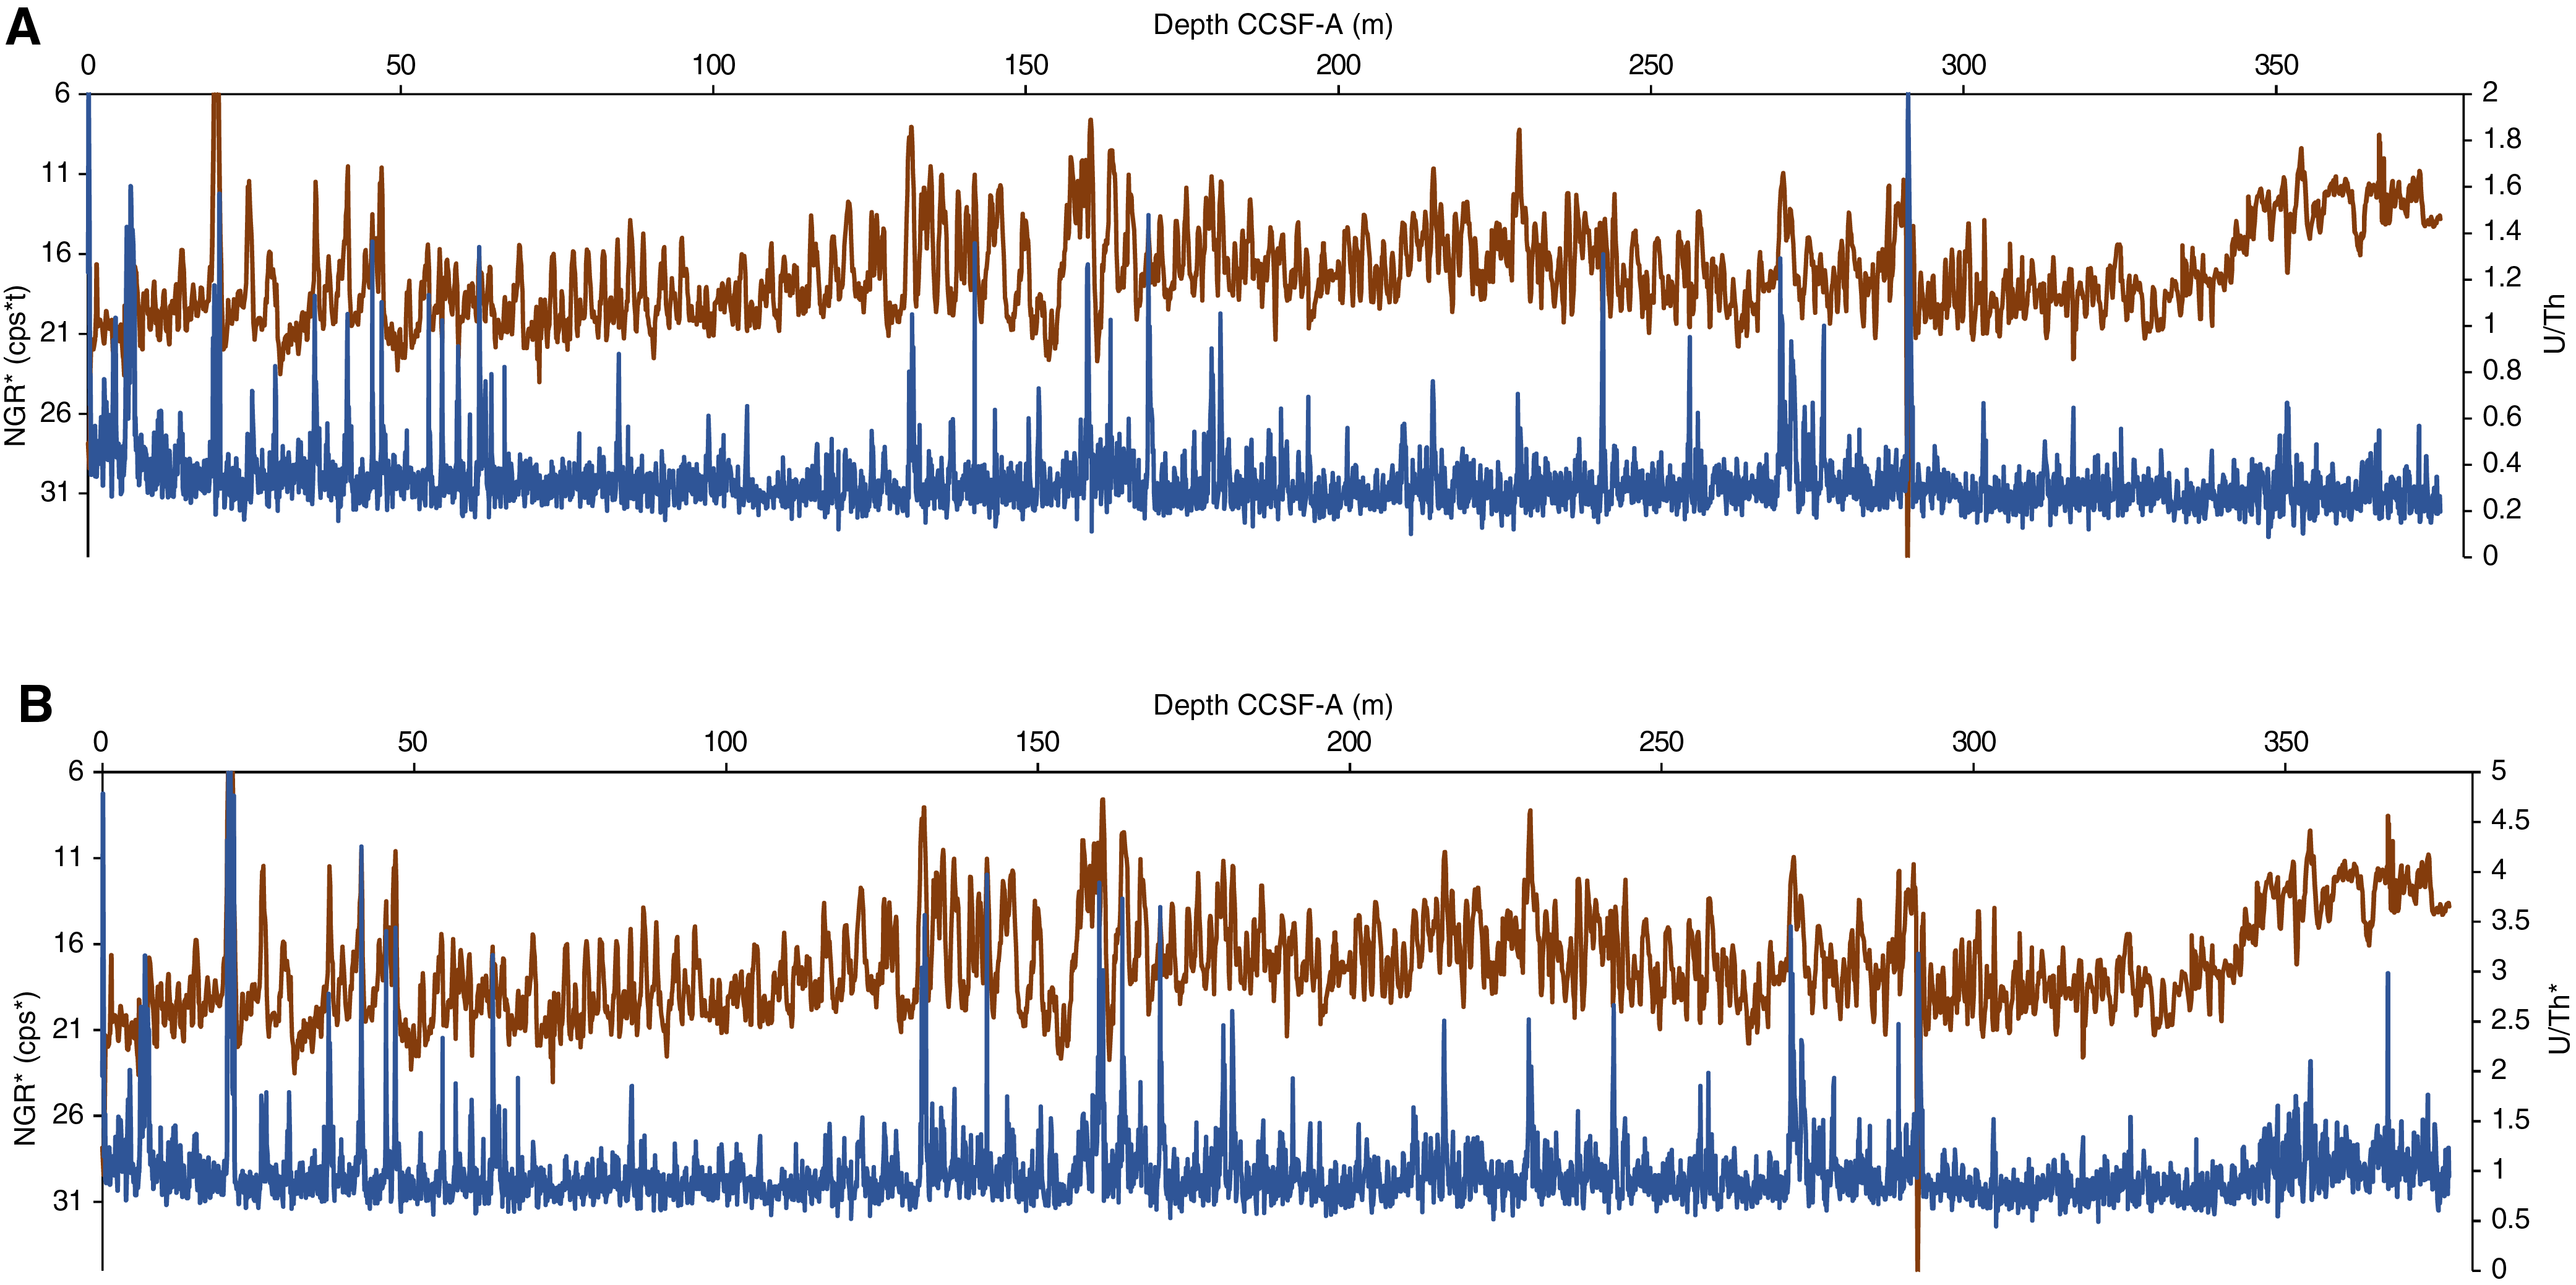
Figure F42. Splice data: NGR* and U/Th.
Bulk density, grain density, and porosity
We used GRA measurements at a 2 cm spacing and discrete MAD values (101 samples from Hole U1543A) to evaluate changes in bulk density at Site U1543. GRA bulk density values in Holes U1543A and U1543B vary from 1.32 to 1.87 g/cm3, and discrete MAD values range from 1.31 to 1.79 g/cm3 (Figure F43). Bulk densities calculated from discrete MAD samples match the range of GRA estimates and display similar trends downhole in Hole U1543A. Three outliers (>3σ) were not used in the regression, and the correlation coefficient between both methods is r2 = 0.934 across all encountered lithofacies. In addition to bulk density, the MAD measurements provide estimates of dry bulk density, grain density, porosity, water content, void ratio, and several other properties, which co-vary downhole. Bulk density and porosity/water content are anticorrelated with weight percent water and vary from 32 to 62 wt%.
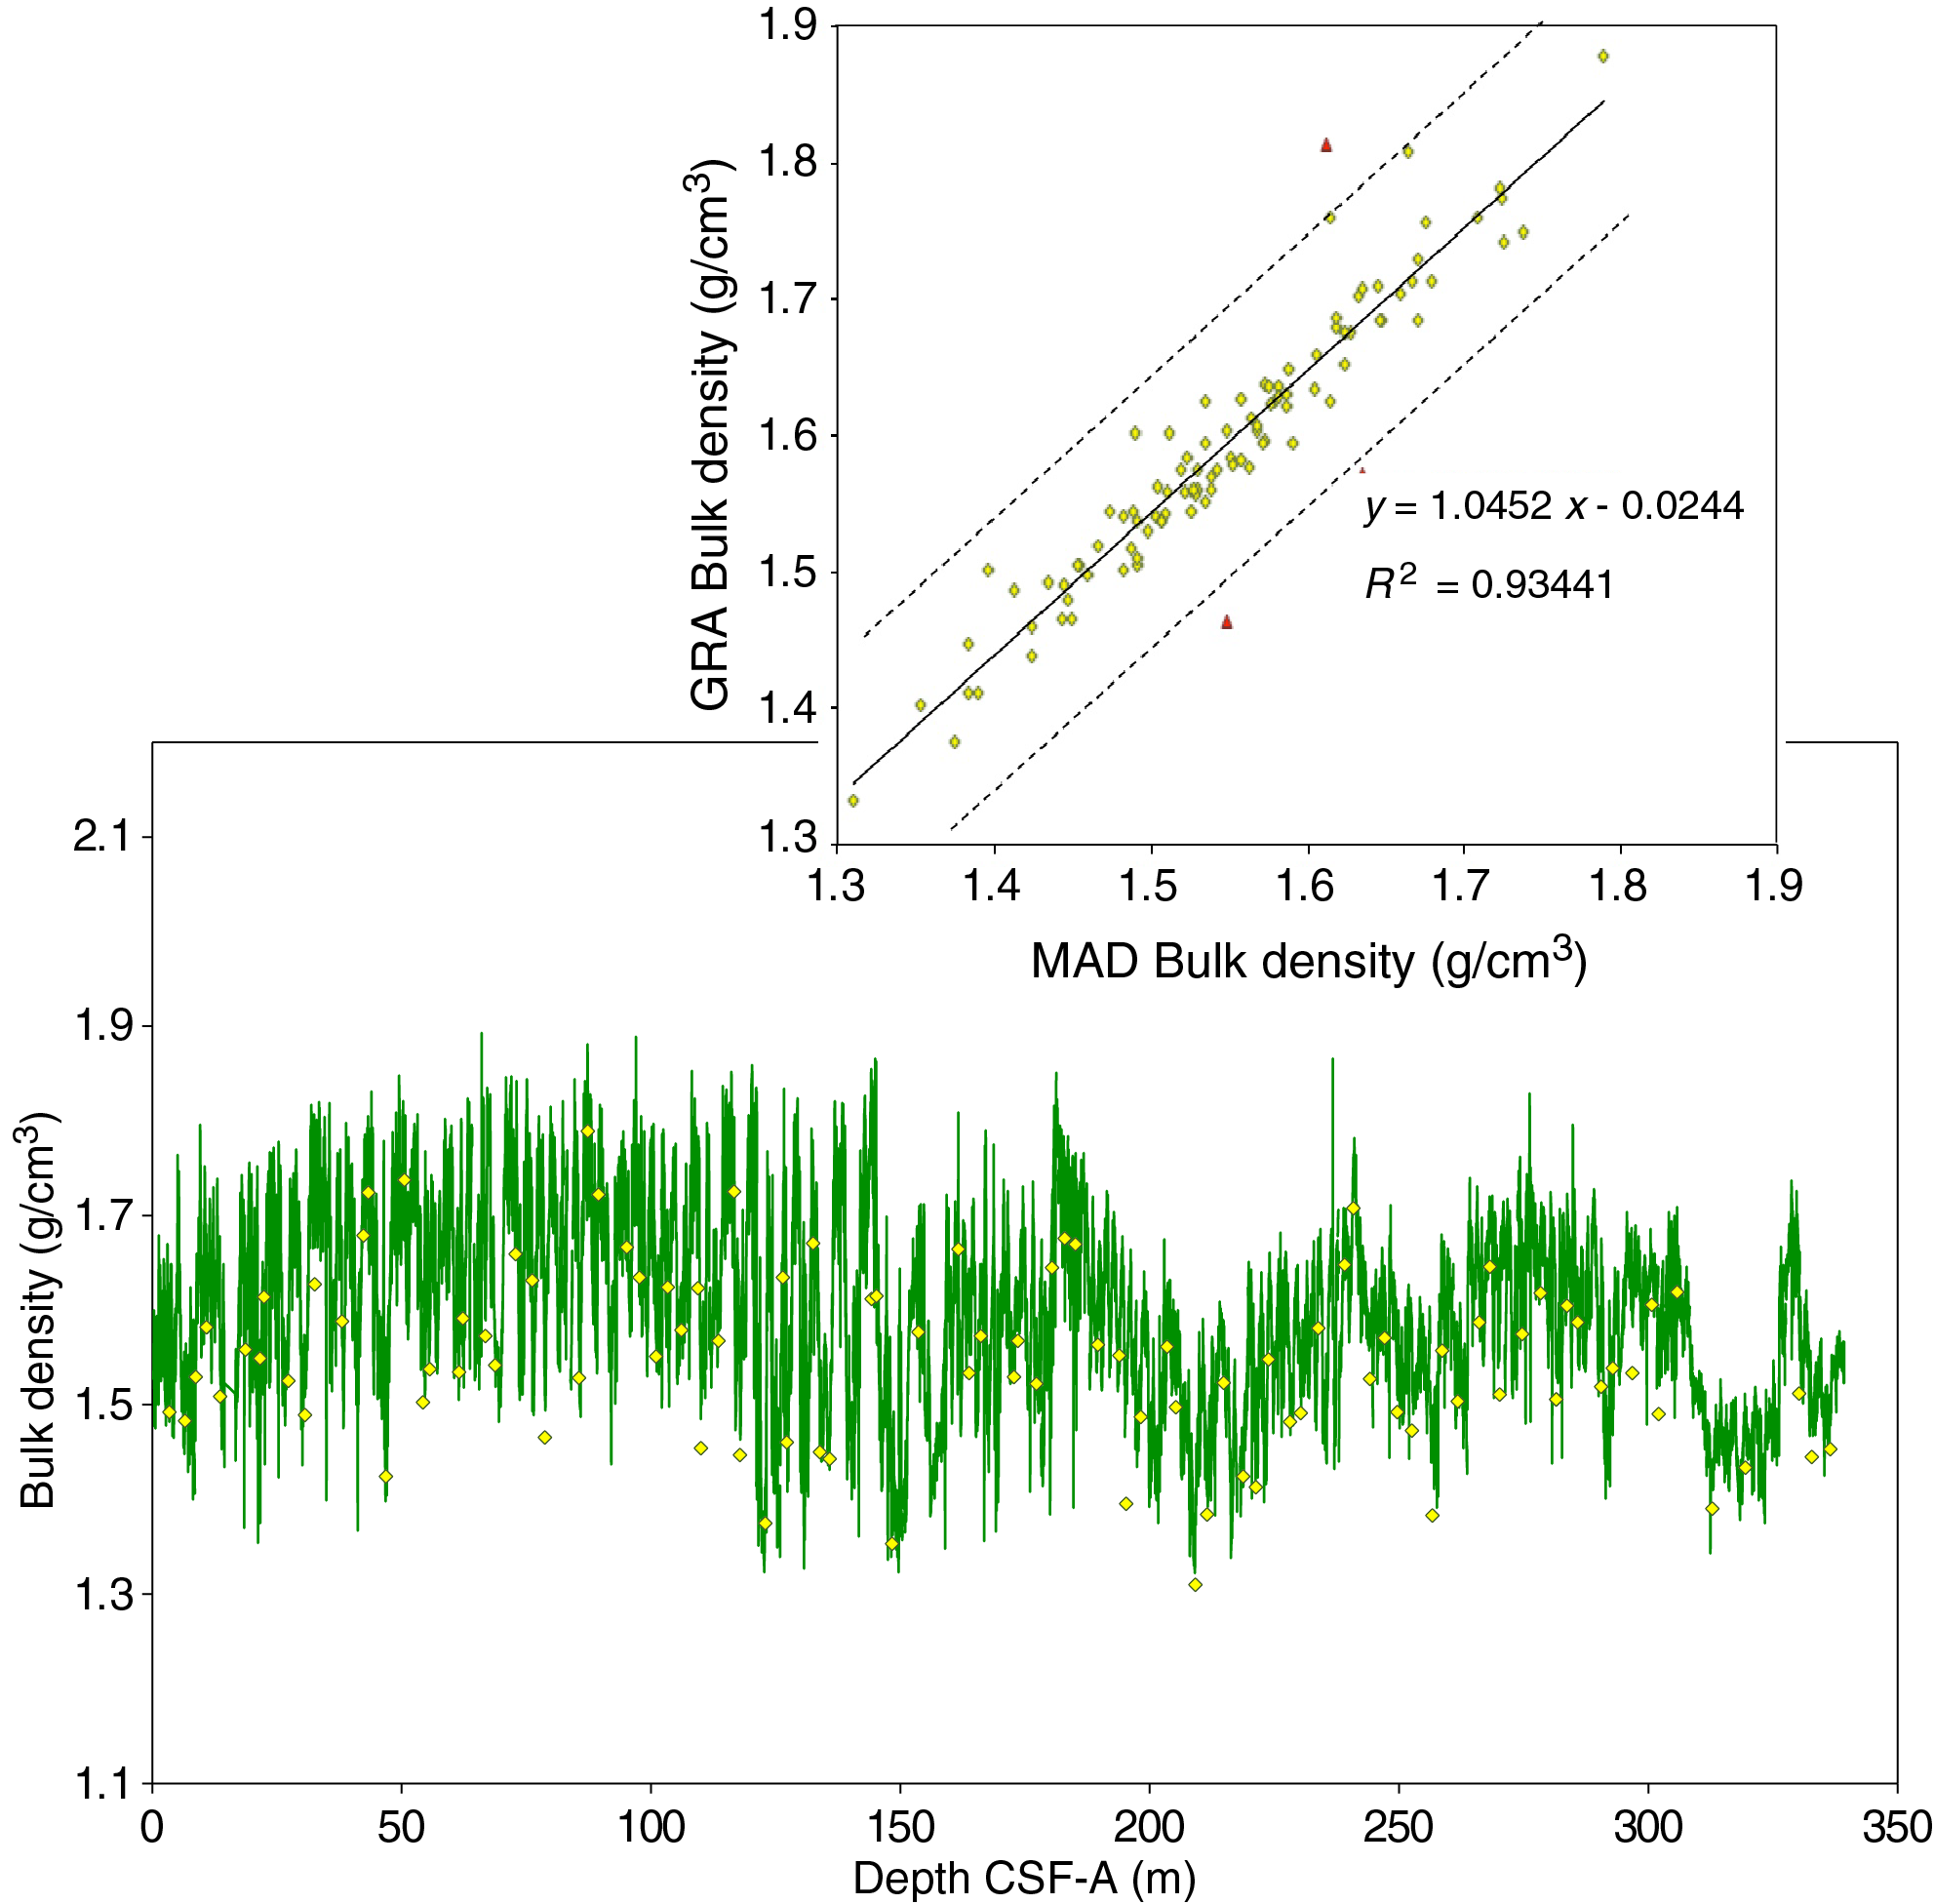
Figure F43. Bulk density data.
The mean GRA values are slightly higher (mean = 1.65 g/cm3) in the top part of the record (0–163 m CCSF-A, which corresponds to the Pleistocene interval) (see Biostratigraphy and Paleomagnetism) than from 163 m CCSF-A to the bottom (mean = 1.57 g/cm3) (Figure F44), which is associated with a higher presence of diatoms in the older part of the record. The highest amplitude variations of GRA are encountered at 168–128 m CCSF-A in the interval where Lithofacies 6, diatom ooze, is encountered, alternating with silt-bearing clay (Lithofacies 8). Lithofacies 6 corresponds to the highest water content (50–60 wt%) and thus to lower bulk density (see Sedimentology). This interval corresponds to the upper end of Unit II and is also related to the highest amplitude changes for MS (Figure F45). Even small variations in contents of biogenic components relative to clay or silt-bearing clay correspond to clear variations in bulk density and similarly to MS and NGR*. The GRA record reveals high-frequency changes in sediment composition that are likely related to environmental changes.
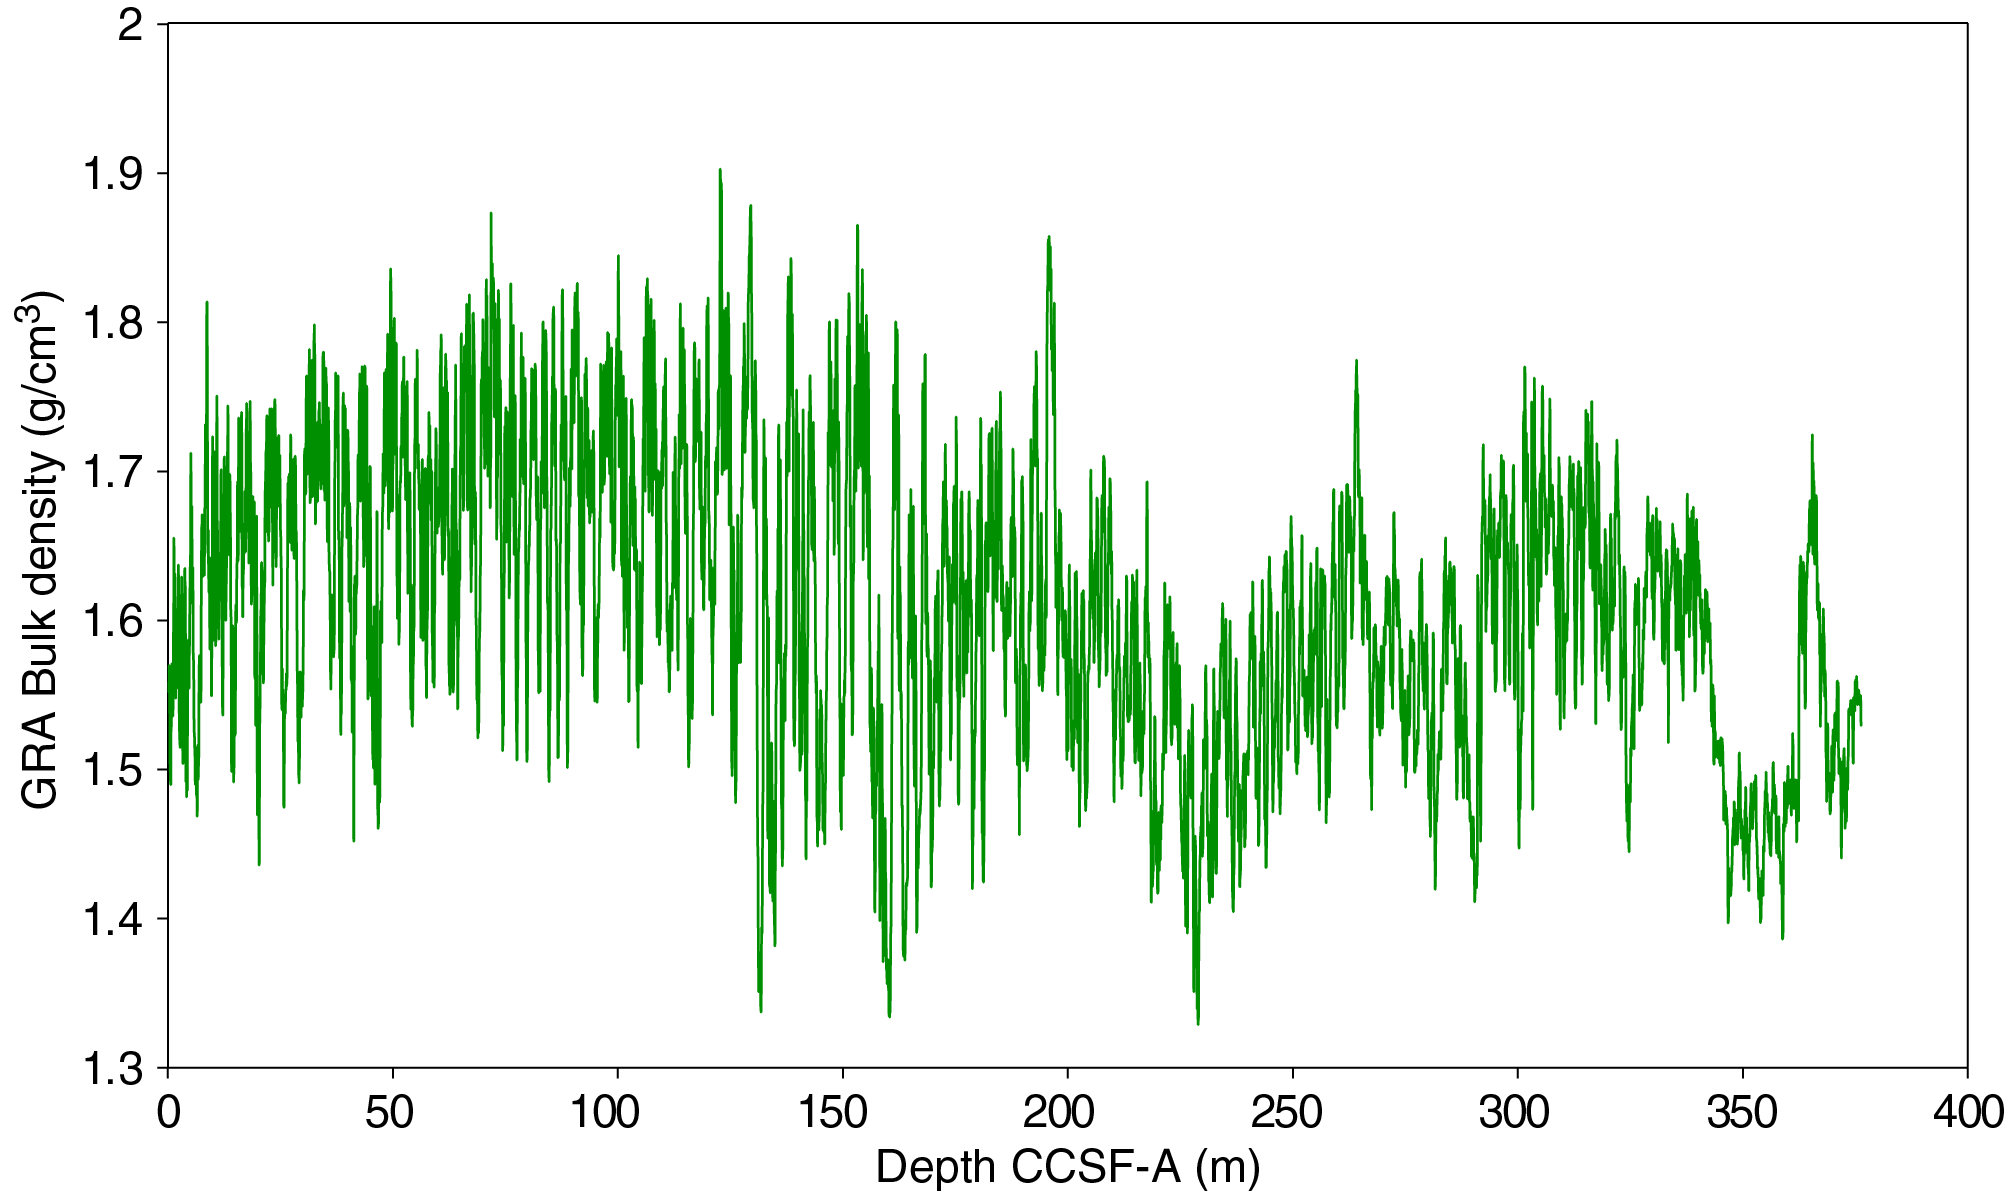
Figure F44. Splice data: WRMSL MS.
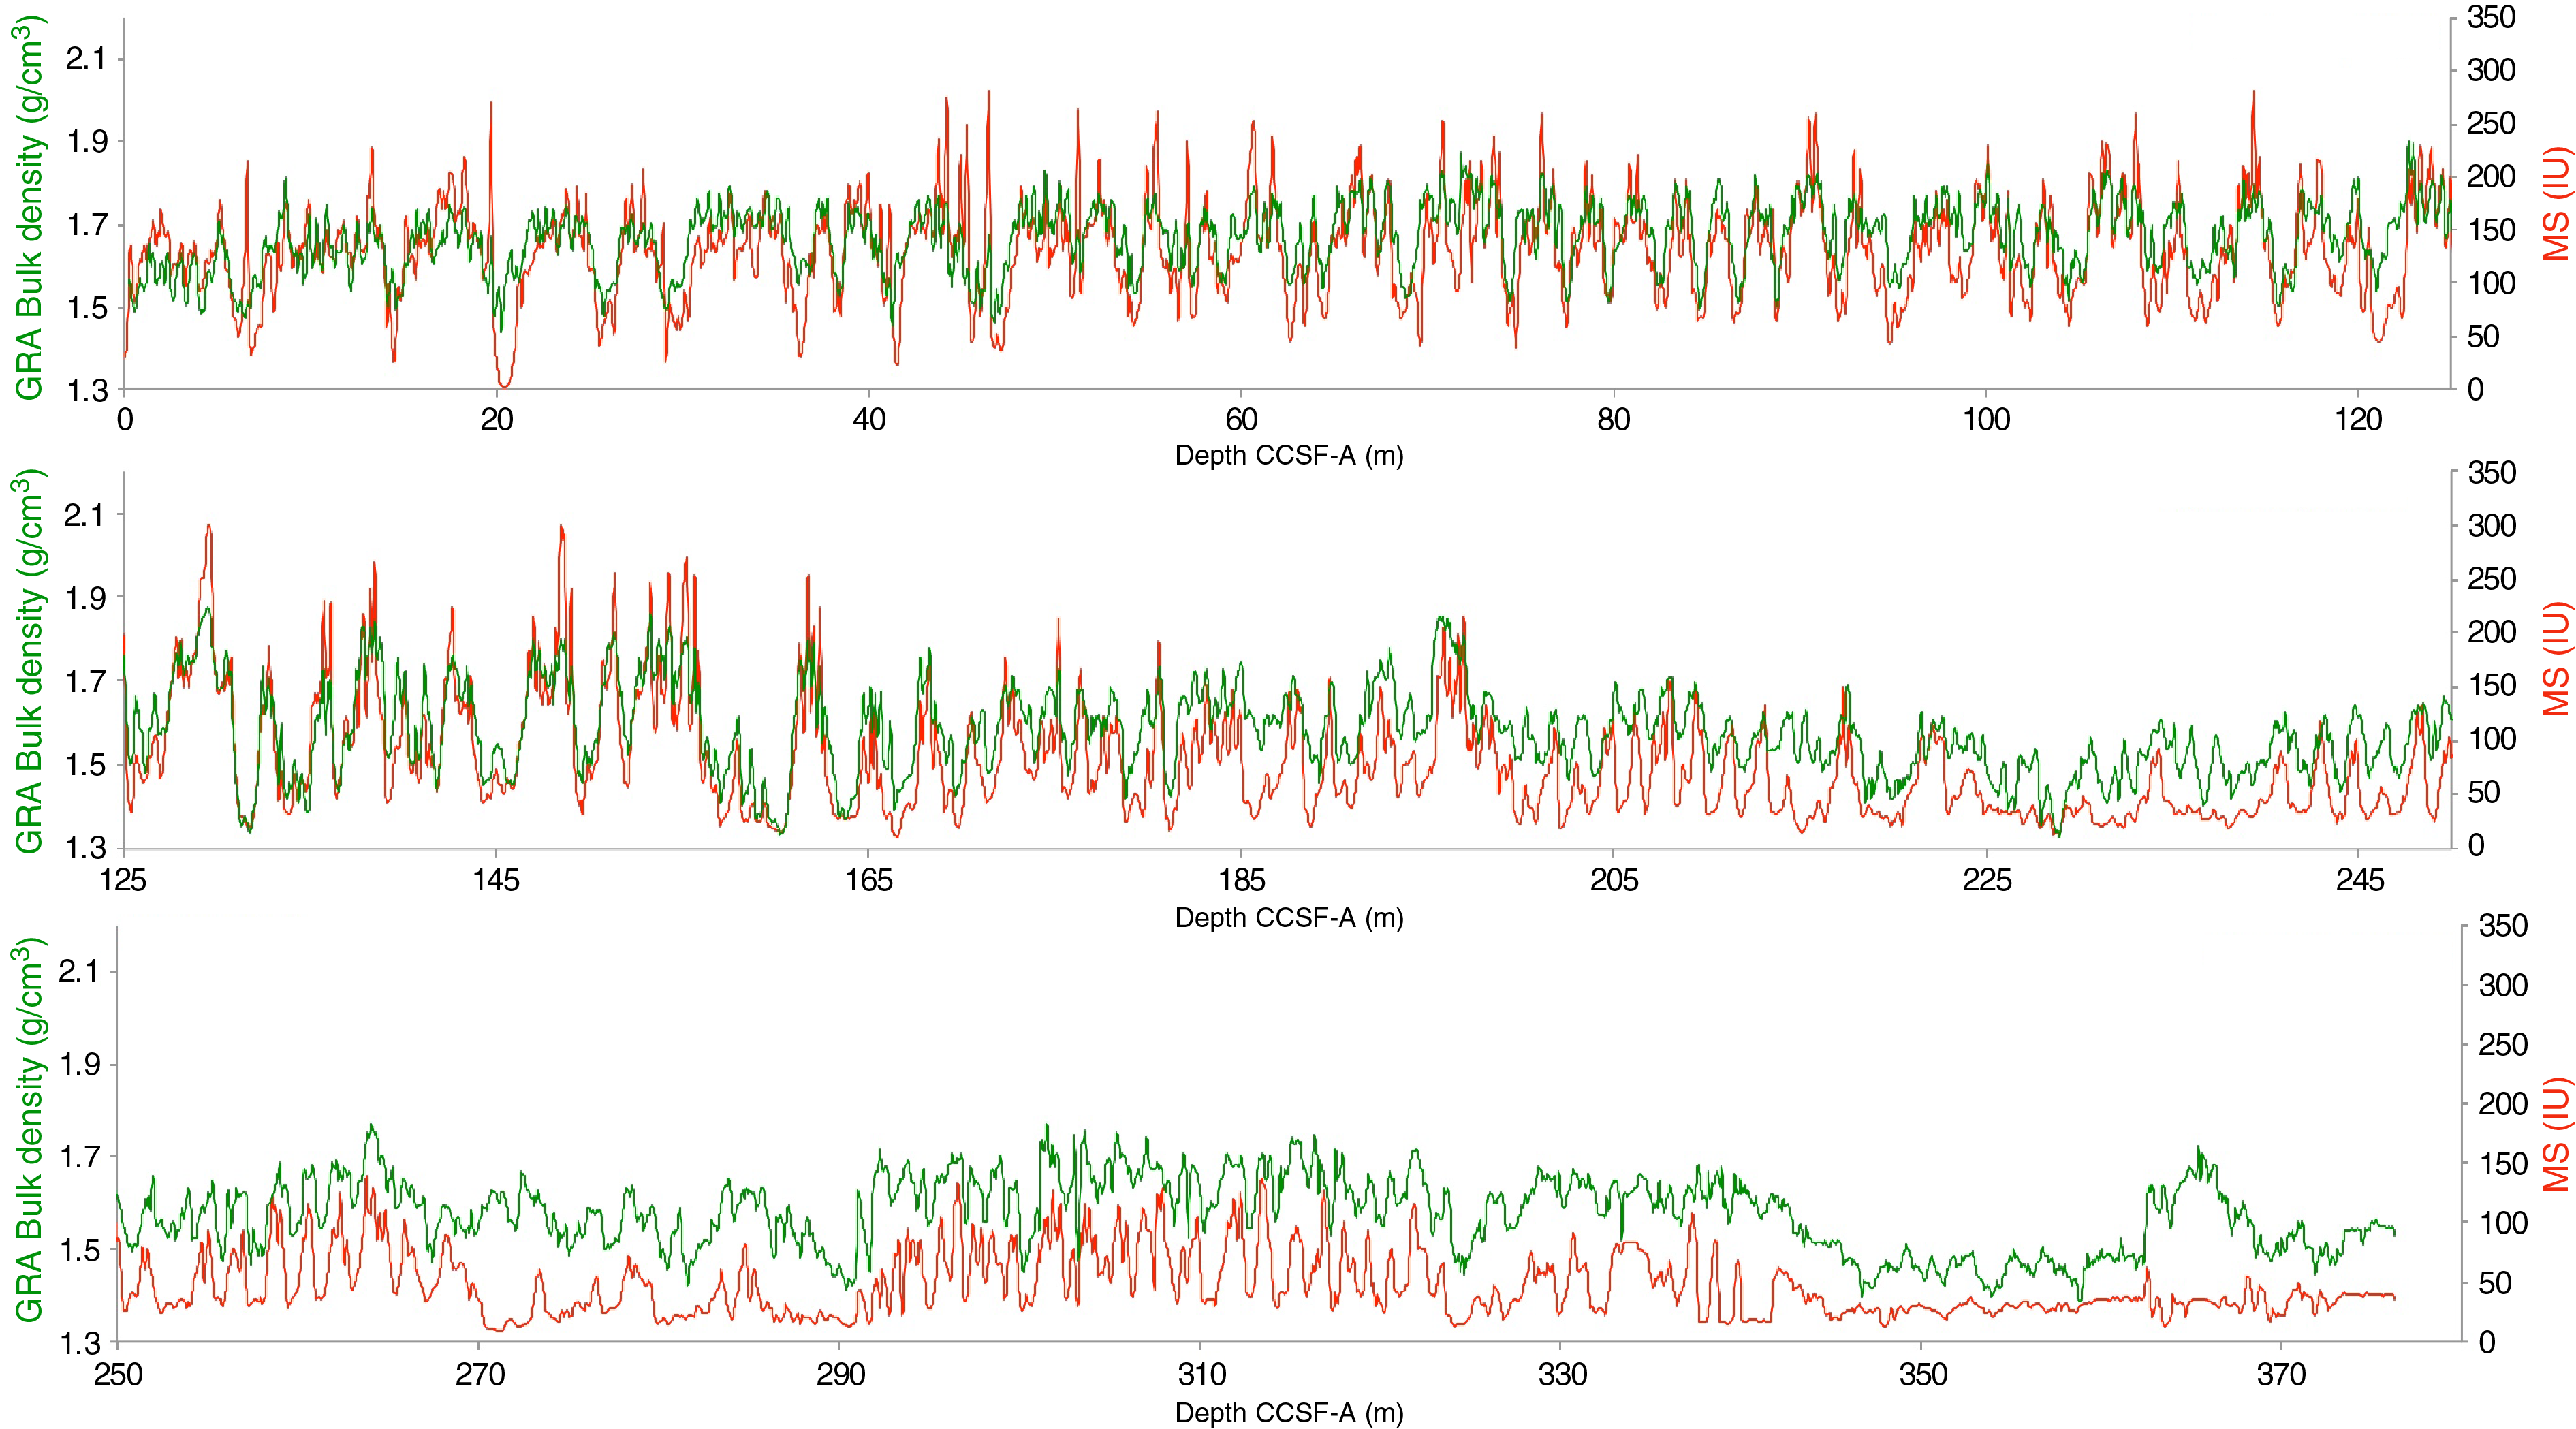
Figure F45. Splice data: WRMSL GRA bulk densities and MS.
Compressional P-wave velocity
P-wave measurements from the WRMSL indicate variations between 1474 and 1545 m/s and a few maximum values as high as 1624 m/s (Figure F46). The measurements carried out using the PWC on working halves vary from 1472 to 1536 m/s, and a linear relationship is observed between the whole round and section half core analyses, although with a low r2 correlation coefficient of 0.272. However, differences between the PWC and the WRMSL measurements are within 20 m/s and lower than the indicated reproducibility for the PWC, which is ±40 m/s. The highest values correspond to thin diatom layers. The first two cores of Hole U1543A and the first core of Hole U1543B, which have a water content between 43 and 50 wt%, indicate low values with a mean of 1480 m/s that is the P-wave velocity in water. Clear oscillations and cycles like those occurring in other physical properties are observed in the two holes: shorter term variations and a superimposed longer term trend. P-wave velocity increases to the bottom of the record from mean values of ~1520 m/s for the lowermost 30 m of the record. The relationship to GRA is changing throughout the hole (Figure F47). Both GRA and P-wave velocity values decrease in Lithofacies 4 (nannofossil ooze). GRA values decrease in Lithofacies 6 (diatom ooze) because of the higher water content, but P-wave velocity increases presumably because of the higher grain size of the diatom ooze.
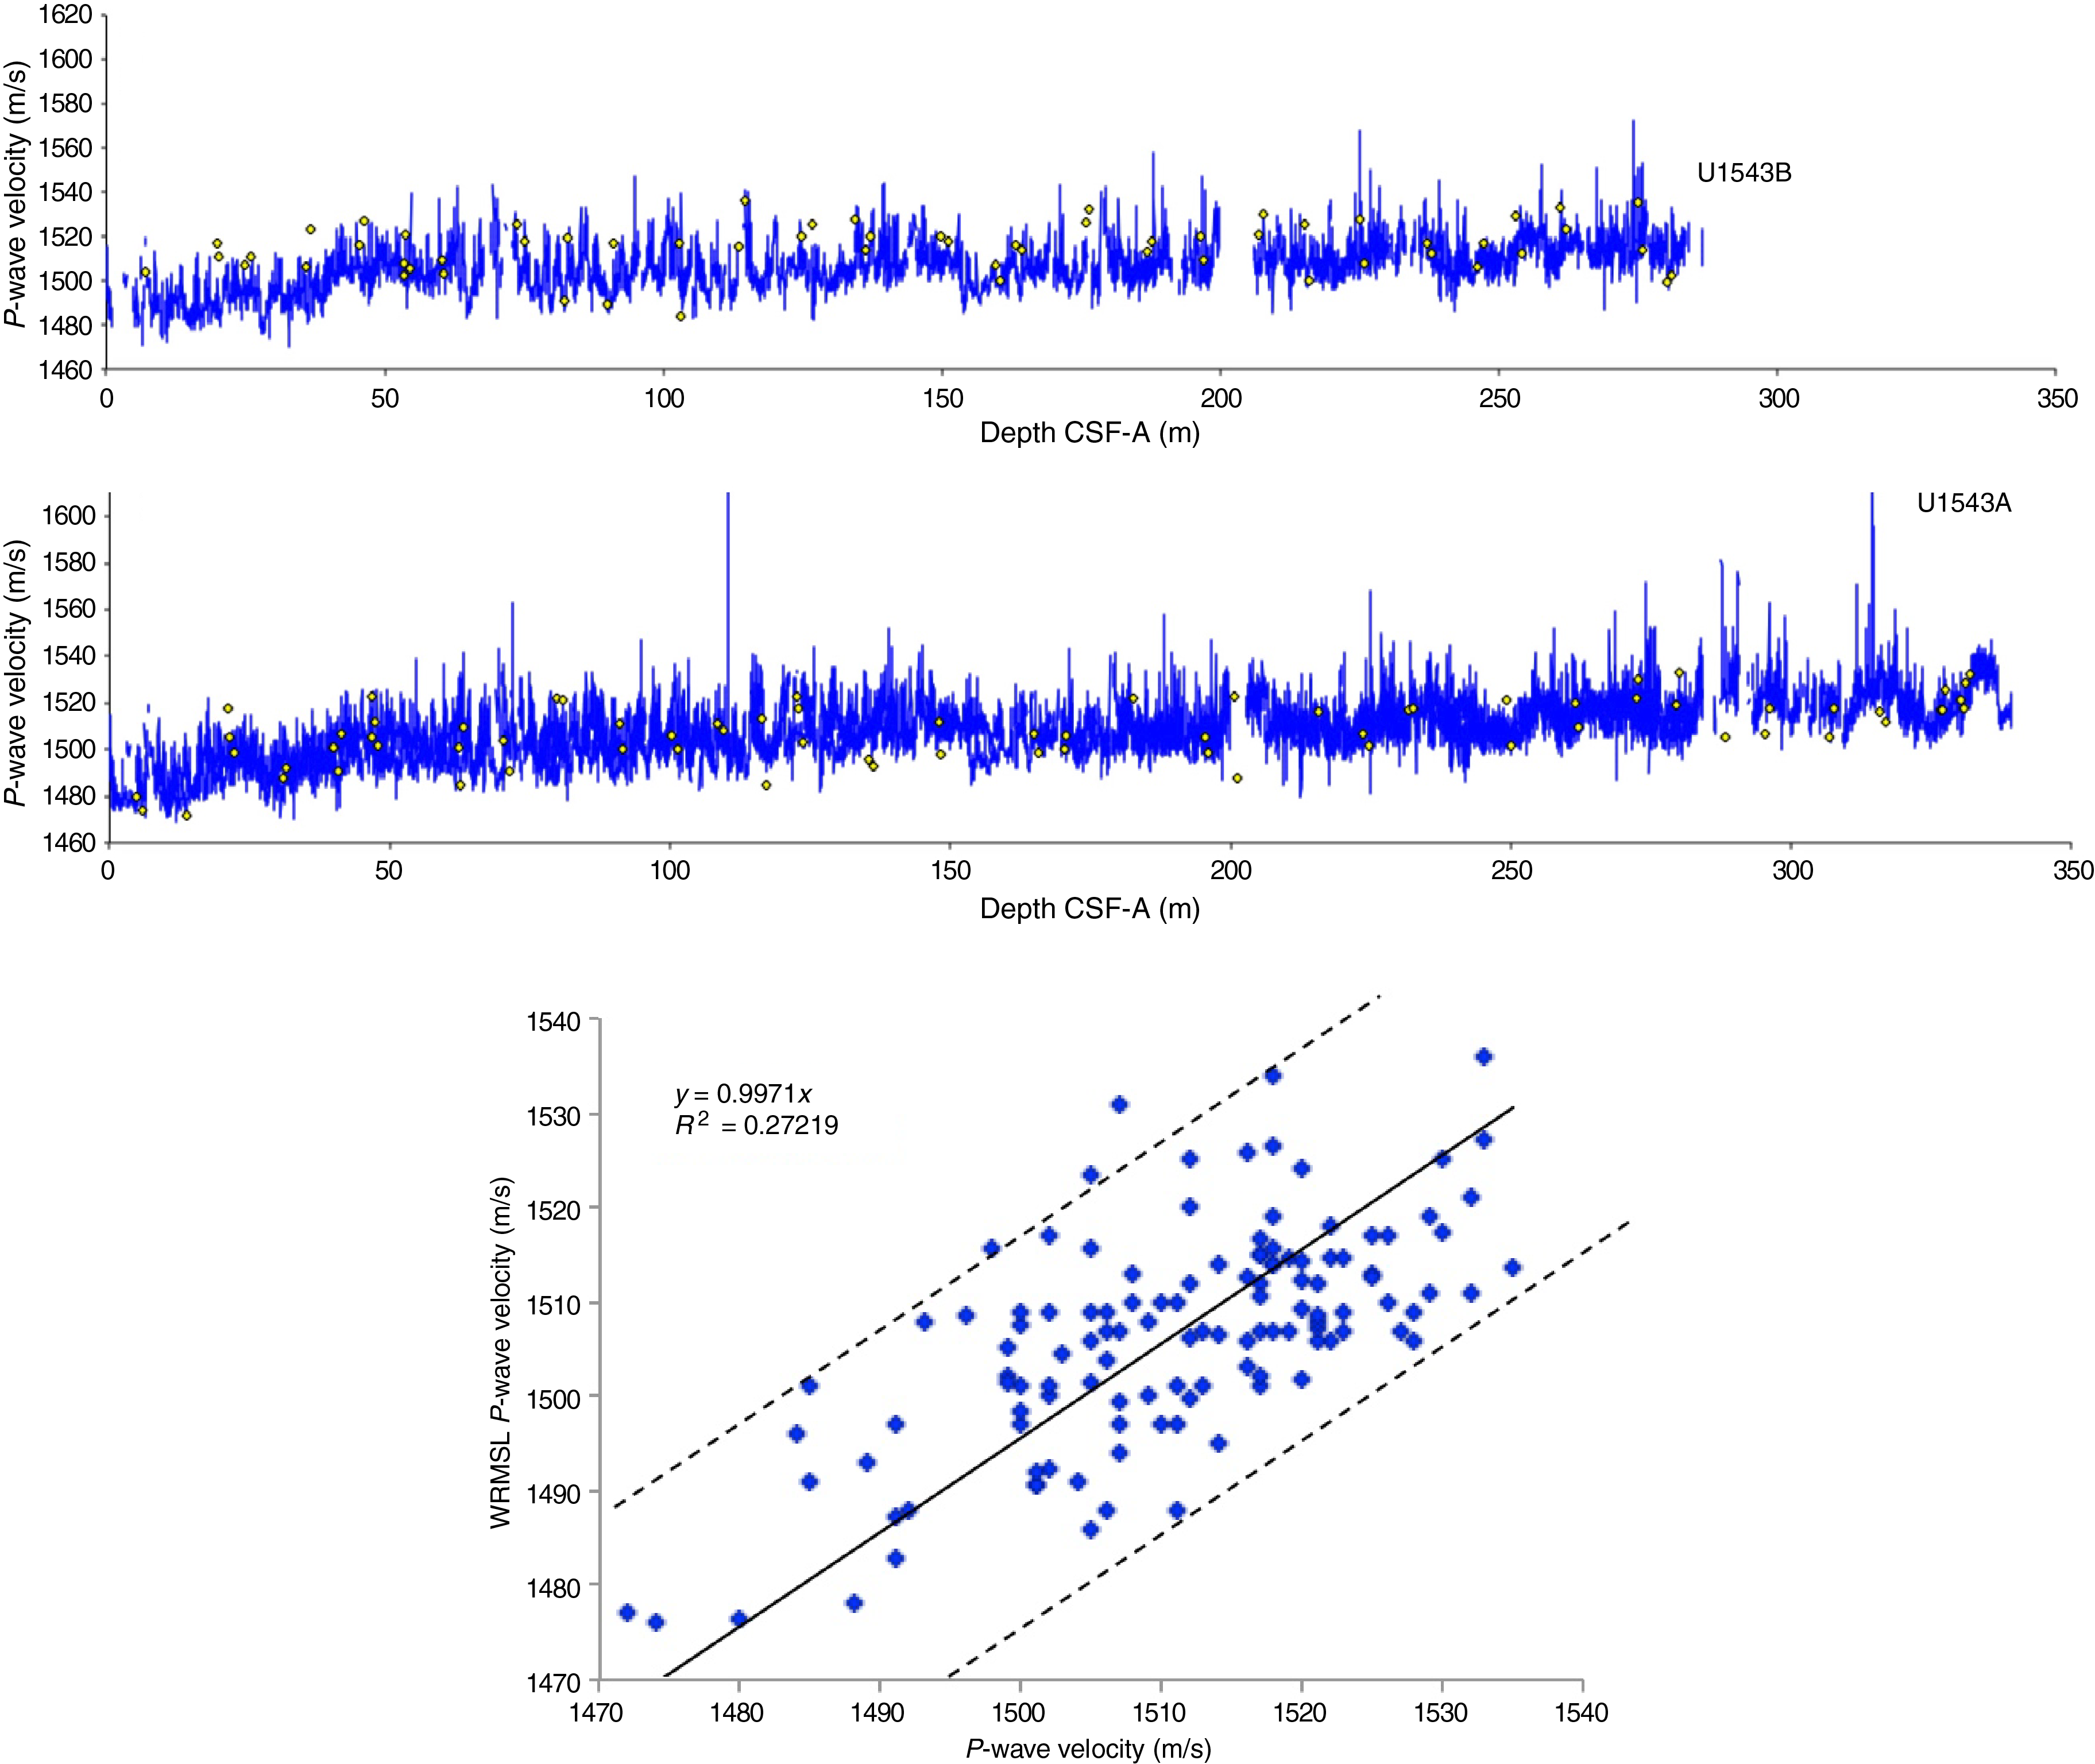
Figure F46. P-wave velocity.
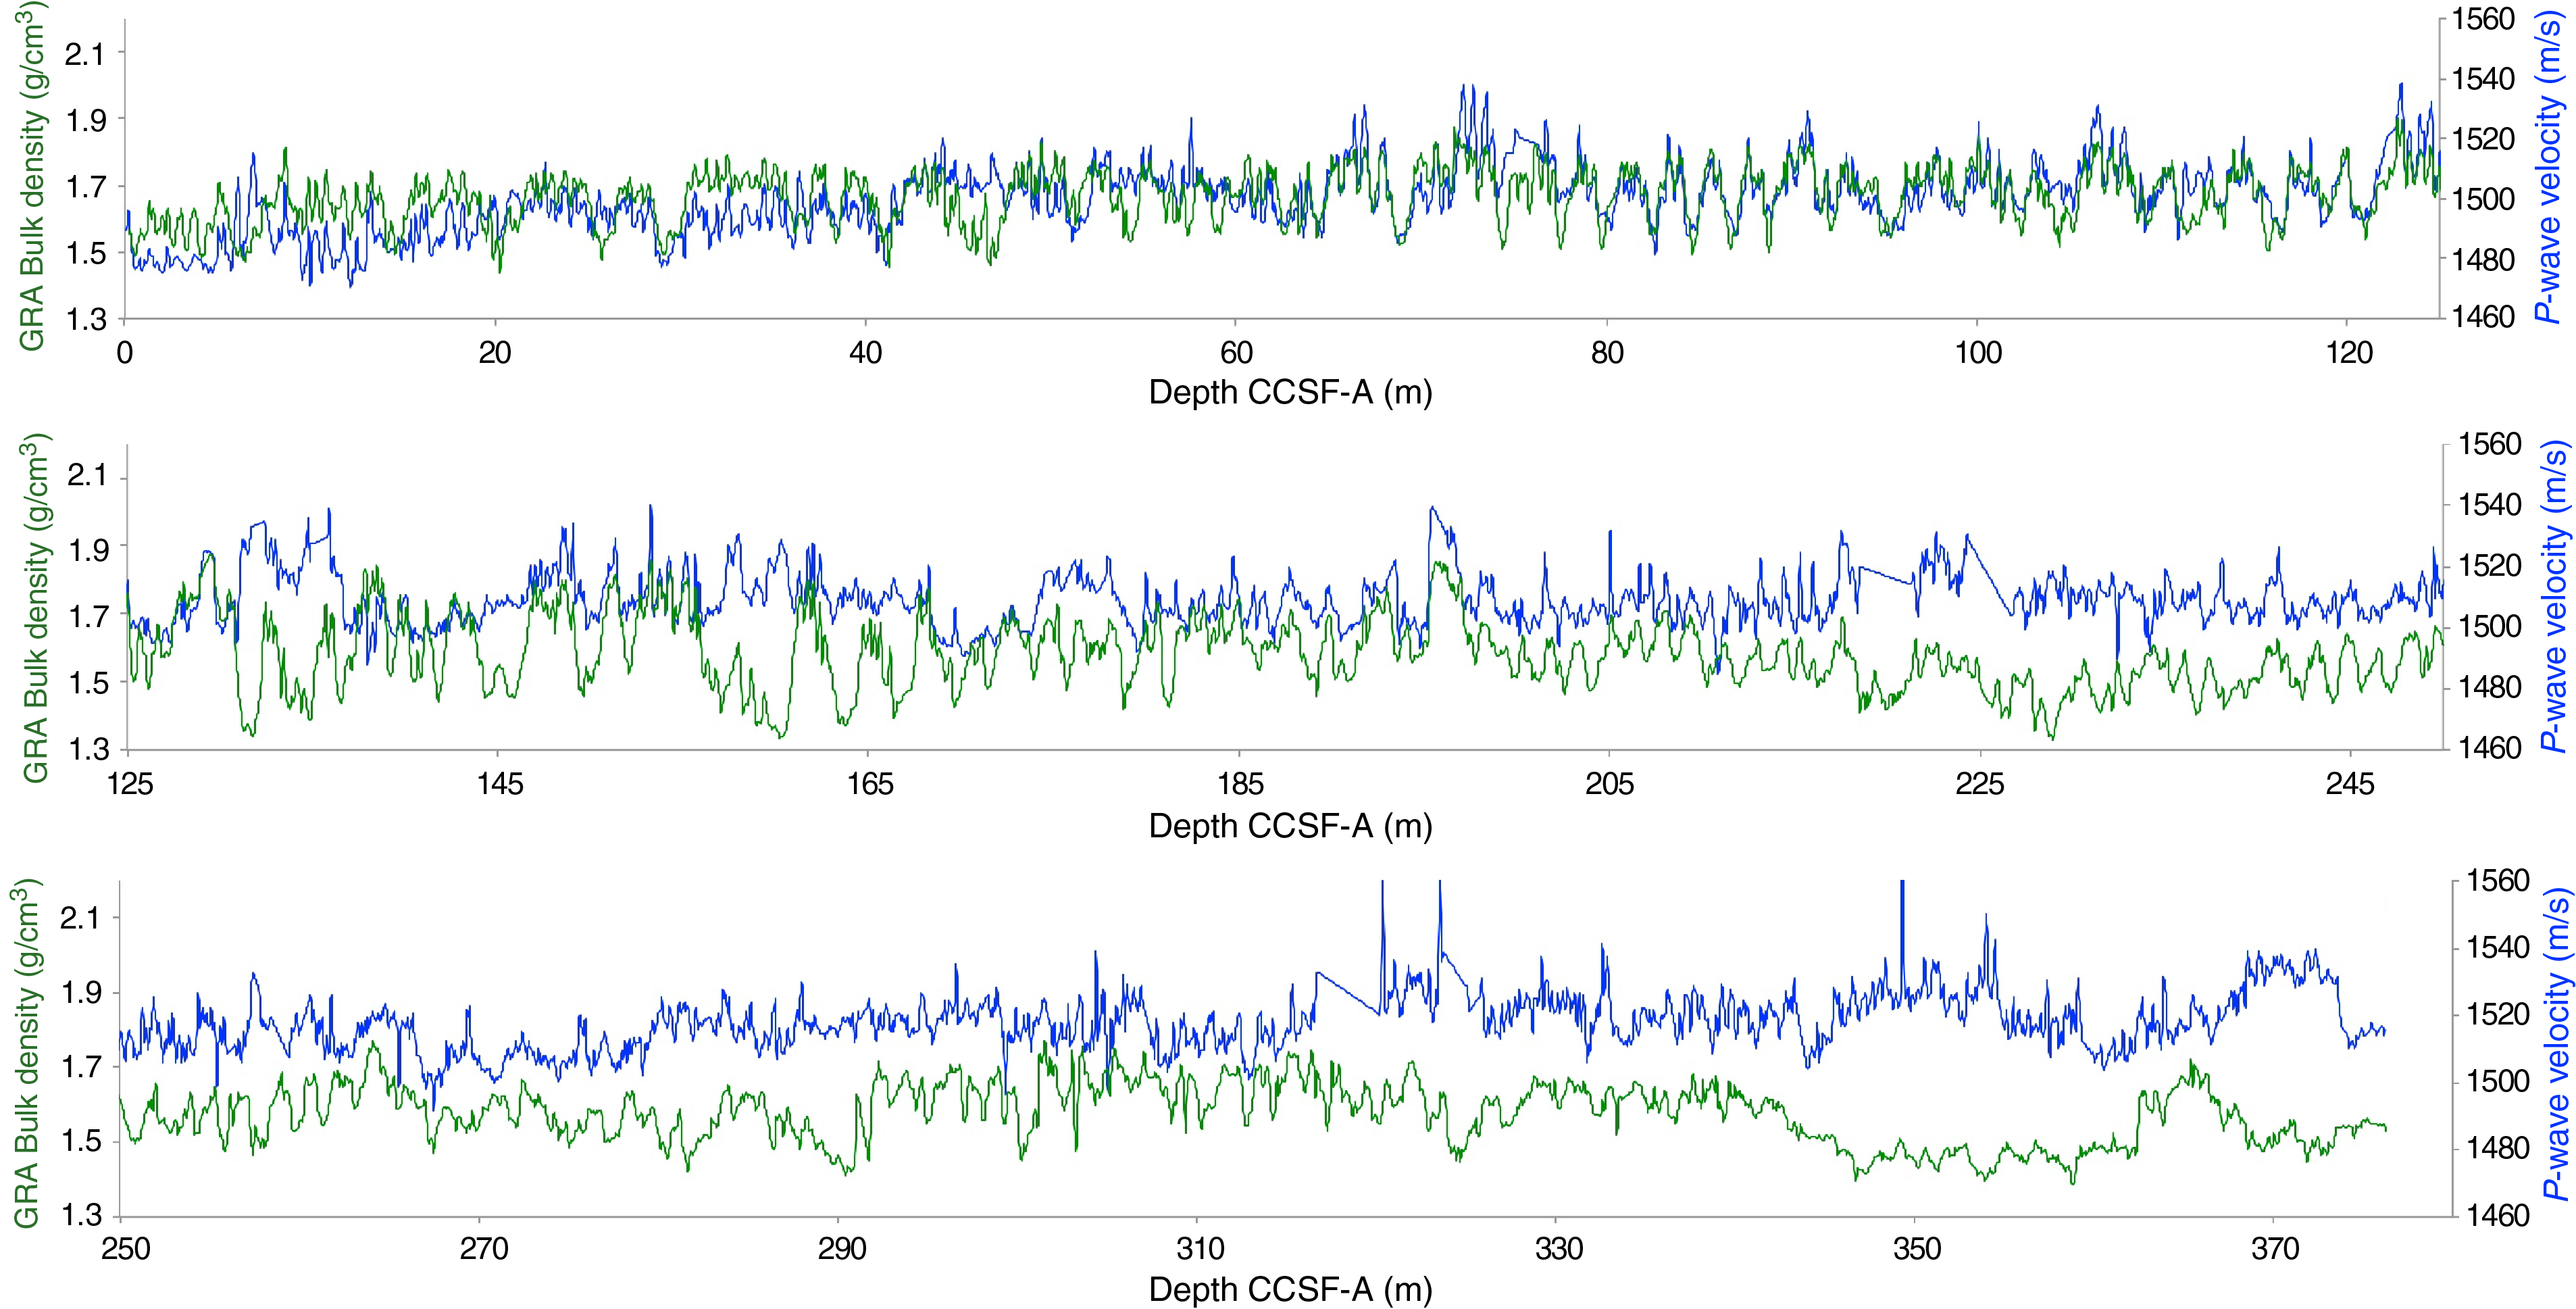
Figure F47. Splice data: WRMSL GRA bulk density processed and WRMSL P-wave velocity.
P-wave velocity and GRA records are positively correlated from 0 to 130 m CCSF-A, an interval that mainly corresponds to changes of silt/clay and nannofossil content (Figure F47). From 130 to 170 m CCSF-A, GRA and P-wave velocity records are mainly anticorrelated, corresponding to the alternation between Lithofacies 6 (silt-bearing and clay-bearing/clayey diatom ooze) and Lithofacies 8 (silt-bearing clay to clay-bearing silt). From 180 to 220 m CCSF-A, the lithostratigraphy indicates mainly Lithofacies 4 and 8, and GRA and P-wave velocity are mainly positively correlated with a few peaks where they are anticorrelated, corresponding to an increase in the diatom content. Finally, from 260 m CCSF-A to the bottom of the record, GRA and P-wave velocity are mainly correlated, corroborating the higher presence of diatoms.
Thermal conductivity
We measured thermal conductivity for Hole U1543A, with mostly one measurement series per retrieved core (Figure F48). For all 36 measurement sets, we used the needle probe on whole-round sections, and in almost all cases, a sufficiently high number of solutions were identified through the TK04 thermal conductivity meter software setup. Overall, thermal conductivity values show a long, nearly linear decrease across Hole U1543A, with only small scatter compared to previous sites. One value set yielded a local minimum of 0.83 W/(m·K) in Section 383-U1543A-8H-3 (67.85 m CSF-A) compared to higher, neighboring values of 1.14 and 1.12 W/(m·K), respectively. However, these low values show no correlation with specific sedimentary or other physical properties facies at that same core depth. In general, however, diatom- and nannofossil-rich oozes are characterized by lower thermal conductivity than terrigenous sediment at this site. Despite their low resolution and some scatter, thermal conductivity mean values might follow rhythmic changes in sediment composition with recurring peaks on a ~60–77 m scale and a shorter recurrence of around 30–40 m ultimately linked to long-time climate variability.
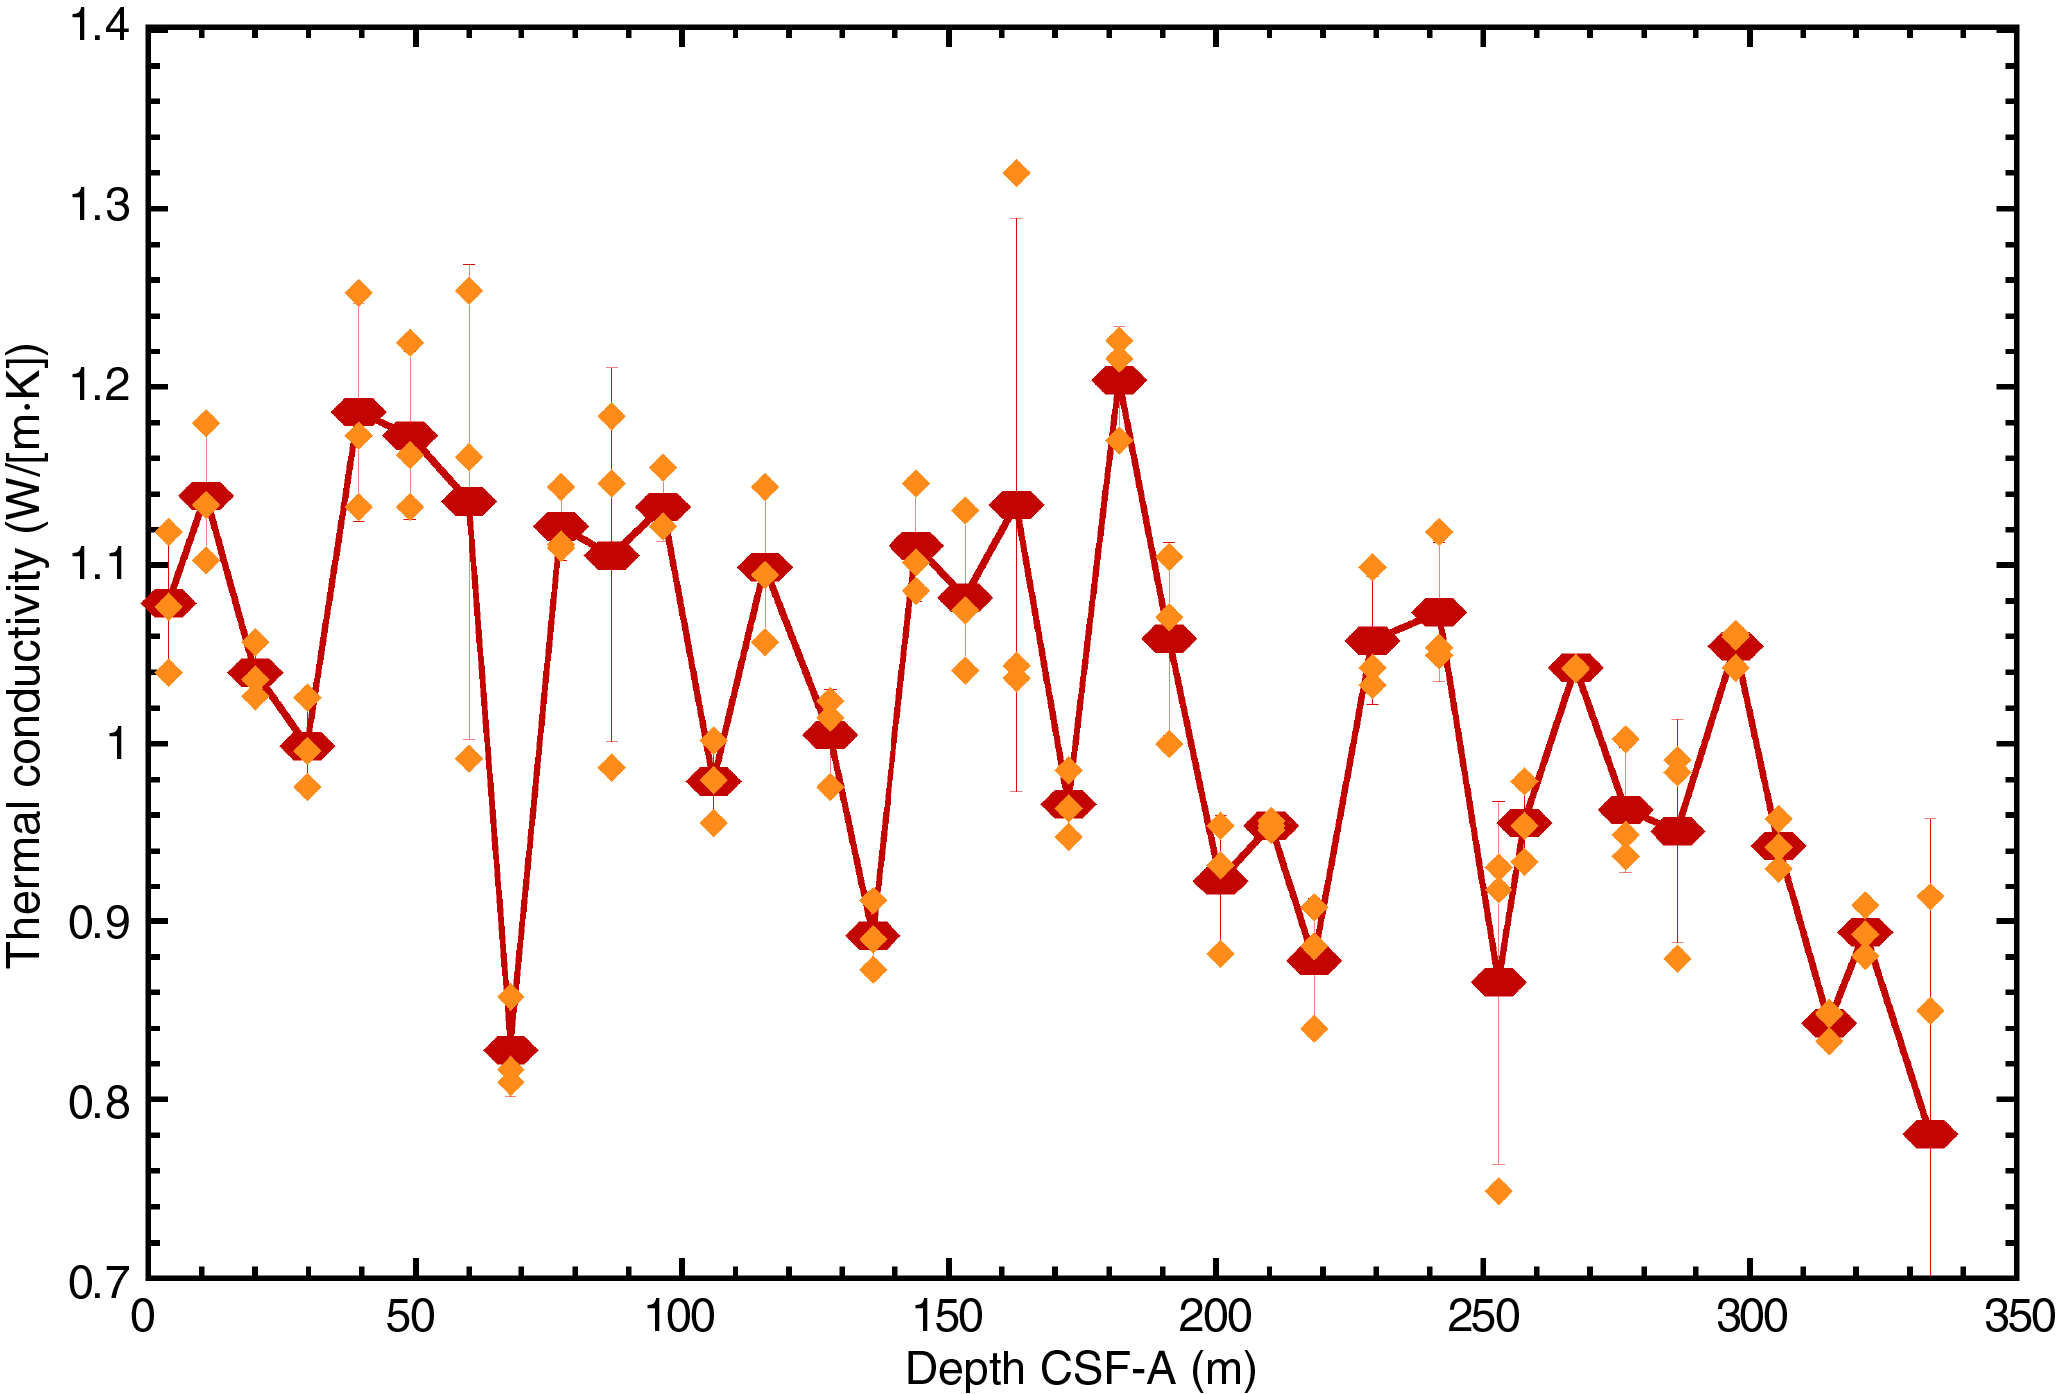
Figure F48. Thermal conductivity data.
Summary
Data acquired from whole-round measurements for Site U1543 are generally in good agreement with those from split-core measurements (Figures F40, F43, F46). For Site U1543, MS, bulk density, and NGR* are positively correlated; higher values correspond to higher terrestrial component in the sediment (Lithofacies 7 and 8), and lower values correspond to increased biogenic components (Lithofacies 4, 6, and 10) (see Sedimentology). Although some minima in those physical properties correspond to changing lithofacies, the physical properties also record subtle changes between terrestrial and biogenic components at both higher resolution and along long-term changes, contributing to the reconstruction of warm and cold climate intervals and providing a promising target for correlation with a isotopic stratigraphy. Furthermore, GRA and P-wave velocity show different behavior for increased nannofossil and diatom presence in Lithofacies 8 (both values decrease for increasing nannofossil content), and GRA decreases whereas P-wave velocity increases in intervals with high diatom content. It is thus possible, by combining the different high-resolution physical property records (GRA, MSL, and PWL), to interpret variations as either changing diatom or nannofossil content within the terrigenous Lithofacies 8.
Downhole measurements
In situ temperature and heat flow
In Hole U1543A, we carried out seven downhole formation temperature measurements using the APCT-3 tool (Table T12). Calculated in situ formation temperatures were derived from the TP-Fit software routine and show a nearly linear increase with depth from 1.81°C at 35.6 m CSF-A to 5.24°C at 206.6 mbsf (Figure F49). The scatter is relatively small, probably due to the relatively high number of deployments in this hole, which reduces uncertainty and helps in identifying outliers or anomalous values. One deployment for Core 383-U1543A-13H at 121.1 mbsf yielded a downhole temperature inversion of 2.38°C. Nonetheless, we used all derived shipboard measurements for calculations of heat flow data because inspection of log sheets and raw data showed no obvious problems when taking Core 13H except for an overpull notation. In contrast, the two deeper APCT-3 tool readings were marked with relatively high heave of about 4 m and thus are less ideal temperature dissipation profiles from the derived temperature log information.

Figure F49. APCT-3 tool heat flow calculations.
Average bottom water temperature was calculated to be 1.260°C, and the recorded minimum was 1.241°C (Table T12). The APCT-3 tool core cutting shoe was routinely placed at the mudline for ~5 min, and the mud pumps were switched off before lowering the tool to target depth. These values represent the average of the means of all seven APCT-3 tool temperature regression series at the mudline level and should be regarded as approximations of true bottom water temperatures. True bottom water temperatures are broadly within the expected temperature range based on World Ocean Atlas 2009 data from Site U1543 (Locarnini, 2010).
Thermal conductivity for Hole U1543A under in situ conditions was estimated from laboratory-determined conductivity measurements using established methods (Pribnow et al., 2000; Hyndman et al., 1974) (see Physical properties in the Expedition 383 methods chapter [Winckler et al., 2021]). Thermal resistance was calculated by cumulatively adding the inverse of the in situ thermal conductivity values over depth intervals downhole (Figure F49). A calculated heat flow of 19 mW/m2 for Hole U1543A was obtained from the slope of the linear fit between in situ temperature and thermal resistance (Pribnow et al., 2000). These values from Site U1543 are relatively low in comparison to those obtained at shallower Site U1542. Values are, however, comparable to those from Site U1539 (11–12 mW/m2), which is located east of the EPR at a similar water depth. This similarity between sites indicates a fairly uniform crustal environment across the study region, despite differences in deposited sedimentary facies and accumulation rates. Comparable low values between 10 and 25 mW/m2 were observed in previous studies (Hensen et al., 2019), although heat flow data density in the subpolar South Pacific is, as stated previously, among the lowest for any oceanic region globally and exhibits high lateral gradients, implying a potential for laterally heterogeneous fluid flow and hydrothermal systems along and within the transform fault zone system near our sites (Hensen et al., 2019).
The geothermal gradient (gT) for Site U1543 is estimated to be ~19 K/km within the total measured depth interval based on a linear fit of temperature versus depth. Reported results were calculated based on a mean thermal conductivity of 0.99 W/(m·K), a core water depth of 3874 m, a sediment density of 1.80 g/cm, a bottom water temperature of 1.26°C, and a laboratory temperature of 18°C. Calculations for heat flow, resistivity, and geothermal gradient were checked for potential bias due to varying assumptions about the bottom water temperature, but reported results remain the same across various assumptions of bottom water temperature changes within a degree Celsius or less.
Stratigraphic correlation
Correlations between holes at Site U1543 were accomplished using Correlator software (version 3.0). Tie points were established mostly using the WRMSL MS data (Figure F50), but in a few cases a combination of measurements was used (Table T13). We constructed a splice from 0 to 325.0 m CCSF-A using Holes U1543A and U1543B (Table T14; Figures F50, F51, F52). The splice contains two gaps that resulted from significant coring disturbance in two cores that could not be used in the splice, as detailed below. Below 317.3 m CCSF-A, only a single hole (U1543A) was drilled, so the last five cores from Hole U1543A were appended to the bottom of the splice.
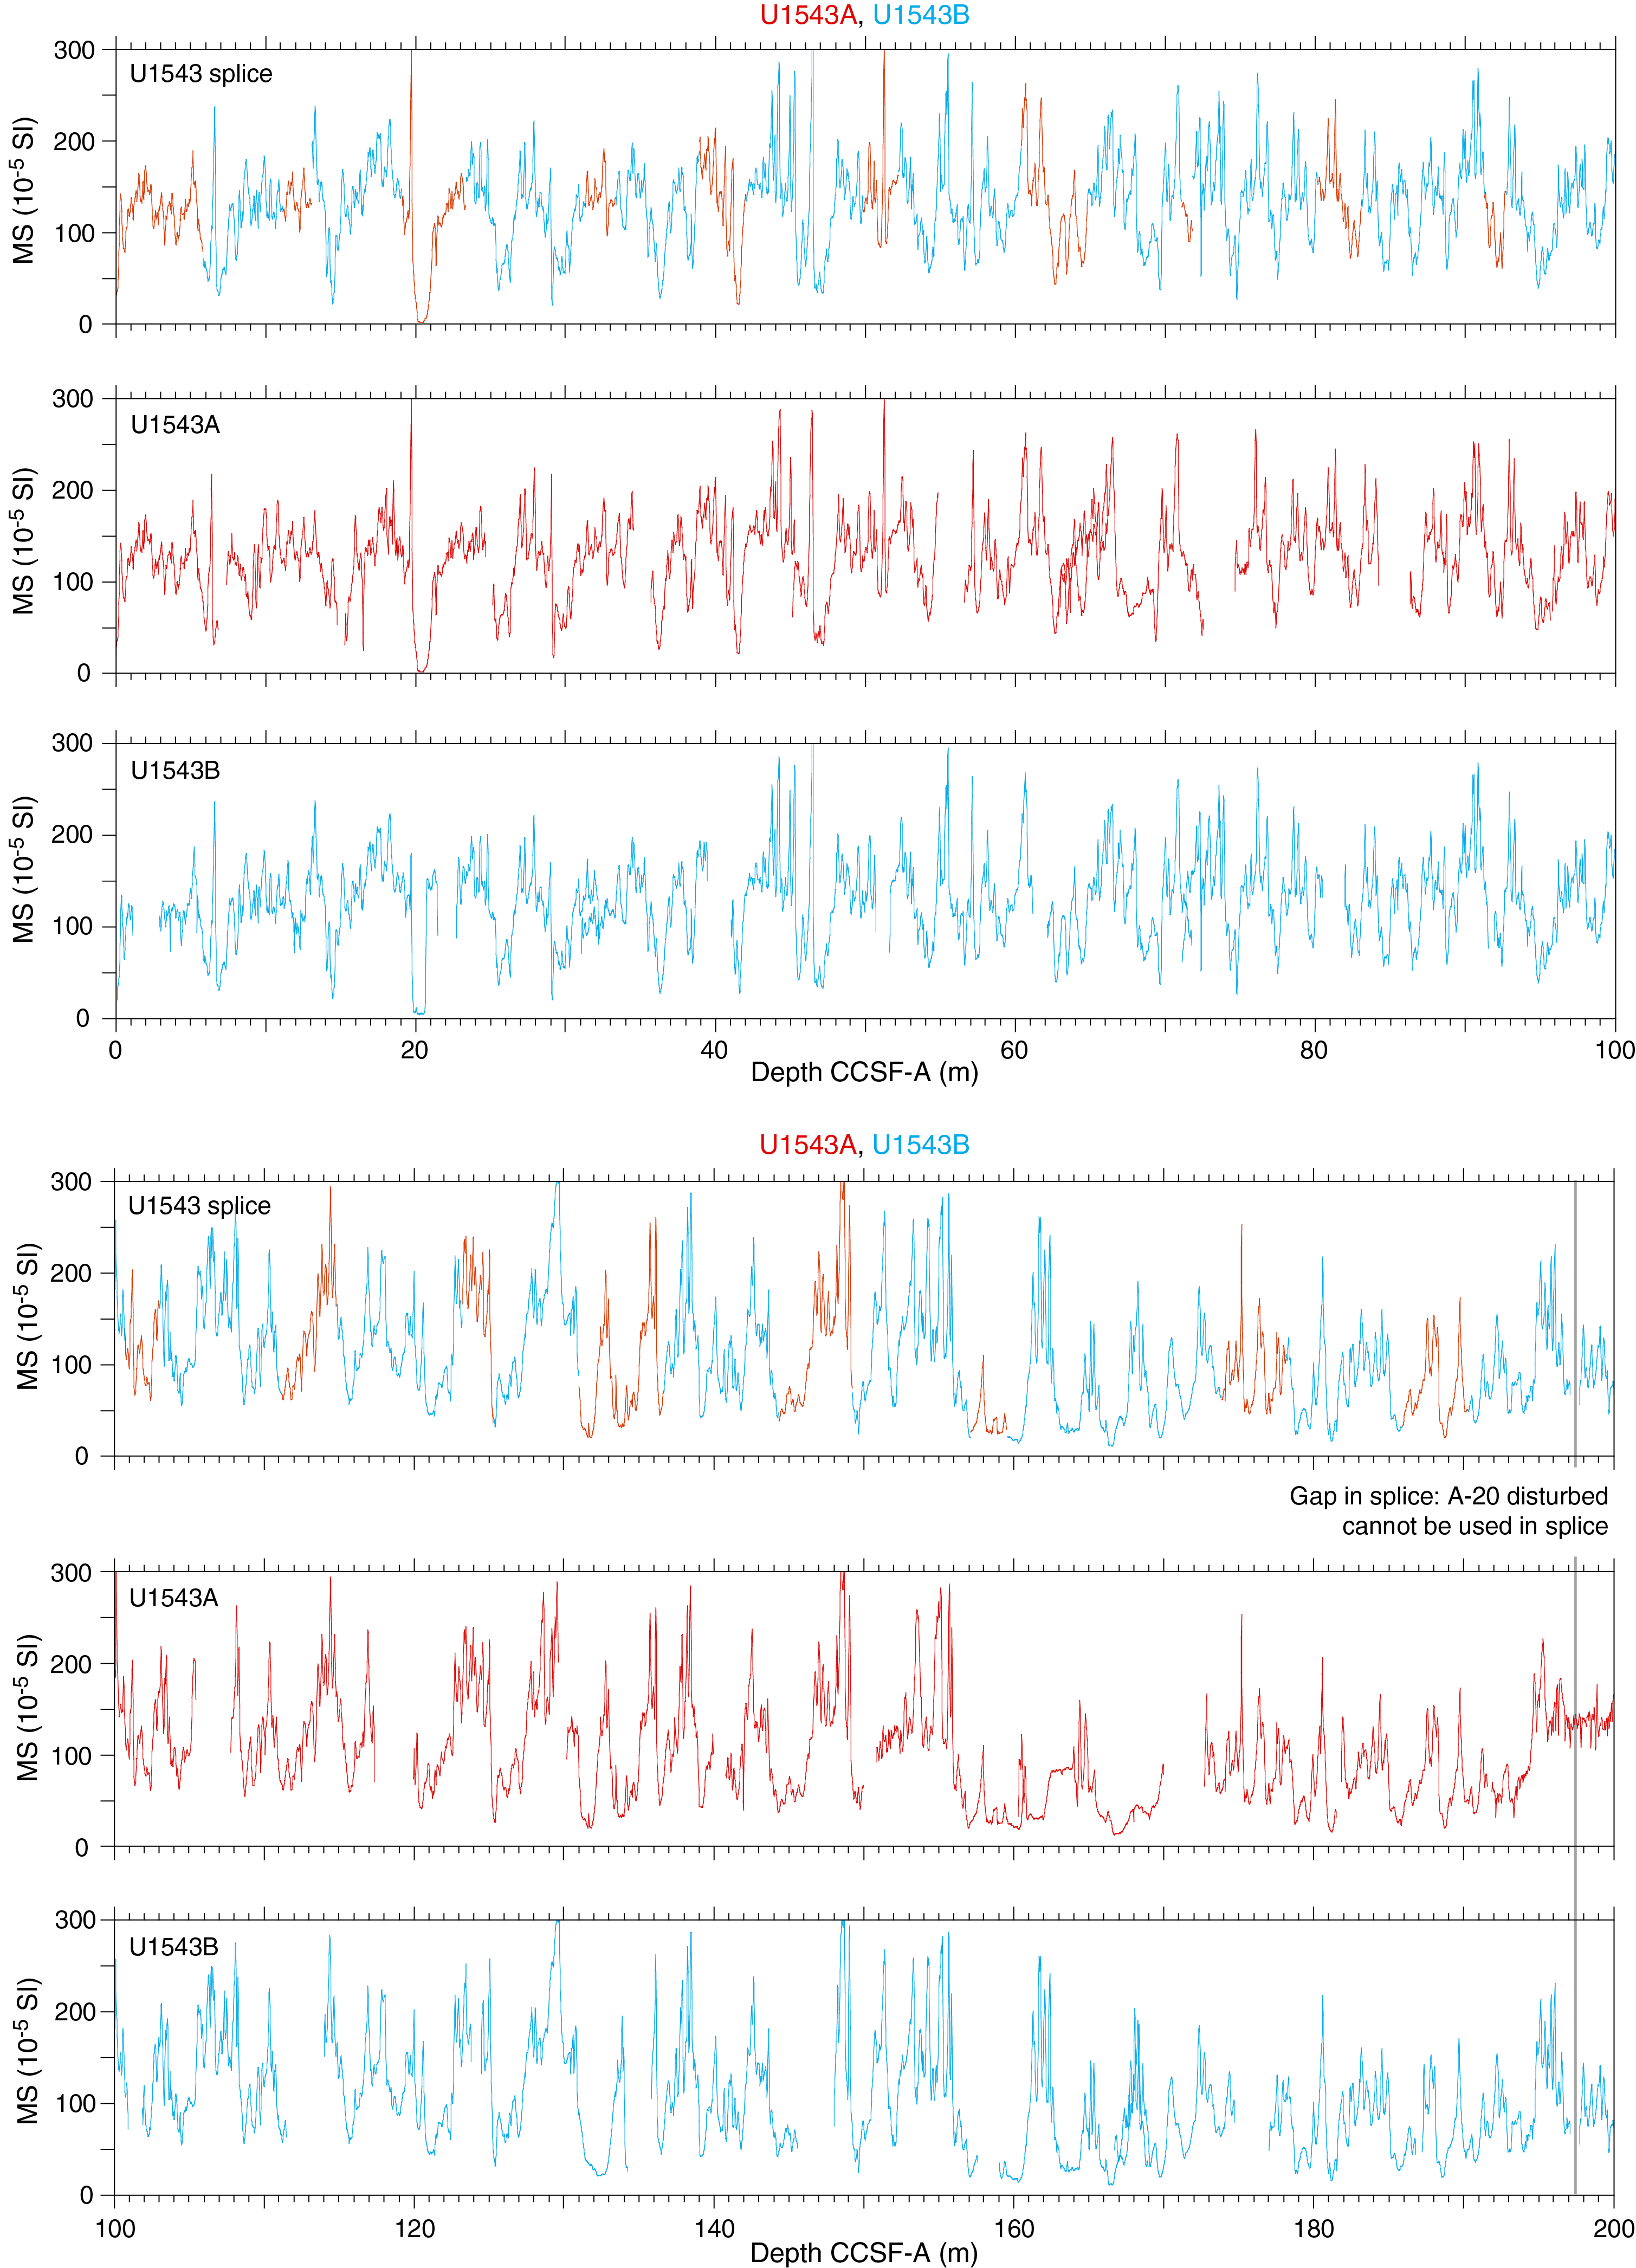
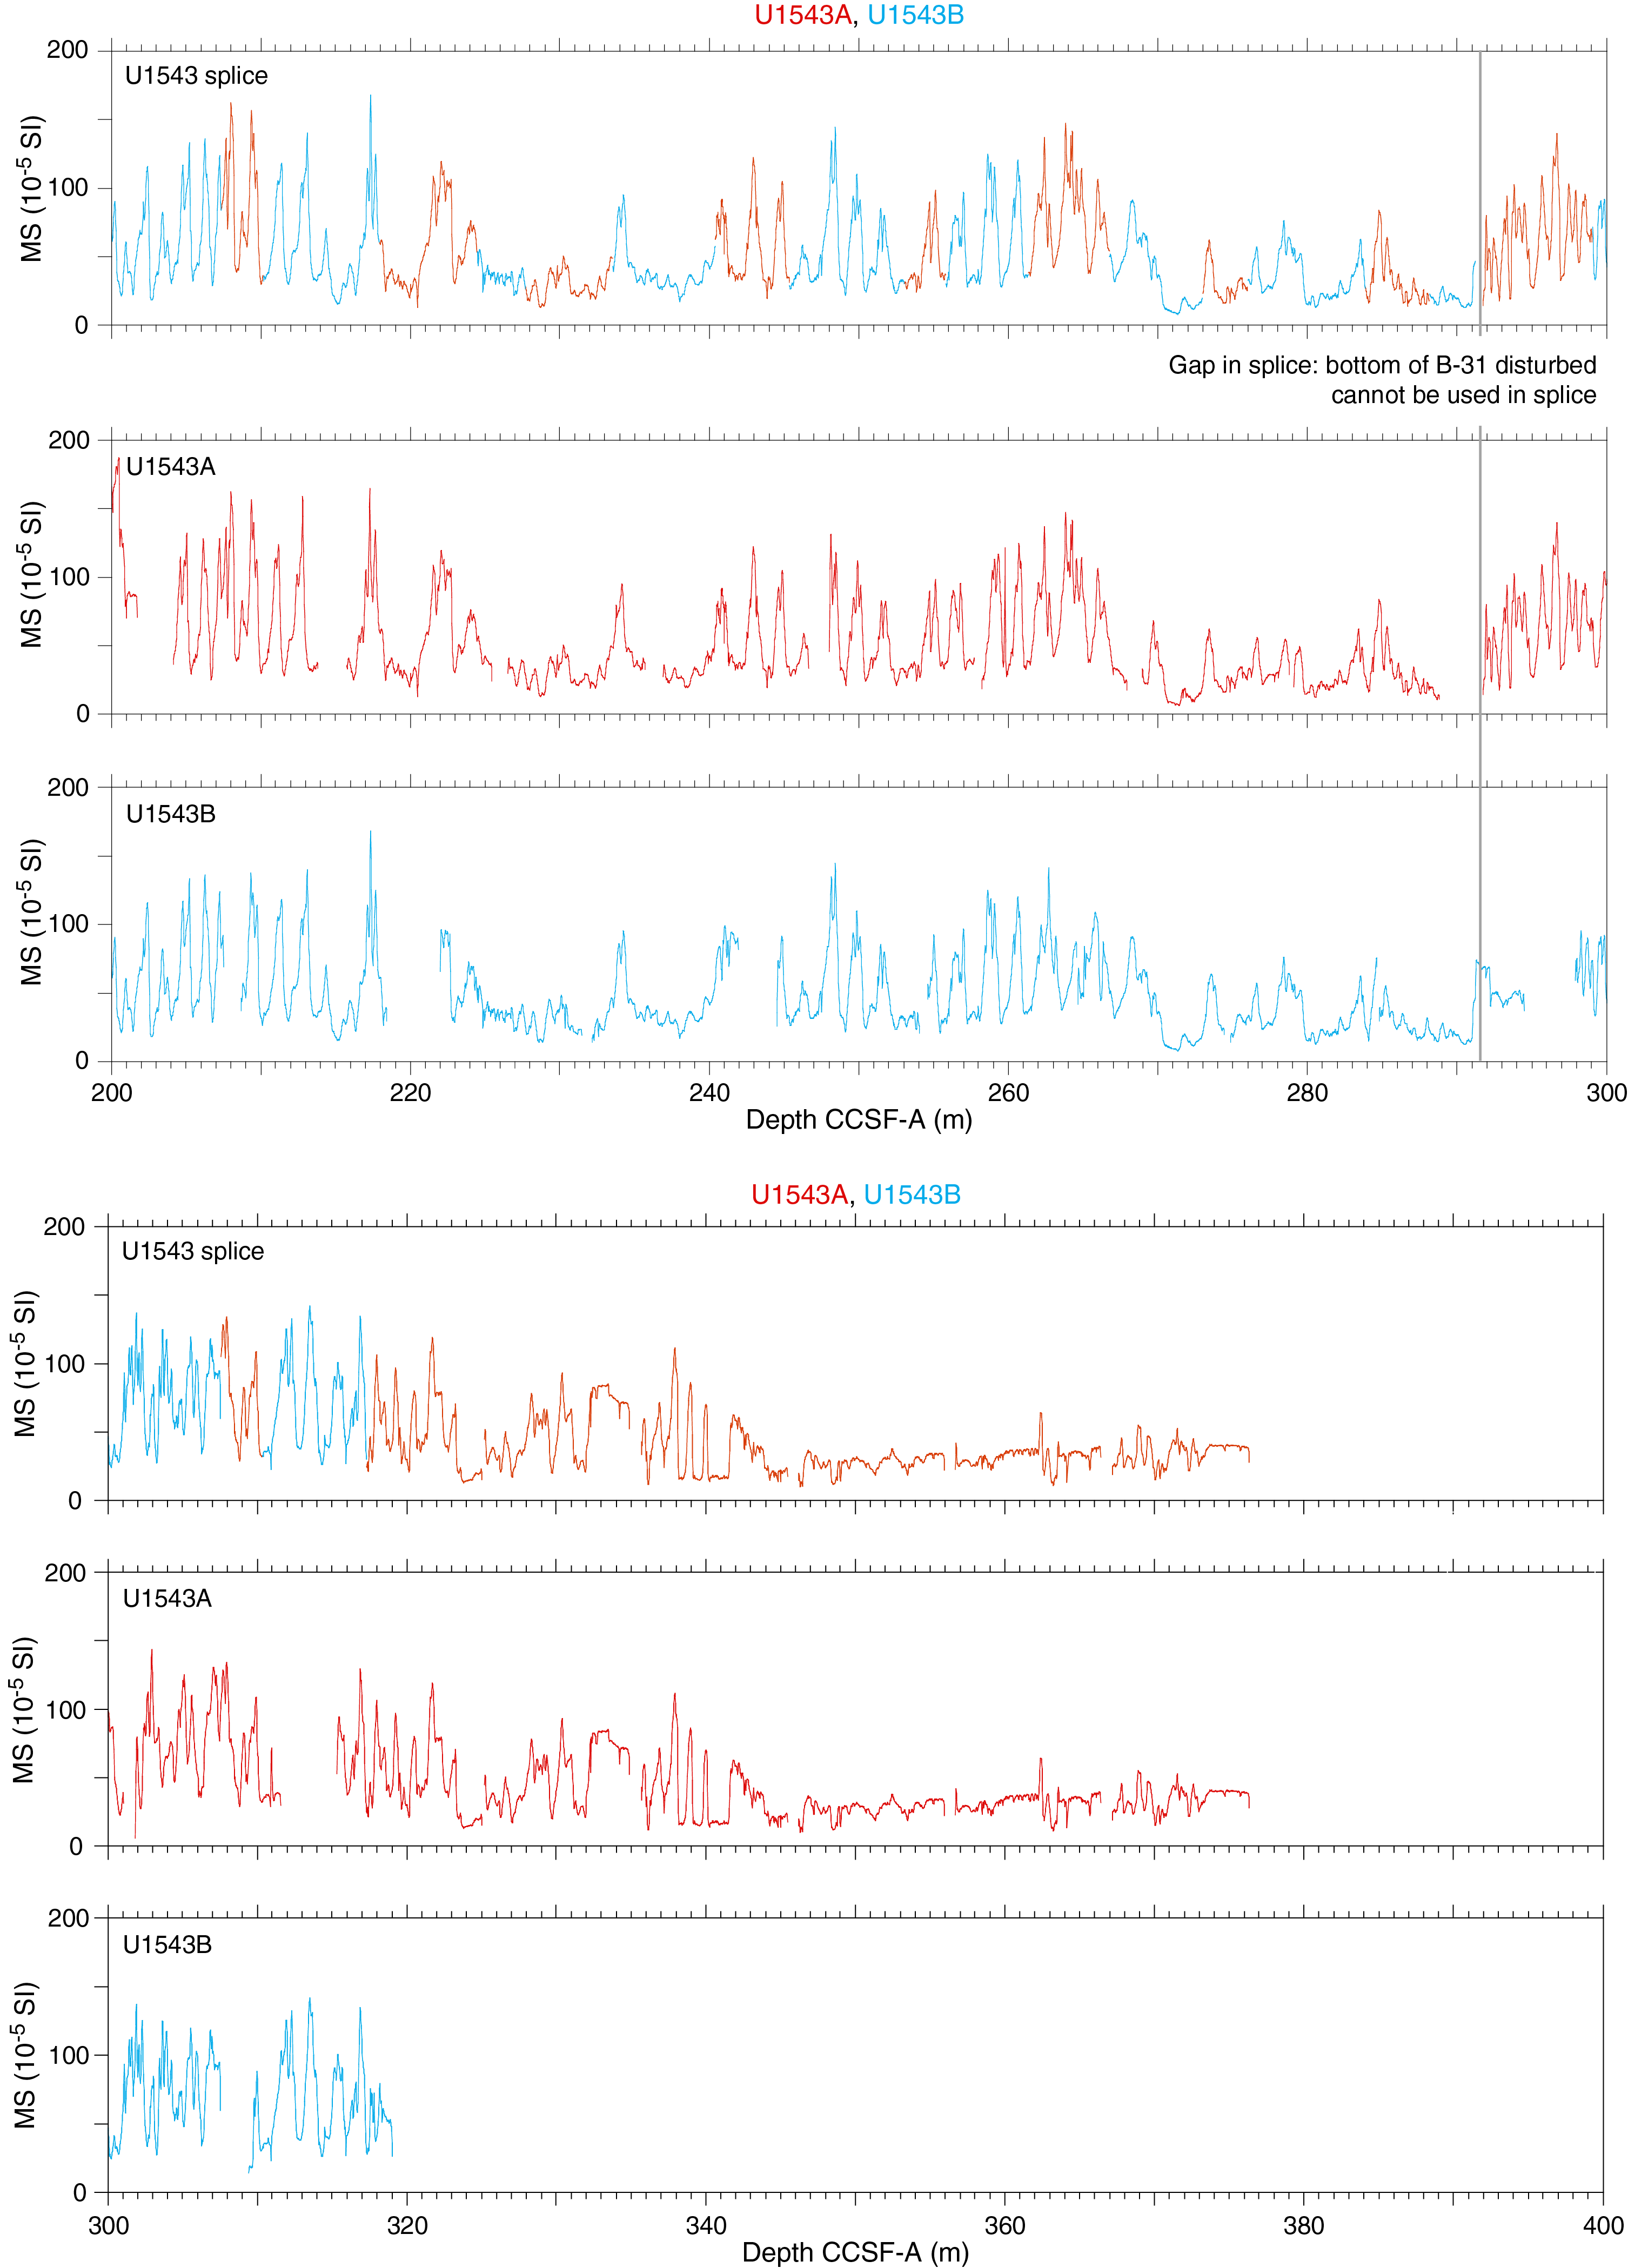
Figure F50. WRMSL MS.
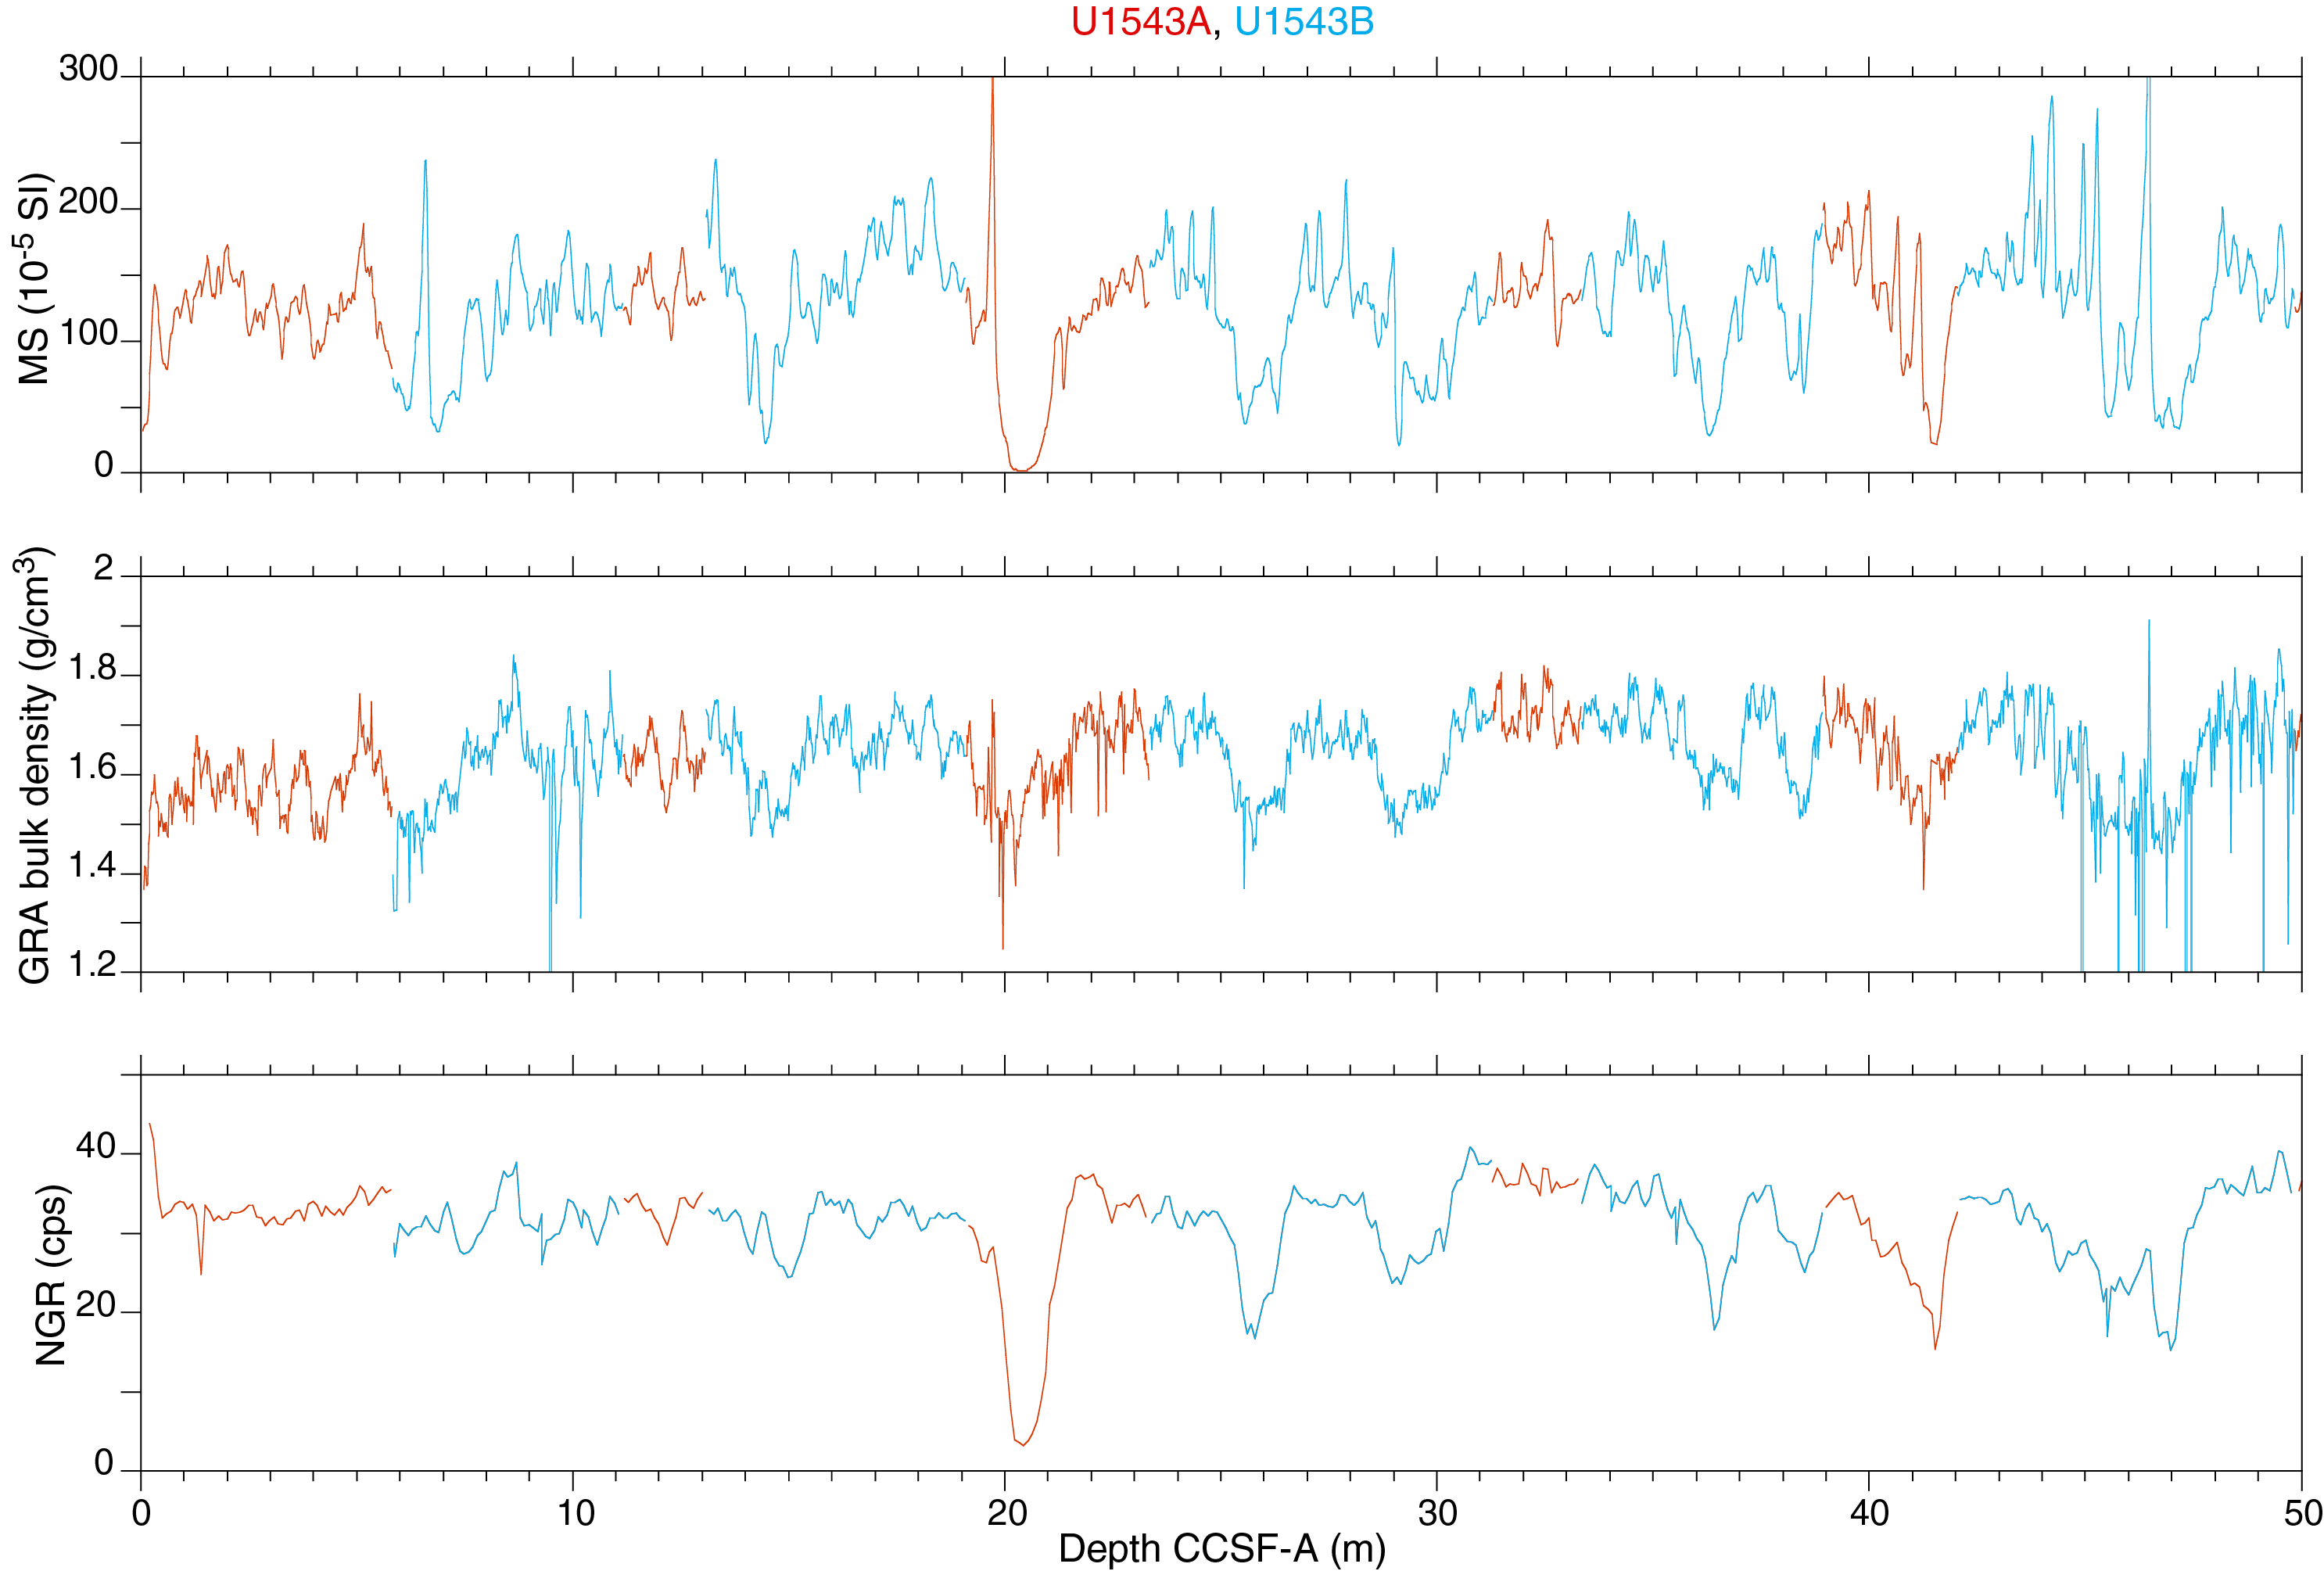
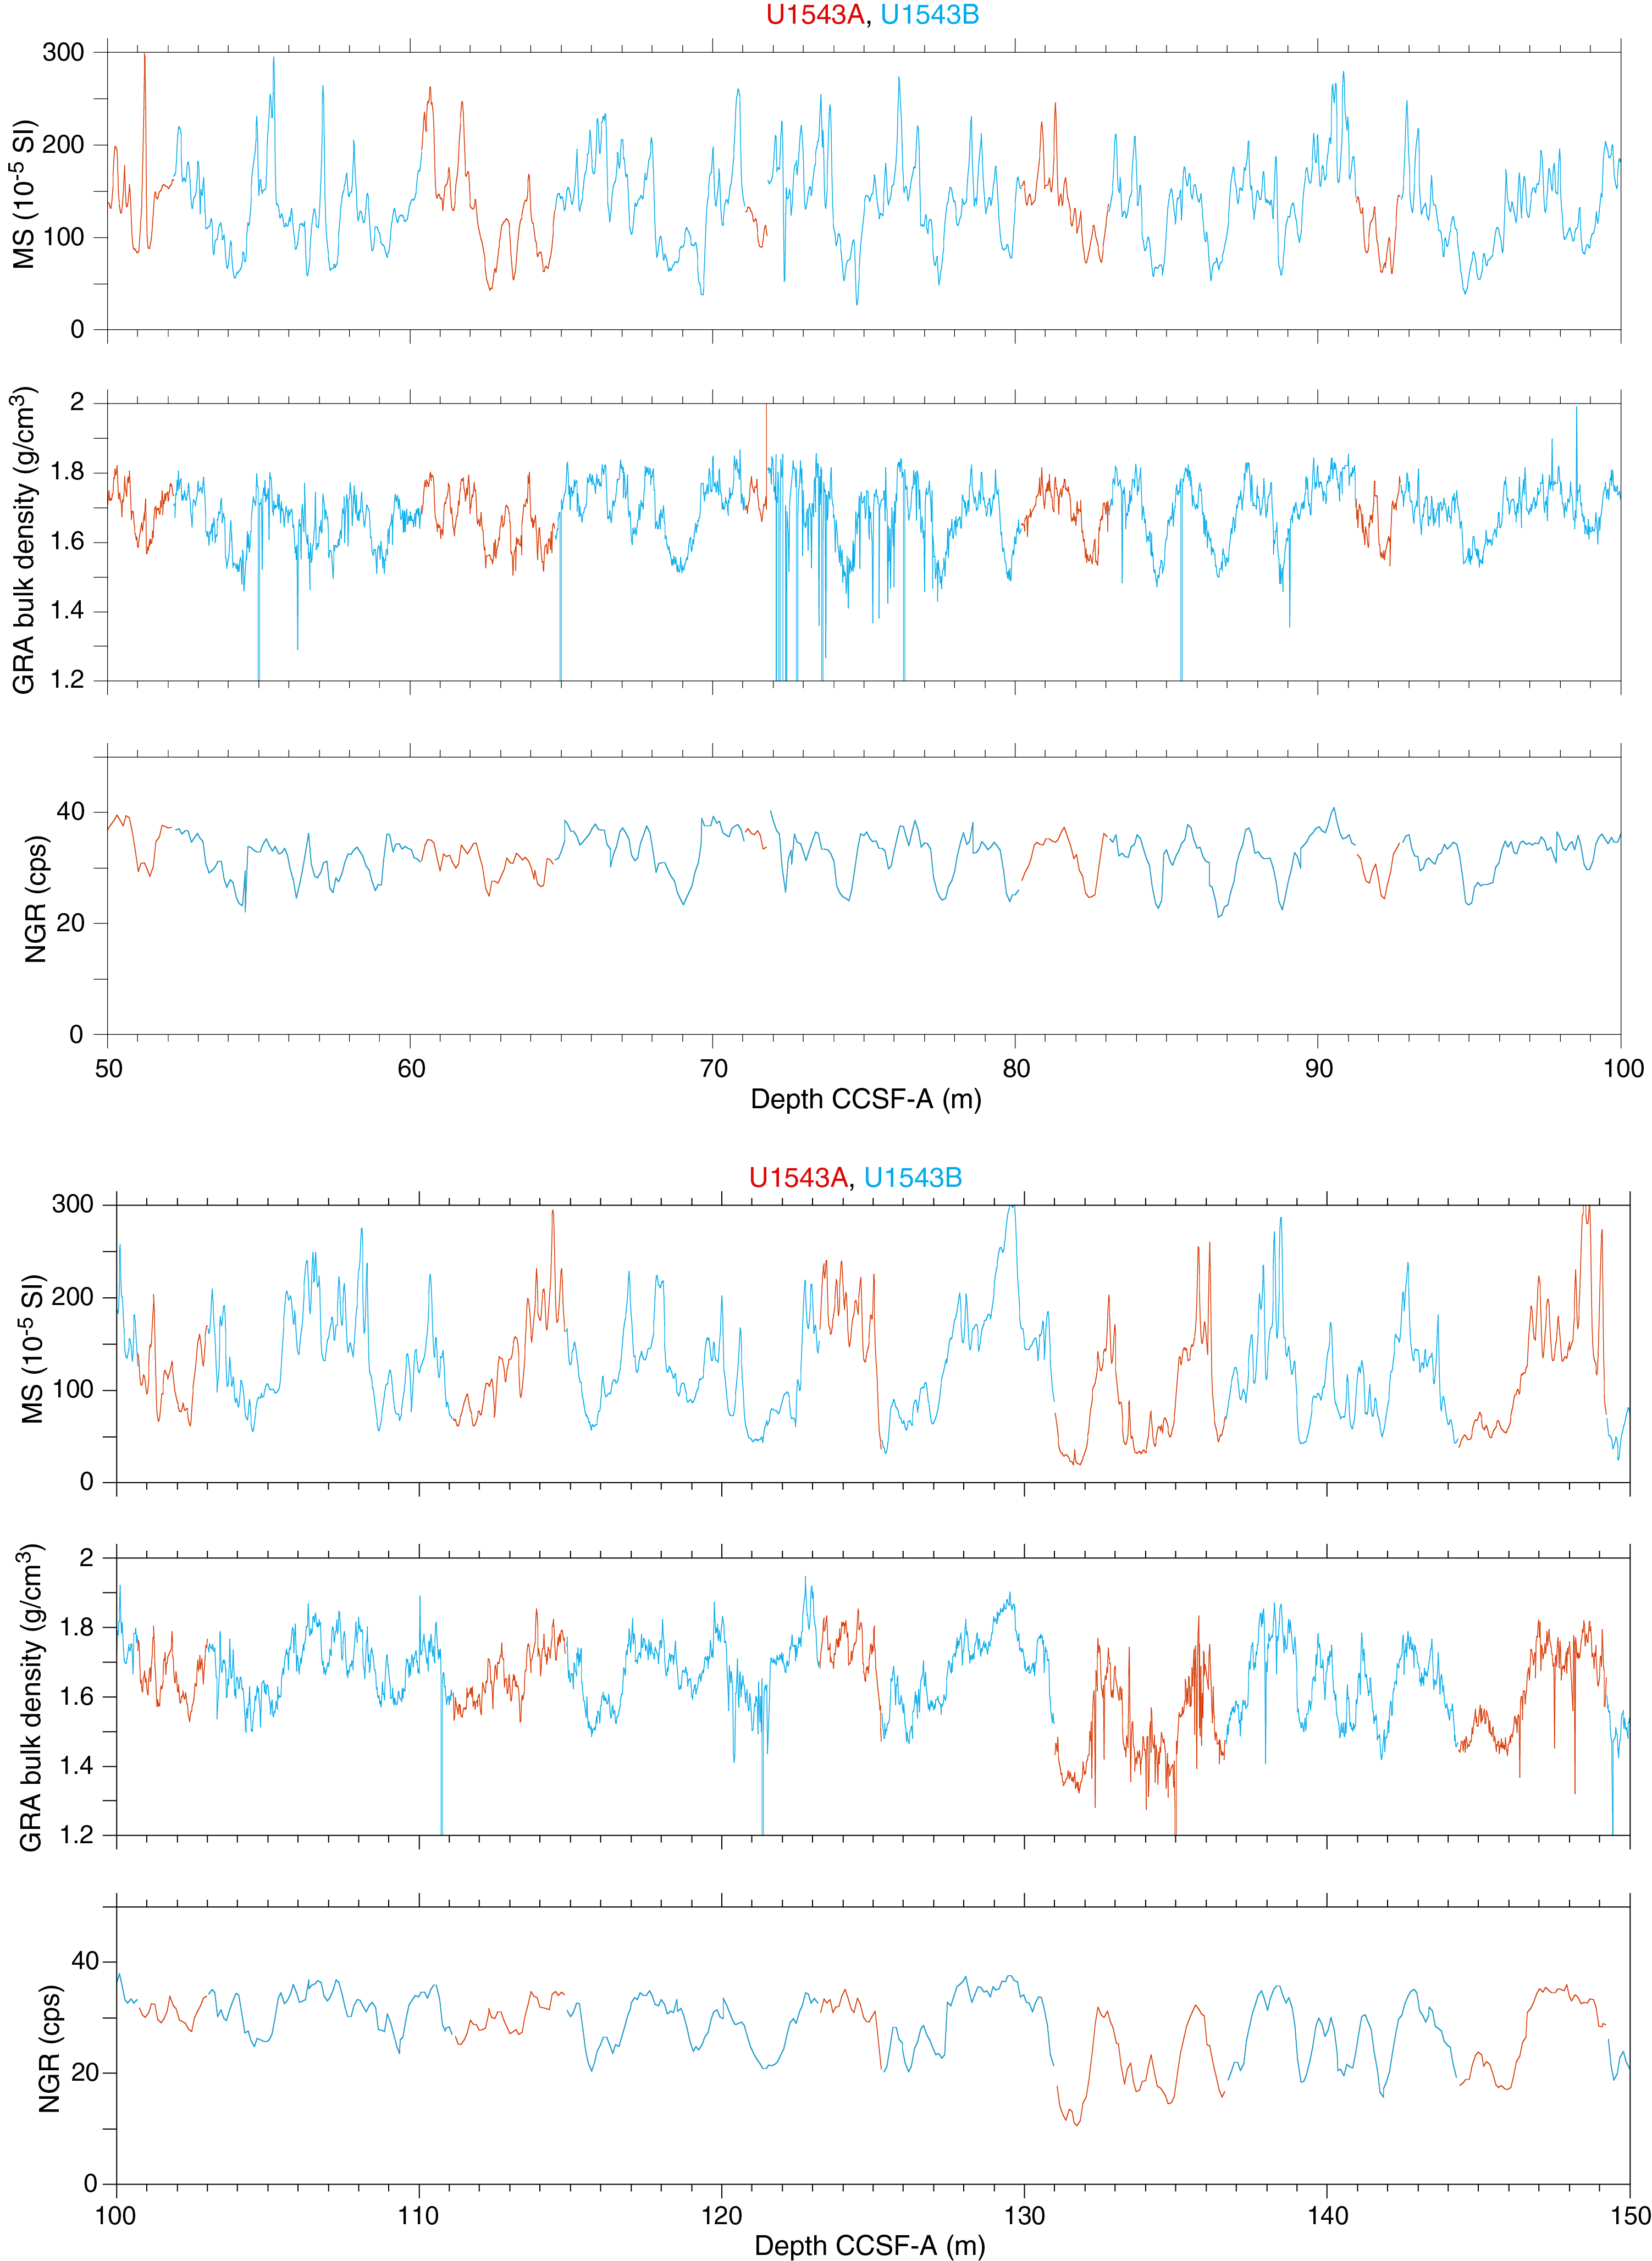
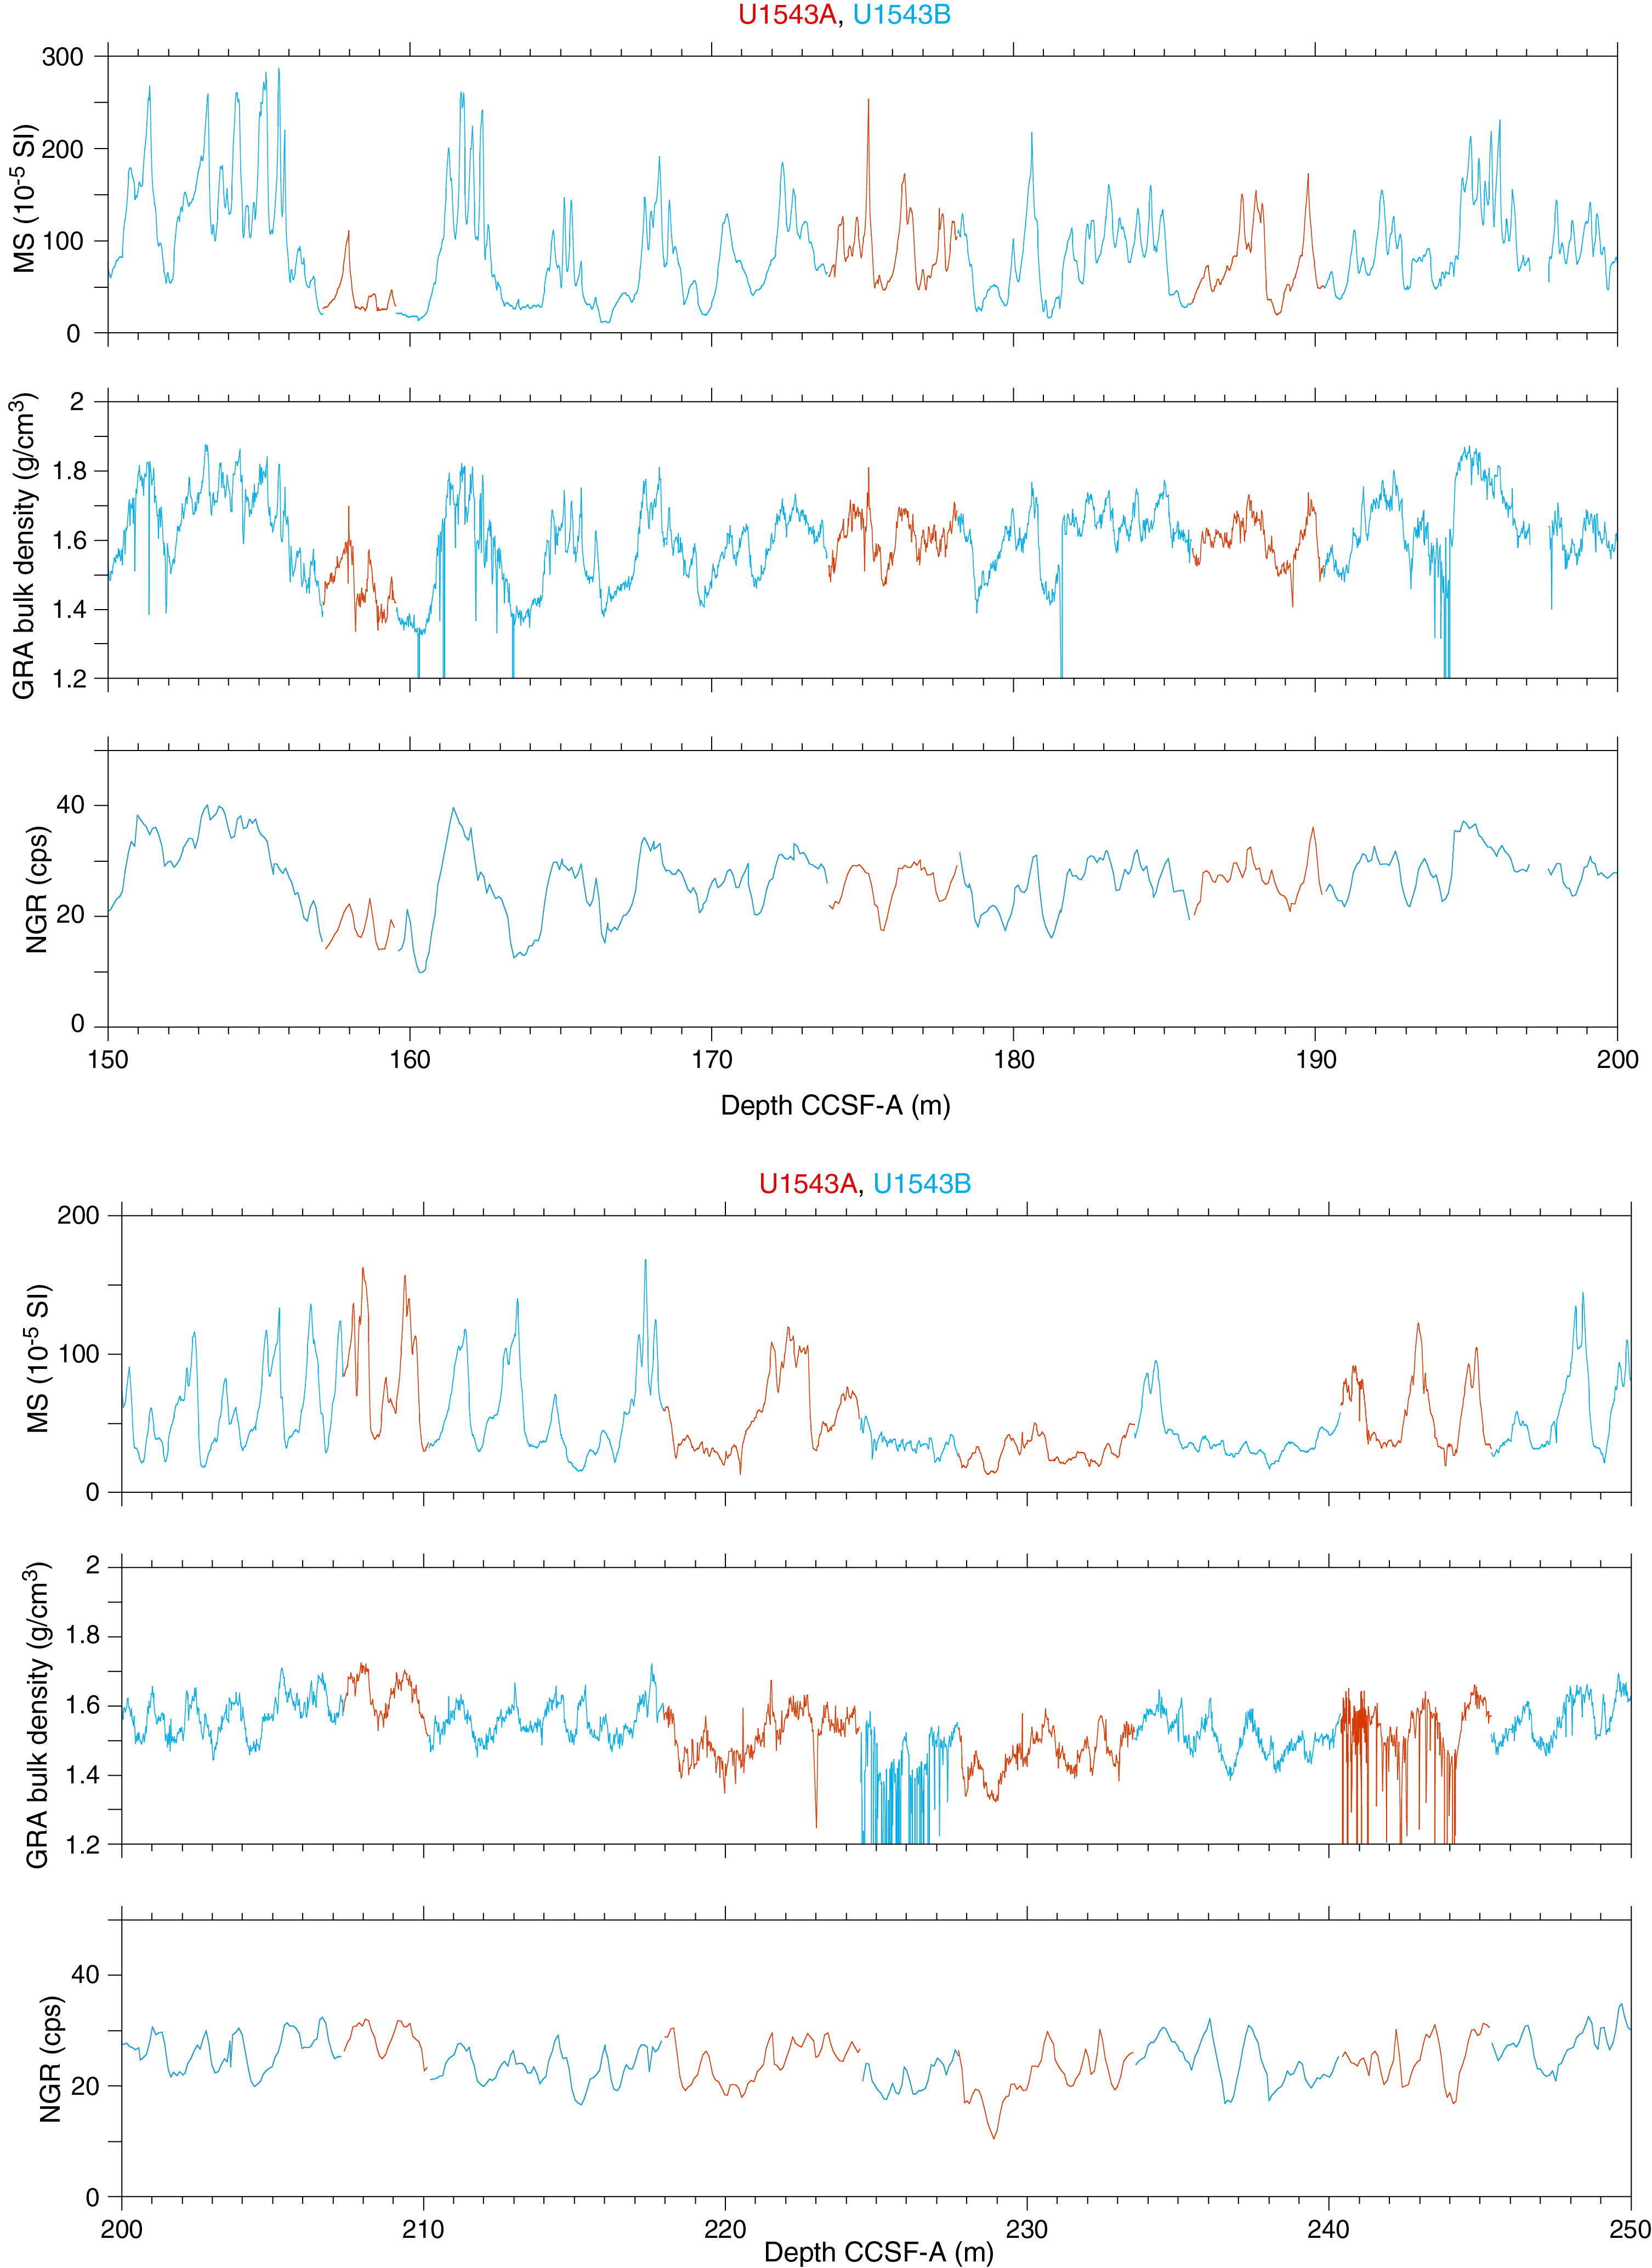
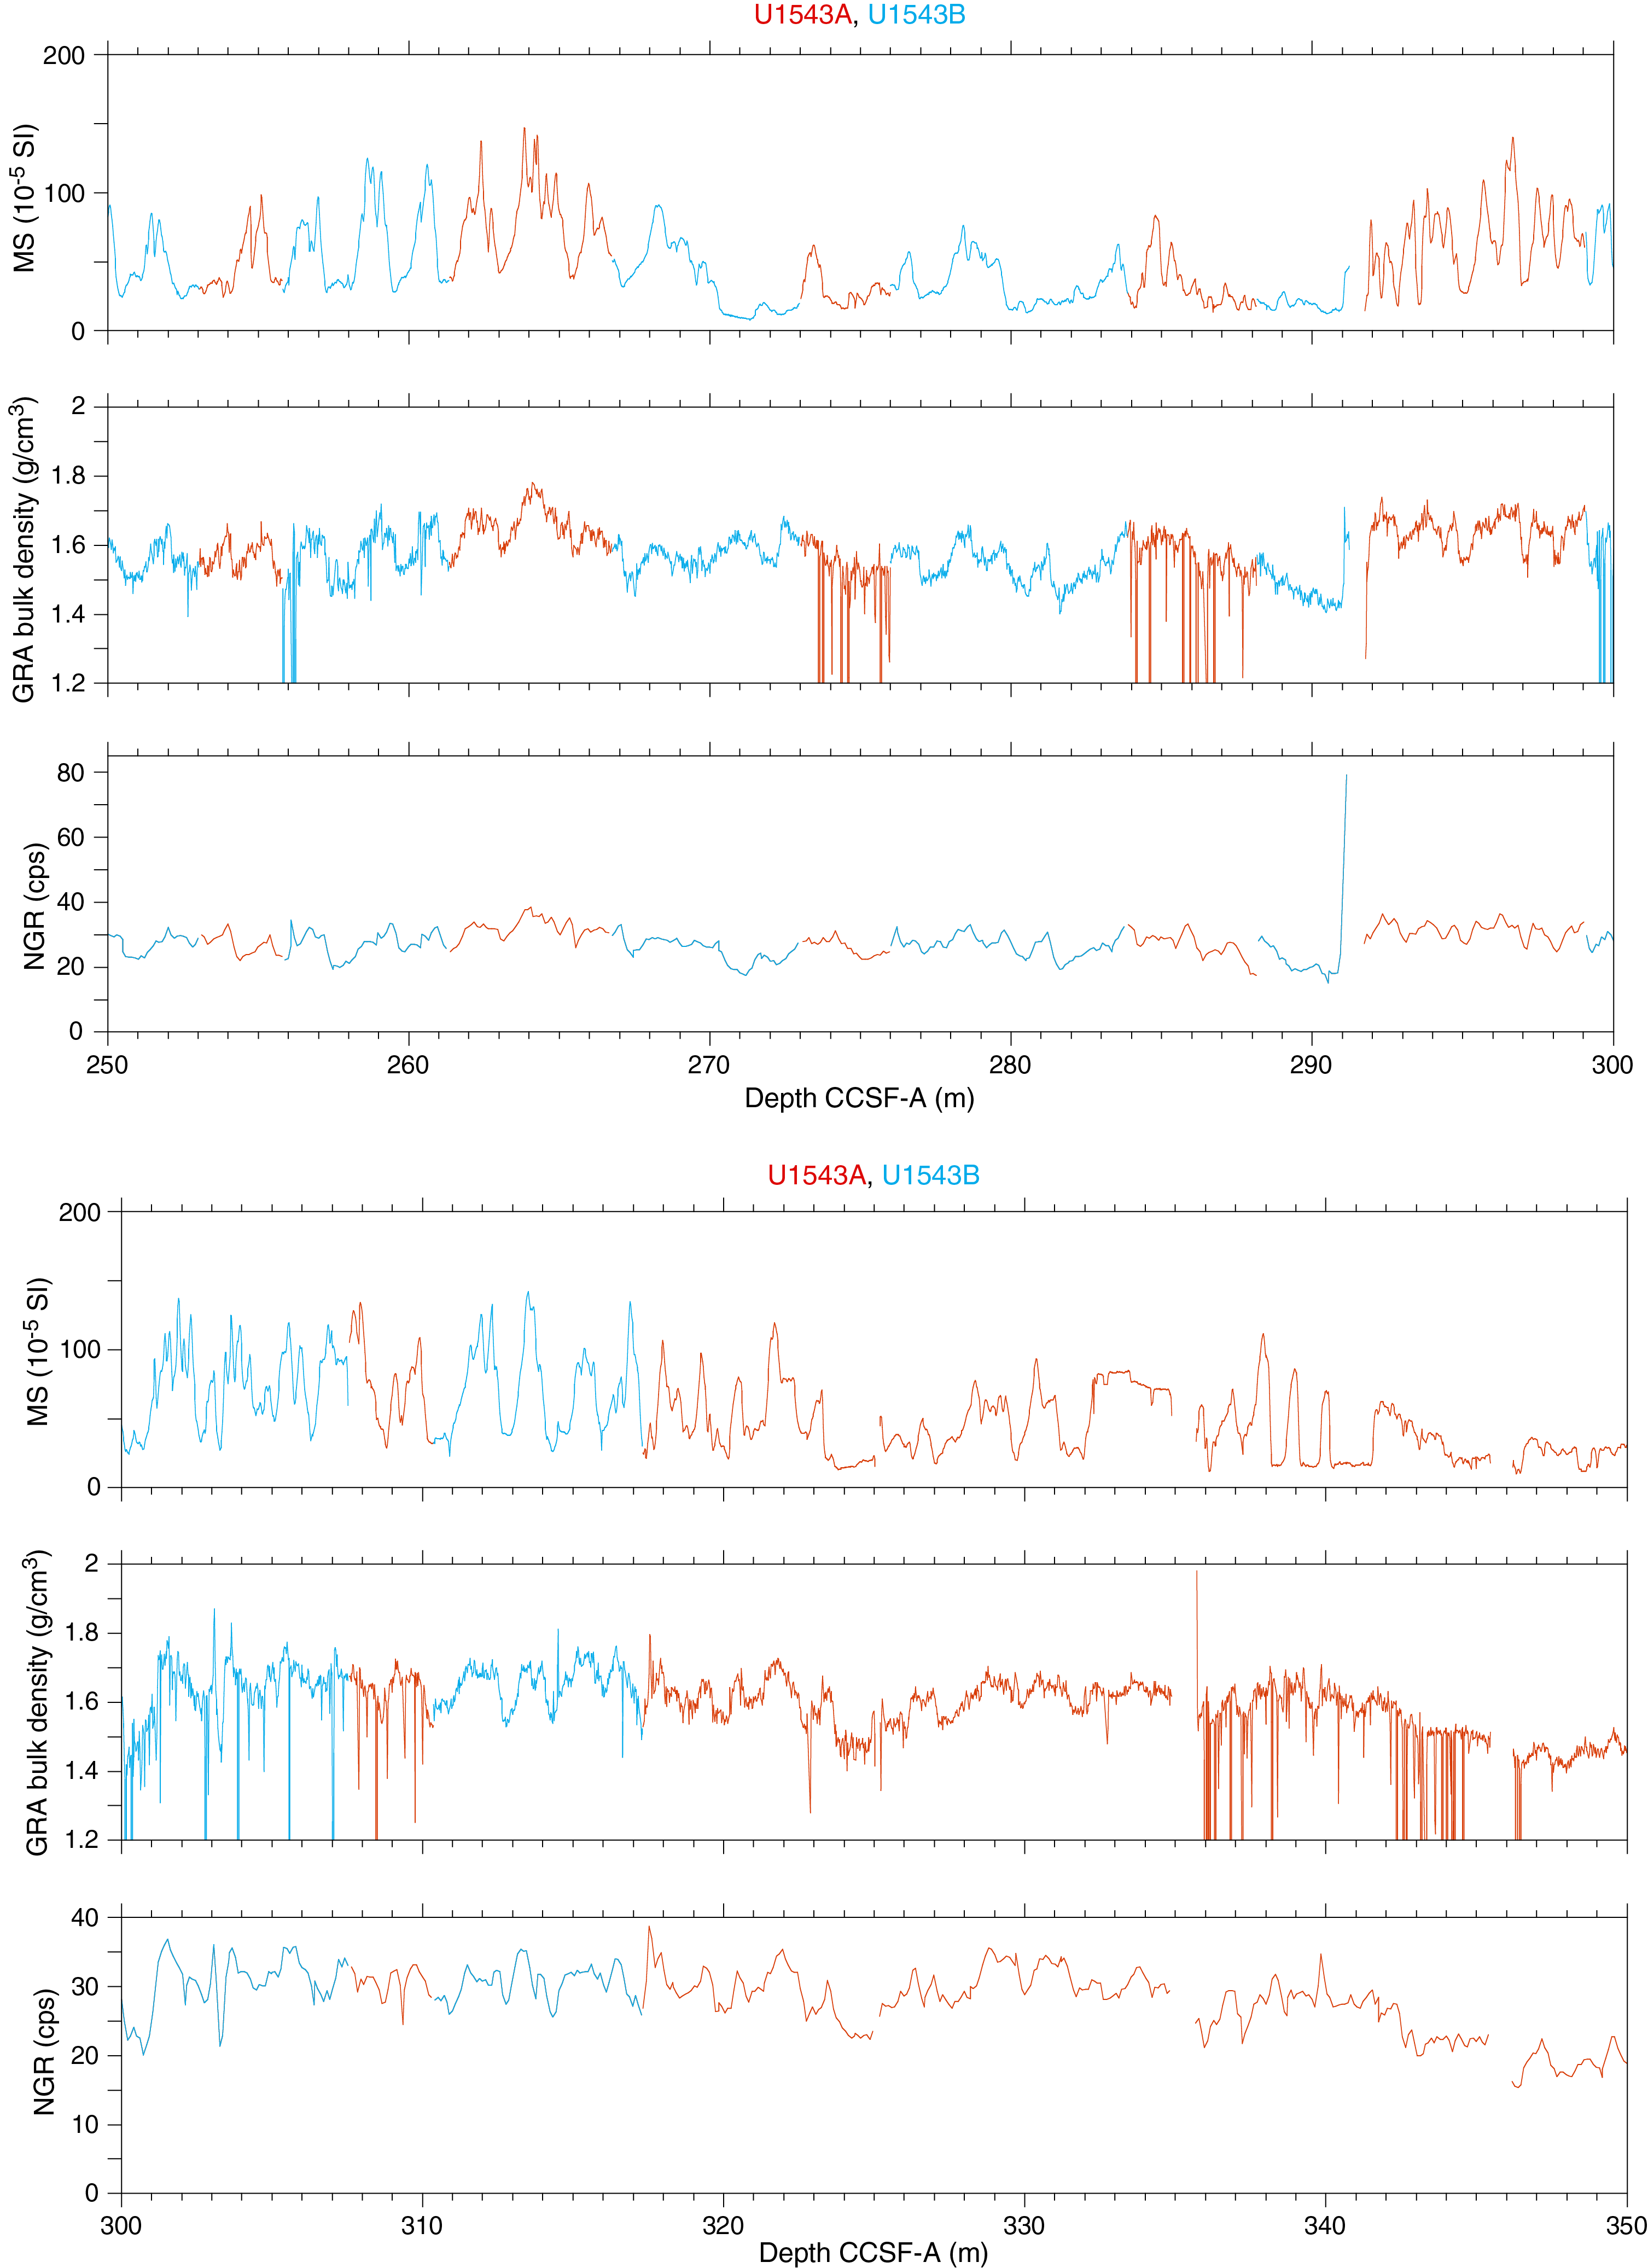
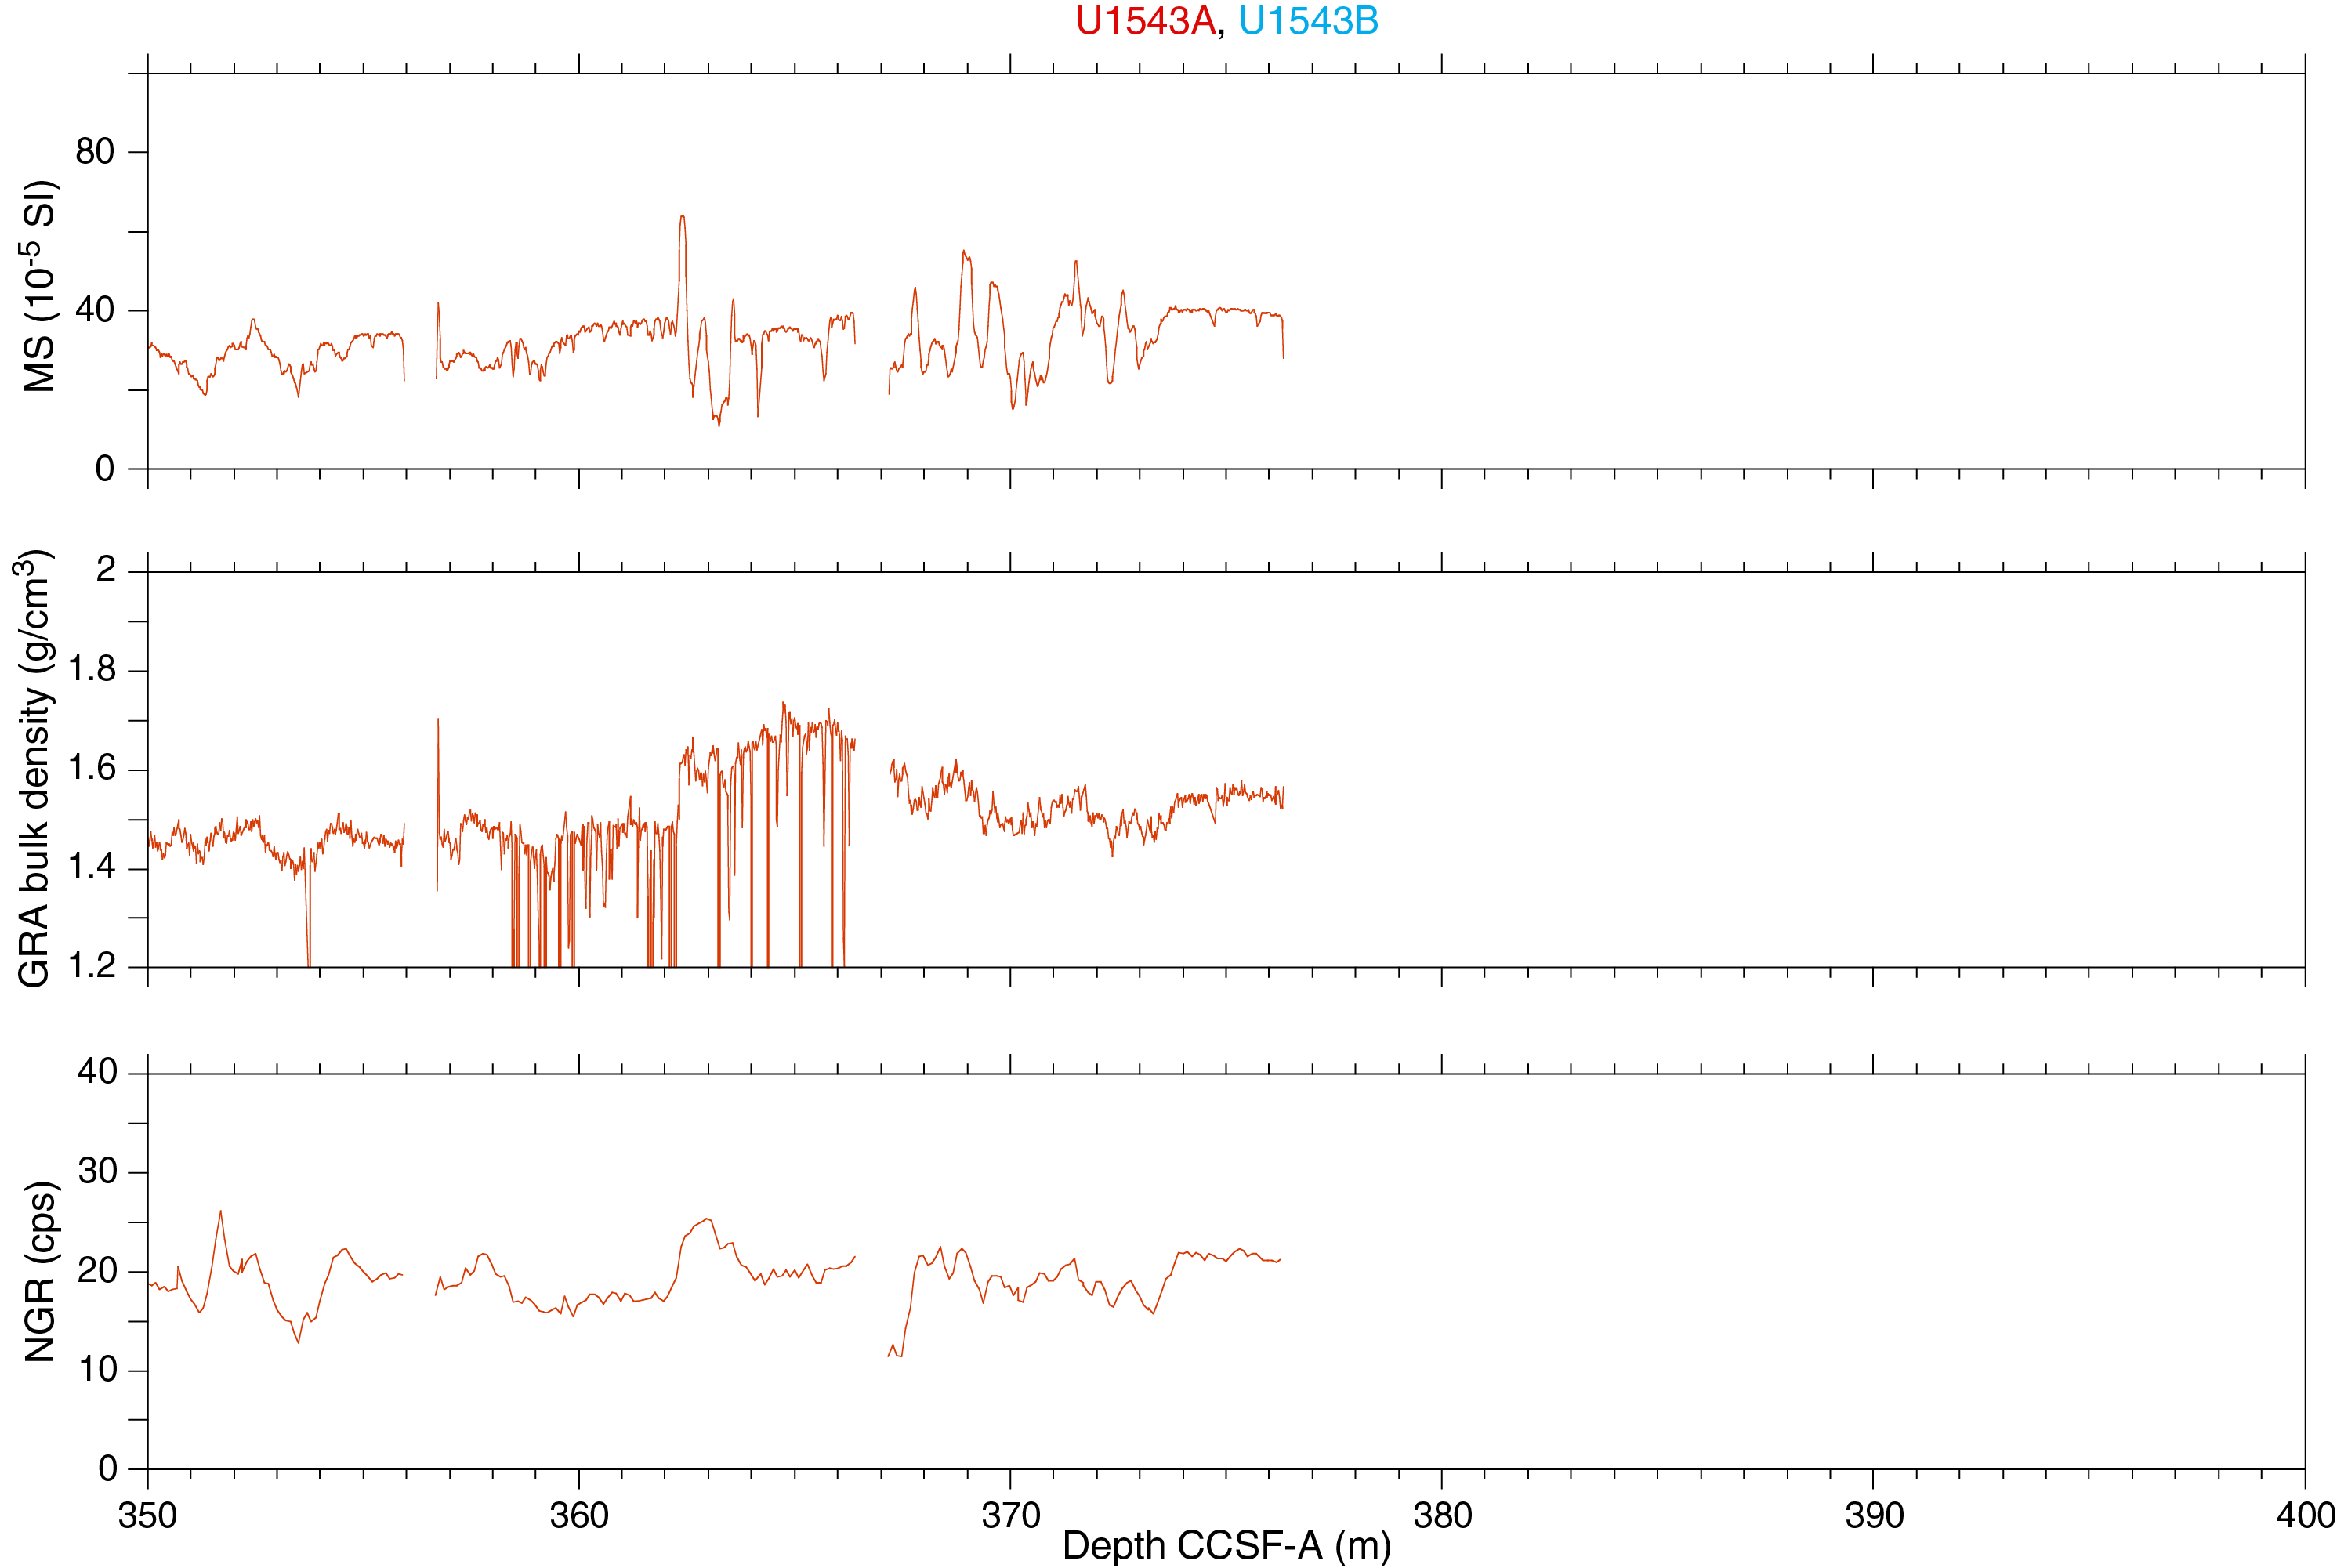
Figure F51. Spliced composite records of WRMSL MS.
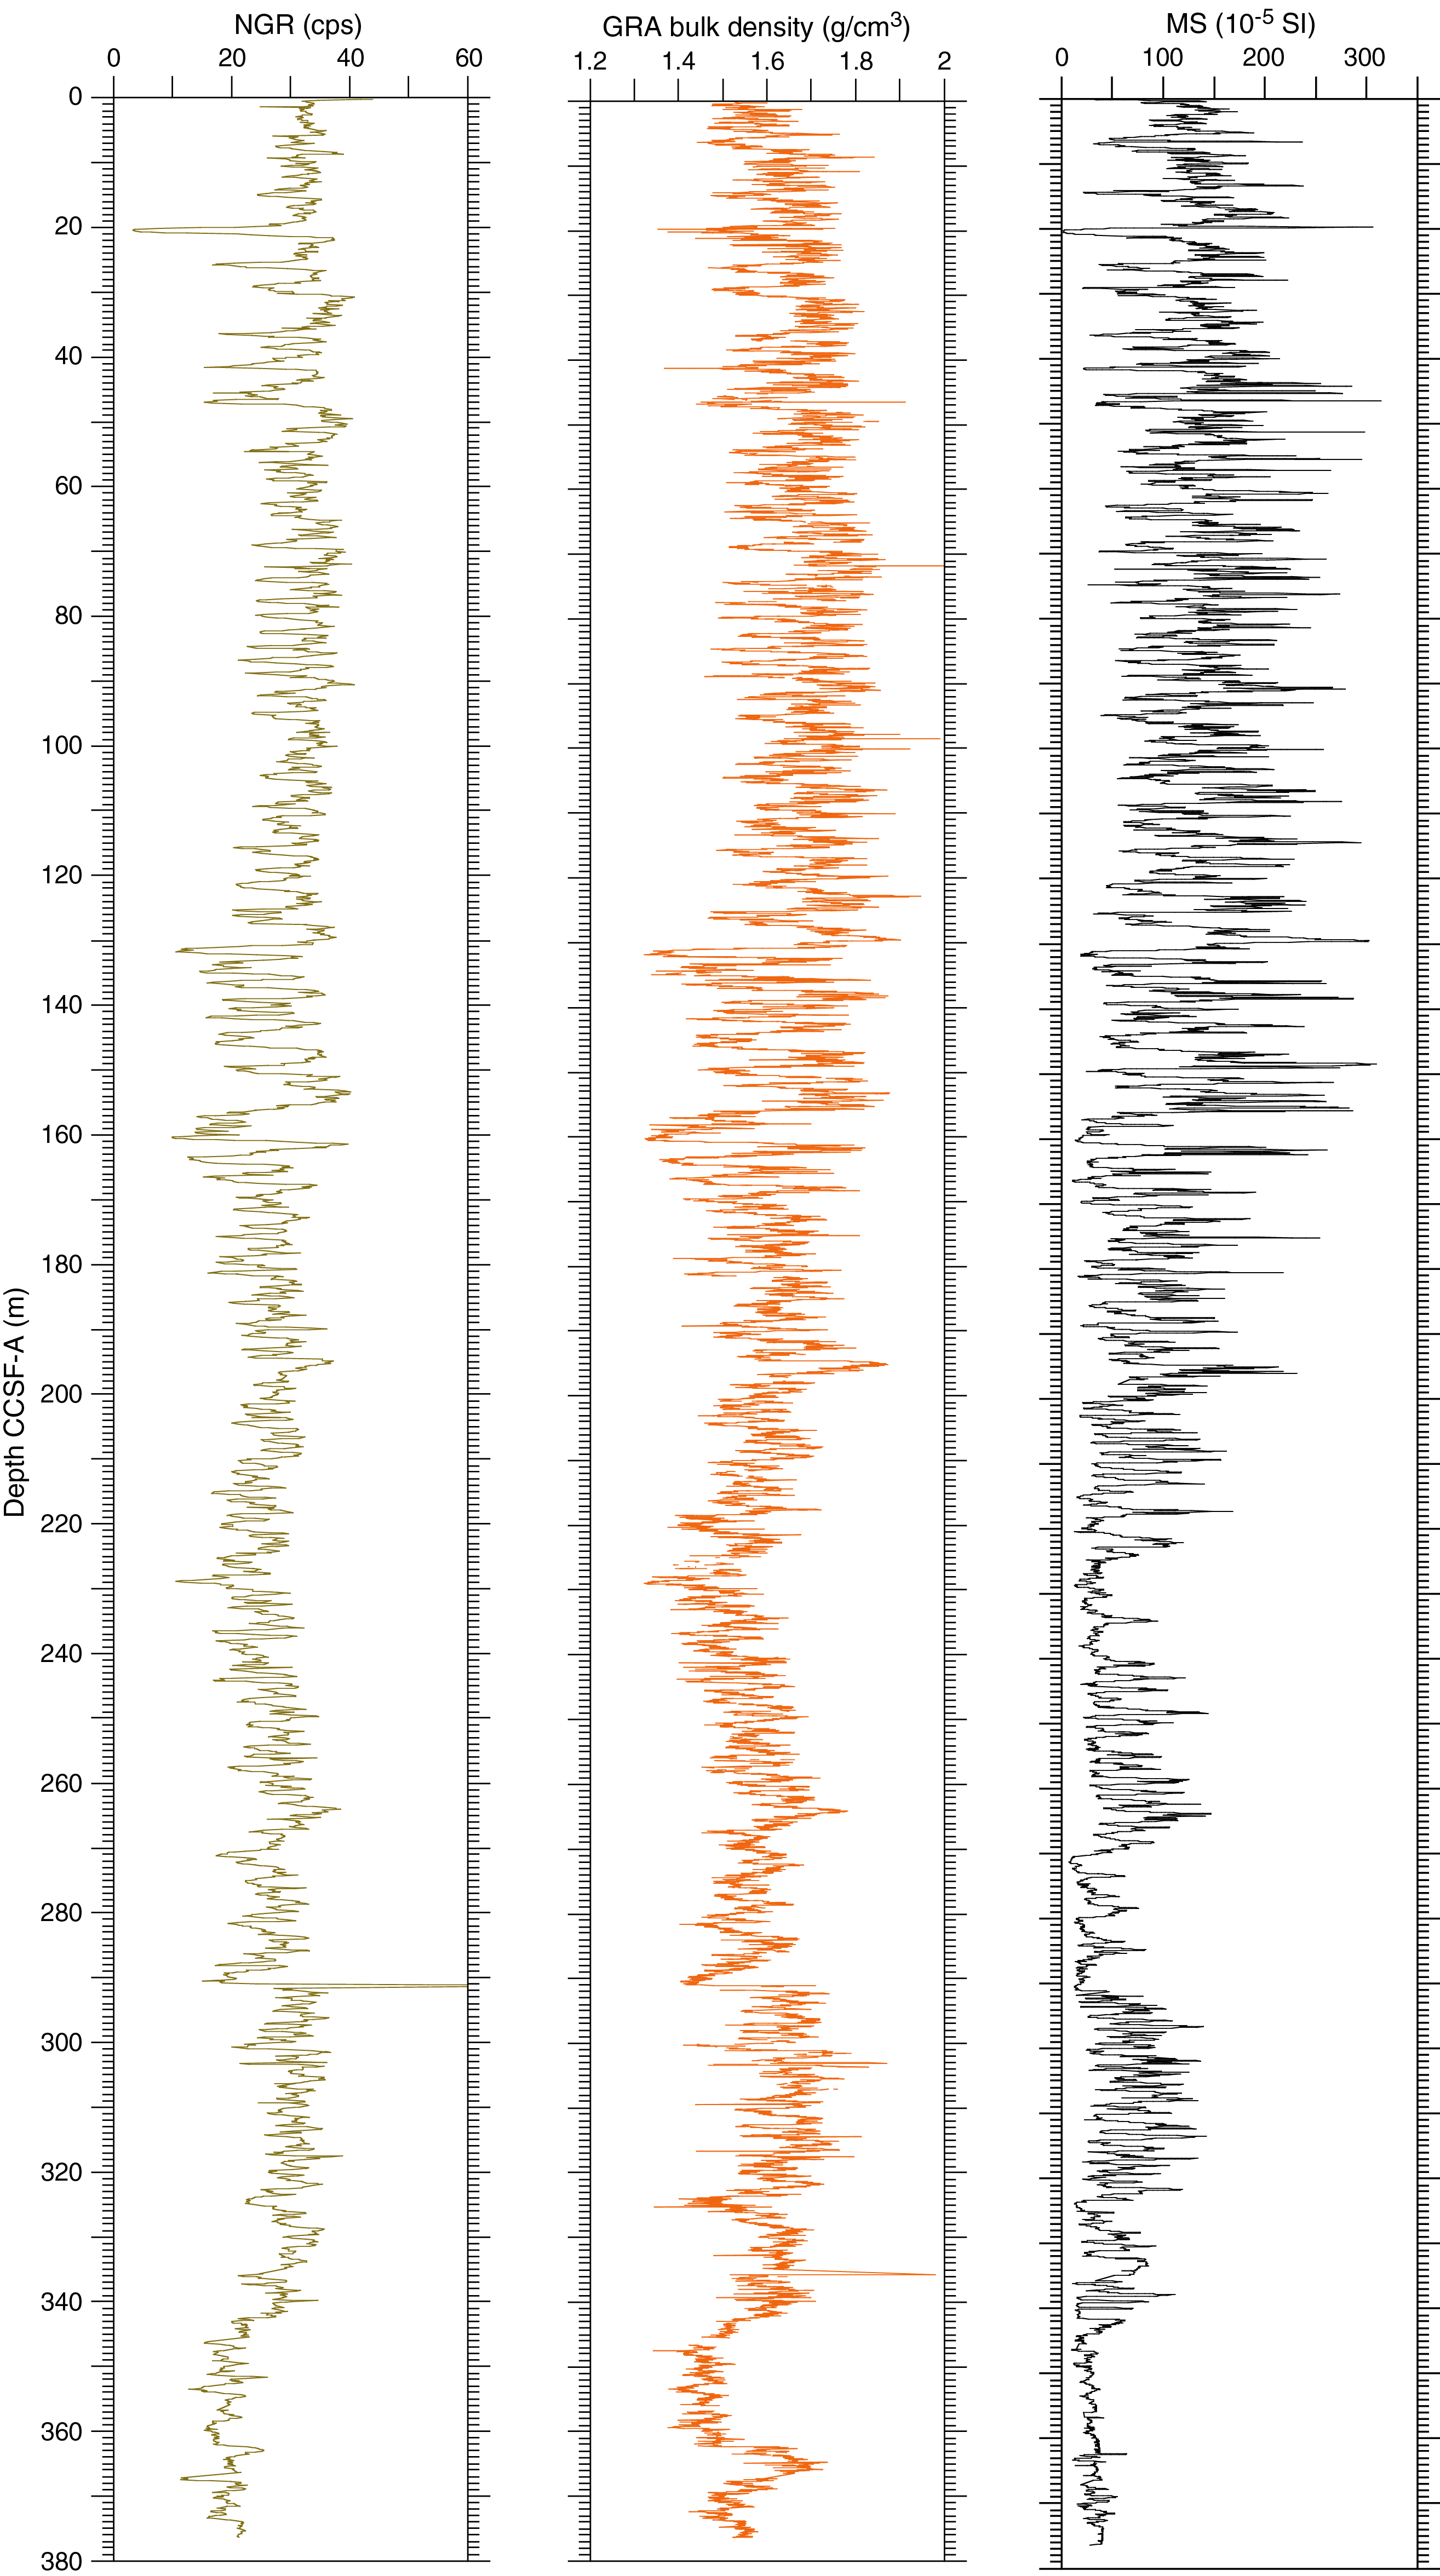
Figure F52. Complete spliced composite records of NGR, GRA bulk density, and MS.
The CCSF-A scale is anchored to the mudline of Core 383-U1543A-1H, which is assigned the depth of 0 m CCSF-A. From this anchor, we worked downhole using Correlator to establish a composite stratigraphy on a core-by-core basis. Interstitial water sampling and shipboard measurement sampling were done on cores from Hole U1543A; thus, our general approach was to use Hole U1543B as the backbone of the splice and try to avoid the use of intervals with coring disturbance.
The upper portion of the splice is continuous with no gaps from 0 to 197.1 m CCSF-A (Figure F50). In this upper part of the splice, a tie point (at 168.5 m CCSF-A) ties the bottom of Core 383-U1543B-18H to the top of Core 19H because a sediment interval appears to have been double-cored. Core 19H was shot from above the bottom of the hole in an attempt to obtain a short (~6 m) core to adjust the position of the core gaps in Hole U1543B relative to those in Hole U1543A. However, Core 383-U1543B-19H was ~8 m long, and the MS and other physical properties data indicate that the upper ~2 m of Core 19H overlaps with the lower ~2 m of Core 18H. Because of severe disturbance in Core 383-U1543A-17H, which covers the same stratigraphic interval, we did not use it in the splice. For this reason, combined with evidence for double-coring as described above, we made the decision to tie the top of Core 383-U1543B-19H to the bottom of Core 18H. This tie point should be confirmed in postcruise research. The upper portion of the splice ends at 197.1 m CCSF-A (Figure F50) because at this depth Core 383-U1543A-20H was highly disturbed and was not used in the splice; instead, Core 383-U1543B-22H was appended to the splice by setting the affine offset using an offset consistent with an increasing cumulative affine offset of 1.0 m CCSF-A per core.
Below the gap at 197.1 CCSF-A, the splice is continuous from 197.7 to 291.2 m CCSF-A in Core 383-U1543B-31H (Figure F50). Below 291.2 m CCSF-A, Core 31H is heavily disturbed and could not be used in the splice. Core 383-U1543A-29H was set to an affine offset of 281.26 m CCSF-A to align with a possible lithologic tie point in Core 383-U1543B-31H.
The splice is then continuous from the top of Core 383-U1543A-29H at 291.7 m CCSF-A to the bottom of Core 31H at 325.0 m CCSF-A. Because drilling at Hole U1543B did not continue beyond 317.3 m CCSF-A, Cores 383-U1543A-32H through 36H were appended to the splice using an increasing cumulative offset of 1.0 m CCSF-A per core.
Core 383-U1543B-25H was used in the splice from 224.5 to 227.7 CCSF-A to bridge the gap between Cores 383-U1543A-22H and 23H. However, the core liner joining Sections 383-U1543B-25H-3 and 25H-4 shattered during section cutting, resulting in possible stratigraphic disturbance in the splice associated with sediments from >50 cm in Section 25H-3 and <50 cm in Section 25H-4.
The cumulative offset between the CSF-A and CCSF-A depth scales is nearly linear for Holes U1543A and U1543B (Figure F53). The growth factor averages 7.1% but varies from 0% to 12%. The average growth factor of 7.1% is consistent with expectations for sediments that expand as a result of release of overburden but have minimal gas expansion because of low concentrations of methane and other gases (see Geochemistry). The CSF-A depth for the top of each core is set to the drilling depth below seafloor (DSF), which is based on the position of the drill string below the seafloor. However, the process of correlation moved each core top depth to a position on the CCSF-A scale that may not represent variable sediment compaction and expansion. Calculation of mass accumulation rates based on the CCSF-A scale should account for differential expansion by dividing apparent depth intervals by the appropriate growth factor.
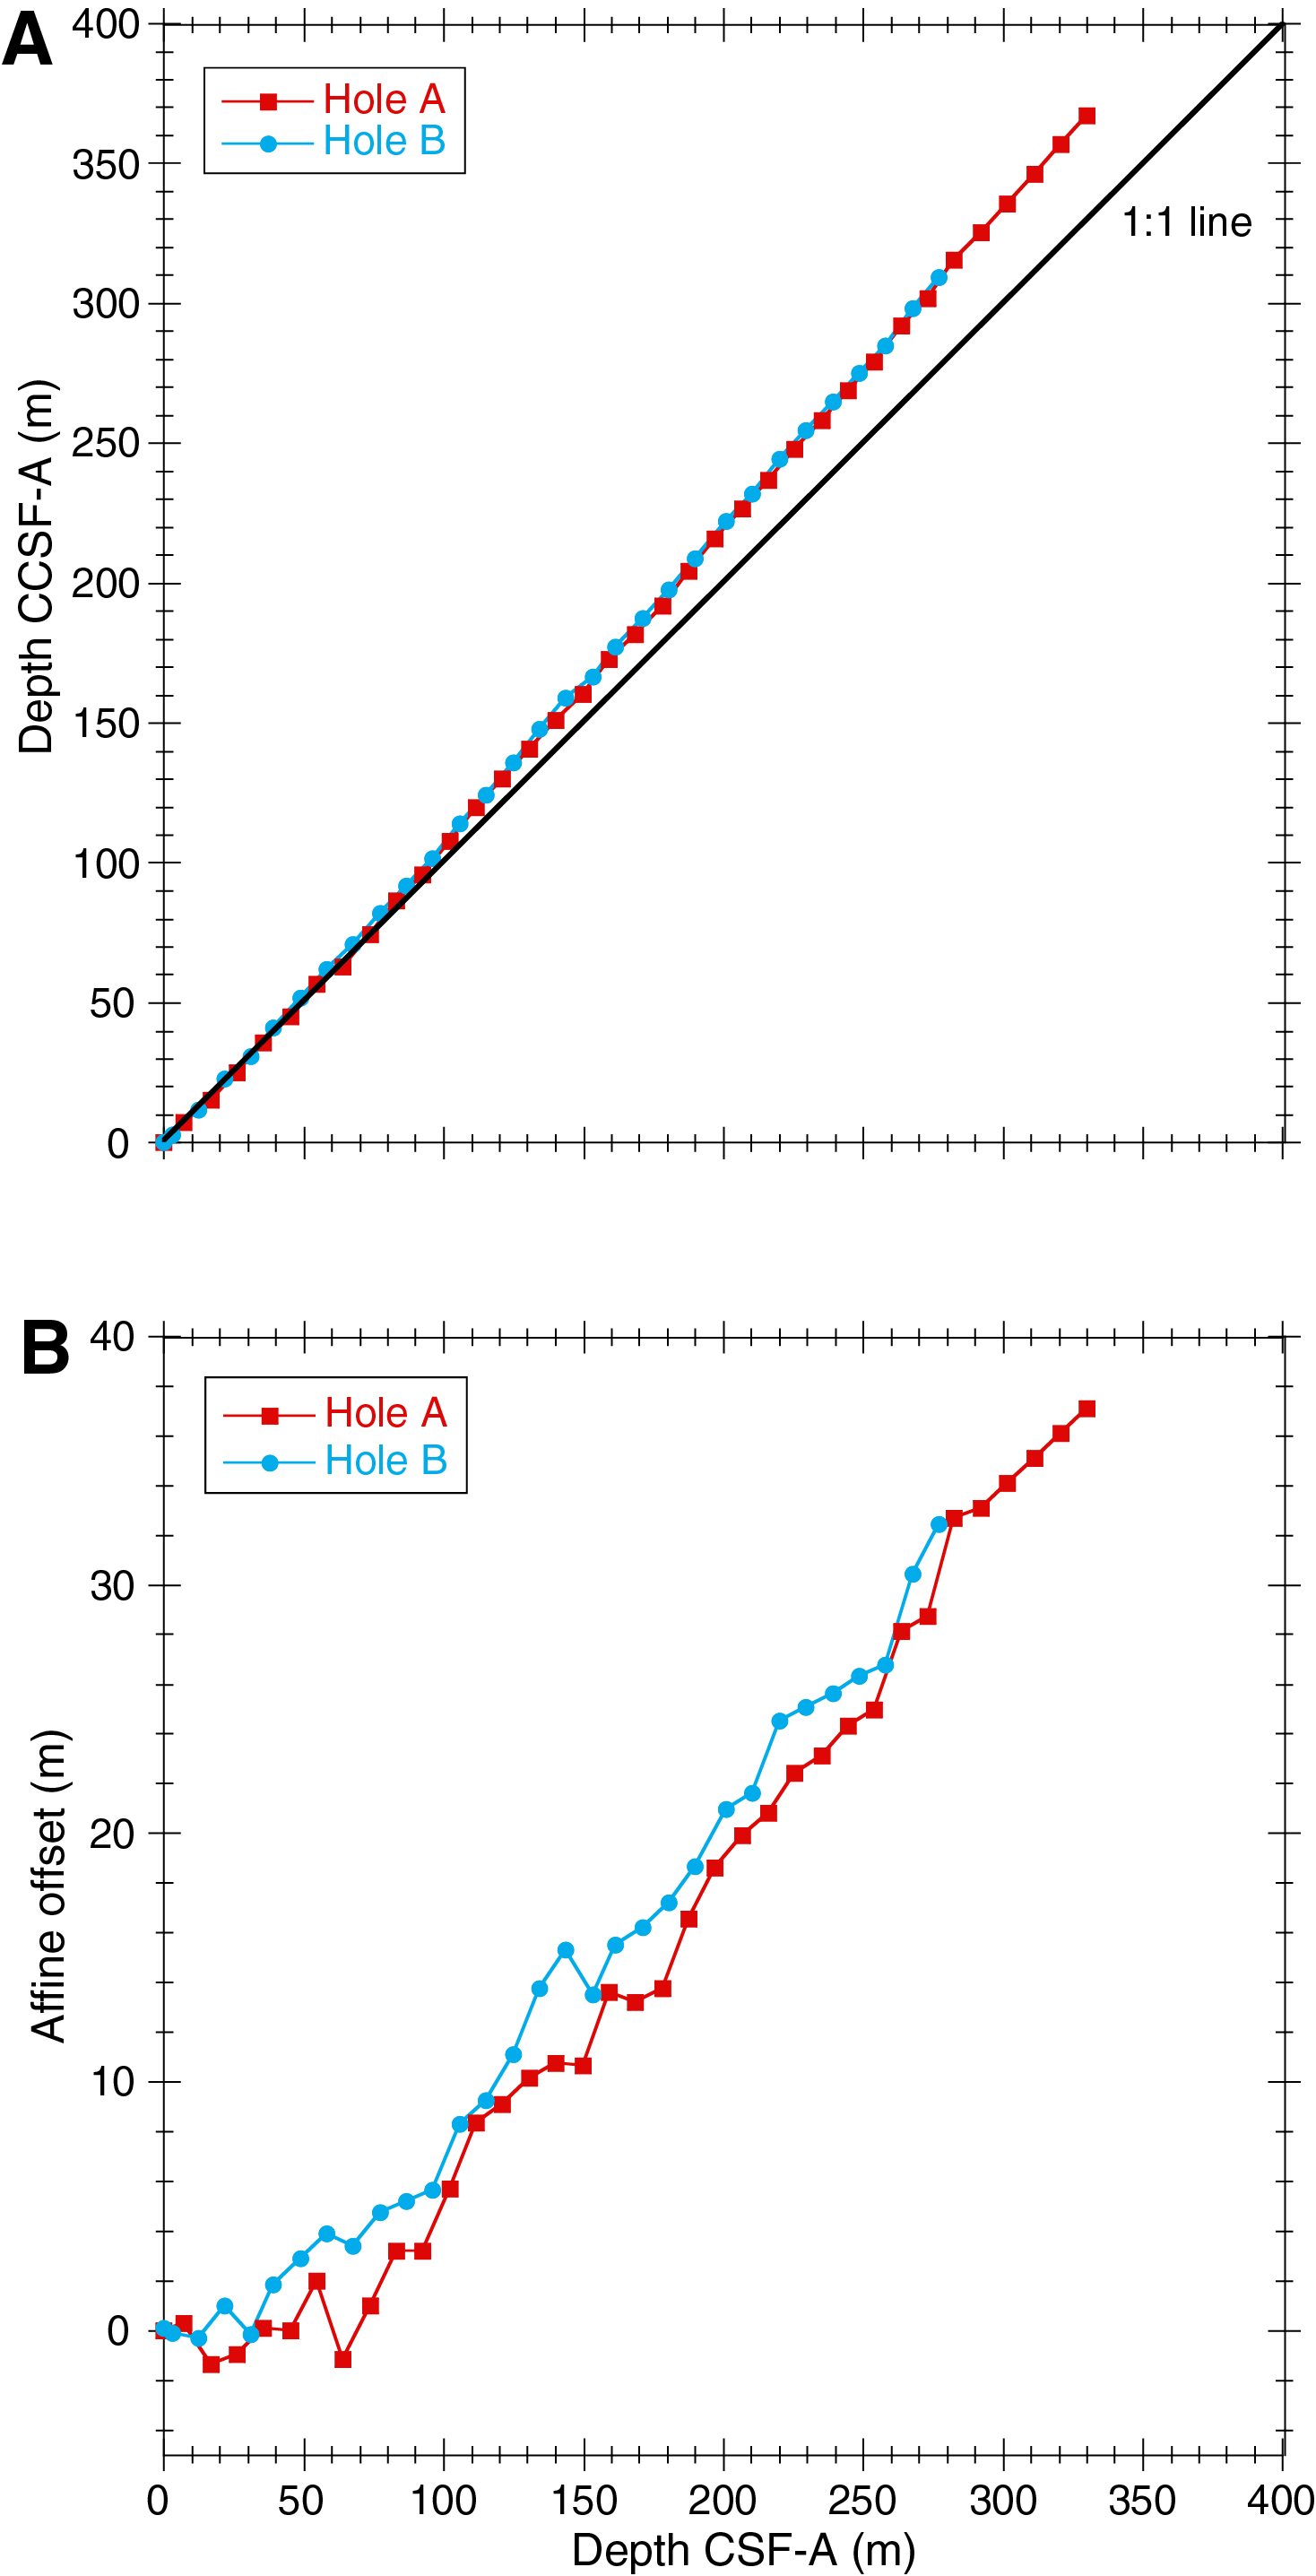
Figure F53. Core depth, composite depth scales, and the growth of cumulative depth offset.
References
Bohaty, S.M., Wise, S.W., Jr., Duncan, R.A., Moore, C.L., and Wallace, P.J., 2003. Neogene diatom biostratigraphy, tephra stratigraphy, and chronology of ODP Hole 1138A, Kerguelen Plateau. In Frey, F.A., Coffin, M.F., Wallace, P.J., and Quilty, P.G. (Eds.), Proceedings of the Ocean Drilling Program, Scientific Results, 183: College Station, TX (Ocean Drilling Program), 1–53. https://doi.org/
Boisvert, W.E., 1969. Technical Report: Major Currents off the West Coasts of North and South America: Washington, D.C. (Naval Oceanographic Office). https://catalog.hathitrust.org/
Calvert, S.E., and Pedersen, T.F., 1994. Sedimentary geochemistry of manganese; implications for the environment of formation of manganiferous black shales. Economic Geology, 91(1):36–47. http://dx.doi.org/
Cande, S.C., and Kent, D.V., 1995. Revised calibration of the geomagnetic polarity timescale for the Late Cretaceous and Cenozoic. Journal of Geophysical Research: Solid Earth, 100(B4):6093–6095. https://doi.org/
Censarek, B., and Gersonde, R., 2002. Miocene diatom biostratigraphy at ODP Sites 689, 690, 1088, 1092 (Atlantic sector of the Southern Ocean). Marine Micropaleontology, 45(3–4):309–356. https://doi.org/
Chaigneau, A., and Pizarro, O., 2005. Surface circulation and fronts of the South Pacific Ocean, east of 120°W. Geophysical Research Letters, 32(8):L08605. https://doi.org/
Ciesielski, P.F., 1975. Biostratigraphy and paleoecology of Neogene and Oligocene silicoflagellates from cores recovered during Antarctic Leg 28, Deep Sea Drilling Project. In Hayes, D.E., Frakes, L.A., et al., Initial Reports of the Deep Sea Drilling Project, 28: Washington, DC (U.S. Government Printing Office), 625–691. https://doi.org/
Cody, R.D., Levy, R.H., Harwood, D.M., and Sadler, P.M., 2008. Thinking outside the zone: high-resolution quantitative diatom biochronology for the Antarctic Neogene. Palaeogeography, Palaeoclimatology, Palaeoecology, 260(1–2):92–121. https://doi.org/
De Vleeschouwer, D., Dunlea, A.G., Auer, G., Anderson, C.H., Brumsack, H., de Loach, A., Gurnis, M., et al., 2017. Quantifying K, U, and Th contents of marine sediments using shipboard natural gamma radiation spectra measured on DV JOIDES Resolution. Geochemistry, Geophysics, Geosystems, 18(3):1053–1064. https://doi.org/
Dunlea, A.G., Murray, R.W., Harris, R.N., Vasiliev, M.A., Evans, H., Spivack, A.J., and D’Hondt, S., 2013. Assessment and use of NGR instrumentation on the JOIDES Resolution to quantify U, Th, and K concentrations in marine sediment. Scientific Drilling, 15:57–63. https://doi.org/
Eagles, G., 2006. Deviations from an ideal thermal subsidence surface in the southern Pacific Ocean. Terra Antarctica Reports, 12:109–118.
Esper, O., and Gersonde, R., 2014. Quaternary surface water temperature estimations: new diatom transfer functions for the Southern Ocean. Palaeogeography, Palaeoclimatology, Palaeoecology, 414:1–19. https://doi.org/
Harwood, D.M., and Maruyama, T., 1992. Middle Eocene to Pleistocene diatom biostratigraphy of Southern Ocean sediments from the Kerguelen Plateau, Leg 120. In Wise, S.W., Jr., Schlich, R., et al., Proceedings of the Ocean Drilling Program, Scientific Results, 120: College Station, TX (Ocean Drilling Program), 683–733. https://doi.org/
Hensen, C., Duarte, J.C., Vannucchi, P., Mazzini, A., Lever, M.A., Terrinha, P., Géli, L., et al., 2019. Marine transform faults and fracture zones: a joint perspective integrating seismicity, fluid flow and life. Frontiers in Earth Science, 7:39. https://doi.org/
Hilgen, F.J., Lourens, L.J., and Van Dam, J.A., 2012. The Neogene period. With contributions by A.G. Beu, A.F. Boyes, R.A. Cooper, W. Krijgsman, J.G. Ogg, W.E. Piller, and D.S. Wilson. In Gradstein, F.M., Ogg, J.G., Schmitz, M.D., and Ogg, G.M. (Eds.), The Geologic Time Scale: Oxford, United Kingdom (Elsevier), 923–978. https://doi.org/
Hornibrook, N.d.B., 1981. Globorotalia (planktic Foraminiferida) in the late Pliocene and early Pleistocene of New Zealand. New Zealand Journal of Geology and Geophysics, 24(2):263–292. https://doi.org/
Hornibrook, N.d.B., and Jenkins, D.G., 1994. DSDP 594, Chatham Rise, New Zealand—late Neogene planktonic foraminiferal biostratigraphy revisited. Journal of Micropalaeontology, 13(2):93–101. https://doi.org/
Hyndman, R.D., Erickson, A.J., and Von Herzen, R.P., 1974. Geothermal measurements on DSDP Leg 26. In Davies, T.A., Luyendyk, B.P., et al., Initial Reports of the Deep Sea Drilling Project, 26: Washington, DC (U.S. Government Printing Office), 451–463. https://doi.org/
Jenkins, D.G., 1993. Cenozoic southern mid- and high-latitude biostratigraphy and chronostratigraphy based on planktonic foraminifera. In Kennett, J.P., and Warnke, D.A. (Eds.), The Antarctic Paleoenvironment: A Perspective on Global Change: Part Two. Antarctic Research Series, 60:125–144. https://agupubs.onlinelibrary.wiley.com/
Jutzeler, M., White, J.D.L., Talling, P.J., McCanta, M., Morgan, S., Le Friant, A., and Ishizuka, O., 2014. Coring disturbances in IODP piston cores with implications for offshore record of volcanic events and the Missoula megafloods. Geochemistry, Geophysics, Geosystems, 15(9):3572–3590. https://doi.org/
Lamy, F., 2016. The Expedition PS97 of the Research Vessel POLARSTERN to the Drake Passage in 2016. Berichte zur Polar und Meeresforschung, 701. http://epic.awi.de/
Lamy, F., Arz, H.W., Kilian, R., Lange, C.B., Lembke-Jene, L., Wengler, M., Kaiser, J., et al., 2015. Glacial reduction and millennial-scale variations in Drake Passage throughflow. Proceedings of the National Academy of Sciences of the United States of America, 112(44):13496–13501. https://doi.org/
Lamy, F., Winckler, G., Alvarez Zarikian, C.A., and the Expedition 383 Scientists, 2021. Supplementary material, https://doi.org/
Locarnini, R.A., Mishonov, A.V., Antonov, J.I., Boyer, T.P., Garcia, H.E., Baranova, O.K., Zweng, M.M., and Johnson, D.R., 2010. World Ocean Atlas 2009 (Volume 1): Temperature. In Levitus, S. (Ed.), NOAA Atlas NESDIS 68: Washington, DC (U.S. Government Printing Office). ftp://ftp.nodc.noaa.gov/
Meyers, P.A., 1994. Preservation of elemental and isotopic source identification of sedimentary organic matter. Chemical Geology, 114(3–4):289–302. https://doi.org/
Pribnow, D., Kinoshita, M., and Stein, C., 2000. Thermal Data Collection and Heat Flow Recalculations for Ocean Drilling Program Legs 101–180: Hanover, Germany (Institute for Joint Geoscientific Research, Institut für Geowissenschaftliche Gemeinschaftsaufgaben [GGA]). http://www-odp.tamu.edu/
Scott, G.H., Kennett, J.P., Wilson, K.J., and Hayward, B.W., 2007. Globorotalia puncticulata: population divergence, dispersal and extinction related to Pliocene–Quaternary water masses. Marine Micropaleontology, 62(4):235–253. https://doi.org/
Soetaert, K., Hofmann, A.F., Middelburg, J.J., Meysman, F.J.R., and Greenwood, J., 2007. The effect of biogeochemical processes on pH. Marine Chemistry, 106(1–2):380–401. (Reprint) http://dx.doi.org/
Tsutsui, H., Takahashi, K., Nishida, N., and Nishiwaki, S., 2009. Intraspecific morphological variation with biometry of Distephanus speculum (Silicoflagellata). Marine Micropaleontology, 72(3–4):239–250. https://doi.org/
Wei, K.-Y., 1994. Stratophenetic tracing of phylogeny using SIMCA pattern recognition technique: a case study of the late Neogene planktonic foraminifera Globoconella clade. Paleobiology, 20(1):52–65. https://doi.org/
Well, R., and Roether, W., 2003. Neon distribution in South Atlantic and South Pacific waters. Deep-Sea Research, Part I: Oceanographic Research Papers, 50(6):721–735. https://doi.org/
Winckler, G., Lamy, F., Alvarez Zarikian, C.A., Arz, H.W., Basak, C., Brombacher, A., Esper, O.M., Farmer, J.R., Gottschalk, J., Herbert, L.C., Iwasaki, S., Lawson, V.J., Lembke-Jene, L., Lo, L., Malinverno, E., Michel, E., Middleton, J.L., Moretti, S., Moy, C.M., Ravelo, A.C., Riesselman, C.R., Saavedra-Pellitero, M., Seo, I., Singh, R.K., Smith, R.A., Souza, A.L., Stoner, J.S., Venancio, I.M., Wan, S., Zhao, X., and Foucher McColl, N., 2021. Expedition 383 methods. In Lamy, F., Winckler, G., Alvarez Zarikian, C.A., and the Expedition 383 Scientists, Dynamics of the Pacific Antarctic Circumpolar Current. Proceedings of the International Ocean Discovery Program, 383: College Station, TX (International Ocean Discovery Program). https://doi.org/
Zielinski, U., and Gersonde, R., 2002. Plio–Pleistocene diatom biostratigraphy from ODP Leg 177, Atlantic sector of the Southern Ocean. Marine Micropaleontology, 45(3–4):225–268. https://doi.org/
1 Lamy, F., Winckler, G., Alvarez Zarikian, C.A., Arz, H.W., Basak, C., Brombacher, A., Esper, O.M., Farmer, J.R., Gottschalk, J., Herbert, L.C., Iwasaki, S., Lawson, V.J., Lembke-Jene, L., Lo, L., Malinverno, E., Michel, E., Middleton, J.L., Moretti, S., Moy, C.M., Ravelo, A.C., Riesselman, C.R., Saavedra-Pellitero, M., Seo, I., Singh, R.K., Smith, R.A., Souza, A.L., Stoner, J.S., Venancio, I.M., Wan, S., Zhao, X., and Foucher McColl, N., 2021. Site U1543. In Lamy, F., Winckler, G., Alvarez Zarikian, C.A., and the Expedition 383 Scientists, Dynamics of the Pacific Antarctic Circumpolar Current. Proceedings of the International Ocean Discovery Program, 383: College Station, TX (International Ocean Discovery Program). https://doi.org/10.14379/iodp.proc.383.107.2021
2 Expedition 383 Scientists’ affiliations.
This work is distributed under the Creative Commons Attribution 4.0 International (CC BY 4.0) license. 