Coggon, R.M., Teagle, D.A.H., Sylvan, J.B., Reece, J., Estes, E.R., Williams, T.J., Christeson, G.L., and the Expedition 390/393 Scientists
Proceedings of the International Ocean Discovery Program Volume 390/393
publications.iodp.org
https://doi.org/10.14379/iodp.proc.390393.209.2024
Data report: high-resolution digital imaging of whole-round hard rocks collected during IODP Expeditions 390C, 395E, 390, and 393, South Atlantic Transect, using a DMT CoreScan31
Lewis J.C. Grant,2 Aled D. Evans,2 Rosalind M. Coggon,2 Justin D. Estep,2 Andrew McIntyre,2 Angela Slagle,2 Sarah J. Widlansky,2 Elmar Albers,2 Michelle Harris,2 Damon A.H. Teagle,2 Jason B. Sylvan,2 Julia S. Reece,2 and the Expedition 390/393 Scientists2
1 Grant, L.J.C., Evans, A.D., Coggon, R.M., Estep, J.D., McIntyre, A., Slagle, A., Widlansky, S.J., Albers, E., Harris, M., Teagle, D.A.H., Sylvan, J.B., Reece, J.S., and the Expedition 390/393 Scientists, 2024. Data report: high-resolution digital imaging of whole-round hard rocks collected during IODP Expeditions 390C, 395E, 390, and 393, South Atlantic Transect, using a DMT CoreScan3. In Coggon, R.M., Teagle, D.A.H., Sylvan, J.B., Reece, J., Estes, E.R., Williams, T.J., Christeson, G.L., and the Expedition 390/393 Scientists, South Atlantic Transect. Proceedings of the International Ocean Discovery Program, 390/393: College Station, TX (International Ocean Discovery Program). https://doi.org/10.14379/iodp.proc.390393.209.2024
2 Expedition 390/393 Scientists’ affiliations. Correspondence author: lewis.grantucl@gmail.com
Abstract
Hard rock cores recovered during International Ocean Discovery Program South Atlantic Transect (SAT) Expeditions 390C, 395E, 390, and 393 were digitally imaged using a DMT CoreScan3 line scanner aboard the R/V JOIDES Resolution during Expeditions 390 and 393. Methods outlined here involve modification of the CoreScan3 to scan >1 m long sections of hard rock at a 40 pixel/mm resolution, four times higher resolution than previously achieved during an ocean drilling campaign. This method is combined with a dedicated Python package (StitchIT) written to compile multiple 20 cm frames into high-resolution core section images. Accompanying this report are all compiled high-resolution section images from the SAT, both as high-resolution individual images of each section and as moderate-resolution visual core description–style images. The methods outline best practices for digitally imaging external core surfaces, and the data set is the first to be generated specifically for emerging machine learning and computer vision applications.
1. Introduction
Technology that can be used to image core prior to splitting, curation, and sampling is invaluable during drilling campaigns concerned with preserving 3D relationships and the appearance of the outer core surfaces, especially for fragile material. During scientific ocean drilling expeditions, the current standard shipboard core flow involves cutting the cores into working and archive halves prior to any digital imaging, with the cut surface of the archive half subsequently imaged using a Section Half Image Logger (SHIL; e.g., Coggon et al., 2024). This system provides a useful visual record of key petrologic features of the cores. However, because it is capable of recording only 2D data, key information regarding the 3D geometries of these features within the cores is ignored. Fragile material (e.g., gouge) may also not survive splitting. Systems that provide an unrolled 360 degree digital image of hard rock core exteriors project 3D data into a 2D reference frame, capturing information regarding the orientations of and spatial relationships between igneous, hydrothermal, and structural features such as unit contacts, veins, alteration halos, fractures, and faults. For example, nonhorizontal planar features manifest as sinusoidal curves in such unrolled images, with amplitude dependent on the dip of the feature. During rotary core barrel (RCB) coring operations, recovery is typically incomplete and core pieces shorter than the core diameter are not oriented because they can freely rotate in the core barrel. Longer pieces, however, can be vertically orientated but may rotate about their cylindrical axis, so they cannot be orientated into their original geographic reference frame. In addition to aiding petrologic interpretations of the cores, unrolled 360 degree whole-round core images can be compared with geographically oriented images of the borehole walls collected using wireline logging tools such as the Formation MicroScanner (FMS) and Ultrasonic Borehole Imager (UBI) to determine the original orientation and depth of core pieces (Tominaga et al., 2009).
During the International Ocean Discovery Program (IODP) South Atlantic Transect (SAT) expeditions, the external surfaces of whole-round RCB basement cores were scanned using a Deutsche Montan Technologie (DMT) CoreScan3 system (Figure F1) prior to splitting. Similar DMT systems were previously used during Ocean Drilling Program Legs 173 (Shipboard Scientific Party, 1998), 179 (Shipboard Scientific Party, 1999), 197 (Shipboard Scientific Party, 2002), and 206 (Shipboard Scientific Party, 2003); IODP Expedition 309/312 (Expedition 309/312 Scientists, 2006); and the International Continental Scientific Drilling Program (ICDP)/IODP Oman Drilling Project (OmanDP) (Kelemen et al., 2020). All of these expeditions imaged sections at a 5 pixel/mm resolution, except for the OmanDP, which imaged all cores at a 10 pixel/mm resolution.
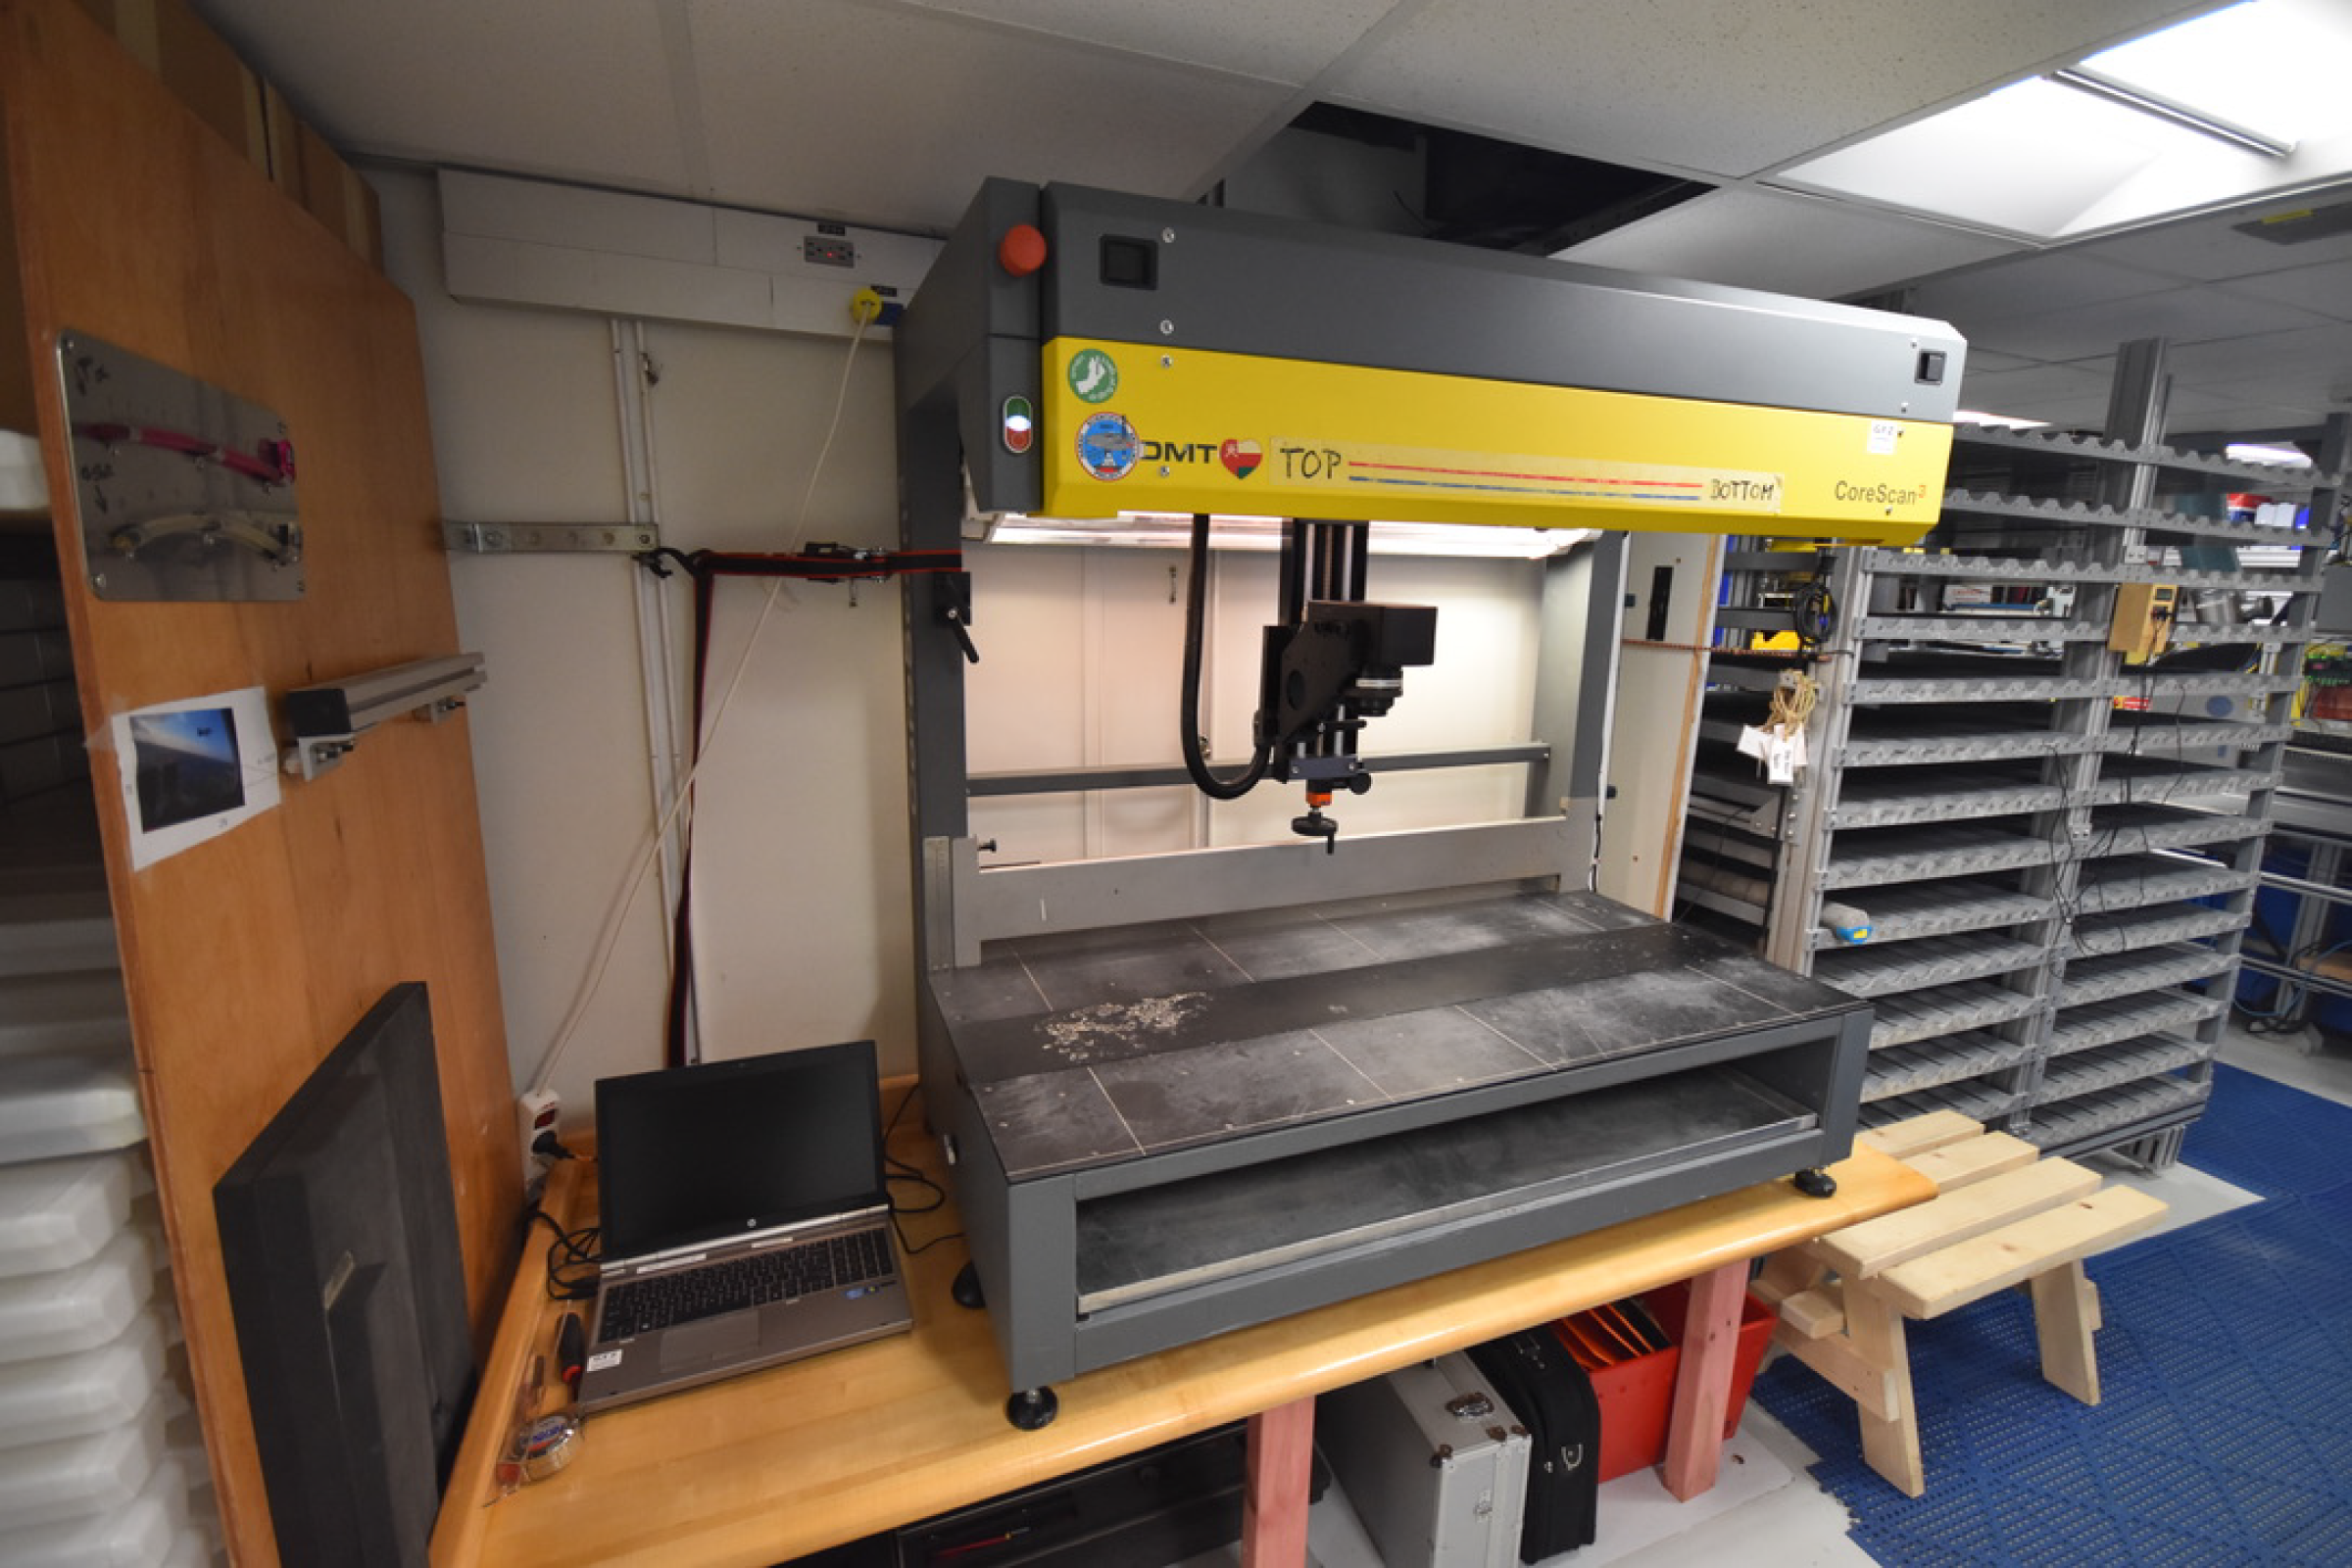
Figure F1. DMT CoreScan3 system.
The aim of this data report is to provide the highest quality core exterior image data set generated during a scientific drilling campaign to date and provide a standardized framework for more consistent future core exterior imaging. With increased processing power and development of deep learning algorithms, research into the interrogation of digital core image data sets with data science methodologies has begun to emerge (De La Houssaye et al., 2019; Alzubaidi et al., 2021; Grant et al., 2024). In response, the methods outlined here aim to standardize the collection and increase the resolution of core images to leverage their full potential in computational applications.
The current line scanning camera attached to the CoreScan3 is capable of generating images at both 10 and 40 pixels/mm. A significant improvement in image quality was made prior to the OmanDP, which was the first scientific drilling campaign to image core exteriors at a 10 pixel/mm resolution (Kelemen et al., 2020). Here, we outline a workflow for efficient acquisition of high-resolution (40 pixels/mm) unrolled 360 degree whole-round images of drill core exteriors developed during IODP Expeditions 390/393 (Coggon et al., 2024) with the aim of providing: (1) a high-quality visual archive of the petrologic features of the cores, including their geometries, to aid petrologic interpretation of the cores and (2) a data set suitable for postexpedition high-resolution core-log integration and computer vision–based interrogation. We also provide the program StitchIT, which was developed for postcruise image processing and compilation of the images of core pieces collected aboard the R/V JOIDES Resolution into high-resolution core section images.
A primary objective of the SAT expeditions is to quantify the timing, duration, and extent of hydrothermal fluid-rock exchange across the aging ridge flank. These exchanges result in the development of hydrothermal features, such as veins, cements, alteration halos and patches, and secondary mineral-filled vesicles that are clearly visible at a 40 pixel/mm resolution. The image data set presented here (see https://zenodo.org/records/10925447) can be interrogated to further refine estimates of the abundance of these features and, hence, the extent of fluid-rock exchange recorded in the cores.
2. Equipment setup
The CoreScan3 is designed to image the full circumference of drill core, producing unrolled images of core up to 1 m long and 25–150 mm in diameter. In 360 degree mode, true color images are recorded at a 5, 10, or 40 pixel/mm resolution by a line scanning camera as the core is incrementally rotated about its cylindrical axis. All scans during the SAT expeditions were captured using the instrument’s high-resolution configuration (40 pixels/mm), in which the camera is positioned above the core with the lens pointing vertically downward. Color correction of the camera was performed daily (Expedition 390) or twice daily (Expedition 393) in low-resolution mode to ensure colors were correctly balanced throughout the data set. All other CoreScan3 operations were conducted in high-resolution mode.
During Expedition 390, it became apparent that lighting conditions were inconsistent in the core laboratory where the CoreScan3 was located, impacting the brightness levels of the images captured. To ensure a consistent and controlled scanning environment, a light-blocking curtain was attached to the CoreScan3 after operations at the first drill site (U1556) of Expedition 390. During the curatorial process, cores were washed to remove drilling residue and put back into their core liners wet; scanning of partially dried cores resulted in color artifacts in the images. To expedite drying, each core piece was raised above its core liner using plastic dividers and dried using a series of fans installed above the core prior to scanning.
To keep brightness and exposure settings constant throughout the data set, default settings of the CoreScan3 software were adjusted to those listed below, which are imperative for accurate image manipulation by our Python program, StitchIT:
- Disabling “auto-adjust exposure,”
- Selecting “no core detection, no selection,” and
- Choosing the appropriate exposure setting for the rock color and keeping it as constant as possible downhole.
These settings produce raw images that have a higher level of brightness consistency than those that have been adjusted by the CoreScan3 software. After all pieces within a section were scanned, images were cropped and saved as bitmap (.BMP) and .DMT files.
3. Scanning procedure
During the shipboard IODP curatorial process, cores are divided into sections up to 1.5 m in length (Coggon et al., 2024), which exceeds the 1 m maximum scan length of the CoreScan3 (Figure F2A). However, even in basement cores with high recovery, individual core pieces rarely exceed 0.5 m in length and, hence, fit on the scanner. Prior to scanning, cores were marked with a red splitting line along their vertical axis and a blue vertical line at the bottom of each piece to indicate the up direction. In high-resolution mode, the CoreScan3’s camera is only able to capture 25 cm of core at a time, so small blue lines were also drawn every 20 cm perpendicular to the red splitting line. These additional blue lines were used as reference points to allow frames to be cropped in a manner that allowed them to be stitched together into a final compiled piece image (Figure F2B). Core pieces longer than 25 cm were therefore scanned in multiple 25 cm frames, starting with the top 25 cm of the piece and working downcore until the entire piece was imaged. For pieces longer than 0.5 m, the top of the piece protruded beyond the rollers when the last frame was imaged.
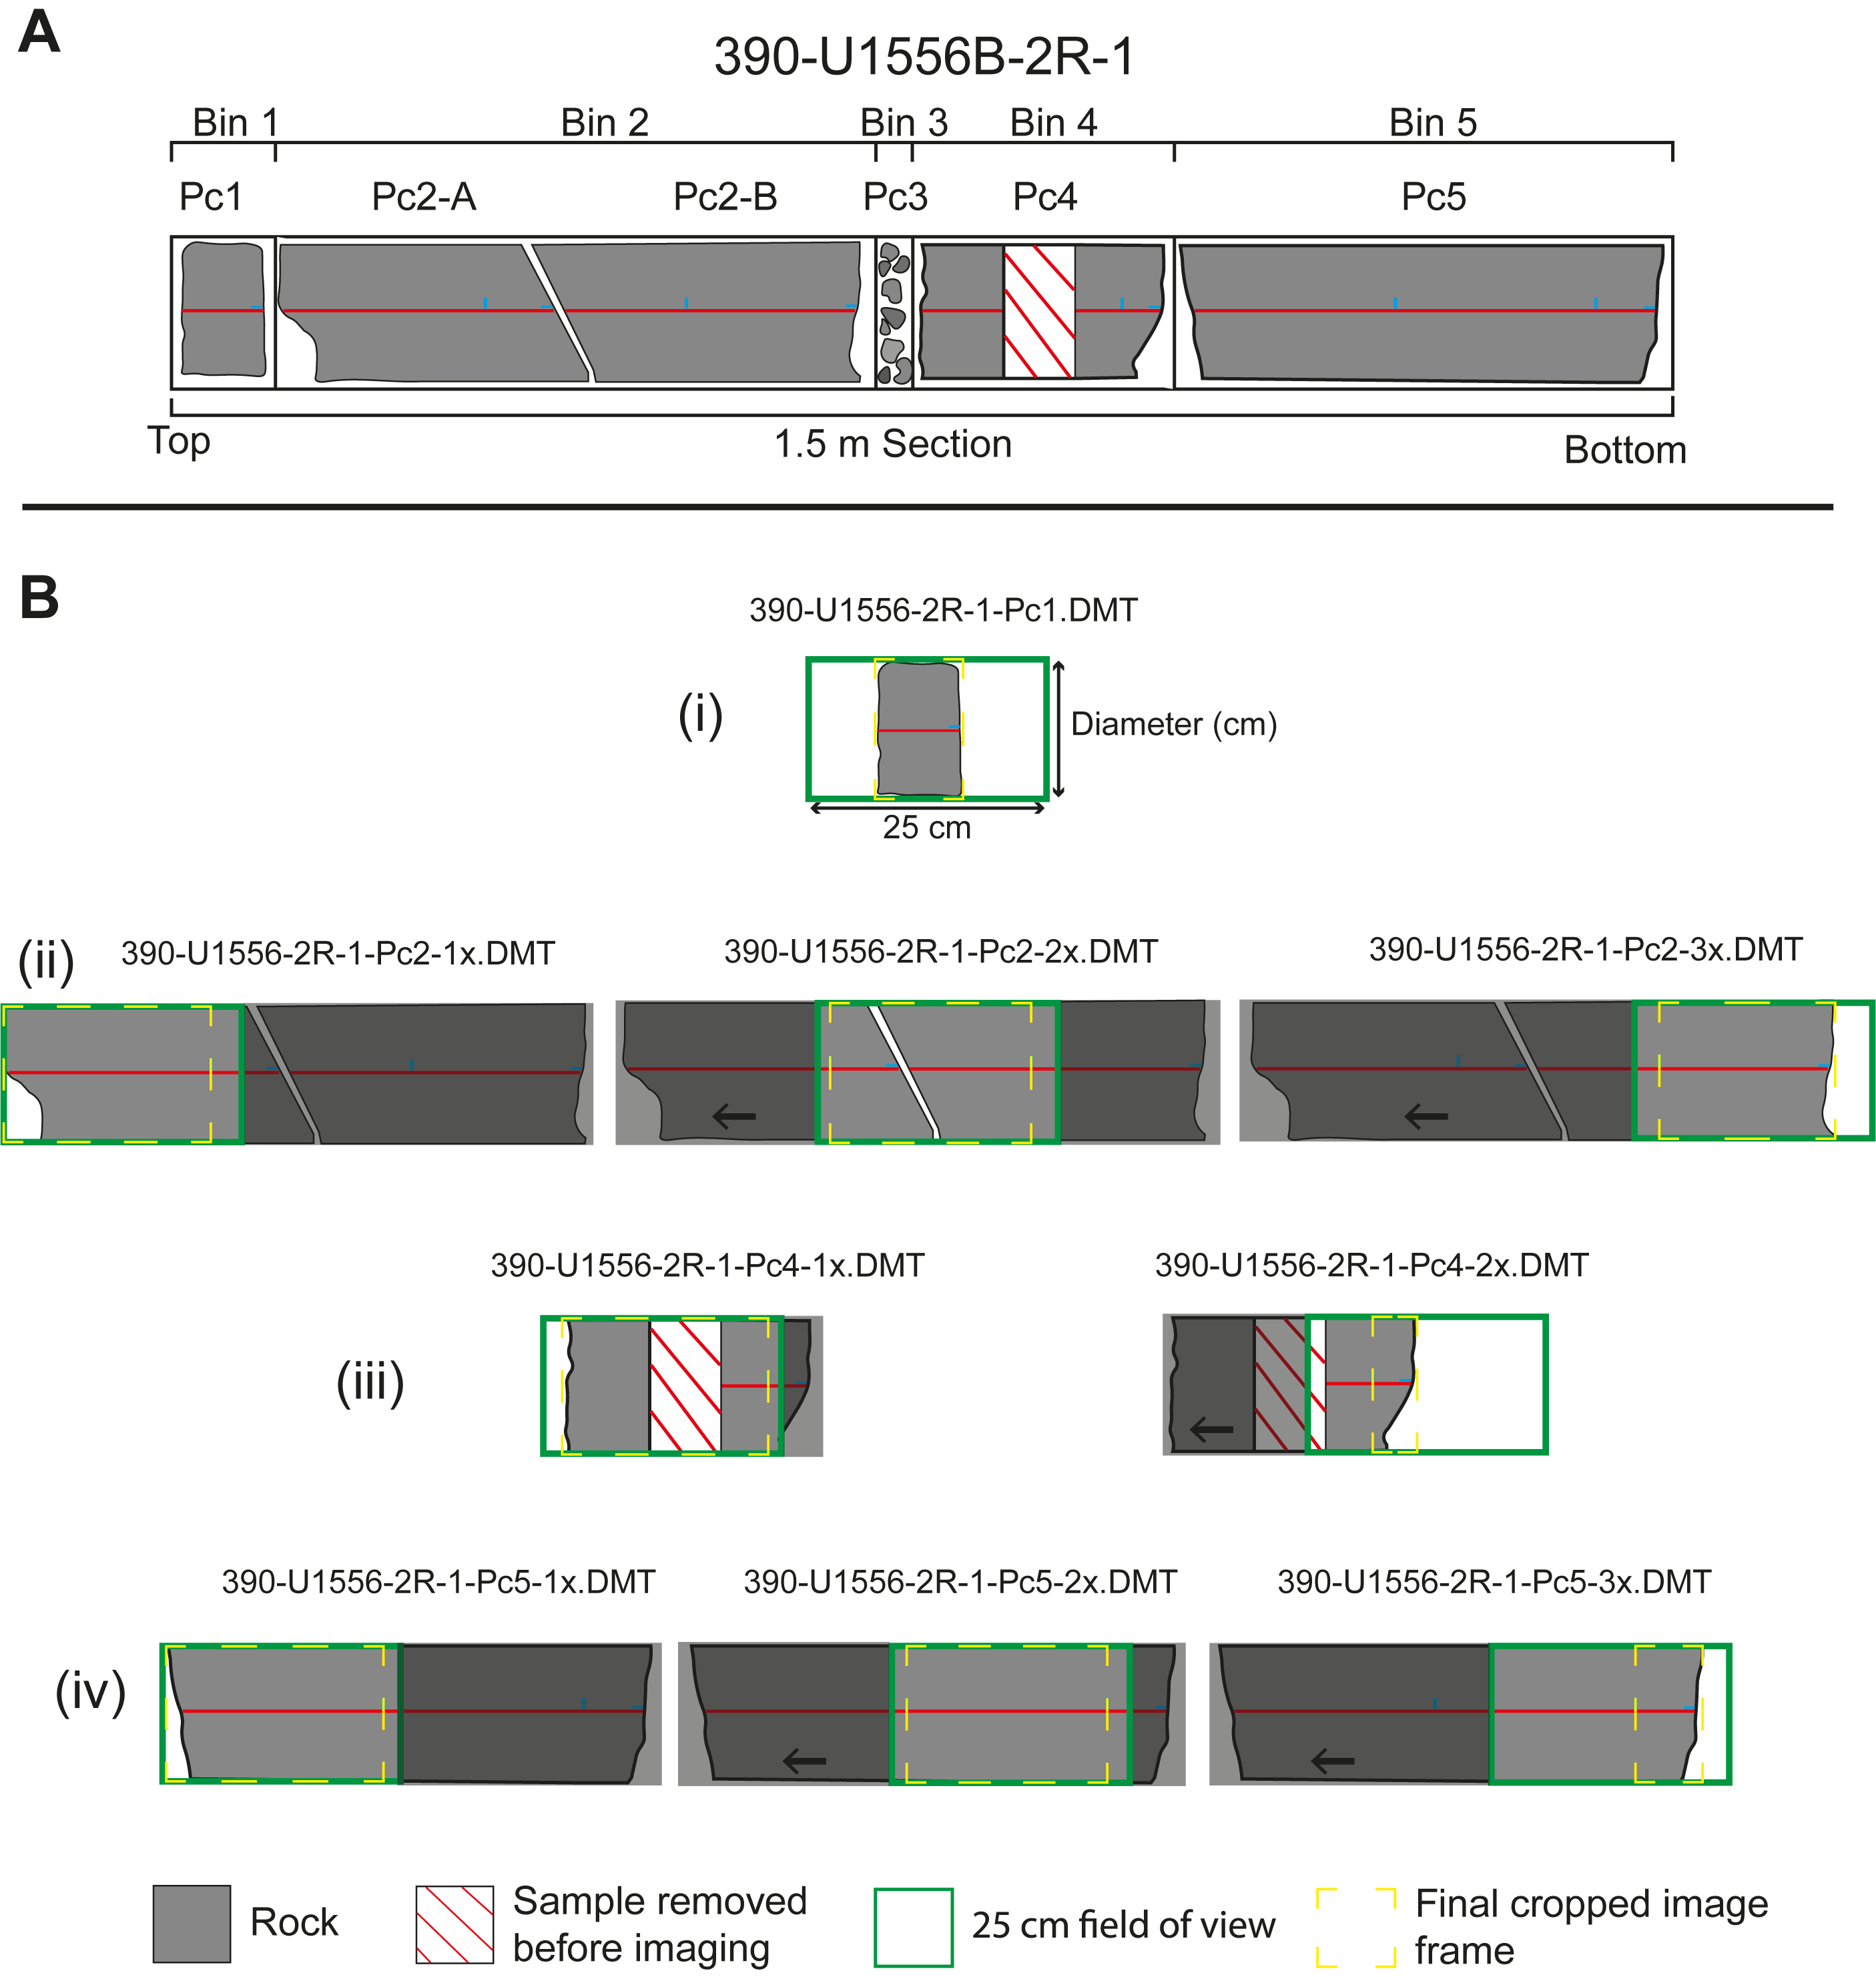
Figure F2. Labeling convention and scanning procedure.
Where core pieces were fractured into multiple subpieces, the subpieces were jigsawed together and scanned as a single piece (Figure F2B). This approach is preferred over scanning subpieces separately because if the contact between two subpieces is angular, the resultant overlap between the subpieces is ignored and the total length of the piece is exaggerated when the images are stitched together. If a subpiece was sampled for microbiological or geochemical analysis prior to scanning, the missing or fragmented remains of the subpiece were replaced with a foam cylinder of the same length to preserve the original length of the core piece.
Only the exterior of core pieces that were able to roll about their cylindrical axis were scanned, although some uneven pieces could be rolled cleanly by supporting them with two round foam pads attached to concrete cylinders. Highly fractured core that could be jigsawed together but was too unstable to roll was held together using heat shrink wrap; however, this was a last resort because the wrap created interference in the images due to spurious reflectance. Core intervals comprising fragmented rubble or small angular pieces were not scanned at all because they didn’t fit and/or roll well on the scanner. As a result, they were only captured in the section-half images (Figure F3).
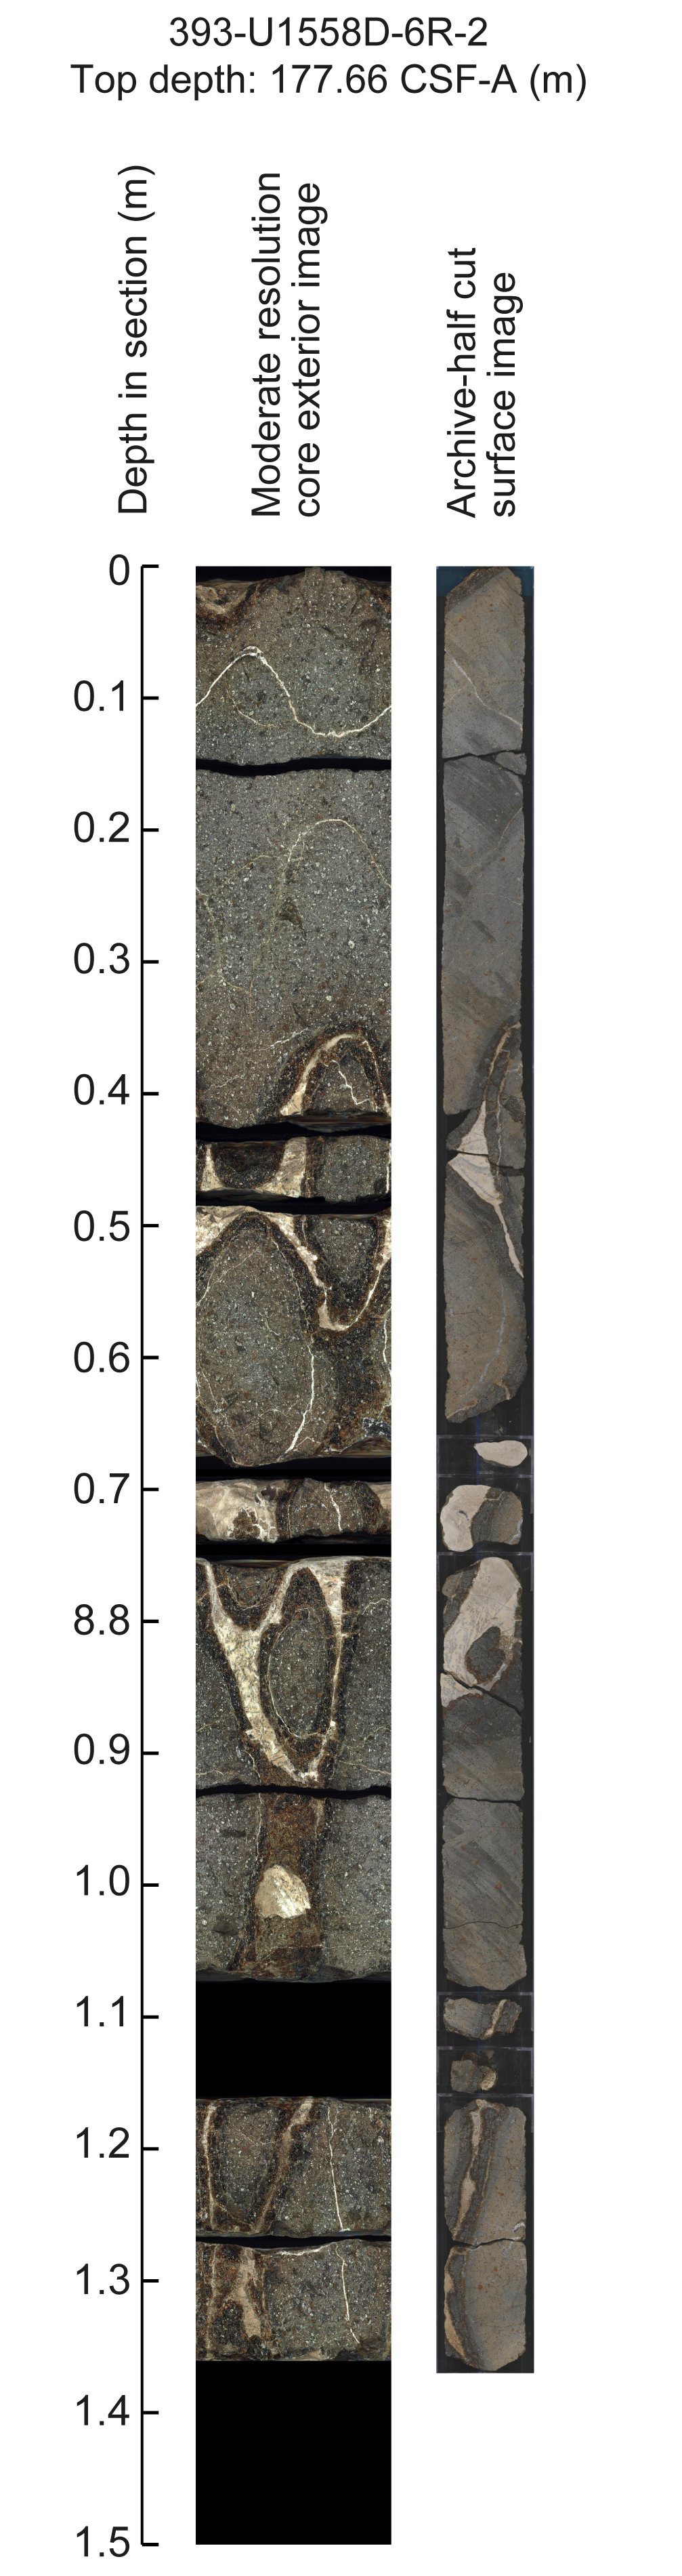
Figure F3. Whole-round and archive-half images.
4. Image processing
Image processing was carried out using StitchIT, a Python program developed as part of this study, to use core piece depth information recorded in the shipboard piece logs to stitch images together and produce a single high-resolution image per whole-round core section. The basic principle of StitchIT is that when orientated vertically, cropped image frames from pieces >25 cm in length can be stacked sequentially to construct a single image of the entire piece. Once all pieces in a core section are compiled, a virtual template is constructed with its length in pixels equaling 1.5 m multiplied by the image resolution (40 pixels/mm). The top offset depth of each piece bin recorded in the section’s piece log can then be used to plot each piece image in its correct spot on the template. StitchIT also has a function that outputs a composite visual core description (VCD)–style image in which a moderate-resolution version of the unwrapped whole-round DMT image is displayed alongside the cut surface image of the archive half (Figure F3).
5. Image normalization
The workflow detailed above was developed in real time over the course of coring operations during Expedition 390 and refined during Expedition 393, based on the experience gained, to improve the quality of the images captured. Once scanned, cores continued their journey through the core laboratory workflow and were split and sampled. It was therefore not possible to rescan cores using any improved scanning methods. After scanning the basement cores from Hole U1556B, it was recognized that the CoreScan3 software’s default settings, as well as inconsistent lighting in the laboratory, caused brightness differences between adjacent frames when stitched together (Figure F4).
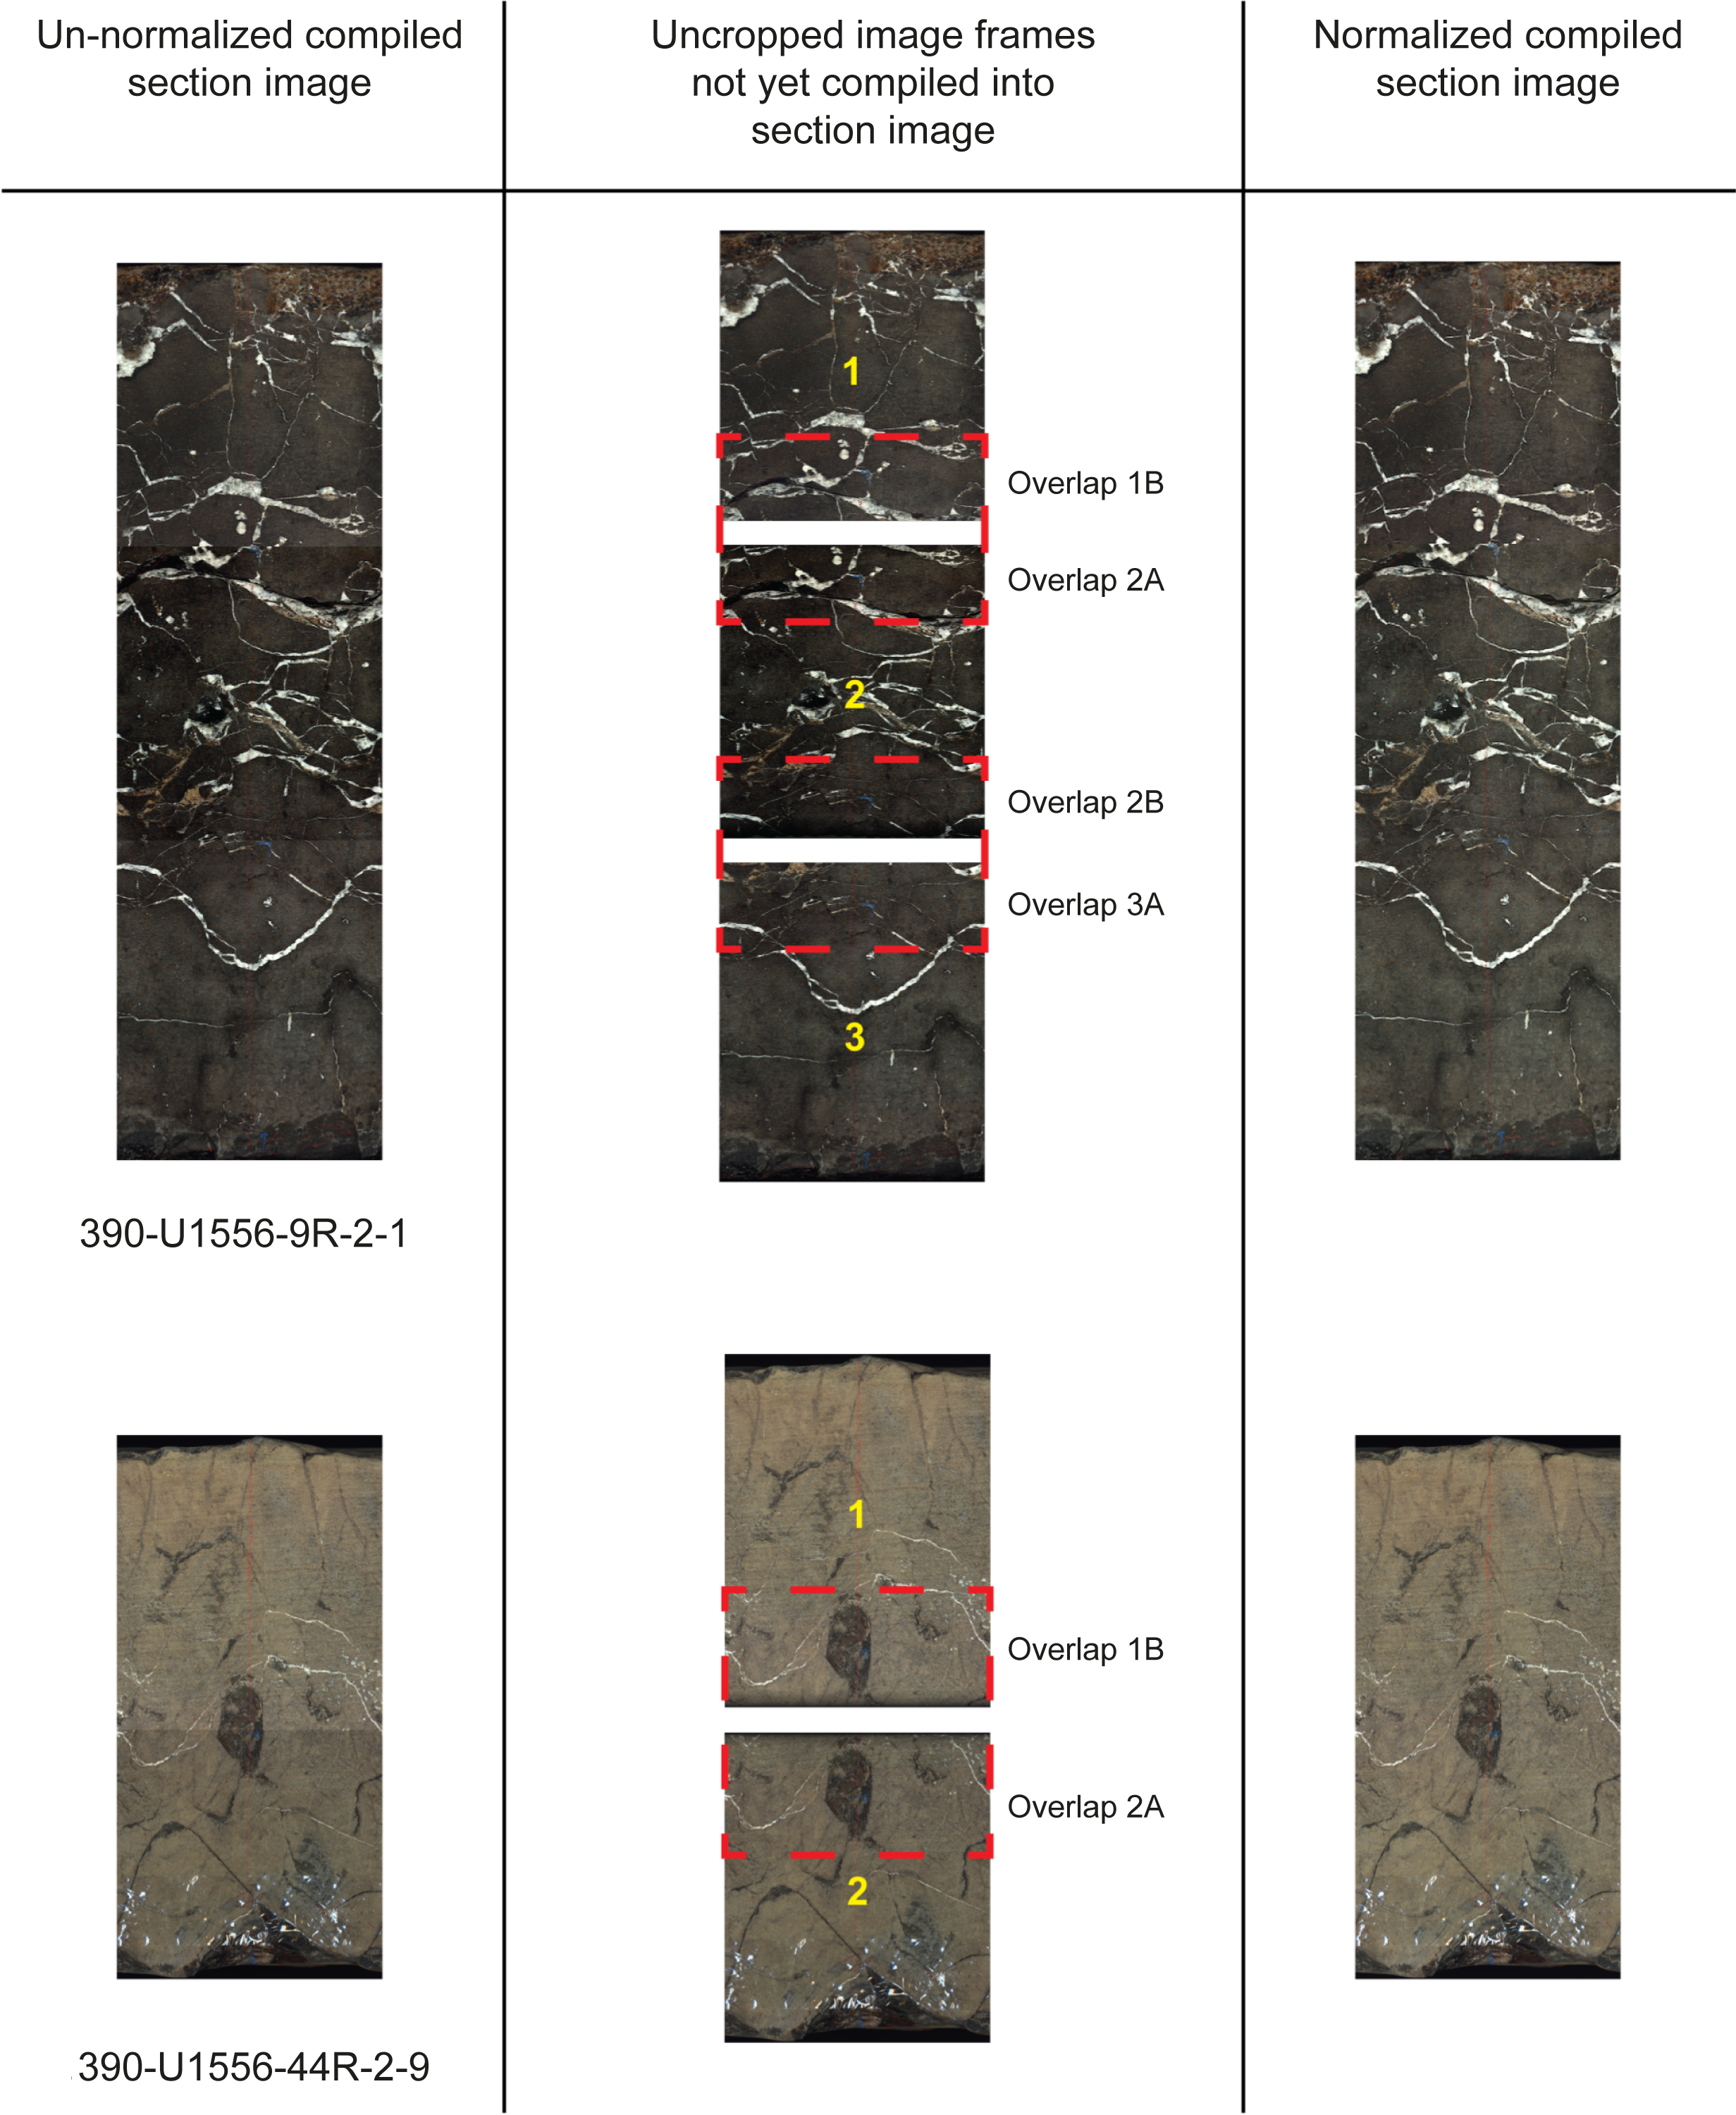
Figure F4. Two pieces of core that were normalized and compiled.
In remote sensing, it is common for brightness discrepancies to occur between images that are taken of the same terrain under differing atmospheric conditions, and normalization of adjacent overlapping scenes allows reduction of such discrepancies (Belgrano et al., 2022; Yong et al., 2001). In the case of the images collected at Hole U1556B, individual 25 cm frames overlap with adjacent frames, so gains and offsets for each frame can be calculated and used to normalize them prior to cropping and stitching into a complete piece image. The overlapping regions of adjacent frames are on average 1–2 cm of identical core material visible in both frames. For each reconstructed core piece image, the uppermost frame (1x) was used as the reference that all the preceding frames were adjusted to using
where S(i)* is the corrected frame and i is the pixel channel, and correction was made to all three channels (red-green-blue color space [RGB]) in the images. As frame 1x is not being corrected, its gain and offset for all channels can be thought of as
whereas the gain and offset of the second frame (2x) are calculated using the mean (µ) and standard deviation (σ) for each channel in the overlapping lower area of image 1x (area 1B) and upper area of image 2x (area 2A) according to
In the case of a core piece consisting of a third frame (3x), frame 2x now acts as the reference to which frame 3x is normalized and the gain and offset must incorporate adjustments already made to frame 2x:
In the same fashion, the gain and offset of the nth frame can be calculated as (Figure F5)
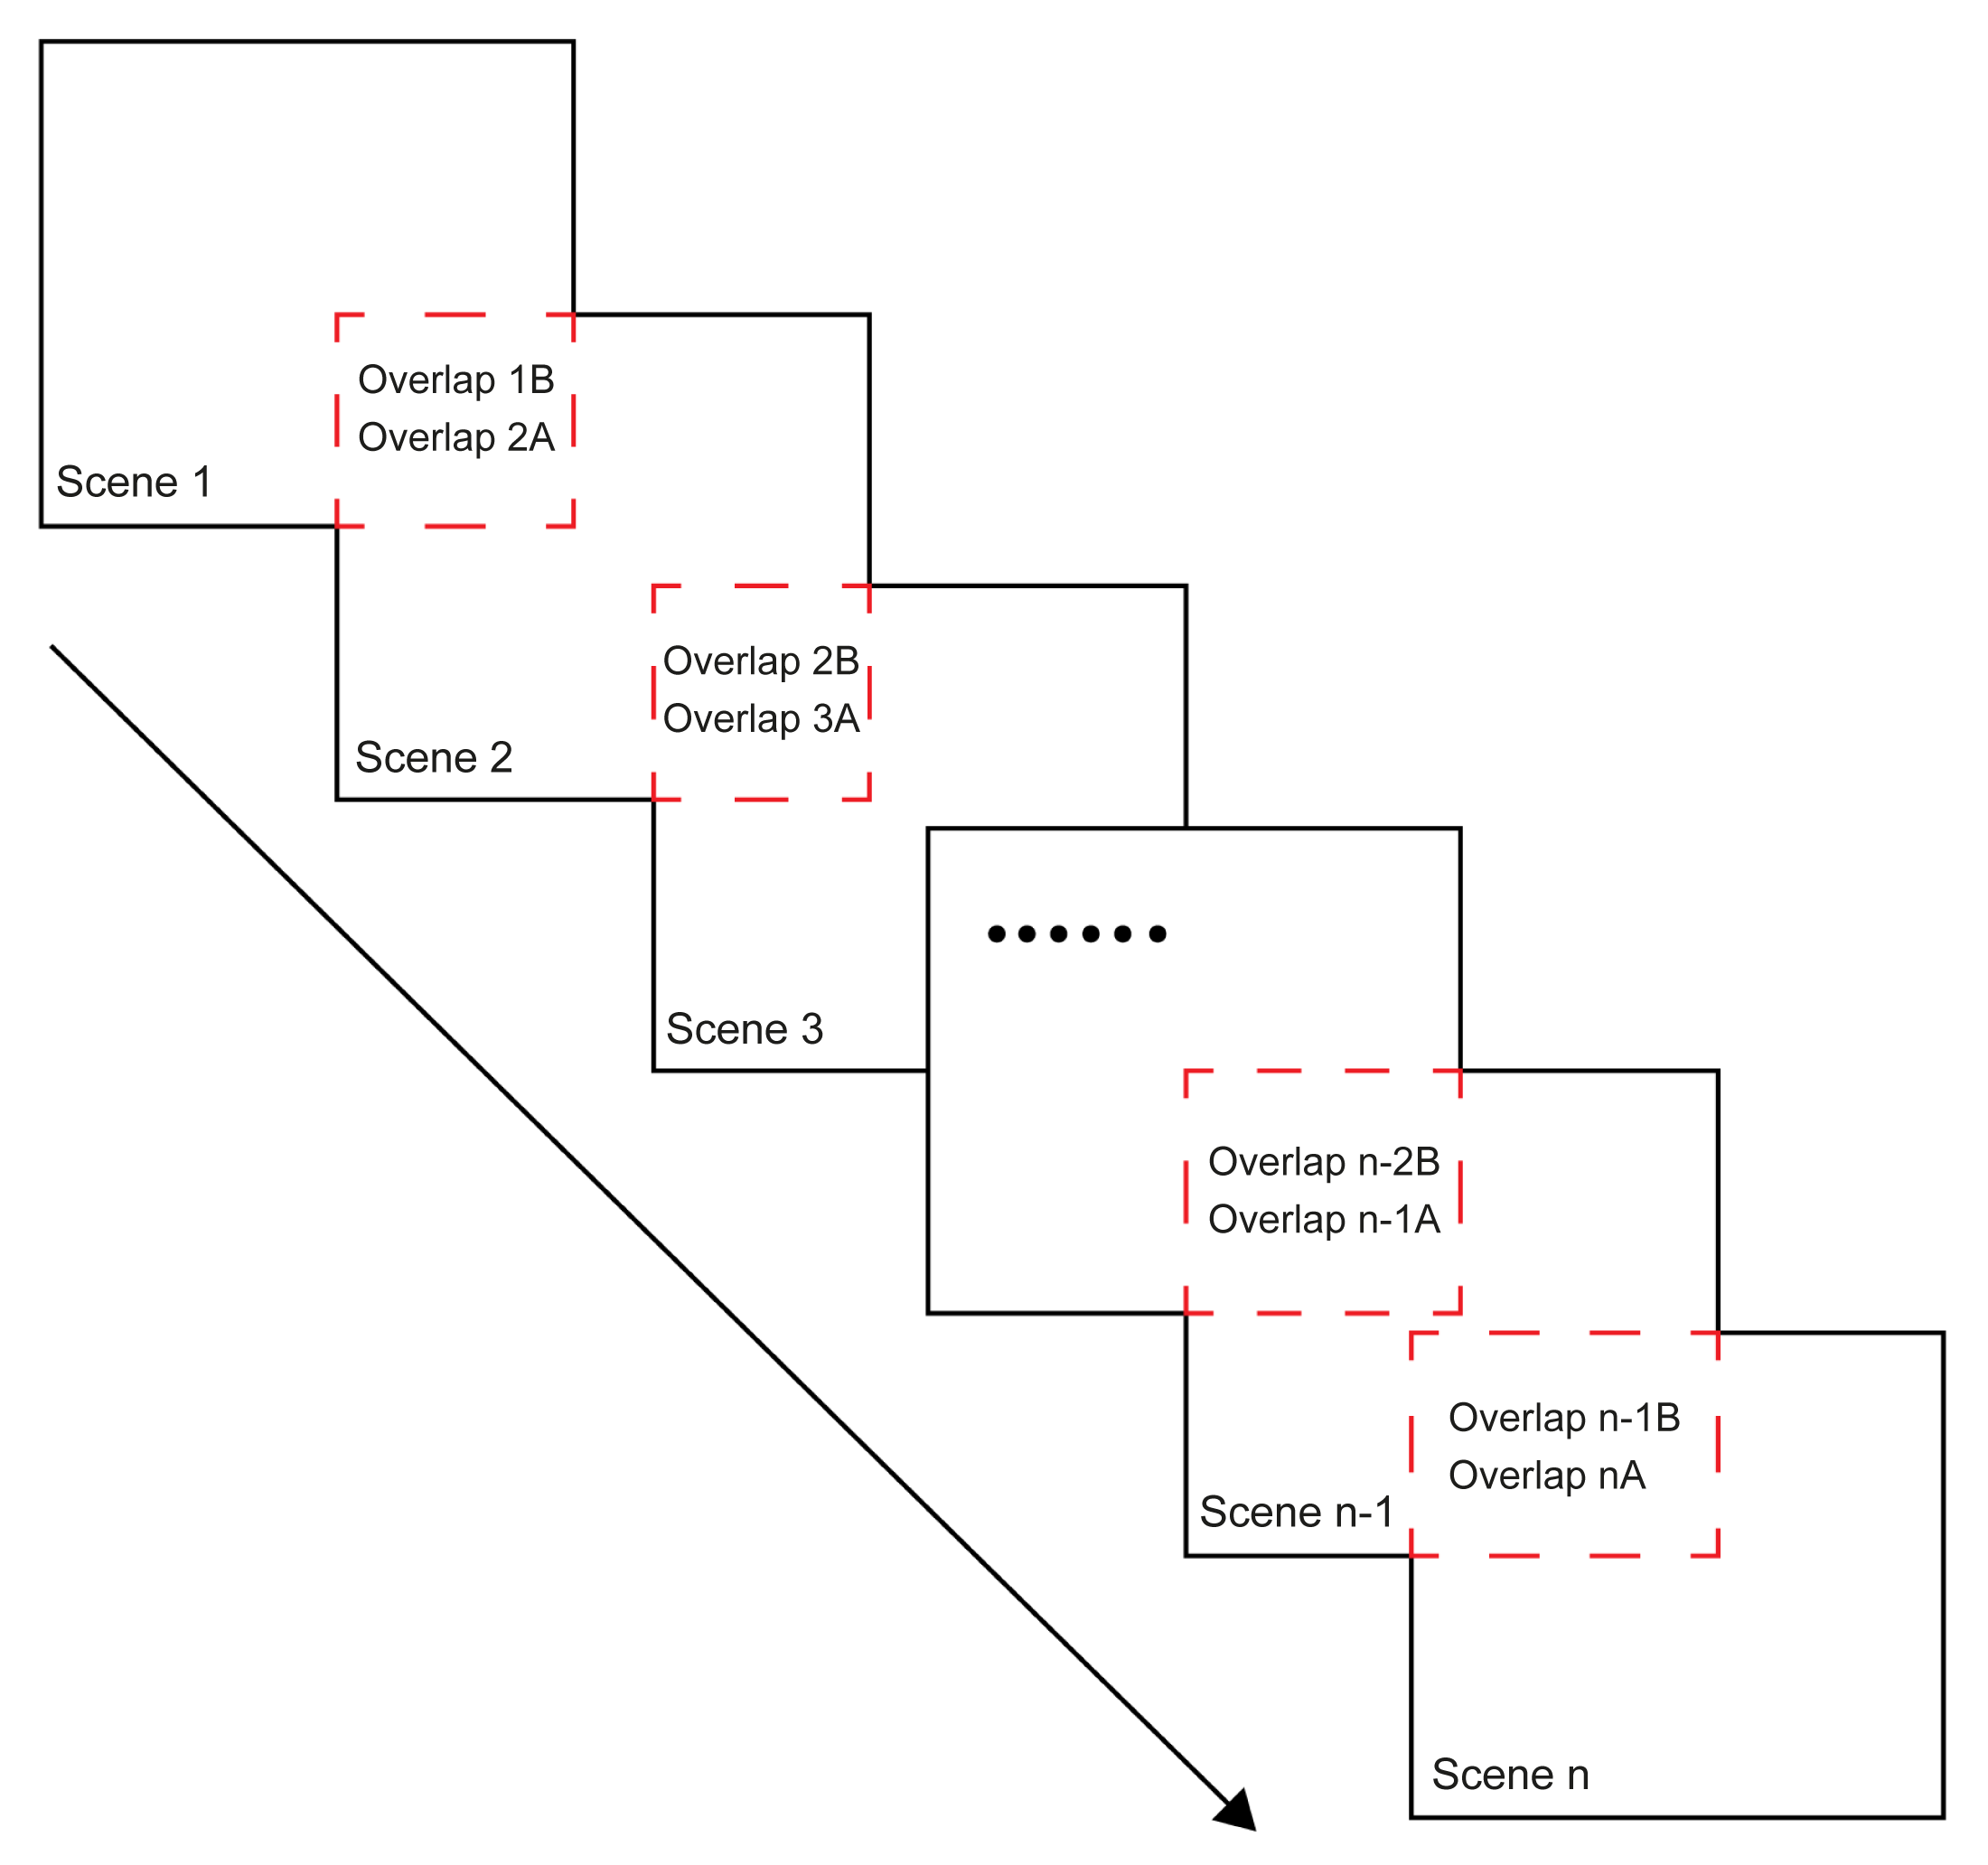
Figure F5. Normalization approach.
This normalization approach was successfully applied to all frames except those that did not have much overlap with adjacent frames. In these cases, a simpler approach was used whereby all frames were normalized to frame 1x by multiplying each channel of the frame to be corrected (Nx) by a scaling factor λ, where
This alternative approach resolved highly visible brightness differences between adjacent frames, albeit not as well when the difference was subtle.
Although these normalization approaches improved the quality of the final compiled whole-round section images, not all images were improved. For example, some cores were not dry prior to image acquisition of the Hole U1556B data set, resulting in suboptimal image quality that could not be corrected postscanning. Regardless, brightness inconsistencies were greatly reduced for the subsequently scanned cores from all other SAT sites by thoroughly drying cores prior to image acquisition, using the CoreScan3 software settings outlined above, and installing a light-blocking curtain around the scanner. Residual inconsistencies were further reduced in StitchIT using the equations described above.
6. Data availability
All high-resolution whole-round DMT images are available as compiled section images with a resolution of 40 pixels/mm, and VCD-style images containing both whole-round and section-half images are available for all sections imaged using the CoreScan3 (https://zenodo.org/records/10925447). StitchIT is freely available on GitHub under a GNU General Public License (https://github.com/LJCGrant/StitchIT/tree/main), and all uses of StitchIT that lead to publication should cite this data report.
7. Summary
The methods outlined in this data report provide a workflow for using a CoreScan3 line scanner to produce higher resolution core section images than previously achieved during scientific ocean drilling expeditions. These methods are designed to be used alongside the dedicated Python script StitchIT to compile core section images with a resolution of 40 pixels/mm. StitchIT also outputs VCD-style figures that plot these high-resolution whole-round images in parallel with section-half images when available. The primary finding of this report is that as data processing and machine learning tools continue to advance, so should the way digital images of geological cores are collected. Legacy image data sets acquired during drilling campaigns currently lack consistent quality but also lack a standardized acquisition methodology and are often stored in different media. Therefore, the machine readability of these data sets is limited. The methods in this report are an attempt to begin defining best practices in geological imaging as artificial intelligence approaches that utilize more advanced machine learning methods become standard practice during drilling campaigns.
8. Acknowledgments
We would like to thank Katja Heeschen and Tino Nesslinger (ICDP); Tim Bronk (IODP-TAMU), Patricia Gibbs (Peters and May), Richard Harfield and colleagues from NOC Stores; and the Cape Town port agent team led by Megan Gobey of the Rennies Ship Agency (Pty) Ltd who helped ensure the safe transport and return of the CoreScan3. A UK-IODP cruise contingency proposal (to DAHT and RMC) was used for the transport and insurance (and customs clearances, etc.) of the CoreScan3 instrument (owned by the International Continental Scientific Drilling Program) to Cape Town (and return) for IODP Expeditions 390/393.
References
Alzubaidi, F., Mostaghimi, P., Swietojanski, P., Clark, S.R., and Armstrong, R.T., 2021. Automated lithology classification from drill core images using convolutional neural networks. Journal of Petroleum Science and Engineering, 197:107933. https://doi.org/10.1016/j.petrol.2020.107933
Belgrano, T.M., Diamond, L.W., Novakovic, N., Hewson, R.D., Hecker, C.A., Wolf, R.C., de Doliwa Zieliński, L., Kuhn, R., and Gilgen, S.A., 2022. Multispectral discrimination of spectrally similar hydrothermal minerals in mafic crust: A 5000 km2 ASTER alteration map of the Oman–UAE ophiolite. Remote Sensing of Environment, 280:113211. https://doi.org/10.1016/j.rse.2022.113211
Coggon, R.M., Teagle, D.A.H., Sylvan, J.B., Reece, J., Estes, E.R., Williams, T.J., Christeson, G.L., Aizawa, M., Albers, E., Amadori, C., Belgrano, T.M., Borrelli, C., Bridges, J.D., Carter, E.J., D’Angelo, T., Dinarès-Turell, J., Doi, N., Estep, J.D., Evans, A., Gilhooly, W.P., III, Grant, L.C.J., Guérin, G.M., Harris, M., Hojnacki, V.M., Hong, G., Jin, X., Jonnalagadda, M., Kaplan, M.R., Kempton, P.D., Kuwano, D., Labonte, J.M., Lam, A.R., Latas, M., Lowery, C.M., Lu, W., McIntyre, A., Moal-Darrigade, P., Pekar, S.F., Robustelli Test, C., Routledge, C.M., Ryan, J.G., Santiago Ramos, D., Shchepetkina, A., Slagle, A.L., Takada, M., Tamborrino, L., Villa, A., Wang, Y., Wee, S.Y., Widlansky, S.J., Yang, K., Kurz, W., Prakasam, M., Tian, L., Yu, T., and Zhang, G., 2024. Expedition 390/393 methods. In Coggon, R.M., Teagle, D.A.H., Sylvan, J.B., Reece, J., Estes, E.R., Williams, T.J., Christeson, G.L., and the Expedition 390/393 Scientists, South Atlantic Transect. Proceedings of the International Ocean Discovery Program, 390/393: College Station, TX (International Ocean Discovery Program). https://doi.org/10.14379/iodp.proc.390393.102.2024
De La Houssaye, B., Flaming, P., Nixon, Q., and Acton, G., 2019. Machine learning and deep learning applications for International Ocean Discovery Program geoscience research. SMU Data Science Review, 2(3):9. https://scholar.smu.edu/datasciencereview/vol2/iss3/9
Expedition 309/312 Scientists, 2006. Expedition 309/312 summary. In Teagle, D.A.H., Alt, J.C., Umino, S., Miyashita, S., Banerjee, N.R., Wilson, D.S., and the Expedition 309/312 Scientists, Proceedings of the Integrated Ocean Drilling Program. 309/312: Washington, DC (Integrated Ocean Drilling Program Management International, Inc.). https://doi.org/10.2204/iodp.proc.309312.101.2006
Grant, L.J.C., Massot-Campos, M., Coggon, R.M., Thornton, B., Rotondo, F., Harris, M., Evans, A.D., and Teagle, D.A.H., 2024. Leveraging spatial metadata in machine learning for improved objective quantification of geological drill core. Earth and Space Science, 11(3):e2023EA003220. https://doi.org/10.1029/2023EA003220
Kelemen, P.B., Matter, J.M., Teagle, D.A.H., Coggon, J.A., and the Oman Drilling Project Science Team, 2020. Methods and explanatory notes. In Kelemen, P.B., Matter, J.M., Teagle, D.A.H., Coggon, J.A., et al., Proceedings of the Oman Drilling Project. College Station, TX (International Ocean Discovery Program). https://doi.org/10.14379/OmanDP.proc.2020
Shipboard Scientific Party, 1998. Leg 173 introduction. In Whitmarsh, R.B., Beslier, M.-O., Wallace, P.J., et al., Proceedings of the Ocean Drilling Program, Initial Reports. 173: College Station, TX (Ocean Drilling Program), 7–30. https://doi.org/10.2973/odp.proc.ir.173.101.1998
Shipboard Scientific Party, 1999. Leg 179 summary. In Pettigrew, T.L., Casey, J.F., Miller, D.J., et al., Proceedings of the Ocean Drilling Program, Initial Reports. 179: College Station, TX (Ocean Drilling Program). https://doi.org/10.2973/odp.proc.ir.179.101.1999
Shipboard Scientific Party, 2002. Leg 197 summary. In Tarduno, J.A., Duncan, R.A., Scholl, D.W., et al., Proceedings of the Ocean Drilling Program, Initial Reports. 197: College Station, TX (Ocean Drilling Program). https://doi.org/10.2973/odp.proc.ir.197.101.2002
Shipboard Scientific Party, 2003. Leg 206 summary. In Wilson, D.S., Teagle, D.A.H., Acton, G.D., et al., Proceedings of the Ocean Drilling Program, Initial Reports. 206: College Station, TX (Ocean Drilling Program). https://doi.org/10.2973/odp.proc.ir.206.101.2003
Tominaga, M., Teagle, D.A.H., Alt, J.C., and Umino, S., 2009. Determination of the volcanostratigraphy of oceanic crust formed at superfast spreading ridge: electrofacies analyses of ODP/IODP Hole 1256D. Geochemistry, Geophysics, Geosystems, 10(1). https://doi.org/10.1029/2008GC002143
Yong, D., Cihlar, J., Beaubien, J., and Latifovic, R., 2001. Radiometric normalization, compositing, and quality control for satellite high resolution image mosaics over large areas. IEEE Transactions on Geoscience and Remote Sensing, 39(3):623–634. https://doi.org/10.1109/36.911119