Uenzelmann-Neben, G., Bohaty, S.M., Childress, L.B., and the Expedition 392 Scientists
Proceedings of the International Ocean Discovery Program Volume 392
publications.iodp.org
https://doi.org/10.14379/iodp.proc.392.105.2023
Site U15811
![]() S.M. Bohaty,
S.M. Bohaty,
![]() G. Uenzelmann-Neben,
G. Uenzelmann-Neben,
![]() L.B. Childress,
L.B. Childress,
![]() O.A. Archontikis,
O.A. Archontikis,
![]() S.J. Batenburg,
S.J. Batenburg,
![]() P.K. Bijl,
P.K. Bijl,
![]() A.M. Burkett,
A.M. Burkett,
![]() H.C. Cawthra,
P. Chanda,
H.C. Cawthra,
P. Chanda,
![]() J.J. Coenen,
J.J. Coenen,
![]() E. Dallanave,
P.C. Davidson,
E. Dallanave,
P.C. Davidson,
![]() K.E. Doiron,
K.E. Doiron,
![]() J. Geldmacher,
J. Geldmacher,
![]() D. Gürer,
D. Gürer,
![]() S.J. Haynes,
S.J. Haynes,
![]() J.O. Herrle,
Y. Ichiyama,
J.O. Herrle,
Y. Ichiyama,
![]() D. Jana,
D. Jana,
![]() M.M. Jones,
M.M. Jones,
![]() C. Kato,
C. Kato,
![]() D.K. Kulhanek,
J. Li,
J. Liu,
D.K. Kulhanek,
J. Li,
J. Liu,
![]() J. McManus,
J. McManus,
![]() A.N. Minakov,
A.N. Minakov,
![]() D.E. Penman,
C.J. Sprain,
D.E. Penman,
C.J. Sprain,
![]() A.C. Tessin,
A.C. Tessin,
![]() T. Wagner, and
T. Wagner, and
![]() T. Westerhold2
T. Westerhold2
1 Bohaty, S.M., Uenzelmann-Neben, G., Childress, L.B., Archontikis, O.A., Batenburg, S.J., Bijl, P.K., Burkett, A.M., Cawthra, H.C., Chanda, P., Coenen, J.J., Dallanave, E., Davidson, P.C., Doiron, K.E., Geldmacher, J., Gürer, D., Haynes, S.J., Herrle, J.O., Ichiyama, Y., Jana, D., Jones, M.M., Kato, C., Kulhanek, D.K., Li, J., Liu, J., McManus, J., Minakov, A.N., Penman, D.E., Sprain, C.J., Tessin, A.C., Wagner, T., and Westerhold, T., 2023. Site U1581. In Uenzelmann-Neben, G., Bohaty, S.M., Childress, L.B., and the Expedition 392 Scientists, Agulhas Plateau Cretaceous Climate. Proceedings of the International Ocean Discovery Program, 392: College Station, TX (International Ocean Discovery Program). https://doi.org/10.14379/iodp.proc.392.105.2023
2 Expedition 392 Scientists’ affiliations.
1. Background and objectives
Site U1581 is located on the deep, flat part of the Transkei Basin (35°40.8654′S, 29°39.0055′E) at 4591 m water depth. This area of the Transkei Basin has a smooth bathymetry with water depths between 4000 and 4600 m, and no apparent dip can be recognized in the site’s vicinity. The site is located on the crossing point of Seismic Lines AWI-20050008 and AWI-20050014. The seismic data show that the Transkei Basin is characterized by the mounded structure of the Agulhas Drift, an elongate sediment drift about 220 m thick and rising about 200 m above the seafloor (Figure F1). This sequence shows a number of high-amplitude internal reflections. Below the base Reflector P (pink line, Figure F1) of the Agulhas Drift, the reflection characteristics change to lower reflectivity. The Agulhas Drift is underlain by the M Drift, a sediment drift formed during the Oligocene and Miocene (Schlüter and Uenzelmann-Neben, 2008). The M Drift shows a strike almost perpendicular to the Agulhas Drift, which is indicative of a strong change in the direction of the prevalent bottom current. Reflector M dominates the seismic image of the M Drift in the middle of the sequence. Reflector E forms the base of Seismic Unit 2, which is only up to 30 m thick. Reflectors K-T and B characterize the deepest seismic unit above rugged oceanic basement (magenta and brown lines, respectively, Figure F1).
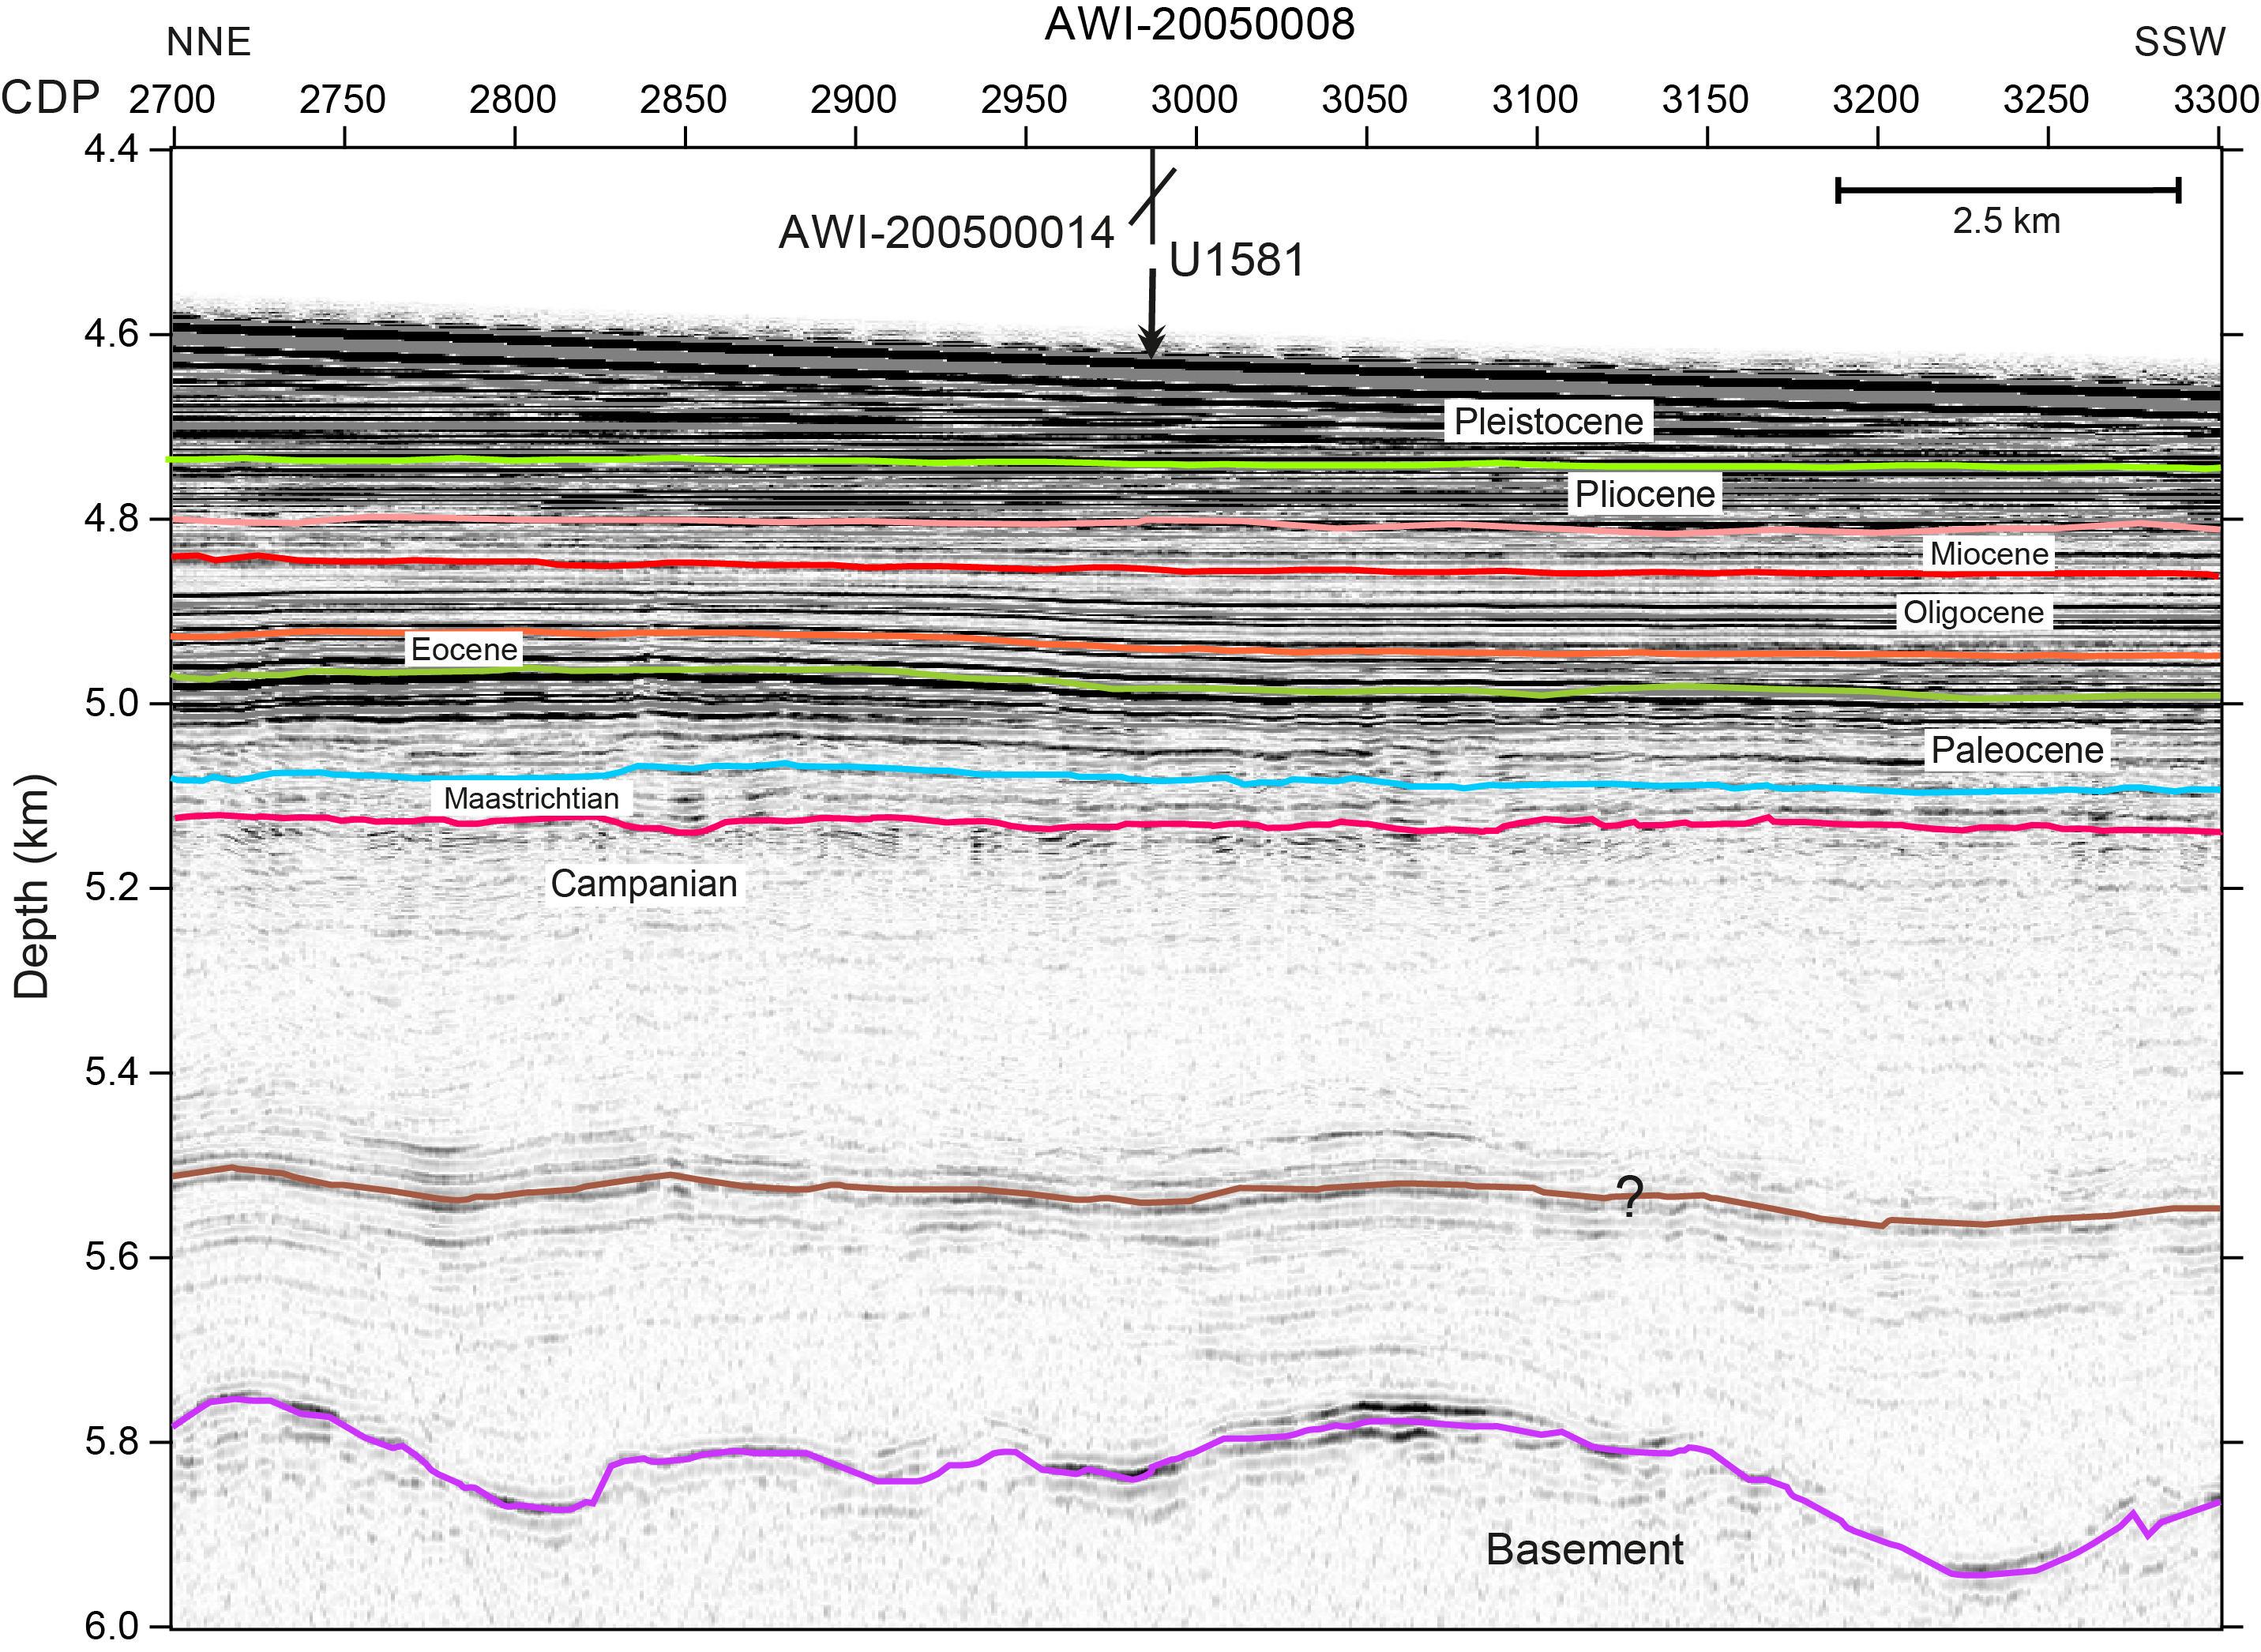
Figure F1. Seismic Line AWI-20050008.
Site U1581 was chosen to recover an Upper Cretaceous and Paleogene sedimentary record, as well as a partial Neogene sequence. This site was especially dedicated to target Reflector B in the Cretaceous sequence. This reflector was interpreted to represent black shales, and recovery of material from the reflector and above and below it was intended to provide information on the formation of black shales in connection with ocean anoxia. Integration of seismic profiles with the drilling results will allow direct dating of the observed Seismic Unconformities K-T, E, O, M, and P and interpreting their causes. Further objectives concern paleoenvironment and paleodepth of the Transkei Basin. At this site, critical intervals of ocean–climate transitions such as the Mi1, the Eocene–Oligocene transition (EOT), the Paleocene/Eocene Thermal Maximum (PETM), the Cretaceous/Paleogene (K/Pg) boundary, and Oceanic Anoxic Events (OAEs) 2 and 3 were expected to be documented in the sedimentary record.
2. Operations
Site U1581 hole locations, water depths, and the number of cores recovered are listed in Table T1. All times are provided in local ship time (UTC + 2 h).
2.1. Hole U1581A
After completing the 338 nmi voyage to Site U1581, we arrived on site at 2345 h on 9 March 2022. The thrusters were lowered, and the ship was switched to full dynamic positioning (DP) mode at 2357 h.
The advanced piston corer/extended core barrel (APC/XCB) bottom-hole assembly (BHA) was assembled, and we began tripping pipe to the seafloor. An acoustic positioning beacon was deployed, and the precision depth recorder (PDR) indicated that the seafloor was 4578.2 meters below sea level (mbsl). We attempted to shoot the first APC core from 4573.8 mbsl; however, this resulted in no recovery (water core). Two additional attempts from 4578.8 and 4583.8 mbsl also resulted in no recovery. Hole U1581A was successfully spudded at 2115 h on 10 March (recovery = 6.88 m), and the seafloor was calculated at 4591.4 mbsl. APC coring continued to 207.2 m core depth below seafloor, Method A (CSF-A) (Core 24H). The advanced piston corer temperature (APCT-3) tool was run on Cores 4H, 7H, 10H, and 13H, and good data were collected for all four. Pressure in the pipe increased while drilling the rathole of Core 24H. A mud sweep was pumped, and the core barrel was pulled back to the surface while the crew continued to circulate and condition the hole with an additional two mud sweeps. When the core barrel returned to the rig floor, it had recovered 8.11 m (Core 25G; the designation for a core with an uncertain depth). A fray in the core line was also discovered and repaired. Cores 26H–29H advanced from 207.2 to 233.8 m CSF-A. We then switched to the half-length APC (HLAPC) system, and Cores 30F–38F advanced from 233.8 to 276.1 m CSF-A. We then switched to the XCB system, and Cores 39X–41X advanced from 276.1 to 300.5 m CSF-A; however, strong swells and resultant low recovery and poor core quality led to the termination of coring in Hole U1581A at 1800 h on 13 March.
The drill string was pulled out of the hole, the pipe was tripped back to the vessel, and the bit cleared the seafloor at 1945 h and the rig floor at 0825 h on 14 March. It was determined that a compassionate evacuation was needed for a crew member. An attempt was made to recover the acoustic positioning beacon. The beacon signaled a clean release from the seafloor; however, the positioning signal was lost temporarily as the beacon rose. The signal was picked up again in the center of the vessel. It appeared the beacon had surfaced inside the moonpool. The upper guide horn was pulled, and the moonpool doors opened, but there was no visible sign of the beacon. The ship was repositioned against the current in case the beacon was lodged underneath the vessel; however, there was still no visual sign of the beacon, and it was deemed lost.
The vessel was switched from DP to cruise mode at 0945 h, and the thrusters were up and secured at 1014 h, beginning the sea passage to Gqeberha (formerly known as Port Elizabeth). The vessel arrived at the edge of the Gqeberha harbor at approximately 0700 h on 15 March. Clearance for the departing crew member was received at 1300 h, and they disembarked the vessel via launch at 1402 h. We then began the transit back to Site U1581, arriving just before noon on 16 March. The thrusters were lowered, and the vessel was switched to DP mode at 1216 h. The acoustic positioning beacon was still providing a signal, revealing that it had not released as previously thought.
A total of 40 cores (plus one ghost core) were taken in Hole U1581A over a 300.5 m interval (recovery = 90.9%). Total time on Hole U1581A was 104.4 h (4.35 days).
2.2 Hole U1581B
The BHA was made up with a C-4 bit and tripped to 4499.7 meters below rig floor (mbrf) before a slip and cut of the drilling line. We continued to trip pipe to the seafloor, and Hole U1581B was spudded at 0230 h on 17 March 2022. A rotary core barrel (RCB) barrel with a center bit was used to drill ahead to 289 m CSF-A, and several mud sweeps were performed during the drill down. The rate of penetration during the drill down averaged 46.2 m/h. The center bit was recovered, and coring commenced with Core 2R at 1445 h on 17 March. Coring continued through 24 March with Core 74R at 997.1 m CSF-A, the final depth for Hole U1581B. The RCB coring rate was 17.3 m/h overall, although the final two cores were cut at 6.9 m/h.
In preparation for downhole logging, the hole was swept with sepiolite mud to flush cuttings. The mechanical bit release (MBR) shifting tool was run down, and the bit was released at 1835 h on 24 March. The hole was then displaced with barite mud, and the drill string was pulled up to 188.9 m CSF-A. At 0100 h on 25 March, the circulating head was rigged up, and the hole was displaced with additional mud to account for the displacement of the drill pipe coming out of the hole. The circulating head was rigged down at 0130 h, and the bottom of the drill string was placed at 77.8 m CSF-A for downhole logging.
At 0230 h, a safety meeting was conducted prior to rigging up for downhole logging, and the Versatile Seismic Imager (VSI) was made up for the first run. The tool began its descent at 0415 h and exited the drill pipe into the hole just after 0800 h, but it encountered a solid ledge at 222.4 m CSF-A at 0830 h. The tool was worked up and down for almost an hour but could not successfully pass the ledge. The decision was made to bring the tool back to surface and lower the drill pipe to cover the ledge. The VSI cleared the rig floor at 1120 h, and the drill pipe was run in to 408.5 m CSF-A. Because of the lack of daylight for another VSI run, a modified triple combination (triple combo) tool string was made up with the Dipole Shear Sonic Imager (DSI) in place of the High-Resolution Laterolog Array (HRLA) unit. The tool string consisted of the Hostile Environment Natural Gamma Ray Sonde (HNGS), Hostile Environment Litho-Density Sonde (HLDS), DSI, and Magnetic Susceptibility Sonde (MSS).
Upon make-up, a problem was found with power to the lower portion of the tool string, and it was found that an alignment pin spring was bent. This was replaced, and the tool string was deployed at 1630 h. At 2606.8 mbrf (still within the water column), there was growing evidence of an electrical fault with the tool. It was decided to bring the tool back to the surface, and it cleared the rig floor at 1845 h. A new head was connected, and the tool was redeployed at 2330 h. The triple combo tool reached 1300.0 mbrf by early 26 March but was again showing an electrical fault, and the decision was made to terminate logging. The tool string was pulled out of the hole, clearing the rotary at 0250 h. The cause of the electrical fault was later determined to be the conductors in the collector and pinched conductors in the logging head. The triple combo tools were disassembled, and the drill string was tripped back to the vessel, clearing the seafloor at 0555 h and the rig floor at 1510 h on 26 March, ending Hole U1581B.
A total of 73 cores were taken in Hole U1581B over a 708.1 m interval (recovery = 76%). Total time on Hole U1581B was 243.12 h (10.13 days).
3. Lithostratigraphy
Site U1581 consists of a ~994 m thick Pleistocene–Campanian sedimentary succession composed of calcareous and siliciclastic sediments. The upper part of the succession is more carbonate-rich, and the lower part is dominantly siliciclastic in composition. Lithostratigraphic unit and subunit boundaries are largely defined using macroscopic core descriptions and smear slides and are supplemented by X-ray diffraction (XRD) analyses, physical properties (see Physical properties), and geochemical data (see Geochemistry). The sedimentary sequence recovered at Site U1581 is divided into two lithostratigraphic units (I and II), each of which is divided into two lithostratigraphic subunits (Ia, Ib, IIa, and IIb) (Figures F2, F3, F4; Table T2).
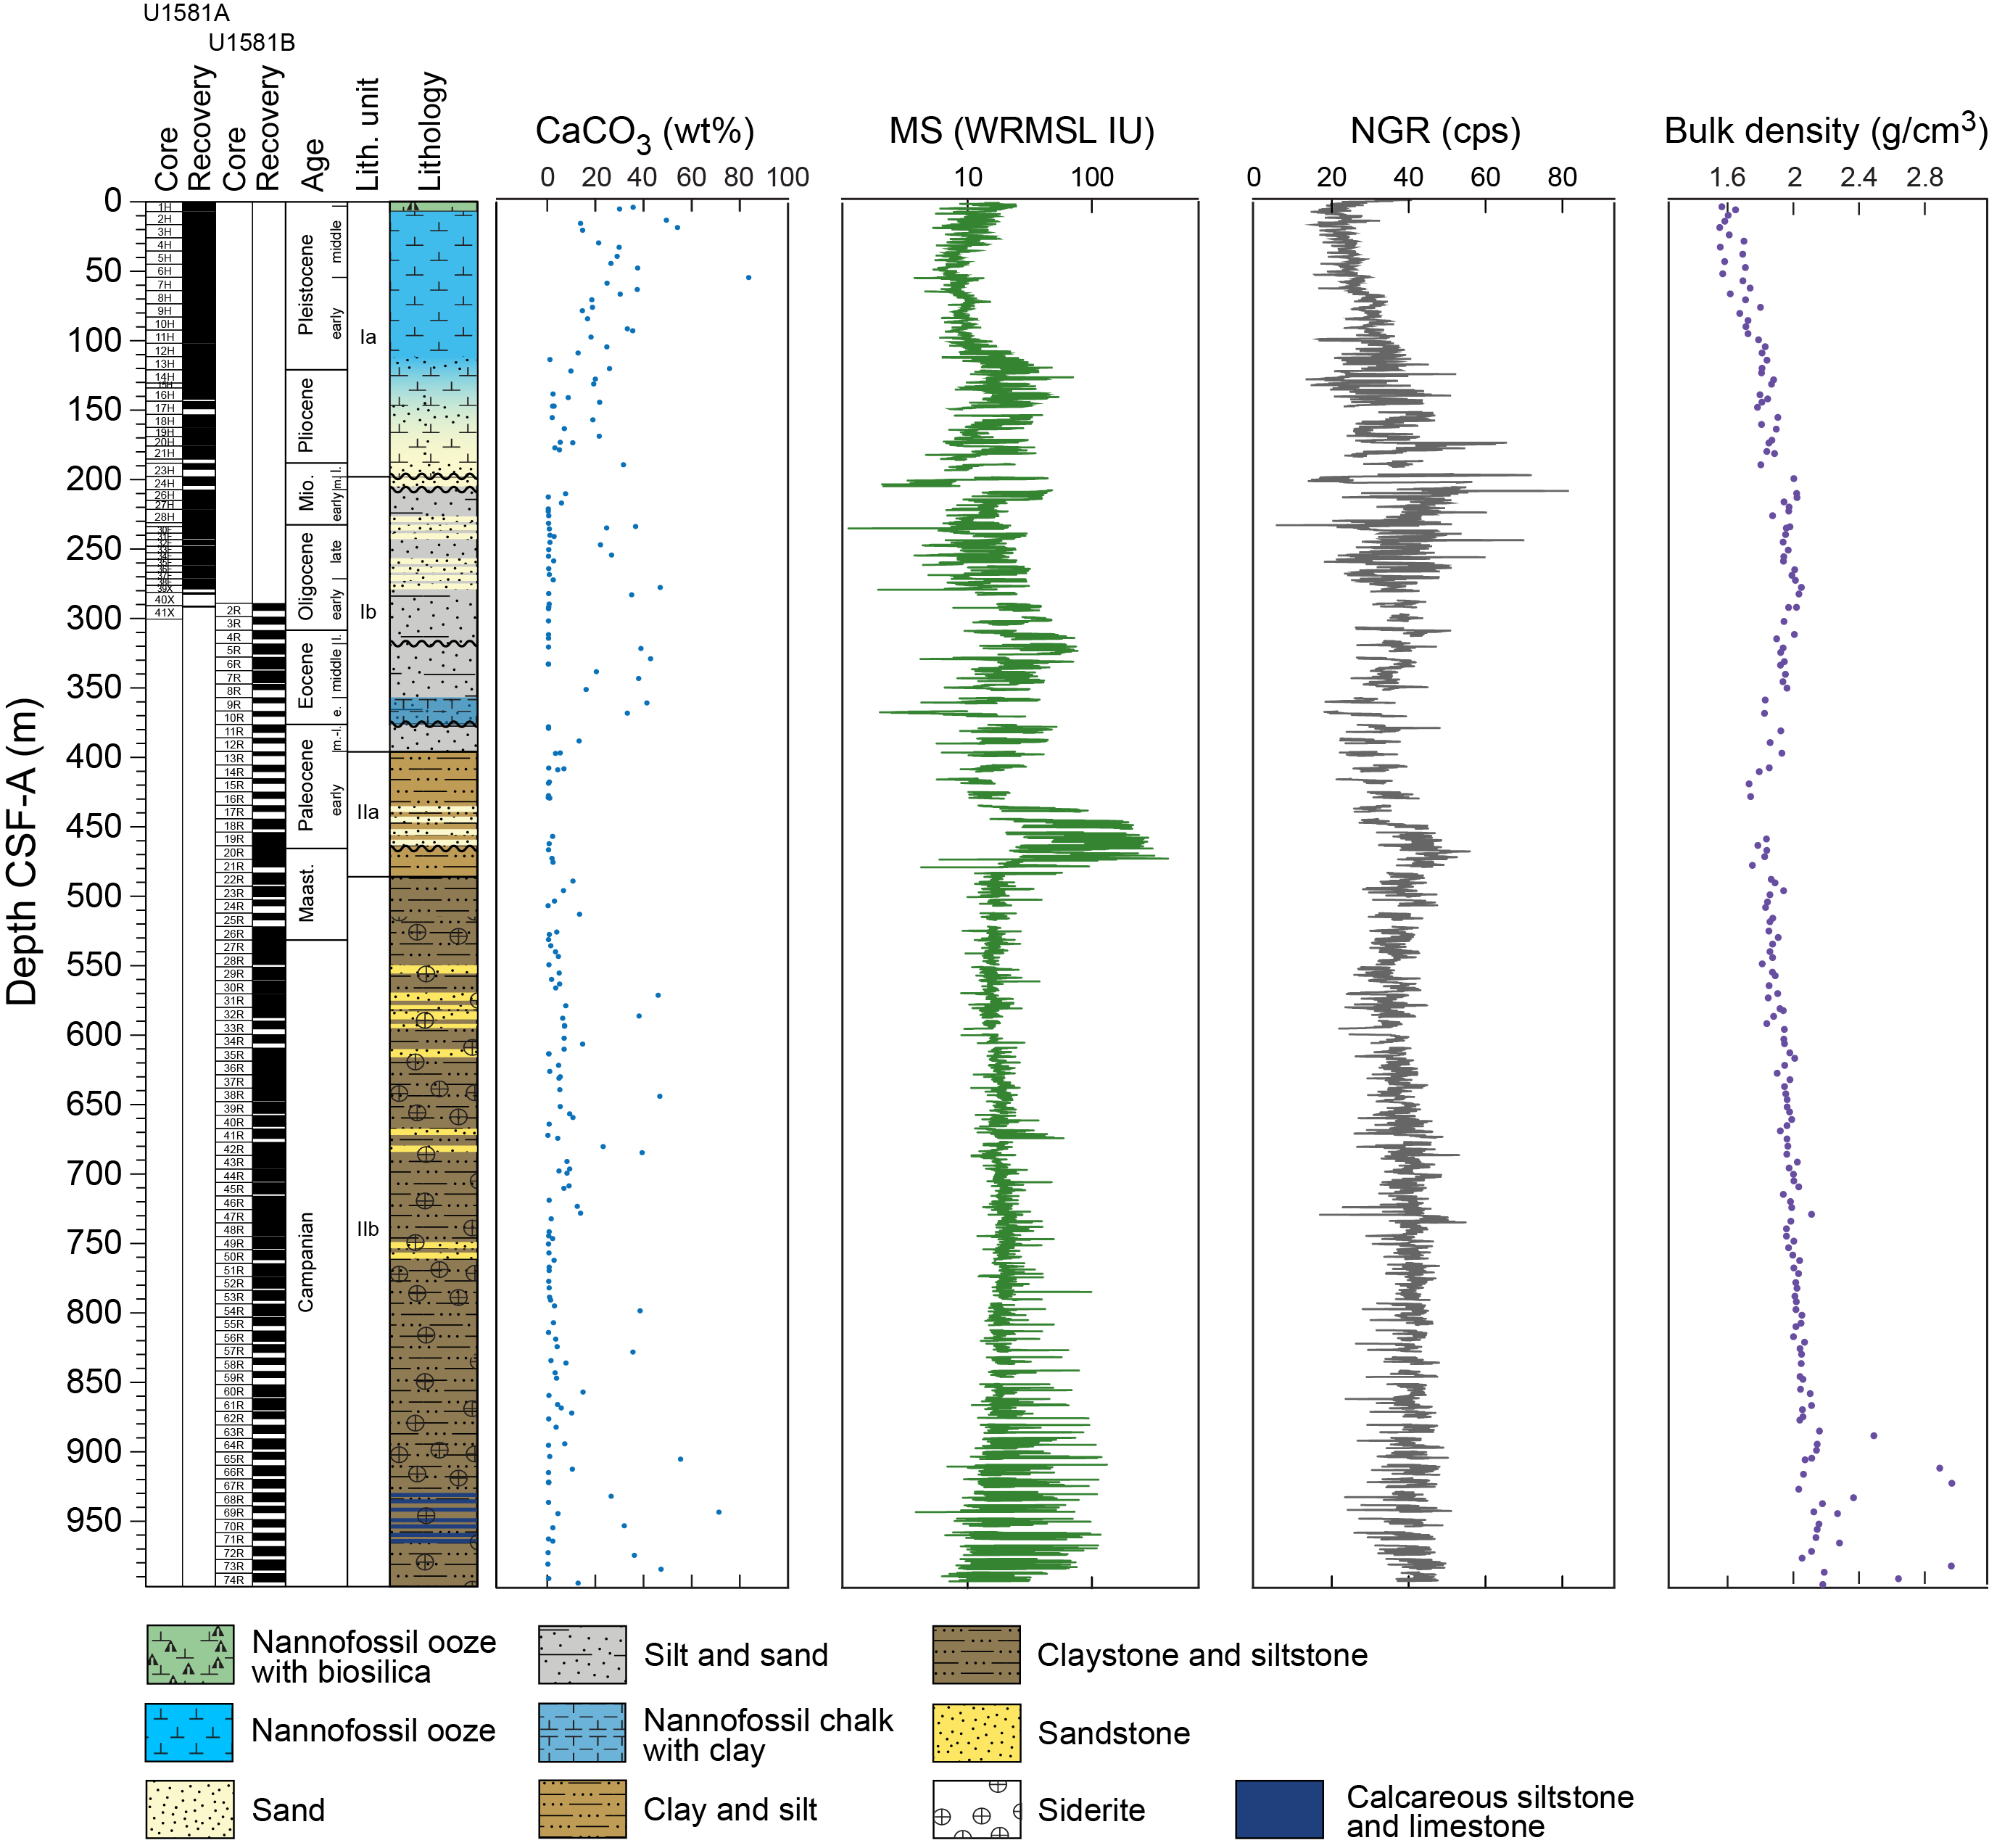
Figure F2. Lithostratigraphic summary.
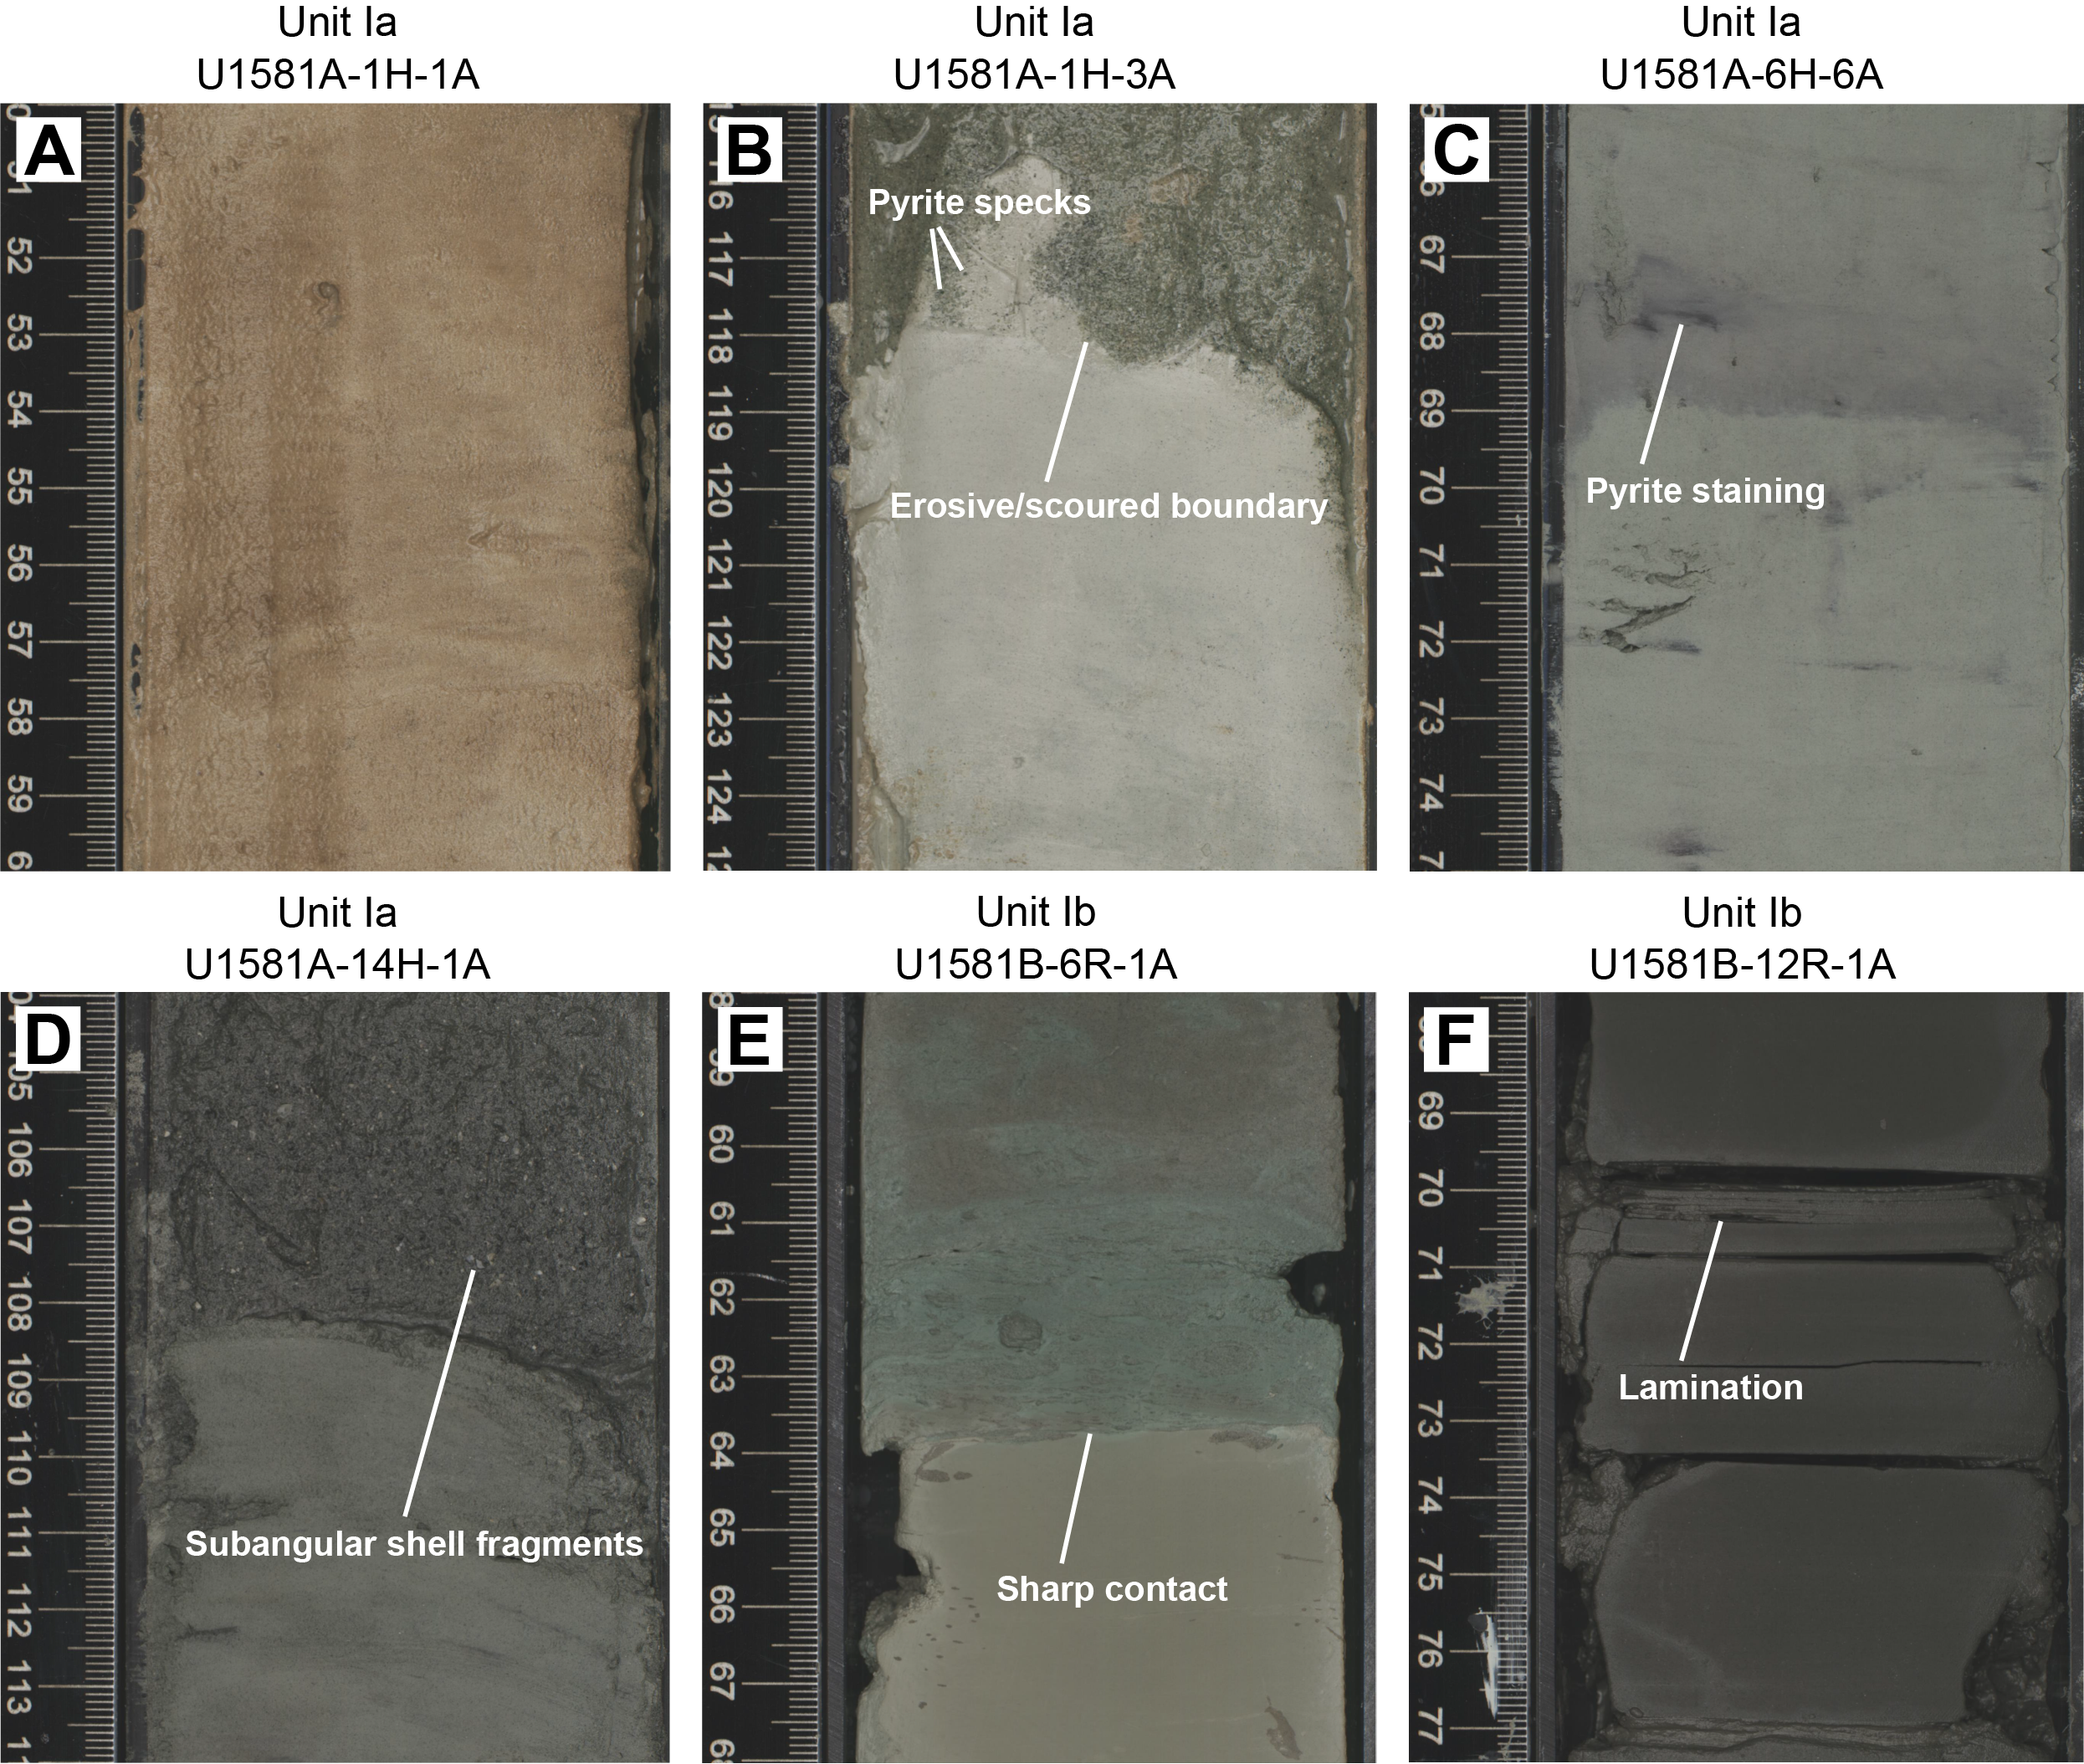
Figure F3. Major lithologies, Site U1581.
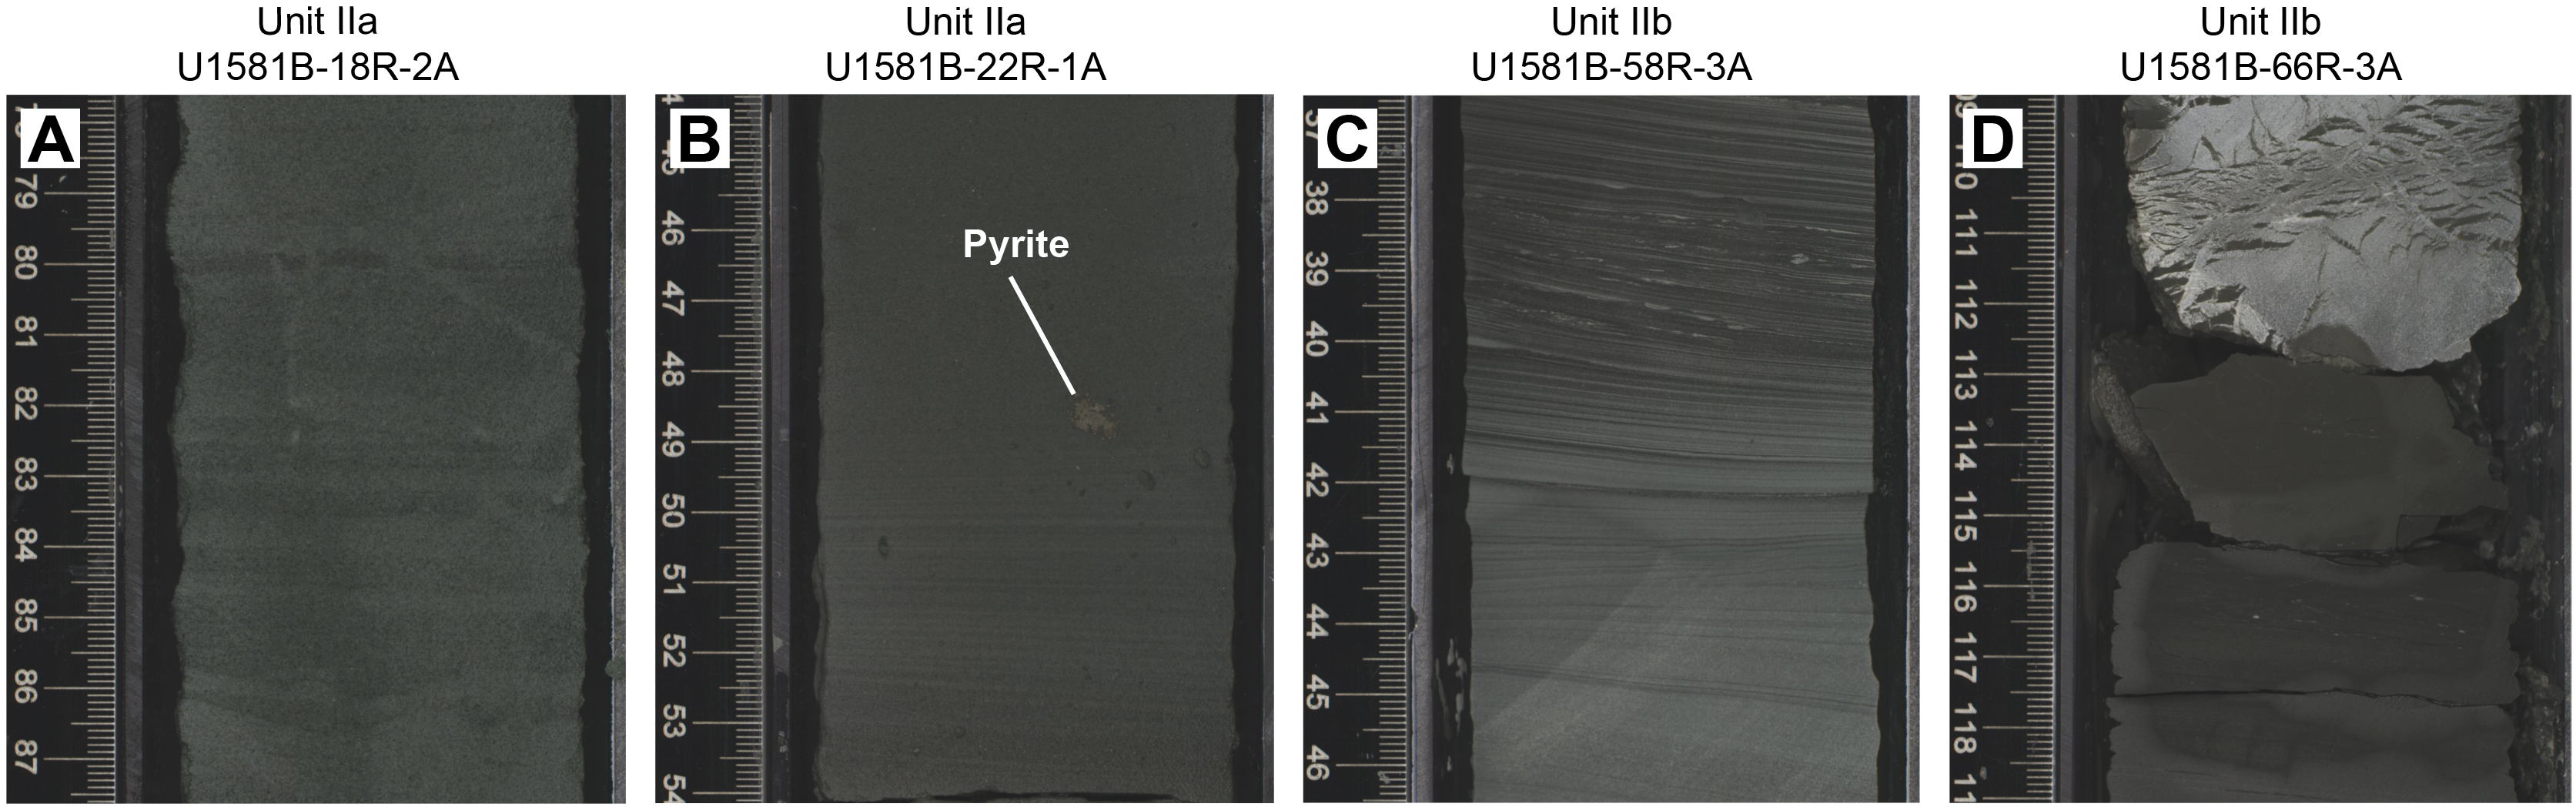
Figure F4. Major lithologies, Hole U1581B.
3.1. Lithostratigraphic Unit I
- Intervals: 392-U1581A-1H-1, 0 cm, to 41X-CC, 15 cm; 392-U1581B-2R-1, 0 cm, to 12R-CC, 24 cm
- Depth: Hole U1581A = 0.0–292.11 m CSF-A; Hole U1581B = 289.00–390.05 m CSF-A
- Age: mid-Pleistocene to mid-Paleocene
- Major lithologies: nannofossil ooze with downsection transition to more sand and silt
Lithostratigraphic Unit I is a 390 m sequence of Pleistocene–upper Paleocene biogenic ooze with variable amounts of sand, silt, and clay. This unit is divided into two subunits (Ia and Ib) based on increasing content of siliciclastic material in Lithostratigraphic Subunit Ib. In Section 392-U1581B-12R-CC, 24 cm (390.05 m CSF-A), the Lithostratigraphic Unit I/II contact is marked by a change in lithology from intercalated siliciclastic and calcareous sediments to predominantly siliciclastic sediments, as well as a decrease in average carbonate content from ~10–12 wt% in Lithostratigraphic Unit I to <6 wt% in Lithostratigraphic Unit II (Figure F2; see Geochemistry). This unit boundary is also characterized by a slight decrease in bulk density (Figure F2) and a downcore increase in porosity (see Physical properties).
3.1.1. Lithostratigraphic Subunit Ia
- Interval: 392-U1581A-1H-1, 0 cm, to 24H-1, 54 cm
- Depth: 0.00–198.24 m CSF-A
- Age: mid-Pleistocene to mid-Miocene
- Major lithologies: nannofossil ooze with sand, silt, and clay
Lithostratigraphic Subunit Ia is ~198 m thick and consists principally of greenish gray, light yellowish brown, and light brown clayey nannofossil ooze, sometimes with biosilica, and grayish green foraminiferal ooze with sand, silt, and clay intervals. The biogenic ooze has massive or mottled bedding and grades into a narrow interval of medium laminated foraminiferal ooze in interval 392-U1581A-1H-3, 78–120 cm. The foraminiferal ooze is characterized by an erosive/scoured boundary at its base, separating it from the greenish gray nannofossil ooze below (Figure F3).
Lithostratigraphic Subunit Ia is characterized by a general increase in density and decrease in porosity with depth (see Physical properties). Frequency and thickness of sand and silt layers increases toward the boundary with Lithostratigraphic Subunit Ib. The Lithostratigraphic Subunit Ia/Ib contact is positioned within a gradual transition from biogenic ooze with variable siliciclastic components to dominantly siliciclastic sediments (sand/silt/clay) with intermittent biogenic ooze intervals (Figure F5).
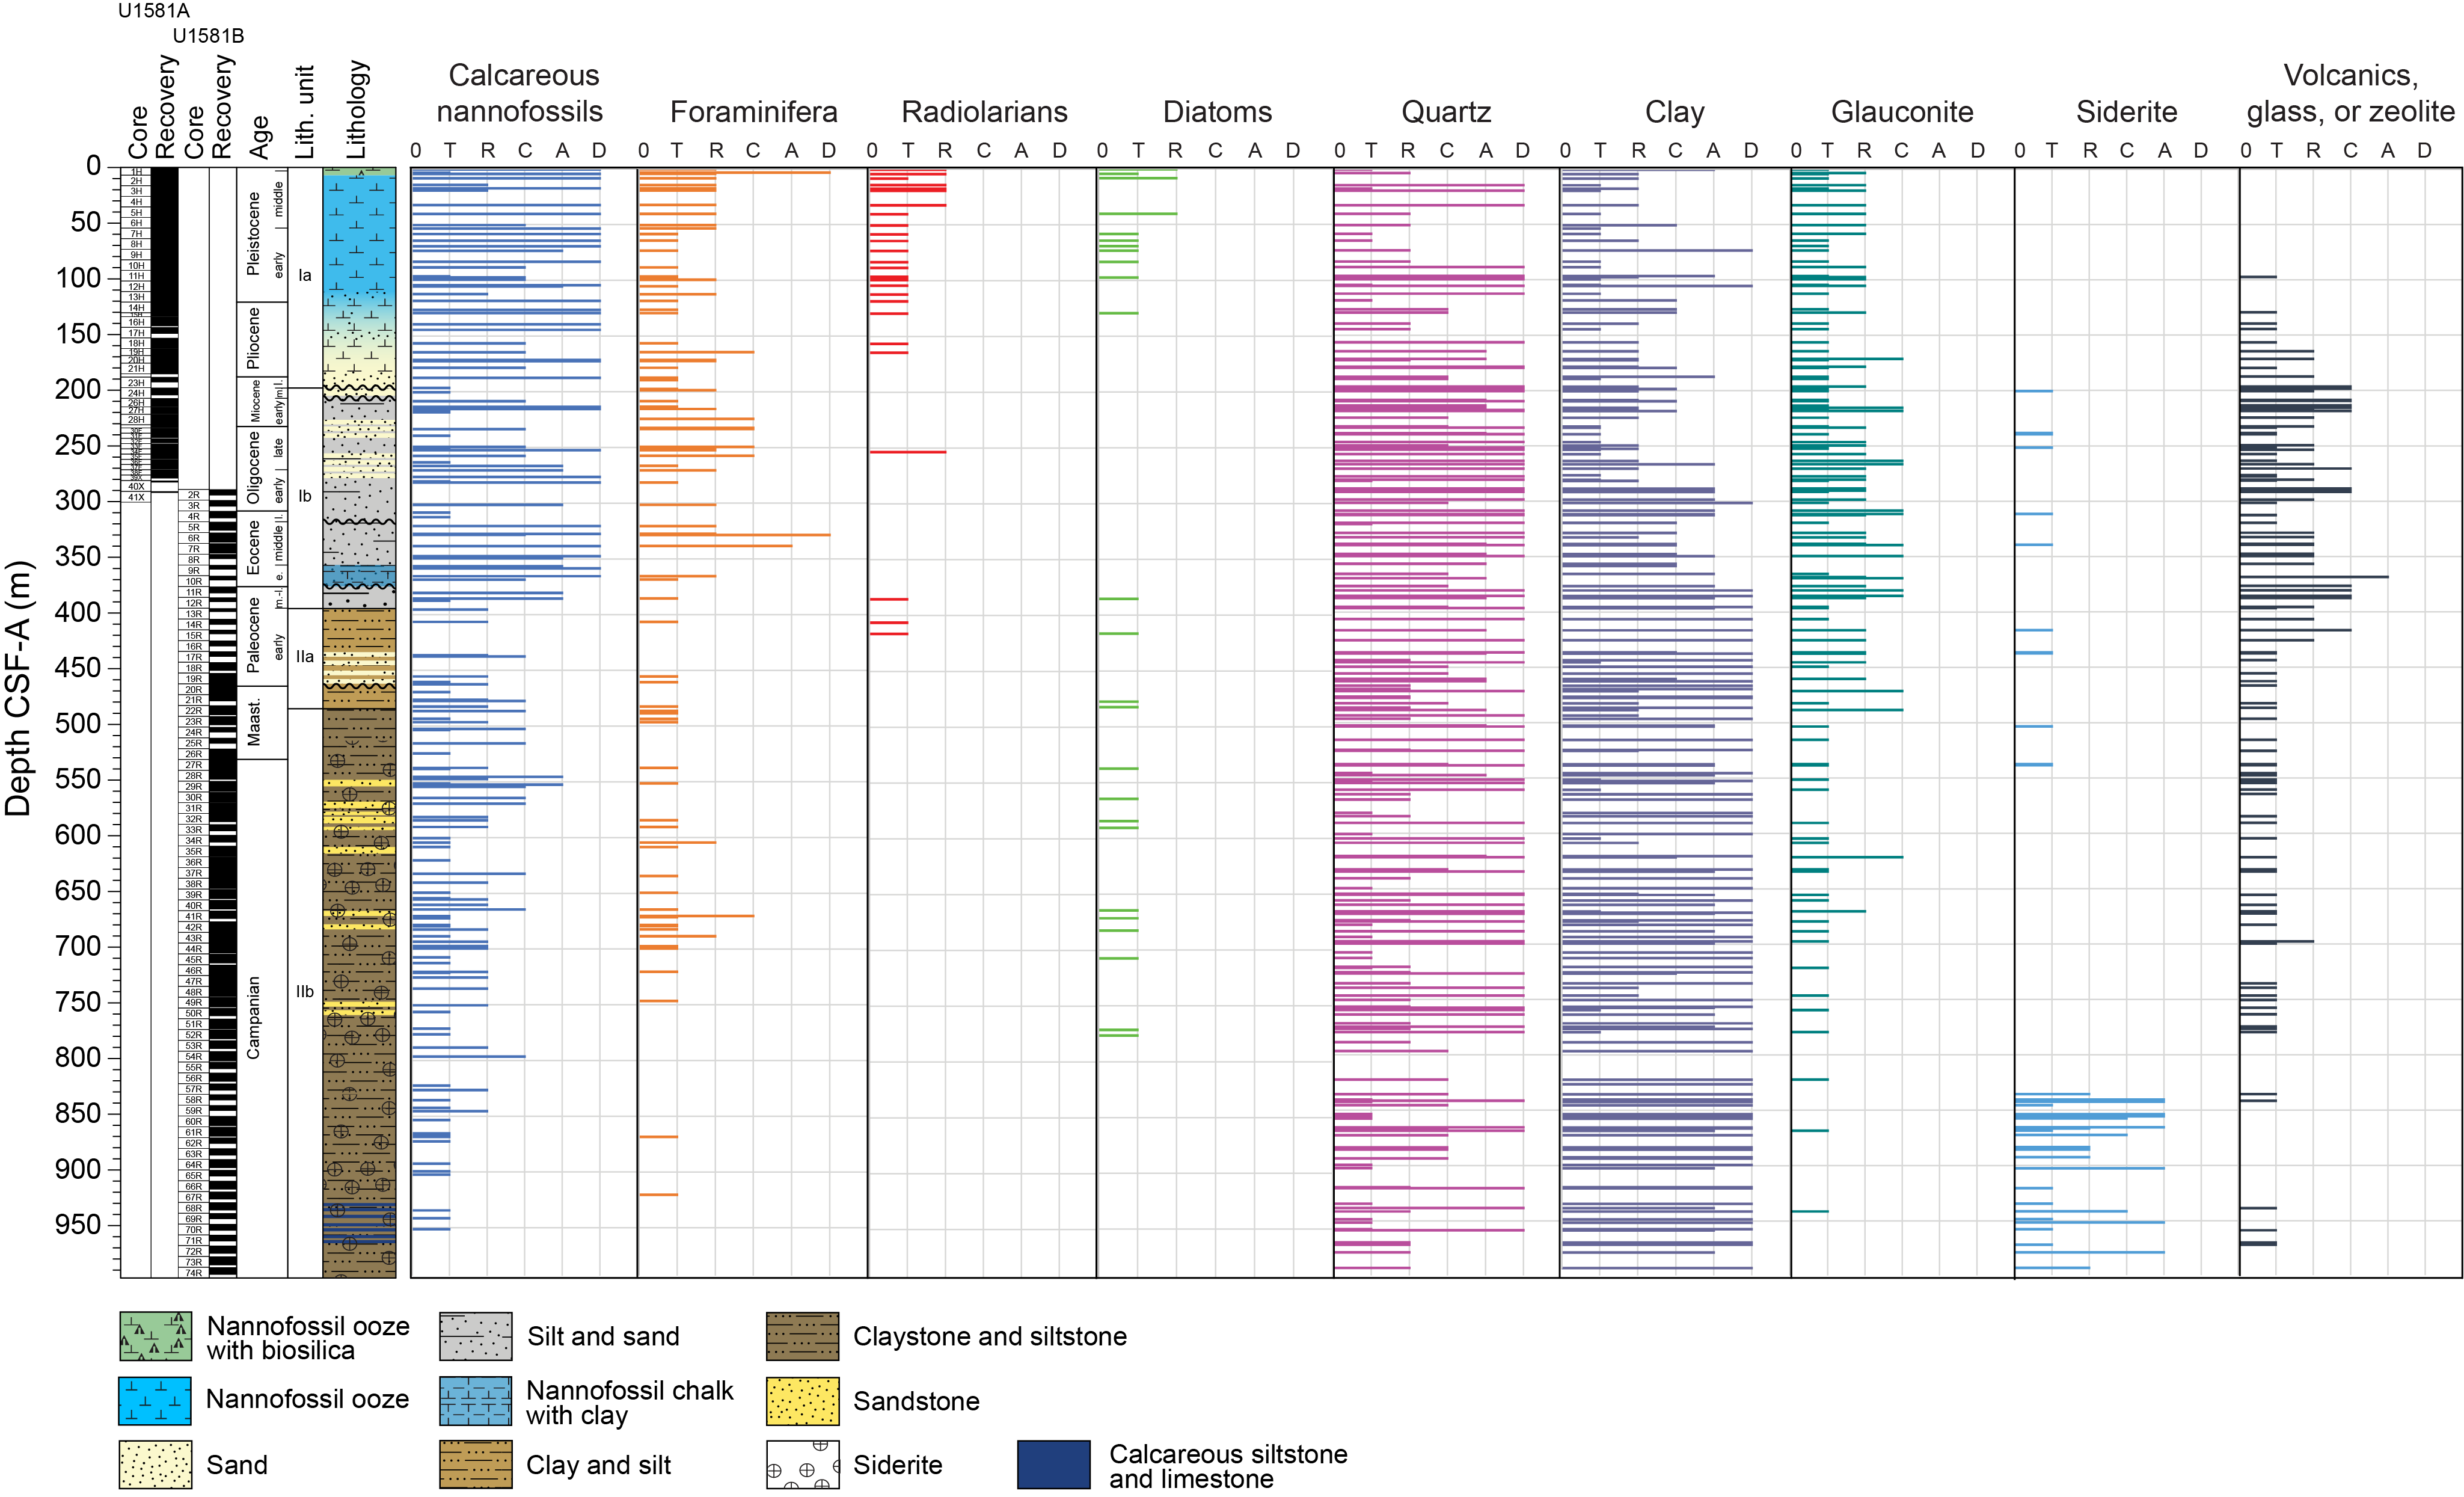
Figure F5. Sedimentary component abundance.
Carbonate content in Lithostratigraphic Subunit Ia is highly variable, ranging ~20–80 wt% in biogenic intervals and <1 wt% in siliciclastic intervals (Figure F2; see Geochemistry). The high variability in carbonate content in the nannofossil-rich (biogenic) intervals can be explained by variable abundance of clay and detrital quartz, as determined from smear slide and XRD analysis (Figures F5, F6).
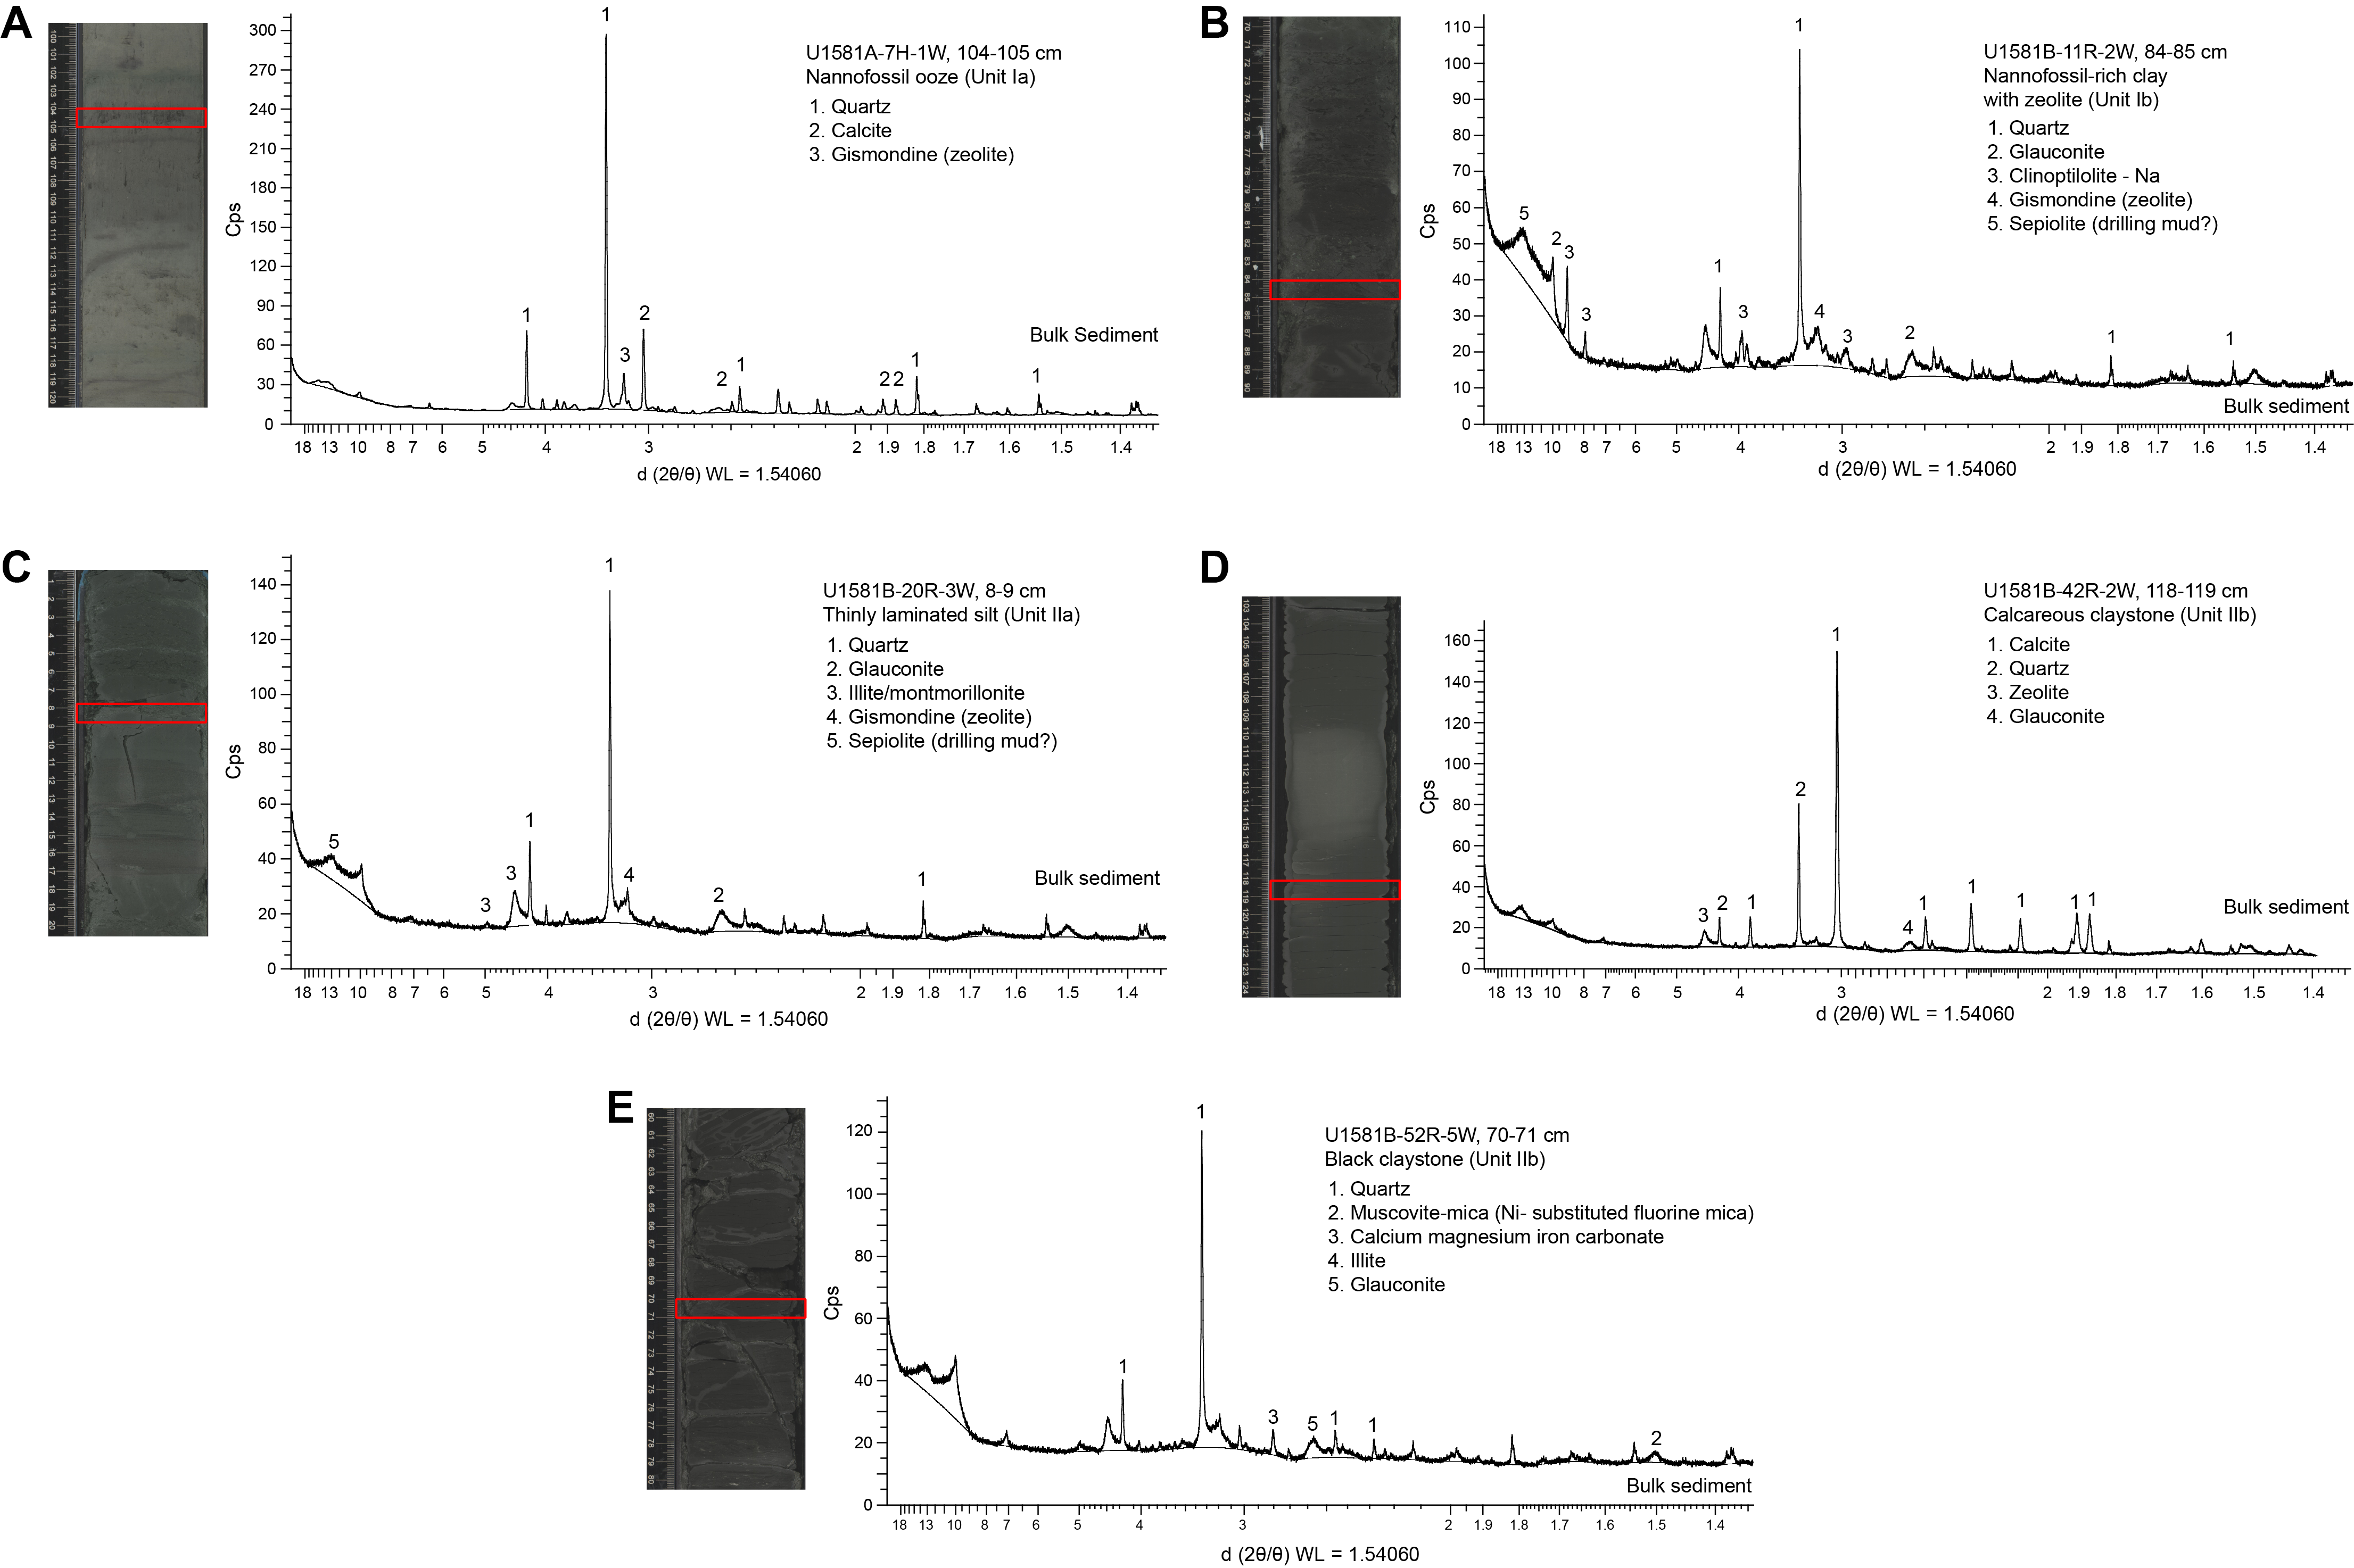
Figure F6. Bulk sediment XRD.
The basal contacts of sand intervals overlying nannofossil ooze are typically sharp or erosive when well recovered but are often disturbed by drilling. Disseminated silt-sized pyrite specks are common throughout the unit. Smear slide observations indicate that sand layers are significantly pyrite rich between Sections 392-U1581A-2H-6 (15.92 m CSF-A) and 10H-1 (83.00 m CSF-A), which corresponds to an interval of increasing interstitial water (IW) alkalinity (see Geochemistry). Biogenic silica is present in the form of sponge spicules, radiolarians, and diatoms throughout the subunit and is most abundant in the uppermost 9.6 m and decreases downsection (Figure F5).
XRD samples were taken from a greenish gray nannofossil ooze interval (Sample 392-U1581A-7H-1, 104–105 cm) (Figure F6A) and two gray sand intervals (Samples 8H-5, 117–118 cm, and 11H-7, 52–53 cm). The dominant component in all samples analyzed from Lithostratigraphic Subunit Ia was quartz, and they all contain some calcite and gismondine (a zeolite mineral). The primary difference between the nannofossil ooze and sand intervals is in the relative proportion of calcite to quartz, which is higher in the ooze interval than in the sand intervals.
3.1.2. Lithostratigraphic Subunit Ib
- Intervals: 392-U1581A-24H-1, 54 cm, to 41X-CC, 15 cm; 392-U1581B-2R-1, 0 cm, to 12R-CC, 24 cm
- Depths: Hole U1581A = 198.24–292.11 m CSF-A; Hole U1581B = 289.00–390.05 m CSF-A
- Age: mid-Miocene to mid-Paleocene
- Major lithologies: intercalated sand, silt with occasional intervals of nannofossil ooze
Lithostratigraphic Subunit Ib is ~94 m thick in Hole U1581A and ~101 m thick in Hole U1581B. It consists predominantly of siliciclastic sand, silt, and clay with occasional biogenic sediments, such as sandy/silty/clayey nannofossil ooze. Biogenic sediments are less common in Lithostratigraphic Subunit Ib than in Lithostratigraphic Subunit Ia and occur as 10–40 cm layers in otherwise continuous packages of sand and silt, except for interval 392-U1581B-8R-1, 0 cm, to 10R-3, 81 cm (347.20–370.37 m CSF-A), where biogenic sediments are relatively more abundant. The siliciclastic sediments consist of medium- to fine-grained sand and silt, range from being massively bedded to laminated, and are occasionally normally graded. In some cases, the massive sands fine upward into nannofossil-rich clay. Rare shell fragments occur in the sand and silt intervals, and pyrite is common throughout. In Section 4R-1, there are recurring intervals of 5–10 cm greenish gray foraminiferal sand beds that are normally graded and are marked by sharp basal contacts.
Carbonate content is generally low (<2 wt%) in this subunit; however, there are a number of discrete decimeter-scale nannofossil-rich intervals where it can be as high as ~40 wt% (Figure F2; see Geochemistry). There are repeated intervals (interbedded with biogenic intervals) characterized by normally graded sand and silt layers with variable thicknesses and sharp lower contacts (Figure F7). These features are consistent with mass movement deposits. The Lithostratigraphic Subunit Ib–IIa transition is marked by a drop in average CaCO3 content from ~10–12 wt% in Lithostratigraphic Unit I to <0.5 wt% in Lithostratigraphic Subunit IIa (see Geochemistry). The Lithostratigraphic Subunit Ib/IIa contact was not recovered.
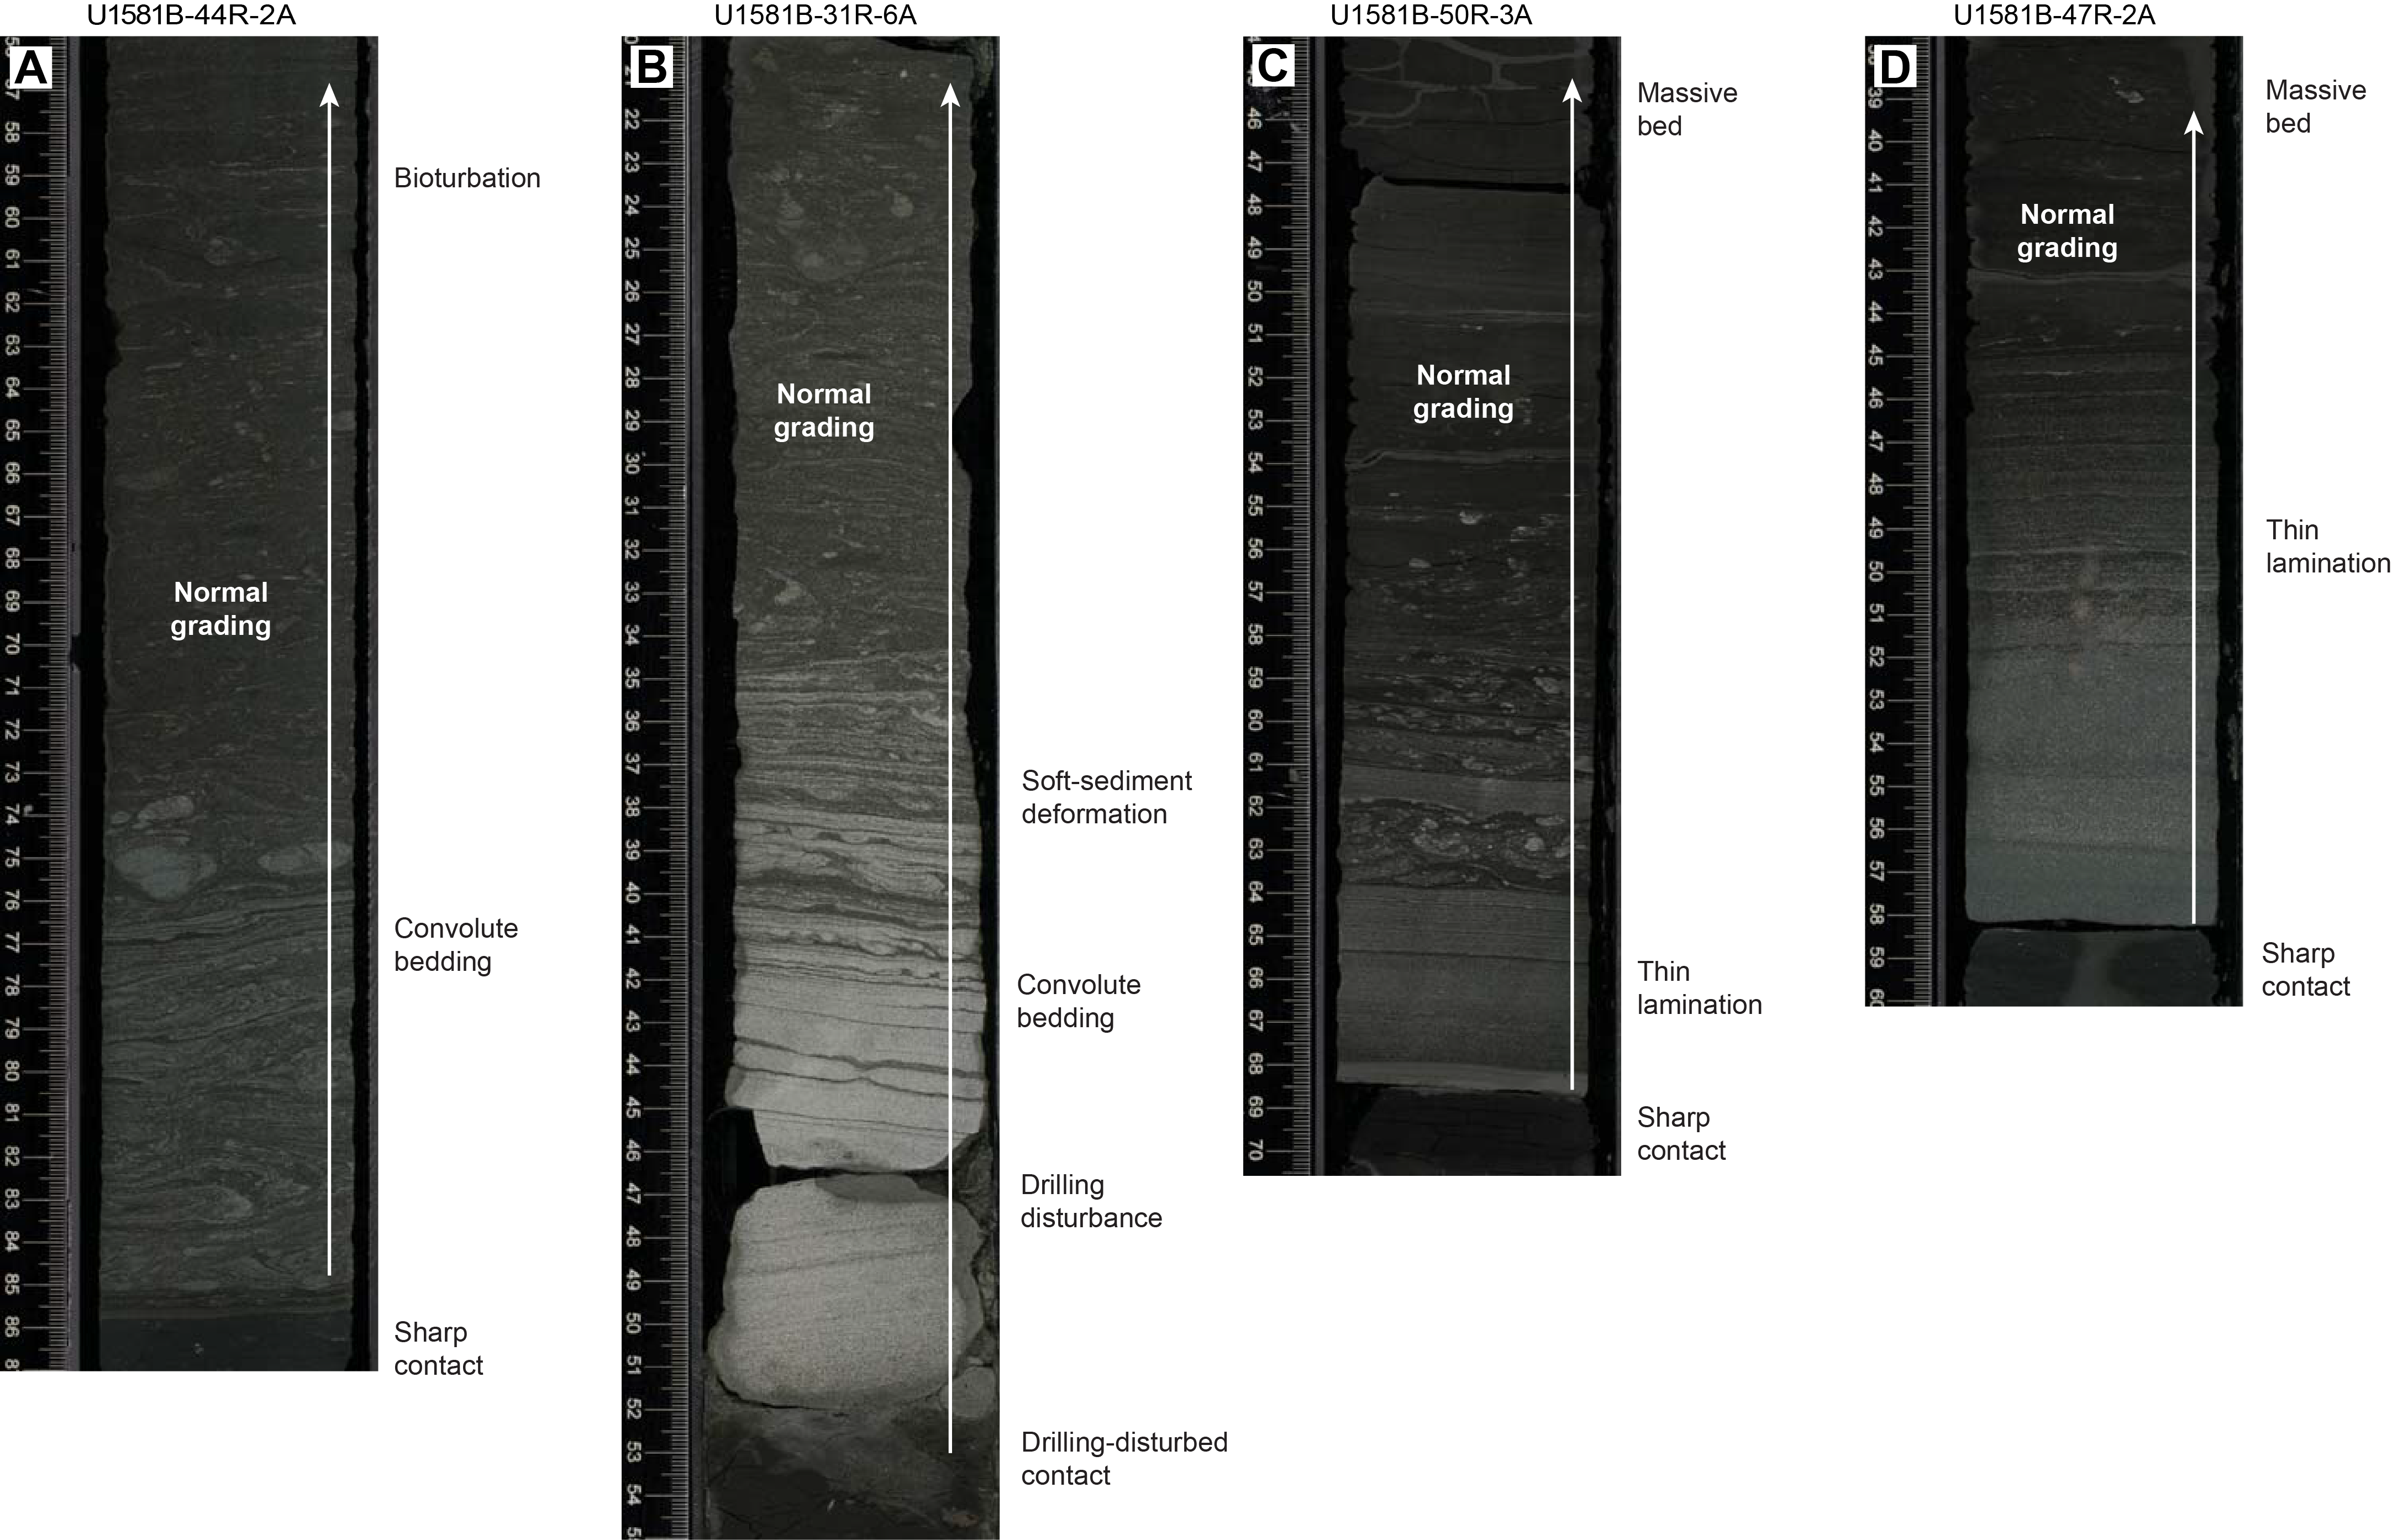
Figure F7. Mass movement deposits.
Smear slides from Lithostratigraphic Subunit Ib show abundant quartz and glauconite (Figures F5, F8). The abundance of nannofossils is variable throughout. Within the subunit, volcanic glass and zeolite, clay, and opaque minerals (including framboidal pyrite) are rare to common, and there are trace amounts of heavy minerals such as zircon (Figure F5). Fibrous to lath-shaped zeolite/clinoptilolite minerals and glauconite are abundant in smear slides from intervals of Sections 392-U1581A-38F-1, 8 cm, to 41X-1, 11 cm (271.48–291.92 m CSF-A); 392-U1581B-2R-1, 0 cm, to 2R-CC, 11 cm (289.0–294.41 m CSF-A); and 10R-3, 81 cm, to 12R-CC, 24 cm (370.37–390.05 m CSF-A). Zeolitic minerals are common in Sections 392-U1581A-38F-1 (8–25, 49–72, and 104–145 cm), 38F-2 (23–119.5 and 134–151 cm), and 39X-2 (116–125 cm). The nannofossil-rich beds in this interval are fine sand– to silt-sized, massive, and normally graded and contain glauconite in Sections 392-U1581B-2R-1 (103–109 cm), 2R-2 (119–123 cm), 2R-3 (61–65, 115–124, and 136–150 cm), and 2R-4 (0–4 and 44–47 cm).
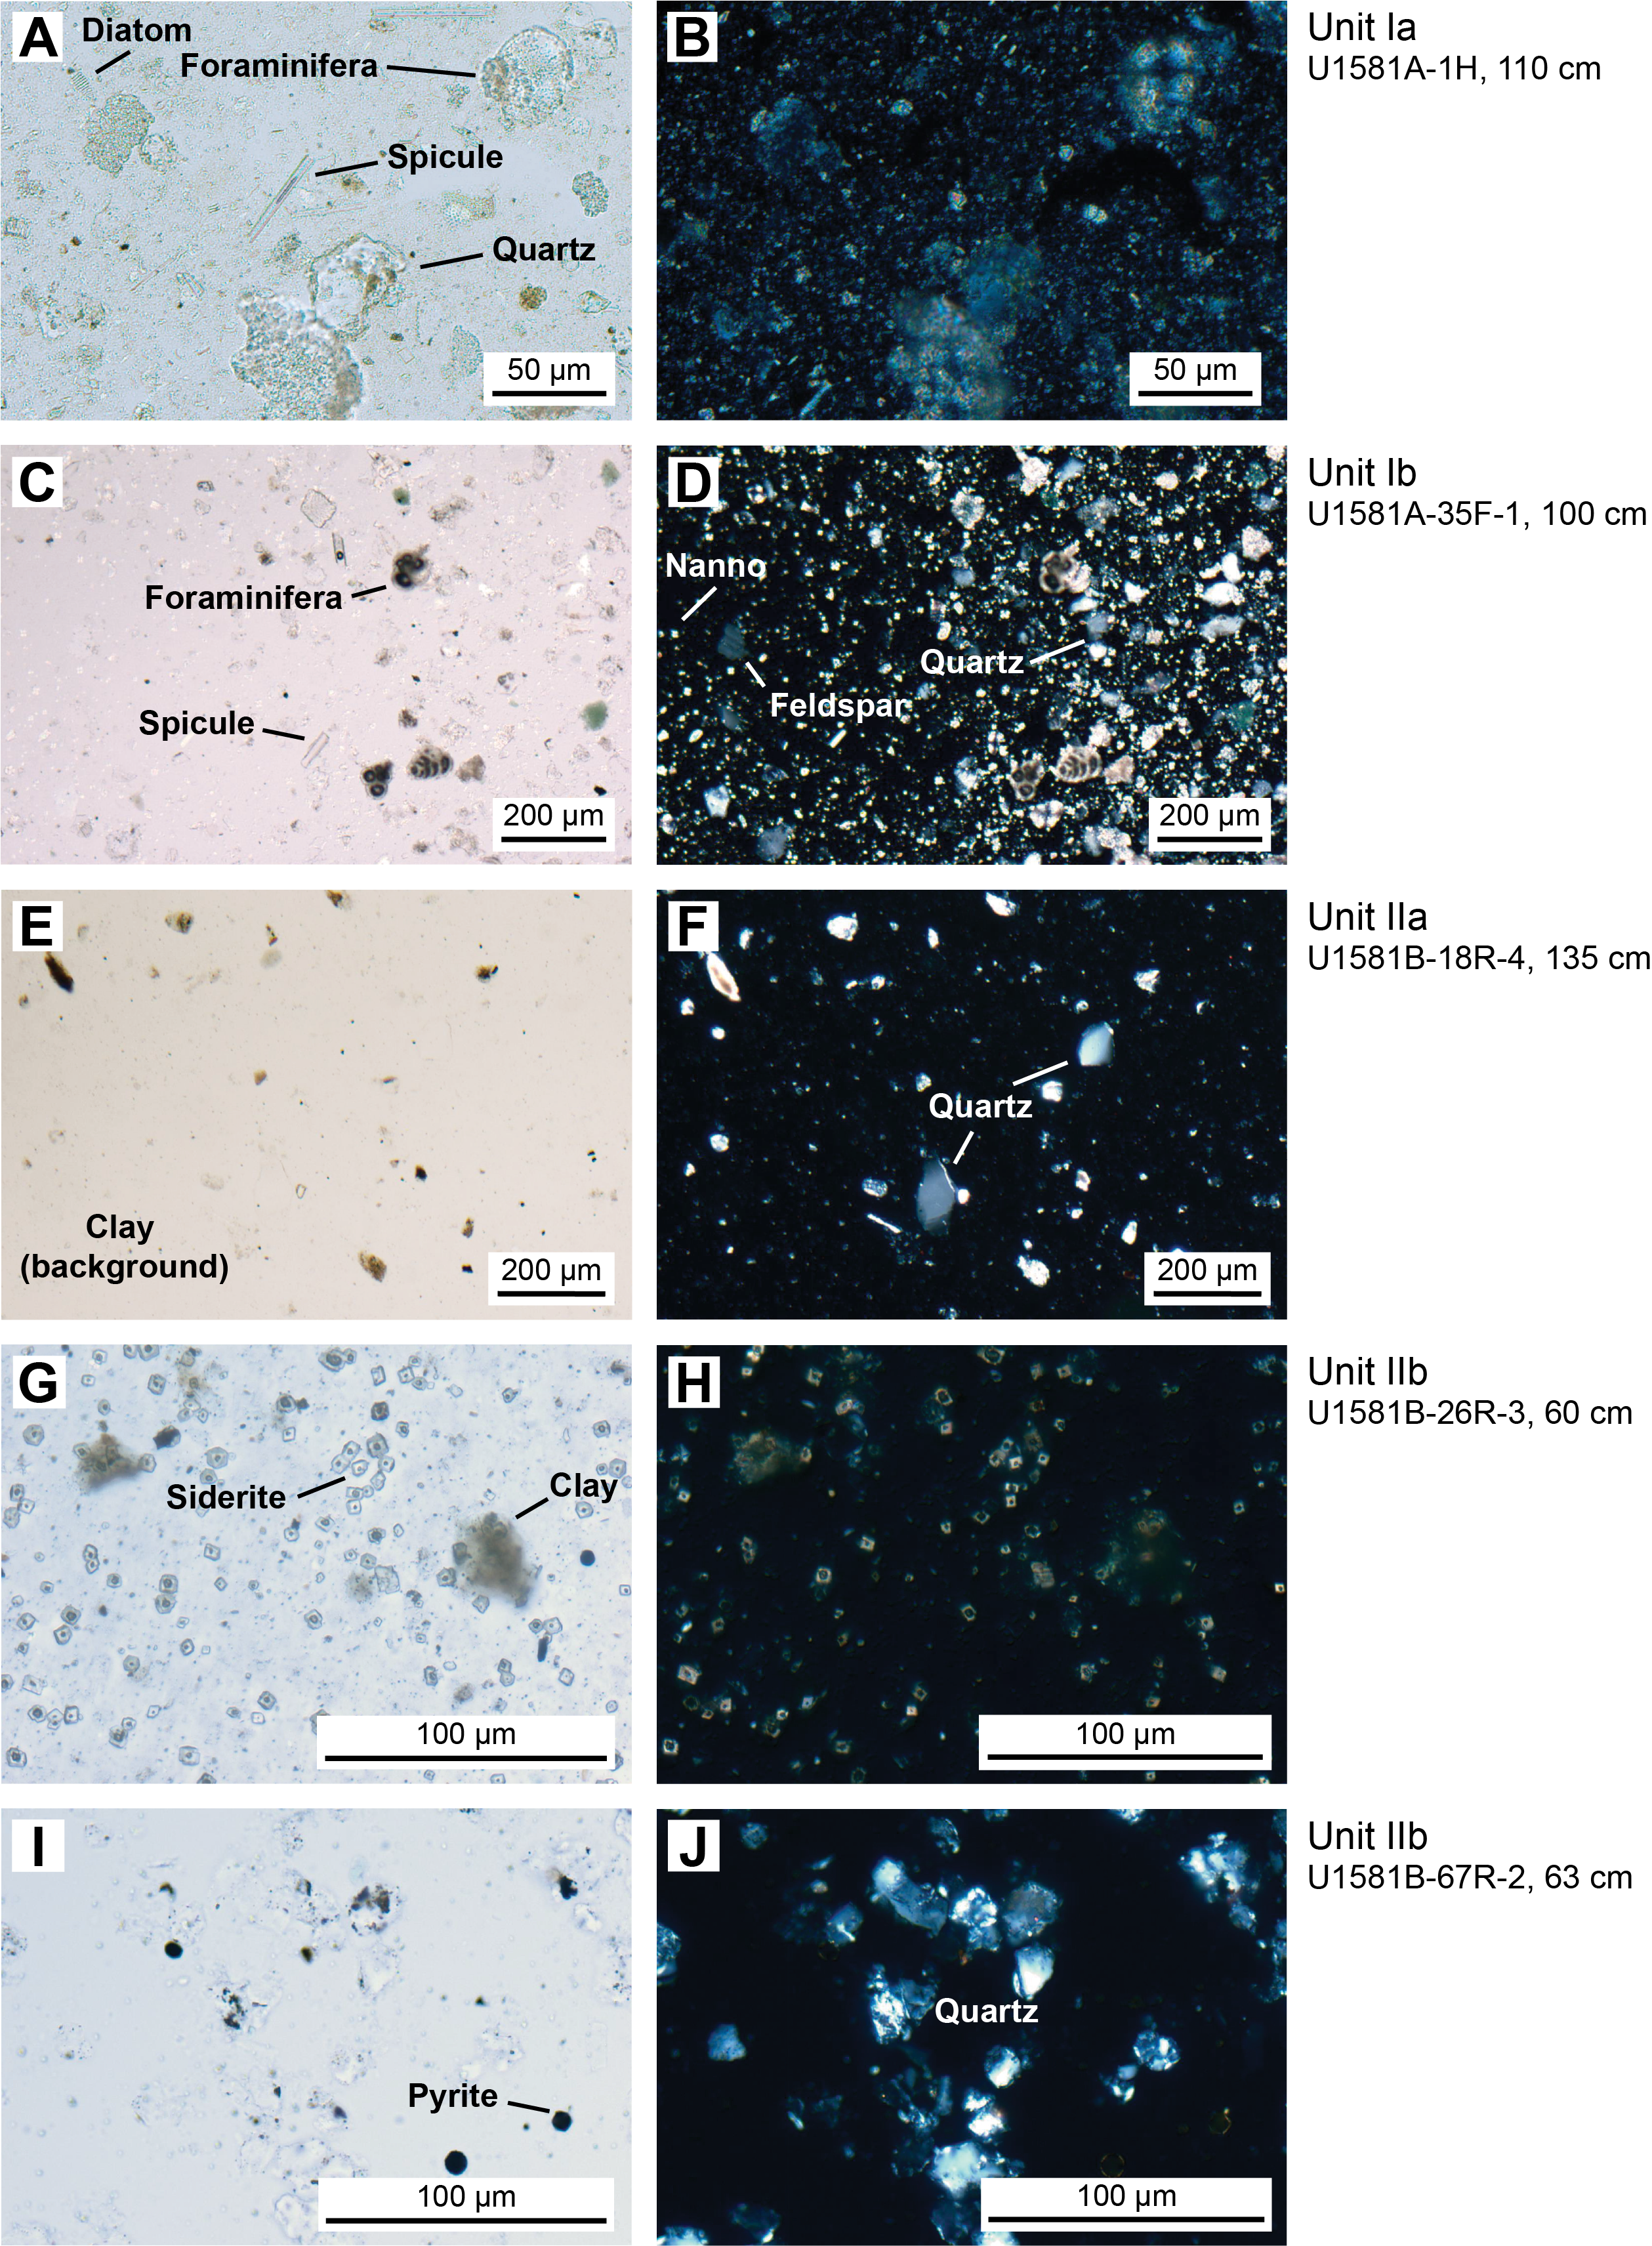
Figure F8. Major sedimentary lithologies.
XRD samples were taken from silt (Sample 392-U1581A-26H-4, 90–91 cm), silty nannofossil chalk with clay (Sample 392-U1581B-9R-1, 66–67 cm), and dark green and black nannofossil-rich clay with zeolite intervals (Samples 11R-2, 84–85 cm [Figure F6B], and 12R-3, 21–22 cm). Quartz is abundant in all samples, and glauconite is observed in all but one of the dark green nannofossil-rich clay intervals. Samples from Cores 11R and 12R contain clinoptilolite.
Core 392-U1581A-25G was recovered at the same depth interval as Core 24H and has been designated a ghost core. Although the lithology of Core 25G is similar to that of Core 24H, the sediment recovered in Core 25G may not be in situ, and therefore was not considered in the lithostratigraphic unit designations.
3.2. Lithostratigraphic Unit II
- Interval: 392-U1581B-13R-1, 0 cm, to 74R-CC, 20 cm
- Depth: 395.70–994.02 m CSF-A
- Age: lower Paleocene to Campanian
- Major lithologies: clay/claystone and silt/siltstone and occasional sand
Lithostratigraphic Unit II is a 598 m lower Paleocene to Campanian sequence of siliciclastic sediments consisting of sand, silt, and clay and sandstone, siltstone, and claystone. This unit is divided into two lithostratigraphic subunits (IIa and IIb) based on the degree of lithification (clay versus claystone). Lithostratigraphic Subunits IIa and IIb have a sharp contact, below which magnetic susceptibility (MS) sharply decreases, bulk density increases, and porosity decreases (Figure F2; see Physical properties).
3.2.1. Lithostratigraphic Subunit IIa
- Interval: 392-U1581B-13R-1, 0 cm, to 22R-3, 6 cm
- Depth: 395.70–486.07 m CSF-A
- Age: lower Paleocene to Maastrichtian
- Major lithologies: clay, clay with silt, silt, and clayey silt with some sand
Lithostratigraphic Subunit IIa is 90 m thick and consists of dark to very dark greenish gray fine-grained sand and silt, clayey silt and very dark greenish gray or black clay, and clay with silt and minor greenish gray to black silicified siltstone with glauconite. Bedding ranges from massive to laminated with normal grading in some intervals. Inoceramids (bivalves) and other shell fragments are observed macroscopically throughout the subunit (e.g., interval 392-U1581B-20R-7, 0–23 cm).
The upper part of the subunit (395.70–435.44 m CSF-A) largely consists of clayey silt and clay with interbeds of silt and coincides with generally low MS and natural gamma radiation (NGR) counts (Figure F2; see Physical properties). In Sections 392-U1581B-17R-1 through 22R-3 (435.44–486.07 m CSF-A), there are frequent intervals (ranging 10–110 cm in thickness) of fine-grained sand that in most cases fine upward into silt or clay. This interval correlates with distinctively high values of MS and NGR counts. Overall, Lithostratigraphic Subunit IIa coincides with low density and high porosity values.
The K/Pg boundary likely occurs at a hiatus in Lithostratigraphic Subunit IIa in interval 392-U1581B-20R-2, 131–133 cm, where lowermost Paleogene sediments overlie lower Maastrichtian sediments (Figure F9; see Chronostratigraphy).
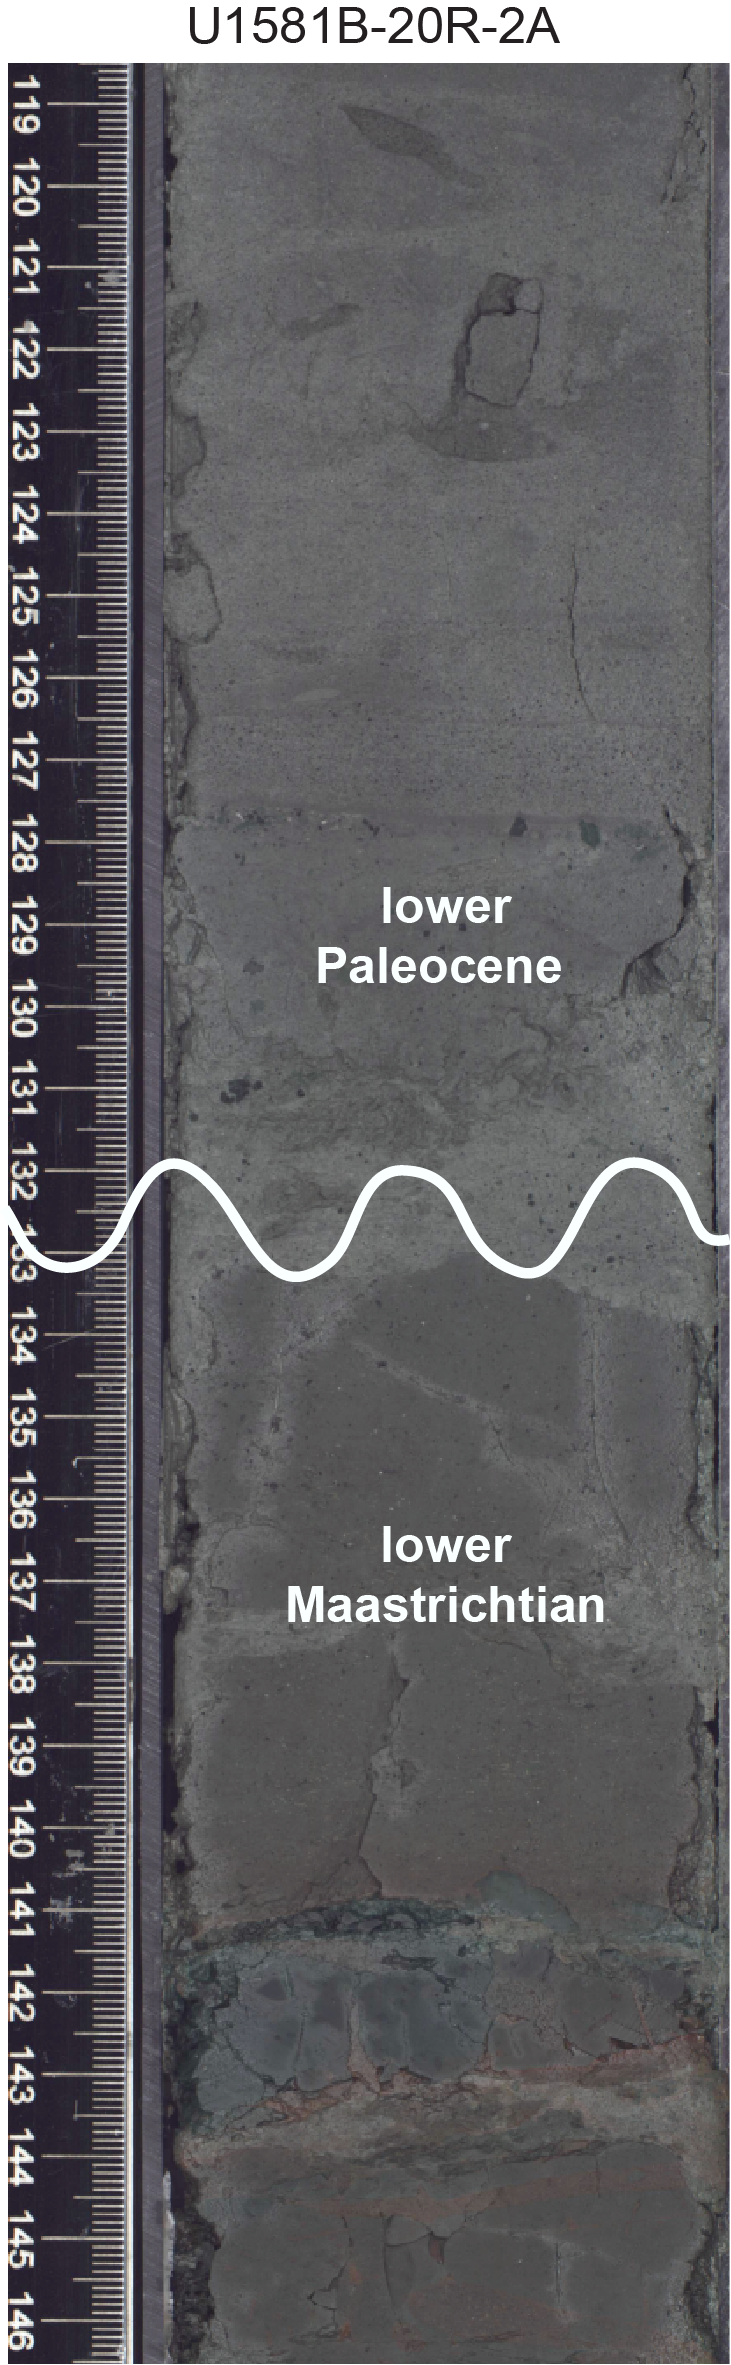
Figure F9. K/Pg boundary.
Smear slides from sand layers generally contain rare to trace inoceramid (bivalve) prisms. Opaque minerals (including framboidal pyrite) are common throughout Lithostratigraphic Subunit IIa and are more common in clay intervals. Nannofossils are rare but well preserved in the clay intervals, and the silt intervals are almost barren of any biogenic grains. Glauconite is typically present in rare abundance, and there are trace amounts of volcanic glass, organic matter, and heavy minerals such as zircon throughout Lithostratigraphic Subunit IIa (Figure F5).
Four samples were taken for XRD analysis in Lithostratigraphic Subunit IIa (392-U1581B-17R-CC, 8–13 cm; 19R-4, 18–19 cm; 20R-3, 8–9 cm [Figure F6C]; and 21R-CC, 9–14 cm). The samples from Cores 17R and 21R were prepared for detailed clay analysis. In both cores, the clays were predominantly composed of smectite group minerals, which is consistent with observed expansion of the sediments in the hours following recovery. In Sample 17R-CC, 8–13 cm, the remainder of the clays consists largely of illite with minor amounts of chlorite, kaolinite, and mixed layer clays. Clinoptilolite and opal-CT are also present, which likely are products of biogenic opal diagenesis. In Sample 21R-CC, 9–14 cm, the nonsmectite clay fraction consists of mostly illite with minor amounts of chlorite and kaolinite. Samples from Sections 19R-4 and 20R-3 are from laminated fine sand and silt intervals, respectively. Bulk XRD results from these sections show a high abundance of quartz, some glauconite, and illite.
3.2.2. Lithostratigraphic Subunit IIb
- Interval: 392-U1581B-22R-3, 6 cm, to 74R-CC, 20 cm
- Depth: 486.07–994.02 m CSF-A
- Age: Maastrichtian to Campanian
- Major lithologies: claystone and siderite-rich claystone and occasional sandstones
Lithostratigraphic Subunit IIb is 508 m thick and consists of dark to very dark greenish gray siltstone, very dark greenish gray or black claystone, and occasional intervals of fine- to medium-grained sandstone. The sandy layers become less frequent toward the bottom of Lithostratigraphic Subunit IIb and are not present below Section 392-U1581B-51R-6, 83 cm (772.53 m CSF-A). Pyrite is abundant throughout the subunit, especially in the upper part between Sections 22R-1, 12 cm, and 31R-3, 90 cm (483.12–574.14 m CSF-A), with some large nodules that are several millimeters to centimeters in diameter. Below ~570 m CSF-A, pyrite occurs as smaller patches or disseminated specks. There are several large burrows infilled with pyrite (e.g., Section 47R-1, 70 cm, and all sections of Core 35R). Some biosiliceous constituents (e.g., diatoms and radiolarians) and foraminiferal tests have been replaced and/or infilled by pyrite (e.g., Sections 37R-5, 117 cm, and 42R-1, 90 cm). There are several well-preserved inoceramids (bivalves) that are possibly in situ and appear to retain their primary shell composition; examples are in Sections 22R-4, 23R-6, 34R-1, 37R-2, 37R-4, 37R-6, 38R-2, 38R-5, 38R-6, 38R-CC, 39R-1, 39R-6, and 41R-1. In interval 38R-5, 20–30 cm, there is an inoceramid present directly above another calcareous invertebrate macrofossil.
Common accessory components observed in Lithostratigraphic Subunit IIb include sand- to silt-sized glauconite, euhedral zircon grains, organic matter, trace amounts of volcanic glass, and rare biogenic calcite. Siderite was noted in smear slides as high-relief, euhedral grains with a cubic to rhombohedral habit and is present in trace amounts as an accessory mineral. Siderite content increases with depth and is often abundant below ~830 m CSF-A, (Figure F5). The increase in siderite abundance coincides with a subtle change in color of the claystones from black and very dark greenish gray to dark gray, dark brownish gray, and olive brown. There are some white intervals (e.g., 392-U1581B-66R-3A, 109–113 cm; Figure F4D) that contain feather-shaped features and are probably a result of dissolution, reprecipitation, and/or deformation.
Preservation of biogenic silica and carbonate is variable throughout Lithostratigraphic Subunit IIb and is generally better in the claystone intervals than the siltstones. Rare to abundant calcareous nannofossils, foraminifera, or fragmented diatoms and radiolarians are observed in smear slides made from claystone layers, such as in Section 392-U1581B-58R-1, 16 cm. However, slides made from similar lithologies in different intervals of the subunit have little to no biogenic material, such as in Section 59R-2, 21 cm. Lithostratigraphic Subunit IIb is characterized by low carbonate (most samples <5 wt% with only a few nannofossil-rich intervals ranging as high as 40 wt%) and high organic carbon content (0.5–1.5 wt%), as well as the highest headspace gas concentrations measured at this site (see Geochemistry and Physical properties).
Mass movement is reflected by repeated fining-upward sequences of sand to silt or silt with soft-sediment deformation features such as convolute lamination or load casts. However, finer grain sizes in Lithostratigraphic Unit II (clays and fine silts) suggest a more distal location with respect to the sediment source in comparison to Lithostratigraphic Unit l (Figure F9).
Eleven samples were taken for XRD analysis from Lithostratigraphic Subunit IIb (392-U1581B-25R-CC, 4–9 cm; 26R-3, 60–61 cm; 31R-3, 98–99 cm; 39R-CC, 19–24 cm; 42R-2, 118–119 cm [Figure F6D]; 48R-4, 111–112 cm; 50R-2, 50–51 cm; 52R-5, 70–71 cm [Figure F6E]; 54R-3, 126–127 cm; 55R-1, 7–8 cm; and 60R-4, 66–67 cm). Samples from Sections 25R-CC and 39R-CC were treated with ethylene glycol and heated for detailed clay analysis (see Lithostratigraphy in the Expedition 392 methods chapter [Uenzelmann-Neben et al., 2023a]). The clay fractions of Cores 25R and 39R largely consist of smectite, an expanding clay. The remainder of the clay fractions are illite group minerals with minor amounts of kaolinite and chlorite. All samples analyzed contain abundant quartz and some glauconite. Samples taken from calcareous claystone intervals (Cores 26R, 54R, and 60R) show high concentrations of iron carbonate minerals (either calcium-magnesium-iron carbonate or siderite), and it is the most abundant component in the sample from Core 60R.
4. Micropaleontology
The 994.02 m thick sedimentary succession recovered at Site U1581 consists of varying proportions of siliciclastic sediment and biogenic ooze (predominantly nannofossil ooze). The siliciclastic component includes coarse-grained units with sharp bases and normal grading that are interpreted as turbidites (see Lithostratigraphy). Thus, an uncertain proportion of the microfossils found in the Site U1581 sediments were probably transported and reworked from nearby shallower settings. Likely transport of components of the microfossil assemblages complicates identification of the biohorizon tops of species, which can be extended upsection into younger sediments because of reworking. Therefore, where possible, biohorizon bases were preferentially identified over biohorizon tops for age model construction (see Chronostratigraphy). We note that the biohorizons identified demonstrate a clear age progression (with systematically younger datums identified upsection), suggesting that transported sediments were deposited quasicontemporaneously. Postcruise research will assess the amount of pelagic sedimentation represented in these sediments.
Figure F10 provides a comprehensive overview of the occurrence and preservation of microfossil groups documented in the Site U1581 sediments. Calcareous nannofossils and dinoflagellate cysts provide reasonably good age control for the entire sampled sequence from the Pleistocene to mid-Campanian (Figure F11; Table T3). Lithostratigraphic Subunit Ia (0–198.24 m CSF-A) (see Lithostratigraphy) consists of Pleistocene to upper Miocene biogenic ooze with silt and sand beds that increase in number and thickness downhole. Calcareous nannofossils and foraminifera are generally abundant and moderately to well preserved throughout this subunit. Reworking of nannofossils is particularly prevalent in the siliciclastic component. Diatoms and other siliceous microfossils (including radiolarians and silicoflagellates) are common to abundant and well preserved in Core 392-U1581A-1H. Below this level, diatoms are present in lower abundance and moderately preserved to ~110 m CSF-A, whereas radiolarians are common to ~93 m CSF-A and present in few numbers to ~175 m CSF-A. Dinocysts are well preserved when present, but their abundance varies throughout the record from few in the Pleistocene and Pliocene (0–101 m CSF-A) to abundant in the Miocene (121.13–198.24 m CSF-A).
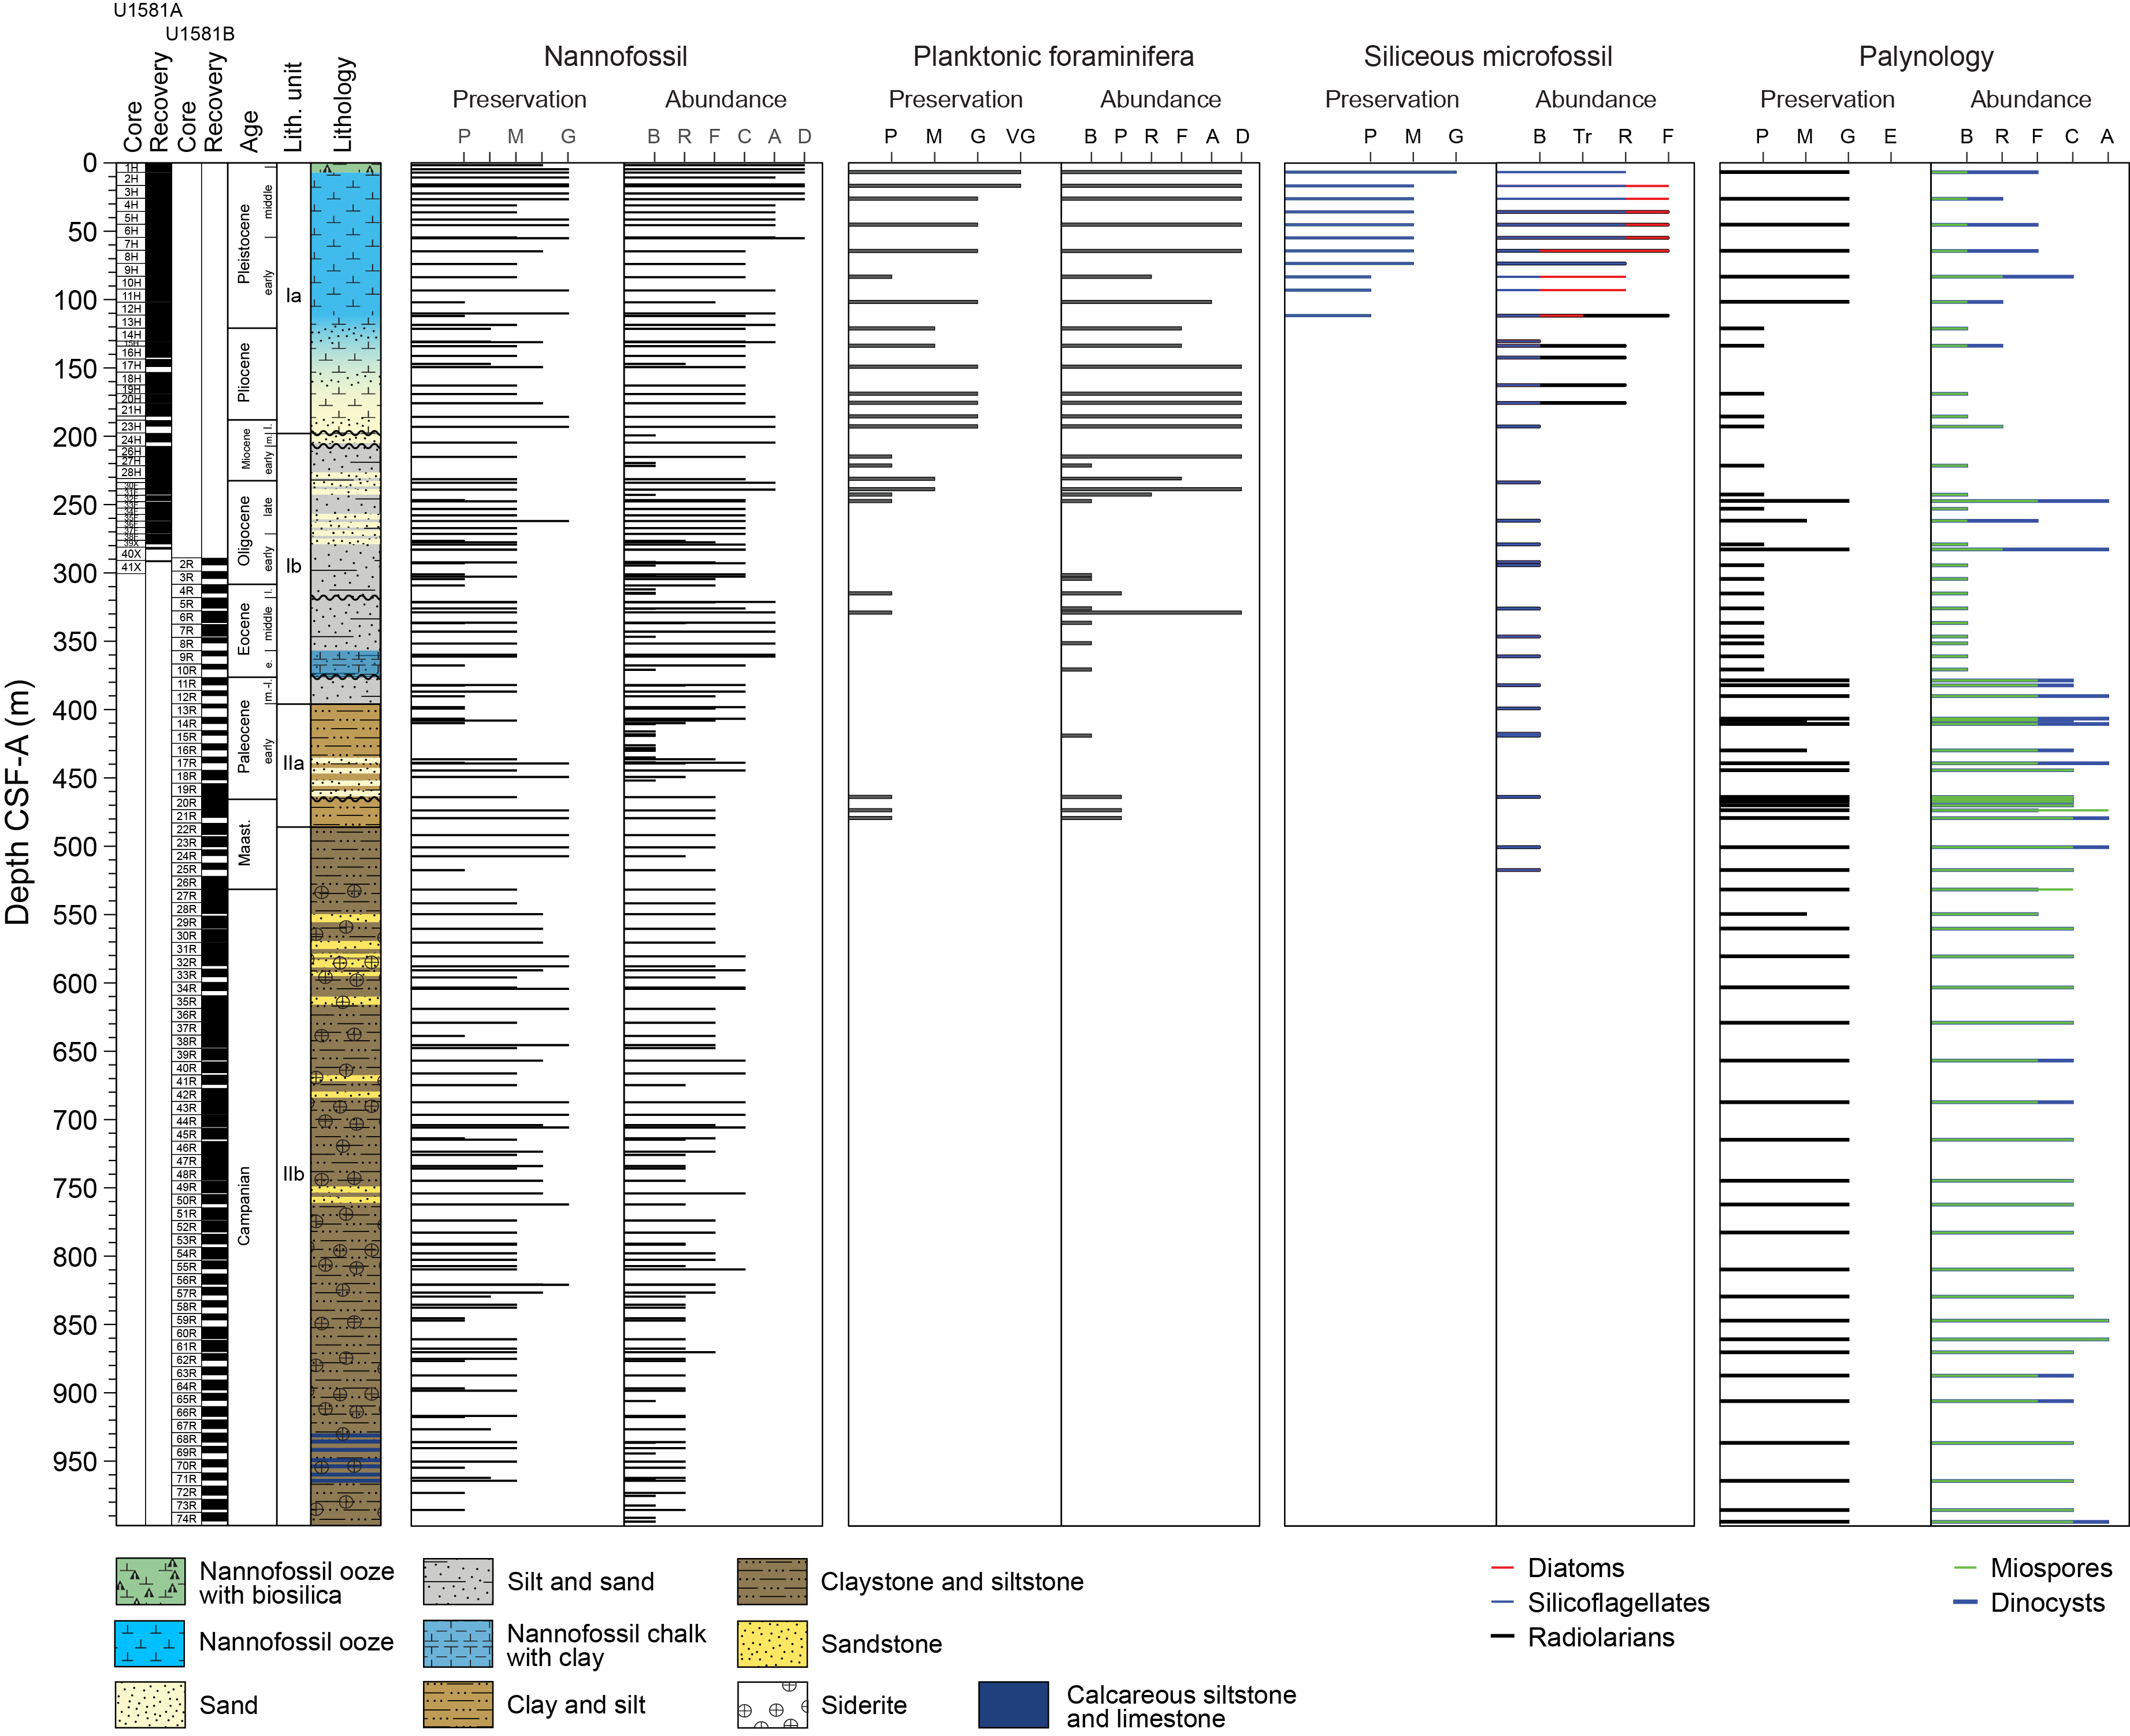
Figure F10. Nannofossil, planktonic foraminifera, siliceous microfossil, and palynomorph preservation and abundance.
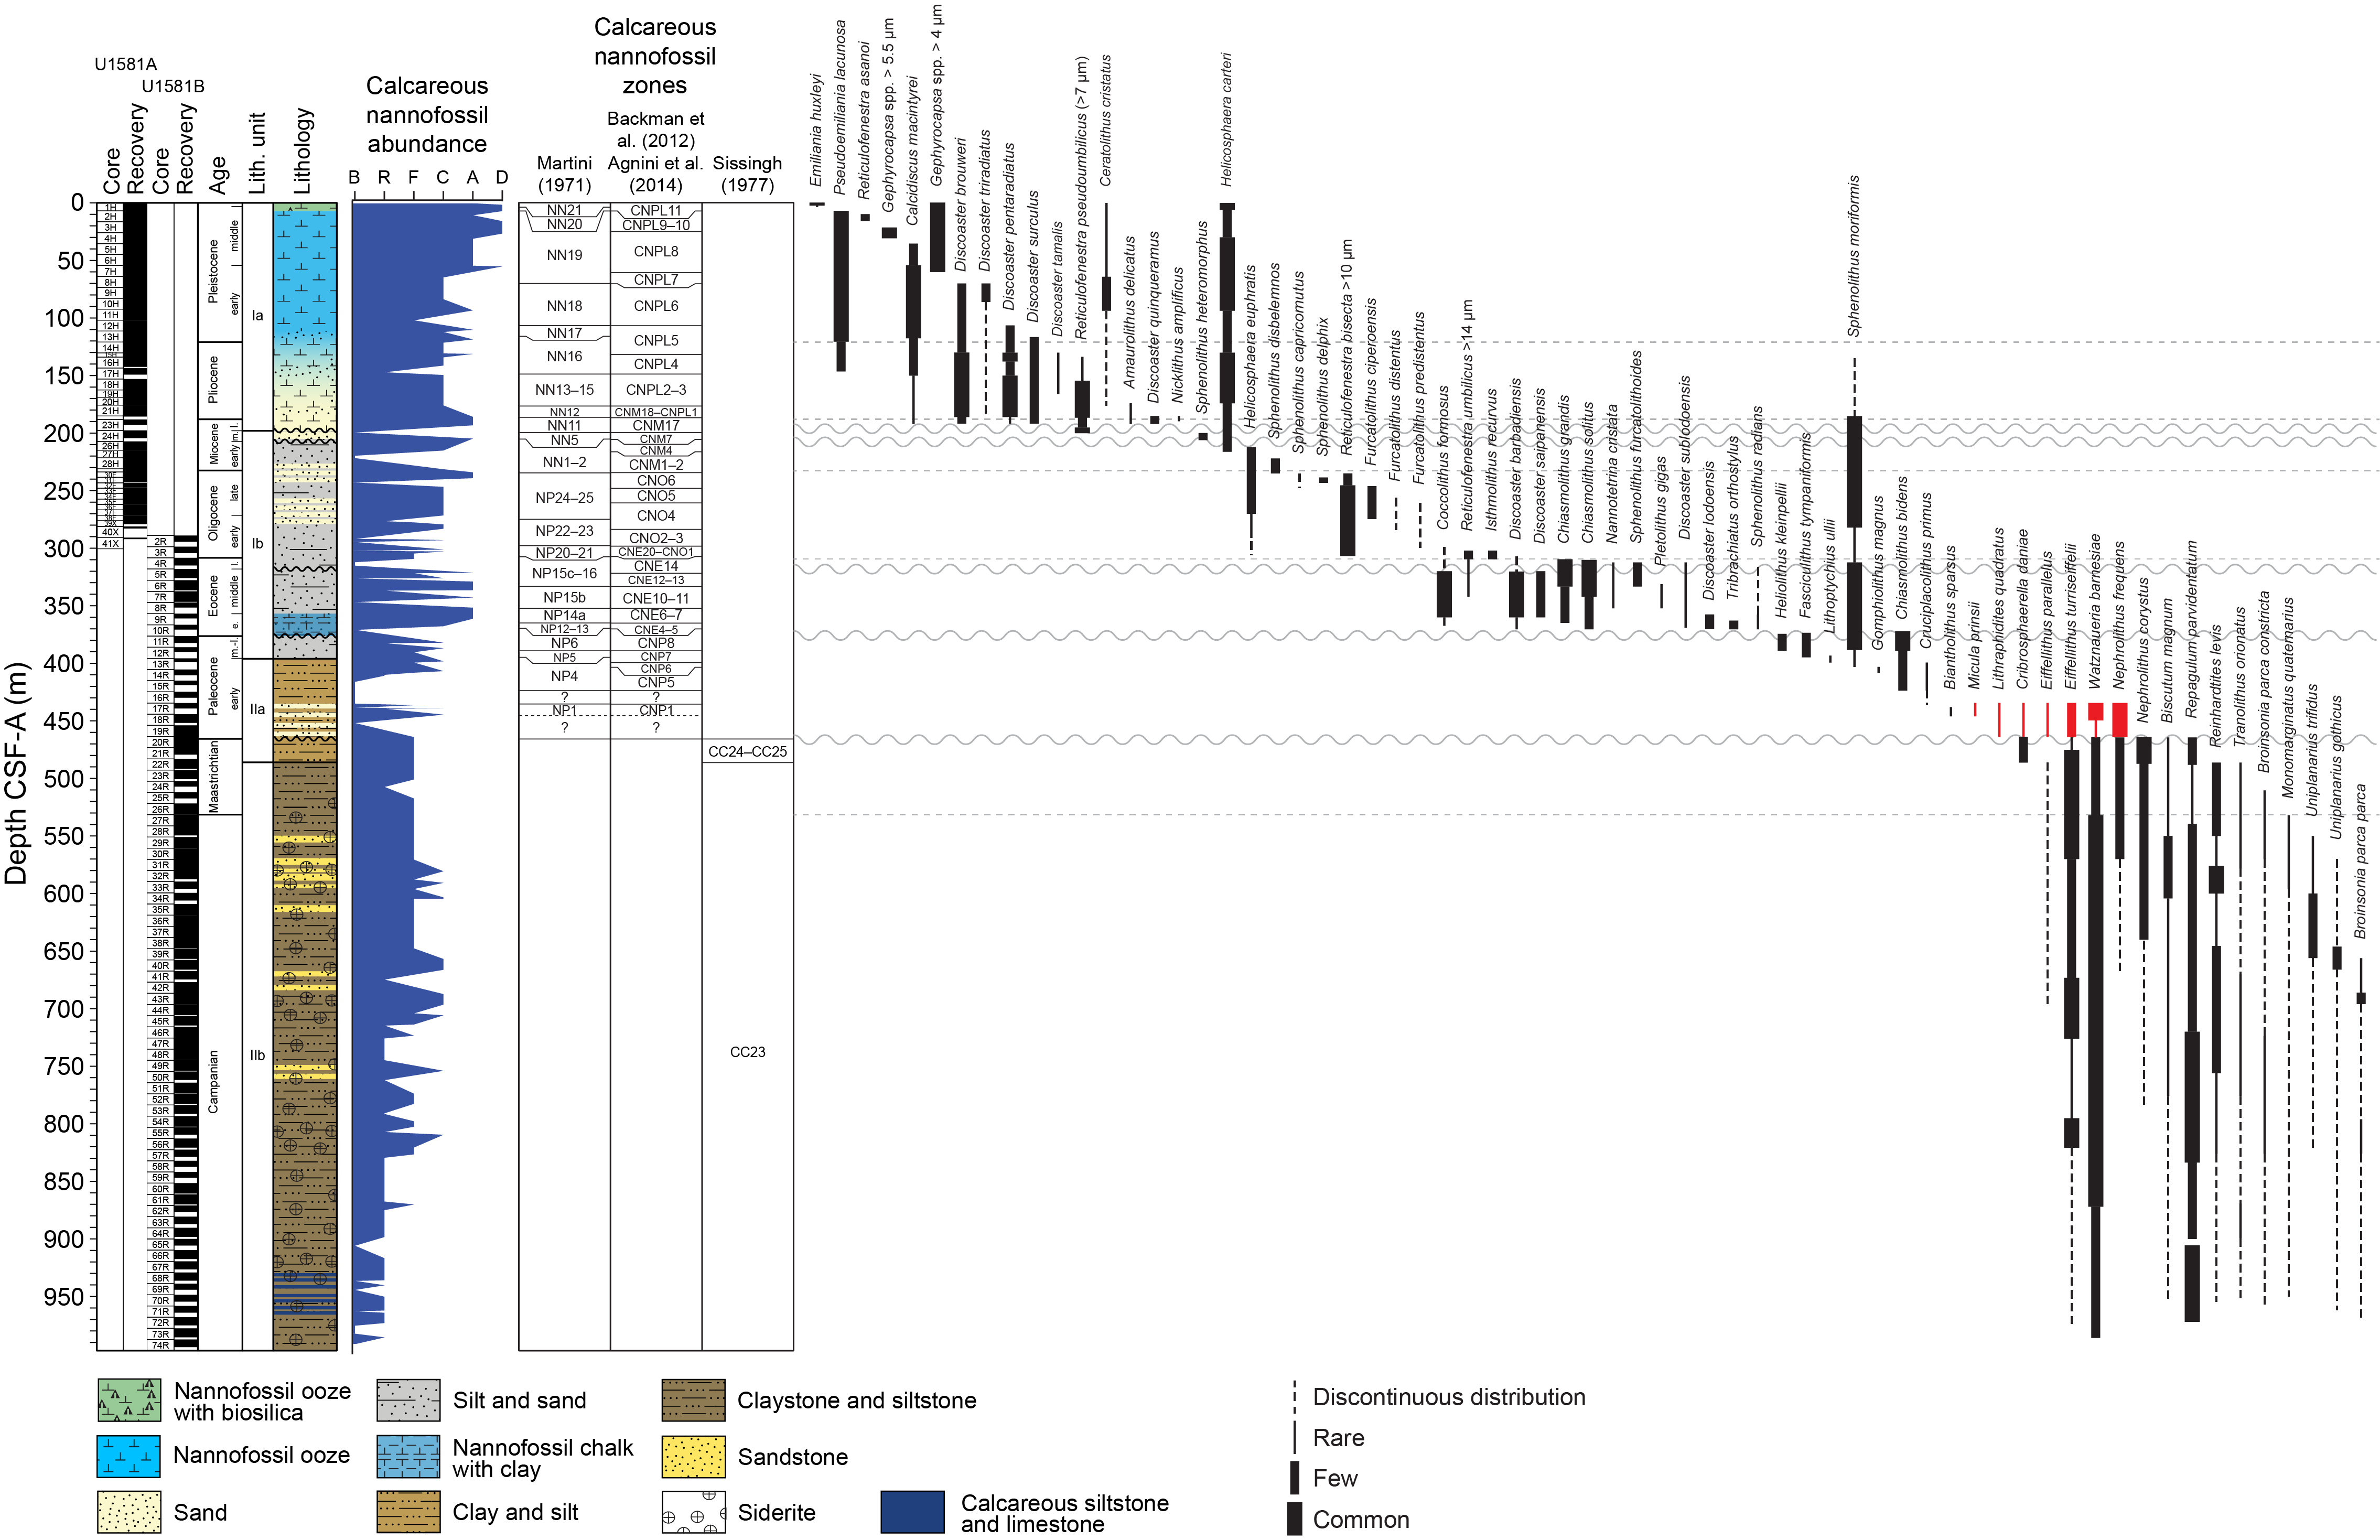
Figure F11. Calcareous nannofossil abundance, zones, and distribution.
In Lithostratigraphic Subunit Ib (198.24–390.05 m CSF-A; late Miocene to mid-Paleocene), sand and silt are the dominant lithologies with intercalated thin beds of nannofossil ooze. Calcareous nannofossils are common to abundant and moderately preserved in many samples from this subunit; however, they are occasionally rare and poorly preserved or absent entirely, particularly in coarser grained lithologies. Foraminifera are abundant but poorly to moderately preserved at the top of this subunit. Below ~240 m CSF-A, they are either absent or present in low numbers and poorly preserved. Siliceous microfossils are absent in this subunit. Poor preservation of dinocysts and miospores continues downhole into the top of Lithostratigraphic Subunit IIb between 198.24 and 242.67 m CSF-A. Dinocysts and miospores are rare to abundant in the Oligocene (247.35–282.75 m CSF-A), absent in the Eocene (294.36–370.61 m CSF-A), and common to abundant in the Paleocene (378.61–395.70 m CSF-A). Abundance of dinocysts and miospores broadly co-varies throughout the sequence.
Lithostratigraphic Unit II (395.70–994.02 m CSF-A; Paleocene–Campanian) is dominantly siliciclastic and is characterized by an increase in lithification downhole from clayey silt and clay with silt to claystone/siltstone, with sand/sandstone beds present throughout. Siderite is present in the lower part of the Site U1581 sequence deeper than ~486 m CSF-A (Lithostratigraphic Subunit IIb), which may be indicative of diagenetic alteration of primary biogenic carbonates. Calcareous nannofossil abundance and preservation varies significantly throughout Lithostratigraphic Unit II. Nannofossils are present in few to common numbers in only some Paleocene samples, and many samples are completely barren. Nannofossils are generally present only in few numbers in the Cretaceous; however, they are surprisingly well preserved, and coccospheres are present in many samples, particularly between ~470 and 770 m CSF-A. Deeper than this, abundance decreases and preservation deteriorates; Core 392-U1581B-74R is devoid of nannofossils. Foraminifera are almost entirely absent in the >63 µm size fraction, but small foraminifera <20 µm in size are observed in smear slides throughout this unit. Pyritized diatom fragments are common throughout much of Lithostratigraphic Unit II. Although they are often fragmented, some samples contain nearly complete pyritized diatom valves. Preservation of dinocysts and miospores is good to moderate in Lithostratigraphic Unit II. Both are common to abundant throughout all samples investigated, and rich and diverse assemblages provide ample opportunity for postcruise study to document the terrestrial and marine paleoenvironmental evolution of the region.
4.1. Calcareous nannofossils
We examined all APC, HLAPC, and XCB core catcher samples from Hole U1581A and all RCB core catcher samples from Hole U1581B to establish a calcareous nannofossil biostratigraphy (Figure F11; Table T3). Additional samples from split core sections were taken from cores when core catcher samples were barren or composed of coarse-grained material. Calcareous nannofossil assemblage distribution data are based on shipboard observations, which focused on identification and tabulation of species that are age diagnostic; therefore, the recorded assemblage may not be fully representative of the entire nannofossil assemblage (Tables T4, T5). Photomicrographs of selected nannofossils are shown in Figures F12, F13, F14.
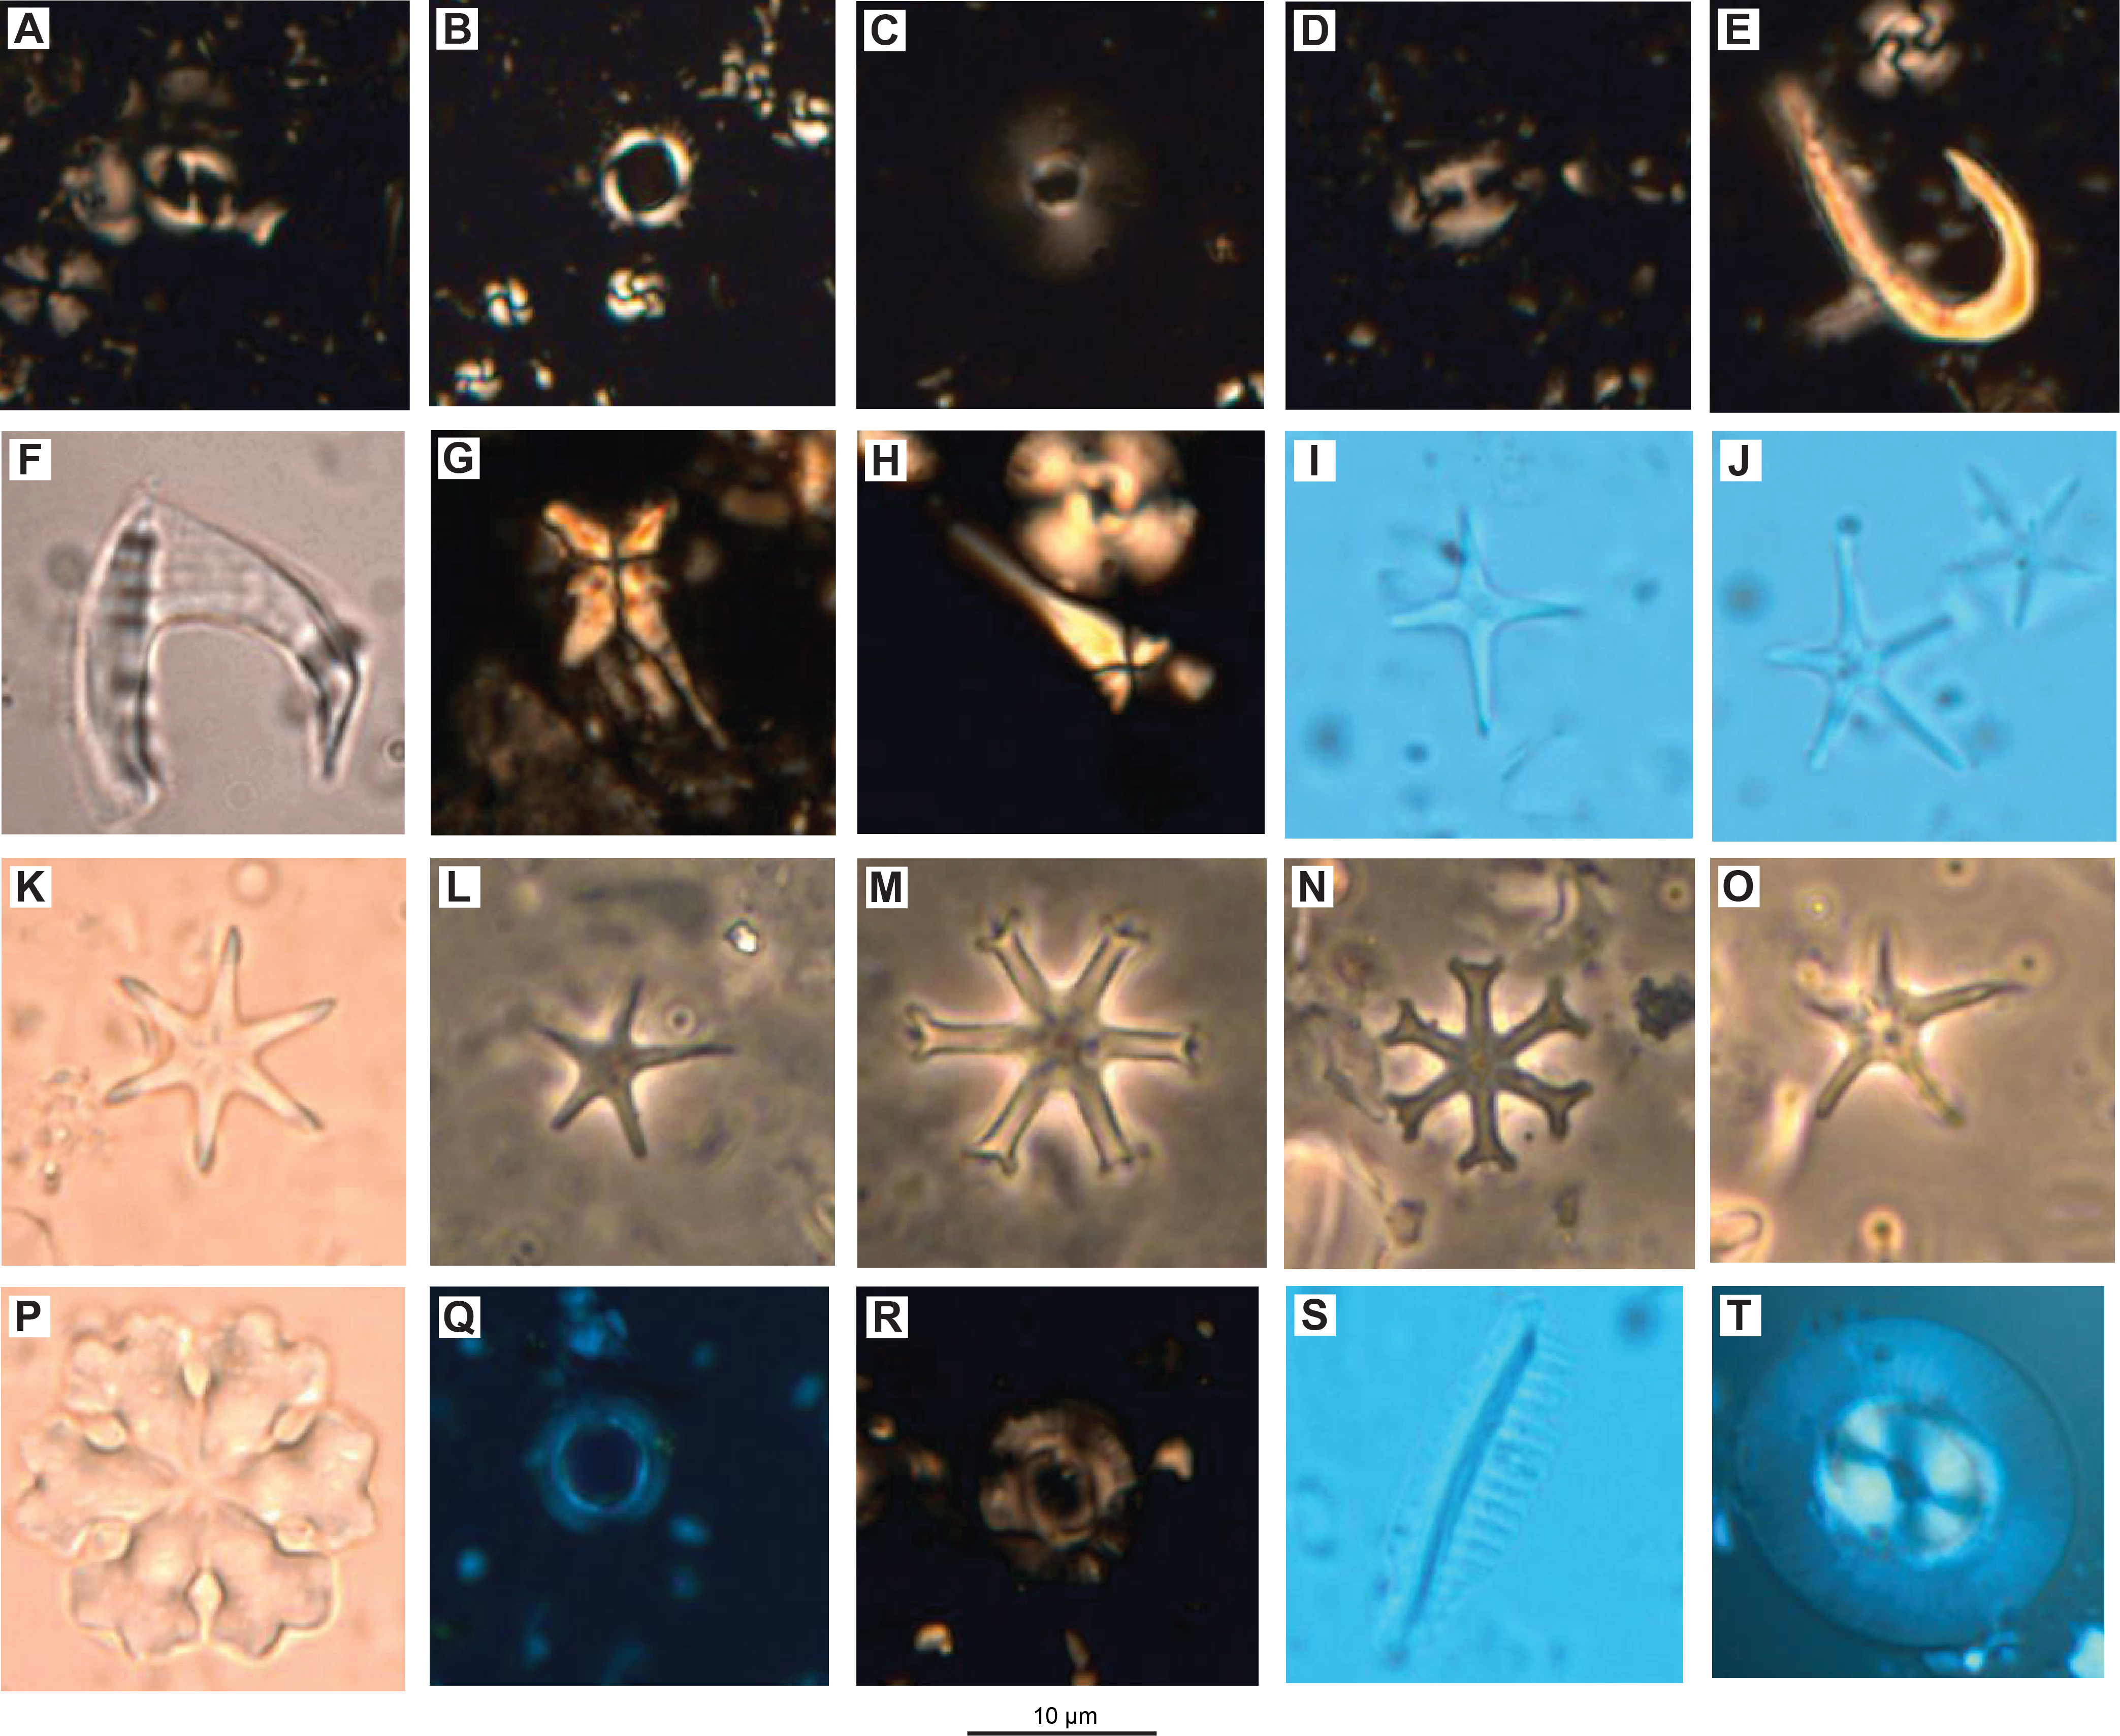
Figure F12. Quaternary and Neogene calcareous nannofossils.
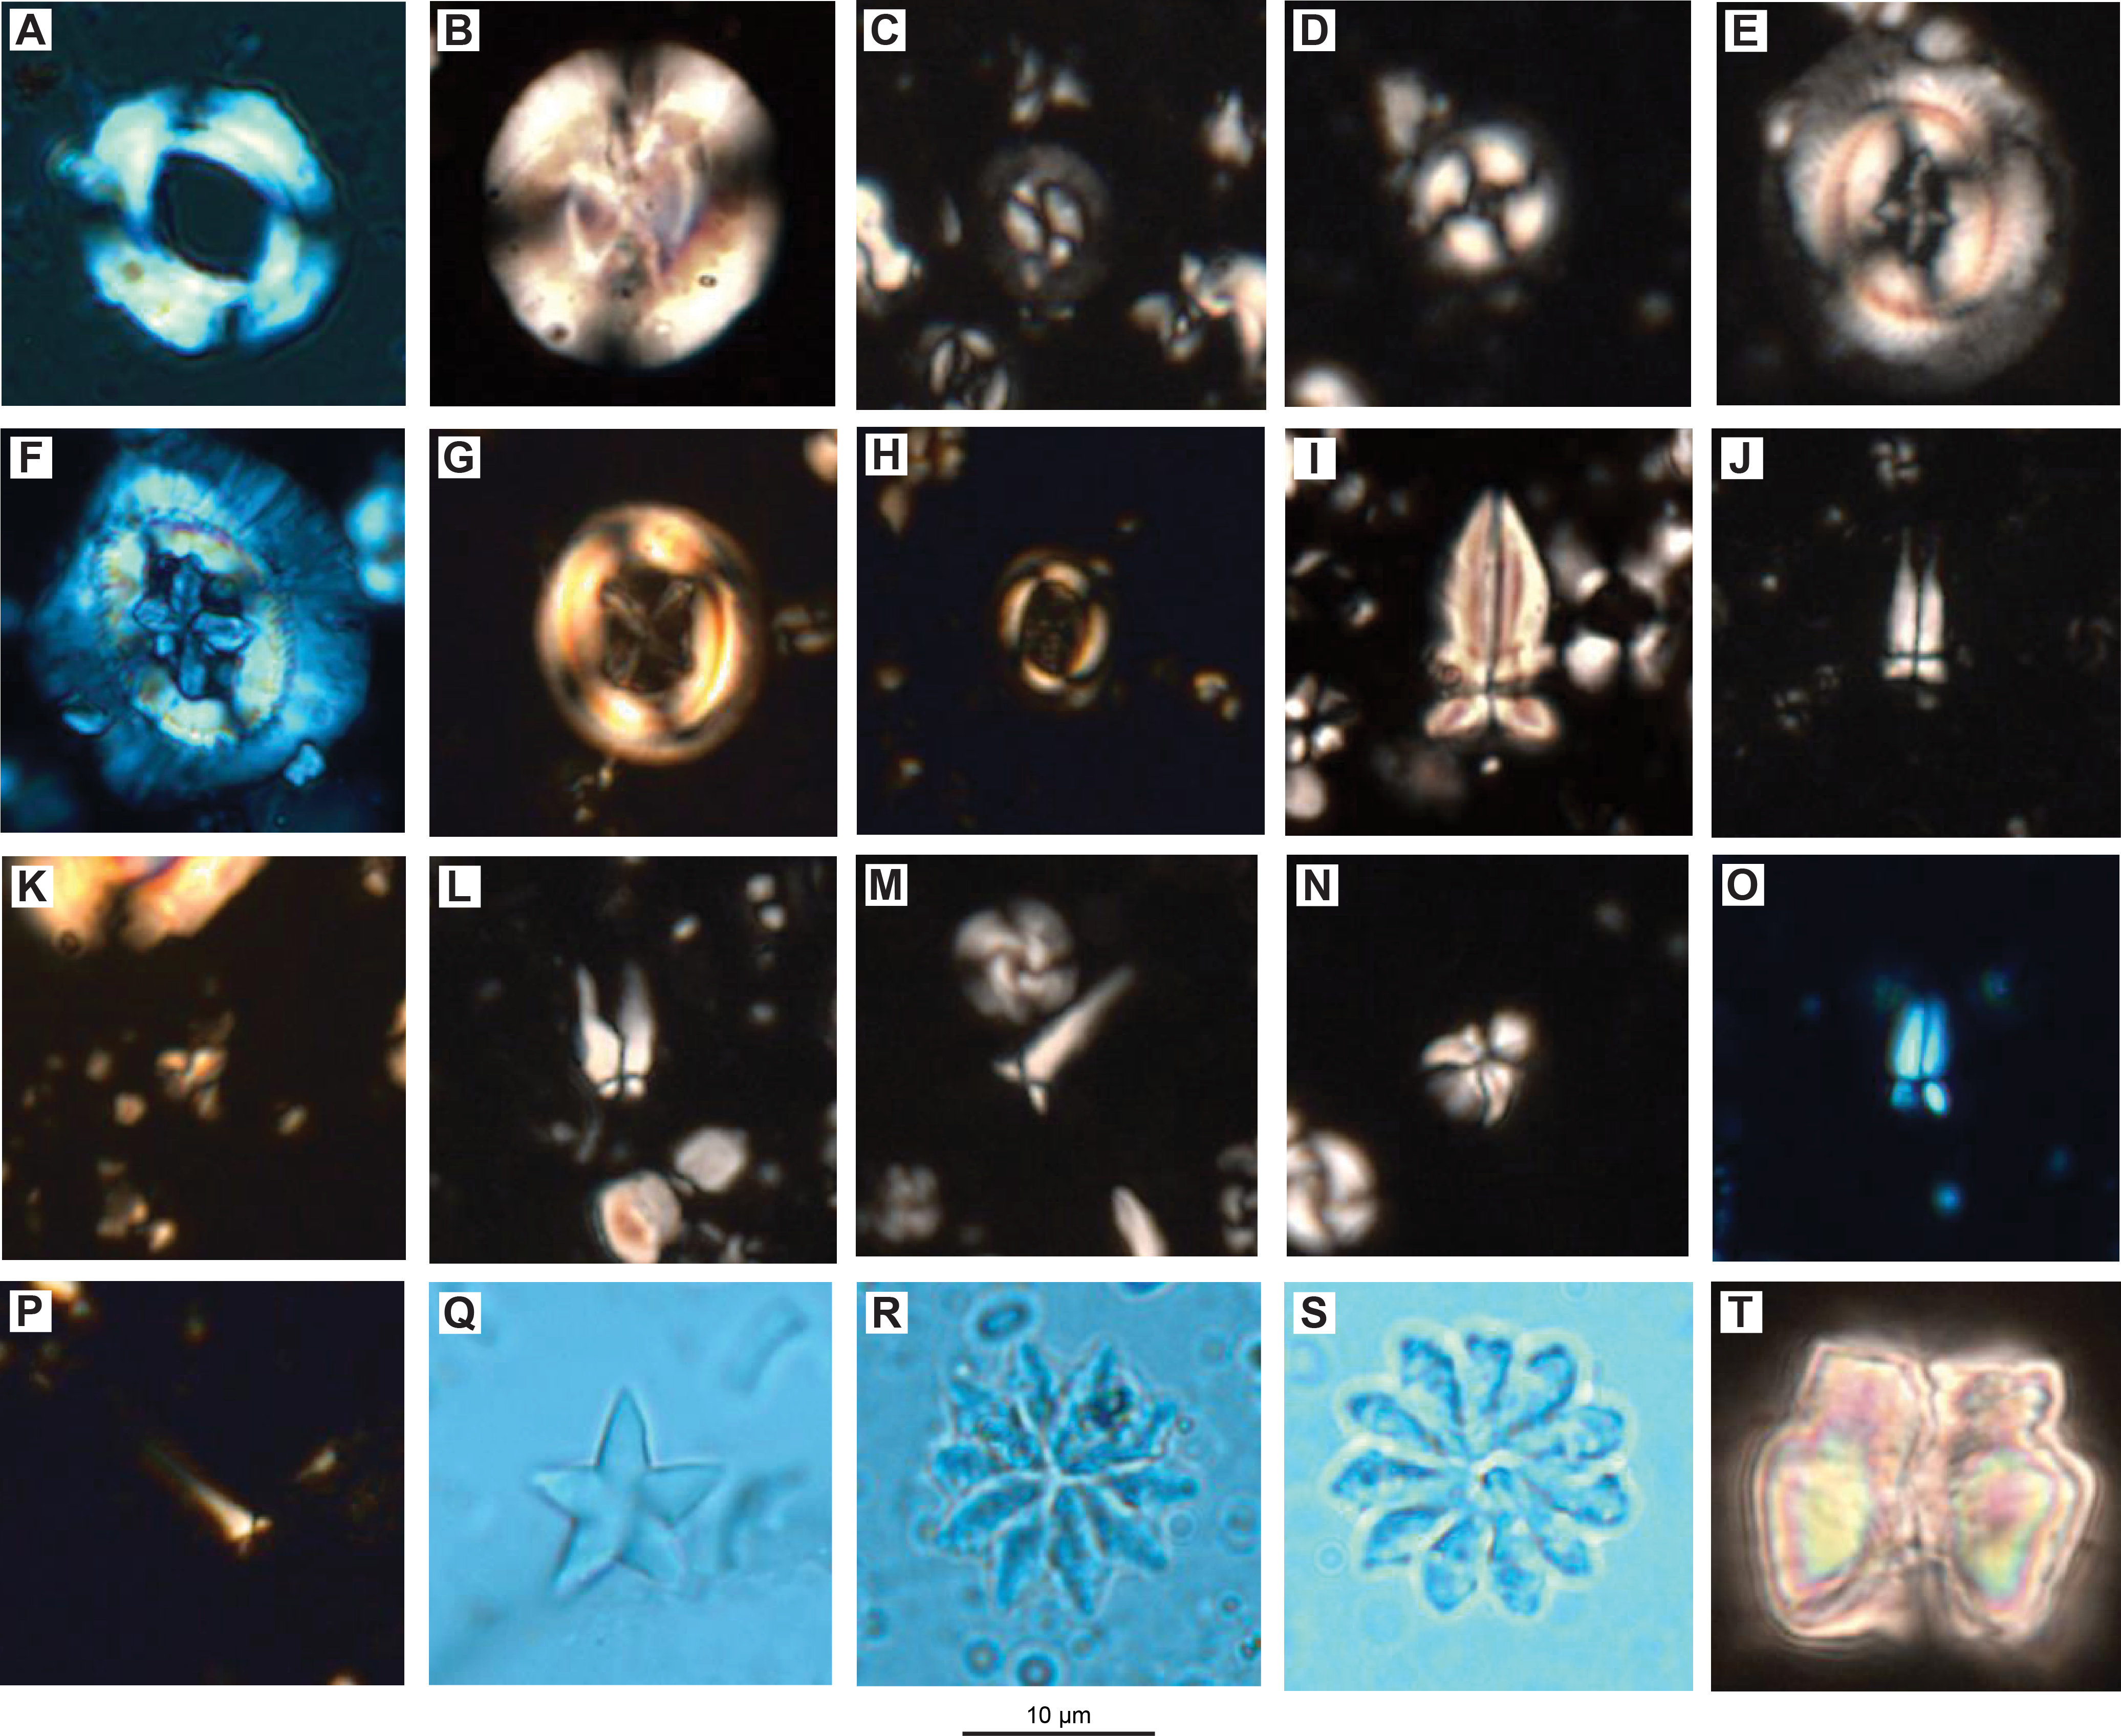
Figure F13. Paleogene calcareous nannofossils.
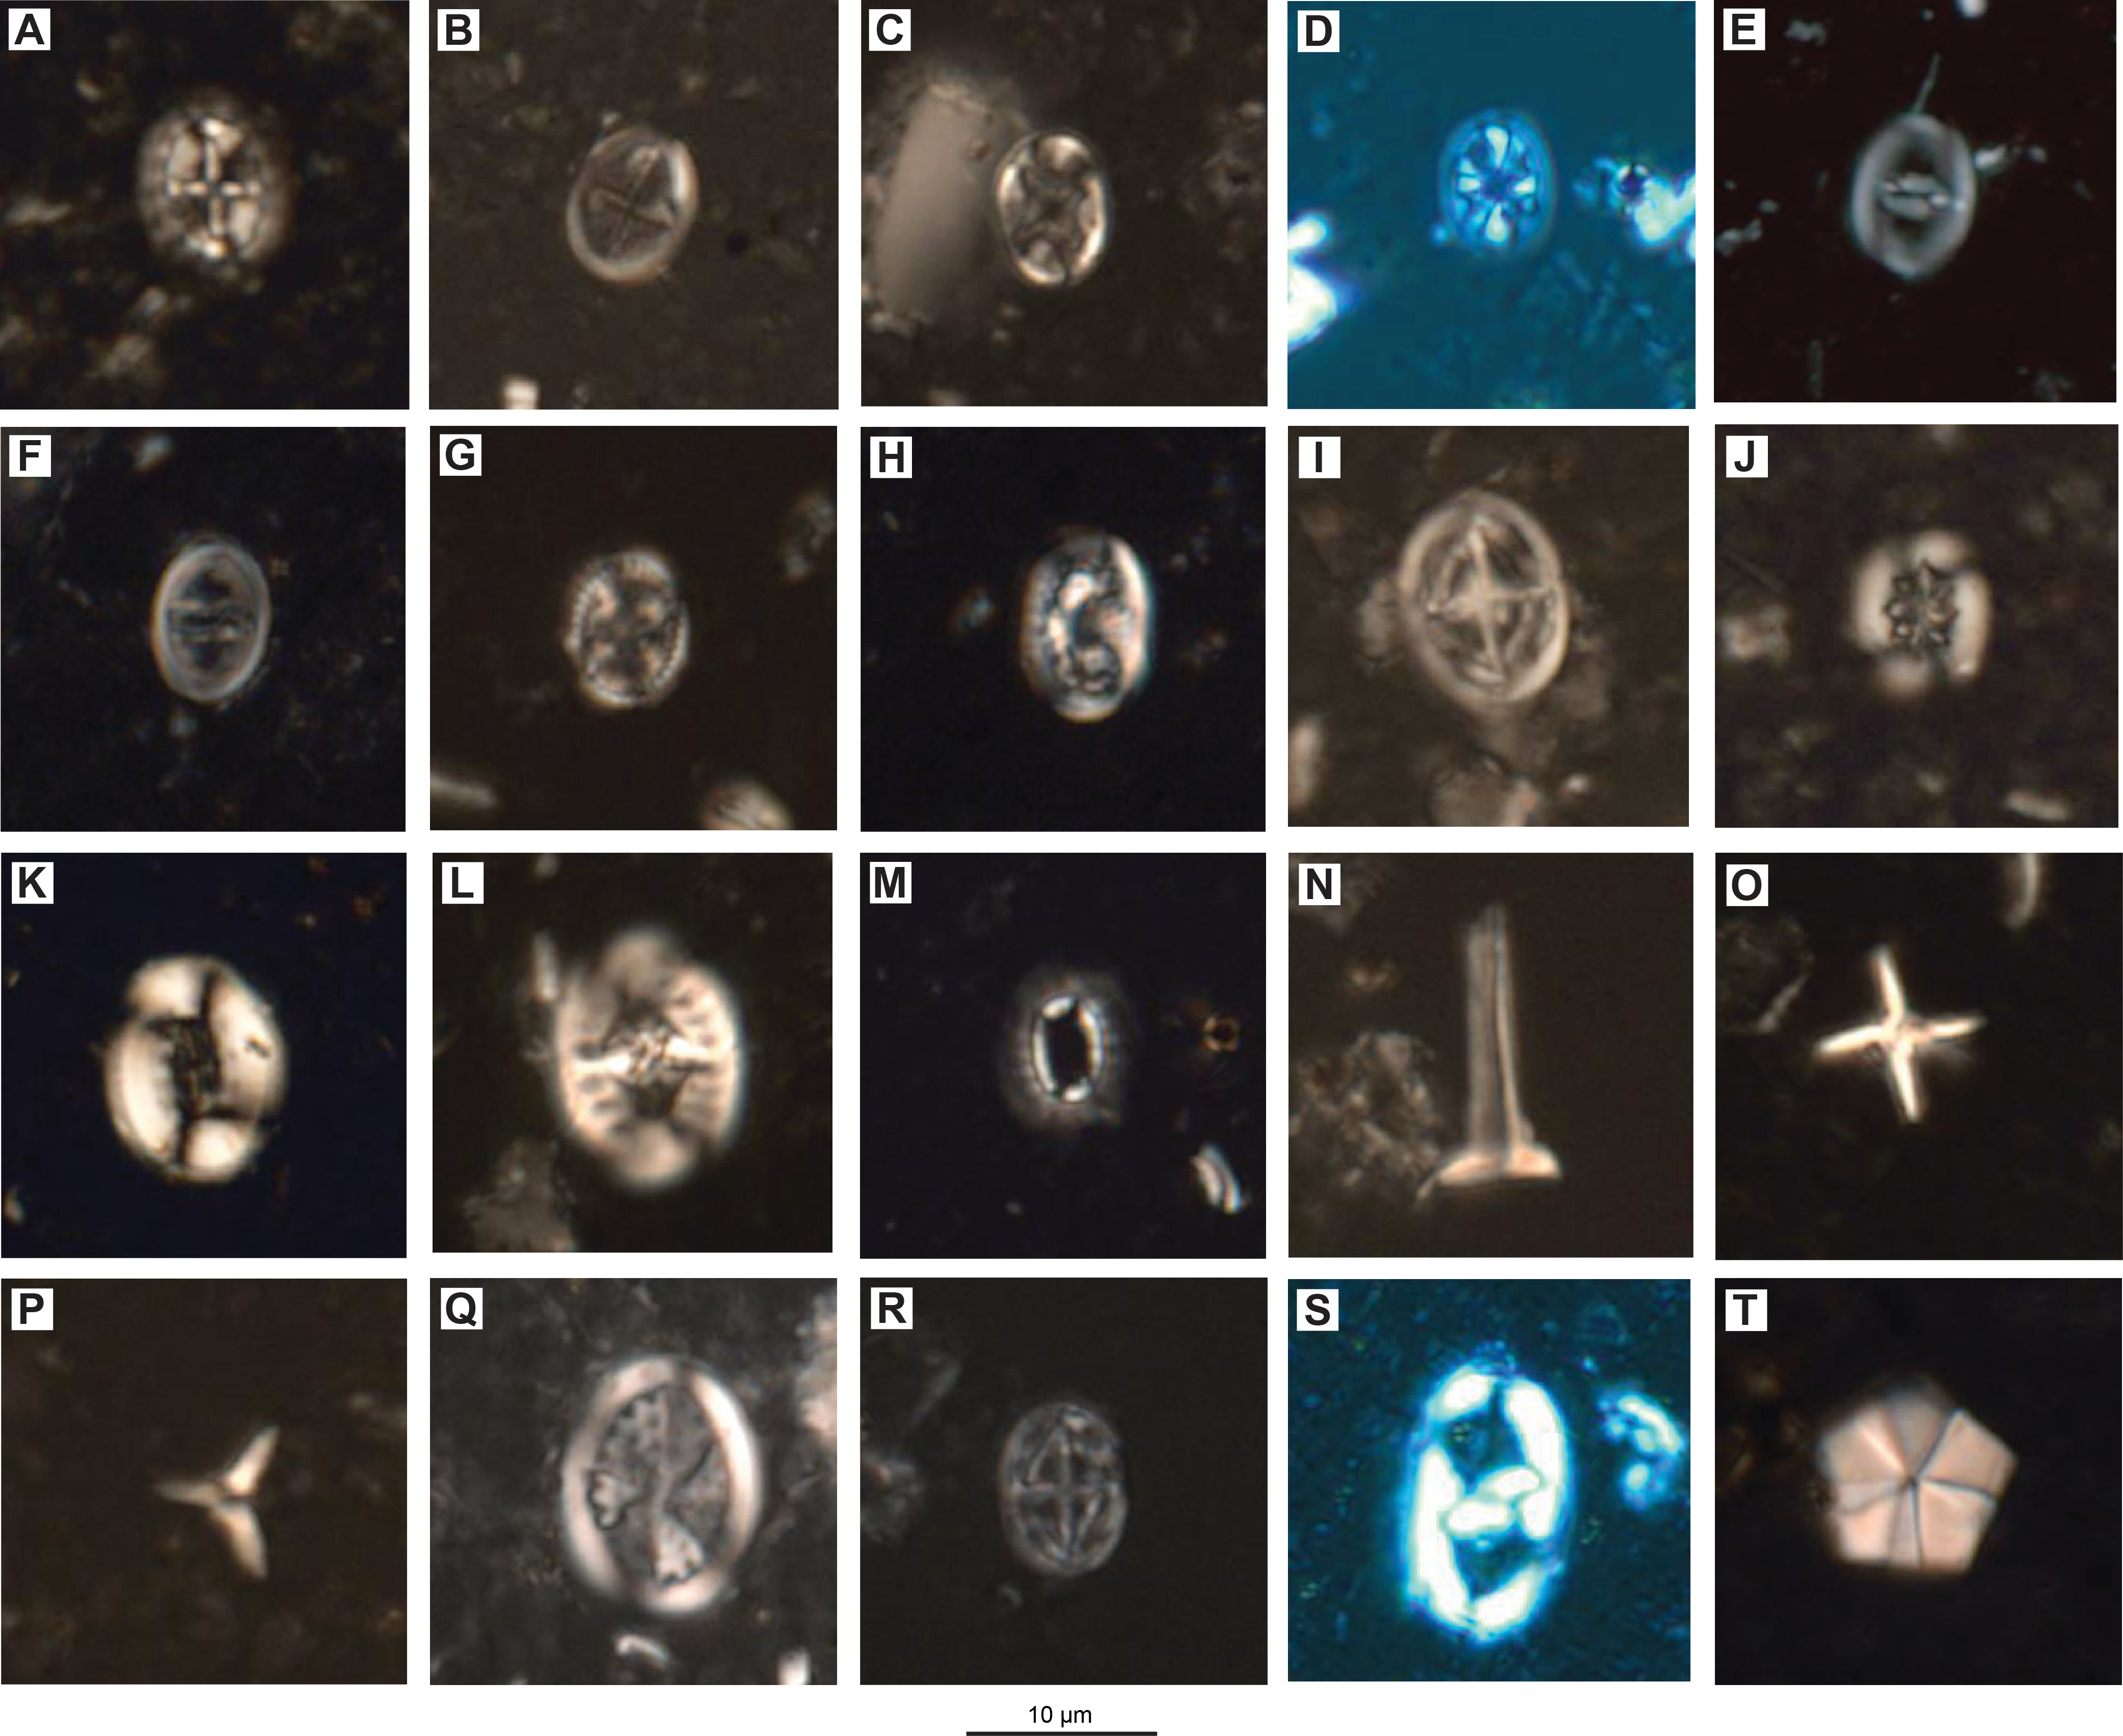
Figure F14. Cretaceous calcareous nannofossils.
Calcareous nannofossils are generally abundant and moderately to well preserved in Lithostratigraphic Subunit Ia (0.0–198.24 m CSF-A), which consists of Pleistocene to upper Miocene biogenic ooze with varying proportions of siliciclastic sediments. Deeper than 198.24 m CSF-A, the siliciclastic component increases significantly, with only occasional beds of nannofossil ooze present in Lithostratigraphic Subunit Ib (198.24–390.05 m CSF-A), which is dated to the middle Miocene to middle to early late Paleocene. Moderately preserved nannofossils are generally present in common numbers in this subunit; however, a few samples are barren. Lithostratigraphic Unit II (395.70–994.02 m CSF-A) consists of middle Paleocene to mid-Campanian clay/claystone and silt/siltstone with intermittent sand/sandstone beds. Moderately preserved nannofossils are present sporadically in the lower and middle Paleocene. Nannofossils are generally well preserved but are only present in sparse numbers in Maastrichtian and uppermost Campanian sediment; however, preservation deteriorates deeper than ~750 m CSF-A, coincident with increasing presence of siderite (see Lithostratigraphy). Abundance also decreases deeper than 750 m CSF-A, and the lowermost core from Hole U1581B (74R; 987.40–994.02 m CSF-A) is devoid of calcareous nannofossils.
4.1.1. Pleistocene
The uppermost sediments at Site U1581 primarily consist of Pleistocene nannofossil ooze with foraminifera interbedded with sand layers. Nannofossils are the dominant biogenic component of the sediment throughout much of this interval and are generally well preserved. Many of the Pleistocene samples contain numerous reworked Neogene and Paleogene taxa, including some species with last appearance datums in the Pleistocene. Despite this difficulty, we identify 10 nannofossil datums to constrain the stratigraphy of the ~120 m thick Pleistocene interval of Hole U1581A.
The mudline sample from Hole U1581A (1H-1, 0 cm) contains a late Pleistocene nannofossil assemblage with abundant Emiliania huxleyi and common Gephyrocapsa spp., Coccolithus pelagicus, Calcidiscus leptoporus, Ceratolithus cristatus, and Florisphaera profunda. Other taxa such as Syracosphaera spp. and Umbilicosphaera foliosa are also present. Sample 1H-1, 135 cm (1.35 m CSF-A), contains questionable specimens of E. huxleyi, so we tentatively identify biohorizon base E. huxleyi (290 ka; n1 in Figure F30 and Table T3) in this sample, indicating that the upper ~1.35 m of sediment is likely younger than 290 ka and assigned to Zones NN21 (Martini, 1971) and CNPL11 (Backman et al., 2012) (Figure F11; Table T3). Sample 1H-CC, 14–19 cm (6.83 m CSF-A), contains common numbers of Pseudoemiliania lacunosa (biohorizon top = 430 ka; n2, same figure) and indicates the tops of Zones NN19 and CNPL10.
The presence of the biostratigraphically useful short-lived taxa (Raffi et al., 2006) Reticulofenestra asanoi (total range = 0.91–1.14 Ma; n3, same figure) in Sample 392-U1581A-2H-6, 110 cm (15.52 m CSF-A), and Gephyrocapsa spp. >5.5 µm (total range = 1.25–1.59 Ma; n4, same figure) in Sample 3H-CC, 13–18 cm (26.29 m CSF-A), allows the placement of these samples within Zone NN19. The biohorizon top of the latter species indicates the top of Zone CNPL8. Biohorizon top Calcidiscus macintyrei (1.60 Ma; n5, same figure) is recognized in Sample 4H-CC, 29–34 cm (35.90 m CSF-A), also within Zones NN19 and CNPL8. Biohorizon base Gephyrocapsa spp. >4 µm (1.71 Ma; n6, same figure) is identified in Sample 6H-CC, 19–24 cm (54.86 m CSF-A), and marks the base of Zone CNPL8.
There is a worldwide shift in nannofossil assemblages between the early and middle Pleistocene (1.80 Ma), with Gephyrocapsa spp. being the dominant group in middle and late Pleistocene assemblages. In the early Pleistocene, only small Gephyrocapsa spp. (<4 µm) are present, and small species of Reticulofenestra make up a dominant component. In addition, the early Pleistocene is marked by the sequential extinction of various discoaster species, culminating with their final extinction at 1.93 Ma. Sporadic reworking of discoasters into middle Pleistocene sediment in Hole U1581A made identifying biohorizon top Discoaster brouweri (1.93 Ma; n7, same figure) difficult; however, we place this event in Sample 392-U1581A-8H-CC, 13–18 cm (73.69 m CSF-A), where we also find biohorizon top Discoaster triradiatus, a 3-rayed form of D. brouweri with a similar stratigraphic range. Biohorizon top D. brouweri (n7, same figure) marks the top of Zones NN18 and CNPL6. Biohorizon base common D. triradiatus (2.16 Ma; n8, same figure) is found in Sample 9H-CC, 20–25 cm (83.33 m CSF-A). Biohorizon top Discoaster pentaradiatus (2.39 Ma; n9, same figure) is identified in Sample 12H-6A, 63 cm (109.88 m CSF-A), and marks the top of Zones NN17 and CNPL5. Biohorizon top Discoaster surculus (2.53 Ma; n10, same figure), which marks the top of Zone NN16, is found in Sample 13H-5, 100 cm (118.26 m CSF-A). This event falls just above the Pliocene/Pleistocene boundary.
4.1.2. Pliocene
Pliocene sediments at Site U1581 generally contain common numbers of moderately preserved nannofossils, with assemblages dominated by Reticulofenestra minuta and Reticulofenestra minutula, and common P. lacunosa, C. pelagicus, and C. leptoporus. Other taxa present in varying numbers include Helicosphaera carteri, F. profunda, Syracosphaera pulchra, and Discoaster spp. The presence of reworked taxa (predominantly Paleogene) inhibited identification of some biohorizons through this interval. The Pliocene stratigraphy is constrained by three nannofossil datums.
Biohorizon top Discoaster tamalis (2.76 Ma; n11 in Figure F30 and Table T3), identified in Sample 392-U1581A-15H-1A, 53 cm (130.93 m CSF-A), marks the top of Zone CNPL4. Despite the presence of reworked nannofossils, we were able to identify biohorizon top Reticulofenestra pseudoumbilicus >7 µm (3.82 Ma; n12, same figure) in Sample 17H-CC, 0–5 cm (149.15 m CSF-A), based on its consistent presence up to this stratigraphic level. This event marks the tops of Zones NN15 and CNPL3. Biohorizon base C. cristatus (5.08 Ma; n13, same figure), found in Sample 20H-CC, 4–9 cm (175.61 m CSF-A), marks the base of Zone NN13 and falls just below the top of Zone CNPL1. This event occurs 250 ky after the Miocene/Pliocene boundary.
4.1.3. Miocene
Much of the Miocene is either missing or is very condensed at Site U1581. Nannofossils are generally abundant in the middle and upper Miocene sediments, whereas some lower Miocene samples are barren. Late Miocene assemblages contain well-preserved discoasters and abundant reticulofenestrids. Other species typically present include C. leptoporus, C. pelagicus, Sphenolithus moriformis, Umbilicosphaera jafari, and Umbilicosphaera rotula. Several biohorizons are found in Sample 392-U1581A-21H-CC, 6–11 cm (185.54 m CSF-A), including biohorizon tops Orthorhabdus rugosus (5.23 Ma) and Discoaster quinqueramus (5.53 Ma). In addition, this sample contains Nicklithus amplificus (n14 in Figure F30 and Table T3), which has a relatively short total range between 5.98 and 6.82 Ma, indicating that this sample is late Miocene in age and assigned to Zones NN11 and CNM18. N. amplificus is absent in Sample 23H-CC, 11–16 cm (192.88 m CSF-A); however, this sample contains R. pseudoumbilicus >7 µm (n15, same figure), indicating that it must be younger than 7.10 Ma, which is when larger R. pseudoumbilicus reappears in the fossil record after a short absence (Raffi et al., 2006).
A significant downhole change in the assemblage between Samples 392-U1581A-23H-CC, 11–16 cm (192.88 m CSF-A), and 24H-CC, 11–16 cm (204.38 m CSF-A), suggests either a hiatus or that the interval recovered in Core 24H is highly condensed. Late Miocene–Pliocene discoasters such as D. quinqueramus, Discoaster berggrenii, D. pentaradiatus, D. surculus, and D. brouweri are absent, whereas Discoaster deflandrei, Discoaster exilis, and Discoaster variabilis are present. Other taxa with biohorizon tops in the late middle and early late Miocene are also present, including the consistent presence of Calcidiscus premacintyrei (biohorizon top = 12.57 Ma) and Coccolithus miopelagicus (biohorizon top = 11.04 Ma). The age of this sample is constrained to Zones NN5 and CNM7 based on the presence of Sphenolithus heteromorphus (biohorizon top = 13.60 Ma; n16, same figure) and absence of Helicosphaera ampliaperta (biohorizon top = 14.86 Ma).
There is another significant downhole change in the nannofossil assemblage in Sample 392-U1581A-26H-CC, 10–15 cm (214.84 m CSF-A). S. heteromorphus and C. premacintyrei are absent. The majority of the assemblage consists of background taxa typical of the Oligocene and early Miocene, including Reticulofenestra spp., Cyclicargolithus floridanus, D. deflandrei, and S. moriformis, together with clearly reworked Eocene–early Oligocene taxa (e.g., Reticulofenestra umbilicus >14 µm). The presence of C. leptoporus and H. carteri point to an early Miocene age for the assemblage. Helicosphaera euphratis is somewhat more abundant than H. carteri, indicating that this sample is close to the crossover from dominantly H. euphratis to dominantly H. carteri; this transition, dated to 20.98 Ma within Zone NN2, marks the base of Zone CNM4 (n17, same figure). We consider a single specimen of Sphenolithus capricornutus as reworked because this taxon should not overlap with the presence of H. carteri. Biohorizon base Sphenolithus disbelemnos (22.90 Ma; n18, same figure), found in Sample 28H-CC, 12–17 cm (231.17 m CSF-A), indicates an earliest Miocene age (Zone NN1/Zone CNM2 [Agnini et al., 2014]). This event falls just above the Oligocene/Miocene boundary.
4.1.4. Oligocene
The Oligocene interval at Site U1581 is constrained by eight nannofossil datums and appears to be relatively continuous at the resolution of shipboard sampling, although the EOT is likely condensed, missing due to a hiatus, or falls within a core gap. The Oligocene generally contains common and moderately preserved nannofossils, with assemblages dominated by C. floridanus, Reticulofenestra spp. (including Reticulofenestra bisecta >10 µm, Reticulofenestra daviesii, and Reticulofenestra filewiczii), and C. pelagicus. Other taxa such as C. miopelagicus, D. deflandrei, S. moriformis, and Zygrhablithus bijugatus are present in frequent numbers. Some samples contain diverse assemblages of Helicosphaera and Pontosphaera. Reworked Paleogene and Cretaceous taxa are also present in many of the studied samples.
The uppermost Oligocene is constrained by biohorizon top S. capricornutus (23.11 Ma; n19 in Figure F30 and Table T3) in Sample 392-U1581A-29H-CC, 7–12 cm (233.74 m CSF-A), and biohorizon base Sphenolithus delphix (23.73 Ma; n20, same figure) in Sample 30F-CC, 16–21 cm (238.76 m CSF-A), indicating upper Zones NP25 and CNO6 (Agnini et al., 2014). Consistent reworking of R. bisecta >10 µm (biohorizon top = 23.13 Ma) throughout Hole U1581A made it impossible to confidently identify this event. Biohorizon top Furcatolithus ciperoensis (24.36 Ma; n21, same figure) in Sample 32F-CC, 8–13 cm (247.35 m CSF-A), indicates the top of Zone CNO5. Chiasmolithus altus (biohorizon top = 25.44 Ma) is also present in this sample; however, we cannot rule out that it is reworked and therefore do not include it in our age model (Table T3). Biohorizon top Furcatolithus predistentus (26.93 Ma; n22, same figure) falls within Zone NP24, indicates the top of Zone CNO4, and is identified in Sample 35F-CC, 54–59 cm (261.77 m CSF-A). Biohorizon base Furcatolithus distentus (30.00 Ma; n24, same figure), found in Sample 40X-2A, 87 cm (282.72 m CSF-A), marks the top of Zone CNO3 and is within Zone NP23.
Poor recovery using the XCB coring system at the bottom of Hole U1581A (276.10–292.11 m CSF-A), coupled with a few barren samples near the base of Hole U1581A and in the first cores recovered from Hole U1581B, made age determination for the lowermost Oligocene difficult. Biohorizon top Coccolithus formosus (32.92 Ma; n25, same figure), which marks the top of Zones NP21 and CNO1, is identified in Sample 392-U1581B-3R-2, 59 cm (300.80 m CSF-A). Biohorizon top Isthmolithus recurvus (33.06 Ma; n26, same figure), recognized in Sample 3R-3, 77 cm (302.48 m CSF-A), falls within Zones NP22 and CNO1.
4.1.5. Eocene
Between Sample 392-U1581B-3R-3, 77 cm (302.48 m CSF-A), and 5R-2, 142 cm (321.01 m CSF-A), nannofossils are sparse and poorly preserved or completely absent in some samples, so it is unclear if Hole U1581B sampled the Eocene/Oligocene boundary. Biohorizon top Discoaster barbadiensis (34.77 Ma; n27 in Figure F30 and Table T3), tentatively identified in Sample 4R-1, 52 cm (308.92 m CSF-A), is indicative of the uppermost Eocene within Zones NP19/NP20 and CNE20. Similar to the Miocene interval, the Eocene stratigraphy at Site U1581 includes several hiatuses or highly condensed intervals; additional postcruise sampling should help to resolve this. We identify 10 nannofossil datums to define the Eocene stratigraphy, coupled with additional information provided by secondary datums. Eocene samples are characterized by rare to abundant nannofossils that are poorly to moderately preserved. Assemblages are dominated by Reticulofenestra spp. together with common C. floridanus, C. formosus, and Coccolithus eopelagicus. Species such as Clausicoccus fenestratus and Clausicoccus subdistichus, Chiasmolithus grandis, Chiasmolithus solitus, Discoaster spp., and Z. bijugatus are also present in frequent numbers. Similar to the Oligocene sediments, some samples contain diverse assemblages of Helicosphaera and Pontosphaera.
Below biohorizon top D. barbadiensis, several samples are barren of nannofossils. The next fossiliferous sample, 392-U1581B-5R-2, 142 cm (321.01 m CSF-A), contains a different assemblage that includes C. solitus (biohorizon top = 40.32 Ma; n28, same figure) but no R. bisecta >10 µm (biohorizon base = 40.25 Ma), indicating that this sample is assigned to Zones NP16 and CNE14. At least 5.5 My is represented in the 12 m between 308.92 and 321.01 m CSF-A where samples examined for nannofossils are barren. Biohorizon top Nannotetrina spp. (41.69 Ma; n29, same figure) falls within Zones NP16 and CNE14 and is found in Sample 5R-3, 23 cm (321.32 m CSF-A). Biohorizon base common R. umbilicus >14 µm (42.72 Ma; n30, same figure), recognized in Sample 6R-1, 83 cm (328.63 m CSF-A), marks the base of Zone CNE13 and falls within Zone NP16.
Pletolithus gigas has a relatively short range between 43.64 and 46.07 Ma, and its total range defines Subzone NP15b and Zones CNE10–CNE11. Its biohorizon top (n31, same figure) is identified in Sample 392-U1581B-6R-7, 59 cm (336.14 m CSF-A). This sample also contains sphenolith taxa with short ranges in the mid-Eocene, including Sphenolithus furcatolithoides and Sphenolithus orphanknollensis. Biohorizon base P. gigas (n32, same figure) is identified in Sample 8R-CC, 18–23 cm (351.44 m CSF-A). Two biohorizons are identified in quick succession below this: biohorizon top Discoaster lodoensis (48.22 Ma; n33, same figure), which marks the top of Zone CNE5, in Sample 9R-2A, 117 cm (359.58 m CSF-A), and biohorizon base common Discoaster sublodoensis (48.80 Ma; base of Zones NP14 and CNE6; n34, same figure) in Sample 9R-CC, 16–21 cm (360.95 m CSF-A). Sample 10R-1A, 85 cm (367.45 m CSF-A), contains nearly equal proportions of Reticulofenestra and Toweius, suggesting that it is near the crossover in abundance from Toweius to Reticulofenestra (n35, same figure), which is dated to 50.65 Ma. This sample also contains Tribrachiatus orthostylus, which also has a biohorizon top dated to 50.65 Ma. This event marks the top of Zones NP12 and CNE4. Sample 10R-CC, 7–12 cm (370.61 m CSF-A), is barren of nannofossils, and the next fossiliferous sample (11R-4A, 97 cm; 381.79 m CSF-A) contains a Paleocene assemblage, indicating that the lower Eocene is missing or highly condensed at Site U1581.
4.1.6. Paleocene
Nannofossil abundance and preservation is variable in the Paleocene interval from Site U1581. Middle and upper(?) Paleocene sediments contain sparse to common nannofossils that are poorly to moderately preserved, whereas much of the lower Paleocene appears to be devoid of nannofossils. Assemblages primarily consist of various species of Toweius, Prinsius, Chiasmolithus, and Cruciplacolithus, together with C. pelagicus and Ericsonia subpertusa. Sample 392-U1581B-11R-4A, 97 cm (381.79 m CSF-A), contains Heliolithus kleinpellii, which has a short range (58.80–59.36 Ma; n36 [top] and n37 [base]; Figure F30 and Table T3) spanning Zones NP6–NP7 and CNP8–CNP9. However, the absence of discoasters, including Discoaster mohleri (biohorizon base = 58.97 Ma, marking the base of Zones NP7 and CNP9), indicates that this sample can be assigned to middle Paleocene Zones NP6/CNP8. The Zone NP6/CNP8 assemblage is present down to Sample 12R-1A, 57 cm (386.57 m CSF-A), where biohorizon base H. kleinpellii (59.36 Ma; n37, same figure) is found. Biohorizon base Fasciculithus tympaniformis (61.27 Ma; n38, same figure), which marks the base of Zone NP5 and is located within lower Zone CNP7, is found in Sample 12R-CC, 19–24 cm (390.00 m CSF-A). Biohorizon base Lithoptychius ulii (61.64 Ma; n39, same figure), identified in Sample 13R-2, 90 cm (397.97 m CSF-A), marks the base of Zone CNP7. The base of Zone CNP6 is identified by biohorizon base S. moriformis group (62.10 Ma; n40, same figure), found in Sample 13R-CC, 17–22 cm (399.01 m CSF-A). One of the first species to evolve in the fasciculith lineage, Gomphiolithus magnus, is found in Sample 14R-1, 106–108 cm (406.46 m CSF-A). The presence of these early members of the fasciculith lineage is particularly noteworthy. Chiasmolithus bidens (biohorizon base = 62.13 Ma; n41, same figure) is present in Sample 14R-4, 15 cm (409.60 m CSF-A); however, samples below this are barren of nannofossils through Sample 17R-1, 24 cm (434.74 m CSF-A), so it is unclear if this represents the true biohorizon base of C. bidens in Zones NP4 and CNP5.
4.1.7. Cretaceous/Paleogene boundary
The stratigraphy of the K/Pg boundary at Site U1581 is complicated by incomplete recovery and one or more hiatuses, together with sparse carbonate microfossils and significant reworking of Cretaceous assemblages. Samples 392-U1581B-17R-2, 9 cm (436.10 m CSF-A); 17R-4, 67 cm (438.66 m CSF-A); and 18R-1, 8 cm (444.28 m CSF-A), contain few to common moderately well preserved nannofossils. The assemblage appears to be latest Maastrichtian based on the presence of well-preserved Micula prinsii (biohorizon base = 67.28 Ma), together with other late Maastrichtian taxa such as Cribrosphaerella daniae, Micula staurophora, Lithraphidites quadratus, Eiffellithus turriseiffelii, Arkhangelskiella cymbiformis, and Prediscosphaera cretacea. However, these samples also contain few to common numbers of calcispheres (calcareous dinoflagellates) and braarudospheres (including Braarudosphaera bigelowii, Braarudosphaera discula, and Micrantholithus breviradiatus), together with Biantholithus sparsus (biohorizon base = 66.04 Ma, n43 in Figure F30 and Table T3). Calcispheres and braarudospheres are “disaster” forms that occur in higher numbers at many sites immediately above the K/Pg boundary, and the presence of B. sparsus also confirms an earliest Danian age for these samples. Other new taxa that evolved following the K/Pg mass extinction may also be present in these samples, but their small size makes them difficult to identify using a transmitted light microscope. We can confidently identify Cruciplacolithus primus 3.5–5 µm (biohorizon base = 65.77 Ma; n42, same figure) in Sample 17R-2, 9 cm (436.10 m CSF-A); however, additional postcruise work using a scanning electron microscope will verify if this and other species (e.g., Neobiscutum parvulum) are present in additional samples.
Sample 392-U1581B-19R-CC, 10–15 cm (463.80 m CSF-A), also contains a Maastrichtian assemblage but without M. prinsii, indicating that the assemblage is not latest Maastrichtian in age. However, this sample also contains few numbers of calcispheres, as well as rare B. bigelowii, which could indicate a post-K/Pg age despite the somewhat different Maastrichtian assemblage present. This interpretation is consistent with results from dinocysts (see Palynology) that indicate that this sample, as well as a sample from Section 20R-2, contains an earliest Danian palynomorph assemblage. Sample 20R-CC, 17–22 cm (473.54 Ma), contains an early Maastrichtian assemblage based on the absence of L. quadratus (biohorizon base = 69.18 Ma), together with the presence of Biscutum magnum, which has a biohorizon top in Chron C31r (69.271–71.451 Ma) in the high-latitude South Atlantic (do Monte Guerra et al., 2016). An early Maastrichtian age is also consistent with the dinocyst assemblage in this sample and suggests the presence of an unconformity in Core 20R. Additional sampling and postcruise work will help to clarify if the K/Pg boundary is missing in the unconformity at this site.
4.1.8. Maastrichtian
Samples 392-U1581B-20R-CC, 17–22 cm, to 26R-7, 79–80 cm (473.54–531.50 m CSF-A), are dated to the early Maastrichtian and contain frequent to common nannofossils that are moderately to well preserved. The assemblage includes frequent to common Nephrolithus corystus, Kamptnerius magnificus, Micula spp., A. cymbiformis, Ahmuellerella octoradiata, Staurolithites spp., Watznaueria barnesiae, and Cribrosphaerella ehrenbergii. Other taxa present in rare to few numbers include C. daniae, B. magnum, E. turriseiffelii, M. staurophora, Prediscosphaera spp., Misceomarginatus pleniporus, Nephrolithus frequens, and Repagulum parvidentatum. The biohorizon tops Reinhardtites levis (70.14 Ma; n44 in Figure F30 and Table T3) and Tranolithus orionatus (71.02 Ma) are found in Sample 22R-CC, 21–26 cm (491.58 m CSF-A). The former datum marks the top of Zone CC24 (Sissingh, 1977; Perch-Nielsen, 1985) and indicates that the interval above is assigned to Zones CC25–CC26. We identify biohorizon top Broinsonia parca constricta (71.94 Ma; n45, same figure) in Sample 24R-CC, 19–24 cm (507.06 m CSF-A). Biohorizon top Monomarginatus quaternarius (72.10 Ma; n46, same figure), which occurs just above the Campanian/Maastrichtian boundary, is found in Sample 26R-7, 79–80 cm (531.50 m CSF-A). These biohorizons occur within Zone CC23.
4.1.9. Campanian
The lower part of the cored succession at Site U1581 in Cores 392-U1581-27R through 74R (531.50–994.02 m CSF-A) is dated to the mid- to late Campanian (<79.90 Ma) based on calcareous nannofossil and dinocyst biostratigraphy along with magnetostratigraphy (see Paleomagnetism). In general, calcareous nannofossils are present in rare to few numbers and are predominantly moderately to well preserved. However, overall abundance decreases and preservation deteriorates below Core 59R (845.16 m CSF-A), coincident with an increase in siderite (see Lithostratigraphy). No nannofossils were found in samples from lowermost Core 74R (993.97 m CSF-A). Species commonly occurring in most of the studied samples include W. barnesiae, R. levis, R. parvidentatum, Staurolithites spp., Micula spp., and Biscutum constans. Other taxa typically present in lower numbers are A. cymbiformis, A. octoradiata, C. ehrenbergii, E. turriseiffelii, K. magnificus, P. cretacea, Retecapsa spp., and M. staurophora.
Three bioevents within Zone CC23 were identified at Site U1581. Biohorizon top Uniplanarius gothicus (72.48 Ma; n47 in Figure F30 and Table T3), found in Sample 392-U1581B-30R-CC, 22–27 cm (570.27 m CSF-A), occurs ~300 ky before the Campanian/Maastrichtian boundary. Biohorizon top Broinsonia parca parca (74.49 Ma; n48, same figure) is identified in Sample 39R-CC, 19–24 cm (656.63 m CSF-A). We were unable to identify the position of biohorizon top Reinhardtites anthophorus (74.47 Ma) in Hole U1581B due to probable reworking of this species. We tentatively place biohorizon base Eiffellithus parallelus (74.74 Ma; n49, same figure) in Sample 43R-CC, 0–5 cm (696.26 m CSF-A); however, we note that this event was difficult to identify due to the presence of other eiffellithid specimens with the central area structure rotated more than 20° off of the short axis, which we assign to Eiffellithus phantasma after Shamrock and Watkins (2009). Biohorizon base Uniplanarius trifidus (76.77 Ma; n50, same figure), identified in Sample 56R-CC, 17–22 cm (820.69 m CSF-A), marks the base of Zone CC22 in the late Campanian.
4.1.10. Cretaceous calcareous nannofossil paleobiogeography and paleoenvironment
The Cretaceous nannofossil assemblages in the Transkei Basin at Site U1581 are similar to those from Sites U1579 and U1580 but also include some taxa absent at the Agulhas Plateau sites (see Micropaleontology in the Site U1579 and Site U1580 chapters [Bohaty et al., 2023a, 2023b]). Assemblages at all sites include N. corystus, B. magnum, Biscutum coronum, and R. parvidentatum, which are species common in the southern high latitudes (e.g., Pospichal and Wise, 1990; Watkins, 1992; Watkins et al., 1996). However, the Site U1581 assemblages additionally include low- to mid-latitude species such as L. quadratus, U. trifidus, and Uniplanarius sissinghii, which provide additional biostratigraphic constraints compared to Sites U1579 and U1580.
Previous work established the biohorizon tops of R. levis in the mid-Maastrichtian and Eiffellithus eximius in the late Campanian as reliable and relatively synchronous biostratigraphic datums across different latitudes (e.g., Pospichal and Wise, 1990; Watkins et al., 1996; do Monte Guerra et al., 2016). We include the biohorizon top of R. levis in the age model for all three sites; however, the biohorizon top of E. eximius is more problematic. At Site U1579, this event appears to be older than expected based on the other biostratigraphic and magnetostratigraphic constraints (see Figure F37 and Table T3 in the Site U1579 chapter [Bohaty et al., 2023a]). At Site U1580, this event occurs just above a long hiatus, and additional postcruise work is required to verify its position and relationship to the age-depth model. This taxon was not found at Site U1581, even though other biostratigraphic constraints such as the biohorizon base U. trifidus (76.77 Ma) and dinocyst biostratigraphy indicate that the lowermost part of Site U1581 is older than the biohorizon top of E. eximius (75.85 Ma). Additional postcruise research of all Campanian sediments recovered during Expedition 392 should help clarify the age of this datum in the southwest Indian Ocean region.
In general, the Maastrichtian to Campanian calcareous nannofossils in the Transkei Basin are exceptionally well preserved with pristine and delicate elements but are present in only sparse numbers compared to Sites U1579 and U1580. The rare occurrence but excellent and pristine preservation of lower Maastrichtian and upper Campanian calcareous nannofossils in the dark clay-rich horizons of Site U1581 is remarkable. Such preservation is usually only found in clay-rich shelf and slope sections rather than deepwater settings below or near the calcite compensation depth (e.g., Bown et al., 2008). Additional postcruise study is needed to determine if some of the nannofossil assemblage represents hemipelagic deposition that was rapidly buried by sedimentation from turbidity currents or if the majority of the assemblage was transported into the basin. Despite their low numbers and likelihood that some if not most of the assemblage represents downslope transport, we anticipate that this site will yield important information about nannoplankton paleobiogeography and evolution in the Late Cretaceous.
4.2. Foraminifera
Core catchers from APC, HLAPC, XCB, and RCB coring of Holes U1581A and U1581B were examined for planktonic and benthic foraminifera from the >63 µm, and in some cases >20 µm, size fraction (Tables T6, T7). Generally, planktonic and benthic foraminifera are present to dominant in Hole U1581A samples (Figures F10, F15, F16) but are rare to barren in Hole U1581B. Preservation is very good in Samples 392-U1581A-1H-1, 0 cm (mudline), to 2H-CC, 17–22 cm (0–16.83 m CSF-A) (Figure F15C), and good in Samples 3H-CC, 13–18 cm, to 23H-CC, 11–16 cm (26.29–192.88 m CSF-A), with the exception of Sample 9H-CC, 20–25 cm (83.33 m CSF-A), where individual foraminifera decreased in average size and preservation quality. Samples 11H-CC, 11–16 cm; 13H-CC, 0–5 cm; and 15H-CC, 0–5 cm (101.75, 121.13, and 133.83 m CSF-A, respectively), sampled coarse-grained sediment interpreted as turbidites, which may contain transported microfossil components (Figure F15E–F15G). Interestingly, the percentage of planktonic foraminifera relative to benthic foraminifera (reported as planktonic/benthic ratio in Table T6) drops to <80% in Samples 7H-CC, 22–27 cm (64.42 m CSF-A), to 15H-CC, 0–5 cm (133.83 m CSF-A). Below this, the ratio increases to >80% and remains at ~80% (with the exception of Sample 26H-CC, 10–15 cm [214.84 m CSF-A], at 66%) to the bottom of Hole U1581A (292.06 m CSF-A).
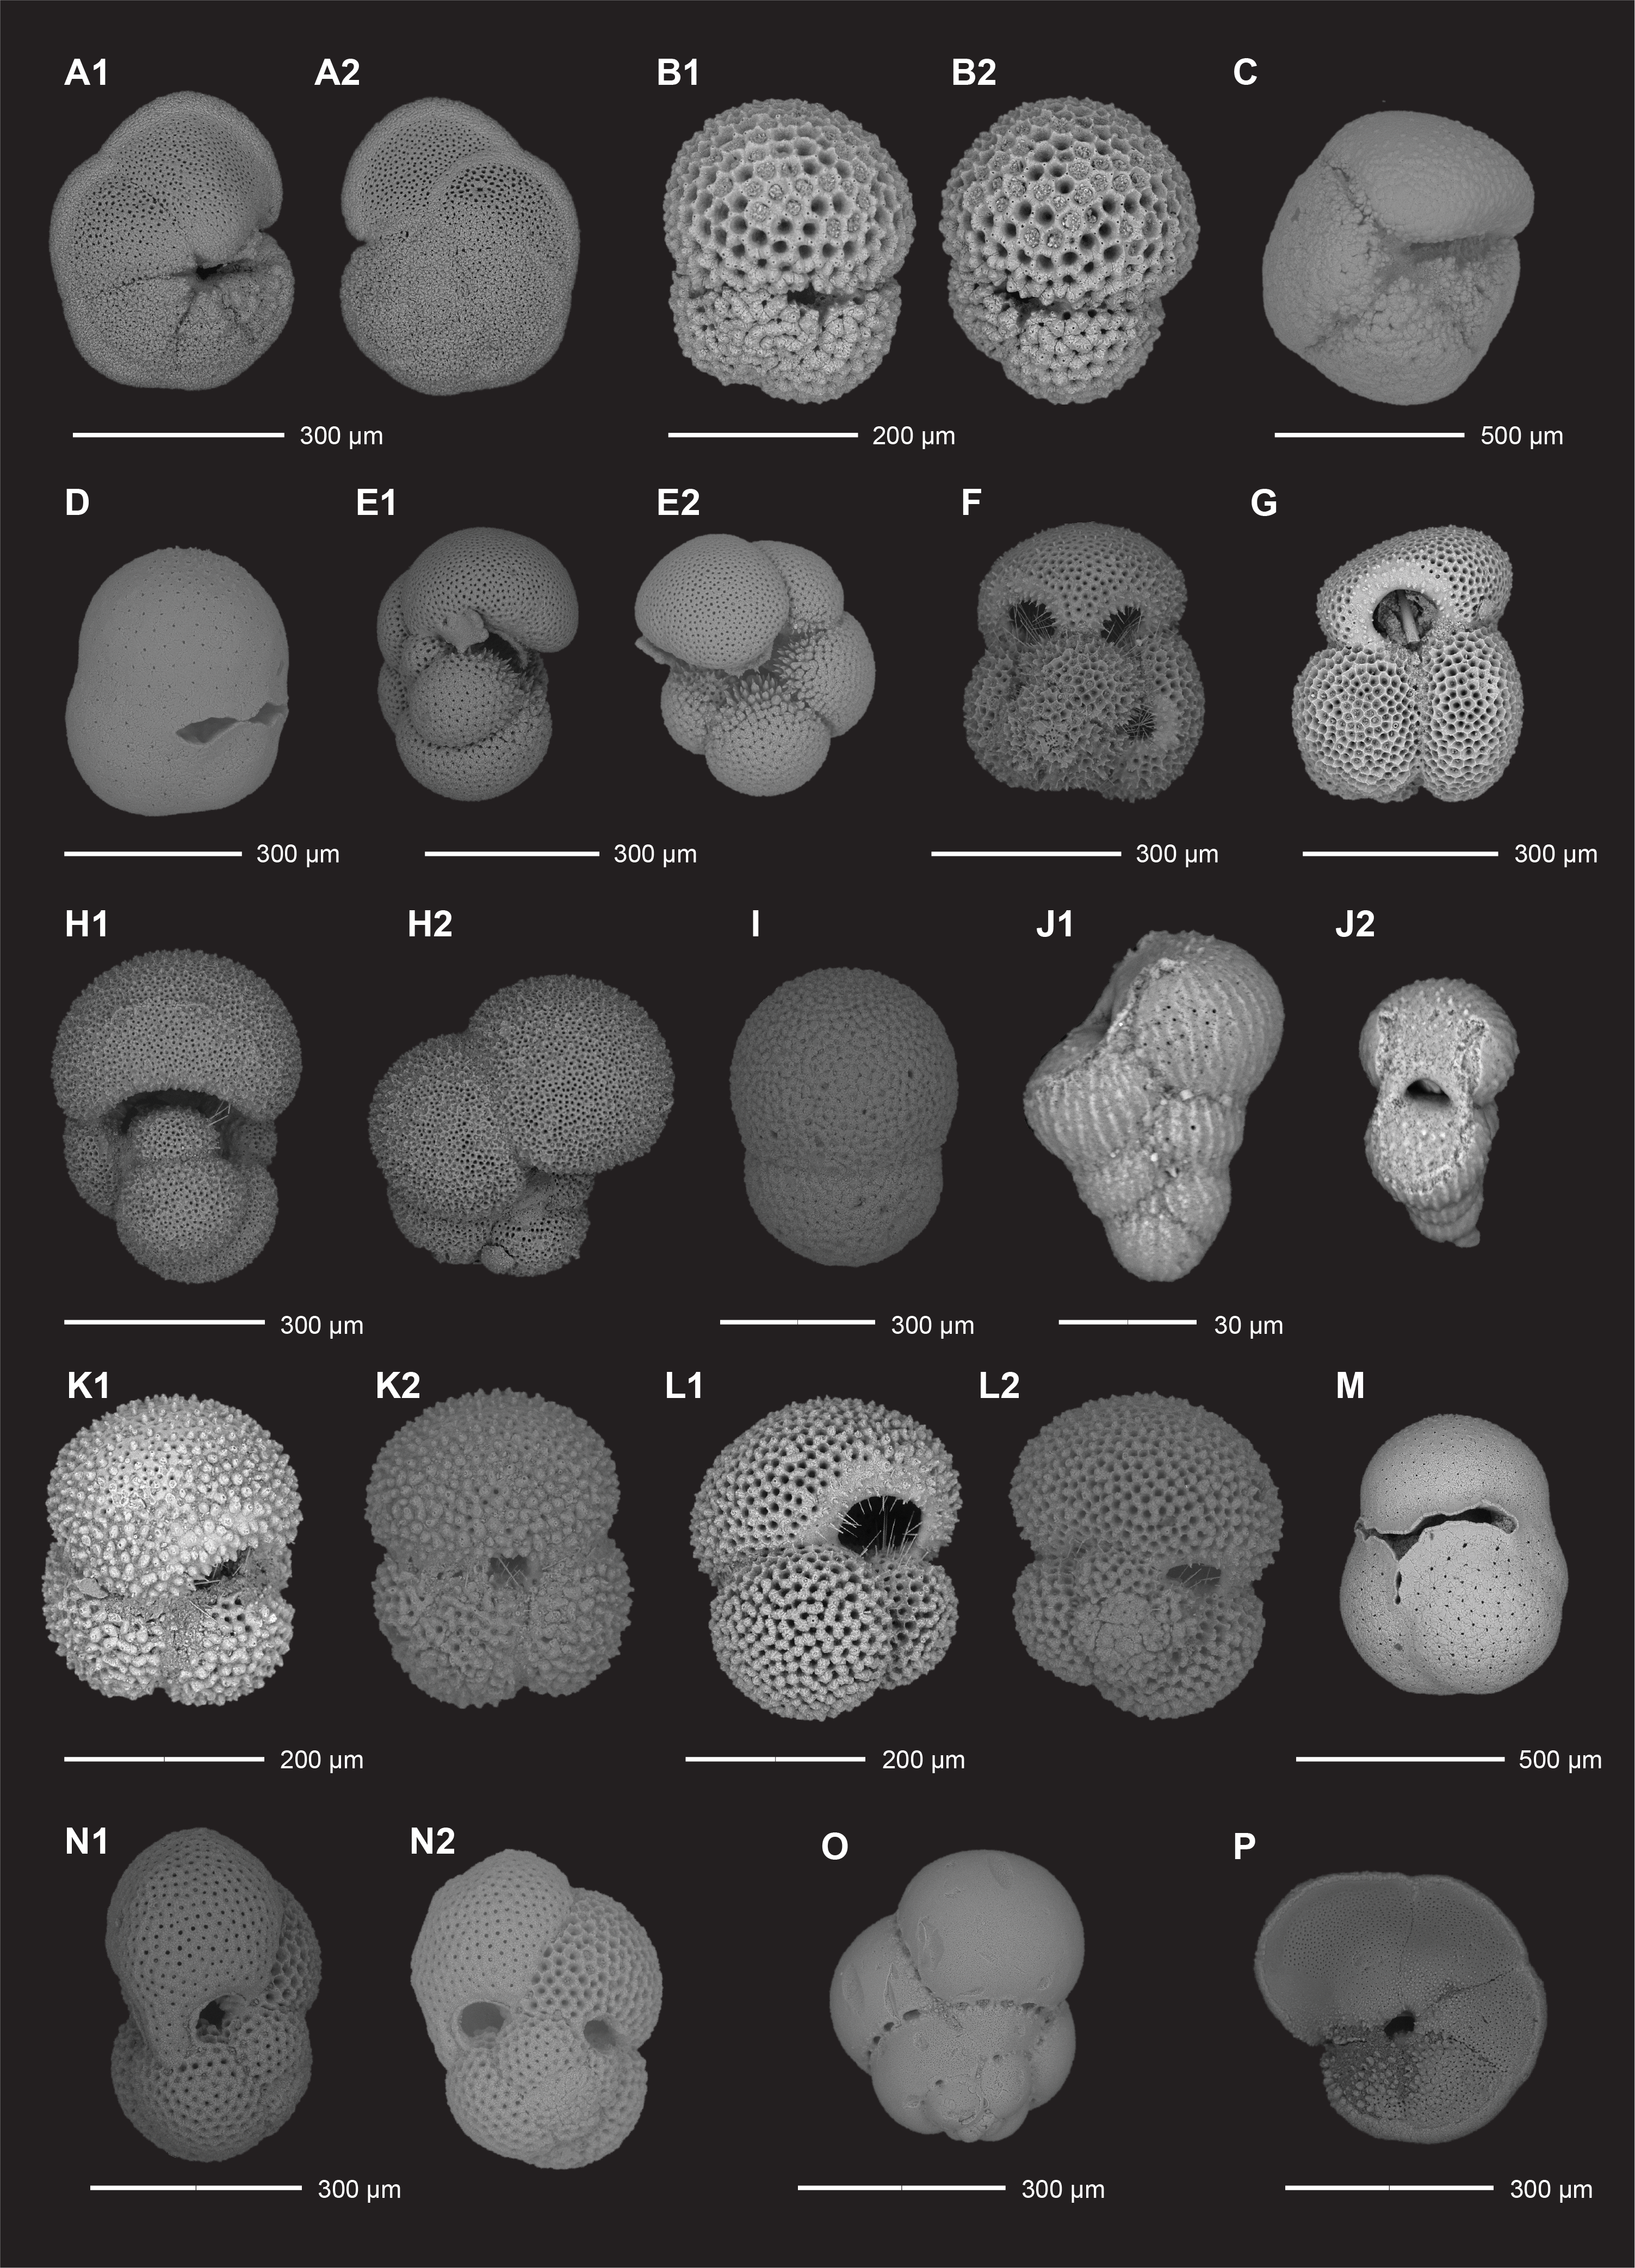
Figure F15. Planktonic foraminifera.
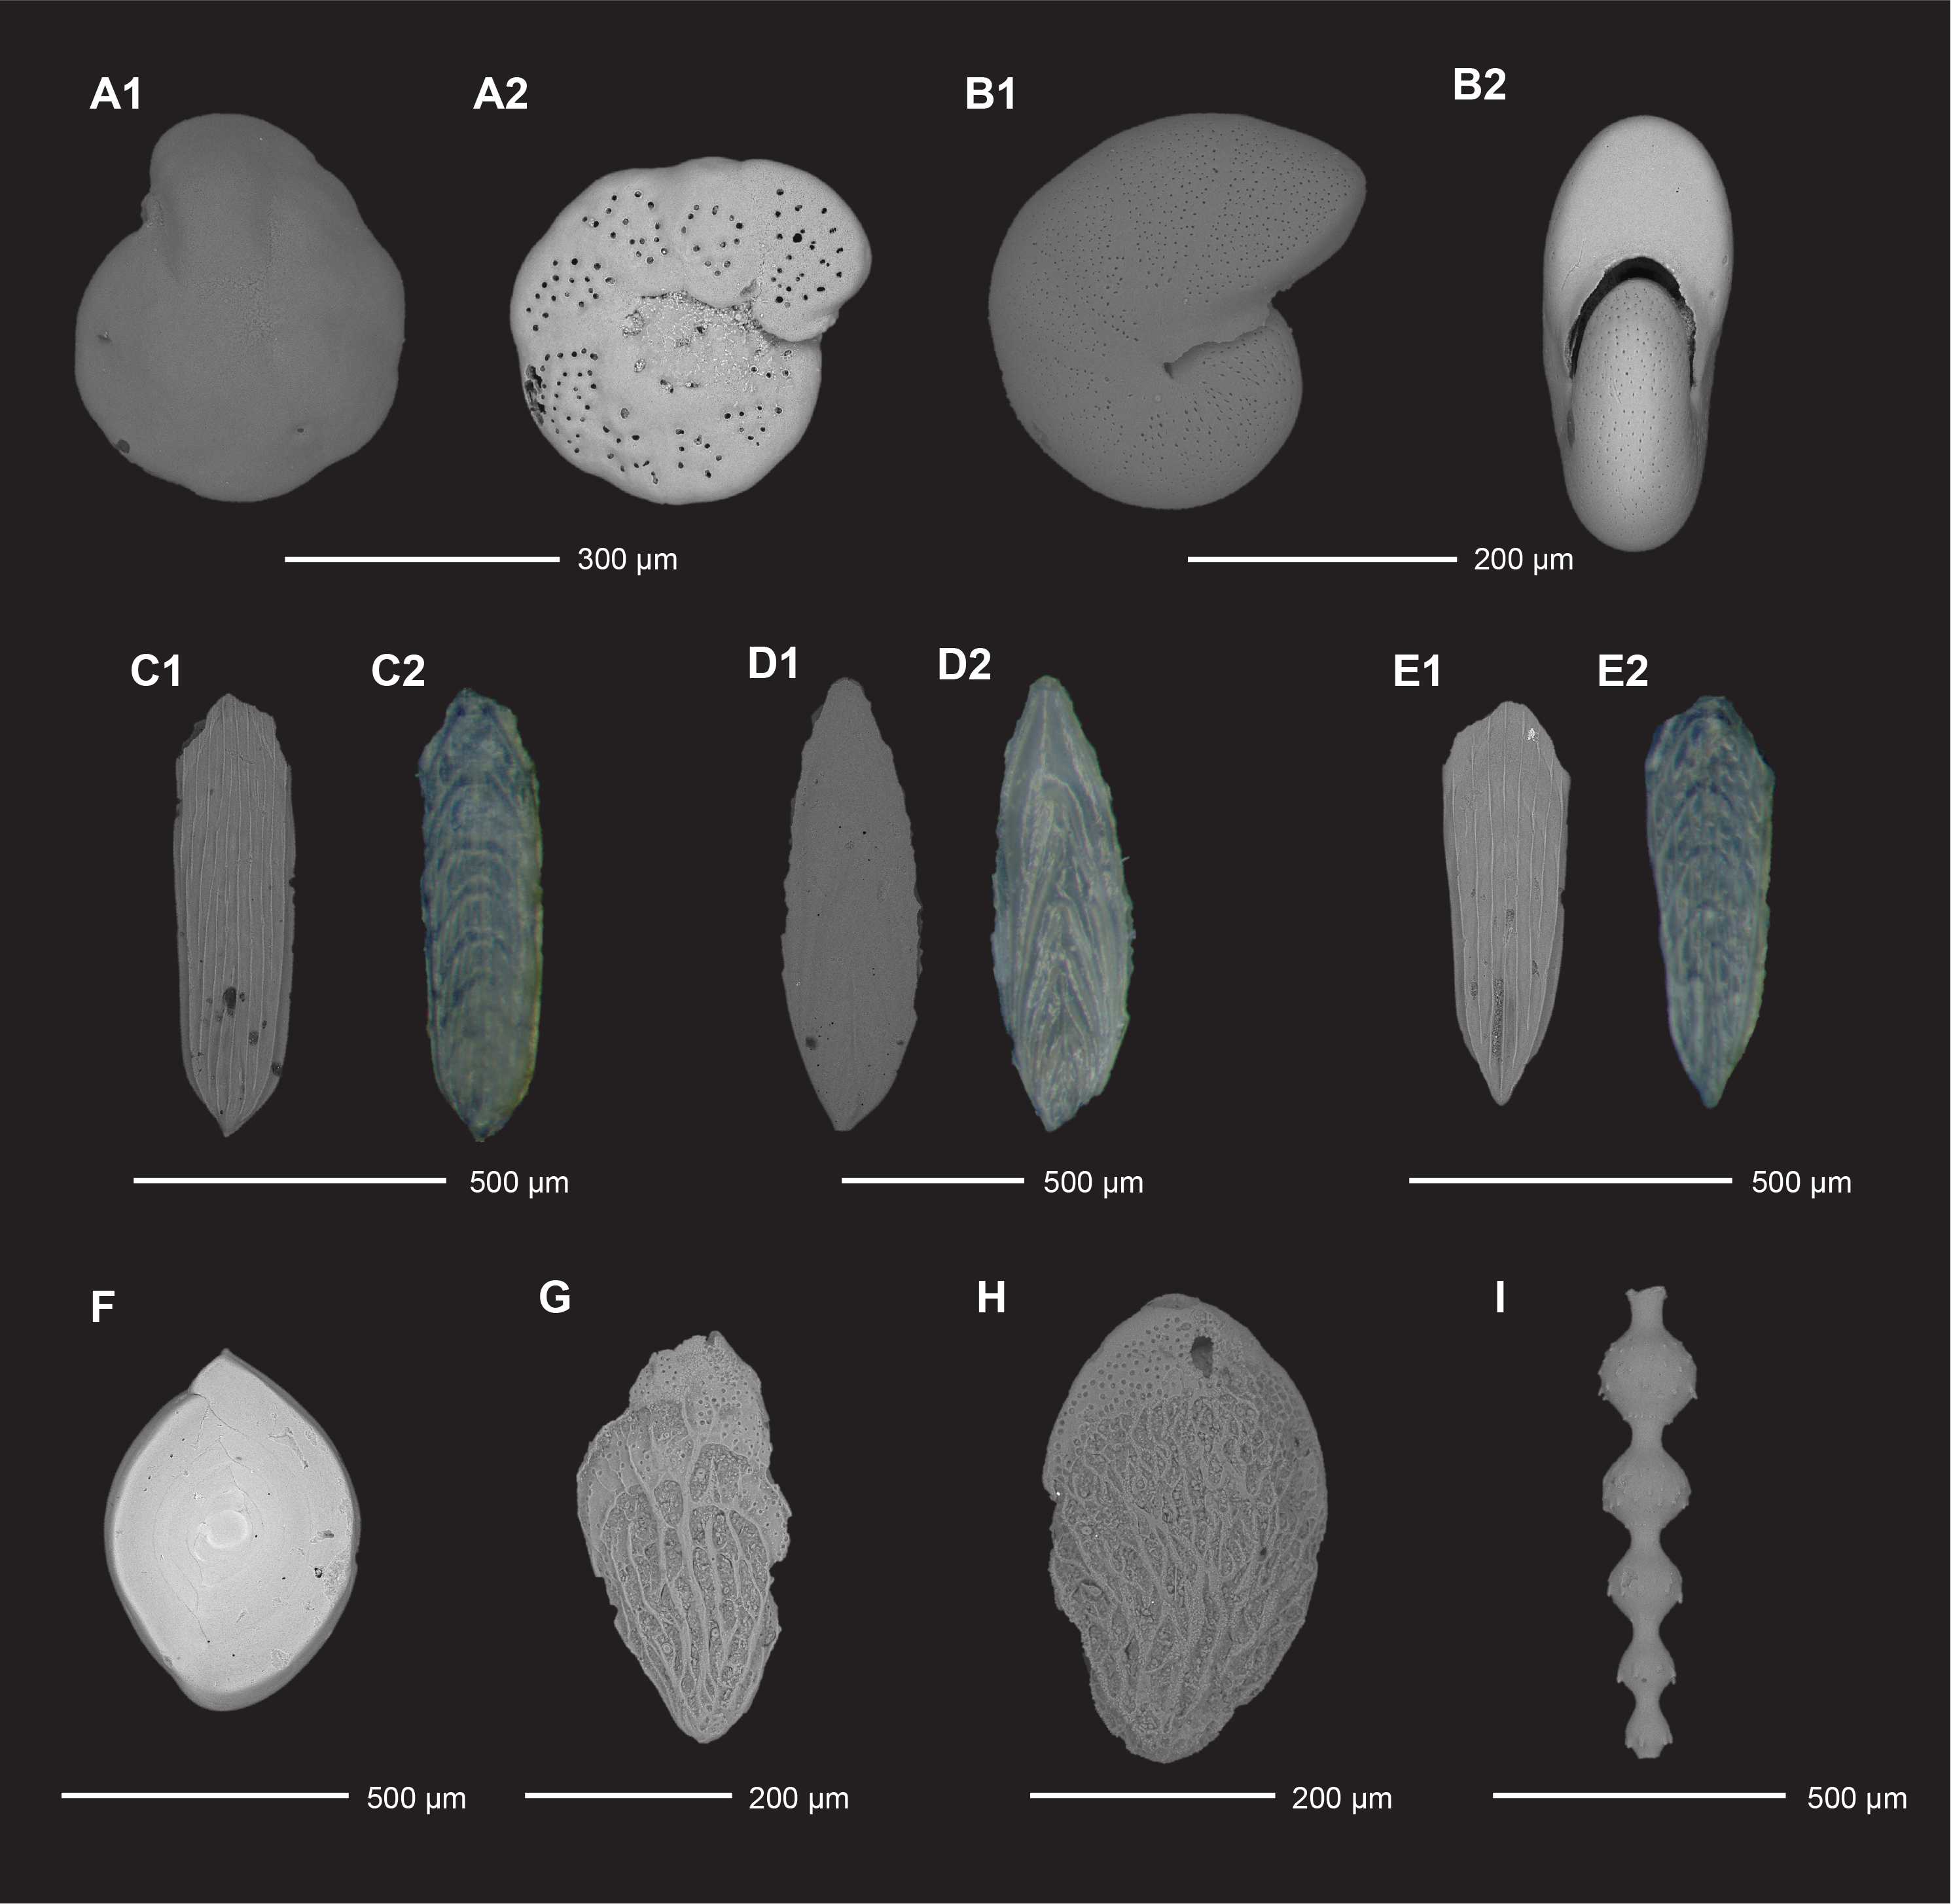
Figure F16. Benthic foraminifera.
Benthic foraminifera commonly associated with the Stilostomella Extinction Event in the mid-Pleistocene, including Pleurostomella spp. and Stilostomella spp., are present to abundant in Samples 392-U1581A-20H-CC, 4–9 cm (175.61 m CSF-A) (Figure F16C, F16D, F16E, F16I), to 30F-CC, 16–21 cm (238.76 m CSF-A). Other benthic species present in the Site U1581 assemblage include Myllostomella fijiensis, Pleurostomella alternans, and Proxifrons inaequalis (Figure F16D). Siphonodosaria ketienziensis (Figure F16I) is particularly dominant, especially in Sample 23H-CC, 11–16 cm (192.88 m CSF-A). Other significant benthic species include Bolivina spp., Cibicides/Cibicidoides spp. (Figure F16A), Globocassidulina subglobosa, Lagena spp., Melonis affinis (Figure F16B), Nuttallides sp., Pullenia bulloides, and Uvigerina peregrina/Uvigerina spp. Preservation of planktonic and benthic foraminifera appears to be less influenced by dissolution and recrystallization and more by mechanical breakage. Other biogenic material observed includes a significant number of fish teeth, ostracods, bryozoa, pteropods, and mollusk and coral fragments. These materials are especially abundant in Samples 11H-CC, 11–16 cm (101.75 m CSF-A), and 15H-CC, 0–5 cm (133.83 m CSF-A), which are from the interval where planktonic/benthic ratios decline.
Few biostratigraphically significant species were noted in samples from Hole U1581B. Planoheterohelix globulosa (biohorizon top = 66.39–67.30 Ma; f1 in Figure F30 and Table T3) is present in Samples 392-U1581B-20R-CC, 17–22 cm (473.54 m CSF-A), and 21R-CC, 9–14 cm (479.20 m CSF-A). In the sample above (19R-CC, 10–15 cm [463.80 m CSF-A]), foraminifera are rare, but a few biserial foraminifera collected from the >20 µm size fraction may be Chiloguembelina (Figure F15J) along with some small unidentified benthics. Both planktonic and benthic foraminifera were also observed in smear slides from Hole U1581B, but no positive identifications could be made.
4.3. Siliceous microfossils
Smear slides were routinely prepared from APC, HLAPC, XCB, and RCB core catcher samples from Holes U1581A and U1581B and checked for the presence of siliceous microfossils. Additionally, 33 samples were decalcified in an attempt to detect rare occurrences of diatoms, silicoflagellates, and radiolarians (Table T8). Most samples from Hole U1581A and all samples from Hole U1581B are barren of siliceous microfossils; however, diatoms were observed in Pleistocene samples of Hole U1581A and pyritized diatoms were observed in some lower Eocene to Cretaceous samples from Hole U1581B, including some complete diatom valves in samples prepared for palynology (Figure F17).
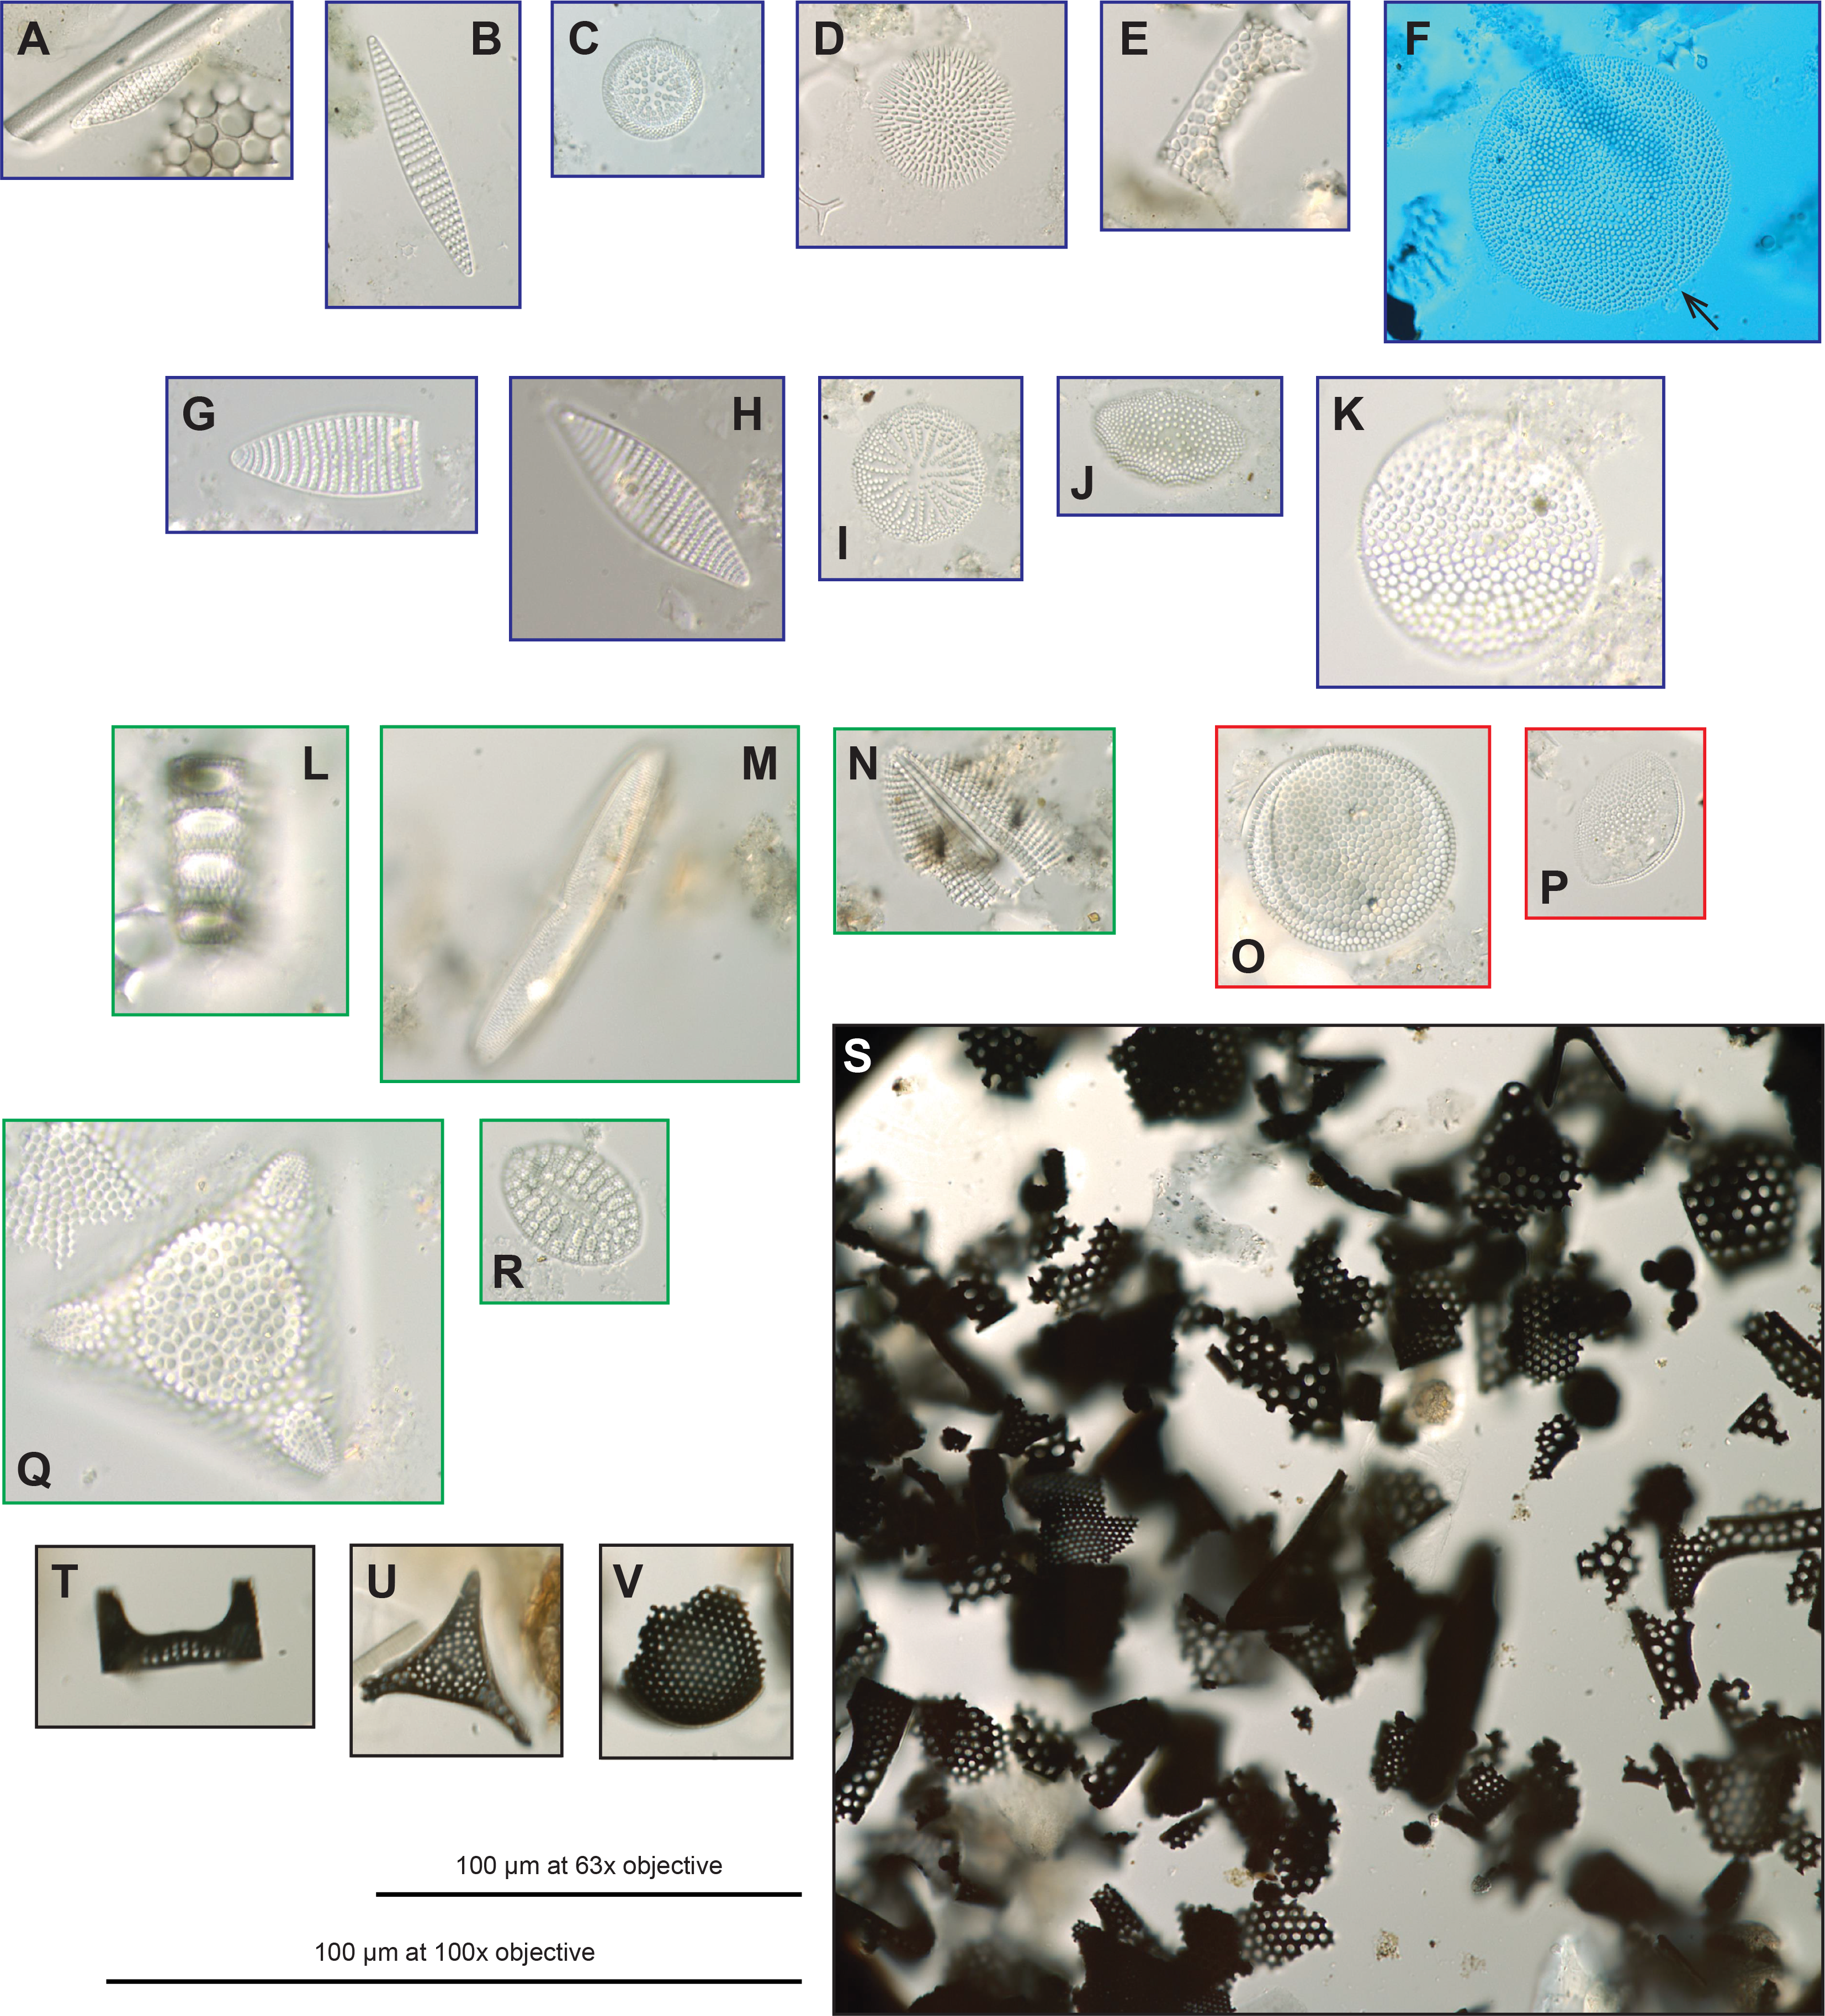
Figure F17. Siliceous microfossils.
The mudline from Hole U1581A (Sample 1H-1, 0 cm) contains diatoms, radiolarians, and silicoflagellates. The diatom assemblage includes subtropical species (Azpeitia nodulifera, Hemidiscus cuneiformis, and Roperia tesselata), Southern Ocean species (Azpeitia tabularis, Eucampia antarctica, Fragilariopsis kerguelensis, and Thalassiosira lentiginosa), and coastal species (Actinoptychus senarius, Aulacodiscus spp., Hyalodiscus spp., and Paralia sulcata).
Diatom preservation decreases downhole in Hole U1581A from good to poor (Figure F10): good preservation in the mudline and Sample 392-U1581A-1H-CC, 14–19 cm (6.83 m CSF-A), decreases to moderate in Samples 2H-CC, 17–22 cm, to 8H-CC, 13–18 cm (16.83–73.69 m CSF-A), and then decreases to poor in Samples 9H-CC, 20–25 cm, to 12H-CC, 11–16 cm (83.33–111.73 m CSF-A). Hole U1581A is barren of diatoms deeper than Core 12H, and diatoms are only observed in pyritized form in Hole U1581B samples. These observations suggest increased diagenetic alteration of biogenic opal downhole at Site U1581, which is supported by clinoptilolite identified in XRD analyses (see Lithostratigraphy); clinoptilolite is a zeolite mineral that is a typical alteration product of biogenic silica in deep-sea sediments (Karpoff et al., 2007).
4.3.1. Pleistocene
The biohorizon tops of Actinocyclus ingens and Thalassiosira elliptipora (di1 in Figure F30 and Table T3) are identified in Sample 392-U1581A-2R-CC, 17–22 cm (16.83 m CSF-A), indicating that this sample is at least 0.70 Ma or older based on the overlap of the age range for these two diatoms, falling within the A. ingens Zone for Southern Ocean diatoms (Scherer et al., 2007; Gradstein et al., 2020). Biohorizon top Fragilariopsis barronii (di2, same figure) occurs in Sample 3H-CC, 13–18 cm (26.29 m CSF-A), which is dated to 1.30 Ma or older and falls within the A. ingens Zone for Southern Ocean diatoms. Biohorizon base F. kerguelensis (di3, same figure) occurs in Sample 6H-CC, 19–24 cm (54.86 m CSF-A), which is dated to 2.33 Ma and falls within the Thalassiosira vulnifica Zone for Southern Ocean diatoms.
4.3.2. Neogene, Paleogene, and Cretaceous
Pyritized diatoms are present in varying abundances in samples processed for palynomorphs from Hole U1581B. A total of nine samples processed for palynomorphs were studied for pyritized diatoms. Species level identification was difficult; however, common forms in Sample 392-U1581B-16R-CC, 15–20 cm (429.82 m CSF-A), could be identified to the genus level and include Hemiaulus spp., Stephanopyxis spp., Trinacria spp., and Triceratium spp. (Figure F17). These forms are common to both the Paleogene and Cretaceous (Fenner, 1985; Strelnikova, 1990; Harwood et al., 2007; Scherer et al., 2007; Barron et al., 2014, 2015). Other samples with pyritized diatoms of a similarly broad range include Samples 20R-5, 30–31 cm (469.95 m CSF-A); 21R-CC, 19–14 cm (479.20 m CSF-A); 23R-CC, 12–17 cm (500.56 m CSF-A); and 52R-CC, 11–16 cm (782.48 m CSF-A).
4.4. Palynology
A total of 18 core catcher samples from Hole U1581A were decalcified and sieved for palynomorph identification. Preservation and abundance vary together, from poor to good and from barren to abundant dinocysts, respectively (Table T9). Miospore abundance varies from barren to few. From Hole U1581B, 40 core catcher samples were processed for palynological investigation and another 9 split core samples were processed to refine the age model in critical intervals. Of the 49 samples prepared from Hole U1581B, 9 (294.36–370.61 m CSF-A) were processed with decalcification steps only and 40 (378.61–993.97 m CSF-A) with hydrofluoric acid (Table T10). Time constraints limited a full assessment of the palynology; therefore, the focus was on age-diagnostic dinocyst species. This also implies that the abundance data may not adequately represent the actual abundance distribution in the samples. Another consequence of shipboard time constraints is that miospores were not identified to genus or species level, although we do report some general observations on the miospore assemblages below. A selection of dinocyst species found in Holes U1581A and U1581B are shown in Figures F18, F19, F20, F21, and a selection of miospores are illustrated in Figure F22.
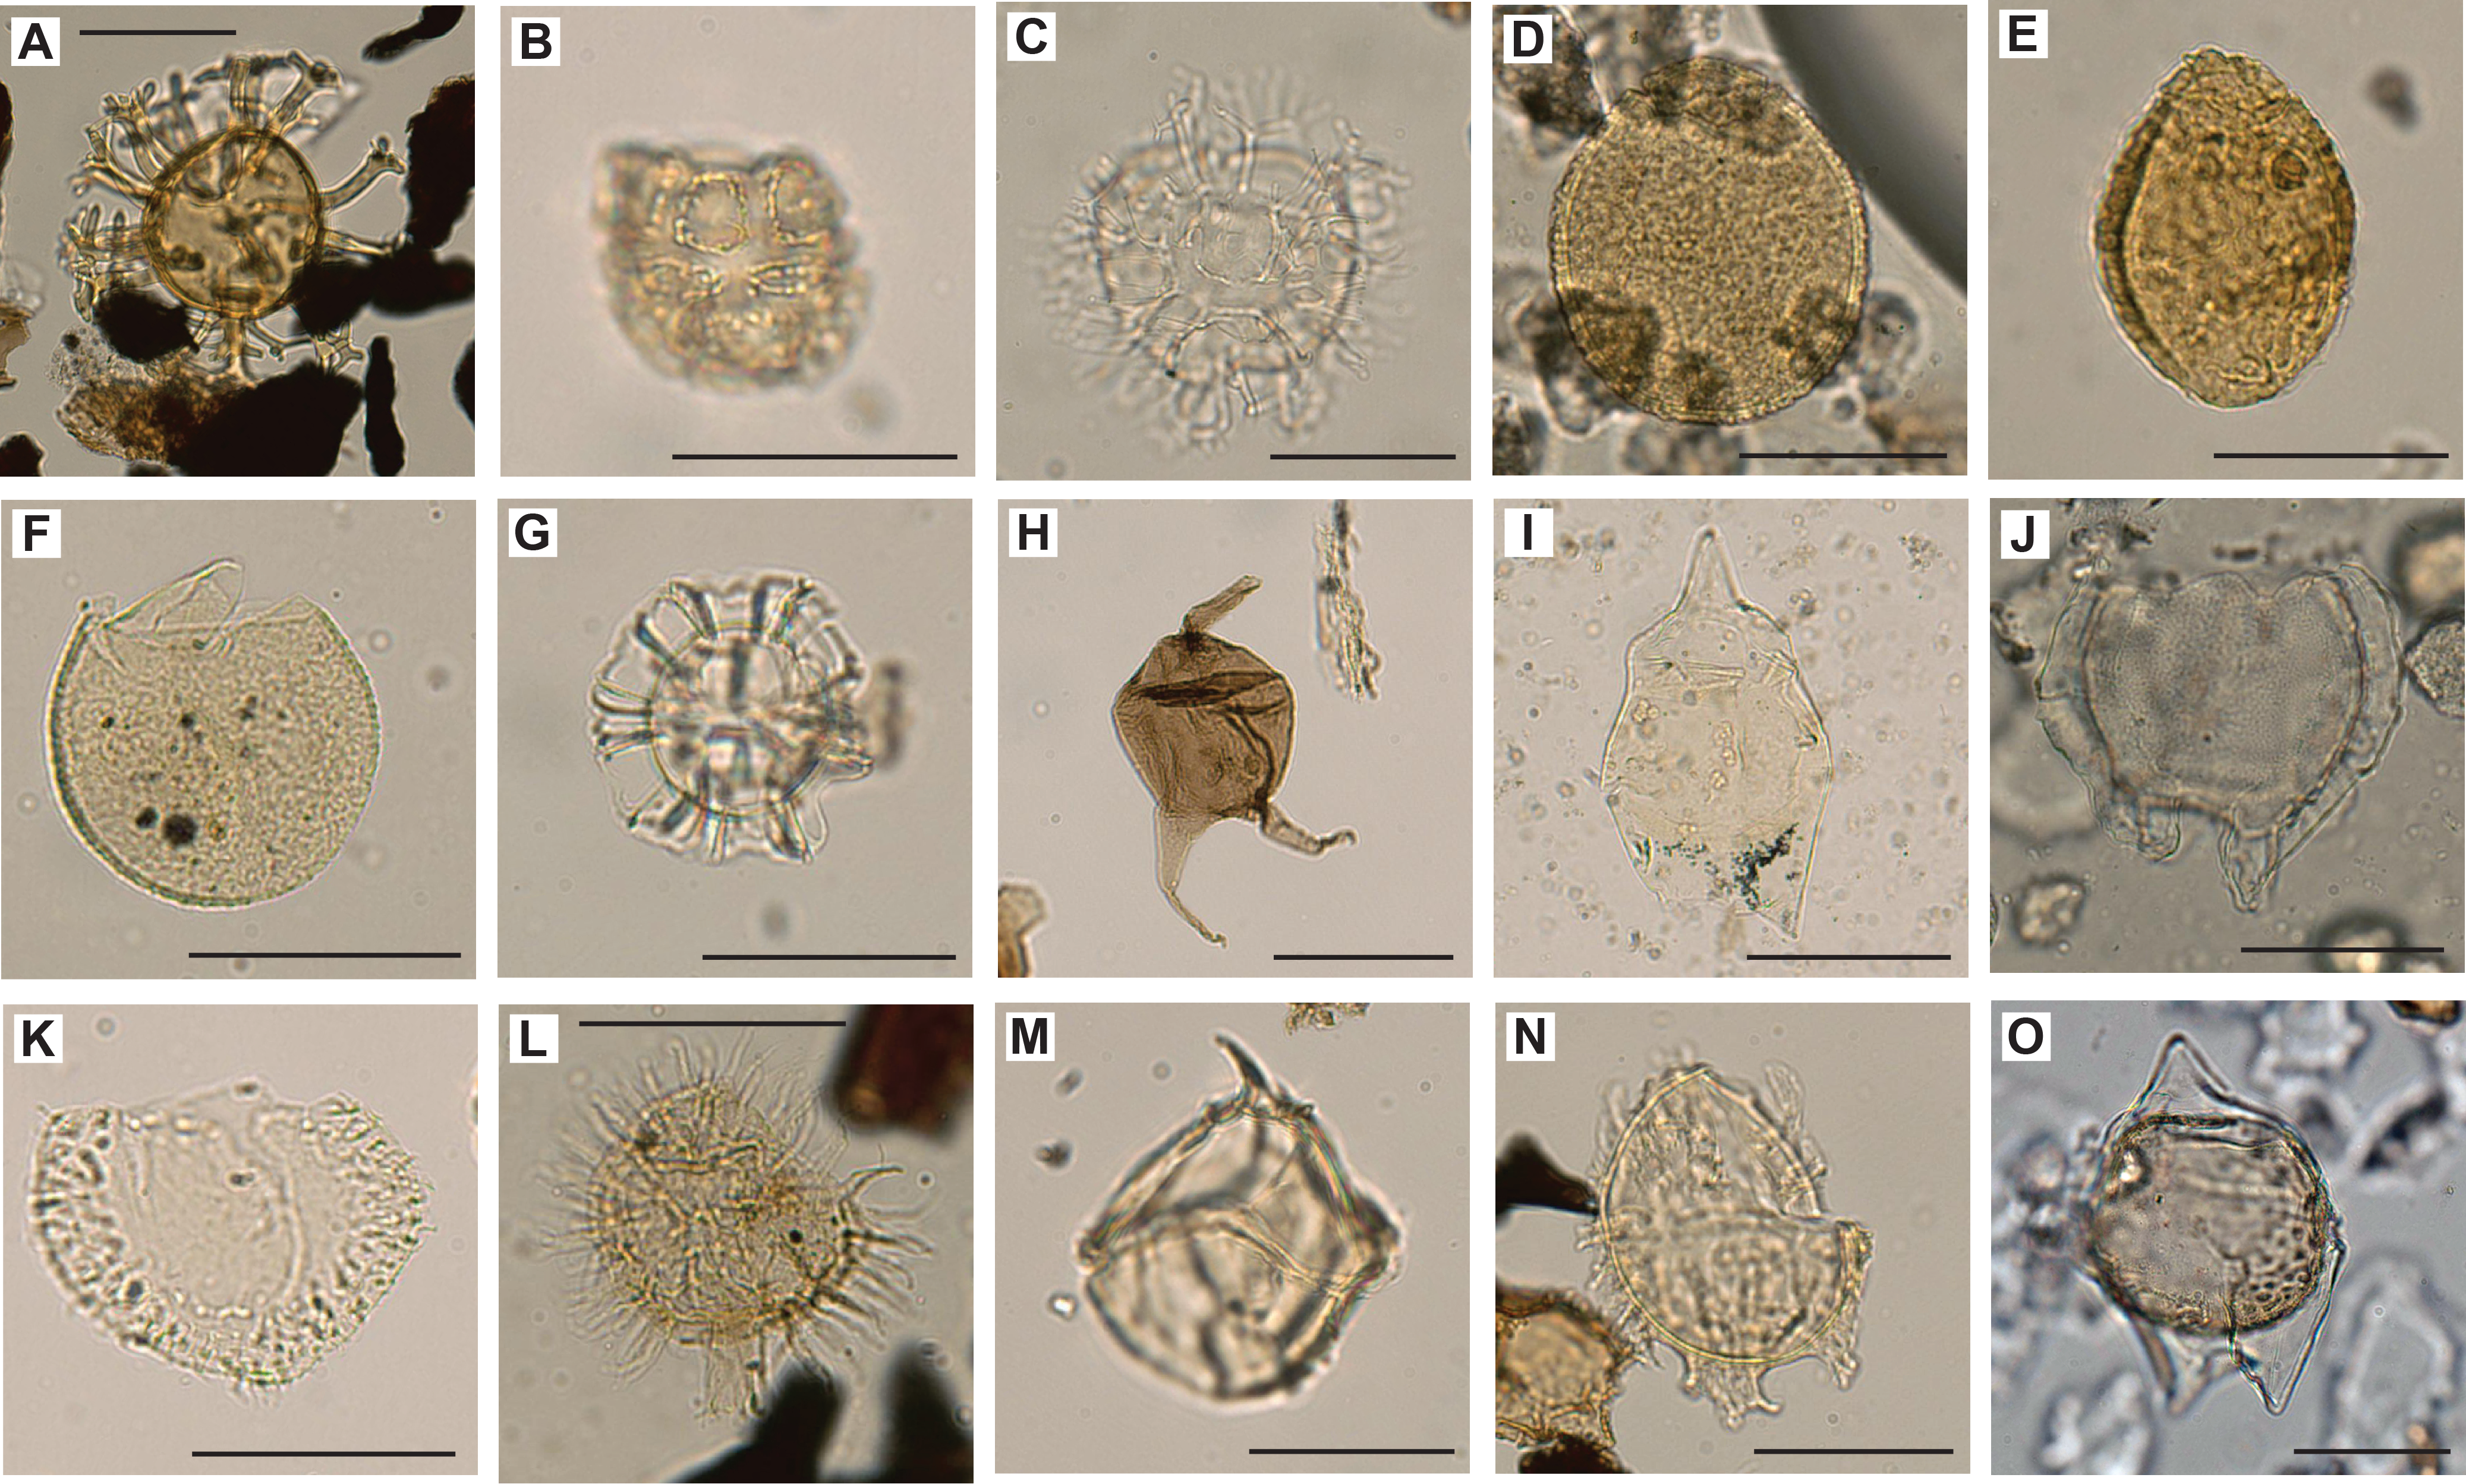
Figure F18. Selected dinocysts, including Cerodinium sp.
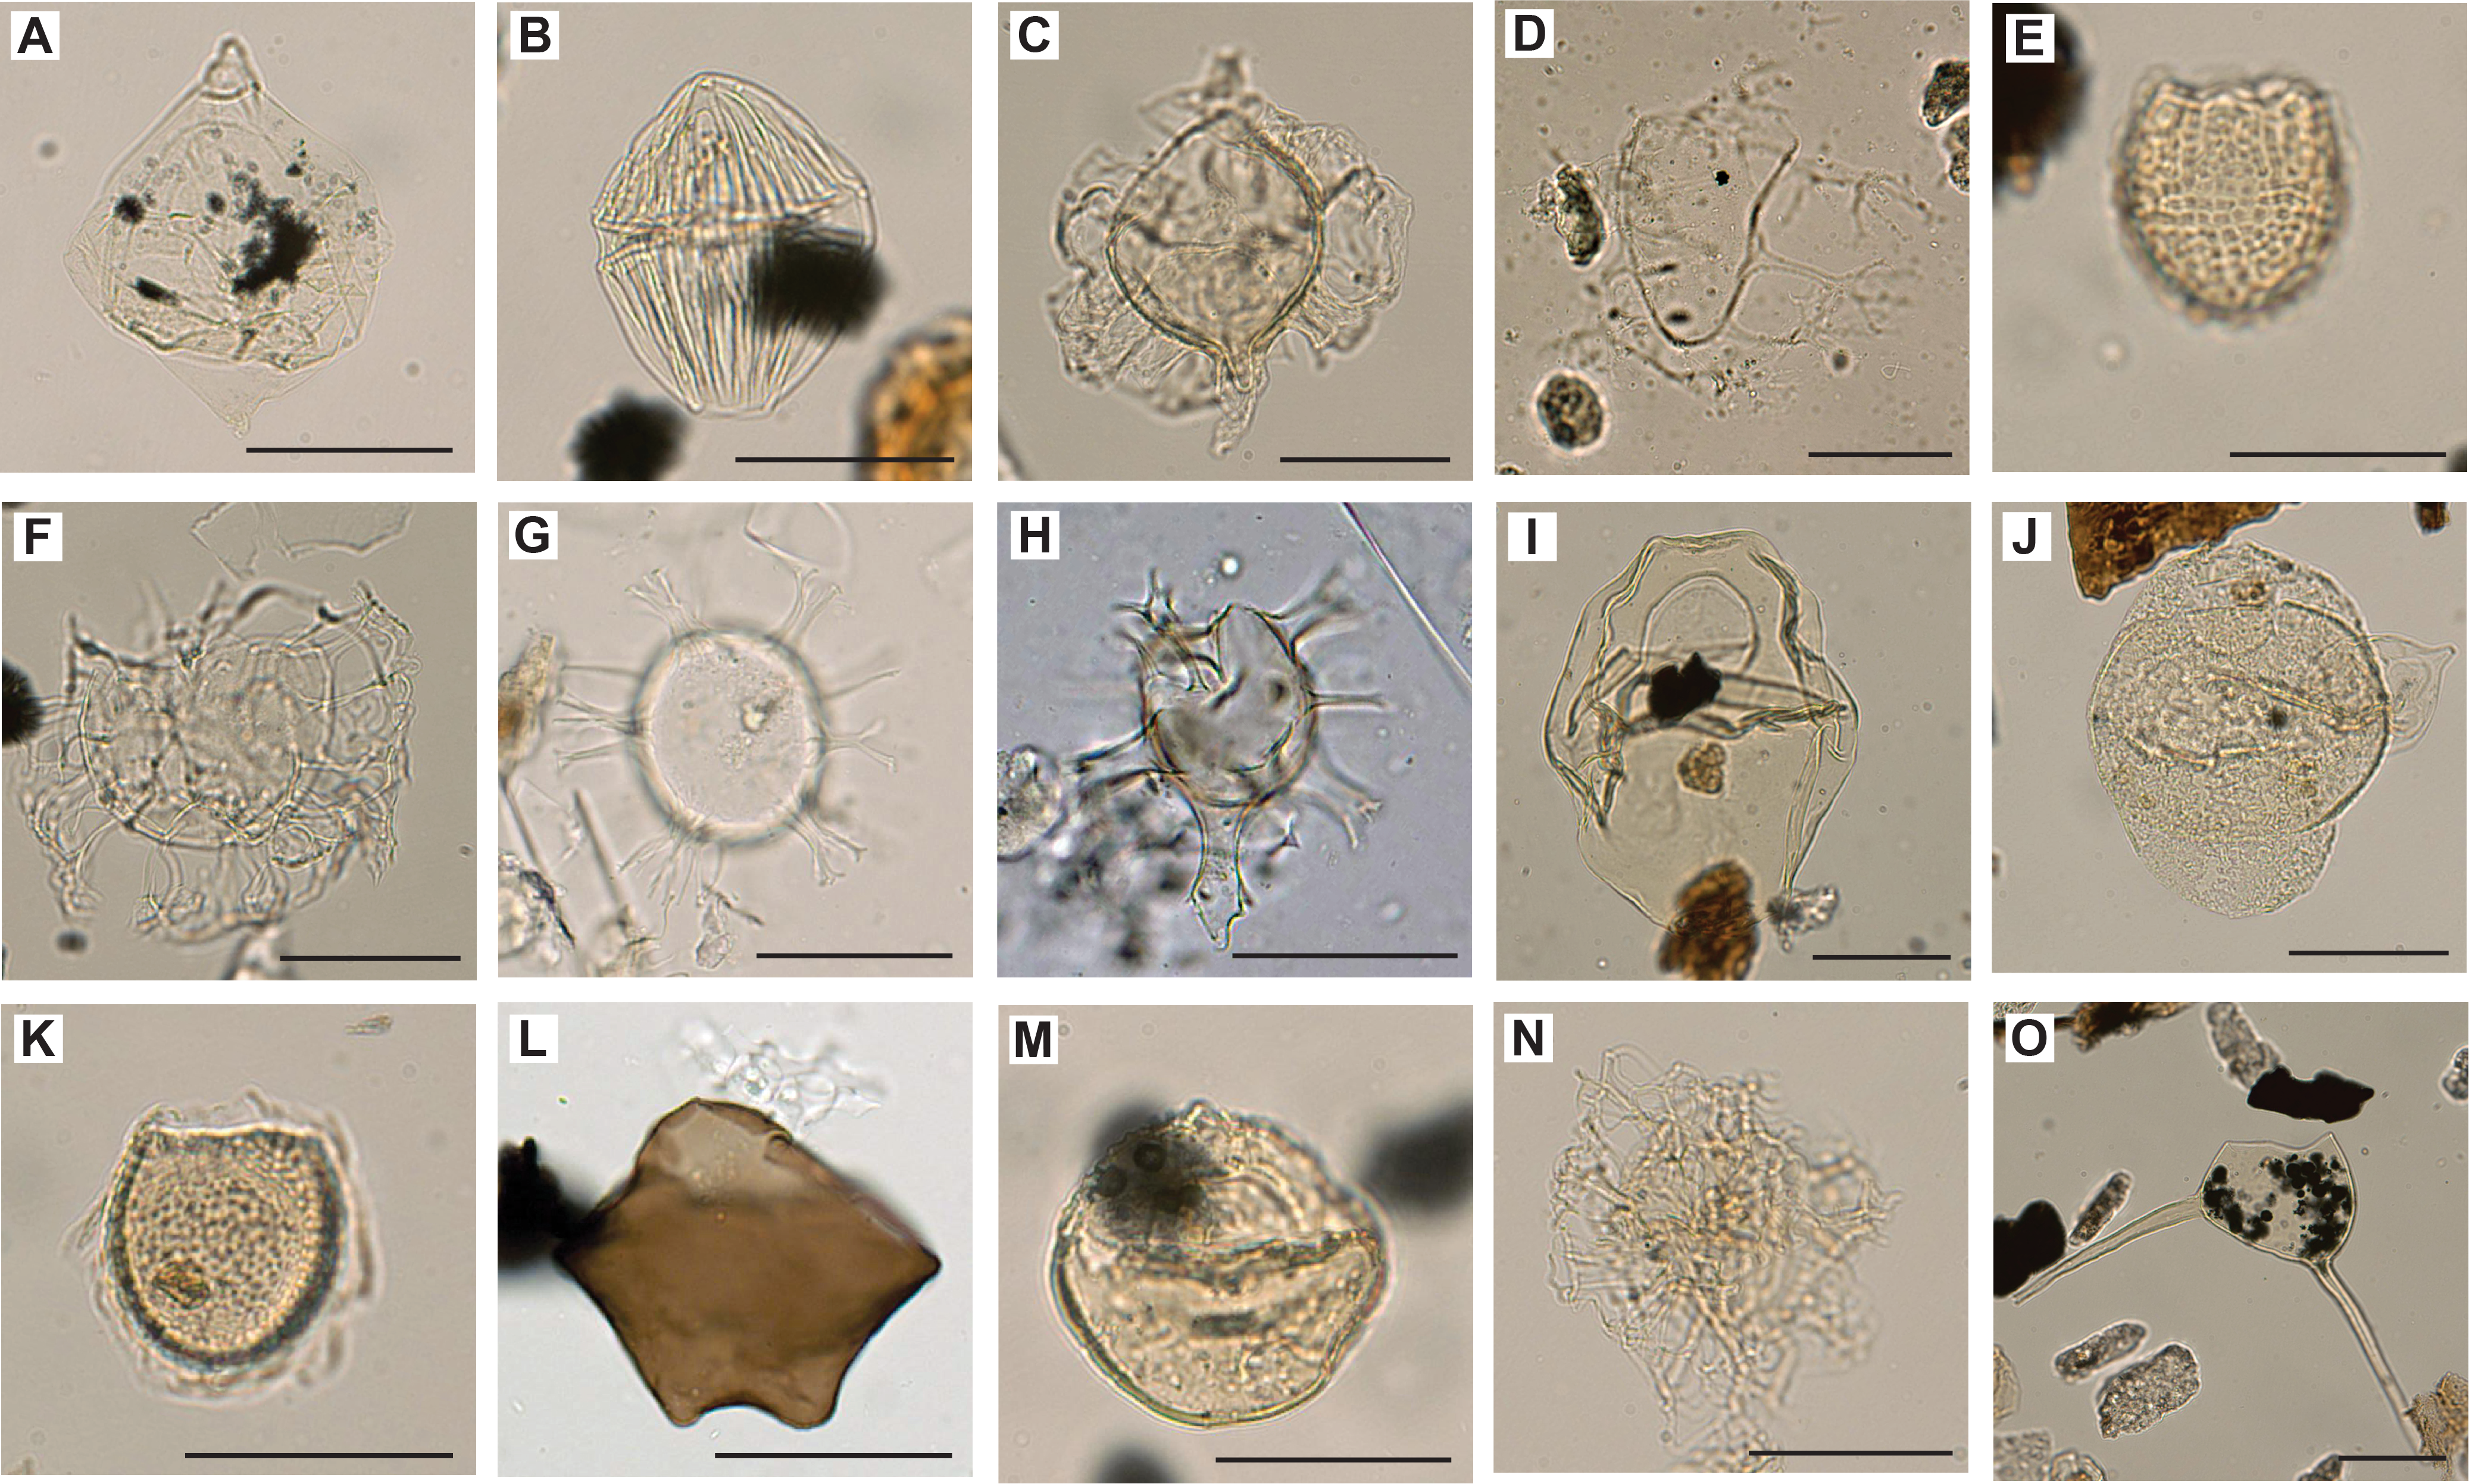
Figure F19. Selected dinocysts, including Lejeunecysta sp.
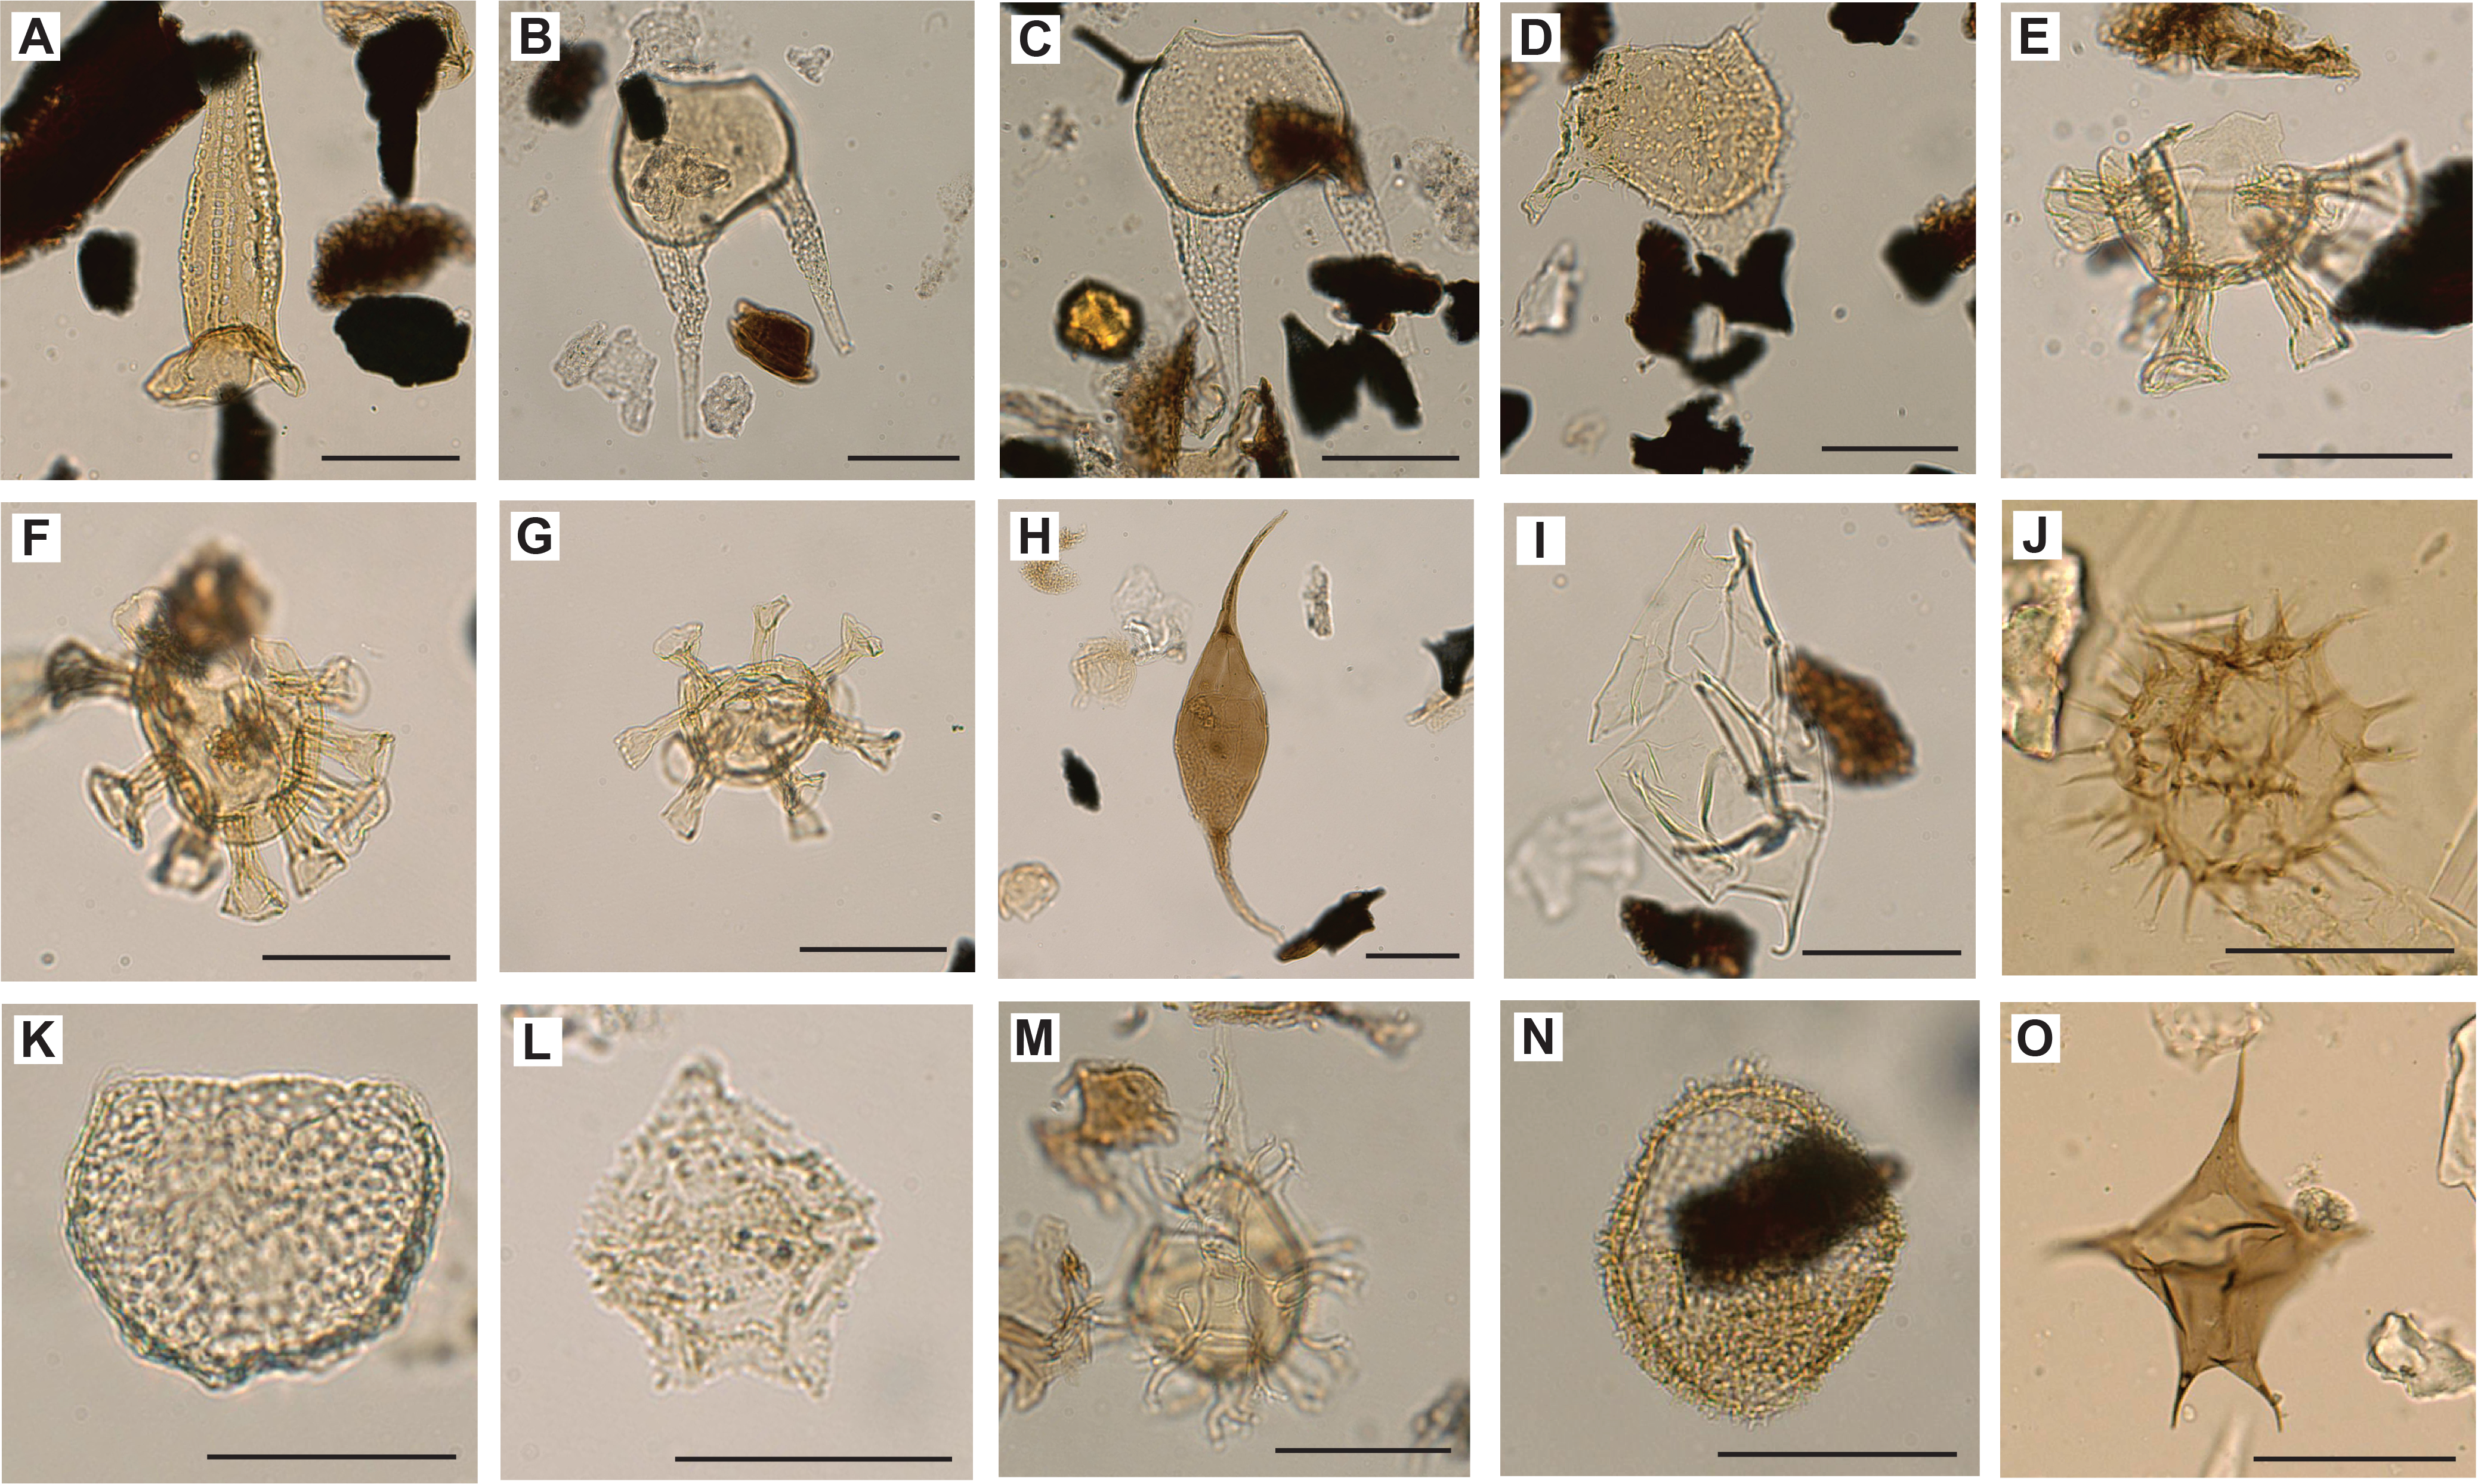
Figure F20. Selected dinocysts, including Odontochitina cribropoda.
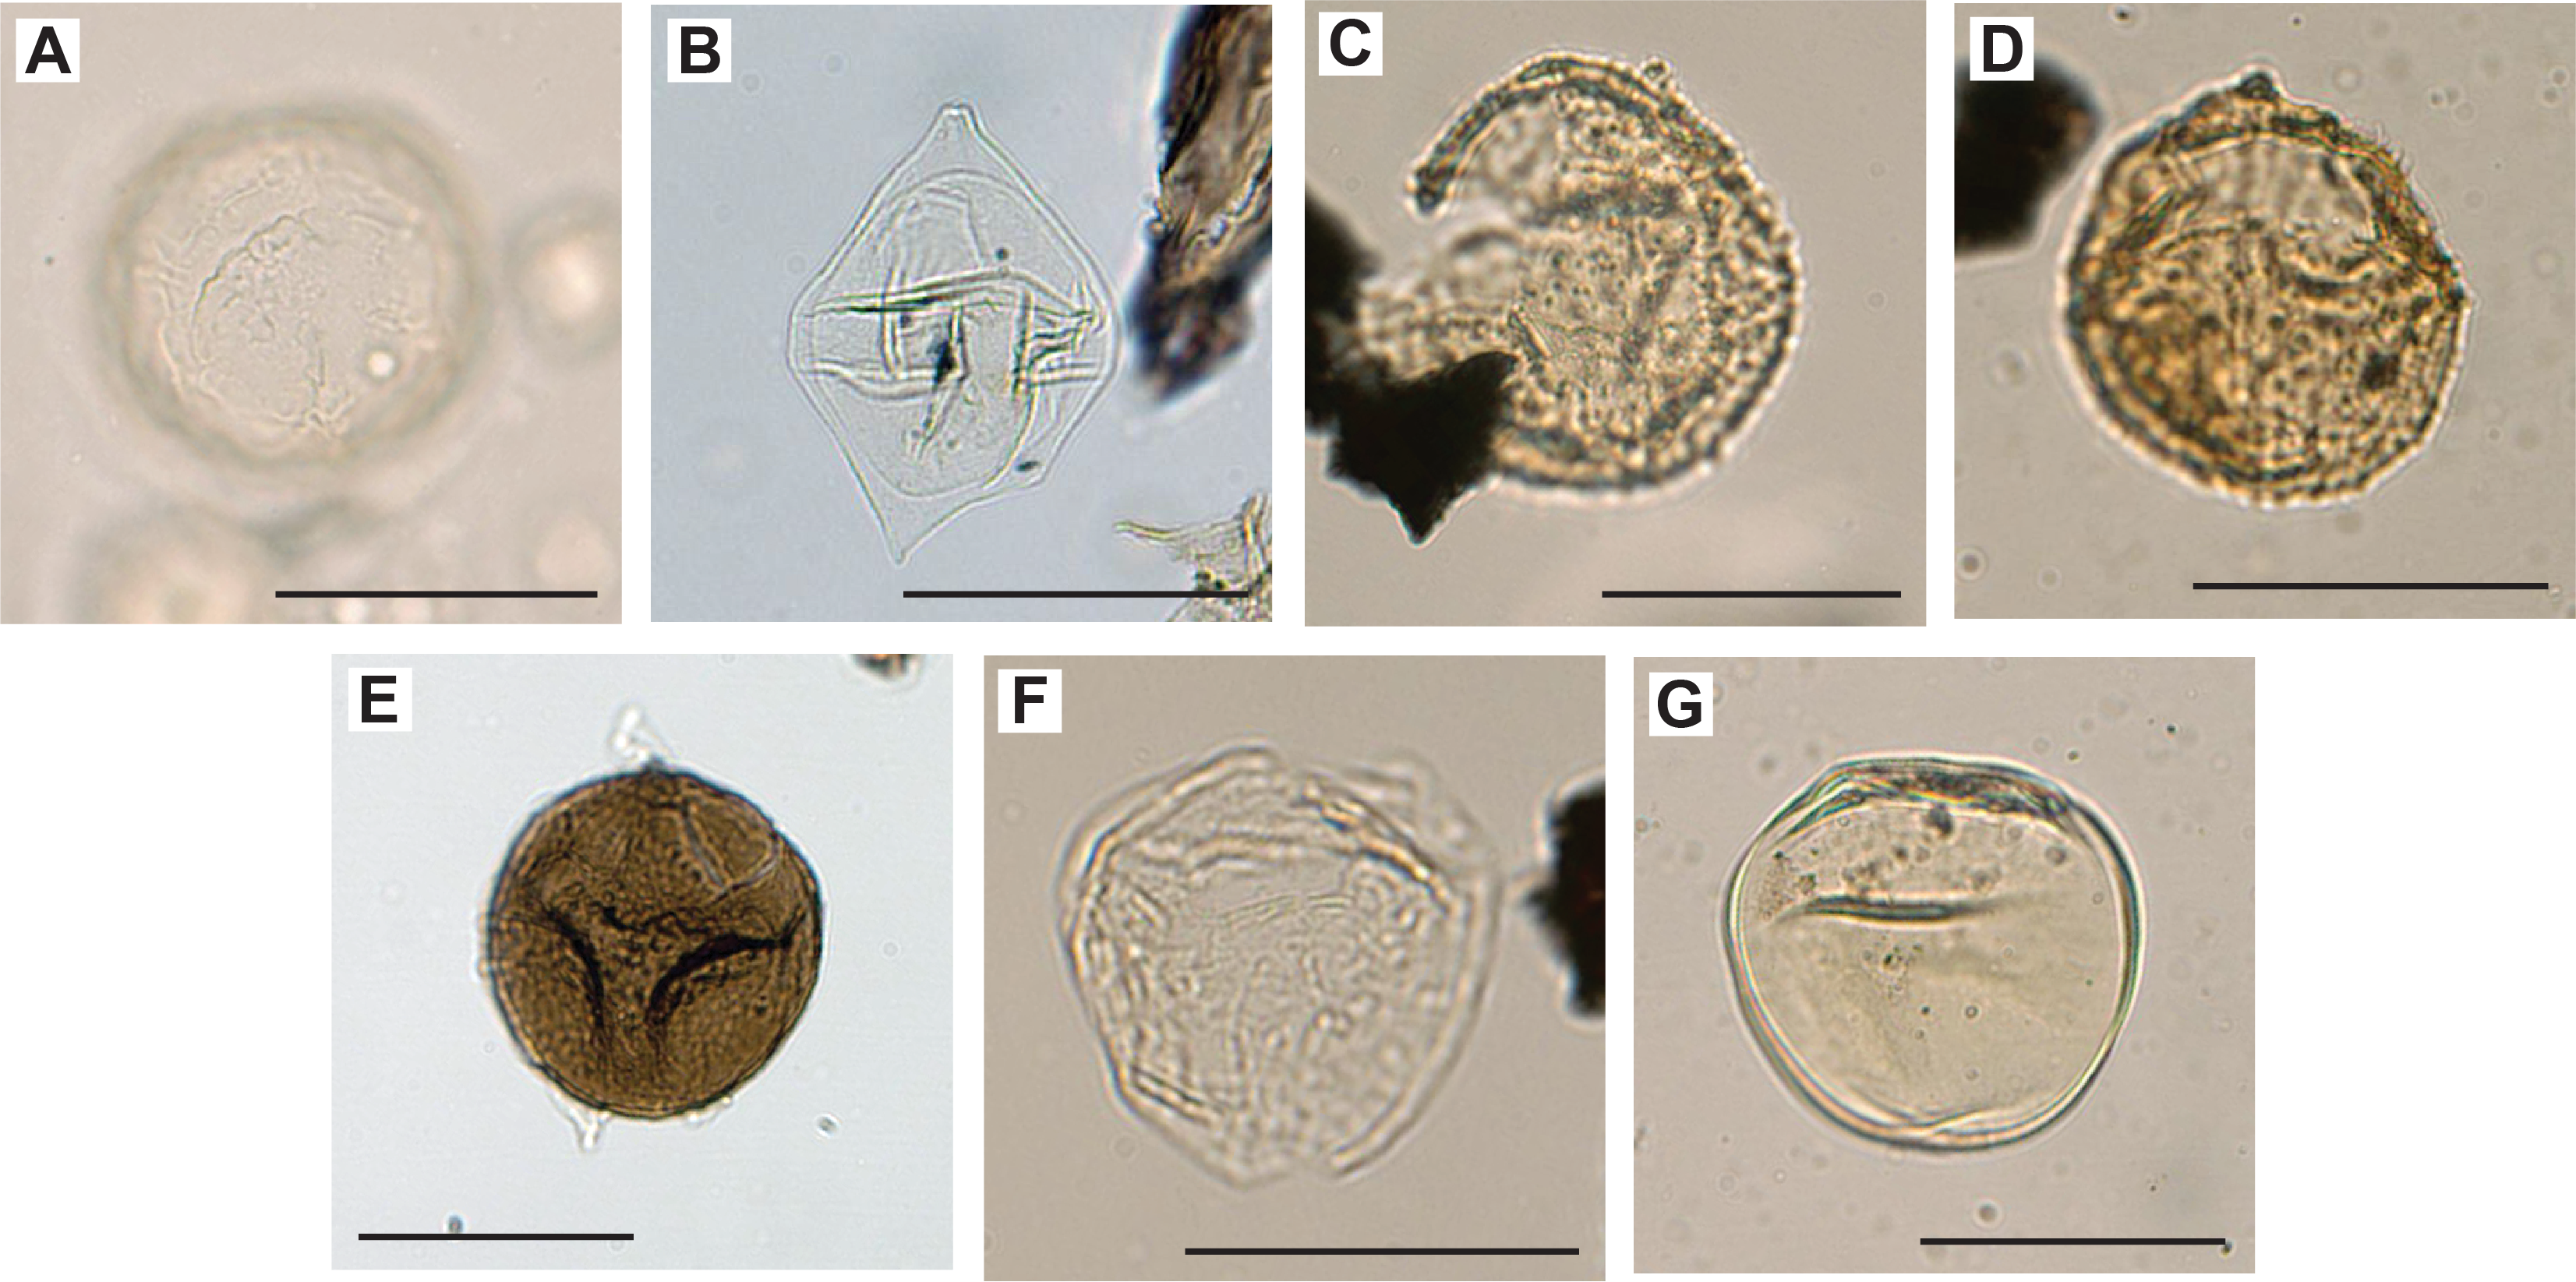
Figure F21. Selected dinocysts, including Stoveracysta inornata.
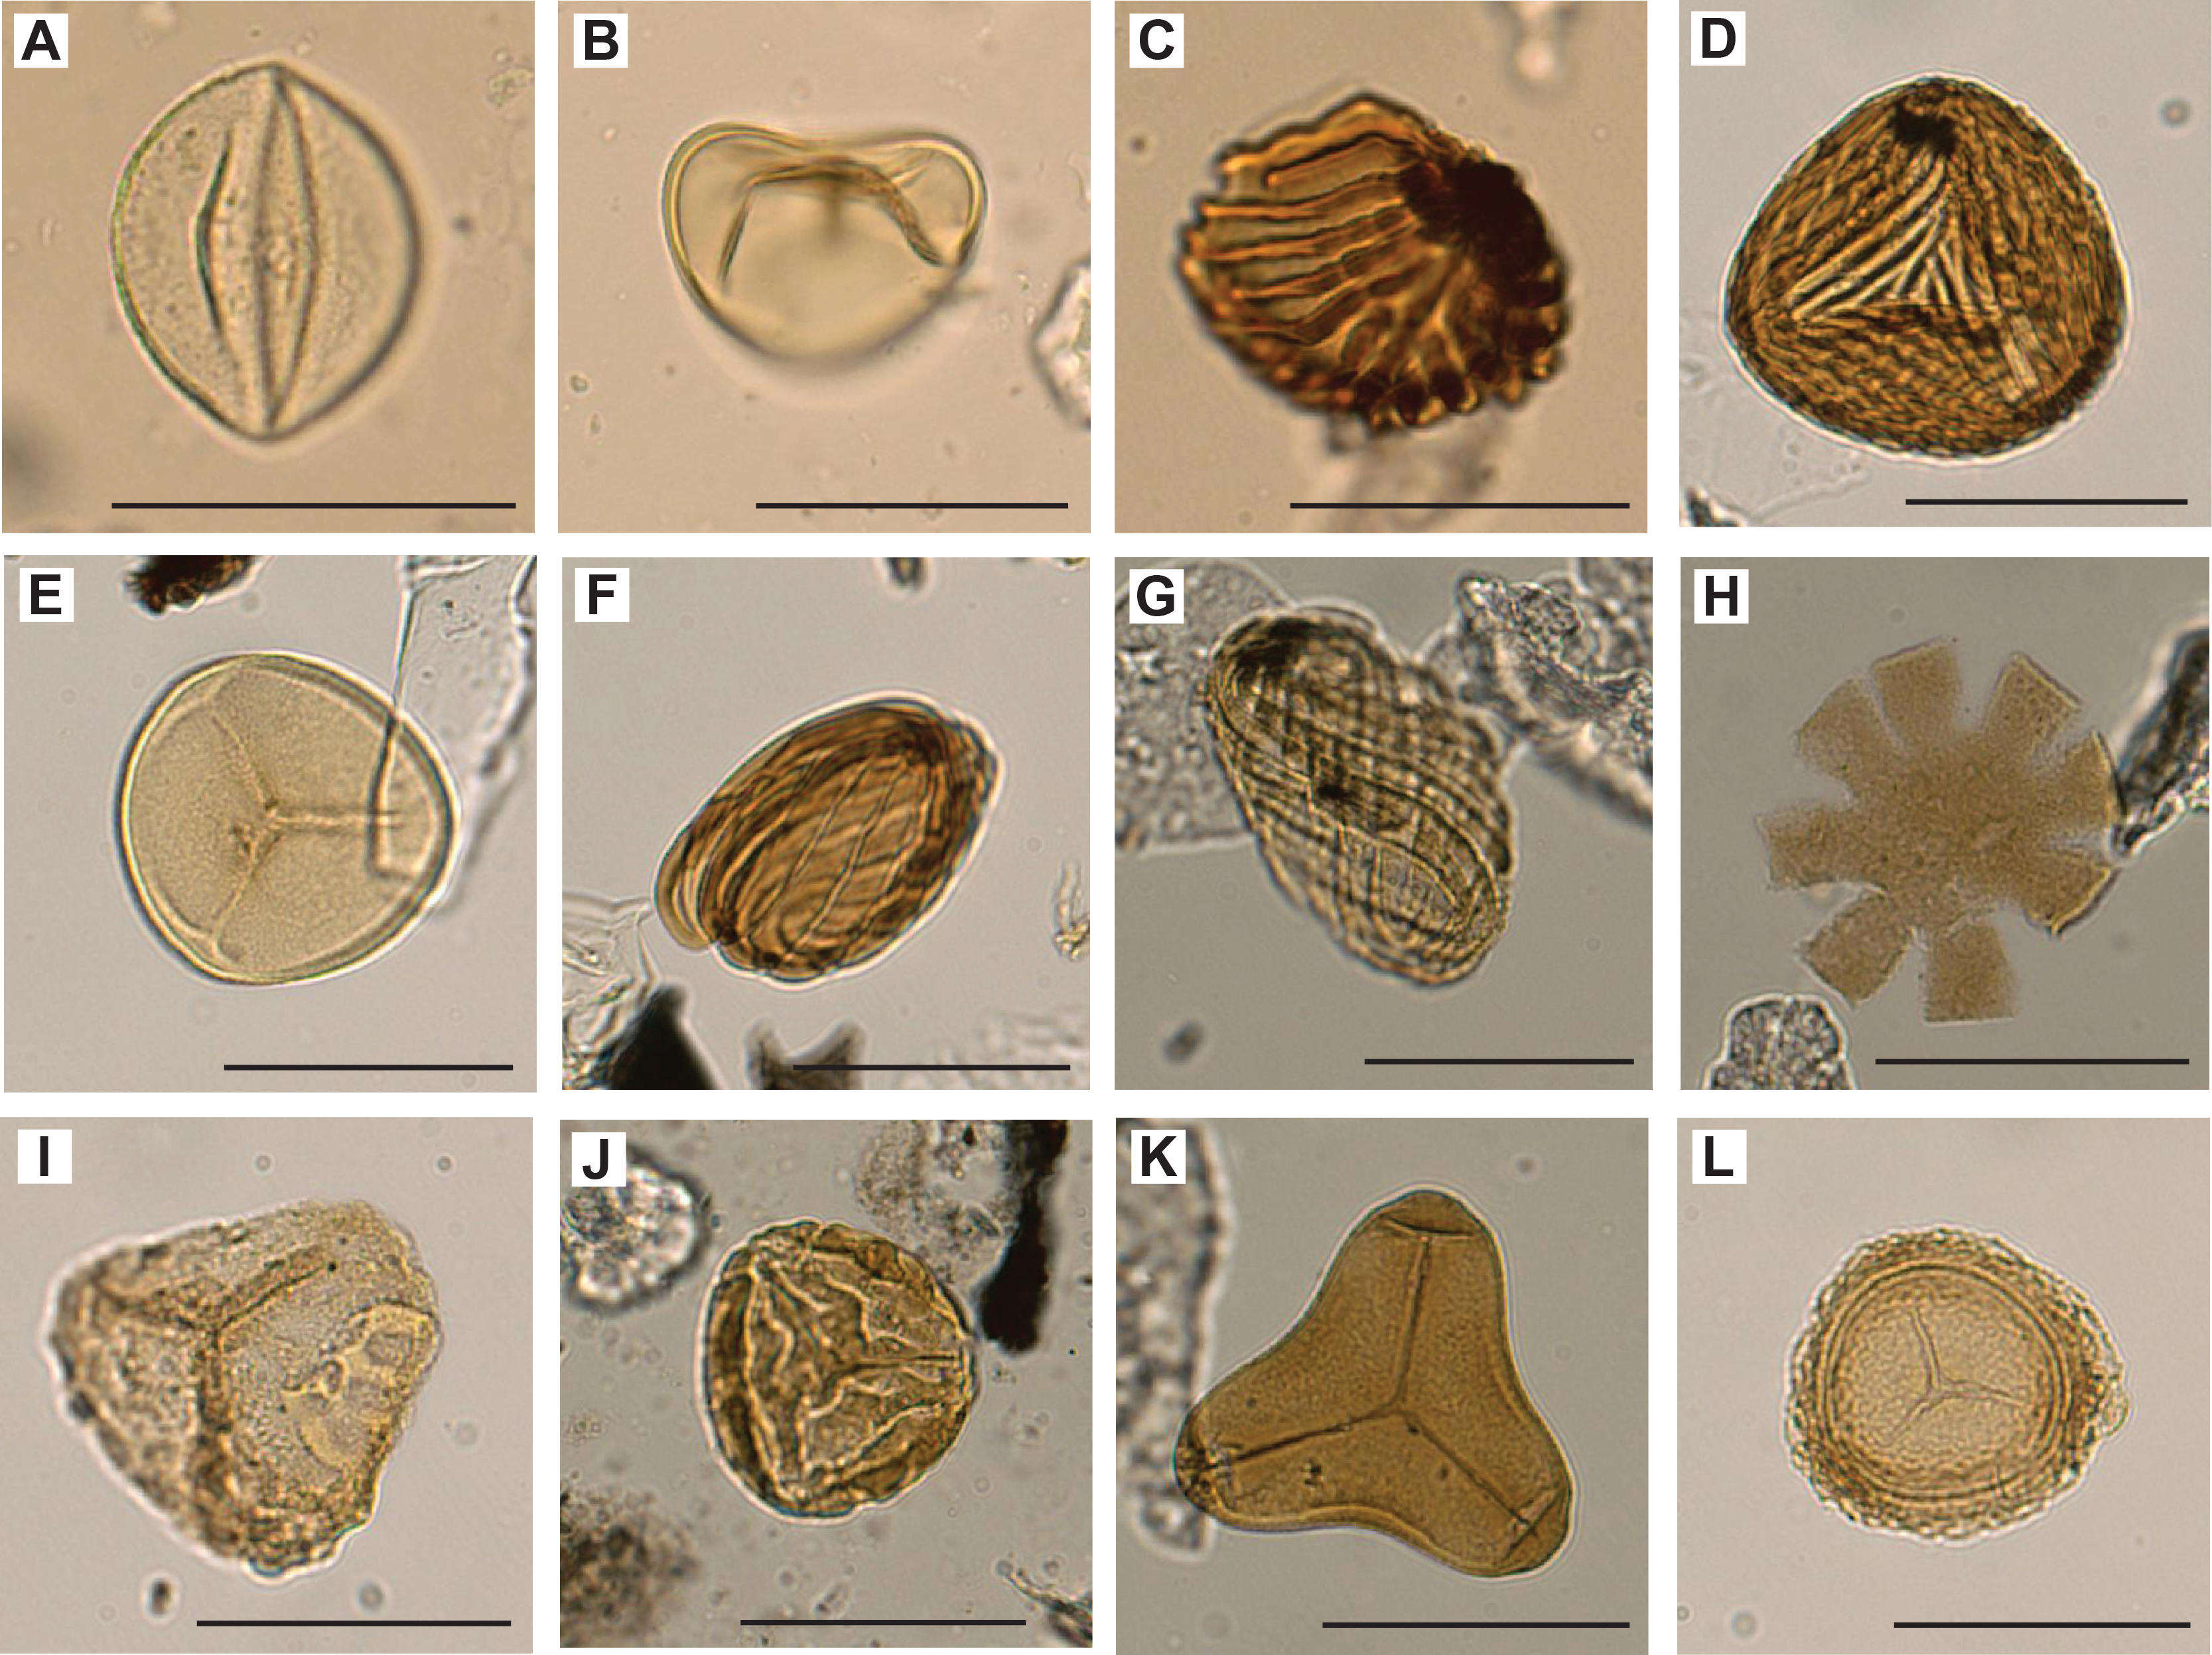
Figure F22. Miospores.
4.4.1. Palynofacies
Throughout the sequence, palynofacies distribution is consistently dominated by black and brown phytoclasts and to a lesser extent by marine and terrestrial palynomorphs. Amorphous organic matter is rare. Brown phytoclasts contain occasional cuticula and woody fragments. Abundances of palynofacies groups broadly covary.
4.4.2. Dinocysts
4.4.2.1. Pleistocene
Core catcher samples from Cores 392-U1581A-1H through 9H (6.83–83.33 m CSF-A) yielded few to common dinocysts. Samples 11H-CC, 11–16 cm (101.75 m CSF-A), and 13H-CC, 0–5 cm (121.13 m CSF-A), are barren or almost barren of dinocysts. Dinocyst assemblages from the Pleistocene are dominated by Spiniferites ramosus and Spiniferites mirabilis, with smaller contributions from Operculodinium centrocarpum and Impagidinium patulum. Protoperidinioid dinocysts dominate Sample 9H-CC, 20–25 cm (83.33 m CSF-A): Brigantedinium simplex, Selenopemphix nephroides, and Stelladinium stellatum. The biohorizon top of Filisphaera filifera (dc1 in Figure F30 and Table T3) in Sample 3H-CC, 13–18 cm (26.29 m CSF-A), at 0.77 Ma and the biohorizon base of S. stellatum (dc2, same figure) in Sample 9H-CC, 20–25 cm (83.33 m CSF-A), at 2.14 Ma provide age constraints for the sequence.
4.4.2.2. Pliocene and Miocene
Sparse occurrences of dinocysts within the Pliocene and Miocene sections of Hole U1581A are of a cosmopolitan nature (e.g., S. ramosus, I. patulum) and do not provide any additional age constraints to the interval between Samples 392-U1581A-15H-CC, 0–5 cm, and 31F-CC, 23–28 cm (133.83–242.67 m CSF-A).
4.4.2.3. Oligocene
The interval between Samples 392-U1581A-32F-CC, 8–13 cm, and 40X-CC (247.35–282.75 m CSF-A) yielded variable abundances of dinocysts. When present, preservation is excellent and assemblages are diverse, with abundant Chiropteridium galea, Hystrichokolpoma cinctum, and O. centrocarpum, common S. ramosus, and few Distatodinium biffi and Thalassiphora pelagica. The biohorizon top of Enneadocysta pectiniformis (26.9 Ma; dc3 in Figure F30 and Table T3) and the base of D. biffi (26.9 Ma; dc4, same figure) in Sample 32F-CC, 8–13 cm (247.35 m CSF-A), provide age constraints for that core. The biohorizon tops of Phthanoperidinium comatum (30.8 Ma; dc5, same figure) and Hystrichokolpoma bullatum (31.0 Ma; dc6, same figure) in Sample 40X-CC, 0–8 cm (282.75 m CSF-A), provide age constraints for the bottom of Hole U1581A.
4.4.2.4. Eocene
The uppermost ~75 m of cored section in Hole U1581B (Cores 2R–10R; 294.36–370.66 m CSF-A), which are dated as early Oligocene–Eocene by nannofossils, are barren of dinocysts.
4.4.2.5. Paleocene
From Core 392-U1581B-11R (376.30 m CSF-A) to the base of Hole U1581B, dinocysts are consistently present in all samples analyzed. Samples 11R-2, 80–81 cm (378.61 m CSF-A), to 16R-CC, 15–20 cm (382.2–429.82 m CSF-A), contain a diverse assemblage of typical mid-Paleocene dinocyst species, with Tanyosphaeridium xanthiopyxides, Thalassiphora delicata, Glaphyrocysta divaricata, Lejeunecysta rotunda, Palaeocystodinium golzowense, and Eisenackia reticulata. Reworking of Late Cretaceous species (Manumiella druggi, Circulodinium distinctum, and Impagidinium cristatum) is sparsely present throughout the section. The presence of E. reticulata (biohorizon top = 59.0 Ma; dc7 in Figure F30 and Table T3) in Sample 11R-2, 80–81 cm (378.61 m CSF-A), suggests that most of the Thanetian and Ypresian is missing at this site. The biohorizon base of T. delicata (59.1 Ma; dc9, same figure) in Sample 11R-CC, 17–22 cm (382.20 m CSF-A), and the top of Palaeoperidinium pyrophorum (59.1 Ma; dc8, same figure) in Sample 12R-CC, 19–24 cm (390.00 m CSF-A; both at 59.1 Ma), provide a robust age constraint for the interval between Cores 11R and 12R that is consistent with nannofossil biostratigraphy. The biohorizon top and base of L. rotunda (61.9–60.6 Ma as calibrated to magnetostratigraphy at Ocean Drilling Program [ODP] Site 1172 [Bijl et al., 2021]; dc12, dc10, same figure) in Samples 14R-CC, 17–22 cm (410.40 m CSF-A), and 14R-1, 106–108 cm (406.46 m CSF-A), respectively, are broadly consistent with the ages based on nannofossil assemblages in this interval. Sample 16R-CC, 15–20 cm (429.82 m CSF-A), has a similar assemblage to those above, with Alisocysta margarita, P. pyrophorum, and T. xanthiopyxides. A prominent assemblage shift occurs between Samples 16R-CC, 15–20 cm (429.82 m CSF-A), and 17R-CC, 8–13 cm (439.19 m CSF-A). The interval between Cores 17R and 19R contains a typical early Danian dinocyst assemblage including M. druggi, Damassadinium californicum, Senoniasphaera inornata, and Trithyrodinium evittii. With the exception of M. druggi, the stratigraphic ranges of these (dc13, dc14, and dc15, same figure) are confined to the early Danian.
4.4.2.6. Cretaceous/Paleogene boundary
Three split core samples from Sections 392-U1581B-20R-2, 53–54 cm (465.63 m CSF-A); 20R-3, 56–57 cm (467.19 m CSF-A); and 20R-5, 30–31 cm (469.95 m CSF-A), were processed to constrain the stratigraphic position of the K/Pg boundary. The biohorizon base of T. evittii (dc19 in Figure F30 and Table T3) in Sample 20R-2, 53–54 cm (465.63 m CSF-A) (Figure F21F), defines the base of the Paleocene. The bases of S. inornata, (dc18, same figure) Cordosphaeridium fibrospinosum (dc16, same figure), and Danea californica (dc17, same figure) in Sample 19R-CC, 10–15 cm (463.80 m CSF-A), all at 66.04 Ma, confirm the proximity of the top of Core 20R to the K/Pg boundary (see below).
4.4.2.7. Maastrichtian and Campanian
In the samples below the biohorizon base of T. evittii (66.04 Ma; dc19 in Figure F30 and Table T3) in Sample 392-U1581B-20R-2, 53–54 cm (465.63 m CSF-A), we find Isabelidinium pellucidum (biohorizon top = 69.1 Ma) and absence of common Manumiella. The latter is characteristic for the late Maastrichtian in the Southern Ocean (Thorn et al., 2009). Consistent with evidence from the nannofossils, we infer a hiatus spanning the earliest Paleocene to the early Maastrichtian based on dinocyst biostratigraphy. The biohorizon top of Trithyrodinium suspectum (69.9 Ma; dc23, same figure) in Sample 21R-CC, 9–14 cm (479.20 m CSF-A), contributes to a linear progression of available age constraints in the uppermost Cretaceous sequence of Hole U1581B, which can be interpolated to infer the top of the Cretaceous section to be ~69.8 Ma. High-resolution postcruise sampling should provide a clearer picture of the duration of this hiatus.
The stratigraphic interval between Samples 392-U1581B-20R-3, 56–57 cm, and 74R-CC, 15–20 cm (467.19–993.97 m CSF-A), contains abundant and diverse dinocyst assemblages with clear age progression. Ages of biohorizon bases and tops are mostly derived from ODP Site 748 (Mao and Mohr, 1992), where dinocyst ranges were calibrated against nannofossil biostratigraphy. Assemblages are composed of a dominance of peridinioid dinocysts, with Isabelidinium, Chatangiella, and Eurydinium, but also common Odontochitina.
A shift in dinocyst assemblages is noted between Samples 392-U1581B-23R-CC, 12–17 cm (500.56 m CSF-A), and 25R-CC, 4–9 cm (517.24 m CSF-A), with the biohorizon bases of Canningia reticulata and P. golzowense and the tops of Dinogymnium spp. and Xenikoon aff. australis (dc26, same figure). The biohorizon top of Isabelidinium cretaceum (dc27, same figure) in Sample 25R-CC, 4–9 cm (517.24 m CSF-A), indicates an age of 71.2 Ma, close to the Campanian/Maastrichtian boundary. The biohorizon top of Batiacasphaera reticulata (dc30, same figure) in Sample 34R-3, 114–116 cm (603.09 m CSF-A), dates it to 74.05 Ma. Below this in Sample 39R-CC, 19–24 cm (656.63 m CSF-A), we note the biohorizon top of Cyclonephelium compactum (74.4 Ma; dc32, same figure). These two ages suggest a high sedimentation rate (~12.5 cm/ky) between ~603.09 and 656.63 m CSF-A, but this may be overestimated because of an inaccurate tie of these events to the Geologic Time Scale 2020 (GTS2020) (Gradstein et al., 2020), in addition to the complexity of abundant reworking and transport at this site.
The interval between Cores 392-U1581B-45R and 55R is characterized by the continuous presence of C. distinctum and common I. pellucidum. Several biohorizon bases and tops are recognized in the interval between Samples 50R-CC, 7–12 cm (761.89 m CSF-A), and 55R-CC, 11–16 cm (809.38 m CSF-A), but provide scattered and inconsistent age constraints that will be further investigated postcruise. The interval between Samples 57R-CC, 20–25 cm (828.63 m CSF-A), and 63R-CC, 23–28 cm (886.99 m CSF-A), is characterized by the consistent presence of Odontochitina costata (dc31, same figure). Samples from the lowermost ~100 m of the succession (between Samples 63R-CC, 23–28 cm [886.99 m CSF-A], and 74R-CC, 15–20 cm [993.97 m CSF-A]) contain common abundance of a conspicuous species of Oligosphaeridium cf. totum and Trichodinium castanea, as well as common Palaeohystrichophora infusorioides, Xenascus ceratoides (dc35, same figure), and Hystrichodinium pulchrum. The biohorizon top of Nelsoniella aceras (78.5 Ma; dc37, same figure) in Sample 73R-CC, 14–19 cm (985.46 m CSF-A), is the best biostratigraphic constraint for the age of the bottom of the hole.
4.4.3. Miospores
Time limitations and focus on biostratigraphic age constraints limited identification of miospores to species level. Miospores are sparse in the Pleistocene, present in the Oligocene, and few to abundant in the Paleocene and Upper Cretaceous and vary in abundance in line with abundance variability of the dinocysts. The diversity is low in the Pleistocene and Oligocene and high in the Paleocene and Cretaceous. There is an overall dominance of spores over pollen. A selection of miospores encountered is shown in Figure F22.
4.4.4. Paleoenvironments
The preservation of organic marine and terrestrial microfossils in the Agulhas Drift at Site U1581 testifies to its rapid sedimentation in the deep Transkei Basin, which prevented oxidation. Although the palynomorphs may be transported into the basin from shallower areas, there is a clear age progression in the assemblages, consistent with that in other sections, which demonstrates that the transported sediments were quasi-contemporaneous. That said, the abundant reworking shows that in addition to (quasi-)contemporaneous sediment, older sediments are also eroded and transported toward the site.
The same can be concluded for the Oligocene and Paleocene–Cretaceous intervals in the record where palynomorphs are also preserved. The assemblages have the composition and diversity typical of continental shelf assemblages, and the abundance of terrestrial palynofacies and palynomorphs (dinocysts and miospores) indicates that the sediment facies contain a dominant transported component with perhaps minor intermixed contributions of hemipelagic sediment. Settings dominated by pelagic sedimentation in a deep basin far offshore would not have such a rich and diverse dinocyst assemblage composed of typical continental shelf species (e.g., Sluijs et al., 2005), a lack of amorphous organic matter, and a dominance of terrestrially derived palynofacies. In addition, there is only slight variability in the yield, abundance, and composition of the palynological associations between lithologies; if anything, the turbiditic coarser siltstones contain slightly less palynofacies than the dark brown claystones. This suggests that in addition to the normally graded intervals, the fine dark mudstones are equally representative of mass transport, perhaps with a minor component of hemipelagic sedimentation. Postcruise research, comparing signals from various lithologic parameters and different microfossil groups, should shed further light on the nature of these sediments.
Despite the transported nature of the sediments, the clear age progression and high diversity makes the sequence ideal for further detailed palynology-based postcruise research for an unprecedented picture of the climatic and paleoceanographic evolution of the southern African hinterland and the Agulhas Plateau region in the Late Cretaceous.
5. Paleomagnetism
Paleomagnetic measurements were performed on archive-half sections from Holes U1581A and U1581B (Cores 392-U1581A-1H through 41X [0.0–292.11 m CSF-A] and 392-U1581B-2R through 74R [289–994.02 m CSF-A]) and on 110 discrete samples collected in both holes (Figures F23, F24). Section halves from Hole U1581A that were entirely composed of poorly or unconsolidated sand were not measured because these would have resulted in unreliable paleomagnetic results. Additionally, a ghost core (Core 25G) was not measured. Rock magnetic experiments were also performed to assess the reliability of magnetic signals, magnetic fabric, and environmental and postdepositional processes, including anisotropy of magnetic susceptibility (AMS) and isothermal remanent magnetization (IRM) acquisition experiments.
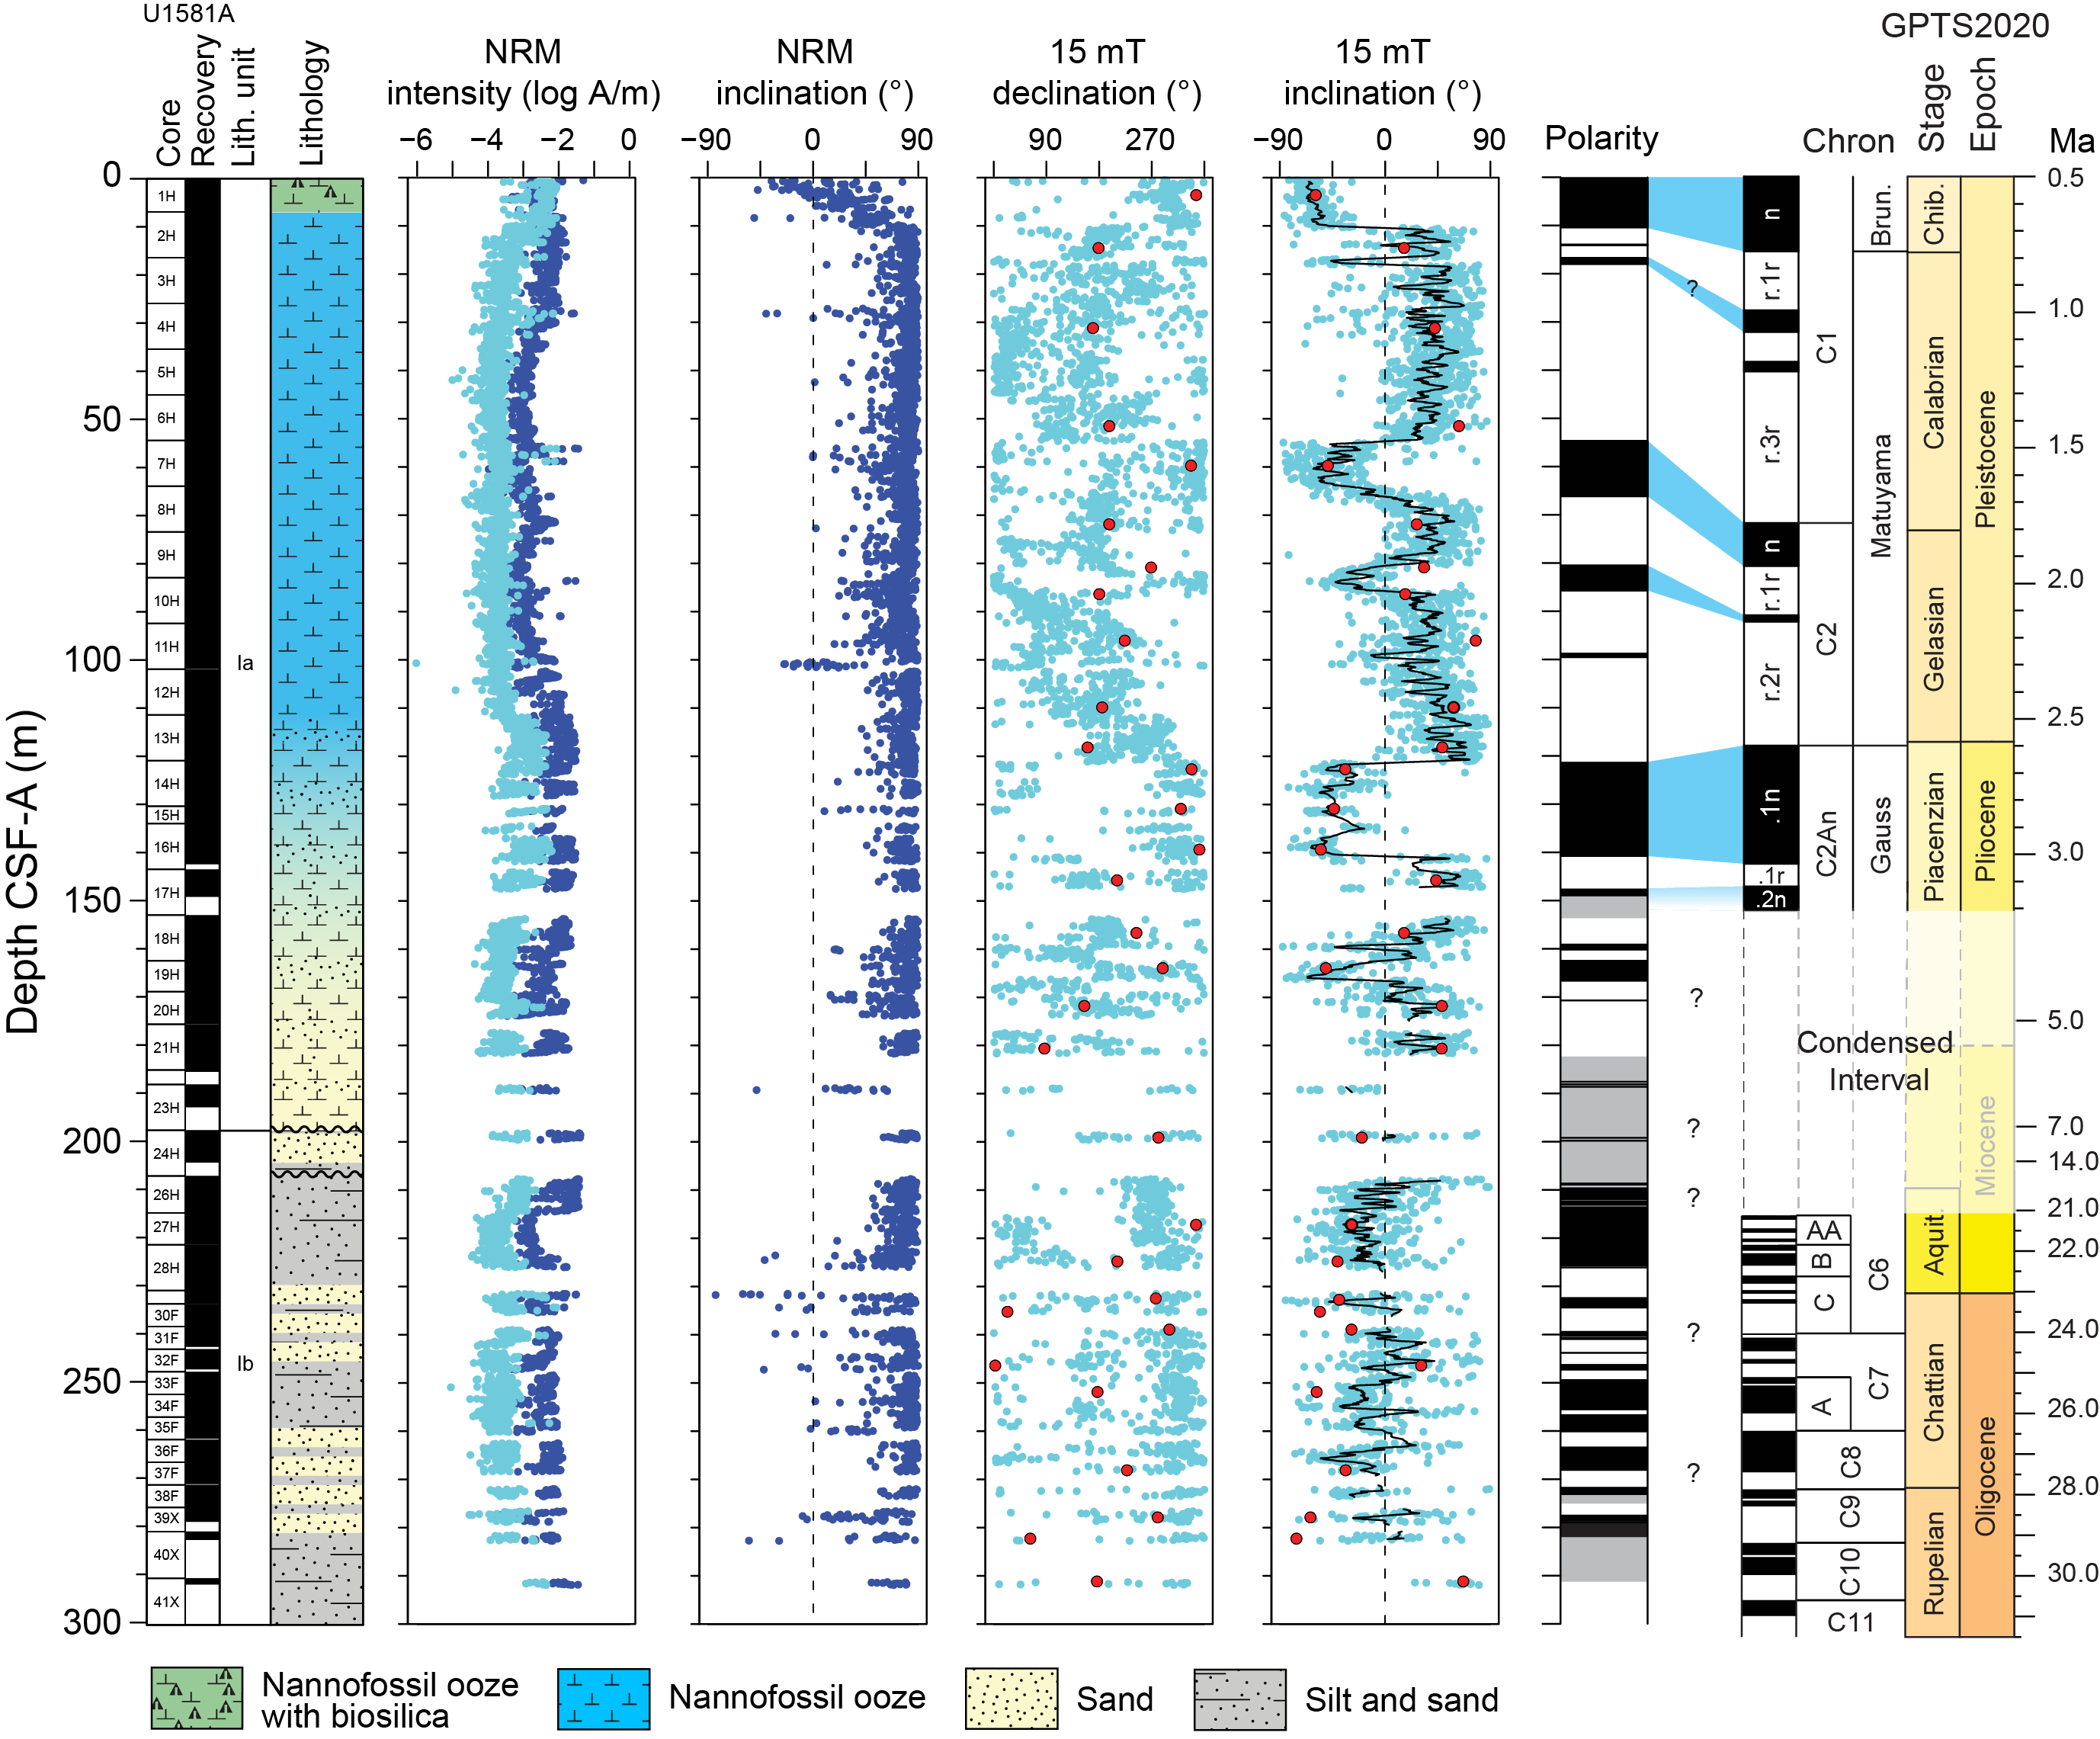
Figure F23. Magnetostratigraphic results, Hole U1581A.
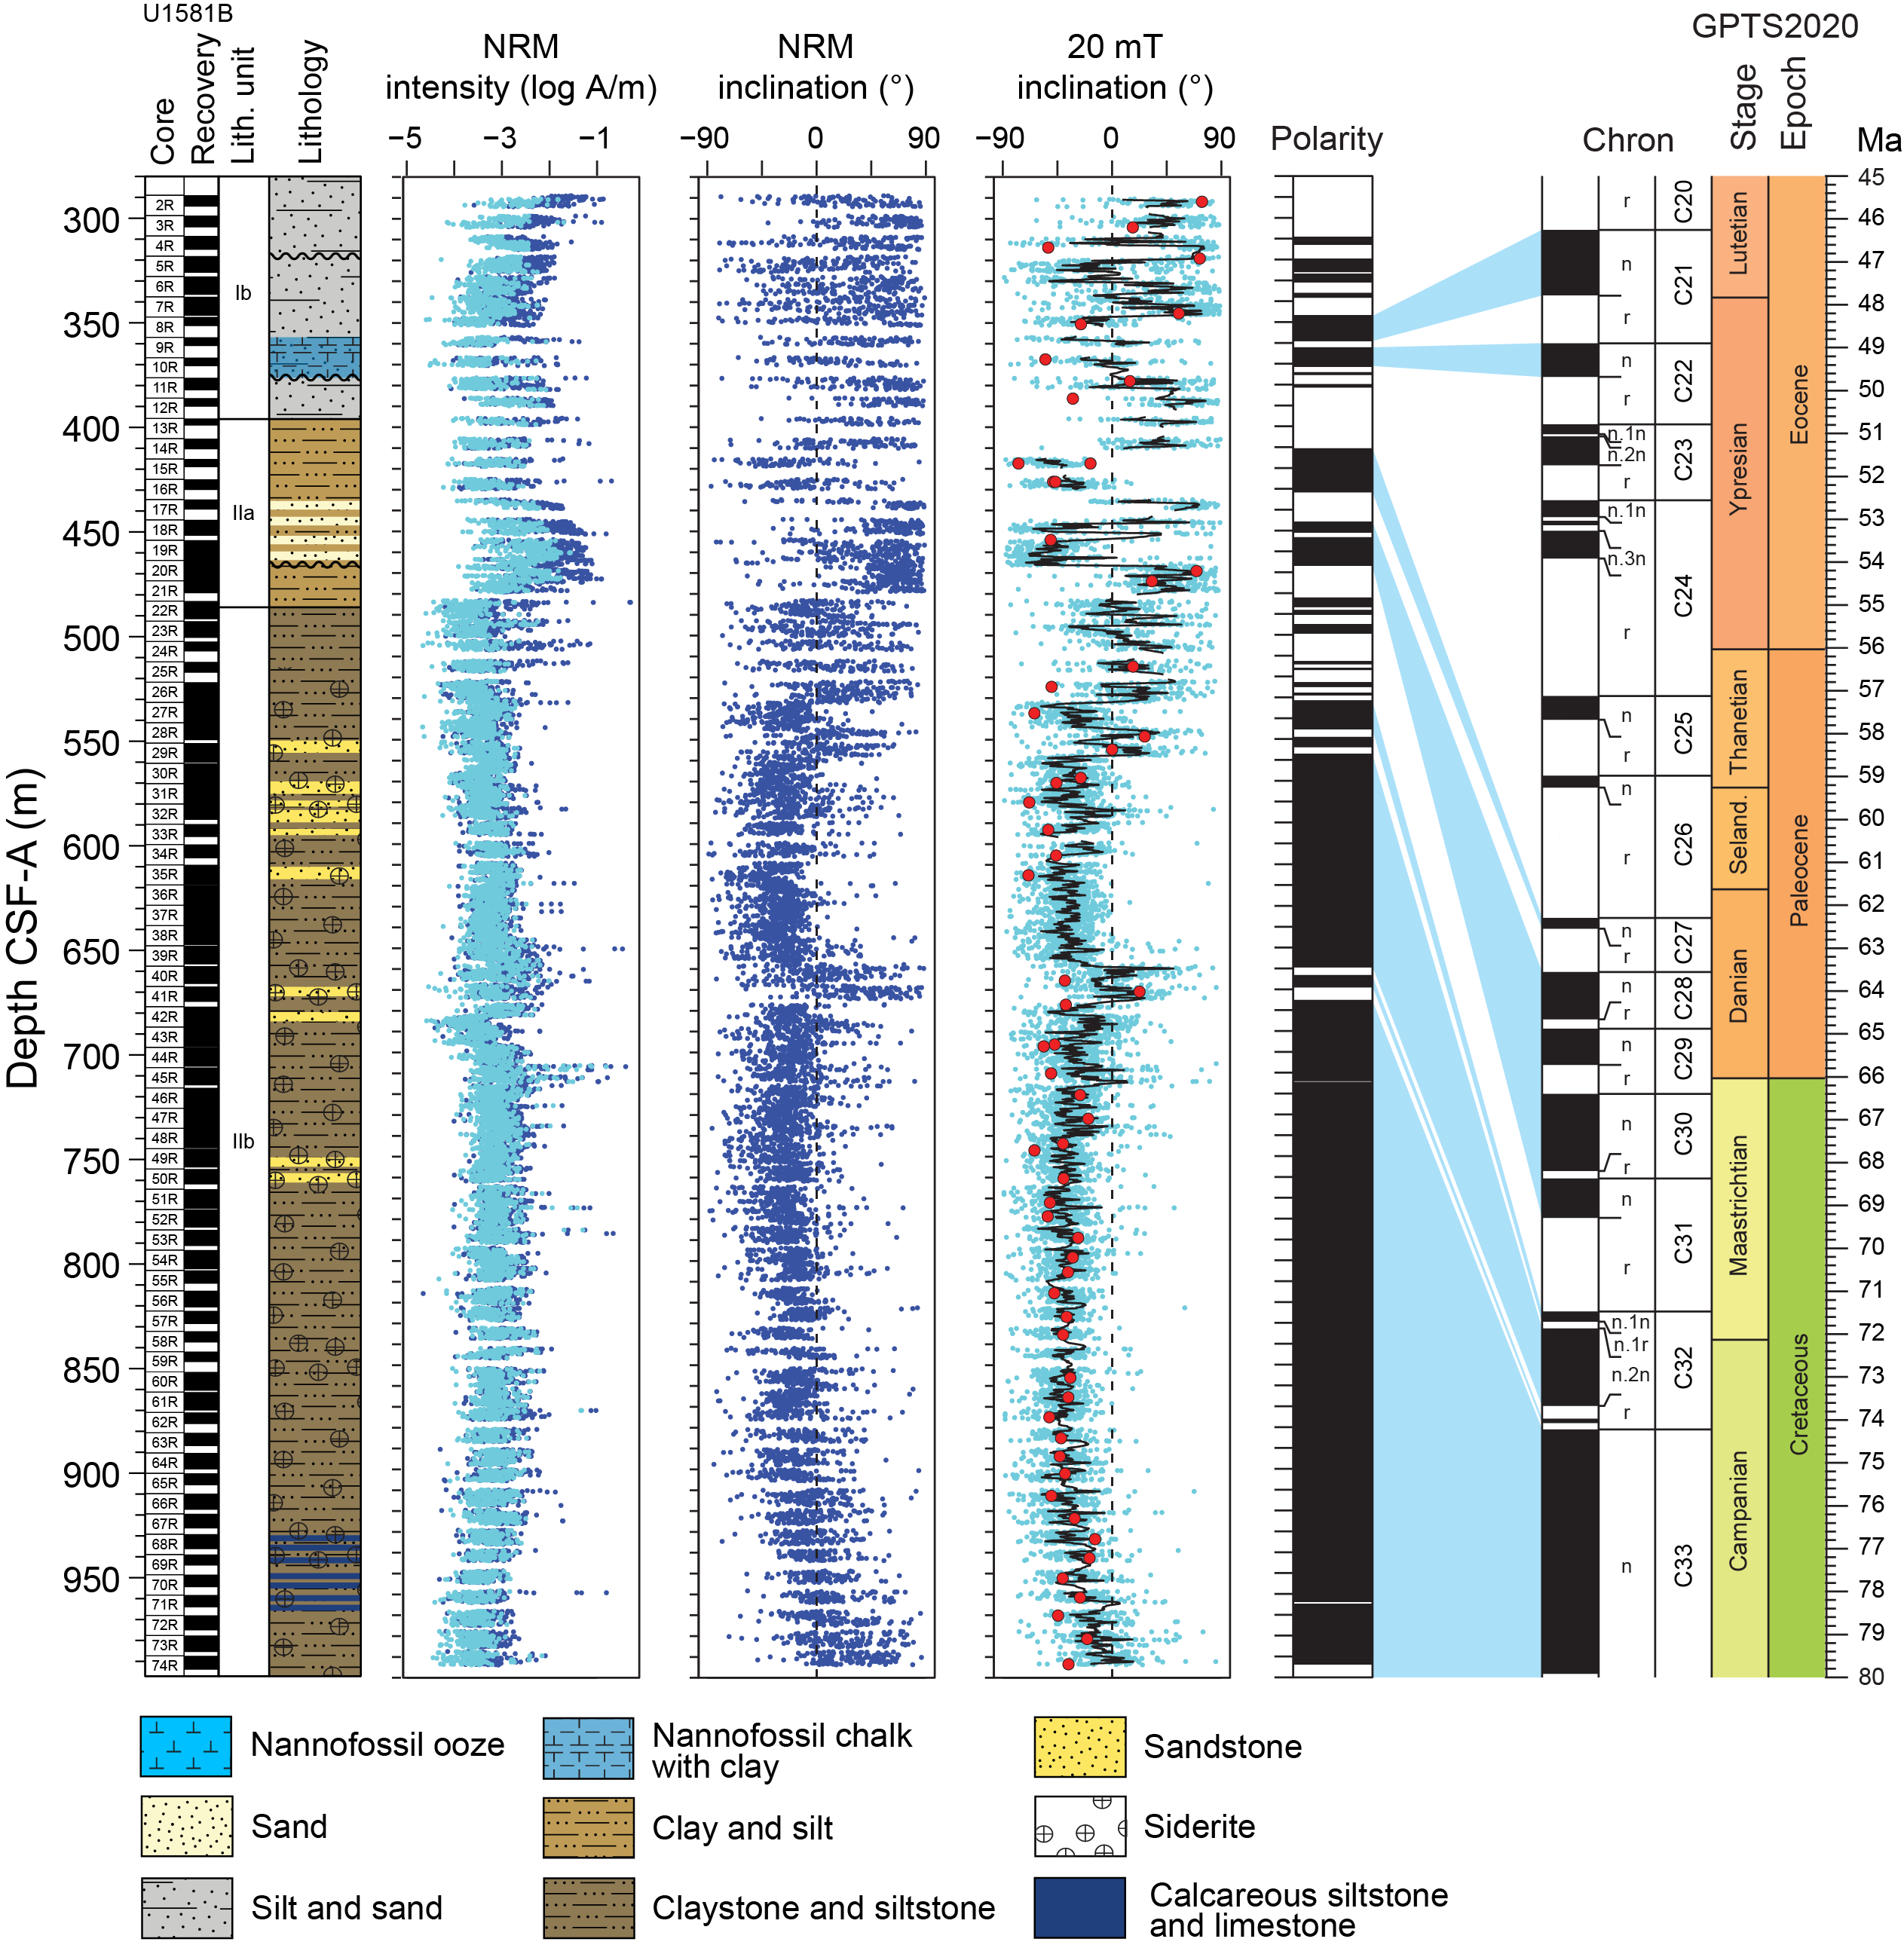
Figure F24. Magnetostratigraphic results, Hole U1581B.
Paleomagnetic measurements were undertaken on archive halves from Holes U1581A and U1581B and on 110 discrete samples from both holes. Paleomagnetic experiments included alternating field (AF) demagnetization, AMS, and IRM acquisition. These experiments were performed to constrain magnetic polarity and the magnetic mineralogy of sedimentary units at Site U1581. Paleomagnetic results are of variable quality, and magnetic polarity could only be determined from ~50% of the cores recovered from Hole U1581A and ~65% of those recovered from Hole U1581B. From cores with clear magnetic polarity, 19 reversals (m1–m19; Figures F30, F31, F32; Table T11) were identified and correlated to chrons in the geomagnetic polarity timescale (GPTS) from the GTS2020 (Ogg, 2020; Gradstein et al., 2020). These include Chrons C1n through C2Ar in Hole U1581A and Chrons C20r through C33n in Hole U1581B. Rock magnetic results indicate that the magnetic mineralogy comprises both ferrimagnetic and antiferromagnetic minerals. There is no observable trend in magnetic mineralogy with depth or between sedimentary units. AMS measurements indicate that the majority of samples from Site U1581 possess a typical oblate sedimentary fabric; however, samples from the basal ~75 m of Lithostratigraphic Subunit IIb possess a prolate fabric.
5.1. Discrete samples
Discrete sediment samples were analyzed from Cores 392-U1581A-1H through 41X (3.61–291.19 m CSF-A) and 392-U1581B-2R through 74R (291.86–993.53 m CSF-A). Core 392-U1581A-22H was not sampled because of poor recovery, and Core 25G (ghost core) was also not sampled. Two cores that were initially thought to span the K/Pg boundary (Cores 392-U1581B-17R and 18R) were also not sampled for discrete measurement. Step-wise AF demagnetization experiments were performed on all samples. AF steps were applied starting at 2 or 5 mT depending on the expected median destructive field estimated from archive-half results. AF steps were progressively increased until either the samples lost 90% of their natural remanent magnetization (NRM) or to a maximum applied field of 120 or 150 mT. This procedure was sufficient to reveal characteristic remanent magnetization (ChRM) directions for 31 of 39 discrete samples from Hole U1581A and 61 of 71 discrete samples from Hole U1581B. We note that despite the determination of ChRM directions, the majority of measured samples from Hole U1581B did not reach complete demagnetization using this procedure. This result suggests that the sediments from Lithostratigraphic Subunits Ib–IIb contain both high- and low-coercivity minerals, with the high-coercivity minerals not (or only partially) demagnetizing during AF treatment. Rock magnetic experiments corroborate this finding and are discussed below. In Hole U1581A, the quality of the demagnetization data decreases downcore, where from Cores 1H–18H (3.61–156.68 m CSF-A), 10 of 16 ChRM directions were determined using principal component analysis (PCA) (Kirschvink, 1980) using PuffinPlot software (Lurcock and Wilson, 2012), whereas only 4 of 17 ChRM directions were determined using PCA from Cores 19H–41X (163.97–291.19 m CSF-A). In Hole U1581B, the quality of demagnetization data was relatively high throughout, and 44 of 61 ChRM directions were determined using PCA. All ChRM directions not determined using PCA were determined using Fisher statistics (Fisher, 1953) on vector endpoints (Figure F25).
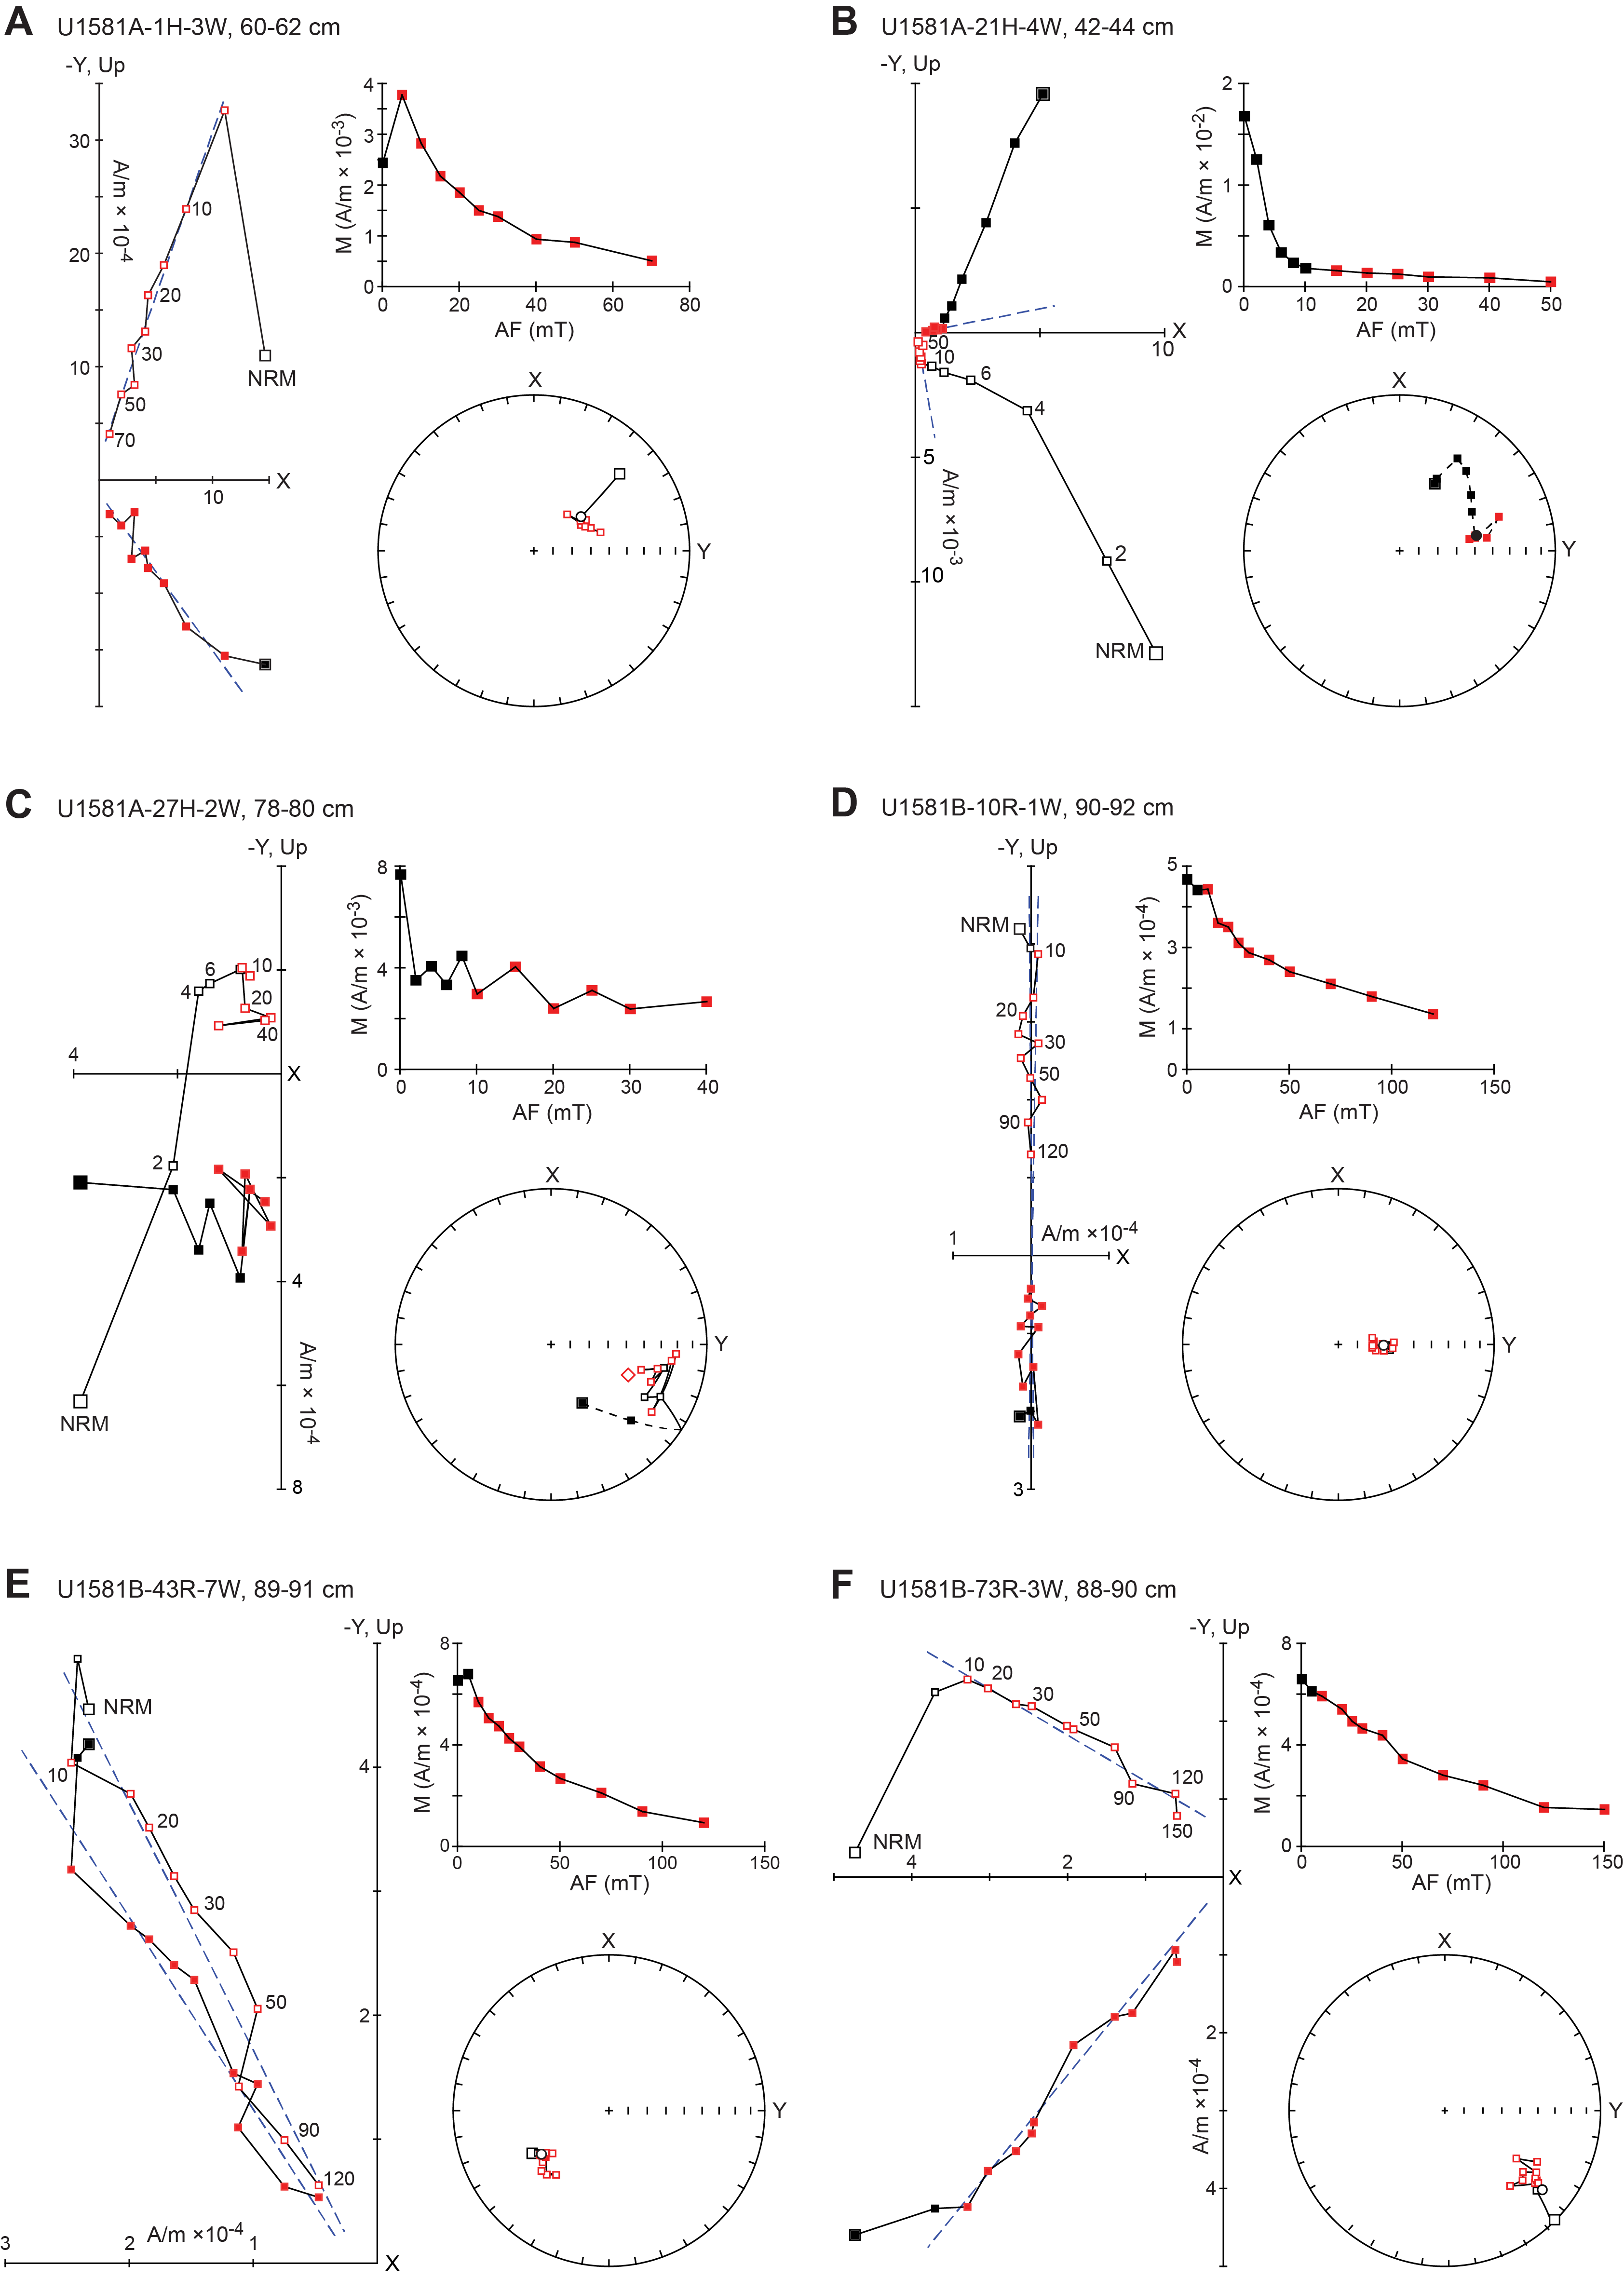
Figure F25. Demagnetization results.
Overall, ChRM directions are organized in two modes, either up-pointing (i.e., negative inclination), which indicates deposition during a normal geomagnetic field, or down-pointing (i.e., positive inclination), which indicates deposition during a reversed geomagnetic field. In Holes U1581A and U1581B, the inclination of the two modes are statistically antipodal (Figure F26), indicating that the determined ChRM directions are unaffected by secondary magnetic overprints and that they are most likely to be primary (Table T12). Specimens from Cores 392-U1581A-1H through 29H (3.63–232.77 m CSF-A) were collected from cores oriented for declination (except Cores 22H and 26H, for which the Icefield MI-5 core orientation tool was not used), and therefore the declination of the paleomagnetic directions with respect to geographic north can be determined. Declination values have preferred north-pointing for normal polarity samples and preferred south-pointing for reversed polarity samples (Figure F26A). However, the distribution of the two declination modes has a large scatter, and average directions were therefore calculated using the inclination-only protocol of McFadden and Reid (1982) (Table T12). In Hole U1581B, all specimens are unoriented because of the RCB drilling technique, and the declination of all directions is uniformly distributed around the vertical axis of the core (Figure F26B), which indicates the absence of pervasive overprinting induced by the drilling system.
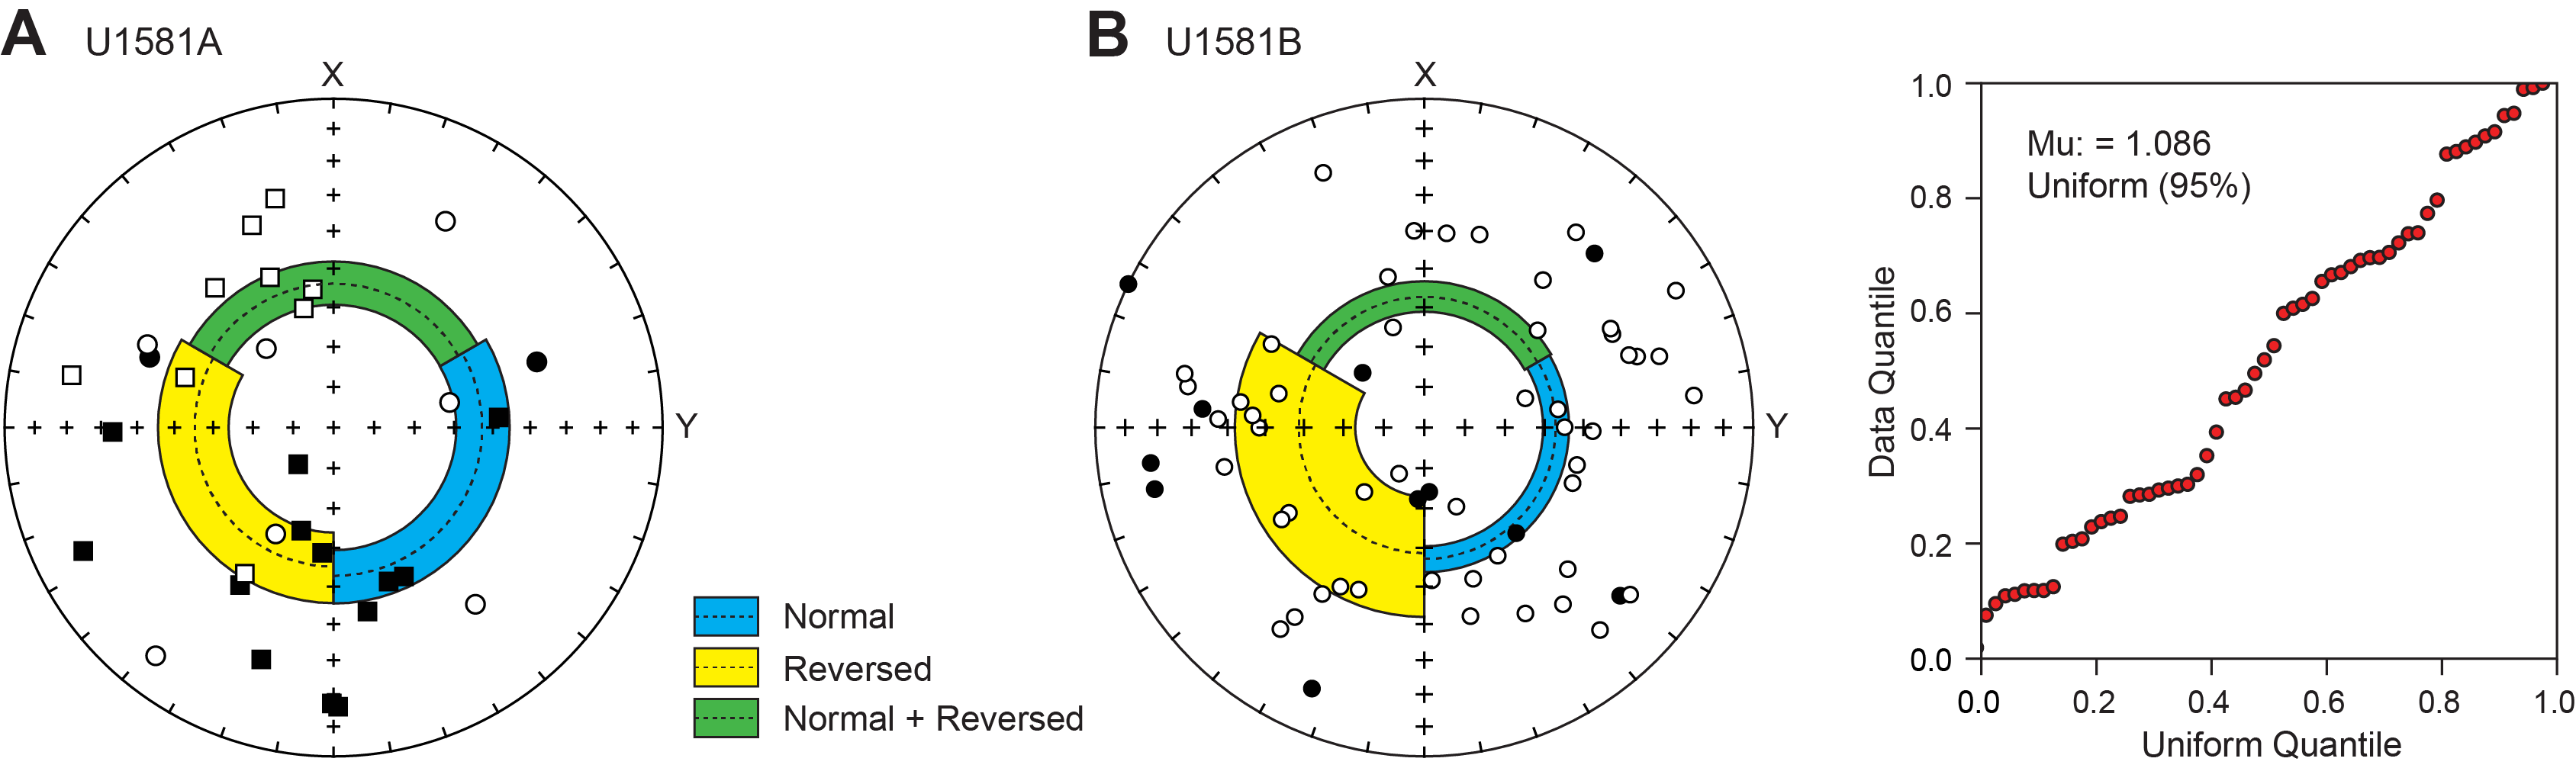
Figure F26. Equal-area projections.
In addition to AF demagnetization, discrete samples were also analyzed for AMS and IRM acquisition. Discrete measurements of MS (Figure F27D), normalized to volume, are consistent with measurements of whole-round cores. AMS experiments of samples from Hole U1581A show a very weak oblate (k1 ≈ k2 > k3, where ki are the axes of the AMS tensor) to triaxial (k1 > k2 > k3) tensor, and the minor AMS axes (k3) are oriented parallel to the (z-)axis of the cores (Figure F28A). Despite the preferred vertical orientation of the k3 axis (typical of undisturbed sediments), the anisotropy parameter (P′) is systematically <1.1 (Figure F28B), indicating the virtual absence of magnetic fabrics. Samples from Hole U1581B show a more pronounced sedimentary fabric, and V1 values (i.e., eigenvalues associated with the k1 axis of the AMS ellipsoid) are well distinguished from V2 and V3, which are statistically equal (Figure F28C). Comparing P′ values with the shape parameter (T), it is observed that the P′ values dominantly correlate with an oblate shape (Figure F28D). This trend, observable from 300 to ~925 m CSF-A, is interrupted in the lowermost ~75 m of the hole (Figure F28E), where the AMS fabric acquires a marked prolate shape (i.e., k1 > k2 ≈ k3), which is a feature normally associated with tectonically deformed sediments.
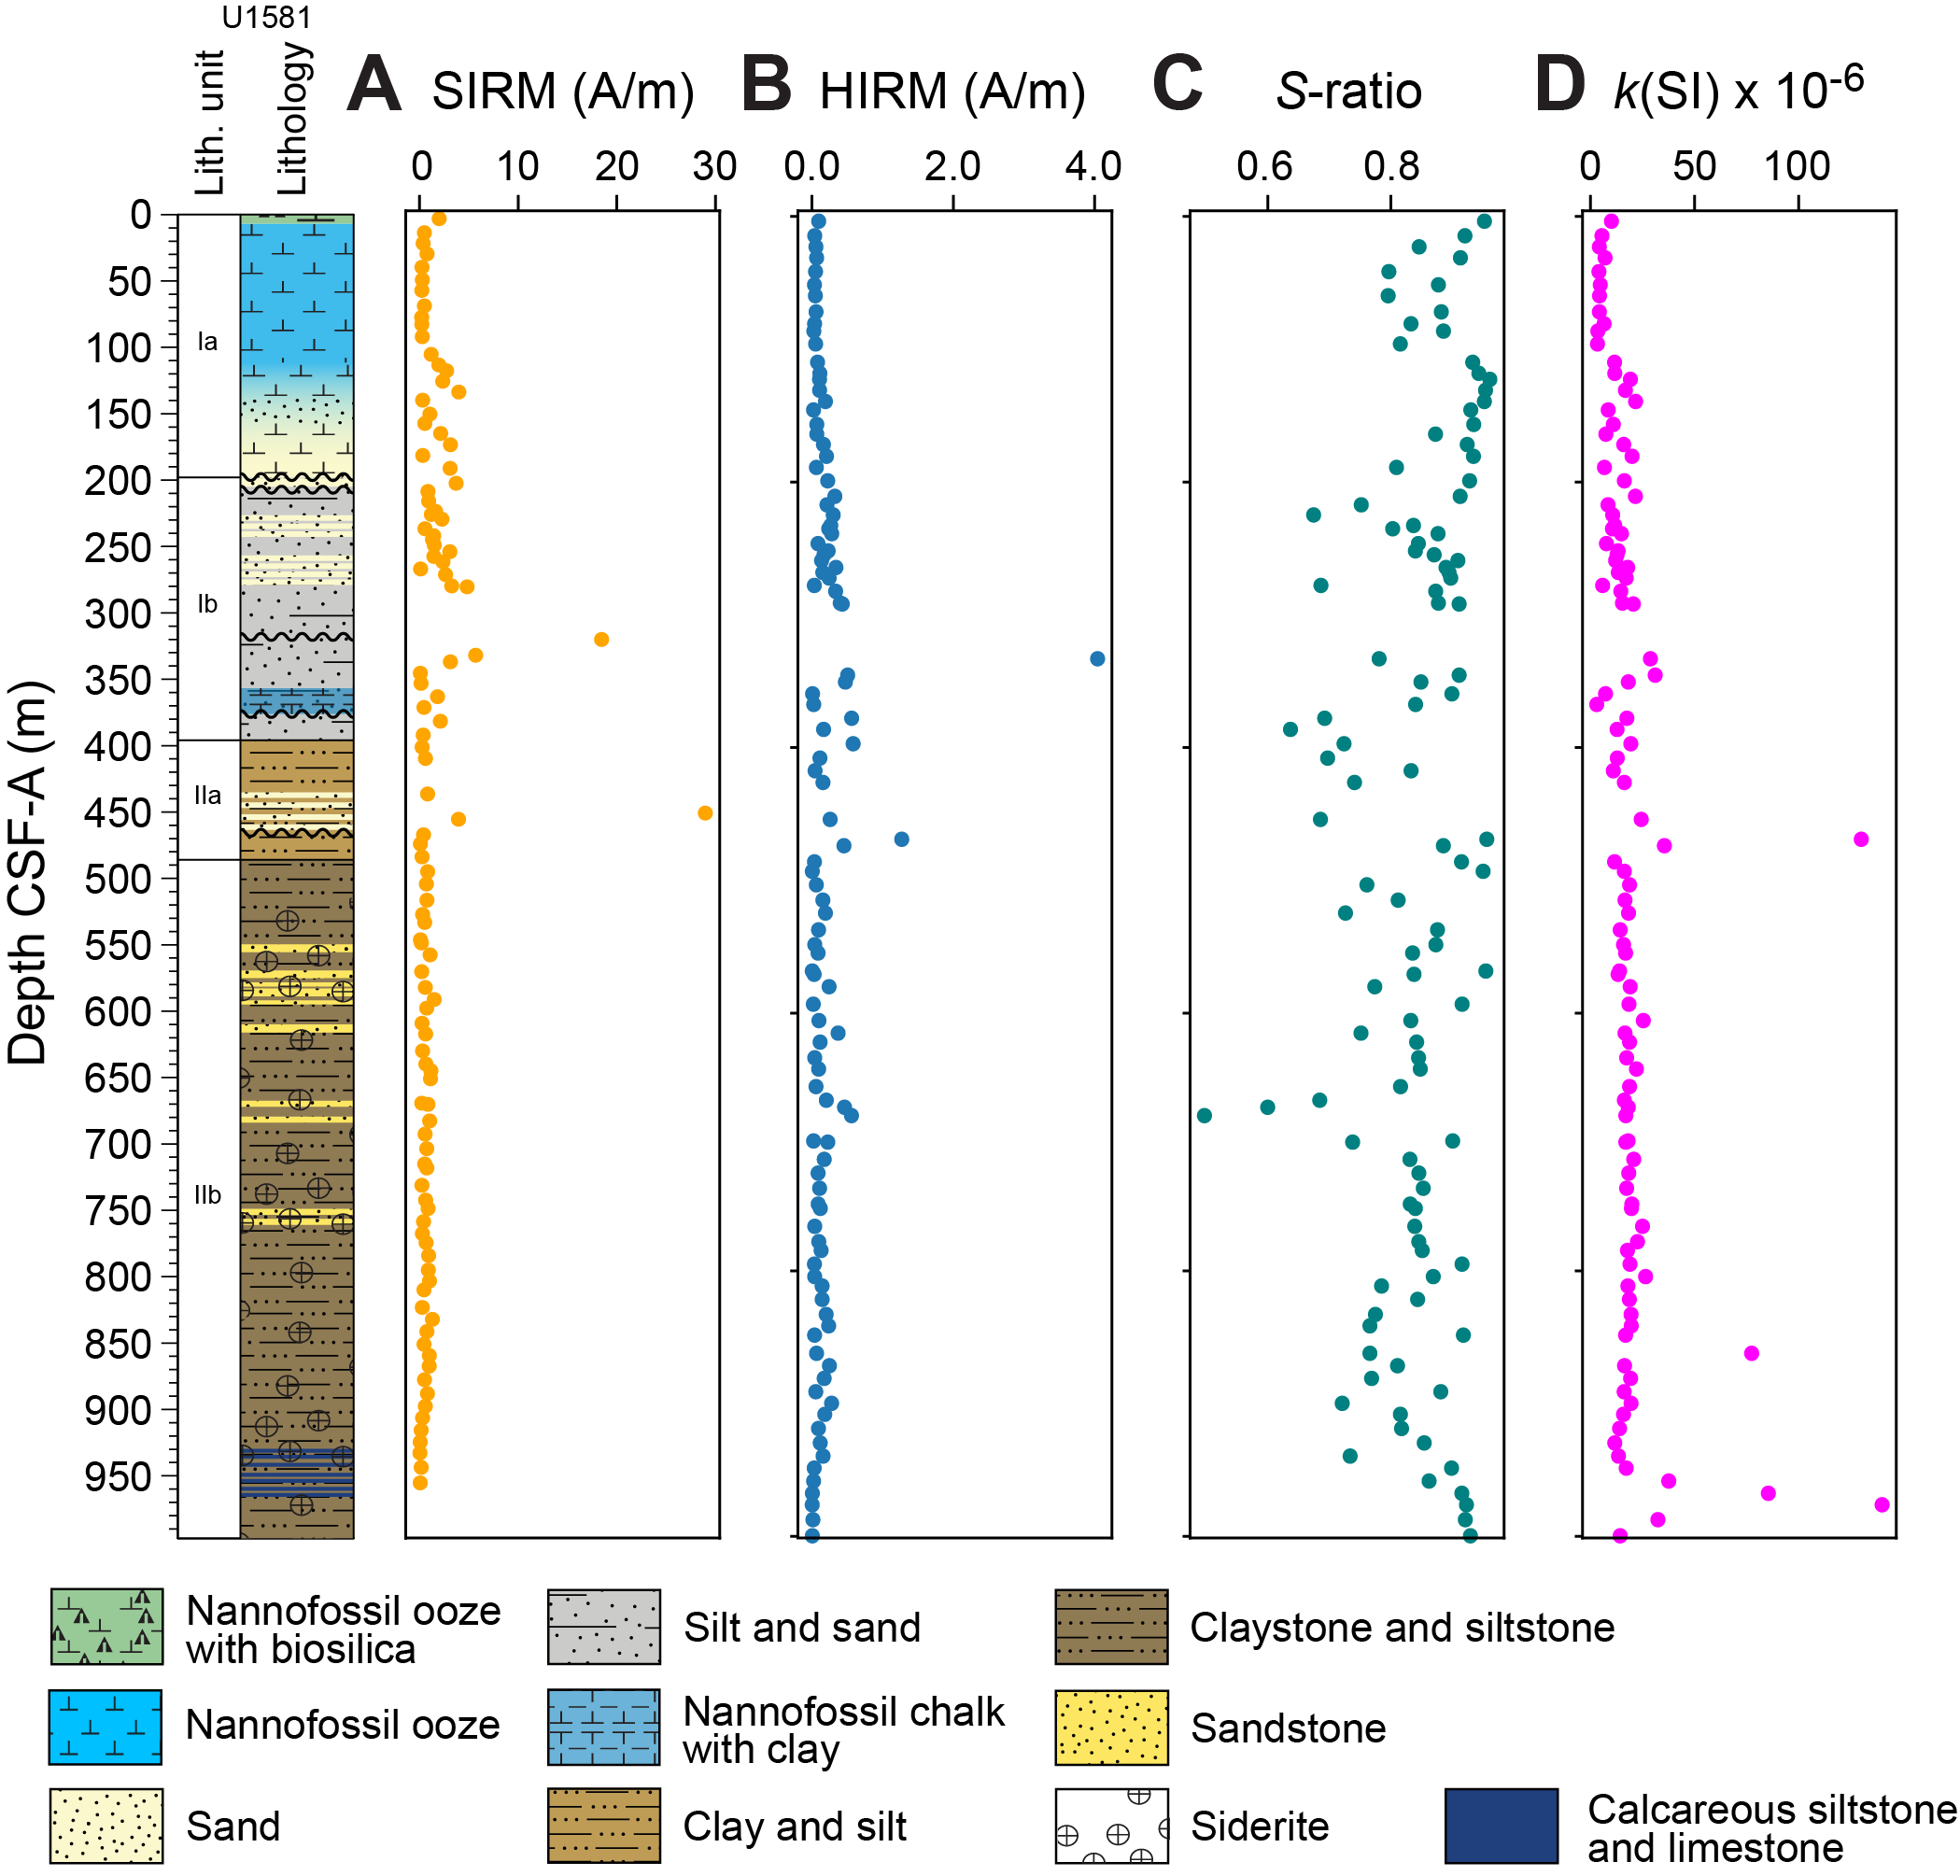
Figure F27. SIRM, HIRM, S -ratio, and MS.
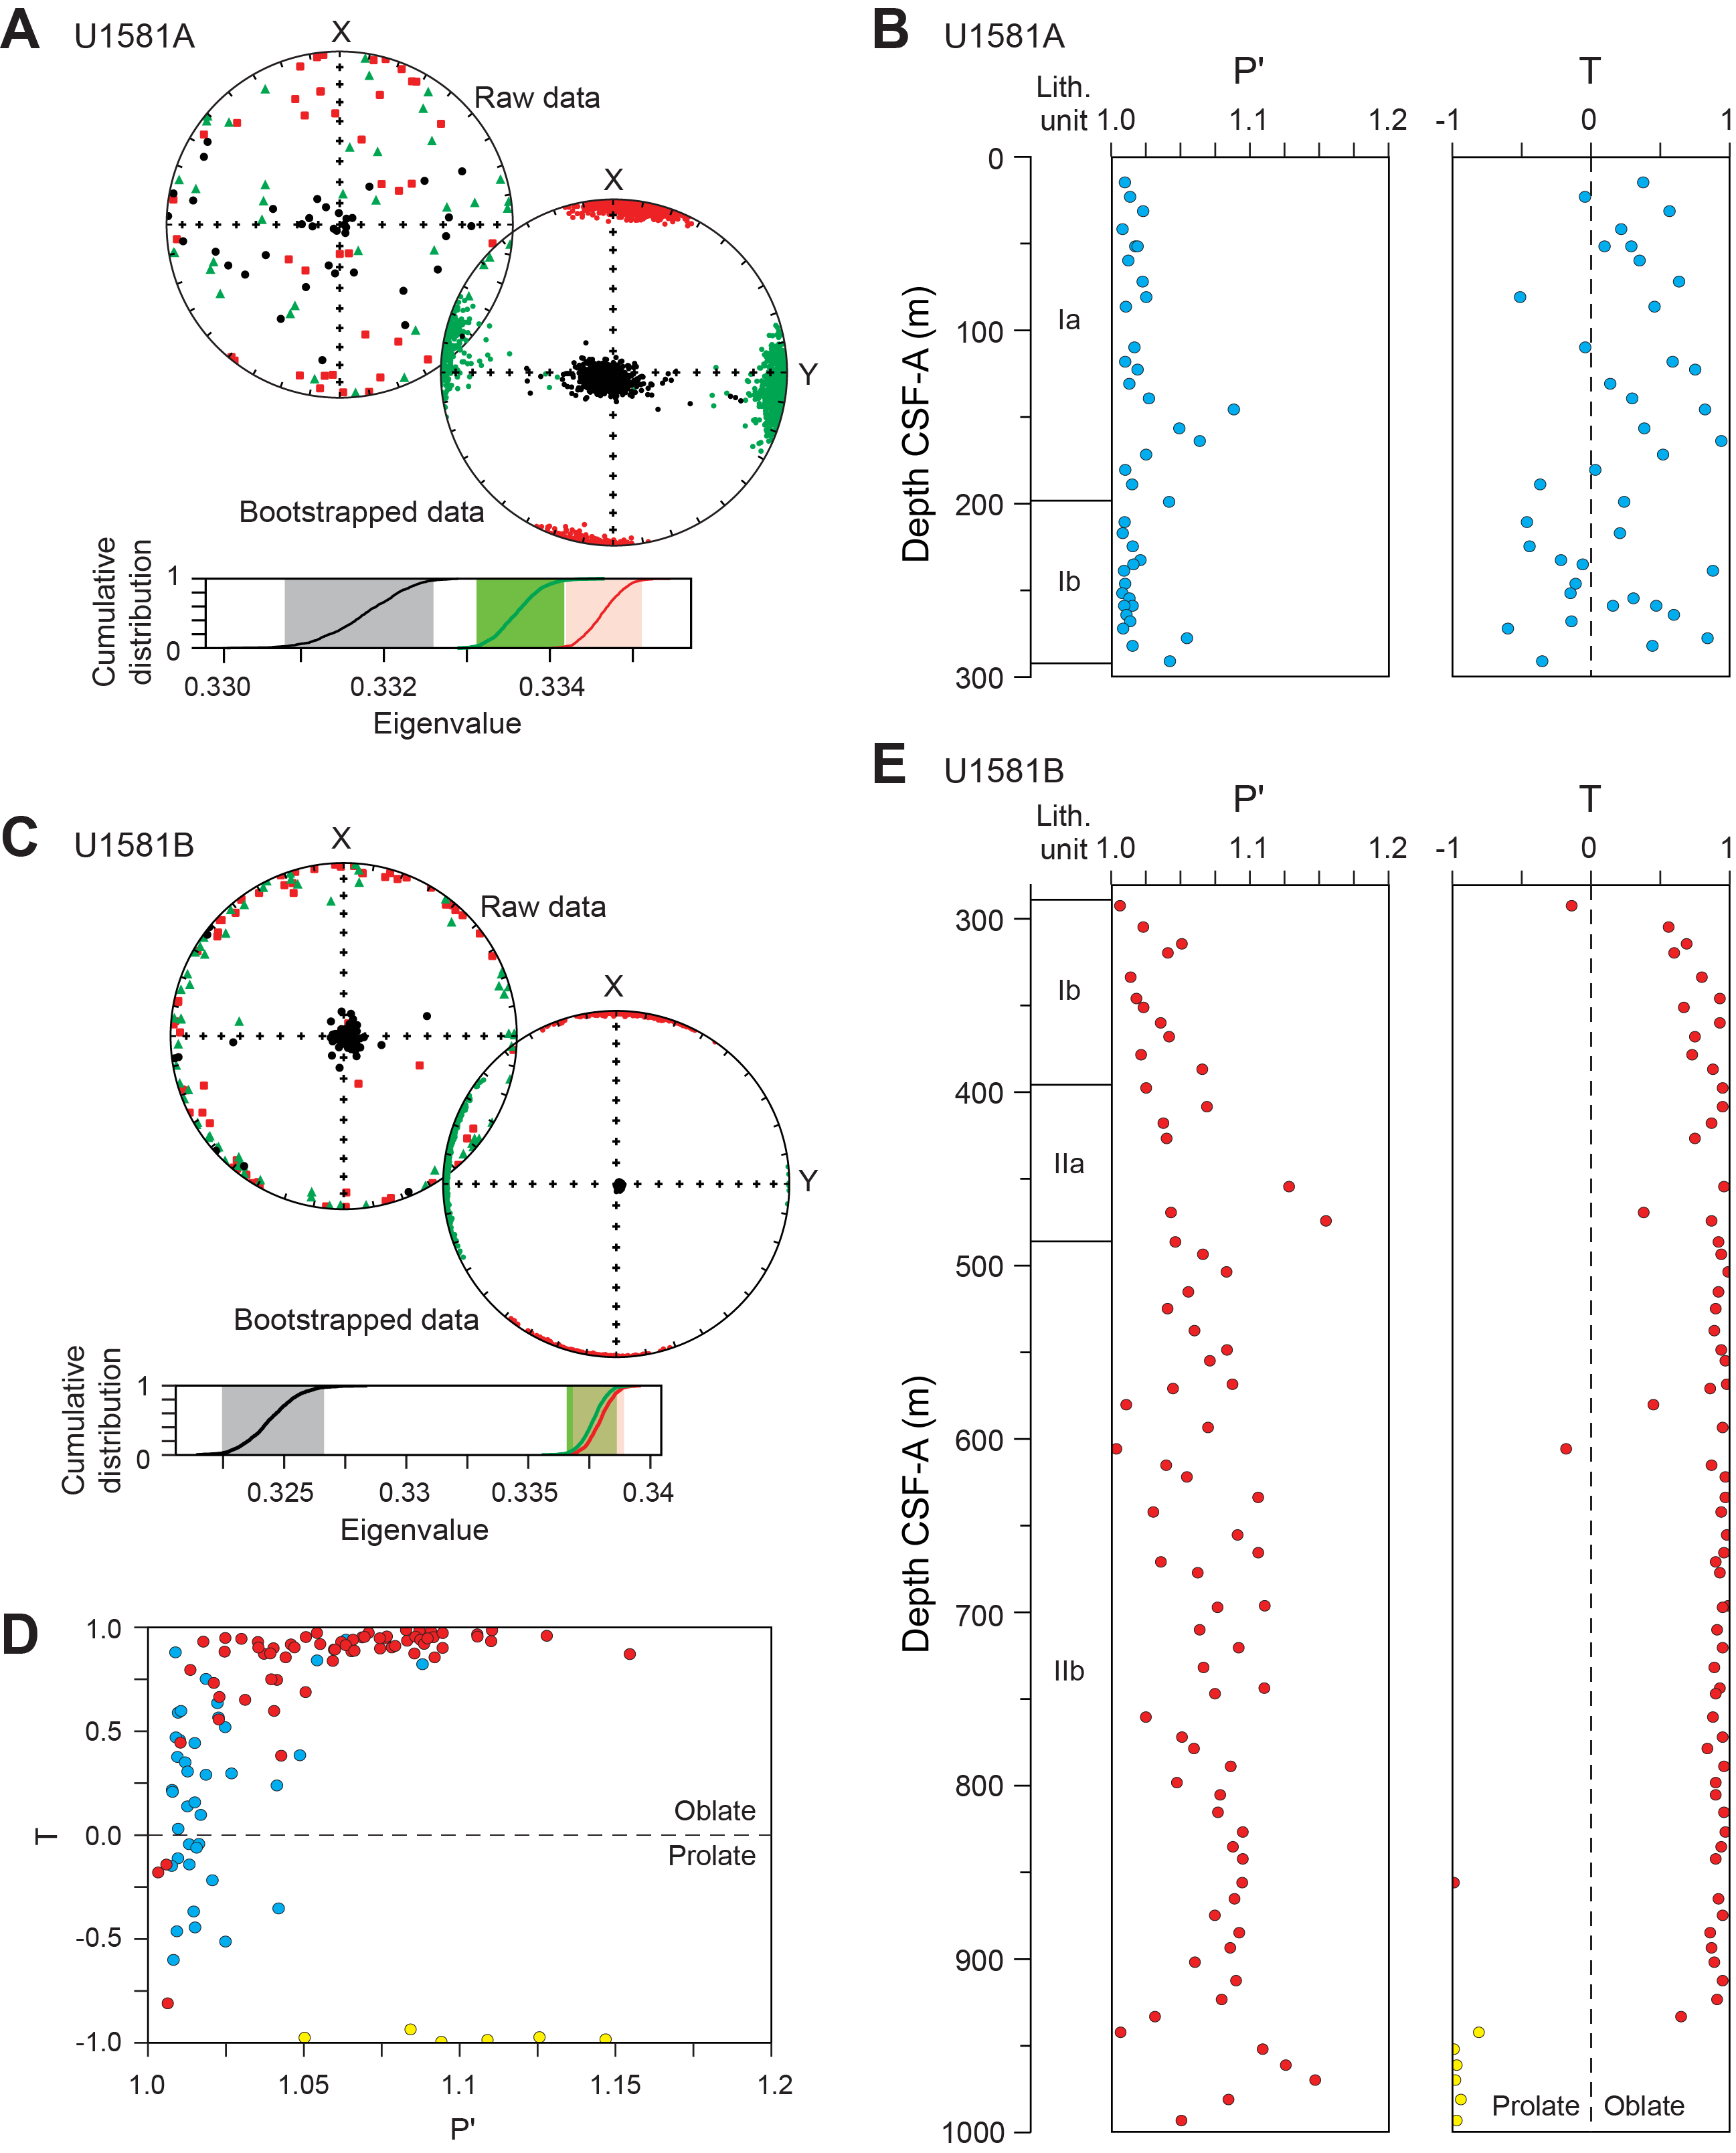
Figure F28. AMS analysis.
Hard IRM (HIRM), saturation IRM (SIRM), and S-ratios were calculated from IRM acquisition experiments (see Paleomagnetism in the Expedition 392 methods chapter [Uenzelmann-Neben et al., 2023a]). SIRM was acquired at an applied field of 1200 mT. HIRM is the contribution of high-coercivity minerals (e.g., hematite) to the total SIRM, and the S-ratio provides an estimate of the relative contribution of low-coercivity (soft) magnetic minerals (e.g., magnetite) to high-coercivity (hard) minerals (e.g., hematite) to the overall magnetic signal. To assess changes in magnetic mineralogy in the sediment column, calculated SIRM, HIRM, S-ratios, and susceptibility were plotted versus depth below seafloor (Figure F27). In Hole U1581A, S-ratios indicate the presence of both regions with dominantly low coercivity minerals (S-ratios = >0.9; ~100–150 m CSF-A) and regions with both low- and high-coercivity minerals (S-ratios = ~0.7> × ≤0.9; ~0–100 and 150–300 m CSF-A). A distinct change in SIRM, HIRM, and susceptibility is observed below ~100 m CSF-A: above this depth, each parameter remains at relatively low values with little variation between samples, whereas below this depth, values become more erratic and jump between lower values similar to those in the upper 100 m and values as much as four times higher. In Hole U1581B, S-ratios indicate that the majority of samples contain a mixture of both high- and low-coercivity minerals and S-ratios vary from >0.9 to as low as ~0.5. For most of the hole, S-ratios do not have a clear trend and vary erratically between ~0.6 and >0.9. Between ~650 and ~680 m CSF-A, S-ratios show a steep decline to a low of ~0.5, which is accompanied by an increase in SIRM and HIRM; however, S-ratios show a sharp increase back to higher values below this depth. Between 700 and 800 m CSF-A, S-ratios are consistently around 0.85 and then begin to vary more below 800 m CSF-A. Finally, between 970 and ~1000 m CSF-A, values are consistently high (S-ratios = >0.9). There are no distinct downhole trends in SIRM, HIRM, or susceptibility and no marked differences between lithostratigraphic units. SIRM values generally range 0–5 A/m, and most HIRM values range 0–0.4 A/m.
5.2. Archive-half measurements
Downhole paleomagnetic NRM measurements in Hole U1581A show a gentle magnetization intensity decrease to Core 5H (~40 m CSF-A) followed by a gradual increase that peaks at Core 13H (~120 m CSF-A); this peak is then sustained to the bottom of the hole (Figure F23). In Hole U1581B, NRM values remain at about the same levels (1 × 10⁻³ to 1 × 10⁻⁴ A/m) throughout the hole (Figure F23). However, in Cores 392-U1581B-17R through 21R (434.5–479.25 m CSF-A) there is a distinct increase in NRM intensity of about two orders of magnitude that drops back to 1 × 10⁻³ to 1 × 10⁻⁴ A/m at Core 22R (483 m CSF-A). All archive halves from both holes, except those with poor recovery, infilled sand, and the ghost core, were subjected to low-field AF demagnetization with a maximum applied AF step of either 15 or 20 mT. Discrete sample analysis shows that demagnetization to these values is generally sufficient to remove secondary overprints and provides a good approximation for ChRM directions. Cores 392-U1581A-1H through 29H (0.0–233.79 m CSF-A) were cored using the APC system and oriented using the Icefield MI-5 (except Cores 22H and 26H). However, declination results were noisy; therefore, only inclination values were used to determine polarity. Cores 30F–38F (233.80–276.27 m CSF-A) were drilled using the HLAPC system, and Cores 39X–41X (276.1–292.11 m CSF-A) were cored using the XCB system, neither of which were oriented. All cores in Hole U1581B (289–994.02 m CSF-A) were RCB cored and therefore not oriented. For unoriented cores, only inclination was used to determine polarity.
To average out noise and aid determination of magnetic polarity, a 15 point moving average was applied to the measured inclination data. In Hole U1581A, the paleomagnetic signal in Cores 1H–16H (0.0–142.46 m CSF-A) is good, and there are reliable intervals of consistent inclination values where polarity could be determined. Both intervals of positive and negative inclination values are observed, indicating that both normal and reversed polarity occur (Figure F29A). Below Core 16H (>143.5 m CSF-A), the paleomagnetic signal is noisy and difficult to interpret. In Hole U1581B, the paleomagnetic signal was of variable quality. For Cores 2R–27R (289–541.53 m CSF-A), the signal is predominantly noisy and polarity intervals are difficult to identify. However, a few clear regions of consistent inclination values exist, and seven reversals were identified in this interval (see Magnetostratigraphy for more detail). Below Core 27R (>541.2 m CSF-A), the paleomagnetic signal is less noisy and clear intervals of stable inclination were identified. These include intervals of both positive and negative inclination, showing both polarity states. Cores 42R–74R (677–994.02 m CSF-A) all have negative inclination values, suggesting deposition during a long normal polarity interval. This extended interval of normal polarity shows a clear peak in inclination values at approximately −45° (Figure F29B). Inclination values in this interval additionally show a shallowing trend with increasing depth, possibly indicating a change in paleolatitude; alternatively, this trend could be the result of increasing sediment compaction. It is also possible that this trend is due to less complete removal of a secondary overprint downhole.
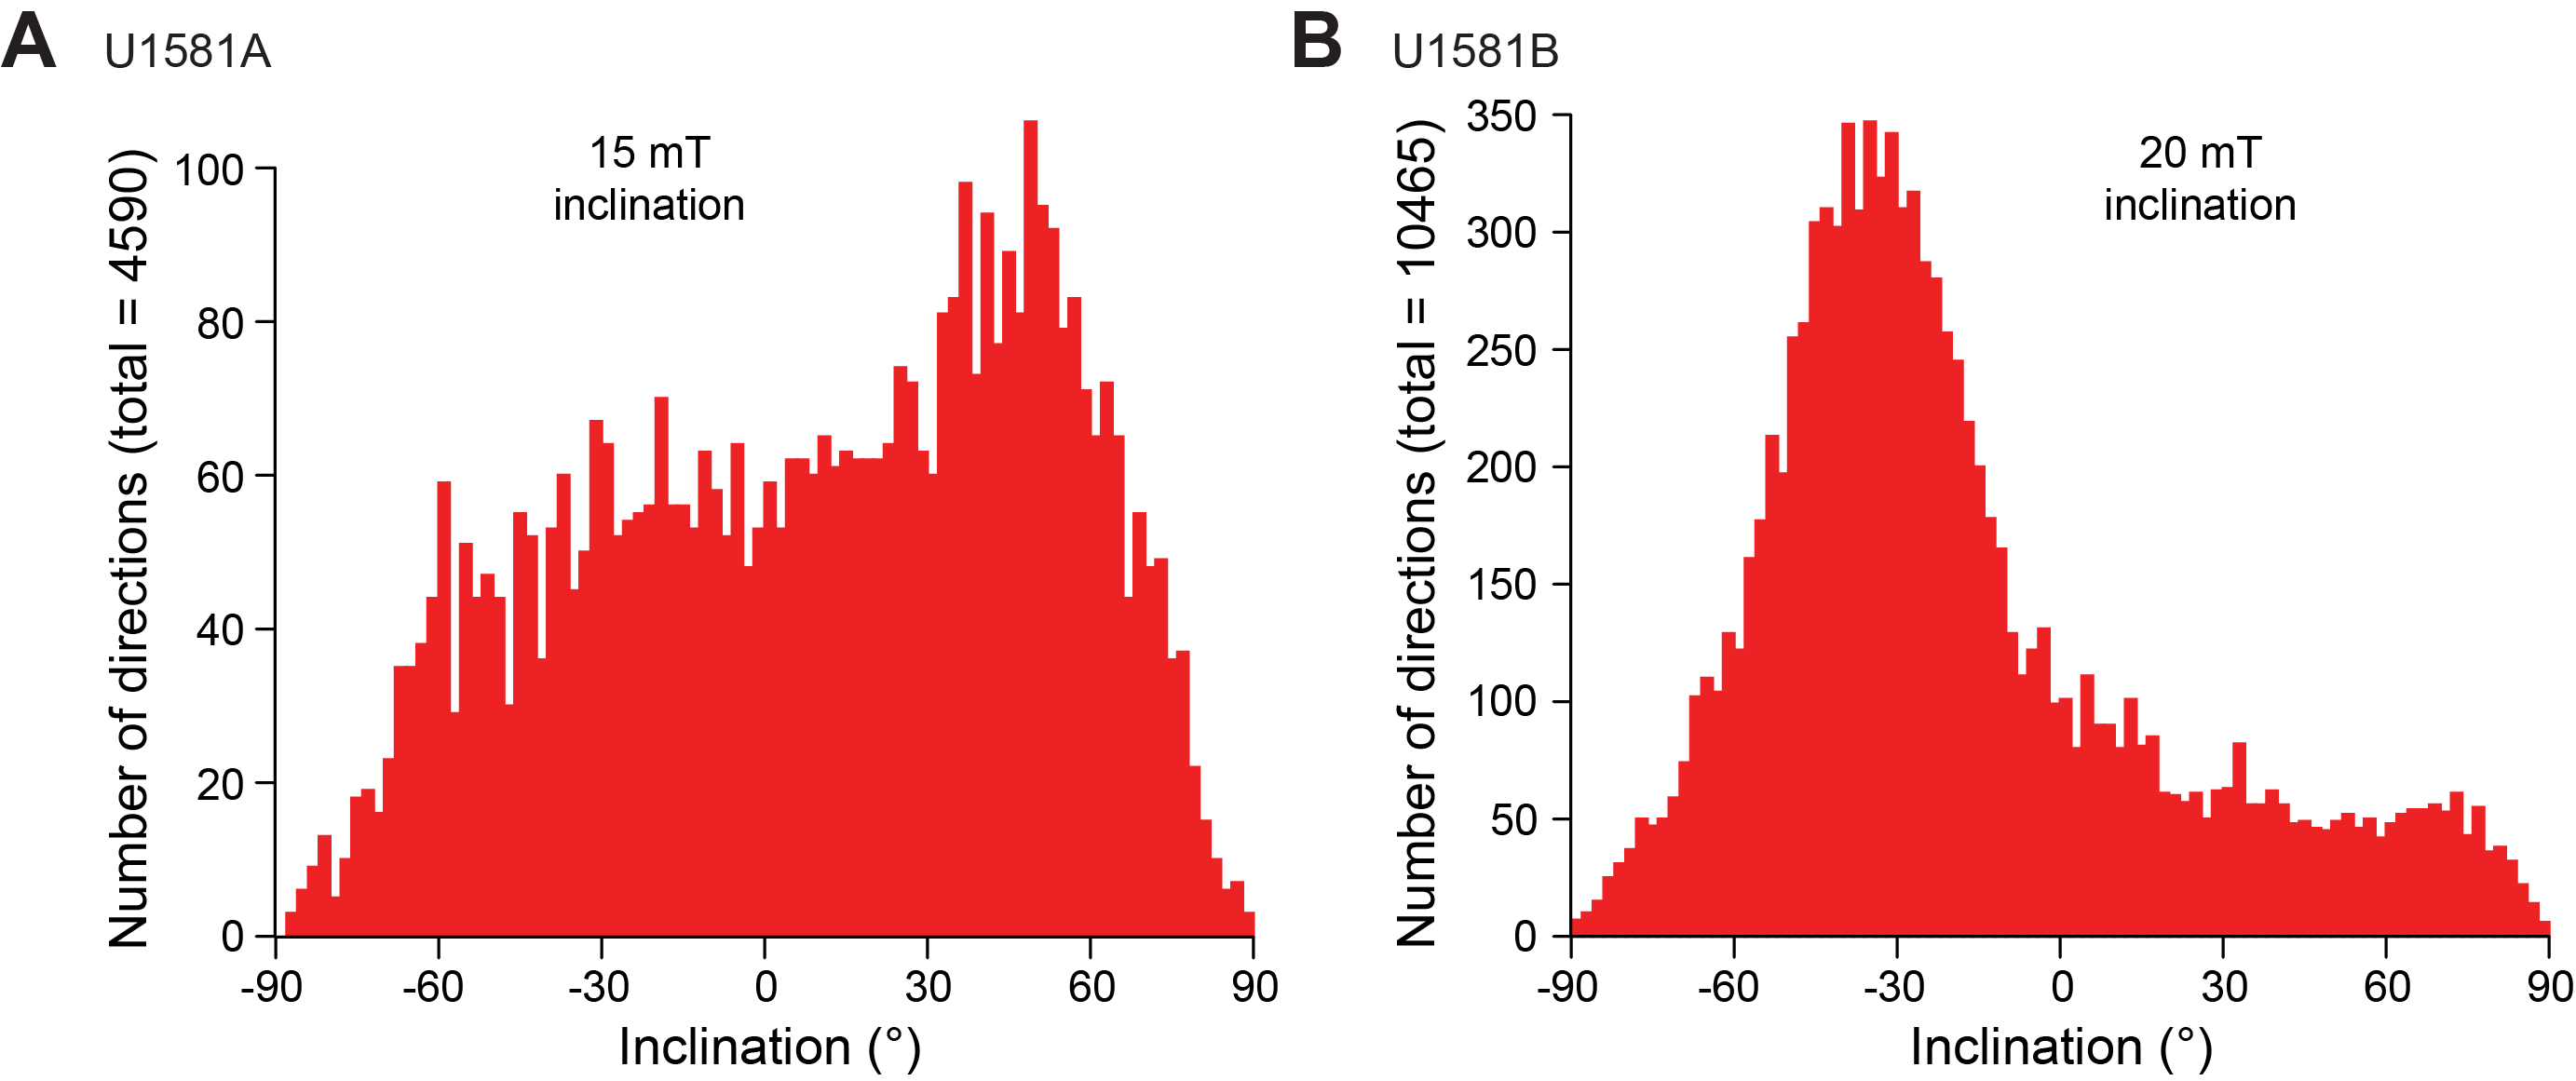
Figure F29. Magnetic inclination data.
5.2.1. Magnetostratigraphy
Throughout Site U1581, there is excellent agreement between inclination values at the last demagnetization step of the archive halves (Hole U1581A = 15 mT; Hole U1581B = 20 mT) and the ChRM inclinations obtained from the discrete samples collected from the working halves. In Cores 392-U1581A-1H through 16H (0.0–142.46 m CSF-A), eight clear magnetic reversals were identified (m1–m8; Figures F30, F31; Table T11). Combining these results with biostratigraphic data, these reversals were successfully correlated to the GPTS (Ogg, 2020) and span from near the base of Chron C1n to the top of Chron C2An.2n (~0.773–3.116 Ma; Pleistocene–Pliocene) (Figure F23; Table T11). Biostratigraphic data identify two hiatuses at Cores 23H–24H and 24H–26H, truncating a large part of the Miocene succession and assigning most of the rest of Hole U1581A to the Oligocene epoch. Unfortunately, data quality was too poor in Cores 17H–41X (143.5–292.11 m CSF-A) to correlate to the GPTS (Figure F23).
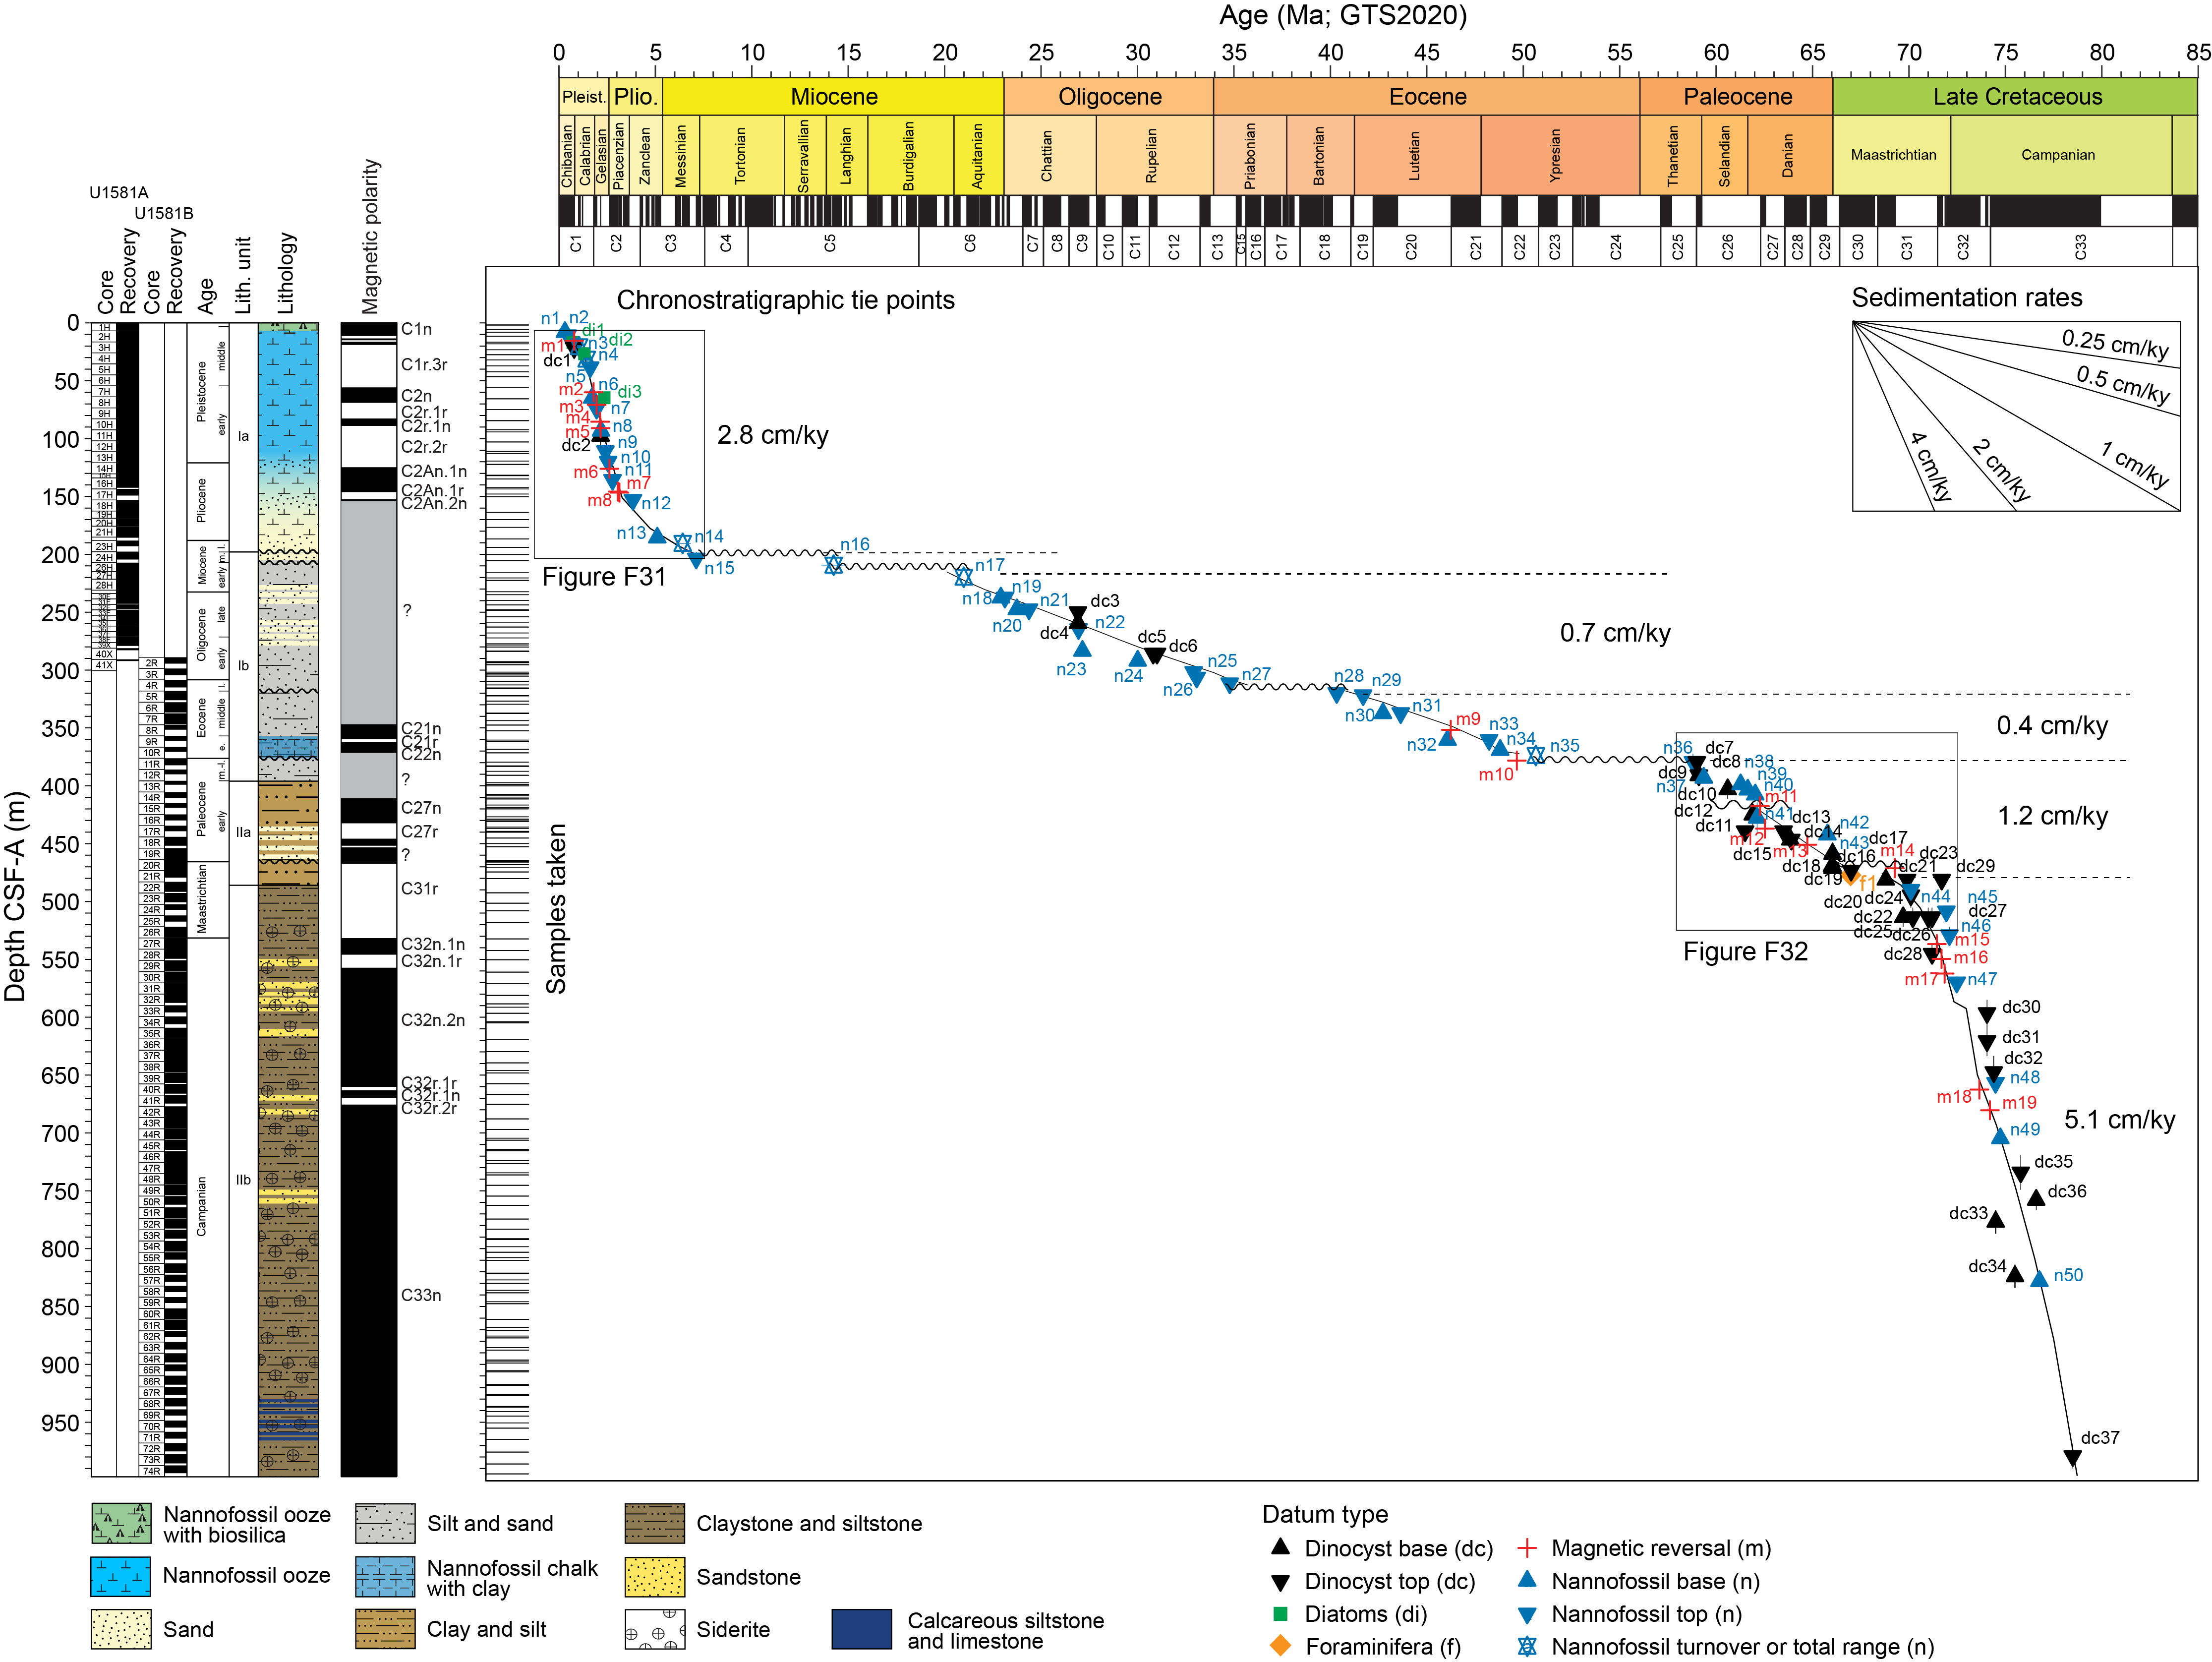
Figure F30. Age-depth model and average sedimentation rates.
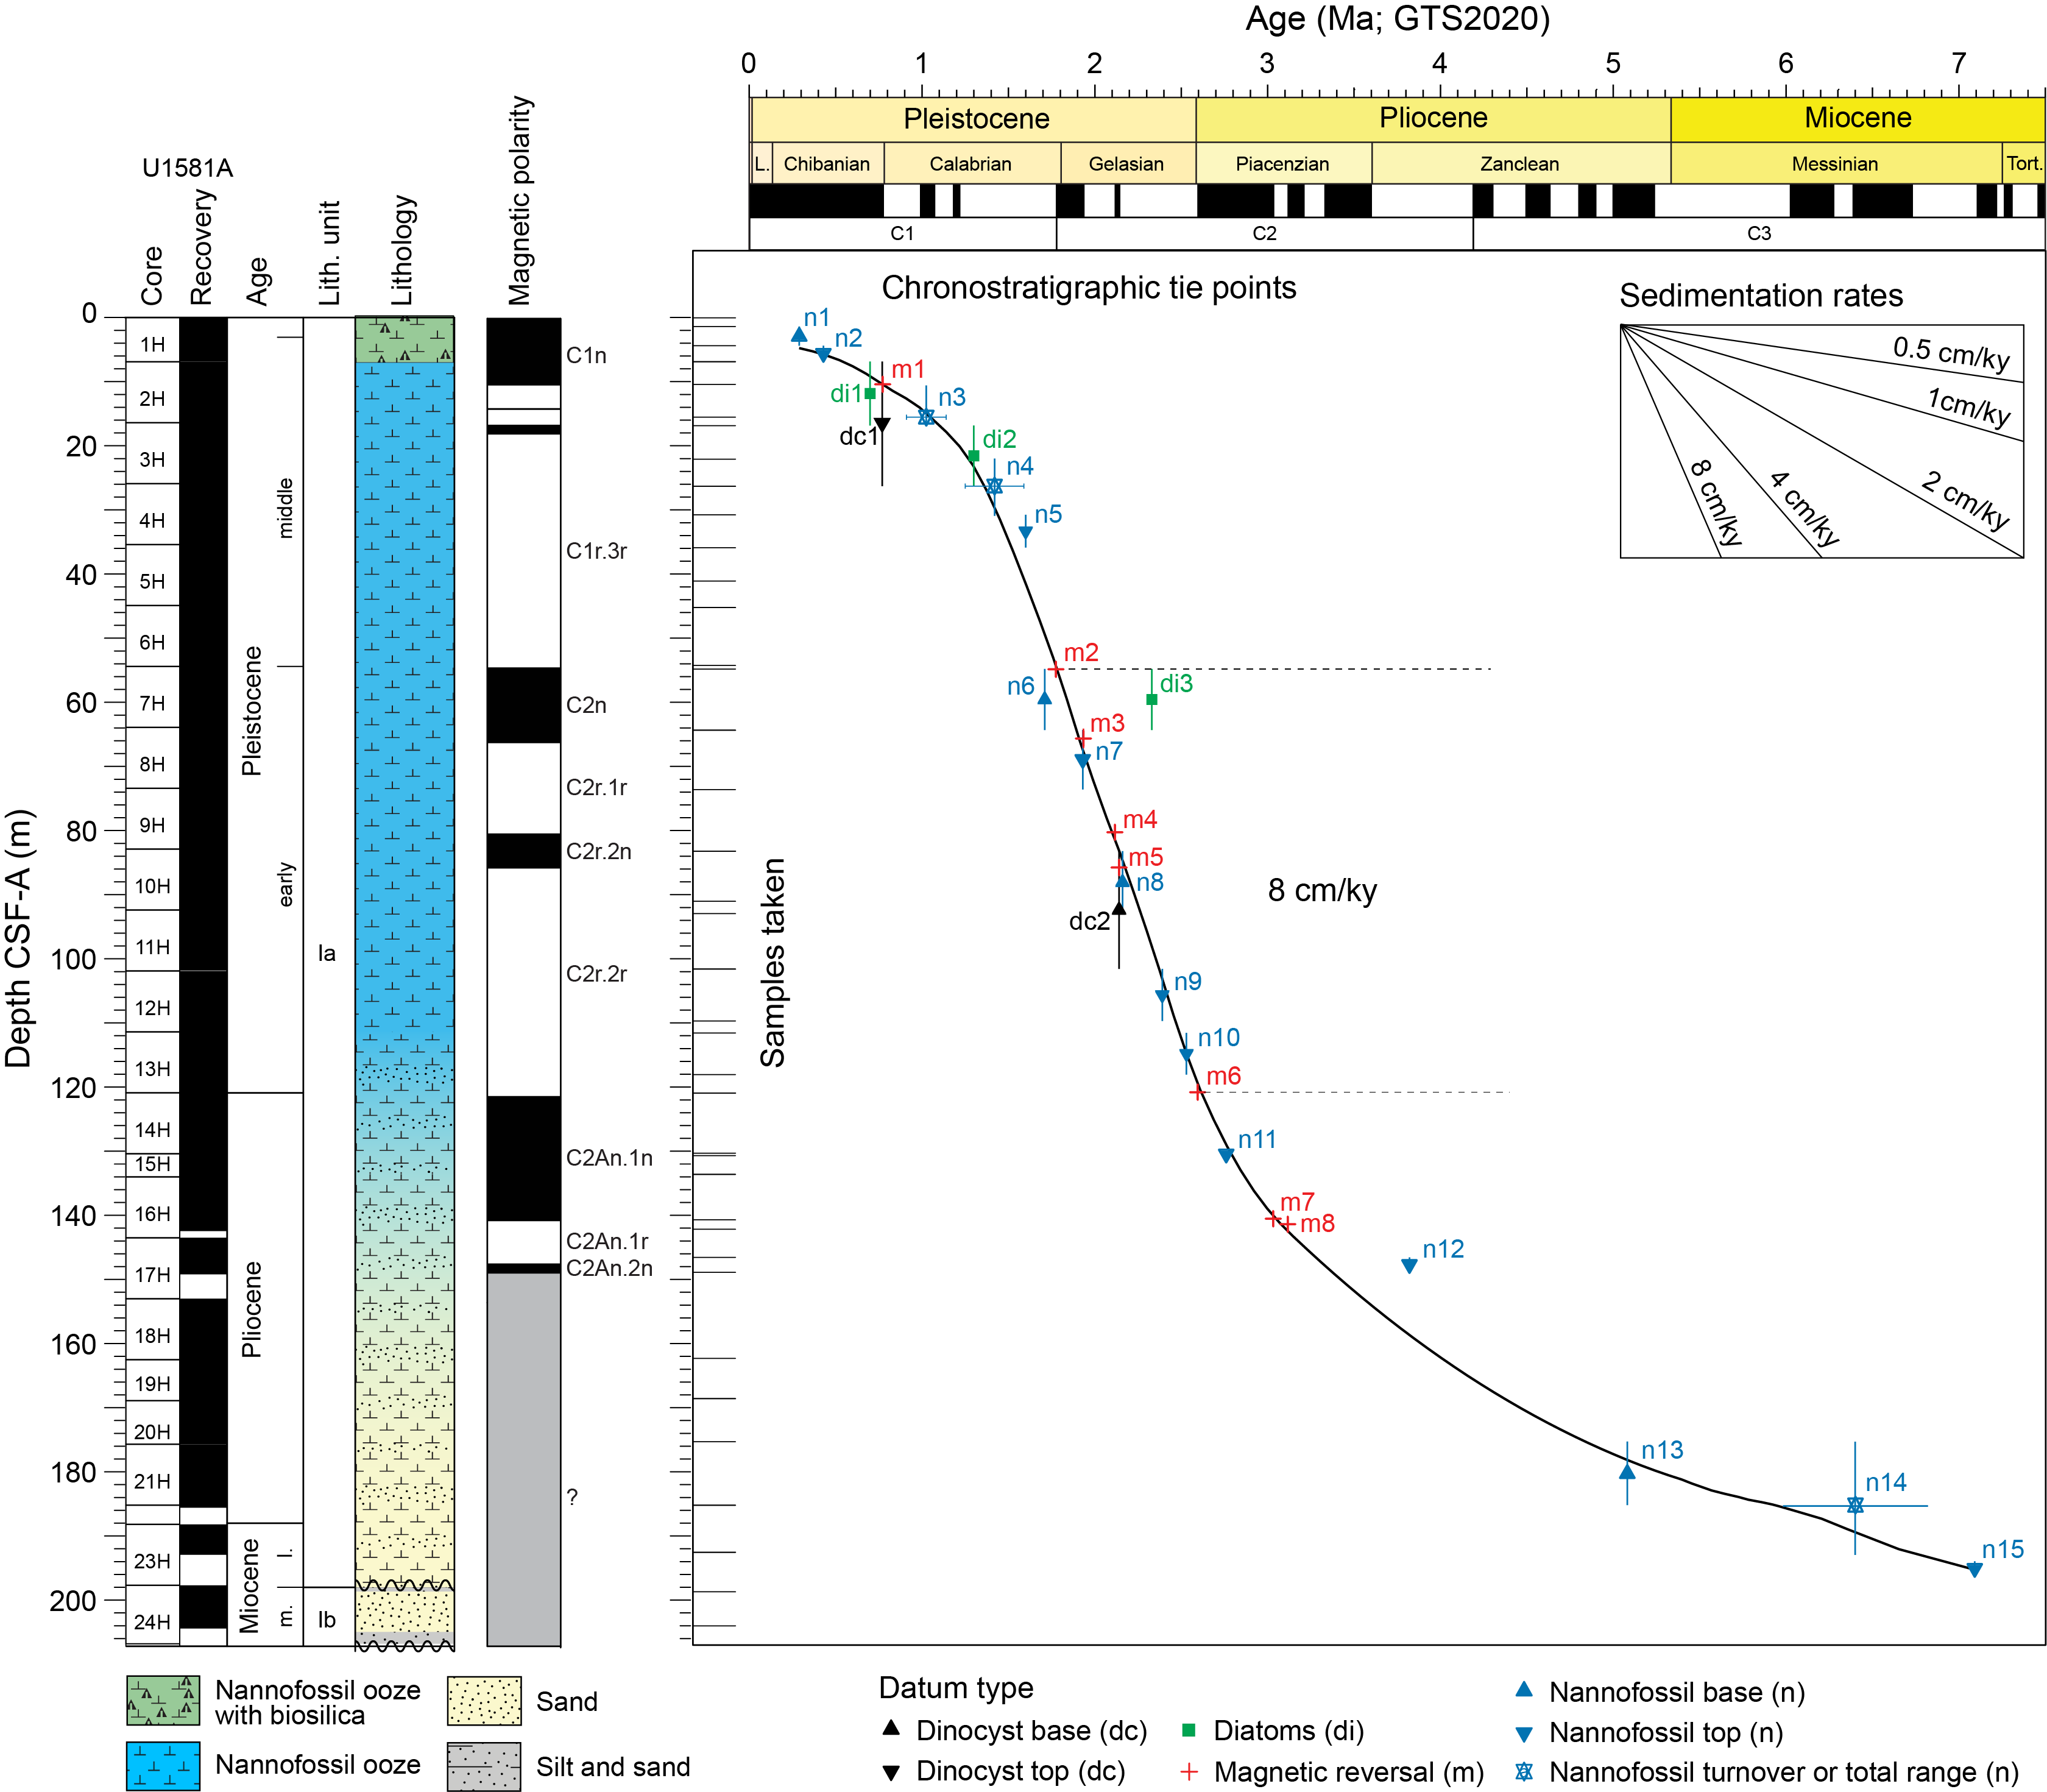
Figure F31. Age-depth model, uppermost 200 m of sediment.
In Hole U1581B, data quality from Cores 2R–26R (289.0–531.51 m CSF-A) was poor. However, from these data, seven reversals were identified (m9–m14; Figures F30, F32; Table T11). In combination with the biostratigraphic constraints, these reversals were correlated to Chrons C20r/C21n (~346.81 m CSF-A), C22n/C22r (~373.41 m CSF-A), C26r/C27n (~412.70 m CSF-A), C27n/C27r (~432.21 m CSF-A), C27r/C28n (~446.13 m CSF-A), and C31n/C31r (~466.48 m CSF-A), spanning from ~46.235 to 69.271 Ma (Figure F24; Table T11). Note that the magnetic reversal from normal to reversed polarity (upsection) in Core 18R (446.13 m CSF-A) could correlate with either the Chron C28r/C29n or C27r/C28n boundary. The correlation of this reversal to Chron C28r/C29n boundary is consistent with the earliest Danian age indicated by dinocyst assemblages (see Chronostratigraphy). However, there is evidence for a potential zone of reversed polarity near the base of Core 18R, with the top of Core 19R showing normal polarity, which is more consistent with the assignment of the reversal at 446.13 m CSF-A to the Chron C27r/C28n boundary. For now, the reversal at 446.13 m CSF-A is tentatively assigned to the C27r/C28n boundary but this may change with postcruise research. Based on the available biostratigraphic constraints, the predominantly normal polarity interval between Cores 18R and 20R is tentatively correlated with Chrons C28n to C31n. This stratigraphic interval straddles the K/Pg boundary, the position of which at present is not precisely determined (see Chronostratigraphy). With finer scale magnetic and biostratigraphic sampling postcruise, it is possible that this chron assignment will change. We also note that based on biostratigraphic constraints, additional unconformities exist between Cores 2R and 27R. The timing and duration of these unconformities will be better resolved in postcruise research and may result in chron assignment changes. In Cores 27R–74R (531.5–994.02 m CSF-A), five magnetic reversals were identified and were successfully correlated to Chrons C31r to C33n (71.451–74.201 Ma) (m15–m19; Figures F24, F30; Table T11). In this interval, sedimentation rate was relatively continuous and high (see Chronostratigraphy).
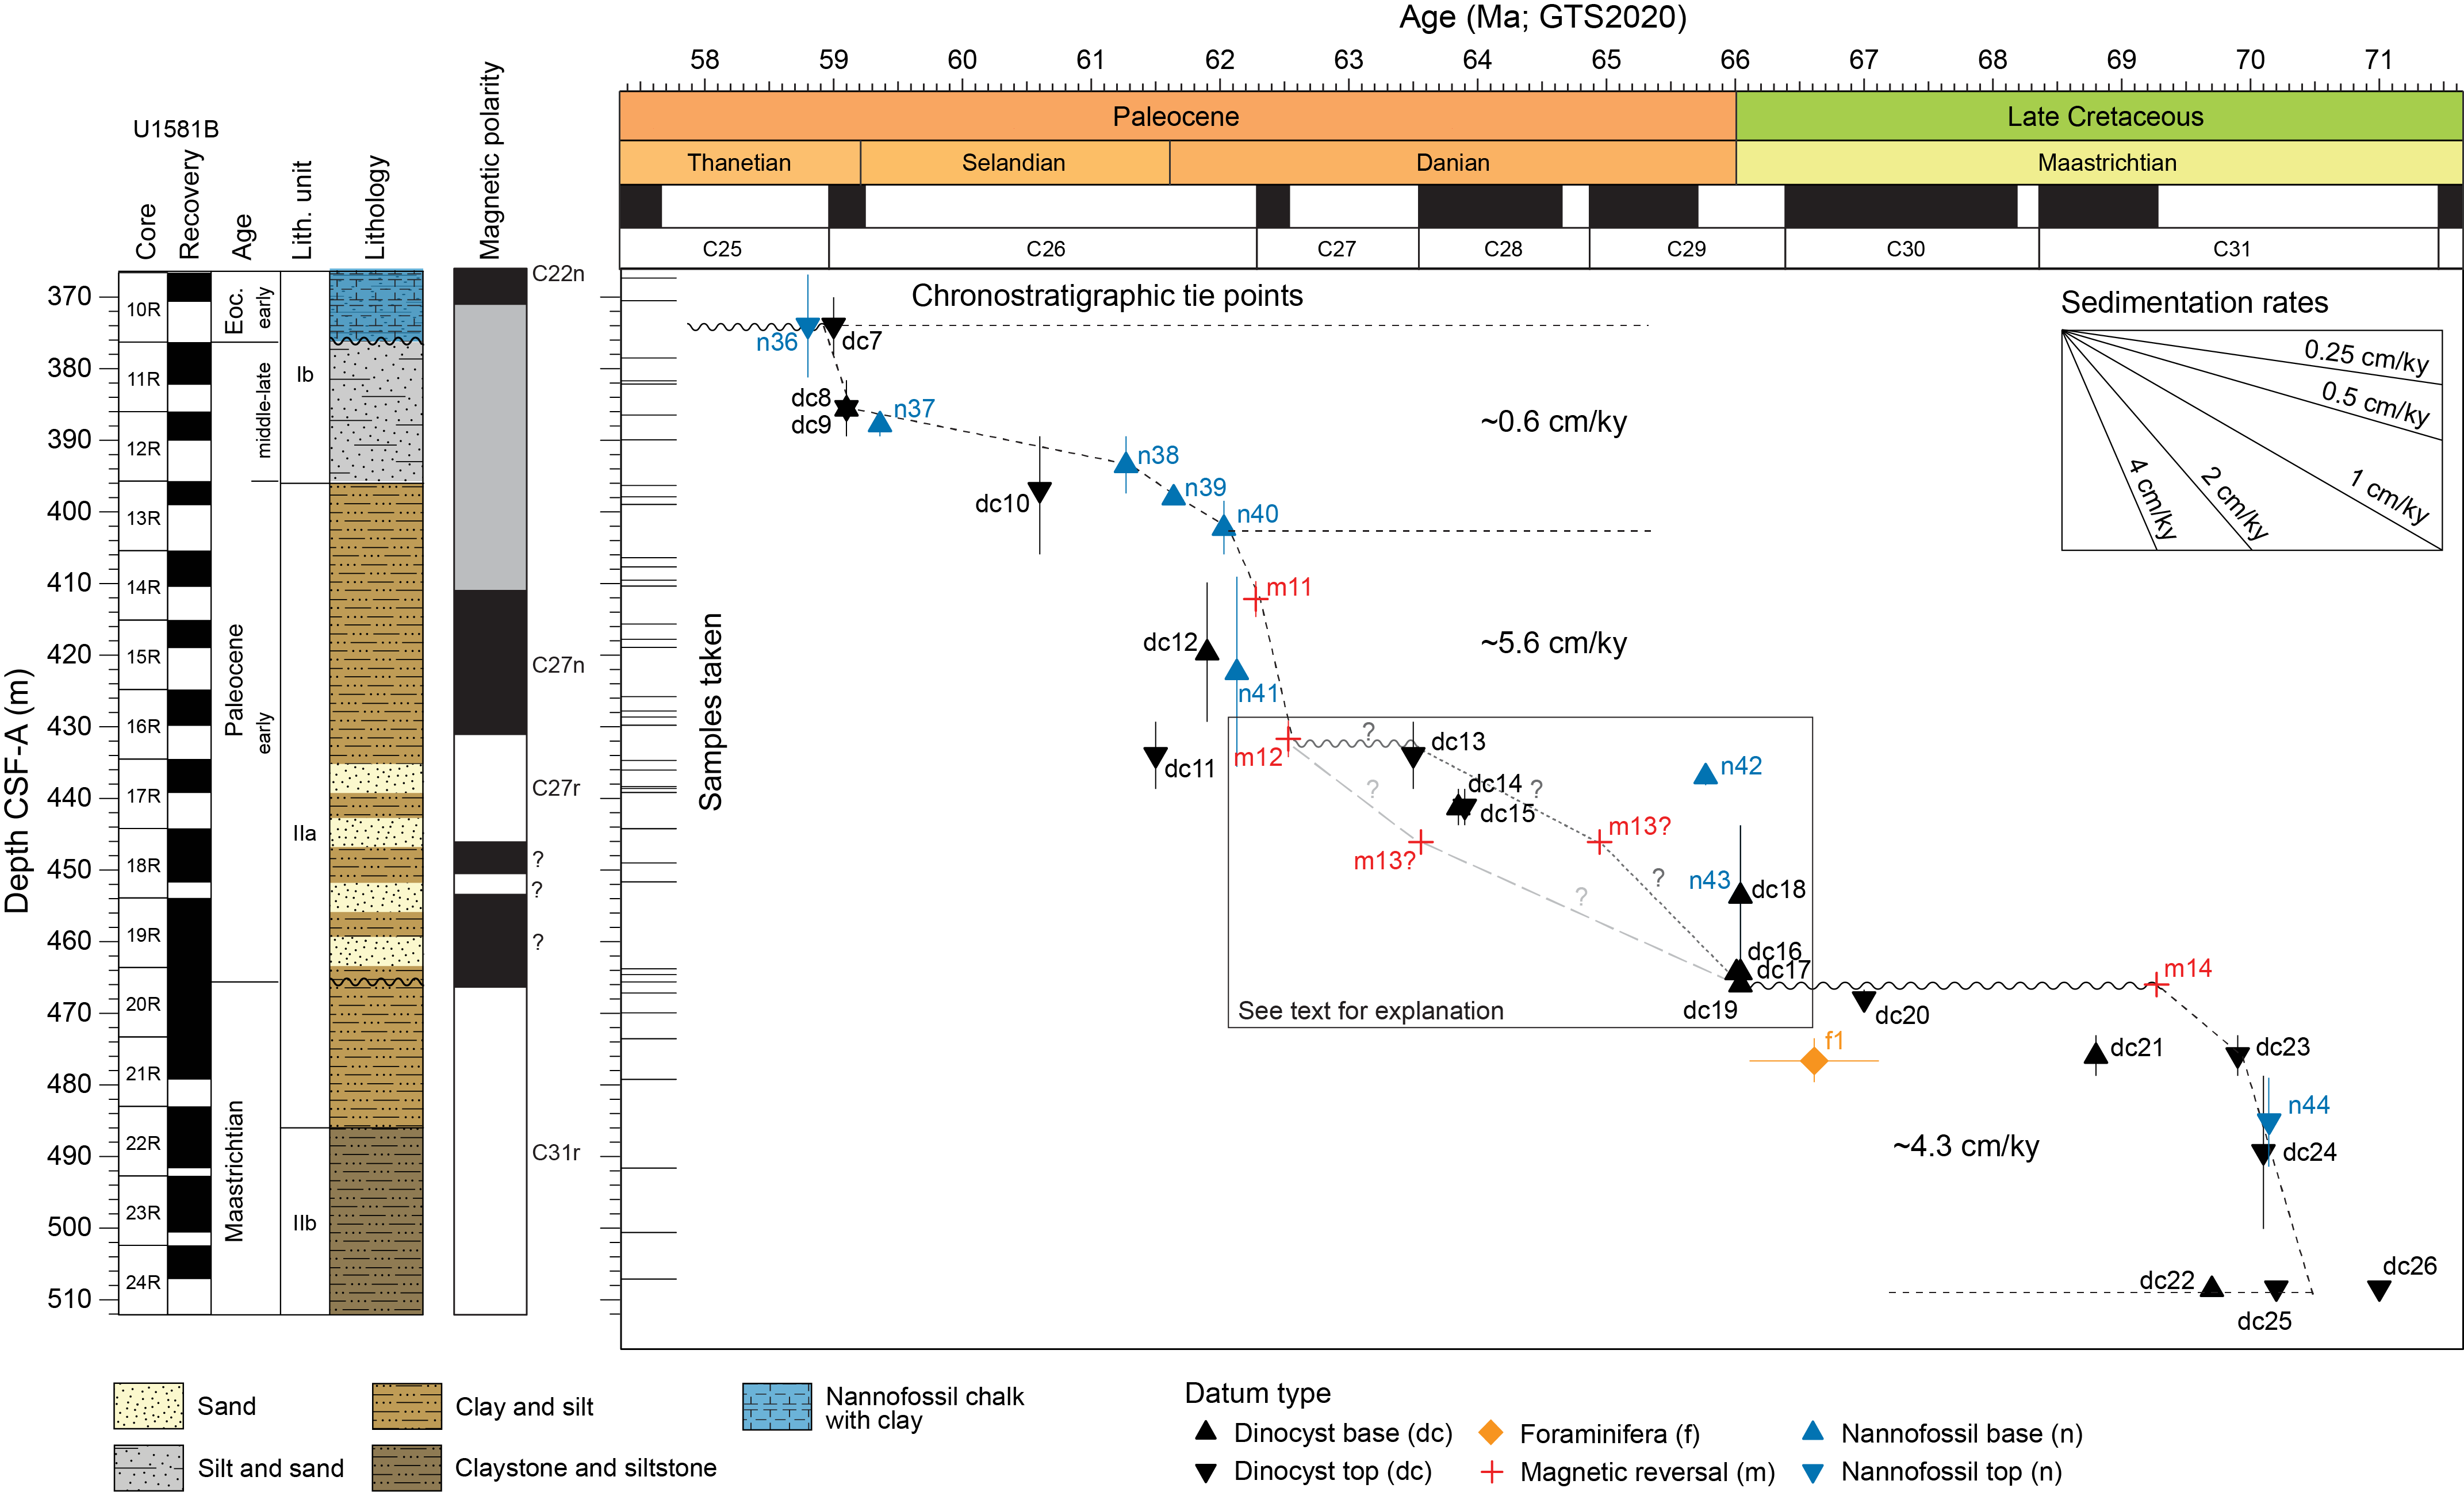
Figure F32. Age-depth model, Maastrichtian–Paleocene interval.
6. Chronostratigraphy
Calcareous nannofossils, planktonic foraminifera, diatoms, dinocysts, and magnetostratigraphy provide age control for the Campanian–Pleistocene sediment sequence recovered at Site U1581 (see Micropaleontology and Paleomagnetism). Nannofossils, foraminifera, and dinocysts provide biostratigraphic age constraints (Table T3) that guided correlation of paleomagnetic reversals to the GPTS (Ogg, 2020) (Table T11) for the Campanian–Paleocene interval (Lithostratigraphic Unit II and the lower part of Lithostratigraphic Subunit Ib; ~994.02–367.45 m CSF-A) (see Lithostratigraphy). Nannofossils and magnetostratigraphy provide age constraints for the Eocene interval (~367.45–306 m CSF-A), where dinocyst data are sparse. For the Oligocene–Miocene interval (~306–192 m CSF-A), only nannofossil and dinocyst datums provide age control because the magnetic data are of poor quality in this interval. In the uppermost Miocene to Pleistocene (~192–0 m CSF-A), magnetostratigraphy, diatoms, nannofossils, and dinocysts provide age control. The ages and sedimentation rates of the sedimentary succession are described below in stratigraphic order (i.e., oldest to youngest) (Figures F30, F31, F32).
6.1. Campanian–Maastrichtian (~79–70 Ma; 994.02 to ~465.63 m CSF-A)
The base of Hole U1581B is dated to ~78.5 Ma using the dinocyst biohorizon top of N. aceras (dc37 in Figure F30 and Table T3) in Sample 73R-CC, 14–19 cm (985.46 m CSF-A) (Figure F30). The consistent normal polarity from 675.68 m CSF-A to the base of the hole further constrains the age of the oldest sediment cored to younger than 79.9 Ma, within Chron C33n. Although there are no further biostratigraphic datums in the lowermost ~150 m in Hole U1581B, the microfossil assemblages, including the persistent presence of dinocyst Isabelidinium magnum, support a mid-Campanian age. Several nannofossil and dinocyst datums were identified in the interval between Cores 57R and 39R (828.63–656.63 m CSF-A), indicating an age between 76.8 and 74.5 Ma for this interval. These biostratigraphic datums also constrain two paleomagnetic reversals at 675.68 and 657.83 m CSF-A, which are correlated to the Chron C33n/C32r.2r and C32r.1r/C32n.2n boundaries, respectively (m19 and m18 in Figure F30 and Table T11).
The biohorizon base of M. quaternarius (72.10 Ma; n46, same figure) approximates the Campanian/Maastrichtian boundary (72.17 Ma) and is identified in Sample 392-U1581B-26R-7, 79–80 cm (531.50 m CSF-A). Uphole, several additional nannofossil and dinocyst biohorizons constrain three paleomagnetic reversals at 557.50, 544.84, and 532.05 m CSF-A to the Chron C32n.2n/C32n.1r, C32n.1r/C32n.1n, and C32n.1n/C31r reversals, respectively (m17, m16, and m15, same figure). The persistent presence of I. pellucidum up to Sample 20R-3, 56–57 cm (467.19 m CSF-A), indicates an early Maastrichtian age for the strata between 531.50 and 467.19 m CSF-A.
The stratigraphy across the K/Pg boundary interval is complex at Site U1581 and includes one or more possible hiatuses, significant reworking, and a complicated magnetic polarity signal. The biohorizon base of T. evittii (66.04 Ma; dc19, same figure) in Sample 392-U1581B-20R-2, 53–54 cm (465.63 m CSF-A) (Figure F32), indicates an earliest Danian age and that the normal polarity in this interval (466.48–446.13 m CSF-A) must be within Chron C29n. This would suggest that the magnetic reversal from reversed to normal polarity below Sample 20R-2, 135 cm (466.45 m CSF-A), correlates to the Chron C29r/C29n reversal; however, the presence of early Maastrichtian dinocyst and nannofossil assemblages in Sections 20R-3, 20R-5, and 20R-CC instead suggests that this reversal may be a result of an unconformity; therefore, we instead correlate the reversed polarity interval between 532.05 and 466.48 m CSF-A with Chron C31r (m14; Figure F32). If this correlation is correct, this implies a hiatus spanning at least the time interval between the Chron C31r/C31n magnetic reversal and the K/Pg boundary (older than ~69.2 to younger than 66.04 Ma).
The average sedimentation rate for the Cretaceous part of the sequence in Hole U1581B is 5.1 cm/ky (Figure F30), with lower sedimentation rates in the early Maastrichtian (~4.3 cm/ky; Figure F32). We note that shipboard age control is of insufficient accuracy and temporal resolution to infer detailed sedimentation rate changes or short hiatuses within the Cretaceous sequence.
6.2. Paleocene (66.04–58.8 Ma; 465.63–367.45 m CSF-A)
The Paleocene sequence in Hole U1581B also has a complex stratigraphy that includes varying sedimentation rates and at least two hiatuses based on age constraints from dinocysts, nannofossils, and magnetostratigraphy (Figure F32). The sequence from Section 20R-2, 135 cm (466.45 m CSF-A), to the top of Core 18R (444.20 m CSF-A) has predominantly normal polarity and contains a number of dinocyst biohorizon bases. At the expanded K/Pg boundary section of El Kef, Tunisia (Brinkhuis et al., 1998), these dinocyst originations are associated with the first phase following the K/Pg boundary (planktonic foraminifera Zone P0) (see Micropaleontology). The lowermost of these biohorizon bases is used to identify the base of the Paleocene succession at Site U1581. Nannofossils from this interval comprise a dominantly reworked Maastrichtian assemblage, particularly in Sample 19R-CC, 10–15 cm (463.80 m CSF-A). Sample 18R-1, 8 cm (444.28 m CSF-A), contains the biohorizon base of B. sparsus (66.04 Ma; n43 in Figures F30 and F32 and Table T3), which is the nannofossil marker for the base of the Paleocene, together with calcispheres and B. bigelowii, which are typically observed in increased abundance following the K/Pg boundary. There is a magnetic reversal from normal to reversed polarity (upsection) in Core 18R at 446.13 m CSF-A, which could correlate with either the Chron C29n/C28r or C28n/C27r boundary (m13 in Figures F30 and F32 and Table T11). The nannofossil assemblages in the samples above this reversal are dominated by reworked Cretaceous taxa, and it is unclear if there is a Danian assemblage present. The correlation of the reversal at 446.13 m CSF-A to the Chron C29n/C28r boundary is consistent with the earliest Danian age indicated by dinocyst assemblages. However, there is evidence for potential reversed polarity near the base of Core 18R, with the top of Core 19R showing normal polarity. If postcruise research supports the presence of reversed polarity near the base of Core 18R, it must correlate to Chron C28r, and the normal polarity in the top of Core 19R must correlate to Chron C29n if the upper part of Core 20R is earliest Danian in age (light gray dashed line in Figure F32). This would make the reversal at 446.13 m CSF-A the Chron C28n/C27r boundary. If postcruise research shows that there is no reversed polarity near the base of Core 18R and that the sediment is of normal polarity in Sections 18R-2 through 20R-2, then we would correlate this normal polarity interval to Chron C29n and the reversal at 446.13 m CSF-A to the Chron C29n/C28r boundary (dark gray undulating and dotted lines in Figure F32). For now, we have shown both options in Figure F32 but have tentatively assigned the reversal at 446.13 to the Chron C28n/C27r boundary in Table T11.
Dinocyst biostratigraphy constrains the age of Core 392-U1581B-17R (439.24–435.50 m CSF-A) to between 64.0 and 63.4 Ma. We infer a hiatus between Cores 17R and 16R based on a shift in the dinocyst assemblage between these two cores, together with the interval of high sedimentation rates inferred between two paleomagnetic reversals in the overlying sequence (Cores 16R–14R; 429.87–405.40 m CSF-A; Figure F32). The top of the Paleocene interval is dated to older than 58.80 Ma based on the biohorizon top of nannofossil H. kleinpellii (n36, same figure) in Sample 11R-4A, 97 cm (381.79 m CSF-A). There is a significant change in the assemblage in Core 10R, indicating another hiatus and that much of the upper Paleocene and lower Eocene are missing at Site U1581 (Figure F32).
Sedimentation rates vary between ~0.6 and 5.6 cm/ky in the Paleocene interval of Site U1581. We identified at least one hiatus or highly condensed interval in addition to those that truncate the base and top of the Paleocene sequence (Figure F32).
6.3. Eocene (~50.65–34.8 Ma; 367.45 to ~306 m CSF-A)
The base of the Eocene section (which is bound by a hiatus) at ~375 m CSF-A is dated to ~50.65 Ma based on the nannofossil biohorizon top of T. orthostylus, together with the transition from an assemblage dominated by Toweius to one dominated by Reticulofenestra (n35 in Figure F30 and Table T3) in Sample 392-U1581B-10R-1A, 85 cm (367.45 m CSF-A). The biohorizon top of C. solitus (40.32 Ma; n28, same figure) in Sample 5R-2, 142 cm (321.01 m CSF-A), indicates a late middle Eocene age. Between these datums, sedimentation rates are very low, ~0.4 cm/ky for the late early and early middle Eocene. There may be a thin uppermost Eocene interval present in Core 4R, as indicated by the occurrence of D. barbadiensis (~34.8 Ma; n27, same figure); however, we cannot exclude that this species is reworked into lower Oligocene sediment in that core. Regardless, nannofossil biostratigraphy supports the presence of a hiatus or highly condensed interval between Cores 5R and 4R (Figure F30). Additional sampling is needed to identify hiatuses or condensed sections within this part of the sequence.
6.4. Oligocene–Miocene (~34.7–7 Ma; ~306–192 m CSF-A)
The Oligocene to lower Miocene sedimentary succession is constrained by 14 calcareous nannofossil and dinocyst biostratigraphic datums (Figure F30). Because of a poor paleomagnetic signal, no magnetic reversals were identified in this interval. The base of the succession is defined by the nannofossil biohorizon top of I. recurvus (33.06 Ma; n26 in Figure F30 and Table T3) in Sample 392-U1581B-3R-3, 77 cm (302.48 m CSF-A). Sedimentation appears to be relatively continuous through the Oligocene and into the lower Miocene up to Sample 392-U1581A-26H-CC, 10–15 cm (214.84 m CSF-A), which is characterized by the presence of few to frequent numbers of H. euphratis and H. carteri. These taxa show a change in abundance from high proportions of H. euphratis to more H. carteri (n17, same figure) after 20.98 Ma. The nearly equal proportions of these species in this sample suggest that it is dated to close to their crossover in abundance (~20.98 Ma). Average sedimentation rates through this interval are ~0.7 cm/ky.
Above this, there are two hiatuses or highly condensed intervals in the Miocene succession. The first is positioned between Cores 392-U1581A-26H and 24H (214.89–204.43 m CSF-A), with Core 24H dated to between 14.86 and 13.60 Ma based on the presence of S. heteromorphus and absence of H. ampliaperta (n16, same figure). Above this, there is another unconformity or condensed interval between the bases of Cores 24H and 23H (204.43–192.93 m CSF-A), and the sediment in Core 23H is dated to ~7 Ma based on the presence of R. pseudoumbilicus >7 µm (n15, same figure) and absence of N. amplificus (n14, same figure).
6.5. Uppermost Miocene–Pleistocene (~7–0 Ma; 192–0 m CSF-A)
The age-depth model for the uppermost Miocene–Pleistocene sedimentary succession in Hole U1581A is constrained by 20 diatom, dinocyst, and calcareous nannofossil biostratigraphic datums as well as 8 magnetic reversals (m1–m8 in Figures F30 and F31 and Table T11). The age at the base of this interval is constrained to ~7 Ma by the presence of R. pseudoumbilicus >7 µm (n15 in Figure F31 and Table T3) in Sample 392-U1581A-23H-CC, 11–16 cm (192.88 m CSF-A), and N. amplificus (total range = 6.82–5.98 Ma) in Sample 21H-CC, 6–11 cm (185.54 m CSF-A). The youngest datum identified is the biohorizon base of E. huxleyi (0.29 Ma; n1, same figure) in Sample 1H-1, 135 cm (1.35 m CSF-A). Sedimentation is interpreted to be relatively continuous through this interval, although the variable lithologic characteristics likely mean that sedimentation rates vary at a finer scale and/or there are short hiatuses in the section due to turbiditic deposition. The average sedimentation rate for this interval is ~2.8 cm/ky. However, there are markedly lower sedimentation rates at both the base (192–121 m CSF-A) and top (54.9–0 m CSF-A) of the succession. Sedimentation rates were highest (~8 cm/ky) in the early Pleistocene between ~2.56 and 1.78 Ma (~121.0–54.9 m CSF-A).
7. Geochemistry
The geochemistry program at Site U1581 was designed to characterize the composition of bulk sediment and IW and report on the presence and abundance of volatile hydrocarbons for routine safety monitoring. A sedimentary sequence spanning the Pleistocene to Upper Cretaceous was recovered at Site U1581 (see Lithostratigraphy, Chronostratigraphy, and Micropaleontology). IW samples were analyzed in Holes U1581A and U1581B through Section 392-U1581B-73R-1 (978.88 m CSF-A); pore water was extractable in all but the final sample in Core 74R (74R-2, 119–129 cm; 990.02 m CSF-A). Sediments were analyzed for carbon and nitrogen in Holes U1581A and U1581B and, for selected samples from Hole U1581B, for sulfur concentration through Section 74R-5 (~993 m CSF-A).
7.1. Headspace hydrocarbon gases
In total, 107 headspace samples were taken and analyzed for routine safety monitoring (Table T13; Figure F33). Note that four samples were run in duplicate. The samples typically were taken from the top of the deepest section above the core catcher in each core with the exception of lithified cores, where sediment was taken from the section breaks of the core for convenience. Hydrocarbons in headspace samples were detected in Holes U1581A and U1581B. Methane ranges 0.1–1458.2 ppmv. Hydrocarbons with chain lengths up to n-hexane (C6) were detected in all but five samples from Sample 392-U1581B-22R-6, 0–5 cm (490.52 m CSF-A), to the bottom of Hole U1581B (Figure F33). Ethane ranges 0–25.2 ppmv. Ethene was not detected (Table T13). Propane ranges 0–25.2 ppmv. Traces of propene were detected in Samples 22R-6, 0–5 cm, and 25R-4, 0–5 cm, with a maximum of 0.65 ppmv. Iso-butane and n-butane range 0–26.2 and 0–13.6 ppmv, respectively. Iso-pentane and n-pentane range 0–34.9 and 0–10.4 ppmv, respectively. Iso-hexane and n-hexane range 0–10.0 and 0–6.6 ppmv, respectively. In Hole U1581B, where methane and ethane are detected, methane to ethane ratios (C1/C2) range 1.7–119.5 throughout the lower part of the sequence with an overall increasing depth trend (Figure F33), starting with Sample 22R-6, 0–5 cm (490.52 m CSF-A). The consistent presence of longer chain length headspace gases (up to hexane) from this depth to the bottom of Hole U1581B is consistent with a thermogenic origin of the hydrocarbons. Notably, the ethane/methane (C2/C1) profile identifies an interval at 490.52–655.22 m CSF-A where ratios are markedly elevated, with a maximum at 610 m CSF-A. This interval of elevated C2/C1 hydrocarbons matches a pronounced decrease in pore water sulfate (see Figure F34), providing strong evidence for the presence of a deep zone of anaerobic oxidation of methane in Hole U1581B.
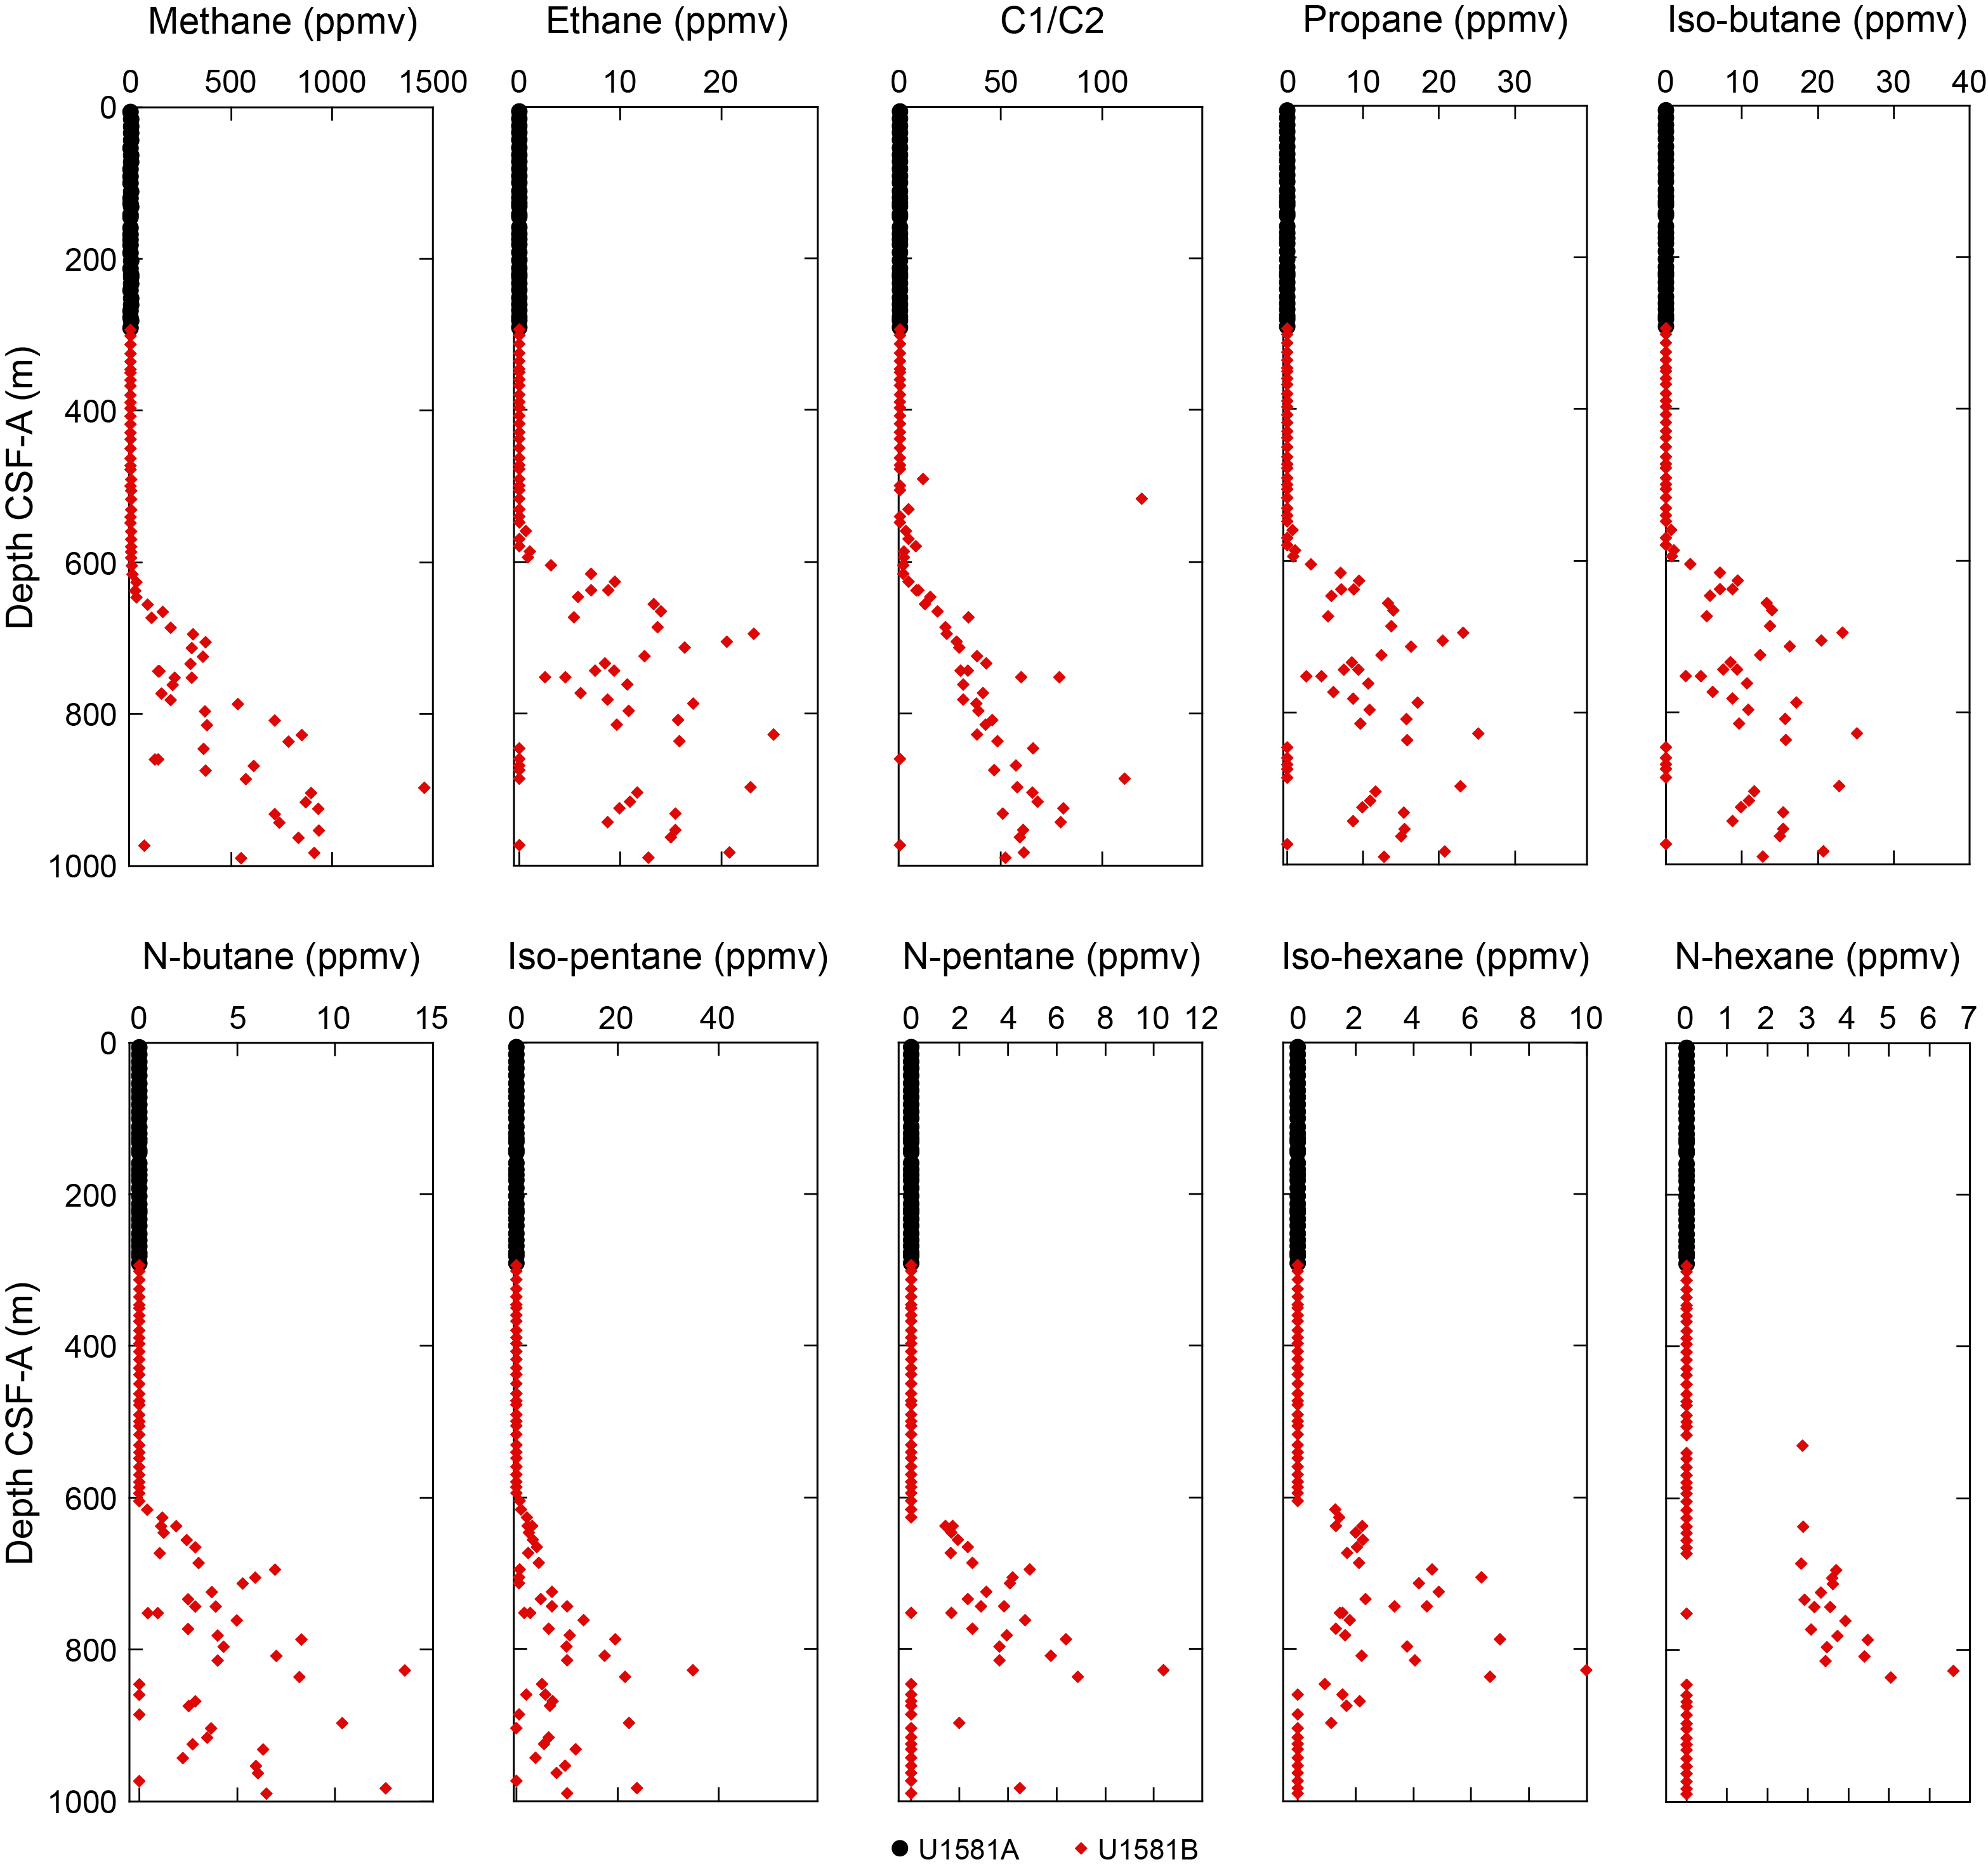
Figure F33. Headspace gas.
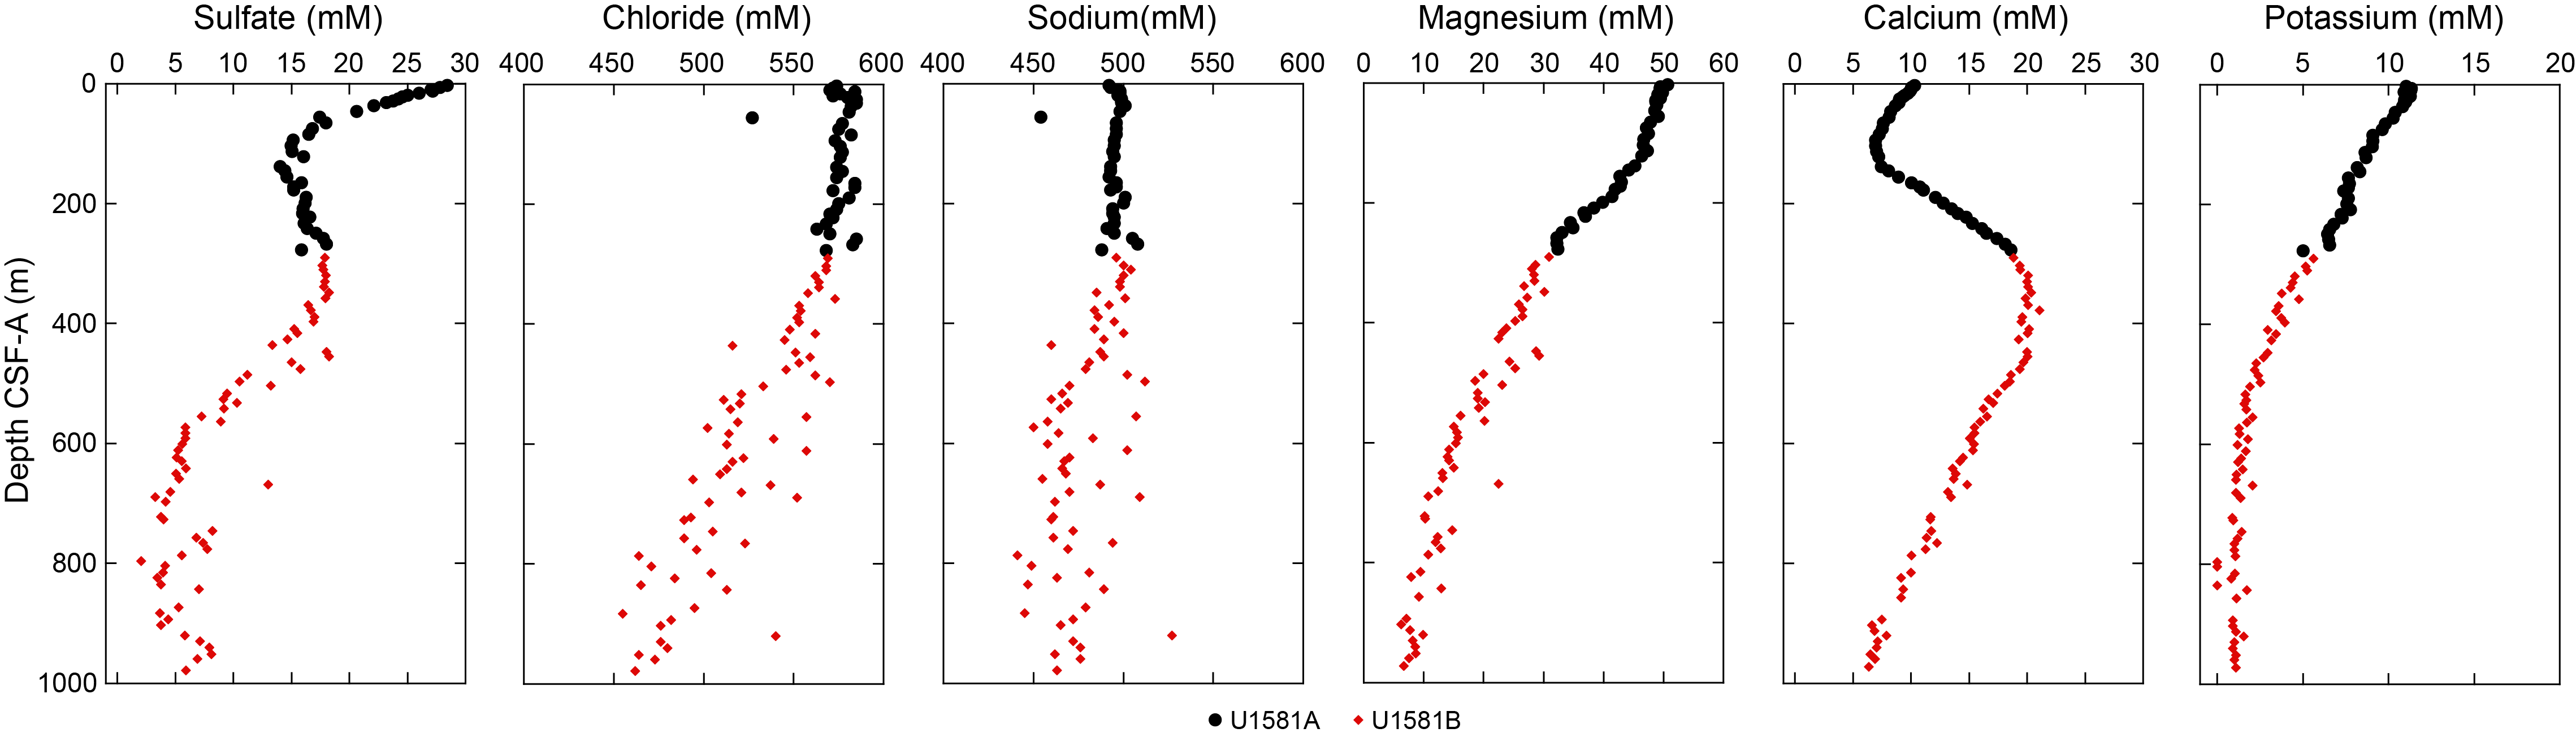
Figure F34. IW sulfate, chloride, sodium, magnesium, calcium, and potassium.
7.2. Interstitial water geochemistry
Samples for IW were collected in Holes U1581A and U1581B (Table T14). Note that although Table T14 presents both inductively coupled plasma–atomic emission spectroscopy (ICP-AES) data and ion chromatography data for many of the major elements, we focus on the ion chromatography results for sulfate, chloride, and sodium and the ICP-AES data for the balance of the major cations because the ICP-AES data appeared to yield more consistent results for these major cations during this expedition. All data are however presented for completeness. When discussing specific depths of samples for Geochemistry, this chapter references the Top depth CSF-A (m) value.
Alkalinity increases from ~3.4 mM in the shallowest sample (392-U1581A-1H-2, 146–151 cm; 2.96 m CSF-A) to 10.0 mM in Sample 9H-1, 141–146 cm (74.81 m CSF-A) (Figure F35; Table T14). Alkalinity then decreases to 1.4 mM in Sample 39X-1, 140–150 cm (277.5 m CSF-A). Below this depth, alkalinity values remain relatively constant and range 0.8–2.4 mM. pH ranges 7.5–8.1 at Site U1581. Ammonium values follow a trend quite similar to alkalinity in all Hole U1581A samples, with a maximum of 1146 µM at 100 m CSF-A decreasing to 257 µM at ~278 m CSF-A. In Hole U1581B, values steadily increase to a maximum of 1098 µM at 920.54 m CSF-A.
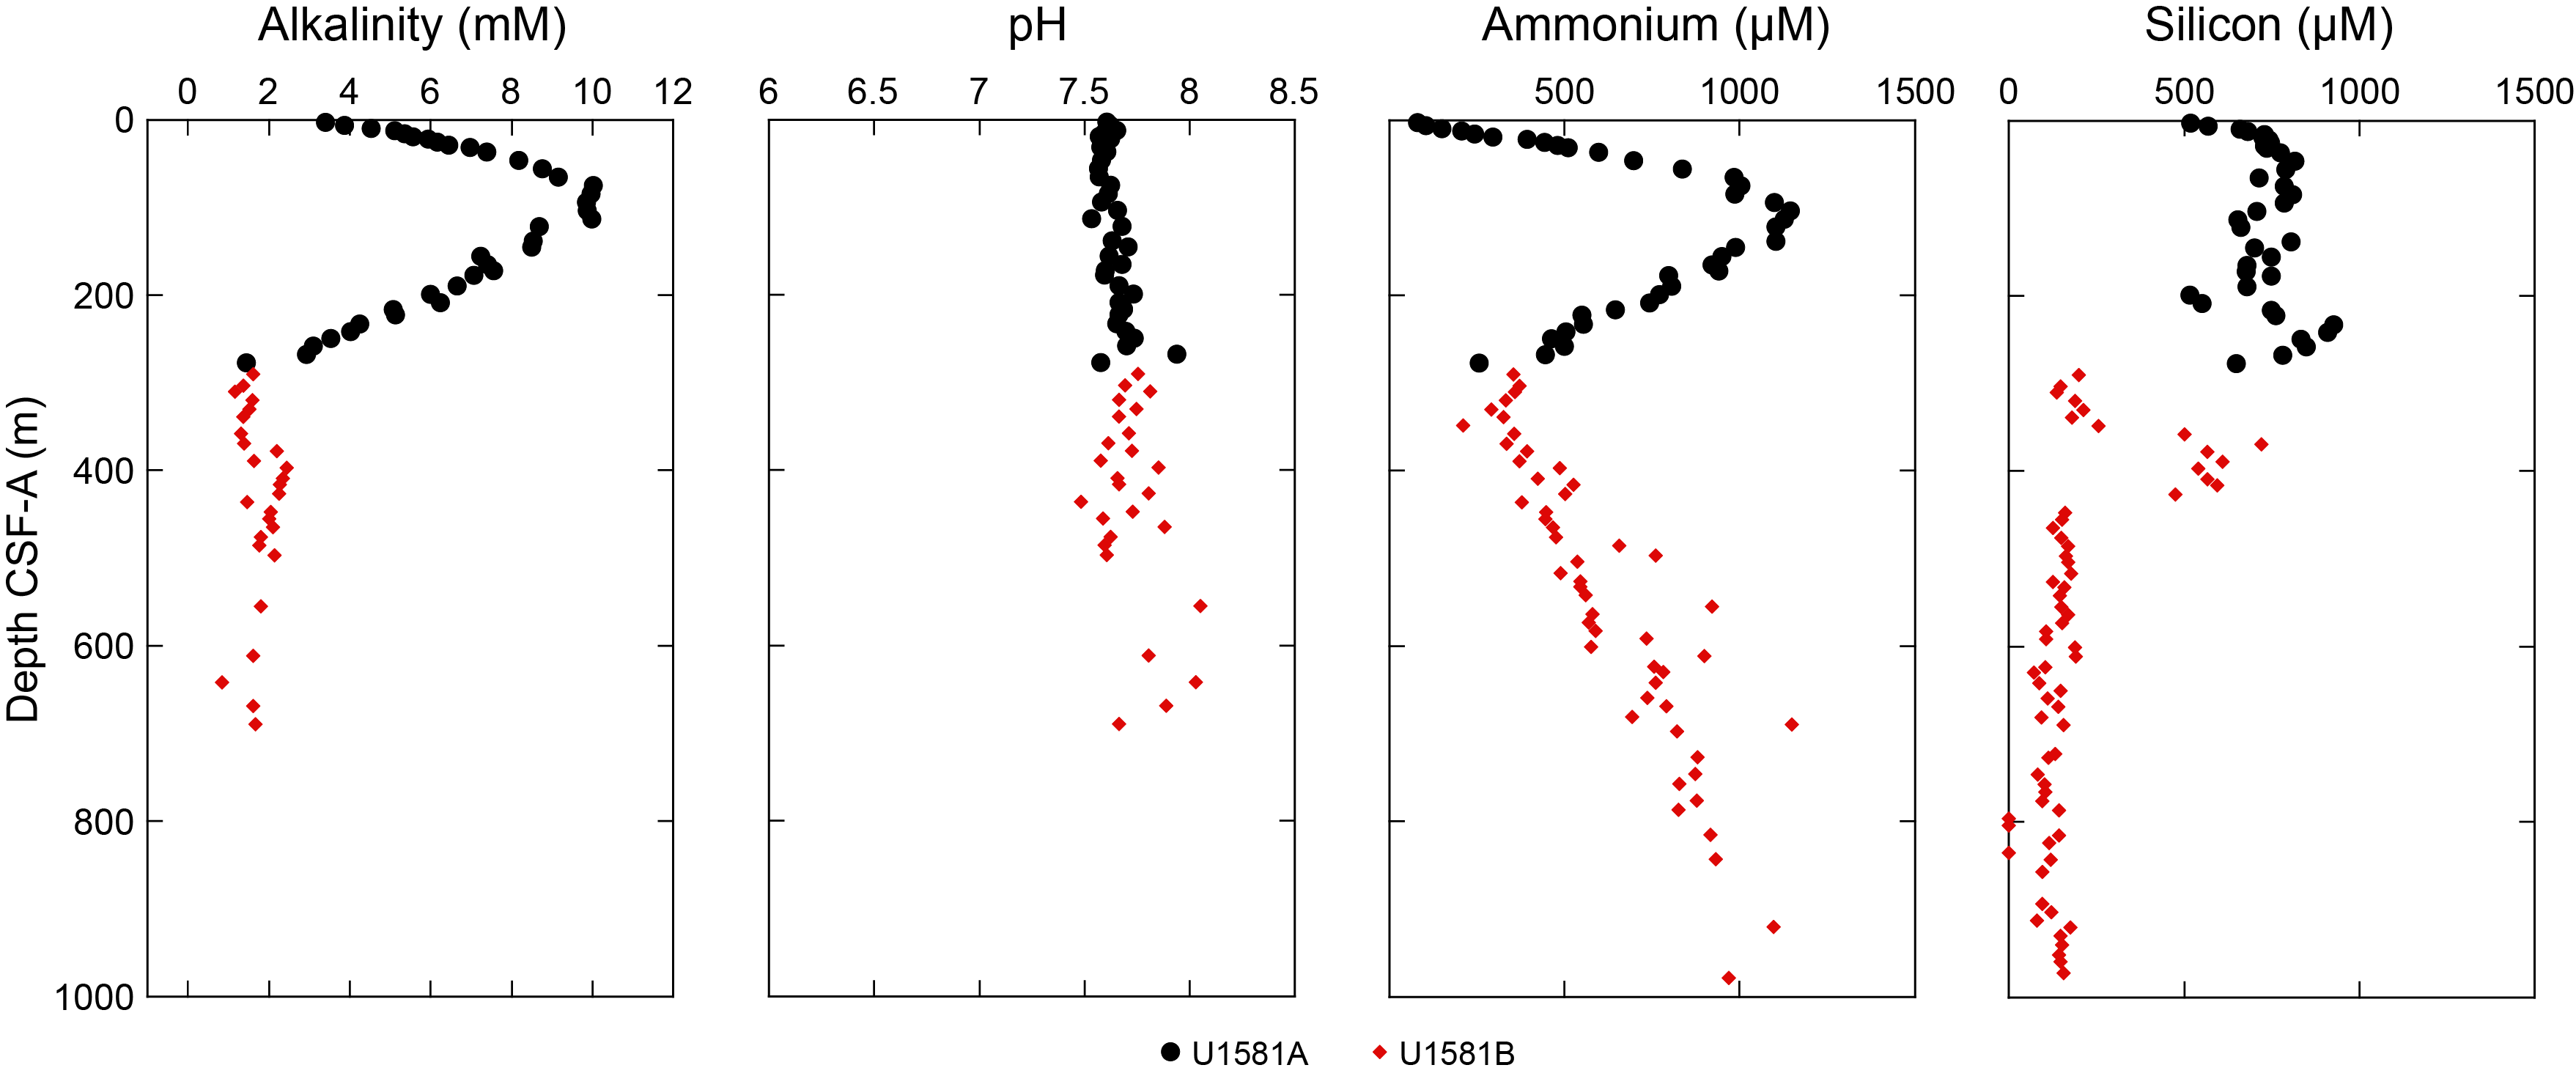
Figure F35. Alkalinity, pH, ammonium, and IW silicon.
For the major cations and anions, a single sample (392-U1581B-54R-2, 136–146 cm; 796.26 m CSF-A) has cation and anion concentrations that are much lower than the surrounding samples, and we therefore exclude this sample from the trends described herein. We have no clear reason for this sample to be so distant from the overall trend; thus, it is presented in the tables. Of the major anions, sulfate decreases at Site U1581 from 28.4 mM at 2.96 m CSF-A to 14.0 mM at 138.46 m CSF-A (Figure F34). Sulfate then increases slightly to 18.3 mM in Sample 8R-1, 141–151 cm (348.61 m CSF-A), before decreasing again to 3.8 mM in Sample 46R-5, 130–140 cm (722.91 m CSF-A). Sulfate ranges 2.1–8.2 mM below this depth. Chloride decreases downhole from 573.6 to as low as 455.5 mM (Figure F34). The major cation sodium shows a marked increase in variability below ~200 m CSF-A, with concentrations ranging 440.9–526.9 mM. Magnesium decreases downhole from 50.7 to 6.7 mM at the base of the hole. Calcium decreases from 10.3 mM at 2.96 m CSF-A to 6.9 mM at 93.81 m CSF-A before increasing to a maximum of 21.1 mM at 377.71 m CSF-A. Below ~400 m, Ca decreases, with concentrations similar to Mg concentrations. Potassium decreases from a maximum of 11.3 mM at 19.37 m CSF-A to 1.2 mM at 600.70 m CSF-A. Below this depth, K concentrations remain stable between ~1 and 2 mM.
Strontium mirrors Ca above 222.95 m CSF-A, with concentrations increasing from seawater to 180.8 µM at 112.82 m CSF-A and then declining to 142.2 µM at 208.65 m CSF-A (Figure F36). Below this depth, Sr increases again to a maximum of 200.0 µM at 377.71 m CSF-A. Strontium gradually declines to 138.2 µM at the base of the hole. From 2.96 to 172.31 m CSF-A, Li increases from 23.7 to 91.2 µM. Lithium then decreases to 58.3 µM at 277.5 m CSF-A before increasing downhole to 295.6 µM at the base of the hole. Above 426.15 m CSF-A, Si ranges 475.2–926.0 µM with the marked exception of lower concentrations between 290.41 and 348.61 m CSF-A. Below that depth, Si markedly drops and concentrations remain between 71.8 and 189.6 µM. Boron is relatively variable but generally increases from the seafloor to a maximum of 733.8 µM at 348.61 m CSF-A. Boron concentrations below ~600 m CSF-A decrease to 177 µM at the base of the hole. Manganese declines from 7.2 µM at the shallowest sample from Hole U1581A to a minimum of 0.6 µM at 122.31 m CSF-A. This minimum is followed by an increase to the site’s peak concentration of 50.0 µM at 208.65 m CSF-A. This peak is succeeded by a decline to near-constant values of ~3–5 µM between 258.71 and 358.31 m CSF-A. Below this depth, values gradually increase to a second maximum of 13.9 µM at 416.21 m CSF-A followed by a gradual decline to <1 µM below 815 m CSF-A. Iron was detectable in the upper 200 m with a maximum concentration of 24.7 µM at 138.46 m CSF-A. Iron increases again between 416.21 and 497.02 m CSF-A (Figure F36).
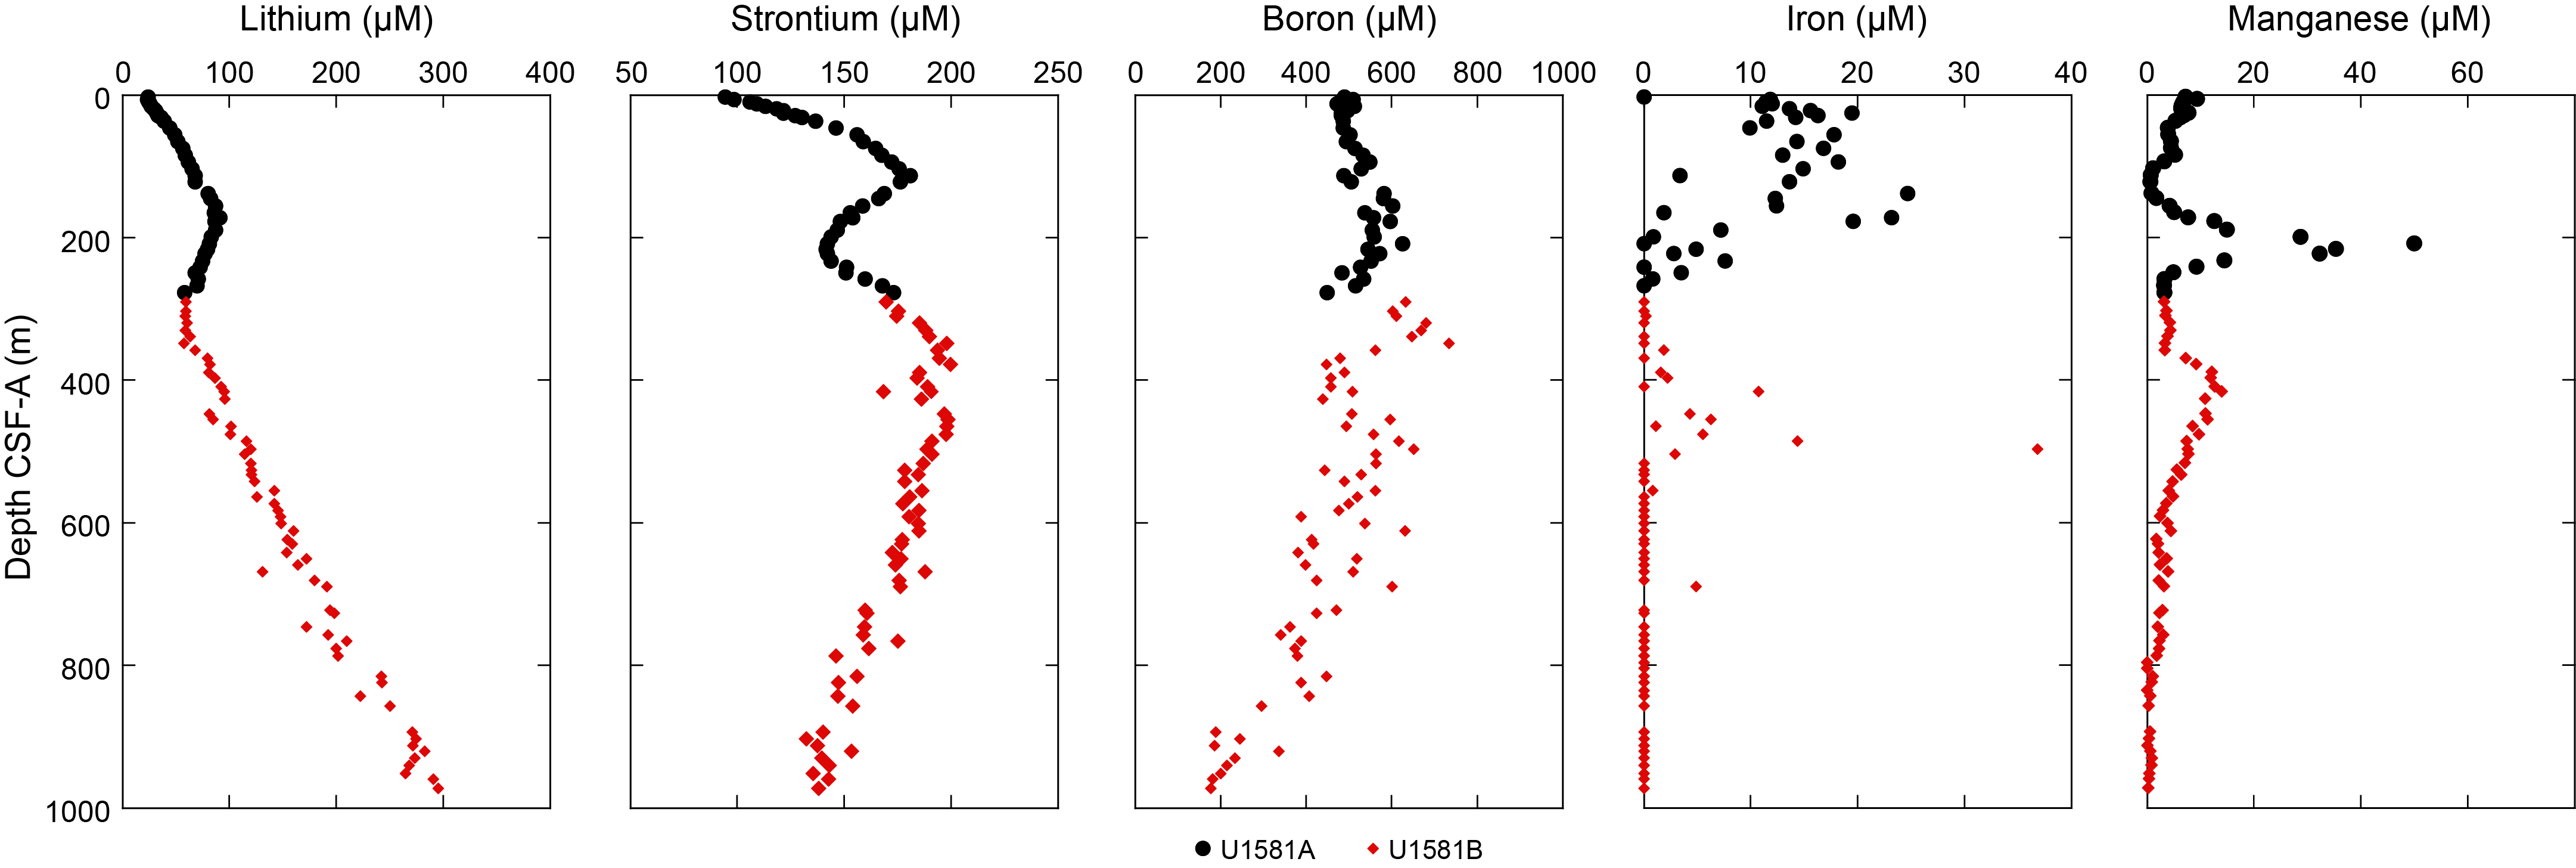
Figure F36. IW lithium, strontium, boron, iron, and manganese.
7.3. Bulk sediment geochemistry
In total, 204 sediment samples were obtained for bulk carbon and nitrogen analyses at Site U1581. One or two samples were routinely taken from the working half sections and more frequently in some cores to capture specific intervals of interest (i.e., lithologic variability). Note that six samples from the IW squeeze cake residues were analyzed for sulfur, total carbon, and nitrogen (Table T15). One of these samples (392-U1581B-36R-3, 0–10 cm) delivered inconsistent data compared to all other samples analyzed. These data are documented in the Laboratory Information Management System (LIMS) database, but this sample will need to be reevaluated for its accuracy. Although we present those data, we exclude this sample from the underlying trends described herein.
Total carbon and carbonate (where carbonate is reported as calcium carbonate) range 0–10.10 and 0–83.4 wt% at Site U1581, respectively, which is consistent with the deposition of pelagic nannofossil oozes with sand and silt, intercalated sand-silt with intermittent intervals that are nannofossil-rich, clay-silt with occasional sand, claystone-siltstone, siderite-rich claystone, and occasional sandstone (see Lithostratigraphy) (Figure F37; Table T15). We observe more variability and generally higher carbonate content (22.1 wt% as CaCO3) in biogenic oozes that characterize the upper ~200 m at this site (Lithostratigraphic Subunit Ia) compared to Lithostratigraphic Subunits Ib–IIb below 200 m CSF-A, which average 8.4 wt% CaCO3. In this lower interval, inorganic carbon and carbonate typically decrease to below 10 wt% and average 1.0 and 8.1 wt%, respectively. As a note of caution for the interpretation of these inorganic carbon records, we emphasize that the main carbonate mineral phase is likely calcite for the predominant part of the biogenic ooze lithologies (Lithostratigraphic Subunit Ia; see Lithostratigraphy for smear slide data). However, in the siliciclastic deposits, where calcareous microfossils are typically rare below 200 m CSF-A (Lithostratigraphic Subunits Ib–IIb), the carbonate content may include other carbonate minerals such as siderite, dolomite, and possibly others (see Lithostratigraphy). Despite these uncertainties, it is worth noting that carbonate carbon persists in selected samples to the bottom of the analyzed sediments (~993 m CSF-A), with local increases to as high as 71 wt% in Sample 392-U1581B-69R-3, 67–68 cm (942.45 m CSF-A). We note 12 horizons between ~320 and ~975 m CSF-A (Cores 5R–72R) with carbonate concentrations around and above 40 wt%. Corresponding lithologies are diverse and include siltstone, sandstone, and dark sideritic claystone (see Lithostratigraphy).
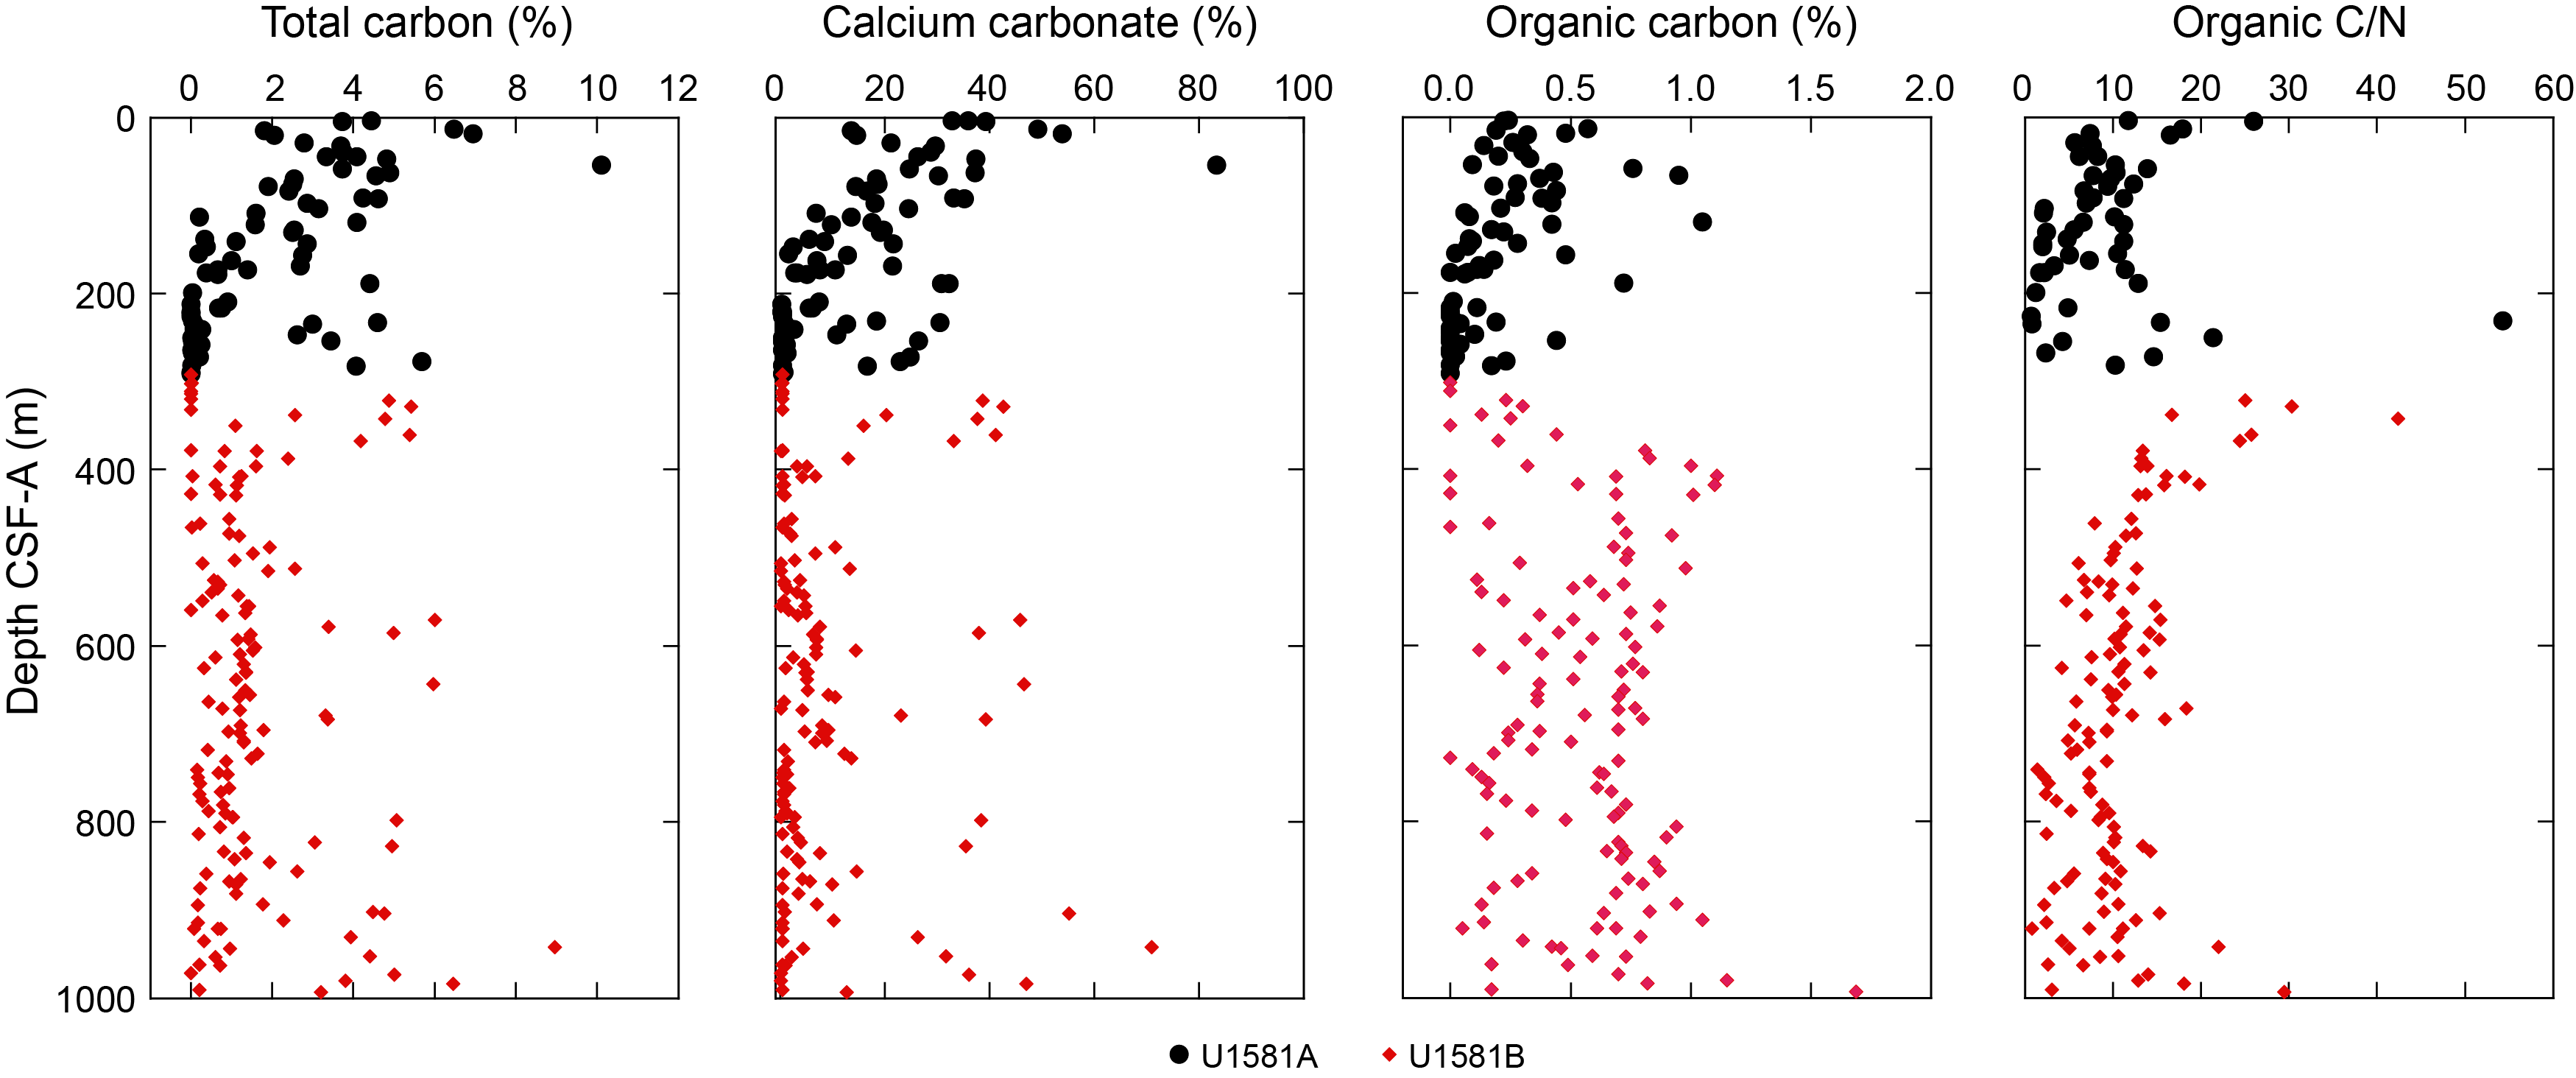
Figure F37. Carbon and organic carbon to nitrogen weight ratio.
Organic carbon contents are calculated as the difference between the total carbon (elemental analyzer measurement) and inorganic carbon (coulometer measurement), which is generally the difference between two large numbers, thereby making this value imprecise. All organic carbon values are reported in Table T15. Values calculated below 0 were below detection limit. The average total organic carbon (TOC) is 0.5 ± 0.3 wt% with minimum and maximum concentrations of 0 and 1.7 wt%, respectively (excluding Sample 392-U1581B-36R-3, 136–146 cm [623.13 m CSF-A], which was 13.1 wt%). Average TOC is slightly elevated to 0.6 wt% below 407.24 m CSF-A. We note that there are seven samples with TOC content at or exceeding 1 wt%. For calculating concentrations of organic carbon, we assume below detection limit concentrations equal 0 throughout the site, reflecting the prominent calcareous ooze, siliciclastic, and claystone character of large parts of the sedimentary sequence that have low organic carbon abundances. These results emphasize the need to determine organic carbon directly using an elemental analyzer in shore-based analysis, using decalcified samples.
Total nitrogen was measured but remained low, at times below the detection limit, for most samples analyzed from Site U1581. Concentrations remain below 0.1 wt% (excluding Sample 392-U1581B-36R-3, 136–146 cm [623.13 m CSF-A], where it is 5.6 wt%), with an average concentration of 0.05 wt%. The low nitrogen values for the entire hole suggest that inorganic nitrogen may be the primary component being analyzed (Table T15). The TOC/N ratio ranges from 54 to close to 0 across the core, with an average of 10.1, suggesting a dominant marine source of organic matter with elevated admixture of terrestrial organic matter for samples with ratios above 15–20 (Goñi et al., 1998).
Total sulfur was measured on 27 samples with TOC exceeding 0.8 wt% and six IW sediment residues (squeeze cakes) based on trends in sulfate from ICP-AES measurements from Site U1581. Concentrations for both sample sets range from below detection limit to 6.1 wt%, with average concentrations at 0.96 wt%. We note the highest concentrations of total S of 6.1 and 2.6 wt%, respectively, for squeeze cake Samples 392-U1581B-28R-1, 118–128 cm, and 36R-3, 136–146 cm, supporting results from ICP-AES analyses. No relationship is observed between TOC wt% and S wt% except for a weak positive covariation when TOC concentrations range between ~0.8 and 1.2 wt% (Table T15).
7.3.1. Sediment geochemistry
All sediment major element concentrations are calculated and presented as element weight percentages (Figure F38); however, in the LIMS database, samples are uploaded as oxide weight percentages. All minor and trace elements are presented in parts per million, both in the LIMS database and Table T16. Sediment ICP-AES analyses were completed on the upper ~620 m at Site U1581. Additional analyses will be completed onshore.
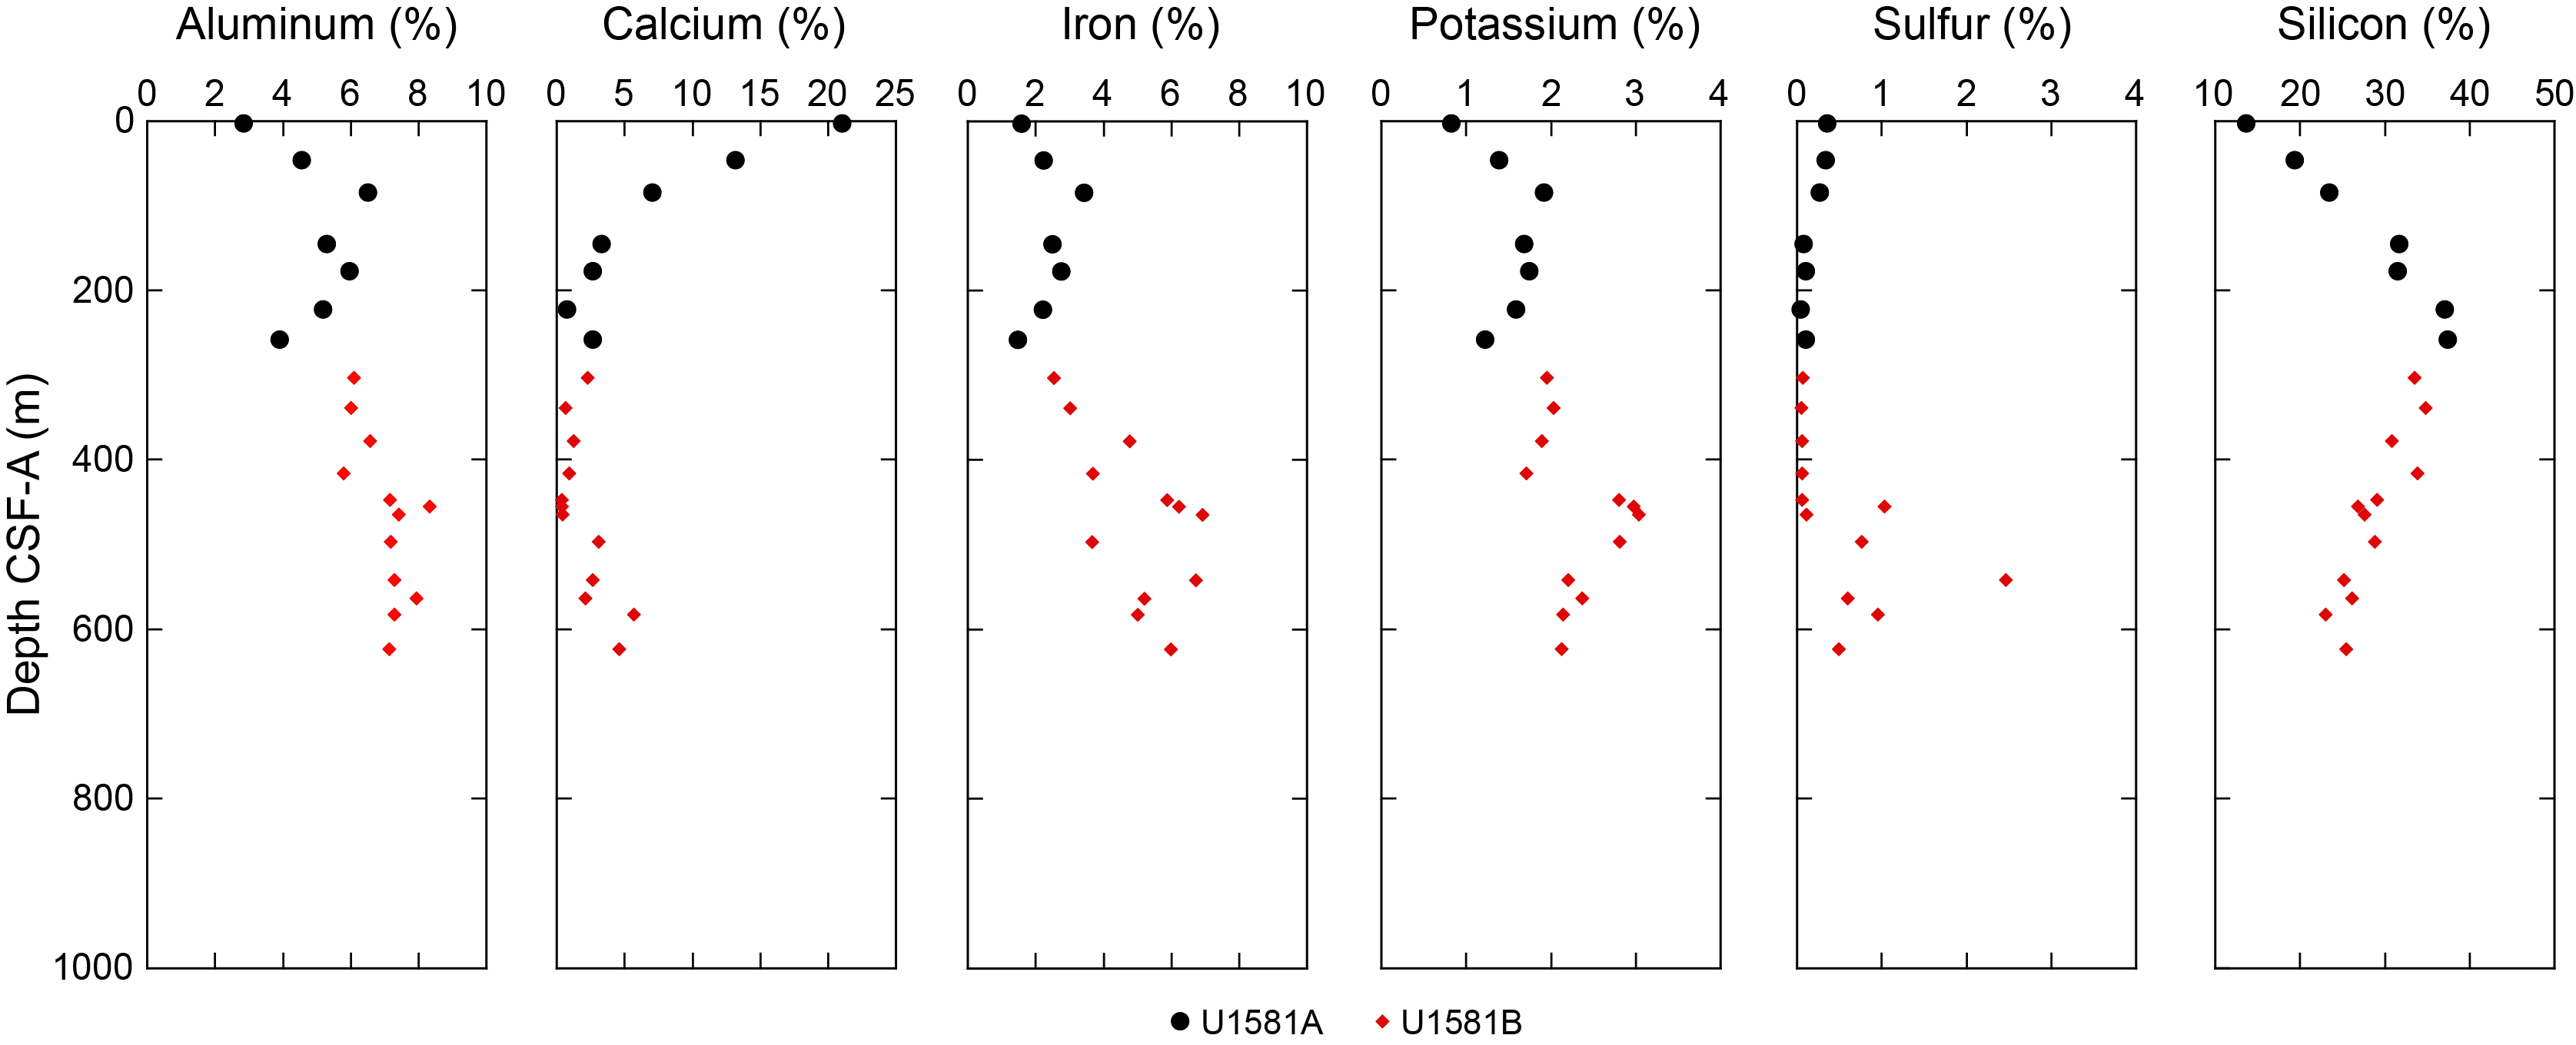
Figure F38. Sediment aluminum, calcium, iron, potassium, sulfur, and silicon.
Aluminum concentrations broadly increase from 2.8 wt% at 2.96 m CSF-A to 7.13 wt% at 623.13 m CSF-A. Silicon concentrations increase from 13.6 wt% at 2.96 m CSF-A to 37.4 wt% at 258.71 m CSF-A before declining to 25.4 wt% at 623.13 m CSF-A. Calcium concentrations likely represent calcium carbonate because of the similarity between the Ca and CaCO3 records. Ca concentrations decline in the upper ~258 m from 21.0 to 2.6 wt% and remain relatively low until 497.02 m CSF-A before increasing slightly to the base of the record. Potassium concentrations are variable throughout the record but generally increase from 0.8 wt% at 2.96 m CSF-A to a maximum concentration of 3.0 wt% at 465 m CSF-A before decreasing to 2.1 wt% at the base of the record.
Iron concentrations broadly increase downhole from 1.6 wt% at 2.96 m CSF-A to 6.0 wt% at 623.13 m CSF-A. The maximum concentration of iron was in Sample 392-U1581B-20R-1, 140–150 cm (465.00 m CSF-A). Sulfur concentrations exhibit a marked increase at 455.30 m CSF-A, where concentrations increase from 0.1 to 1.0 wt%. Concentrations of sulfur remain elevated to the base of the record, with a maximum concentration of 2.5 wt% at 542.38 m CSF-A.
8. Physical properties
Standard physical properties measurements were made on Hole U1581A and U1581B cores using the Whole-Round Multisensor Logger (WRMSL), Section Half Multisensor Logger (SHMSL), and Natural Gamma Radiation Logger (NGRL). Discrete measurements were made for moisture and density (MAD) analysis, thermal conductivity, and P-wave velocities using the P-wave caliper (PWC) system.
In Hole U1581A, core disturbance was common in cores collected using the APC, HLAPC, and XCB systems, affecting the continuous track measurements of physical properties for cores. Discrete sampling for thermal conductivity and MAD analyses avoided core disturbance wherever readily identifiable. Many of the clay-rich lithologies at Site U1581 expanded in volume upon recovery, likely altering some physical properties. In Hole U1581B, the trends in physical properties show a continuation of observations recorded in Hole U1581A. Average NGR levels and deconvolved U, Th, and K concentrations are higher at Site U1581 compared to the two previous sites on the Agulhas Plateau, reflecting lower carbonate content and higher clay content in the Transkei Basin. P-wave velocity, thermal conductivity, and bulk density all increase downcore through the biogenic oozes of Lithostratigraphic Subunit Ia in the upper 198.24 m. At the contact between Lithostratigraphic Subunits Ia and Ib (~198.24 m CSF-A), a sharp ~0.2–0.3 g/cm3 increase in bulk density occurs where a hiatus is indicated by biostratigraphic analysis (see Micropaleontology and Chronostratigraphy). Finer scale changes in physical properties at Site U1581, such as in NGR and MS, are associated with decimeter-scale nannofossil ooze/chalk beds that are likely turbiditic in origin (see Lithostratigraphy). A major increase in MS to ~400 instrument units (IU) occurs in the clayey silts and silty clays of Lithostratigraphic Subunit IIa (395.70–486.07 m CSF-A) and may correspond to the transition from the Late Cretaceous to the Paleogene. The grain density of claystones in Lithostratigraphic Subunit IIb (486.07–994.02 m CSF-A) is high (~2.75–2.85 g/ cm3) and likely relates to the presence of authigenic minerals such as pyrite and siderite. P-wave velocity at Site U1581 increases downcore relatively linearly from ~1650 m/s at the seafloor to ~2200 m/s at the base of Lithostratigraphic Unit II (994.02 m CSF-A).
8.1. Natural gamma radiation
NGR values in the cores from Site U1581 vary between lithostratigraphic units and generally range between ~20 and 50 counts/s. Below an initial decrease in NGR from 40.8 counts/s immediately below the seafloor (0.30 m CSF-A) to 14.5 counts/s at 8.9 m CSF-A, NGR gradually increases downhole by approximately 30 counts/s to the boundary of Lithostratigraphic Subunits Ia and Ib at 198.24 m CSF-A (Figure F39). From 210 m to 235 m CSF-A, NGR shows a 15 counts/s decrease downcore; from 235 m CSF-A to the bottom of Hole U1581A at 292.11 m CSF-A, NGR averages 37 counts/s.
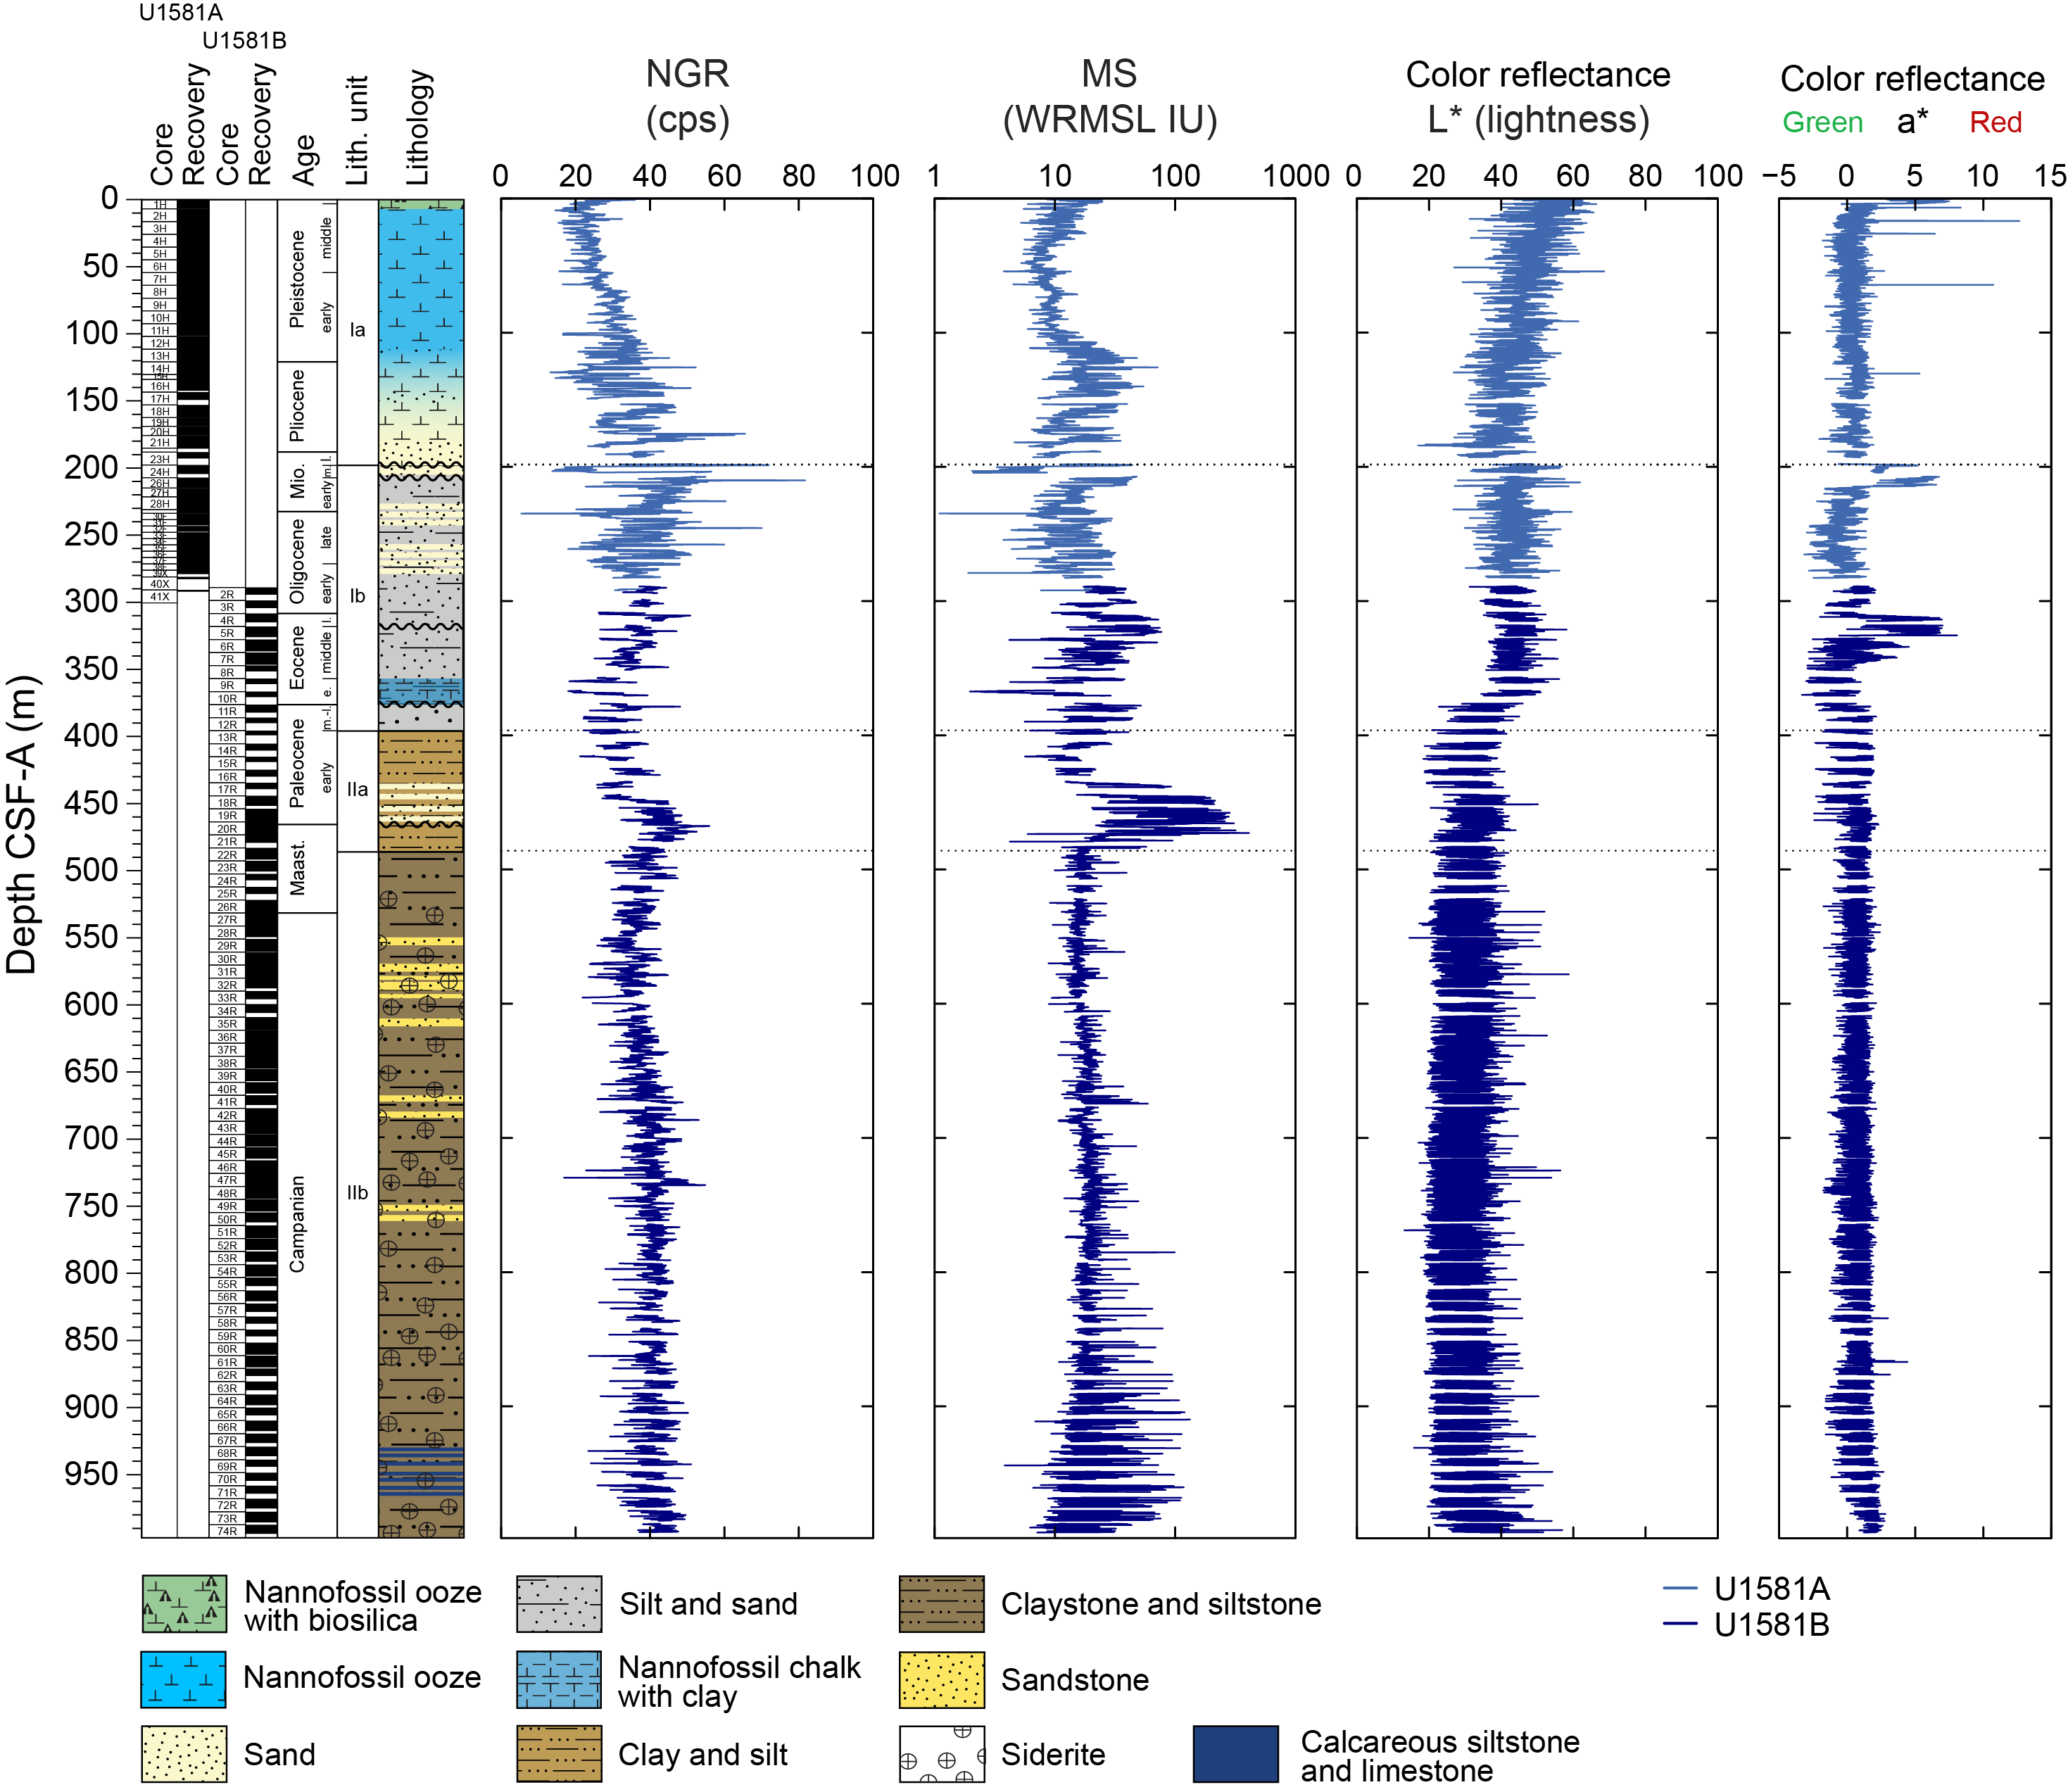
Figure F39. Physical properties.
In Hole U1581B, NGR is stable and ranges between 30 and 50 counts/s in the upper part of the intercalated sands and silts of Lithostratigraphic Subunit Ib (Figure F39). Toward the lower interval of this subunit, NGR slightly decreases to 20–40 counts/s. In the clayey silt and clay with silt alternation of Lithostratigraphic Subunit IIa (435.44–486.07 m CSF-A), NGR averages ~40 counts/s. The highest NGR value in Hole U1581B (55.9 counts/s) is observed at 467.63 m CSF-A in Core 20R. In the claystone/clayey siltstone intercalations in Lithostratigraphic Subunit IIb, NGR first decreases downcore to 30 counts/s at 560 m CSF-A, and then it increases downcore to an average of 40 counts/s at 650 m CSF-A. Below 650 m CSF-A, NGR averages 40 counts/s with increasing variability below 850 m CSF-A. In individual cores, NGR is higher in darker clay-rich beds and lower in the lighter hued sandy beds.
Elemental abundance depth profiles of K, U, and Th were deconvolved from the NGRL spectral data (see Physical properties in the Expedition 392 methods chapter [Uenzelmann-Neben et al., 2023a]) and provide additional insights into trends of the full NGR profile, along with geochemical information for the site (Figure F40; see Geochemistry). Deconvolved NGR data reveal an enrichment of U content in the biogenic ooze in Lithostratigraphic Unit I (0.0–3.5 m CSF-A). K, U, and Th contents slightly increase to ~2 wt%, 2 ppm, and 7 ppm, respectively, near the contact of Lithostratigraphic Subunits Ia and Ib (198.24 m CSF-A). K contents peak for the site between 447 and 475 m CSF-A, with the 25 point moving average exceeding 2.5 wt% in the lower interval of Lithostratigraphic Subunit IIa (395.70–486.07 m CSF-A). In the underlying Cretaceous claystones and siltstones of Lithostratigraphic Subunit IIb, K, U, and Th contents vary in a narrow range around means of 2.2 wt% for K, ~5 ppm for Th, and ~1.8 ppm for U (Figure F40).
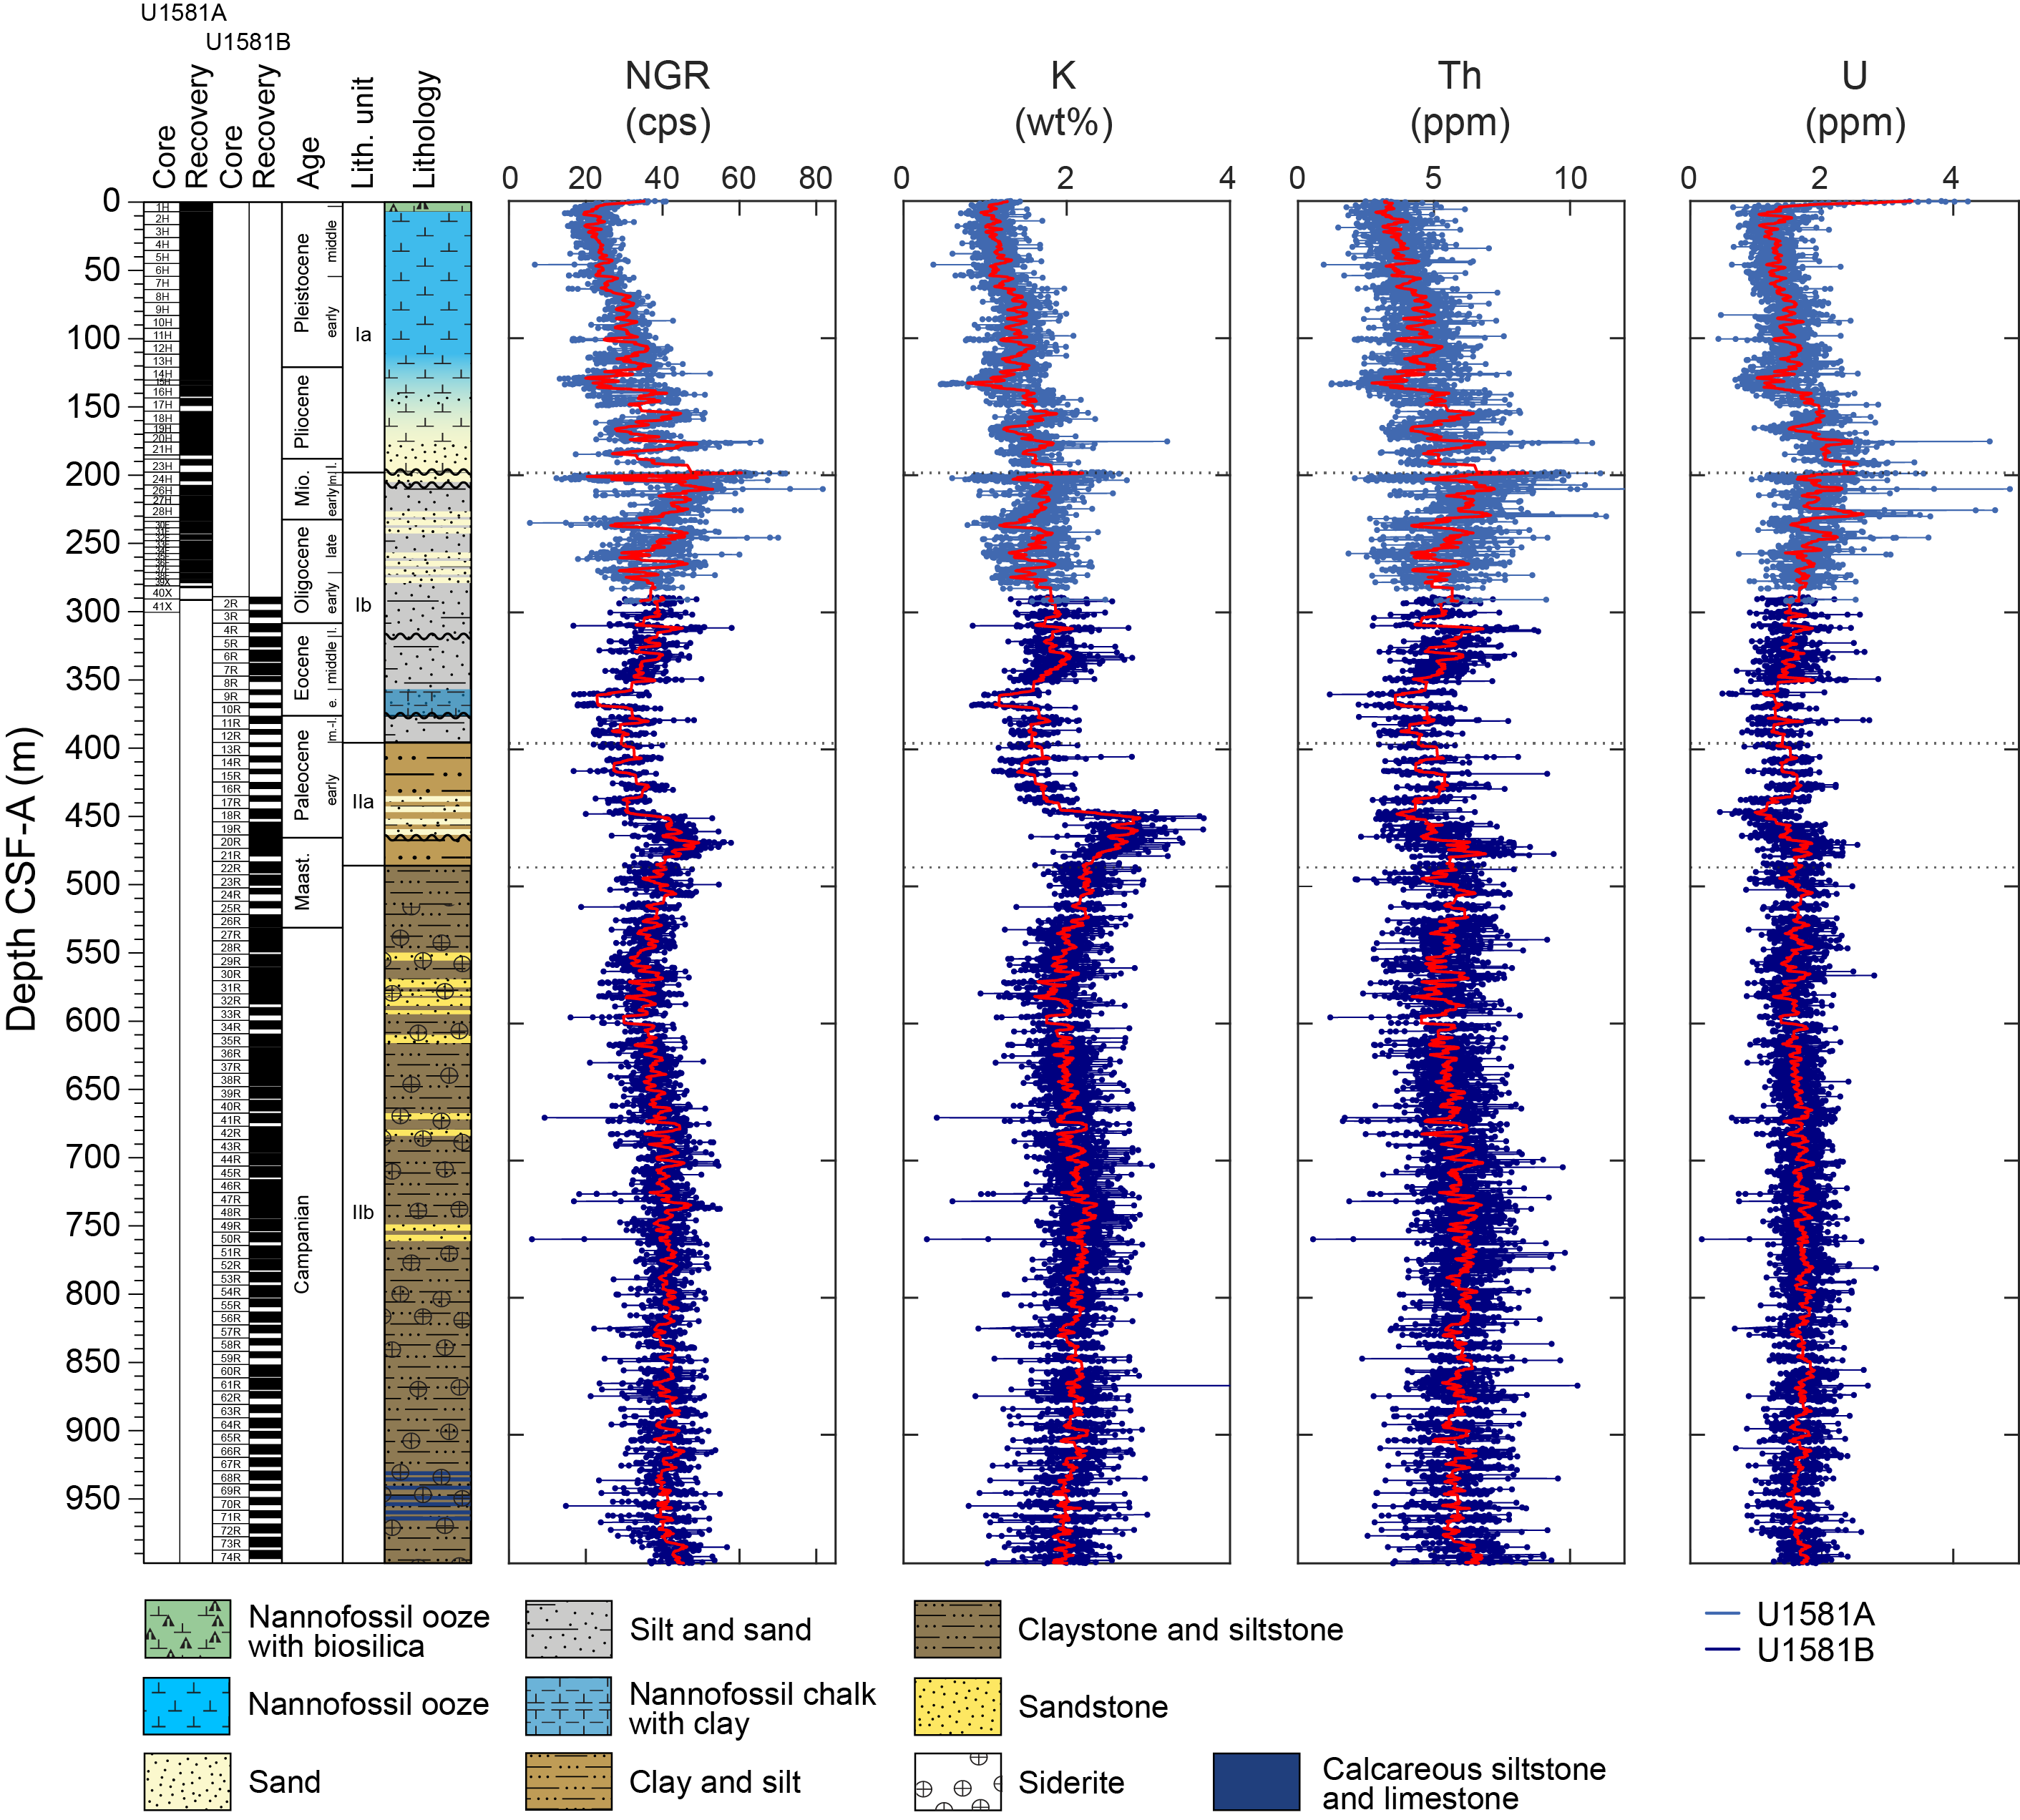
Figure F40. NGR and K, Th, and U.
NGR data from different lithostratigraphic units at Site U1581 plot in distinct domains on a Th-K diagram, which can be used to constrain clay mineralogy (Quirein et al., 1982). The distribution of Th/K ratios in Lithostratigraphic Subunit Ia (0–199 m CSF-A) is consistent with a clay mineral composition of montmorillonite and/or illite (Figure F41A). Lithostratigraphic Subunit Ib has a distinct trend with K content of about 1.5 wt% and Th in the range of 4–9 ppm, which may be associated with montmorillonite and/or mixed clays (Figure F41B). A bimodal distribution of K and Th in Lithostratigraphic Subunit IIa indicates illite and mica/glauconite clay minerals in the Late Cretaceous to Paleogene transition, along with K enrichment (Figure F41C). Lithostratigraphic Subunit IIb (486.07–994.02 m CSF-A) is characterized by Th/K ratios of ~2, which can be associated with illite and micas (Figure F41D).
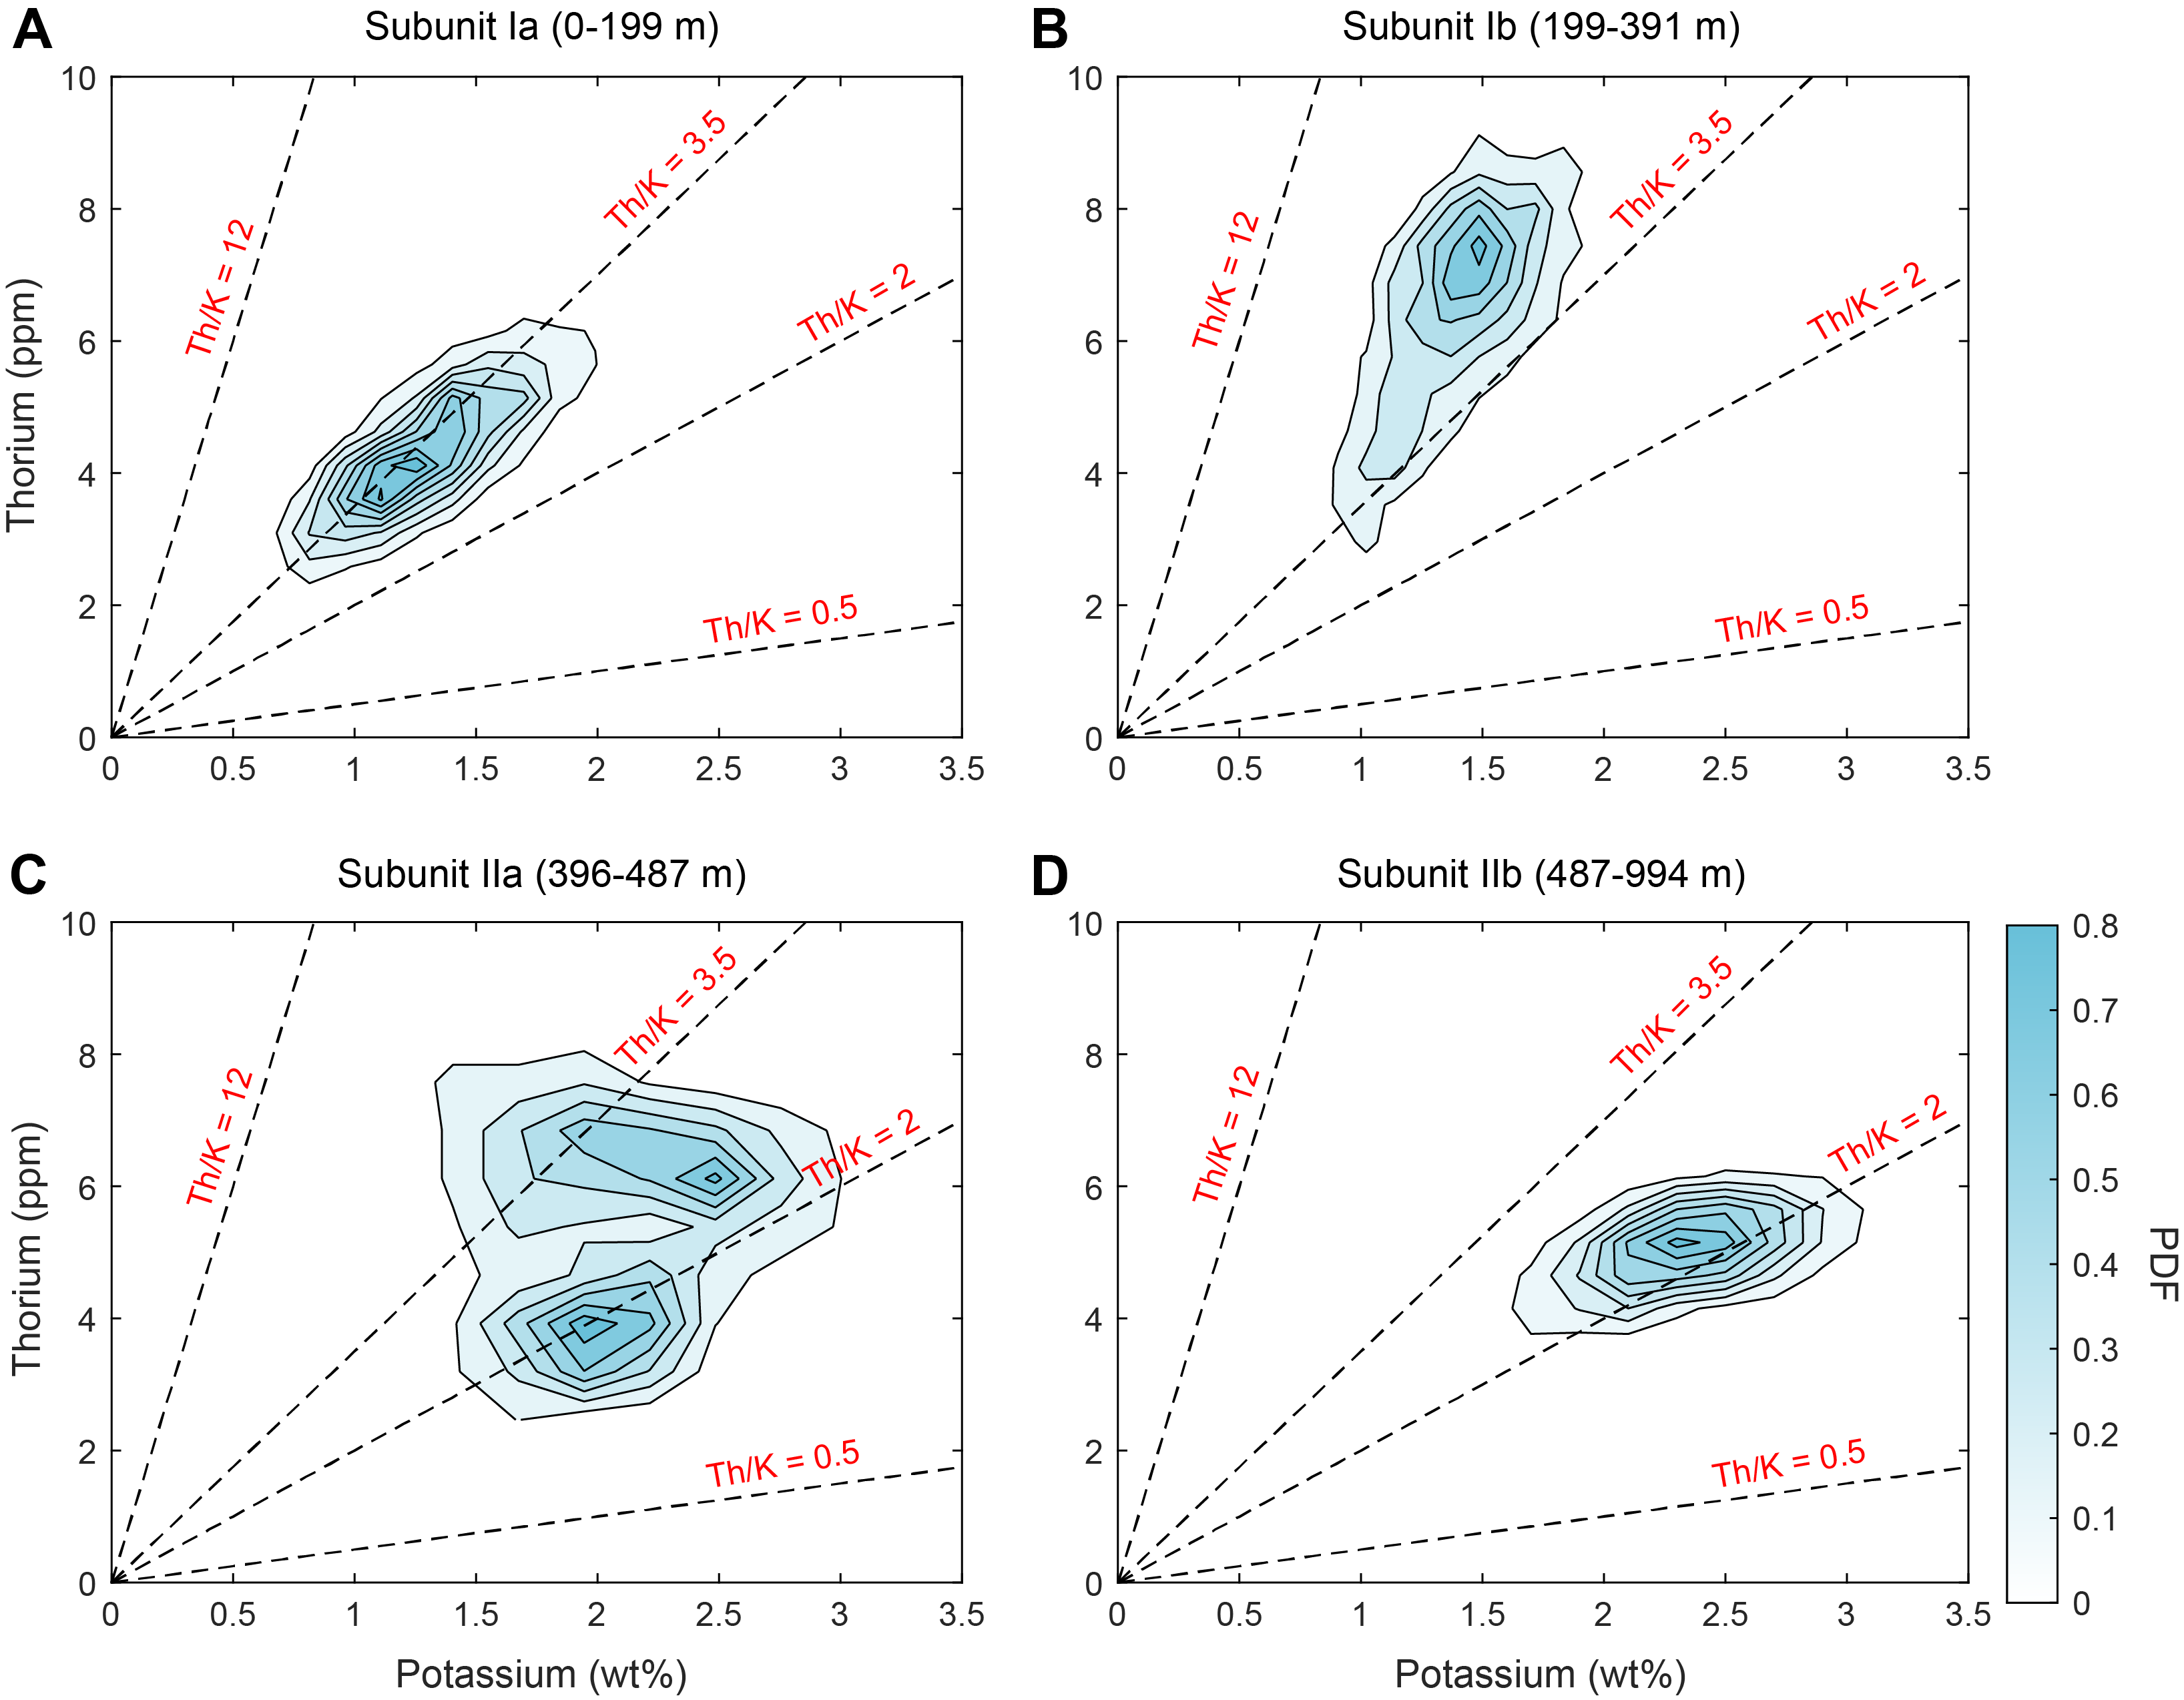
Figure F41. Th vs. K.
8.2. Color reflectance
In the biogenic ooze with siliciclastics of Lithostratigraphic Subunit Ia, L* (lightness) ranges 35–60 and gradually decreases from the seafloor to the base of the subunit at 198.24 m CSF-A (Figure F39). L* is abruptly higher (average = ~43) below the contact with Lithostratigraphic Subunit Ib (198.24 m CSF-A), where it remains stable to 360 m CSF-A. Below this depth, L* decreases to ~30 at the base of the unit at 435.44 m CSF-A. In Lithostratigraphic Unit II, L* is stable at ~30. Average L* increases slightly only at the base of the Hole U1581B (970–994 m CSF-A) (Figure F39). Notably, the variability of L* is relatively low (~15–20) throughout the site. The green versus red parameter of a* is very uniform and averages slightly more than 0, reflecting the overall dark color of the sedimentary succession. Anomalous intervals with higher a* values include the more reddish sediments near the top of Hole U1581A (0–3.90 m CSF-A), the brown ghost core interval (~198–207 m CSF-A), and deeper reddish clayey sediments (310.85–325.64 m CSF-A).
8.3. Magnetic susceptibility
MS measured on both the WRMSL and SHMSL range across one to two orders of magnitude between the different lithostratigraphic units at Site U1581 (Figure F39). In the biogenic ooze of Lithostratigraphic Subunit Ia (0–198.24 m CSF-A), MS is around 15 IU immediately below the seafloor, gradually decreases to ~7 IU at ~50 m CSF-A, and remains around this value to ~100 m CSF-A. Below this level, MS steadily increases to an average of ~25 IU at 120 m CSF-A, remaining at this level to the base of Lithostratigraphic Unit I. Interestingly, the amplitude below 100 m CSF-A is significantly higher (±15 IU) than in the section above (±5 IU). This change reflects the more common occurrence of turbidites, which are characterized by higher MS values at their base, in the lower section of the subunit. In Lithostratigraphic Subunit Ib (198.24–90.05 m CSF-A), the variability in MS data remains high because of the frequent occurrence of turbidites. A prominent change is encountered in the clayey silt and clay with silt alternations of Lithostratigraphic Subunit IIa (395.70–486.07 m CSF-A). In this subunit, MS increases to an average of more than 100 IU, and variations range 20 to almost 400 IU (the highest values encountered in sand intervals) (Figure F39). In Lithostratigraphic Subunit IIb, MS decreases abruptly (average = 15 IU), showing little variability to ~850 m CSF-A. Below this depth, the variability in MS increases because of the more frequent occurrence of lithified siderite-rich sandy layers, and very high peaks in MS exceeding 100 IU occur in some siderite-rich beds.
8.4. Bulk density, grain density, and porosity
The bulk density of whole-round sections from Site U1581 was measured using gamma ray attenuation (GRA) bulk density on the WRMSL. MAD measurements were made for 191 discrete samples at a resolution of two samples per full core or one sample per half core (Figures F42, F43). Both techniques resolve similar depth trends in bulk density (Figure F44), and GRA bulk density and MAD data are equivalent for samples from Hole U1581A, which was cored using the APC, HLAPC, and XCB systems (Figure F45). For samples from Hole U1581B, however, MAD bulk density averages ~0.1 to 0.2 g/cm3 higher than GRA bulk density because of incomplete filling of the core liner with the RCB cores. After applying a volume correction to raw GRA bulk density data (see Physical properties in the Expedition 392 methods chapter [Uenzelmann-Neben et al., 2023a]), density values obtained using these two methods are similar (Figure F45).
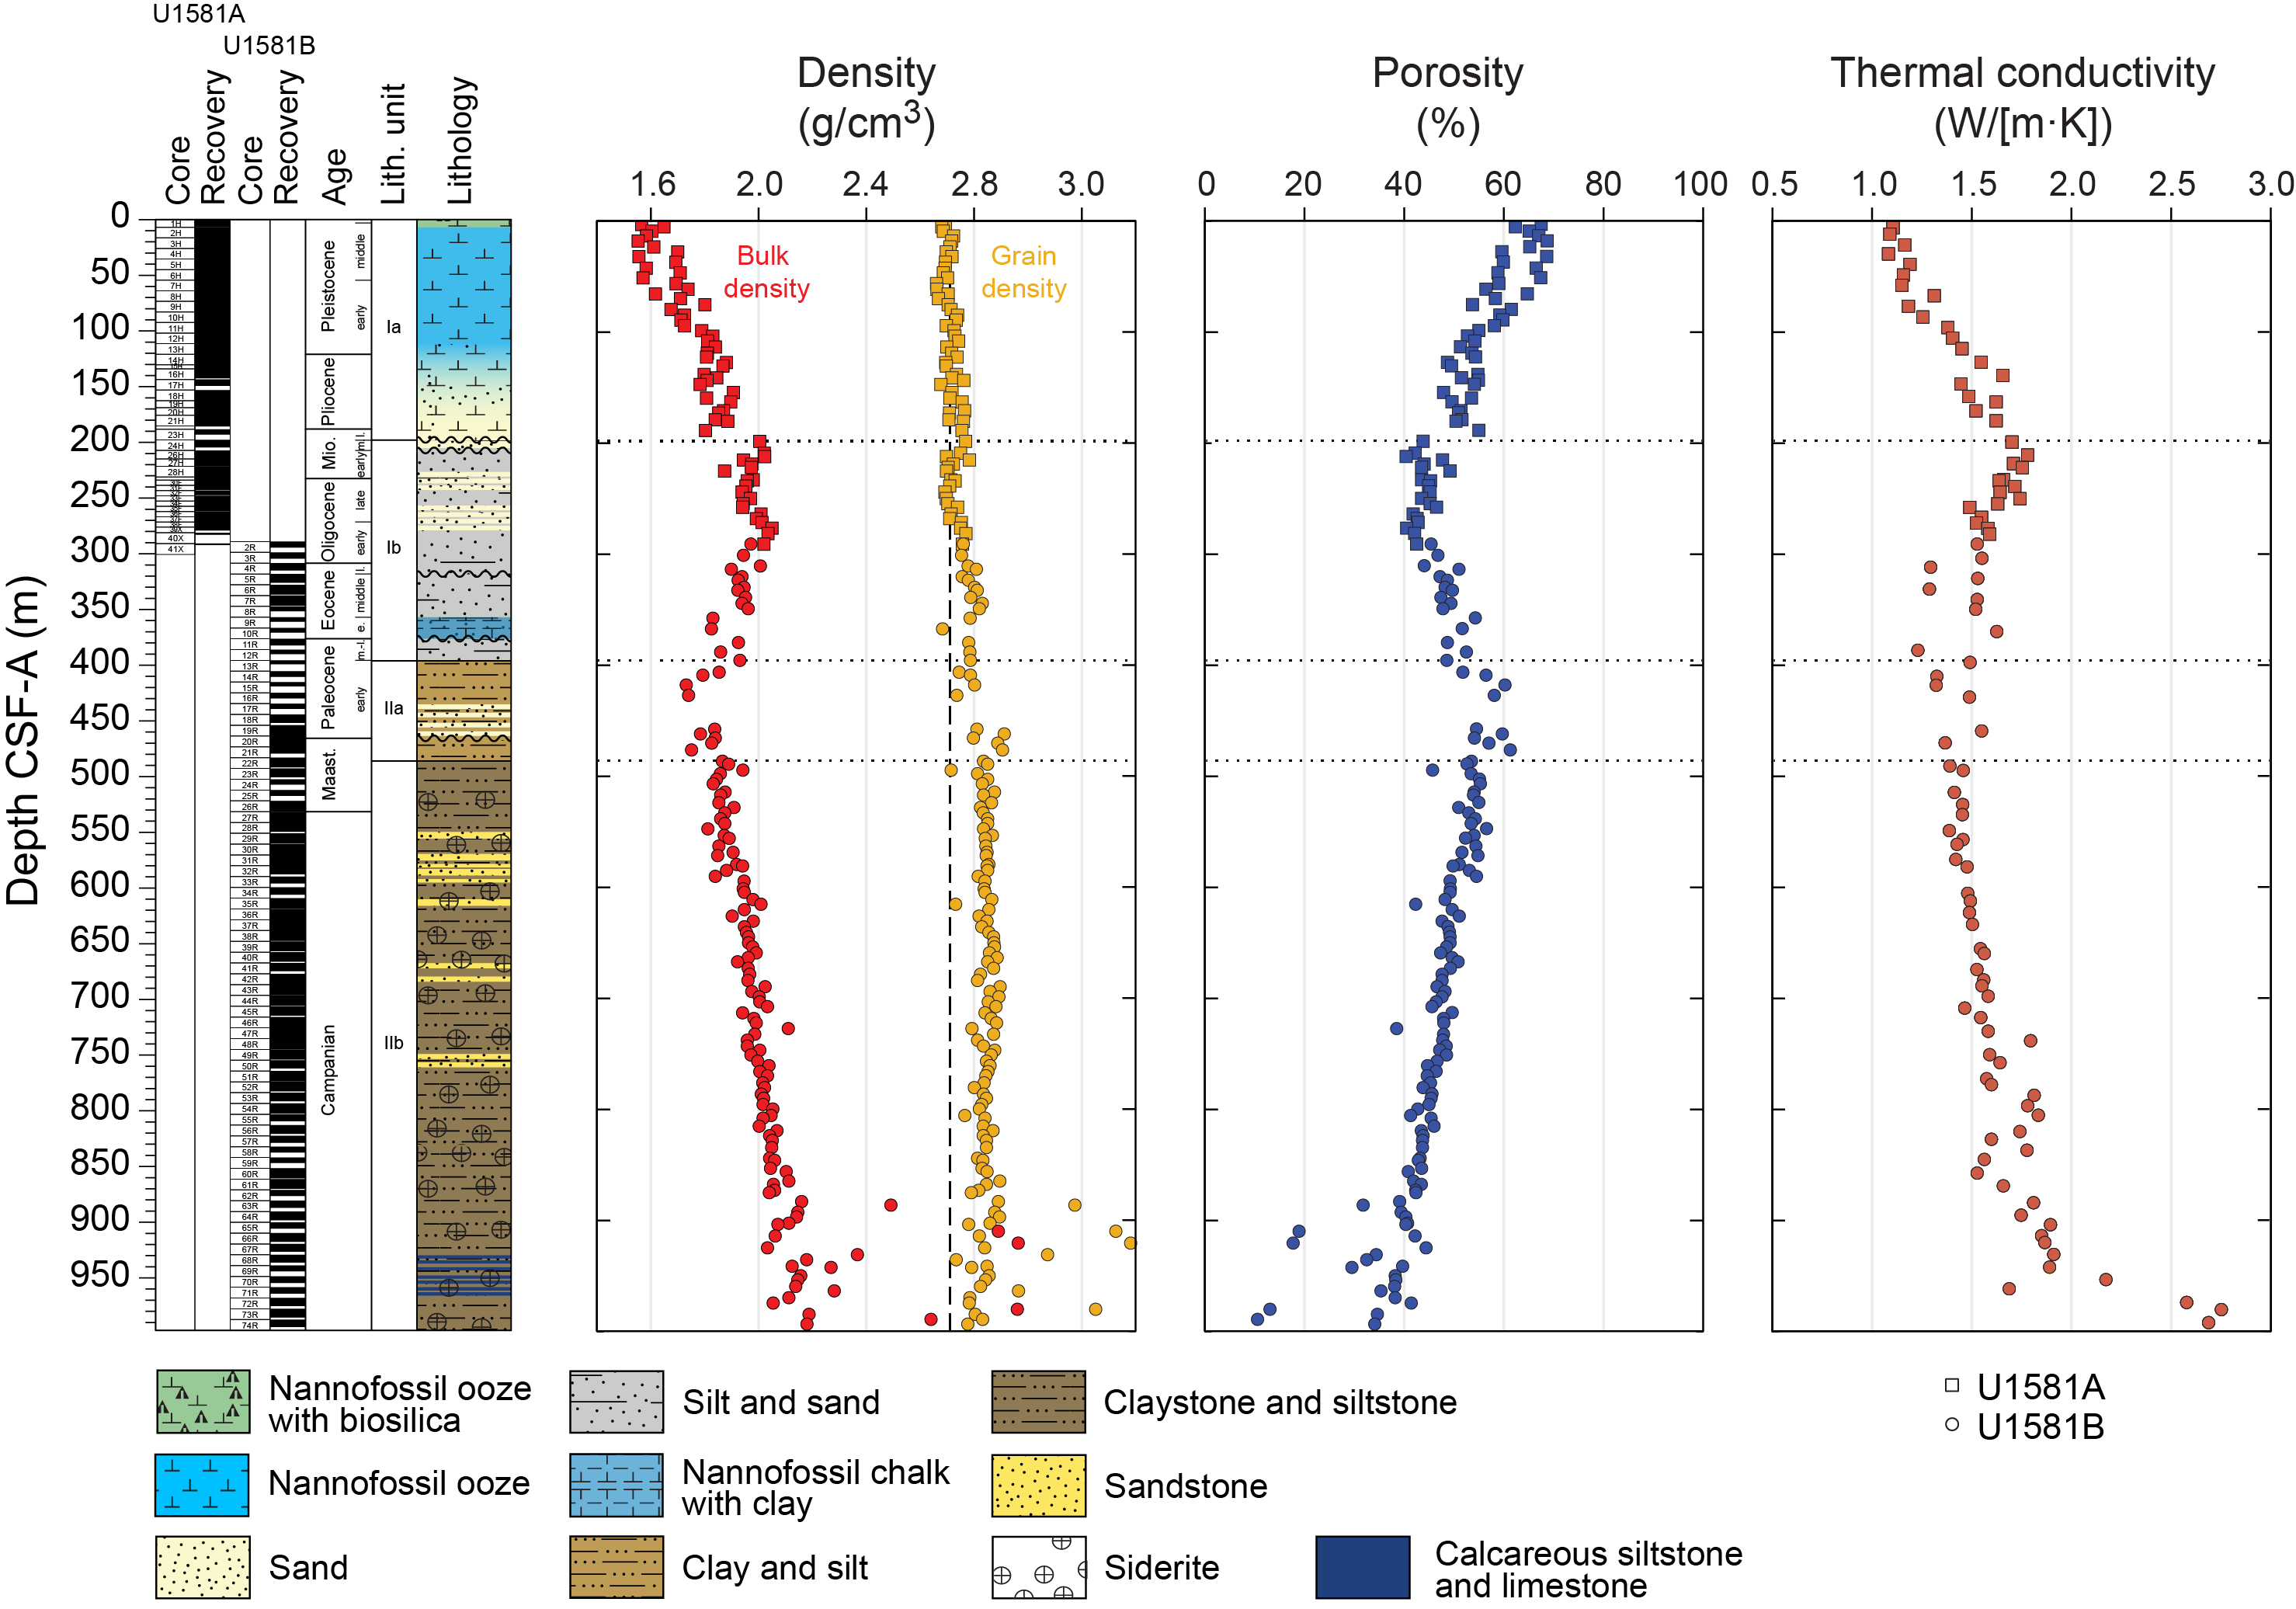
Figure F42. MAD and thermal conductivity results.
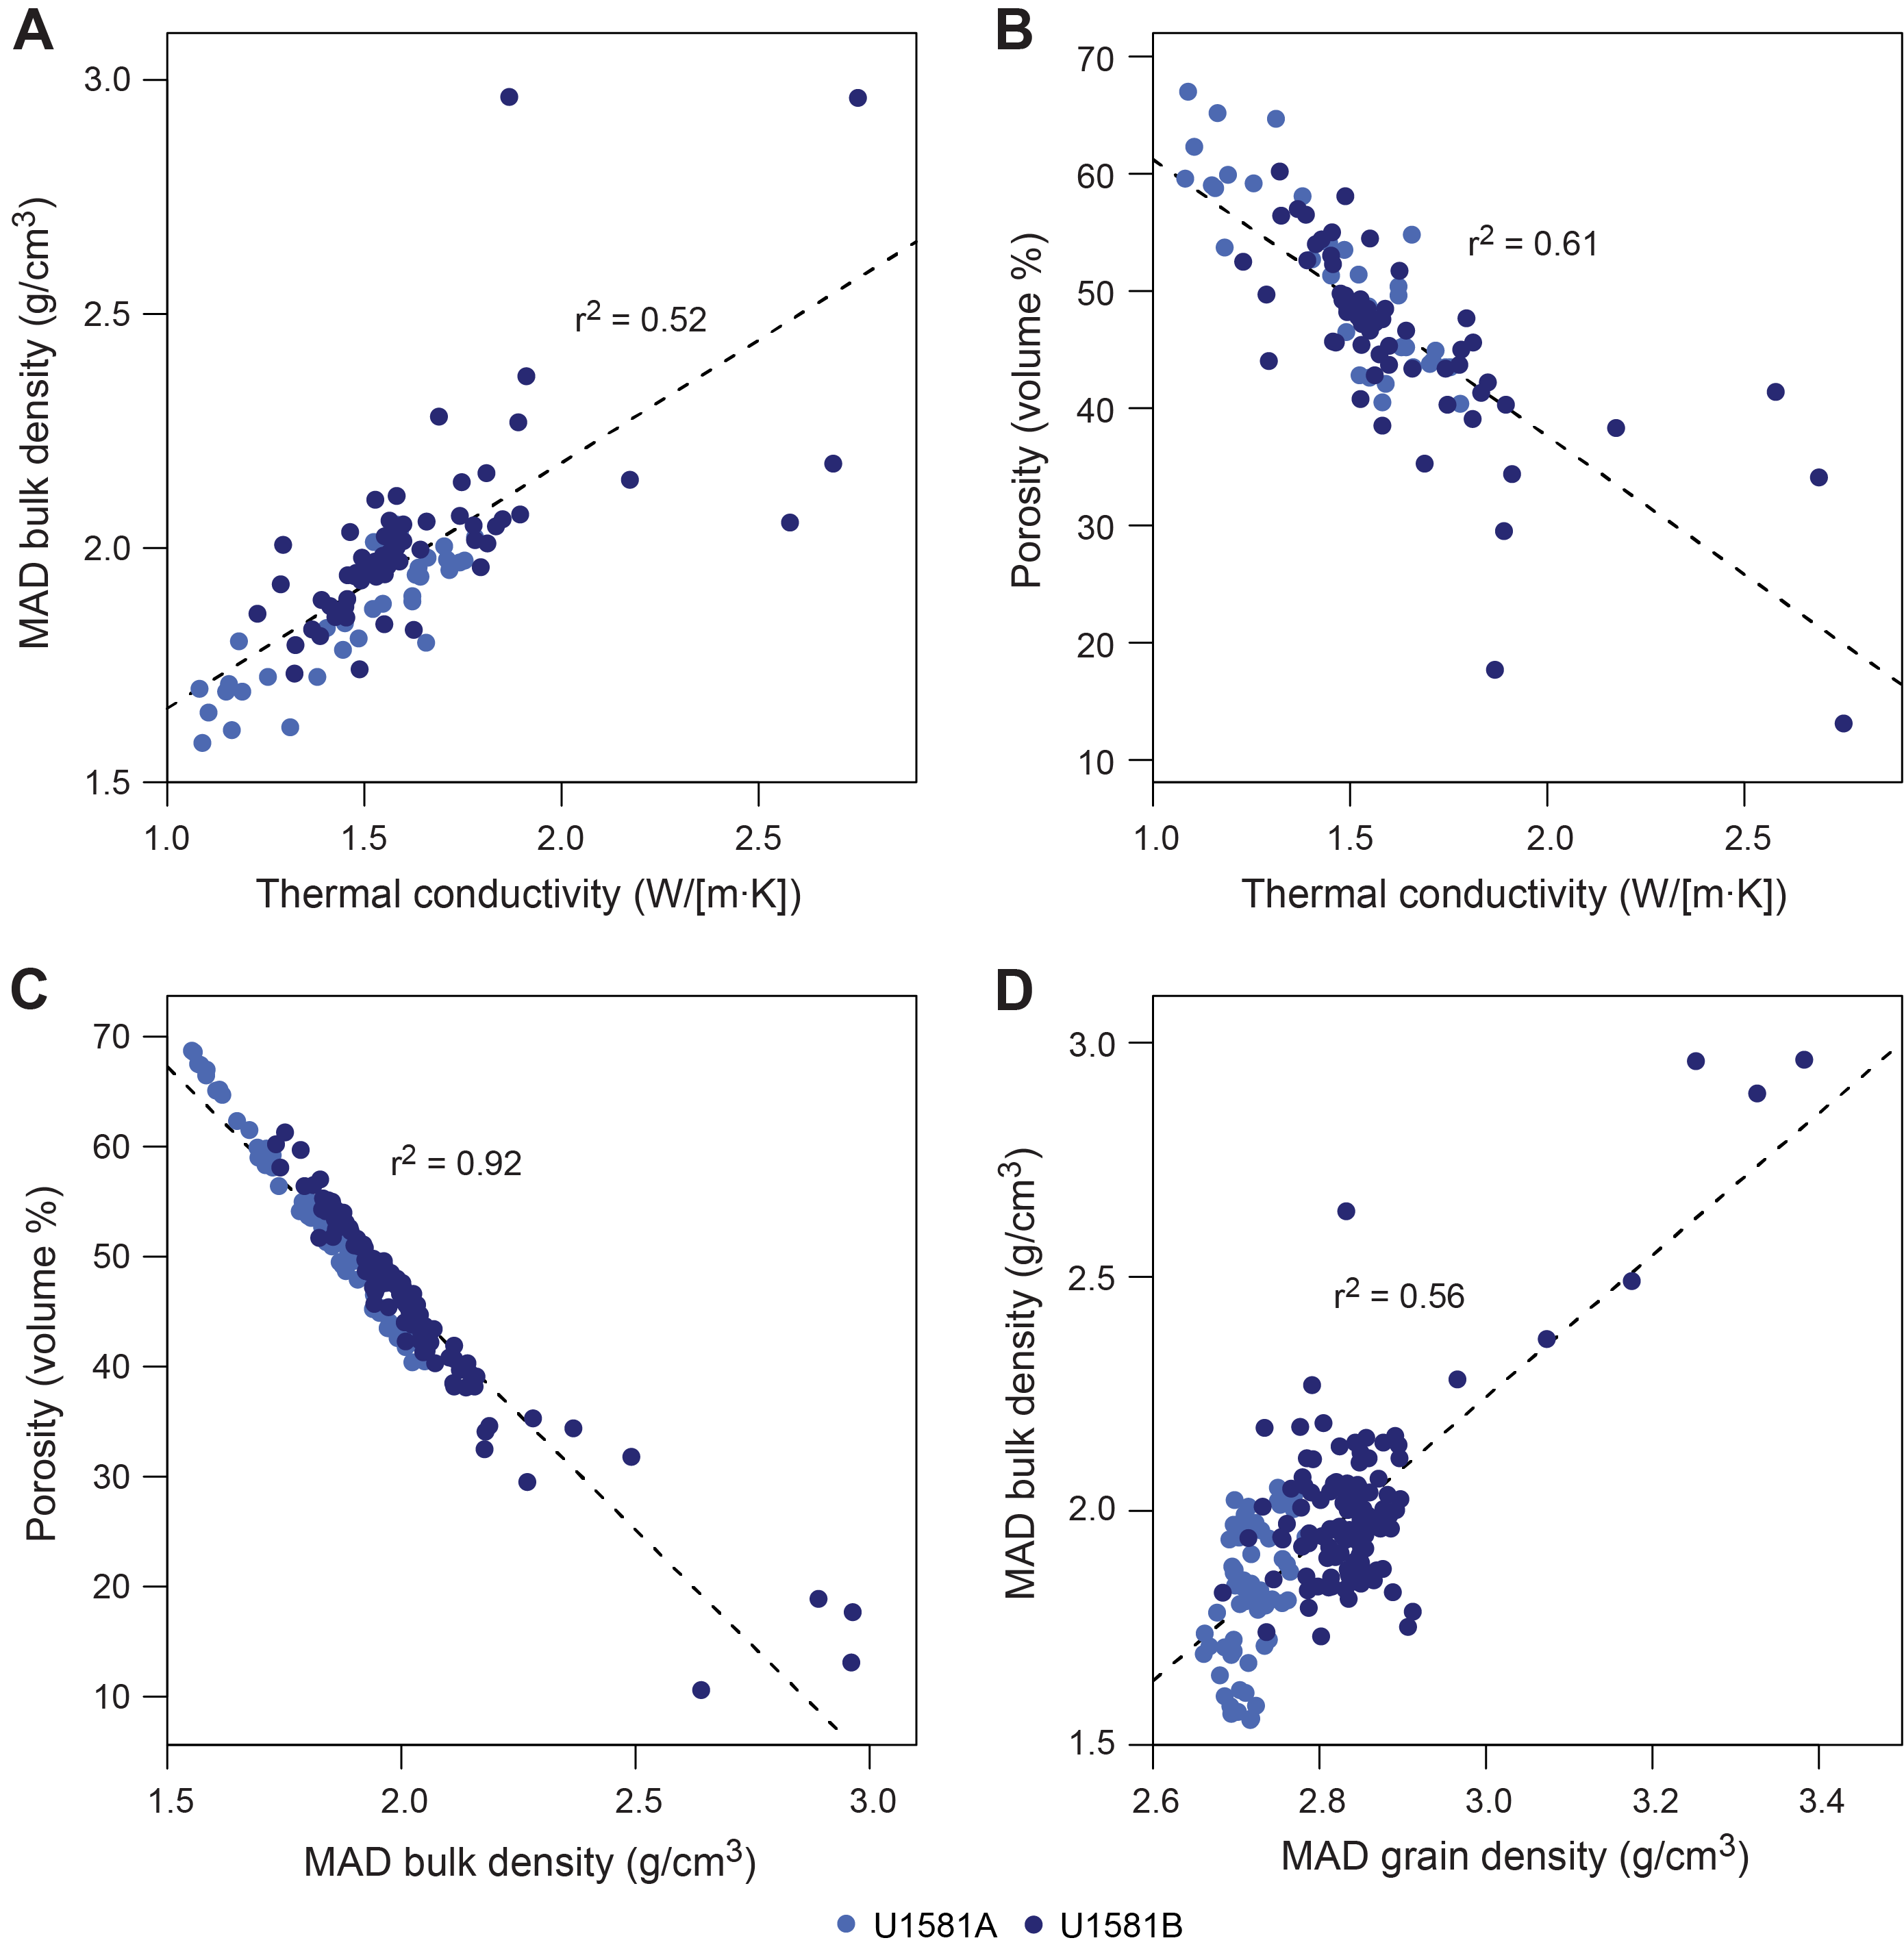
Figure F43. MAD results.
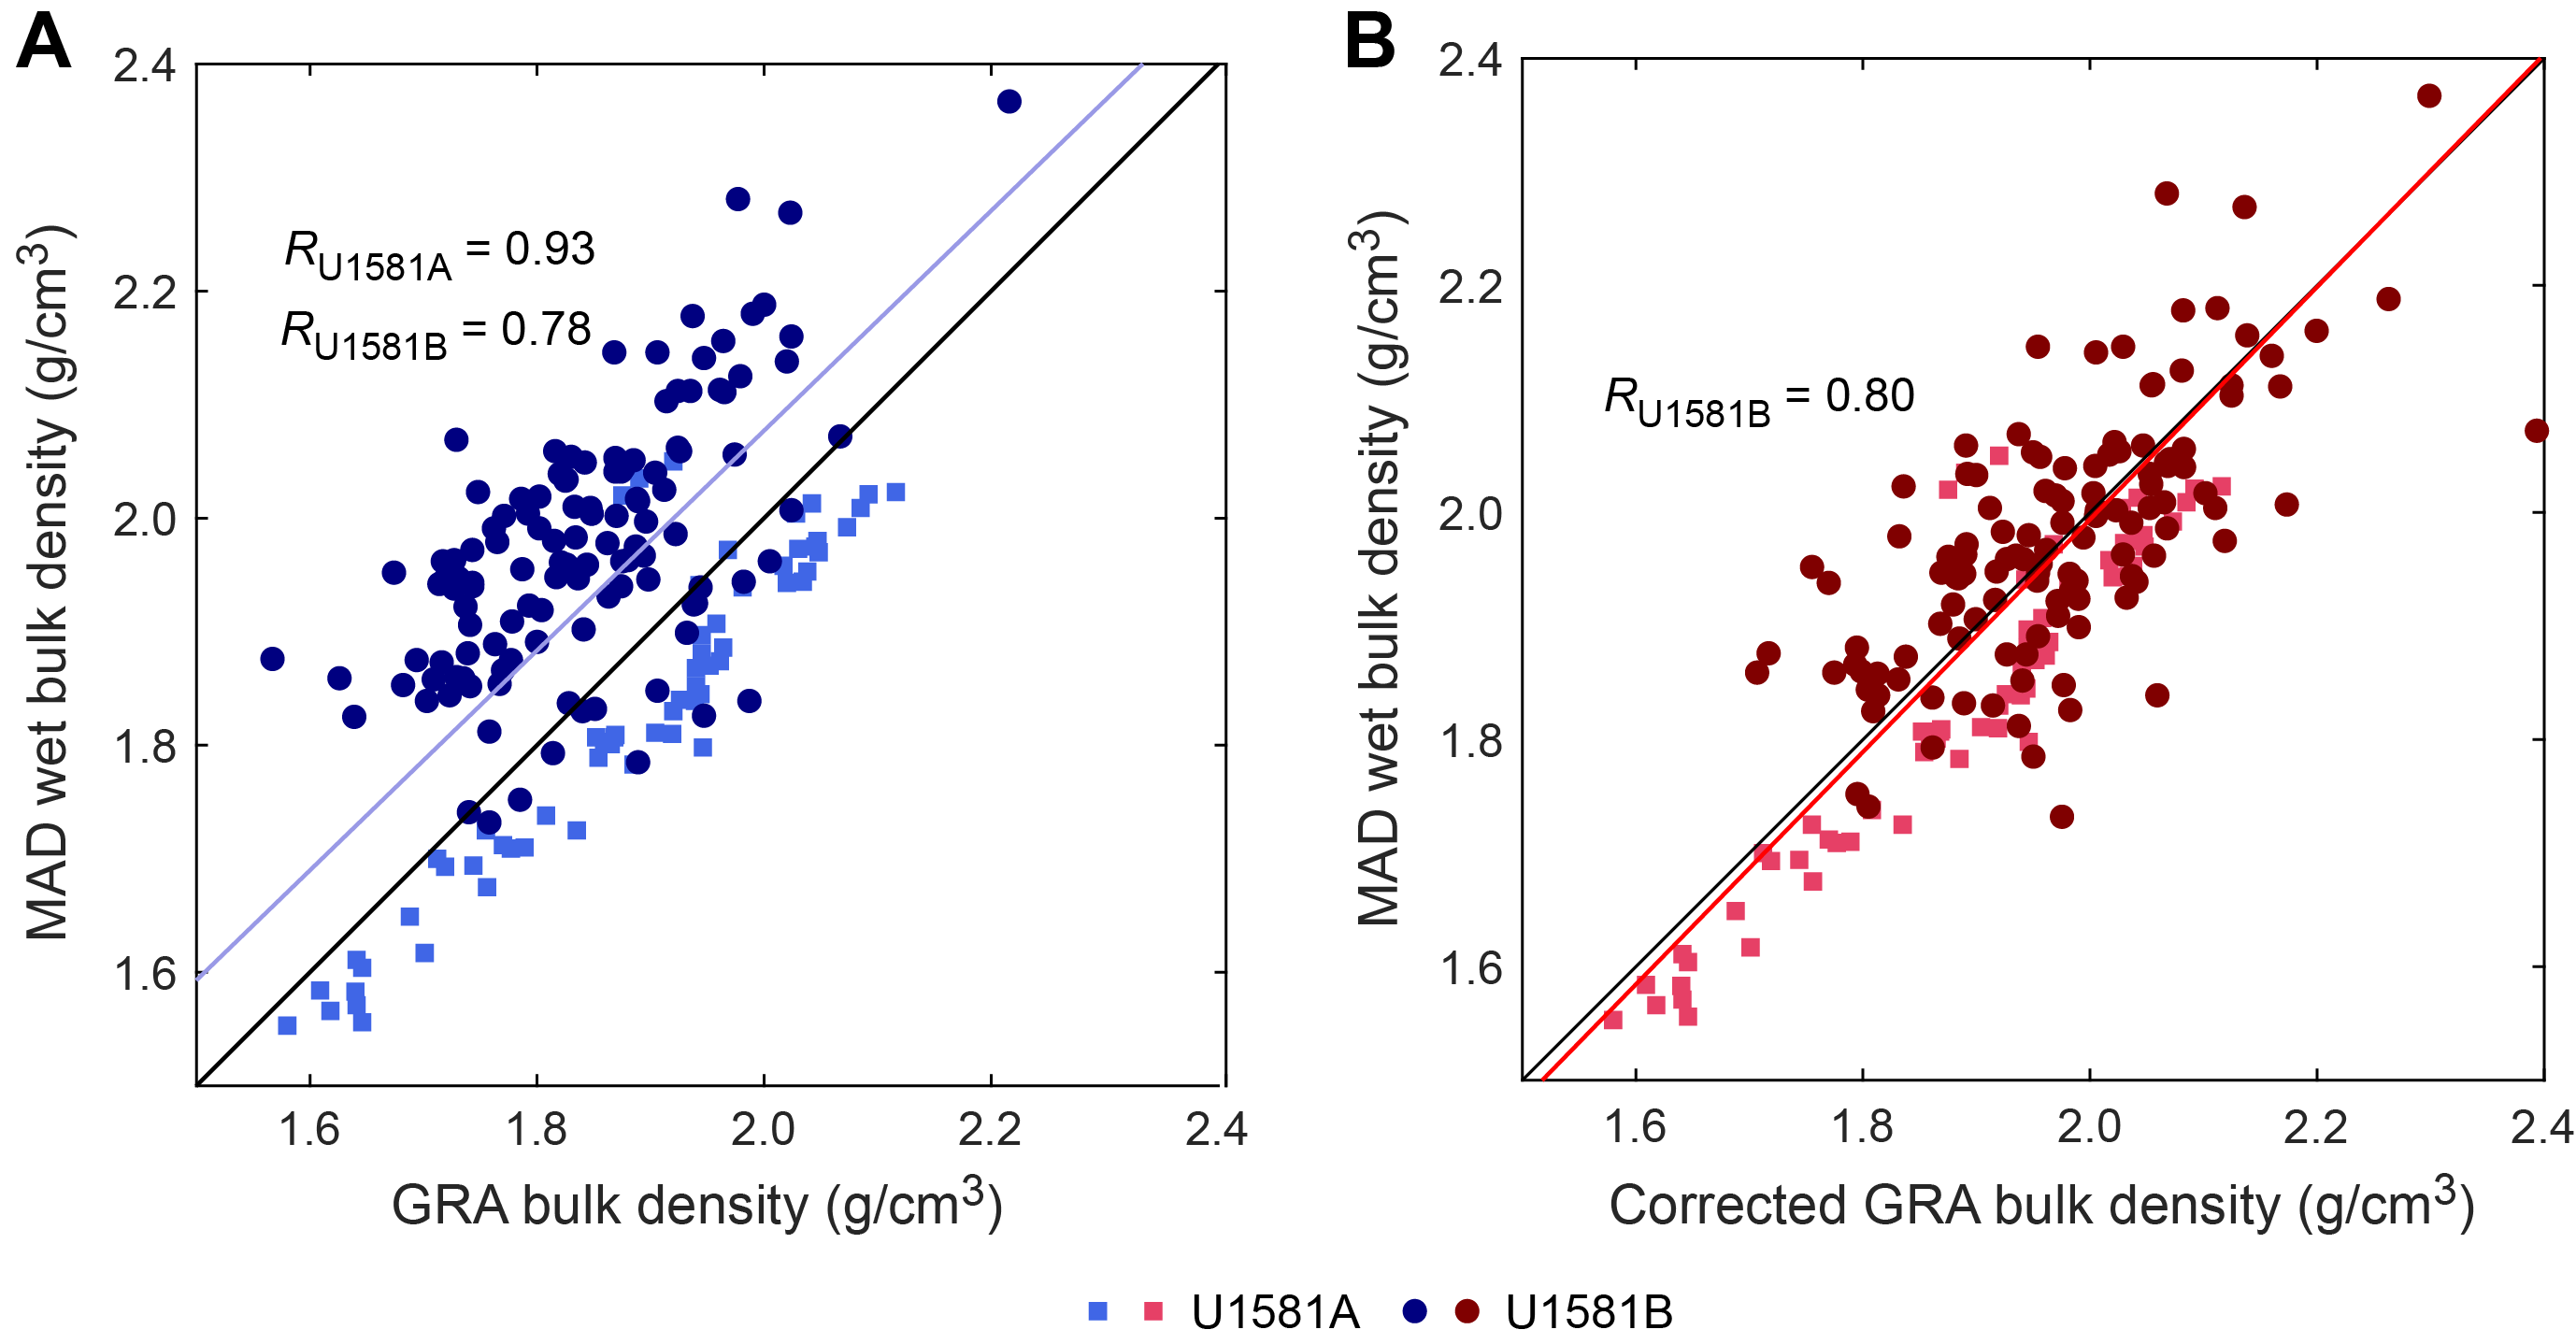
Figure F44. WRMSL density and P-wave velocity.
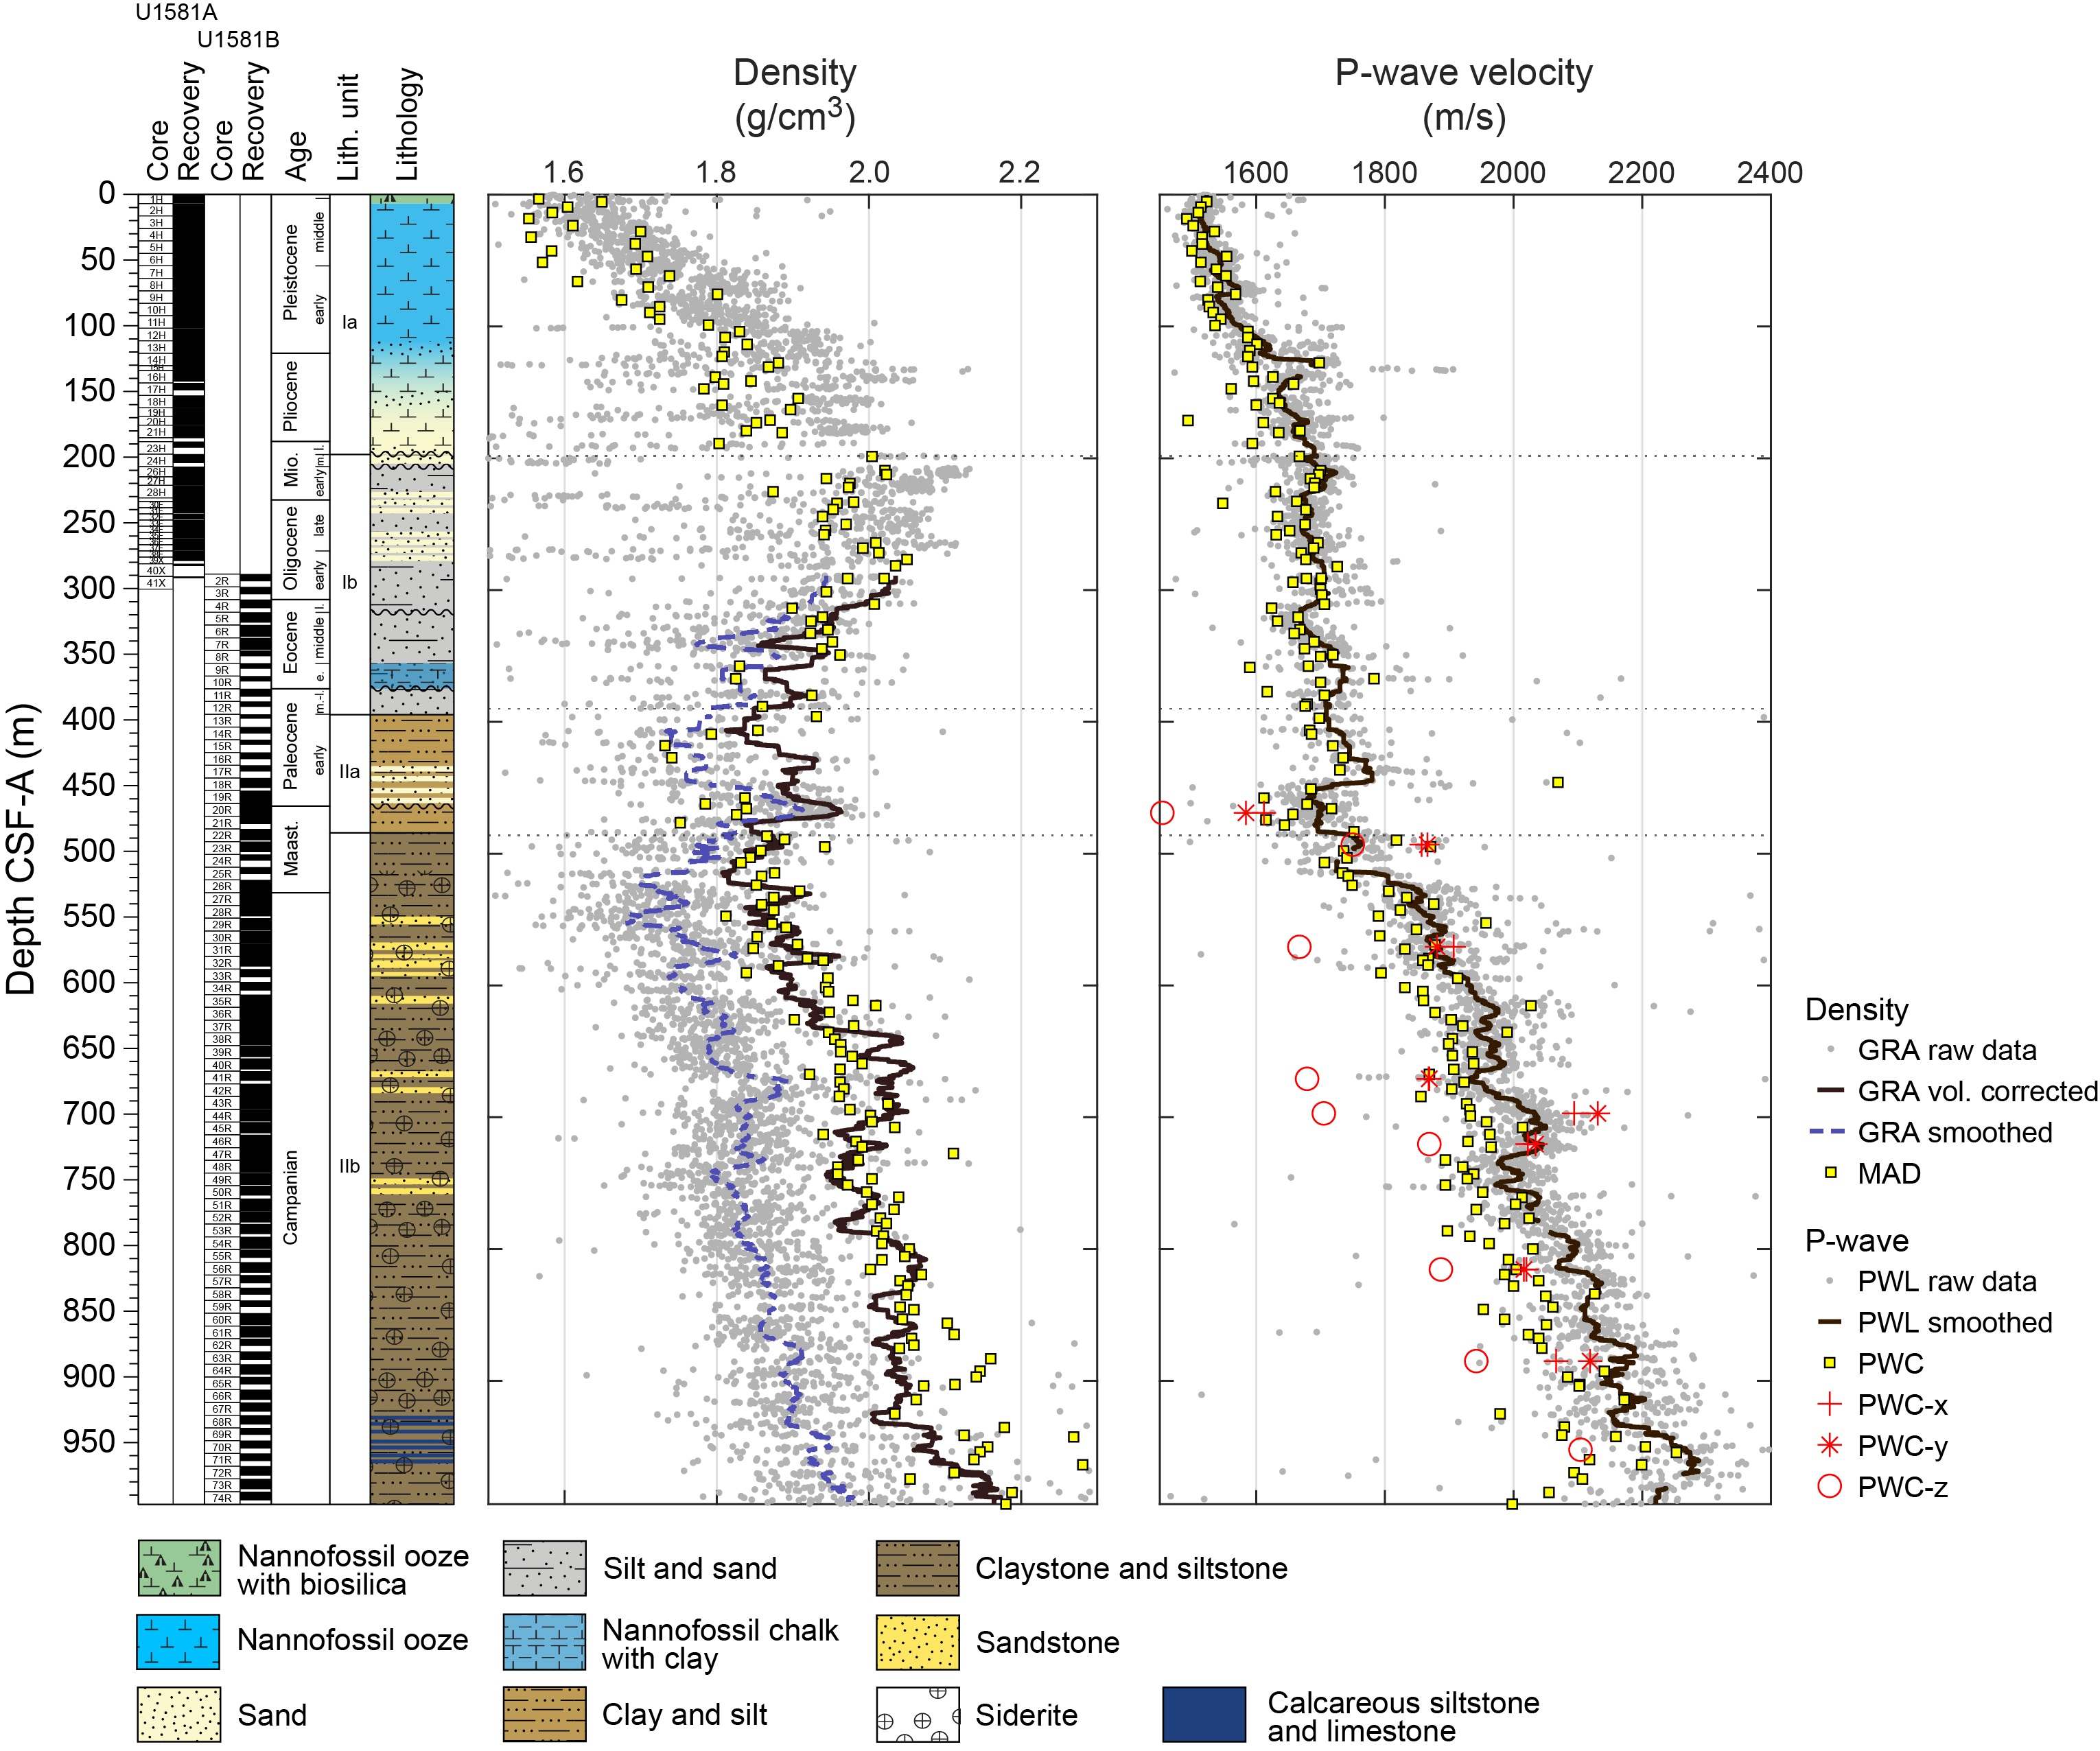
Figure F45. Bulk density.
The average bulk density of sediments at Site U1581 increases downcore from ~1.6 g/cm3 immediately below the seafloor to ~1.9 g/cm3 at the base of the biogenic ooze in Lithostratigraphic Subunit Ia (0–198.24 m CSF-A). Bulk density decreases with depth from ~1.9–2.0 g/cm3 in the sand and silt interbeds of Lithostratigraphic Subunit Ib to ~1.7–1.8 g/cm3 in Lithostratigraphic Subunit IIa (Figure F42). In the underlying Cretaceous siltstones and clayey siltstones of Lithostratigraphic Subunit IIb below ~486.07 m CSF-A, bulk density increases linearly downcore to an average of ~2.2 g/cm3 near the bottom of Hole U1581B.
Porosity at Site U1581 generally decreases with depth from ~60%–70% immediately below the seafloor in the biogenic oozes of Lithostratigraphic Subunit Ia to less than 40% below ~900 m CSF-A in the deepest intervals of claystones and siltstones in Lithostratigraphic Subunit IIb (Figure F42). Local spikes in bulk and grain density below 900 m CSF-A correspond to thin (~10–20 cm) low porosity siderite-rich beds. MAD analyses of these beds indicate bulk densities of 2.5–3.0 g/cm3 and grain densities of 3.0–3.4 g/cm3. The grain density measured in Hole U1581A (mean MAD analyses = 2.71 g/cm3; standard deviation = 0.03 g/cm3) overlaps with the grain density of calcite (2.71 g/cm3) (http://webmineral.com), which is consistent with the significant component of carbonate content in Lithostratigraphic Unit I (Figure F43A; see Geochemistry). Below 290 m CSF-A in Hole U1581B, average grain density increases to more than 2.8 g/cm3, which is consistent with the common occurrence of high-density minerals in the interval such as pyrite and siderite (see Lithostratigraphy).
8.5. P-wave velocity
P-wave velocities of cores from Site U1581 were measured using the P-wave logger (PWL) on the WRMSL at a spatial resolution of 2.5 cm. P-wave velocity (discrete, measured using PWC) was also measured on one to two samples per core. In addition to standard track and caliper measurements, nine discrete samples of lithified sediments from Hole U1581B were analyzed for P-wave directional information. The PWL and PWC P-wave velocities increase with depth from ~1500 m/s at the seafloor to ~2250 m/s at ~997 m CSF-A (Figure F44). PWC P-wave velocities in Lithostratigraphic Unit I (0–390.05 m CSF-A) and Lithostratigraphic Subunit IIa (395.70–486.07 m CSF-A) are relatively low (<1800 m/s). P-wave velocity increases at a higher rate with depth in Lithostratigraphic Subunit IIb (486.07–994.02 m CSF-A). The PWC measurements on discrete samples indicate 10%–15% lower vertical (PWC-z) velocity values compared to horizontal (PWC-x) velocities, which is typical for claystones (Figure F44). The degree of seismic anisotropy appears to decrease with depth. Comparisons of the PWC and smoothed WRMSL PWL data show good agreement in downcore trends and P-wave velocities (Figure F44).
8.6. Thermal conductivity
Thermal conductivity data were measured on section halves using a puck probe (Figure F42). Pervasive biscuiting of the clay-rich facies at Site U1581 limited the measurement of thermal conductivity to more sand-rich lithologies, which tended to provide more intact core surfaces for analysis. Thermal conductivity correlates inversely with MAD porosity and positively with MAD bulk density (Figure F43A, F43B). The correlation coefficients between thermal conductivity and MAD parameters are nominally weaker at Site U1581 than Site U1580 (see Figure F45A, F45B in the Site U1580 chapter [Bohaty et al., 2023b]). This may relate to differences in sampling. At Site U1581, samples for MAD data were collected from clayey, silty, and sandy lithologies, whereas thermal conductivity data almost exclusively originated from coarser grained sandy lithologies.
Thermal conductivity increases from ~1.0 W/(m·K) at the seafloor to generally 1.4–2.0 W/(m·K) in Lithostratigraphic Subunit IIb (486.07–994.02 m CSF-A) (Figure F42). Notably, in the deepest three cores at Site U1581 (392-U1581B-72R through 74R) below 973 m CSF-A, thermal conductivity increases to 2.5–2.8 W/(m·K). This sharp increase corresponds to a more lithified interval with lower porosity and higher bulk density and may represent a seismic reflector near the base of Hole U1581B. When combined with downhole temperature measurements from Hole U1581A (see Downhole measurements), thermal conductivity values are useful for constraining heat flow and the thermal history in the Transkei Basin. In-depth analysis will be done in the postcruise research.
9. Downhole measurements
Downhole measurements at Site U1581 included formation temperature measurements in Hole U1581A. Because of electrical connection problems during wireline logging in Hole U1581B, only NGR wireline logging data were collected between ~80 and 220 m wireline log matched depth below seafloor (WMSF) (see Operations).
9.1. Wireline logging
Downhole NGR data were acquired between 80 and 220 m WMSF using the Enhanced Digital Telemetry Cartridge (EDTC) run at the top of the triple combo tool string (Figure F46). The logging data provide downhole NGR data across the poorly recovered interval underlying Pliocene–Pleistocene sediments (see Lithostratigraphy and Chronostratigraphy), including the ghost core (392-U1581A-25G). These data allow for detailed correlation between Cores 10H–26H and the downhole logging data. The cyclic patterns observed in the downhole NGR profile are characteristic for alternating sand and clay-rich turbiditic deposits.
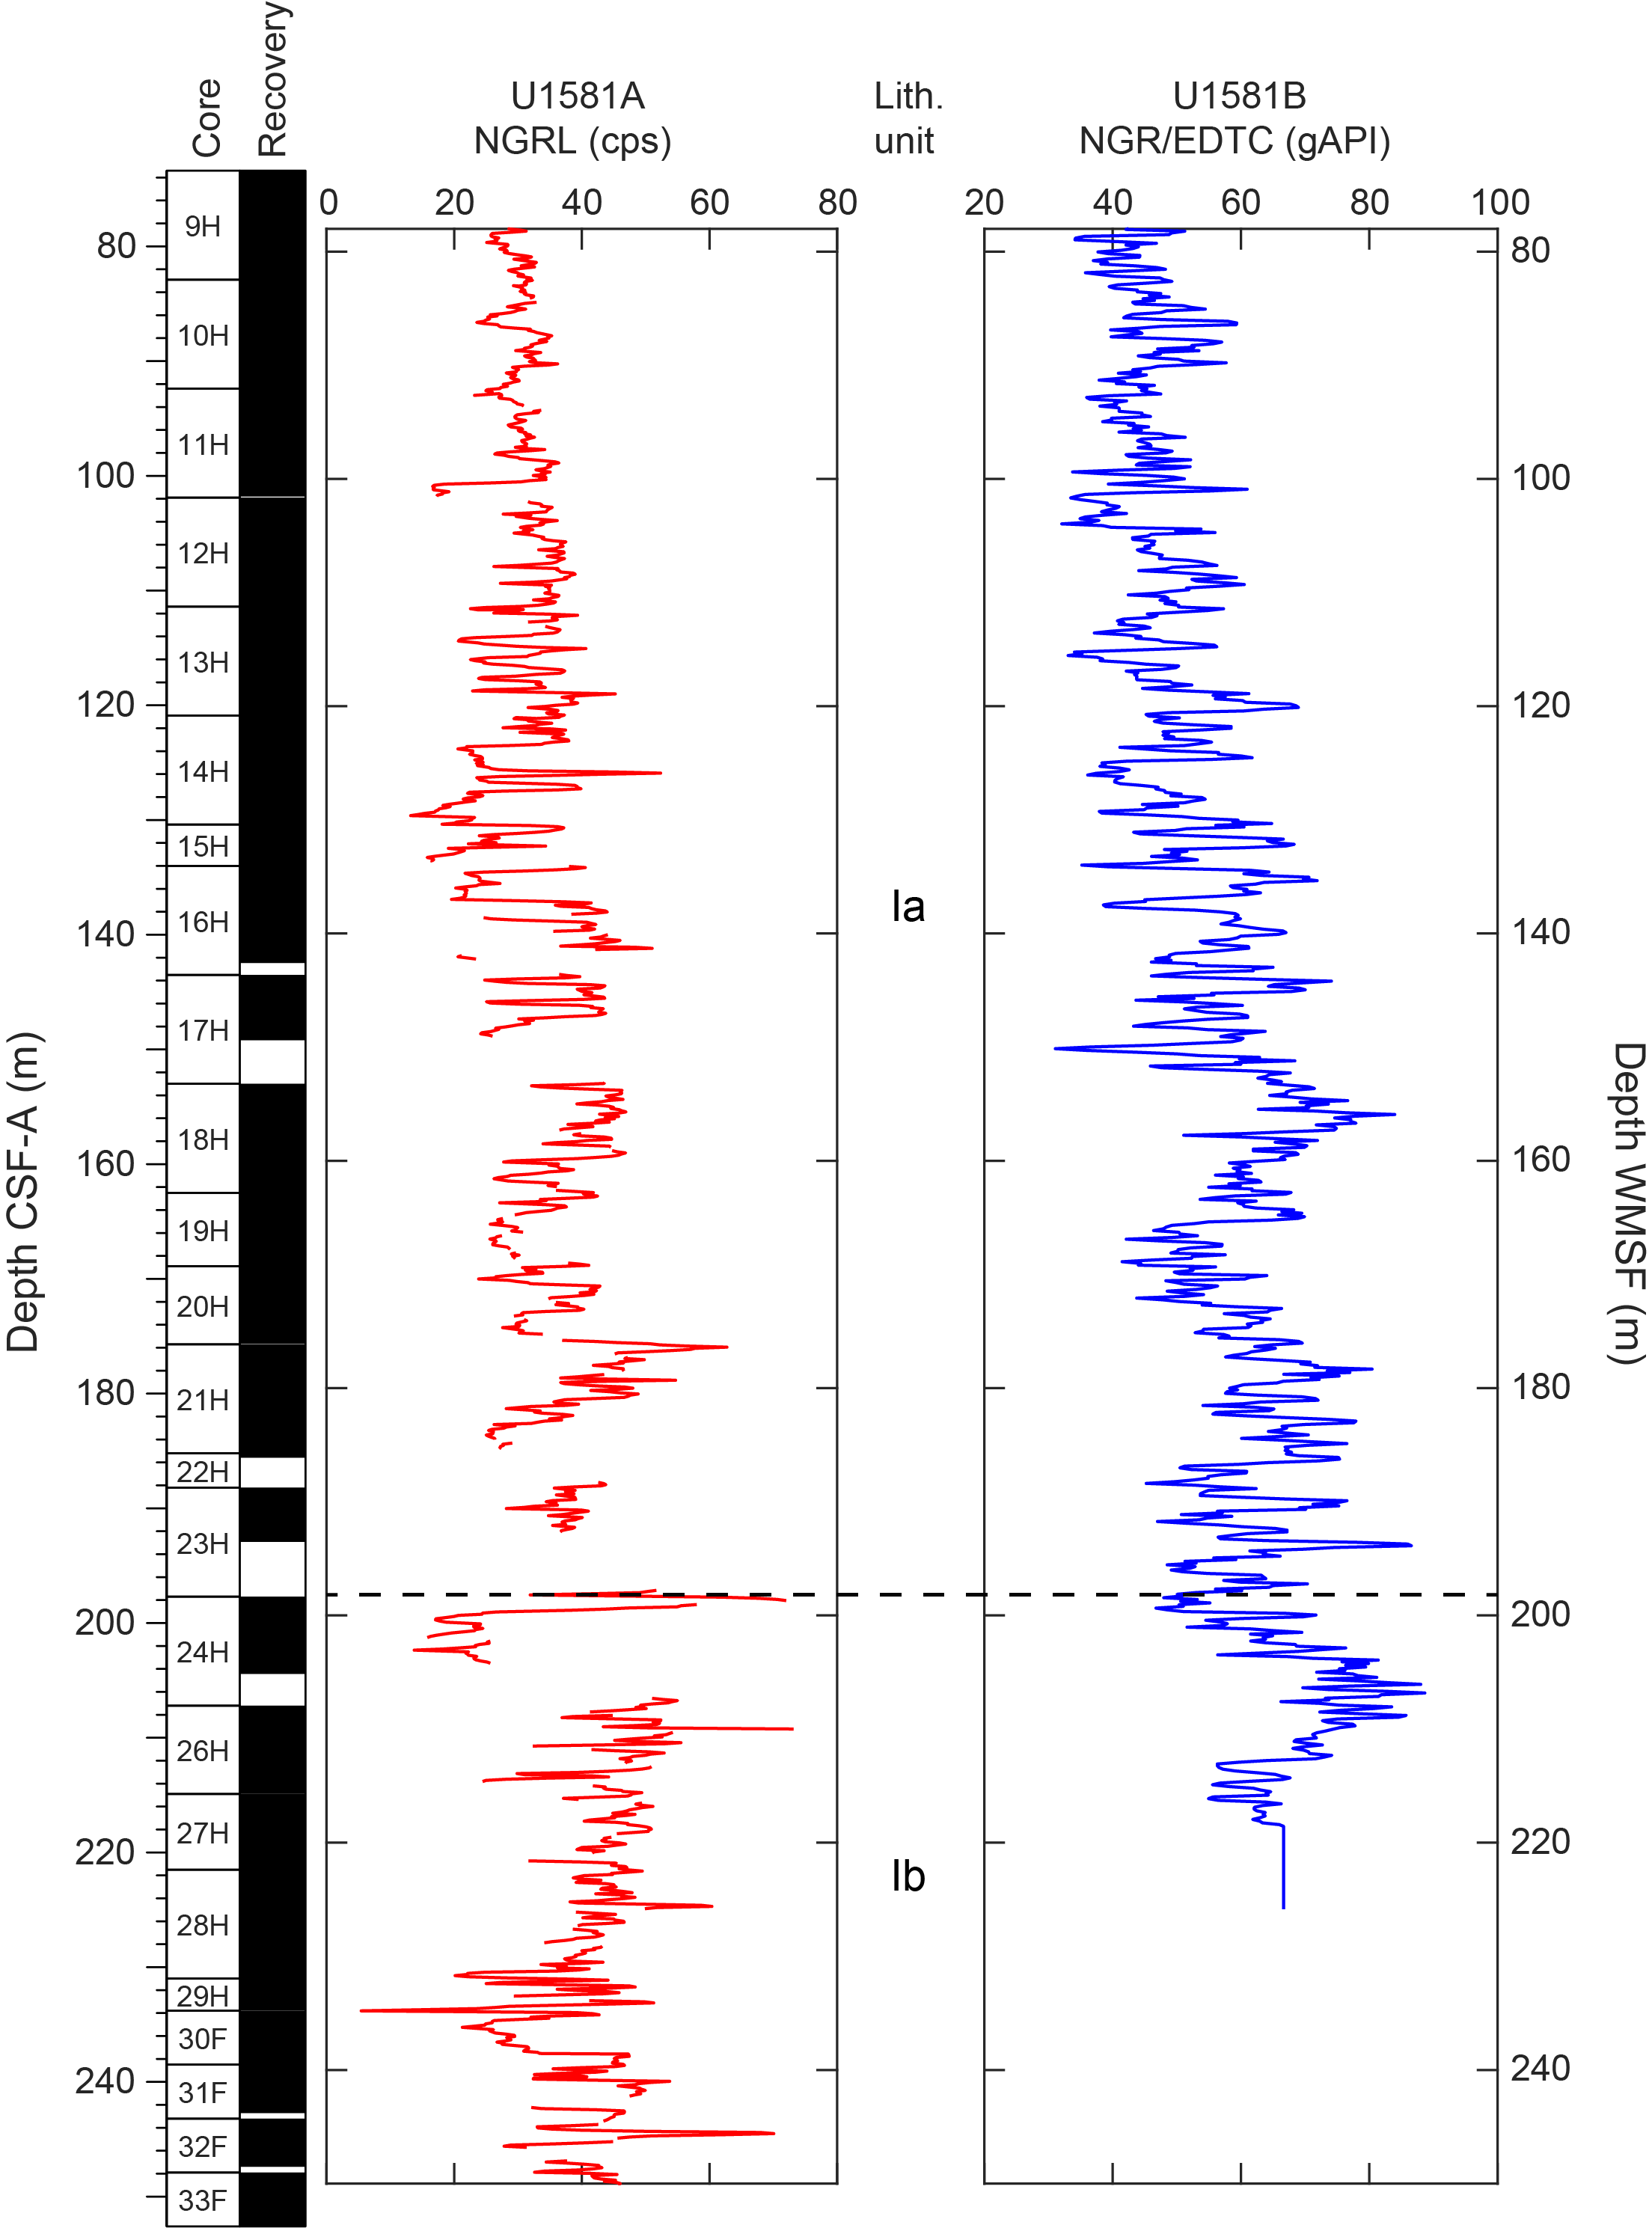
Figure F46. NGRL whole-round core data vs. EDTC downhole log data.
9.2. Formation temperature
Borehole formation temperatures were measured using the APCT-3 tool (see Downhole measurements in the Expedition 392 methods chapter [Uenzelmann-Neben et al., 2023a]) during APC coring of four cores in Hole U1581A (Cores 4H [35.4 m CSF-A], 7H [54.4 m CSF-A], 10H [92.4 m CSF-A], and 13H [120.9 m CSF-A]). Temperature measurements were of good quality, displaying characteristic thermal cooling curves (Figure F47). Initial equilibrium temperature data are available through the LIMS database. However, further shipboard refinement of the thermal cooling curve fits were made and are presented here. The equilibrium borehole temperature was calculated using the TP-Fit software and returned the following values: 2.83° ± 0.002°C, 4.13° ± 0.002°C, 5.43° ± 0.011°C, and 6.10° ± 0.033°C (Heesemann et al. 2006). A geothermal gradient of ~37.0°C/km and a heat flow of ~47.3 mW/m2 were calculated using the Bullard method (Bullard, 1954) (Figure F48). These preliminary results are generally consistent with prior measurements for the Transkei Basin published in the global heat flow database by Fuchs et al. (2021) but require further postcruise analysis and uncertainty estimation.
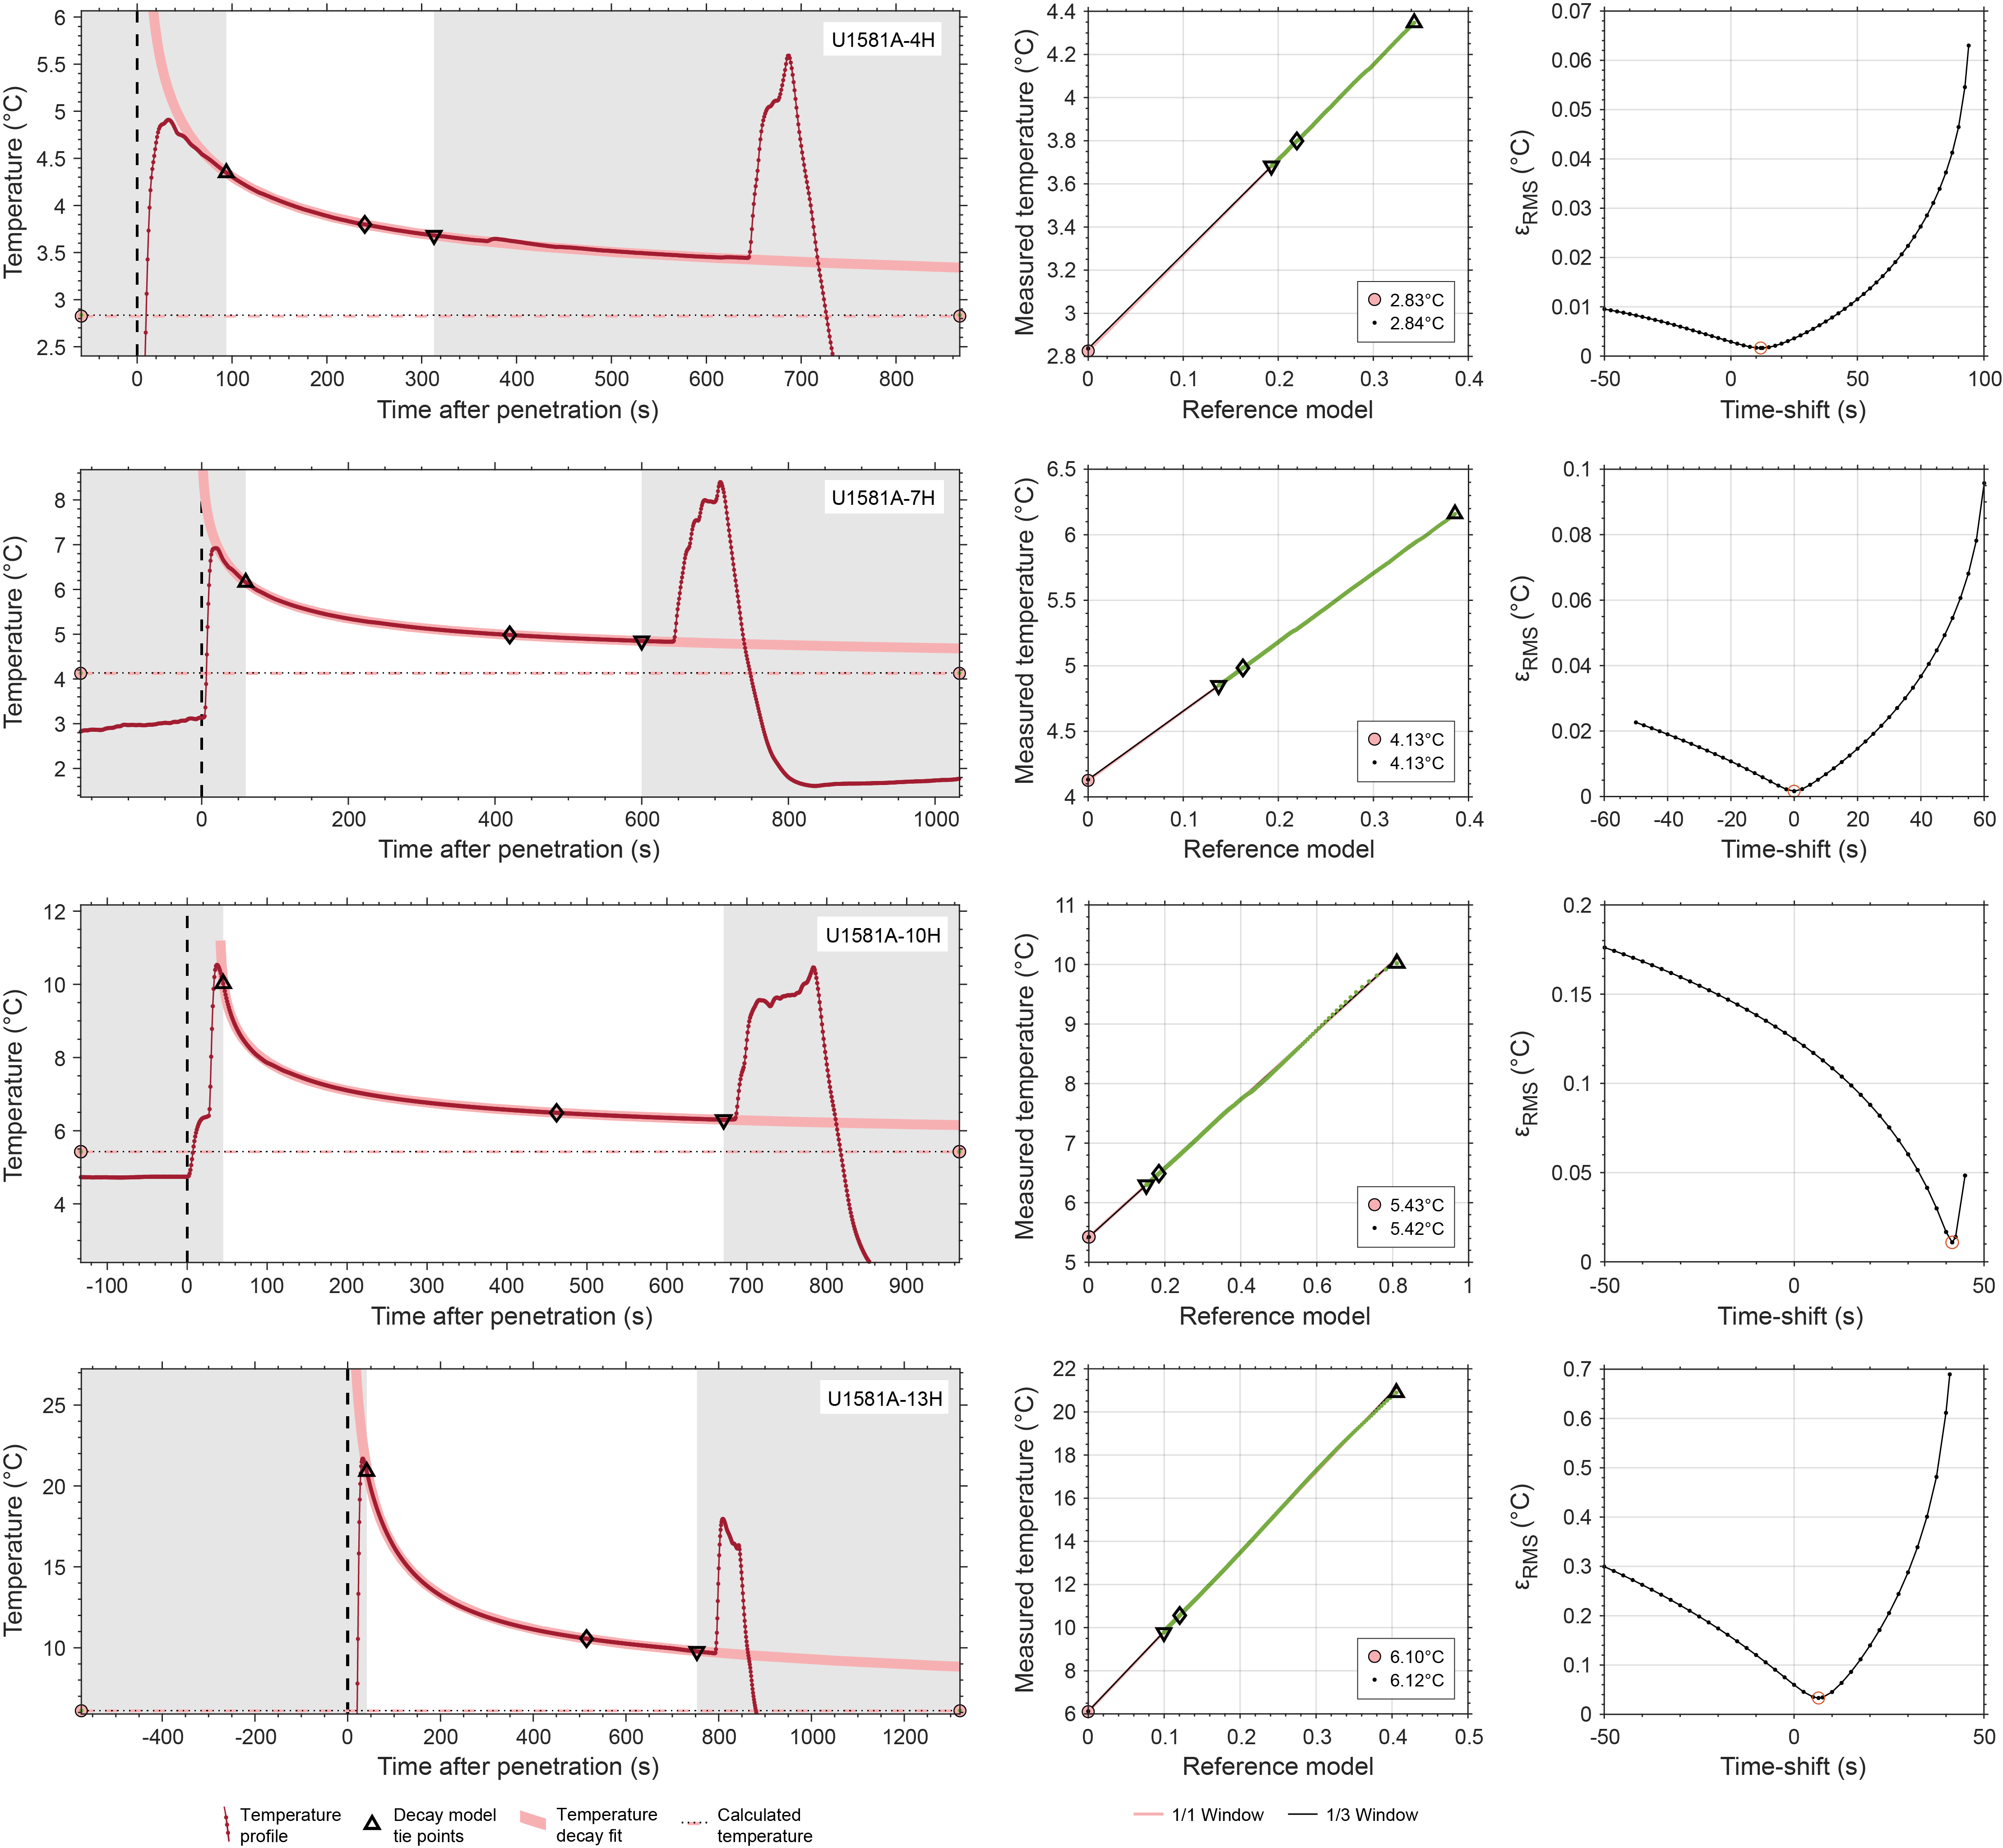
Figure F47. Downhole temperature data.
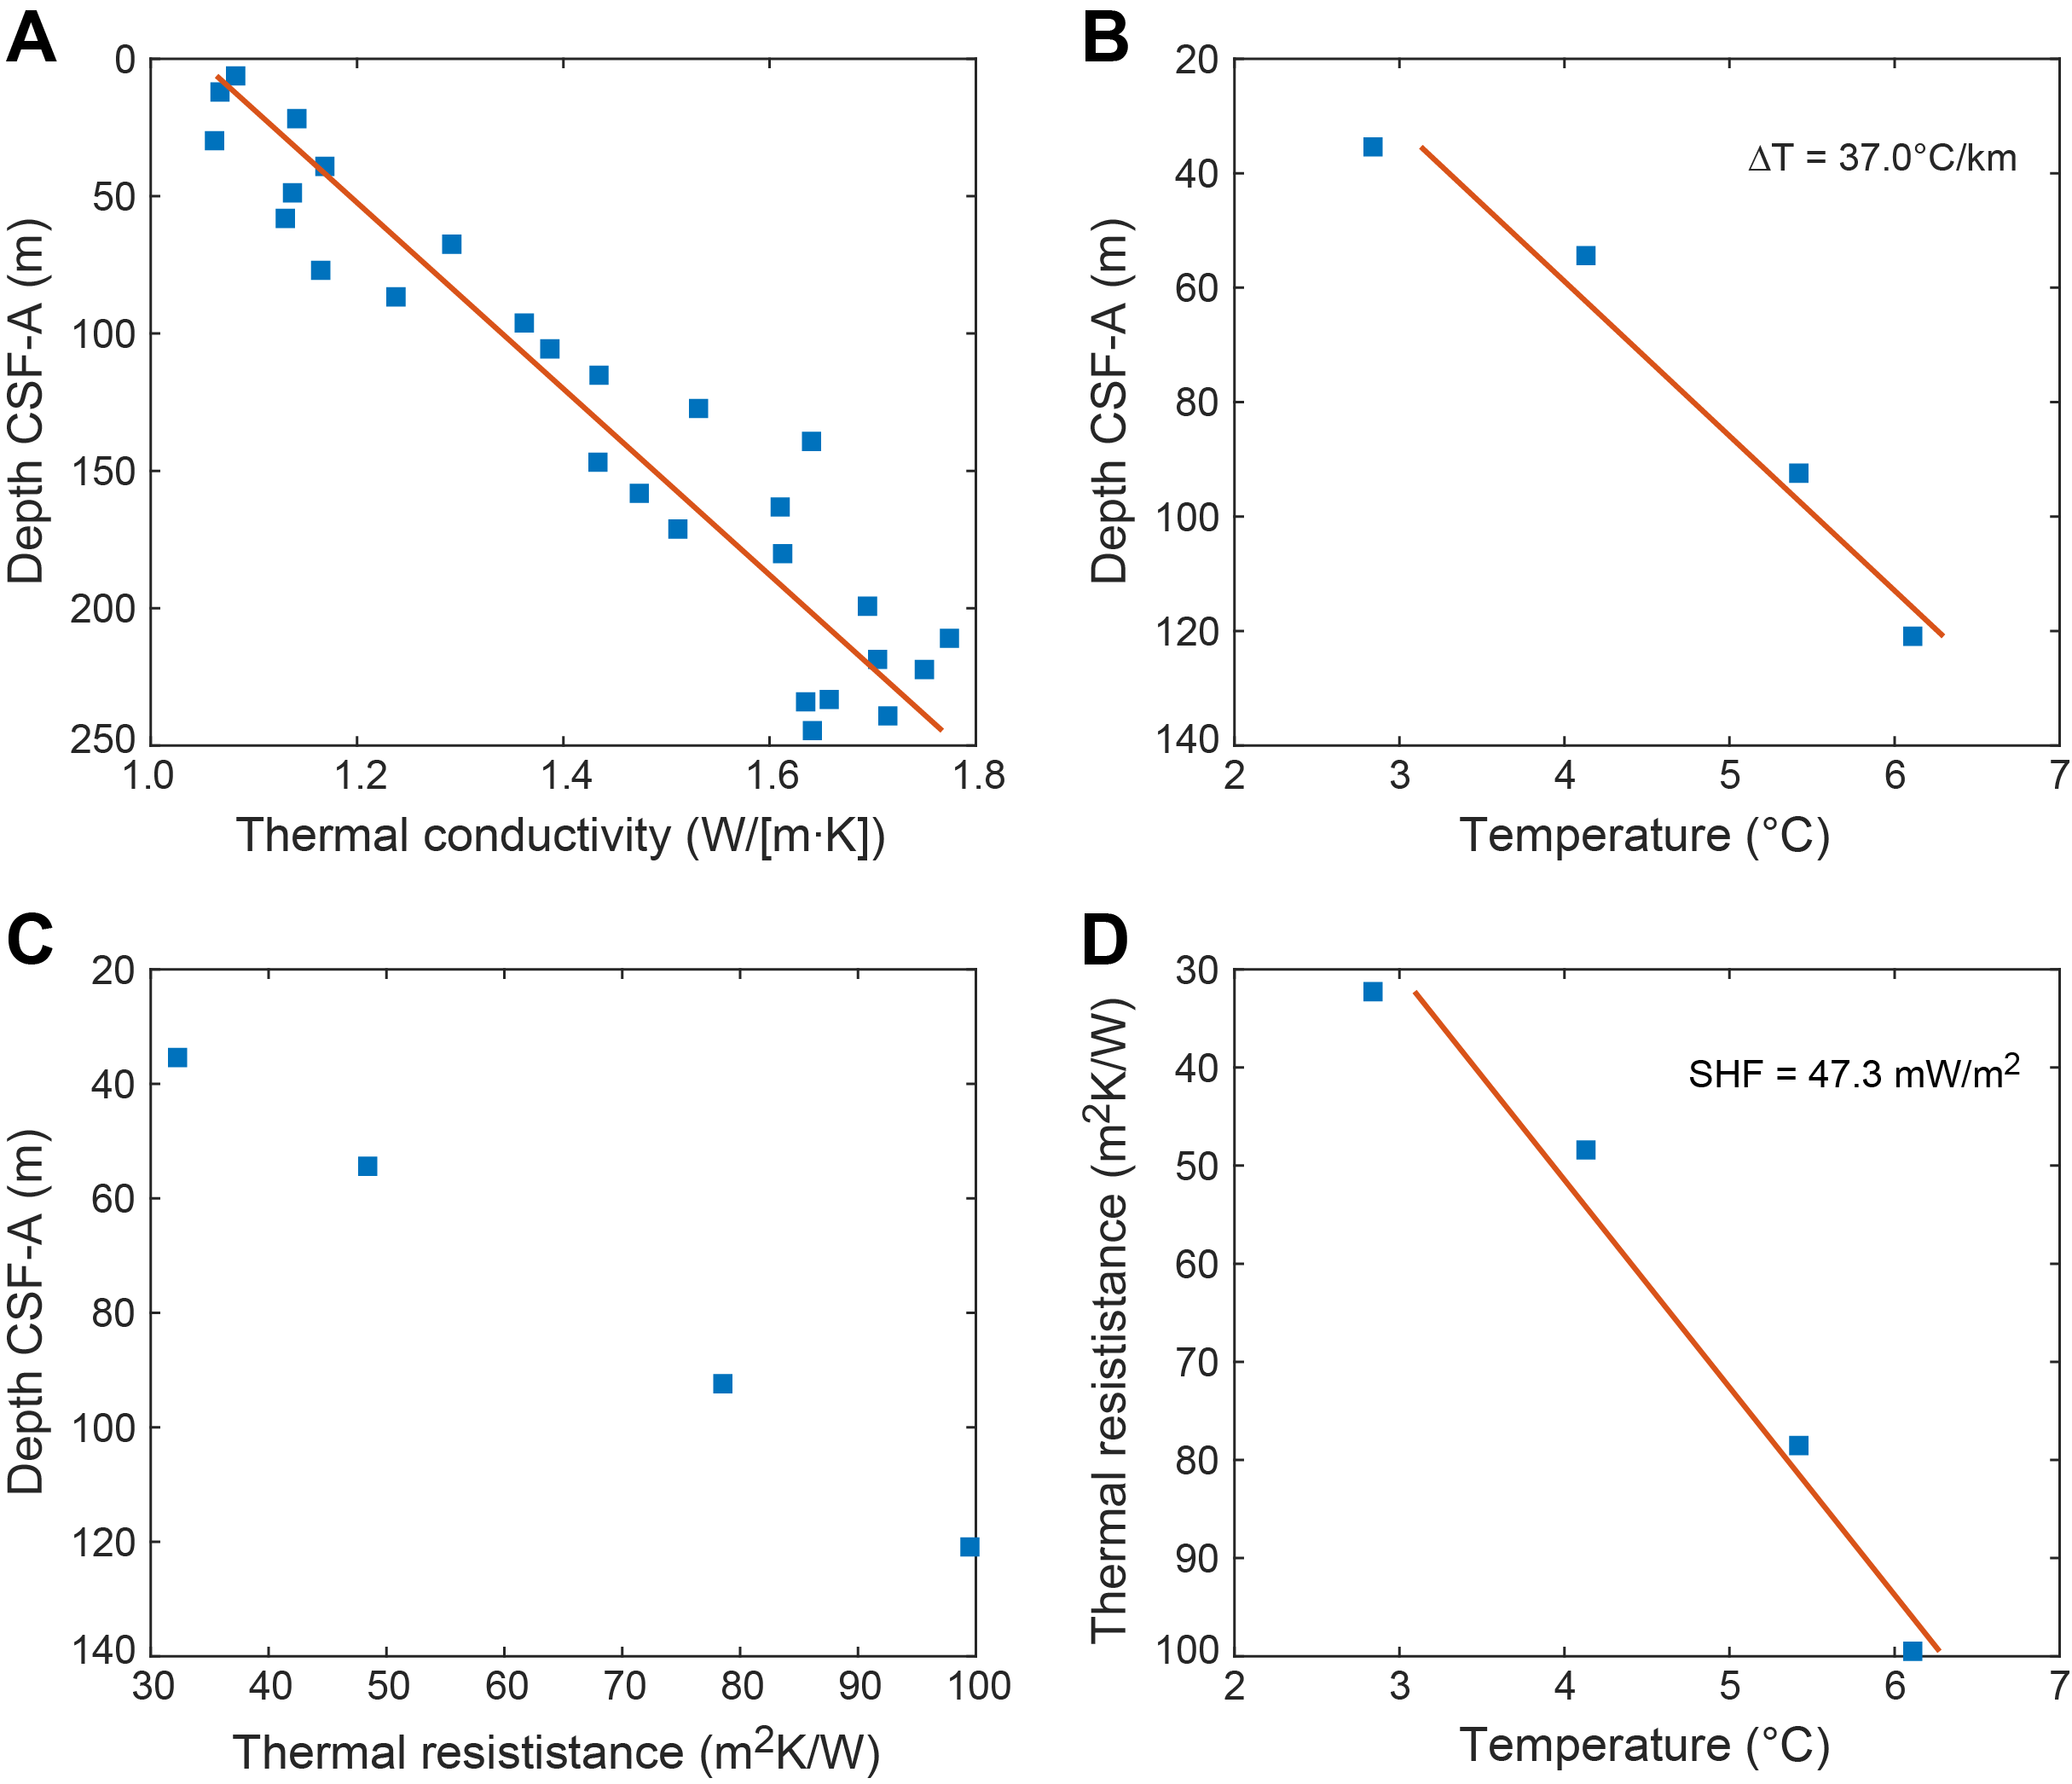
Figure F48. Heat flow estimation results.
References
Agnini, C., Fornaciari, E., Raffi, I., Catanzariti, R., Pälike, H., Backman, J., and Rio, D., 2014. Biozonation and biochronology of Paleogene calcareous nannofossils from low and middle latitudes. Newsletters on Stratigraphy, 47(2):131–181. https://doi.org/
Backman, J., Raffi, I., Rio, D., Fornaciari, E., and Pälike, H., 2012. Biozonation and biochronology of Miocene through Pleistocene calcareous nannofossils from low and middle latitudes. Newsletters on Stratigraphy, 45(3):221–244. https://doi.org/
Barron, J.A., Bukry, D.B., and Gersonde, R., 2014. Diatom and silicoflagellate biostratigraphy for the late Eocene: ODP 1090 (sub-Antarctic Atlantic). In Kociolek, J.P., Kulikovskiy, M.S., Witkowski, J., and Harwood, D.M. (Eds.), Diatom research over time and space Morphology, taxonomy, ecology and distribution of diatoms-from fossil to recent, marine to freshwater, established species and genera to new ones. Stuttgart, Germany (Nova Hedwigia), 1–32. http://pubs.er.usgs.gov/
Barron, J.A., Stickley, C.E., and Bukry, D., 2015. Paleoceanographic, and paleoclimatic constraints on the global Eocene diatom and silicoflagellate record. Palaeogeography, Palaeoclimatology, Palaeoecology, 422:85–100. https://doi.org/
Bijl, P.K., Frieling, J., Cramwinckel, M.J., Boschman, C., Sluijs, A., and Peterse, F., 2021. Maastrichtian–Rupelian paleoclimates in the southwest Pacific – a critical reevaluation of biomarker paleothermometry and dinoflagellate cyst paleoecology at Ocean Drilling Program Site 1172. Climate of the Past, 17(6):2393–2425. https://doi.org/
Bohaty, S.M., Uenzelmann-Neben, G., Childress, L.B., Archontikis, O.A., Batenburg, S.J., Bijl, P.K., Burkett, A.M., Cawthra, H.C., Chanda, P., Coenen, J.J., Dallanave, E., Davidson, P.C., Doiron, K.E., Geldmacher, J., Gürer, D., Haynes, S.J., Herrle, J.O., Ichiyama, Y., Jana, D., Jones, M.M., Kato, C., Kulhanek, D.K., Li, J., Liu, J., McManus, J., Minakov, A.N., Penman, D.E., Sprain, C.J., Tessin, A.C., Wagner, T., and Westerhold, T., 2023a. Site U1579. In Uenzelmann-Neben, G., Bohaty, S.M., Childress, L.B., and the Expedition 392 Scientists, Agulhas Plateau Cretaceous Climate. Proceedings of the International Ocean Discovery Program, 392: College Station, TX (International Ocean Discovery Program). https://doi.org/
Bohaty, S.M., Uenzelmann-Neben, G., Childress, L.B., Archontikis, O.A., Batenburg, S.J., Bijl, P.K., Burkett, A.M., Cawthra, H.C., Chanda, P., Coenen, J.J., Dallanave, E., Davidson, P.C., Doiron, K.E., Geldmacher, J., Gürer, D., Haynes, S.J., Herrle, J.O., Ichiyama, Y., Jana, D., Jones, M.M., Kato, C., Kulhanek, D.K., Li, J., Liu, J., McManus, J., Minakov, A.N., Penman, D.E., Sprain, C.J., Tessin, A.C., Wagner, T., and Westerhold, T., 2023b. Site U1580. In Uenzelmann-Neben, G., Bohaty, S.M., Childress, L.B., and the Expedition 392 Scientists, Agulhas Plateau Cretaceous Climate. Proceedings of the International Ocean Discovery Program, 392: College Station, TX (International Ocean Discovery Program). https://doi.org/
Bown, P.R., Jones, T.D., Lees, J.A., Randell, R.D., Mizzi, J.A., Pearson, P.N., Coxall, H.K., Young, J.R., Nicholas, C.J., Karega, A., Singano, J., and Wade, B.S., 2008. A Paleogene calcareous microfossil Konservat-Lagerstätte from the Kilwa Group of coastal Tanzania. GSA Bulletin, 120(1–2):3–12. https://doi.org/
Brinkhuis, H., Bujak, J.P., Smit, J., Versteegh, G.J.M., and Visscher, H., 1998. Dinoflagellate-based sea surface temperature reconstructions across the Cretaceous–Tertiary boundary. Palaeogeography, Palaeoclimatology, Palaeoecology, 141(1):67–83. https://doi.org/
Bullard, E.C., 1954. The flow of heat through the floor of the Atlantic Ocean. Proceedings of the Royal Society of London, A: Mathematical and Physical Sciences, 222(1150):408–429. https://doi.org/
do Monte Guerra, R., Concheyro, A., Wise, S.W., Kender, S., Fauth, G., 2016. New latitude-based nannofossil zonations for the Campanian–Maastrichtian of the South Atlantic Ocean and their paleoceanographic implications. Palaeogeography, Palaeoclimatology, Palaeoecology, 452:55–67. https://www.sciencedirect.com/
Fenner, J., 1985. Late Cretaceous to Oligocene planktonic diatoms. In Bolli, H.M., Saunders, J.B. and Perch-Nielsen, K., Plankton stratigraphy. Cambridge, United Kingdom (Cambridge University Press), 713–762.
Fisher, N.I., Lewis, T., and Embleton, B.J.J., 1987. Statistical Analysis of Spherical Data: Cambridge, United Kingdom (Cambridge University Press). https://doi.org/
Fisher, R.A., 1953. Dispersion on a sphere. Proceedings of the Royal Society A: Mathematical, Physical and Engineering Sciences, 217(1130):295–305. https://doi.org/
Fuchs, S., Norden, B., and the International Heat Flow Commission, 2021. The Global Heat Flow Database. GFZ Data Services. https://doi.org/
Goñi, M.A., Ruttenberg, K.C., and Eglinton, T.I., 1998. A reassessment of the sources and importance of land-derived organic matter in surface sediments from the Gulf of Mexico. Geochimica et Cosmochimica Acta, 62(18):3055-3075. https://doi.org/
Gradstein, F.M., Ogg, J.G., Schmitz, M.D., and Ogg, G.M. (Eds.), 2020. The Geologic Time Scale 2020: Amsterdam (Elsevier BV). https://doi.org/
Harwood, D., Nikolaev, V.A., and Winter, D., 2007. Cretaceous records of diatom evolution, radiation, and expansion. Paleontol. Soc. Paper, 13:33–59. https://www.researchgate.net/
Heesemann, M., Villinger, H.W., Tréhu, A.T.F.M., and White, S., 2006. Data report: testing and deployment of the new APCT-3 tool to determine in situ temperatures while piston coring. In Riedel, M., Collett, T.S., Malone, M.J., and the Expedition 311 Scientists, Proceedings of the Integrated Ocean Drilling Program. 311: Washington, DC (Integrated Ocean Drilling Program Management International, Inc.). https://doi.org/
Karpoff, A.M., Destrigneville, C., Stille, P., 2007. Clinoptilolite as a new proxy of enhanced biogenic silica productivity in lower Miocene carbonate sediments of the Bahamas platform: Isotopic and thermodynamic evidence. Chemical Geology, 245(3):285–304. https://doi.org/
Kirschvink, J.L., 1980. The least-squares line and plane and the analysis of paleomagnetic data. Geophysical Journal International, 62(3):699–718. https://doi.org/
Lurcock, P.C., and Wilson, G.S., 2012. PuffinPlot: a versatile, user-friendly program for paleomagnetic analysis. Geochemistry, Geophysics, Geosystems, 13(6):Q06Z45. https://doi.org/
Mao, S., and Mohr, B.A.R., 1992. Late Cretaceous dinoflagellate cysts (?Santonian-Maestrichtian) from the southern Indian Ocean (Hole 748C). Proceedings of the Ocean Drilling Program, Central Kerguelen Plateau; covering Leg 120 of the cruises of the drilling vessel JOIDES Resolution, Fremantle, Australia, to Fremantle, Australia, sites 747-751, 20 February to 30 April 1988; Part 1, 120:307. http://hdl.handle.net/
Martini, E., 1971. Standard Tertiary and Quaternary calcareous nannoplankton zonation. Proceedings of the Second Planktonic Conference, Roma, 1970:739–785.
McFadden, P.L., and Reid, A.B., 1982. Analysis of paleomagnetic inclination data. Geophysical Journal International, 69(2):307–319. https://doi.org/
Ogg, J.G., 2020. Geomagnetic Polarity Time Scale. In Gradstein, F.M., Ogg, J.G., Schmitz, M., and Ogg, G. (Eds.), Geologic Time Scale 2020. Amsterdam (Elsevier), 159–192. https://doi.org/
Perch-Nielsen, K., 1985. Mesozoic calcareous nannofossils. In Bolli, H.M., Saunders, J.B., and Perch-Nielsen, K., Plankton Stratigraphy (Volume 1). Cambridge, UK (Cambridge University Press), 329–426.
Pospichal, J.J., Wise, Jr., S.W., 1990. Maestrichtian calcareous nannofossil biostratigraphy of Maud Rise, ODP Leg 113 Sites 689 and 690, Weddell Sea. Proceedings of the Ocean Drilling Program, Weddell Sea, Antarctica, covering Leg 113 of the cruises of the Drilling Vessel JOIDES Resolution, Valparaiso, Chile, to East Cove, Falkland Islands, sites 689-697, 25 December 1986-11 March 1987, 113:465. http://hdl.handle.net/
Quirein, J.A., Gardner, J.S., and Watson, J.T., 1982. Combined natural gamma ray spectral/lithodensity measurements applied to complex lithologies. Presented at the SPE Annual Technical Conference and Exhibition.
https://doi.org/
Raffi, I., Backman, J., Fornaciari, E., Pälike, H., Rio, D., Lourens, L., and Hilgen, F., 2006. A review of calcareous nannofossil astrobiochronology encompassing the past 25 million years. Quaternary Science Reviews, 25(23):3113–3137. https://doi.org/
Scherer, R.P., Gladenkov, A.Y., and Barron, J.A., 2007. Methods and applications of Cenozoic marine diatom biostratigraphy. In Strratt, S., Pond Scum to Carbon Sink: Geological and Environmental Applications of the Diatoms. The Paleontological Society Papers, 13: 61–83. https://doi.org/
Schlüter, P., and Uenzelmann-Neben, G., 2008. Indications for bottom current activity since Eocene times: The climate and ocean gateway archive of the Transkei Basin, South Africa. Global and Planetary Change, 60(3–):416–428. https://doi.org/
Shamrock, J., and Watkins, D., 2009. Evolution of the Cretaceous Calcareous Nanofossil Genus Eiffellithus and Its Biostratigraphic Significance. Cretaceous Research, 30(5):1083–1102. https://doi.org/
Sissingh, W., 1977. Biostratigraphy of Cretaceous calcareous nannoplankton. Geologie en Mijnbouw, 56:37–65.
Sluijs, A., Pross, J., and Brinkhuis, H., 2005. From greenhouse to icehouse; organic-walled dinoflagellate cysts as paleoenvironmental indicators in the Paleogene. Earth-Science Reviews, 68(3):281–315. https://doi.org/
Strelnikova, N.I., 1990. Evolution of diatoms during the Cretaceous and Paleogene periods. In Simola, H., Proceedings of the Tenth International Diatom Symposium. Koenigstein, Germany (Koeltz Scientific Books), 195–204.
Tauxe, L., 1992. Paleomagnetic Principles and Practice: Dordrecht (Kluwer Academic Publishers).
Thorn, V.C., Riding, J.B., and Francis, J.E., 2009. The Late Cretaceous dinoflagellate cyst Manumiella — Biostratigraphy, systematics, and paleoecological signals in Antarctica. Review of Palaeobotany and Palynology, 156(3):436-448. https://www.sciencedirect.com/
Uenzelmann-Neben, G., Bohaty, S.M., Childress, L.B., and the Expedition 392 Scientists, 2022. Expedition 392 Preliminary Report: Agulhas Plateau Cretaceous Climate. International Ocean Discovery Program. https://doi.org/
Uenzelmann-Neben, G., Bohaty, S.M., Childress, L.B., Archontikis, O.A., Batenburg, S.J., Bijl, P.K., Burkett, A.M., Cawthra, H.C., Chanda, P., Coenen, J.J., Dallanave, E., Davidson, P.C., Doiron, K.E., Geldmacher, J., Gürer, D., Haynes, S.J., Herrle, J.O., Ichiyama, Y., Jana, D., Jones, M.M., Kato, C., Kulhanek, D.K., Li, J., Liu, J., McManus, J., Minakov, A.N., Penman, D.E., Sprain, C.J., Tessin, A.C., Wagner, T., and Westerhold, T., 2023a. Expedition 392 methods. In Uenzelmann-Neben, G., Bohaty, S.M., Childress, L.B., and the Expedition 392 Scientists, Agulhas Plateau Cretaceous Climate. Proceedings of the International Ocean Discovery Program, 392: College Station, TX (International Ocean Discovery Program). https://doi.org/
Uenzelmann-Neben, G., Bohaty, S.M., Childress, L.B., Archontikis, O.A., Batenburg, S.J., Bijl, P.K., Burkett, A.M., Cawthra, H.C., Chanda, P., Coenen, J.J., Dallanave, E., Davidson, P.C., Doiron, K.E., Geldmacher, J., Gürer, D., Haynes, S.J., Herrle, J.O., Ichiyama, Y., Jana, D., Jones, M.M., Kato, C., Kulhanek, D.K., Li, J., Liu, J., McManus, J., Minakov, A.N., Penman, D.E., Sprain, C.J., Tessin, A.C., Wagner, T., and Westerhold, T., 2023b. Expedition 392 summary. In Uenzelmann-Neben, G., Bohaty, S.M., Childress, L.B., and the Expedition 392 Scientists, Agulhas Plateau Cretaceous Climate. Proceedings of the International Ocean Discovery Program, 392: College Station, TX (International Ocean Discovery Program). https://doi.org/
Watkins, D.K., 1992. Upper Cretaceous nannofossils from Leg 120, Kerguelen Plateau, Southern Ocean. Proceedings of the Ocean Drilling Program, Central Kerguelen Plateau; covering Leg 120 of the cruises of the drilling vessel JOIDES Resolution, Fremantle, Australia, to Fremantle, Australia, sites 747-751, 20 February to 30 April 1988; Part 1, 120:343. http://hdl.handle.net/
Watkins, D.K., Wise, S.W., Jr., Popsichal, J.J., and Crux, J., 1996. Upper Cretaceous calcareous nannofossil biostratigraphy and paleoceanography of the Southern Ocean. Presented at the Microfossils and Oceanic Environments, Aberstwyth, Wales, 19–21 April 1994.