Parnell-Turner, R.E., Briais, A., LeVay, L.J., and the Expedition 395 Scientists
Proceedings of the International Ocean Discovery Program Volume 395
publications.iodp.org
https://doi.org/10.14379/iodp.proc.395.103.2025
Site U15541
![]() R.E. Parnell-Turner,
R.E. Parnell-Turner,
![]() A. Briais,
A. Briais,
![]() L.J. LeVay,
L.J. LeVay,
![]() Y. Cui,
Y. Cui,
![]() A. Di Chiara,
A. Di Chiara,
![]() J.P. Dodd,
J.P. Dodd,
![]() T. Dunkley Jones,
T. Dunkley Jones,
![]() D. Dwyer,
D. Dwyer,
![]() D.E. Eason,
D.E. Eason, ![]() S.A. Friedman,
S.A. Friedman,
![]() S.R. Hemming,
S.R. Hemming,
![]() K. Hochmuth,
K. Hochmuth,
![]() H. Ibrahim,
H. Ibrahim,
![]() C. Jasper,
C. Jasper,
![]() B.T. Karatsolis,
B.T. Karatsolis,
![]() S. Lee,
S. Lee,
![]() D.E. LeBlanc,
D.E. LeBlanc,
![]() M.R. Lindsay,
M.R. Lindsay,
![]() D.D. McNamara,
D.D. McNamara,
![]() S.E. Modestou,
S.E. Modestou,
![]() B. Murton,
B. Murton,
![]() S. OConnell,
S. OConnell,
![]() G.T. Pasquet,
G.T. Pasquet,
![]() P.N. Pearson,
S.P. Qian,
P.N. Pearson,
S.P. Qian,
![]() Y. Rosenthal,
Y. Rosenthal,
![]() S. Satolli,
S. Satolli,
![]() M. Sinnesael,
T. Suzuki,
M. Sinnesael,
T. Suzuki,
![]() T. Thulasi Doss,
T. Thulasi Doss,
![]() N.J. White,
N.J. White,
![]() T. Wu,
T. Wu,
![]() A. Yang Yang
A. Yang Yang
![]() V. dos Santos Rocha,
C. Pearman, and
C-Y. Tien2
V. dos Santos Rocha,
C. Pearman, and
C-Y. Tien2
1 Parnell-Turner, R.E., Briais, A., LeVay, L.J., Cui, Y., Di Chiara, A., Dodd, J.P., Dunkley Jones, T., Dwyer, D., Eason, D.E., Friedman, S.A., Hemming, S.R., Hochmuth, K., Ibrahim, H., Jasper, C., Karatsolis, B.T., Lee, S., LeBlanc, D.E., Lindsay, M.R., McNamara, D.D., Modestou, S.E., Murton, B., OConnell, S., Pasquet, G.T., Pearson, P.N., Qian, S.P., Rosenthal, Y., Satolli, S., Sinnesael, M., Suzuki, T., Thulasi Doss, T., White, N.J., Wu, T., Yang Yang, A., dos Santos Rocha, V., Pearman, C., and Tien, C.-Y., 2025. Site U1554. In Parnell-Turner, R.E., Briais, A., LeVay, L.J., and the Expedition 395 Scientists, Reykjanes Mantle Convection and Climate. Proceedings of the International Ocean Discovery Program, 395: College Station, TX (International Ocean Discovery Program). https://doi.org/10.14379/iodp.proc.395.103.2025
2 Expedition 395 Scientists' affiliations.
1. Background and objectives
Site U1554 is located on Björn drift, on the eastern flank of the Reykjanes Ridge in the North Atlantic Ocean. The Reykjanes Ridge flanks host a series of crustal V-shaped ridges (VSRs) and V-shaped troughs (VSTs) (Figure F1), whose origins and relation with Iceland mantle plume temperature variations are debated. Site U1554 is located on VST 2b, identifiable in the free-air gravity anomaly map and the reflection seismic profile (Figure F2). It sits on ocean crust with an age of 12.7 Ma estimated from magnetic anomalies and plate reconstruction models. The Reykjanes Ridge flanks are also the site of major drift deposits: Björn and Gardar drifts on the eastern flank of the ridge and Eirik drift on the eastern flank of the Greenland margin. These rapidly accumulated contourite drift sediments have the potential to record variations in past climate and ocean circulation on millennial timescales. The sedimentation rate of the drifts can serve as a proxy for deep water current strength, providing information on oceanic gateways to the Norwegian Sea and their potential ties to Iceland mantle plume behavior.
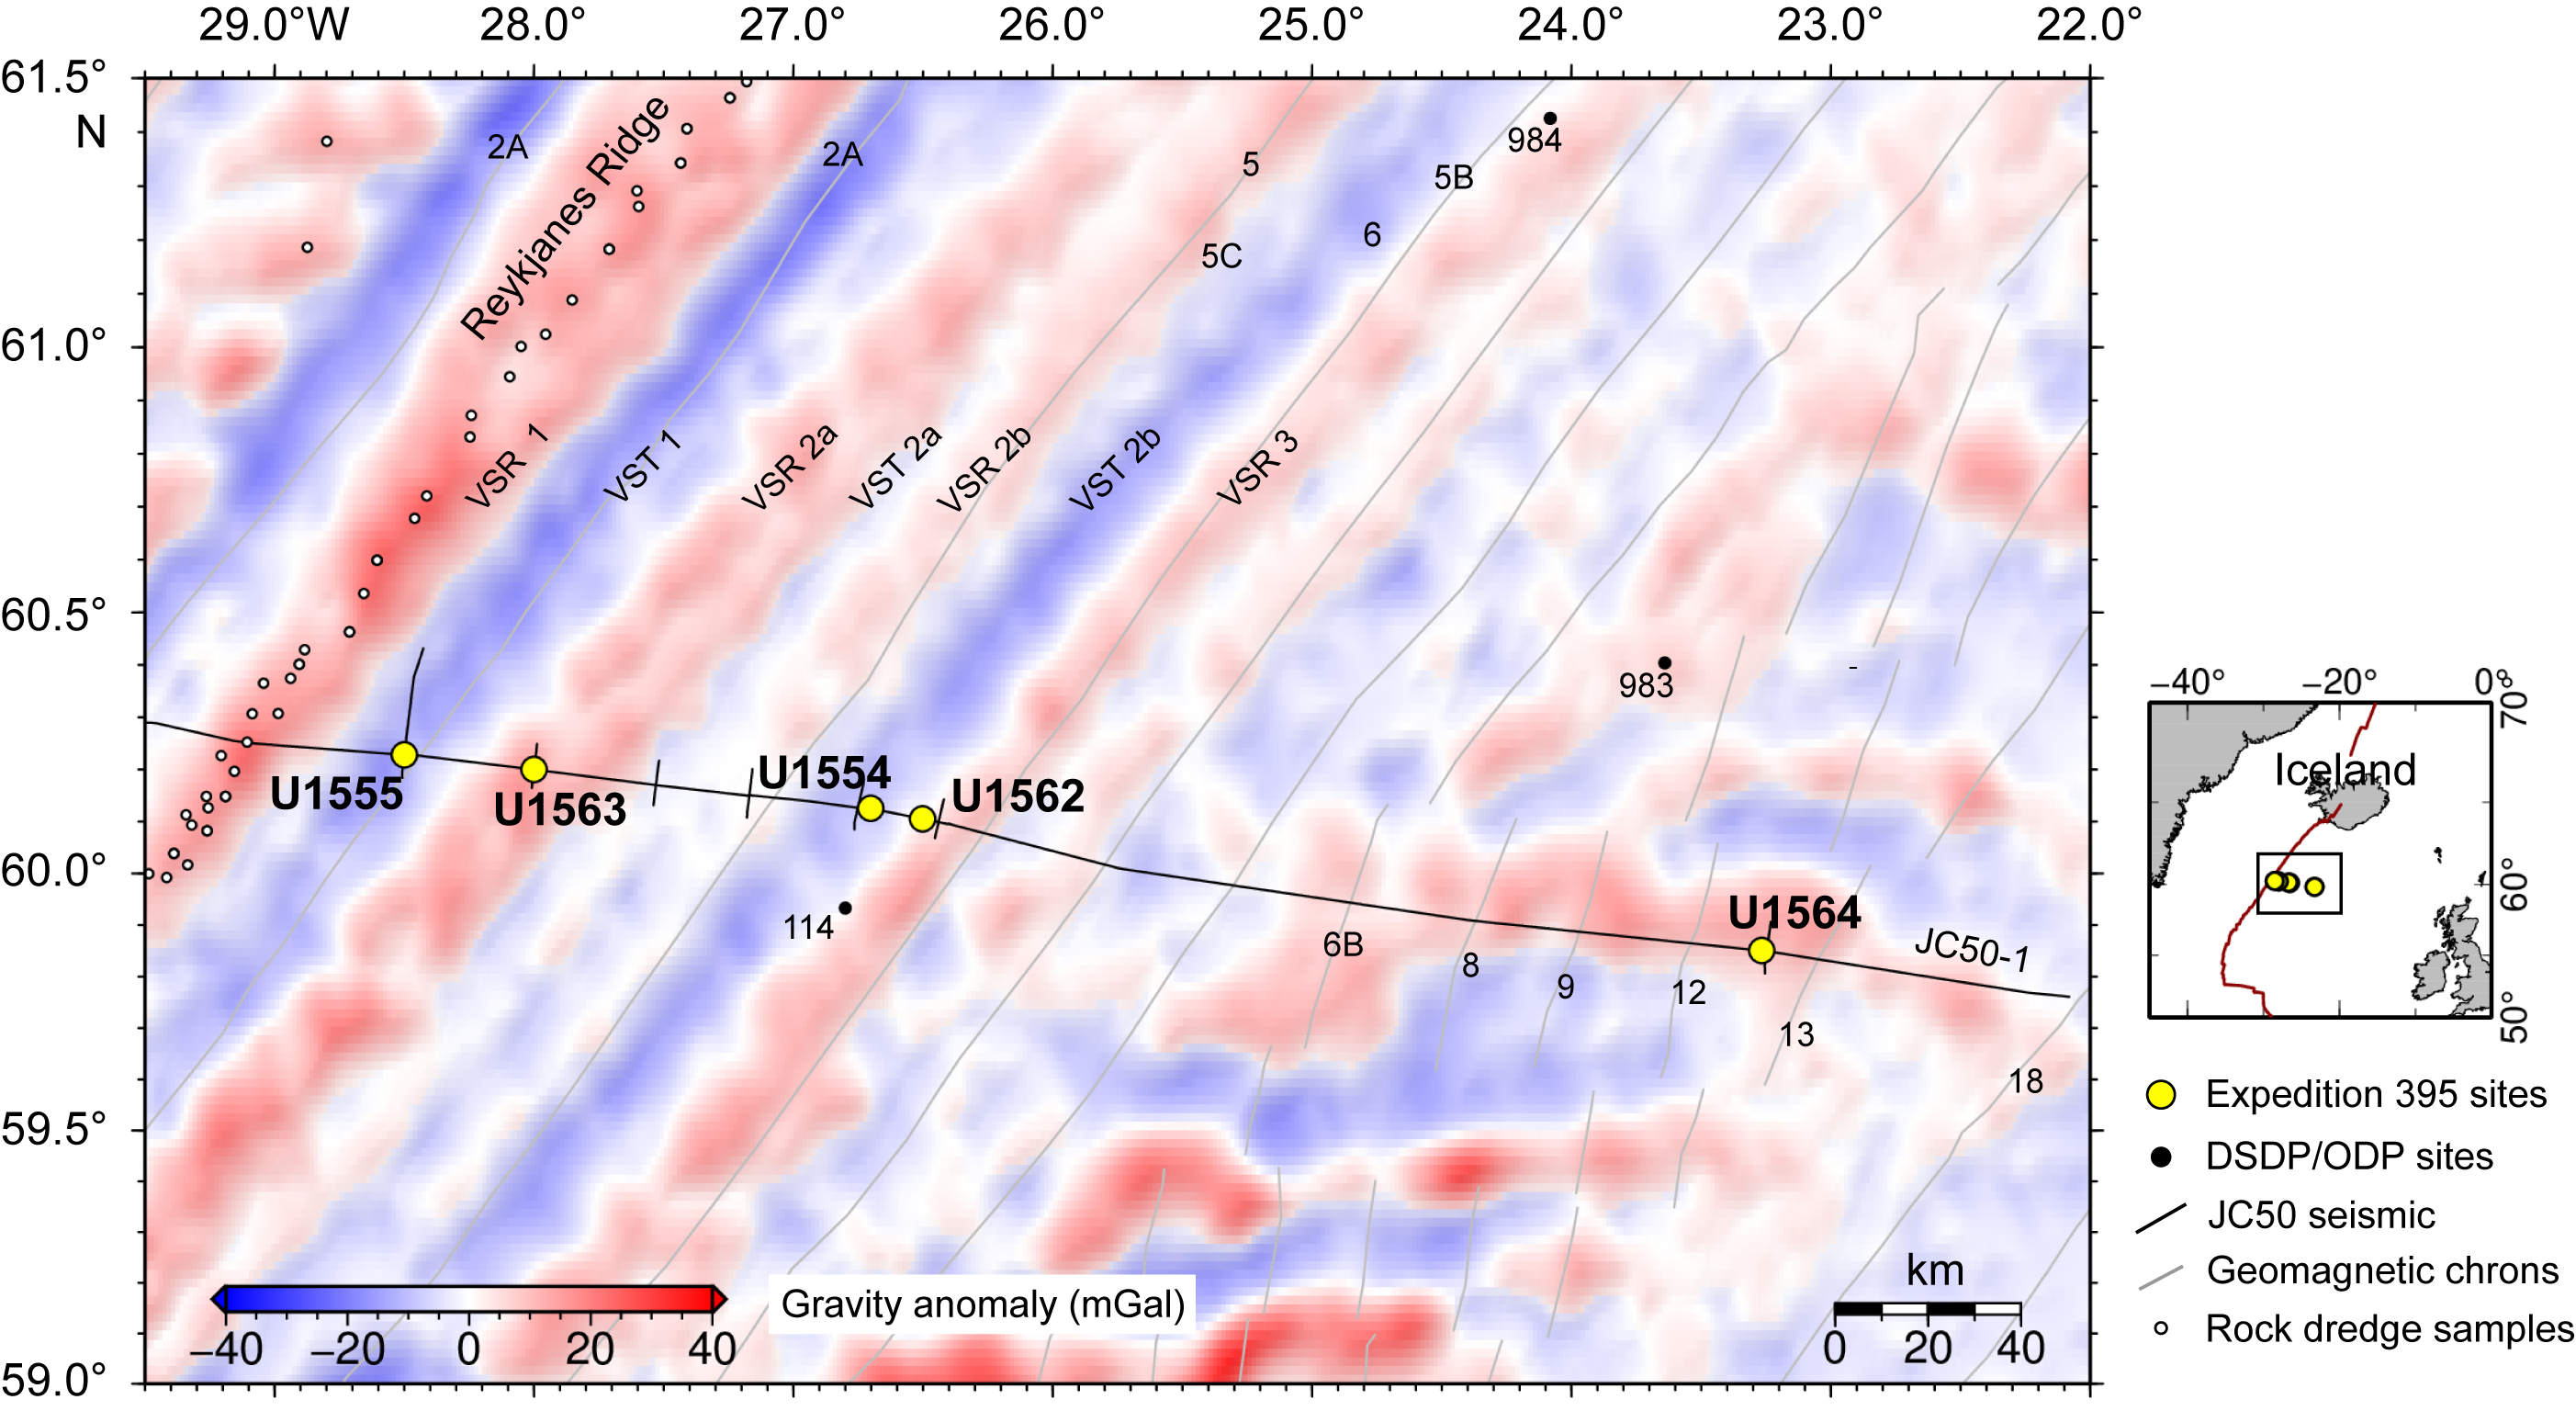
Figure F1. Satellite free-air gravity anomaly map.
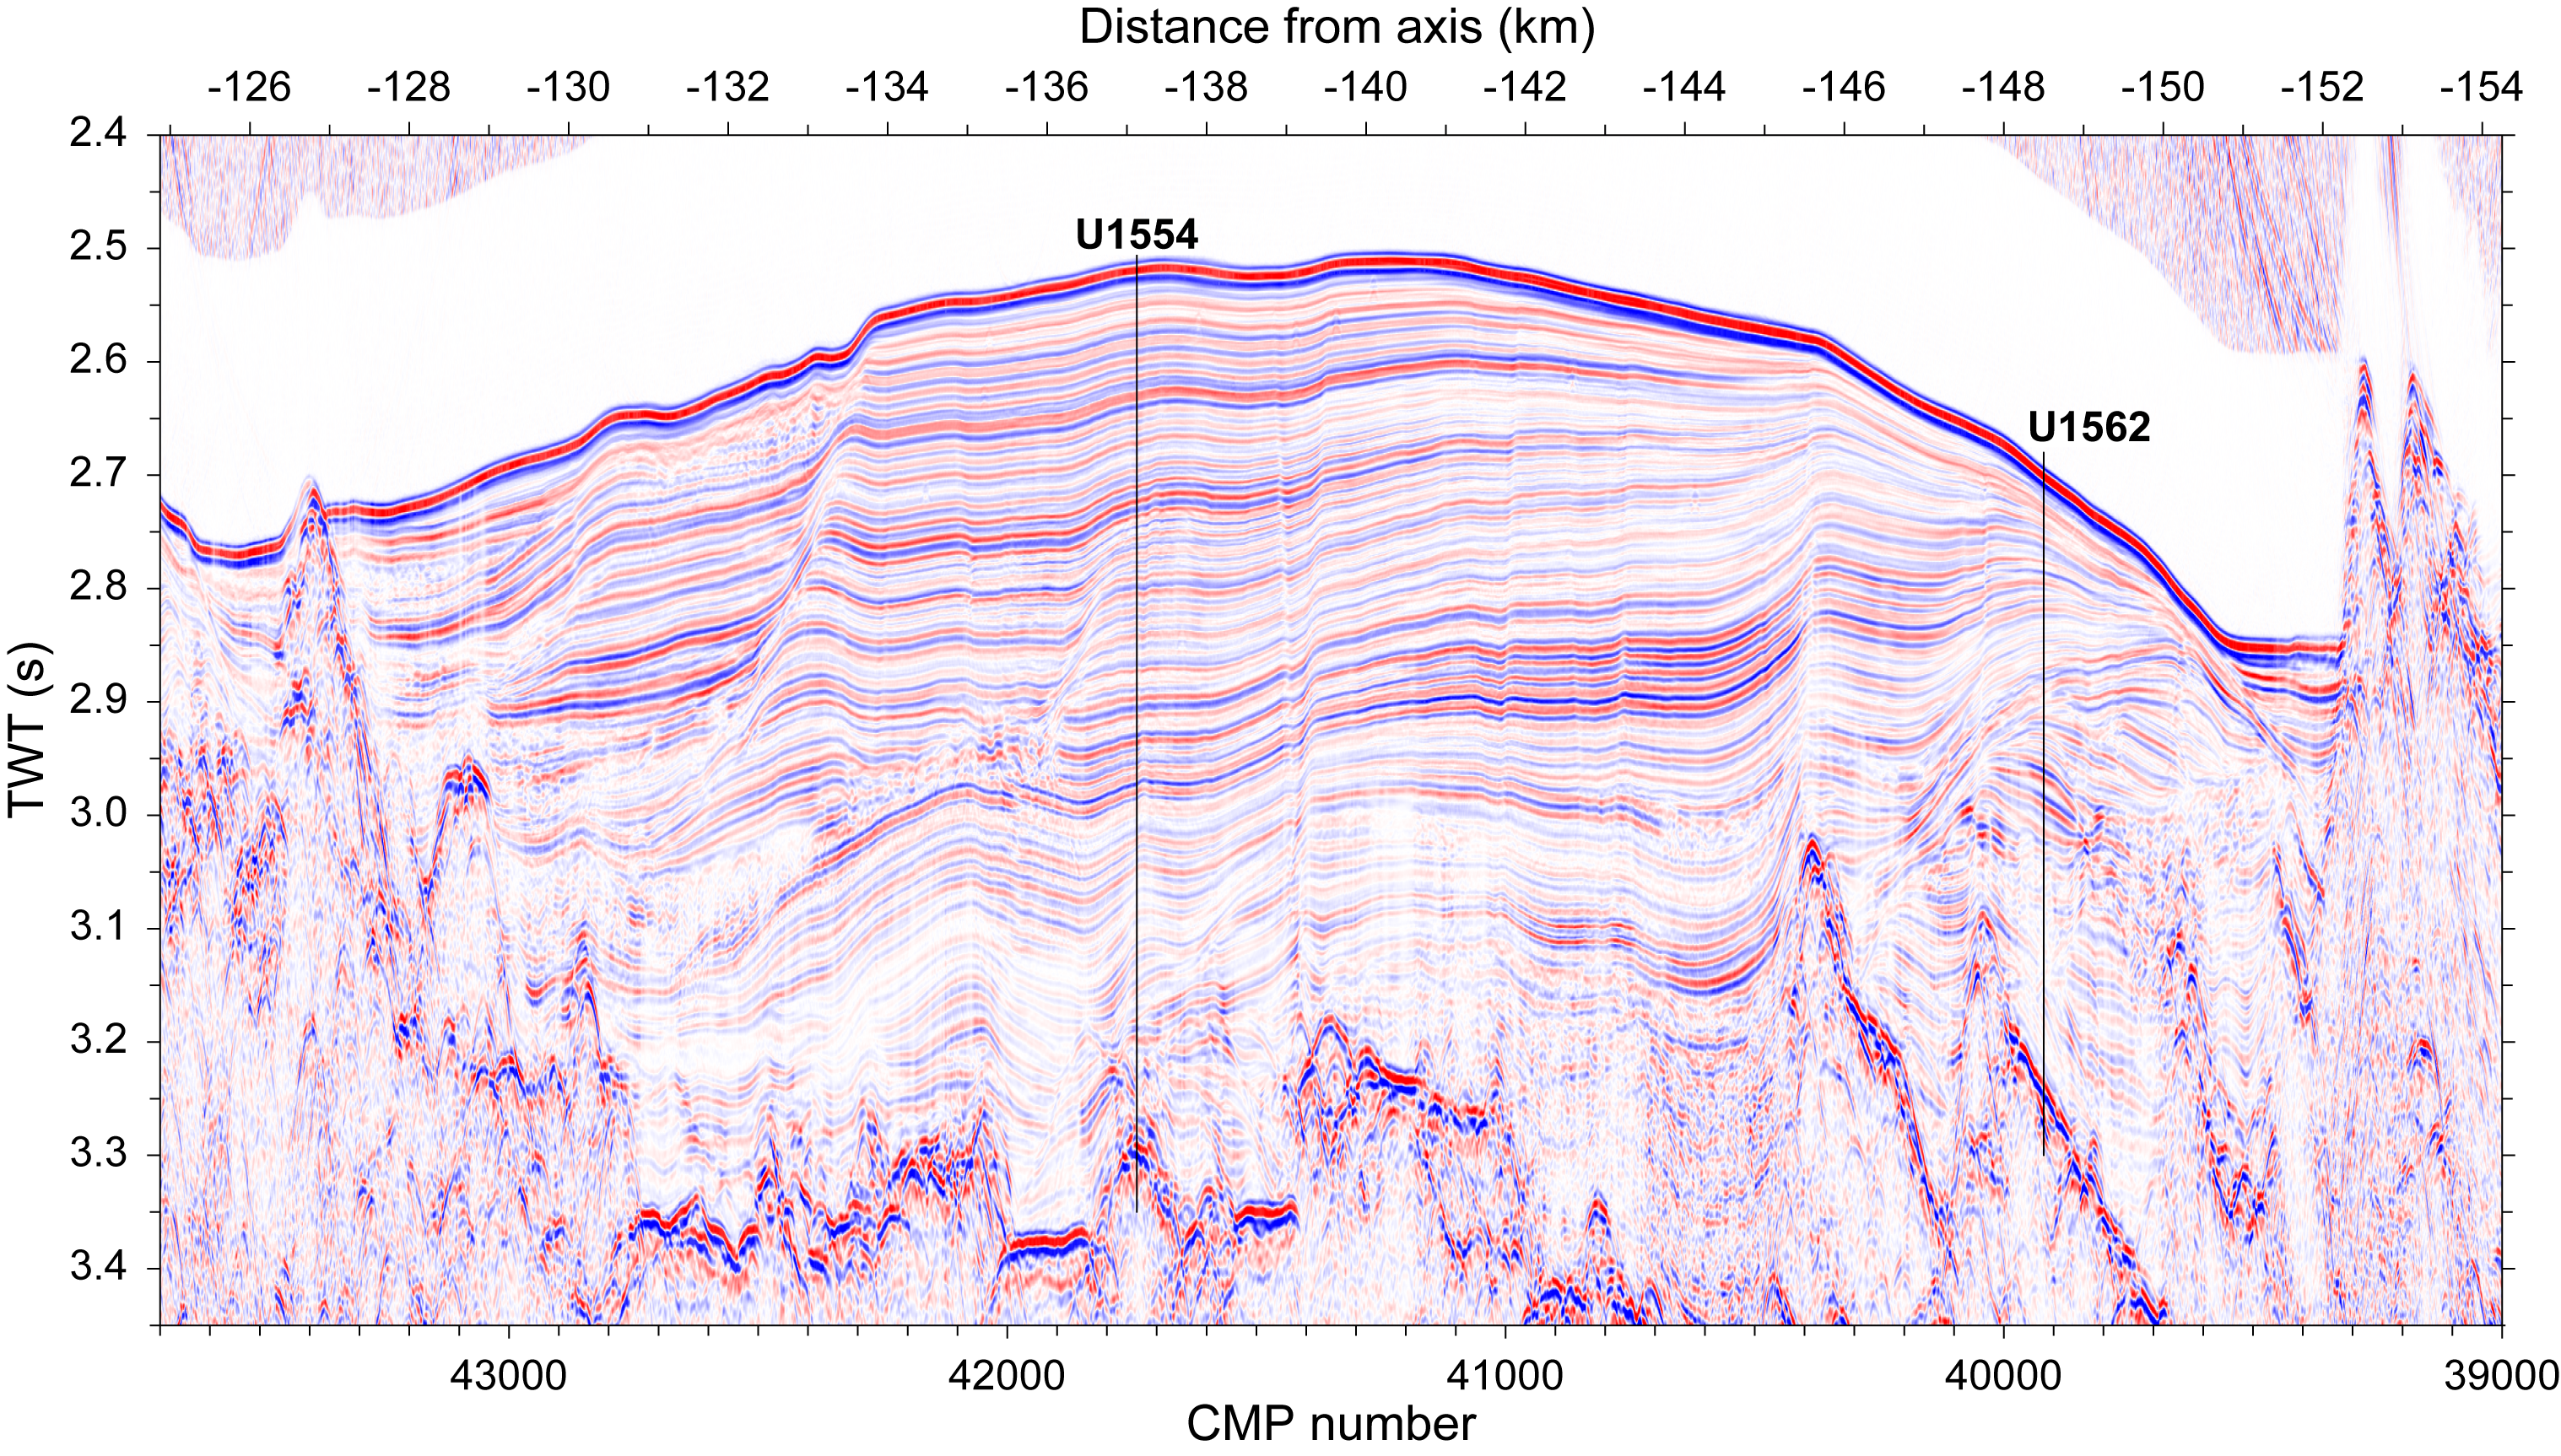
Figure F2. Seismic Profile JC50-1.
Site U1554 is located on Seismic Line JC50-1 (common midpoint [CMP] 41740) near the intersection with Seismic Line JC50-C3 (CMP 1005) (Figures F2, F3); both lines were obtained in 2010 during RRS James Cook Cruise JC50 (Parnell-Turner et al., 2017). Sediment thickness at Site U1554 was expected to be ~705 m (3.288 s two-way traveltime [TWT]) based on seismic imagery (Figure F2). The sediment section at the site coincides with the thickest part of Björn drift along the seismic reflection profile. One target for Site U1554 was to obtain a continuous sedimentary record through Björn drift. Another target was to core the basaltic crust to provide constraints on mantle melting conditions and hydrothermal alteration. Cores and data from this site address all three of the primary science objectives: (1) crustal accretion and mantle behavior; (2) ocean circulation, gateways, and sedimentation; and (3) time-dependent hydrothermal alteration of oceanic crust.
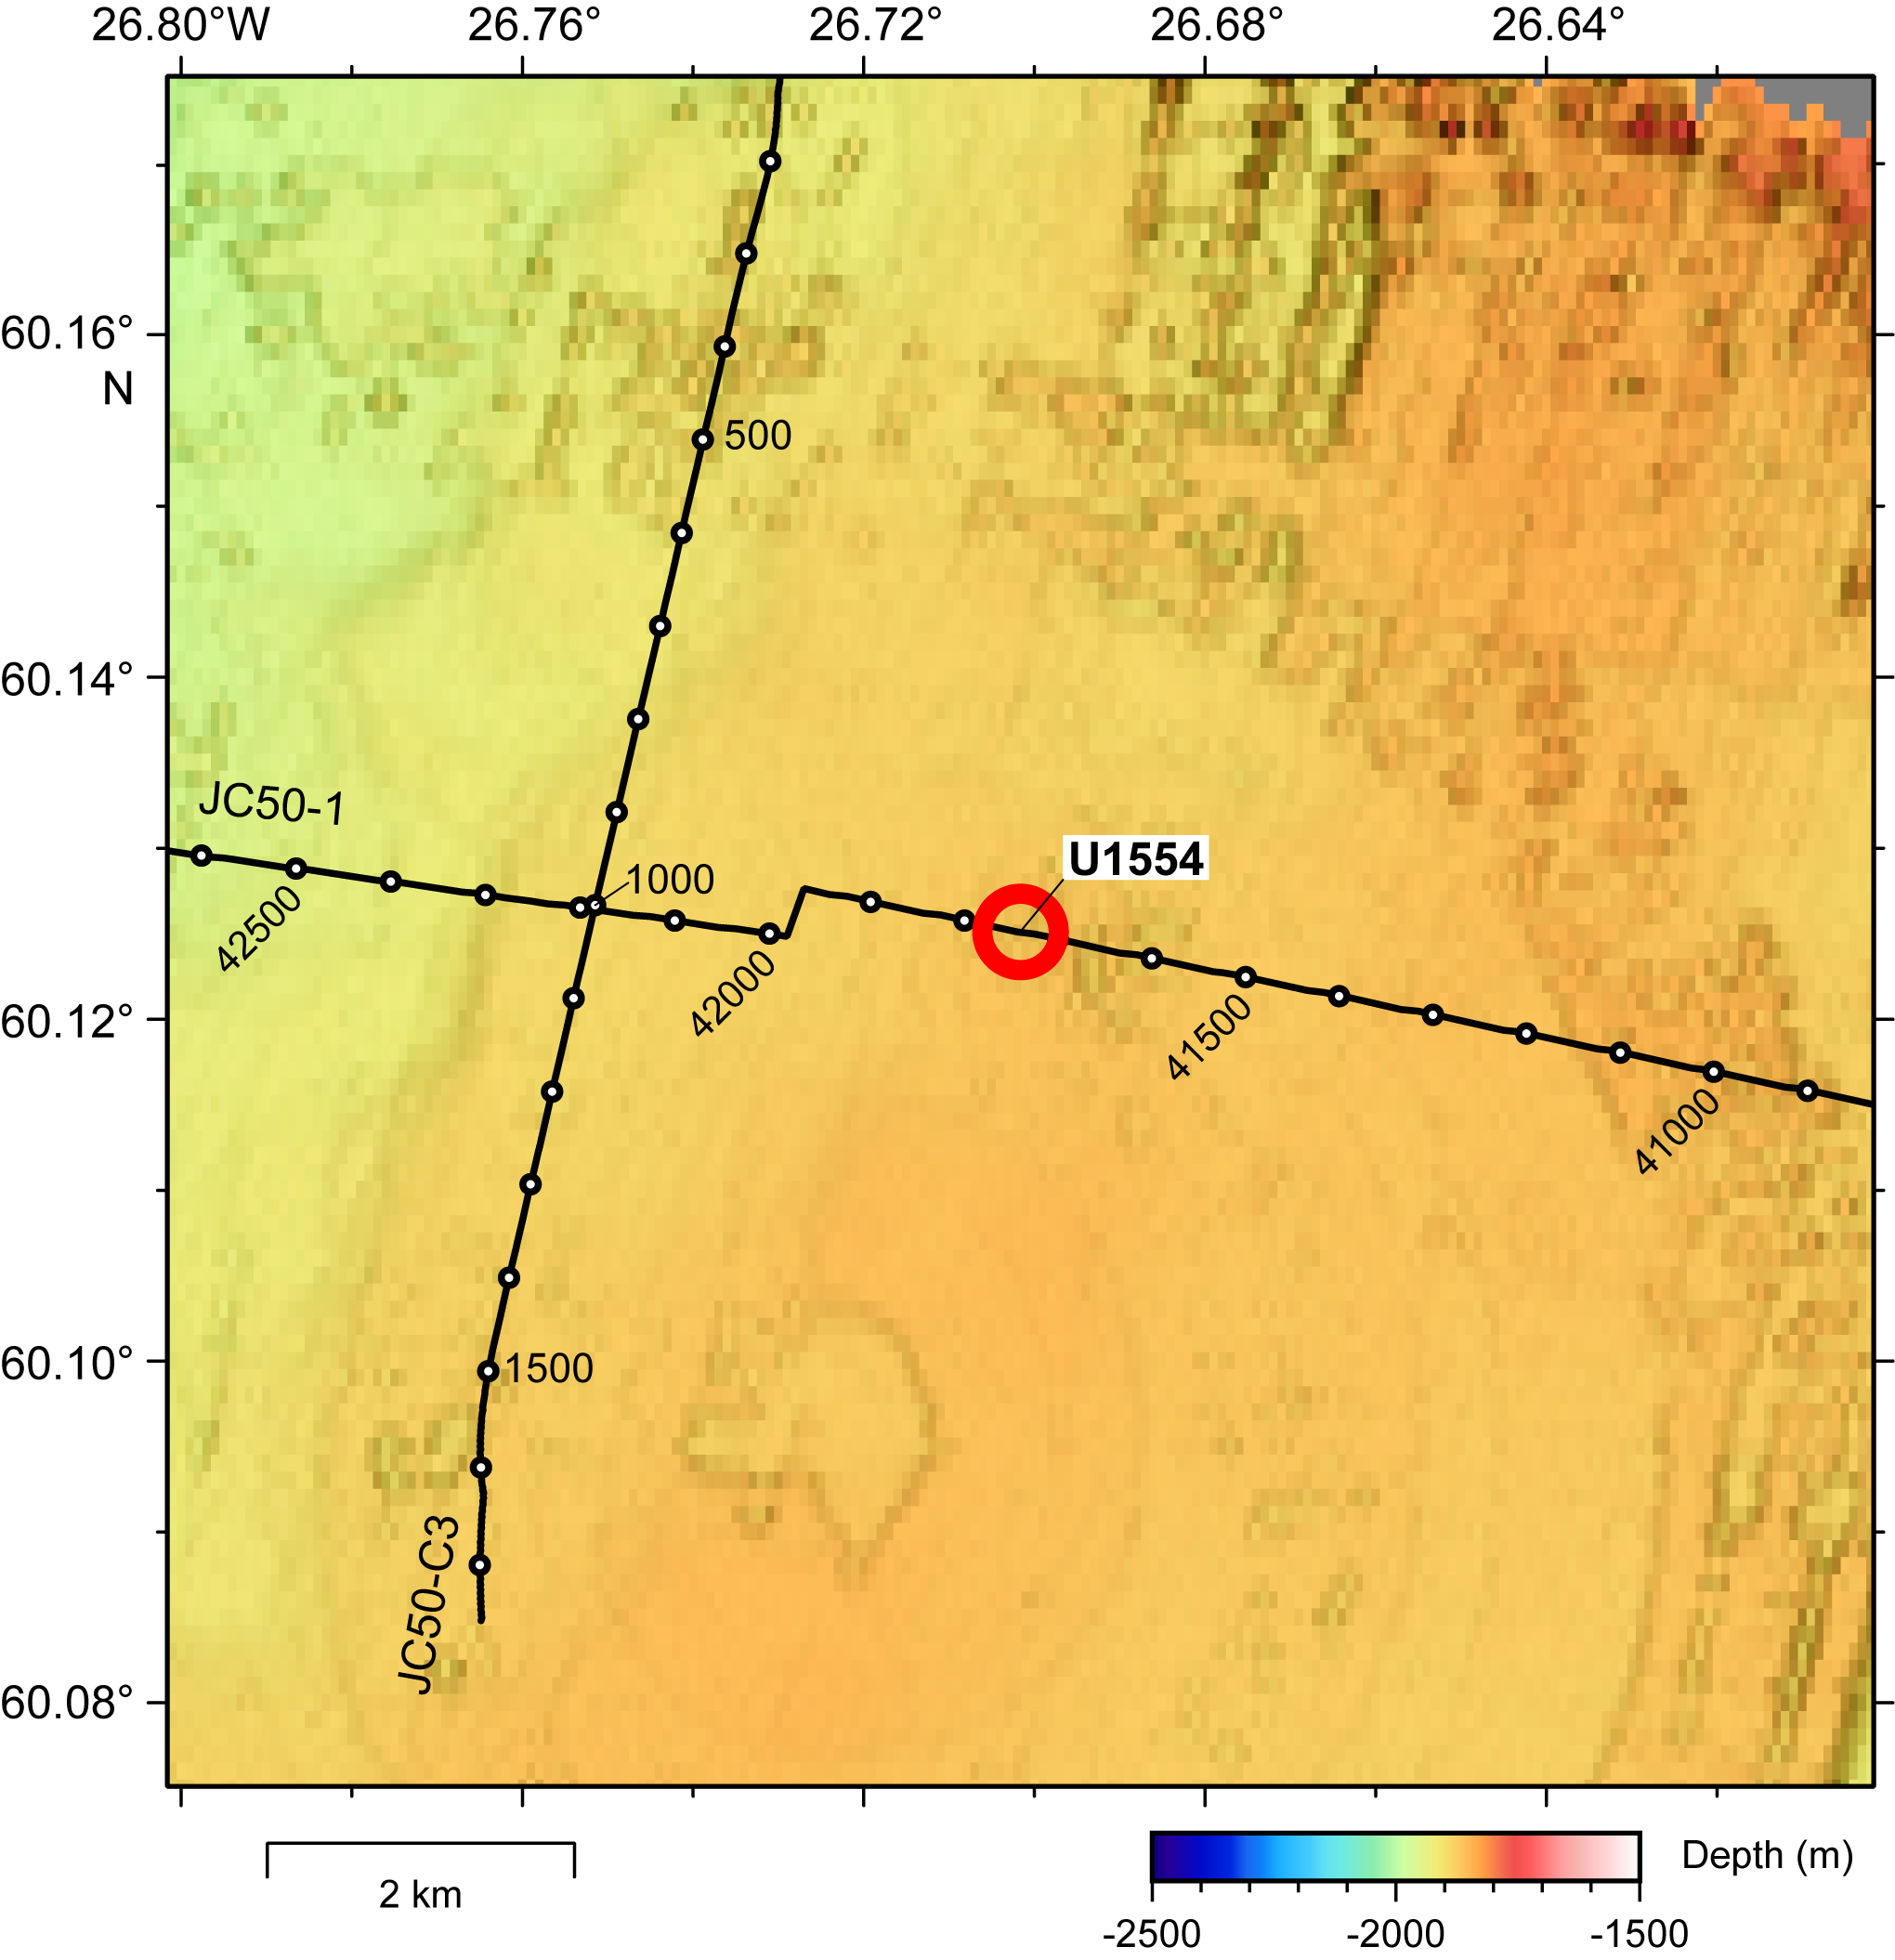
Figure F3. Bathymetric map.
The operational objectives for this site were to core the sedimentary section using the advanced piston corer (APC)/extended core barrel (XCB) system to the sediment/basement interface, install a reentry system with casing, use the rotary core barrel (RCB) system to core ~130 m into the basement, and use downhole wireline tools to log the borehole.
2. Operations
Site U1554 (60°07.5060′N, 26°42.0960′W) consists of eight holes drilled during Expeditions 384, 395C, and 395 (Table T1). Holes U1554A–U1554D were cored during Expedition 384 in July 2020. These holes extend to 23.5–76.0 m drilling depth below seafloor (DSF). The recovered cores were used to create a stratigraphic splice of the section. Paleomagnetic data from these cores were used to test and resolve issues with the Icefield MI-5 core orientation tool (see Blum et al. [2020] for additional information). Both the Icefield MI-5 and FlexIT orientation tools were deployed (Table T1). Holes U1554E and U1554F were cored and logged with downhole tools during Expedition 395C. These holes extend to 647.7 and 779.9 m DSF, respectively. Finally, Holes U1554G and U1554H were cored to ~355 m DSF during Expedition 395.
A total of 194 cores were recovered at Site U1554. These cores collected 1611.82 m of sediment and basalt over a 1683.9 m cored interval (96% recovery) (Table T1).
The APC system was used to core a 953.2 m interval with 985.51 m of core recovered (103% recovery). The half-length APC (HLAPC) recovered 15.16 m of sediment across a 14.1 m interval (108% recovery). The XCB system was deployed over a 556.7 m interval and recovered 511.0 m of core (92% recovery). The RCB system was deployed over a 159.9 m interval with 100.15 m of core recovered (63% recovery). Downhole wireline logging operations were undertaken in Holes U1554E and U1554F.
The total time spent on Holes U1554A–U1554H was 22.48 days (Table T1; see Table T1 in the Expedition 395 summary chapter [Parnell-Turner et al., 2025b]): 2.09 days during Expedition 384, 16.89 days during Expedition 395C, and 3.50 days during Expedition 395.
2.1. Expedition 384
2.1.1. Hole U1554A
The vessel arrived at Site U1554 at 0600 h UTC on 27 July 2020. The thrusters were lowered, and the ship switched to dynamic positioning (DP) mode at 0629 h, ending the 1100 nmi transit from Kristiansand, Norway. An APC/XCB bottom-hole assembly (BHA) was made up and deployed at 1445 h. The bit was positioned at ~1861 meters below sea level (mbsl), and Hole U1554A (60°07.5038′N, 26°42.0955′W) was spudded at 2300 h. Core 1H recovered 5.74 m of sediment, placing the seafloor at 1869.8 mbsl. Coring advanced to 72.2 m DSF with Cores 2H–8H. Following Core 8H, the pipe was pulled up, and the bit cleared the seafloor at 0625 on 28 July, ending Hole U1554A.
All APC cores were collected with nonmagnetic core barrels. Cores 384-U1554A-1H through 4H were oriented using the Icefield MI-5, and Cores 5H–8H were oriented using the FlexIT tool. Eight APC cores with 74.71 m of core were recovered from a 72.2 m interval (104% recovery).
2.1.2. Hole U1554B
The vessel was offset 20 m east of Hole U1554A, and Hole U1554B (60°07.5058′N, 26°42.0748′W) was spudded at 0735 h on 28 July 2020. Cores 1H–8H recovered 76.75 m of core over the 76.0 m cored interval (101% recovery). Hole U1554B ended at 1500 h on 28 July when the bit cleared the seafloor.
All APC cores were collected with nonmagnetic core barrels and oriented using the Icefield MI-5.
2.1.3. Hole U1554C
The ship was offset 20 m south of Hole U1554B to core Hole U1554C (60°07.4950′N, 26°42.0747′W). Hole U1554C was spudded at 1600 h on 28 July 2020. The seafloor depth was calculated at 1869.0 mbsl based upon the recovery of Core 1H (8.5 m). Cores 1H–8H were collected over a 75.0 m interval with 77.03 m of core recovered (103% recovery). The drill pipe was pulled from the hole, and the bit cleared the seafloor at 2345 h on 28 July, ending Hole U1554C.
All APC cores were collected with nonmagnetic core barrels. Cores 384-U1554C-1H through 4H were oriented using the FlexIT tool, and Cores 5H–8H were oriented with the Icefield MI-5.
2.1.4. Hole U1554D
The vessel was offset 20 m west of Hole U1554C. Hole U1554D (60°07.4941′N, 26°42.0968′W) was spudded at 0055 h on 29 July 2020. The hole was washed down to 14 m DSF (interval 11), and Core 2H was collected from 14.0–23.5 m DSF with 9.72 m of sediment recovered (102% recovery). This core was collected for the future testing of shipboard track systems and is no longer part of this expedition.
Following coring operations, the drill pipe was pulled out of the hole with the bit clearing the seafloor at 0140 h and the rotary table at 0715 h on 29 July. The drill string and BHA were broken down, and the vessel was secured for transit at 0820 h. The thrusters were raised, and the ship began the transit to Site U1555 at 0900 h on 29 July, ending Site U1554.
2.2. Expedition 395C
2.2.1. Hole U1554E
Following a 54 nmi transit from Site U1555, the vessel arrived at Site U1554 early on 24 June 2021. The ship's thrusters were lowered at 0124 h, and the vessel switched to DP mode at 0136 h. The APC/XCB BHA and drill string were made up and run to the seafloor (1869.8 mbsl). At 0754 h, Hole U1554E (60°7.5235′N, 26°42.1324′W) was spudded and drilled without recovery to 66.3 m DSF. Coring using the APC progressed from 66.3 to 218.3 m DSF (Cores 2H–17H) with 157.92 m of sediment recovered (104% recovery). The cores expanded upon arrival on the core receiving platform. When taking Core 17H, the core barrel could not be pulled out of the sediment using the drill pipe. The barrel was drilled over using the drill string to free the core.
Formation temperature measurements using the advanced piston corer temperature (APCT-3) tool were collected on Cores 395C-U1554E-2H, 5H, 8H, and 11H. All APC cores were oriented with the Icefield MI-5 and collected using nonmagnetic core barrels.
The XCB was deployed following Core 395C-U1554E-17H. Cores 18X–62X (218.3–647.7 m DSF) were collected with 383.15 m of core recovered (89% recovery). The basement was encountered at ~647 m DSF while drilling Core 62X; the core contained 1 m of basalt interlayered with carbonate sediment. The final hole depth was 647.7 m DSF.
A total of 61 cores were collected in Hole U1554E, with 541.07 m of core collected over a 581.4 m interval (93% recovery).
Following coring operations, the hole was cleaned and displaced with heavy mud and the drill string was pulled up to 72.8 m DSF. The triple combination (triple combo) tool string was made up and run in the hole at 2100 h on 27 June. The tool string was able to descend to the base of the hole (~647 m DSF), and the triple combo made two passes of the borehole. The first attempt to pull the triple combo through the bit and into the drill pipe occurred at 0115 h on 28 June. The lockable float valve (LFV) at the bit had closed, preventing the tool string from reentering the pipe. After several hours of pumping seawater and rotating the drill string, the triple combo was pulled past the LFV, and the tools reached the surface at 0845 h. The Formation MicroScanner (FMS)-sonic tool string was assembled and deployed at 1120 h. A go-devil was attached to the top of the tool string to lock open the LFV. After two passes of the borehole, the FMS-sonic was unable to pass through the LFV and reenter the pipe. After additional pumping, the tools were successfully recovered, and the FMS-sonic tool string reached the rig floor at 2055 h. Based on the caliper results from the triple combo, which showed that the borehole was washed out to greater than a 14 inch diameter for the majority of the hole, the decision was made to not run the Versatile Seismic Imager (VSI). Following logging operations, the drill string was pulled out of the hole with the bit clearing the seafloor at 2210 h on 28 June. At 0245 h on 29 June, the bit cleared the rotary table, ending the hole.
2.2.2. Hole U1554F
The ship was positioned over the Hole U1554F coordinates (60°7.5136′N, 26°42.1140′W), ~25 m southeast of Hole U1554E, and the rig floor crew began assembling the casing and reentry system. The mud skirt of the reentry system was moved over the moonpool, and the hydraulic release tool (HRT) was made up and racked in the derrick. A 602.3 m long casing string, composed of 52 joints of 10¾ inch casing, was assembled (Figure F4). The HRT running tool was attached to the casing and lowered to the mud skirt. The HRT running tool was then detached and put back into the derrick. The mud motor, underreamer, and bit were assembled and tested. The first mud motor rotated too freely and was replaced with a second mud motor. After a successful test, the crew made up the BHA with the HRT running tool assembly and the reentry cone. At 0638 h on 30 June 2021, the HRT reentry system was deployed through the moonpool. The casing and drill string were run to 1552 mbsl, and the subsea camera system was deployed to observe the casing operations. Hole U1554F was spudded at 1345 h at 1869.7 mbsl, and the casing was drilled in to 602 m DSF with the bit at 606.3 m DSF. Once the casing and reentry system were in place, a go-devil was pumped down the pipe to activate the HRT running tool and release the drill string from the casing. The drill string, including the HRT running tool assembly, was pulled from the hole with the bit clearing the seafloor at 1610 h on 1 July. The rig floor crew broke down the HRT running tool assembly.
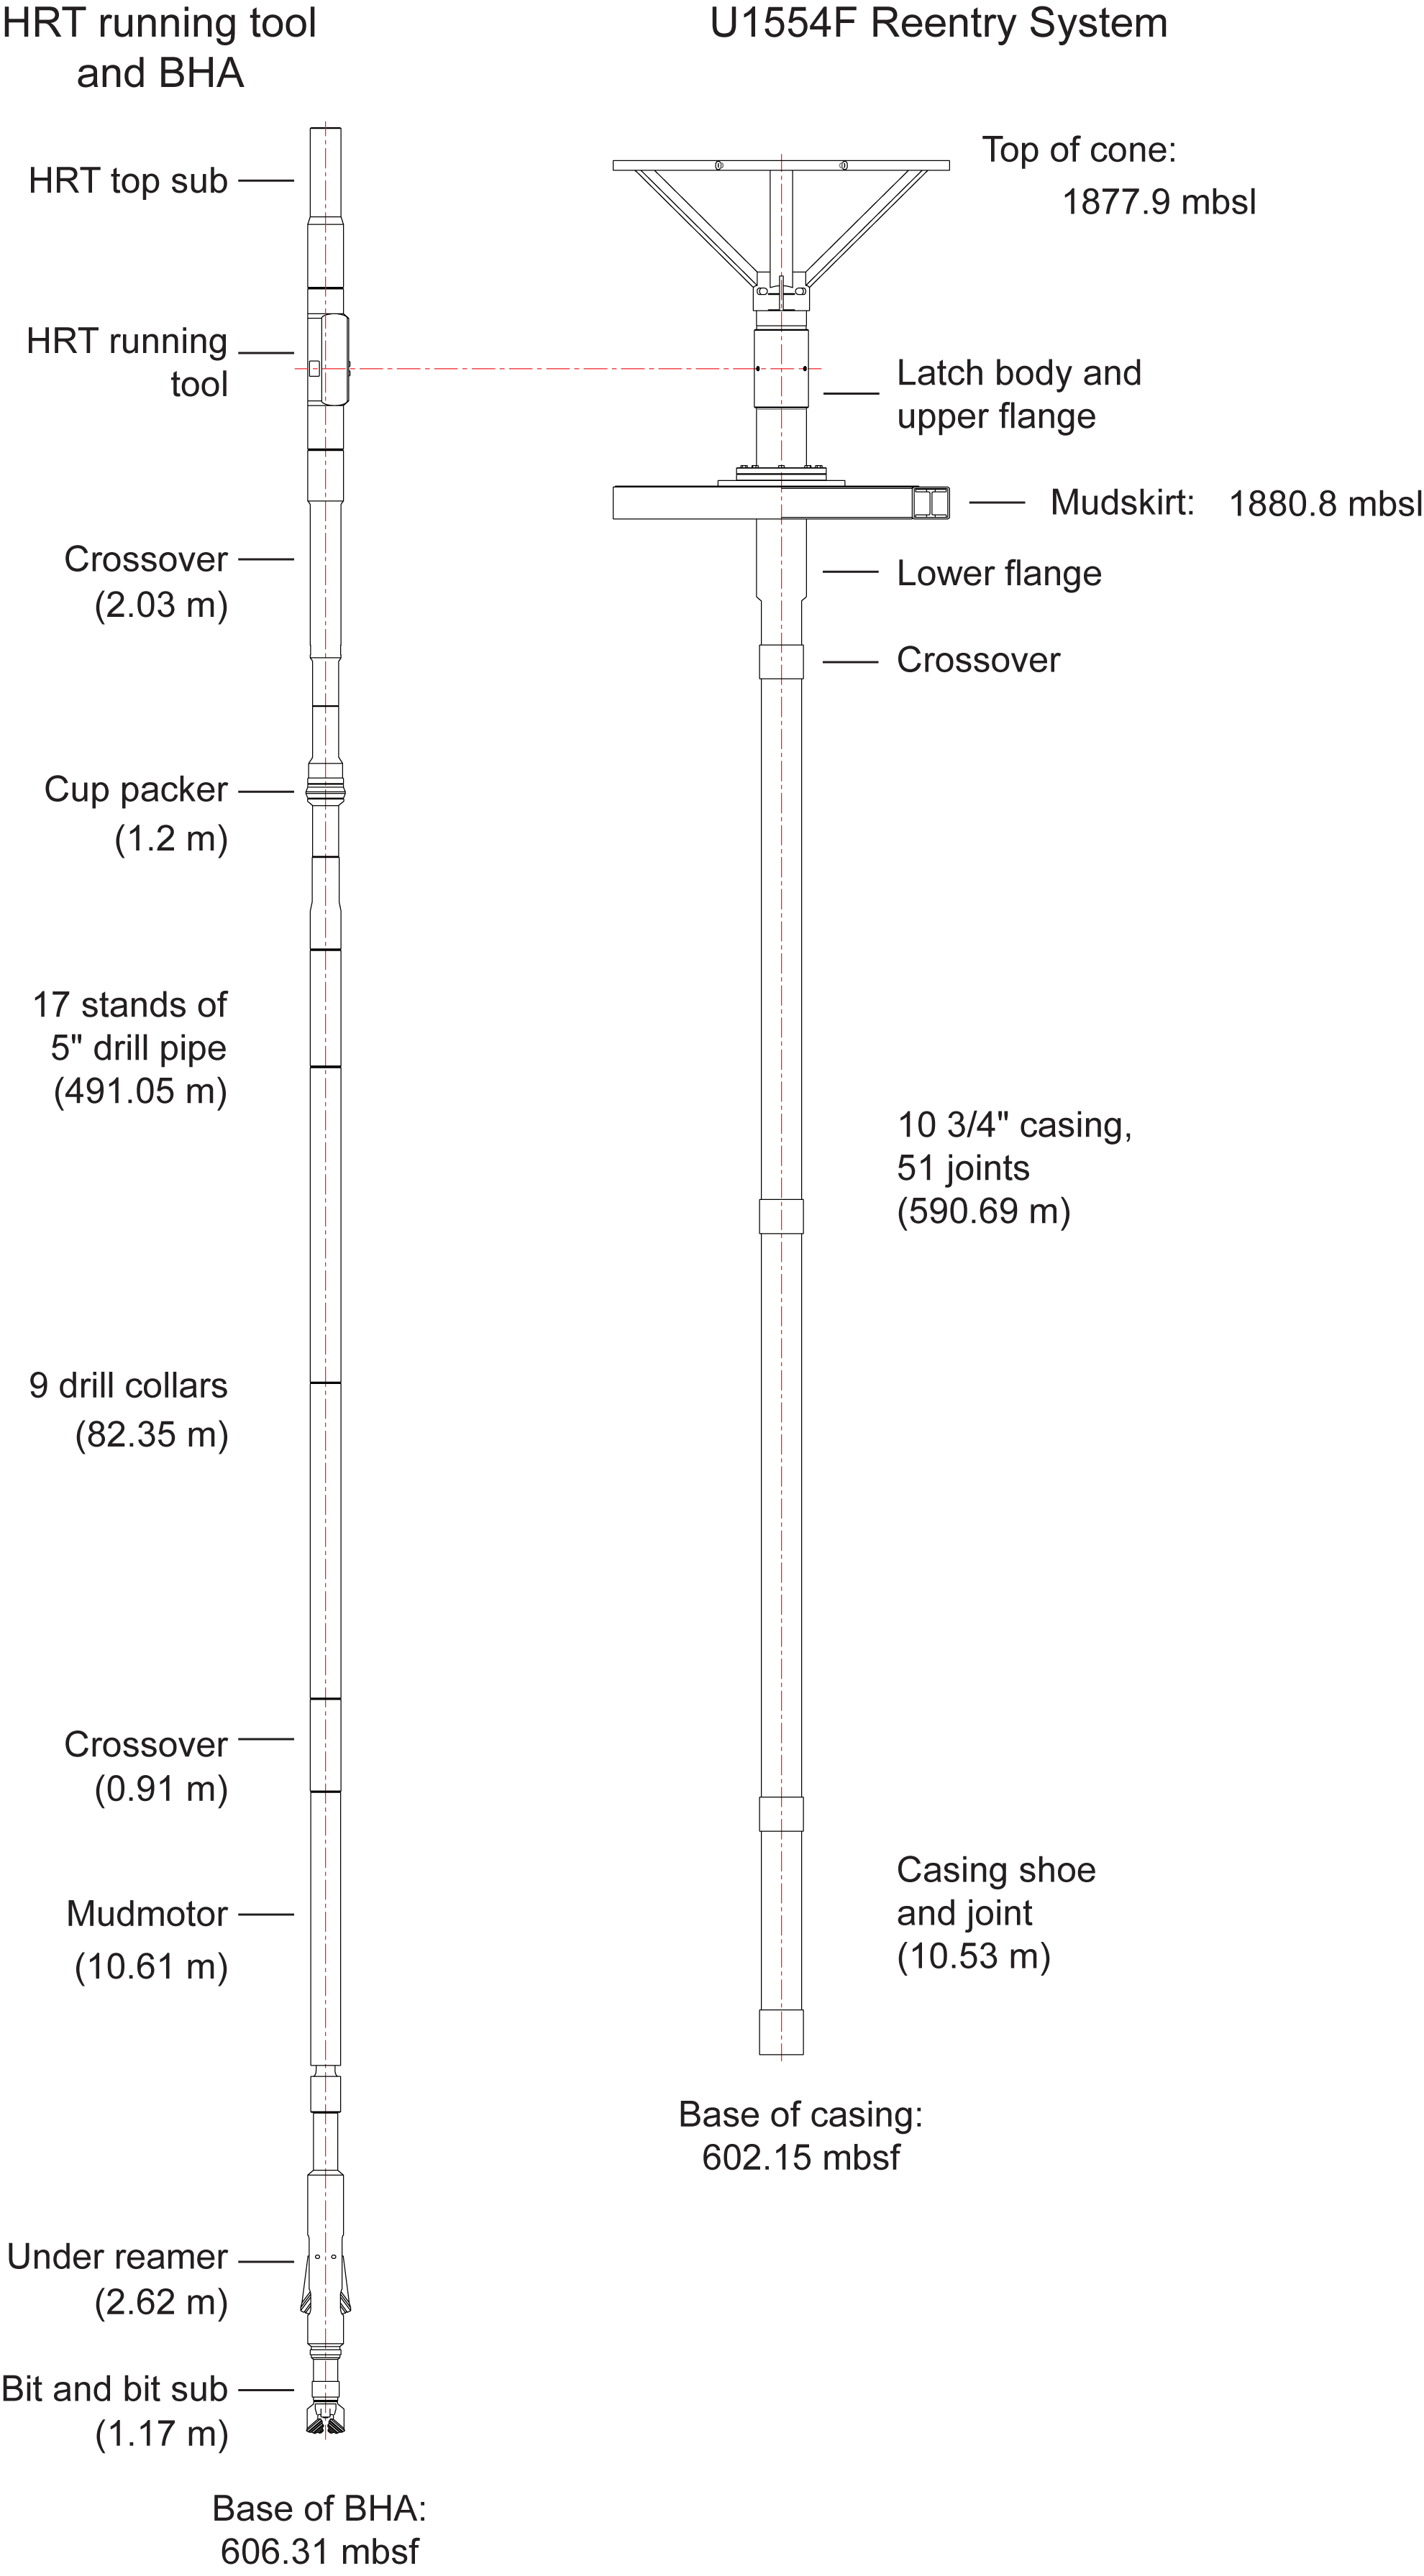
Figure F4. HRT running tool, BHA, and reentry system.
An RCB BHA with a C-4 RCB bit and the drill pipe was made up and run to 1836.5 mbsl. The subsea camera, along with the Conductivity-Temperature-Depth (CTD) tool, was run to the end of the drill string to observe the bit reenter Hole U1554F. The bit entered Hole U1554F at 1057 h on 2 July. The subsea camera was retrieved, and the drill string advanced to the base of the casing string (602 m DSF). The center bit was dropped into the RCB bit, and Hole U1554F was drilled without recovery to 620 m DSF. Two drilled intervals, 11 (0–606.3 m DSF) and 12 (606.3–620 m DSF), were recorded for the hole. The center bit was retrieved, and an RCB core barrel was deployed. Cores 3R–5R were advanced from 620 to 649.1 m DSF, and 19.86 m of core was recovered (68% recovery). Core 5R contained the sediment/basement interface at ~647 m DSF. Cores 6R–20R advanced from 649.1 to 721.7 m DSF with 45.91 m of basalt recovered (63% recovery).
Following Core 395C-U1554F-20R, the drill bit had reached 50 rotating hours. The drill string was pulled from the hole to change the drill bit, and the bit cleared the seafloor at 1840 h and the rotary table at 2210 h on 5 July. A new C-7 RCB drill bit was made up to the BHA. The drill string was assembled, and the subsea camera, along with the CTD tool, was deployed for the reentry. The bit reentered Hole U1554F at 0405 h on 6 July. The subsea camera was recovered, and the drill string advanced to 721.7 m DSF. RCB coring resumed from 721.7 to 779.9 m DSF with the recovery of Cores 21R–32R.
In total, 30 cores over a 159.9 m interval were recovered from Hole U1554F. The core recovery for this hole was 100.15 m (63% recovery). The basement cores were advanced at an average rate of 1.76 m/h.
Following coring operations, the hole was conditioned for downhole wireline logging with a 50 bbl high-viscosity mud sweep and then displaced with seawater. The drill pipe was pulled out of the hole, and the subsea camera was deployed to observe operations. The drill bit cleared the seafloor at 0643 h on 8 July, and the ship was offset 20 m northeast. A rotary shifting tool was run to release the drill bit and allow the logging tools to exit the drill pipe. The bit was released at 0756 h, and at 0955 h the pipe reentered Hole U1554F. The subsea camera was recovered, and the drill string deployed to 589.2 m DSF inside the casing string. The triple combo logging tool string was made up and run for two passes of the borehole from 602 m DSF, the base of the casing string, to the bottom of the hole at 779 m DSF. At 2010 h, the triple combo tool string reached the drill floor and was broken down. The FMS-sonic tool string was made up and run at 0410 h on 9 July. After making two logging passes, the FMS-sonic tool string was recovered to the rig floor, disassembled, and laid out. The Ultrasonic Borehole Imager (UBI) tool string was then made up and deployed to the bottom of the hole. The UBI made two logging passes, taking 360° images of the borehole wall. The UBI tool string was recovered and laid out at 1425 h. The drill pipe was pulled up from 588 to 69 m DSF in preparation of running the VSI from the base of the hole up through the casing string. However, foggy conditions throughout the afternoon and evening inhibited visibility and prevented the start of the protected species observation (PSO) protocols. At day break, visibility had worsened, and conditions were not forecast to improve until evening. Because of the time already allocated to Site U1554, the decision was made to abandon the VSI logging run and begin operations at Site U1562. The drill pipe was pulled up and cleared the seafloor at 0755 h on 10 July, ending Hole U1554F and Site U1554.
The vessel returned to Hole U1554F on 21 July 2021 to attempt to complete the VSI logging operations. The ship completed the 6.1 nmi transit in DP mode from Site U1562 to Hole U1554F at 0730 h. The subsea camera was deployed, and the drill pipe was lowered to 1836 mbsl. The drill pipe was positioned over the reentry cone and reentered Hole U1554F at 0930 h. The subsea camera was retrieved, and pipe was run to 68.5 m DSF within the casing string in preparation for downhole logging with the VSI tool. At ~1030 h, fog had formed around the vessel and reduced visibility. The vessel waited on the fog to clear, and at 1250 h the VSI was deployed to the base of the casing string (602 m DSF), the air guns were set in the water, and the PSO protocols were initiated. Nearly immediately, whales were spotted in the exclusion zone, which delayed the start of the VSI operations. After 2 h of tracking whales in the vicinity of the vessel, foggy conditions reduced visibility, prohibiting the continuation of PSO watch. With the fog forecast to worsen throughout the evening and into the next day, the planned VSI operations were canceled at 1600 h in favor of coring at the next site. The VSI was pulled from the drill pipe, and the tool reached the rig floor at 1700 h. While retrieving the tool string, visibility briefly improved only to reveal that the whales had come closer to the ship, confirming the decision to leave the site. The drill pipe was pulled out of the hole, and the end of the pipe cleared the seafloor at 1840 h and the rig floor at 2210 h on 21 July. The rig floor was secured for transit, and the thrusters were raised. The vessel began the 39 nmi transit to Site U1563 at 2236 h, ending Hole U1554F.
2.3. Expedition 395
2.3.1. Hole U1554G
Following a 104 nmi transit from Site U1564, the ship arrived at Site U1554 at 1800 h on 27 June 2023. The thrusters were lowered, and the vessel switched to DP mode, beginning Hole U1554G (60°7.5037′N, 26°42.1129′W) at 1842 h. An APC/XCB BHA was made up, and the drill string was lowered to 1864.6 mbsl. Hole U1554G was spudded at 0340 h on 28 June. Core 1H recovered 5.43 m of sediment, establishing a seafloor depth of 1868.7 mbsl. Cores 1H–22H were advanced to 202.90 m DSF, recovering 210.3 m of core (104% recovery).
The average ship heave on 28 June was over 2 m, creating challenging coring conditions. The APCT-3 tool was run during Core 395-U1554G-4H but produced noisy, poor measurements. Subsequent APCT-3 runs were postponed to Hole U1554H. Cores 395-U1554G-9H through 13H were misfires, with the shear pins releasing early. The core orientation tool was removed on Cores 12H–14H to see if that affected the misfires; however, this did not solve the problem. The orientation tool was redeployed beginning with Core 15H. While landing the core barrel in the BHA during Core 17H, the shear pin in the overshot tool sheared, releasing the core barrel. A second wireline run was required to retrieve the core barrel.
Coring continued from 202.9 to 288.4 m DSF with Cores 395-U1554G-23H through 31H. Cores 30H and 31H were partial strokes, and Core 31H experienced high overpull and was drilled over with the bit and BHA. After reaching refusal of the APC system, the HLAPC was deployed for Cores 32F–34F (288.4–302.5 m DSF). All three cores were partial strokes.
APC cores, except for Cores 395-U1554G-12H through 14H, were oriented using the Icefield MI-5. All APC and HLAPC cores were collected using nonmagnetic core barrels.
XCB coring advanced the hole from 302.5 to 355.0 m DSF, recovering Cores 395-U1554G-35X through 40X. The target depth of the hole was achieved, and the drill string was pulled out of the hole with the bit clearing the seafloor at 1745 h on 29 June, marking the end of Hole U1554G. A total of 40 cores were taken in Hole U1554G over the 355.0 m cored interval. Core recovery was 102%, and 362.3 m of sediment was collected.
2.3.2. Hole U1554H
The ship was offset 20 m south of Hole U1554G. At 2135 h on 29 June 2023, Hole U1554H (60°07.4952′N, 26°42.1188′W) was spudded with Core 1H recovering 9.4 m. The seafloor was calculated at 1866.7 mbsl. Cores 1H–30H advanced to 280.1 m DSF, and temperature measurements using the APCT-3 tool were collected on Cores 4H, 7H, 10H, 13H, and 16H. Core 7H was a 4.7 m advance; however, the bit was lifted off the bottom to shoot the core barrel and the APCT-3 tool was deployed for this core. The combination of the ship heave, the core barrel sitting in the formation for several minutes collecting temperature data, and the half empty core barrel resulted in sediment getting sucked into the barrel and 9.41 m (200%) recovery. The temperature measurement for this core was poor. While the core barrel was descending for Core 24H, the core barrel separated from the sinker bars and fell to the bottom of the BHA. A fishing tool was run down to retrieve the barrel. Once it returned to the rig floor, the shear pins in the BHA were replaced and Core 24H was again attempted; however, it was a partial stroke.
All APC cores were oriented using the Icefield MI-5 and collected using nonmagnetic core barrels.
The decision was made to switch to the XCB system when the overpull on the core barrels increased and Cores 395-U1554H-31X through 38X (280.1–354.9 m DSF) were collected. After reaching the target depth for the hole, the drill string was pulled out of the hole. The drill bit cleared the seafloor at 0640 h on 1 July, ending Hole U1554H and Site U1554. The vessel began the transit in DP mode to Site U1562.
A total of 38 cores were recovered in Hole U1554H, with 370.22 m of core recovered across a 354.9 m interval (104% recovery).
3. Lithostratigraphy
The sediments at Site U1554 are primarily composed of silty clay, with some minor intervals of silty clay with biogenics and silty clay with carbonate. The base of the sedimentary sequence is nannofossil chalk down to basement. Sediments were recovered during Expeditions 384, 395C, and 395 in all eight of the holes, although the single core recovered from Hole 384-U1554D was not curated and was instead used for testing shipboard track systems.
Lithologic unit definitions are based primarily on Holes 395C-U1554E and 395-U1554H because they include the longest and most complete sedimentary records recovered (Figure F5). The base of the sedimentary sequence is pinned to the depth of the sediment/basement interface recovered in Hole 395C-U1554F. Calcium carbonate (CaCO3) measurements were obtained from Holes 395-U1554G and 395C-U1554E. We assume that sample depths are equivalent between Holes U1554G and U1554H for the purpose of comparing holes in this initial report.
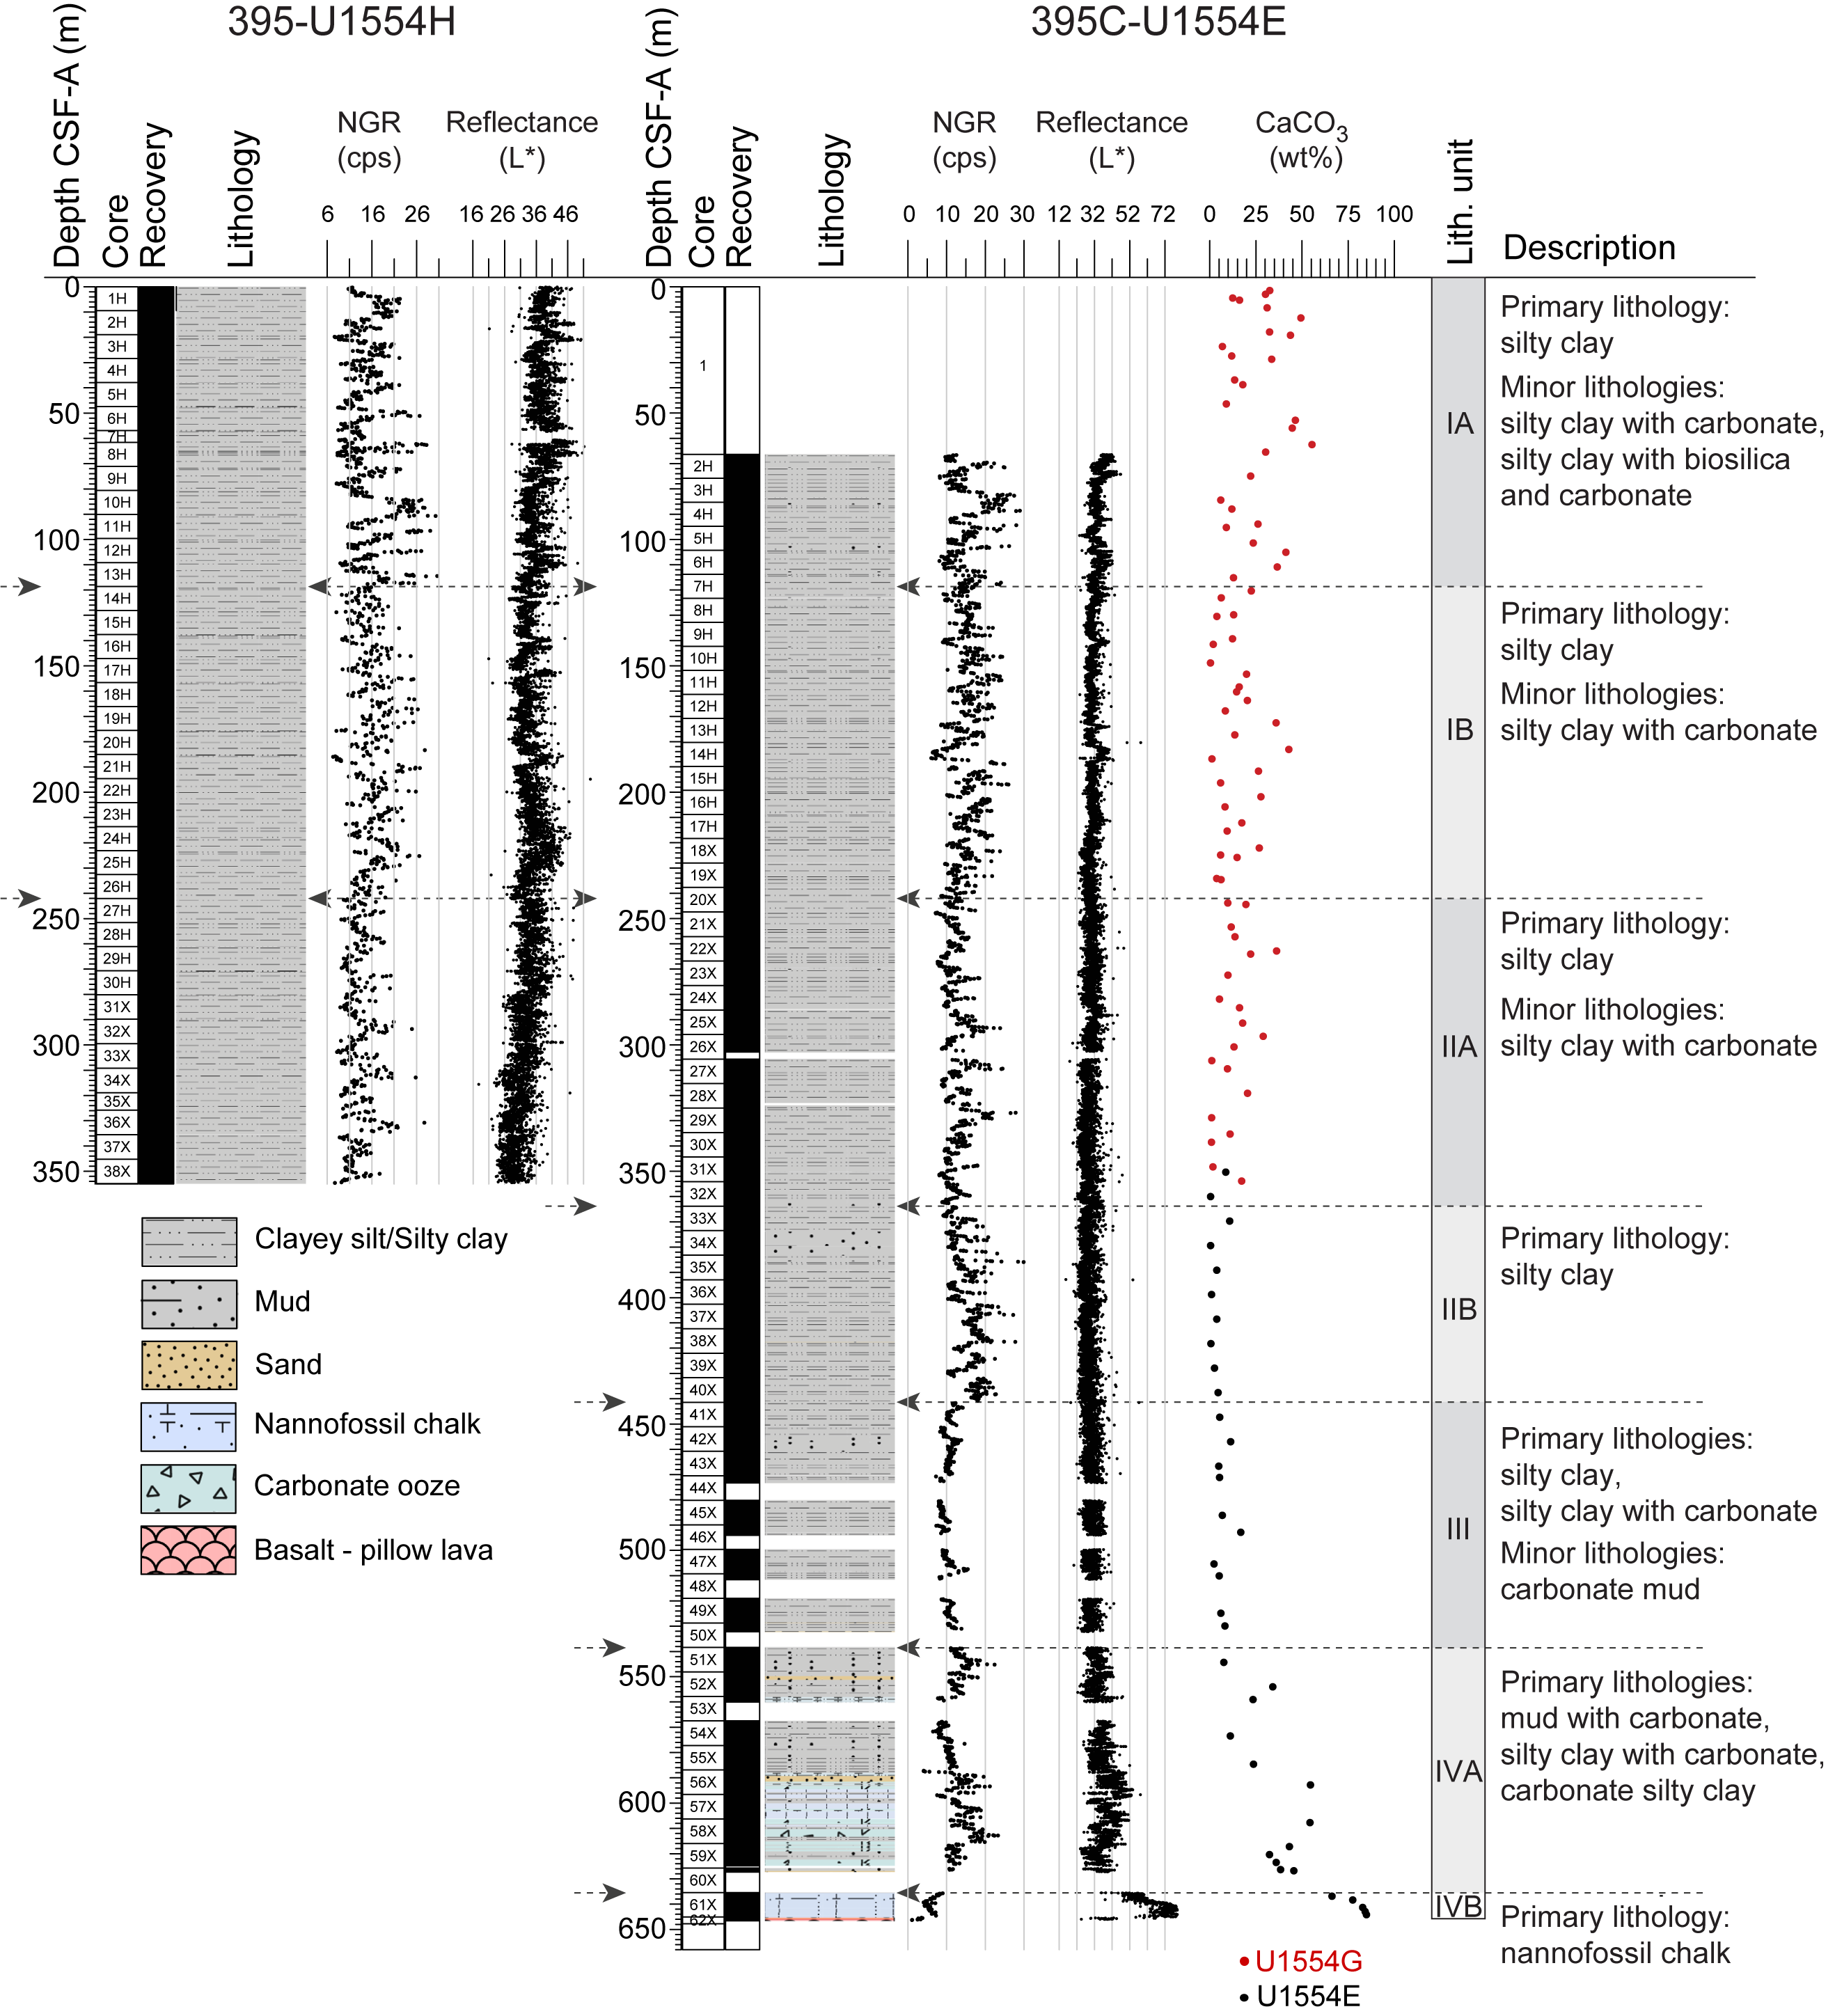
Figure F5. Lithostratigraphic units.
Four lithostratigraphic units are observed at this site (I–IV). Units I, II, and IV are divided into two subunits (IA, IB, IIA, IIB, IVA, and IVB) (Table T2). Photographic images of representative lithologies for the different units are shown in Figure F6. Unit and subunit boundaries were identified based on five parameters: (1) visual core description, (2) natural gamma radiation (NGR), (3) color reflectance (L* parameter), (4) smear slide examination, and (5) bulk CaCO3 measurements. Unit boundaries and corresponding physical properties data are shown in Figures F5 and F7. To assist interpretation of sedimentologic patterns at this site, NGR and reflectance data were smoothed after cleaning using an eighth-order lowpass Butterworth filter with a cutoff of 0.125 times the Nyquist frequency (see Physical properties in the Expedition 395 methods chapter [Parnell-Turner et al., 2025a]). This bidirectional linear digital filter avoids phase shift, maintaining correct peak positions (Butterworth, 1930; Lyons, 2011).
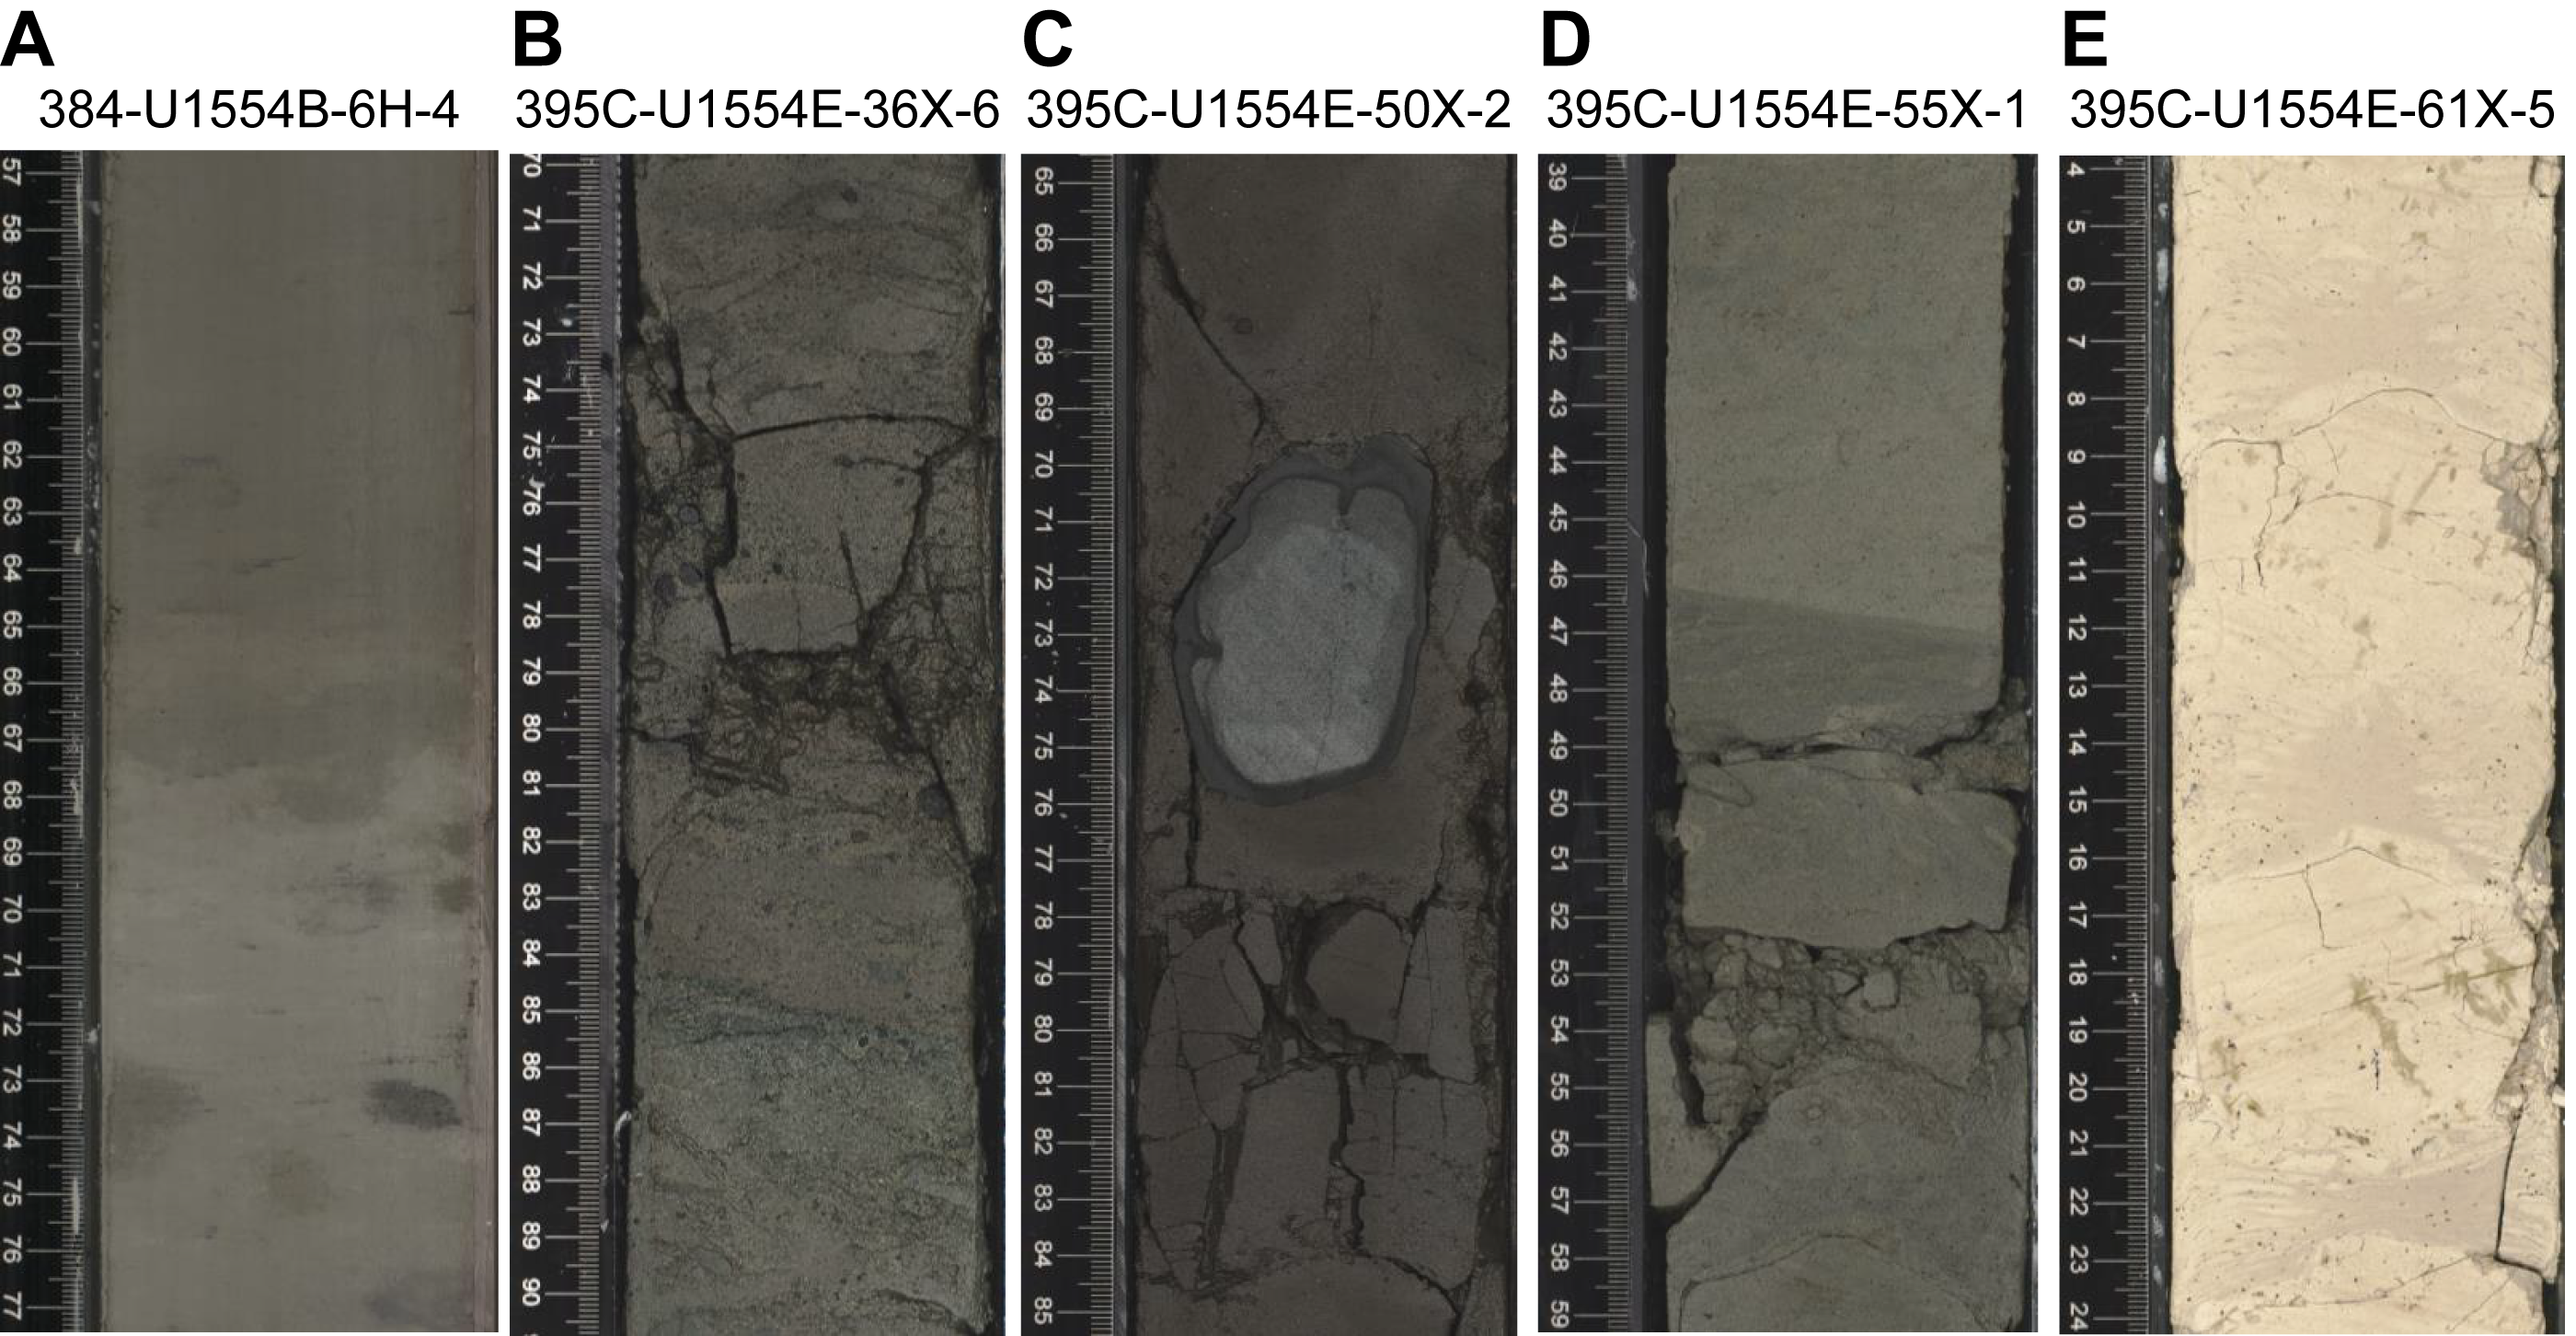
Figure F6. Sedimentary textures and features.
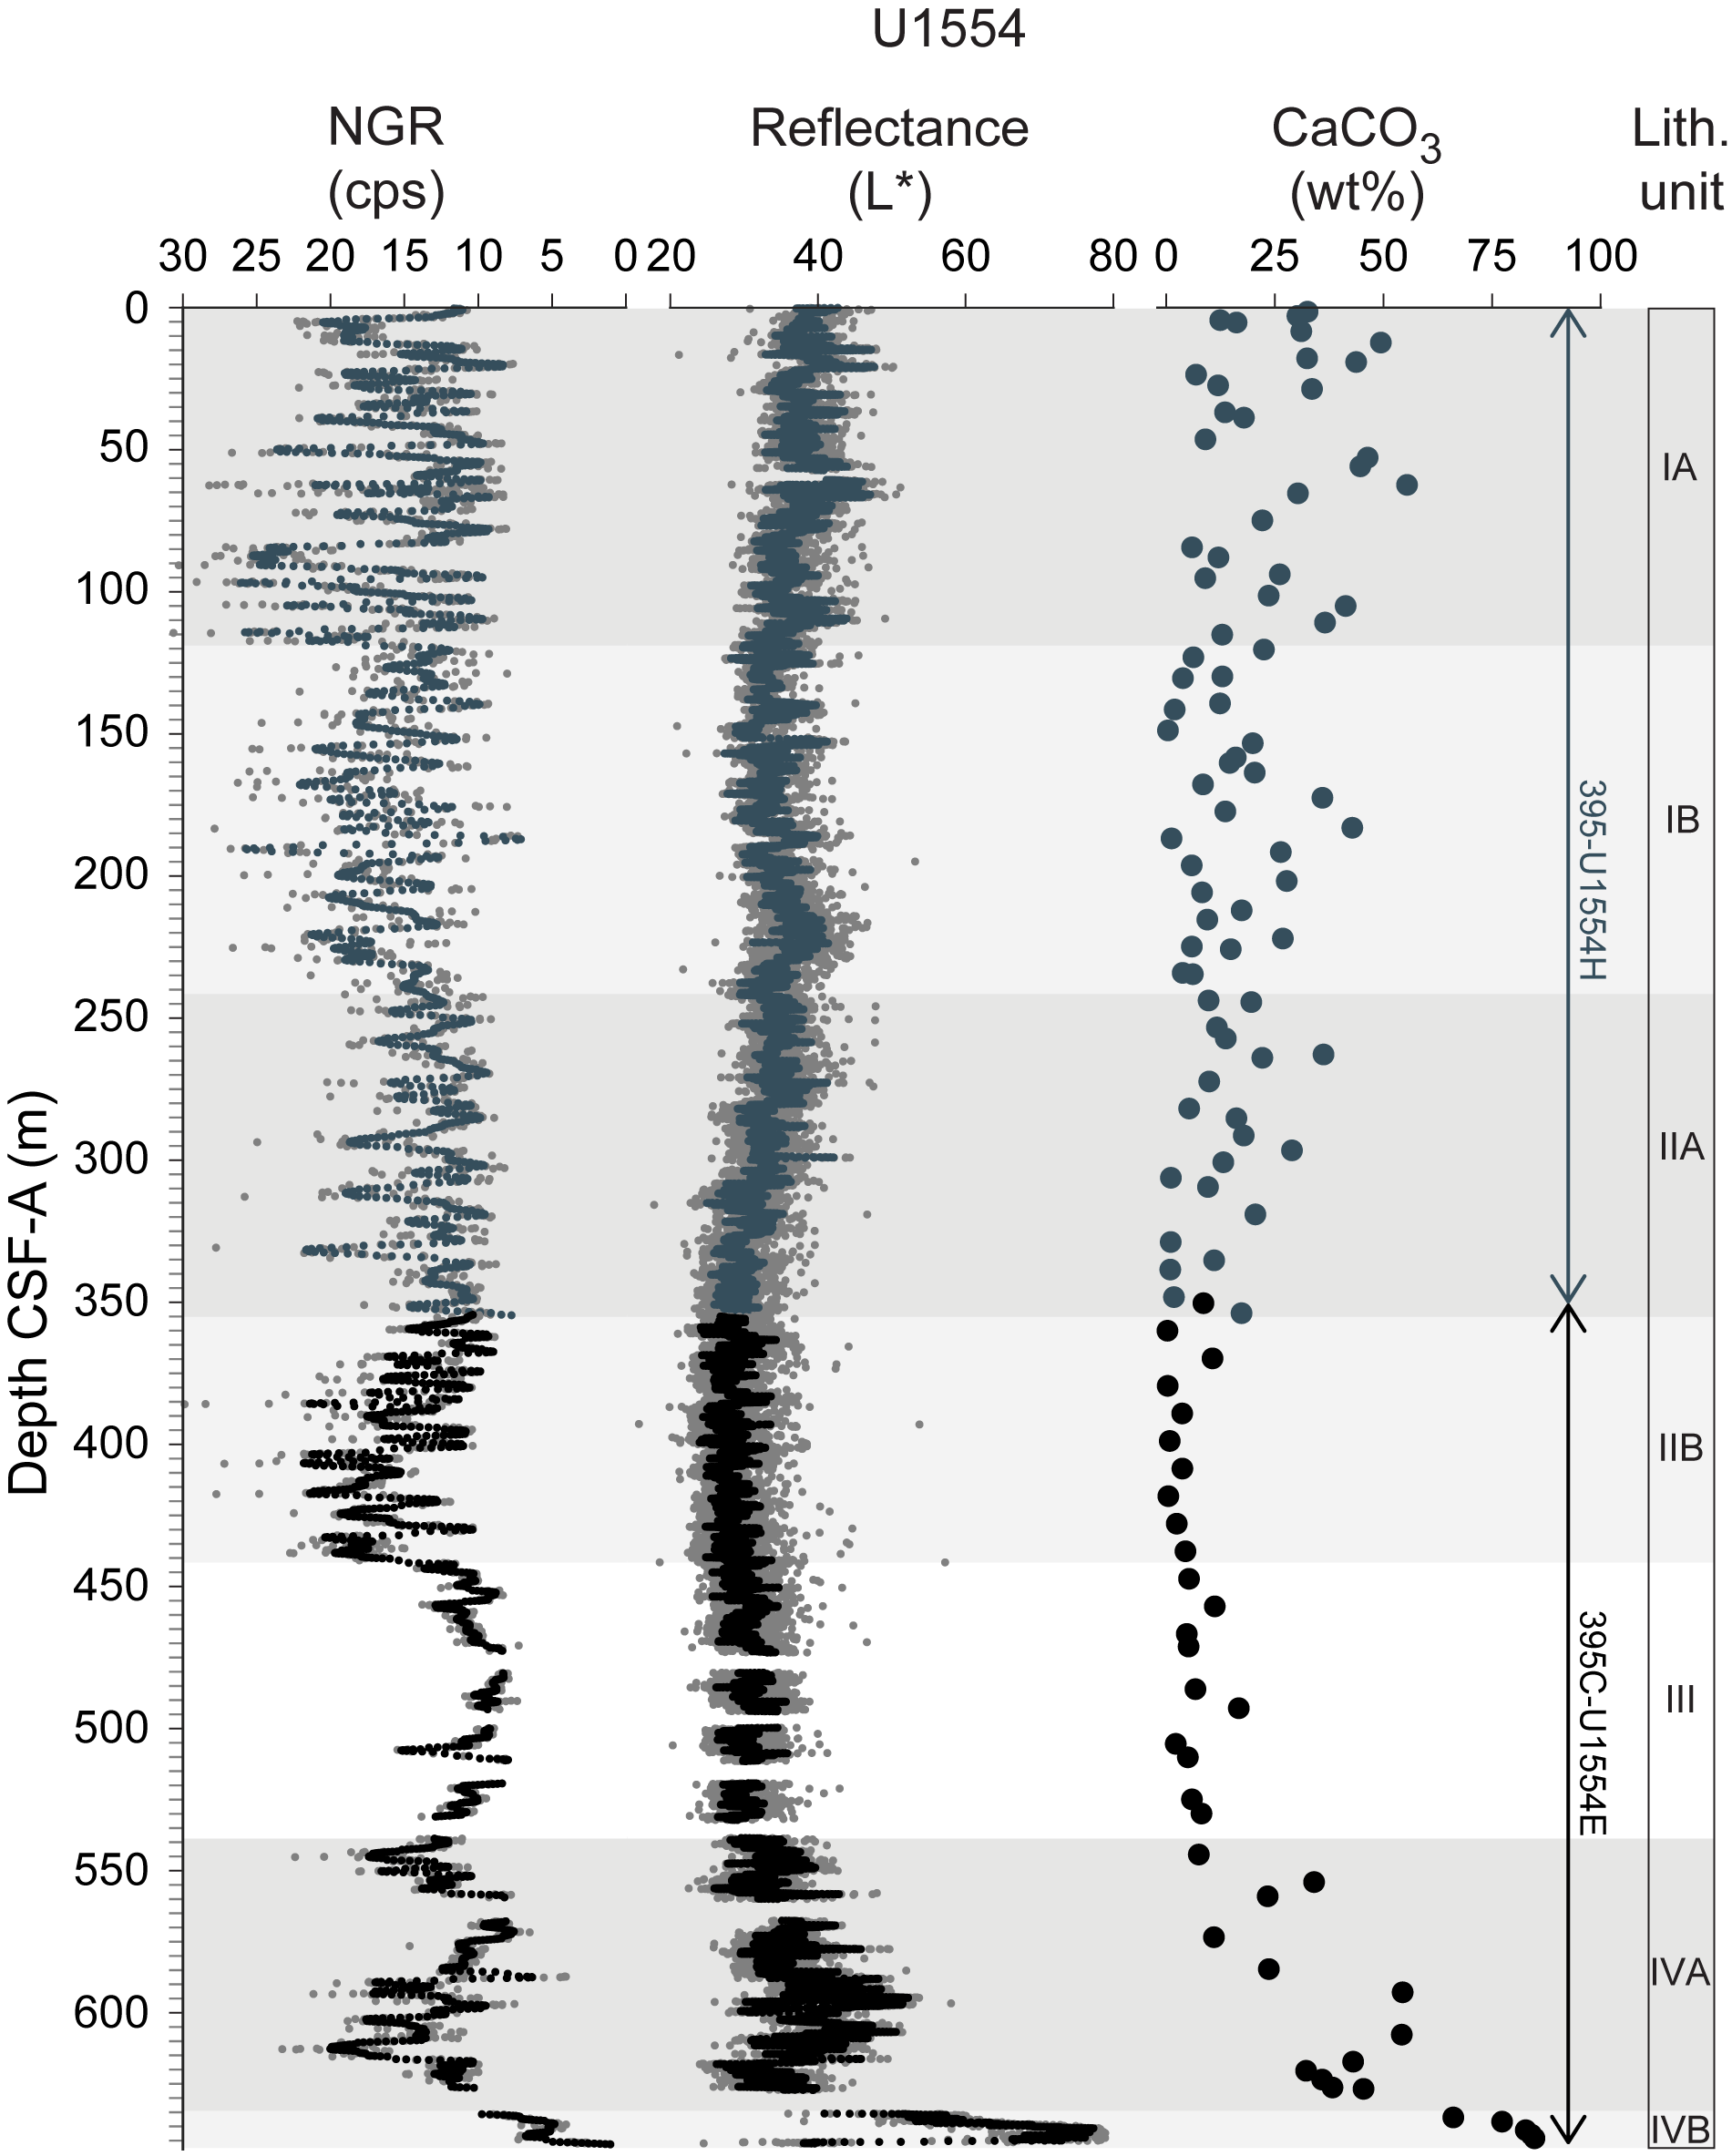
Figure F7. Lithologic unit definition parameters.
CaCO3 measurements were spaced approximately one to three per 10 m and thus are a partial representation of variability in carbonate content downhole. Clasts are present in all units at Site U1554; clasts >2 cm are described in further detail below (Table T3).
3.1. Lithostratigraphic Unit I
- Intervals: 384-U1554A-1H-1, 0 cm, to end of hole; 384-U1554B-1H-1, 0 cm, to end of hole; 384-U1554C-1H-1, 0 cm, to end of hole; 395C-U1554E-2H-1, 0 cm, to 20X-4, 0 cm; 395-U1554G-1H-1, 0 cm, to 27H-1, 0 cm; 395-U1554H-1H-1, 0 cm, to 27H-1, 0 cm
- Depths: Hole U1554A = 0–72.68 m core depth below seafloor, Method A (CSF-A); Hole U1554B = 0–76.45 m CSF-A; Hole U1554C = 0–75.24 m CSF-A; Hole U1554E = 66.3–240.3 m CSF-A; Hole U1554G = 0–240.9 m CSF-A; Hole U1554H = 0–242.1 m CSF-A
- Thickness: Hole U1554A = 72.68 m; Hole U1554B = 76.45 m; Hole U1554C = 75.24 m; Hole U1554E = 174.0 m; Hole U1554G = 240.9 m; Hole U1554H = 242.1 m
- Age: Holocene to early Pliocene
- Lithology: silty clay
Unit I sediments are predominantly gray, greenish gray, grayish brown, dark gray, and very dark gray silty clay, clayey silt, silty clay with carbonate, clayey silt with carbonate, and silty clay with biogenics (Figure F6A). Both biosilica (diatoms, radiolarians, sponge spicules, and silicoflagellates) and minor amounts of carbonate (nannofossils and foraminifers) are present throughout (Figure F8A, F8B). The terrigenous component is dominated by quartz and feldspar with smaller amounts of glass, oxides, pyrite, and opaque grains. Glauconite in minor amounts is consistently observed throughout this unit (Figure F8C, F8D). Bioturbation is generally sparse to abundant. Drilling disturbance is generally confined to soupy or moderately deformed intervals at the uppermost sections of some cores. Unit I is divided into two subunits.
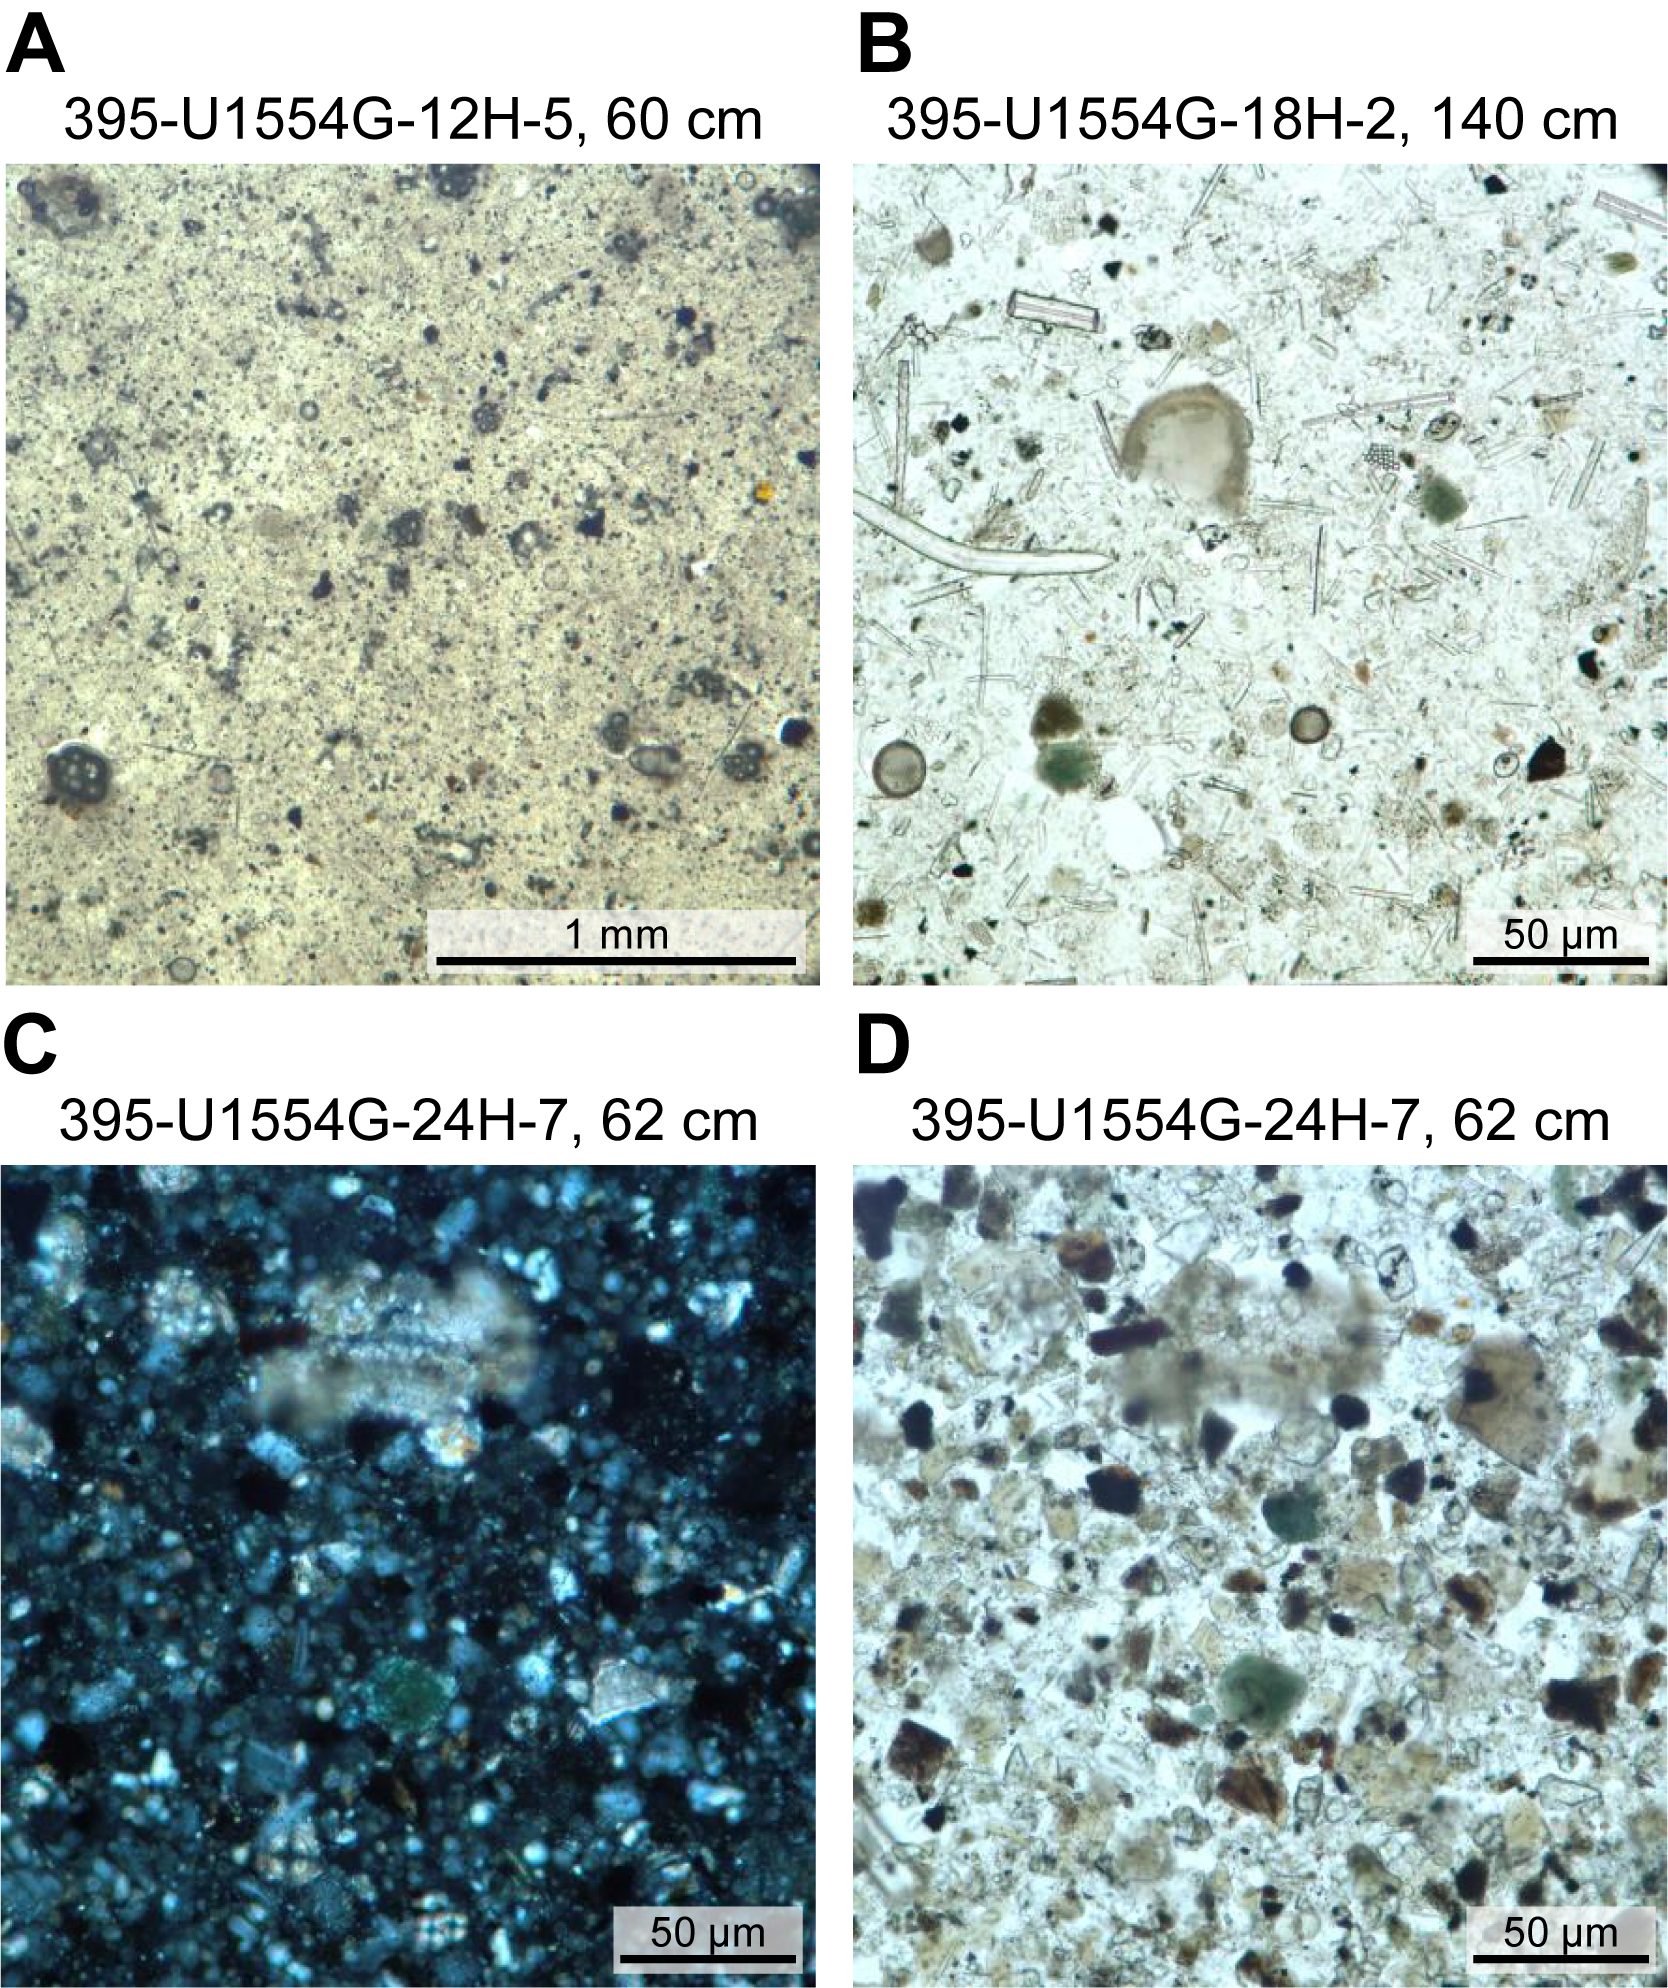
Figure F8. Typical lithologies.
3.1.1. Lithostratigraphic Subunit IA
- Intervals: 384-U1554A-1H-1, 0 cm, to end of hole; 384-U1554B-1H-1, 0 cm, to end of hole; 384-U1554C-1H-1, 0 cm, to end of hole; 395C-U1554E-2H-1, 0 cm, to 7H-3, 151 cm; 395-U1554G-1H-1, 0 cm, to 14H-1, 0 cm; 395-U1554H-1H-1, 0 cm, to 14H-1, 0 cm
- Depths: Hole U1554A = 0–72.68 m CSF-A; Hole U1554B = 0–76.45 m CSF-A; Hole U1554C = 0–75.24 m CSF-A; Hole U1554E = 66.3–118.3 m CSF-A; Hole U1554G = 0–117.4 m CSF-A; Hole U1554H = 0–118.6 m CSF-A
- Thickness: Hole U1554A = 72.68 m; Hole U1554B = 76.45 m; Hole U1554C = 75.24 m; Hole U1554E = 52 m; Hole U1554G = 117.4 m; Hole U1554H = 118.6 m
- Age: Holocene to late Pleistocene
- Lithology: silty clay
Subunit IA is primarily composed of light greenish gray silty clay with biogenics and dark gray to very dark gray silty clay. Unit boundaries were defined partly using physical properties measurements, including high-amplitude cyclic variations in NGR and low L* reflectance. This subunit contains three clasts >2 cm (Table T3). CaCO3 ranges 6–45 wt% (average = 24 wt%); the highest value is in the middle of the subunit in Section 395-U1554G-7H-2, 56 cm. Small clasts (<2 cm) are present intermittently. Three large clasts (>2 cm) are observed in the sediment (not fall-in); two are basalt, and one is a crystalline rock. Fresh, open burrows are present in Cores 395-U1554H-1H and 2H. Filled burrows with halos, pyritized burrows, and shell fragments are also observed. Sharp color contacts and bioturbated boundaries are present throughout the subunit (Figure F6A). A thin layer (~3 mm) of glass is present in Section 6H-7, 16 cm, between silty clay (above) and silty clay with biogenics (below) (Figure F9A).
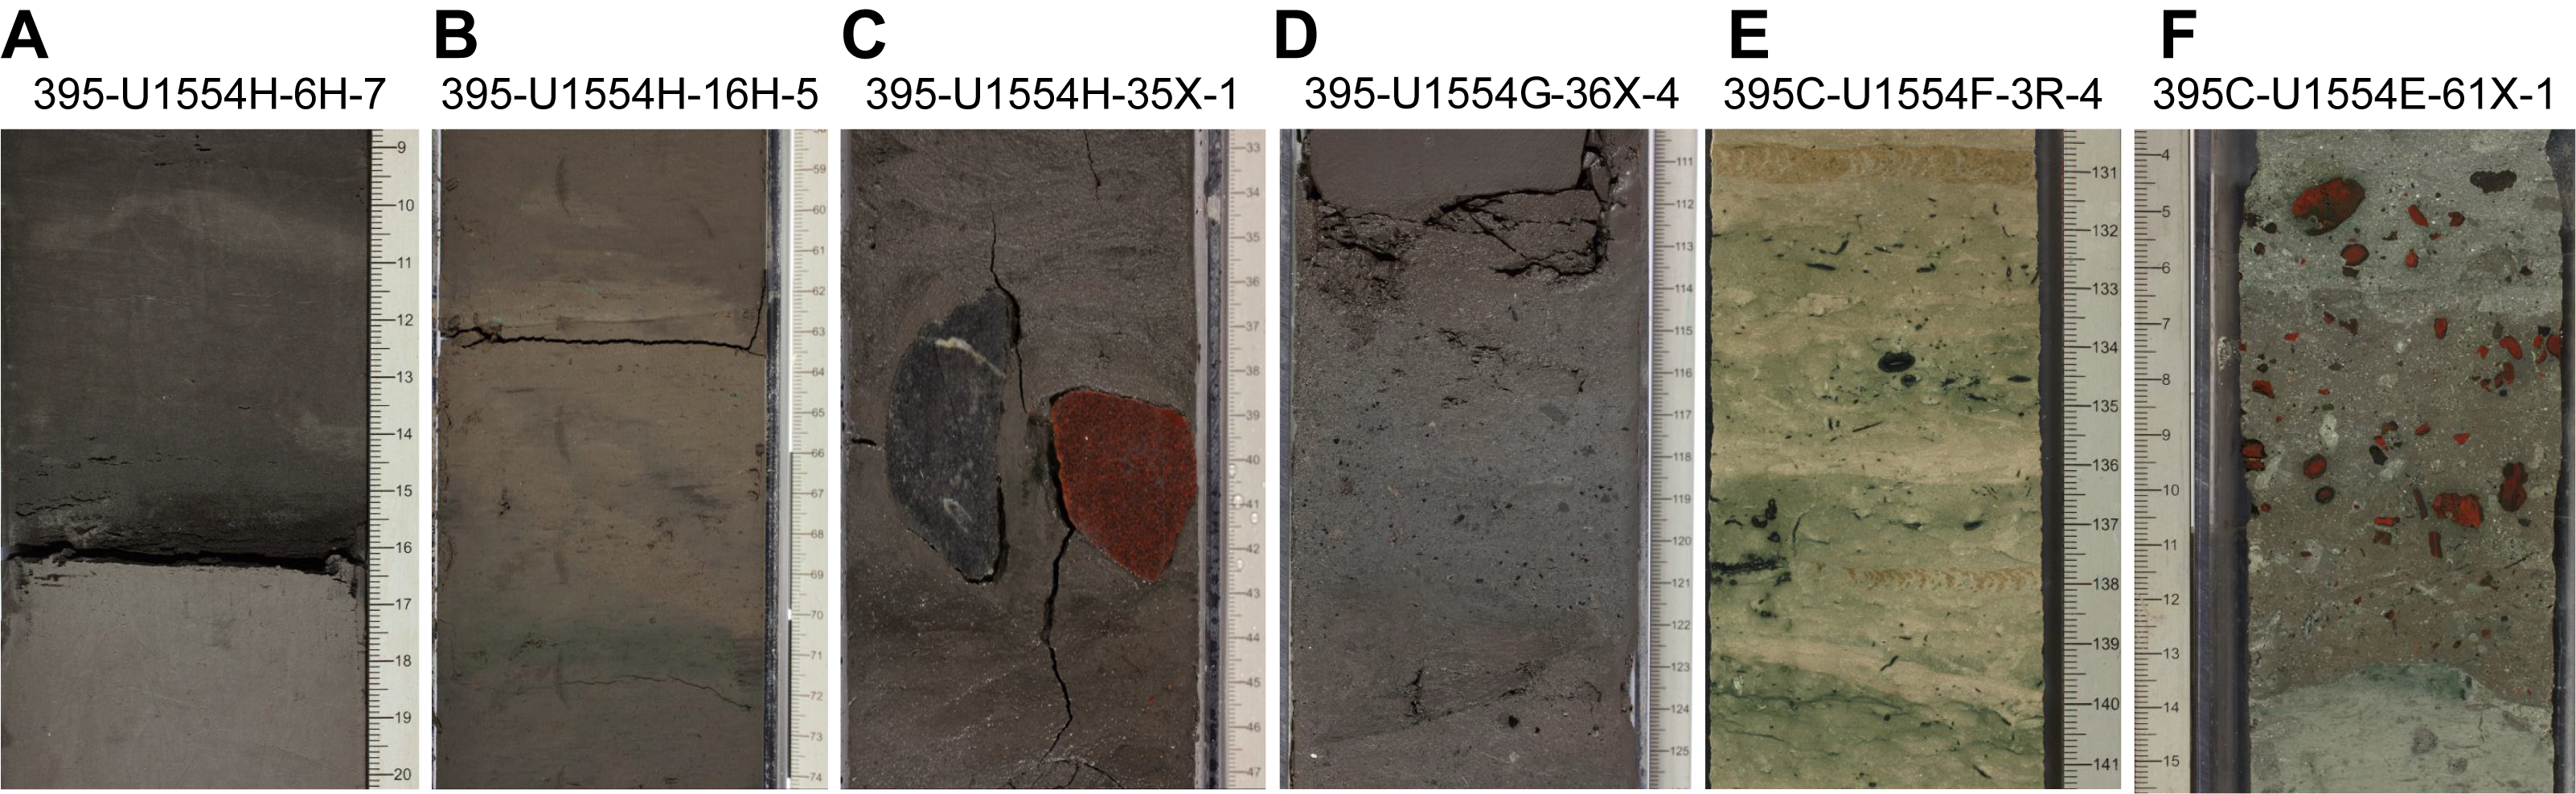
Figure F9. Lithologies and clasts.
3.1.2. Lithostratigraphic Subunit IB
- Intervals: 395C-U1554E-7H-4, 0 cm, to 20X-4, 0 cm; 395-U1554G-14H-1, 0 cm, to 27H-1, 0 cm; 395-U1554H-14H-1, 0 cm, to 27H-1, 0 cm
- Depths: Hole U1554E = 118.3–240.3 m CSF-A; Hole U1554G = 117.4–240.9 m CSF-A; Hole U1554H = 118.6–242.1 m CSF-A
- Thickness: Hole U1554E = 122 m; Hole U1554G = 123.5 m; Hole U1554H = 123.5 m
- Age: late Pleistocene to early Pleistocene
- Lithology: silty clay
Subunit IB is composed of primarily dark gray to black silty clay. Unit boundaries were defined partly using physical properties measurements and overall low L* reflectance. Subunit IB displays lower amplitude but higher frequency cyclic variations in NGR compared to Subunit IA. Subunit IB contains two clasts >2 cm (Table T3): a black crystalline clast in Section 395-U1554G-14H-1 and a highly angular vesicular basalt clast in Section 395-U1554H-17H-3. CaCO3 ranges 6–43 wt% in this subunit.
Green and very dark gray banding (e.g., Figure F9B) is observed in several intervals of Core 395-U1554H-17H, including between intervals 17H-1, 138 cm, to 17H-2, 87 cm; 17H-4, 0 cm, to 17H-6, 136 cm; and 17H-7, 15 cm, to 17H-7, 54 cm. These bands appear to have no compositional difference in smear slides compared to surrounding sediments.
3.2. Lithostratigraphic Unit II
- Intervals: 395C-U1554E-20X-4, 0 cm, to 41X-1, 0 cm; 395-U1554G-27H-1, 0 cm, to end of hole; 395-U1554H-27H-1, 0 cm, to end of hole
- Depths: Hole U1554E = 240.3–441.4 m CSF-A; Hole U1554G = 240.9–354.97 m CSF-A; Hole U1554H = 242.1–354.8 m CSF-A
- Thickness: Hole U1554E = 201.1 m; Hole U1554G = 114.07 m; Hole U1554H = 112.7 m
- Age: early Pleistocene to late Pliocene
- Lithology: silty clay and silty clay with carbonate
Lithologic description of Unit II is based primarily on sediments from Hole U1554E, which contains the complete sedimentary sequence of Unit II. Unit II sediments are predominantly gray, greenish gray, grayish brown, dark gray, and very dark gray and composed of silty clay, silty clay with carbonate, and silty clay with biogenics. Carbonate microfossils (nannofossils and foraminifers) are present in Subunit IIA but rare in Subunit IIB. The decrease in carbonate abundance and the change in the frequency and amplitude of the NGR variations are used to define two subunits. Clasts >2 cm are observed in both subunits (Figure F9C).
Between the top of Unit II (~240 m CSF-A) and 297 m CSF-A (Hole U1554G) and 280 m CSF-A (Hole U1554H), the top of the first section of each core is soupy or moderately to severely deformed. Below these depths, the cores were recovered with the XCB system and are moderately to severely biscuited. Bioturbation is sparse to moderate although often difficult to identify because of the absence of color changes. Throughout the unit, thin intervals of sparsely distributed sand and gravel are observed, both within and between biscuits (Figure F9D). Foraminifers, gastropod fragments, and irregular ash blebs are visible on the split core surface in some intervals. Thin (1–10 mm) greenish gray layers are present throughout but changes in mineral assemblage proportions are not identifiable in smear slide.
3.2.1. Lithostratigraphic Subunit IIA
- Intervals: 395C-U1554E-20X-4, 0 cm, to 34X-1, 0 cm; 395-U1554G-27H-1, 0 cm, to end of hole; 395-U1554H-27H-1, 0 cm, to end of hole
- Depths: Hole U1554E = 240.3–373.5 m CSF-A; Hole U1554G = 240.9–354.97 m CSF-A; Hole U1554H = 242.1–354.8 m CSF-A
- Thickness: Hole U1554E = 133.2 m; Hole U1554G = 114.07 m; Hole U1554H = 112.7 m
- Age: early Pleistocene
- Primary lithology: silty clay with carbonate
Subunit IIA is dominated by dark olive gray silty clay with carbonate (e.g., nannofossils and foraminifers) and biosilica (e.g., sponge spicules). Layers of mud with higher sand content are present as recurring intervals with a 10–40 cm periodicity. Two sand- and gravel-rich layers, as well as layers containing occasional dispersed sand and gravel, are observed in Cores 395C-U1554E-22X through 27X. Numerous clasts (n = 15) were identified; however, all but one were found at or near the top of Section 1 of the core in which they were recovered (Table T3) and are therefore most likely the result of fall-in from higher in the borehole. Unit boundaries were defined partly using physical properties measurements, including lower overall NGR values with low-amplitude, high-frequency cyclic variations and overall low L* reflectance. CaCO3 ranges ~0–36 wt%.
3.2.2. Lithostratigraphic Subunit IIB
- Interval: 395C-U1554E-34X-1, 0 cm, to 41X-1, 0 cm
- Depth: 373.5–441.4 m CSF-A
- Thickness: 67.9 m
- Age: early Pleistocene to late Pliocene
- Primary lithology: silty clay
Subunit IIB is dominated by dark olive gray silty clay (Figure F6B). Microfossils are generally rare, with sponge spicules being the most frequently observed microfossil in this subunit. Only one clast was identified on the split core surface, at the base of Section 395C-U1554E-40X-2 (Table T3). L* reflectance is low throughout Unit II; however, NGR variations in Subunit IIB have shorter wavelengths compared to Subunit IIA. CaCO3 values are lower than Subunit IIA, ranging ~0–4 wt%.
3.3. Lithostratigraphic Unit III
- Interval: 395C-U1554E-41X-1, 0 cm, to 51X-1, 0 cm
- Depth: 441.4–538.4 m CSF-A
- Thickness: 97 m
- Age: Pliocene
- Lithologies: silty clay, silty clay with carbonate
The sediments in Unit III are predominantly dark olive gray and olive gray silty clay and silty clay with carbonate. Between 455 and 461 m CSF-A, sand and foraminifers are present. Throughout this unit, NGR is dominated by low-amplitude, short-frequency cycles overprinted on a single longer wavelength cycle. L* reflectance and CaCO3 values are both generally low, with a narrow range for CaCO3 of 2–17 wt%. Despite the low carbonate values, nannofossils and foraminifers are commonly present in this unit.
Drilling disturbance is moderate to severe in Unit III, with cores in the upper part of the unit being biscuited and those in the lower part being fractured, with a few soupy intervals. Bioturbation is sparse to moderate.
Seven clasts were identified in this unit (Table T3); six are near the top of Section 1 in the core in which they were recovered, implying they may be fall-in. One in particular stands out: a 6 cm long dark gray basalt clast in interval 395C-U1554E-50X-2, 70–76 cm, that shows peculiar orientation (Figure F6C) where the long axis of the clast is parallel to the core liner. Although the sediment in this core is moderately fractured because of drilling, the disturbance directly around the clast itself indicates the clast has not been reoriented. The sediments surrounding the clast are also well enough preserved to support the inference that this clast was recovered in situ, implying the core depth from seafloor is accurate (~530.7 m CSF-A). Thin section observations of this clast reveal a groundmass texture that is unlike the recovered basement from any of the expedition sites (see Thin Section Report 395C-U1554E-50X-2-W 71/74-TSB-TS 59 in Core descriptions), implying transport from a distant source. Inductively coupled plasma–atomic emission spectroscopy (ICP-AES) analysis was performed on a subsample of this clast; Sr, Y, Zn, and Zr concentrations are markedly different from the basaltic basement of this site (data are available in the Laboratory Information Management System [LIMS] database).
3.4. Lithostratigraphic Unit IV
- Intervals: 395C-U1554E-51X-1, 0 cm, to 62X-CC, 0 cm; 395C-U1554F-3R-1, 0 cm, to 5R-2, 88 cm
- Depths: Hole U1554E = 538.4–645.23 m CSF-A; Hole U1554F = 620.0–641.6 m CSF-A
- Thickness: Hole U1554E = 106.83 m; Hole U1554F = 21.6 m
- Age: early Pliocene to middle Miocene
- Lithologies: mud with carbonate, silty clay with carbonate, carbonate silty clay, nannofossil chalk, and limestone
Unit IV is mostly olive gray and dark olive gray mud with carbonate, carbonate mud, silty clay with carbonate, and carbonate silty clay. The base of the sedimentary section is mostly pale brown nannofossil chalk. This unit contains the transition between mainly terrigenous sediments above to mainly authigenic, carbonate-rich sediments below. Green bands, green mottling, and bioturbation are observed in the chalk (Figure F9E). Clasts which are likely to be scoria are also observed in the interbedded chalk and the limestone close to the basement contact (Figure F9F). Cores throughout Unit IV in Hole U1554E are highly biscuited and fragmented. Cores 395C-U1554F-3R and 4R are well recovered and not fragmented. Bioturbation is sparse to abundant.
3.4.1. Lithostratigraphic Subunit IVA
- Intervals: 395C-U1554E-51X-1, 0 cm, to 61X-1, 0 cm; 395C-U1554F-3R-1, 0 cm, to 3R-5, 60 cm
- Depths: Hole U1554E = 538.4–635.4 m CSF-A; Hole U1554F= 620.0–626.6 m CSF-A
- Thickness: Hole U1554E = 97 m; Hole U1554F = 6.6 m
- Age: early Pliocene to late Miocene
- Lithologies: mud with carbonate, carbonate mud, silty clay with carbonate, and carbonate silty clay
Subunit IVA primarily consists of olive gray to dark olive gray mud with carbonate, carbonate mud, silty clay with carbonate, and carbonate silty clay. NGR in this subunit is characterized by low-amplitude, high-frequency cycles overprinted on longer wavelength, low-amplitude cycles. L* reflectance and CaCO3 values increase with depth throughout this subunit, with CaCO3 ranging 8–54 wt%. These values reflect a downhole shift from sediments dominated by terrigenous input to an authigenic, carbonate-rich composition. Sharp color contacts are also observed (Figure F6D). Four clasts were identified, two at the tops of Sections 395C-U1554E-51X-1 and 59X-1 and two others in Sections 54X-3 and 395C-U1554F-3R-5 (Table T3). They are dark gray and either identified as basalt or likely to be basalt. Several smaller scoria clasts are also present. Soft-sediment deformation features are observed throughout Cores 395C-U1554E-54X through 58X (567.5–616.0 m CSF-A).
3.4.2. Lithostratigraphic Subunit IVB
- Intervals: 395C-U1554E-61X-1, 0 cm, to 62X-CC, 0 cm; 395C-U1554F-3R-5, 60 cm, to 5R-2, 88 cm
- Depths: Hole U1554E = 635.4–645.23 m CSF-A; Hole U1554F = 626.6–641.6 m CSF-A
- Thickness: Hole U1554E = 9.83 m; Hole U1554F = 15.0 m
- Age: middle Miocene
- Lithology: nannofossil chalk, limestone
Subunit IVB consists of primarily light gray to pale brown nannofossil chalk and limestone. NGR values in Subunit IVB are the lowest of Site U1554, and L* reflectance is the highest. CaCO3 values are considerably higher than in the overlying units, ranging 66–85 wt%, consistent with the classification as nannofossil chalk (Figure F6E). Smear slide observations confirm the sediments are dominated by nannofossils with some foraminifers. The results of smear slide analysis and CaCO3 weight percent confirm that Subunit IVB represents a sedimentary system dominated by open ocean, biogenic input. Extensive bioturbation, likely over multiple generations of bioturbators, is also observed in the nannofossil ooze, with green mottling and color banding (Figure F9E).
Subunit IVB lies directly above the sediment/basement interface and is a short interval in both holes that recovered this part of the sequence. Two unique features are observed in this subunit: (1) interval 395C-U1554E-61X-1, 0–14 cm, contains several angular to subangular reddish scoria clasts (Figure F9F); and (2) a 65 cm thick dark colored layer with abundant bioturbation and bioturbated transitional contacts is observed in interval 395C-U1554F-3R-4, 60–125 cm. These two features likely represent volcanic activity, although they cannot be correlated between holes because of poor recovery over these intervals. Multiple small (<1 cm) black clasts are observed throughout Core 395C-U1554E-61X, and a 4 cm wide red, black, and green weathered scoria clast is observed in Section 395C-U1554F-4R-1.
3.5. XRD results
A subset (n = 29) of squeeze cake residues were analyzed using X-ray diffraction (XRD). Example spectra and general XRD results are shown in Figure F10 and Table T4. XRD spectra indicate variable calcite content consistent with other observations and carbonate content measurements. Additional minerals identified are consistent with the significant proportions of terrigenous and/or igneous source minerals observed in smear slides (e.g, quartz, feldspars, pyroxene, and mica group minerals). XRD samples were not specifically prepared for clay mineral analysis, and peaks with a 2θ of <15° should be treated with caution; however, most samples display peaks in this region, consistent with the presence of clay minerals. Future analysis of clay mineralogy in these samples could be useful for determining shifts in deposition processes and sediment sources.
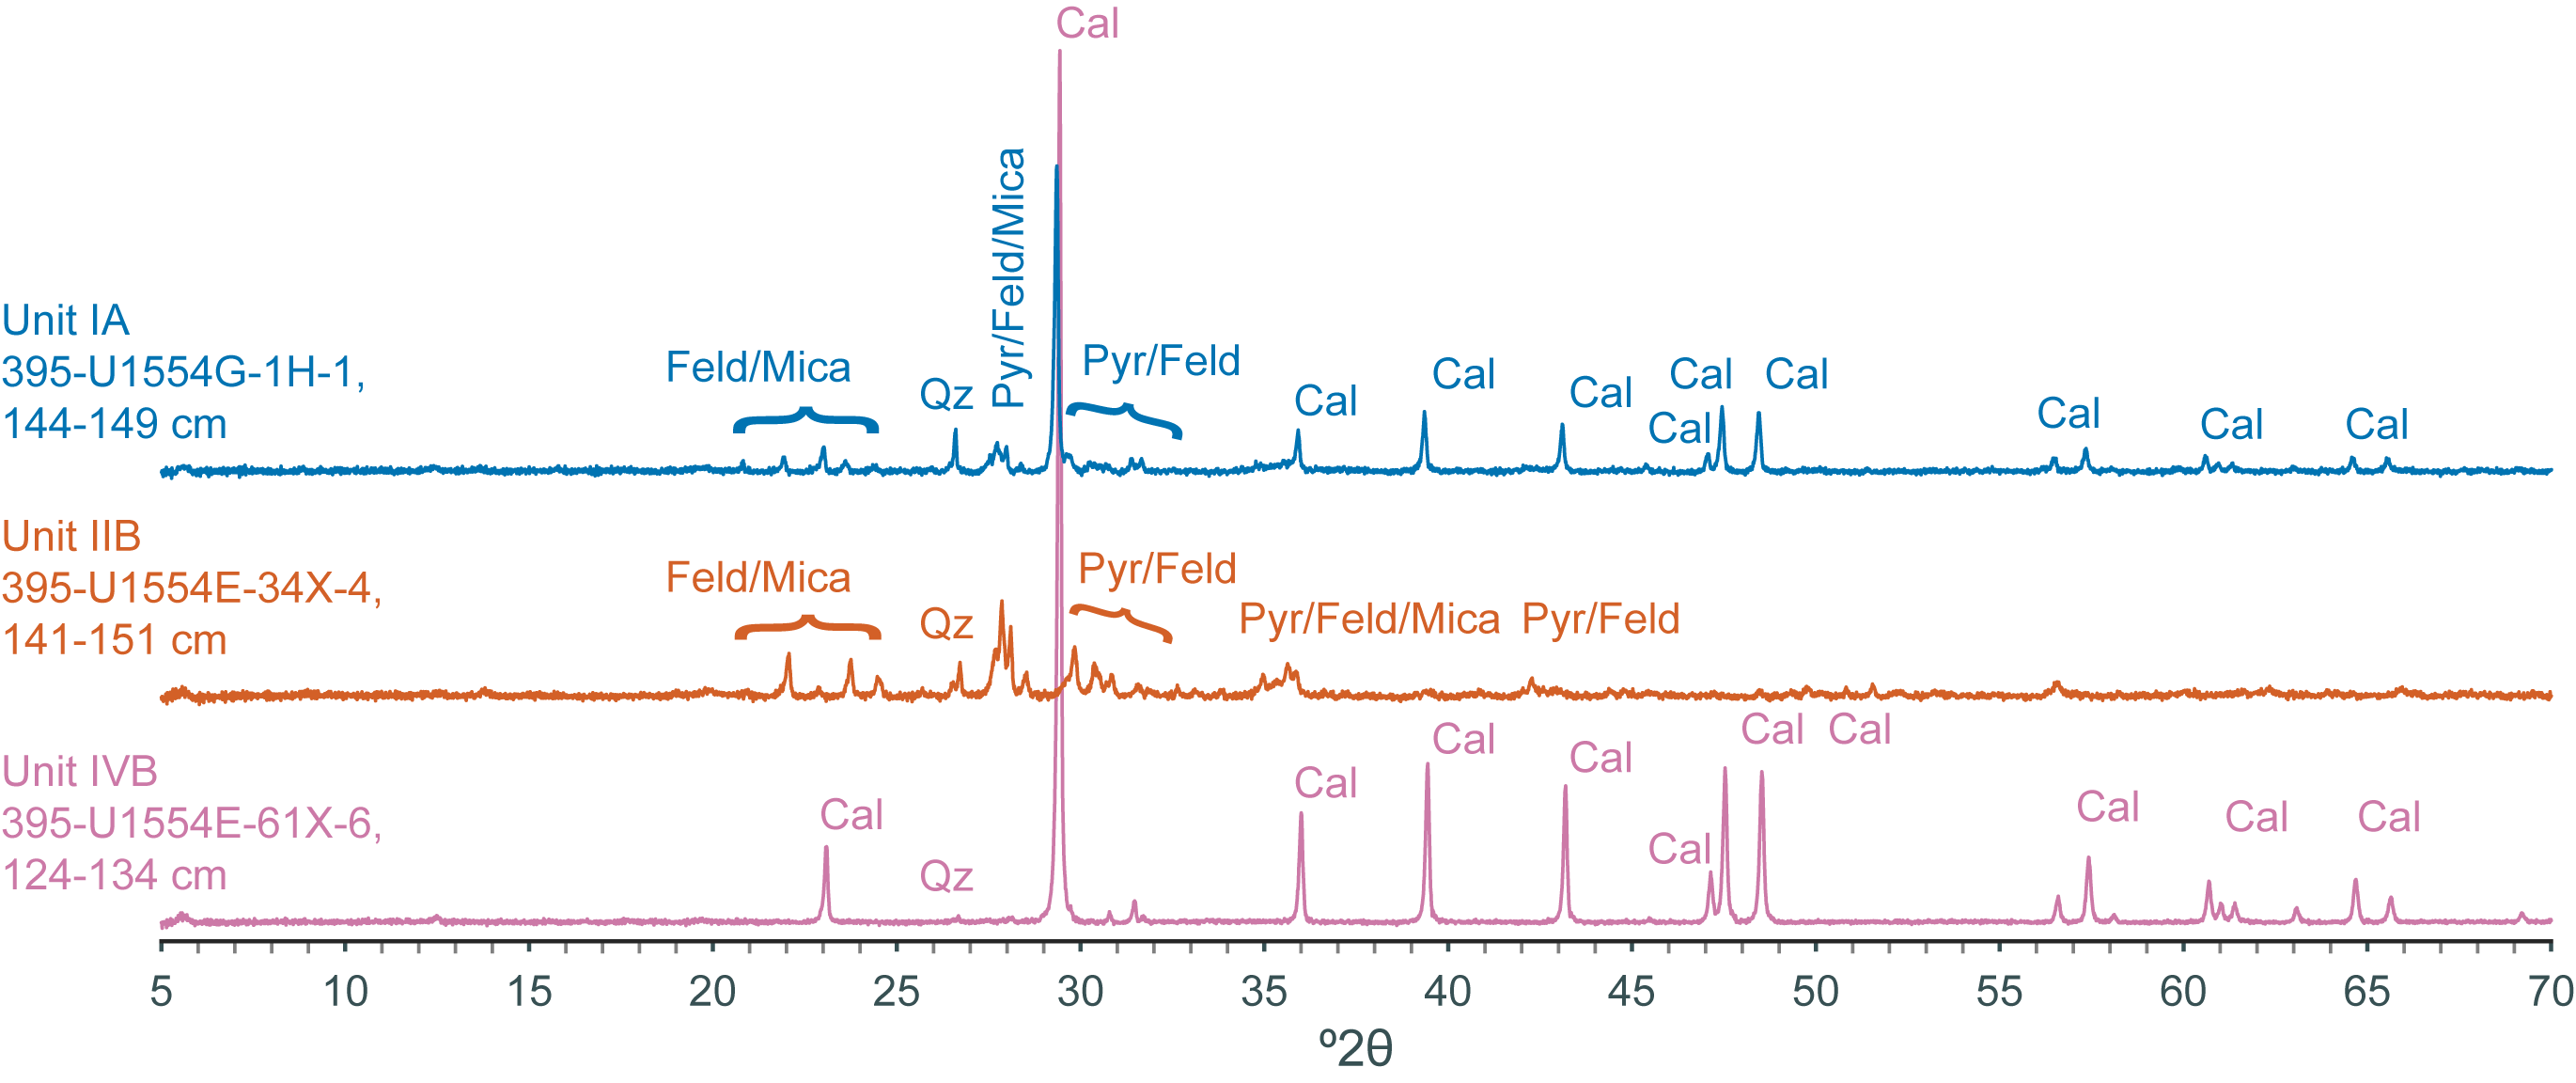
Figure F10. Powder XRD results.
4. Igneous petrology
Site U1554 is located in VST 2b, where the oceanic basement has an estimated age of 12.7 Ma. Based on seismic reflection data, the site is located on a basement high approximately ~1 km wide (Figure F11). Two boreholes recovered basalt: Holes 395C-U1554E (recovery = 1.3 m) and 395C-U1554F (recovery = 80 m) (Figure F12). The contact between basement basalt and the overlying sedimentary strata was not directly sampled in either hole.
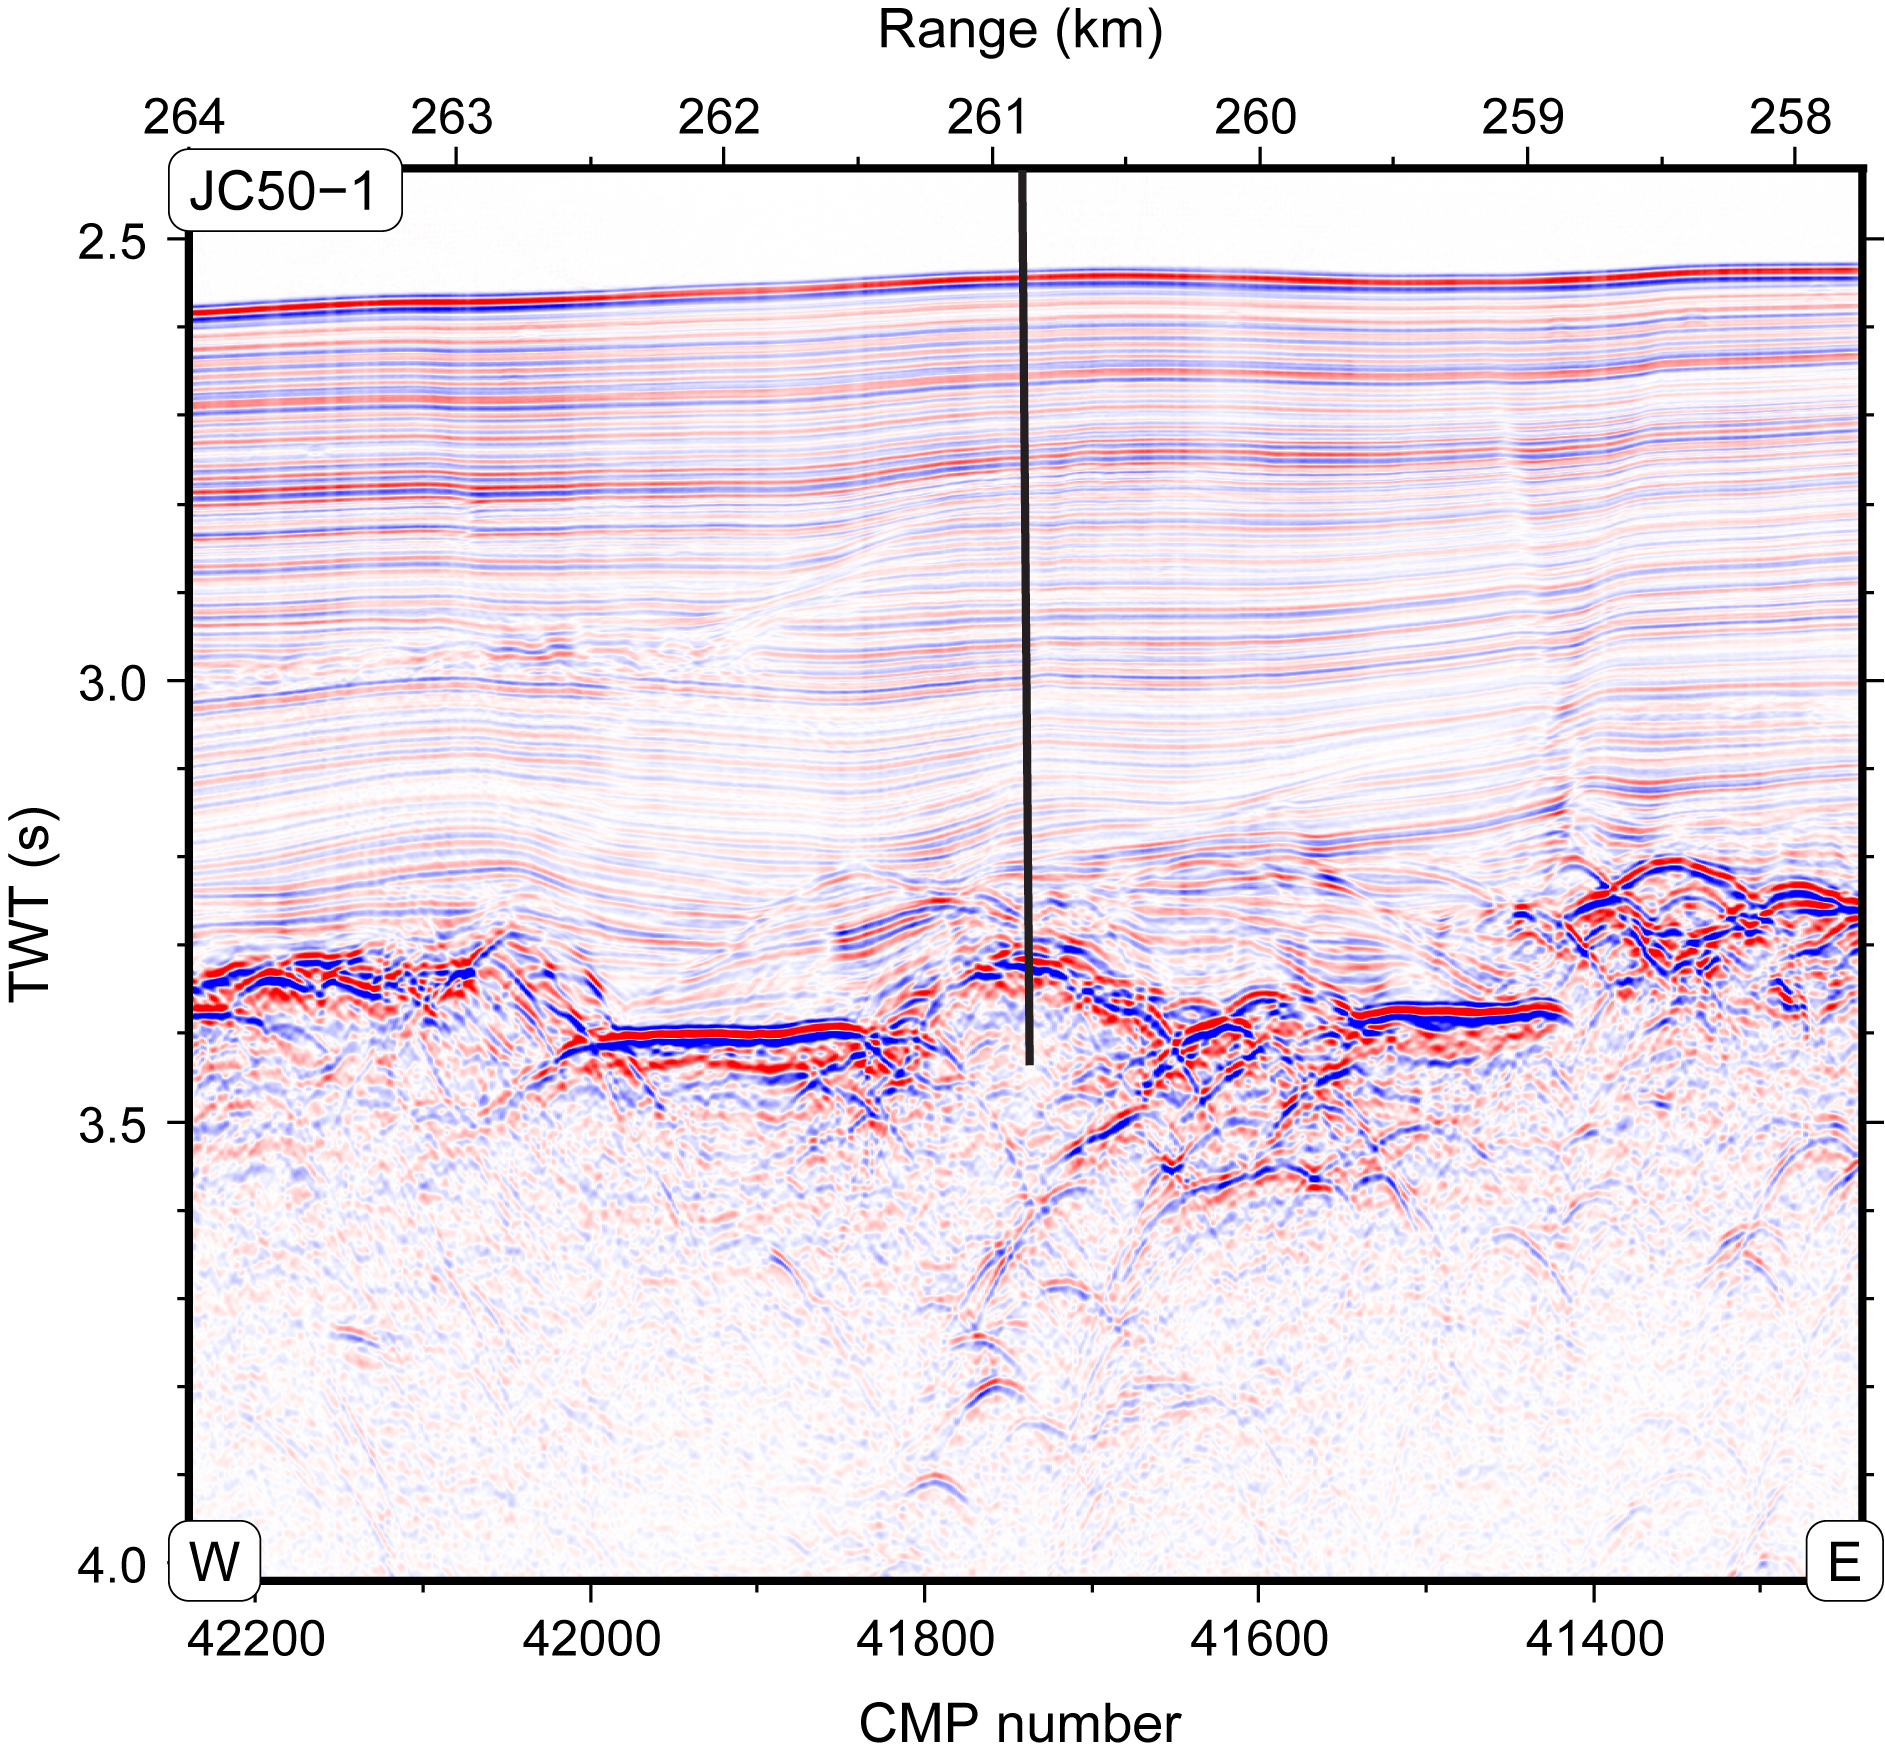
Figure F11. Location of Site U1554 on Seismic Line JC50-1.
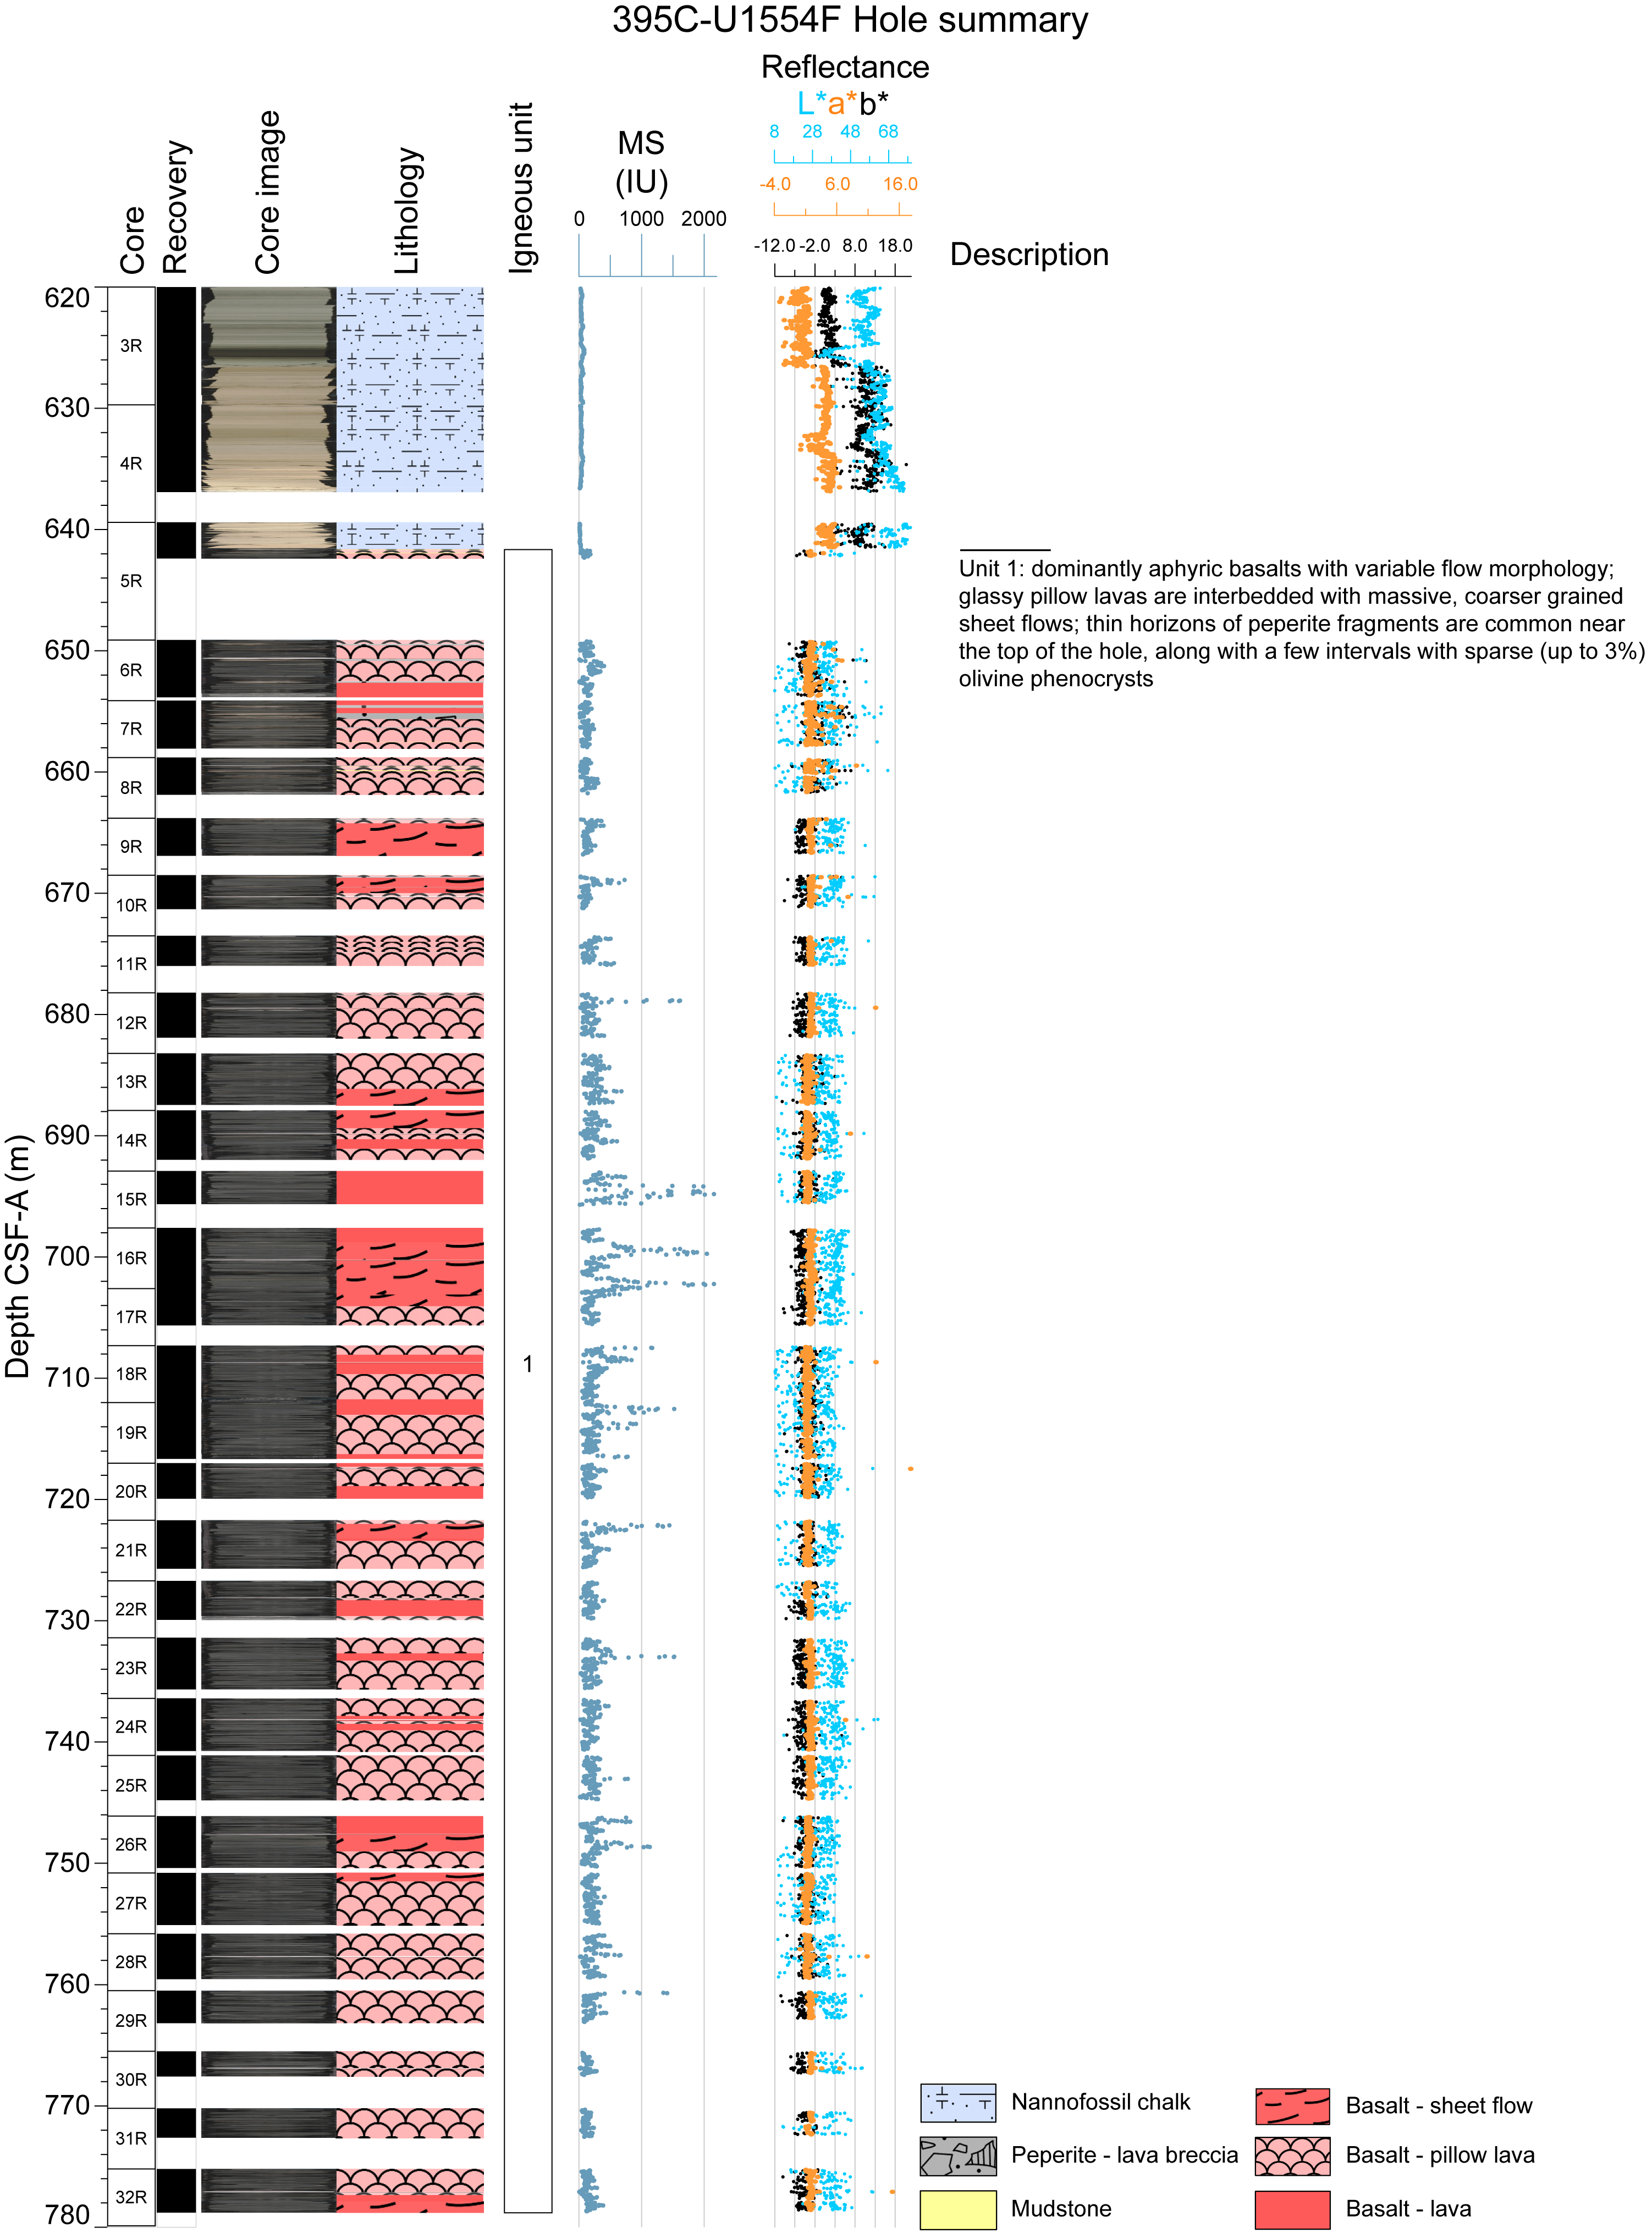
Figure F12. Lithostratigraphic summary.
4.1. Lithostratigraphy
Igneous rock cores from Site U1554 mainly consist of two clearly identifiable lava flow types, as outlined in Igneous petrology in the Expedition 395 methods chapter (Parnell-Turner et al., 2025a): pillow lavas, which are often fine grained and fragmented, and more coherent, massive sheet-like flows (Figure F13). Thin layers of intercalated baked calcareous mudstone and peperite occur in the upper third of the sequence. There is negligible peperite in the rest of the sequence.
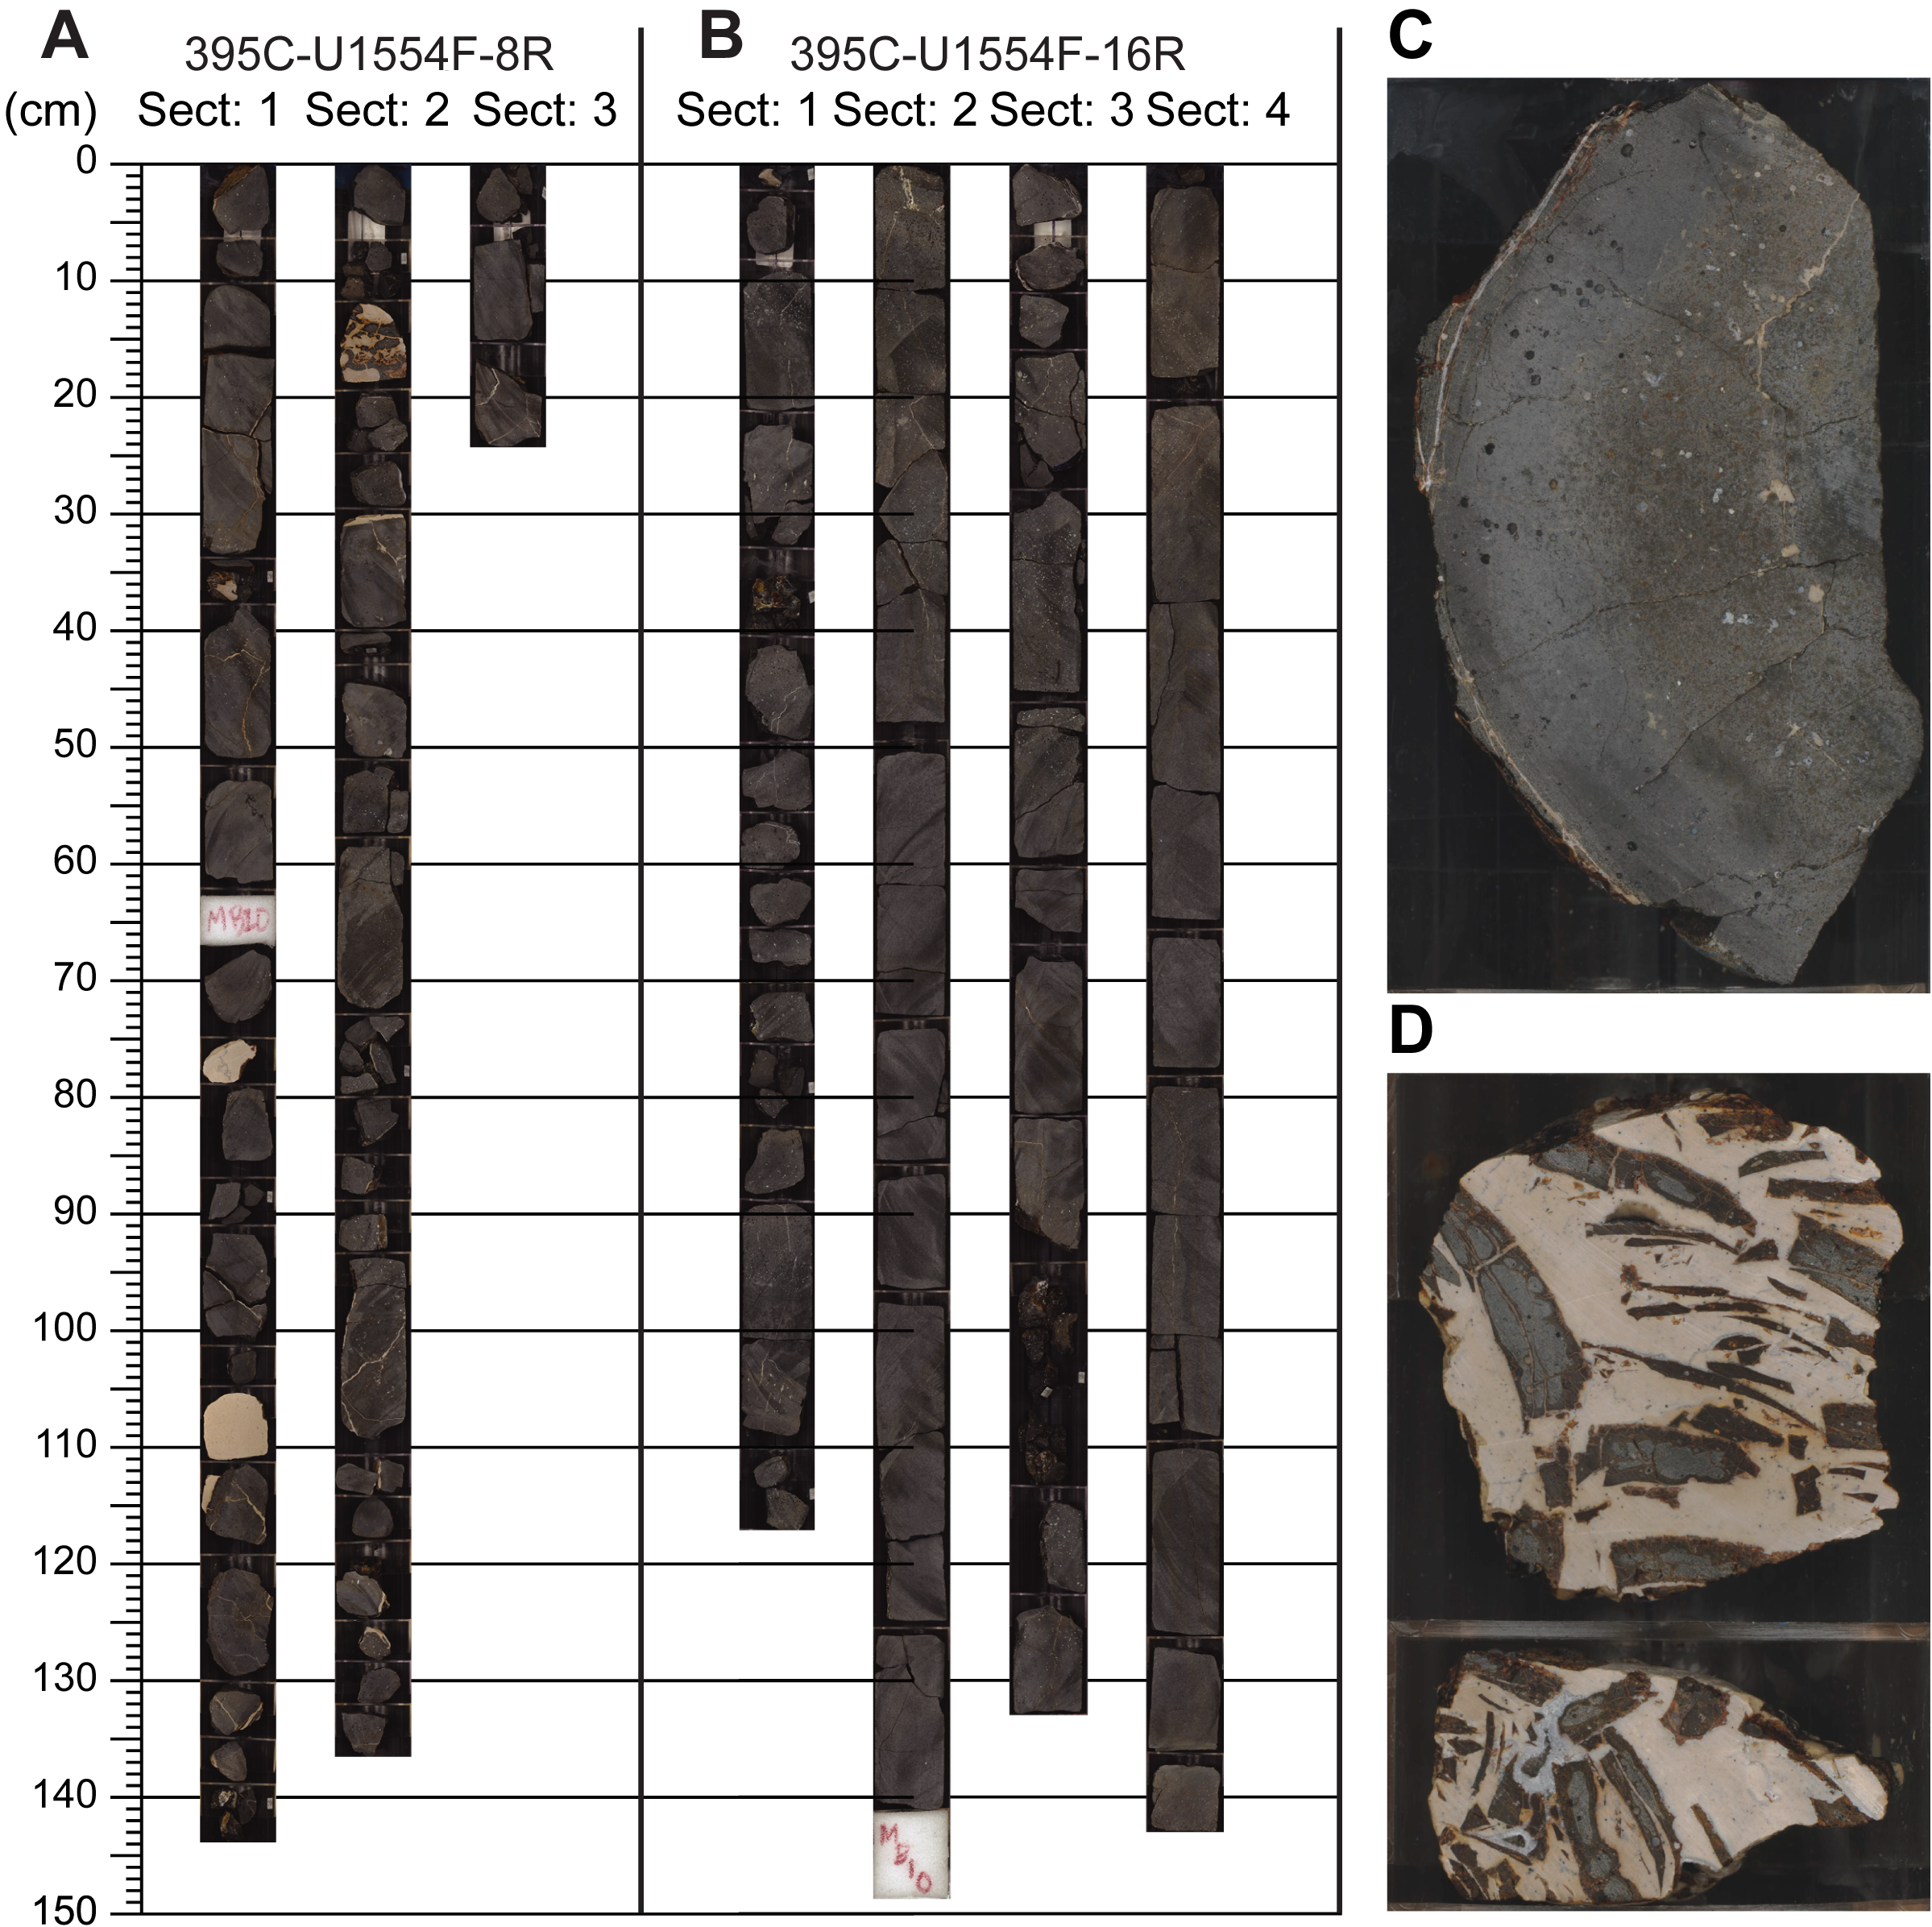
Figure F13. Common lithologies.
Hole U1554E recovered a 1.3 m thick basalt sequence consisting of two pillow lava intervals separated by a single sheet flow. These sparsely vesicular to nonvesicular rocks comprise mixed aphyric and sparsely olivine phyric basalts with a hypocrystalline fine-grained groundmass. The pillow lavas contain thin glass rinds and glass shards (up to 8 mm). Contacts with intercalated calcareous mudstones are often marked by glass layers. These basalts are moderately altered with evidence of palagonite. Intercalated mudstones are generally light yellow with veins of carbonate and iron oxide.
Hole U1554F recovered ~80 m of volcanic basement (63% recovery), which is mainly aphyric basalts with variable flow morphology. Glassy pillow lavas are common throughout the hole, with occasional horizons of coarser grained sheet flows (up to 10 m thick), particularly in the top half of the hole. These massive sheet flows are less abundant and thinner (1–2 m) below ~710 m CSF-A. Thin horizons and isolated fragments of peperite and baked calcareous mudstone are also common near the top of the hole but rare below 680 m CSF-A. Similar to other sites, lava flow morphology in Hole U1554F is weakly correlated with physical properties measurements (see Physical properties), with sheet-like flows exhibiting slightly higher magnetic susceptibility (MS) and L* reflectance values than pillow lavas.
4.2. Core descriptions
Lithologic descriptions are based on a combination of macroscopic core observations, microscopic thin section observations, and a variety of physical properties (e.g., MS, color reflectance, and wireline logs). Visual core descriptions (VCDs) provide a useful synthesis of key descriptive elements summarized here (Figure F12).
The basement section of Hole U1554F contains both igneous and sedimentary rocks. The principal lava morphologies are sheet flows and pillow lavas (Figure F13). The less abundant sheet flows are characterized by coherent and relatively homogeneous layers of fine- to medium-grained aphyric or sparsely olivine phyric basalts. In the middle of this hole, sheet flows are several meters thick and often coarser grained toward their centers. Upper and lower contacts are generally sharp and have thin (millimeter-scale) glassy rinds. In contrast to the slightly altered basalts observed at the younger VST locality (Site U1555), these sheet flows are moderately altered and often have brown altered flow margins and carbonate-filled fractures and vesicles. Many of the fractures have alteration halos that can be several centimeters wide. Alteration is more prevalent in the upper two thirds of the hole, with slightly lower extents in the bottom third (see Alteration petrology and structural geology).
Pillow lava units consist of fine-grained aphyric basalt fragments with numerous curved contacts, chilled margins, concentric bands of mostly filled vesicles, and glassy rinds (e.g., interval 395C-U1554F-31R-1, 100–115 cm). These moderately altered fragments are hypocrystalline with mottled devitrification. In addition to thin (<5 mm) glass rinds, Hole U1554F contains occasional thick glass layers (e.g., interval 6R-1, 80–90 cm), and rinds or shards as thick as ~1–2 cm. As discussed previously, it can be difficult to discriminate between thin sheet flows and thick pillow lavas or lobate flows, especially because recovery is incomplete. Thin sheet flows and pillow lavas are sometimes finely interbedded.
There are numerous thin sedimentary layers in the uppermost 37 m of the cored interval of Hole U1554F. At the top of the sequence, nannofossil chalk contains rounded basalt fragments, although a clear sediment/basement contact is not exposed. Thin (5–10 cm) sedimentary and volcaniclastic horizons occur near the top of the cored interval. These horizons usually contain peperite, indicating the molten lava interacted with cold, wet carbonate sediment (e.g., Skilling et al., 2002) (e.g., interval 395C-U1554F-7R-1, 104–150 cm). The peperite typically has a baked mudstone matrix (which has sometimes been recrystallized) and hosts glass shards up to 11 mm thick (e.g., interval 23R-3, 15–20 cm). Sheet flow units occasionally contain mudstone-filled fractures.
Igneous core material is mostly basalts that are largely aphyric, with some sparse olivine phenocrysts present near the top of the cored interval and sparse olivine microphenocrysts visible in thin sections. The interiors of sheet flows are coarser grained with holocrystalline textures. A range of secondary alteration minerals and crystals are encountered, including celadonite, iron oxyhydroxides, and clays together with minor zeolite and chlorite (see Alteration petrology and structural geology).
Vesicles are generally filled, usually with calcite, celadonite, or zeolite, and often occur either at the tops of flows or as discrete bands within flows, sometimes forming large vugs (~3 mm) in sheet flows. In pillow lava fragments, vesicles tend to be smaller (<0.5 mm) and form quasiconcentric bands immediately beneath chilled margins.
Basalts from Site U1554 are relatively homogeneous in terms of their mineralogical and geochemical compositions. Given the lack of clear petrologic transitions indicative of changes in magmatic composition, as well as the relative dearth of sedimentary horizons beneath the uppermost parts of the hole, we consider the cored section to be a single lithologic unit. Because recovery is incomplete, it is possible that some sediment horizons were not sampled because they are more likely to be washed out during RCB operations. However, we note that the downhole logging data for this hole also lacks clear evidence for thick (meter-scale) sediment packages (see Downhole measurements).
4.3. Thin sections
Thin sections were sampled throughout Hole U1554F with an average spacing of ~5 m (see Core descriptions). Six thin sections are from sheet flows, and nine are from pillow lavas. Based on thin section observations, these rocks can be generally described as sparsely to moderately (i.e., 1%–7%) olivine phyric basalt with slight to moderate alteration (Figure F14). Most olivine phenocrysts are small (<0.5 mm) and often occur as aggregates, but large (~2 mm) olivine crystals with spinel inclusions are occasionally present. Large olivines are sometimes almost completely altered. Within pillow lava units, groundmass olivines often exhibit hopper morphologies that indicate rapid cooling. Plagioclase is the most abundant groundmass crystal, often acicular or tabular in shape. Zone textures are not observed. The groundmass is generally intersertal, with altered clinopyroxene mesostasis, opaque oxides, and altered glass occupying the space between plagioclase grains. The sheet flows are usually holocrystalline with an intergranular texture that suggests slow cooling, and some contain large plagioclase crystals aligned in the direction of flow. Several sections are exceptionally vesicular (up to 15%). Vesicles are sometimes infilled with zeolite or calcite.
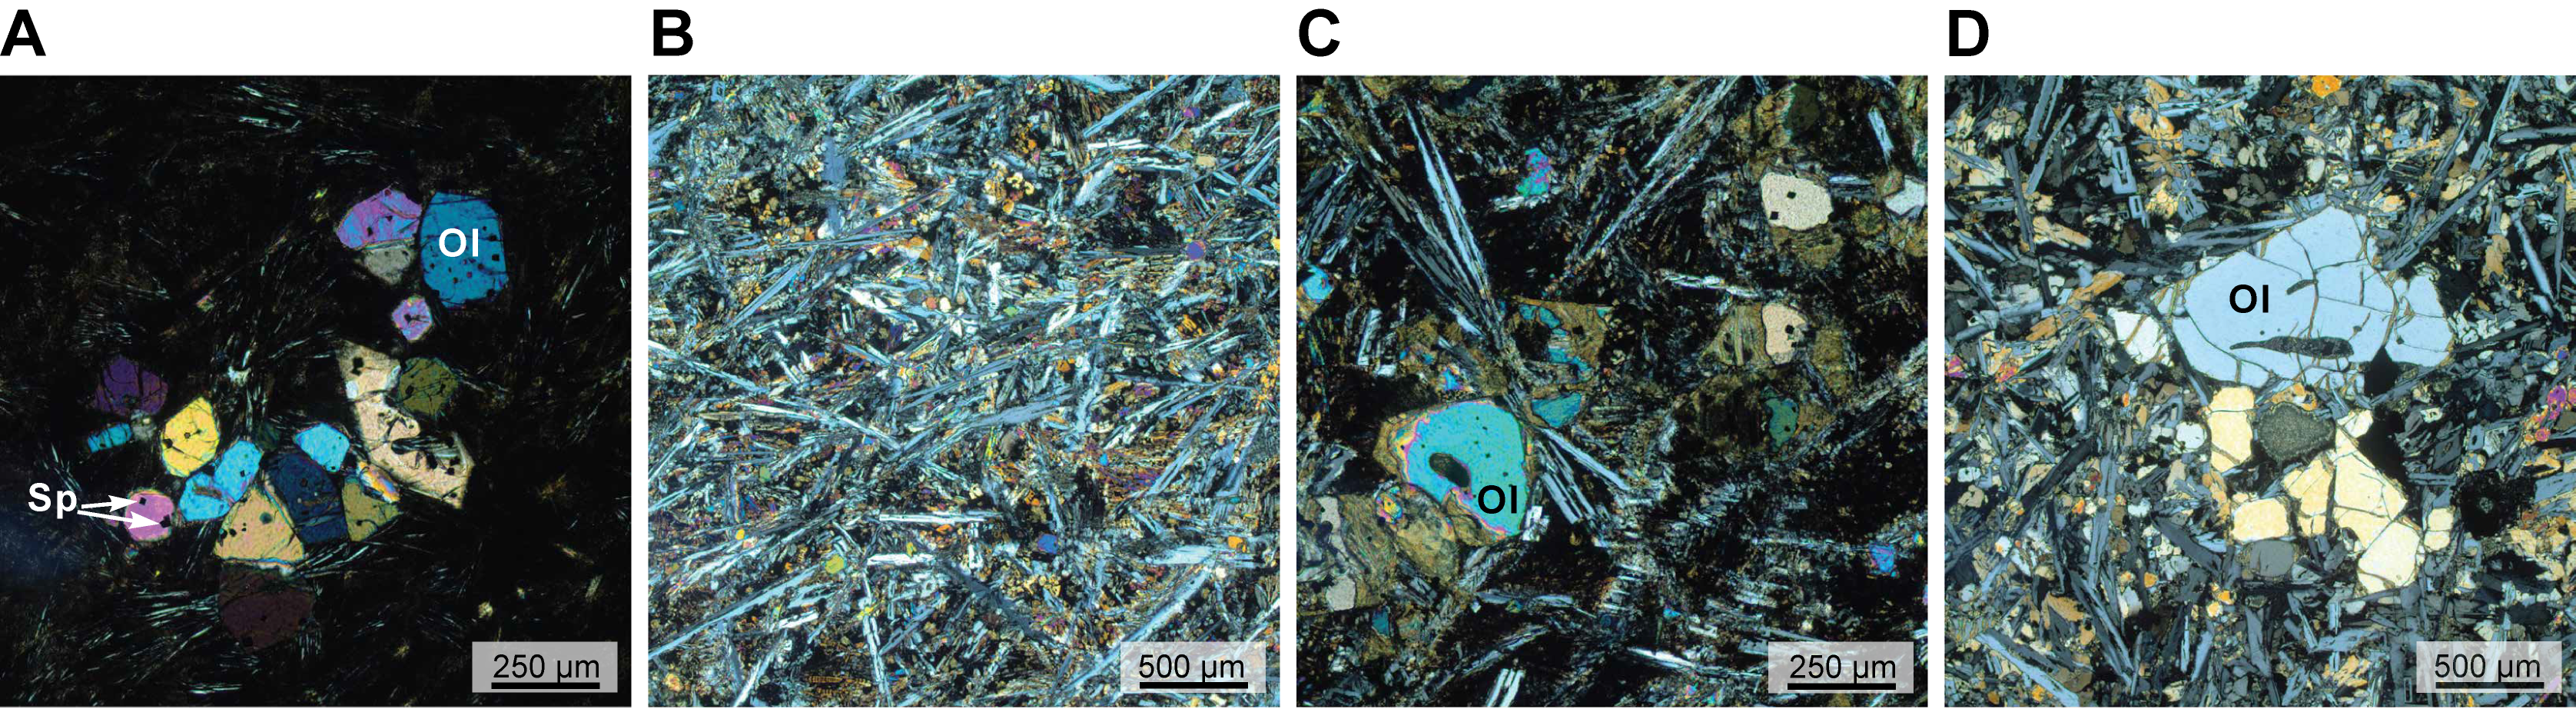
Figure F14. Basalt thin sections.
4.4. Igneous geochemistry
Two shipboard geochemical data sets exist for Hole U1554F (see Geochemistry and microbiology in the Expedition 395 methods chapter [Parnell-Turner et al., 2025a]). Raw counts from portable X-ray fluorescence (pXRF) analyses are shown in Figure F15. Major element concentrations (e.g., Mg, Al, and Si) are noisy, with significant scatter throughout the hole. However, certain incompatible trace elements (e.g., Zr and Y) have more coherent trends and provided a helpful preliminary characterization of the hole during shipboard operations. Incompatible elements such as Ti, Y, Zr, and the Zr/Y ratio are remarkably constant with depth through the hole. A handful of measurements at the base of the hole with anomalously low abundances for many elements have been determined to be artifacts and have been excluded here.
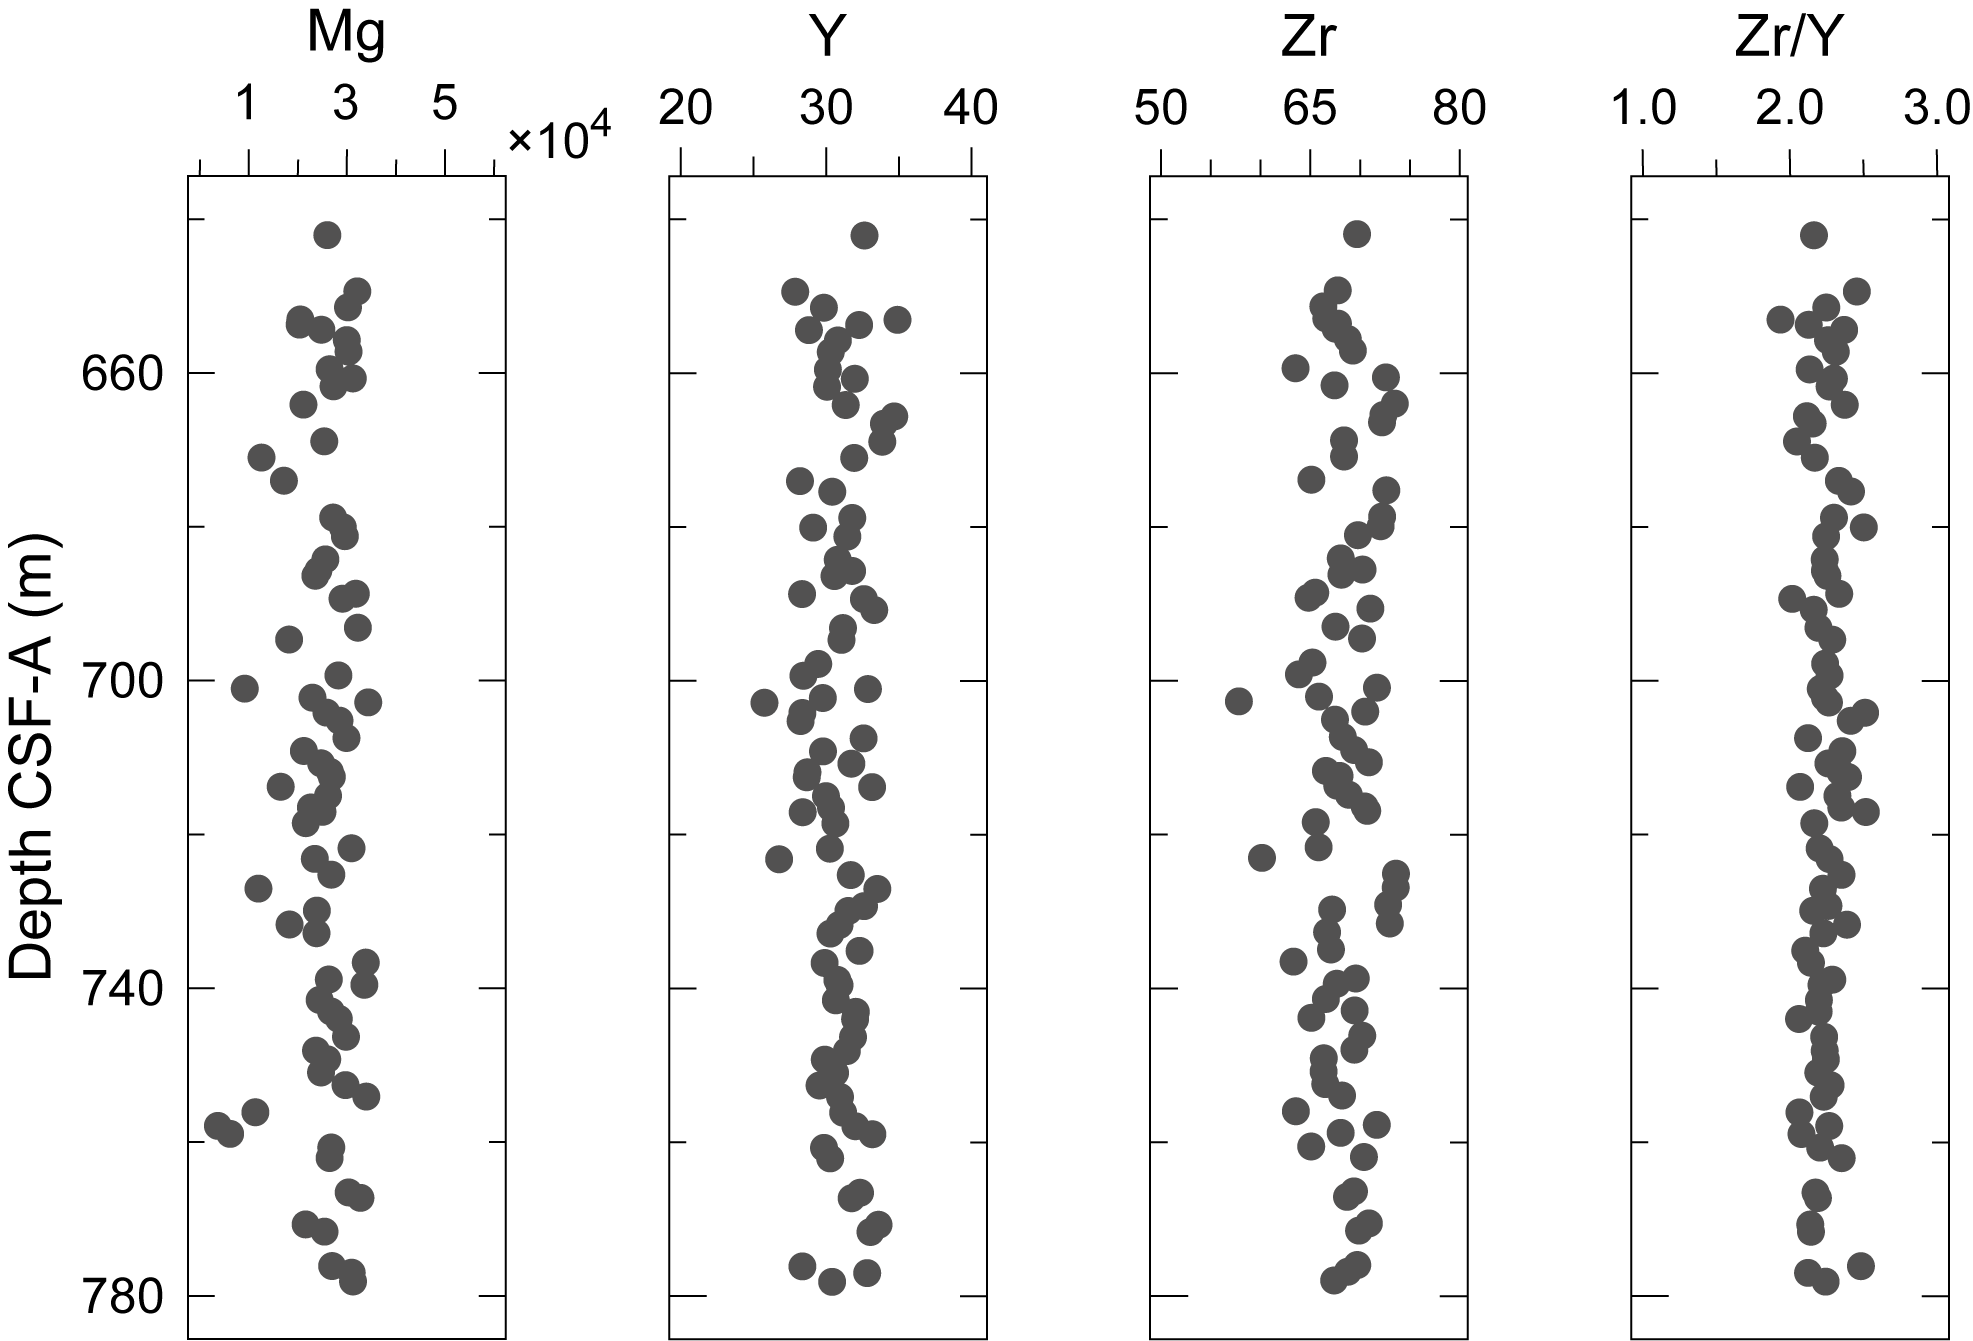
Figure F15. Major and trace element pXRF compositional data.
ICP-AES analyses were conducted on 15 samples that are co-located with thin section billets. These analyses are evenly distributed throughout Hole U1554F. Measurements of MgO, Al2O3, CaO, Y, and Zr are presented in Figure F16. MgO decreases slightly downhole, with an average value of 7.99 wt% and a minimum value of 7.36 wt%. This site has the highest average Zr/Y of all the expedition sites, with an average value of 3.0 ± 0.2. The high Zr/Y ratio at Site U1554 is broadly similar to dredge samples from an anomalously enriched seamount on the Reykjanes Ridge (Murton et al., 2002). Based on additional trace element concentrations from postcruise analyses, the high Zr content at this site likely reflects mantle source enrichment in addition to the reduced melt fraction expected for VSTs.
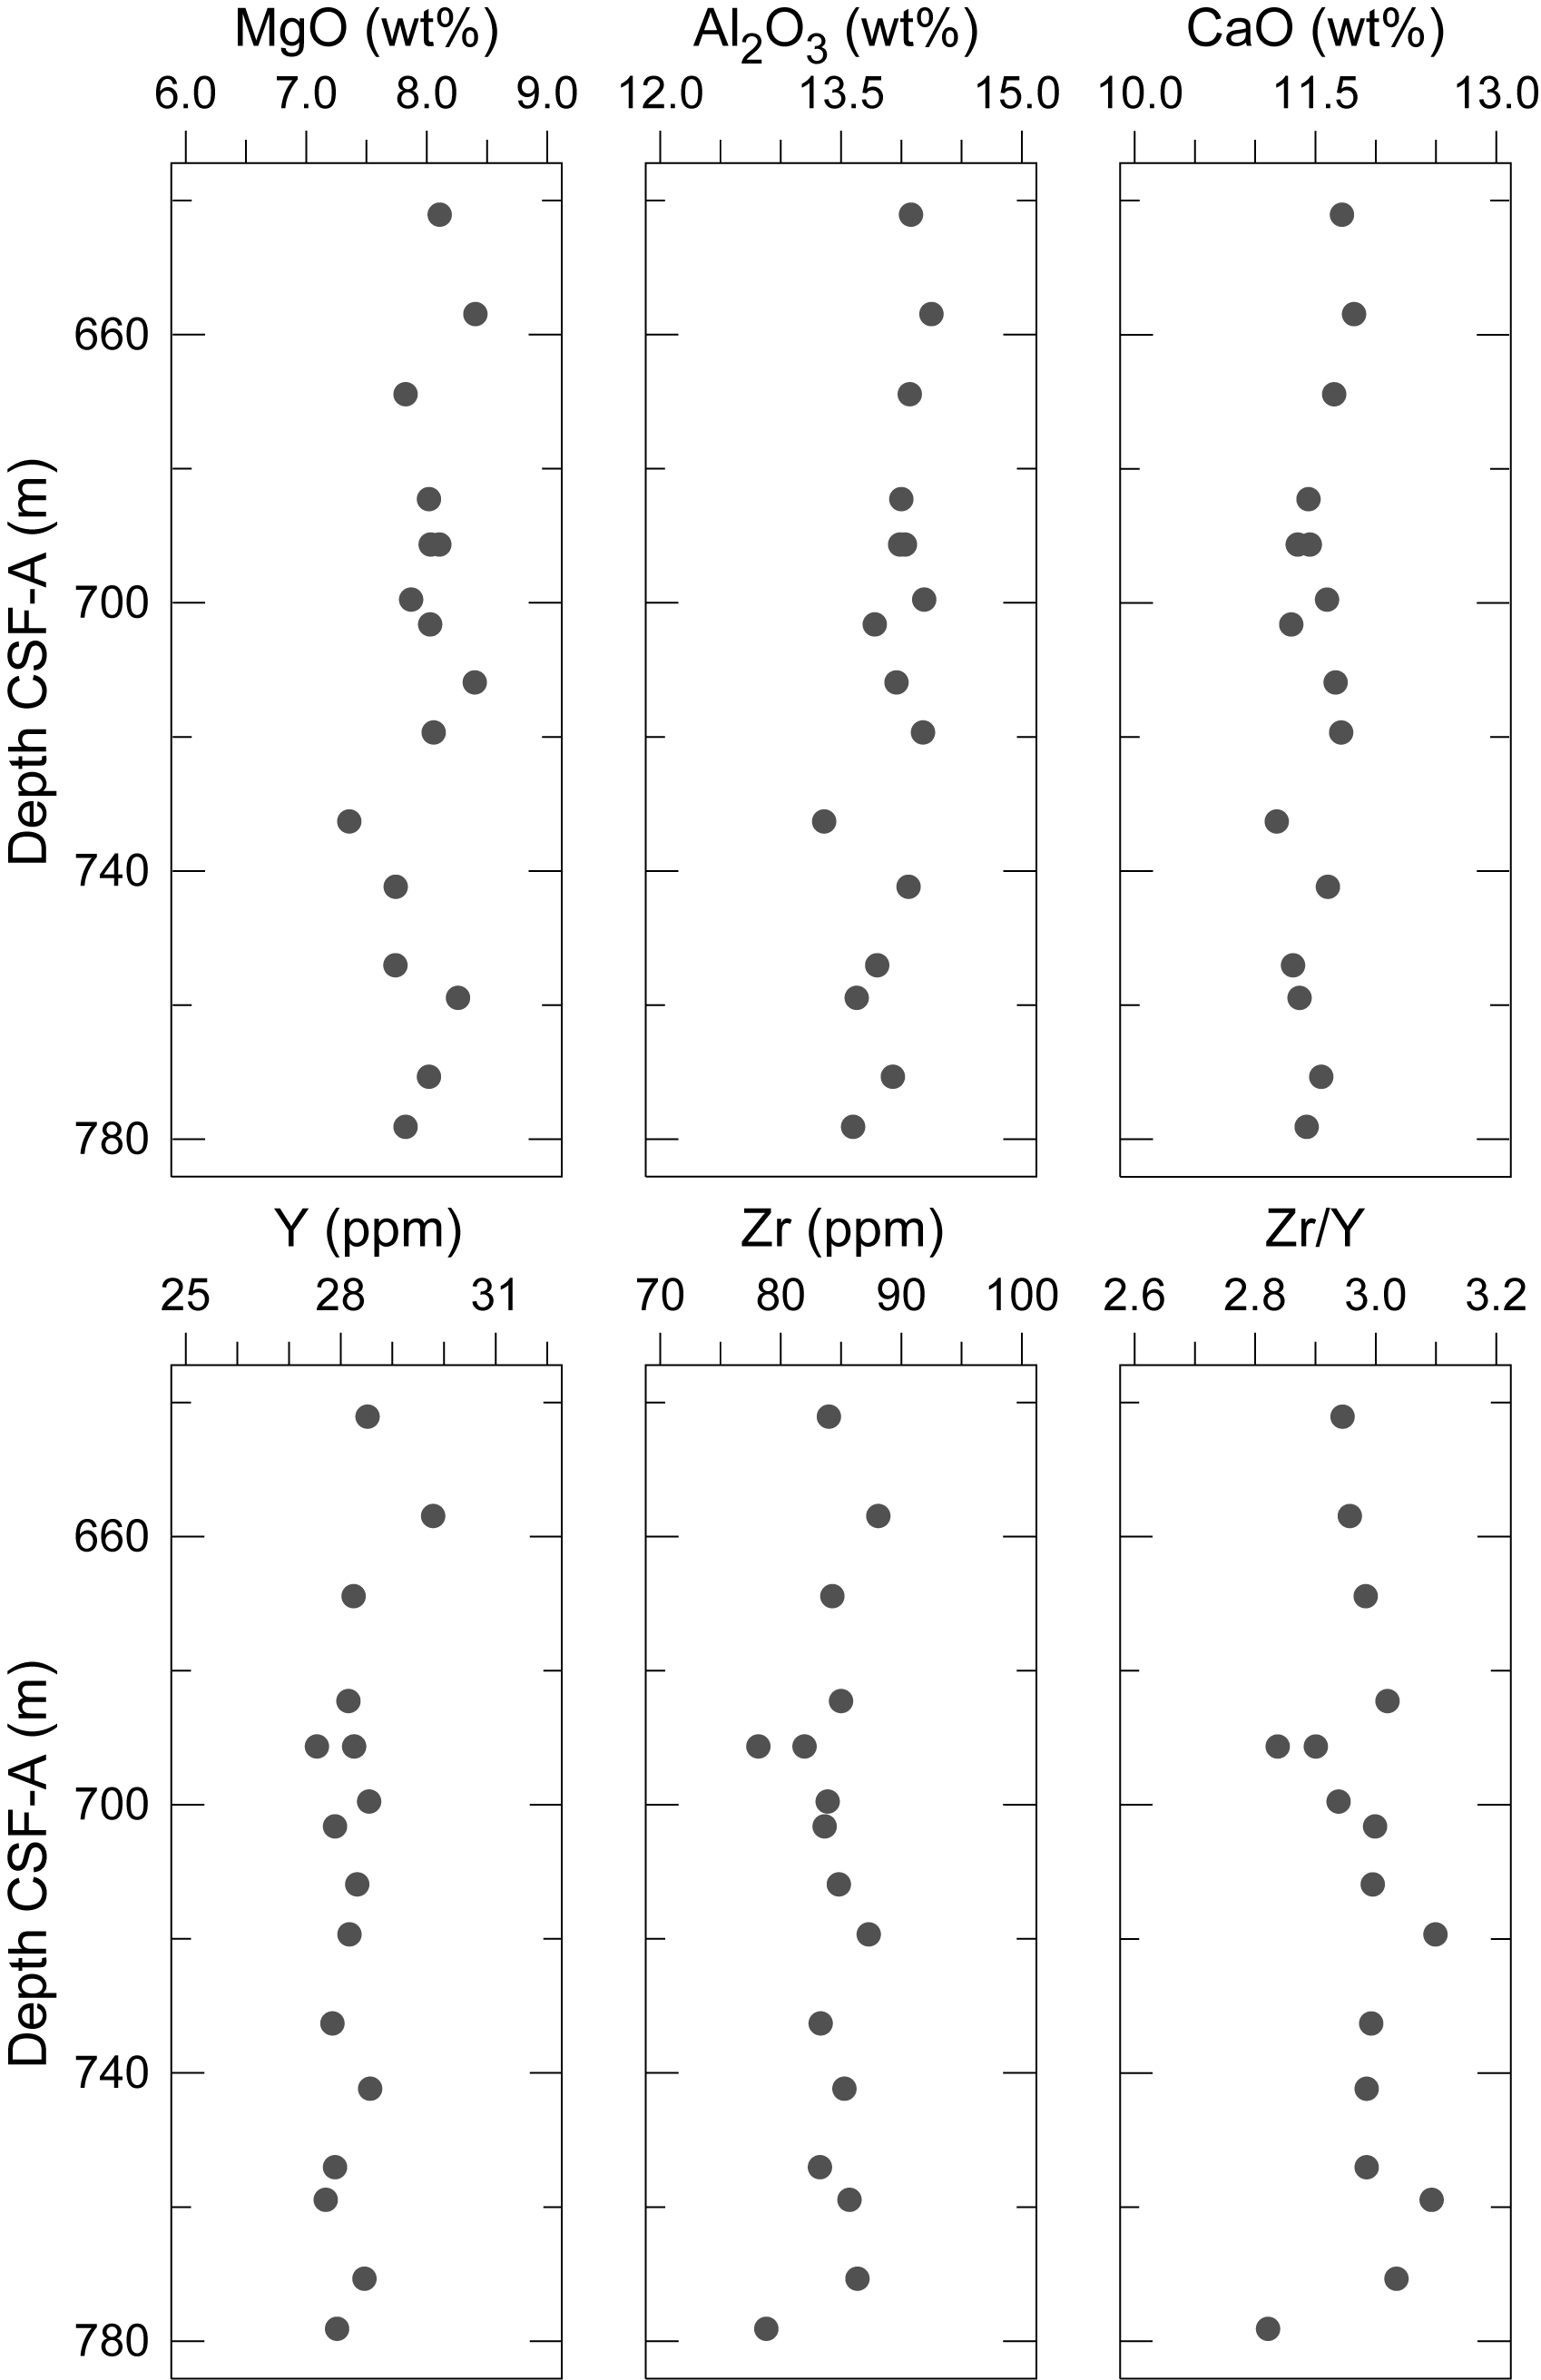
Figure F16. Major and trace element bulk rock ICP-AES.
4.5. Correlations and interpretation
Core description results are combined with thin section interpretations, shipboard geochemical analyses, physical properties, and downhole logging results to develop a preliminary interpretation of Site U1554. There is a weak correlation between MS and flow morphology in Hole U1554F, with excursions to higher MS in the thicker sheet flow units (see Physical properties). In basalts, MS is dominated by the presence of magnetite and/or titanomagnetite. We suggest that these accessory minerals might occur in greater amounts in sheet flows compared with pillow lavas due to slower cooling and more extensive oxide fractionation. There is also a weak correlation between L* color reflectance and sheet flow distribution. As at Site U1555, correlations between lithologic units and rock alteration suggest that peperites, and to a lesser degree sheet flows, are associated with higher degrees of alteration (see Alteration petrology and structural geology).
Despite having a high basement recovery rate compared to the other sites, incomplete recovery of a narrow diameter core still presents challenges for interpreting the eruptive history at this site. One key observation is that a repeated series of pillows and more massive lavas were emplaced with only minor evidence for intercalated sediment layers in the recovered core material, which are concentrated in the uppermost 40 m of the basalt section. This pattern could be due to carbonate layers being preferentially washed out during RCB operations. Downhole logging at this site shows low-density, low-resistivity layers near depths with particularly low recovery that could be very thin (<1 m) layers of sediment; however, the recovered material from these cores is dominated by small and relatively fresh pillow fragments, and borehole images are consistent with fractured lava or flow boundaries (see Downhole measurements). The relative lack of carbonate horizons suggests the time between eruptive episodes is sufficiently short to prevent any significant sediment accumulation.
Given the geochemical and mineralogical uniformity, lack of evidence for long eruptive hiatuses, and mound-like basement high in the seismic reflection images, our preliminary interpretation is that this hole is situated on a small seamount or volcanic ridge approximately ~1 km wide at the base, which was fed by a batch of magma with relatively homogeneous composition. This interpretation is also consistent with preliminary geochemical results, which indicate that its composition is anomalously enriched, similar to compositions sampled from large enriched seamounts near the ridge axis (Murton et al., 2002).
Unlike VST Site U1555, Site U1554 is mostly pillow basalts, which make up ~65% of the recovered lavas. Massive, sheet-like flows are less abundant at Site U1554, representing ~16% of the basalt units compared to >40% at Site U1555. The abundance of pillow lavas with little compositional or mineralogical variation suggests formation by sustained eruption at relatively low effusion rates. This finding is consistent with correlations between magma supply and lava morphology observed at other mid-ocean ridges (e.g., Colman et al., 2012), wherein low magma supply tends to favor long-lived, low-effusion eruptions dominated by pillow basalts.
5. Alteration petrology and structural geology
At Site U1554, ~1.06 and ~80.84 m of basalt core was recovered from Holes 395C-U1554E and 395C-U1554F, respectively. Here, we visually describe the alteration style and composition of these basalts and the alteration mineral fill of their vesicles and document the occurrence and mineral fill of fractures.
5.1. Basalt alteration
Basalt from Site U1554 contains intervals of peperite and completely altered carbonate sediments, the latter comprising ~0.25% of the recovered basement core at this site. Peperites at Site U1554 consist of altered carbonate sediments containing fragments of basalt and basaltic glass (see Igneous petrology). Alteration is reported for basalt core and basalt fragments in peperite intervals.
We consider ~85% of the basalt core obtained from Holes U1554E and U1554F to be slightly altered, with 12% moderately altered, 2% highly altered, ~0.2% considered completely altered, and <0.1% considered fresh basalt (Figure F17). The alteration style of the basalt at Site U1554 is mostly pervasive (background), although halo alteration is also present in lower abundances in Holes U1554E and U1554F. In Hole U1554F, two depth intervals display higher degrees of alteration intensity: ~649–661 m CSF-A, where alteration intensity is as high as 100%, and 683–719 m CSF-A, where alteration is as high as 80% (Figure F18). The more intensely altered interval, ~649–661 m CSF-A, coincides with core sections that contain numerous peperite and altered carbonate sediment intervals within a package of pillow lavas. The second interval, 683–719 m CSF-A, coincides with a basalt sheet flow on top of a sequence of thinner pillow and sheet basalt lavas (See Igneous petrology).
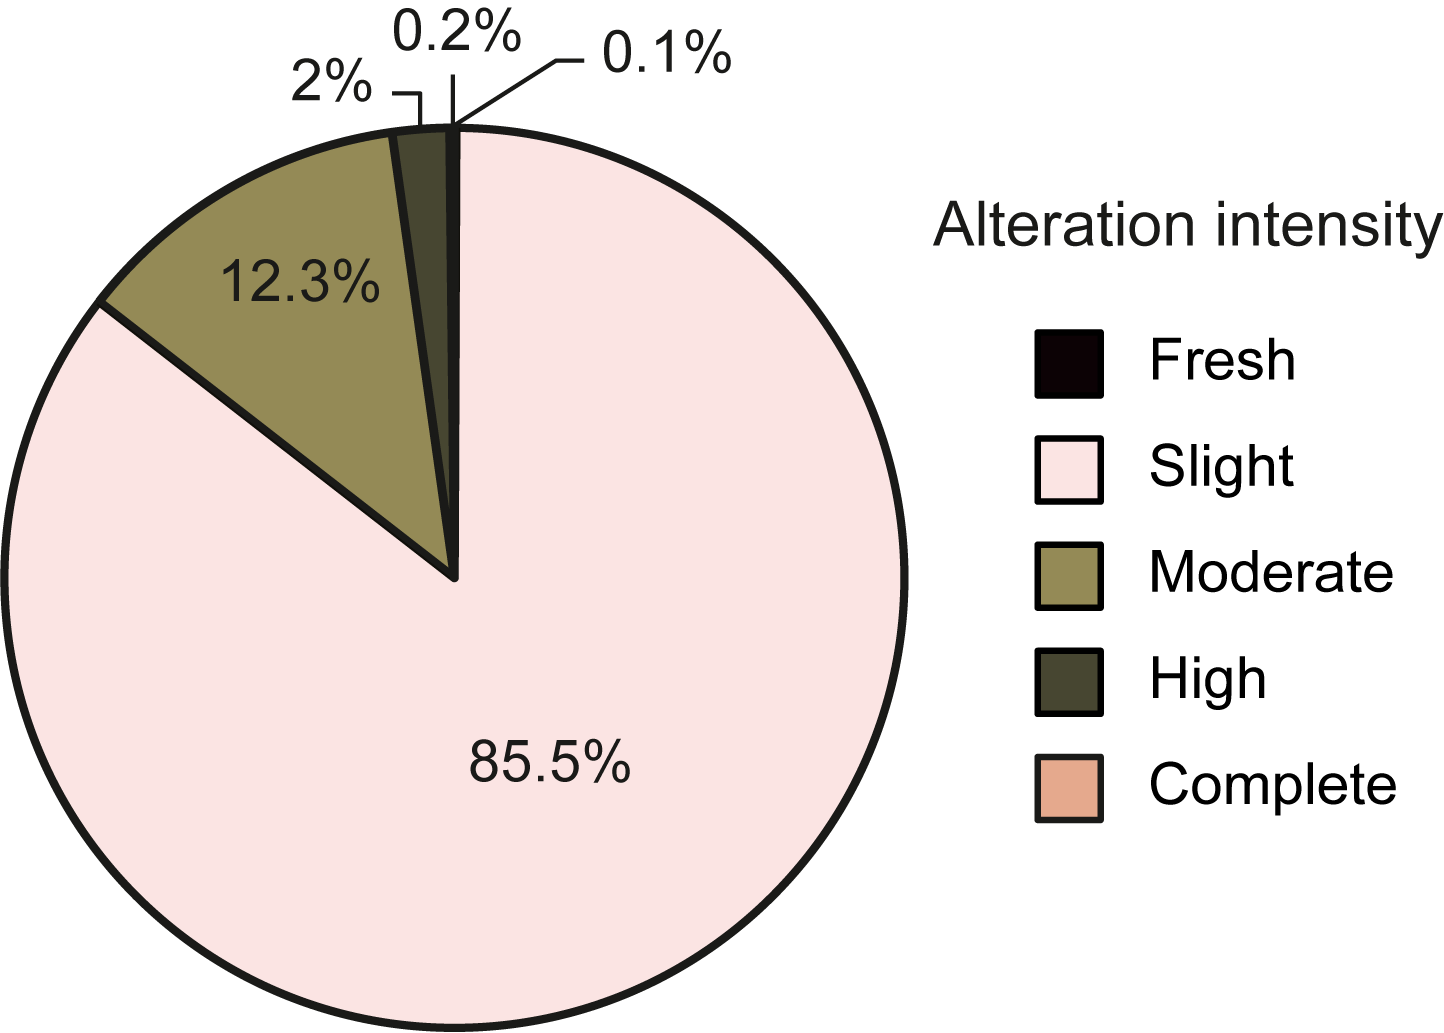
Figure F17. Proportional degree of basalt alteration.
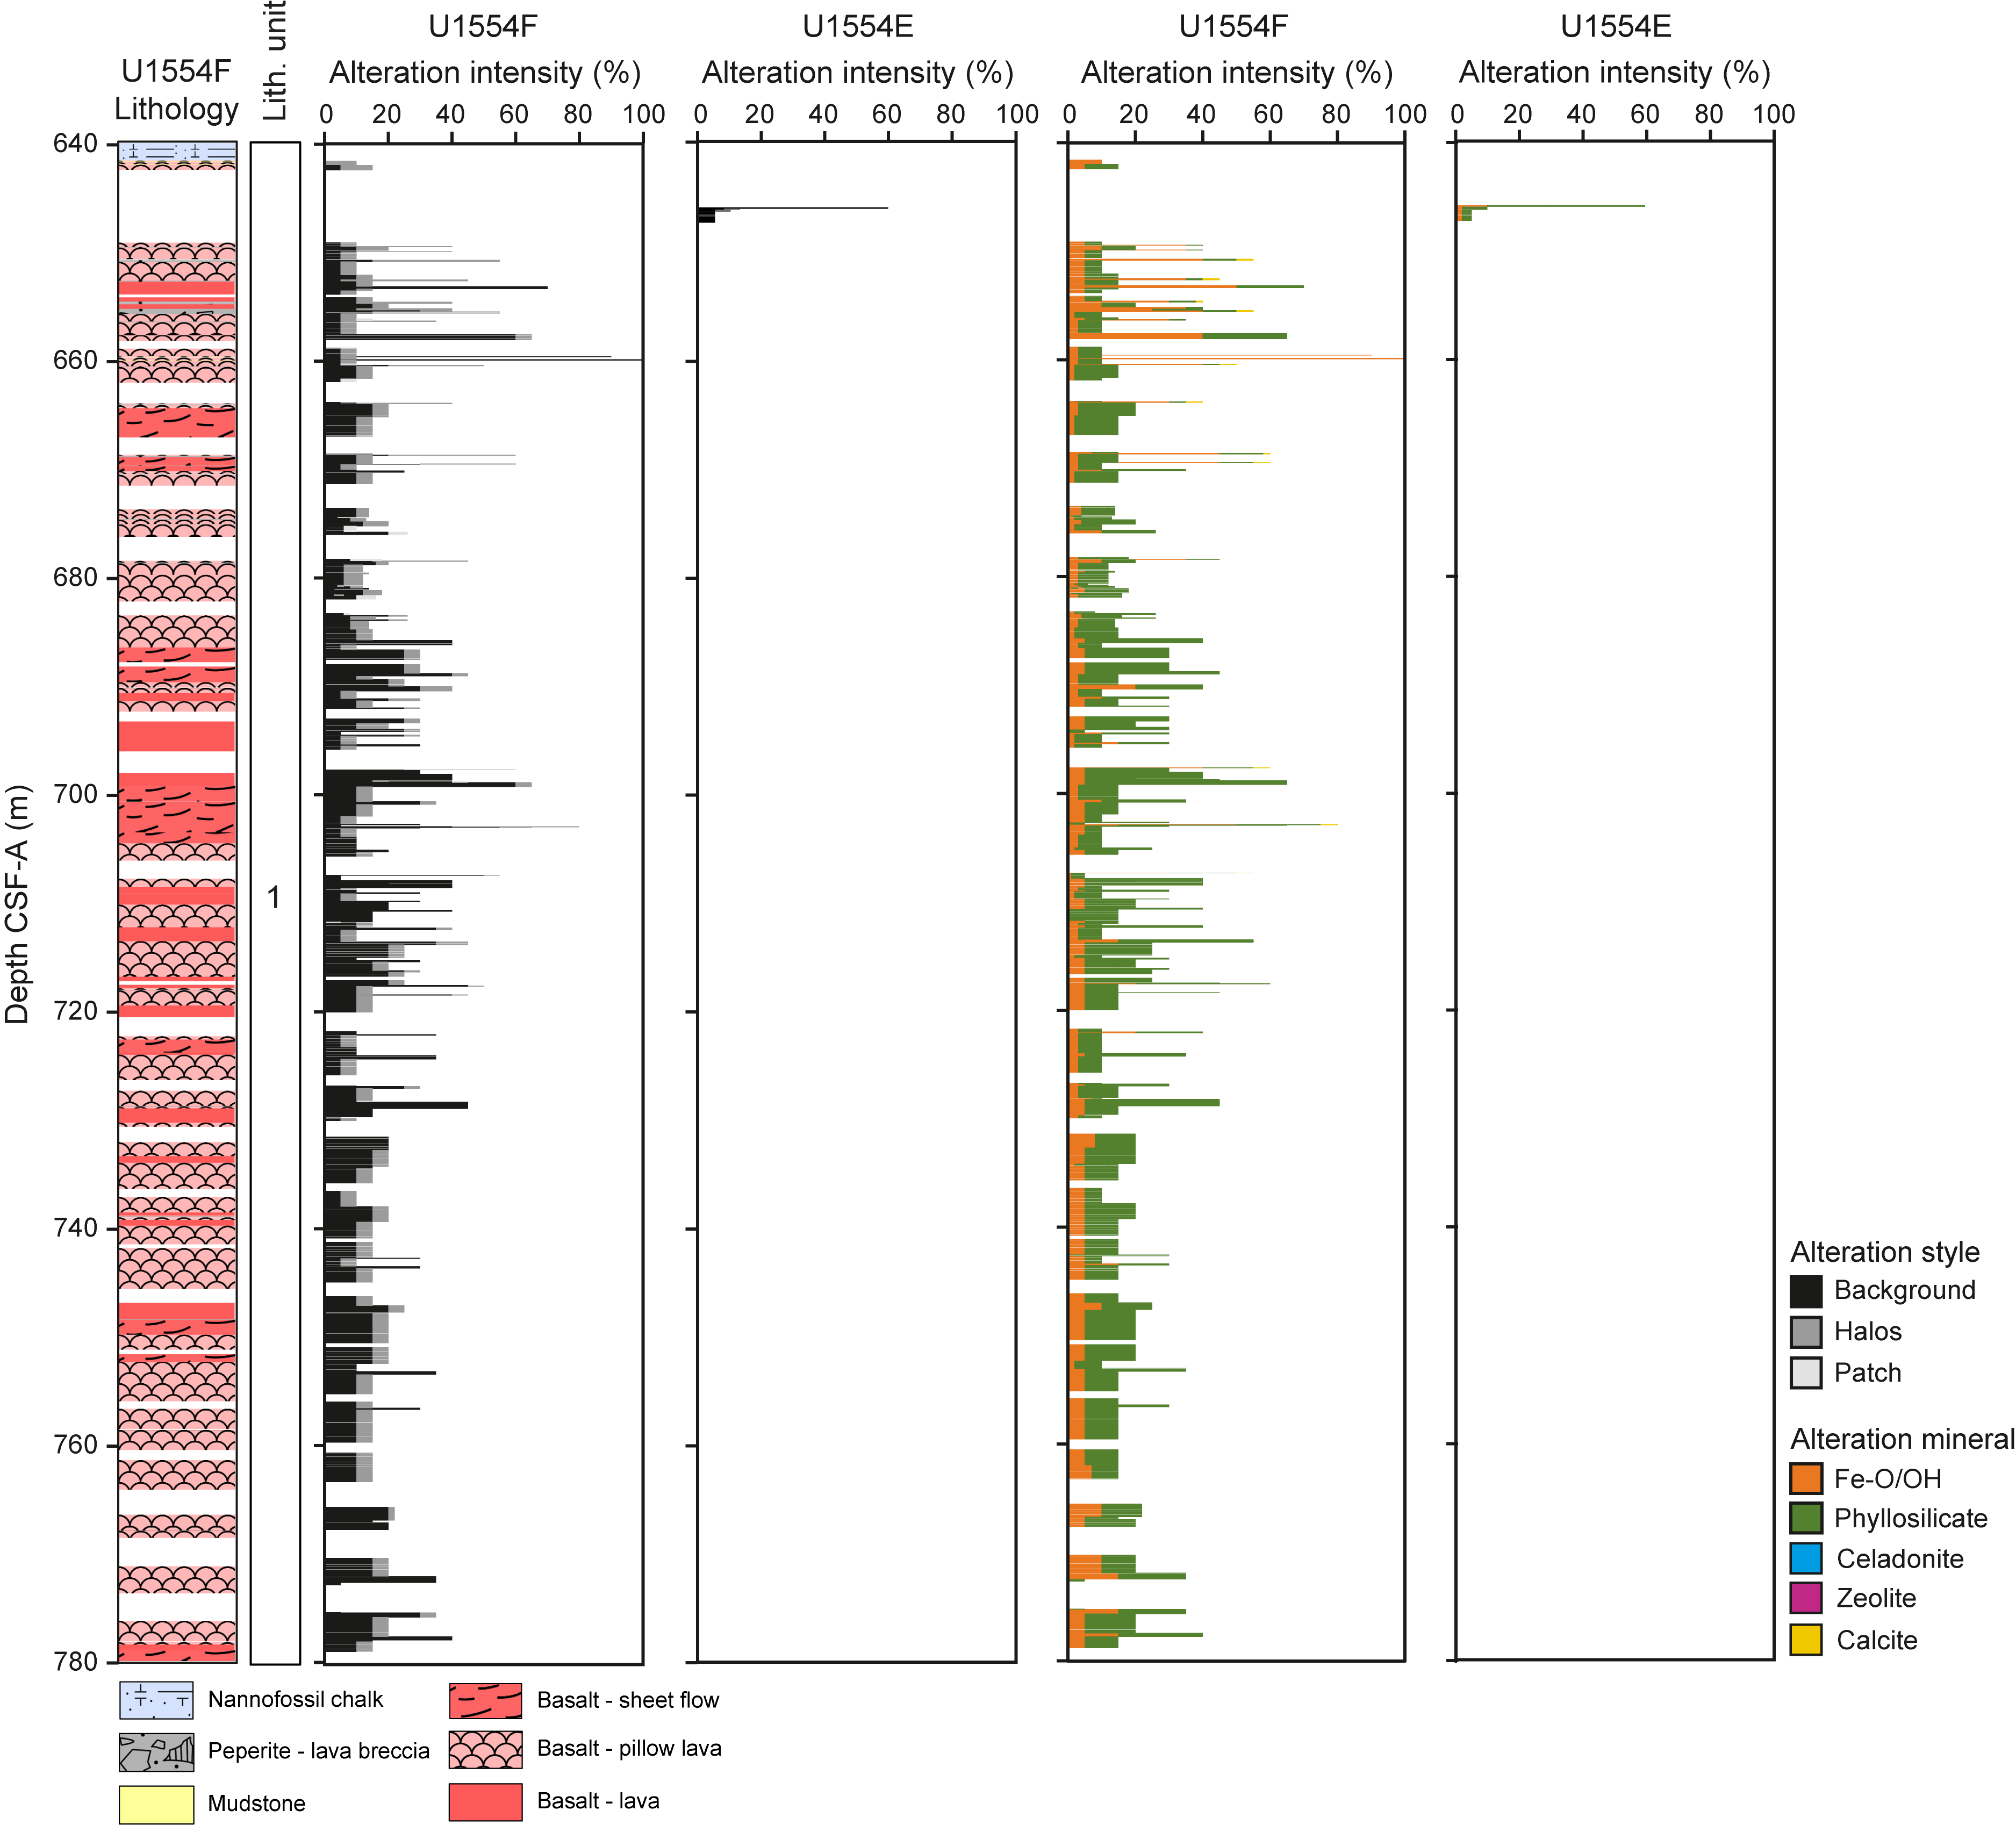
Figure F18. Lithologic interpretation and units and alteration intensity variation.
The main basalt alteration mineral assemblage at Site U1554 consists of phyllosilicates + Fe-oxide/oxyhydroxides, as well as minor calcite (Figure F18). Calcite alteration is predominantly observed in the more intensely altered interval 649–661 m CSF-A. The amount of Fe-oxide/oxyhydroxide and clay alteration also increases in this interval. Rims of basalt clasts in peperite intervals display strong to complete alteration to palagonitic material (rich in Fe-oxide/oxyhydroxides), which in some clasts decreases in intensity toward their centers. In thin section, the basaltic groundmass appears variably altered to saponite and celadonite, with disseminated dendritic magnetite and brown, smectite-like alteration in places (Figure F19). Olivine phenocrysts are variably replaced by a pale brown to green saponite phase with occasional celadonite (Figure F19).
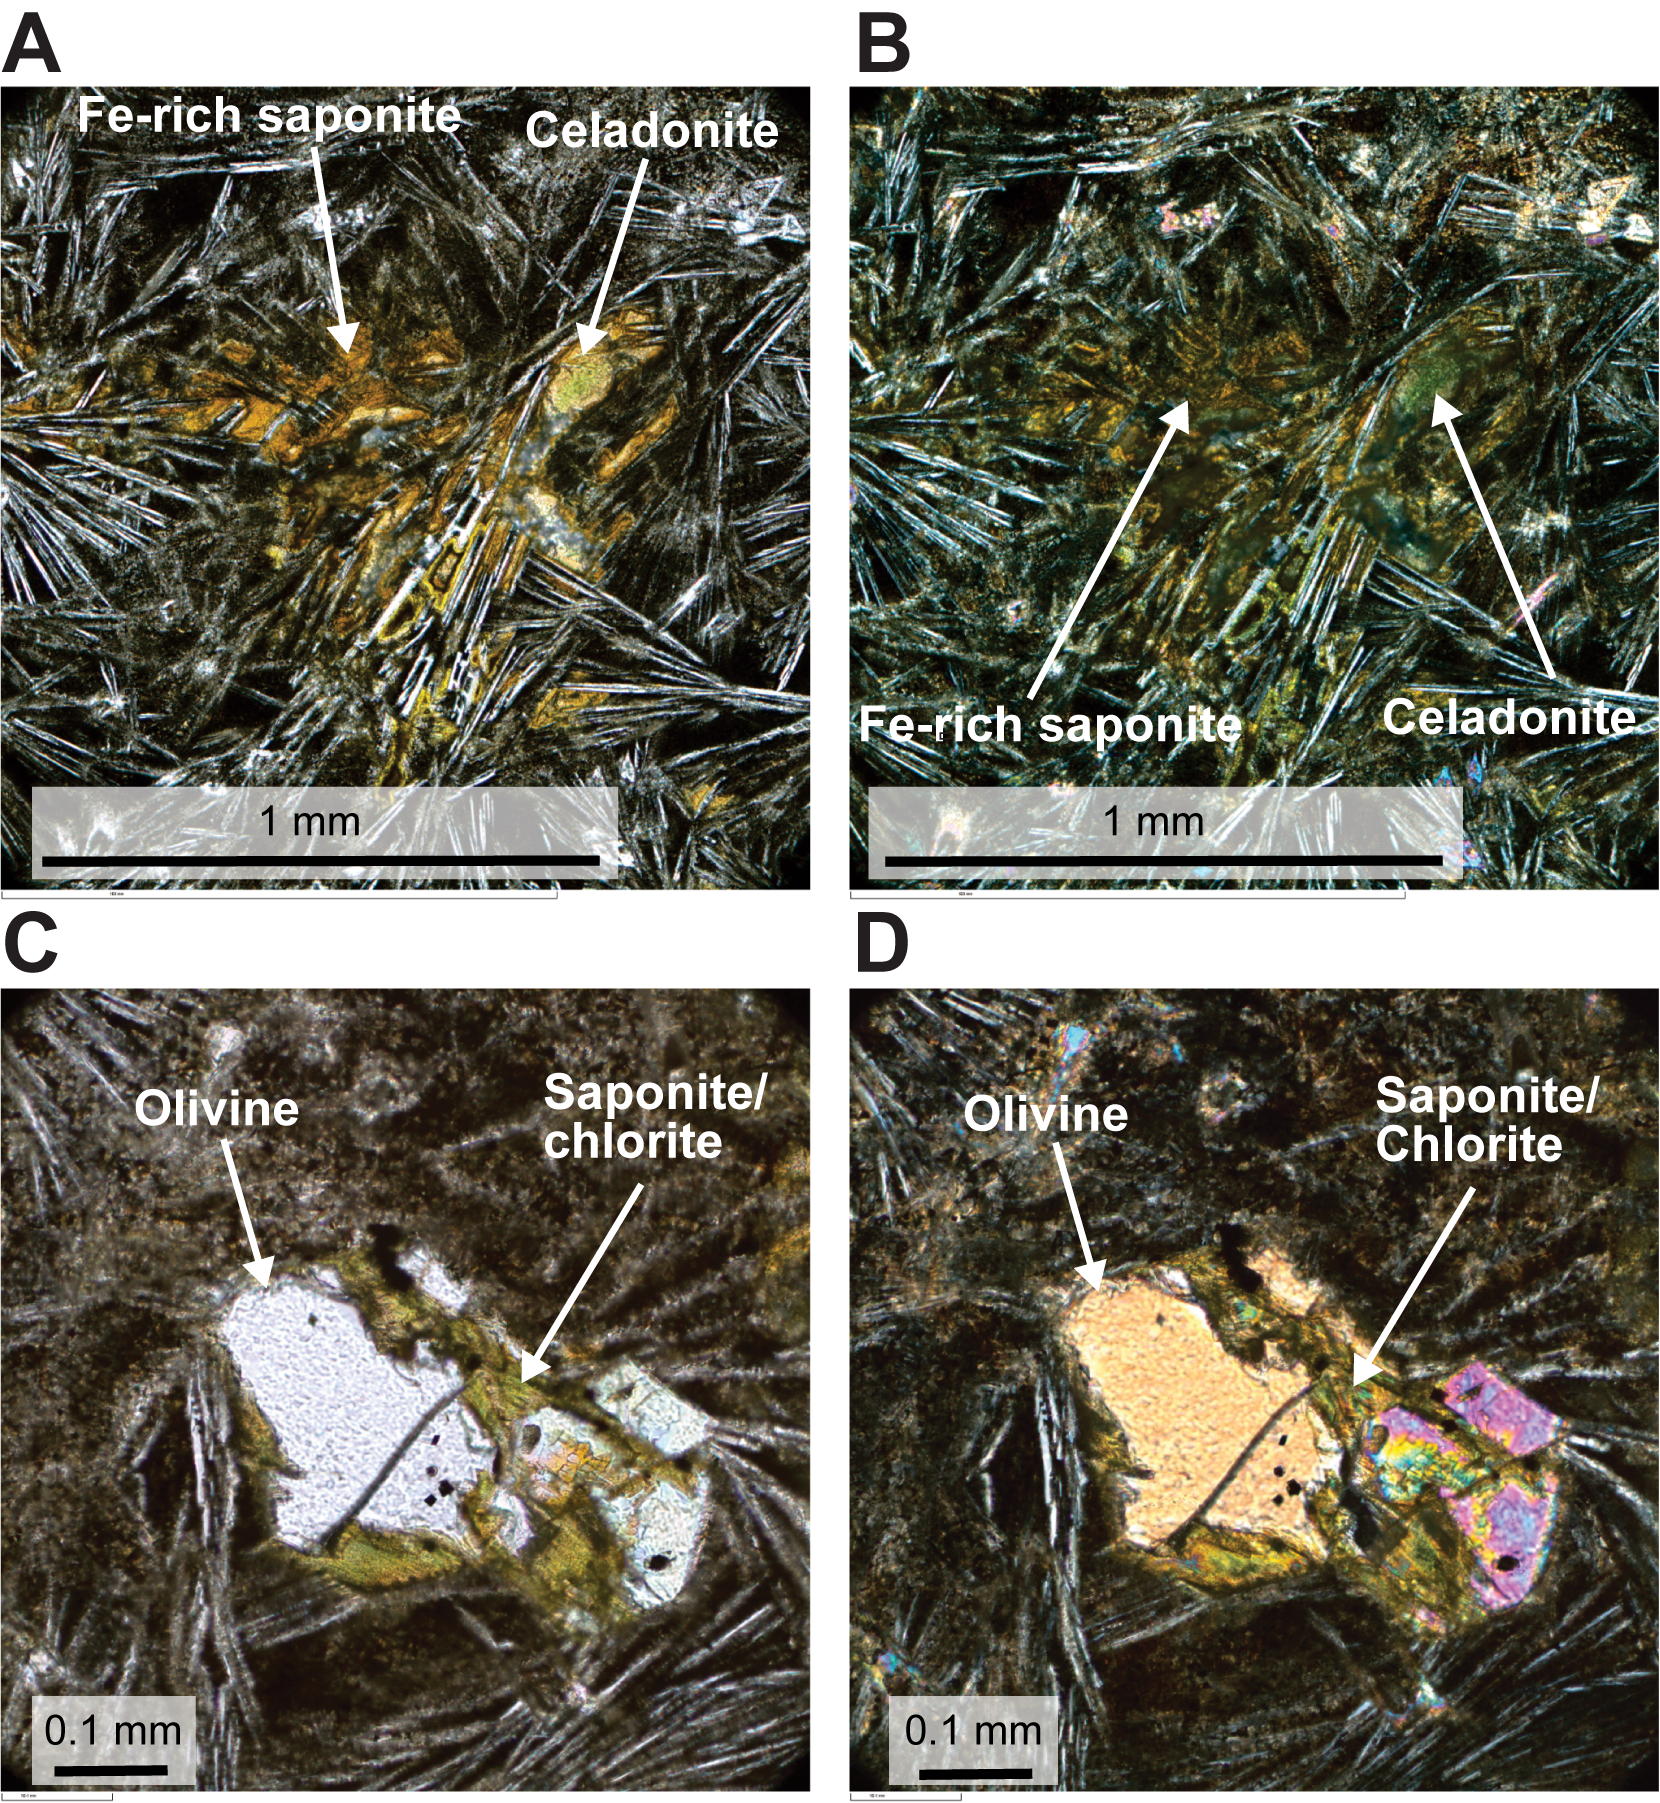
Figure F19. Alteration and replacement.
The percentage of vesicles filled with alteration minerals varies between 20% and 100% at Site U1554. The vesicle filling minerals are predominantly clay/saponite, celadonite, chlorite, Fe-oxide/oxyhydroxides, and carbonate (Figure F20). Moderate amounts of amorphous silica and zeolite are identified in thin sections as vesicle mineral fills, the latter likely being phillipsite, showing a radial, acicular crystal texture in places (Sample 395C-U1554F-31R-1, 49–52 cm) (Figure F20F). Thin sections under reflected light also show magnetite within vesicle mineral layers (Figure F20A, F20B). Chlorite becomes a more common vesicle filling mineral with increasing depth from ~684 m CSF-A. A dark green clay component of the vesicle mineral assemblage appearing in interval 673–722 m CSF-A is identified as the swelling clay, smectite. The mineral fill of most vesicles shows a color zonation, with celadonite-filled vesicles presenting a range of colors from dark blue to pale blue to pale green. Dark blue celadonite in vesicles becomes more common with increasing depth at Site U1554, particularly below ~722 m CSF-A. There is no correlation between the percentage of vesicles filled and the alteration intensity of the basalt core at Site U1554. Some vesicles show <1 mm wide alteration halos in the basalt around them.
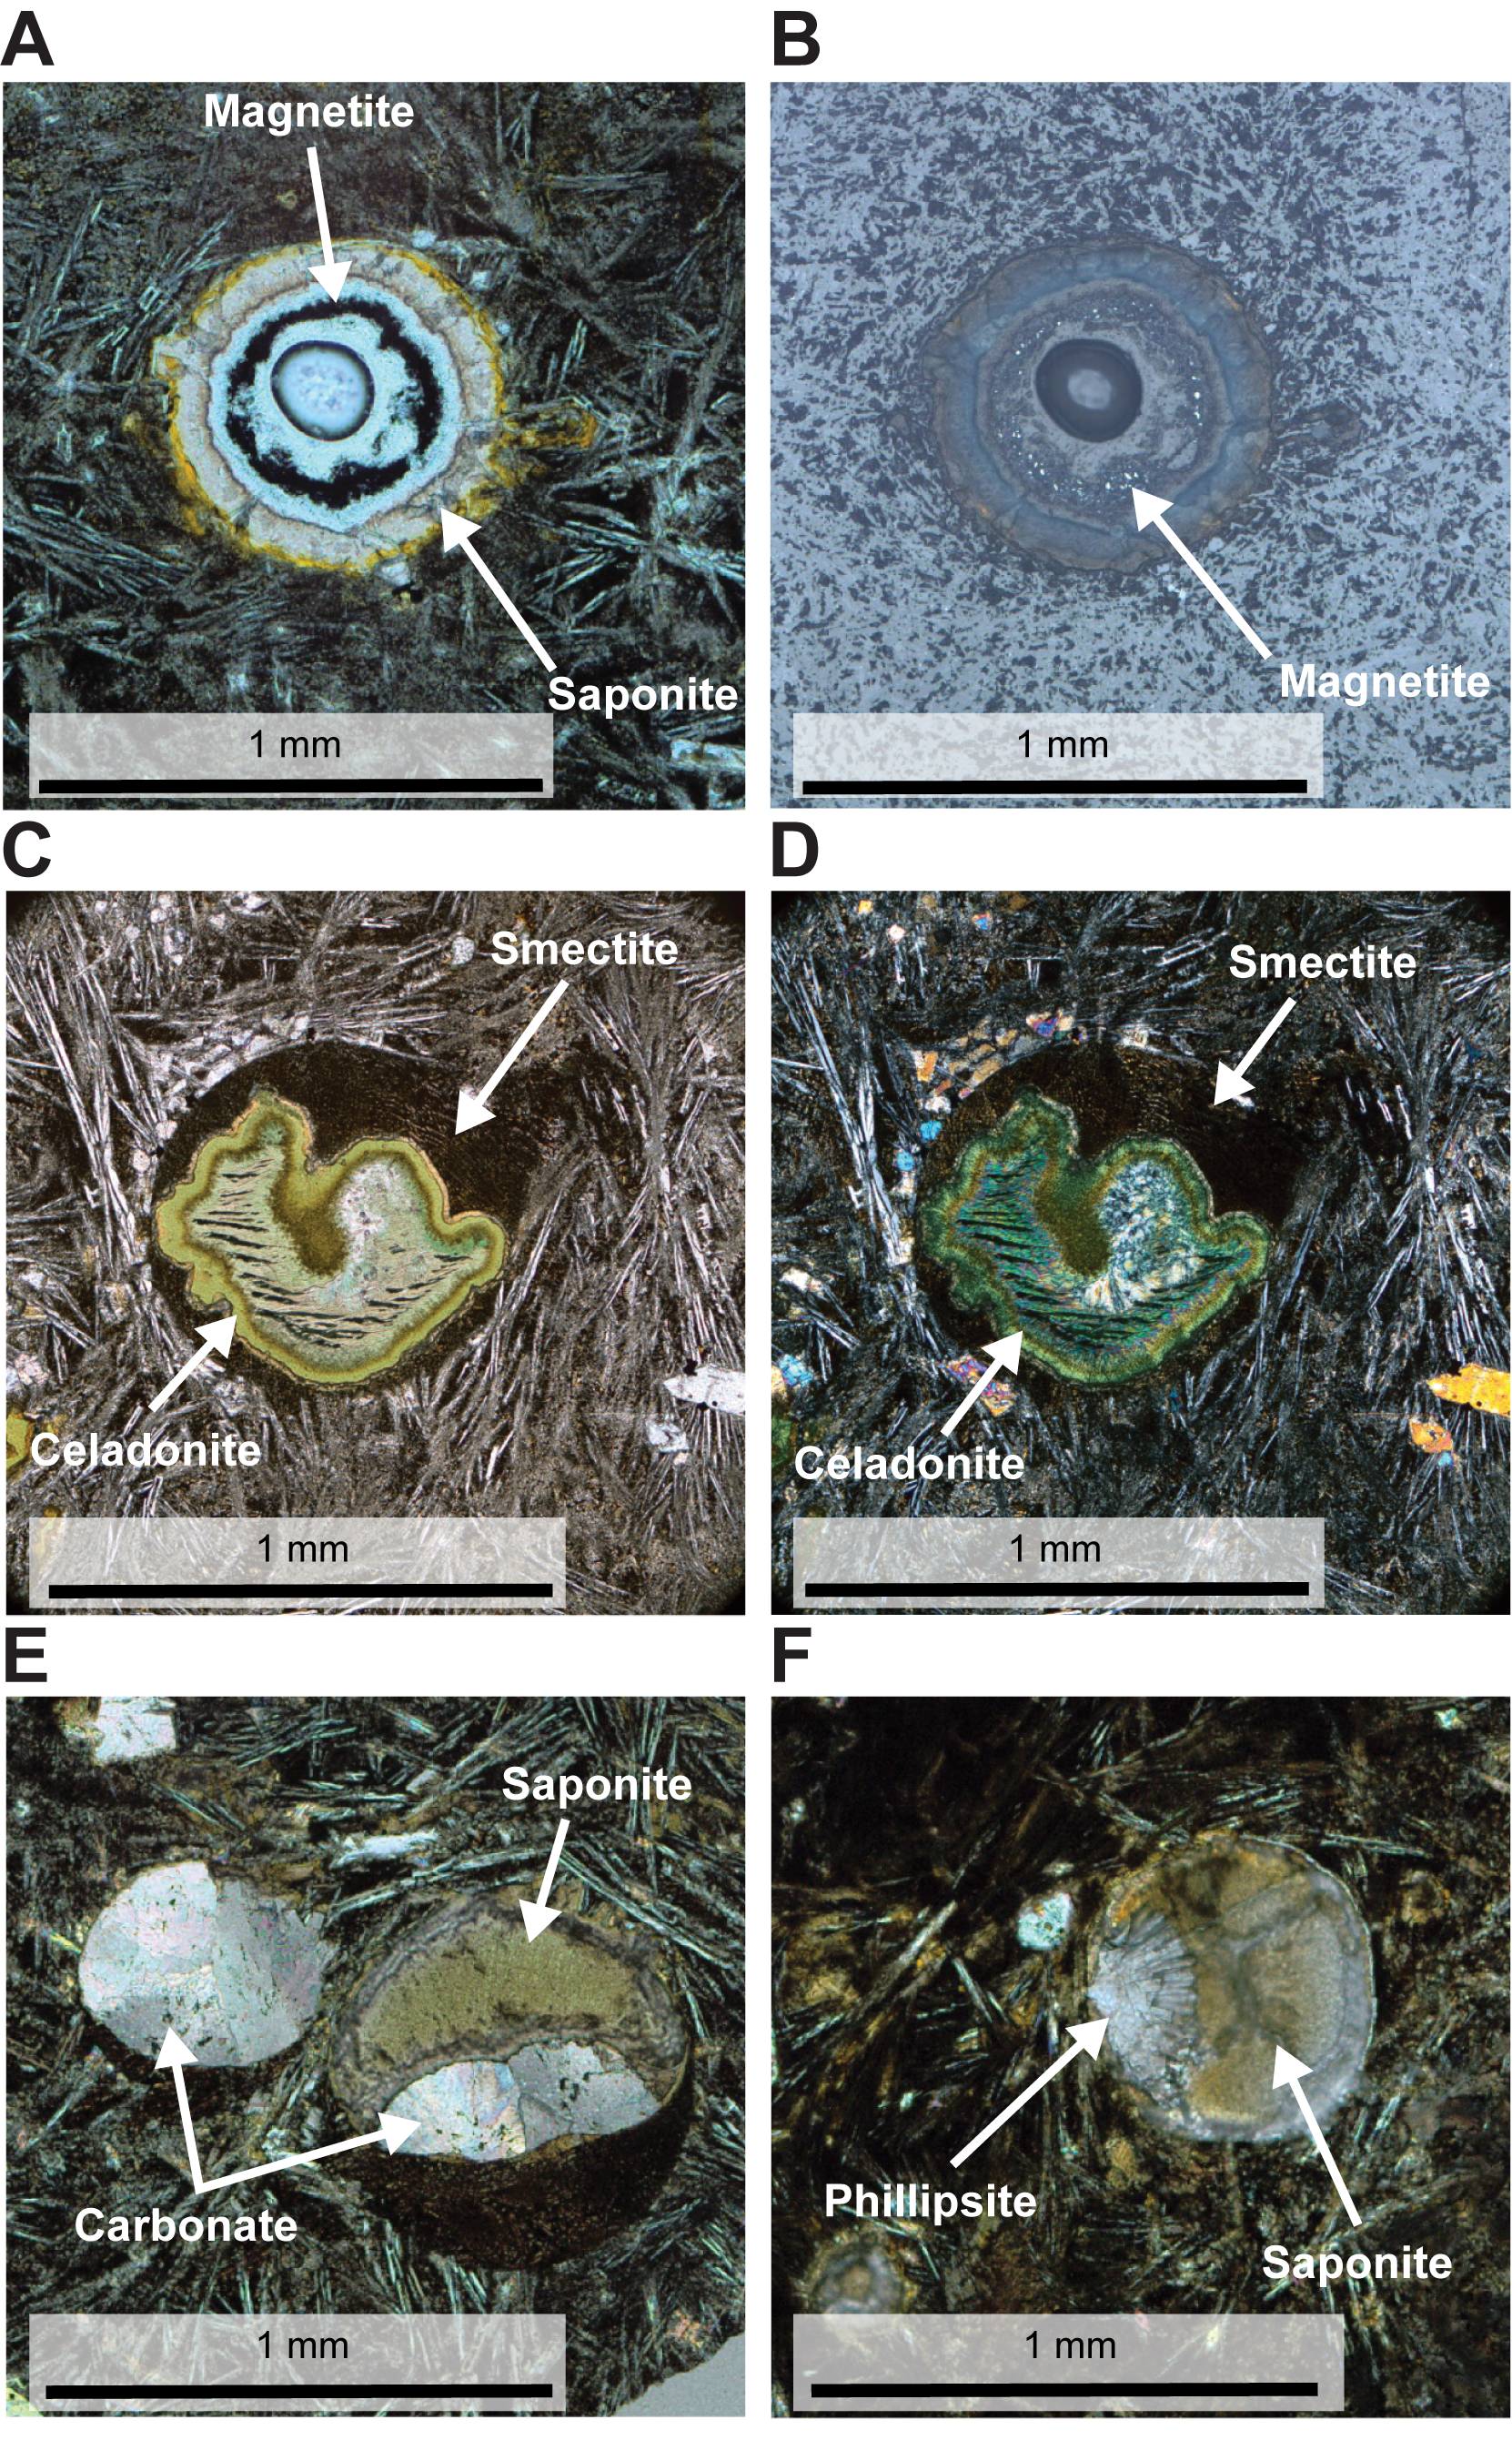
Figure F20. Vesicles.
Minerals infilling a vesicle from thin section Sample 395C-U1554F-14R-3, 133–136 cm, were analyzed with energy dispersive spectrometry (EDS). Maps were acquired for 11 elements (Si, O, Al, Ca, Mg, Fe, K, Na, S, Ba, and Ti), and EDS spectra were analyzed for two zones of interest in the filled vesicle (Figure F21). The EDS spectrum for Zone 1 shows that the orange-red mineral vesicle fill (as it appears in transmitted light microscopy) is Fe-, O-, and Si-rich with minor Mg and Al, which can be interpreted to represent iddingsite material. The EDS spectrum for Zone 2 shows strong spectral peaks for Si, Mg, and O as well as K, Fe, and Al, which can be interpreted to represent a vesicle fill of celadonite possibly mixed with some smectite.
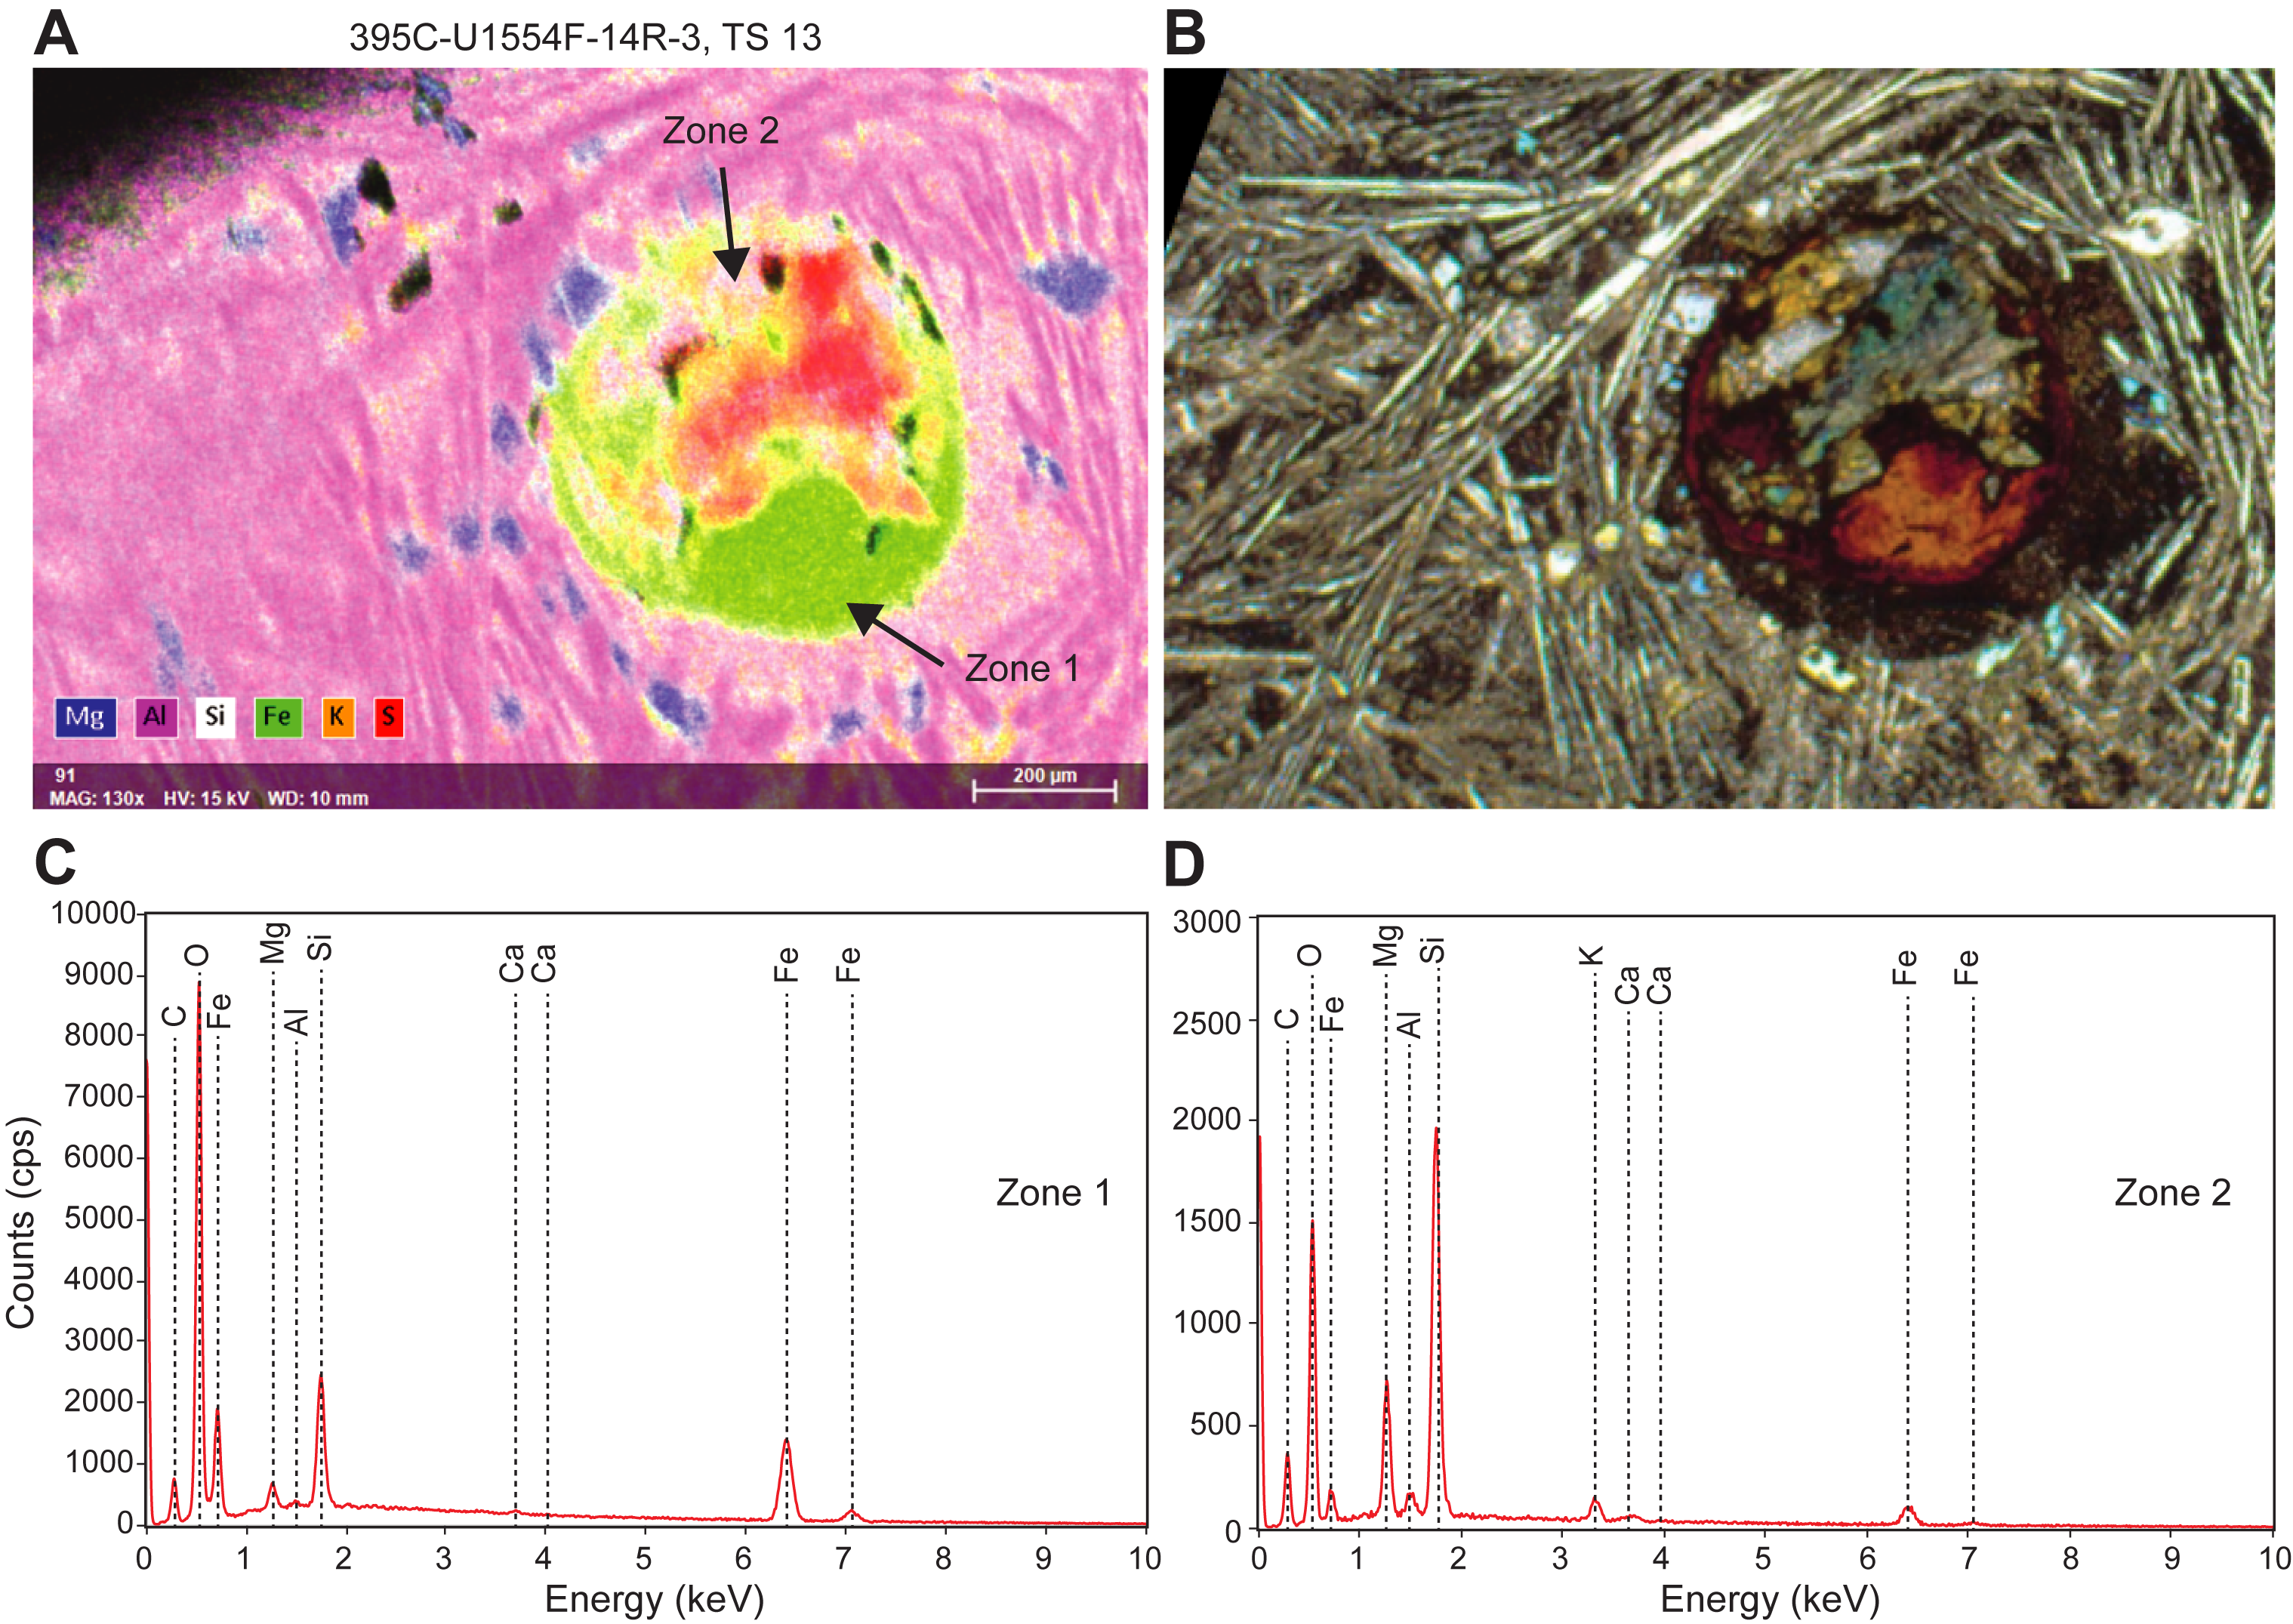
Figure F21. Vesicle with multiple mineral fills.
5.2. Structural geology
Fracture density in Holes U1554E and U1554F is 17 fractures per meter of recovered core (~14 fractures per meter of curated core; Figure F22). Several depths of higher fracture density (over 20 fractures per meter) are observed in Hole U1554F at ~653, ~729, ~750, and ~766 m CSF-A (Figure F22). Fractures were not observed at the sediment/basalt interface (~641–649 m CSF-A) because of a gap in core recovery at ~642–649 m CSF-A. Fractures (Figure F23) are predominantly 0.5 mm (67%) and 1 mm (23%) wide. Most of the observed fracture types are classified as partially open (58%) or vein (28%; Figure F24A), and open fractures represent ~10% and unknown make up 5%. Fractures (Figure F24B) are mostly anastomosing in shape (69%), with 28% planar and the remaining 3% as multiple other shapes. Fracture connectivity (Figure F24C) at Site U1554 is documented as mostly crosscutting (44%) or single (not connected to other fractures = 36%). A further 19% of fractures are described as part of a complex network of interconnected fractures and usually correspond to veins in or next to basaltic glass. Fractures observed at Site U1554 do not seem to have a preferred attitude with respect to the core axis (Figure F24D).
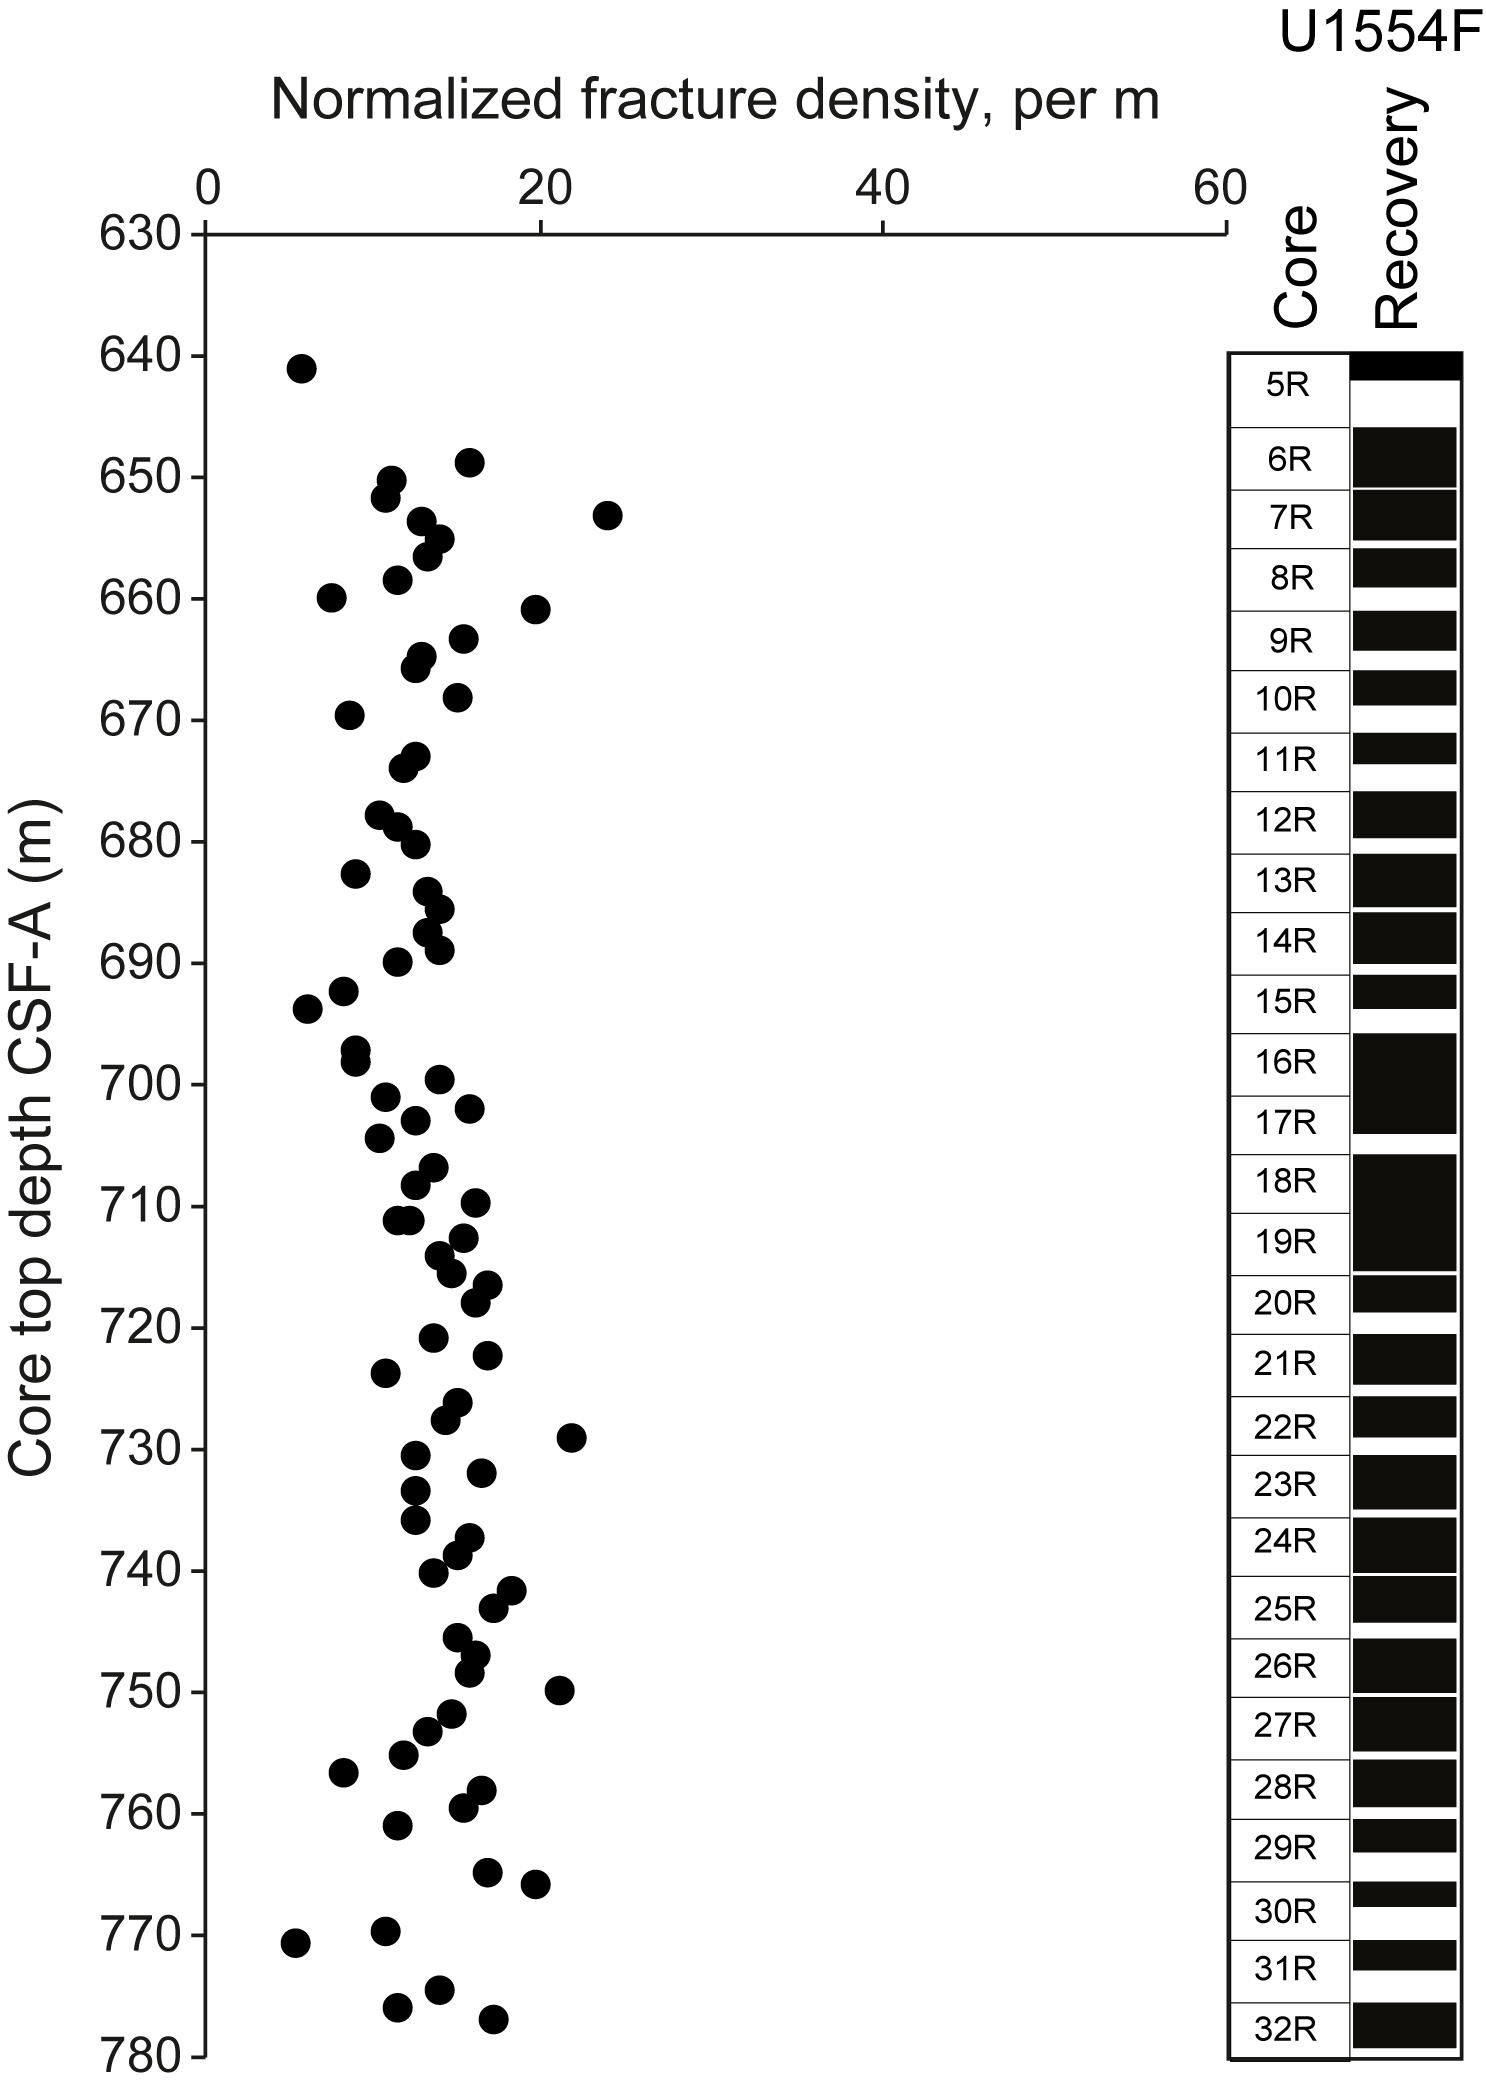
Figure F22. Fracture density.
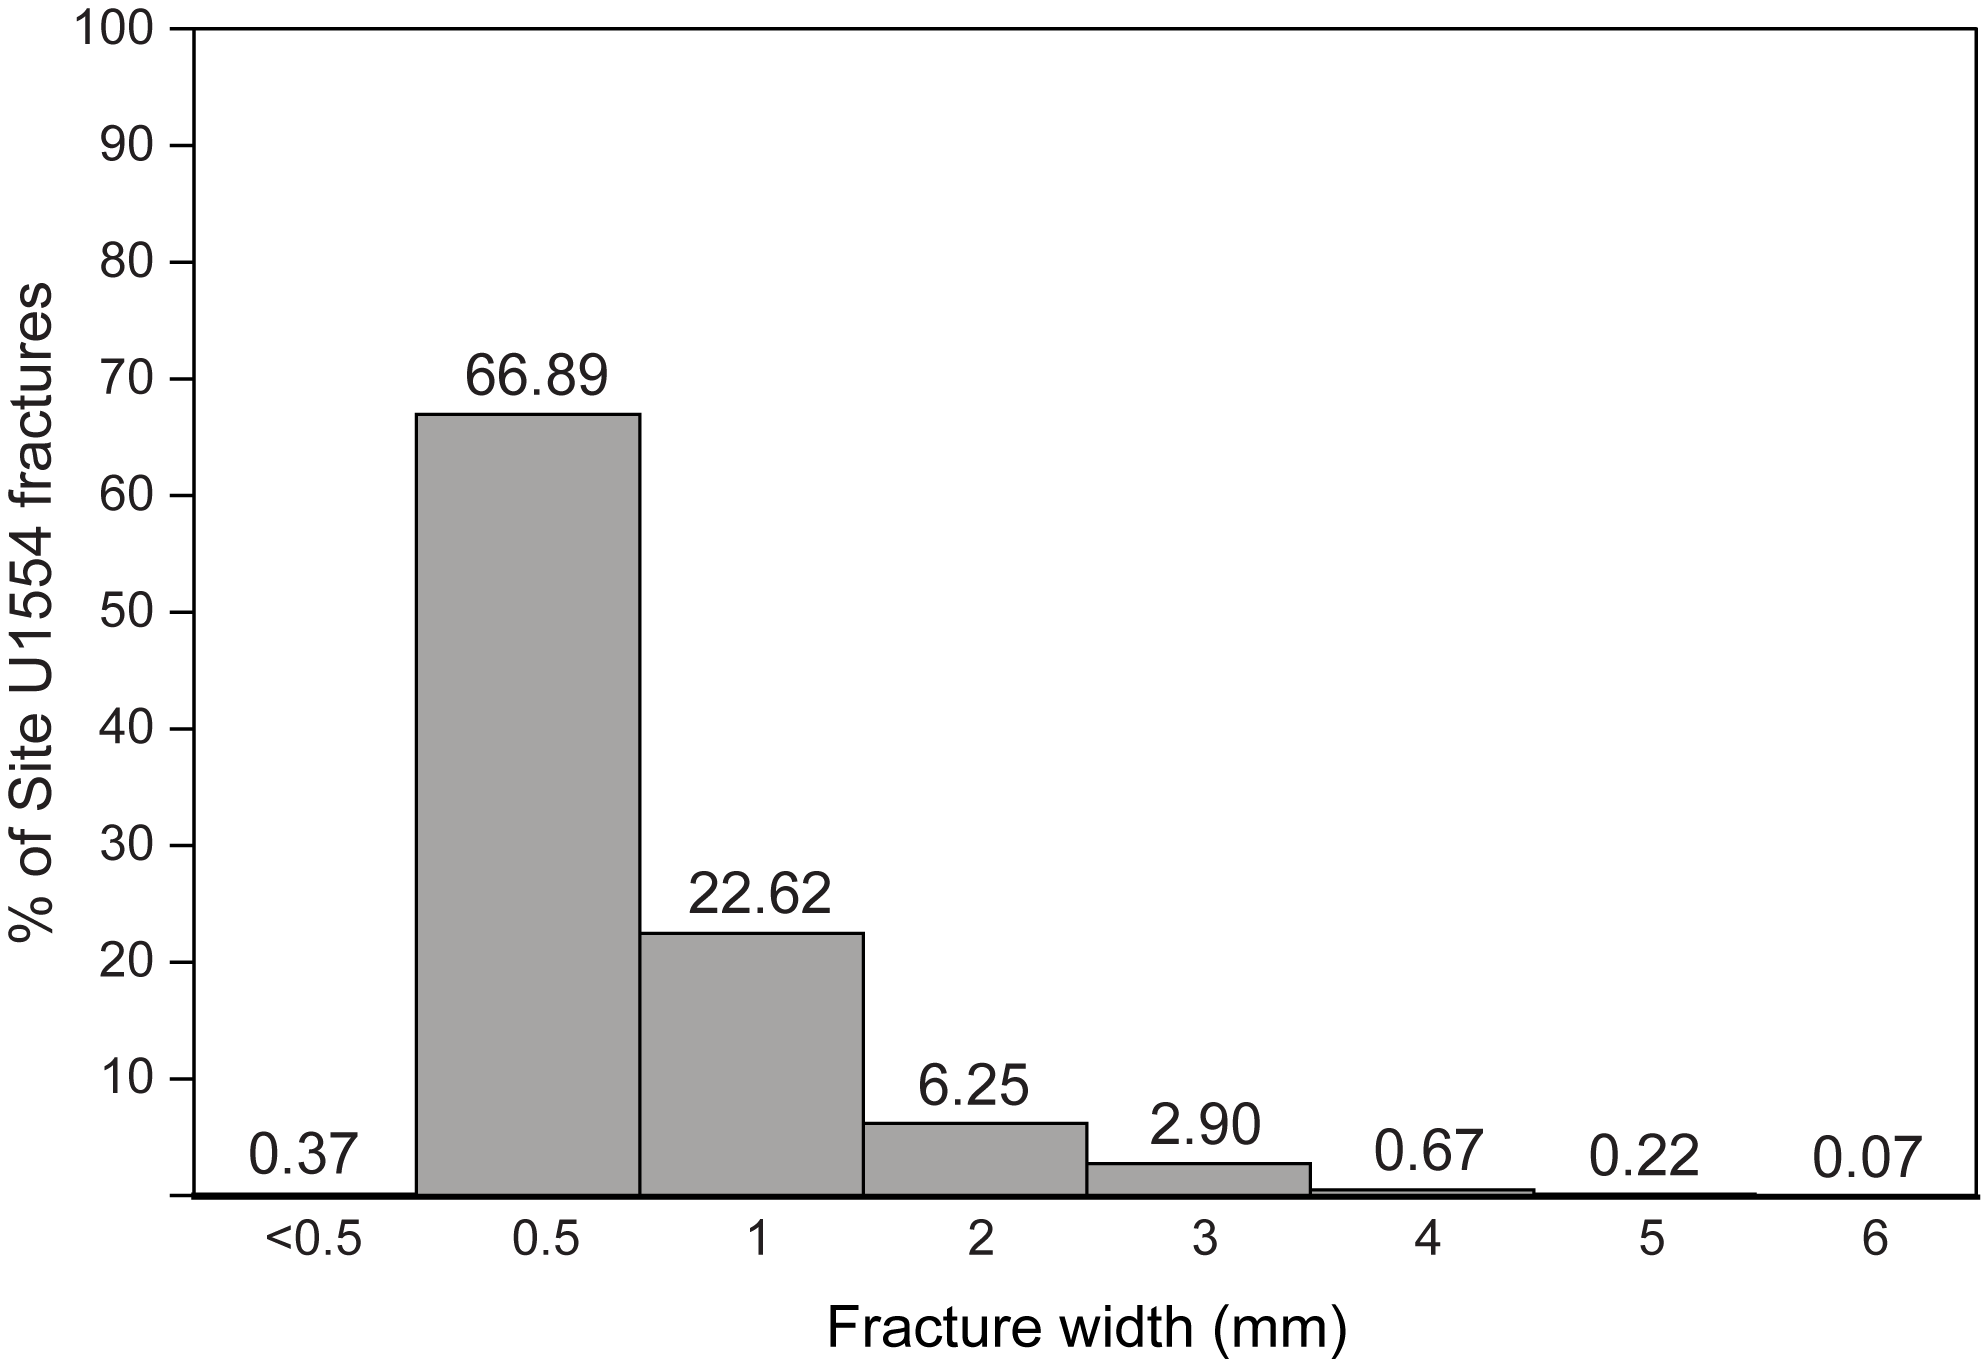
Figure F23. Fracture width distribution.
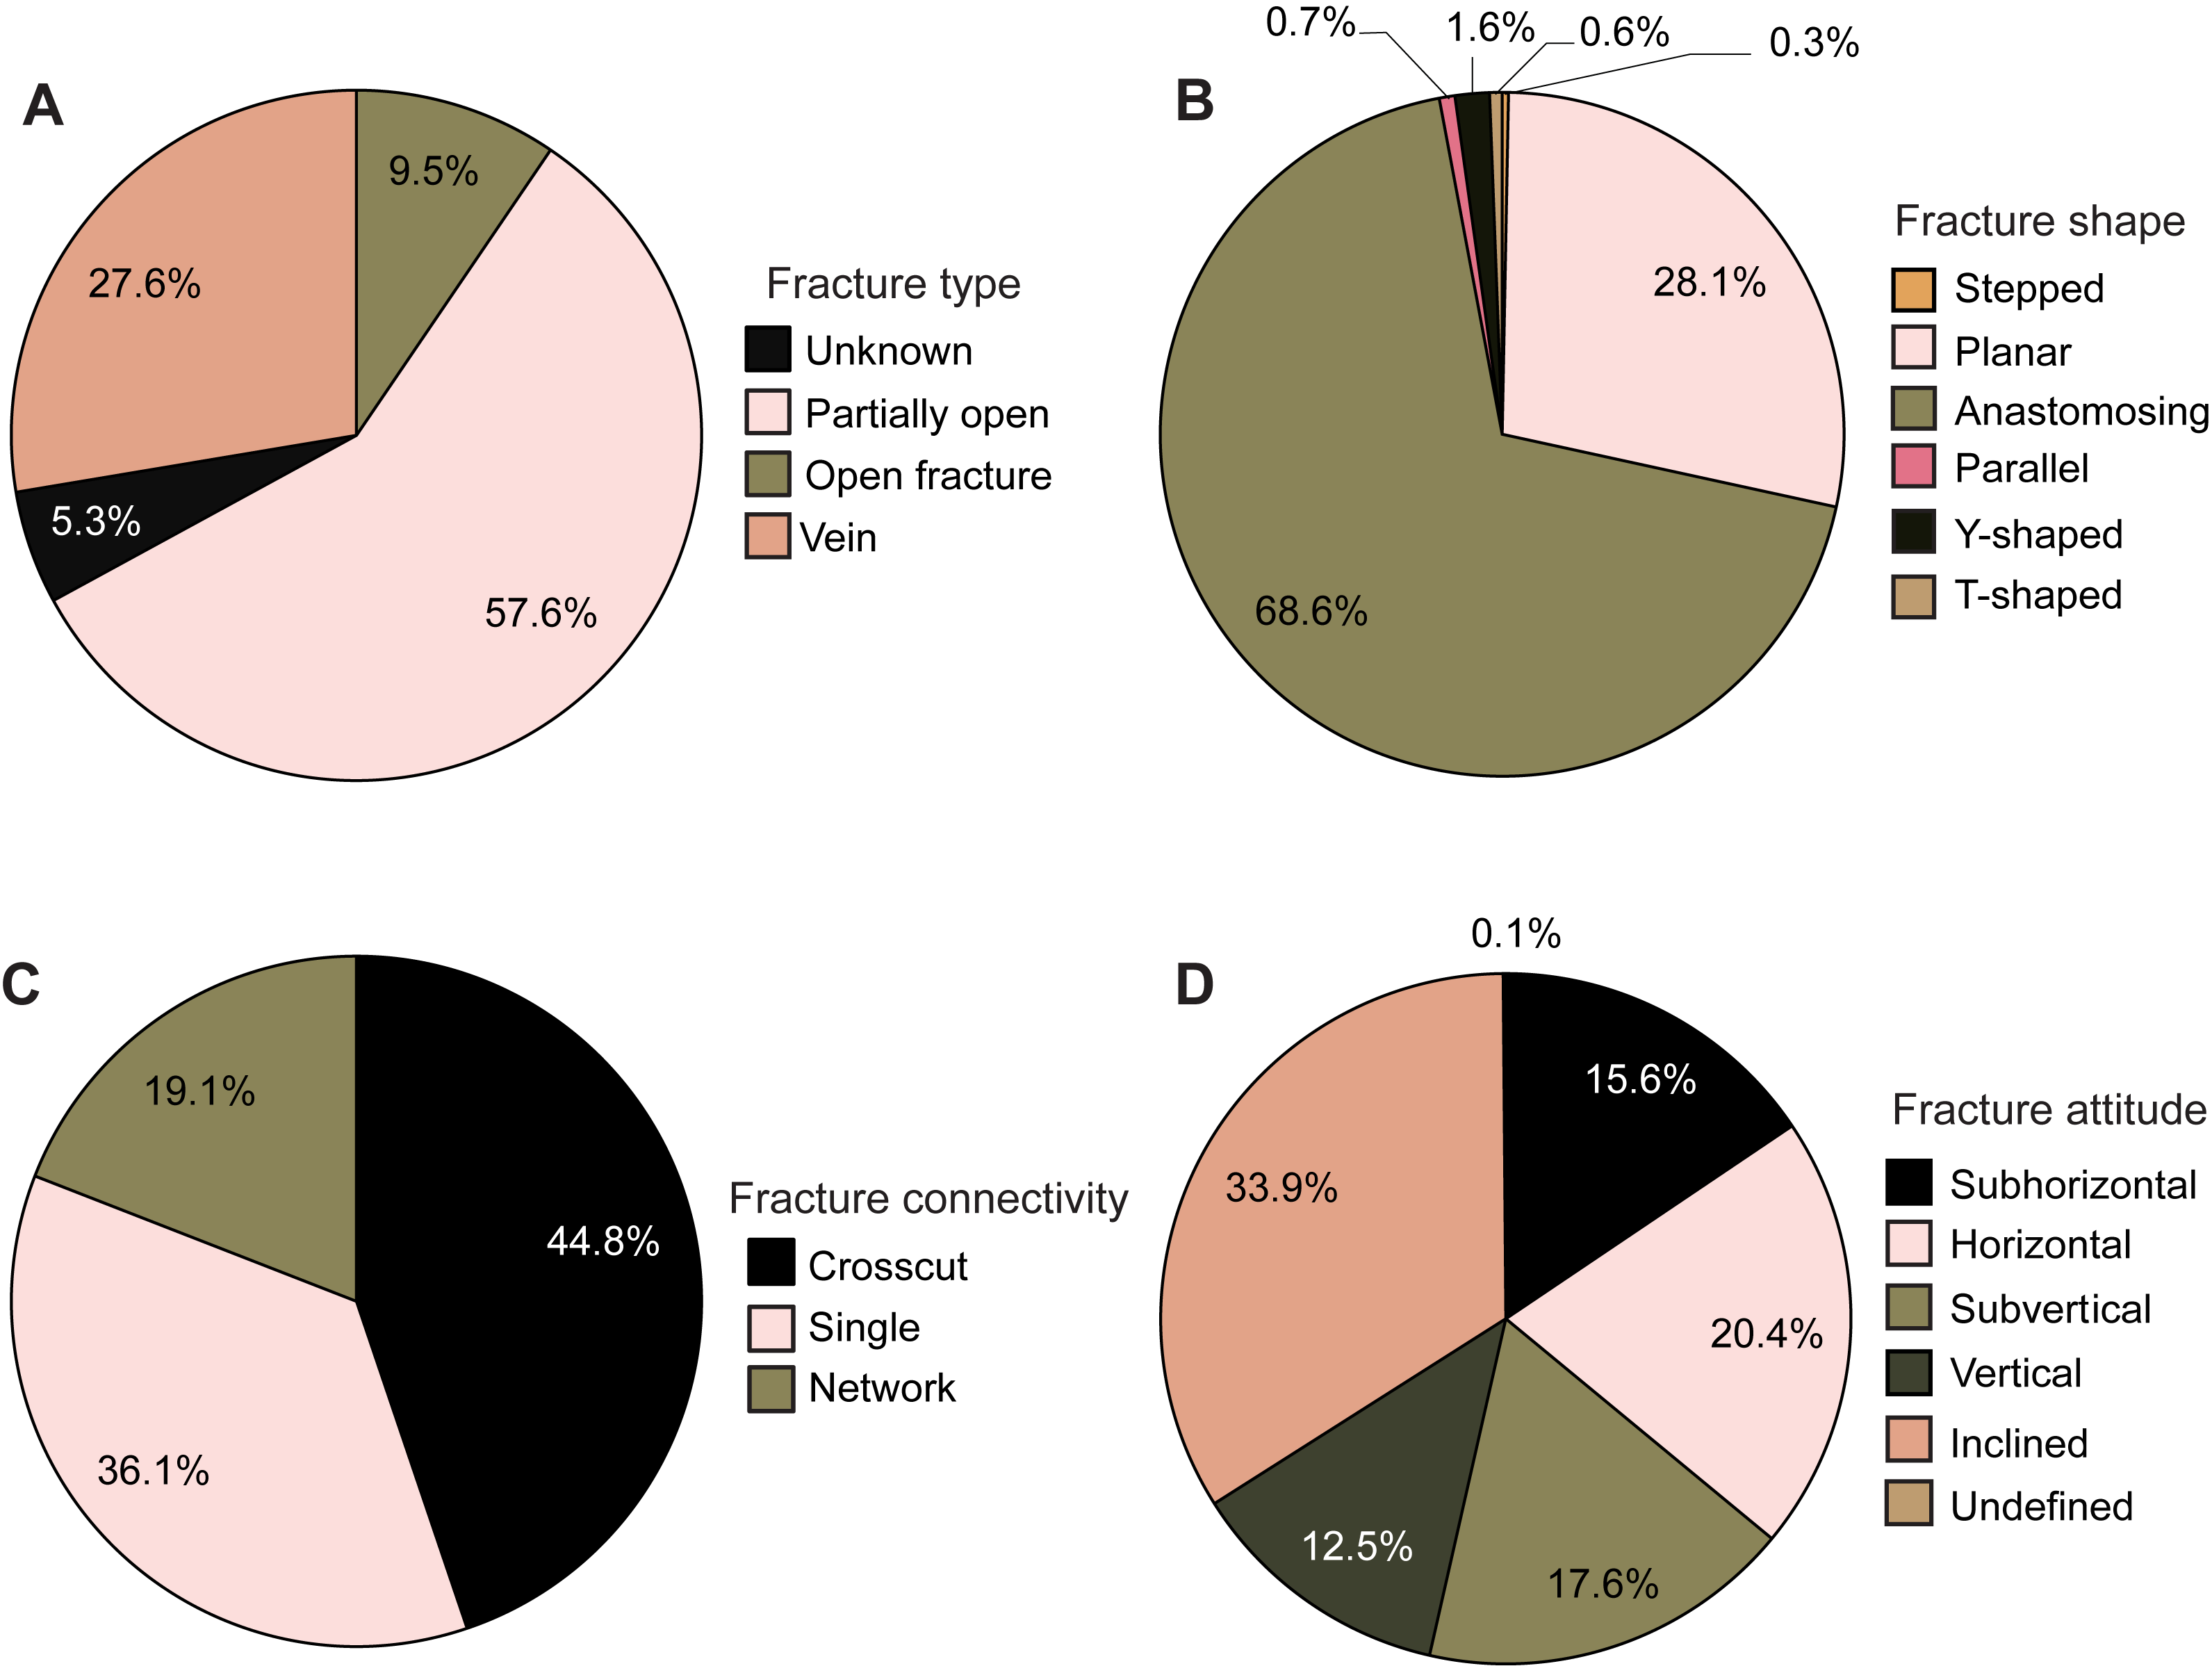
Figure F24. Fractures.
Fracture mineral fill, mostly cryptocrystalline, was determined by color, visual inspection under a hand lens, and reaction to dilute HCl acid. Figure F25 shows the occurrence of fracture mineral fill in Hole U1554F. In Hole U1554E, for the 1.06 m of basalt recovered, the mineral fill of each of the 13 fractures is mainly cryptocrystalline to microcrystalline carbonate ± Fe-oxide/oxyhydroxide ± phyllosilicate or Fe-oxide/oxyhydroxide ± phyllosilicate. In Hole U1554F, fracture mineral fill assemblages are largely dominated by carbonate with a phyllosilicate ± Fe-oxide/oxyhydroxide mixture and minor celadonite in some fractures. It should be noted that no zeolites have been recorded at this site, despite the large amount of basaltic glass. Zeolite and more specifically phillipsite are often observed on glass in association with a dark blue celadonite coating. Basaltic glass is largely palagonitized. The typically cryptocrystalline nature of the mineralization makes it difficult to distinguish such minerals macroscopically. Principal fracture mineral assemblages are invariant with depth in Hole U1554F. Celadonite minerals start to occur in fractures below ~664 m CSF-A in Hole U1554F. Finally, in Hole U1554F, some fractures are filled or partially filled with carbonate sediment (Figure F26). In interval 395C-U1554F-11R-1, 104–114 cm, globular carbonate fill is coated with a layer of pale green celadonite. Peperite and altered carbonate sediment intervals show a later stage of brittle deformation resulting in the formation of carbonate veins, which can appear amorphous and globular in places. These carbonate veins commonly cut through the carbonate matrix around the basaltic fragments but occasionally cut through both. From basalt core images, some millimeter to 2 cm wide alteration halos are found around some fractures, including those with carbonate sediment fill. Fracture alteration halos are commonly brown, gray, or brown with a gray border (Figure F27). The mineral fill of vesicles within these alteration halos is primarily carbonate and clay rich, with some celadonite Fe-oxide/oxyhydroxides in places.
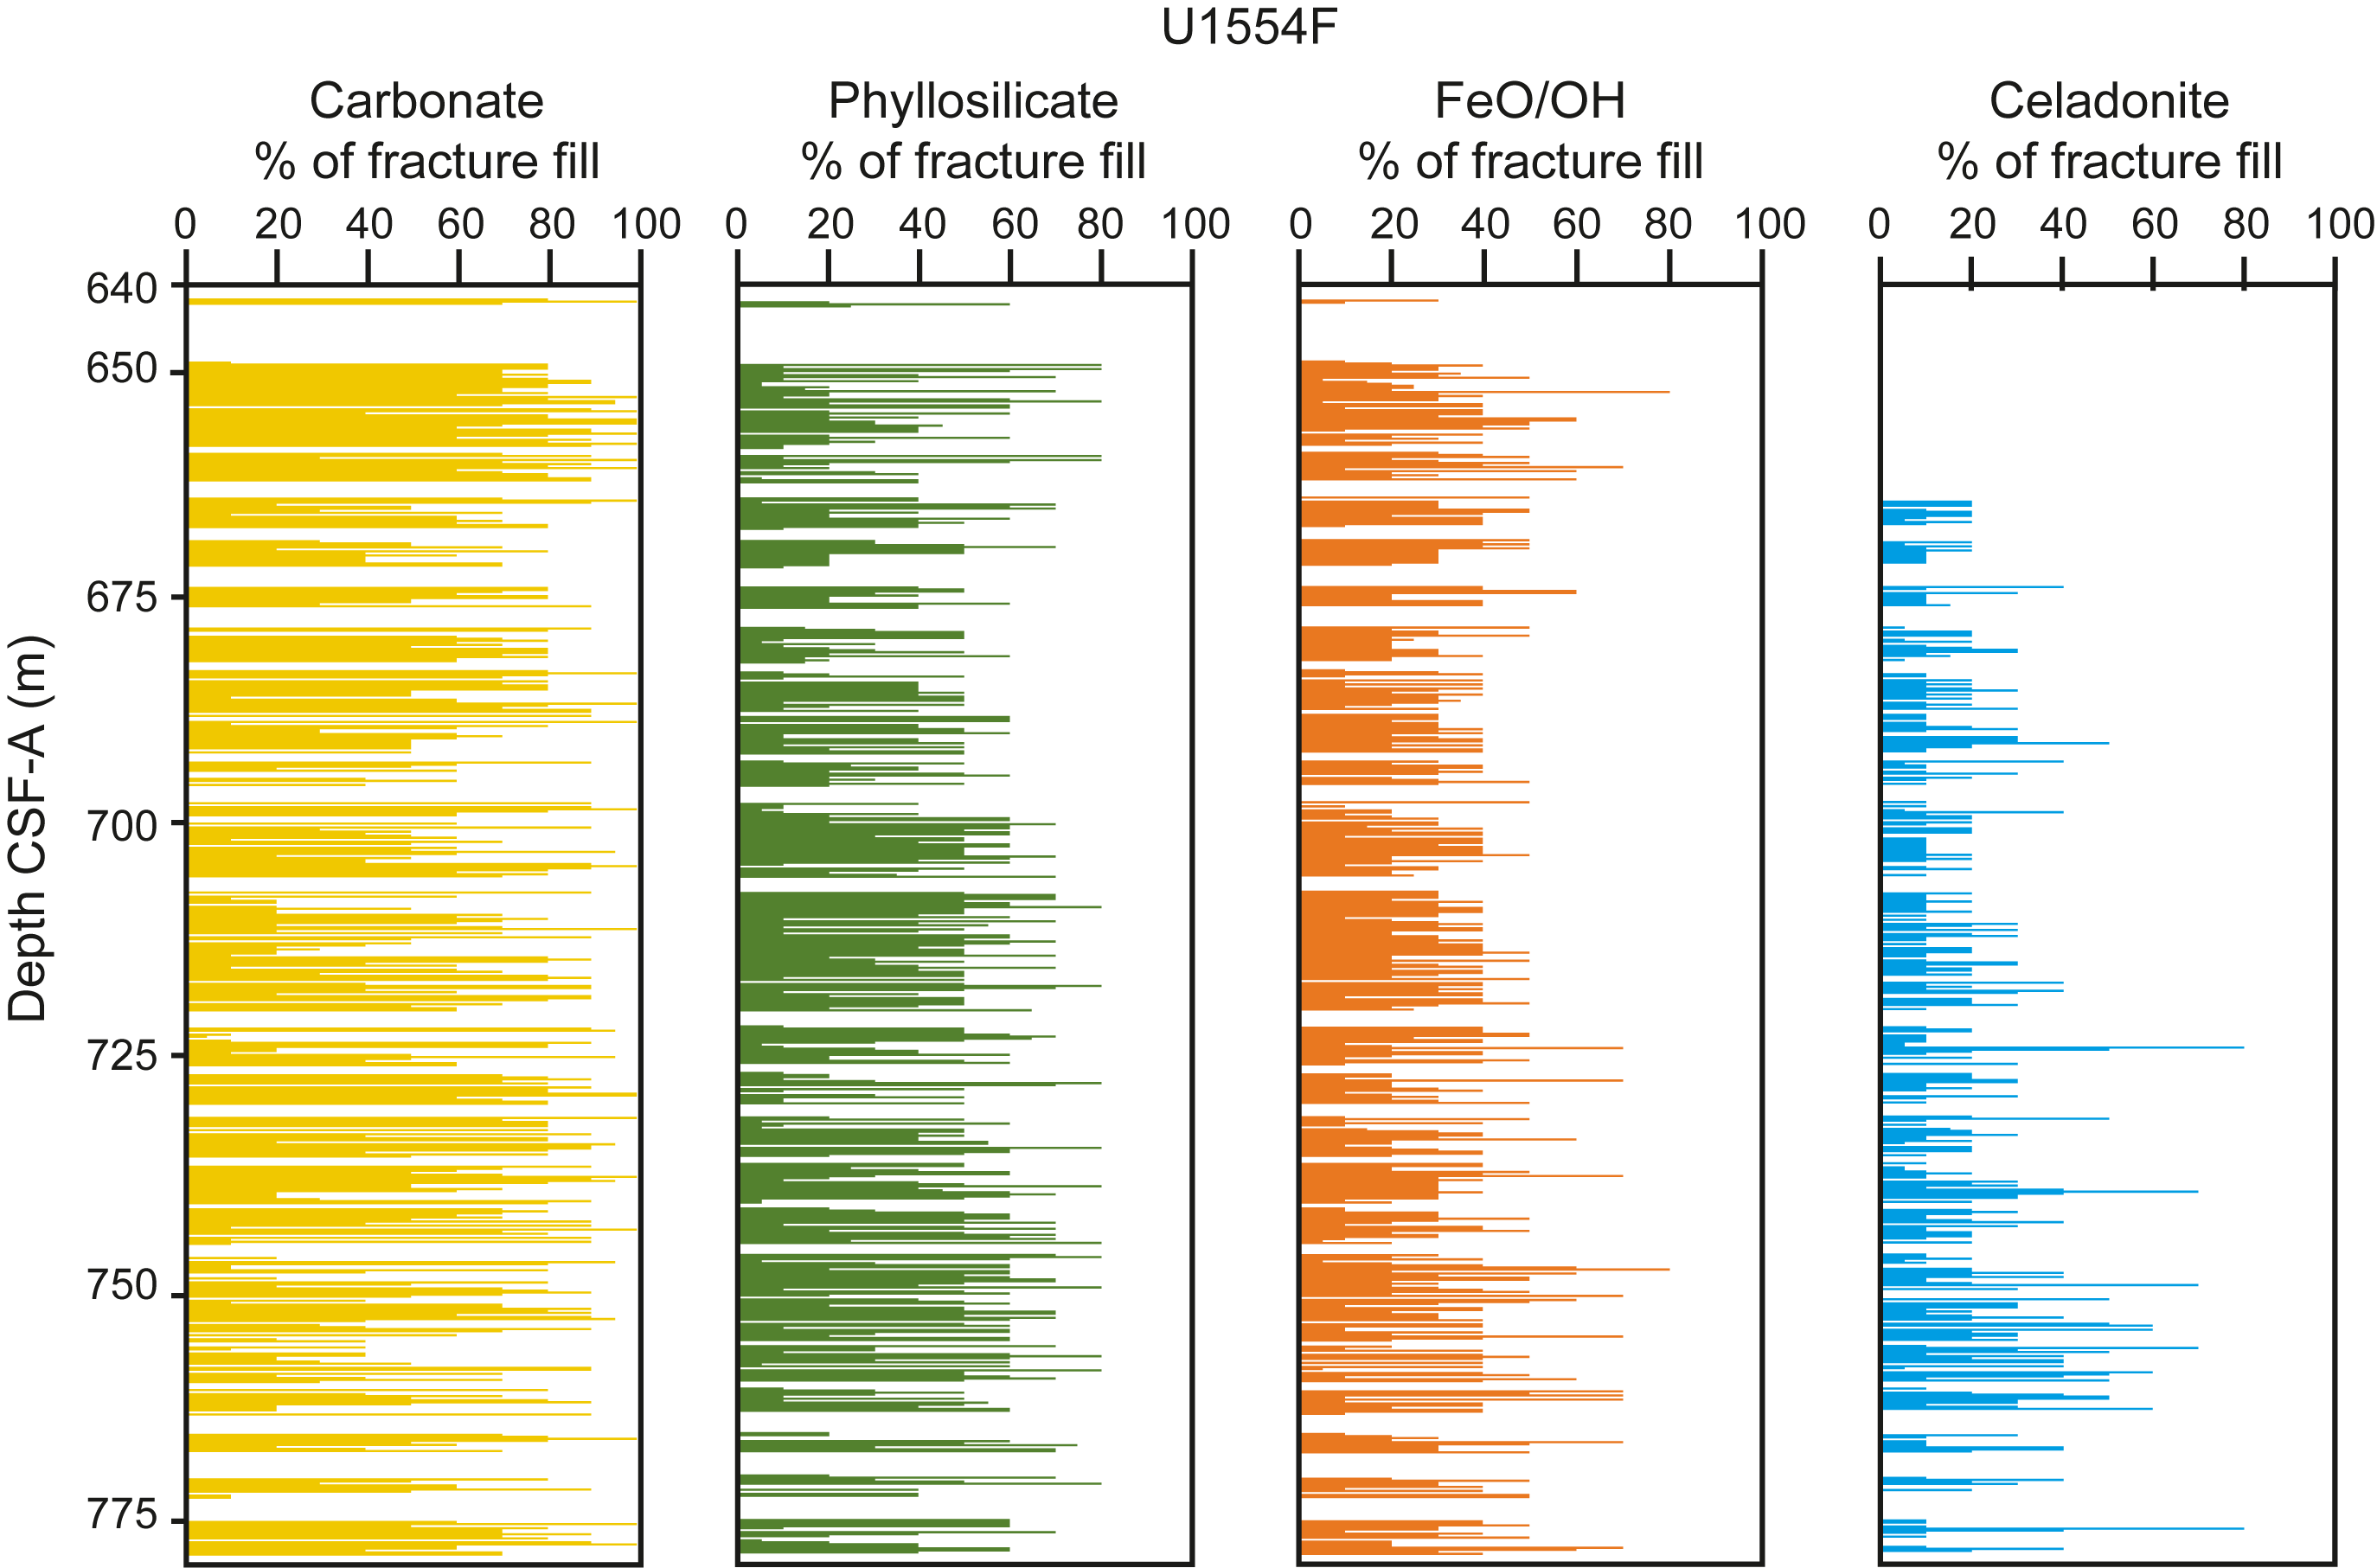
Figure F25. Mineral fill percentage.
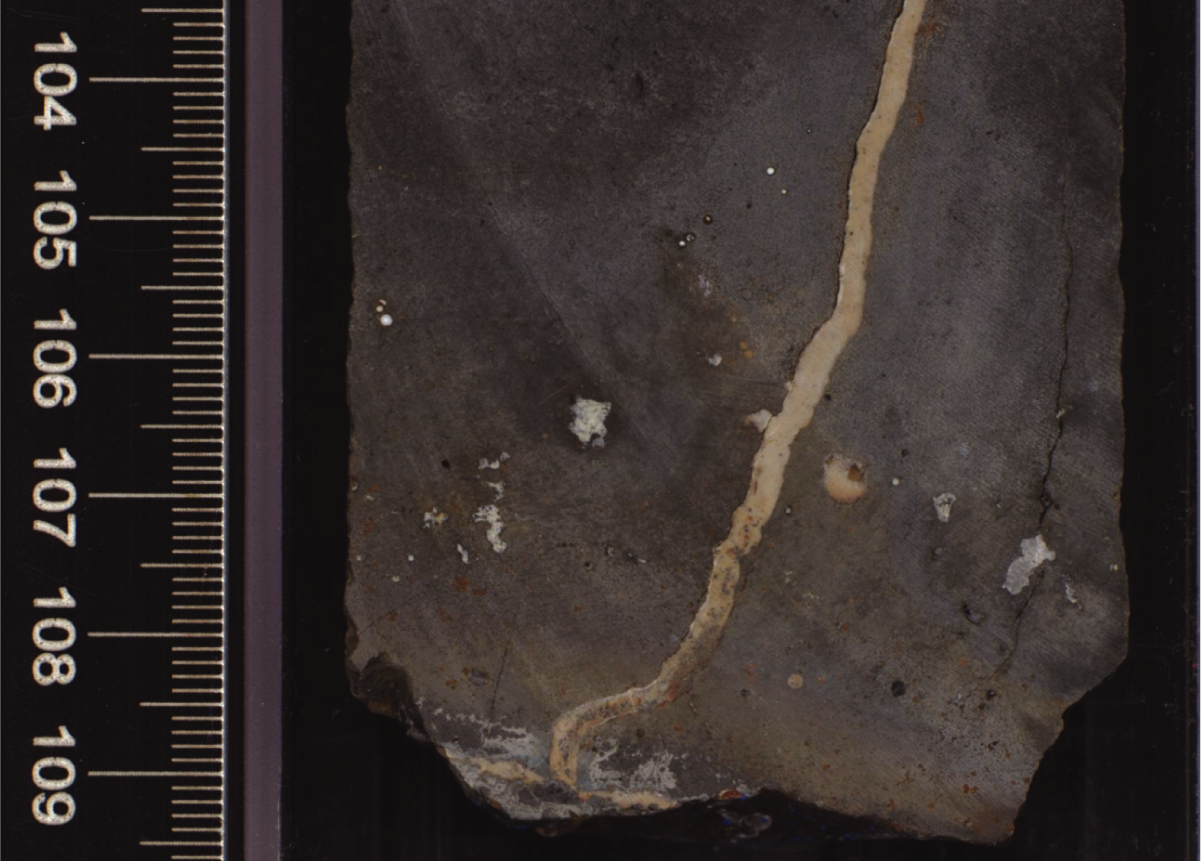
Figure F26. Carbonate sediment filling basalt fractures and vesicles.
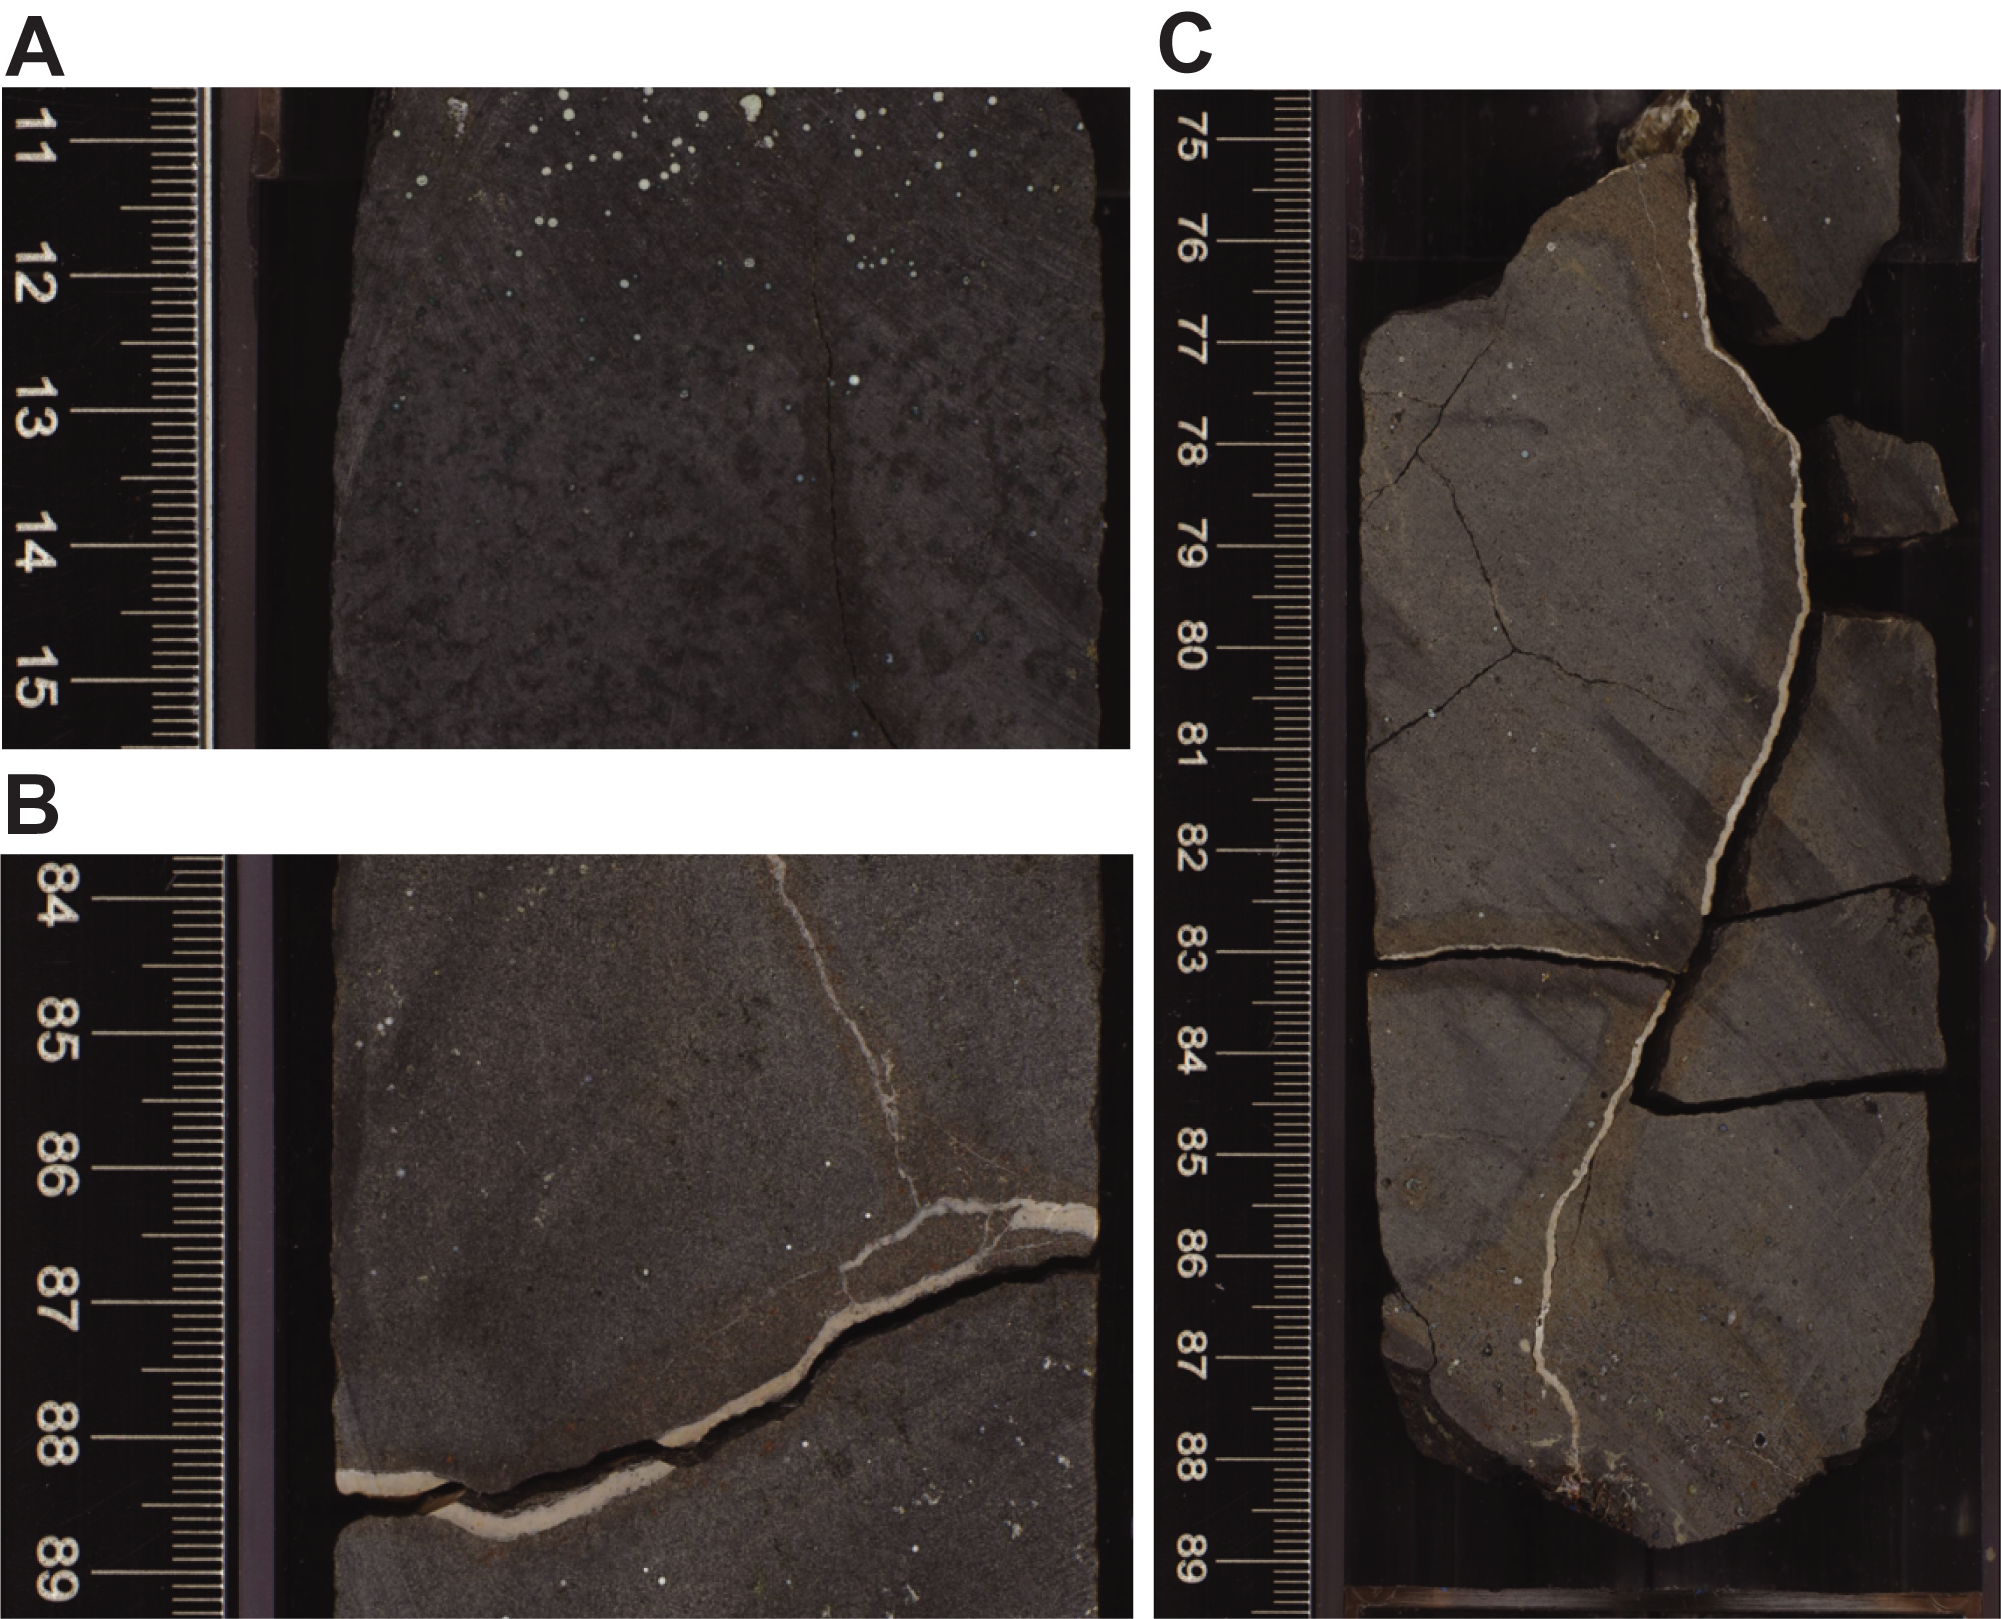
Figure F27. Alteration halos.
6. Micropaleontology
At Site U1554, a 647 m interval of upper Miocene to upper Pleistocene silty clay and nannofossil chalk was recovered across multiple holes. Micropaleontological analyses were undertaken on samples cored during Expedition 395C, which recovered sediments in Hole U1554E from 66 to 647.7 m CSF-A. Analyses were also carried out on samples from Hole U1554G, which was drilled during Expedition 395 and recovered core from 0 to 354.97 m CSF-A. Cores from both holes were recovered using the APC and XCB systems; the HLAPC was deployed in Hole U1554G. In Hole U1554E, basement was encountered at ~647 m CSF-A in Core 62X, which contains 1 m of basalt interlayered with carbonate sediment. Samples from the upper portion of an expanded Pleistocene succession (to 354.97 m CSF-A) were analyzed for micropaleontology from Holes U1554G and U1554E. Below this level, only samples from Hole U1554E are available for study. Biohorizons used in the age model are based on calcareous nannoplankton, planktonic foraminifers, and bolboforms. Calcareous nannofossils and planktonic foraminifers are present in varying abundances from barren or nearly barren samples to those with very high abundances, most likely reflecting glacial–interglacial variability in temperatures, salinity, and/or ice cover in the Quaternary part of the succession. Bolboforms, when present, are always rare or few.
6.1. Calcareous nannofossils
A total of 60 core catcher samples from Hole U1554E and 54 core catcher and within-section samples from Hole U1554G were studied for calcareous nannofossils. Observations were undertaken using plane-polarized light (PPL), cross-polarized light (XPL), and circular-polarized light. A list of calcareous nannofossil bioevents is provided in Table T5. Calcareous nannofossils are present in most samples with differing abundances alternating in intervals downcore (from few to dominant). In a distinct interval between Samples 395C-U1554E-33X-CC (373.46 m CSF-A) and 40X-CC (441.59 m CSF-A), five out of seven samples are barren of nannofossils. Preservation is mostly very good in the upper ~255 m with occasional intervals of moderate preservation, but it becomes good to moderate with some intervals of poor preservation deeper in the succession.
Samples from the expanded Pleistocene succession recovered in Hole U1554G show distinct changes in the abundance of nannofossils and their species composition downcore. The uppermost core catcher sample (1H-CC; 5.38 m CSF-A) contains abundant Emiliania huxleyi (confirmed with scanning electron microscope [SEM] observations) with few small Gephyrocapsa species, Coccolithus pelagicus, and Calcidiscus leptoporus. The base common E. huxleyi biohorizon (0.09 Ma) is located between Samples 1H-CC (5.38 m CSF-A) and 2H-CC (15.24 m CSF-A), and the biohorizon base E. huxleyi (0.29 Ma) is placed between Samples 5H-CC (43.91 m CSF-A) and 6H-CC (53.26 m CSF-A), as confirmed by shipboard SEM observations. Between these biohorizons, the biohorizon top acme Gephyrocapsa caribbeanica (0.28 Ma) is identified with light microscope (XPL and circular-polarized light) observations between Samples 4H-CC (34.43 m CSF-A) and 5H-CC (43.91 m CSF-A). Samples 3H-CC (24.69 m CSF-A) to 5H-CC (43.91 m CSF-A) have notably lower nannofossil abundance (few) than the intervals above, where nannofossils are common (Samples 1H-CC [5.38 m CSF-A] and 2H-CC [15.24 m CSF-A]). Nannofossils are dominant in the layers immediately below this interval (mostly G. caribbeanica), between Samples 6H-CC (53.26 m CSF-A) and 8H-CC (72.38 m CSF-A). The biohorizon top Pseudoemiliania lacunosa (0.43 Ma) is placed between Samples 7H-CC (62.93 m CSF-A) and 8H-CC (72.38 m CSF-A). The biohorizon top Reticulofenestra asanoi (0.91 Ma) is constrained between Samples 13H-2, 120 cm (110.60 m CSF-A), and 13H-CC (117.88 m CSF-A), and the base common occurrence of the same species (1.14 Ma) is placed between Samples 16H-CC (146.25 m CSF-A) and 17H-CC (155.79 m CSF-A). The biohorizon top Helicosphaera sellii (1.24 Ma) is placed between Samples 18H-6, 110 cm (163.88 m CSF-A), and 18H-CC (165.36 m CSF-A). Close to this biohorizon, and calibrated to be within 10 ky, top Gephyrocapsa >5.5 µm (1.25 Ma) was observed between Samples 17H-CC (155.79 m CSF-A) and 18H-6, 110 cm (163.88 m CSF-A). Three more Pleistocene biohorizons were identified in Hole U1554G, namely the base Gephyrocapsa >5.5 µm (1.59 Ma) between Samples 20H-CC (184.00 m CSF-A) and 21H-2, 68 cm (186.05 m CSF-A); top Calcidiscus macintyrei (1.60 Ma) between Samples 23H-CC (212.90 m CSF-A) and 24H-CC (222.34 m CSF-A); and base Gephyrocapsa >4 µm (1.71 Ma) between Samples 25H-CC (231.82 m CSF-A) and 26H-CC (234.96 m CSF-A).
In the Pliocene, top Reticulofenestra pseudoumbilicus (3.82 Ma) was the only identified biohorizon, mainly due to the low abundance or total absence of low- to midlatitude marker species of the genera Ceratolithus, Amaurolithus, and Discoaster. Top R. pseudoumbilicus is placed between Samples 395C-U1554E-51X-CC (547.89 m CSF-A) and 52X-CC (557.92 m CSF-A). In the upper Miocene, three biohorizons are identified. First, the top (7.10 Ma) and base (8.80 Ma) R. pseudoumbilicus paracme are respectively placed between Samples 55X-CC (586.87 m CSF-A) and 56X-CC (596.79 m CSF-A) and Samples 57X-CC (606.04 m CSF-A) and 58X-CC (616.02 m CSF-A). Finally, the biohorizon top Coccolithus miopelagicus (11.04 Ma) was identified in Hole U1554E between Samples 60X-CC (627.21 m CSF-A) and 61X-CC (645.18 m CSF-A), constraining the bottom of the hole to be older than 11.04 Ma.
6.2. Planktonic foraminifers
The planktonic foraminifer biostratigraphy at Site U1554 is based on shipboard analysis of 39 core catcher samples from Hole U1554G and 74 samples from Hole U1554E, the latter of which were studied in the micropaleontology laboratory at University College London (UK). Analysis of Hole U1554E samples focused on the interval from 500 m CSF-A to the bottom of the hole, including three samples per section of core that were taken to supplement the core catcher samples. A list of planktonic foraminifer bioevents is provided in Table T6.
Planktonic foraminifers are dominant or abundant in most sample residues, with four general exceptions: first, where quartz grains and rock fragments dominate (interpreted as glaciogenic deposits, e.g., Sample 395C-U1554E-26X-CC [302.80 m CSF-A]); second, where pyrite fragments dominate (possibly indicating diagenetic dissolution adjacent to nodules, e.g., Sample 42X-CC [460.87 m CSF-A]); third, where glass (tephra) dominates (interpreted as ash beds, e.g., Sample 48X-1, 79–80 cm [510.09 m CSF-A]); and fourth, where glauconite and/or phosphate dominate (possibly indicating sediment redistribution, with several samples in Core 59X [616.00–624.80 m CSF-A]). Preservation is mostly excellent or very good throughout Hole U1554E and in Hole U1554G from the top of the hole to Sample 57X-CC (606 m CSF-A). Below that depth, foraminifers are mostly infilled with diagenetic calcite, but their preservation is still evaluated as good to the lowermost sample examined, Sample 395C-U1554E-61X-CC (645.18 m CSF-A).
Sample 395-U1554G-1H-1, 0 cm, was taken from the mudline. It features a moderately diverse assemblage with the coarse fraction containing common Globigerina bulloides in association with few to rare Globigerina umbilicata and Globigerina cariacoensis, few Globoconella inflata, and rare Globorotalia scitula. Neogloboquadrinids are rare, including larger specimens assigned to Neogloboquadrina dutertrei, as well as dextral Neogloboquadrina incompta and sinistral Neogloboquadrina pachyderma. The fine fraction is dominated by the microperforate species Globigerinita glutinata and Globigerinita uvula with few Turborotalita quinqueloba.
N. pachyderma is common to abundant in most samples examined in Hole U1554G to Sample 23H-CC (212.90 m CSF-A), which are therefore assigned to the N. pachyderma Zone. Assemblages in this interval vary markedly between those dominated by N. pachyderma, often with common quartz and rock fragments interpreted as ice-rafted debris (IRD), and those with more diverse assemblages and little or no IRD, similar to the mudline sample. This variation is attributed to glacial–interglacial cyclicity. The bottom common occurrence of sinistral encrusted N. pachyderma (1.82 Ma), which marks the base of the N. pachyderma Zone, is between Samples 25H-CC (231.82 m CSF-A) and 27H-CC (250.92 m CSF-A) and occurs at a correlative level in Hole U1554E between Samples 18X-CC (227.84 m CSF-A) and 20X-CC (247.27 m CSF-A).
The base of G. inflata (2.06 Ma), marking the base of the G. inflata Zone, is located in Hole U1554E between Samples 24X-CC (285.83 m CSF-A) and 26X-CC (302.80 m CSF-A), with the lower sample, immediately below this datum, dominated by quartz with frequent rock fragments, interpreted as indicating an early Pleistocene glaciation.
Species of the genus Globigerina have a patchy distribution in the succession at Site U1554. The bases of both G. cariacoensis and G. umbilicata are defined by rare occurrences of morphotypes that intergrade with G. bulloides, and although the bioevents are biostratigraphically useful at low resolution, they are difficult to constrain precisely because they rely on somewhat subjective criteria for separating the taxa.
The top of Neogloboquadrina atlantica (2.26 Ma), which defines the base of the G. bulloides partial range zone, is between Samples 395C-U1554E-32X-CC (363.88 m CSF-A) and 36X-CC (402.63 m CSF-A). The intervening Sample 34X-CC (383.24 m CSF-A) is dominated by quartz and rock fragments with very scarce foraminifers. Sample 38X-CC (422.09 m CSF-A) is the lowest in the record that has abundant quartz and rock fragments interpreted as IRD. It has long been recognized that the topmost N. atlantica corresponds approximately to the first pronounced glacial phase in the area (Berggren, 1972; Poore and Berggren, 1975).
A change in the nature of the micropaleontological residues occurs between Samples 395C-U1554E-50X-1, 105–107 cm (529.75 m CSF-A), and 50X-3, 57–59 cm (531.87 m CSF-A), below which glauconite tends to be dominant or abundant to Sample 60X-CC (627.21 m CSF-A). Five glassy spherules (two blue, two green, and one brown) between 150 and 300 µm in diameter were found in the residue of Sample 50X-CC (532.19 m CSF-A). The spherules show apparent surface craters that are consistent with the morphology of known impact spherules. It is likely they are reworked because they occur in a sample with large amounts of glauconite, which may be redeposited.
The important index species Globoconella puncticulata, the lowest occurrence of which defines the base of the G. puncticulata/N. atlantica concurrent range zone, has a rare and patchy distribution in the upper part of its range but is consistently present in Samples 395C-U1554E-51X-1, 54–56 cm (538.94 m CSF-A) to 53X-2, 4–6 cm (559.77 m CSF-A). It is abundant in the latter sample but absent below it, from Sample 53X-CC (560.01 m CSF-A) downward. The first occurrence of G. puncticulata is often associated with the base Globorotalia crassaformis, but at this site the latter level occurs slightly lower, between Samples 53X-CC (560.01 m CSF-A) and 54X-1, 79–81 cm (568.29 m CSF-A), suggesting that there is a slight offset between these events as was previously detected at Deep Sea Drilling Project (DSDP) Site 606 (Weaver, 1987; see Micropaleontology in the Expedition 395 methods chapter [Parnell-Turner et al., 2025a]).
The succession from Sample 395C-U1554E-54X-1, 79–81 cm (568.29 m CSF-A), to Sample 57X-CC (606.04 m CSF-A) is dominated by sinistrally coiled N. atlantica. Below that, the coiling ratio fluctuates significantly with some dextrally dominant or random samples, with a coiling shift that may be useful for biostratigraphy (Figure F28; Table T7) (see discussion in Weaver, 1987; Flower, 1999).
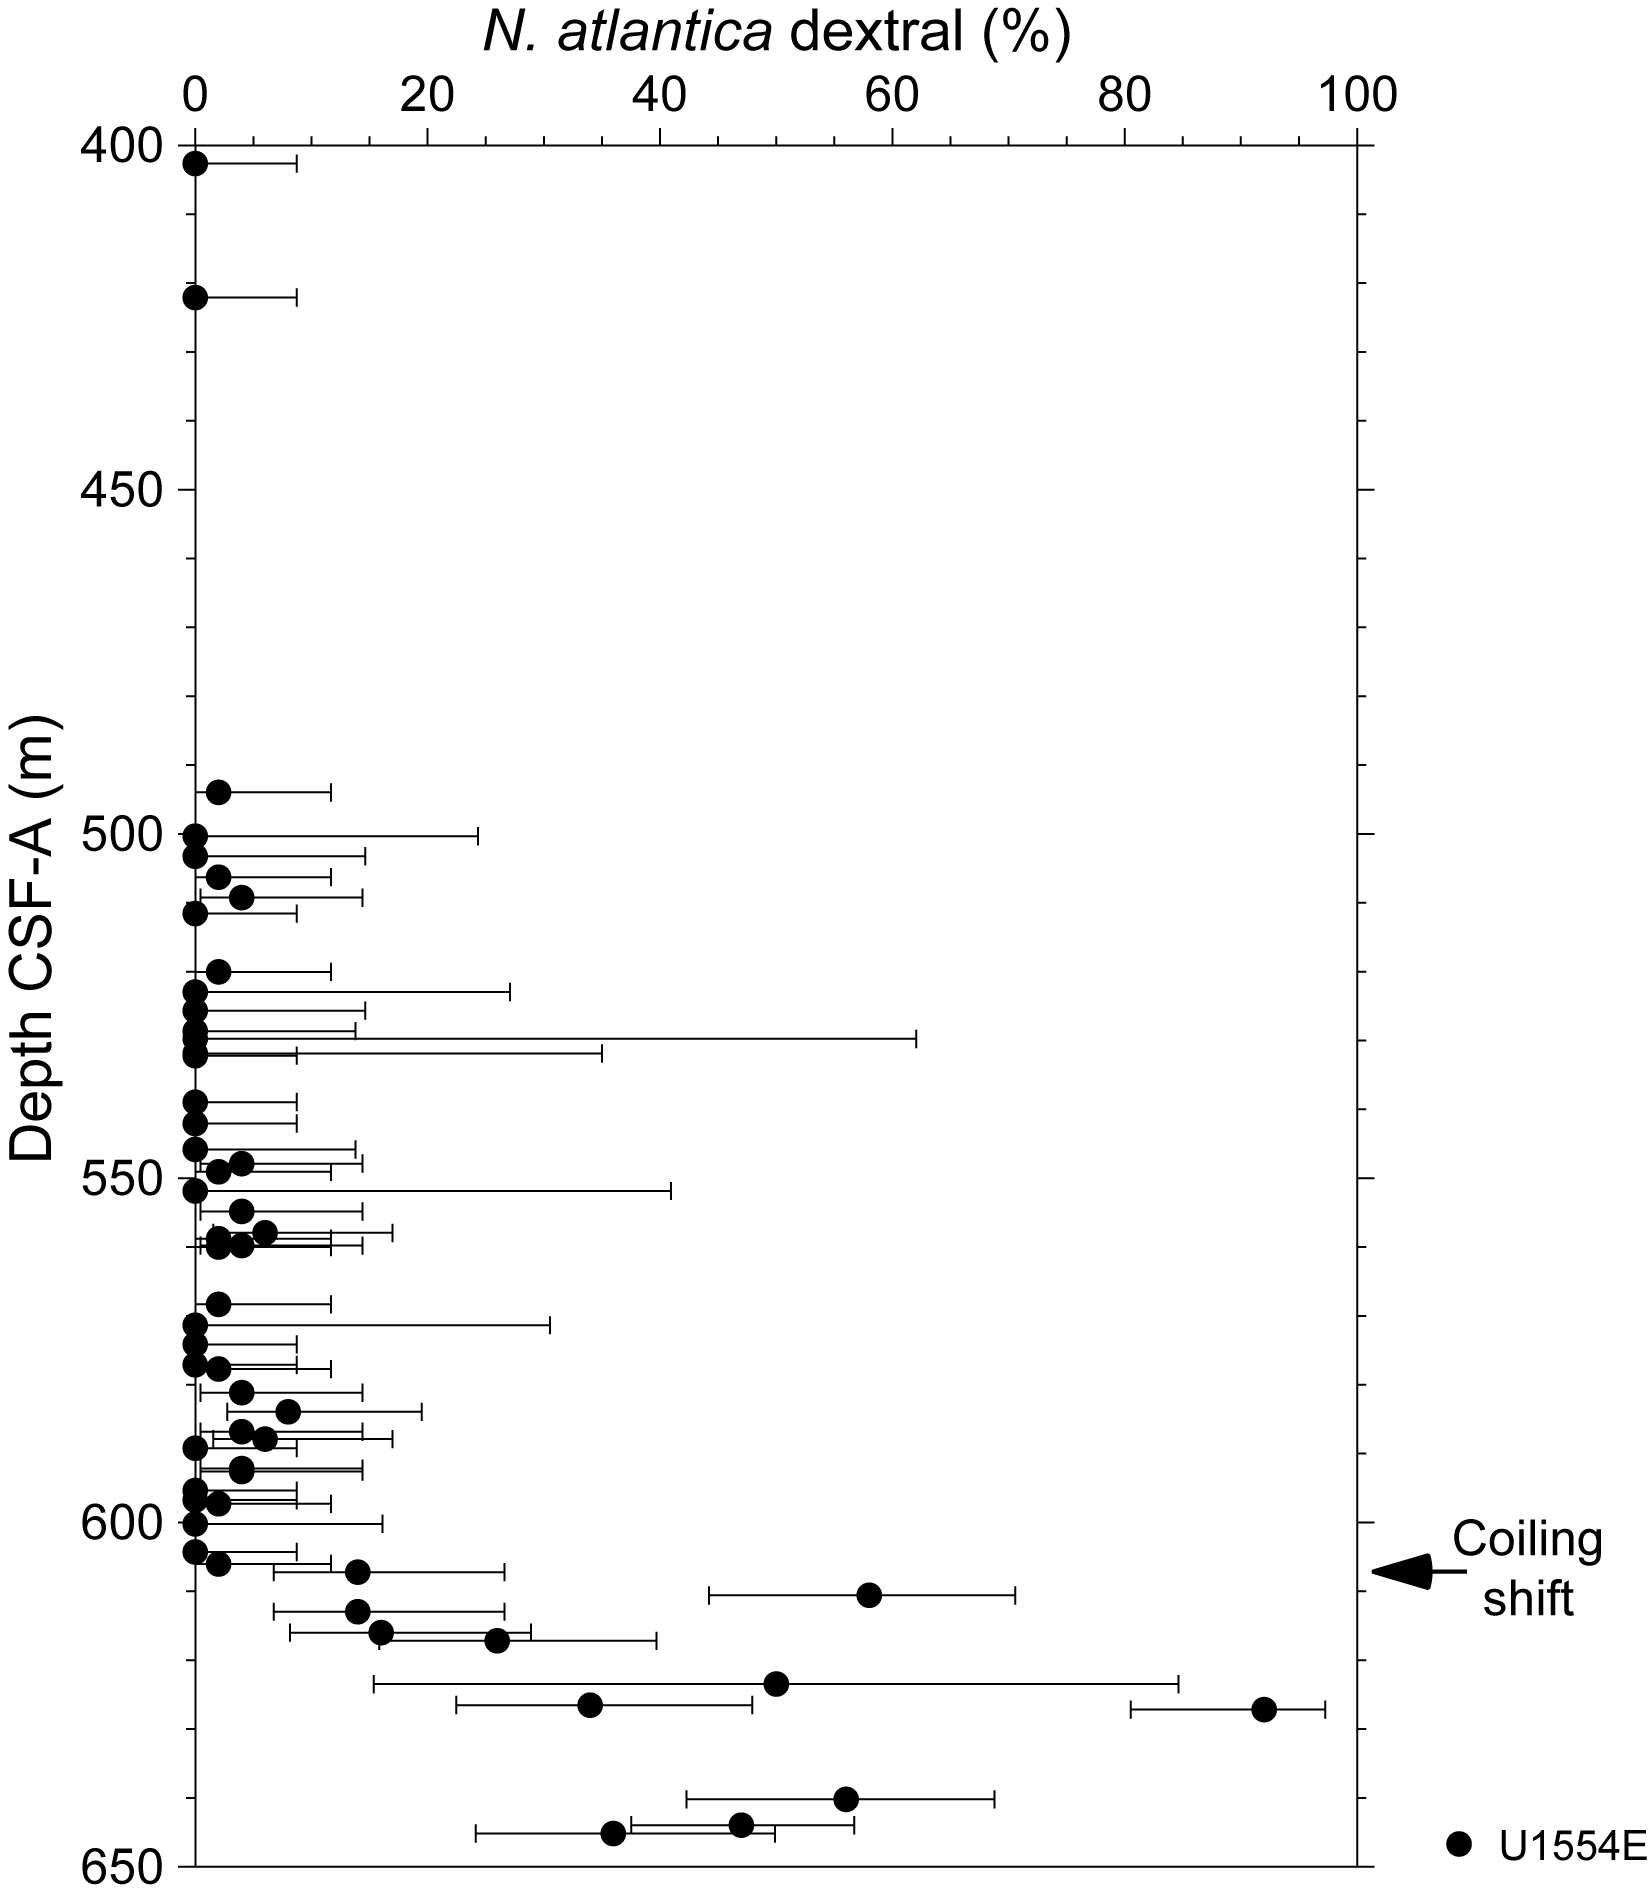
Figure F28. N. atlantica coiling ratios.
Globorotalia cibaoensis occurs in a sequence of samples from Sample 395C-U1554E-56X-6, 98–100 cm (595.38 m CSF-A), to Sample 59X-1, 122–124 cm (617.22 m CSF-A), with a lowest occurrence between Samples 59X-1, 122–124 cm (617.22 m CSF-A), and 59X-3, 136–138 cm (620.37 m CSF-A), that may provide some biostratigraphic control but with low confidence because the taxon is always rare and not very distinctive with respect to other Globorotalia in the same interval.
A notable change in assemblage occurs between Samples 395C-U1554E-60X-1, 83–85 cm (626.53 m CSF-A), and 60X-CC (627.21m CSF-A), which coincides with base G. bulloides sensu stricto and below which N. atlantica has a less well-developed morphology similar to the primitive N. atlantica of Poore (1979) or N. atlantica praeatlantica of Foresi et al. (2002).
The top of Paragloborotalia mayeri, marking the base of the Paragloborotalia continuosa partial range zone (10.54 Ma), occurs between Samples 395C-U1554E-60X-1, 83–85 cm (626.53 m CSF-A), and 60X-CC (627.21 m CSF-A). This species is distinguished by a high-arched aperture and strongly curved sutures on the spiral side. There are no specimens referable to the Paragloborotalia siakensis morphotype with straight sutures. Specimens with fewer than five chambers in the final whorl are potentially referable to the morphospecies Paragloborotalia acrostoma Wezel, although they are obviously part of the same population and were therefore not subdivided. P. mayeri has a sinistral dominance in the two samples examined at the bottom of the hole as is normal near the top of its stratigraphic range (e.g., Winter and Pearson, 2001).
The base of Neogloboquadrina acostaensis (10.57 Ma) is placed between Sample 395C-U1554E-61X-4, 32–34 cm (640.23 m CSF-A) and 61X-6, 106–108 cm (643.98 m CSF-A). The lowermost sample examined, Sample 61X-CC (645.18 m CSF-A), contains P. mayeri and N. atlantica in the absence of Fohsella fohsi and so can be assigned to the P. mayeri highest occurrence? zone with an estimated age of between 10.54 and 11.76 Ma.
6.3. Bolboforms
The bolboform biostratigraphy at Site U1554 is based on samples from Hole U1554E that were processed in the micropaleontology laboratory at University College London and studied shipboard during Expedition 395. A list of bolboform biohorizons is given in Table T8. Bolboforms occur in most samples from Sample 395C-U1554E-53X-2, 4–6 cm (559.77 m CSF-A), to the bottom of the hole, although specimens are always few or rare. The shallowest bolboforms encountered, in Samples 53X-2, 4–6 cm (559.77 m CSF-A), and 54X-3, 83–85 cm (571.33 m CSF-A), are of doubtful taxonomic affinity, and no species diagnostic of the uppermost Bolboforma costairregularis Zone were found. The top of Bolboforma intermedia (5.85 Ma), which marks the base of the B. costairregularis Zone, is identified between Samples 54X-CC (577.09 m CSF-A) and 55X-1, 49–51 cm (577.69 m CSF-A). Assemblages in the B. intermedia Zone are moderately diverse and include Bolboforma laevis, Bolboforma cf. gracireticulata, and Bolboforma cf. communis. The stratigraphic range of Bolboforma metzmacheri overlaps with B. intermedia. The top of B. metzmacheri (8.15 Ma) occurs between Samples 55X-5, 73–75 cm (583.96 m CSF-A), and 55X-CC (586.87 m CSF-A). The base of B. intermedia (8.18 Ma), which marks the base of the B. intermedia Zone, is between Samples 57X-1, 67–69 cm (597.27 m CSF-A), and 57X-3, 60–62 cm (600.20 m CSF-A). The base of B. metzmacheri (9.89 Ma), which marks the base of the B. metzmacheri Zone, is between Samples 59X-1, 122–124 cm (617.22 m CSF-A), and 61X-1, 17–19 cm (635.57 m CSF-A). The four samples studied from the lowermost core recovered in the hole, Core 61X, contain rare to few specimens of a distinctive form similar to that illustrated as Bolboforma sp. from the Miocene sequence of DSDP Site 604 (western North Atlantic) by Poag and Karowe (1986).
7. Physical properties
The suite of physical properties measurements made for Site U1554 is documented in Table T9. Physical properties data were collected on all cores, including limited measurements of thermal conductivity. Figures are not presented for Holes 384-U1554A through 384-U1554C (Blum et al., 2020) because they show variations similar to those in Holes 395-U1554G and 395-U1554H and are relatively short compared to the other holes at this site. Physical properties data were cleaned for half the response function corresponding to the instruments at the top and bottom of each section, and values deemed to be artifacts were removed from the respective figures (Table T10). All raw data are retained in the LIMS database.
7.1. Whole-round measurements
Figures F29, F30, F31, and F32 summarize data collected on whole-round cores measured using the Whole-Round Multisensor Logger (WRMSL) and the Natural Gamma Radiation Logger (NGRL) for Holes 395C-U1554E, 395C-U1554F, 395-U1554G, and 395-U1554H, respectively. Holes U1554E, U1554G, and U1554H were cored through the sedimentary succession at Site U1554, and in Hole U1554F the lowermost sediments, the sediment/basement interface, and basement basalts were cored (the latter starting at ~641 m CSF-A). Holes U1554E and U1554F recovered the lowermost sediments and basalt, and Holes U1554G and U1554H extended from the seafloor to ~350 m CSF-A. Data were cleaned for half the response function corresponding to the instruments at the top and bottom of each section, and values deemed to be artifacts were removed from the respective figures.
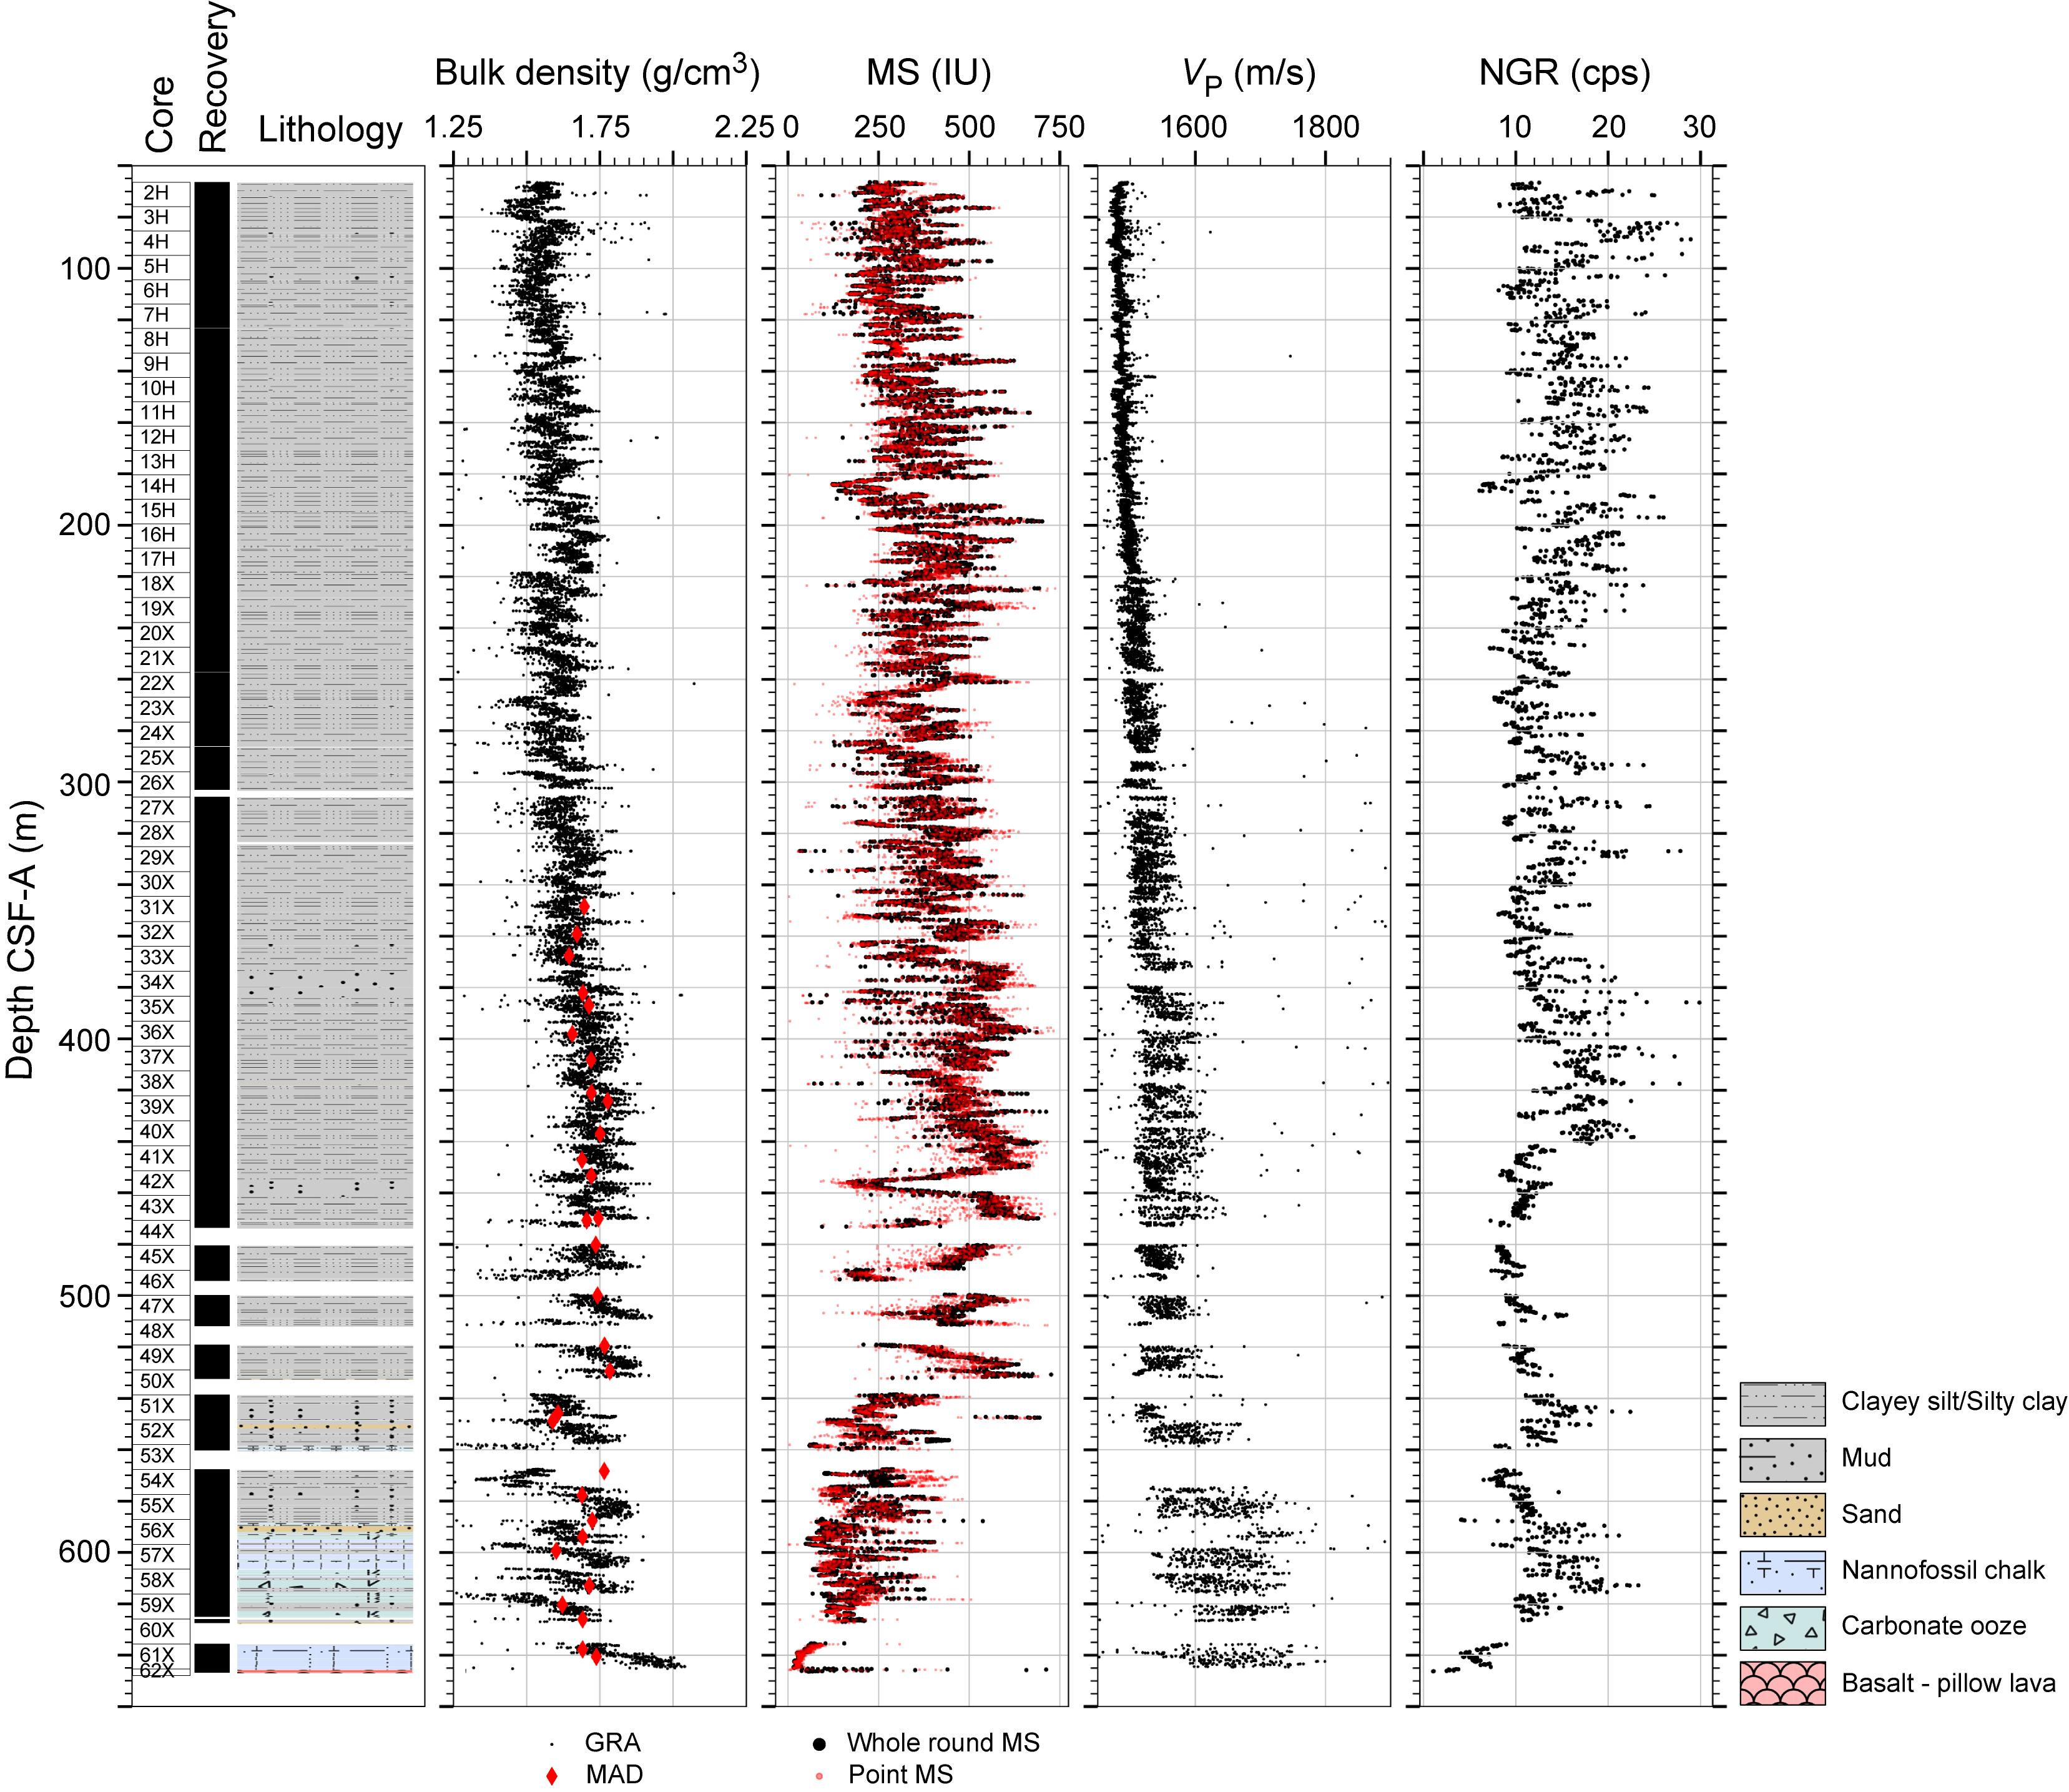
Figure F29. Physical properties measurements, Hole U1554E.
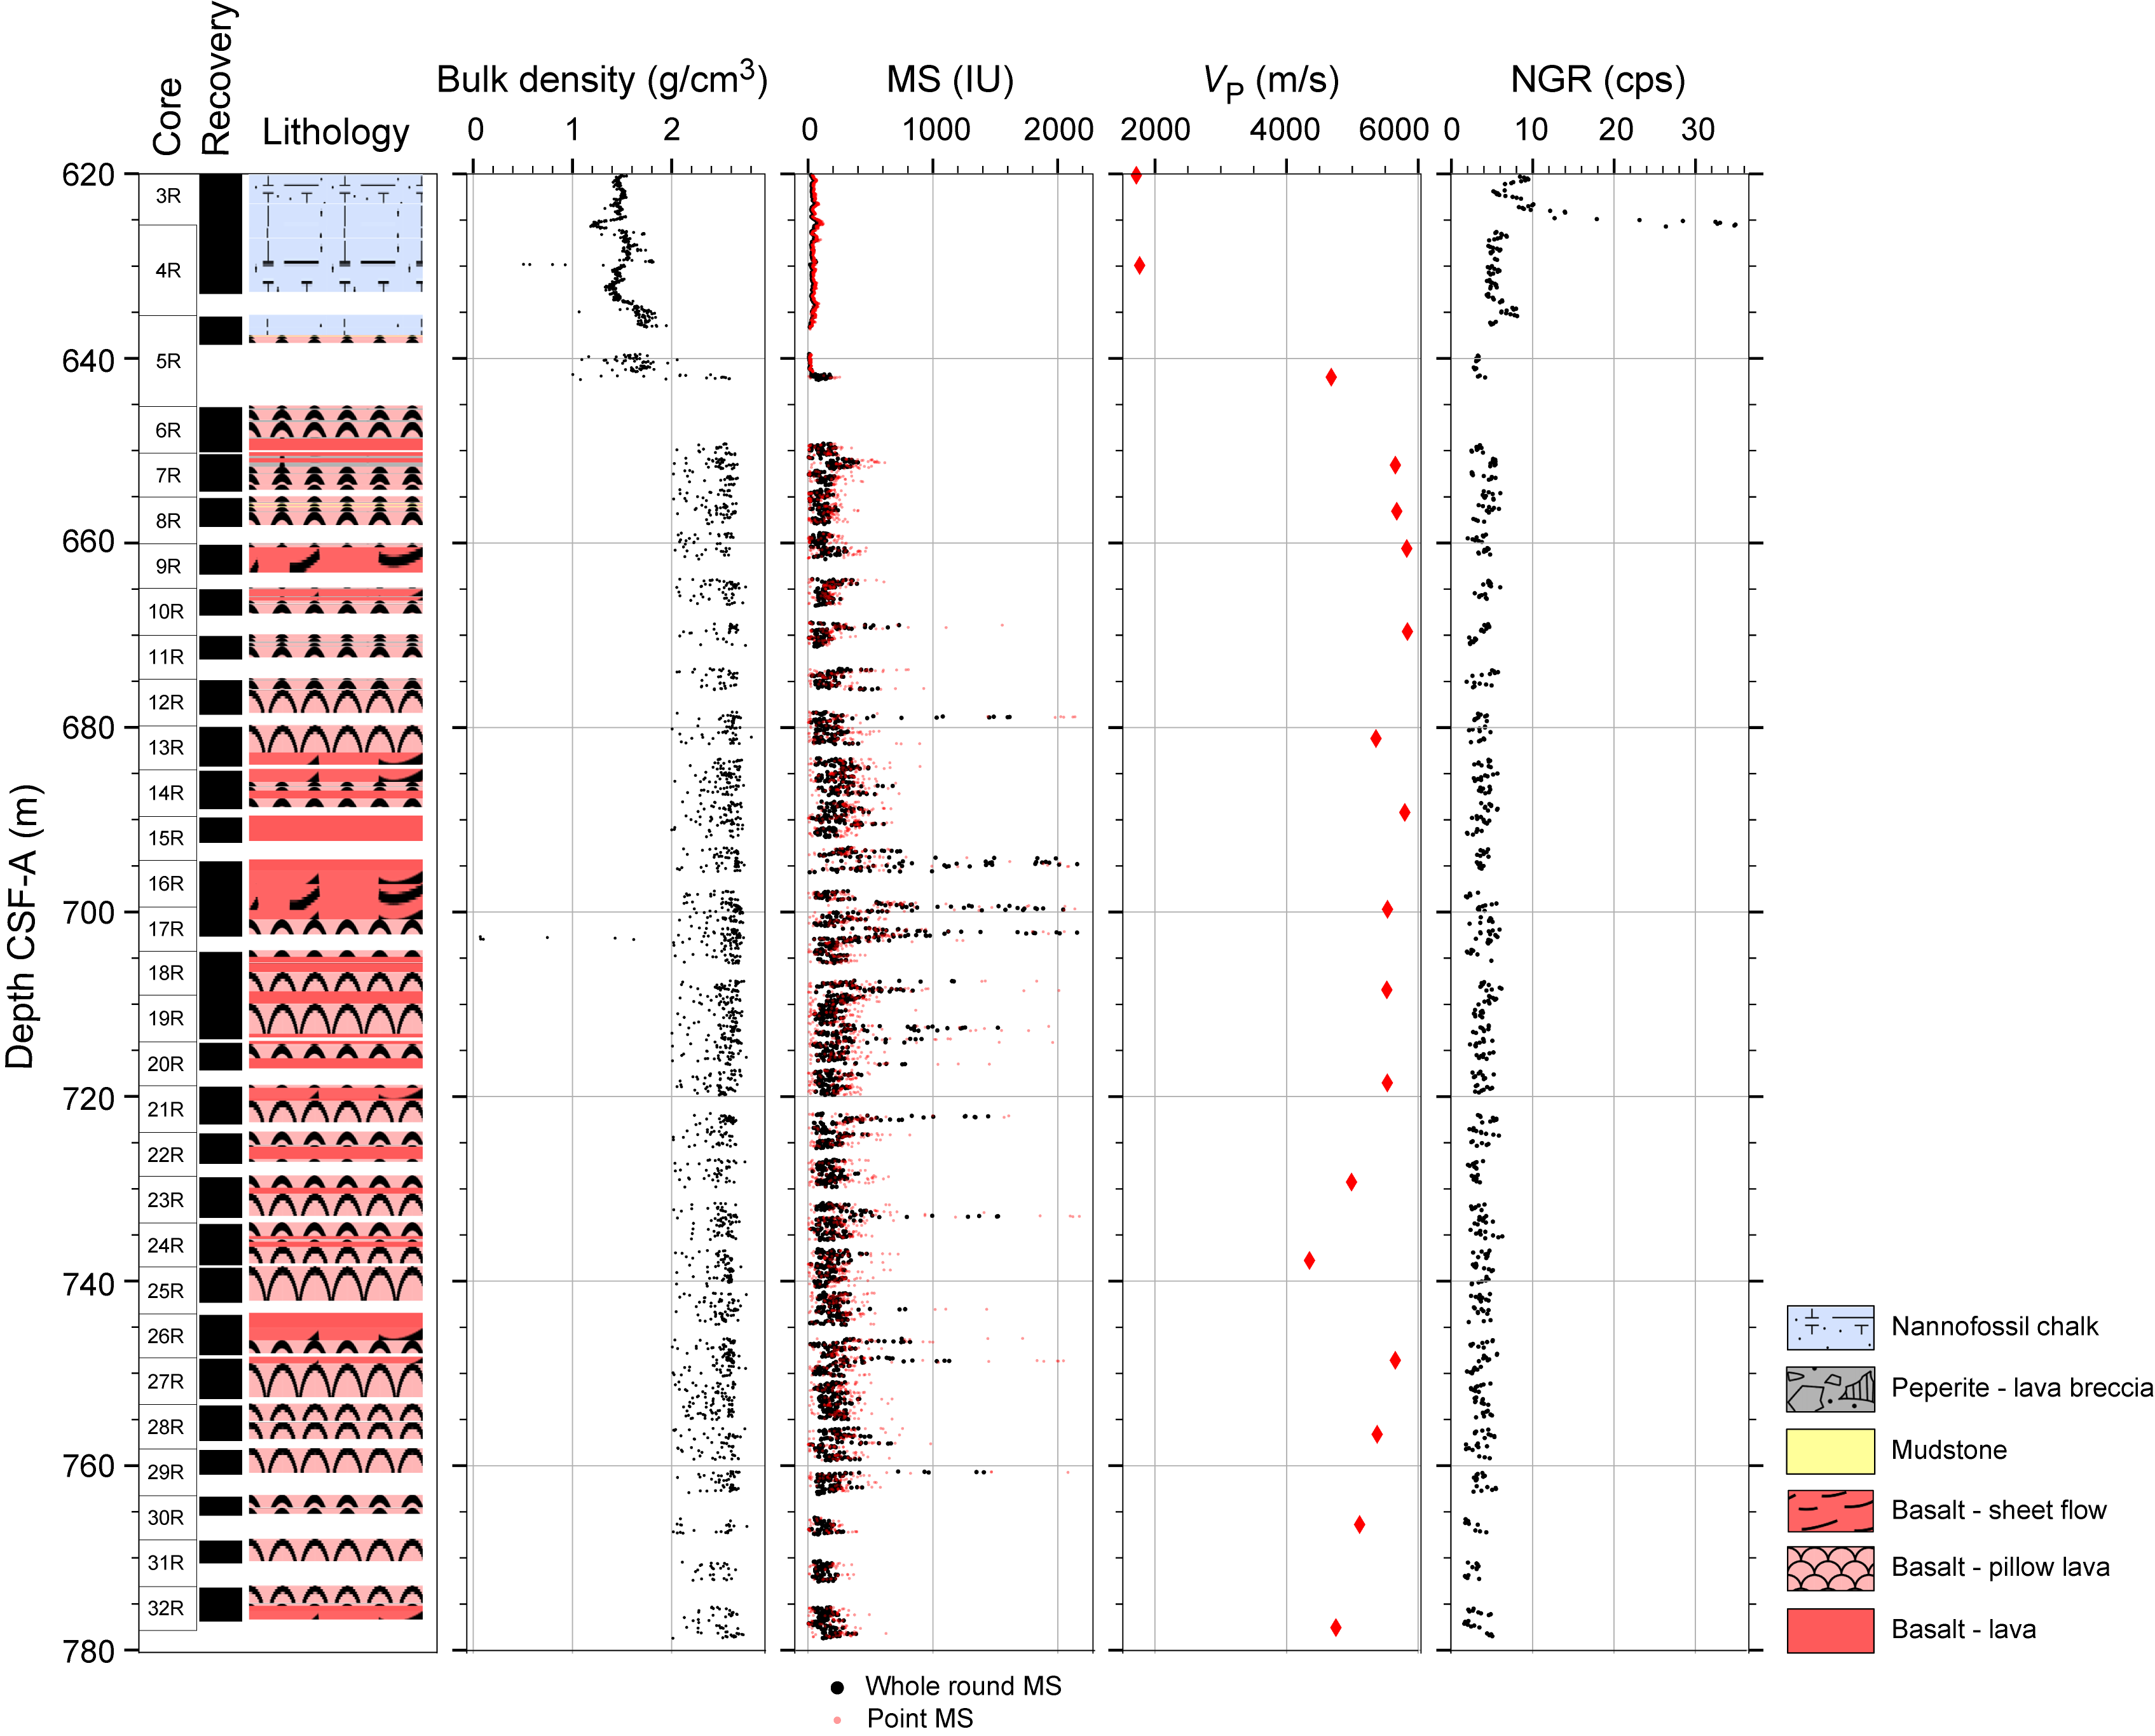
Figure F30. Physical properties measurements, Hole U1554F.
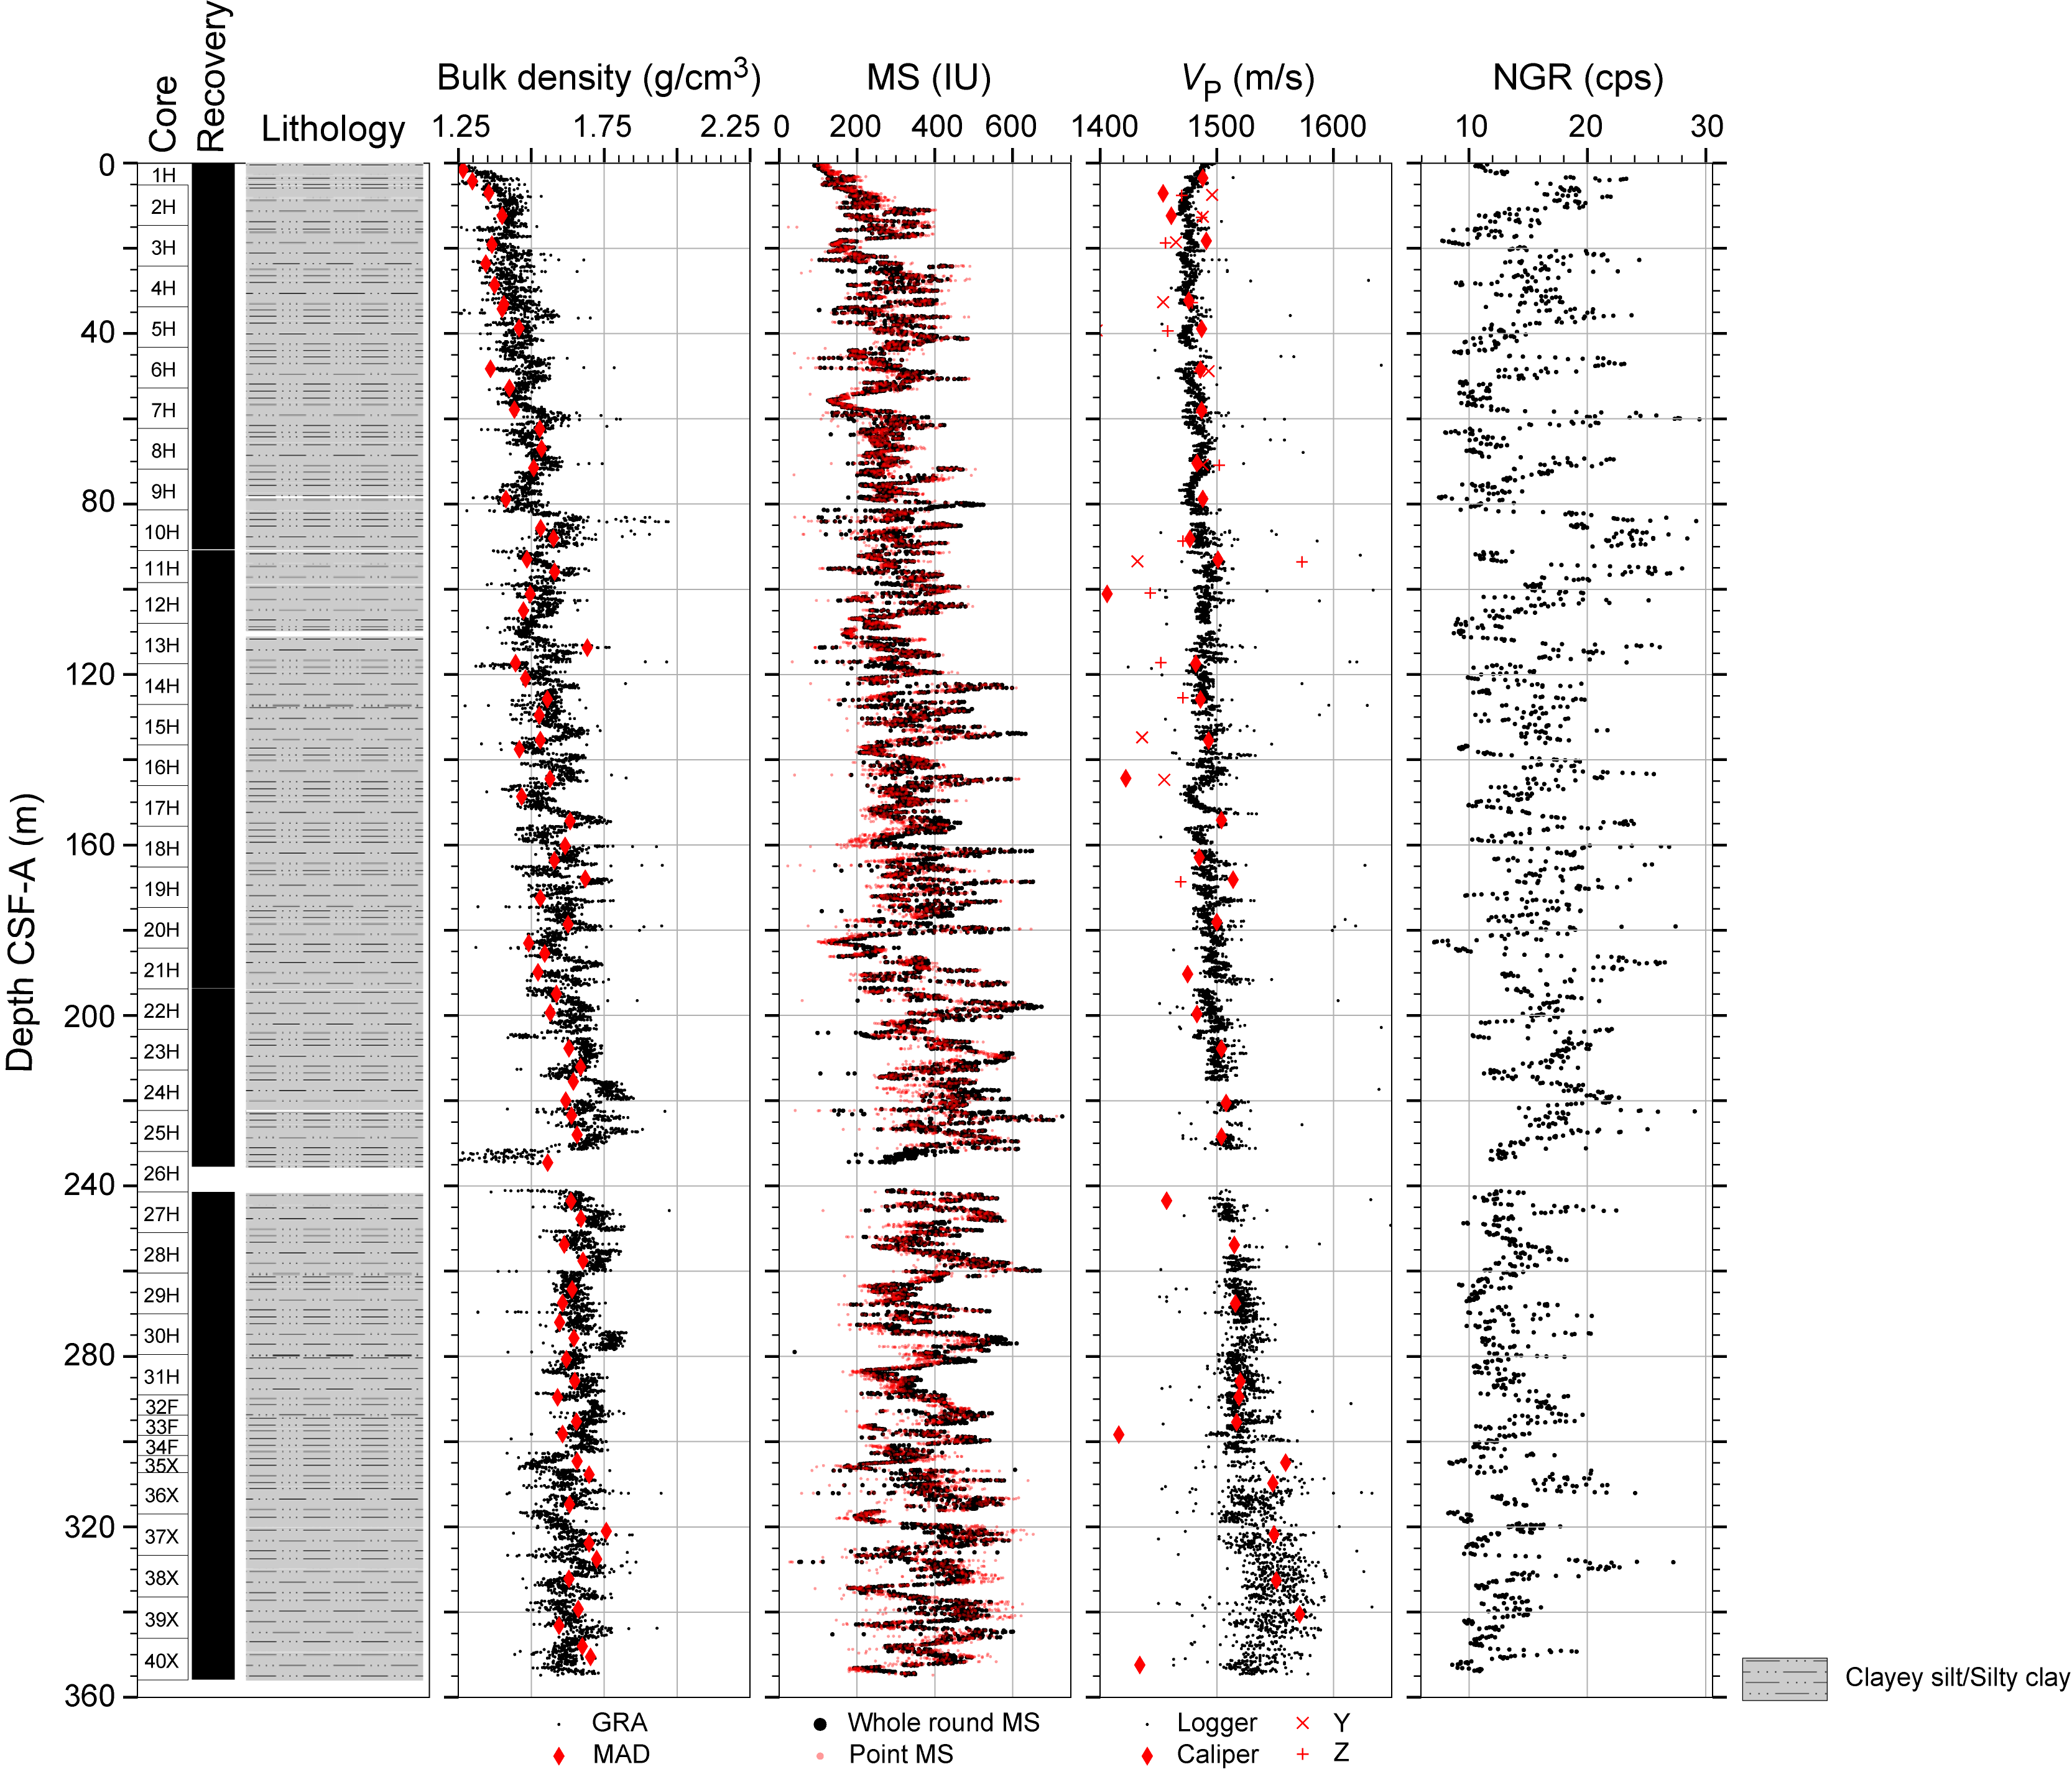
Figure F31. Physical properties measurements, Hole U1554G.
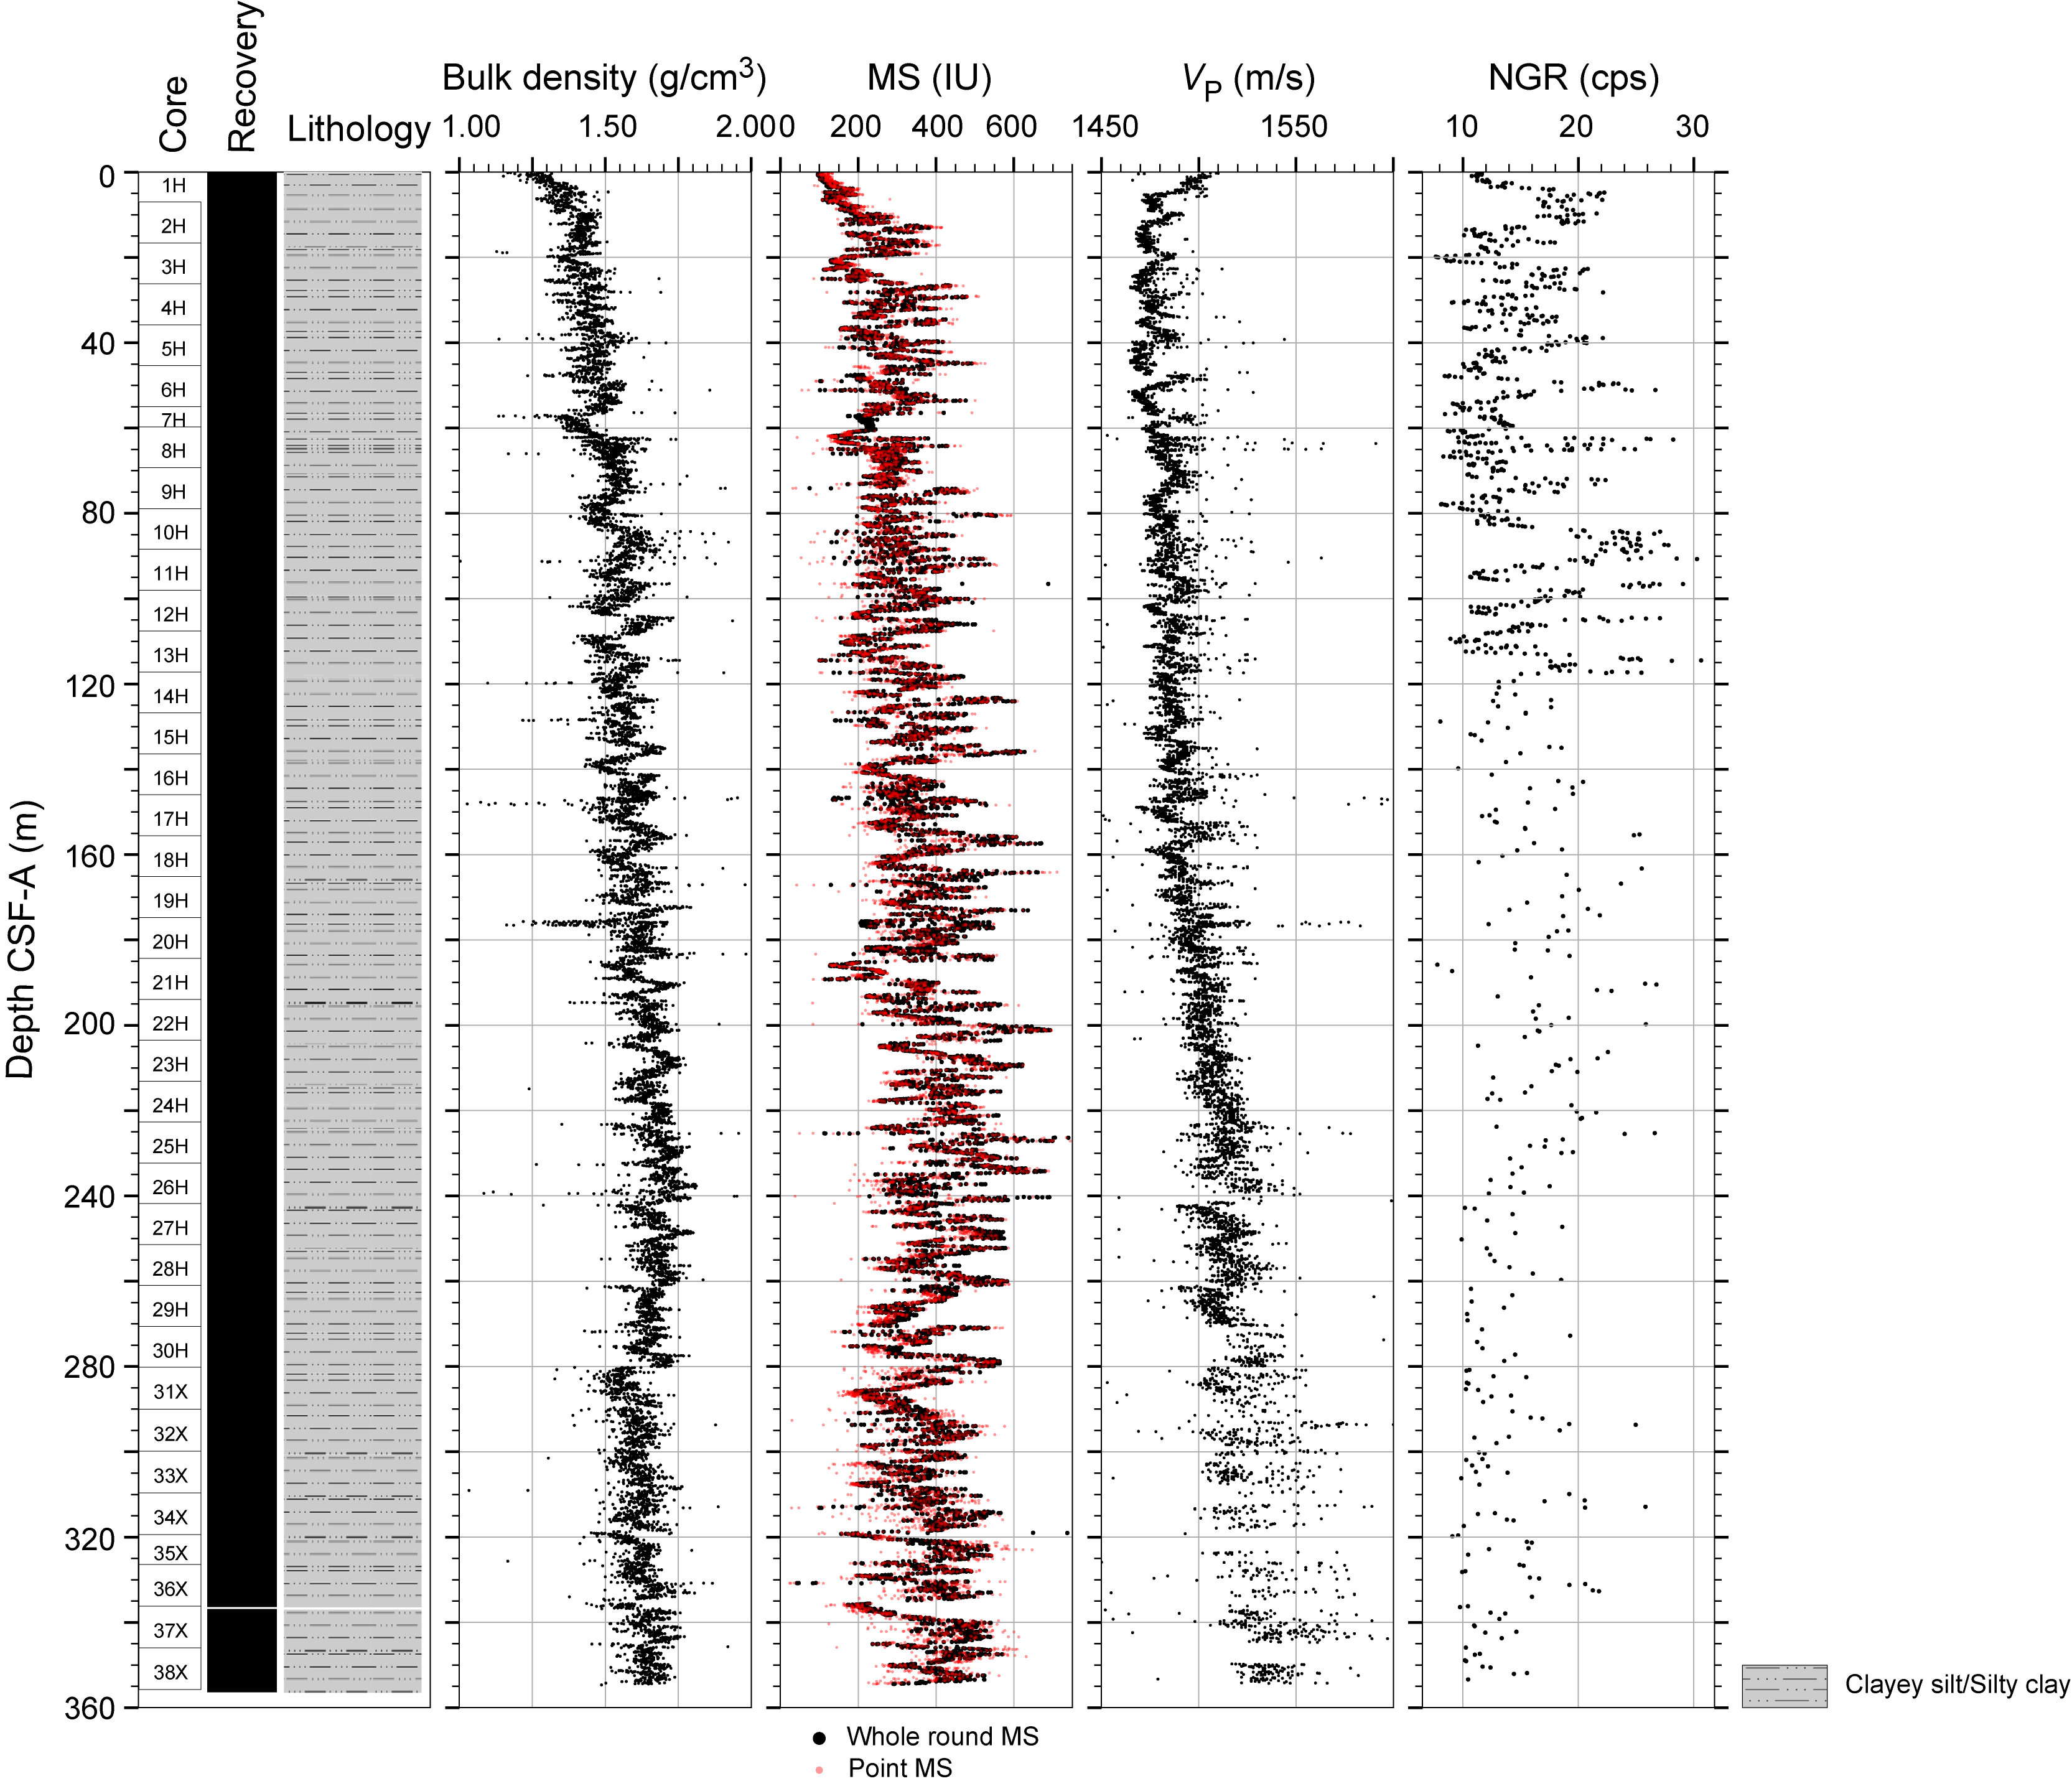
Figure F32. Physical properties measurements, Hole U1554H.
Bulk density broadly shows an increase from 1.4 to 1.8 g/cm3 from the seafloor to 450 m CSF-A (Figures F29, F31, F32). In this depth interval, density fluctuates with noticeable increases and decreases at ~85, 160, 180, 220, 260, 325, and 410 m CSF-A. Density measured from the moisture and density (MAD) discrete samples is consistent with the WRMSL bulk density measurements. Both WRMSL MS and NGR suggest similar oscillatory behavior to that observed in bulk density, where we observe changes from high to low values that become more pronounced below ~450 m CSF-A. P-wave velocity (VP) measured with the WRMSL and discretely with VP caliper (PWC) shows a gradual increase with depth. However, fluctuating cycles with tens of meters period of higher and lower VP values are seen along this trend (Figures F31, F32). Several core recovery gaps in Hole U1554E between 470 and 570 m CSF-A preclude more detailed observations of physical properties trends in this interval.
The deepest ~80 m interval of Hole U1554E (~570–647.7 m CSF-A) is characterized by large variations in bulk density, a trend that is also reflected in the MS data, color records (Figures F29, F33), and more variable lithology (see Lithostratigraphy and Stratigraphic correlation). The two deepest cores from Hole U1554E (61X and 62X), composed of nannofossil chalk, differ from the overlying sedimentary material, with higher bulk densities (more than 1.8 g/cm3), lower MS (<200 IU), and lower NGR (<10 counts/s; Figure F29). Recovery in Hole U1554F includes approximately 20 m of sediment (Cores 3R and 4R), which likely correspond to the deepest sediment recovered in Hole U1554E. The sediment/basement interface is located in Core 395C-U1554F-5R. The bulk density of these lowermost 20 m of sediments ranges 1.1–1.8 g/cm3 in Hole U1554F with a notable drop at ~625 m CSF-A that correlates with an increase in the gamma radiation readings (to >30 American Petroleum Institute gamma radiation units [gAPI] from a background level of <10 gAPI; Figure F30) (see Downhole measurements). Below the nannofossil chalk at the base of the sedimentary sequence, basalt basement was recovered in Cores 395C-U1554F-5R through 32R to ~780 m CSF-A (Figure F30). The bulk density measured on basalt cores averages around 2.5 g/cm3. However, incomplete fill of the core liners means the measured density is lower than the actual density throughout the basalt interval. MS in the basalts is more variable than the sediments at Site U1554, whereas gamma radiation measurements are remarkably consistent throughout the basalt interval (see Downhole measurements).
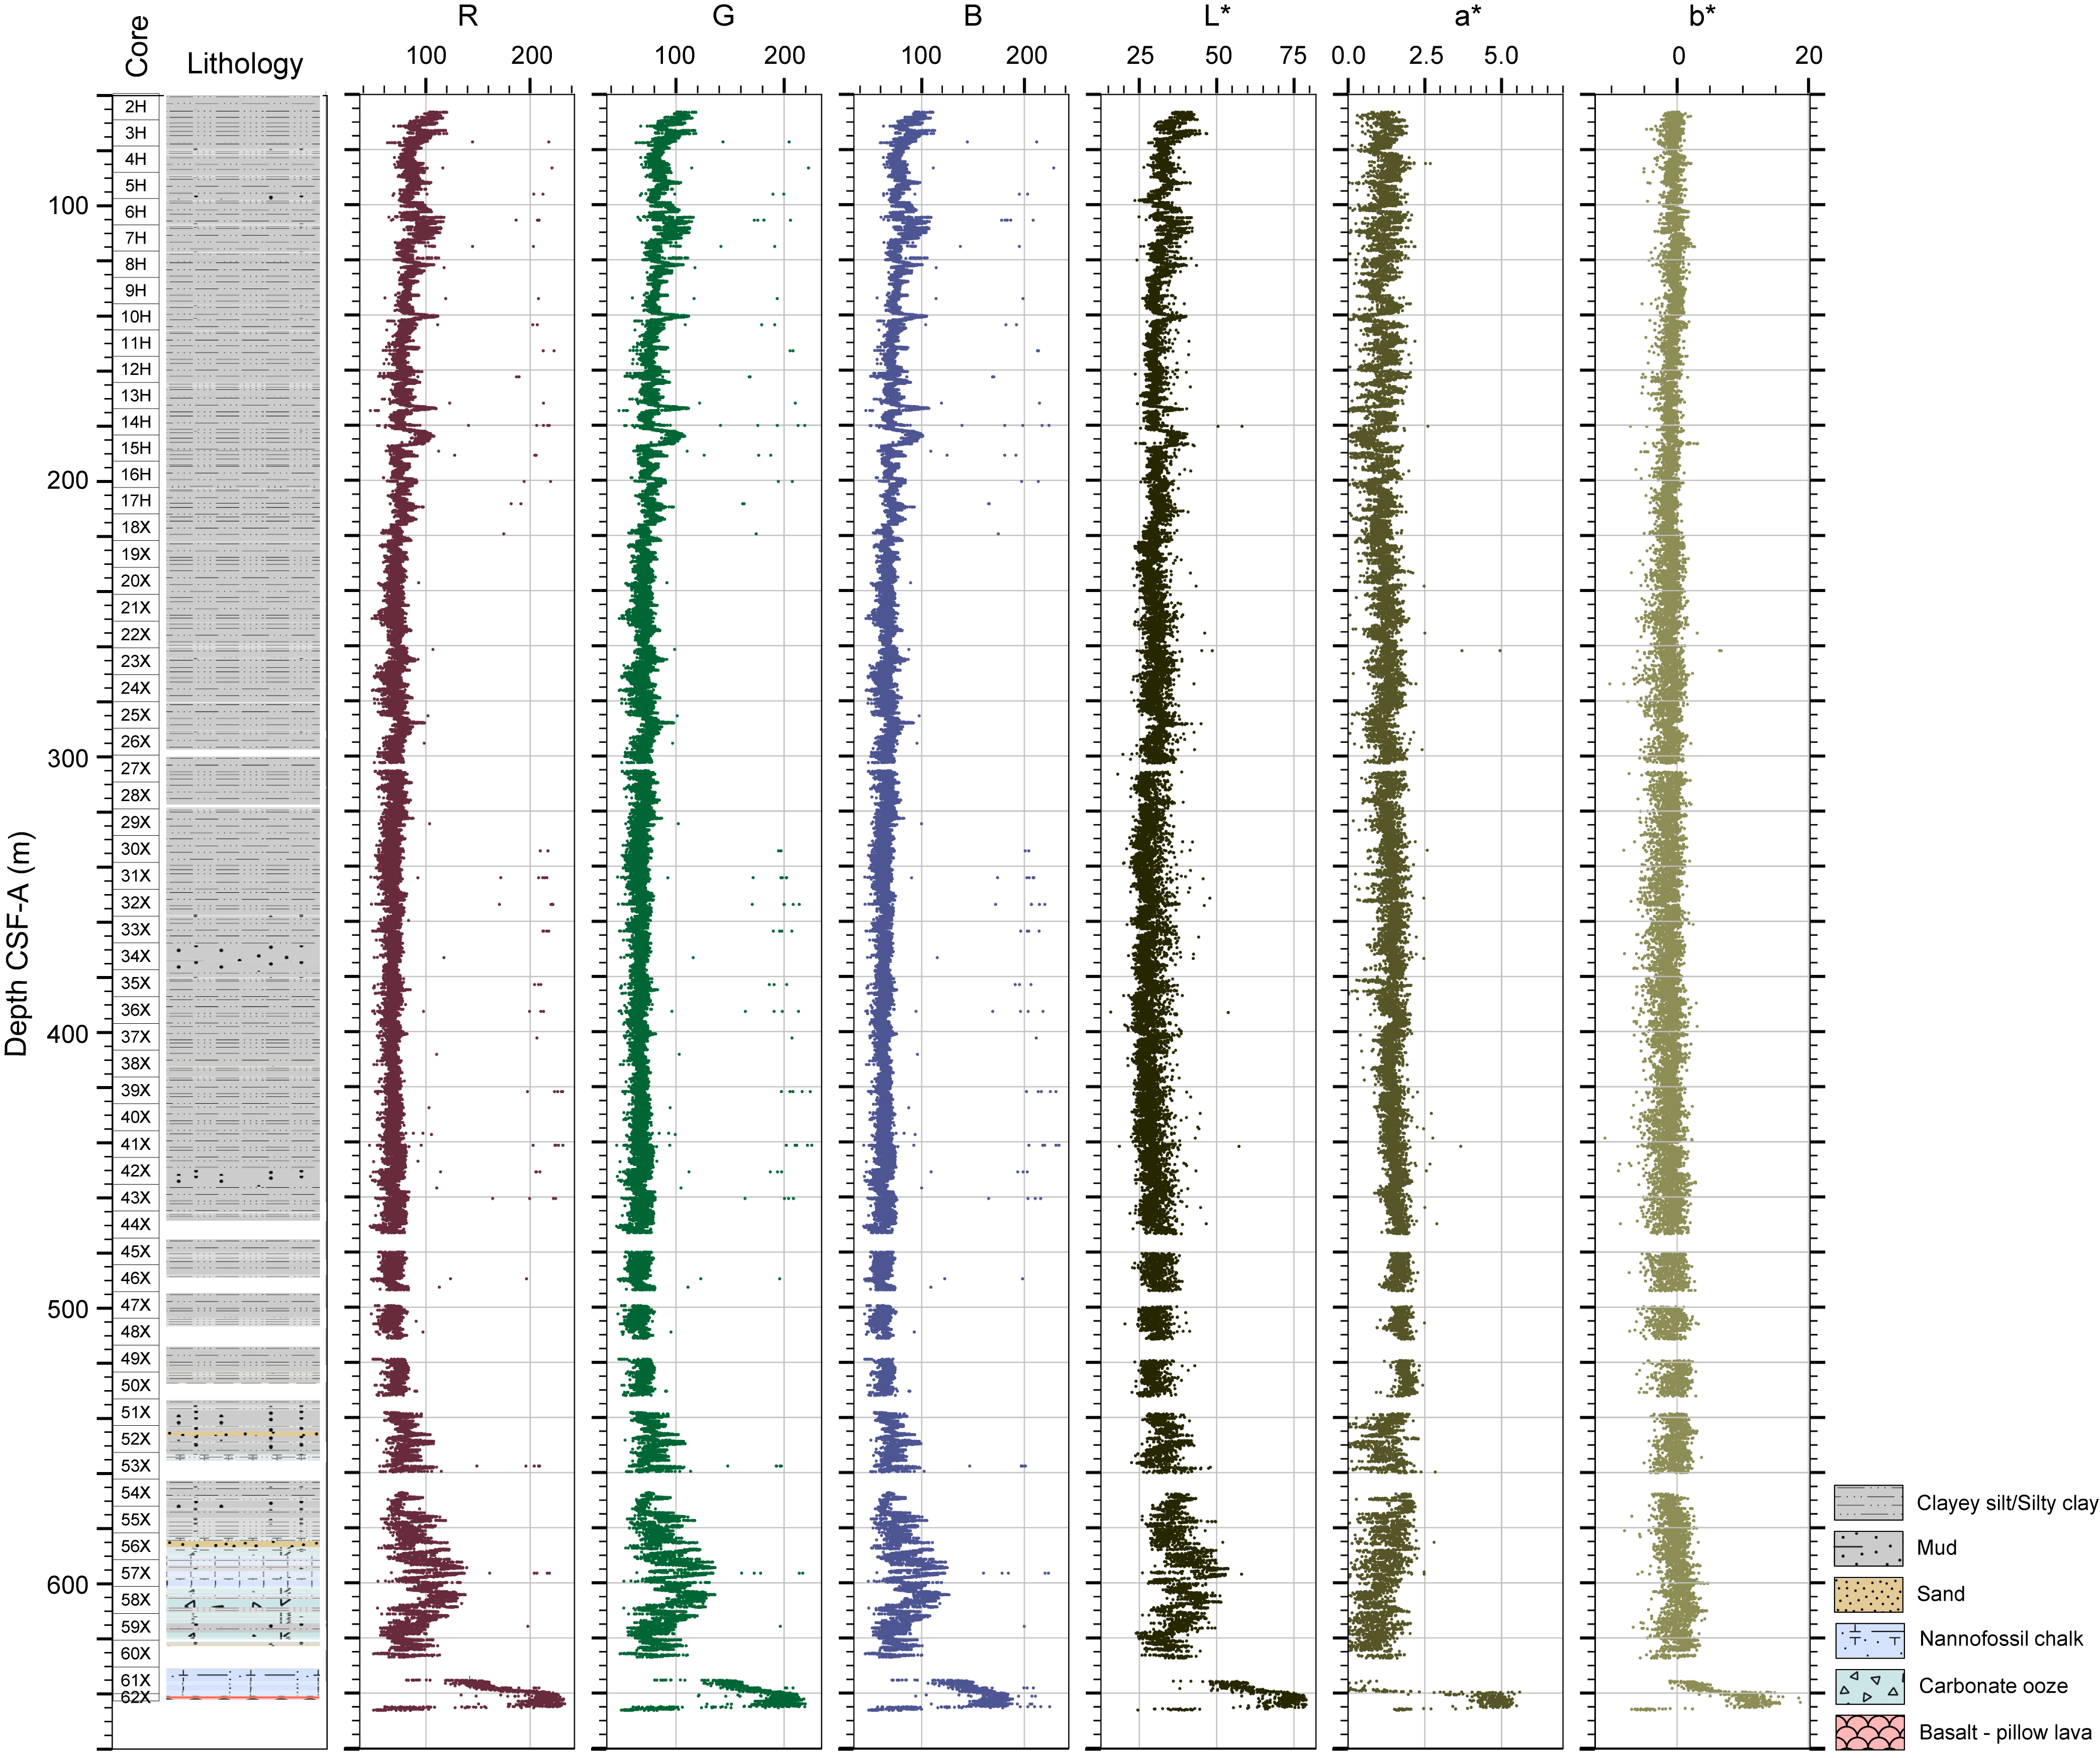
Figure F33. Archive-half colorimetry and reflectance measurements, Hole U1554E.
7.2. Split core measurements
Figures F33, F34, F35, and F36 summarize the reflectance and colorimetry data collected on the archive halves measured using the Section Half Multisensor Logger (SHMSL) for Holes U1554E–U1554H. Point MS (MSP) data are shown in Figures F29, F30, F31, and F33 alongside the WRMSL MS data. Both types of MS measurements show consistent relative variations, and the absolute values for the sediments are very similar to each other.
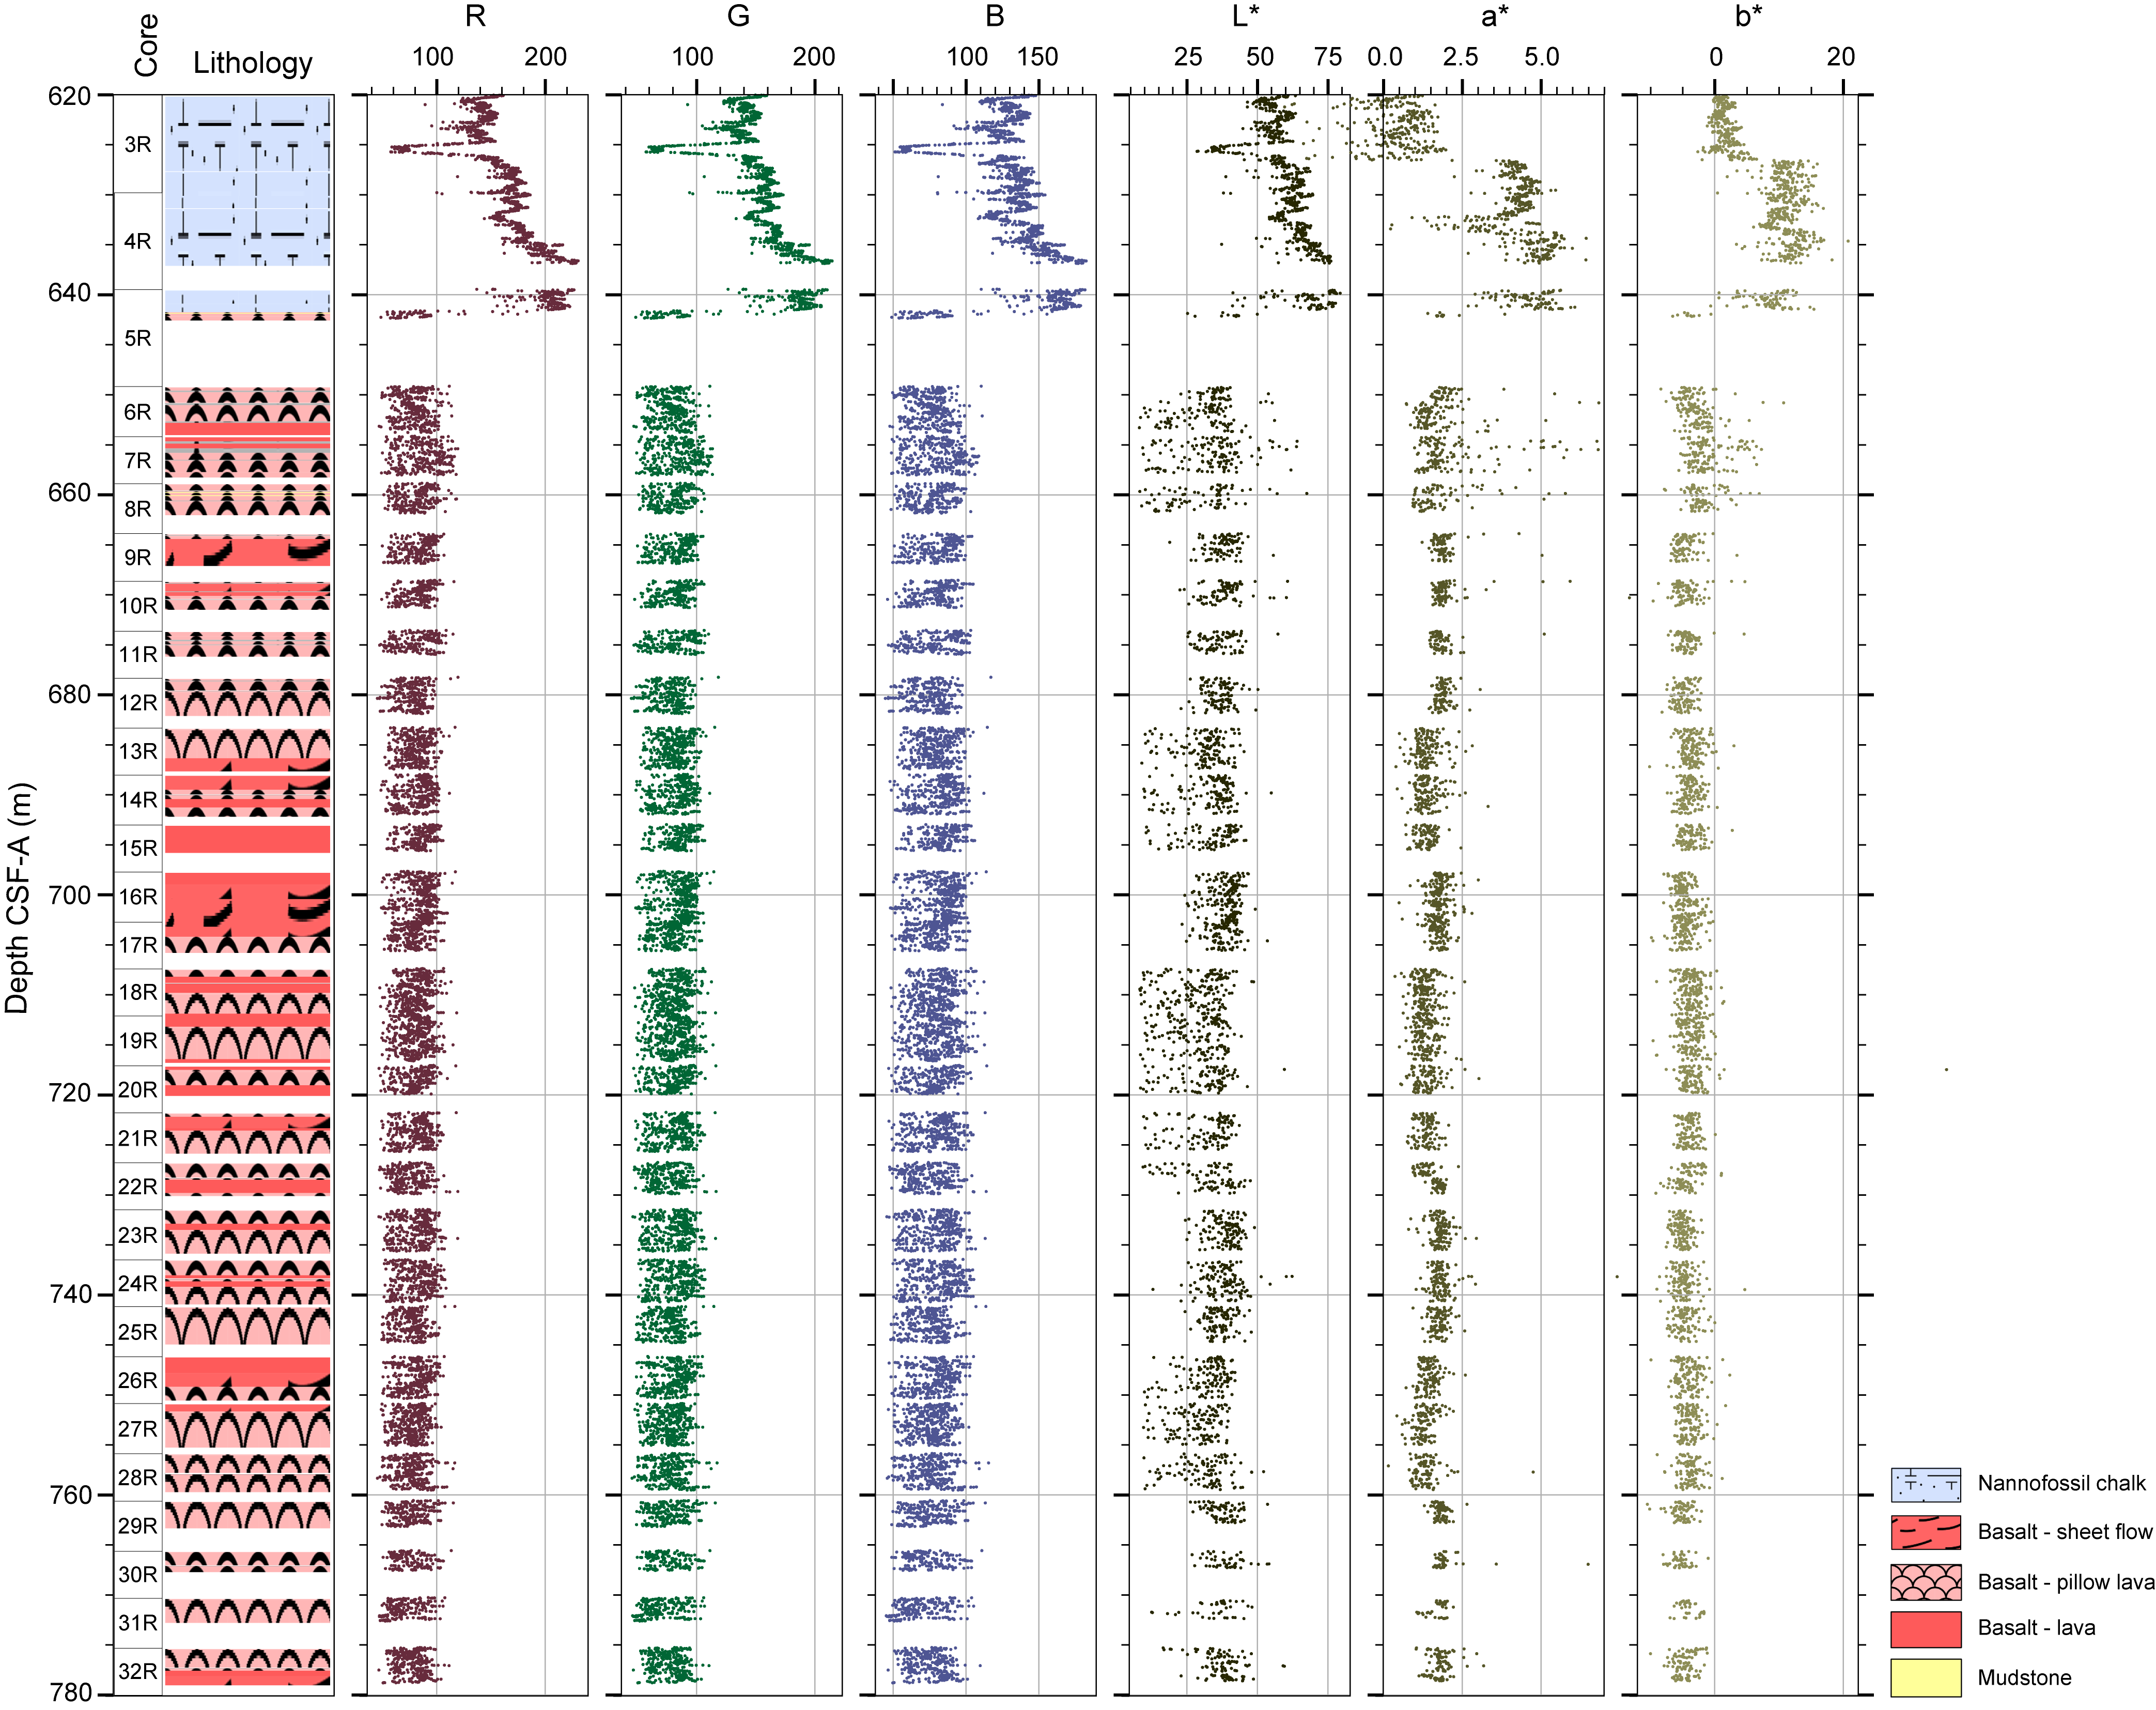
Figure F34. Archive-half colorimetry and reflectance measurements, Hole U1554F.
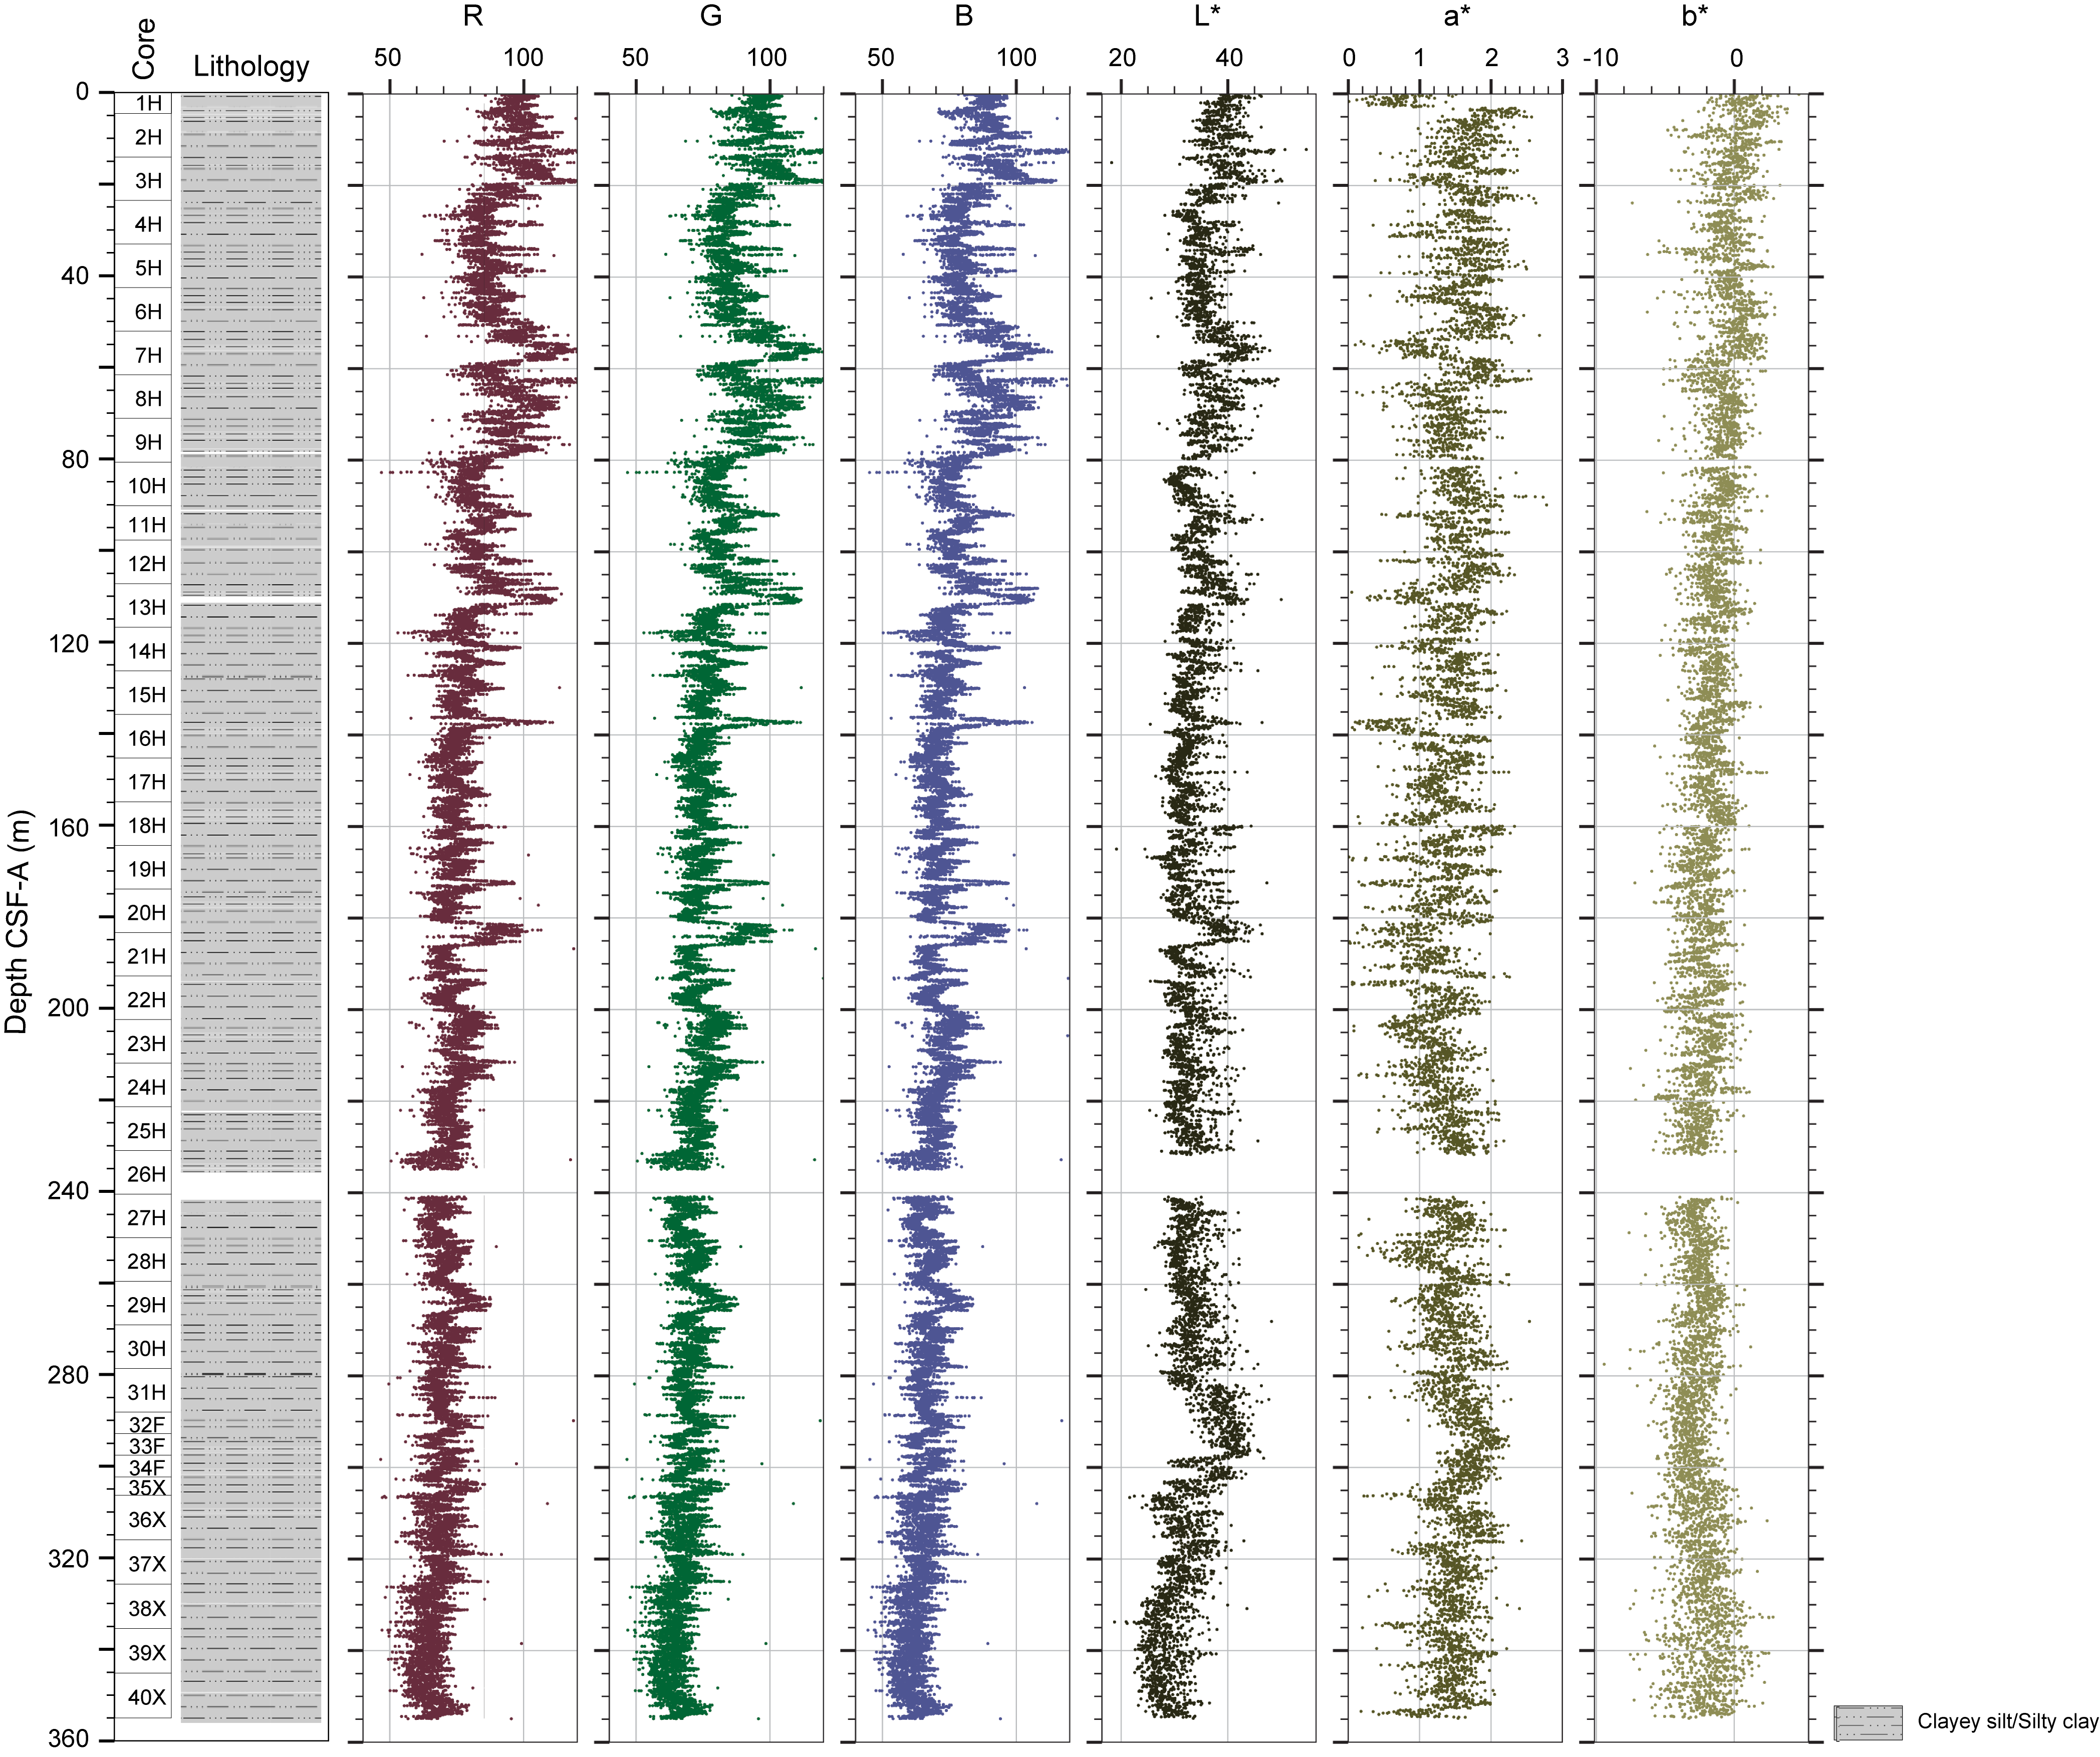
Figure F35. Archive-half colorimetry and reflectance measurements, Hole U1554G.
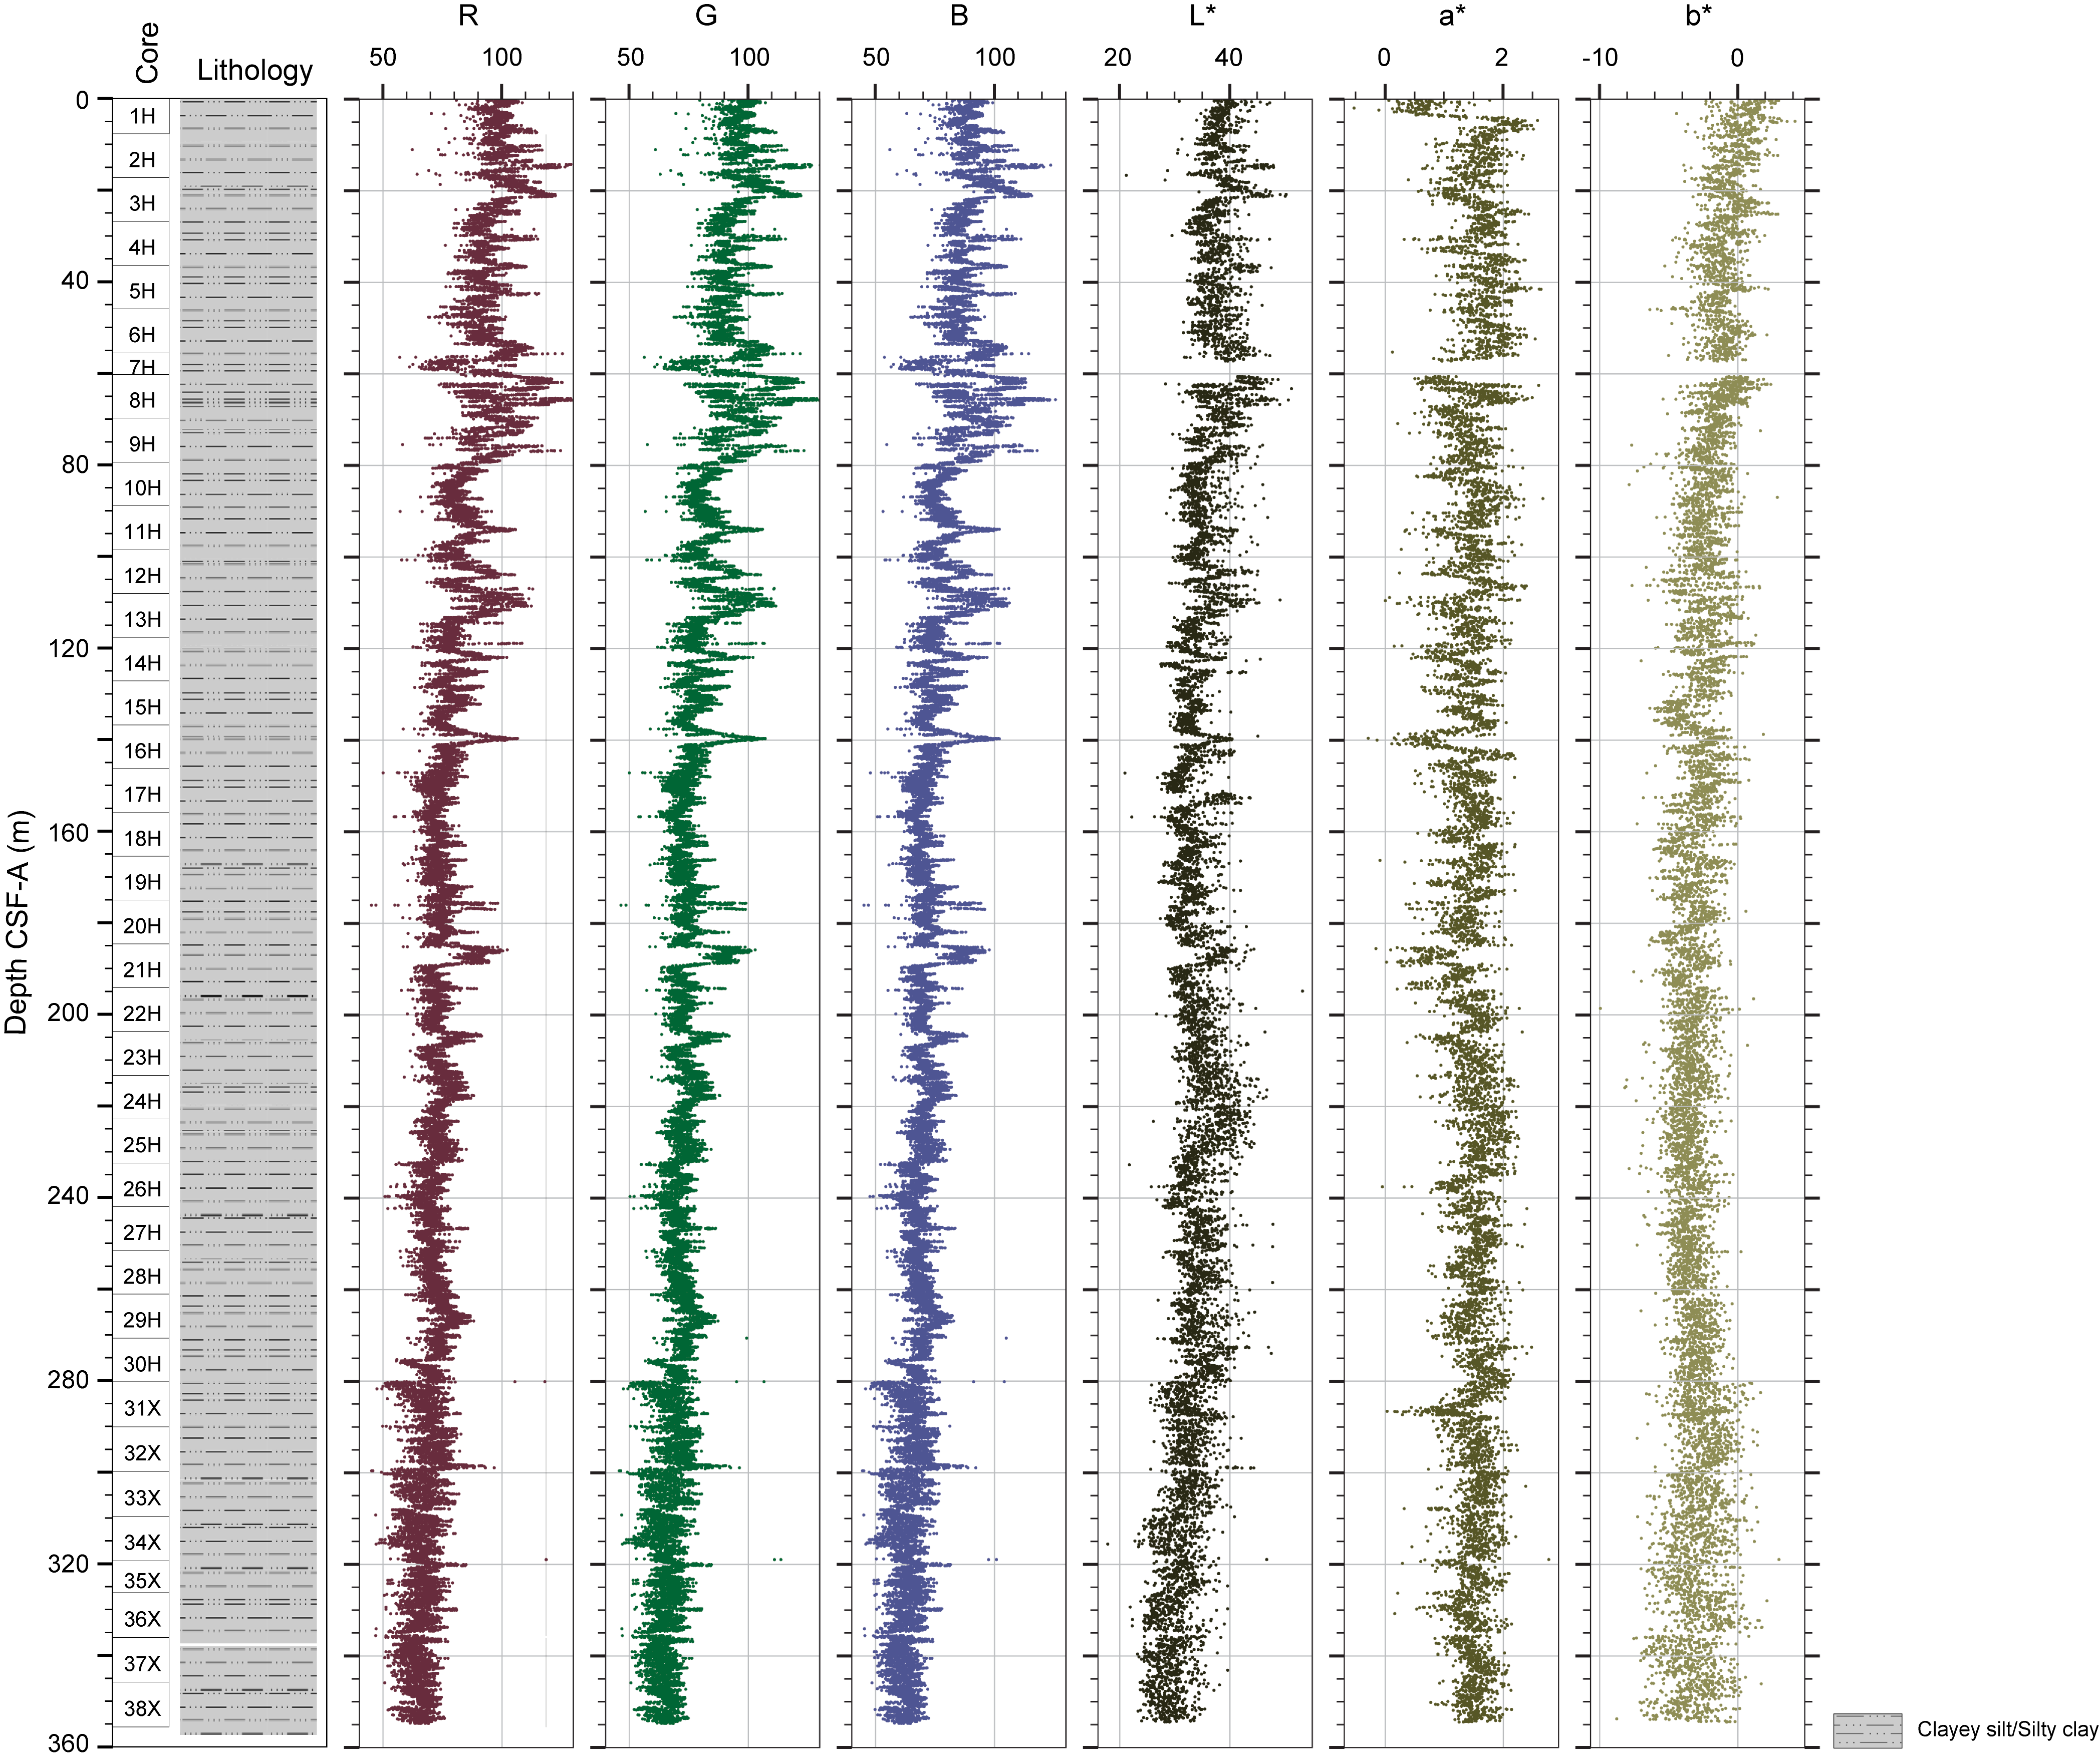
Figure F36. Archive-half colorimetry and reflectance measurements, Hole U1554H.
Color variations in the upper ~470 m of the sedimentary section, recovered in Holes U1554E, U1554G, and U1554H, show comparable broad patterns with a gradual darkening downcore and larger variability in the uppermost ~220 m of the site (Figures F33, F35, F36). Below ~625 m CSF-A, increases in a* and b* are evident and coincide with an increase in carbonate material in the sediment (see Lithostratigraphy). RGB and L*a*b* color and reflectance values show distinct changes at the sediment/basement interface, where the basalts are darker compared to the overlying sediments. Noticeably, the basalt L* measurements, and to a lesser extent the a* measurements, show lower values in the ~650–665, 685–695, 705–725, and 745–760 m CSF-A intervals (Figures F34, F35, F36), but these intervals do not seem to correspond to any specific lithology changes.
7.3. Discrete measurements
7.3.1. P-wave velocity
VP measurements were made in the x-direction at approximately 10 m spacing using the caliper on the Section Half Measurement Gantry (SHMG) for sediment from Hole U1554G. Values range 1416–1571 m/s (Figure F31). SHMG bayonet measurements in both the z-direction (1291–1493 m/s) and y-direction (1358–1909 m/s) were taken on Cores 2H–19H. Bayonet measurements were not made in sections with brittle sediment or with coring disturbance because the disturbance would result in unreliable results. In the basement section of Hole U1554F, VP measurements were made on basalt pieces in the x-direction using the caliper system at approximately 10 m intervals, with values ranging 4348–5837 m/s.
7.3.2. Moisture and density
MAD measurements were taken on sediment cores, approximately one per 10 m in Holes U1554A, U1554B, and U1554E and every ~5 m in Hole U1554G. Bulk density values for Holes U1554E and U1554G are shown in Figures F29 and F31 alongside bulk density estimates from the WRMSL. MAD estimates of bulk density values for each hole are in good agreement with gamma ray attenuation (GRA) bulk density estimates measured using the WRMSL. Porosity ranges 61–84 vol%, bulk density ranges 1.2–1.7 g/cm3, and grain density varies from 2.6 to 2.8 g/cm3.
7.3.3. Thermal conductivity
Thermal conductivity measurements were made on selected sections, approximately one per 10 m, in Holes U1554E, U1554G, and U1554H (Figure F56). Thermal conductivity measurements from the sedimentary section of Site U1554 are combined with downhole formation temperature measurements to estimate heat flow in Downhole measurements.
7.3.4. X-ray scans
Whole rounds and section halves from Holes U1554G and U1554H were measured on the X-Ray Linescan Logger (XSCAN), and occasionally core sections that displayed possible IRD were 3D-scanned using measurement angles of 0°, 45°, 90° and 135°. Energy used to scan the raw image ranged between 90–100 kV and 0.8 mA. Figure F37 shows an example of IRD in XSCAN images.
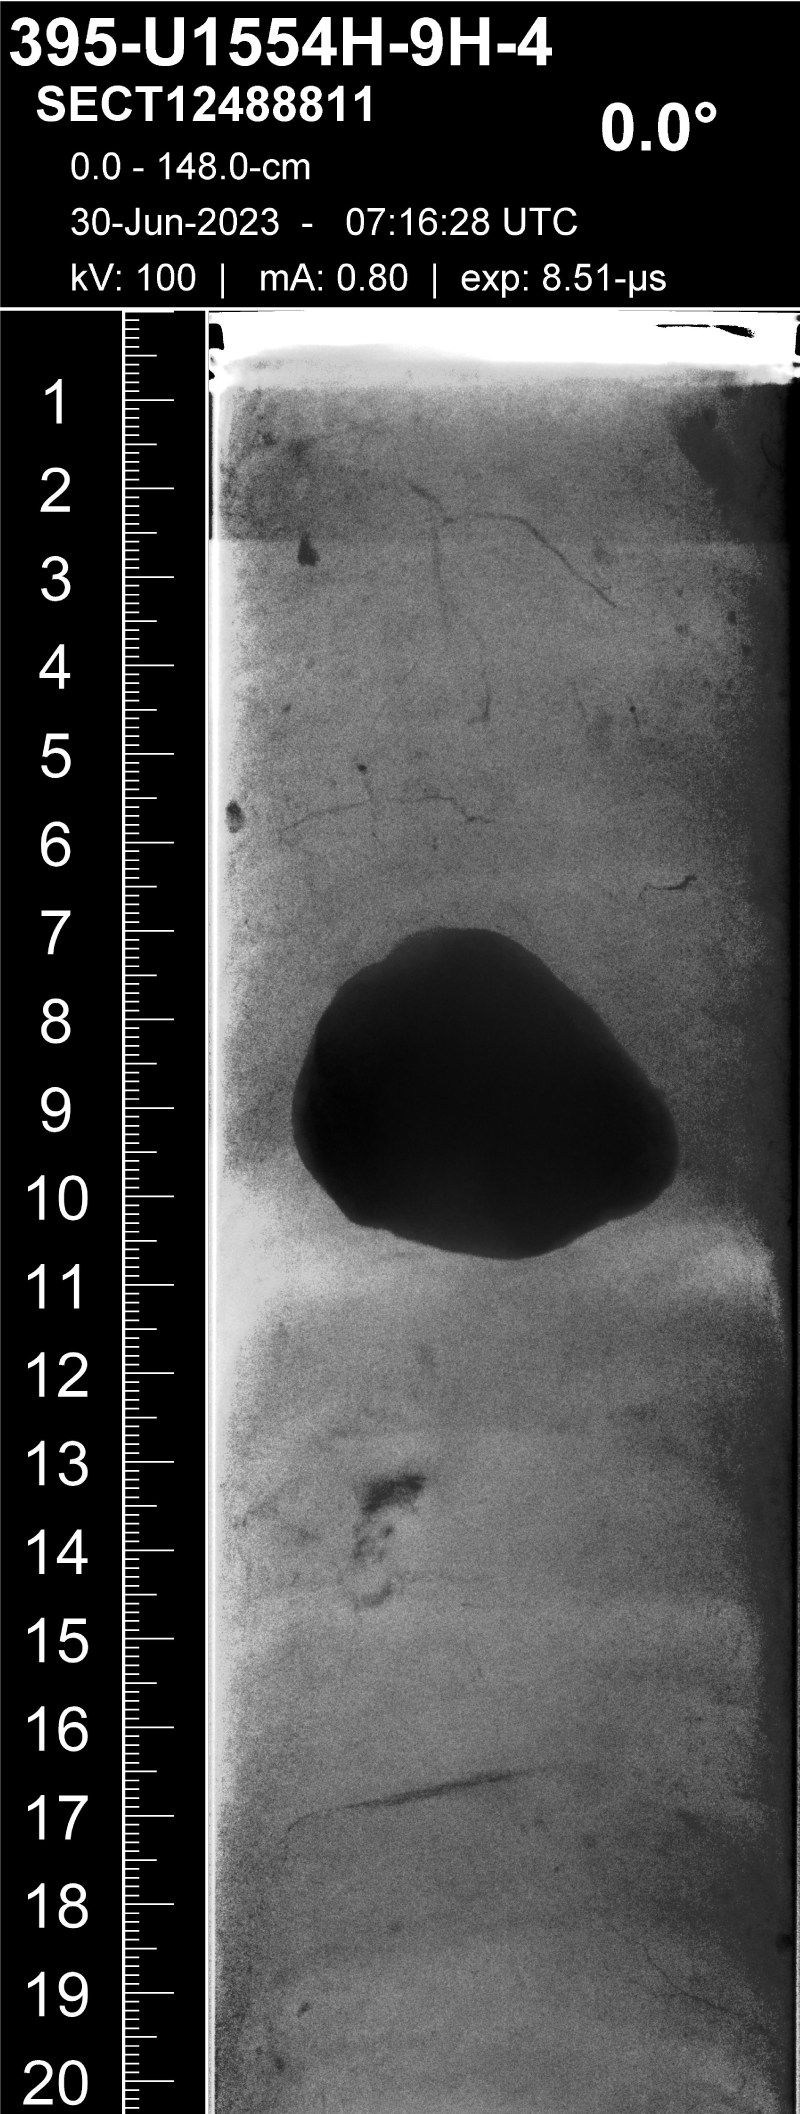
Figure F37. XSCAN image.
8. Stratigraphic correlation
A ~0–70 m CSF-A splice for Holes 384-U1554A through 384-U1554C was constructed during Expedition 384 (Table T11). The stratigraphic correlation reported here includes the main sedimentary targets of coring from Expeditions 384, 395C, and 395 (i.e., we do not attempt correlation in Holes 384-U1554D and 395C-U1554F). Prior to reaching the drill site, the stratigraphic correlators used data from Holes U1554A–U1554C to become familiar with the Correlator software. The records from Holes U1554A–U1554C and 395C-U1554E were used to inform the coring strategy for Hole 395-U1554G. MS data from whole-round measurements were used for near real-time correlation because they often reveal strong contrasts between lithologic sequences. These data can be obtained shortly after the core is recovered on deck at 5.0 cm resolution using the Special Task Multisensor Logger (STMSL) to guide operational decisions. Whole-round MS data collected at 2.5 cm resolution using the WRMSL were used to construct the final shipboard splices. An overview of the MS data from Holes U1554A–U1554C, U1554E, U1554G, and 395-U1554H and the wireline log from Hole U1554E are presented in Figure F38.
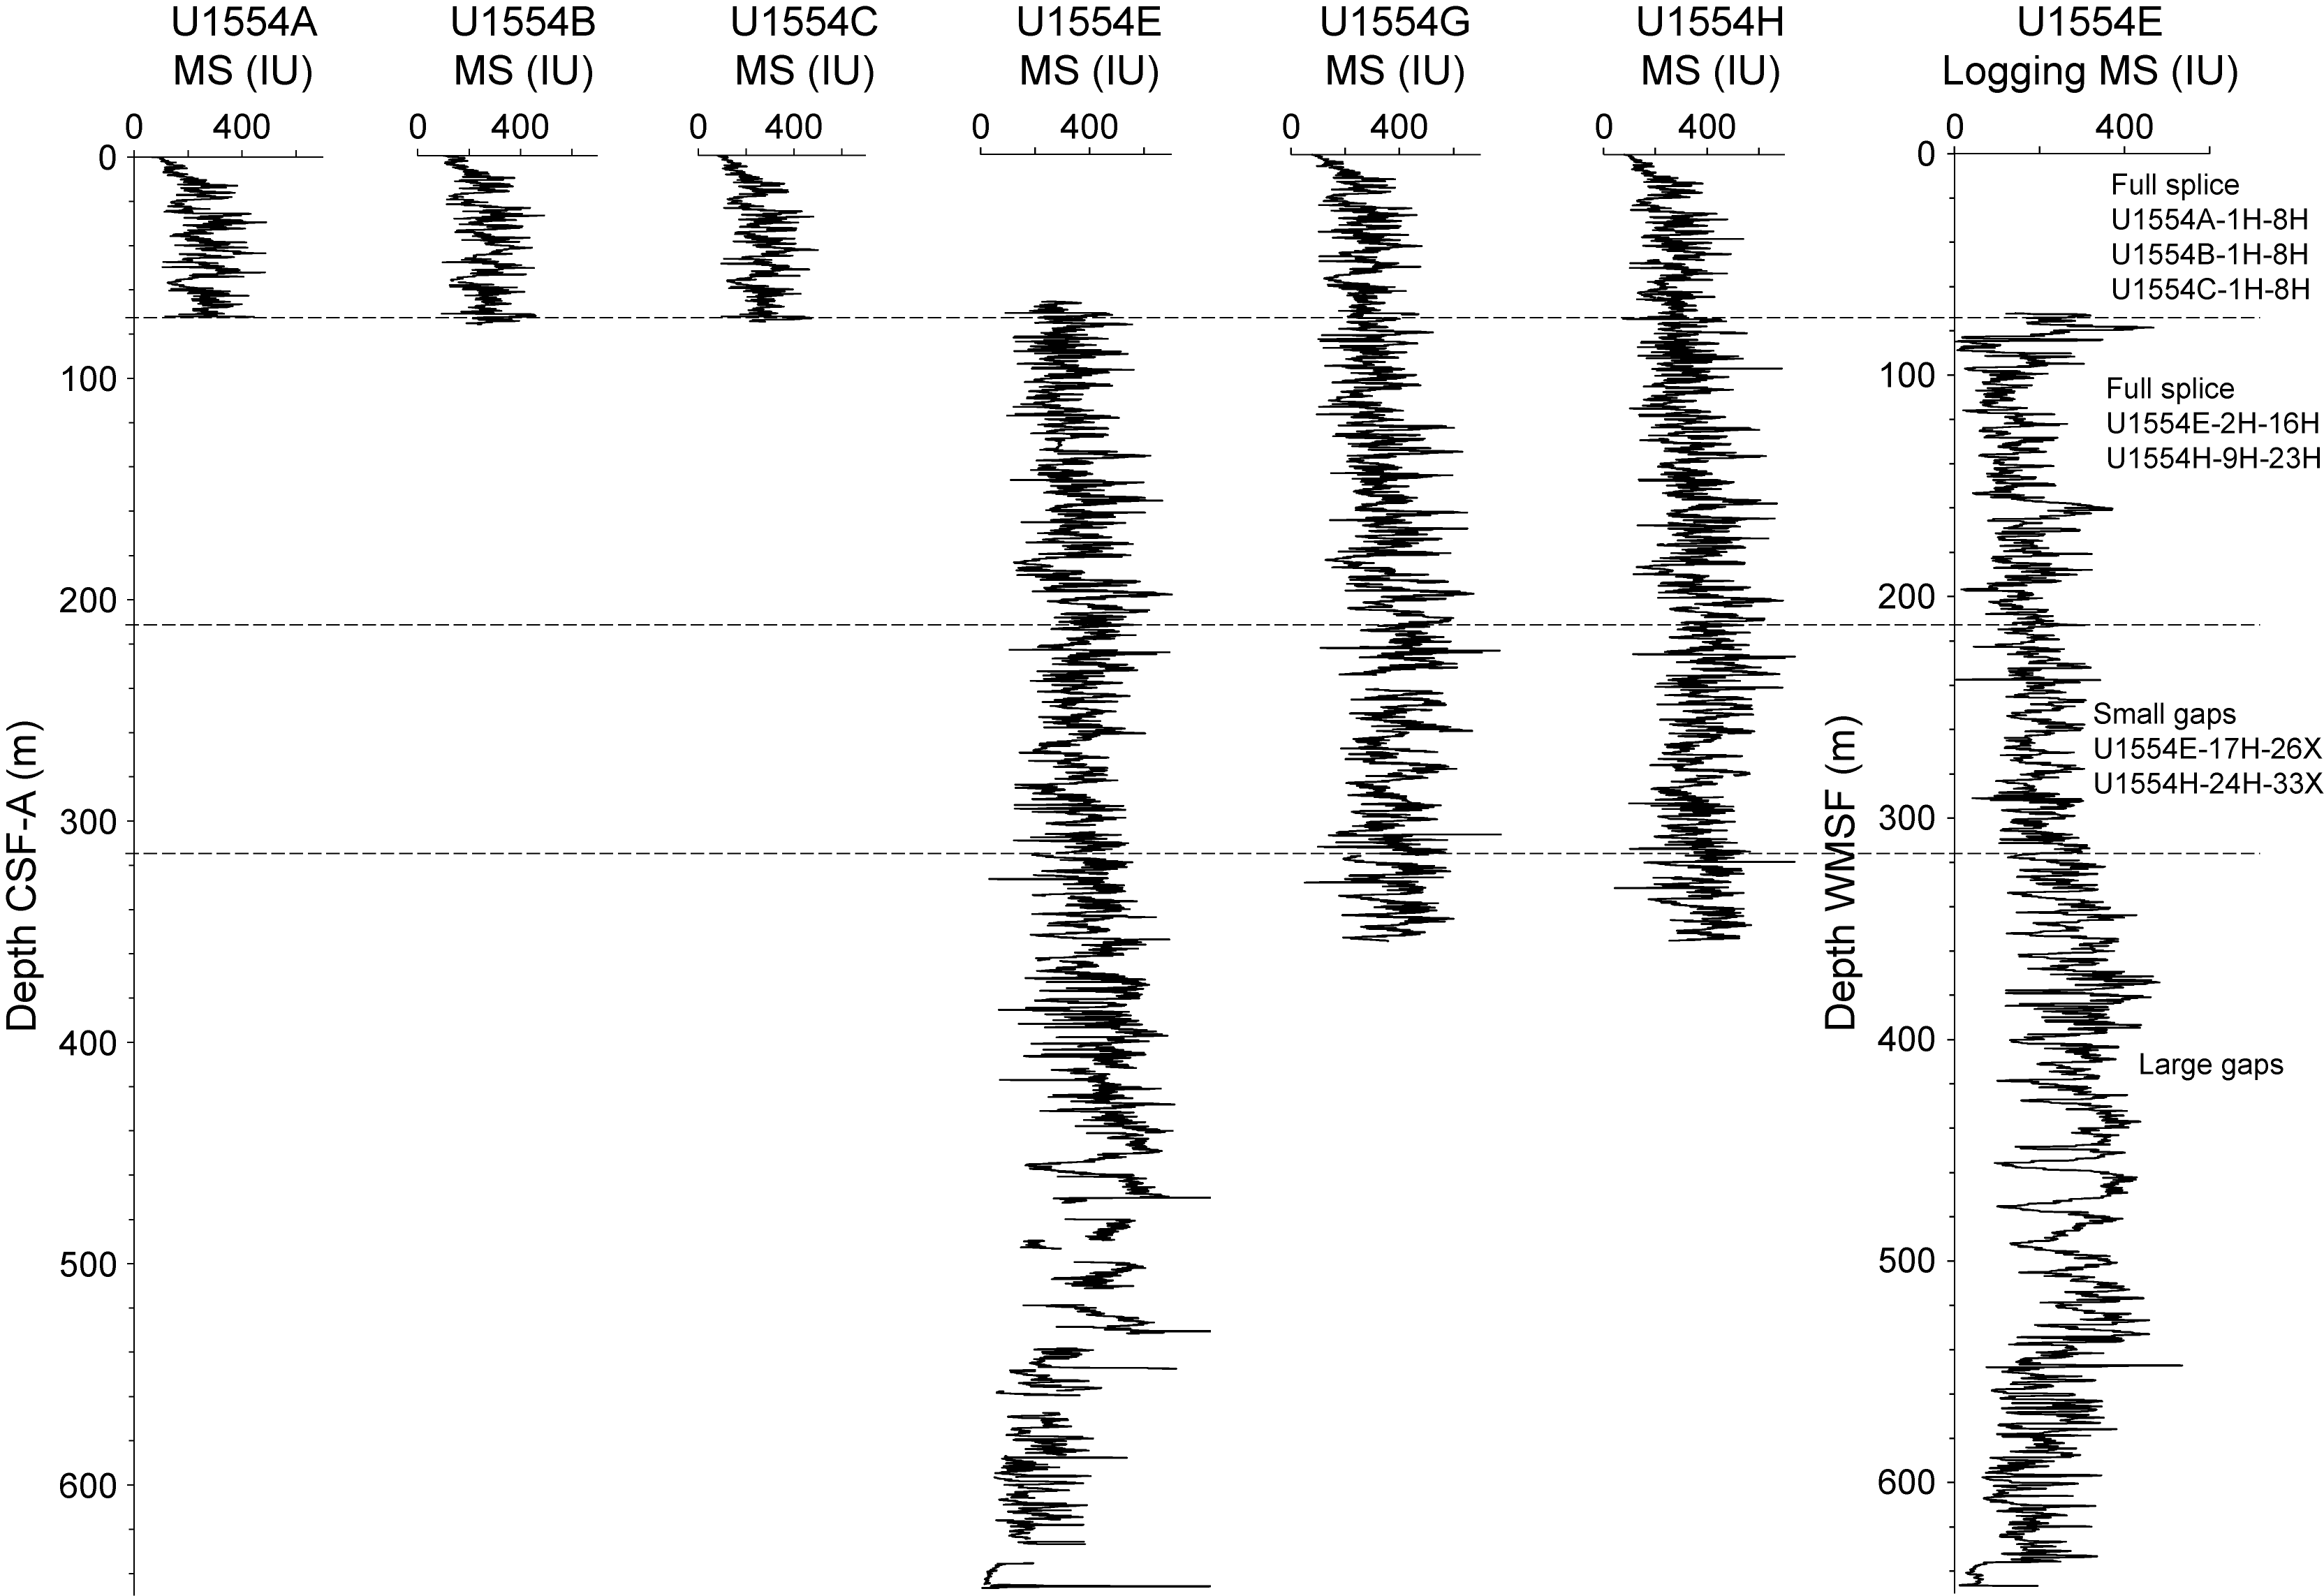
Figure F38. WRMSL and wireline logging MS.
8.1. Correlation between holes
In Hole U1554G, the first (mudline) core recovered 5.43 m to offset coring gaps with Hole U1554E using the APC system. In Hole U1554H, the first core recovered 9.39 m, essentially replicating the uppermost section of Hole U1554E. Correlation was achieved without gaps to 228 m core composite depth below seafloor, Method A (CCSF-A) (Figures F39, F40). At this depth, the bases of Cores 395C-U1554E-16H (208.96 m CSF-A), 395-U1554G-23H (212.95 m CSF-A), and 395-U1554H-23H (214.12 m CSF-A) are closely aligned, precluding a stratigraphic tie with subsequent cores, thus leading to a gap in the splice. Based on the pattern of variability and correlation with the MS downhole logging record from Hole U1554E, this gap is estimated to be ~1 m. Although there is partial alignment between Cores 395C-U1554E-18F and 395-U1554G-24H, the features are indistinct and would give a very low confidence tie, so this ambiguity resulted in a small gap (Figure F41). This gap could potentially be resolved postcruise with additional X-ray fluorescence (XRF) core scanning or another proxy. A similar situation exists between Cores 395C-U1554E-19F, 395-U1554G-25H, and 395-U1554H-25H. For Cores 395C-U1554E-19F through 395-U1554H-30H, ties can be confidently made. The top of Core 395C-U1554E-25F and the bottom of Cores 395-U1554G-31H and 395-U1554H-31X do not have distinctive features in the MS data that permit them to be confidently tied, but other proxies may help future efforts. Cores 395C-U1554E-25F through 395-U1554H-33X can be tied to avoid gaps. Although retained as a gap in the shipboard splice, it may be possible to tie the top of Core 395-U1554G-36X to the bottom of Core 395-U1554H-33X. Cores are in alignment, so they are correlated but not tied to bridge gaps from Core 395-U1554H-33X to Cores 395C-U1554E-31F, 395-U1554G-40X, or 395-U1554H-38X. Holes U1554G and U1554H do not extend beyond Core 395C-U1554E-31F (Figure F38).
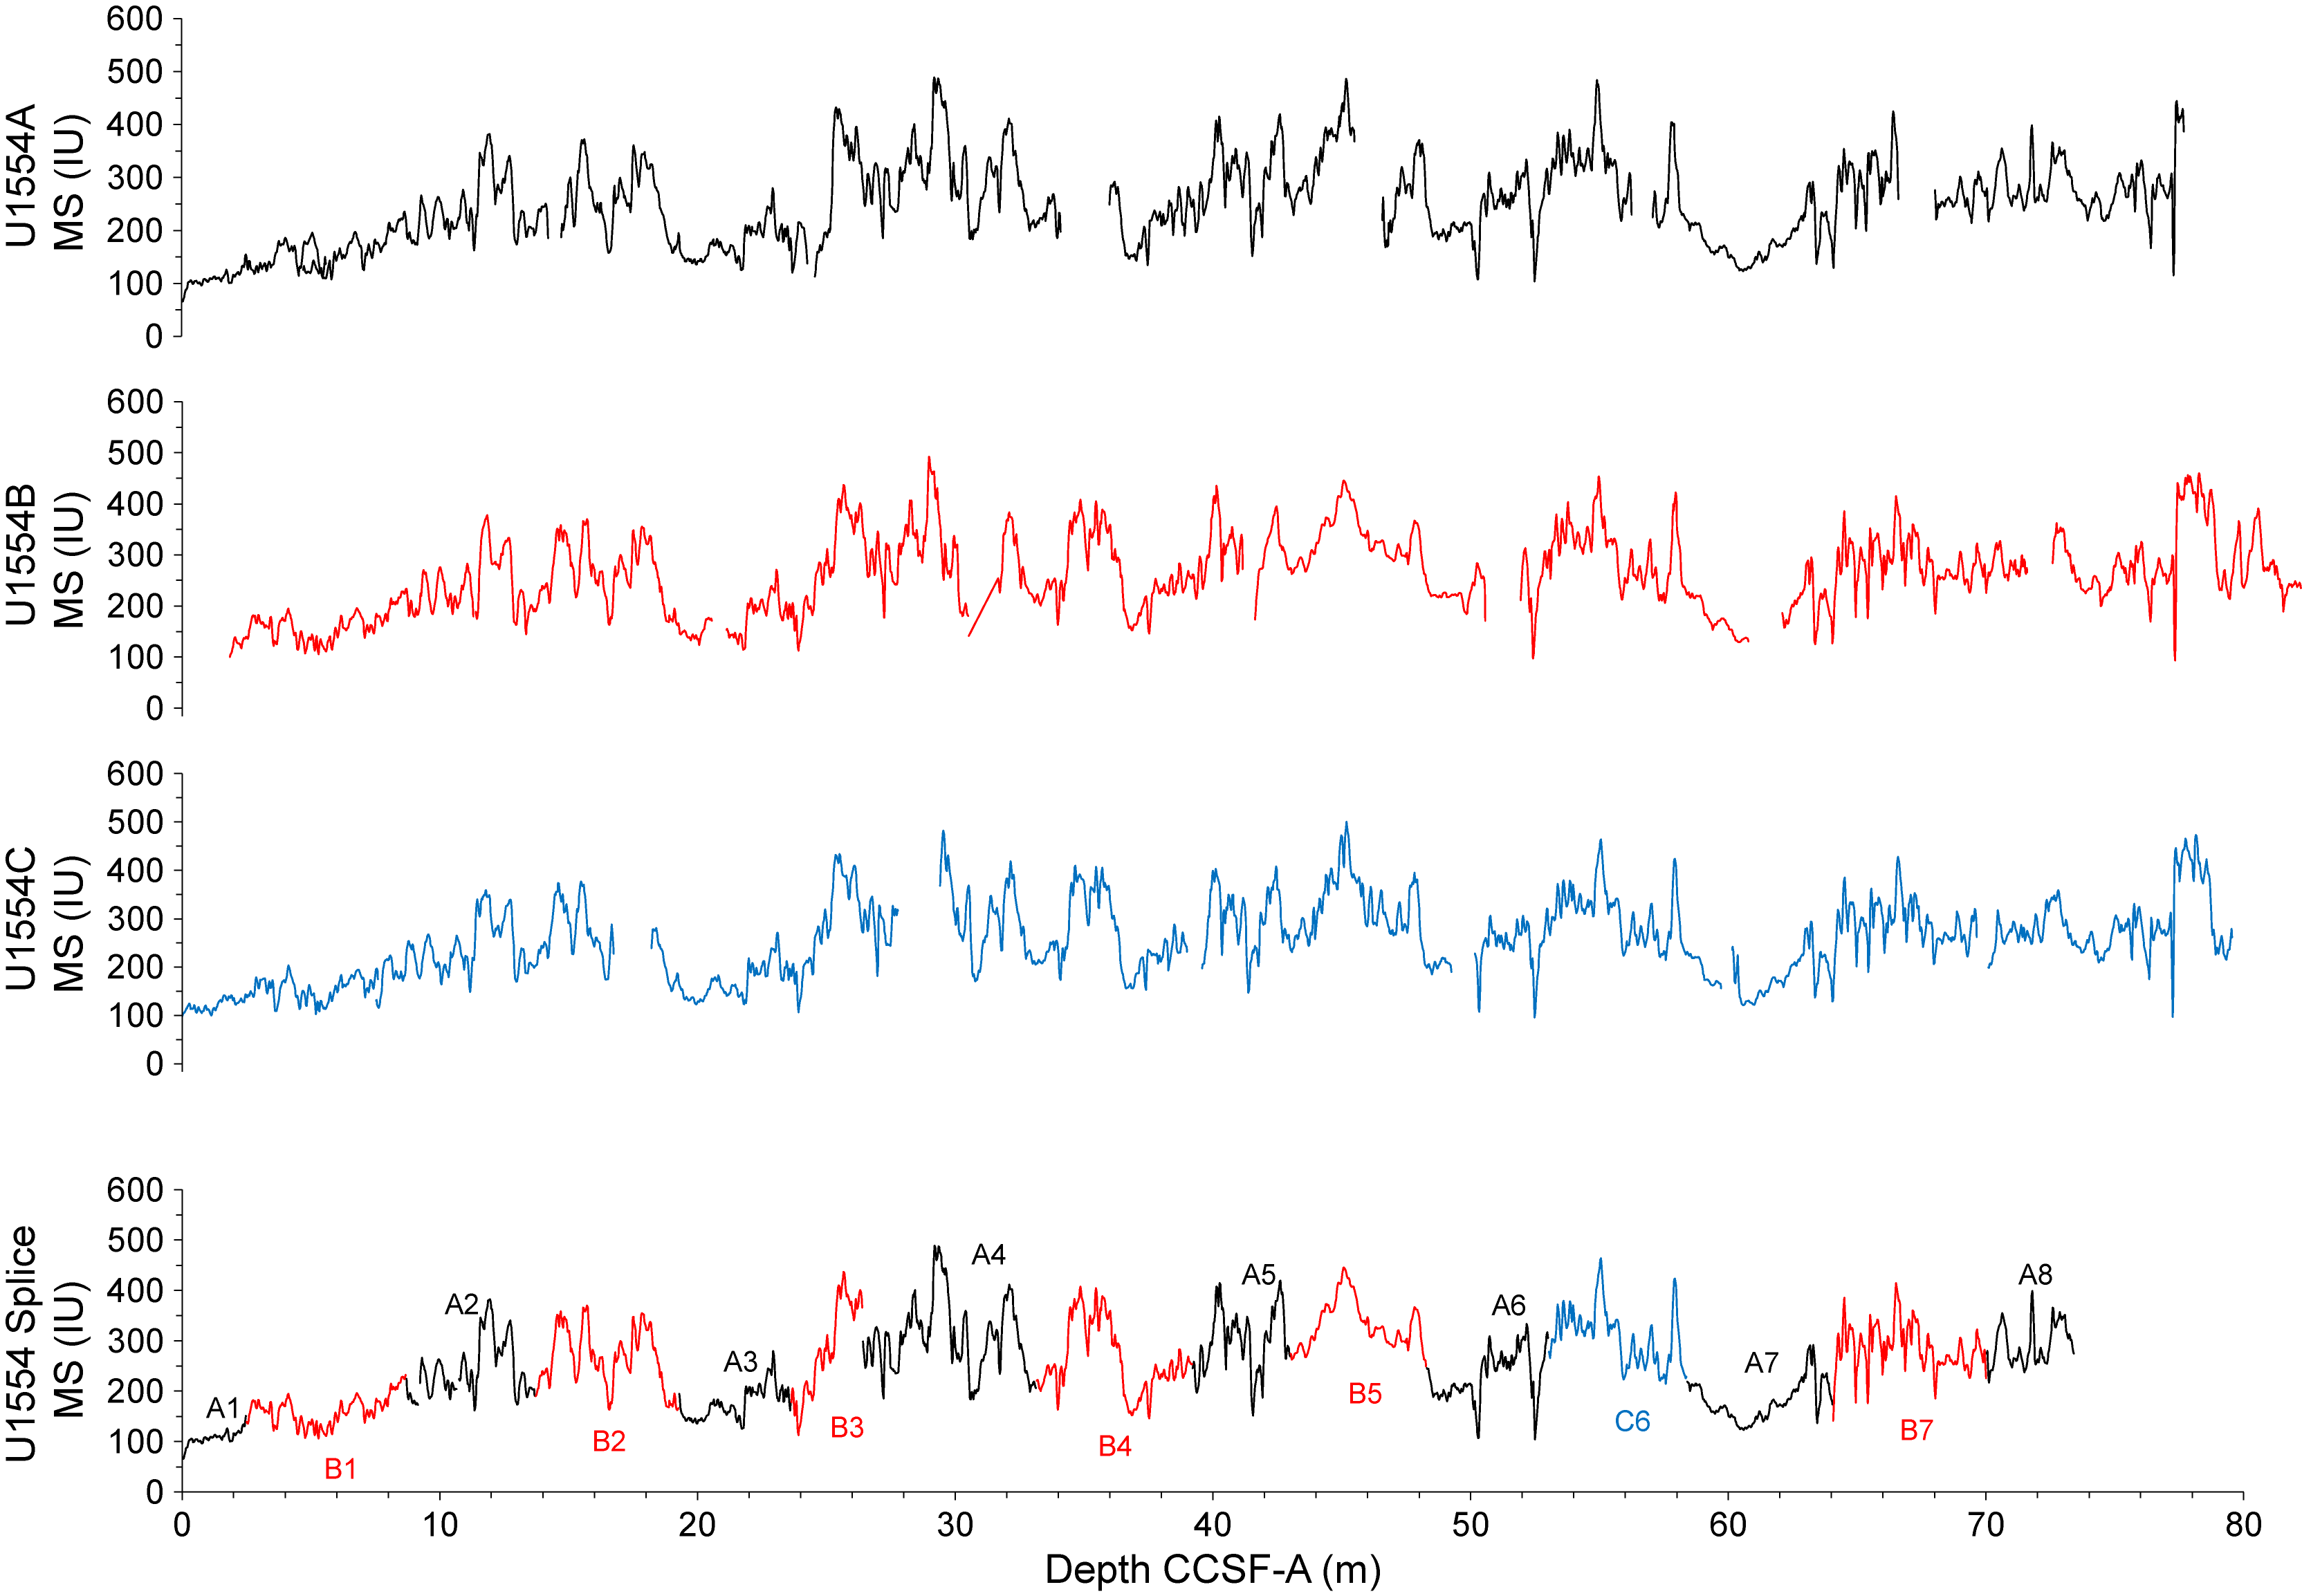
Figure F39. Splice for 0–75 m CCSF-A.
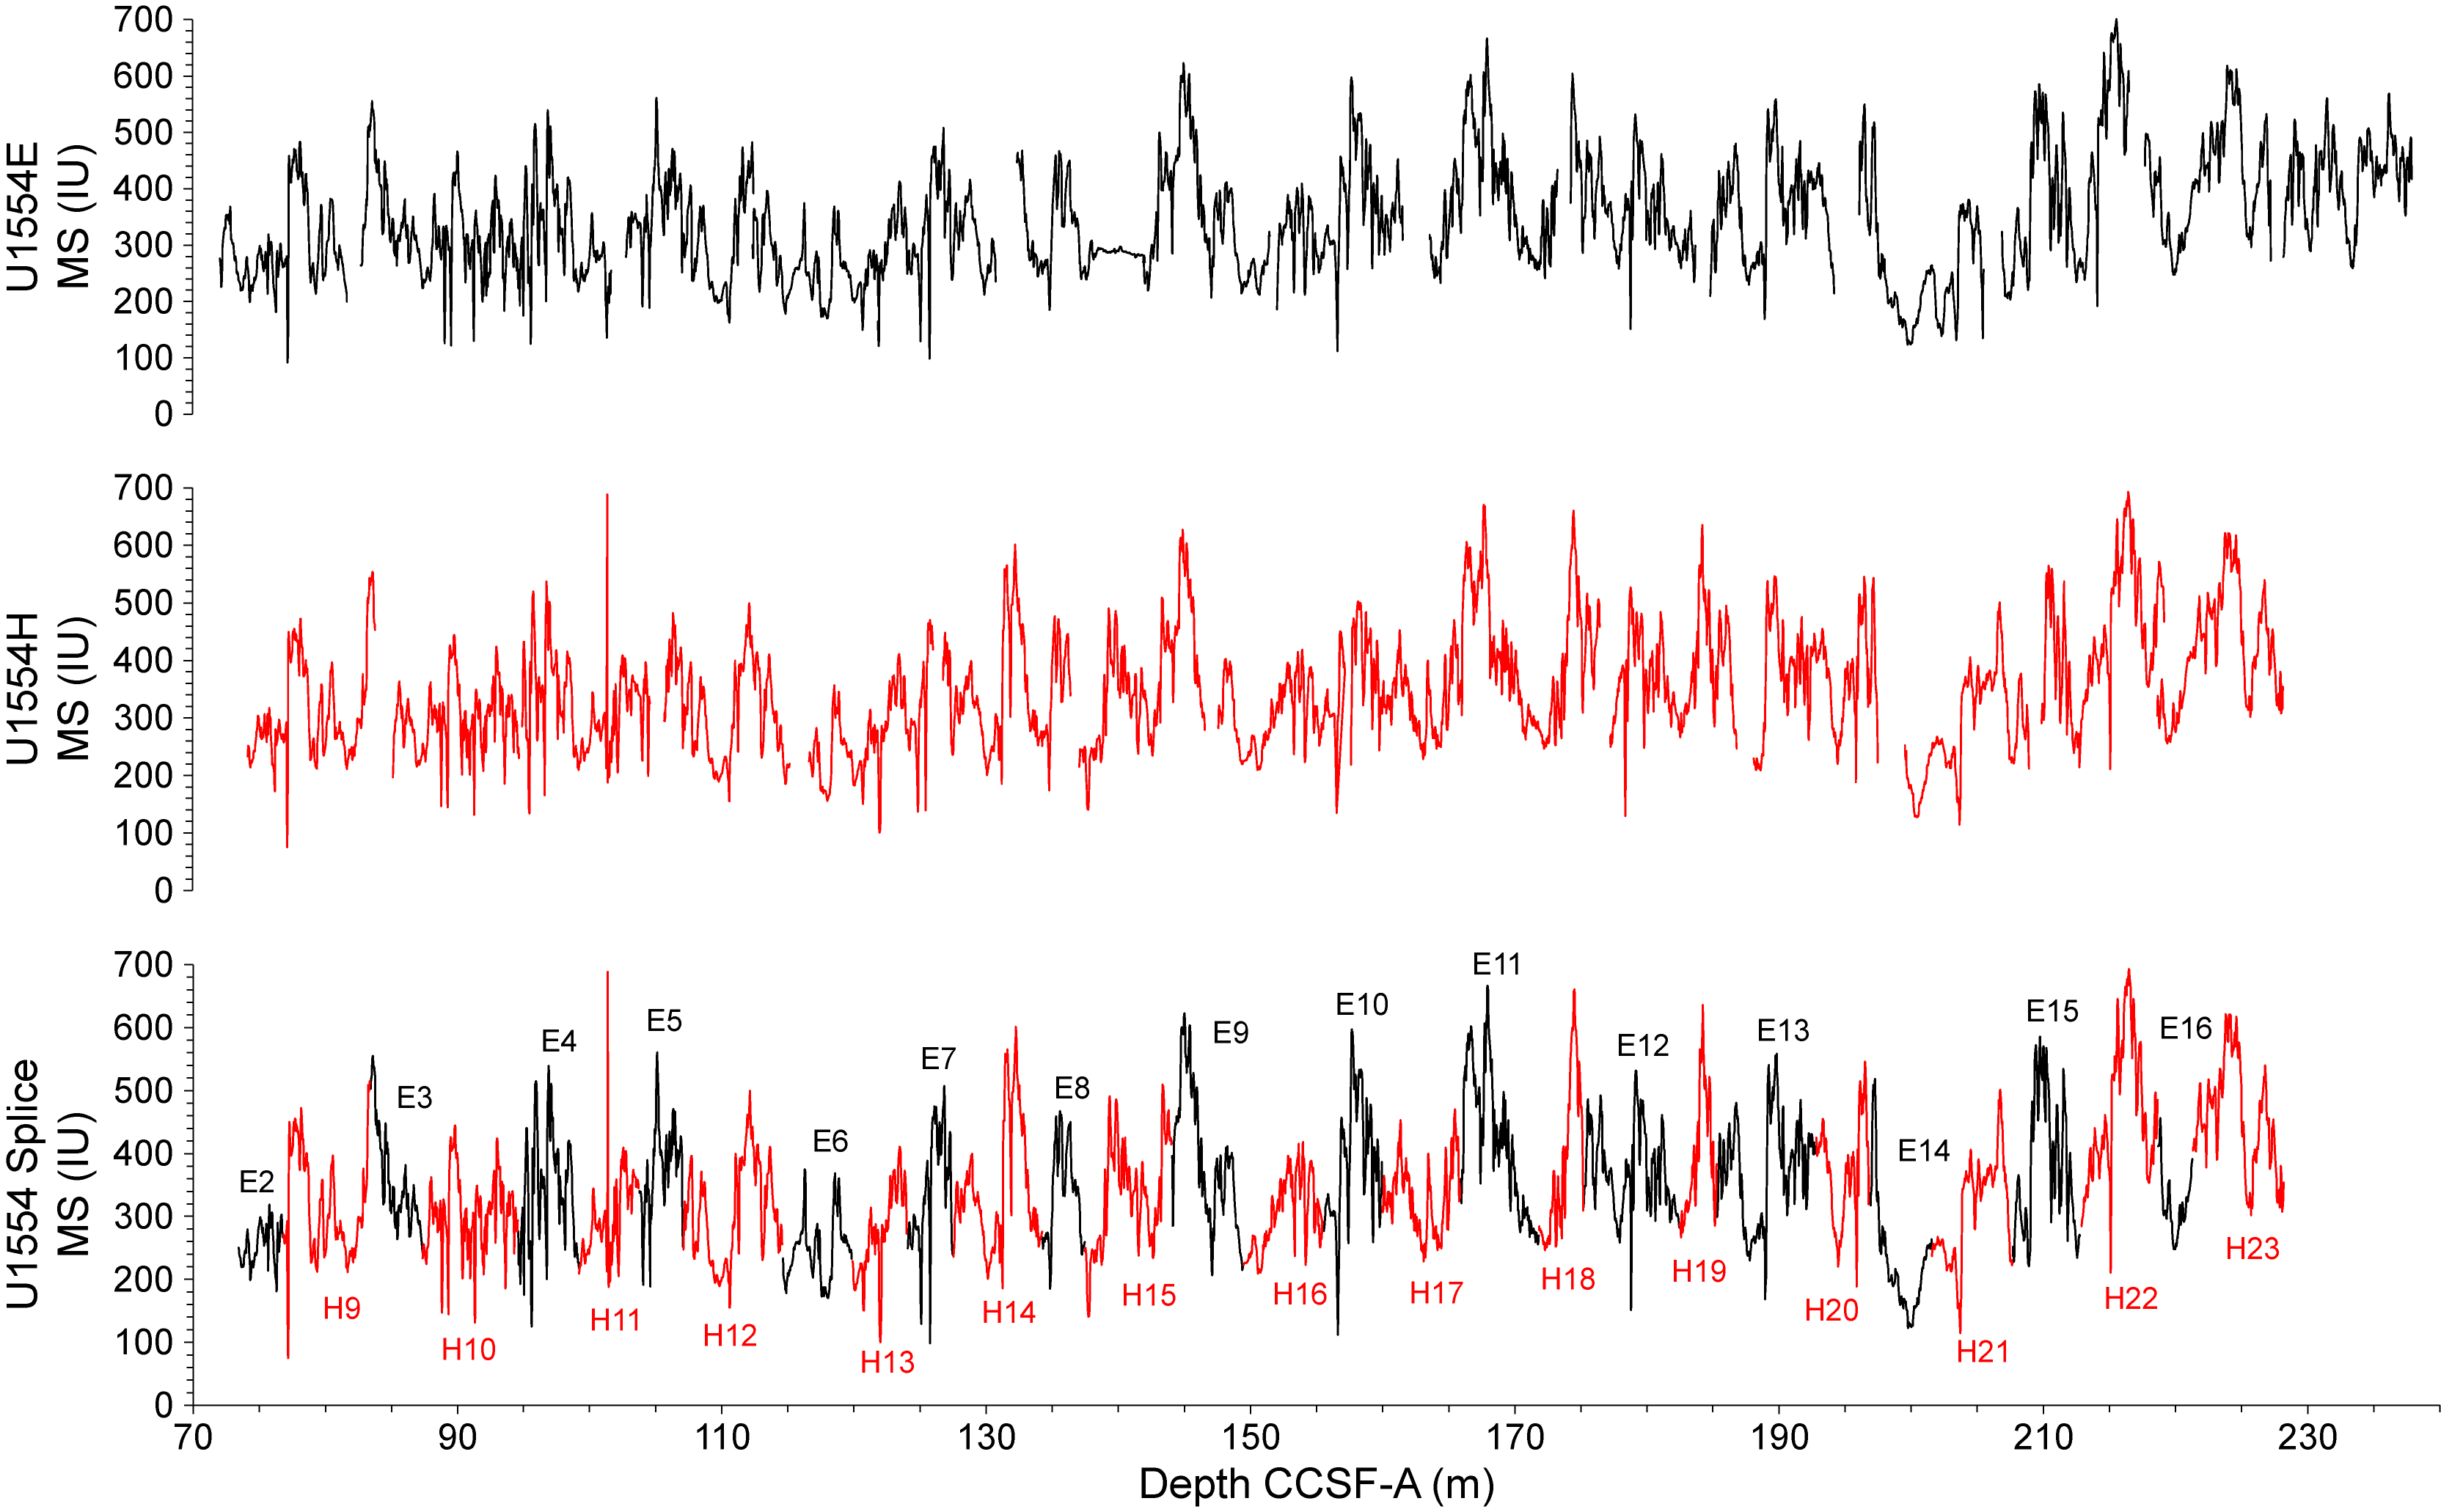
Figure F40. Splice for 75–230 m CCSF-A.
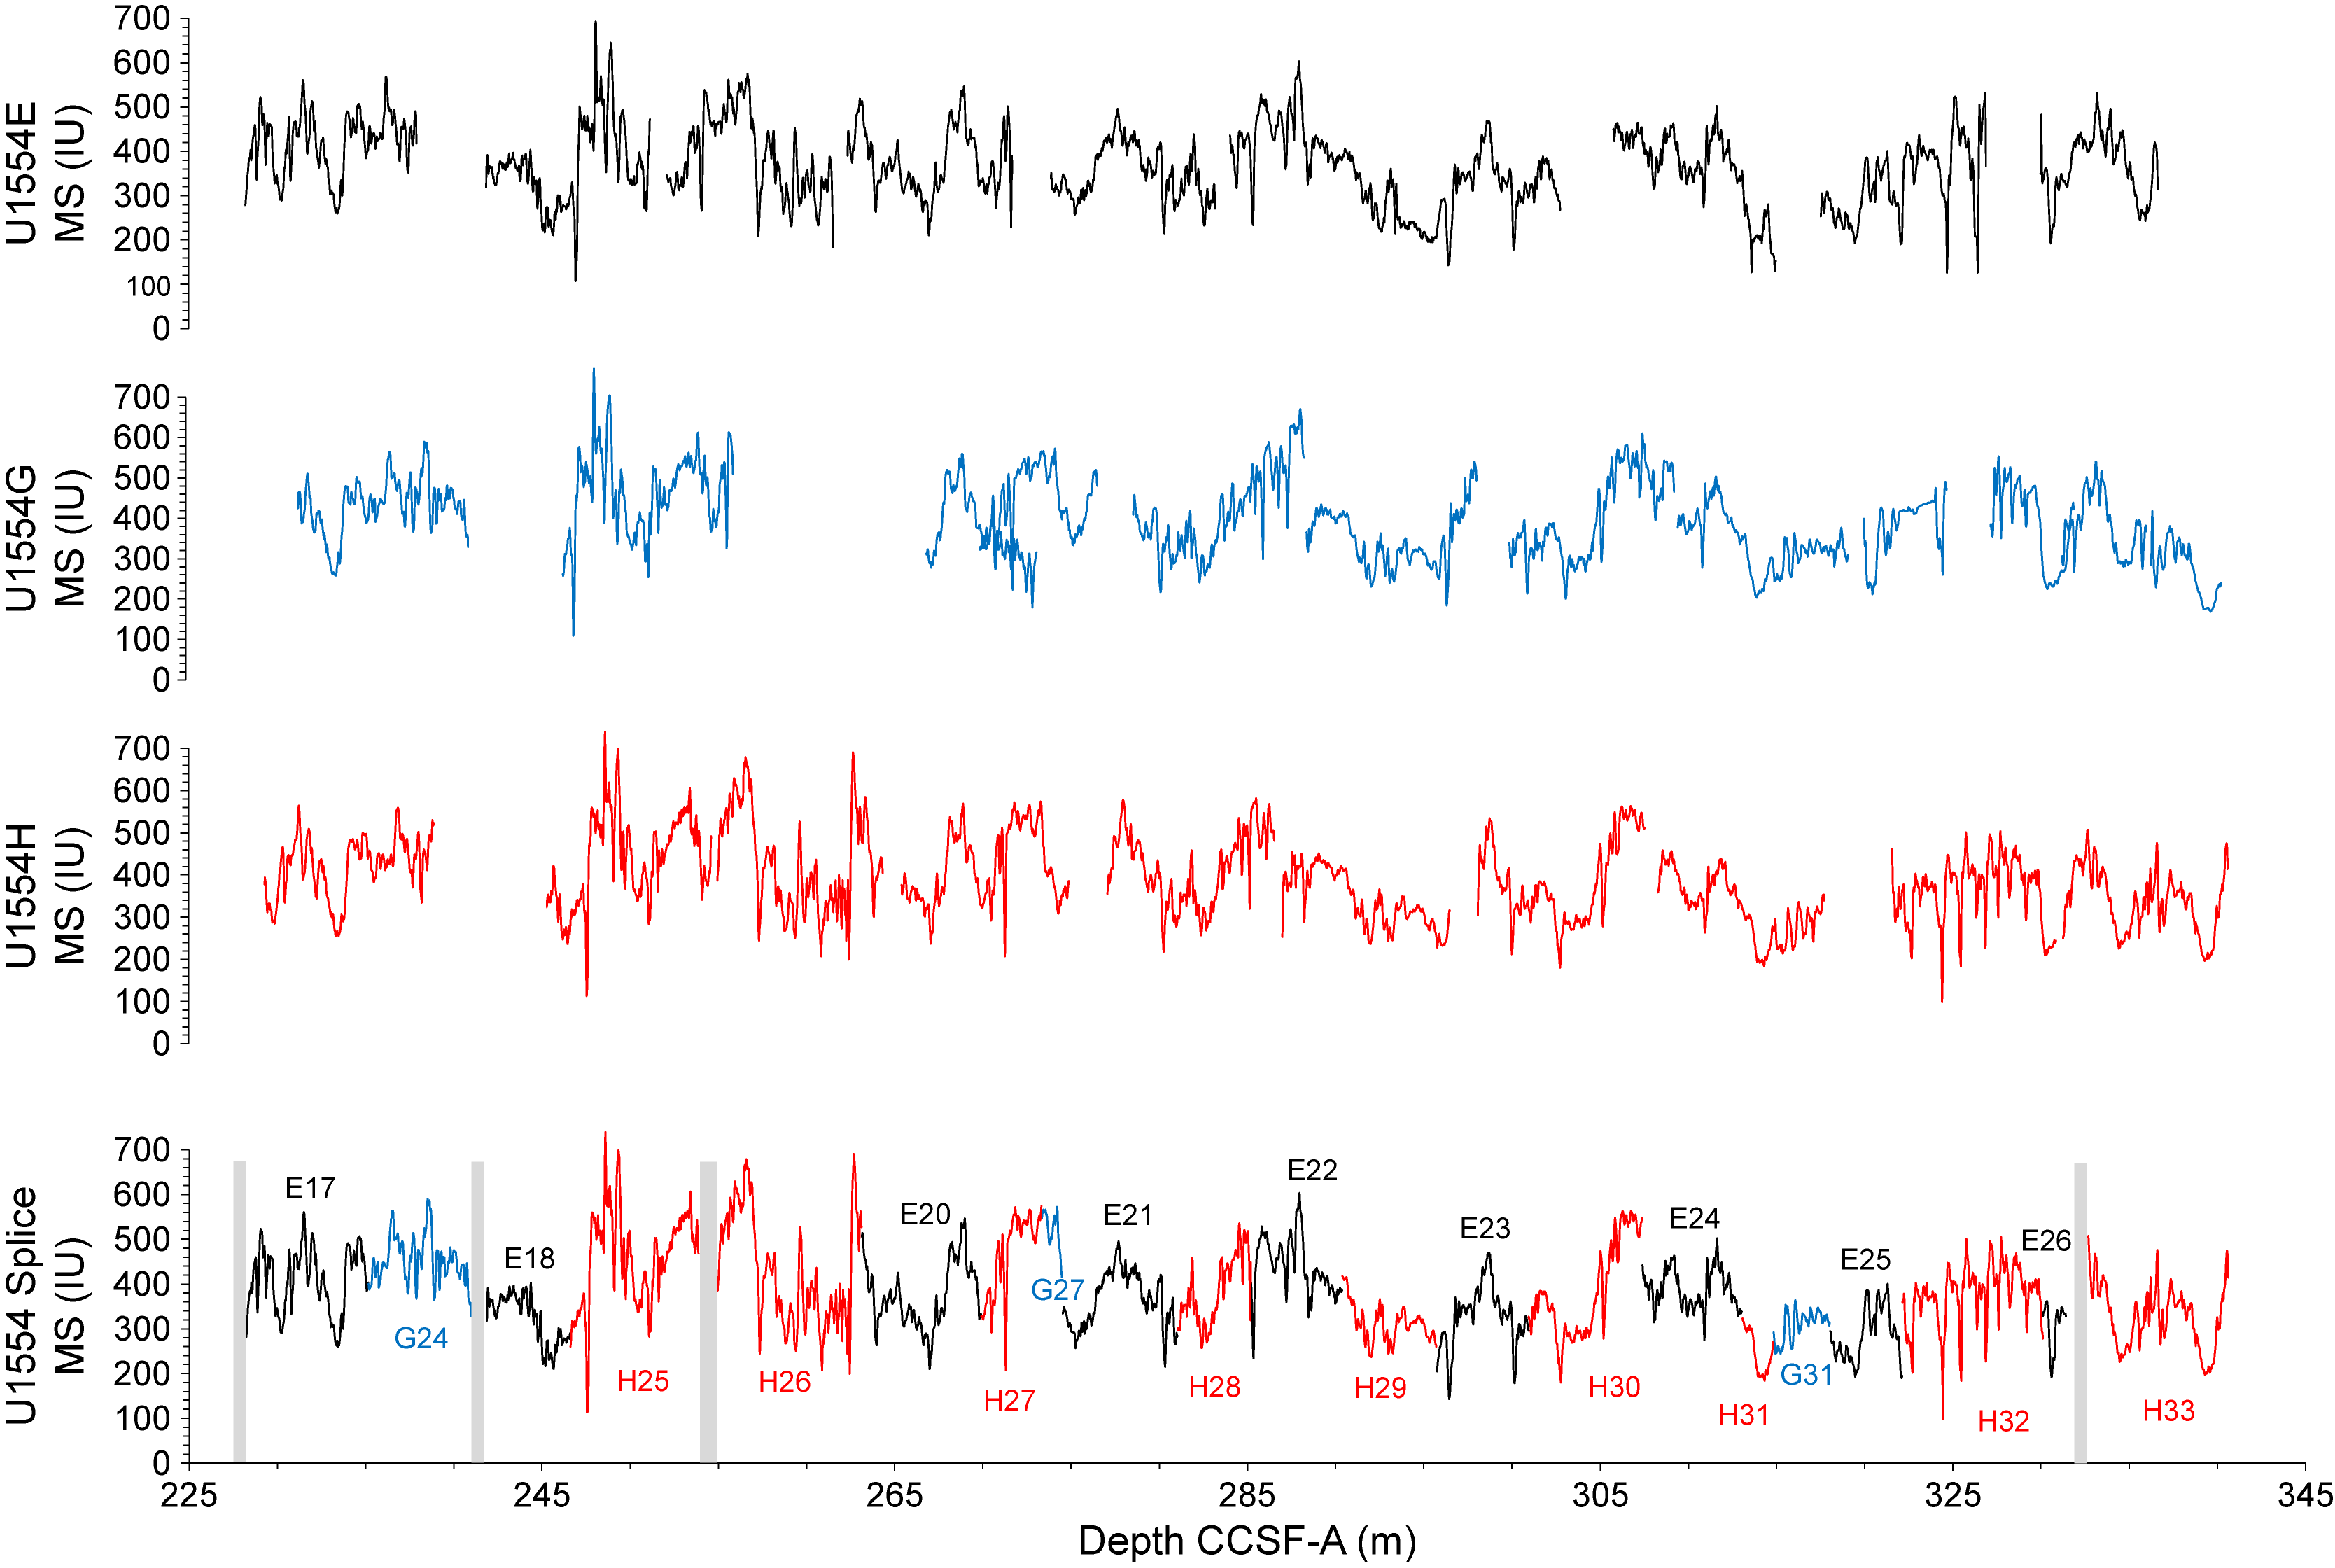
Figure F41. Splice for 225–345 m CCSF-A.
8.2. Construction of the splice
The splice for the uppermost ~75 m CCSF-A is very similar to that produced during Expedition 384 and includes only Holes U1554A–U1554C (Figure F39). A continuous splice was constructed using only Holes U1554E and U1554H from Core 395C-U1554E-2H (which was tied to Core 384-U1554A-7H from the initial splice) through Core 395-U1554H-23H (Figure F40). During recovery of Cores 395-U1554G-9H through 13H, relatively elevated vessel heave resulted in suboptimal operating conditions, so cores for the splice were selected to best avoid intervals with prominent drilling disturbance. Despite this strategy and attempts to tie even where features are subtle, some connections do not yield a perfectly smooth curve for the splice (e.g., Cores 395-U1554H-30H and 395C-U1554E-24F [Figure F41] and Cores 384-U1554B-3H and 384-U1554A-4H [Figure F39]). Between 225 and 345 m CCSF-A, several gaps are unavoidable, although after plotting the splice data it appears that some of the gaps might be filled with the information at hand if there is time for further revision (Figure F41, shaded bars). Core catcher sections were not included in the splice, and figures presented here do not include measurements in core catcher sections.
9. Paleomagnetism
9.1. Shipboard measurements
Shipboard paleomagnetic investigations (see Paleomagnetism in the Expedition 395 methods chapter [Parnell-Turner et al., 2025a]) consisted of NRM measurement and in-line alternating field (AF) demagnetization of archive-half sections on the pass-through 2G Enterprises superconducting rock magnetometer (SRM). Up to 13 steps at up to 1 cm resolution were applied to the archive-half sediment cores from Expedition 384 Site U1554 (see Table T7 in the Expedition 395 methods chapter [Parnell-Turner et al., 2025a]). For Expedition 395C, time constraints limited testing parameters to be between five and six demagnetization steps with 1 to 2.5 cm resolution for the sediments and five steps of demagnetization (0, 10, 15, 20, and 25 mT) at 2 cm spacing for the basalts of Hole 395C-U1554F (see Table T7 in the Expedition 395 methods chapter [Parnell-Turner et al., 2025a]). Measurement parameters during Expedition 395 were chosen to align with those used in earlier Expeditions 384 and 395C, time constraints, the goals for the site, and preservation of data for postcruise U-channel analysis. NRM only was measured for Hole 395-U1554G and Cores 395-U1554H-1H through 7H at 5 and 2.5 cm spacing, respectively. For Cores 8H–38X, we used four demagnetization steps (0, 10, 15, and 20 mT) at 2.5 to 5 cm spacing (see Table T7 in the Expedition 395 methods chapter [Parnell-Turner et al., 2025a]).
No discrete samples were collected from Site U1554 during Expeditions 395 and 395C, but 15 discrete samples were collected during Expedition 384 from Holes U1554A and U1554B to characterize their magnetic properties (Blum et al., 2020).
Directional data from Expeditions 395C and 395 were analyzed using the PuffinPlot software (Version 1.4.1; Lurcock and Florindo, 2019).
9.2. Demagnetization behavior of sedimentary rocks
Inclination data from cores curated at Site U1554 during Expeditions 384, 395C, and 395 are shown in Figure F42 (note that no core was curated from Hole 384-U1554D). Hole U1554G and the upper part of Hole U1554H were only run for NRM because they are repeat records from Holes 384-U1554A through 384-U1554C and the material was preserved for future study.
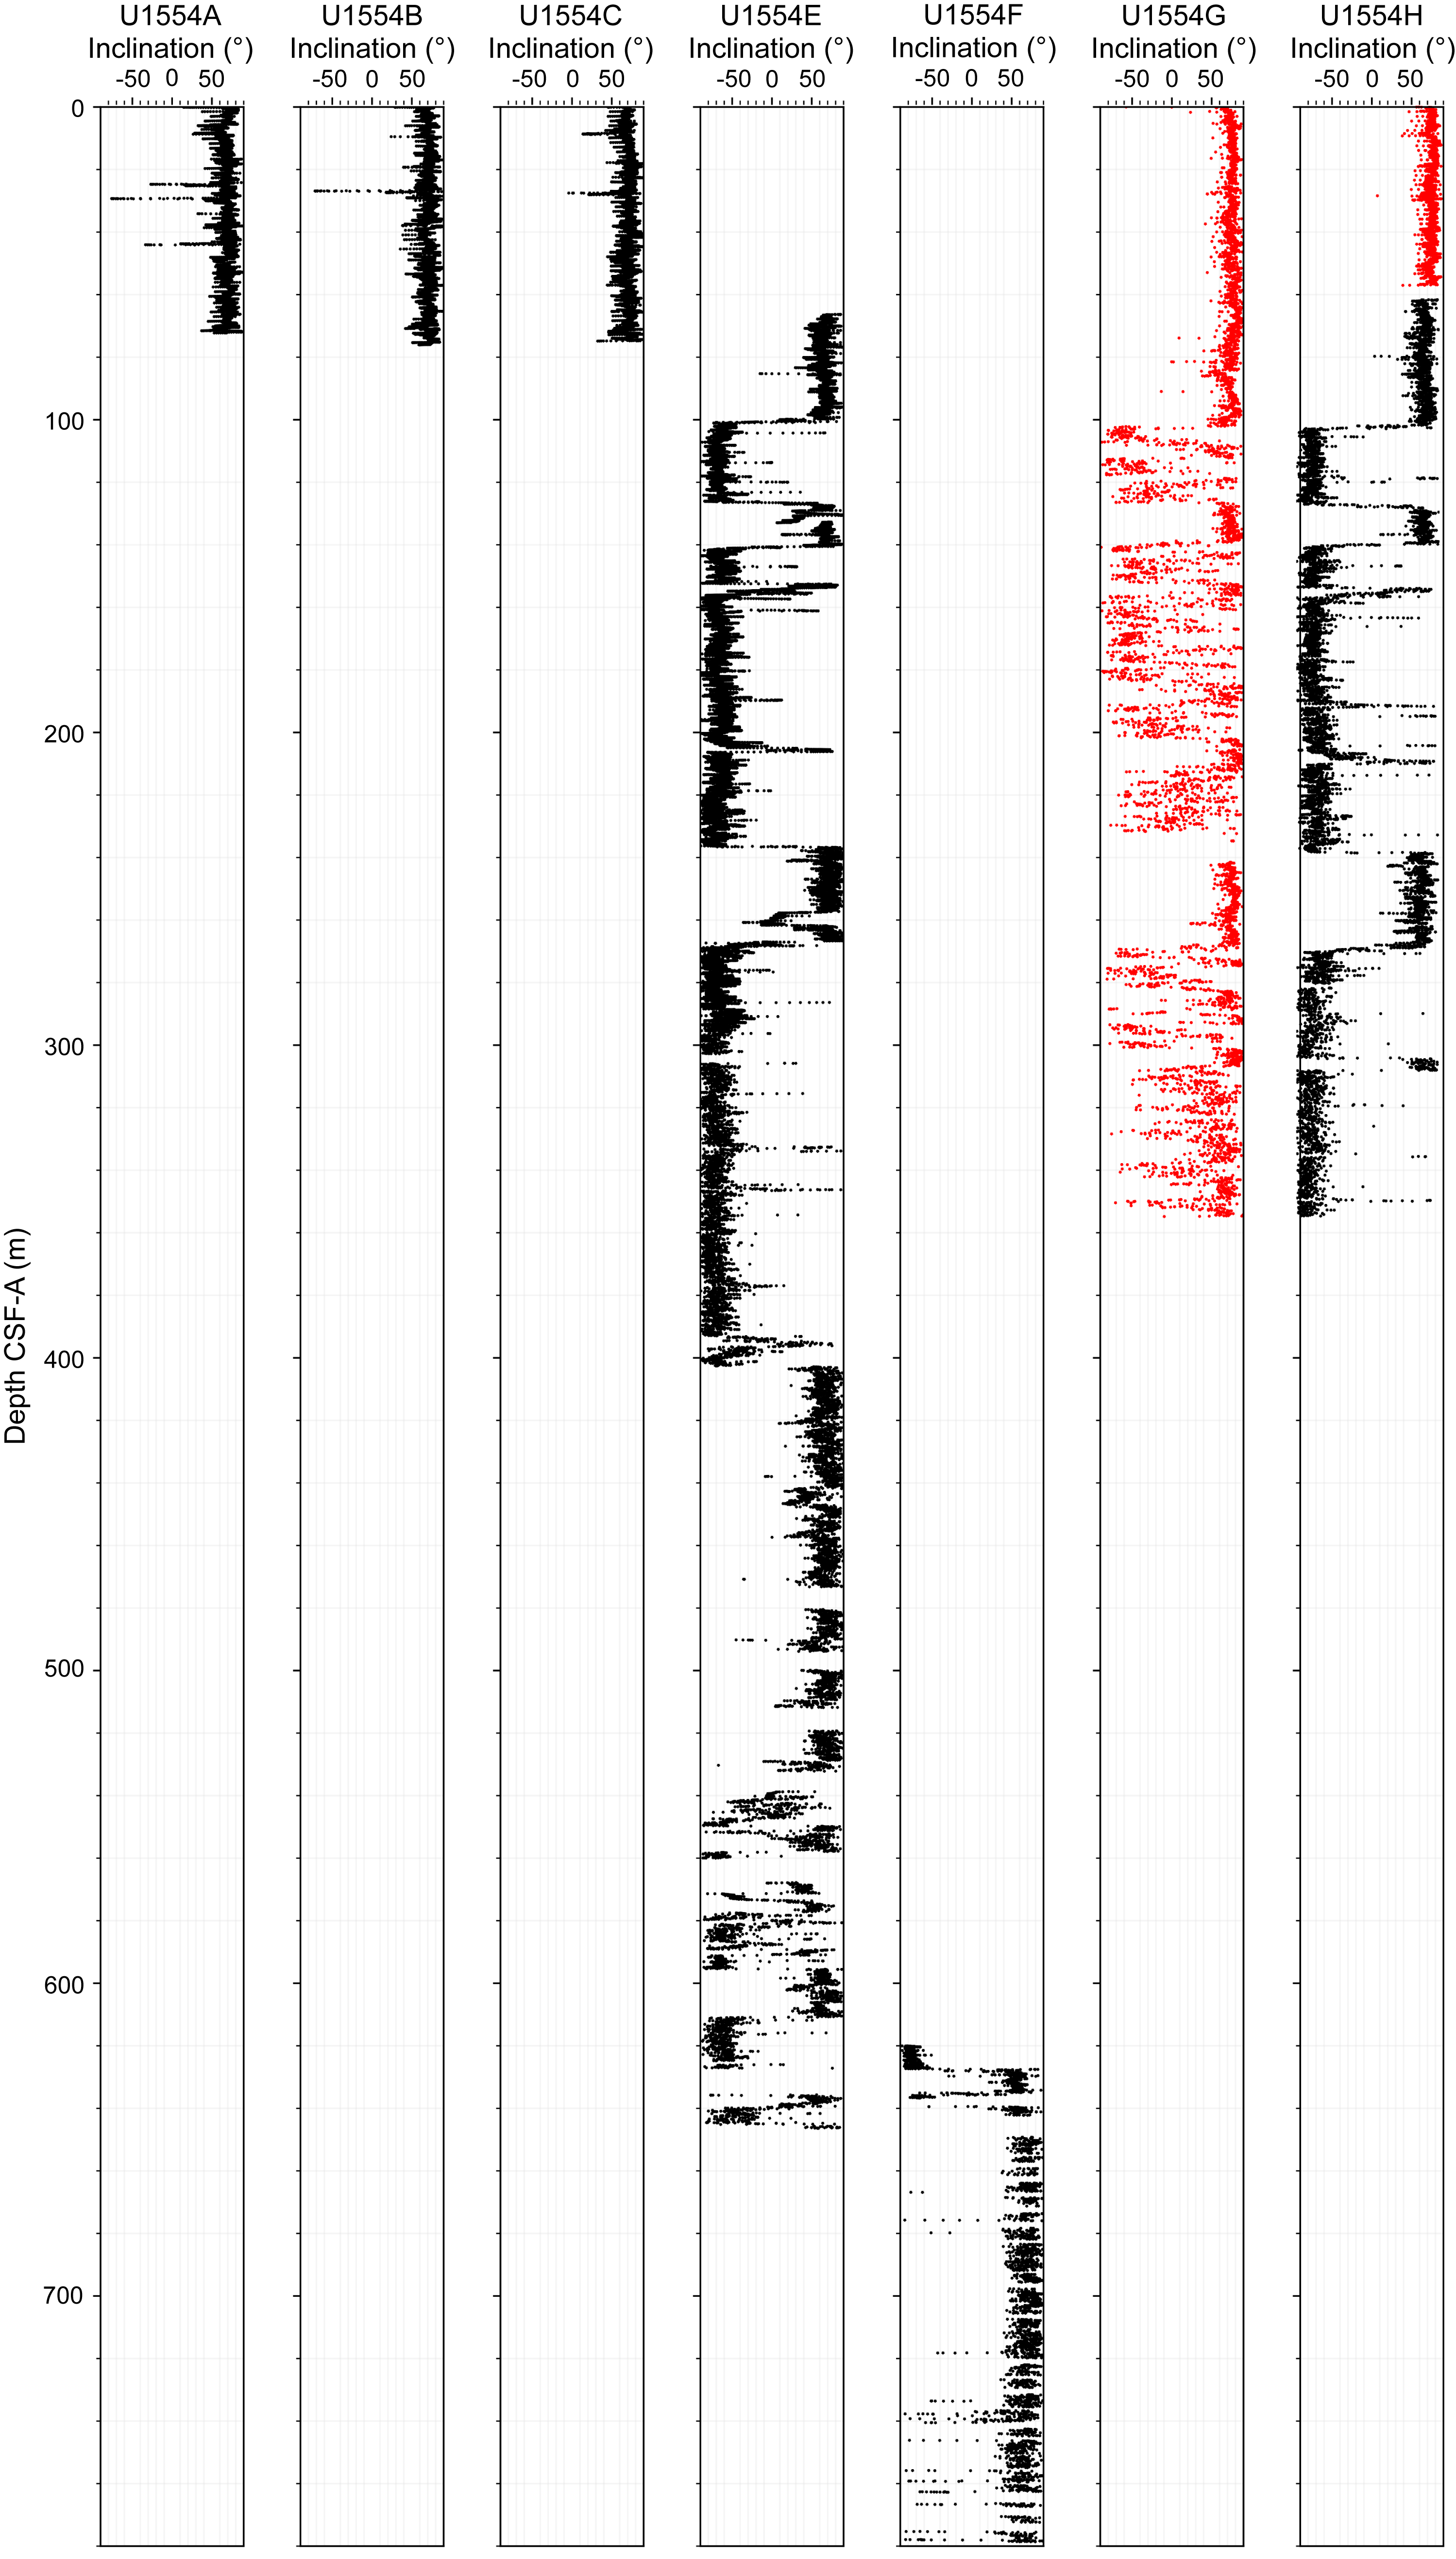
Figure F42. Inclinations.
After the removal of an overprint up to 10 mT, stepwise AF demagnetization up to between 20 and 35 mT allowed the identification of a stable characteristic remanent magnetization, even if the initial NRM was not completely demagnetized. This approach allowed both normal (Figure F43B, F43C, F43F) and reversed polarities (Figure F43A, F43D, F43E) to be isolated.
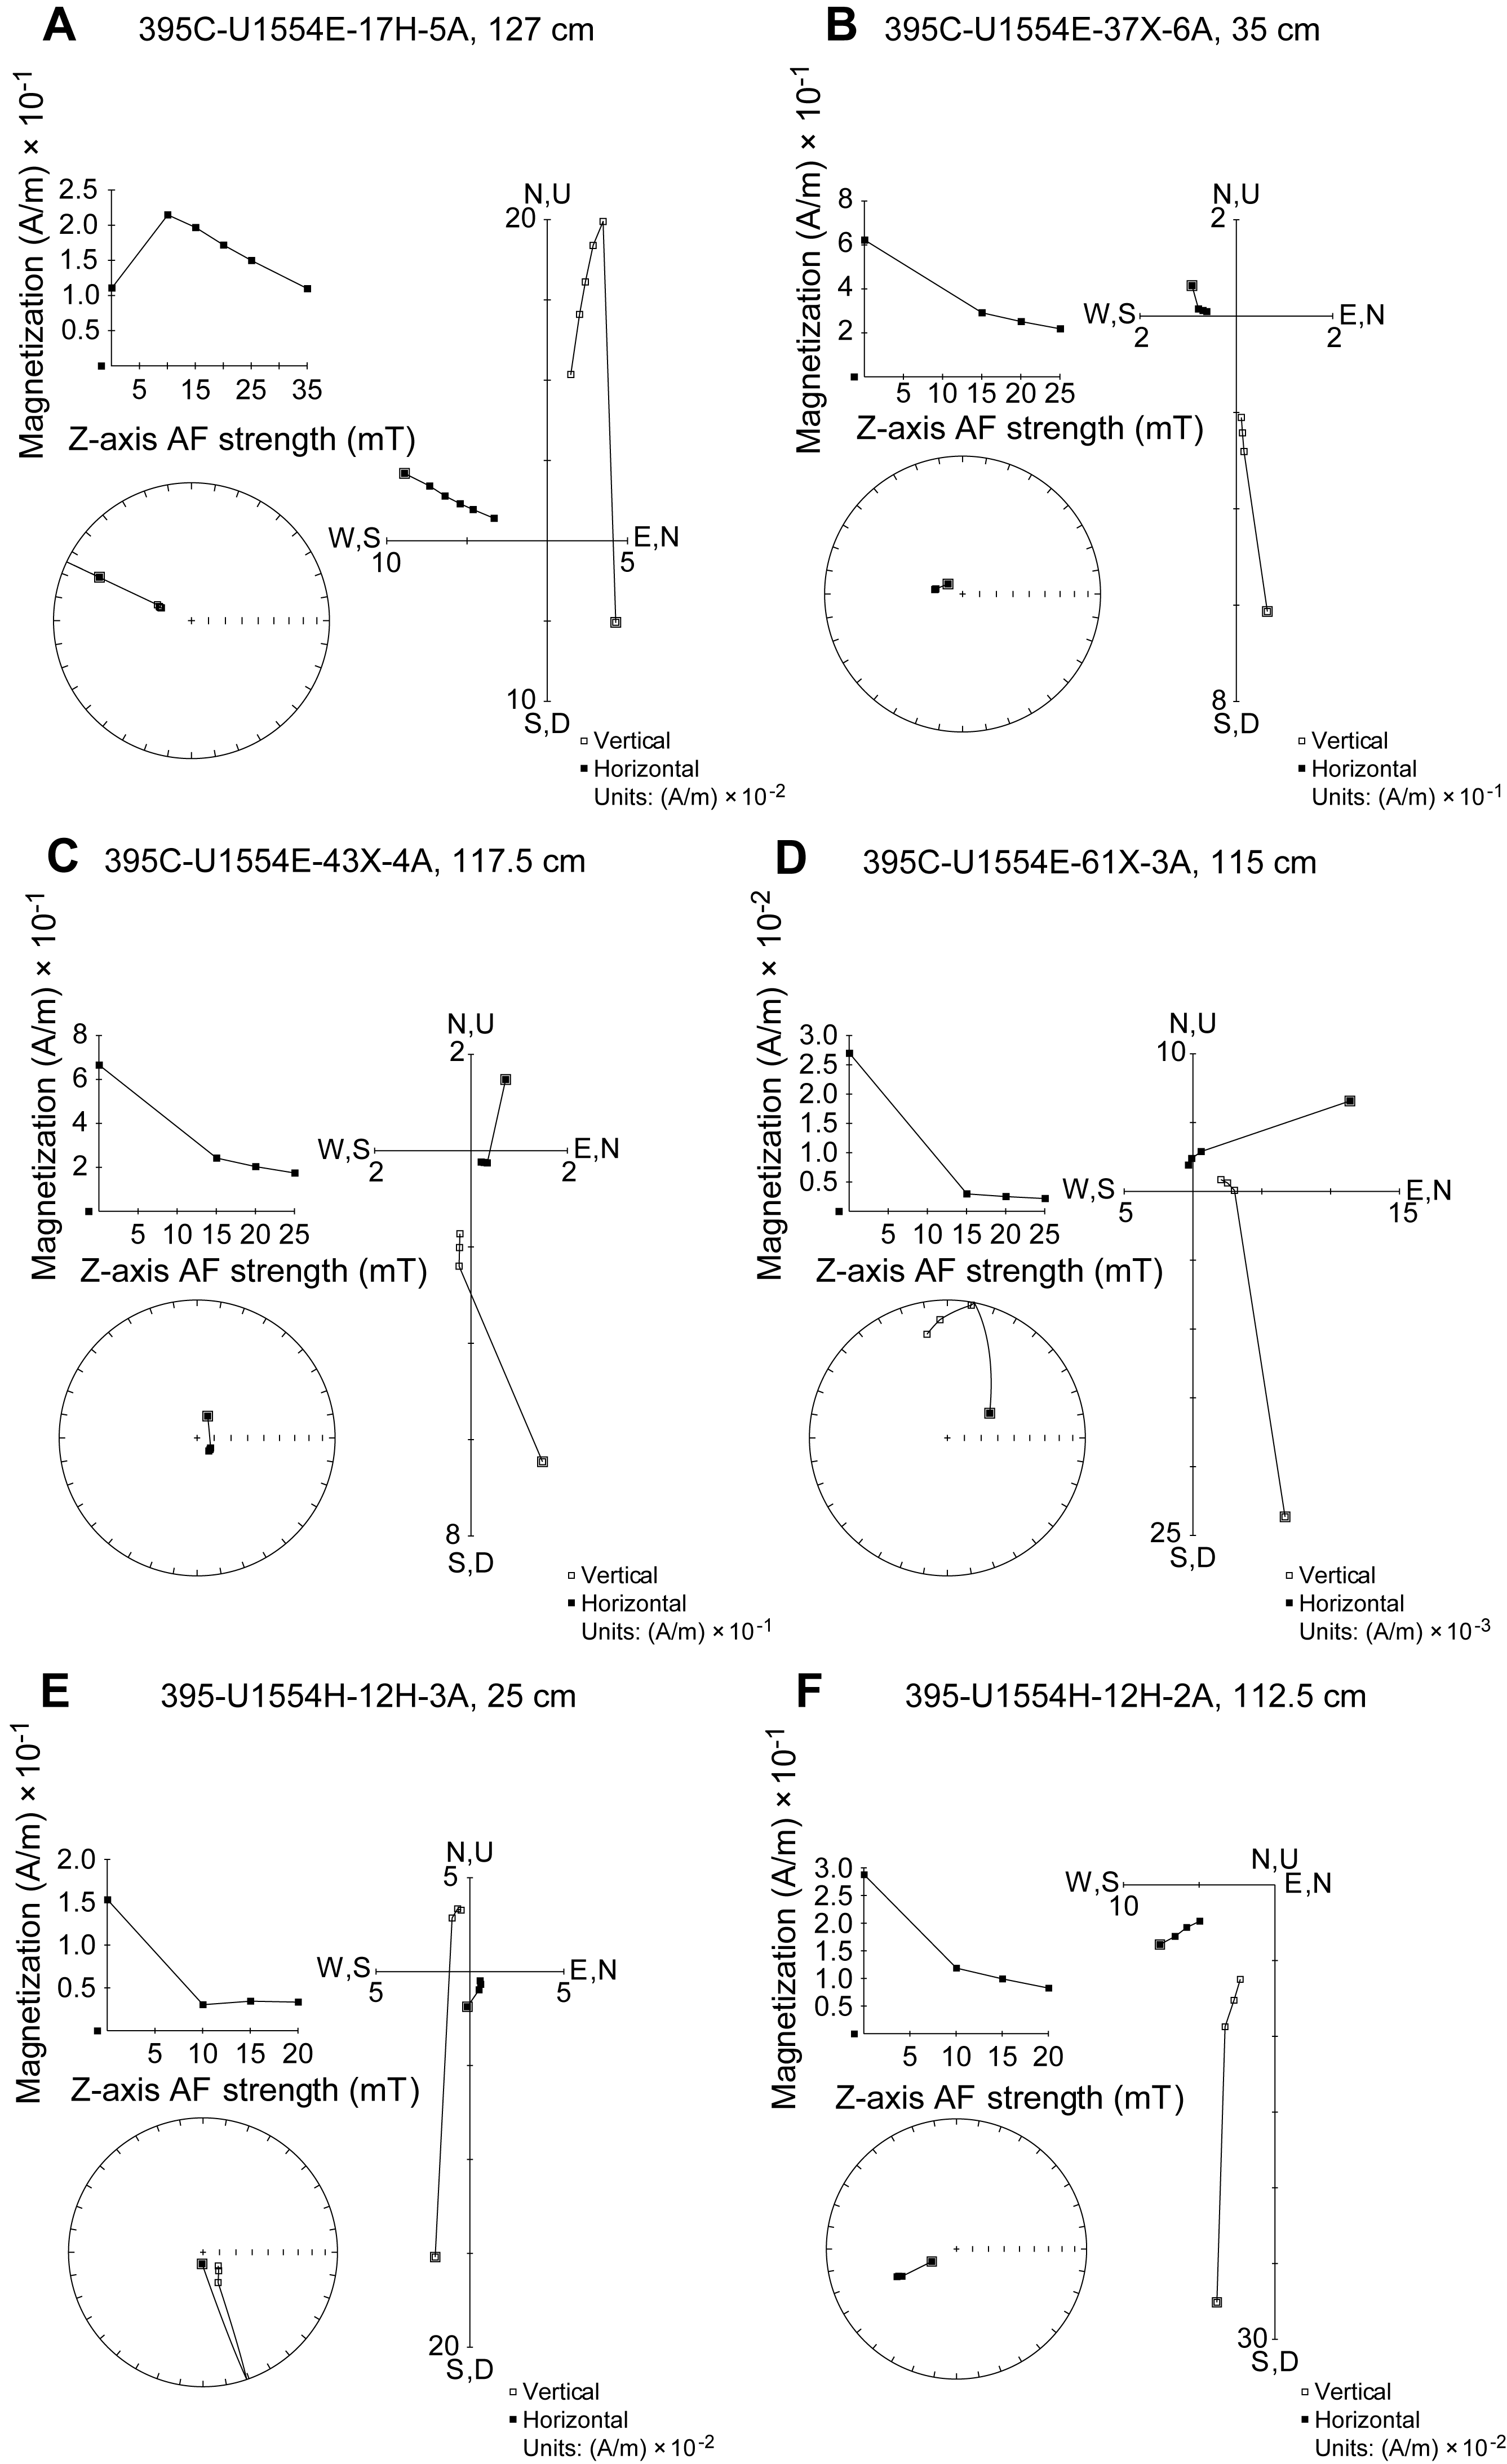
Figure F43. Demagnetization of sediments, Holes U1554E and U1554H.
We observe a drilling overprint starting at 400 m CSF-A coinciding with Core 395C-U1554E-37X (Figure F43B–F43D), characterized by a steep to near-vertical inclination. Therefore, it is not possible to isolate the primary magnetization below 400 m CSF-A.
Holes U1554A–U1554C (Figures F44, F45, F46) are characterized by positive and steep inclinations after demagnetization at 20 mT, indicating a normal polarity, which is expected from their relatively shallow depth.

Figure F44. Paleomagnetic measurements, Hole U1554A.
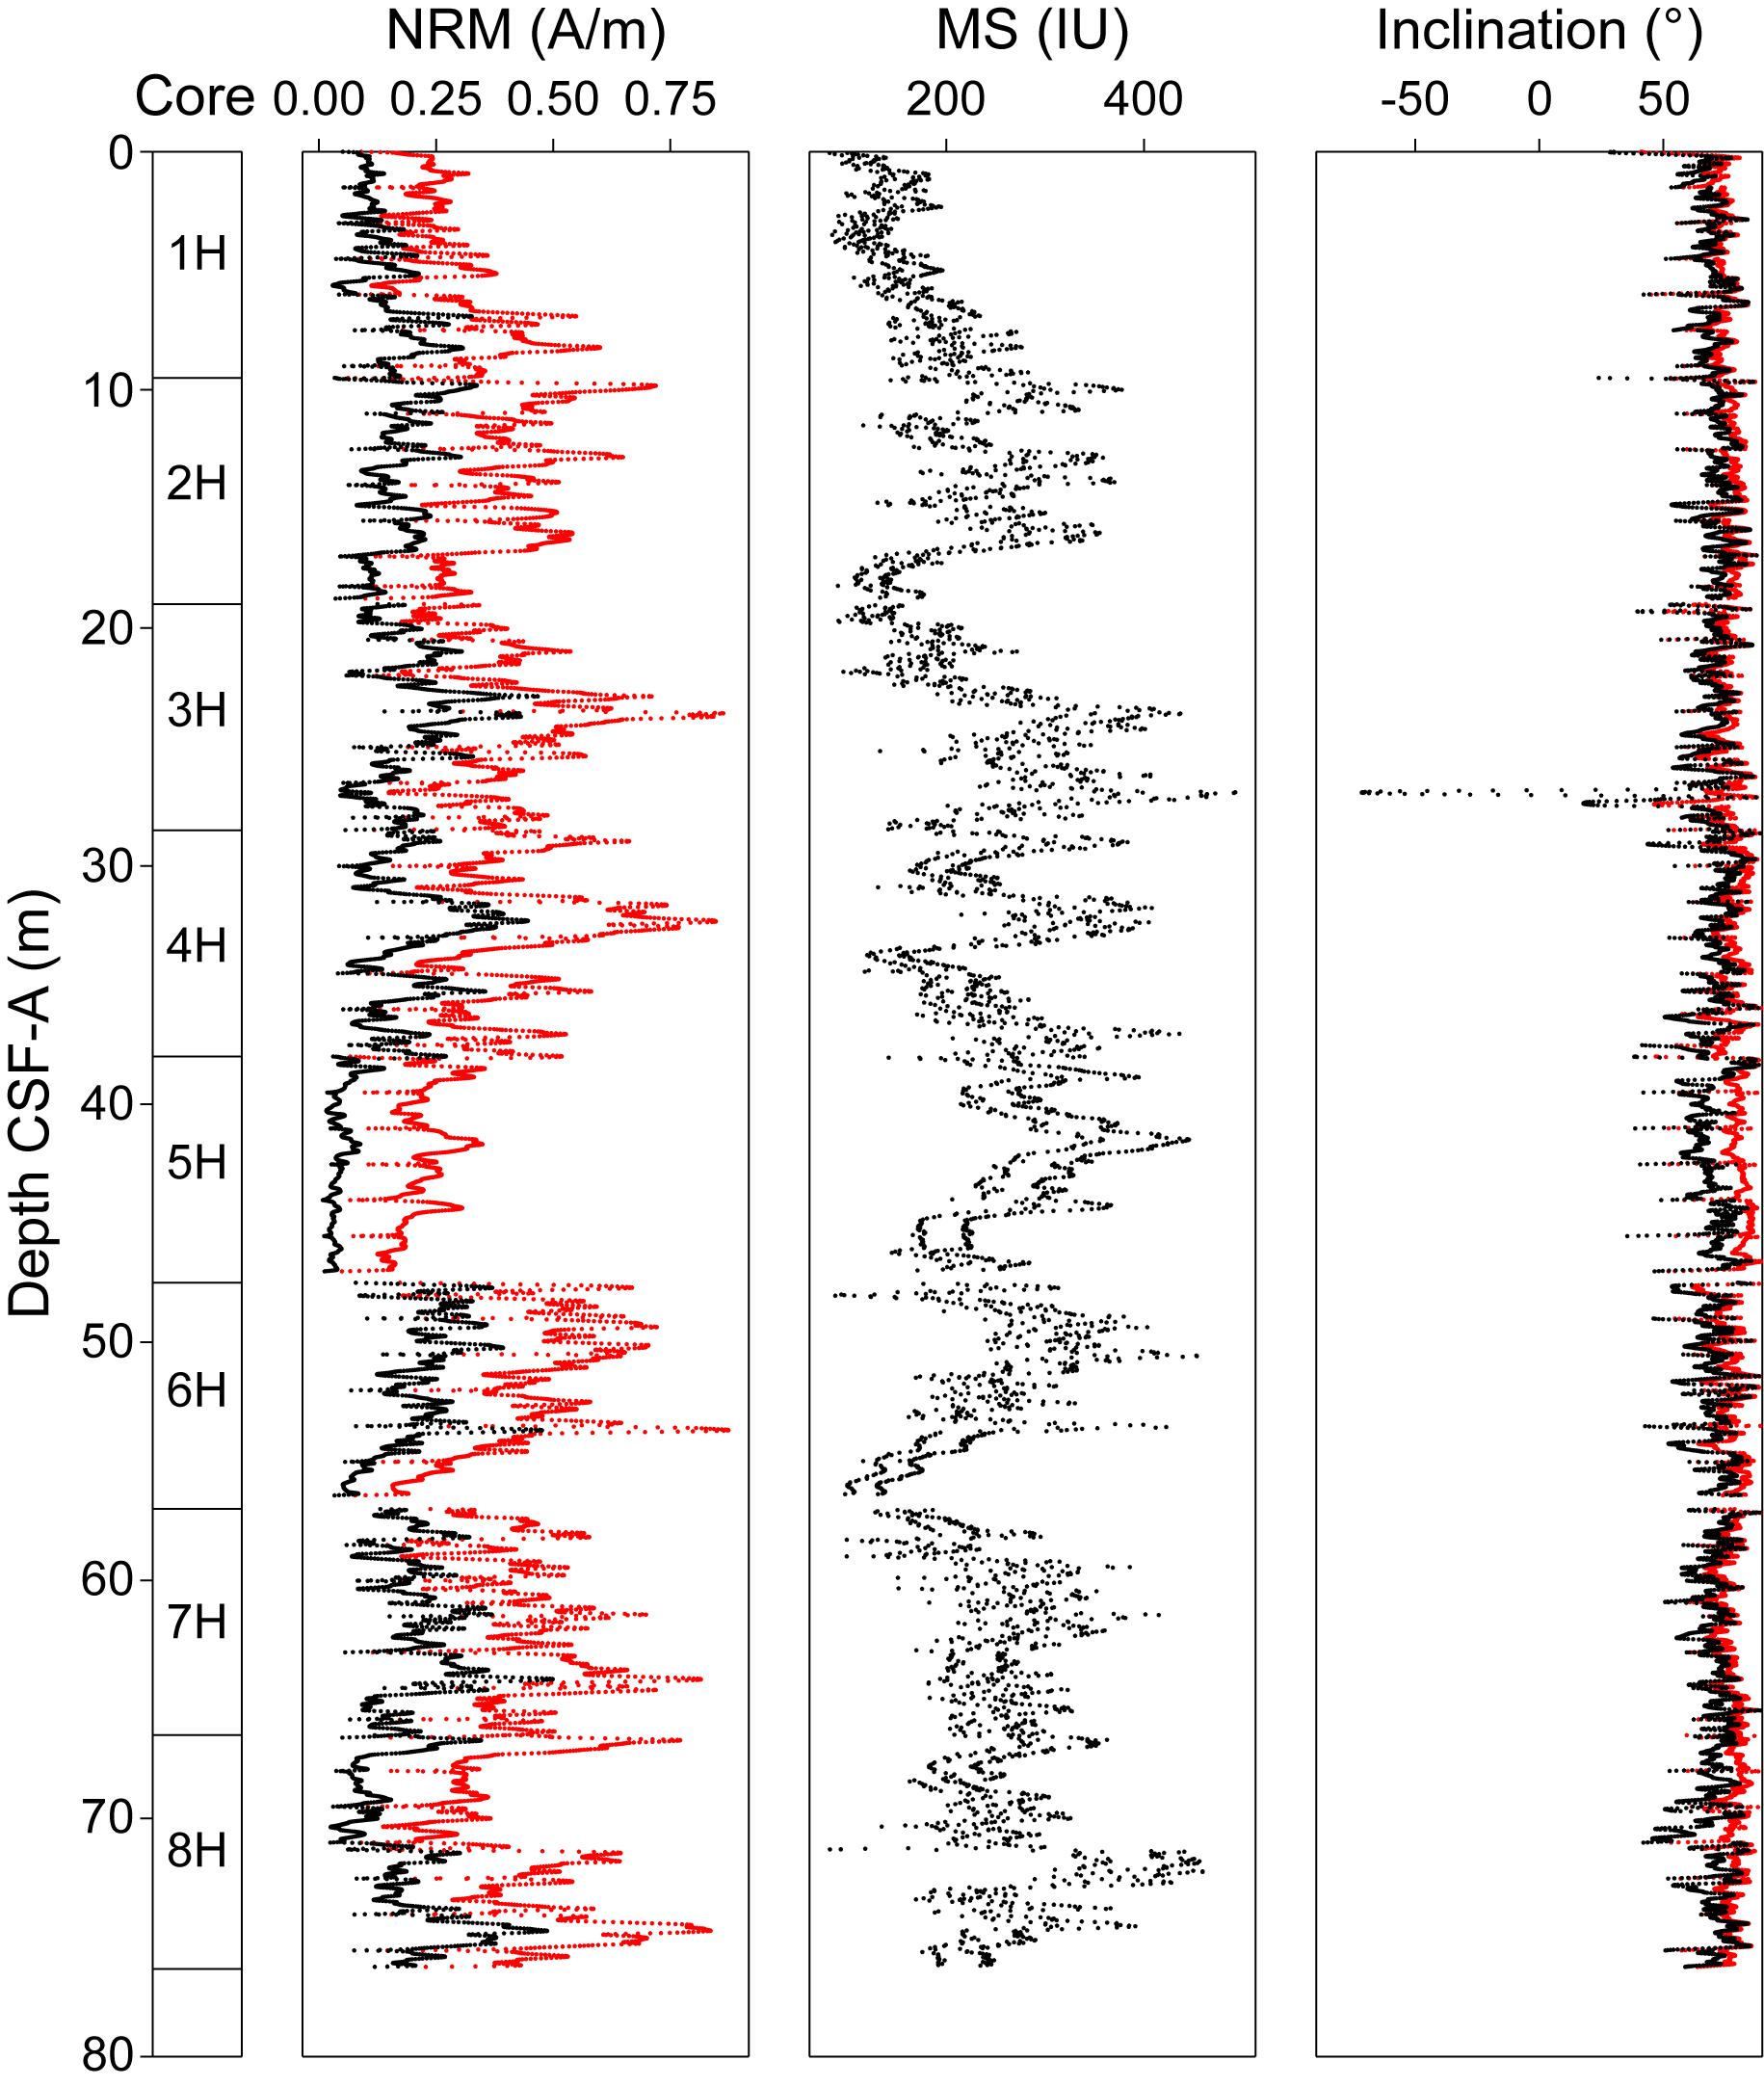
Figure F45. Paleomagnetic measurements, Hole U1554B.
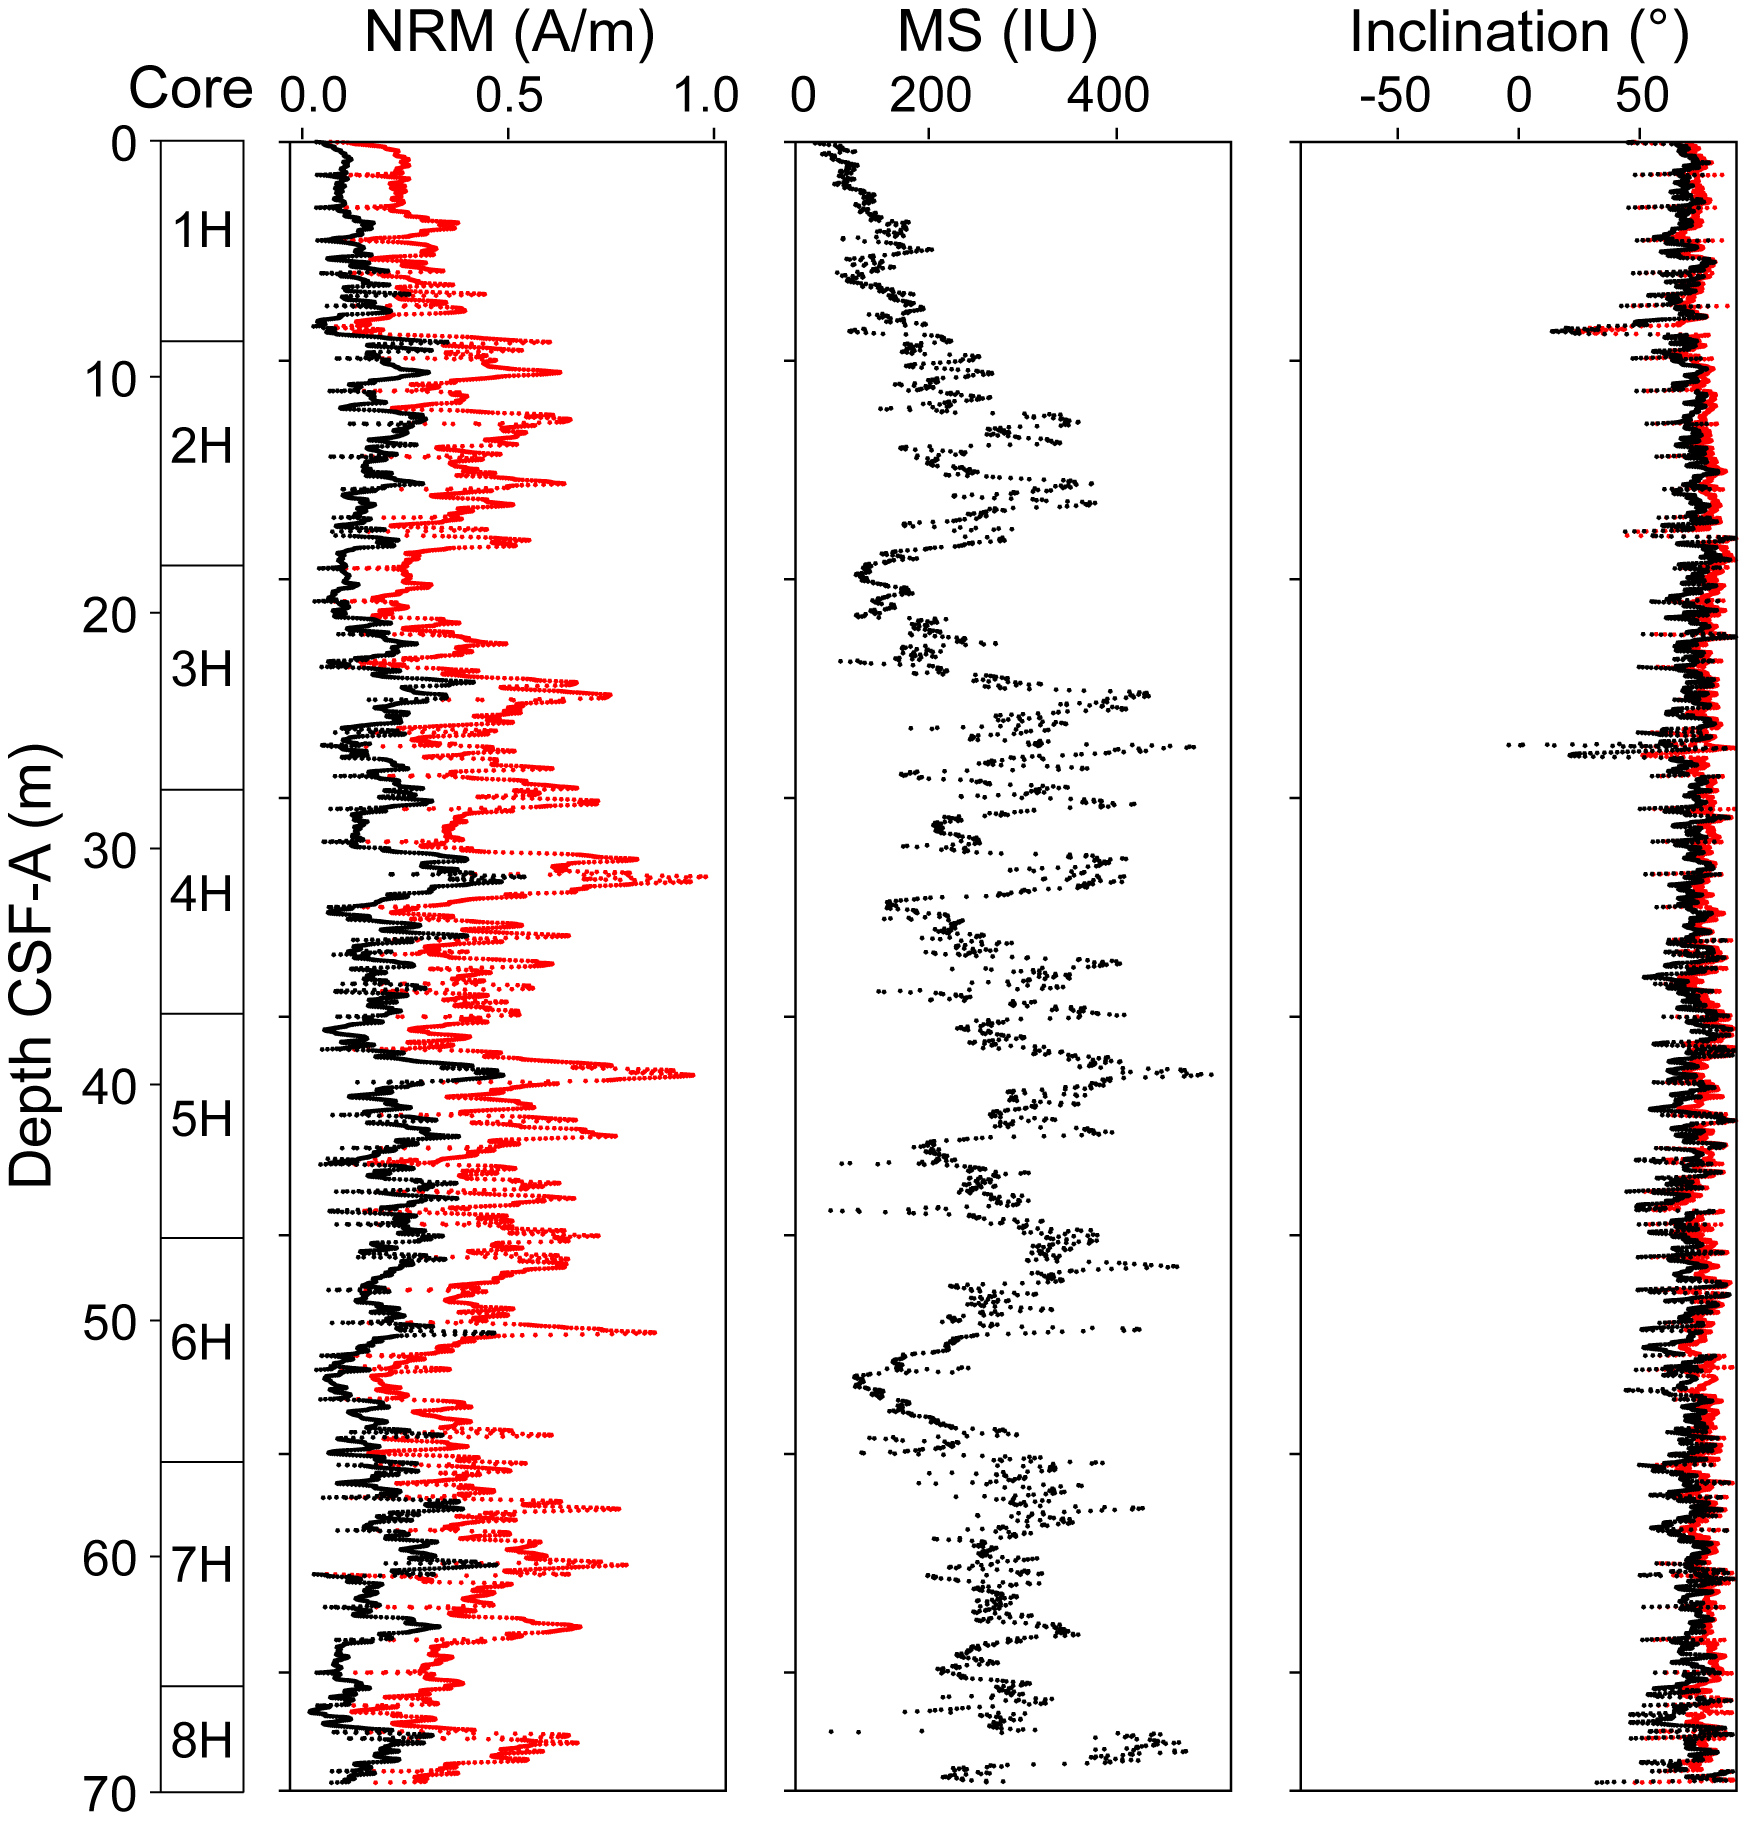
Figure F46. Paleomagnetic measurements, Hole U1554C.
The NRM intensity in Hole U1554A varies from 1.7 × 10⁻² to 9.0 × 10⁻¹ A/m with an average value of 3.8 × 10⁻¹ A/m (Figure F44). For Hole U1554B, the NRM intensity varies from 4.9 × 10⁻² to 8.8 × 10⁻¹ A/m with an average value of 3.8 × 10⁻¹ A/m (Figure F45). Similarly, the NRM intensity for Hole U1554C varies from 6.0 × 10⁻² to 9.8 × 10⁻¹ A/m with an average value of 4.0 × 10⁻¹ A/m (Figure F46). The NRM intensity in Hole 395C-U1554E varies from 3.2 × 10⁻⁵ to 7.2 A/m with an average value of 2.7 × 10⁻¹ A/m (Figure F47). In Hole U1554G, the NRM intensity varies from 8 × 10⁻³ to 4.7 A/m with an average of 2.84 × 10⁻¹ A/m (Figure F48). For Hole U1554H, the NRM intensity varies from 2.9 × 10⁻³ to 2.0 A/m with an average of 3.2 × 10⁻¹ A/m (Figure F49).
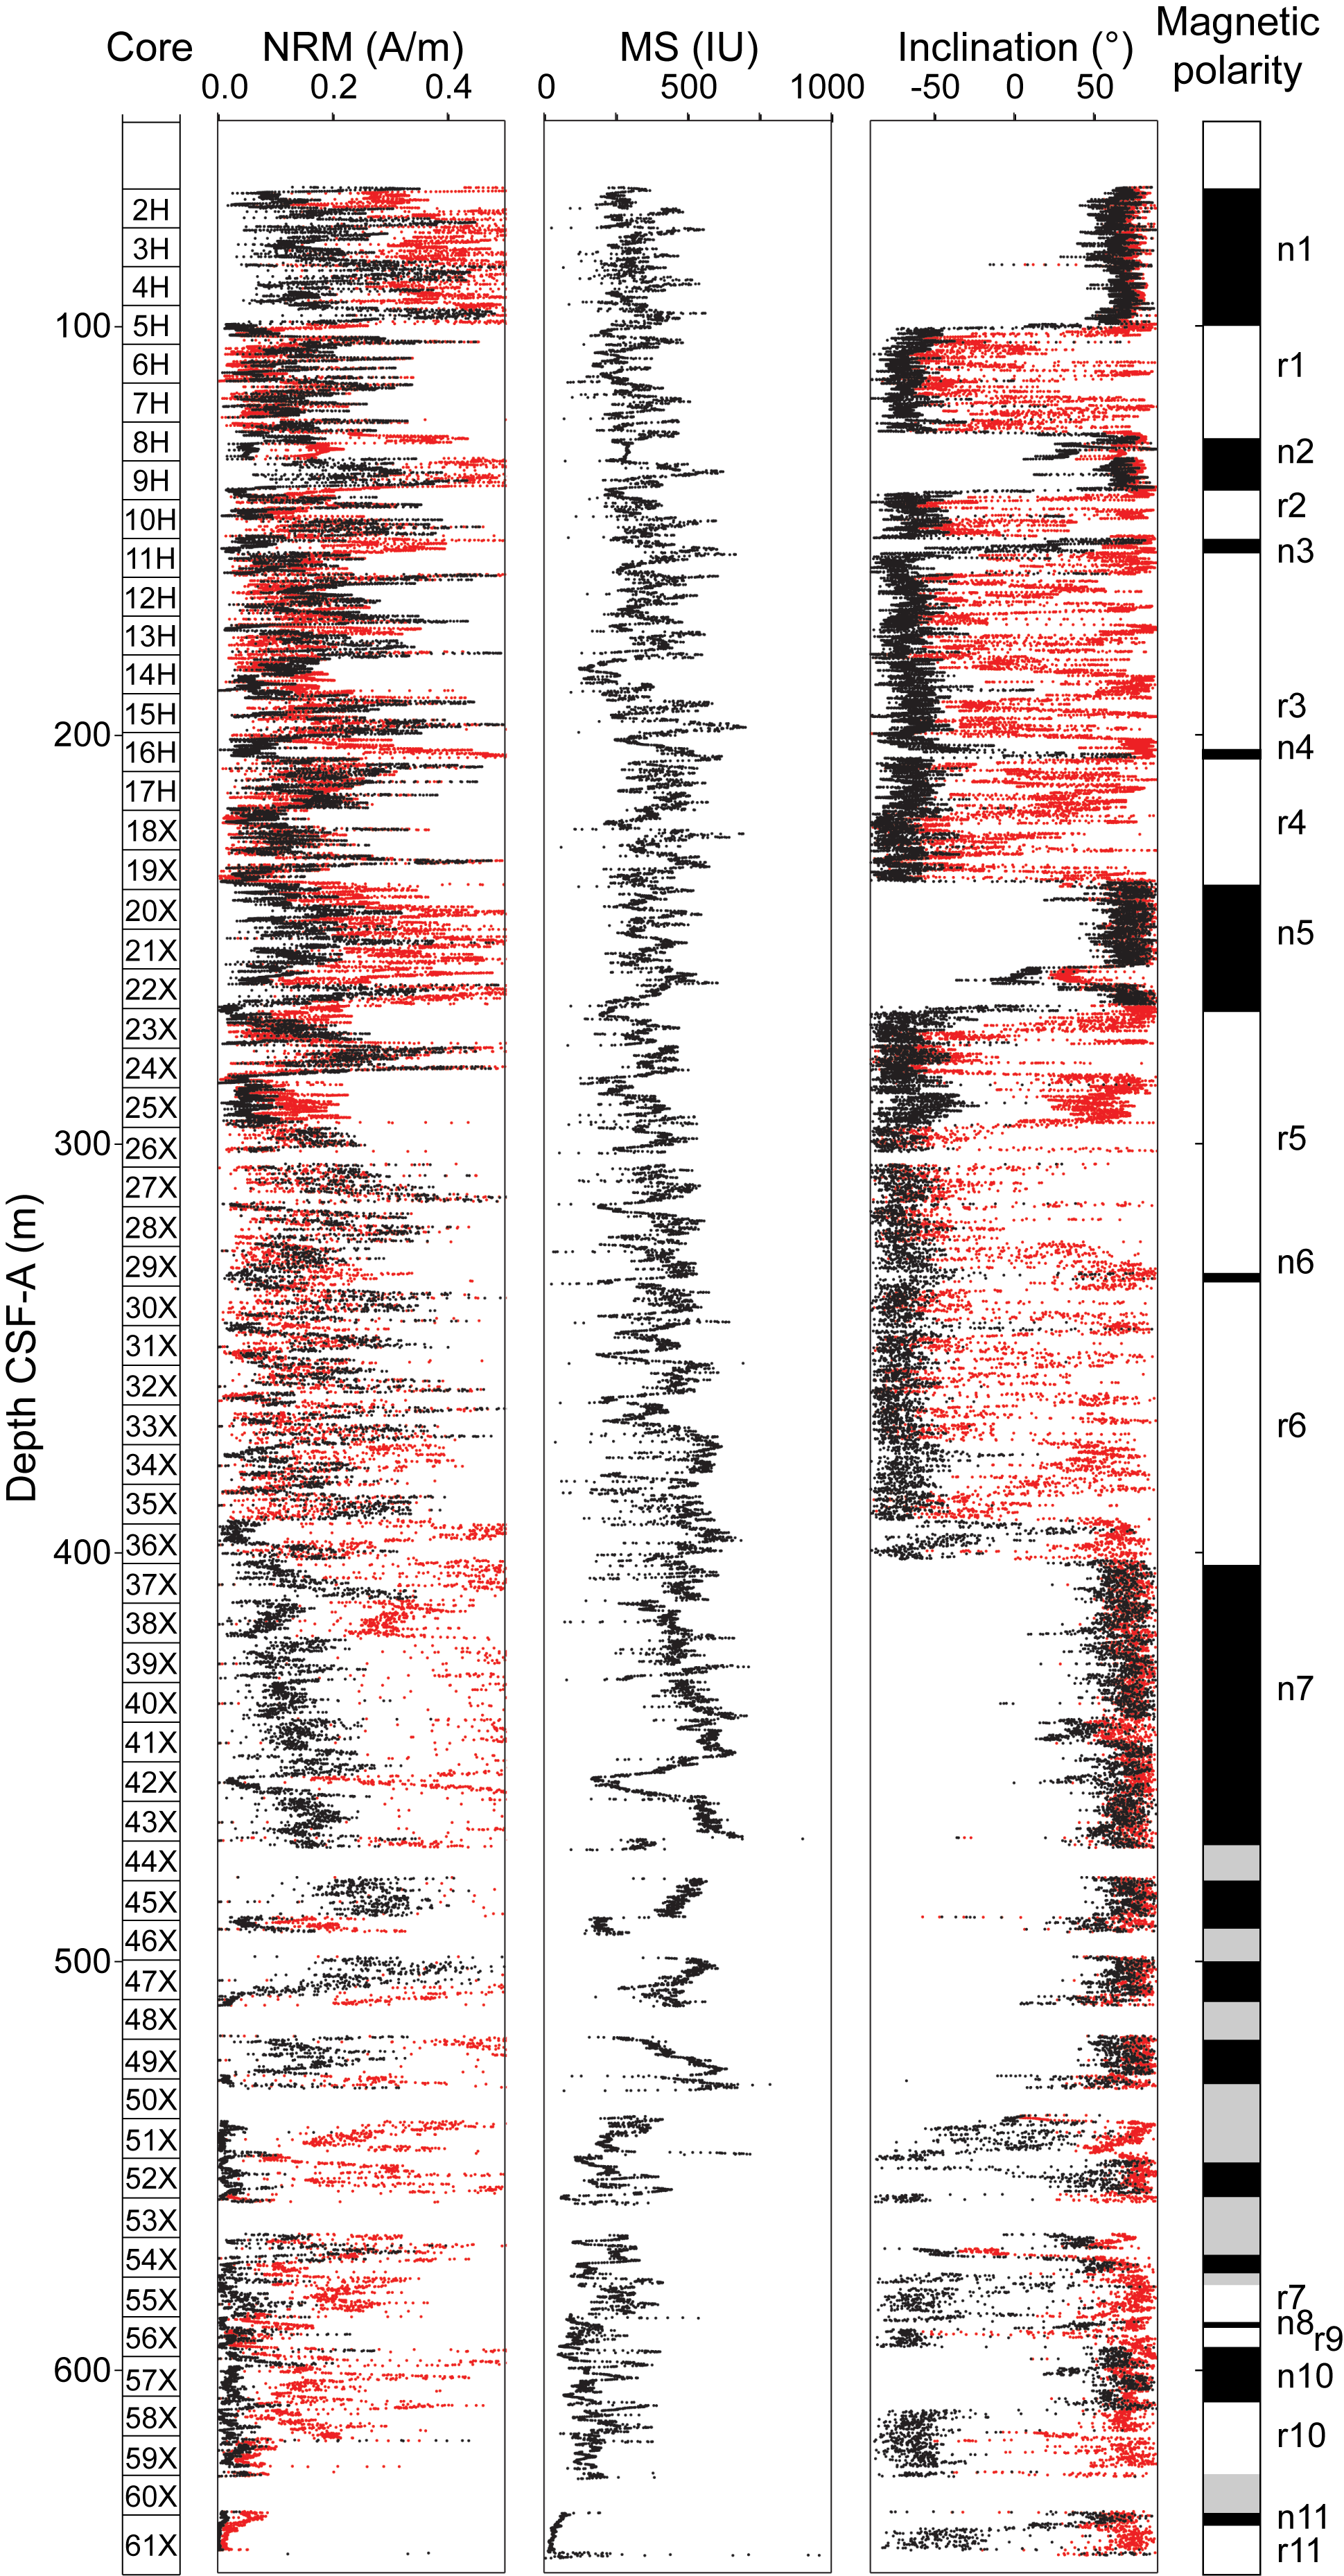
Figure F47. Paleomagnetic measurements, Hole U1554E.
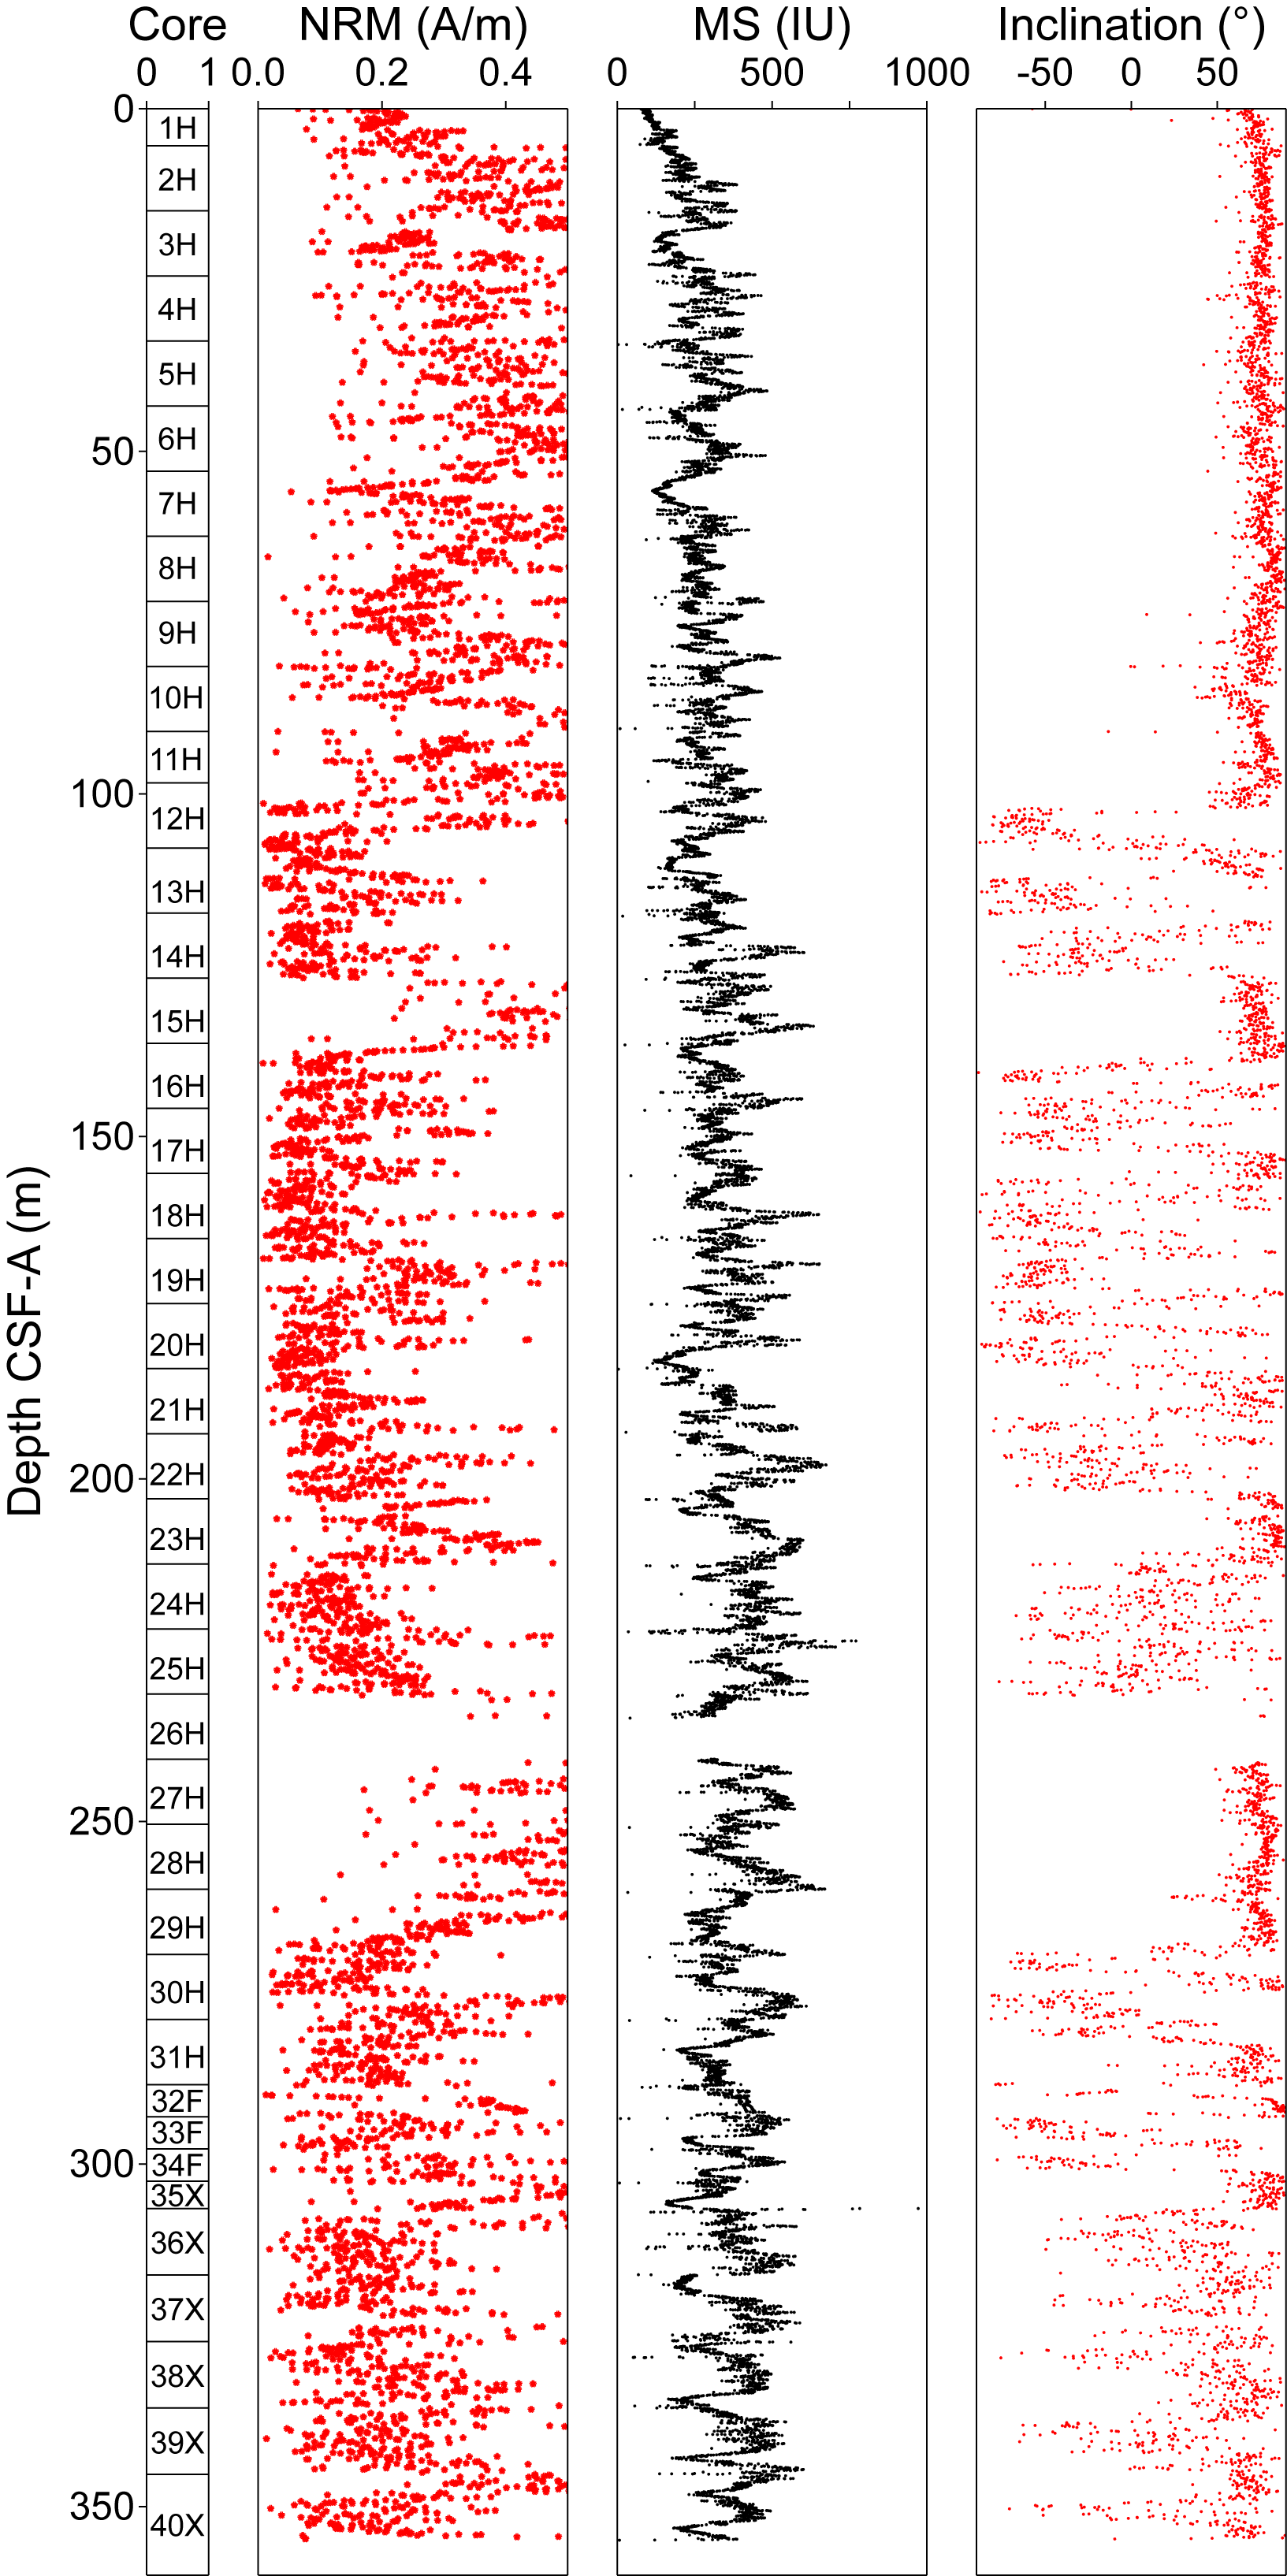
Figure F48. Paleomagnetic measurements, Hole U1554G.
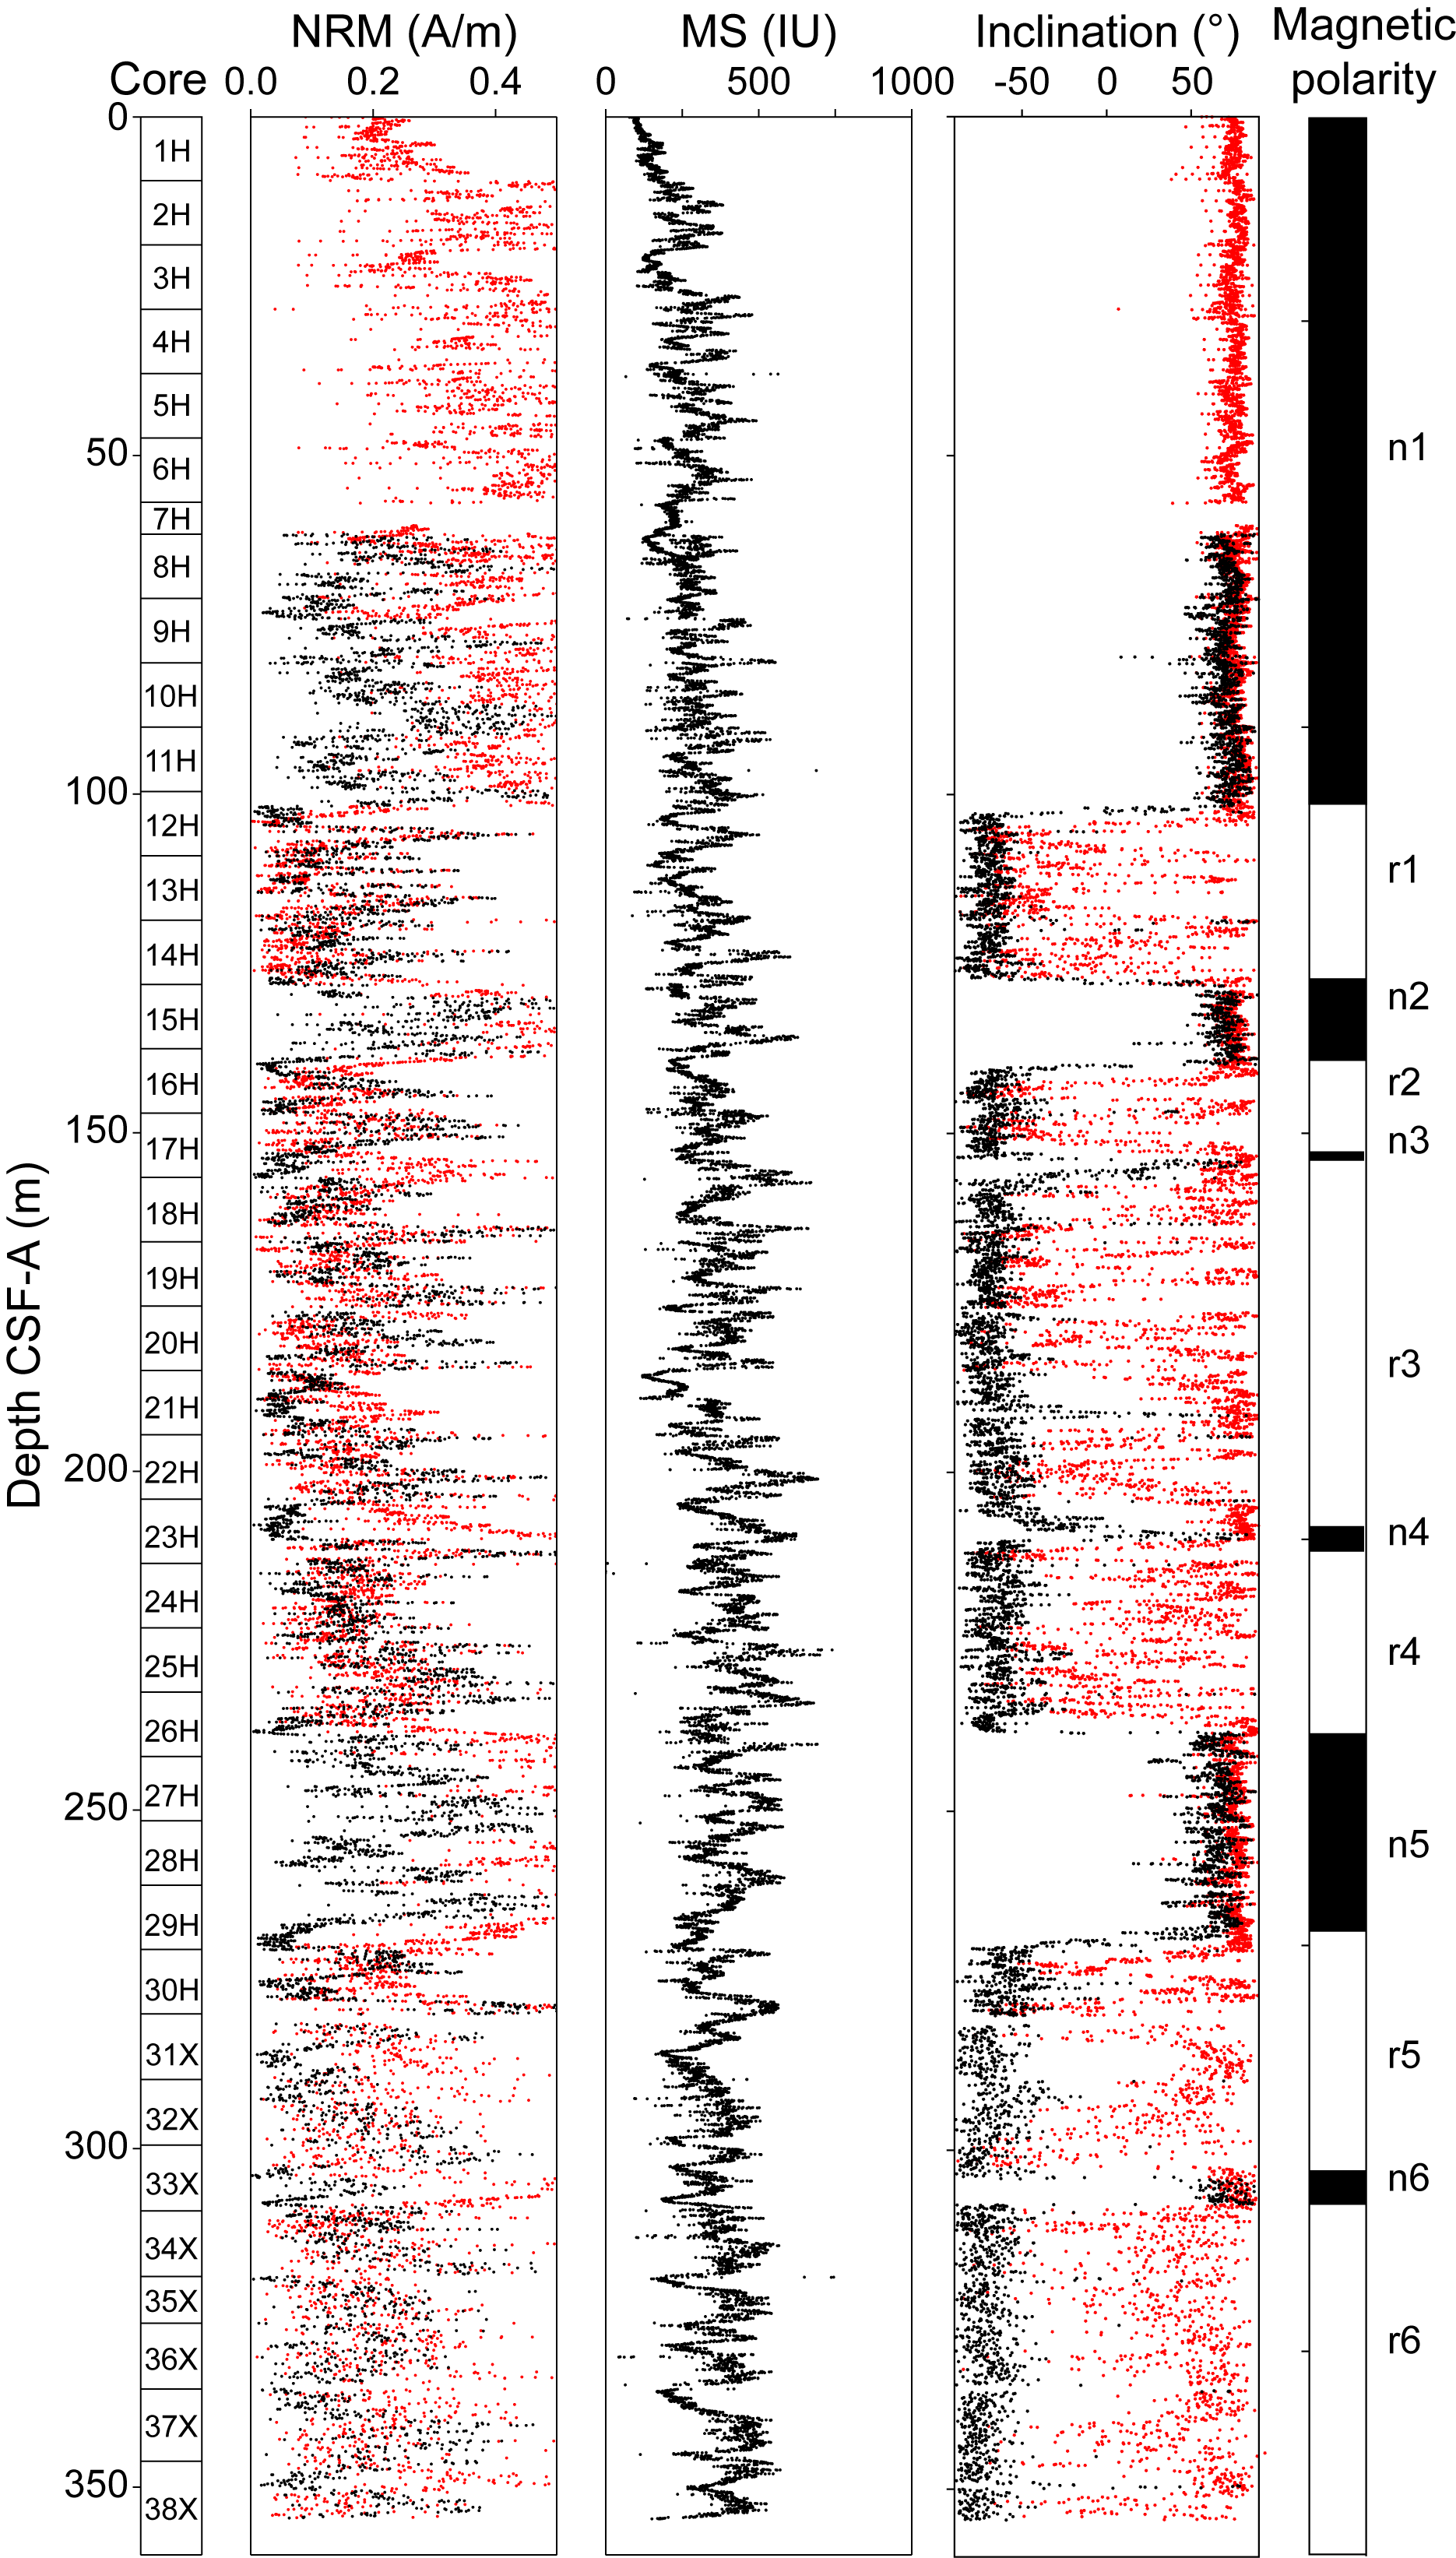
Figure F49. Paleomagnetic measurements, Hole U1554H.
The MS in Hole U1554A obtained by point measurement on section halves (see Physical properties) varies from 44.5 to 570.0 IU with an average value of 260.7 IU (Figure F44). The MS in Hole U1554B varies from 32.0 to 522.2 IU with an average of 276.3 IU (Figure F45). Similarly, the MS in Hole U1554C varies from 5.6 to 526.3 IU with an average of 263.7 IU (Figure F46). The MS in Hole U1554E varies from 2.5 to 5571.4 IU with a median value of 354.3 IU (Figure F47). Anomalously high MS values around 538 m CSF-A could be attributed to the presence of a clast found in interval 395C-U1554E-50X-2, 69.5–76.0 cm (Figure F47). If these values are removed, the average MS is 353.8 IU (with a maximum value of 1960.9 IU). The MS in Hole U1554G varies from 3.0 to 1397.2 IU with an average of 335.2 IU (Figure F48). The MS in Hole U1554H varies from 0.1 to 766.7 IU with an average of 333.0 IU (Figure F49).
In sections cored with the APC/HLAPC, both NRM and MS show considerable variability with depth, most likely following the changes in carbonate and silica content in sedimentary units (see Lithostratigraphy). In the sections cored with the XCB method, this correlation is poorly defined (Figure F47).
9.3. Demagnetization behavior of basalts
The igneous rocks of Hole U1554F consist of various types of basalt, including sheet flows and pillows with varying degrees of alteration (see Igneous petrology). Typical examples of demagnetization behavior and polarity interpretation are shown in Figure F50. Most of the basalts either do not, or not fully, demagnetize at 25 mT (Figure F50A, F50B, F50D, F50F), with some exceptions (e.g., Figure F50C, F50E). After the removal of a drilling overprint at 10–15 mT (e.g., the subvertical inclination in Figure F50A), usually one component of magnetization can be isolated. AF demagnetization shows two types of behavior: (1) with over 80% magnetization loss before 25 mT (soft magnetization behavior) or (2) no significant loss of magnetization at 25 mT (hard magnetization behavior).
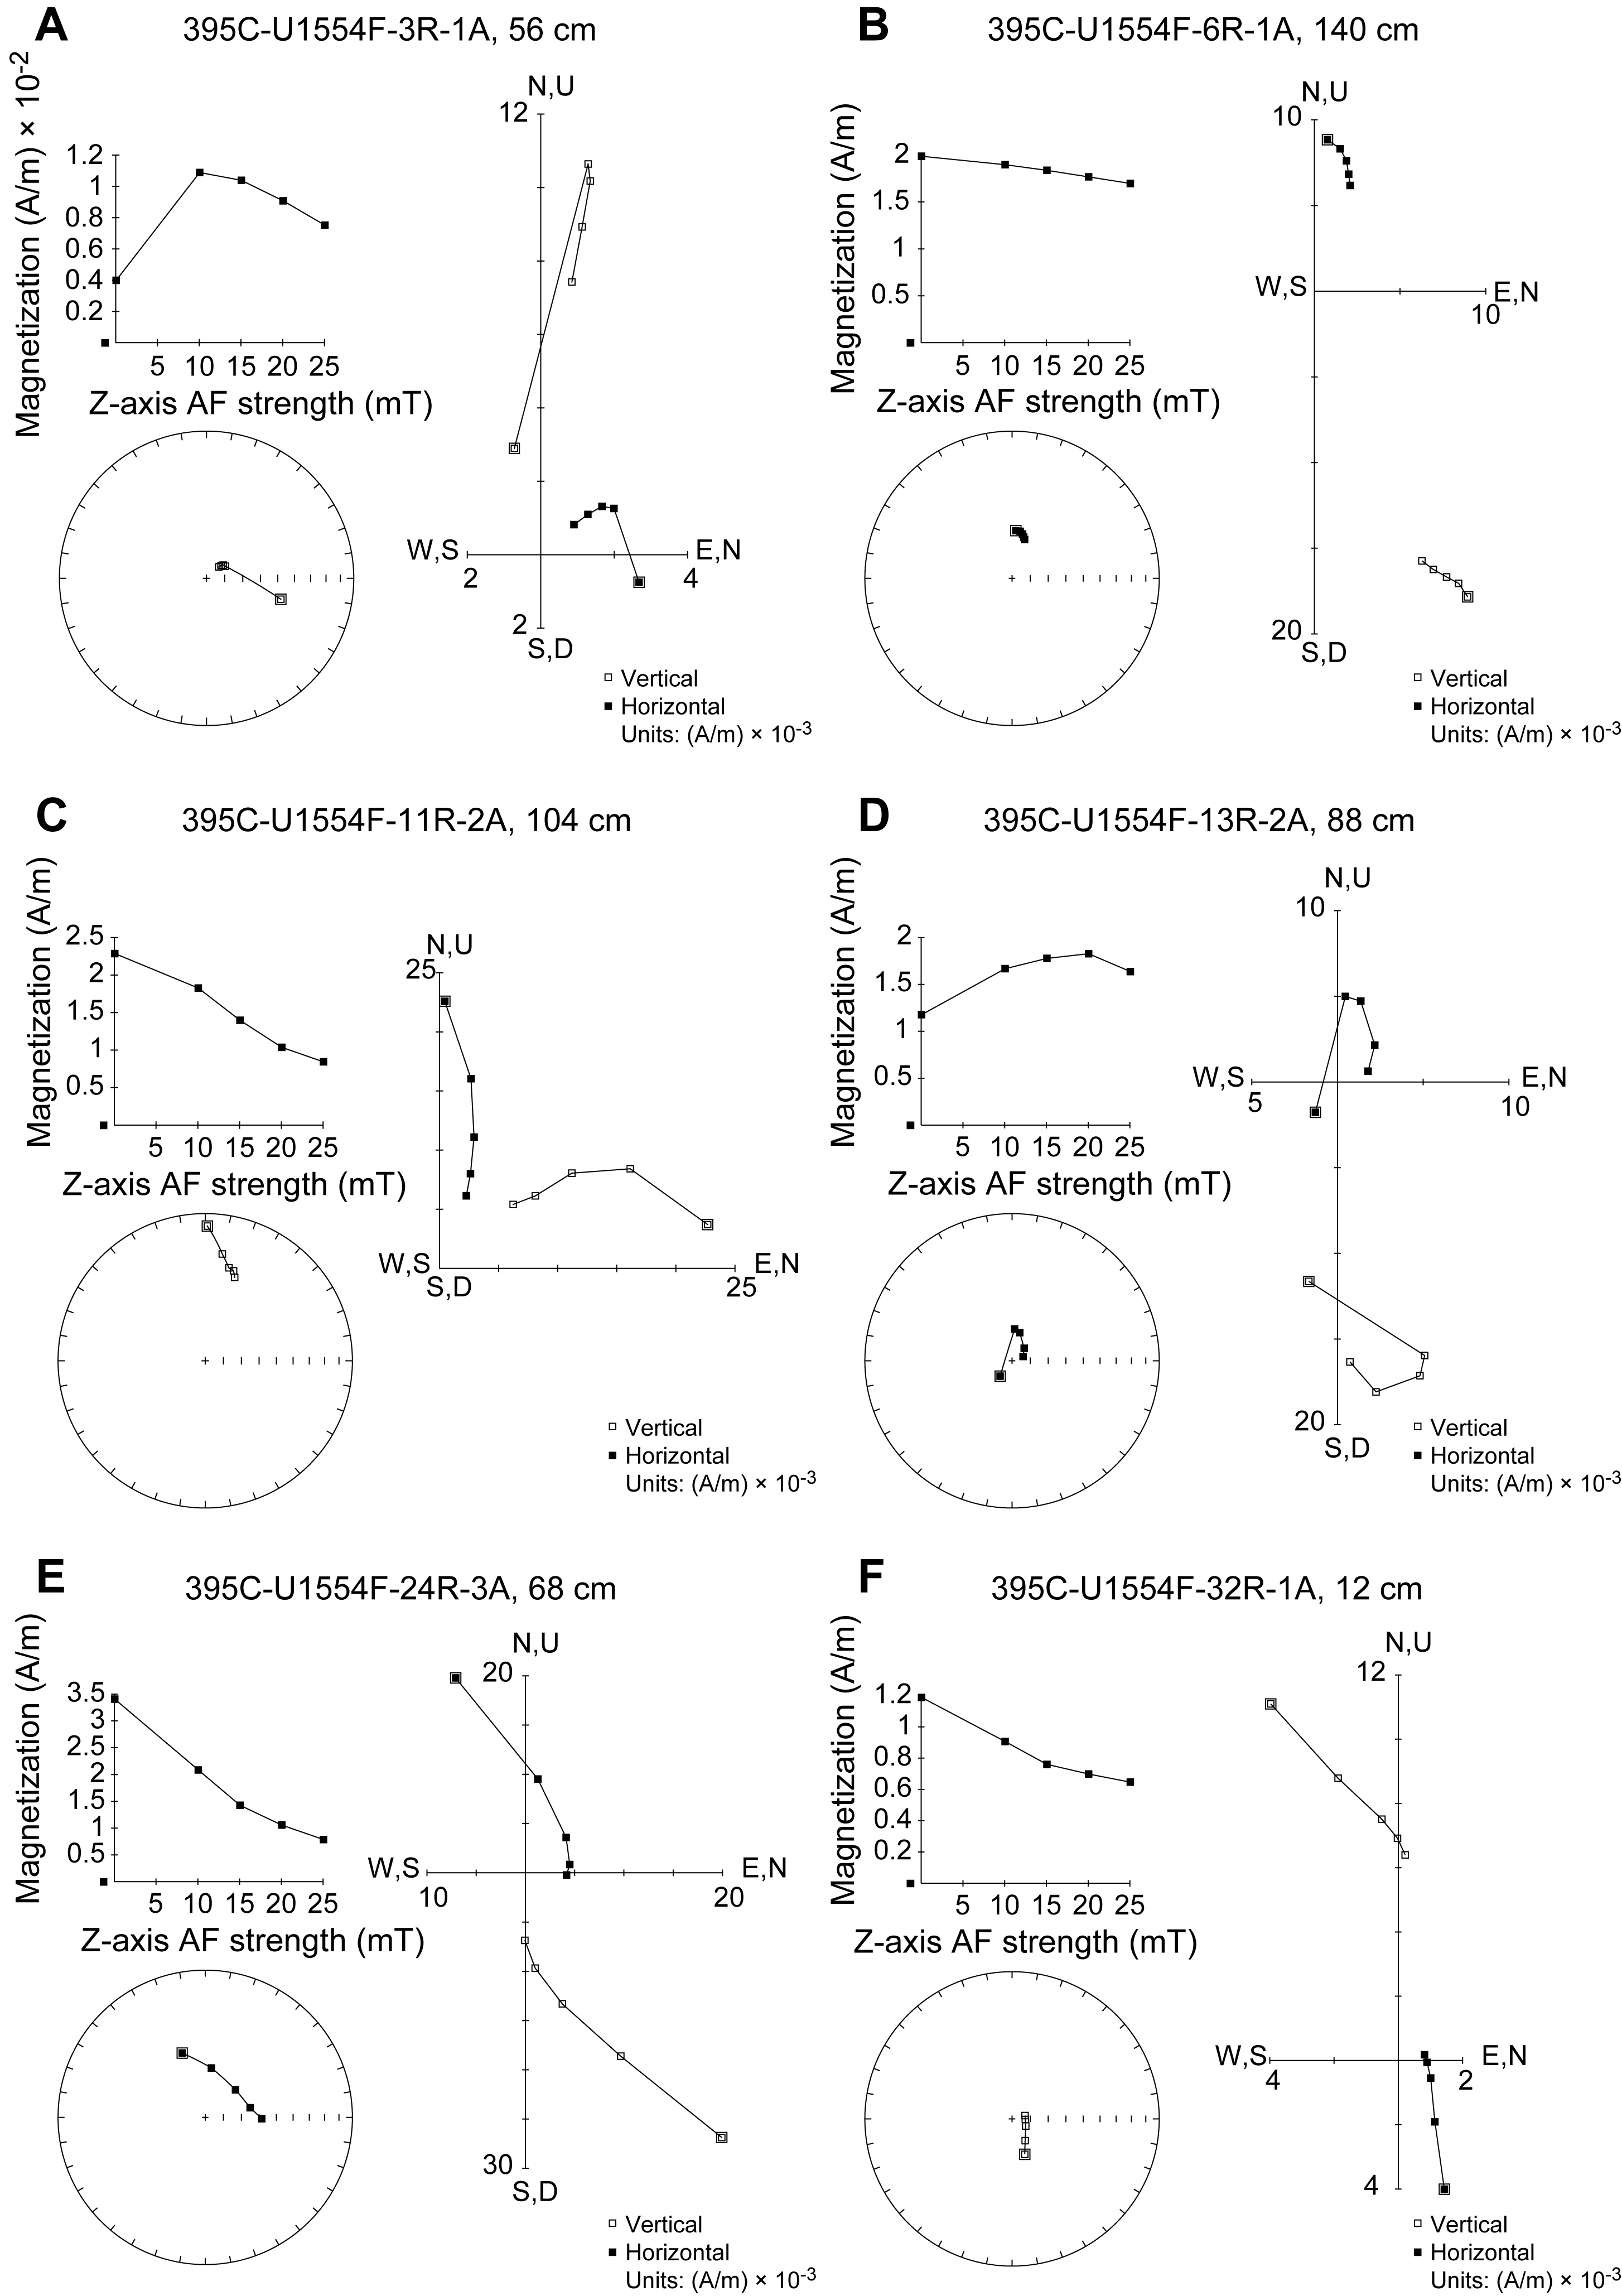
Figure F50. Demagnetization of sediments, Hole U1554F.
The variations in MS coincide with those in NRM intensity and intensity after 25 mT of demagnetization (Figure F51).
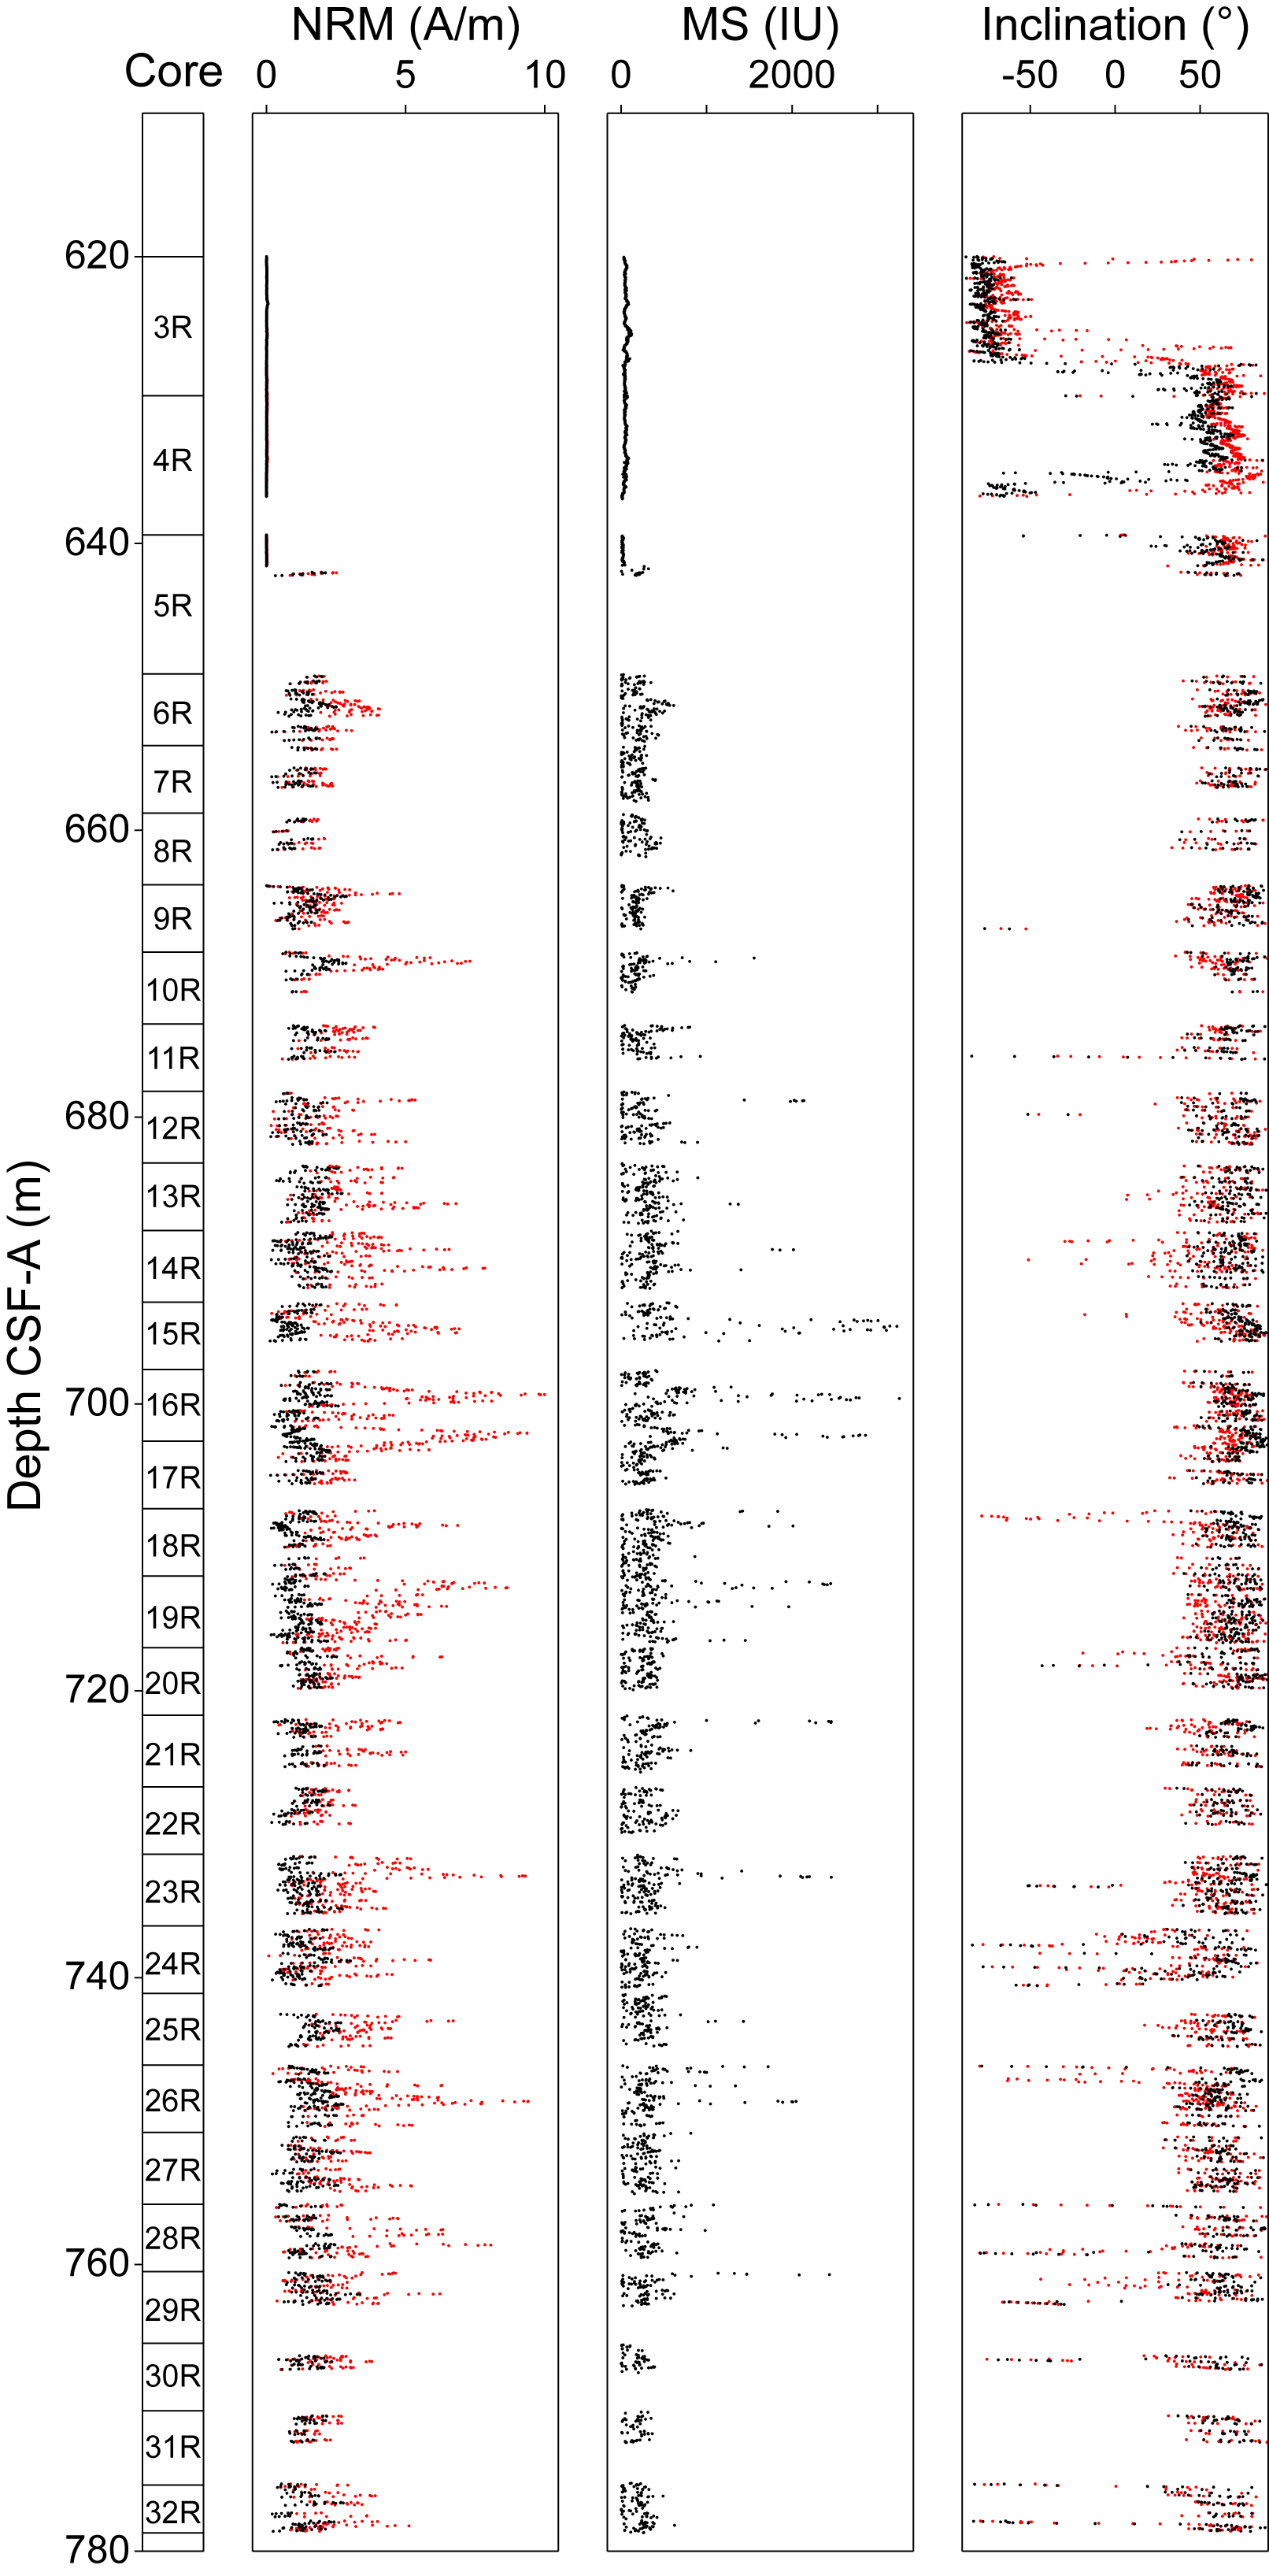
Figure F51. Paleomagnetic measurements, Hole U1554F.
The sediment/basement interface is located at ~640 m CSF-A (Figure F51), with considerable change in the NRM intensity and MS values. Most of the basalts show normal polarity.
9.4. Magnetostratigraphy
Variations in inclination at depths less than 400 m CSF-A reflect changes in the magnetic polarities, highlighting short and long-duration magnetic events. Normal polarities (plotted in black on Figure F47) are characterized by positive inclinations, with short secular variations around values similar to the present-day field calculated at Site U1554 using the International Geomagnetic Reference Field (IGRF) model (Alken et al., 2021), with an inclination of 73°. The base of the Brunhes normal polarity chron is recognized around 100 m CSF-A in Holes U1554E and U1554H. In Hole U1554E, 11 normal and 11 reversed polarity intervals were recognized (Figure F47), and 6 normal and 6 reversed polarity intervals were recognized in Hole U1554H (Figure F49). The demagnetization step at 20 mT from Hole U1554E archive halves was used to establish the magnetic events for the uppermost 400 m at Site U1554, which were then correlated with reference geomagnetic polarity timescale (GPTS; Ogg, 2020) to constrain an age-depth trend (Table T12). Between 400 m CSF-A and the bottom of Core 395-U1554E-62X at 650 m CSF-A, gaps in the sediment recovery hampered interpretation of the magnetostratigraphy and did not allow for construction of an age model (see Age model).
10. Geochemistry and microbiology
Cores taken during Expeditions 384 (Hole U1554A), 395C (Holes U1554E and U1554F), and 395 (Holes U1554G and U1554H) were analyzed for headspace gas, interstitial water (IW) chemistry, and bulk sediment/basalt geochemistry. Geochemistry of basalts from Site U1554 is described in Igneous petrology. Headspace gas analyses were conducted in Holes U1554A and U1554E; methane concentrations are variable and range 0 to ~12,000 ppmv. Ethane was absent in all holes. Holes U1554E and U1554G were analyzed for IW chemistry and bulk sediment geochemistry. IW calcium ion (Ca2+) and magnesium ion (Mg2+) concentrations display similar trends with depth. Sulfate ion (SO42−) concentrations have seawater-like values at the top and bottom of the sediment column. CaCO3 ranges 0.3–84.8 wt% with the highest CaCO3 content from 617.21 m CSF-A to the sediment/basement interface. Bulk sediment generally has low total organic carbon (TOC), total nitrogen (TN), and total sulfur (TS) content. Dissolved oxygen measurements were conducted on whole-round cores from Hole U1554G to ~347 m CSF-A (Core 40X).
10.1. Volatile hydrocarbons
Methane concentrations throughout the sedimentary sections of Site U1554 (Holes U1554A and U1554E) increase from 0 ppmv at the sediment/water interface to 11,968 ppmv at 301.92 m CSF-A (Section 395C-U1554E-23X-5) (Figure F52). Methane concentrations decrease to ~326 ppmv at 398.9 m CSF-A (Section 36X-5) and approach 0 ppmv at the sediment/basement interface (Figure F52). The increased methane concentrations and the absence of ethane in the middle part of the sedimentary sequence suggest increased biogenic methane gas production rather than thermogenic gas sources.
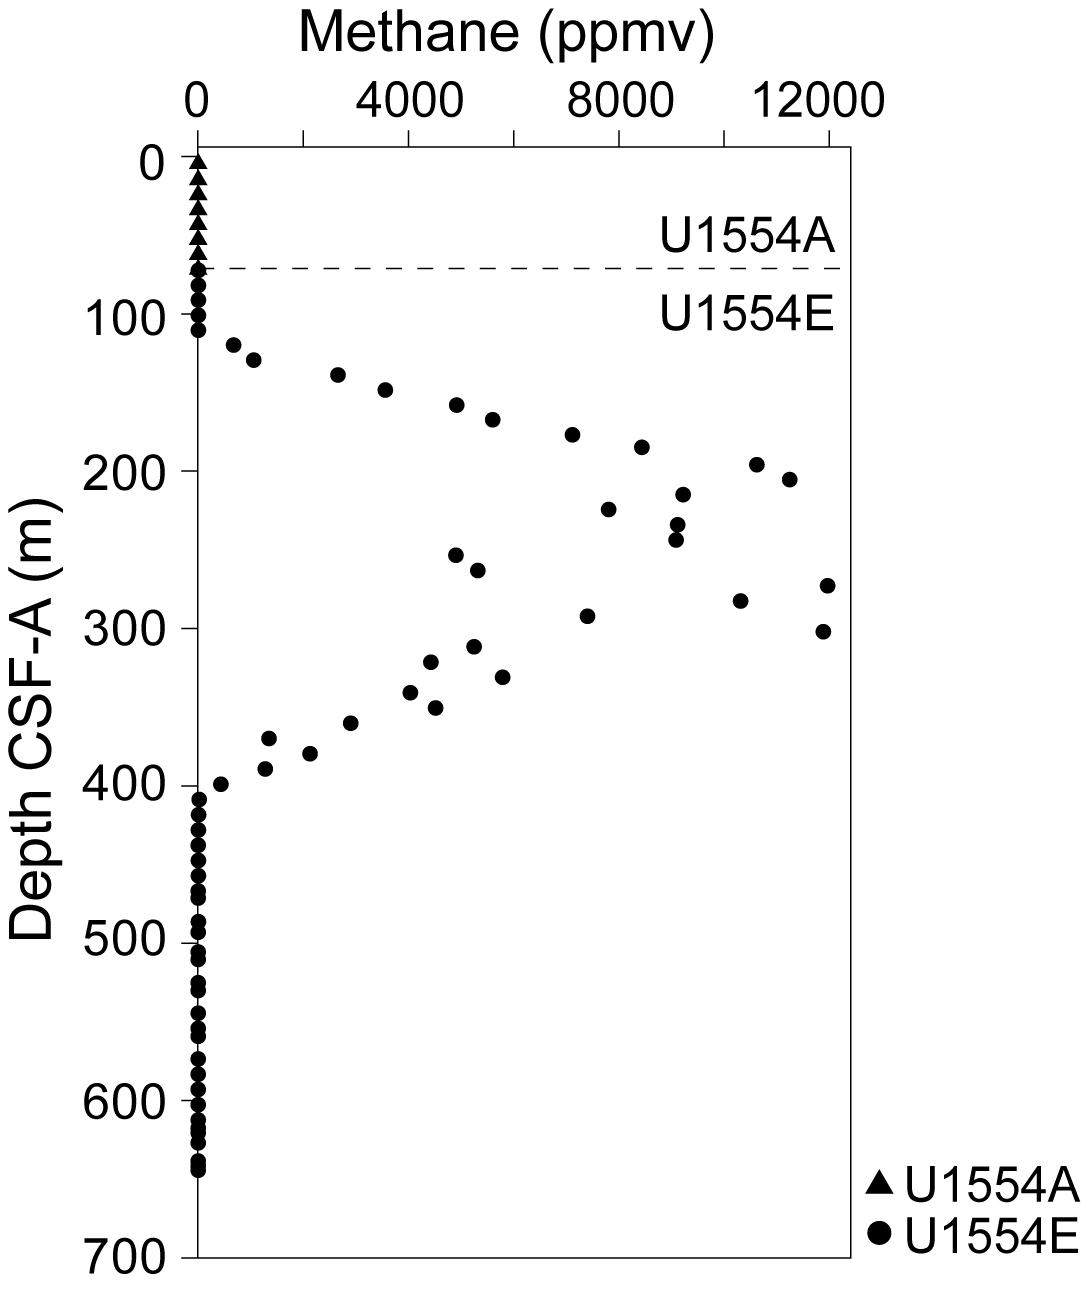
Figure F52. Composite gas analyses of methane concentrations.
10.2. Interstitial water chemistry
A total of 74 IW samples were squeezed from 5 or 10 cm long whole-round samples from 1.44 to 644.16 m CSF-A in Holes U1554E (Cores 31X–61X) and U1554G (Cores 1H–40X). In Hole U1554E, the lowermost IW sample was collected from Section 61X-6 (644.16 m CSF-A) adjacent to the sediment/basement interface. Data acquired from analysis of IW in Holes U1554E and U1554G reveal downhole trends in pH, alkalinity, dissolved magnesium (Mg2+), sulfate (SO42−), calcium (Ca2+), and strontium (Sr2+) (Figure F53). pH is near constant throughout the sediment column (7.81 ± 0.8). Alkalinity ranges from near seawater values at the top (Sample 395-U1554G-1H-1, 144–149 cm; 4.5 mM) and bottom (Sample 395C-U1554E-61X-6, 124–134 cm; 2.3 mM) of the sediment sequence to high values (e.g., 20.4 mM in Sample 395-U1554G-14H-2, 143–148 cm) in the middle part of the sediment column. IW Mg2+ concentrations range 31.9–52.1 mM. Mg2+ concentrations are highest (~50 mM) in the top and bottom part of the sedimentary sequence, and the lowest Mg2+ concentrations (32 mM) occur at 300.73 m CSF-A (Sample 34F-2, 144–149 cm). SO42− concentrations range 0.5–27.5 mM and display a bimodal distribution with high values observed at the top and bottom of the sedimentary sequence. SO42− concentrations decrease to ≤1 mM between 110.83 (Sample 13H-2, 144–149 cm) and 398.8 m CSF-A (Sample 36X-4, 144–149 cm) before increasing downhole toward the sediment/basement interface. Ca2+ concentrations range 2.1–13.5 mM and generally display a similar trend as Mg2+, with the highest concentrations in the middle part of the sedimentary sequence. Sr2+ concentrations range from 55.1 µM at 84.37 m CSF-A to 138.0 µM at 573.41 m CSF-A, with a peak at approximately 580 m CSF-A.
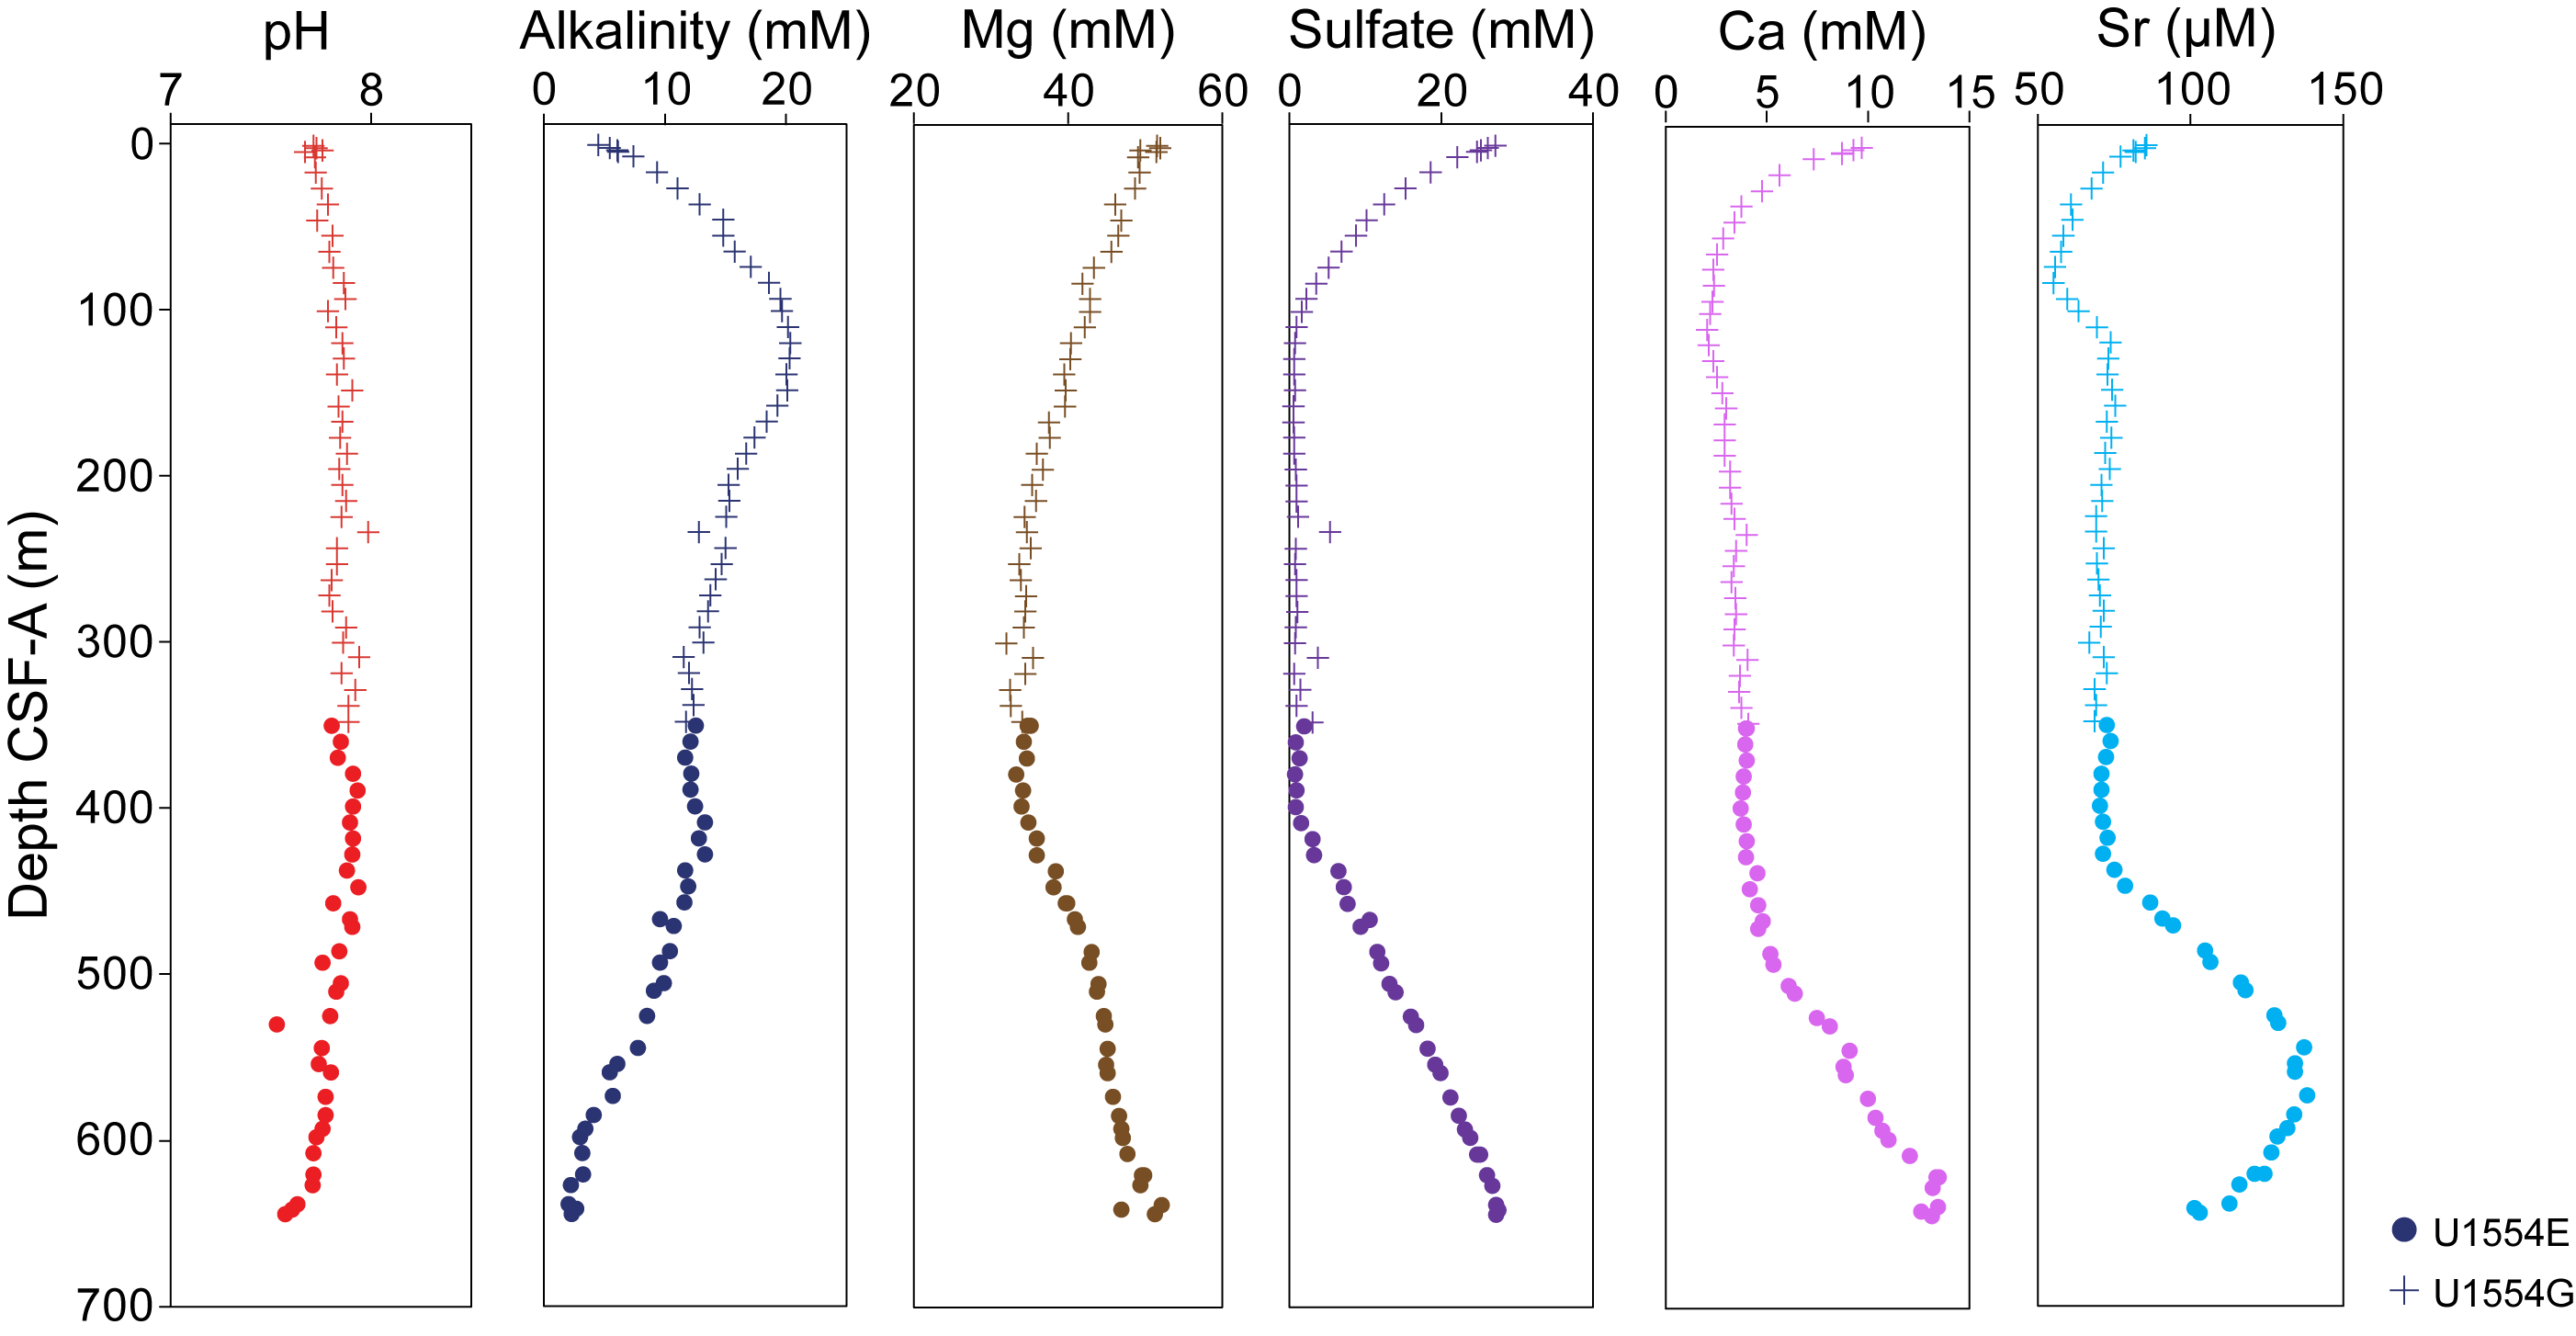
Figure F53. IW, pH, alkalinity, and dissolved ion concentrations.
10.2.1. Bulk sediment geochemistry
10.2.1.1. Carbonate, nitrogen, carbon, and sulfur
Discrete sediment samples (n = 111) were collected from squeeze cake residues and from the working half of cores during sediment description of Cores 395C-U1554E-31X through 61X (below 350.32 m CSF-A) and 395-U1554G-1H through 40X (above 348.18 m CSF-A). Samples were analyzed for total carbon (TC), TN, and total inorganic carbon (TIC). For Hole U1554G, sedimentary TS was also analyzed. TOC content and CaCO3 weight percent were subsequently calculated from the TIC and TC measurements. TOC content is generally low (average = 0.39 ± 0.33 wt%) with two outliers that were the result of analytical errors and thus excluded from the discussion (Samples 395C-U1554E-51X-4, 141–145 cm, and 395-U1554G-5H-4, 31–32 cm). CaCO3 ranges 0.3–84.8 wt% with substantial variance between 0 and 370 m CSF-A and low values between 370 and 554.01 m CSF-A. The highest CaCO3 content (average = 49.4 wt%; n = 16) is from 554.01 m CSF-A to the sediment/basement interface (Figure F54). For Hole U1554E, CaCO3 was measured on squeeze cake residues; however, for Hole U1554G, additional sediment samples (Figure F54) were chosen so that the resulting geochemical information (e.g., CaCO3 content) could be used to aid in lithologic description. Differences in the CaCO3 content between the sampling strategies (Figure F54, open versus closed circles) reflects the sampling bias and variable sedimentary CaCO3 content in different lithologic layers. TN ranges 0.0–0.20 wt%. TS was only measured in Hole U1554G and ranges 0.02–1.15 wt%.
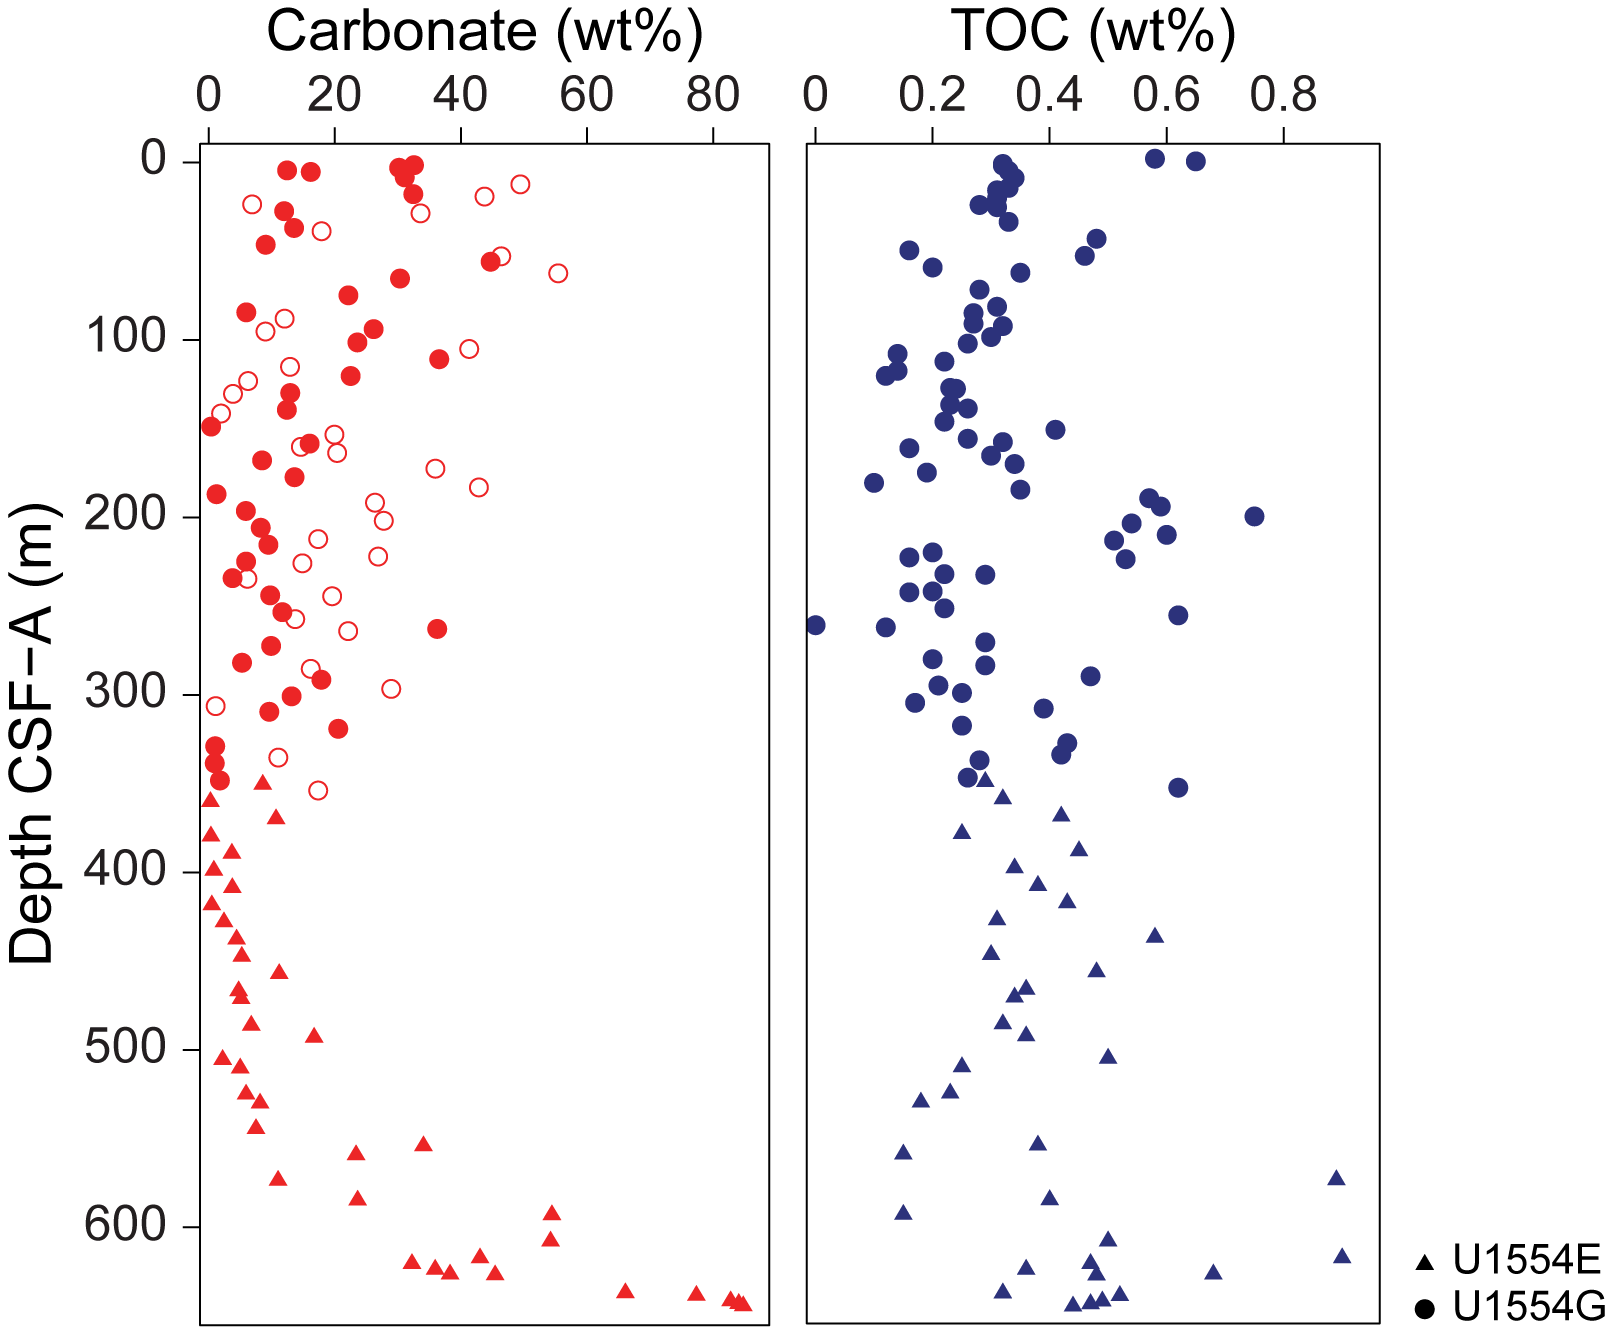
Figure F54. CaCO3 and TOC.
10.2.2. Microbiology
Microbiological sampling of sediments from Holes U1554E–U1554G was focused on collecting samples for culture-independent approaches. A total of 33 sediment samples from Hole U1554E and 33 sediment samples from Hole U1554G, each 5 cm3, were collected with a sterile cut-end syringe or were aseptically sampled from the interior portion of IW whole-round samples for shore-based analyses. For samples where IW analyses were not conducted because of a lack of available pore water, a 5 cm whole-round sample was collected for microbiological analysis. A total of 14 whole-round samples of hard rock were collected from Hole U1554F.
11. Downhole measurements
Downhole logging operations at Site U1554 were conducted in Holes 395C-U1554E and 395C-U1554F. Both holes were logged with the triple combo tool string, consisting of the Magnetic Susceptibility Sonde (MSS), High-Resolution Laterolog Array (HRLA), Accelerator Porosity Sonde (APS), Hostile Environment Litho-Density Sonde (HLDS), and Hostile Environment Natural Gamma Ray Sonde (HNGS) (see Table T15 in the Expedition 395 methods chapter [Parnell-Turner et al., 2025a]). The FMS-sonic tool string, consisting of the FMS, Dipole Sonic Imager (DSI), General Purpose Inclinometry Tool (GPIT), and HNGS, was deployed in both holes, as well as the VSI tool string, consisting of the VSI and GPIT. The UBI tool string, consisting of the UBI, GPIT, and HNGS, was also deployed in Hole U1554F. Further details on logging instruments and procedures can be found in Downhole measurements in the Expedition 395 methods chapter (Parnell-Turner et al., 2025a), and hole-specific procedures are detailed here. Formation temperature measurements were acquired at four locations in Hole U1554E (Cores 2H, 5H, 8H, and 11H) and five locations in Hole U1554H (Cores 4H, 7H, 10H, 13H, and 16H) using the APCT-3 tool.
11.1. Logging procedure and log data processing
11.1.1. Hole U1554E
After the completion of coring operations, sepiolite and barite were added to the hole to stabilize the borehole prior to logging operations. The triple combo tool was deployed, and after the triple combo tool string downlog (Data Set 033PUP) and repeat (Data Set 008PUP) passes were completed, the drill pipe was pulled ~10 m higher and the main uplog (Data Set 009PUP) pass was run. There were difficulties in recovering the triple combo and bringing it into the drill pipe. It should be noted that the triple combo gamma readings from Hole U1554E are artificially high. A comparison of the triple combo gamma log with the NGR data collected from Hole U1554E cores, as well as with the triple combo gamma log readings from Hole U1554F where they overlap (~588–612 m wireline matched logging depth below seafloor [WMSF]) (Figure F55), shows that these high values are likely to be spurious. The reason for this offset in gamma readings between holes is unclear, but one possibility is that the tool was not centralized in Hole U1554E. The FMS-sonic tool string was then deployed, which, like the triple combo tool string, had some difficulties reentering the drill pipe following the logging runs. The initial FMS-sonic tool string downlog pass (Data Set 028PUP) was performed with caliper arms closed, and then a repeat downlog (Data Set 030PUP) and an uplog (Data Set 031PUP) pass were performed. As with the triple combo tool string, gamma values were artificially high. Despite the gamma log measurement issues for downhole logging in Hole U1554E, the amount by which gamma log is overestimated seems to be consistent with depth. Therefore, variations in the gamma log data can be used to define logging units.
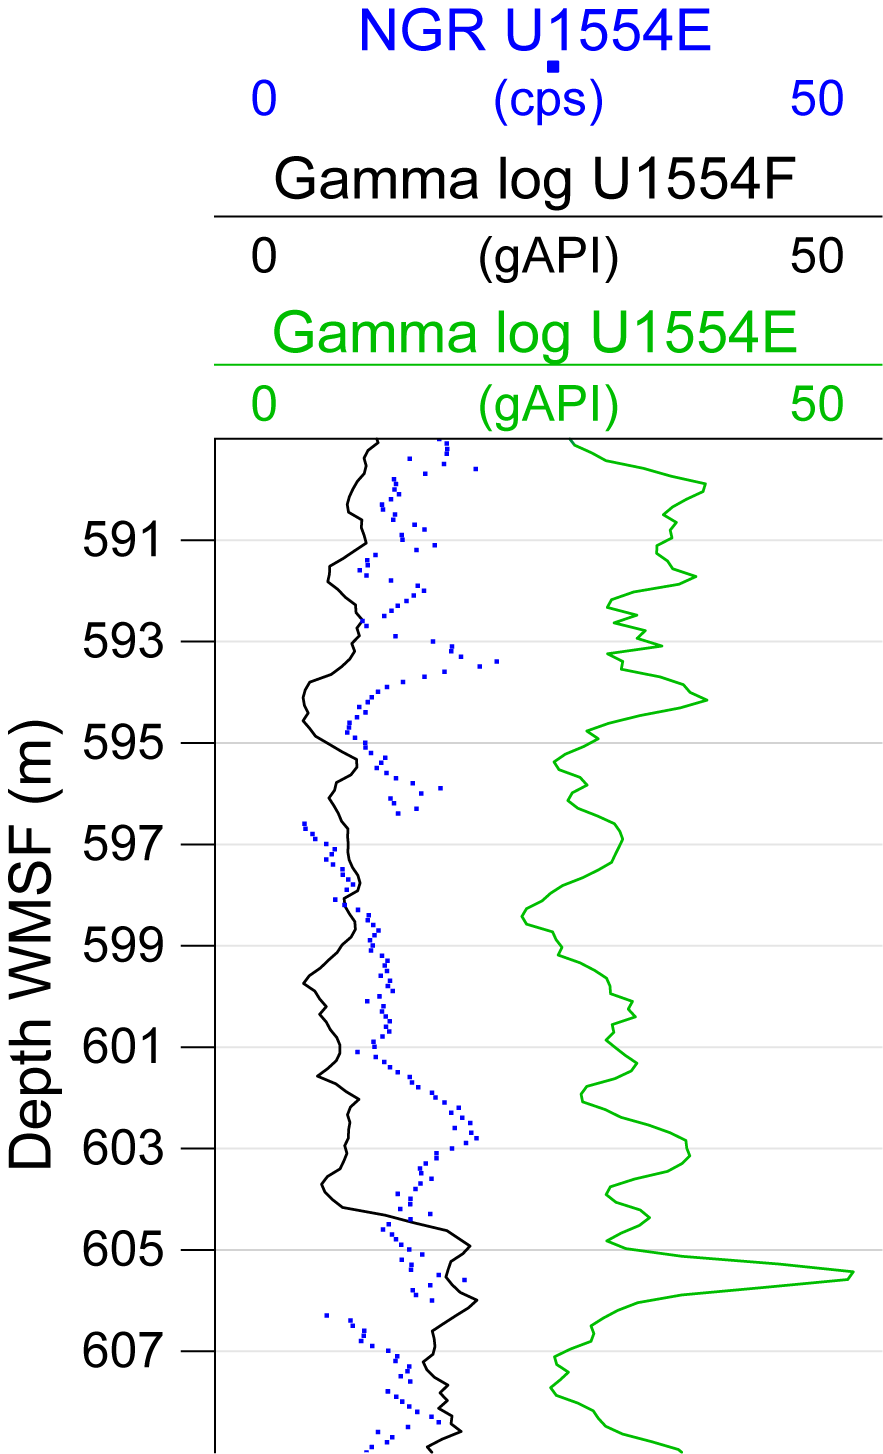
Figure F55. Gamma log.
Data from the triple combo and FMS tool strings were depth matched on the downlog pass of the triple combo tool string because it permitted seafloor depth to be determined by a step in the gamma log at ~1880.8 m WRF, which matches the driller's seafloor depth. Following depth matching of logs from different tool strings and passes, the logs were depth shifted to the defined seafloor depth. The wireline heave compensator countered the minor ship heave (0.5–1 m) during logging.
The HNGS and HRLA data were corrected for hole size, and the APS and HLDS data were corrected for standoff and hole size during acquisition. The HLDS and APS data were recorded at sampling intervals of 2.54 and 5.08 cm, respectively, and gamma log measurements from the Enhanced Digital Telemetry Cartridge (EDTC) were recorded at sampling intervals of both 5.08 and 15.24 cm. The HRLA data were acquired every 5.08 cm but were resampled in the database at 15.24 cm for better comparison with other acquired logs. Borehole widths exceed the bit size by 6.35–17.78 cm between 111 and 226 m WMSF and show borehole ovalization between 226 and 640 m WMSF. Such borehole shape irregularity can adversely affect most logging tools, especially the APS, HLDS, and FMS, which all require eccentralization and good contact with the borehole wall. Shear wave velocity (VS) data were reported as unreliable above 240 m WMSF by the onshore borehole logging data processing team at Lamont-Doherty Earth Observatory (LDEO). Downhole temperatures acquired in Hole U1554E increase from 5.59°C to 8.25°C (Cores 2H, 5H, 8H, and 11H) (Figure F56).
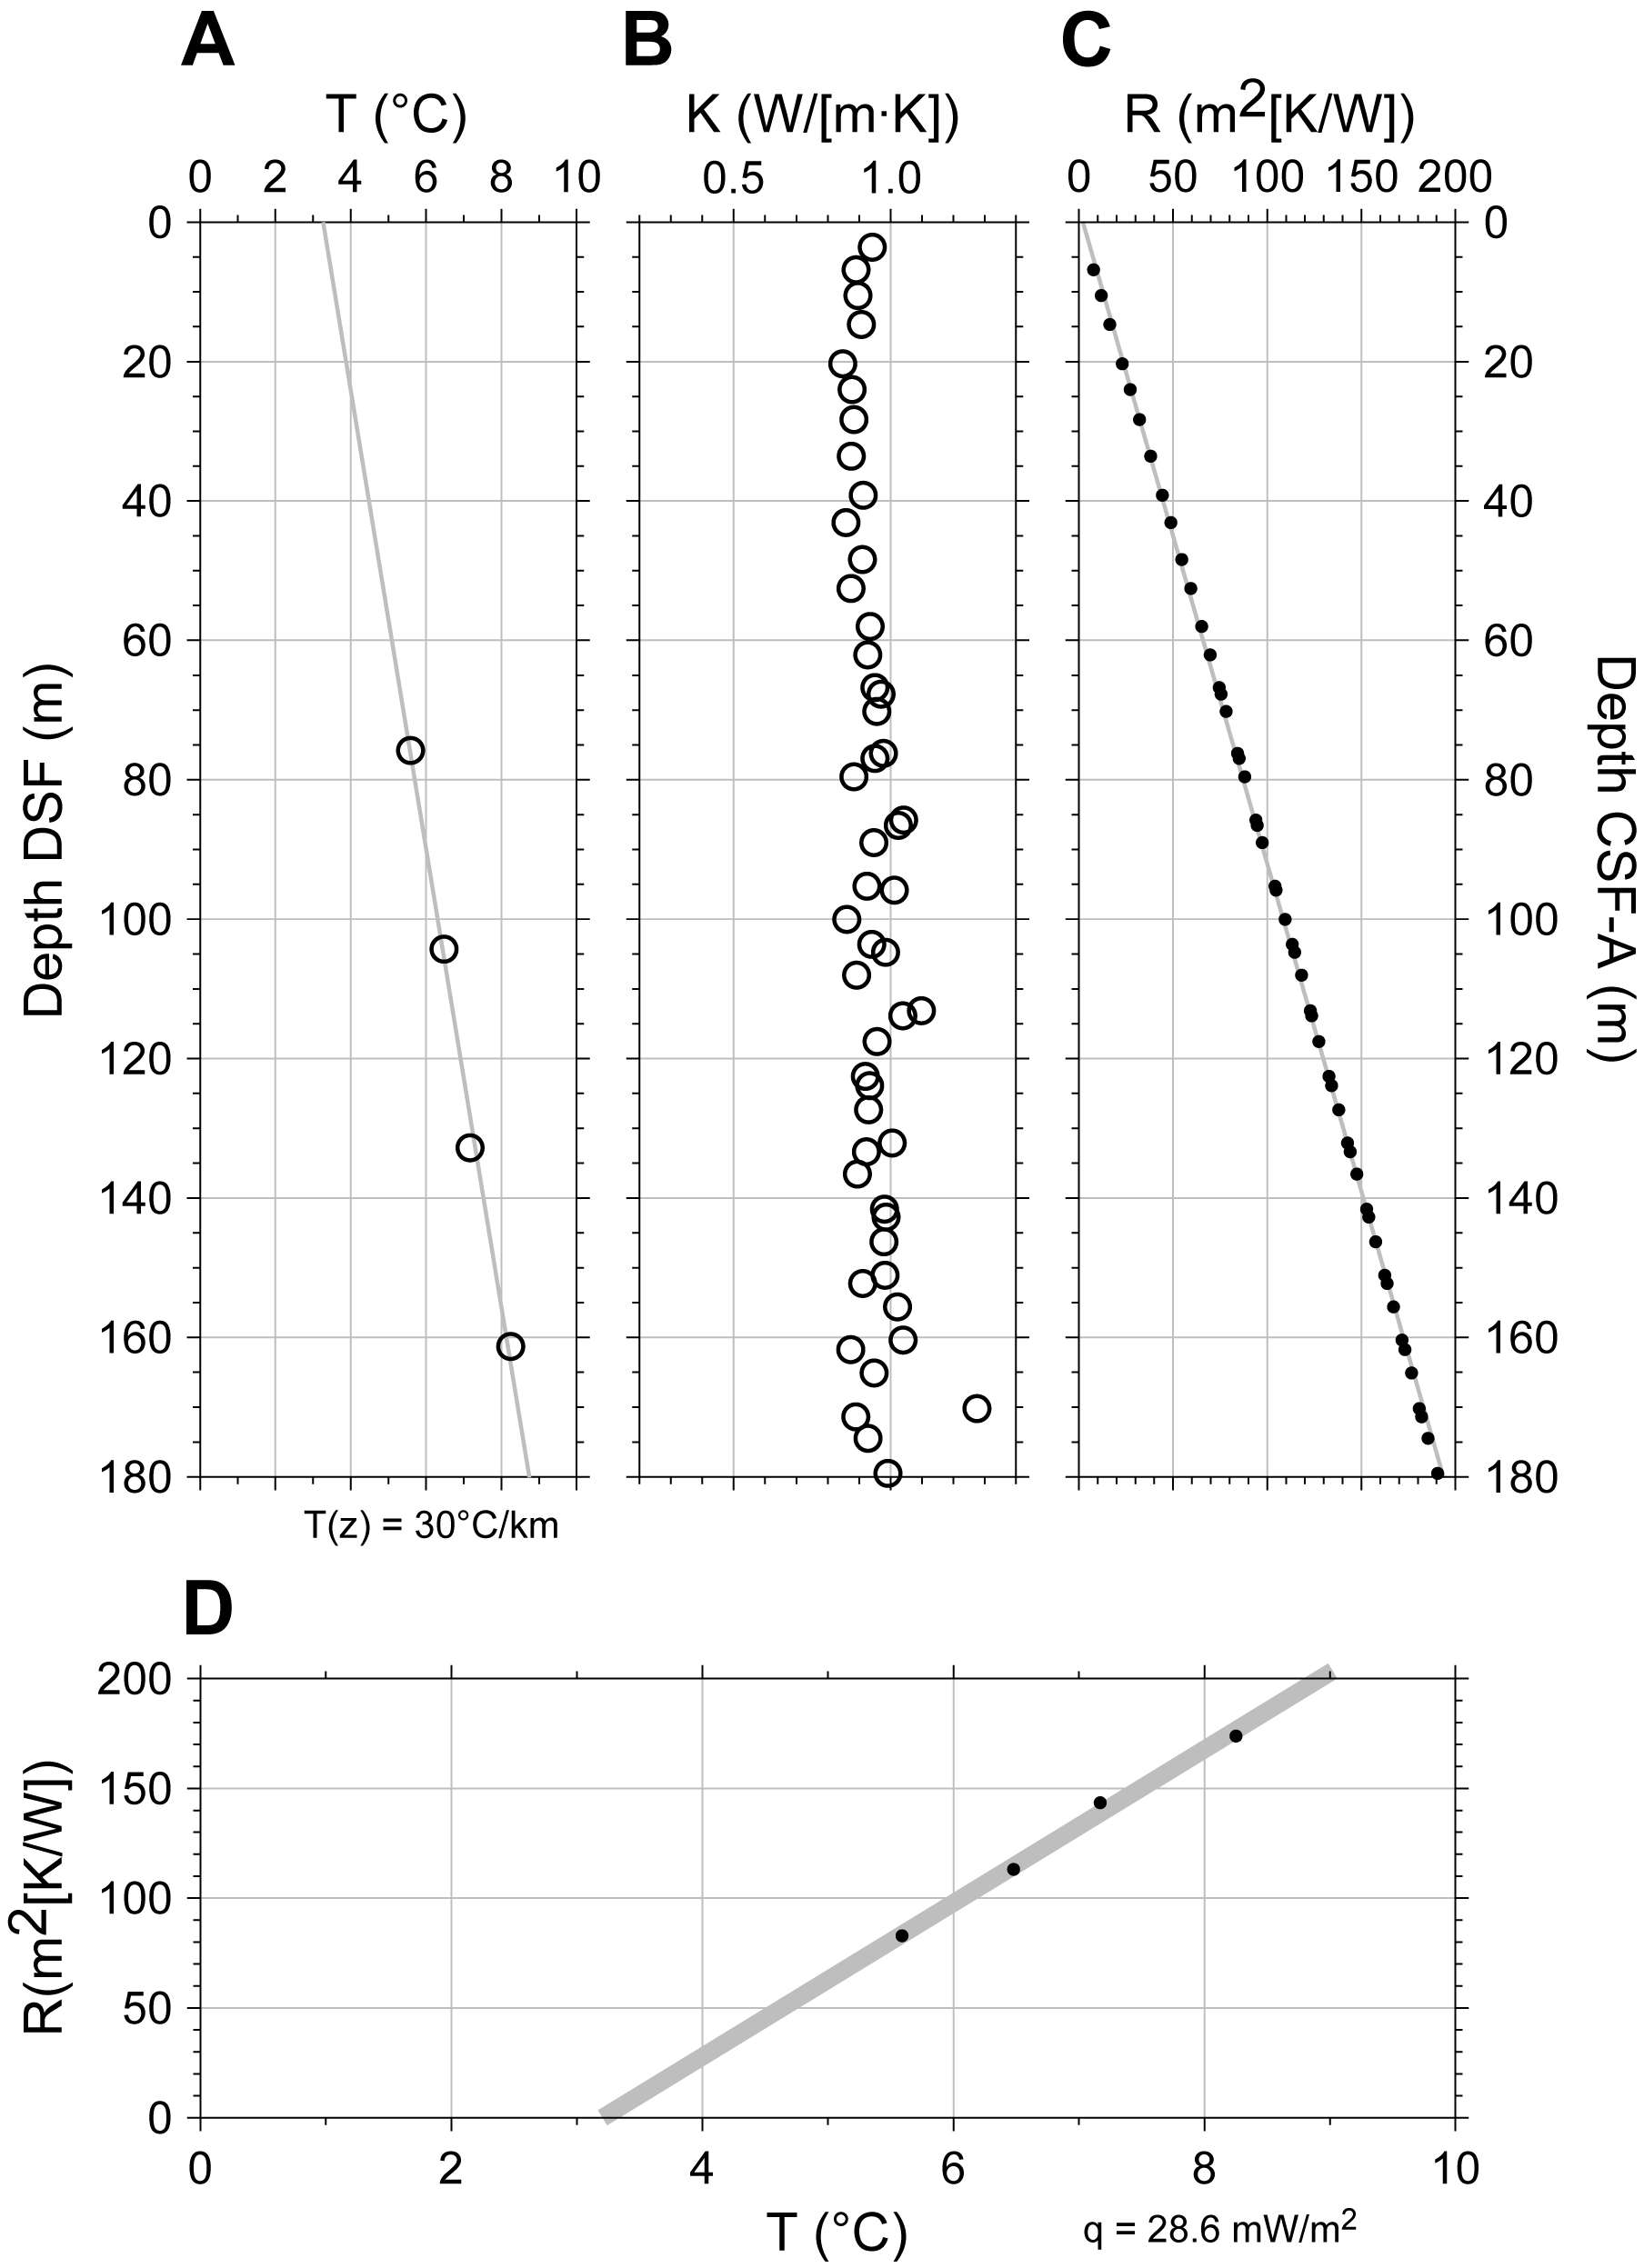
Figure F56. Thermal gradient and heat flow estimates.
11.1.2. Hole U1554F
After drilling, Hole U1554F was prepared for logging operations with a 50 bbl high-viscosity mud sweep. The hole was then displaced with seawater. The aim of this logging run was to complement logging data from the lower sediment packages in Hole U1554E and to log the basement (Table T13). Casing was set to 603.5 m WSF (602 m DSF). The triple combo tool string was run as a downlog (Data Set 007LDP), followed by a repeat uplog pass (Data Set 008LUP) and a main uplog pass (Data Set 009LUP). This pass was followed by the FMS-sonic tool string, which was run downhole (Data Set 029PUP) and then run as a repeat uplog pass (Data Set 030PUP) and a main uplog pass (Data Set 031PUP). The UBI tool string was deployed, first as a downlog (Data Set 071PUP) with the UBI switched off and only logging fluid velocity, then as a repeat uplog (Data Set 047LUP) and a main uplog pass (Data Set 048LUP) to capture the UBI image log, and then as a final uplog pass (Data Set 049PUP) with the UBI turned off. No difficulty was reported in getting the tool string inside the casing (603.5 m WSF) and drill pipe (590 m WSF) in Hole U1554F. All logs were depth matched to the gamma log from the main uplog pass of the triple combo tool string, and then all logs were depth shifted to the logger's seafloor of 1879.5 m WRF. This seafloor depth was identified by a step in the gamma log from the triple combo uplog main pass and differs by 1.3 m from the driller's seafloor depth (1880.8 m drilling depth below rig floor [DRF]).
The HNGS and HRLA data were corrected for hole size, and the APS and HLDS data were corrected for standoff and hole size during acquisition. The HLDS and APS data were recorded at sampling rates of 2.54 and 5.08 cm, respectively, in addition to the standard sampling rate of 15.24 cm. The HRLA data were acquired every 5.08 cm but were resampled to 15.24 cm for better comparison with other acquired logs. Borehole shape is excellent through most of Hole U1554F and in agreement with bit size, with only short intervals of widening to a maximum of ~14 inches at ~642 and 644 m WMSF from FMS caliper and to a maximum of ~17 inches over the interval 640–647 m WMSF from the triple combo hydraulic caliper (Figure F57). These good borehole conditions suggest a good degree of reliability in data produced by tools that require eccentralization and good contact with the borehole wall (i.e., APS, HLDS, and FMS), with only the interval 640–647 m WMSF as a possible exception.
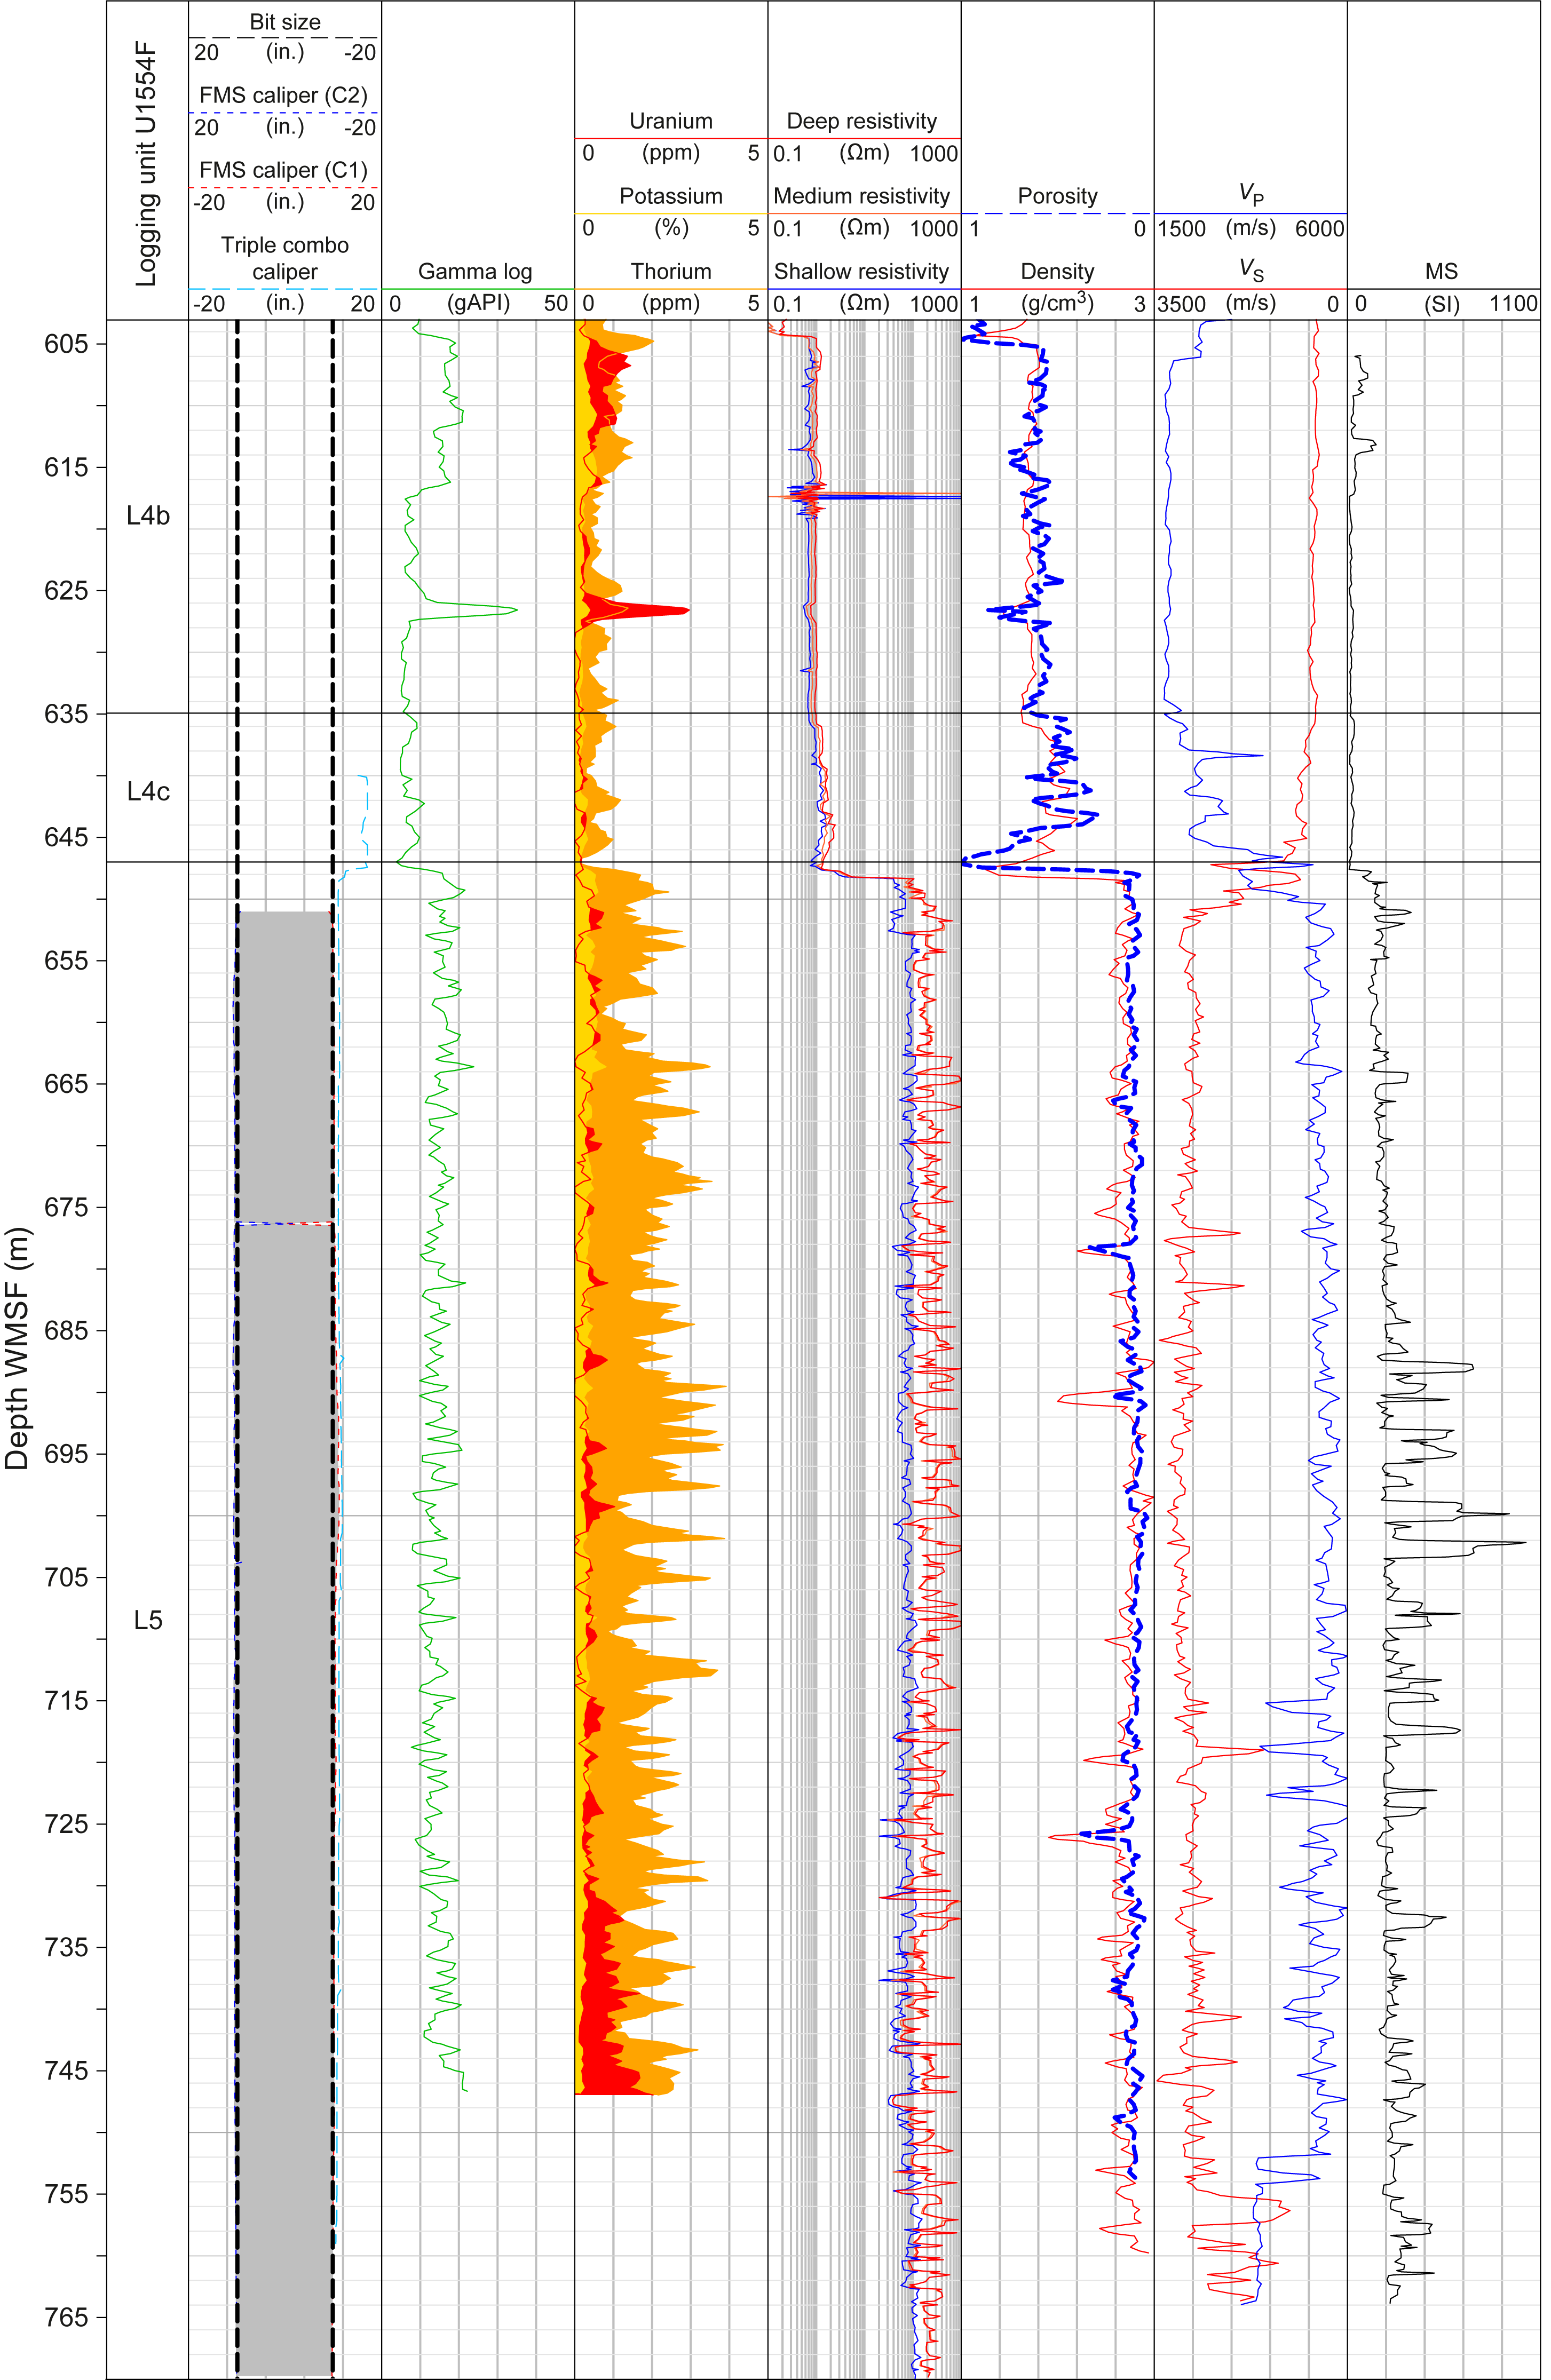
Figure F57. Downhole logging data, Hole U1554F.
Both the FMS and UBI image logs are of good quality, reduced only in a few places by some stick and pull artifacts predominantly on the UBI image log. An approximately 0.8 m offset between similar geologic features on the UBI and FMS image logs is observed, likely due to uncertainty in the image log processing, such as the application of wireline speed corrections. This issue should be considered when correlating between these image logs postcruise.
11.1.3. Hole U1554H
Downhole measurements acquired in Hole U1554H were formation temperatures (Cores 4H, 7H, 10H, 13H, and 16H). The values increase downhole from 4.35° to 7.77°C (Figure F56).
11.2. Logging units
Here we define the logging units for Site U1554 and suggest tentative correlations across Holes U1554E and U1554F where possible (Table T14).
11.2.1. Logging Unit L1
Logging Unit L1 is defined from the top of Hole U1554E (seafloor) to where a marked increase in the gamma log occurs at ~108 m WMSF.
11.2.1.1. Logging Subunit L1a
Logging Subunit L1a is defined solely by the suppressed gamma log measurements (maximum = 5 gAPI) resulting from the tool measuring through the drill pipe. Despite measuring through the drill pipe, the gamma log signal shows distinct variations that may be interpretable. Subunit L1a corresponds to the upper part of Lithostratigraphic Subunit IA (0–75 m CSF-A) (see Lithostratigraphy).
11.2.1.2. Logging Subunit L1b
Logging Subunit L1b comprises the open hole portion of Unit L1 and is defined by low gamma log (~10–25 gAPI) that shows a gradual increase with depth toward the bottom of the subunit. The Th spectral gamma measurement fluctuates in this subunit and can be as high as 2.8 ppm, and the U and K contents are consistently low at around 0.2–0.8 ppm and 0.2%–0.5%, respectively. The deep resistivity log for Subunit L1a records slightly higher (~1 Ωm) measurements than the shallow (0.5 Ωm) and medium (0.7 Ωm) logs, and all three resistivity log measurements are invariant throughout the subunit. Subunit L1b is further characterized by porosities fluctuating from 0.6 to 0.9 and an average density of around 1.4 ± 0.1 g/cm3. The MS log shows overall lower values compared to Unit L2 and contains a number of marked peaks across three depth intervals: ~77–82 (468 SI), ~84 (344 SI), and ~90–96 (303 SI) m WMSF. This logging subunit corresponds to the lower portion of Lithostratigraphic Subunit IA (75–108 m CSF-A).
11.2.2. Logging Unit L2
The top and bottom of Logging Unit L2 are marked by an increase and decrease, respectively, in the gamma log. Unit L2 is further defined by a series of 1–10 m cycles in the gamma log. Peaks in the gamma measurements are mostly comprised of Th signals, as noted from the spectral gamma logs.
11.2.2.1. Logging Subunit L2a
Logging Subunit L2a is defined by an average gamma log response of 27 ± 5 gAPI and shows cycles of distinct 1–10 m long gamma radiation peaks that can increase up to 49 gAPI. These gamma radiation peaks are dominated by a Th signal up to 4.5 ppm, as shown on the spectral gamma logs. Either or both of the K and U counts are also observed to increase in the high Th peaks but to a lesser extent. Electrical resistivity measurements show large fluctuations to ~150 m WSF, below which they are relatively invariant to the bottom of Subunit L2a, with typical deep resistivity of ~1.1 Ωm. The deep resistivity is consistently ~0.2 and ~0.4 Ωm higher than the medium and shallow resistivity measurements, respectively, in Subunit L2a. Porosity fluctuates from 0.7 to 1 to ~150 m WSF and then gradually decreases from ~0.9 to 0.7 to ~250 m WSF, after which they remain ~0.7 to the bottom of Subunit L2a. The bulk density gradually increases with depth in Subunit L2a from ~1.4 to ~1.8 g/cm3. VP increases with depth from ~1604 to ~1825 m/s, and VS increases from ~353 to ~480 m/s with depth in Subunit L2a. MS fluctuates between 66 SI and 432 SI in a cyclical manner and gradually increases with depth in the top part of the subunit to ~150 m WMSF. Subunit L2a corresponds to the lower part of Lithostratigraphic Subunit IA and to Subunits IB (108–117.4 m CSF-A) and IIA (117.4–375 m CSF-A) (see Lithostratigraphy).
11.2.2.2. Logging Subunit L2b
Logging Subunit L2b is differentiated from Subunit L2a by longer wavelength cycles in the gamma log fluctuations with depth. Gamma peaks are still dominated by Th counts reaching up to 5 ppm. Density and porosity are invariant throughout Subunit L2b, at ~1.8 g/cm3 and ~0.67, respectively. Electrical resistivity is relatively constant throughout the unit (deep resistivity = ~1.2 Ωm) and decreases slightly in the bottom 5 m of the subunit. VP gradually increases from ~1750 to ~1820 m/s, and VS increases from ~440 to ~540 m/s with depth. MS varies cyclically between 114 and 424 SI as in Subunit L2a, and the wavelength of these cycles increases with depth. This subunit corresponds to Lithostratigraphic Subunit IIB (see Lithostratigraphy).
11.2.3. Logging Unit L3
Logging Unit L3 is defined by a decrease in gamma log response relative to Units L2 and L4. The lower gamma log (average = 19.2 ± 2.5 gAPI) is relatively constant over this depth interval, with a minor peak at ~461 m WMSF, in contrast to the cyclic fluctuations observed in Units L2 and L4. The spectral gamma Th counts are also lower than those observed in Units L2 and L4, although there are subtle cycles of high and low values in Unit L3. Electrical resistivity decreases slightly compared to Unit L2 (deep resistivity = ~1.1 Ωm), and bulk density (~1.8 g/cm3) and porosity (~0.65) are relatively constant. VP and VS continue to increase with depth in Unit L3 to bottom values of ~1885 and ~560 m/s, respectively. A further defining characteristic of Unit L3 is the progressive lengthening of the MS cycles that begins in Subunit L2b, which at the bottom of Unit L3 change back to shorter wavelengths. This logging unit corresponds to the uppermost 45 m of Lithostratigraphic Unit III (441.1–496 m CSF-A) (see Lithostratigraphy).
11.2.4. Logging Unit L4
The top of Logging Unit L4 is marked by an increase in gamma log response (27.7 ± 5.2 gAPI), which remains constant with depth to near the sediment/basement interface at ~647 m WMSF.
11.2.4.1. Logging Subunit L4a
Logging Subunit L4a is characterized by increased gamma log relative to Unit L3 (average = 25 ± 11 gAPI), and spectral gamma logs show that Th dominates this gamma radiation signal (values up to 4 ppm). Like the logging units above, Th counts fluctuate cyclically. Electrical resistivity remains at similar values to Unit L3 and is relatively constant with depth, as do density and porosity. VP increases slightly with depth to ~1950 m/s, and VS increases slightly to ~600 m/s. MS is broadly similar to that in Units L2 and L3, although the spacing between peaks and troughs is reduced compared to Unit L3 and appears similar to MS cycles observed throughout Unit L2. This subunit corresponds to the lower part of Lithostratigraphic Unit III (495–538.1 m CSF-A) (see Lithostratigraphy).
11.2.4.2. Logging Subunit L4b
The transition from Logging Subunit L4a to Logging Subunit L4b is marked by small but sharp decreases in resistivity, density, porosity, VS, and MS and a small but sharp increase in VP, as defined on wireline logs from Hole U1554E (Figure F58). The transition between Subunits L4b and L4c is defined by a small increase in resistivity, a decrease in porosity, increases in density and VP, and a less pronounced increase in VS, as shown in wireline logs from Hole U1554F (Figure F57).
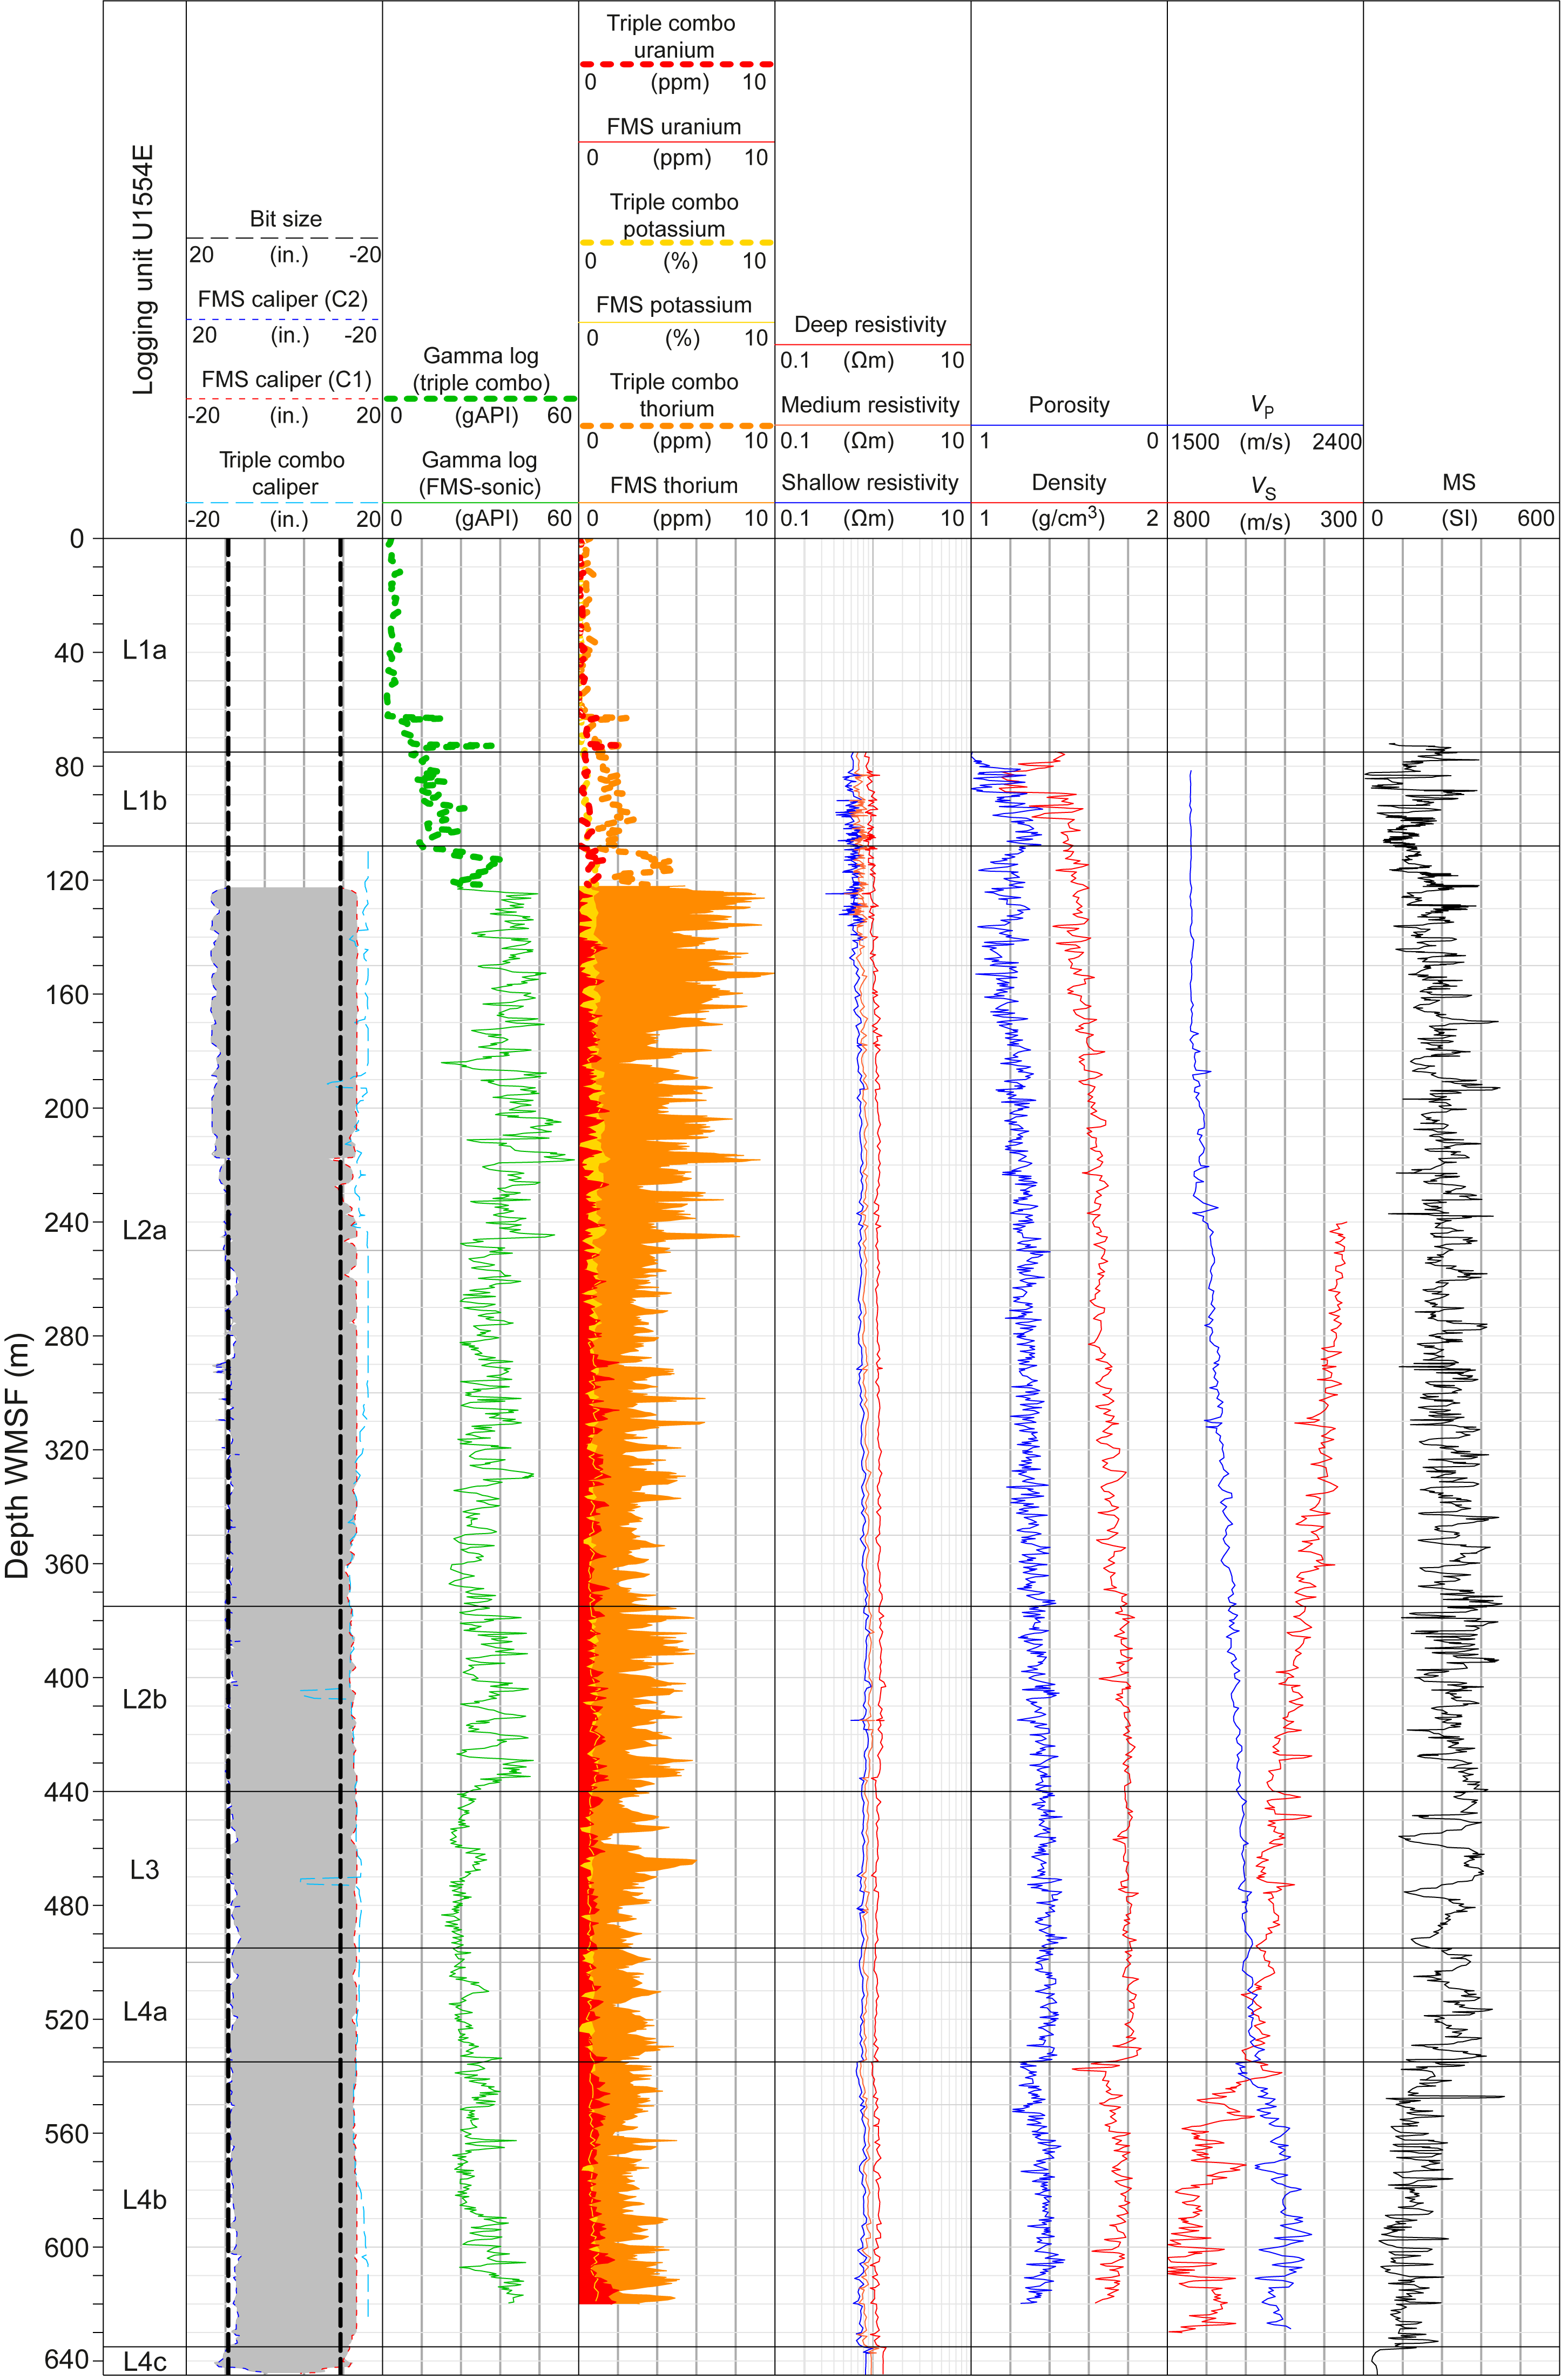
Figure F58. Downhole logging data, Hole U1554E.
The gamma log in Subunit L4b is similar to that in Subunit L4a with similar cycles of high and low gamma radiation throughout. Although the spectral gamma logs show Th remains the dominant component of the gamma signal in Subunit L4b, one specific gamma radiation peak at ~627 m WMSF is dominated by a higher U signal. This U-dominated gamma peak corresponds to a slight decrease in resistivity, an increase in porosity (up to 0.86), and a decrease in density (to ~1.44 g/cm3) and is also observed in physical properties data collected on the core from Hole U1554F (see Physical properties). After an initial resistivity low at the top of Subunit L4b, resistivity increases and becomes consistent again at ~550 m WMSF (deep resistivity of ~1.1 Ωm). Similarly, porosity decreases and density increases with depth from the top of Subunit L4b, becoming invariant with depth from ~560 m WMSF at ~0.6 and 1.8 g/cm3, respectively. VP and VS increase rapidly from the top of Subunit L4b to ~550 m WMSF, after which they fluctuate with depth to the bottom of Subunit L4b (VP ranges 1720–1900 m/s; VS ranges 510–730 m/s). MS in Subunit L4b shows an overall decrease compared to the upper logging units, ranging 50–440 SI but still displaying similar wavelength cycles to those observed in Unit L2. Apart from the outlier noted above, porosity decreases with depth (to 0.3) and density increases (to 2.2 g/cm3). Subunit L4b correlates to Lithostratigraphic Unit IV (538.4– 635.4 m CSF-A) (see Lithostratigraphy).
11.2.4.3. Logging Subunit L4c
Logging Subunit L4c comprises the bottom portion of the sediment package that sits above the basaltic basement of Site U1554 and contains distinct logging responses (Figure F57). The gamma log is low throughout Subunit L4c (range = 5–11 gAPI) and is dominated by a Th component. Resistivity is slightly higher than Subunit L4b sediments and is consistent in Subunit L4c, showing values between 1 and 2.5 Ωm. Porosity and density fluctuate in Subunit L4c with increases in density paired with decreases in porosity and vice versa. Density is as high as ~2.2 g/cm3 in Subunit L4c, and porosity is as low as 0.29. At the sediment/basement interface, porosity increases to nearly 1 and density decreases to ~1.2 g/cm3. VP increases rapidly with depth in Subunit L4c from 1740 to 4490 m/s, with some intervals of increased VP at ~638 and ~642 m WMSF. VS also increases with depth in Subunit L4c (from 578 to 1152 m/s). The MS log changes from fluctuating in Subunit L4b to being more constant in this subunit (average = 28 ± 8 SI).
11.2.5. Logging Unit L5
Logging Unit L5 is distinguished by marked changes in all downhole logs and represents the entire basement section cored in Hole U1554F. Gamma log values are much higher than in the sediment units (average = 14 ± 3 gAPI). Small fluctuations on the gamma log are attributed to increasing and decreasing Th counts in the signal. A small increase in spectral gamma U is noted from ~730 m WSF to the bottom of Hole U1554F at 770 m WSF. Resistivity is also significantly higher than in the logging units above, with deep resistivity ranging ~20–1650 Ωm. Resistivity logs show variation on the meter scale, with intervals of increased resistivity often showing separation between the shallow and medium/deep resistivity measurements (e.g., ~702 m WMSF). Porosity is unsurprisingly much lower in Unit L5 than in the sedimentary units above, with values <0.2 for most of the drilled basement section. As expected, density is higher in Unit L5 than in the sedimentary units above, and is mostly >2.7 g/m3 throughout. Throughout Unit L5, the density log shows short intervals (<1 m) where values decrease below ~2.7 g/cm3, which are often, but not always, accompanied by increases in porosity to >0.2 (e.g., 690 m WMSF). VP and VS gradually increase in the top 3 m of basement, reaching averages of 5400 ± 340 m/s and 2870 ± 220 m/s, respectively. Fluctuations in both VS and VP are observable in Unit L5 and often occur over the same depth intervals (e.g., ~719 m WMSF). The top of Unit L5 is marked by an increase in MS to a background level of ~200 SI. MS also shows frequent meter-scale increases up to 1030 SI, some of which correlate to the previously mentioned meter-scale resistivity increases.
11.3. Borehole image logging
FMS image logs were acquired in sediment sections from Hole U1554E and basement sections from Hole U1554F (Figures F59, F60). An acoustic image log was also acquired for the drilled basement section of Hole U1554F (Figure F60). Excellent image quality allows a range of geologic features to be described and measured, including sedimentary bedding, lithologic texture, and fractures.
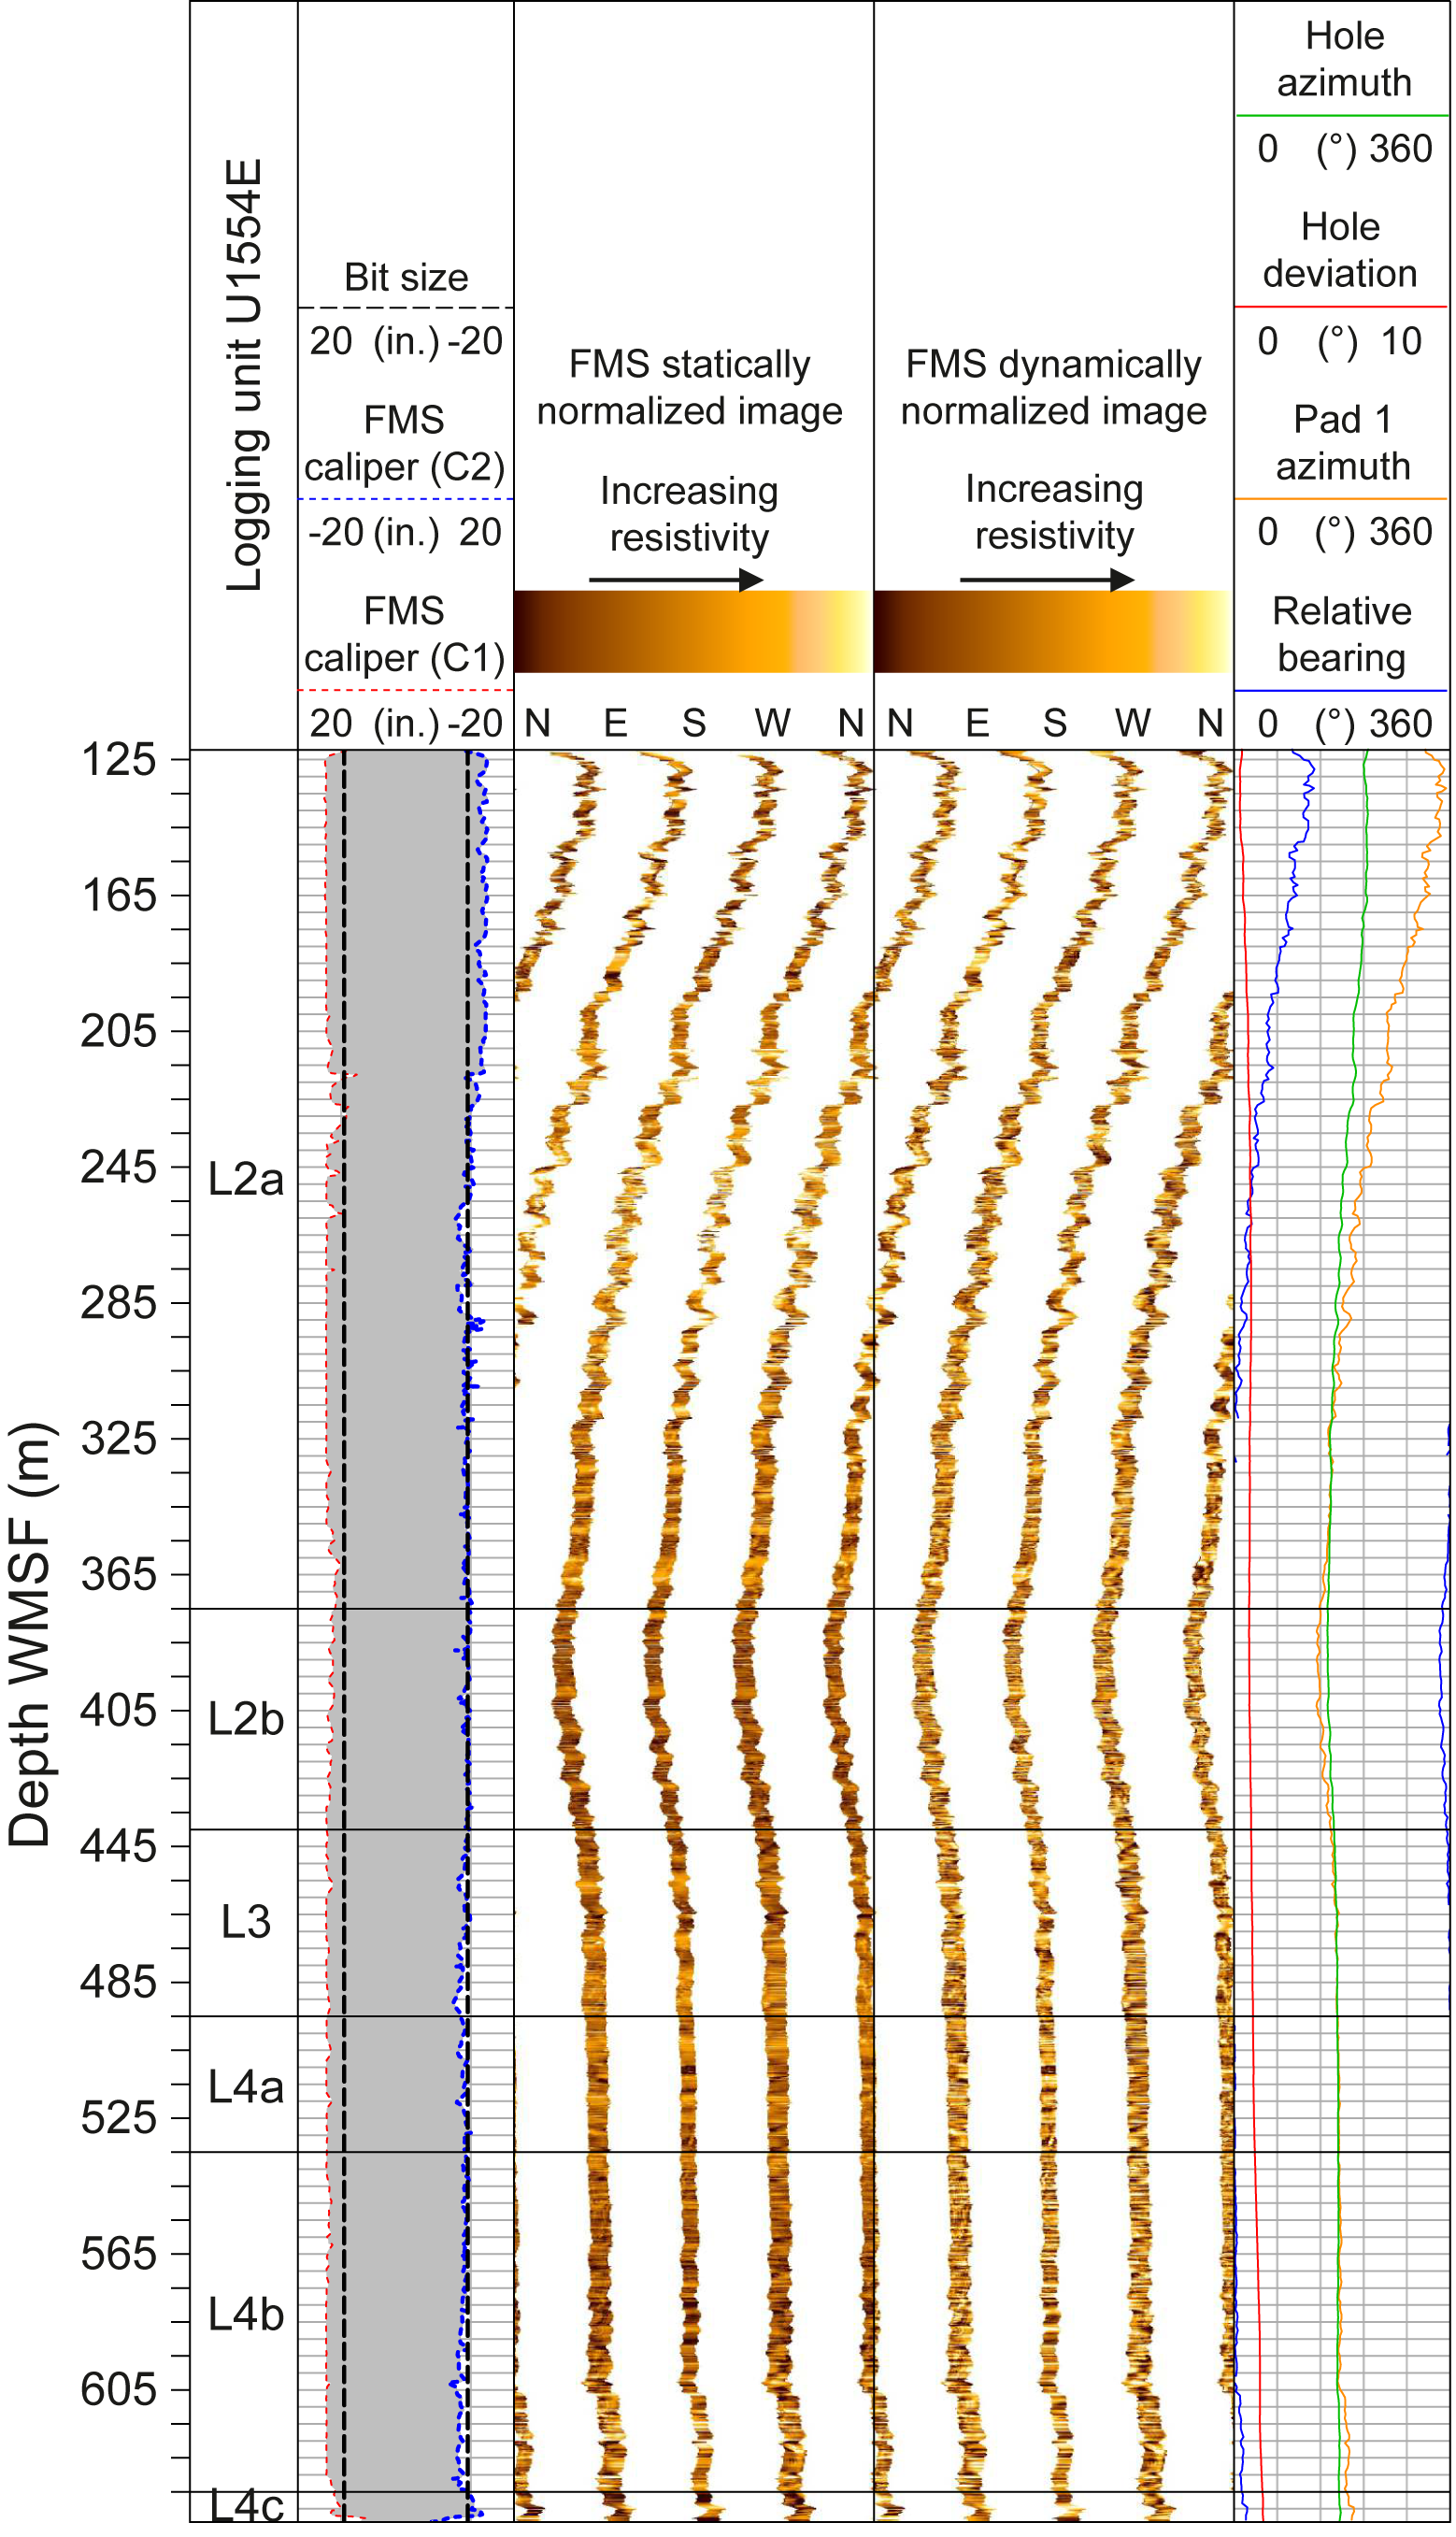
Figure F59. Wireline image data, Hole U1554E.
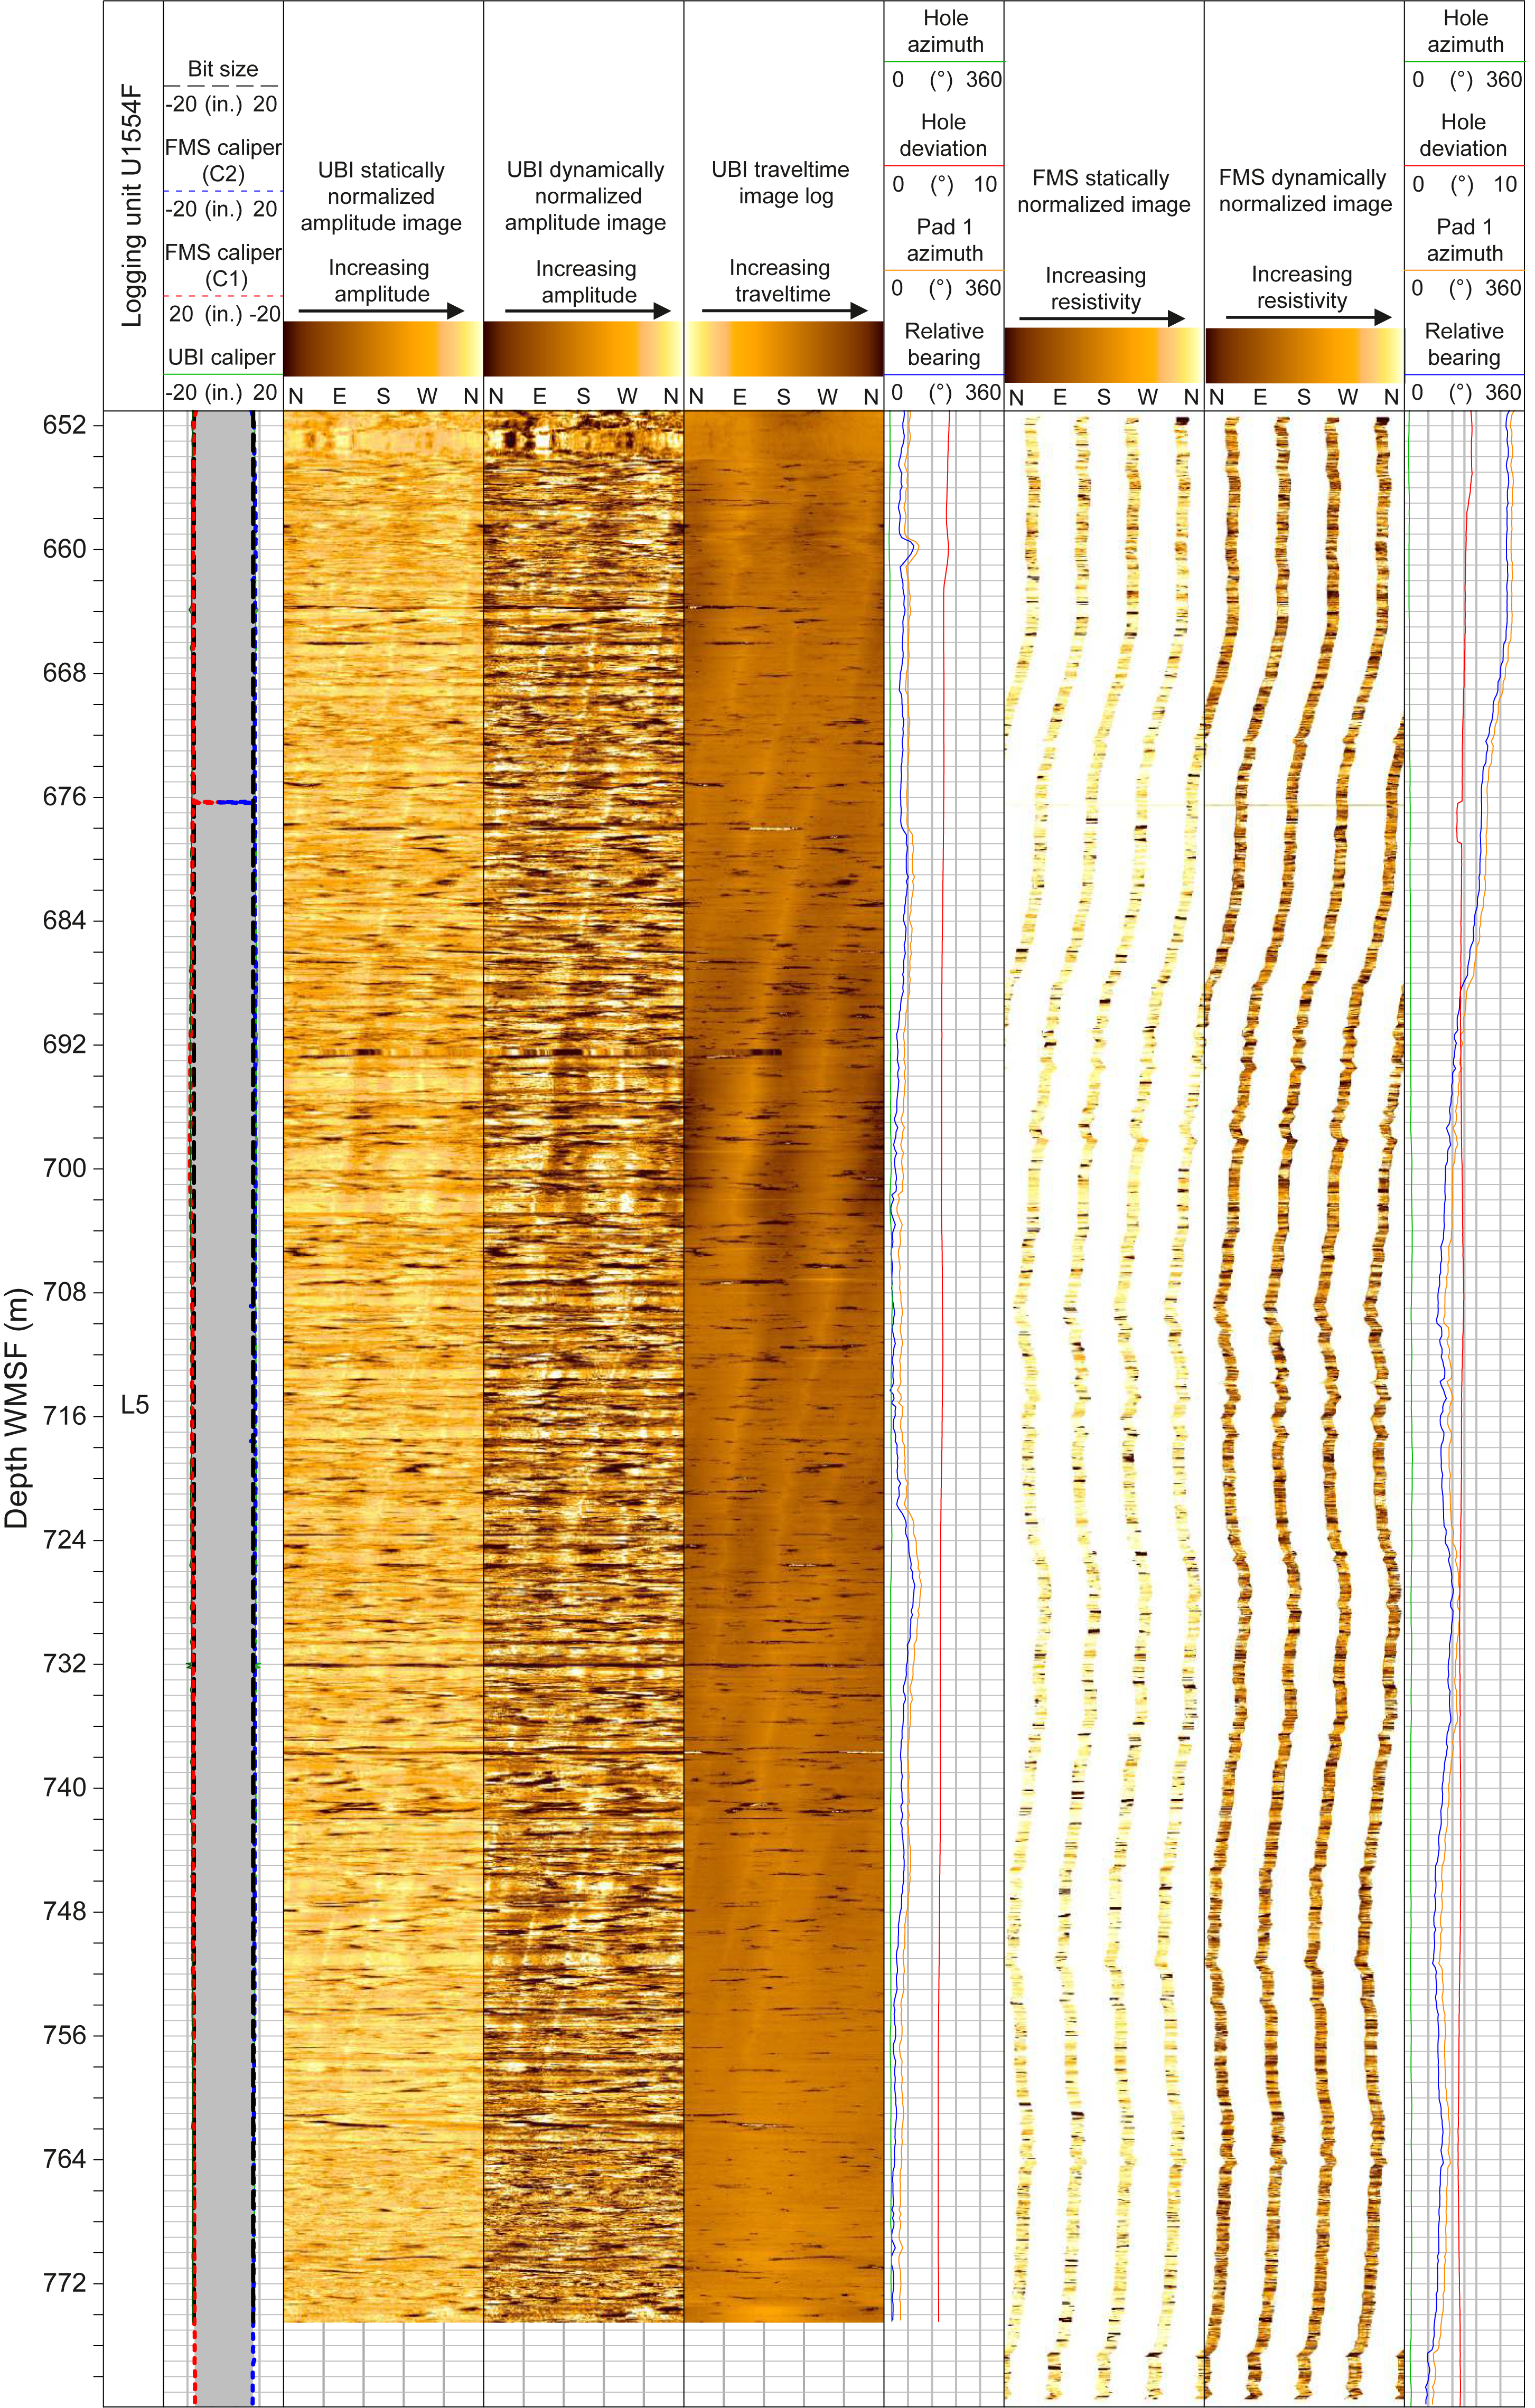
Figure F60. Wireline image data, Hole U1554F.
The resistivity image log from Hole U1554E covers the depth interval containing Logging Subunits L2a–L4c (~125–642 m WMSF). Unit L2 is characterized by closely spaced, decimeter-scale, gently dipping alternating resistive and conductive sedimentary layers. Unit L3 has slightly thicker layering than Unit L2, and layers have increased amplitude, suggesting a higher angle of dip here. Unit L4 shows gently dipping sedimentary layers with thin conductive layers interbedded with decimeter-thick resistive layers, which in places appear fractured. From the top of Subunit L4b to ~552 m WMSF, resistivity images show a number of centimeter- to decimeter-sized conductive or resistive patches that may be clasts (Figure F61A). Acoustic and resistivity image logs from Hole U1554F were acquired entirely within Unit L5 (basement) at ~651–775 (acoustic image log) and ~651–780 m WMSF (resistivity image log). Acoustic image logs show both high- and low-amplitude image facies, with the low-amplitude image facies containing multiple fractures and what may be small-scale pillow structures (Figure F61B). Similarly, resistivity images of the basement basalts show alternating bands of high and low resistivity crosscut by a complex set of resistive and conductive fractures.
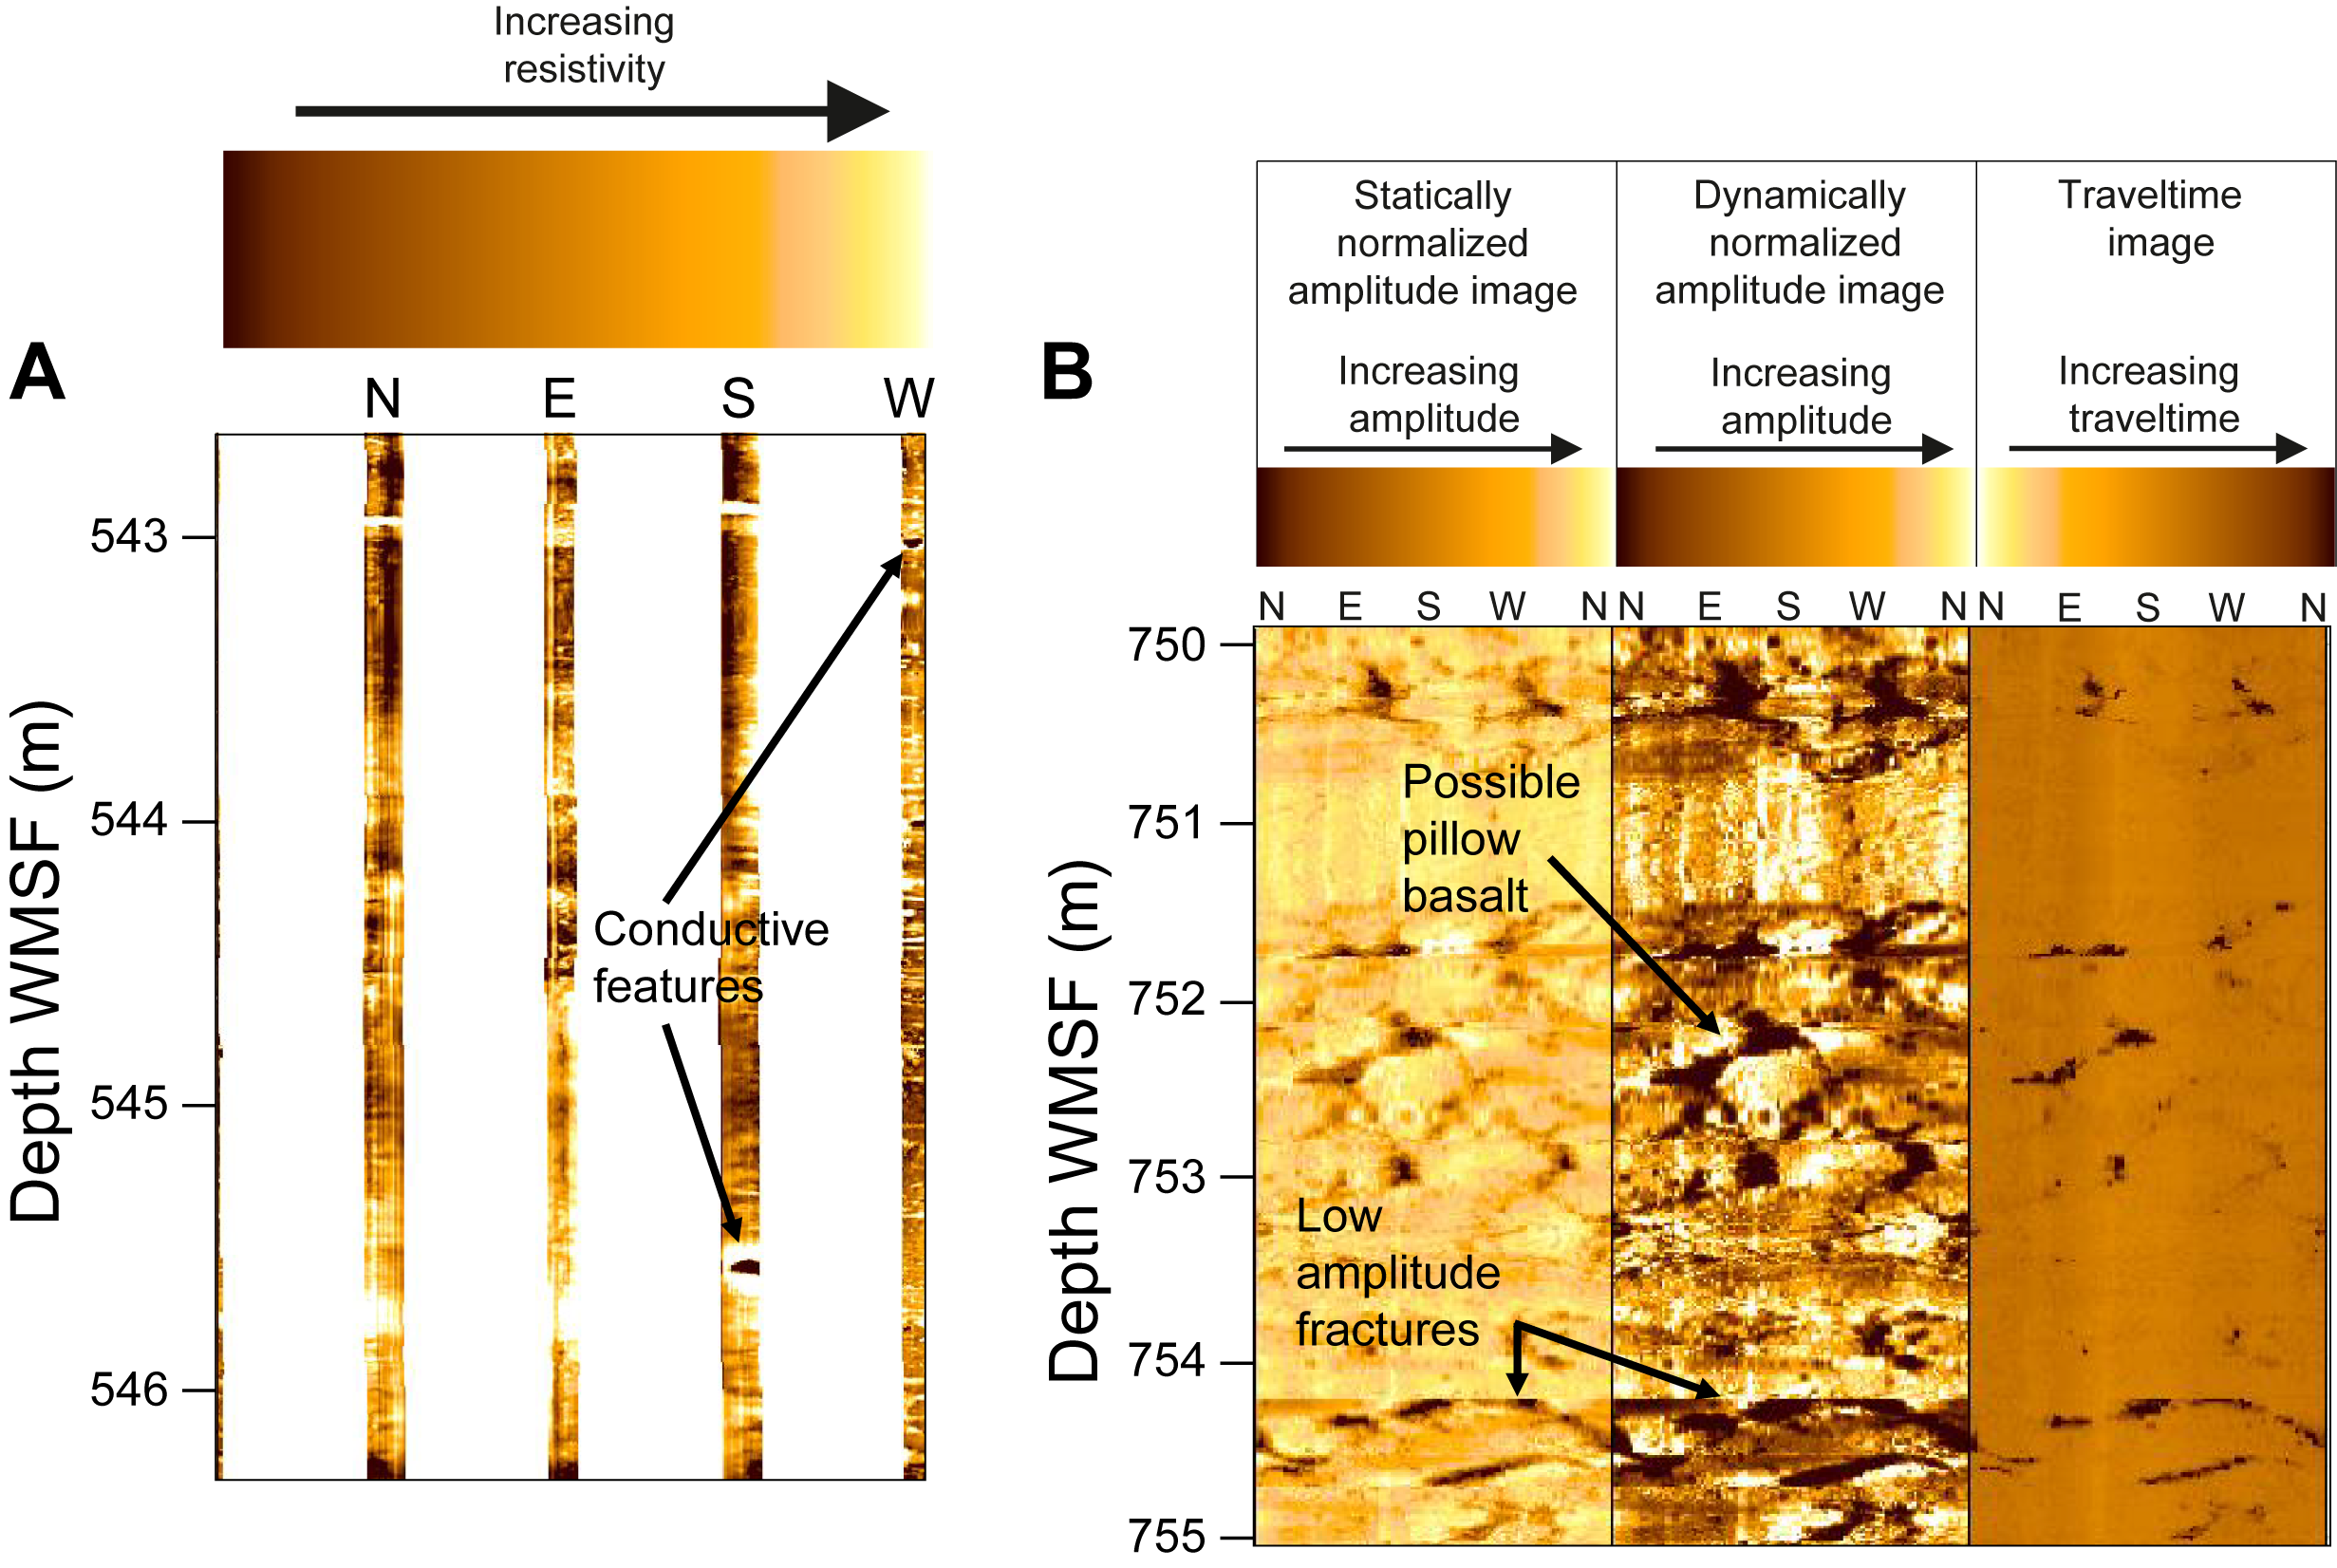
Figure F61. Conductive features.
11.4. Downhole temperature and heat flow
Four APCT-3 tool measurements were made in Hole U1554E, and five were made in Hole U1554H. Data from Hole U1554E appear reliable (Figure F62A); however, observed heat pulse decays for Cores 395C-U1554H-4H and 7H contain spikes, likely due to increased heave causing motion of the APC cutting shoe during measurement (Figure F62B). As a result, downhole temperature measurements from U1554H are considered unreliable. Projected downhole formation temperatures in Hole U1554E range from 5.6°C at 75.8 m DSF to 8.3°C at 161.3 m DSF (Figures F56A, F62A; Table T15), giving a geothermal gradient of 30°C/km. Thermal conductivity under in situ conditions, K, was estimated from laboratory-determined thermal conductivity from Holes U1554E and U1554H using the method of Hyndman et al. (1974) (Figure F56B). A linear function for depth-dependent thermal resistance (R) was obtained by integrating the inverse of the thermal conductivity over depth and applying a linear least-squares fit (Figure F56C). This function was used to estimate thermal resistance at each corresponding APCT-3 measurement depth. A heat flow of 28.6 mW/m2 was obtained from a linear least-squares fit of the relationship between temperature and thermal resistance (Bullard, 1939), whose slope is the vertical heat flow (Figure F56D).
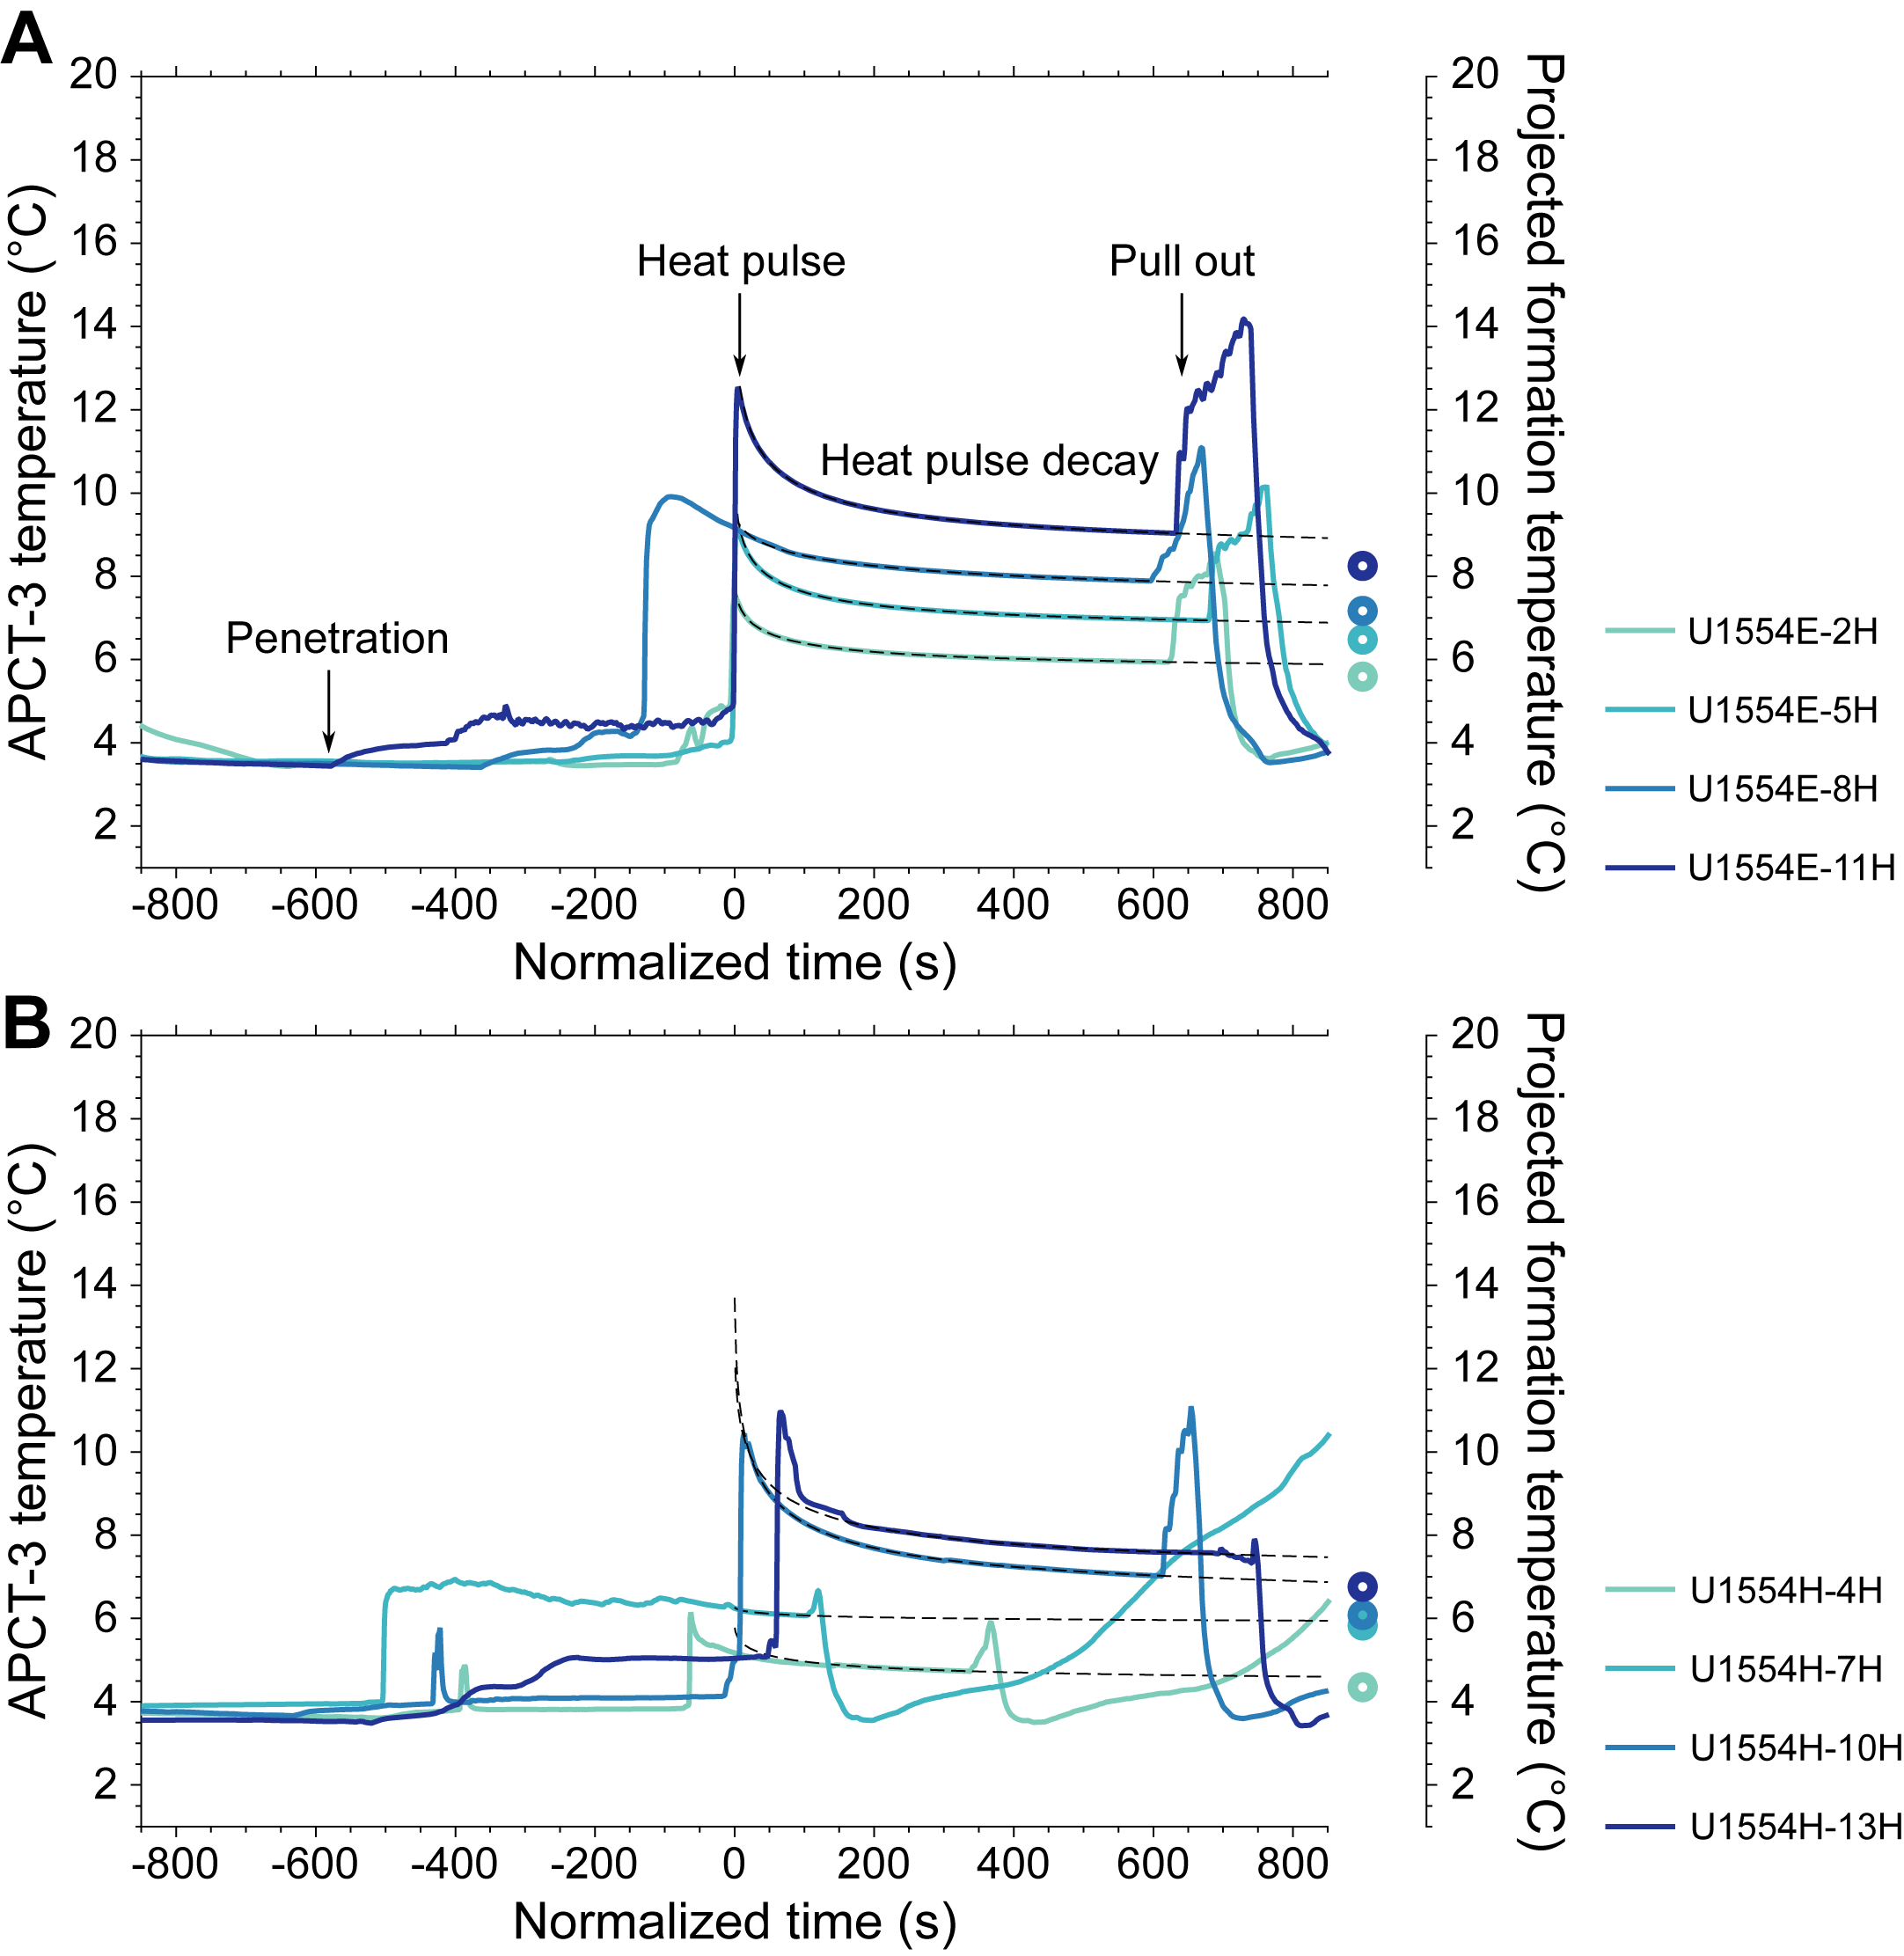
Figure F62. APCT-3 temperature-time series and projected formation temperatures.
12. Age model
Site U1554 is located near the center of Björn drift where the sedimentary succession is near its thickest on site survey Seismic Profile JC50-1 (see Background and objectives). The site survey profiles show acoustically continuous reflectors through most of the succession from the seafloor to ~3.2 s TWT (Figure F2). Between that level and a clear basement reflection at ~3.3 s TWT, the seismic reflection profiles show greater complexity, including less continuous reflections and some apparent angular discordance of reflections along the profiles. In comparison to Site U1562, which was drilled near the eastern edge of Björn drift, the upper part of the succession above ~3.2 s TWT appears more expanded and the lower part is more condensed (Figure F2).
Age model tie points and interpolated boundaries at Site U1554 are provided in Table T16 and Figure F63. The age model is derived mainly from the succession in Hole 395C-U1554E, which was cored continuously from the seafloor to the basement at 645.20 m CSF-A, with additional biostratigraphic constraints from Hole 395-U1554G. From the seafloor to the base of Matuyama Subchron C2r.2r at 402.34 m CSF-A, the age model is based on magnetostratigraphic reversals (see Paleomagnetism) complemented by calcareous nannofossil and planktonic foraminifer biostratigraphy (see Micropaleontology). Below that depth, a succession of magnetic polarity reversals was recorded, but their magnetostratigraphic interpretation is highly uncertain because of gaps in the record, so the age model relies on biostratigraphy alone, which is based on calcareous nannofossils, planktonic foraminifers, and bolboforms.
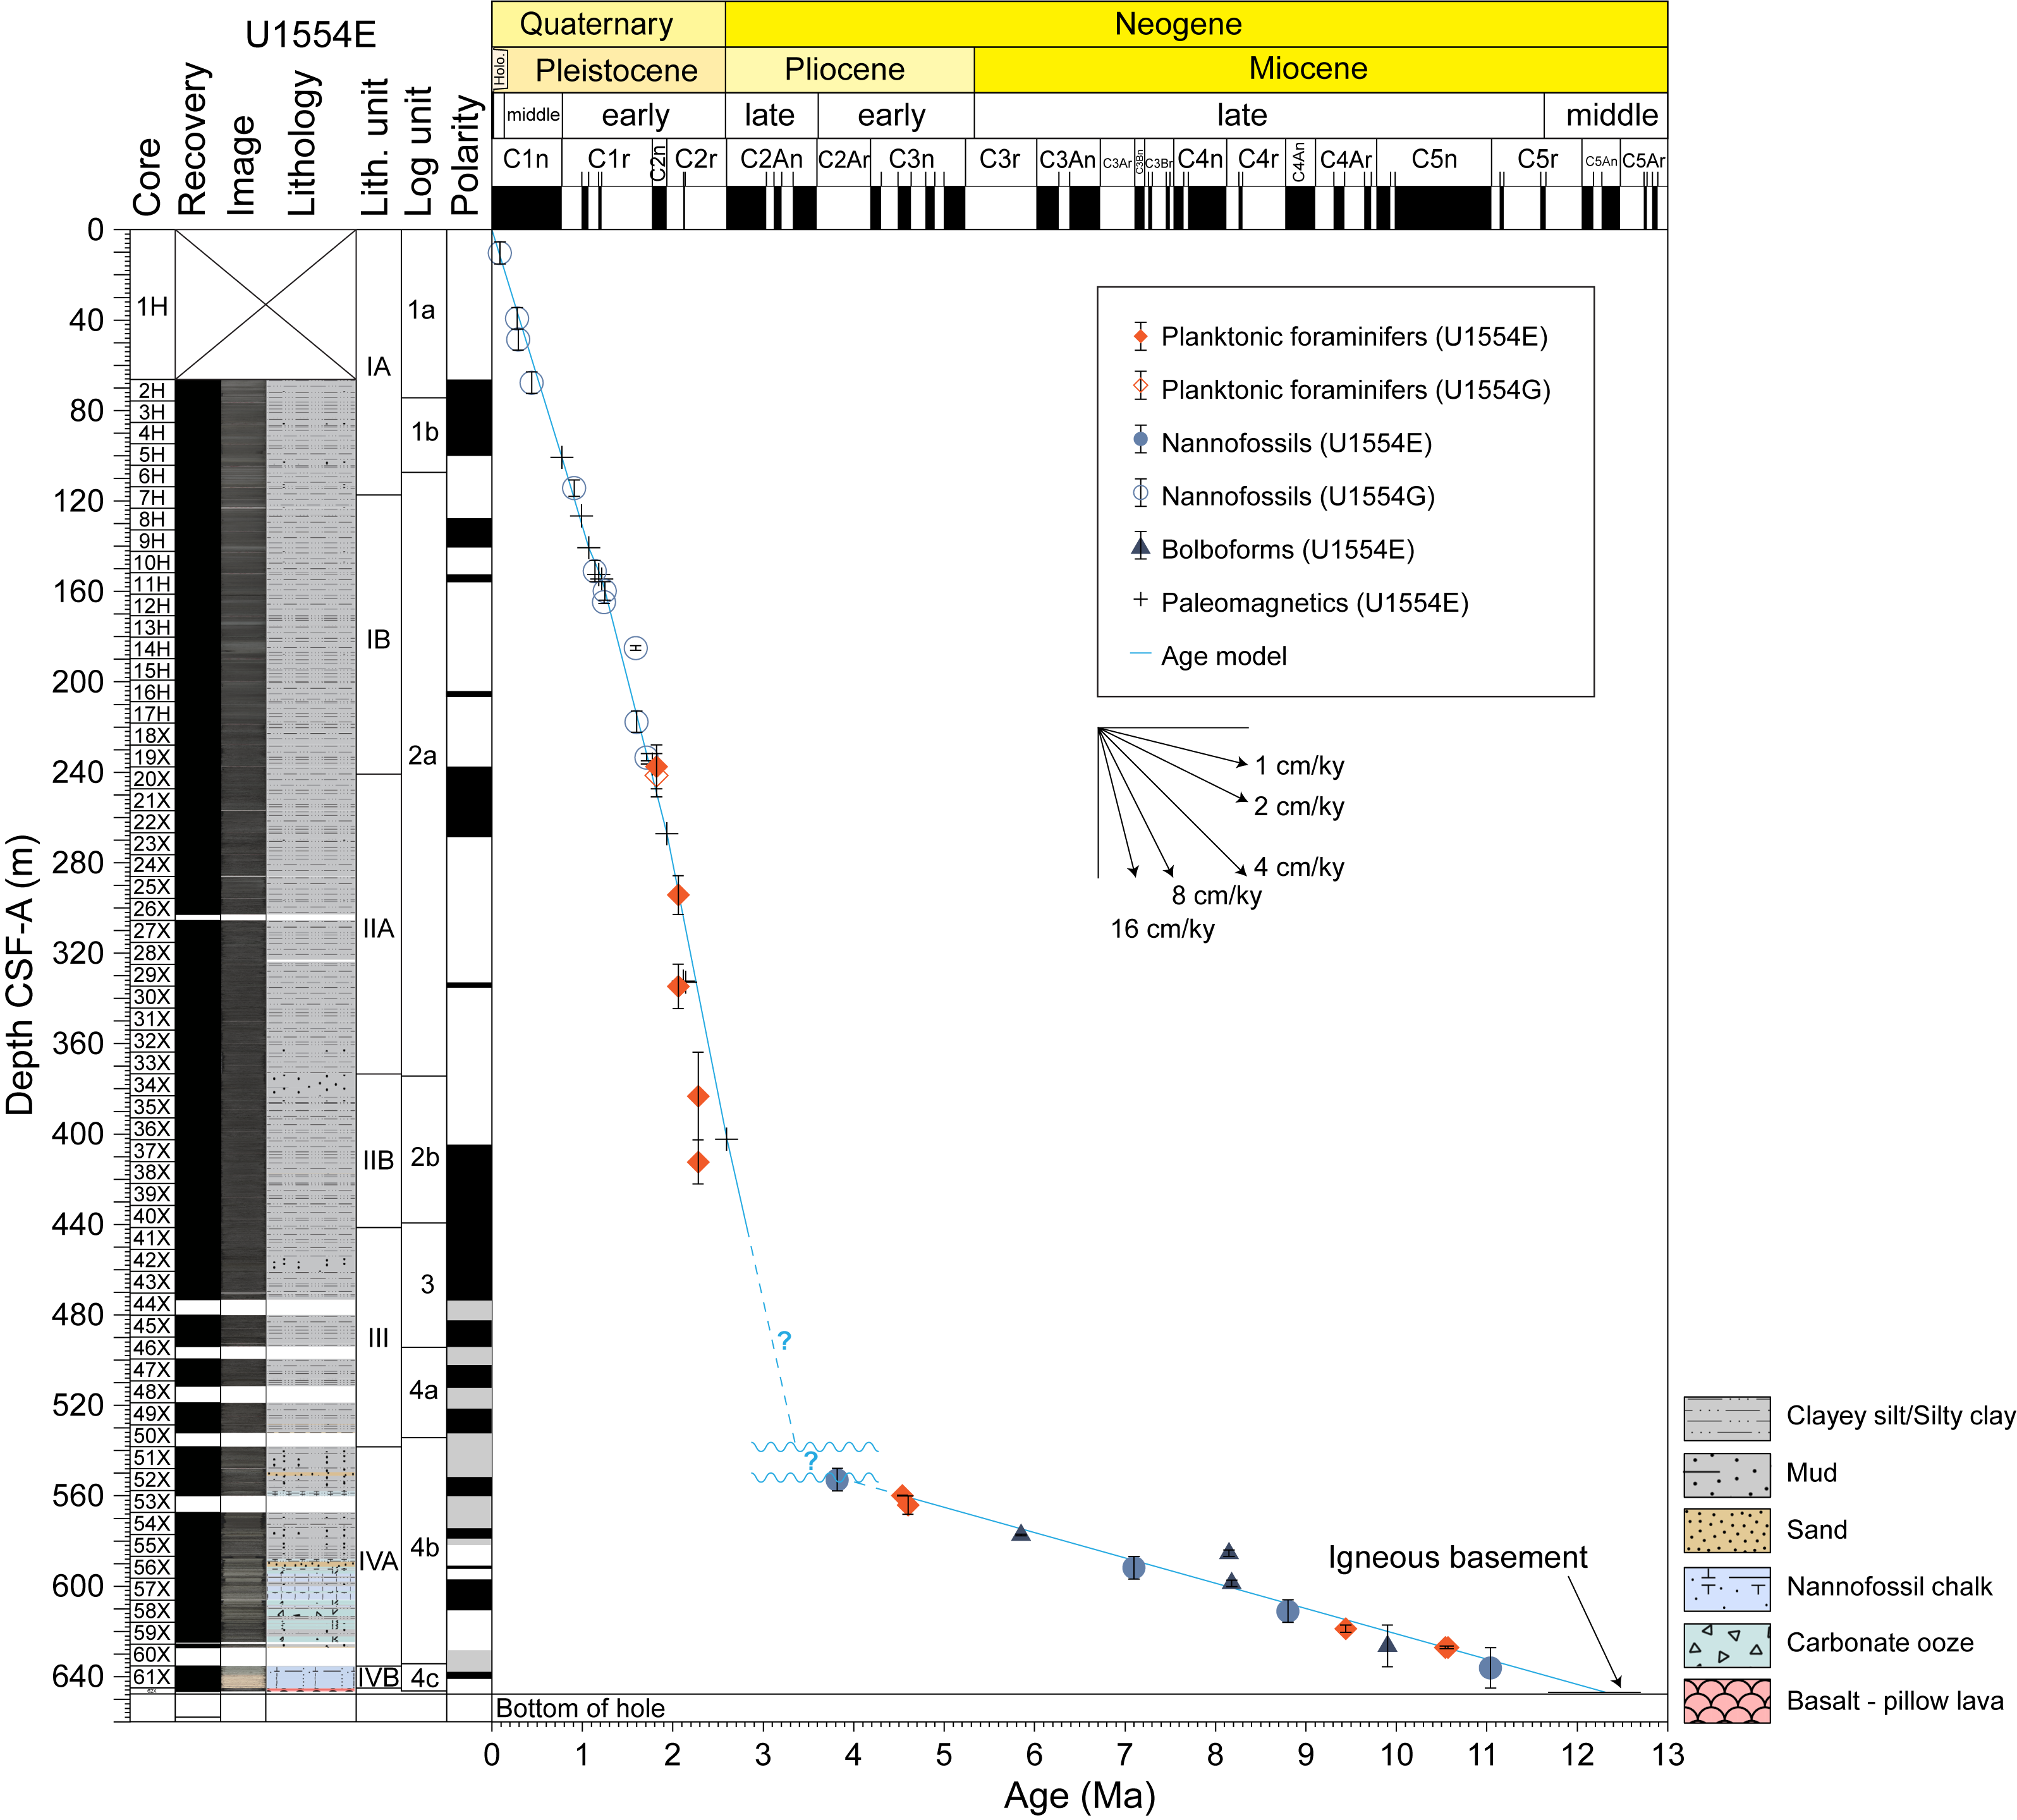
Figure F63. Preliminary age model for the sedimentary succession.
From the seafloor to the base of Chron C2r.2r (2.595 Ma) at 402.34 m CSF-A, the age model is straightforward and well constrained. Some biostratigraphic constraints deviate slightly from the linear model fit, but these can be explained by taxonomic uncertainties or possible diachrony between the calibration sites and this relatively high latitude location (see Micropaleontology). The data indicate continuous, high-rate sedimentation. The average sedimentation rate for Lithostratigraphic Subunit IA, from the seafloor to 118 m CSF-A (see Lithostratigraphy) is ~13 cm/ky. The average sedimentation rate for Subunit IB and Unit II combined is 17 cm/ky. These sedimentation rates are consistent with a fast-accumulating contourite drift deposit.
For the lower part of the succession from 560 m CSF-A to basement, we present a simple linear age model using two relatively well defined planktonic foraminifer bioevents (Base G. puncticulata at 560 m CSF-A and top P. mayeri at 627 m CSF-A). The average accumulation rate for this part of the succession is much lower than the overlying interval, at ~0.9 cm/ky. There may be cryptic hiatuses, as evidenced by two bolboform age estimates that lie slightly off the best fit model, but we cannot discount diachrony because the bolboform assemblages at this site differ from the main calibration site, Ocean Drilling Program (ODP) Site 982 in the Hatton-Rockall Basin (Spiegler, 1999) (see Micropaleontology). The biostratigraphic data are therefore not considered sufficiently reliable to support firm conclusions without clear lithologic or cyclostratigraphic evidence of hiatuses. The interval is characterized by a series of magnetic polarity reversals, but because of the low sedimentation rate the magnetostratigraphic interpretation remains preliminary (see Paleomagnetism).
The most uncertain part of the age model is between ~440 and 552 m CSF-A, which corresponds to Lithostratigraphic Unit III and the upper part of Subunit IVA. Downhole logging data show a sharp decrease in bulk density at ~535 m WMSF, which corresponds to the top of Logging Unit L3b (see Downhole measurements) and is at a similar level to the base of Lithostratigraphic Unit III at ~538 m CSF-A (see Lithostratigraphy). Two clasts were observed embedded in the clay- or silt-rich sediment core, one apparently of basalt ~7 cm in diameter in Section 395C-U1554E-50X-2 and one of relatively angular sedimentary rock ~3 cm in diameter in Section 52X-3 (see Lithostratigraphy). Basalt pebbles were also observed at the top of Core 51X. The stratigraphic interval immediately above this interval (Cores 48X–50X; 511–532 m CSF-A) shows evidence of winnowing, concentrating glauconite, and reworking of middle Miocene microfossils from levels equivalent to the lowermost part of the stratigraphic succession at the site (see Micropaleontology).
In this interval, within which there is a substantial change in the long-term sedimentation rate, we take a conservative approach by extrapolating the relatively well constrained sedimentation rate from higher in the succession to 535 m CSF-A but consider this part of the age model to carry significant uncertainty (Figure F63).
Igneous basement in Hole 395C-U1554F was encountered at 645.23 m CSF-A. The age of the oldest sediment above this, extrapolated downward using the linear age model for the lower part of the sedimentary succession, is ~12.16 Ma. This age is slightly younger than the age of the basement as estimated from regional magnetic anomaly data of 12.68 Ma (see Background and objectives).
References
Alken, P., Thébault, E., Beggan, C.D., Amit, H., Aubert, J., Baerenzung, J., Bondar, T.N., Brown, W.J., Califf, S., Chambodut, A., Chulliat, A., Cox, G.A., Finlay, C.C., Fournier, A., Gillet, N., Grayver, A., Hammer, M.D., Holschneider, M., Huder, L., Hulot, G., Jager, T., Kloss, C., Korte, M., Kuang, W., Kuvshinov, A., Langlais, B., Léger, J.M., Lesur, V., Livermore, P.W., Lowes, F.J., Macmillan, S., Magnes, W., Mandea, M., Marsal, S., Matzka, J., Metman, M.C., Minami, T., Morschhauser, A., Mound, J.E., Nair, M., Nakano, S., Olsen, N., Pavón-Carrasco, F.J., Petrov, V.G., Ropp, G., Rother, M., Sabaka, T.J., Sanchez, S., Saturnino, D., Schnepf, N.R., Shen, X., Stolle, C., Tangborn, A., Tøffner-Clausen, L., Toh, H., Torta, J.M., Varner, J., Vervelidou, F., Vigneron, P., Wardinski, I., Wicht, J., Woods, A., Yang, Y., Zeren, Z., and Zhou, B., 2021. International Geomagnetic Reference Field: the thirteenth generation. Earth, Planets and Space, 73(1):49. https://doi.org/10.1186/s40623-020-01288-x
Berggren, W.A., 1972. Cenozoic biostratigraphy and paleobiogeography of the North Atlantic. In Laughton, A.S., Berggren, W.A., et al., Initial Reports of the Deep Sea Drilling Project. 12: Washington, DC (US Government Printing Office), 965–1001. https://doi.org/10.2973/dsdp.proc.12.114.1972
Blum, P., Rhinehart, B., and Acton, G.D., 2020. International Ocean Discovery Program Expedition 384 Preliminary Report. International Ocean Discovery Program. https://doi.org/10.14379/iodp.pr.384.2020
Bullard, E.C., 1939. Heat flow in South Africa. Proceedings of the Royal Society of London, A: Mathematical and Physical Sciences, 173(955):474–502. https://doi.org/10.1098/rspa.1939.0159
Butterworth, S., 1930. On the theory of filter amplifiers. Experimental Wireless and the Wireless Engineer, 7:536–541. https://www.gonascent.com/papers/butter.pdf
Colman, A., Sinton, J.M., White, S.M., McClinton, J.T., Bowles, J.A., Rubin, K.H., Behn, M.D., Cushman, B., Eason, D.E., Gregg, T.K.P., Grönvold, K., Hidalgo, S., Howell, J., Neill, O., and Russo, C., 2012. Effects of variable magma supply on mid-ocean ridge eruptions: constraints from mapped lava flow fields along the Galápagos Spreading Center. Geochemistry, Geophysics, Geosystems, 13(8). https://doi.org/10.1029/2012GC004163
Flower, B.P., 1999. Data report: planktonic foraminifers from the subpolar North Atlantic and Nordic Seas: Sites 980–987 and 907. In Raymo, M.E., Jansen, E., Blum, P., and Herbert, T.D. (Eds.), Proceedings of the Ocean Drilling Program, Scientific Results. 162: College Station, TX (Ocean Drilling Program). https://doi.org/10.2973/odp.proc.sr.162.038.1999
Foresi, L.M., Iaccarino, S.M., and Salvatorini, G., 2002. Neogloboquadrina alantica preatlantica, new subspecies from late Middle Miocene. Rivista Italiana Di Paleontologia E Stratigrafia, 108(2). https://doi.org/10.13130/2039-4942/5479
Hartmann, A., and Villinger, H., 2002. Inversion of marine heat flow measurements by expansion of the temperature decay function. Geophysical Journal International, 148(3):628–636. https://doi.org/10.1046/j.1365-246X.2002.01600.x
Hyndman, R.D., Erickson, A.J., and Von Herzen, R.P., 1974. Geothermal measurements on DSDP Leg 26. In Davies, T.A., Luyendyk, B.P., et al., Initial Reports of the Deep Sea Drilling Project. 26: Washington, DC (US Government Printing Office), 451–463. https://doi.org/10.2973/dsdp.proc.26.113.1974
Lurcock, P.C., and Florindo, F., 2019. New developments in the PuffinPlot paleomagnetic data analysis program. Geochemistry, Geophysics, Geosystems, 20(11):5578–5587. https://doi.org/10.1029/2019GC008537
Lyons, R.G., 2011. Understanding Digital Signal Processing (Third edition): Upper Saddle River, NJ (Prentice Hall). https://www.iro.umontreal.ca/~mignotte/IFT3205/Documents/UnderstandingDigitalSignalProcessing.pdf
Murton, B.J., Taylor, R.N., and Thirlwall, M.F., 2002. Plume–ridge Interaction: a geochemical perspective from the Reykjanes Ridge. Journal of Petrology, 43(11):1987–2012. https://doi.org/10.1093/petrology/43.11.1987
Ogg, J.G., 2020. Geomagnetic Polarity Time Scale. In Gradstein, F.M., Ogg, J.G., Schmitz, M., and Ogg, G. (Eds.), Geologic Time Scale 2020. Amsterdam (Elsevier), 159–192. https://doi.org/10.1016/B978-0-12-824360-2.00005-X
Parnell-Turner, R.E., Briais, A., LeVay, L.J., Cui, Y., Di Chiara, A., Dodd, J.P., Dunkley Jones, T., Dwyer, D., Eason, D.E., Friedman, S.A., Hemming, S.R., Hochmuth, K., Ibrahim, H., Jasper, C., Karatsolis, B.T., Lee, S., LeBlanc, D.E., Lindsay, M.R., McNamara, D.D., Modestou, S.E., Murton, B., OConnell, S., Pasquet, G.T., Pearson, P.N., Qian, S.P., Rosenthal, Y., Satolli, S., Sinnesael, M., Suzuki, T., Thulasi Doss, T., White, N.J., Wu, T., and Yang Yang, A., 2025a. Expedition 395 methods. In Parnell-Turner, R.E., Briais, A., LeVay, L.J., and the Expedition 395 Scientists, Reykjanes Mantle Convection and Climate. Proceedings of the International Ocean Discovery Program, 395: College Station, TX (International Ocean Discovery Program). https://doi.org/10.14379/iodp.proc.395.102.2025
Parnell-Turner, R.E., Briais, A., LeVay, L.J., Cui, Y., Di Chiara, A., Dodd, J.P., Dunkley Jones, T., Dwyer, D., Eason, D.E., Friedman, S.A., Hemming, S.R., Hochmuth, K., Ibrahim, H., Jasper, C., Karatsolis, B.T., Lee, S., LeBlanc, D.E., Lindsay, M.R., McNamara, D.D., Modestou, S.E., Murton, B., OConnell, S., Pasquet, G.T., Pearson, P.N., Qian, S.P., Rosenthal, Y., Satolli, S., Sinnesael, M., Suzuki, T., Thulasi Doss, T., White, N.J., Wu, T., Yang Yang, A., dos Santos Rocha, V., Pearman, C., and Tien, C.-Y., 2025b. Expedition 395 summary. In Parnell-Turner, R.E., Briais, A., LeVay, L.J., and the Expedition 395 Scientists, Reykjanes Mantle Convection and Climate. Proceedings of the International Ocean Discovery Program, 395: College Station, TX (International Ocean Discovery Program). https://doi.org/10.14379/iodp.proc.395.101.2025
Parnell-Turner, R.E., Briais, A., LeVay, L.J., and the Expedition 395 Scientists, 2025c. Supplementary material, https://doi.org/10.14379/iodp.proc.395supp.2025. In Parnell-Turner, R.E., Briais, A., LeVay, L.J., and the Expedition 395 Scientists, Reykjanes Mantle Convection and Climate. Proceedings of the International Ocean Discovery Program, 395: College Station, TX (International Ocean Discovery Program).
Parnell-Turner, R., White, N., Henstock, T.J., Jones, S.M., Maclennan, J., and Murton, B.J., 2017. Causes and consequences of diachronous v-shaped ridges in the North Atlantic Ocean. Journal of Geophysical Research: Solid Earth, 122(11):8675–8708. https://doi.org/10.1002/2017JB014225
Poag, C.W., and Karowe, A.L., 1986. Stratigraphic potential of Bolboforma significantly increased by new finds in the North Atlantic and South Pacific. Palaios, 1(2):162–171. https://doi.org/10.2307/3514510
Poore, R.Z., 1979. Oligocene through Quaternary planktonic foraminiferal biostratigraphy of the North Atlantic: DSDP Leg 49. In Luyendyk, B.P., Cann, J.R., et al., Initial Reports of the Deep Sea Drilling Project. 49: Washington, DC (US Government Printing Office), 447–517. https://doi.org/10.2973/dsdp.proc.49.115.1979
Poore, R.Z., and Berggren, W.A., 1975. Late Cenozoic planktonic foraminiferal biostratigraphy and paleoclimatology of Hatton-Rockall Basin; DSDP Site 116. Journal of Foraminiferal Research, 5(4):270–293. https://doi.org/10.2113/gsjfr.5.4.270
Skilling, I.P., White, J.D.L., and McPhie, J., 2002. Peperite: a review of magma–sediment mingling. Journal of Volcanology and Geothermal Research, 114(1–2):1–17. https://doi.org/10.1016/S0377-0273(01)00278-5
Spiegler, D., 1999. Bolboforma biostratigraphy from the Hatton-Rockall Basin (North Atlantic). In Raymo, M.E., Jansen, E., Blum, P., and Herbert, T.D., Proceedings of the Ocean Drilling Program, Scientific Results, 162. College Station, TX (Ocean Drilling Program), 35–49. https://doi.org/10.2973/odp.proc.sr.162.013.1999
Weaver, P.P.E., 1987. Late Miocene to recent planktonic foraminifers from the North Atlantic: Deep Sea Drilling Project Leg 94. In Ruddiman, W.F., Kidd, R. B., Thomas, E., et al., Initial Reports of the Deep Sea Drilling Project. 94: Washington, DC (US Government Printing Office), 703–727. https://doi.org/10.2973/dsdp.proc.94.114.1987
Winter, C.J., and Pearson, P.N., 2001. Coiling directions in some Miocene planktonic Foraminifera. Journal of Micropalaeontology, 20(1):29–30. https://www.lyellcollection.org/doi/abs/10.1144/jm.20.1.29
Zijderveld, J.D.A., 1967. AC demagnetization of rocks: analysis of results. In Runcorn, S.K.C., Creer, K.M., and Collinson, D.W. (Eds.), Methods in Palaeomagnetism. Developments in Solid Earth Geophysics, 3: 254–286. https://doi.org/10.1016/B978-1-4832-2894-5.50049-5