Parnell-Turner, R.E., Briais, A., LeVay, L.J., and the Expedition 395 Scientists
Proceedings of the International Ocean Discovery Program Volume 395
publications.iodp.org
https://doi.org/10.14379/iodp.proc.395.104.2025
Site U15551
![]() A. Briais,
A. Briais,
![]() R.E. Parnell-Turner,
R.E. Parnell-Turner,
![]() L.J. LeVay,
L.J. LeVay,
![]() Y. Cui,
Y. Cui,
![]() A. Di Chiara,
A. Di Chiara,
![]() J.P. Dodd,
J.P. Dodd,
![]() T. Dunkley Jones,
T. Dunkley Jones,
![]() D.P. Dwyer,
D.P. Dwyer,
![]() D.E. Eason,
D.E. Eason,
![]() S. Friedman,
S. Friedman,
![]() S.R. Hemming,
S.R. Hemming,
![]() K. Hochmuth,
K. Hochmuth,
![]() H. Ibrahim,
H. Ibrahim,
![]() C. Jasper,
C. Jasper,
![]() B.T. Karatsolis,
B.T. Karatsolis,
![]() S. Lee,
S. Lee,
![]() D.E. LeBlanc,
D.E. LeBlanc,
![]() M.R. Lindsay,
M.R. Lindsay,
![]() D.D. McNamara,
D.D. McNamara,
![]() S.E. Modestou,
S.E. Modestou,
![]() B. Murton,
B. Murton,
![]() S. OConnell,
S. OConnell,
![]() G.T. Pasquet,
G.T. Pasquet,
![]() P.N. Pearson,
S.-P. Qian,
P.N. Pearson,
S.-P. Qian,
![]() Y. Rosenthal,
Y. Rosenthal,
![]() S. Satolli,
S. Satolli,
![]() M. Sinnesael,
T. Suzuki,
M. Sinnesael,
T. Suzuki,
![]() T. Thulasi Doss,
T. Thulasi Doss,
![]() N.J. White,
N.J. White,
![]() T. Wu,
T. Wu,
![]() A. Yang Yang,
A. Yang Yang,
![]() V. dos Santos Rocha,
C. Pearman, and
C.-Y. Tien2
V. dos Santos Rocha,
C. Pearman, and
C.-Y. Tien2
1 Briais, A., Parnell-Turner, R.E., LeVay, L.J., Cui, Y., Di Chiara, A., Dodd, J.P., Dunkley Jones, T., Dwyer, D., Eason, D.E., Friedman, S.A., Hemming, S.R., Hochmuth, K., Ibrahim, H., Jasper, C., Karatsolis, B.T., Lee, S., LeBlanc, D.E., Lindsay, M.R., McNamara, D.D., Modestou, S.E., Murton, B., OConnell, S., Pasquet, G.T., Pearson, P.N., Qian, S.P., Rosenthal, Y., Satolli, S., Sinnesael, M., Suzuki, T., Thulasi Doss, T., White, N.J., Wu, T., Yang Yang, A., dos Santos Rocha, V., Pearman, C., and Tien, C.-Y., 2025. Site U1555. In Parnell-Turner, R.E., Briais, A., LeVay, L.J., and the Expedition 395 Scientists, Reykjanes Mantle Convection and Climate. Proceedings of the International Ocean Discovery Program, 395: College Station, TX (International Ocean Discovery Program). https://doi.org/10.14379/iodp.proc.395.104.2025
2 Expedition 395 Scientists' affiliations.
1. Background and objectives
The Reykjanes Ridge flanks host a series of crustal V-shaped ridges (VSRs) and V-shaped troughs (VSTs) (Figure F1) whose origins are debated. Expedition 384, 395C, and 395 sites comprise a crustal flow line transect across the eastern flank of Reykjanes Ridge and one site on its western flank on the conjugate flow line. The sites sample two pairs of VSR/VST structures and provide constraints on the formation of these features. Crustal ages at site locations on the eastern flank of the slow-spreading Reykjanes Ridge are estimated to range 2.8–32 Ma; the site located to the west, near the Greenland margin, has an estimated basement age of 49 Ma. This range of ages provides a unique opportunity to quantify the timing and extent of hydrothermal fluid–rock exchange on a slow-spreading ridge that experienced rapid sedimentation and variations in tectonic architecture.
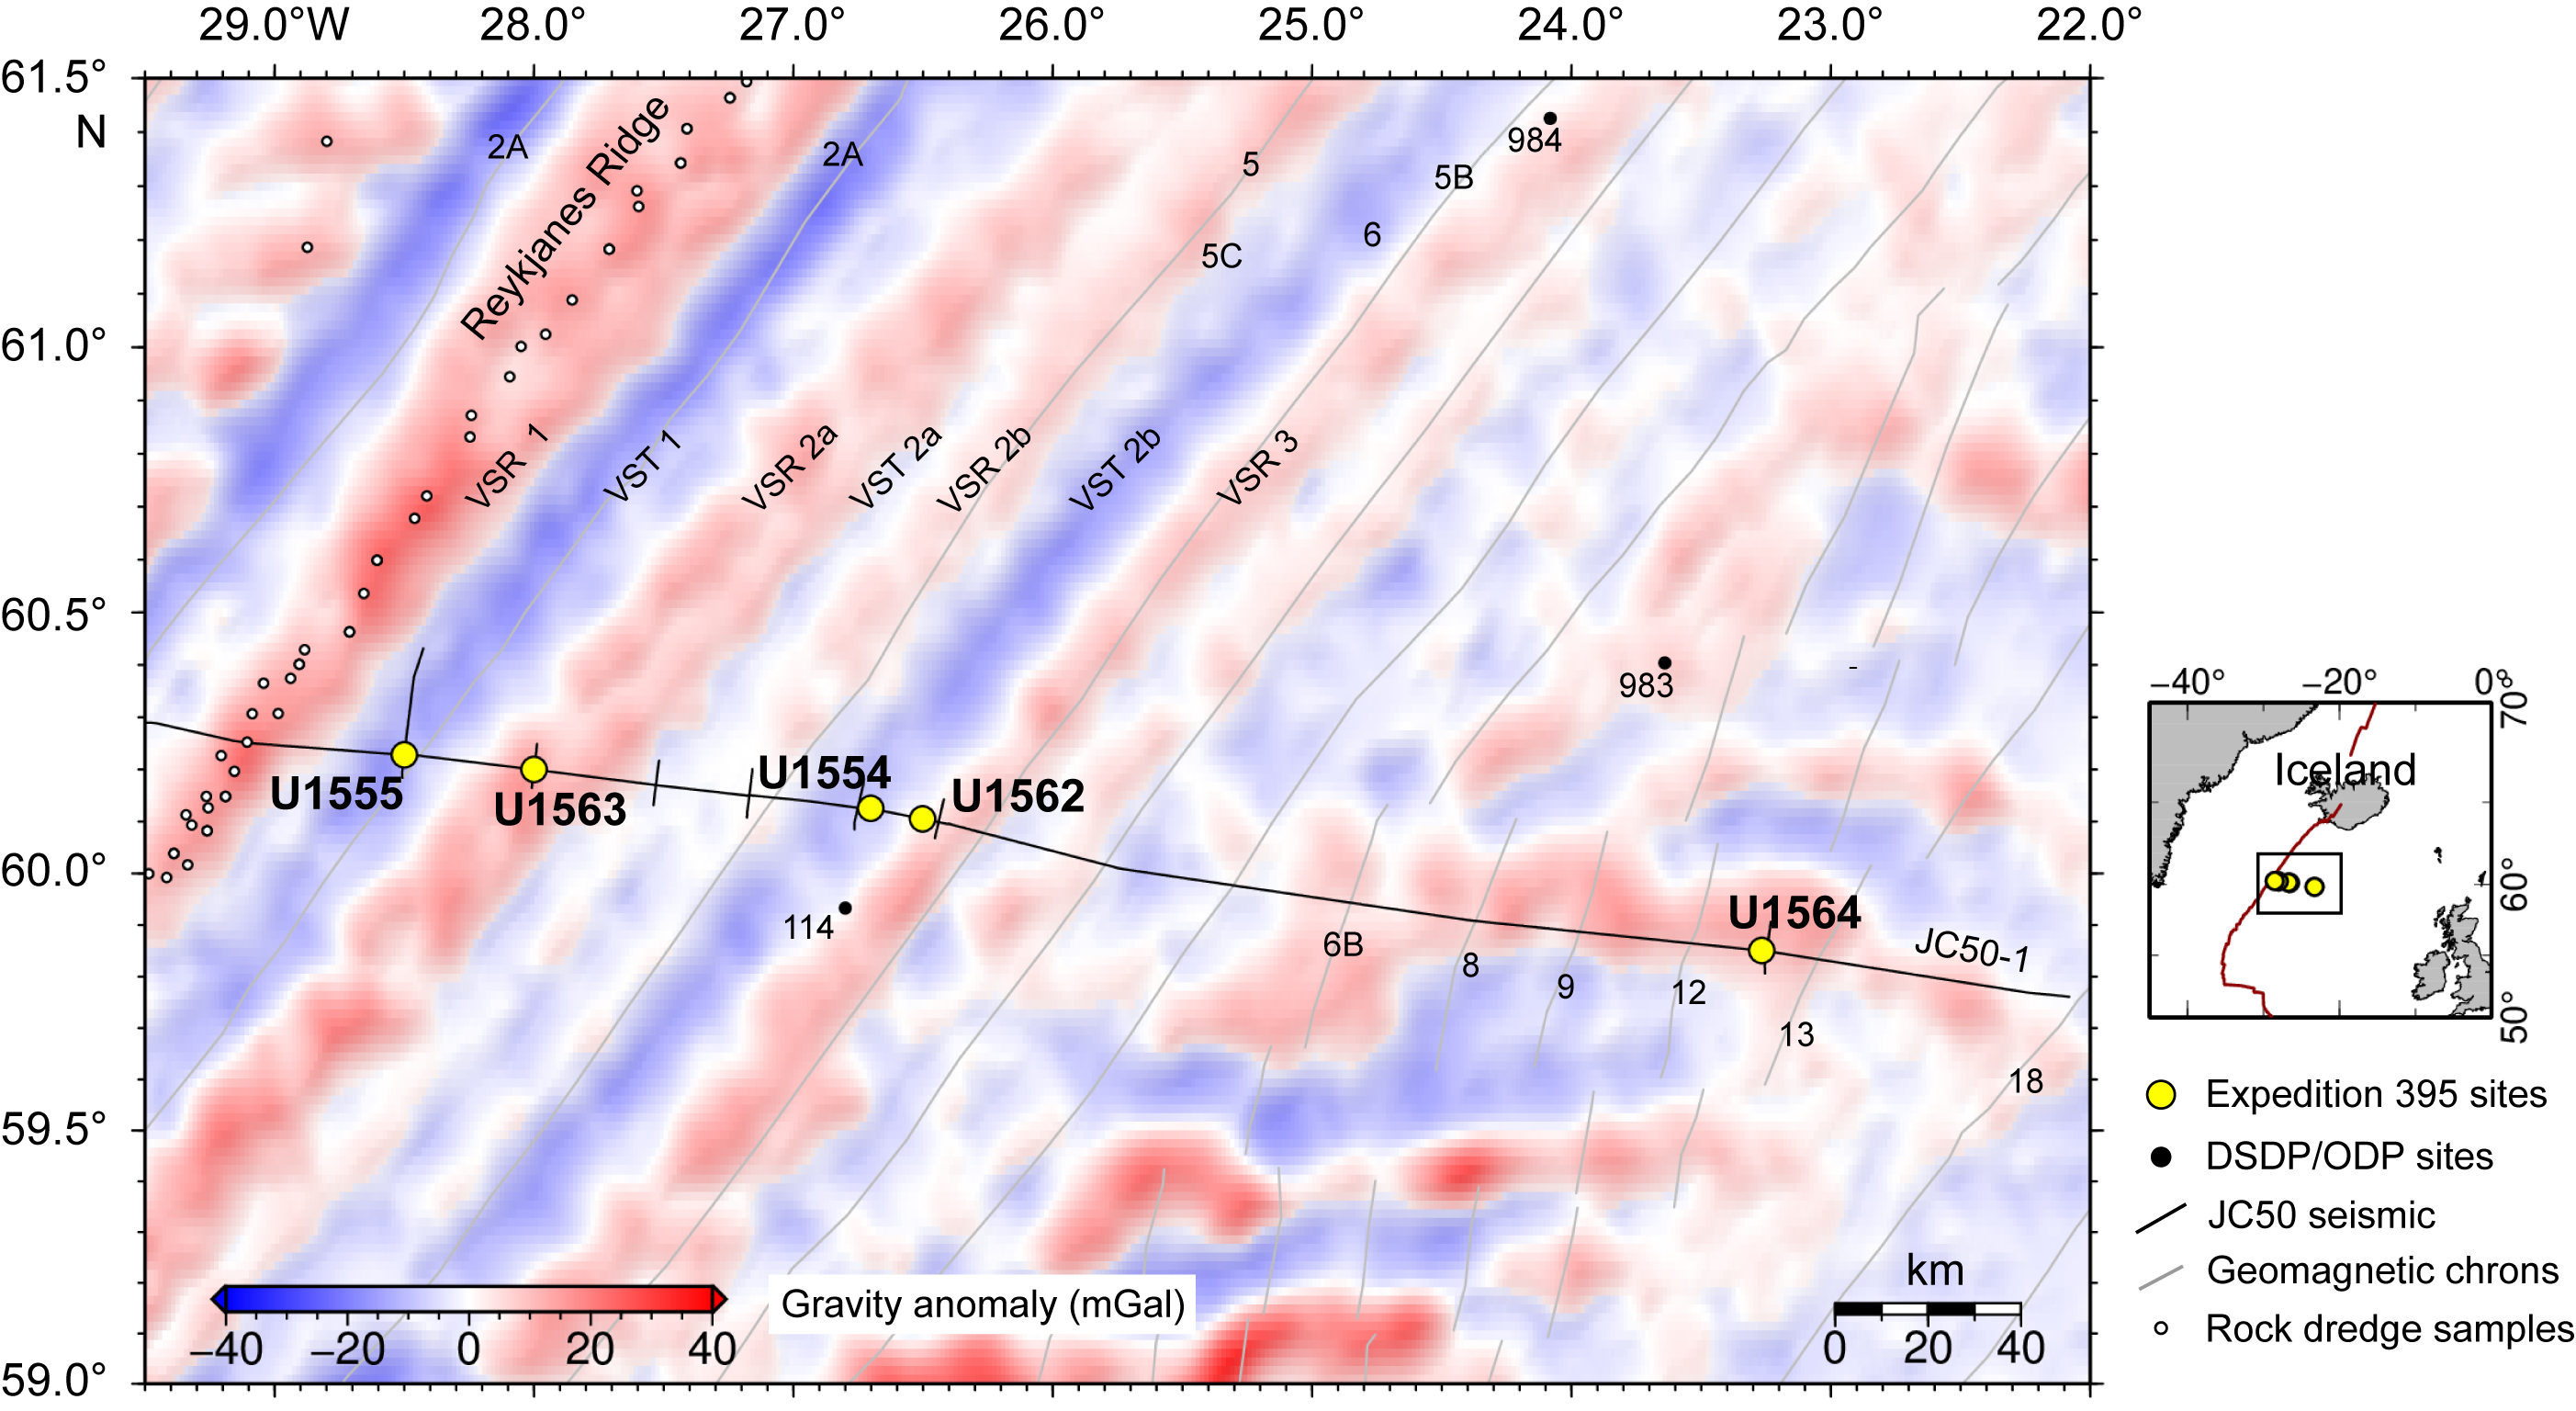
Figure F1. Satellite free-air gravity anomaly map.
In the transect formed by the series of sites on the eastern flank of the Reykjanes Ridge along a plate tectonic flowline, Site U1555 is the closest to the mid-ocean ridge (~36 km west of the site). The expected age of the crust at this site is ~2.8 Ma based on satellite and regional aeromagnetic data. It is located in VST 1, defined by a free-air gravity anomaly low (Figure F1). Site U1555 is located at the intersection of Seismic Lines JC50-1 and JC50-C7 (Common Midpoints [CMPs] 57881 and 3720, respectively) (Figures F2, F3), obtained in 2010 during RRS James Cook Cruise JC50 (Parnell-Turner et al., 2017). Site U1555 sits on an area of relatively smooth seafloor between two abyssal hills, where the basement is draped with a layer of acoustically continuous sediments (Figures F2, F3). Sediment thickness at Site U1555 was expected to be ~210 m (2.318 s two-way traveltime [TWT]) based on seismic imagery. The two main objectives for this site were (1) to obtain the composition of basalts associated with VST 1 and (2) to evaluate the degree of alteration of relatively young crust along a plate-spreading flowline transect. The aim is to compare the composition of the basalts at Site U1555 with those at the other sites, in particular the basalts recovered at Site U1563 located on VSR 2a to the east and those dredged at the present-day VSR 1 tip located at the axis just to the west (Murton et al., 2002) (Figure F1). Because this site represents the youngest crust to be cored during Expeditions 384, 395C, and 395, the basalts cored at Site U1555 represent an end-member for the off-axis evolution of basalt alteration.
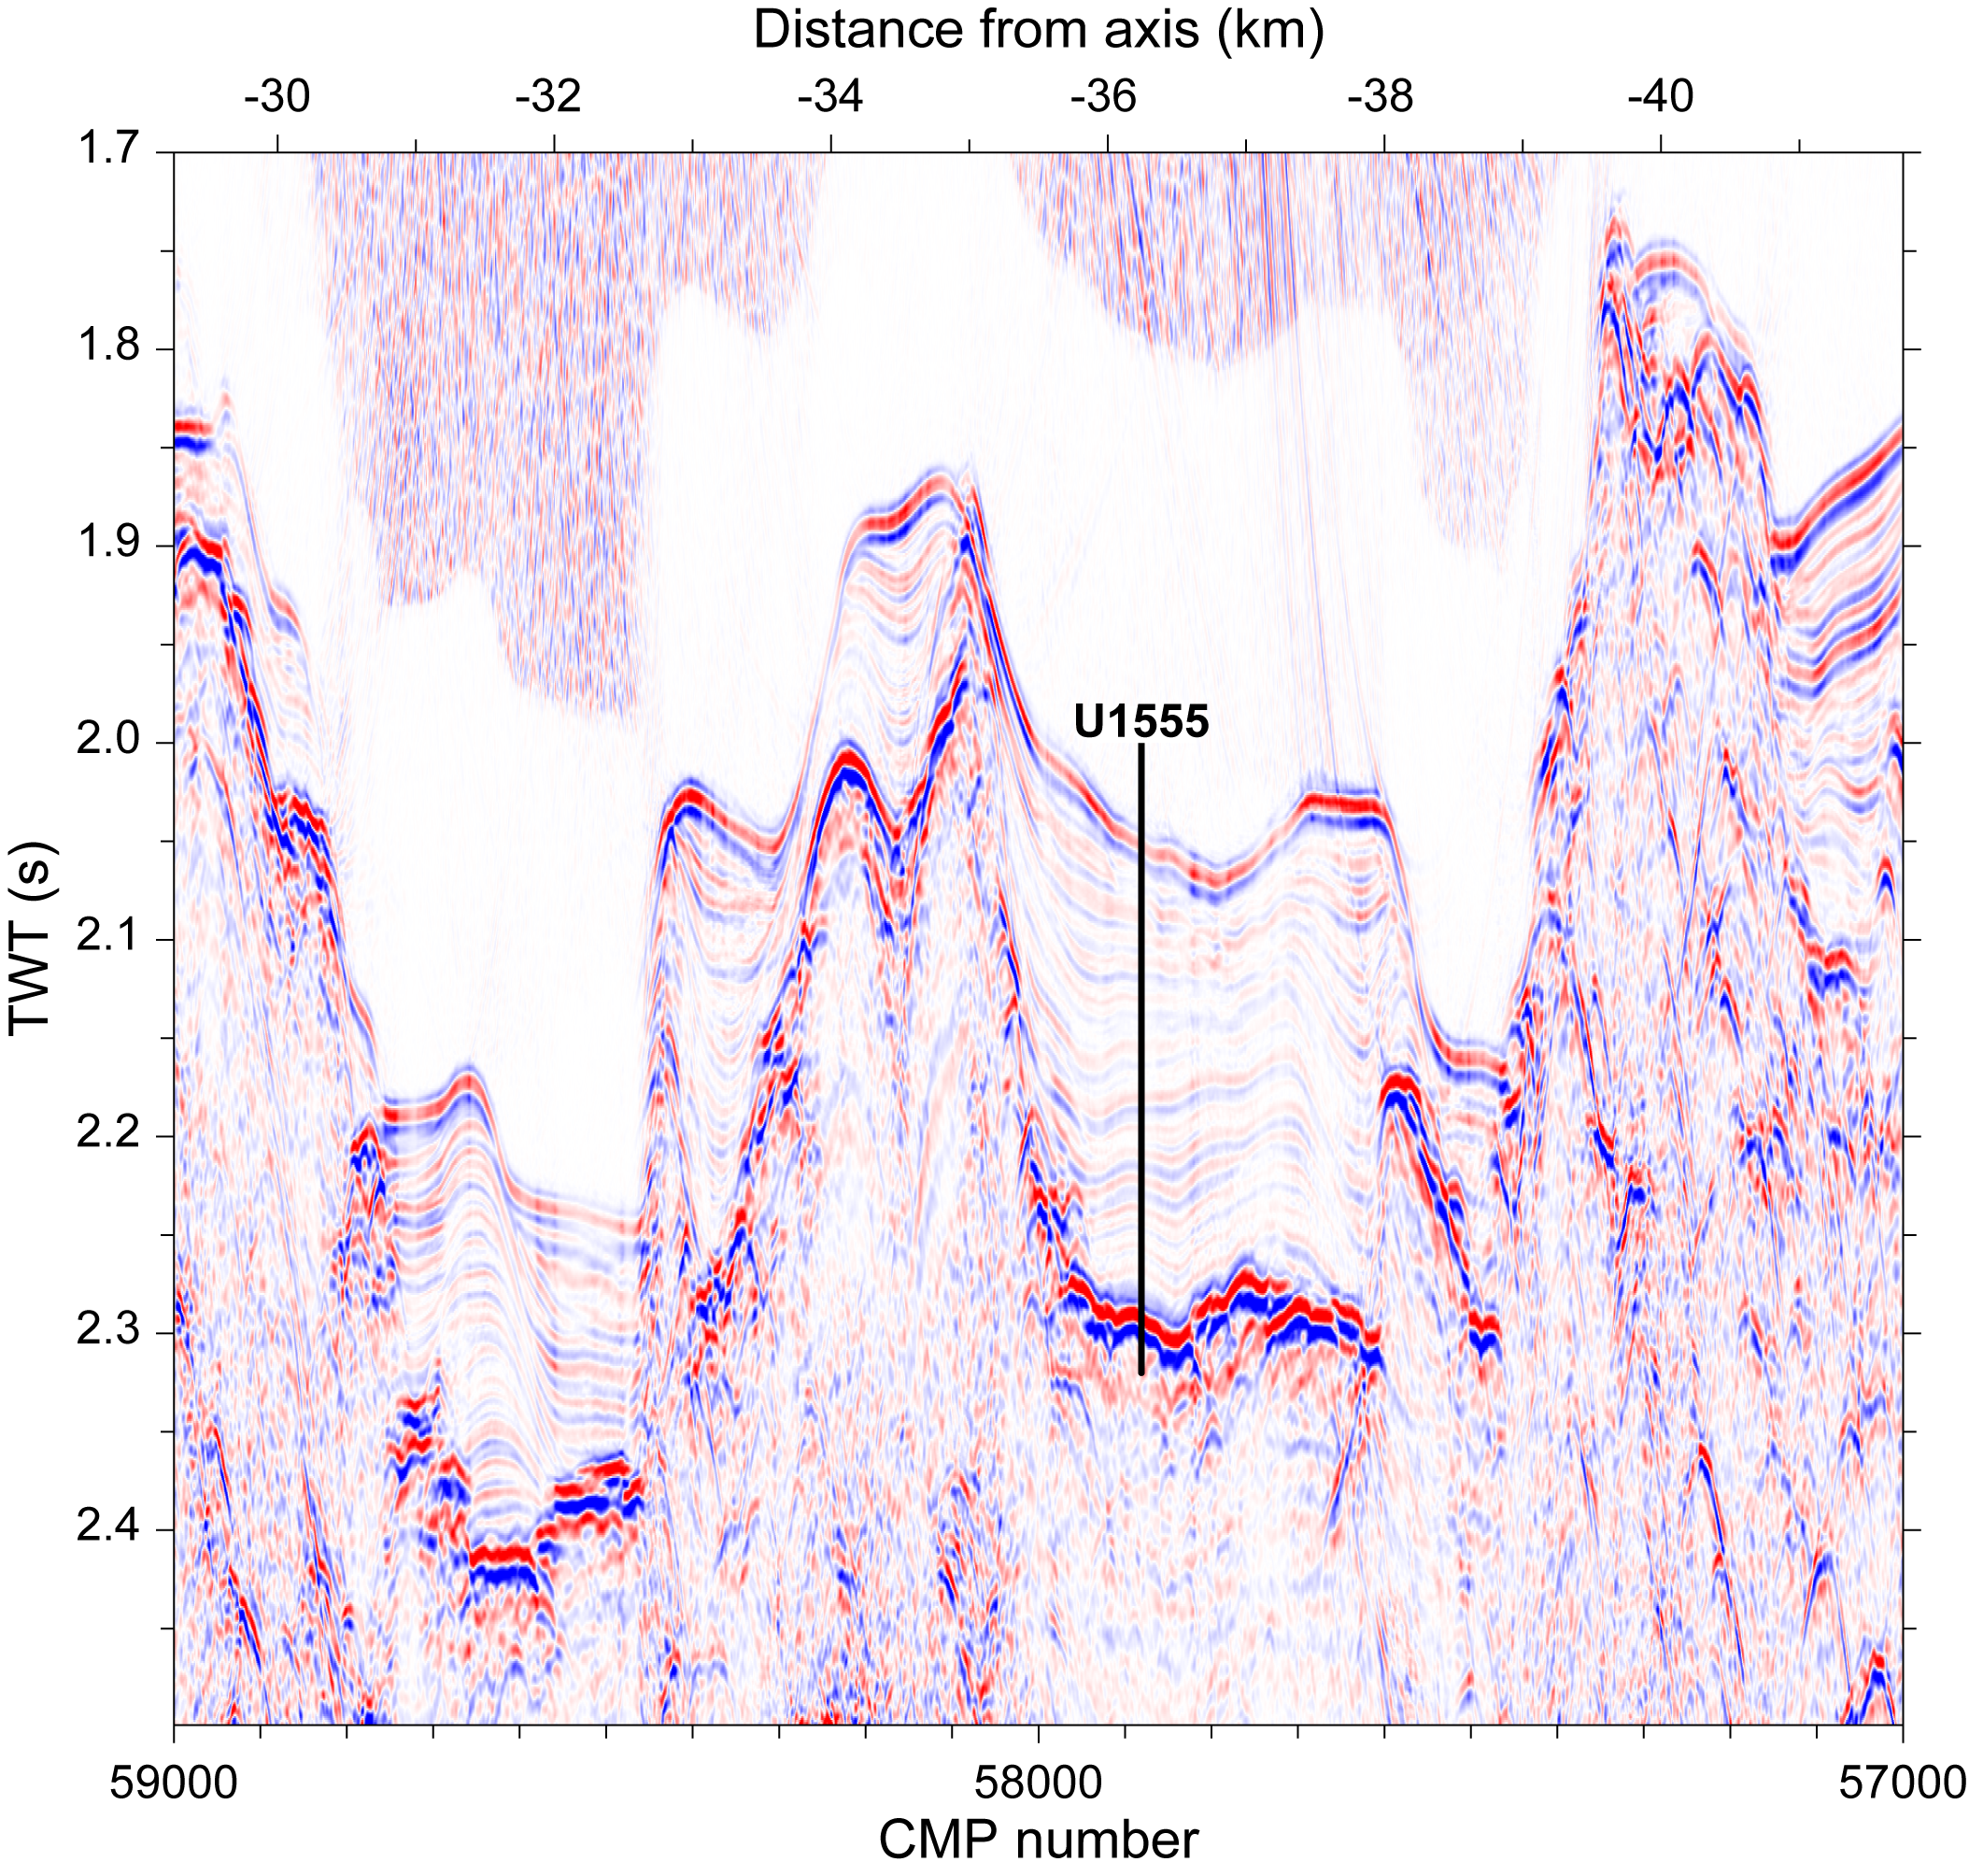
Figure F2. Seismic Profile JC50-1.
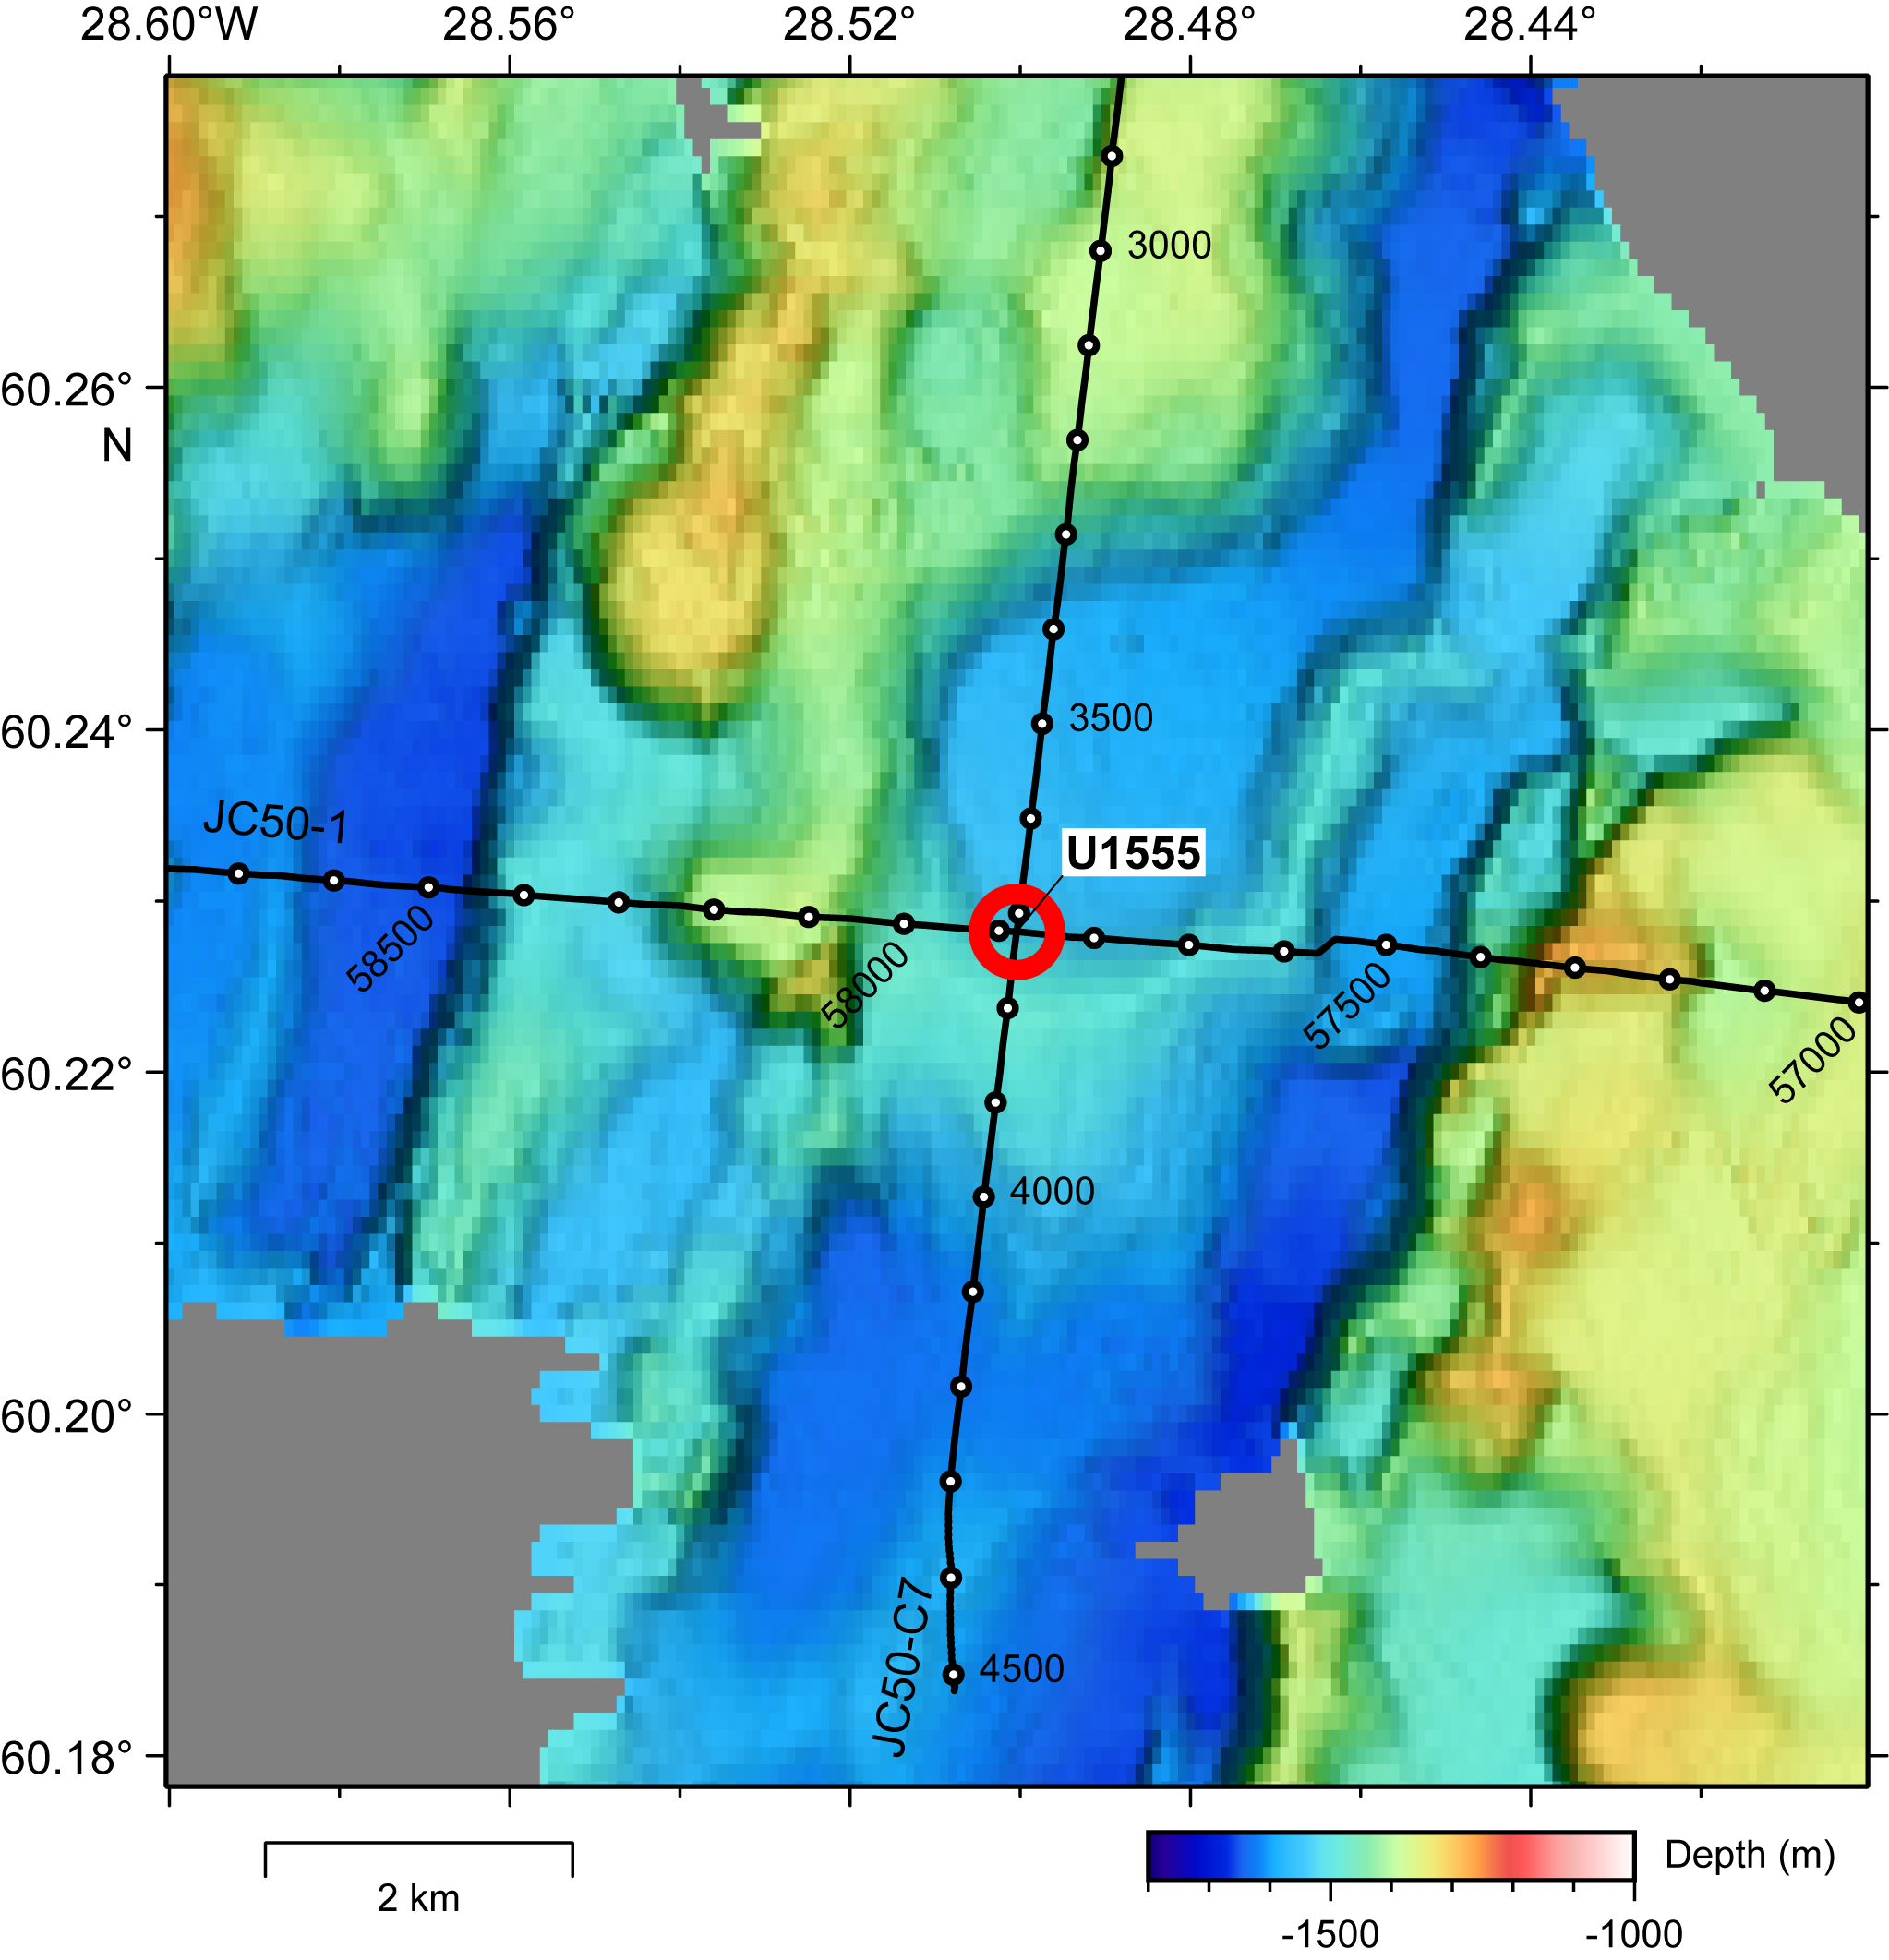
Figure F3. Bathymetric map.
2. Operations
Site U1555 (60°13.6908′N, 28°30.0240′W) consists of nine holes drilled during Expeditions 384 and 395C. Holes U1555A–U1555E were drilled as part of the Expedition 384 engineering tests in August 2020. The goal of this expedition was to test a variety of drilling and coring bits to improve future operations in igneous ocean crust. For detailed information about operations in these holes, see Blum et al. (2020). Holes U1555F–U1555I were cored and logged in support of the Expedition 395 science objectives during Expeditions 384 and 395C. The hole depths range 177.5–376.5 m drilling depth below seafloor (DSF) (Table T1). Overall, 94 cores were recovered at the site (Table T1).
A total of 352.89 m of core over a 546.2 m interval were recovered for the site (65% recovery) (Table T1). The advanced piston corer (APC) system was used to core a 166.88 m interval with 166.58 m of core recovered (100% recovery). The extended core barrel (XCB) system was deployed over a 12.7 m interval and recovered 13.48 m of core (106% recovery). The rotary core barrel (RCB) system was deployed over a 368.7 m interval with 188.8 m of core recovered (51% recovery). Downhole wireline logging operations were undertaken in Holes U1555G and U1555I.
The total time spent on Holes U1555F–U1555I was 18.9 days (Table T1).
2.1. Expedition 384
2.1.1. Hole U1555F
Hole U1555F (60°13.6861′N, 28°30.0207′W) was spudded at 2200 h UTC on 9 August 2020. Coring used a 9⅞ inch RCB polycrystalline diamond compact coring bit (Blum et al., 2020). Core 1R captured the sediment/water interface at the seafloor and recovered 2.5 m of sediment. Based on the recovery, the seafloor depth was calculated at 1523.5 meters below sea level (mbsl).
Hole U1555F was drilled ahead without recovery until basement was tagged at 176.3 m DSF at 0415 h on 10 August. RCB coring advanced to 184.3 m DSF and was terminated after recovering Core 9R. The rate of penetration was extremely low (less than 0.4 m/h), resulting in an advancement of 8.1 m over ~26 h. The total basement recovery for the hole was 5.81 m (72%).
The drill pipe was pulled from the hole with the bit clearing the seafloor at 0700 h and the rig floor at 0935 h on 11 August, ending Hole U1555F.
2.1.2. Hole U1555G
Following operations in Hole U1555F, the vessel was offset ~20 m east. Hole U1555G (60°13.6849′N, 28°29.9997′W) was spudded at 1620 h on 11 August 2020 using a standard C-7 RCB bit. Hole U1555G was drilled without coring to 168.6 m DSF. Core 2R advanced from 168.6 to 178.3 m DSF across the sediment/basement interface, and 0.66 m of basalt was recovered. Cores 3R–27R were recovered to 309.5 m DSF, 133.3 m into the basement. In total, 60.3 m of core was recovered over a 140.9 m section (43% recovery).
Following coring operations, the hole was displaced with 50 bbl of heavy mud. The drill bit was released at the bottom of the hole, and the drill string was pulled up to 202.4 m DSF, approximately 25 m into the basement section. The triple combination (triple combo) tool string was made up and deployed for two passes of the borehole. The base of the tool string reached 305.4 m DSF. Following the passes, the tool string was pulled from the hole and laid out at 1000 h on 15 August. The Formation MicroScanner (FMS)-sonic tool string was assembled and run in the hole for two logging passes, reaching a maximum depth of 295.4 m DSF. The tools were pulled out of the hole at 1540 h. The final logging tool string, the Versatile Seismic Imager (VSI), was made up, and the protected species observation protocols were initiated. An initial sighting of whales at 1610 h delayed the start of the air guns by 1 h. The air guns were ramped up, and the VSI was deployed to two stations at 235 and 300 m DSF. The tool string was pulled from the hole at 2130 h.
Hole U1555G was again displaced with heavy mud, and the drill string was pulled up to 85.4 m DSF to allow for the downhole logging of the sedimentary section and the sediment/basement interface. The triple combo tool was made up and run to ~1500 mbsl. At 0500 h on 16 August, a motor bearing on the logging winch failed and the deployment of the tools was immediately stopped. The logging winch line and triple combo were pulled from the drill pipe using T-bars and the coring winch line. The triple combo tool string reached the rig floor at 1415 h. The ~1500 m of logging line was removed from the winch, and the drill pipe was pulled from the hole. The end of the BHA reached the rotary table at 2300 h, ending Hole U1555G.
After nearly a day of inspection, the electric drive motor on the logging winch was deemed not repairable, requiring the termination of the remaining operations of Expedition 384. The thrusters were raised, and the ship began the sea passage to Kristiansand, Norway, at 0812 h on 18 August.
2.2. Expedition 395C
2.2.1. Transit to Site U1555
On 11 June 2021, the pilot boarded the ship at 0852 h in Reykjavik, Iceland. After some difficulties with the mooring lines, the ship left the dock with the last line away at 0948 h. At 1000 h, the pilot departed, and the ship began the 312 nmi transit to Site U1555. The ship averaged 11.6 kt and arrived at Site U1555 at 1225 h on 12 June. The thrusters were lowered, and the vessel switched to dynamic positioning (DP) mode, beginning Hole U1555H at 1300 h.
2.2.2. Hole U1555H
Hole U1555H (60°13.6924′N, 28°30.0240′W) was positioned 12 m northwest of Hole U1555F. The crew began to assemble the drill collars until the weather deteriorated with winds blowing up to 40 kt. From 1645 to 2045 h on 12 June 2021, the vessel was waiting on weather. After the wind subsided, the crew continued to assemble the drill collars and made up the drill bit. The drill string was advanced to 1518.6 mbsl and positioned to fire the first piston core to establish the seafloor depth.
Coring in Hole U1555H was initiated at 0650 h on 13 June. Core 1H recovered a good mudline with 5 m of sediment, placing the seafloor depth at 1523.6 mbsl. Cores 1H–10H were cored to 90.5 m DSF. Following Core 10H, 150 m of the core winch line was cut to remove damaged portions. Coring continued with Cores 11H–15H to 138 m DSF. The core winch line was again damaged when it got stuck in the oil saver sub on the top drive. After removing, cutting, and reheading the line, coring continued with Cores 16H–18H (138–166.5 m DSF). The XCB system was deployed for the remaining cores. Core 19X was advanced 6 m to ensure that Core 20X would drill through the sediment/basement interface, which was encountered at 176.5 m DSF. The final depth of Hole U1555H was 177.5 m DSF. The crew began tripping pipe, and the bit cleared the seafloor at 1525 h on 14 June. At 2000 h, the bit cleared the rotary table, ending Hole U1555H.
All APC cores were collected using nonmagnetic core barrels and oriented using the Icefield MI-5 core orientation tool. Formation temperature measurements were collected on Cores 395C-U1555H-4H, 7H, 10H, and 13H using the advanced piston corer temperature (APCT-3) tool. A partial core stroke was recorded on Core 16H.
A total of 180.06 m of core was recovered from Hole U1555H with 101% recovery. The APC system collected 18 cores over a 166.5 m interval with 166.58 m recovered (100%). Two cores were taken using the XCB system over a 11.0 m interval with 13.48 m recovered (123%).
2.2.3. Hole U1555I
The ship was offset 24 m east-southeast of Hole U1555H (9 m north of Hole U1555G) for operations in Hole U1555I. As the crew worked to assemble the drill string and the RCB BHA, the weather deteriorated, and at 0315 h on 15 June 2021 operations ceased and the vessel began waiting on weather. Winds picked up to over 30 kt with waves up to 5.5 m over the course of the day. After 30 h, operations resumed at 0900 h on 16 June.
Hole U1555I (60°13.6897′N, 28°29.9984′W) was spudded at 1000 h on 16 June and drilled without core recovery to 159.3 m DSF. The water depth for Hole U1555I was 1523.6 mbsl. The RCB system was used to cut all cores from Hole U1555I. Cores 2R and 3R were collected from 159.3 to 178.7 m DSF (77% sediment recovery), and the sediment/basement interface was encountered at 176.5 m DSF. Cores 4R–6R (178.7–207.8 m DSF) were cut from the basement using 9.7 m coring advances. Beginning with Core 7R, the drill string was advanced ~5 m for each core to prevent the core from jamming inside the barrel. Mud sweeps were performed following Core 8R because hole conditions had deteriorated. Coring continued with Cores 9R–26R (227.2–304.8 m DSF). After cutting Core 26R, the drill bit reached 49 rotating hours and the decision was made to change the bit.
At 0320 h on 20 June, a free-fall funnel was deployed to allow for reentry into the hole. The subsea camera was deployed to observe the placement of the funnel and to ensure that the pipe did not move it out of position when the bit exited the hole. The Conductivity-Temperature-Depth (CTD) tool was deployed on the subsea camera frame to collect temperature, pressure, and conductivity measurements of the seawater. The bit cleared the seafloor at 0450 h, the subsea camera was retrieved, and the bit cleared the rotary table at 0930 h. After changing the drill bit, the drill string was reassembled and the subsea camera was deployed for the reentry of Hole U1555I. The free-fall funnel remained in position, and the bit reentered Hole U1555I at 1605 h. After recovering the subsea camera, the center bit was dropped and the drill string advanced to 304.8 m DSF. Mud sweeps were used to clean the hole of debris.
Cores 395C-U1555I-27R through 41R were cut from 304.8 to 376.5 m DSF, and 30.9 m of basalt was recovered (43%). Core recovery significantly decreased in Cores 38R–40R (358.3–372.7 m DSF) with only 10% of the basalt section retrieved. After reaching 376.5 m DSF, or 200 m into the basement, coring concluded in Hole U1555I on 22 June.
A total of 40 RCB cores were recovered from Hole U1555I with 48% core recovery (sediment recovery = 77%; basalt recovery = 45%). Cores were collected over a 217.2 m long interval, and 104.19 m of core was recovered.
Following coring operations, the borehole was prepped for downhole wireline logging operations. A high-viscosity mud sweep was used to clean the hole of debris. The drill bit was dropped at the bottom of the hole, and the drill pipe was brought up to 75.6 m DSF. The triple combo logging tool string was assembled and deployed at 1720 h on 22 June. The tool descended to the bottom of the hole and began making its first pass up the hole. At 1755 h, the triple combo became stuck. After several attempts to pull the tools free using the Schlumberger logging line winch, the decision was made to lower the drill pipe over the tools to clear the obstruction. The drill pipe was lowered, and the top of the triple combo was encountered at 183.5 m DSF, ~7 m below the sediment/basement interface. The obstruction in the hole was at 225.5 m DSF. The drill pipe was lowered until the obstruction was pushed past the base of the tool string. At 1015 h on 23 June, the tool string was free and the rig floor crew began pulling the tools up using the core winch line. At 1400 h, the tools were at the rig floor and disassembled, and the drill pipe was pulled from the hole. At 1700 h, the pipe cleared the seafloor, and at 2015 h it cleared the rotary table. The vessel was secured for transit, and the thrusters were raised at 2036 h, ending Hole U1555I and Site U1555.
3. Lithostratigraphy
The sediments at Site U1555 are primarily composed of silty clay or clayey silt. Sediments recovered from Hole 395C-U1555H include the complete sequence from seafloor to basement; however, Hole 395C-U1555I recovered only the lowermost sediments (166.83–174.82 m core depth below seafloor, Method A [CSF-A]) above the sediment/basement interface. One unit is observed at this site (Unit I) and is divided into two subunits (Table T2). Unit and subunit divisions were made based on (1) visual core description, (2) natural gamma radiation (NGR), (3) magnetic susceptibility (MS) measurements, (4) smear slide examination, and (5) bulk calcium carbonate (CaCO3) measurements. CaCO3 measurements are spaced approximately one per core (~10 m) and thus are a partial representation of carbonate variability downhole. Unit division and corresponding physical properties data are shown in Figure F4.

Figure F4. Lithostratigraphic summary.
3.1. Lithostratigraphic Unit I
- Intervals: 395C-U1555H-1H-1, 0 cm, to 20X-CC, 12 cm; 395C-U1555I-2R-1, 0 cm, to 3R-CC, 6 cm
- Depths: Hole U1555H = 0–178.86 m CSF-A; Hole U1555I = 166.83–174.82 m CSF-A
- Thickness: Hole U1555H = 178.86 m; Hole U1555I = 7.99 m
- Age: Holocene to Pliocene
- Lithology: silty clay or clayey silt, silty clay or clayey silt with biogenics
Unit I includes predominantly grayish brown, olive gray, and dark grayish brown silty clay or clayey silt (Table T2). Both carbonate (foraminifers [trace] and nannofossils [common]) and biosilica (sponge spicules, radiolarians, and diatoms [all trace]) are present throughout. The terrigenous components are predominantly quartz and feldspar with smaller amounts of glass, oxides, and glauconite. Gravel (2 mm to 2 cm) is observed sparsely throughout Hole U1555H. Clasts (>2 cm) are observed in Hole U1555H in both subunits (Table T3); these are described in further detail below, and an example is shown in Figure F5A. Bioturbation in most core sections is absent to sparse, although moderate to abundant bioturbation is observed in some sections when there are changes in color and/or lithology. Graded beds, sharp boundaries, especially color boundaries (Figure F5B) and laminations are present but rare, as are gray and olive green layers. Gradational color changes are common (Figure F5C). Core disturbances are primarily slight to moderate and usually confined to the upper and lower sections of each core. Severe biscuiting is observed in the lowermost cores (19X and 20X) (Figure F5D). Although sediments recovered at Site U1555 have fairly uniform composition and color, Unit I was divided based on patterns in NGR and MS, which display a marked change in wavelength at 62 m CSF-A (Figure F4).
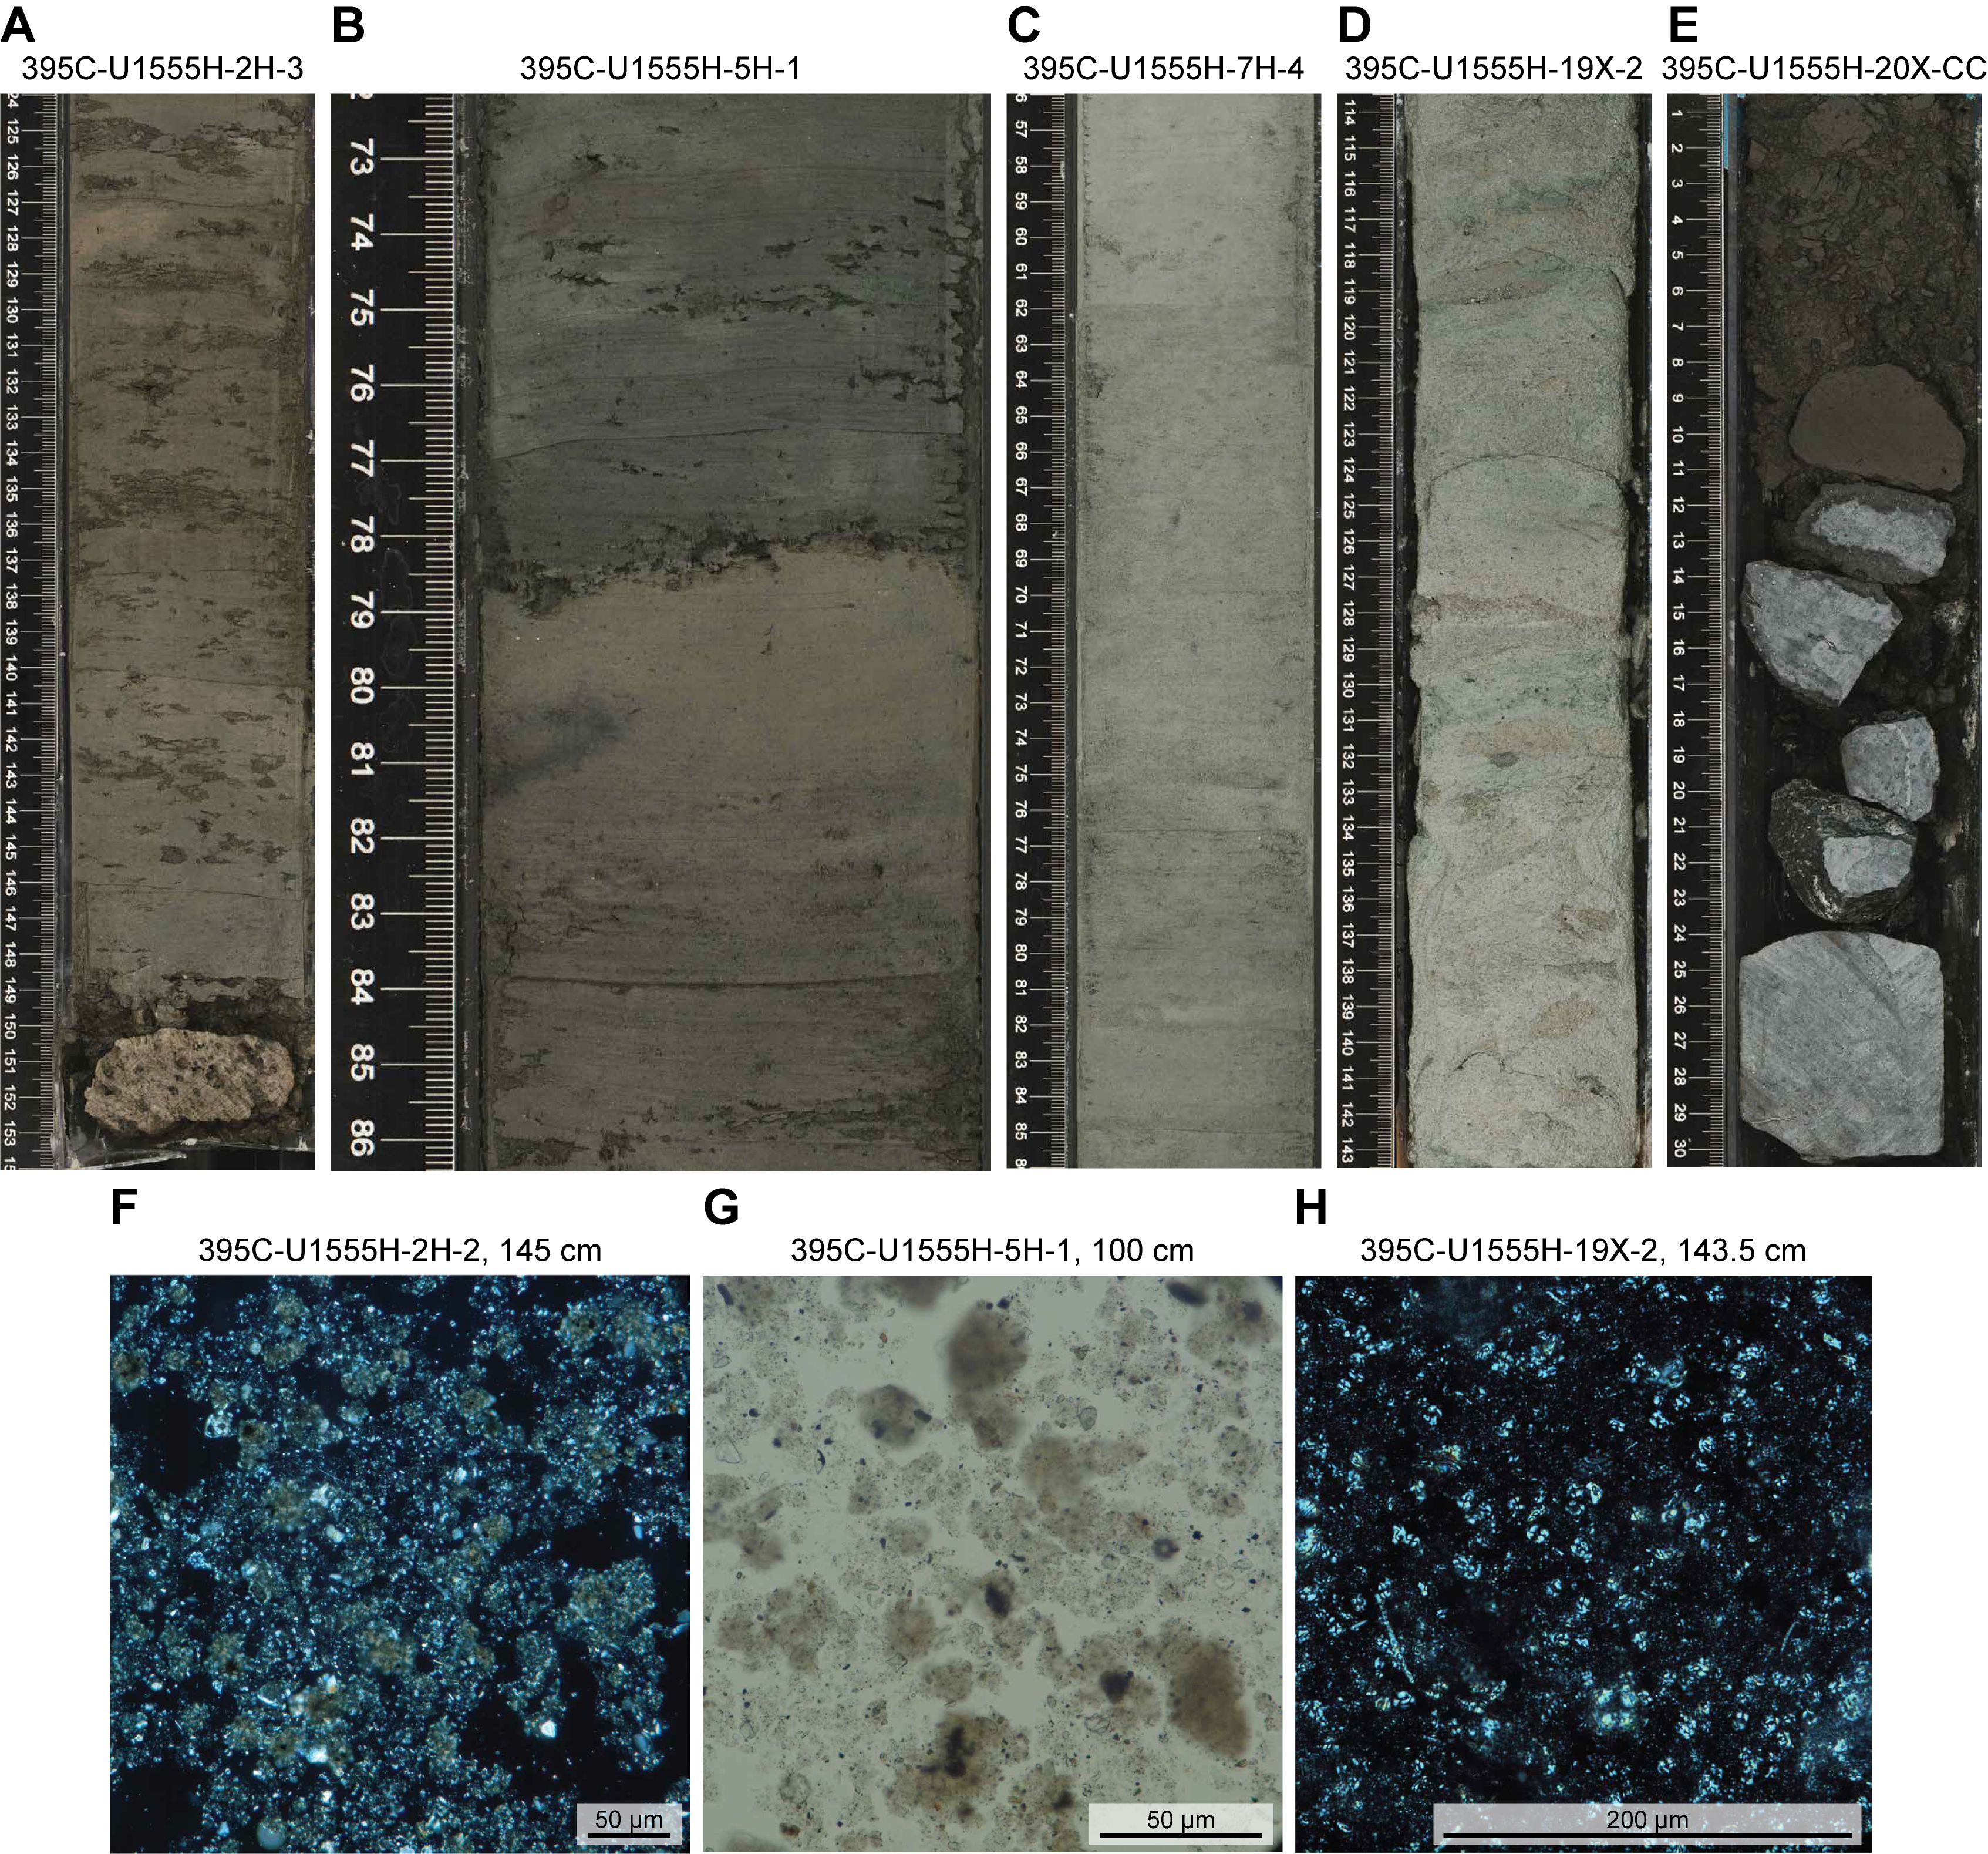
Figure F5. Sedimentary texture and features.
3.1.1. Lithostratigraphic Subunit IA
- Interval: 395C-U1555H-1H-1, 0 cm, to 8H-1, 0 cm
- Depth: 0–62.00 m CSF-A
- Thickness: 62.00 m
- Age: Holocene to middle Pleistocene
- Lithology: silty clay or clayey silt
Subunit IA is composed of primarily light brownish gray, grayish brown, and dark grayish brown silty clay or clayey silt. The measured CaCO3 weight percentage ranges from near zero at the base of the subunit (Section 395C-U1555H-7H-2, 55 cm) to nearly 17 wt% near the top (Section 2H-2, 8 cm). Small clasts (<2 cm) are observed, albeit rarely, throughout this subunit. Clasts >2 cm (n = 6) are also observed (Table T3). Sharp color contacts are present in the uppermost 6 m and rarely thereafter (Core 1H at 0.8, 1, 2.9, 3.9, 4.2, 4.3, and 4.8 m CSF-A). Mottling is common. Graded beds (a few cm to ~10 cm thick) are observed across Cores 1H–4H at 2.7, 2.8, and 4.7 m CSF-A, with gravel at the base of some beds. There is a sharp color contact in Section 5H-1, 79 cm (34.3 m CSF-A) (Figure F5B). Immediately above this contact, the sediments contain fine gravel, suggesting an erosive environment. The sediment immediately below the contact is lighter and slightly brownish in color. NGR is characterized by higher frequency variability in this subunit compared to Subunit IB.
3.1.2. Lithostratigraphic Subunit IB
- Intervals: 395C-U1555H-8H-1, 0 cm, to 20X-CC, 12 cm; 395C-U1555I-2R-1, 0 cm, to 3R-CC, 6 cm
- Depths: Hole U1555H = 62.00–178.86 m CSF-A; Hole U1555I = 166.83–174.82 m CSF-A
- Thickness: Hole U1555H = 116.86 m; Hole U1555I = 7.99 m
- Age: middle Pleistocene to Pliocene
- Lithology: silty clay or clayey silt with biogenics
Subunit IB is composed of primarily olive gray, dark grayish brown, and grayish brown silty clay or clayey silt with biogenics. NGR is characterized by lower amplitude and longer wavelength cyclicity compared to Subunit IA, consistent with the change in sedimentation rate inferred from the age model close to the top of this subunit (Figure F47). Biogenic grains (nannofossils, foraminifers, and biosiliceous fossils) are slightly more abundant in Subunit IB compared to Subunit IA. CaCO3 concentration is relatively low throughout this subunit, ranging 0–22 wt%. An anomalous CaCO3 peak of 53 wt% is observed toward the bottom of this subunit (Sample 395C-U1555H-19X-2, 145 cm; 169.45 m CSF-A) (Figure F5) at ~7m above the sediment/basement interface, which corresponds to a light olive gray interval that bears significantly more carbonate, primarily nannofossils, than the surrounding sediments. Color bands are observed in Core 17H at several intervals (e.g., 17H-1, 138 cm, to 17H-2, 87 cm; 17H-4, 0 cm, to 17H-6, 136 cm; and 17H-7, 15–54 cm). This subunit contains two subrounded basalt clasts (Table T3). Gravel and small clasts (2 mm to 2 cm) are observed throughout this subunit, along with larger clasts, especially in Cores 18H and 19X (Table T3). Hole U1555H terminated just below the sediment/basement interface, with approximately 2.65 My old silty clay overlying basalt (Figure F5E).
3.2. XRD results
A subset of squeeze cake residue samples (n = 7) were analyzed using X-ray diffraction (XRD). Results are consistent with smear slide and macroscopic observations (Figure F6; Table T4). Samples show variable mixtures between terrigenous and/or igneous source minerals, including quartz, assorted feldspar and pyroxene, and mica; calcite is also observed, consistent with authigenic pelagic carbonate inputs. XRD samples were not specifically prepared for clay mineral analysis, and peaks with a 2θ of <15° should be treated with caution; however, most samples display peaks in this region, consistent with the presence of clay minerals. Future analysis of the clay mineralogy in these samples could be useful for determining shifts in deposition processes and sediment sources.
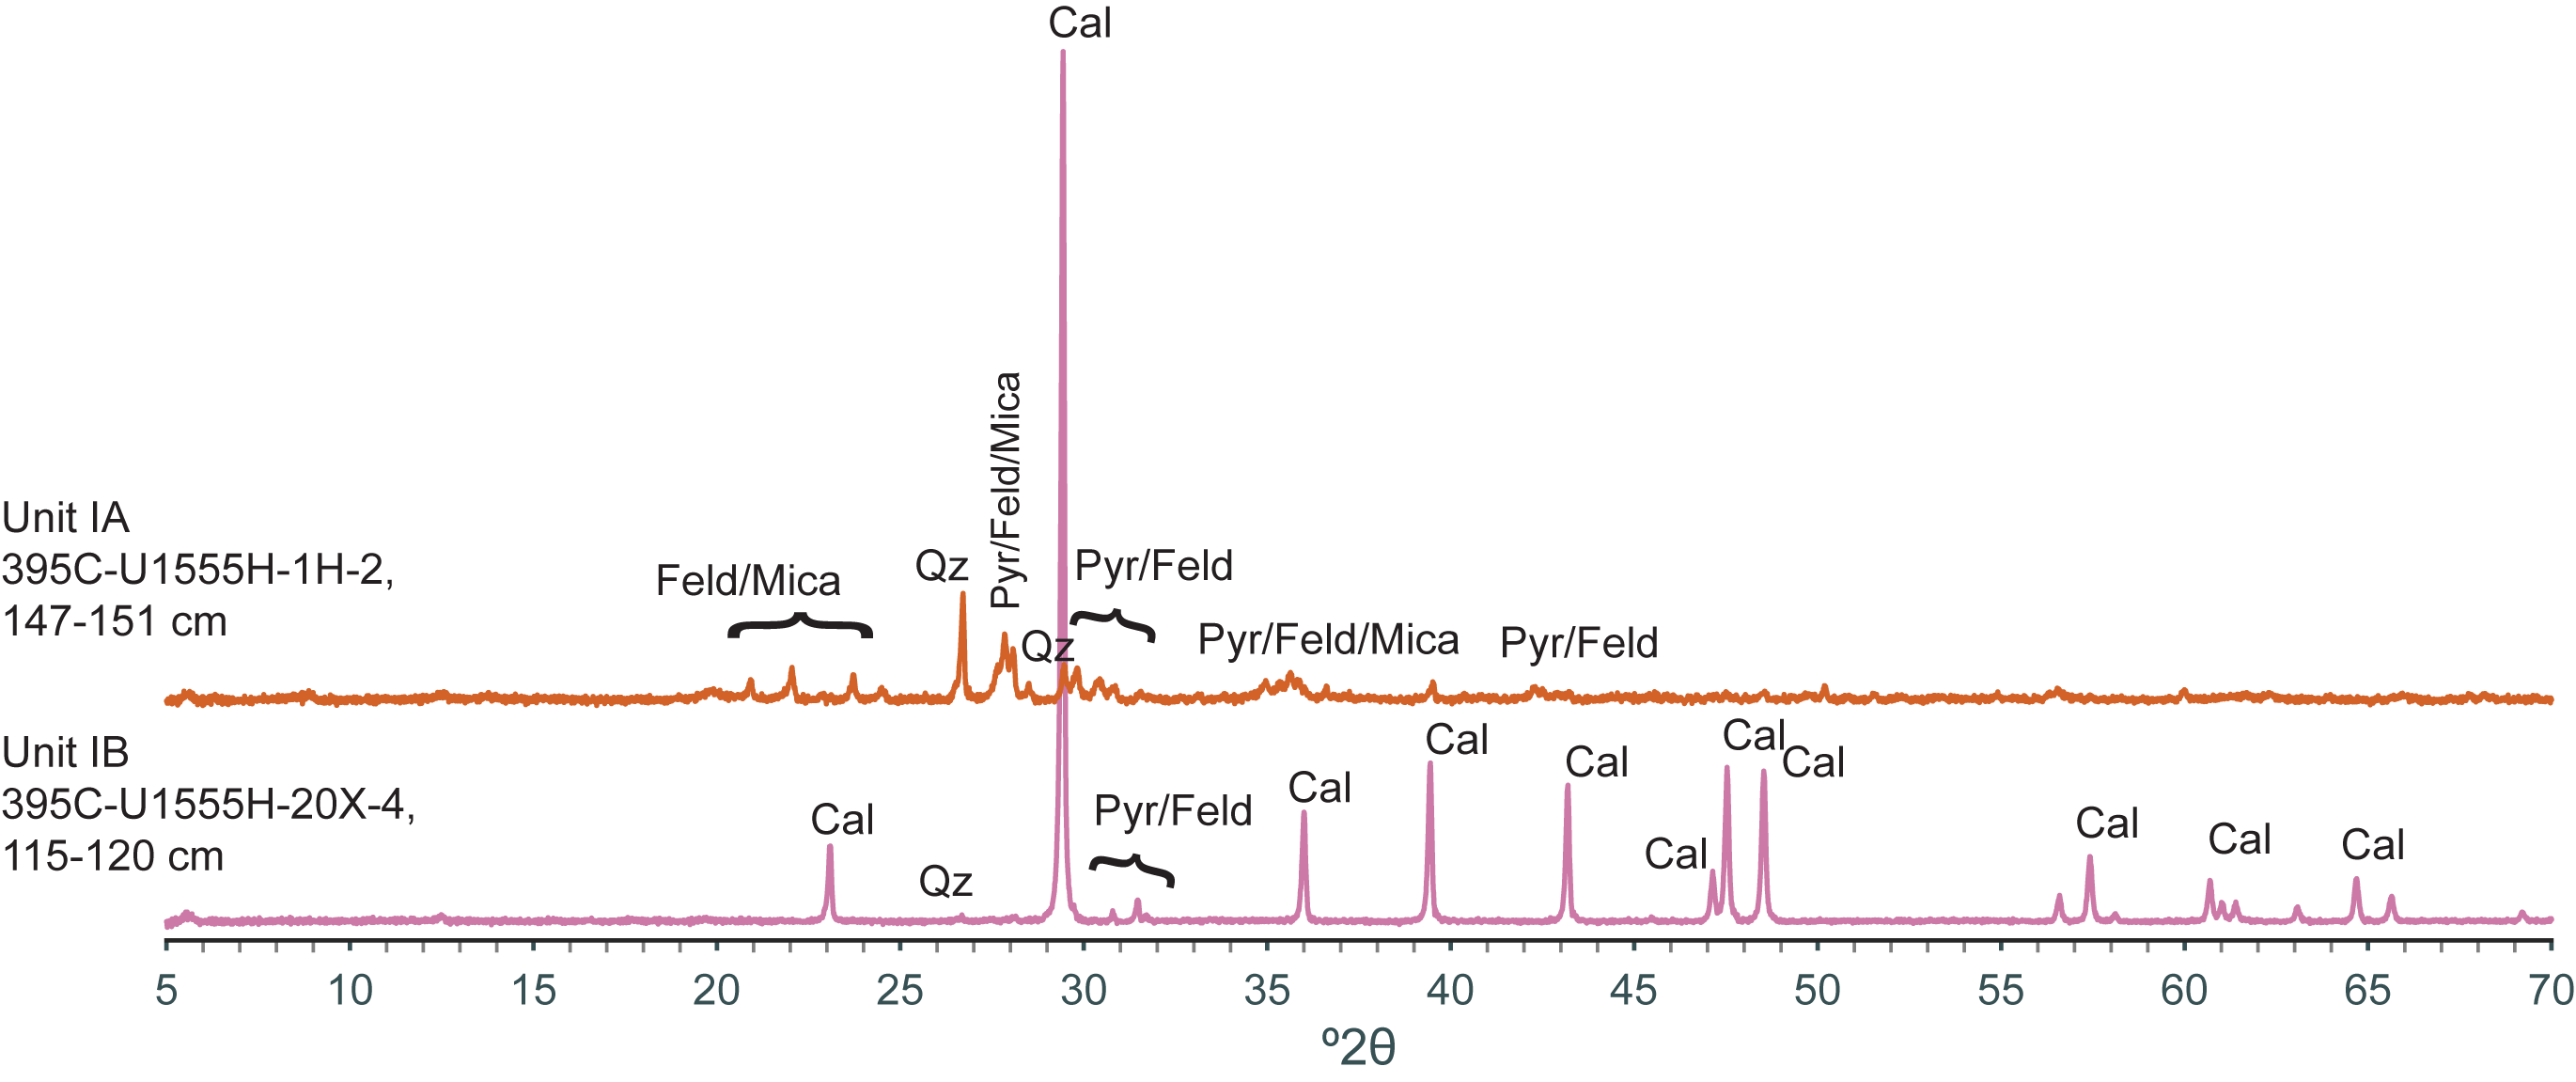
Figure F6. Powder XRD results.
4. Igneous petrology
Site U1555 is located on the youngest crustal VST with an estimated basement age of 2.8 Ma (Figure F7). This site was first cored during Expedition 384 drill bit tests (Blum et al., 2020), resulting in ~75 m of basalt recovery from Holes 384-U1555F and 384-U1555G (Figure F8A). During Expedition 395C, Hole 395C-U1555I cored ~200 m into basement (45% recovery) (Figure F8B). Coring at Hole 395C-U1555H recovered an additional 0.4 m of basalt at the base of the sedimentary sequence. The contact between overlying sedimentary strata and basalt is poorly defined in Holes U1555G and U1555H. In both cases, fine-grained gray mudstone overlies vesicular clasts of moderately fresh basalt.
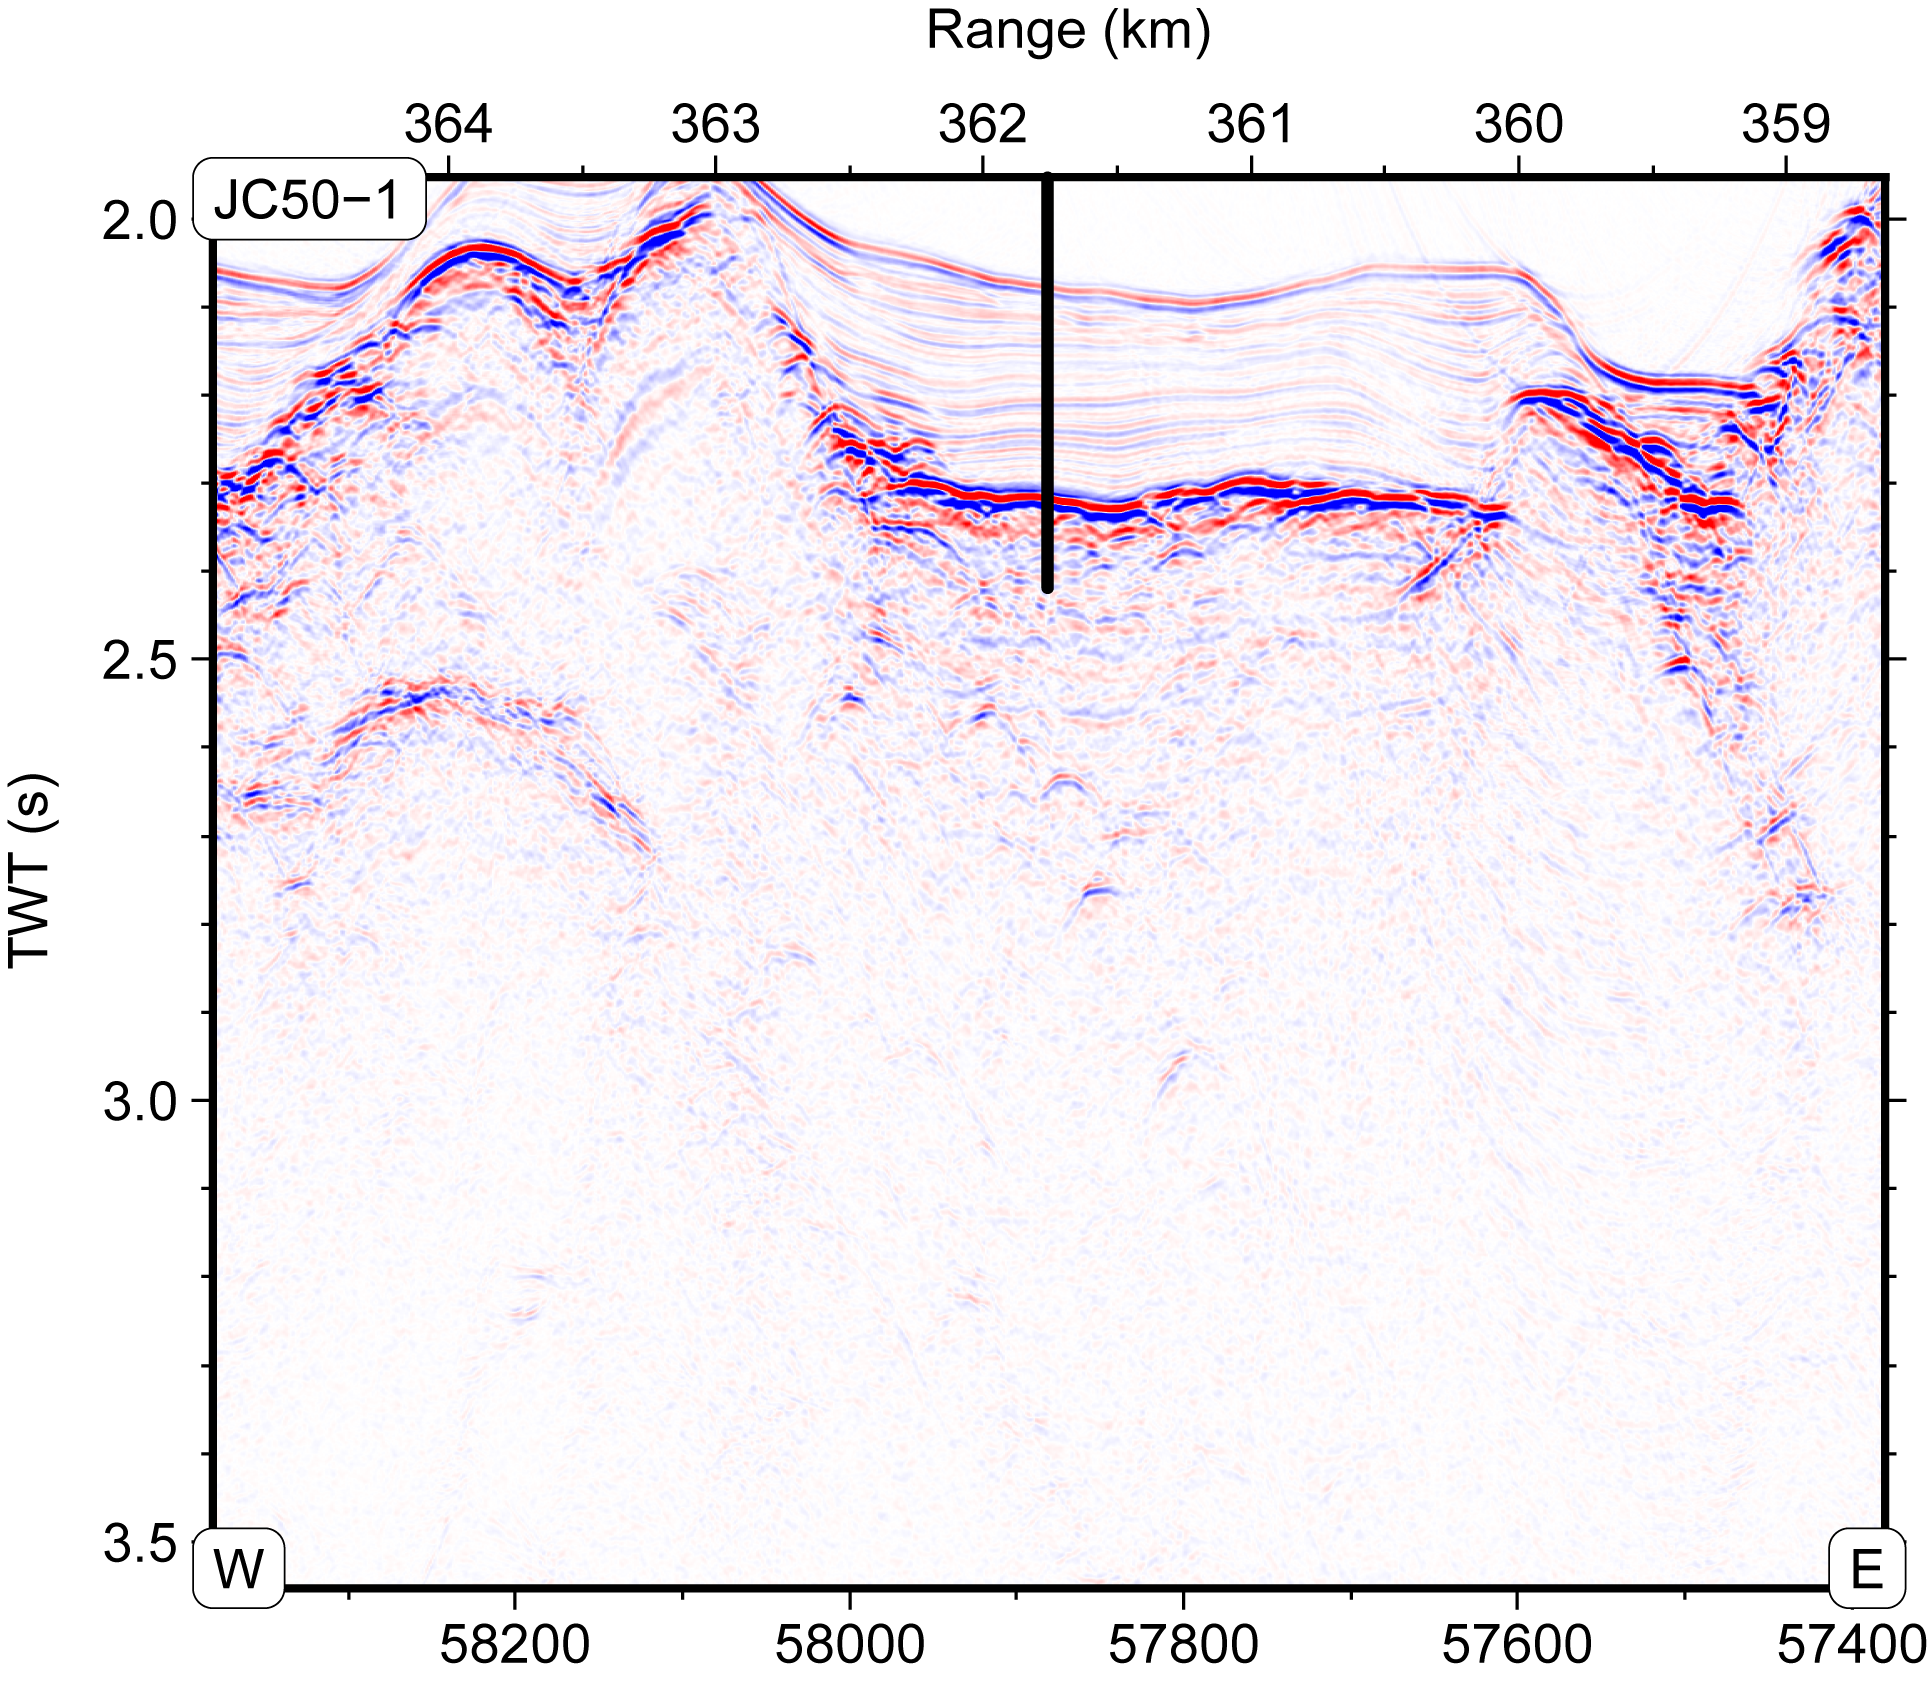
Figure F7. Location of Site U1555 on Seismic Line JC50-1.

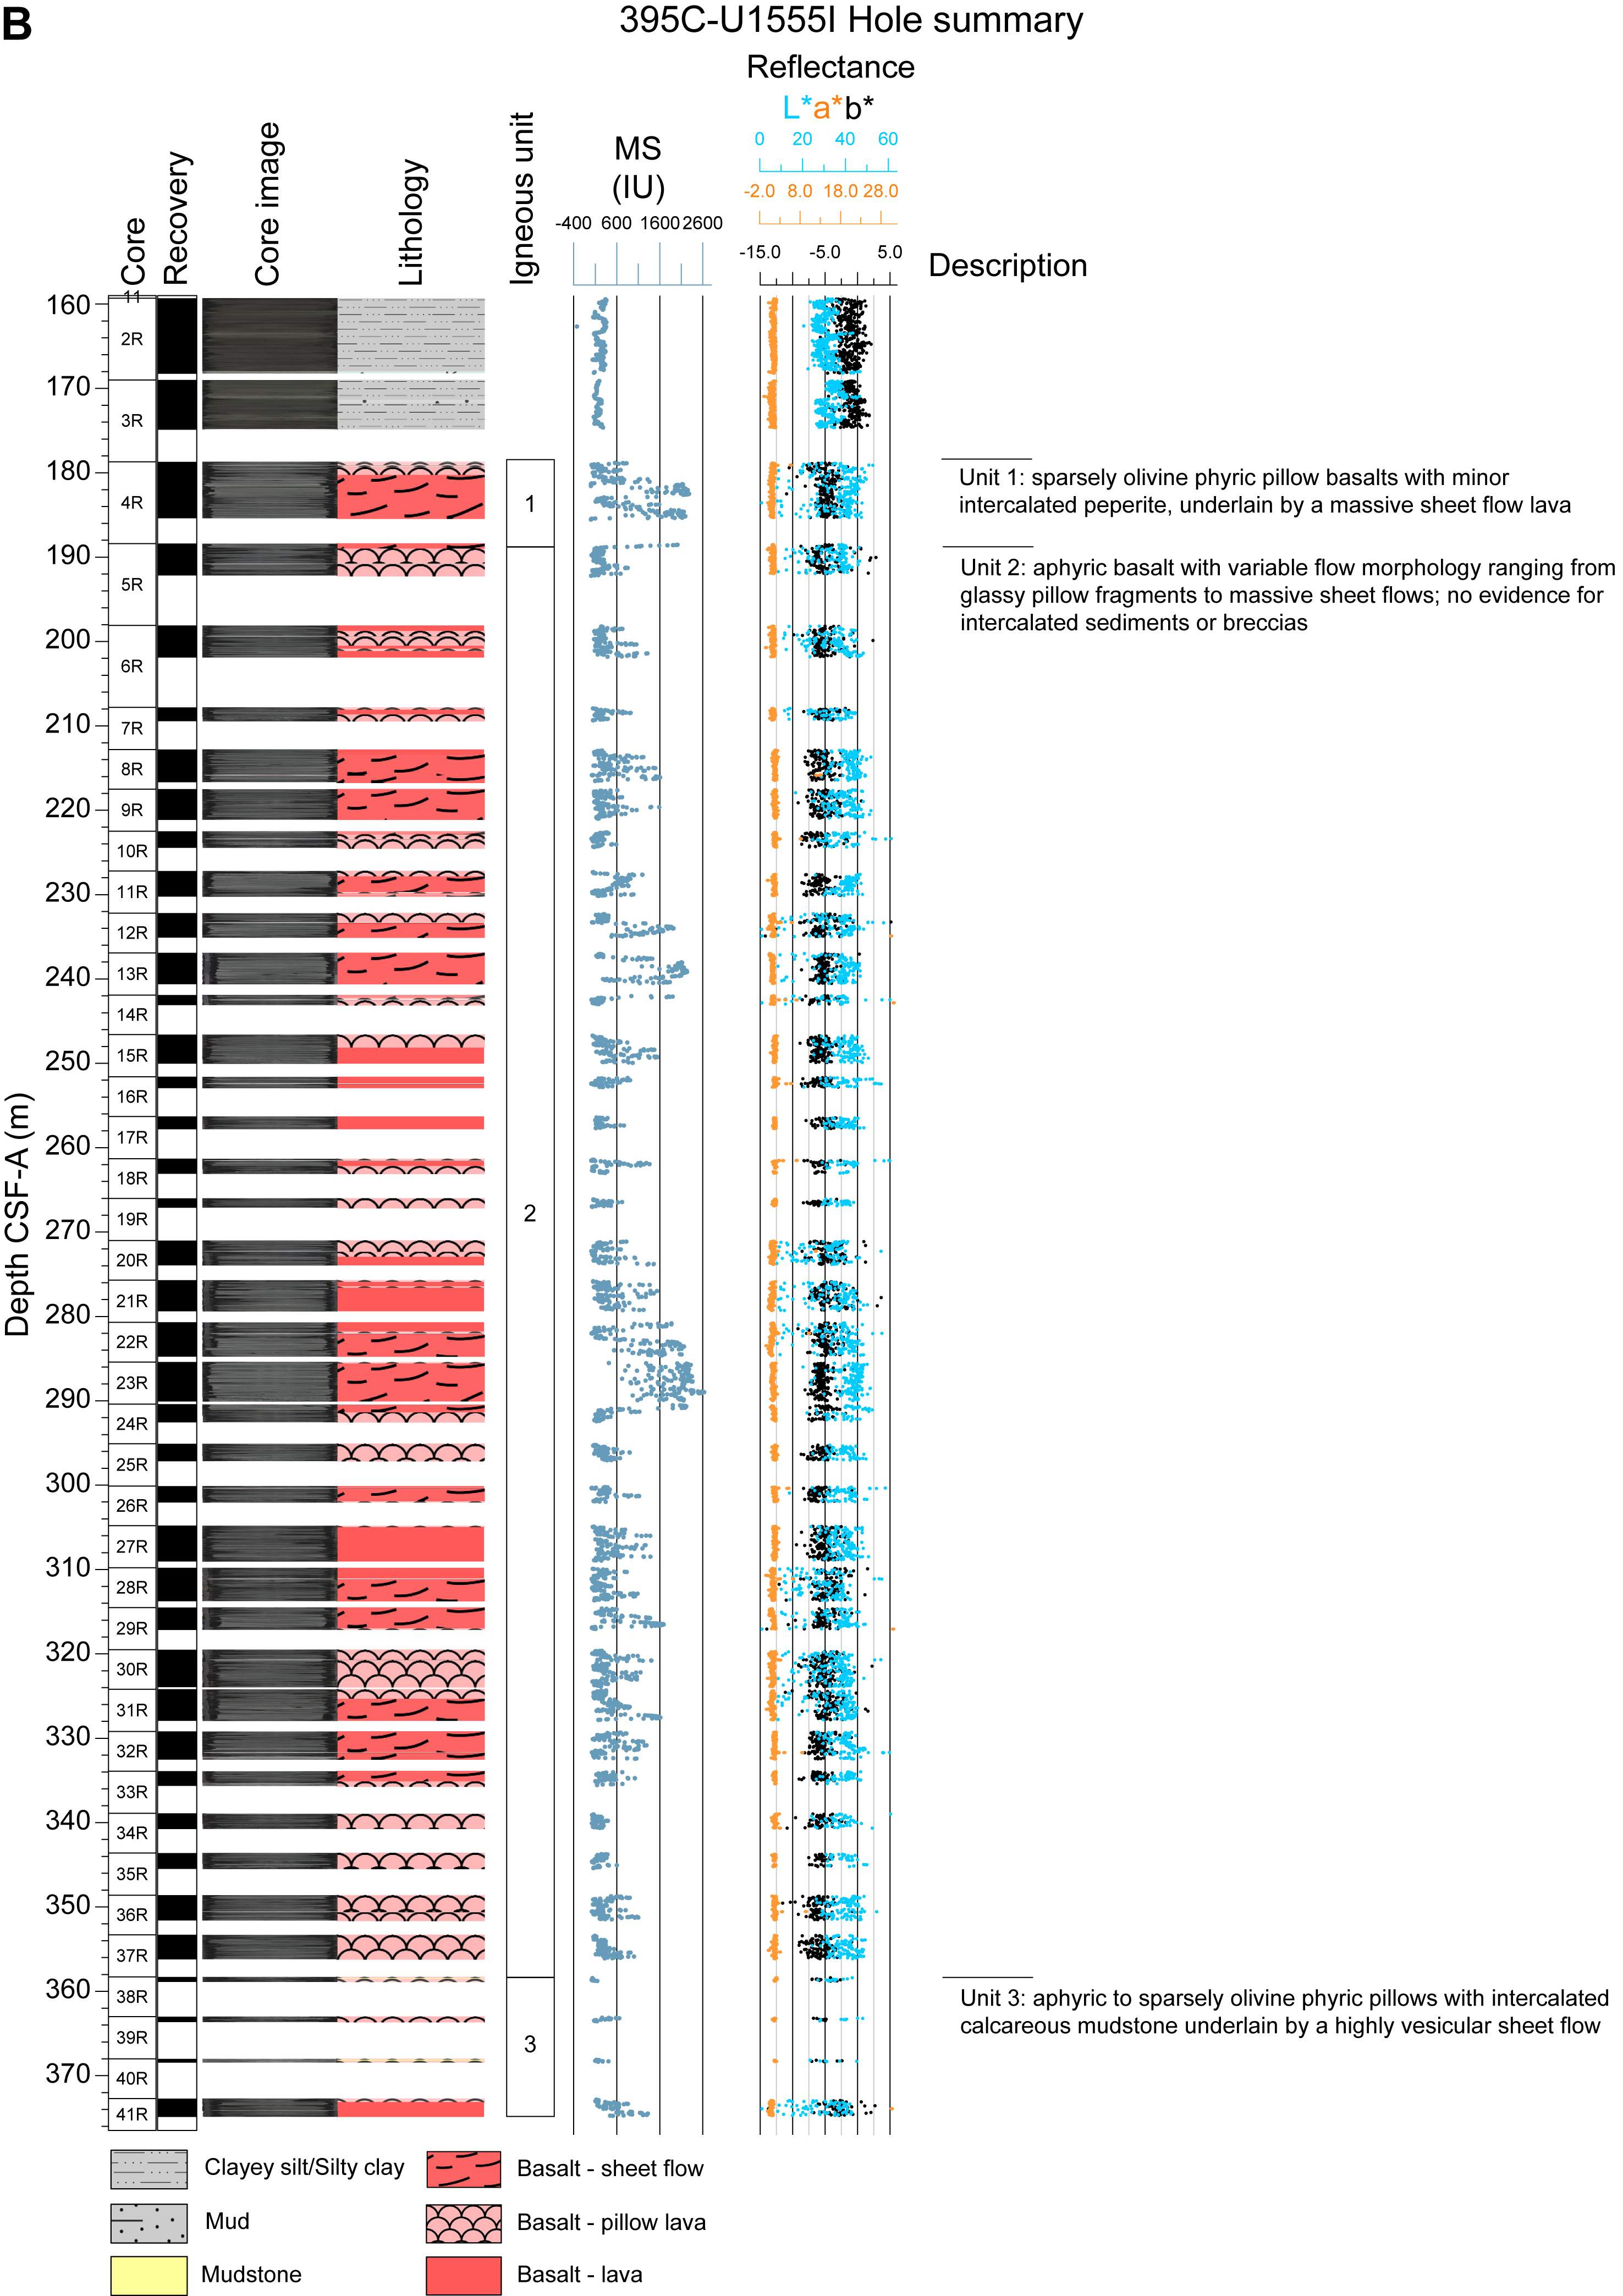
Figure F8. Lithostratigraphic summaries.
4.1. Lithostratigraphy
Igneous rock cores from Site U1555 are dominated by pillow lavas, which are often fragmented, and coherent sheet flow intervals (Figure F9). Approximately 25% of the basalt recovered at this site has ambiguous flow morphology and has not been categorized. Recovered basement material contains minimal intercalated sediment.
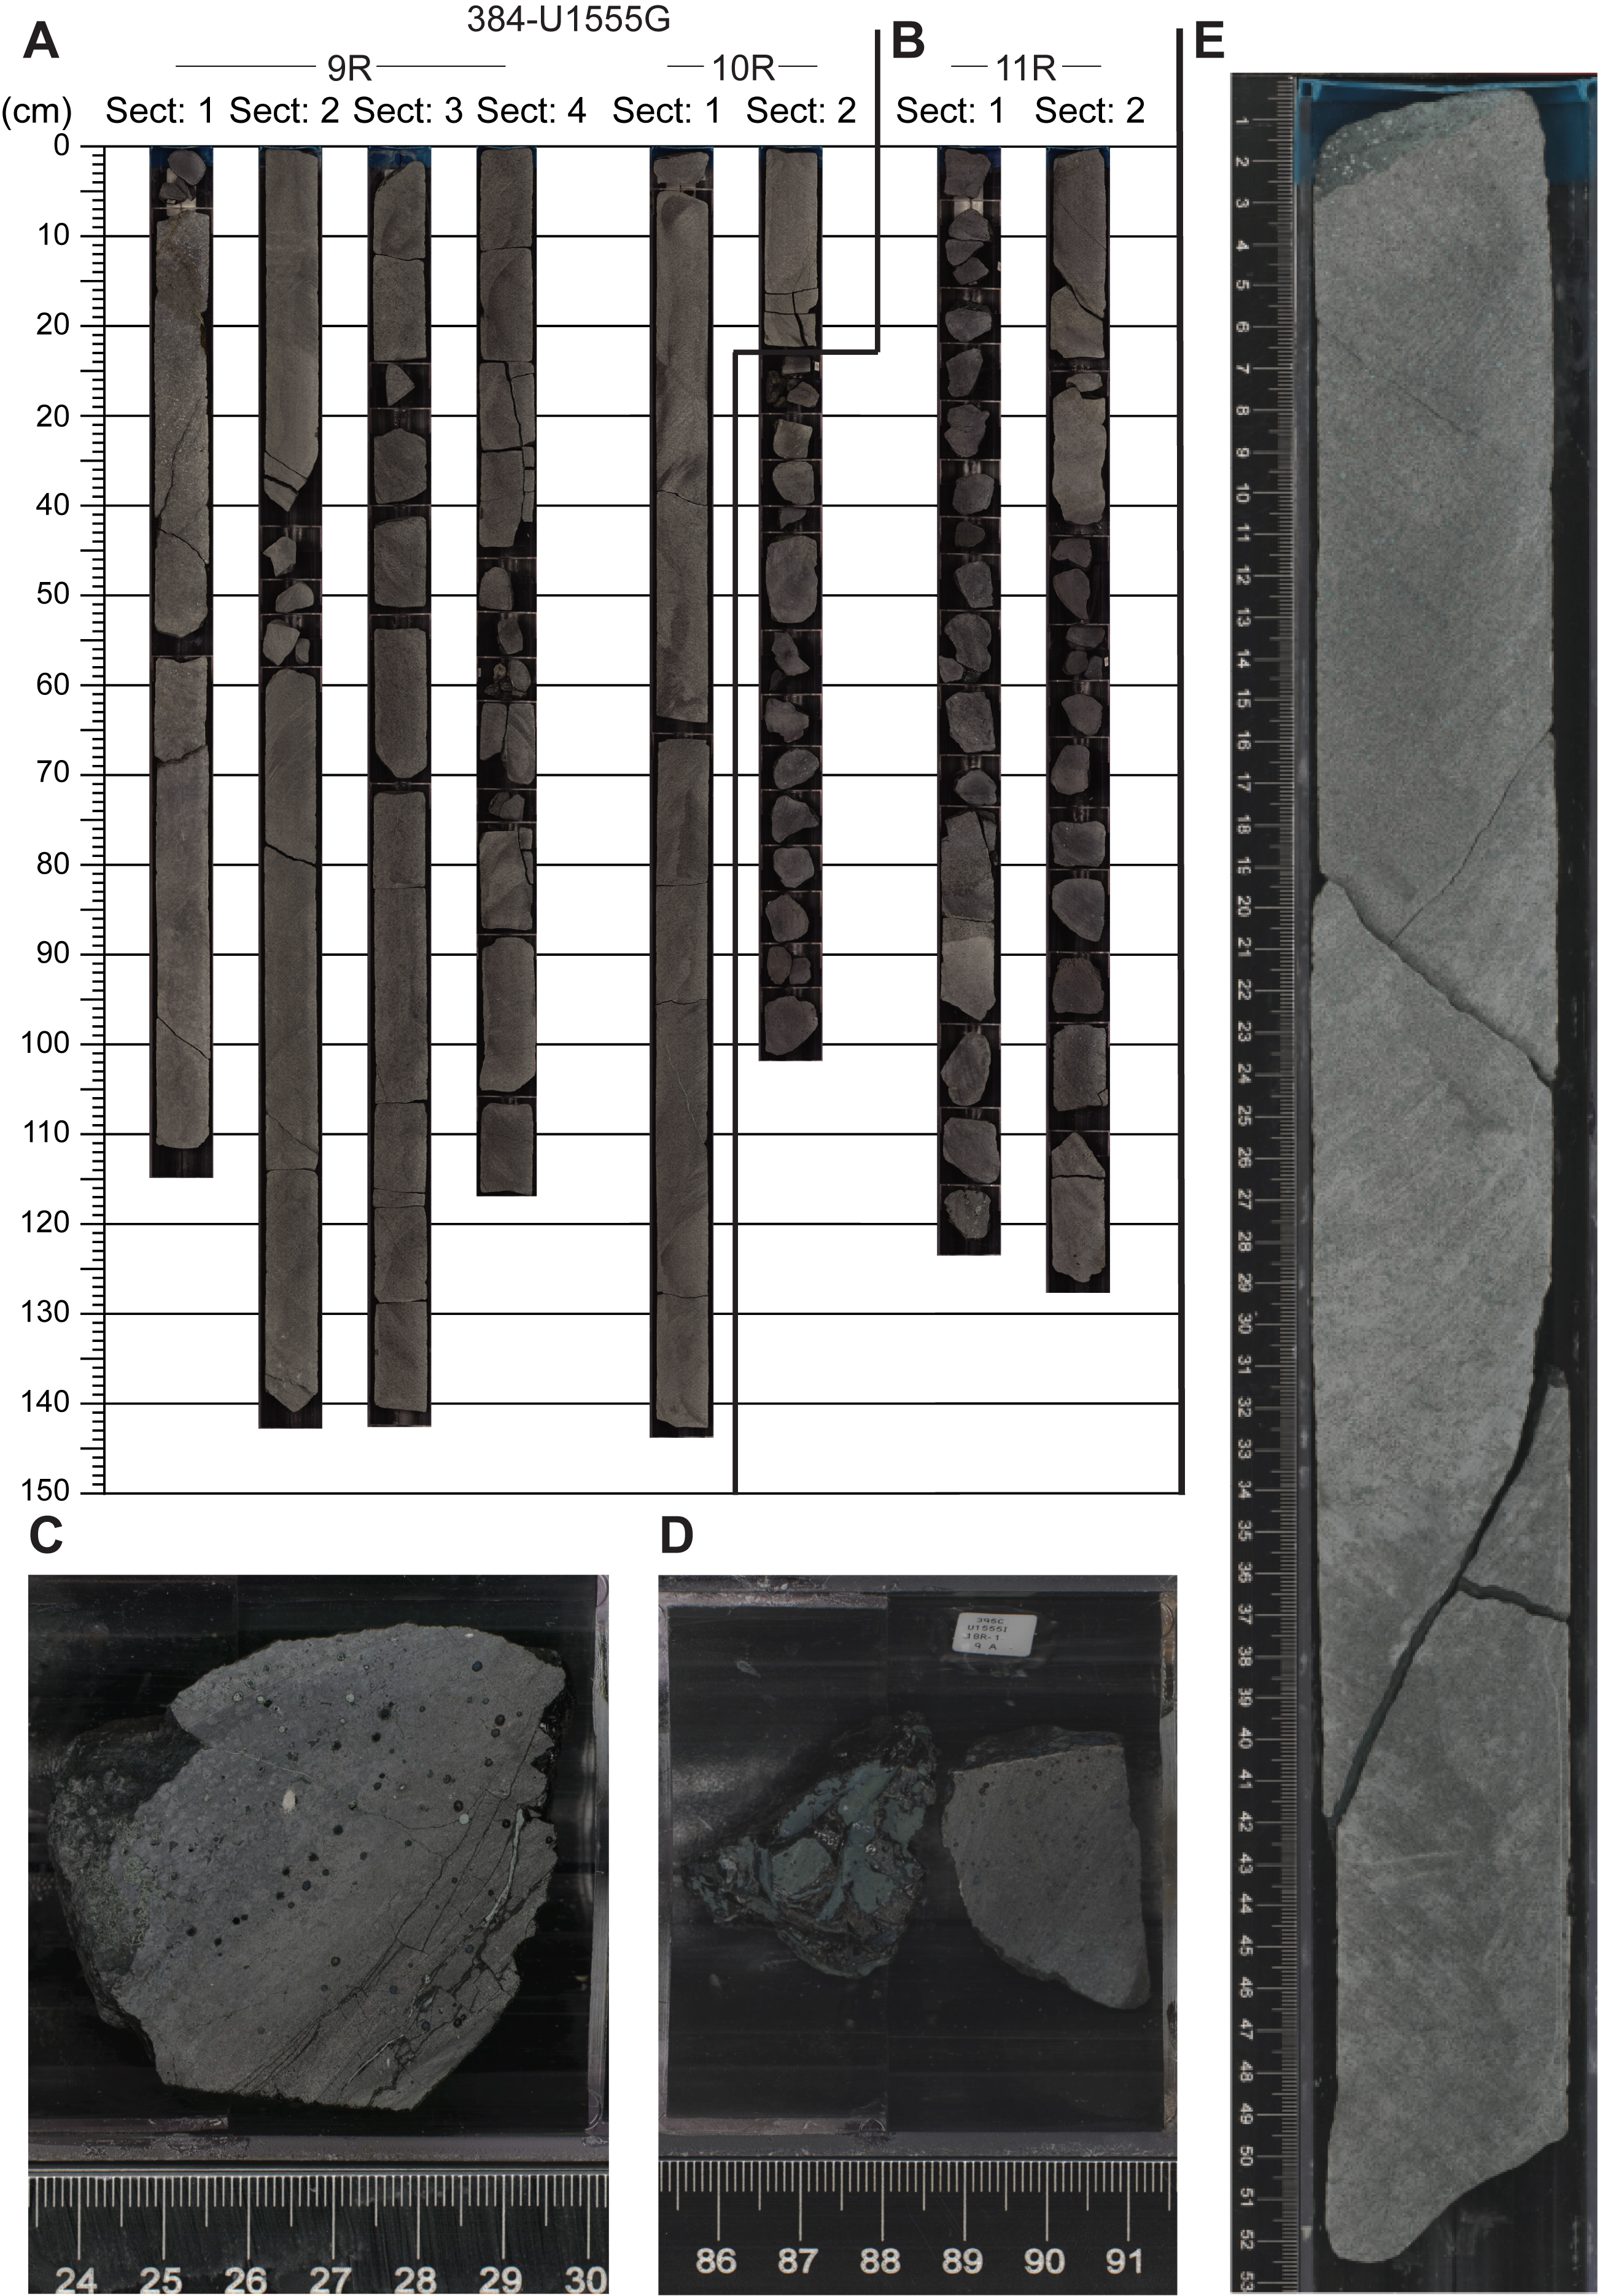
Figure F9. Common lithologies.
Hole U1555F recovered a short sequence of hypocrystalline aphyric basalt with mostly sheet flow morphology. These sheet flows are generally fine grained with downward coarsening and moderate devitrification. They are mostly nonvesicular, though some intervals contain large sparse vesicles and vugs. Basalt fragments with curved chilled margins and thin glass rinds occur, with a few thicker glass rinds and fragments (up to 15 mm).
Coring in Hole U1555G achieved 43% recovery. The upper two thirds of the hole mainly consist of massive intervals of aphyric basalts with an olivine-rich groundmass. Packages of sheet flows are at least 3–6 m thick and often have chilled margins that are hypocrystalline with signs of mottled devitrification. Glassy rinds and sparse vesicles are common. In some places, inclined bands of vesicles and irregular-shaped vugs occur, with occasional signs of flow banding. The thickest sheet flows are holocrystalline with medium-grained, nonvesicular interiors. Sheet flow intervals are interspersed with glassy pillow lava intervals, with some glass rinds up to 2 cm thick. Toward the base of the hole, recovered material is dominated by pillow lava fragments. These fragments consist of aphyric basalt with moderate devitrification, sparse vesicularity, and glass rinds. There are occasional pieces of metamorphosed sandstone, interpreted as dropstones.
Hole U1555H reached the sediment/basement contact, where the core catcher collected seven pieces of fresh vesicular basalt, the largest of which is 5 cm across.
Hole U1555I is the thickest and most complete section with the highest recovery rate (48%) at Site U1555, providing the clearest perspective on the basalt lithostratigraphy of this VST (Figure F8B). The basement sequence consists of a series of intercalated sheet flows and pillow lava intervals with very little sediment recovery. The top of this section is marked by a set of pillow lavas and thin peperitic breccia with glassy olivine phyric basalt. Vesicularity is sparse. This interval is underlain by a massive sheet flow, beneath which macroscopic olivine phenocrysts are not observed. The remainder of the hole is largely aphyric, fine-grained basalt with morphologies that range from glassy pillow fragments to more massive basalts with sheet-like morphologies. Massive sheet flows are up to ~15 m thick and tend to have quenched to fine-grained flow margins and coarser grained interiors. Pillow lava recovery increases near the bottom of the hole, with a ~40 m thick package of recovered pillows near the base. The deepest pillow sequence contains very sparse olivine microphenocrysts with variable extents of alteration, and two intervals of foraminifer-rich mudstone, each ~10 cm thick (~358 and ~368 m CSF-A). At the base of the hole, lavas become coarser grained and highly vesicular (up to 30%). There are many good examples of curved chilled margins with glassy rinds and selvages throughout the hole, including a few exceptionally thick glass fragments (up to 25 mm thick).
4.2. Core descriptions
Lithologic descriptions are based on a combination of detailed core section observations, thin section observations, and physical properties measurements (e.g., MS, color reflectance, and wireline logs). Visual core descriptions (VCDs) provide a useful synthesis of key descriptive elements summarized here.
Igneous lithologies at Site U1555 can be divided into two principal morphologic categories: pillow lavas and more massive, sheet-like lava (Figure F9). Sheet flows recovered at this site are characterized by thick, coherent packages of fine- to medium-grained aphyric or sparsely olivine phyric basalts. They tend to be continuous over many meters with significantly coarser grained interiors, and some exhibit inclined flow banding. Upper and lower contacts are generally sharp and sometimes have thin glassy rinds. Pillow lavas consist of highly fragmented fine-grained aphyric basalt with curved contacts, chilled margins, concentric bands of small vesicles, and glassy rinds (e.g., Figure F9C). Glass mostly occurs as thin rinds, although isolated centimeter-thick glass layers can be found (e.g., Figure F9D). During core description, it was occasionally difficult to discriminate between thin sheet flows and thick pillow lavas or lobate flows, especially when recovery is fragmented and incomplete. Minor lithologies consist of thin (~10 cm) horizons of foraminifer-rich mudstone and a single peperitic breccia layer (Section 395C-U1555I-4R-1).
Igneous core material is mostly aphyric olivine basalts, with a few sparsely phyric intervals where olivine phenocrysts are clearly visible under hand lens. A range of secondary alteration minerals and crystals are encountered, including clays and iron oxyhydroxides, with minor zeolite and celadonite (see Alteration petrology and structural geology). Vesicularity tends to be sparse, although some intervals contain inclined bands of filled vesicles and irregular shaped vugs. Vesicles are often filled, usually with calcite, zeolite, celadonite, and chlorite. In pillow lava fragments, vesicles tend to be small (<0.5 mm) and form quasiconcentric bands immediately beneath chilled margins.
We used the presence of sediment-rich horizons (i.e., significant horizon of intercalated sediment or peperite) and mineralogical changes (e.g., aphyric versus olivine phyric) to divide the basement succession into igneous lithologic units (Table T5). This approach results in three igneous lithologic units for Hole U1555I (Figure F8B) and only one each for Holes U1555F and U1555G, which lack clear unit boundaries. Because of incomplete recovery and a general lack of well-defined contacts, our unit boundary locations are approximate and preliminary.
4.2.1. Hole 384-U1555F
This short sequence of basalts consists of ~8 m of lava mostly consisting of thin sheet flows (~5 m) with occasional glassy pillow lava fragments. Bands of large vesicles occur in places. There are no sediments in the basement section in this hole.
4.2.2. Hole 384-U1555G
Core from this hole consists of a single unit of aphyric basalt with flow morphologies that range from small, fine-grained pillows to medium-grained sheet flows (Igneous Lithologic Unit 2). There are several thick sheet flows (~15 m), particularly in the upper half of the hole. Pillow lavas increase toward the base, with packages up to ~25 m thick. No sediment horizons were recovered from the basement in this hole aside from a single sandstone fragment that may be a dropstone (interval 384-U1555G-12R-1, 13–17 cm).
4.2.3. Hole 395C-U1555I
This hole can be divided into three igneous lithologic units. Recovery in the uppermost ~10 m of cored basement is dominated by sparsely olivine-phyric basalt with minor amounts of intercalated peperite (Igneous Lithologic Unit 1). This first unit is topped by pillow lavas with massive sheet flow lava underneath. Below this unit, olivine phenocrysts disappear at the hand sample scale, and Igneous Lithologic Unit 2 consists of aphyric basalt with flow morphologies ranging from small glassy pillow fragments to massive sheet flows. No intercalated sediments or breccias are recovered in this unit, which continues for most of the hole with little to no mineralogical variation. At the base of the hole, there is a short series of aphyric to sparsely olivine-phyric pillow fragments underlain by highly vesicular medium-grained lava (Igneous Lithologic Unit 3). This unit contains minor amounts of intercalated calcareous mudstone, with relatively poor overall recovery.
4.3. Thin sections
Thin section sampling at Site U1555 includes seven thin sections from Hole U1555F, eight thin sections from Hole U1555G, and eight thin sections from the bottom of Hole U1555I (see Core descriptions). A mix of sheet flows and pillow lavas were sampled. They can be generally described as fine-grained aphyric or sparsely olivine-phyric basalts with slight to moderate alteration (Figure F10). Phenocrysts are largely absent, although small olivine microphenocrysts (<0.5 mm) are present in low abundances (<5%) in some thin sections. Several sections have abundant vesicles (up to 15%), which are often infilled with calcite or zeolite. Plagioclase is the most abundant groundmass mineral phase, often forming skeletal tabular or prismatic laths. The space between plagioclase laths is occupied by olivine and clinopyroxene microcrystals, altered clinopyroxene mesostasis, opaque oxides, and altered glass.
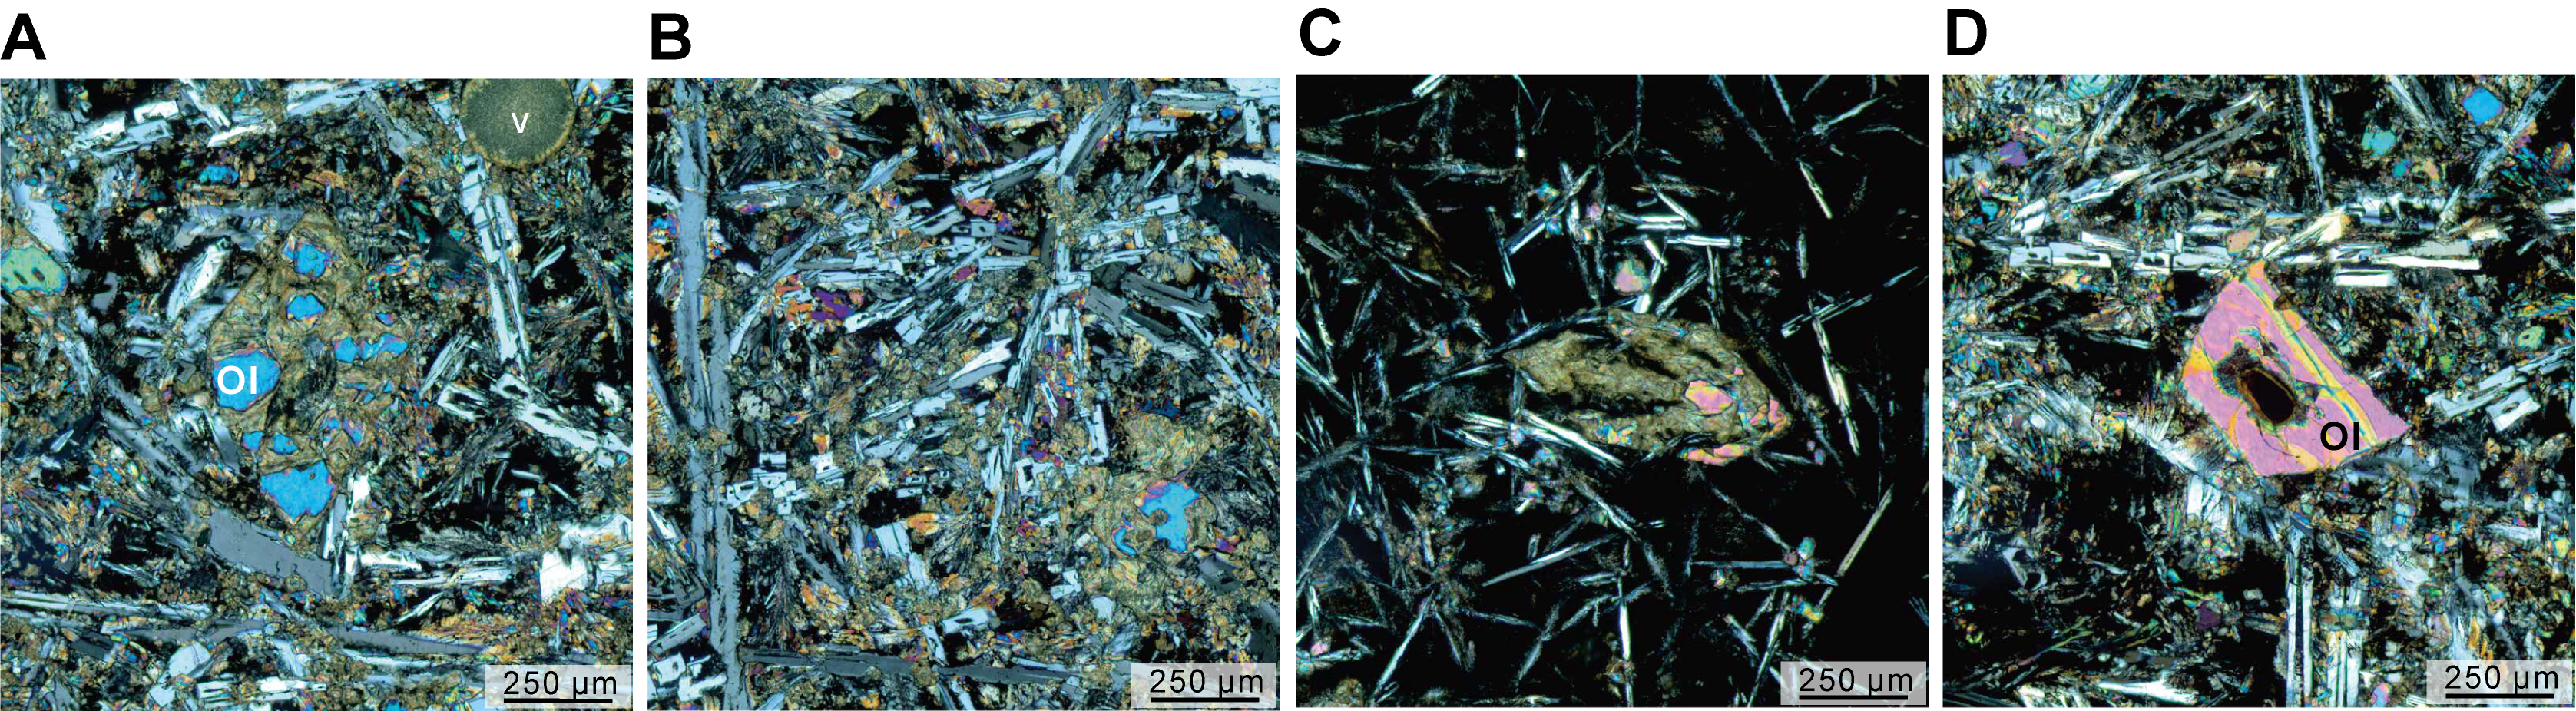
Figure F10. Basalt thin sections.
4.4. Igneous geochemistry
There are two shipboard geochemical data sets from Hole U1555I (see Geochemistry and microbiology in the Expedition 395 methods chapter [Parnell-Turner et al., 2025a]). Raw counts from portable X-ray fluorescence (pXRF) analyses are shown in Figure F11. Major elements such as Mg and Si show significant scatter, particularly near the top and bottom of the hole. However, some useful incompatible trace elements (e.g., Zr and Y) show more coherent trends and provided a useful preliminary characterization of the hole during shipboard operations. Incompatible elements such as Ti, Y, Zr, and the Zr/Y ratio show slight increases upsection, suggesting a slight decrease in mantle melt fraction through time. The observed change in compositional gradient near the base of the hole may be an artifact and should be interpreted with caution.
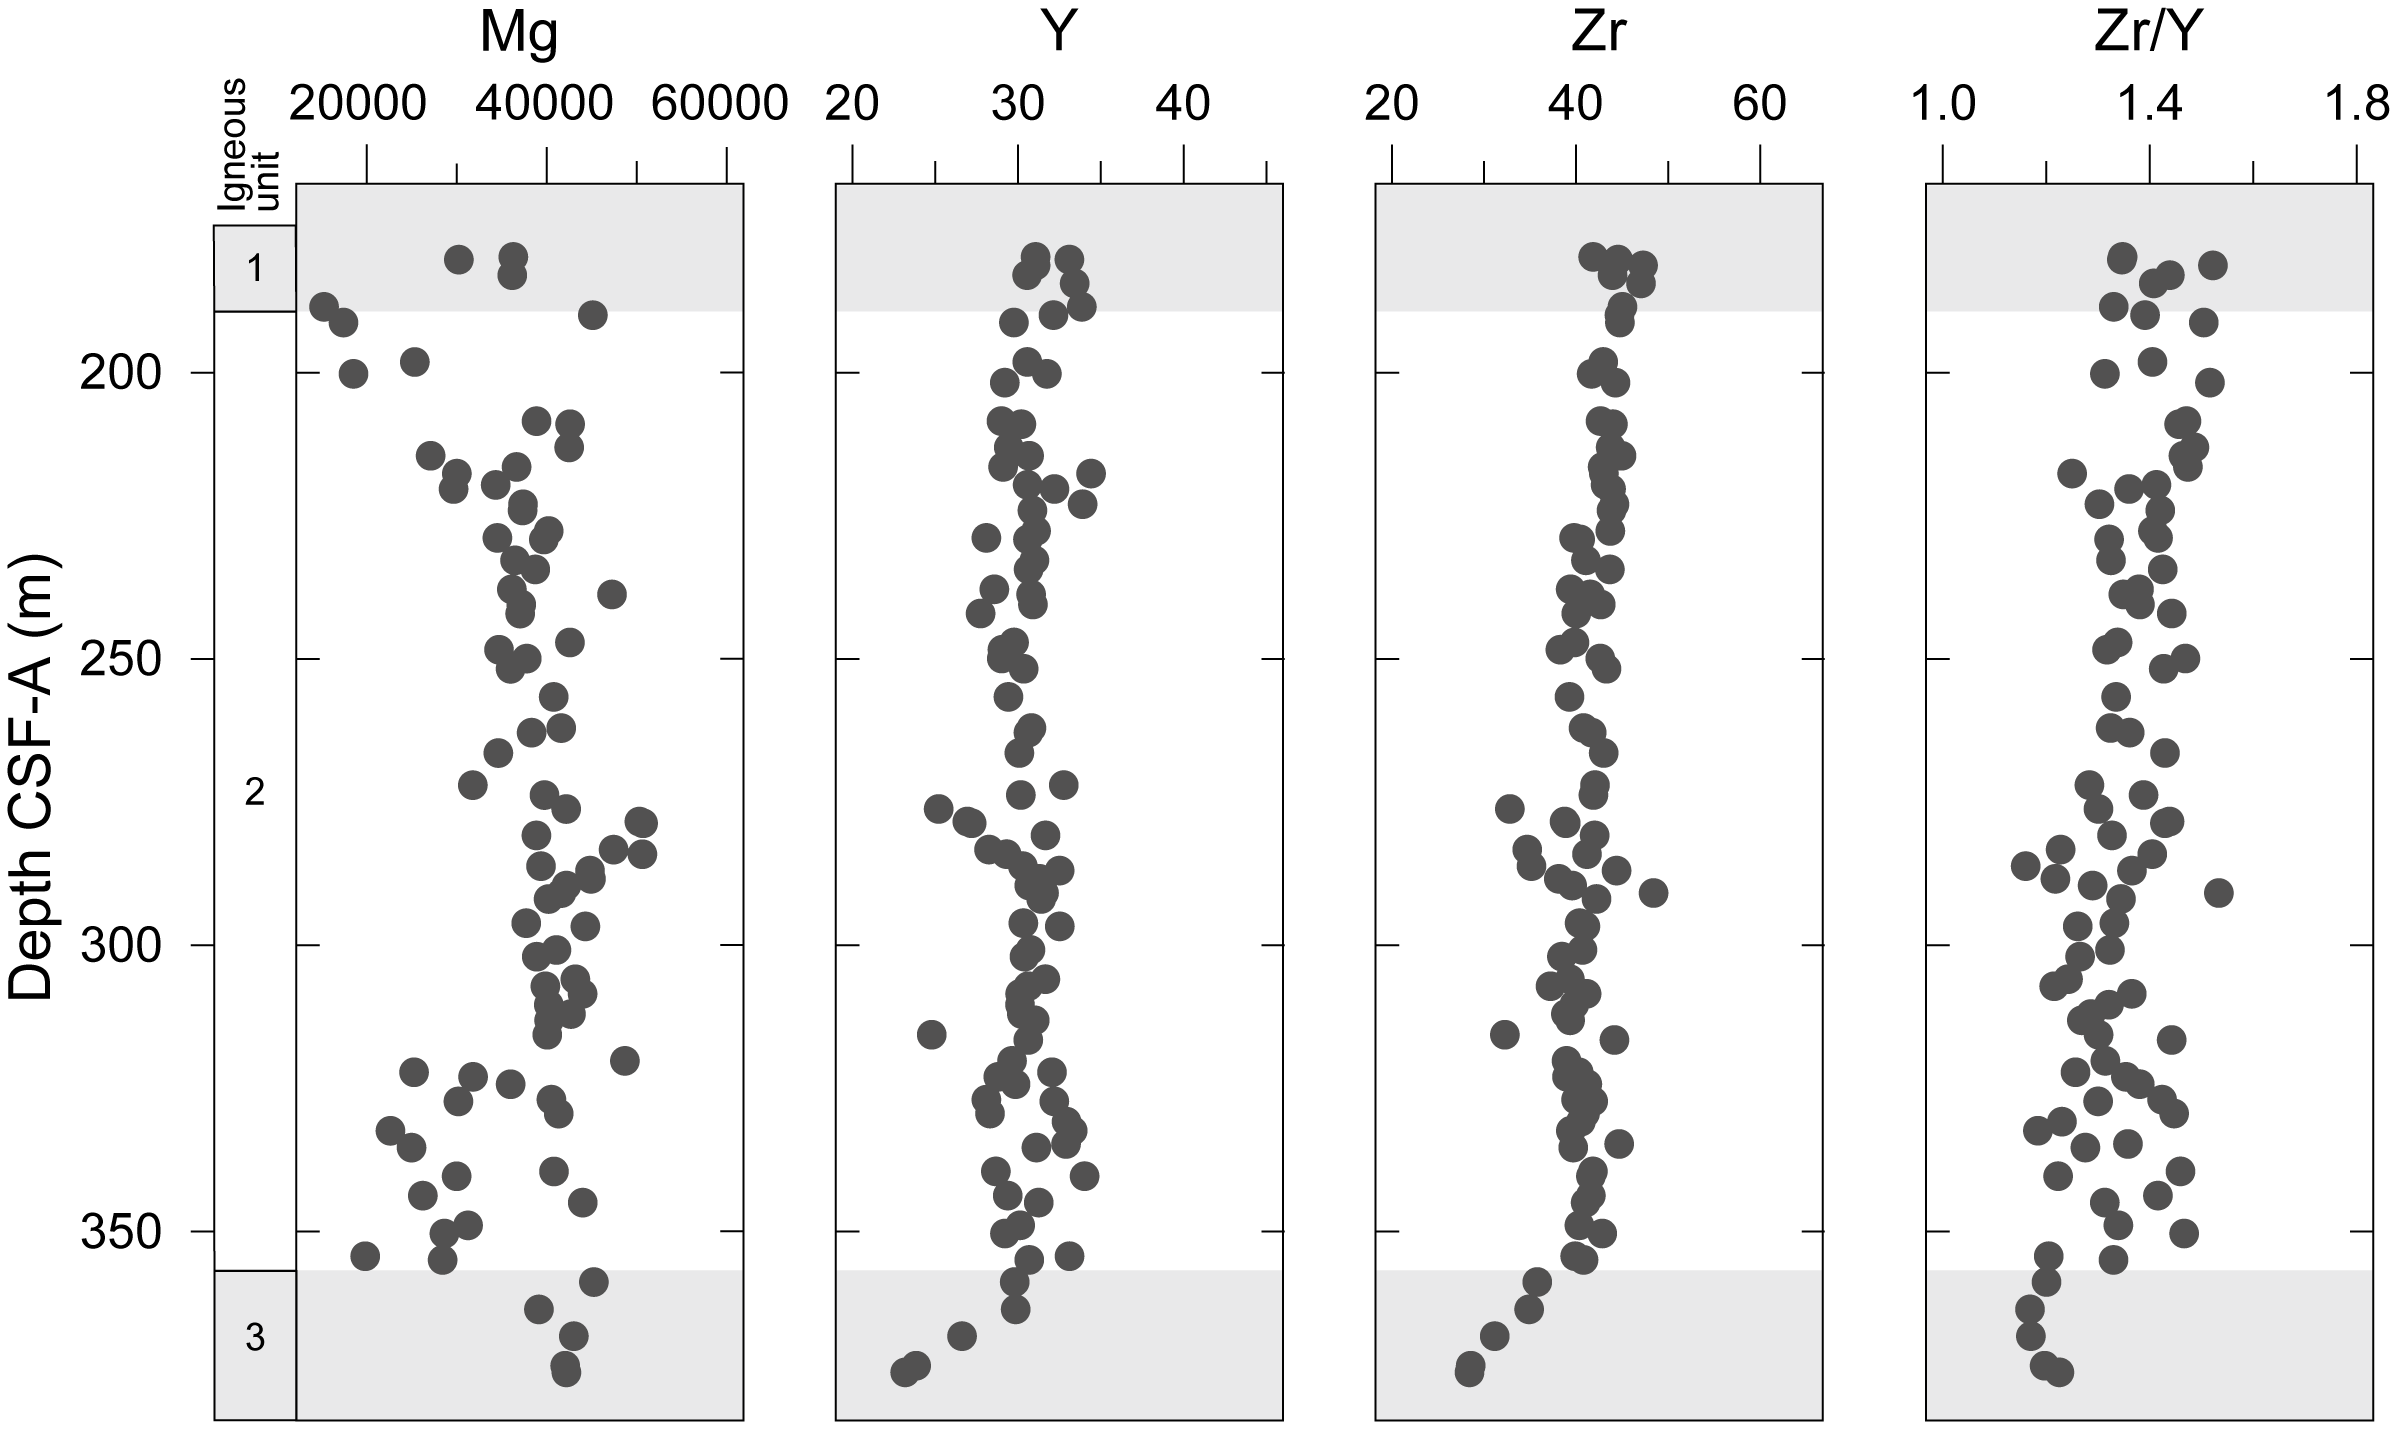
Figure F11. Major and trace element pXRF compositional data.
Inductively coupled plasma–atomic emission spectroscopy (ICP-AES) analyses were conducted on eight samples that are co-located with thin section billets from the bottom half of Hole U1555I. Additional samples for ICP-AES analysis were collected from Hole U1555G; however, there was not sufficient time to run the samples on board, and they were collected as personal samples. Measurements of MgO, Al2O3, CaO, TiO2, Y, and Zr are presented in Figure F12. MgO has a mean value of 8.14 wt% with a minimum of 6.30 wt%. Al2O3 and CaO exhibit minimal variation, clustering around values of ~14.0 and ~11.5 wt%, respectively. Significantly, Zr/Y has an average value of 1.9, which is consistent with values obtained for dredged basalt glasses from 59° to 60°N on the active spreading center, the current tip of VST 1 (Murton et al., 2002; Jones et al., 2014).
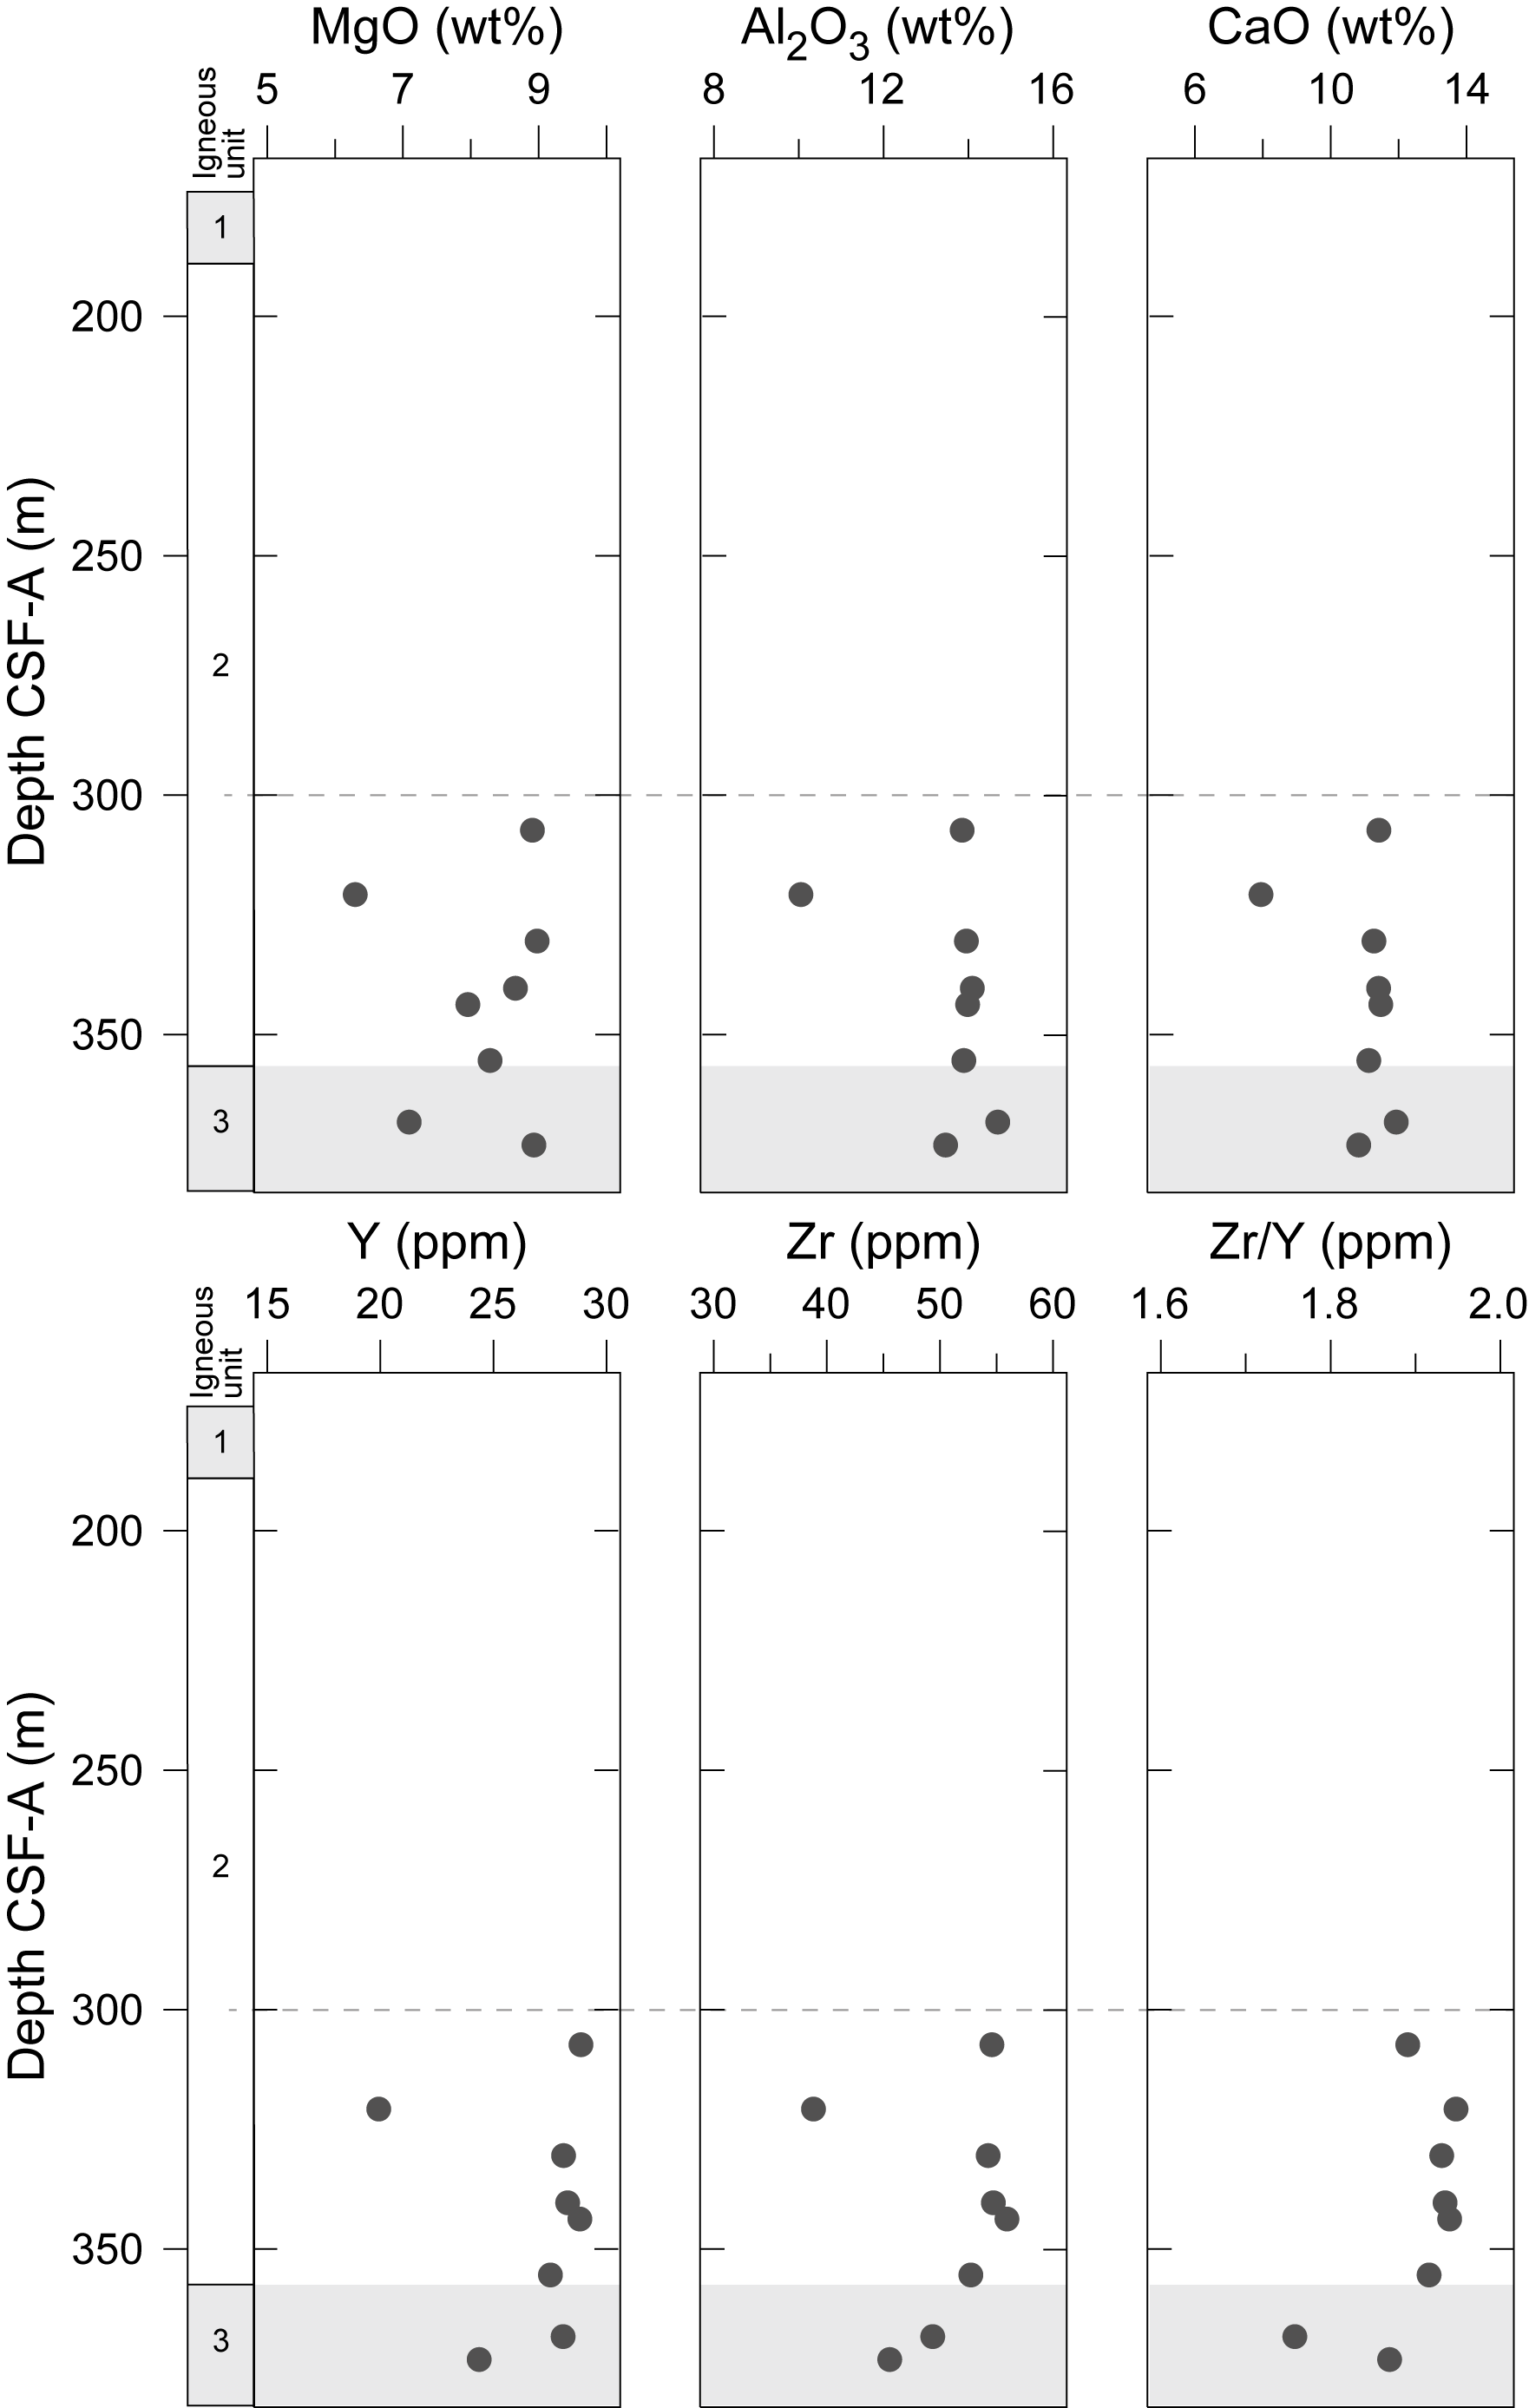
Figure F12. Major and trace element bulk rock ICP-AES analyses.
4.5. Correlations and interpretation
Core description results were combined with thin section interpretations, shipboard geochemical analyses, physical properties, and downhole logging results to develop a preliminary interpretation of Site U1555. There is an approximate correlation between MS and flow morphology for the two deeper holes (see Physical properties). In Hole U1555I, there are three prominent peaks in MS, as well as several subsidiary peaks, that closely match the distribution of sheet flow units with depth (Figure F8B). In Hole U1555G, the most prominent peak in MS corresponds to the thickest and most coherent sheet flow, and subsidiary peaks of MS also show good correlations with other sheet flows (Figure F8A). In basalts, MS is dominated by the presence of magnetite and/or titanomagnetite. We suggest that these accessory minerals occur in greater abundance in sheet flows compared with pillow lavas. Sheet flows also weakly correlate with color reflectance data, exhibiting slightly lower values of a* (red/green) and higher L* light reflectance (see Physical properties). The correlation between sheet flows and a* is better for Hole U1555I than Hole U1555G. Finally, correlations between igneous lithologic units and rock alteration suggest that sheet flows are typically more altered than pillow lavas (see Alteration petrology and structural geology).
A detailed interpretation of the magmatic history of VST 1 is challenging given the limitations of sampling a spatially complex sequence of extrusive igneous rocks with 6 cm diameter cores. Additionally, the deepest hole penetrates ~200 m with a recovery of just under 50%, which is a shallow and incomplete vertical sample of oceanic crust. Despite these challenges, a key observation from this site is that a repeated series of sheet flows and pillow lavas were extruded onto the surface with little evidence for any significant sediment deposition in the recovered core material. This observation suggests either that eruptive hiatuses are too short to accumulate significant amounts of sediment or the cores have sampled relatively thick, continuous eruptive packages at this site, as suggested by the relative mineralogical and geochemical homogeneity and minimal evidence for unit boundaries (i.e., three preliminary units for this site compared to five at the two VSR sites). Because VSTs are thought to have slightly lower magma supply than VSRs (e.g., Jones et al., 2014), the latter interpretation would be consistent with observations at other hotspot-influenced spreading centers (e.g., Colman et al., 2012), wherein regions with lower magma supply tend to be associated with less frequent but larger volume eruptions on average.
5. Alteration petrology and structural geology
A total of ~5.81, ~60.3, ~0.33, and ~89.3 m of basement core was recovered from Holes 384-U1555F, 384-U1555G, 395C-U1555H, and 395C-U1555I, respectively. Here, we visually describe the alteration style and composition of the basement basalts and the alteration mineral fill of their vesicles and document the occurrence and mineral fill of fractures in the basement core.
5.1. Basalt alteration
Based on the classification scheme outlined in Table T1 in the Expedition 395 methods chapter (Parnell-Turner et al., 2025a), 82.7% of the basalt core obtained from all four Holes at Site U1555 can be classified as slightly altered (Figure F13). Only ~13% of the basalt core is moderately altered, ~2.8% is highly altered, and ~1.5% is considered fresh basalt (not altered). Alteration intensity does not show any systematic change with depth in any Site U1555 holes (Figures F14, F15). Basalt alteration is predominantly classified as background alteration in all holes, and halo and patch alteration is minor in comparison, suggesting alteration at this site is more pervasive than localized at Site U1555 (Figure F14). The more altered depth intervals of basalt at this site do, however, show a mix of all three alteration styles.
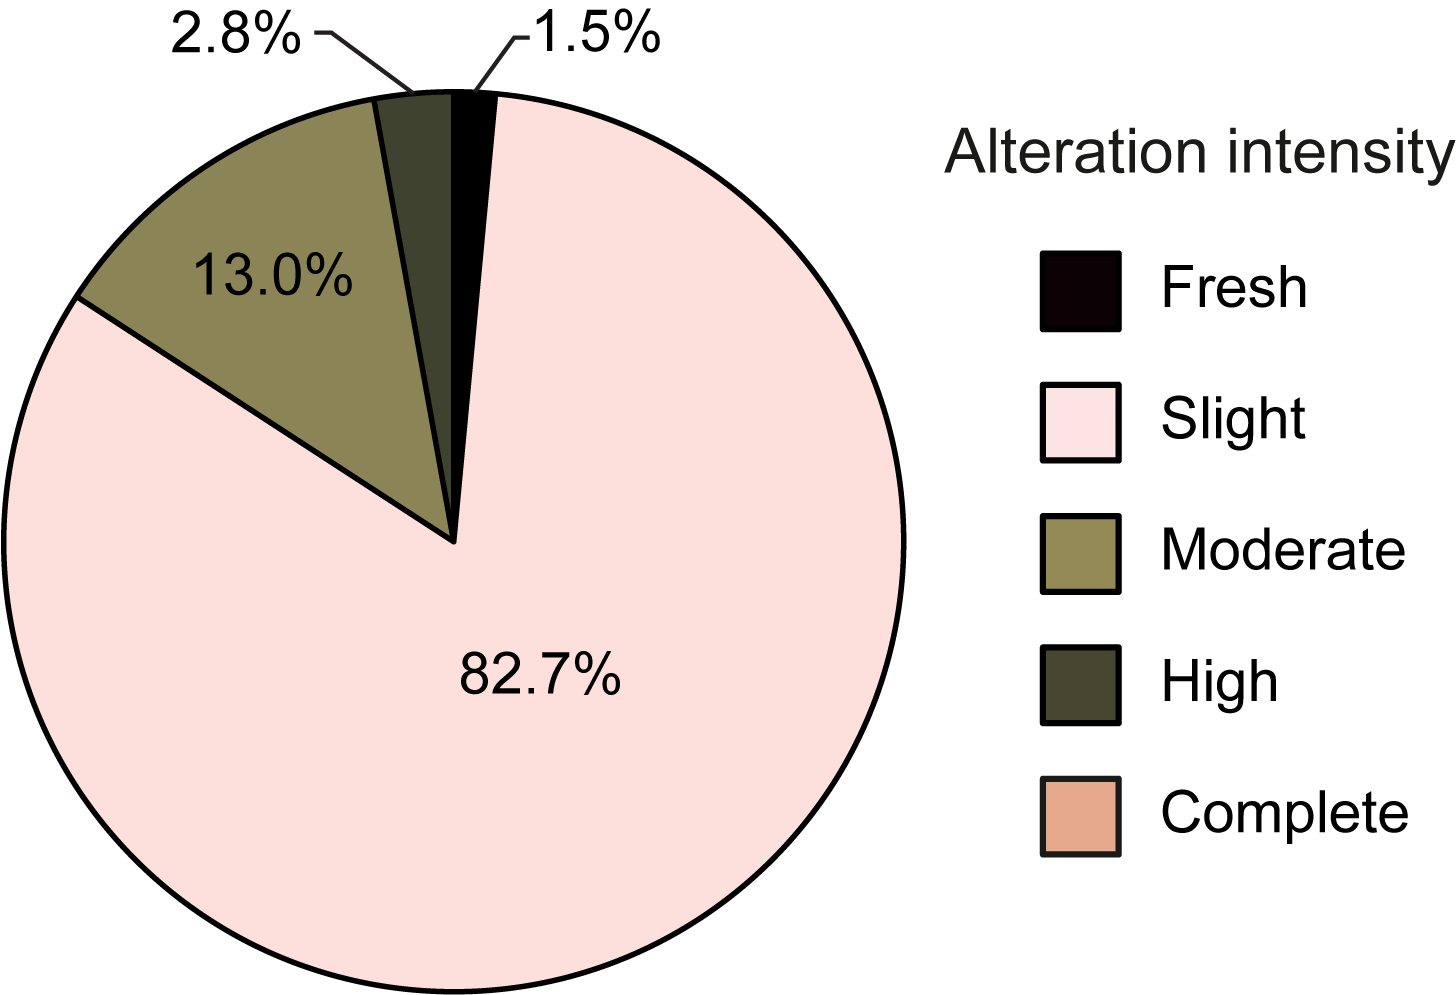
Figure F13. Percentages of degree of alteration.
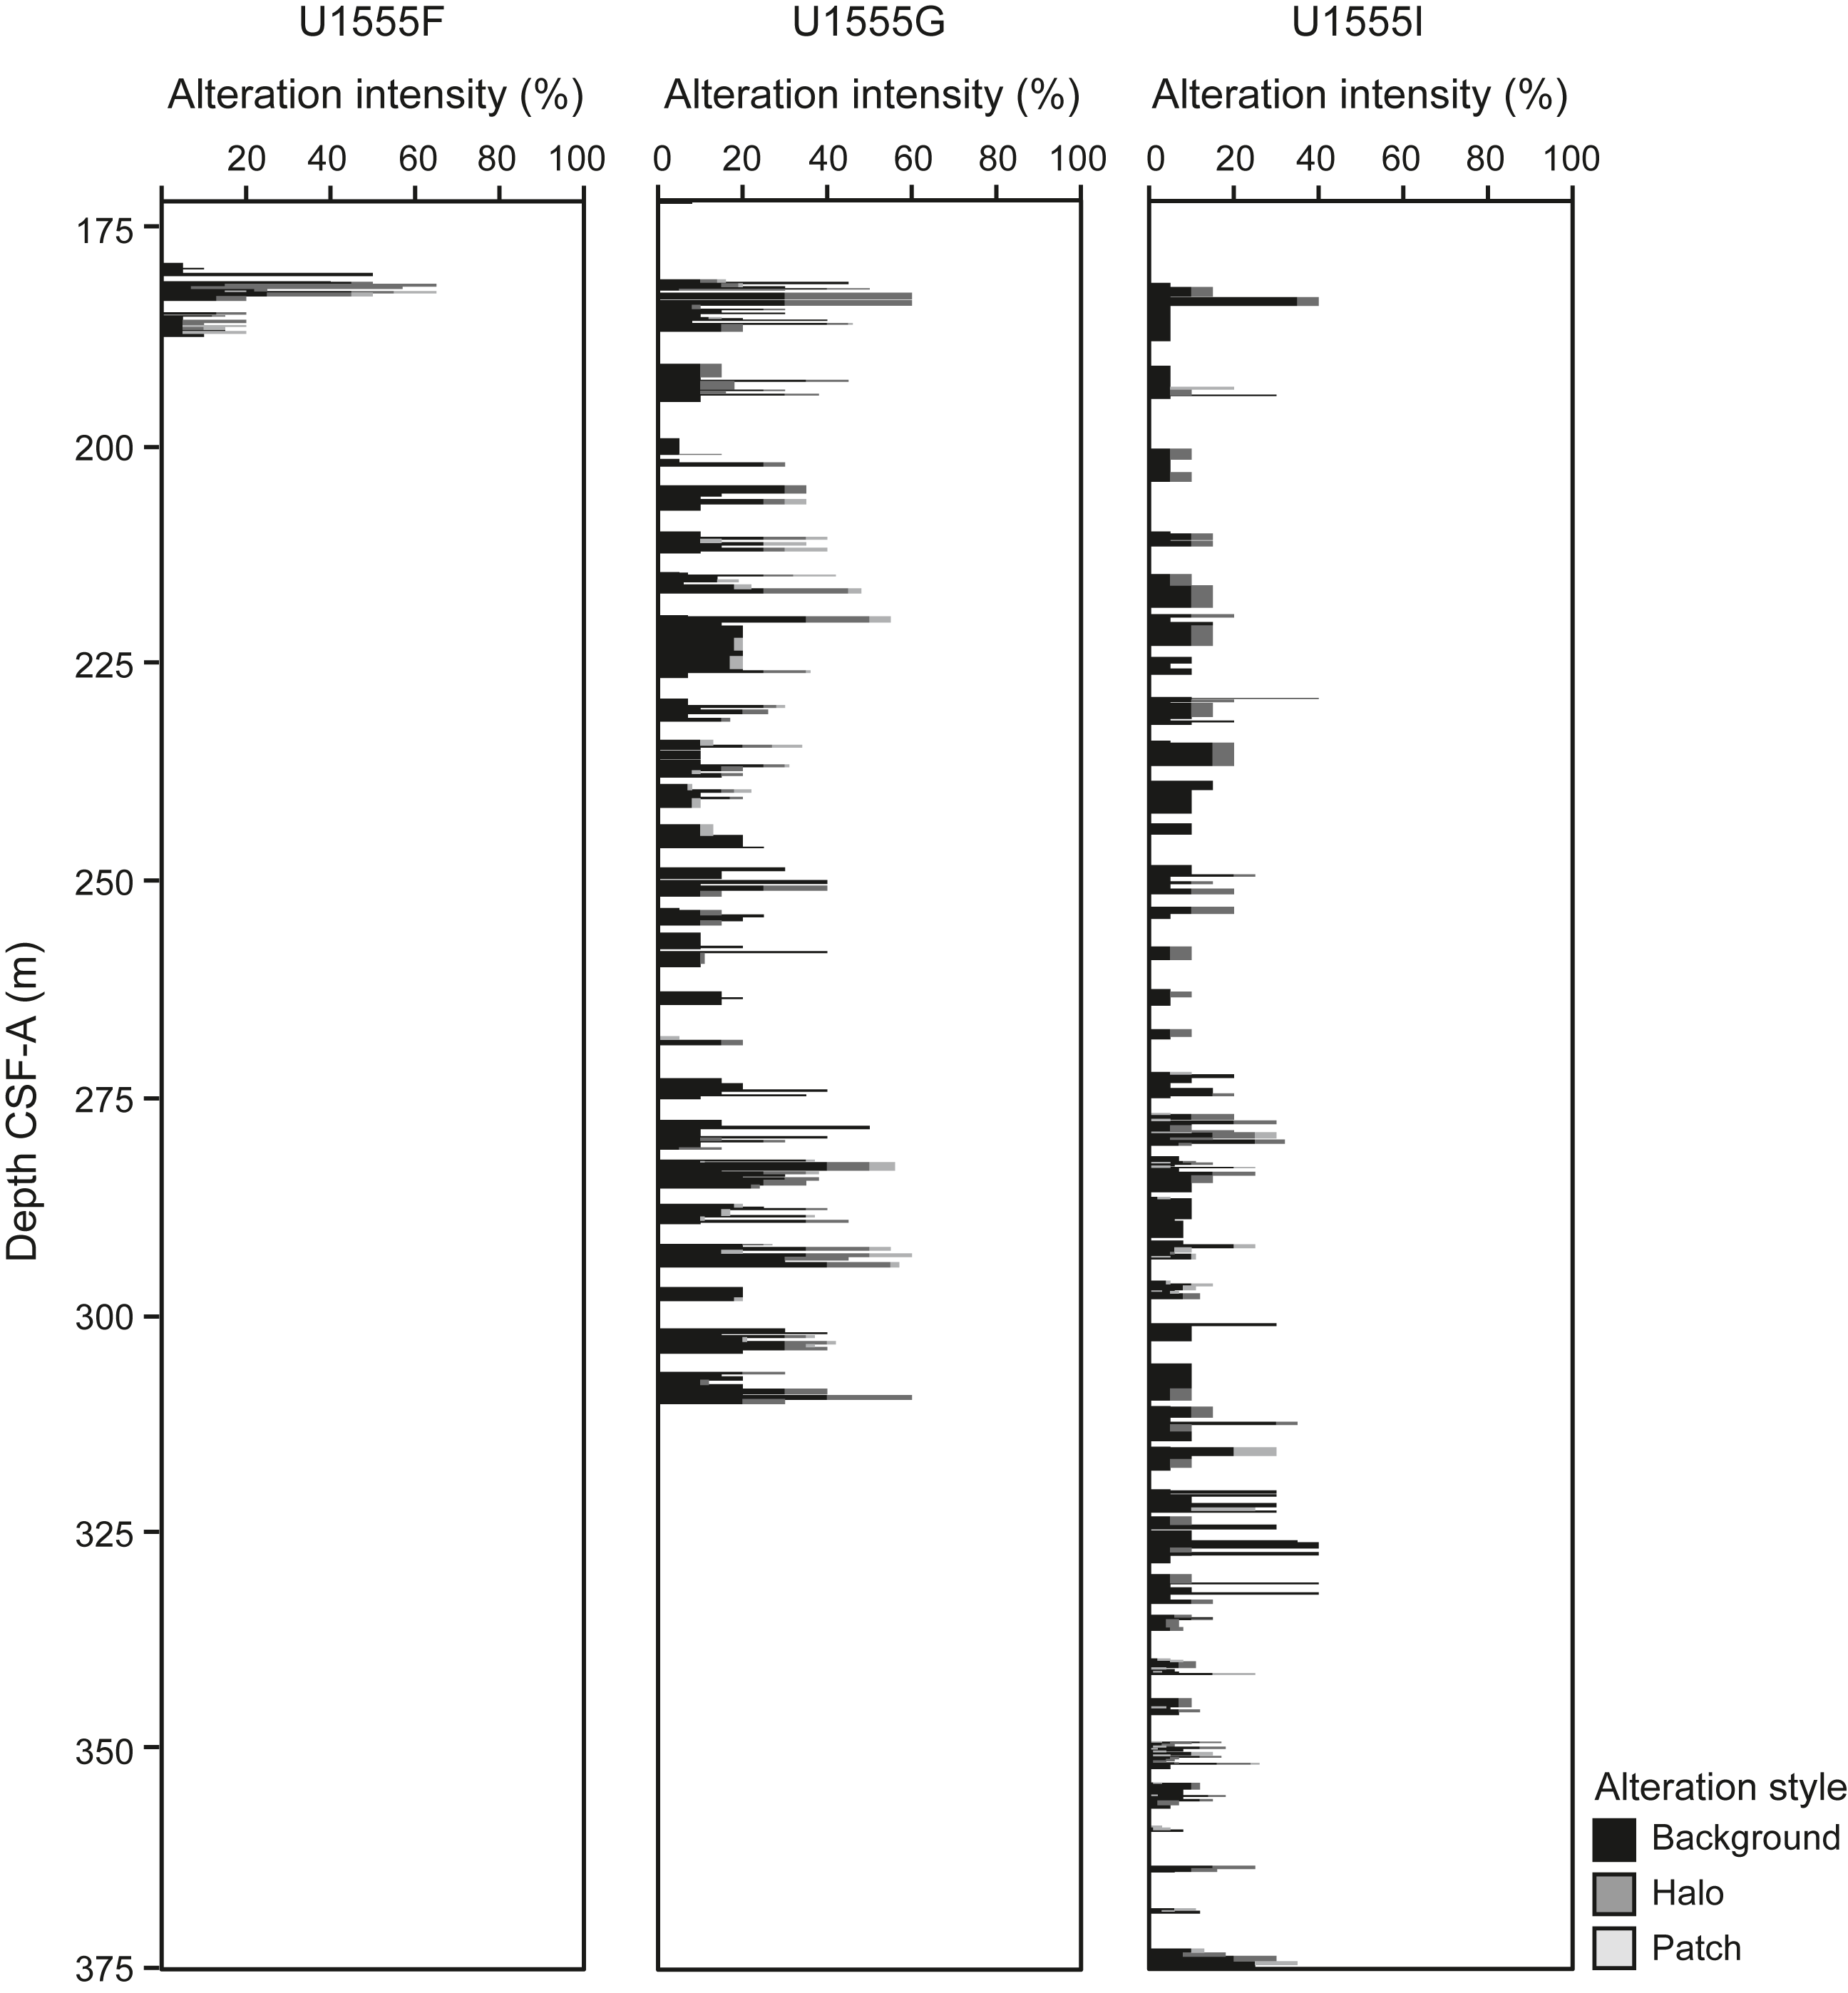
Figure F14. Alteration intensity variation and mineral assemblage.
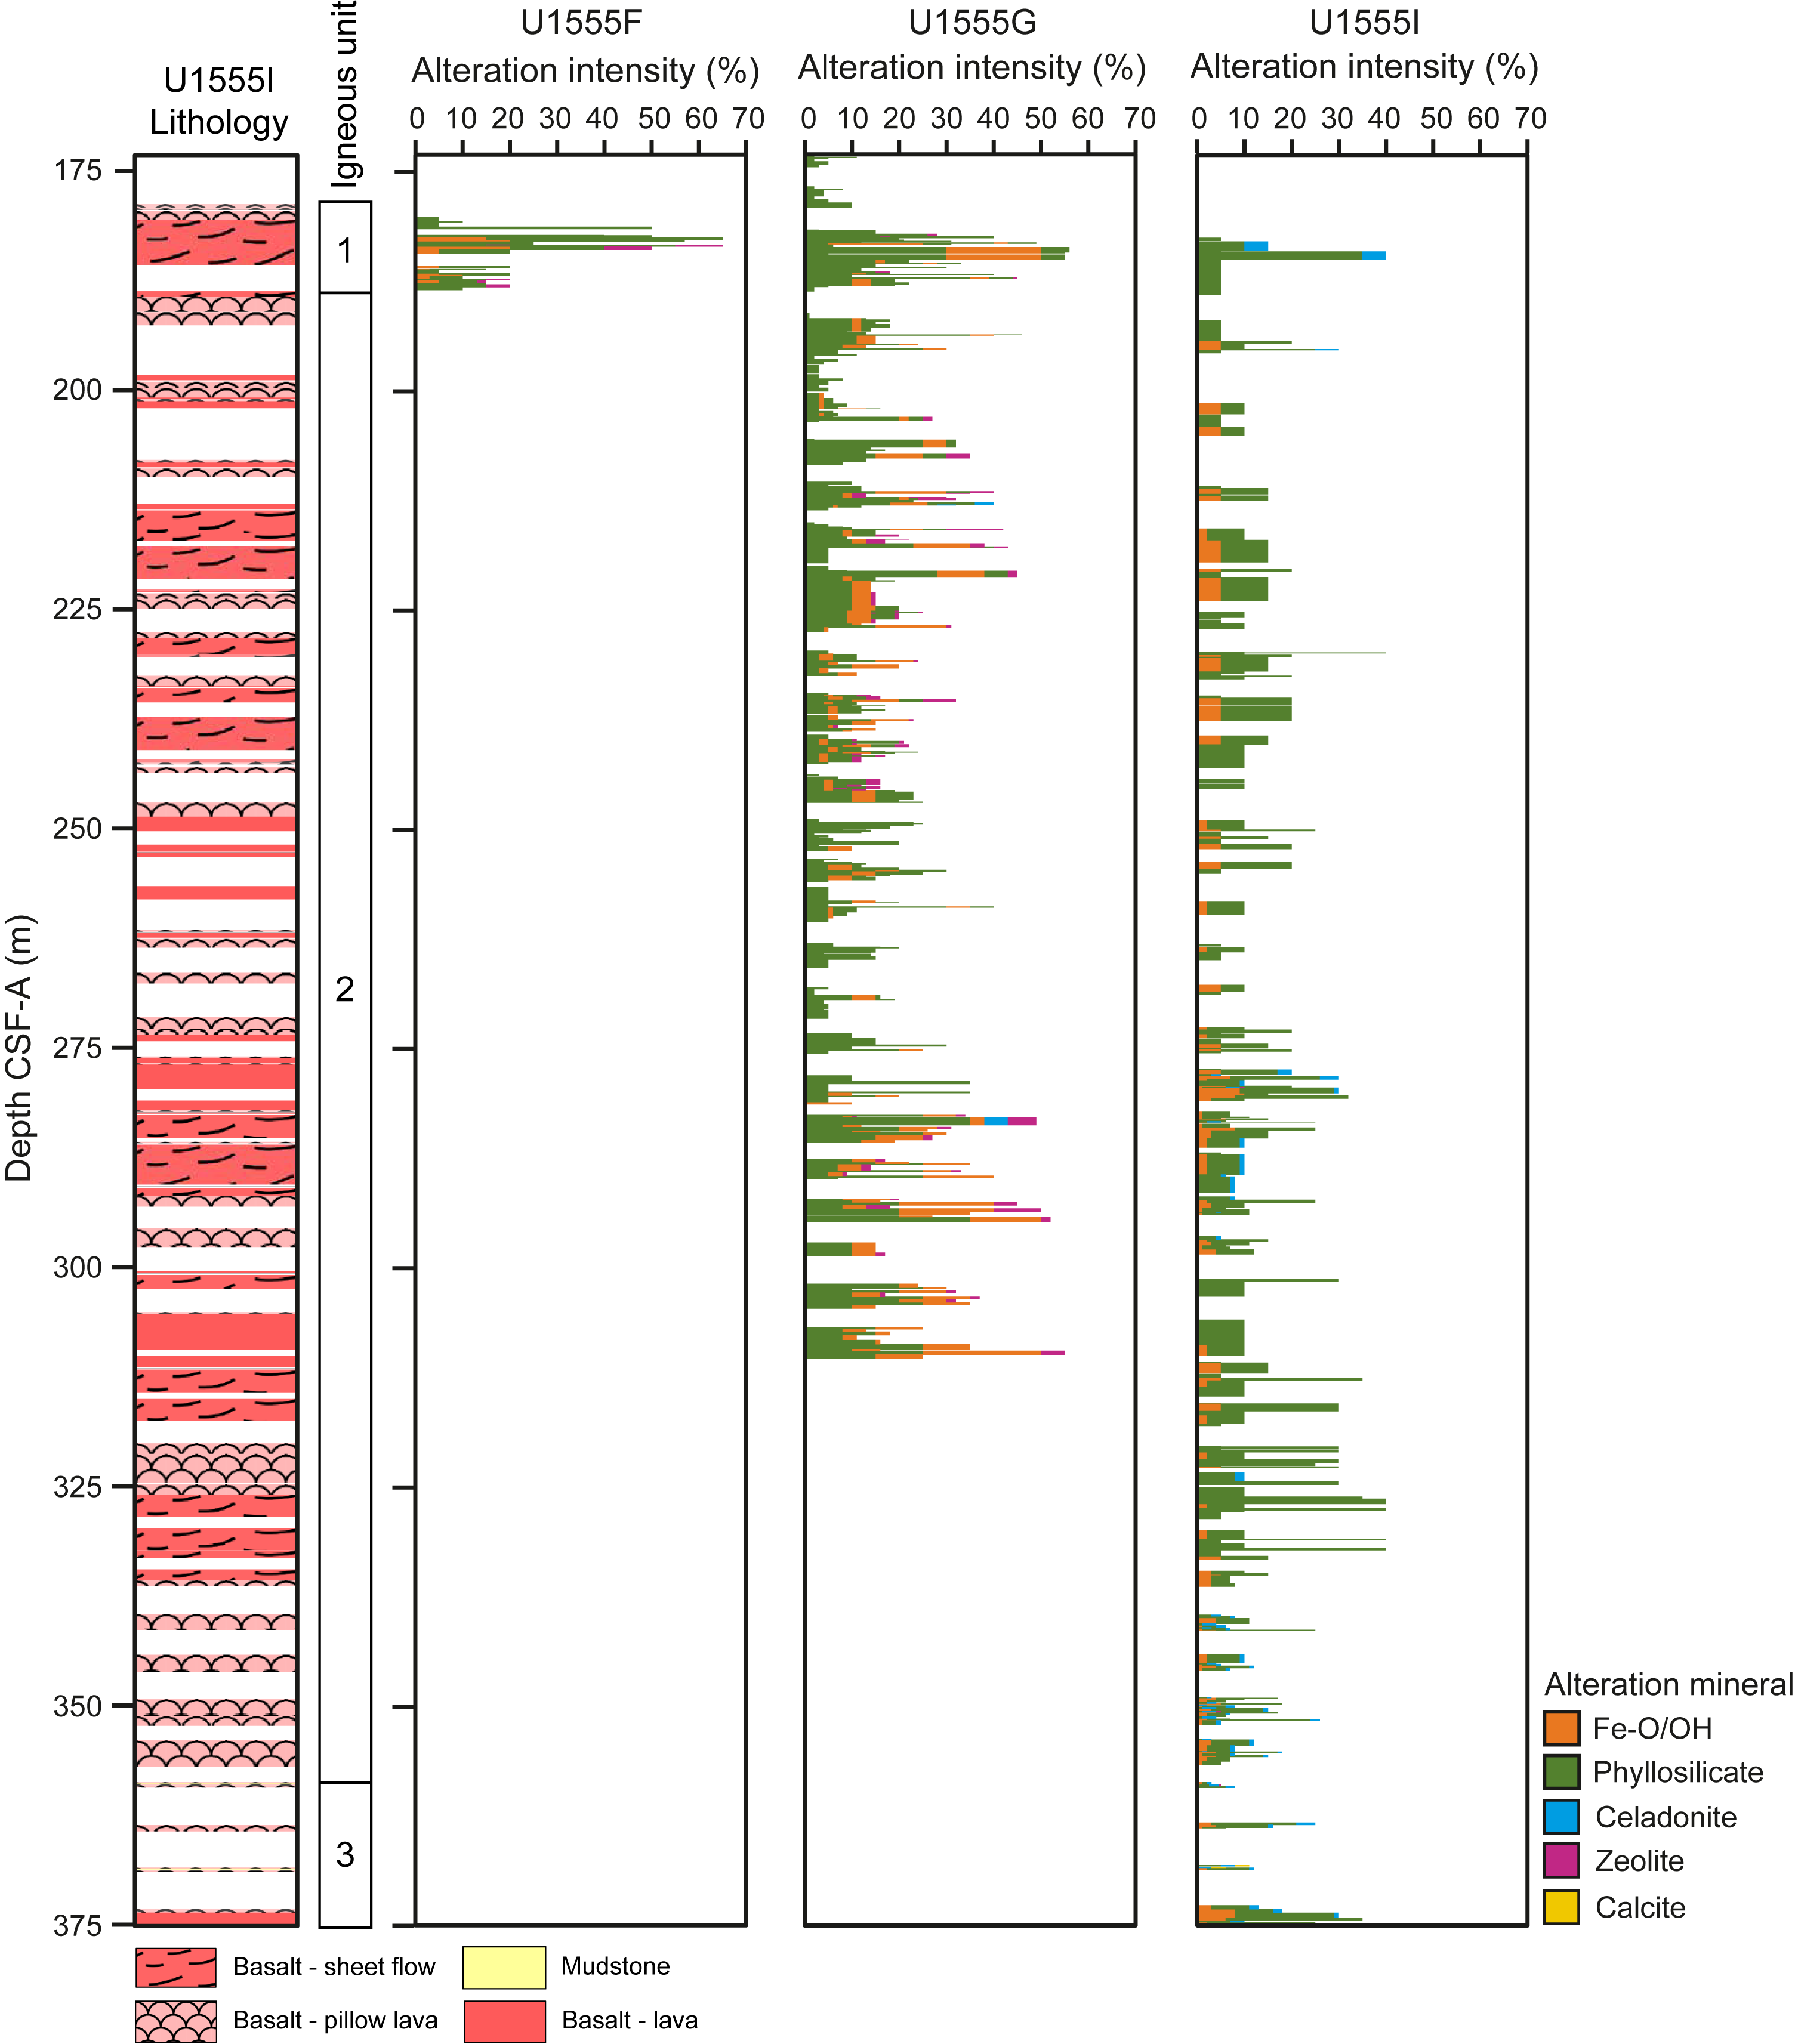
Figure F15. Lithologic interpretation and units and alteration intensity variation and style.
The alteration mineral assemblage in Site U1555 basalt cores is mainly phyllosilicate + Fe-oxide/oxyhydroxides with occasional zeolite and celadonite (Figures F15, F16). It is possible that the zeolite alteration percentage in Holes U1555F and U1555G is overestimated, and some may instead be carbonate. This uncertainty is due to the use of very dilute HCl acid during core description that did not react with observed white-buff colored alteration minerals on this core, which were therefore classified as zeolite. Phyllosilicate and Fe-oxide/oxyhydroxide bulk alteration percentages vary little with depth, although in intervals that are more heavily altered we see increases in the amount of Fe-oxide/oxyhydroxides alteration. Some depth intervals in Holes U1555H and U1555I are primarily phyllosilicate altered, notably at the top of Hole U1555I, which in thin section has a phyllosilicate appearance (Figure F16). Zeolite alteration can appear on fresh basalt and basalt glass surfaces as millimeter-sized, globular crystals, provisionally identified here as phillipsite, which can also be coated in dark blue celadonite.
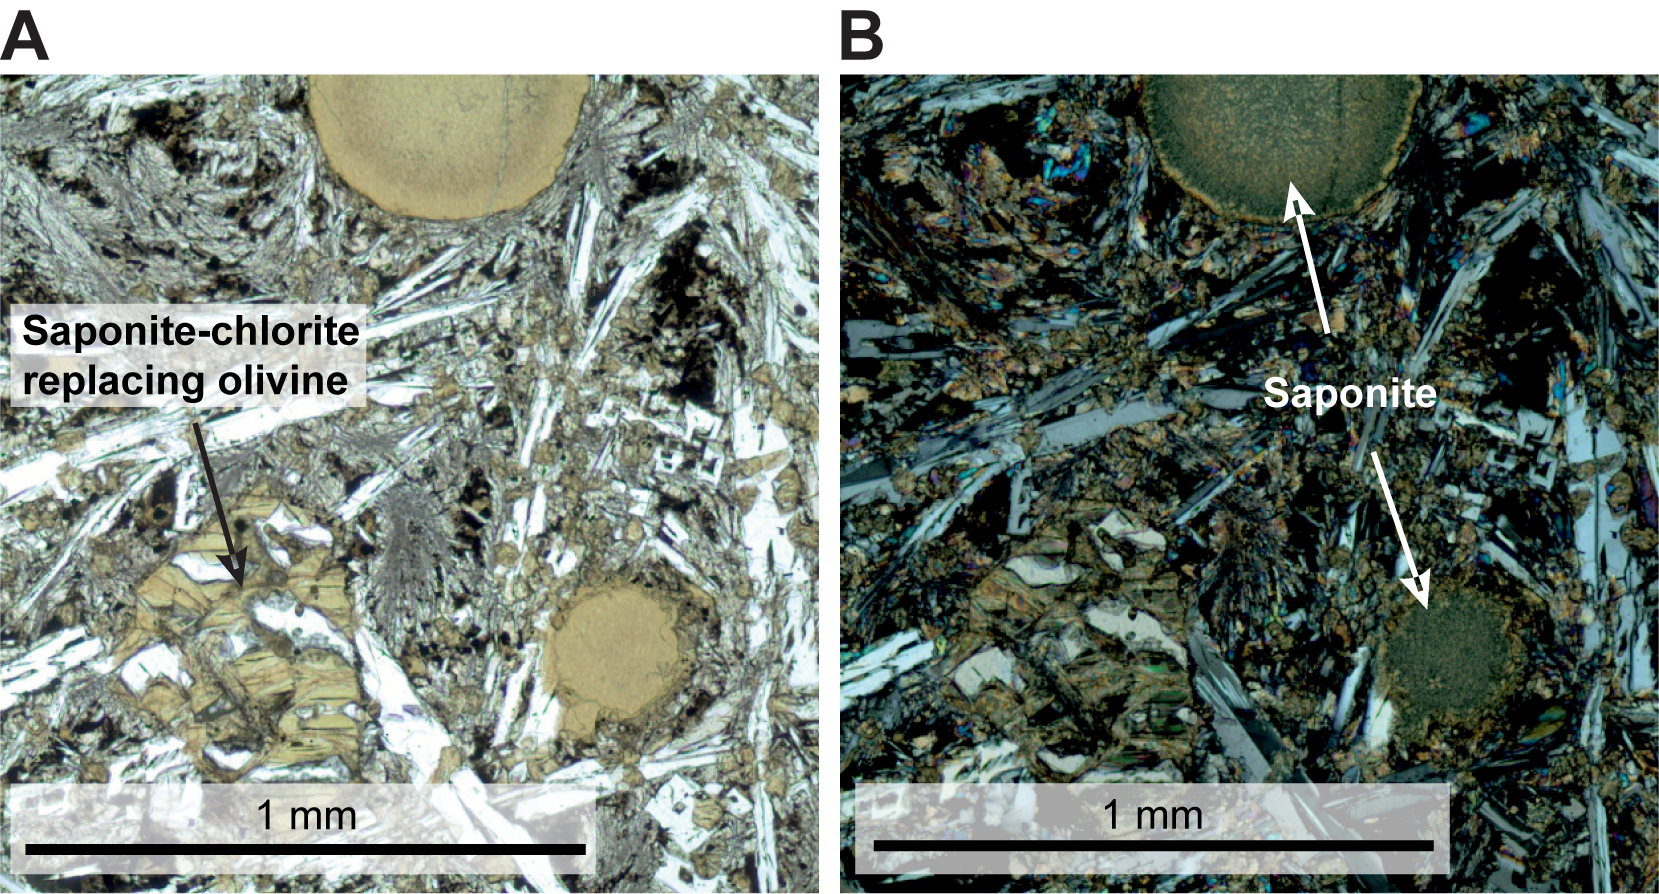
Figure F16. Chlorite and clay/saponite alteration of olivine phenocrysts and groundmass in basalt, and saponite filled vesicles.
Between 20% and 100% of basaltic vesicles are filled with alteration minerals, predominantly celadonite with lesser amounts of carbonate, Fe-oxide/oxyhydroxides, zeolite, phyllosilicate, and sulfides (pyrrhotite, hematite, and pyrite) (Figure F17). Most vesicles show a color zonation in their mineral fill, with celadonite-filled vesicles exhibiting a range of colors from dark blue to pale blue to pale green (Figure F17A, F17F). Dark blue celadonite in vesicles is more commonly observed in fresh basalt intervals. There is no correlation between the percentage of vesicles filled with alteration minerals and the alteration intensity of the basalt core in Site U1555. In some large vesicles, zeolite crystals with acicular forms are provisionally identified as natrolite.
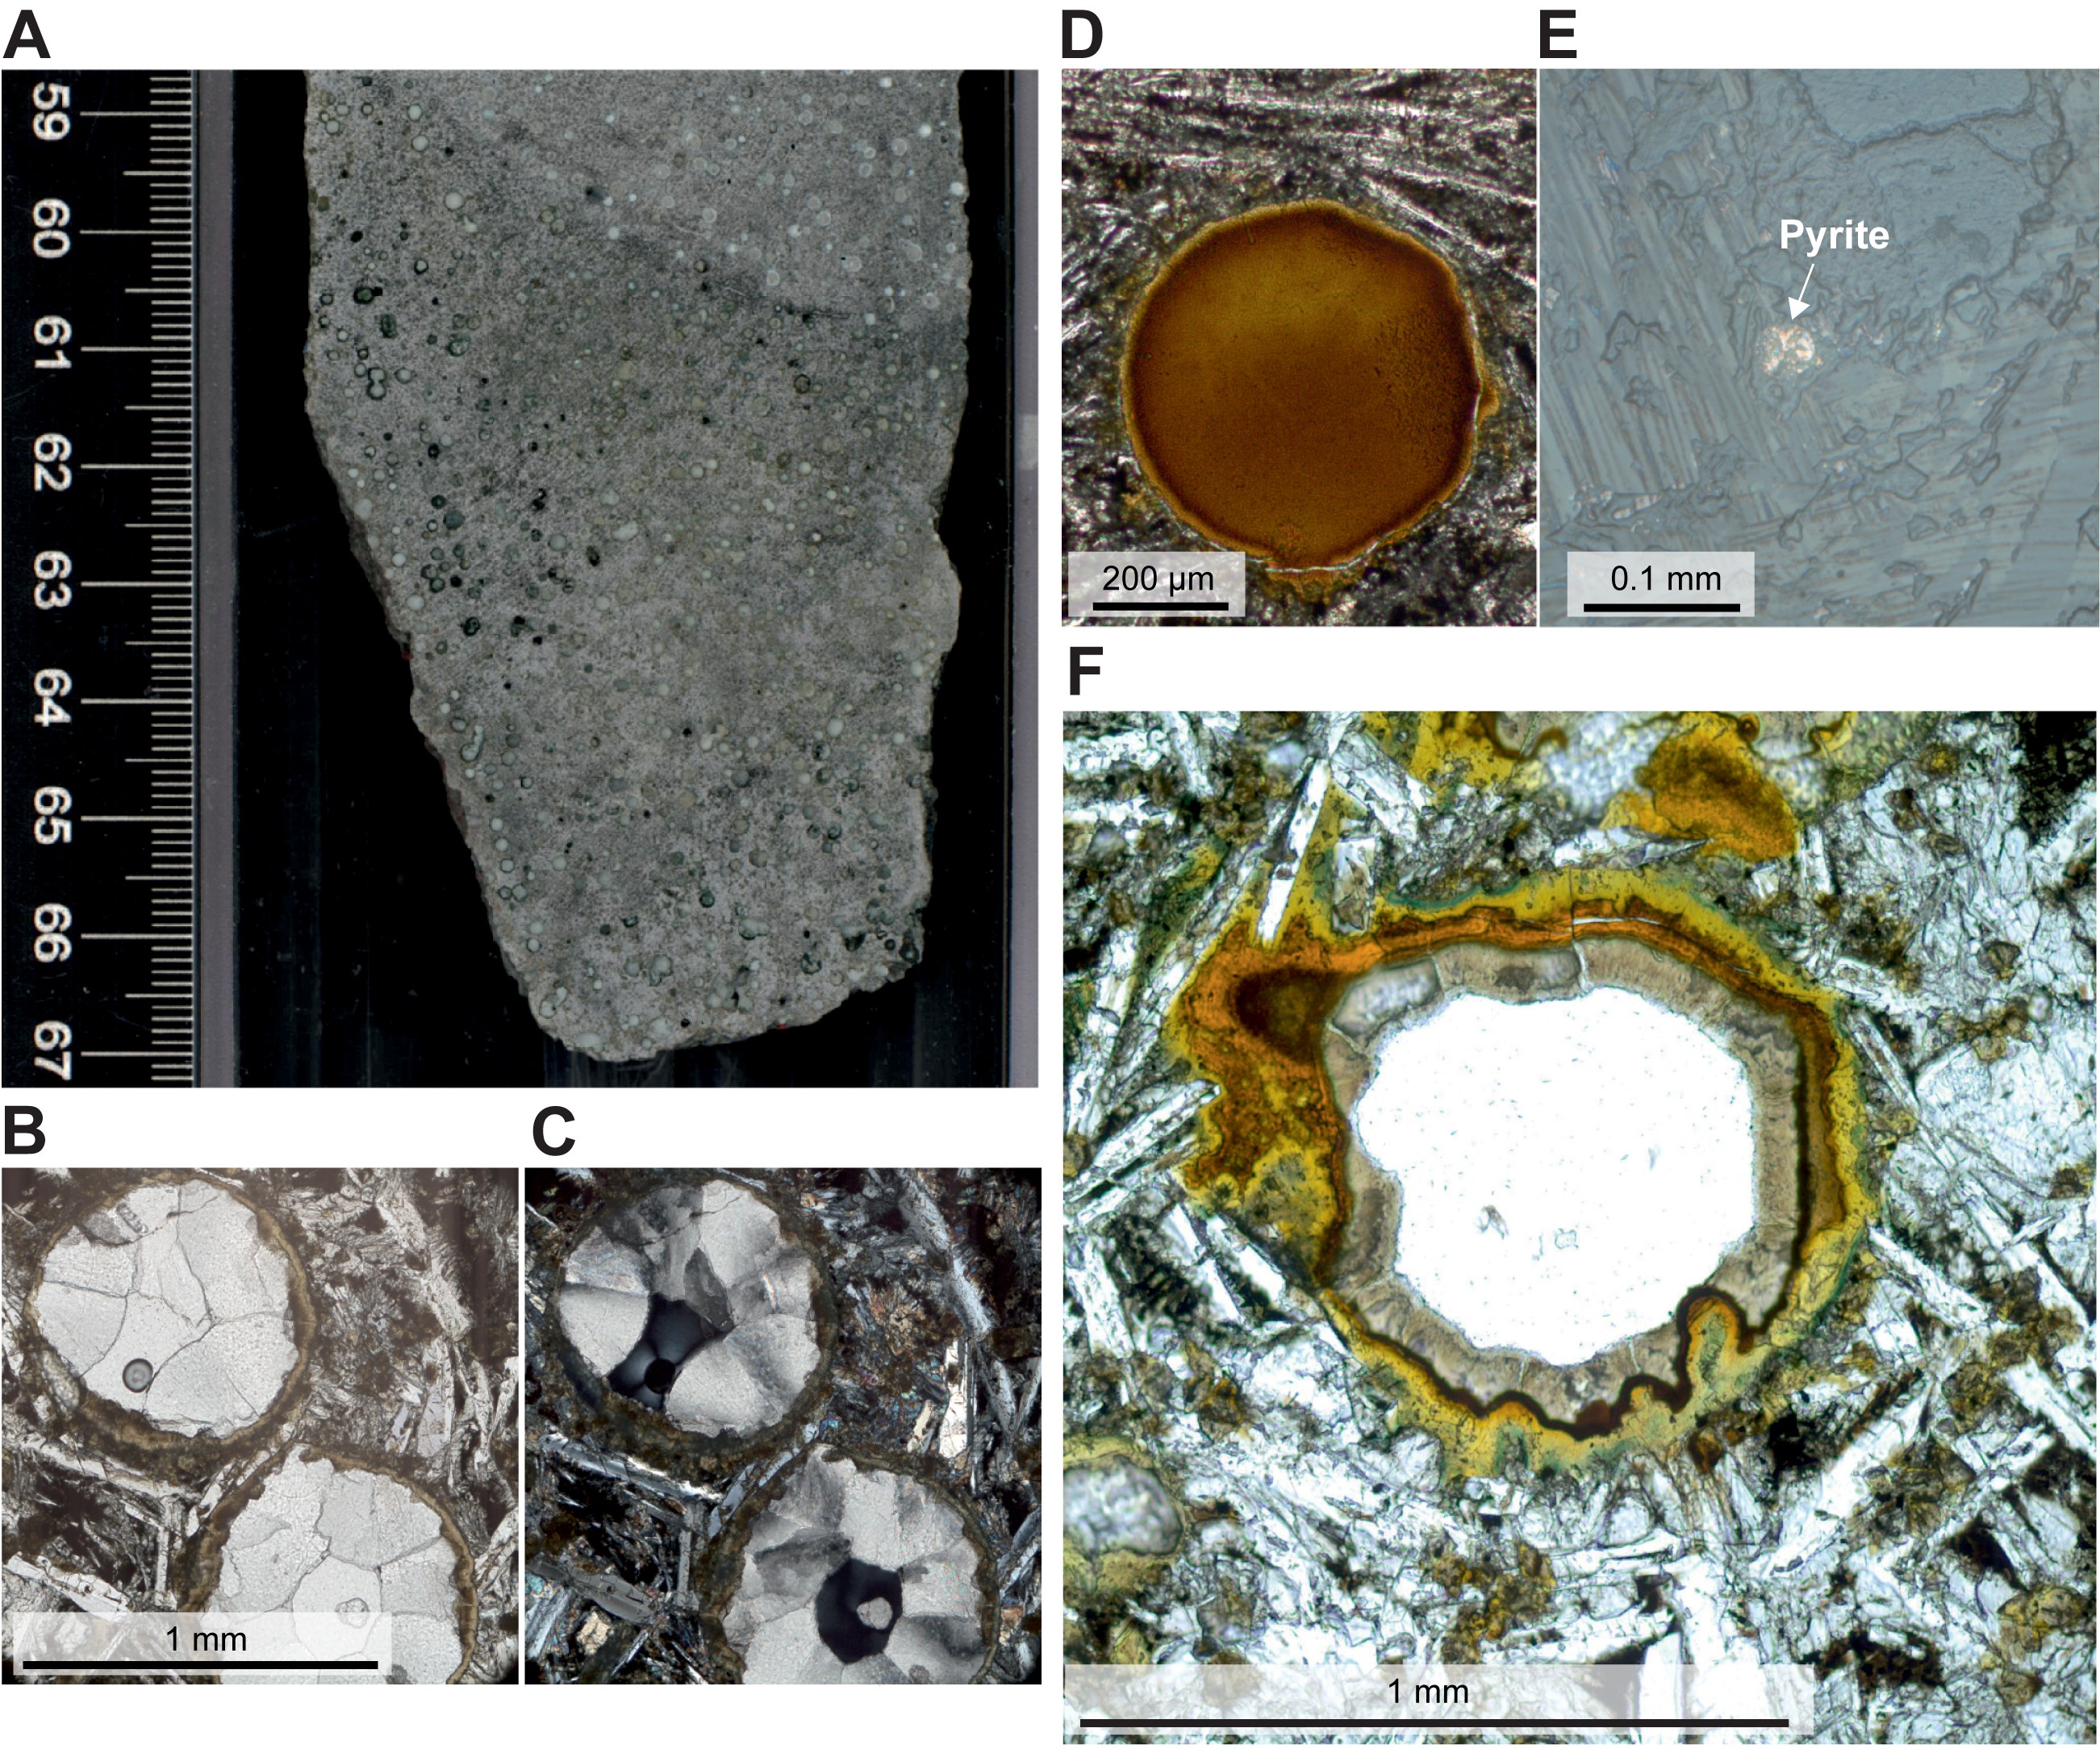
Figure F17. Vesicle fill and pyrite.
Energy dispersive spectrometry (EDS) was used to obtain elemental maps (for Mg, Al, Si, Fe, and K) and spectra of a filled vesicle from thin section Sample 395C-U1555I-41R-1, 84–87 cm, and from two zones of interest within this vesicle mineral fill (Figure F18). The EDS spectrum for Zone 1 shows strong Mg, Al, O, and Si peaks indicative of a chlorite/smectite vesicle fill connected to a similarly filled fracture cutting through the vesicle. The EDS spectrum for Zone 2 shows strong peaks in Si, Mg, Al, O, and K (minor Ca and Fe peaks), indicating a celadonite layer within the vesicle.
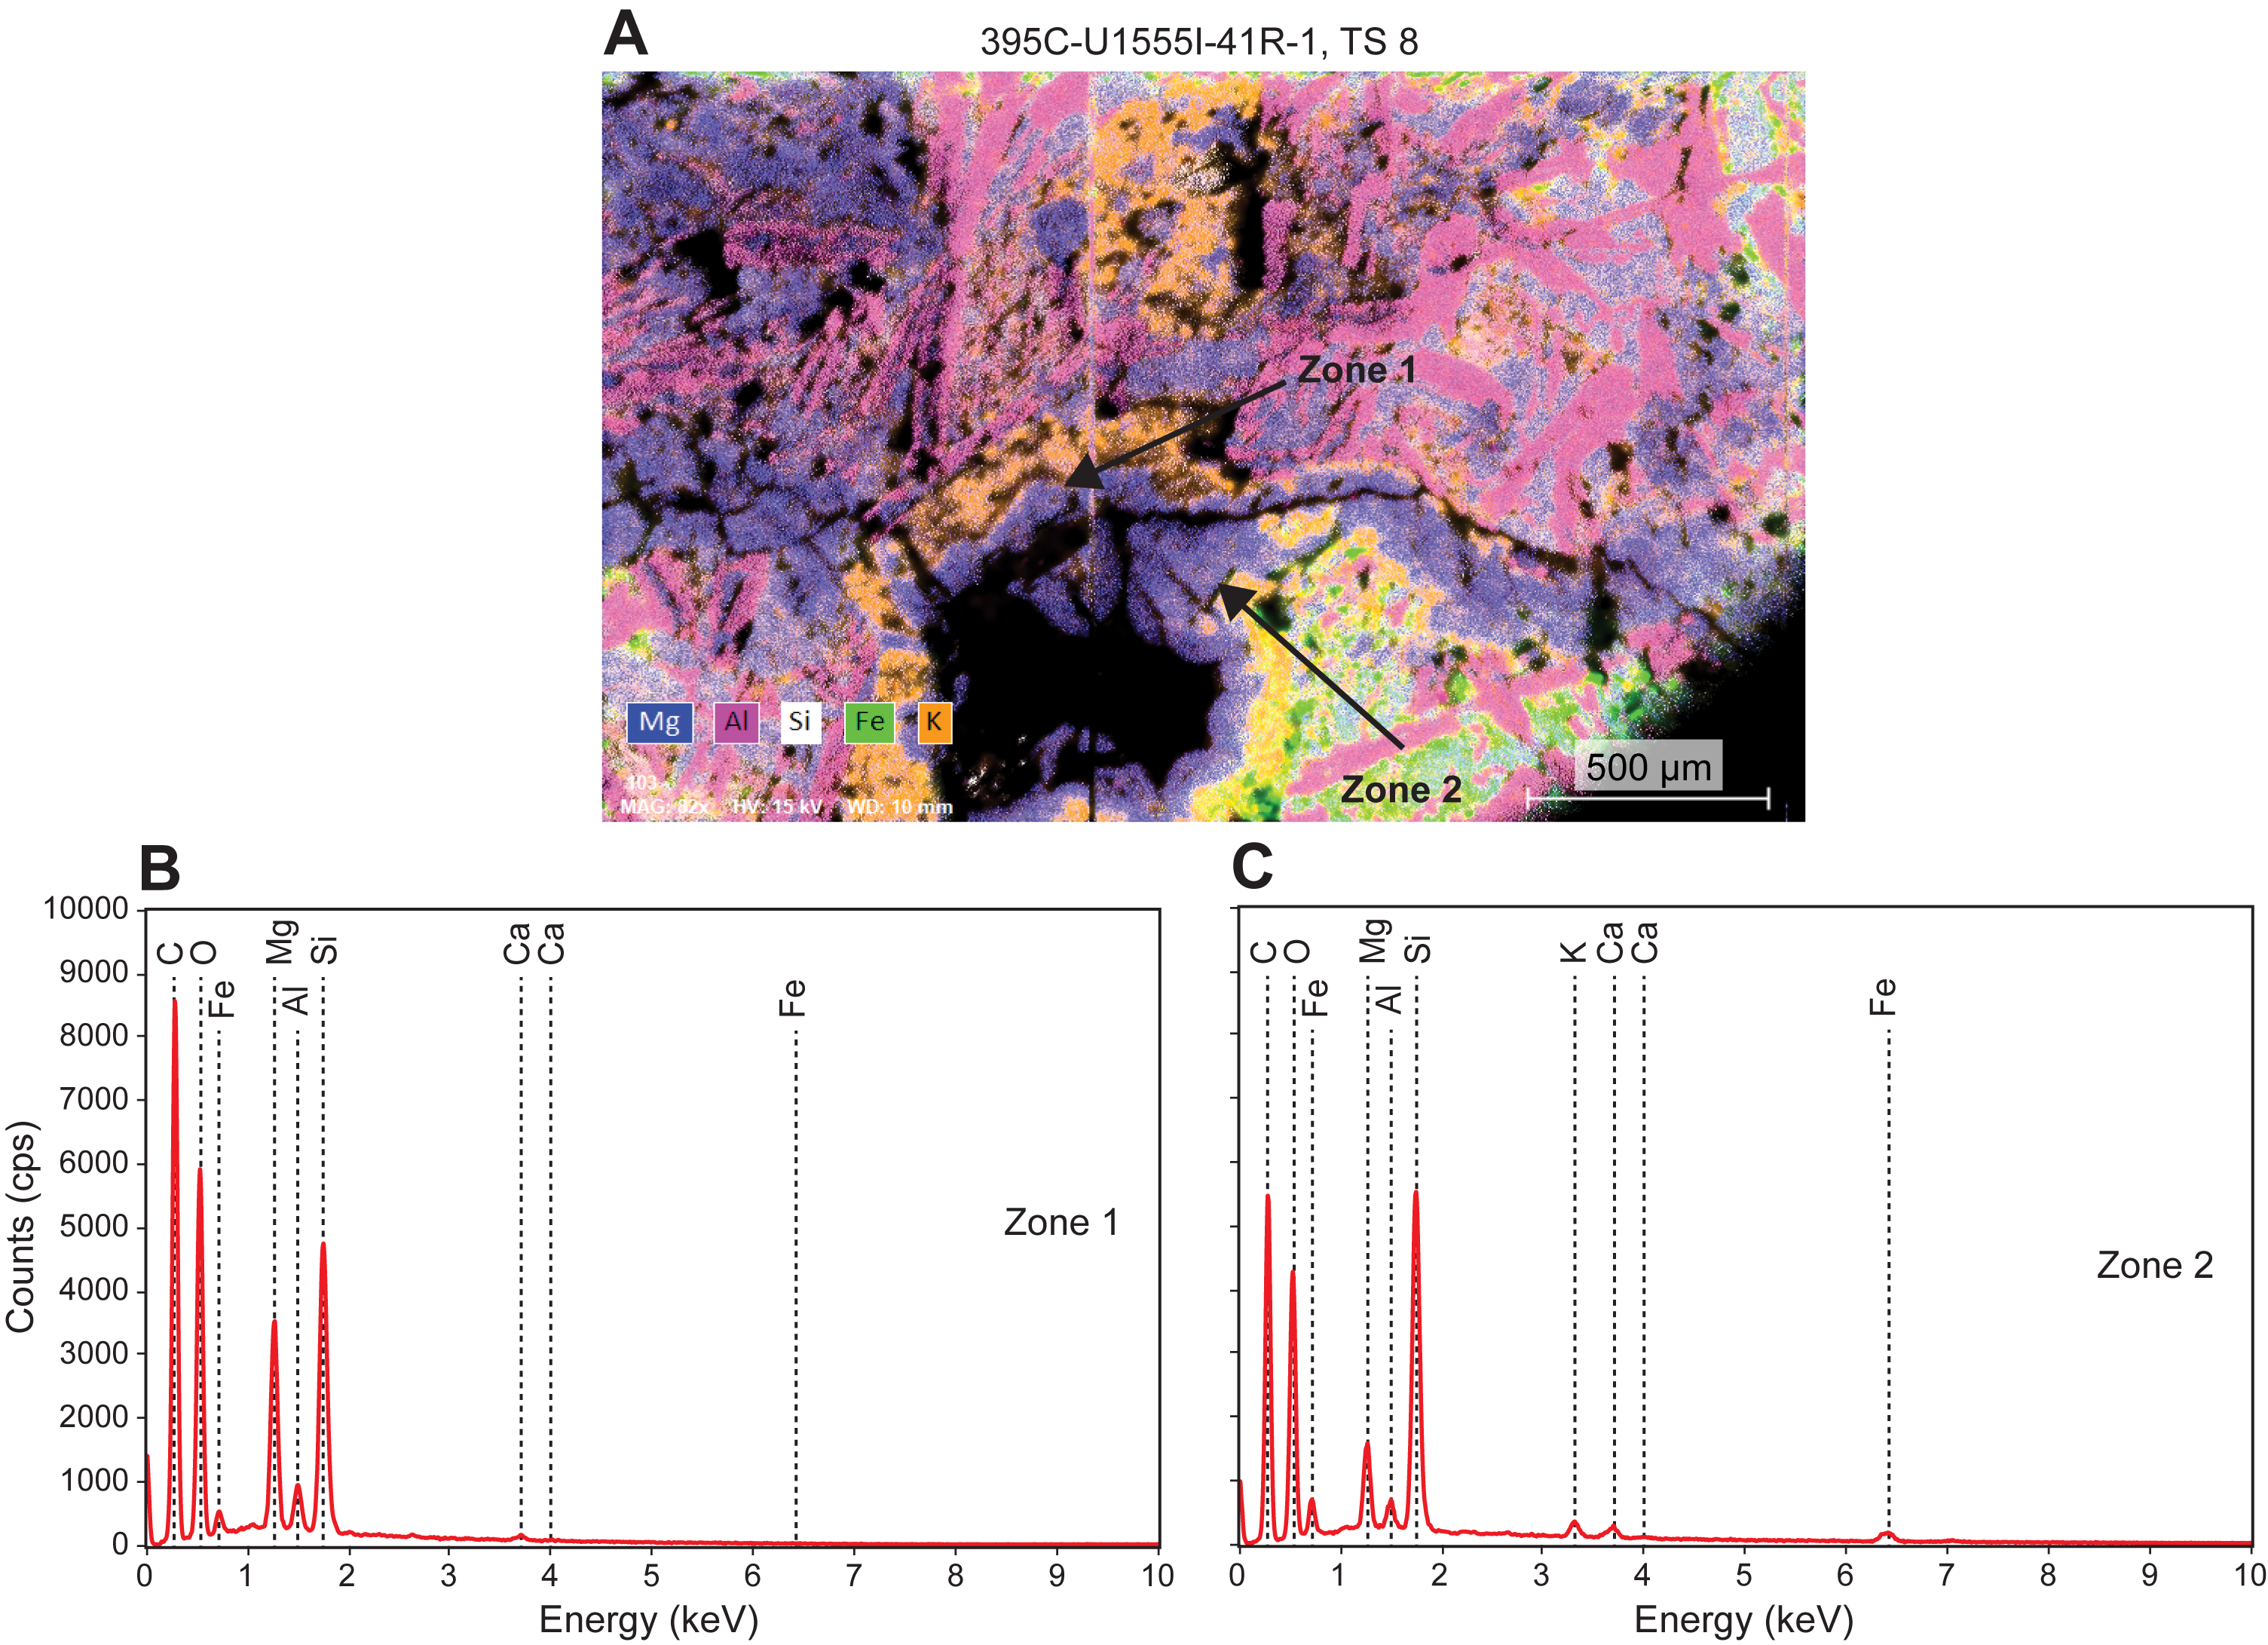
Figure F18. Filled fracture cutting through a filled vesicle.
5.2. Structural geology
Fracture density in Holes U1555F, U1555G, and U1555I is ~14 fractures per meter of recovered core and ~12 fractures per meter of curated core (Figure F19). An interval of higher fracture density is observed in Hole U1555G at ~218–222 m CSF-A (32 fractures per meter of curated core). An increase in fracture density at this depth interval is also apparent in Hole U1555I (16 fractures per meter of curated core at 200–222 m CSF-A), with an additional deeper interval of higher fracture density observed in this hole (~22 fractures per meter of curated core at 285–292 m CSF-A). Basement core recovered from Hole U1555F at 182–184 m CSF-A is more densely fractured than core recovered between 176 and 182 m CSF-A.
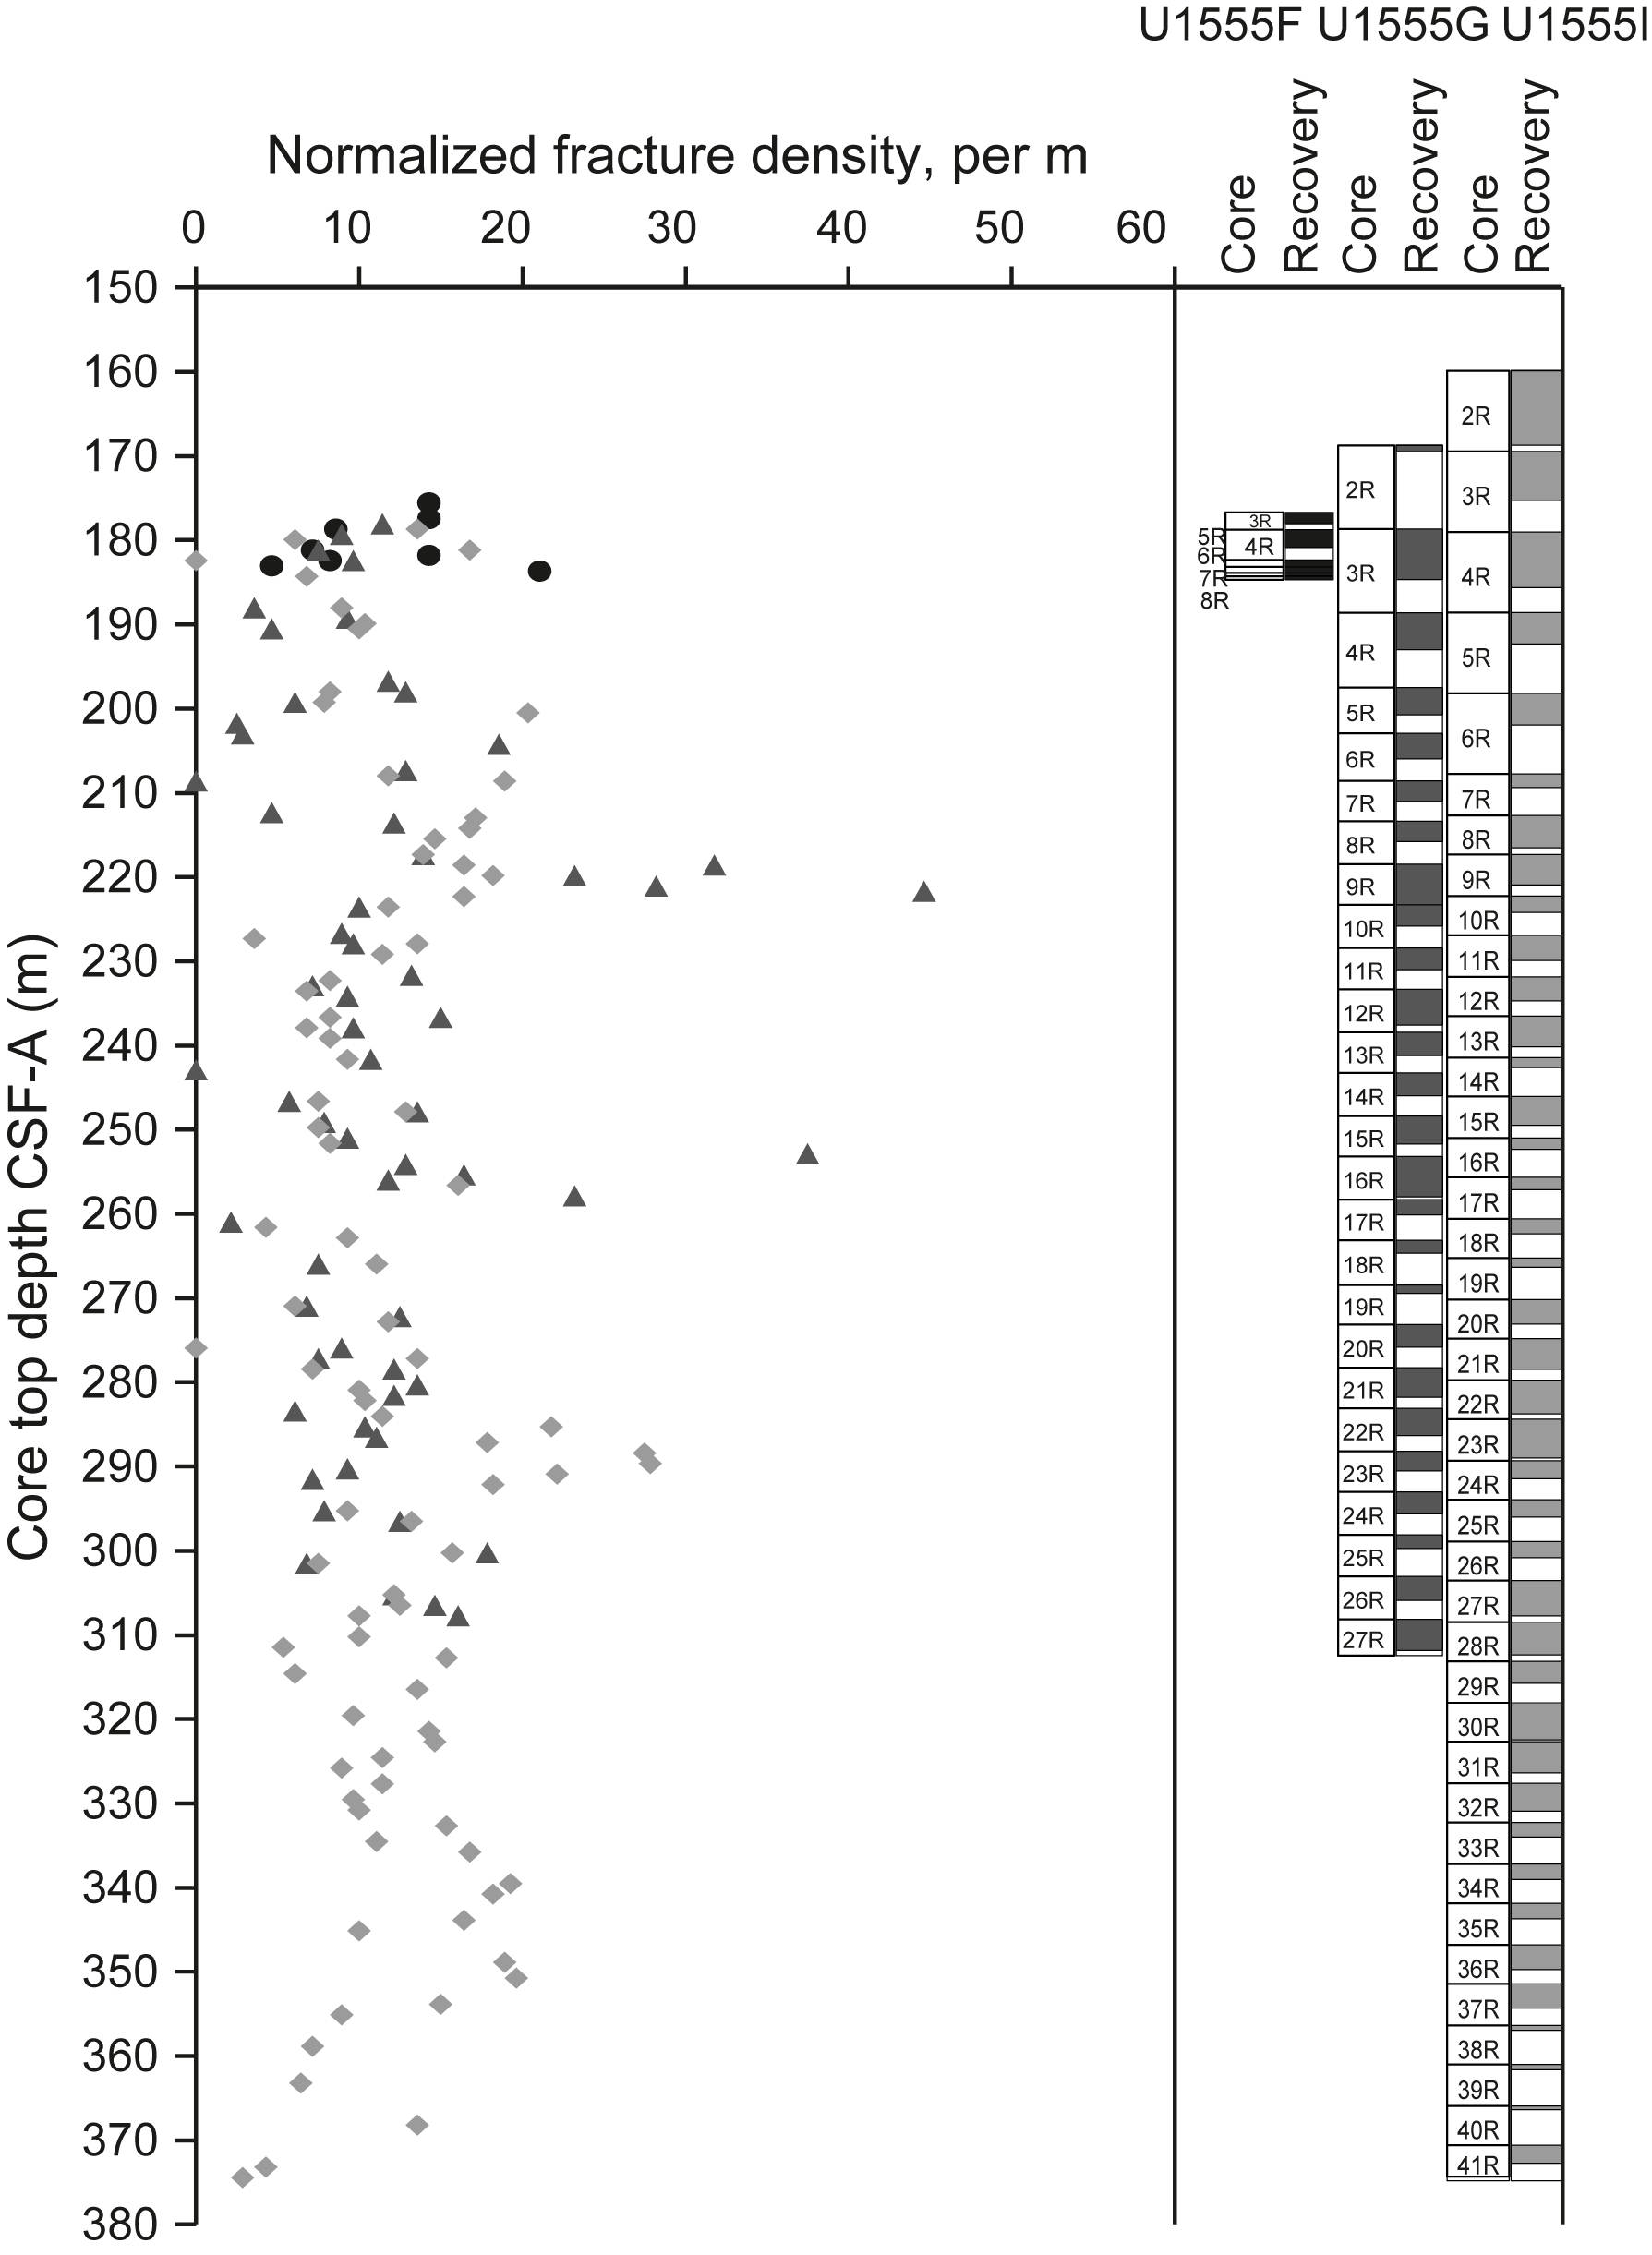
Figure F19. Fracture density.
Fractures (Figure F20) are typically ≤0.5 mm wide (95%). The widest fractures are associated with a 4 mm wide celadonite vein in Hole U1555I at 238.22 m CSF-A and a 4 mm wide chlorite + Fe-oxide/oxyhydroxide + clay vein in Hole U1555G at 217.31 m CSF-A (Figure F21). Most of the observed fracture types are classified as unknown (25%) or partially open (60%) (Figure F22A), whereas completely mineralized veins represent ~15% and open fractures make up <1%. Fractures (Figure F22B) are mostly planar in shape (69%), with 23% anastomosing and the remaining 8% taking a variety of other shapes. Fracture connectivity (Figure F22C) at Site U1555 is mostly either documented as single (not connected to other fractures; 44%) or cross-cutting (40%). A further 15% of fractures are described as part of a complex network of interconnected fractures. Fractures observed at Site U1555 do not seem to have a preferred attitude with respect to the core axis (Figure F22D).
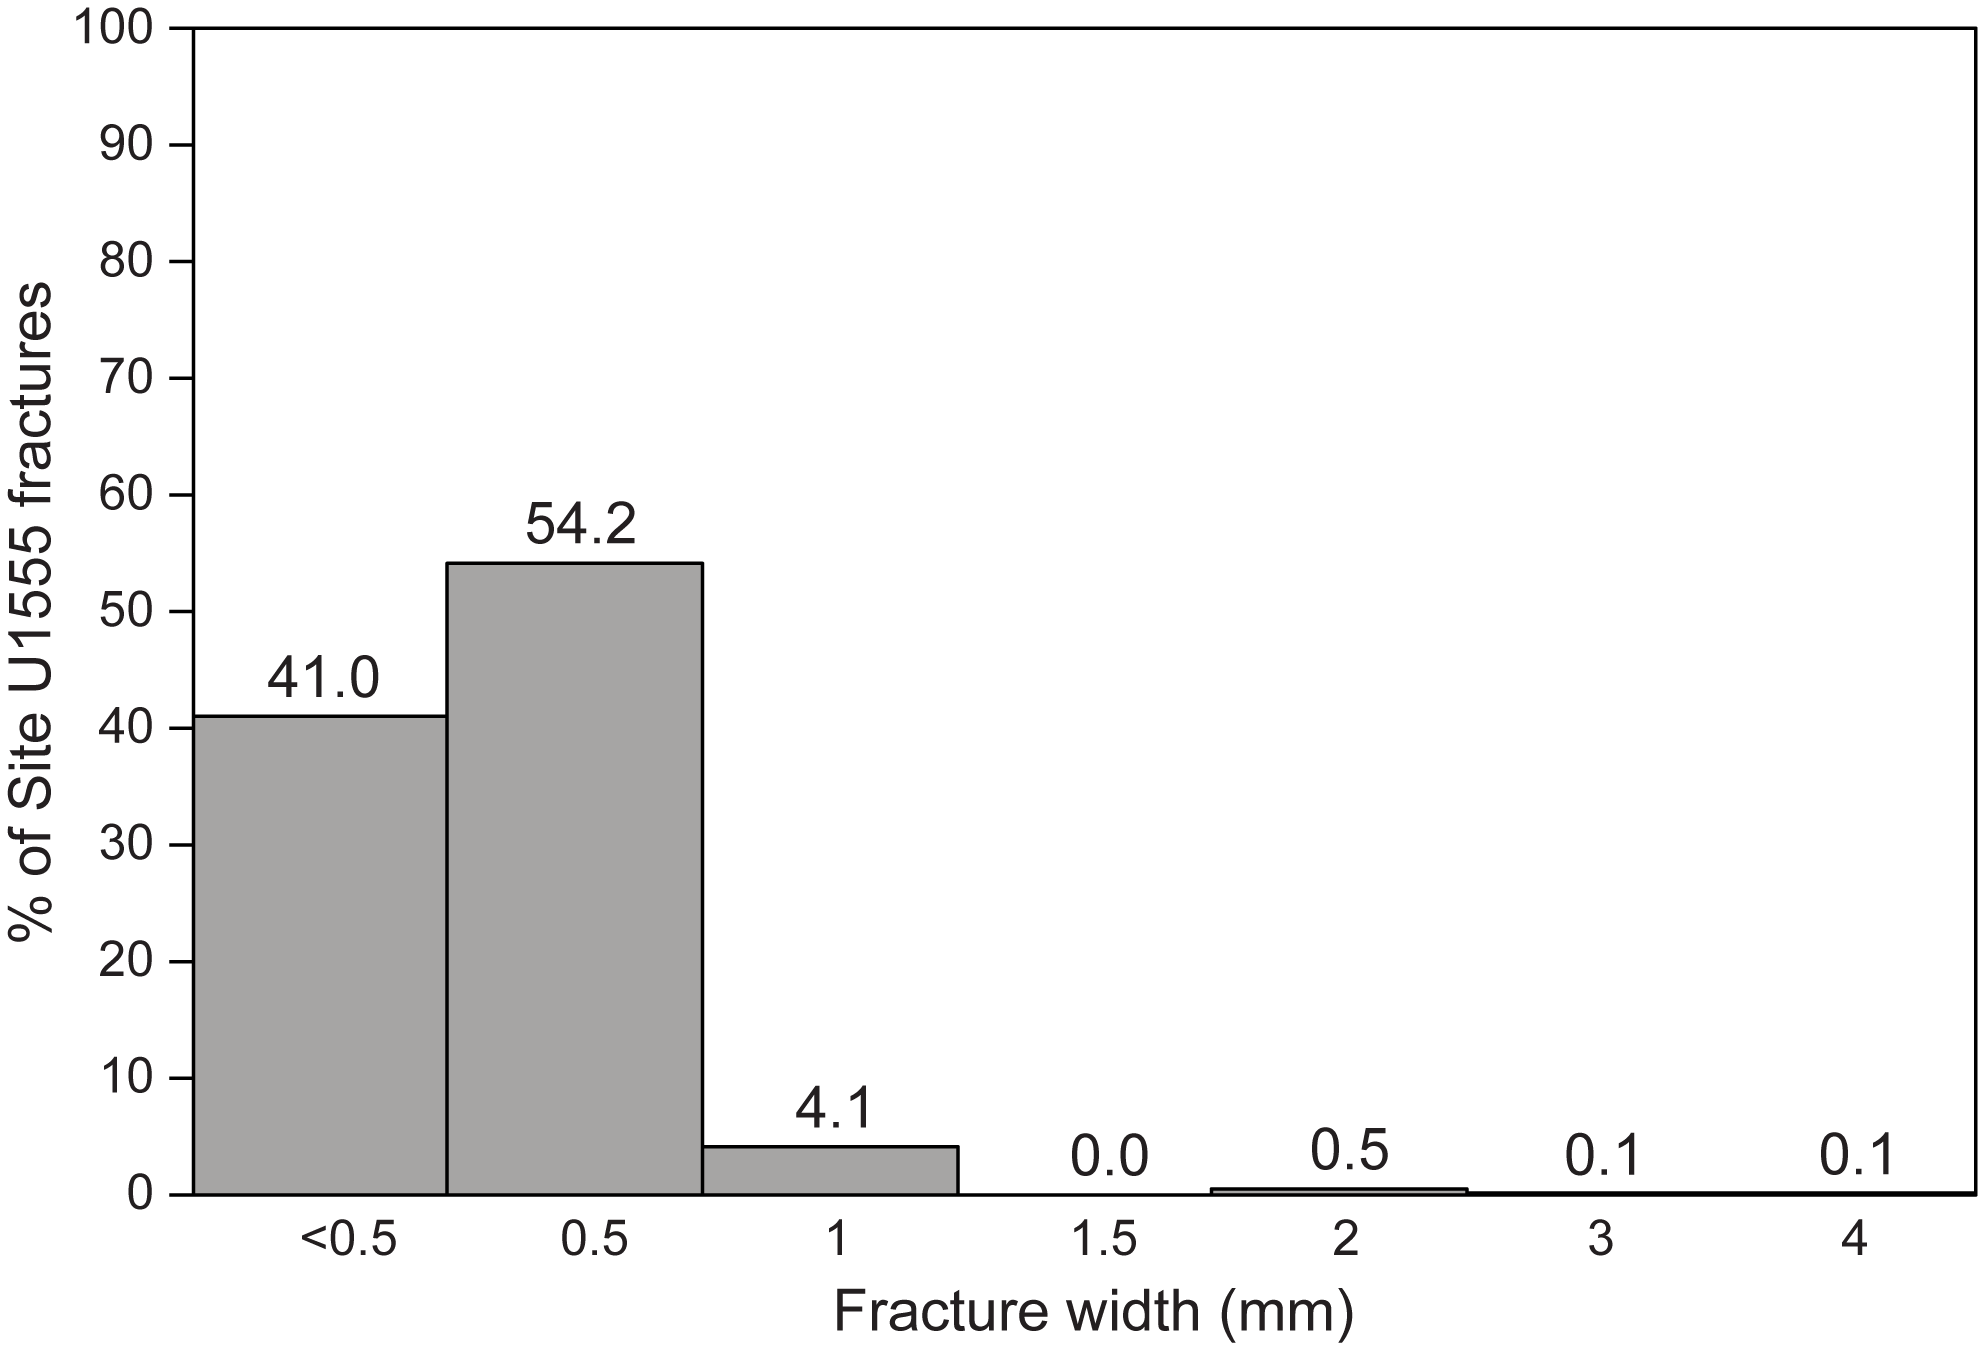
Figure F20. Fracture width distribution.
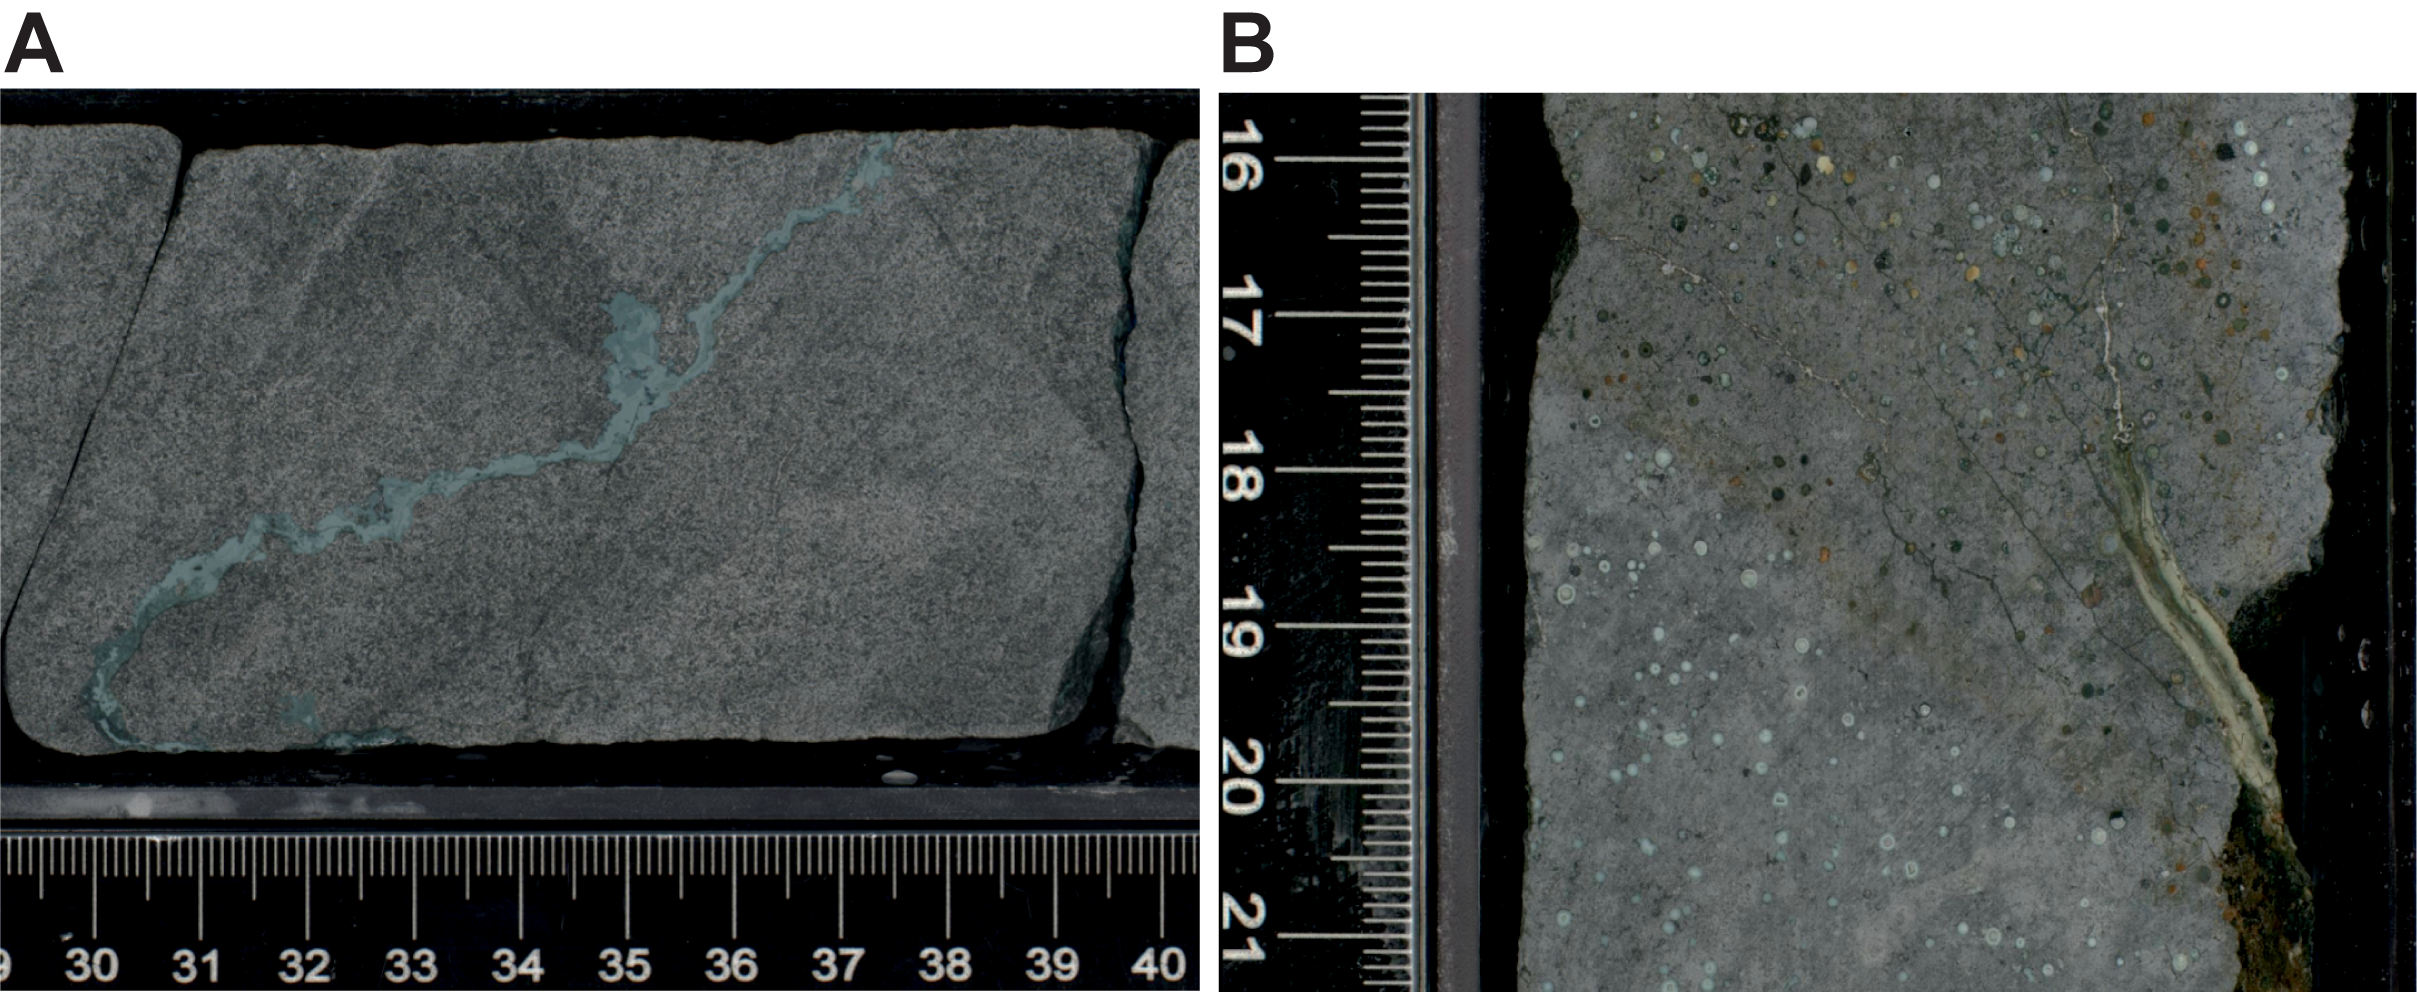
Figure F21. Filled fractures.
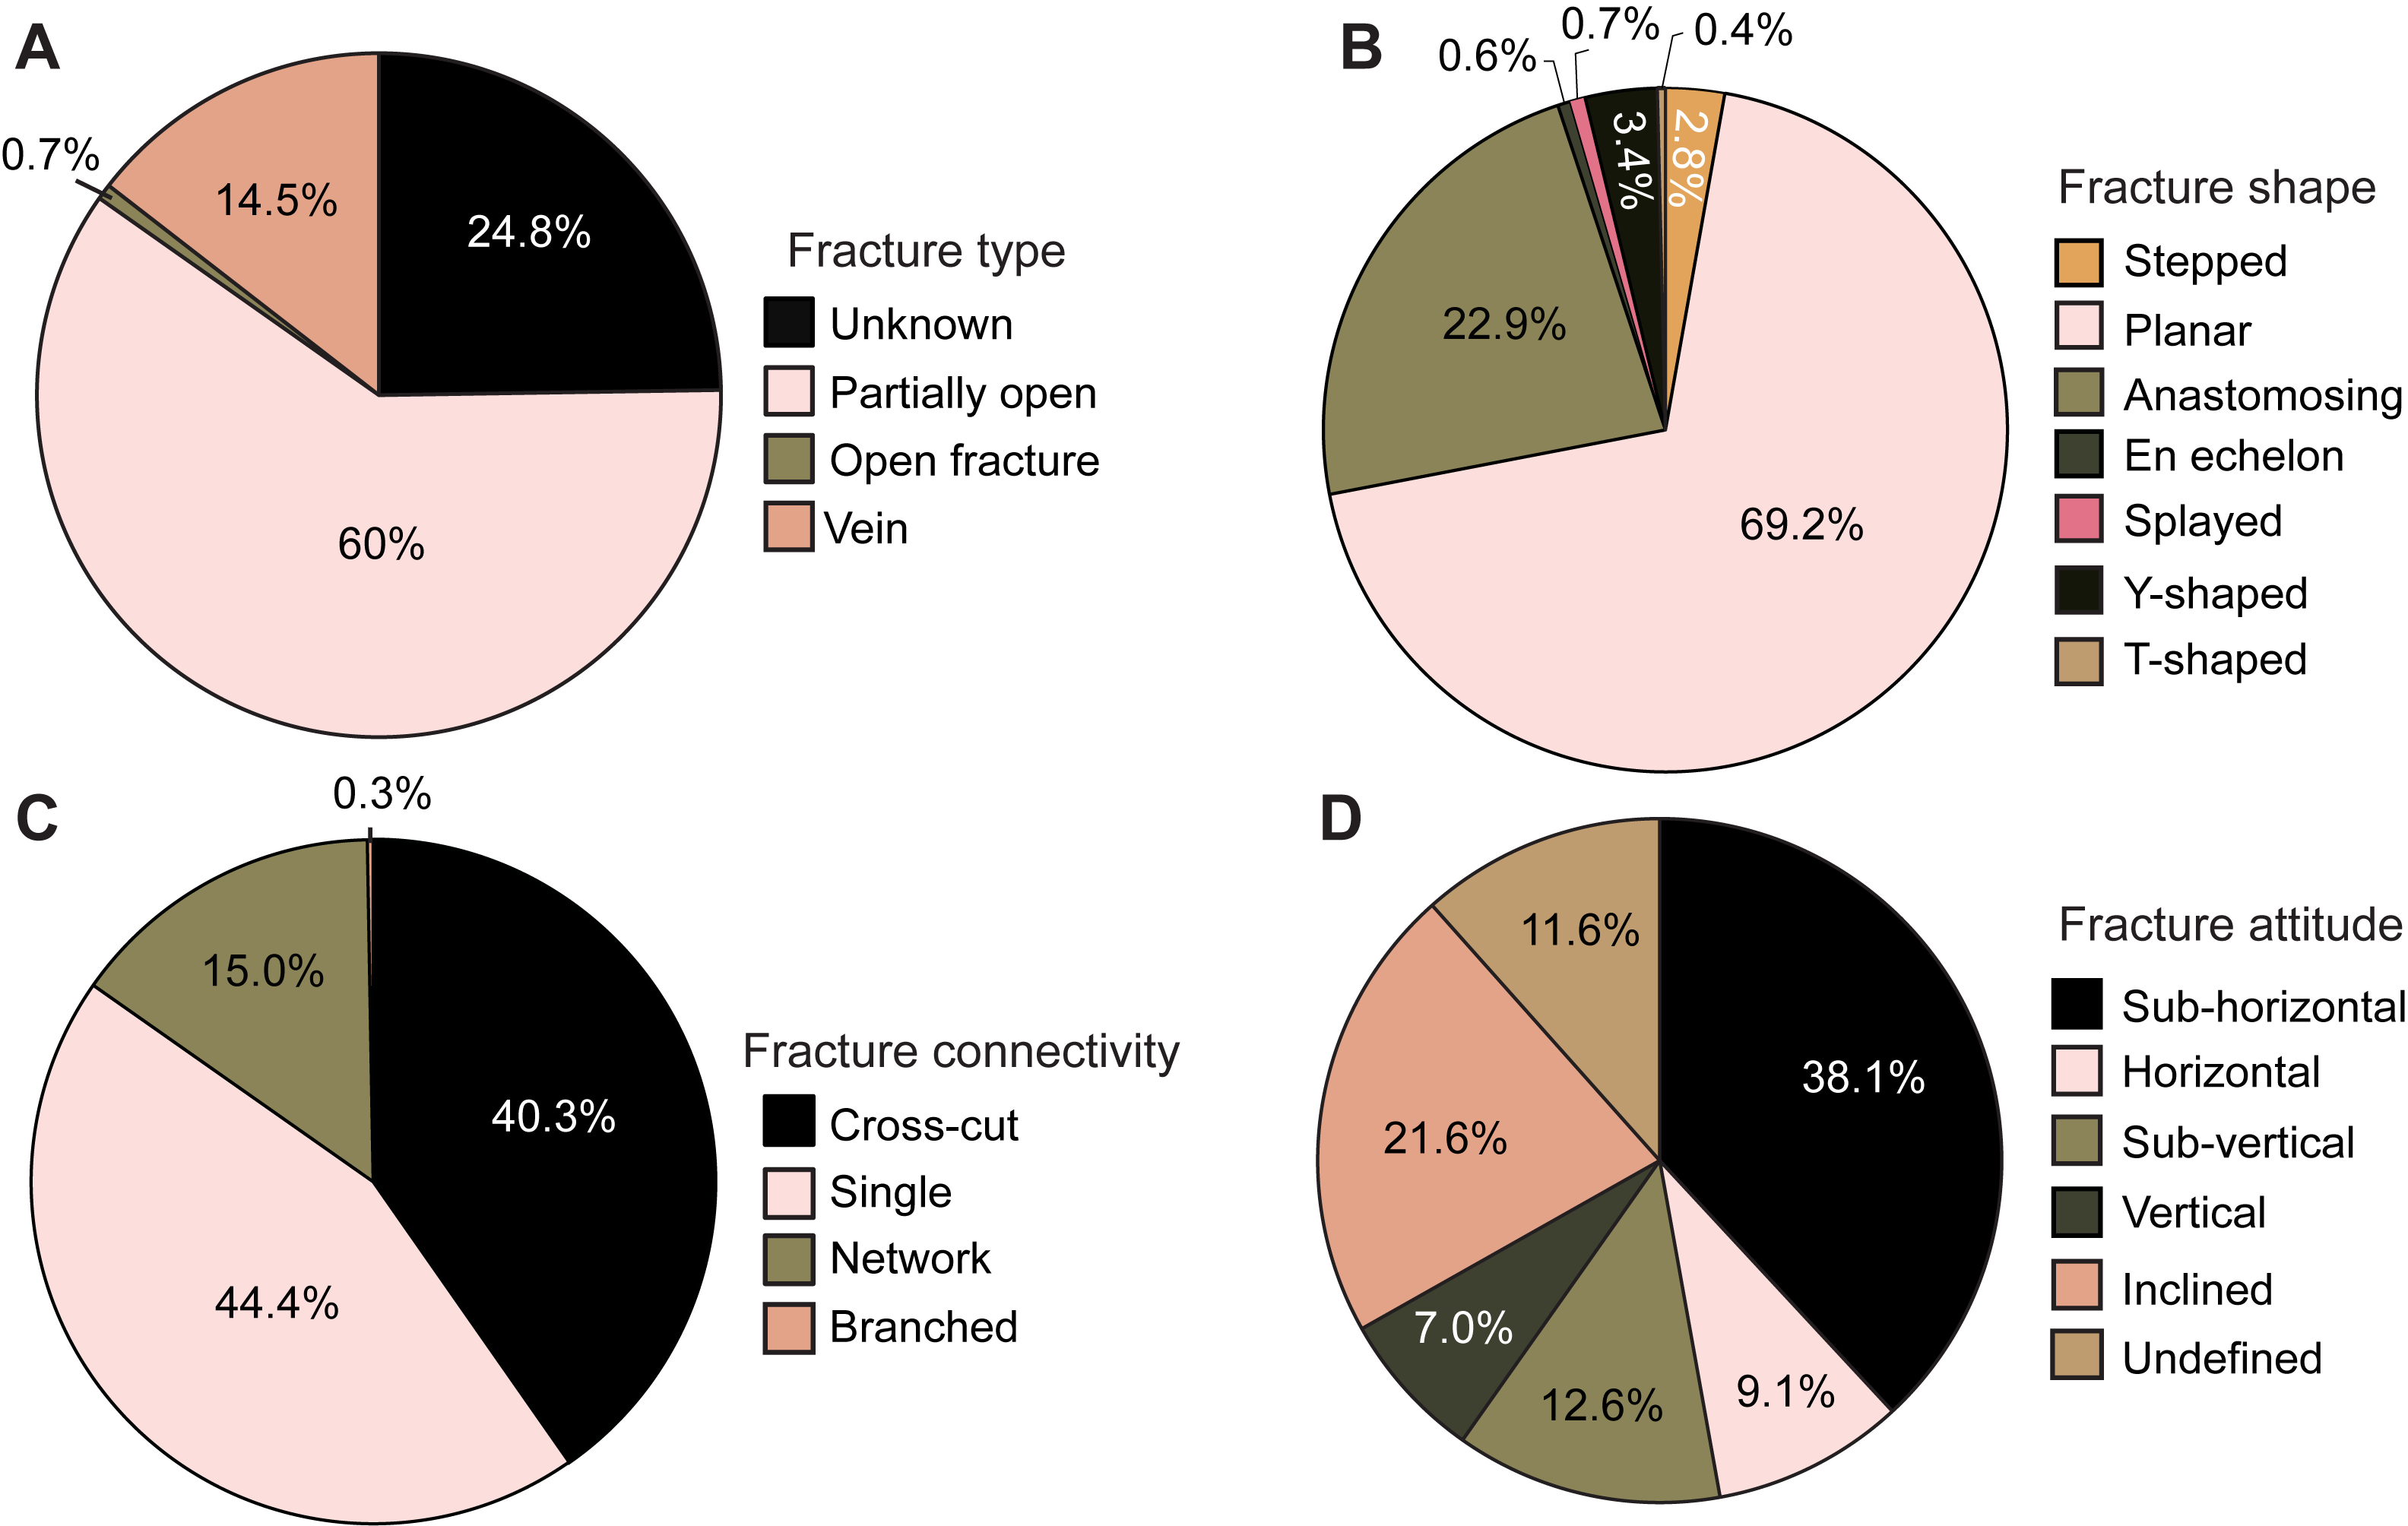
Figure F22. Fractures.
Most fracture mineral fill is classified as cryptocrystalline, and mineralogy was therefore primarily determined by color and reaction to dilute HCl acid. Figure F23 shows the occurrence of fracture mineral fill against depth for Holes U1555F, U1555G, and U1555I. Fracture mineral fill is also reported in Hole U1555H, but only one carbonate-filled fracture was reported from the basalt core from this hole. For approximately the first meter from the top of the basalts in Hole U1555F, fractures are filled with predominantly carbonate, below which, for the remaining 6 m, the primary fracture fill changes to phyllosilicate + Fe-oxide/oxyhydroxides. In Holes U1555G and U1555I, fracture fill mineralogy varies with depth between two broad assemblages: one dominated by phyllosilicate + Fe-oxide/oxyhydroxides and another dominated by celadonite + zeolites. Hole U1555I shows these two fracture fill assemblages intermixed from 0 to 271 m CSF-A. The primary fracture fill is phyllosilicate + Fe-oxide/oxyhydroxides at 271–300 m CSF-A, celadonite + zeolite at 300–332 m CSF-A, and phyllosilicate + Fe-oxide/oxyhydroxides again at 332–375 m CSF-A. We note that the phyllosilicate + Fe-oxide/oxyhydroxide-rich interval (271–300 m CSF-A) coincides with an interval of increased fracture density. A similar fracture fill pattern can be observed in Hole U1555G with mixed fracture fill assemblages at 178–218 m CSF-A, primarily phyllosilicate + Fe-oxide/oxyhydroxide fracture fill assemblages at 218–243 m CSF-A, celadonite + zeolite fracture fill assemblages at 243–278 m CSF-A, and back to phyllosilicate + Fe-oxide/oxyhydroxide fracture fill assemblages at the bottom of the hole (278–309 m CSF-A).
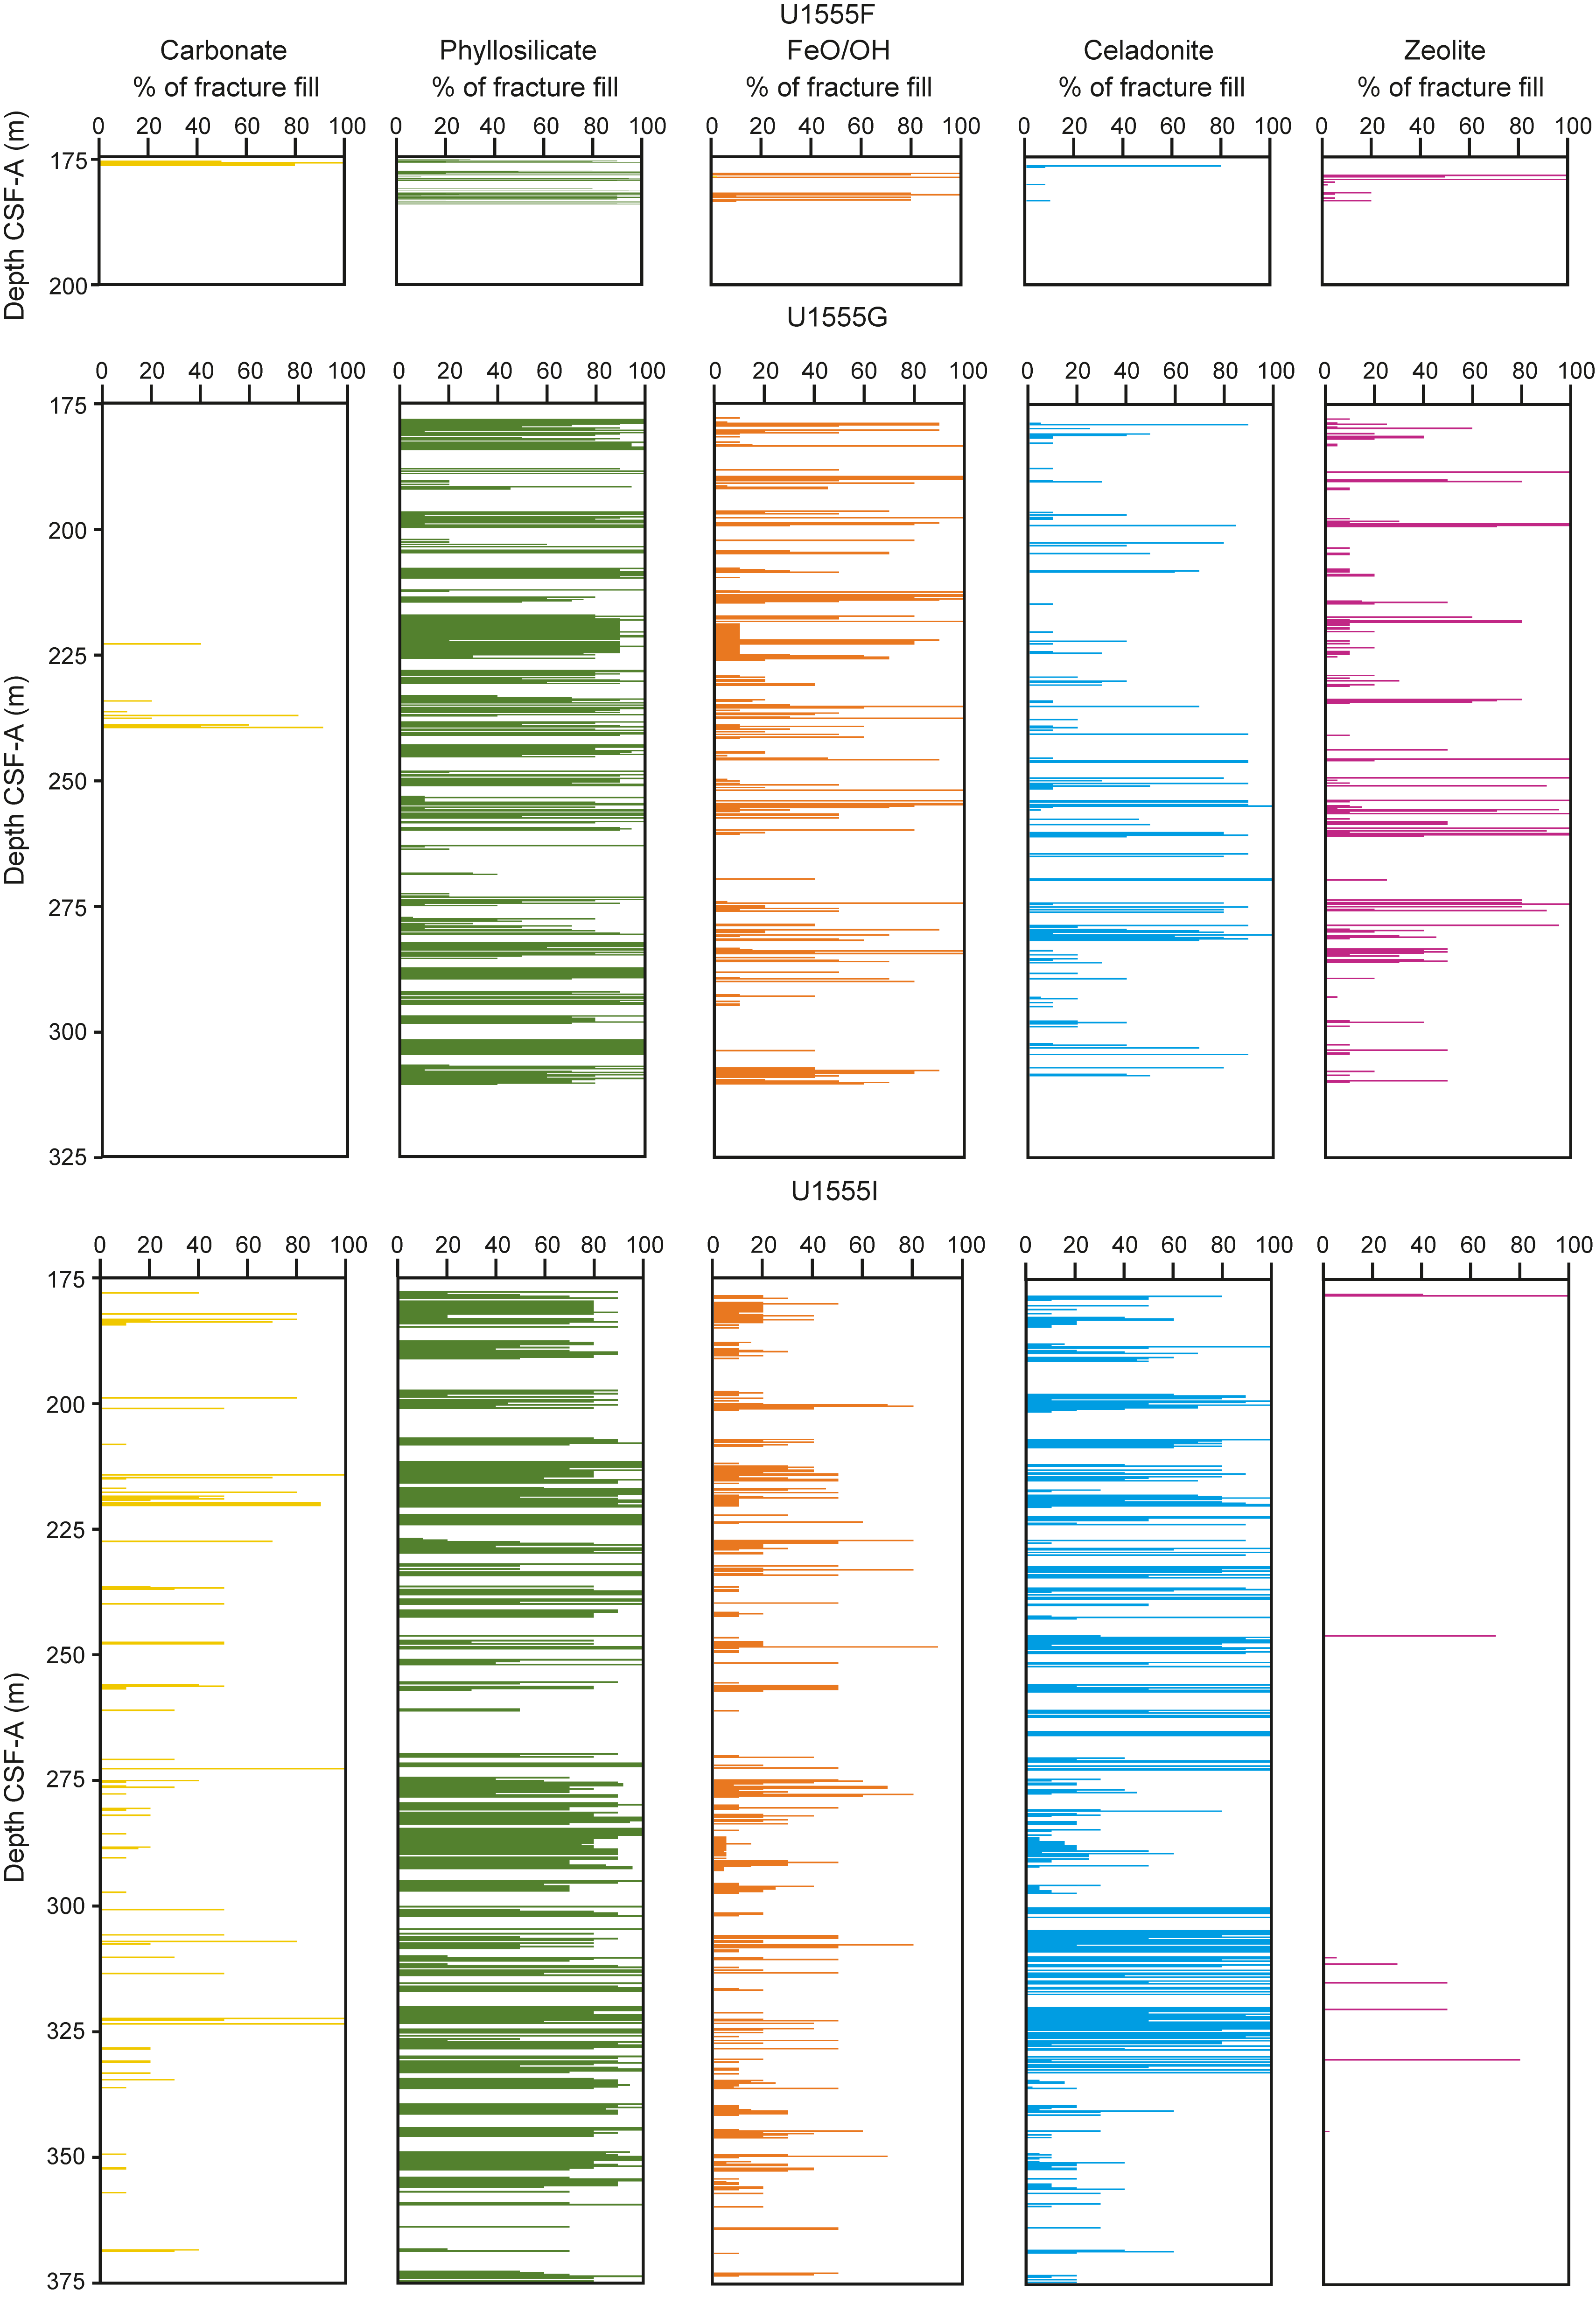
Figure F23. Mineral fill percentage for individual fractures.
The wider fractures show alteration halos that are marked by a change in the color of the basalt around the fracture, usually to a pale gray with a brown border (Figure F24), the width of which ranges 0.5–27 mm. The mineral fill of vesicles in these alteration halos is mainly clay in the pale gray basalt and Fe-oxide/oxyhydroxide in the brown regions of the alteration halos.
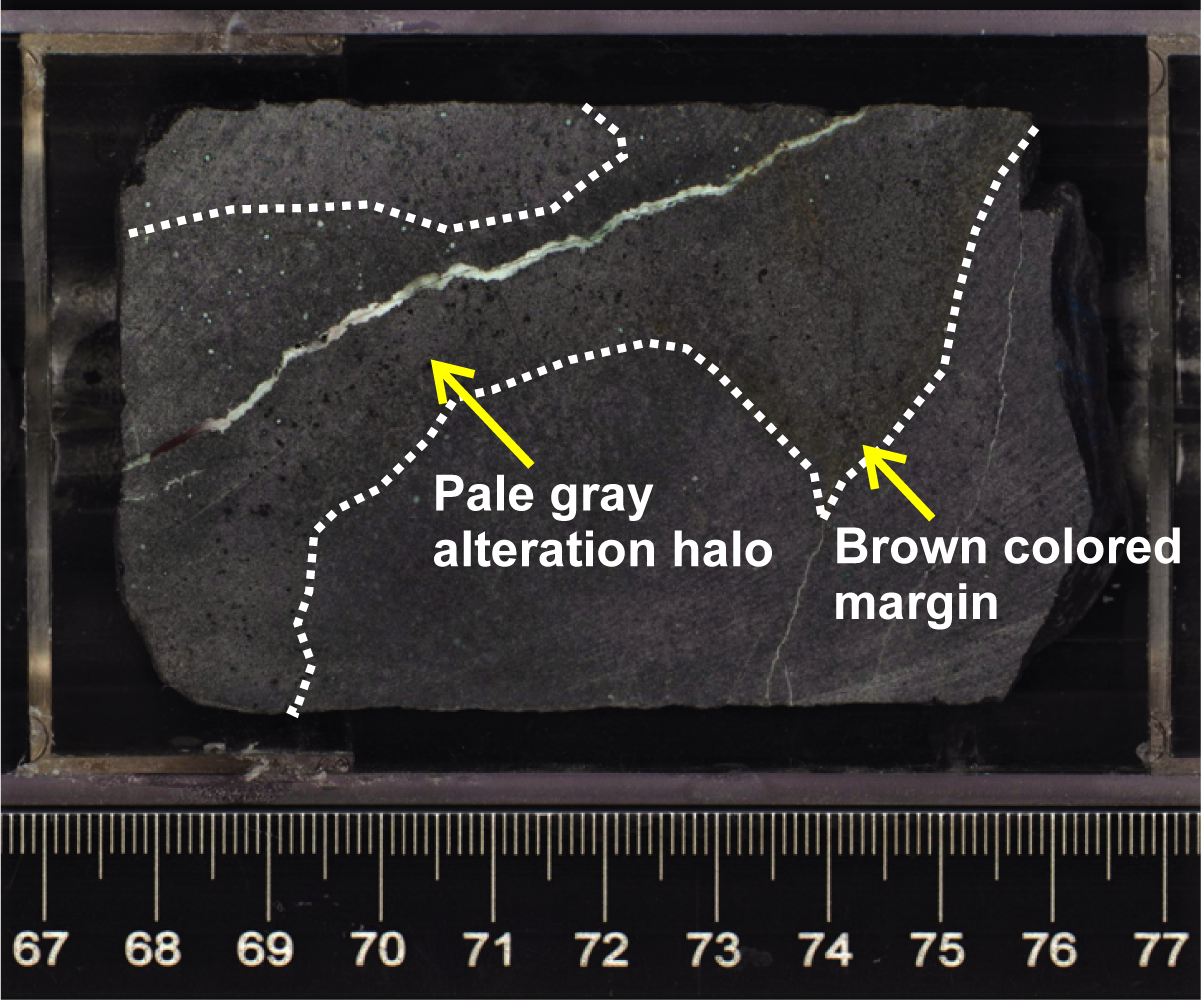
Figure F24. Basalt core piece with a white mineral vein.
6. Micropaleontology
At Site U1555, a 177.5 m thick sedimentary succession of uppermost Pliocene and Pleistocene silty clay was recovered in Hole 395C-U1555H, which was cored using the APC and XCB systems. Some sediments were also recovered in Hole 395C-U1555I in Cores 2R and 3R, which were cored using the RCB system. Calcareous nannofossils and planktonic foraminifers are present with moderate to high abundances in most samples studied, although there are some barren intervals.
6.1. Calcareous nannofossils
A total of 21 core catcher samples were studied for calcareous nannofossils at Site U1555, 19 from Hole U1555H and 2 from Hole U1555I. Observations were undertaken using plane- and cross-polarized light. A list of calcareous nannofossil biohorizons is provided in Table T6. Calcareous nannofossil abundance ranges from few to abundant in most samples, although three samples are barren: Samples 395C-U1555H-6H-CC (52.04 m CSF-A), 16H-CC (147.85 m CSF-A), and 18H-CC (166.83 m CSF-A). The preservation of nannofossils is mostly moderate, although an interval of poor preservation occurs between Samples 13H-CC and 15H-CC (119.29–136.44 m CSF-A), within which reworked species are also observed.
Gephyrocapsa species dominate samples in the upper portion of the record in Samples 395C-U1555H-1H-CC (5.01 m CSF-A) through 12H-CC (109.92 m CSF-A) with common Coccolithus pelagicus, Calcidiscus leptoporus, Pseudoemiliania spp., Helicosphaera spp., and Pontosphaera spp. Between Samples 9H-CC (81.51 m CSF-A) and 12H-CC (109.92 m CSF-A), Discoaster spp. are observed in all samples studied. Species of the genus Reticulofenestra (small and medium sized) are common below Section 11H-CC (98.74 m CSF-A).
Three Pleistocene biozones were identified, defined by the following biohorizons: base Emiliania huxleyi (0.29 Ma; base of Zone NN21) between Samples 395C-U1555H-1H-CC (5.01 m CSF-A) and 2H-CC (14.95 m CSF-A), top Pseudoemiliania lacunosa (0.43 Ma; base of Zone NN20) between Samples 2H-CC (14.95 m CSF-A) and 3H-CC (23.83 m CSF-A), and top Discoaster brouweri (1.93 Ma; base of Zone NN19) between Samples 10H-CC (89.35 m CSF-A) and 11H-CC (98.74 m CSF-A). An additional biohorizon, top Helicosphaera sellii, occurs between Samples 6H-1, 107 cm (44.07 m CSF-A), and 7H-2, 144 cm (55.45 m CSF-A), and is located just above the lithostratigraphic boundary between Subunits IA and IB at 62.00 m CSF-A. The deepest of these biohorizons, top D. brouweri, constrains the base of the hole to be older than 1.93 Ma.
6.2. Planktonic foraminifers
A total of 14 samples were studied for planktonic foraminifers at Site U1555, 12 from Hole U1555H (including 1 from the mudline) and 2 from Hole U1555I. All samples apart from the Hole U1555H mudline were taken from core catchers. A list of planktonic foraminifer bioevents is provided in Table T7. Planktonic foraminifers are dominant or abundant in most samples, except where quartz and rock fragments dominate (Figure F25). In Sample 395C-U1555I-3R-CC, glass (interpreted as tephra) is dominant. Preservation is mostly excellent or very good.
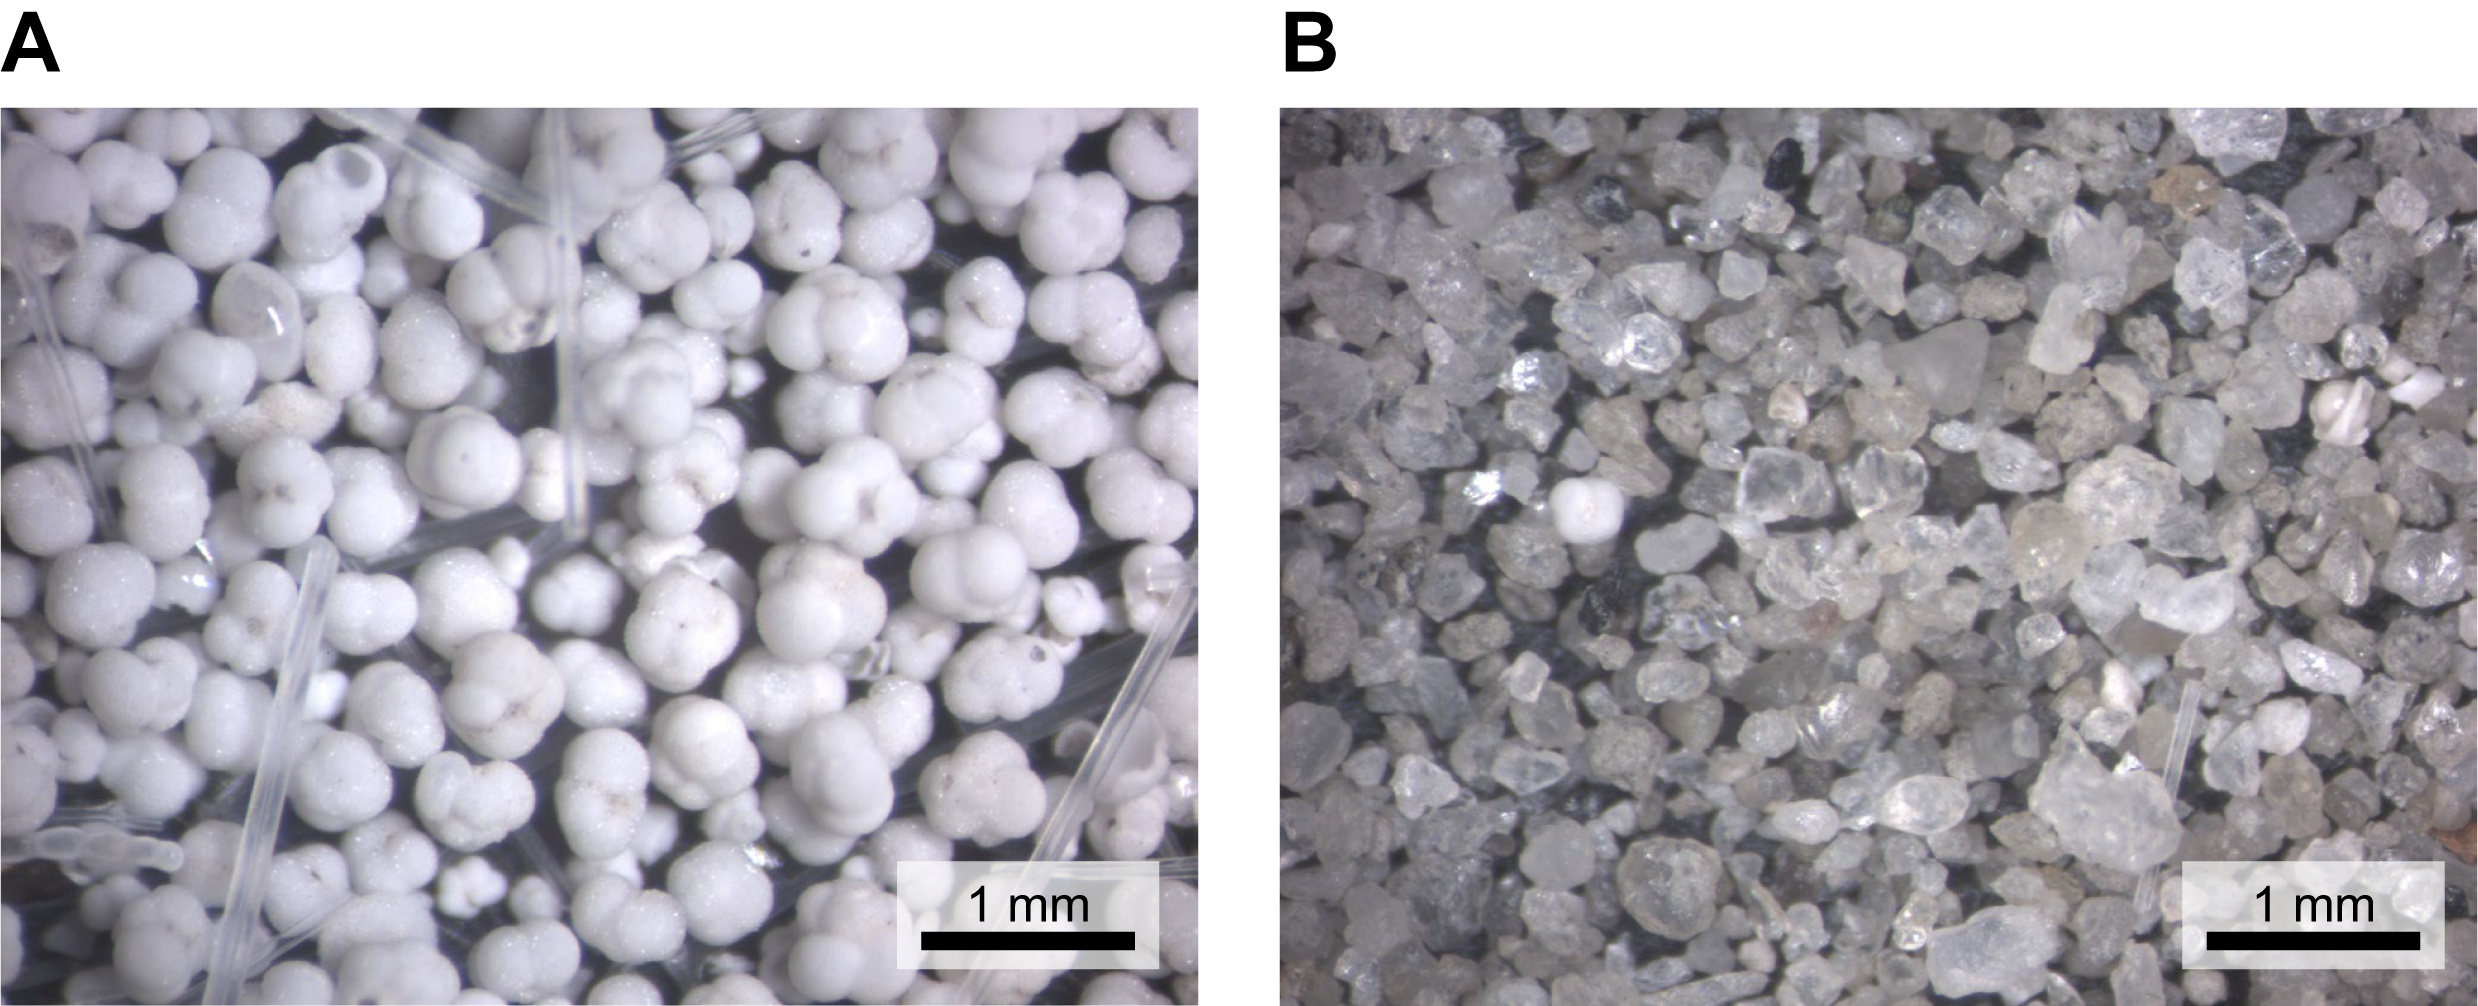
Figure F25. Comparison of washed residues.
In Hole U1555H, the mudline Sample 1H-1, 0 cm, contains abundant excellently preserved planktonic foraminifers. The larger size fractions contain abundant Globigerina bulloides and common Globigerina umbilicata. Medium size fractions contain abundant Turborotalita quinqueloba and frequent Neogloboquadrina incompta and Globorotalia scitula. Rare Globoconella inflata, Orbulina universa, and Globigerina falconensis were observed. The fine fraction contains abundant Globigerinita glutinata, Globigerinita uvula, and Tenuitellita parkerae. Two pink specimens of Globoturborotalita rubescens, which is rare at this latitude, were observed.
Samples 395C-U1555H-1H-CC (5.01 m CSF-A) through 9H-CC (81.51 m CSF-A) contain encrusted sinistral Neogloboquadrina pachyderma and are therefore assigned to the N. pachyderma partial range zone. Sample 5H-CC (42.32 m CSF-A) is dominated by quartz and rock fragments that are interpreted as ice-rafted debris (IRD) with very rare planktonic foraminifers, which probably comes from a glacial interval. The base of common encrusted sinistral N. pachyderma (1.82 Ma), marking the base of the N. pachyderma partial range zone, is between Samples 9H-CC (81.51 m CSF-A) and 10H-CC (89.35 m CSF-A), although rare N. pachyderma are observed below this level.
Samples 395C-U1555H-10H-CC (89.35 m CSF-A) through 12H-CC (109.92 m CSF-A) contain G. inflata and occasional Globoconella blowi and are thus assigned to the G. inflata lowest occurrence zone. The base of G. inflata (2.06 Ma) is a well-defined event between Samples 12H-CC (109.92 m CSF-A) and 13H-CC (119.29 m CSF-A).
A major change in assemblage occurs between Samples 395C-U1555H-15H-CC (136.44 m CSF-A) and 17H-CC (157.08 m CSF-A). The intervening Sample 16H-CC (147.85 m CSF-A) is devoid of planktonic foraminifers but contains common quartz and rock fragments and therefore appears to be from a glacial interval. Sample 17H-CC (157.08 m CSF-A) contains dominant sinistral Neogloboquadrina atlantica in the absence of G. inflata and is therefore assigned to the Globoconella puncticulata/N. atlantica concurrent range zone.
In Hole U1555I, a similar assemblage to that in Sample 395C-U1555H-17H-CC (157.08 m CSF-A) was found in RCB cored Samples 395C-U1555I-2R-CC (168.23 m CSF-A) and 3R-CC (174.85 m CSF-A). Sample 3R-CC contains frequent quartz grains that are interpreted as IRD.
7. Physical properties
Holes 384-U1555A through 384-U1555E were drilled as engineering tests, and no core was recovered. Holes 384-U1555F, 384-U1555G, and 395C-U1555I recovered primarily basalt below the drilled sediment section. Hole 395C-U1555H recovered the sedimentary sequence. The suite of measurements made for Site U1555 is documented in Table T8. Physical properties data were collected on cores from Hole U1555F, but because only 2.5 m of sediment and 6 m of basalt was recovered, these data are not presented in figures here. Physical properties data were cleaned to remove half the response function corresponding to the instruments at the top and bottom of each section, and values deemed artifacts were removed from the respective figures (Table T9). All raw data are retained in the Laboratory Information Management System (LIMS) database.
7.1. Whole-round measurements
Figures F26, F27, and F28 summarize data collected on whole-round cores measured using the Whole-Round Multisensor Logger (WRMSL) and the Natural Gamma Radiation Logger (NGRL) for Holes U1555G, U1555H, and U1555I, respectively.
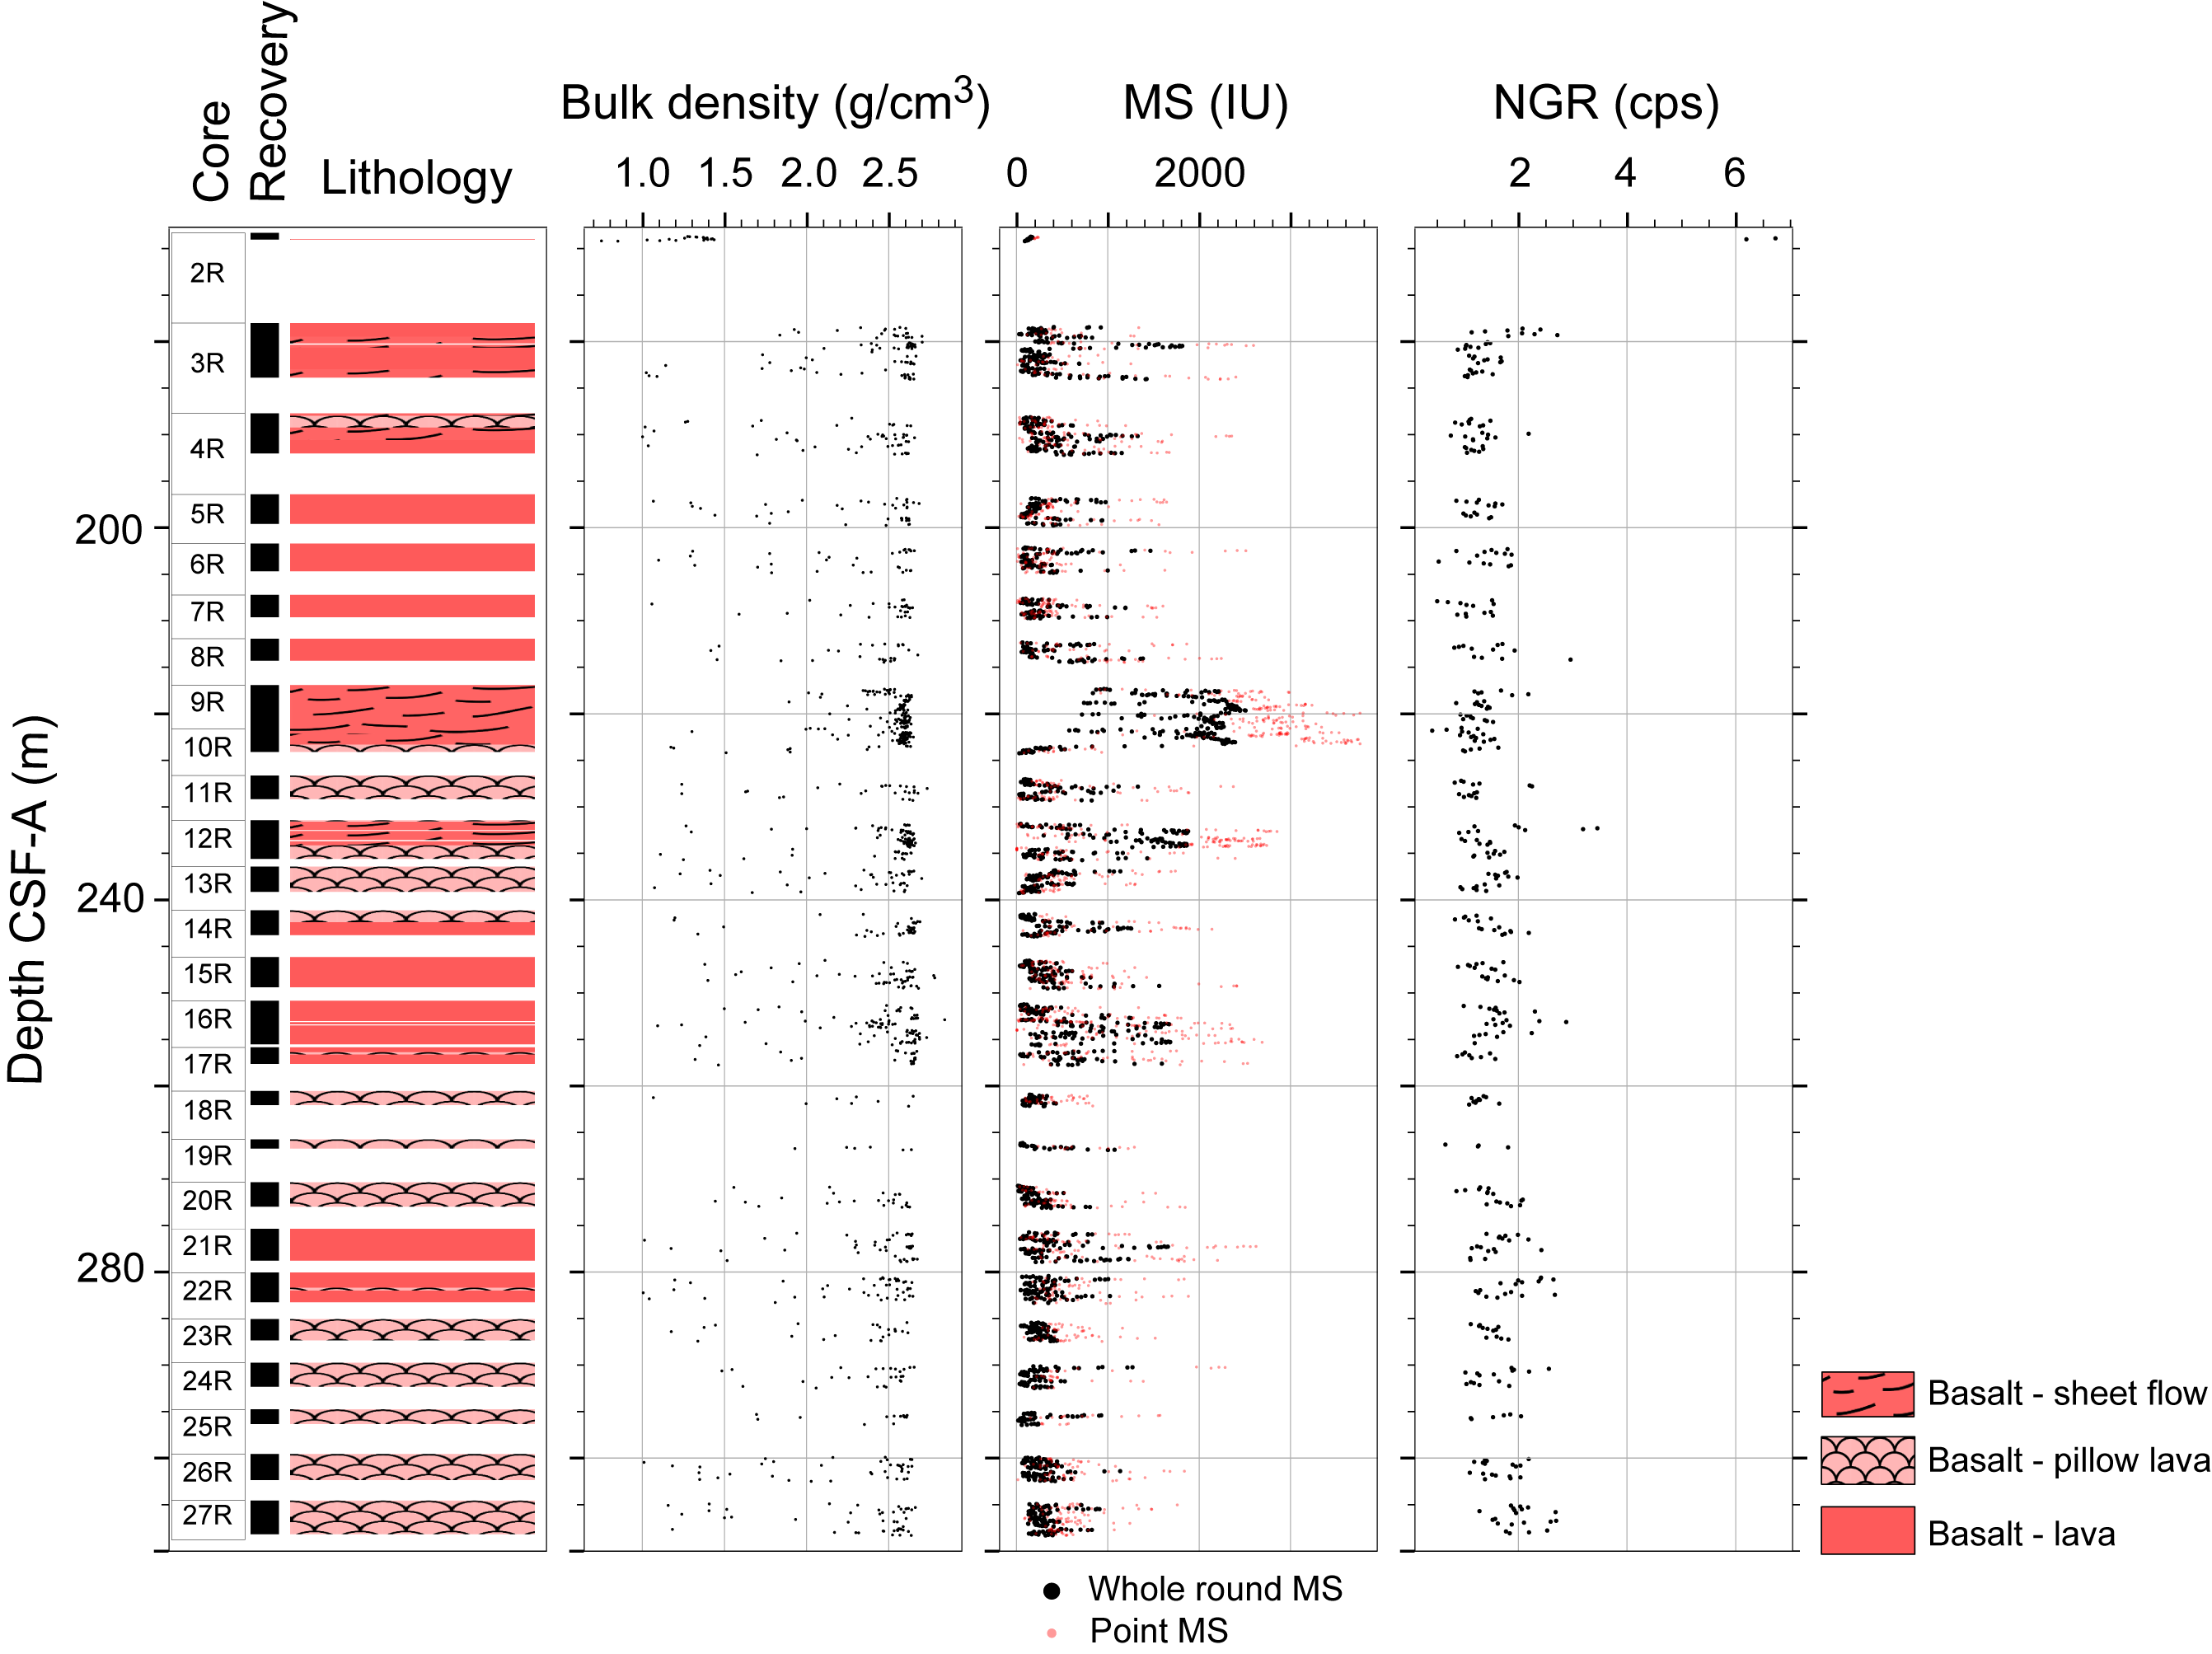
Figure F26. Physical properties measurements, Hole U1555G.
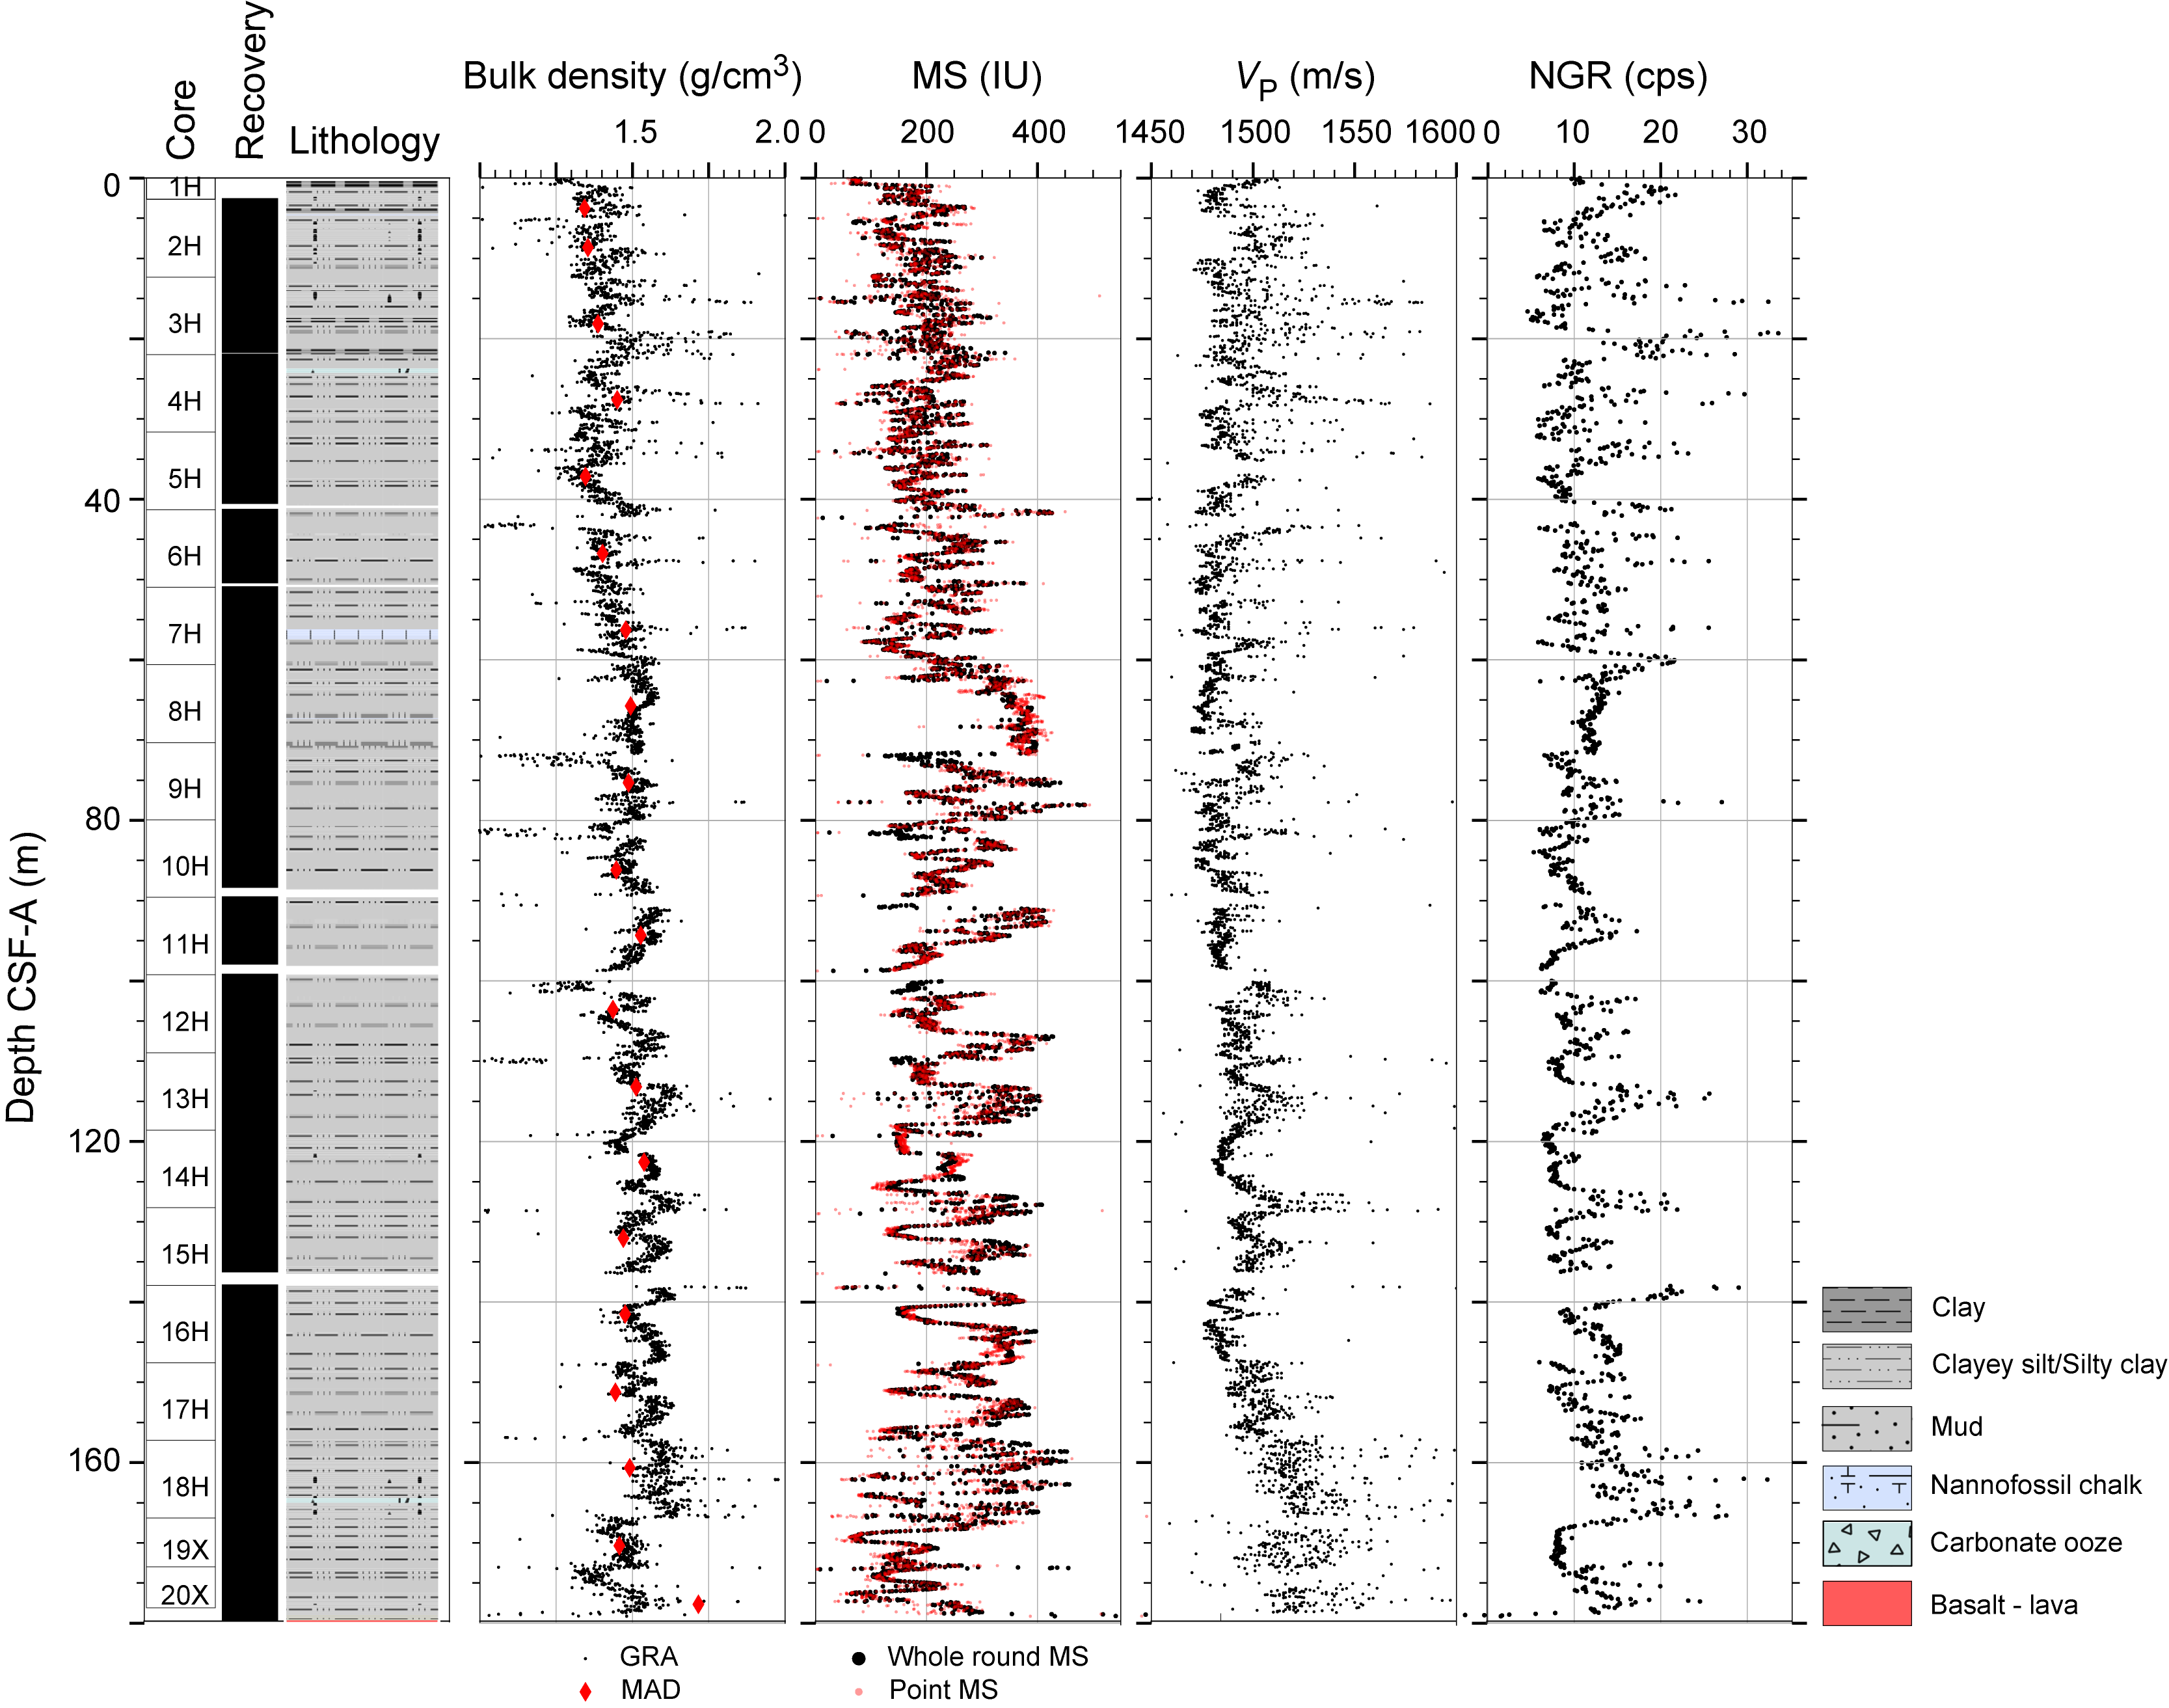
Figure F27. Physical properties measurements, Hole U1555H.
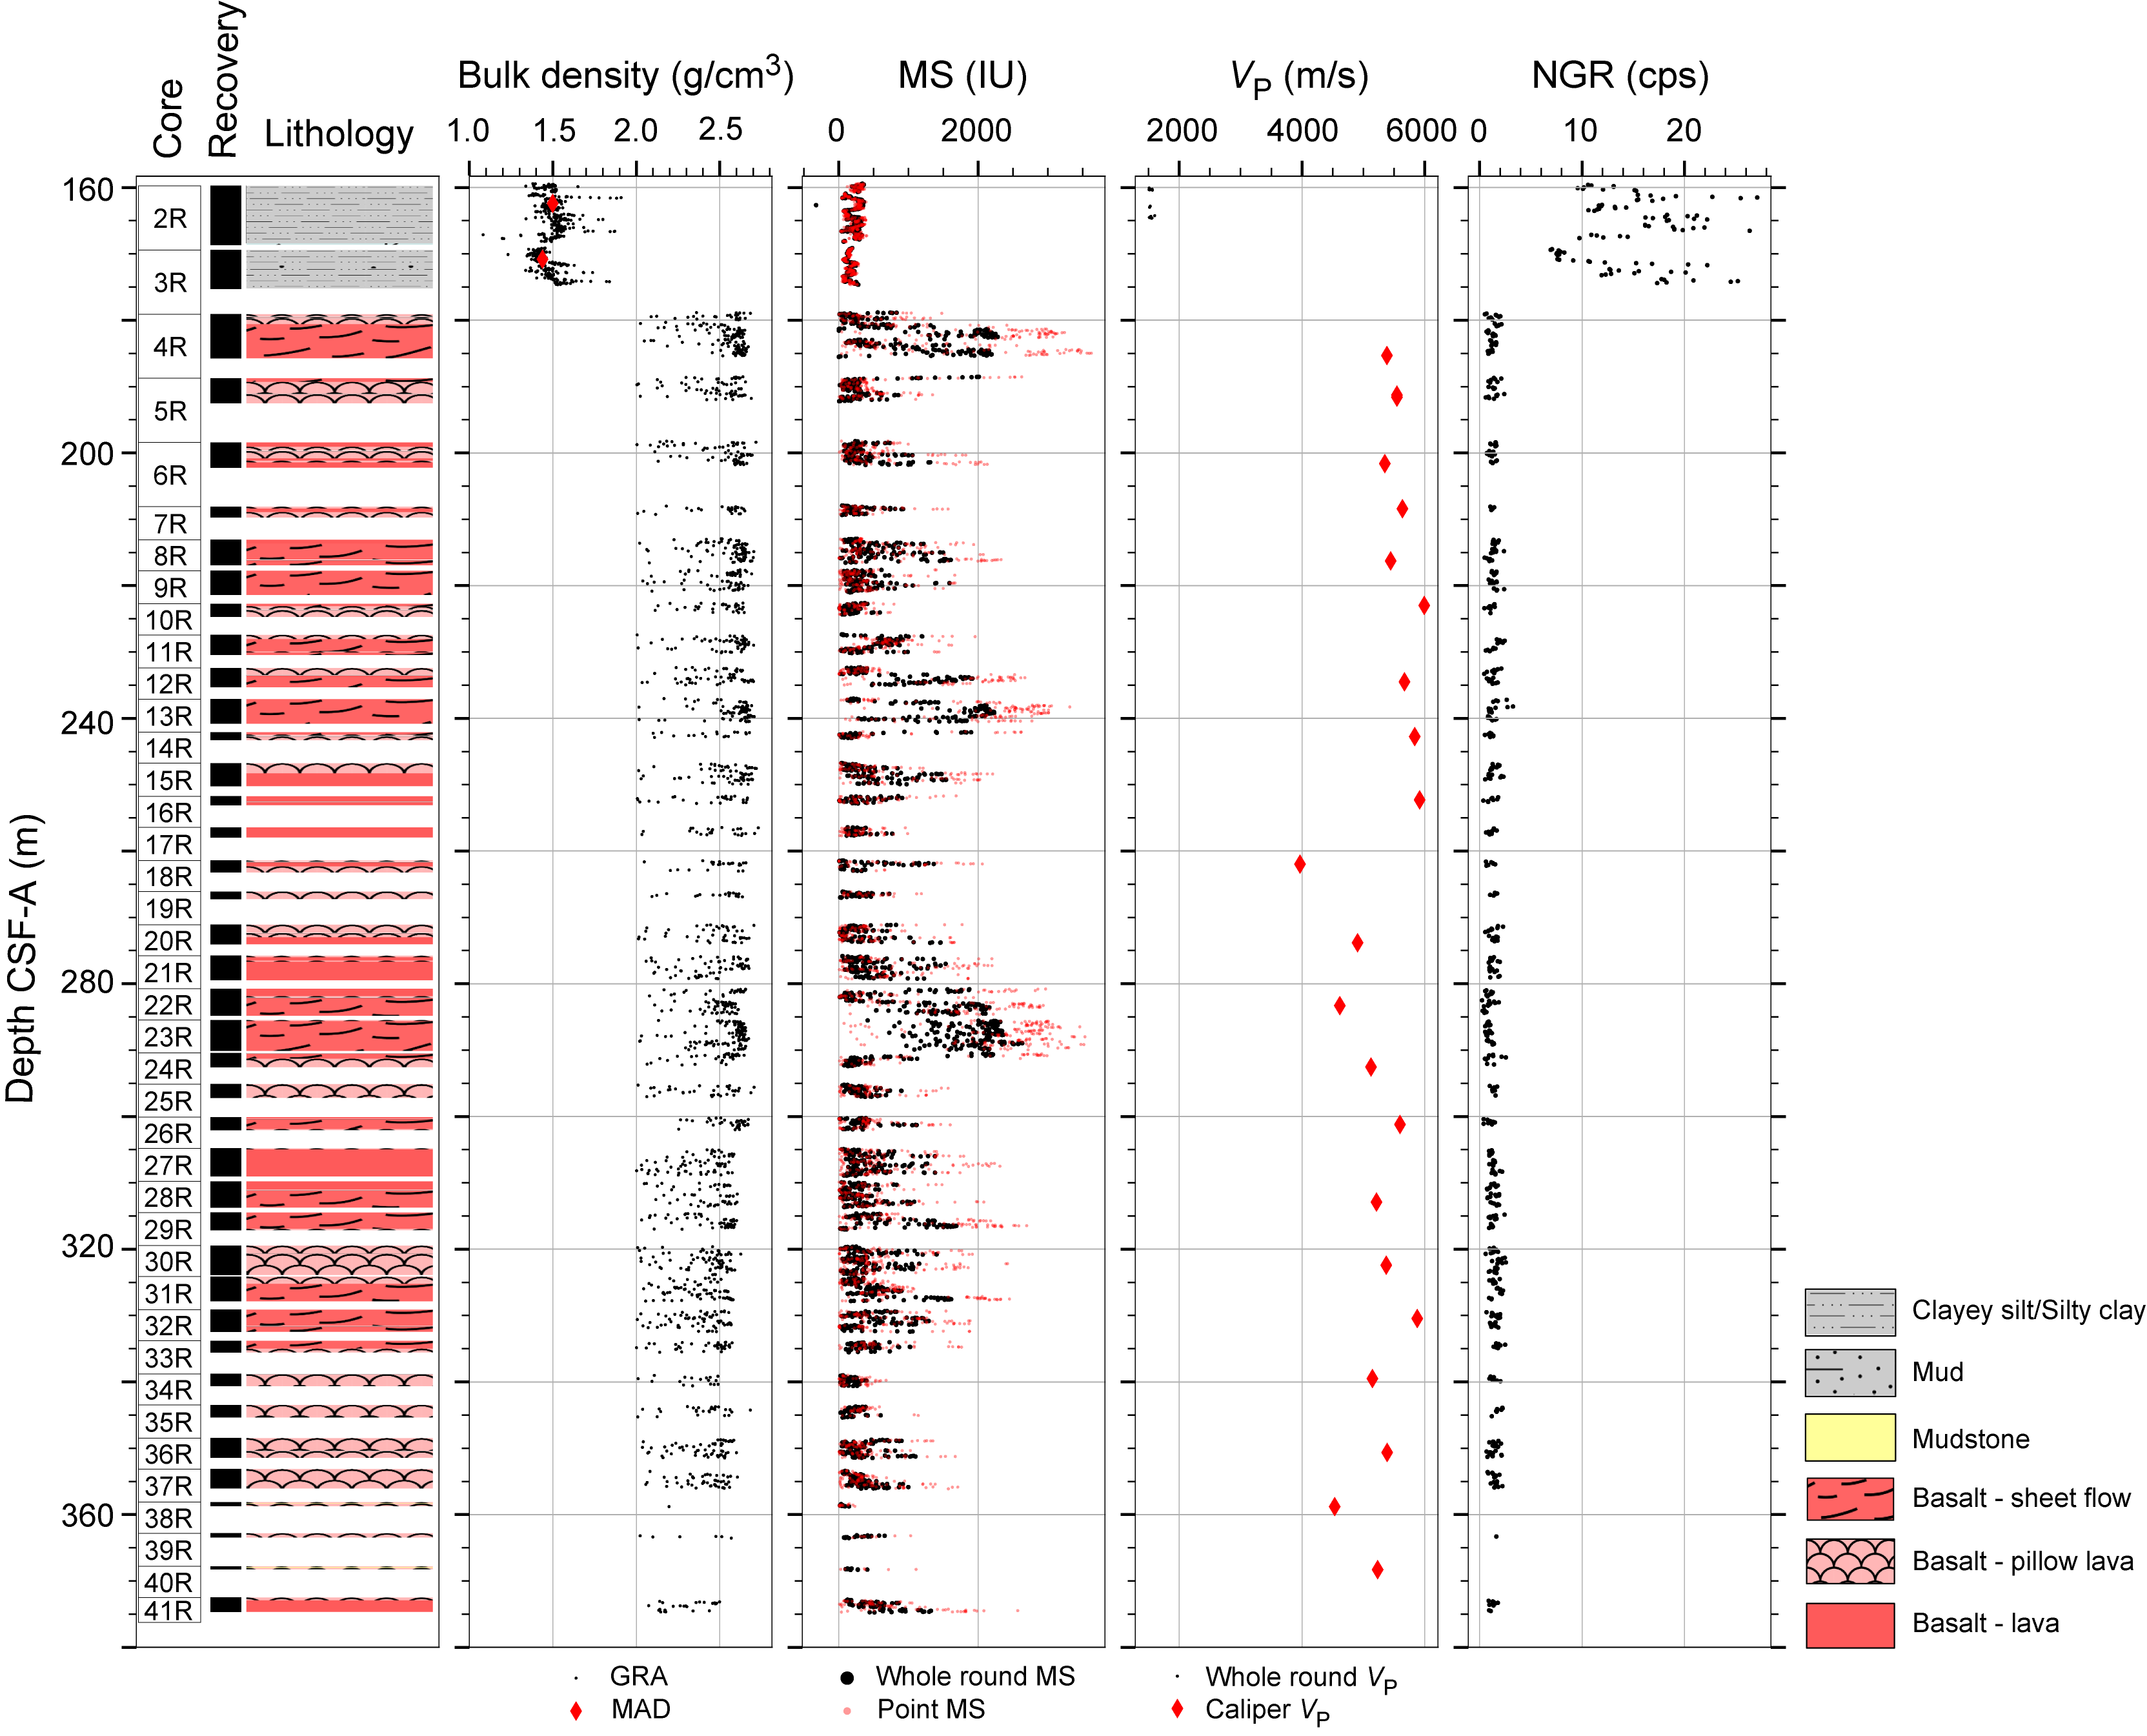
Figure F28. Physical properties measurements, Hole U1555I.
A strong contrast is seen in gamma ray attenuation (GRA) bulk density, MS, and NGR between the sediment and basalt (Figure F28). GRA bulk density sediment values are typically around 1.5 g/cm3, and basalt values fall within a range of 2.0–2.5 g/cm3. The values for GRA bulk density and MS in the basalts are likely lower than the true rock properties due to significant voids in the sections. The MS values are approximately an order of magnitude higher for the basalts (e.g., 2000 IU) compared to the sediments (200 IU). The sedimentary MS values often show meter-scale variability with an amplitude of a few 100 IU. Intervals of elevated MS values identified, for example, in Hole U1555G around 220 m CSF-A and Hole U1555I at 280 m CSF-A are interpreted to represent multiple basalt units (see Igneous petrology, Alteration petrology and structural geology, and Downhole measurements). P-wave velocity (VP) measurements were not attempted on the basalts because the instrument does not yield reliable data without a full core liner. VP measurements from WRMSL were therefore only taken on the sediment cores (PWL in Table T8) and vary around typical values of 1500 m/s with some point outliers (Figure F27). NGR values are about an order of magnitude lower for the basalts compared to the sediments. NGR shows some cyclicity in the sediments (Figure F27).
7.2. Split core measurements
Figures F29, F30, and F31 summarize the reflectance and colorimetry data collected on archive halves measured using the Section Half Multisensor Logger (SHMSL). The point MS (MSP) data are shown in Figures F26, F27, F28, and F29 alongside the WRMSL MS data. Both types of MS measurements show similar relative variations; the absolute values for the sediments are very close to each other, and the MSP values for the basalts are slightly higher than the WRMSL values. Color reflectance in the sediment section corresponds to major lithology changes (Figure F28), and the presence of voids in the basalt core sections leads to considerable noise (Figure F31). In Hole U1555H, there is a notable trend to increasing values (brightening toward lighter colors) in the uppermost 40 m of the sedimentary sequence, including a sharp double peak around 60 m CSF-A (Figure F30). This double peak falls close to the inferred boundary between Lithostratigraphic Subunits IA and IB defined using geophysical properties characteristics and corresponding to a distinct change in accumulation rate regimes (see Lithostratigraphy and Age model).
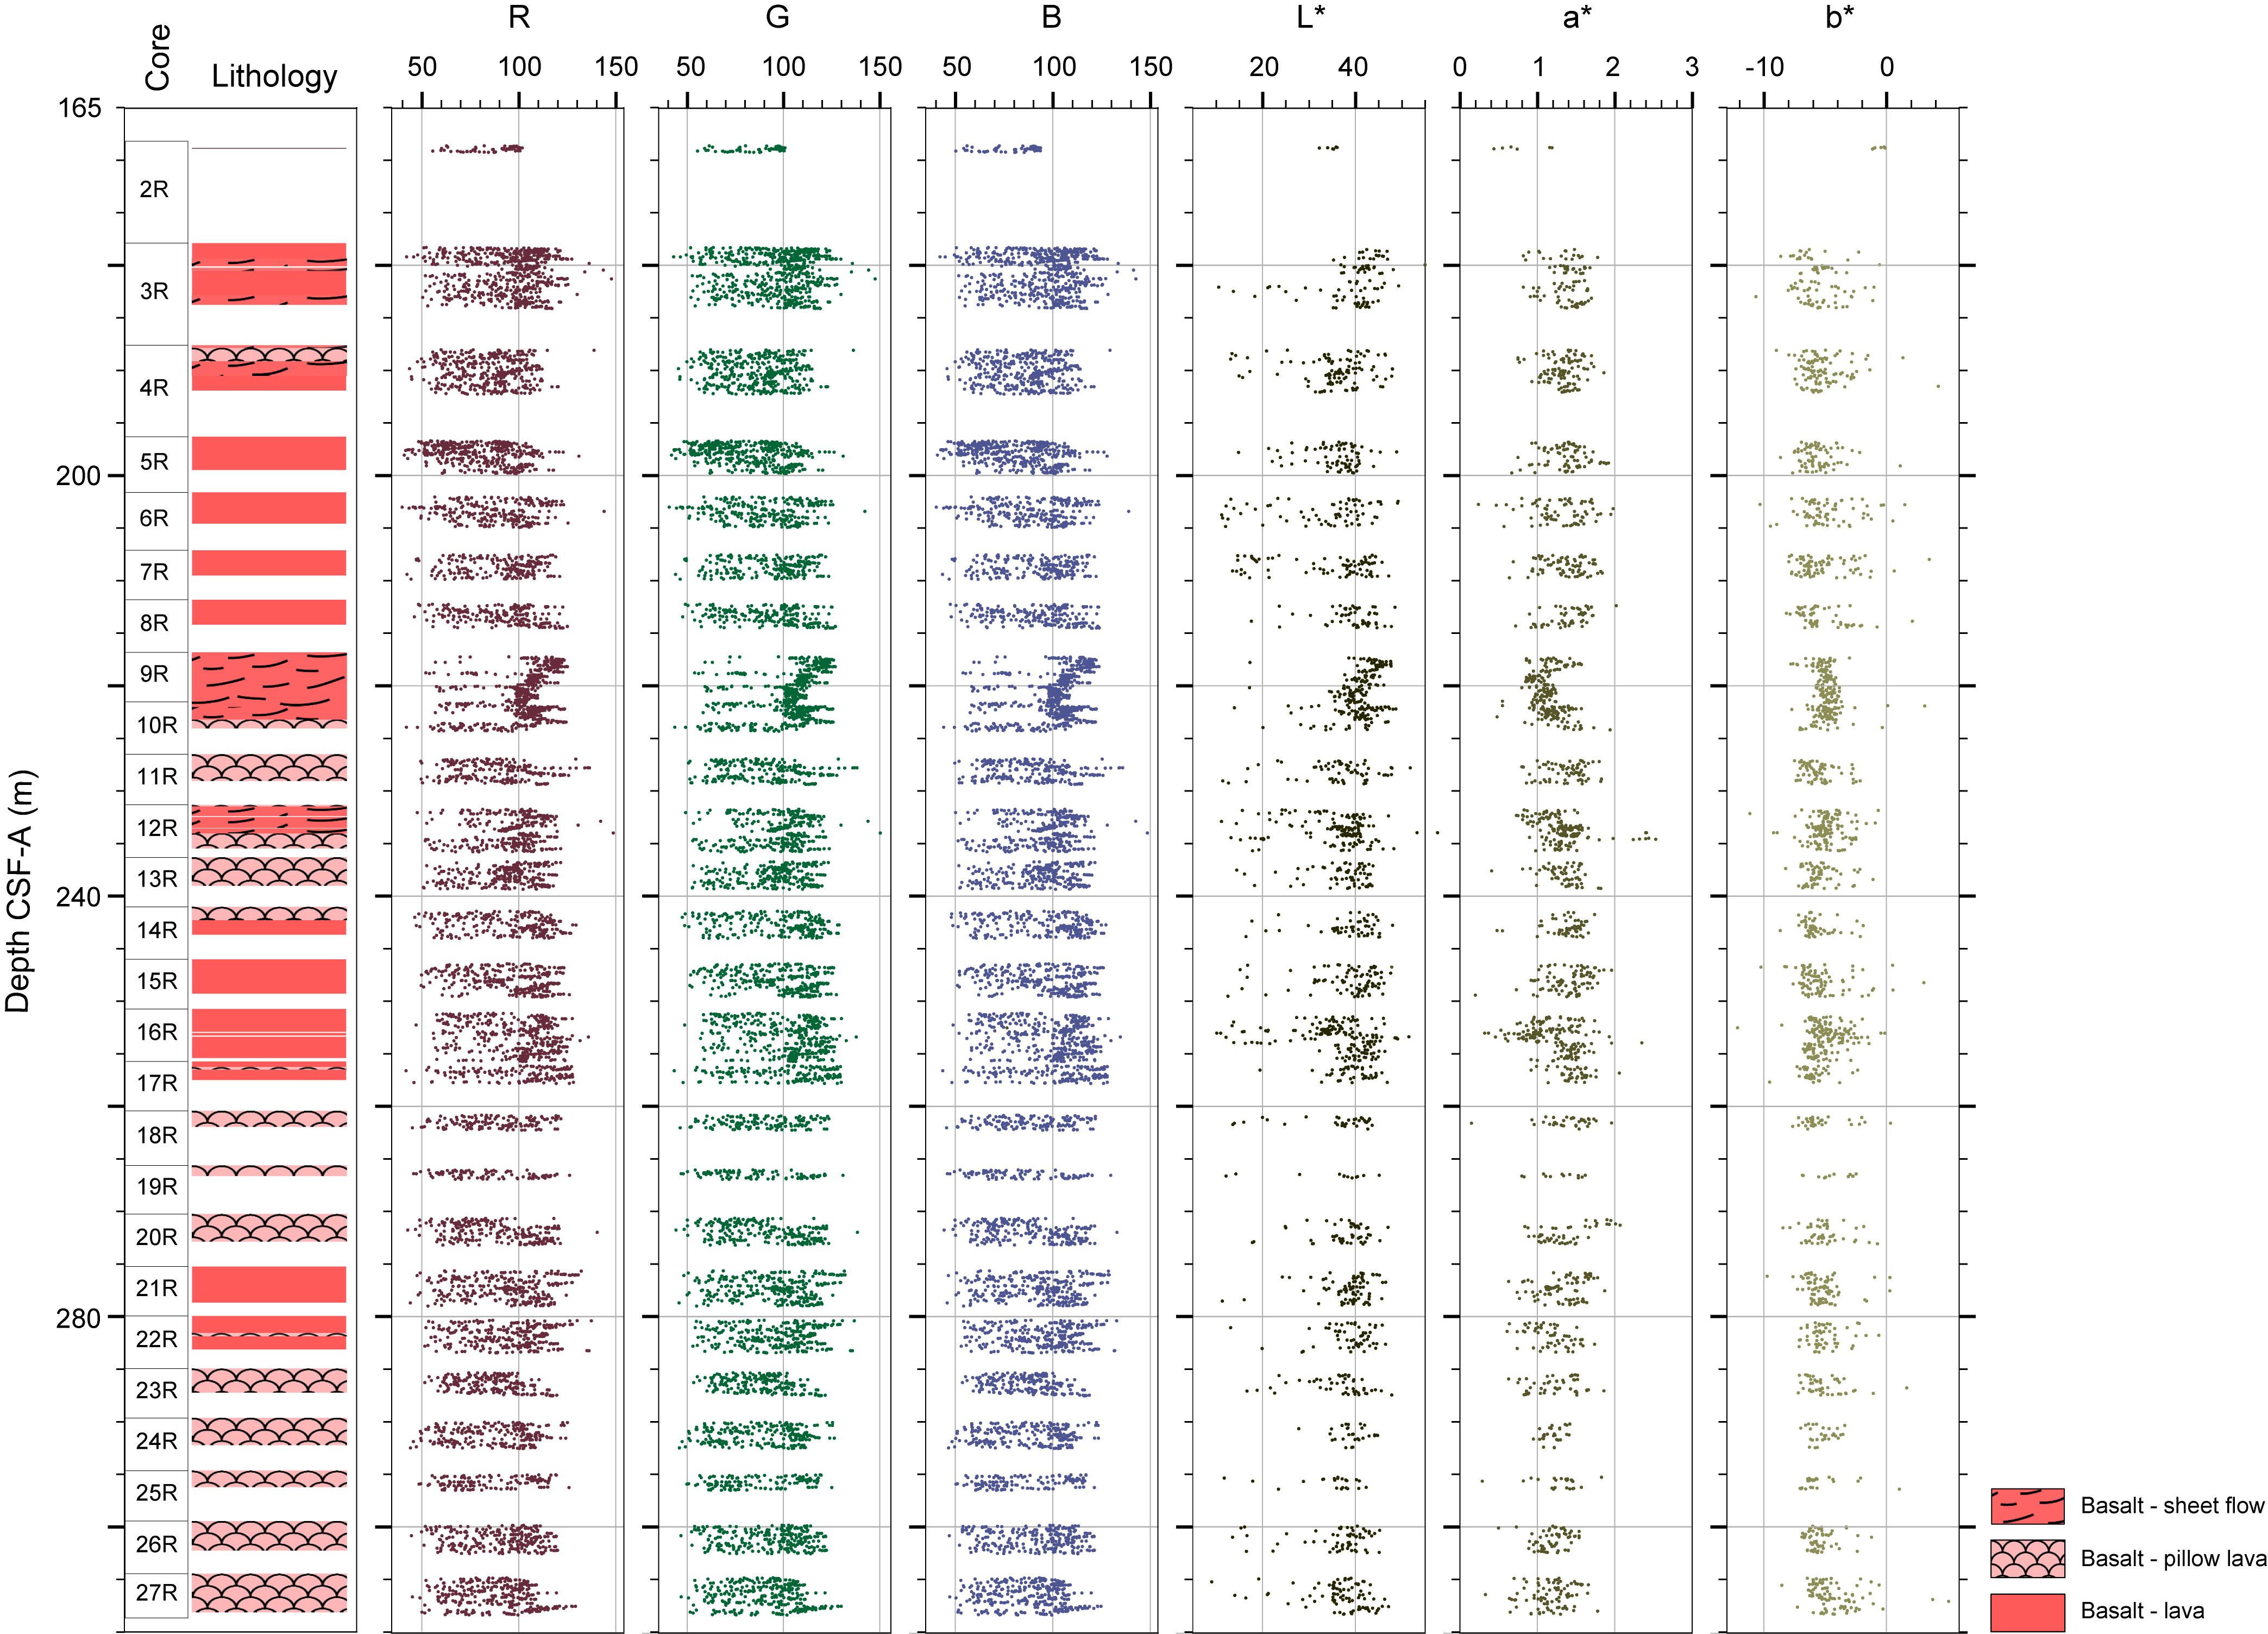
Figure F29. Archive-half colorimetry and reflectance measurements, Hole U1555G.
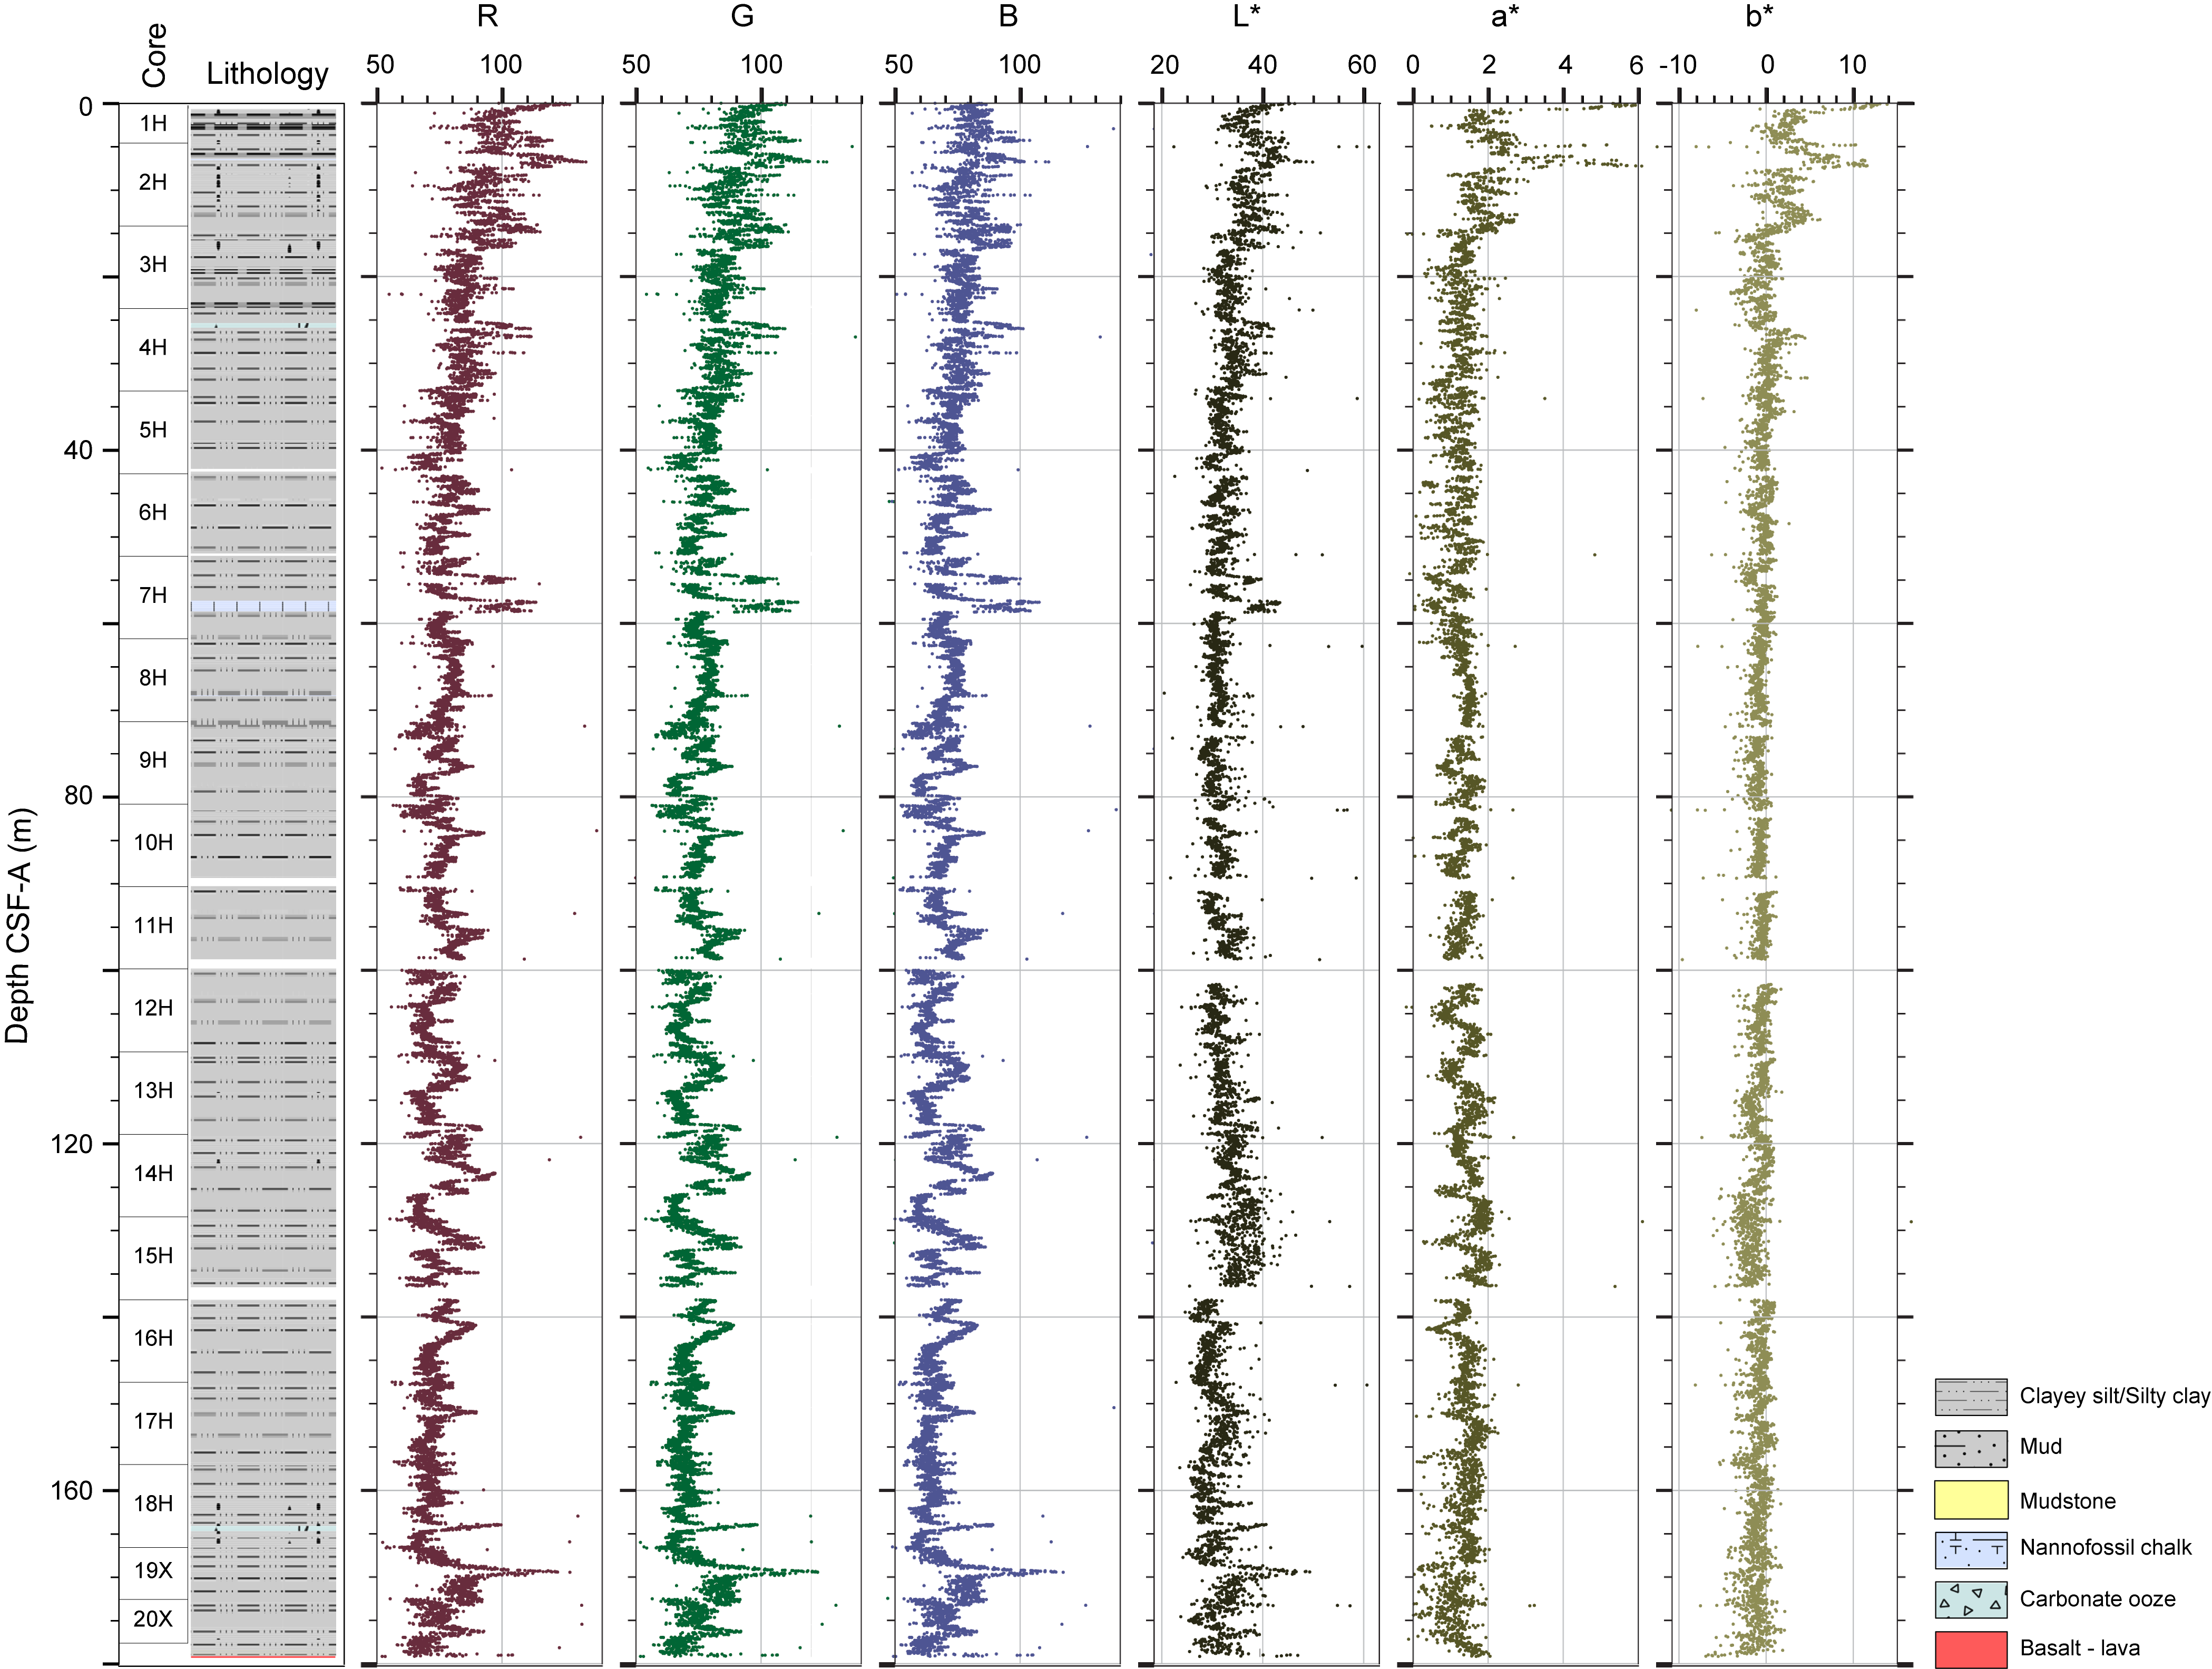
Figure F30. Archive-half colorimetry and reflectance measurements, Hole U1555H.
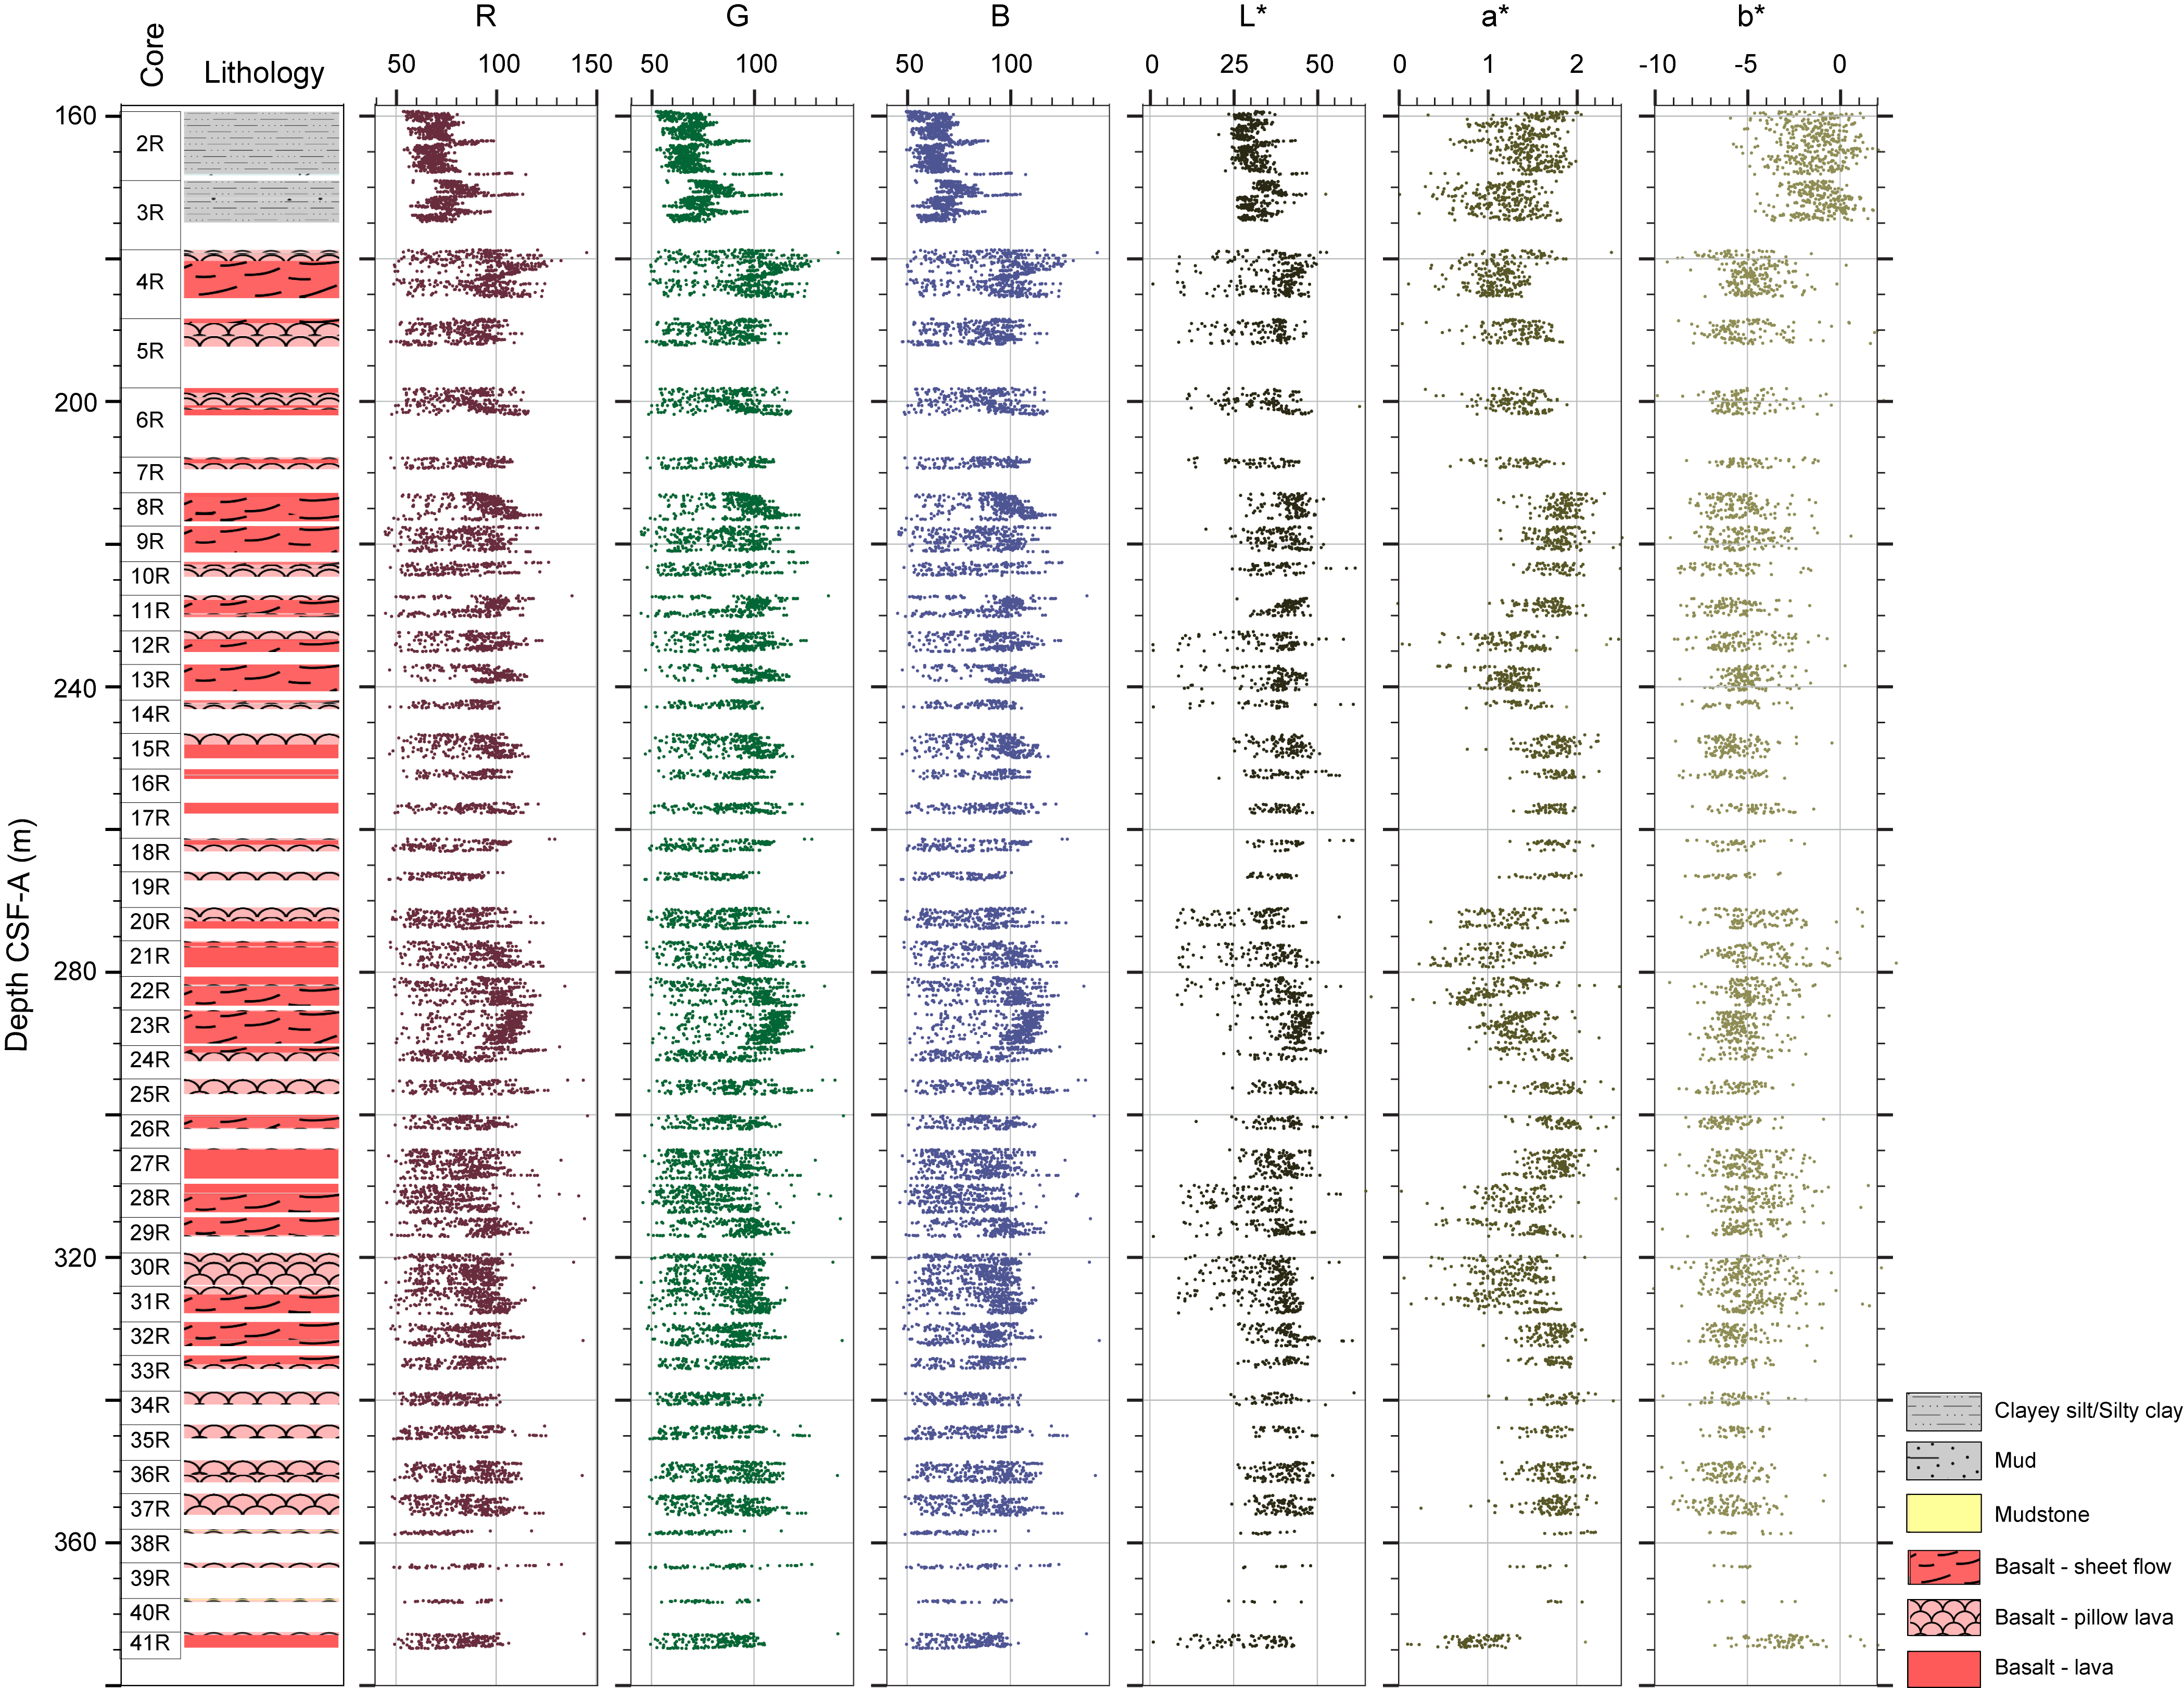
Figure F31. Archive-half colorimetry and reflectance measurements, Hole U1555I.
7.3. Discrete measurements
7.3.1. P-wave velocity
VP caliper (PWC) measurements were made at approximately 10 m spacing in the basalt interval of Hole U1555I. Velocity, measured in the x-direction, ranges 3967–5990 m/s.
7.3.2. Moisture and density
Moisture and density (MAD) were measured on sediment cores, approximately one per core. No MAD measurements were made on basalt. Bulk density values for Hole U1555H are shown in Figure F27 alongside the WRMSL bulk density estimates. Porosity ranges 71–82 vol%; there is one outlying value of 63 vol%. Bulk density ranges 1.3–1.5 g/cm3 with one outlying value at 1.7 g/cm3 (also the lowest porosity). Grain density varies from 2.7 to 2.9 g/cm3. MAD estimates of bulk density values in the two cores from Hole U1555I are 1.5 and 1.4 g/cm3 and are in good agreement with the WRMSL GRA bulk density estimates.
7.3.3. Thermal conductivity
Thermal conductivity measurements were made on selected working-half sections, approximately one per core, in Holes U1555H and U1555I. Thermal conductivity is typically 1.60–1.80 W/(m·K) in the sedimentary section of Hole U1555H and 0.78–0.97 W/(m·K) in the basement section of Hole U1555I (Figure F46). Thermal conductivity measurements in the sedimentary section of Hole U1555H are combined with downhole formation temperature measurements to estimate heat flow in Downhole measurements.
8. Paleomagnetism
8.1. Shipboard measurements
Shipboard paleomagnetic investigations were conducted on archive-half cores from Holes 384-U1555F, 384-U1555G, 395C-U1555H, and 395C-U1555I. Four discrete samples were collected and analyzed from Hole U1555F (Blum et al., 2020). The primary objectives were to determine directions of natural remanent magnetization (NRM) components (including magnetic polarity) and downhole variation of magnetic properties. Collected sediment data were used to infer magnetostratigraphy.
The stepwise demagnetization data were analyzed using principal component analysis (PCA) to define the characteristic remanent magnetization (ChRM) (Kirschvink, 1980). Data visualization using Zijderveld demagnetization plots and equal area projections (Zijderveld, 1967) and PCA were conducted using the PuffinPlot software (Version 1.4.1; Lurcock and Florindo, 2019). A summary of the inclinations from Holes U1555G and U1555H and is presented in Figure F32.
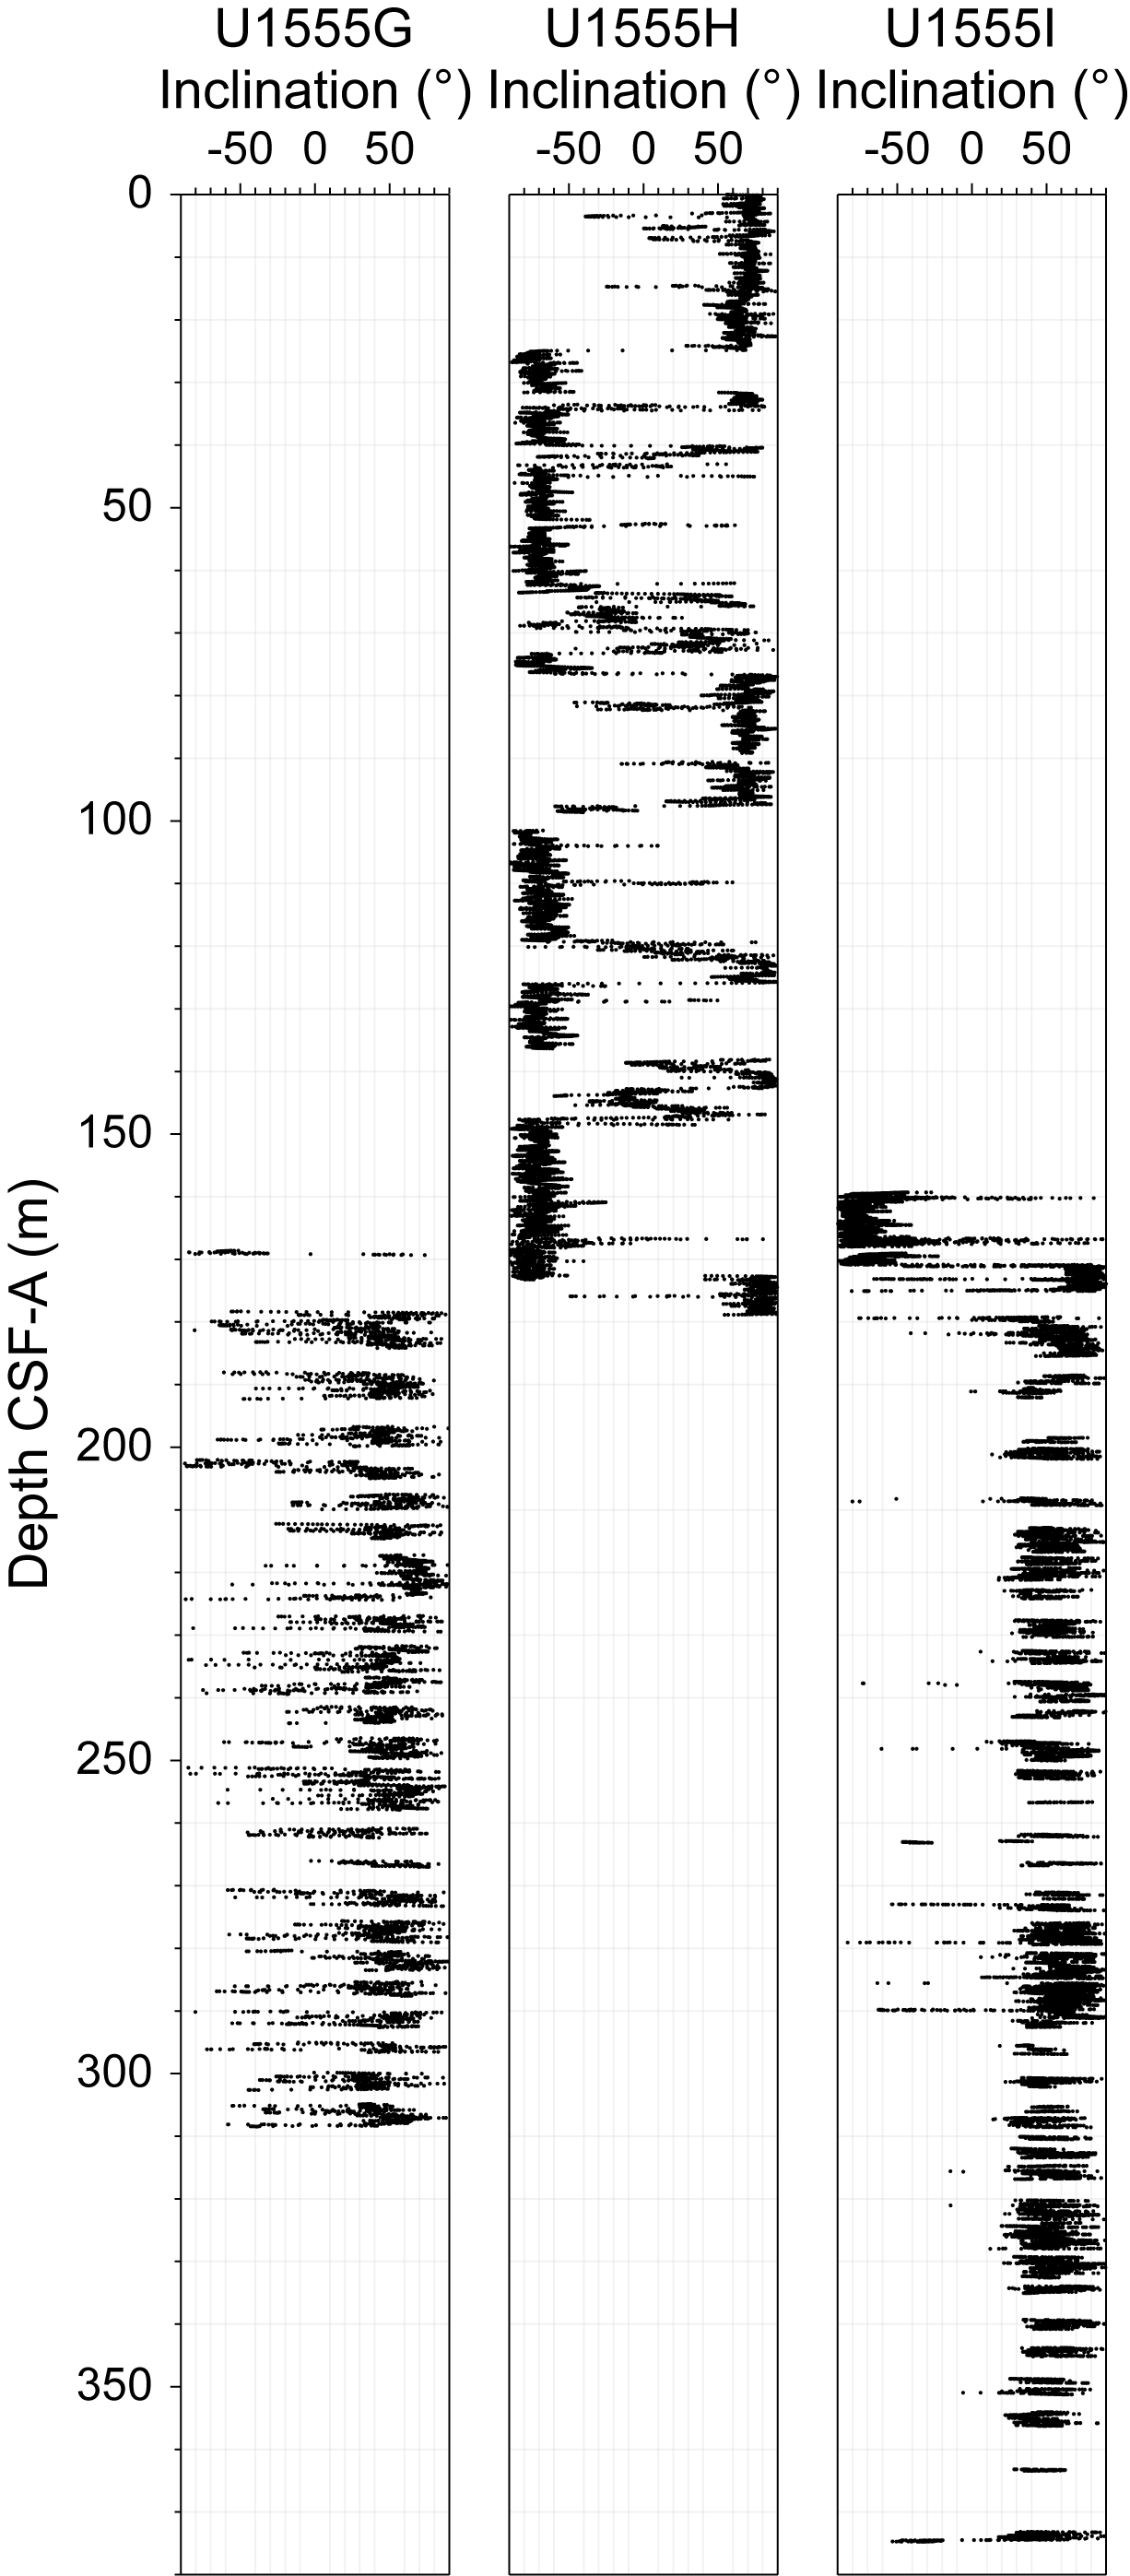
Figure F32. Inclination.
8.2. Demagnetization behavior of sedimentary rocks
Stepwise alternating field (AF) demagnetization was performed at 1 cm intervals on the sediments from Hole U1555H and Cores 395C-U1555I-2R and 3R in six steps up to 35 mT, with the exception of Section 3R-4, which was measured at five steps up to 30 mT (see Paleomagnetism in the Expedition 395 methods chapter [Parnell-Turner et al., 2025a]). After the removal of an overprint by the 10 mT step, a stable ChRM directed to the origin was isolated, even if the sediment was not completely demagnetized. Both normal and reversed polarities were recognized (Figure F33A, F33B).
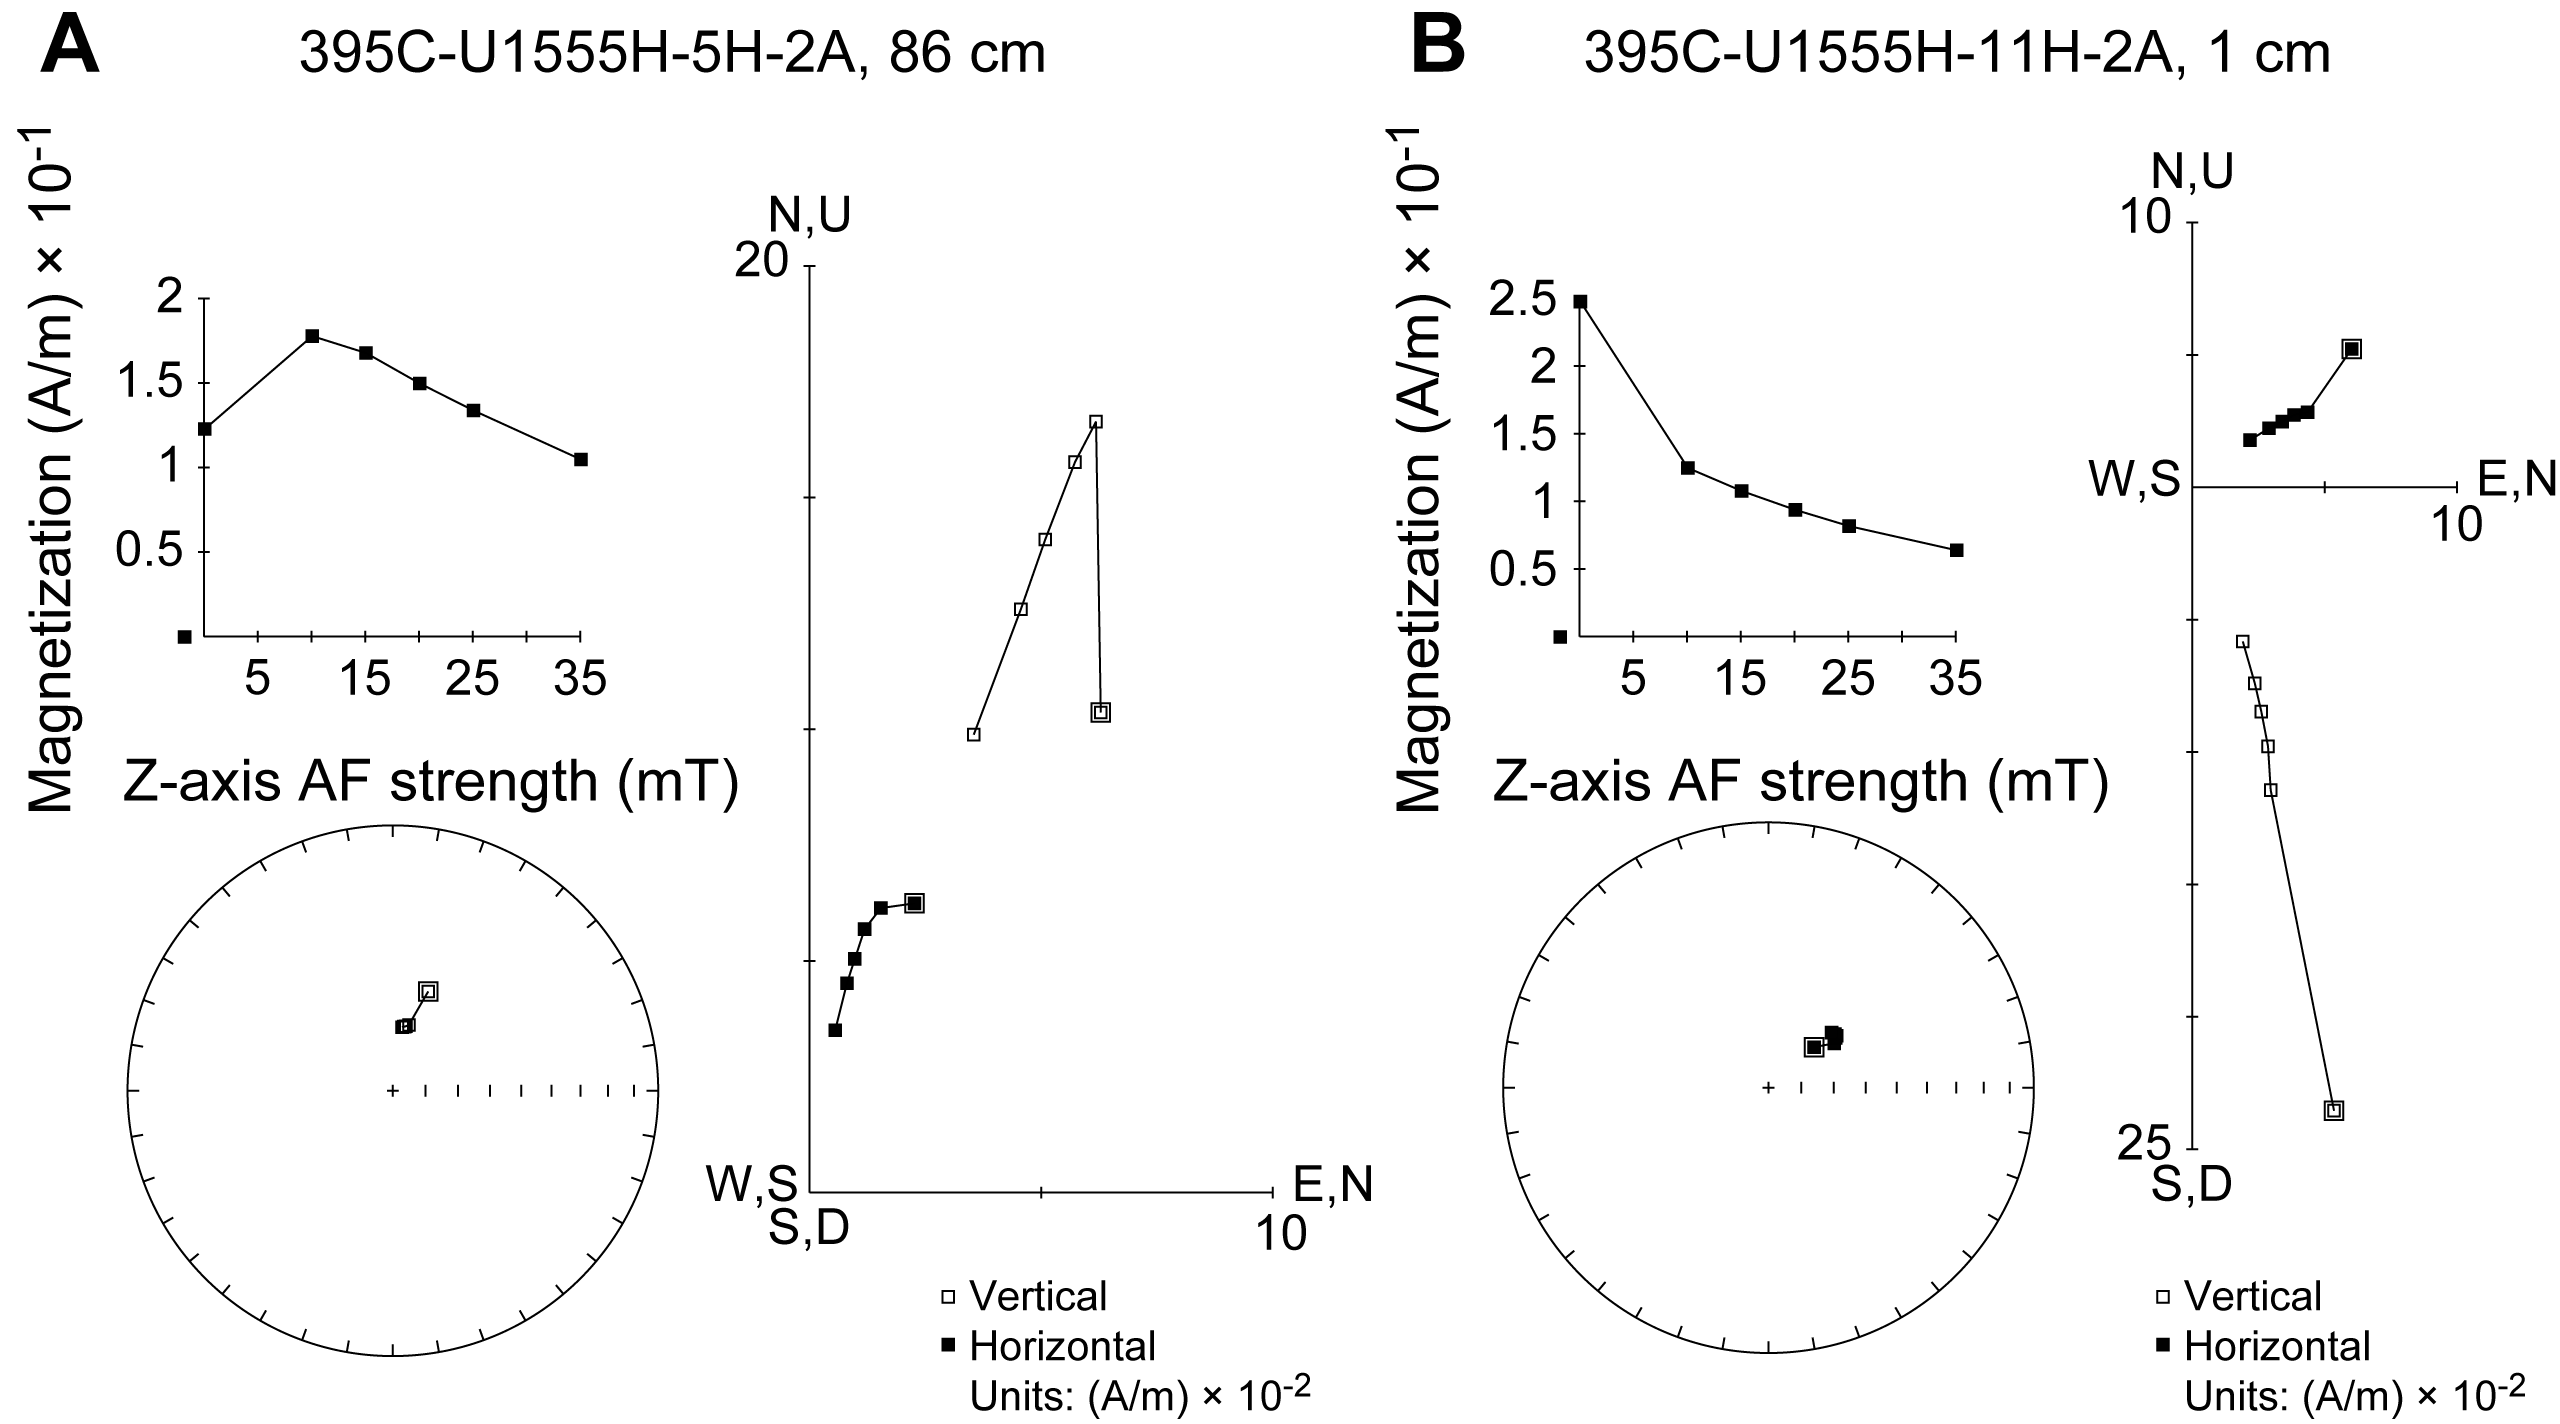
Figure F33. Demagnetization of archive halves.
The NRM intensity from Hole U1555H varies from 7.4 × 10⁻⁴ to 1.7 A/m and averages 1.9 × 10⁻¹ A/m, reflecting typical values of sedimentary rocks. The point MS obtained from section halves (see Physical properties) varies from 2.9 to 2443.9 IU and averages 233.6 IU. Both NRM and MS from section halves show a significant variable cyclicity between 80 and 170 m CSF-A (Figure F34).
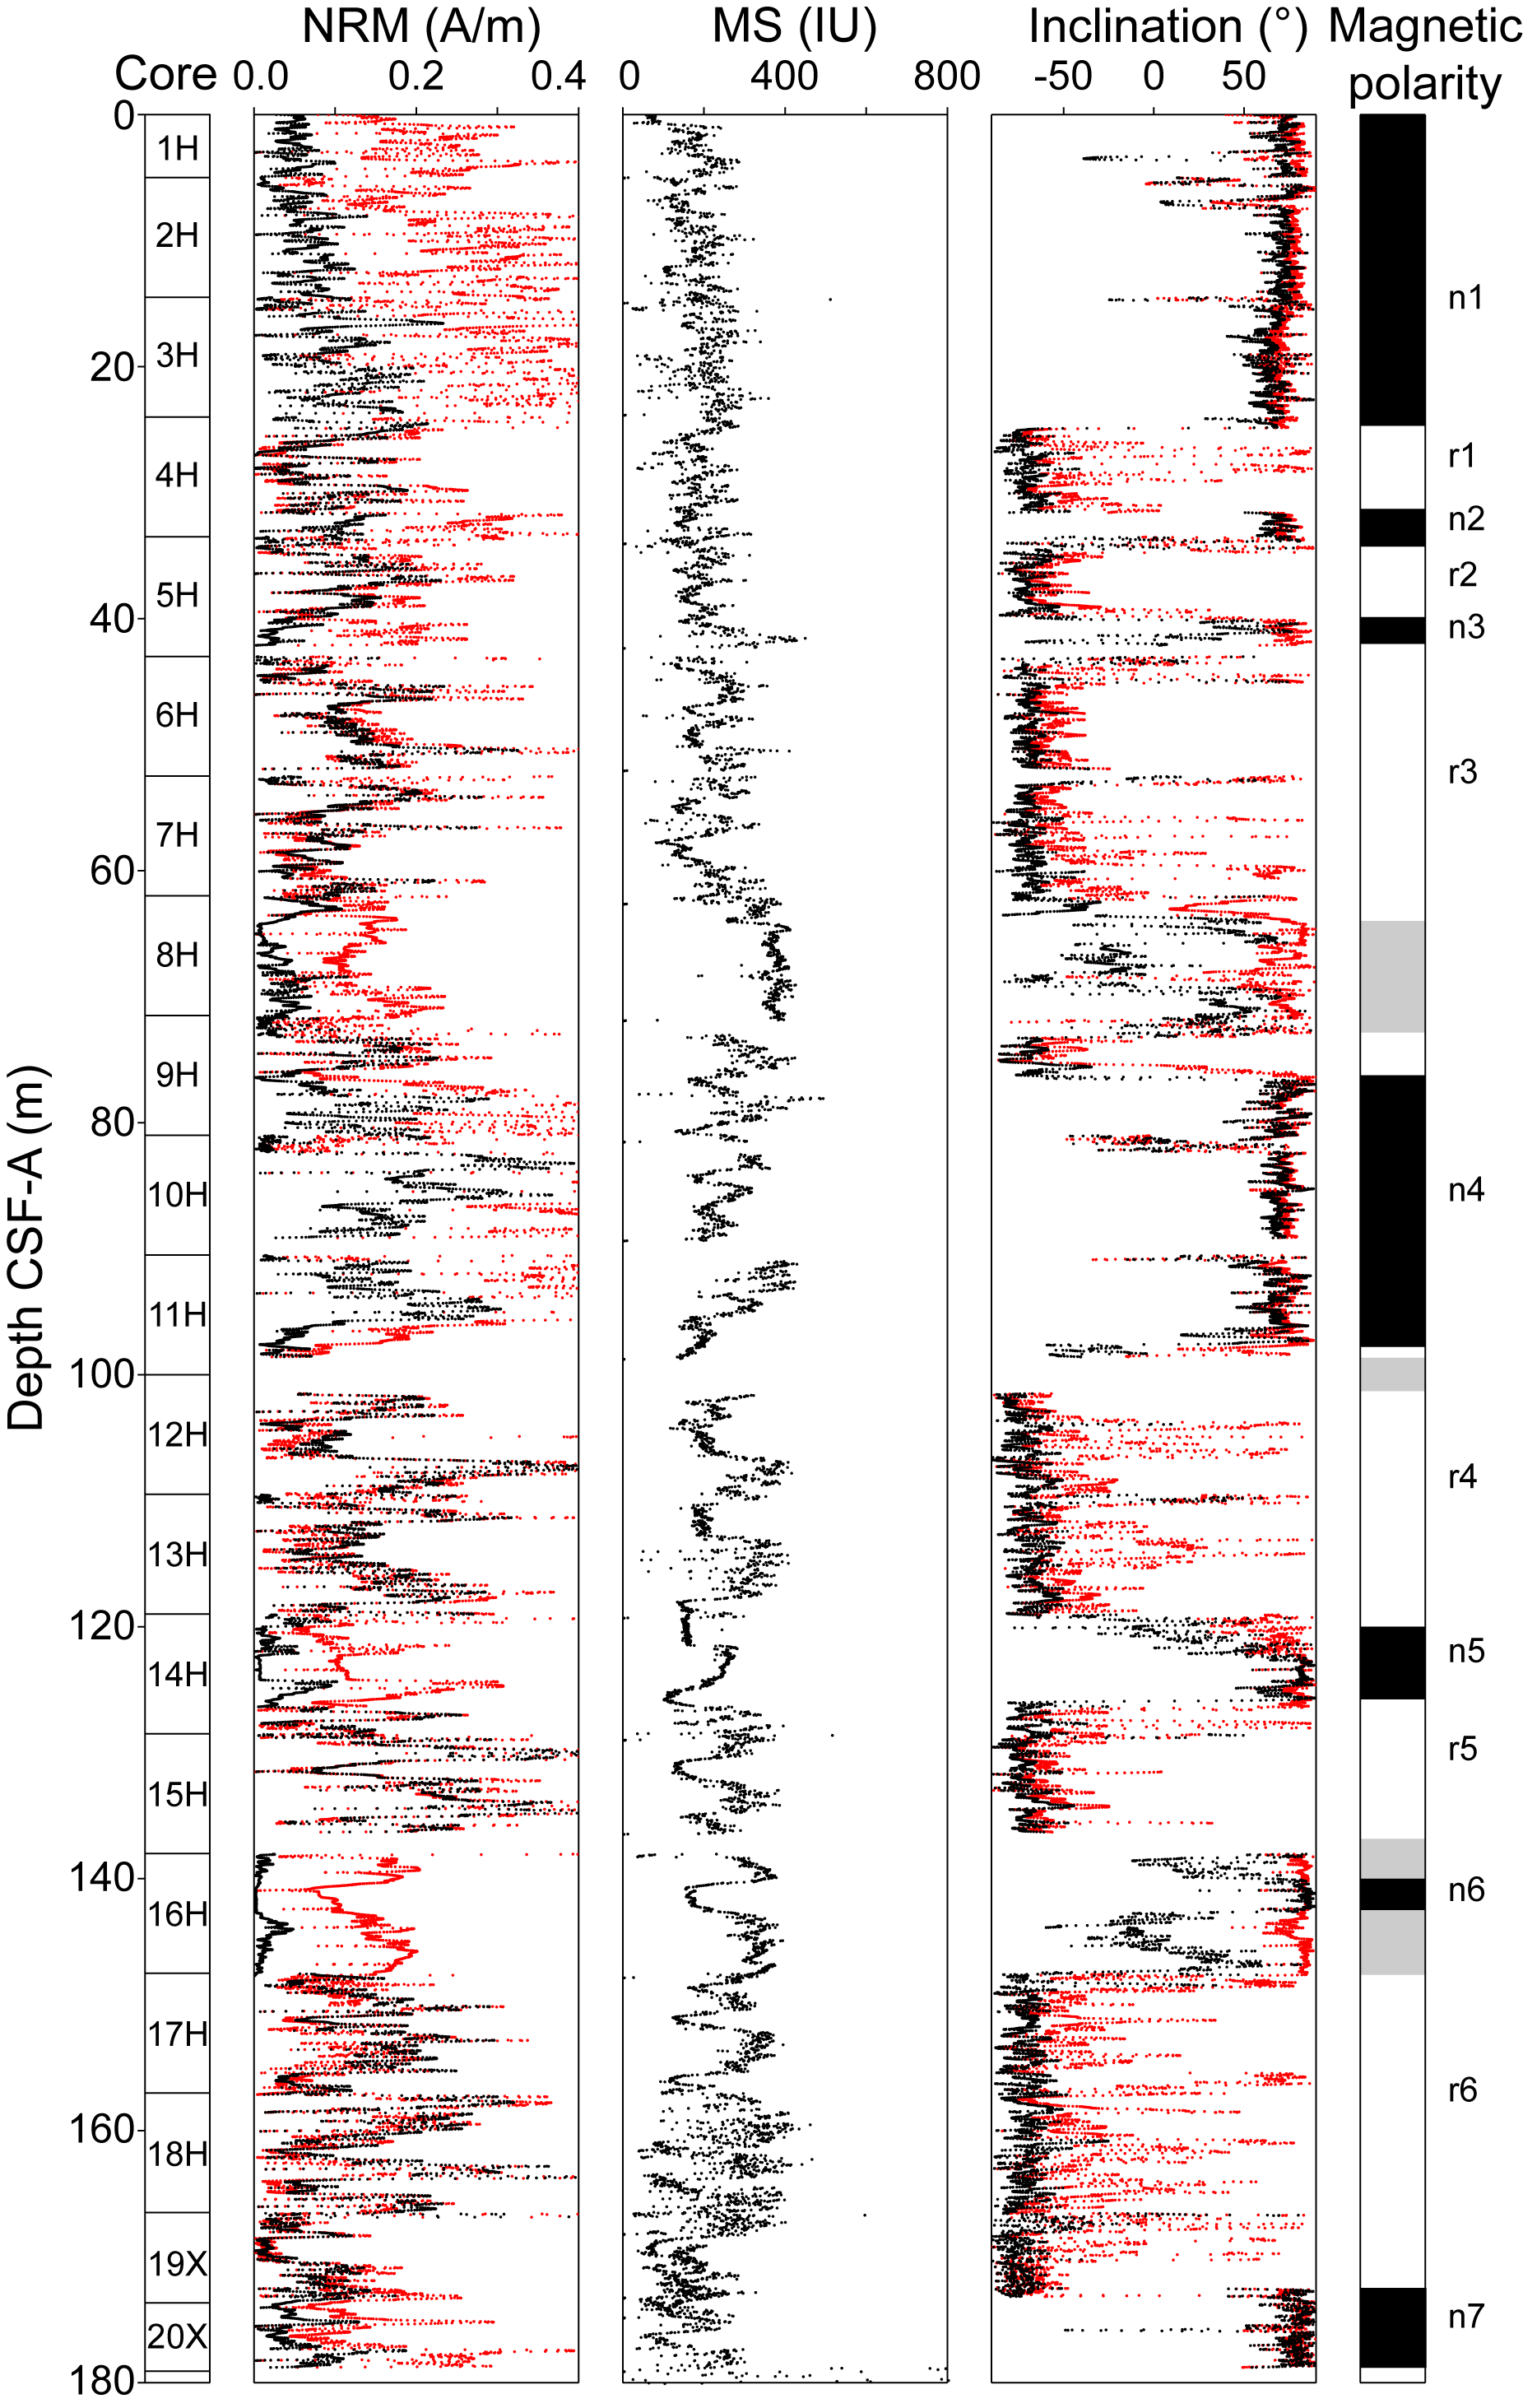
Figure F34. Paleomagnetic measurements, Hole U1555H.
8.3. Demagnetization behavior of basalts
The igneous rocks from Hole U1555I consist of basalt (see Igneous petrology). Seven steps of demagnetization (0, 5, 10, 15, 20, 25, and 30 mT) at 1 cm spacing were applied to Sections 4R-1 through 41R-2. Typical examples of demagnetization behavior and polarity interpretation are shown in Figure F35. Most of the basalts do not fully demagnetize at 30 mT (Figure F35A, F35C, F35D), with few exceptions (Figure F35B). After the removal of a drilling overprint at 10–15 mT, usually one component of magnetization is isolated and has a normal polarity. However, a few samples show multiple components (Figure F35C) or reversed polarity (Figure F35A).
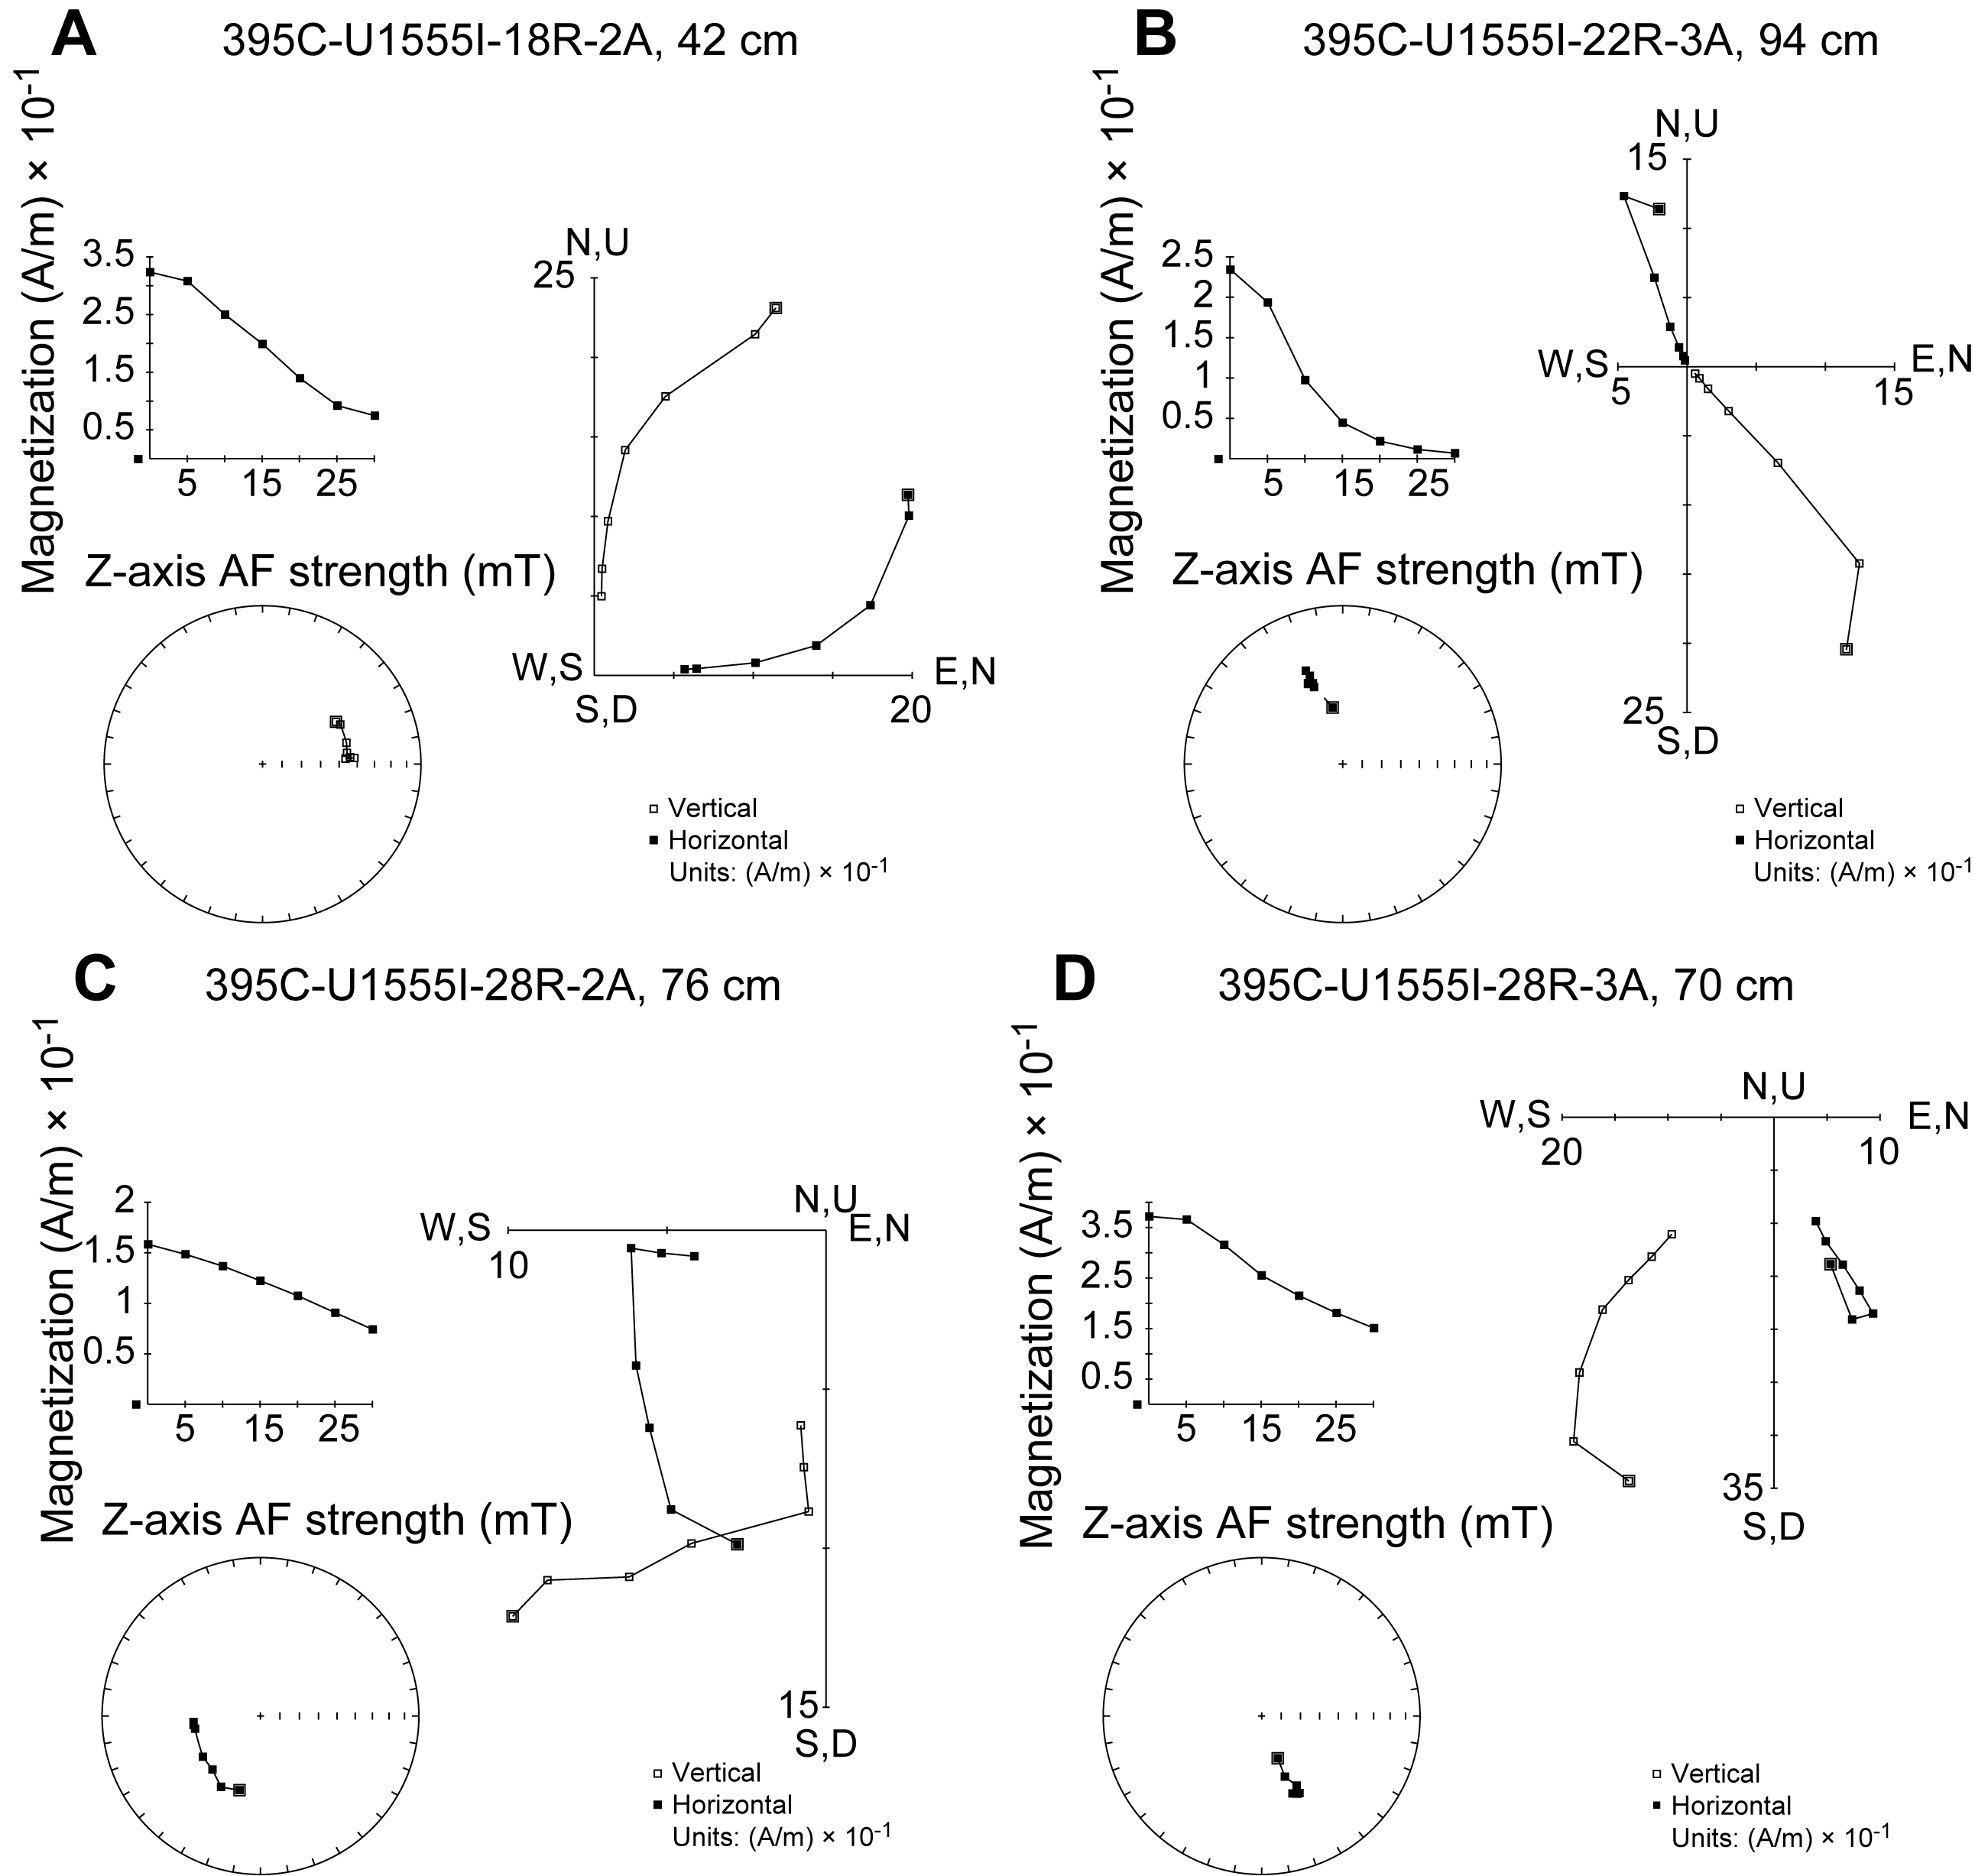
Figure F35. Demagnetization behaviors.
The sediment/basement interface in Hole U1555I is at ~179 m CSF-A (Figure F36) and is associated with a marked increase in NRM intensity, from an average of 1.3 × 10⁻¹ A/m (varying from 3.5 × 10⁻⁵ to 4.9 × 10⁻¹ A/m) for the sedimentary rocks to an average of 3.5 A/m (varying from 2.15 × 10⁻¹ to 7.5 A/m) in the igneous rocks.
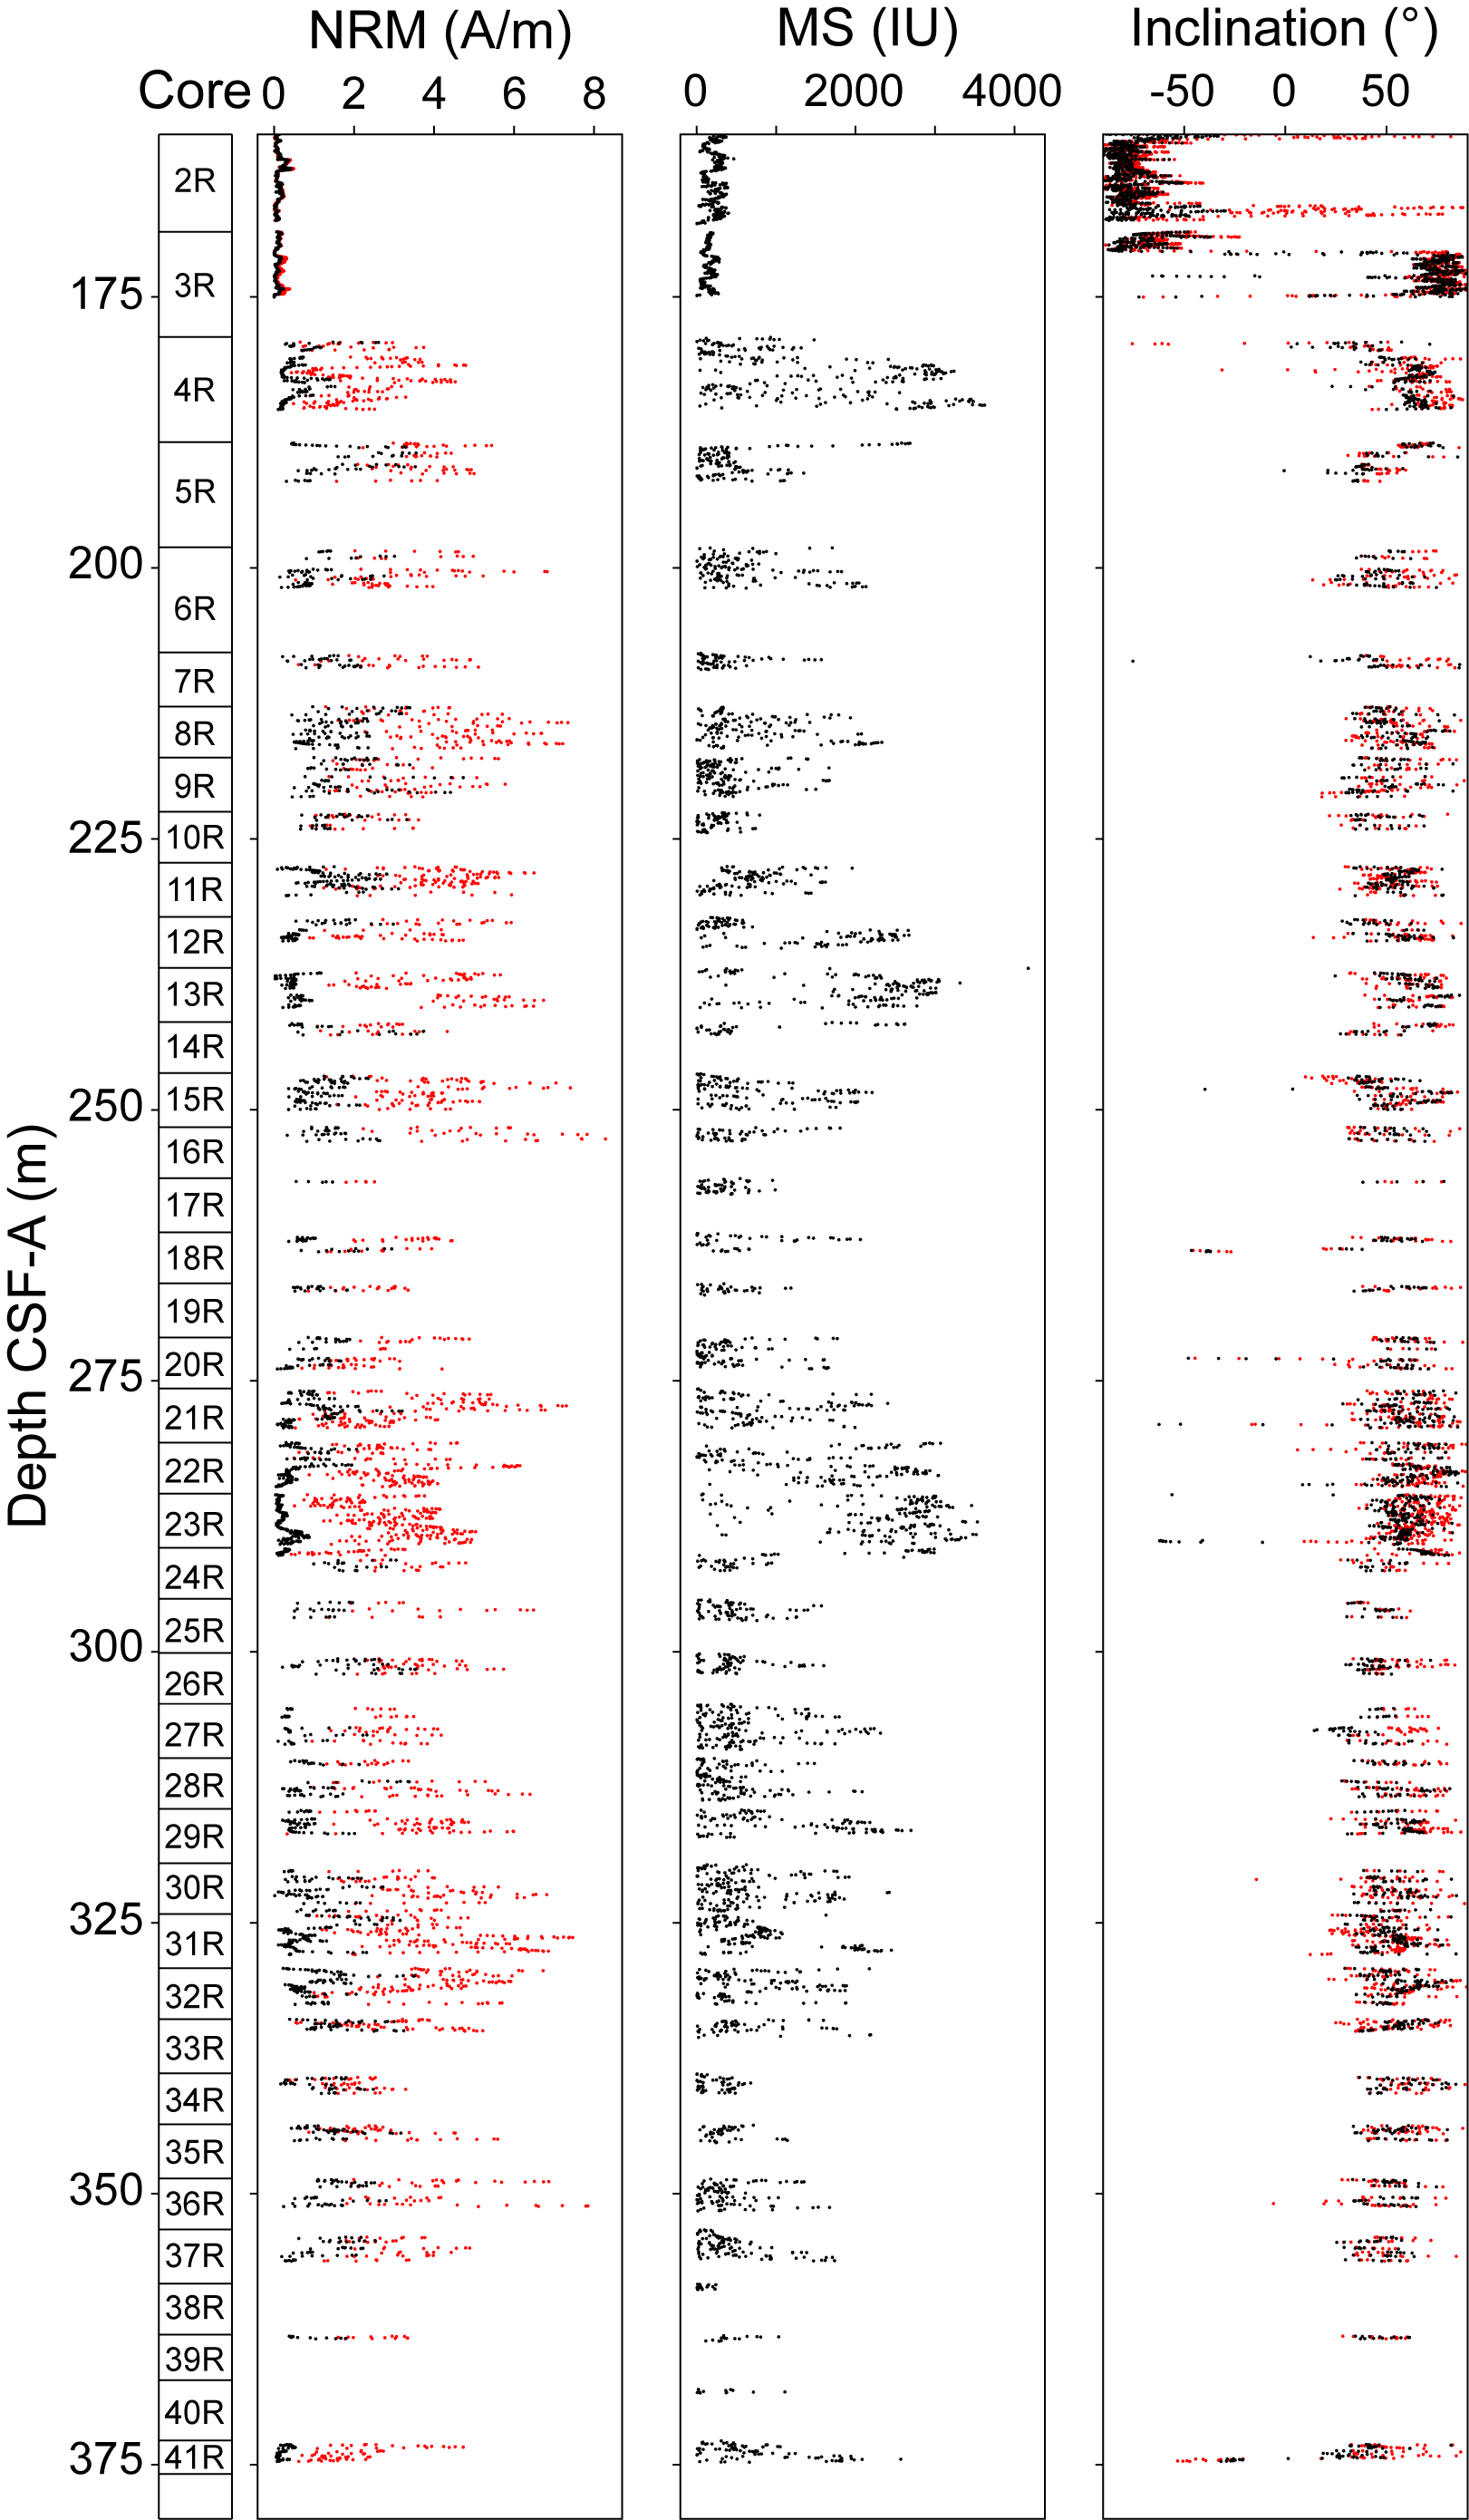
Figure F36. Paleomagnetic measurements, Hole U1555I.
Most of the basalts show normal polarity (Figure F36) except for Core 395C-U1555I-41R, which shows reversed polarity.
AF demagnetization shows two types of behaviors: (1) over 80% magnetization loss before 25 mT (i.e., considered magnetically soft) or (2) no significant loss of magnetization at 25 mT (i.e., considered magnetically hard). These two behaviors correlate with the MS values ranging 2–4180 IU and averaging 770 IU (Figure F36). Such correlation could indicate the presence of alteration in the basalts or may indicate the presence of basaltic flows because flow boundaries are associated with marked changes in MS (e.g., Cañón-Tapia, 2004; Boiron et al., 2013; Caballero-Miranda et al., 2016).
Basalt cores from Holes U1555F and U1555G were measured at 1 cm spacing, even when core pieces were less than 8 cm long or if a spacer was at the measurement point. The predominantly normal inclination values do not allow for a magnetostratigraphic interpretation (Hole U1555G is shown in Figure F37).
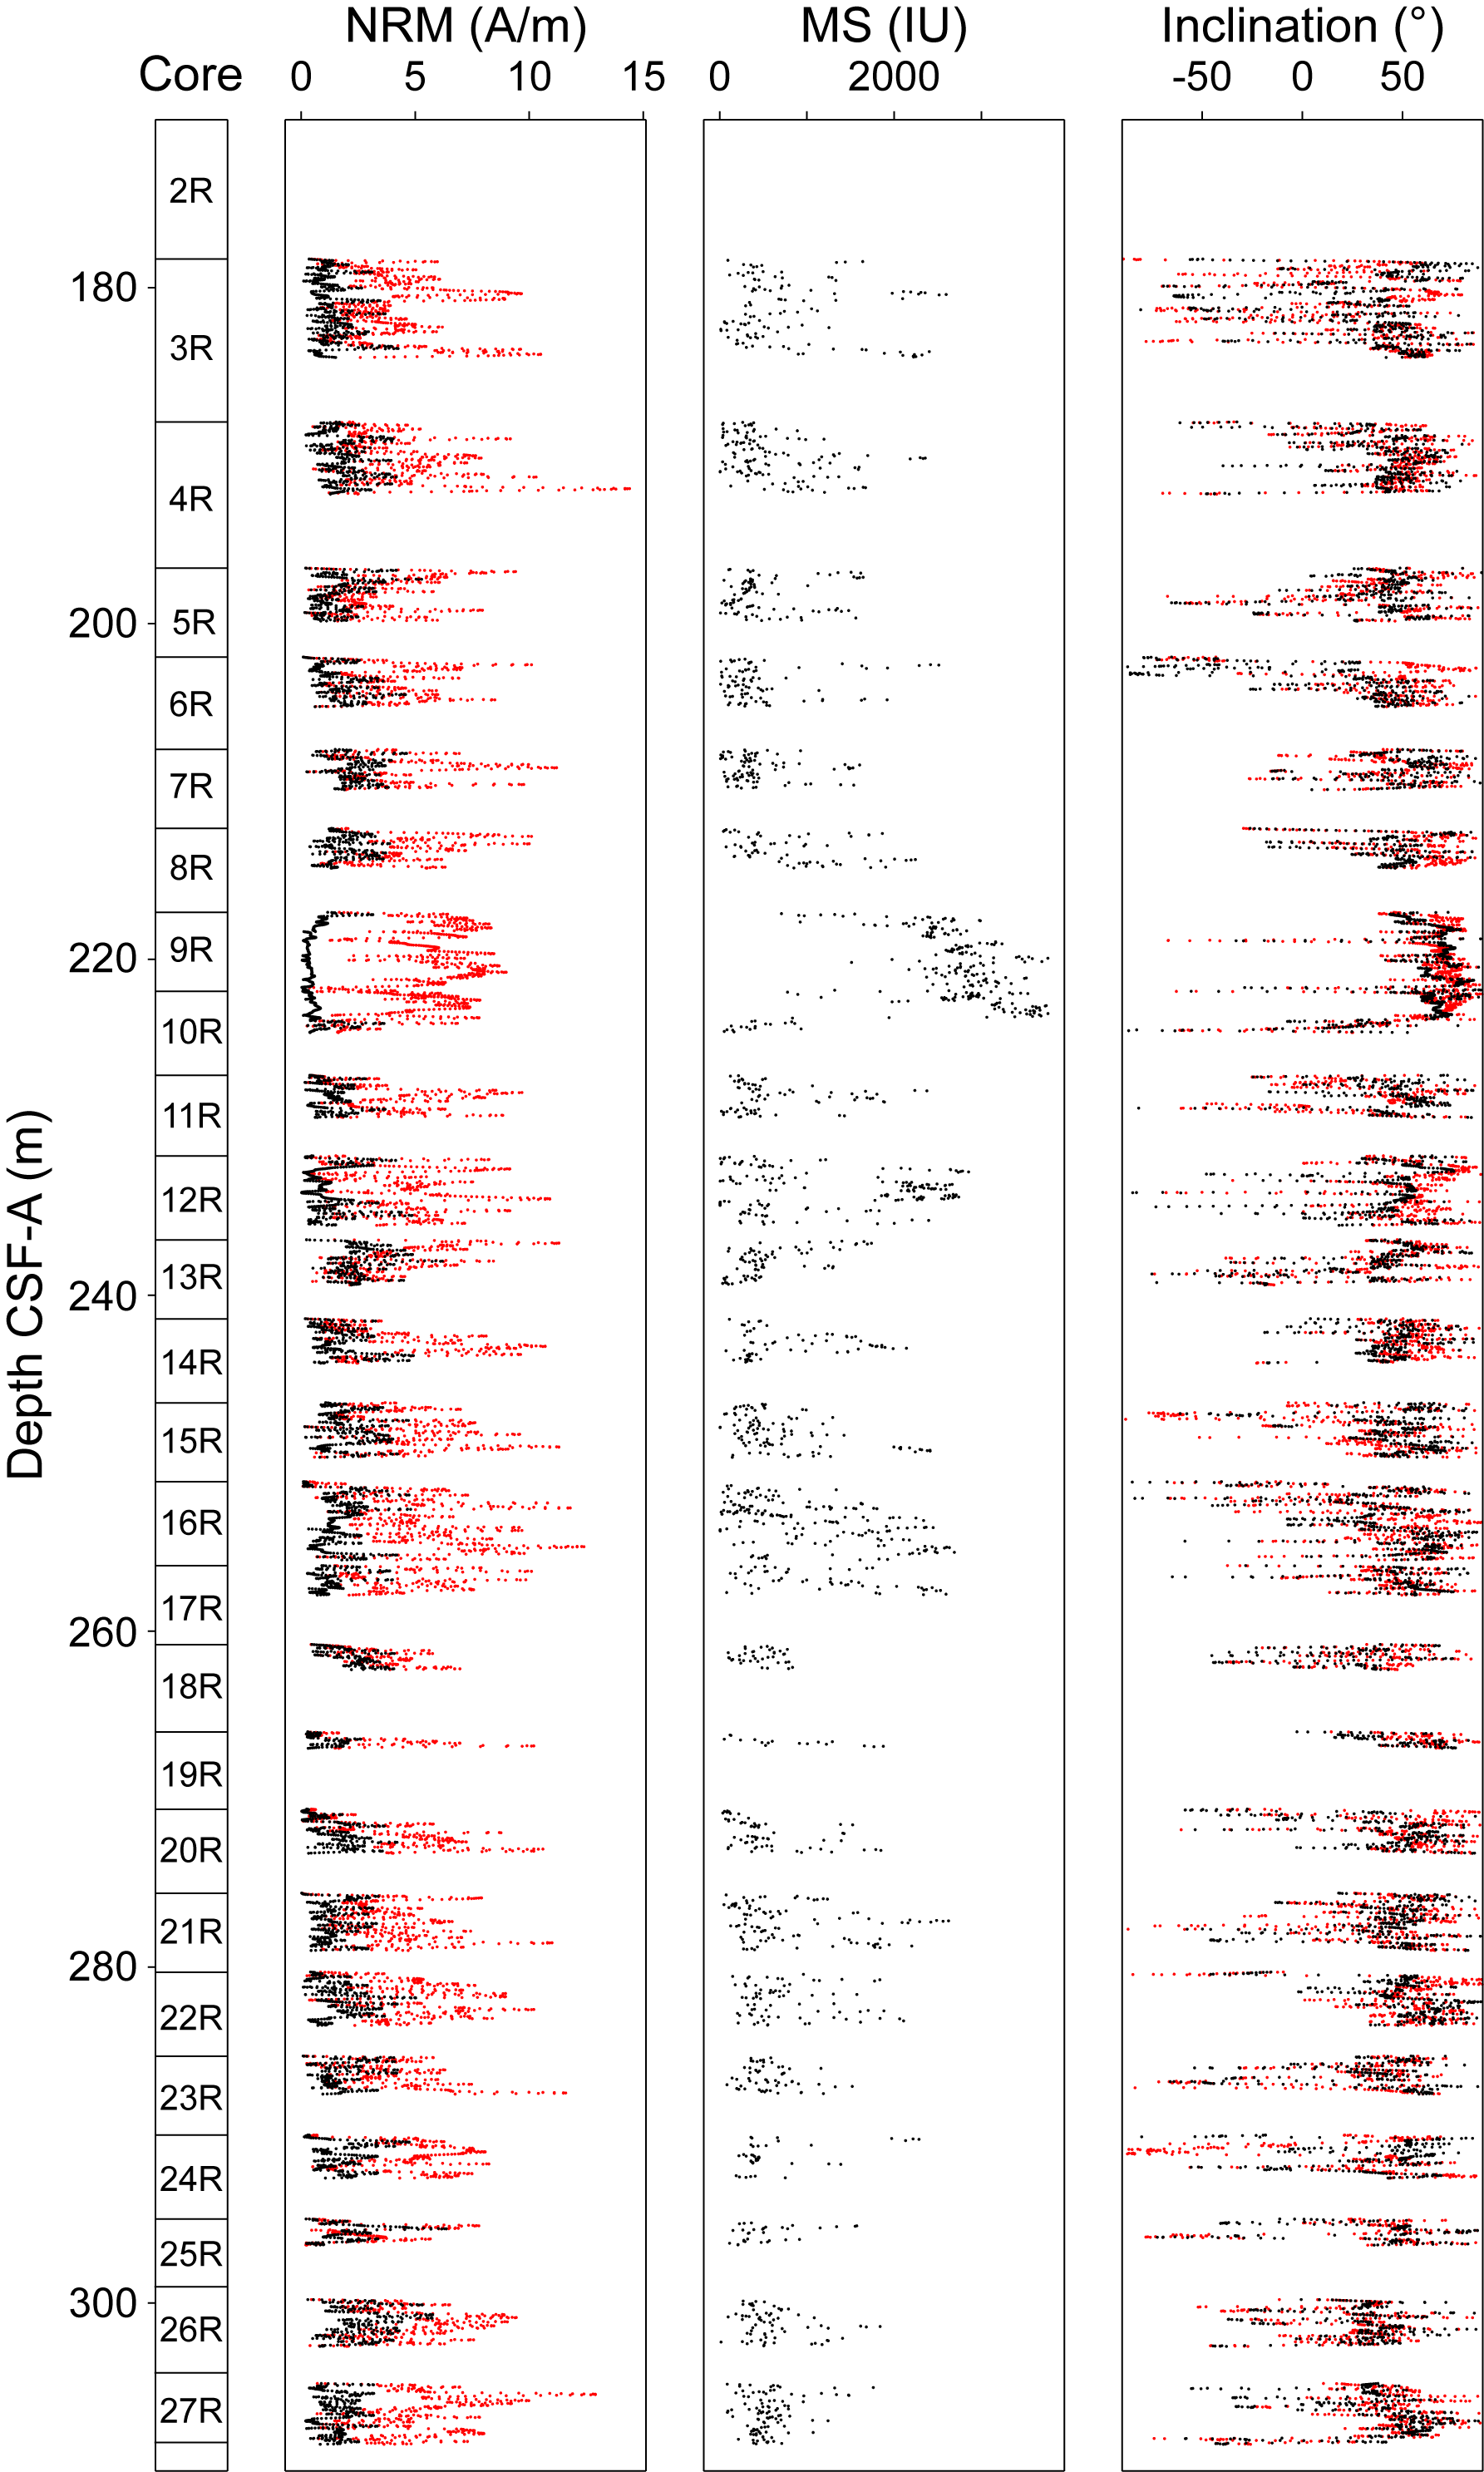
Figure F37. Paleomagnetic measurements, Hole U1555G.
8.4. Magnetostratigraphy
The magnetostratigraphy of Site U1555 is based on the correlation of the polarity assigned to the archive-half cores from Hole U1555H (Figure F34; Table T10) and the polarities reported in the reference geomagnetic polarity timescale (GPTS) (Ogg., 2020) (Table T10). Variations in inclination reflect changes in the magnetic polarities, highlighting short- and long-duration magnetic events. A succession of seven normal and six reversed intervals was recognized (Figure F34). Normal polarities (plotted in black in Figure F34) in the Brunhes are characterized by positive inclinations and have an average inclination similar to the present-day value of 73° calculated at Site U1555 using the International Geomagnetic Reference Field model (Alken et al., 2021). The magnetostratigraphic tie points are plotted along with those from microfossil ages obtained from shipboard samples to reconstruct a preliminary age model (see Age model).
9. Geochemistry and microbiology
Cores taken during Expedition 395C (Holes U1555H and U1555I) were analyzed for headspace gas, interstitial water (IW) chemistry, sediment carbon and nitrogen chemistry (CaCO3, total carbon [TC], and total nitrogen [TN]), and bulk sediment/basalt geochemistry. The geochemistry of basalts at Site U1555 is described in Igneous petrology. No geochemical analyses were conducted during Expedition 384 (Holes U1555F and U1555G). Methane and ethane concentrations are low (≤3 ppmv) and below the detection limits, respectively. Downhole trends in IW chemistry include increasing calcium ion (Ca2+) and decreasing magnesium ion (Mg2+) concentrations with depth. Sulfate (SO42−) concentrations have a small range (SO42− = 28.6 ± 1.5 mM) and exhibit a decreasing trend with depth. In contrast, IW strontium, lithium, and silicon concentrations generally increase with depth. For IW samples taken near the sediment/basalt interface, ion concentrations support the hypothesis that fluid-rock interactions have influenced IW composition. Bulk sediment total organic carbon (TOC) and CaCO3 contents are generally low (maximums = 0.3 wt% and 11%, respectively).
9.1. Volatile hydrocarbons
Gas analyses for the 178 m sediment section in Hole U1555H indicate very low hydrocarbon concentrations (Figure F38), suggesting a general lack of biogenic and/or thermogenic gas production or any upward migration. However, there is a subtle increase in methane, possibly because of microbial activity, with a peak value of 3.14 ppmv at 102.92 m CSF-A.
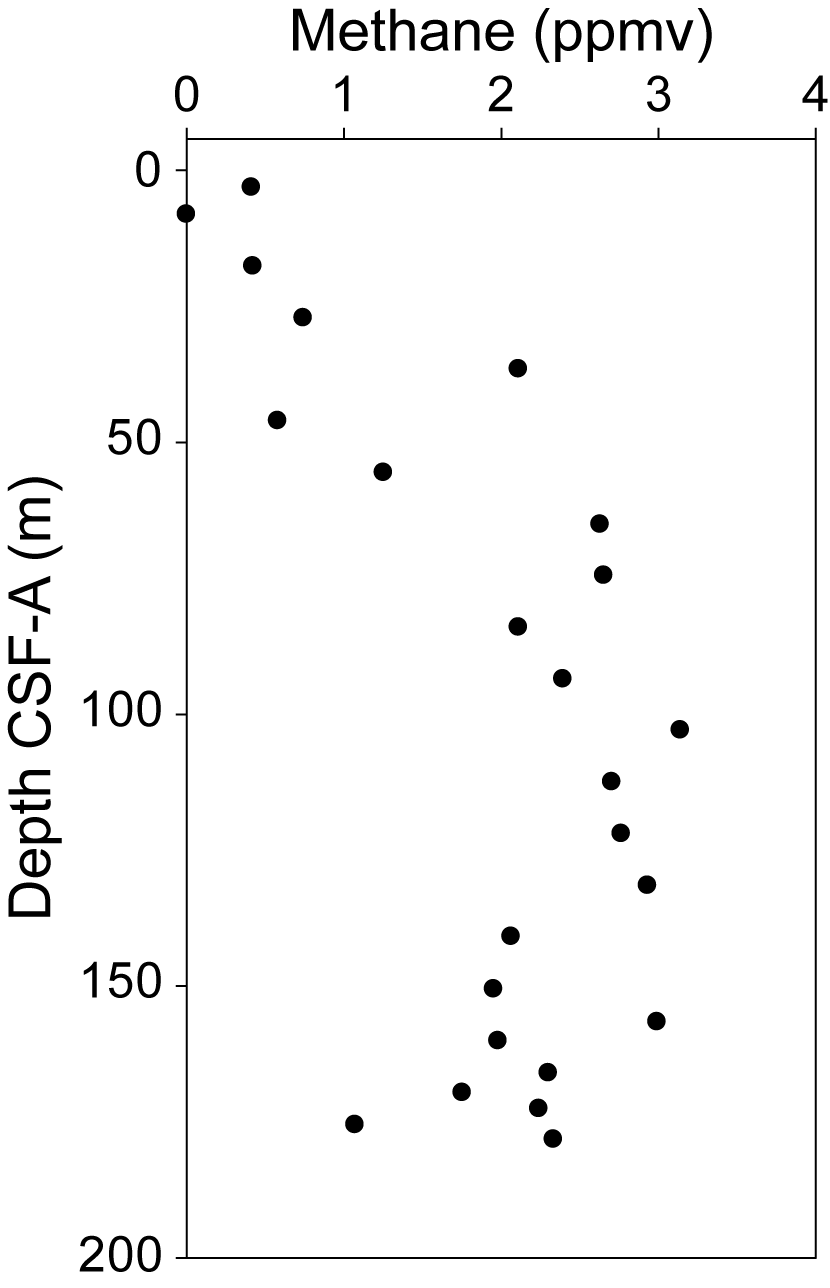
Figure F38. Gas analyses of methane concentrations.
9.2. Interstitial water chemistry
A total of 25 IW samples were squeezed from 10 cm whole-round samples from 2.97 to 178.16 m CSF-A in Hole U1555H, with sampling resolution dictated by core recovery and lithology. One additional water analysis was conducted on the mudline (sediment/water interface). In Hole U1555H, the deepest IW sample was collected from the core adjacent to the sediment/basalt interface. Data acquired from analysis of IW in Hole U1555H are shown in Figure F39. Alkalinity shows a narrow range in concentration (2.5–4.14 mM), with the lowest concentrations in the top ~20 m of the sediment column. pH is constant throughout the sediment column (7.7 ± 0.8). Dissolved magnesium (Mg2+) concentrations range 47–54 mM and decrease downward toward the basement, reaching the lowest concentration (47 mM) at 131.41 m CSF-A. Sulfate concentrations range 24.7–29.3 mM with a maximum concentration (29.3 mM) at the mudline and a decrease downhole, reaching the lowest concentration (24.7 mM) at 172.45 m CSF-A in a slight inflection point minimum before a short increasing trend to the bottom of the profile. Dissolved calcium concentrations increase steadily downhole, ranging 10.6–16.4 mM. Dissolved strontium concentrations range 92.8–115.3 µM and generally increase downhole toward the basement, although they show a gentle decreasing trend from ~120 m to the bottom of the measured interval.
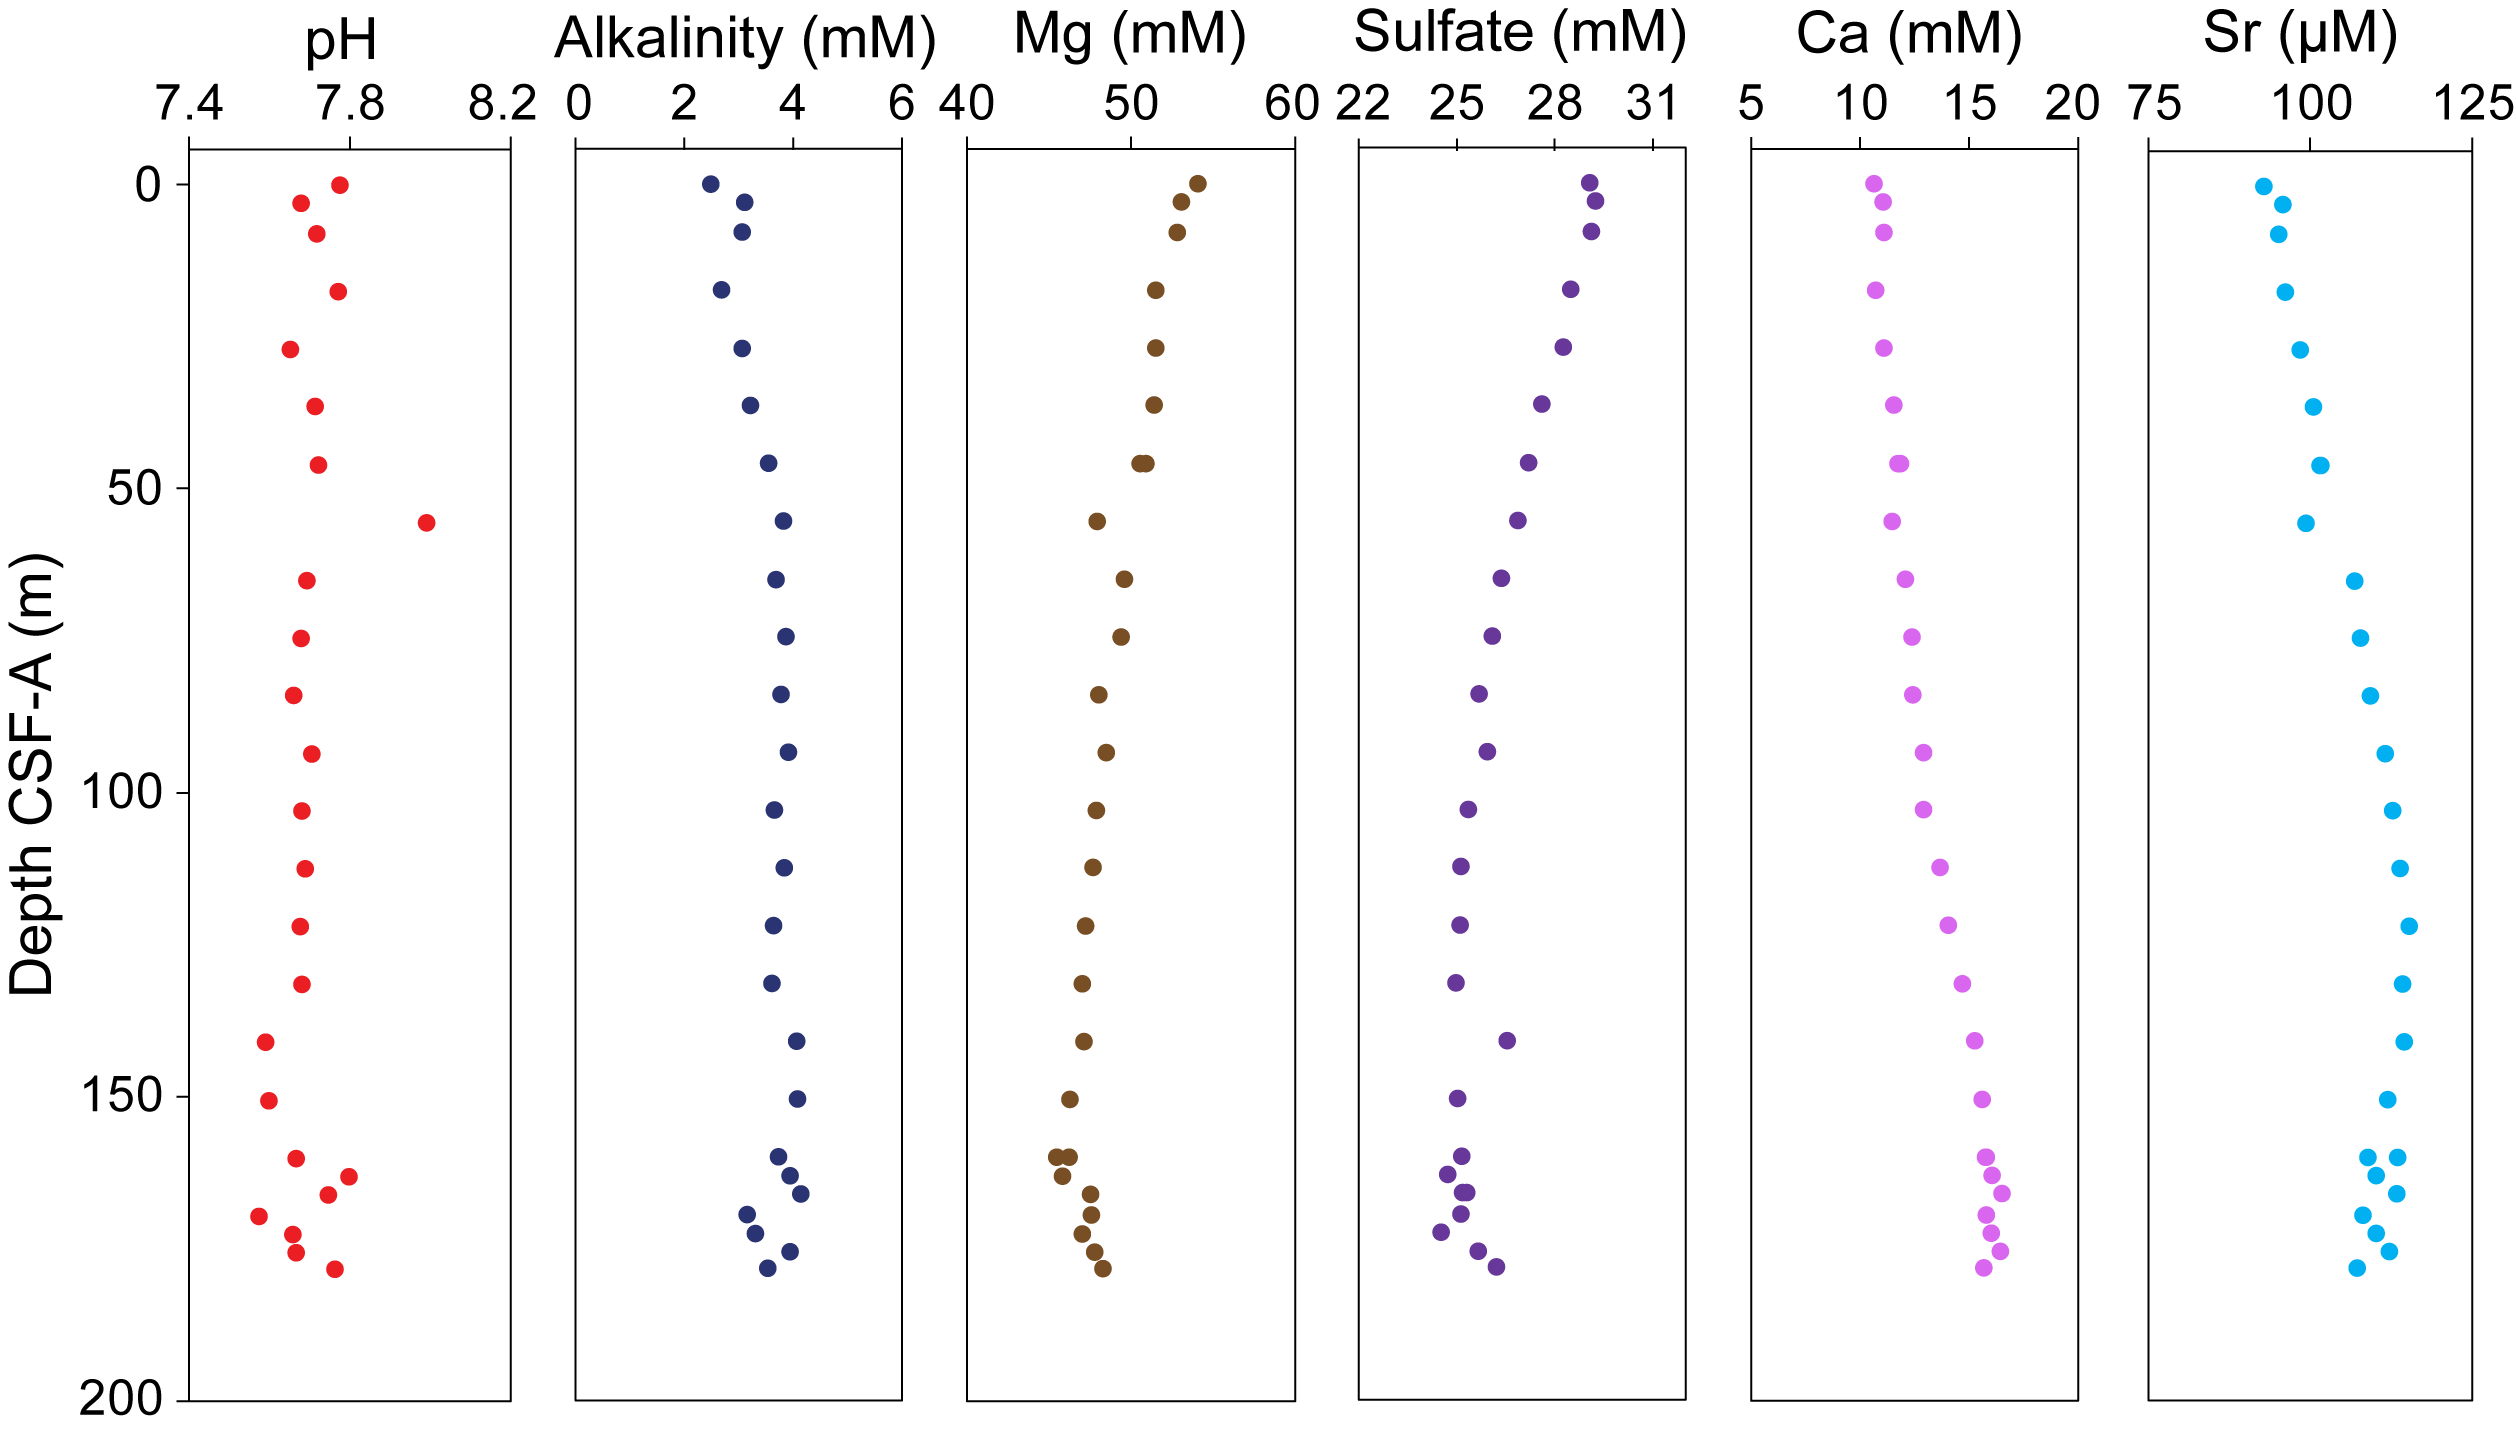
Figure F39. IW pH, alkalinity, and concentrations of selected ions.
9.2.1. Bulk sediment geochemistry
9.2.1.1. Carbon, nitrogen, and carbonate
Discrete sediment samples (n = 26) were collected from squeeze cake residues in Hole U1555H and analyzed for TC, TN, and total inorganic carbon. TOC and CaCO3 content were subsequently calculated (Figure F40). TOC content is generally low (≤3 wt%). The average CaCO3 content is 11.3 wt% (total range = <0.1 to 22.0 wt%), with one outlier in Sample 395C-U1555H-19X-2, 145 cm (53.3 wt%). TN is <0.1 wt% throughout the entire hole. TOC and CaCO3 vary with depth but show a similar pattern, indicating co-occurrence of organic carbon and CaCO3 throughout the sediment column. Anomalously high values for both TOC and CaCO3 are observed at 169.45 m CSF-A.
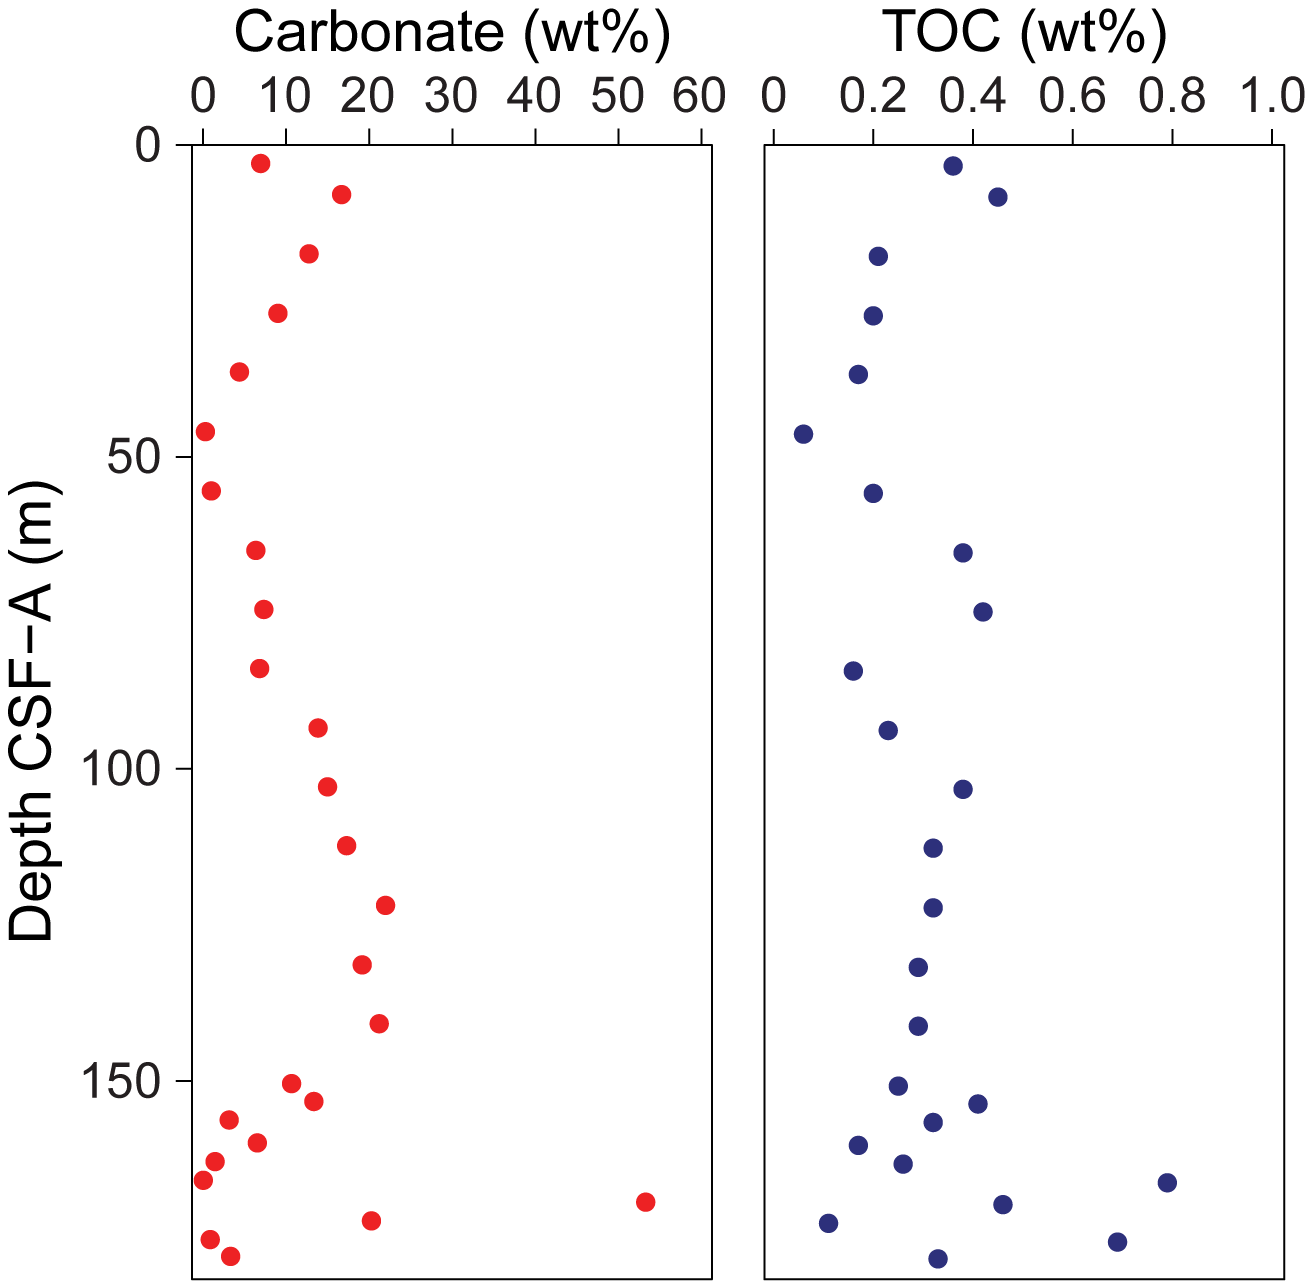
Figure F40. CaCO3 and TOC.
9.2.2. Microbiology
Microbiological sampling of sediments from Hole U1555H was focused on collecting samples for culture-independent approaches. A total of 24 sediment samples for microbiological analysis were collected with a sterile cut-end syringe from Hole U1555H, each 5 cm3. A total of 19 whole-round samples of hard rock were collected from Hole U1555I for shore-based microbiological analyses.
10. Downhole measurements
Details of logging tools and procedures can be found in Downhole measurements in the Expedition 395 methods chapter (Parnell-Turner et al., 2025a), and only hole-specific procedures are detailed here. Downhole logging operations at Site U1555 were conducted in Holes 384-U1555G, 395C-U1555H, and 395C-U1555I. Holes U1555I and U1555G were both logged with the triple combo tool string (Magnetic Susceptibility Sonde [MSS], High-Resolution Laterolog Array [HRLA], Accelerator Porosity Sonde [APS], and Hostile Environment Litho-Density Sonde [HLDS]), and Hole U1555G was additionally logged with the FMS-sonic tool string (FMS, Dipole Sonic Imager [DSI], General Purpose Inclinometry Tool [GPIT], and Hostile Environment Natural Gamma Ray Sonde [HNGS]) and the VSI tool string (VSI and HNGS) (Table T11). During coring in Hole U1555H, formation temperature measurements were acquired at four locations (Cores 4H, 7H, 10H, and 13H) using the APCT-3 tool.
10.1. Logging procedure and log data processing
10.1.1. Hole 384-U1555G
Logging operations were documented as uneventful for Hole U1555G and comprised a downlog, short repeat, and main uplog pass for both the triple combo and FMS-sonic tool strings (Table T11). The wireline heave compensator (WHC) was used while tools were logging open hole, and the average ship's heave was 0.5–1 m during logging passes. Before downhole logging in Hole U1555G, heavy mud (sepiolite and barite) was used to displace the hole contents. This heavy mud was left in the hole during logging.
All logging passes were depth matched to the gamma ray log from the main pass of the FMS-sonic tool string (Data Set 078LUP). The gamma log recorded by the triple combo tool string is unreliable at Site U1555 because the APS was unintentionally active during the triple combo run. We therefore prefer to use the gamma log recorded by the FMS-sonic tool string for Site U1555. Depth-matched logs were shifted to seafloor determined from a step in the gamma ray log at 1532 m wireline log depth below seafloor (WSF), a difference of 2.6 m from the driller's seafloor depth of 1534.6 m drilling depth below rig floor [DRF]). We note here that the 2 m WSF offset between the triple combo and FMS-sonic logs (Blum et al., 2020) was addressed with the depth matching process performed. Calipers indicate good hole quality with most values between bit size (9.875 inches) and ~10 inches and some minor depth intervals widening to ~15 inches (Figure F41). In the wider borehole depth intervals, logging data should be assessed carefully for accuracy, particularly those readings that require tool eccentralization to make measurements from the hole wall.

Figure F41. Downhole logging data, Hole U1555G.
The HLDS and APS sampling intervals were 2.54 and 5.08 cm, respectively, in addition to the standard sampling interval of 15.24 cm. DSI data were deemed to be of acceptable quality by the data processing team at the Lamont-Doherty Earth Observatory (LDEO). Triple combo tool string data from the three passes were compared to test for repeatability. All passes show good repeatability except for the gamma ray from the triple combo main pass (Data Set 069PUP), which is not used, as explained above. During the downlog pass of the triple combo and the FMS-sonic tool strings, the caliper was closed, which prevented the use of the HLDS tool in the triple combo tool string and the FMS in the FMS-sonic tool string for these passes.
The resistivity borehole images are of good quality. Image quality deteriorates on the repeat pass image log at ~272–273.5 m wireline log matched depth below seafloor (WMSF) and on the main pass image log at 276.5–279 m WMSF because the tool calipers were closed over these depths to overcome the tool becoming stuck during logging. Despite this image log quality deterioration, geologic features are still identifiable on the image log but should be interpreted with caution.
The VSI tool string was used to record five shots at each of two stations at 235.1 and 295.6 m WSF.
10.1.2. Hole 395C-U1555I
A high-viscosity mud sweep was used to clean Hole U1555I of debris prior to logging. The drill bit was dropped at the bottom of the hole, and the drill pipe was brought up to 75.6 m DSF. The triple combo tool string was lowered to the bottom of the hole, recording on its way down (0–371 m DSF; Data Set 027LUP), and experienced no problems. Because this downlog pass was a reference log, the caliper was closed, and therefore the APS (porosity) and HLDS (density) tools were not operational. Because the caliper was not recorded, borehole shape calibrations are not applied to measurements from this downlog pass, and all data from it should be interpreted with caution. The uplog pass of the triple combo tool string (Data Set 026LUP) met resistance and became stuck at 183.5 m DSF (~7 m below the sediment/basement interface) because of an obstruction in the hole at ~225.5 m DSF. Several attempts were made to log up past this depth but with no success. The tool string was fished out of the hole, and the remaining planned downhole logging for Hole U1555I was not undertaken.
Despite these difficulties with downhole logging in Hole U1555I, the triple combo tool string collected data on the downlog and over the lowermost ~180 m (220–371 m WMSF) of the hole during its first and only uphole pass prior to becoming stuck. We review here caliper, gamma radiation, spectral gamma, resistivity, density, and porosity measurements from the uplog portion of the hole, as well as gamma radiation, spectral gamma, and resistivity measurements from 0 to 220 m WMSF from the downlog and MS from the downlog, which is comparable to the same data on the uplog pass. Depth matching of the logs from Hole U1555I was performed using the resistivity log from the downlog of the triple combo tool string because it is the only tool pass to cross the seafloor. Depth matched logs are depth shifted to seafloor as reported by the drillers (1534.5 mbsl).
Density (HLDS) and neutron porosity (APS) were measured at sampling intervals of 2.54 and 5.08 cm, respectively, in addition to the standard sampling interval of 15.24 cm. Gamma ray data from the Enhanced Digital Telemetry Cartridge (EDTC) was recorded at sampling intervals of 5.08 and 15.24 cm, and resistivity (HRLA) data were acquired every 5.08 cm, although in the database it is also resampled at 15.24 cm for ease of comparison with other logs. The HNGS, HRLA, and HLDS data are corrected for hole size during acquisition, and the APS tool data is corrected for standoff during acquisition. Because the borehole was consistently larger than the 9.875 inch bit size (ranging 10–17 inches), some borehole deterioration and consequent uncertainty can be expected in data acquired using the tools that require contact with the borehole wall (density and porosity).
10.2. Logging units
Here we define Logging Units L1 and L2 for Site U1555 and describe their correlation across Holes U1555G and U1555I (Table T12). The two major logging units are reported based on obvious logging tool response changes at the sediment/basement interface, where Unit L1 describes the sediment package, and Unit L2 describes the basement basalts. Logging subunits for the sediment package are based only on where the gamma log no longer is suppressed due to measurement through drill pipe.
10.2.1. Logging Subunit L1a
Logging Subunit L1a is defined solely by the gamma ray signal because this depth interval was within the drill pipe during logging (Hole U1555I = 0–85 m WMSF; Hole U1555G = 0–145 m WMSF). Subunit L1a is only confidently identified in Hole U1555I, and here it comprises Lithostratigraphic Unit IA and a small (22 m) portion of Lithostratigraphic Unit IB (see Lithostratigraphy). The gamma ray signal over Subunit L1a in Hole U1555I gradually increases with depth from near 0 American Petroleum Institute gamma radiation units (gAPI) at the seafloor to ~4 gAPI at the bottom of the unit (Figure F42).
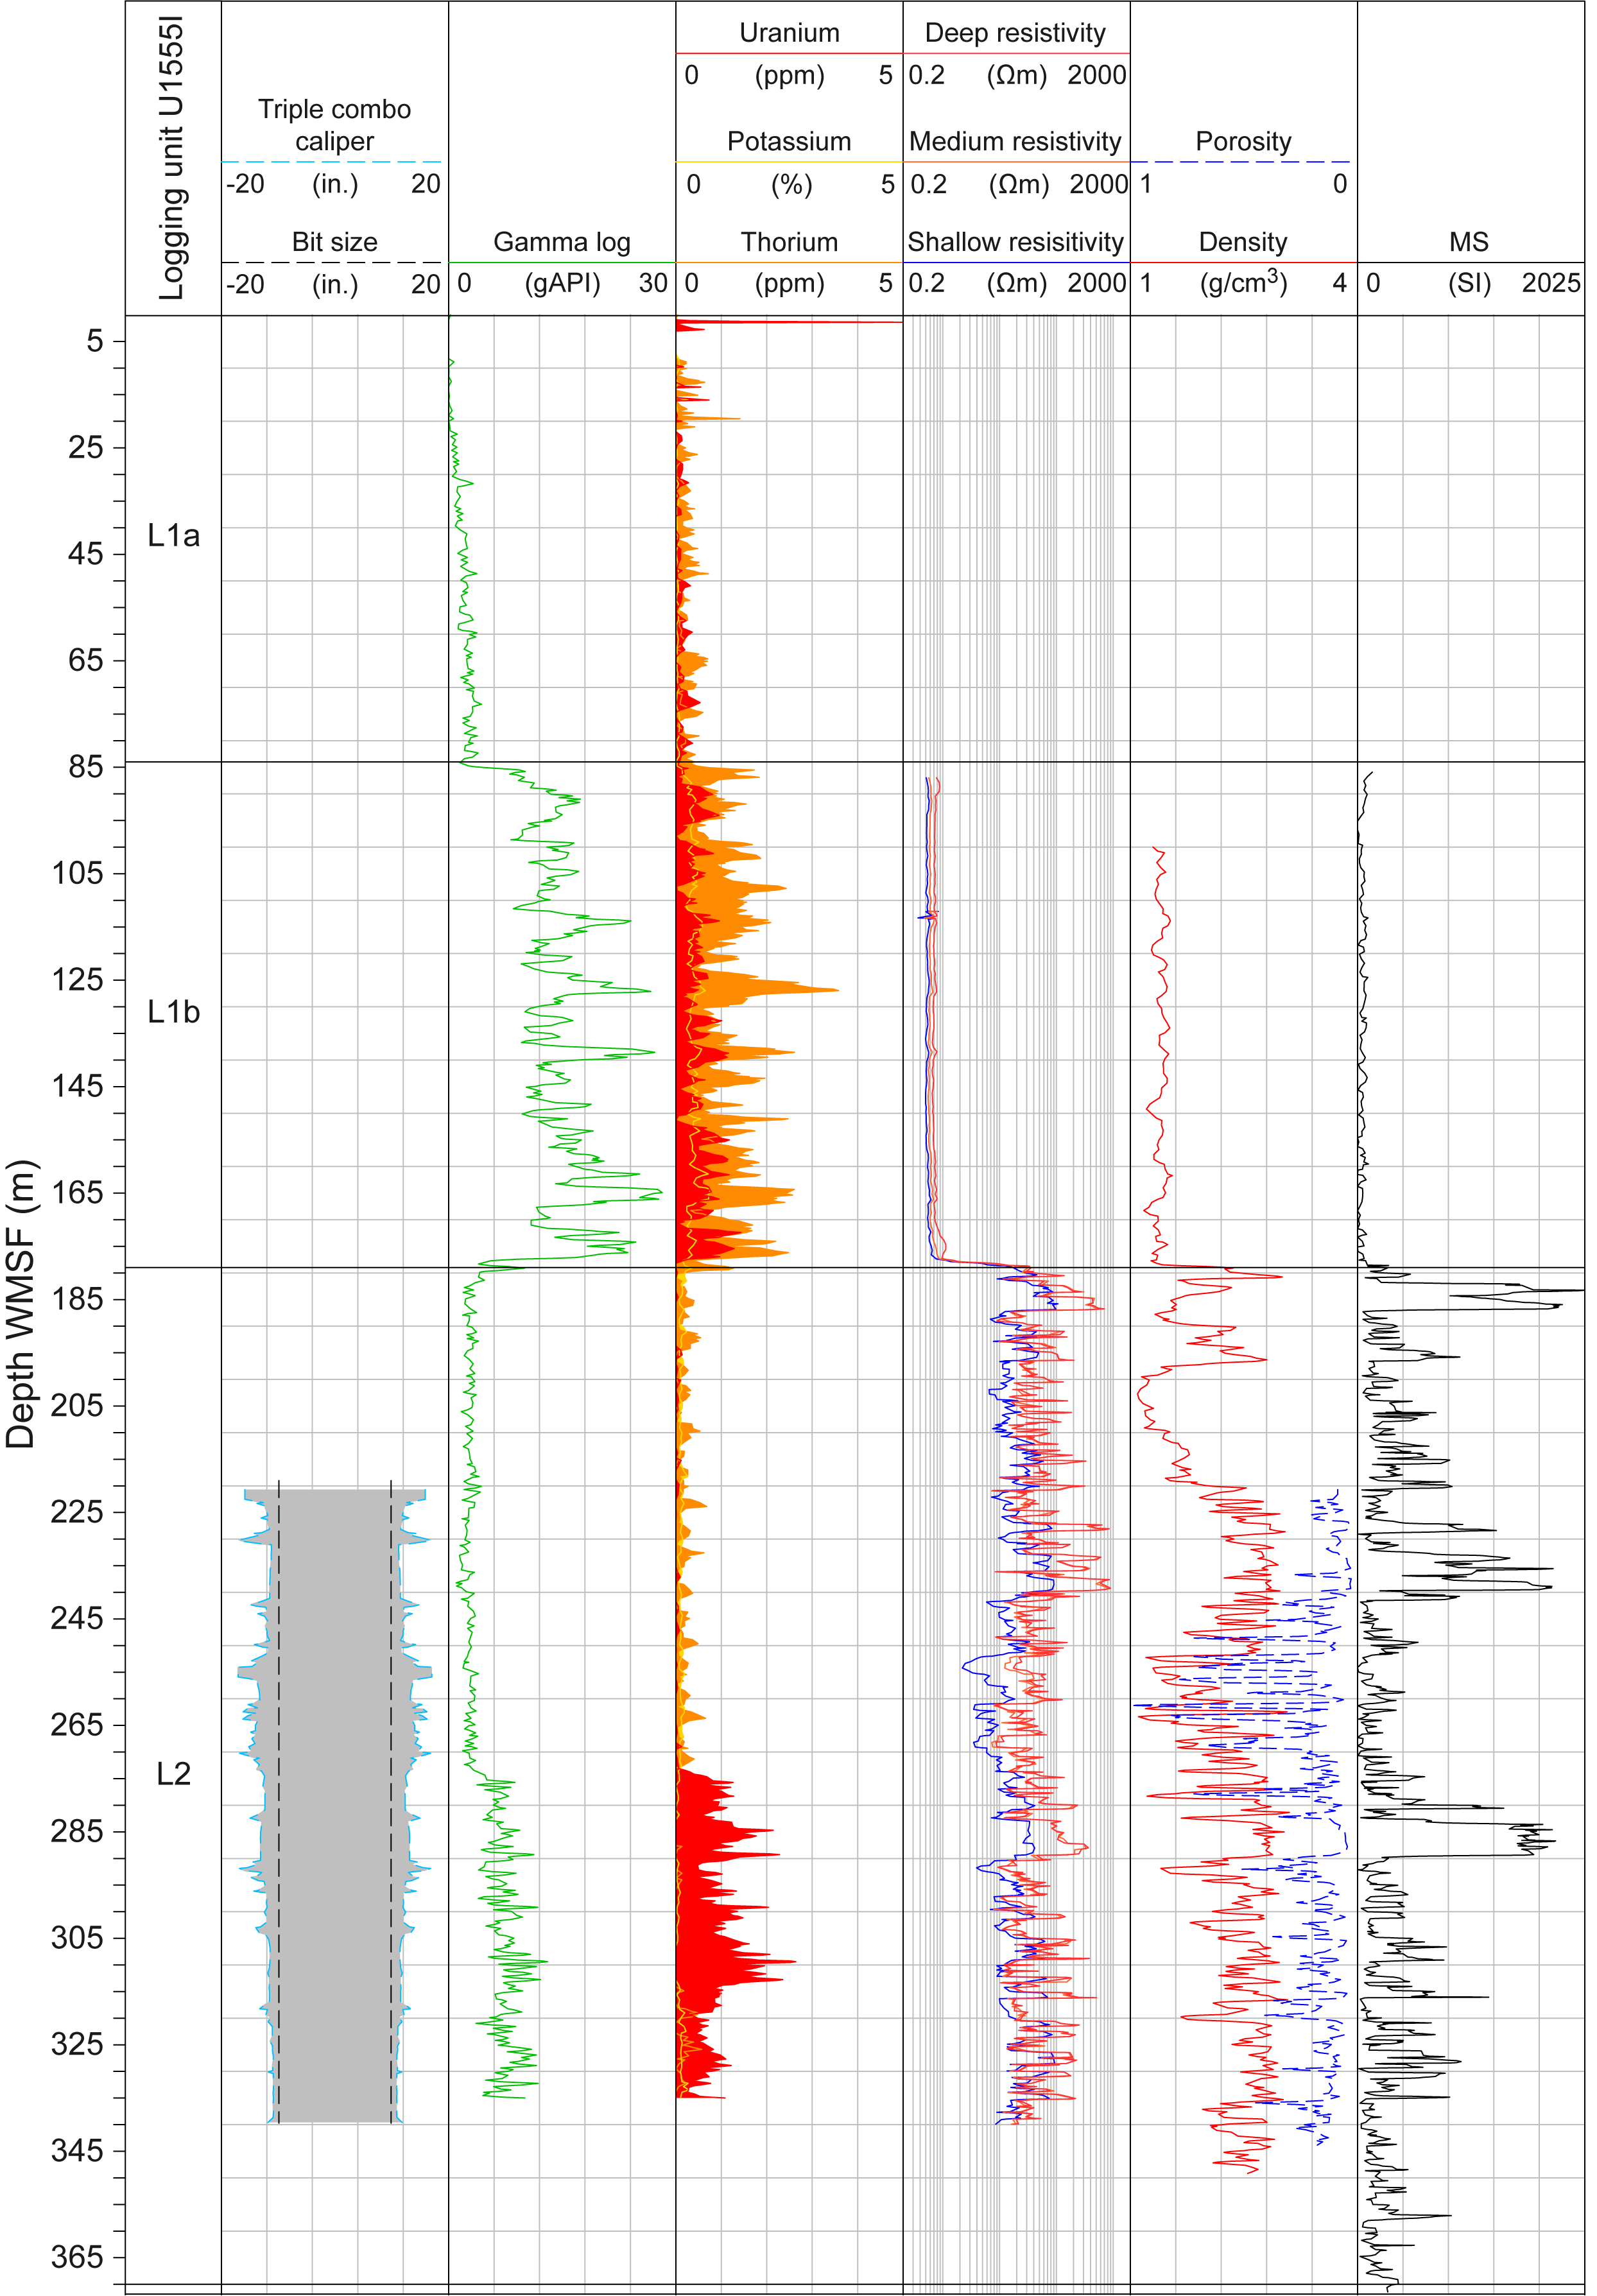
Figure F42. Downhole logging data, Hole U1555I.
10.2.2. Logging Subunit L1b
Logging Subunit L1b is defined by notable downhole logging signals (Figure F41), although it is only confidently identified in Hole U1555I. In Hole U1555I, Subunit L1b shows consistently low shallow, medium, and deep resistivity (0.5–1.1 Ωm). The gamma log shows a variable response with intervals of both low (~10–13 gAPI) and increased (up to 28 gAPI) gamma counts. Spectral gamma logs show that peaks of higher gamma rays are due mostly to increases in Th content, although K and U content also increase to a lesser degree. Similar gamma signals are noted for Subunit L1b in Hole U1555G but are more suppressed than those in Hole U1555I. MS is relatively constant across this subunit (10–70 SI). Subunit L1b encompasses the remainder of Lithostratigraphic Unit IB (see Lithostratigraphy).
10.2.3. Logging Unit L2
In Hole U1555I, an abrupt change occurs in the logging responses of the triple combo downlog pass (Data Set 071PUP) at ~179 m WMSF, which corresponds to the sediment/basement interface. This change marks the top of Logging Unit L2, which represents the change from the sedimentary package comprising Unit L1 to the basaltic basement. Changes in logging responses at ~179 m WMSF include an overall increase in resistivity (from consistently ~0.6 Ωm in the sediments to values ranging 2–963 Ωm), a decrease in total gamma radiation to a consistent value of ~3 gAPI, a decrease in all spectral gamma counts, and large fluctuations in the MS log (ranging 100–1500 SI) (Figure F42). A similar but subtler decrease in gamma radiation values from ~6 to ~3 gAPI is noted in Hole U1555G at a similar depth (~180 m WMSF), marking the same lithologic transition from sediments to basalt for this hole (Figure F41). In the lower portion of Hole U1555G, an increase in Th counts is related to the presence of heavy drilling mud (sepiolite and barite) in the hole that was not displaced by seawater before logging.
Several depth intervals in Unit L2 in Holes U1555I and U1555G show multiple ~1–7 m thick occurrences of high resistivity with marked separations between shallow and deep resistivity readings (e.g., 184–187 m WMSF) (Figures F41, F42). These intervals correlate with increases in density (up to ~3.1 g/cm3), MS (as high as ~1750 SI), VP (up to ~6880 m/s), and shear wave velocity (VS) (up to ~3670 m/s) and decreases in porosity (as low as ~0.02). We interpret them as marking massive basalt lava flows. In between these intervals, resistivity fluctuates, lower values of density (as low as ~1.3 g/cm3) and MS (as low as ~100–750 SI) are observed, and porosity increases (as high as 0.8). Some of these high-resistivity intervals can be correlated between Holes U1555I and U1555G. For example, a 7 m thick distinct interval occurs at 218–225 m WMSF in Hole U1555G, showing near identical resistivity and MS patterns to the 283–290 m WMSF depth interval in Hole U1555I. If this correlation is correct, it suggests a basalt lava flow may be offset up to 65 m between Holes U1555G and U1555I.
10.3. Borehole image logging
FMS image logs were acquired in Hole U1555G in basalt basement rocks (Figure F43) and show two main image log facies. The first facies has a more homogeneous image log appearance with relatively high resistivity compared to other depth intervals (e.g., between 273 and 280 m WMSF). Multiple conductive planar features, dominantly of lower relative resistivity, are visible in these image log facies intervals. The second main image log facies is characterized by a mix of conductive and resistive layering (Figure F44), within which conductive planar features appear to cut across these layers in places (interpreted as conductive fractures).
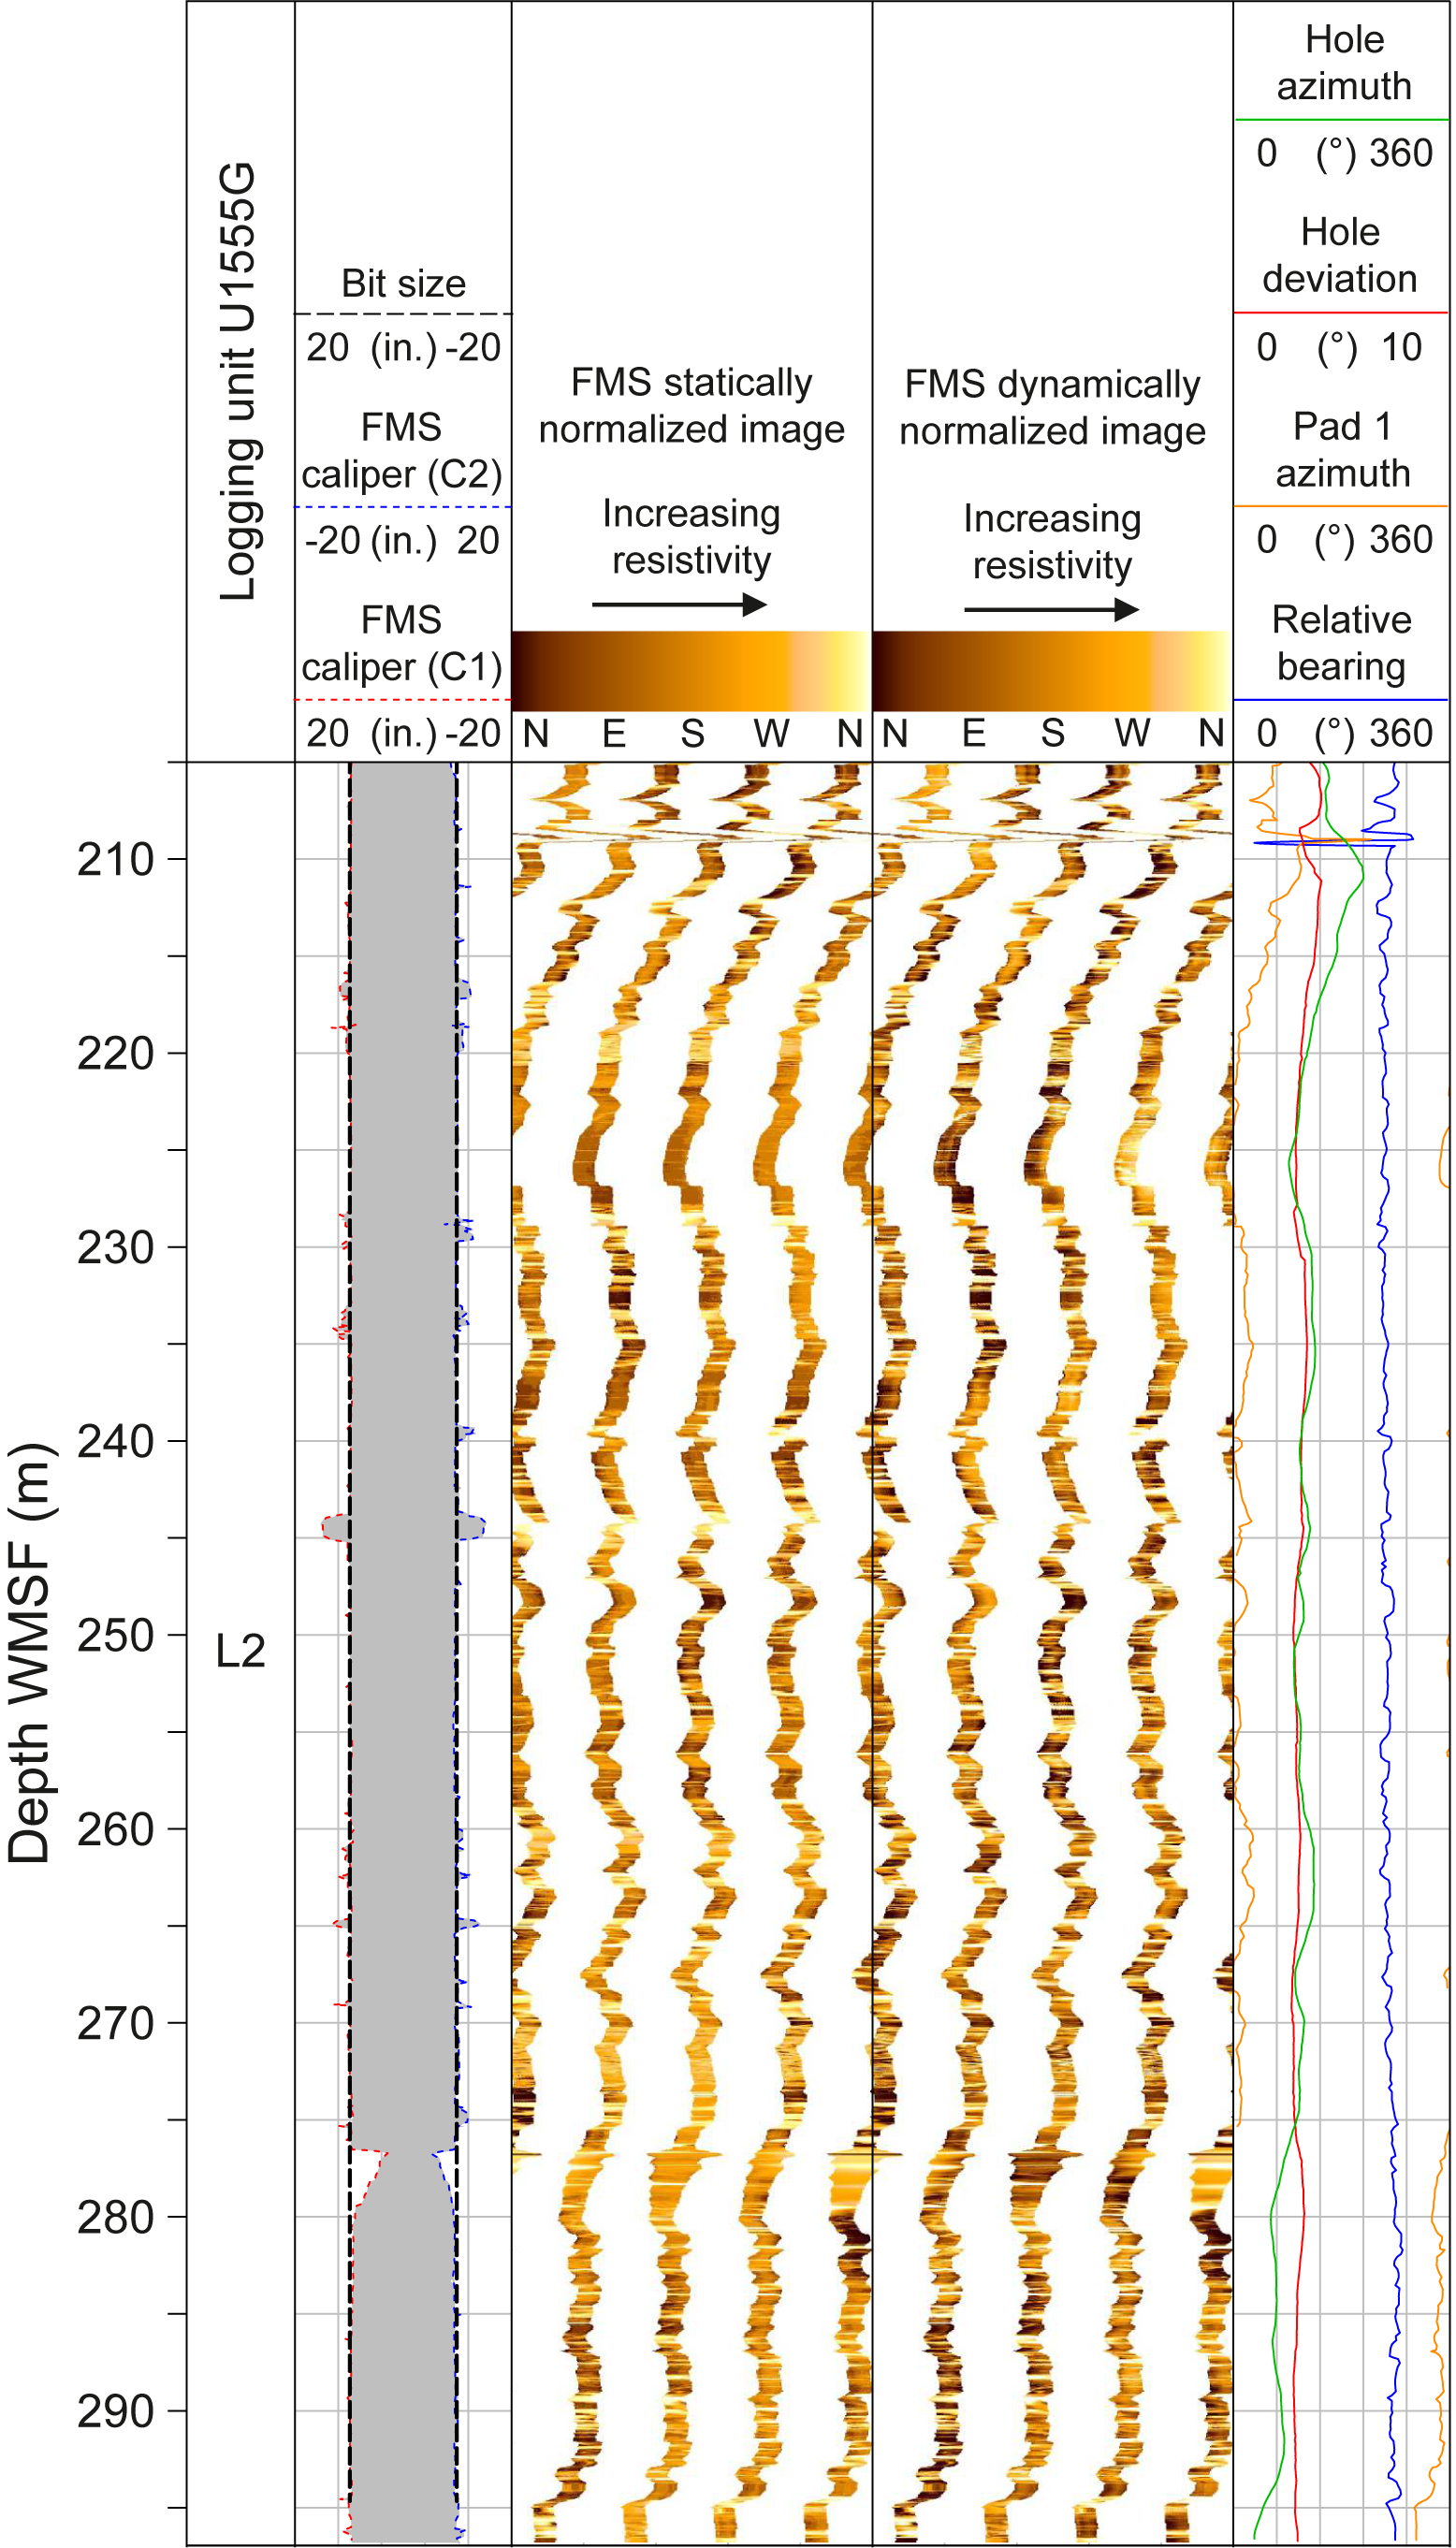
Figure F43. Wireline image data.
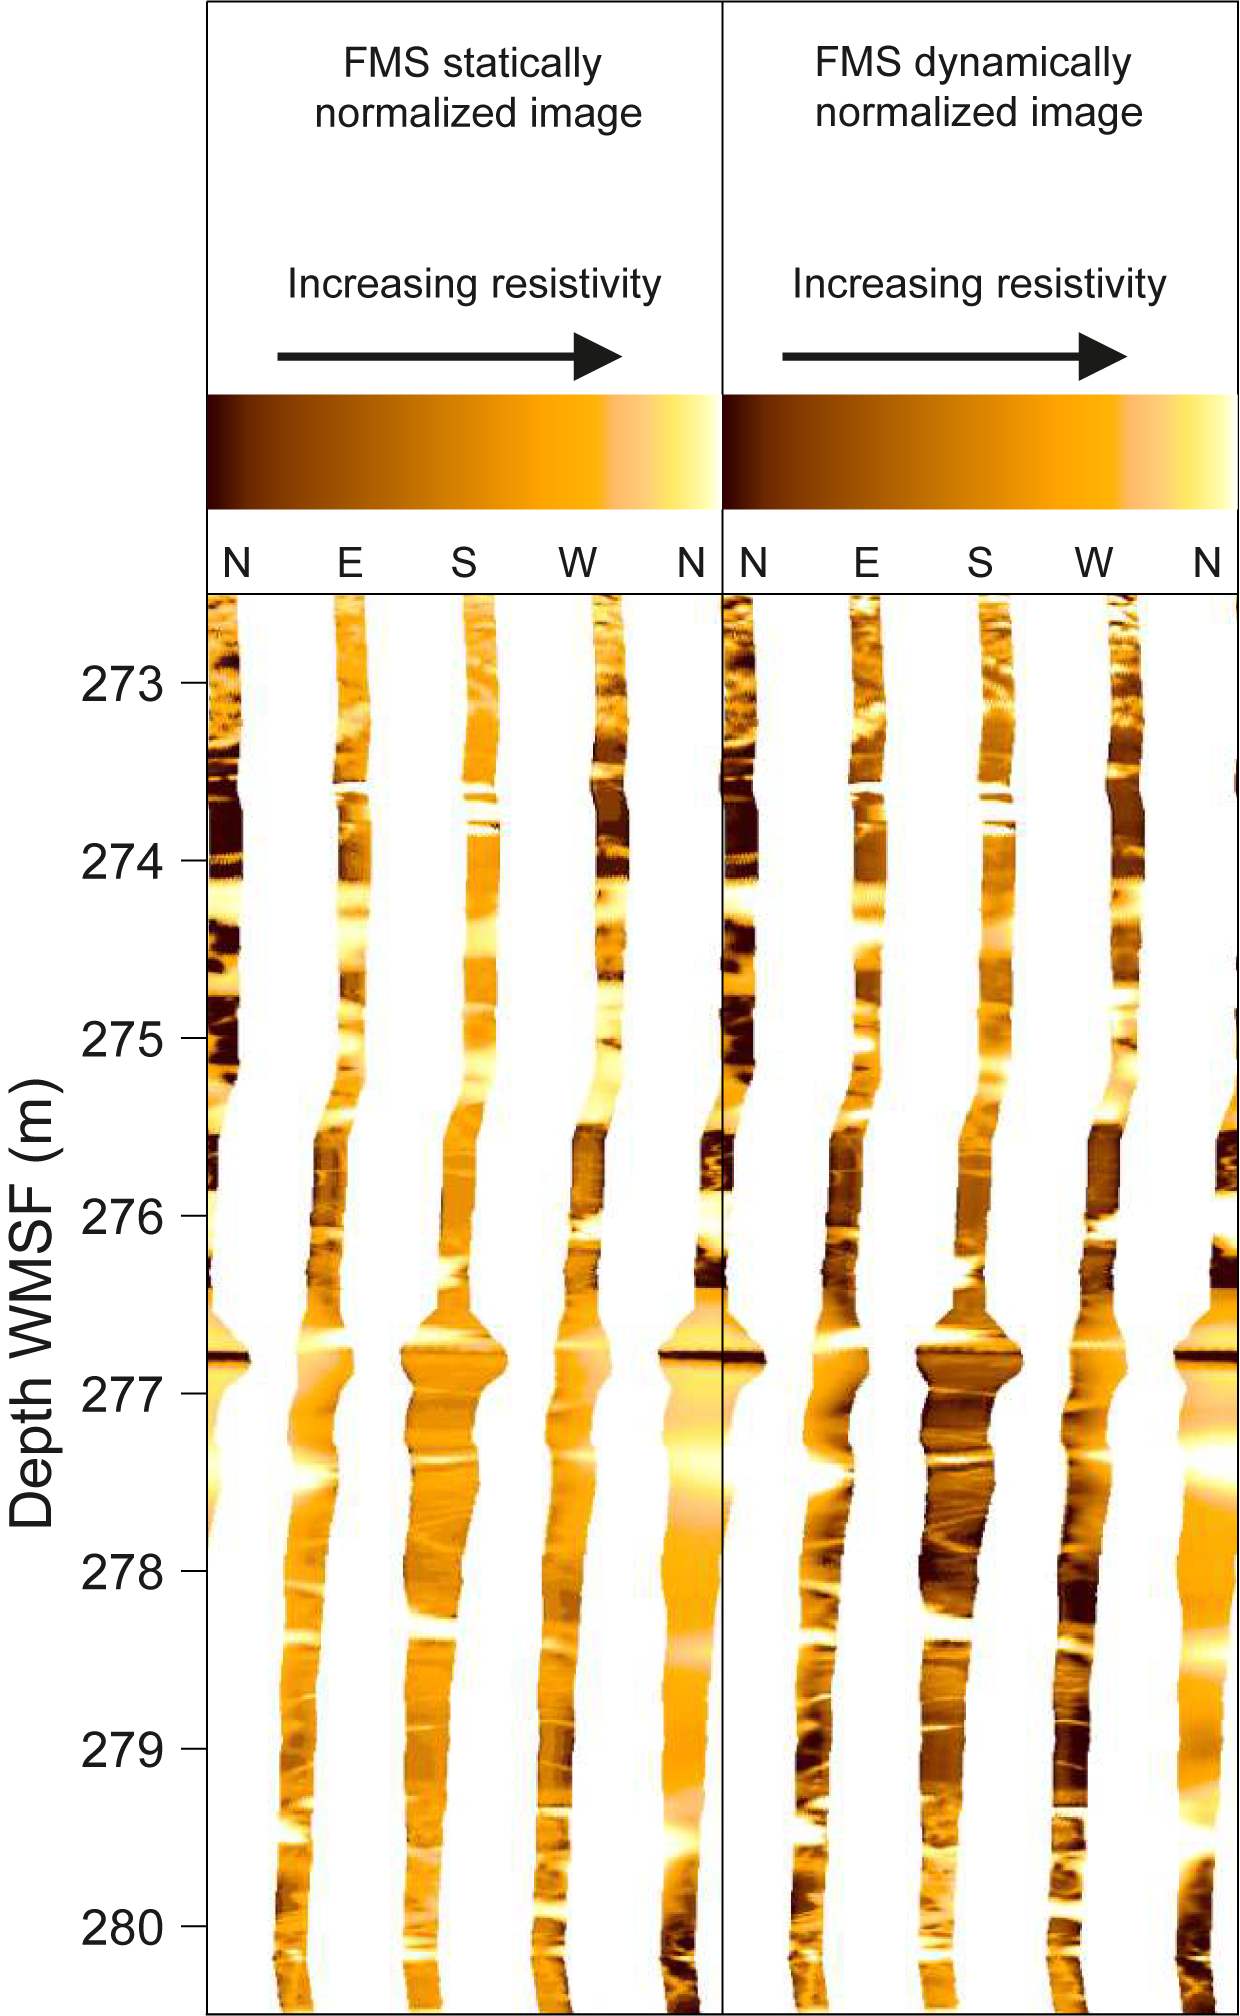
Figure F44. Conductive and resistive features.
10.4. Downhole temperature and heat flow
Four APCT-3 measurements were made in Hole U1555H, yielding projected formation temperatures ranging from 8.3°C at 33.5 m DSF to 18.4°C at 119.0 m DSF (Figures F45, F46A; Table T13) and giving a geothermal gradient of 119°C/km. Thermal conductivity under in situ conditions (K) was estimated from laboratory-determined thermal conductivity from Hole U1555H using the method of Hyndman et al. (1974) (Figure F46B). A linear function for depth-dependent thermal resistance (R) was obtained by integrating the inverse of the thermal conductivity over depth and applying a linear least-squares fit (Figure F46C). This function was used to estimate thermal resistance at each corresponding APCT-3 measurement depth. A heat flow of 105.8 mW/m2 was obtained from a linear least-squares fit of the relationship between temperature and thermal resistance (Bullard, 1939), whose slope is the vertical heat flow (Figure F46D).
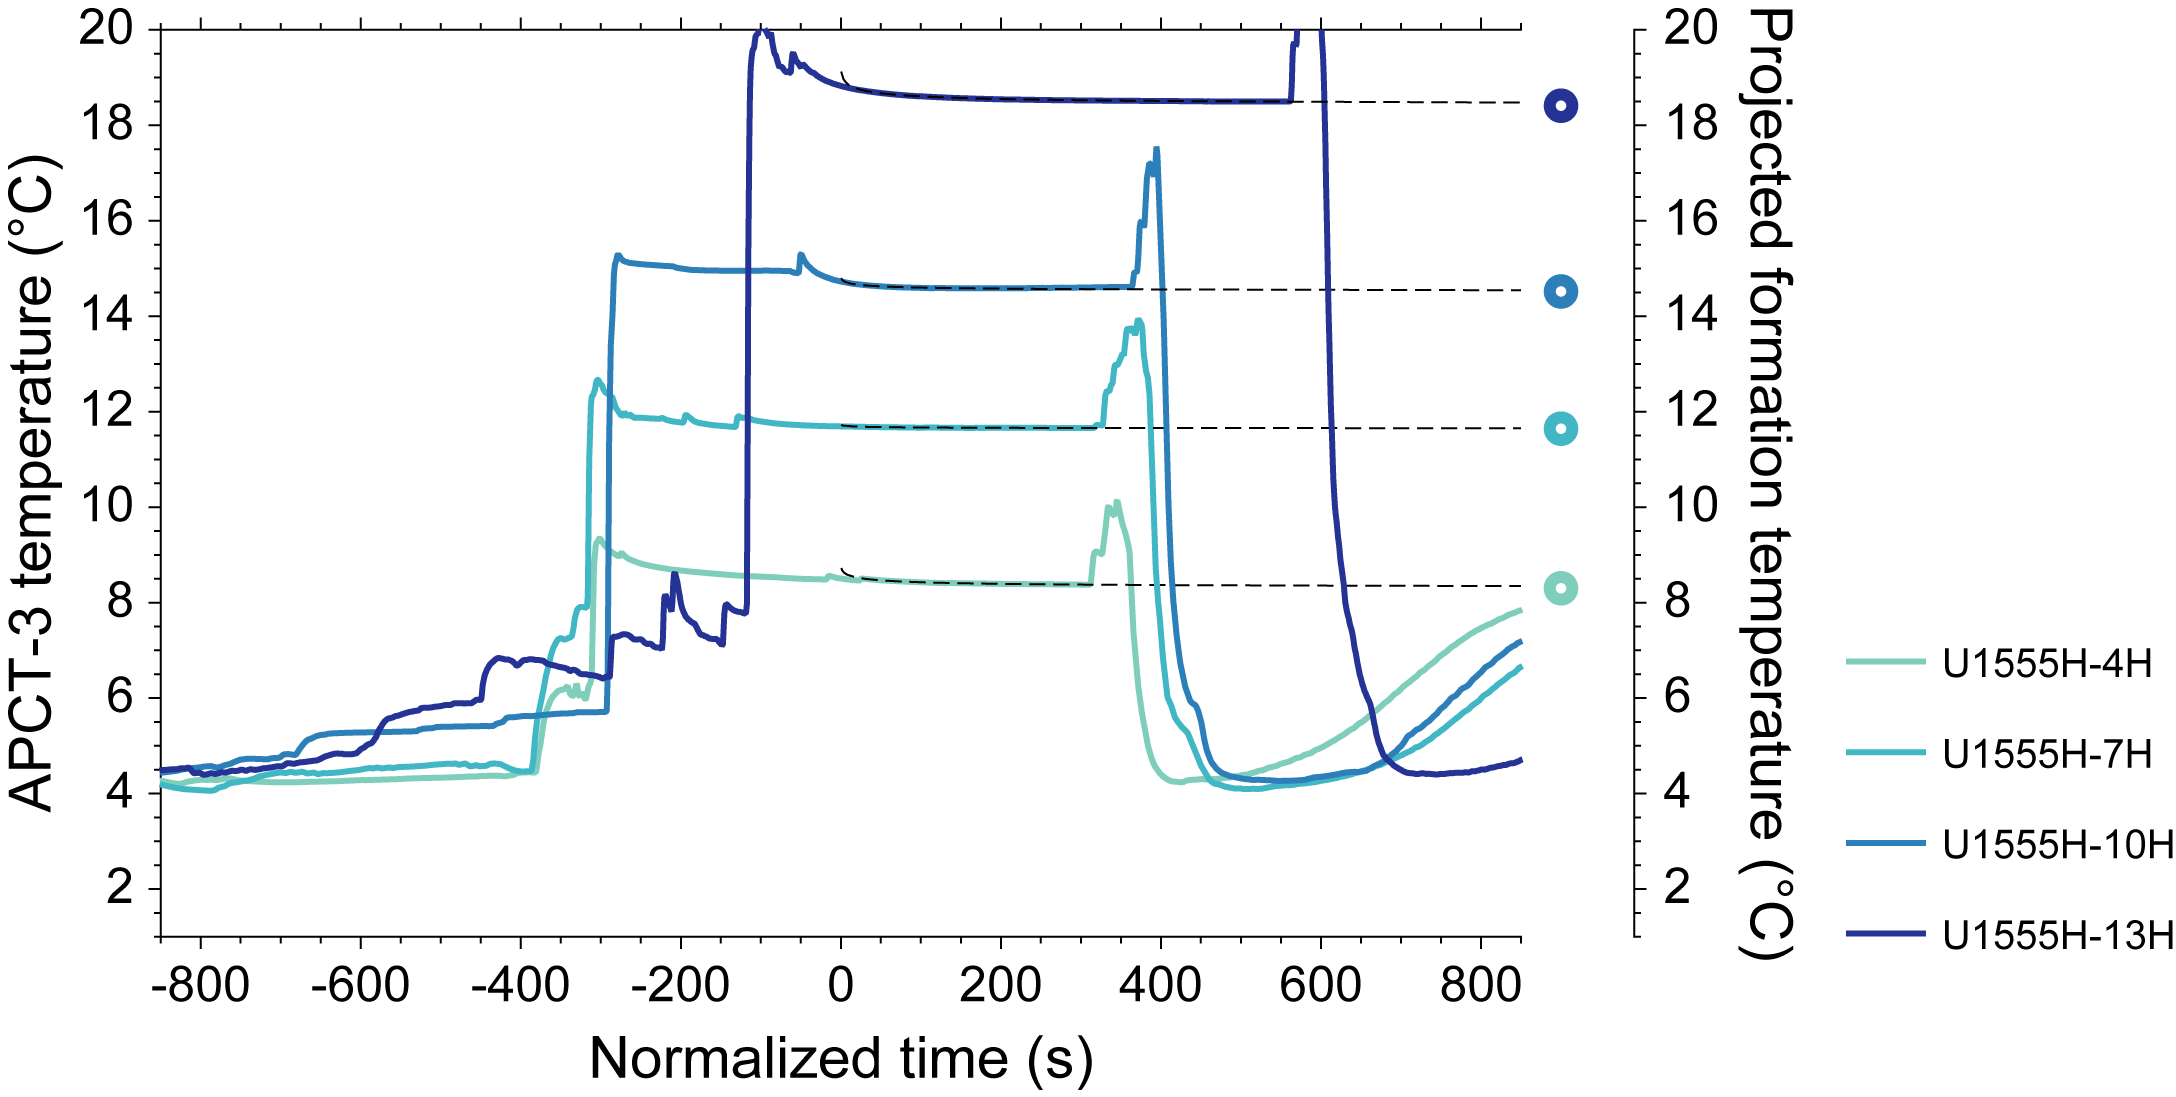
Figure F45. APCT-3 temperature-time series and projected formation temperature estimates.
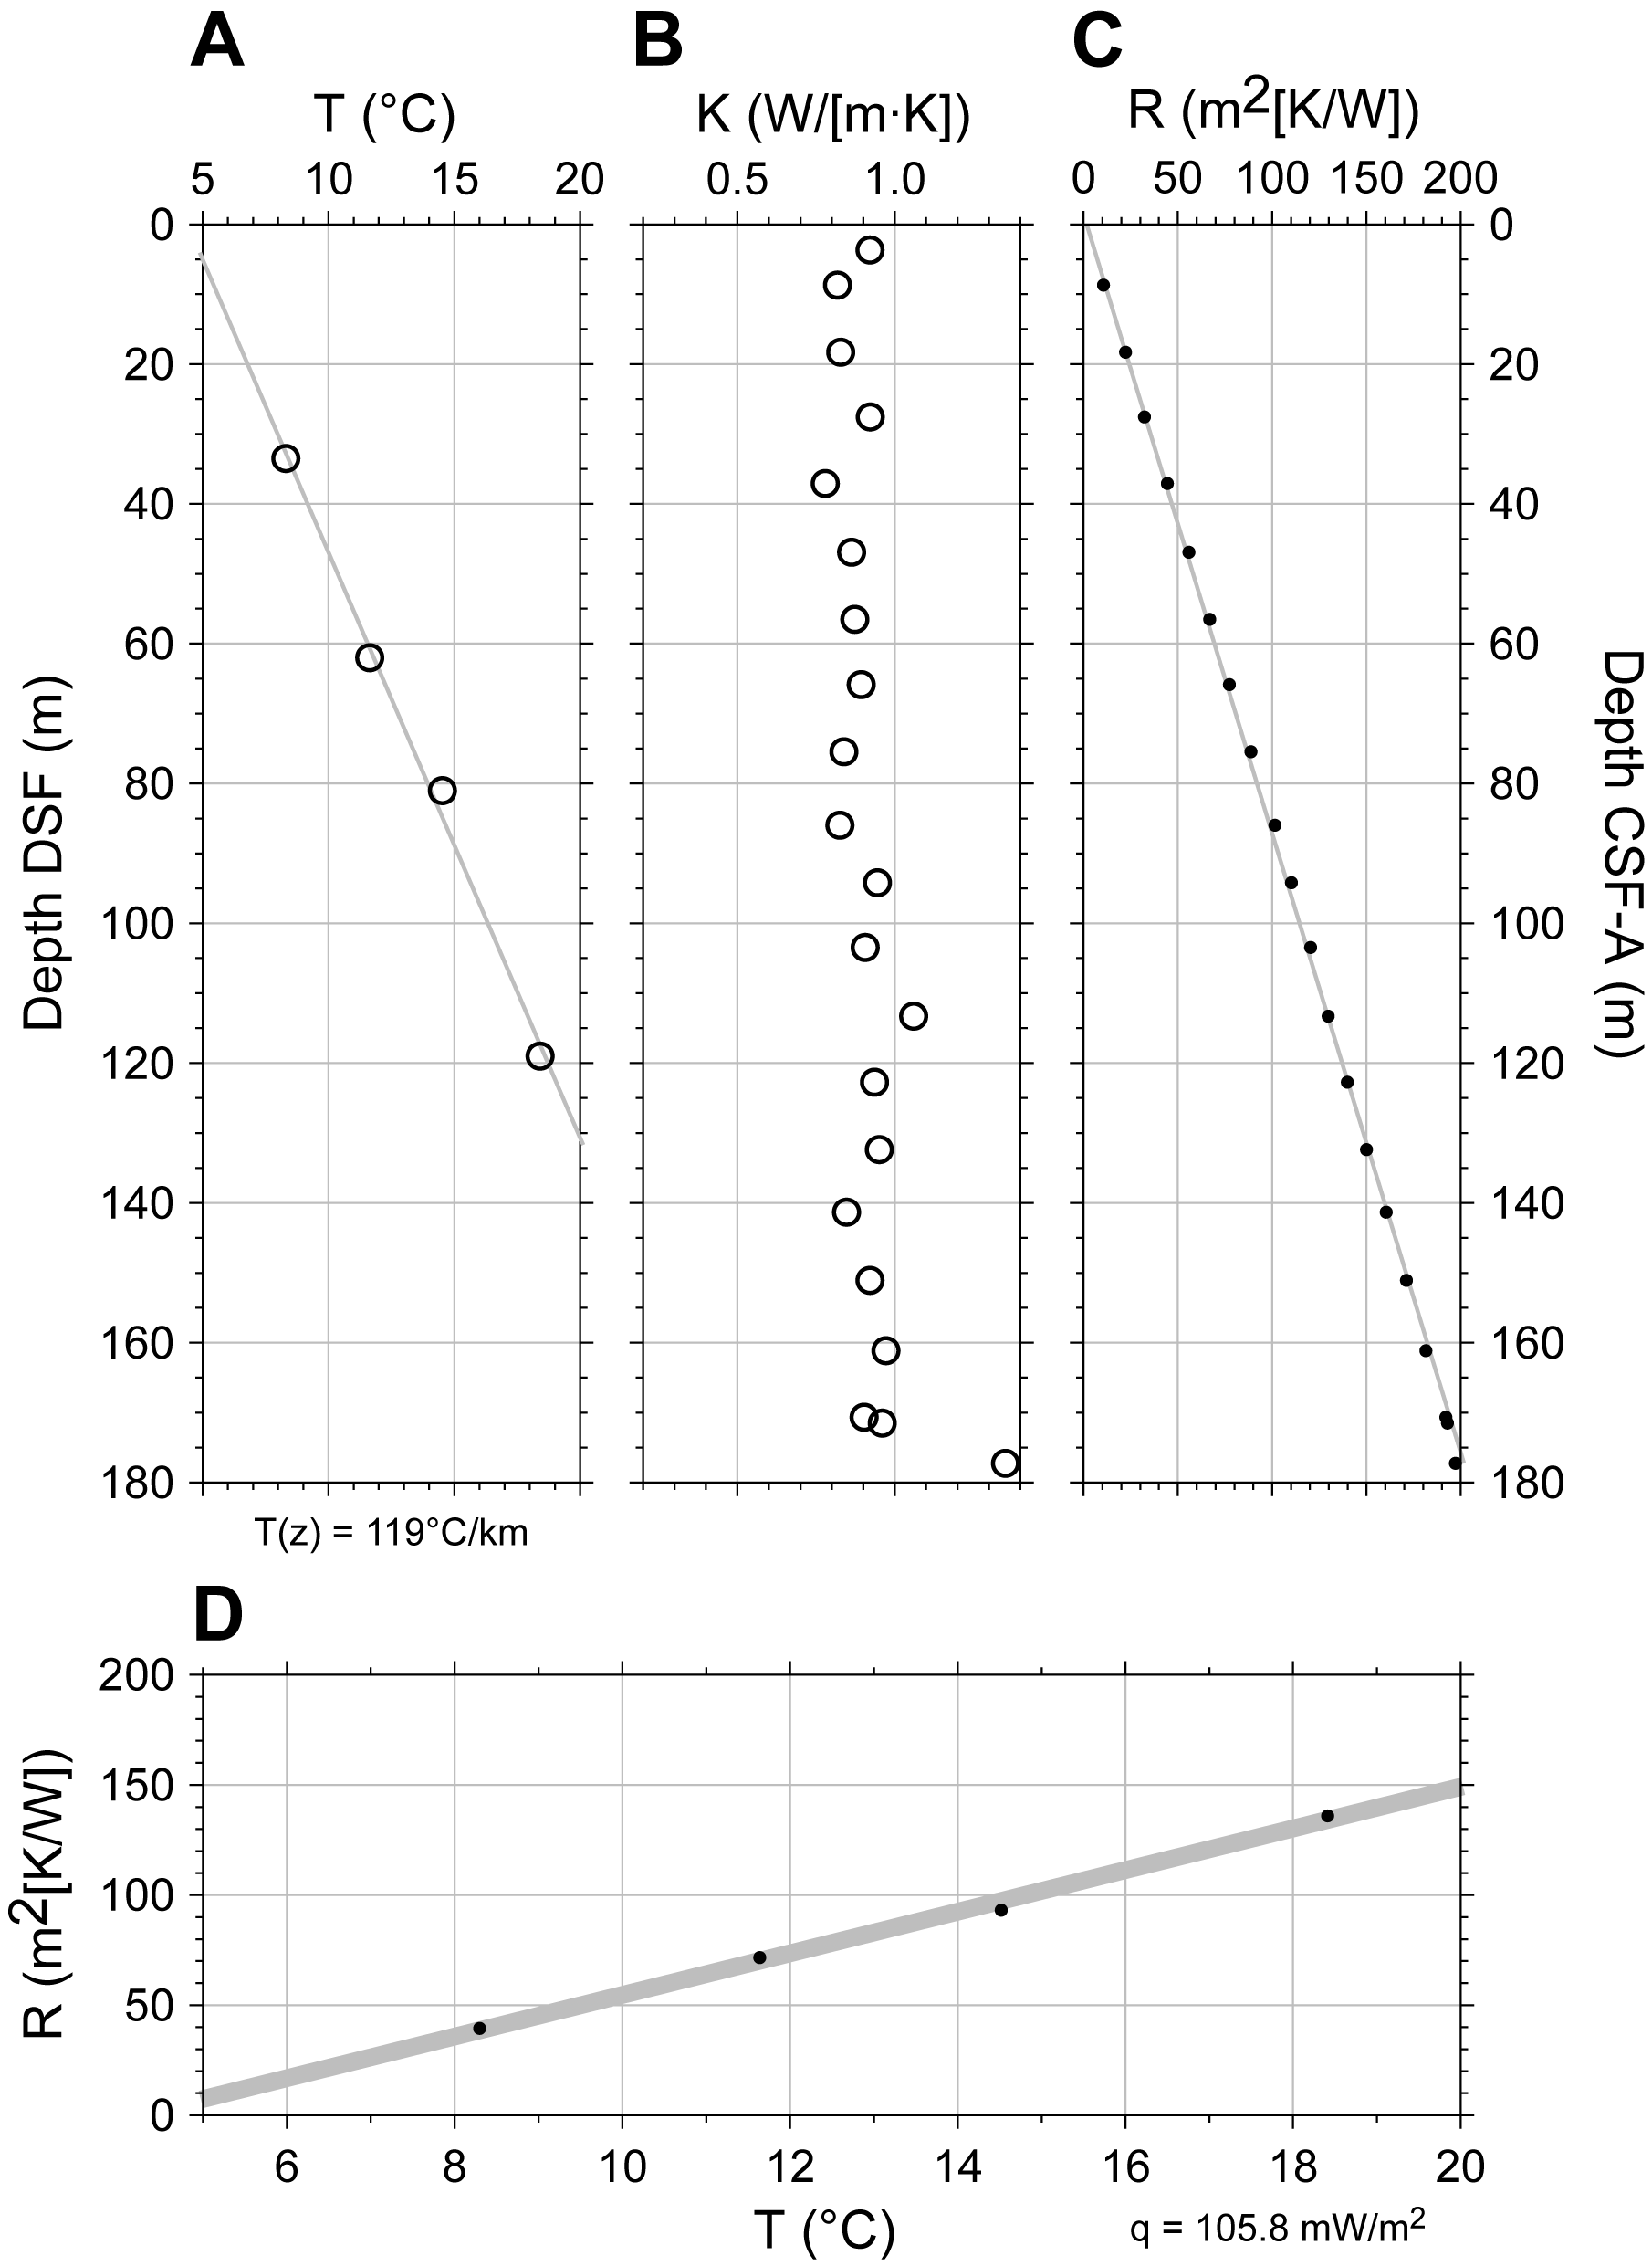
Figure F46. Thermal gradient and heat flow estimates.
11. Age model
Site survey seismic reflection profiles for Site U1555 (see Background and objectives) show acoustically continuous reflections for most of the sedimentary succession, although some uneven reflections could indicate possible stratigraphic discontinuities in the upper part of the succession between the seafloor and ~2.1 s TWT (Figure F2). Magnetostratigraphic and biostratigraphic age constraints for the sedimentary succession in Hole 395C-U1555H (see Micropaleontology and Paleomagnetism) are plotted in Figure F47. In general, there is good consistency between the results from the different data sets. The age constraints and lithologic variations indicate that the uppermost ~60 m of the succession has a lower average apparent sedimentation rate (~3.6 cm/ky) than the rest of the hole (~10 cm/ky). Apart from the change at ~60 m CSF-A, there are no major changes in lithology or other clear sedimentologic evidence for stratigraphic gaps in any part of the succession. However, cryptic disconformities may exist and could be revealed in future research if glacial and/or interglacial cycles can be identified and counted.
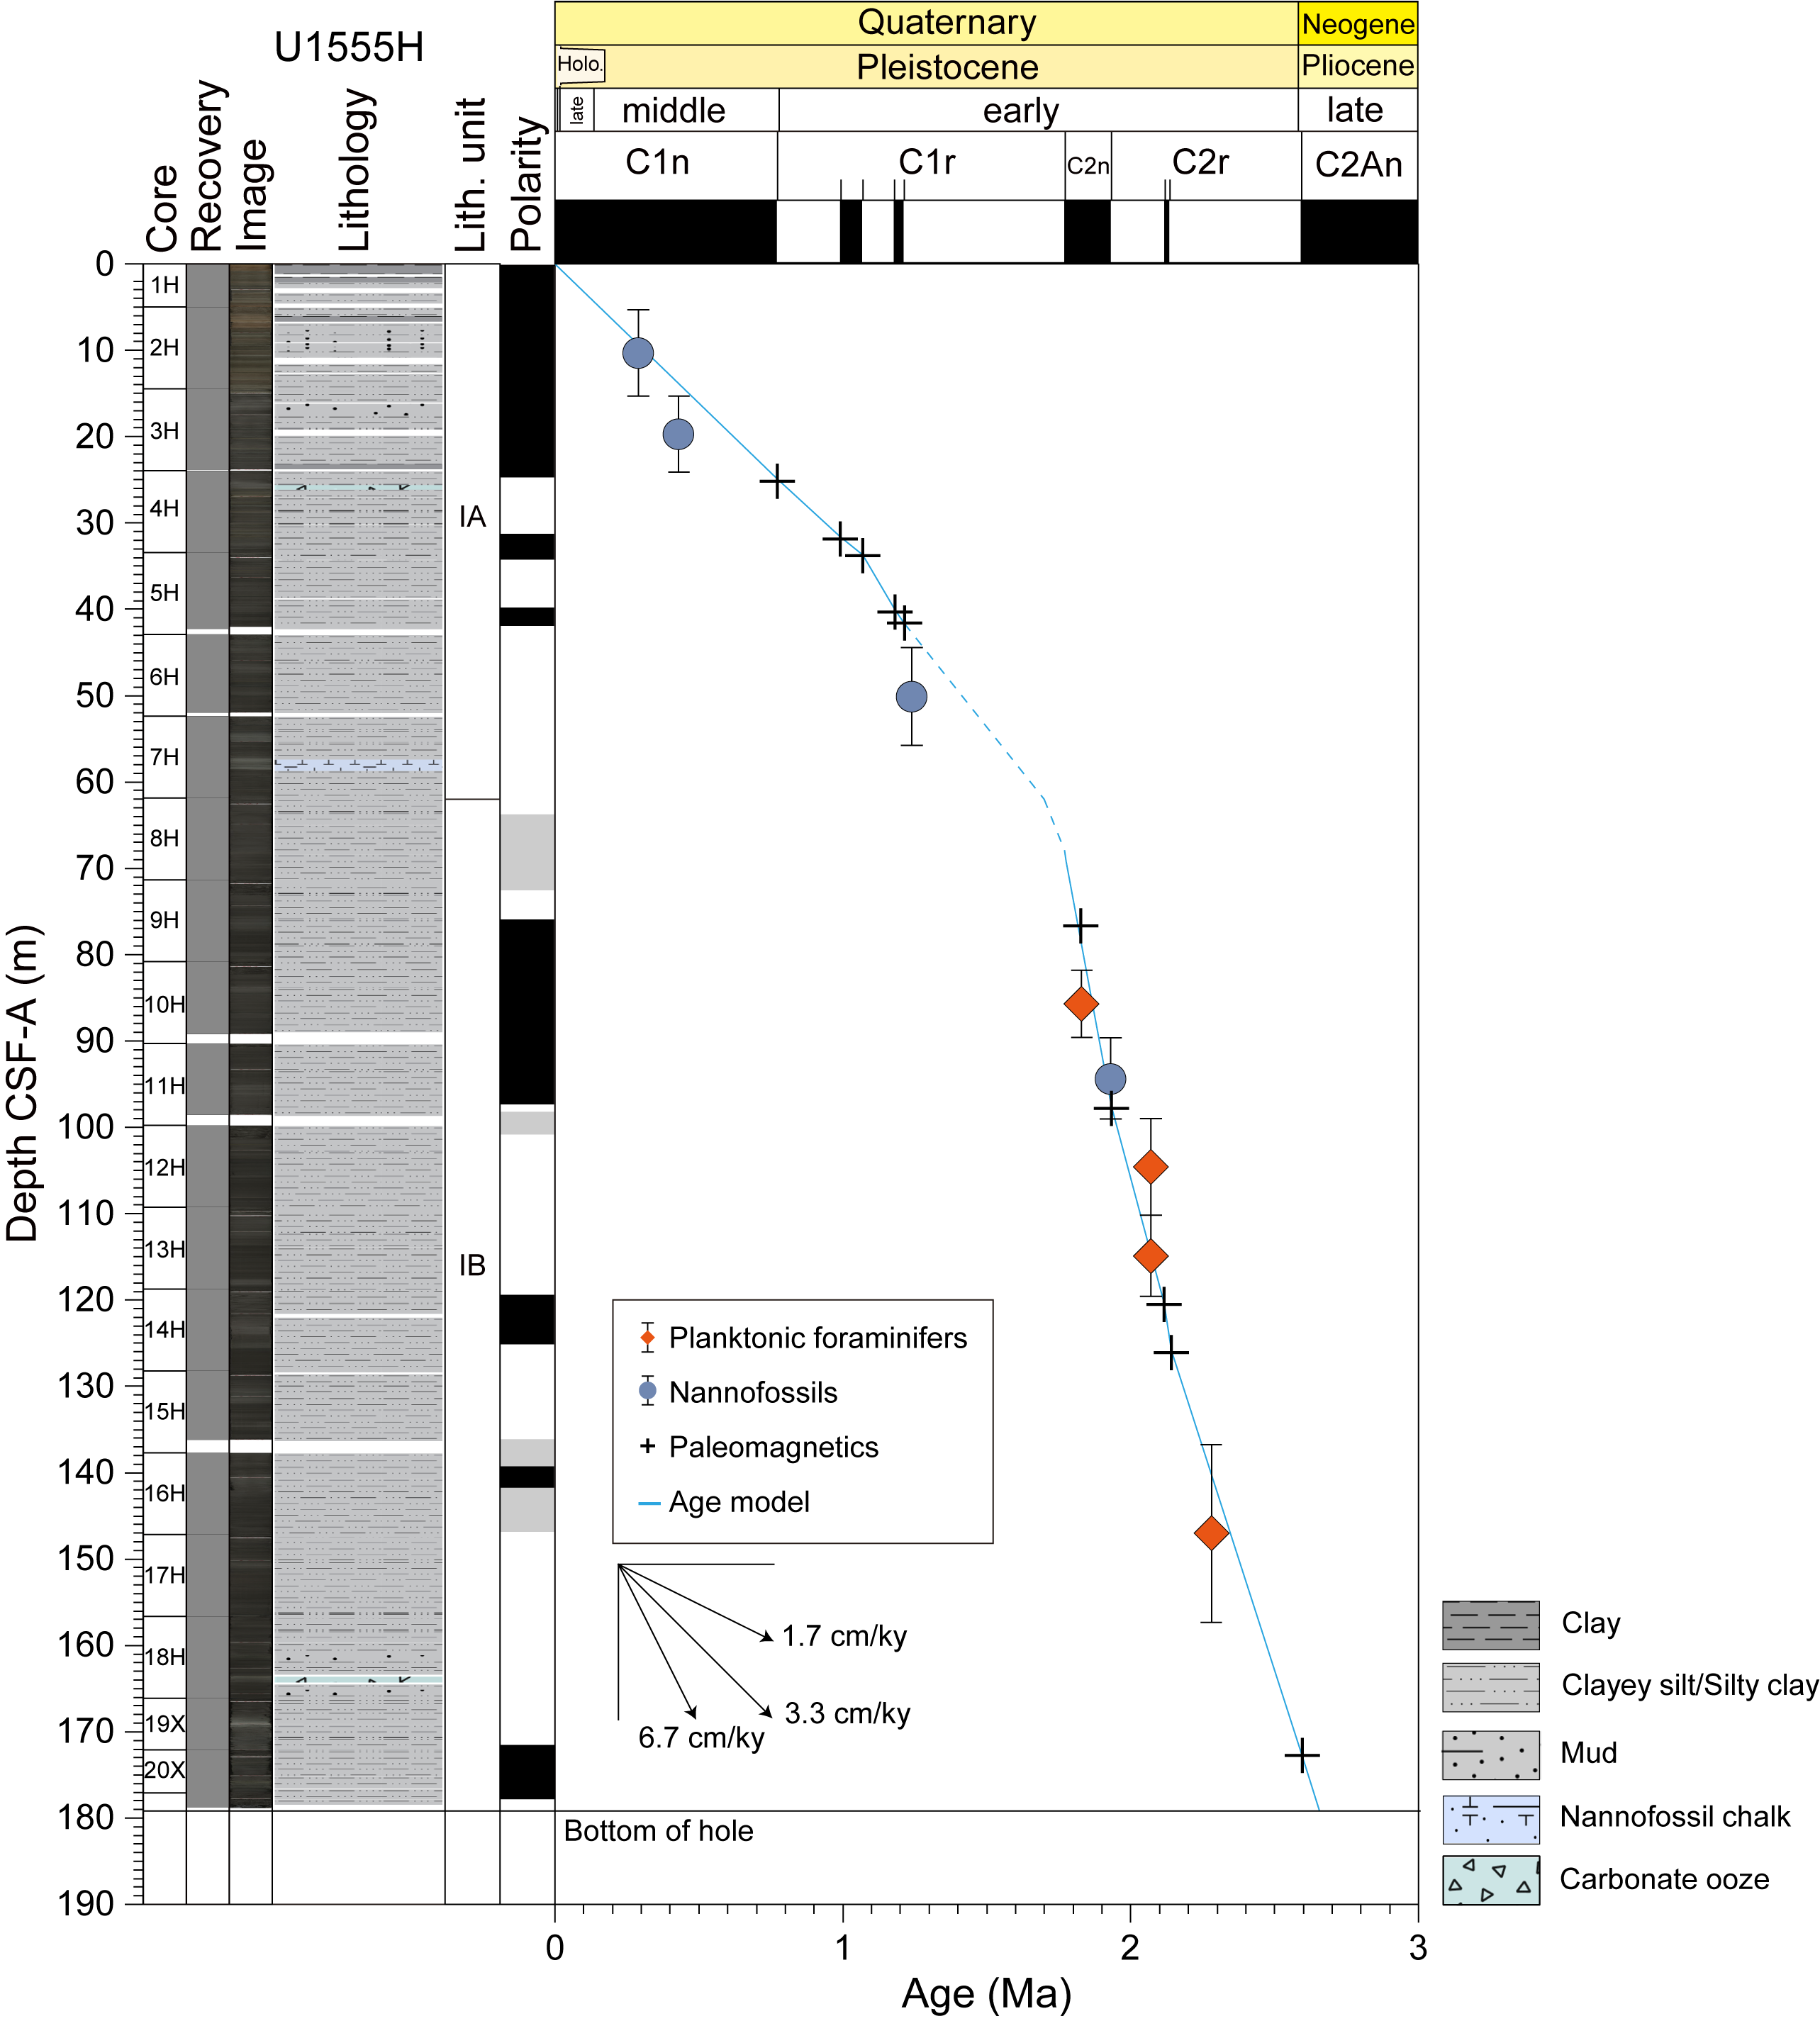
Figure F47. Preliminary age model for the sedimentary succession.
The inferred change in sedimentation rate corresponds approximately to the transition between Lithostratigraphic Subunits IA and IB at 62 m CSF-A (see Lithostratigraphy). The interval below this (~62–72 m CSF-A) is characterized by relatively constant and high NGR and MS values, and more variability is observed in the intervals above and below (see Physical properties and Lithostratigraphy). We use the lithologic transition at 62 m CSF-A as a convenient tie point in the age model and infer that it represents the possible change in sedimentation rate, but we attach a level of uncertainty to this part of the age model, as illustrated by the dotted line on Figure F47.
The age model for Hole U1555H is based on linear interpolation between the selected tie points listed in Table T14. The age control points are all based on magnetostratigraphy at this site because they are generally consistent with the biostratigraphy and more precisely located in the succession. The age of the oldest sediment in Hole U1555H, which is in contact with igneous basement at the bottom of Section 20X-CC (see Lithostratigraphy), is estimated by downward extrapolation to be ~2.65 Ma. The estimated age of the basement based on satellite and regional shipboard magnetic data is 2.8 Ma (see Background and objectives).
References
Alken, P., Thébault, E., Beggan, C.D., Amit, H., Aubert, J., Baerenzung, J., Bondar, T.N., Brown, W.J., Califf, S., Chambodut, A., Chulliat, A., Cox, G.A., Finlay, C.C., Fournier, A., Gillet, N., Grayver, A., Hammer, M.D., Holschneider, M., Huder, L., Hulot, G., Jager, T., Kloss, C., Korte, M., Kuang, W., Kuvshinov, A., Langlais, B., Léger, J.M., Lesur, V., Livermore, P.W., Lowes, F.J., Macmillan, S., Magnes, W., Mandea, M., Marsal, S., Matzka, J., Metman, M.C., Minami, T., Morschhauser, A., Mound, J.E., Nair, M., Nakano, S., Olsen, N., Pavón-Carrasco, F.J., Petrov, V.G., Ropp, G., Rother, M., Sabaka, T.J., Sanchez, S., Saturnino, D., Schnepf, N.R., Shen, X., Stolle, C., Tangborn, A., Tøffner-Clausen, L., Toh, H., Torta, J.M., Varner, J., Vervelidou, F., Vigneron, P., Wardinski, I., Wicht, J., Woods, A., Yang, Y., Zeren, Z., and Zhou, B., 2021. International Geomagnetic Reference Field: the thirteenth generation. Earth, Planets and Space, 73(1):49. https://doi.org/10.1186/s40623-020-01288-x
Blum, P., Rhinehart, B., and Acton, G.D., 2020. International Ocean Discovery Program Expedition 384 Preliminary Report. International Ocean Discovery Program. https://doi.org/10.14379/iodp.pr.384.2020
Boiron, T., Bascou, J., Camps, P., Ferré, E.C., Maurice, C., Guy, B., Gerbe, M.-C., and Launeau, P., 2013. Internal structure of basalt flows: insights from magnetic and crystallographic fabrics of the La Palisse volcanics, French Massif Central. Geophysical Journal International, 193(2):585–602. https://doi.org/10.1093/gji/ggs115
Bullard, E.C., 1939. Heat flow in South Africa. Proceedings of the Royal Society of London, A: Mathematical and Physical Sciences, 173(955):474–502. https://doi.org/10.1098/rspa.1939.0159
Caballero-Miranda, C.I., Alva-Valdivia, L.M., González-Rangel, J.A., Gogitchaishvili, A., Urrutia-Fucugauchi, J., and Kontny, A., 2016. Vertical AMS variation within basalt flow profiles from the Xitle volcano (Mexico) as indicator of heterogeneous strain in lava flows. Journal of Volcanology and Geothermal Research, 311:9–28. https://doi.org/10.1016/j.jvolgeores.2016.01.003
Cañón-Tapia, E., 2004. Anisotropy of magnetic susceptibility of lava flows and dykes: a historical account. In Martín-Herníndez, F., Lüneberg, C.M., Aubourg, C., and Jackson, M. (Eds.), Magnetic Fabric: Methods and Applications. Geological Society, London, Special Publications, 238: 205–225. https://doi.org/10.1144/GSL.SP.2004.238.01.14
Colman, A., Sinton, J.M., White, S.M., McClinton, J.T., Bowles, J.A., Rubin, K.H., Behn, M.D., Cushman, B., Eason, D.E., Gregg, T.K.P., Grönvold, K., Hidalgo, S., Howell, J., Neill, O., and Russo, C., 2012. Effects of variable magma supply on mid-ocean ridge eruptions: constraints from mapped lava flow fields along the Galápagos Spreading Center. Geochemistry, Geophysics, Geosystems, 13(8). https://doi.org/10.1029/2012GC004163
Hartmann, A., and Villinger, H., 2002. Inversion of marine heat flow measurements by expansion of the temperature decay function. Geophysical Journal International, 148(3):628–636. https://doi.org/10.1046/j.1365-246X.2002.01600.x
Hyndman, R.D., Erickson, A.J., and Von Herzen, R.P., 1974. Geothermal measurements on DSDP Leg 26. In Davies, T.A., Luyendyk, B.P., et al., Initial Reports of the Deep Sea Drilling Project. 26: Washington, DC (US Government Printing Office), 451–463. https://doi.org/10.2973/dsdp.proc.26.113.1974
Jones, S.M., Murton, B.J., Fitton, J.G., White, N.J., Maclennan, J., and Walters, R.L., 2014. A joint geochemical–geophysical record of time-dependent mantle convection south of Iceland. Earth and Planetary Science Letters, 386:86–97. https://doi.org/10.1016/j.epsl.2013.09.029
Kirschvink, J.L., 1980. The least-squares line and plane and the analysis of palaeomagnetic data. Geophysical Journal International, 62(3):699–718. https://doi.org/10.1111/j.1365-246X.1980.tb02601.x
Lurcock, P.C., and Florindo, F., 2019. New developments in the PuffinPlot paleomagnetic data analysis program. Geochemistry, Geophysics, Geosystems, 20(11):5578–5587. https://doi.org/10.1029/2019GC008537
Murton, B.J., Taylor, R.N., and Thirlwall, M.F., 2002. Plume–ridge Interaction: a geochemical perspective from the Reykjanes Ridge. Journal of Petrology, 43(11):1987–2012. https://doi.org/10.1093/petrology/43.11.1987
Ogg, J.G., 2020. Geomagnetic Polarity Time Scale. In Gradstein, F.M., Ogg, J.G., Schmitz, M., and Ogg, G. (Eds.), Geologic Time Scale 2020. Amsterdam (Elsevier), 159–192. https://doi.org/10.1016/B978-0-12-824360-2.00005-X
Parnell-Turner, R., White, N., Henstock, T.J., Jones, S.M., Maclennan, J., and Murton, B.J., 2017. Causes and consequences of diachronous v-shaped ridges in the North Atlantic Ocean. Journal of Geophysical Research: Solid Earth, 122(11):8675–8708. https://doi.org/10.1002/2017JB014225
Parnell-Turner, R.E., Briais, A., LeVay, L.J., Cui, Y., Di Chiara, A., Dodd, J.P., Dunkley Jones, T., Dwyer, D., Eason, D.E., Friedman, S.A., Hemming, S.R., Hochmuth, K., Ibrahim, H., Jasper, C., Karatsolis, B.T., Lee, S., LeBlanc, D.E., Lindsay, M.R., McNamara, D.D., Modestou, S.E., Murton, B., OConnell, S., Pasquet, G.T., Pearson, P.N., Qian, S.P., Rosenthal, Y., Satolli, S., Sinnesael, M., Suzuki, T., Thulasi Doss, T., White, N.J., Wu, T., and Yang Yang, A., 2025a. Expedition 395 methods. In Parnell-Turner, R.E., Briais, A., LeVay, L.J., and the Expedition 395 Scientists, Reykjanes Mantle Convection and Climate. Proceedings of the International Ocean Discovery Program, 395: College Station, TX (International Ocean Discovery Program). https://doi.org/10.14379/iodp.proc.395.102.2025
Parnell-Turner, R.E., Briais, A., LeVay, L.J., and the Expedition 395 Scientists, 2025b. Supplementary material, https://doi.org/10.14379/iodp.proc.395supp.2025. In Parnell-Turner, R.E., Briais, A., LeVay, L.J., and the Expedition 395 Scientists, Reykjanes Mantle Convection and Climate. Proceedings of the International Ocean Discovery Program, 395: College Station, TX (International Ocean Discovery Program).
Zijderveld, J.D.A., 1967. AC demagnetization of rocks: analysis of results. In Runcorn, S.K.C., Creer, K.M., and Collinson, D.W. (Eds.), Methods in Palaeomagnetism. Developments in Solid Earth Geophysics, 3: 254–286. https://doi.org/10.1016/B978-1-4832-2894-5.50049-5