Parnell-Turner, R.E., Briais, A., LeVay, L.J., and the Expedition 395 Scientists
Proceedings of the International Ocean Discovery Program Volume 395
publications.iodp.org
https://doi.org/10.14379/iodp.proc.395.106.2025
Site U15631
![]() A. Briais,
A. Briais,
![]() R.E. Parnell-Turner,
R.E. Parnell-Turner,
![]() L.J. LeVay,
L.J. LeVay,
![]() Y. Cui,
Y. Cui,
![]() A. Di Chiara,
A. Di Chiara,
![]() J.P. Dodd,
J.P. Dodd,
![]() T. Dunkley Jones,
T. Dunkley Jones,
![]() D.P. Dwyer,
D.P. Dwyer,
![]() D.E. Eason,
D.E. Eason,
![]() S. Friedman,
S. Friedman,
![]() S.R. Hemming,
S.R. Hemming,
![]() K. Hochmuth,
K. Hochmuth,
![]() H. Ibrahim,
H. Ibrahim,
![]() C. Jasper,
C. Jasper,
![]() B.T. Karatsolis,
B.T. Karatsolis,
![]() S. Lee,
S. Lee,
![]() D.E. LeBlanc,
D.E. LeBlanc,
![]() M.R. Lindsay,
M.R. Lindsay,
![]() D.D. McNamara,
D.D. McNamara,
![]() S.E. Modestou,
S.E. Modestou,
![]() B. Murton,
B. Murton,
![]() S. OConnell,
S. OConnell,
![]() G.T. Pasquet,
G.T. Pasquet,
![]() P.N. Pearson,
S.-P. Qian,
P.N. Pearson,
S.-P. Qian,
![]() Y. Rosenthal,
Y. Rosenthal,
![]() S. Satolli,
S. Satolli,
![]() M. Sinnesael,
T. Suzuki,
M. Sinnesael,
T. Suzuki,
![]() T. Thulasi Doss,
T. Thulasi Doss,
![]() N.J. White,
N.J. White,
![]() T. Wu,
T. Wu,
![]() A. Yang Yang,
A. Yang Yang,
![]() V. dos Santos Rocha,
C. Pearman, and
C.-Y. Tian2
V. dos Santos Rocha,
C. Pearman, and
C.-Y. Tian2
1 Briais, A., Parnell-Turner, R.E., LeVay, L.J., Cui, Y., Di Chiara, A., Dodd, J.P., Dunkley Jones, T., Dwyer, D., Eason, D.E., Friedman, S.A., Hemming, S.R., Hochmuth, K., Ibrahim, H., Jasper, C., Karatsolis, B.T., Lee, S., LeBlanc, D.E., Lindsay, M.R., McNamara, D.D., Modestou, S.E., Murton, B., OConnell, S., Pasquet, G.T., Pearson, P.N., Qian, S.P., Rosenthal, Y., Satolli, S., Sinnesael, M., Suzuki, T., Thulasi Doss, T., White, N.J., Wu, T., Yang Yang, A., dos Santos Rocha, V., Pearman, C., and Tian, C.Y., 2025. Site U1563. In Parnell-Turner, R.E., Briais, A., LeVay, L.J., and the Expedition 395 Scientists, Reykjanes Mantle Convection and Climate. Proceedings of the International Ocean Discovery Program, 395: College Station, TX (International Ocean Discovery Program). https://doi.org/10.14379/iodp.proc.395.106.2025
2 Expedition 395 Scientists' affiliations.
1. Background and objectives
The Reykjanes Ridge flanks host a series of crustal V-shaped ridges (VSRs) and V-shaped troughs (VSTs) (Figure F1) whose origins are debated. Expedition 384, 395C, and 395 sites comprise a crustal flow line transect across the eastern flank of Reykjanes Ridge and one site on its western flank on the conjugate flow line. The sites sample two pairs of VSR/VST structures. Crustal ages at site locations on the eastern flank of the slow-spreading Reykjanes Ridge are estimated to range 2.8–32 Ma; the site located to the west, near the Greenland margin, has an estimated basement age of 49 Ma. This range of ages provides a unique opportunity to quantify the timing and extent of hydrothermal fluid–rock exchange on a slow-spreading ridge flank that experienced rapid sedimentation and variations in tectonic architecture. Finally, the rapidly accumulated contourite drift sediments at these sites have the potential to record variations in past climate and ocean circulation on millennial timescales.
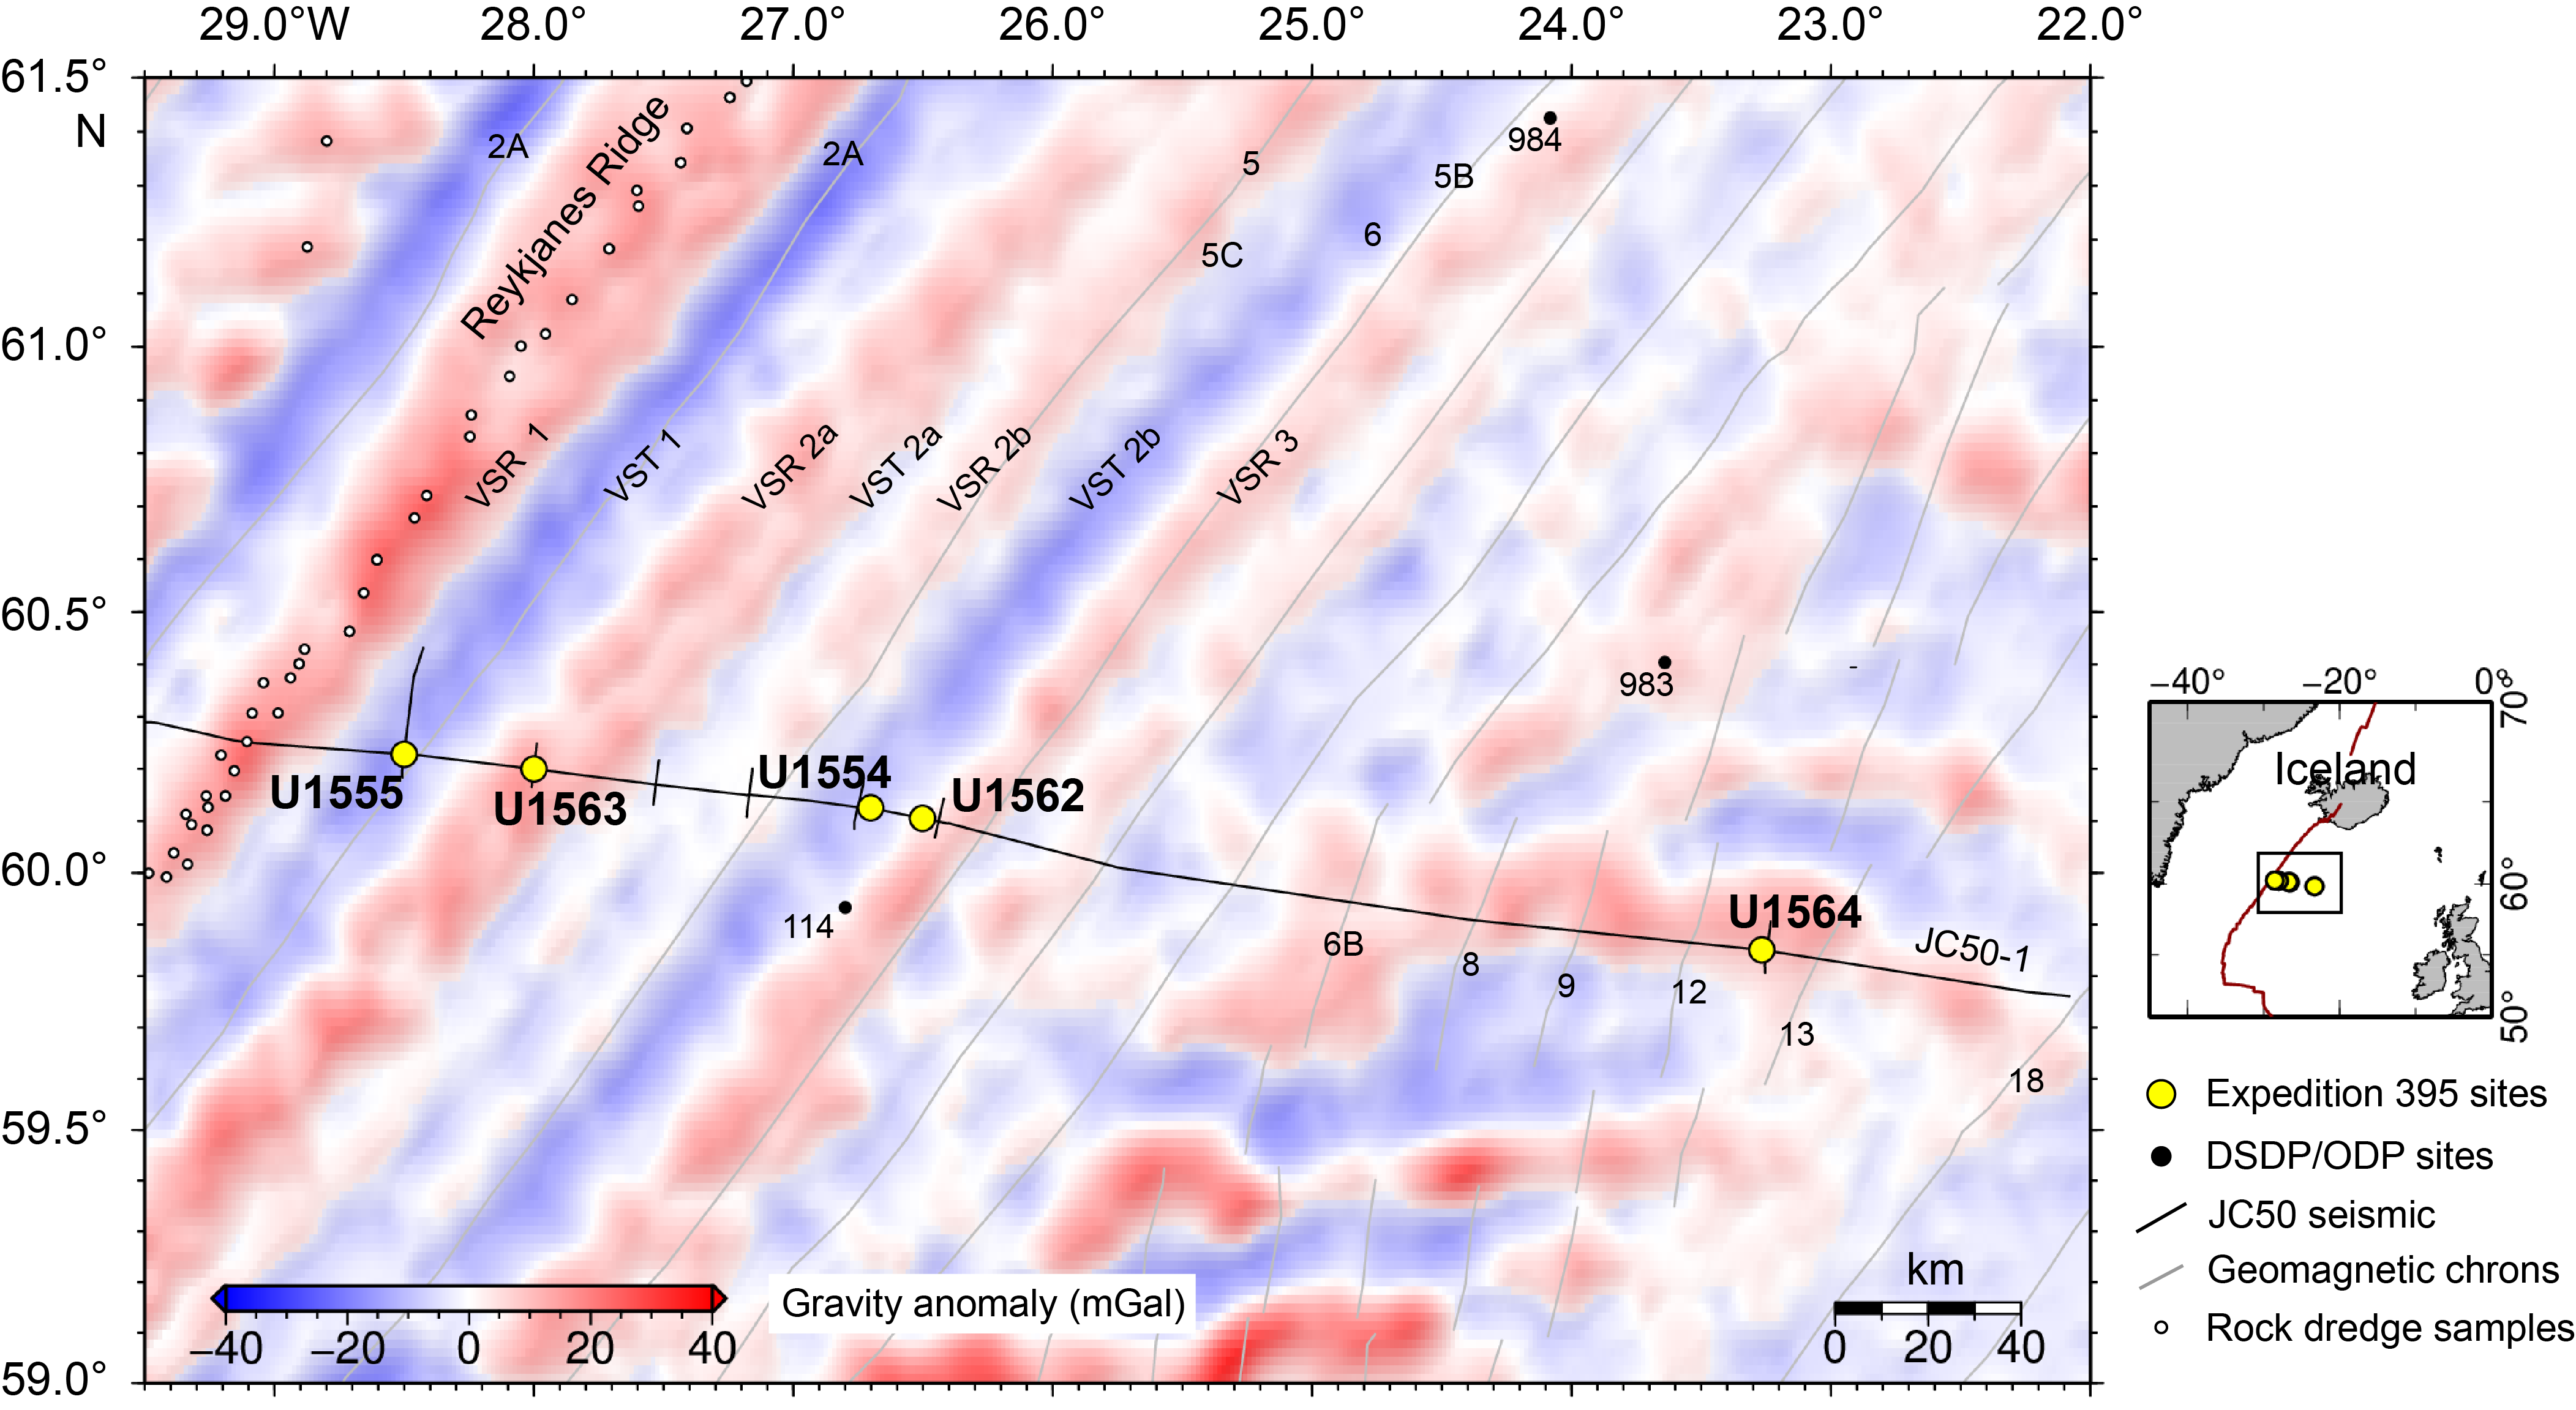
Figure F1. Satellite free-air gravity anomaly map.
Within the transect formed by the series of sites on the eastern flank of the Reykjanes Ridge along a plate tectonic flow line, Site U1563 sits on VSR-2a, defined by a free-air gravity anomaly high and reflection seismic basement high (Figure F1). It is located ~64 km east of the ridge axis, farther away from the ridge axis than nearby Site U1555, which sits on VST-1. The expected age of the crust at Site U1563 is ~5.23 Ma based on satellite and regional aeromagnetic data. This site is located at the intersection of Seismic Lines JC50-1 and JC50-C6 (Common Midpoints 53393 and 888, respectively) (Figures F2, F3), obtained in 2010 during RRS James Cook Cruise JC50 (Parnell-Turner et al., 2017). Site U1563 sits on the outer flank of a volcanic abyssal hill in an area where the basement is draped with a layer of acoustically continuous sediments (Figures F2, F3). Sediment thickness at Site U1563 was expected to be ~340 m (2.319 s two-way traveltime [TWT]) based on seismic imagery. The two main objectives for this site were (1) to obtain the composition of basalts associated with VSR-2a and (2) to evaluate the degree of alteration of relatively young crust along a plate spreading flow line transect. The aim is to compare the composition of the basalts at Site U1563 with those at the other sites, in particular the present-day VSR-1 tip located at the axis just to the west, and with those at Site U1555 located on VST-1 to the west (Figure F1). This site represents some of the youngest crust cored during Expeditions 384, 395C, and 395, and the basalts cored at Site U1563 will allow the off-axis evolution of basalt alteration to be investigated.
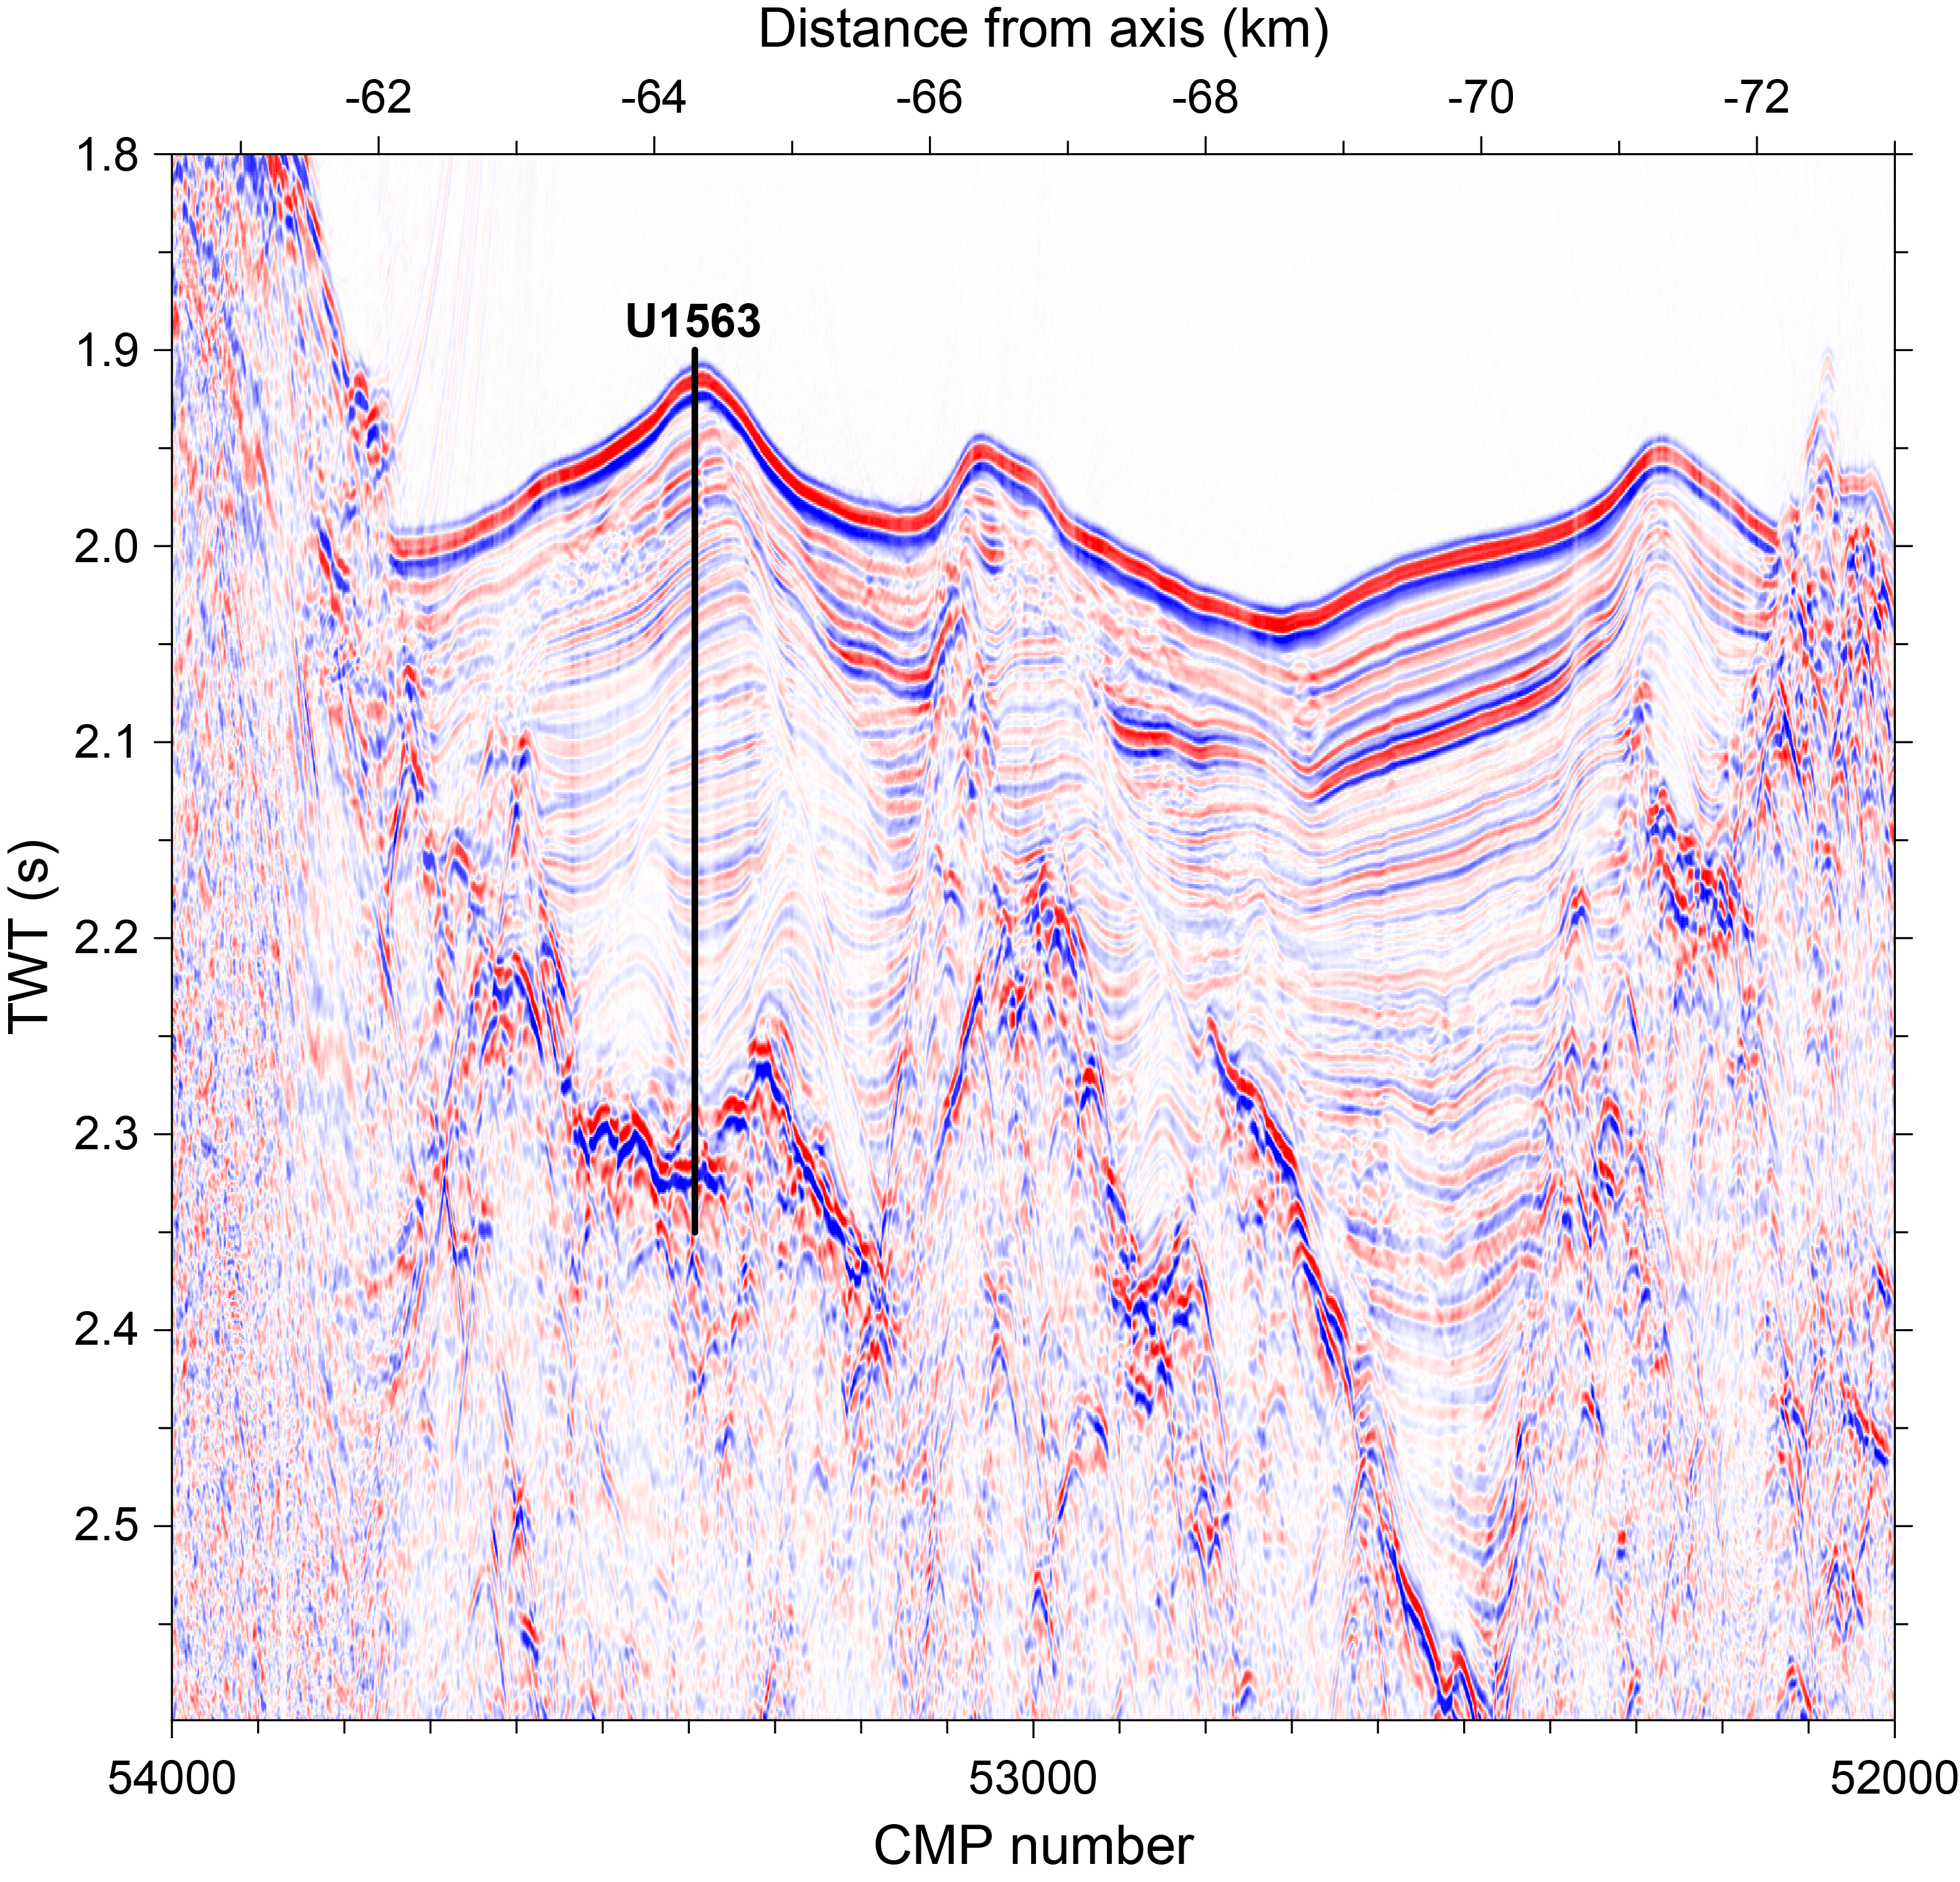
Figure F2. Seismic Profile JC50-1.
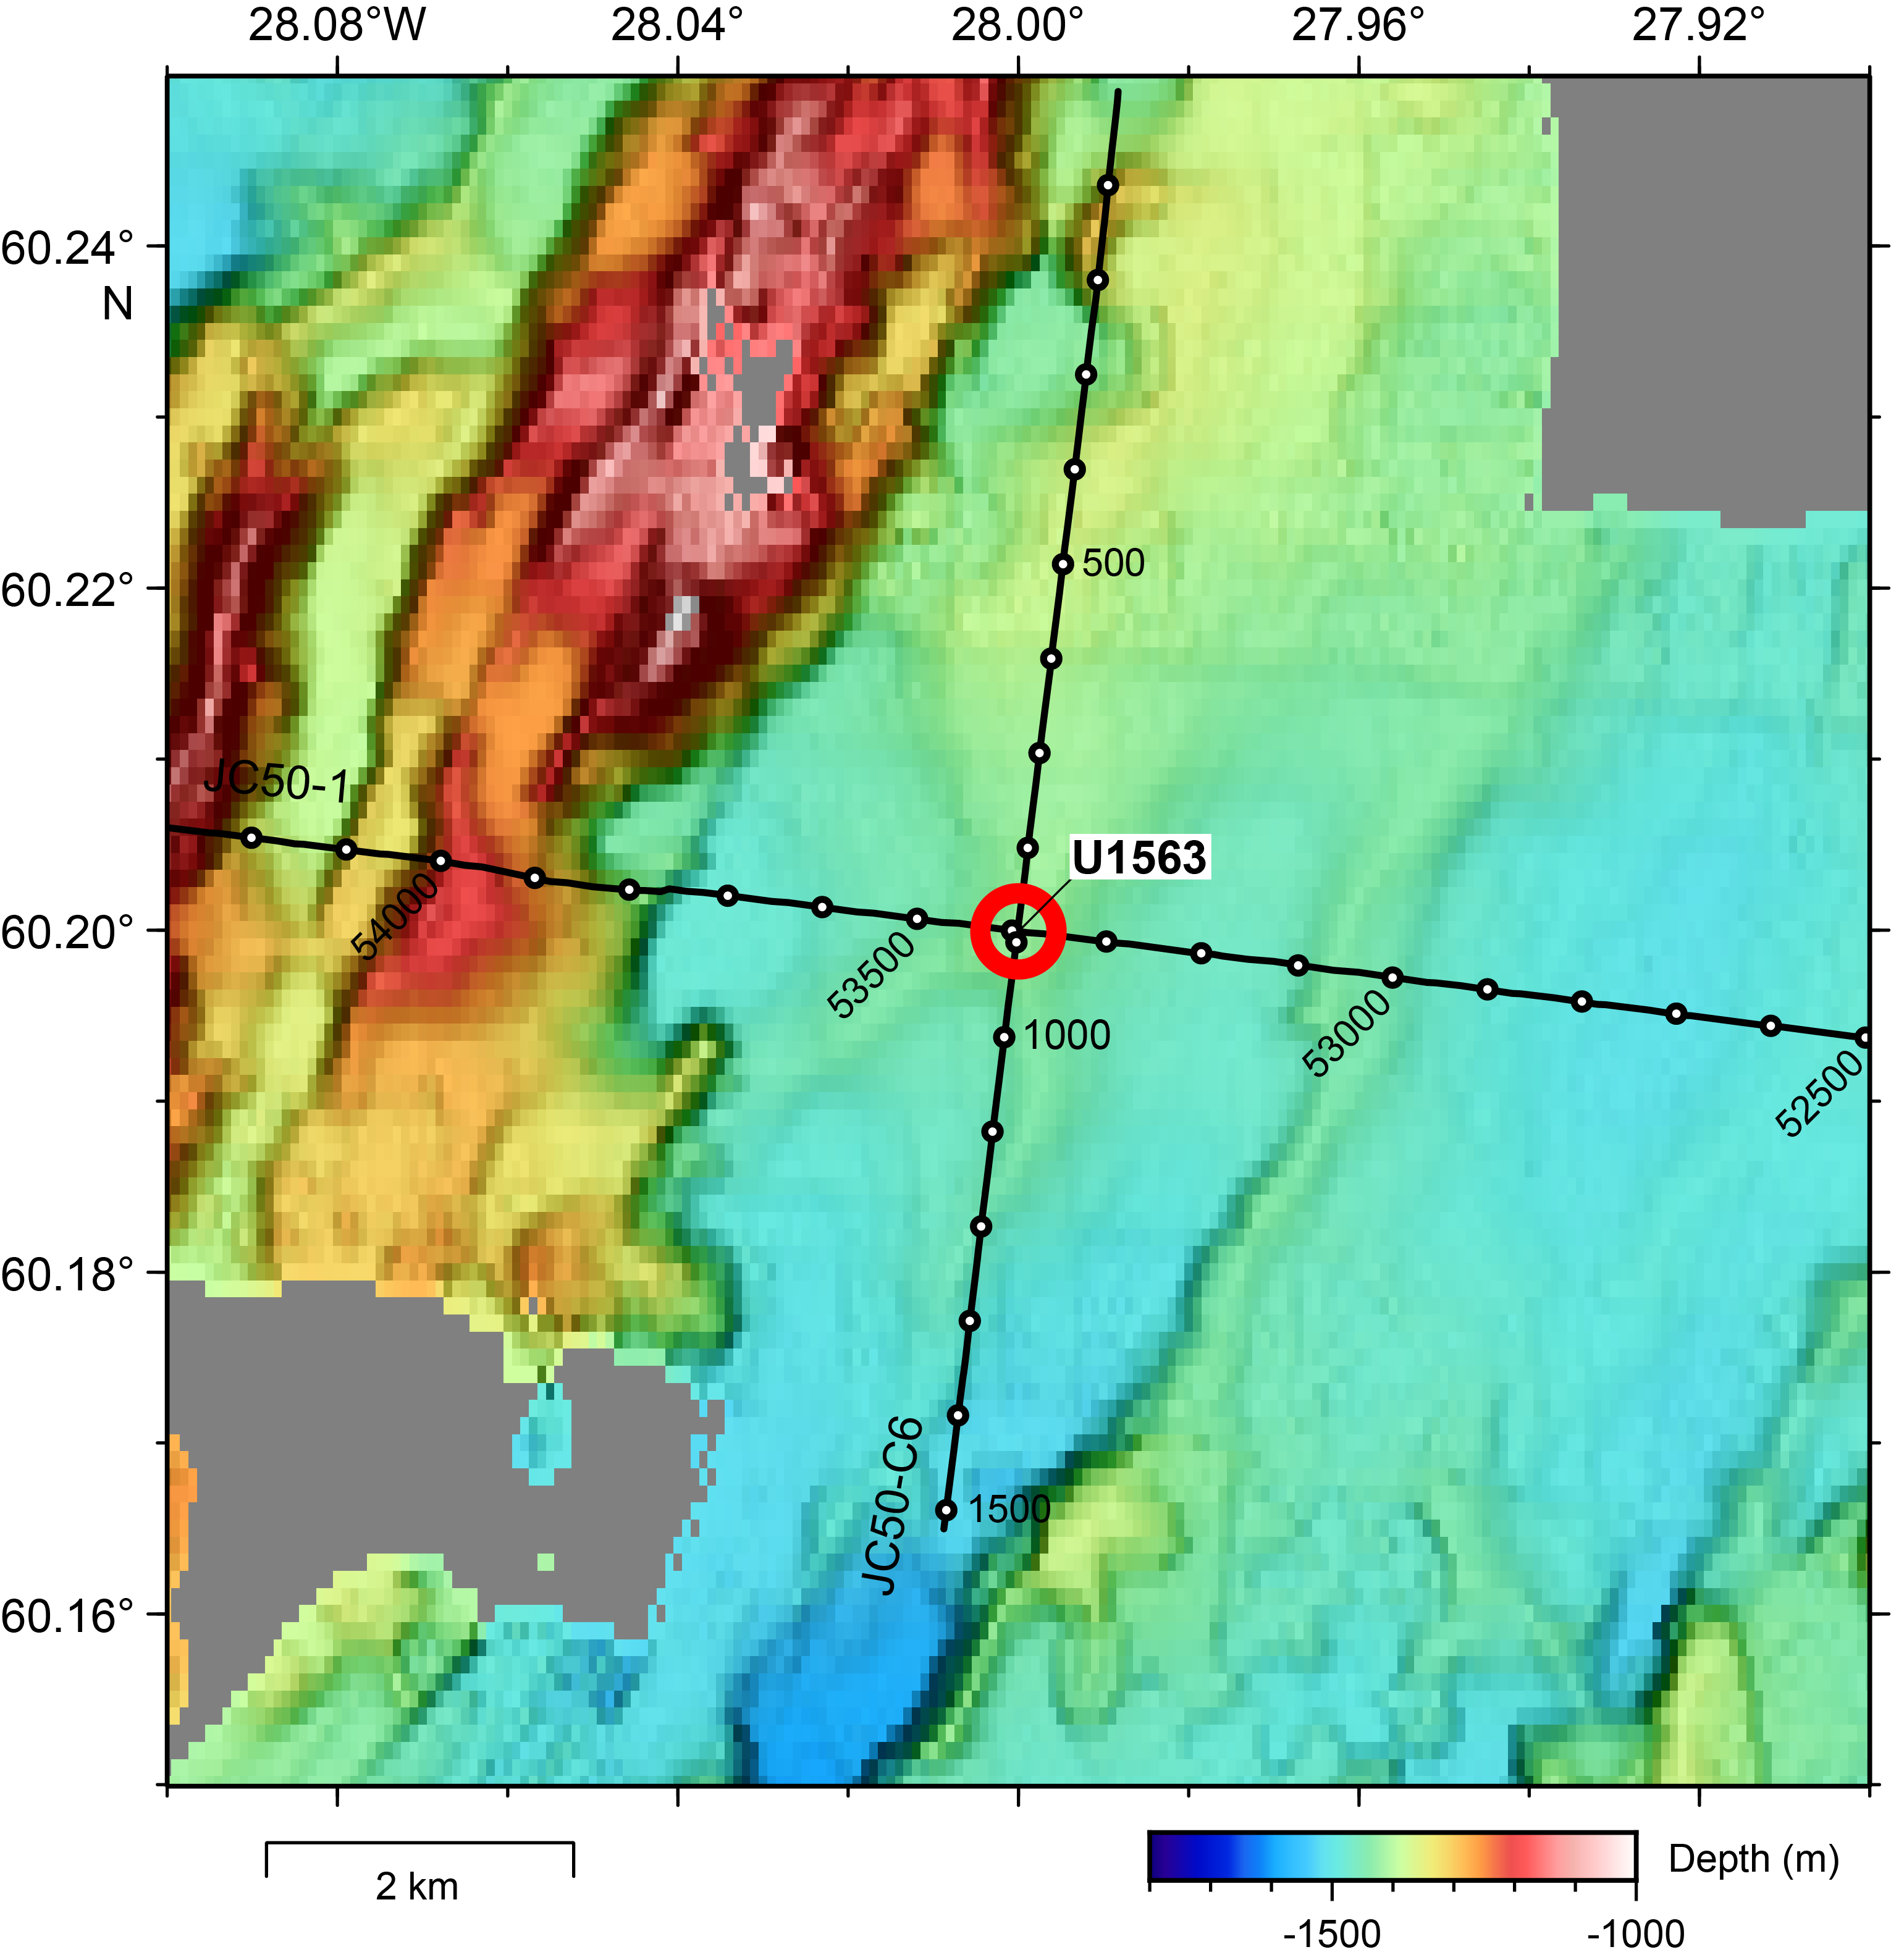
Figure F3. Bathymetric map.
2. Operations
Site U1563 (60°11.9964′N, 28°00.0000′W) consists of two holes, 395C-U1563A and 395C-U1563B, that extend to 327.6–456.6 m drilling depth below seafloor (DSF) (Table T1).
A total of 80 cores were recovered at Site U1563. These cores collected 397.36 m of sediment and basalt over a 482.8 m cored interval (79% recovery). The advanced piston corer (APC) system was used to collect 21 cores over a 197.4 m interval with 207.05 m of core recovered (105% recovery). The half-length APC (HLAPC) was deployed for 26 cores and recovered 122.35 m of sediment from a 122.2 m interval (100% recovery). The extended core barrel (XCB) system was deployed over an 8.0 m interval. The two XCB cores recovered 5.58 m of sediment and basalt (70% recovery). The rotary core barrel (RCB) system was deployed over a 155.2 m interval with 44.38 m of core recovered (29% recovery). A total of 31 cores were collected with the RCB system. Downhole wireline logging operations using three logging tools took place in Hole U1563B.
The total time spent at Site U1563 was 8.12 days.
2.1. Hole U1563A
The vessel completed the 39 nmi transit from Site U1562 to Site U1563 on 22 July 2021. The thrusters were lowered at 0212 h UTC, and the ship entered dynamic positioning mode at 0235 h, marking the start of Site U1563. The APC/XCB bottom-hole assembly (BHA) was made up, and the drill string was deployed to 1415.7 meters below sea level (mbsl). Hole U1563A (60°11.9985′N, 28°00.0209′W) was spudded at 0800 h. Core 1H recovered 7.4 m of sediment, placing the seafloor at 1417.8 mbsl. Cores 2H–16H advanced to 149.9 m DSF (105% recovery). During the collection of Core 16H, the core barrel became detached from the sinker bars and overshot tool when the shear pin in the overshot tool evidently failed. The sinker bars and overshot tool were recovered, the overshot tool was replaced, and the core barrel was retrieved. However, the APC piston rods had twisted while the core barrel was in the BHA, and the rods required replacement. Coring continued with Cores 17H–21H advancing from 149.4 to 197.4 m DSF. APC refusal was reached with Core 21H when, after the core barrel became stuck in the sediment, 130,000 lb of overpull was required to release the barrel from the formation. The HLAPC was deployed for Cores 22F–47F (197.4–319.6 m DSF) and was switched out for the XCB coring system as the bit neared the estimated depth of the basement. Core 48X (319.6–326.6 m DSF) recovered the sediment/basement interface, and the basement was encountered at 326.4 m DSF. Core 49X was cored to ensure that basement had in fact been reached. The core advanced 1 m to a final hole depth of 327.6 m DSF, and 0.42 m of basalt was recovered. Following Core 49X, the drill string was pulled out of the hole. The bit cleared the seafloor at 0400 h and the rotary table at 0715 h on 24 July, ending Hole U1563A.
A total of 334.98 m of core was recovered over a 327.6 m interval (102% recovery).
2.2. Hole U1563B
The ship was offset 21 m east of Hole U1563A, ~3 m from the site coordinates, and the RCB BHA was made up with a C-7 RCB drill bit. The drill string was made up and deployed to 1403 mbsl. The center bit was lowered into the RCB bit, and Hole U1563B (60°11.9946′N, 27°59.9996′W) was spudded at 1605 h on 24 July 2021.
Hole U1563B was advanced without coring to 301.4 m DSF. The center bit was retrieved, and Cores 2R–5R were advanced from 301.4 to 325.8 m DSF. The sediment/basement interface was encountered at ~315 m DSF but was not preserved in Core 3R. While coring Core 5R, the wind increased to sustained speeds of 35 kt, gusting up to 45 kt, and the vessel began waiting on weather at 0800 h on 25 July. It was noted that there was an unusual noise emanating from a transformer for three of the thrusters. To troubleshoot the issue, the three affected thrusters needed to be shut down. The vessel resumed operations at 1330 h once the wind speeds had died down. Core 5R was recovered, and the drill string pulled up to 90 m DSF to work on the thrusters. It was discovered that the insulation around a transformer cable was loose. Once this was repaired, the ship was able to resume operations at 1845 h on 25 July. The crew deployed a wash barrel into the BHA and lowered the bit to 325.8 m DSF. After a high-viscosity mud sweep to clean the hole, the wash barrel was retrieved and a core barrel was deployed for Core 6R. Coring continued with Cores 6R–32R advancing from 325.8 to 456.6 m DSF. Following Cores 25R–32R, the crew cleaned the hole with high-viscosity mud because of deteriorating hole conditions. After Core 32R was recovered, the drill pipe became stuck in the hole, unable to rotate, circulate, or move. Coring operations were terminated, and after ~1.5 h the pipe was freed and the drill string was pulled up to 363.9 m DSF. The hole was prepared for downhole logging operations with another high-viscosity mud sweep. The rotary shifting tool was deployed to release the drill bit and allow logging tools to exit the drill pipe. The RCB drill bit was released in the hole at 2325 h on 28 July.
In total, 44.38 m of core was recovered over a 155.2 m cored interval (29% recovery). Coring of the basalts advanced at an average rate of penetration of 3.6 m/h.
The drill pipe was pulled up to 87.6 m DSF in preparation for downhole logging operations. The triple combination (triple combo) tool string was assembled and deployed at 0410 h on 29 July. The tool made two passes of the borehole, reaching 313.9 m DSF. At 0900 h, the triple combo reached the rig floor and was broken down. The second logging run was the Versatile Seismic Imager (VSI) tool. At 1045 h, the VSI tool was deployed and the protected species observation protocols began. Whales were sighted in the area, delaying the start of operations. Once it was deemed safe to fire the air guns, the VSI was lowered to three stations: 283.9, 292.9, and 308.9 m DSF. Only the bottom two stations recorded successful measurements. At 1652 h, the protected species observation watch ended and the tools were pulled out of the hole, reaching the rig floor at 1810 h. After the VSI tool was broken down, the Formation MicroScanner (FMS)-sonic tool string was assembled and deployed at 1935 h. The FMS-sonic tool string descended to 311.0 m DSF and recorded resistivity images of the borehole. The tools were pulled up to the rig floor at 2325 h, and the day ended while breaking down the FMS-sonic tool string. The crew pulled the drill pipe up with the end of the pipe clearing the seafloor at 0105 h on 30 July and the rotary table at 0513 h. The rig floor was secured, thrusters were raised, and the vessel began the 144 nmi sea passage to Site U1564 at 0518 h on 30 July.
3. Lithostratigraphy
The sediments at Site U1563 are primarily composed of silty clay and clayey silt in the upper portion and foraminifer and nannofossil ooze and chalk in the lower section (Table T2). They are divided into four lithostratigraphic units (Figure F4) on the basis of (1) visual core description, (2) natural gamma radiation (NGR), (3) bulk calcium carbonate (CaCO3) measurements, (4) smear slide examination, (5) reflectance (L*), and (6) magnetic susceptibility (MS) measurements. To assist in understanding the sedimentological patterns at this site, NGR and color reflectance data were smoothed using an eighth-order low pass Butterworth filter with a cutoff of 0.125 times the Nyquist frequency (Figure F5; this was applied to data that had undergone cleaning; see Physical properties in the Expedition 395 methods chapter [Parnell-Turner et al., 2025a]). This bidirectional linear digital filter avoids phase shift, maintaining correct peak positions (Butterworth, 1930; Lyons, 2011). CaCO3 measurements are widely spaced and consequently only partially document carbonate variability; the Ca/Ti ratio from shore-based scanning X-ray fluorescence (XRF) measurements on the split core surface for the lower part of Hole 395C-U1563A were used to supplement the CaCO3 measurements (Figure F5).
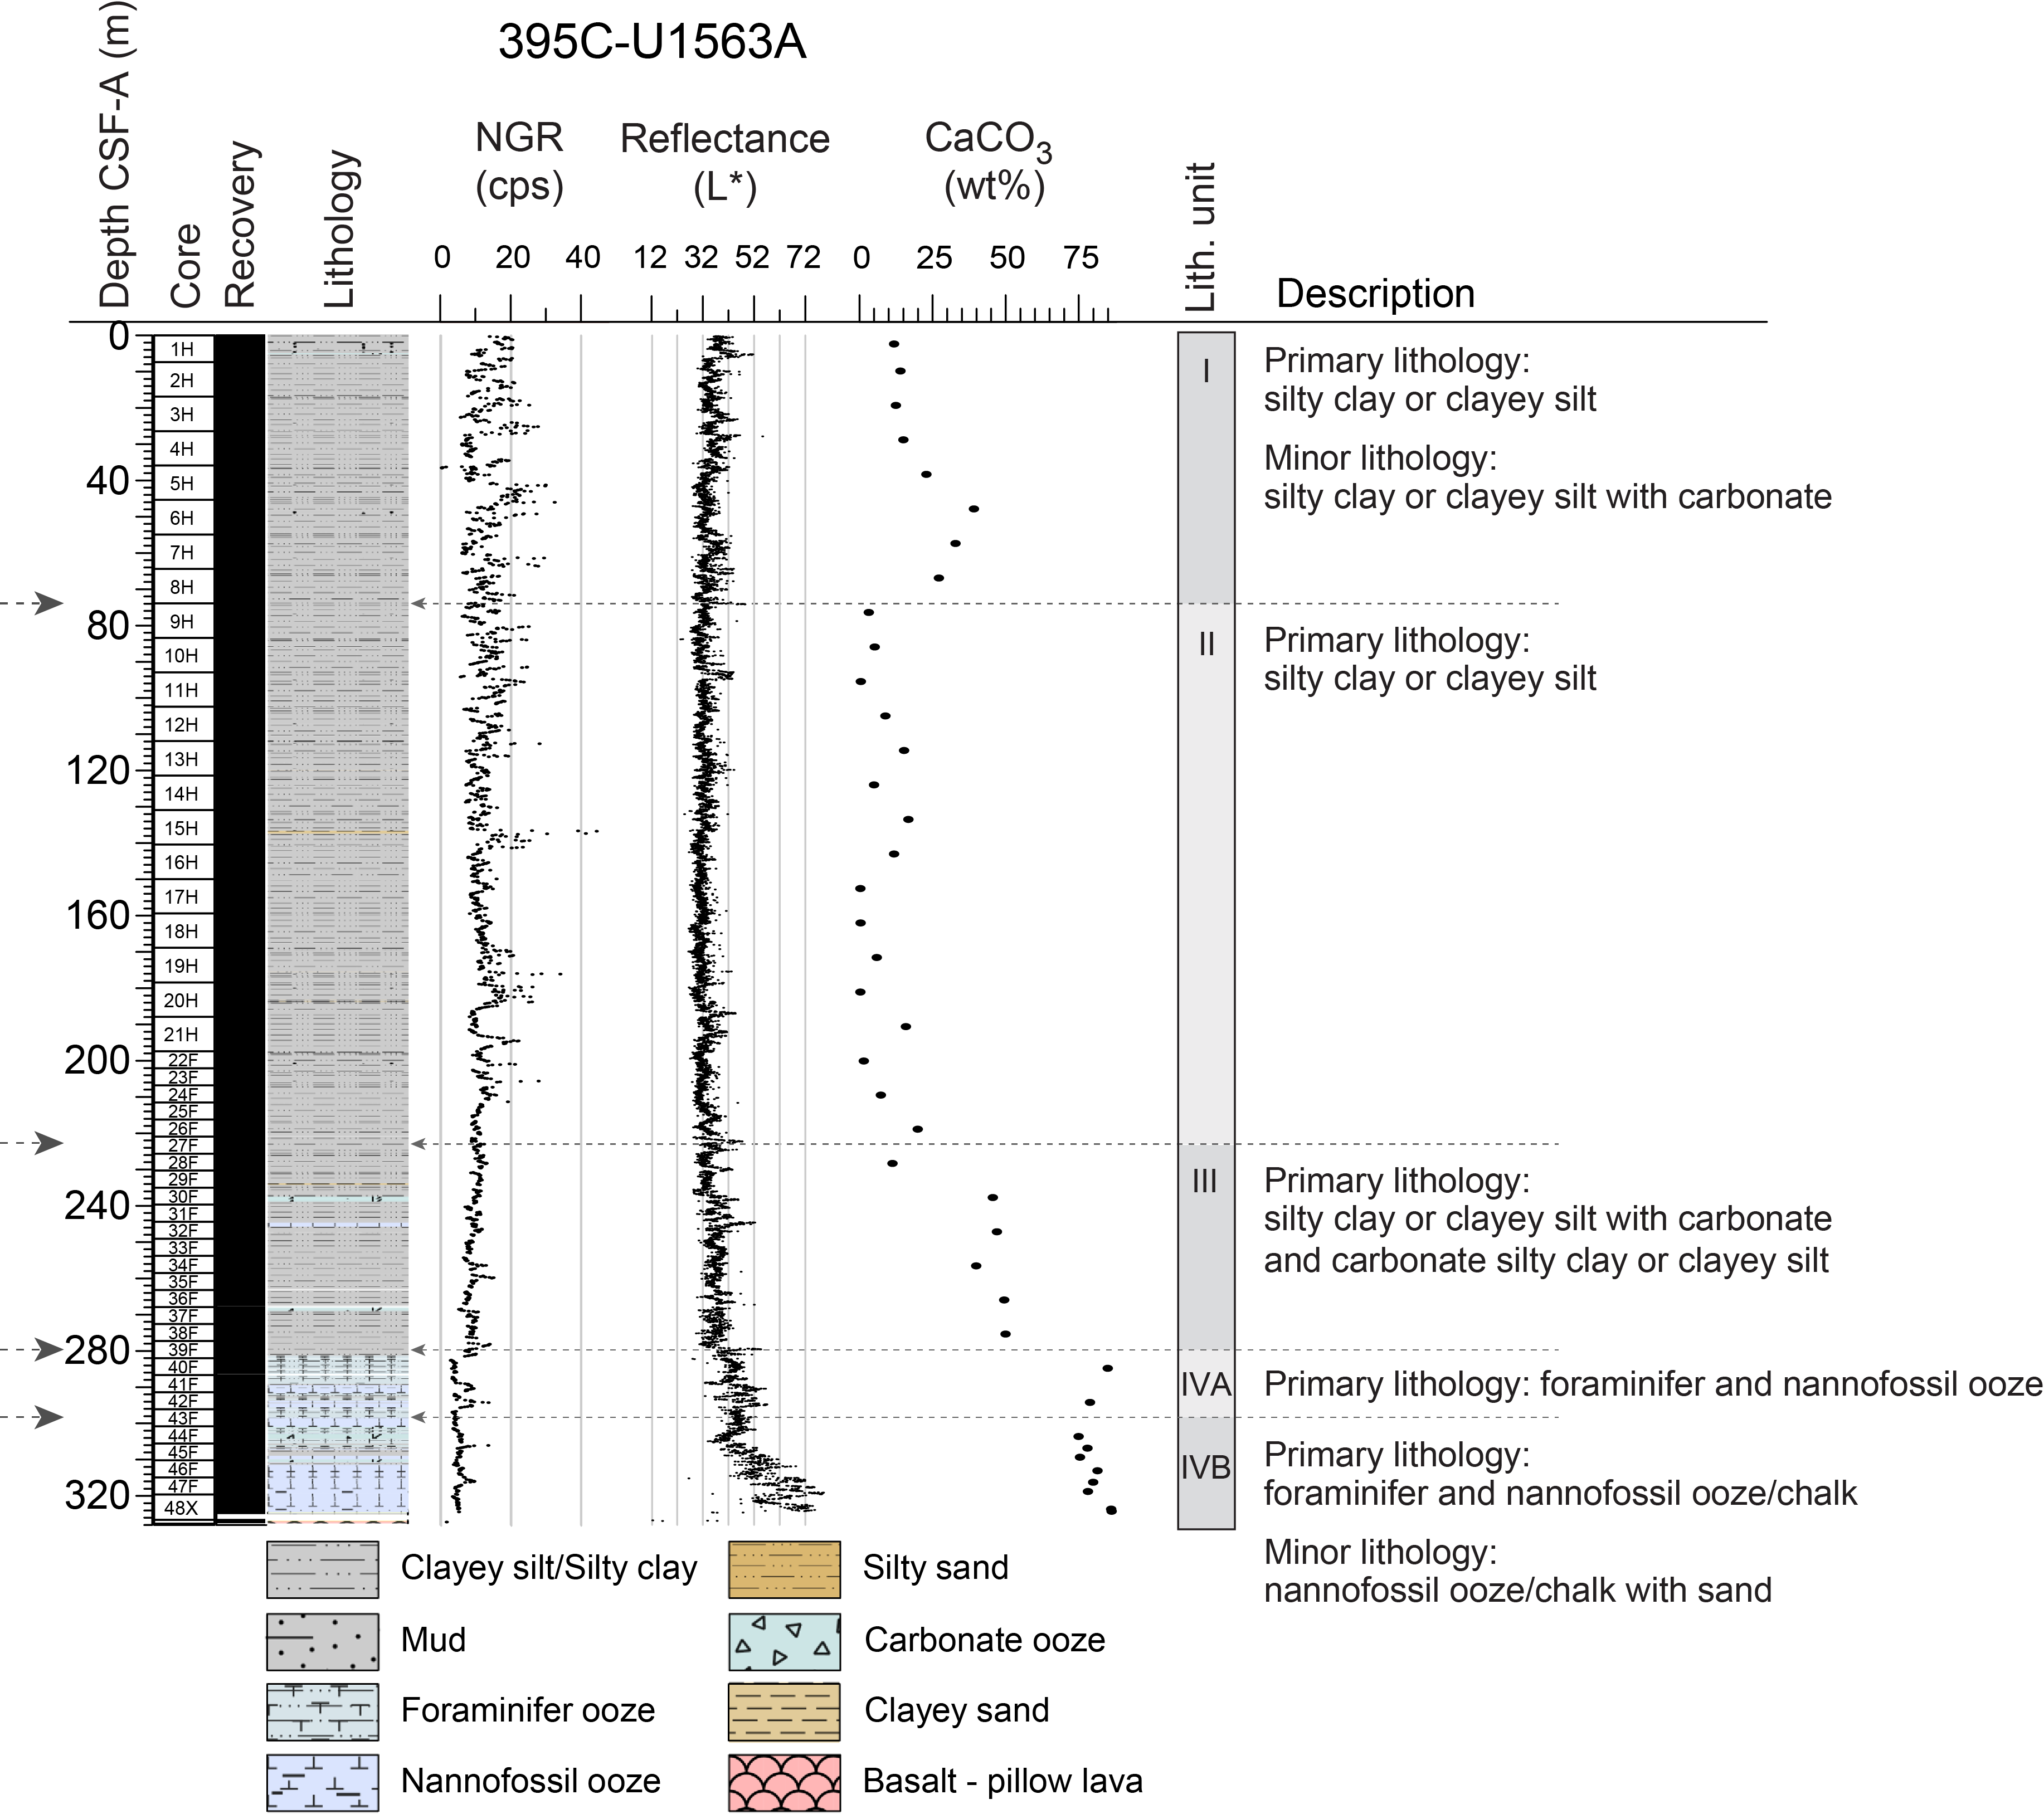
Figure F4. Lithostratigraphic summary, Hole U1563A.
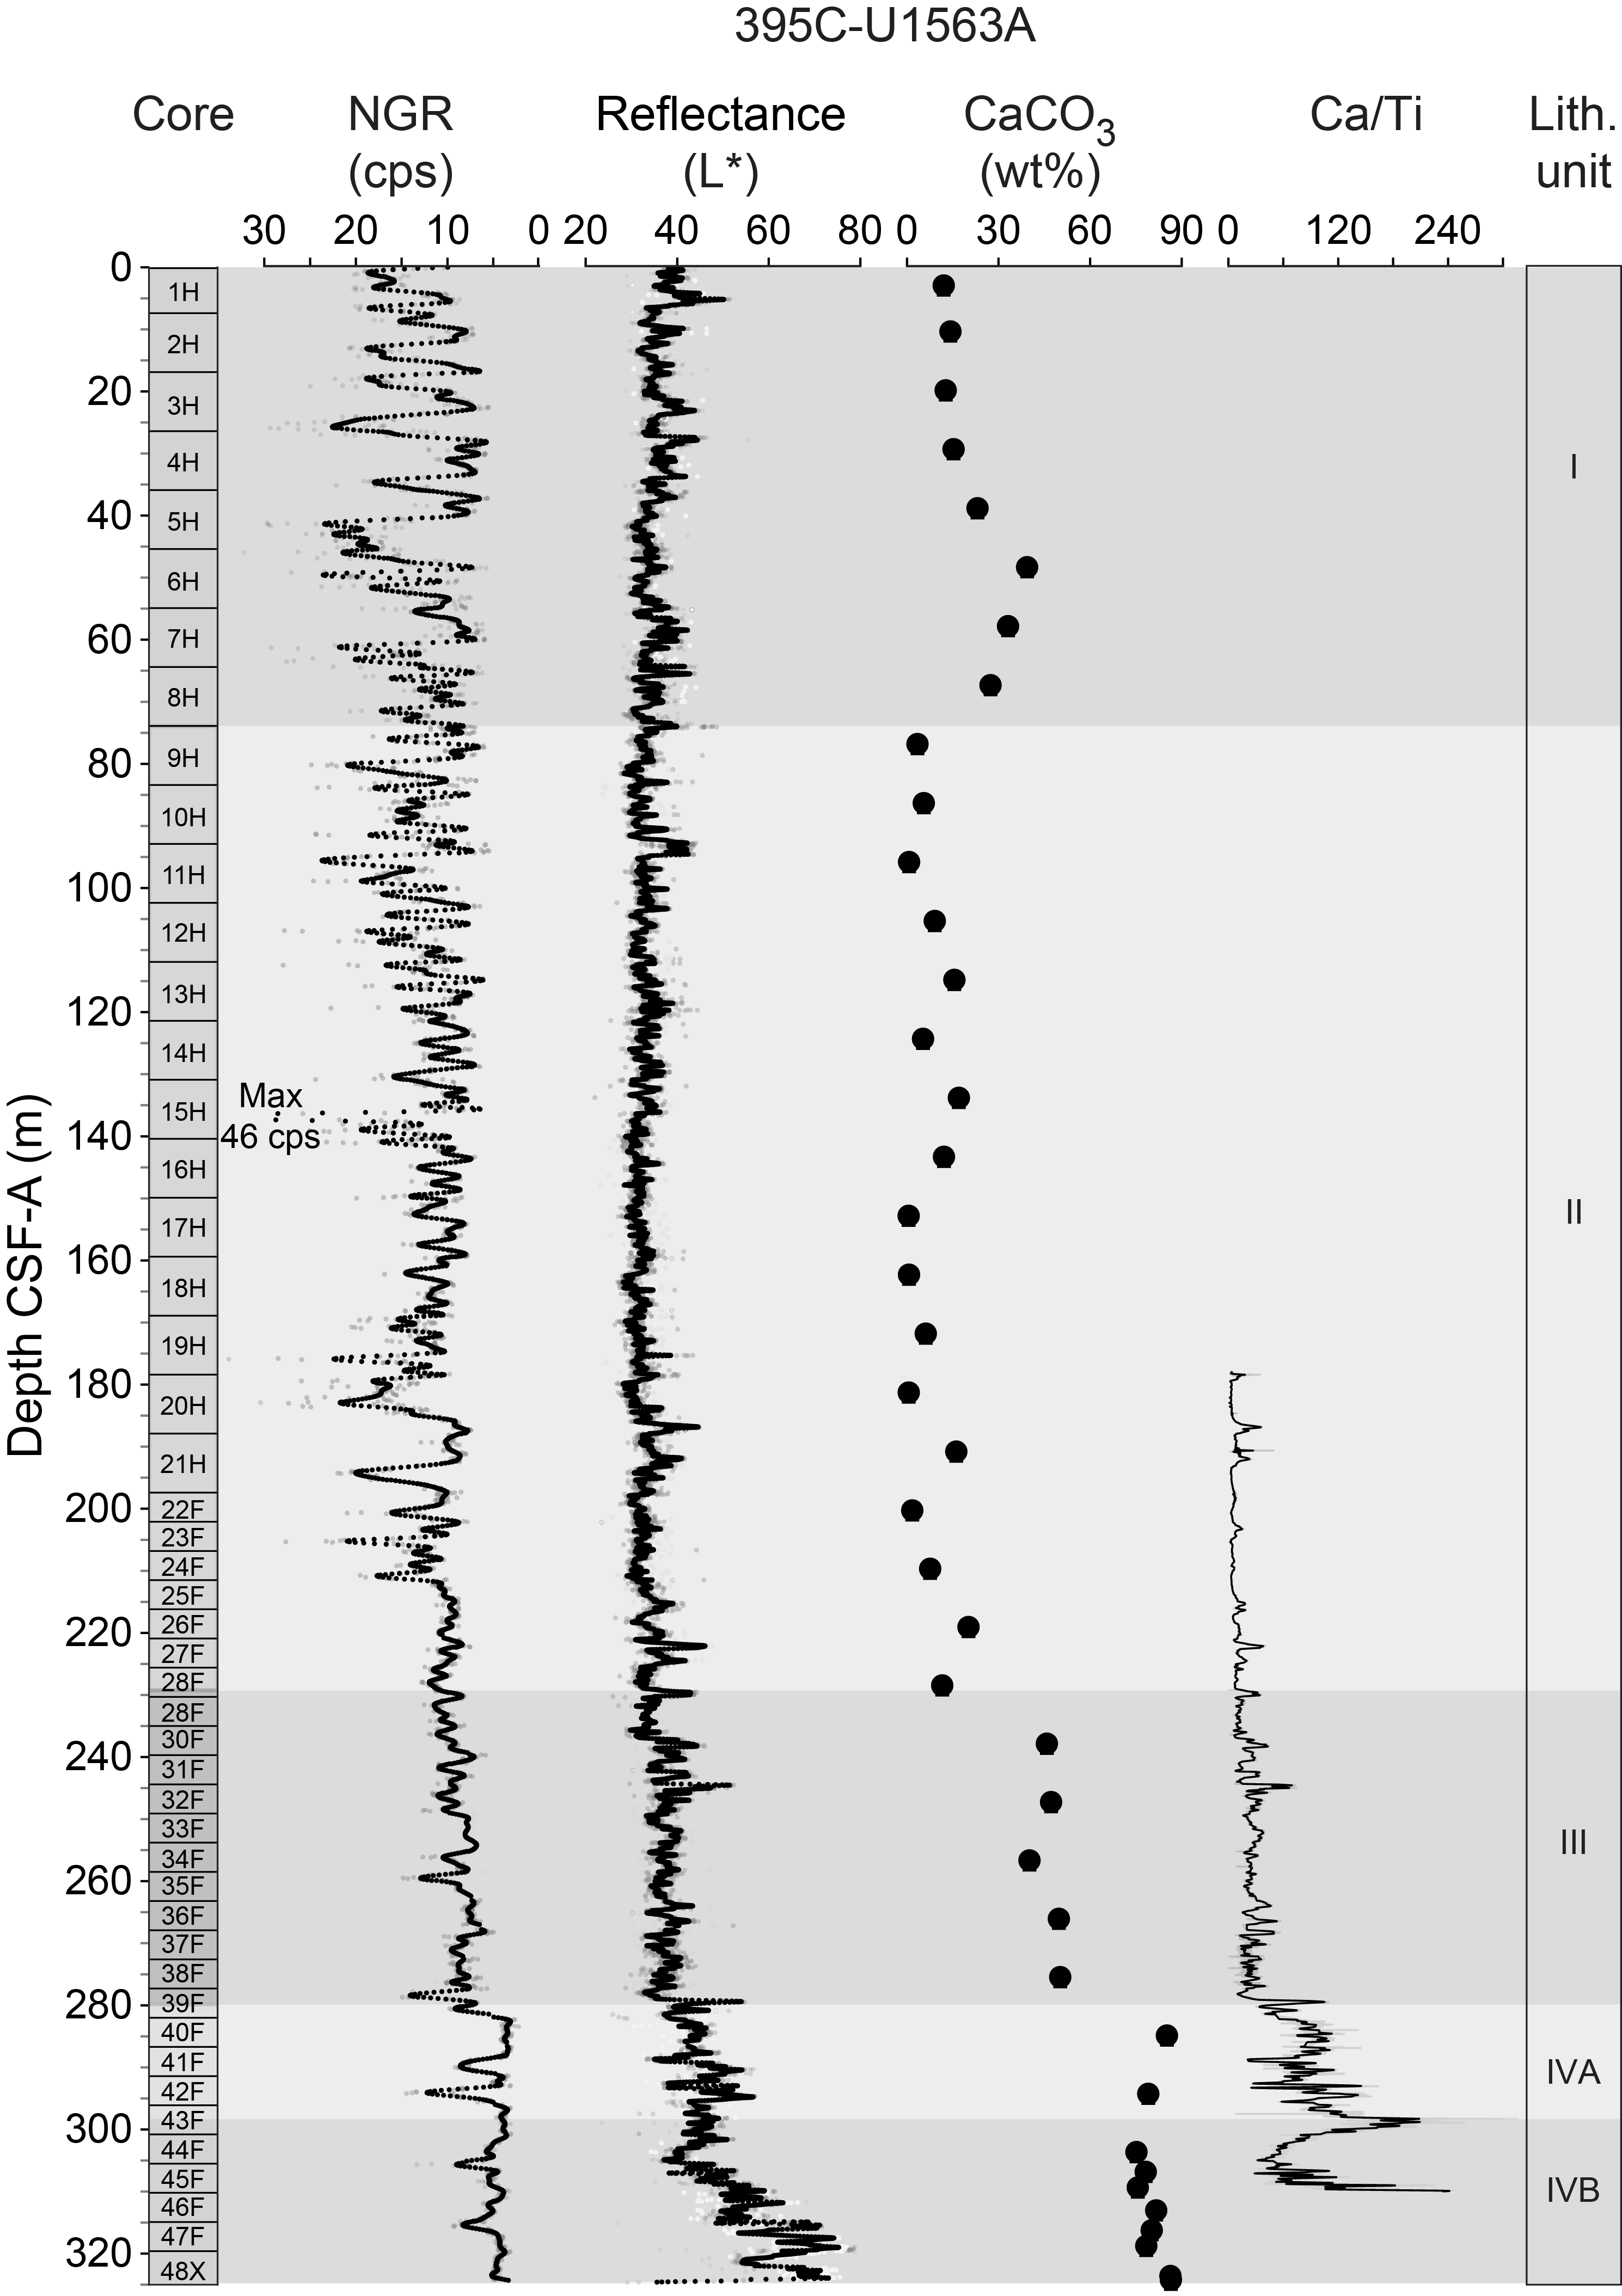
Figure F5. Lithologic unit definition parameters.
3.1. Lithostratigraphic Unit I
- Interval: 395C-U1563A-1H, 0 cm, to 9H-1, 0 cm
- Depth: 0–73.9 m core depth below seafloor, Method A (CSF-A)
- Thickness: 73.9 m
- Age: Holocene to early Pleistocene
- Lithology: silty clay or clayey silt, silty clay or clayey silt with carbonate
Unit I is primarily olive gray, dark olive gray, dark gray, dark grayish brown, and very dark grayish brown silty clay or clayey silt and silty clay or clayey silt with carbonate (Figures F6A, F7A, F7B). Carbonate microfossils (foraminifers and nannofossils) are present in amounts ranging from a few per smear slide to over 30%. Biosilica (sponge spicules [abundant], radiolarians [rare], and diatoms [common]) are present throughout in minor amounts (<10%) (Figure F8A). The terrigenous component is primarily quartz and feldspar, although glauconite and glass are also present, especially in the deeper sediments. Gravel (2 mm to 2 cm) is present as dispersed clasts but is not common.
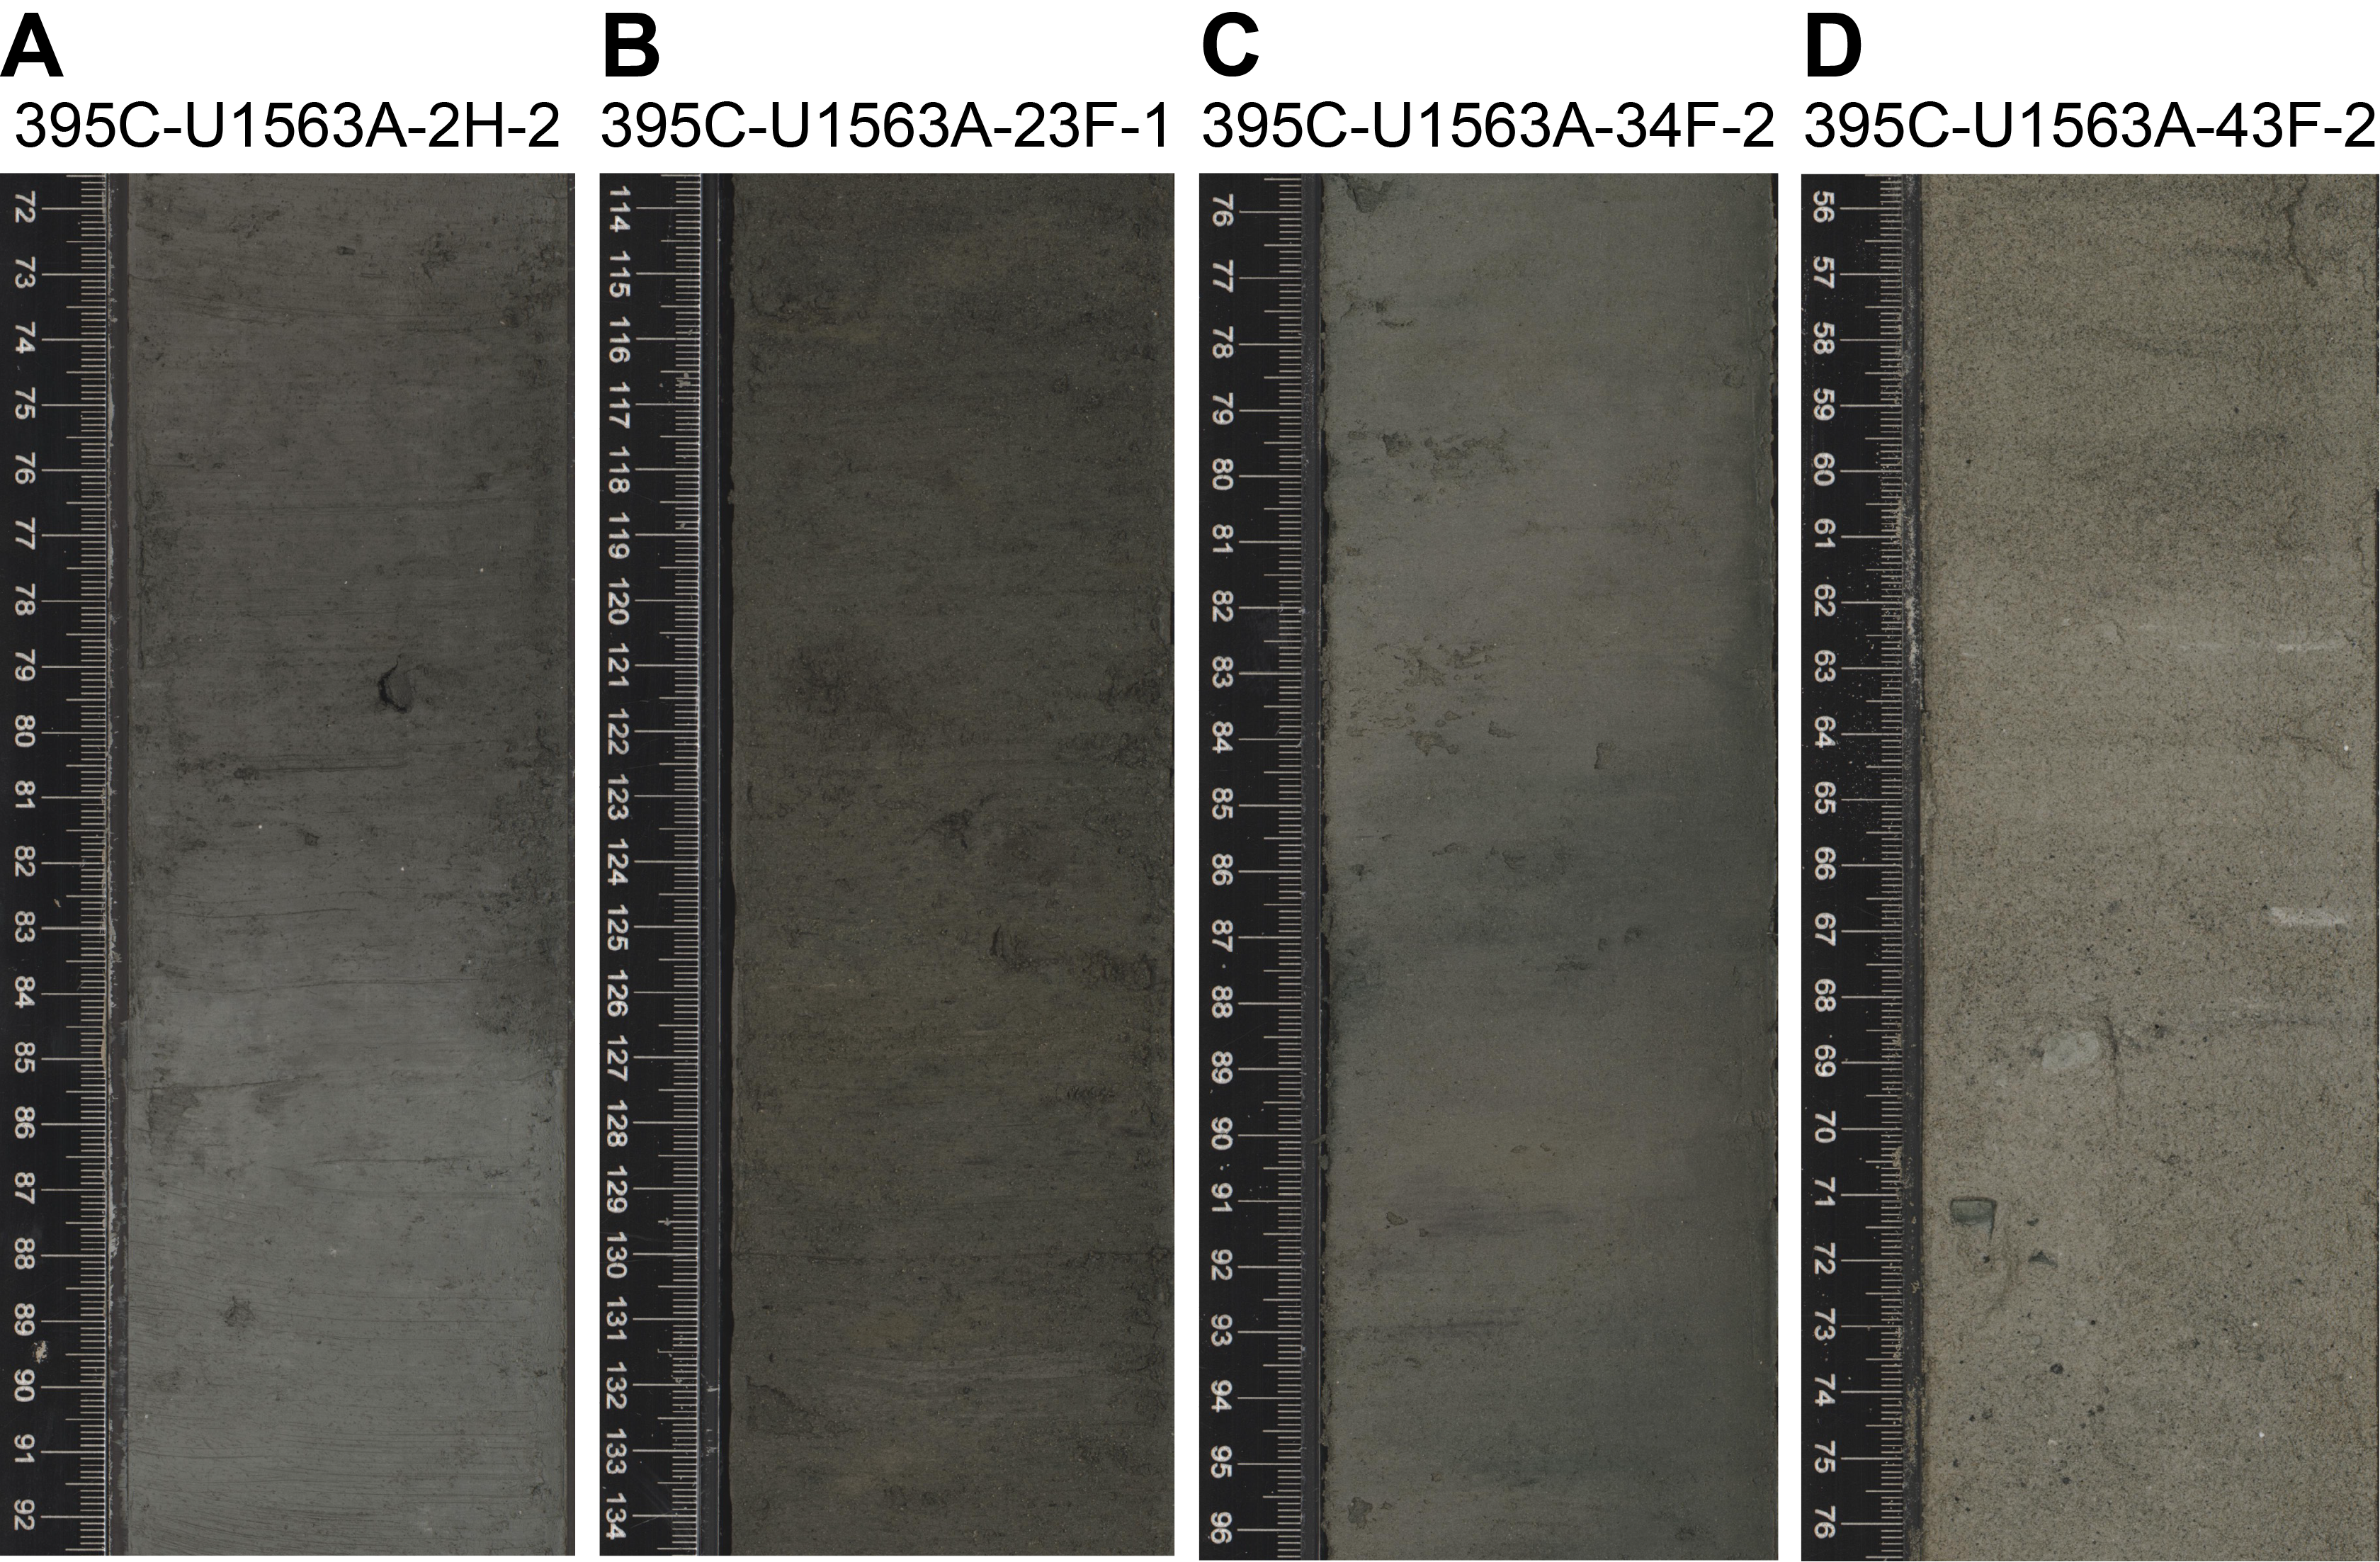
Figure F6. Representative lithologies.
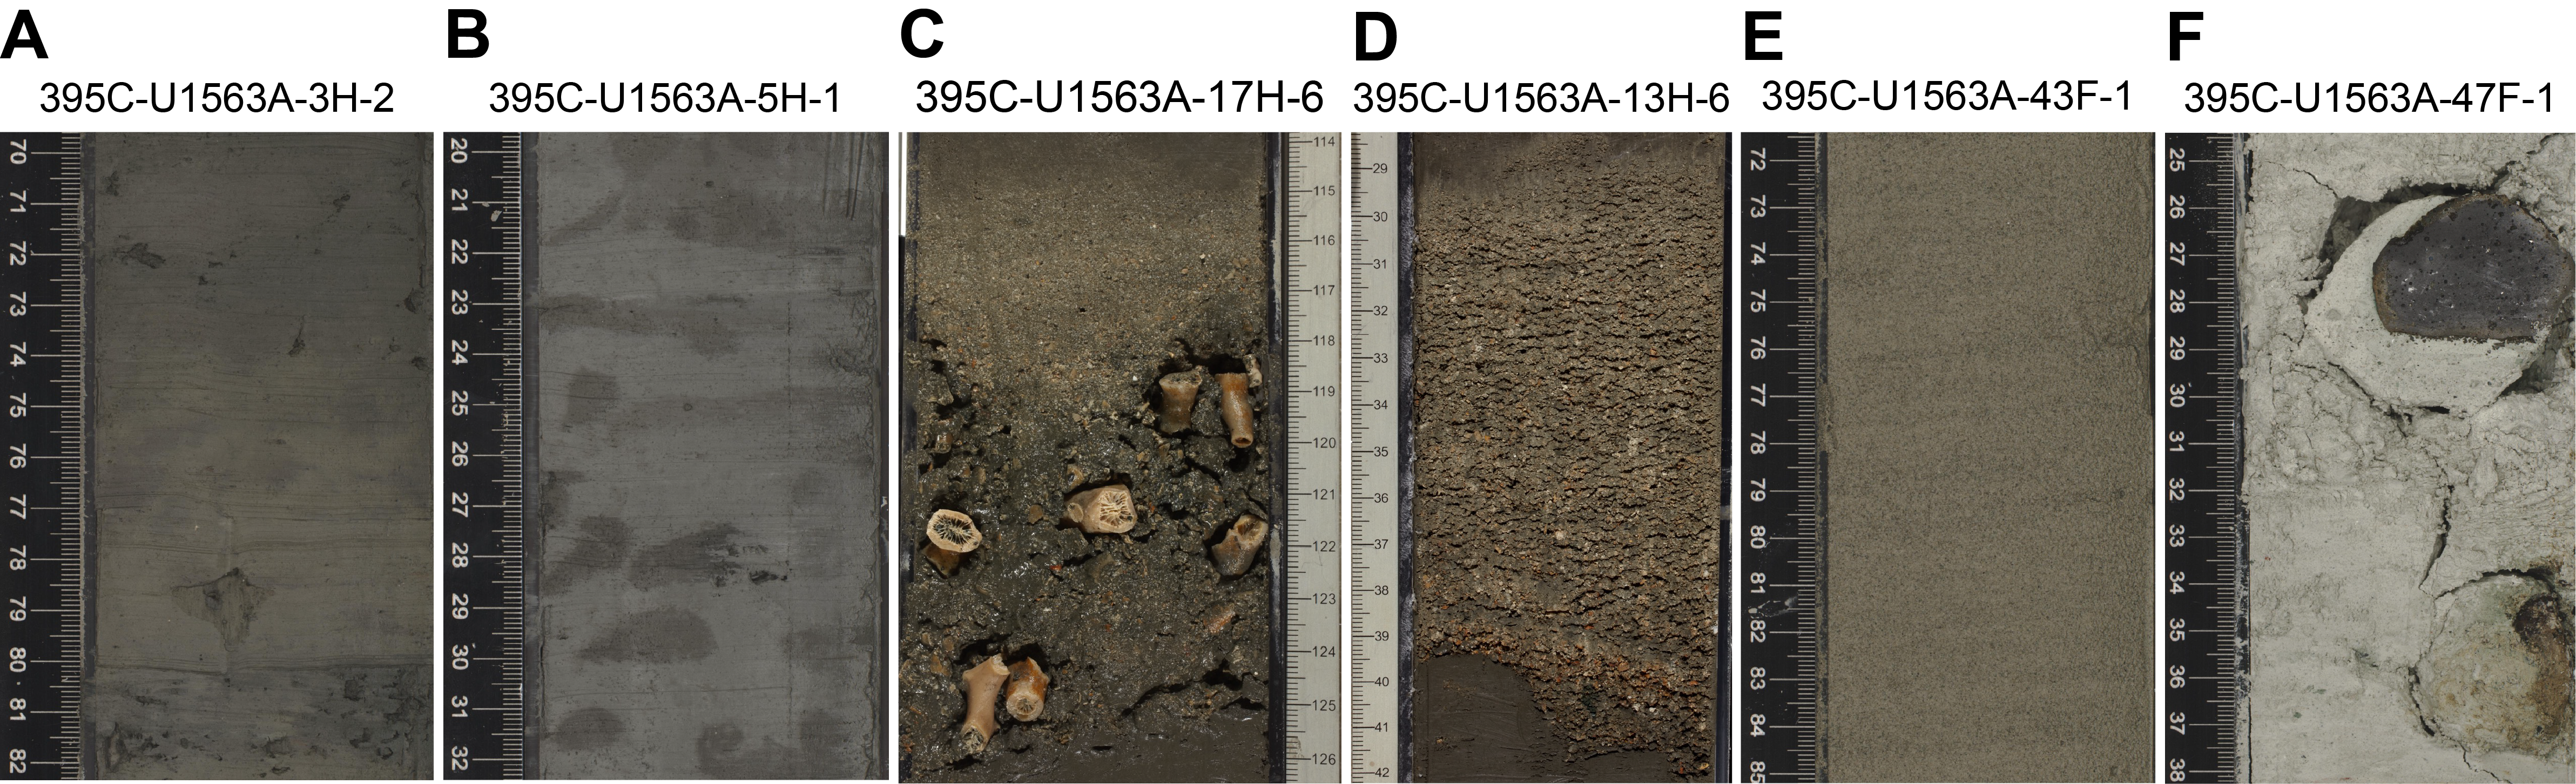
Figure F7. Notable features.
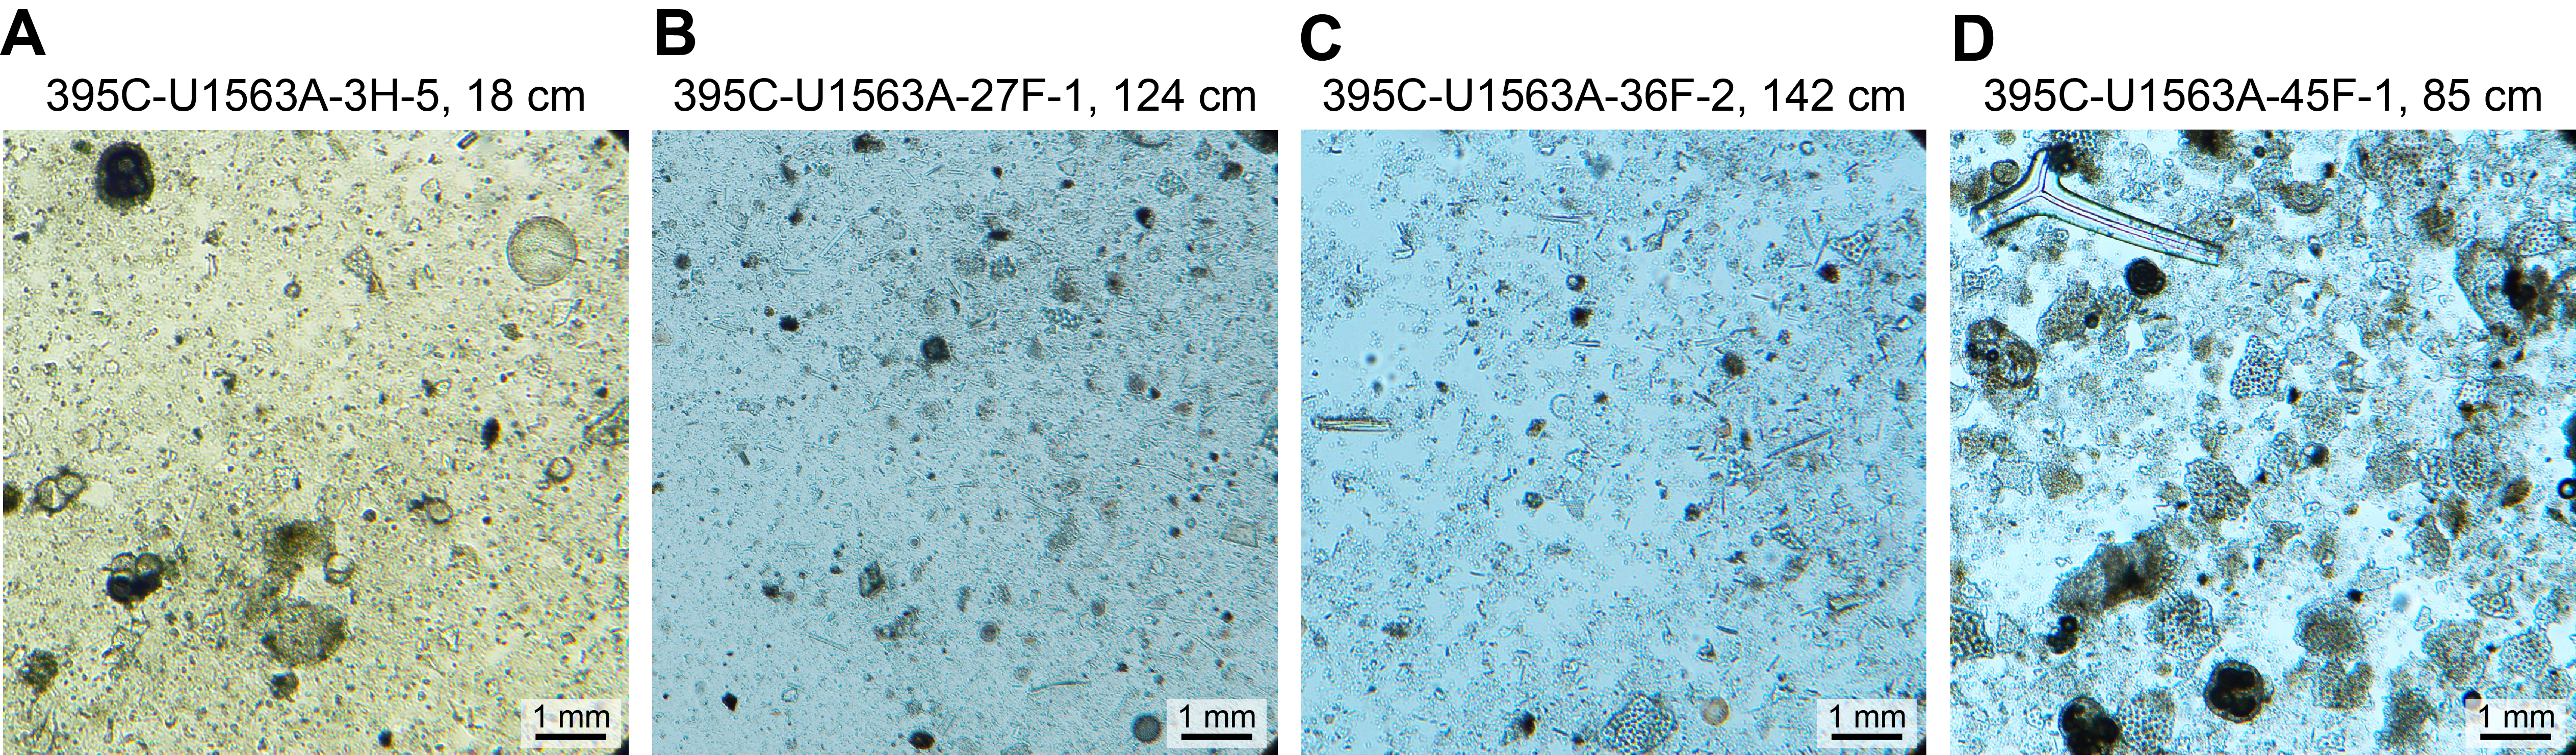
Figure F8. Silty clay or clayey silt and foraminifer chalk.
Bioturbation varies from absent in homogeneous sediment to moderate where there are color boundaries. Mottling, rather than distinct trace fossils, is most common (Figure F7A, F7B). Laminae and sand lenses are present but rare, along with thin (< 1 cm thick) dark layers, which could be devitrified glass. CaCO3 concentration ranges 12.4–39.1 wt% (n = 8; average = 22 wt%). The upper few centimeters of cores are commonly soupy, but other coring disturbance is low, with the exception of a few short intervals of moderately to severely deformed sediments.
3.2. Lithostratigraphic Unit II
- Interval: 395C-U1563A-9H-1, 0 cm, to 28F-3, 70 cm
- Depth: 73.9–229.3 m CSF-A
- Thickness: 155.4 m
- Age: early Pleistocene to late Pliocene
- Lithology: silty clay or clayey silt
Unit II is primarily olive gray and dark grayish brown silty clay or clayey silt, with some silty clay or clayey silt with carbonate interbedded with olive gray, light olive gray, gray, and grayish brown silty clay or clayey silt with carbonate (Figure F6B). Boundaries between carbonate-rich sediment (below) to silty clay (above) tend to be sharper than transitions from silty clay (below) to carbonate-rich sediment (above). CaCO3 concentration ranges 0.4–19.9 wt% (n = 18; average = 8 wt%). Bioturbation is sparse to absent. Drilling disturbance is mostly absent, but where present it ranges from moderate deformation to strong fragmentation.
Terrigenous grains are primarily quartz, feldspar, and glass; glauconite, oxides, and pyrite are also present. Biogenic components include sponge spicules, radiolarians, diatoms, nannofossils, and foraminifers (Figure F8B). Decimeter-scale dark and light color variations are present throughout the unit. Sand and dispersed gravel are present but rare. Large (up to 2 cm long) coral fragments are present in Core 395C-U1563A-17F (Figure F7C). Three graded gravel-sand layers with sharp, erosive contacts are present in Cores 13F, 19F, and 21F. Each layer contains abundant smaller coral fragments up to 1 cm long and varies from 3 to 14 cm in thickness (Figure F7D).
3.3. Lithostratigraphic Unit III
- Interval: 395C-U1563A-28F-3, 70 cm, to 39F-2, 0 cm
- Depth: 229.3–279.8 m CSF-A
- Thickness: 50.5 m
- Age: late Pliocene to early Pliocene
- Lithology: silty clay or clayey silt with carbonate, carbonate silty clay or clayey silt
Unit III is primarily olive gray silty clay or clayey silt with carbonate and carbonate silty clay or clayey silt. Thin (millimeters to several centimeters) grayish green areas are present at closely spaced (<10 cm) but irregular intervals. The carbonate component contains both nannofossils and foraminifers. Small amounts of biosilica (diatoms and sponge spicules) are common (Figure F8C). Bioturbation is sparse to moderate. CaCO3 weight percentage for five measurements ranges 40–50 wt% (n = 5; average = 46 wt%). Drilling disturbance is not common, but where present it generally appears as slight to moderate deformation.
3.4. Lithostratigraphic Unit IV
- Interval: 395C-U1563A-39F-2, 0 cm, to 48X-CC, 20 cm
- Depth: 279.8–324.8 m CSF-A
- Thickness: 45 m
- Age: early Pliocene
- Lithology: foraminifer and nannofossil ooze and chalk
Unit IV is primarily light gray, light olive gray, and light yellowish brown nannofossil and foraminifer ooze and becomes more lithified with depth (chalk). Dark olive gray to grayish brown bands are thinly interbedded with lighter pale brown, white, and pale yellow sediments (Figure F7E). Olive gray silty clay or clayey silt is present in some darker intervals. Silt- and sand-size grains are rare, although when present they are primarily composed of glass and opaque minerals. CaCO3 concentration is uniformly high at 75–86 wt% (average = 80 wt%). Biosiliceous microfossils are present in minor amounts (Figure F8D). Basalt clasts, scoria, and other clasts are also observed in this unit (Figure F7F; Table T3). Shore-based scanning XRF Ca/Ti ratios are elevated in this unit compared to Unit III, with the exception of the interval between 310 and 330 m CSF-A (Figure F5). XCB cores from this hole are moderately deformed by biscuiting, making it difficult to distinguish a clear ooze/chalk boundary. Parts of the HLAPC cores are also moderately deformed.
3.4.1. Lithostratigraphic Subunit IVA
- Interval: 395C-U1563A-39F-2, 0 cm, to 43F-2, 65 cm
- Depth: 279.8–298.3 m CSF-A
- Thickness: 18.5 m
- Age: early Pliocene
- Lithologies: foraminifer and nannofossil ooze
Subunit IVA is primarily light olive gray, dark olive gray, gray, grayish brown, and lighter pale brown foraminifer and nannofossil ooze. Most color changes are gradual. Thin horizontal color bands (centimeter scale) are present (Figure F7E). Bioturbation varies from moderate to abundant, and laminations are observed in one short interval. Cores are slightly deformed with rare soupy layers.
3.4.2. Lithostratigraphic Subunit IVB
- Interval: 395C-U1563A-43F-2, 65 cm, to 48X-CC, 20 cm
- Depth: 298.3–324.8 m CSF-A
- Thickness: 26.5 m
- Age: early Pliocene
- Lithologies: foraminifer and nannofossil ooze and chalk
Subunit IVB is primarily light gray, light olive gray, light yellowish brown, pale yellowish brown nannofossil and foraminifer ooze, becoming chalk with depth. A short interval with horizontal banding of multiple lithologies of light olive gray and olive gray carbonate silty clay or clayey silt, nannofossil silty clay or clayey silt, silty clay or clayey silt with nannofossils, and nannofossils with sand is present between 307.0 and 308.5 m CSF-A. Similar color banding persists below 308.5 m CSF-A, but layers are subhorizontal, suggesting minor soft-sediment deformation. Sand is observed in the lower part of the unit. Basalt clasts, scoria, and other clasts are also present. Drilling disturbance increases downhole; Core 395C-U1563A-48X is severely biscuited.
3.5. XRD results
A subset of squeeze cake residue samples (n = 9) were analyzed for X-ray diffraction (XRD). Results are consistent with smear slide and macroscopic observations (Figure F9; Table T4). The amount of calcite implied by the diffraction patterns is variable but consistent with CaCO3 weight percent measurements. Sample 395C-U1563A-44F-2, 146–151 cm, taken near the base of the recovered sequence from Unit IV, is primarily calcite, as expected. Additional minerals identified are consistent with the significant proportions of terrigenous and/or igneous source minerals observed in smear slide, including quartz, assorted feldspar, and pyroxene. Samples from Hole U1563A often have stronger quartz peaks compared to other expedition sites. A range of feldspars were identified across the samples measured, ranging between the albite and anorthite solid solution series end-members. XRD samples were not specifically prepared for clay mineral analysis, and peaks with a 2θ of <15° should be treated with caution; however, most samples display peaks in this region, consistent with the presence of clay minerals. Future analysis of the clay mineralogy in these samples could be useful for determining shifts in deposition processes and sediment sources.
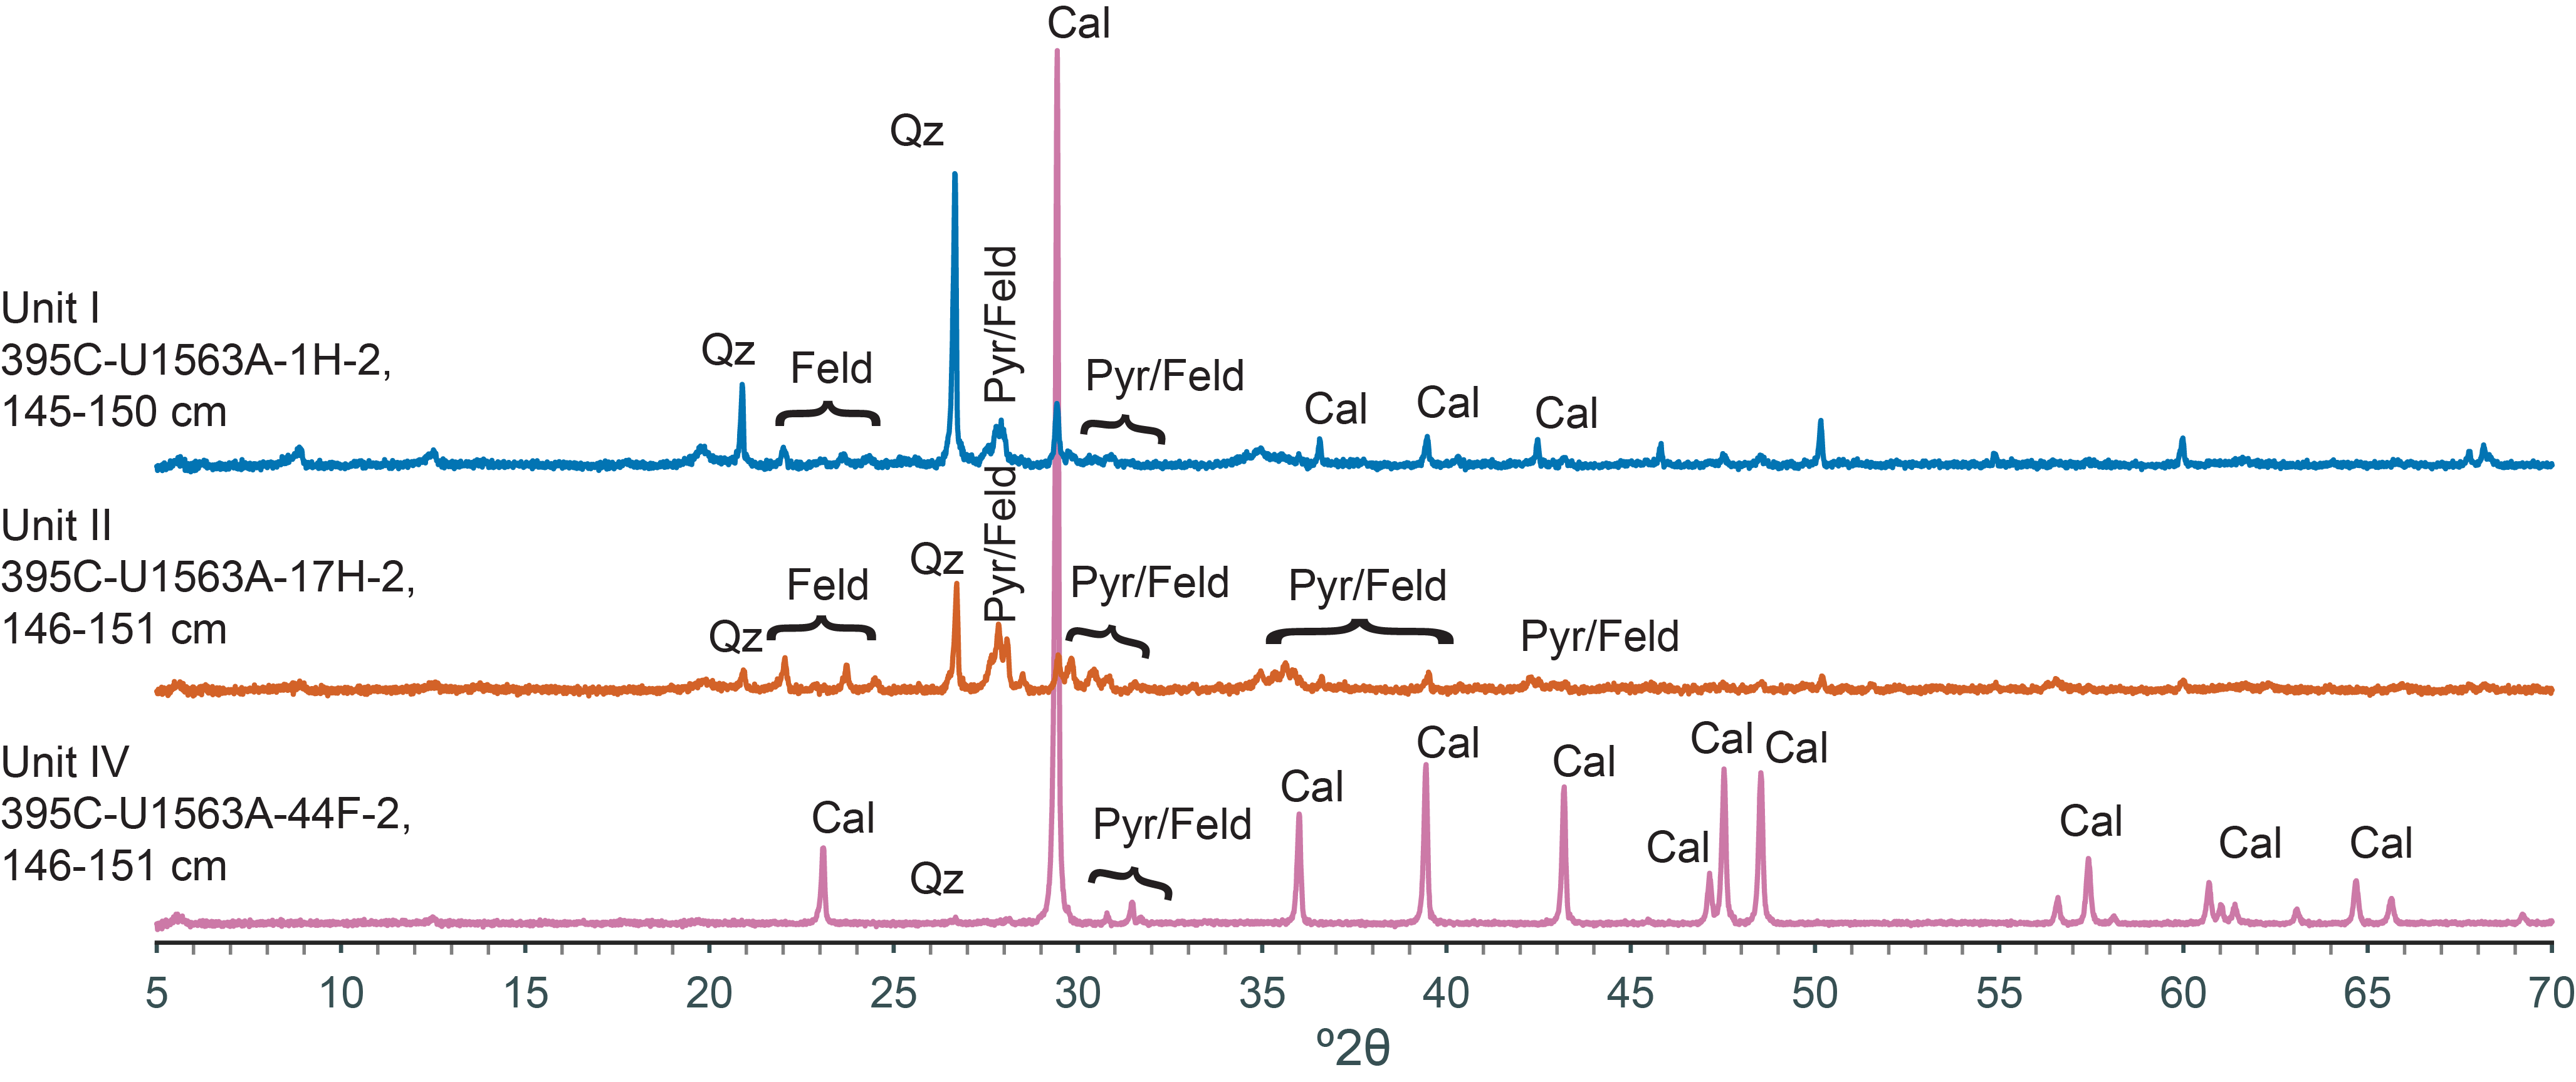
Figure F9. Powder XRD results.
4. Igneous petrology
Site U1563 is located on VSR 2a, and the estimated basement age is 5.2 Ma. Coring in Hole 395C-U1563B reached ~456 m CSF-A (~154 m into basement) with 29% recovery (Figure F10). Minor amounts of basaltic pillow fragments and breccia (<1 m) were also recovered in the last two cores from Hole 395C-U1563A (Cores 48X and 49X). In both holes, the sediment/basement interface consists of basalt clasts overlain by calcareous ooze or chalk, with intervals of baked mudstone and peperite indicating lava-sediment interaction in the uppermost ~20 m of Hole U1563B. Intercalated sediments and peperite layers are relatively common throughout Hole U1563B, making up nearly ~15% of the recovered material.
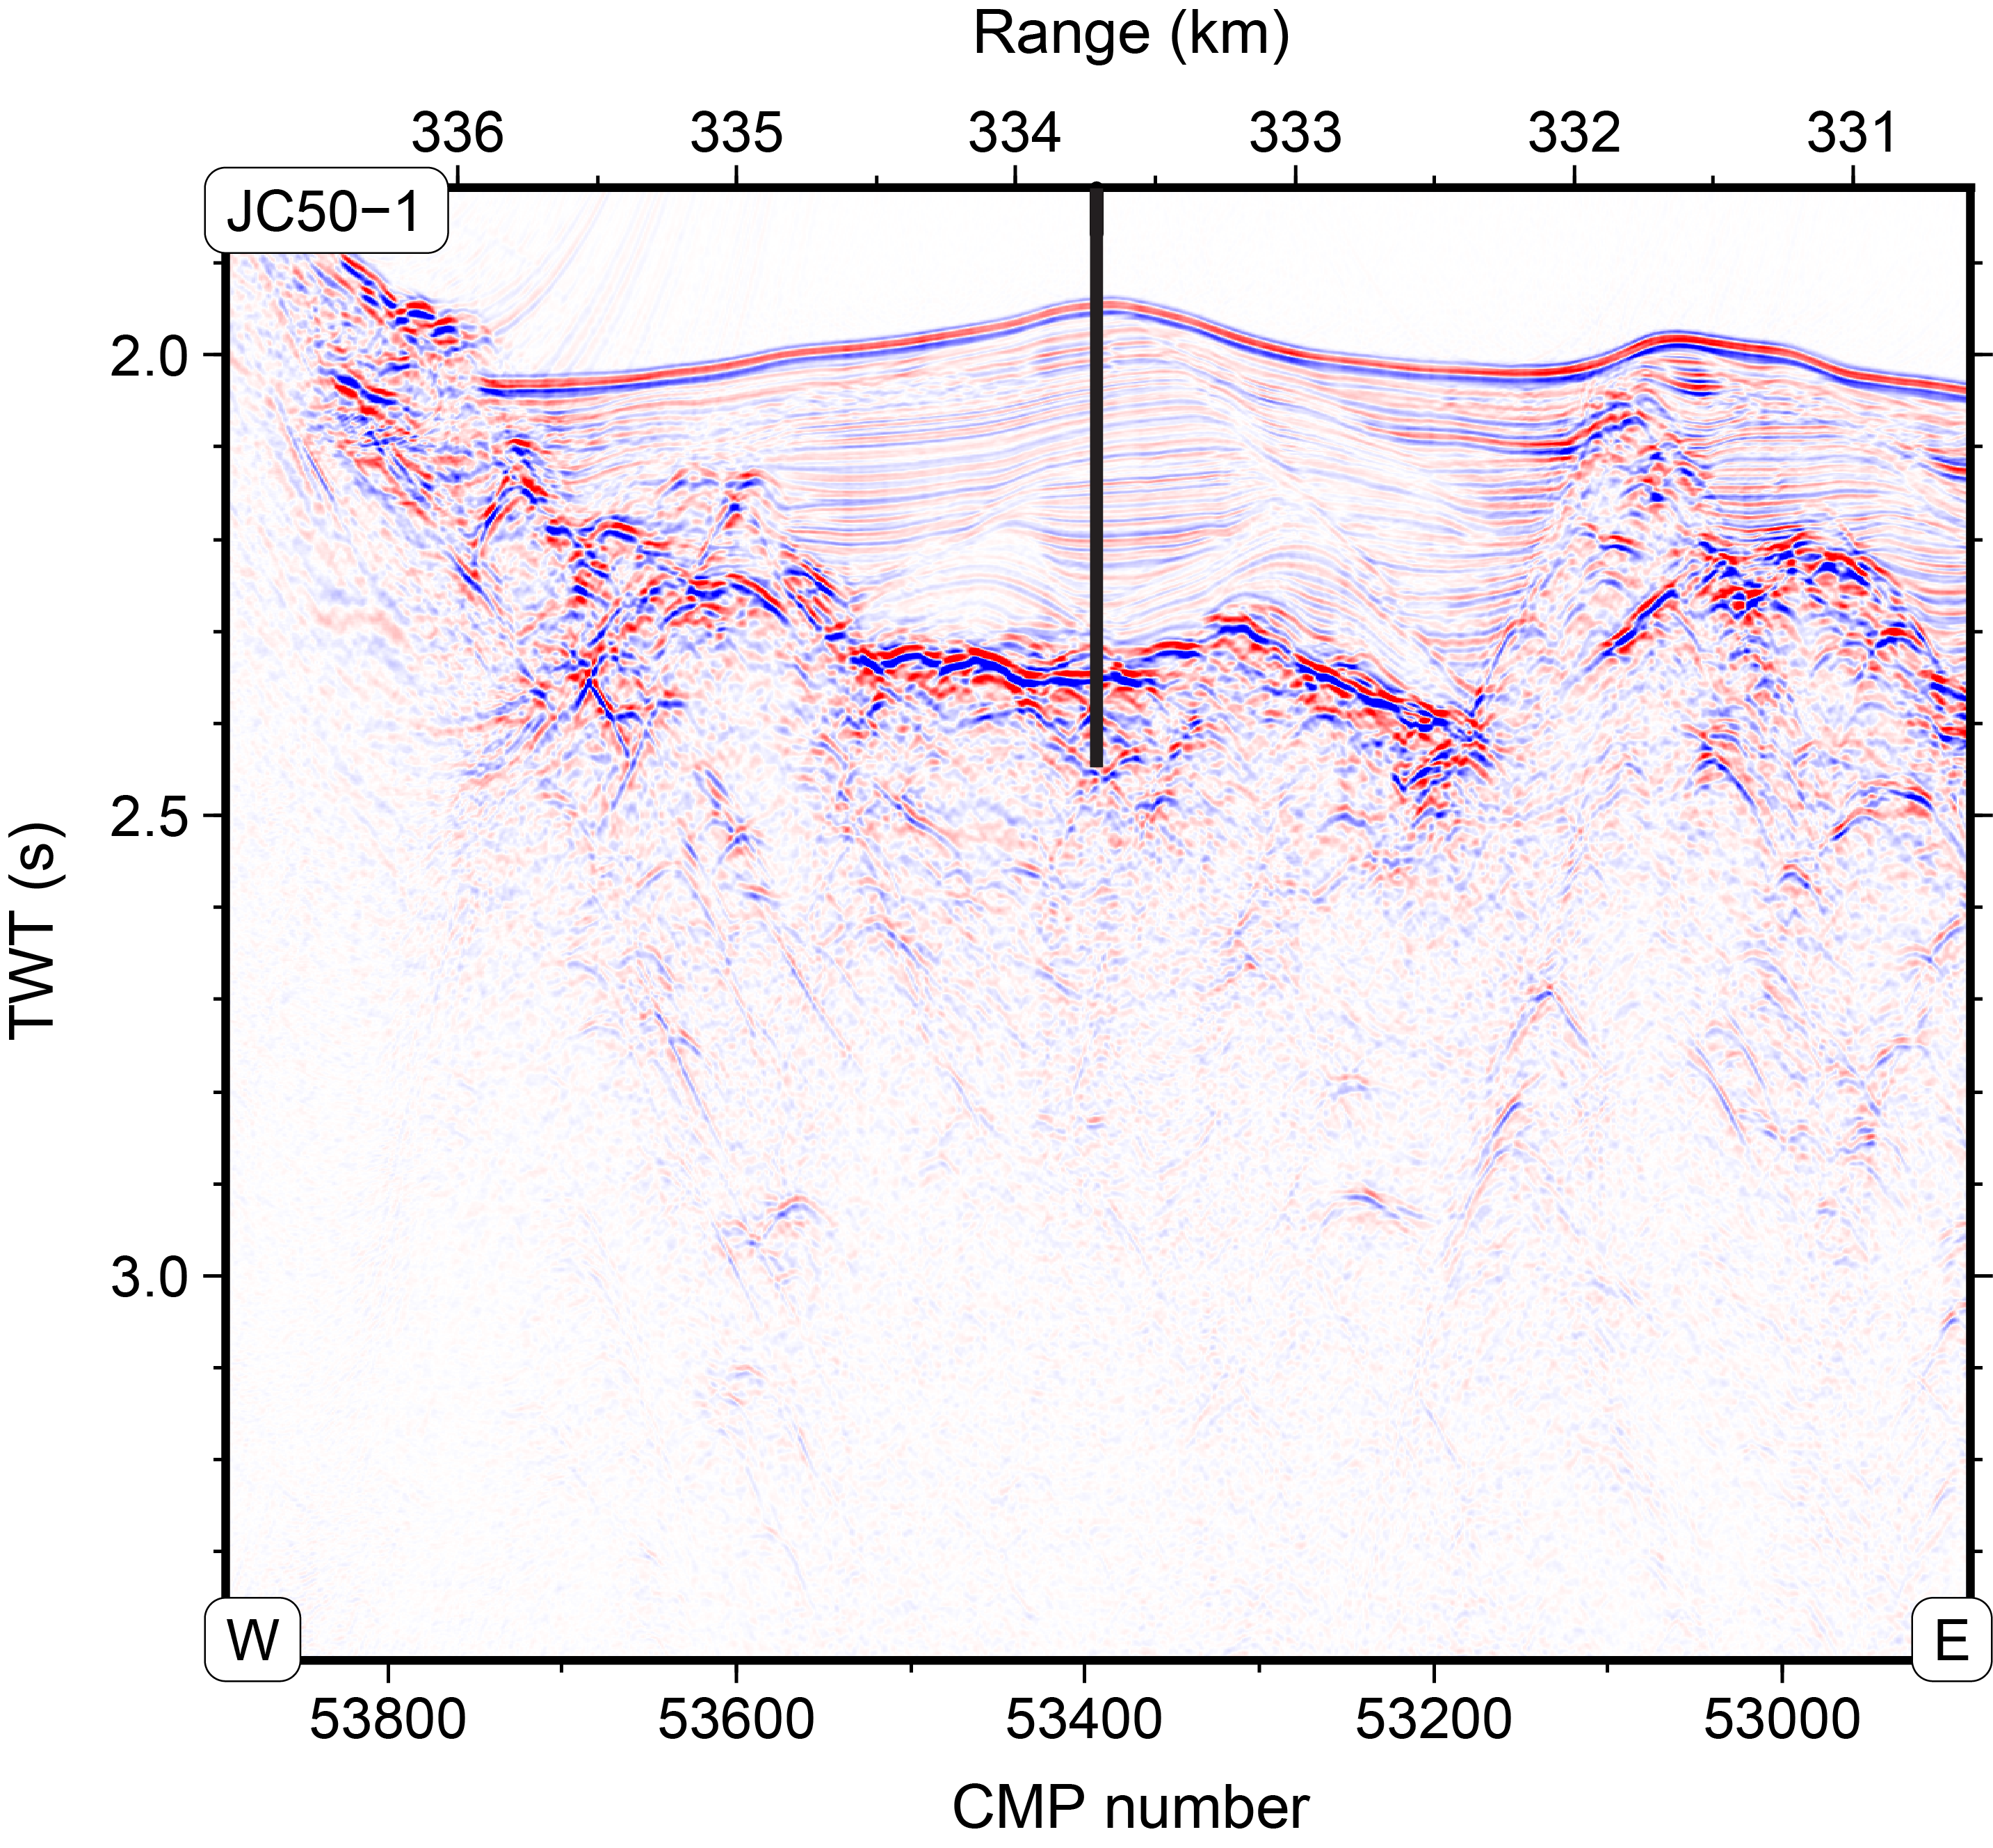
Figure F10. Location of Site U1563 on Seismic Line JC50-1.
4.1. Lithostratigraphy
Igneous rock cores from Site U1563 are mostly pillow basalts (>50%), with a few sheet flow intervals recovered at ~370–380 and ~415–420 m CSF-A. Overall, the basalts are sparsely to moderately olivine phyric and relatively homogeneous in chemical composition. This site also contains abundant peperite (~8%) and intercalated sediment (~6%) (Figure F11).
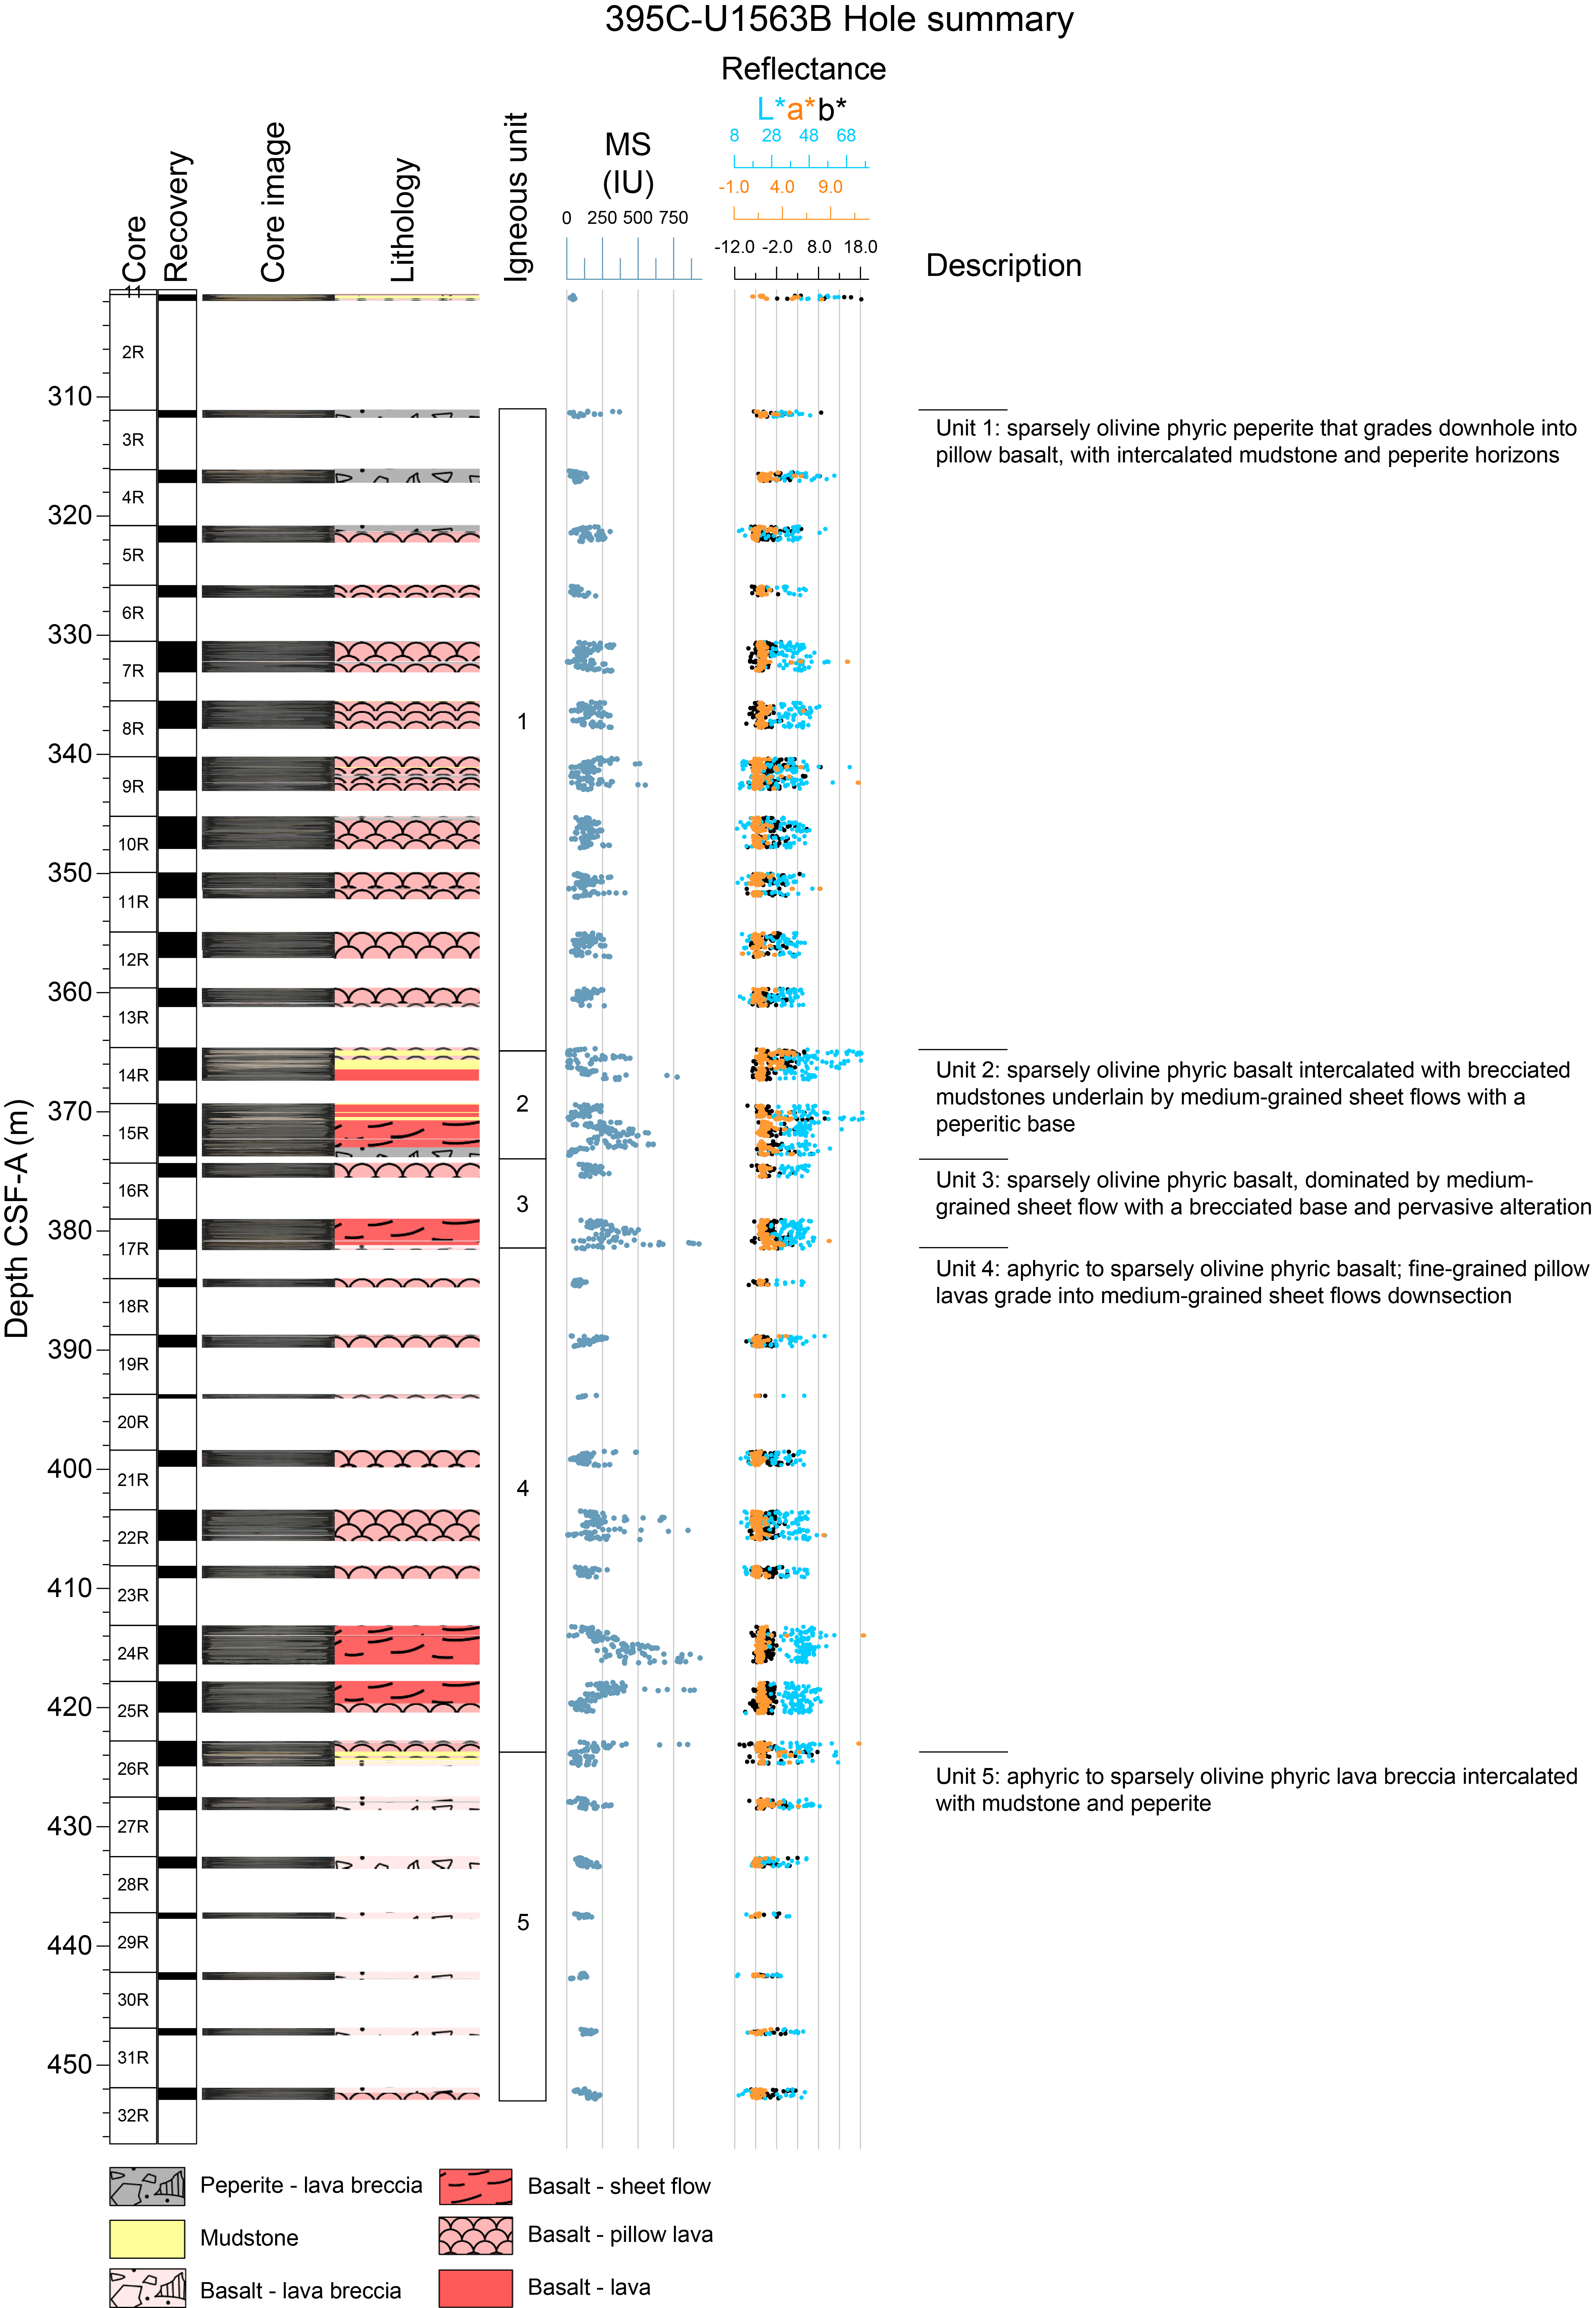
Figure F11. Lithostratigraphic summary, Hole U1563B.
Hole U1563A reached the sediment/basement contact at ~324.5 m CSF-A, sampling small glassy pillow fragments and lava breccia overlain by white calcareous ooze in Cores 48X and 49X. Core 49X contains sparsely olivine phyric basalt overlain by several fragments of baked sediment.
Coring in Hole U1563B began just above the sediment–basement transition and reached a final depth of ~456 m CSF-A. There is no clear sediment/basement contact in this hole, but the first basaltic fragments occur at ~302 m CSF-A. Cores are primarily composed of sparsely to moderately olivine phyric basalt with thin intercalated carbonate and peperite fragments. Igneous lithology in this hole is dominated by pillow basalts, which make up more than 50% of the total recovery. The pillows are typically hypocrystalline with chilled margins and mottled or patchy devitrification. Thin glass rinds are common, with some larger glass fragments up to 10 cm long and 5 cm wide. The pillow basalts are mostly sparsely vesicular, with a few moderately to highly vesicular intervals. Vesicles commonly occur in bands near the edges of flows or pillow lobes, and there are many intervals of peperite or intercalated carbonates, especially in the top half of the hole. The peperites exhibit a variety of features indicative of lava-sediment interaction (e.g., Skilling et al., 2002), including abundant basalt clasts with quenched glassy rims, fluidal margins, sediment intrusion into cracks and vesicles, and baked carbonate matrixes. There are three sheet flows up to 6 m thick, which are mostly nonvesicular with a few sparse vesicles near flow boundaries. These sheet flows are sparsely to moderately olivine phyric, with a groundmass that grades from medium grained to a chilled margin near the top or base. As at other sites, the sheet flows also exhibit higher MS and higher L* color reflectance than the pillow lavas (Figure F11; see Physical properties). Most basalts exhibit slight to moderate alteration with carbonate veins throughout (see Alteration petrology and structural geology). Interval 395C-U1563B-17R-2, 51–75 cm, contains a heavily altered coarse-grained basalt fragment that is likely a dropstone of subaerial origin, found within a lava breccia unit.
4.2. Core descriptions
Descriptions are based on a combination of detailed macroscopic observations of core sections, microscopic thin section observations, and physical properties measurements (e.g., MS, color reflectance, and wireline logs). Some key primary characteristics are summarized in the visual core descriptions (VCDs).
Igneous lithologies at Site U1563 fall into three main morphological categories: pillow lavas, sheet flows, and peperites (Figure F12). The pillow lavas consist of aphyric to sparsely olivine phyric basalt, often highly fragmented, with chilled margins, concentric vesicle bands, and thin glass rinds. The sheet flows recovered at this site are at least ~2–5 m thick and have coarser groundmass in their interiors. Flow morphology was difficult to determine for ~5% of the basalt intervals, which could be either thin sheet flows or large pillows or lobate flows. Peperite layers, which make up ~8% of the total recovered core, are characterized by fragmented glass and lava fragments in a carbonate matrix and show evidence for lava-sediment interaction (e.g., basalt fragments with quenched rims, baked sediment, and fluidal margins). These units often contain abundant glass shards and fragments. Glass is relatively abundant in this core, with occasional thick glassy pillow rinds and glassy fragments in the peperite (up to 10 cm). Minor lithologies include thin intervals of calcareous mudstone, which is sometimes brecciated. Vesicles are sparse to moderately abundant, with vesicle contents mostly <15% (maximum = ~30%). Vesicles commonly occur in bands and are often filled with celadonite and Fe-oxide/oxyhydroxides, with moderate amounts of carbonate, amorphous silica, and clay and minor amounts of zeolite. Veins of clay, chlorite, celadonite, and Fe oxide are common, with highly variable degrees of alteration (see Alteration petrology and structural geology).
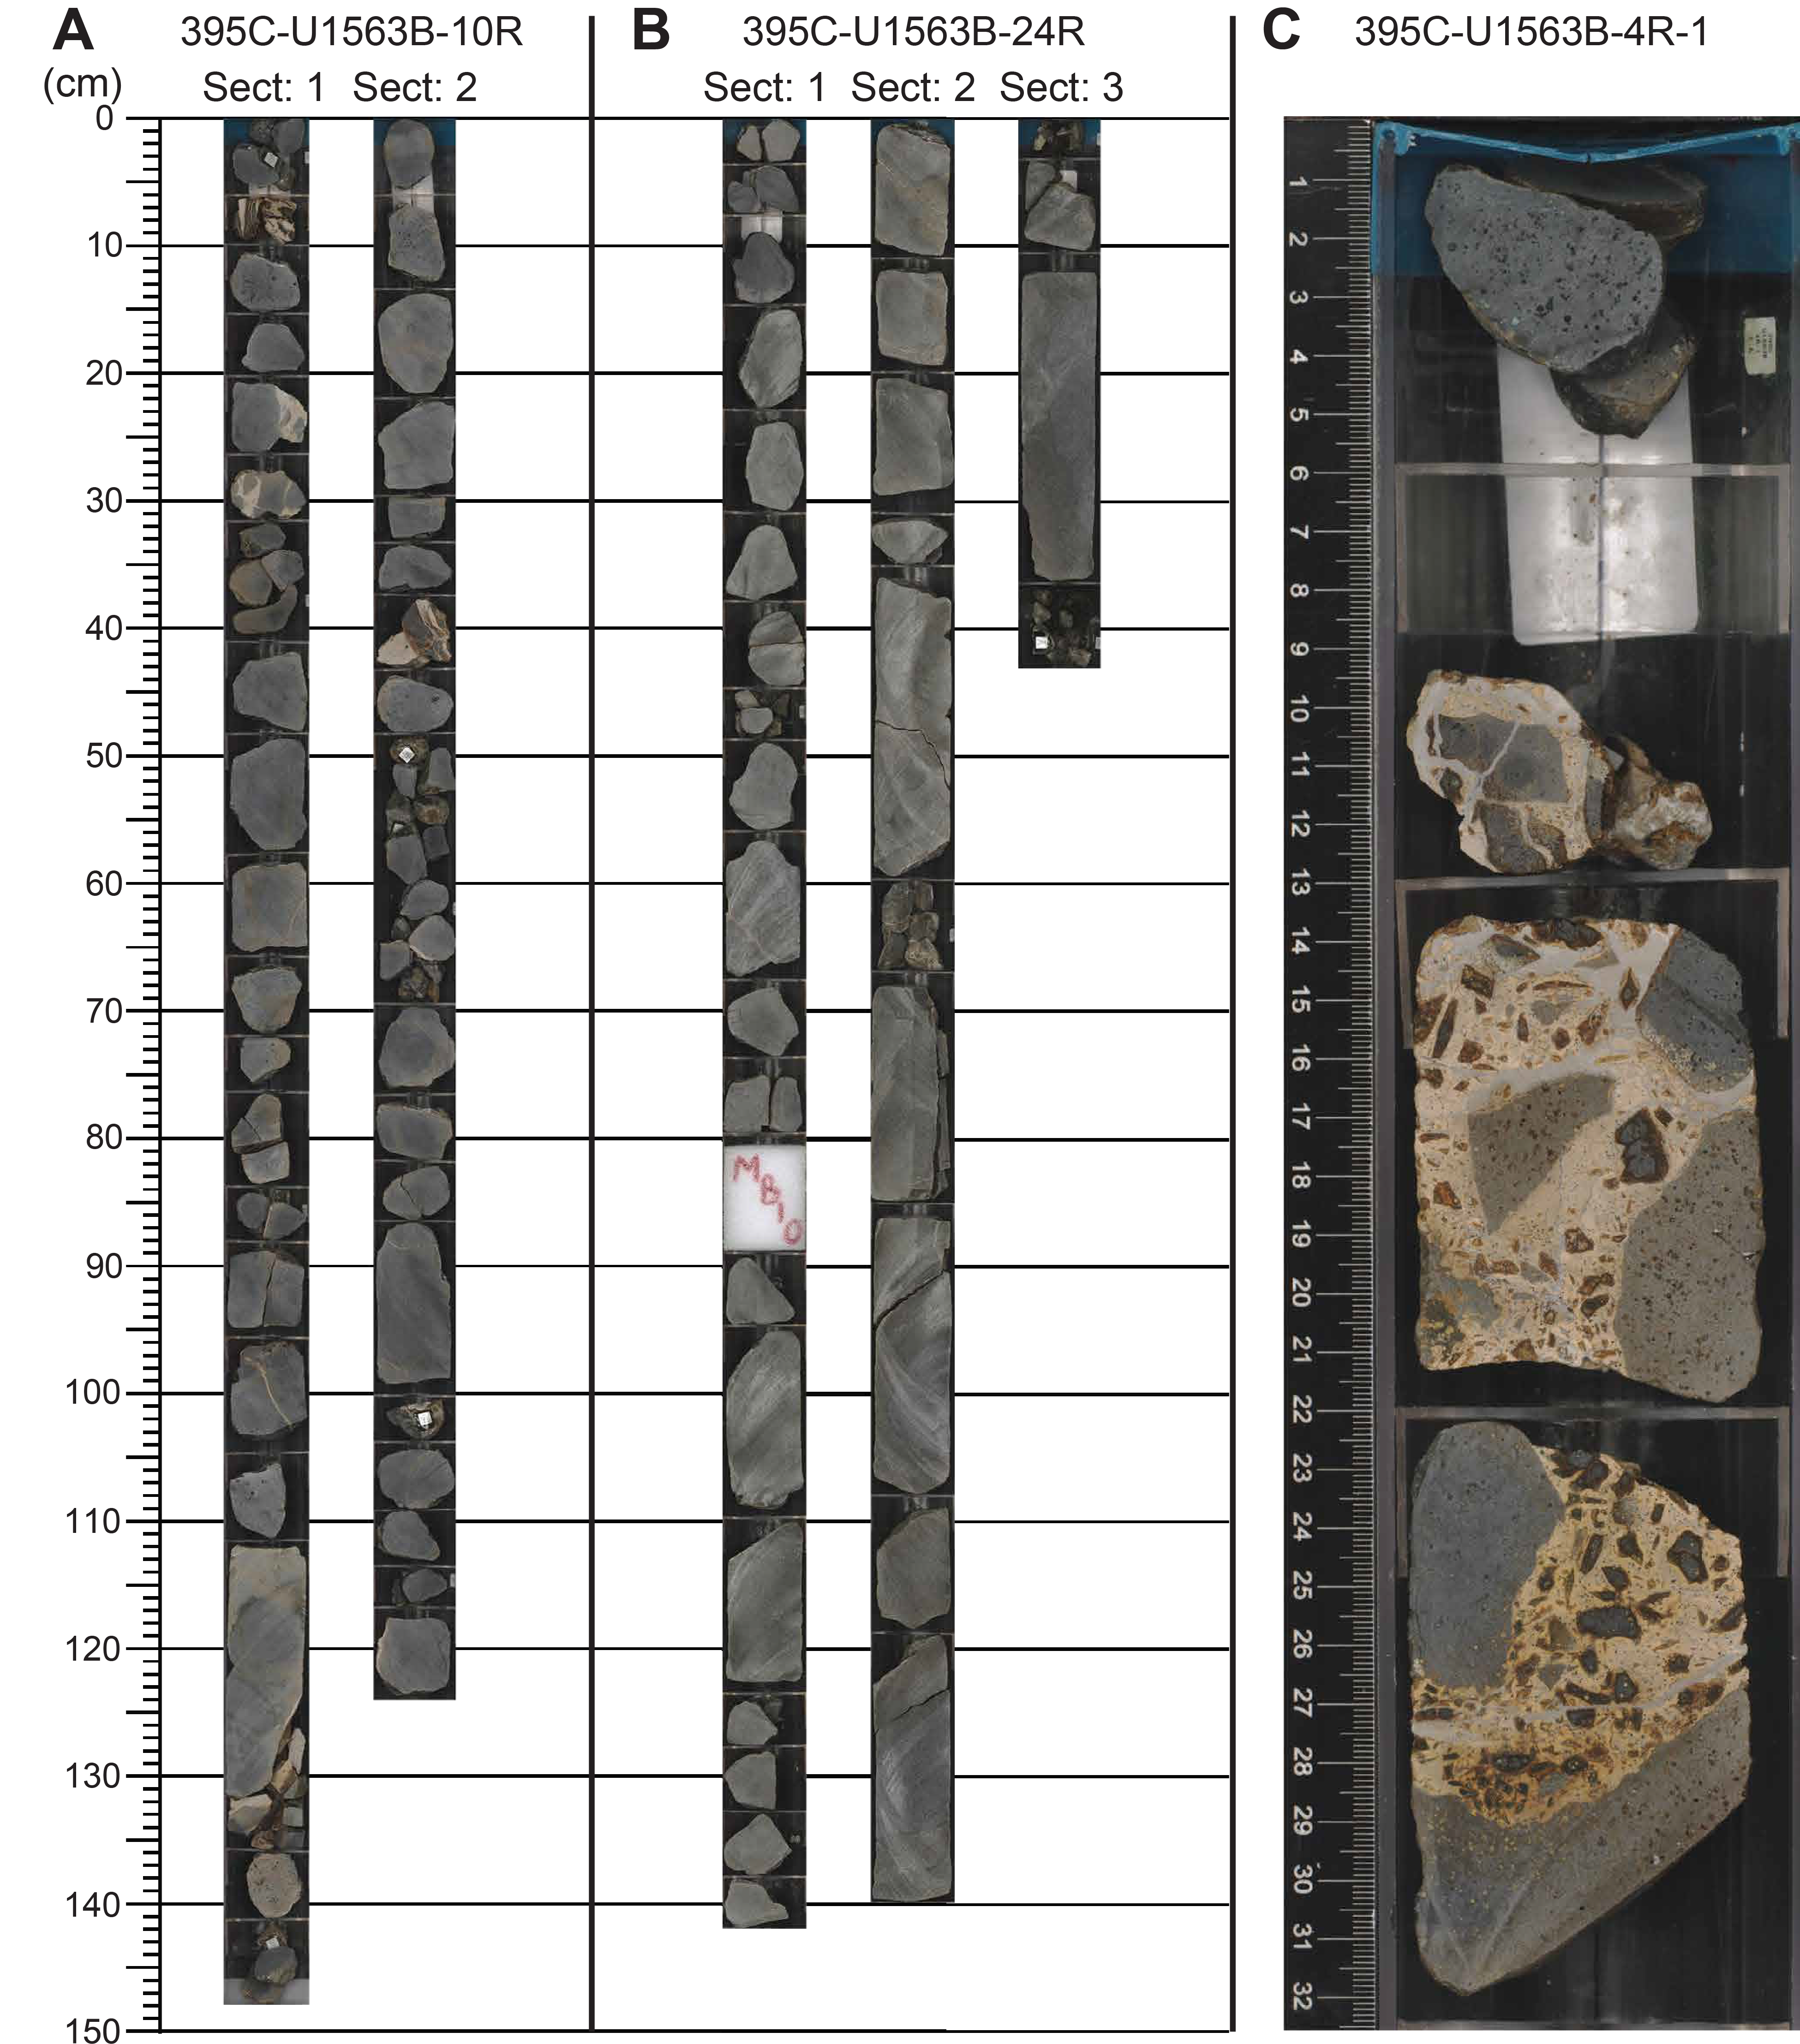
Figure F12. Common lithologies.
We used the presence of sediment-rich horizons (i.e., significant intercalated sediment or peperite) and mineralogical changes (e.g., aphyric to olivine phyric basalt) to divide the basement succession into igneous lithologic units (Table T5). Because of incomplete recovery and a general lack of well-defined contacts, our unit boundary locations are approximate and preliminary. We note that the cores with the lowest recovery are associated with pillow fragments, peperites, and/or intercalated sediment. Although downhole logging data were not collected in the basement at this site, this pattern is consistent with observations from other sites, which show a general correlation between recovery rate, rock density, and lava morphology.
4.2.1. Hole U1563A
A short sequence of basaltic material recovered at the base of Hole U1563A consists of lava breccia in a matrix of foraminiferal ooze overlying ~0.5 m of small pillow fragments that are sparsely olivine phyric with thin glass rinds.
4.2.2. Hole U1563B
This hole can be divided into five igneous lithologic units. Recovery in the top ~20 m of the cored section is dominated by peperite, which grades into a ~55 m thick sequence of pillow lavas with occasional thin intervals of peperite fragments (Igneous Lithologic Unit 1). Below this interval, Unit 2 consists of a short sequence of intercalated mudstone breccias and the first of three medium-grained sheet flows with a peperitic base. This pattern then repeats, with Units 3 and 4 consisting of a sequence of peperites to pillows (~2 and 30 m thick, respectively) underlain by sheet flows (~2 and 6 m thick, respectively). Core recovery decreases significantly to <30% from Core 395C-U1563B-27R (427 m CSF-A) downhole, and the remainder of the hole consists of lava breccias, pillow fragments, and intercalated sediments (Unit 5).
4.3. Thin sections
Thin sections were sampled from Hole U1563B with an average spacing of ~8 m (see Core descriptions), resulting in 17 thin sections sampled mostly from pillow lavas. These lavas are sparsely to moderately olivine phyric (2%–10%) with slight to moderate alteration (Figure F13). Olivine phenocrysts range from small microphenocrysts to relatively large, euhedral olivines up to ~4 mm across. Skeletal and dendritic olivines are common in the pillow lavas (Figure F13D), often with swallowtail crystal forms indicative of high degrees of undercooling (e.g., Faure et al., 2003). Some larger olivine crystals are rimmed with rod-like olivines, suggesting a later stage of rapid cooling. Plagioclase is the most abundant groundmass mineral, usually forming acicular or small tabular laths without significant zoning. The groundmass usually exhibits intergranular and intersertal textures containing clinopyroxene mesostasis and microcrystals, opaque oxides, and altered glass. A thin section sampled from a sheet flow in Section 395C-U1563B-14R-2 exhibits a crystalline, medium-grained groundmass with plagioclase, clinopyroxene, and opaque oxides (Figure F13B), suggesting slower cooling than the rapid quench textures that dominate the pillow lavas. Vesicles are present but mostly in low abundance (<10%) and are often filled with secondary phases such as celadonite and Fe-oxide/oxyhydroxide.
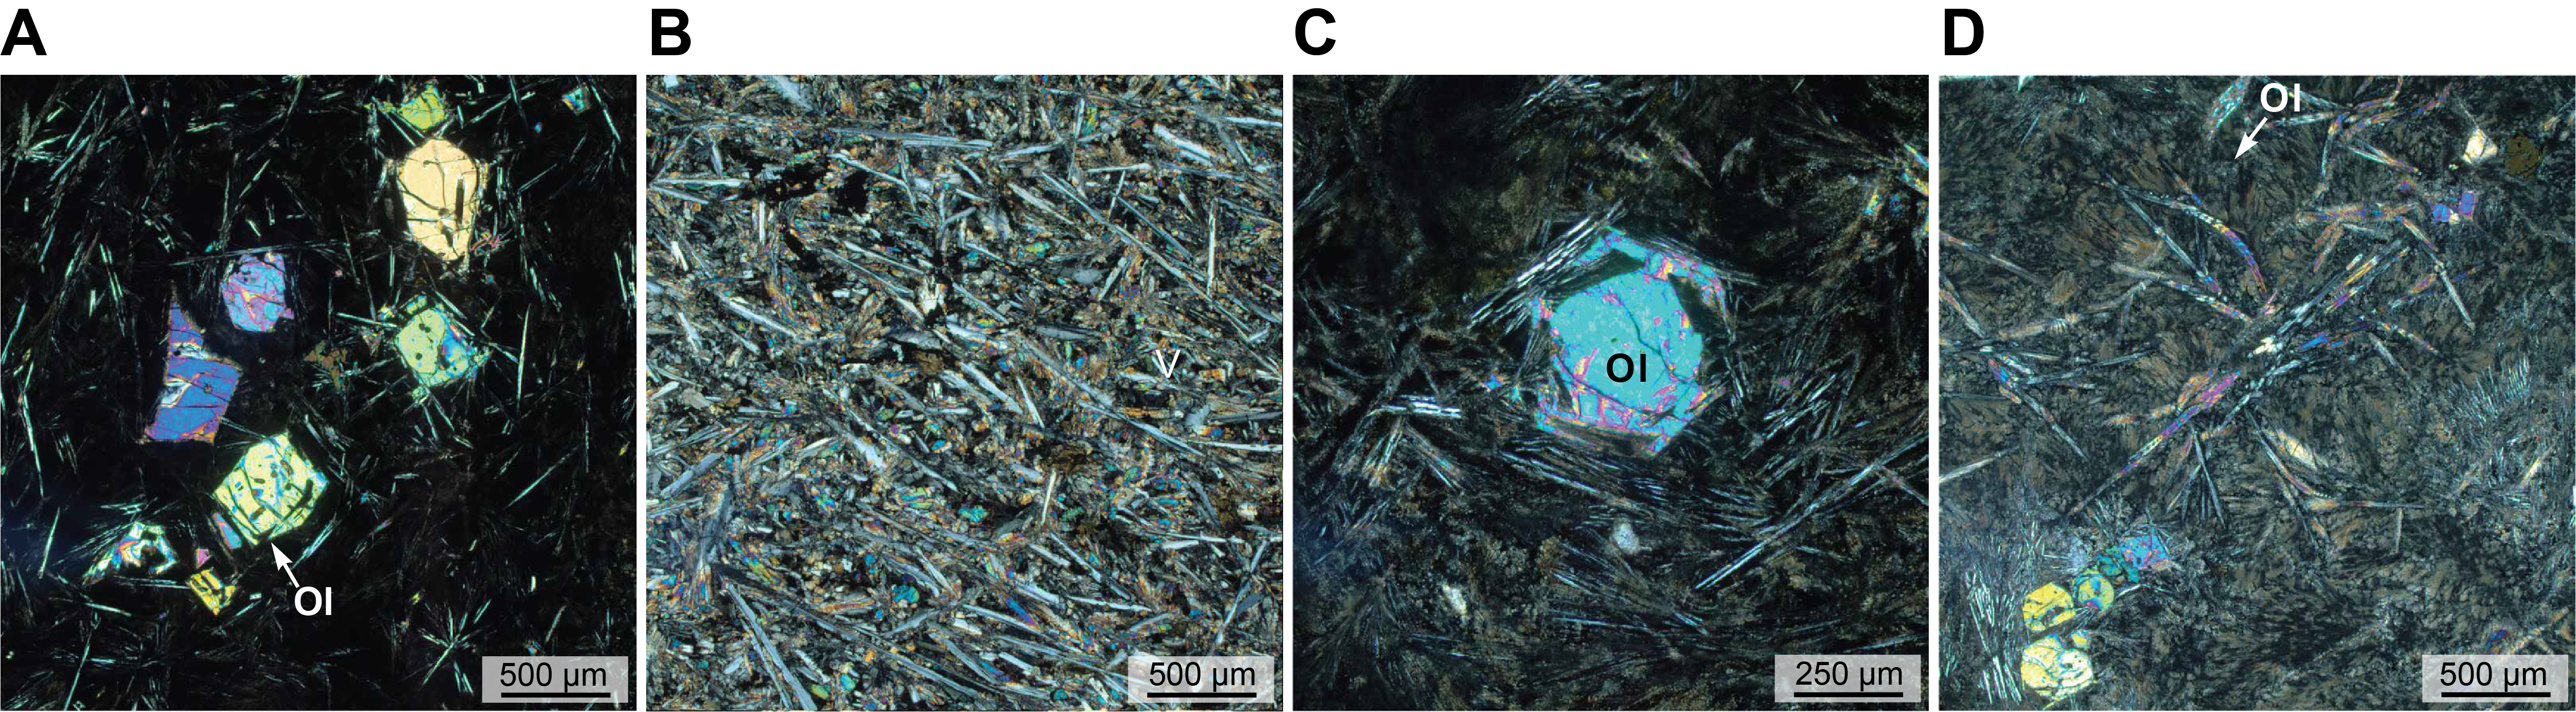
Figure F13. Basalt thin sections.
4.4. Igneous geochemistry
Shipboard measurements on basalts from Hole U1563B included portable XRF (pXRF) and inductively coupled plasma–atomic emission spectroscopy (ICP-AES) analyses (see Geochemistry and microbiology in the Expedition 395 methods chapter [Parnell-Turner et al., 2025a]).
The pXRF analyses were primarily used to assess geochemical variability and identify downhole trends or deviations, if any. Raw counts from pXRF analyses are shown in Figure F14. Major elements such as Mg and Al show considerable scatter, as expected of this method, but some trace elements (e.g., Zr and Y) exhibit more coherent trends and provided a useful preliminary characterization of the hole during shipboard operations. Although we caution against overinterpreting the raw pXRF data, we note that Zr and Y exhibit several small offsets that correlate with the depths of identified unit boundaries and seem to be reflected in the ICP-AES data as well.
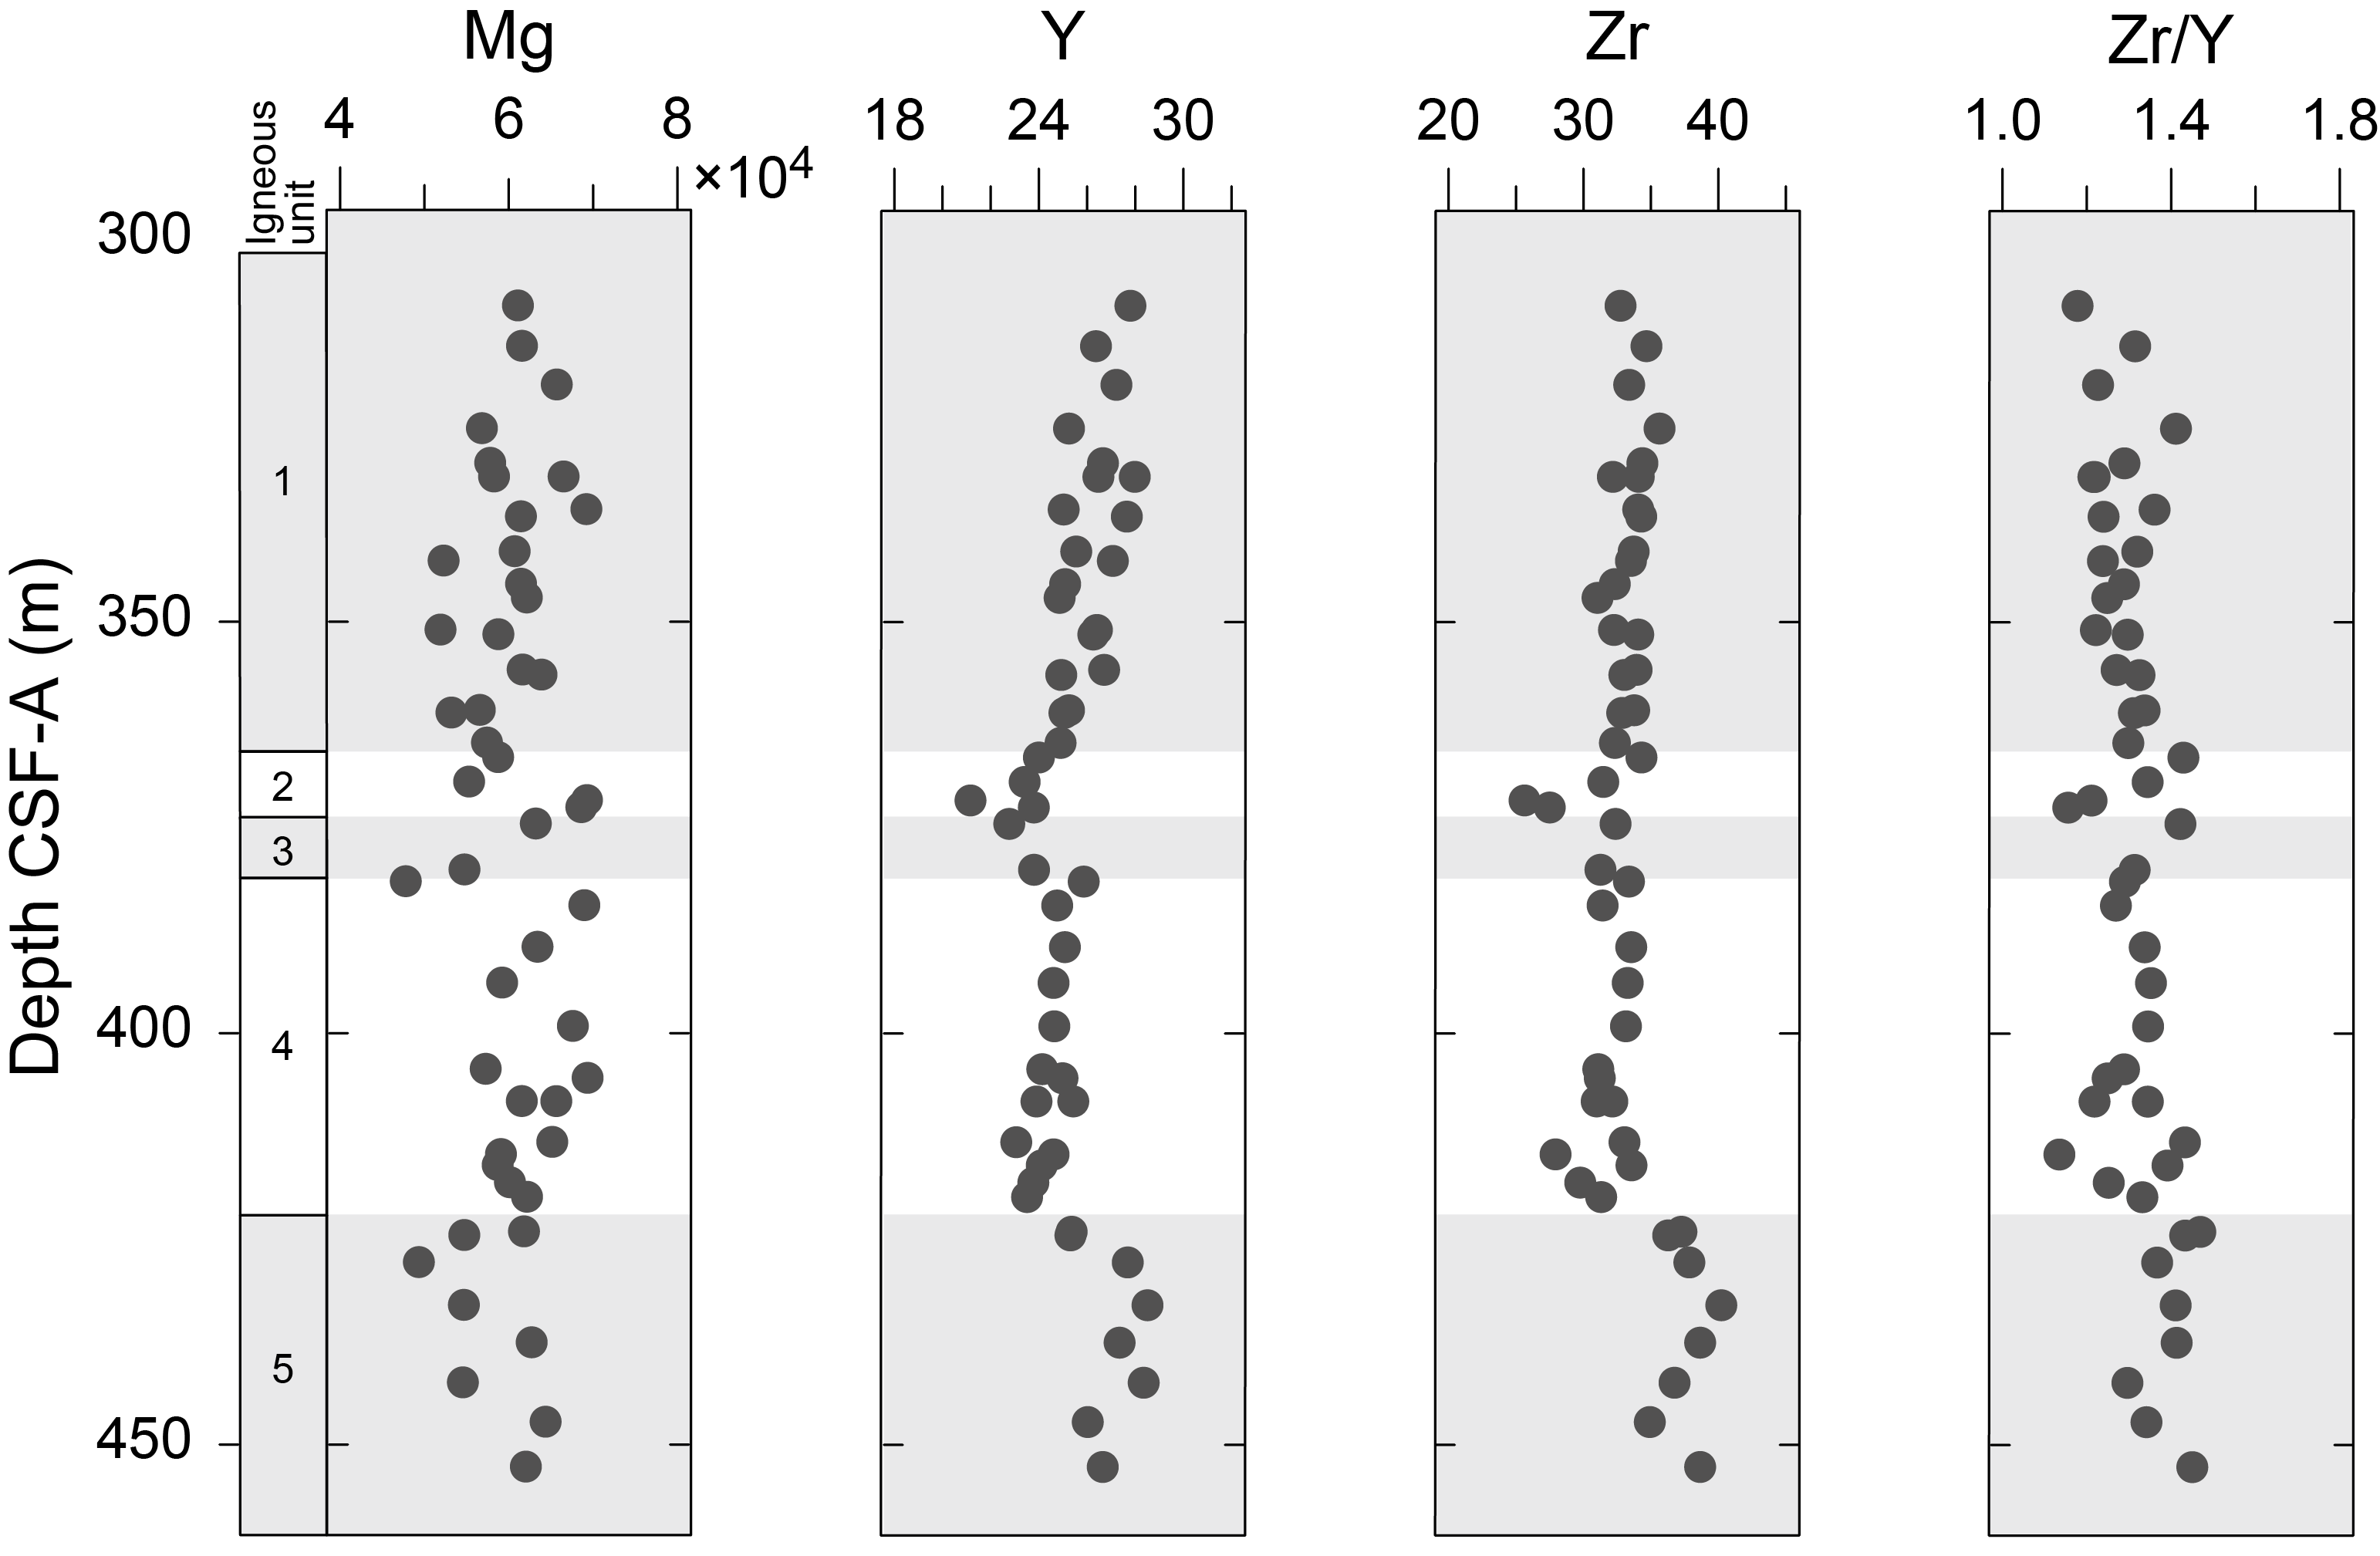
Figure F14. Major and trace element pXRF compositional data.
ICP-AES analyses were performed on 17 samples that are co-located with thin section samples throughout the hole. Measurements of selected major and trace elements are shown in Figure F15. MgO varies from 8.16 to 9.76 wt% with an average value of ~8.9 wt%. Al2O3 and CaO show minimal variation, averaging ~14.2 and 11.7 wt%, respectively. Average Zr/Y is ~2.0, consistent with values from VSR basalts dredged from the ridge axis (Murton et al., 2002; Jones et al., 2014).
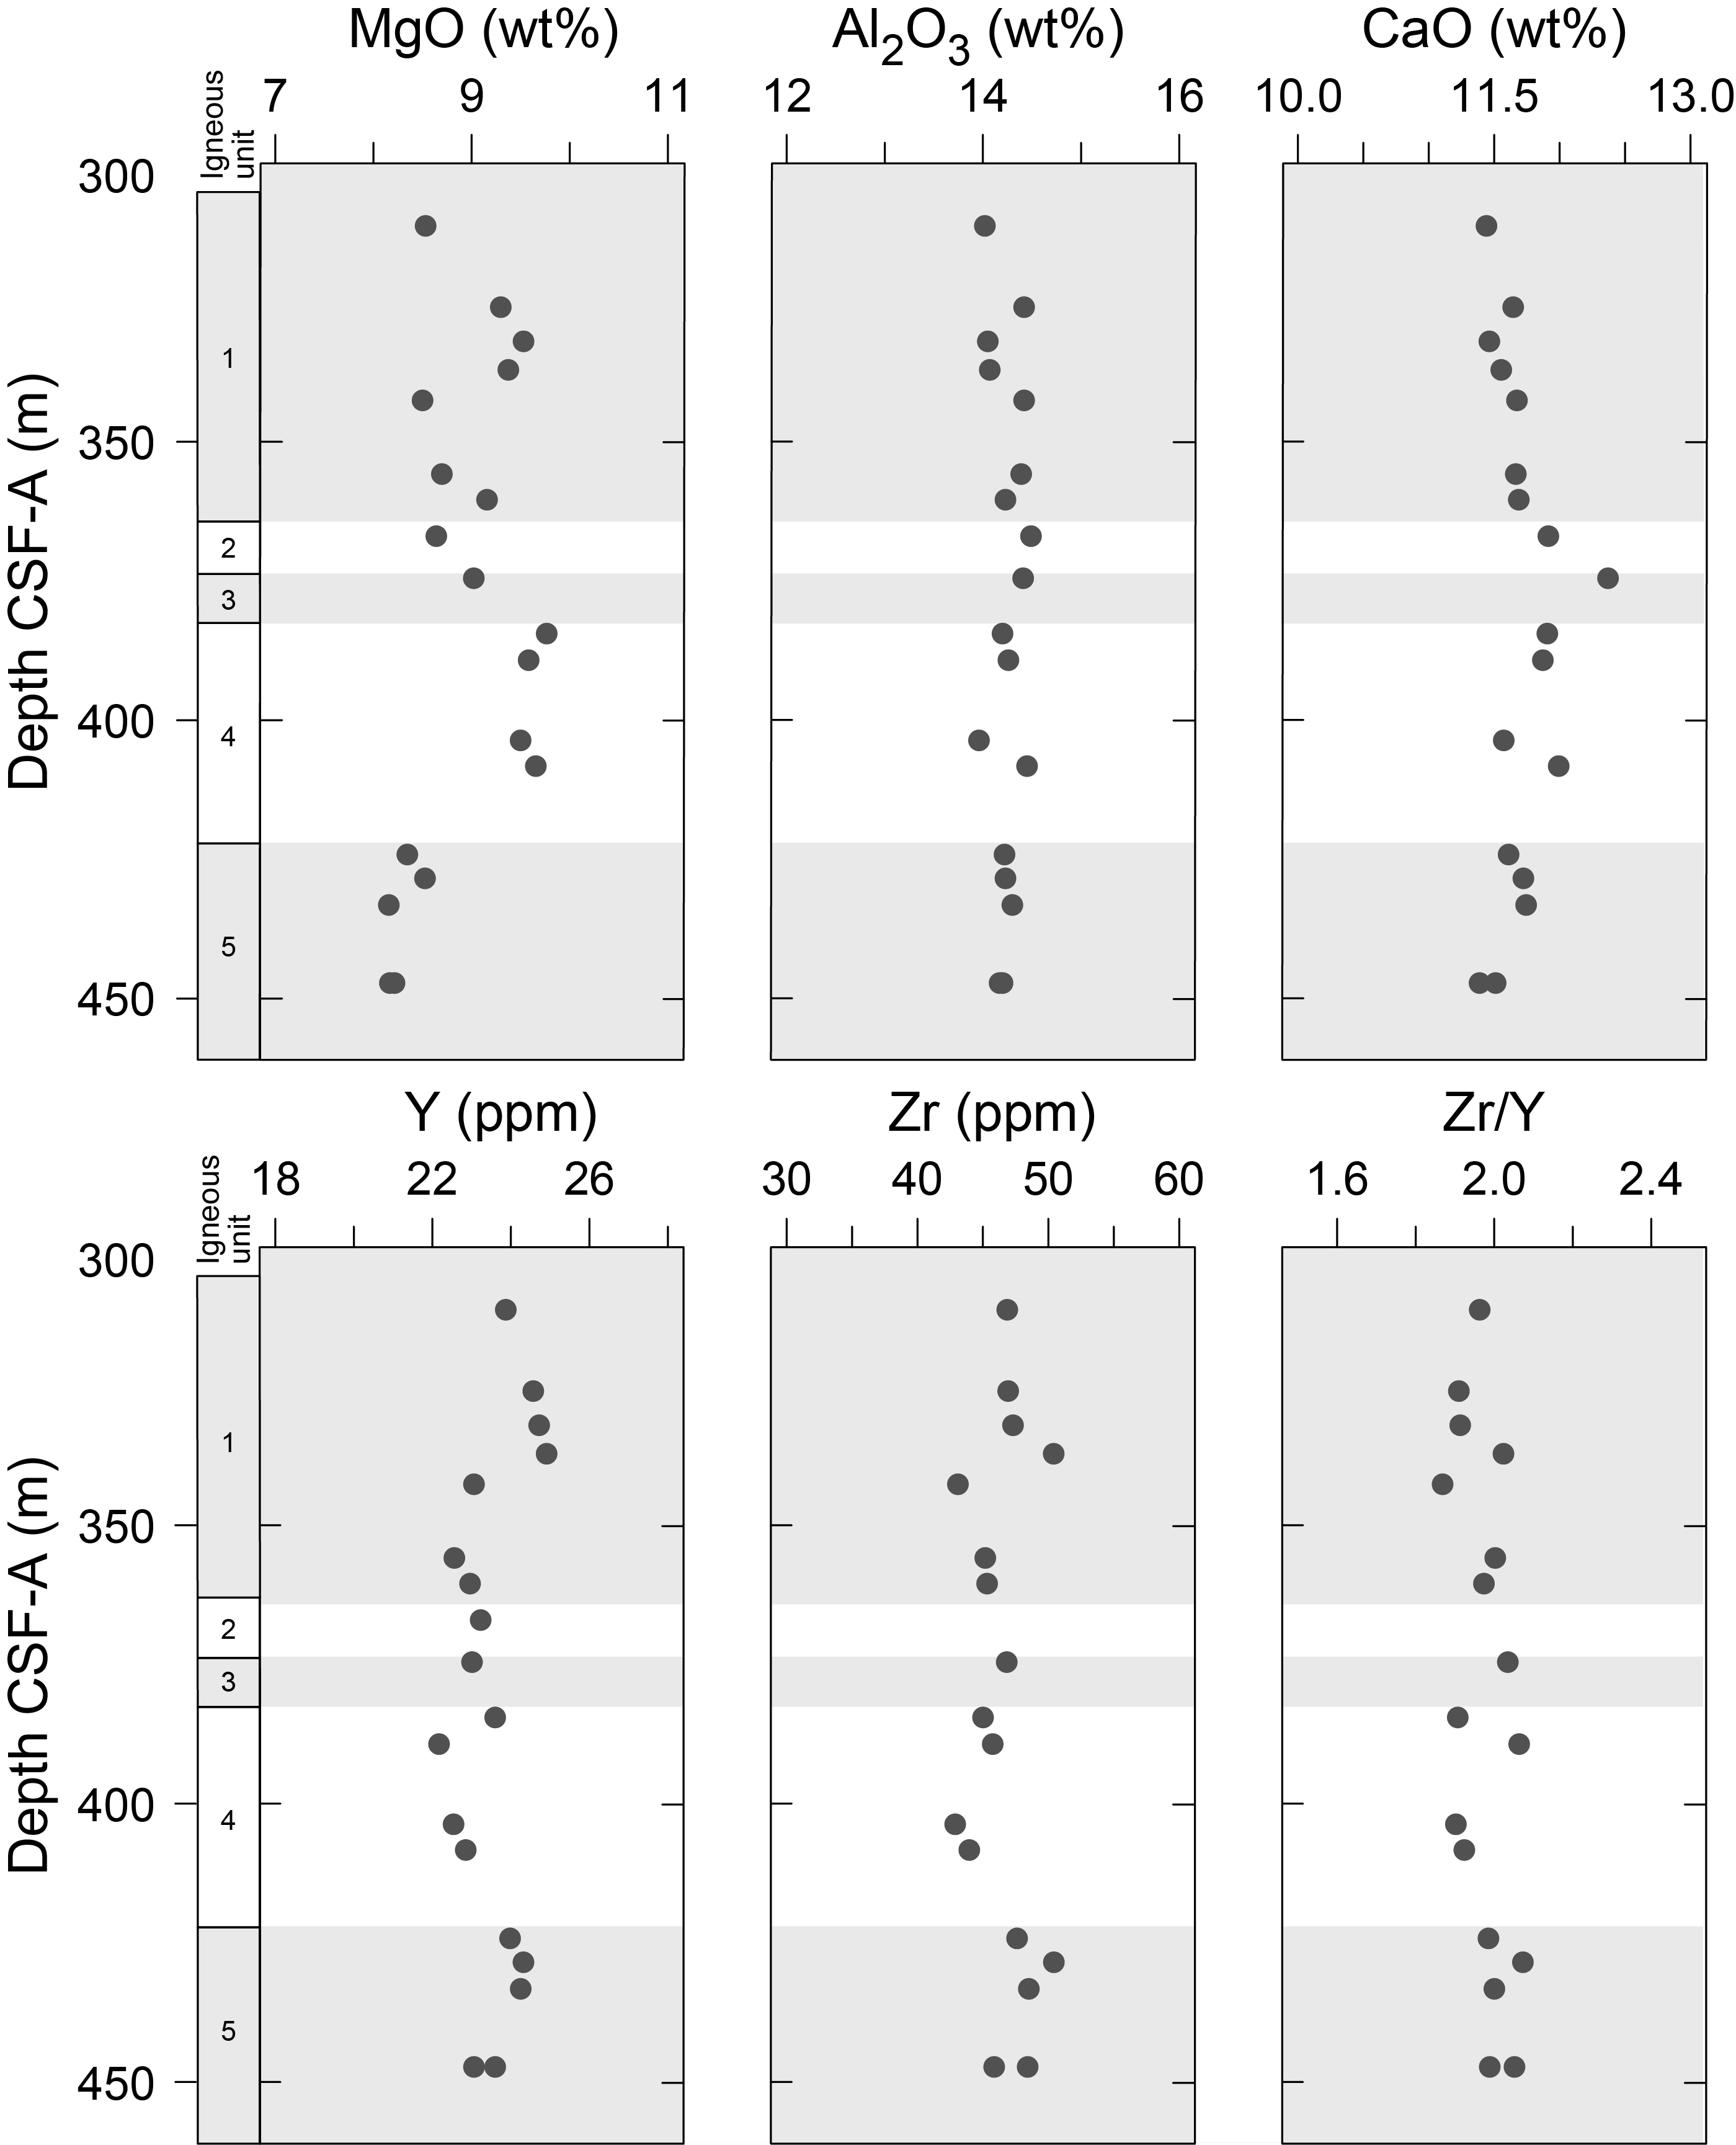
Figure F15. Major and trace element bulk rock ICP-AES.
4.5. Correlations and interpretation
Core description results can be combined with thin section observations, physical properties, downhole logging results, and shipboard geochemical analyses to develop a preliminary interpretation of Site U1563. As at other Expedition 395 sites, there is a correlation between MS and lithology (see Physical properties), with sheet flows exhibiting higher MS on average than pillow lavas and peperites (Figure F11). This correlation is likely due to a greater abundance of Fe-oxides (e.g., magnetite and titanomagnetite) in the sheet flows. Similarly, sheet flows exhibit higher L* color reflectance (Figure F11) and higher alteration intensities on average (see Alteration petrology and structural geology).
Hole U1563B had the lowest recovery rate of the basement holes cored during Expedition 395, perhaps due to the abundance of peperite and intercalated sediment at this site. Recovery is particularly poor in peperite and other brecciated intervals, and we suspect that coring preferentially samples peperite regions where the carbonate matrix is baked and rich in basalt clasts and much of the surrounding sediment matrix is lost. The recovered peperite shows abundant evidence for lava-sediment interaction. Basalt clasts in the peperite have quenched glassy rims and a range of morphologies from angular, blocky fragments to irregular and fluidal margins. The matrix is commonly baked and sometimes recrystallized, and some margins show signs of sediment fluidization and mobilization into cracks and vesicles, suggesting that the host sediment was relatively wet and unconsolidated (e.g., Skilling et al., 2002).
Multiple horizons of peperite were recovered, indicating that lava has repeatedly flowed or erupted into carbonate ooze at this site. The prevalence of sediment at this site is particularly interesting given that Site U1563 is on a VSR and thus thought to have higher average magma supply than the VST sites. One might therefore expect more frequent eruptions and less sediment accumulation than at Sites U1554 and U1555, both located on VSTs. Instead, there must be a significant amount of sediment accumulation at this site to produce such thick sequences of peperite and mudstone breccias. Sedimentation rates would have to be extremely high to produce such assemblages at the ridge axis. Instead, we speculate that the VSR sites may be sampling late stage off-axis eruptions or eruptions that flowed off-axis into already sedimented areas.
5. Alteration petrology and structural geology
At Site U1563, ~0.42 and ~44 m of basement core was recovered from Holes 395C-U1563A and 395C-U1563B, respectively. Here, we document the basalt alteration style and composition, the secondary mineral fill of vesicles, and the occurrence and mineral fill of fractures in all basement cores.
5.1. Basalt alteration
Basalt from Hole U1563B contains intervals of peperite and completely altered carbonate sediments, the latter comprising ~5% of recovered core at this site. Peperites at Site U1563 consist of altered carbonate sediments containing fragments of younger basalt and basaltic glass (see Igneous petrology). The alteration petrology reported for peperite intervals only includes the basalt core and basalt fragments within the peperite.
We consider ~54% of the basalt core obtained from both holes at Site U1563 to be slightly altered, with 36% moderately altered, 8.5% highly altered, ~1% completely altered, and <1% fresh basalt (Figure F16). Carbonate sediment intervals in the core are completely altered and sometimes appear brecciated and fragmented. Basalt alteration at Site U1563 is predominantly pervasive (background), although localized alteration styles (halo and, to a lesser degree, patch) increase in basalt core intervals where peperite and carbonate sediments are common (Figure F17). In Hole U1563B, basalt alteration intensity is typically >40% at ~301–384 m CSF-A, <40% at 384–413 m CSF-A, and >40% again at 413–453 m CSF-A (Figure F17). The decrease in alteration intensity from ~384–413 m CSF-A coincides with an interval of basaltic pillow lavas with few peperite or baked carbonate sediment intervals (see Igneous petrology).
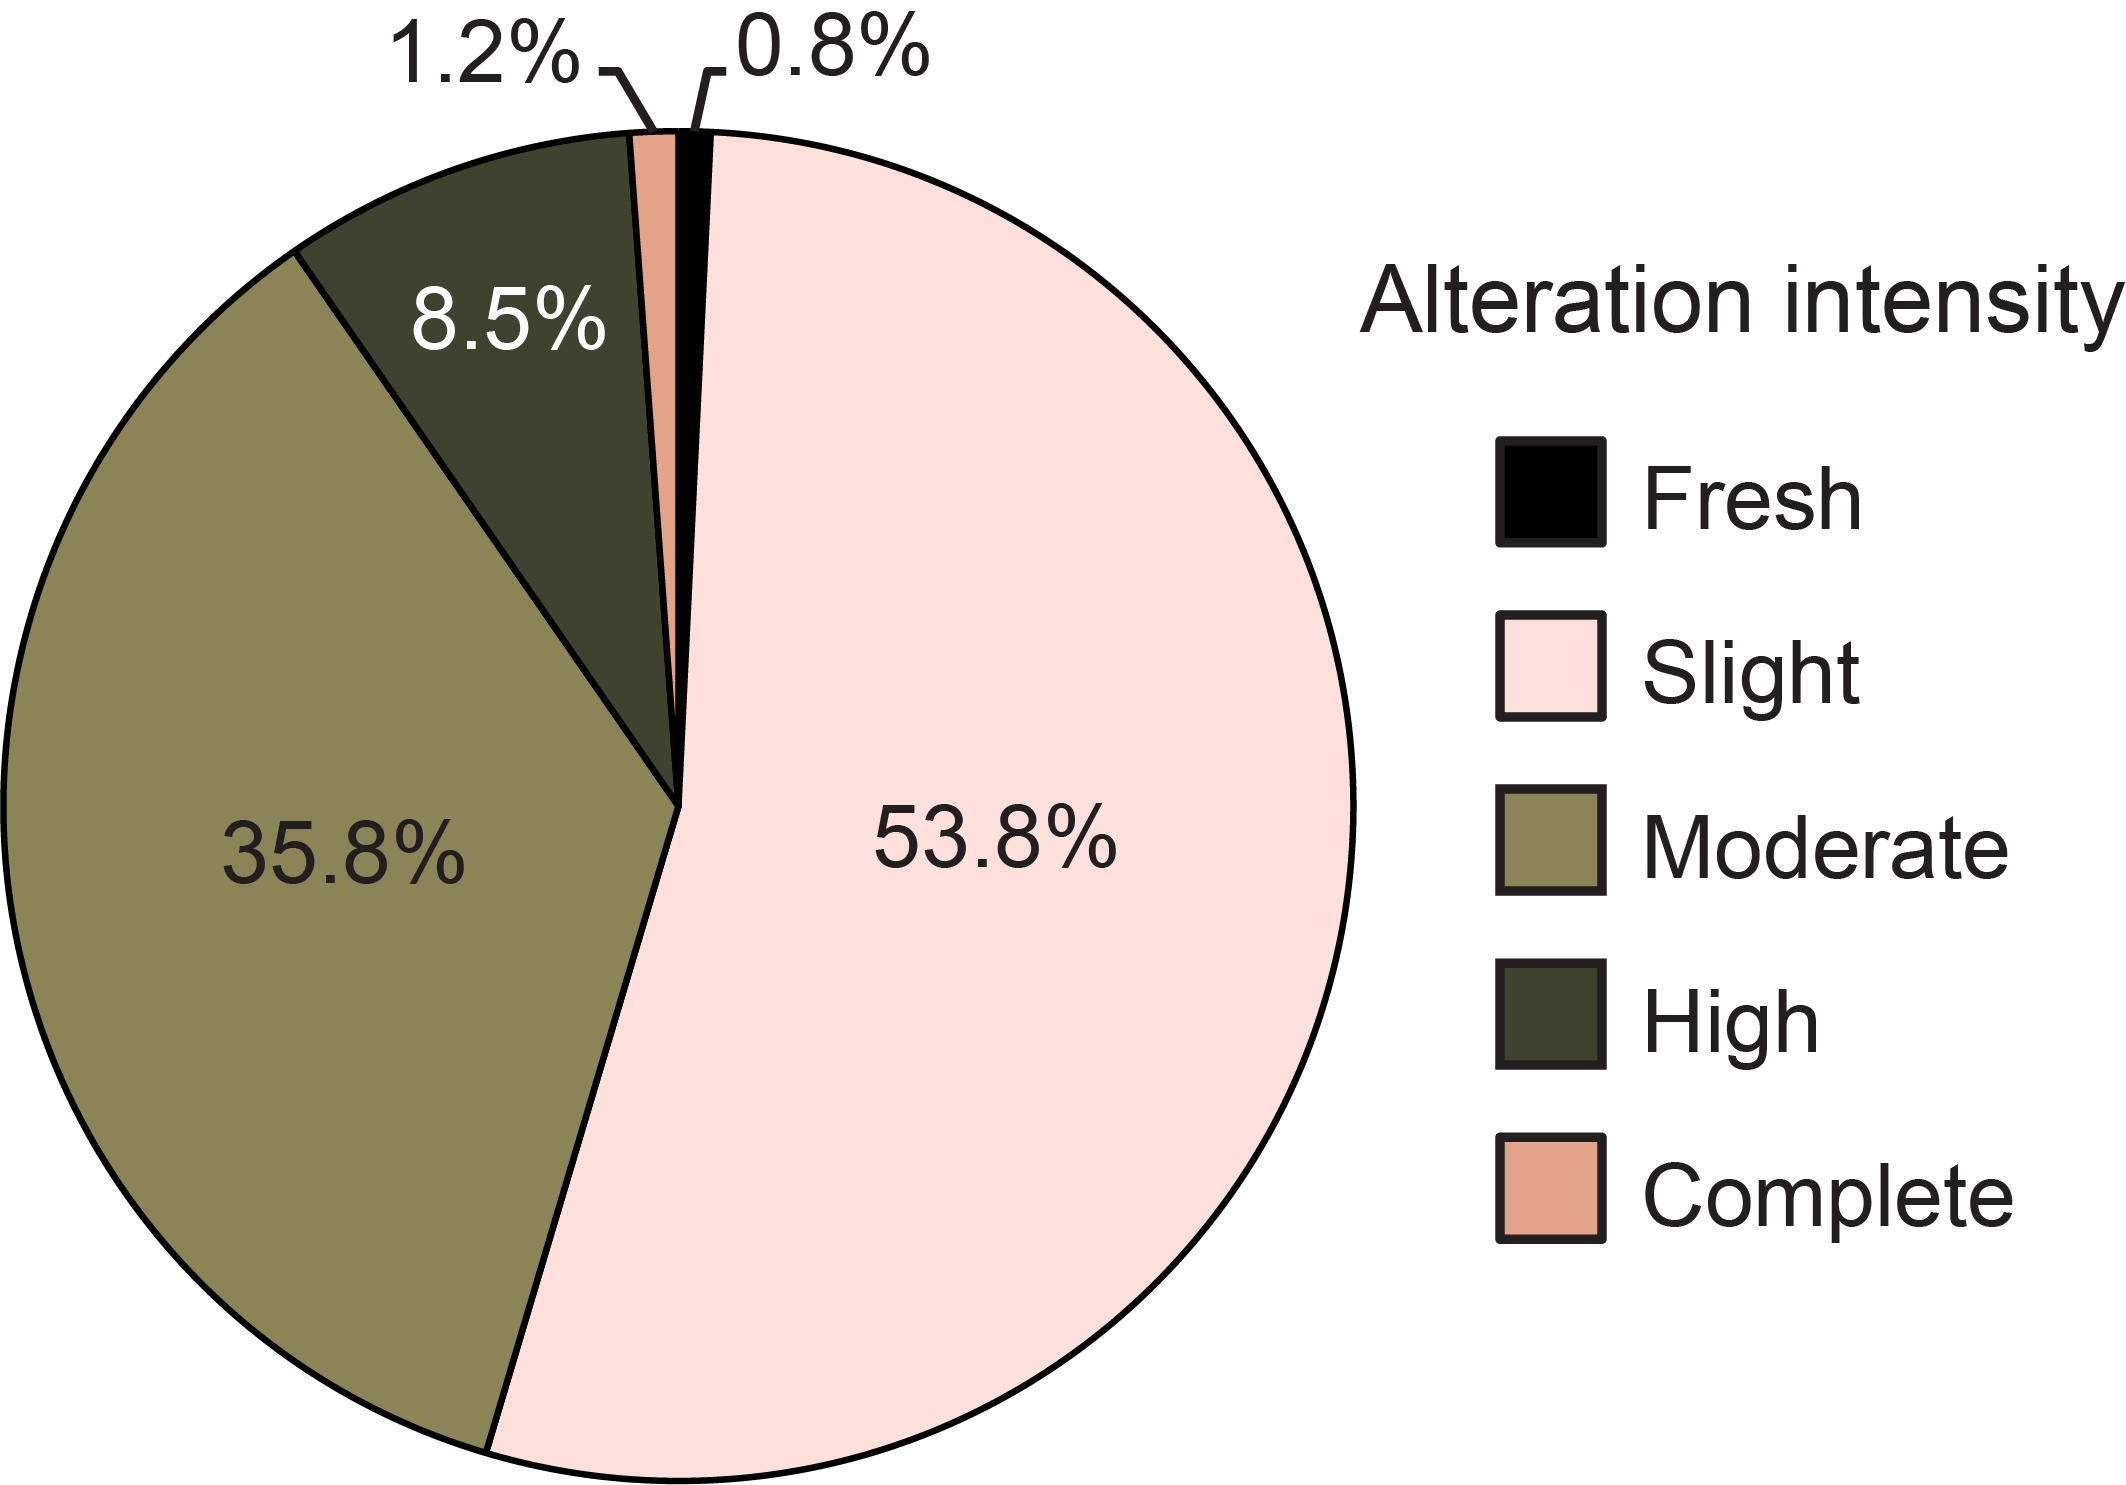
Figure F16. Percentages of degree of basalt alteration.
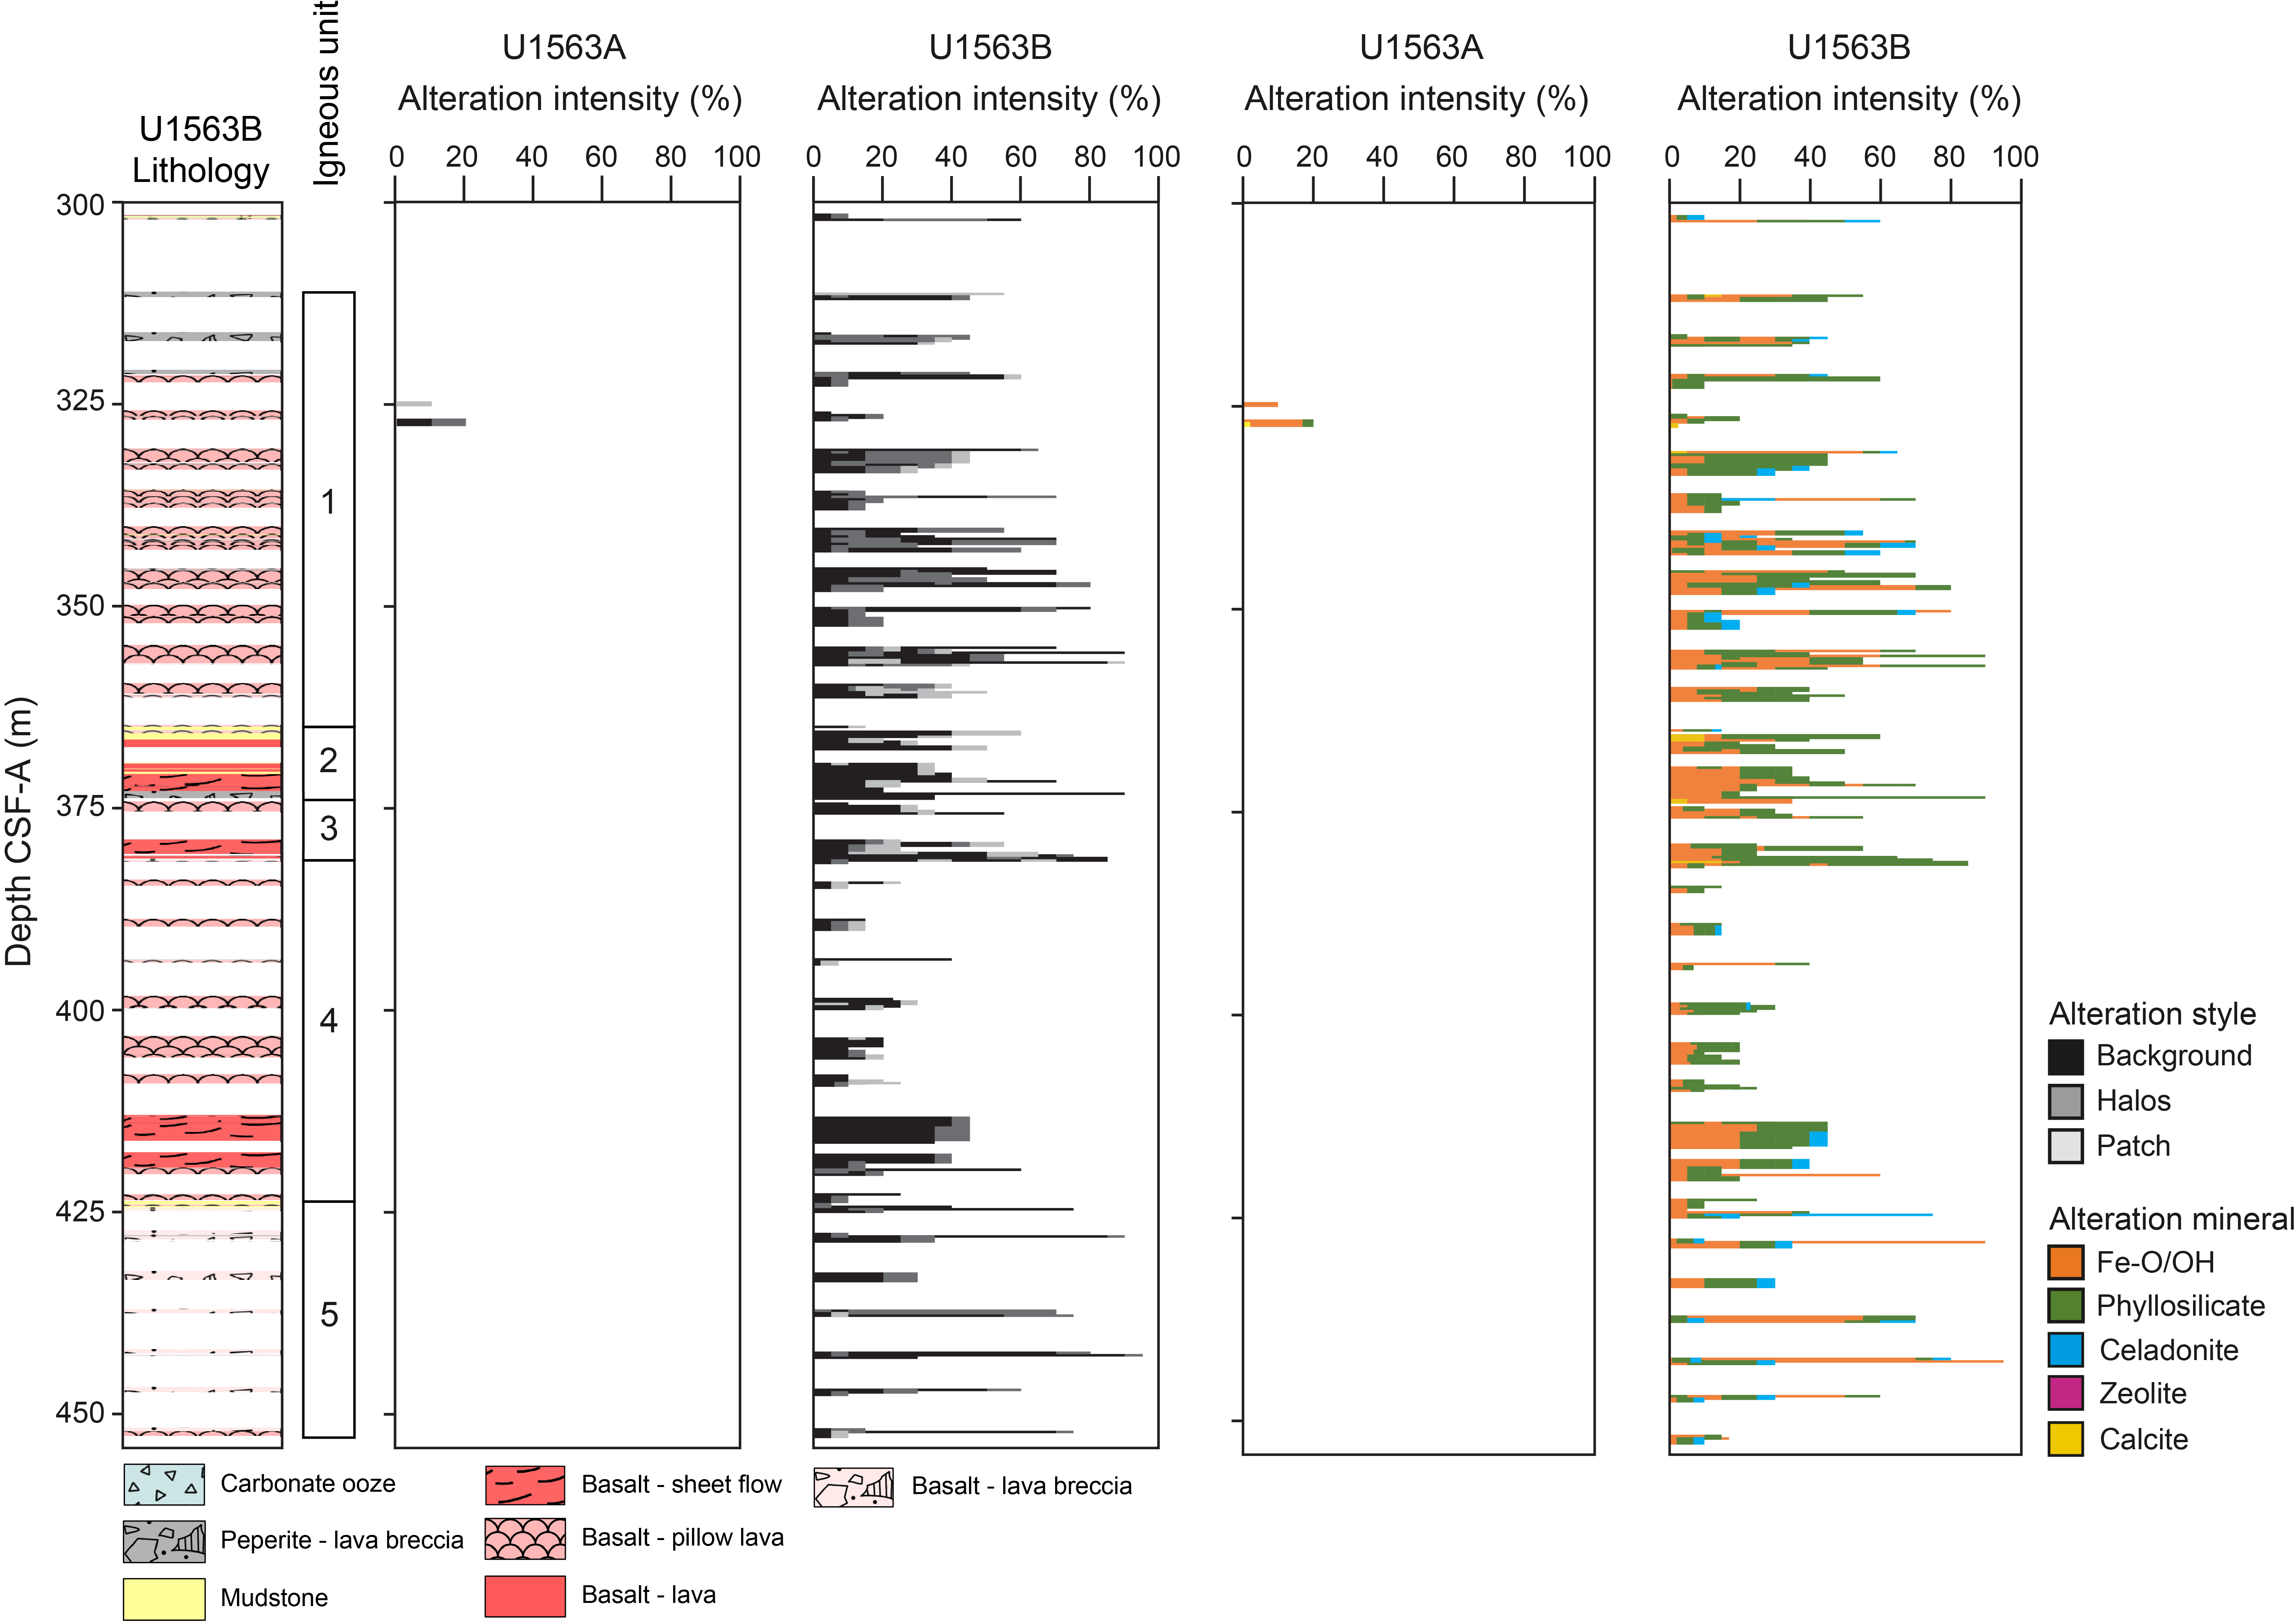
Figure F17. Lithologic interpretation and units and alteration intensity variation.
The alteration mineral assemblage in Site U1563 basalt cores is mostly Fe-oxide/oxyhydroxides and phyllosilicates (Figure F17). The rims of basalt clasts in peperite display strong to complete alteration to palagonitic material (i.e., rich in Fe-oxide/oxyhydroxides), which in some clasts decreases in intensity toward their centers (Figure F18). In thin section, basalt appears highly altered to phyllosilicates, with pale brown clay and saponite-rich alteration in olivines and celadonite-rich alteration in groundmass and vesicles (Figure F19A). Very fine grained, disseminated magnetite or titanomagnetite is observed in the basalt groundmass, occasionally exhibiting a dendritic form (Figure F19B). Calcite is occasionally observed replacing plagioclase (Figure F19C) and as olivine inclusions (Figure F20). Olivine phenocrysts show partial to near-complete replacement by saponite with some magnetite, although determining whether the magnetite is part of the primary mineralogy or of the alteration assemblage is difficult (Figure F19D).
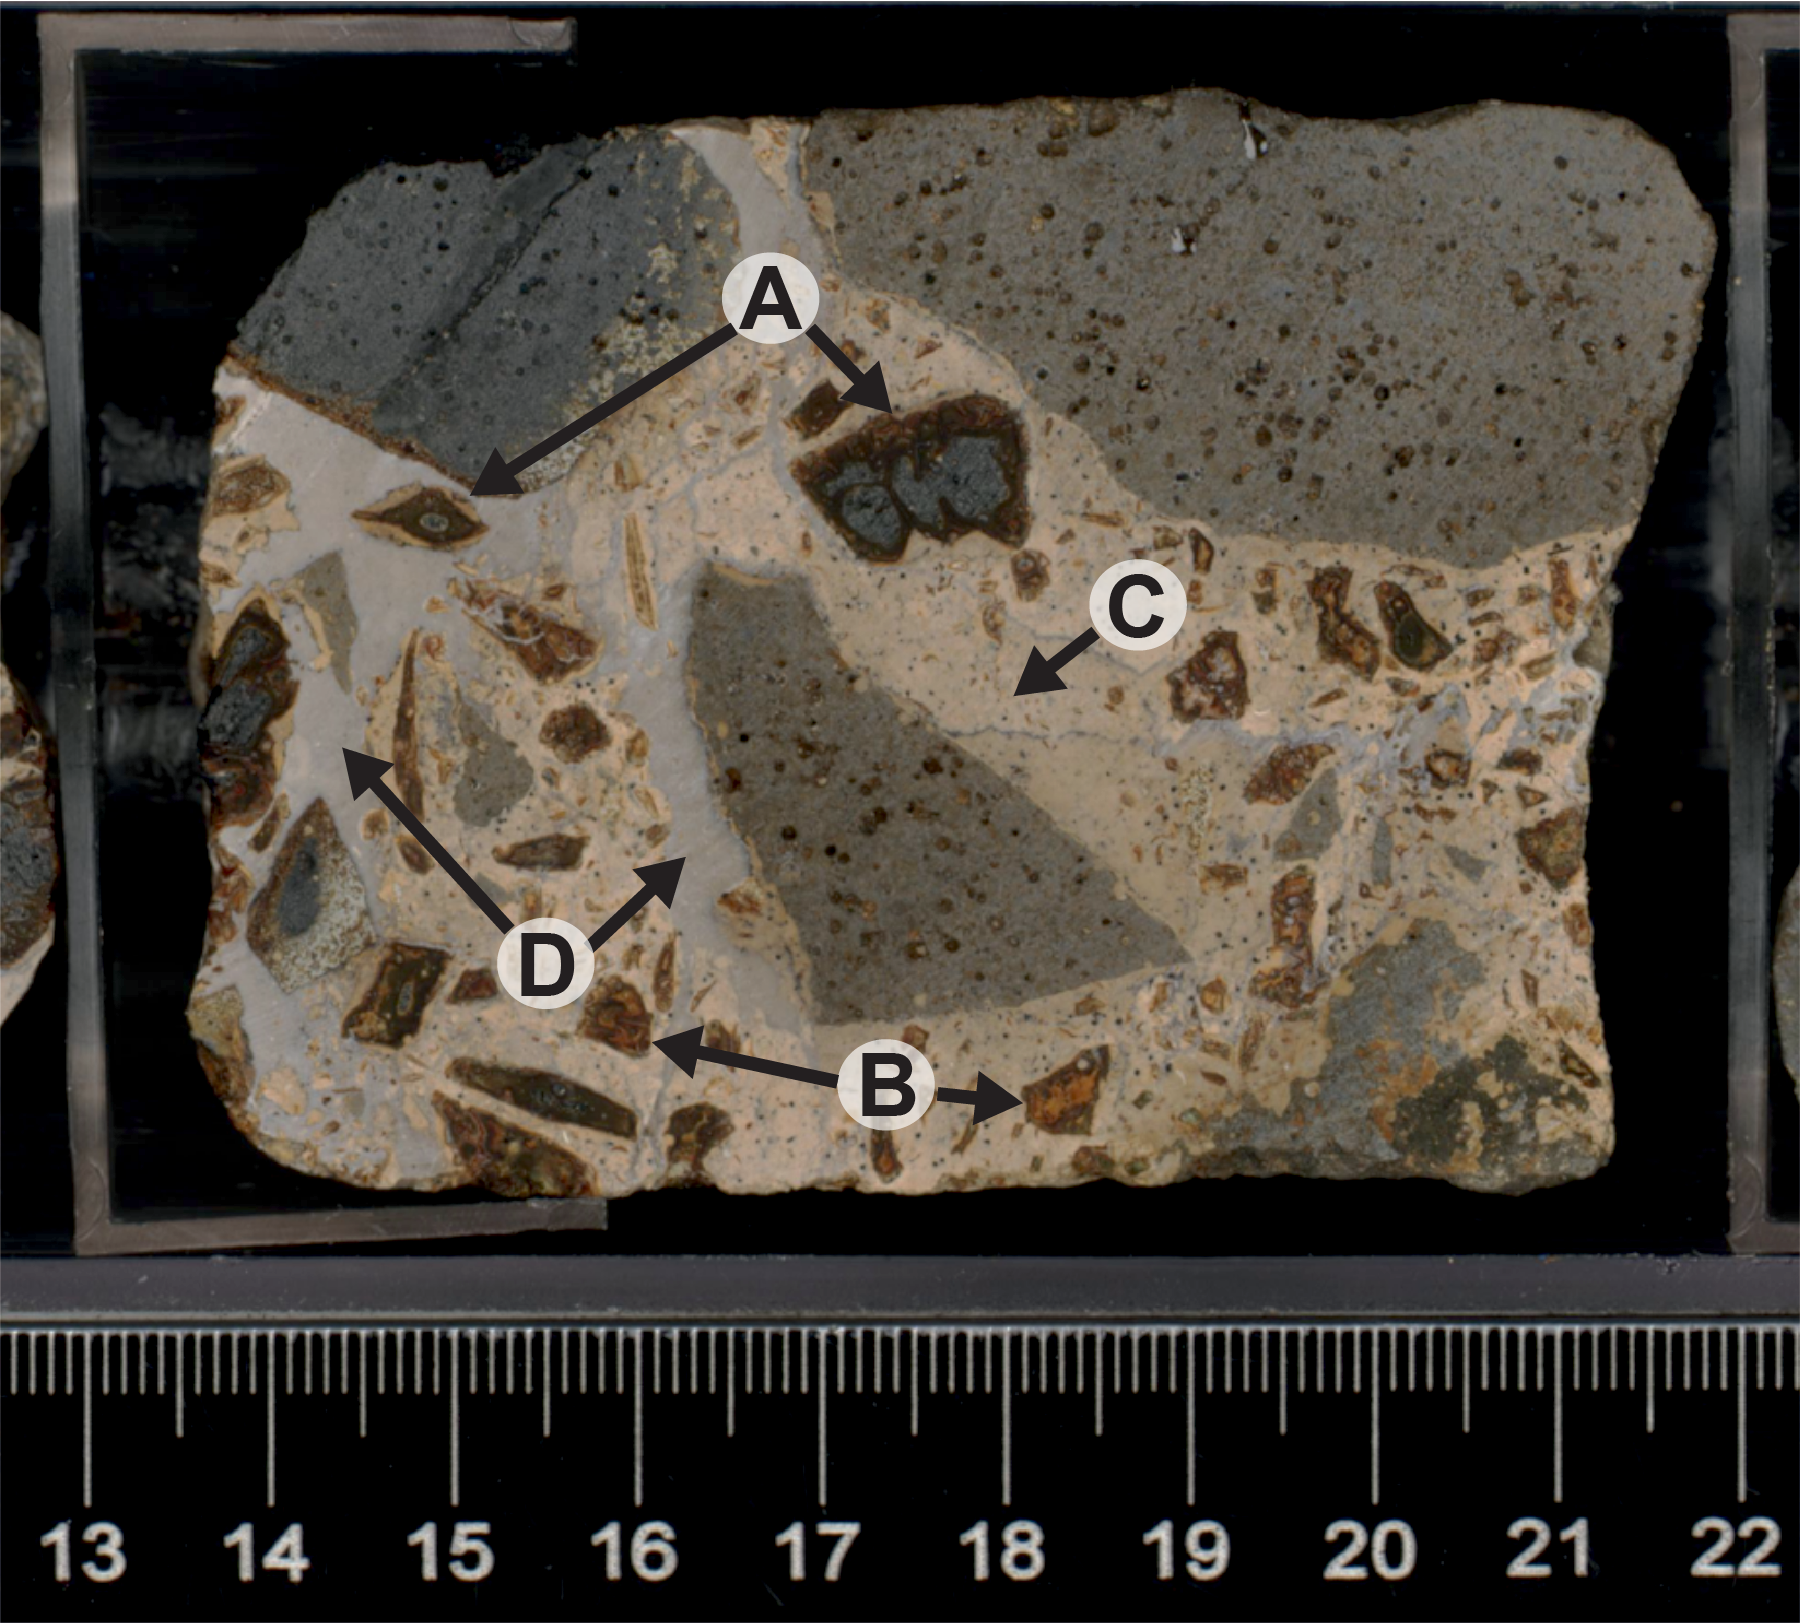
Figure F18. Peperite.
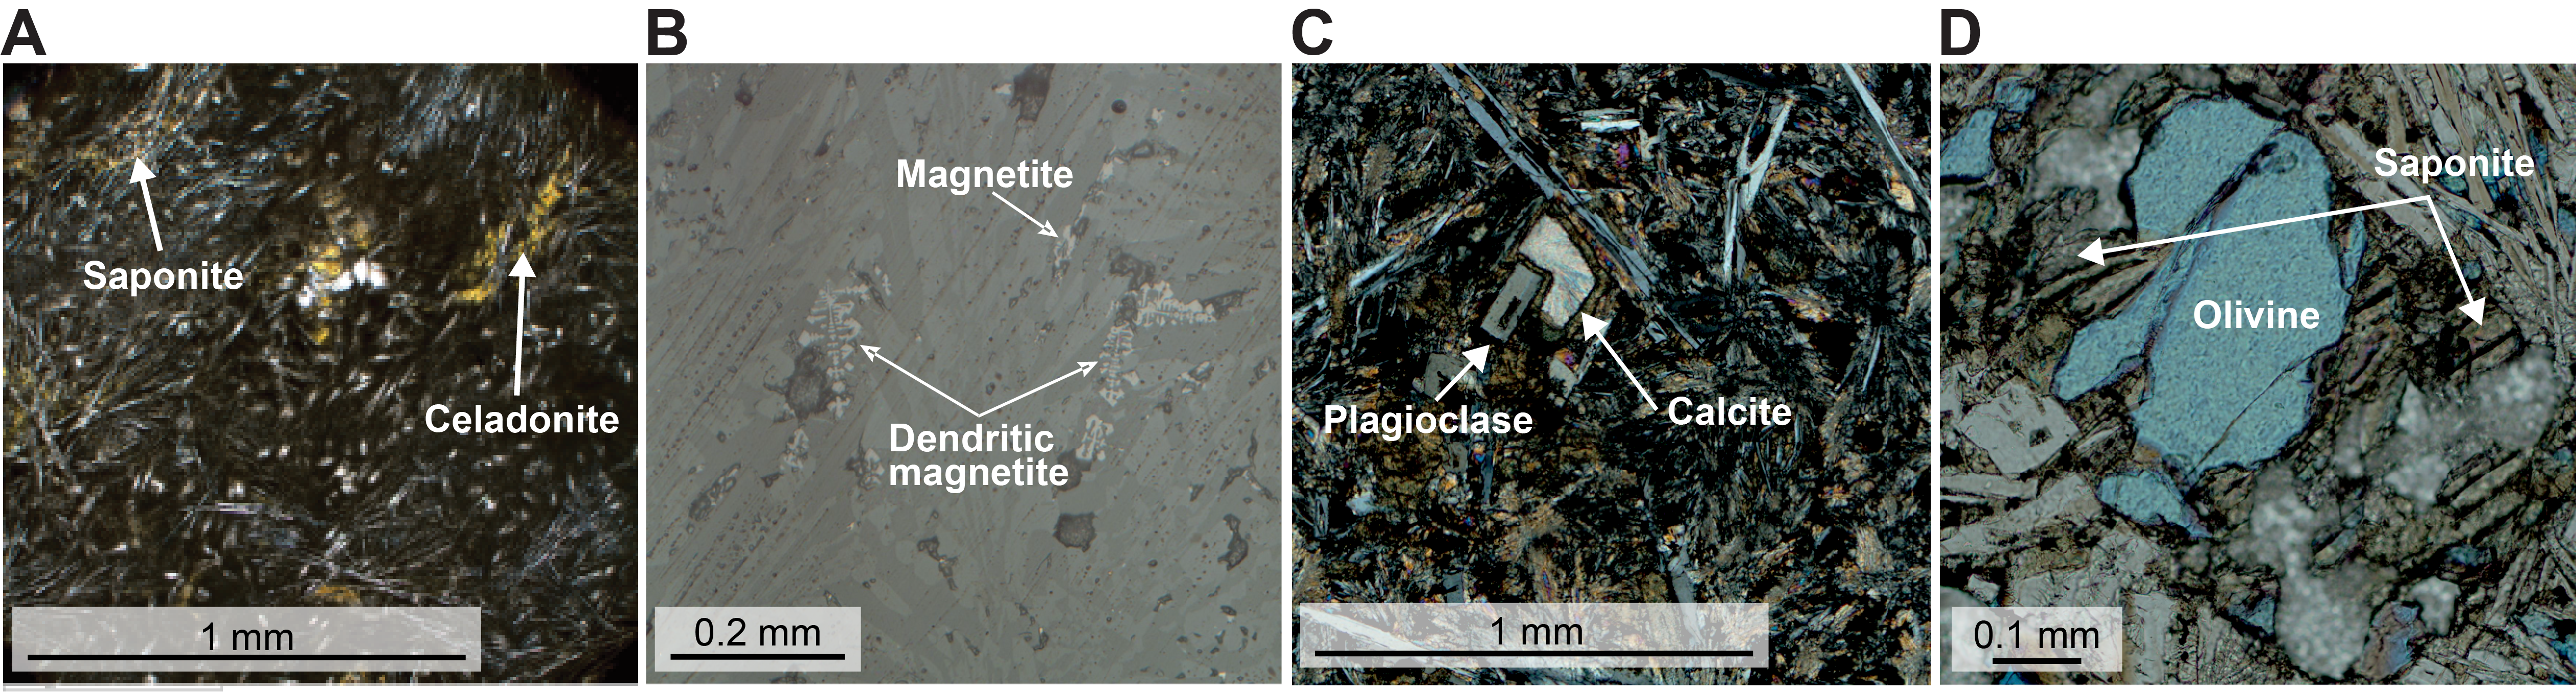
Figure F19. Alteration and replacement.
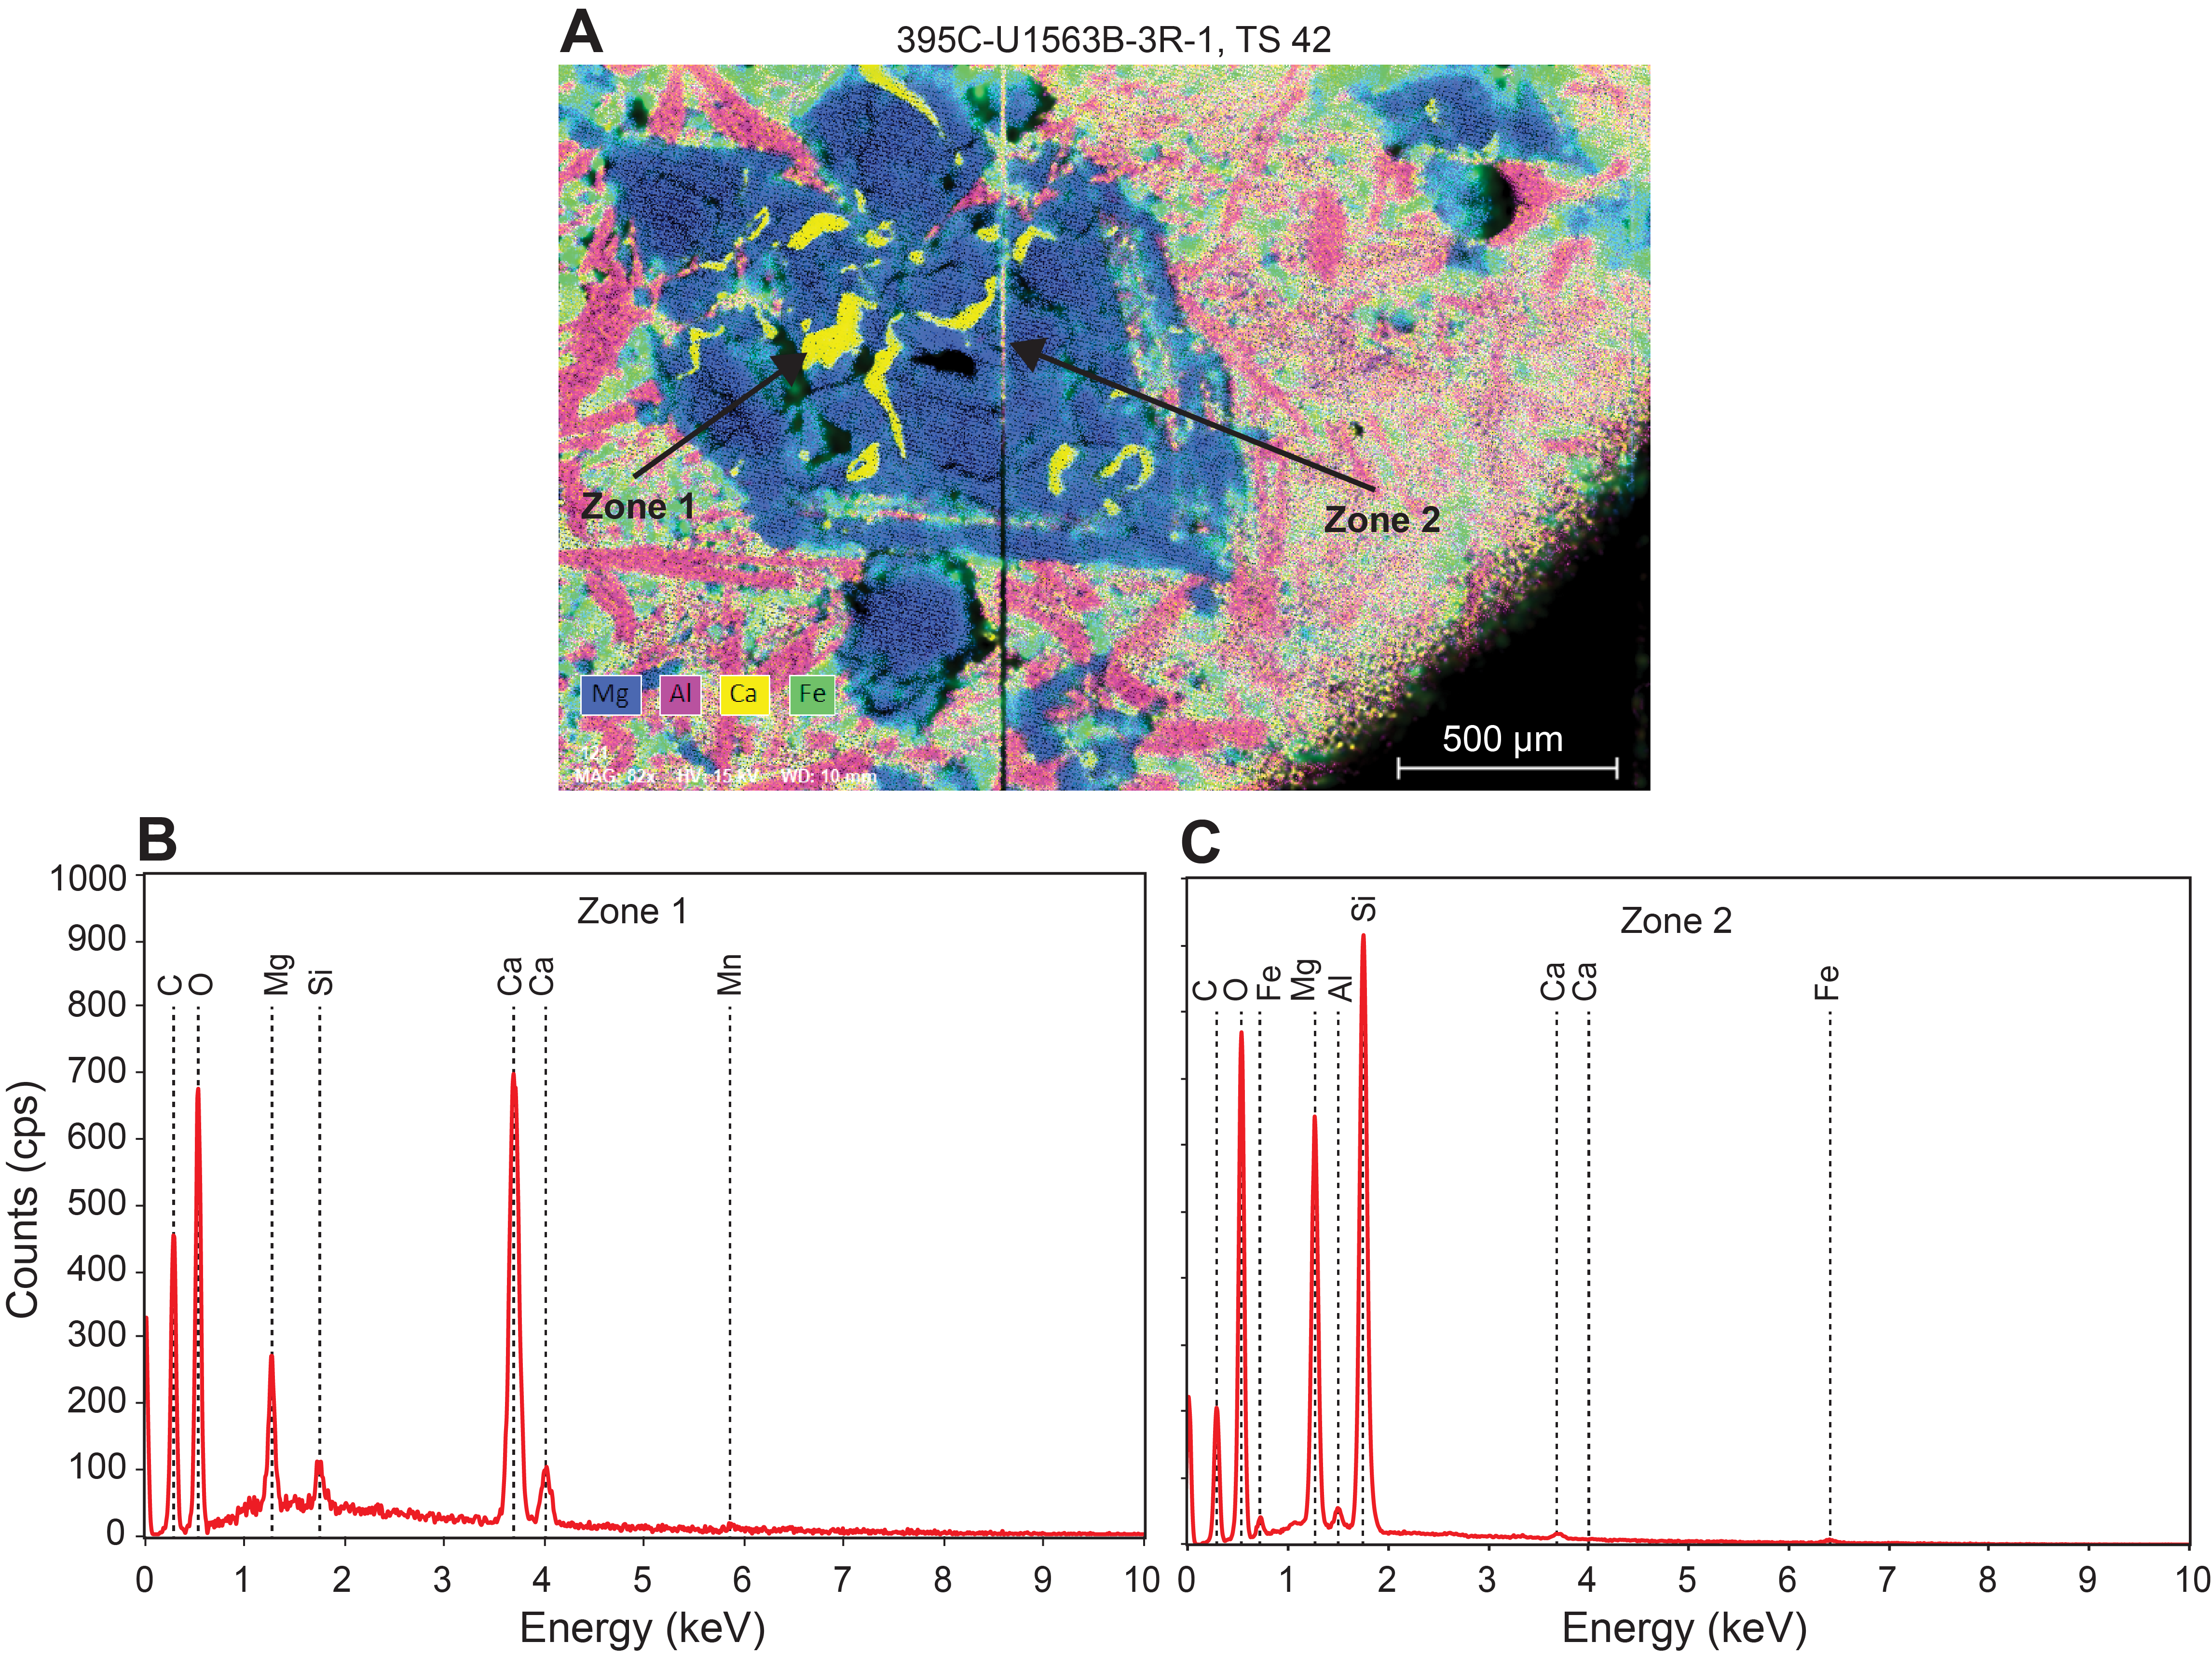
Figure F20. Skeletal olivine phenocryst.
Energy dispersive spectrometry (EDS) was used to acquire elemental maps and spectra for a skeletal olivine crystal from Sample 395C-U1563B-3R-1, 13–16 cm. EDS analyses produced a range of elemental maps (for Si, O, Al, Ca, Mg, Fe, K, Na, and Mn) and spectra in two zones of interest (Figure F20). The EDS spectrum for Zone 1 shows strong spectral peaks for Ca and O with minor Mg and Si, suggesting an Mg-calcite infilling within the skeletal olivine (Figure F20B). The EDS spectrum for Zone 2 shows strong peaks for Si (stronger than the Mg peak), O, and Mg, with minor Fe, Al, and Ca, suggesting the skeletal olivine is likely close to a forsterite end-member with some replacement by saponite (Figure F20C).
The fraction of vesicles filled with alteration minerals varies between 20% and 100% at Site U1563. Vesicle filling minerals are frequently celadonite and Fe-oxide/oxyhydroxides, with moderate amounts of carbonate, amorphous silica, and phyllosilicates, and minor zeolite (Figure F21). Reflected light microscopy suggests that goethite is among the Fe-oxide/oxyhydroxide minerals present in vesicles. Crystals of carbonate and zeolite are observed in some vesicles. Thin sections under reflected light show that some vesicles have pyrite and magnetite mineralization around their rims and occasionally within the vesicles. Most vesicles show color zonation in their mineral fill, with celadonite-filled vesicles exhibiting a range of colors from dark blue to pale blue to pale green (Figure F21A). Dark blue celadonite is common in Site U1563, although there is a noticeable lack of dark blue celadonite vesicle fill at 360–417 m CSF-A. There is no correlation between the percentage of vesicles filled and the alteration intensity of the basalt core at Site U1563. Some vesicles have <1 mm wide alteration halos in the basalt around them.
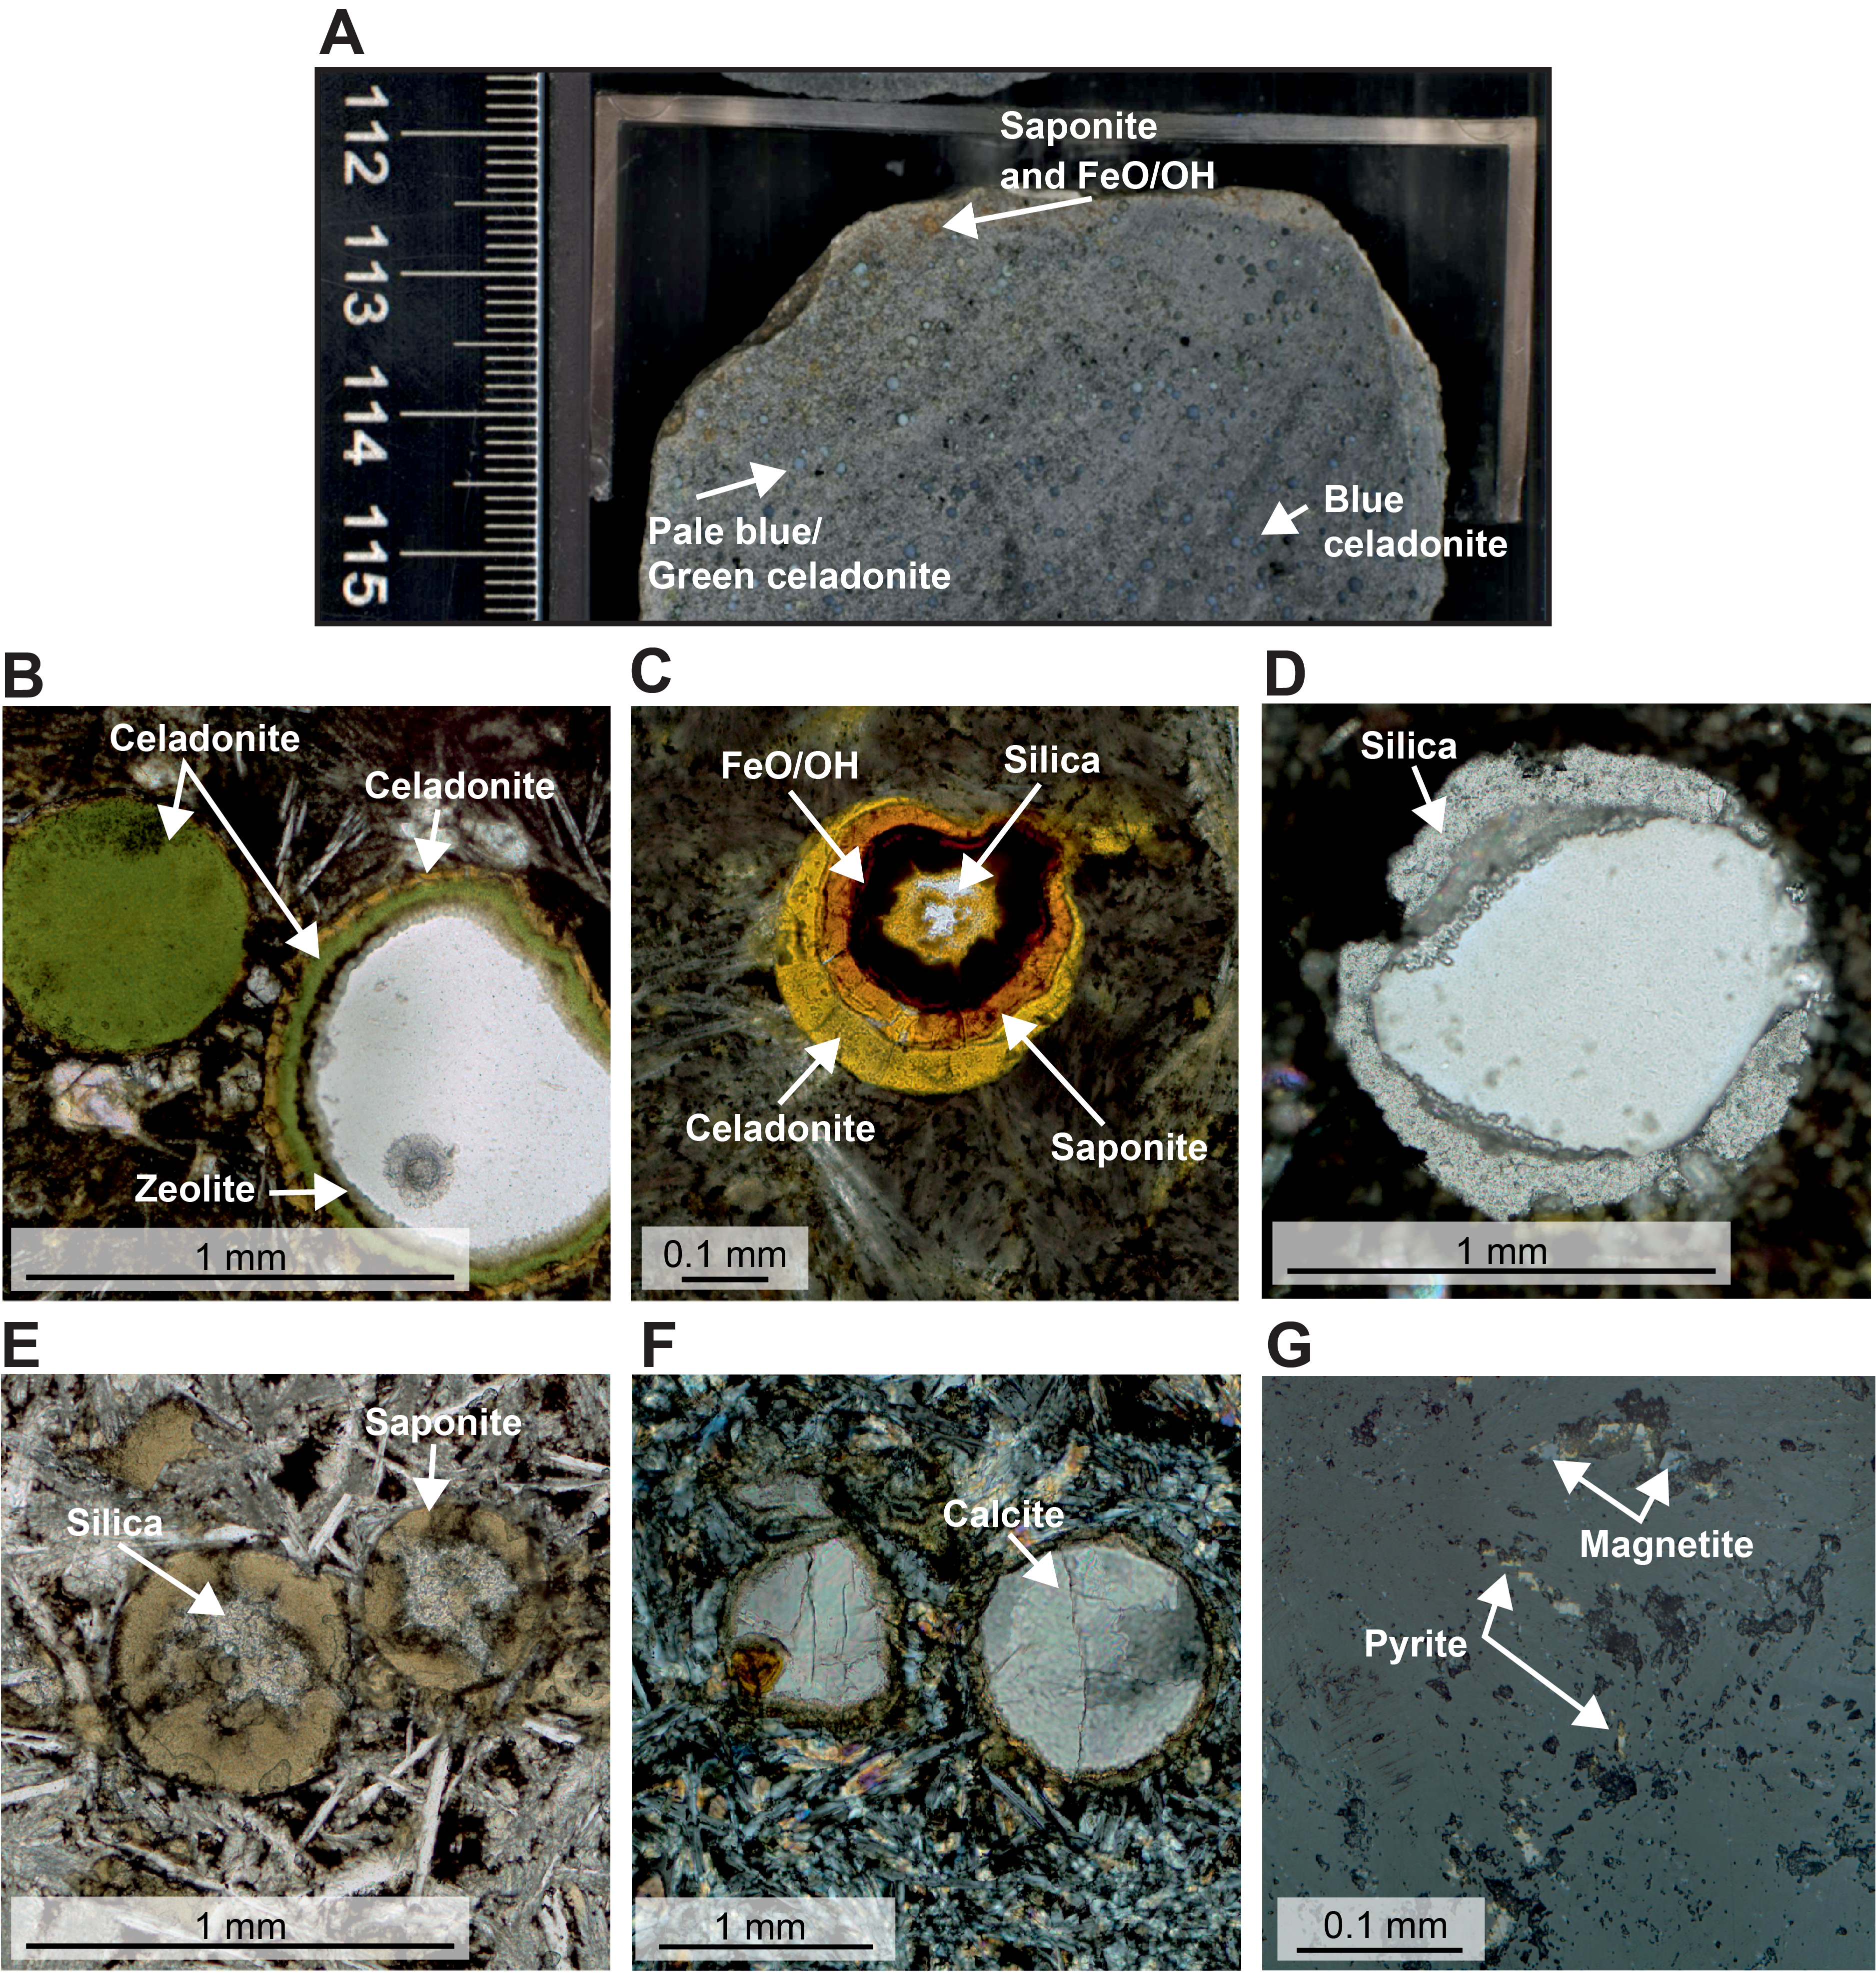
Figure F21. Alteration and fills.
5.2. Structural geology
Fracture density at Site 395C-U1563 is ~18 fractures per meter of recovered core on average and ~15 fractures per meter of curated core. Density varies with depth, with a higher density of ~24 fractures per meter of recovered core at 370–388 m CSF-A and a lower density of ~6 fractures per meter of recovered core at 423–452 m CSF-A (Figure F22). Fractures are commonly 0.5 mm wide (54%) with an additional ~21% too narrow to measure (<0.5 mm) and ~19% measuring 1 mm wide (Figure F23A). The widest fractures recorded are four 5 mm wide carbonate veins located at ~320–332 m CSF-A and two 4 mm wide carbonate + Fe-oxide/oxyhydroxide veins at ~360 m CSF-A. These wide carbonate veins cut through peperite lithologies, and the carbonate + Fe-oxide/oxyhydroxide veins cut though an interval of moderately altered basalt (Figure F23B, F23C).
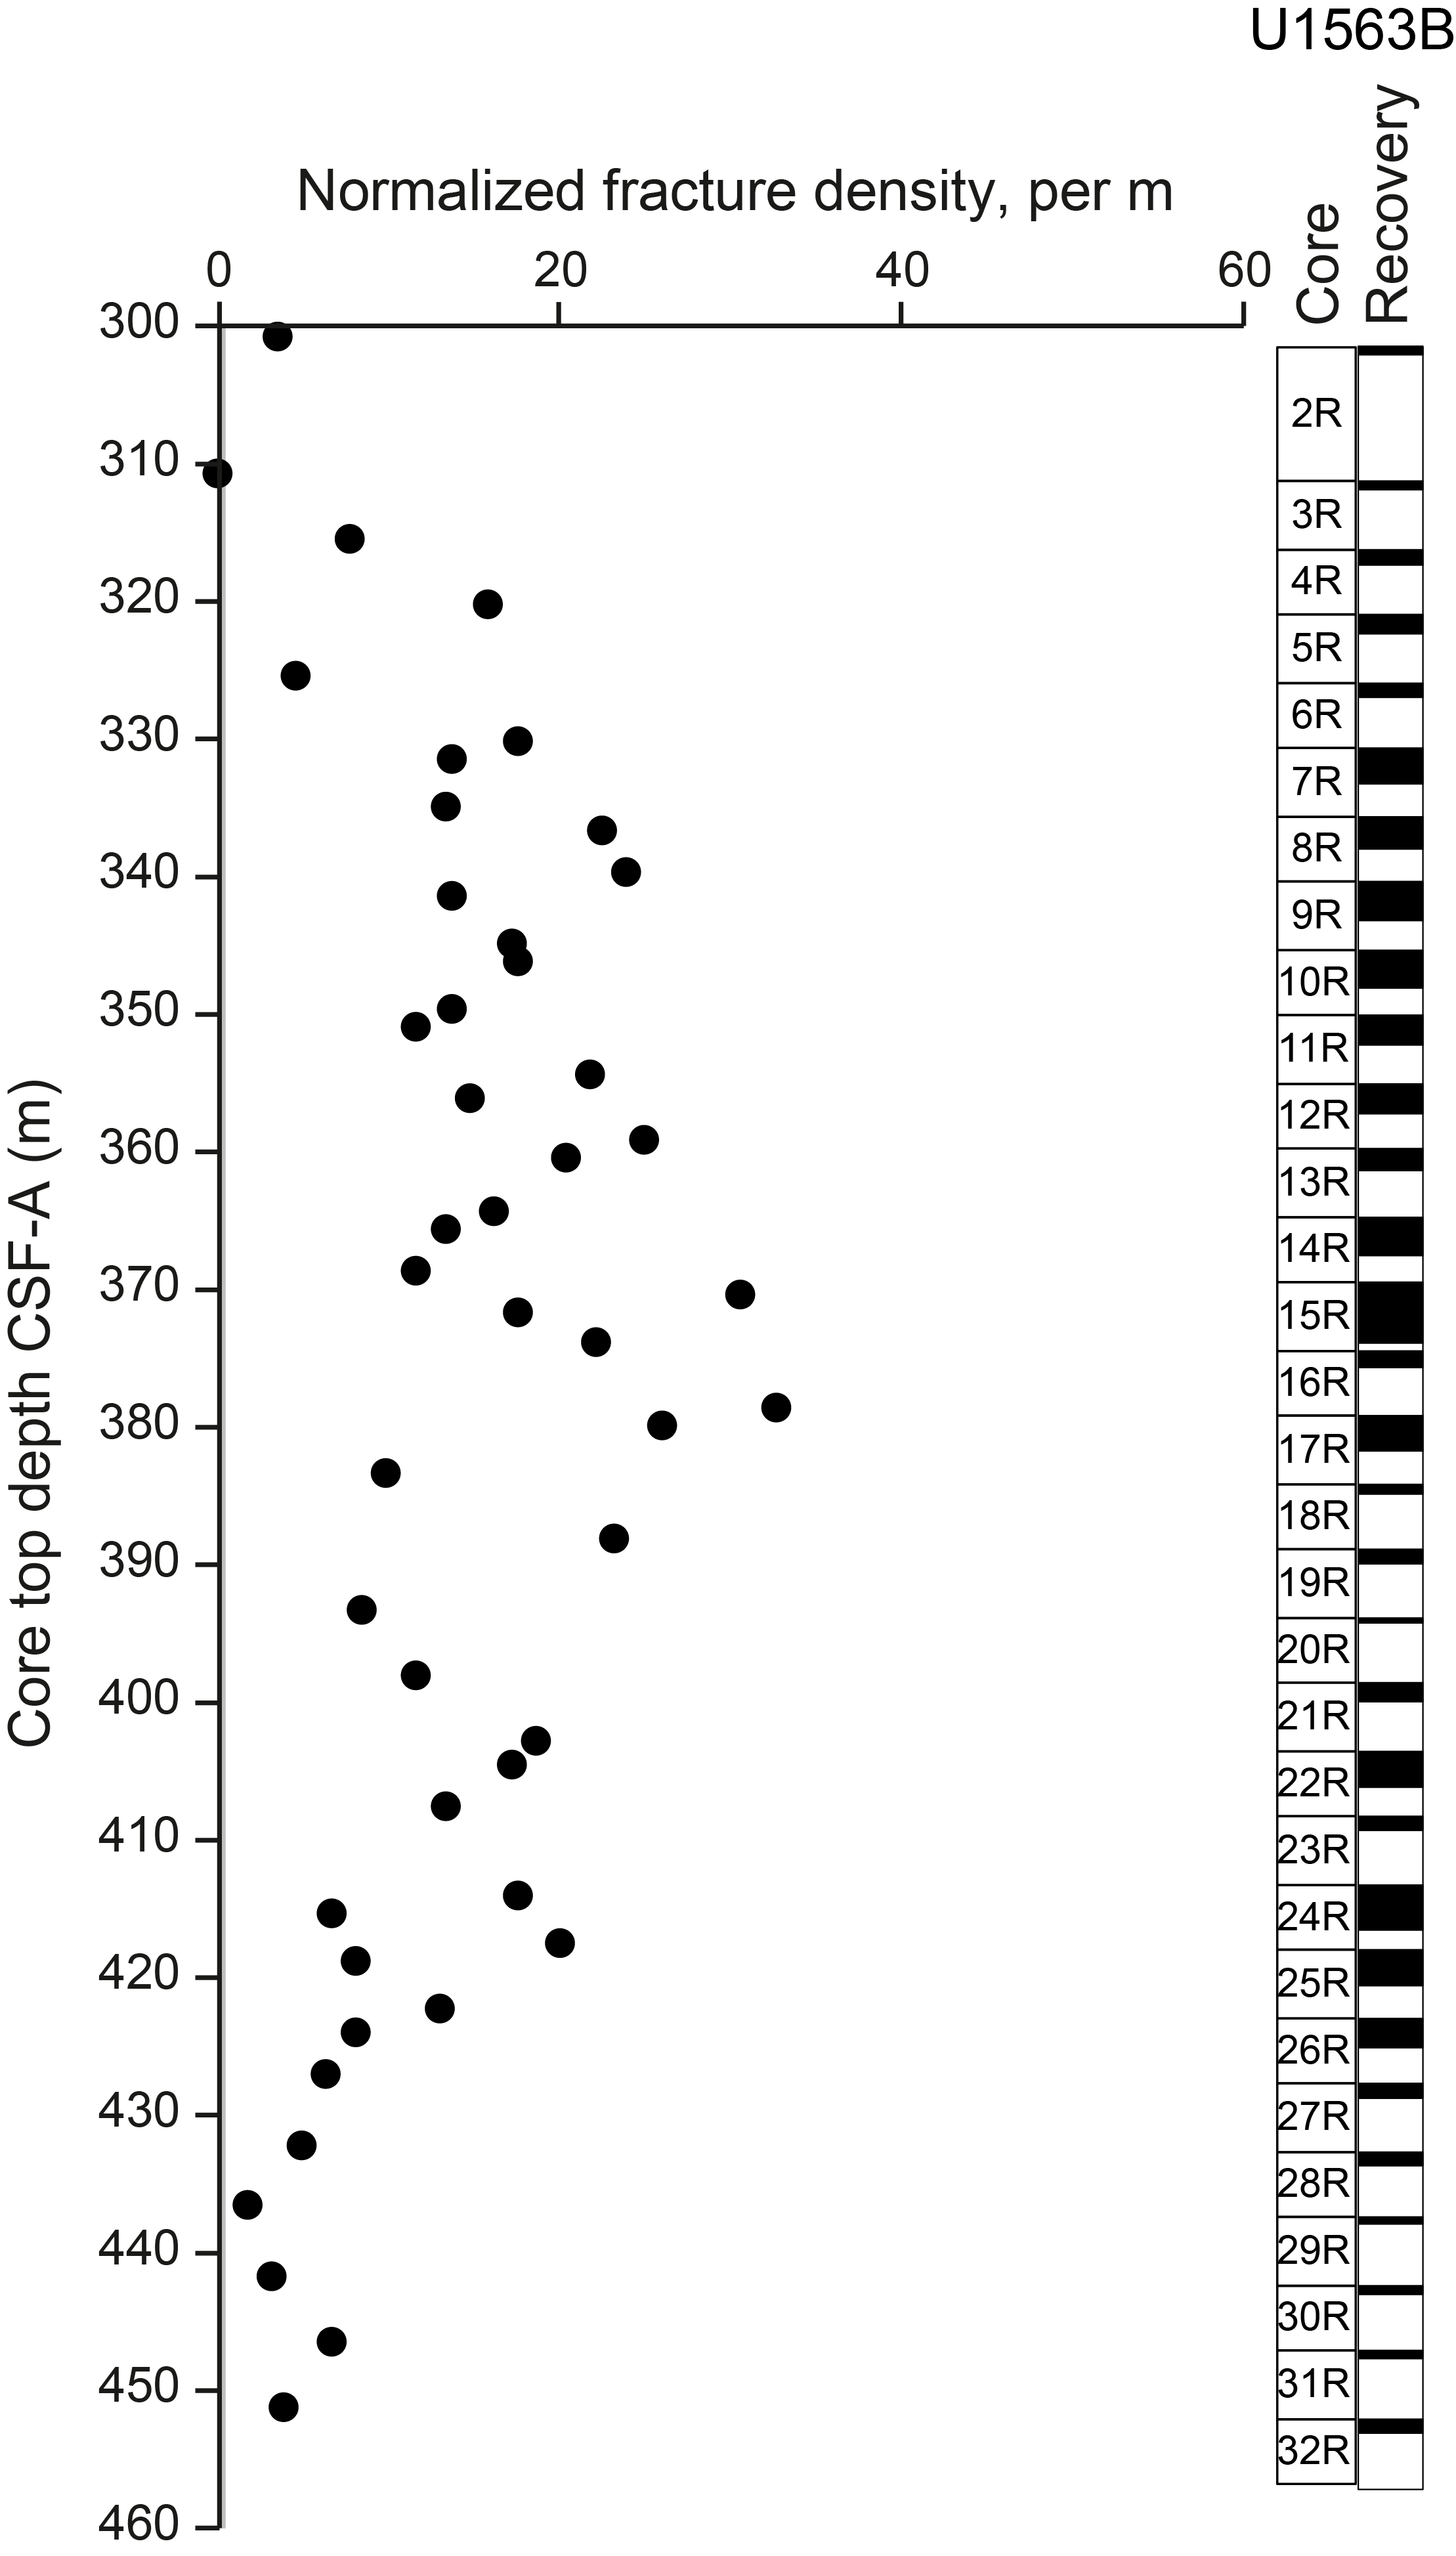
Figure F22. Fracture density normalized by curated section length.
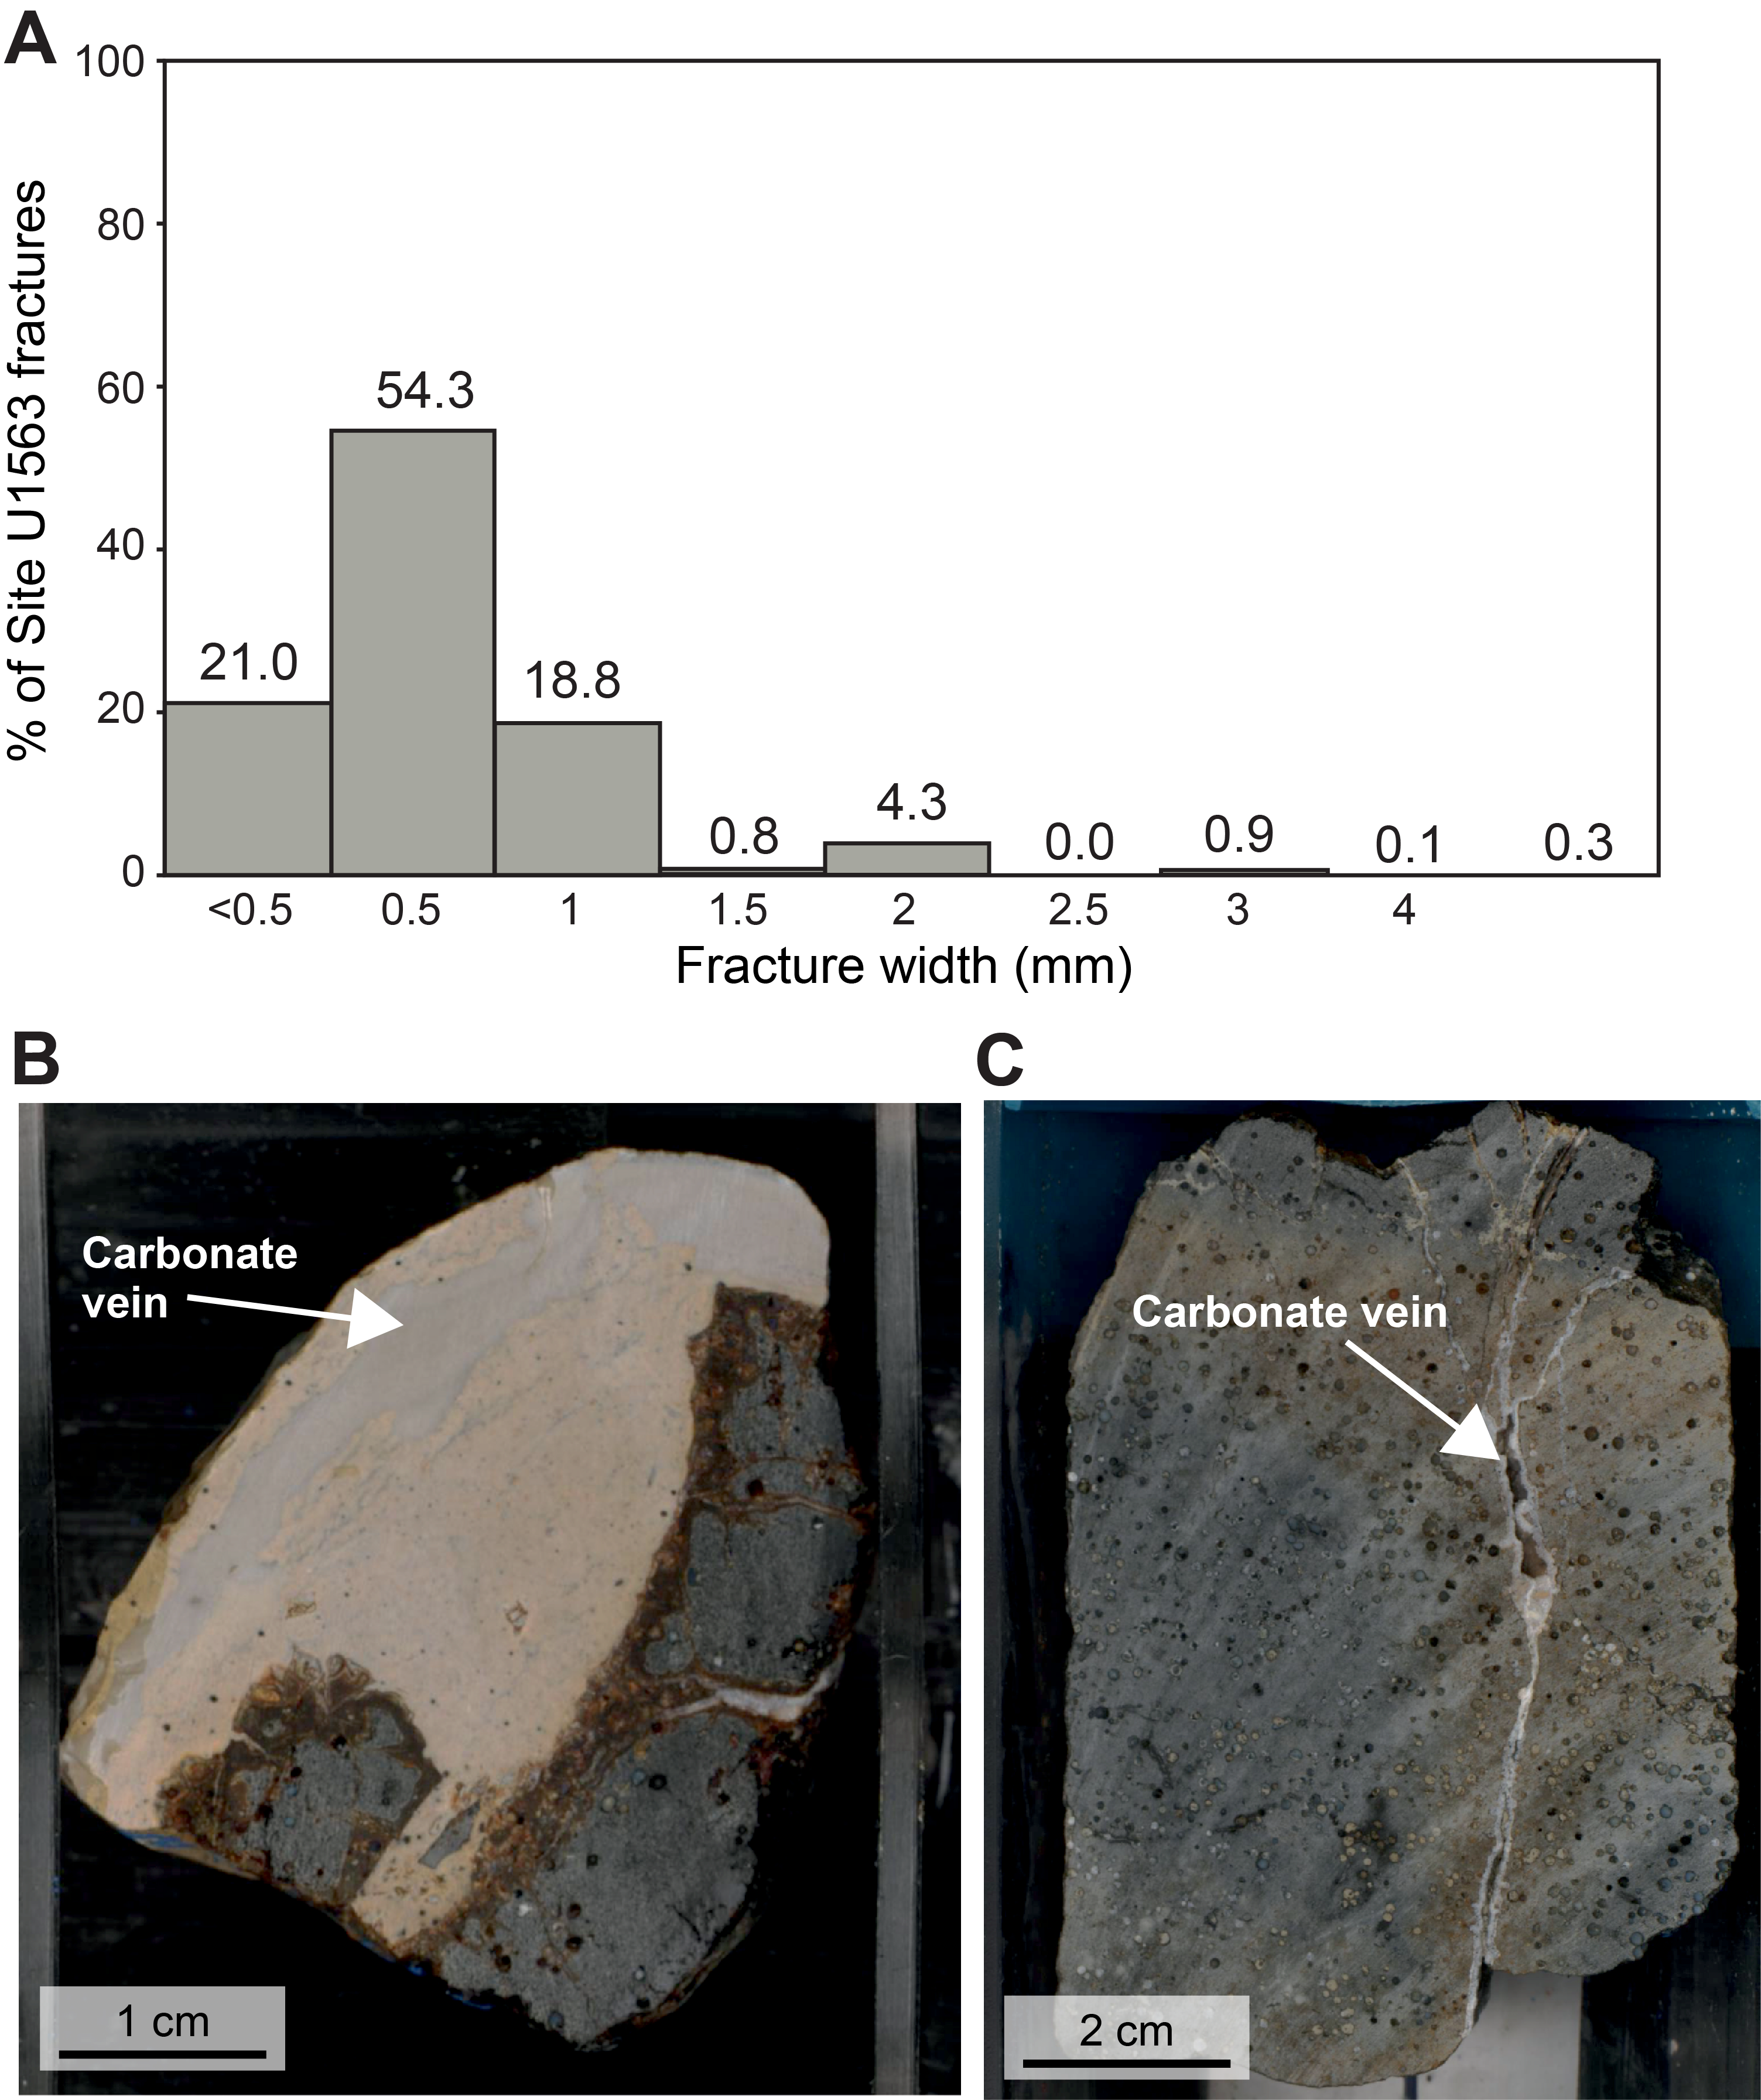
Figure F23. Fractures and veins.
Roughly equal proportions of observed fractures are classified as unknown (29%), partially open (40%), and vein (31%) (Figure F24A), with only one open fracture observed (~404 m CSF-A). Fractures are planar (49%) or anastomosing (43%) in shape, and the remaining 8% takes a variety of shapes (Figure F24B). Fracture connectivity at Site U1563 is classified as single (not connected to other fractures; 31%), cross-cutting (44%), and those organized in a complex structural network (26%) (Figure F24C). There is no preferred fracture attitude with respect to the core's long axis at Site U1563 (Figure F24D).
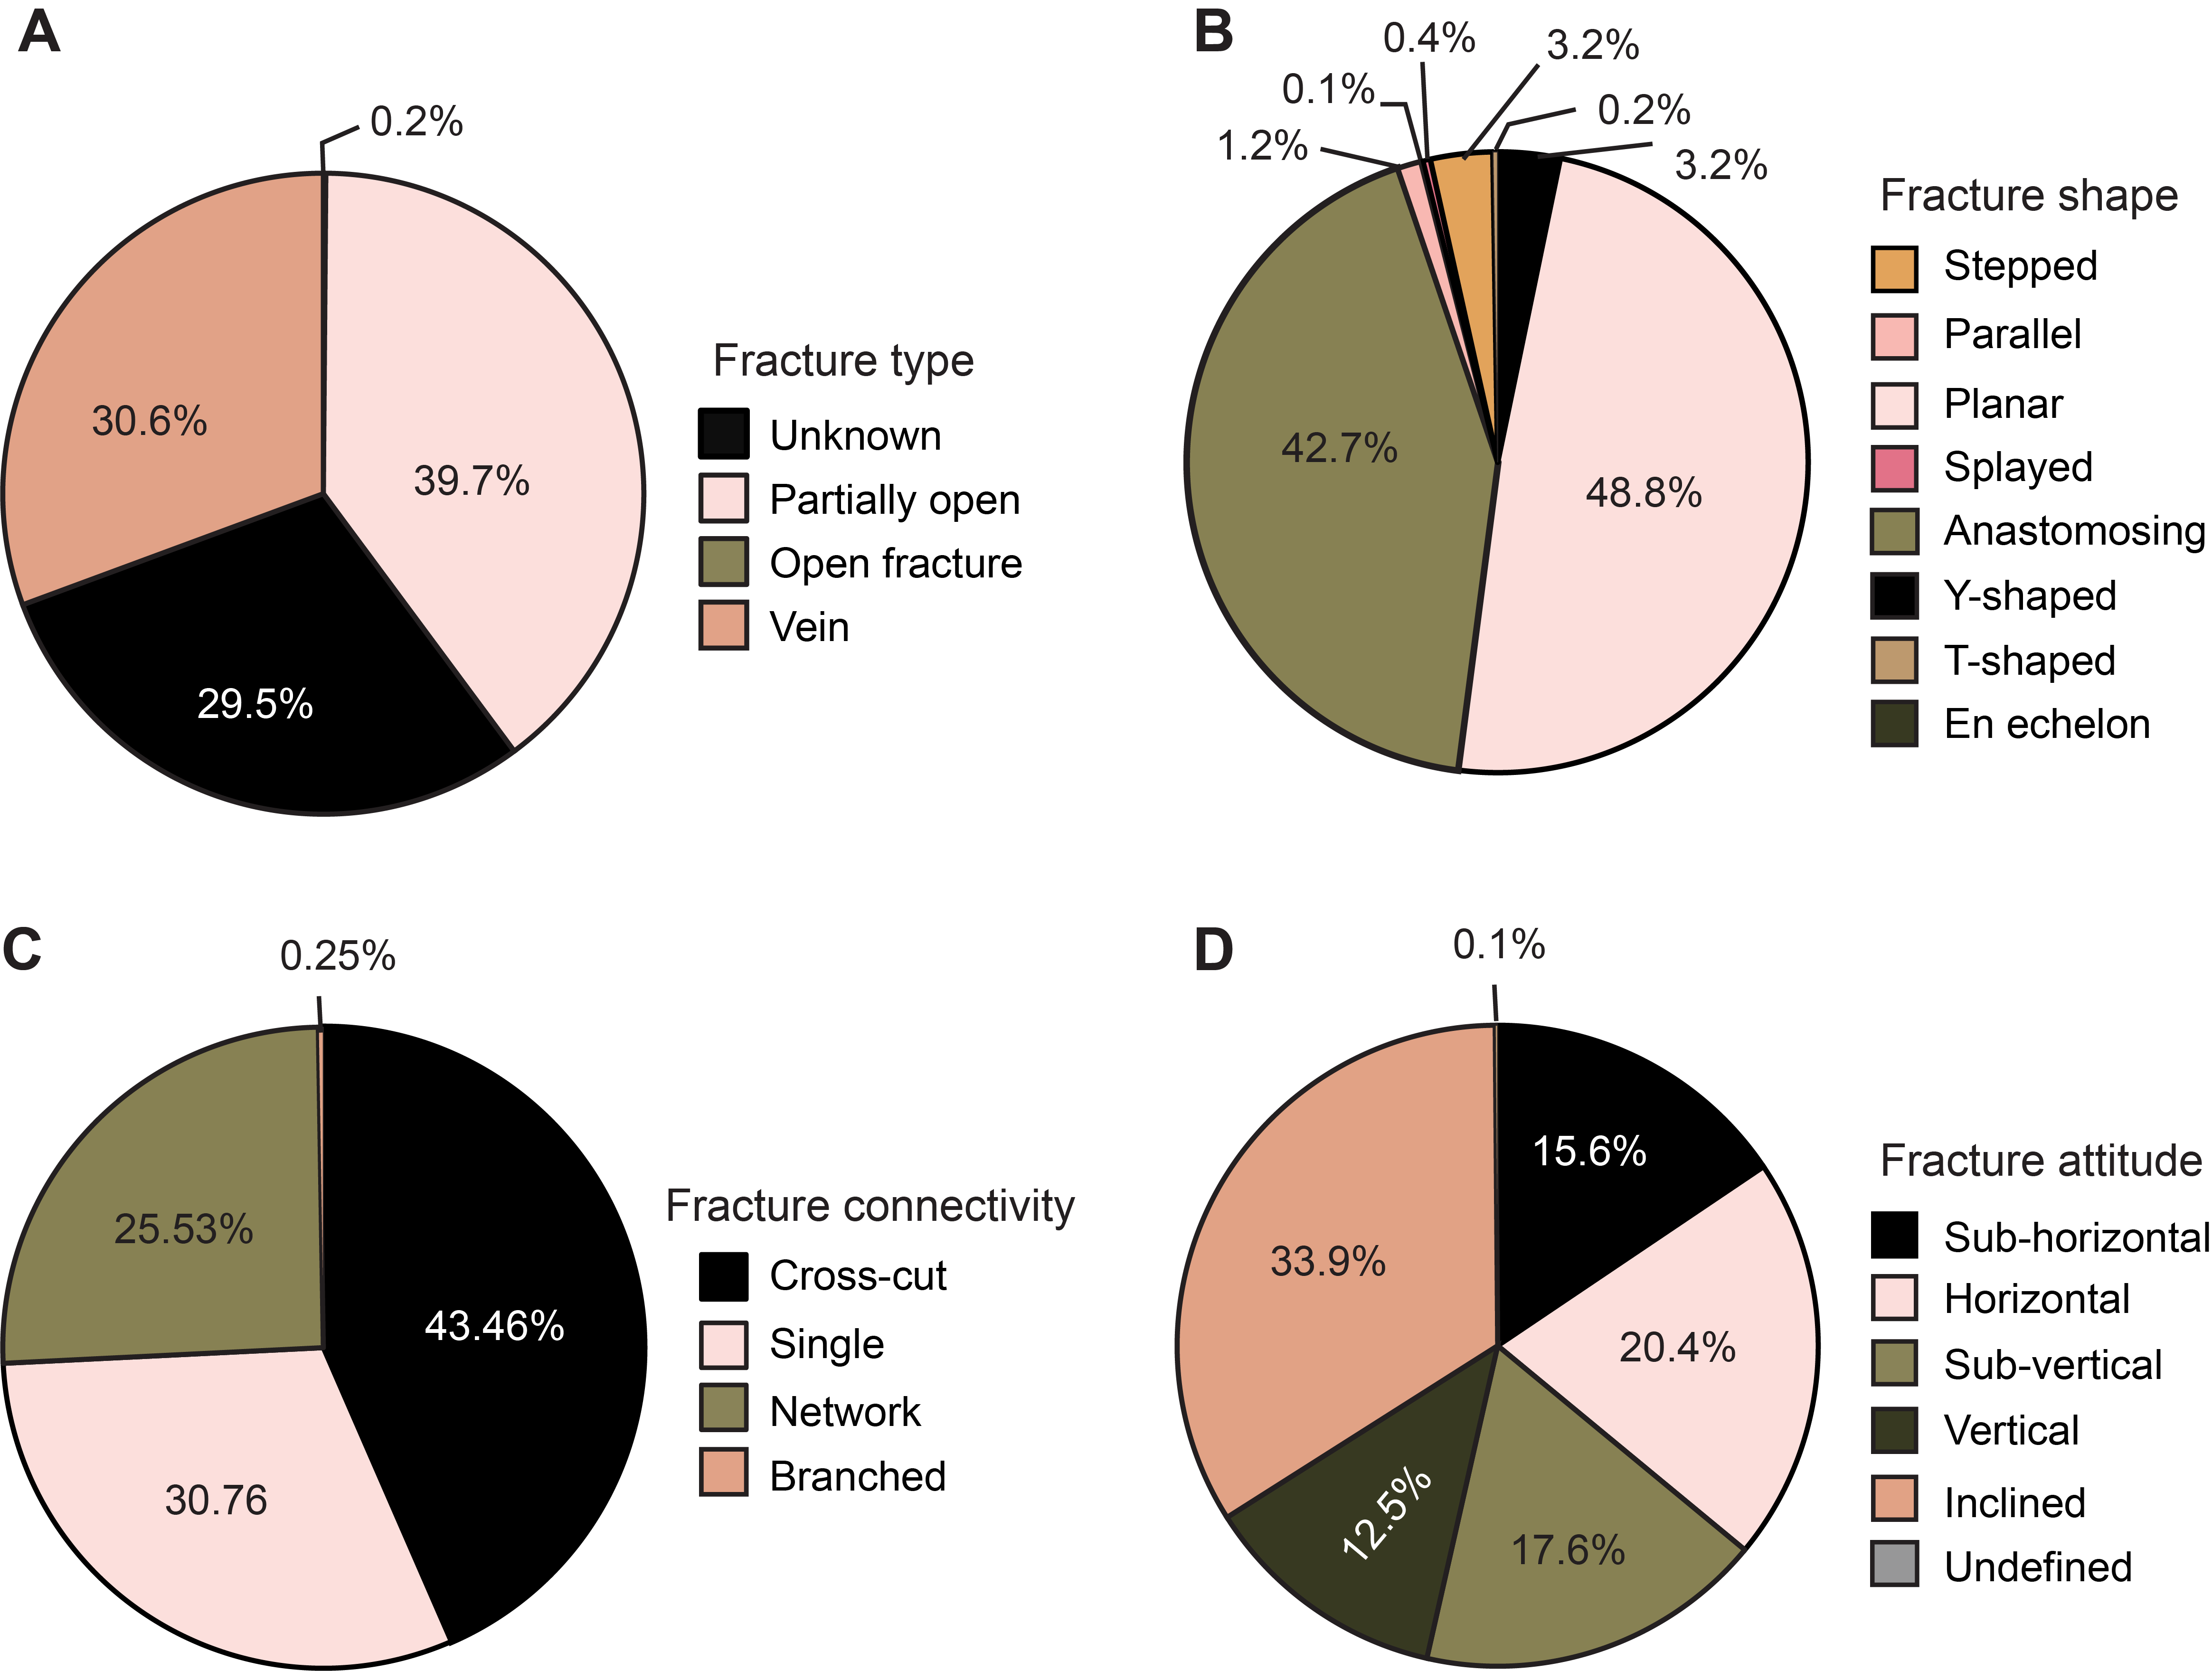
Figure F24. Fractures in basalt cores.
Most fracture mineral fill at this site is classified as cryptocrystalline or amorphous, and mineralogy is therefore primarily determined by color, visual appearance under a hand lens, and reaction to dilute HCl acid. Figure F25 shows the occurrence of fracture mineral fill versus depth for Hole U1563B. Only one fracture is recorded for Hole U1563A. Fracture mineral fill assemblages are either carbonate ± Fe-oxide/oxyhydroxide or Fe-oxide/oxyhydroxide ± phyllosilicate, with minor zeolite, celadonite, and epidote in some fractures. The primary fracture fill mineral shows some variation, but for the majority of Hole U1563B it is carbonate, likely calcite. Carbonate minerals can appear amorphous and globular, crystalline, or layered in various fractures. The occurrence of zeolite and epidote in the fracture fill assemblage is only observed in interval ~320–326 m CSF-A.
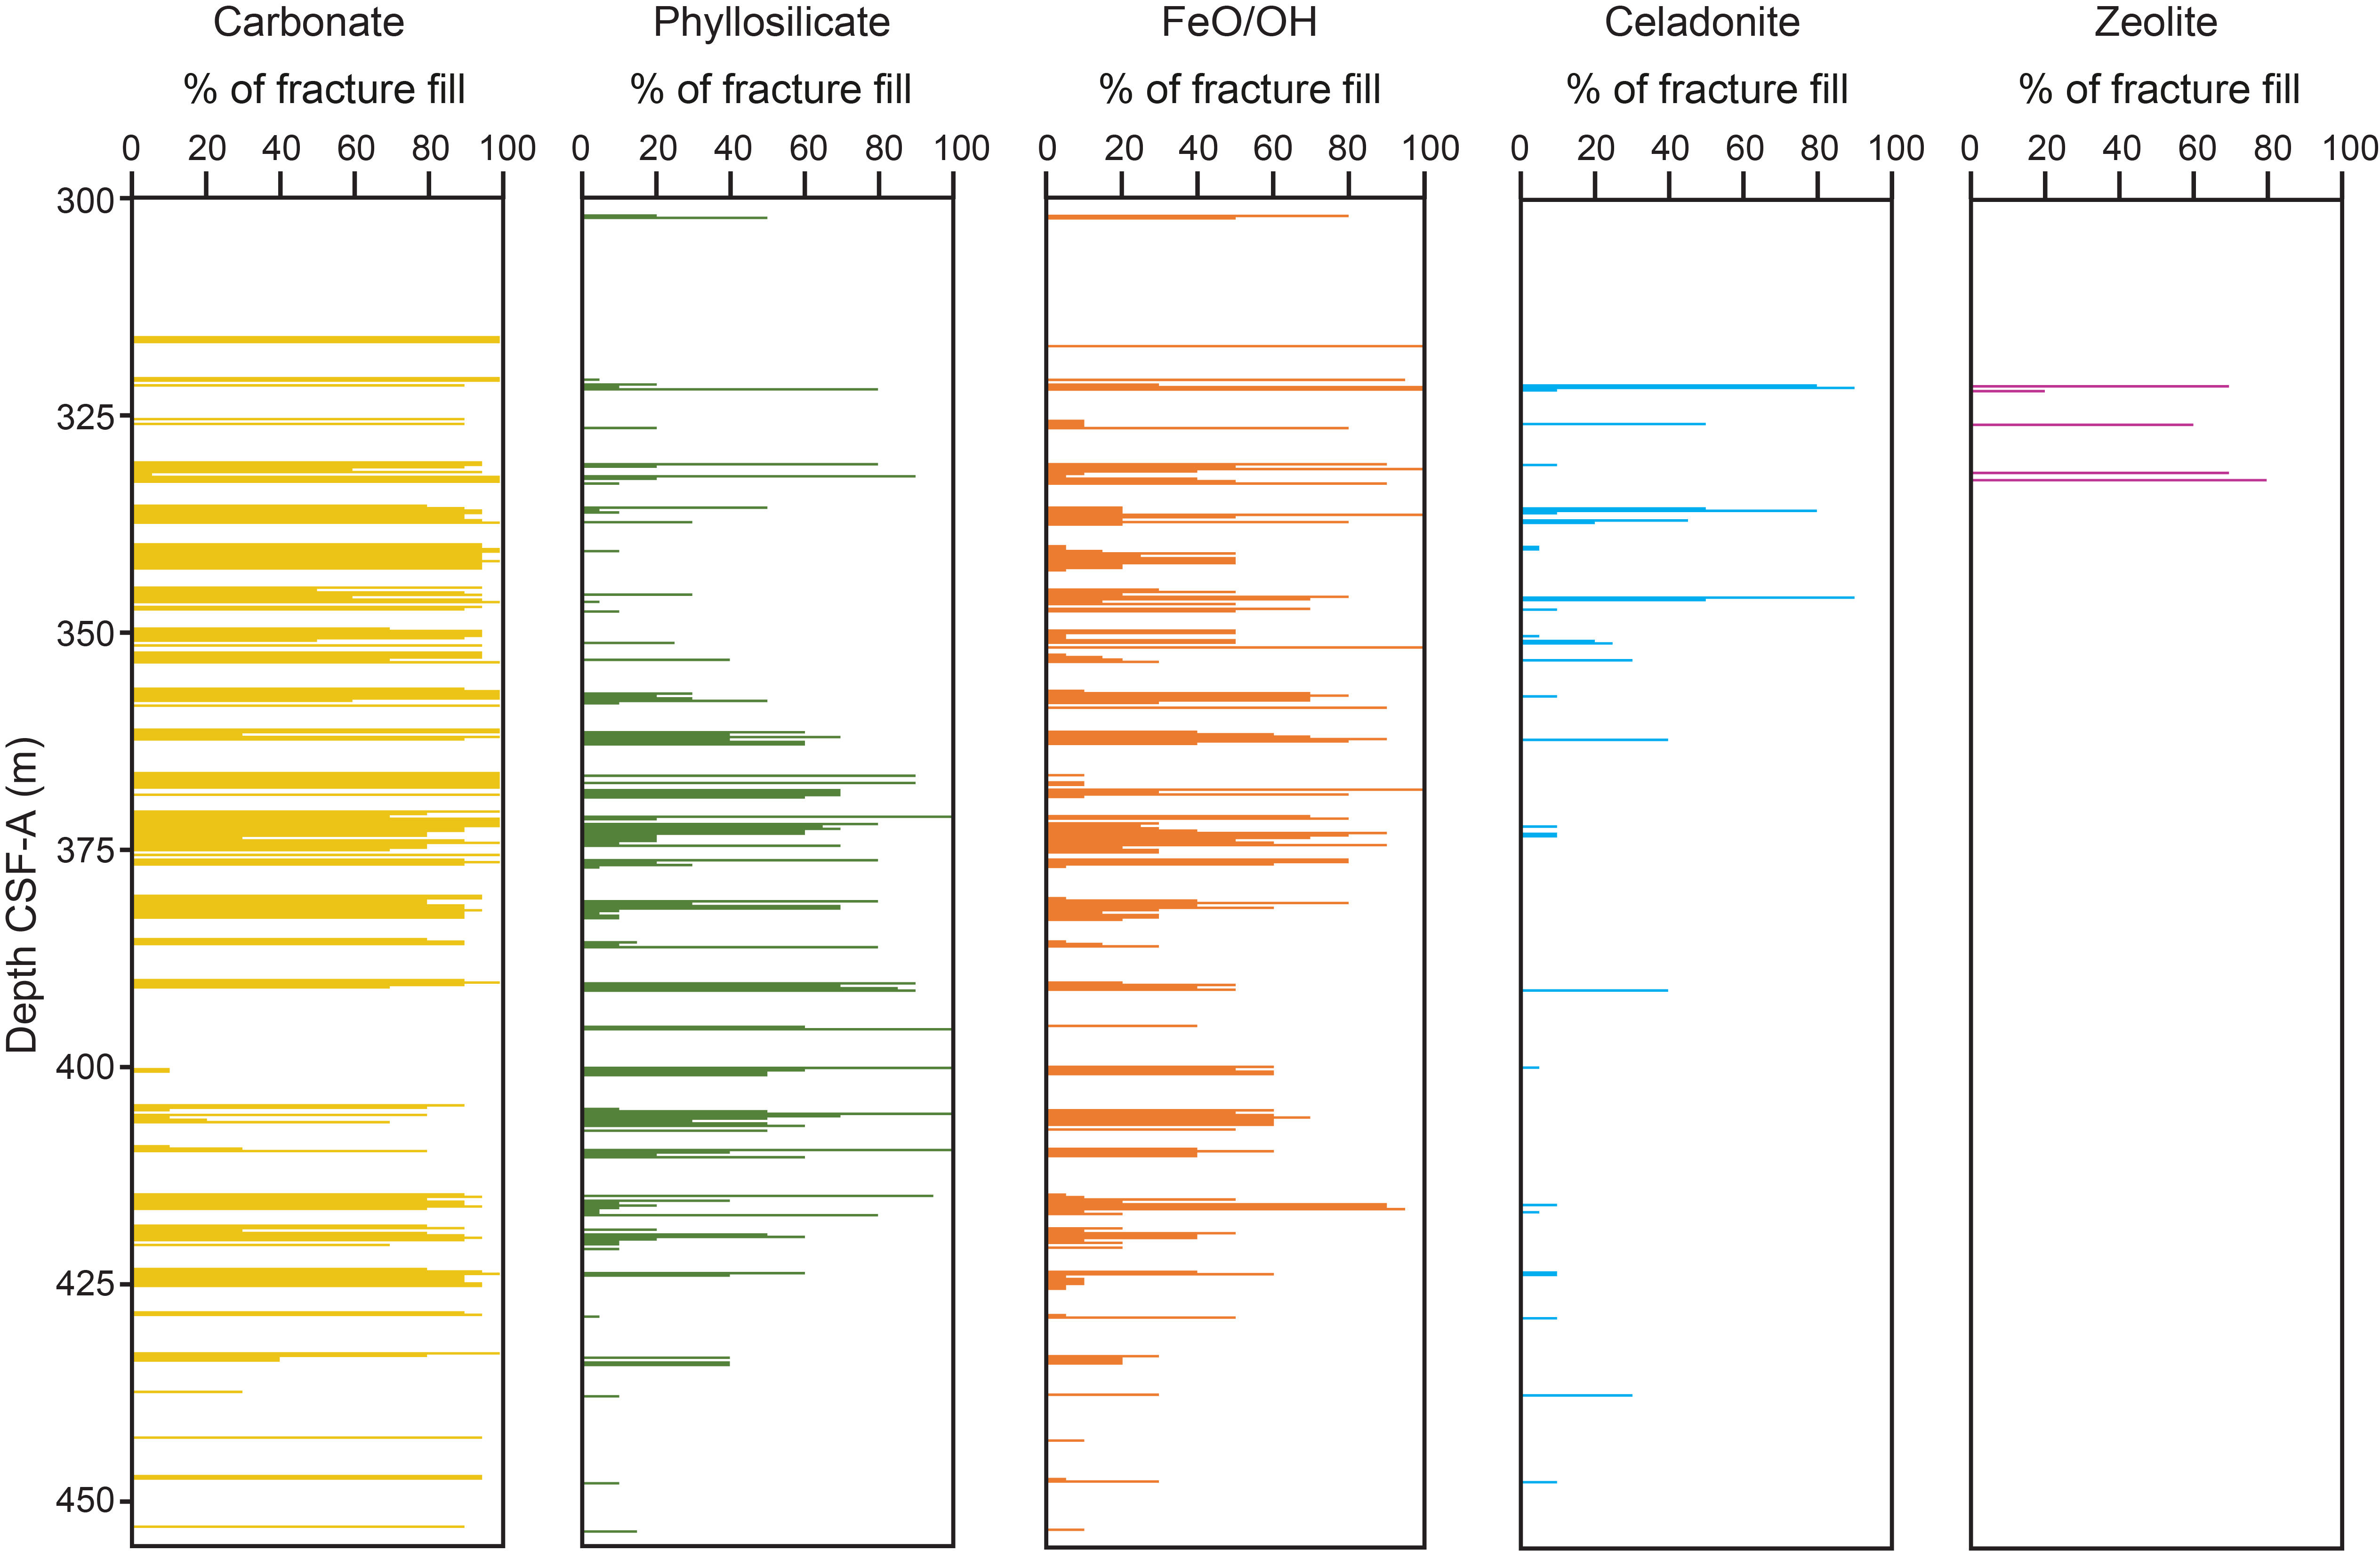
Figure F25. Percentage of mineral fill for individual fractures.
Peperite and altered carbonate sediment intervals show a later stage of brittle deformation resulting in the formation of carbonate veins, some of which show a globular texture. These carbonate veins commonly cut through the carbonate matrix around the basaltic fragments but occasionally cut through both (Figure F23B). At 389–413 m CSF-A, carbonate becomes less common in the fracture mineral assemblage, which contains more phyllosilicate + Fe-oxide/oxyhydroxide. This interval is associated with the less altered interval of pillow basalts.
Alteration halos with widths ranging 0.5–18 mm are marked by a range of color changes in the basalt host rock. Brown, pale green, and gray alteration halos highlight localized alteration around fractures to Fe-oxide/oxyhydroxides, celadonite, and clay minerals, respectively (Figure F26). Often, fracture alteration halos have colored borders, noted in Hole U1563B as pale gray (likely a clay rich border), brown (Fe-oxide/oxyhydroxide rich border), and pale green (likely a celadonite-rich border). The mineral fill of vesicles within these alteration halos is predominantly clay rich in the paler gray basalt and Fe-oxide/oxyhydroxide in the brown borders of the alteration halos.
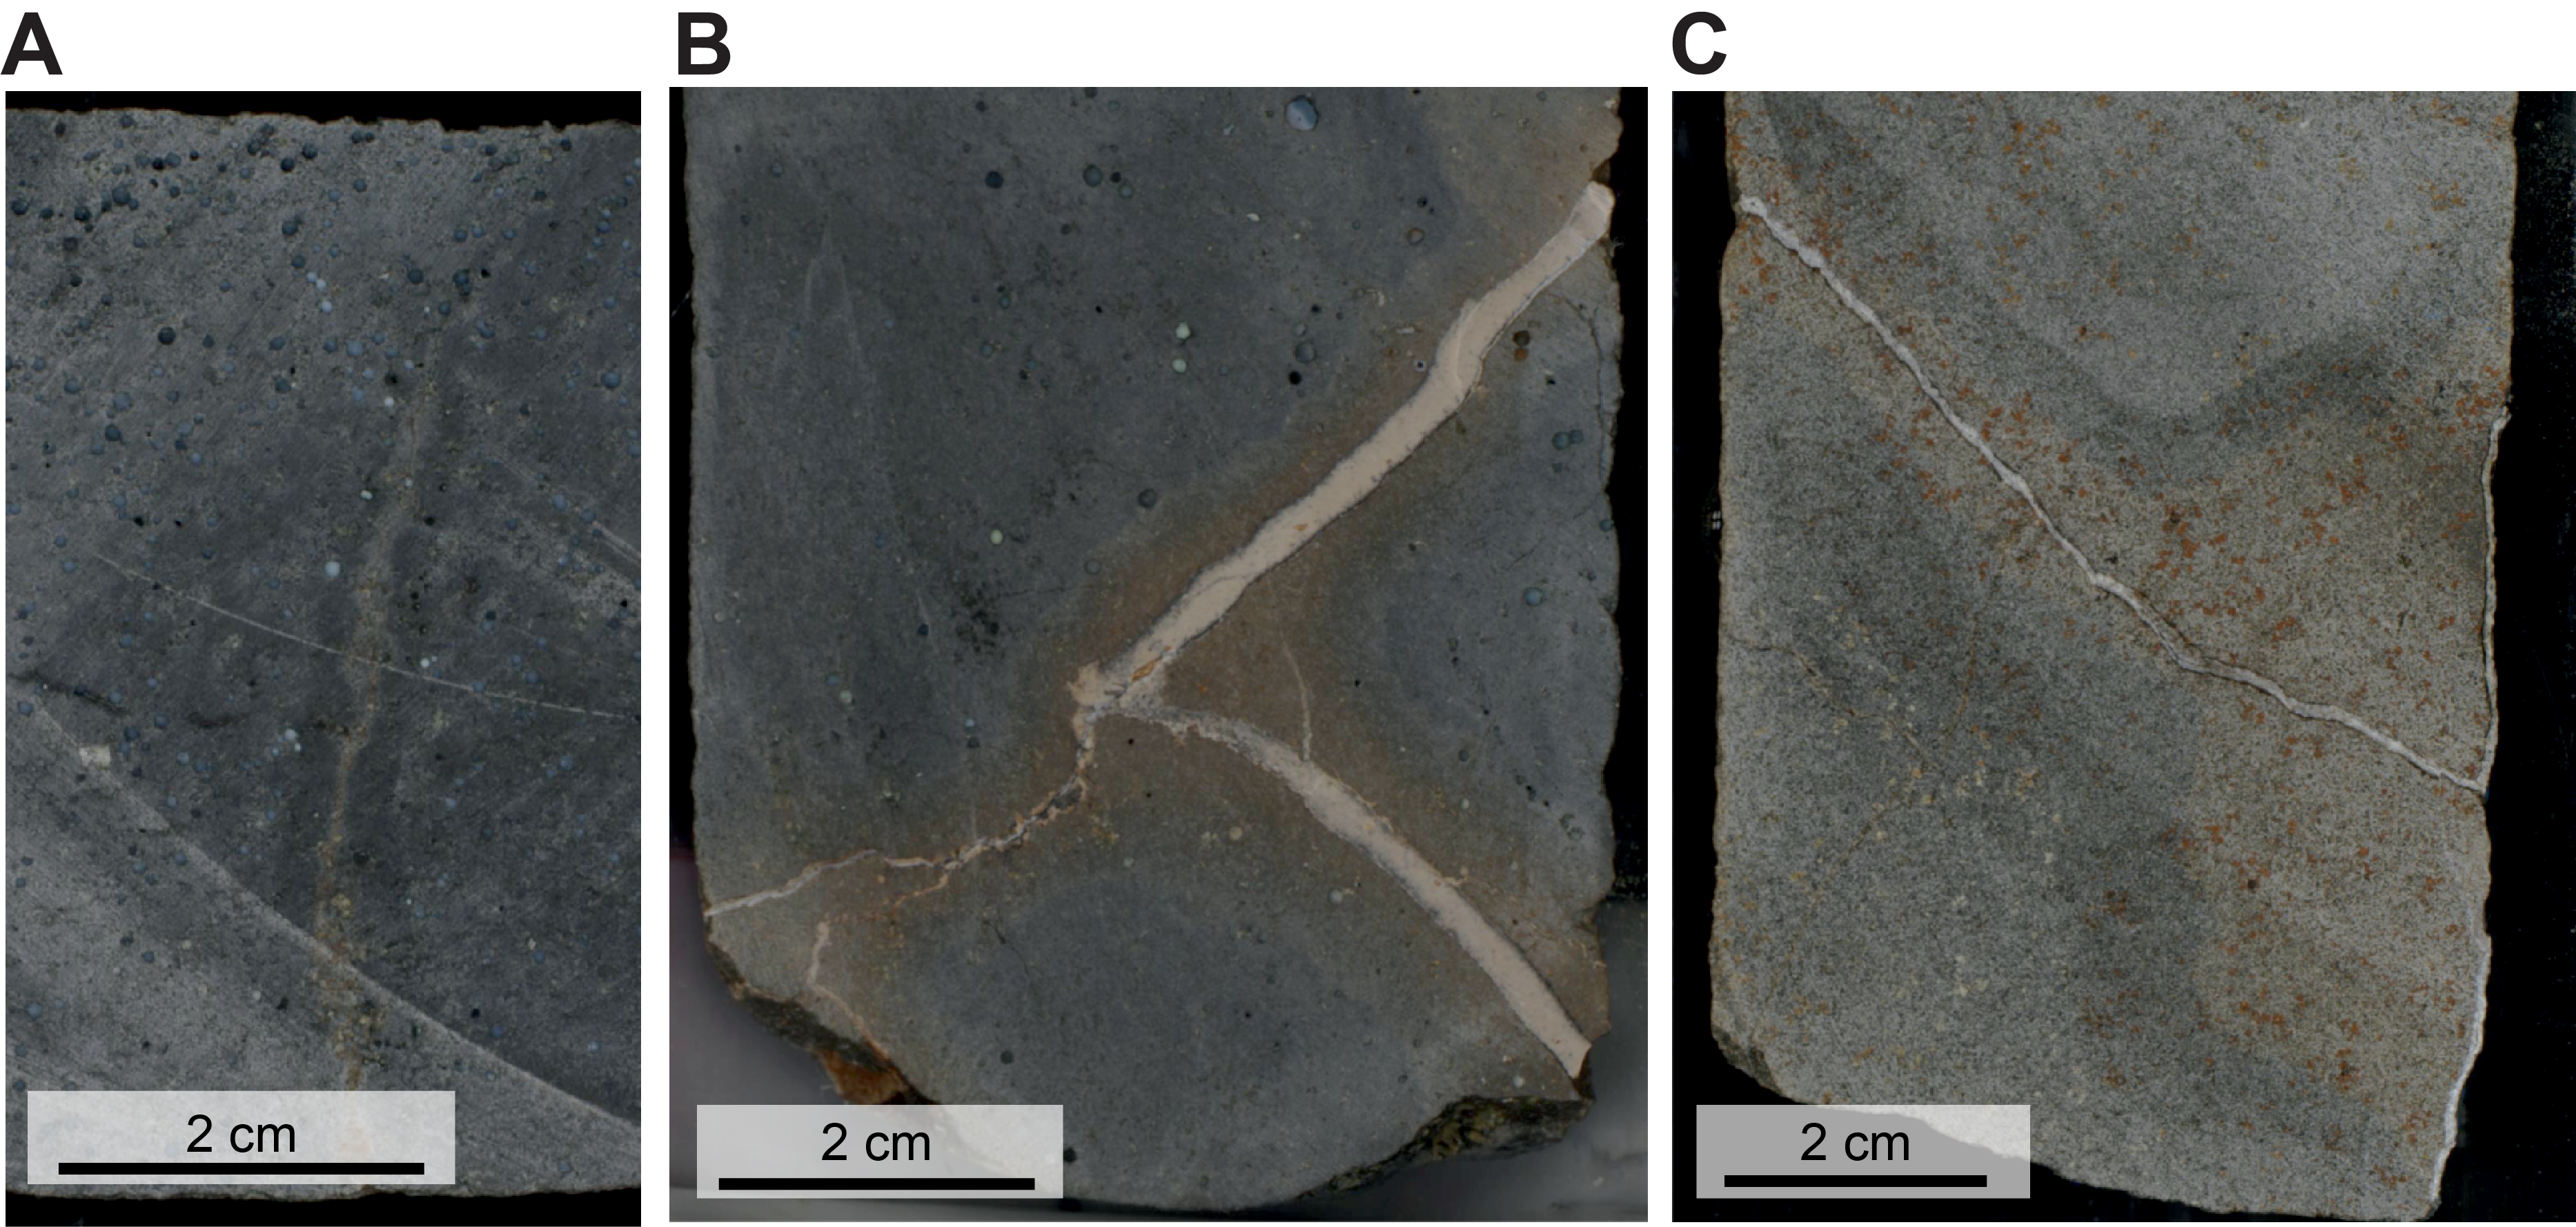
Figure F26. Fracture alteration halos.
6. Micropaleontology
A 327.6 m interval of lower Pliocene to upper Pleistocene silty clay was recovered in Hole 395C-U1563A, which was cored using the APC and XCB systems. Calcareous nannofossils and planktonic foraminifers are present with moderate to high abundances in most samples studied, although there are some barren intervals.
6.1. Calcareous nannofossils
A total of 35 core catcher samples were studied for calcareous nannofossils from Hole U1563A. Observations were undertaken using plane- and cross-polarized light. A list of calcareous nannofossil bioevents is provided in Table T6. Calcareous nannofossils are present in most samples, ranging from common to dominant abundance and with moderate preservation. The preservation of calcareous nannofossils is best in the upper part of the succession in Samples 395C-U1563A-1H-CC (7.41 m CSF-A) through 8H-CC (74.37 m CSF-A). Three samples are barren or contain very few nannofossils: Samples 15H-CC (140.85 m CSF-A), 16H-CC (150.28 m CSF-A), and 24F-CC (211.66 m CSF-A).
In the Pleistocene succession above Sample 395C-U1563A-12H-CC (112.26 m CSF-A), Gephyrocapsa species are consistently present, becoming dominant in Samples 6H-CC (55.28 m CSF-A) and 10H-CC (93.52 m CSF-A). Other common taxa include Calcidiscus spp., Pseudoemiliania spp., Helicosphaera spp., and Pontosphaera spp.; Coccolithus pelagicus is consistently present to abundant except in the interval between Samples 5H-CC (45.83 m CSF-A) and 9H-CC (83.86 m CSF-A). Below the barren (or with very few nannofossils) interval in Samples 15H-CC (140.85 m CSF-A) through 16H-CC (150.28 m CSF-A), species of the genus Reticulofenestra are common to abundant to the base of the hole. Calcidiscus macintyrei is consistently present in the samples between the two barren intervals in Samples 16H-CC (150.28 m CSF-A) and 24F-CC (211.66 m CSF-A).
Two Pleistocene biozones were identified, defined by the following biohorizons: base Emiliania huxleyi (0.29 Ma; base NN21) between Samples 395C-U1563A-1H-CC (7.41 m CSF-A) and 2H-CC (17.26 m CSF-A) and top Pseudoemiliania lacunosa (0.43 Ma; base NN20) between Samples 2H-CC (17.26 m CSF-A) and 3H-CC (26.79 m CSF-A) (Table T6). Top Reticulofenestra pseudoumbilicus (3.82 Ma) defines the base of undifferentiated Biozones NN16–NN19 between Samples 42F-CC (295.86 m CSF-A) and 44F-CC (305.39 m CSF-A) and constrains the base of the hole to be older than 3.82 Ma.
6.2. Planktonic foraminifers
A total of 18 samples were studied for planktonic foraminifers from Hole U1563A, including one from the mudline. Planktonic foraminifers are a dominant or abundant component of most samples examined except intervals where quartz grains accompanied by frequent rock fragments dominate, which are interpreted as glaciogenic deposits. Preservation is excellent in the interval from the core top to Sample 5H-CC (45.83 m CSF-A), mostly very good to Sample 36F-CC (267.18 m CSF-A), and good to the lowermost sample examined, Sample 48X-CC (324.43 m CSF-A). A list of planktonic foraminifer bioevents is provided in Table T7. Light microscope images of all residues can be downloaded from the Laboratory Information Management System (LIMS) database.
Sample 395C-U1563A-1H-1, 0 cm (mudline), contains a typical Holocene assemblage dominated by Globigerina bulloides and related species in the absence of Neogloboquadrina pachyderma. Rare pink specimens of Globoturborotalita rubescens were observed. Sinistral encrusted N. pachyderma is common to dominant in Samples 1H-CC (7.41 m CSF-A) through 13H-CC (122.02 m CSF-A), which are therefore assigned to the N. pachyderma partial range zone. The lowest occurrence of Globoconella inflata (2.06 Ma), marking the base of the G. inflata lowest occurrence zone, was found between Samples 14H-CC (131.21 m CSF-A) and 16H-CC (150.28 m CSF-A).
Three tentatively identified examples of Neogloboquadrina atlantica, two of which are iron stained, were found in the large residue of Sample 395C-U1563A-17H-CC (159.84 m CSF-A). These specimens are interpreted as reworked because elsewhere in the area, N. atlantica is abundant immediately prior to its extinction. The top occurrence of N. atlantica (2.26 Ma), which marks the base of the G. bulloides partial range zone, is therefore placed between Samples 17H-CC (159.84 m CSF-A) and 18H-CC (169.28 m CSF-A). Sinistral N. atlantica is common to dominant in most samples from there to the bottom of the hole.
Base Globoconella puncticulata, which marks the base of the G. puncticulata/N. atlantica concurrent range zone, occurs between Samples 395C-U1563A-44F-CC (305.39 m CSF-A) and 46F-CC (315.13 m CSF-A), suggesting that the oldest sediments at the site are >4.54 Ma. In locating this biohorizon, it is important to distinguish the marker species from Globorotalia crassaformis, which at this site extends a little lower to between Samples 46F-CC (315.13 m CSF-A) and 48X-CC (324.43 m CSF-A). These latter two samples are assigned to the Globorotalia cibaoensis zone because they are below the base of G. puncticulata, although the marker species was not observed at this site.
7. Physical properties
A range of whole-round, section-half, and discrete sample physical properties were measured on ~335 m of sediment core recovered from Hole 395C-U1563A and ~44.4 m of basement core recovered from Hole 395C-U1563B (Table T8). Physical properties data were cleaned for half the response function corresponding to the instruments at the top and bottom of each section, and values deemed artifacts were removed from the respective figures (Table T9). All raw data are retained in the LIMS database.
7.1. Whole-round measurements
Figures F27 and F28 summarize whole-round physical properties measurements collected using the Whole-Round Multisensor Logger (WRMSL) and the Natural Gamma Radiation Logger (NGRL) for core from Holes U1563A and U1563B, respectively. Gamma ray attenuation (GRA) bulk density, MS, and NGR measurements show a distinct difference between the sediment and basement cores. Density values within the sediment core average ~1.5 g/cm3, and basement core density ranges 2.0–2.5 g/cm3. WRMSL bulk density measurements for Hole U1563A are consistent with moisture and density (MAD) measurements from discrete sediment samples. Sediment core density shows a gradual increase from ~1.4 g/cm3 at the top of Hole U1563A to ~1.6 g/cm3 at about 200 m CSF-A, and meter-scale fluctuations are found throughout this depth interval. Below 200 m CSF-A, density decreases slightly (to ~1.5 g/cm3) before increasing again, reaching values as high as ~1.8 g/cm3 in the lowermost sediment interval. GRA bulk density measurements from basalt in Hole U1563B are invariant with depth, ranging 2.0–2.7 g/cm3.
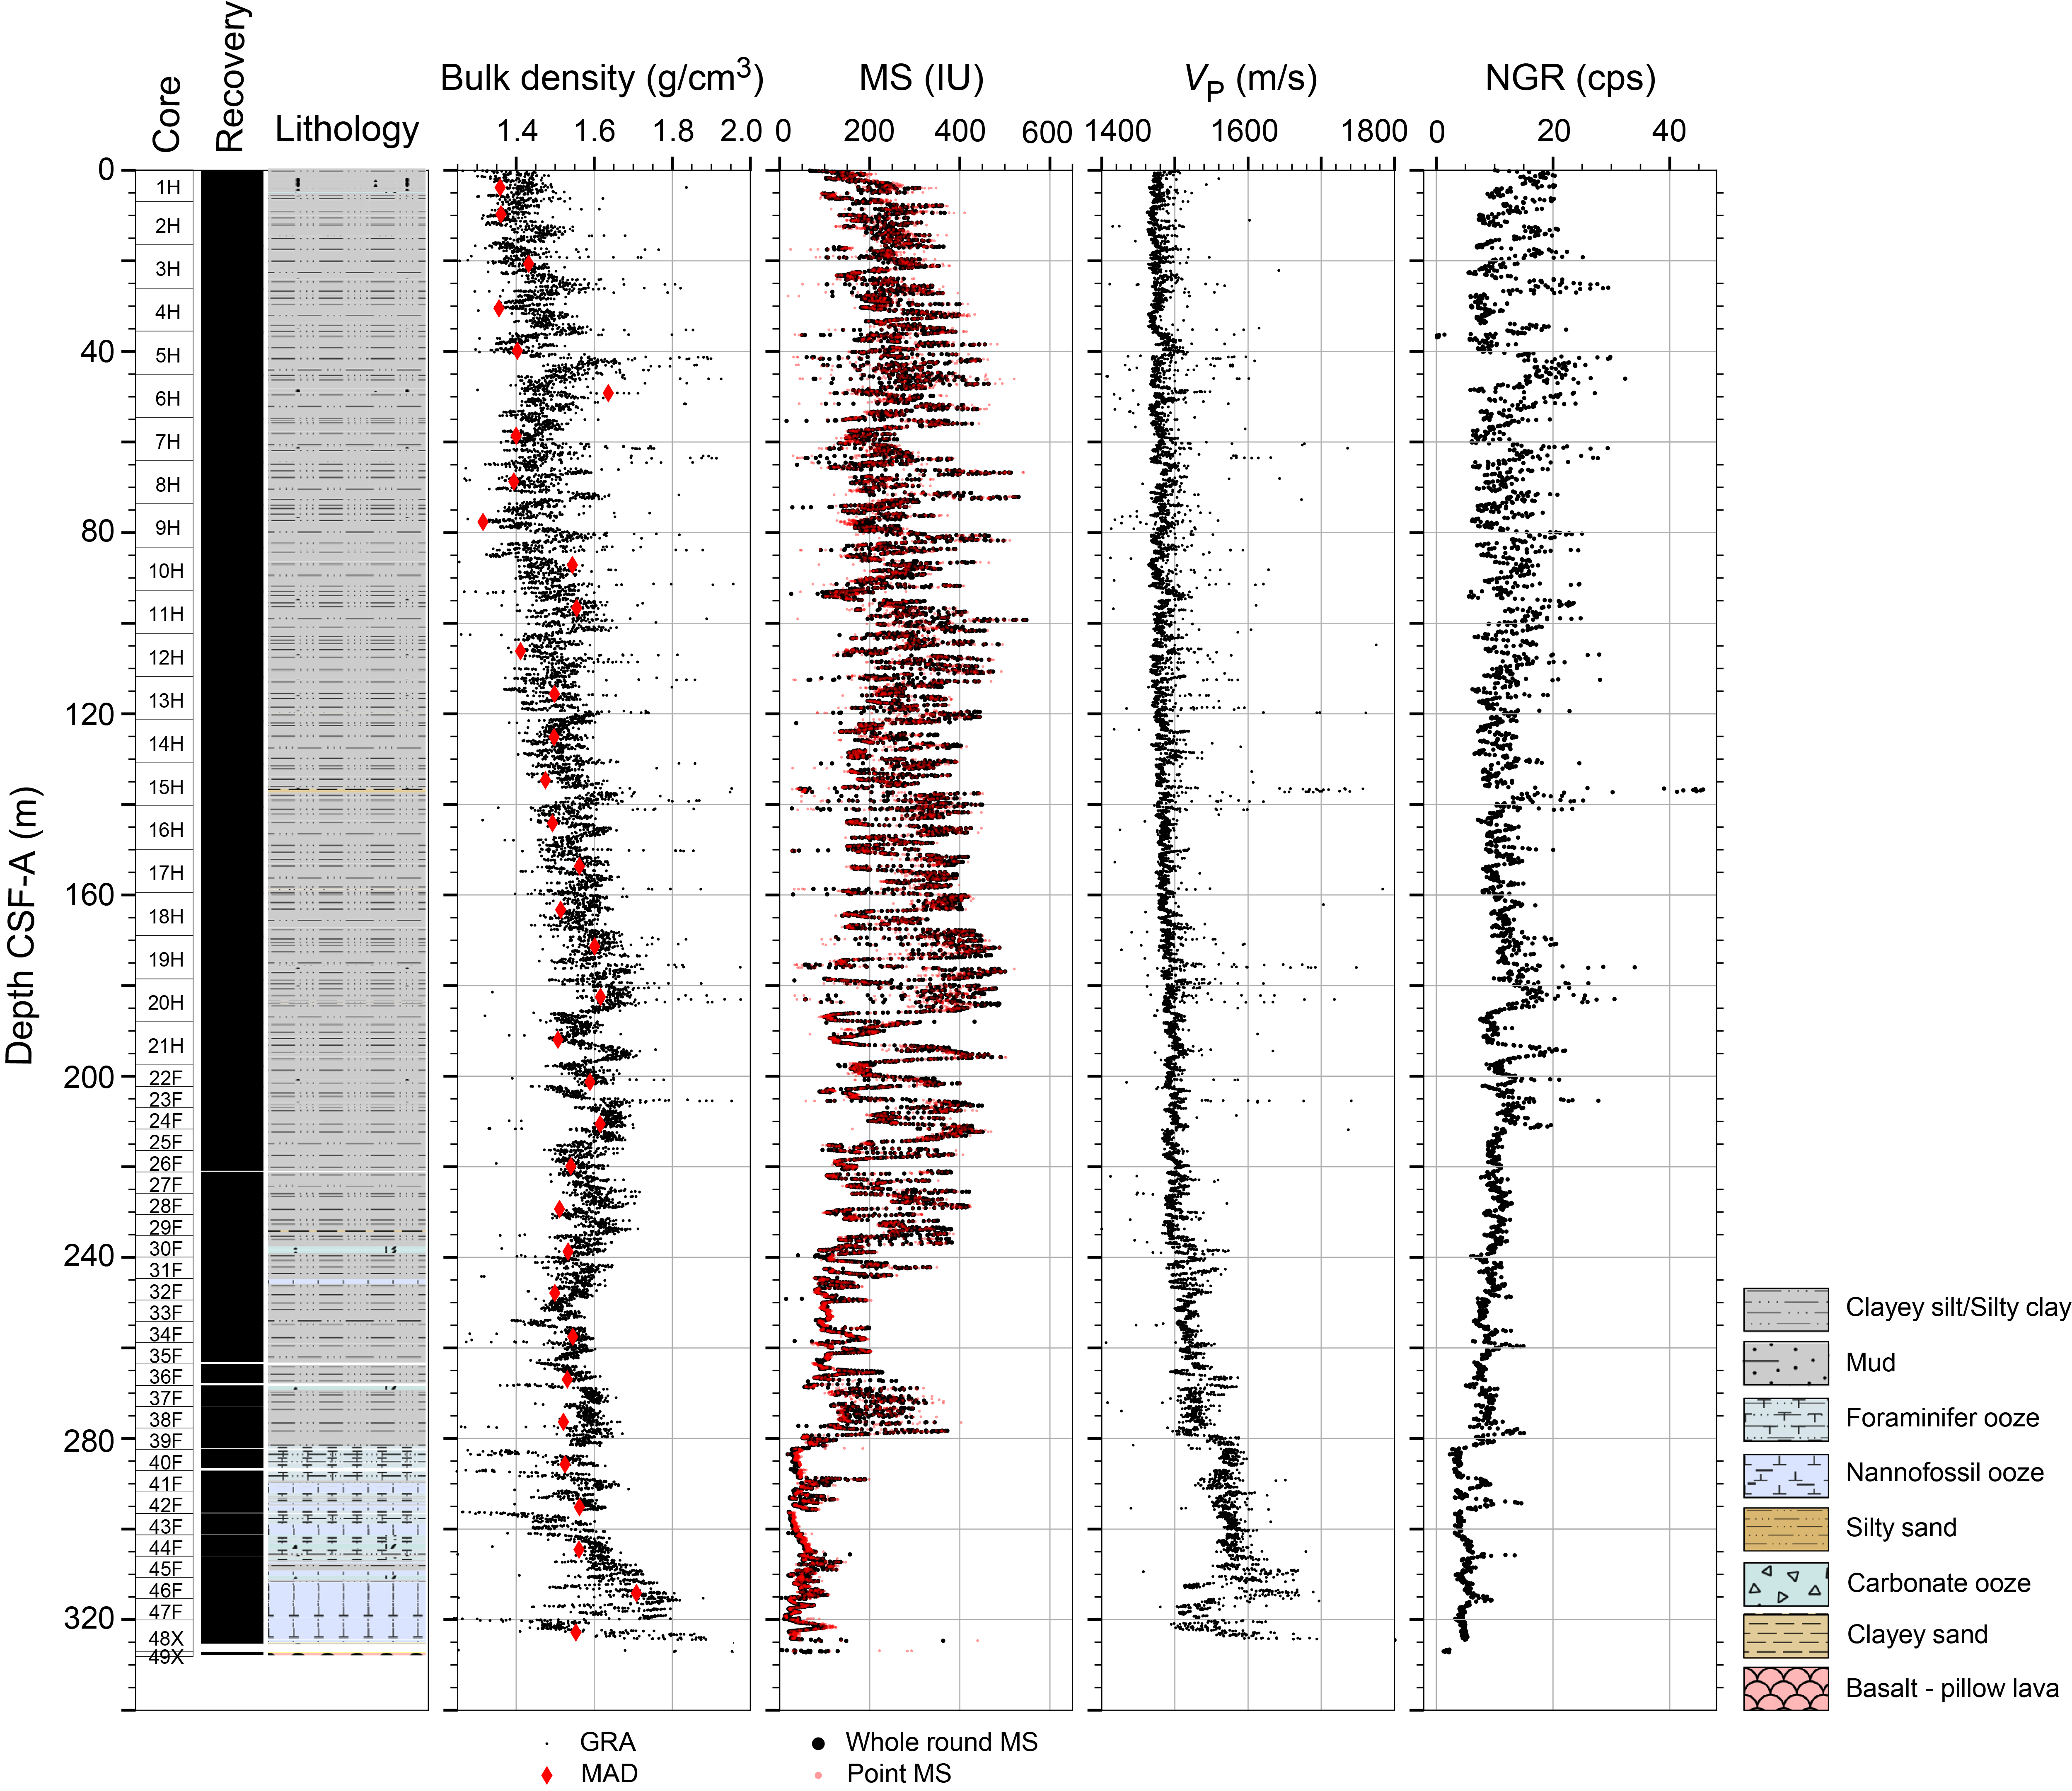
Figure F27. Physical properties measurements, Hole U1563A.
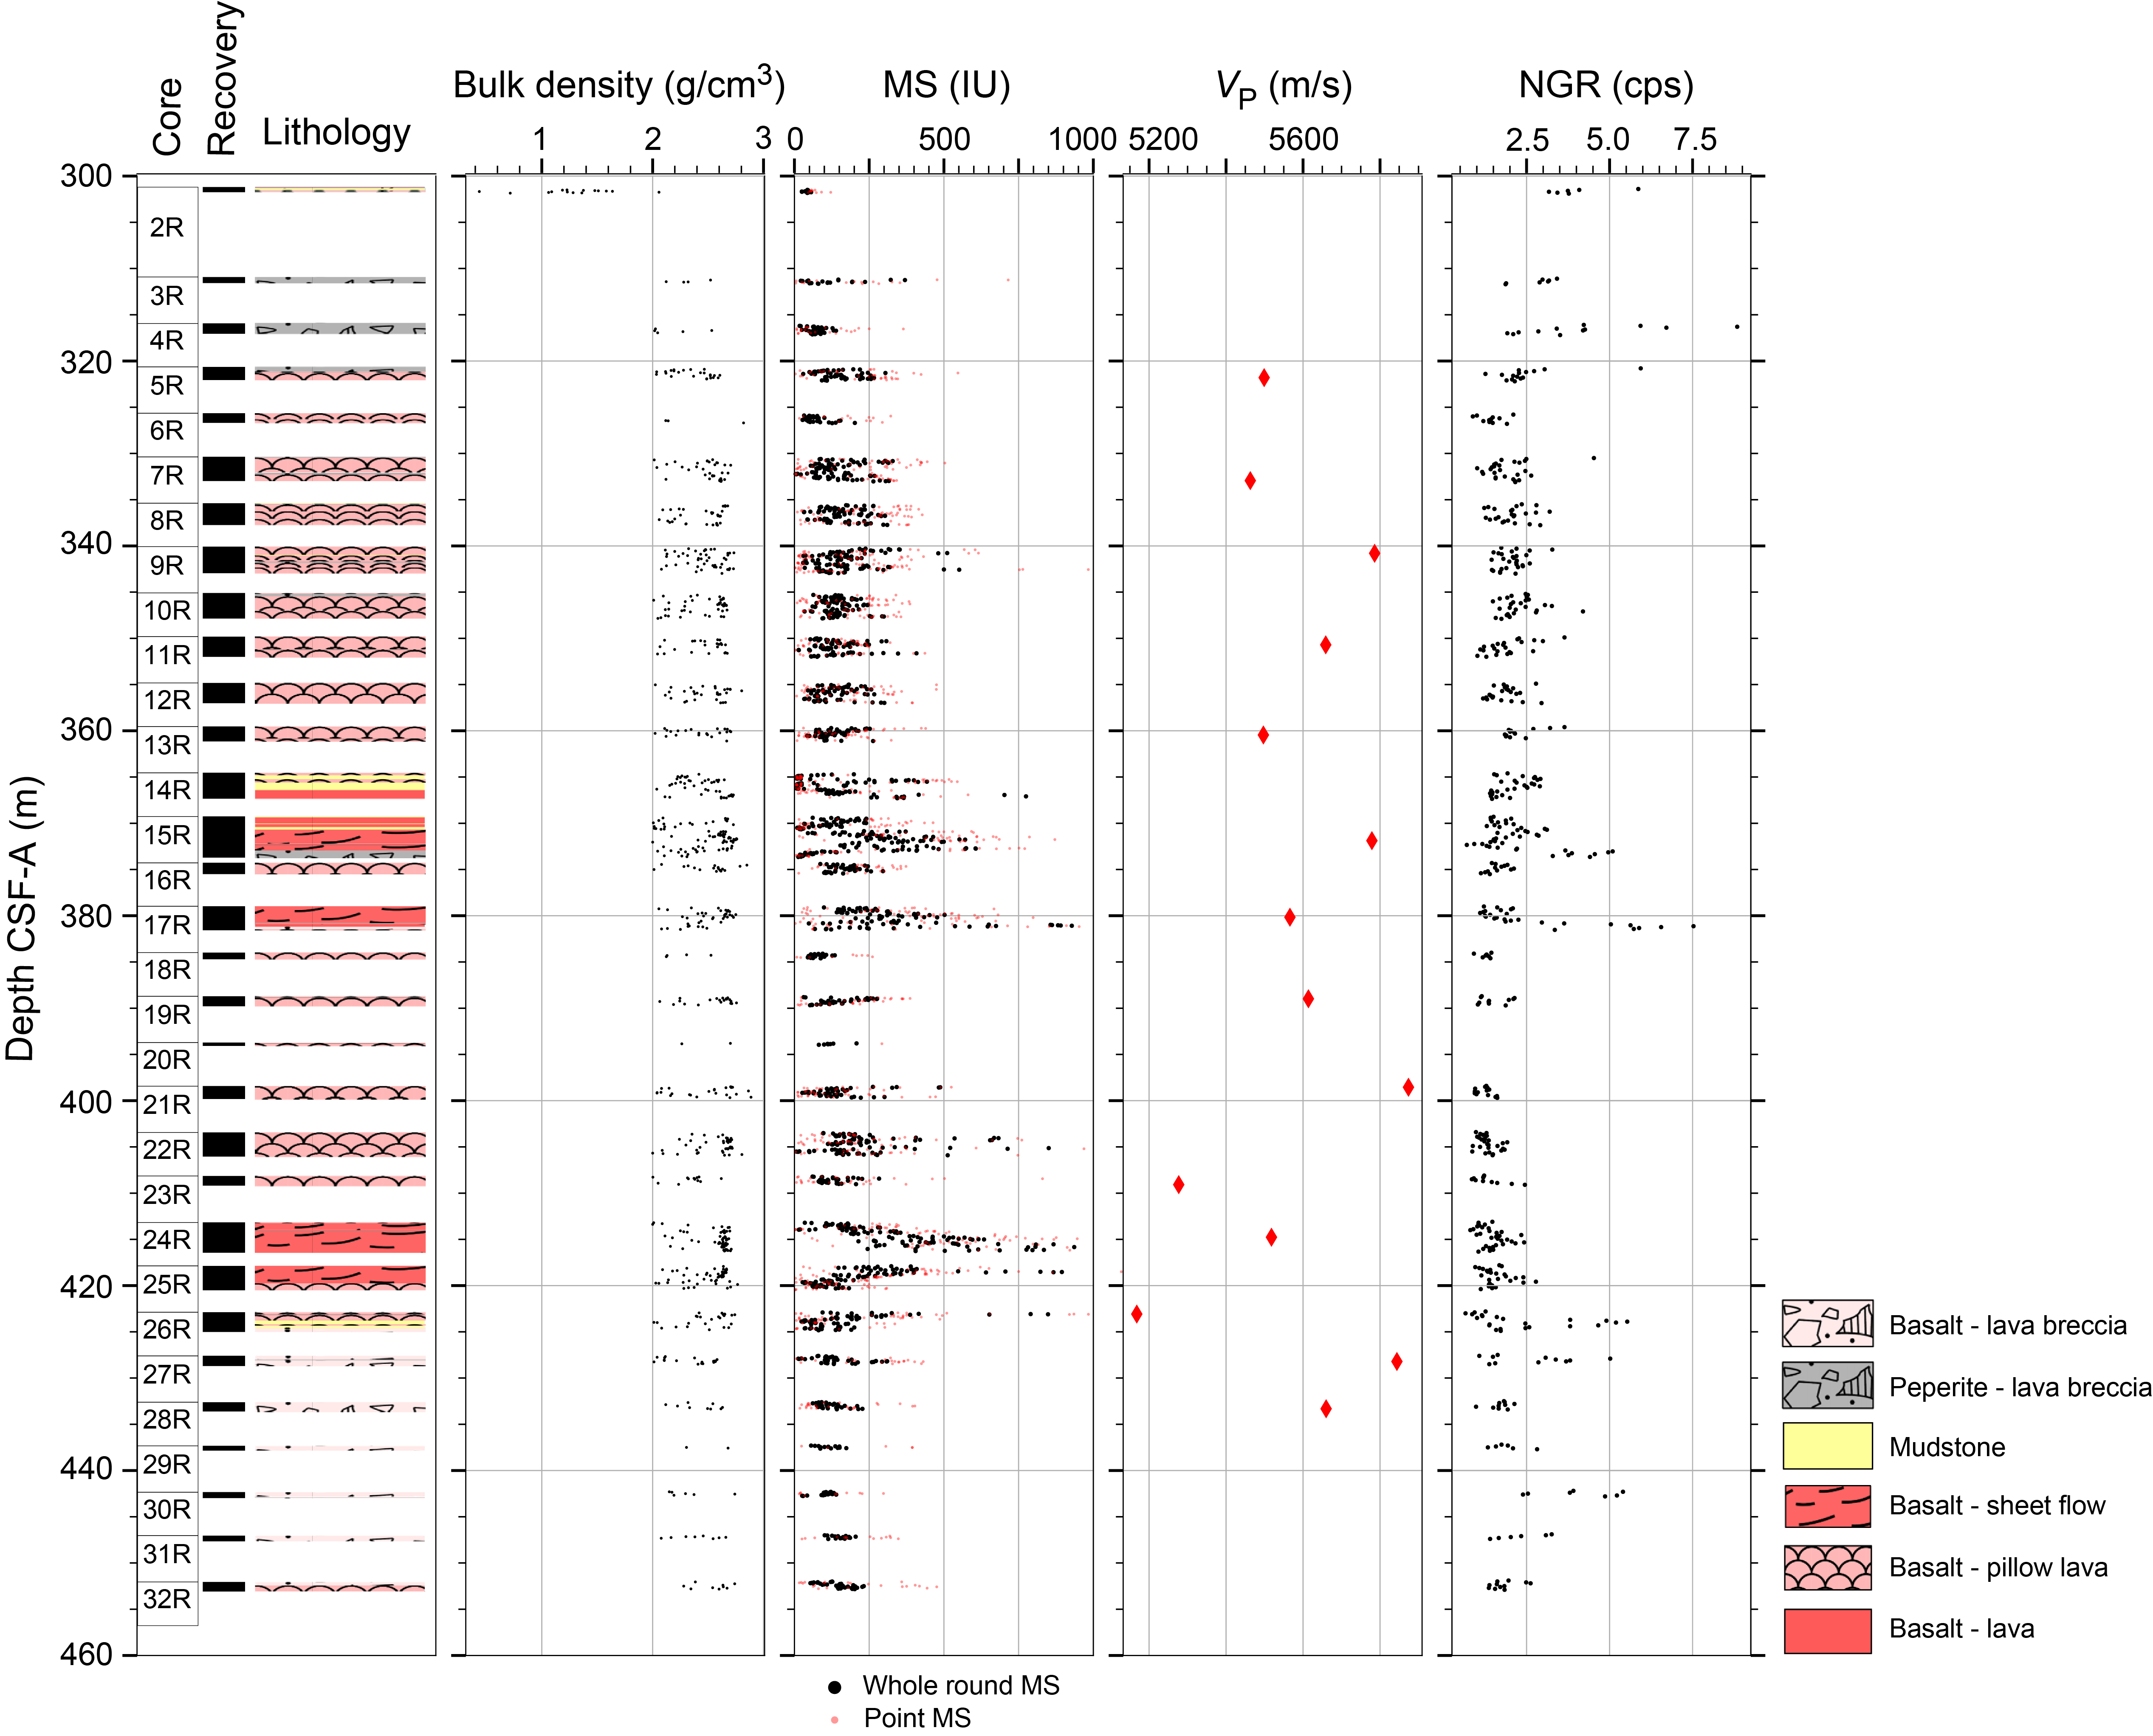
Figure F28. Physical properties measurements, Hole U1563B.
MS measured on Hole U1563A sedimentary cores ranges ~100–500 IU and shows meter-scale variability between 0 and 280 m CSF-A with amplitudes as high as ~200 IU. At ~280 m CSF-A, MS decreases to <100 IU and displays less variability. MS measured on basalt from Hole U1563B shows values typically <250 IU. However, certain depth intervals show large peaks in MS, as high as ~1000 IU. Comparison with petrological classification of these cores shows these high excursions in MS are associated with basaltic sheet flows (see Igneous petrology).
WRMSL P-wave velocity (VP) measurements of the sediment core from Hole U1563A (PWL in Table T8) show a gradual increase with depth from around 1475 to ~1540 m/s from the top of the hole to ~280 m CSF-A. At ~280 m CSF-A, VP shows a stepped increase to ~1575 m/s, below which there is little variability to ~310 m CSF-A. Deeper than 310 m CSF-A, VP varies at the meter scale between 1500 and 1700 m/s. This lower sediment interval is also characterized by higher bulk density and lower MS and NGR compared to the intervals above. WRMSL VP measurements were not acquired for the basement core from Hole U1563B because the recovered material did not fully fill the core liner, which precluded accurate measurement of this physical property with this equipment. Comparison between the Hole U1563A WRMSL MS data and the downhole logging MS measurements (see Downhole measurements) shows comparable relative variations to ~280 m CSF-A, below which the downhole logging MS values start to increase in contrast to the consistent decreased values measured on core with the WRMSL (Figure F29). This offset may be explained by the reduction in borehole diameter as shown by the caliper profile, causing the MS sensor to be closer to the borehole wall and increasing the intensity of the signal (see Downhole measurements).
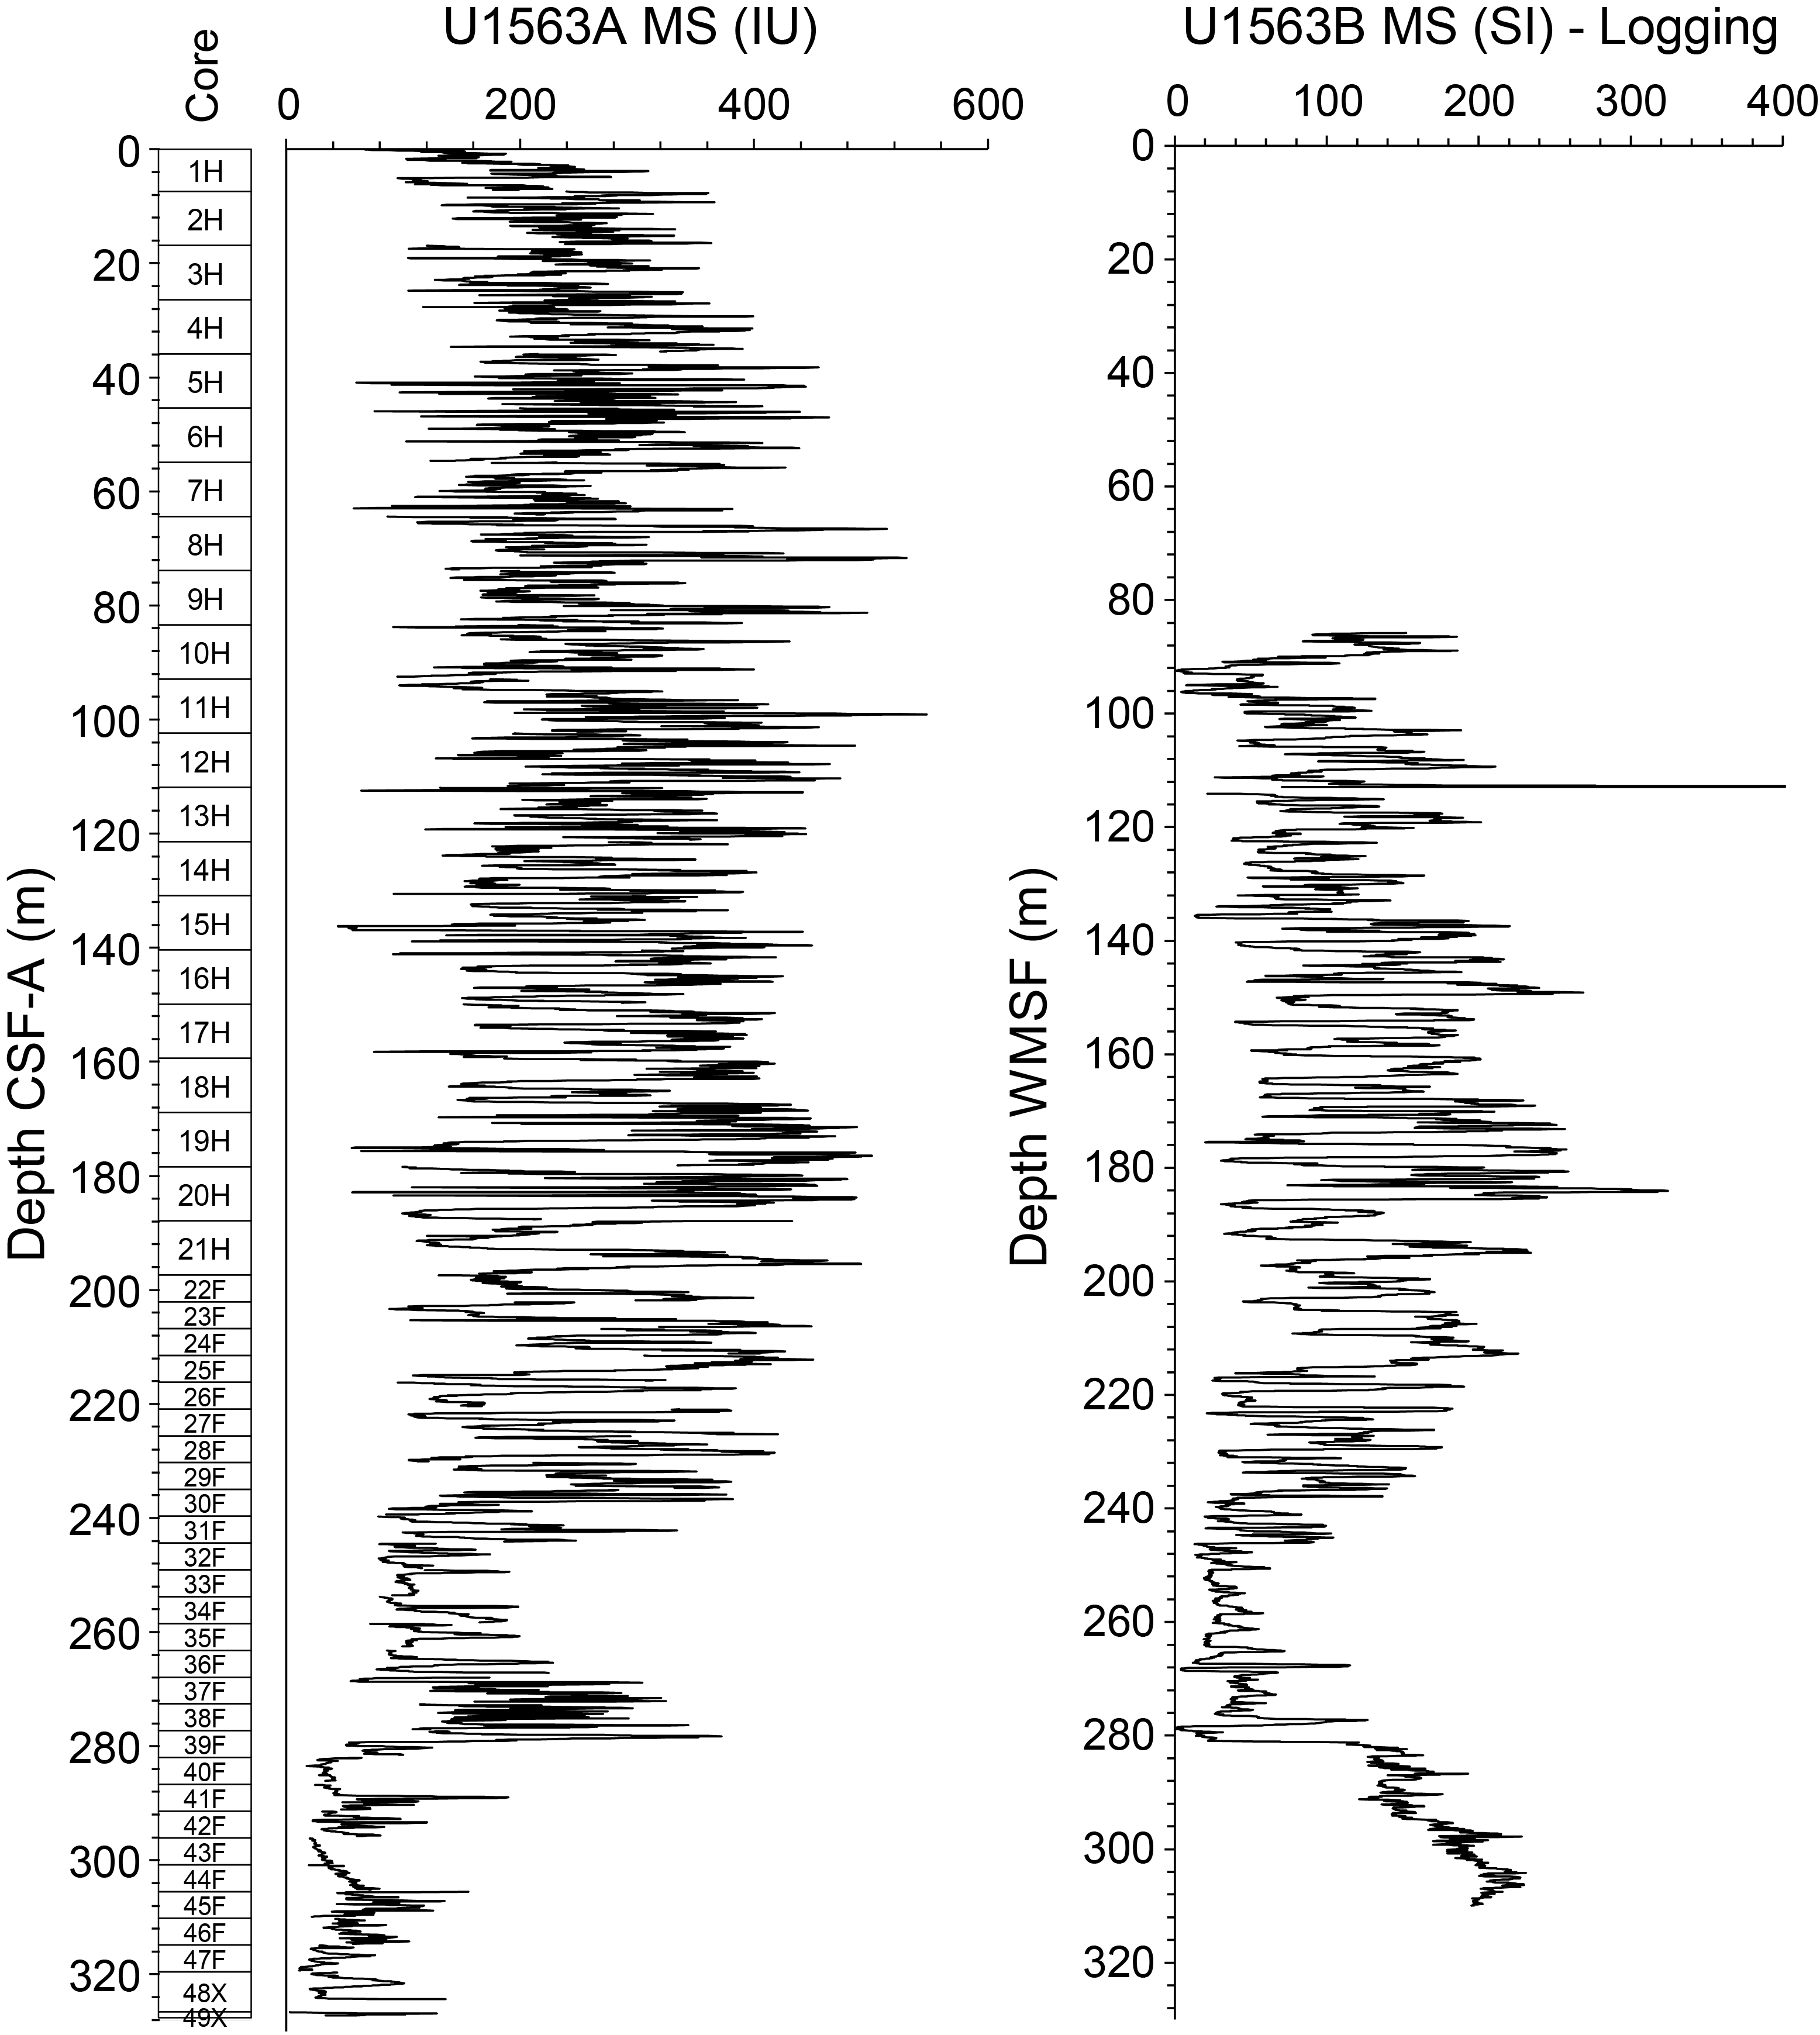
Figure F29. WRMSL MS vs. downhole logging MS.
Between 0 and ~200 m CSF-A, NGR measurements on sediment cores from Hole U1563A fluctuate through meter-scale cycles between 5 and 25 counts/s in a pattern similar to that shown by the MS measurements. From ~200 to 280 m CSF-A, NGR values gradually decrease from ~15 to ~10 counts/s with muted variability. A sharp decrease is found in NGR below ~280 m CSF-A to around 5 counts/s, with a few short increases to the bottom of Hole U1563A. NGR measured on the basalt cores in Hole U1563B are <2.5 counts/s for most of the hole. These predominantly low NGR values, and the low MS values reported for basement core, may be due to the presence of voids or space around core rubble. In some basement intervals, NGR is higher (up to ~8 counts/s), and these more elevated values seem to correspond to either sheet flow basalts, peperite intervals, or altered carbonate sediment intervals in Hole U1563B (see Igneous petrology).
In summary, whole-round measurements show distinct changes in all properties below 280 m CSF-A, and in density and VP at ~305 m CSF-A. From 0 to 240 m CSF-A, density, MS, and NGR properties show synchronous cyclical variation. A notable feature in sediment cores from Hole U1563A is the occurrence of several coarser layers that contain coral fragments (see Lithostratigraphy), which exhibit lower density and MS and higher NGR, VP, and a* values compared to the surrounding sediment.
7.2. Section-half measurements
Figures F30 and F31 summarize the reflectance and colorimetry data collected on the archive halves measured using the Section Half Multisensor Logger (SHMSL) for Holes U1563A and U1563B, respectively. The point MS (MSP) data from Holes U1563A and U1563B are displayed in Figures F27 and F28, respectively, alongside the corresponding WRMSL MS data. Both whole-round and section-half MS measurements show the same relative variations in both holes, although the MSP values measured on basement section halves appear to have slightly higher values than those measured on whole-round sections.
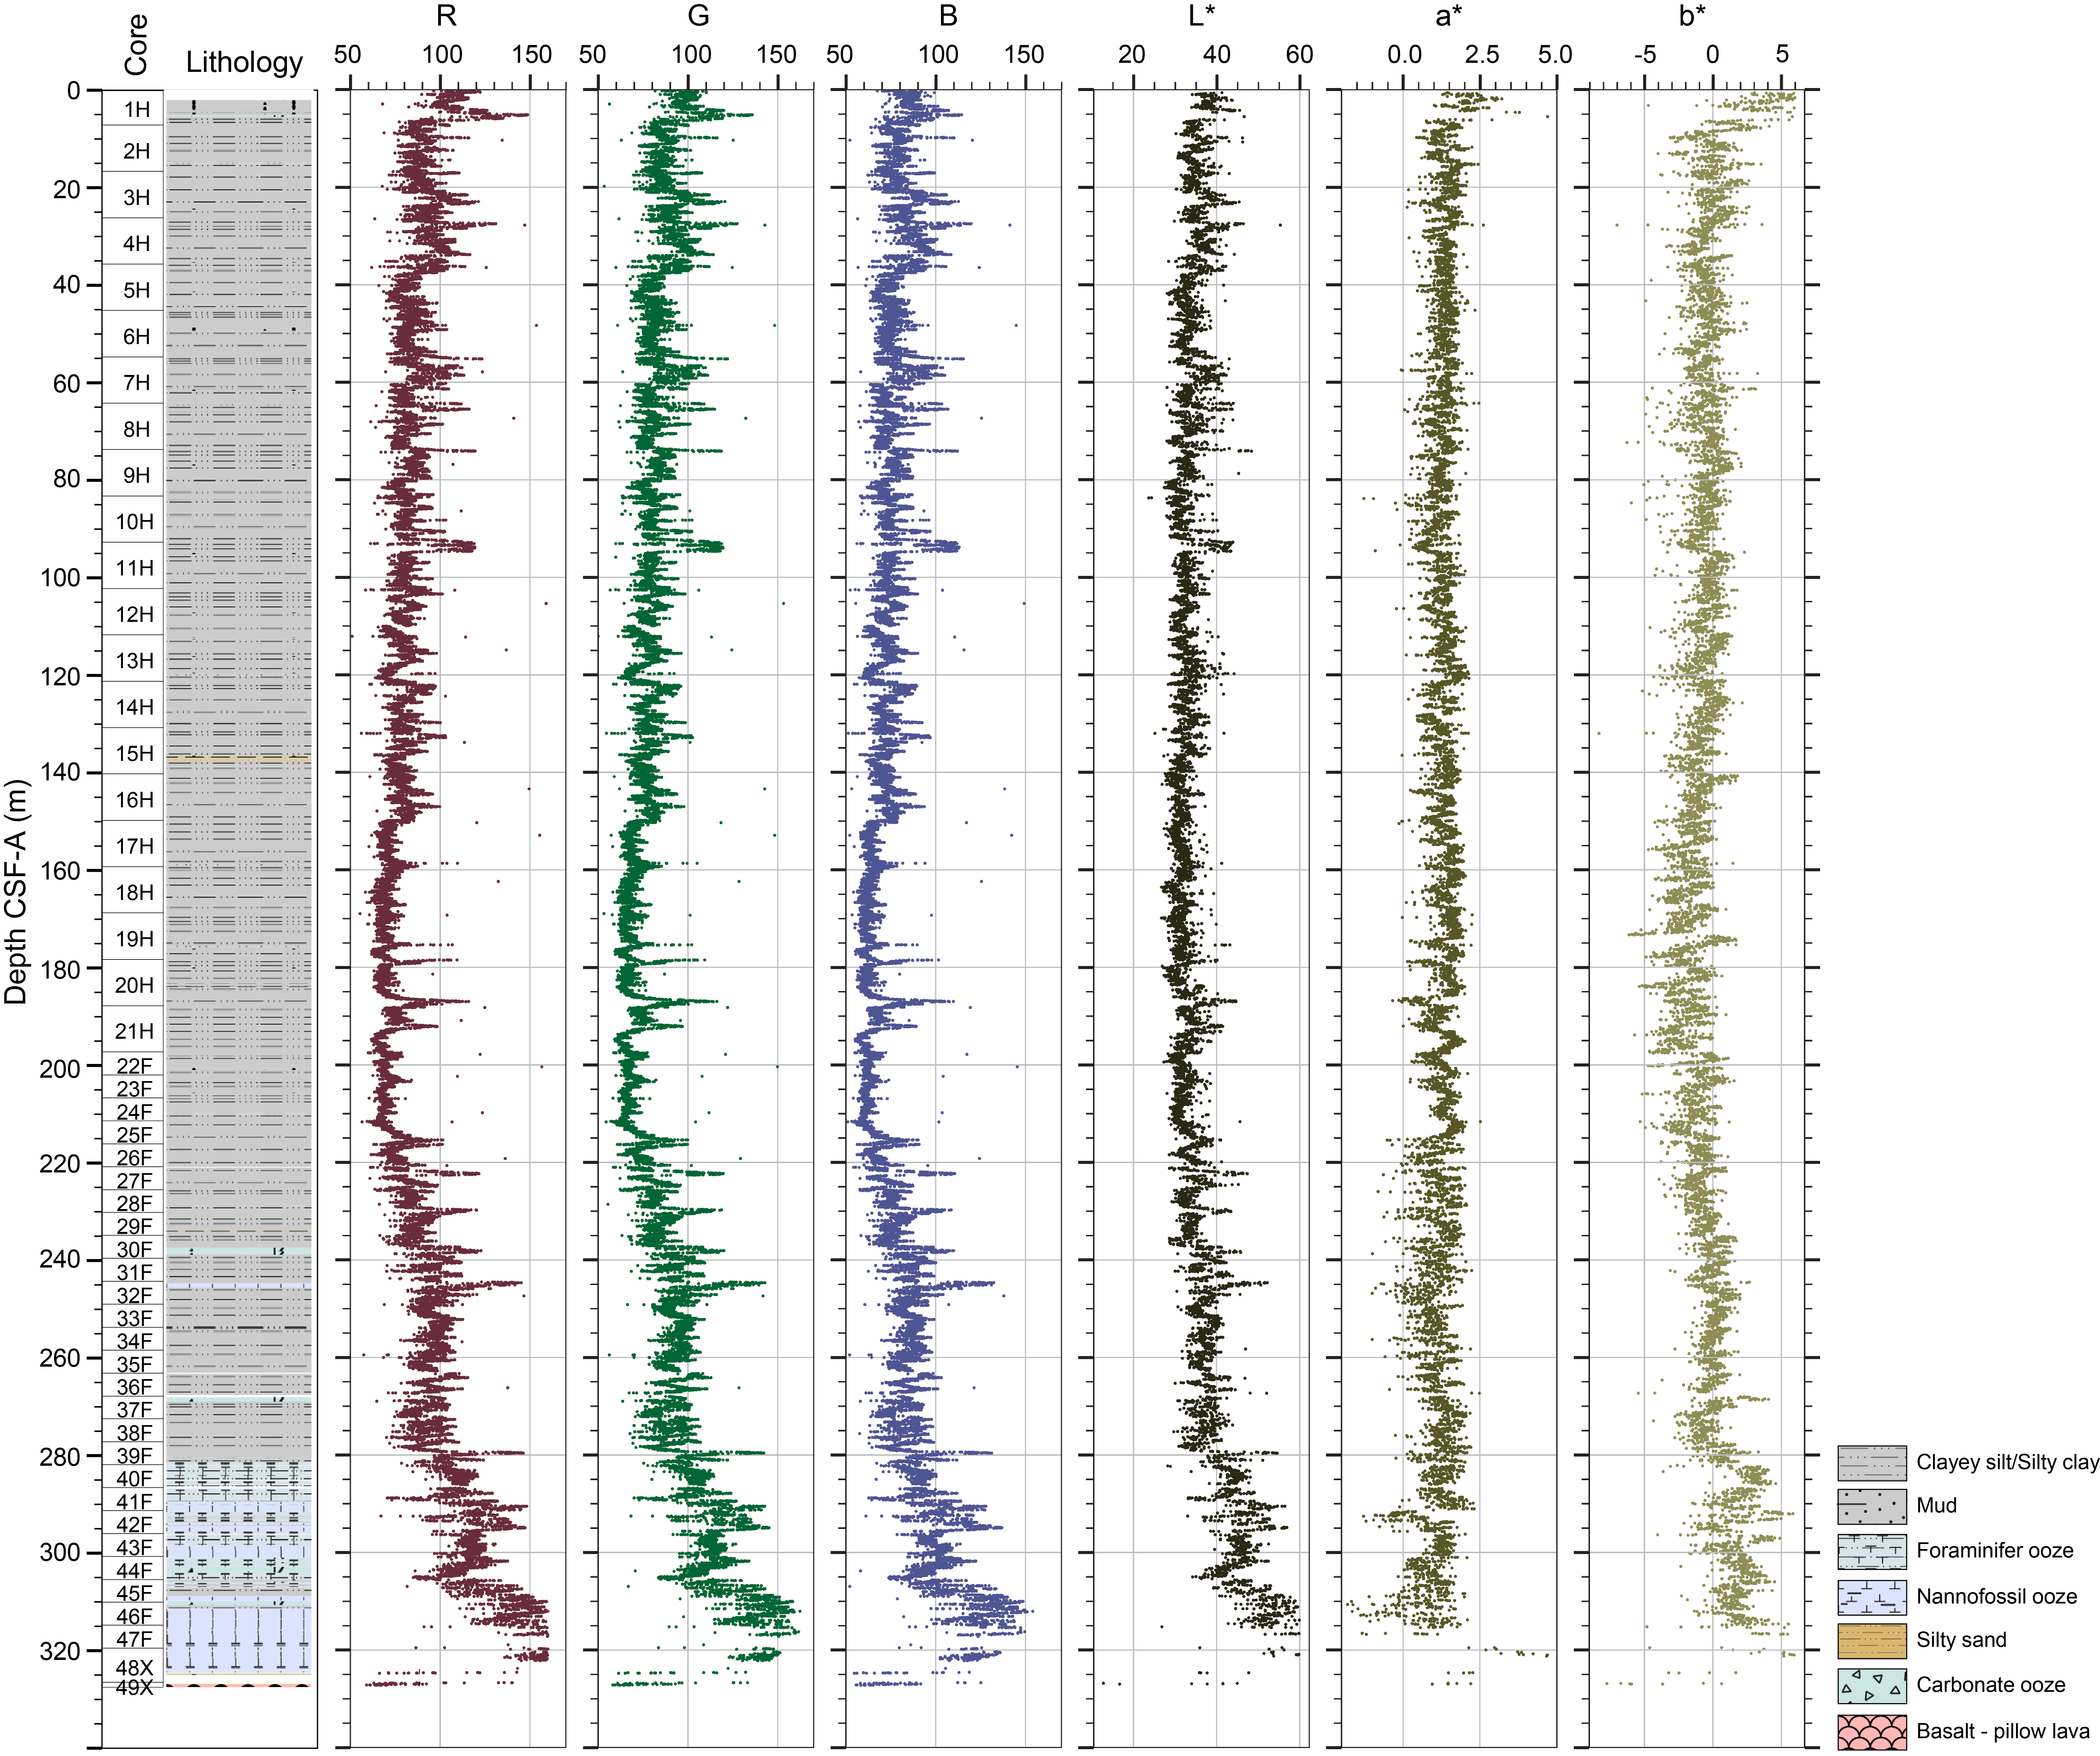
Figure F30. Archive-half colorimetry and reflectance measurements, Hole U1563A.
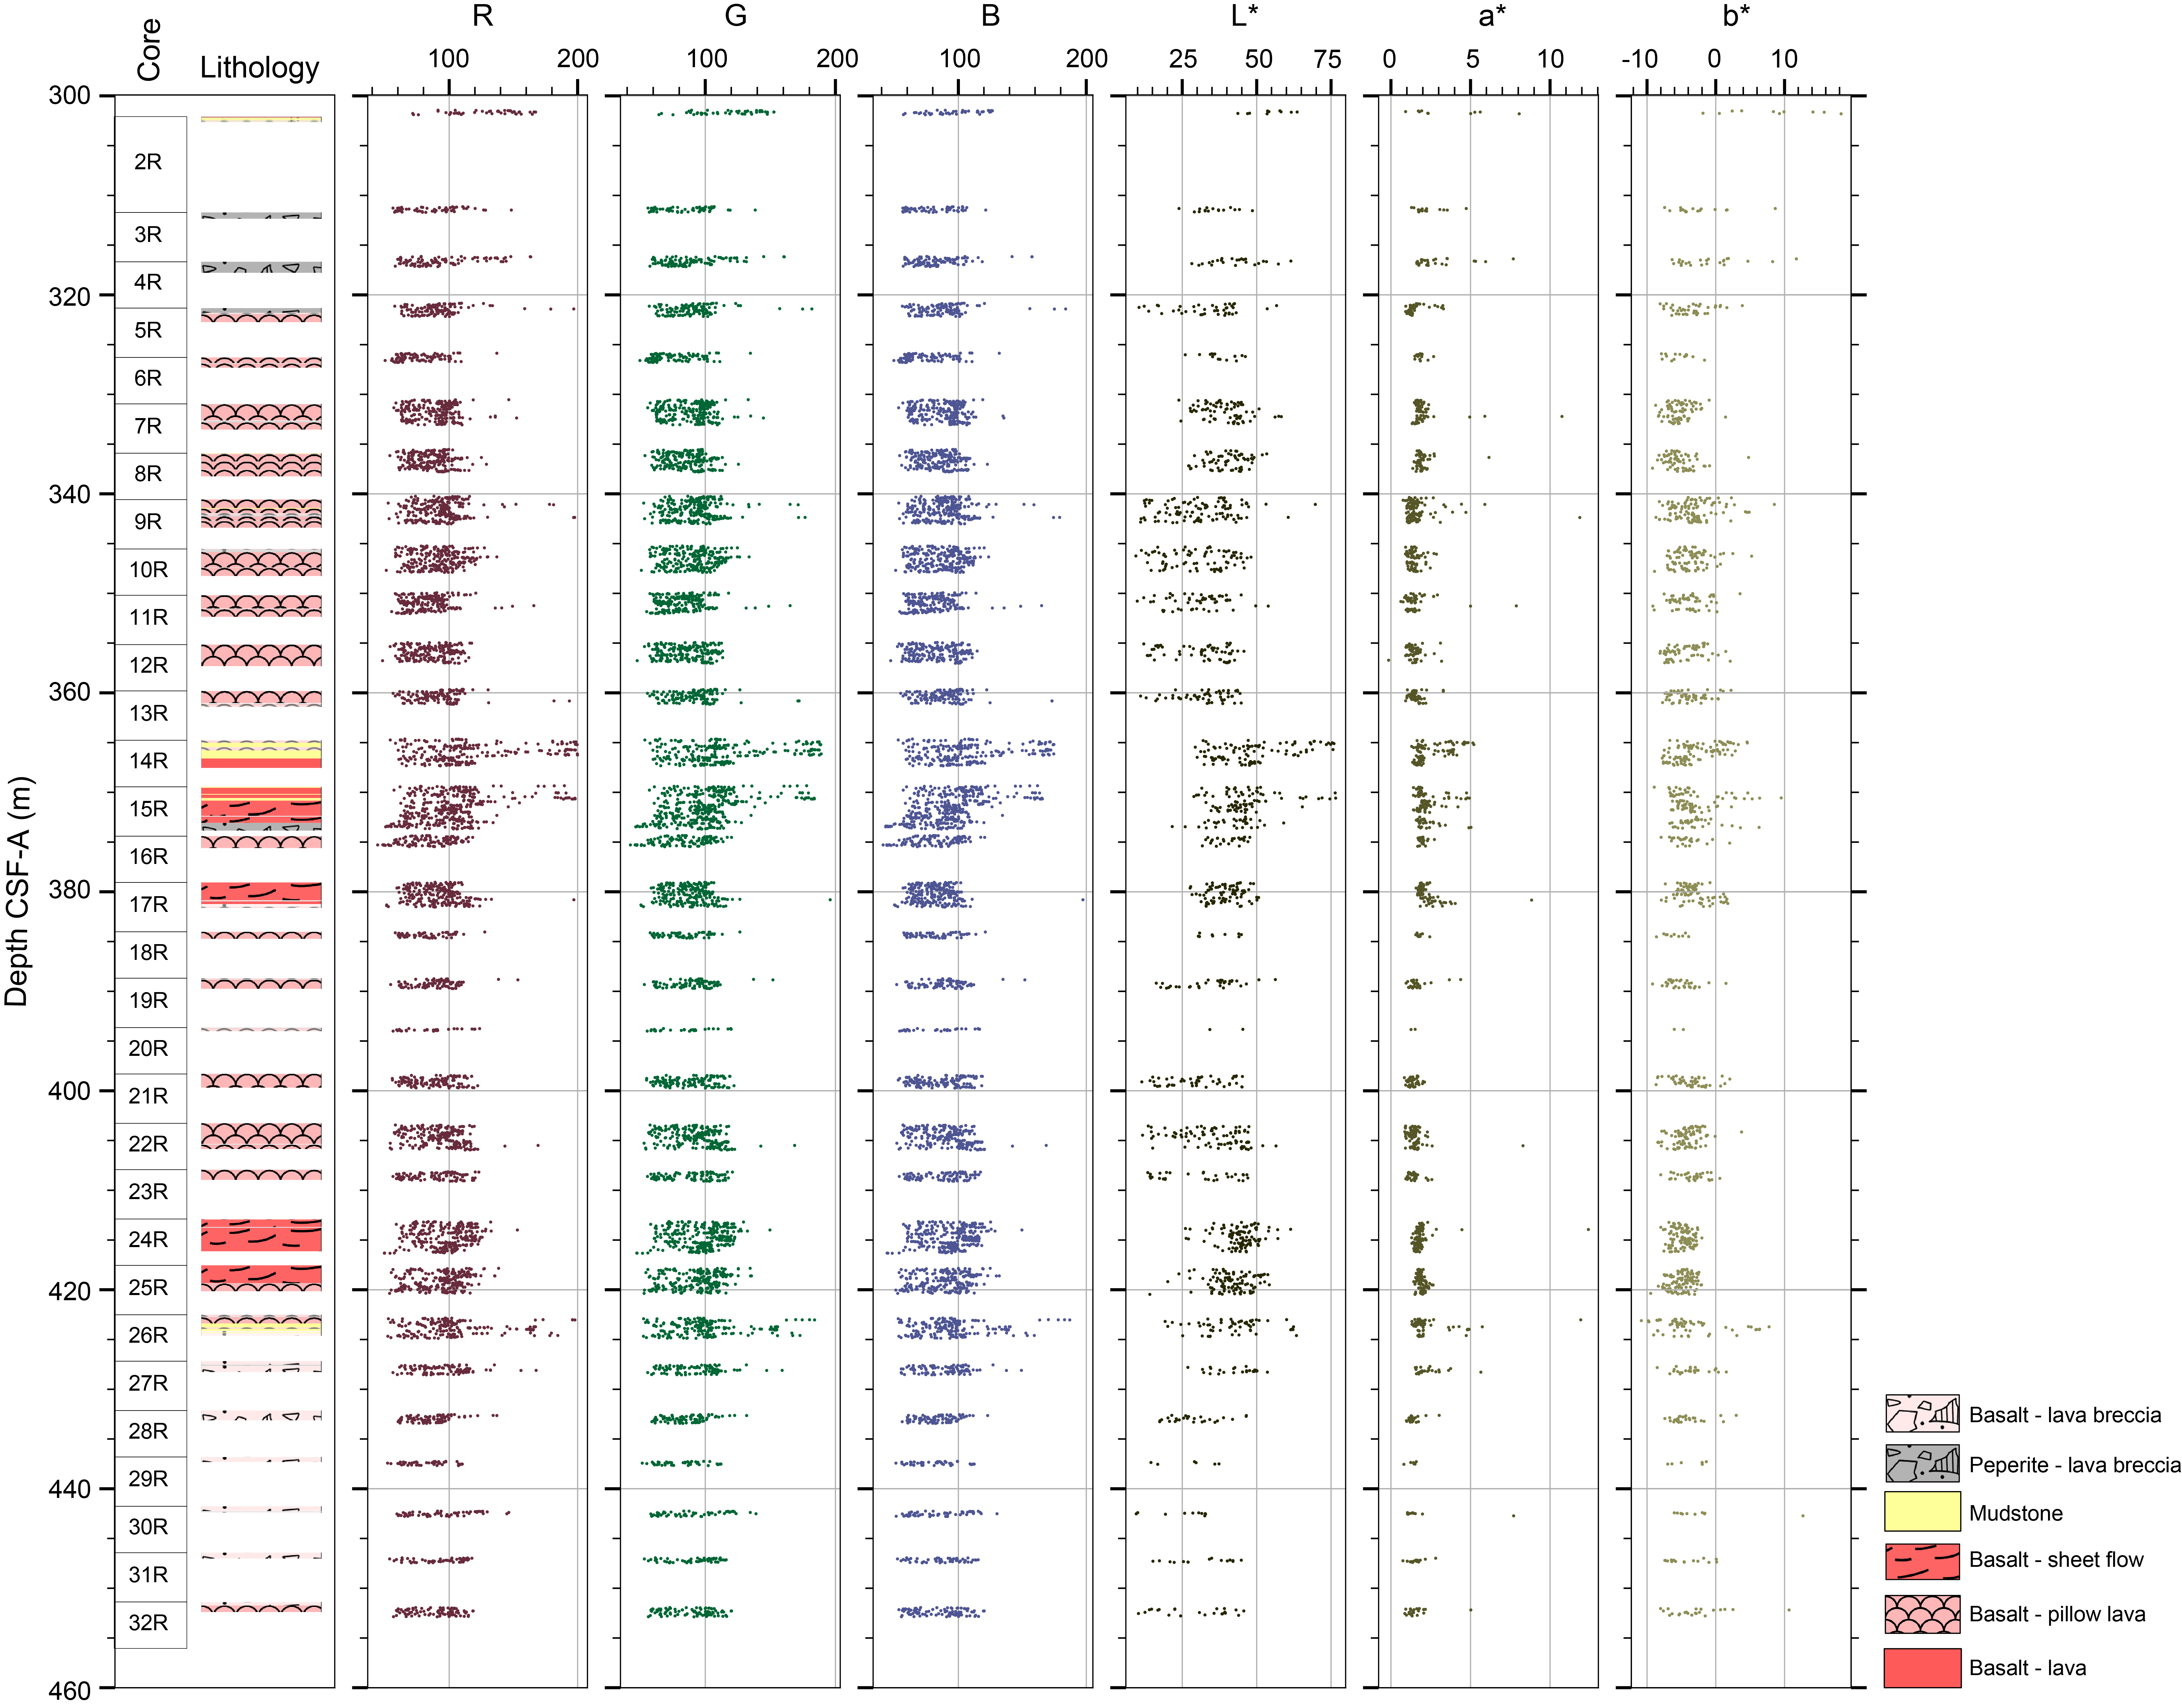
Figure F31. Archive-half colorimetry and reflectance measurements, Hole U1563B.
Reflectance and colorimetry data measured on Hole U1563A sediment cores show progressively darker values downhole to about 220 m CSF-A. This darkening trend is occasionally interrupted by the occurrence of brighter layers (e.g., at ~188 m CSF-A). Below ~220 m CSF-A, there are five distinct intervals with alternating darker and lighter reflectance (~220–245, 245–280, 280–295, 295–305, and 305–315 m CSF-A). Below 315 m CSF-A, the sediment is consistently darker. Reflectance and colorimetry data for the basement cores from Hole U1563B are noisy, although the intermixed intervals of carbonate sediment and peperites can be seen as markedly lighter values compared to the surrounding basalt rock.
7.3. Discrete measurements
7.3.1. P-wave velocity
VP caliper (PWC) measurements (made in the x-direction, perpendicular to the core long axis) were made at approximately 10 m spacing on the basement core from Hole U1563B. VP values range 5178–5874 m/s (Figure F28).
7.3.2. Moisture and density
MAD measurements were acquired from sediment cores in Hole U1563A and were taken at a resolution of approximately one per 10 m. Bulk density values are shown in Figure F27 alongside the corresponding WRMSL bulk density measurements and show good correlation with each other. Porosity calculated from these data ranges 0.6–0.8 vol%, and grain density varies from 2.7 to 2.9 g/cm3.
7.3.3. Thermal conductivity
Thermal conductivity measurements were made on working-half sections at a resolution of about 10 m (one per APC core from Cores 395C-U1563A-1H through 22F and one every other HLAPC core from Cores 23F–37F). Thermal conductivity is typically 0.7–1.0 W/(m·K) and is relatively constant downhole. Thermal conductivity measurements were combined with downhole formation temperature measurements to estimate heat flow at Site U1563 (see Downhole measurements; Figure F43).
8. Paleomagnetism
8.1. Shipboard measurements
During Expedition 395C, shipboard paleomagnetic investigations of Holes 395C-U1563A and 395C-U1563B (Figure F32; see Paleomagnetism in the Expedition 395 methods chapter [Parnell-Turner et al., 2025a]) consisted of in-line alternating field (AF) demagnetization and measurement of archive-half sections that contained basalt on the 2G Enterprises pass-through superconducting rock magnetometer (SRM). For sediments, five demagnetization steps (0, 10, 15, 20, and 25 mT) at 2.5 cm spacing were performed for Sections 395C-U1563A-1H-1 through 48X-1, and four steps (0, 15, 20, and 25 mT) were adopted for Sections 48X-2 through 48X-4. For sediments and basalts from Hole U1563B, five steps of demagnetization (0, 10, 15, 20, and 25 mT) at 2 cm spacing were adopted (see Table T7 in the Expedition 395 methods chapter [Parnell-Turner et al., 2025a]).
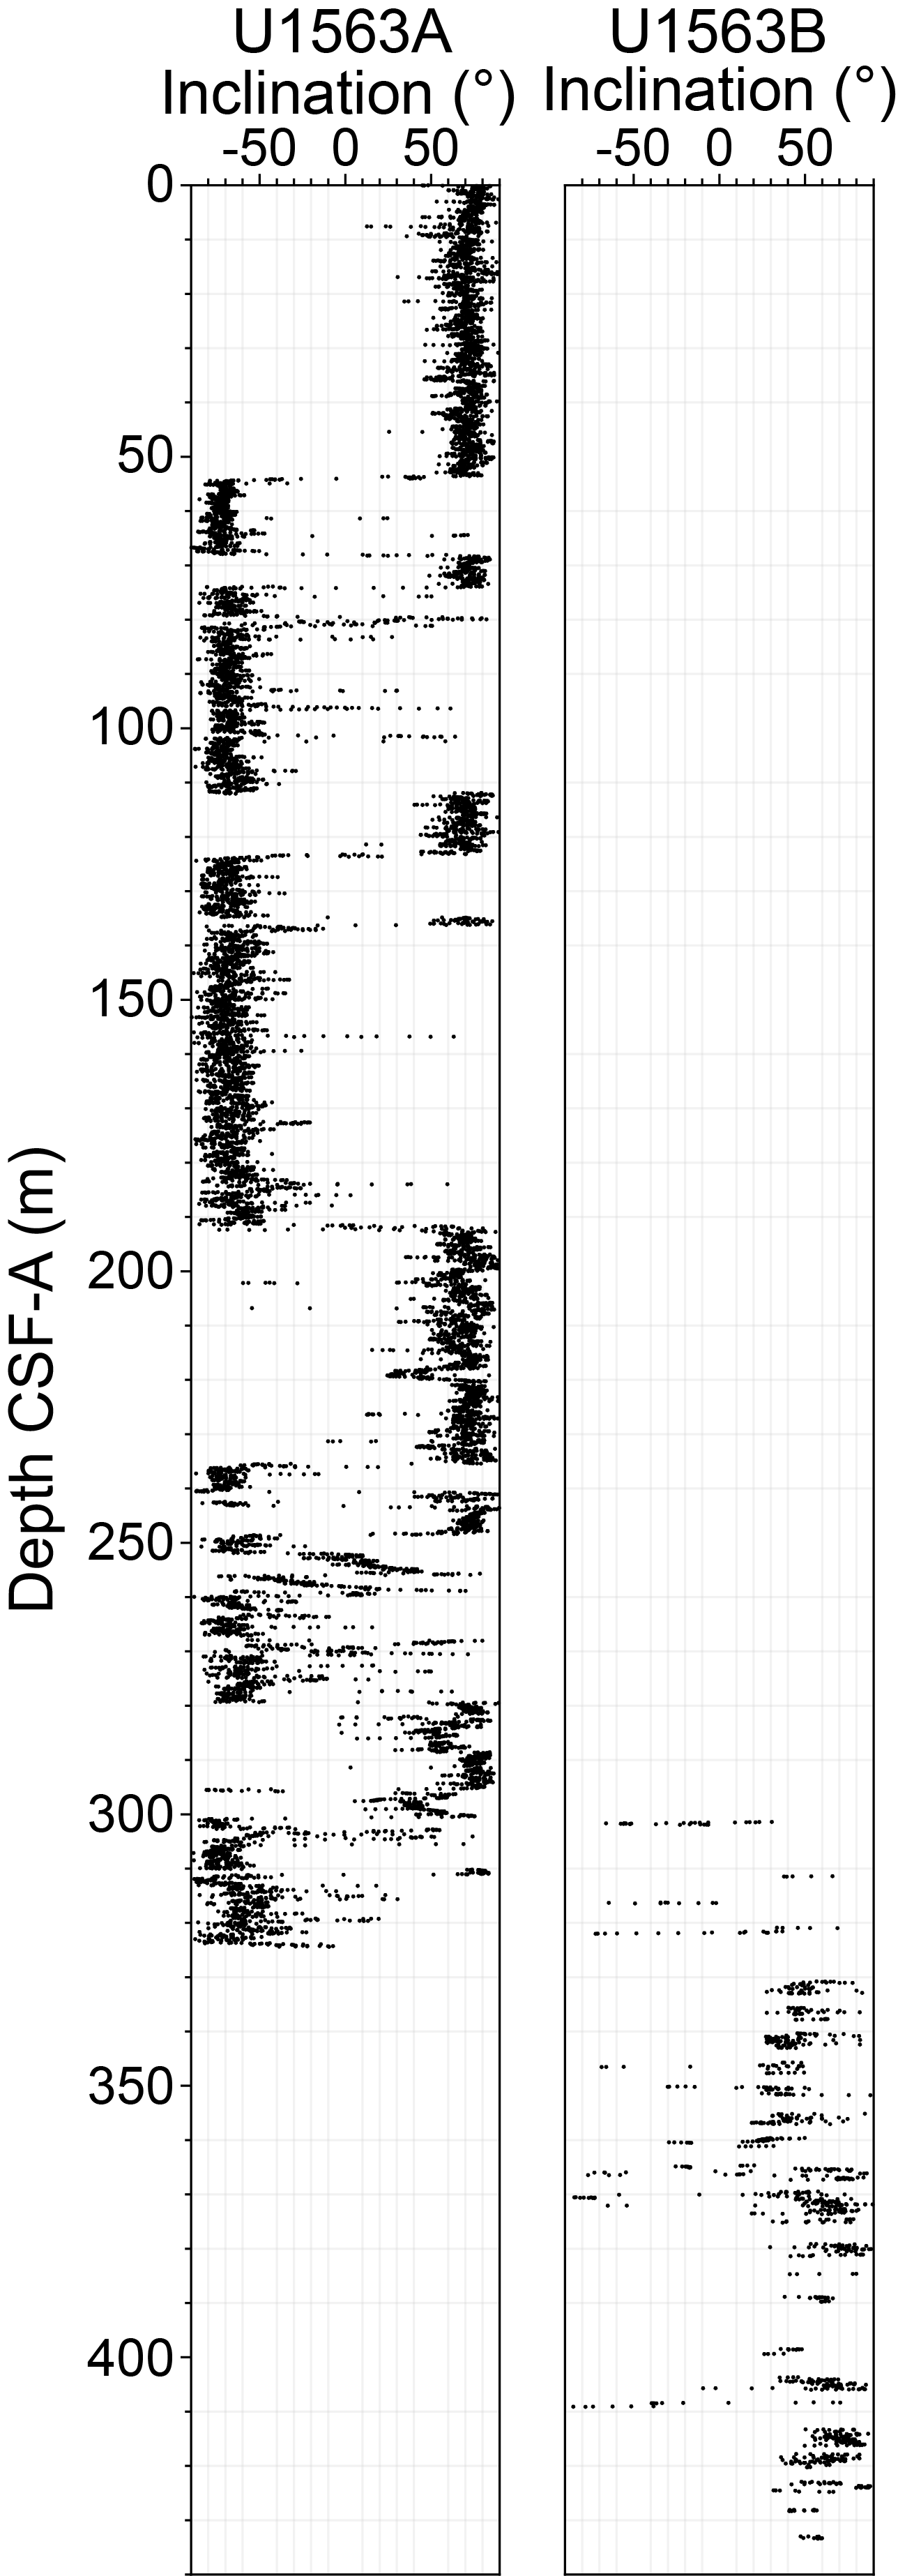
Figure F32. Inclination.
8.2. Demagnetization behavior of sedimentary rocks
After the removal of an overprint at 10 mT, stepwise AF demagnetization performed up to 25 mT successfully isolated a stable ChRM directed to the origin of the Zijderveld plot, even if not completely demagnetized (Zijderveld, 1967). Both normal (Figure F33A, F33D) and reverse (Figure F33B, F33C) polarities were isolated.
Figure F33. Demagnetization behaviors of sediments.
The natural remanent magnetization (NRM) intensity from sediments in Hole U1563A varies from 7.6 × 10⁻⁵ to 1.54 A/m (average = 2.2 × 10⁻¹ A/m), reflecting typical values of sedimentary rocks. The NRM trend decreases below 240 m CSF-A, from Core 395C-U1563A-30F to the bottom of the hole (Figure F34).
Figure F34. Paleomagnetic measurements, Hole U1563A.
MS obtained by point measurement on section halves (see Physical properties) varies from 3.0 to 708.9 IU (mean = 217.8 IU). Similar to the NRM intensity trend, MS decreases below 240 m CSF-A.
Both NRM and MS show significant variability with depth, most likely following the changes in carbonate and silica content in sedimentary units (Figure F34).
The paleomagnetic results are summarized in Figure F34. Variations in terms of inclination reflect changes in the magnetic polarities, highlighting short- and long-duration magnetic events. Normal polarities (in black) show short secular variations around values similar to the present-day field at Site U1563 calculated using the International Geomagnetic Reference Field model (Alken et al., 2021).
8.3. Demagnetization behavior of basalts
Typical examples of demagnetization, behavior, and polarity interpretation from igneous rocks from Hole U1563B are shown in Figure F35. Most of the basalts do not fully demagnetize at 25 mT (Figure F35A), with few exceptions (Figure F35C), and some samples do not demagnetize at all (Figure F35B, F35D). After the removal of a drilling overprint at 10–15 mT, usually one component of magnetization is isolated, indicating either a normal (Figure F35A, F35D) or reverse polarity (Figure F35B, F35C).
Figure F35. Demagnetization behaviors of basalts.
The transition from sedimentary to igneous rocks occurs between Cores 395C-U1563B-2R and 3R at about ~304 m CSF-A. NRM intensity for Hole U1563B varies from 2.2 × 10⁻³ to 6.1 A/m (average = 1.7 A/m), and MS varies from 2.0 to 1962.6 IU (average = 245.9 IU) (Figure F36).
Figure F36. Paleomagnetic measurements, Hole U1563B.
8.4. Magnetostratigraphy
We reconstructed the magnetostratigraphy of Site U1563 based on the inclinations measured at 25 mT demagnetization step from archive-half cores from Hole U1563A (Figure F34; Table T10).
A succession of eight normal and eight reversed intervals is recognized (Figure F34). The magnetic polarities were correlated to the standard timescale (Ogg, 2020), and the data were plotted along with constrained ages from shipboard microfossil biostratigraphy (see Age model).
Based on inclinations only, the boundary between the Brunhes and Matuyama Chrons is interpreted at ~54 m CSF-A (0.773 Ma), and the boundary between the Matuyama and Gauss Chrons is interpreted at ~ 191 m CSF-A (2.595 Ma) (Table T10).
9. Geochemistry and microbiology
Cores from Hole 395C-U1563A were analyzed for headspace gas, interstitial water (IW) chemistry, and bulk sediment geochemistry. Cores from Hole 395C-U1563B were analyzed for bulk basalt geochemistry; these results are described in Igneous petrology. Methane concentrations are low (<2 ppmv). Ethane is below detection limit. IW calcium (Ca2+), magnesium (Mg2+), and sulfate (SO42−) generally co-vary with seawater-like values at the top and bottom of the sedimentary sequence. The average total organic carbon (TOC) is 0.3 ± 0.2 wt%. CaCO3 mostly displays a similar trend to TOC over the same intervals, with low but variable values in the upper portion of Hole U1563A (average = 33.5 ± 30.8 wt%); however, from ~285 m CSF-A (Section 40F-2) to the sediment/basalt interface, CaCO3 averages 80.4 ± 4.2 wt%.
9.1. Volatile hydrocarbons
Methane concentrations throughout the sedimentary section of Hole U1563A are low (<2.2 ppmv) (Figure F37). Two slight increases in methane (near ~50 and ~270 m CSF-A) suggest some biogenic methane gas production. The lack of ethane indicates that thermogenic gas sources are not likely to be present.
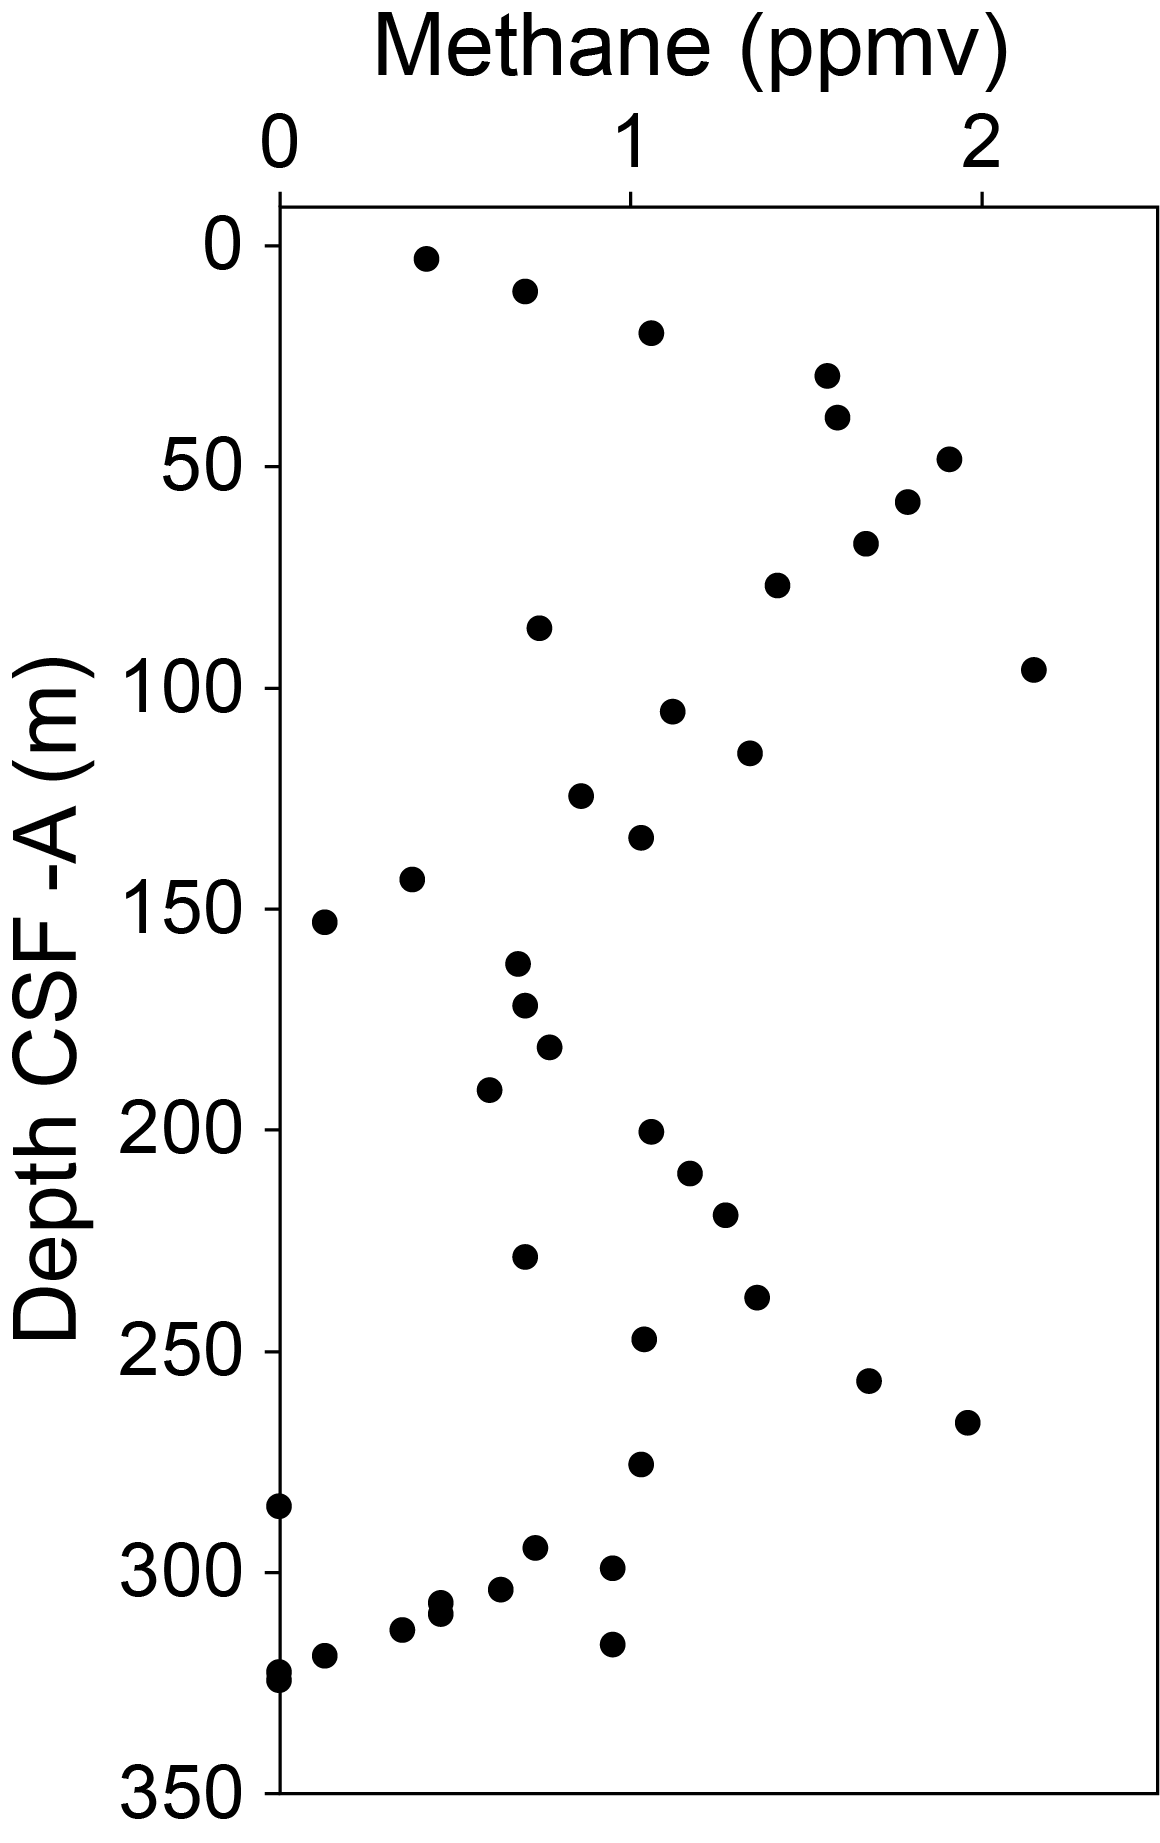
Figure F37. Gas analyses of methane concentrations.
9.2. Interstitial water chemistry
A total of 40 IW samples were squeezed from 5 to 10 cm long whole-round samples from 2.95 to 324.33 m CSF-A in Hole U1563A (Cores 1H–48X). The lowermost IW sample was collected from the core adjacent to the sediment/basalt interface. Selected data acquired from analysis of IW from Hole U1563A are shown in Figure F38. Alkalinity ranges from seawater values in the mudline sample (Sample 1H-1, 0 cm; 2.4 mM) and bottom of the sediment (Sample 47F-1, 145–150 cm; 2.2 mM) to slightly higher values in the middle part of the sedimentary sequence (e.g., Sample 24F-2, 145–150 cm; 5.8 mM). pH is consistent throughout the sediment interval (7.7± 0.1), and Mg2+ concentrations range 49.1–55.1 mM with the highest concentrations (55.1 mM) in the upper sediments (Sample 1H-2, 145–150 cm) and the lowest (49.1 mM) at 181.35 m CSF-A (Sample 20H-2, 145–150 cm). SO42− concentrations range 23.5–29.2 mM, with high values at the top and bottom of the sedimentary pile. Ca2+ concentrations range 8.4–12.3 mM with little trend, and Sr2+ concentrations range 91.9–119.5 µM with a maximum at about 300 m CSF-A.
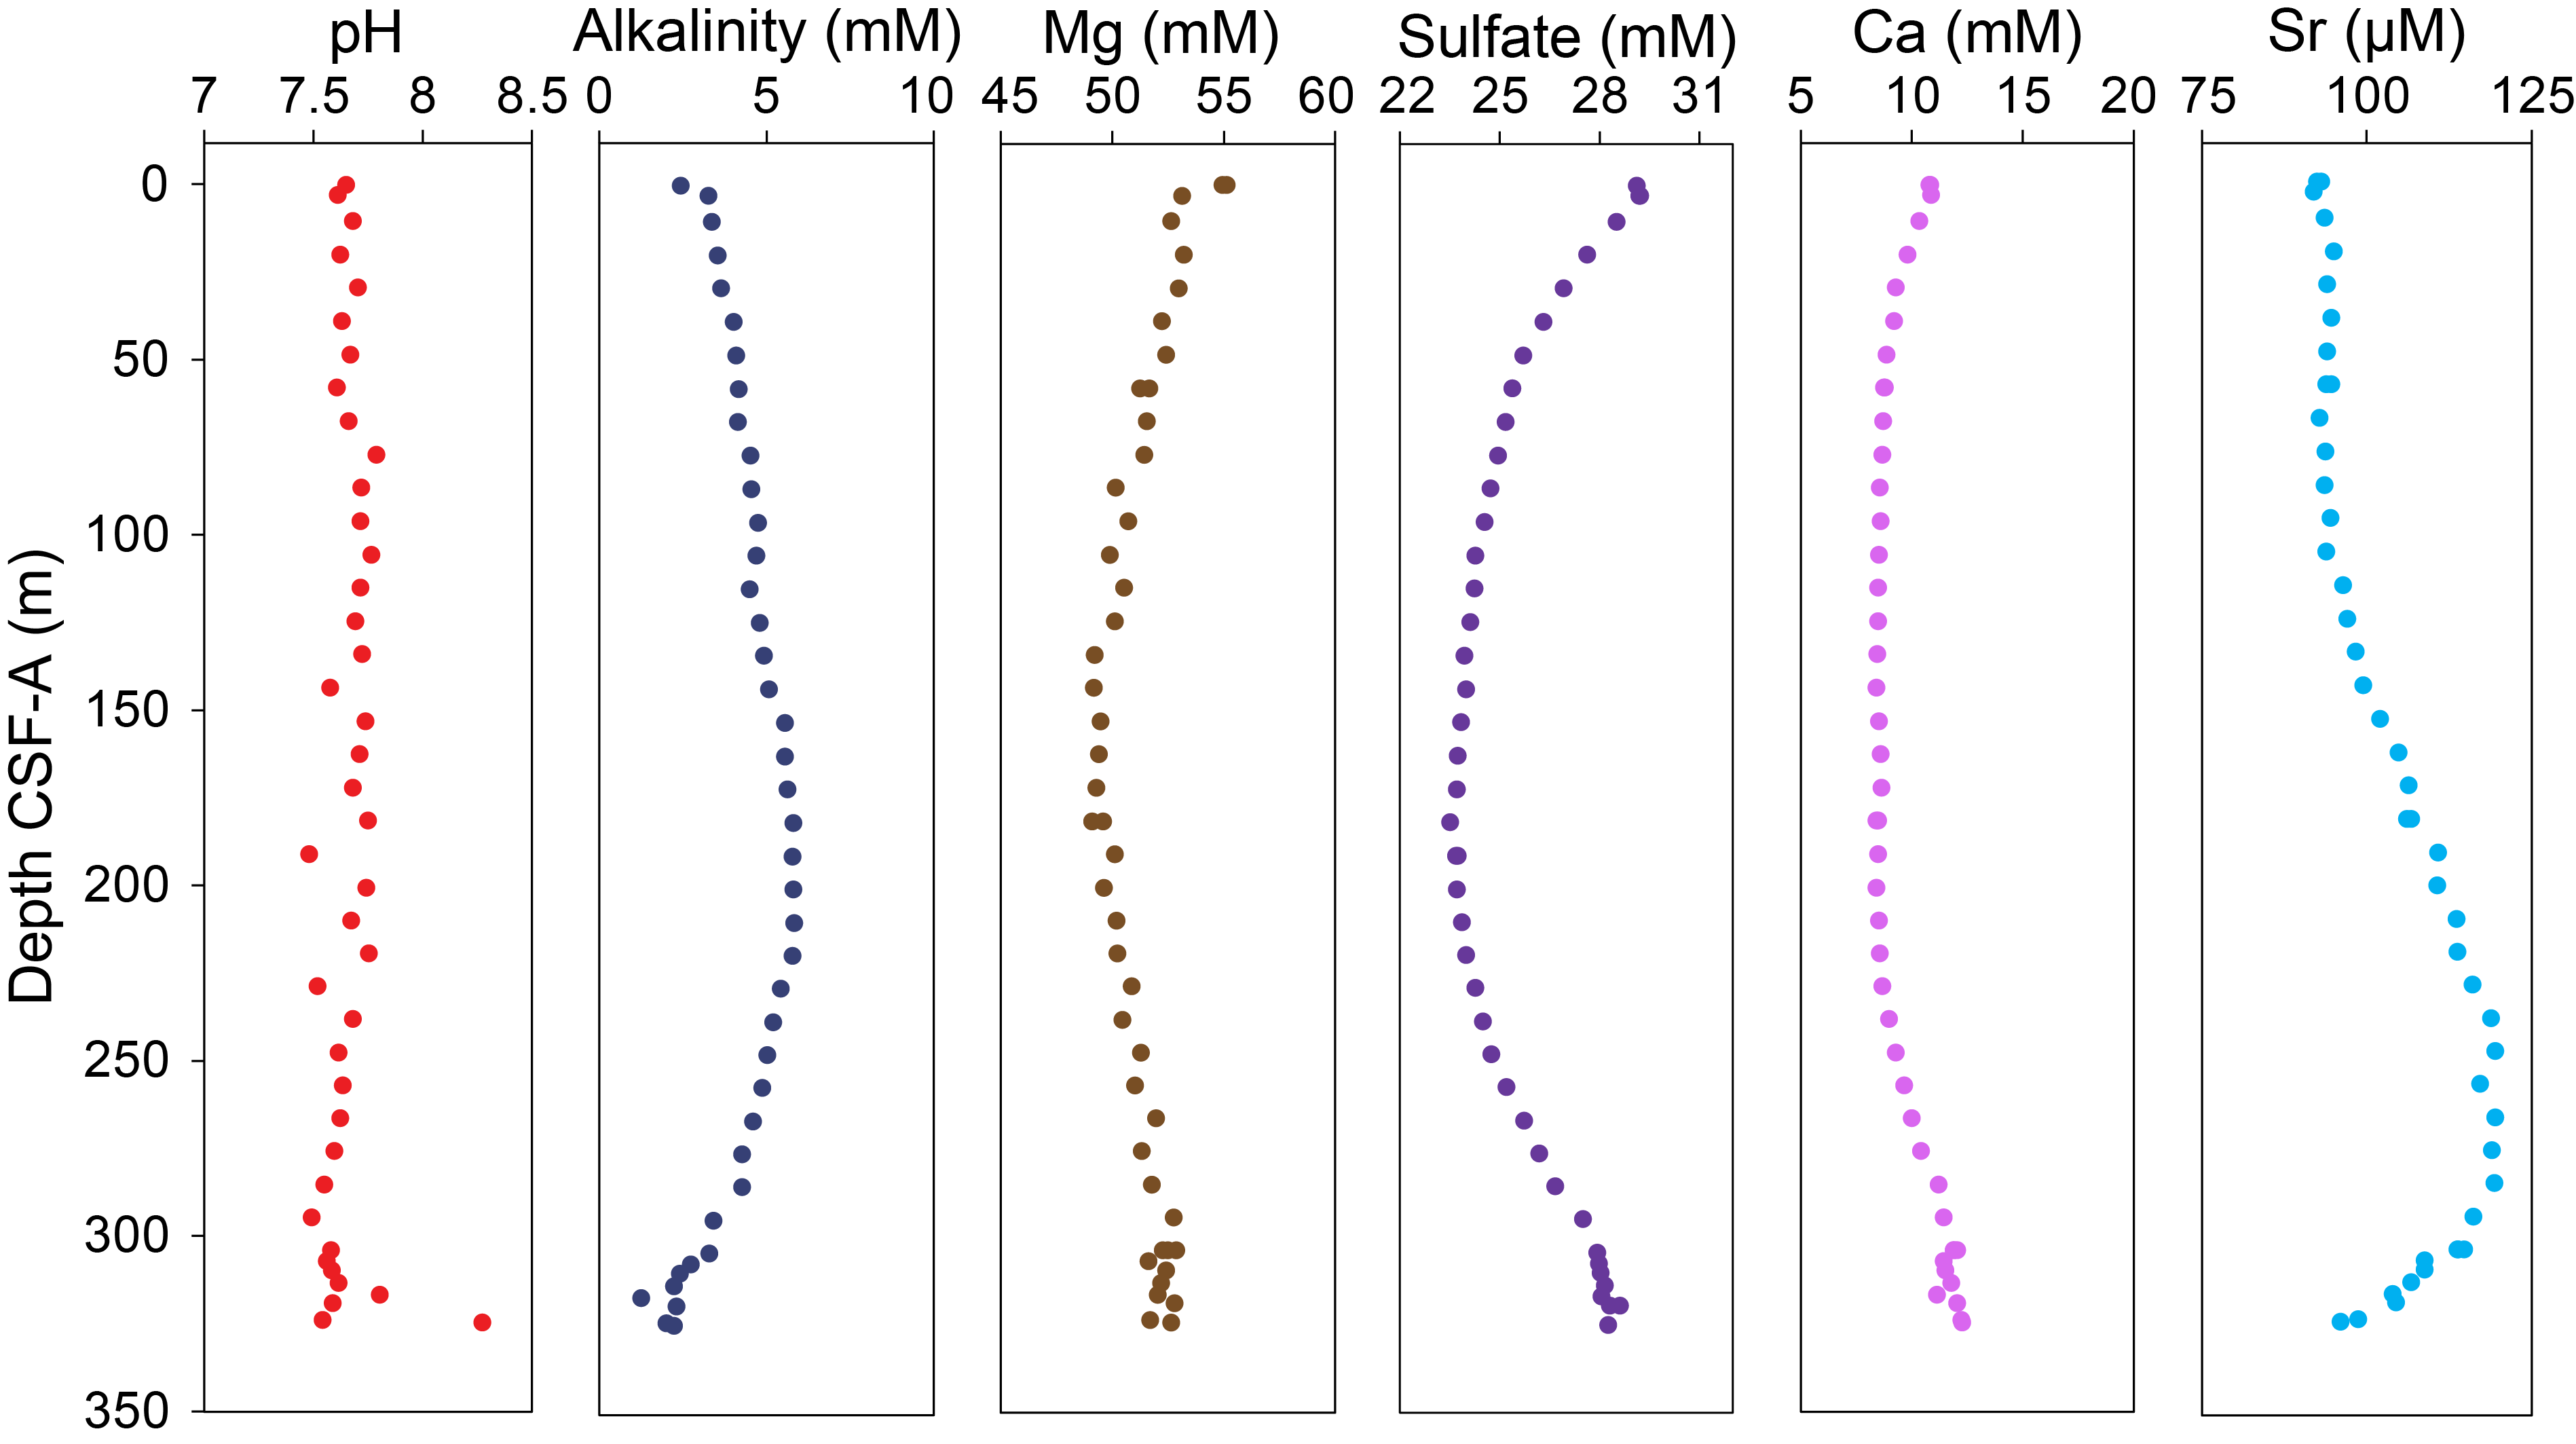
Figure F38. IW pH, alkalinity, and concentrations of selected ions.
9.2.1. Bulk sediment geochemistry
9.2.1.1. Carbonate, nitrogen, carbon, and sulfur
Discrete sediment samples (n = 40) were collected from squeeze cake residues in Cores 395C-U1563A-1H through 47F and analyzed for total carbon (TC), total nitrogen (TN), and total inorganic carbon (TIC). TOC content and CaCO3 weight percent were subsequently calculated from the TIC and TC measurements. Based on these measurements, the calculated TOC content is low (0.1–0.9 wt%) (Figure F39). The average CaCO3 content is 33.5 wt% (0.3–86 wt%) with a general increase from ~200 m CSF-A to the sediment/basement interface, where the highest CaCO3 content was observed. TN ranges 0.0–0.05 wt%. Total sedimentary sulfur was not analyzed at this site.
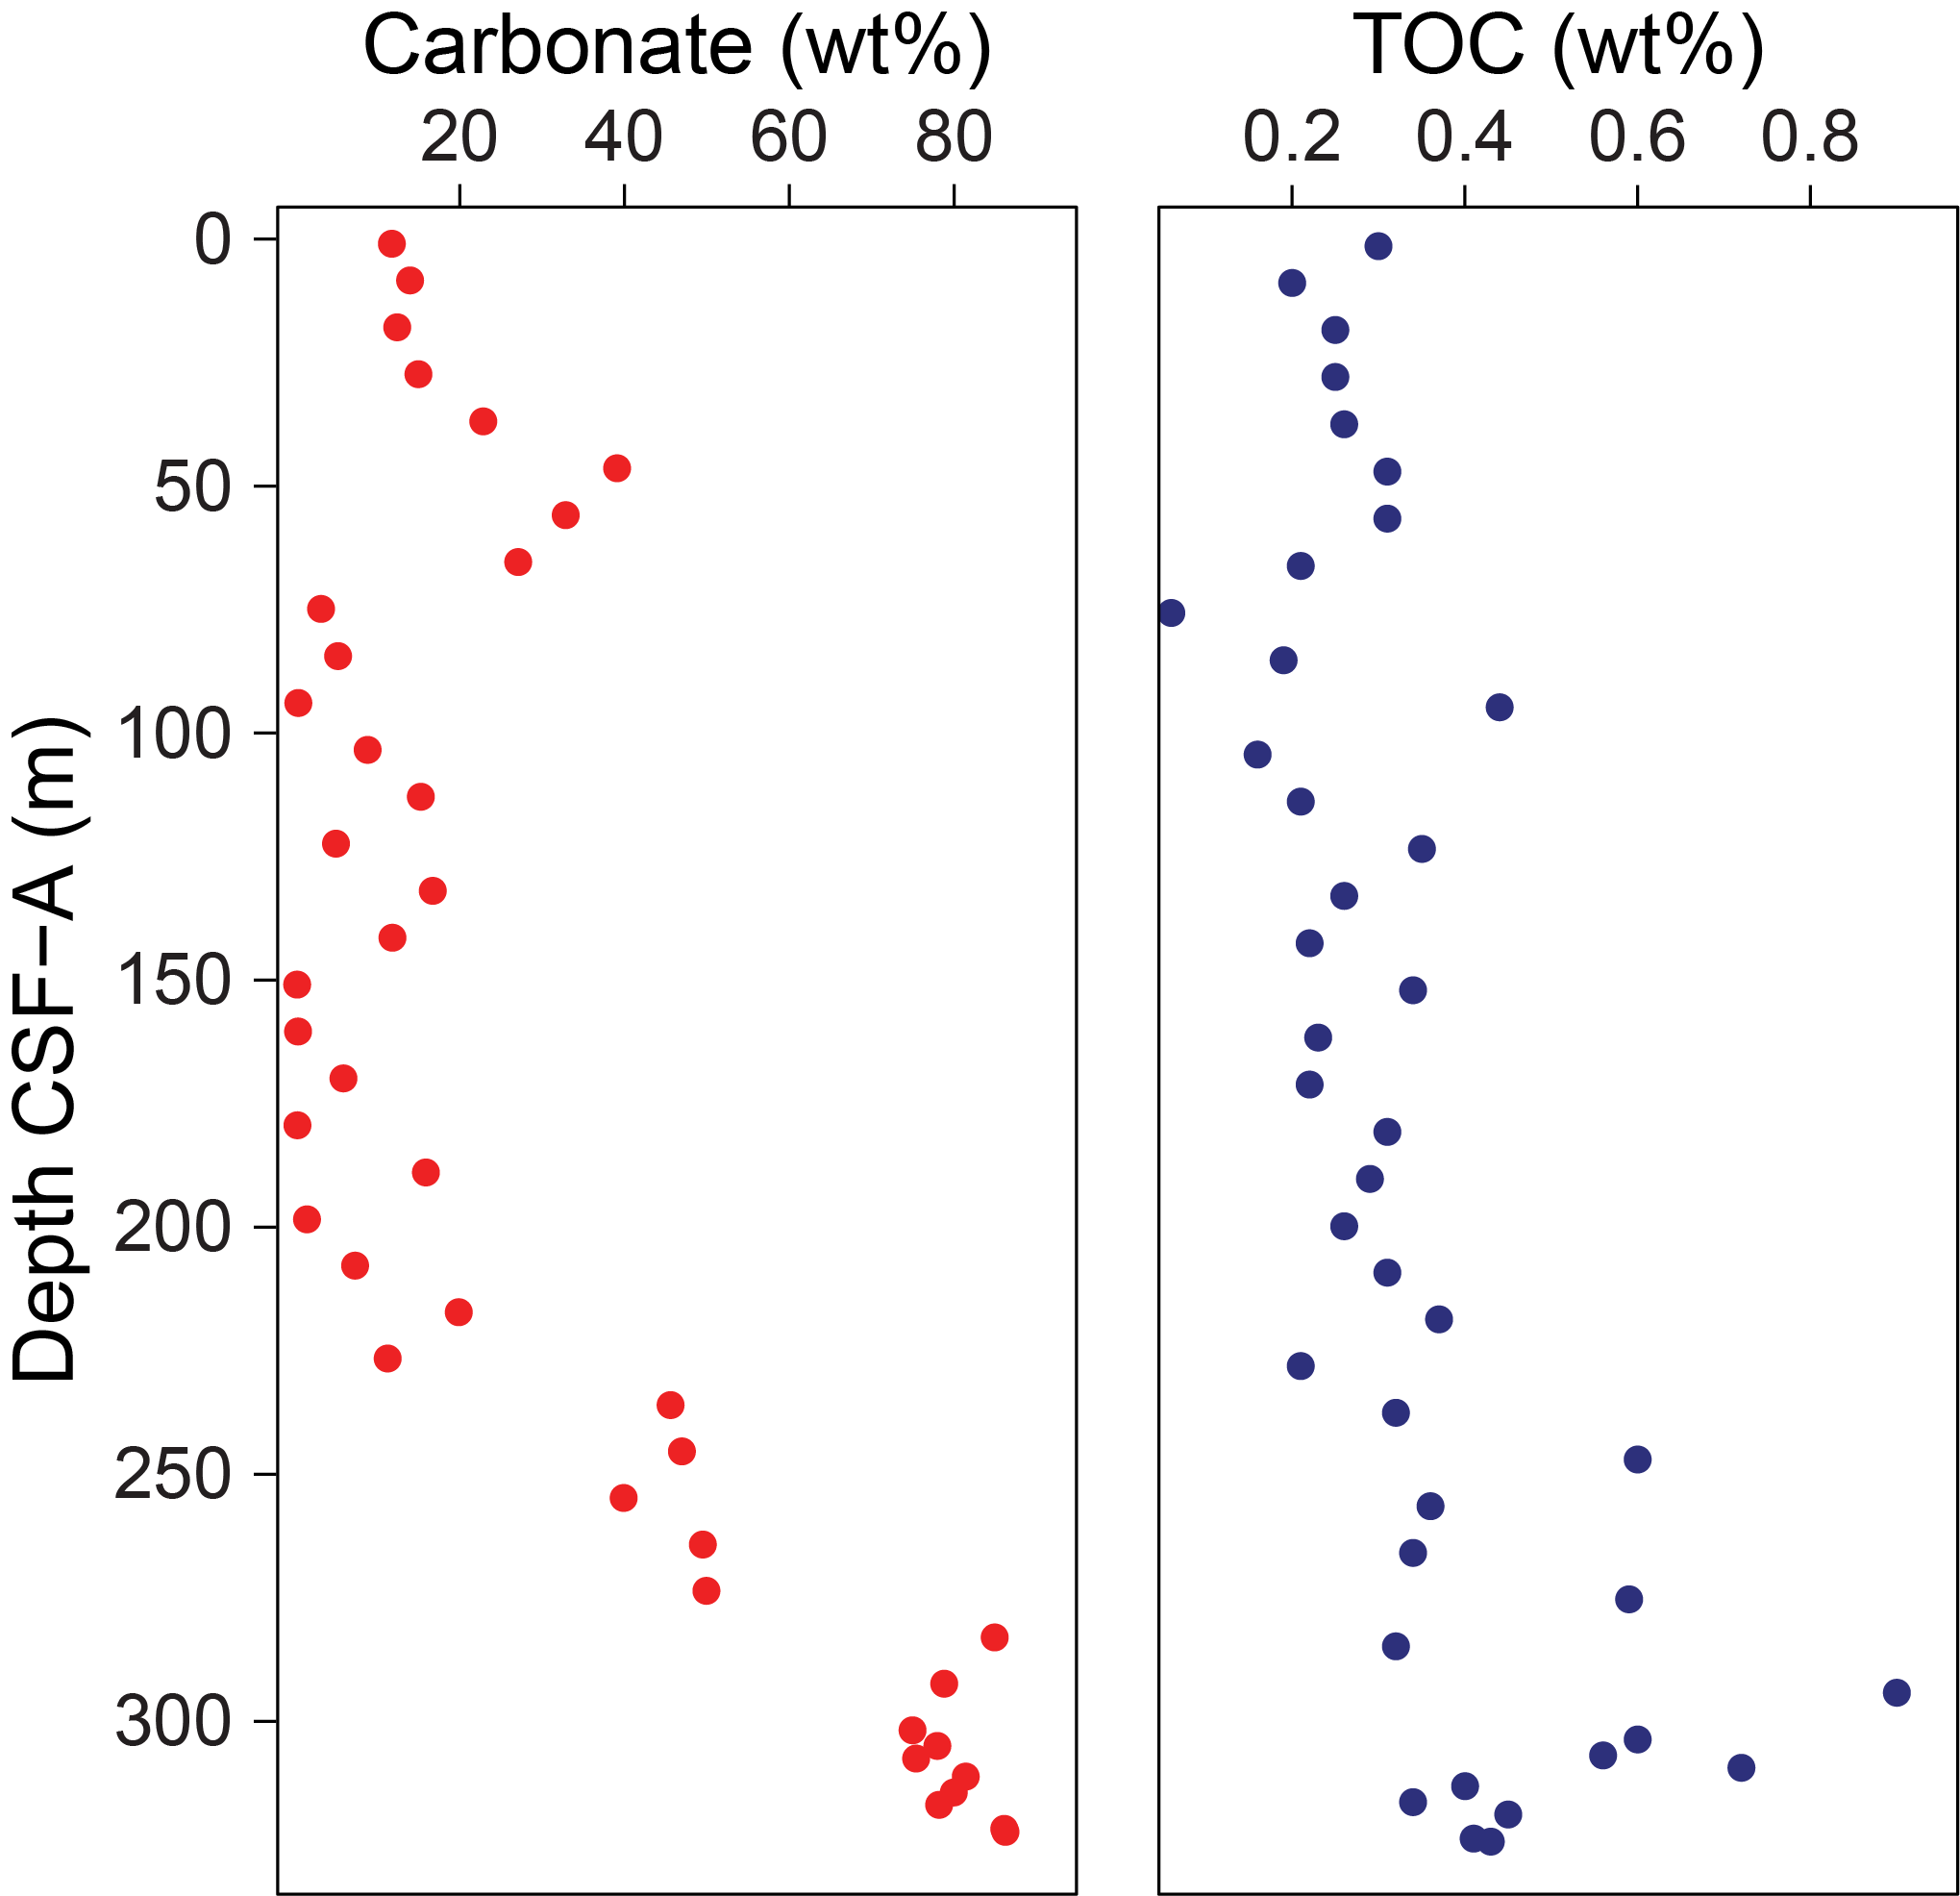
Figure F39. CaCO3 and TOC.
9.3. Microbiology
Microbiological sampling of sediments from Hole U1563A was focused on collecting samples for culture-independent analyses. A total of 40 sediment samples from Hole U1563A, each 5 cm3, were collected with a sterile cut-end syringe. A total of 11 whole-round samples of hard rock were collected in Hole U1563B for shore-based microbiological analyses.
10. Downhole measurements
Details on tools and logging procedures can be found in Downhole measurements in the Expedition 395 methods chapter (Parnell-Turner et al., 2025a), and only hole-specific procedures are detailed here. Downhole logging operations at Site U1563 were conducted in Hole 395C-U1563B, which was logged with the triple combo tool string (Magnetic Susceptibility Sonde [MSS], High-Resolution Laterolog Array [HRLA], Accelerator Porosity Sonde [APS], Hostile Environment Litho-Density Sonde [HLDS], and Hostile Environment Natural Gamma Ray Sonde [HNGS]), the FMS-sonic tool string (FMS, Dipole Sonic Imager [DSI], General Purpose Inclinometry Tool [GPIT], and HNGS), and the VSI tool string (VSI and HNGS) (Table T11). While drilling Hole 395C-U1563A, formation temperature measurements were acquired at four locations (Cores 395C-U1563A-4H, 7H, 10H, and 13H) using the advanced piston corer temperature (APCT-3) tool.
10.1. Logging procedure and log data processing
Conditions in Hole U1563B quickly deteriorated after drilling was completed; therefore, it was decided to log only the sedimentary interval of the hole. The hole was cleaned with heavy mud, the drill pipe was raised to ~85.5 m wireline log depth below seafloor (WSF), and the heavy mud (sepiolite and barite) used during drilling was displaced by seawater. The triple combo tool string was run first. During the downlog pass (Data Set 041PUP), the caliper was closed and the APS source was turned off. Therefore, the APS and HLDS tools acquired no data during this initial pass. Some difficulty was experienced getting the tool string out of the drill pipe, and several attempts were needed to remove the blockage at the bottom of the pipe before logging operations could proceed. Following the successful cleaning of the blockage, a repeat pass (Data Set 014LUP) was acquired with the caliper open and the APS source on; this was followed by the main uplog pass (Data Set 016LUP), which extended to the seafloor. A false start of the main pass meant the bottom of the logged interval in Hole U1563B was radioactively activated by the APS tool, resulting in artificially higher than normal gamma and spectral gamma radiation measurements at ~1704 m wireline log depth below rig floor (WRF). Furthermore, the HLDS caliper had trouble opening during the triple combo tool string pass, and its measurements should be treated with caution. The FMS-sonic tool string was run as a downlog pass (Data Set 072PUP), a repeat pass (Data Set 029LUP), and a main uplog pass (Data Set 030LUP). All tool string logs are depth matched using the gamma radiation log from the triple combo tool string main pass and then depth shifted to the logger's seafloor depth of ~1427.5 m WRF. Seafloor was picked by the logging engineer by a step in gamma ray values at ~1427.5 m WRF (differing by 1.6 m from driller's seafloor depth, which was 1429.1 m drilling depth below rig floor [DRF]). The wireline heave compensator (WHC) was used whenever the tools were in the open hole; the average vessel heave was 0.25–0.5 m.
Calipers indicate that hole quality suffers from ovalization at ~136–234 m wireline log matched depth below seafloor (WMSF), indicated by the C2 caliper measurement being consistently larger than the C1 caliper measurement across this interval. Additionally, in the interval from ~234 m WMSF to the bottom of the hole, the borehole is enlarged to as much as ~15 inches (Figure F40). Given the poor hole quality, logging data should be assessed carefully for accuracy, particularly those readings that require tool eccentralization to make measurements from the hole wall.
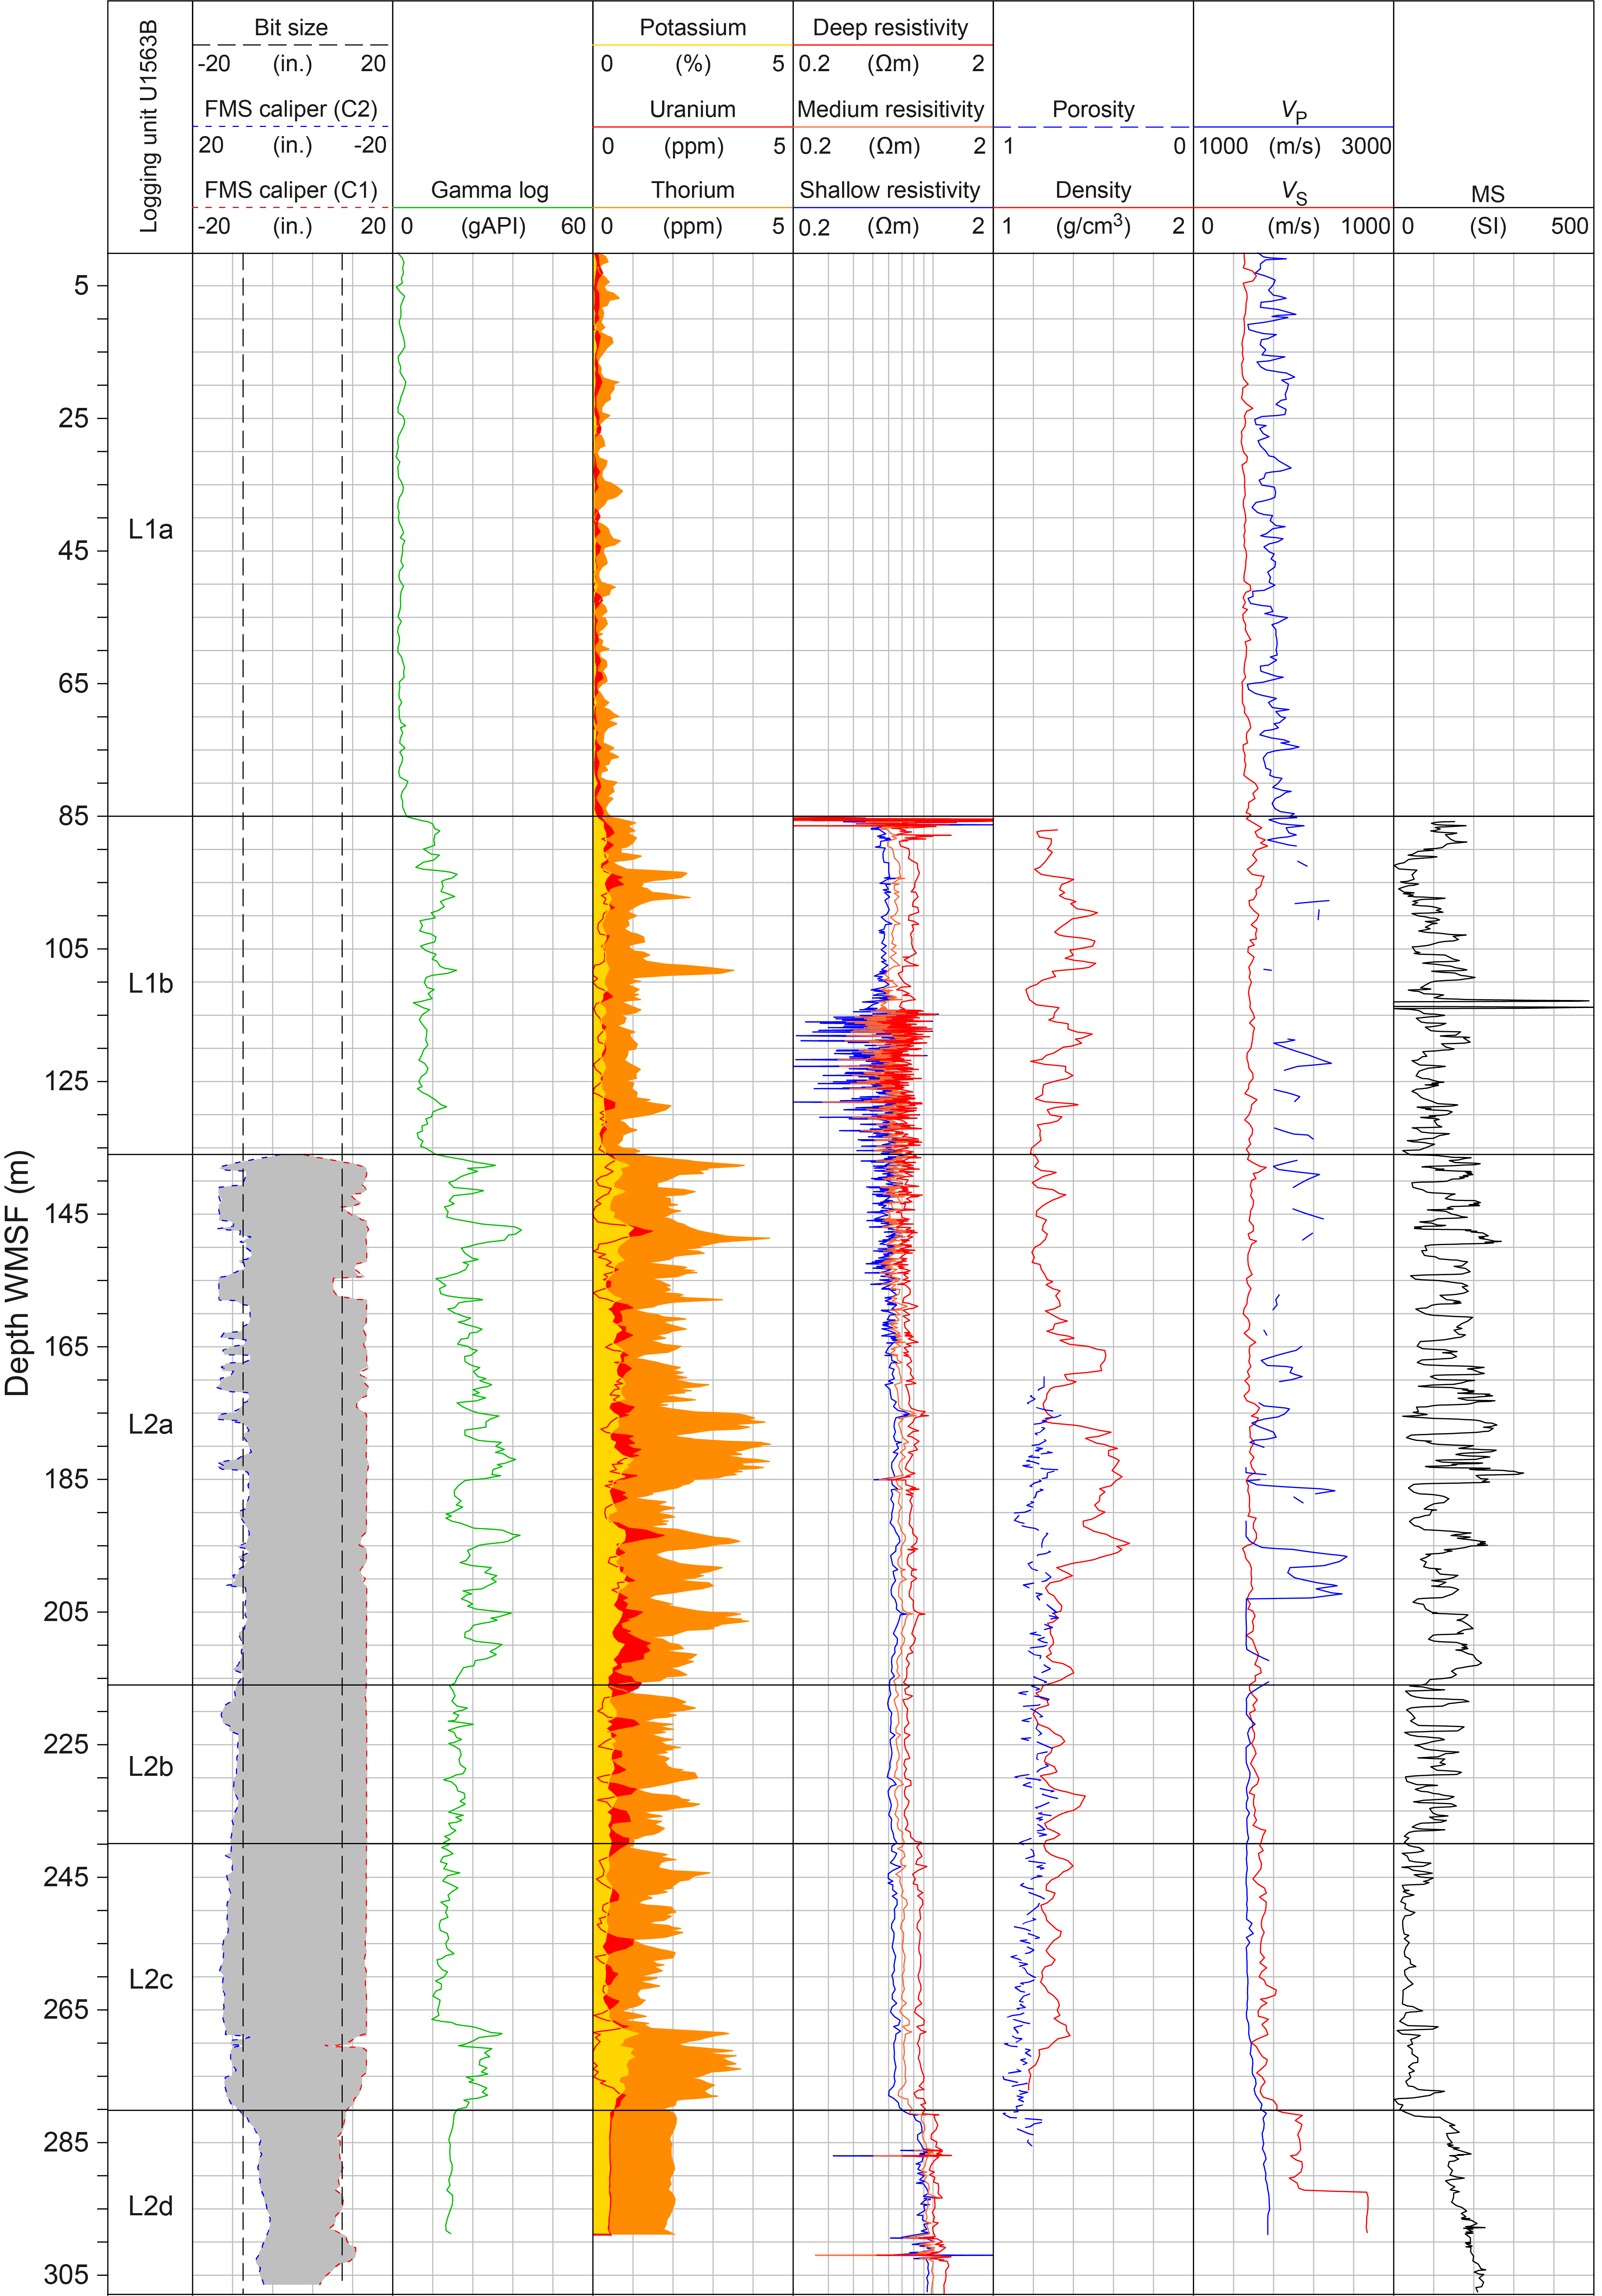
Figure F40. Downhole logging data.
The HNGS, HRLA, and HLDS data were corrected for hole size during logging, and APS data were corrected for tool standoff during logging. The HLDS and APS recorded density and porosity at sampling intervals of 2.54 and 5.08 cm, respectively, in addition to the standard sampling interval of 15.24 cm. DSI data were deemed to be of acceptable quality by the data processing team at the Lamont-Doherty Earth Observatory (LDEO). Triple combo and FMS-sonic tool string data from the three separate passes were compared to each other to assess repeatability. All passes show good repeatability except for the gamma ray from the triple combo main pass (Data Set 016LUP), which shows increased counts below ~275 m WMSF because the formation was still affected by radioactive activation of the APS false start at the beginning of the main pass. VP measurements were of very poor quality in the larger section of the hole above ~215 m WMSF where the measured velocity is slower than that of the drilling mud, so these measurements should be ignored.
The FMS image log from Hole U1563B is mostly of poor quality because of borehole enlargement and ovalization. Irregular borehole shape caused poor orientation of the tool string over the intervals 138–141, 154–158, 166–168, 182–184, 269–271, and 295–308 m WMSF, as shown by the inclinometry data (Figure F41), which reduces borehole image quality. Sawtooth artifacts are present throughout the entire image log, reducing image quality.
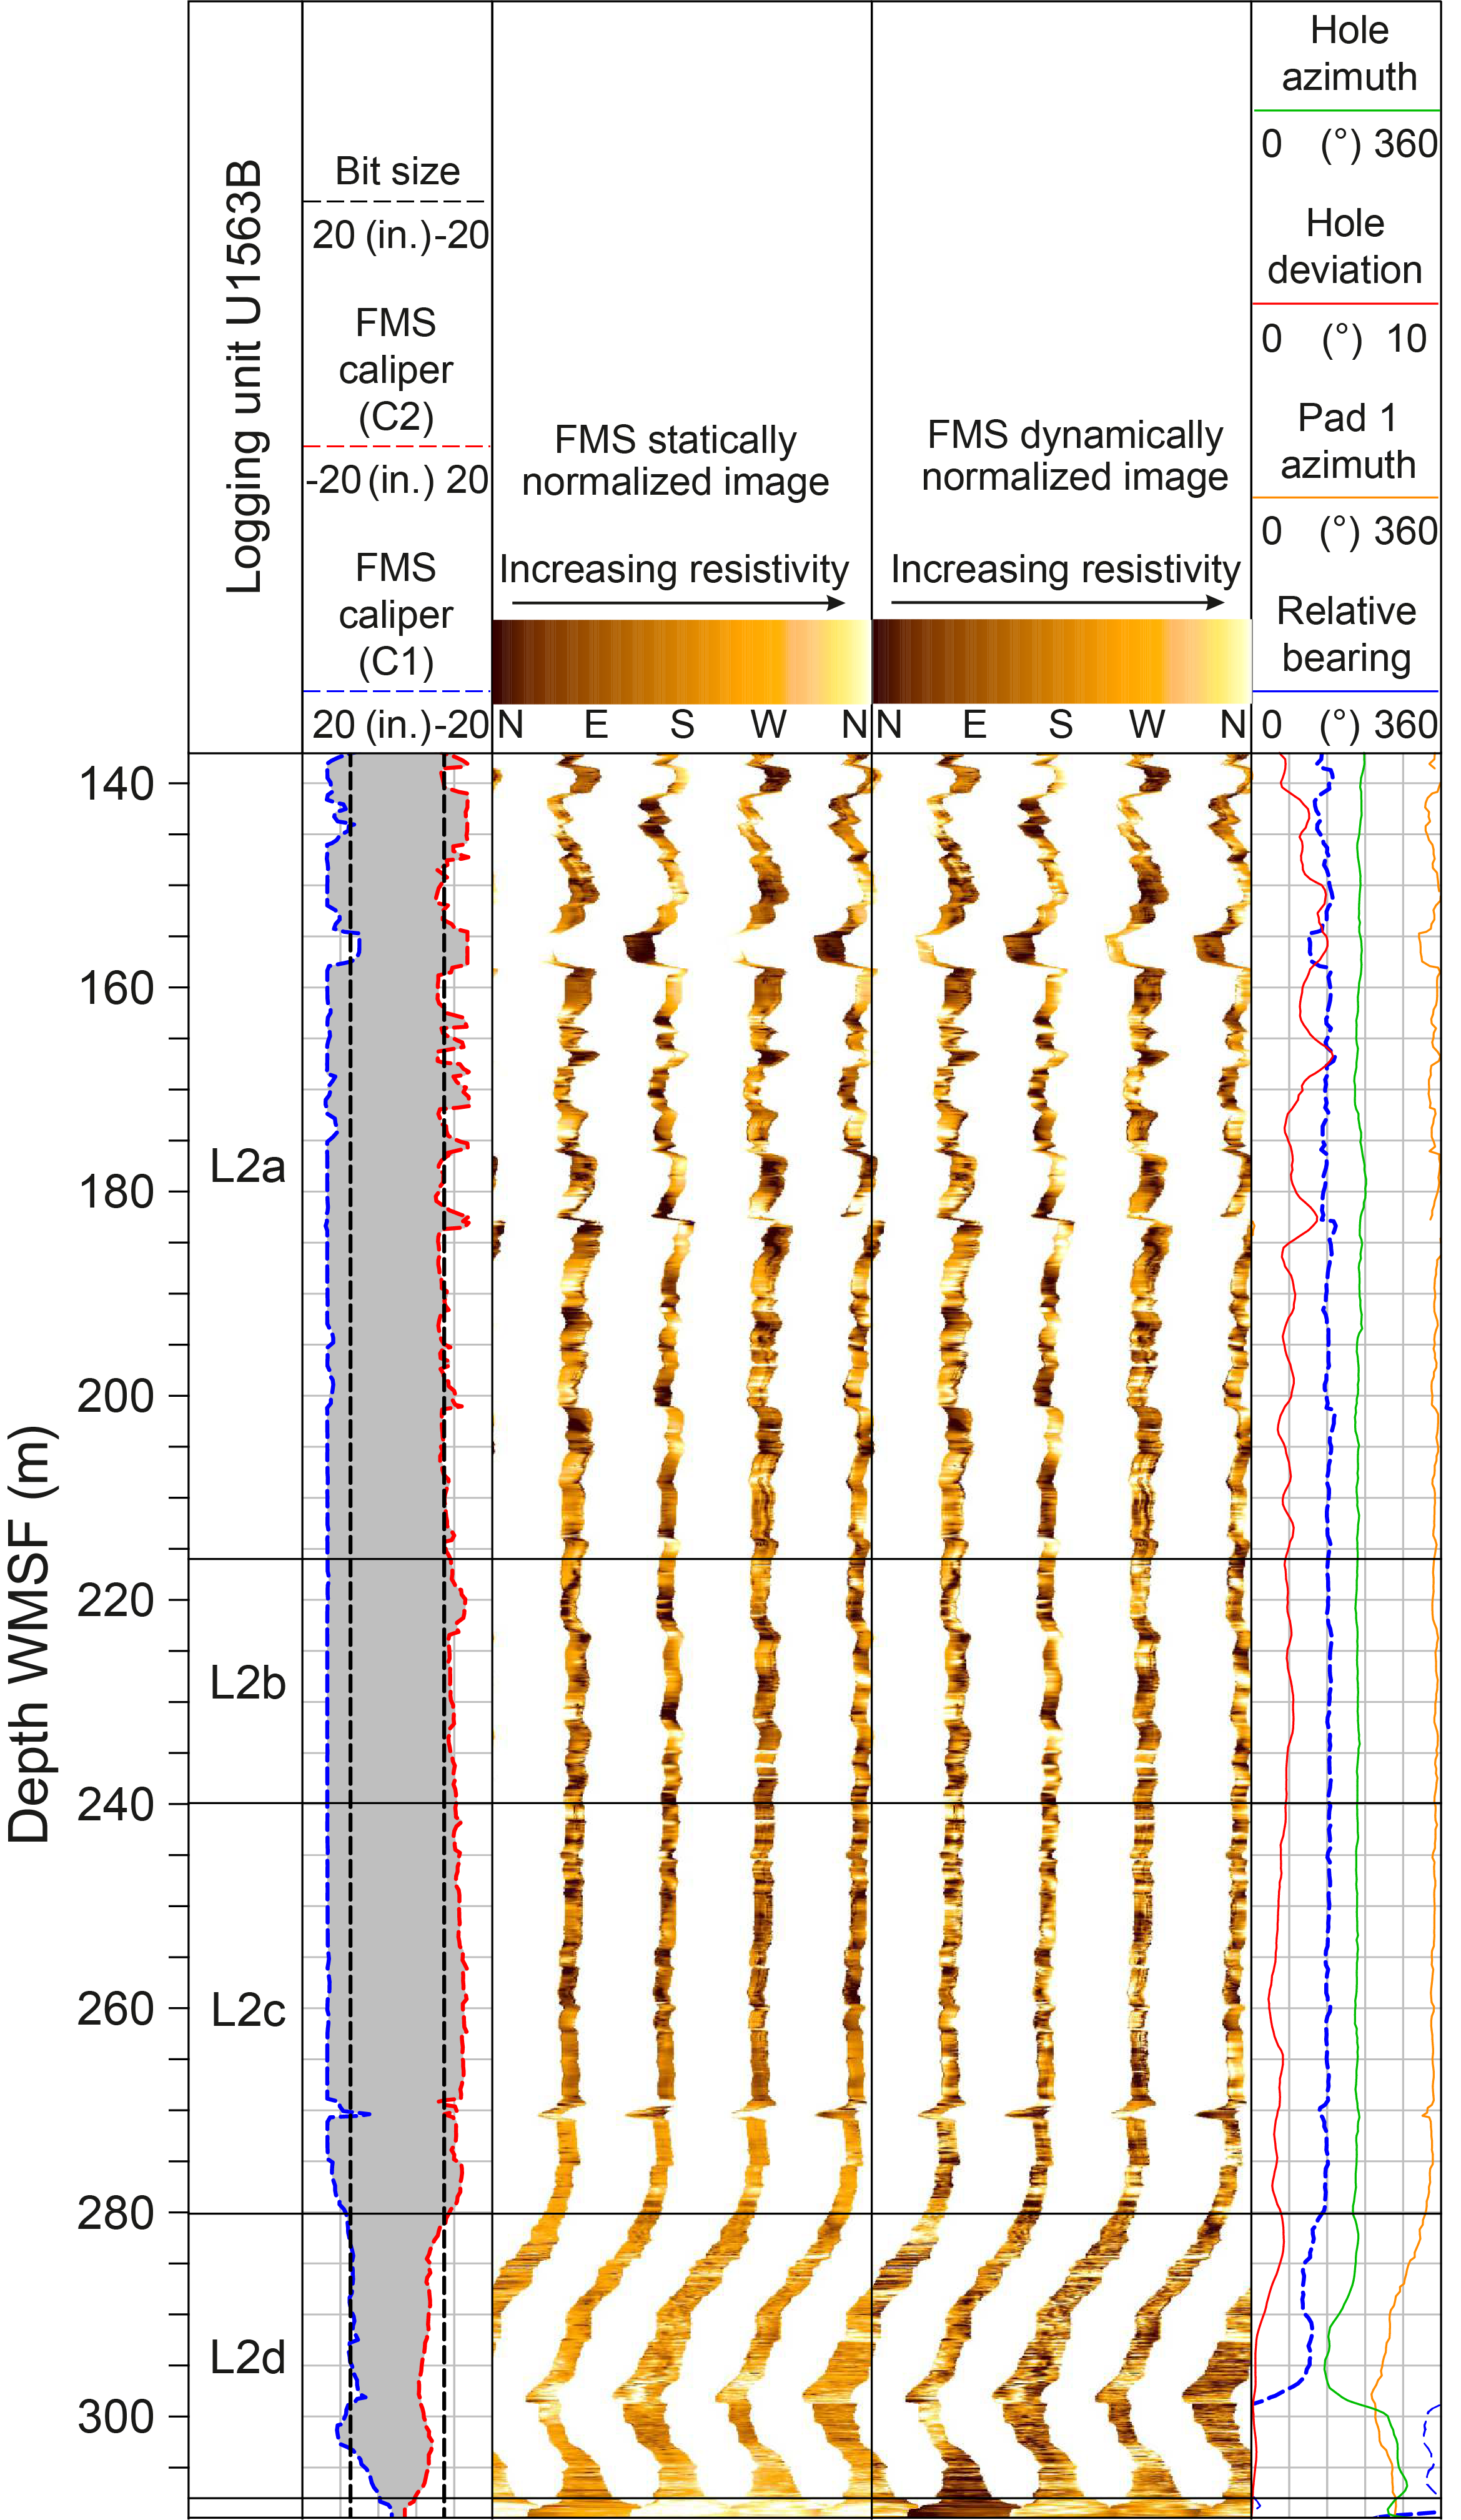
Figure F41. Wireline image data.
The VSI tool string was run after starting with a brief uplog pass to depth-tie any upcoming shots to the triple combo main pass. VSI measurements were acquired at four stations, but only two (~296 and 306 m WMSF) recorded good shots.
10.2. Logging units
Two logging units are defined in Hole U1563B (Logging Units L1 [0–136 m WMSF] and L2 [136–308 m WMSF]) based on a distinct increase in the gamma radiation logs at 136 m WMSF (Figure F40; Table T12). Further changes in the gamma, resistivity, shear wave velocity (VS), and MS logs are used to define two subunits in Unit L1 (L1a and L1b) and four subunits in Unit L2 (L2a, L2b, L2c, and L2d). During drilling in Hole U1563A, four downhole temperatures were made using the APCT-3 tool in Unit L1. The APCT-3 tool was used to project equilibration temperatures of 5.7°C at 35.9 m CSF-A, 6.36°C at 64.4 m CSF-A, 7.42°C at 92.9 m CSF-A, and 8.46°C at 121.4 m CSF-A.
10.2.1. Logging Subunit L1a
The uppermost 85 m of the Hole U1563B logging data set was collected through the drill pipe, and therefore only suppressed gamma log can be used to assess the formation. This logging subunit consists of an average gamma radiation signal of ~2.2 ± 0.9 American Petroleum Institute gamma radiation units (gAPI). Logging Subunit L1a spans Lithostratigraphic Unit I and the uppermost 11 m of Lithostratigraphic Unit II (see Lithostratigraphy).
10.2.2. Logging Subunit L1b
Logging Subunit L1b shows increased gamma radiation with respect to Subunit L1a with values up to ~17.3 ± 5.1 gAPI because there is no longer any suppression of the signal from the drill pipe. The gamma response fluctuates in this unit and contains distinct peaks of up to ~20 gAPI. These elevated gamma radiation peaks correlate to elevated spectral gamma Th counts up to 3.6 ppm. Resistivity values are consistently low (~0.5–0.8 Ωm) in Subunit L1b to ~114 m WMSF, and below that, resistivity values fluctuate over short depth intervals, decreasing to as low as 0.12 Ωm. The lower resistivity readings may be related to unfavorable hole conditions. Density ranges 1.2–1.6 g/cm3 with porosity measurements falling between 1.0 and 0.6. VS ranges 250–350 m/s, and although VP measurements are mostly unreliable in Subunit L1b, occasional reliable data points provide readings between 1800 and 2260 m/s. MS cycles between near 0 to 210 SI over short depth intervals. Subunit L1b corresponds to the upper interval (85–136 m CSF-A) of Lithostratigraphic Unit II (see Lithostratigraphy).
10.2.3. Logging Subunit L2a
The top of Logging Subunit L2a is defined by an increase in gamma log to an average around 24 ± 6 gAPI, several distinct peaks in the spectral gamma Th counts (up to ~4.5 ppm), and an increase in MS average and variability (average = 138 ± 59 SI). Resistivity remains low in this subunit (0.5–0.8 Ωm) and does not vary considerably as in Subunit L1b. VP measurements are unreliable throughout this logging subunit, and VS measurements are fairly uniform with depth (average = 385 ± 19 m/s). Porosity ranges 0.6–0.9, and density is predominantly ~1.4 g/cm3 but increases to ~1.6 g/cm3 between ~165–169 and ~178–196 m WMSF. This logging unit is entirely within Lithostratigraphic Unit II (see Lithostratigraphy).
10.2.4. Logging Subunit L2b
The top of Logging Subunit L2b is distinguished from Subunit L2a by a decrease in gamma radiation to ~19 ± 2 gAPI, but Subunit L2b still contains peaks in Th counts (up to 2.6 ppm). This subunit is further distinguished by a slight decrease in MS (average = 92 ± 45 SI) with shorter wavelength fluctuations than in Subunit L2a. Resistivity, porosity, density, VP, and VS measurements in Subunit L2b are comparable to those in Subunit L2a. This logging unit spans the lower part of Lithostratigraphic Unit II and the upper part of Lithostratigraphic Unit III (see Lithostratigraphy).
10.2.5. Logging Subunit L2c
The top of Logging Subunit L2c is distinguished from Subunit L2b by a decrease in gamma radiation to an average of 15 ± 2 gAPI. There is a sharp increase in gamma radiation at ~266 m WMSF, but this may be due to the presence of drilling mud collecting in the bottom of the hole and/or due to the early radioactive activation of the formation by the logging tool, as mentioned earlier, and it is therefore unlikely to be a real geological signature. Thorium peaks are still present throughout Subunit L2c, similar to Subunit L2b. The top of Subunit L2c is further marked by a decrease in MS (average = 39 ± 20 SI), which becomes relatively constant, and a subtle increase in resistivity (~0.9 Ωm) and VS (343 ± 22 m/s). Density is typically ~1.25 g/cm3, and porosity is high and increases with depth in this logging unit (from ~0.8 to 0.92). VP is similar to that measured in Subunit L2b (average = ~1547 ± 23 m/s). This logging unit corresponds to the lower portion of Lithostratigraphic Unit III (see Lithostratigraphy).
10.2.6. Logging Subunit L2d
Logging Subunit L2d is distinguished from Subunit L2c by increases in resistivity (~1.1 Ωm), VS (average = 524 ± 30 m/s), VP (average = 1724 ± 27 m/s), and MS (average = 158 ± 41 SI), as well as a decrease in porosity to as low as 0.7. Gamma radiation (~18 gAPI) is higher than in Subunit L2c but shows an uncharacteristically invariant signal that should be interpreted with caution. Density measurements were not acquired in this deeper unit because of the tool arrangement. This logging unit corresponds to the uppermost ~28 m of Lithostratigraphic Unit IV (see Lithostratigraphy).
10.3. Borehole imaging
Despite the suboptimal FMS borehole image quality, some geologic features are observable, such as decimeter-scale alternating conductive and resistive bedding (e.g., 240– 250 m WMSF) (Figure F41).
10.4. Downhole temperature and heat flow
Four APCT-3 downhole temperature measurements were made in Hole U1563A, yielding projected formation temperature that ranged from 5.27°C at 35.9 m DSF to 8.46°C at 121.4 m DSF (Figures F42, F43A; Table T13) and giving a geothermal gradient of 37°C/km. Thermal conductivity under in situ conditions (K) was estimated from laboratory-determined thermal conductivity from Hole U1563A using the method of Hyndman et al. (1974) (Figure F43B). A linear function for depth-dependent thermal resistance (R) was obtained by integrating the inverse of the thermal conductivity over depth and applying a linear least-squares fit (Figure F43C). This function was used to estimate thermal resistance at each corresponding APCT-3 downhole temperature measurement depth. A heat flow of 32.5 mW/m2 was obtained from a linear least-squares fit of the relationship between temperature and thermal resistance (Bullard, 1939), whose slope is the vertical heat flow (Figure F43D).
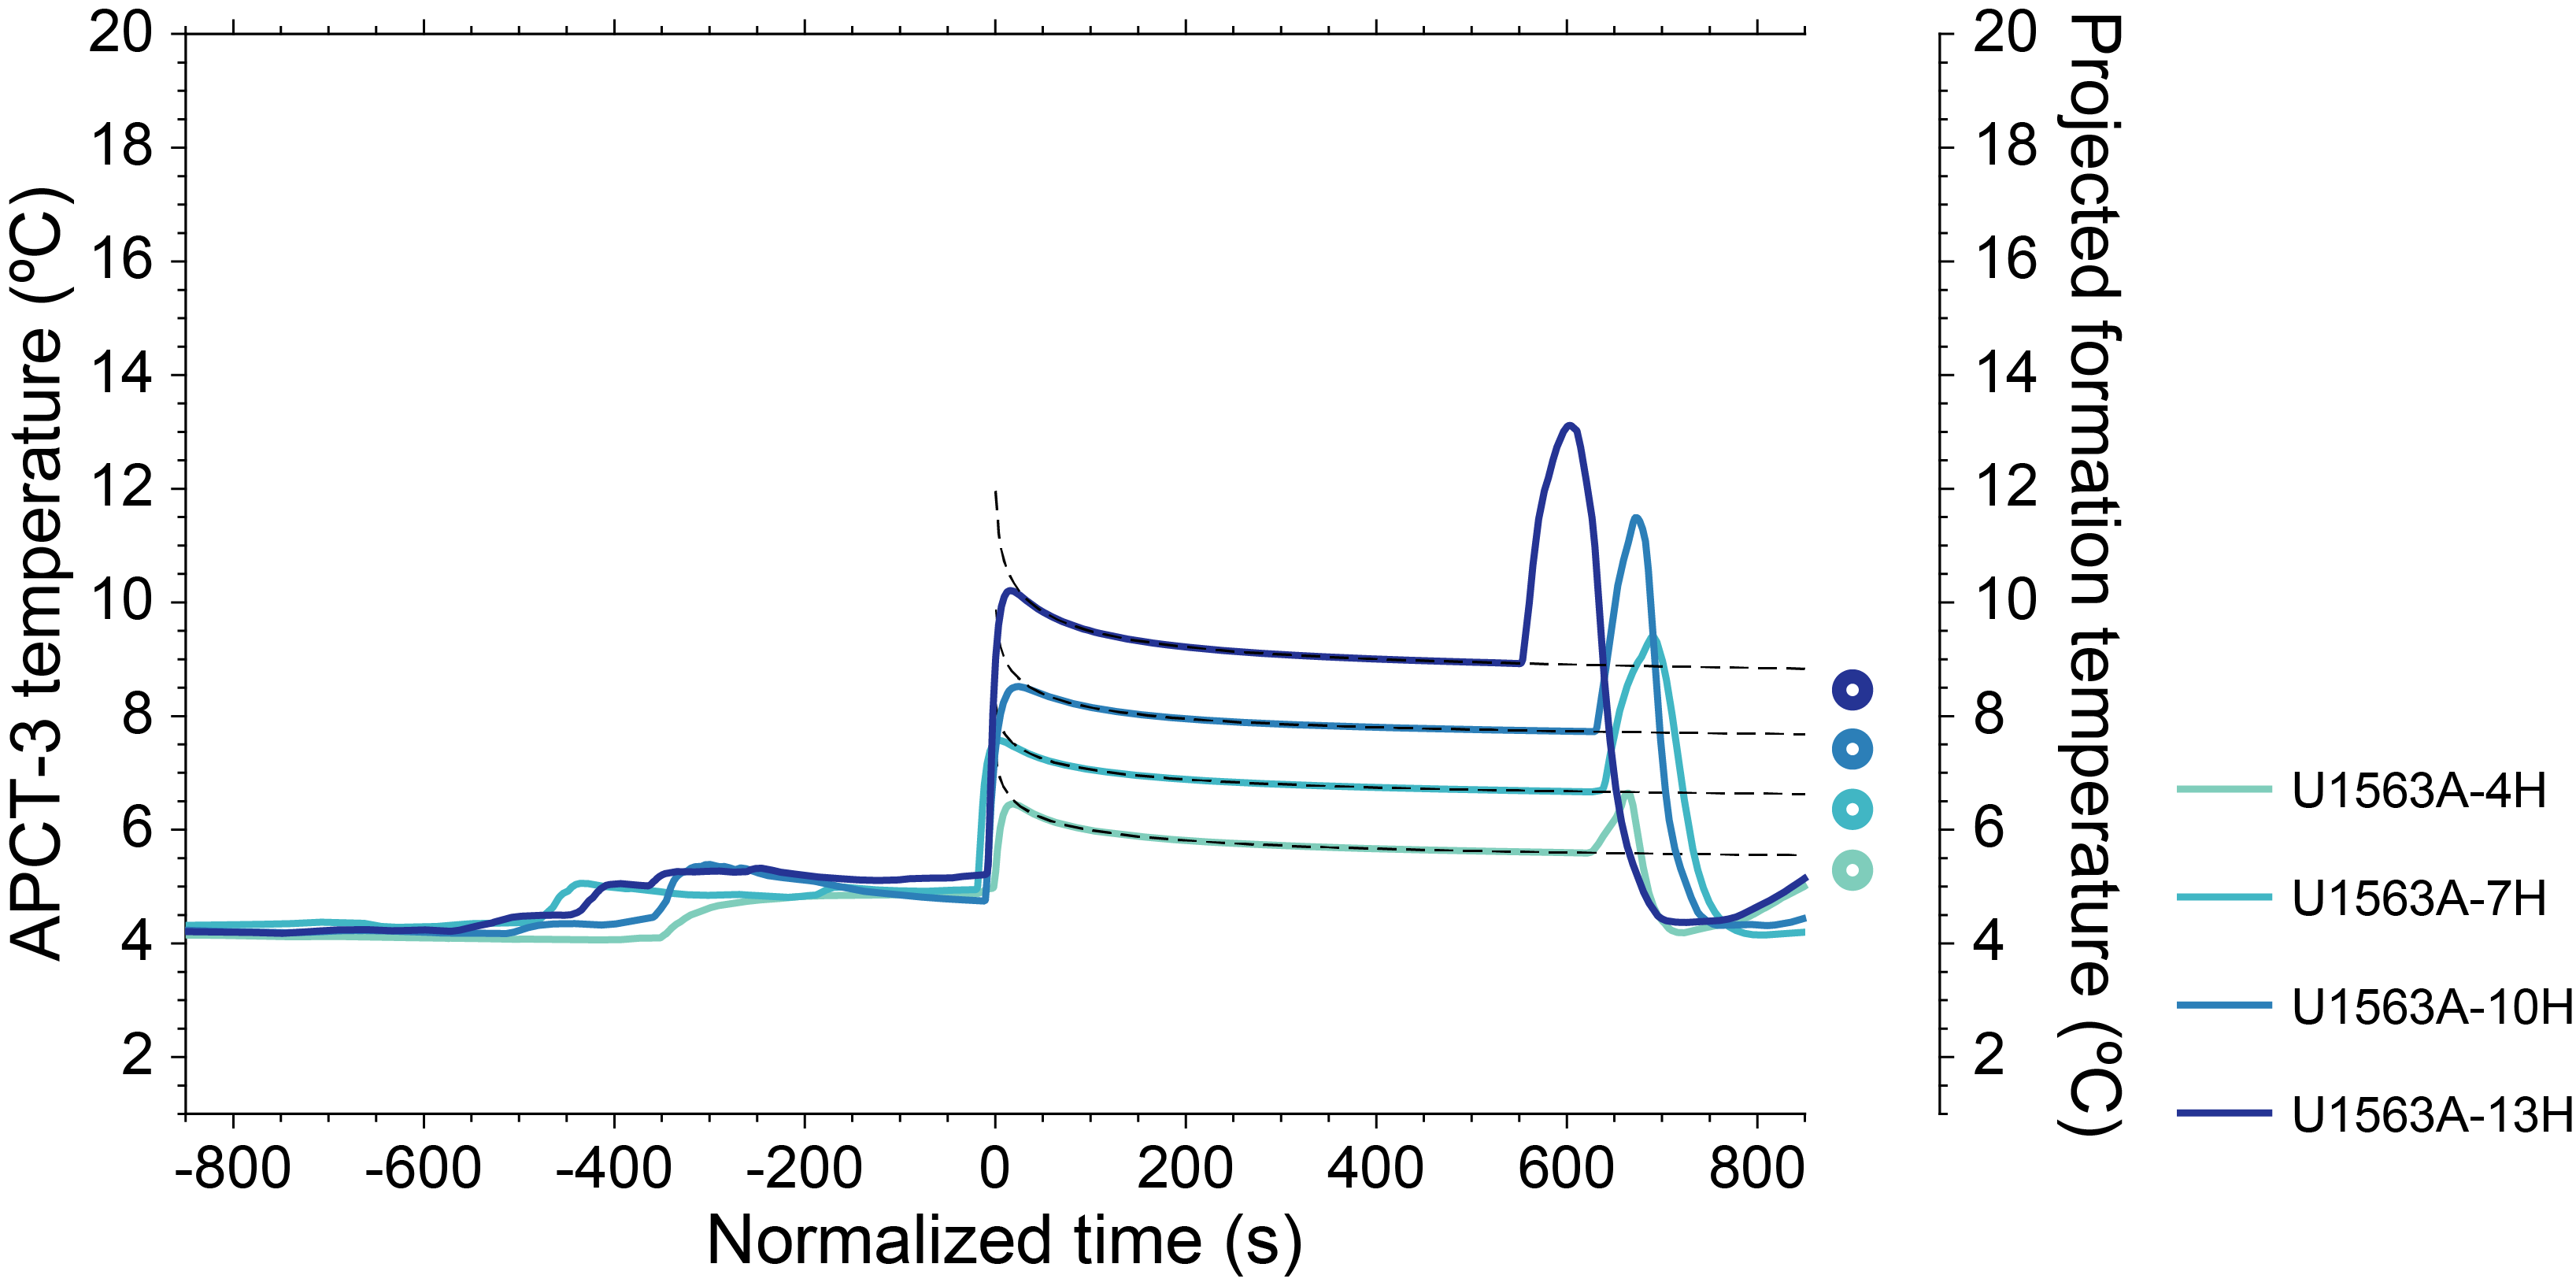
Figure F42. APCT-3 temperature-time series and projected formation temperatures.
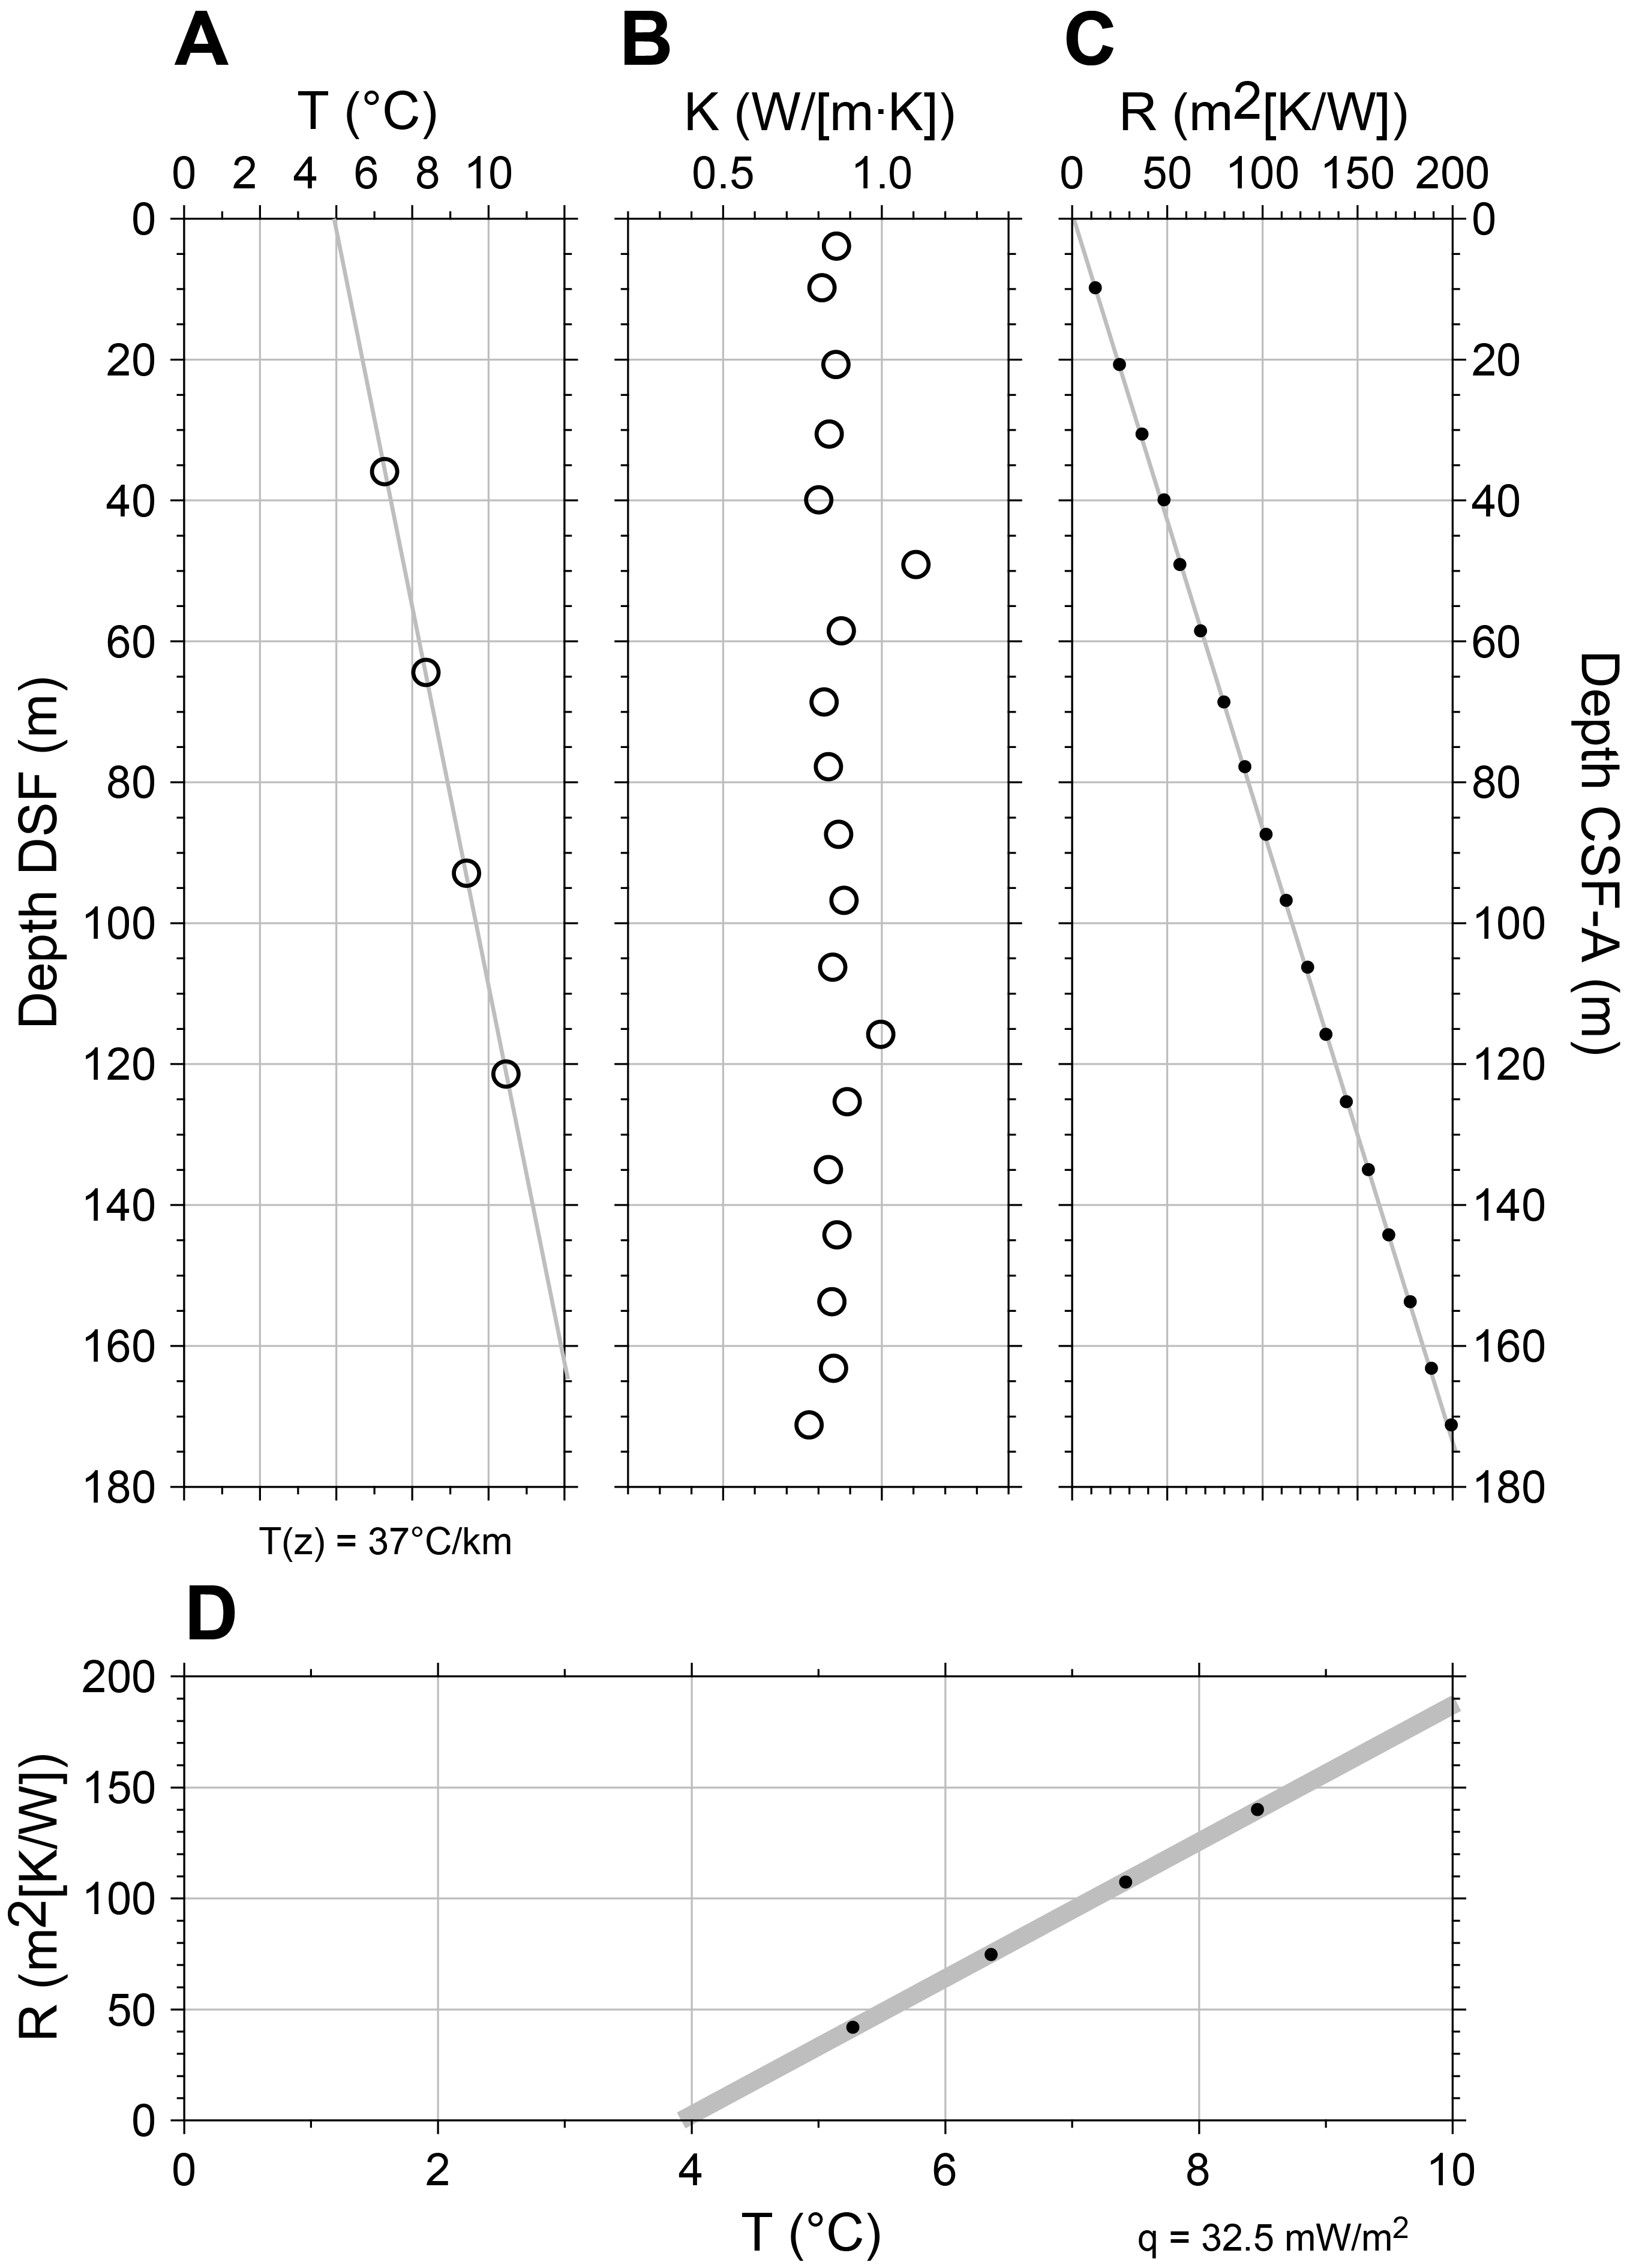
Figure F43. Thermal gradient and heat flow estimates.
11. Age model
Site survey seismic reflection profiles for Site U1563 (see Background and objectives) show acoustically continuous reflections throughout the sedimentary succession. Biostratigraphic and magnetostratigraphic age constraints for Hole 359C-U1563A (see Micropaleontology and Paleomagnetism) are combined as an age-depth plot in Figure F44. Tie points for the provisional age model are based on a combination of magnetostratigraphic and biostratigraphic data (Table T14). In general, there is good agreement between the results from the various data sets.
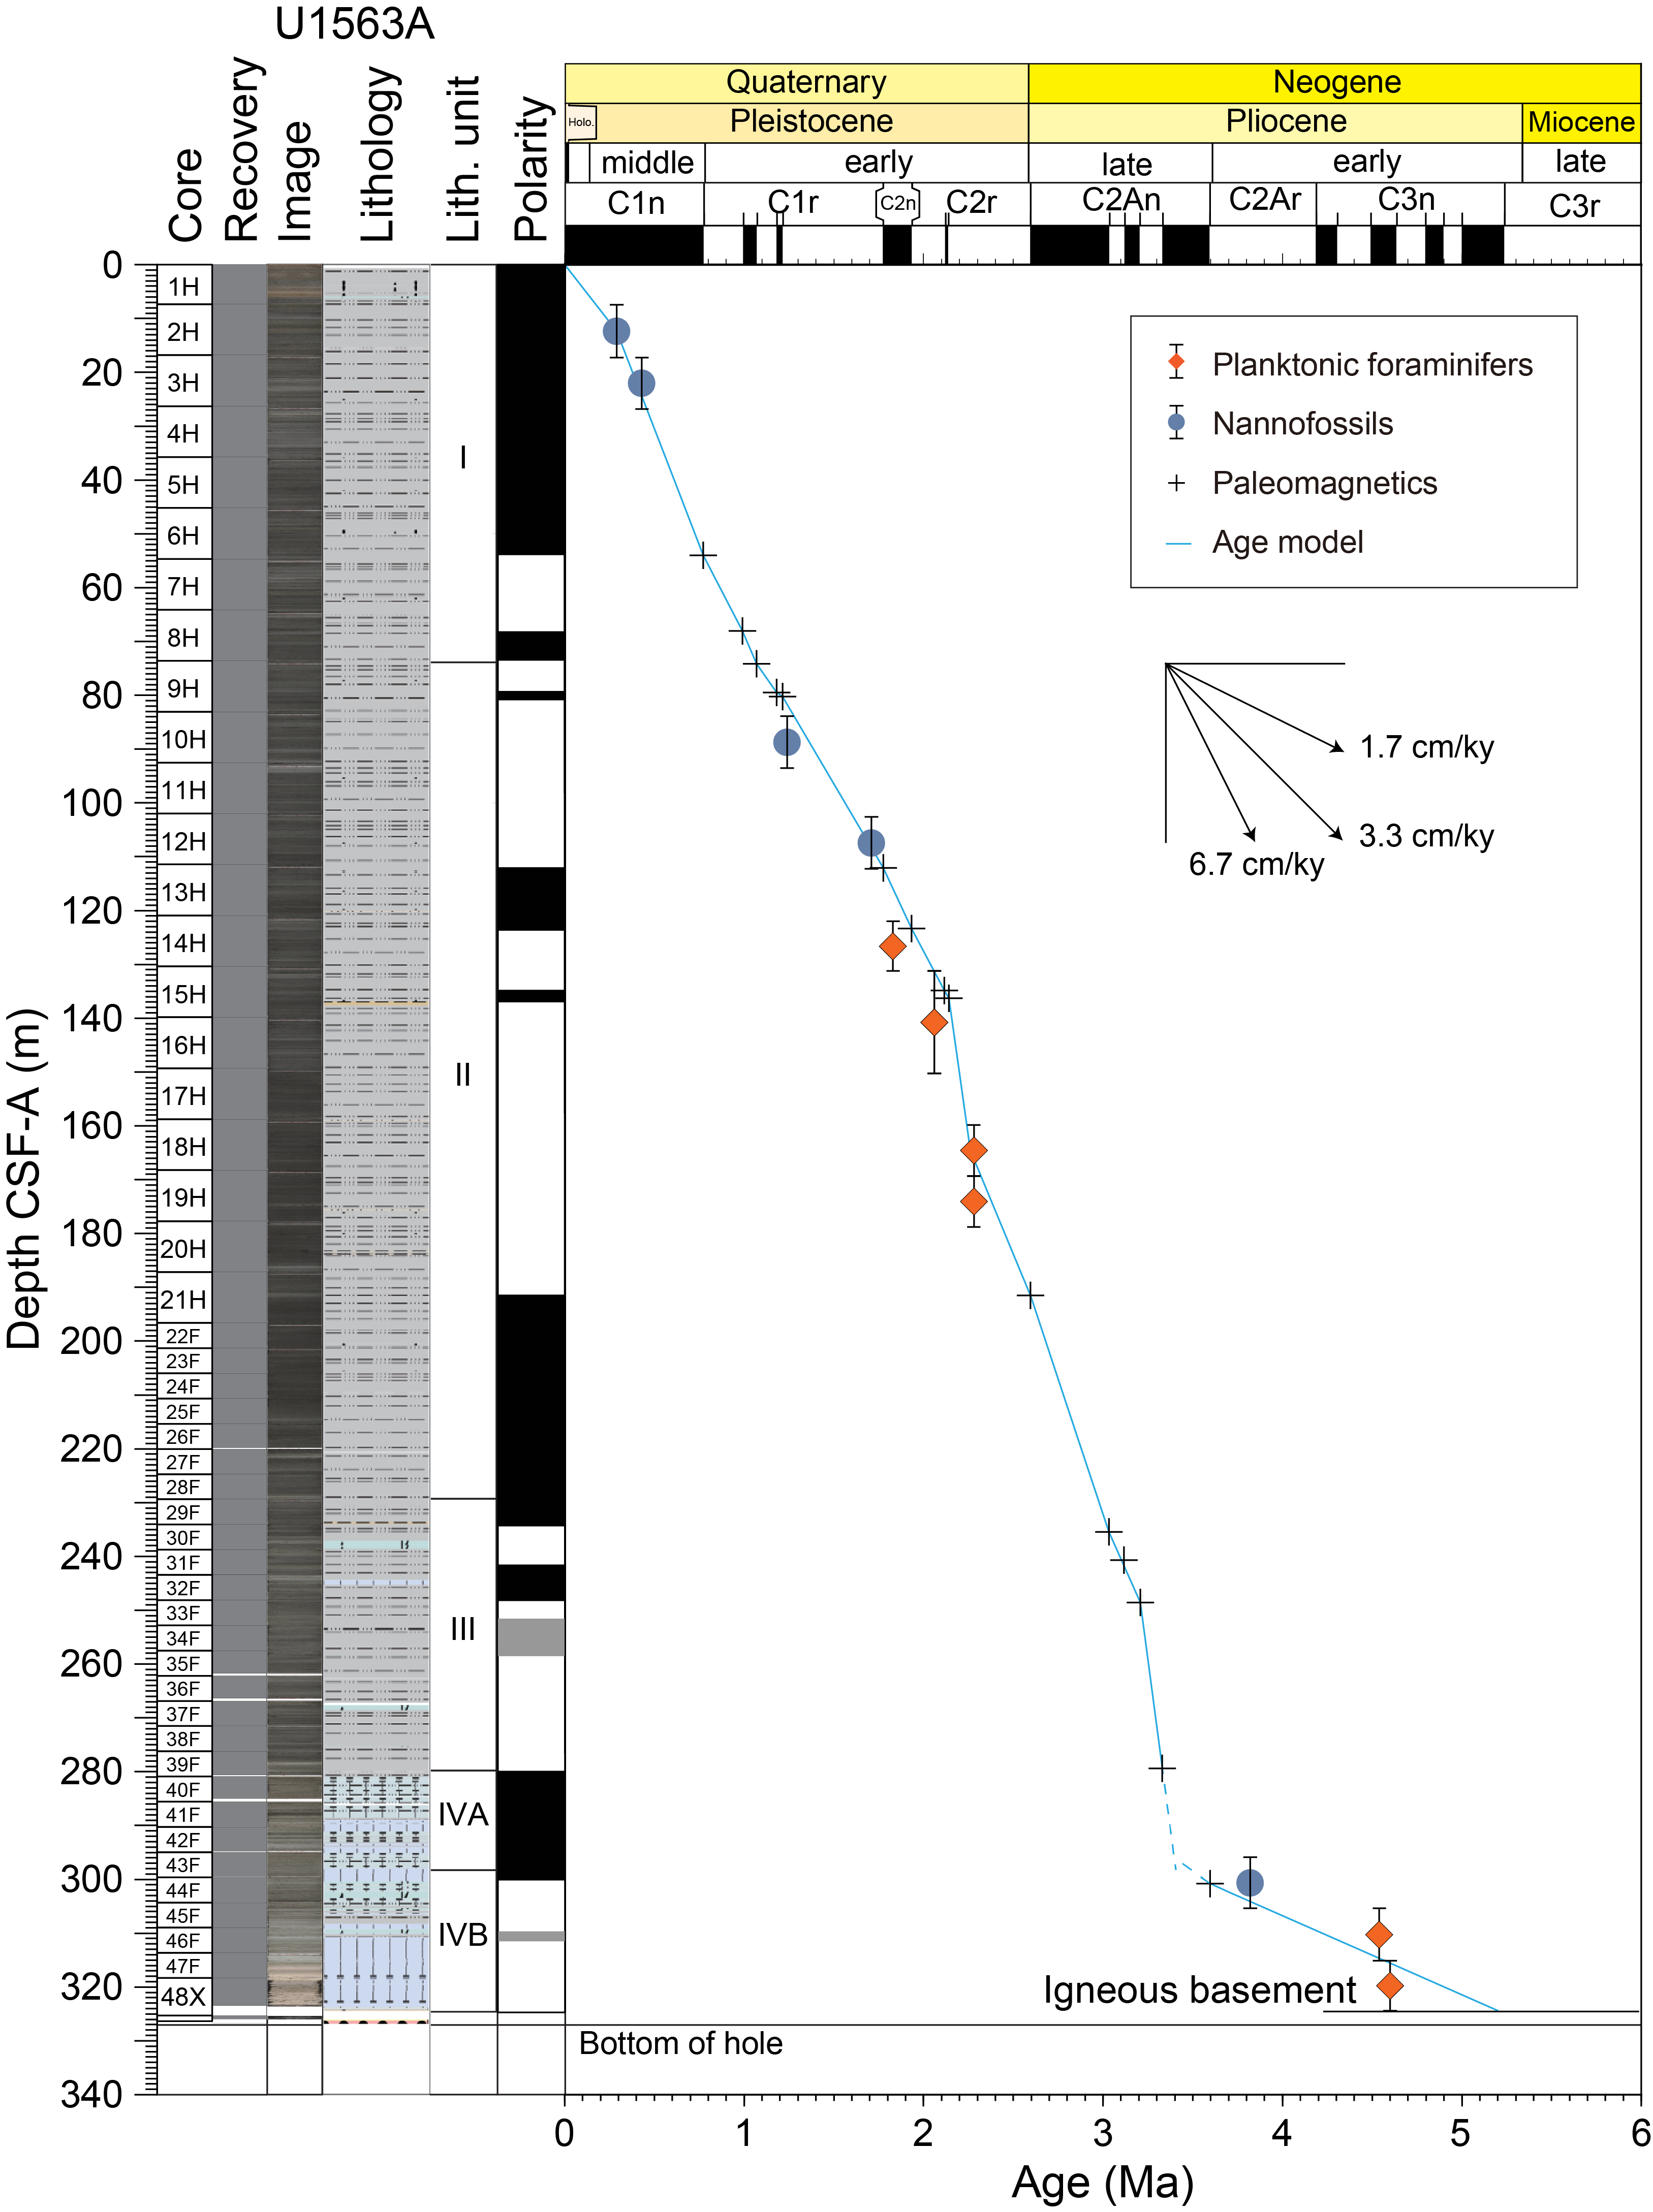
Figure F44. Age model for the sedimentary succession.
The sedimentary succession appears fairly continuous to the base of Feni Subchron C2r.1n (2.140 Ma) at 136.29 m CSF-A, with an average sedimentation rate of ~6.3 cm/ky. From that depth to the base of Subchron C2An.2n (3.207 Ma) at 248.57 m CSF-A, the average sedimentation rate is higher (10.5 cm/ky). There may be a slight hiatus, or condensed interval, around the abrupt change in sedimentation rate near the base of Gauss Subchron C2An.3n (3.596 Ma) at ~300 m CSF-A, close to the Lithostratigraphic Subunit IVA–IVB transition (see Lithostratigraphy). This lithologic boundary is used as the inflection point in the age model, with an age estimate of 3.41 Ma when extrapolated from above; this compares to an age of 3.43 Ma when extrapolated from below, signifying little missing time, although the sedimentological change at this level may represent noncontinuous deposition and should be treated with caution.
The best age constraint toward the bottom of the hole is provided by a combination of two closely spaced planktonic foraminifer bioevents, the base of G. puncticulata (4.54 Ma) and the base of G. crassaformis (4.60 Ma), which are assigned a mean age of 4.57 Ma in the age model. Sample 395C-U1563A-46F-CC at 315.13 m CSF-A lies between these events and is used as a tie point with an interpolated age of 4.57 Ma. Using this constraint, the average sedimentation rate for the lower part of the succession below Subchron C2An.3n (3.596 Ma) is ~1.5 cm/ky, and the extrapolated age estimate for the oldest sediment at the site is 5.22 Ma. This corresponds well with the anticipated basement age of 5.2 Ma estimated from satellite and regional shipboard magnetic data (see Background and objectives).
References
Alken, P., Thébault, E., Beggan, C.D., Amit, H., Aubert, J., Baerenzung, J., Bondar, T.N., Brown, W.J., Califf, S., Chambodut, A., Chulliat, A., Cox, G.A., Finlay, C.C., Fournier, A., Gillet, N., Grayver, A., Hammer, M.D., Holschneider, M., Huder, L., Hulot, G., Jager, T., Kloss, C., Korte, M., Kuang, W., Kuvshinov, A., Langlais, B., Léger, J.M., Lesur, V., Livermore, P.W., Lowes, F.J., Macmillan, S., Magnes, W., Mandea, M., Marsal, S., Matzka, J., Metman, M.C., Minami, T., Morschhauser, A., Mound, J.E., Nair, M., Nakano, S., Olsen, N., Pavón-Carrasco, F.J., Petrov, V.G., Ropp, G., Rother, M., Sabaka, T.J., Sanchez, S., Saturnino, D., Schnepf, N.R., Shen, X., Stolle, C., Tangborn, A., Tøffner-Clausen, L., Toh, H., Torta, J.M., Varner, J., Vervelidou, F., Vigneron, P., Wardinski, I., Wicht, J., Woods, A., Yang, Y., Zeren, Z., and Zhou, B., 2021. International Geomagnetic Reference Field: the thirteenth generation. Earth, Planets and Space, 73(1):49. https://doi.org/10.1186/s40623-020-01288-x
Bullard, E.C., 1939. Heat flow in South Africa. Proceedings of the Royal Society of London, A: Mathematical and Physical Sciences, 173(955):474–502. https://doi.org/10.1098/rspa.1939.0159
Butterworth, S., 1930. On the theory of filter amplifiers. Experimental Wireless and the Wireless Engineer, 7:536–541. https://www.gonascent.com/papers/butter.pdf
Faure, F., Trolliard, G., Nicollet, C., and Montel, J.-M., 2003. A developmental model of olivine morphology as a function of the cooling rate and the degree of undercooling. Contributions to Mineralogy and Petrology, 145(2):251–263. https://doi.org/10.1007/s00410-003-0449-y
Hartmann, A., and Villinger, H., 2002. Inversion of marine heat flow measurements by expansion of the temperature decay function. Geophysical Journal International, 148(3):628–636. https://doi.org/10.1046/j.1365-246X.2002.01600.x
Hyndman, R.D., Erickson, A.J., and Von Herzen, R.P., 1974. Geothermal measurements on DSDP Leg 26. In Davies, T.A., Luyendyk, B.P., et al., Initial Reports of the Deep Sea Drilling Project. 26: Washington, DC (US Government Printing Office), 451–463. https://doi.org/10.2973/dsdp.proc.26.113.1974
Jones, S.M., Murton, B.J., Fitton, J.G., White, N.J., Maclennan, J., and Walters, R.L., 2014. A joint geochemical–geophysical record of time-dependent mantle convection south of Iceland. Earth and Planetary Science Letters, 386:86–97. https://doi.org/10.1016/j.epsl.2013.09.029
Lyons, R.G., 2011. Understanding Digital Signal Processing (Third edition): Upper Saddle River, NJ (Prentice Hall). https://www.iro.umontreal.ca/~mignotte/IFT3205/Documents/UnderstandingDigitalSignalProcessing.pdf
Murton, B.J., Taylor, R.N., and Thirlwall, M.F., 2002. Plume–ridge Interaction: a geochemical perspective from the Reykjanes Ridge. Journal of Petrology, 43(11):1987–2012. https://doi.org/10.1093/petrology/43.11.1987
Ogg, J.G., 2020. Geomagnetic Polarity Time Scale. In Gradstein, F.M., Ogg, J.G., Schmitz, M., and Ogg, G. (Eds.), Geologic Time Scale 2020. Amsterdam (Elsevier), 159–192. https://doi.org/10.1016/B978-0-12-824360-2.00005-X
Parnell-Turner, R., White, N., Henstock, T.J., Jones, S.M., Maclennan, J., and Murton, B.J., 2017. Causes and consequences of diachronous v-shaped ridges in the North Atlantic Ocean. Journal of Geophysical Research: Solid Earth, 122(11):8675–8708. https://doi.org/10.1002/2017JB014225
Parnell-Turner, R.E., Briais, A., LeVay, L.J., Cui, Y., Di Chiara, A., Dodd, J.P., Dunkley Jones, T., Dwyer, D., Eason, D.E., Friedman, S.A., Hemming, S.R., Hochmuth, K., Ibrahim, H., Jasper, C., Karatsolis, B.T., Lee, S., LeBlanc, D.E., Lindsay, M.R., McNamara, D.D., Modestou, S.E., Murton, B., OConnell, S., Pasquet, G.T., Pearson, P.N., Qian, S.P., Rosenthal, Y., Satolli, S., Sinnesael, M., Suzuki, T., Thulasi Doss, T., White, N.J., Wu, T., and Yang Yang, A., 2025a. Expedition 395 methods. In Parnell-Turner, R.E., Briais, A., LeVay, L.J., and the Expedition 395 Scientists, Reykjanes Mantle Convection and Climate. Proceedings of the International Ocean Discovery Program, 395: College Station, TX (International Ocean Discovery Program). https://doi.org/10.14379/iodp.proc.395.102.2025
Parnell-Turner, R.E., Briais, A., LeVay, L.J., and the Expedition 395 Scientists, 2025b. Supplementary material, https://doi.org/10.14379/iodp.proc.395supp.2025. In Parnell-Turner, R.E., Briais, A., LeVay, L.J., and the Expedition 395 Scientists, Reykjanes Mantle Convection and Climate. Proceedings of the International Ocean Discovery Program, 395: College Station, TX (International Ocean Discovery Program).
Skilling, I.P., White, J.D.L., and McPhie, J., 2002. Peperite: a review of magma–sediment mingling. Journal of Volcanology and Geothermal Research, 114(1–2):1–17. https://doi.org/10.1016/S0377-0273(01)00278-5
Zijderveld, J.D.A., 1967. AC demagnetization of rocks: analysis of results. In Runcorn, S.K.C., Creer, K.M., and Collinson, D.W. (Eds.), Methods in Palaeomagnetism. Developments in Solid Earth Geophysics, 3: 254–286. https://doi.org/10.1016/B978-1-4832-2894-5.50049-5