Parnell-Turner, R.E., Briais, A., LeVay, L.J., and the Expedition 395 Scientists
Proceedings of the International Ocean Discovery Program Volume 395
publications.iodp.org
https://doi.org/10.14379/iodp.proc.395.107.2025
Site U15641
![]() R.E. Parnell-Turner,
R.E. Parnell-Turner,
![]() A. Briais,
A. Briais,
![]() L.J. LeVay,
L.J. LeVay,
![]() Y. Cui,
Y. Cui,
![]() A. Di Chiara,
A. Di Chiara,
![]() J.P. Dodd,
J.P. Dodd,
![]() T. Dunkley Jones,
T. Dunkley Jones,
![]() D. Dwyer,
D. Dwyer,
![]() D.E. Eason,
D.E. Eason,
![]() S.A. Friedman,
S.A. Friedman,
![]() S.R. Hemming,
S.R. Hemming,
![]() K. Hochmuth,
K. Hochmuth,
![]() H. Ibrahim,
H. Ibrahim,
![]() C. Jasper,
C. Jasper,
![]() B.T. Karatsolis,
B.T. Karatsolis,
![]() S. Lee,
S. Lee,
![]() D.E. LeBlanc,
D.E. LeBlanc,
![]() M.R. Lindsay,
M.R. Lindsay,
![]() D.D. McNamara,
D.D. McNamara,
![]() S.E. Modestou,
S.E. Modestou,
![]() B. Murton,
B. Murton,
![]() S. OConnell,
S. OConnell,
![]() G.T. Pasquet,
G.T. Pasquet,
![]() P.N. Pearson,
S.P. Qian,
P.N. Pearson,
S.P. Qian,
![]() Y. Rosenthal,
Y. Rosenthal,
![]() S. Satolli,
S. Satolli,
![]() M. Sinnesael,
T. Suzuki,
M. Sinnesael,
T. Suzuki,
![]() T. Thulasi Doss,
T. Thulasi Doss,
![]() N.J. White,
N.J. White,
![]() T. Wu,
T. Wu,
![]() A. Yang Yang, and
A. Yang Yang, and
![]() V. dos Santos Rocha 2
V. dos Santos Rocha 2
1 Parnell-Turner, R.E., Briais, A., LeVay, L.J., Cui, Y., Di Chiara, A., Dodd, J.P., Dunkley Jones, T., Dwyer, D., Eason, D.E., Friedman, S.A., Hemming, S.R., Hochmuth, K., Ibrahim, H., Jasper, C., Karatsolis, B.T., Lee, S., LeBlanc, D.E., Lindsay, M.R., McNamara, D.D., Modestou, S.E., Murton, B., OConnell, S., Pasquet, G.T., Pearson, P.N., Qian, S.P., Rosenthal, Y., Satolli, S., Sinnesael, M., Suzuki, T., Thulasi Doss, T., White, N.J., Wu, T., Yang Yang, A., and dos Santos Rocha, V., 2025. Site U1564. In Parnell-Turner, R.E., Briais, A., LeVay, L.J., and the Expedition 395 Scientists, Reykjanes Mantle Convection and Climate. Proceedings of the International Ocean Discovery Program, 395: College Station, TX (International Ocean Discovery Program). https://doi.org/10.14379/iodp.proc.395.107.2025
2 Expedition 395 Scientists' affiliations.
1. Background and objectives
Site U1564 is located in the North Atlantic Ocean on the eastern flank of Reykjanes Ridge, south of Iceland (Figure F1). It is located on Seismic Line JC50-1 (Common Midpoint [CMP] 10710) near the intersection with Seismic Line JC50-C1 (CMP 1019); both lines were obtained in 2010 during RRS James Cook Cruise JC50 (Figures F2, F3) (Parnell-Turner et al., 2017). Expedition 384, 395C, and 395 sites comprise a crustal flow line transect across the eastern flank of Reykjanes Ridge. Four sites (U1554, U1555, U1562, and U1563) sampled two pairs of the V-shaped ridges (VSRs) and V-shaped troughs (VSTs) that straddle the flanks of Reykjanes Ridge. Site U1564 is located on crust with a segmented pattern that does not show evidence of VSRs or VSTs. The estimated basement age at Site U1564 is 32.4 Ma based on magnetic anomalies. Basalt samples from this site provide a record with which to compare samples from VST/VSR pairs, which will place constraints on the formation of these crustal structures and on hydrothermal alteration of the crust with time.
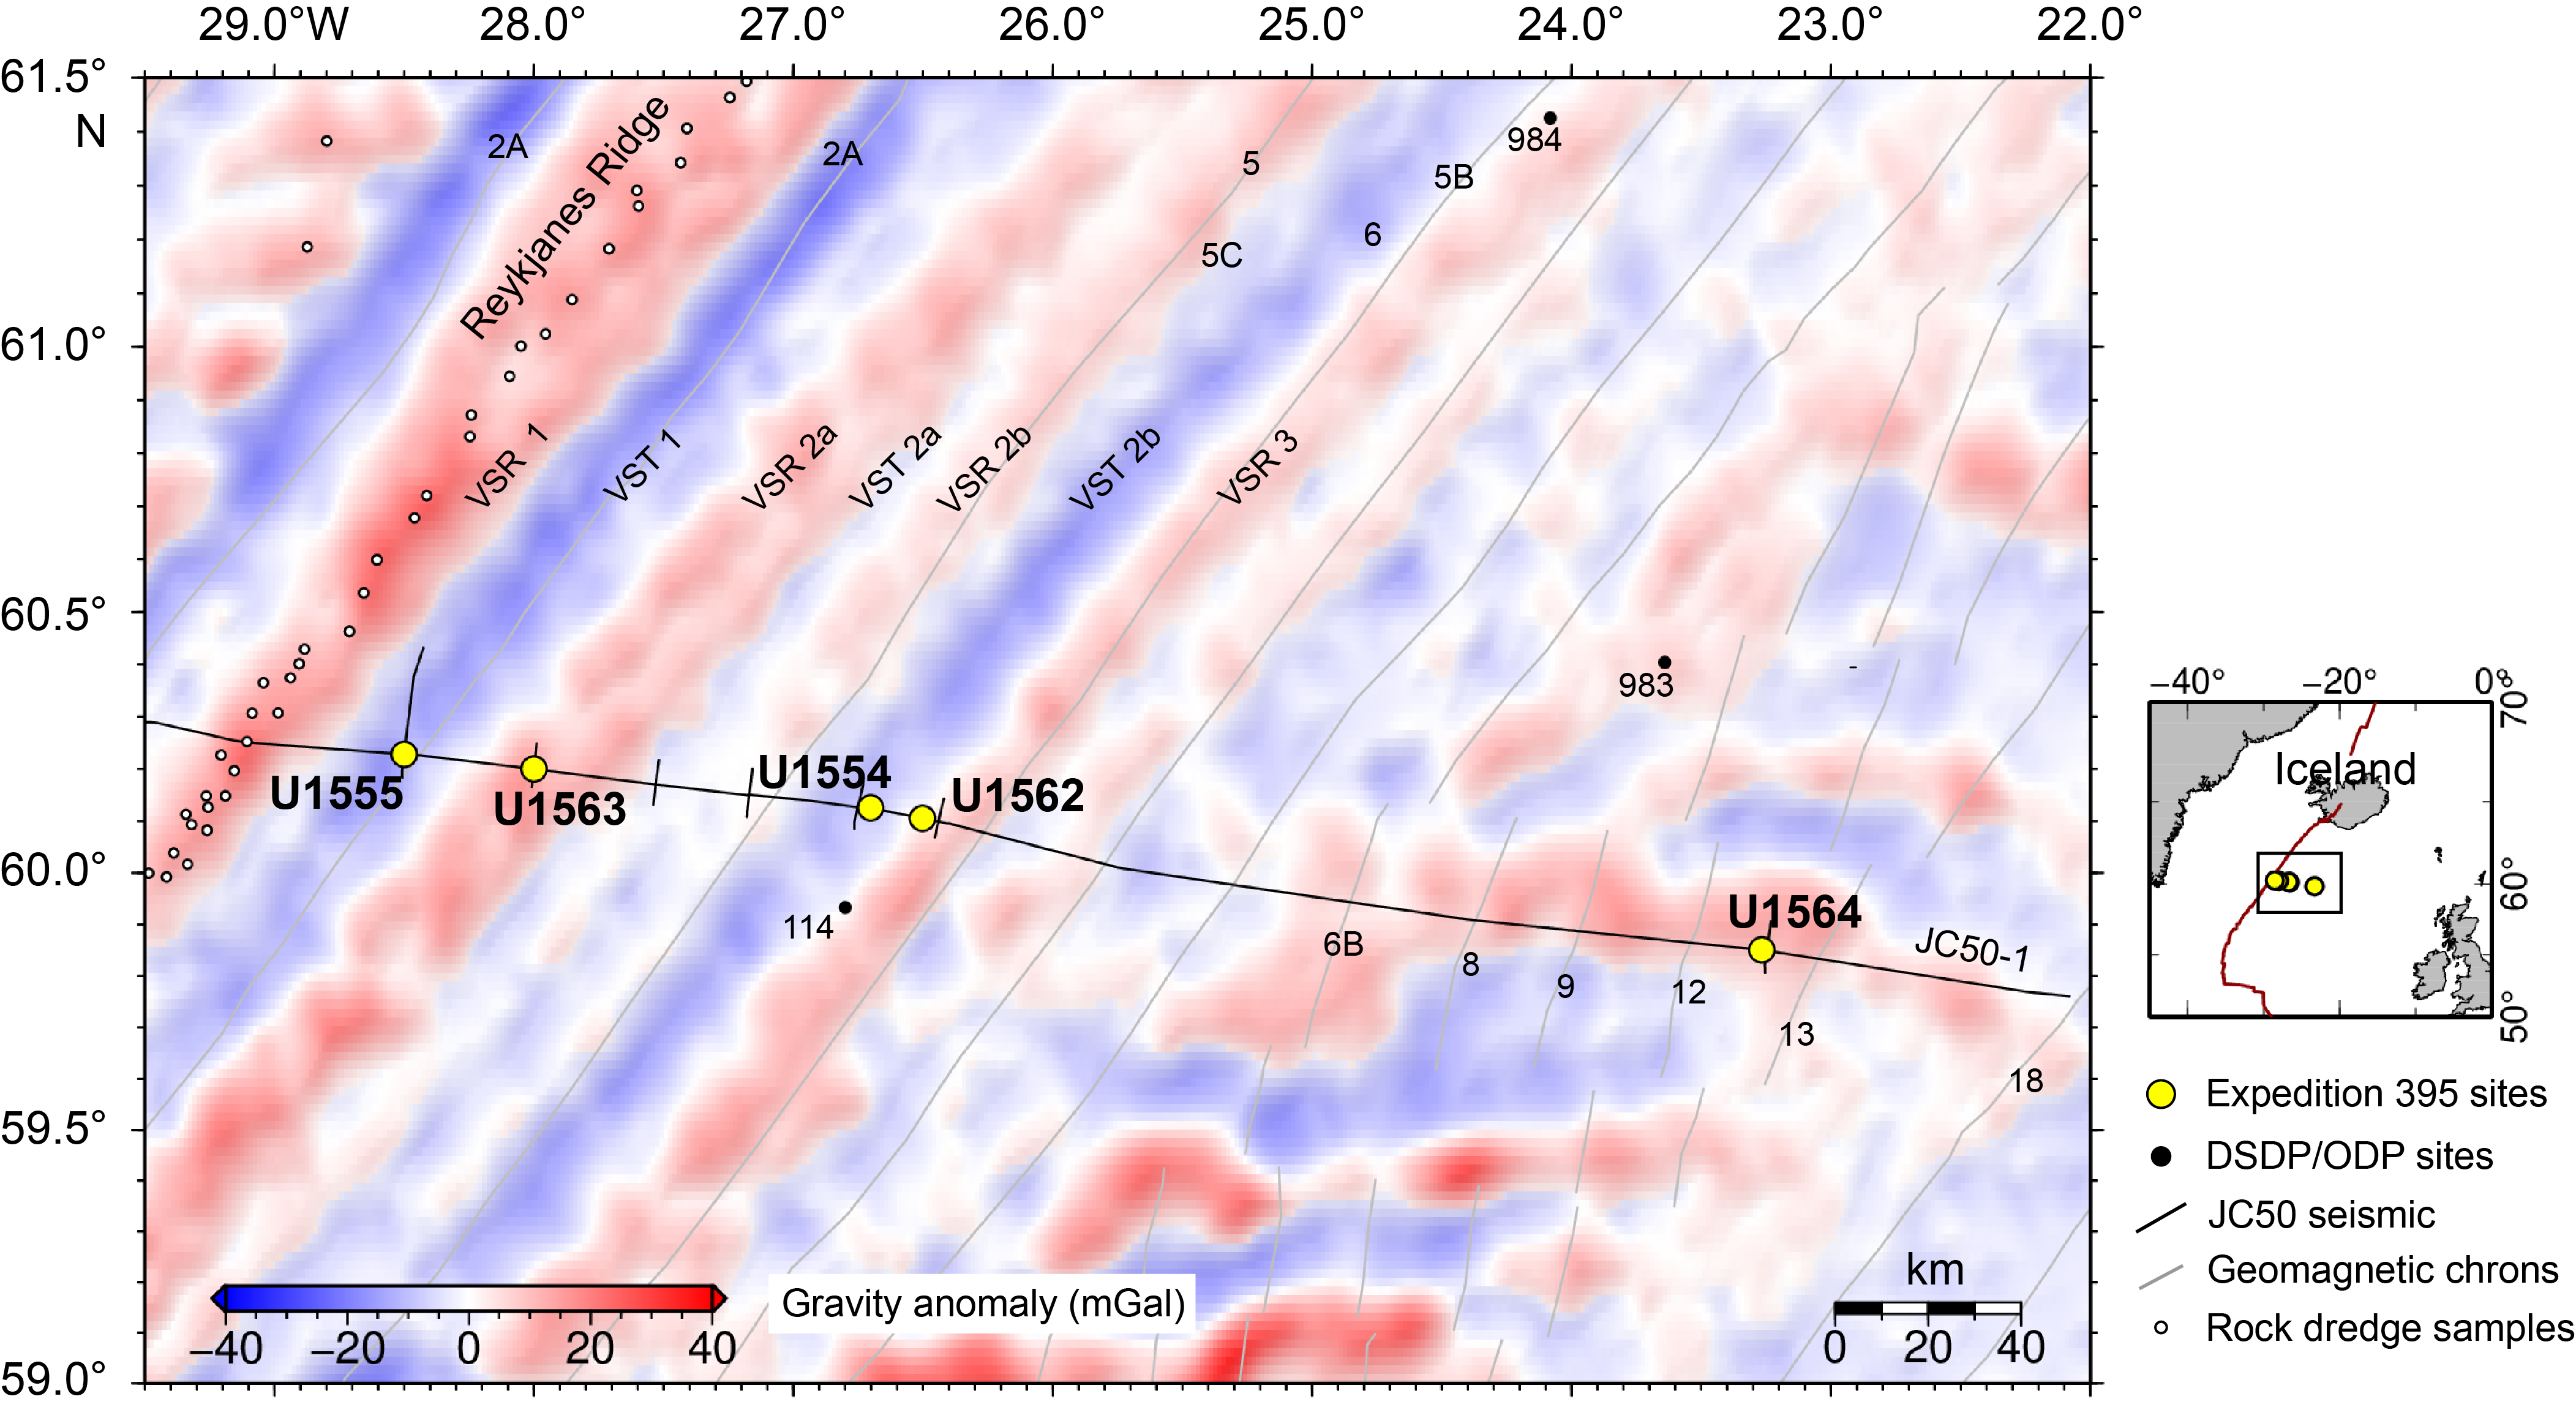
Figure F1. Satellite free-air gravity anomaly map.
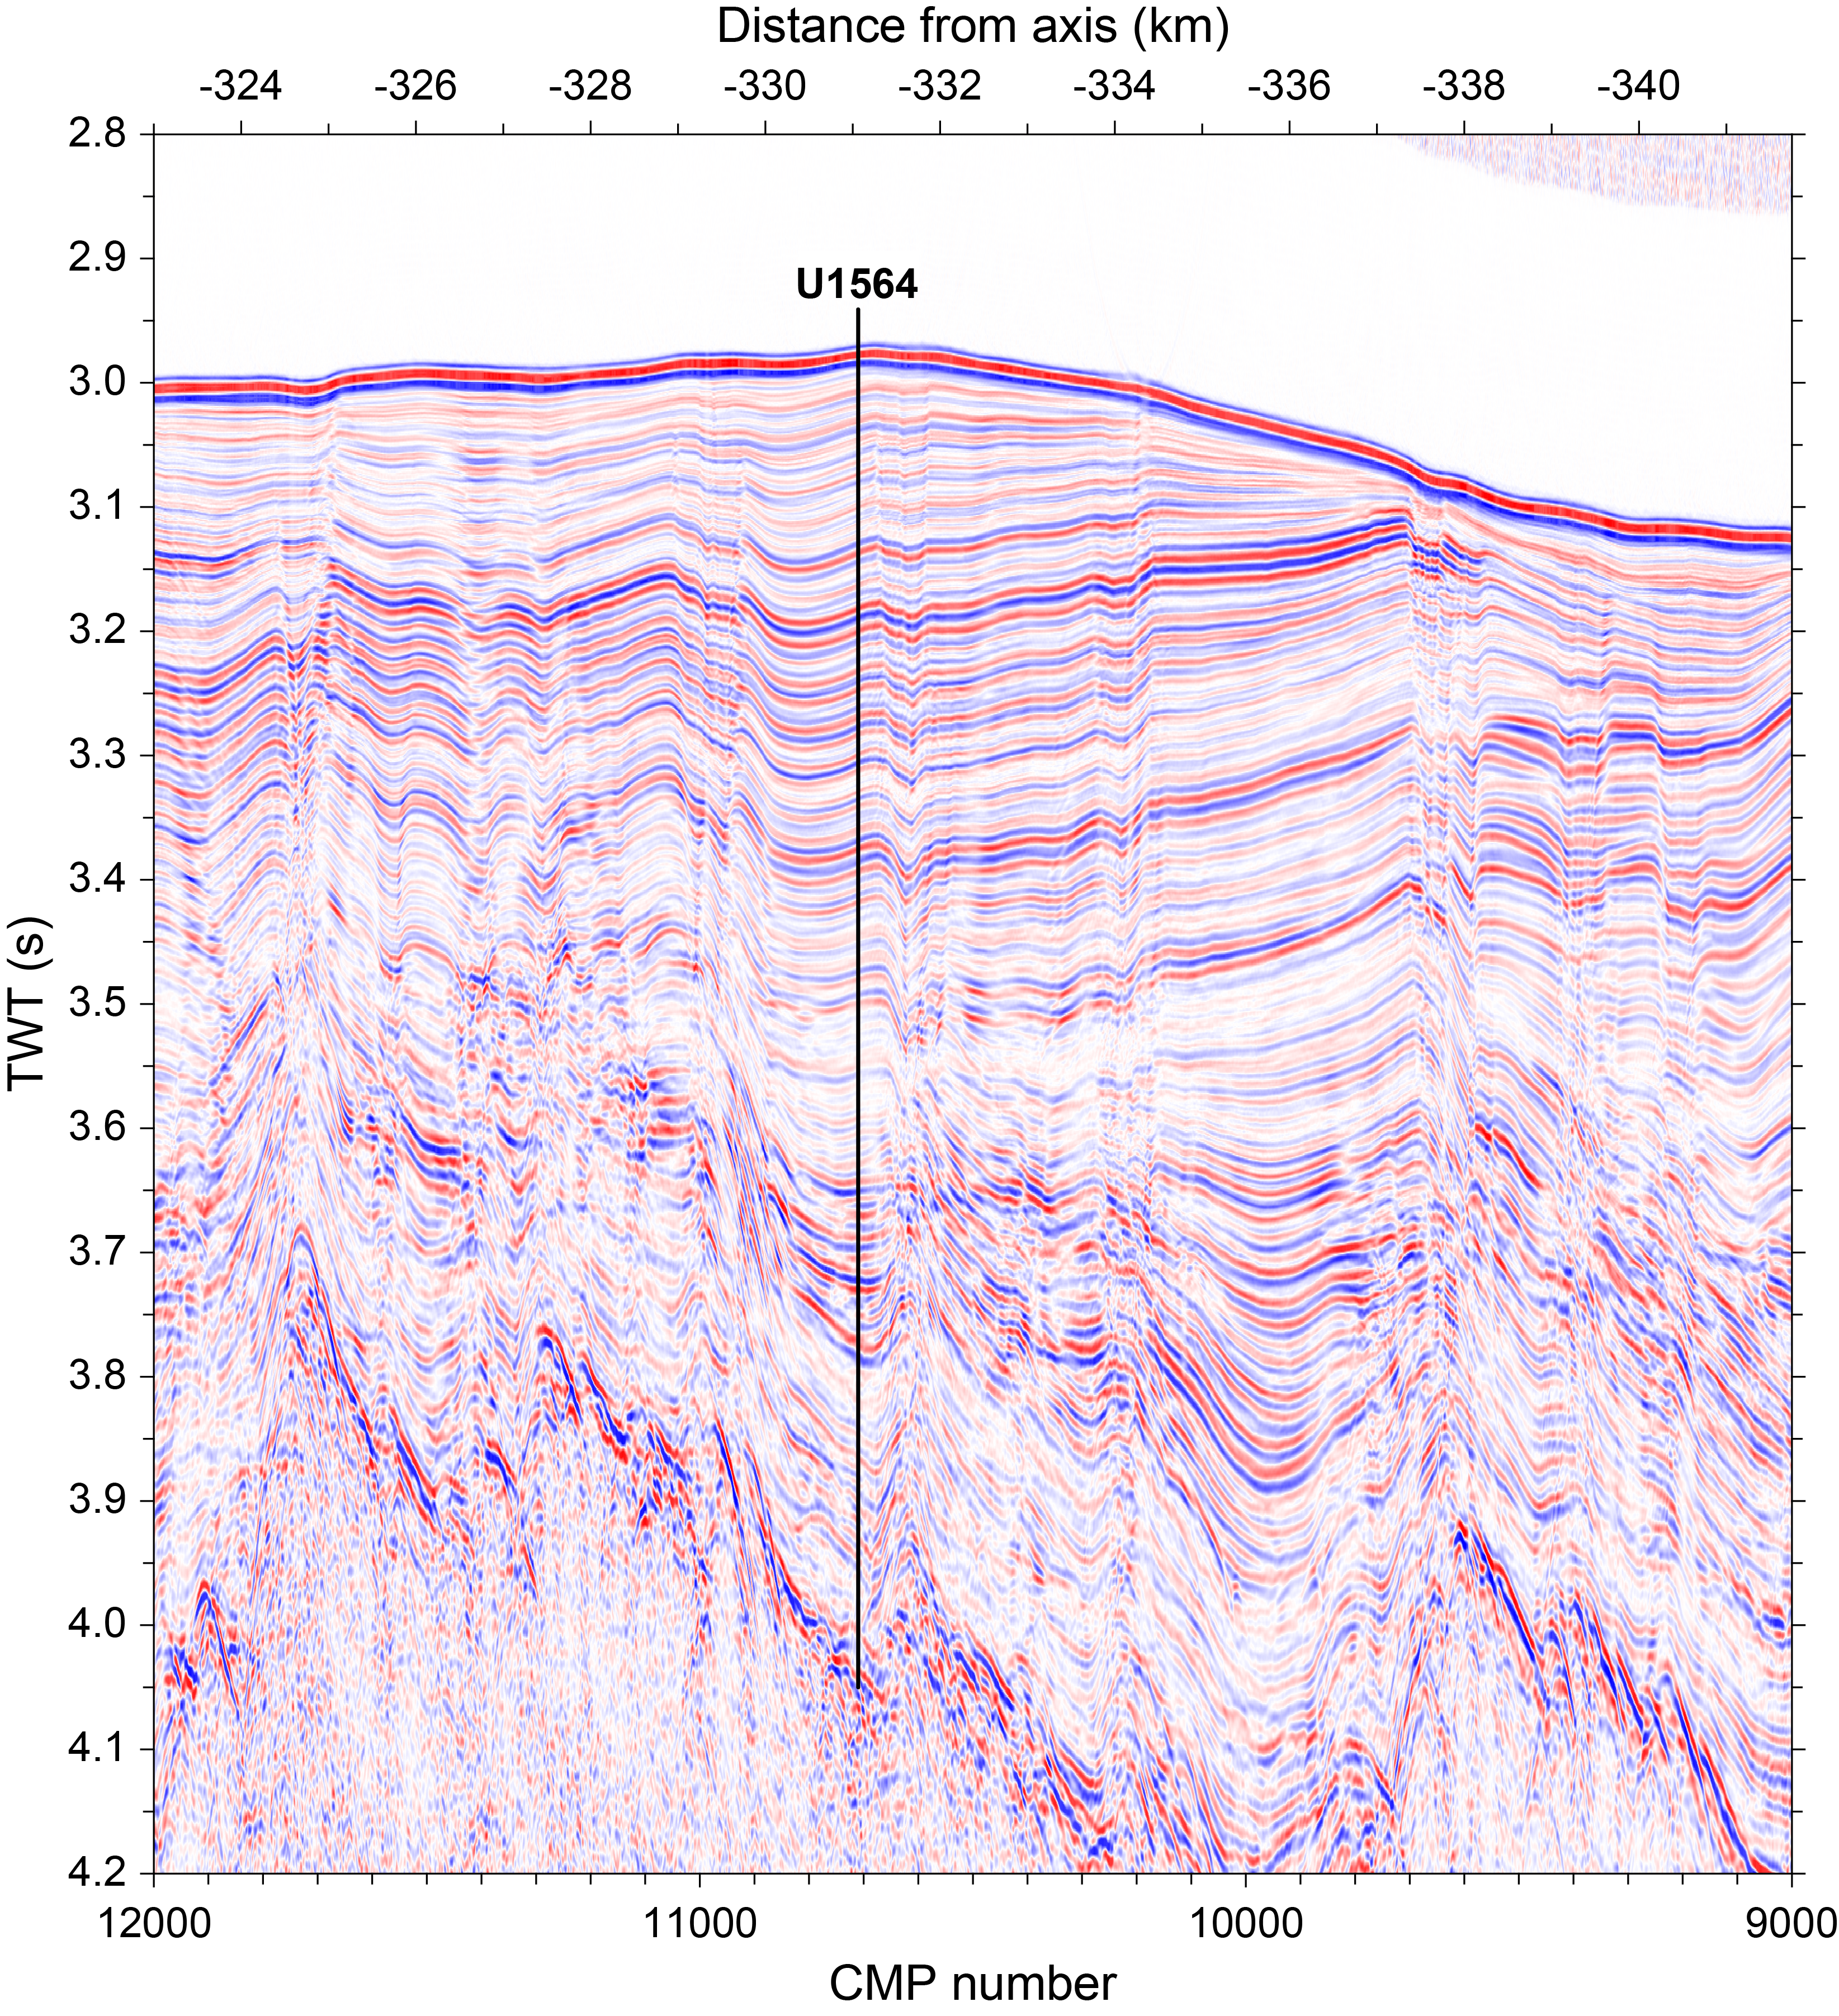
Figure F2. Seismic Profile JC50-1.
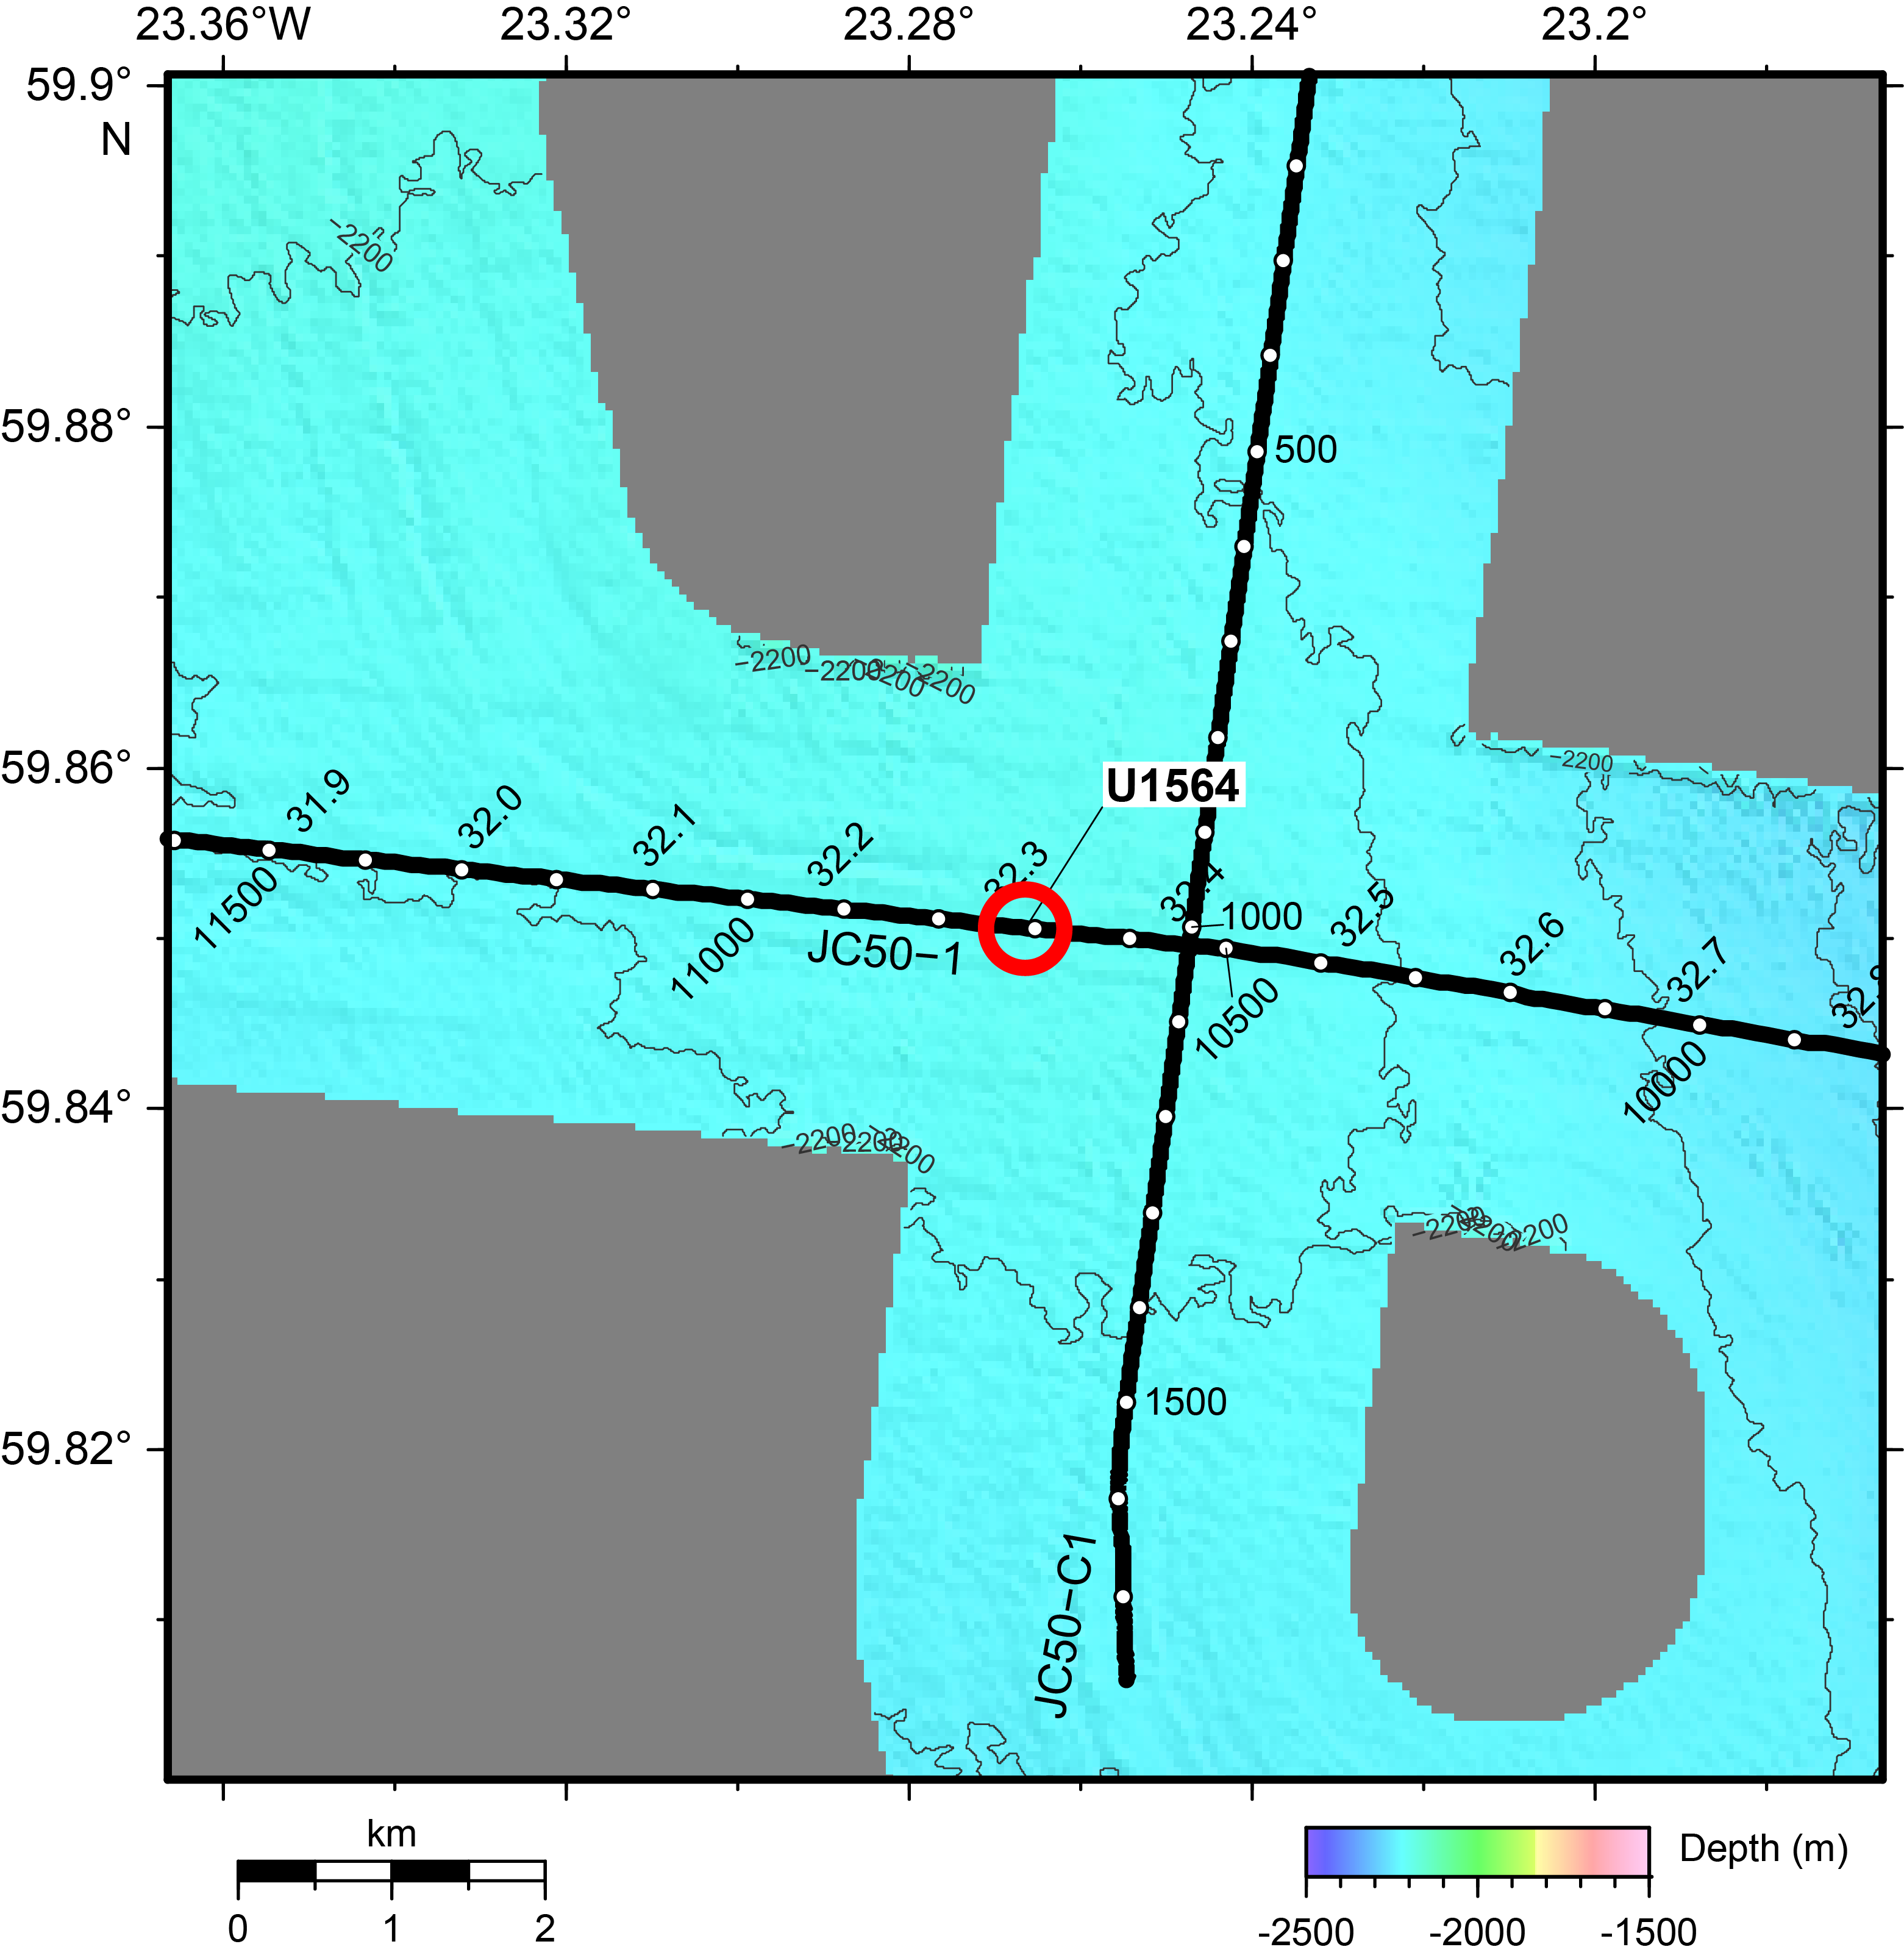
Figure F3. Bathymetric map.
Site U1564 is also located on Gardar drift, one of the major contourite drifts in the North Atlantic Ocean, a known archive of millennial-scale paleoceanographic change. The sedimentation rate of this drift serves as a proxy for deepwater current strength, providing information on oceanic gateways and their potential ties to transient mantle plume behavior. Nearby Site 983 was cored on Gardar drift during Ocean Drilling Program (ODP) Leg 162, obtaining a sedimentary sequence to 1.7 Ma (early Pleistocene) (Jansen and Raymo, 1996). Samples from Site 983 have resulted in multiple publications that have documented the paleoclimate and oceanography of the North Atlantic Ocean (e.g., Channell et al., 1997; Raymo et al., 1998; Barker et al., 2019). Cores from Site U1564 extend this record to Oligocene times. Sediment thickness at this site was expected to be ~970 m (3.983 s two-way traveltime [TWT]) (Figure F2).
One main target for Site U1564 was to obtain basalt core from crust not showing traces of VST/VSR structures. Another main target was to obtain a continuous sedimentary record of Gardar drift. Cores and data from this site will address all three of the primary science objectives for Expedition 395: (1) crustal accretion and mantle behavior; (2) ocean circulation, gateways, and sedimentation; and (3) time-dependent hydrothermal alteration of oceanic crust.
The operational objectives for this site were to core the sedimentary section using the advanced piston corer (APC), extended core barrel (XCB), and rotary core barrel (RCB) systems, install a reentry system with casing to 600 meters below seafloor (mbsf), use the RCB system to core ~130 m into the basement, and use downhole wireline tools to log the borehole.
2. Operations
Site U1564 (59°51.0366′N, 23°15.9858′W) consists of six holes drilled during Expeditions 395C and 395 (Table T1). These holes extend to 9.5–1169.7 m drilling depth below seafloor (DSF).
A total of 255 cores were recovered for Site U1564. These cores collected 1881.5 m of sediment and 114.2 m of basalt over a 2155.1 m cored interval (99% recovery). The APC system was used to collect 65 cores over a 609.0 m interval with 636.10 m of core recovered (104% recovery). The half-length APC (HLAPC) was deployed for 24 cores and recovered 117.76 m of sediment from a 112.8 m interval (104% recovery). The XCB system was deployed over an 861.6 m interval. The 91 XCB cores recovered 807.67 m of sediment (94%). The RCB system was deployed for 75 cores and recovered 434.15 m of sediment and basalt across a 571.7 m interval (76% recovery). Downhole wireline logging operations using the triple combination (triple combo), Formation MicroScanner (FMS)-sonic, and Ultrasonic Borehole Imager (UBI) logging tools took place in Holes 395C-U1564C and 395-U1564F.
The total time spent at Site U1564 was 26.98 days.
2.1. Expedition 395C
2.1.1. Hole U1564A
The vessel arrived at Site U1564 at 1748 h (UTC) on 30 July 2021. The thrusters were lowered, the ship entered dynamic positioning (DP) mode, and the drill string was made up with an APC/XCB bottom-hole assembly (BHA). The drill string was run to 2220.0 meters below sea level (mbsl) to spud Hole U1564A (59°51.0377′N, 23°16.0071′W) ~20 m west of the site coordinates. The exact site coordinates were reserved for future reentry system and casing installation during Expedition 395. Hole U1564A was initiated at 0245 h on 31 July, and Core 1H recovered a full core (9.89 m), prohibiting the establishment of the seafloor depth.
2.1.2. Hole U1564B
The ship was offset 20 m east (directly over the site coordinates, where casing operations were planned), and Hole U1564B (59°51.0372′N, 23°15.9868′W) was spudded at 0342 h on 31 July 2021. Core 1H recovered 7.22 m of sediment, placing the seafloor at 2207.9 mbsl. Coring continued through Core 3H until an error in the ship's offset was noted, and operations in Hole U1564B were terminated. The bit cleared the seafloor at 0630 h, ending Hole U1564B.
A total of 26.81 m of core was collected over a 26.2 m cored interval (102% recovery).
2.1.3. Hole U1564C
The ship was offset 20 m west of Hole U1564A, and Hole U1564C (59°51.0374′N, 23°16.0087′W) was spudded at 0707 h on 31 July 2021. The seafloor depth was calculated at 2208.1 mbsl based on the recovery of Core 1H (7.02 m). Coring continued with the APC system, and Cores 2H–17H were recovered (7.0–159.0 m DSF). Core 17H required significant overpull (90,000 lb) to release the core barrel from the sediment. Coring with the full-length APC was terminated, and the crew began making up the HLAPC barrels. Cores 18F–35F advanced from 159.0 to 243.6 m DSF. The overpull while retrieving Core 35F was over 80,000 lb, and coring switched to the XCB system. Cores 36X–75X were collected to 628.9 m DSF. Following Core 75X, the crew began pulling up the drill string in preparation for downhole logging operations using the triple combo tool string.
The drill pipe was raised until the bit was at 80.6 m DSF. The triple combo tool string was made up, and at 0250 h on 4 August the tool string was deployed. The triple combo descended to the bottom of the hole (628.9 m DSF) and made two passes of the borehole. The tool was recovered at 0930 h and broken down. The FMS-sonic tool string was made up, deployed to the base of the hole, and made a single pass imaging the borehole wall. The FMS-sonic tool was brought up to the rig floor at 1640 h and broken down. The downhole logging equipment was put away, and the logging tools were moved to the helideck. The rig floor crew began pulling up the pipe, and the bit cleared the seafloor at 1845 h. At 1920 h, four of the five thruster pods were raised; they were secured at 2236 h. The bit cleared the rig floor at 0100 h on 5 August, the remaining thruster pod was raised, and at 0106 h the ship switched from DP mode to Bridge control, ending Site U1564. The ship began the 293 nmi transit to Reykjavik, Iceland.
All APC cores were oriented using the Icefield MI-5 core orientation tool. Formation temperature measurements were taken on Cores 395C-U1564C-4H, 7H, 10H, 13H, and 15H; however, the third-generation advanced piston corer temperature (APCT-3) tool flooded on Core 4H and no data were collected for this measurement.
In all, 618.71 m of core was recovered from Hole U1564C (98% recovery). A total of 17 APC cores were collected over a 159.0 m interval, and 164.90 m of sediment was recovered (104% recovery). Coring with the HLAPC system resulted in 87.77 m of core recovered over 84.6 m (104% recovery). Finally, the XCB system was deployed 40 times, and 366.04 m of sediment was cored over a 385.3 m interval (95% recovery).
2.2. Expedition 395
2.2.1. Ponta Delgada, Portugal, and transit
Expedition 395 began at 0800 h (UTC) on 12 June 2023 at NATO Berth 12 in Ponta Delgada, Azores (Portugal). The vessel had been in port since 8 June following Expedition 399. The recovered core material from Expedition 399 contained veins of chrysotile, a form of asbestos. The ship had returned to port early so that a professional crew could clean the laboratory spaces. On 13 June, the Expedition 395 JOIDES Resolution Science Operator (JRSO) technical staff boarded the ship at 0900 h, followed by the science party at 1200 h. The JRSO staff and Siem Offshore crew completed their crossover meetings, and the Expedition 399 staff disembarked the vessel.
The loading and unloading of freight and shipments continued throughout the day on 13 and 14 June. On 14 June, the cleaning of the laboratory spaces for asbestos concluded, and the cleaners collected the final air samples. On the afternoon of 15 June, the ship was notified that the air samples collected in the laboratory spaces prior to the start of deep cleaning contained no trace of asbestos. The laboratories were opened, and the JRSO technical staff immediately got to work reassembling laboratory equipment and computers.
On the morning of 16 June, the final member of the science party boarded the vessel. At 1333 h, the tugboats were secured to the vessel, and the last line from shore was away at 1354 h. The pilot disembarked at 1404 h, and at 1418 h the vessel began the sea passage to Site U1564. Following a 3 y delay due to the global COVID-19 pandemic, Expedition 395 was underway.
Following a 1349.5 nmi voyage at an average speed of 11.2 kt, the vessel arrived on site at 1424 h on 21 June.
2.2.2. Hole U1564D
The thrusters were lowered and secured at 1456 h on 21 June 2023, and the ship was fully in DP mode at 1502 h. The rig crew removed the core barrels from their shucks, made up a 163.1 m long APC/XCB BHA, and began tripping the drill pipe. Once the pipe was assembled, the crew pumped a pig, a foam device with bristles used to clean the interior of the drill string. Hole U1564D (59°51.0483′N, 23°16.0080′W; 2208.1 mbsl) was spudded at 0500 h 22 June with the first core on deck at 0530 h. The stratigraphic correlators monitored coring gaps between Holes U1564C and U1564D using data from the Special Task Multisensor Logger (STMSL), which was run at a low resolution, usually 5 cm.
The APC system was used for Cores 395-U1564D-1H through 22H (0–209.0 m DSF), and 218.87 m of core was recovered (105% recovery). Pieces of the pig were recovered in Cores 1H and 2H. APC refusal was reached in Core 22H, which was drilled over with the drill bit to recover the core barrel. The HLAPC system was deployed for Cores 23F–29F (209.0–239.2 m DSF). The stratigraphic correlators requested a 2 m drilled interval (interval 261), from 223.2 to 225.2 m DSF, to offset coring gaps. Because of the challenges associated with covering coring gaps in sections that used the HLAPC, the XCB using a polycrystalline diamond compact (PDC) bit and cutting shoe was deployed as a test to see if the core quality was similar to that of the HLAPC. Core 30X was recovered, and based on initial magnetic susceptibility (MS) measurements and X-ray images, the core appeared to be in good condition. The decision was made to continue with the XCB system. The HLAPC cored section recovered 29.99 m of core over a 28.2 m long section (106% recovery).
Because of the good weather and favorable hole conditions, the decision was made to continue coring to ~700 m DSF in this hole. Coring with the XCB system continued with Cores 395-U1564D-30X through 74X (239.2–657.3 m DSF). Mud sweeps were used to clean the hole following the recovery of Cores 60X, 66X, 69X and 72X. The rate of penetration slowed, and recovery in the final three cores (72X–74X) was lower than the rest of the hole (33% recovery) due to the water jets in the cutting shoe getting clogged with sediment. The hole was terminated at a final depth of 657.3 m DSF. A total of 73 cores were collected in Hole U1564D over a 655.3 m interval and recovered 632.42 m of core (97% recovery).
The drill pipe was pulled out of the hole, with the bit clearing the seafloor at 2015 h on 25 June, ending Hole U1564D.
All APC cores were oriented using the Icefield MI-5 tool. All APC and HLAPC cores were collected using nonmagnetic core barrels. Formation temperature measurements were collected during Cores 395-U1564D-4H, 7H, 10H, and 13H using the APCT-3 tool.
A total of 22 APC cores were collected over a 209.0 m interval, and 218.87 m of sediment was recovered (105% recovery). Recovery for the six HLAPC cores was 106%, with 29.99 m of core recovered over 28.2 m. Finally, the XCB system was deployed for 45 cores, and 383.56 m of sediment was recovered over a 418.1 m interval (92% recovery). One drilled interval (395-U1564D-261; 2.0 m) was recorded for the hole.
2.2.3. Hole U1564E
The vessel was offset 20 m east, and Hole U1564E (59°51.0485′N, 23°15.9876′W) was spudded at 2306 h on 25 June 2023. Core 1H recovered a 5.8 m mudline core, establishing a seafloor depth of 2207.3 mbsl. Coring continued from 5.8 to 205.3 m DSF with Cores 1H–22H. It required 70,000 lb of overpull to free the core barrel from the formation on Core 22H, and the XCB was deployed for the remainder of the hole. Cores 23X–28X extended the hole to 263.5 m DSF. Following Core 28X, the decision was made to end the hole. A total of 273.7 m of sediment was recovered from the 263.5 m cored interval in Hole U1564E (104% recovery).
At 0030 h on 27 June, the drill bit cleared the seafloor, and at 0545 h the bit cleared the rig floor. At 0640 h, the ship was secured for transit. The thrusters were raised, and the transit to Site U1554 began at 0700 h, ending Hole U1564E.
The science objective of obtaining cores of the basaltic basement required the use of a reentry system and casing string to safely advance the bit to the estimated basement depth of ~975 m DSF and to allow for a drill bit change if needed. However, at the start of the expedition only one set of Schlumberger pipe severing tools were on the vessel, and it was not certain that they would detonate if the drill pipe was stuck in the hole. This uncertainty posed a safety risk to the vessel and could have resulted in losing thousands of meters of drill pipe if such a situation arose. New severing tools were on order and waiting to be shipped at the start of the expedition. The vessel continued operations at other sites while waiting for the severing tools to be shipped to Reykjavik, Iceland, and delivered to the vessel before proceeding with the Site U1564 casing operations.
All APC cores were oriented using the Icefield MI-5 tool and were collected using nonmagnetic core barrels. Formation temperature measurements were taken on Cores 395-U1564E-4H, 7H, 10H, and 13H using the APCT-3 tool.
A total of 22 APC cores were collected over a 205.3 m interval, and 215.63 m of sediment was recovered (105% recovery). The XCB cut six cores across a 58.2 m interval and recovered 58.07 m of sediment (100% recovery).
2.2.4. Hole U1564F
The vessel completed the 448 nmi transit from Site U1602 to Site U1564 at 2030 h on 25 July 2023. The thrusters were lowered, and the ship was put into DP mode at 2106 h, resuming operations at Site U1564.
The rig crew made up the hydraulic release tool (HRT) casing running stand. The weather was forecast to deteriorate throughout the day with ~5 m heave, preventing the assembly of the casing and reentry system. The vessel began waiting on weather at 0200 h on 26 July.
At 1500 h on 26 July, the Icelandic Coast Guard offshore patrol vessel, Þór (Thor), arrived to deliver the Schlumberger severing devices and other supplies. After waiting nearly 2 h, the transfer was postponed because of weather. Thor returned the next day (aka Thor's-day) at 0823 h for the transfer of severing tools, supplies, and fresh produce. Thor pulled alongside the vessel, and the portside aft crane was used to transfer six pallets onto the helideck starting at 0902 h. By 0919 h, the transfer was complete, and Thor departed at 0925 h.
The rig crew began preparing for the casing installation operations on 27 July immediately following the departure of Thor. The mud motor and underreamer assembly were made up and tested. After a successful test, this assembly was racked in the derrick. The rig crew began assembling and welding the casing string to a length of 550 m (Figure F4). The HRT was installed to lower the casing to the mud skirt on the moonpool doors. The running tool was pulled back up to the rig floor. The casing stinger, made up of the drill bit, mud motor, underreamer, and drill pipe, was run through the casing. The cup packer, a device that prevents cuttings from filling the casing, and the HRT were attached to the stinger, lowered to the moonpool, and bolted to the guide base. The reentry cone was then welded to the guide base. At 1200 h on 28 July, the moonpool doors were opened, and the guide base with the reentry cone was lowered below the ship. The rig crew began making up the drill string to 2180 mbsl. The vibration isolated television (VIT) subsea camera system, along with 2 and 5 L Niskin water samplers and the Conductivity-Temperature-Depth (CTD) tool, were deployed at 1730 h. At 1800 h, the upper guide horn was installed. The top drive was picked up, and the bit was spaced out to initiate Hole U1564F at 2125 h on 28 July. The casing string was drilled to 550 m DSF, and the bit advanced to 553.5 m DSF. The go-devil was pumped down the pipe to release the casing stinger from the reentry system. The Niskin bottles were triggered, and the drill pipe was pulled up 20 m into the casing to ensure that the underreamer and mud motor entered without issue. The VIT camera system was retrieved, and the drill string was pulled to surface. The bit cleared the seafloor at 1440 h on 29 July and the rig floor at 2230 h. The 5 L Niskin failed to close and did not retrieve a water sample.
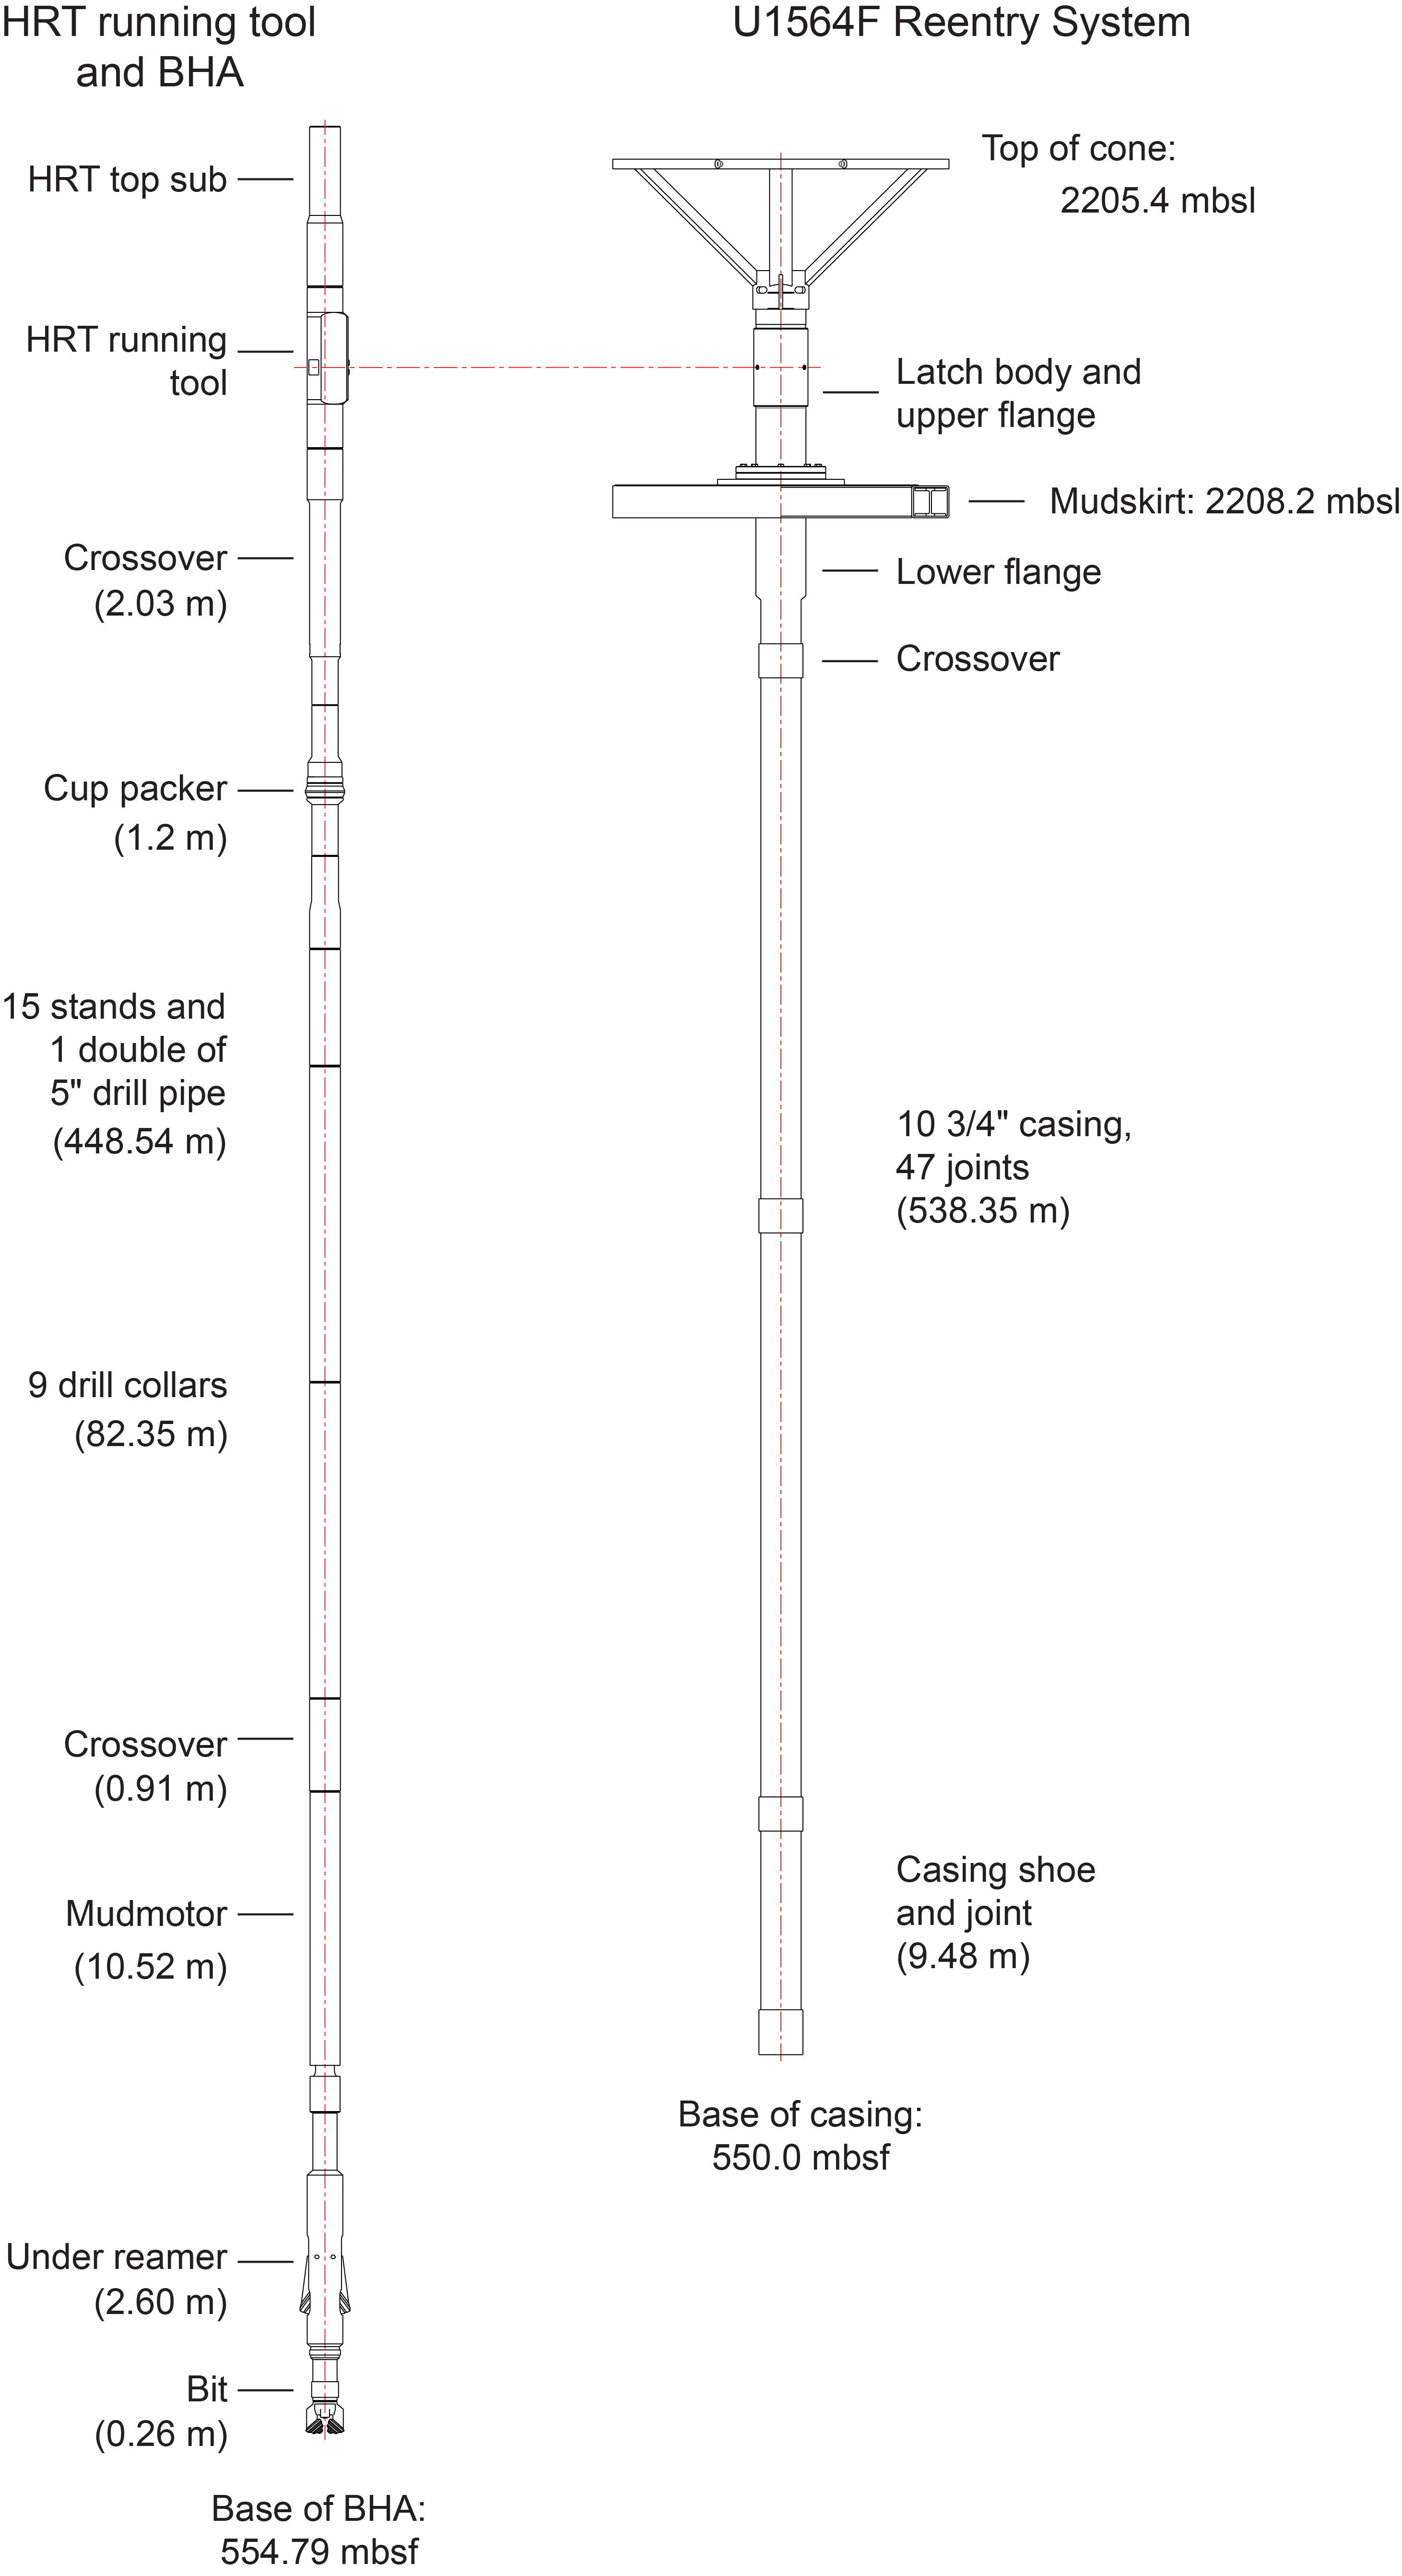
Figure F4. HRT running tool, BHA, and reentry system.
After breaking down the reentry equipment, the RCB BHA was made up with a C-4 drill bit. The drill pipe was run to 1598.7 mbsl. The VIT camera system, with the CTD tool and both Niskin bottles attached, was deployed through the moonpool at 0845 h on 30 July, and the drill pipe was filled with water. The drill string continued to be lowered to several meters above the seafloor. The reentry cone for Hole U1564F was found, and the bit reentered the hole at 1052 h on 30 July. Both Niskin bottles were successfully triggered near the seafloor. The VIT camera was recovered while the drill string was lowered to the base of the hole, and the top drive was picked up. The center bit was deployed, and the hole was conditioned with 20 bbl of high-viscosity mud. The hole was advanced without recovery from 553.4 to 598.0 m DSF. The center bit was retrieved, and an RCB core barrel was deployed.
Cores 395-U1564F-2R through 43R (598.0–995.8 m DSF) were recovered. Core 4R had no recovery. The basaltic basement was reached at ~997.2 m DSF in Core 44R. This core recovered 7.03 m of material (74% recovery), including 1.43 m of sediment; the remainder is basalt. Coring continued with Cores 45R–49R (1005.3–1039.2 m DSF). Beginning with Core 46R, all cores were half advances (4.7 or 5.0 m), except for Core 48R.
Following Core 395-U1564F-49R, the drill bit had reached 59.7 rotating hours, and the drill string was pulled out of the hole to change the bit. At 1640 h on 4 August, the bit cleared the seafloor, and the vessel was offset 20 m east of Hole U1564F. At 2030 h, the bit cleared the rig floor. A C-7 RCB bit and mechanical bit release were made up. The drill pipe and BHA were run from the ship to near the seafloor for reentry into Hole U1564F. At 0315 h on 5 August, the VIT camera was deployed to guide the hole reentry. The bit was spaced out, and, after nearly 2 h of searching for the reentry cone, the bit entered Hole U1564F at 0725 h. The drill pipe was run in the hole, and the subsea camera was retrieved. At 1115 h, coring resumed.
Cores 395-U1564F-50R through 76R (1039.2–1169.7 m DSF) were retrieved. Core 52R was cut in 20 min over a 4.9 m interval and contains 3.83 m of sediment. Core 53R also contains a 0.65 m package of sediment. Erratic standpipe pressure was observed while cutting Core 74R, and the core barrel was retrieved after only a 3.9 m advance. It was suspected that the core barrel had come unlatched from the BHA and there was rock blocking the bit throat. A bit deplugger was deployed, but there was no indication that anything was jammed in the bit.
Hole U1564F was terminated at a final depth of 1169.7 m DSF. A total of 434.15 m of core was recovered from a 571.7 m interval (76% recovery). Recovery in the basement section was high (66%), with 114.20 m of core recovered over 172.4 m. Two drilled intervals totaling 598.0 m were recorded.
Following the completion of coring operations, the hole was cleaned with a 50 bbl high-viscosity mud sweep in preparation of downhole logging operations. The drill pipe was pulled out of the hole. At 0215 h on 9 August, the subsea camera was deployed and descended to near the seafloor. The bit cleared the seafloor at 0325 h, and the vessel was offset 20 m from Hole U1564F. The mechanical bit release sleeve was activated, and the drill bit fell to the seafloor. The end of the drill pipe reentered Hole U1564F at 0625 h. The end of the pipe was positioned at 59.3 m DSF within the casing string for logging operations.
The triple combo tool string was rigged up and deployed to the base of the hole (1169.7 m DSF). On the upward pass, the Accelerator Porosity Sonde (APS) malfunctioned and porosity measurements were not collected. Following a complete pass of the hole, the triple combo was pulled to the rig floor and broken down. The FMS-sonic tool string was made up and deployed in the hole. On the downward pass, the Dipole Sonic Imager (DSI) malfunctioned and was not used. Two passes of the borehole were successfully made with the FMS-sonic tool string. At 0530 h on 10 August, it reached the rig floor and was broken down. The UBI was run to 1164.7 m wireline log depth below seafloor (WSF), 5 m above the base of the hole. The average heave over the course of the day was 1.8 m, which made it difficult to run imaging tools. Because of the weather conditions, the UBI was to be run at a lower resolution scan. However, the basement section was first logged at high resolution to test the image quality and because there was enough time in the program. The UBI was then lowered back to 1164.7 m WSF, and the entire hole was logged at a lower resolution scan. The UBI was retrieved and broken down. The rig crew pulled the drill pipe out of the hole, with the bit clearing the seafloor at 1525 h on 10 August. The BHA was broken down, and the end of the pipe reached the rig floor at 2130 h. The vessel was secured for transit, and at 2206 h the vessel was switched from DP to cruise mode, ending Site U1564. The thrusters were raised, and the vessel began the 293 nmi transit to Reykjavik at 2230 h.
2.2.5. Transit to Reykjavik
Following a 293 nmi transit, the vessel reached the pilot station, and the pilot boarded at 0705 h on 12 August 2023. JOIDES Resolution came into Skarfabakki Harbour in Reykjavik, Iceland. The first line ashore at Vatnagardsbakki Berth was at 0812 h, marking the end of Expedition 395.
3. Lithostratigraphy
Sediments at Site U1564 were recovered during Expedition 395C (Holes U1564A–U1564C) and Expedition 395 (Holes U1564D–U1564F). Lithostratigraphic unit and subunit division at this site are based on (1) visual core description, (2) natural gamma radiation (NGR), (3) smear slide examination, (4) bulk calcium carbonate (CaCO3) measurements (n = 235), and (5) L* reflectance (Figures F5, F6; Table T2). To assist understanding the sedimentological patterns at this site, NGR and color reflectance data were smoothed using an eighth-order lowpass Butterworth filter with a cutoff of 0.125 times the Nyquist frequency (Figure F6; this was applied to data that had undergone cleaning; see Physical properties in the Expedition 395 methods chapter [Parnell-Turner et al., 2025a]). This bidirectional linear digital filter avoids phase shift, maintaining correct peak positions (Butterworth, 1930; Lyons, 2011).
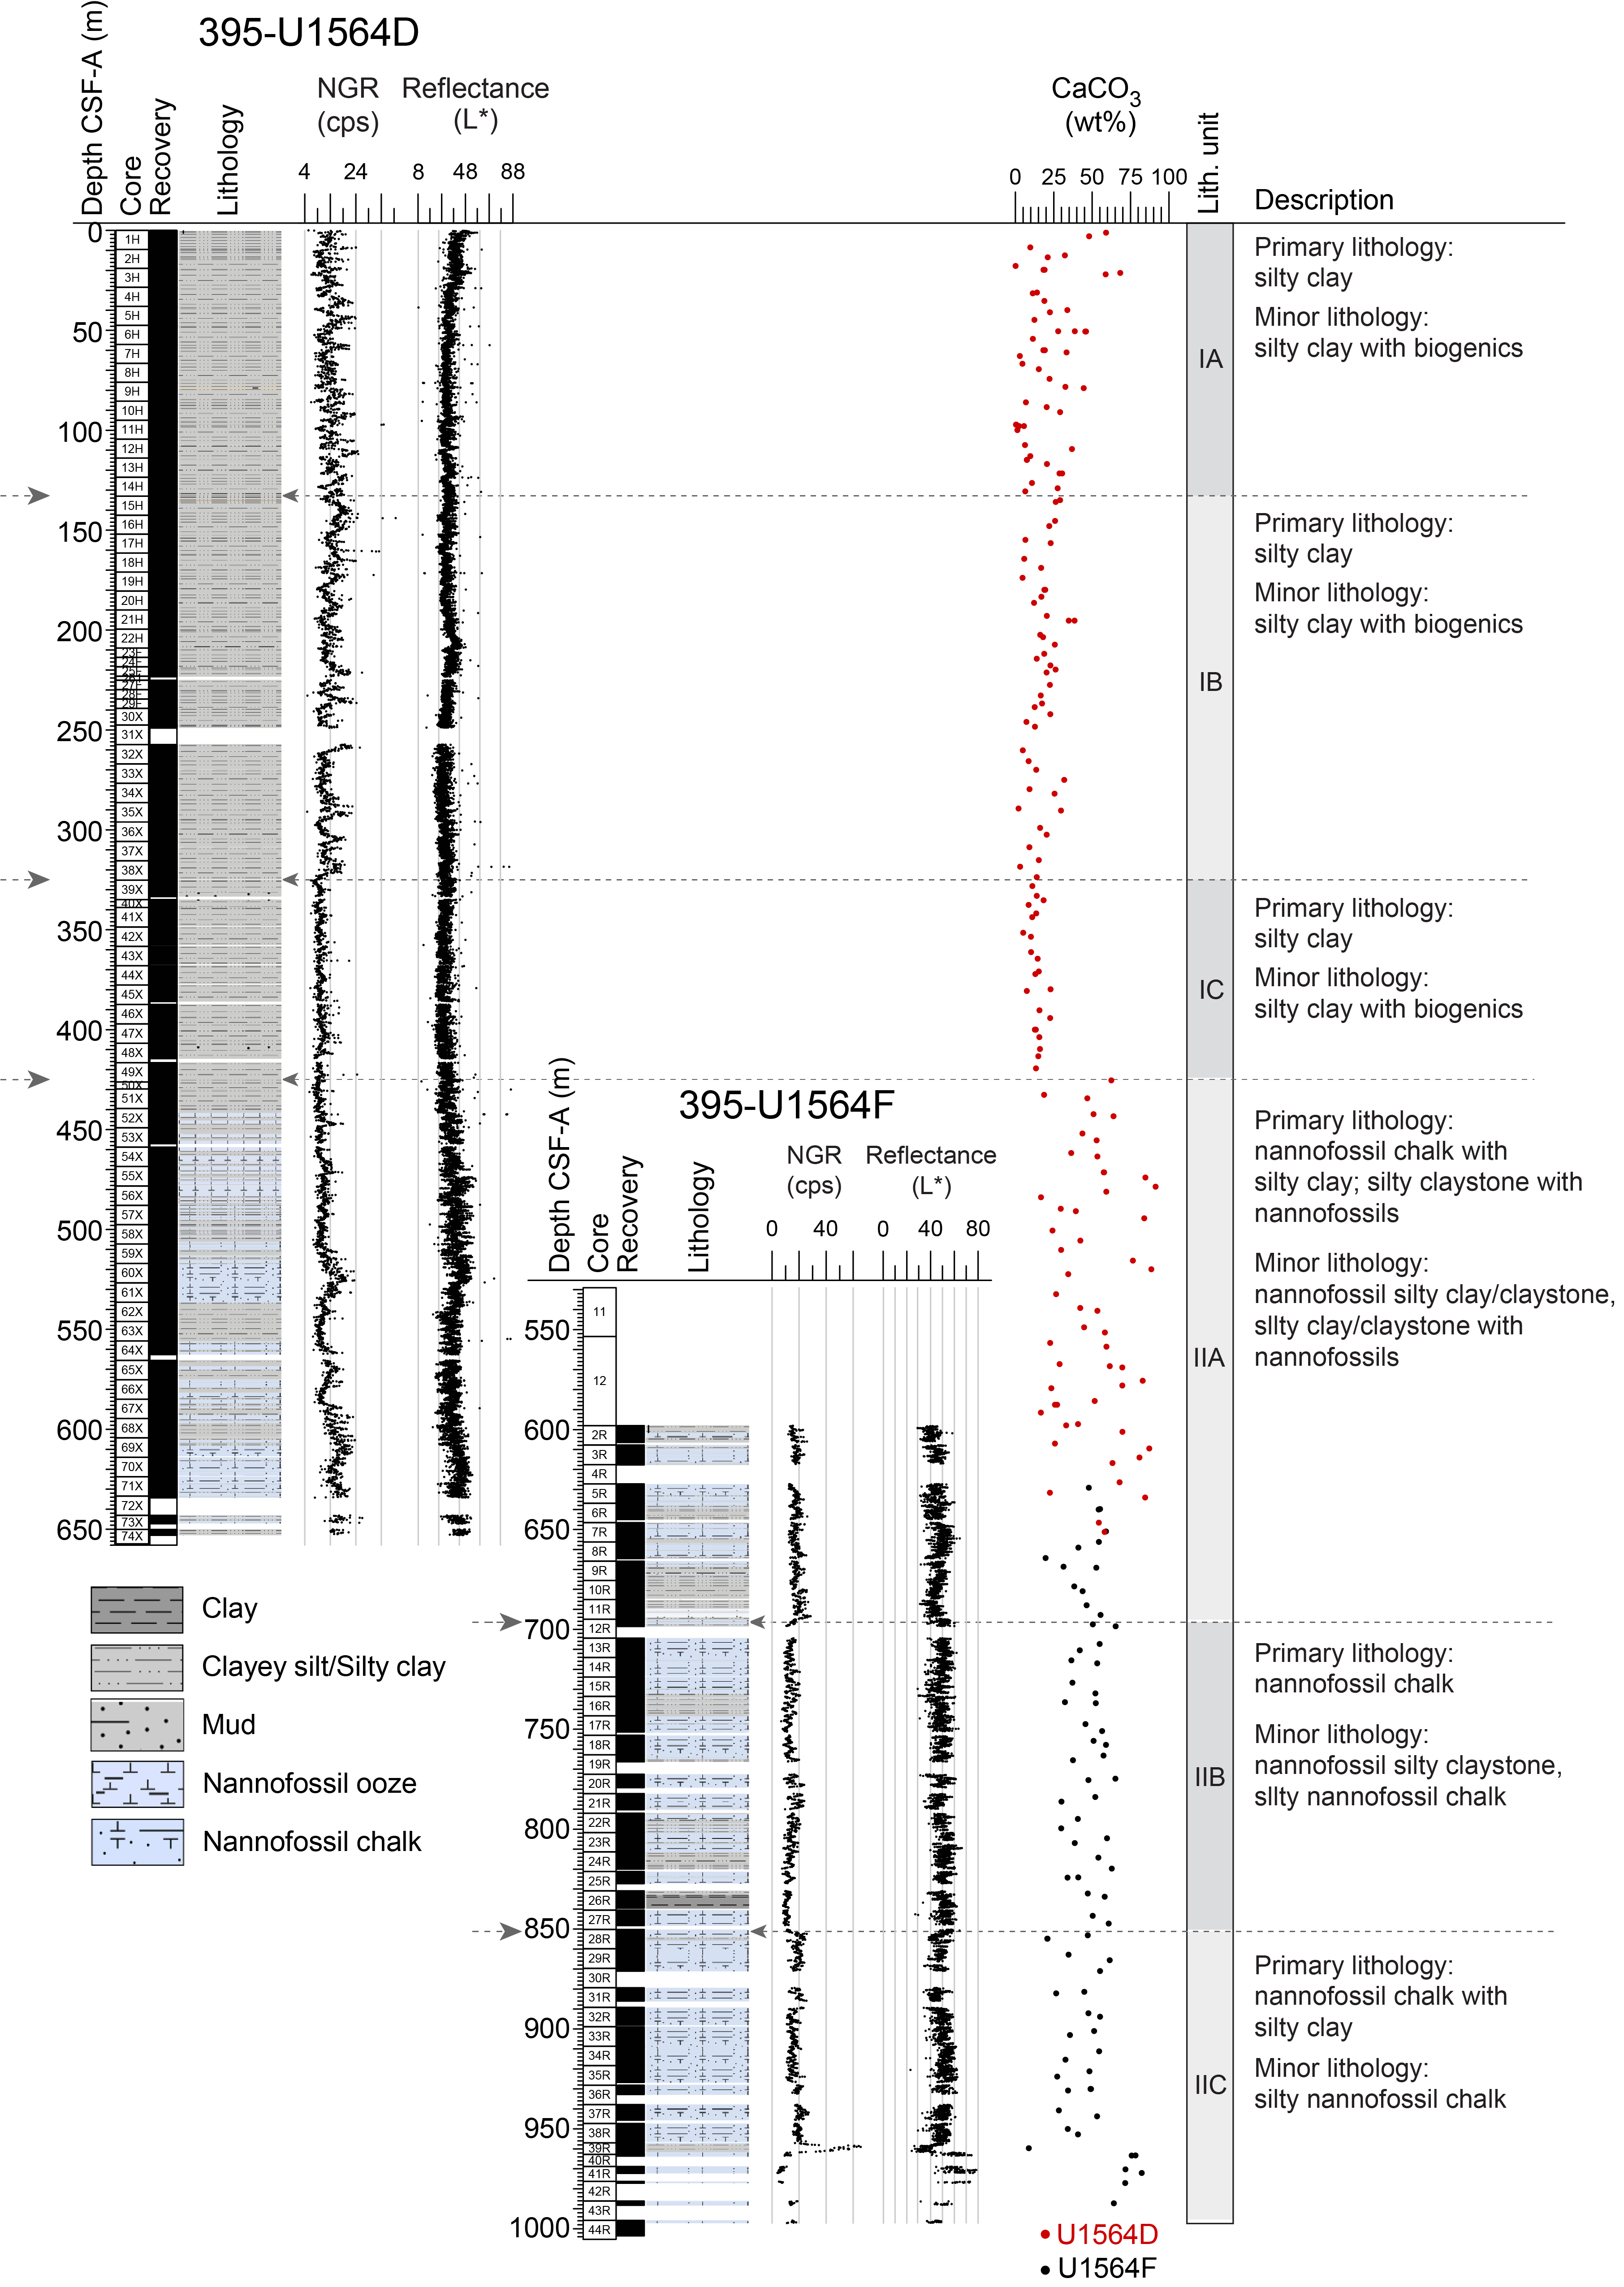
Figure F5. Lithostratigraphic summary.
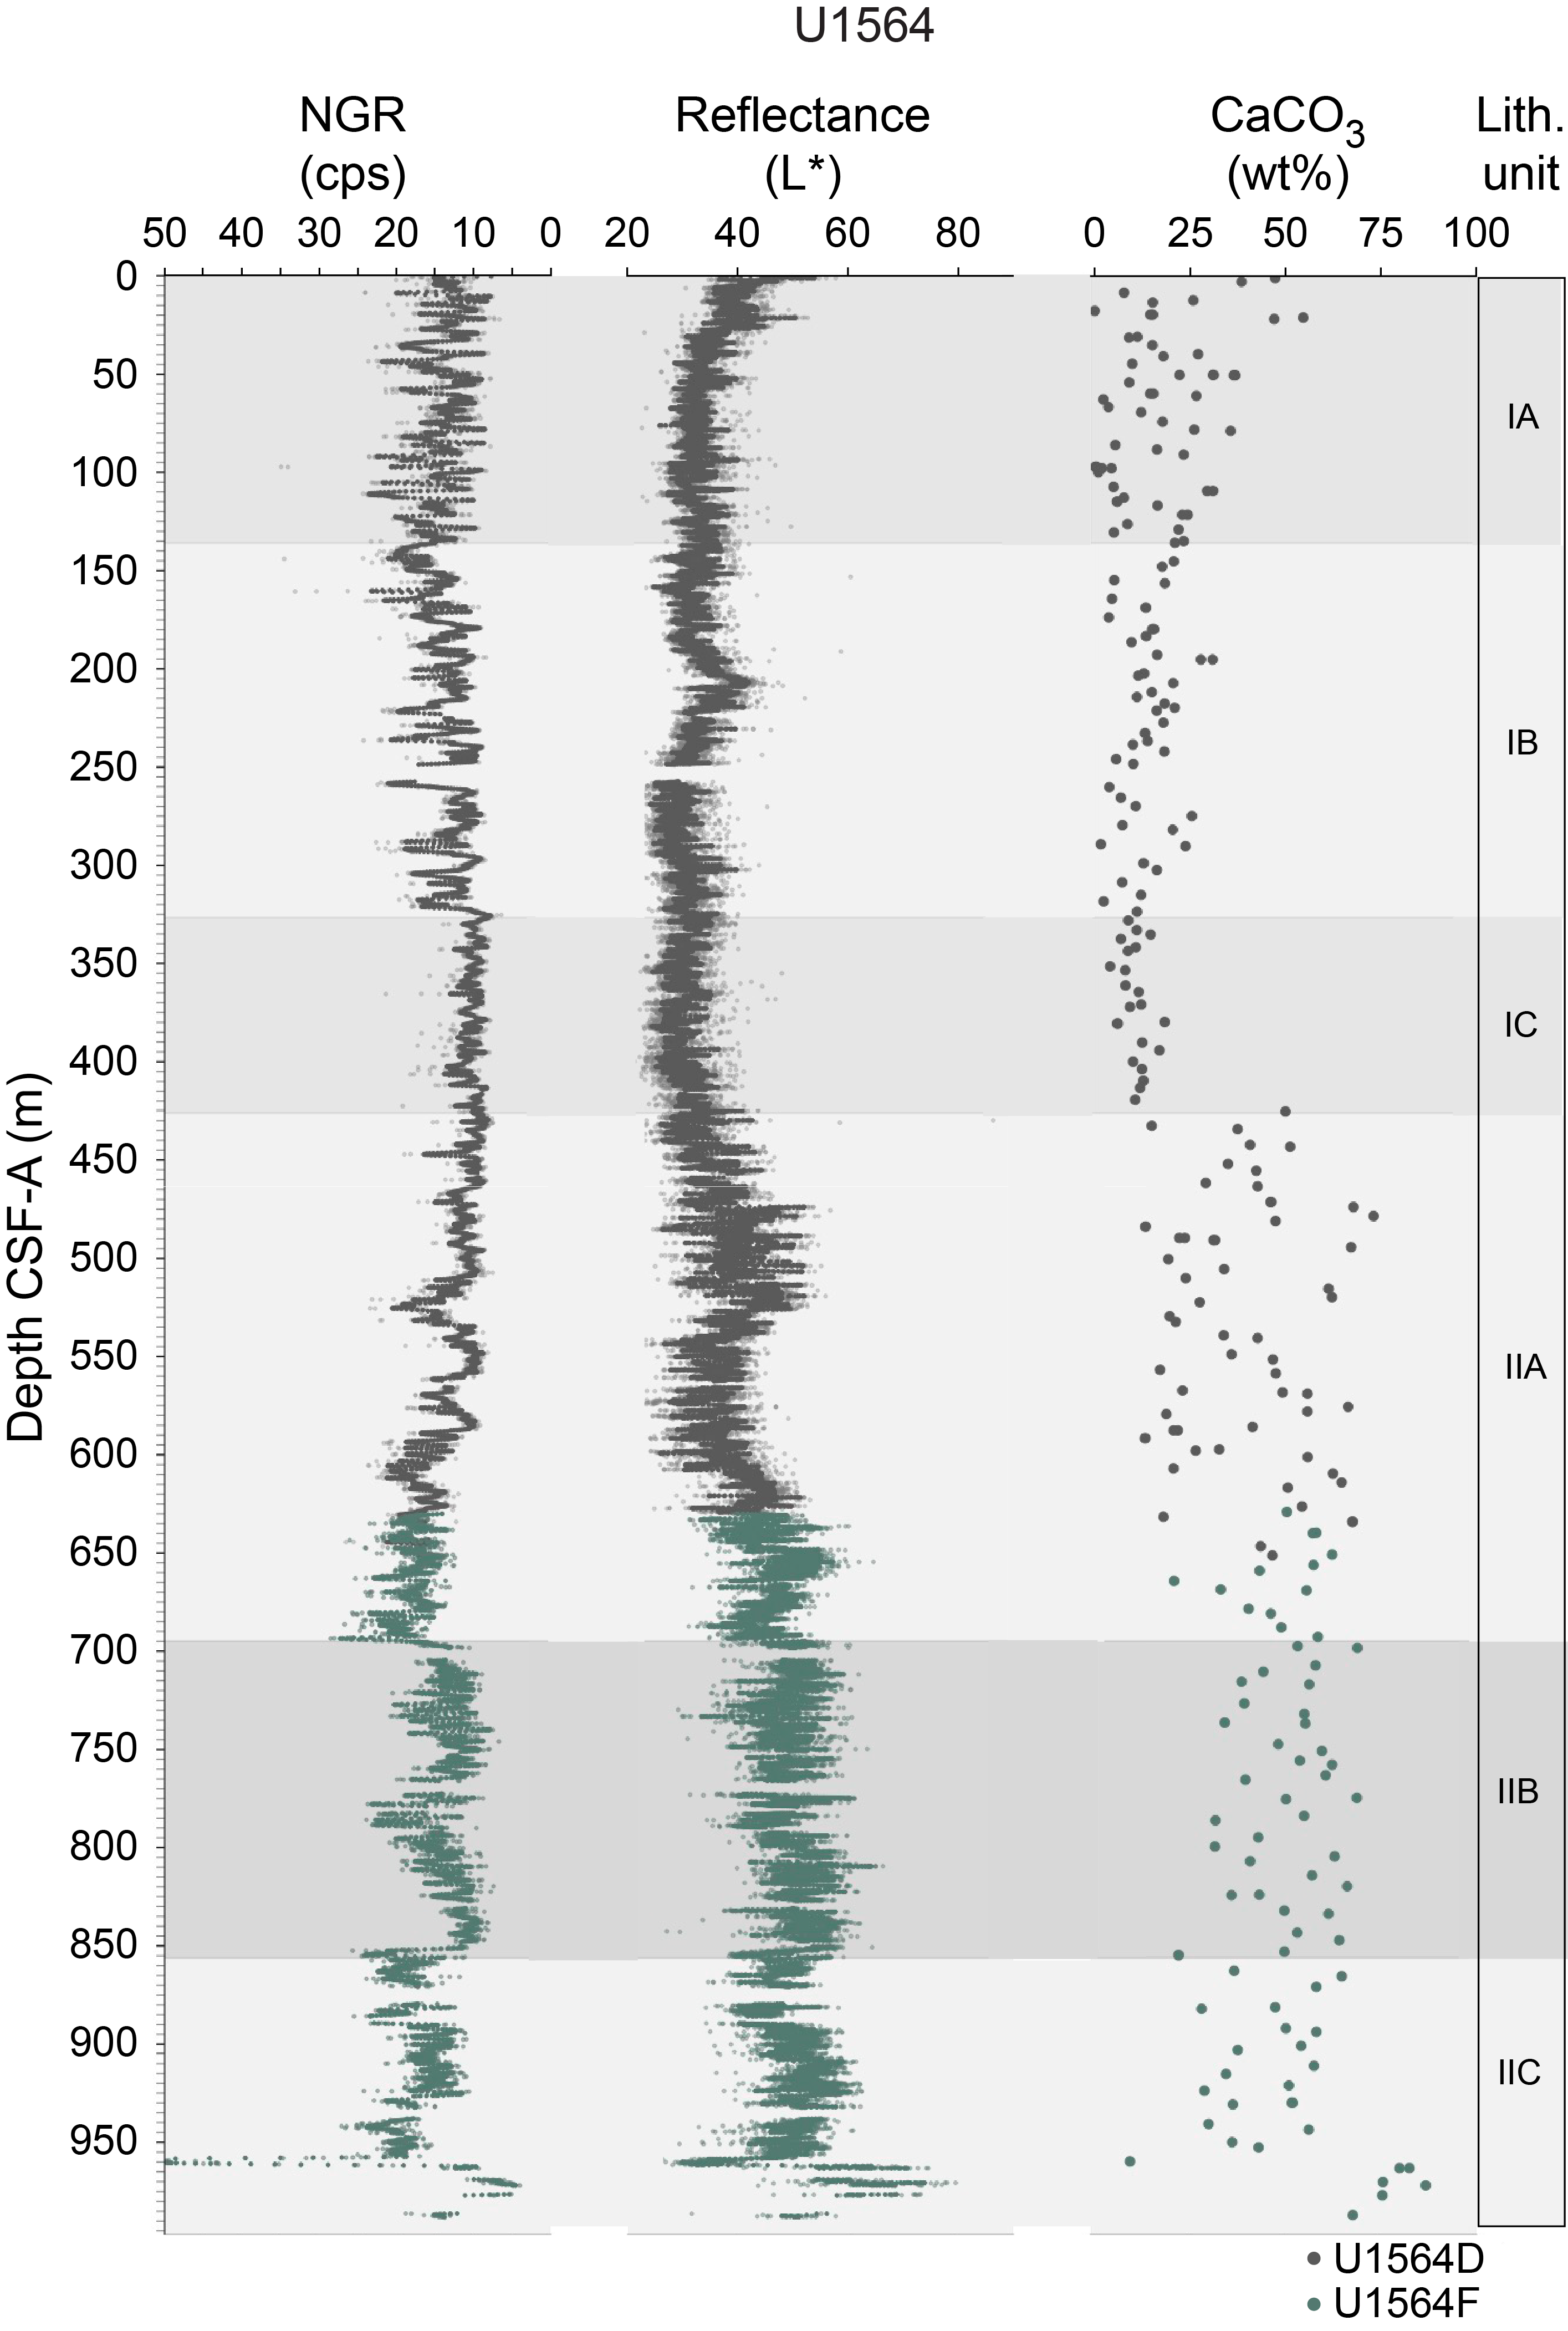
Figure F6. Lithologic unit definition parameters.
Based on the above properties, the Site U1564 sediment sequence is divided into two units (I and II); each unit is divided into three subunits. Unit I is primarily composed of silty clay, and Unit II is primarily nannofossil chalk with silty clay. Small volcanic clasts are observed throughout; larger clasts (>2 cm) with varied compositions are detailed in Table T3.
3.1. Lithostratigraphic Unit I
- Intervals: 395C-U1564A-1H-1, 0 cm, to end of hole; 395C-U1564B-1H-1, 0 cm, to end of hole; 395C-U1564C-1H-1, 0 cm, to 55X-2, 0 cm; 395-U1564D-1H-1, 0 cm, to 50X-1, 0 cm; 395-U1564E-1H-1, 0 cm, to end of hole
- Depths: Hole U1564A = 0–9.89 m core depth below seafloor, Method A (CSF-A); Hole U1564B = 0–26.49 m CSF-A; Hole U1564C = 0–426.70 m CSF-A; Hole U1564D = 0–426.20 m CSF-A; Hole U1564E = 0–263.40 m CSF-A
- Thickness: Hole U1564A = 9.89 m; Hole U1564B = 26.49 m; Hole U1564C = 426.70 m; Hole U1564D = 426.20 m; Hole U1564E = 263.40 m
- Age: Holocene to early Pliocene
- Lithology: silty clay
The primary lithology of Unit I is silty clay; the most prominent minor lithology is silty clay with biogenics. Unit I is divided into Subunits IA–IC based on changes in the wavelength of NGR cycles (Figure F5). There are discrepancies between the lithologic description of Hole U1564C and the other holes that contain Unit I. The presence of sandy lithologies in Hole U1564C is frequently documented; however, these lithologies do not appear in Holes U1564D or U1564E. The description of Hole U1564C took place following Expedition 395C and should be considered preliminary. We advise the reader to rely on the descriptions of Holes U1564D and U1564E.
3.1.1. Lithostratigraphic Subunit IA
- Intervals: 395C-U1564A-1H-1, 0 cm, to end of hole; 395C-U1564B-1H-1, 0 cm, to end of hole; 395C-U1564C-1H-1, 0 cm, to 15H-4, 0 cm; 395-U1564D-1H-1, 0 cm, to 15H-3, 0 cm; 395-U1564E-1H-1, 0 cm, to 15H-5, 0 cm
- Depths: Hole U1564A = 0–9.89 m CSF-A; Hole U1564B = 0–26.49 m CSF-A; Hole U1564C = 0–135.01 m CSF-A; Hole U1564D = 0–135.93 m CSF-A; Hole U1564E = 0–135.27 m CSF-A
- Thickness: Hole U1564A = 9.89 m; Hole U1564B = 26.49 m; Hole U1564C = 135.01 m; Hole U1564D = 135.93 m; Hole U1564E = 135.27 m
- Age: Holocene to middle Pleistocene
- Lithology: silty clay
Subunit IA is primarily silty clay, most commonly light gray, light brownish gray, and gray in Holes U1564A–U1564C. These cores were described onshore ~10 months after recovery. During Expedition 395, when cores were described within hours of recovery, colors for Subunit IA in Holes U1564D and U1564E were mostly gray to very dark gray and greenish gray to very dark greenish gray. The discrepancy is likely due to oxidation of the sediments prior to core description following Expedition 395C. Subunit IA exhibits high-frequency, high-amplitude variation in NGR values. CaCO3 values range 0–55 wt% (average = 18 wt%). The terrigenous component contains quartz, feldspar, glass, opaque grains, glauconite, and oxides (Figure F7A, F7B). The biogenic component in this subunit is as follows: nannofossils are prevalent, foraminifers and sponge spicules are common, diatoms and radiolarians appear in trace to common amounts, and silicoflagellates appear intermittently in trace abundances.
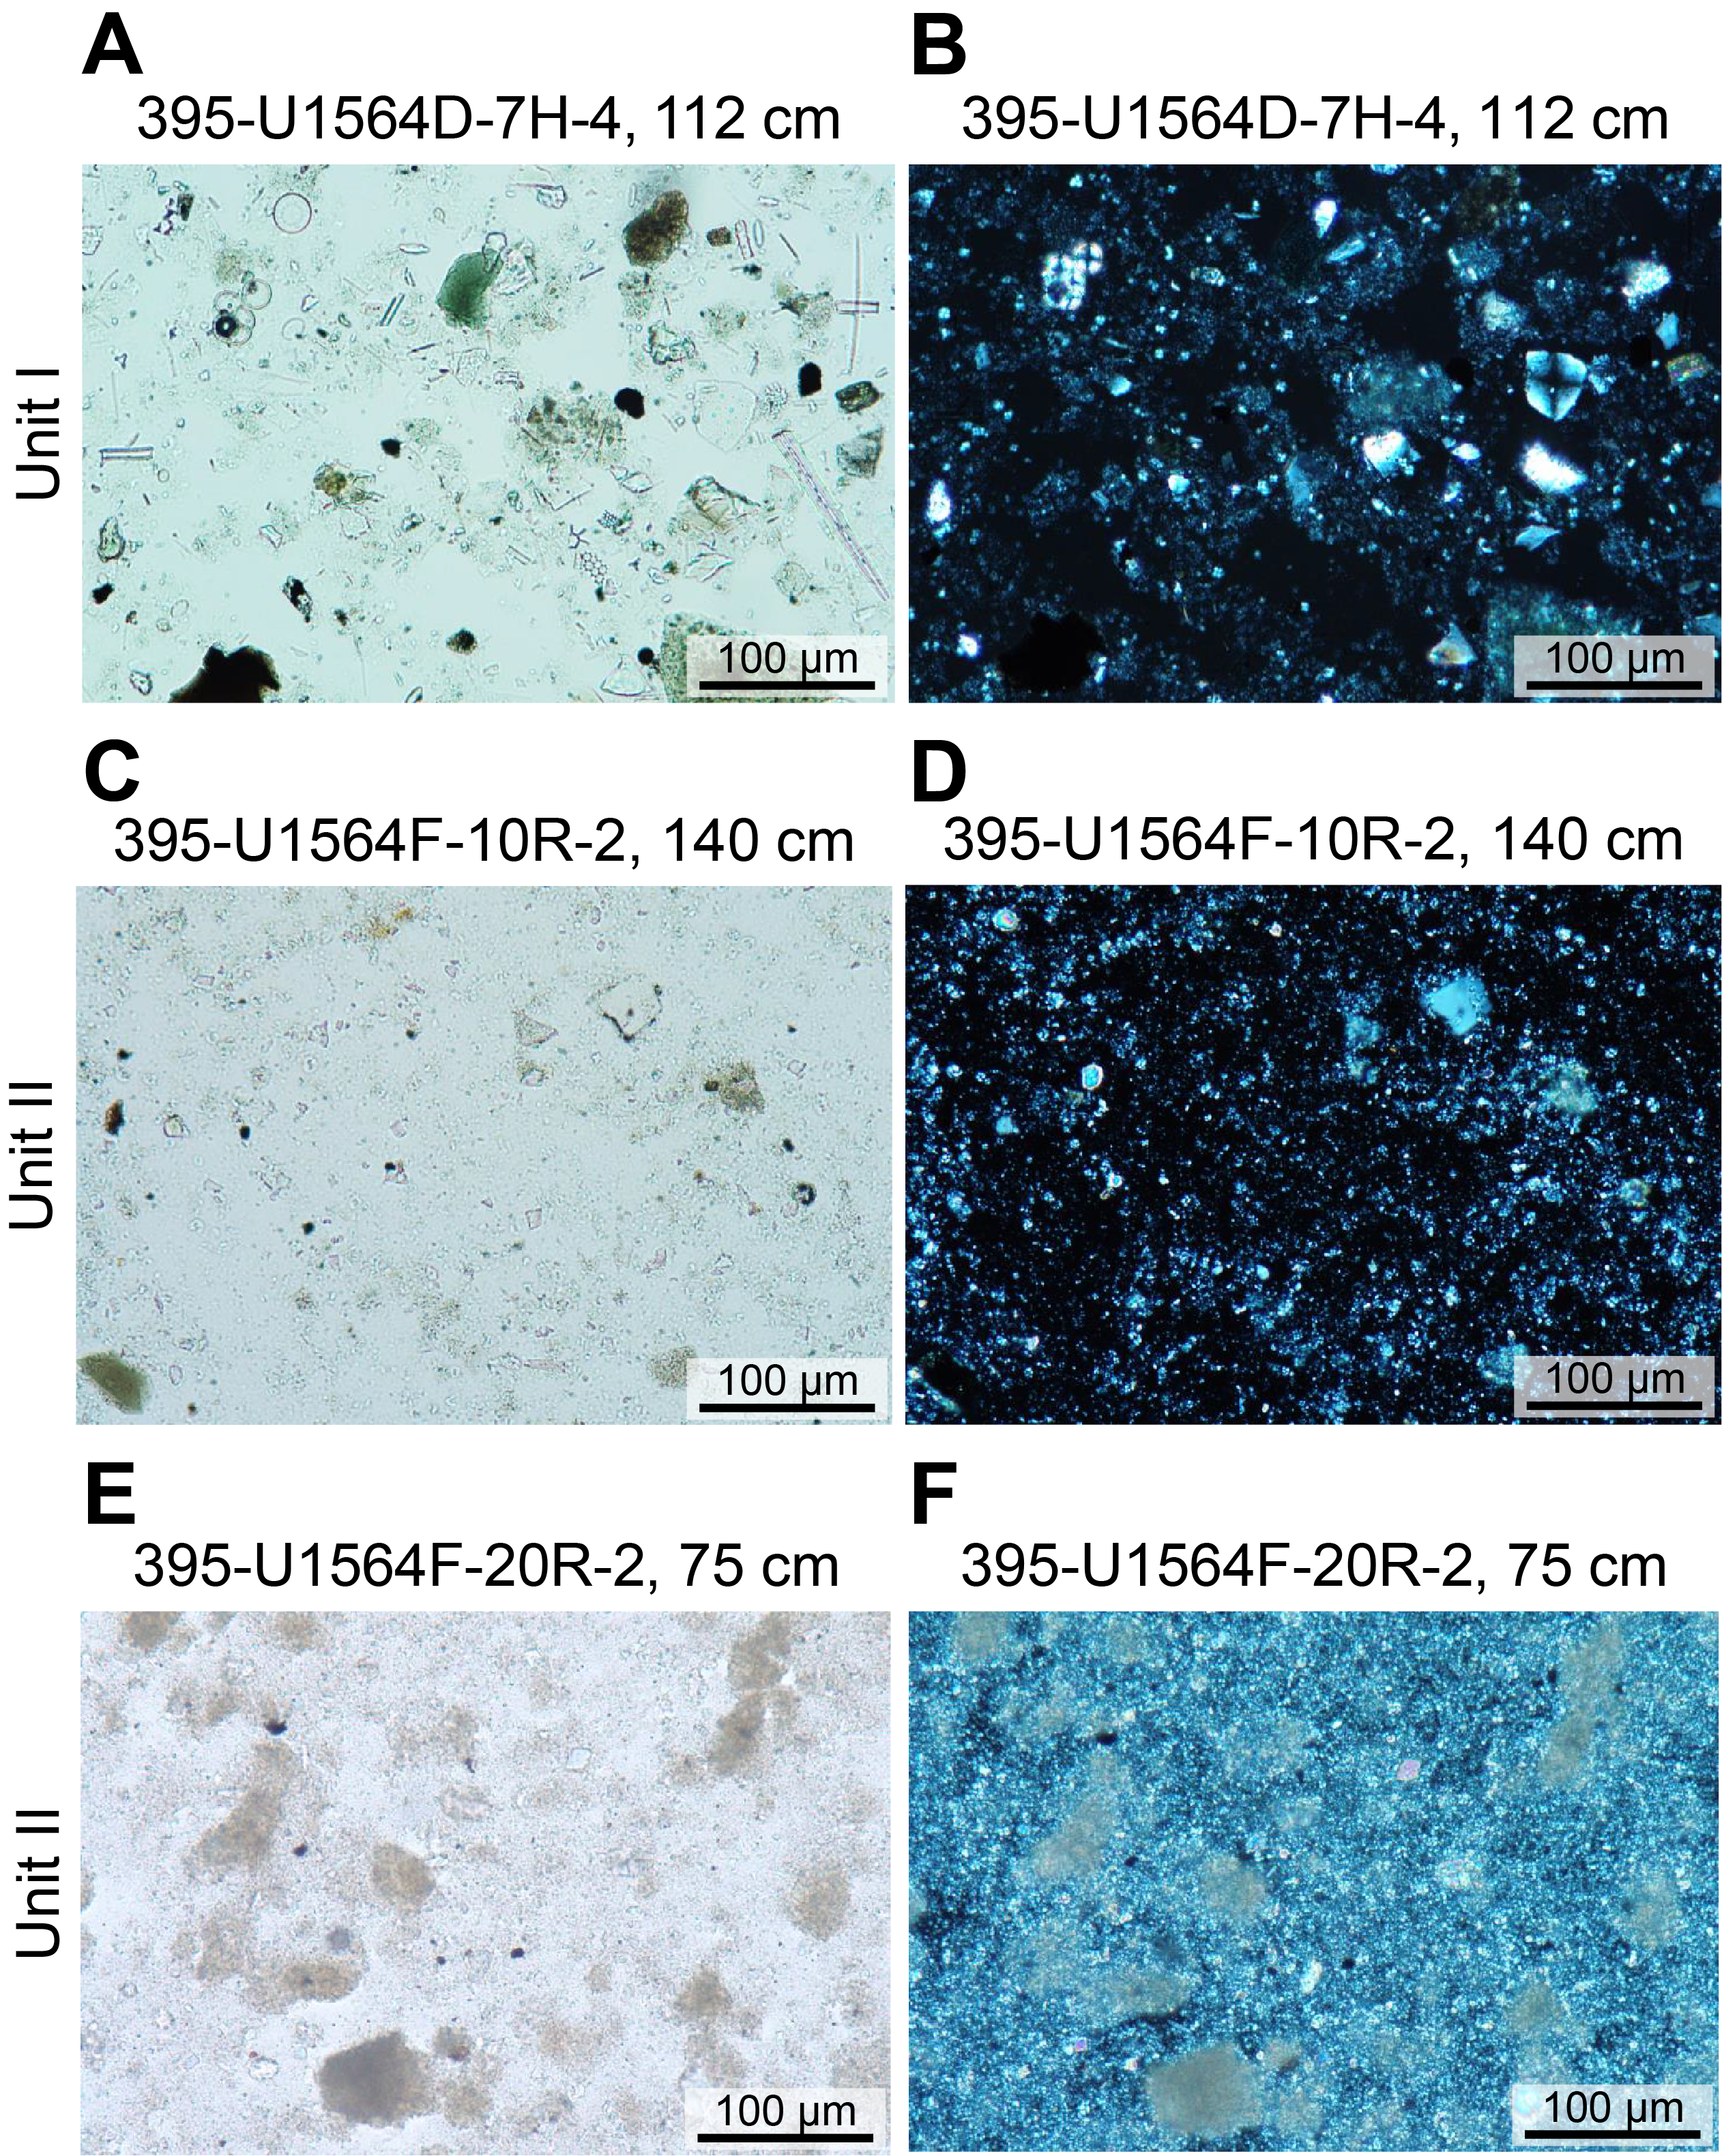
Figure F7. Representative lithologies.
A ~10 cm thick light gray glass layer is observed in intervals 395C-U1564C-11H-6, 97–111 cm; 395-U1564D-11H-2, 73–82 cm; and 395-U1564E-11H-5, 85–94 cm (Figure F8A, F8B). A second glass layer overlying a sharp contact is observed in Cores 395C-U1564C-15H, 395-U1564D-15H, and 395-U1564E-15H (Figure F8C). A fining-upward graded bed is present in Section 395C-U1564C-10H-3, and soft-sediment deformation is present in Section 395-U1564D-13H-2. Centimeter-thick, horizontal, dark green bands are common throughout Subunit IA; these bands do not show a difference in composition compared to surrounding sediments in smear slide (Figure F9A). Sharp contacts are observed occasionally (e.g., Figure F9C, F9D). On average, bioturbation intensity is moderate throughout the subunit. Cores in the lower half of Subunit IA (395-U1564D-7H through 14H; 57.0–135.86 m CSF-A) display moderate drilling deformation, and some core top intervals are soupy.
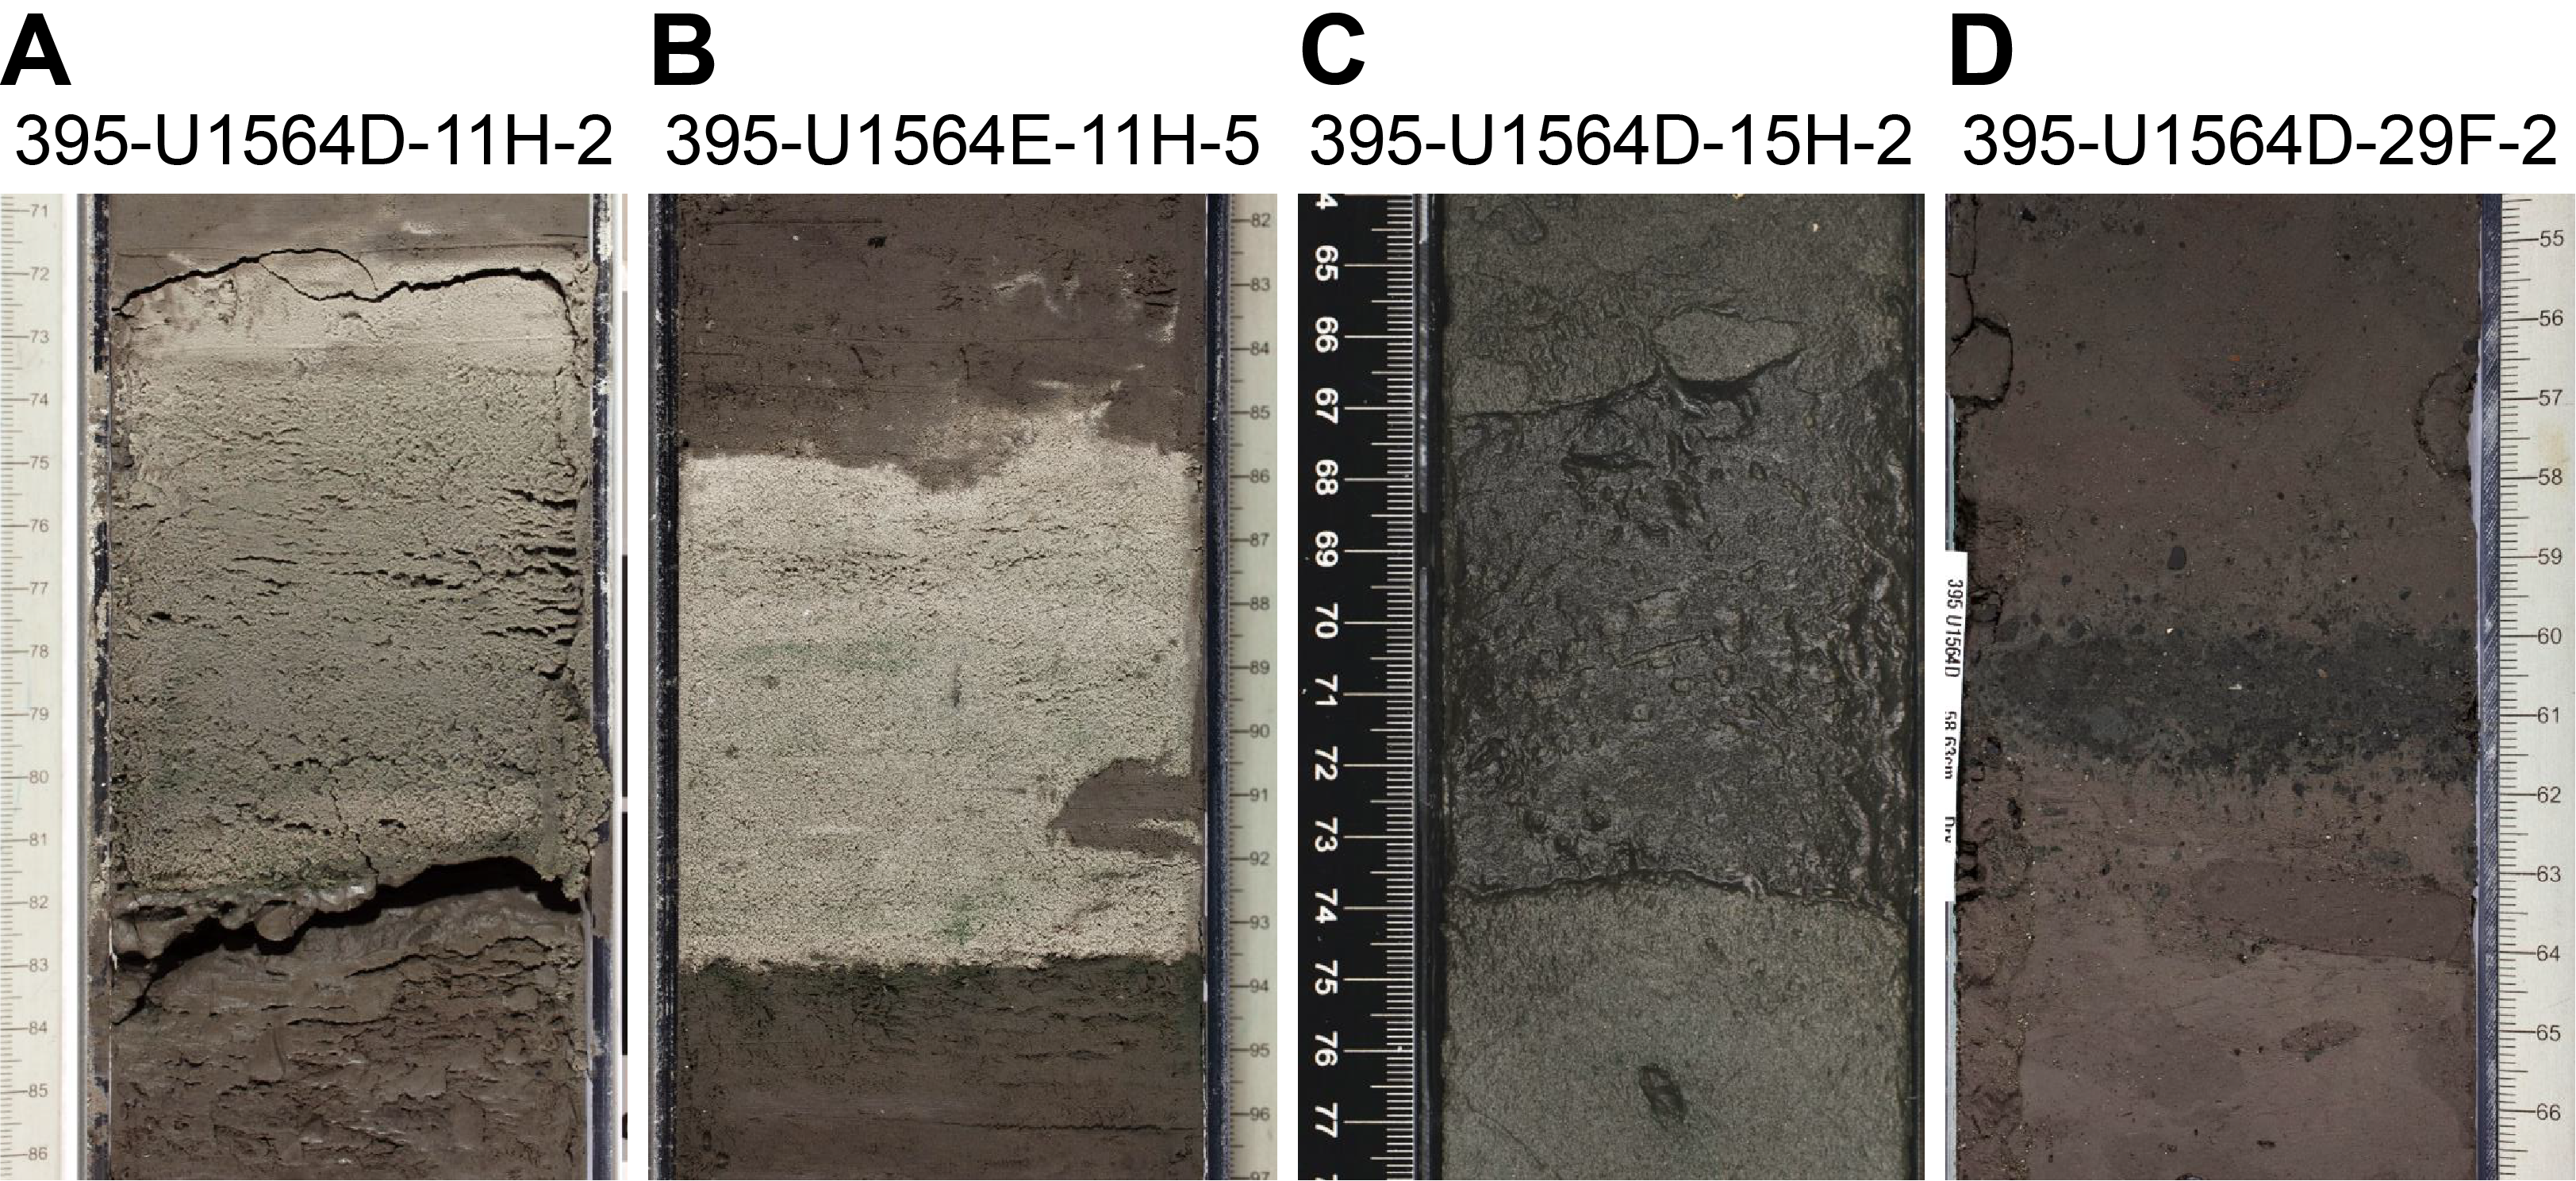
Figure F8. Selected glass layers.
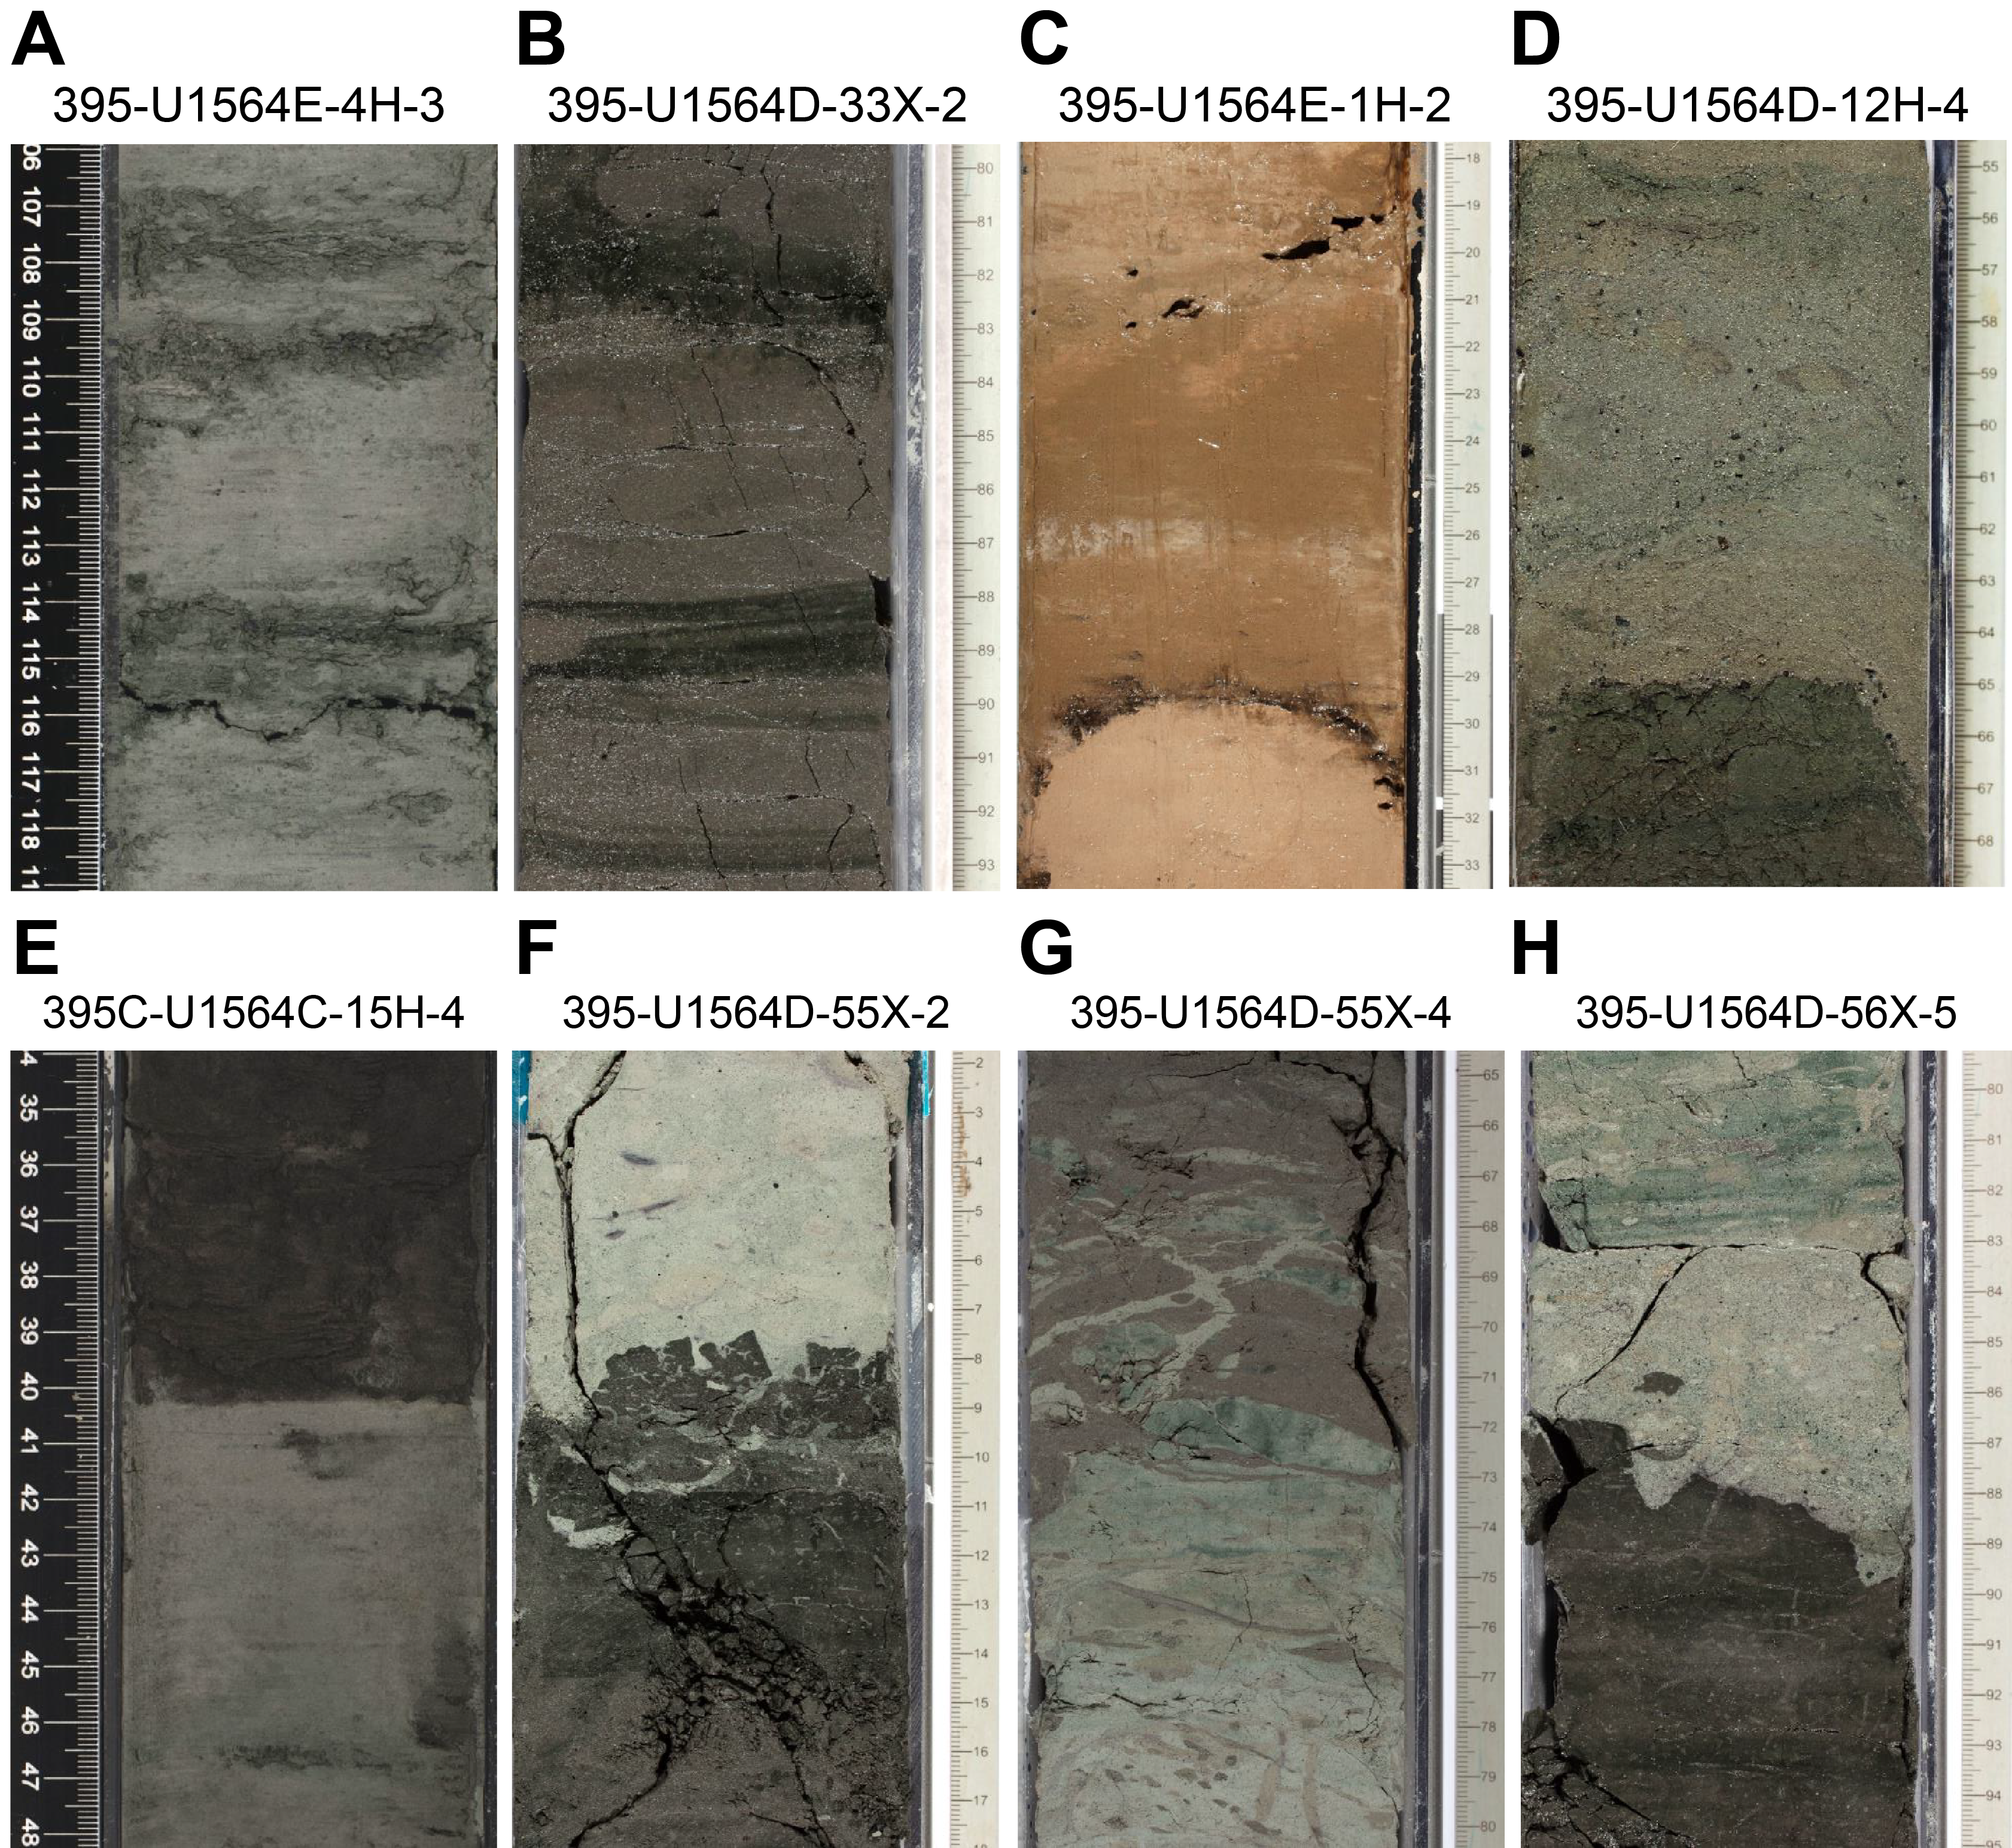
Figure F9. Dark banding and sharp contacts.
3.1.2. Lithostratigraphic Subunit IB
- Intervals: 395C-U1564C-15H-4, 0 cm, to 44X-CC, 0 cm; 395-U1564D-15H-3, 0 cm, to 39X-2, 0 cm; 395-U1564E-15H-5, 0 cm, to end of hole
- Depths: Hole U1564C = 135.01–326.37 m CSF-A; Hole U1564D = 135.93–326.71 m CSF-A; Hole U1564E = 135.27–263.40 m CSF-A
- Thickness: Hole U1564C = 191.36 m; Hole U1564D = 190.78 m; Hole U1564E = 128.13 m
- Age: early Pleistocene to late Pliocene
- Lithology: silty clay
Subunit IB is primarily silty clay. Hole U1564C sediments are light olive gray, olive gray, dark olive gray, and dark green brown, whereas the sediments from Holes U1564D and U1564E are predominantly very dark gray (likely due to the difference in time between core recovery and description). NGR values in Subunit IB display a lower frequency variability in comparison to Subunit IA (Figure F5). Reflectance (L*) remains fairly consistent throughout Subunit IB. CaCO3 values range 2–31 wt% (average = 14 wt%). The terrigenous component is primarily quartz, feldspar, pyrite, glass, and opaque grains. Glauconite, chlorite, and oxides are also present. Within the biogenic fraction, nannofossils and foraminifers are abundant, and siliceous microfossils are common to rare throughout the subunit.
Several glass layers, 0.5 to 1 cm thick, are observed in this subunit, including in Cores 395C-U1564C-15H through 27F, 29F, and 39X–41X (Figure F8D). Dark green bands are present throughout the subunit (Figure F9B). Sharp contacts are present in Cores 395-U1564D-24F (213.70–218.70 m CSF-A) and 395C-U1564C-15H, 38X, and 39X (e.g., Figure F9E). Pyrite-filled and halo-ringed burrows are present in Cores 395-U1564E-20H through 22H (176.80–205.83 m CSF-A). Bioturbation of this subunit is generally sparse to moderate. Some core sections are moderately deformed, fragmented or biscuited.
3.1.3. Lithostratigraphic Subunit IC
- Intervals: 395C-U1564C-44X-CC, 0 cm, to 55X-2, 0 cm; 395-U1564D-39X-2, 0 cm, to 50X-1, 0 cm
- Depths: Hole U1564C = 326.37–426.70 m CSF-A; Hole U1564D = 326.71–426.20 m CSF-A
- Thickness: Hole U1564C = 100.33 m; Hole U1564D = 99.49 m
- Age: late to early Pliocene
- Lithology: silty clay
Subunit IC is primarily dark olive gray, very dark gray, greenish black, and black silty clay. This subunit has lower values and lower amplitude cycles in NGR compared to the overlying sediments (Figure F5). Reflectance (L*) is relatively constant. CaCO3 values range 4–18 wt% (average = 13 wt%). The terrigenous component is primarily quartz and feldspar, with a significant amount of glass along with opaque grains, pyrite, and glauconite (Figure F7C, F7D). Within the biogenic component, nannofossils are dominant and foraminifers, diatoms, and sponge spicules are mostly common. Dark green bands and shell fragments are present. There is a centimeter-scale glass layer with sand in Section 395-U1564D-43X-6, 45 cm, and a sharp boundary is present a few centimeters below this layer in Section 43X-6, 52 cm (365.80–366.92 m CSF-A). The precise nature of the relationship between this boundary to the glass layer above is difficult to discern, however, because of drilling disturbance. Bioturbation is sparse to abundant. Cores are moderately disturbed, displaying biscuiting and fragmentation, and some are strongly brecciated.
3.2. Lithostratigraphic Unit II
- Intervals: 395C-U1564C-55X-2, 0 cm, to end of hole; 395-U1564D-50X-1, 0 cm, to end of hole; 395-U1564F-2R-1, 0 cm, to 44R-2, 0 cm
- Depths: Hole U1564C = 426.70–629.12 m CSF-A; Hole U1564D = 426.20–653.01 m CSF-A; Hole U1564F = 598.00–997.23 m CSF-A
- Thickness: Hole U1564C = 202.42 m; Hole U1564D = 226.81 m; Hole U1564F = 399.23 m
- Age: early Pliocene to early Oligocene
- Lithology: nannofossil chalk with silty clay
The lithologic boundary between Units I and II is based on a major change in lithology from silty clay (Unit I) to nannofossil chalk with silty clay (Unit II) at ~426 m CSF-A. This change in lithology is consistent with an increase in CaCO3 weight percent and L* reflectance (Figures F5, F6). Unit II is divided into Subunits IIA–IIC based on primary lithology changes and variability in NGR and L* reflectance.
3.2.1. Lithostratigraphic Subunit IIA
- Intervals: 395C-U1564C-55X-2, 0 cm, to end of hole; 395-U1564D-50X-1, 0 cm, to end of hole; 395-U1564F-2R-1, 0 cm, to 12R-1, 0 cm
- Depths: Hole U1564C = 426.70–629.12 m CSF-A; Hole U1564D = 426.20–653.01 m CSF-A; Hole U1564F = 598.00–694.90 m CSF-A
- Thickness: Hole U1564C = 202.42 m; Hole U1564D = 226.81 m; Hole U1564F = 96.9 m
- Age: early Pliocene to late Miocene
- Lithology: nannofossil chalk with silty clay; silty claystone with nannofossils
The sediments in Subunit IIA contain repeating sediment packages that include light greenish gray to very dark greenish gray nannofossil chalk interbedded with gray to very dark gray silty clay with nannofossils. This change is consistent with a sharp increase in maximum CaCO3 at ~426 m CSF-A at the top of this subunit (Figure F5). Subunit IIB CaCO3 concentration ranges 13–71 wt% (average = 42 wt%). Reflectance (L*) displays more cyclical behavior in comparison to overlying sediment, also consistent with the cyclical behavior in lithology. NGR displays high-frequency, low-amplitude cycles in the upper part of this subunit, transitioning to lower frequency cycles and higher values toward the base. The sediments become more lithified, to nannofossil chalk, at ~488 m CSF-A. Several sharp boundaries and color graded beds are present in Cores 395C-U1564C-50X through 67X and 395-U1564D-55X through 61X between about 426 and 530 m CSF-A (Figure F9F–F9H). Dark green bands and burrows are also present. Several fractures and veins are observed within the lithified sediments, some with calcite and pyrite infilling (e.g., Core 70X) between 618.53 and 620.04 m CSF-A. The terrigenous fraction is primarily quartz and feldspar; glass, opaque grains, pyrite, and oxides are common, and glauconite is observed. The terrigenous grains become more difficult to identify as the sediment becomes more lithified due to grains clumping together and calcite overgrowths. In addition to nannofossils (dominant), foraminifers are commonly observed, and sponge spicules are common to rare. Bioturbation is mostly moderate to abundant. The cores of this subunit are slightly to severely fragmented.
3.2.2. Lithostratigraphic Subunit IIB
- Interval: 395-U1564F-12R-1, 0 cm, to 28R-5, 0 cm
- Depth: 694.90–856.19 m CSF-A
- Thickness: 161.29 m
- Age: late to early Miocene
- Lithology: nannofossil chalk
Subunit IIB is primarily light greenish gray and greenish gray nannofossil chalk and dark greenish gray silty nannofossil chalk. NGR values are lower throughout this subunit compared to values in the subunits above and below (Figure F5). CaCO3 ranges 31–69 wt% (average = 50 wt%). A 1 cm thick glass layer is present in interval 395-U1564F-14R-4, 135–136 cm (719.92 m CSF-A). Multiple fractures with slickensides and veins filled with silt, calcite, and pyrite are present in Subunit IIB (e.g., Cores 14R and 26R) (Figure F10A, F10B). Several very dark gray to black bands are present in Core 21R. Soft-sediment deformation and sharp contacts are observed in Core 26R. The terrigenous component is primarily quartz and feldspar; also observed are diagenetic calcite, glass, glauconite, opaque grains, pyrite, and oxides. Bioturbation is abundant throughout. Burrows with pyrite infilling and/or halos are present. Nannofossils are abundant, and foraminifers and sponge spicules are rare to common. The cores of Subunit IIB display slight to severe fragmentation.
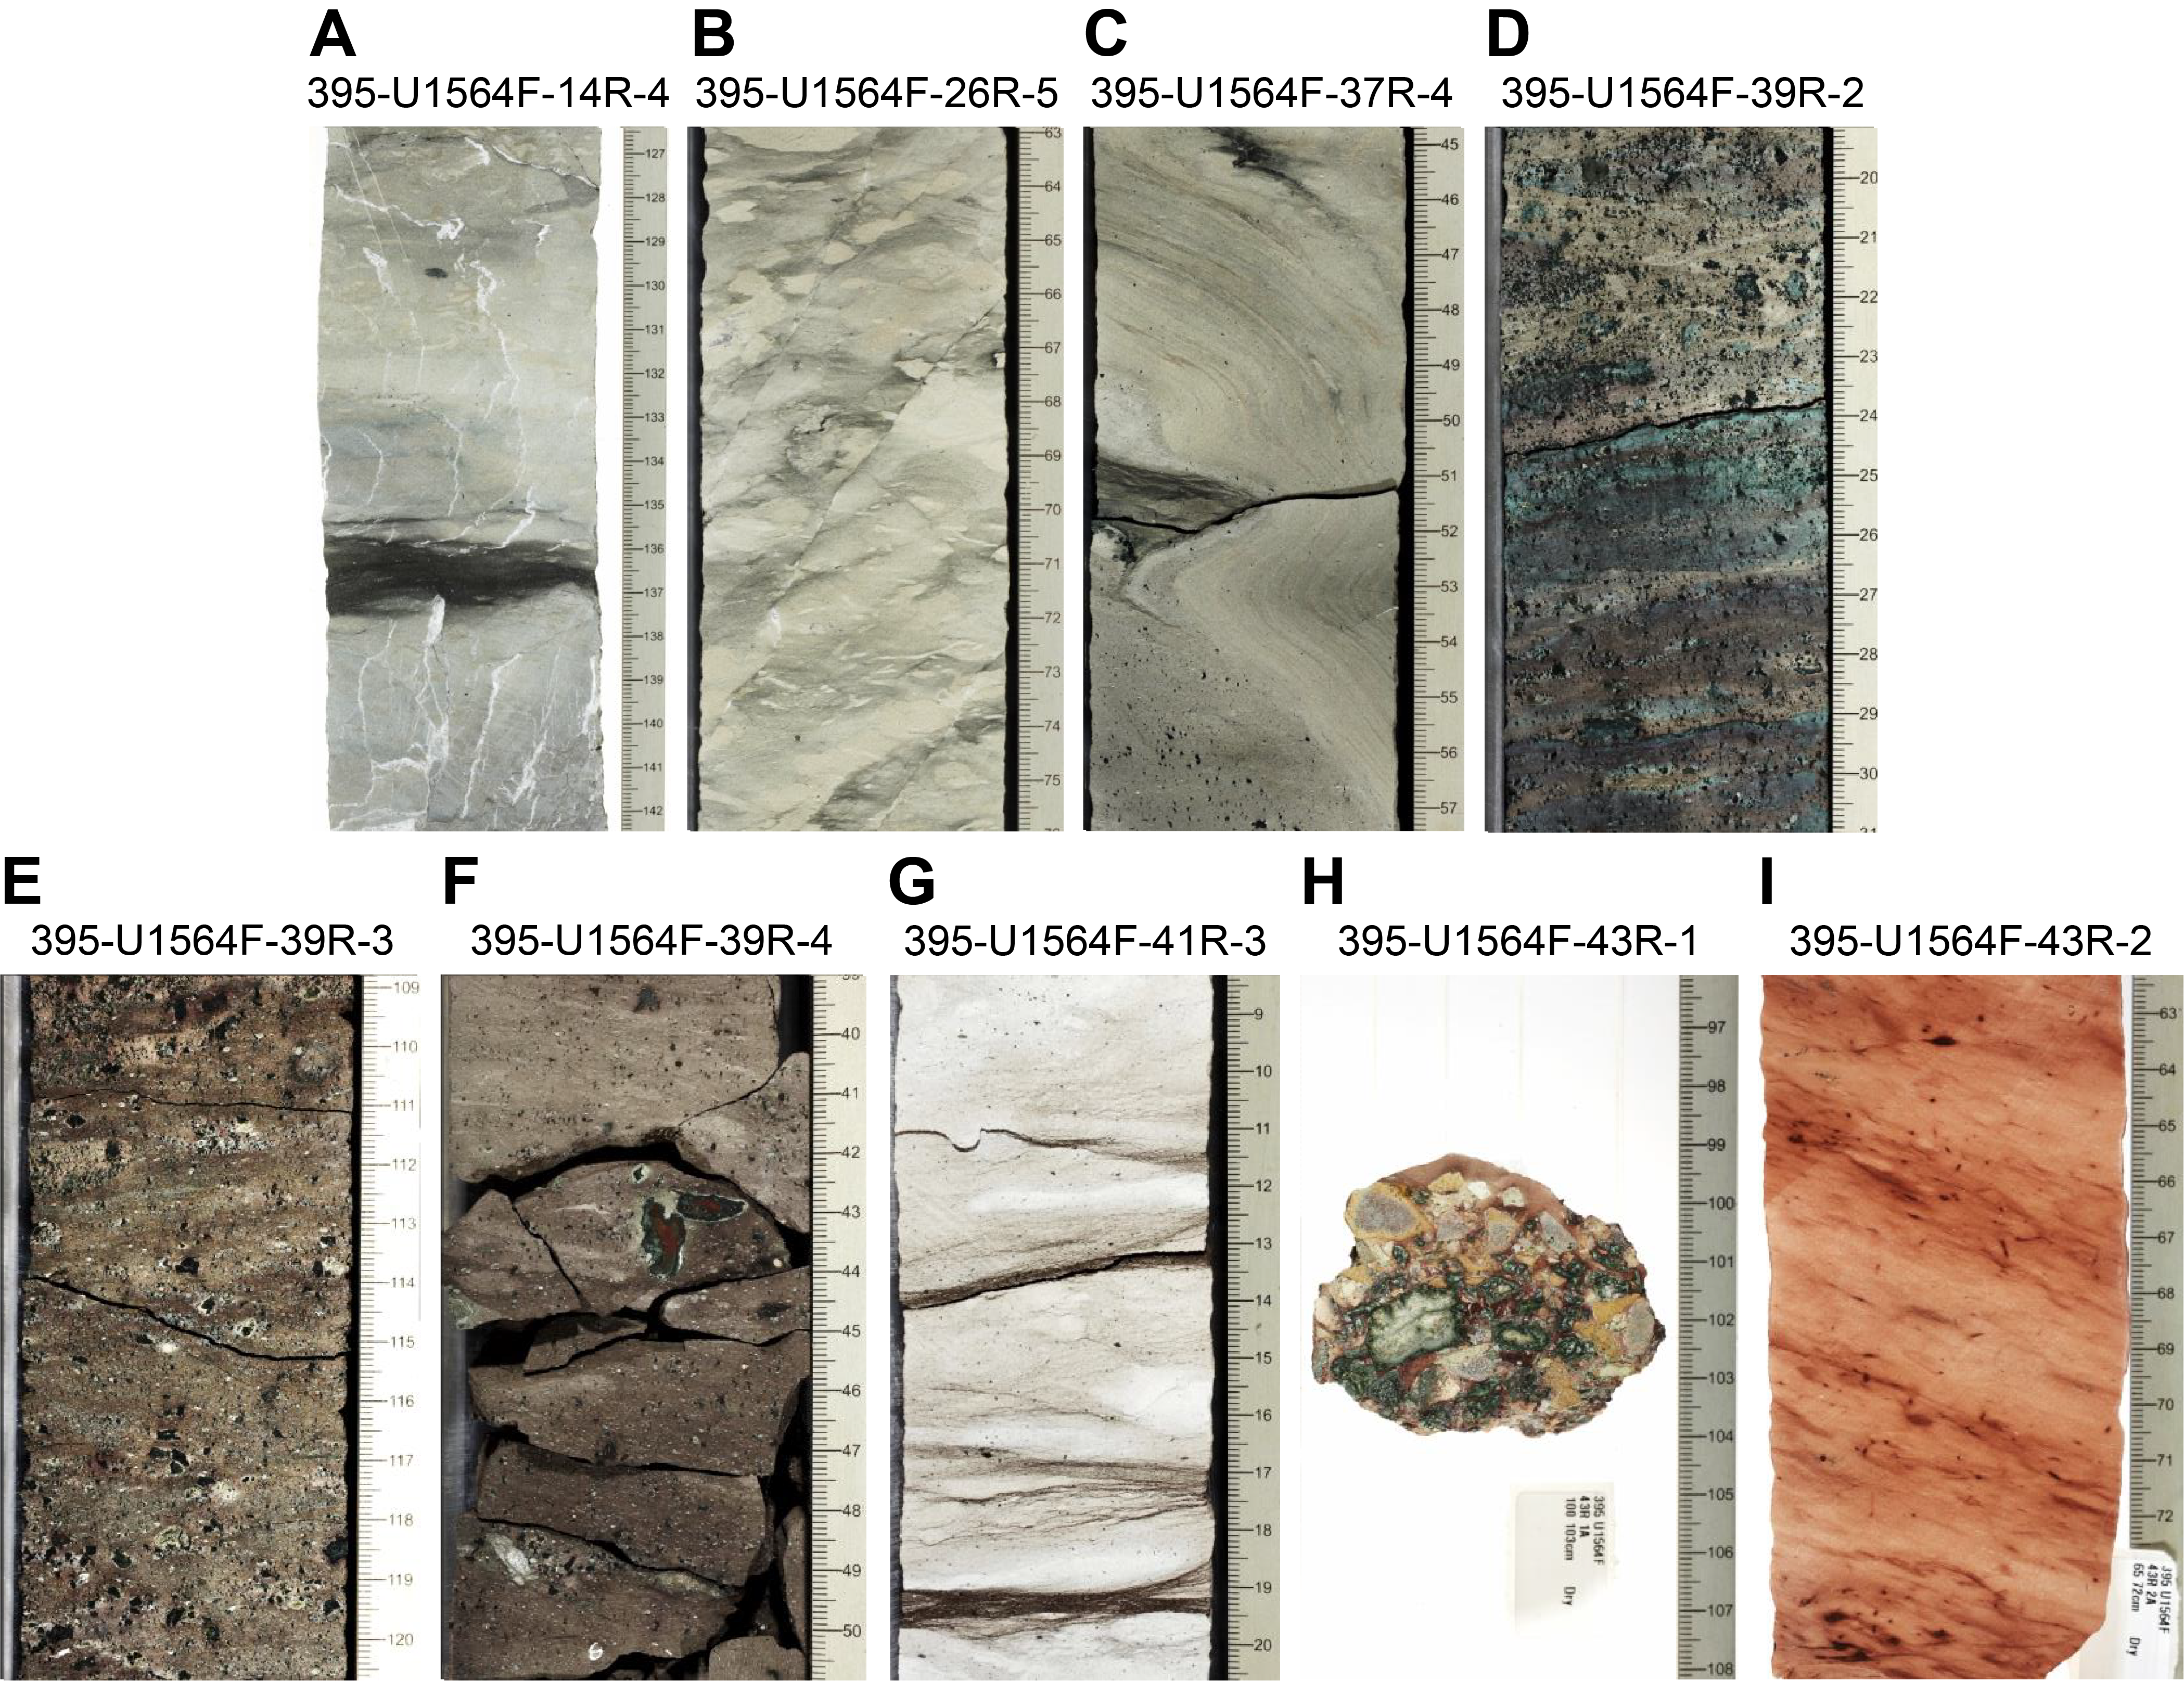
Figure F10. Lithologic features.
3.2.3. Lithostratigraphic Subunit IIC
- Intervals: 395-U1564F-28R-5, 0 cm, to 44R-2, 0 cm; 395-U1564F-52R-2, 0 cm, to 53R-1, 71 cm
- Depths: Hole U1564F = 856.19–997.23 m CSF-A, 1049.26–1054.61 m CSF-A
- Thickness: Hole U1564F = 141.04 m, 5.35 m
- Age: early Miocene to early Oligocene
- Lithology: nannofossil chalk with silty clay
Subunit IIC is primarily gray to greenish gray nannofossil chalk with silty clay. Prominent minor lithologies in this subunit include light greenish gray to very dark greenish gray silty nannofossil chalk and clayey nannofossil chalk. CaCO3 values are highly variable and range 9–87 wt% (average = 52 wt%) (Figure F5). Consistent with the high CaCO3 concentrations in this subunit, nannofossils are generally the primary sediment component observed in smear slide (Figure F7E, F7F); however, quartz, feldspar, glauconite, glass, oxides, and opaque grains are still present throughout. Additional biogenic components include foraminifers and sponge spicules, and both are rare to common. Sharp contacts, laminations, and apparent laminations are observed in Cores 395-U1564F-28R (850.20–860.20 m CSF-A) and 32R (889.20–898.01 m CSF-A). Features consistent with soft-sediment deformation are found in a continuous interval between Cores 37R and 38R (937.80–956.47 m CSF-A). These features include apparent laminations, soft-sediment folds, and offsets on either side of fine grained, homogeneous contacts, which are a few millimeters thick. A soft-sediment fold is clearly visible in interval 37R-4, 44–57 cm (Figure F10C). Calcite infilling and glauconite pellets are dispersed throughout Cores 37R–39R (937.80–963.45 m CSF-A). Fractures, many with very thin calcite vein infilling, continue to be observed in this subunit. At approximately 958 m CSF-A, relatively close to the sediment/basement interface, layers of reddish gray, pinkish gray, and reddish brown nannofossil chalk become interbedded with nannofossil chalk of similar color to the overlying intervals (Figure F10H). A ~3.5 m thick layer of dark green and red sediments with abundant glauconite pellets and clasts (sand size to ~2 cm) in Core 39R coincides with a strong peak in NGR at ~960 m CSF-A (Figures F5, F6, F10D–F10F). Stylolites and glauconite grains are present in Cores 41R–44R (968.80–997.23 m CSF-A) (Figure F10G). A small piece of brecciated sediment with clasts of malachite, calcite with malachite rims, and possible jarosite is present in interval 43R-1A, 100–103 cm (Figure F10H). Cores in this subunit are slightly to highly fragmented, and bioturbation is generally abundant.
Intervals of reddish brown and greenish gray nannofossil chalk are interbedded in the basalt basement below the upper sediment/basement interface in Cores 395-U1564F-52R, 53R, 63R, 65R, 66R, 70R, and 73R. Some of the interbedded sediment layers are brecciated. These sediment beds range in thickness from ~5 m near the top of the basement unit to beds of only a few centimeters thick downhole. Sediment of similar composition is also found infilling larger fractures in the uppermost beds of basalt in Hole U1564F.
3.3. XRD results
A subset of squeeze cake residues and other samples (n = 17) were analyzed for X-ray diffraction (XRD). Results are consistent with smear slide, thin section, and macroscopic observations (Figure F11; Table T4). The amount of calcite implied by the diffraction patterns is variable but consistent with measured CaCO3 content. Minerals identified from this site are consistent with the terrigenous and authigenic minerals observed in smear slide, and include quartz, assorted feldspar and pyroxene, pyrite, and calcite. Three samples were decarbonated to identify minor phases (see Geochemistry and microbiology in the Expedition 395 methods chapter [Parnell-Turner et al., 2025a]); these additional analyses (noted as decarbonated in Figure F11) allowed for more certainty in the identification of pyrite and zeolite minerals. Decarbonated Samples 395-U1564F-33R-3, 139–149 cm, and 34R-2, 110–115 cm, displayed strong peaks for zeolite minerals; the cores these samples were taken from also featured prominent fracturing. XRD samples were not specifically prepared for clay mineral analysis, and peaks with a 2θ of <15° should be treated with caution; however, most samples display peaks in this region, consistent with the presence of clay minerals. Future analysis of the clay mineralogy in these samples could be useful for determining shifts in deposition processes and sediment sources.
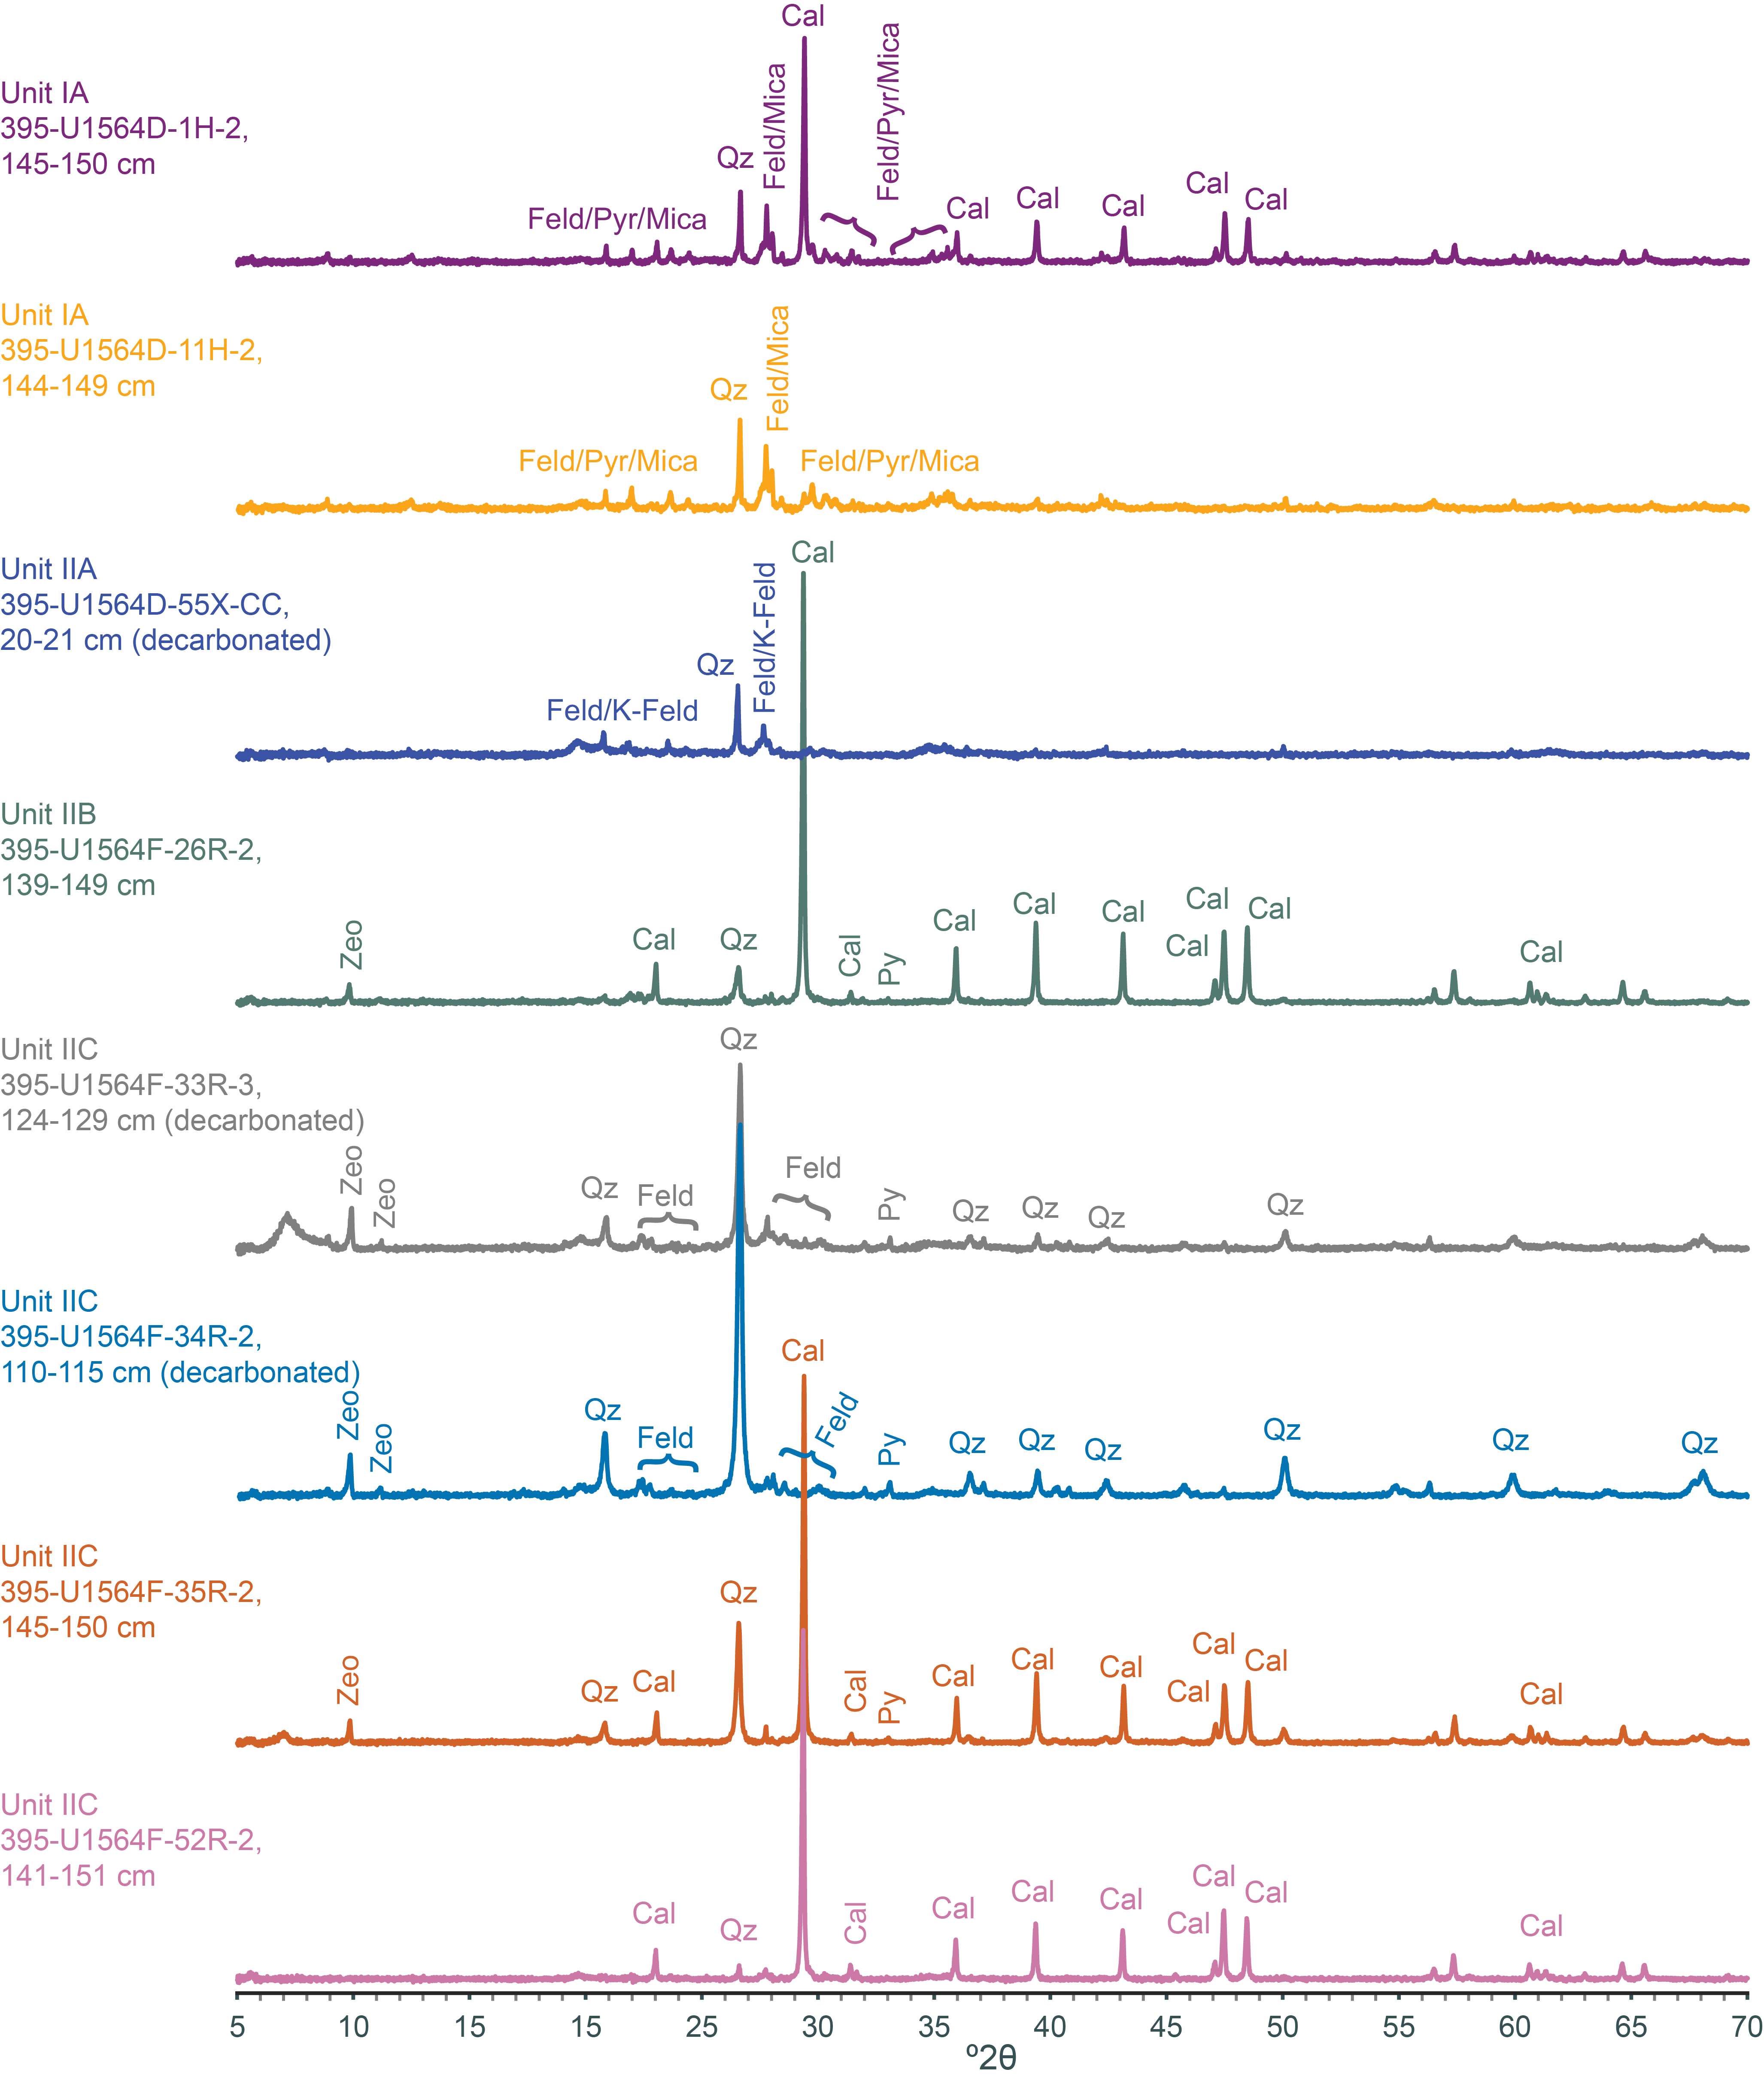
Figure F11. Powder XRD results.
3.4. Thin section analysis
Thin sections (n = 16) taken between Cores 395-U1564F-10R and 43R were examined. Thin sections locations were chosen to examine fine-scale laminations and mineral composition. The microscopic structures show silt and clay in a fine-grained carbonate matrix. Thin layers and laminations are commonly defined by discontinuous layers of silt-sized dark minerals and oriented silt grains. The silt size fraction is primarily composed of quartz, feldspar, and calcite, with glauconite, hornblende, mica, and chlorite also present. Glauconite is present as both an autochthonous and detrital mineral. Stylolites are observed in thin section and are composed of very fine clay with some detrital quartz and feldspar.
4. Igneous petrology
Site U1564 is located on oceanic crust that formed an estimated 32.3 My ago when the Reykjanes Ridge was segmented by a series of transform offsets (Figure F12). In this region, oceanic crust does not show any obvious evidence of VSRs or VSTs. Coring in Hole 395-U1564F reached 1169.7 m CSF-A (Figure F13), drilled 172.4 m into basement, and recovered 114.2 m of basalt (66% recovery).
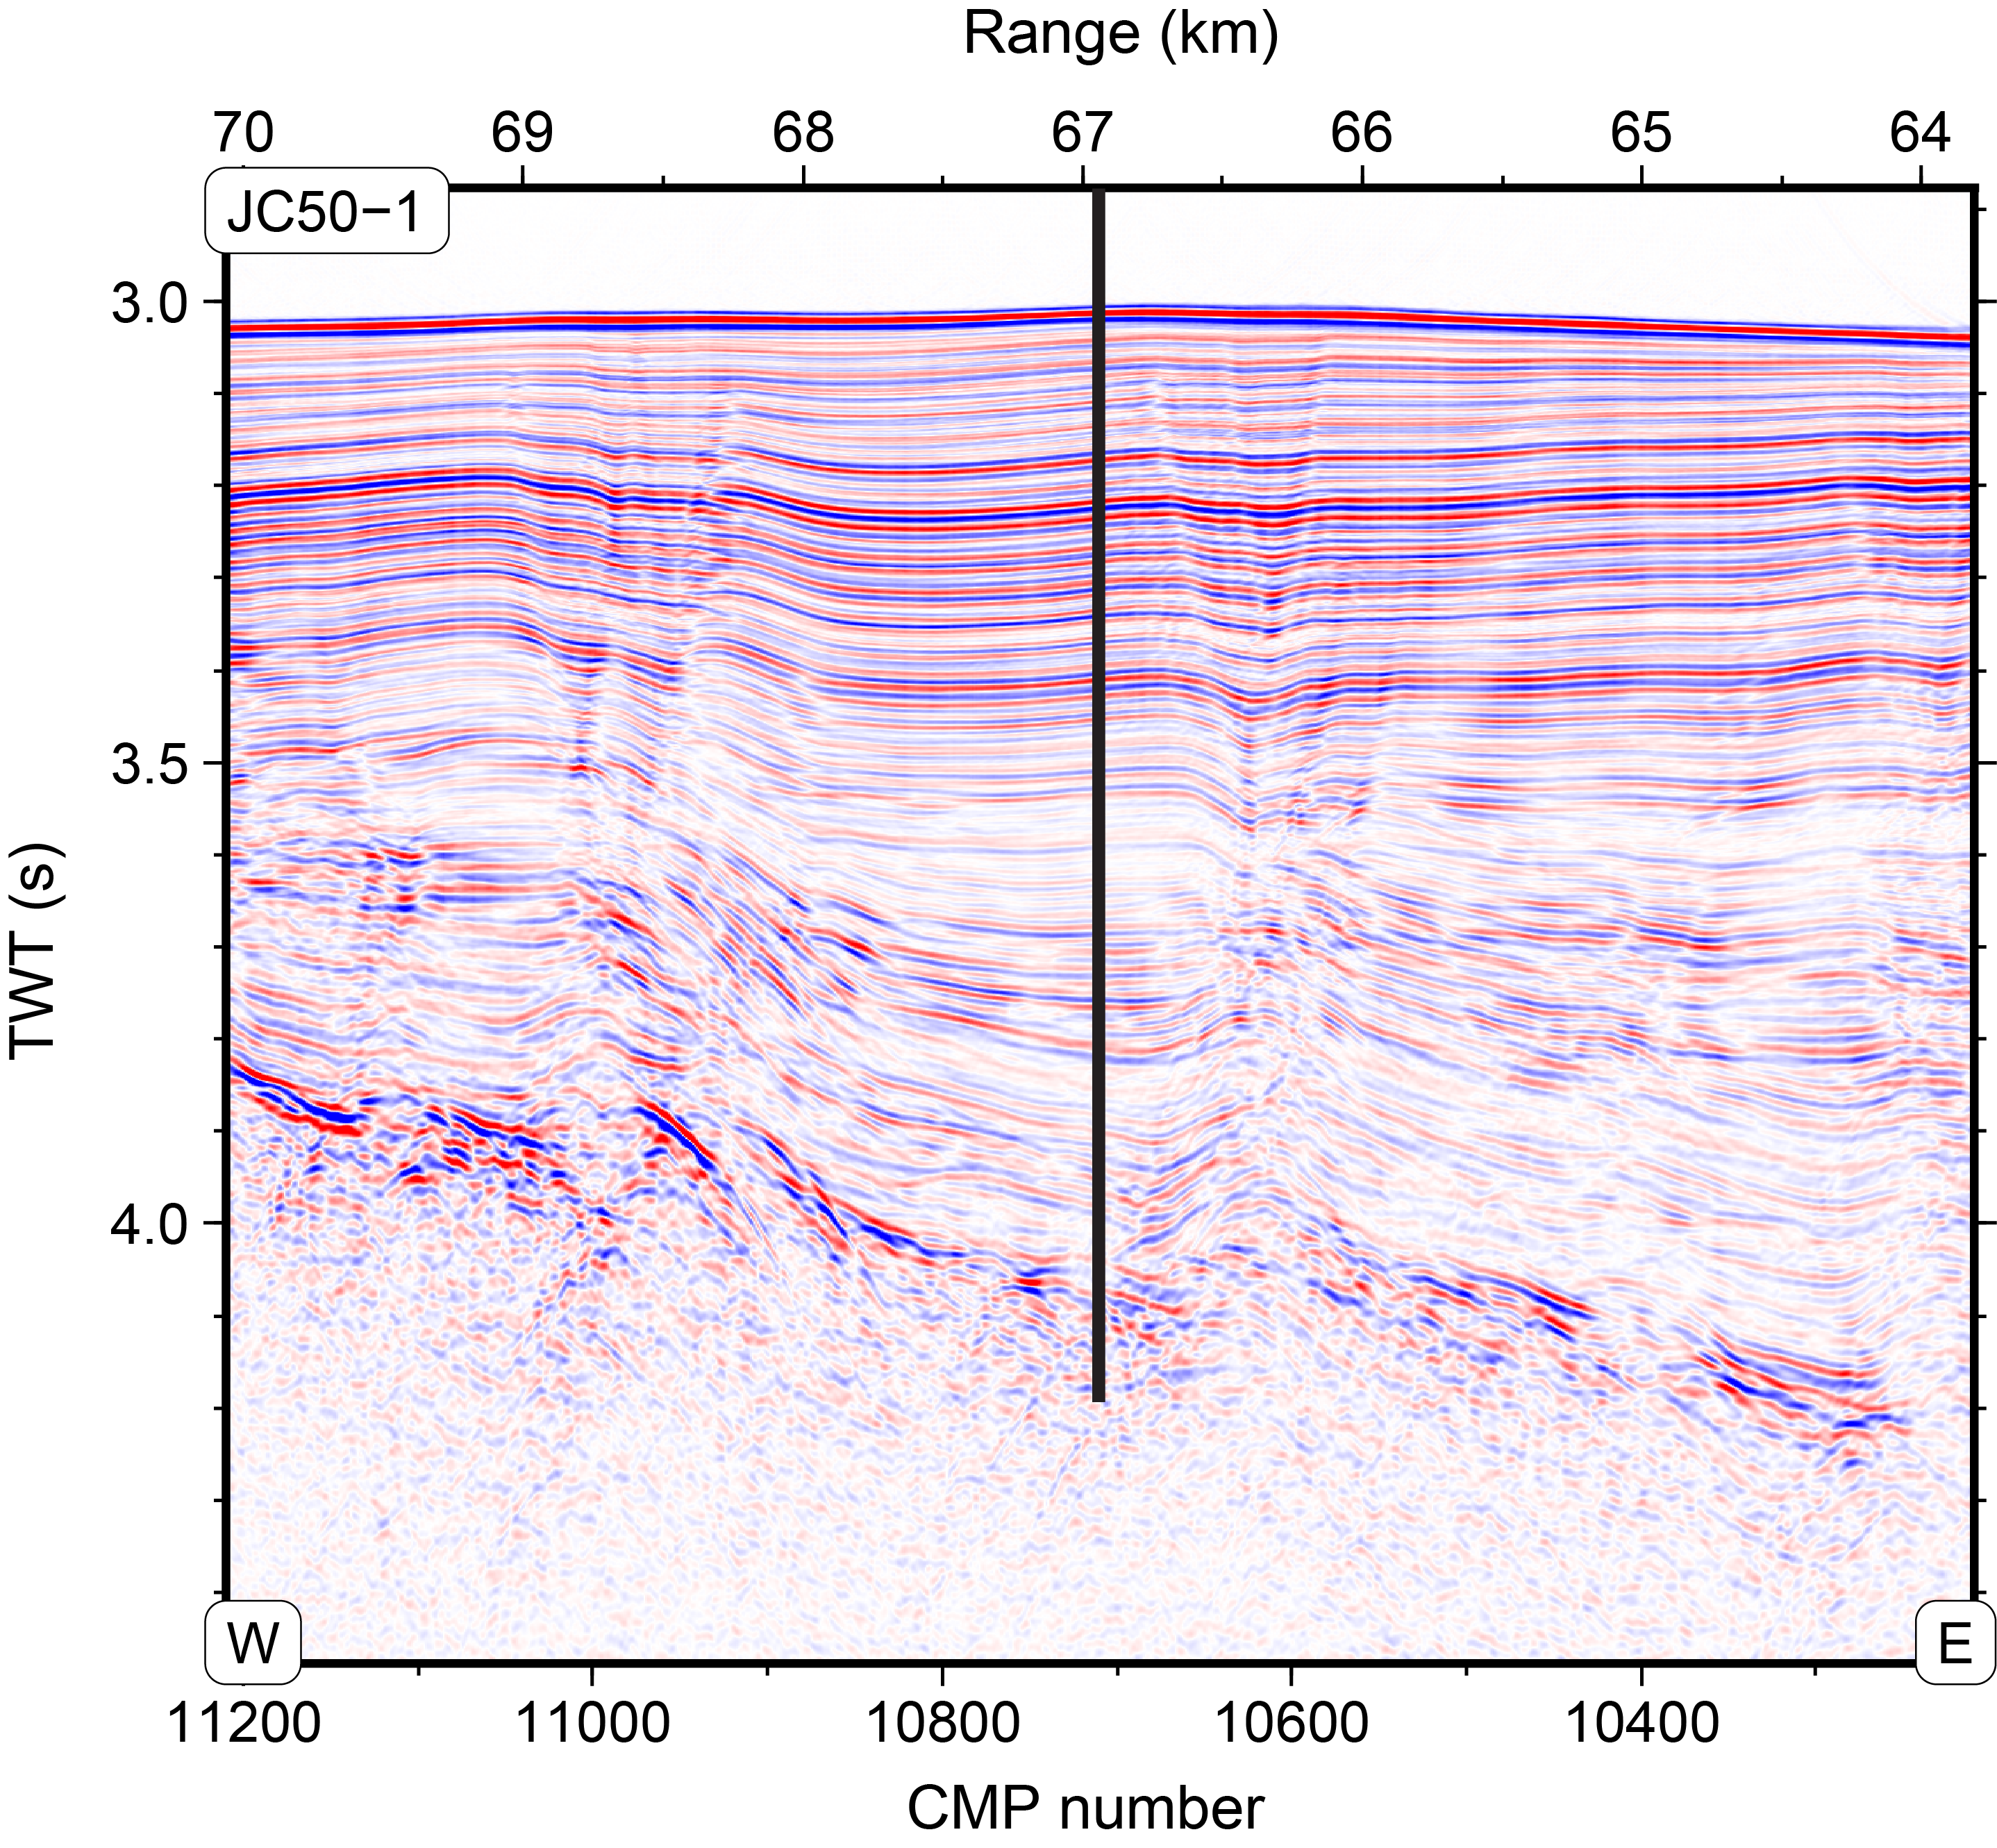
Figure F12. Site U1564 location on Seismic Line JC50-1.
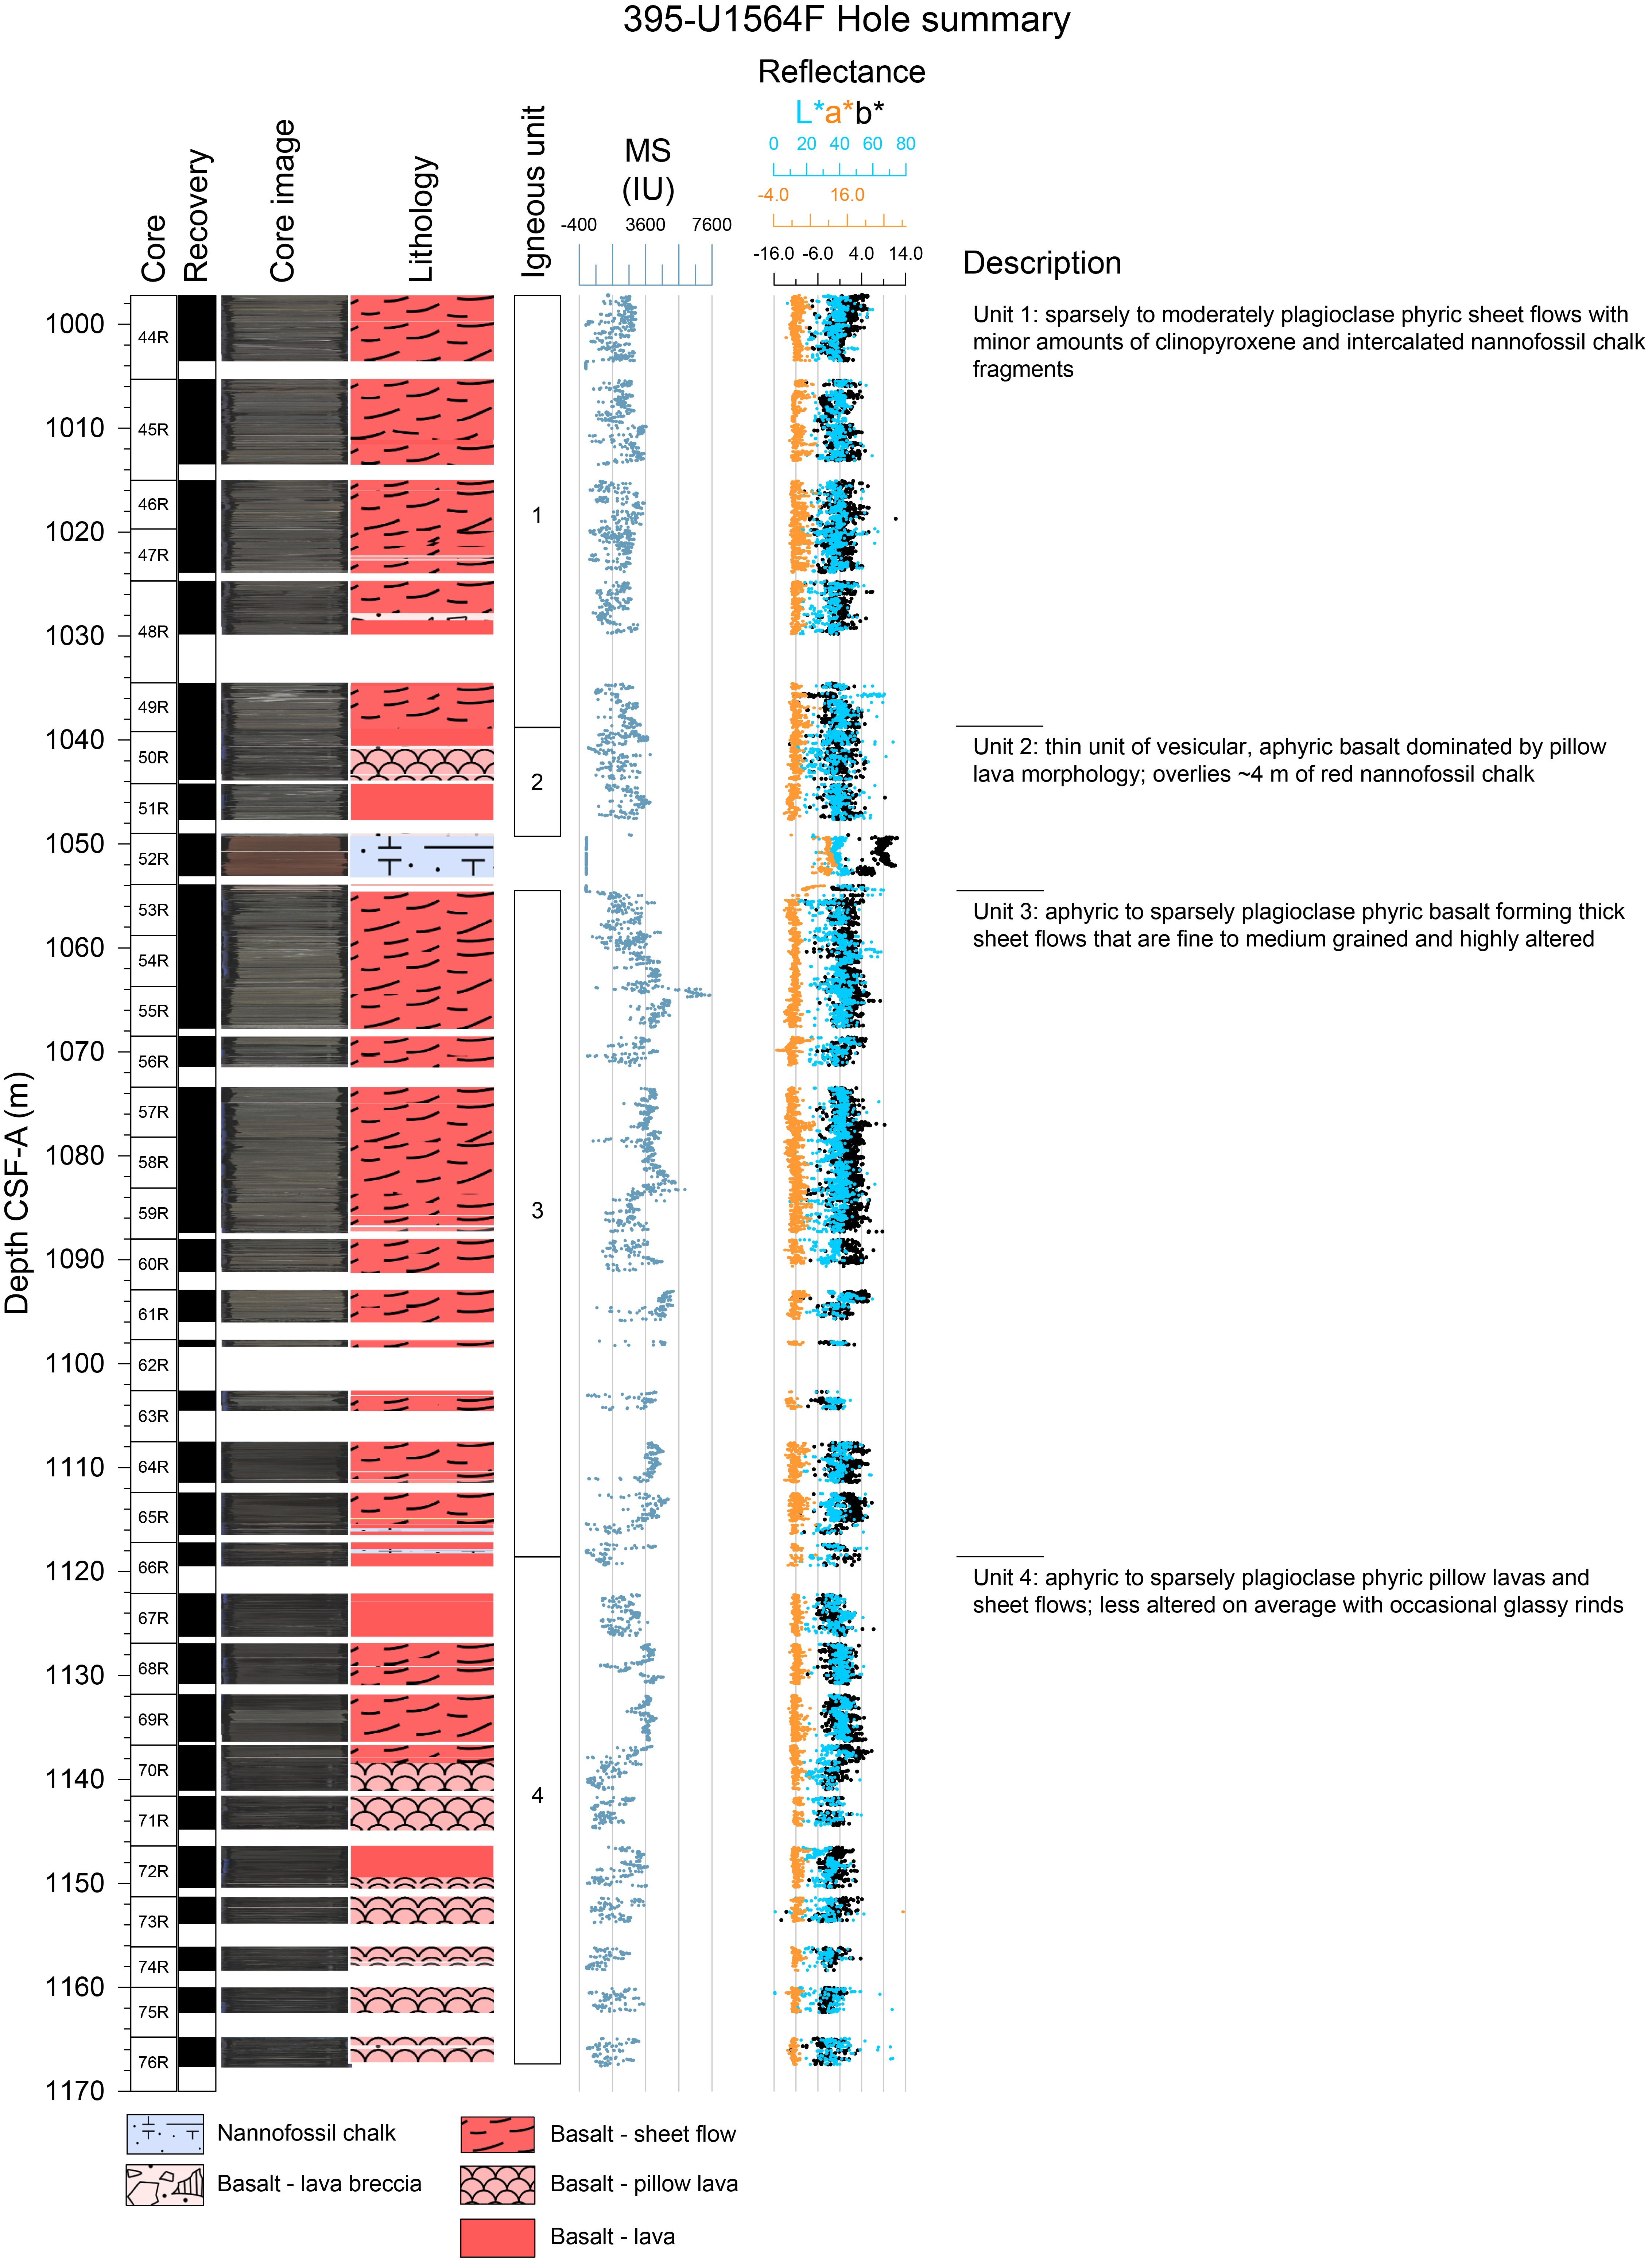
Figure F13. Lithologic summary.
4.1. Lithostratigraphy
Hole U1564F was the only hole to recover basement at this site, with the first basalts occurring at the top of Section 44R-2. The sediment/basement contact was not directly recovered in this hole. Igneous rock cores from Site U1564 are almost entirely altered sheet flows that contain sediment-filled fractures and anastomosing calcite veins. These massive sheet flows comprise sparsely plagioclase phyric basalt with occasional clinopyroxene microphenocrysts. In many places, plagioclase phenocrysts are large (~2–4 mm) although frequently altered. There are two major intervals of continuous, pervasively altered massive lava, the first of which occurs between 970 and 1028 m CSF-A. This interval is underlain by two thinner sheet flow intervals that are ~10 and ~4 m thick, respectively, interbedded with pillow lava and occasional fragments of lava breccia and brecciated vein material. Some of the breccias have jigsaw geometries and contain fragments with possible palagonite-rich rims. A 3.8 m thick interval of reddish brown (2.5YR 4/6) nannofossil chalk marks the base of this sequence and may represent a significant eruption hiatus. The second interval of massive sheet flows occurs between 1054 and 1117 m CSF-A. This interval is more highly altered on average than the first sheet flow interval. Two more sediment horizons consisting of a pale red (2.5YR 6/2) nannofossil chalk occur at the base of this interval (~1115 and 1118 m CSF-A), the largest of which is ~0.3 m thick. Beneath these horizons, a short sequence of massive flows gives way to pillow lavas (~1138 m CSF-A), which, apart from a single 3 m thick massive flow, continue to the base of the hole. There are excellent examples of small (~6 cm) pillow fragments with curved glassy chilled margins and vesicle bands. These basalt fragments are mostly aphyric with a groundmass dominated by acicular plagioclase grains and clinopyroxene mesostasis.
As found at other sites, the massive sheet flows exhibit higher MS and L* color reflectance than the pillow lavas (Figure F13; see Physical properties).
4.2. Core descriptions
These descriptions are based on a combination of detailed macroscopic observations of core sections, microscopic thin section observations, and physical properties measurements (e.g., MS, color reflectance, and wireline logs). Some key primary characteristics are summarized in the visual core descriptions (VCDs).
Igneous lithologies at Site U1564 fall into three principal morphological categories: massive sheet-like flows, pillow lavas, and breccias (Figures F14, F15). The massive flows recovered at this site are each up to tens of meters thick and can be difficult to distinguish from each other. These flows are generally sparsely plagioclase phyric basalts with fine- to medium-grained groundmasses consisting of plagioclase, clinopyroxene, and opaque minerals. Groundmass coarsens toward flow interiors. Plagioclase phenocrysts and occasional clinopyroxene microphenocrysts are visible in hand specimen. There is no olivine present.
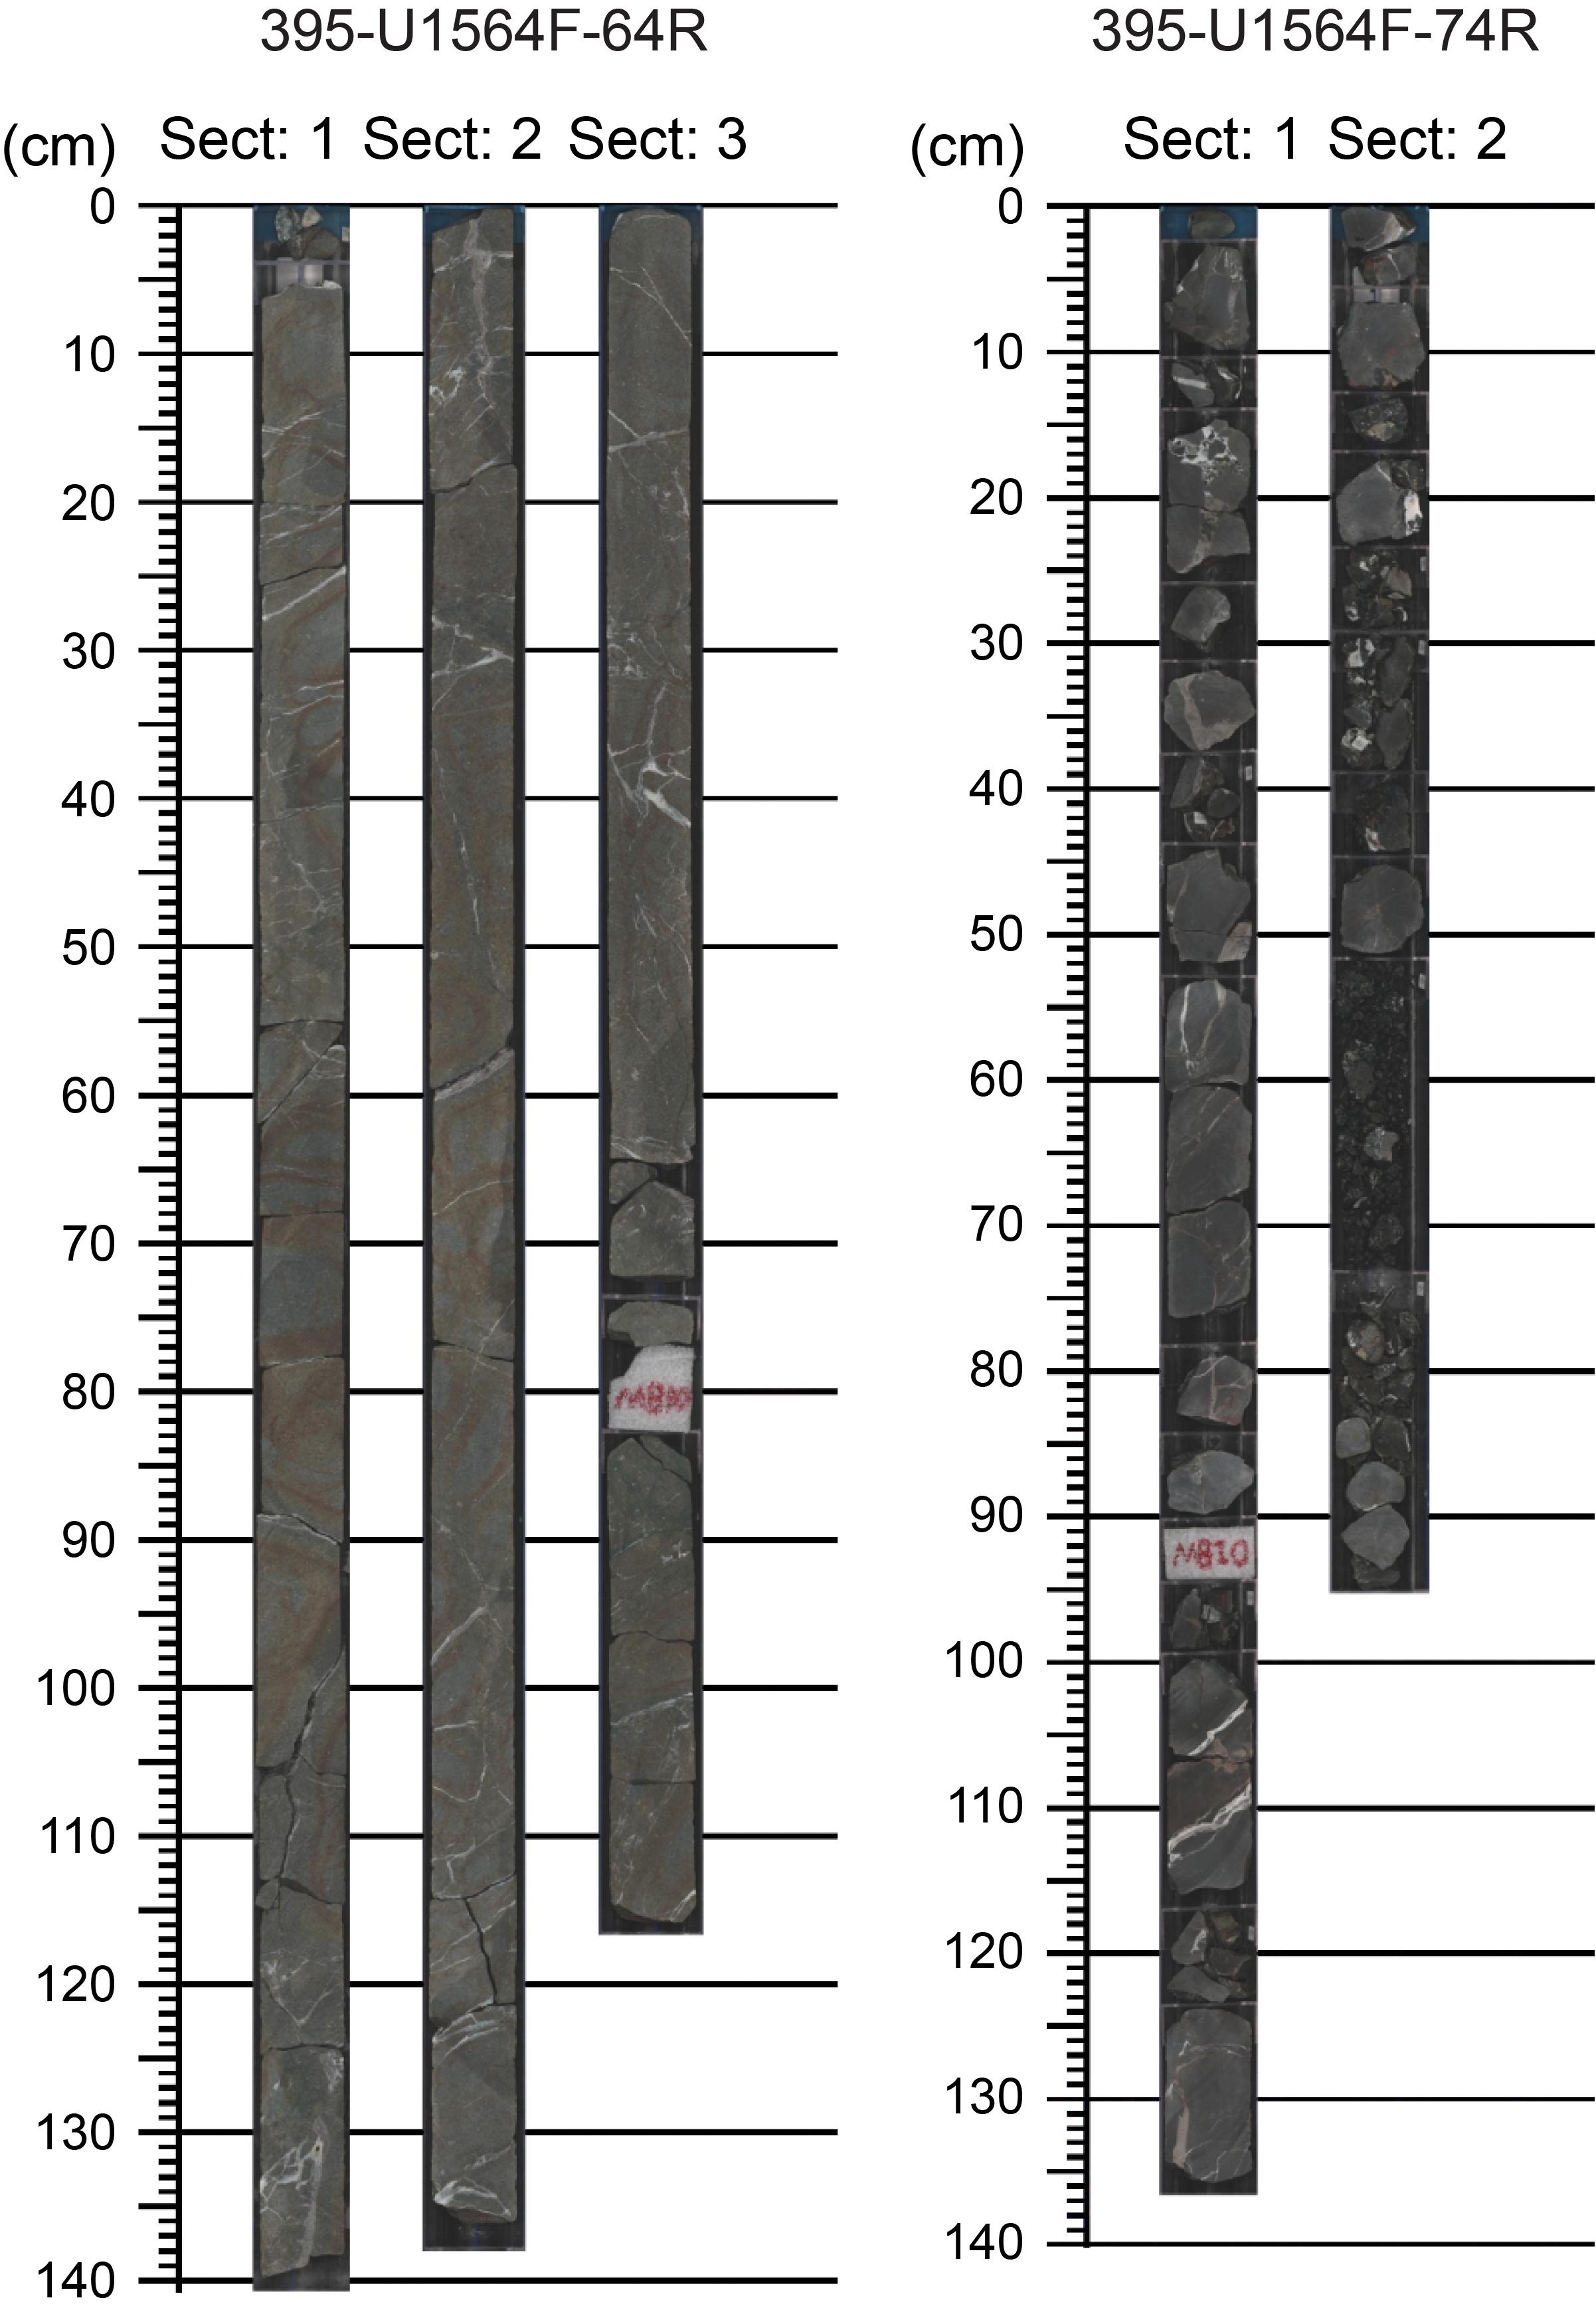
Figure F14. Typical lithologies.
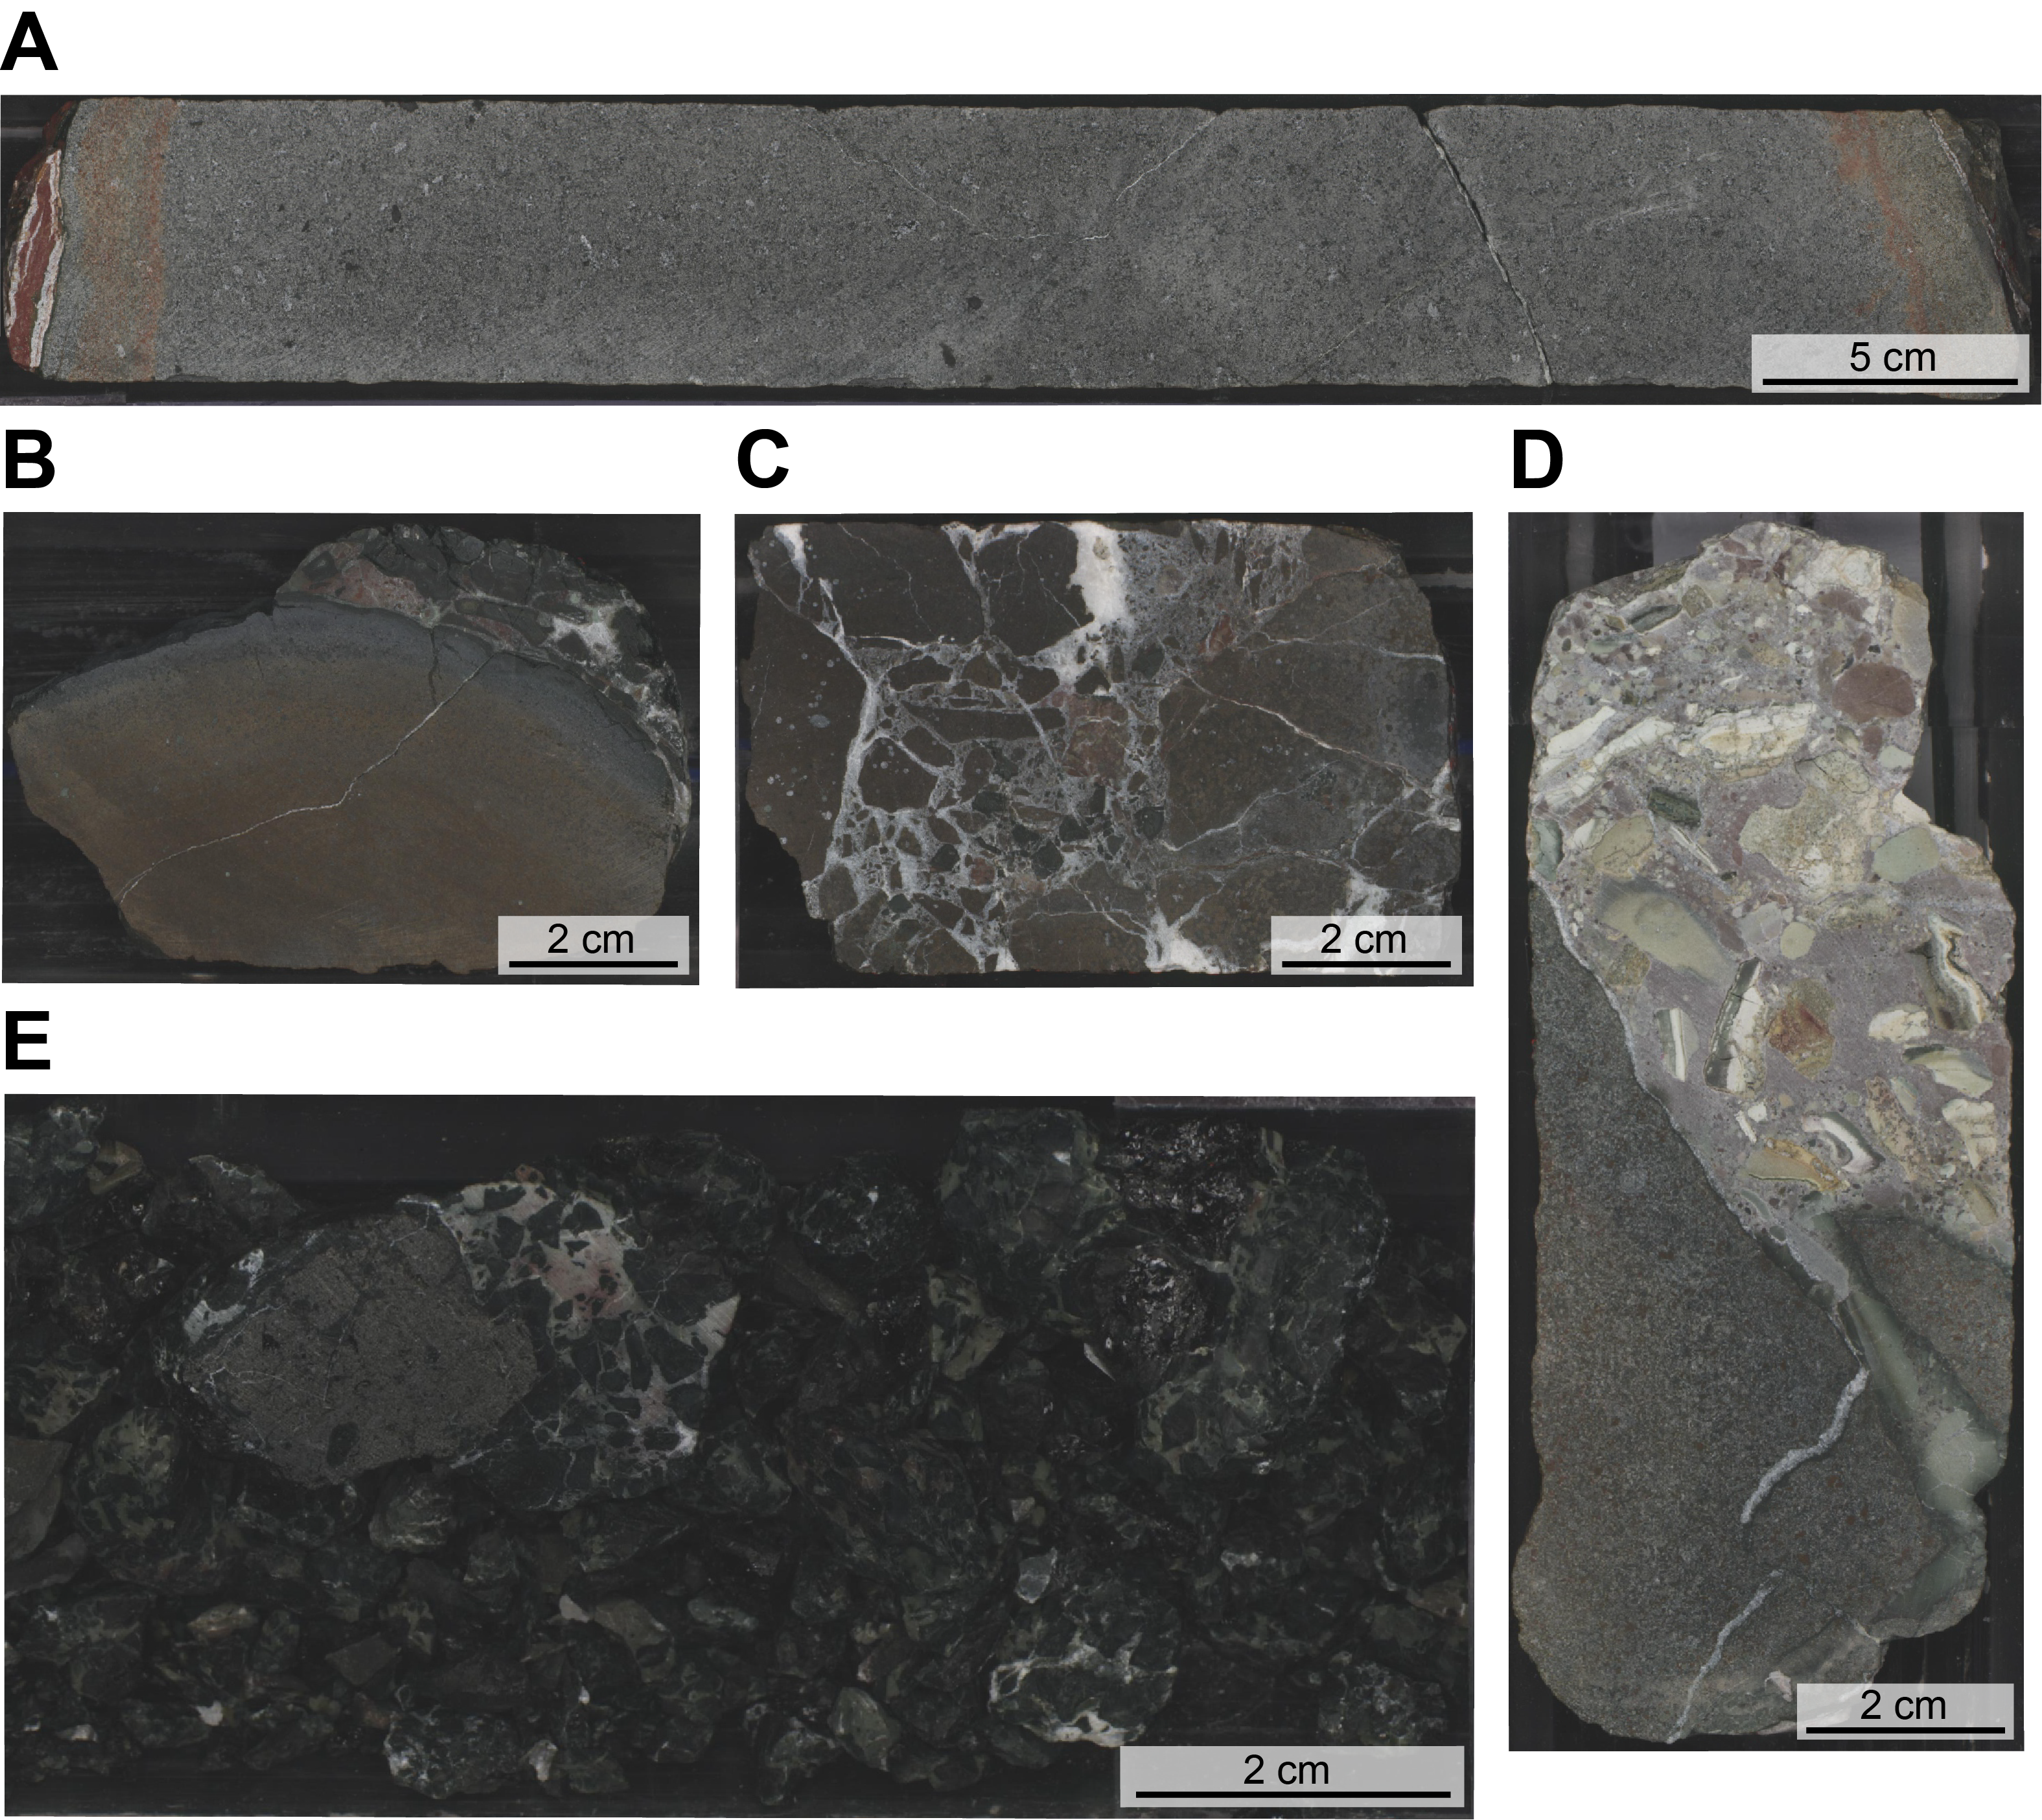
Figure F15. Basalt.
The pillow lavas consist of aphyric to sparsely plagioclase phyric basalt. They are highly fragmented with chilled margins, concentric vesicle bands, and thin glass rinds. In general, glass is quite altered, but in interval 395-U1564F-74R-2, 52–73 cm, there are abundant fragments of fresher glass. Lava breccias are relatively rare within the sheet flow intervals, where they consist of jigsaw basalt fragments set within heavily recrystallized sediment in what appear to be large brecciated veins. Within the pillow lava intervals, these breccias are more common, and the presence of altered rinds and possible fluidal textures suggests some may originally have been peperites (Figure F15).
Vesicles are sparse (<5%) within the sheet flows and generally occur at flow tops. These vesicles are small (~1 mm) and filled with celadonite and Fe oxide/oxyhydroxides, with moderate amounts of carbonate, amorphous silica, and clay and minor amounts of zeolite and chlorite. Veins of clay, chlorite, celadonite, and Fe oxide are common, with highly variable degrees of alteration (see Alteration petrology and structural geology).
We use lithologic and mineralogical changes to divide the basement succession into igneous lithologic units (Figure F13; Table T5). Because of incomplete recovery and the general lack of well-defined contacts, our unit boundary locations are approximate and preliminary. We note that cores with the lowest recovery are associated with pillow fragments and/or intercalated sediment. This pattern is consistent with observations from other Expedition 395 sites, which show general correlations between recovery rate, rock density, and lava morphology.
4.2.1. Hole U1564F
Hole U1564F is divided into four igneous lithologic units (Figure F13). Recovery within the top ~40 m of the cored section is dominated by sparsely to moderately plagioclase phyric sheet flows with minor amounts of clinopyroxene (Igneous Lithologic Unit 1). Occasional fragments of reddish brown (2.5YR 4/6) nannofossil chalk and brecciated sediment veins occur in this unit. Beneath this lava sequence, a thin unit of vesicular, aphyric basalt with mostly pillow lava morphology (Unit 2) overlies a 3.8 m thick sediment package. Unit 3 is a series of strongly altered sheet flows that consist of aphyric to sparsely plagioclase phyric basalt. It overlies another ~32 cm thick sediment layer that separates Units 3 and 4. In Unit 4, the dominant flow morphology transitions to pillow lavas, which are still aphyric to sparsely plagioclase phyric but less altered on average, with abundant chilled margins and occasional glass rinds and fragments.
4.3. Thin sections
A total of 28 thin sections were made for Hole U1564F with an average spacing of 10 m (see Core descriptions). Four typical examples are shown in Figure F16. Most thin sections are from moderately altered massive sheet flow intervals. Many of these sections have large (up to 4 mm) plagioclase phenocrysts that show zone textures, twinning, and small (<0.1 mm) melt inclusions. These phenocrysts are subhedral and tabular with slight clay alteration. The groundmass is generally fine- to medium-grained and intergranular, consisting of plagioclase, clinopyroxene, and opaque minerals. A minority of sections from sheet flows are even coarser grained and lack obvious phenocrysts. Alteration is variable and sometimes significant with extensive chlorite and other clay-rich minerals. Sparse vesicles are generally filled with calcite or celadonite. Four thin sections come from altered pillow lava fragments. These pillow sections are generally aphyric and vesicular with a fine-grained altered groundmass. This groundmass consists of acicular plagioclase with snowflake texture, clinopyroxene mesostasis, and opaque minerals. There is no evidence of fresh olivine in any of the thin sections from this site.
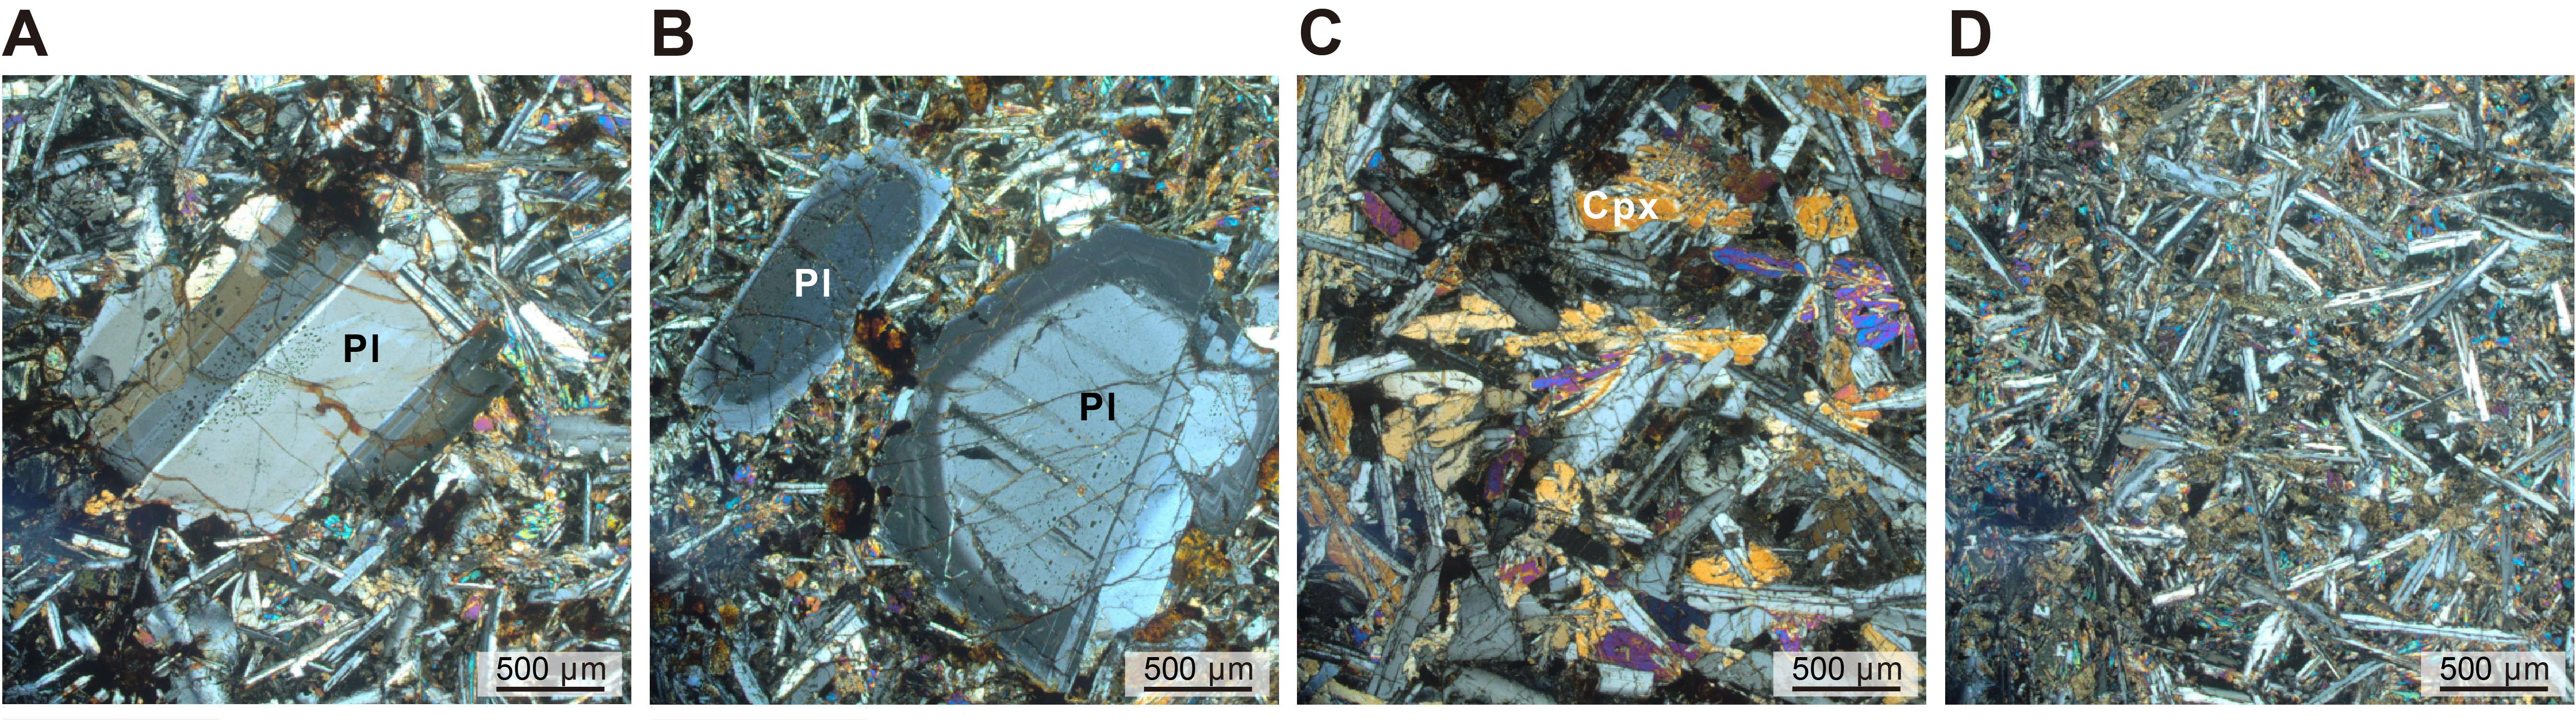
Figure F16. Basalt thin sections.
4.4. Igneous geochemistry
Shipboard measurements on basalts from Hole U1564F included portable X-ray fluorescence (pXRF) and inductively coupled plasma–atomic emission spectroscopy (ICP-AES) analyses (see Geochemistry and microbiology in the Expedition 395 methods chapter [Parnell-Turner et al., 2025a]).
The pXRF analyses were primarily used to assess geochemical variability and identify downhole trends or deviations, if any (Figure F17). Major elements such as Mg and Al show considerable scatter, as expected of this method, but some trace elements (e.g., Zr and Y) exhibit more coherent trends and provide a useful preliminary characterization of the hole during shipboard operations. Although we caution against overinterpreting raw pXRF data, we note that Zr and Y exhibit several small offsets that correlate with the depths of identified unit boundaries and seem to be reflected in the ICP-AES data as well.
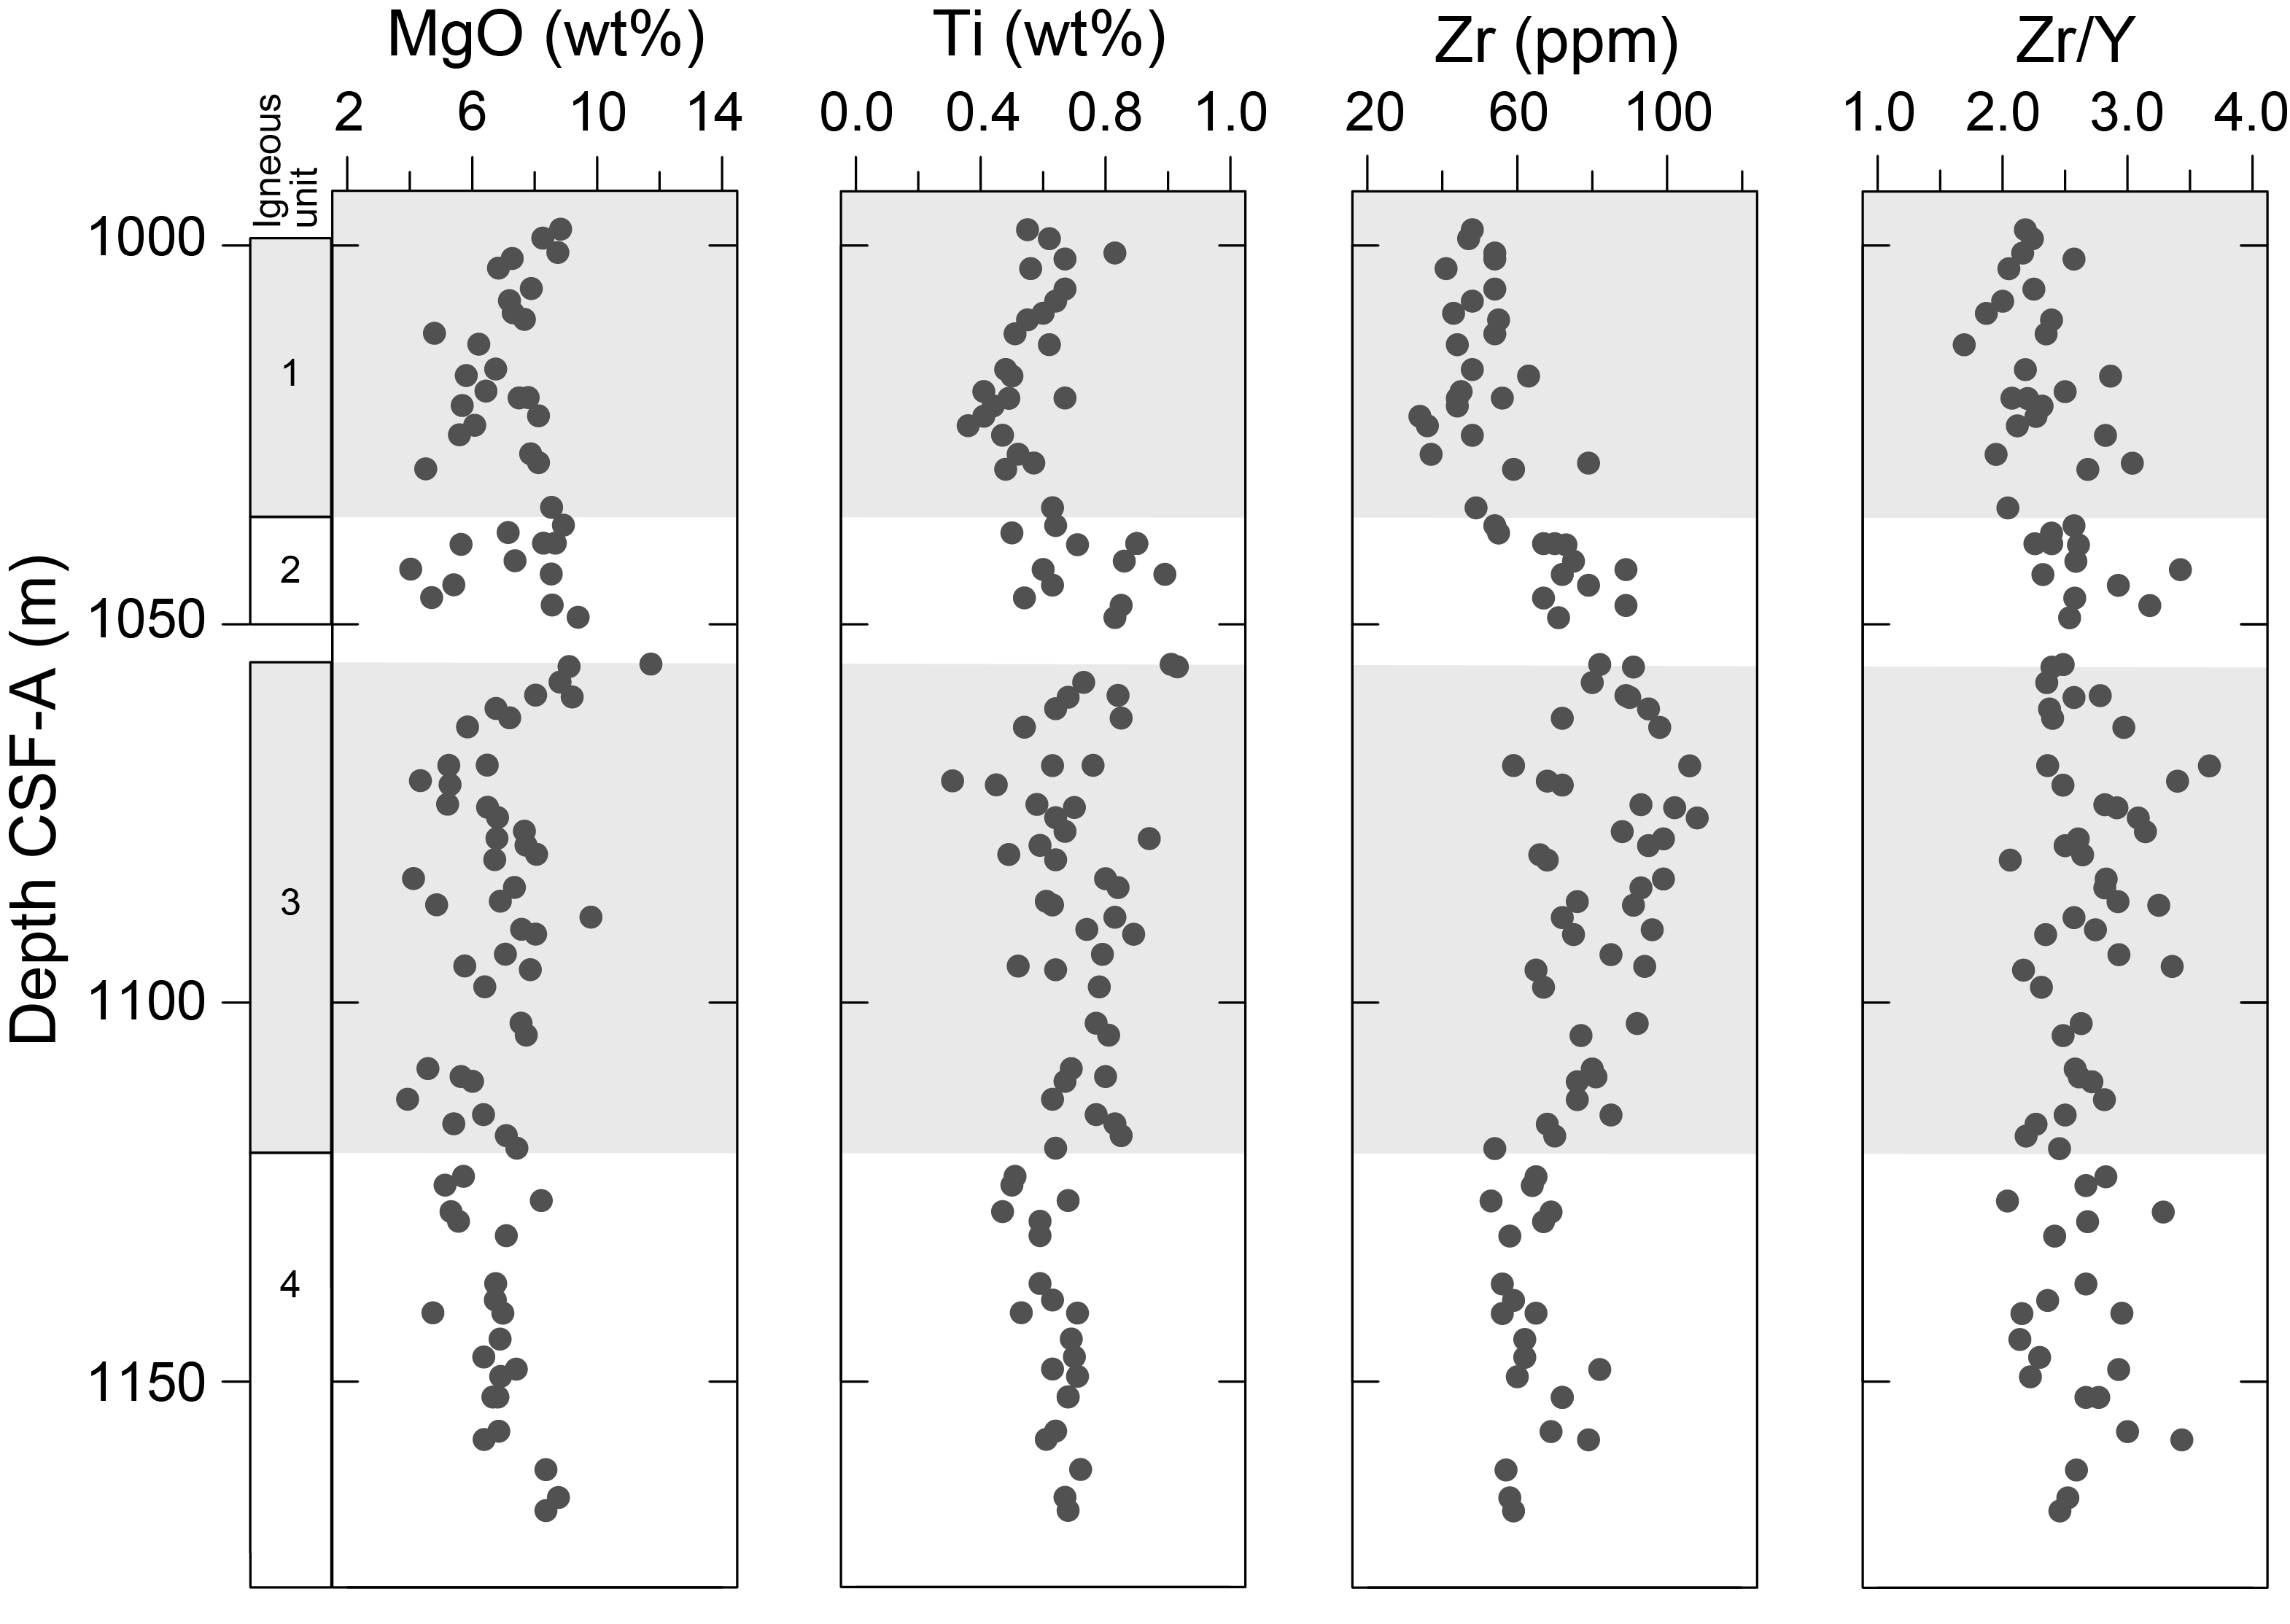
Figure F17. pXRF compositional data.
ICP-AES analyses were performed on 16 samples that are co-located with thin section samples throughout the hole. Measurements of selected major and trace elements are shown in Figure F18. MgO in these samples varies from 5.76 to 7.93 wt% (average = 7.14 wt%). Average Zr/Y is ~2.3, which is intermediate between the most enriched Hole U1554F (mean = 3.0) and the other VST and VSR sites (mean = ~1.9). These preliminary Zr/Y ratios are higher than most Reykjanes Ridge basalts and are most similar to some of the more enriched compositions found near Iceland or at isolated seamounts sampled along the ridge axis (Murton et al., 2002; Jones et al., 2014).

Figure F18. Bulk rock ICP-AES analyses.
4.5. Correlations and interpretation
Core description results are combined with thin section observations, physical properties, downhole logging results, and shipboard geochemical analyses to develop a preliminary interpretation of Site U1564. As found at other sites, there is a positive correlation between MS and lithology (see Physical properties), with sheet flows exhibiting higher MS on average than pillow lavas and breccias (Figure F13). This correlation is likely due to a greater abundance of Fe-oxides (e.g., magnetite and titanomagnetite) in the sheet flows. Similarly, sheet flows exhibit higher L* and slightly lower a* color reflectance (Figure F13), as well as higher alteration intensities on average (see Alteration petrology and structural geology).
Hole U1564F had a high recovery rate of ~66% in the basement, likely due in part to the thick packages of continuous sheet flows and pervasive alteration that dominate this site. As found at Expedition 395C sites, recovery is lower for cores containing pillow lavas and lava breccias.
5. Alteration petrology and structural geology
During Expedition 395, ~119.46 m of basement core was recovered from Hole U1564F. Here, we document the style and composition of basalt alteration, the secondary mineral fill of vesicles, and the occurrence and mineral fill of fractures in the basement cores.
5.1. Basalt alteration
Basement from Site 395-U1564 contains basaltic lavas, numerous intervals of intermixed brecciated lavas and sediments, and sediment intervals, which comprise ~3.8% of the recovered basement core at this site (see Igneous petrology). Here, alteration is reported for basalt core intervals.
We estimate ~44% of the basalt core obtained from Hole U1564F to be completely altered, with 31% highly altered, 19% moderately altered, and ~6% slightly altered (Figure F19). The alteration style displayed by the basalt in this hole is mainly pervasive (background), although localized alteration in the form of altered halos around fractures is also present, contributing significantly to the alteration style of basalt core at ~997–1040 m CSF-A (Figure F20). We note that alteration style was recorded as halo only when the fracture generating an alteration halo was observed on the core. Alteration intensity seems to decrease below 1137 m CSF-A, where more pillow lavas start to appear.
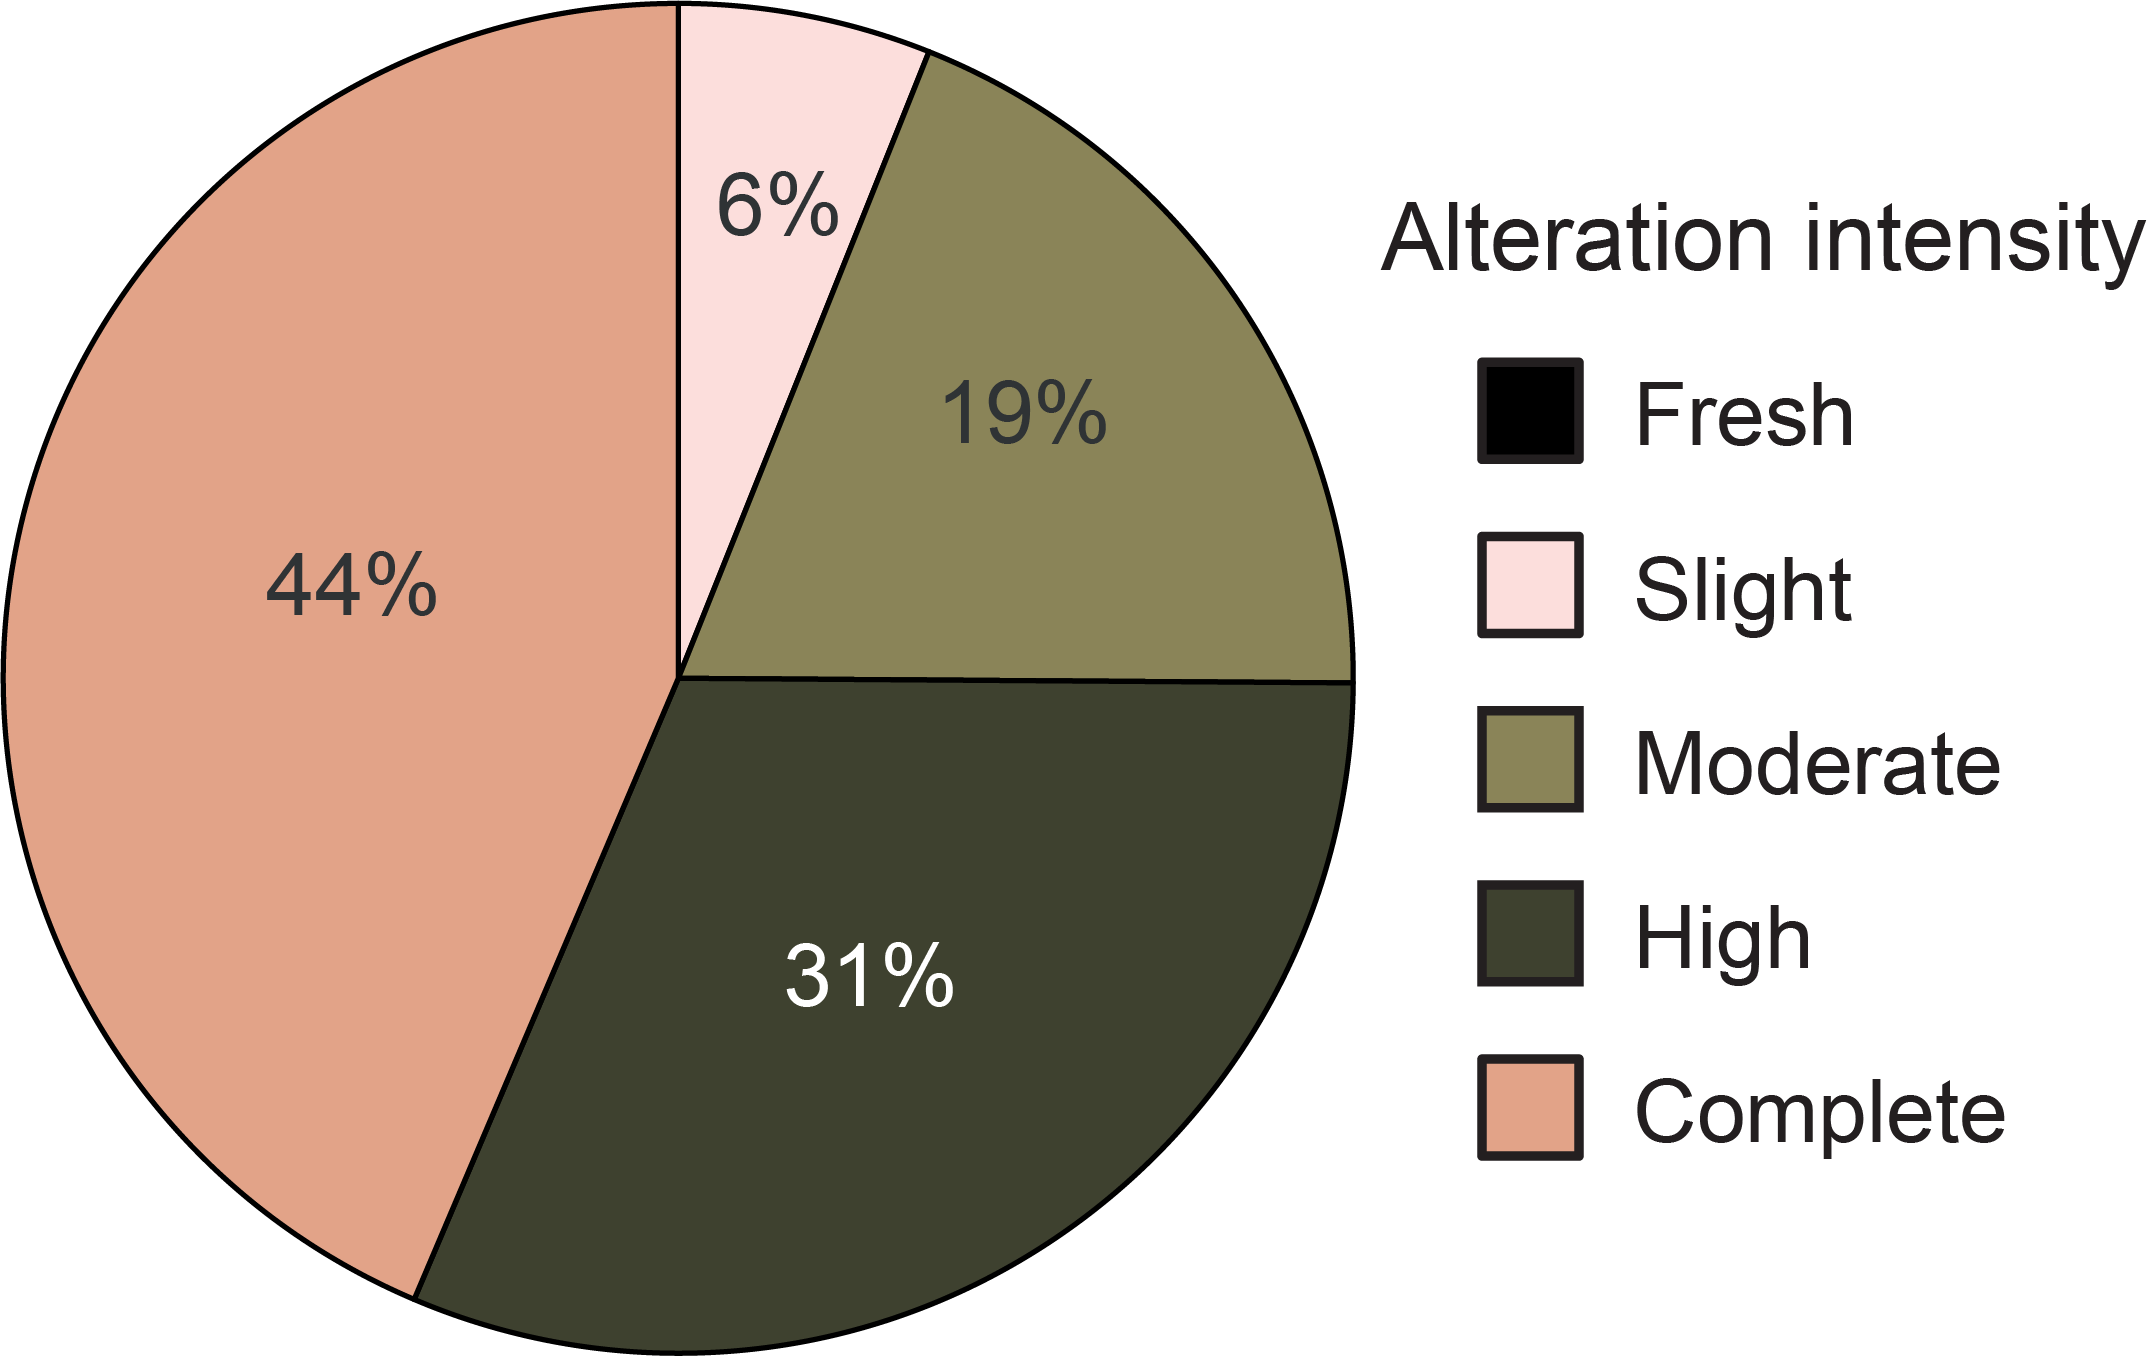
Figure F19. Basalt alteration.
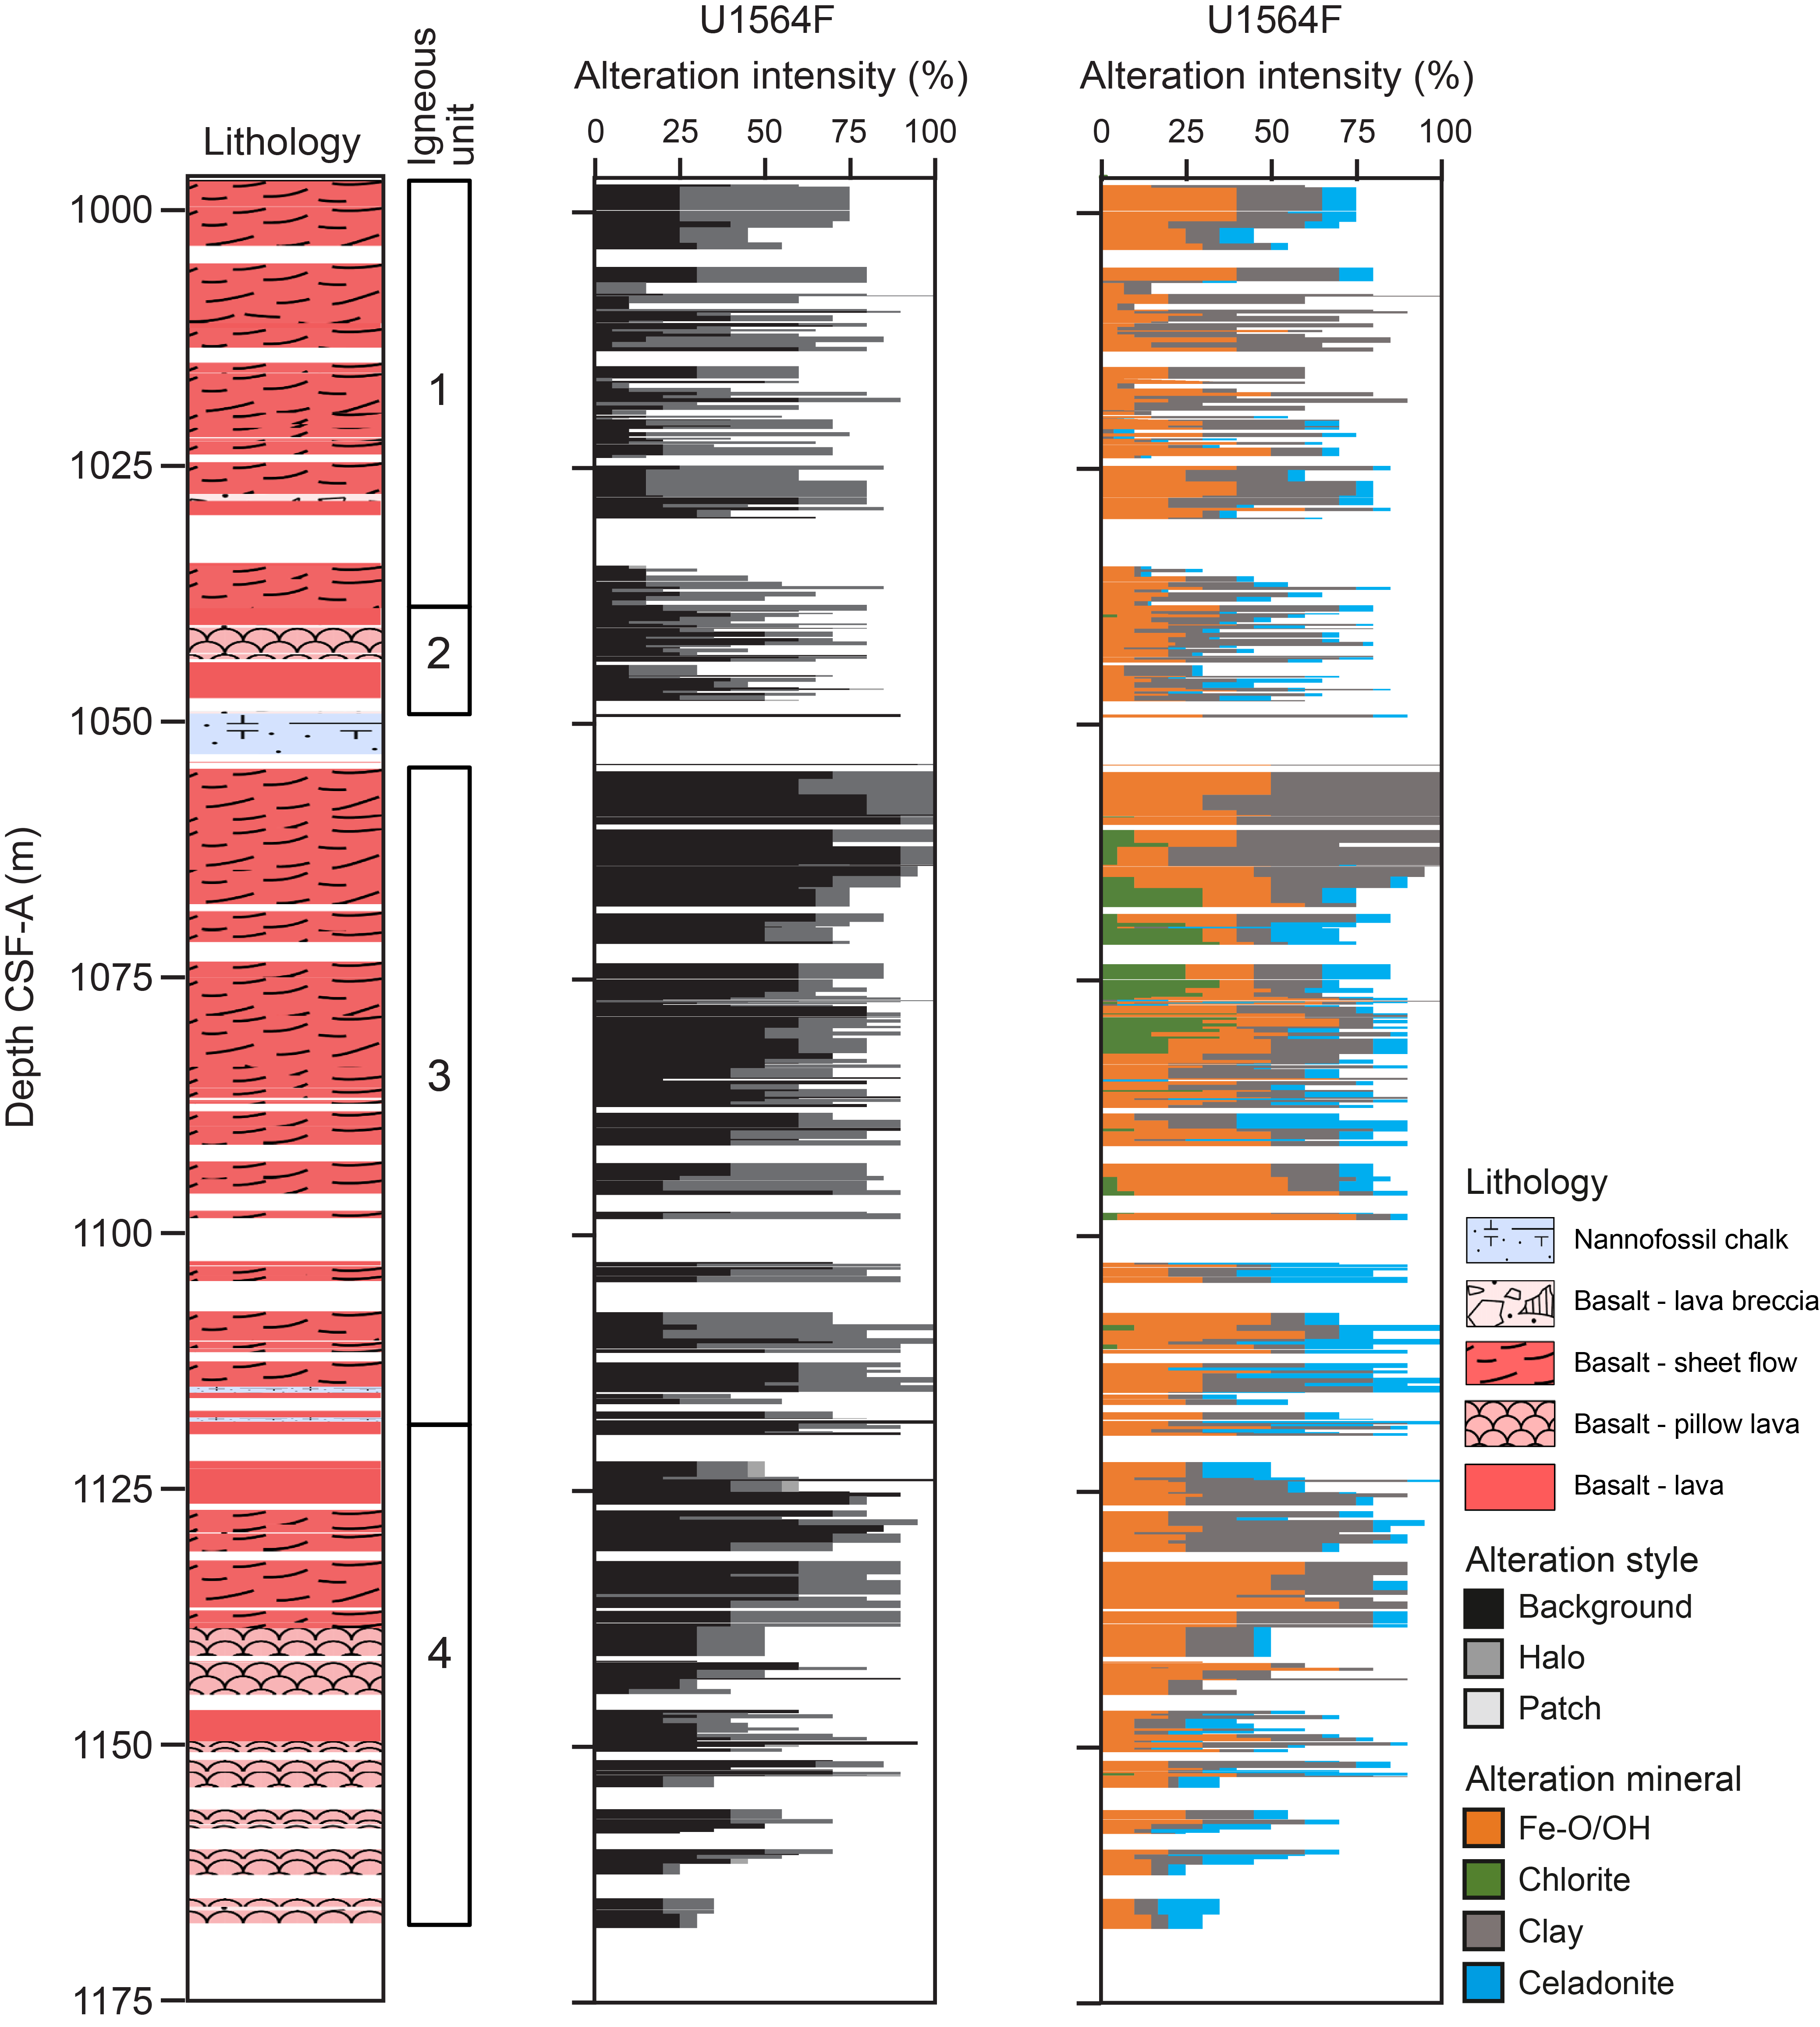
Figure F20. Lithology and alteration.
The most commonly occurring basalt alteration mineral assemblage at Site U1564 consists of Fe-oxide/oxyhydroxides + clay + celadonite (Figure F20). Chlorite starts to appear in the alteration assemblage at ~1066–1079 m CSF-A. Basaltic glass, found sporadically below 1137 m CSF-A, is largely devitrified and displays a dark green to navy blue celadonite coating. Lava breccias contain glass and basalt fragments whose rims are strongly to completely altered to palagonitic material (rich in Fe-oxide/oxyhydroxides), sometimes decreasing in intensity toward their center. In thin section, the basaltic groundmass appears variably altered mainly to clay minerals (likely smectites such as saponite), celadonite, and calcite (Figure F21A). Calcite is commonly found replacing plagioclase crystals in the basalts, and saponite (sometimes mixed with other phyllosilicates like chlorite and/or talc) can be seen replacing pyroxene crystals (Figure F21B, F21C).
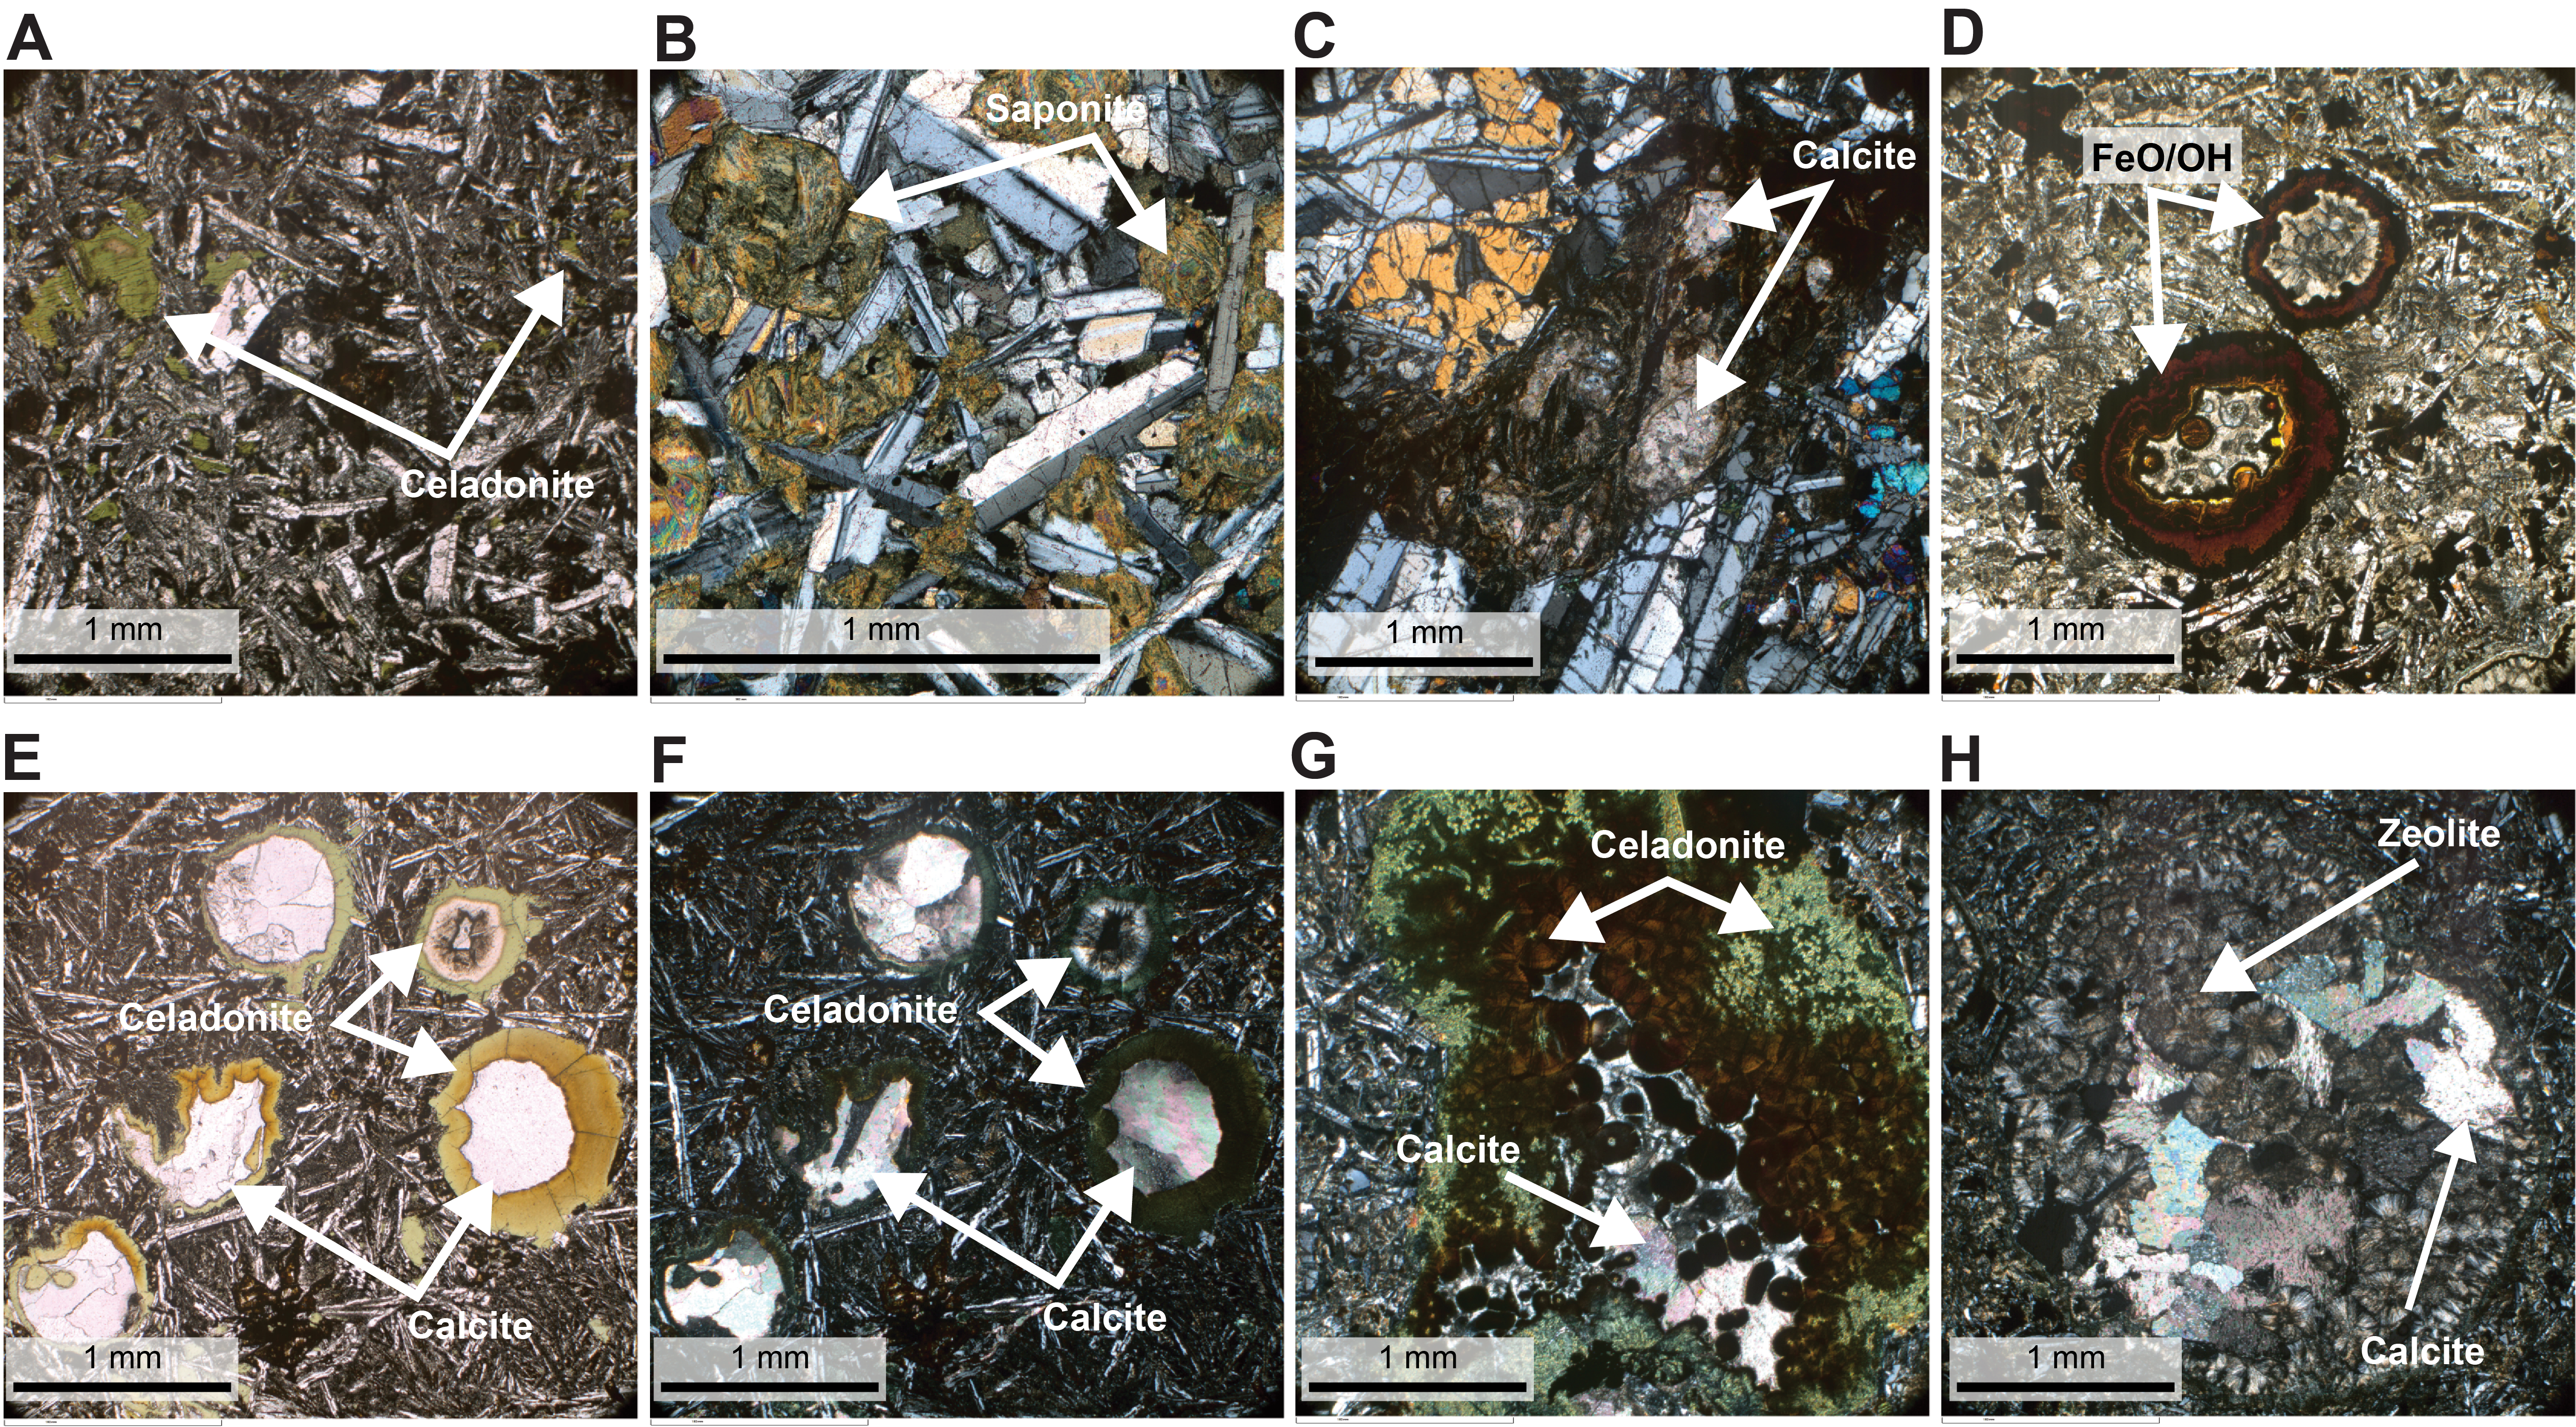
Figure F21. Alteration.
The fraction of vesicles filled with alteration minerals is mostly 100% in basalt cores from Site U1564. Vesicle-filling minerals are mostly Fe-oxide/oxyhydroxides, celadonite, and calcite, with moderate saponite and minor zeolite (phillipsite) (Figure F21D–F21H). Thin section Sample 395-U1564F-73R-1, 21–23 cm, displays calcite-filled vesicles with celadonite rims, as well as other vesicles containing calcite and a zeolite phase (possibly phillipsite) (Figure F21E–F21H). The mineral fill of most observed vesicles exhibit color zonation, representing multiple mineral fill components. Some vesicles have <1 mm wide alteration halos forming in the basalt around them.
5.2. Structural geology
Fracture analysis at Site U1564 revealed 2729 fractures in basement cores from Hole U1564F. An average occurrence rate of ~23 fractures per meter of recovered core is reported (~20 fractures per meter of curated core), and fracture density gradually increases with depth in this hole (Figure F22). Many of the 2729 fractures recorded at Site U1564 have widths <1 mm (34.7%) (Figure F23). Wider fractures are also common, with 2.6% of fractures wider than 10 mm, the widest being a 34 mm wide carbonate- and quartz-filled fracture (Figure F24). Such wide fractures are more commonly observed above ~1067 m CSF-A than below (Figure F25). Crystalline fractures commonly host crystals 0.5–2 mm in size, but some contain large crystal sizes, with a maximum size of 15 mm reported for a wide carbonate and quartz filled fracture (~1044 m CSF-A) (Figure F24). Most fractures are classified as veins (88.6%) with anastomosing (51.4%) or planar (31.4%) morphologies, and most occur in a crosscutting (48%) or network (26%) connectedness (Figure F26A–F26C). There is no preferred fracture attitude (with respect to the borehole) observed in basement cores from Hole U1564F (Figure F26D).
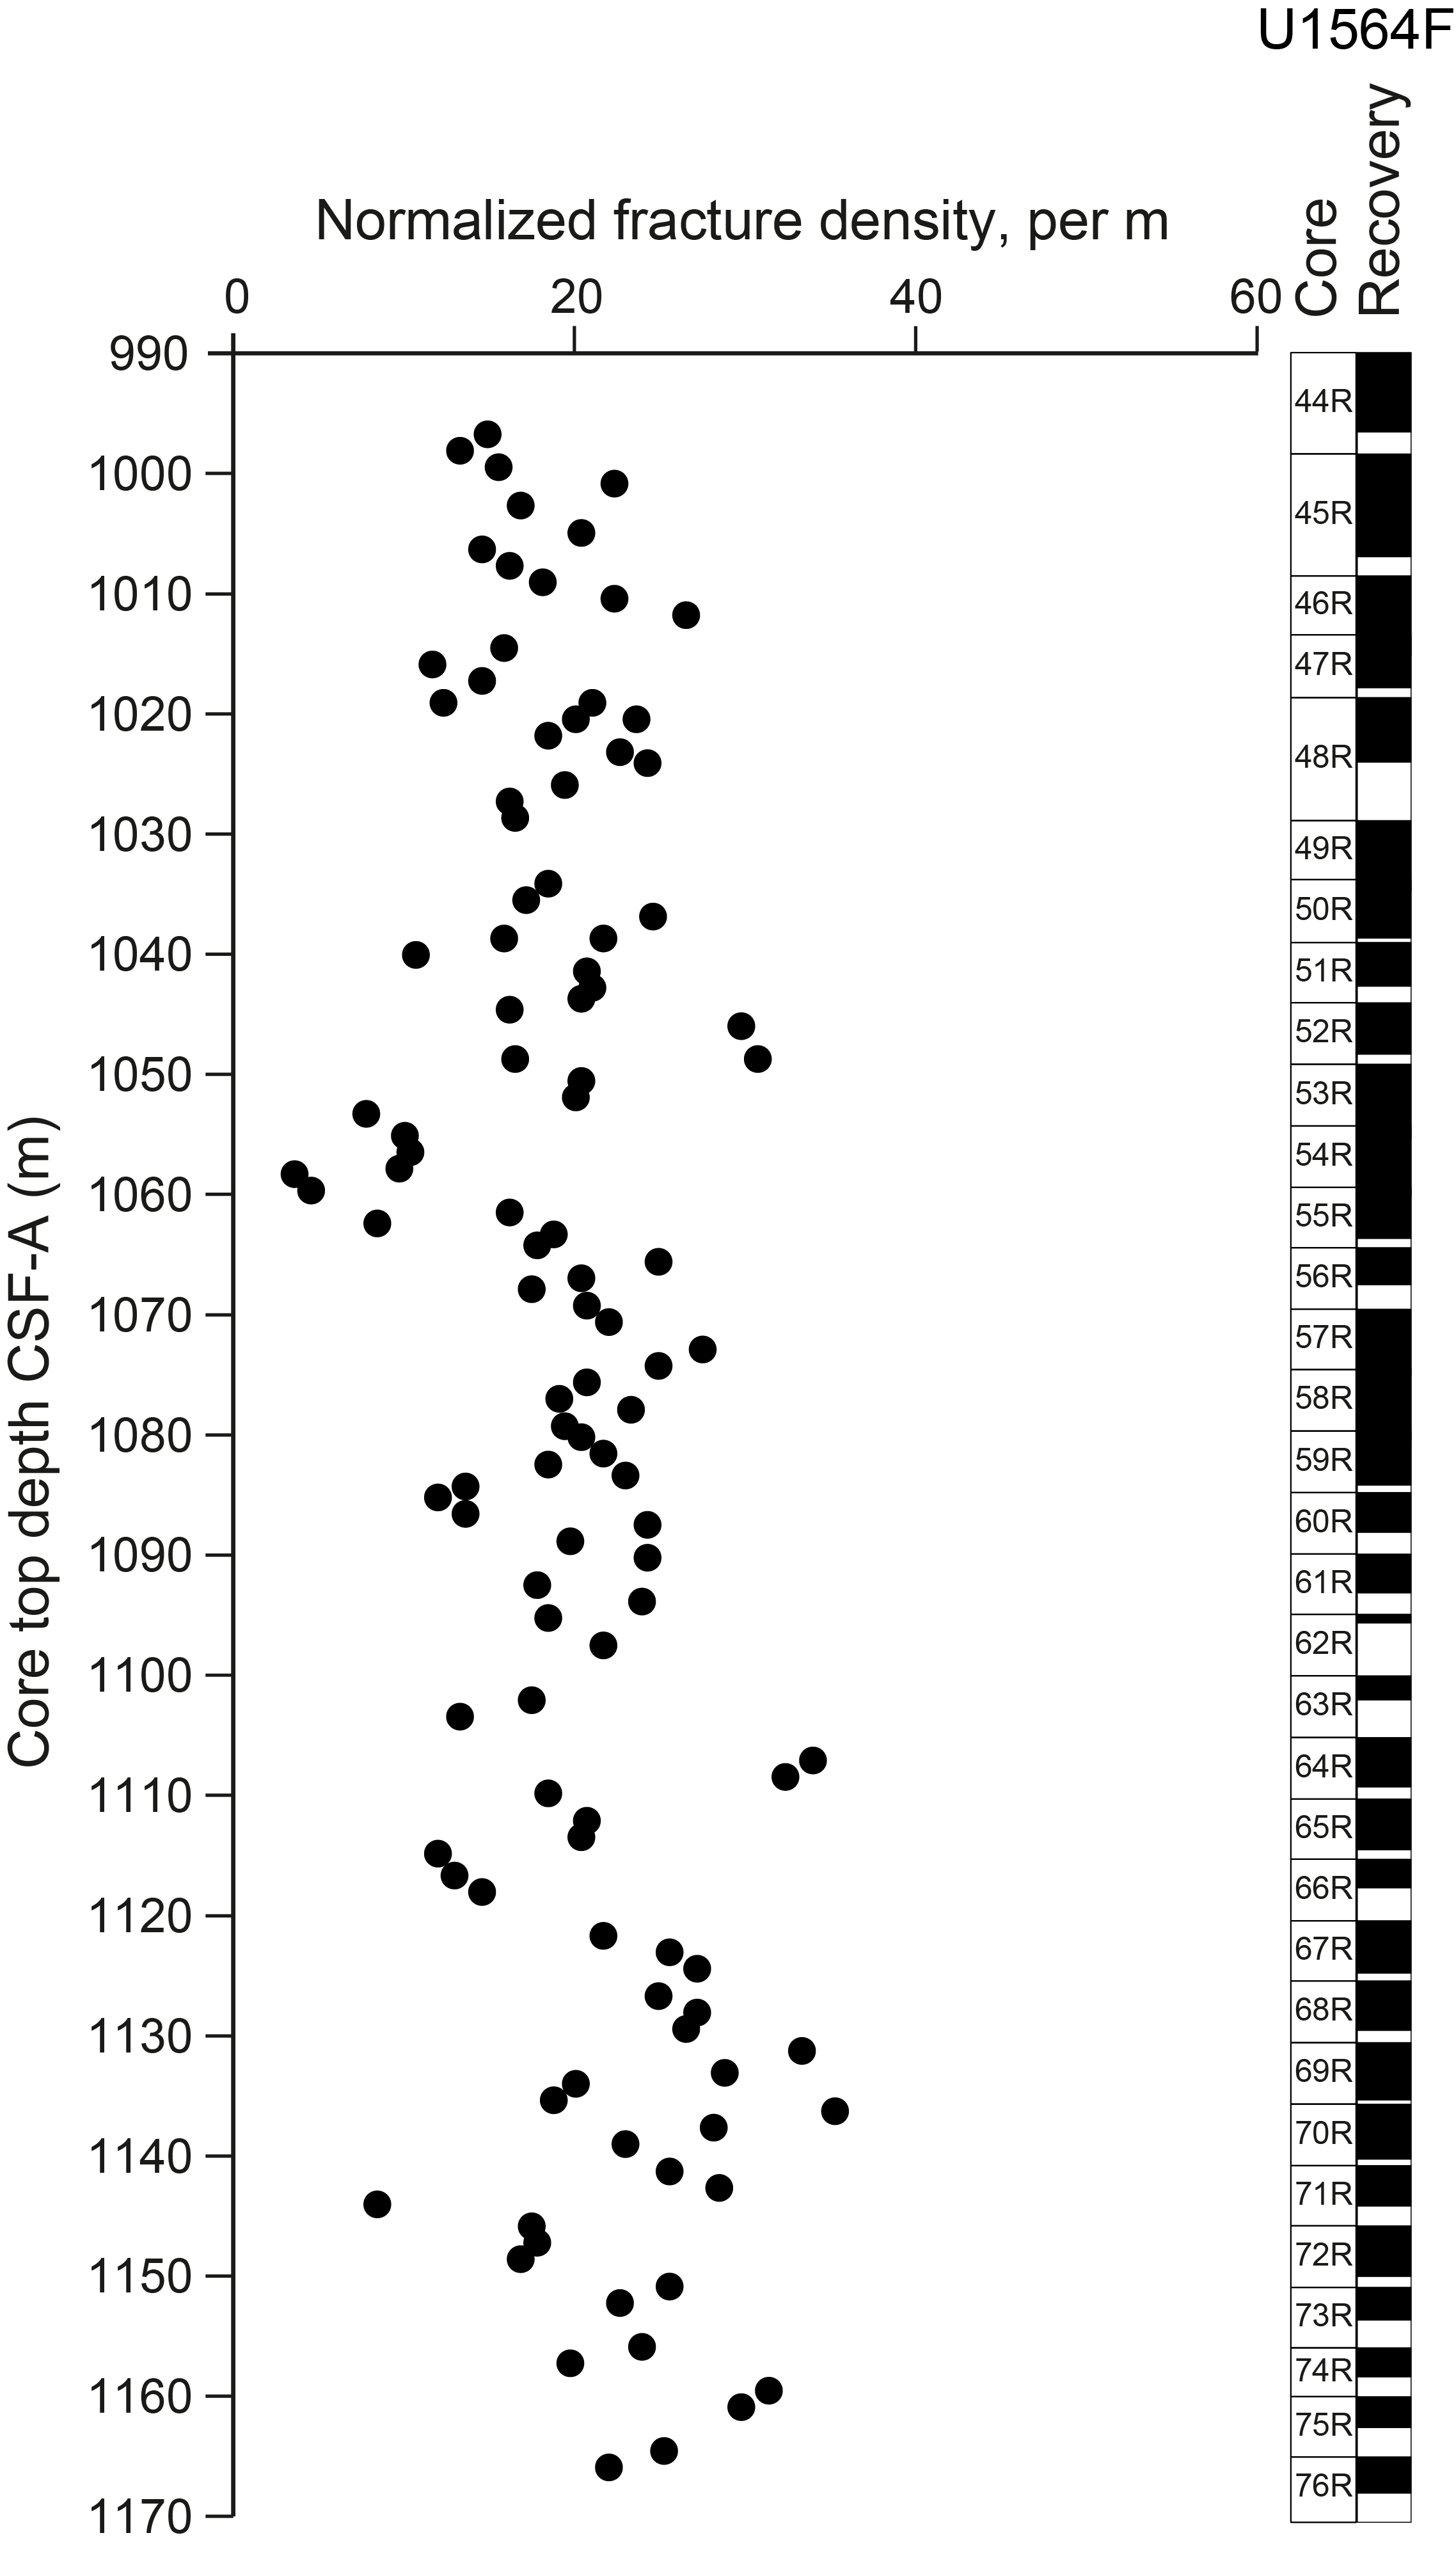
Figure F22. Fracture density.
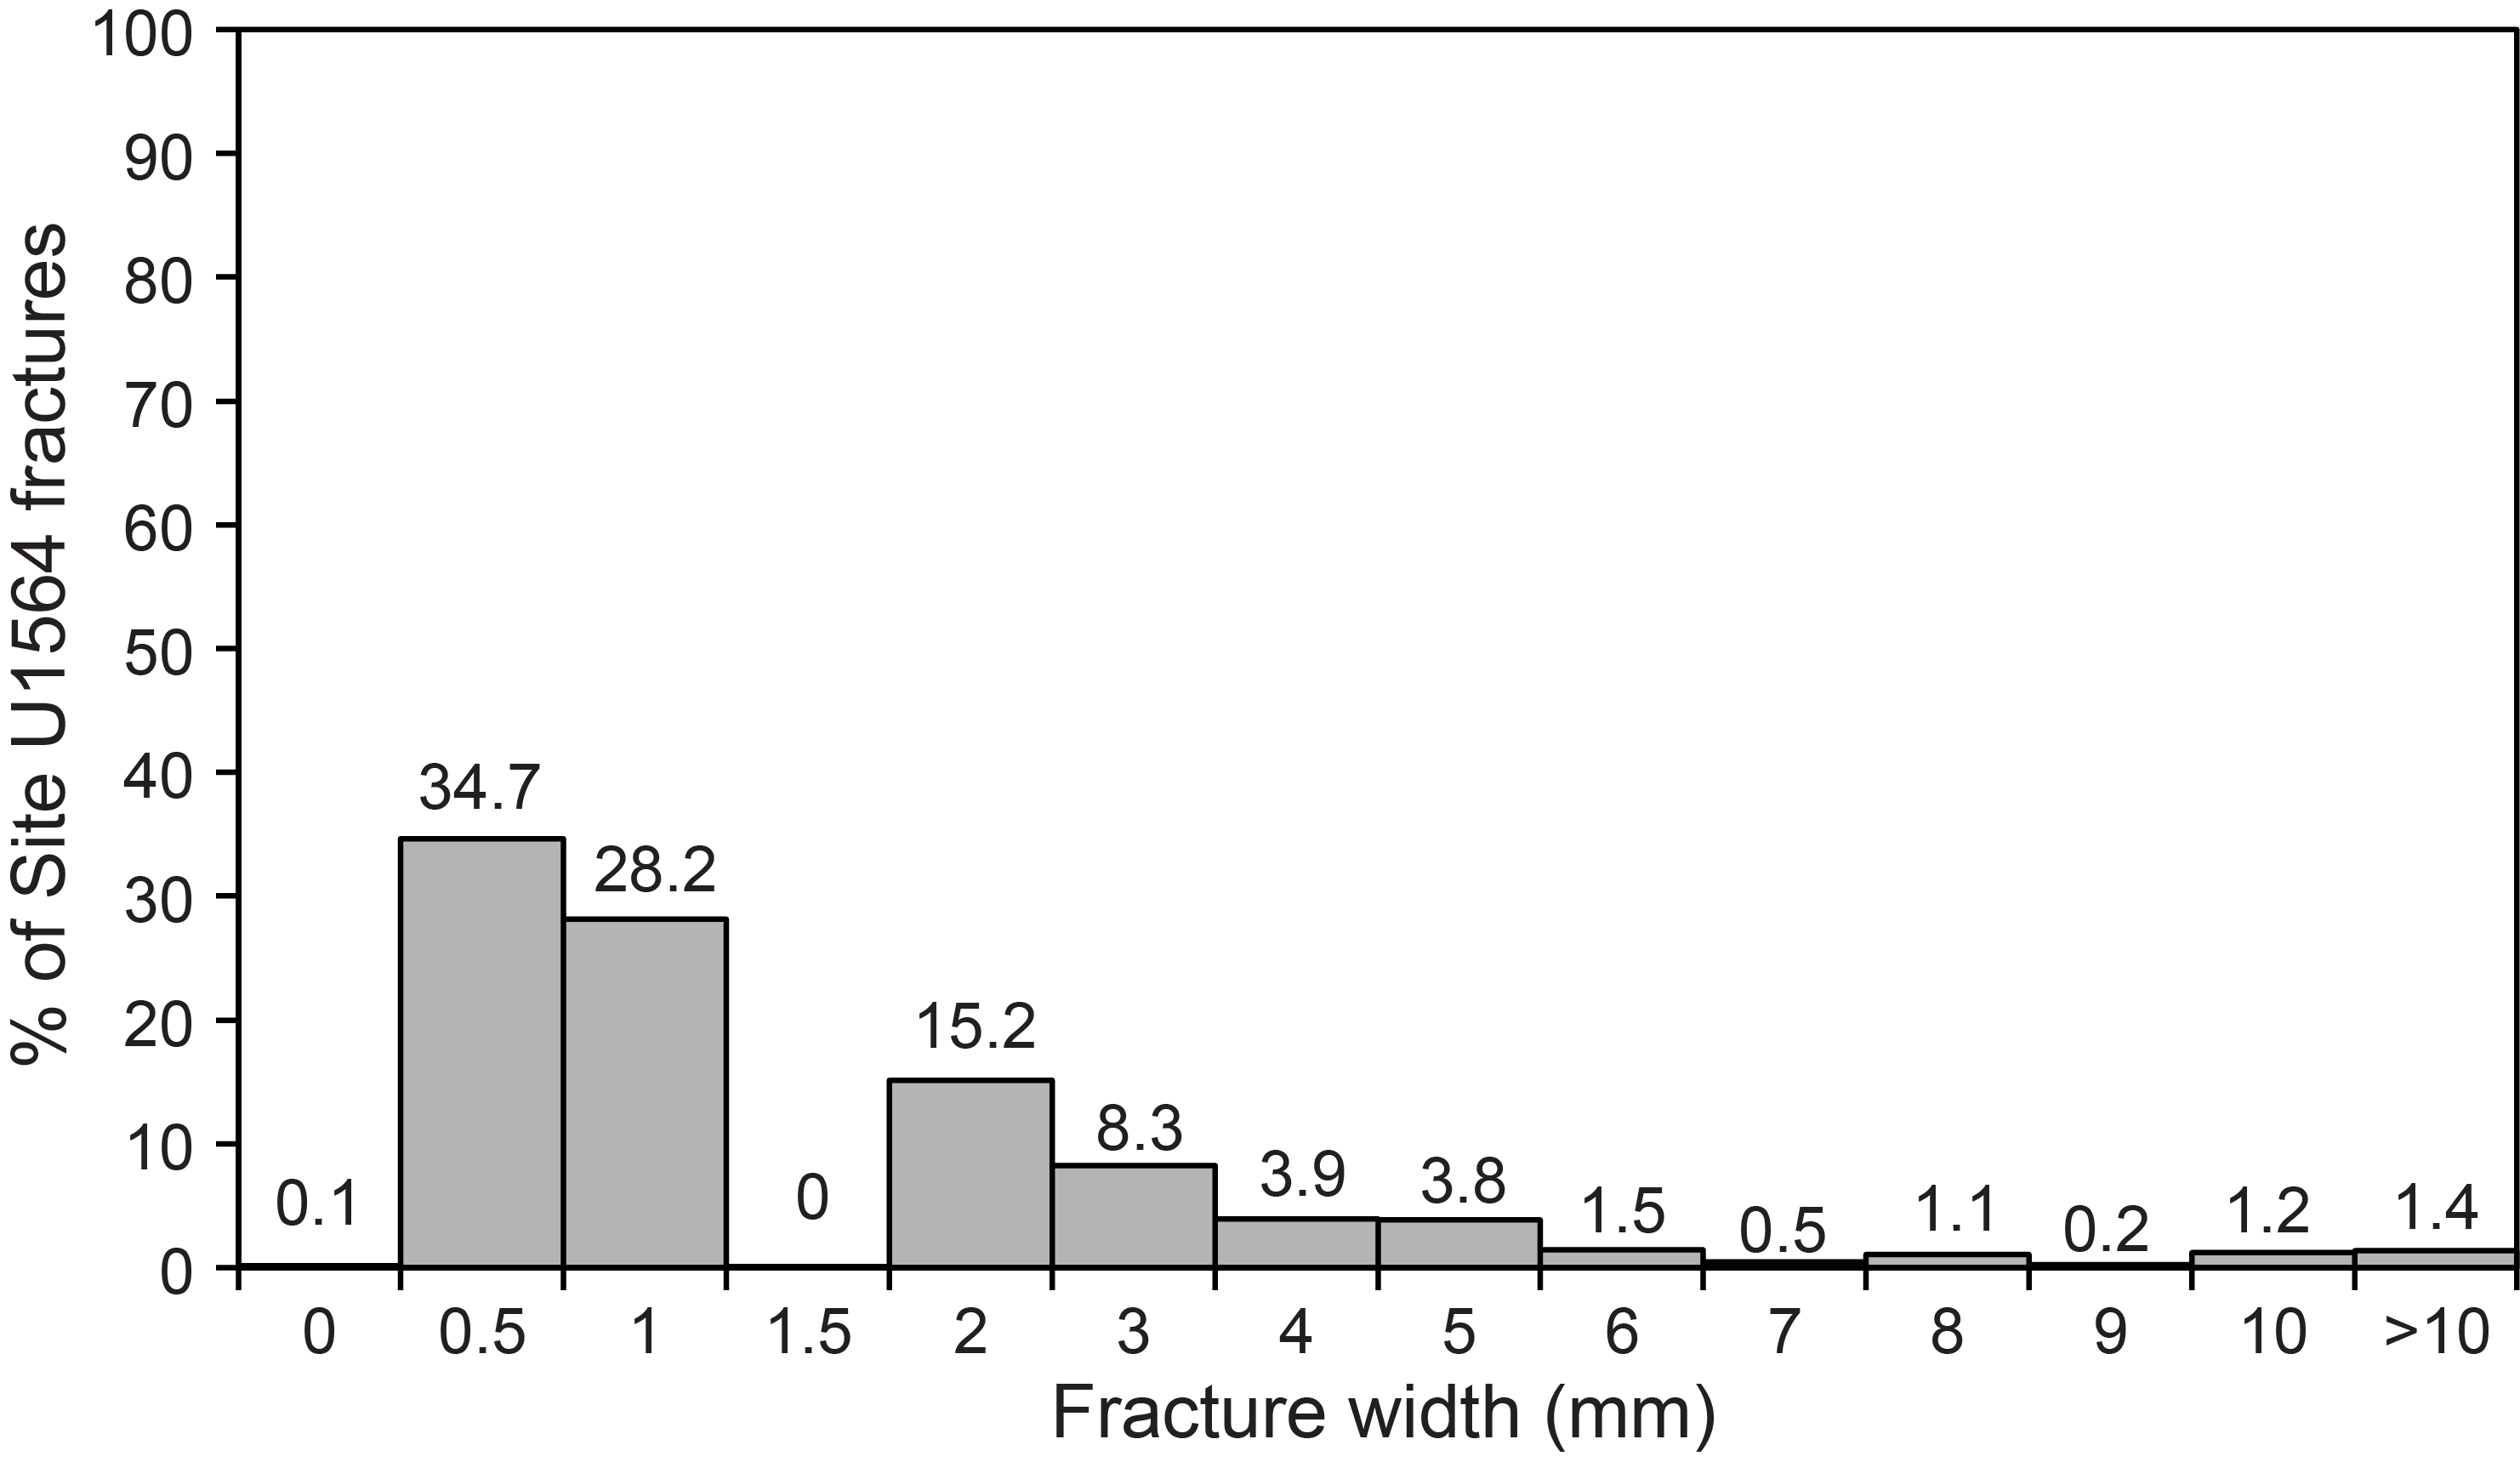
Figure F23. Fracture thickness.
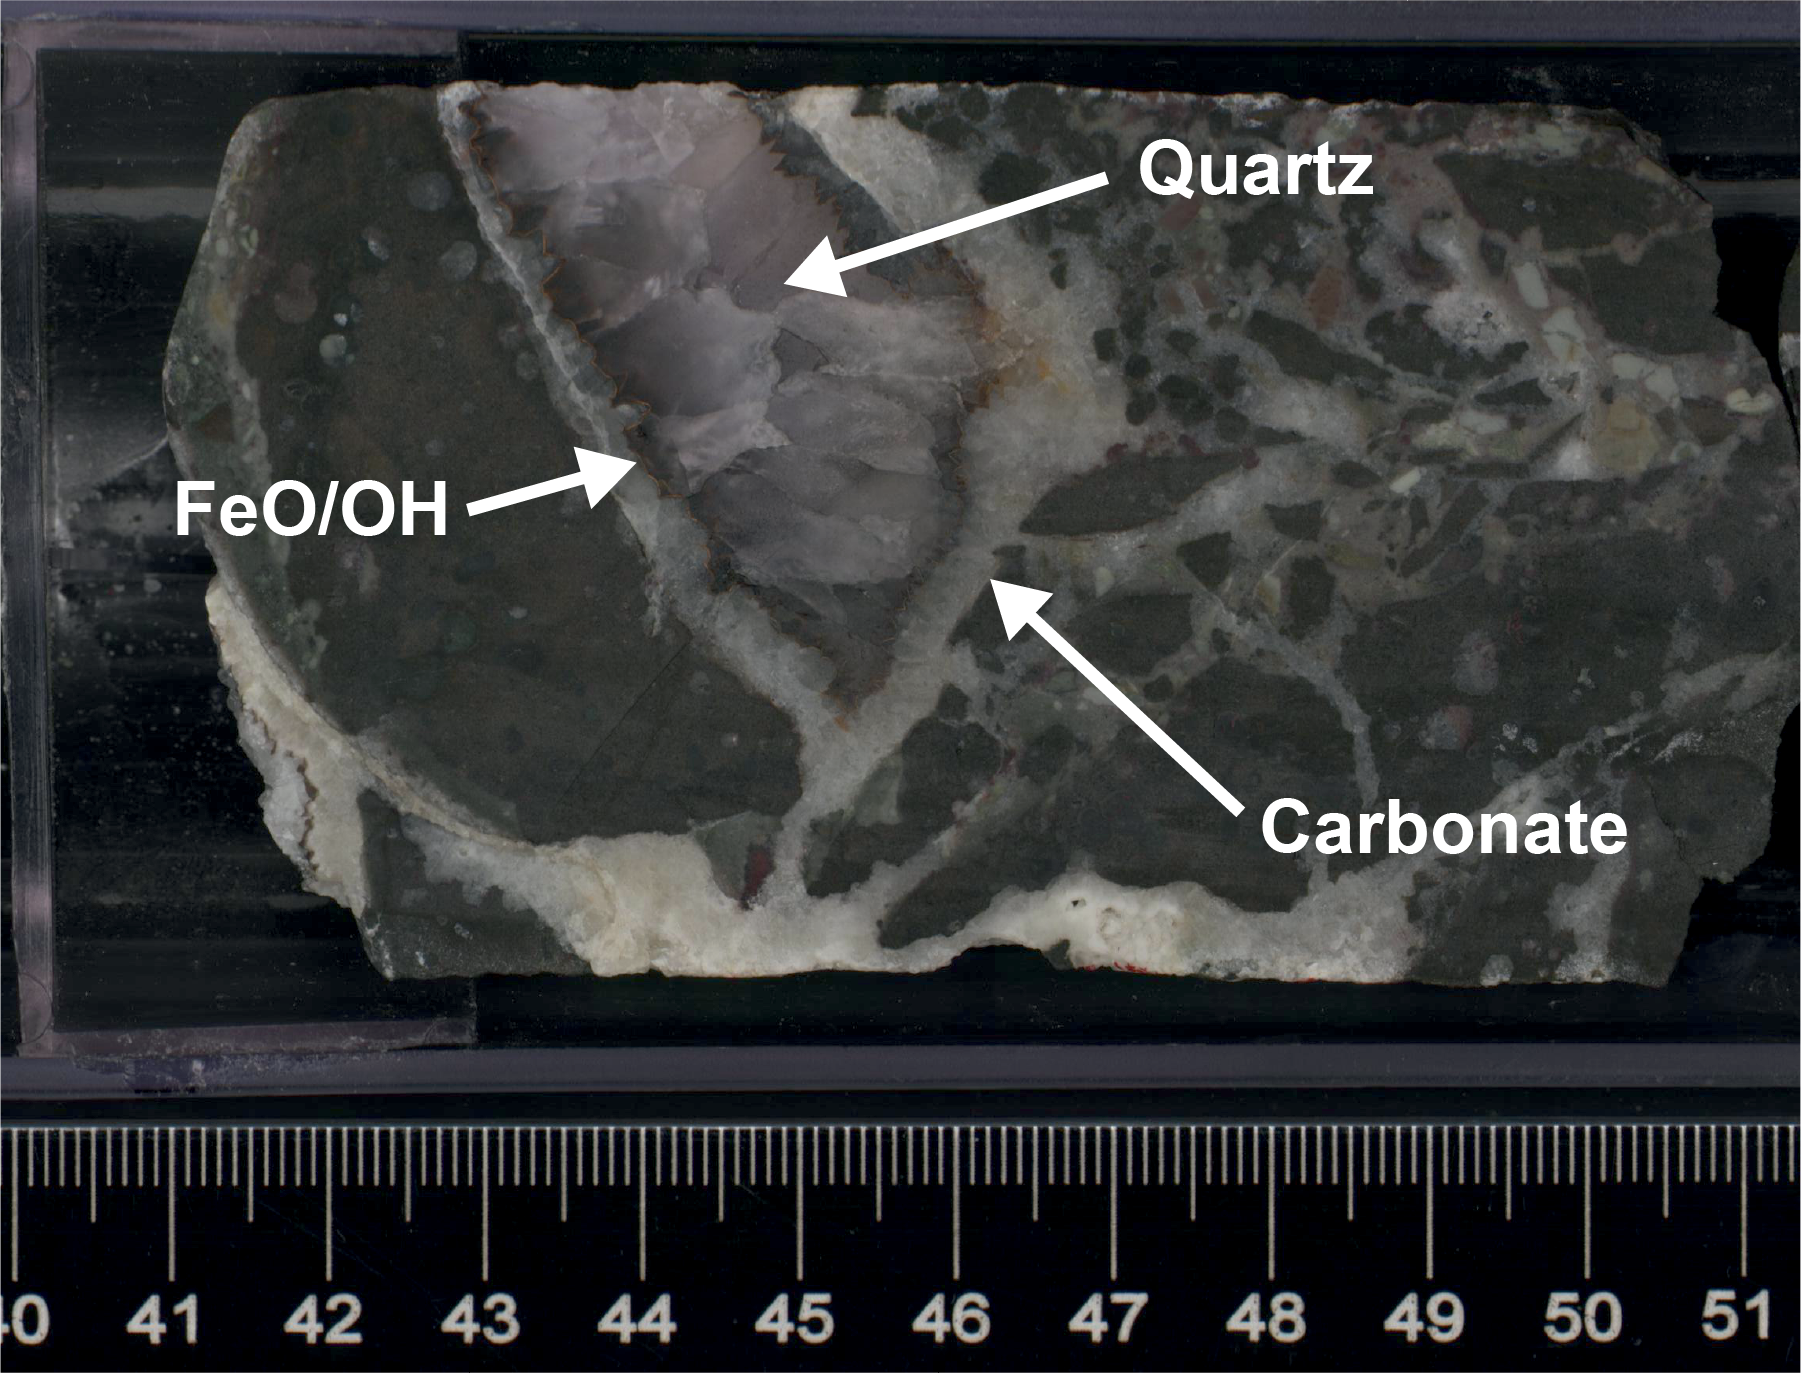
Figure F24. Carbonate- and quartz-filled fractures.
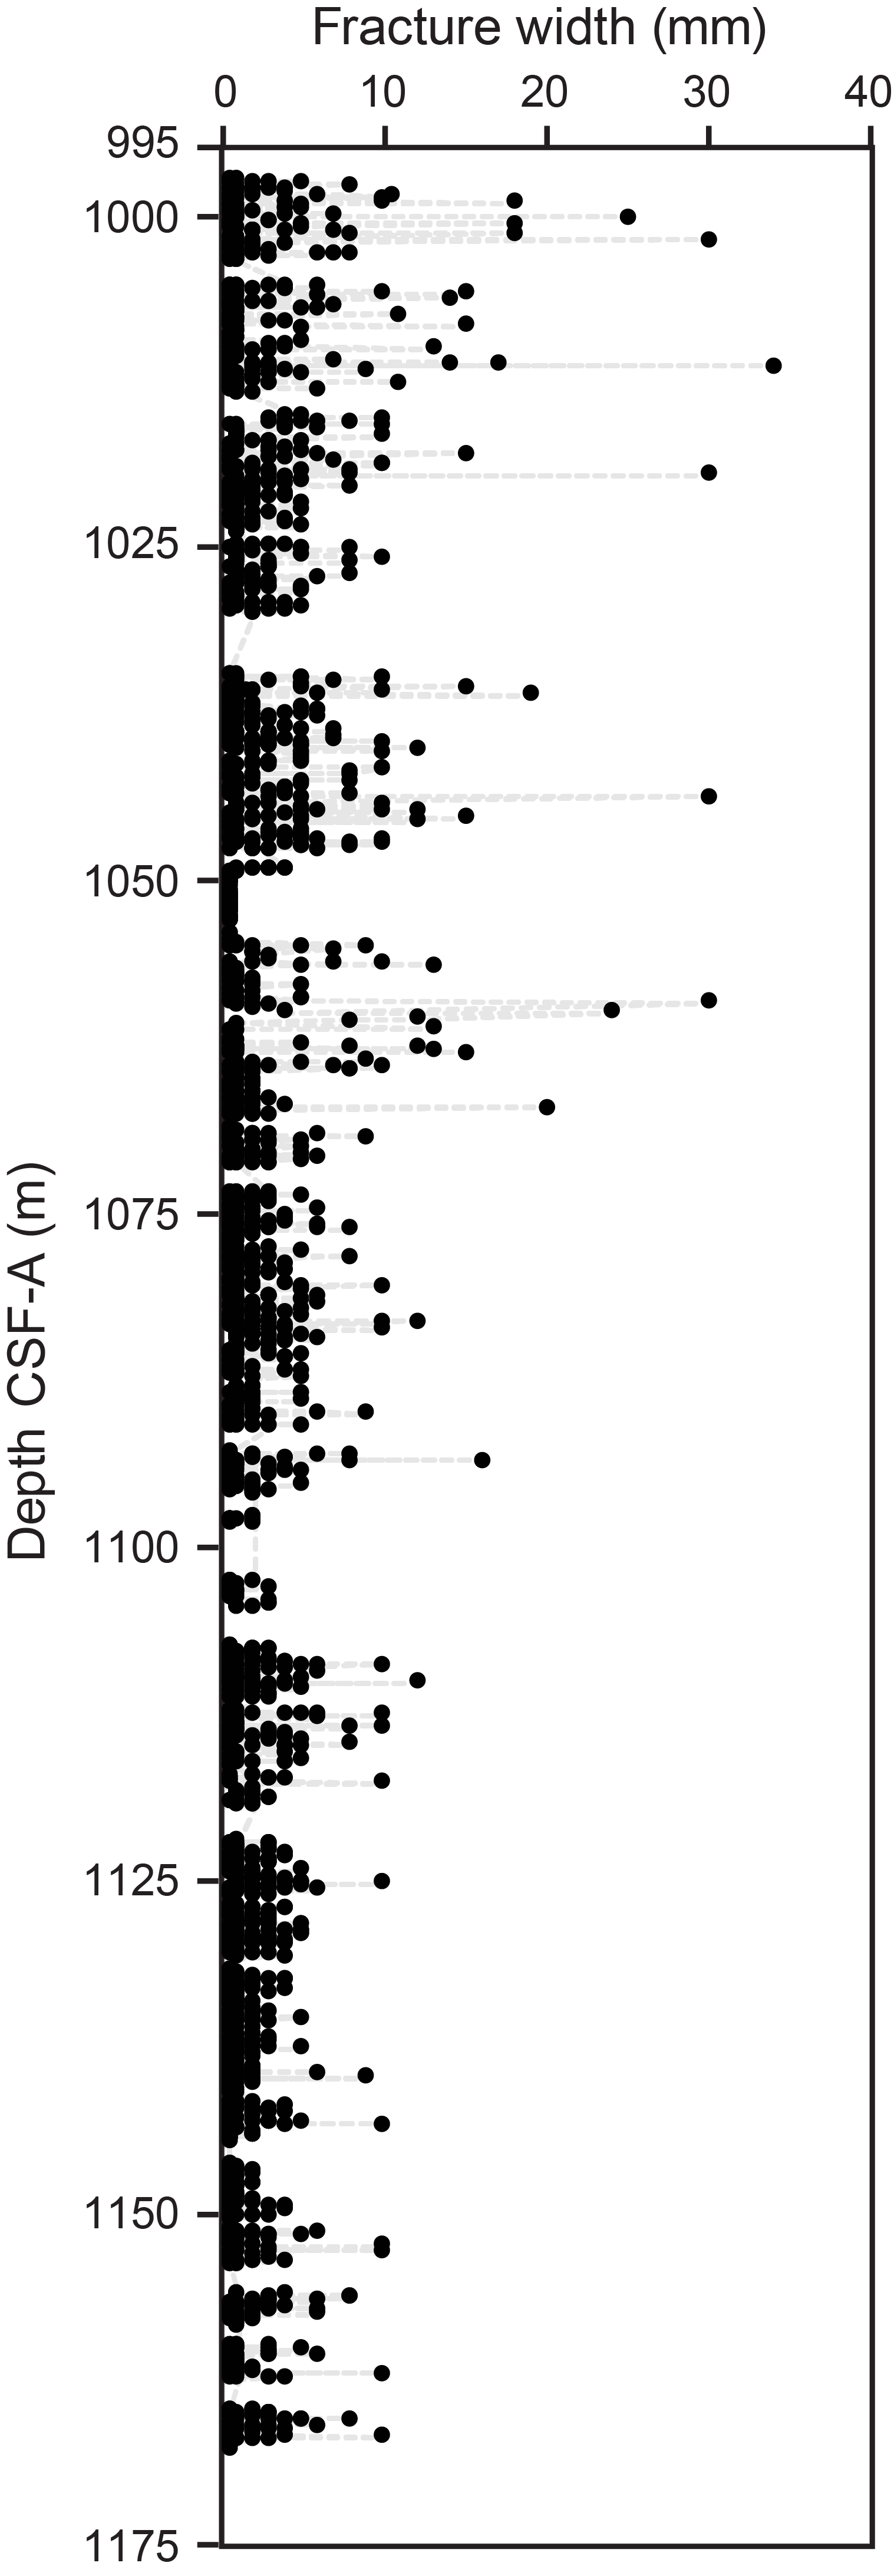
Figure F25. Fracture width.
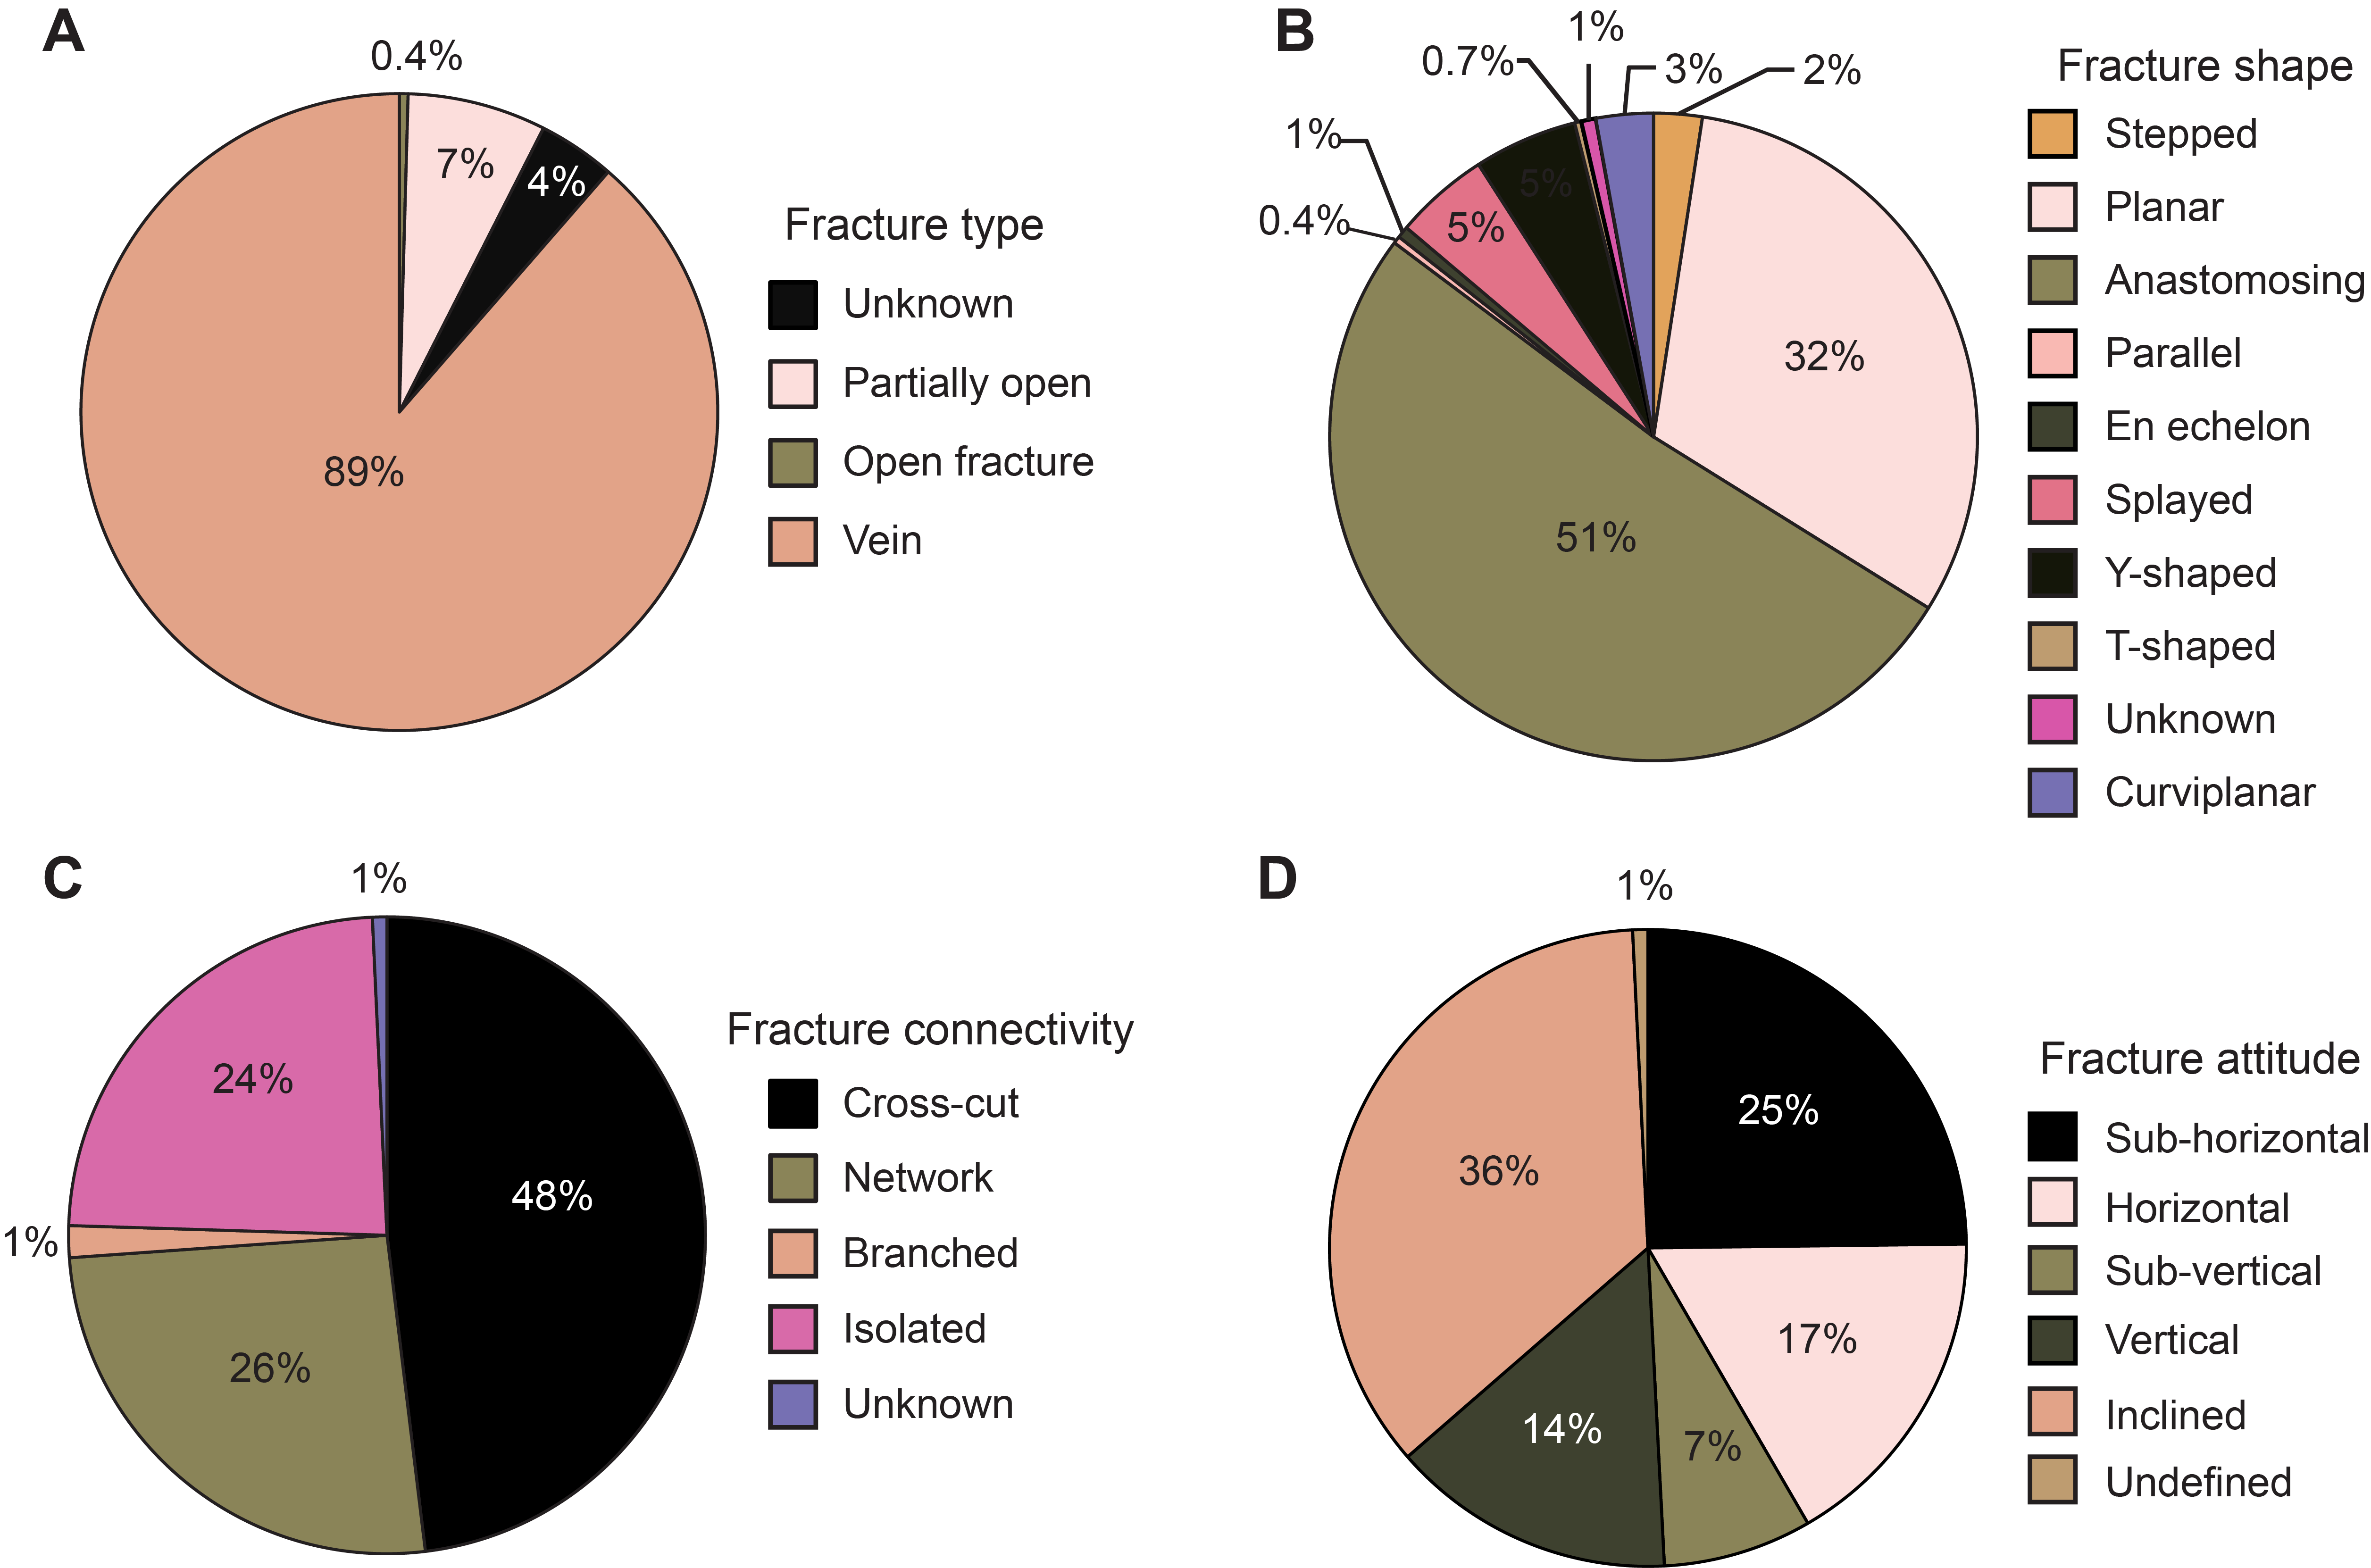
Figure F26. Fractures.
Fracture mineral fill classification was determined by color, visual inspection under a hand lens, scratch tests, and reaction to dilute HCl acid. In Hole U1564F, the mineral fill of the 2729 documented fractures is predominantly crystalline to microcrystalline carbonate with Fe-oxide/oxyhydroxide, clay, and celadonite, with minor occurrence of chlorite at 1015–1030 and 1057–1095 m CSF-A (Figure F27). Minor quartz is observed sporadically, often as a final precipitate preceded by first carbonate and then an FeO/OH layer of mineralization. Fe-oxide/oxyhydroxide, calcite, chlorite, and celadonite fracture fills are also observed in thin section. Fracture alteration halos range in width from 0.1 to >15 cm when their full extent is visible, with colors varying from red to brown to green-gray or green-brown. The mineral fill of vesicles within these alteration halos is predominantly composed of Fe-oxide/oxyhydroxides and calcite and is clay rich with some celadonite.
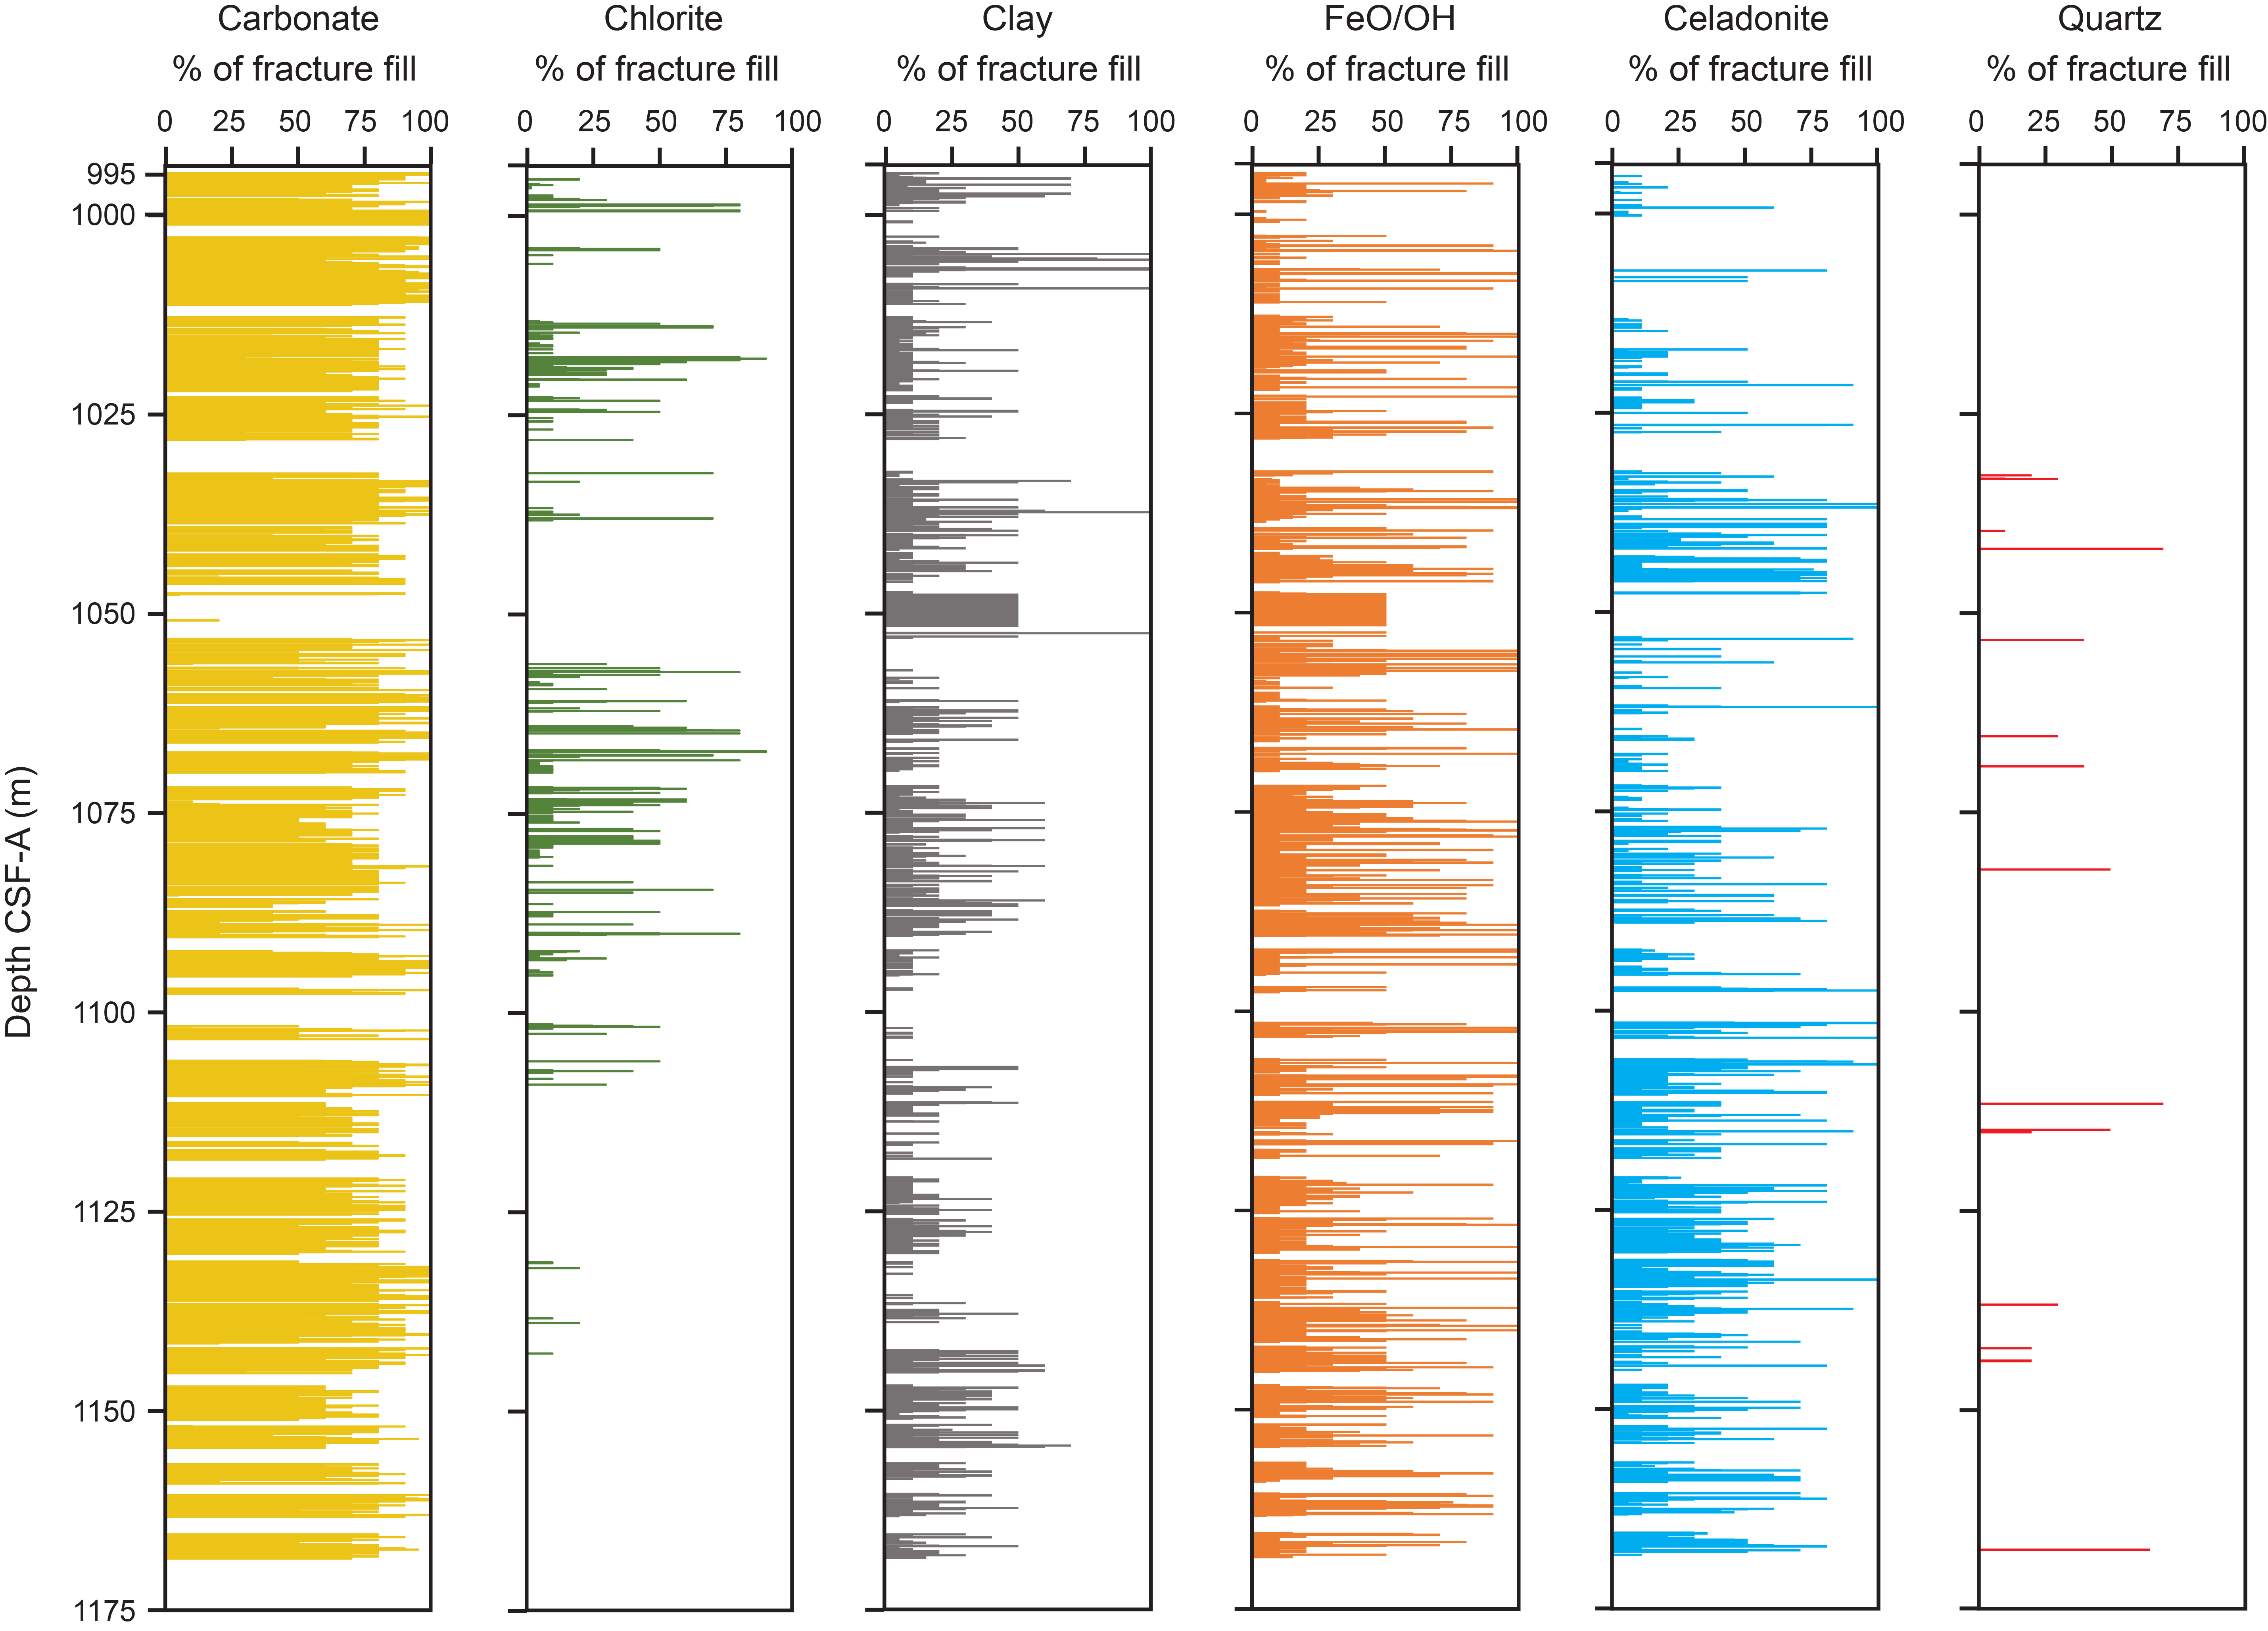
Figure F27. Mineral fill.
6. Micropaleontology
At Site U1564, a 997.23 m long interval of lower Oligocene to upper Pleistocene sediment was recovered across multiple holes. Lithologies of the recovered sediments are mostly silty clay, transitioning to lower Miocene and Oligocene successions dominated by nannofossil chalks. Planktonic foraminifer analyses were undertaken on samples from Holes 395C-U1564C, 395-U1564D, and 395-U1564F. Calcareous nannofossil analyses focused on Holes U1564D and U1564F, with additional calcareous nannofossil markers identified in the upper Pleistocene of Hole 395-U1564E. Biohorizons used in the age model are based on calcareous nannoplankton and planktonic foraminifers, which are present in varying abundances through the succession from barren or nearly barren samples to those with very high abundances.
6.1. Calcareous nannofossils
A total of 196 core catcher and working-half section samples were studied for calcareous nannofossils: 95 from Hole U1564D, 13 from Hole U1564E, and 88 from Hole U1564F. Observations were undertaken using plane-, cross-, and circular-polarized light. A list of calcareous nannofossil bioevents from both studied holes is provided in Table T6. The following description of the main biostratigraphic observations is mostly based on the results from Holes U1564D and U1564F.
Calcareous nannofossils are present in almost all samples observed, ranging from few to dominant in abundance and with poor to very good preservation. Preservation worsens with depth in the succession. The top of Hole U1564D has good to very good preservation to Sample 395-U1564D-60X-CC (526.84 m CSF-A). Below this depth, preservation is mostly moderate to good to Sample 395-U1564F-12R-2, 2 cm (696.37 m CSF-A) and then moderate to poor to the lowest sediment recovered in Hole U1564F (Sample 53R-1, 51 cm; 1054.40 m CSF-A).
A total of nine Pleistocene biostratigraphic constraints were identified (Table T6), providing an excellent biochronology from the top acme Gephyrocapsa caribbeanica (0.28 Ma) between Samples 395-U1564E-2H-4, 60 cm (10.88 m CSF-A), and 2H-5, 60 cm (12.38 m CSF-A), to top Discoaster surculus (2.53 Ma), constrained to be above Sample 395-U1564D-46X-CC (397.11 m CSF-A). Calcareous nannofossils are consistently present in the Pleistocene sediments observed, with the implication that surface water conditions at this location were predominantly suitable for coccolithophore productivity through Pleistocene glacial–interglacial climate cycles. Pleistocene assemblages are dominated by small reticulofenestrids (Emiliania huxleyi, Gephyrocapsa spp., and Reticulofenestra spp.). The early Pleistocene discoaster species Discoaster brouweri and D. surculus were observed as singletons in occasional samples, and we used the highest observation of each to provide a minimum depth constraint for each of their top occurrences (top D. brouweri [1.93 Ma] = Sample 29F-CC; top D. surculus [2.53 Ma] = Sample 46X-CC).
Although calcareous nannofossils are almost consistently present with moderate to very good preservation in the Pliocene sediments of Hole U1564D, only one calcareous nannofossil biohorizon was identified for this interval. This biohorizon is top Reticulofenestra pseudoumbilicus (3.82 Ma) between Samples 55X-1, 100 cm (469.50 m CSF-A), and 55X-2, 4 cm (470.05 m CSF-A). Other standard Pliocene biohorizons (Raffi et al., 2020) are not recognized because of the absence or very low abundance of Discoaster marker species within the Pliocene sediments at Site U1564 and the complete absence of Amaurolithus and Ceratolithus.
The late Miocene marker species Discoaster quinqueramus, which has a biohorizon top (5.53 Ma), is rarely observed in samples from Hole U1564D, and we use the highest occurrence in Sample 67X-CC (594.77 m CSF-A) as a minimum depth constraint on this biohorizon. The abundance distribution of R. pseudoumbilicus through the Miocene is also complex and makes identification of the paracme of this species (7.10–8.80 Ma) difficult. The distinctive late Miocene size reduction of R. pseudoumbilicus was described in the tropical Indian Ocean by Young (1990) and has now entered biostratigraphic schemes and is defined as a period of absence of morphotypes larger than 7 µm (Raffi et al., 2020). However, Young (1990) originally noted that its biostratigraphic application to high-latitude successions may not be reliable because of diachrony, different patterns of size changes through time, and the complexities of distinguishing between R. pseudoumbilicus and large specimens of Reticulofenestra perplexa. Here, we have applied an 8 µm rather than the 7 µm size threshold of Young (1990) because this higher threshold is preferred by experienced industrial biostratigraphers (https://www.mikrotax.org/Nannotax3/cenozoic/Reticulofenestra_pseudoumbilicus). Larger morphotypes of R. perplexa in Holes U1564D and U1564F regularly show a somewhat open central area, although a more fully closed central area morphology is dominant. As a result, true R. pseudoumbilicus morphologies must be carefully distinguished and characterized by their wide central area, which is typically wider than the shield width. Despite these complexities, there is a distinct interval with almost no R. pseudoumbilicus >8 µm morphotypes present at the base of Hole U1564D and the top of Hole U1564F. We identify this interval as the paracme, with a top paracme in Hole U1564D between Samples 70X-CC (623.21 m CSF-A) and 71X-CC (633.40 m CSF-A) and in Hole U1564F between Samples 4R-CC (617.50 m CSF-A) and 5R-4, 8 cm (631.45 m CSF-A). The base paracme is identified in Hole U1564F only, between Samples 12R-2, 2 cm (696.37 m CSF-A), and 12R-CC (698.48 m CSF-A).
The upper Miocene biohorizon top Coccolithus miopelagicus (11.04 Ma) is placed at the same level as the base paracme R. pseudoumbilicus between Samples 395-U1564F-12R-2, 2 cm (696.37 m CSF-A), and 12R-CC (698.48 m CSF-A). C. miopelagicus is relatively rare, but below this biohorizon, top C. miopelagicus morphotypes that exceed 14 µm in length are consistently observed downhole to at least Sample 35R-CC (926.67 m CSF-A). The close association of this biohorizon with the base paracme R. pseudoumbilicus is not taken to indicate a significant hiatus or unconformity but is rather consistent with the pattern of C. miopelagicus at Site U1602 and suggests a substantially younger age for the top of this species in the high-latitude North Atlantic Ocean.
A series of biohorizons with calibrated ages around 12.45–14.86 Ma cluster around ~764–802 m CSF-A, providing confidence in the age of this interval. The most reliable in placement are top Sphenolithus heteromorphus (13.60 Ma), between Samples 395-U1564F-20R-CC (779.17 m CSF-A) and 21R-5, 58 cm (788.13 m CSF-A), and top Helicosphaera ampliaperta (14.86 Ma), between Samples 22R-CC (801.99 m CSF-A) and 23R-4, 71 cm (807.39 m CSF-A). Top common Cyclicargolithus floridanus is placed between Samples 22R-5, 111 cm (799.12 m CSF-A), and 22R-CC (801.99 m CSF-A), below which both small (<5 µm) and medium (5–11 µm) sized morphotypes of C. floridanus are consistently present with abundances of rare to few. The placement of this top C. floridanus is below top S. heteromorphus even though it has a younger calibrated age (13.33 Ma compared to 13.60 Ma). In samples stratigraphically above the picked top common C. floridanus, this species is present in both small- and medium-sized forms to Sample 20R-2, 10 cm, but is very rare (~1–3 specimens in two transects). It is most likely that top common C. floridanus, which reaches maximum abundances in the low-latitude oceans (Wei and Wise, 1990), is somewhat diachronous into the high latitudes.
Two other upper Miocene biostratigraphic constraints are based on very rare occurrences of Calcidiscus premacintyrei and Coronocyclus nitescens, the highest of which are in Sample 395-U1564F-19R-CC (764.46 m CSF-A). As a result of the uncertainty associated with such rare occurrences, this sample is used as the maximum depth of the top of both species (12.45 Ma for C. nitescens and 12.57 Ma for C. premacintyrei).
Only one biohorizon is identified in the lower Miocene, base common S. heteromorphus (17.65 Ma), which is placed between Samples 395-U1564F-26R-CC (839.51 m CSF-A) and 27R-2, 46 cm (842.39 m CSF-A). It should be noted, however, that S. heteromorphus is always rare, and this biohorizon is placed at the last downhole observed occurrence of this species.
The Oligocene/Miocene boundary (23.04 Ma) is approximated by top Cyclicargolithus abisectus (>11 µm) between Samples 395-U1564F-34R-CC (918.40 m CSF-A) and 35R-5, 18 cm (923.88 m CSF-A), below which both taxa are frequent to common in occurrence and constitute a significant component of Oligocene assemblages. Although this event is not a well-calibrated biohorizon, it is widely considered to occur in the Oligocene to basal Miocene nannofossil Zone NN1 (Young, 1998) with an estimated age range of 22.82–23.13 Ma.
Oligocene assemblages are uniformly dominated by a few taxa: C. floridanus across a range of sizes (3–11 µm), C. abisectus, Reticulofenestra bisecta, Reticulofenestra dictyoda, and Reticulofenestra lockeri with frequent Sphenolithus moriformis. In contrast to Site U1602, Chiasmolithus spp. are rare in the Oligocene of Site U1564. However, very overgrown morphotypes of Furcatolithus were observed in samples from Hole U1564F. These specimens mostly appear as paired but clearly separate parallel blocks of thickened (orange birefringence colors) calcite but in some cases have the characteristic small “feet” of Furcatolithus predistentus still preserved at the base of the overgrown duocrystalline Furcatolithus spine. The highest observation of these morphotypes is used to place top F. predistentus (26.93 Ma) between Samples 395-U1564F-39R-CC (963.42 m CSF-A) and 40R-CC (963.59 m CSF-A).
The age of the base of the sedimentary succession in Hole U1564F is constrained by the downhole appearance of Reticulofenestra umbilicus (top 32.02 Ma) between Samples 43R-1, 9 cm (986.19 m CSF-A), and 43R-1, 92 cm (987.02 m CSF-A). A further ~4 m thick interval of dusky red to white nannofossil chalks was recovered within the base of Core 52R and the top of Core 53R below a sequence of ~45 m of basalt. Samples taken from these nannofossil chalks yielded common nannofossils with moderate to poor preservation. Although these samples are biostratigraphically within the same zone (NP22) as samples from Core 44R above the basalt, they are distinct in having higher abundances of R. umbilicus, Reticulofenestra daviesii, and Clausicoccus subdistichus, and, for the first time in any Expedition 395C/395 nannofossil sample, the presence of Blackites tenuis spines. With the established southern hemisphere latitudinal diachrony in the top Coccolithus formosus bioevent (32.96 Ma) (Berggren et al., 1995), it is possible that this event is also diachronous in the northern high latitudes, and the absence of this species in the base of Hole U1564F does not preclude a sediment age very close to the Eocene/Oligocene boundary. One specimen of C. formosus was observed in Sample 44R-1, 87 cm (996.67 m CSF-A), but despite searching multiple other samples below this level, no other occurrences were noted. Because reworked C. formosus was very rarely observed within Miocene sediments from Expedition 395 sites, the occurrence of this species at the base of Hole U1564F cannot be treated as a robust biostratigraphic constraint.
6.2. Planktonic foraminifers
Planktonic foraminifers were studied in samples from Holes U1564C–U1564F. A total of 36 samples were studied from Hole U1564C from ~7 to ~630 m CSF-A. A total of 61 samples were studied from Hole U1564D from ~10 to ~653 m CSF-A. A single sample was studied from Hole U1564E, which captured the mudline. A total of 43 samples were studied from Hole U1564F from ~606 to ~1053 m CSF-A. Planktonic foraminifers are common to dominant in most samples examined except where quartz grains and rock fragments predominate, indicating glacial conditions, or where tephra predominates. Preservation is very good to excellent to about 530 m CSF-A. Below that level, the sediment becomes progressively harder and the foraminifers are mostly infilled by calcite. Aside from the infilling, preservation remains moderate to good to about 800 m CSF-A. Below this level, the sediment was very difficult to process even after freeze-drying and soaking in hydrogen peroxide (see Micropaleontology in the Expedition 395 methods chapter [Parnell-Turner et al., 2025a]) and only occasional samples were studied. Foraminifers were studied in thin section from about 960 m CSF-A to the bottom of the succession. A list of planktonic foraminifer bioevents is provided in Table T7.
Sample 395-U1564E-1H-1, 0 cm, from the mudline contains a well-preserved assemblage dominated by Globigerina bulloides with frequent Globigerina umbilicata and rare Globigerina cariacoensis. Other frequent components are Globoconella inflata and dextral Neogloboquadrina incompta/Neogloboquadrina dutertrei. A single specimen of Globorotalia truncatulinoides was found, which is a very rare species at this latitude.
Samples 395C-U1564C-1H-CC (6.97 m CSF-A) and 395-U1564D-1H-CC (9.56 m CSF-A) both contain a low diversity assemblage dominated by Neogloboquadrina pachyderma of various morphotypes, with few G. bulloides and rare G. umbilicata, G. cariacoensis, N. incompta, Orbulina universa, Turborotalita quinqueloba, and Globigerinita glutinata. The sedimentary succession in the upper part of Holes U1564C and U1564D is characterized by varying assemblages and changing amounts of quartz and rock fragments to the base of common encrusted N. pachyderma, marking the base of the N. pachyderma Zone (1.82 Ma) between Samples 395-U1564D-17H-CC (161.91 m CSF-A) and 18H-CC (171.49 m CSF-A). Below this level in the G. inflata Zone, N. incompta is mostly frequent to abundant with only rare specimens of N. pachyderma present. Base G. inflata, marking the base of the G. inflata Zone (2.06 Ma), is between Samples 395C-U1564C-30F-CC (220.28 m CSF-A) and 32F-CC (229.70 m CSF-A) and at a correlative level in Hole U1564D.
Top Neogloboquadrina atlantica, marking the base of the G. bulloides Zone (2.26 Ma), is most precisely located in Hole U1564C between Samples 38X-CC (269.96 m CSF-A) and 39X-CC (279.79 m CSF-A). Base Globoconella puncticulata, marking the base of the G. puncticulata/N. atlantica Zone (4.54 Ma), occurs in the same sampling interval as base Globoconella crassaformis (4.60 Ma) in Holes U1564C and U1564D. In Hole U1564D, this is between Samples 56X-CC (487.96 m CSF-A) and 57X-CC (497.54 m CSF-A), and the biohorizon occurs at a similar level in Hole U1564C.
The underlying Globorotalia cibaoensis Zone corresponds to a relatively long duration biochron that began at 9.44 Ma. Base G. cibaoensis, marking the base of the biozone, is tentatively located in poorly preserved material between Samples 395-U1564F-14R-CC (723.27 m CSF-A) and 17R-CC (751.37 m CSF-A). Coiling ratios in N. atlantica were measured throughout its stratigraphic range in Holes U1564C, U1564D, and U1564F (Figure F28; Table T8). Assemblages are sinistrally dominated to Sample 395-U1564F-8R-CC (664.55 m CSF-A). The dextral to sinistral (upcore) coiling shift (tentatively calibrated at 9.23 Ma) is located between this level and Sample 9R-CC (675.78 m CSF-A).
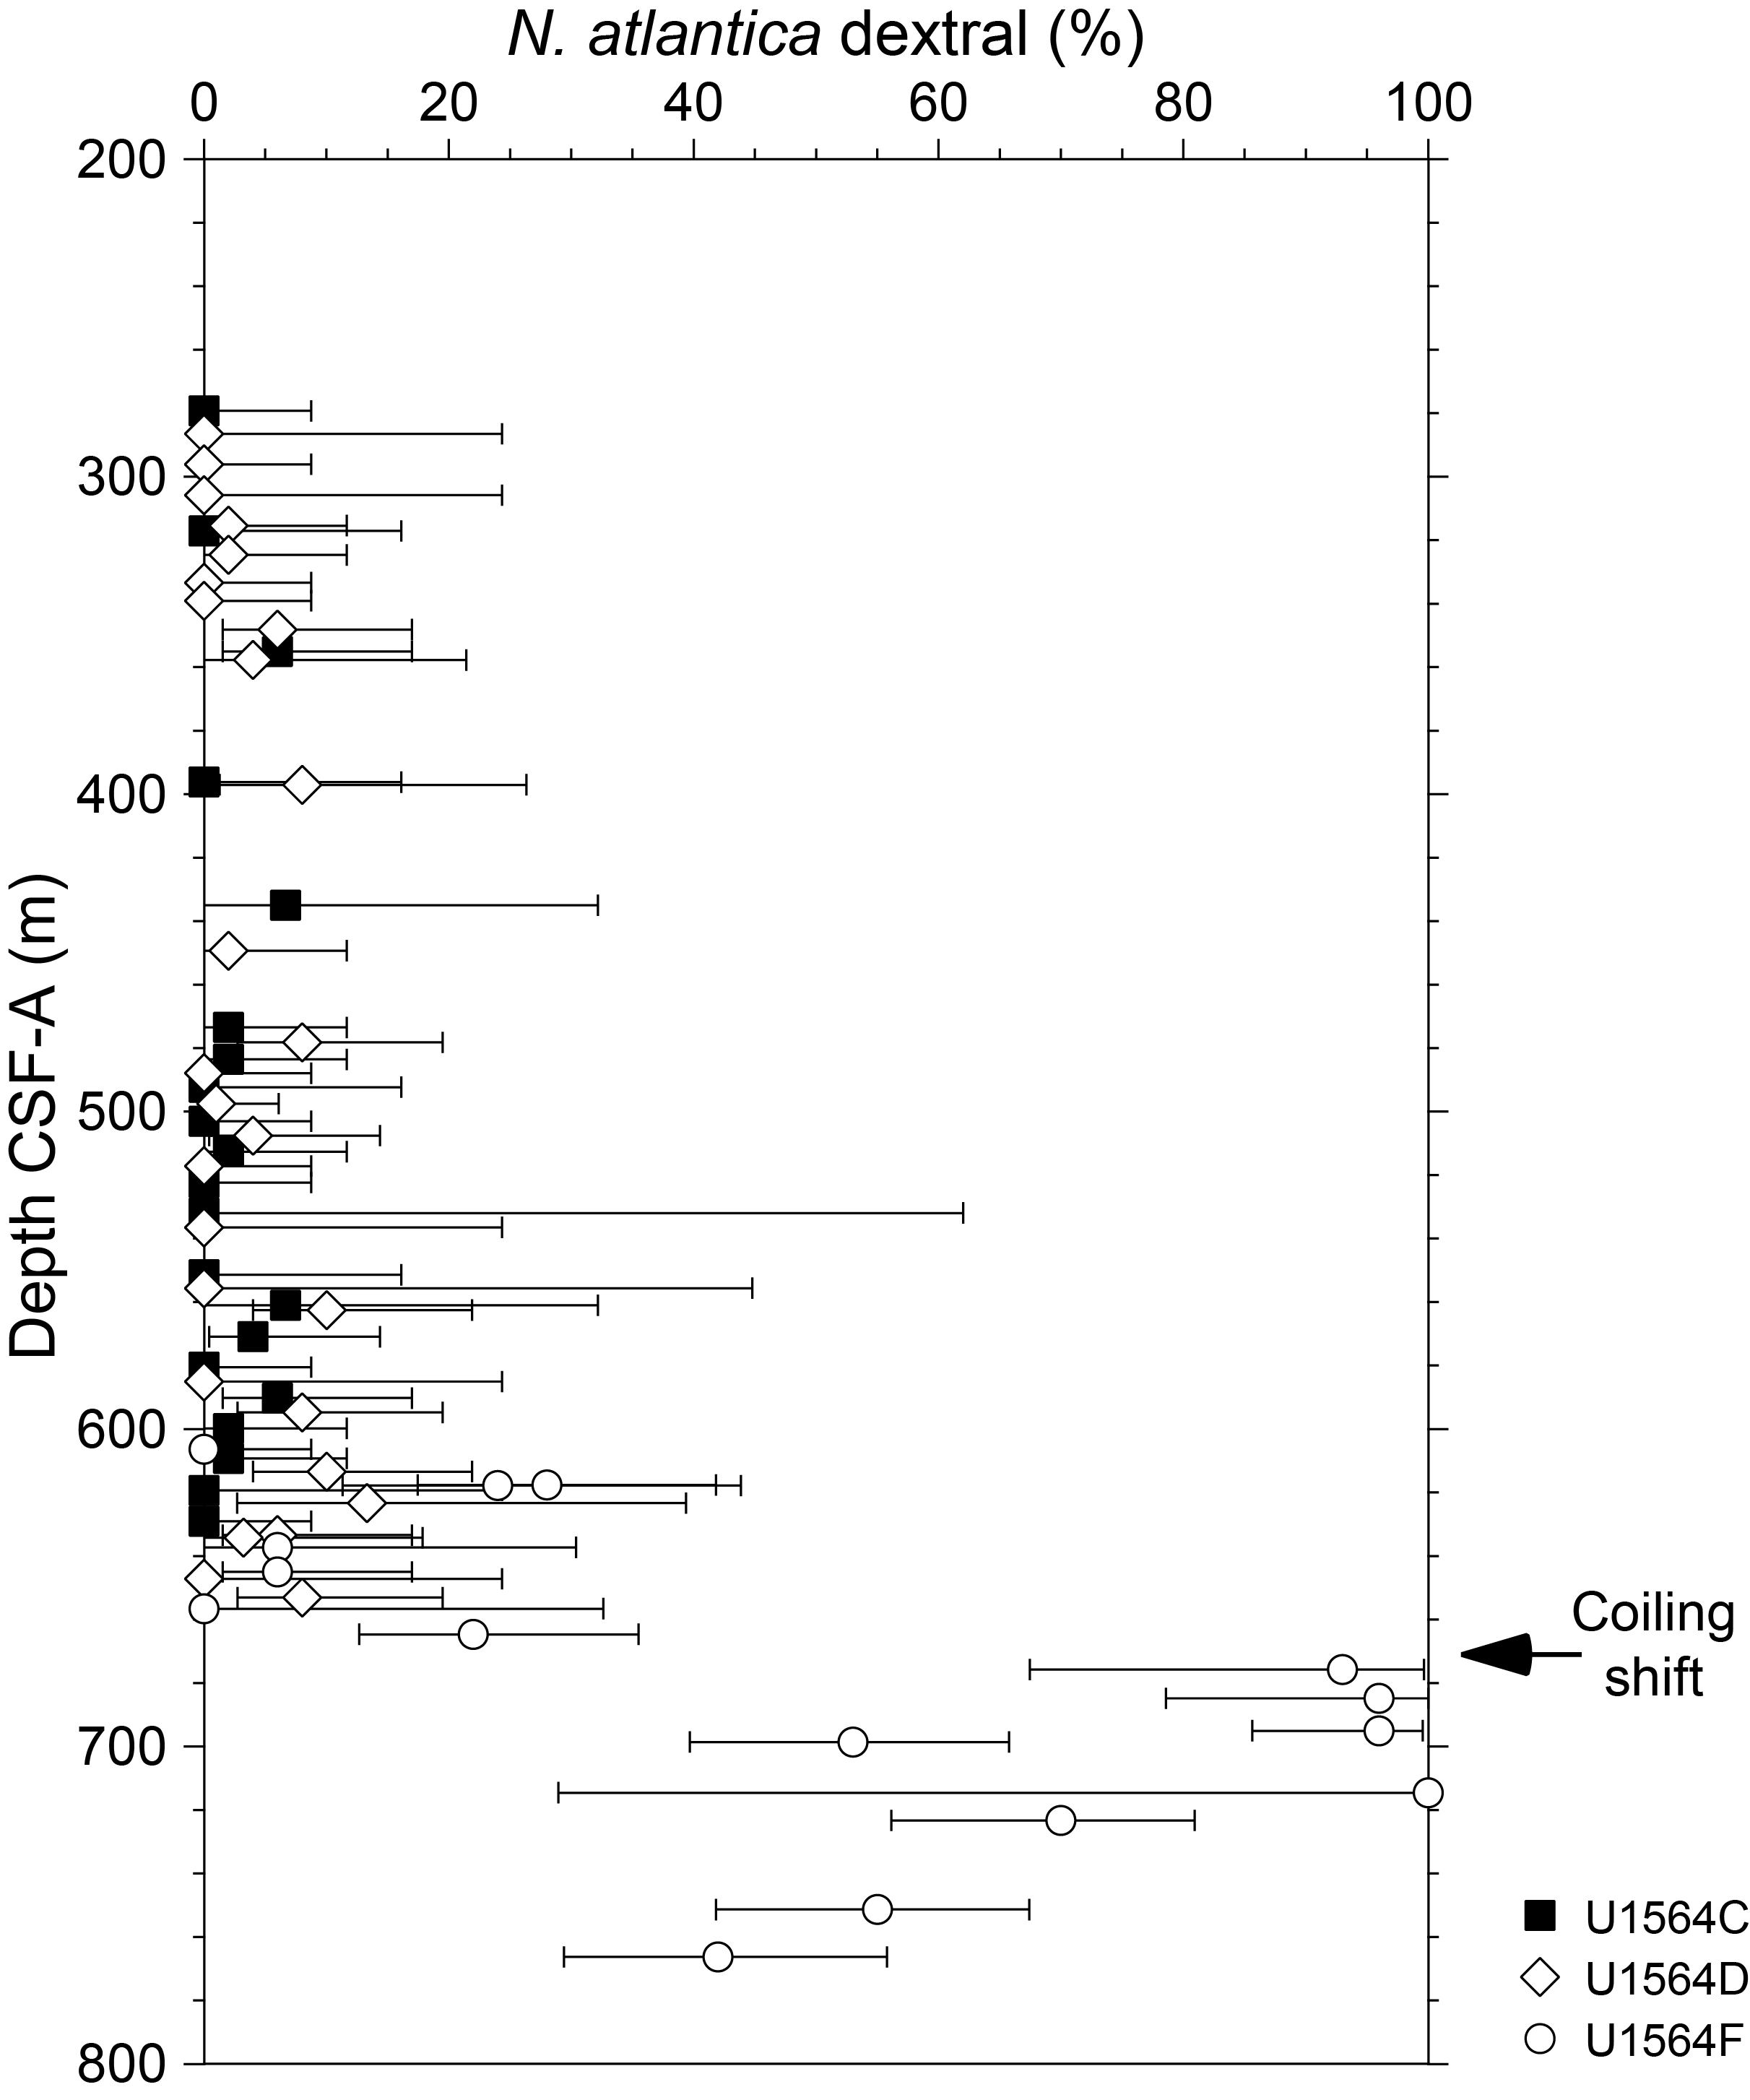
Figure F28. N. atlantica coiling ratios.
O. universa has a patchy stratigraphic distribution at Site U1564, as at other Expedition 395/395C sites, which apparently represents a series of local incursions. The lowermost recorded sample containing O. universa is Sample 395-U1564F-21R-CC (790.20 m CSF-A). This occurrence provides an upper biostratigraphic constraint for the true global first occurrence at 15.12 Ma.
We were not able to provide many additional biostratigraphic constraints based on planktonic foraminifers lower in the succession because of difficulties extracting identifiable specimens from the hard rocky matrix. From Core 395-U1564F-40R-CC (963.59 m CSF-A) toward the bottom of the hole, we studied the assemblages in thin section. This approach allowed us to tentatively locate the top common occurrence of the distinctive (in-section) biserial tests of Chiloguembelina cubensis, marking the base of Paragloborotalia opima Zone O5 (27.29 Ma) between Samples 41R-CC (972.21 m CSF-A) and 42R-CC (977.16 m CSF-A). We did not observe any planispiral Pseudohastigerina in thin sections to Sample 43R-CC (988.18 m CSF-A), which suggests that the sediment from the regular succession above basement is from lower Oligocene Zones O2–O4 undifferentiated (32.2–27.29 Ma).
The basement succession contains a substantial interval of reddish nannofossil chalk that occurs ~50 m below the top of basement and forms most of Core 395-U1564F-52R. Sample 52R-CC (1053.04 m CSF-A) was soft enough to extract foraminifers. The assemblage, although only moderately well preserved, is typical of the lowermost Oligocene Pseudohastigerina naguewichiensis Zone (Zone O1), including Subbotina gortanii, Subbotina angiporoides, C. cubensis, Dipsidripella danvillensis, Tenuitella gemma, and diminutive P. naguewichiensis with no larger pseudohastigerinids. This assemblage indicates an age in the range of 33.8–32.2 Ma for this deeply buried sediment package.
7. Physical properties
A range of whole-round, section-half, and discrete sample physical properties were measured on ~10 m of sediment core from Hole 395C-U1564A, ~27 m from Hole 395C-U1564B, ~629 m from Hole 395C-U1564C, ~660 m from Hole 395-U1564D, ~265 m from Hole 395-U1564E, and ~390 m from Hole 395-U1564F (Table T9). Approximately 112 m of basalt was measured from Hole U1564F. Physical properties data were cleaned for half the response function corresponding to the instruments at the top and bottom of each section, and values deemed artifacts were removed from the respective figures (Table T10). All raw data are retained in the Laboratory Information Management System (LIMS) database.
7.1. Whole-round measurements
Whole-round measurements comprise gamma ray attenuation (GRA) bulk density, MS, P-wave velocity (VP), and NGR. Measurements were carried out for all six holes at Site U1564 using a combination of the Whole-Round Multisensor Logger (WRMSL) and the Natural Gamma Radiation Logger (NGRL).
WRMSL bulk density measurements for the shallow Holes U1564A and U1564B vary between 1.3 and 1.7 g/cm3 and average 1.5 g/cm3. As expected, the four deeper holes have larger systematic variations. In Hole U1564C, there is a considerable degree of scatter and the average density is 1.6 g/cm3, ranging from 1.5 g/cm3 at the top of the hole to ~1.9 g/cm3 at the base (Figure F29). In the uppermost 100 m of this hole, there is clearly a significant anomaly or measurement artifact. It is very unlikely that there is a positive density excursion between 55 and 80 m CSF-A that gives rise to a density inversion. No such anomaly is observed in the other holes, in other whole-round values, or in the moisture and density (MAD) samples. Also, the bulk density values at 90–100 m CSF-A are lower than 1.5 g/cm3, which is unrealistic. In Holes U1564D and U1564E, density increases monotonically with depth and there is no evidence of anomalous artifacts (Figures F30, F31). At the top of each hole, average densities are ~1.5 and ~1.4 g/cm3, respectively. The density at the base of Hole U1564D is ~1.9 g/cm3, which is consistent with the density measured in Hole U1564C at the same depth. Bulk densities steadily increase to about 2 g/cm3 near the bottom of the sediment section of Hole U1564F (Figure F32). The whole-round density measurements are systematically lower than the MAD measurements, likely due to the smaller diameter of RCB cores not filling the liner. The bulk density profile for the entire sedimentary succession as represented by Holes U1564D and U1564F is summarized in Figure F33. Notable features are a rapid increase of density within the uppermost 250 m, followed by approximately constant density to 560 m CSF-A. The minor density excursions occurring at several levels often coincide with the presence of carbonate-rich layers (see Lithostratigraphy). There is a larger stepwise increase in density at 560 m CSF-A.
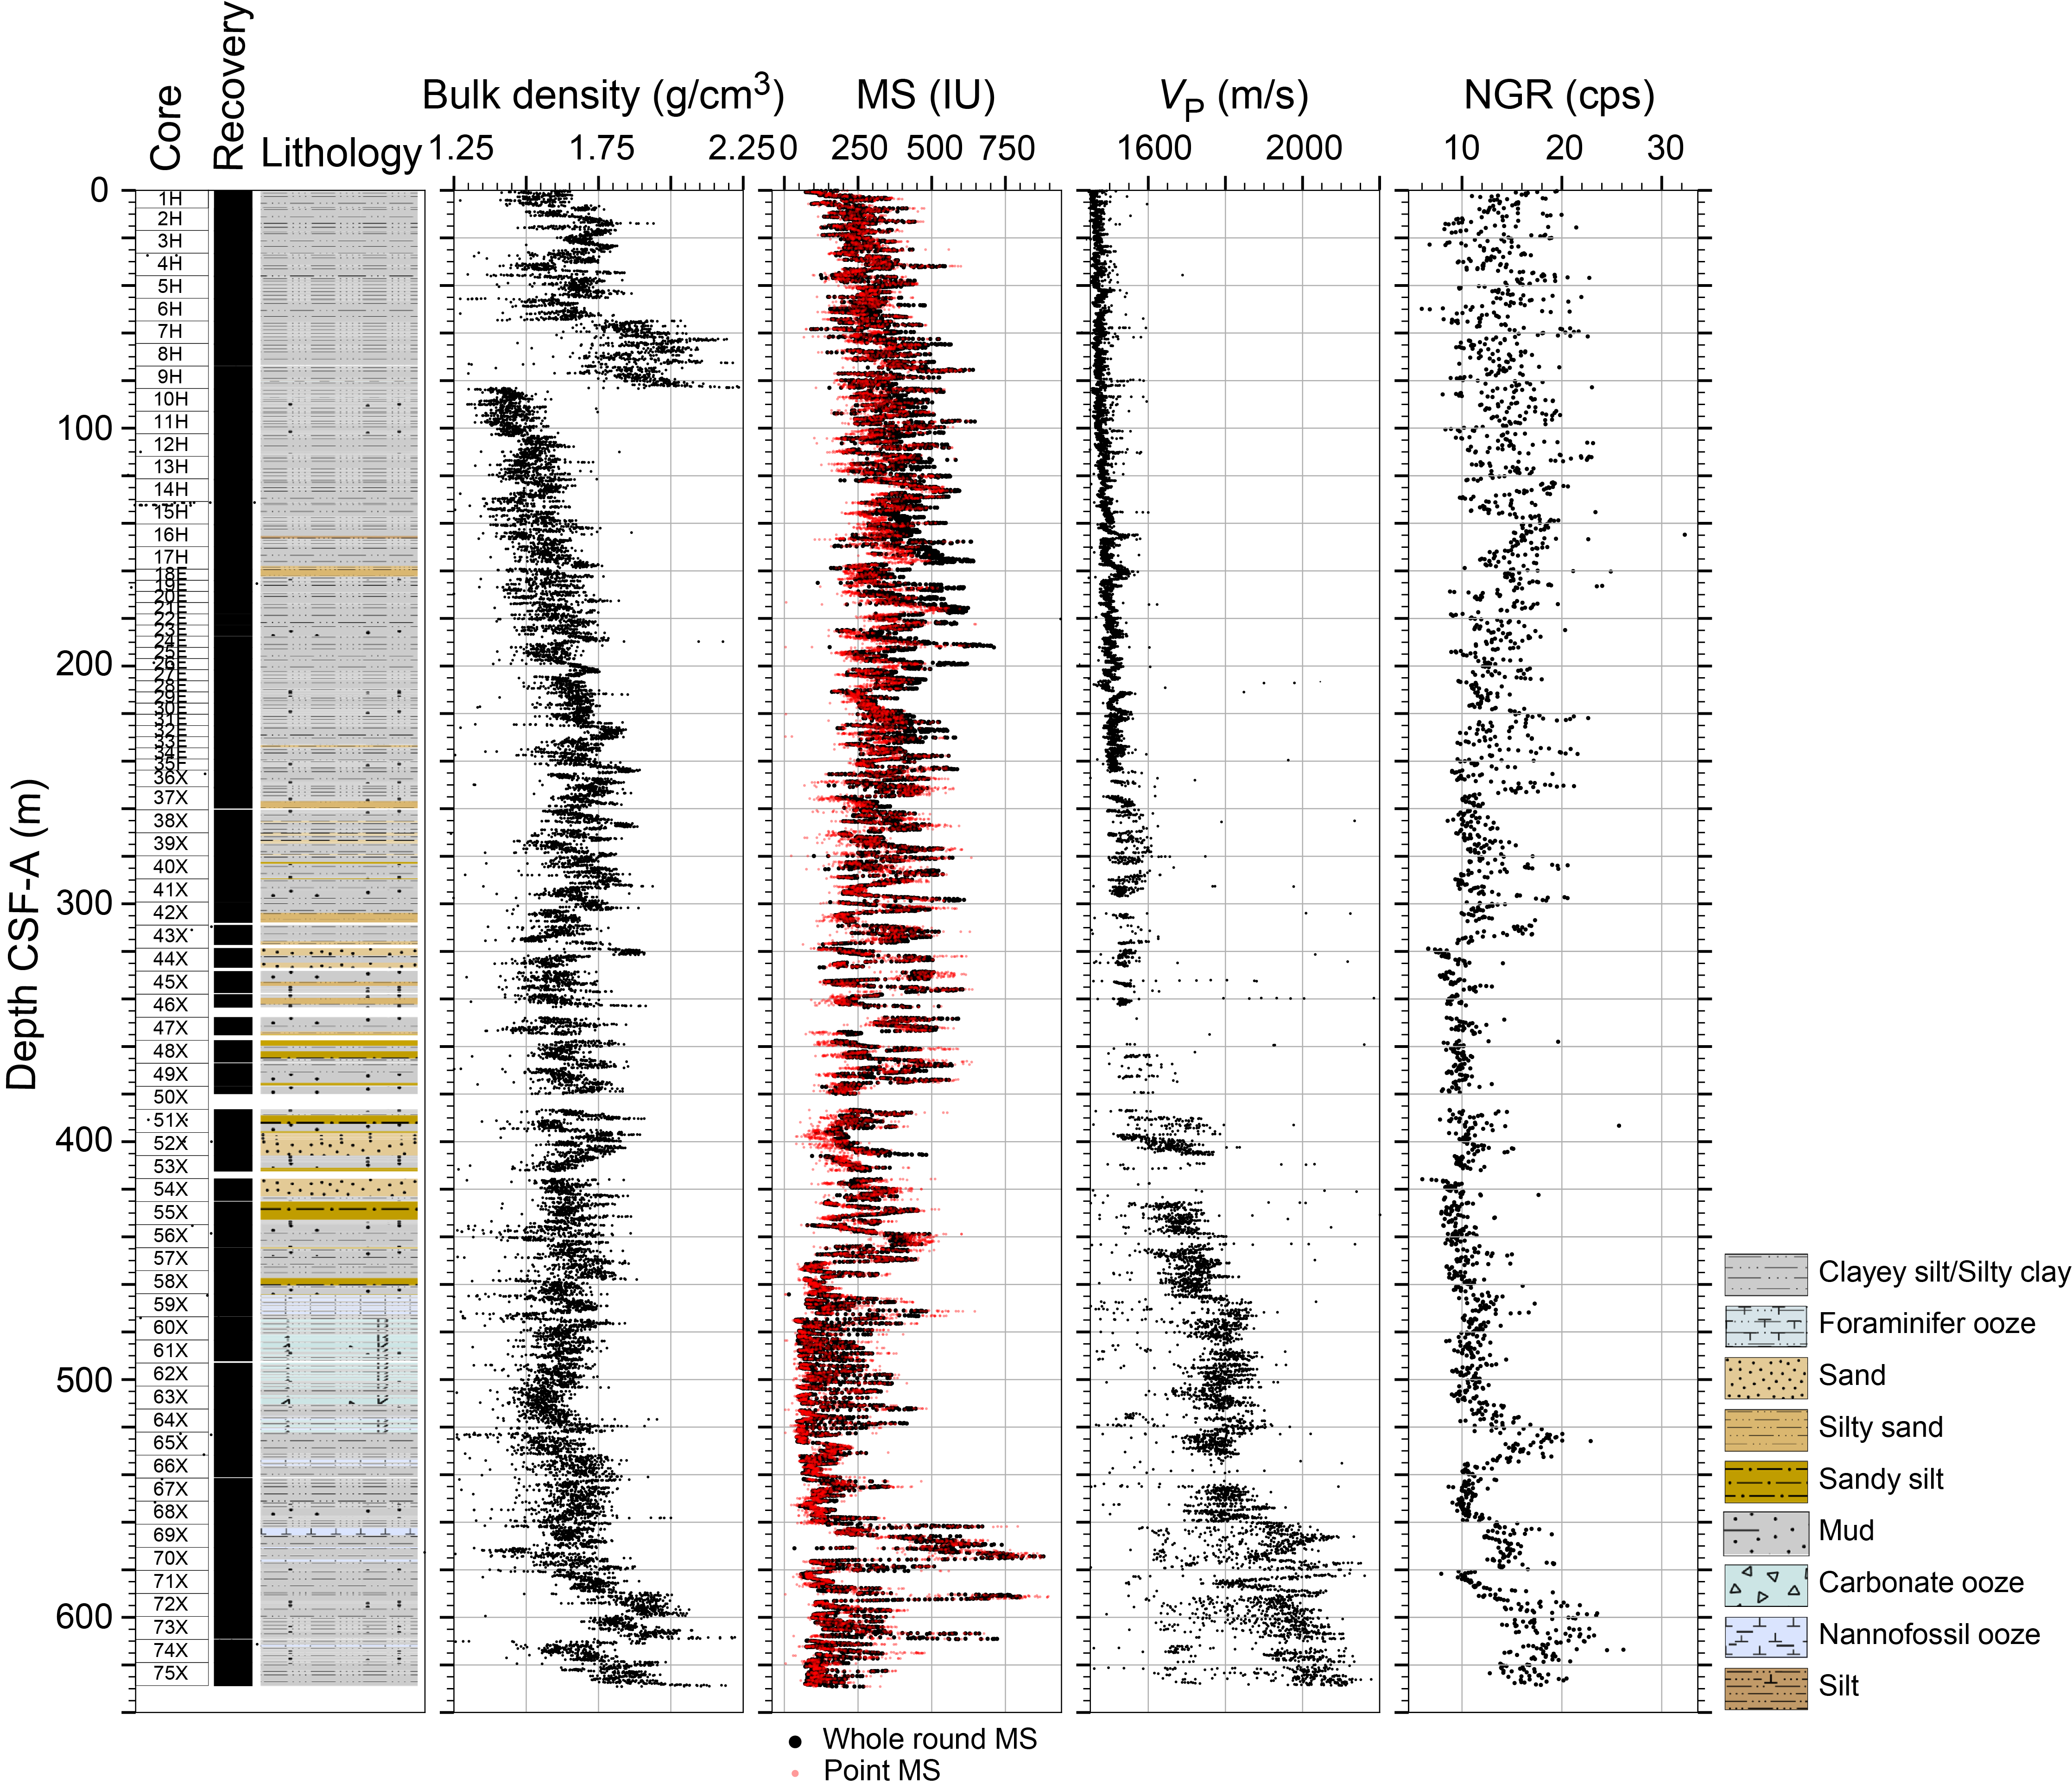
Figure F29. Physical properties measurements, Hole U1564C.
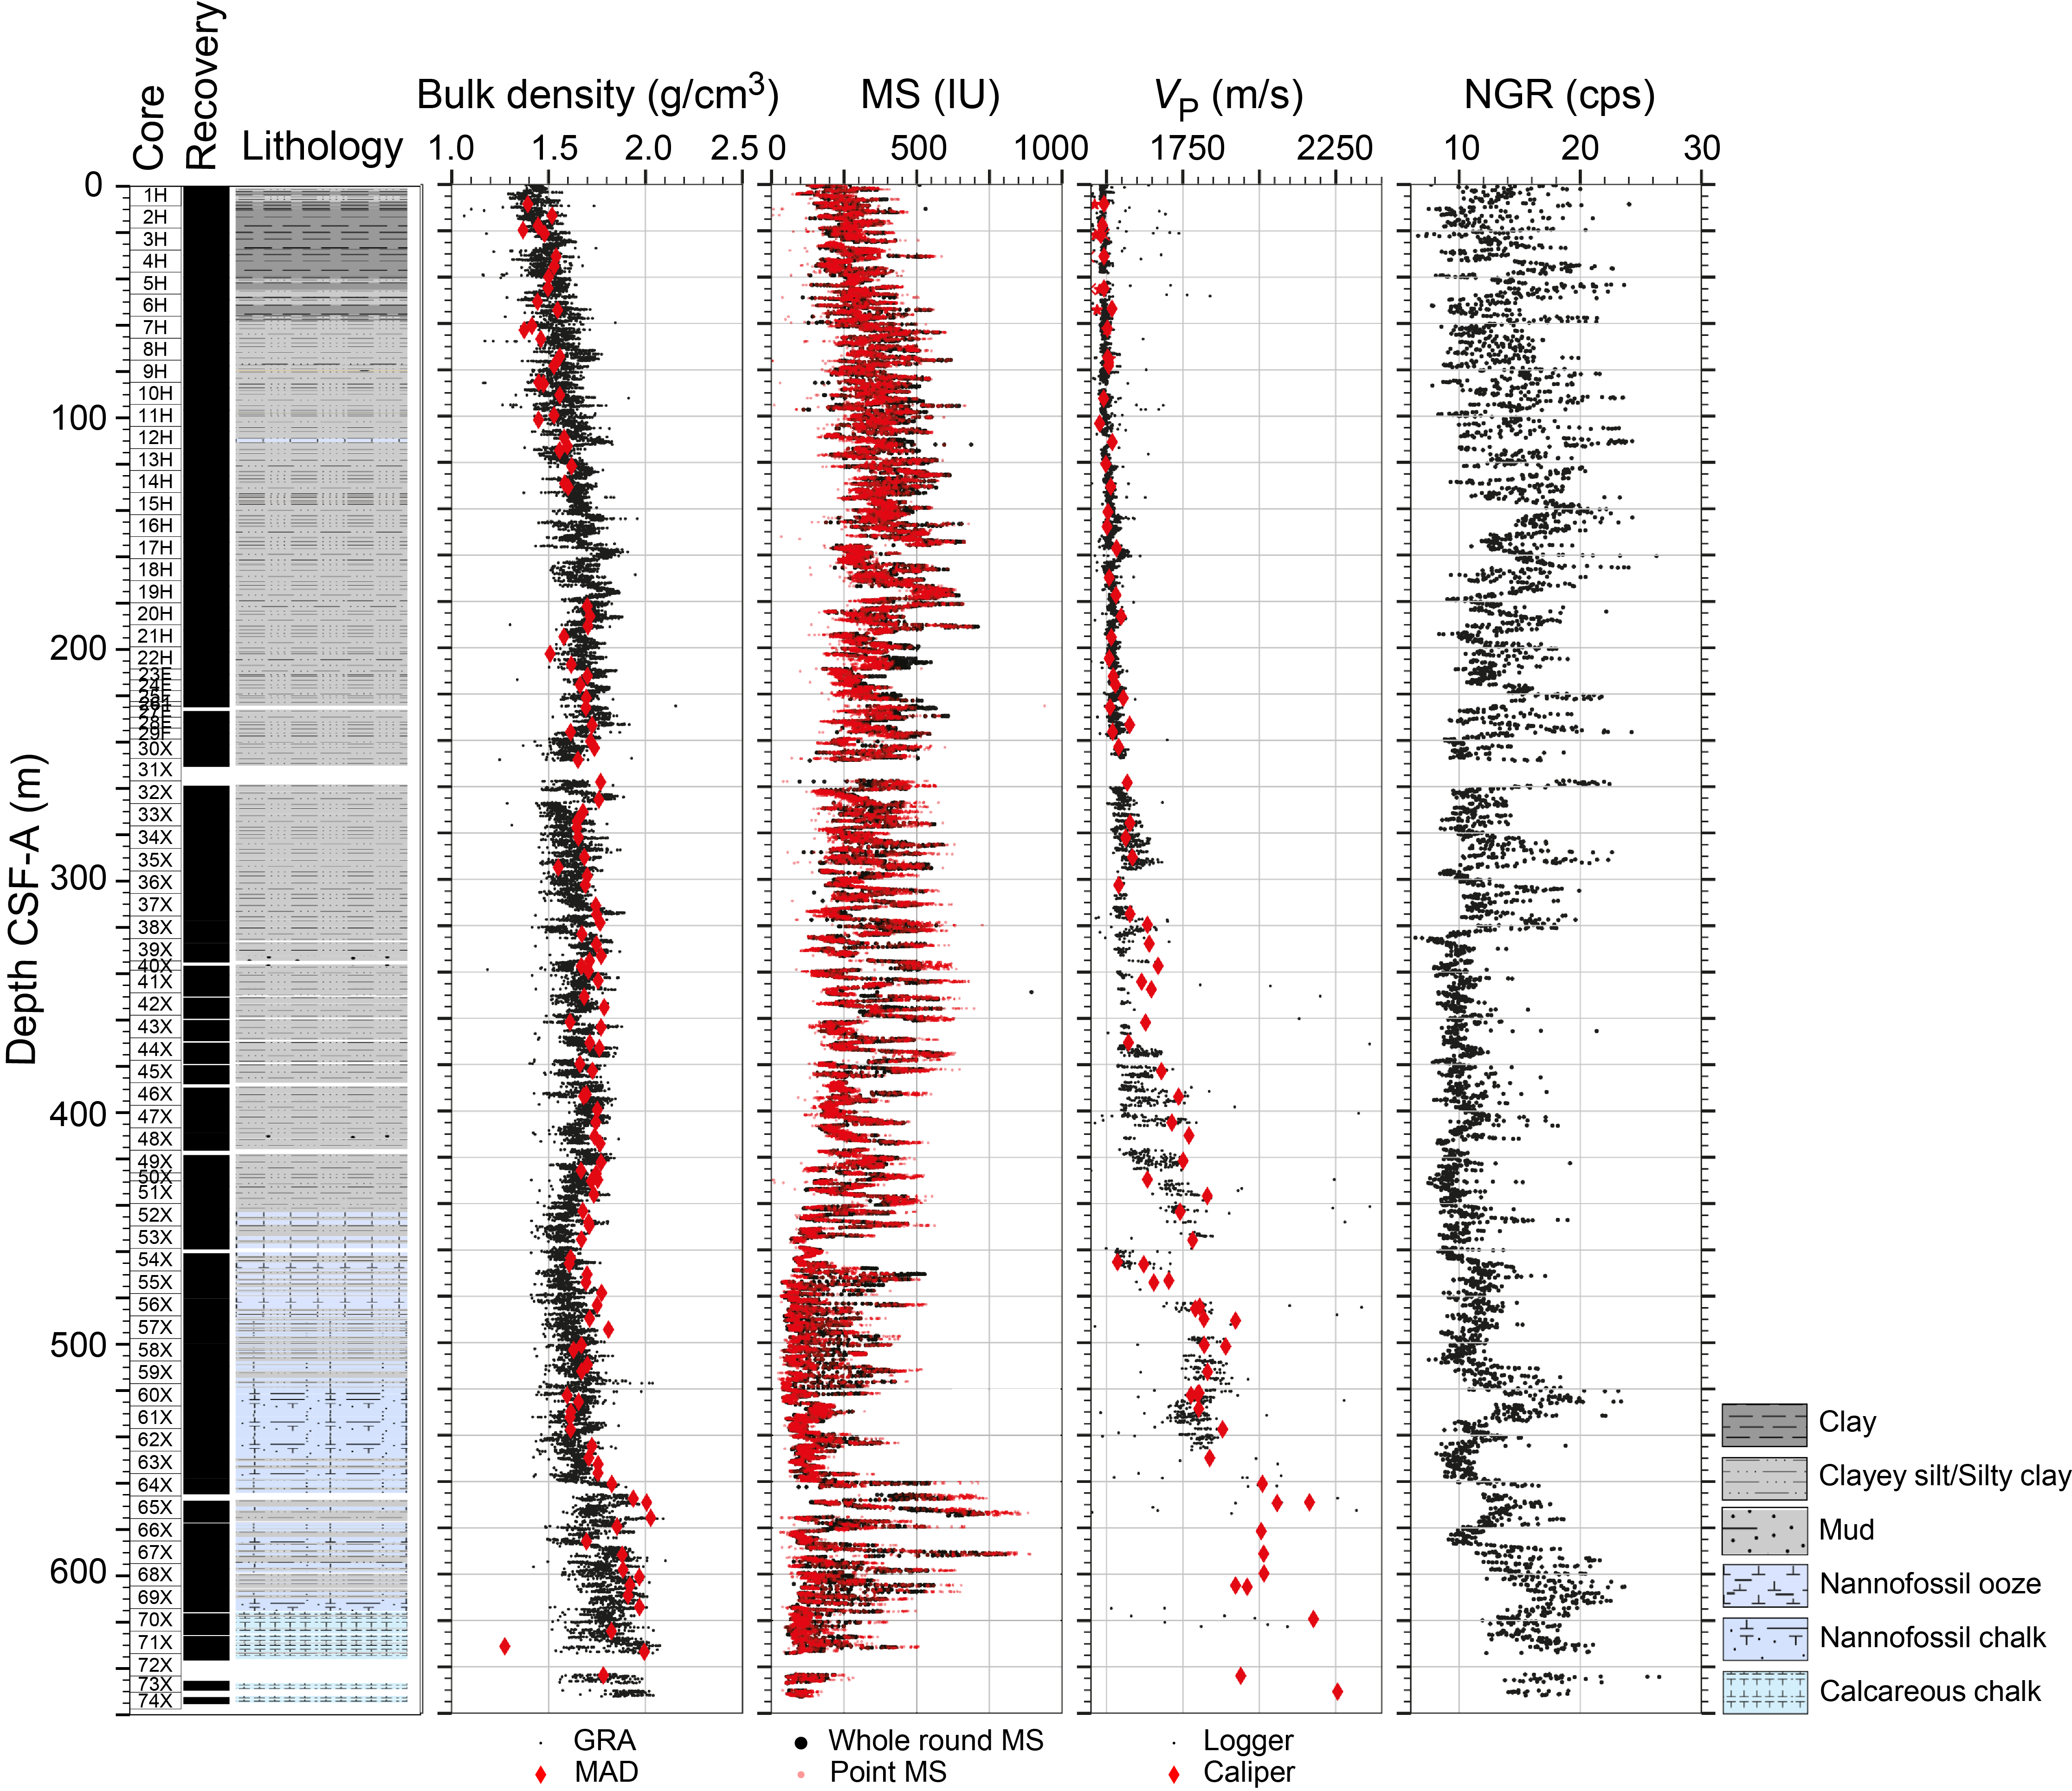
Figure F30. Physical properties measurements, Hole U1564D.
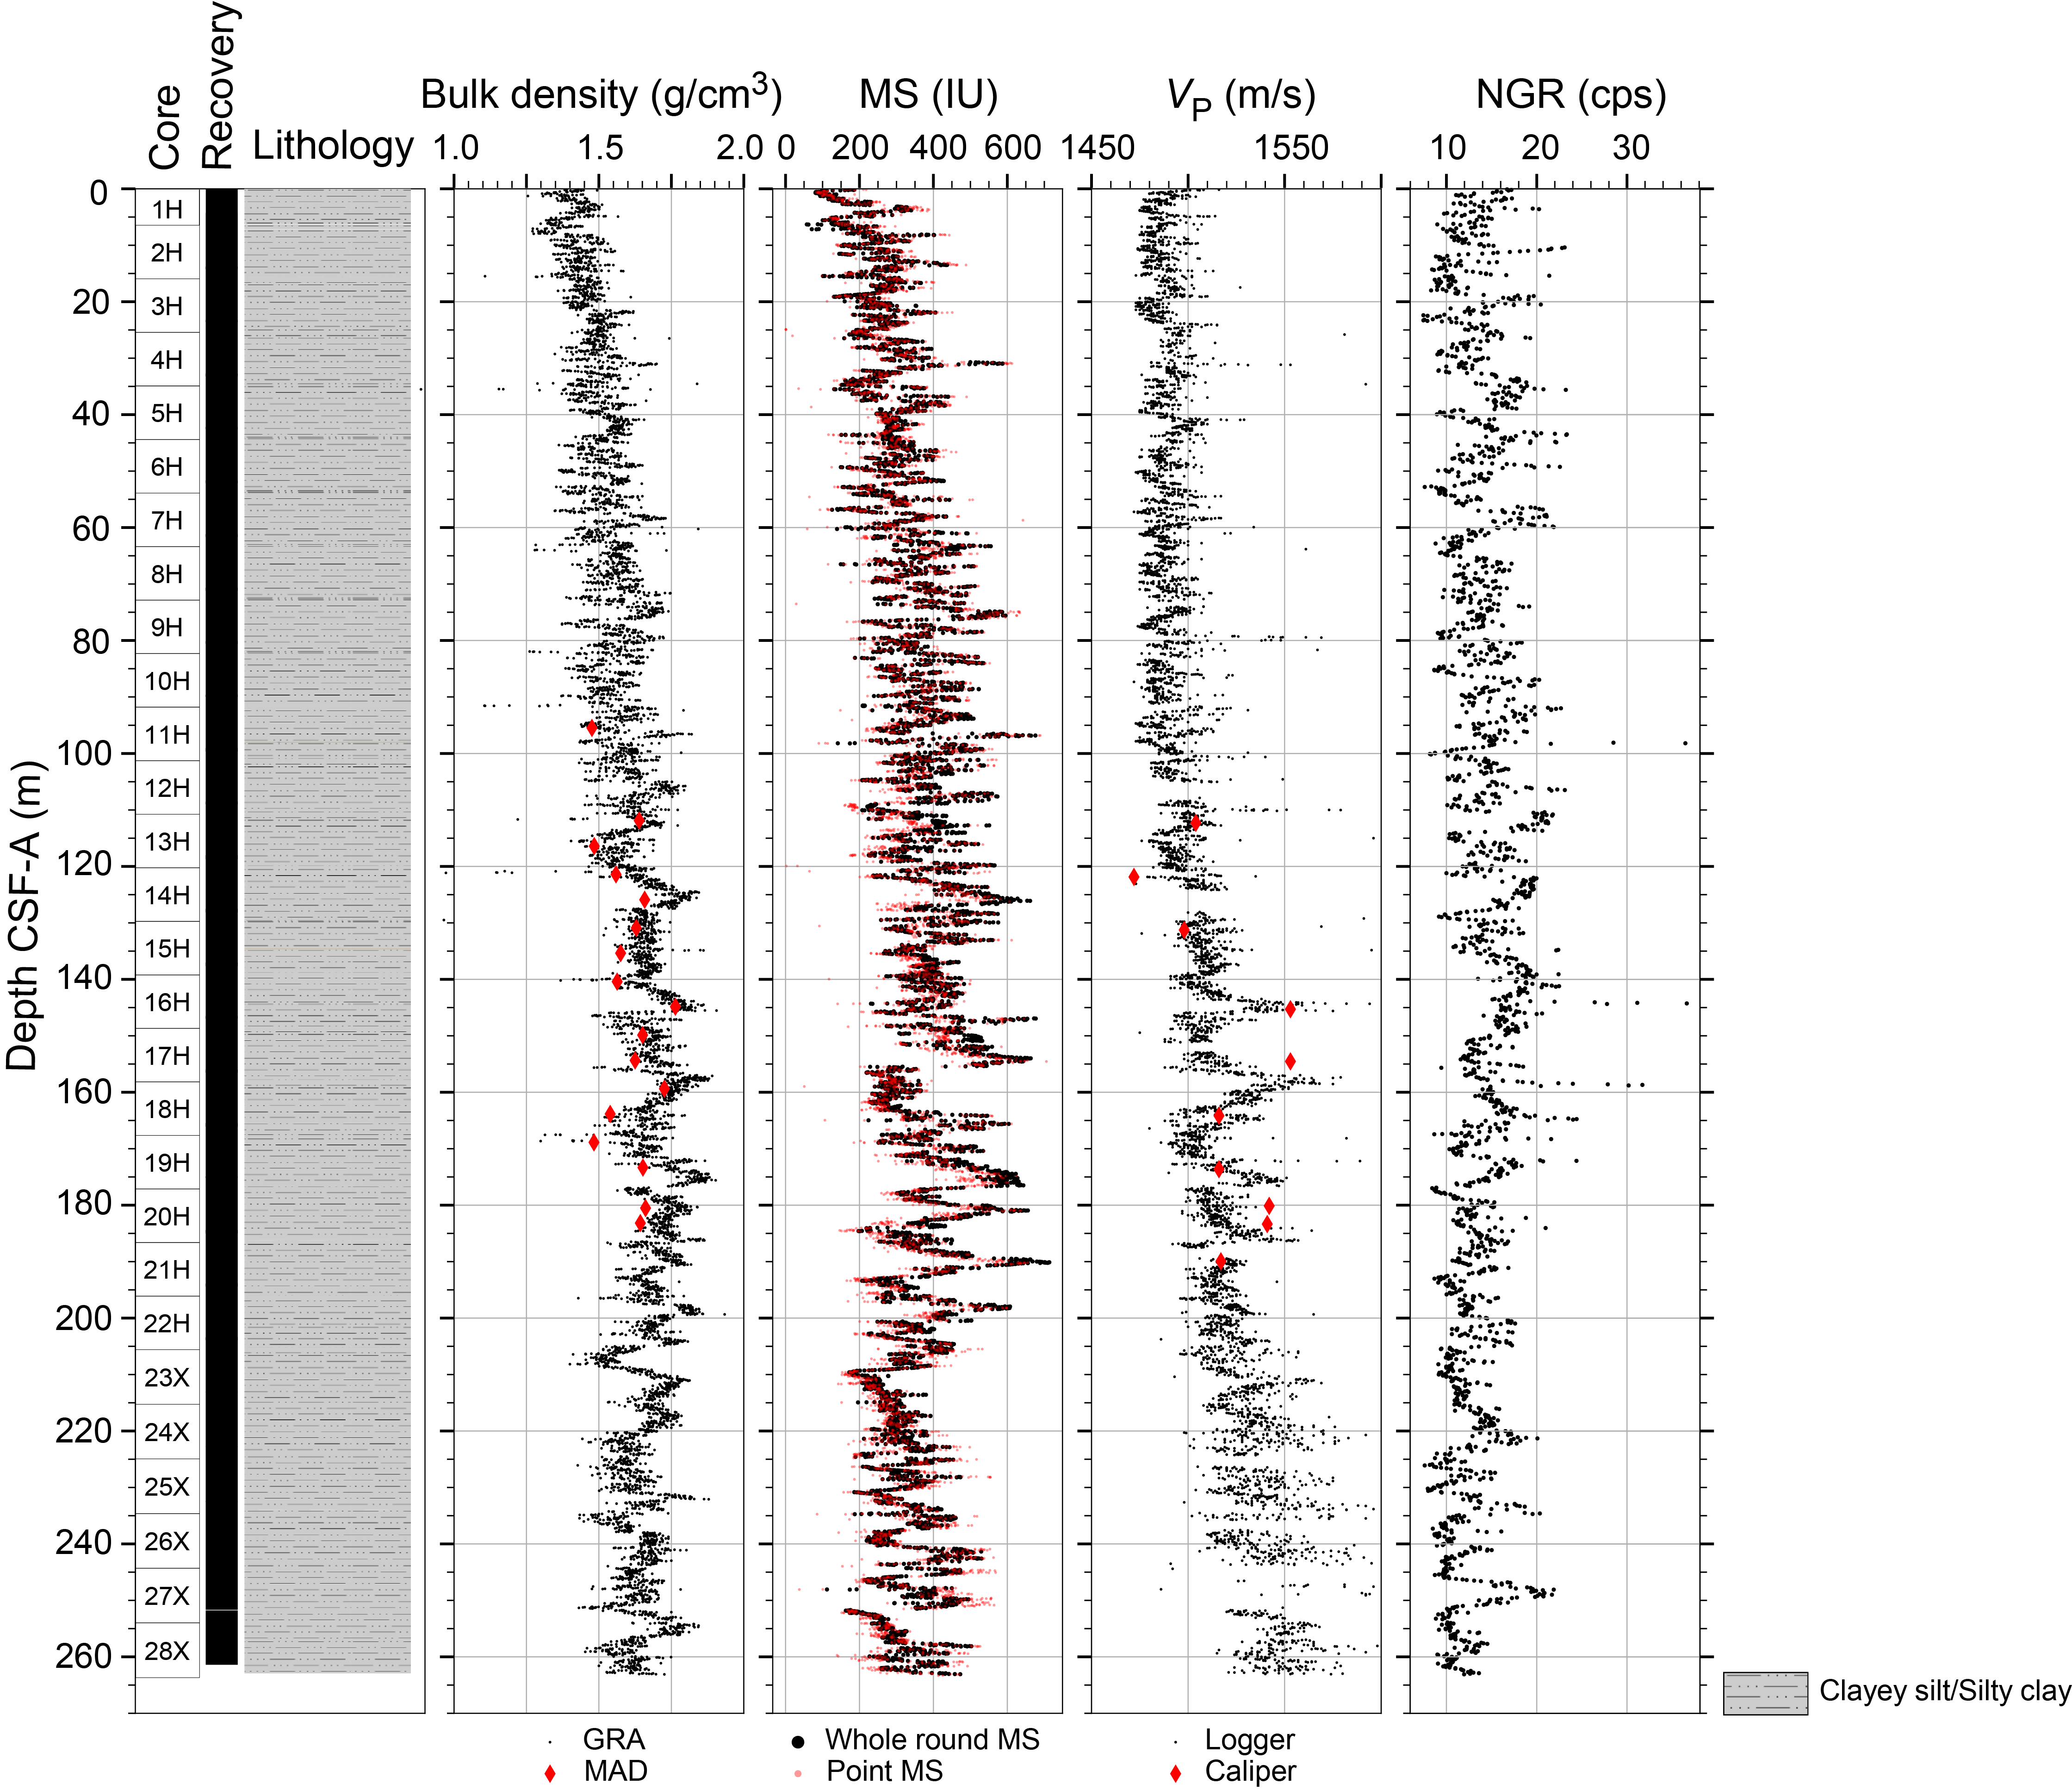
Figure F31. Physical properties measurements, Hole U1564E.
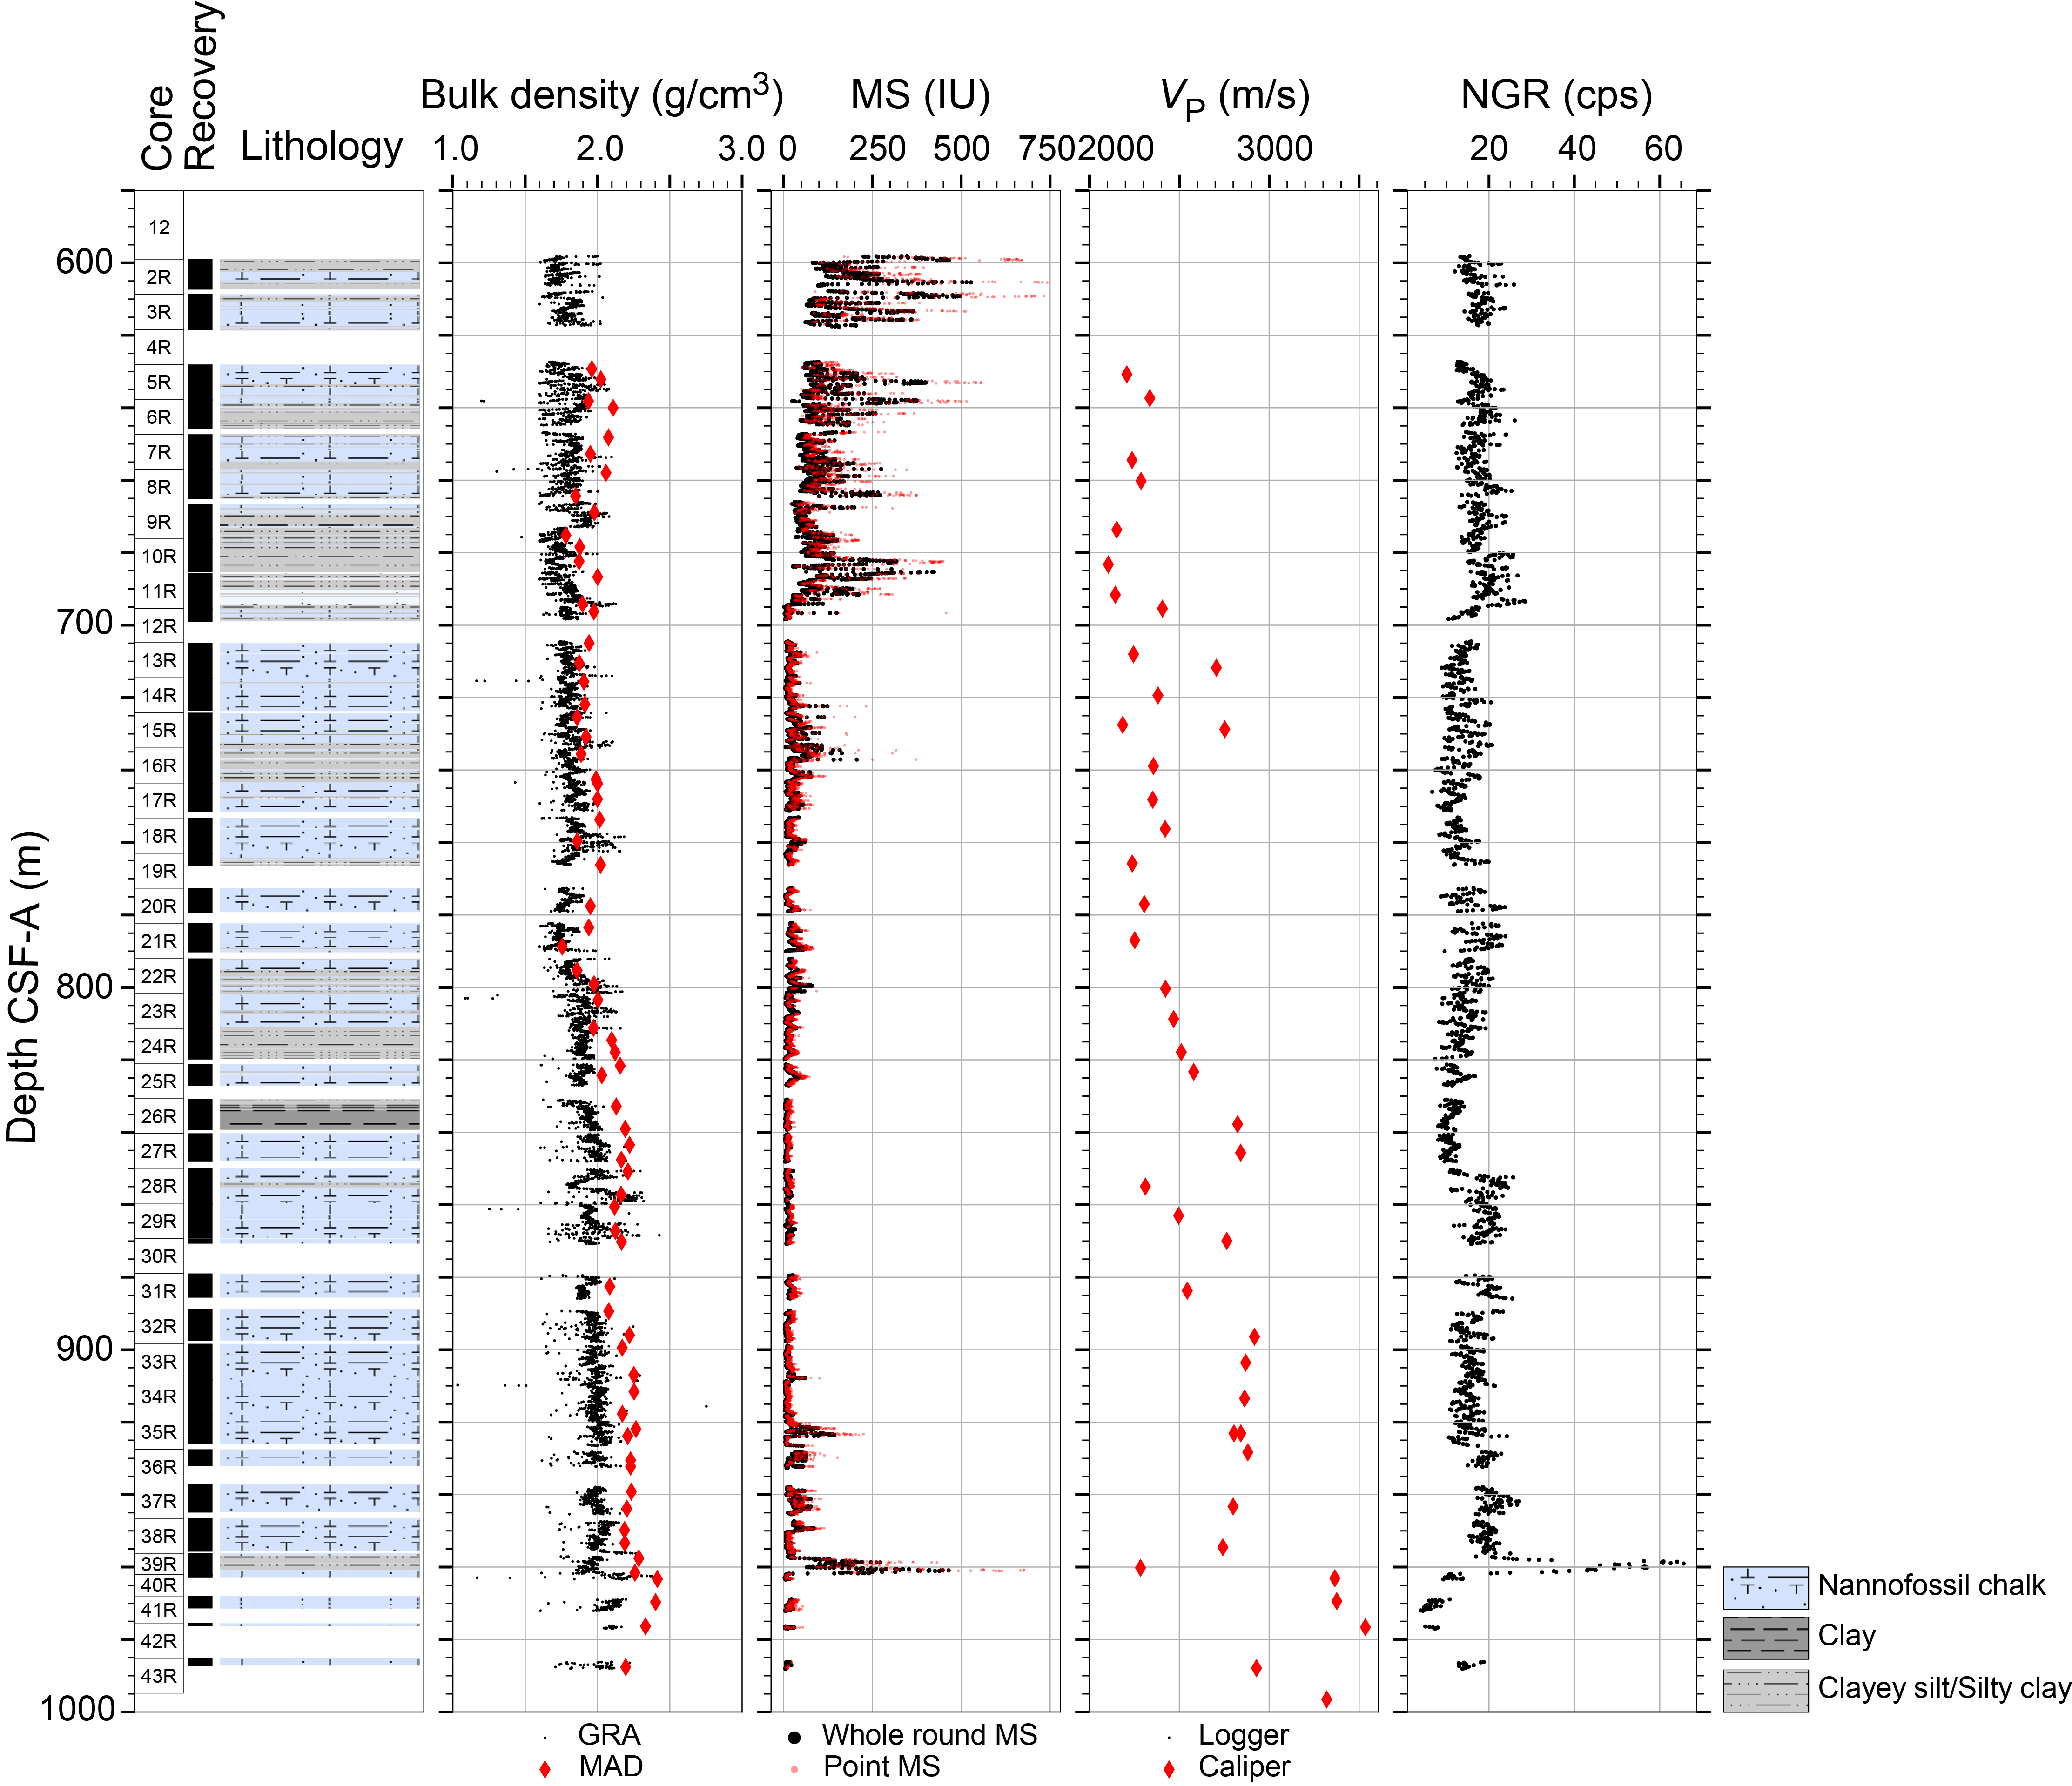
Figure F32. Physical properties measurements of the sedimentary section, Hole U1564F.
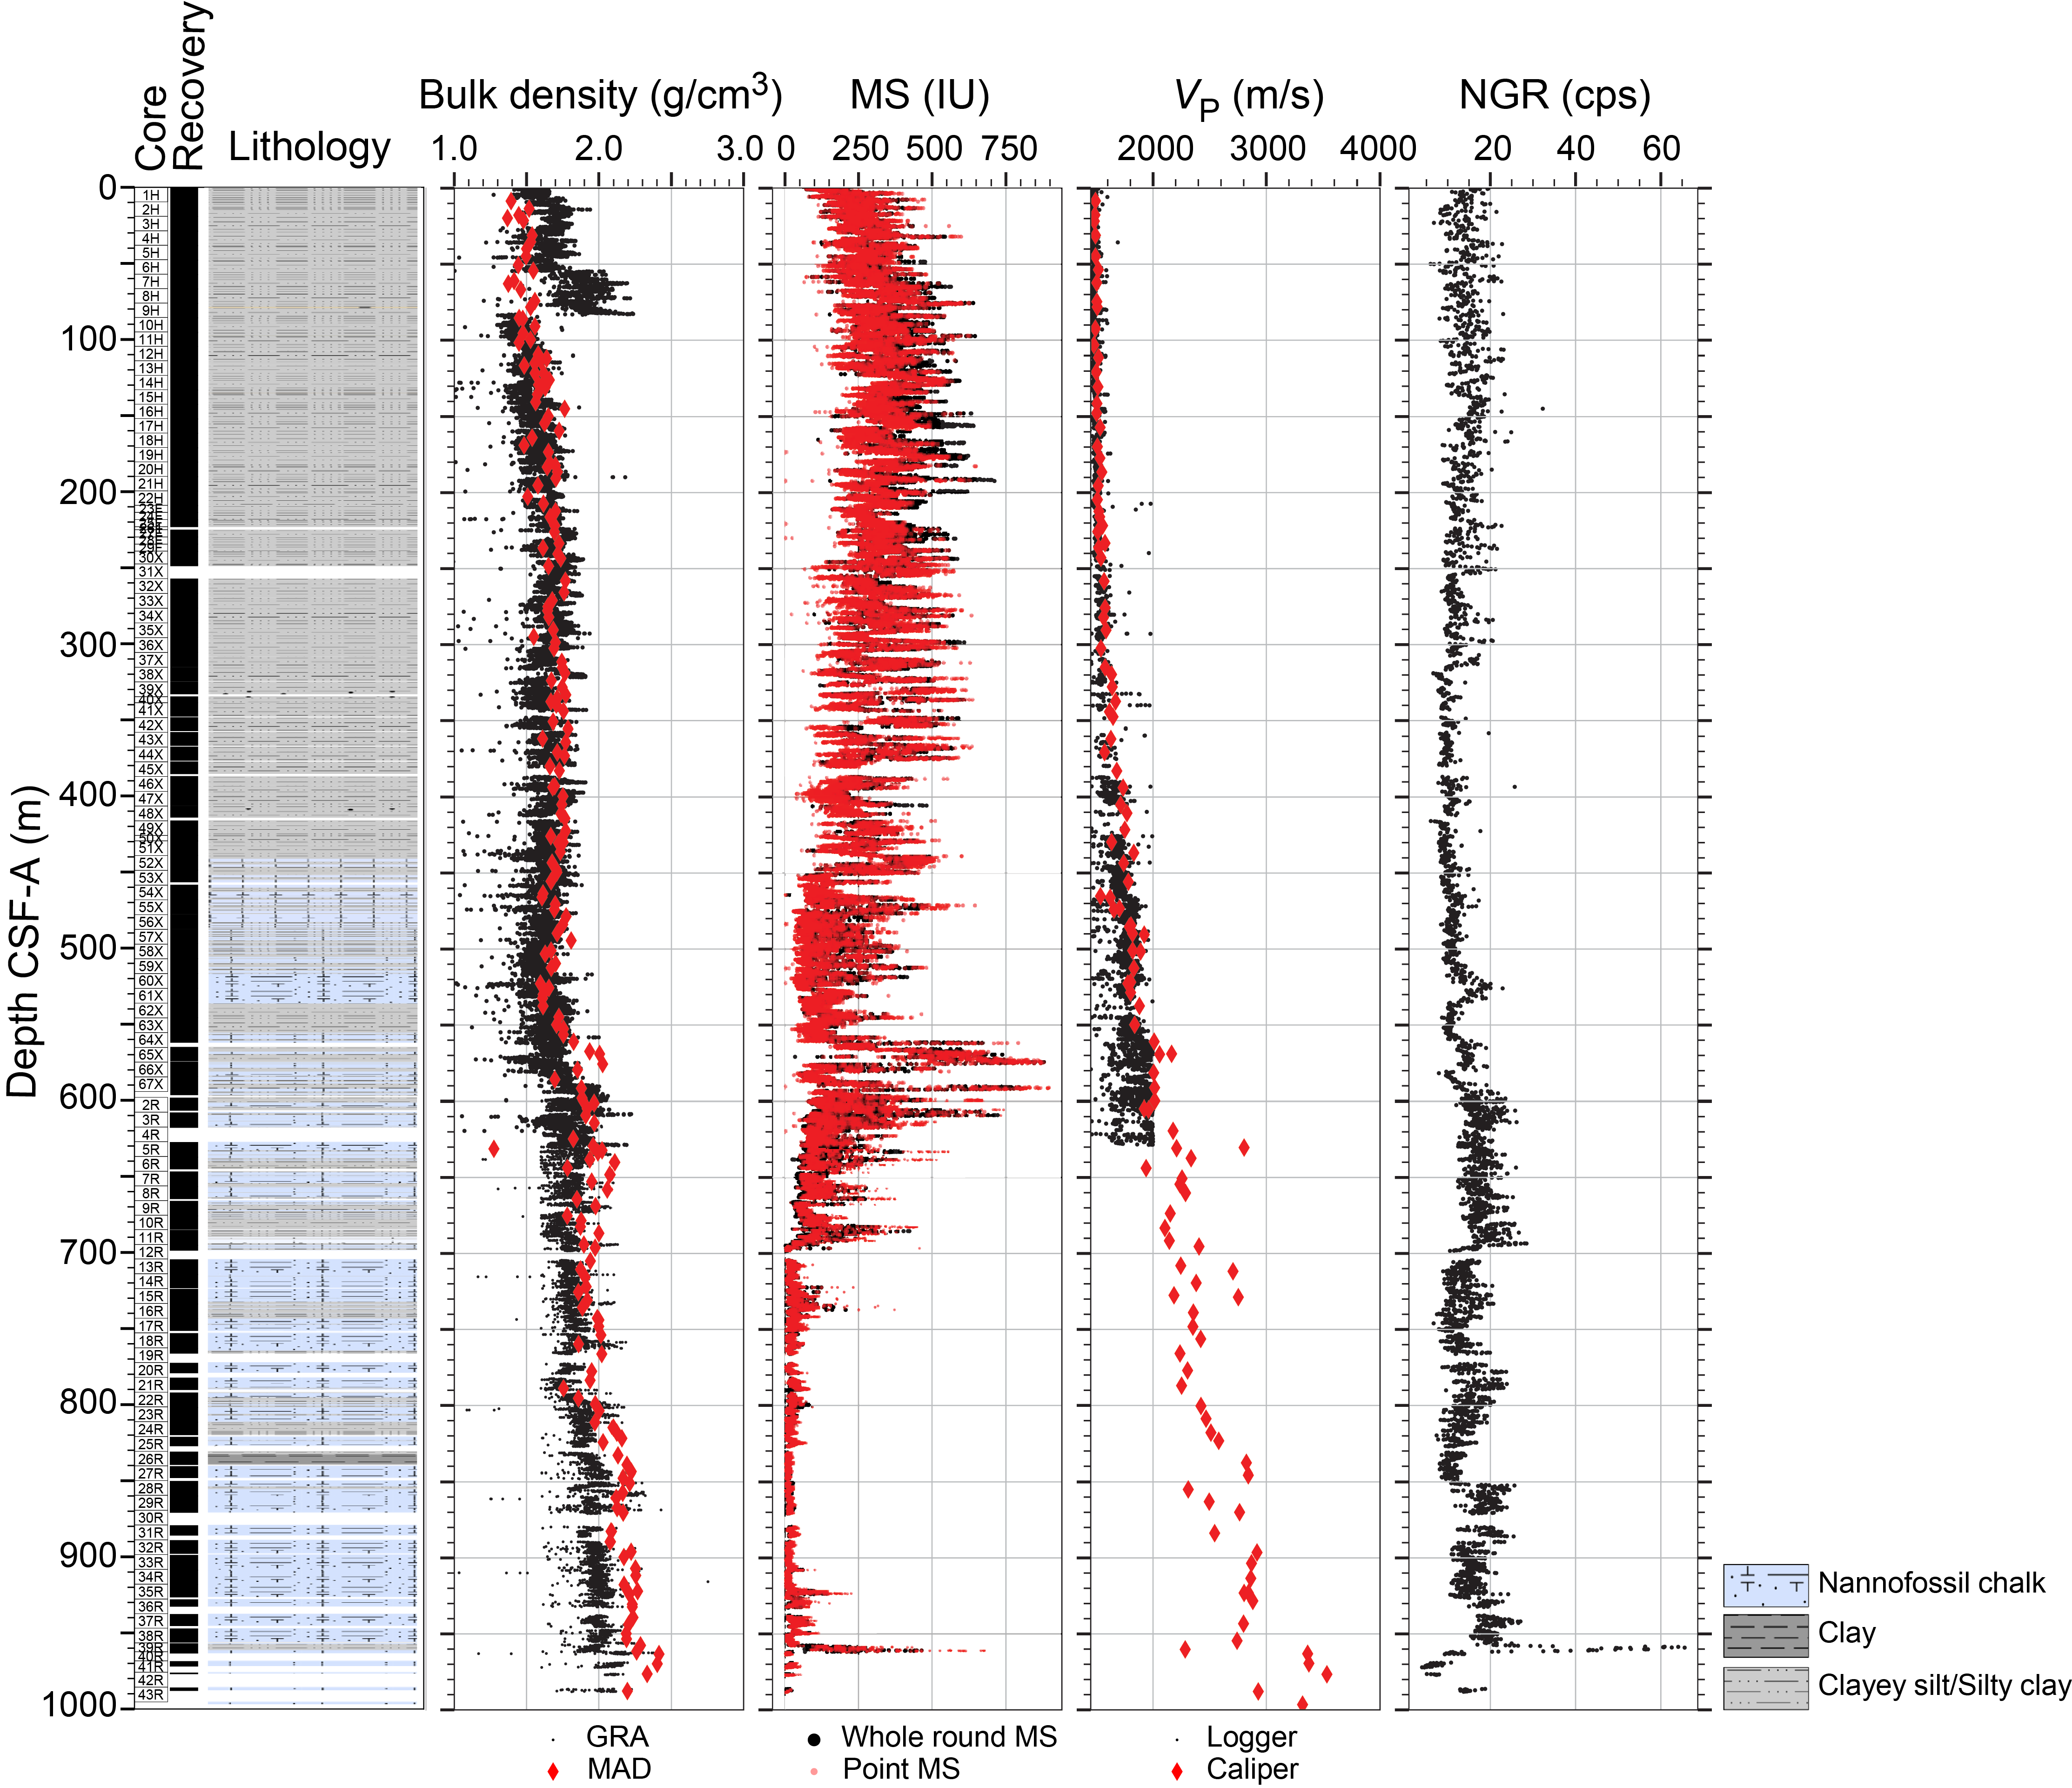
Figure F33. Physical properties measurement composite.
MS measurements in the shallow Hole U1564B vary between 50 and 450 IU with well-resolved cyclical excursions (Figure F34). Hole U1564E measurements show that cyclic excursions continue to dominate but that MS gradually increases with depth over a range of 260 m (Figure F31). Measurements from Holes U1564C and U1564D provide a useful and consistent picture of MS changes over the depth range of 0–650 m CSF-A (Figures F29, F30). In both cases, the MS at the top of the interval averages ~150 IU. There is then a gradual bow-shaped increase to ~250 IU and a decrease to below 200 IU at 380 m CSF-A. The remainder of each interval is punctuated by a series of excursions, the most notable of which occur at ~460 and 560 m CSF-A. These two excursions coincide with significant changes in density gradients and are consistent with logged lithologic variations (see Lithostratigraphy). In Hole U1564F, MS decreases to 700 m CSF-A, after which it stays consistently low to 920 m CSF-A (Figure F33). Below this depth, some higher peaks occur, including a more pronounced peak in MS at 960 m CSF-A.
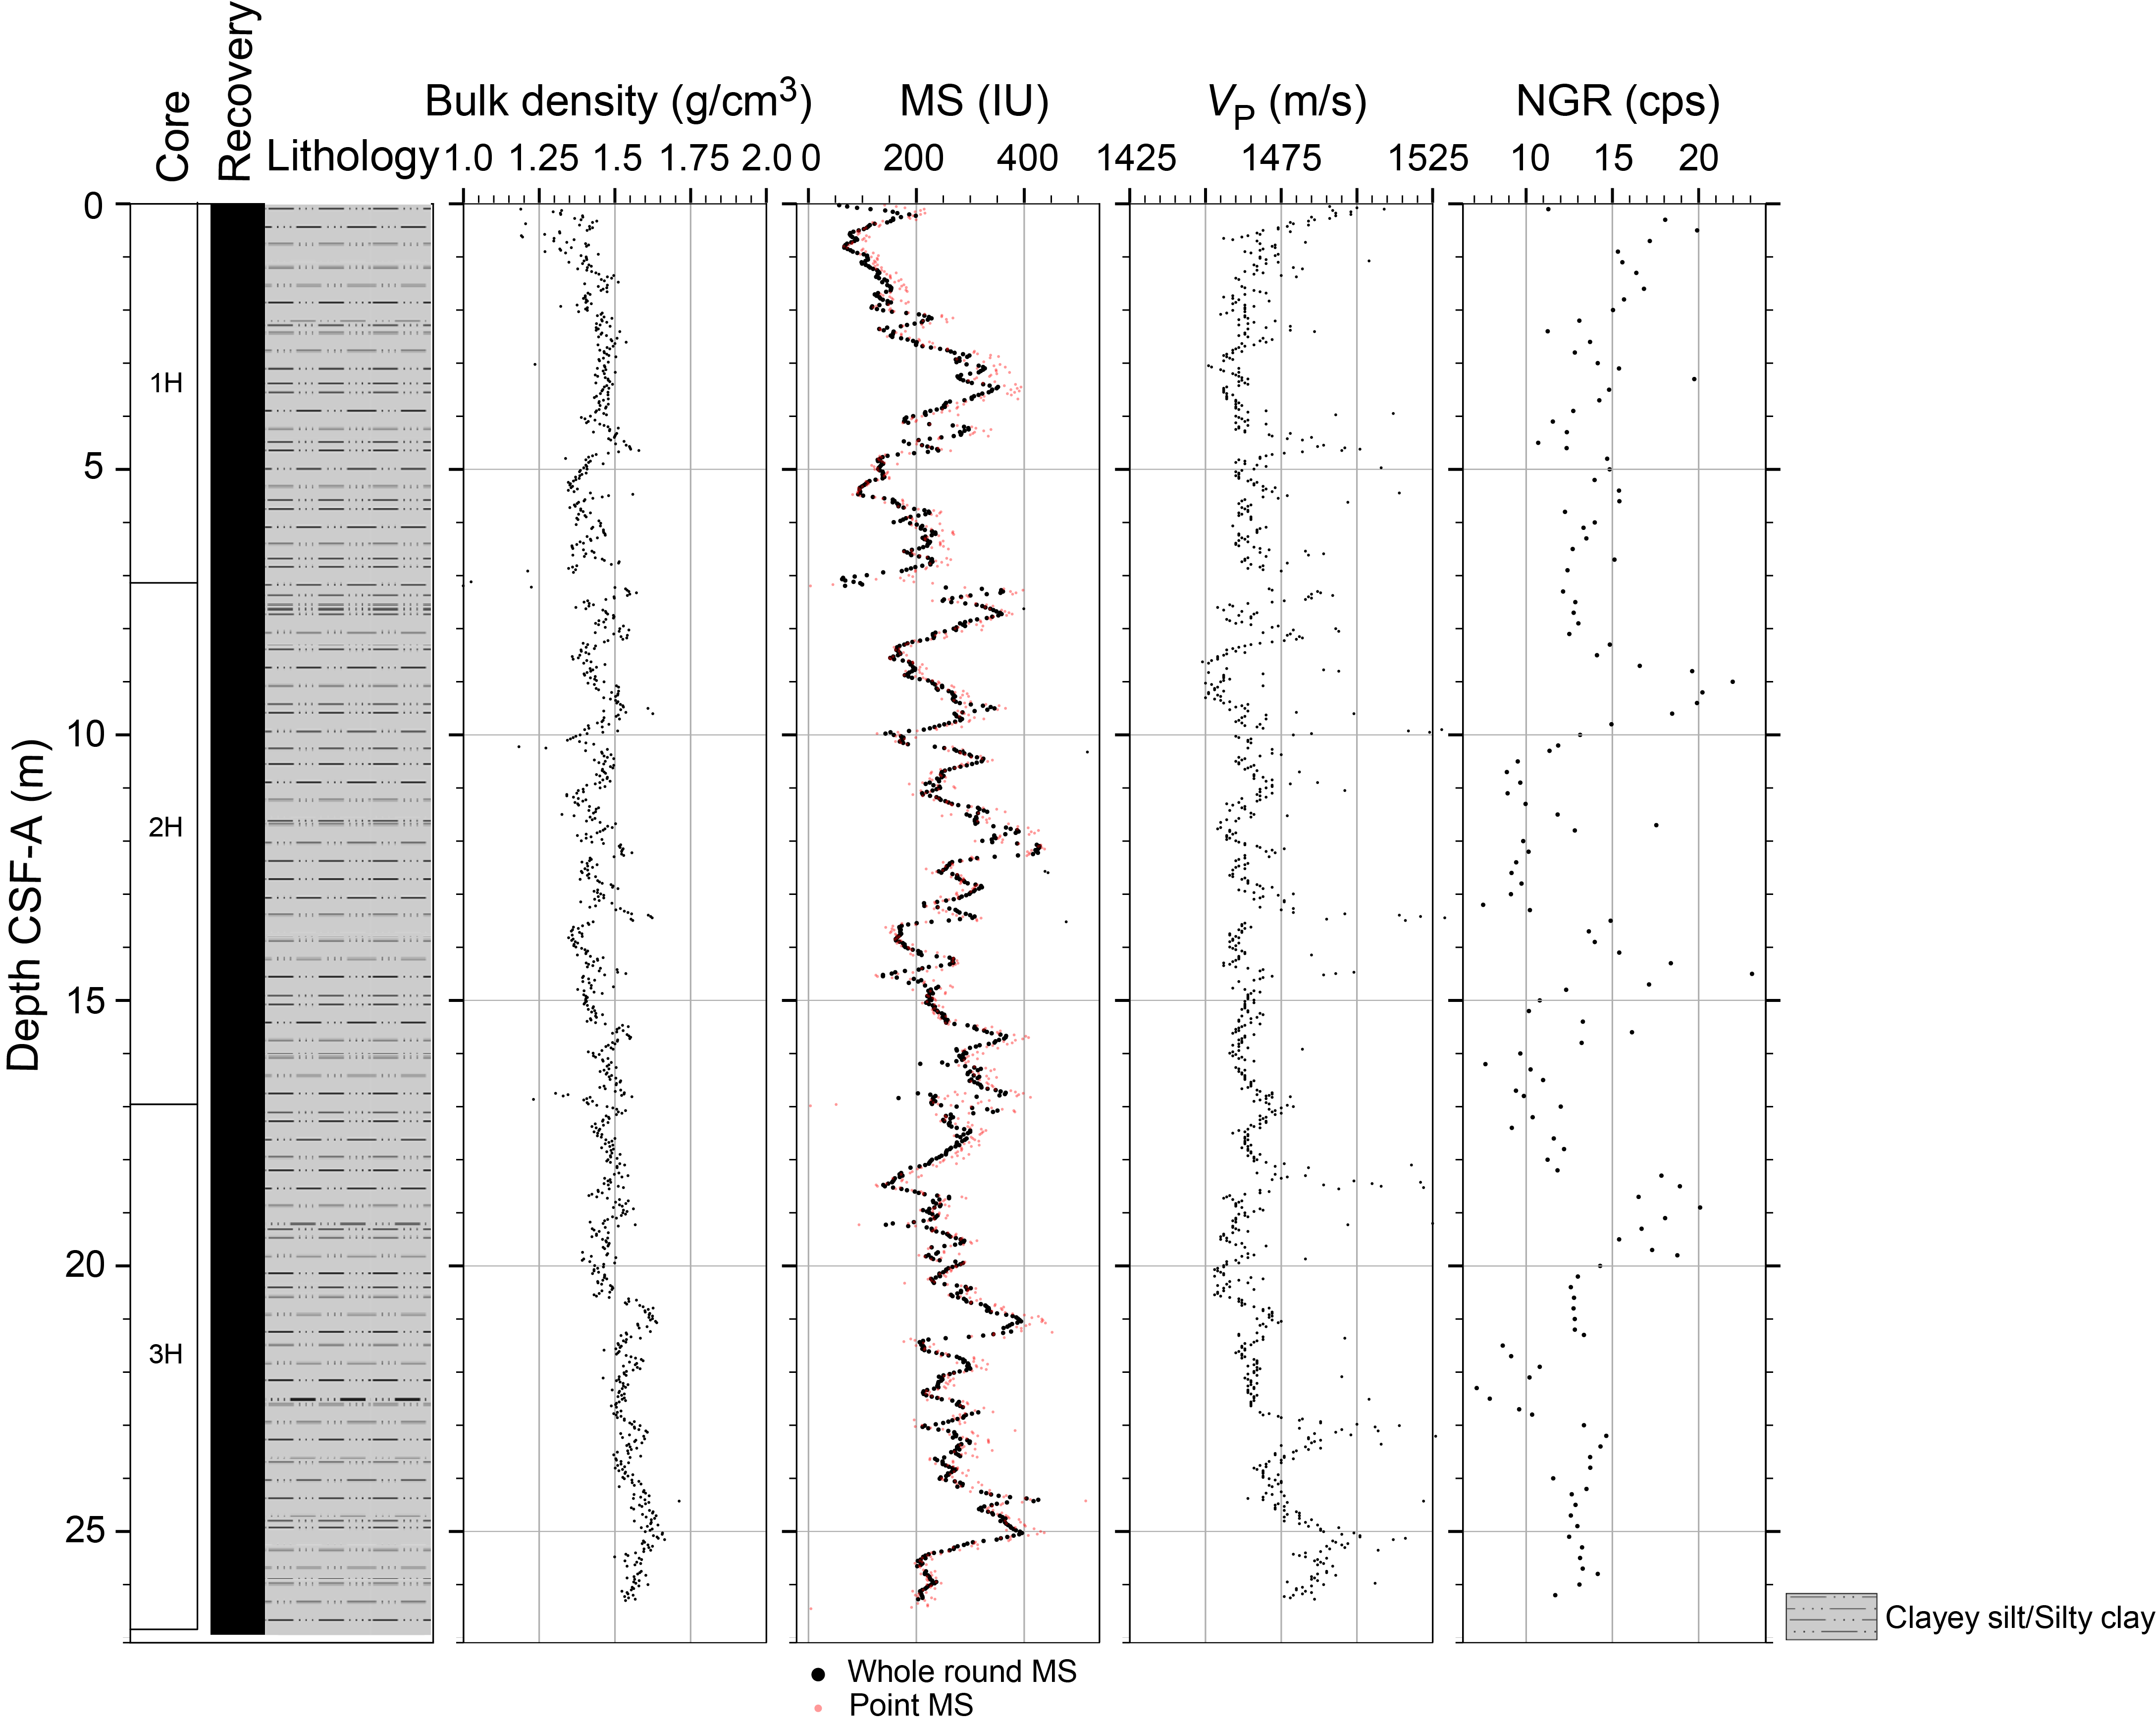
Figure F34. Physical properties measurements, Hole U1564B.
WRMSL VP measurements from all holes through the sedimentary succession show a consistent and gradual increase with depth from the surface to ~380 m CSF-A. WRMSL VP measurements were not collected in Hole U1564F because it was cored with the RCB system. The main exceptions to the generally increasing trend at shallow depths are a series of positive excursions from 140 to 260 m CSF-A that are most obvious in Hole U1564E (Figure F31). At greater depths, Holes U1564C and U1564D show significant increases in VP at ~380, ~480, and ~560 m CSF-A, which are broadly consistent with MS excursions (Figures F29, F30). These velocity increases could be caused by lithologic variations.
The NGR measurements for Holes U1564C and U1564D show a clear division at ~320 m CSF-A (Figures F29, F30). From the surface to this depth, both NGR profiles are characterized by 5–10 m long cycles with amplitudes of at least ±5 counts/s. Below ~320 m CSF-A, NGR variations are considerably damped (±2 counts/s). Below 500 m CSF-A, similar long period (50 m) variations are visible in both holes. Low NGR approximately coincides with low VP and MS. These NGR patterns near the bottom of Holes U1564C and U1564D are broadly consistent with the presence and absence of carbonate lithologies determined from sedimentary logging and carbonate analyses (see Lithostratigraphy and Geochemistry and microbiology). For example, carbonate-rich horizons with reduced terrigenous fractions at 540–560, 580, and 620 m CSF-A negatively correlate with NGR measurements. Similar correlations are apparent in Holes U1564B and U1564E (Figures F31, F34). NGR in Hole U1564F varies typically between 10 and 20 counts/s, with the exception of a pronounced excursion at 960 m CSF-A that shows values reaching as high as 70 counts/s (Figures F32, F35). Several stepwise transitions occur around 700, 850, and 960 m CSF-A.
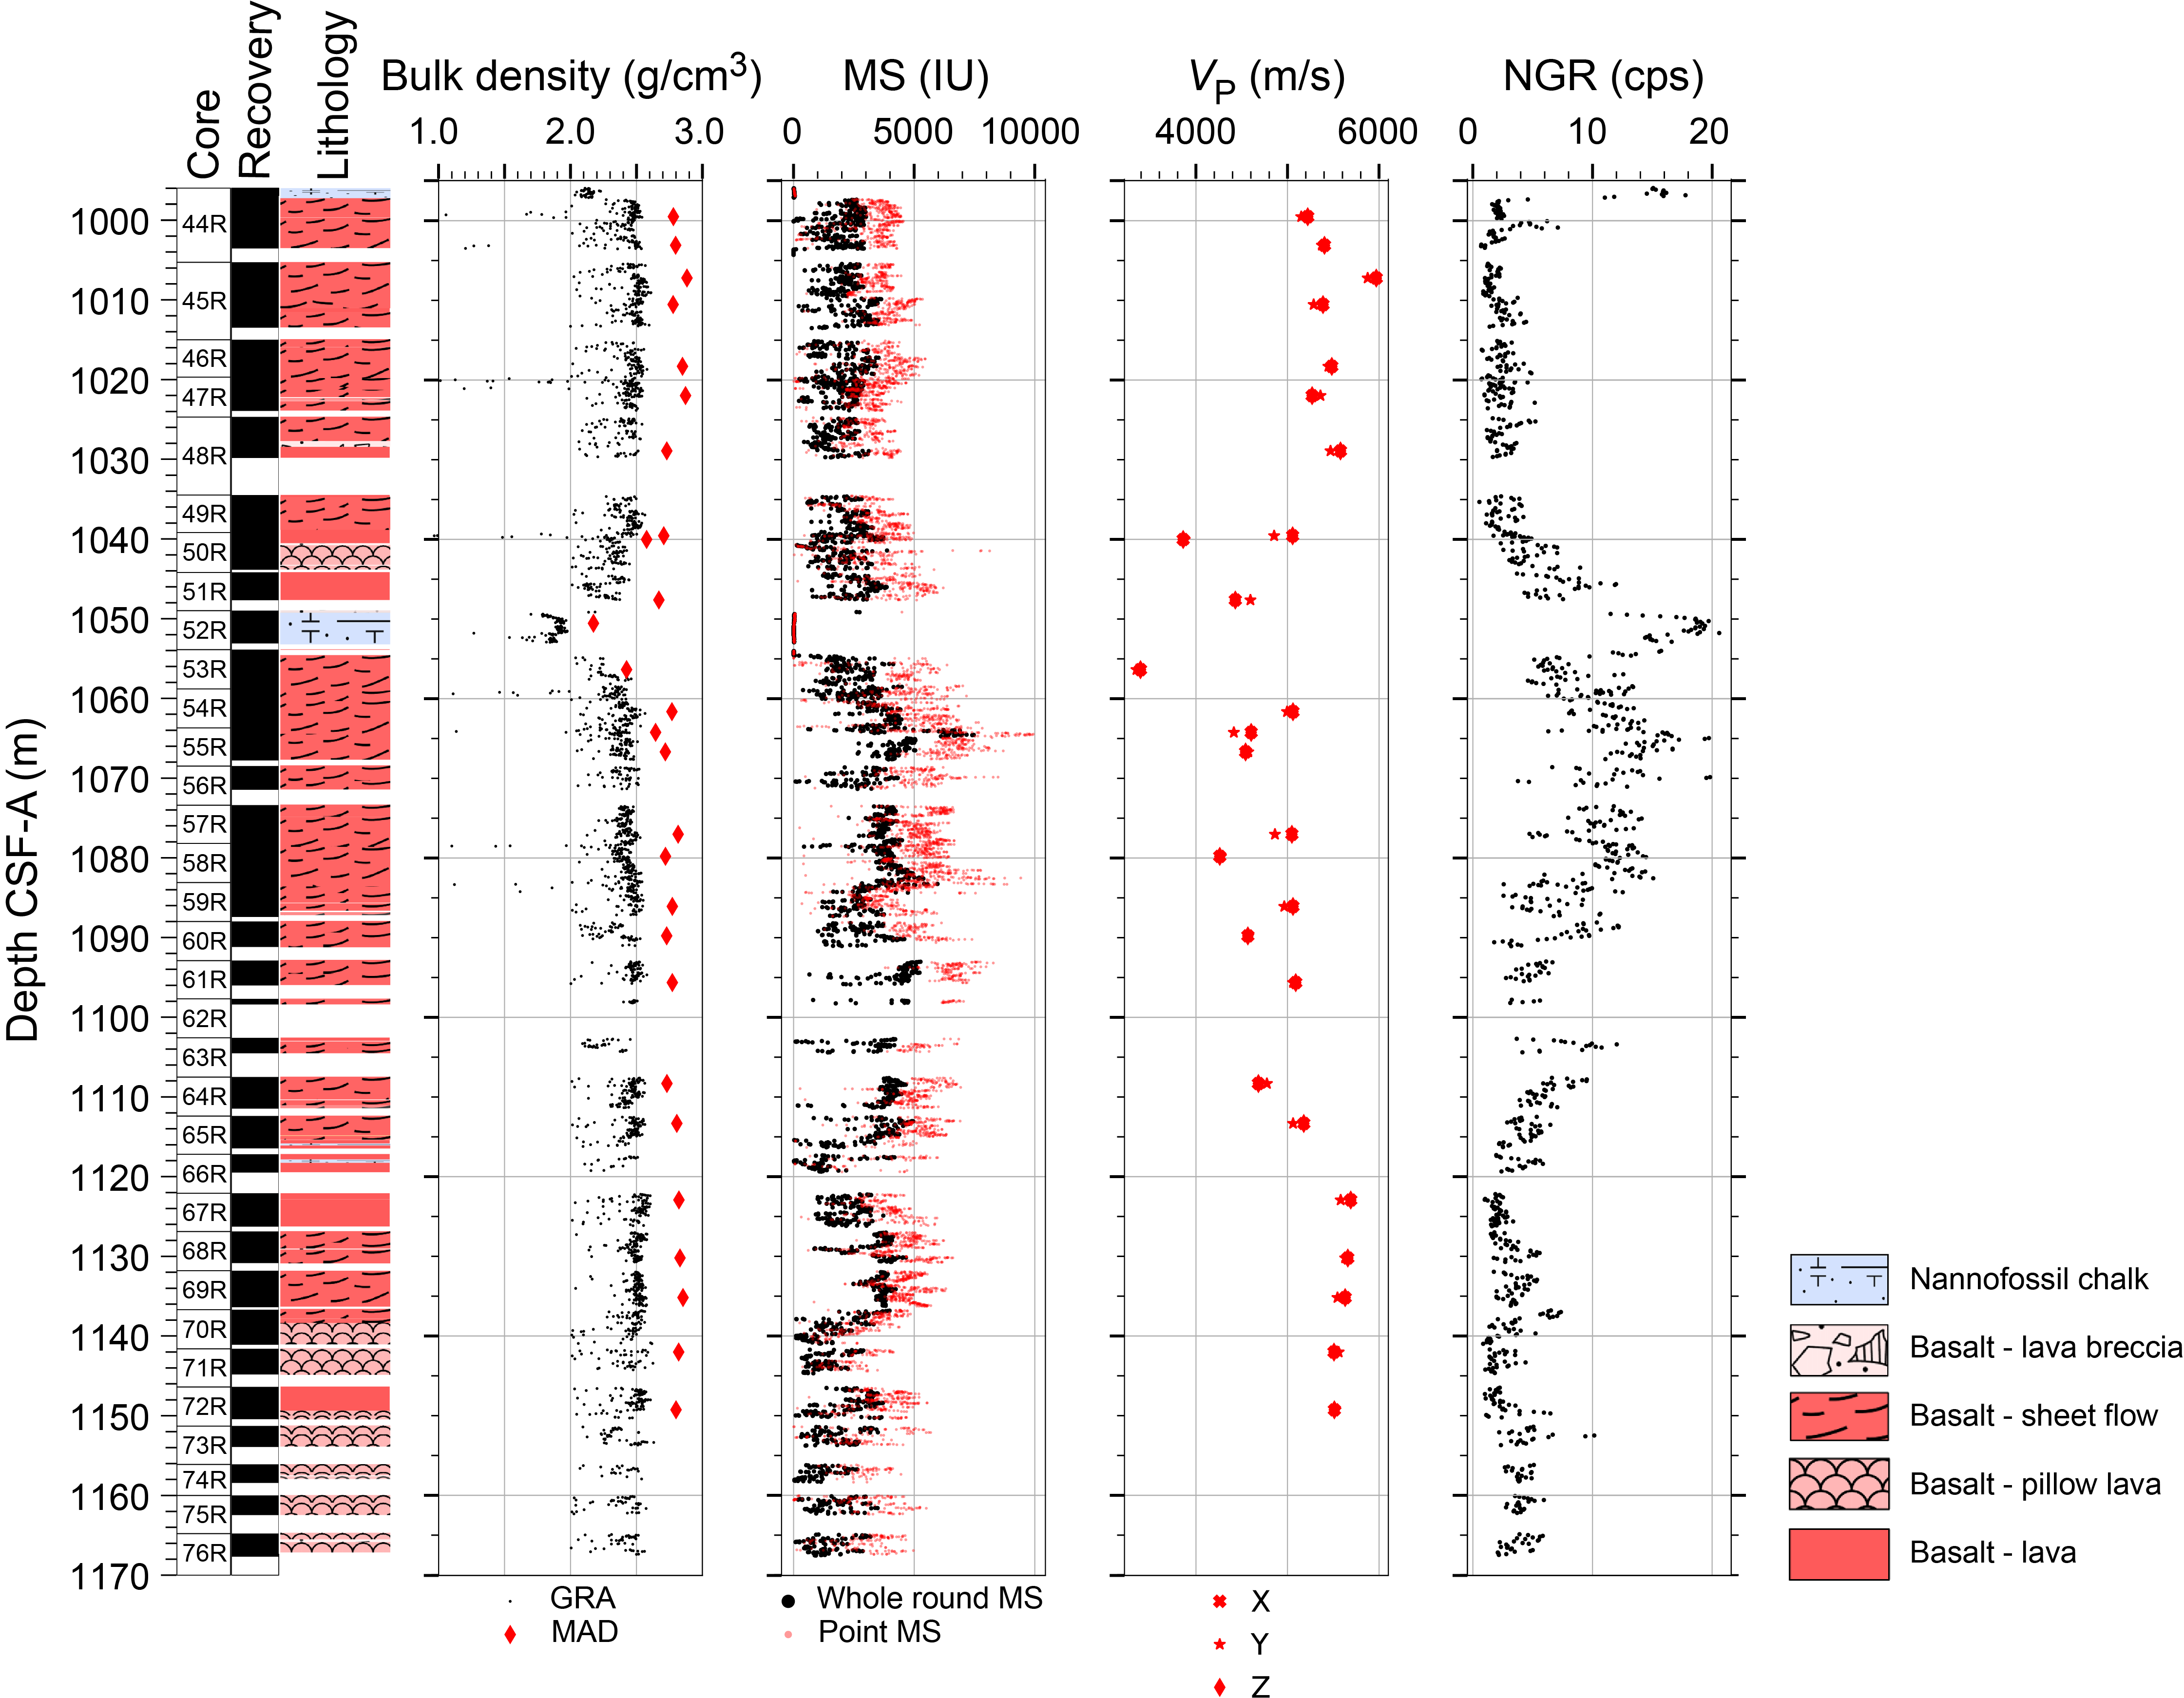
Figure F35. Physical properties measurements of the basement rock section, Hole U1564F.
Basement material in Core 395-U1564F-44R has GRA bulk density measurements that average around 2.5 g/cm3, which is lower than the MAD-derived densities of the recovered core due to the incomplete fill of the liner (Figure F35). Intercalated sediments (e.g., Core 52R) show a density of 1.8 g/cm3. MS from the WRMSL is slightly lower than point MS (MSP) measured on the Section Half Multisensor Logger (SHMSL) but shows very similar trends with higher values (up to 5000 IU) in areas of higher densities. The intercalated sediment layers show MS below 10 IU comparable to the sedimentary strata close to the sediment/basement interface. NGR counts are reduced in comparison to the sediments (below 10 counts/s), but between 1040 and 1090 m CSF-A increased values as high as 20 counts/s are observed.
7.2. Section-half measurements
Section-half reflectance and colorimetry measurements were carried out on all archive halves using the SHMSL and Section Half Imaging Logger (SHIL). These measurements are summarized in Figures F36, F37, F38, F39, F40, F41, and F42 (MSP is displayed on the relevant WRMSL diagrams).
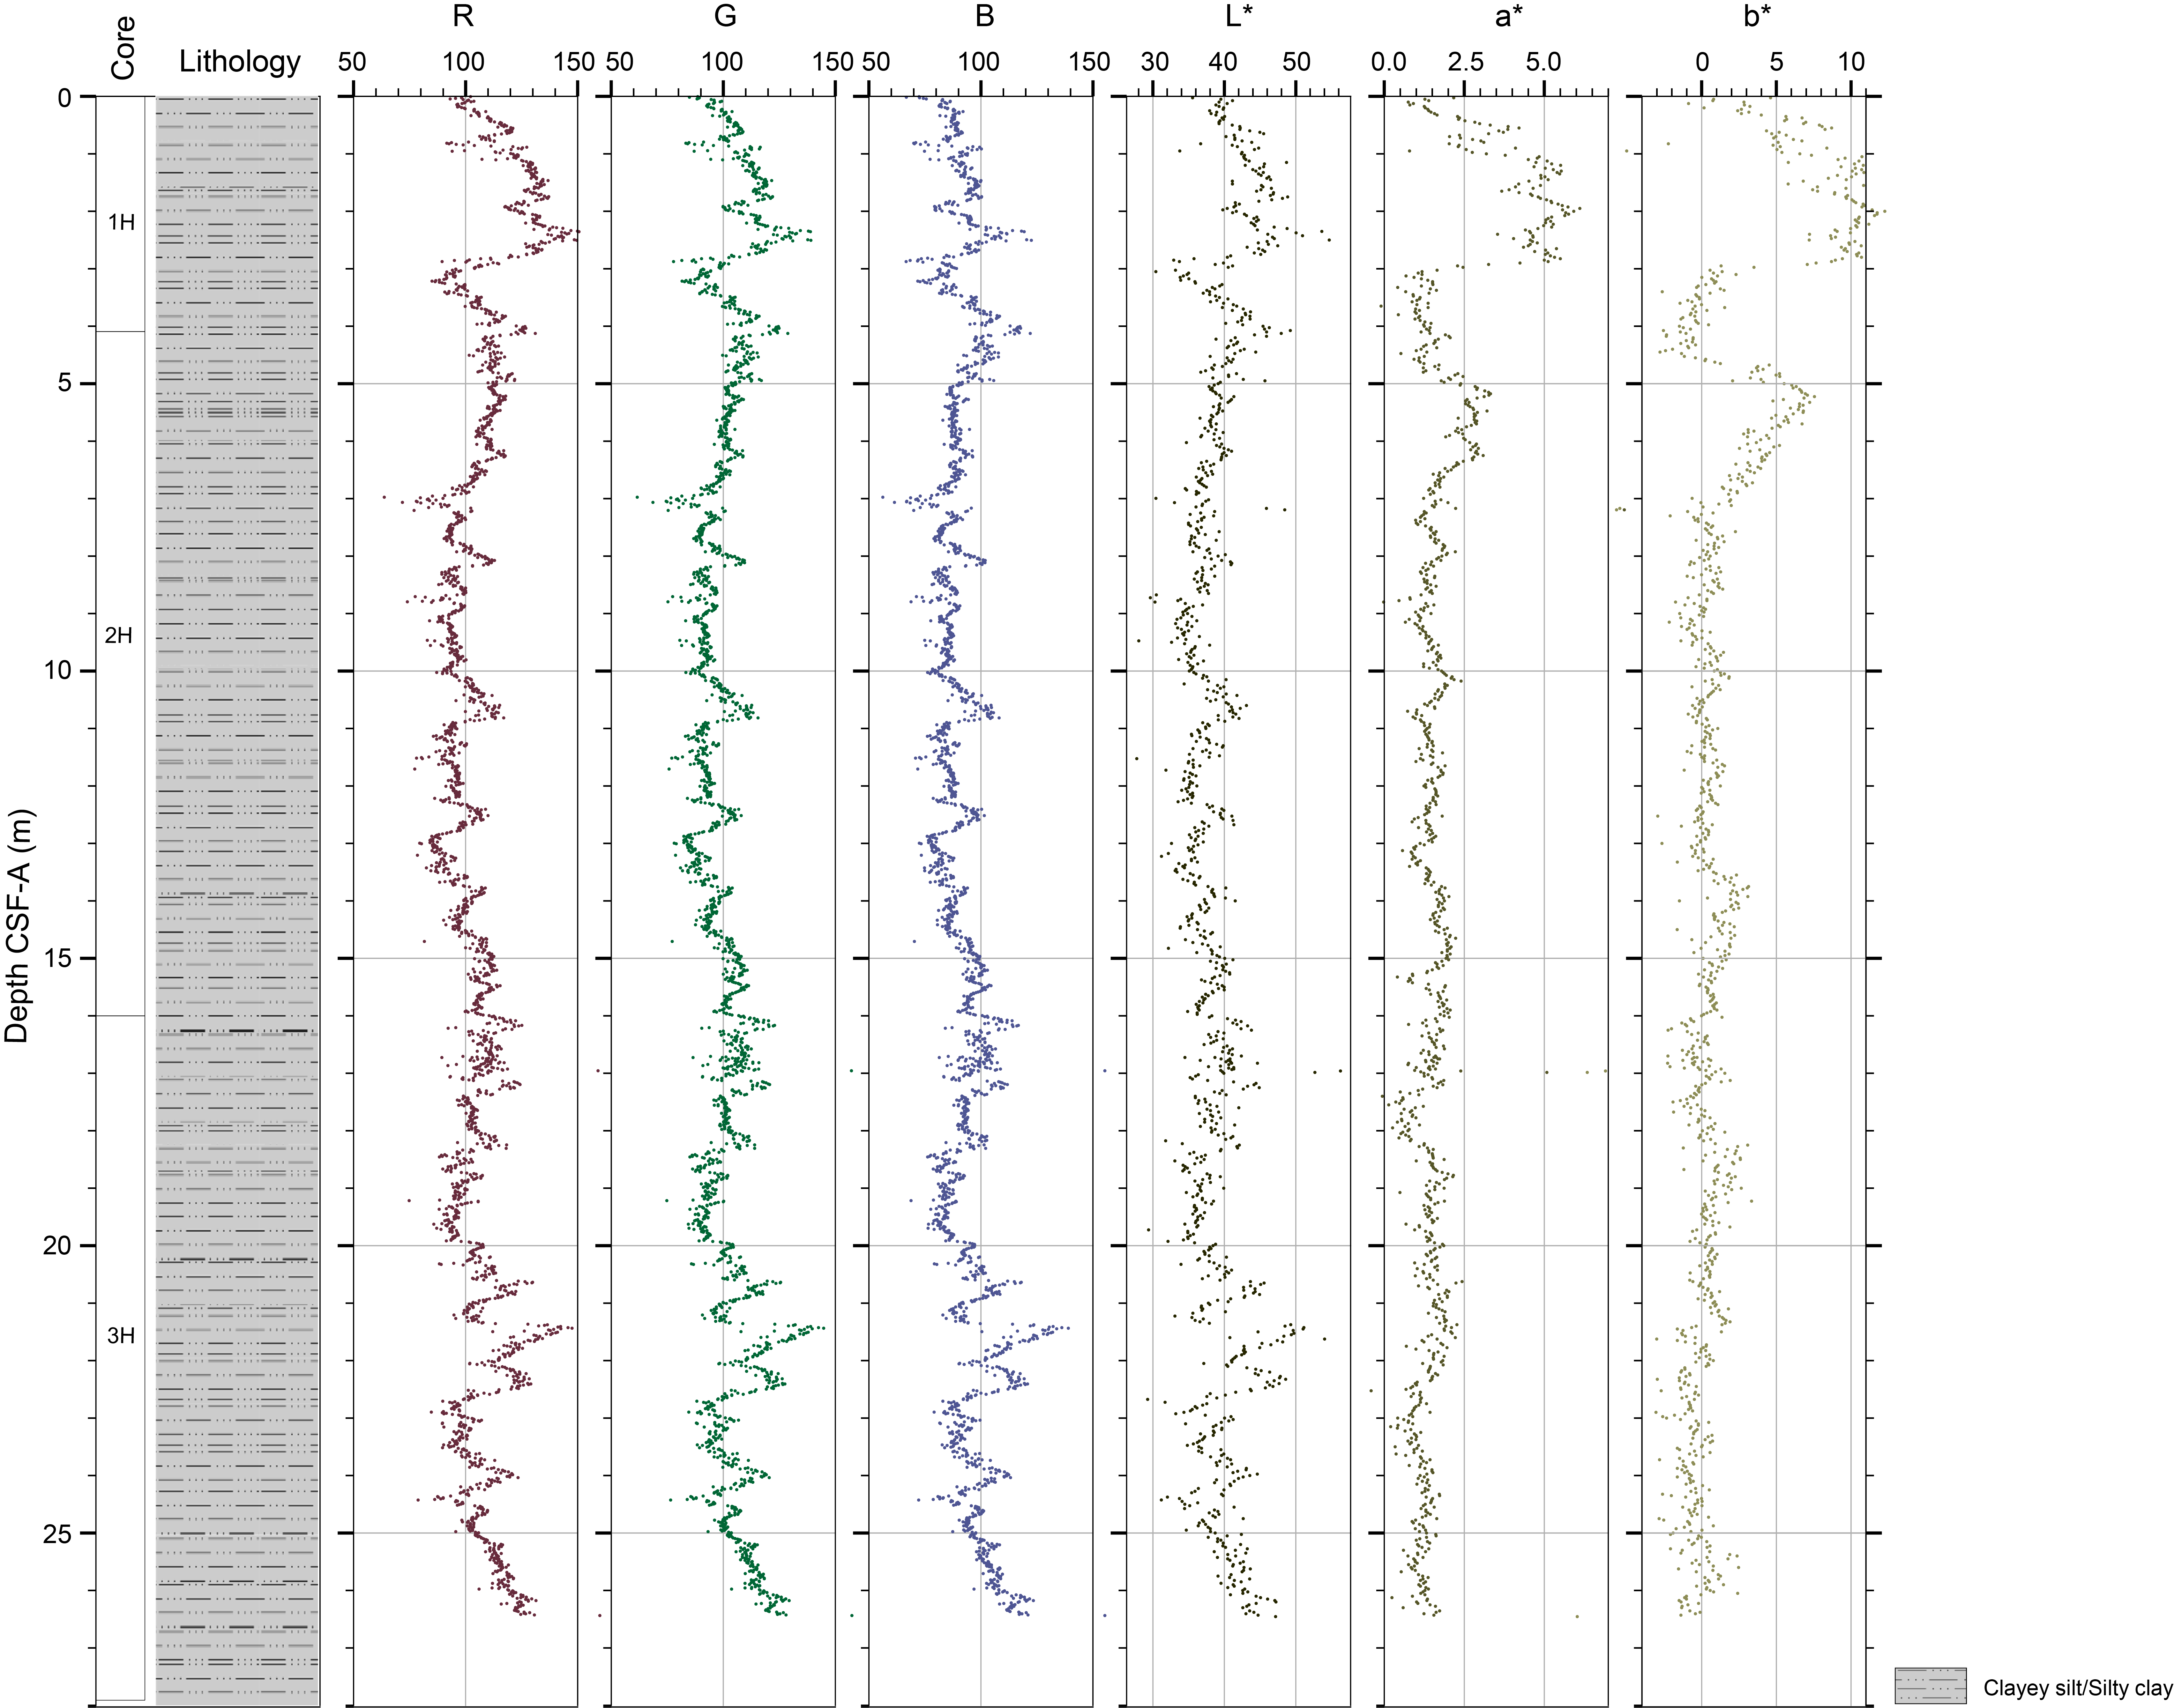
Figure F36. Archive-half colorimetry and reflectance measurements, Hole U1564B.
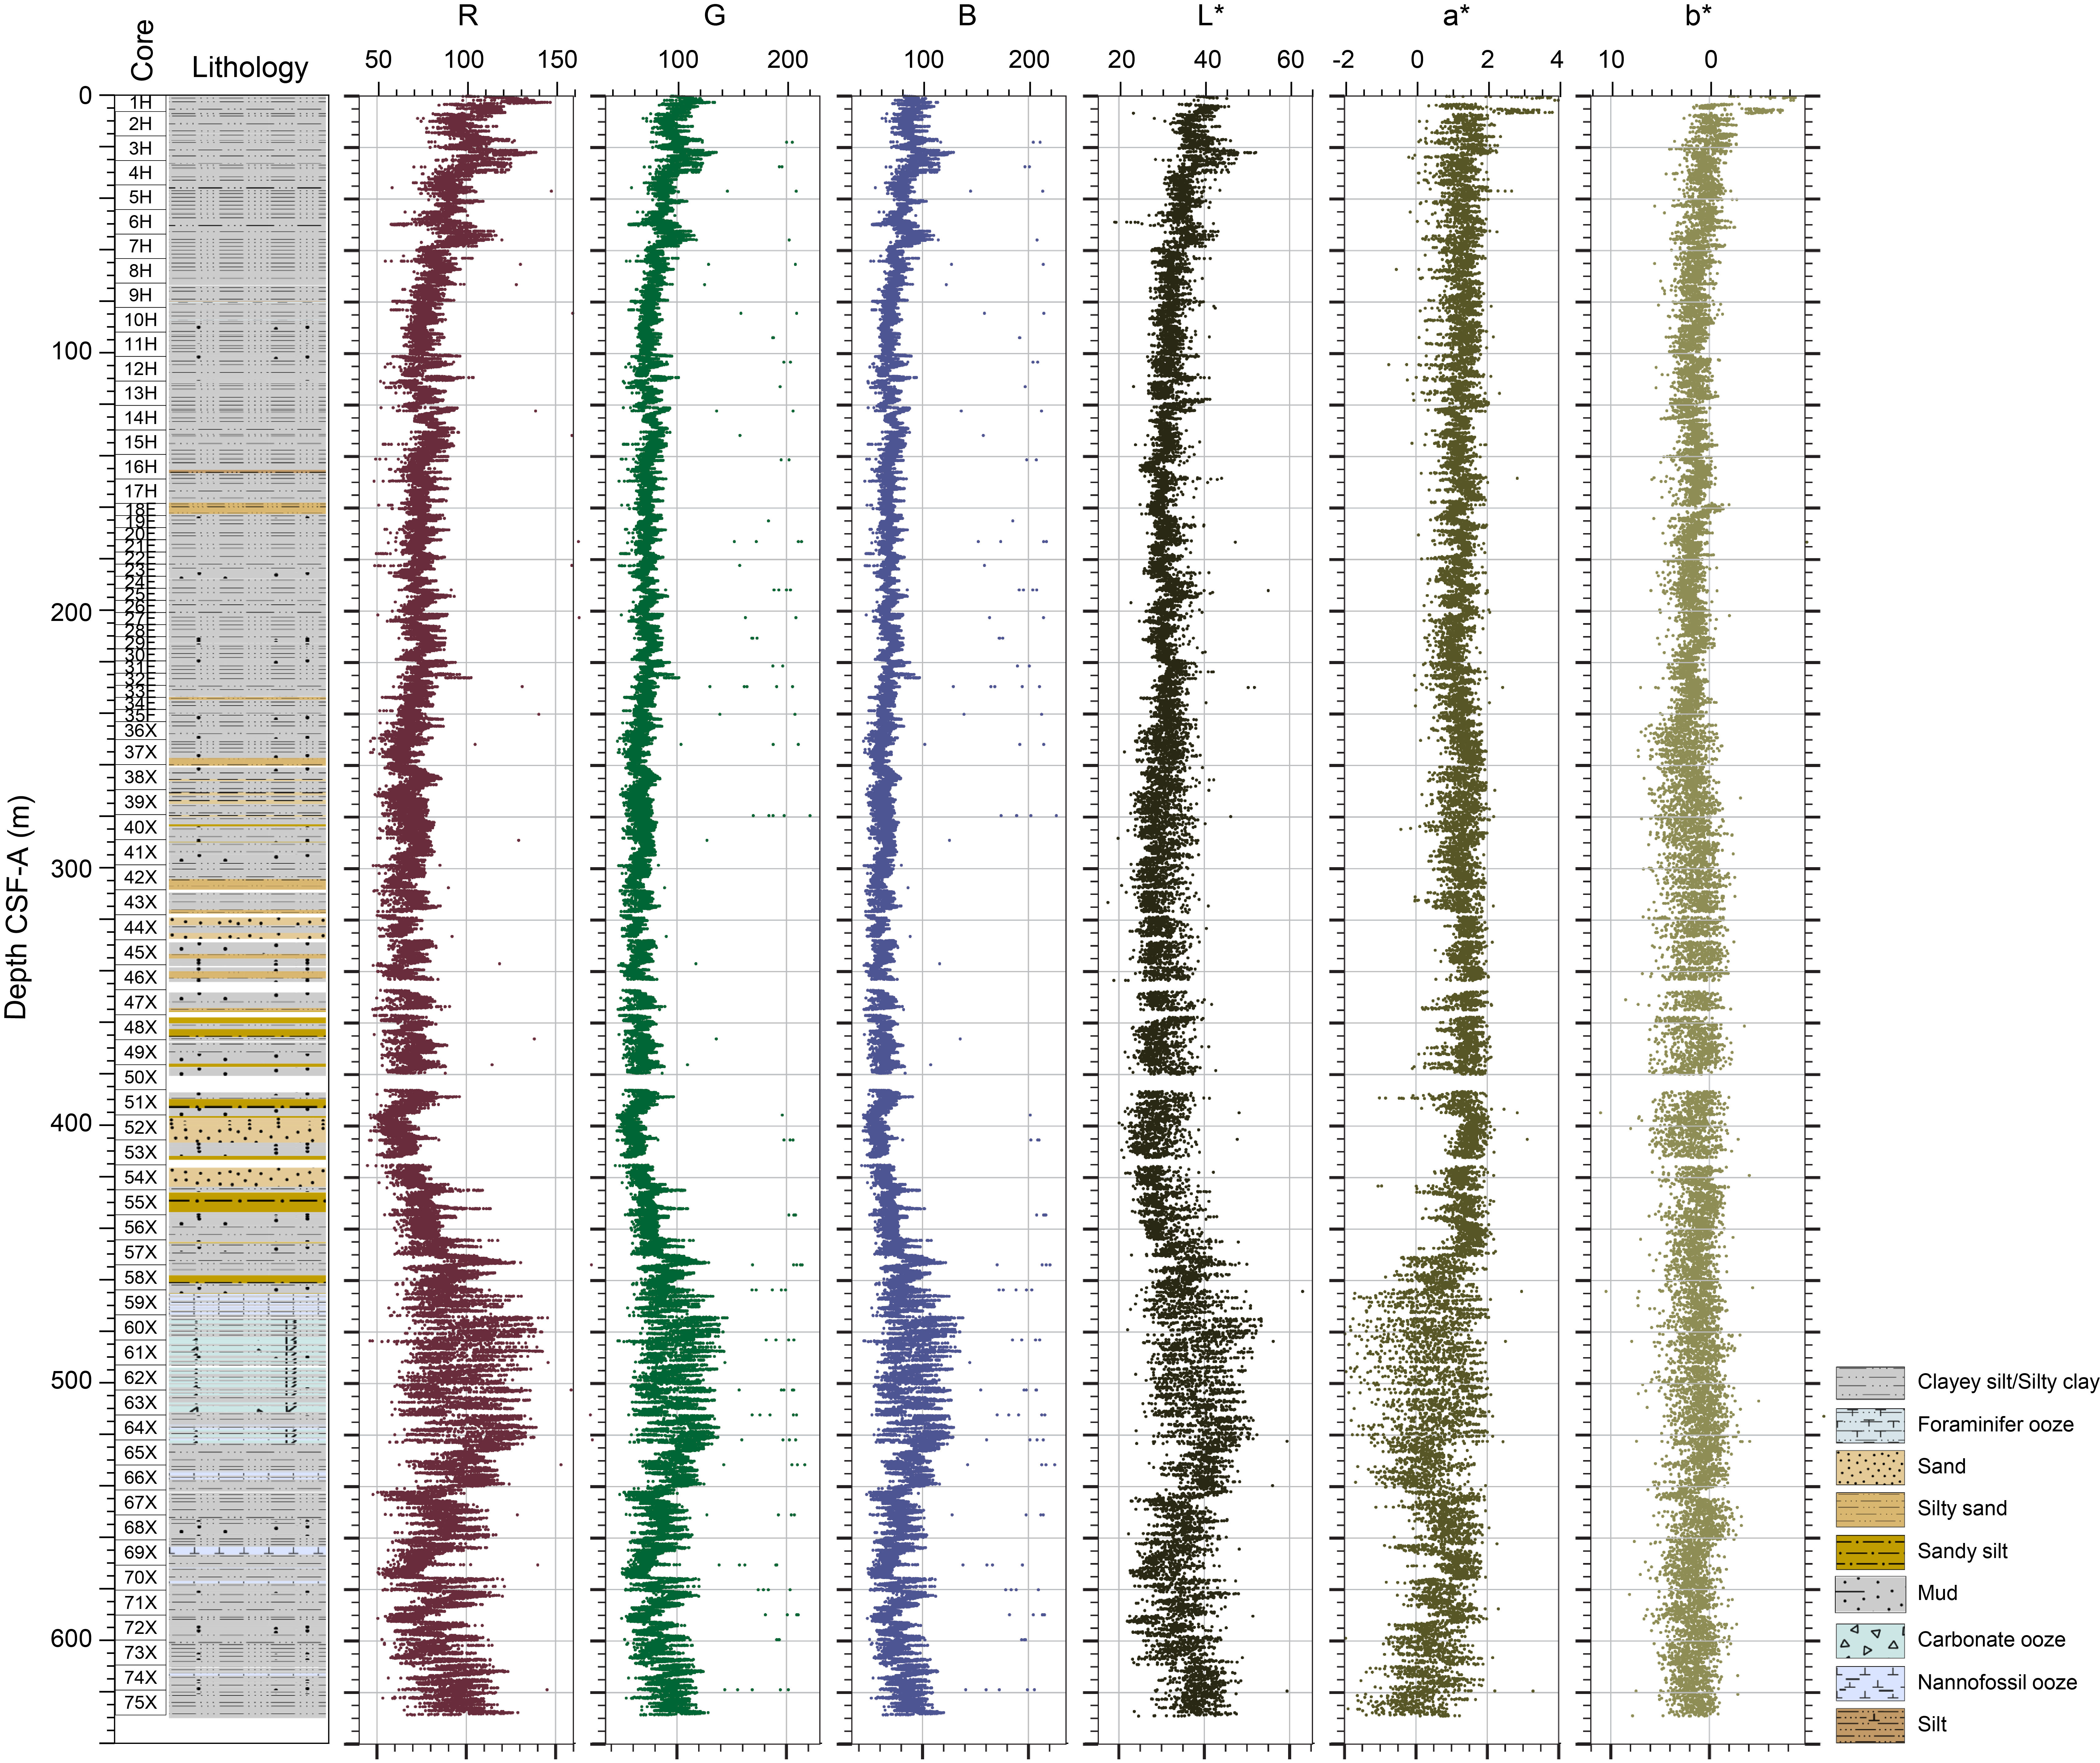
Figure F37. Archive-half colorimetry and reflectance measurements, Hole U1564C.
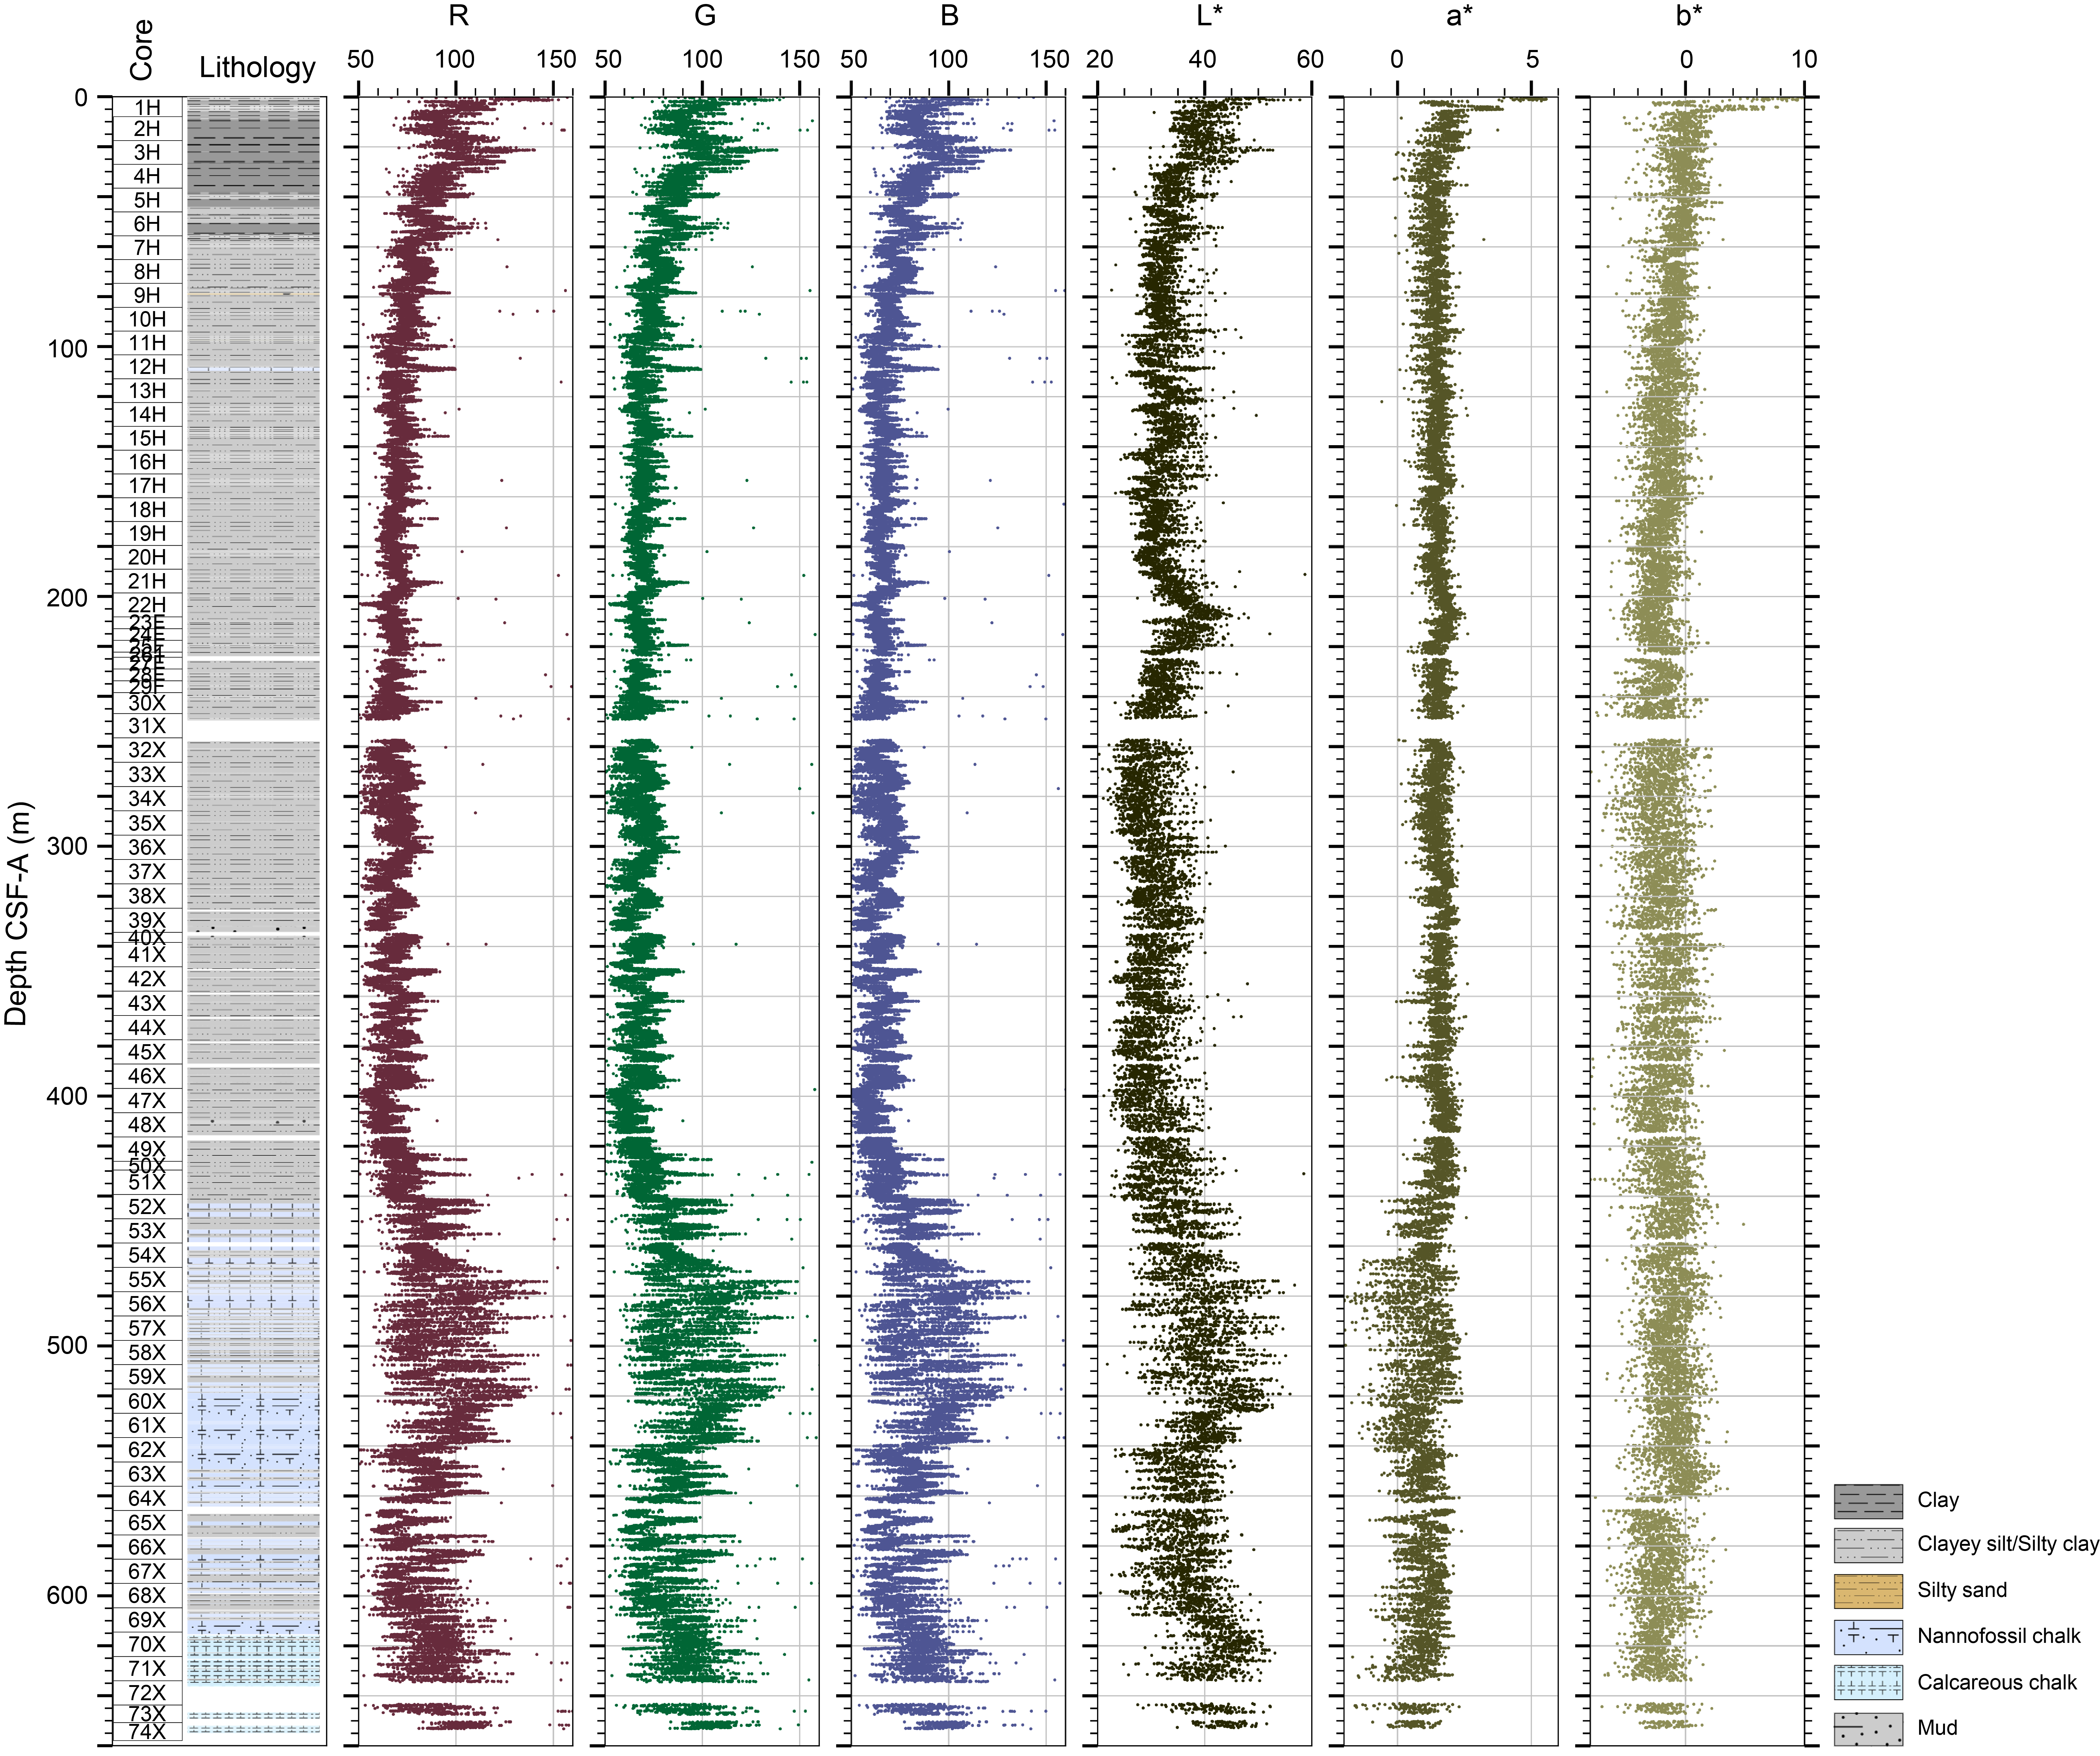
Figure F38. Archive-half colorimetry and reflectance measurements, Hole U1564D.
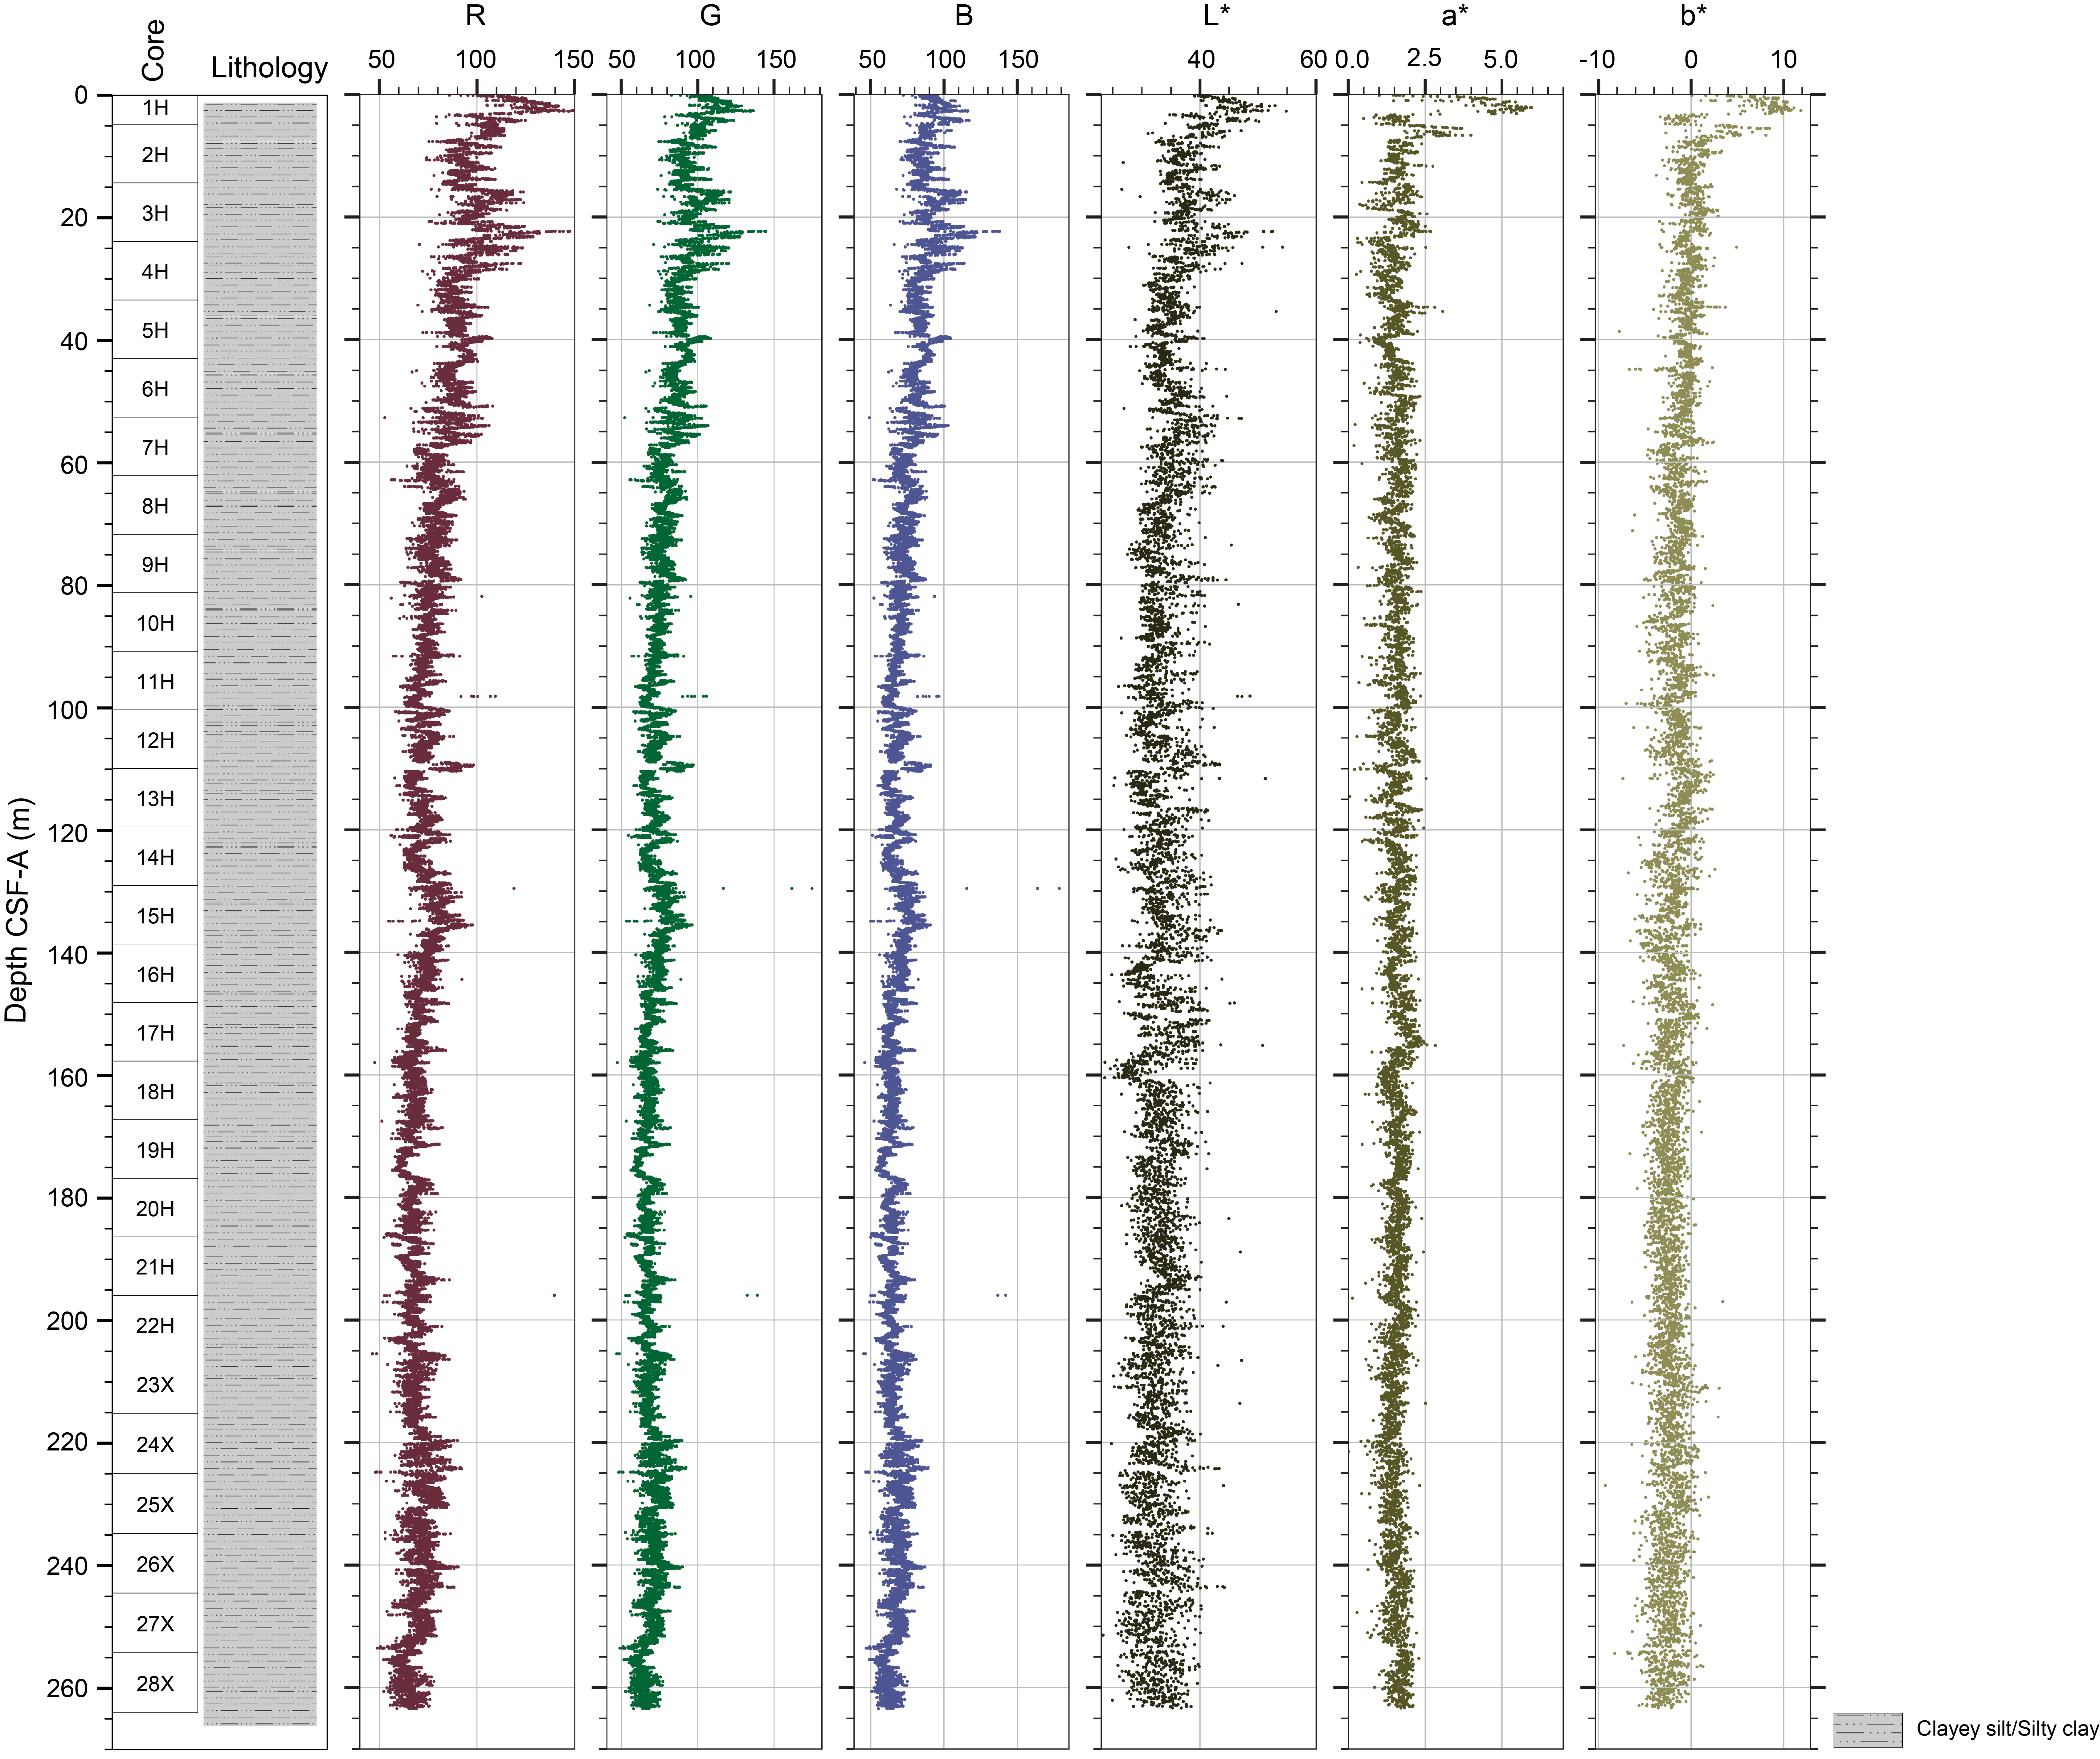
Figure F39. Archive-half colorimetry and reflectance measurements, Hole U1564E.
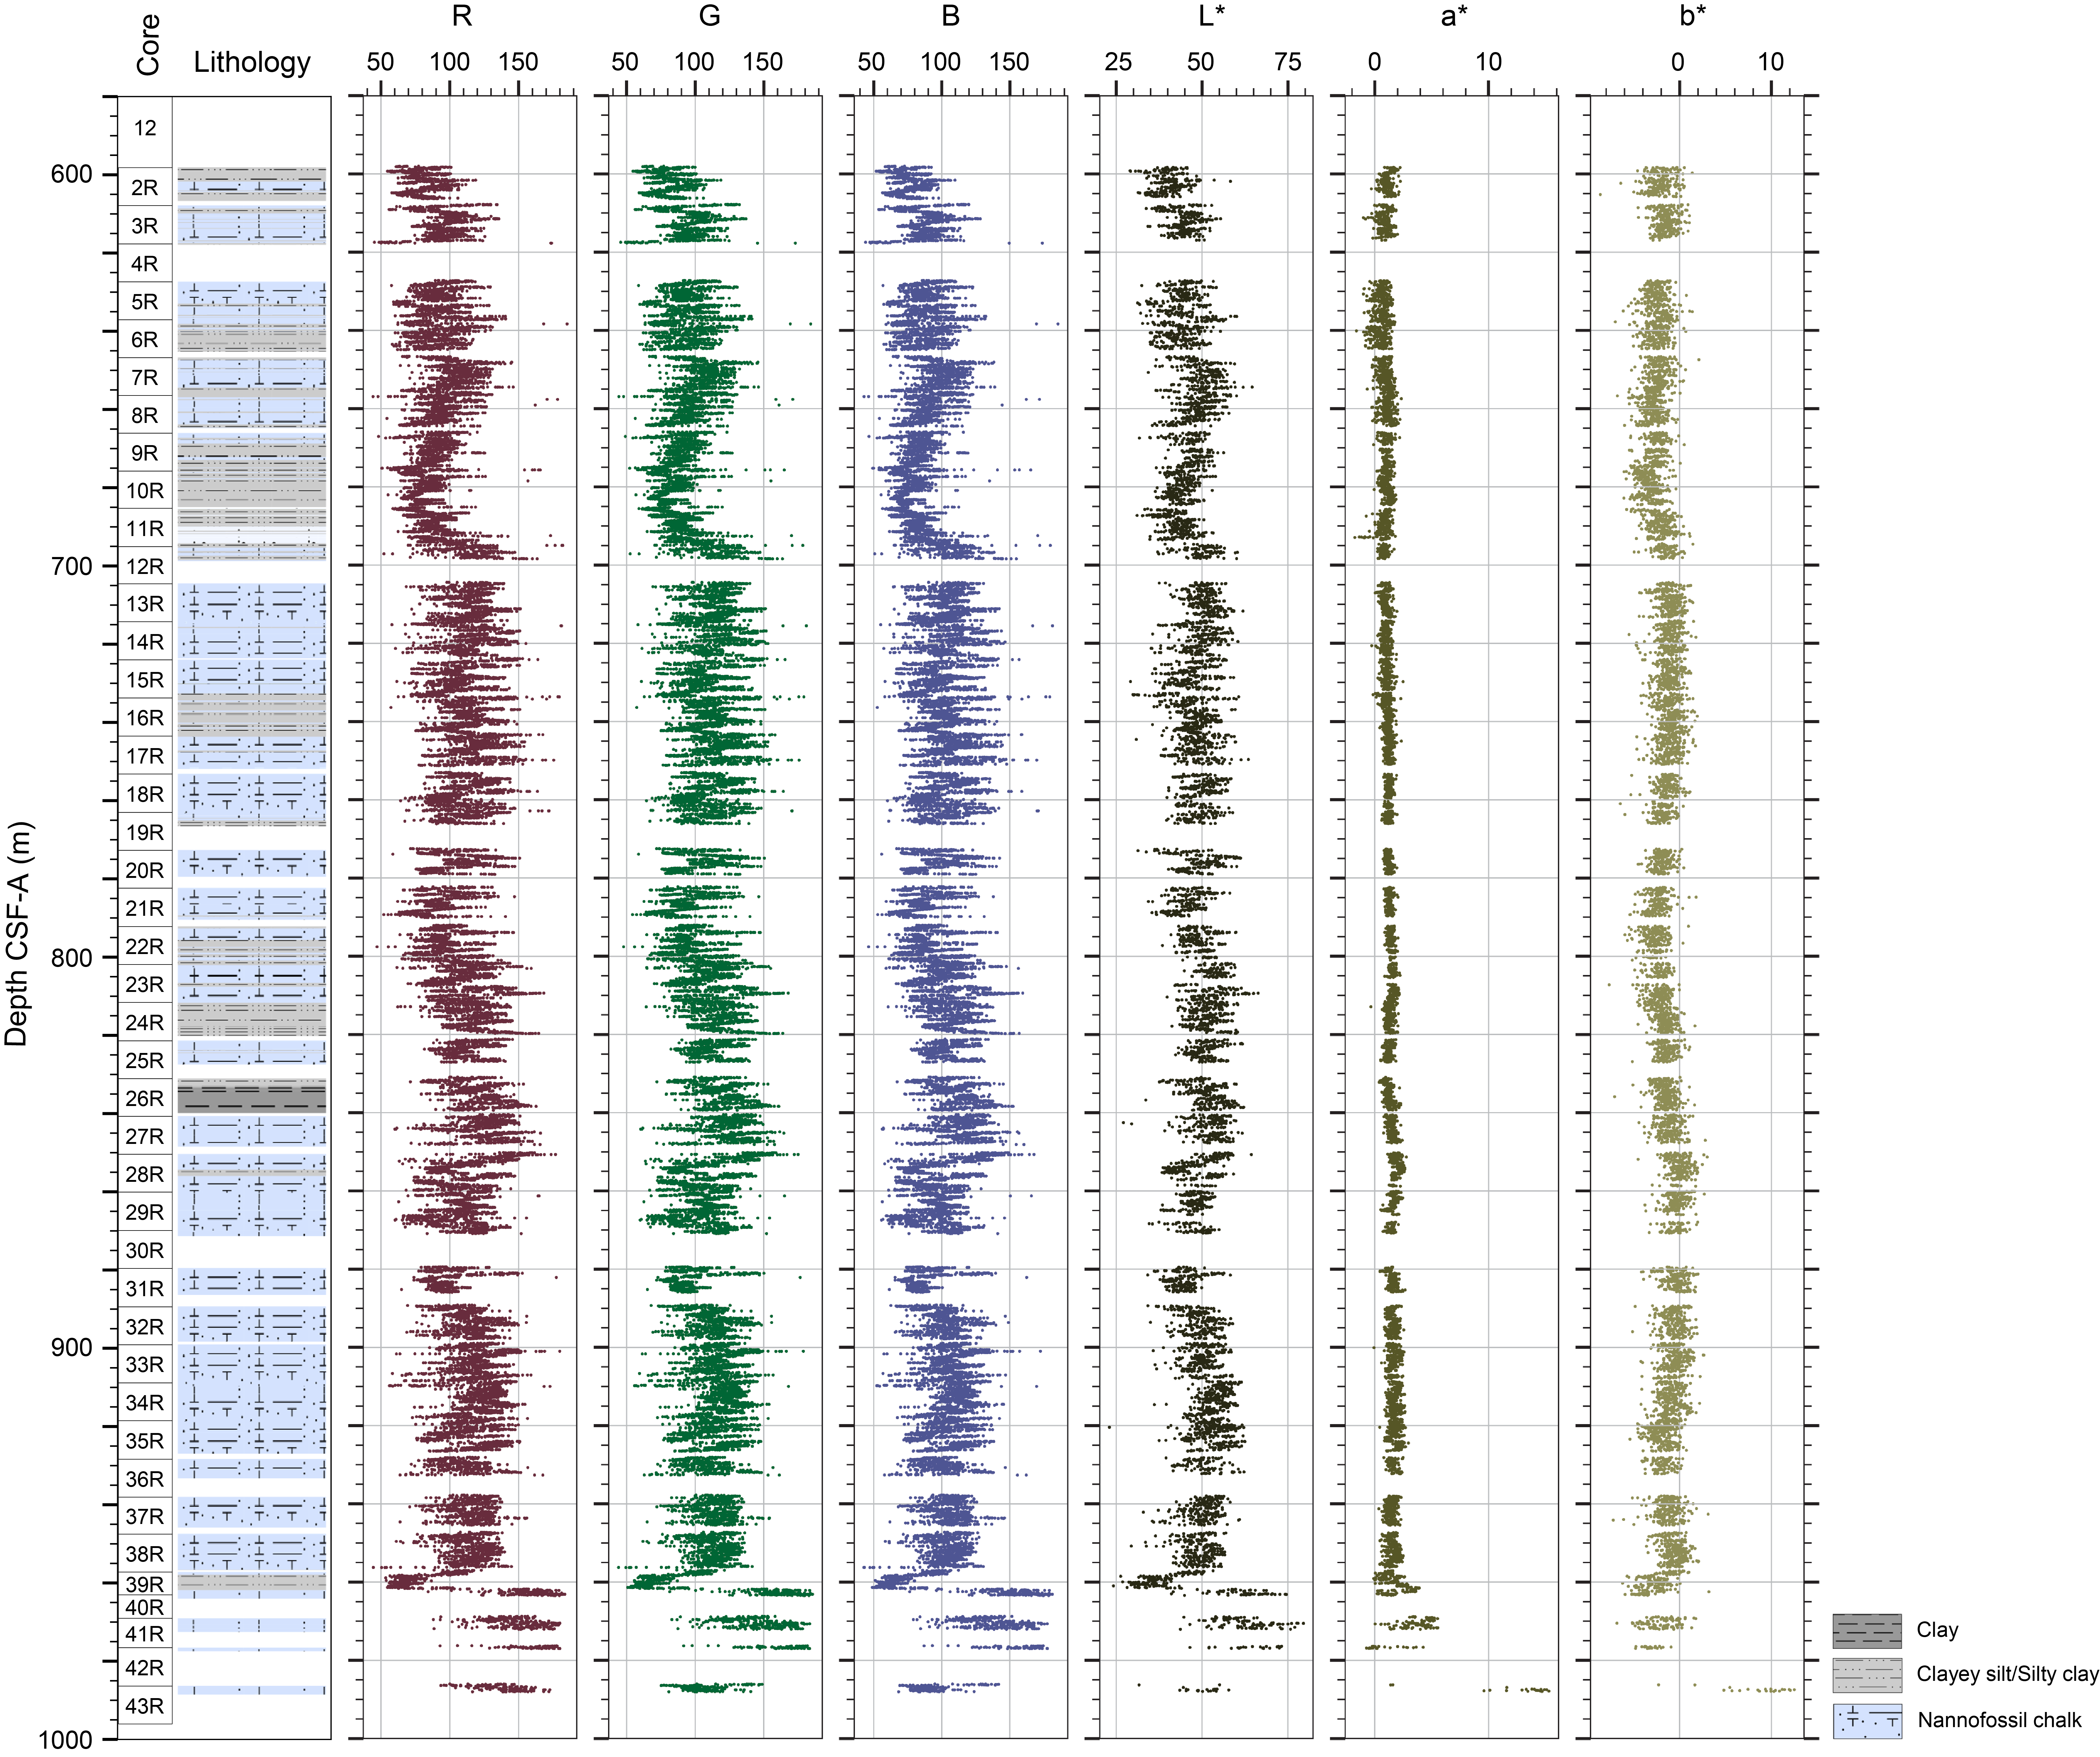
Figure F40. Archive-half colorimetry and reflectance measurements of the sedimentary section, Hole U1564F.
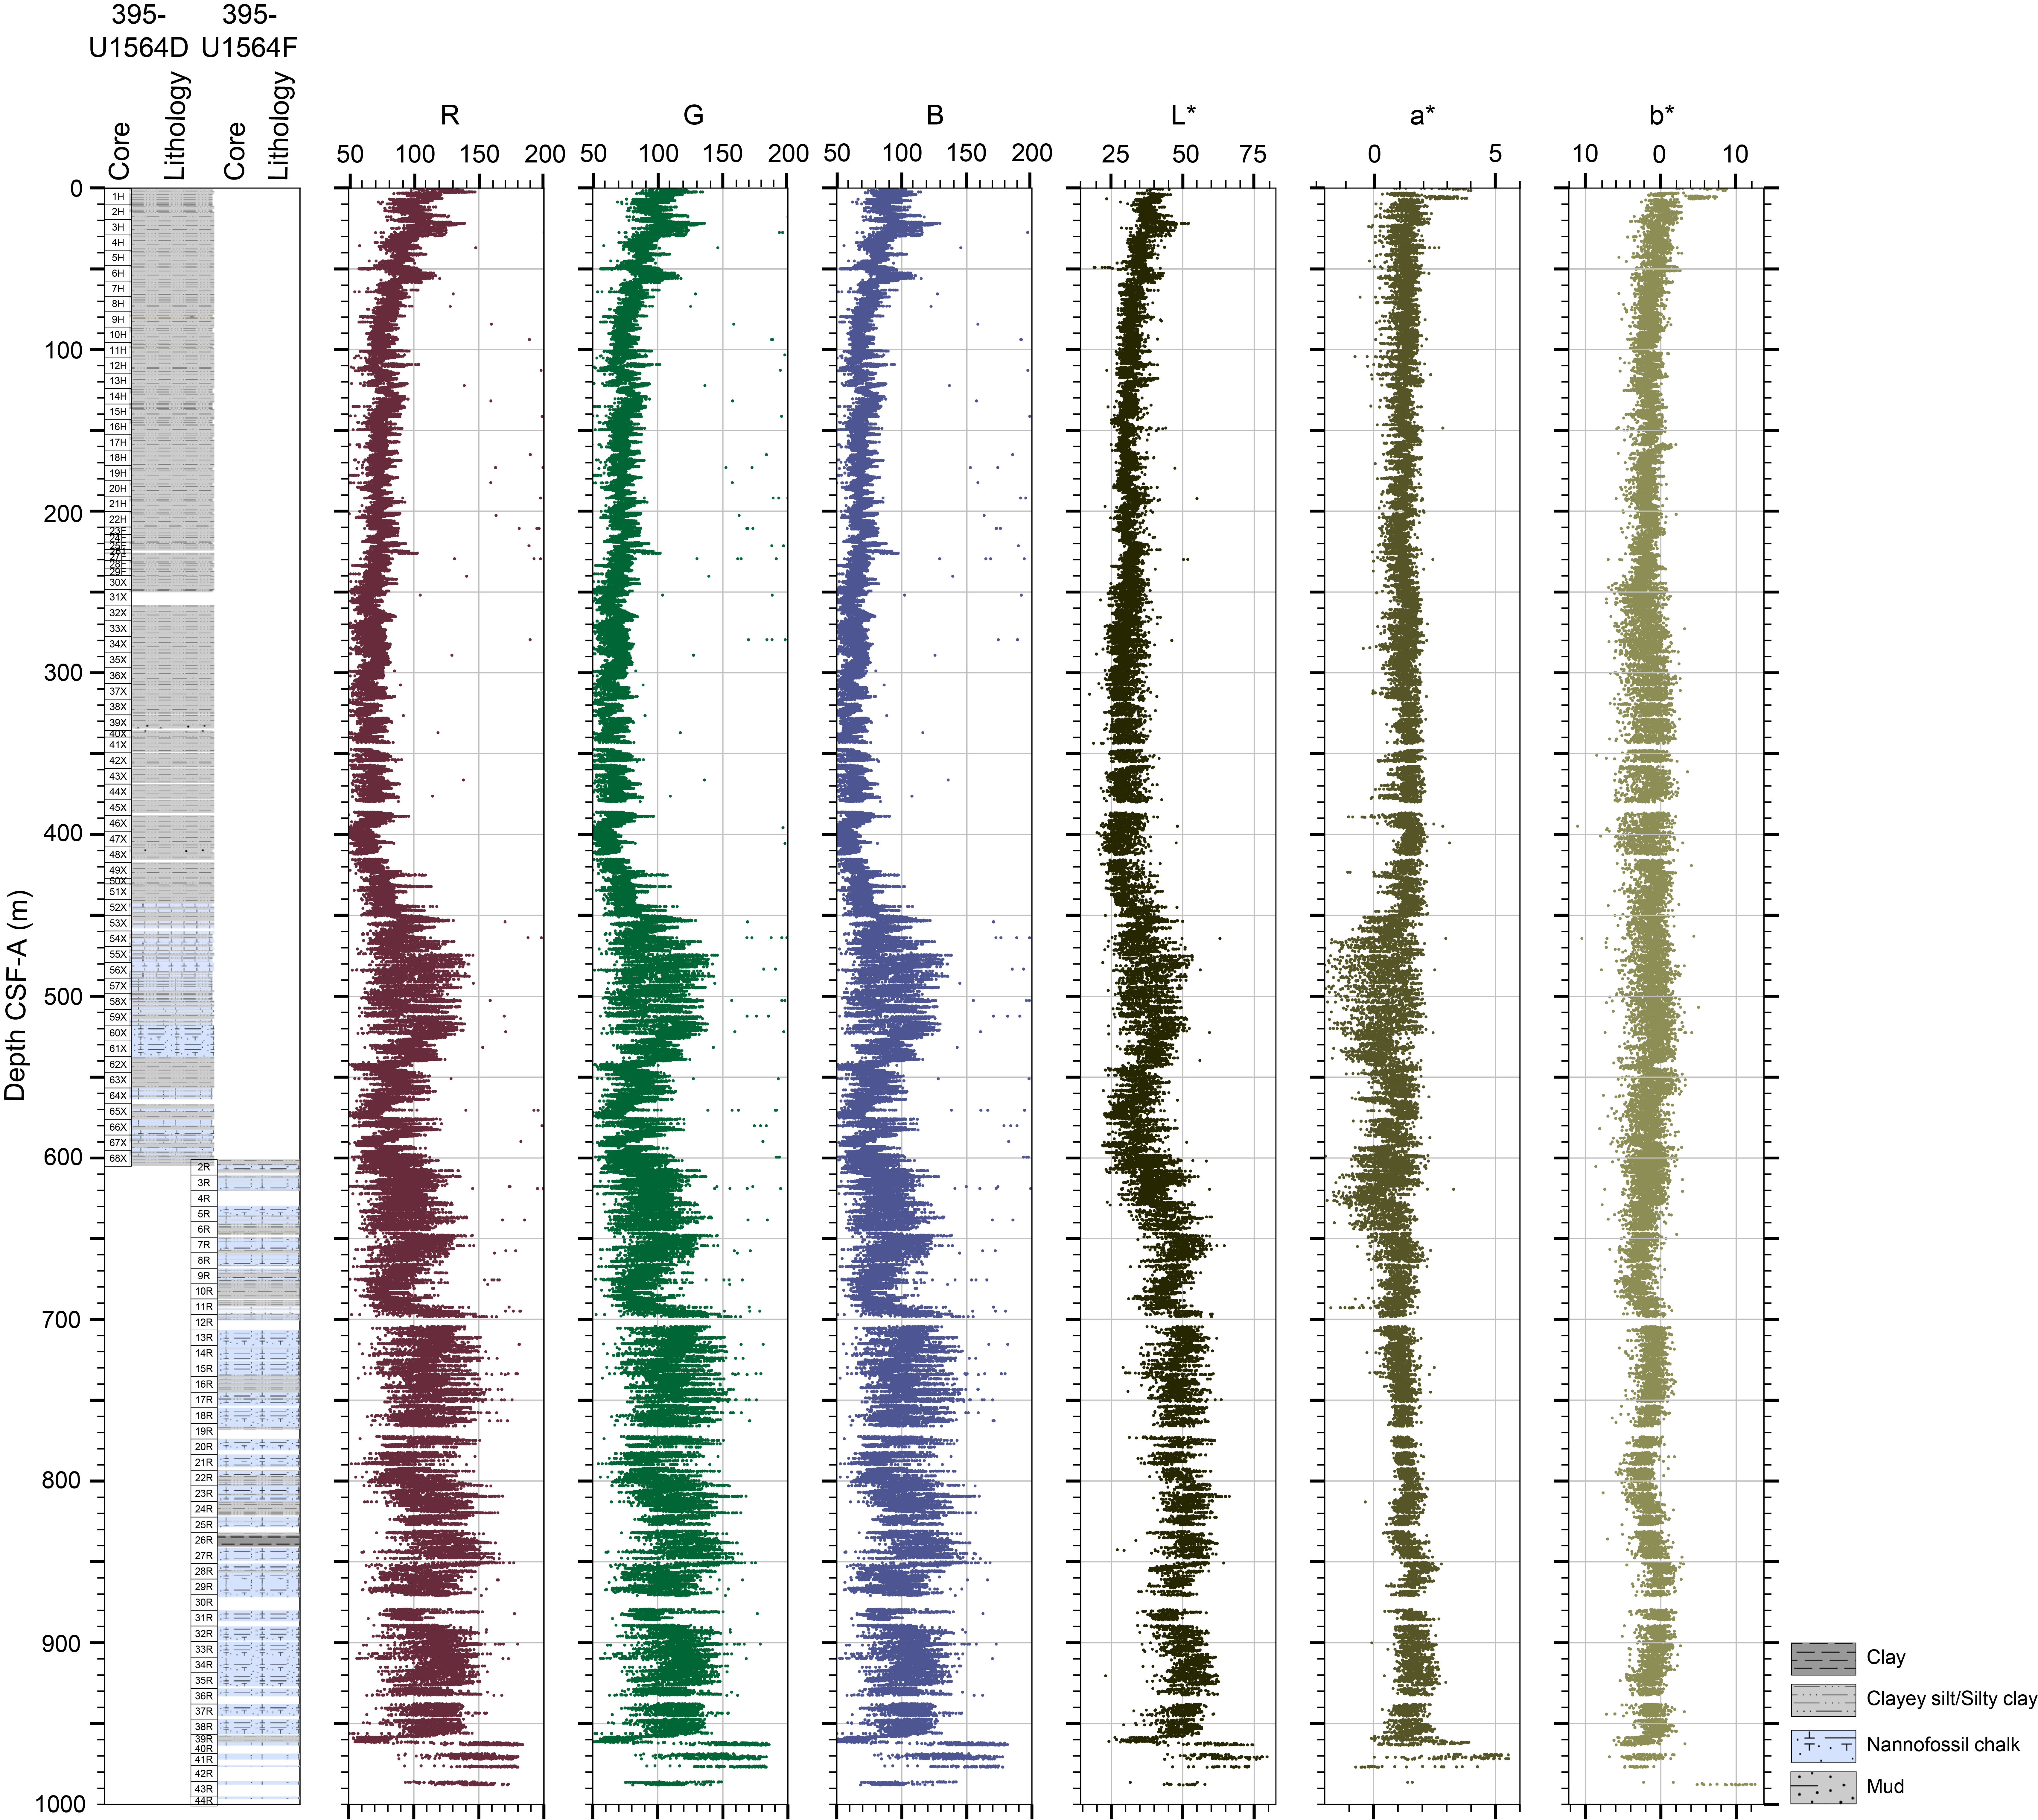
Figure F41. Archive-half colorimetry and reflectance measurements composite.
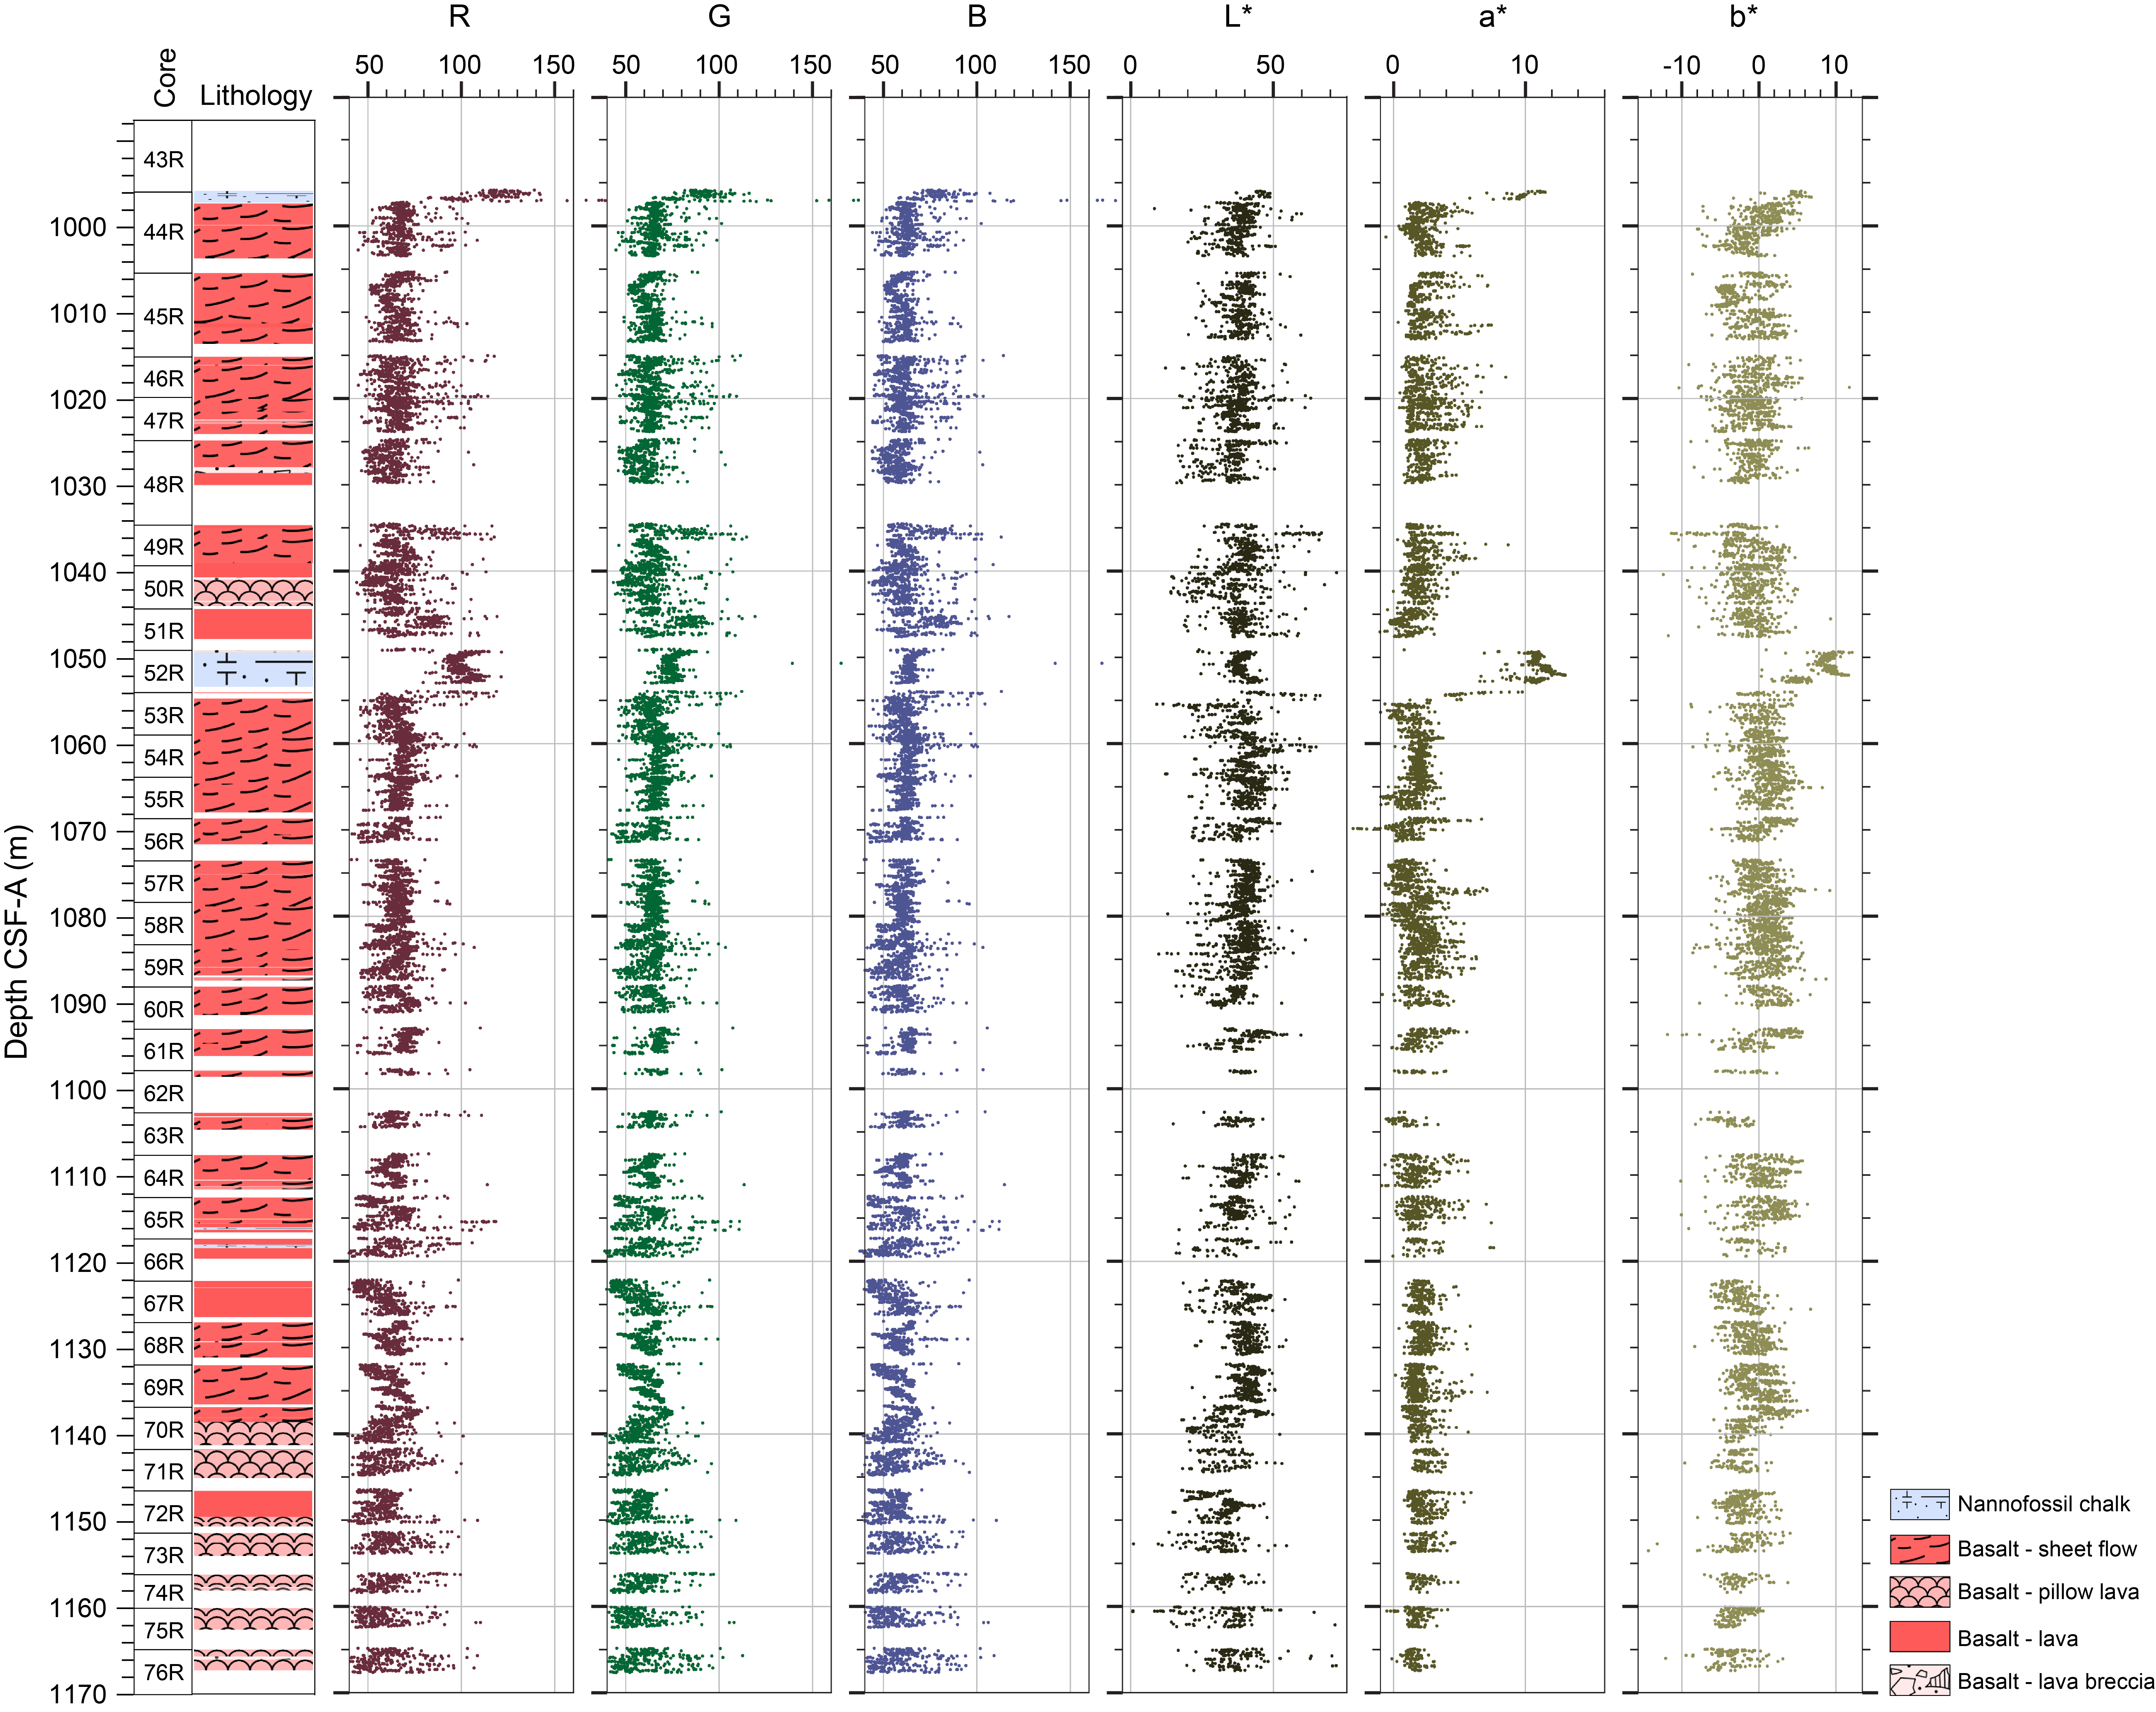
Figure F42. Archive-half colorimetry and reflectance measurements of the basement rock section, Hole U1564F.
Whole-round and section-half MS measurements are in excellent agreement with closely matching periodicities and amplitudes. The principal difference is that section-half measurements are shifted to slightly higher values, typically by about 100 IU (Figures F34, F35).
For Holes U1564C and U1564D (Figures F37, F38), RGB logs have distinctive trends that correlate with lithostratigraphy and other physical properties. There are three obvious color divisions. First, a series of matching color excursions occur within the upper 60 m that match fine-scale lithologic variations. Second, there is a much more subdued pattern of variation between 60 and 420 m CSF-A. Third, the basal sections of both holes are characterized by longer period large-amplitude color excursions. This last division is strikingly consistent with lithostratigraphic variations. The RGB colorimetry shows high amplitude variability in Hole U1564F with an abrupt shift toward darker colors at 960 m CSF-A and lighter colors below.
The RGB divisions are clarified by examining perceptual lightness (L*) and chromaticity ratios (a* and b*). It is clear that b* has minimal downhole variation. The carbonate-dominated intervals at the base of Holes U1564C and U1564D are characterized by a combination of elevated values of L* and low positive to negative values of a*. Under certain circumstances, optical lightness is a known proxy of relative changes in carbonate content (Balsam et al., 1999). L* and a* weakly correlate with lithostratigraphy within the upper few hundred meters of both holes.
The basement cores were processed on the SHIL (dry and wet images) and SHMSL (Figure F42). SHMSL MSP data show overall higher values than WRMSL MS measurements, but both clearly show the same structures. Again, the intercalated sediments show up clearly in the color data as high a* and b* at 1040 and 1090 m CSF-A. Color variations within the basaltic layers can be observed in the b* component.
7.3. Discrete measurements
VP caliper (PWC) measurements were carried out perpendicular to the core long axes at a spacing of approximately 10 m for Hole U1564D (Figure F30). In the uppermost 300 m, these spot measurements are in excellent agreement with WRMSL VP values. Below 300 m, both sets of measurements suffer from scatter but are in broad agreement. For cores from Hole U1564E (Figure F31), ten additional spot measurements were made, which are consistent with long period variations visible in the WRMSL values. WRMSL VP measurements were not carried out for Hole U1564F, but the discrete measurements show an increasing trend with depth toward 3500 m/s (Figures F32, F35).
MAD measurements were principally carried out for Holes U1564D and U1564F (Figures F30, F32). Discrete sample values are generally consistent with WRMSL GRA bulk density measurements. However, there is a systematic and changing discrepancy as a function of depth. MAD and WRMSL measurements broadly agree to ~250 m CSF-A, although at the shallowest levels where porosity is high the MAD method does not work as well. At greater depths, WRMSL measurements are consistently lower than MAD measurements with an average offset of 0.15 g/cm3. This offset can be accounted for by the fact that XCB drilling yields a smaller diameter core, which acts to decrease WRMSL bulk density measurements.
Thermal conductivity measurements were carried out on working-half sections at intervals of about 10 m (one per core) for the sedimentary sequence and at ~5 m intervals for the basalt. Thermal conductivity was used with the downhole temperature measurements to estimate heat flow (see Downhole measurements).
The processing order for discrete basalt samples was modified from that used for sedimentary intervals (see Physical properties in the Expedition 395 methods chapter [Parnell-Turner et al., 2025a]). The density from MAD is consistently higher than that from WRMSL and averages around 2.9 g/cm3. VP was measured in three directions, with the Z-component usually being the fastest. Higher NGR counts correspond to slower VP (around 5000 m/s), with maximum observed velocities of 5800 m/s. Thermal conductivity was measured on full water-saturated core pieces, and values vary between 1.4 and 1.8 W/K.
8. Stratigraphic correlation
The stratigraphic correlation reported here includes the main sedimentary targets of stratigraphically overlapping cores from Holes 395C-U1564C, 395-U1564D, and 395-U1564E. MS data from whole-round measurements were used for near real-time correlation because they often reveal strong contrasts between lithologic sequences. These data were obtained shortly after the core was recovered on deck at 5.0 cm resolution using the STMSL to guide operational decisions. Whole-round MS data, collected at 2.5 cm resolution using the WRMSL, were used to construct the final shipboard splices (Table T11). An overview of the MS data from Holes U1564C, U1564D, and U1564E and the downhole logging MS data from Hole U1564C are presented in Figure F43.
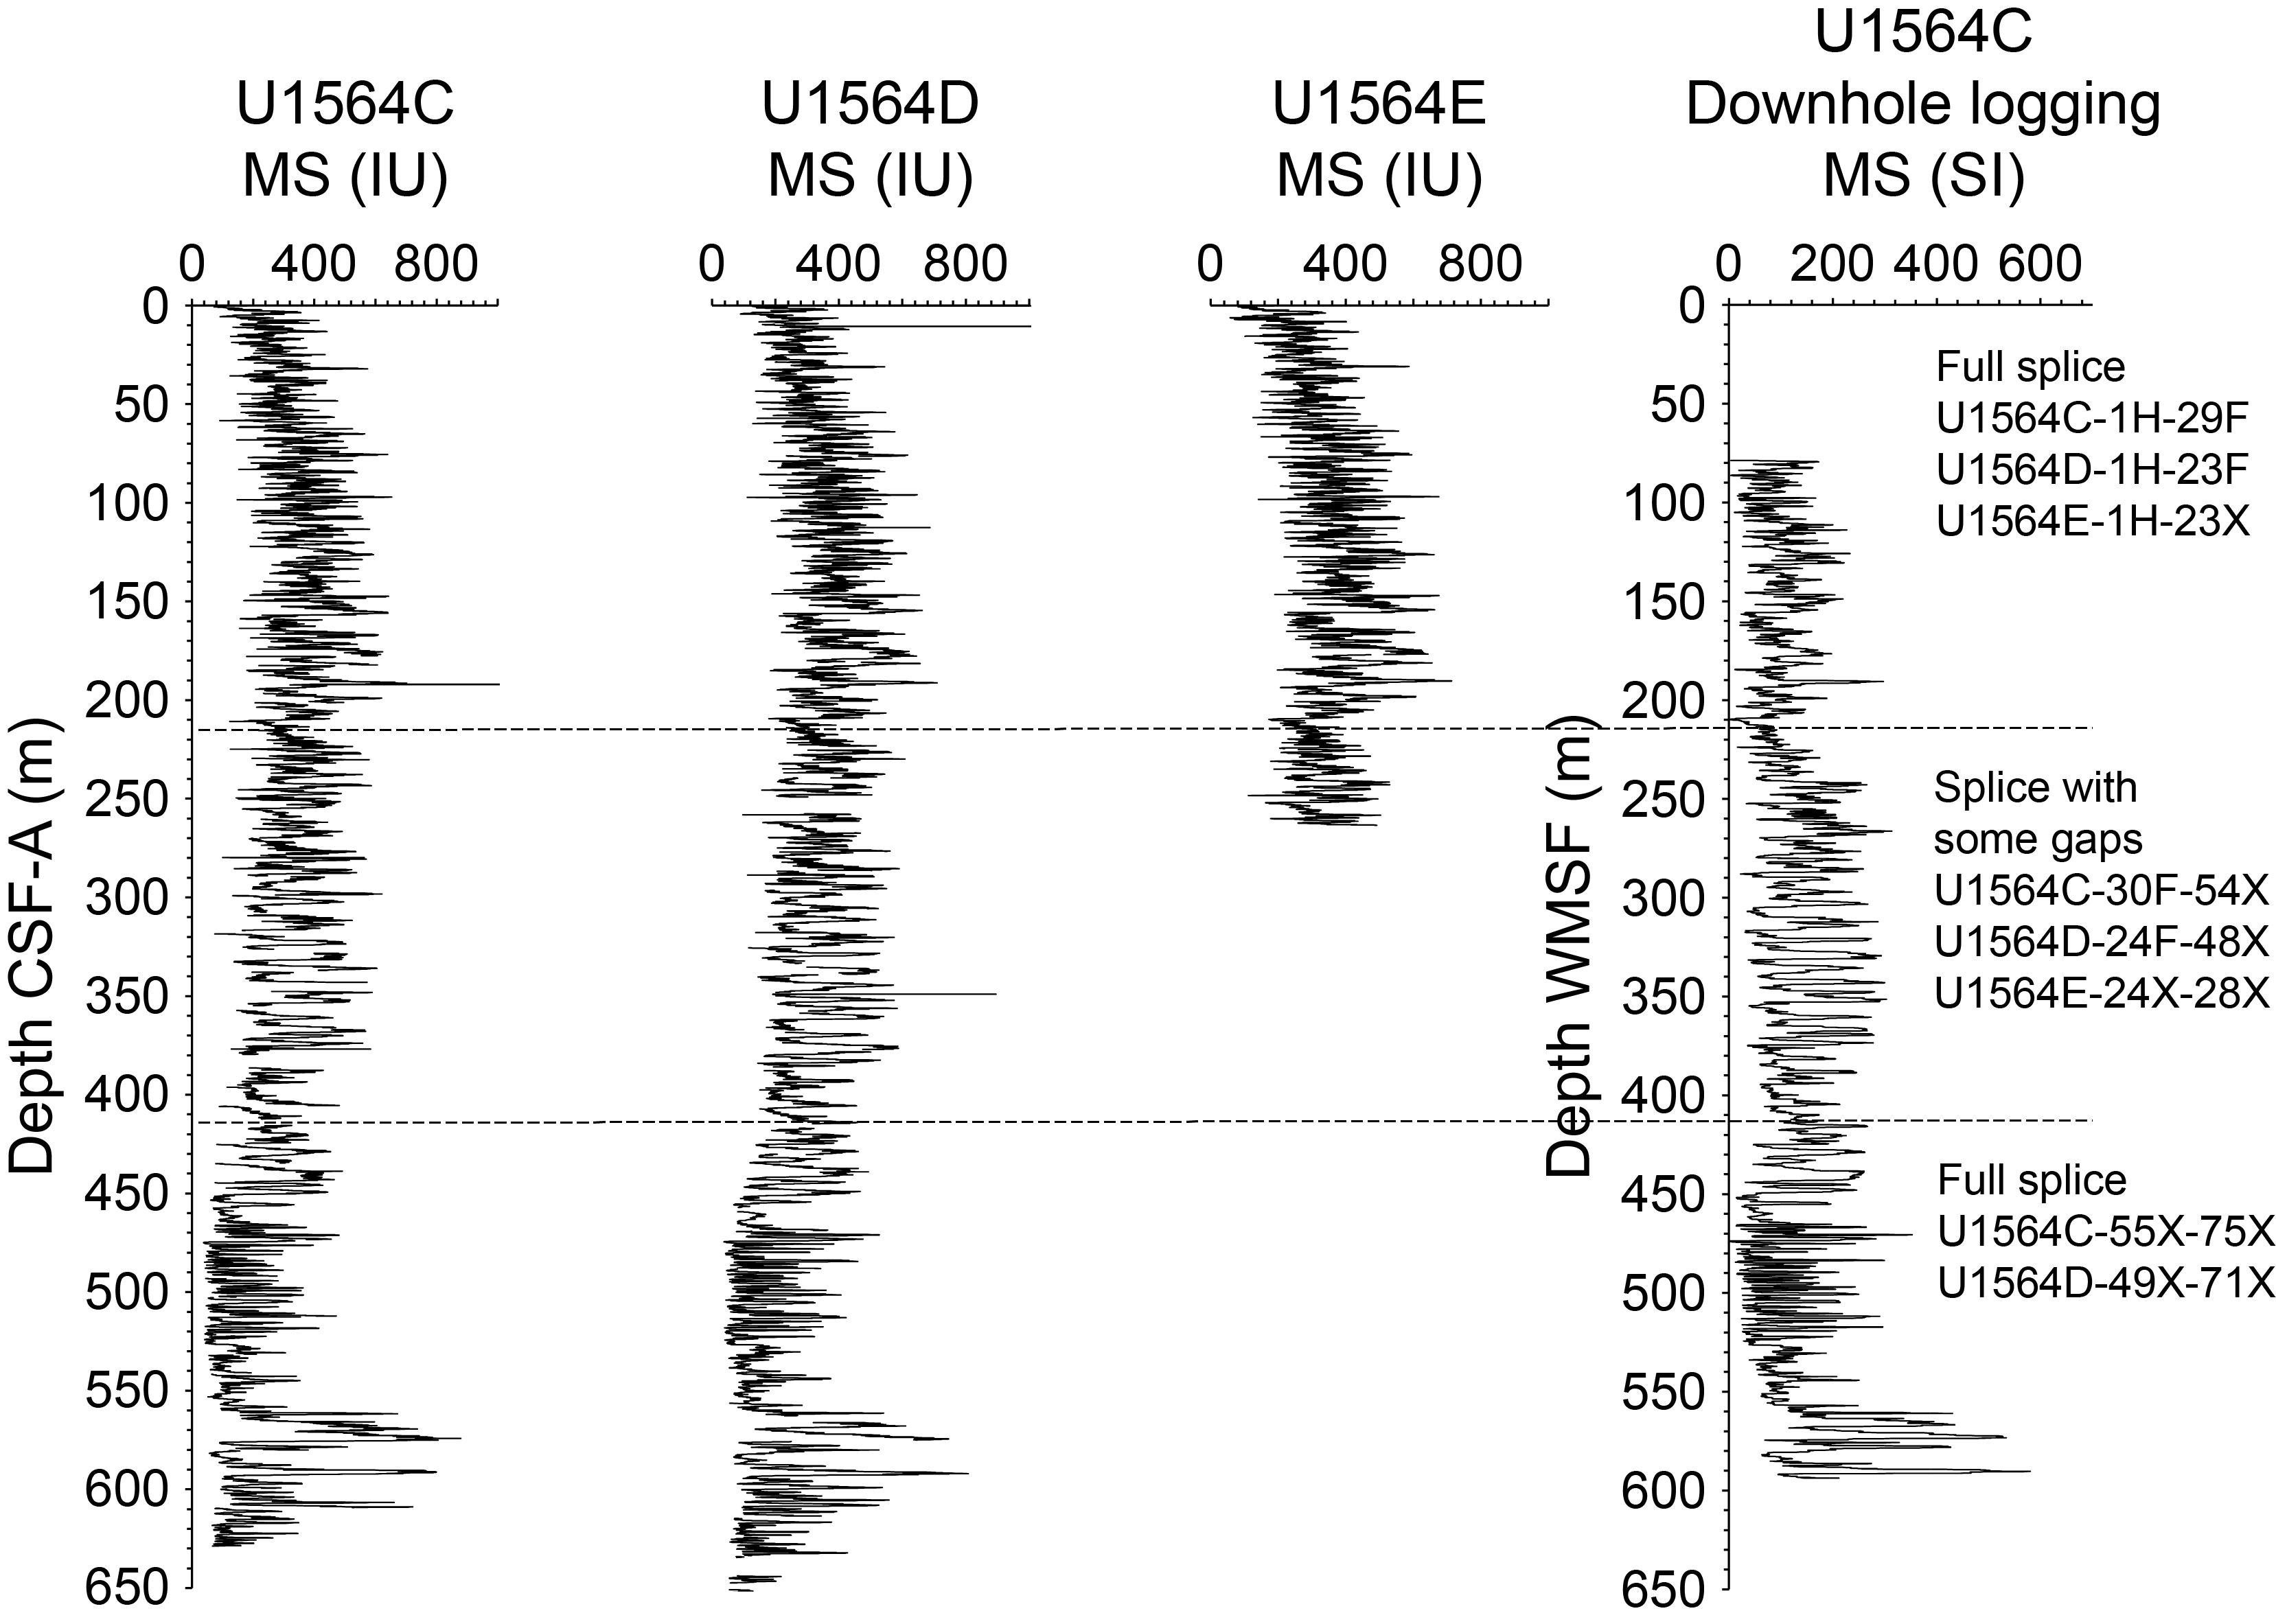
Figure F43. WRMSL and downhole wireline logging MS.
8.1. Correlation between holes
In Hole U1564D, the first core missed the mudline and recovered 9.61 m. In Hole U1564E, the first core included the mudline and recovered 5.93 m. This offset allowed bridging of coring gaps between Holes U1564D and U1564E to 239 m core composite depth below seafloor, Method A (CCSF-A) (Figure F44). At this depth, close alignment between the base of Cores 395C-U1564C-29F (215.54 m CSF-A), 395-U1564D-23F (213.94 m CSF-A), and 395-U1564E-23X (215.05 m CSF-A) prevented a tie with subsequent cores, leading to a gap. Based on the pattern of variability and correlation with the MS downhole logging data from Hole U1564C, the gap is estimated to be approximately 1 m (Figure F45). A similar small gap occurs at the base of Cores 395C-U1564C-31F, 395-U1564D-25F, and 395-U1564E-24X. The interval between Cores 395C-U1564C-32F and 43X is complete using a combination of cores from Holes U1564D and U1564E, but we note that ties between three pairs of cores (Cores 395C-U1564C-39X and 395-U1564D-35X, 395C-U1564C-41X and 395-U1564D-37X, and 395C-U1564C-42X and 395-U1564D-38X) are located close to core ends and are therefore potentially more prone to error. Above and below Core 395-U1564D-39X, a gap of 1–2 m is estimated (Figure F45). Based on comparison with the MS downhole logging data from Hole U1564C, a gap of ~6 m is estimated between Cores 395-U1564D-45X and 46X. Smaller gaps are inferred between Cores 395C-U1564C-51X and 52X, 395-U1564D-47X and 48X, and 48X and 49X. Correlation across the interval between Cores 49X through 71X and 395C-U1564C-55X through 75X is well constrained, with a close tie between the bottom of Core 395-U1564D-49X and the top of Core 395C-U1564C-55X. This fully spliced, floating sequence continues through the last core (75X) at the base of Hole U1564C at 674.71 m CCSF-A (Figure F46).
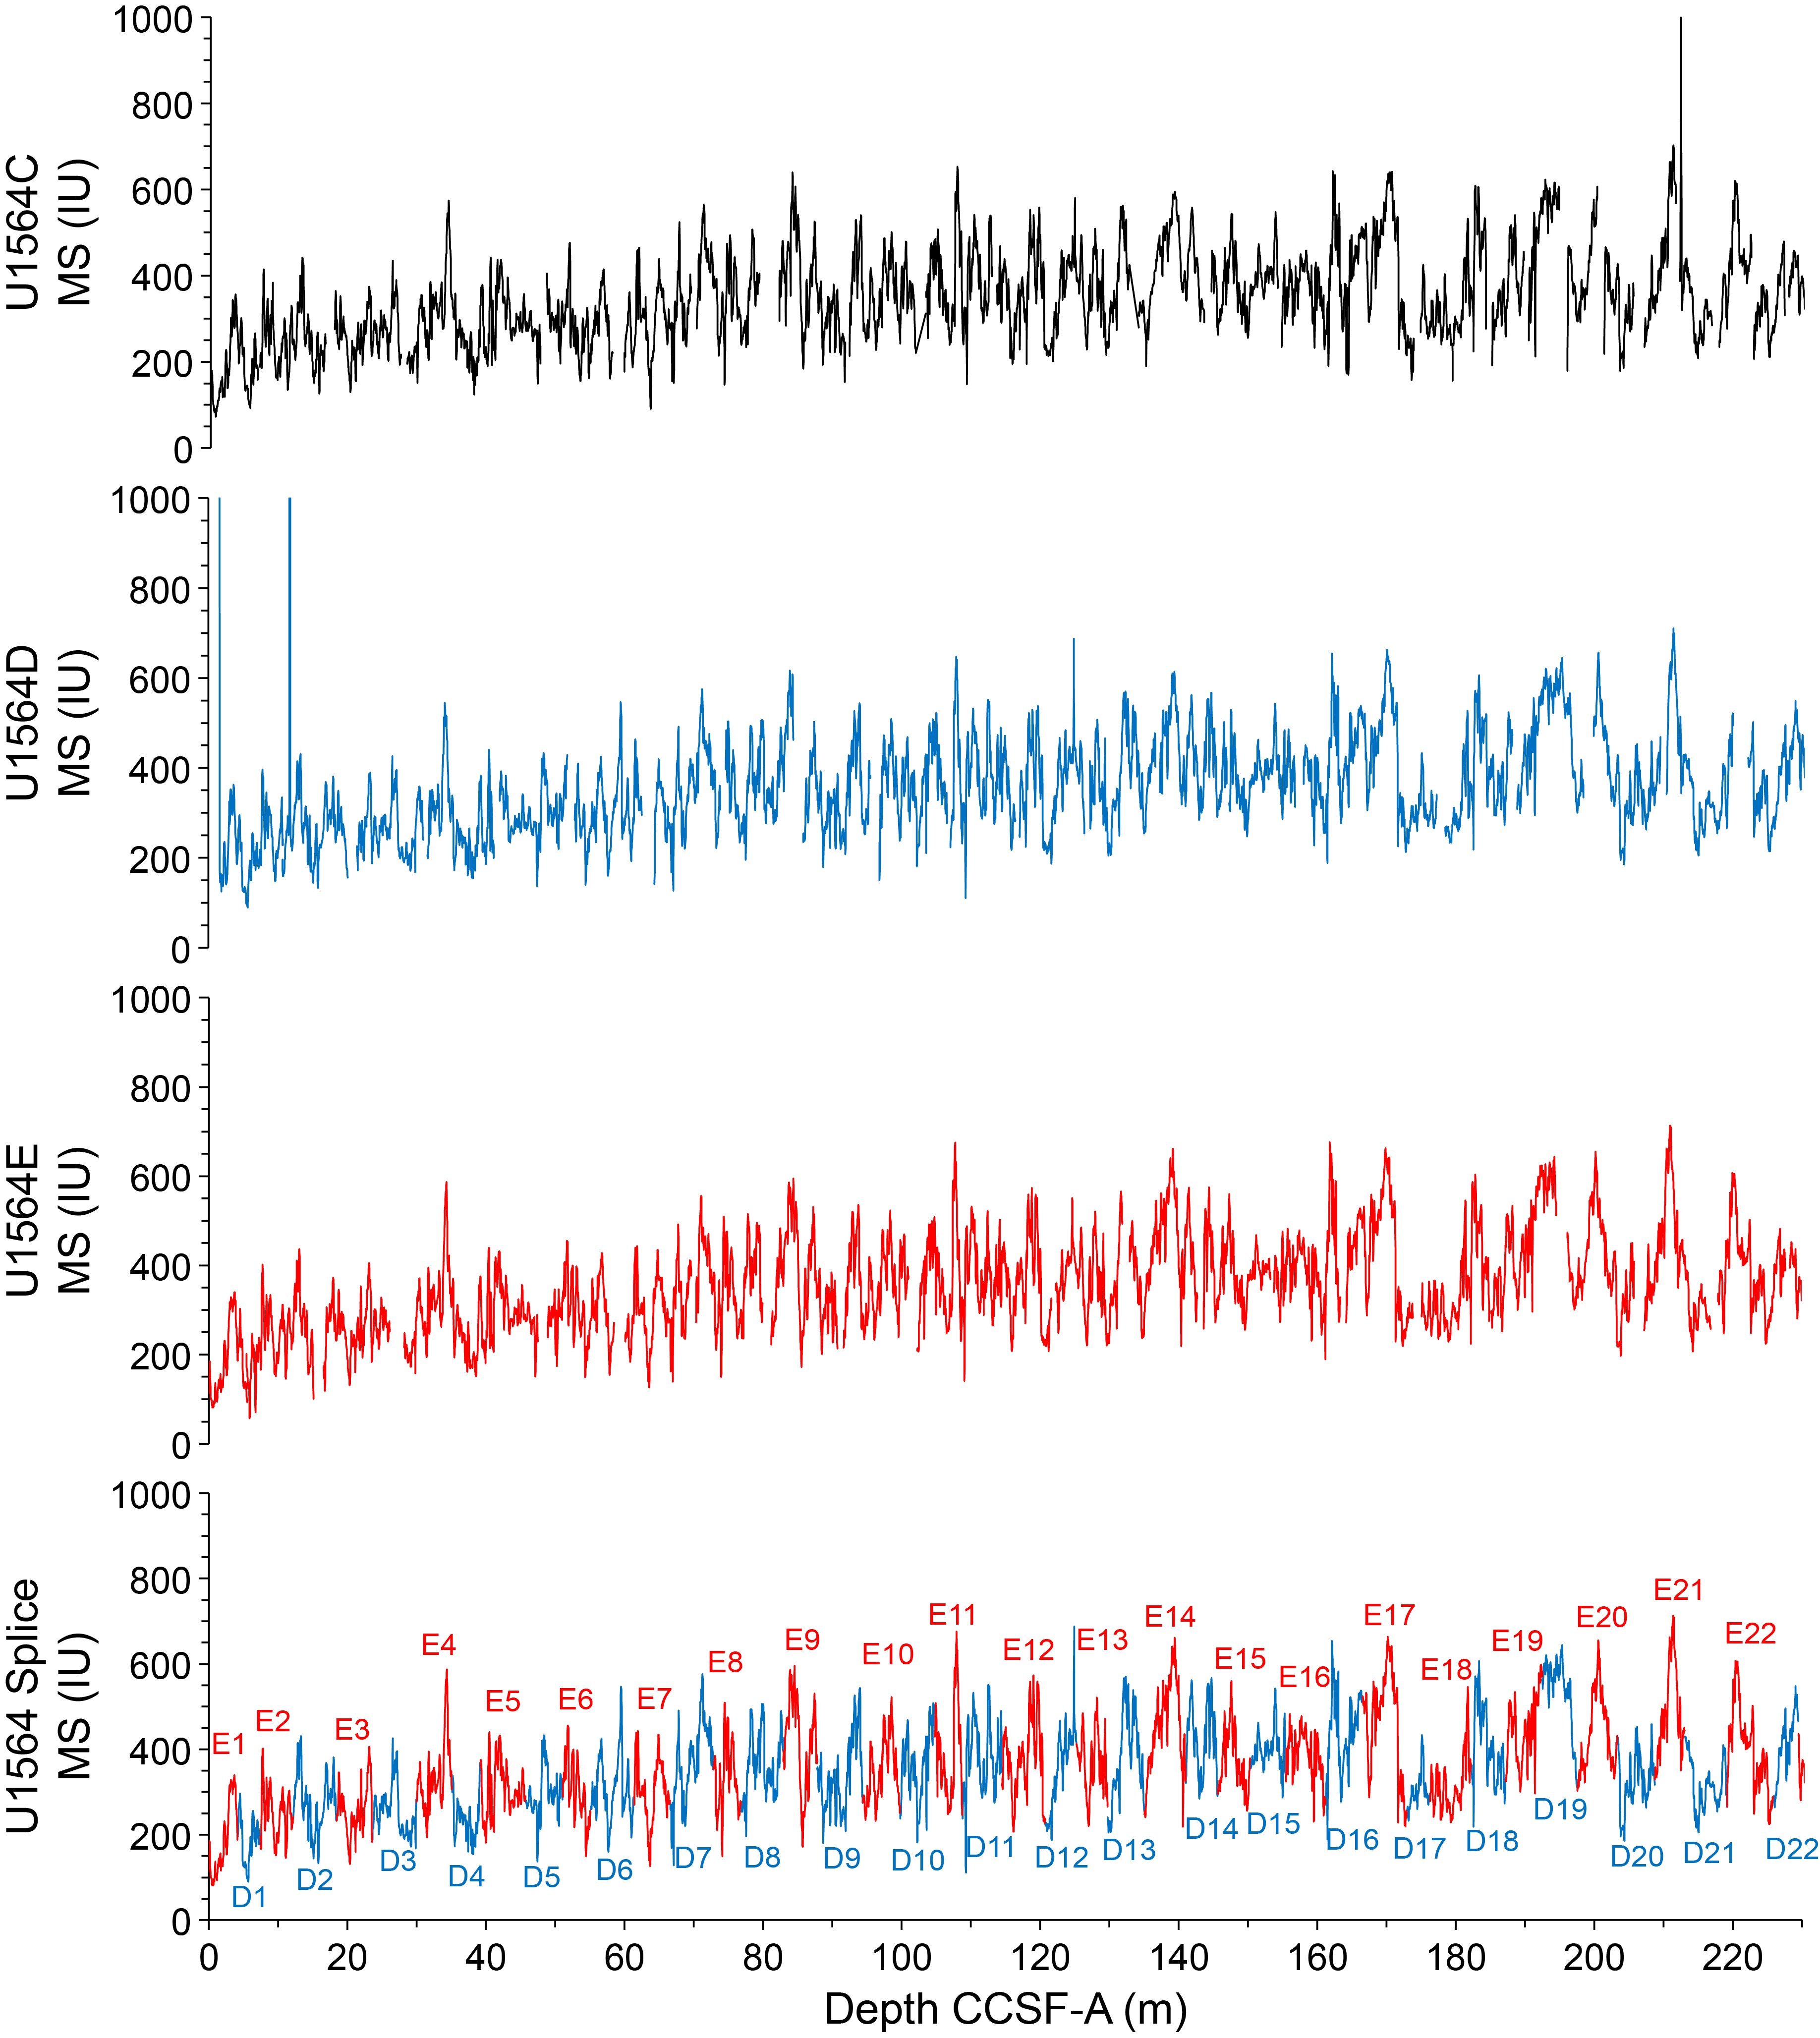
Figure F44. Splice for upper 230 m CCSF-A.
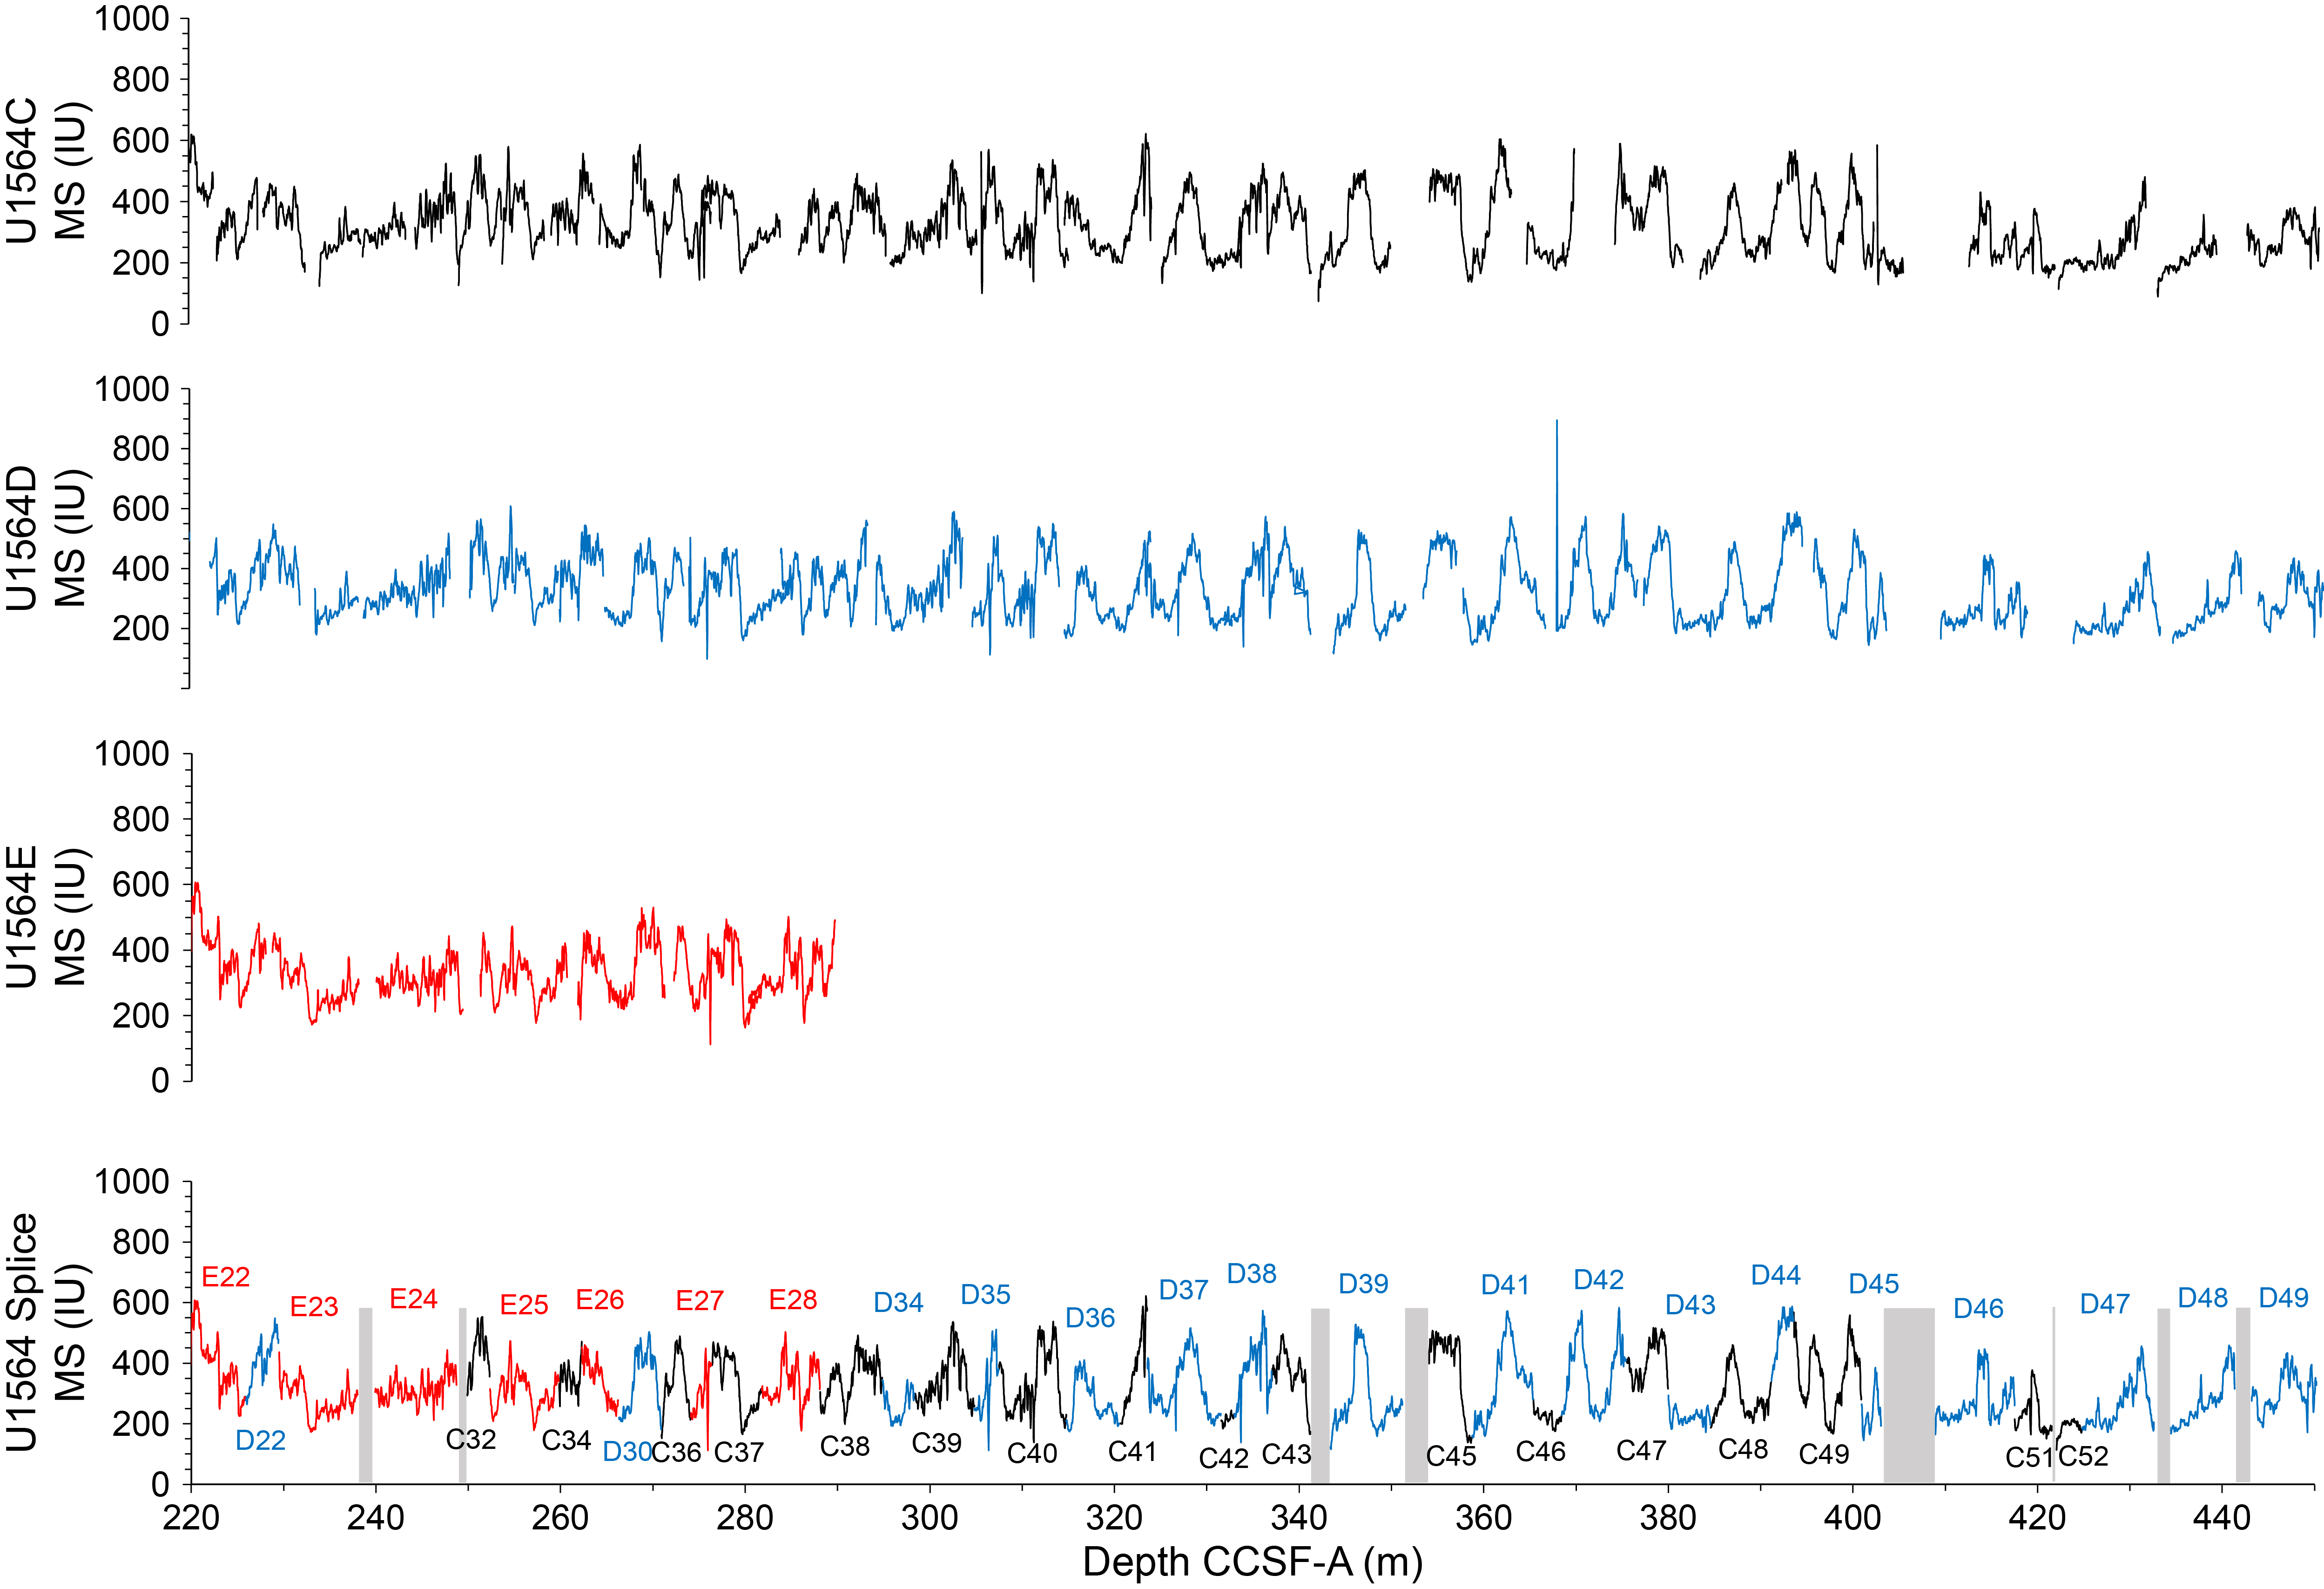
Figure F45. Splice for 220–450 m CCSF-A.
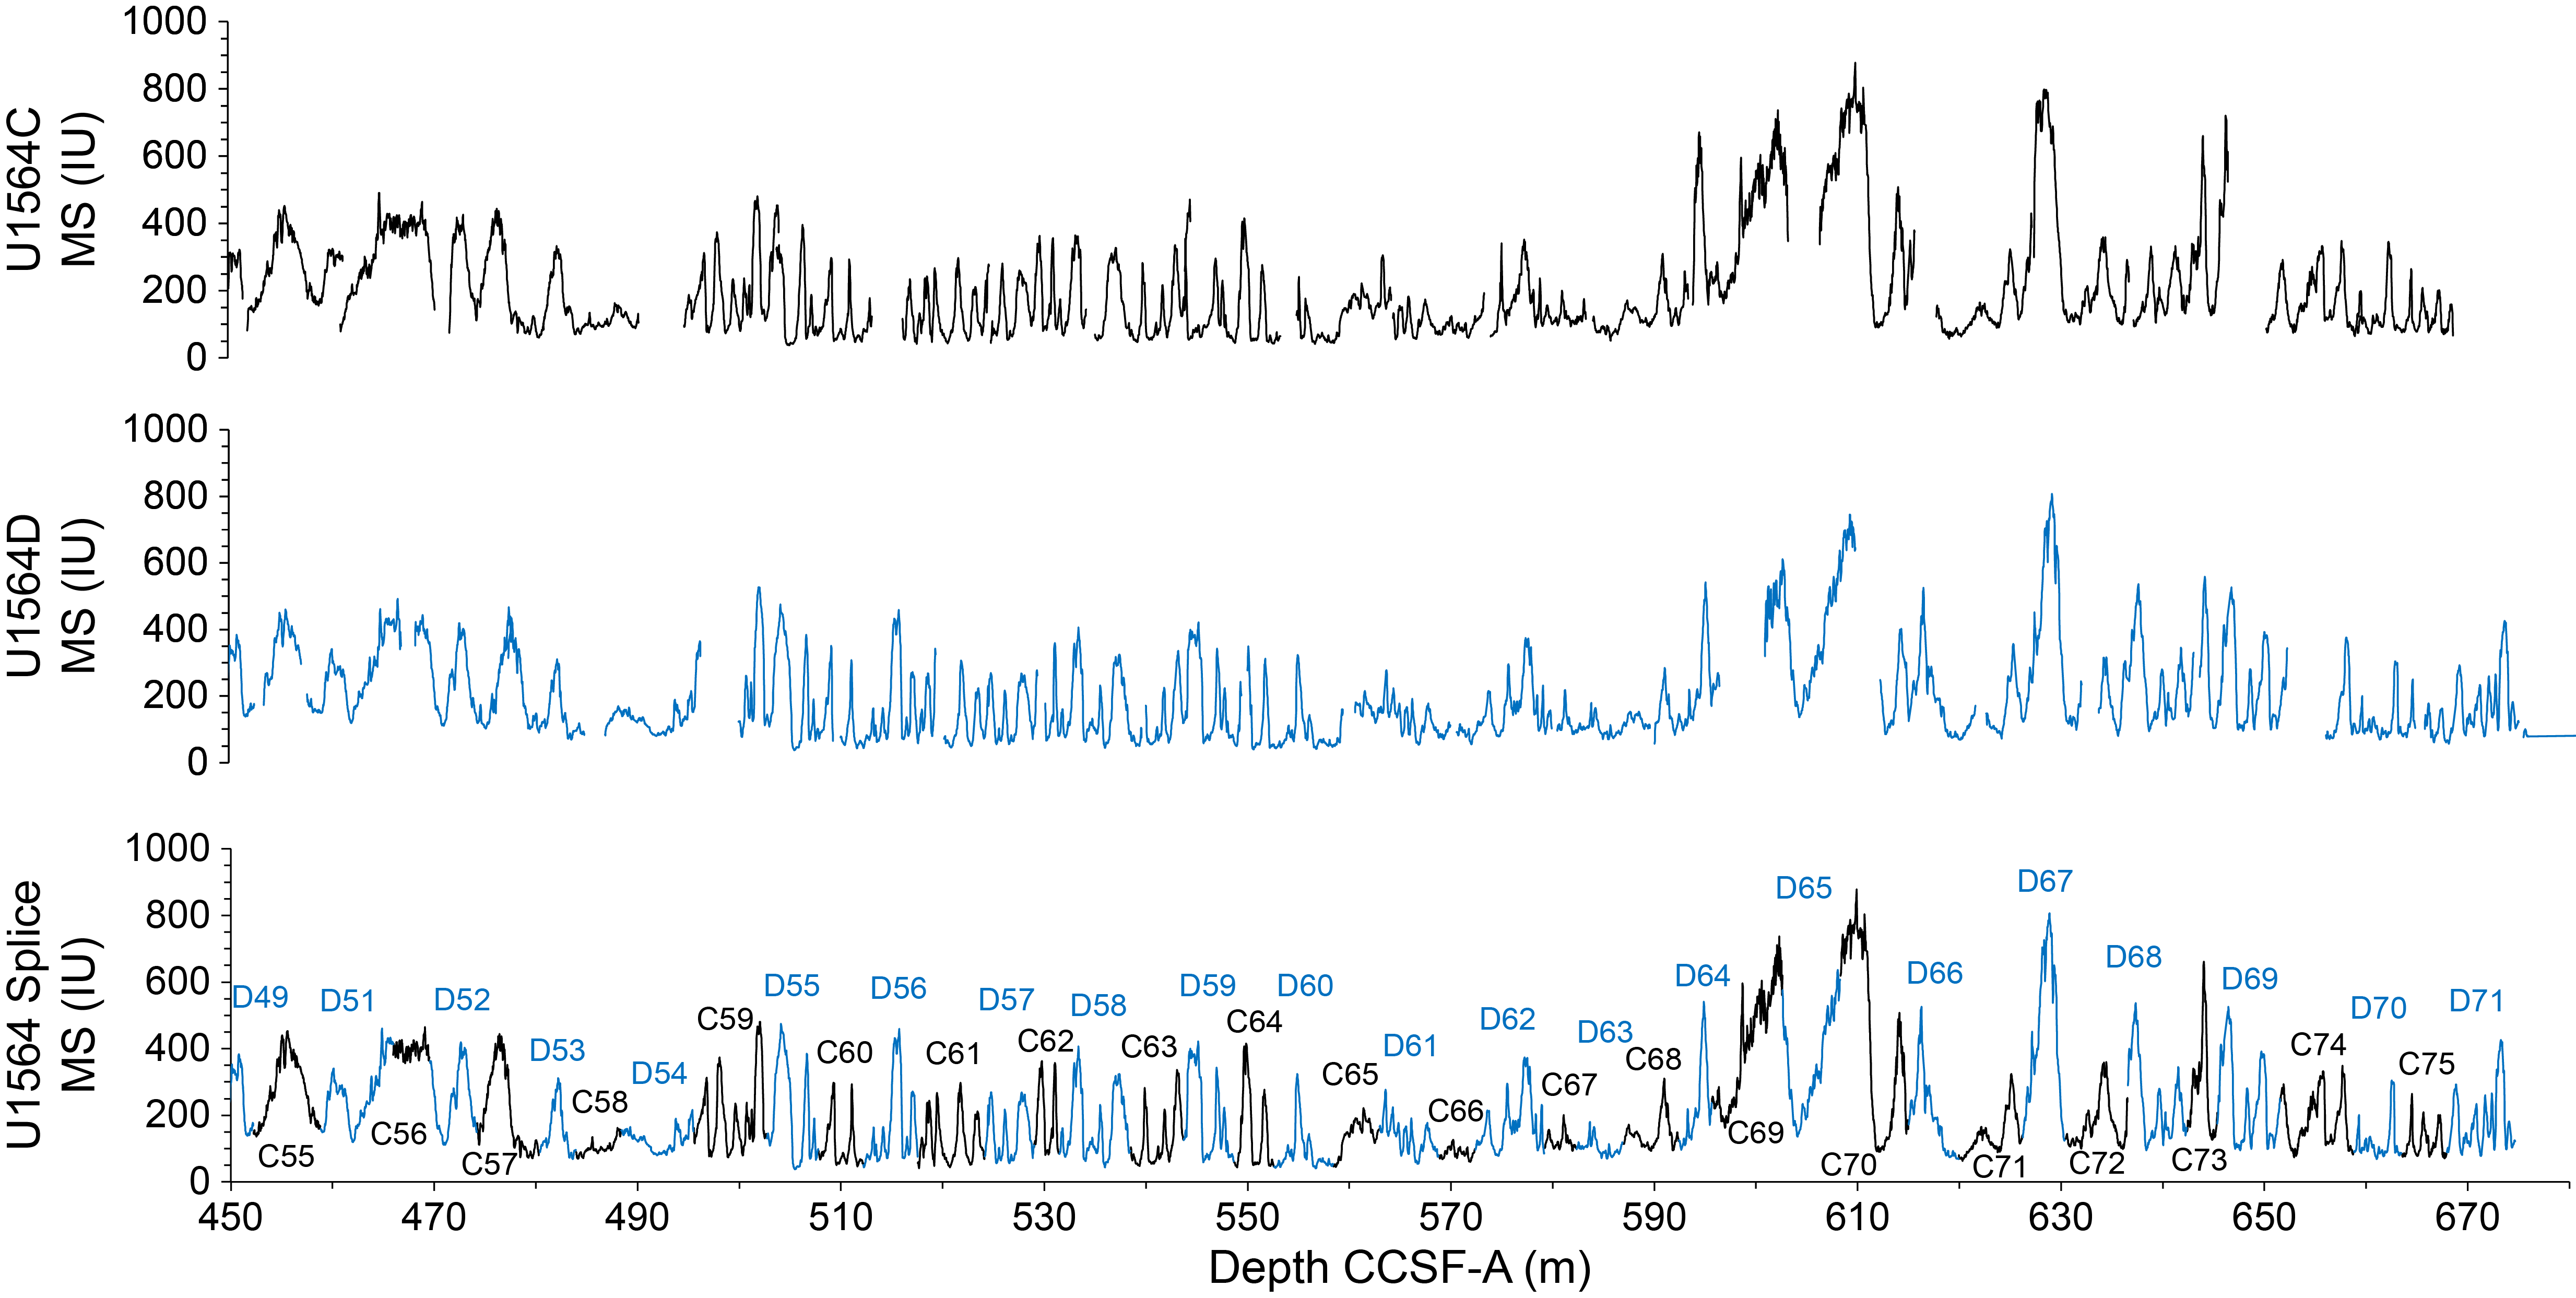
Figure F46. Splice for 450–680 m CCSF-A.
8.2. Construction of the splice
The splice for Site U1564 contains two long uninterrupted intervals (Figures F44, F46) with an approximately 200 m long interval in between that has several gaps (Figure F45). In Cores 395-U1564E-1H through 23X, a continuous splice was constructed using only Holes U1564D and U1564E (Figure F44). The lowermost continuous part of the Site U1564 shipboard splice was constructed using material from Cores 395-U1564D-49X through 71X and 395C-U1564C-55X through 75X (Figure F46).
Between 220 and 420 m CSF-A, several gaps are unavoidable, and cores from Holes U1564C, U1564D, and U1564E were positioned to our best judgment with additional guidance from the downhole wireline MS logging profile from Hole U1564C.
9. Paleomagnetism
9.1. Shipboard measurements
Shipboard paleomagnetic investigations were conducted on the archive-half cores from Holes 395C-U1564A, 395C-U1564B, 395C-U1564C, 395-U1564D, 395-U1564E, and 395-U1564F (Figure F47). Three demagnetization steps (0, 15, and 20 mT) were performed at 5 cm spacing in Holes U1564A–U1564C (see Table T7 in the Expedition 395 methods chapter [Parnell-Turner et al., 2025a]). Sections 395-U1564D-1H-1 through 51X-4 and 56X-1 through 74X-2 were demagnetized with four steps (0, 10, 15, and 20 mT), and Sections 51X-5 through 55X-CC were demagnetized with six steps (0, 10, 15, 20, 25, and 30 mT), all at 2.5 cm spacing. Hole U1564E was demagnetized with four steps (0, 10, 15, and 20 mT) at 5 cm spacing. For sediments from Hole U1564F, six demagnetization steps of 0, 10, 15, 20, 25, and 30 mT were used at a spacing of 2.5 cm. Oriented discrete samples with a frequency of one to three per core were collected starting from Core 5R. The sediment/basement interface is between Sections 44R-1 and 44R-2 (997 m CSF-A). In Sections 44R-2 through 68R-3, nine steps (0, 5, 10, 15, 20, 25, 30, 35, and 40) were measured with a spacing of 1 cm. In Sections 69R-1 through 76R-2, six steps (0, 5, 10, 15, 20, and 25) were measured with a spacing of 1 cm. In Hole U1564D, 34 oriented discrete samples (cubes) were collected from working halves in the sedimentary sequence, 81 oriented cubes were collected from sediments in Hole U1564F, and 27 oriented cubes were collected from the basement section of Hole U1564F.
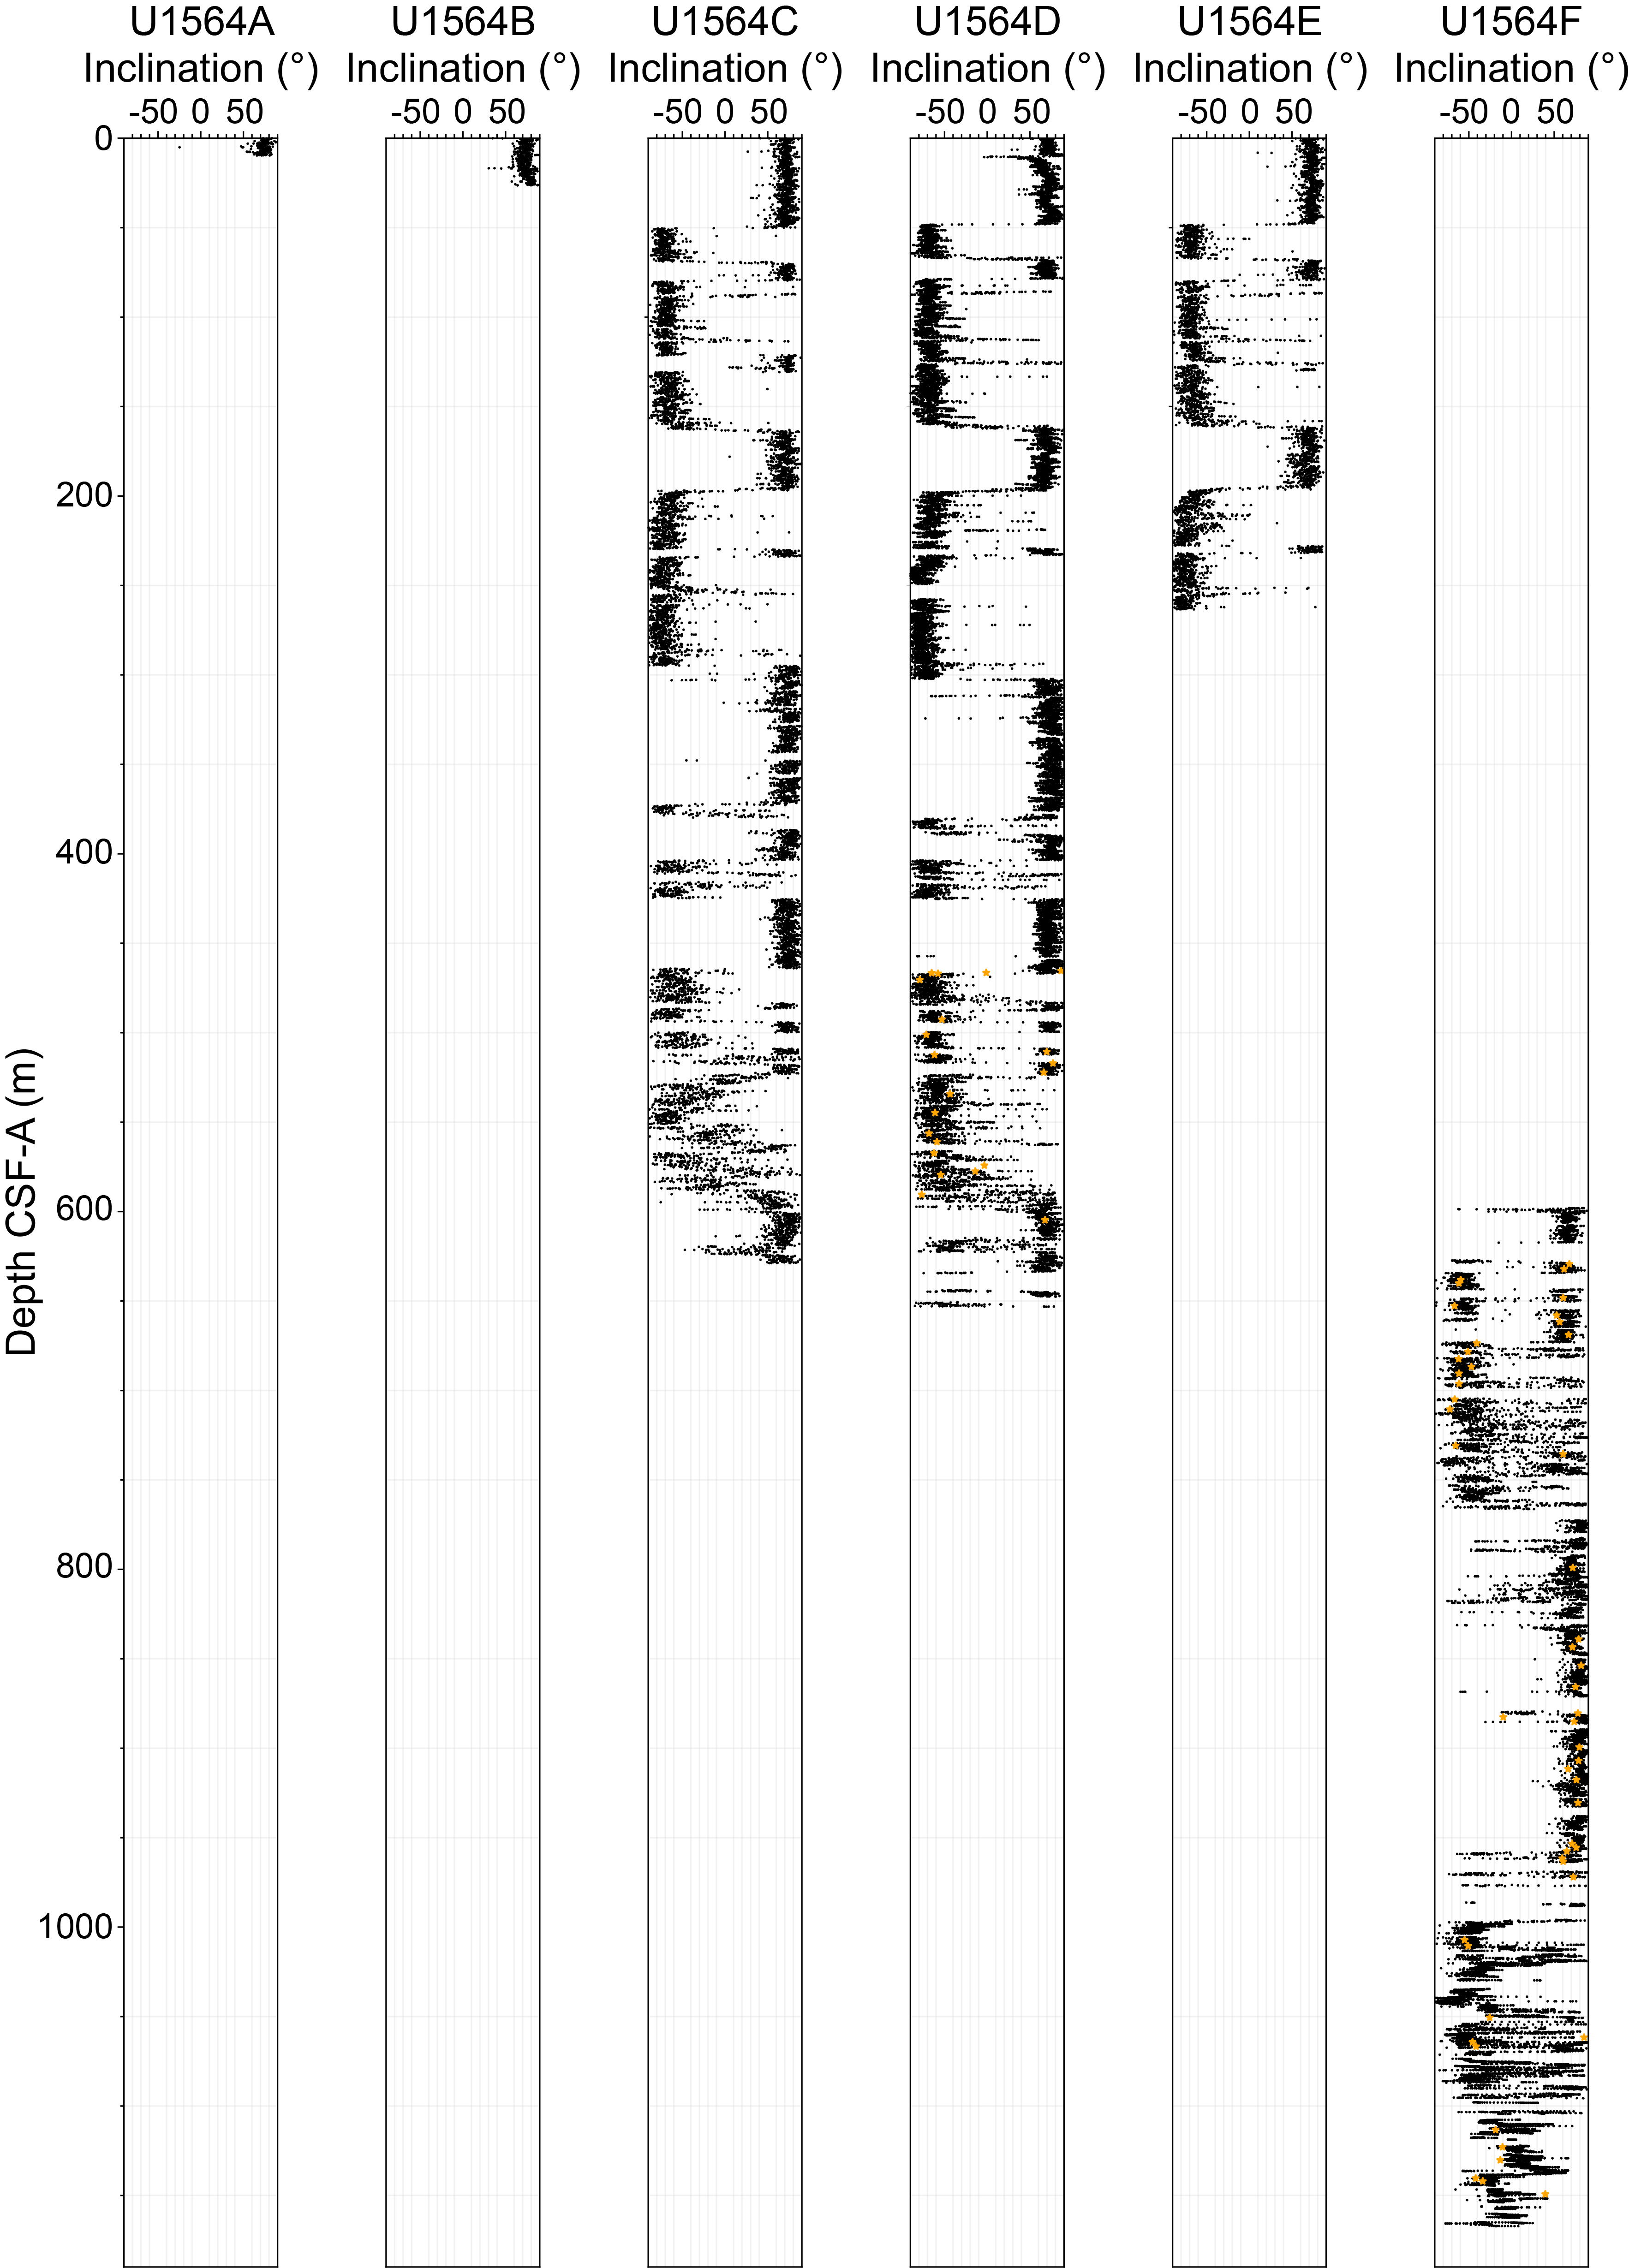
Figure F47. Inclination.
For all 142 discrete samples, the anisotropy of magnetic susceptibility (AMS) was first measured (Figure F48), and then an alternating field (AF) demagnetization was applied from NRM up to 100 mT (if needed), with a stepwise demagnetization sequence of 5, 10, 15, 20, 25, 30, 40, 50, 60, 80, and 100 mT (Figure F49). The thermal demagnetization protocol was run on nine samples from Hole U1564F, eight from the basement, and one from the chalk interval within basement rocks (Sample 52R-2, 128–130 cm), with steps at 50°C intervals from NRM to 600°C. On discrete samples, the anhysteretic remanent magnetization (ARM) was also measured at a 50 µT bias field and 100 mT demagnetizing field, and on a subset, the isothermal remanent magnetization (IRM) was also measured at 100, 300, 500, and 1000 mT and AF demagnetized (see Paleomagnetism in the Expedition 395 methods chapter [Parnell-Turner et al., 2025a]).
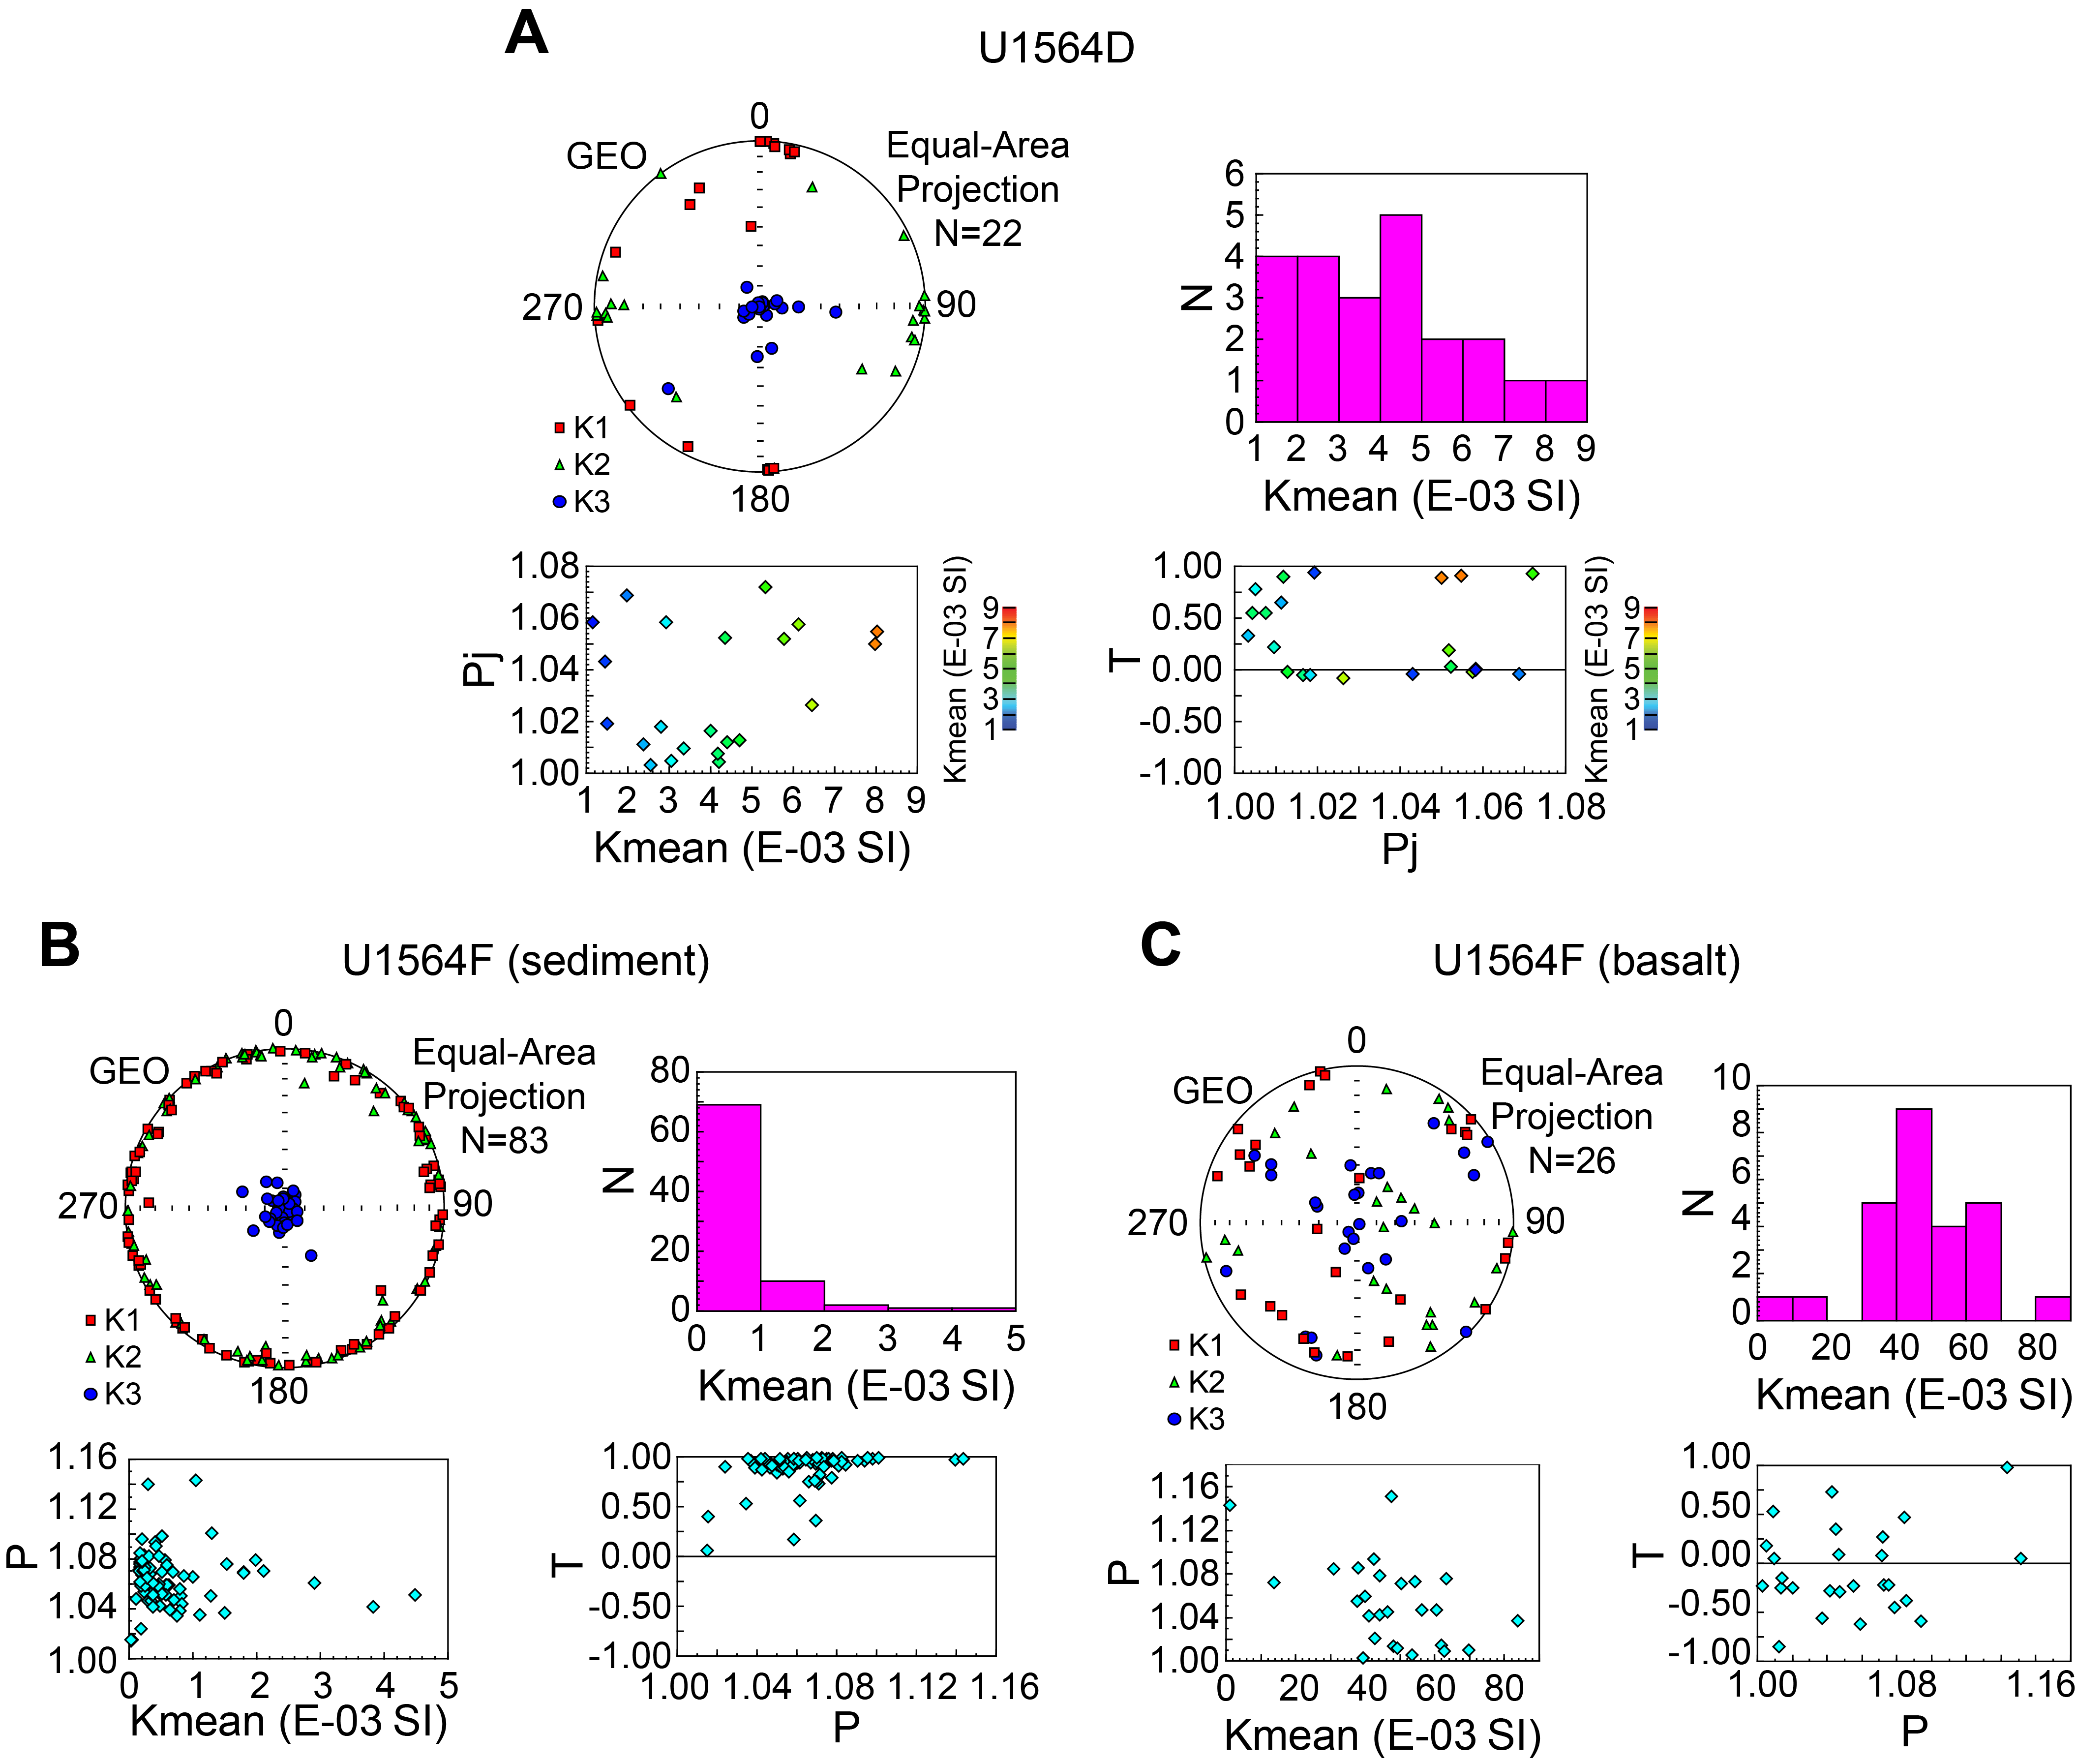
Figure F48. AMS.
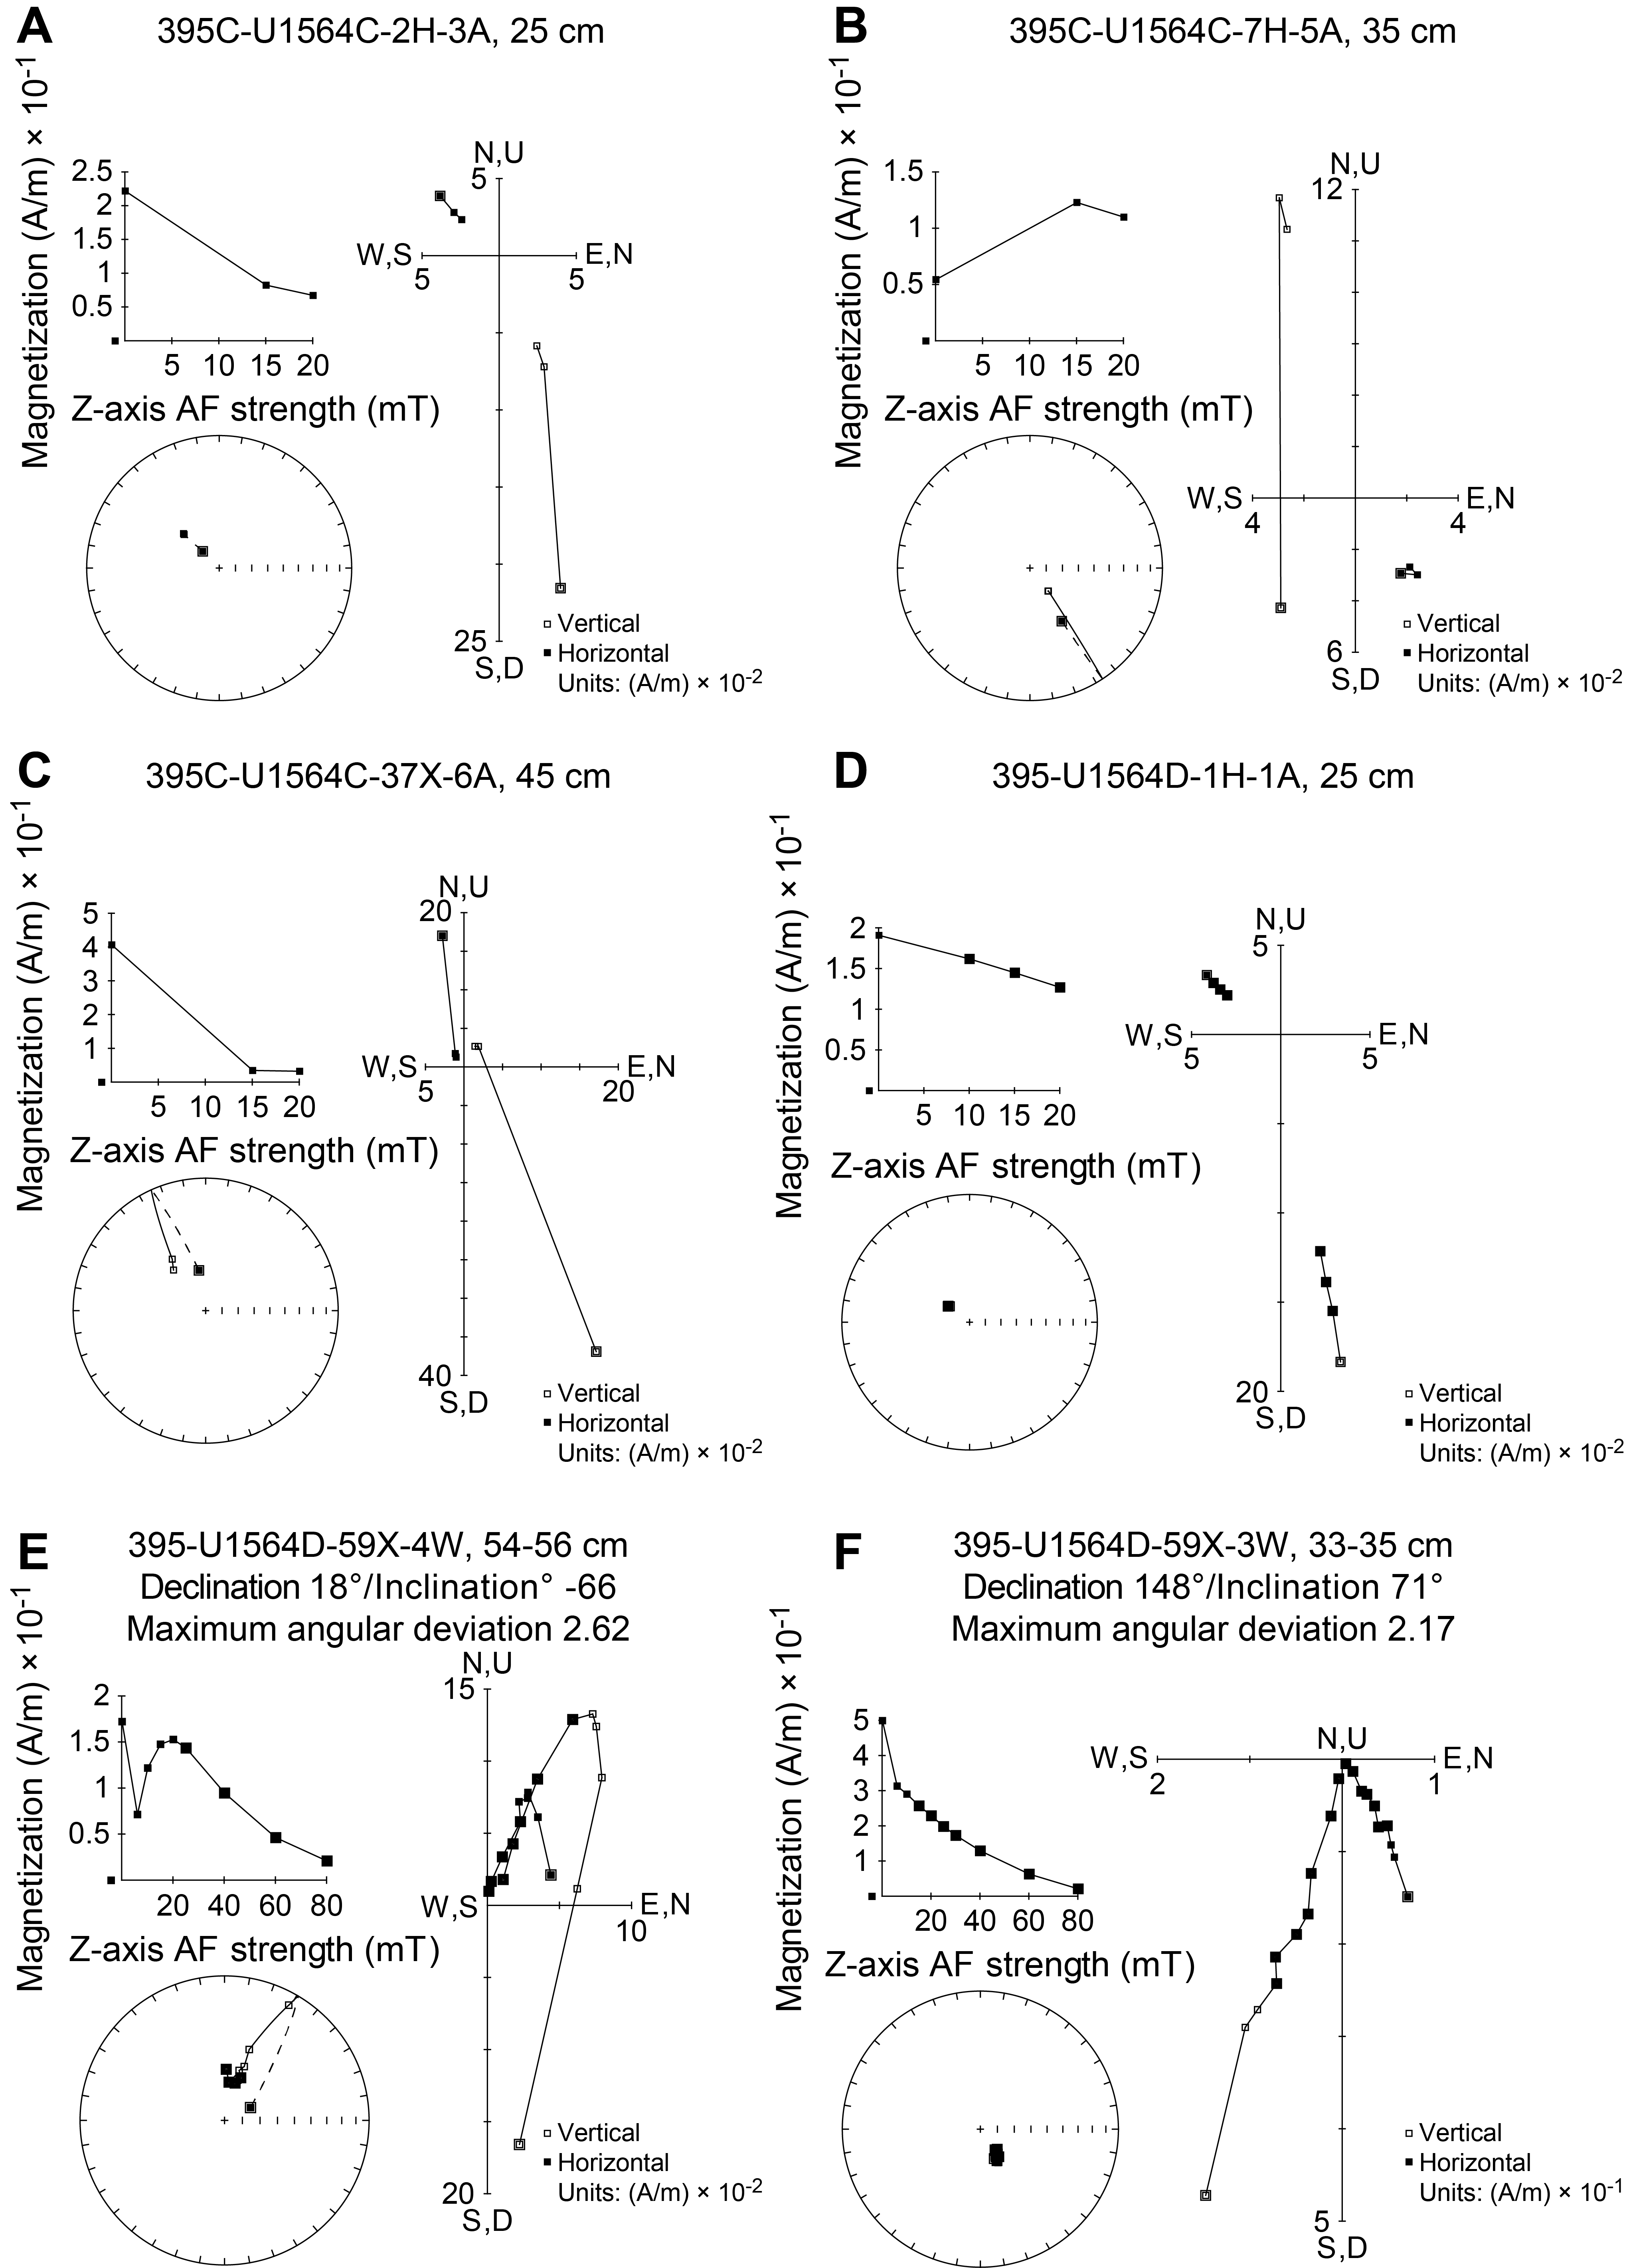
Figure F49. Demagnetization.
The maximum demagnetization step (20 or 30 mT) inclination data from archive-half sections of sediments was used to determine magnetic polarities in each hole. Directional data were analyzed using Zijderveld diagrams (Zijderveld, 1967). For discrete sample data, the characteristic remanent magnetization (ChRM) direction(s) were calculated using principal component analysis (PCA) (Kirschvink, 1980) using PuffinPlot software (Version 1.4.1; Lurcock and Florindo, 2019).
9.2. Demagnetization behavior of sedimentary rocks
In most cases, after the removal of an overprint up to 10 mT, stepwise AF demagnetization performed up to 20 or 30 mT on the archive-half measurements (or up to 100 mT for the discrete samples) successfully isolated a stable and primary magnetization directed to the origin of the Zijderveld plot, even if not completely demagnetized (Figure F49A, F49B, F49D). Normal and reverse polarities were identified in all holes. In some cases, a primary component could not be identified because the NRM was fully demagnetized within the 10 mT step (Figure F49C). Paleomagnetic results from the discrete samples (Figure F49E, F49F) replicate the data obtained with the downcore measurements on the archive-half sections.
NRM intensity varies from 1.0 × 10⁻² to 3.0 A/m (average = 0.4 A/m) in Hole U1564C, from 1.1 × 10⁻⁶ to 2.4 A/m (average = 2.7 × 10⁻¹ A/m) in Hole U1564D, and from 7.7 × 10⁻³ to 1.6 A/m (average = 3.3 × 10⁻¹ A/m) in Hole U1564E. In Hole U1564F, NRM intensity varies from 2.4 × 10⁻⁵ to 7.6 × 10⁻¹ A/m in the sedimentary succession (average = 2.1 × 10⁻²).
The MS obtained by point measurement on section halves (Figures F50, F51, F52, F53, F54; see Physical properties) varies from 2.6 to 2238.7 IU (average = 272.5 IU) in Hole U1564C, from 0.2 to 1181.5 IU (average = 290.7 IU) in Hole U1564D, from 0.4 to 705.6 IU (average = 335.1 IU) in Hole U1564E, and from 8.4 × 10⁻¹ to 741.8 IU (average = 71.1 IU) in sediments from Hole U1564F. Both NRM and MS show considerable variability with depth, most likely due to changes in carbonate and silica content in sedimentary units (see Lithostratigraphy). The paleomagnetic results are summarized in Figure F47, where the variations in terms of inclination reflect changes in the magnetic polarities and are replicated in all the holes.
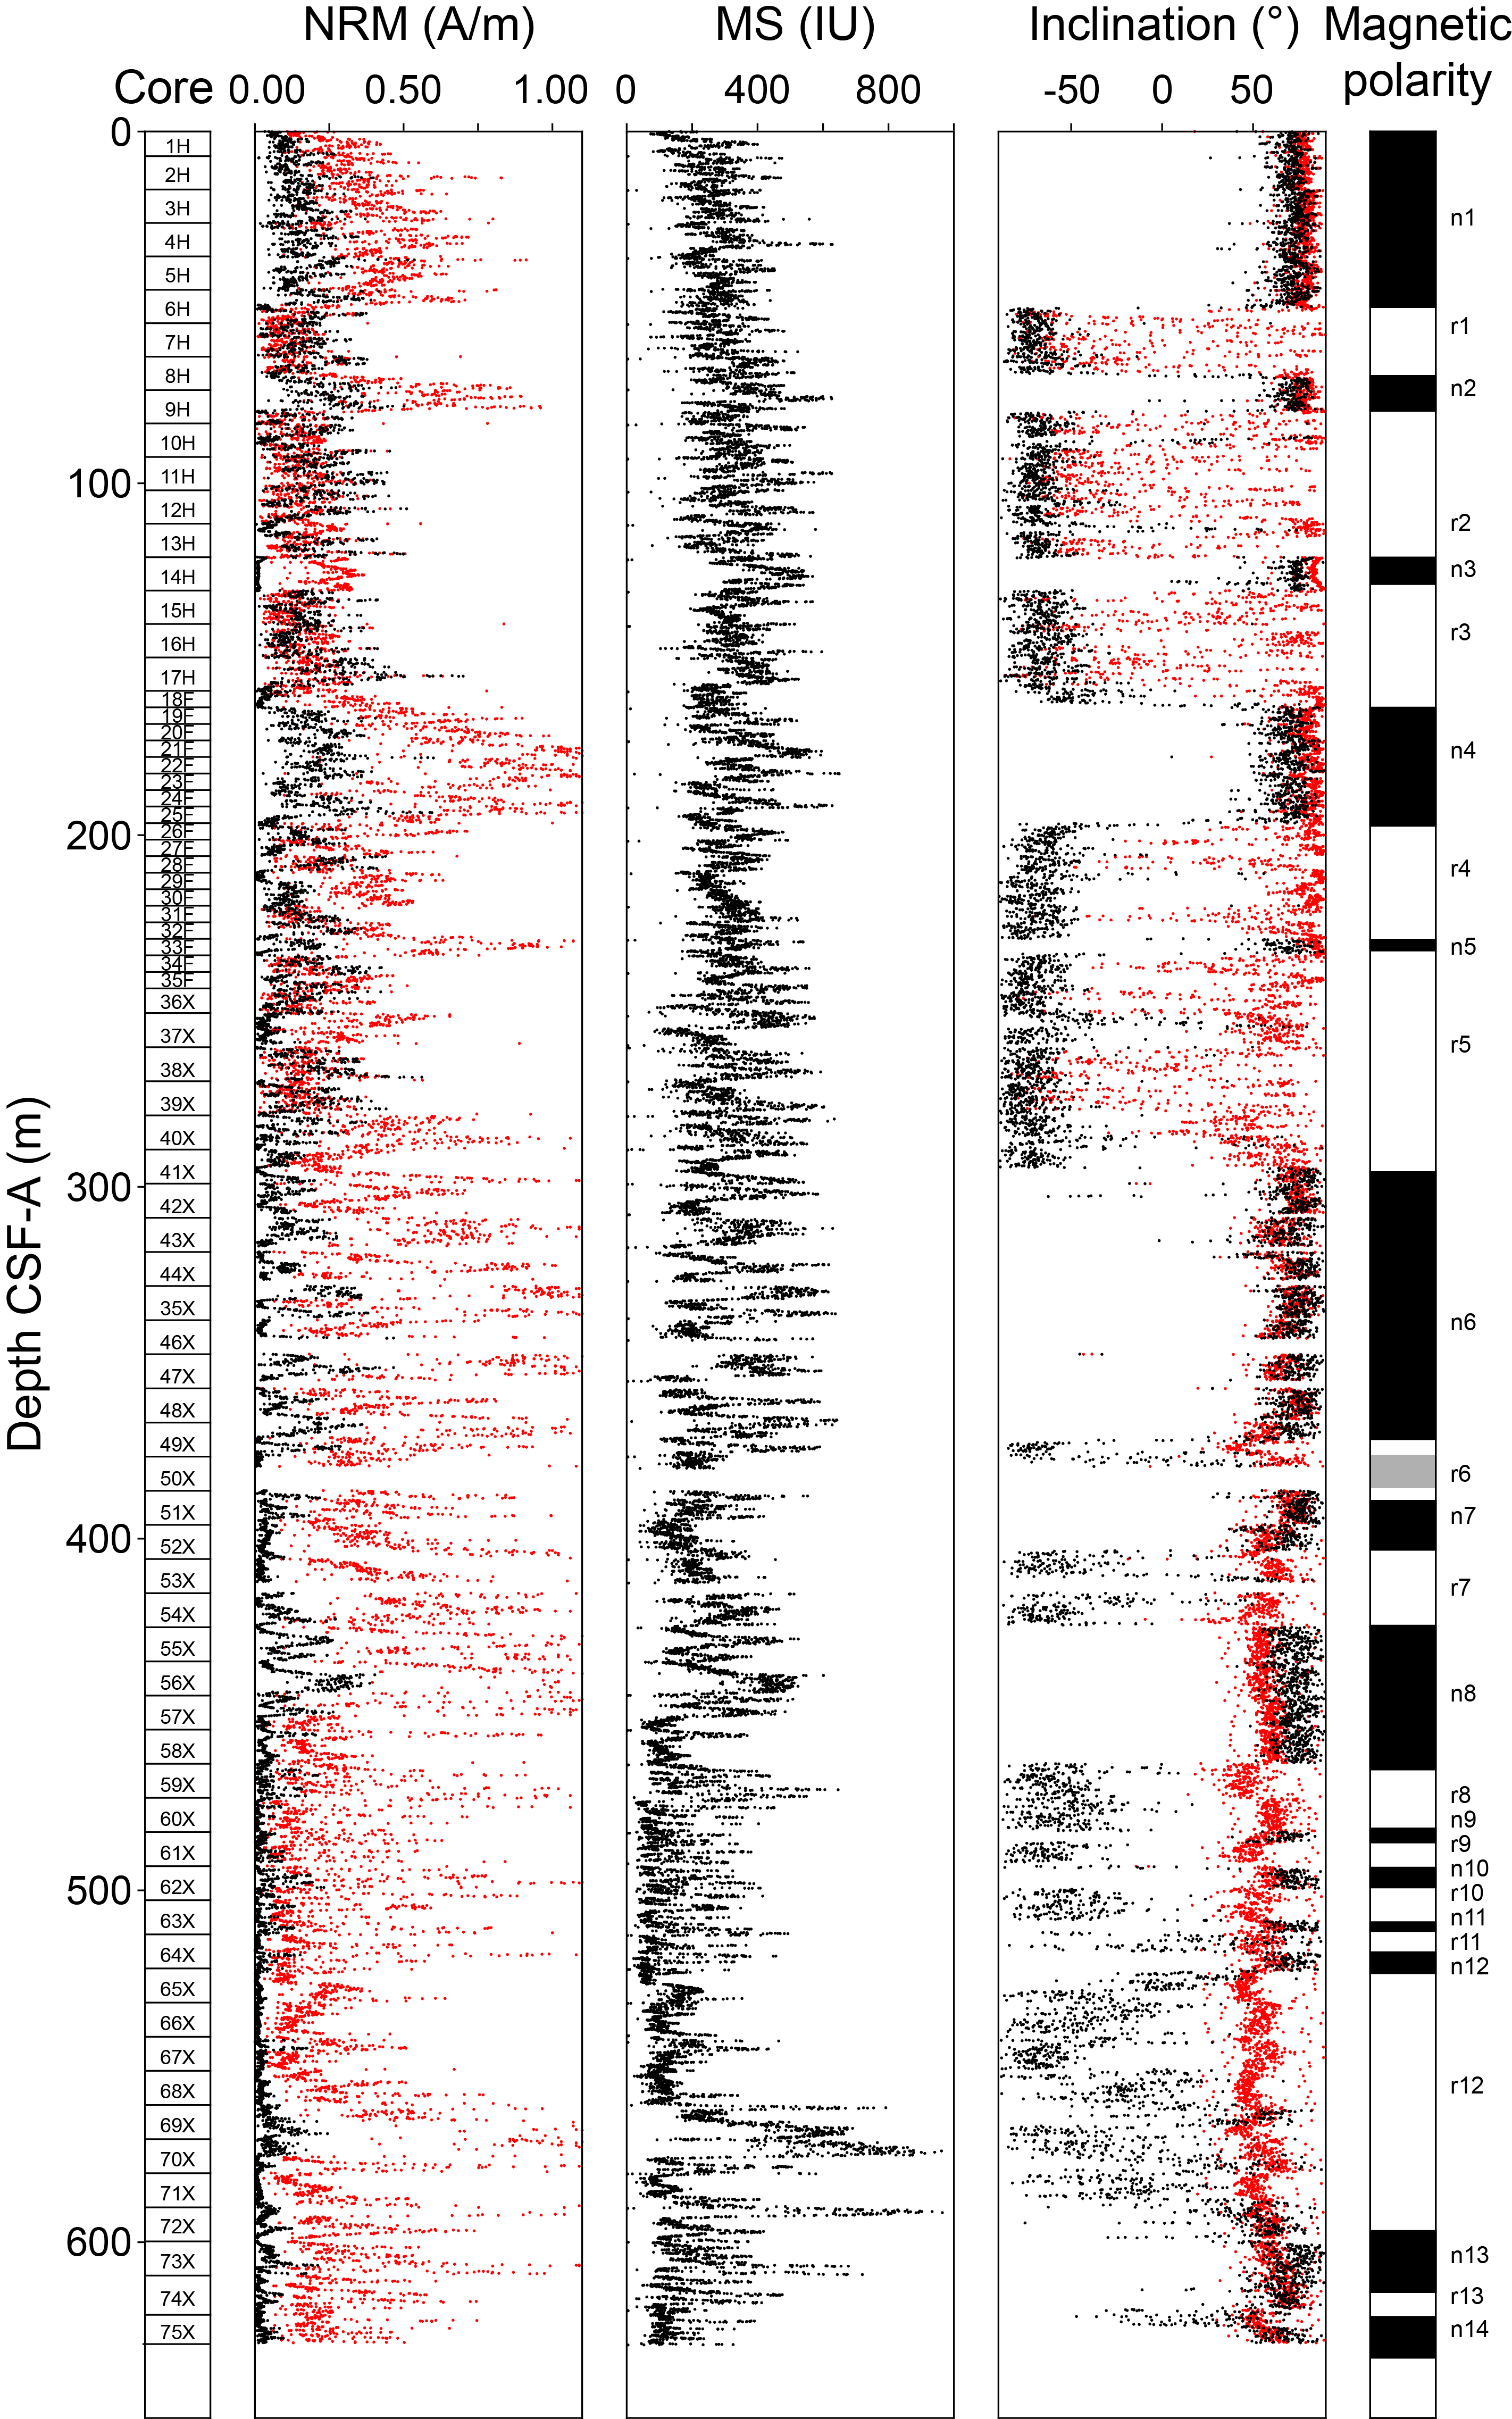
Figure F50. Paleomagnetic measurements, Hole U1564C.
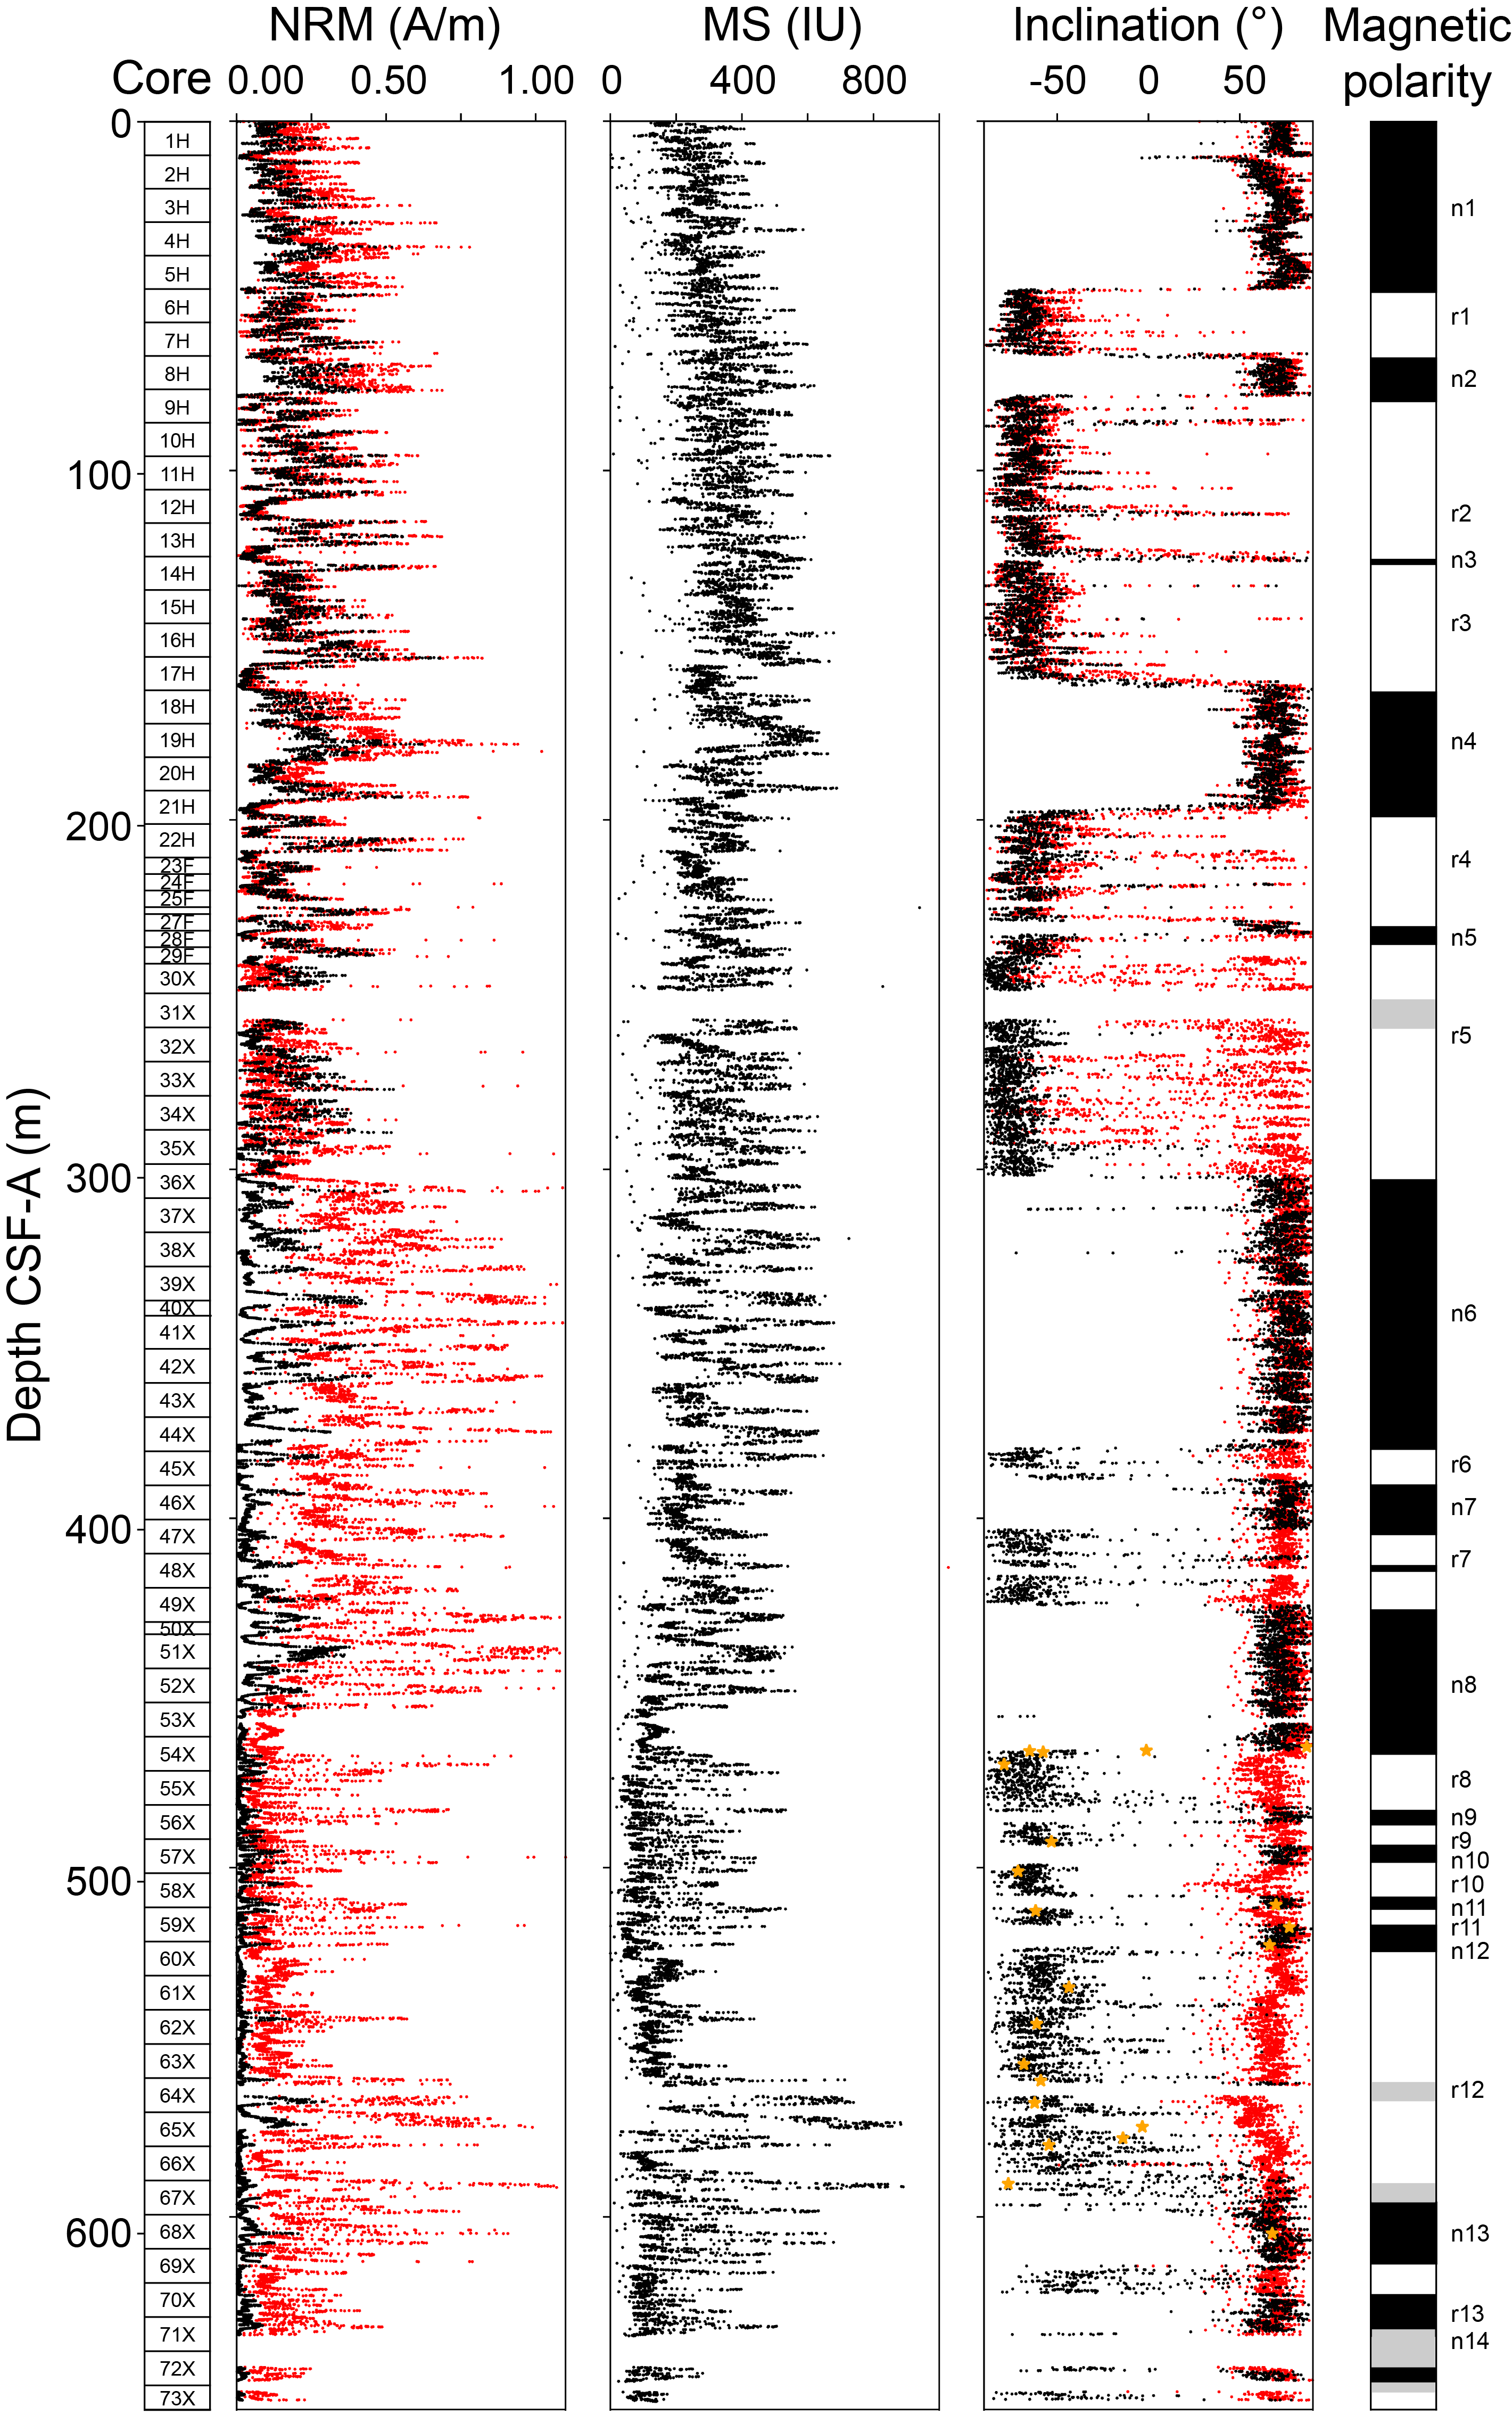
Figure F51. Paleomagnetic measurements, Hole U1564D.

Figure F52. Paleomagnetic measurements, Hole U1564E.
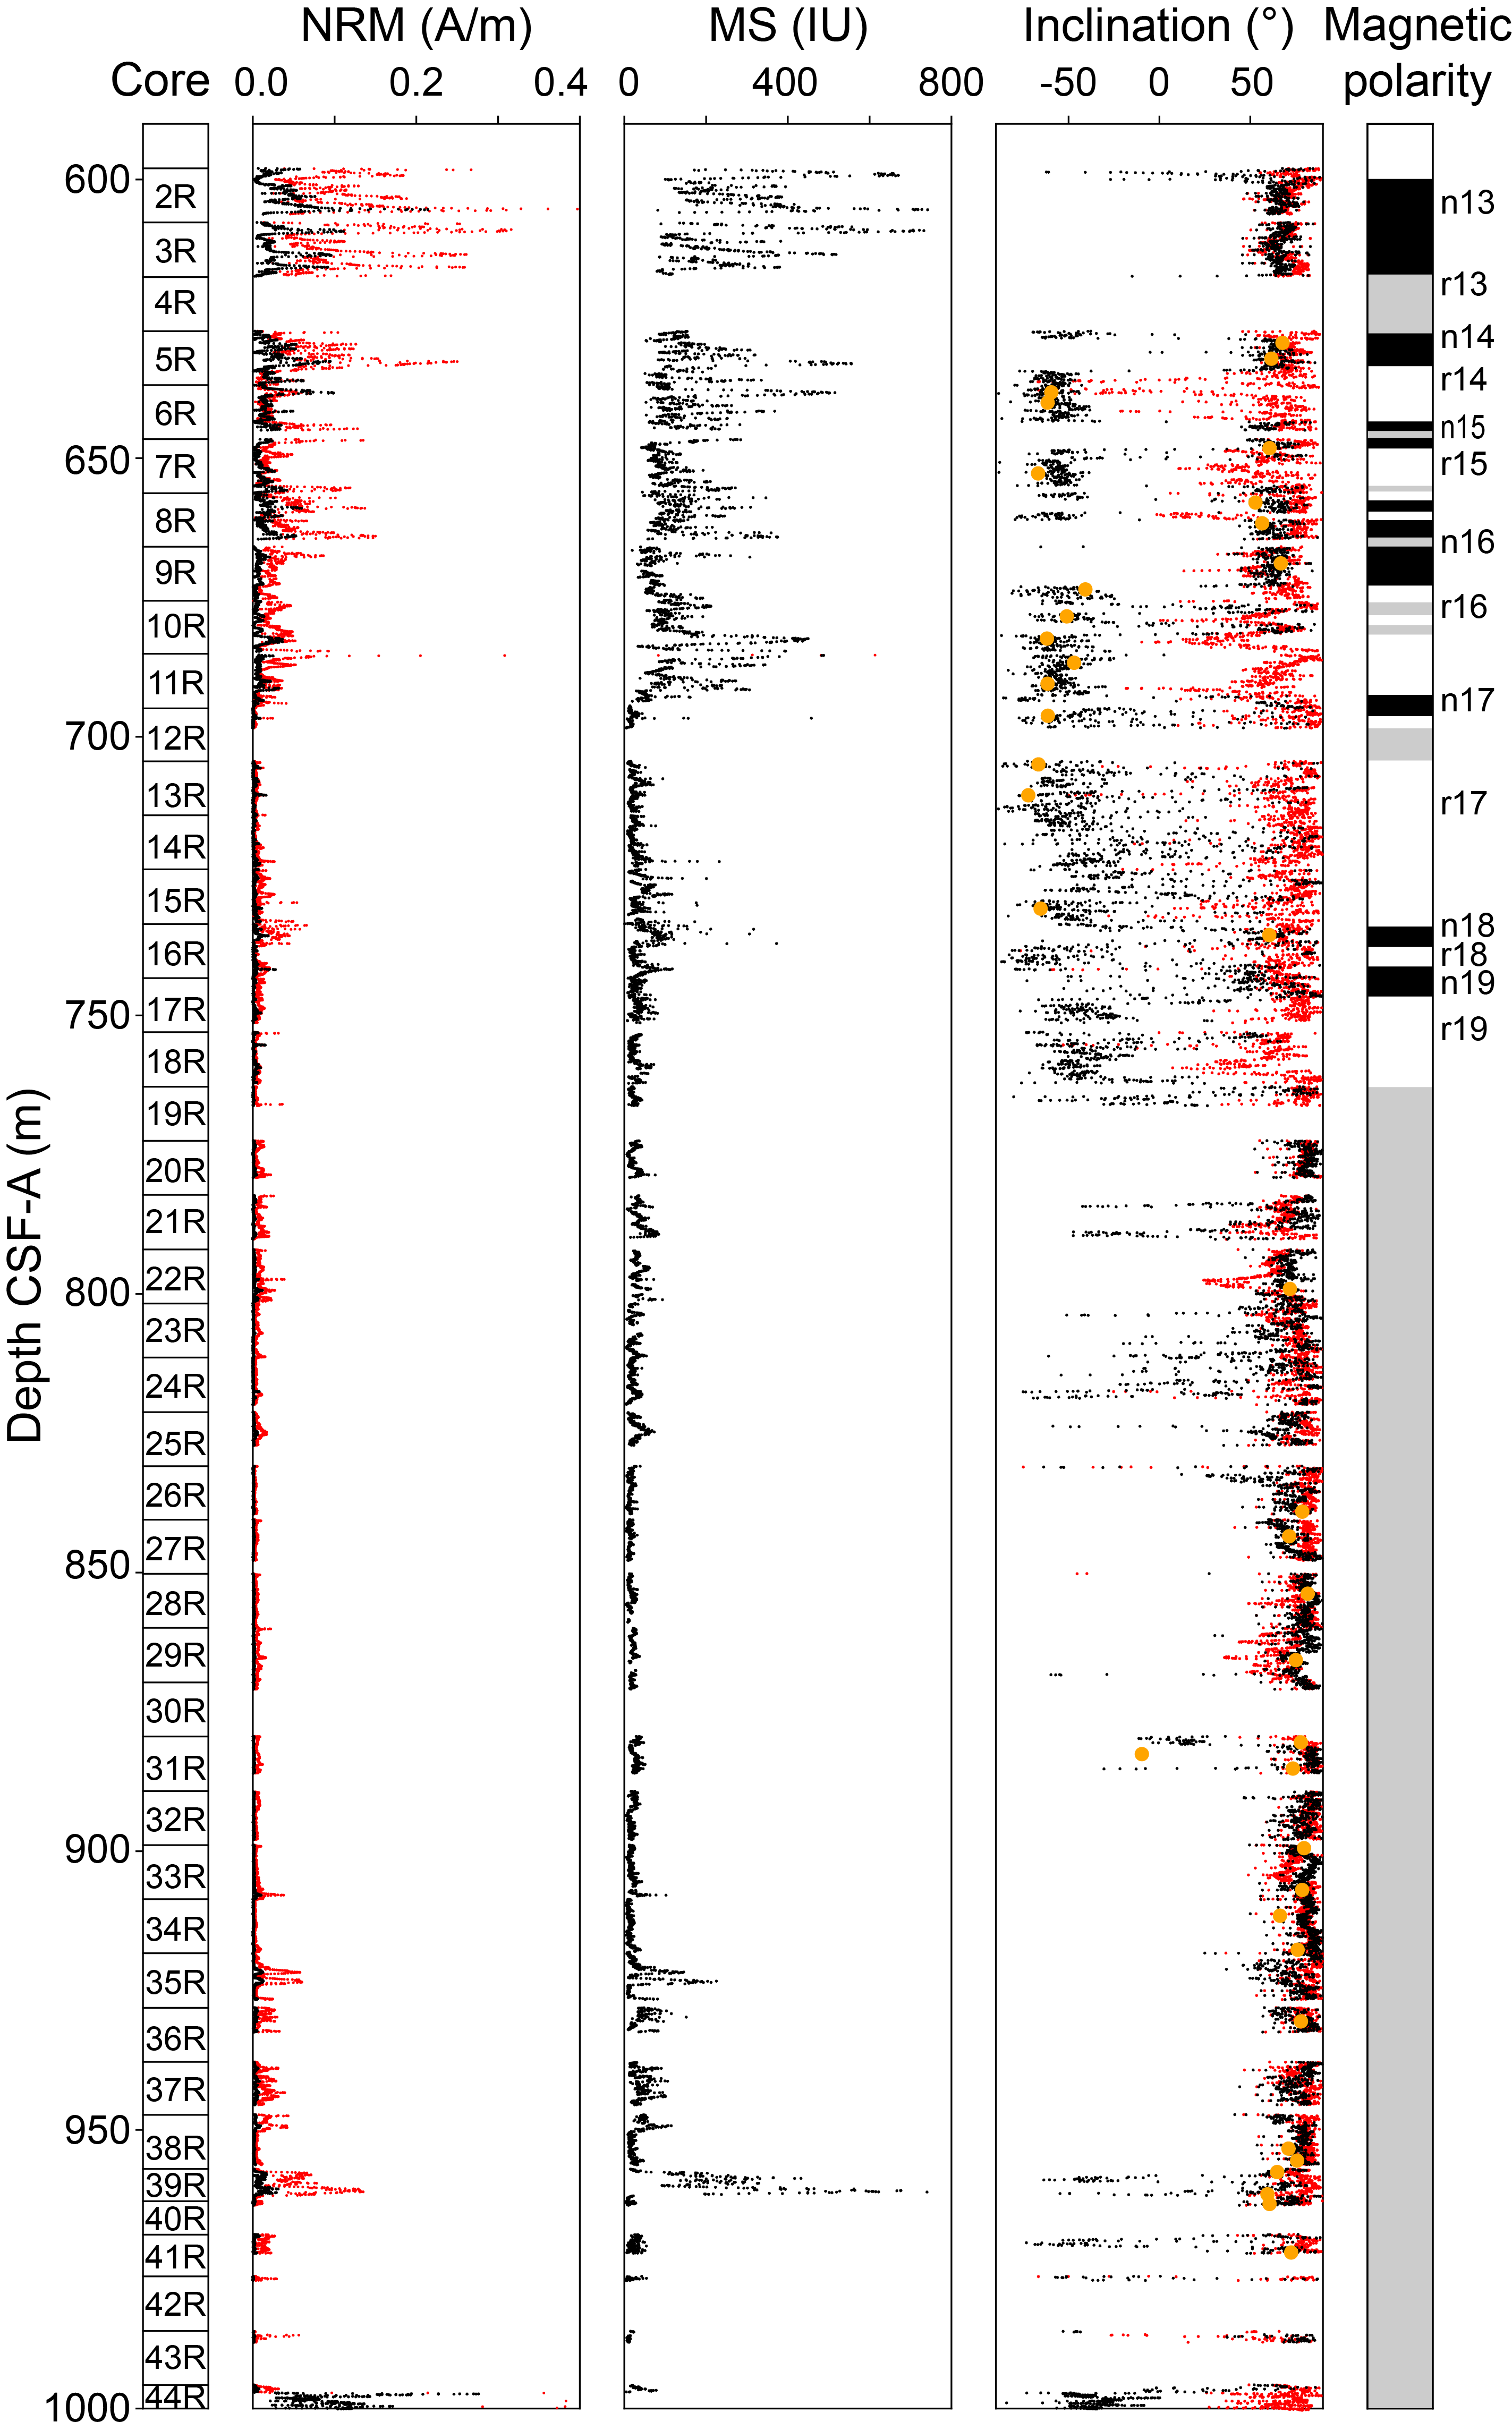
Figure F53. Paleomagnetic measurements from sediments, Hole U1564F.
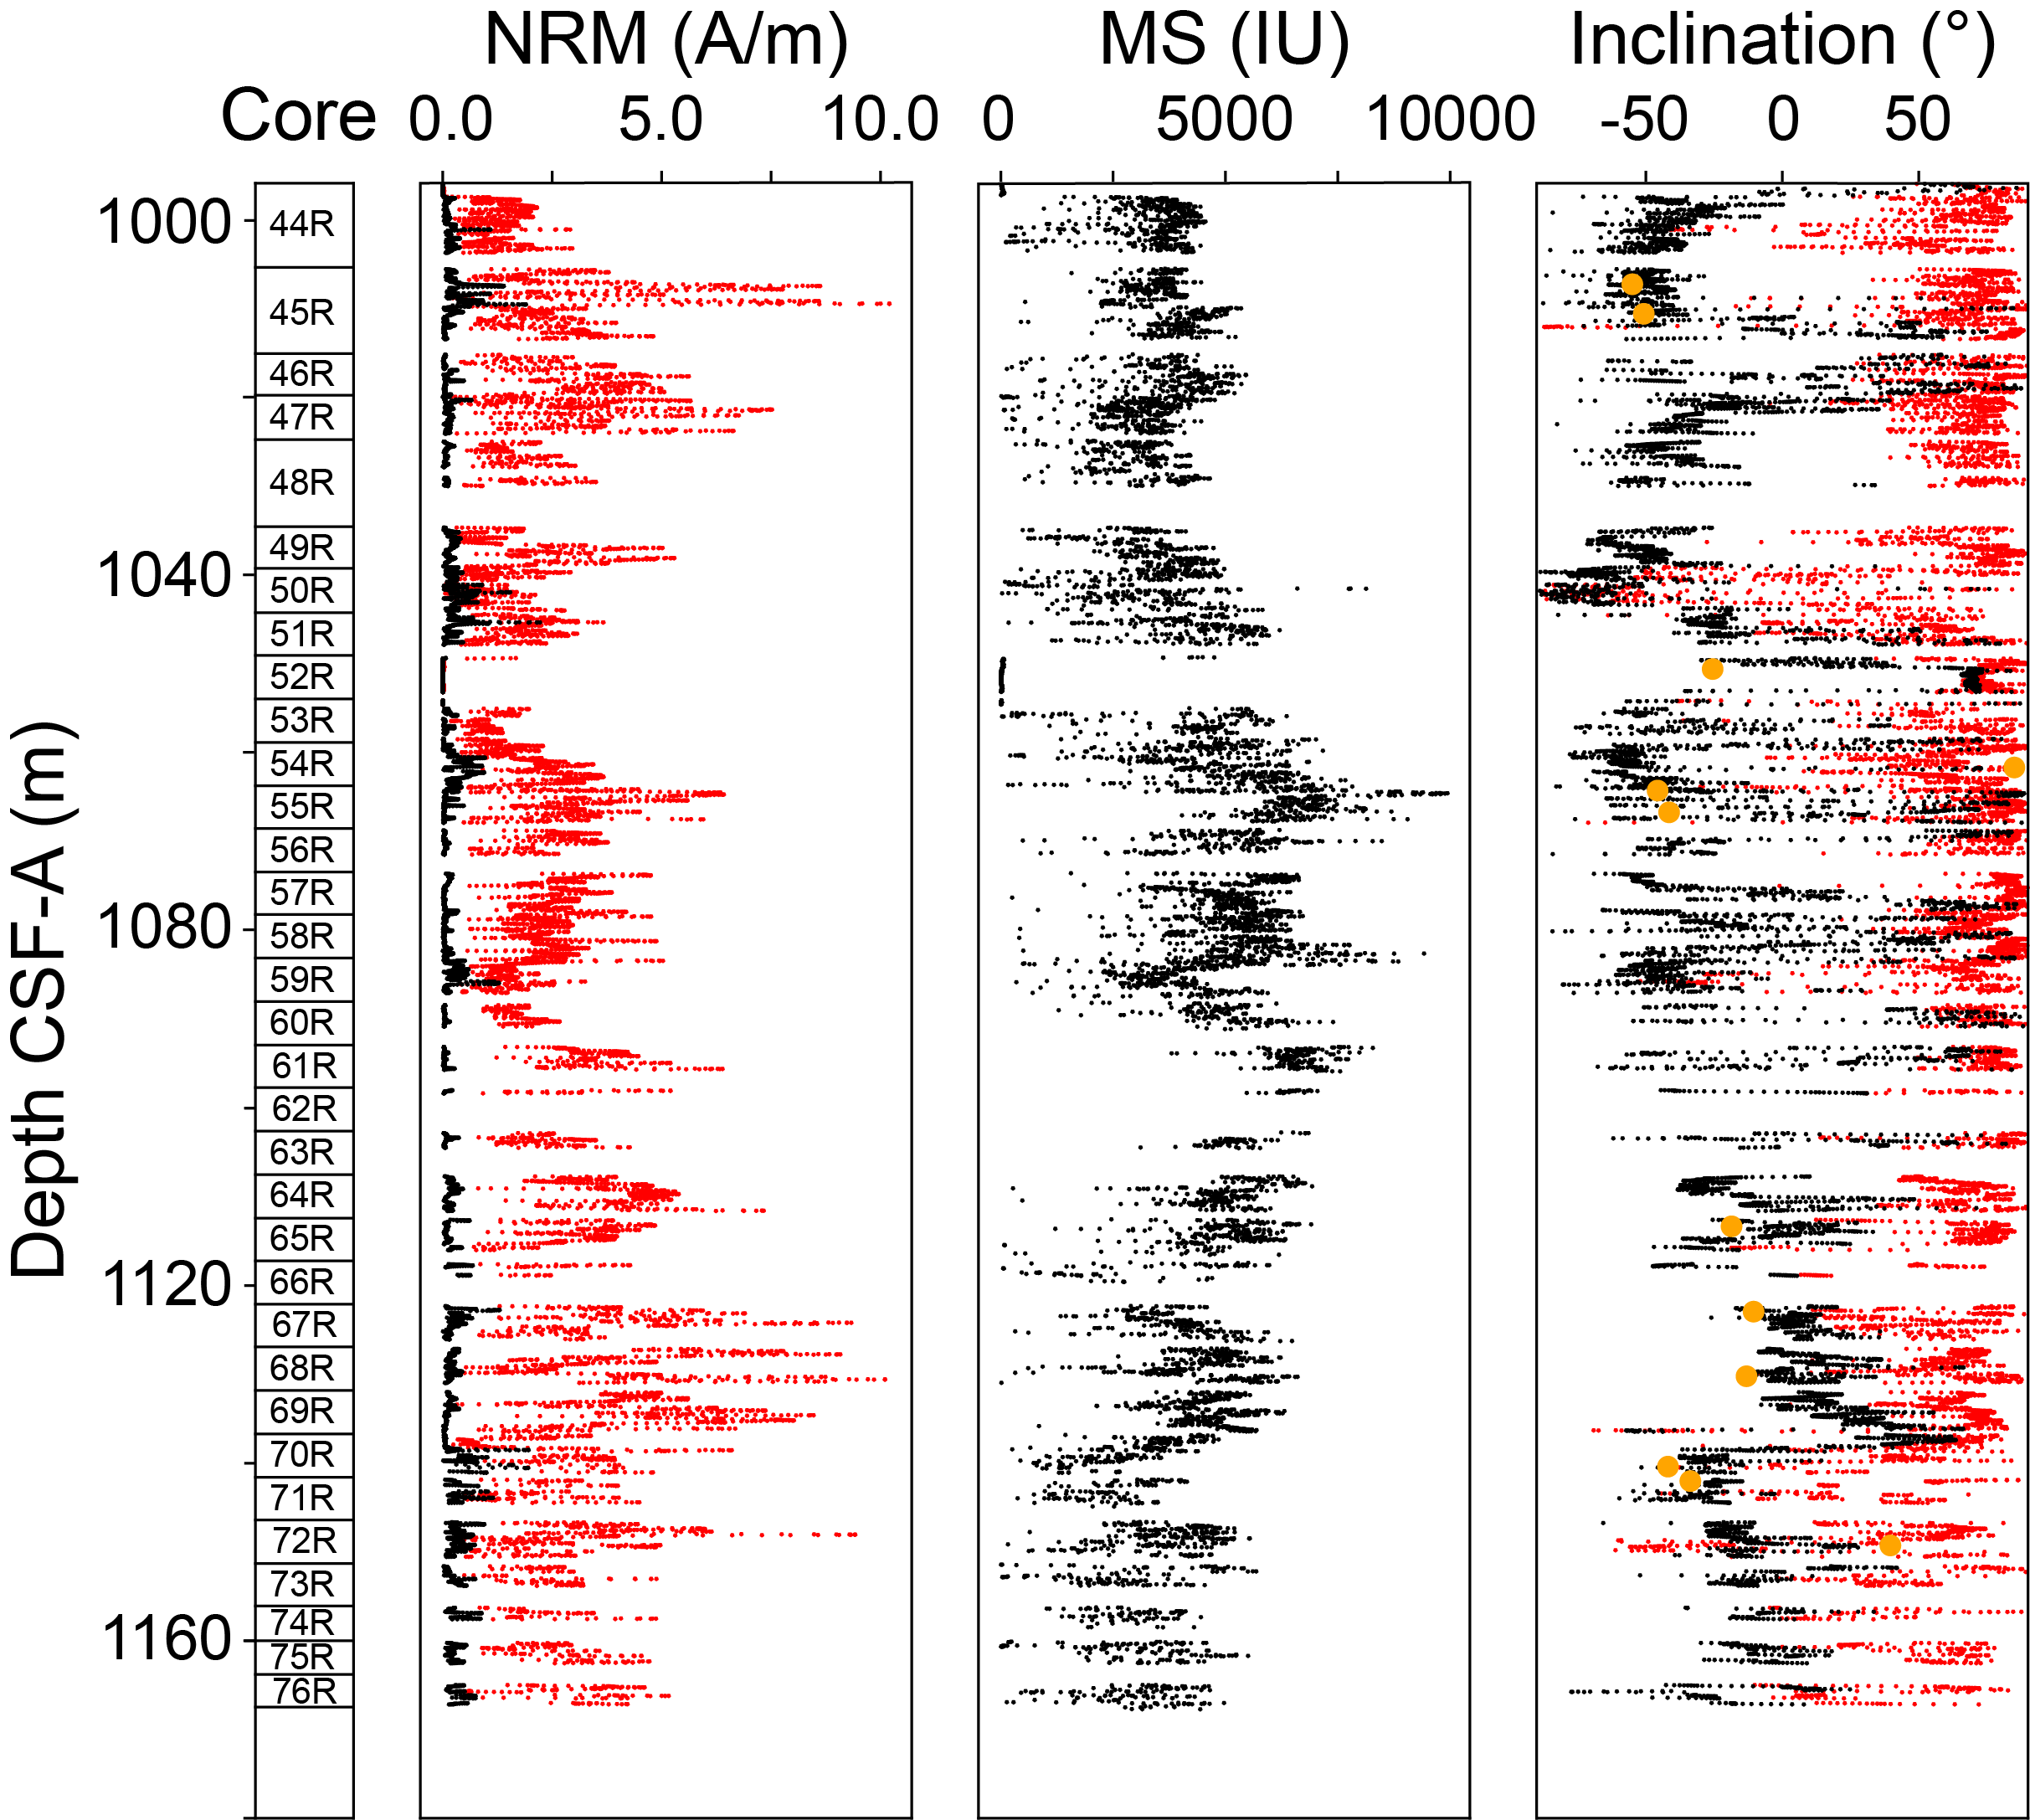
Figure F54. Paleomagnetic measurements from basement rocks, Hole U1564F.
The AMS data from the discrete samples collected in sediment from Holes U1564D and U1564F show an anisotropy tensor compatible with a predominantly sedimentary fabric with a minimum axis of anisotropy (blue circles in the stereonet of Figure F48) vertical and the intermediate (green triangles) and maximum (red squares) axes in a subhorizontal plane. The AMS data from the discrete samples collected in the top of the sediment cores show a scattered fabric that is likely due to the lack of compaction.
The ARM and IRM at 100 mT from Hole U1564D are plotted with depth in Figure F55. The ARM data show a consistent intensity of about 0.4 A/m from 465 to ~556 m CSF-A. Below ~560 m CSF-A, the ARM intensity increases to ~0.8 A/m. The IRM component is relatively low (~10 A/m) at ~465 m CSF-A, and increases over a short depth interval with peaks at 500 and 570 m CSF-A (up to ~50 mT) followed by a decreasing trend to about 20 mT.
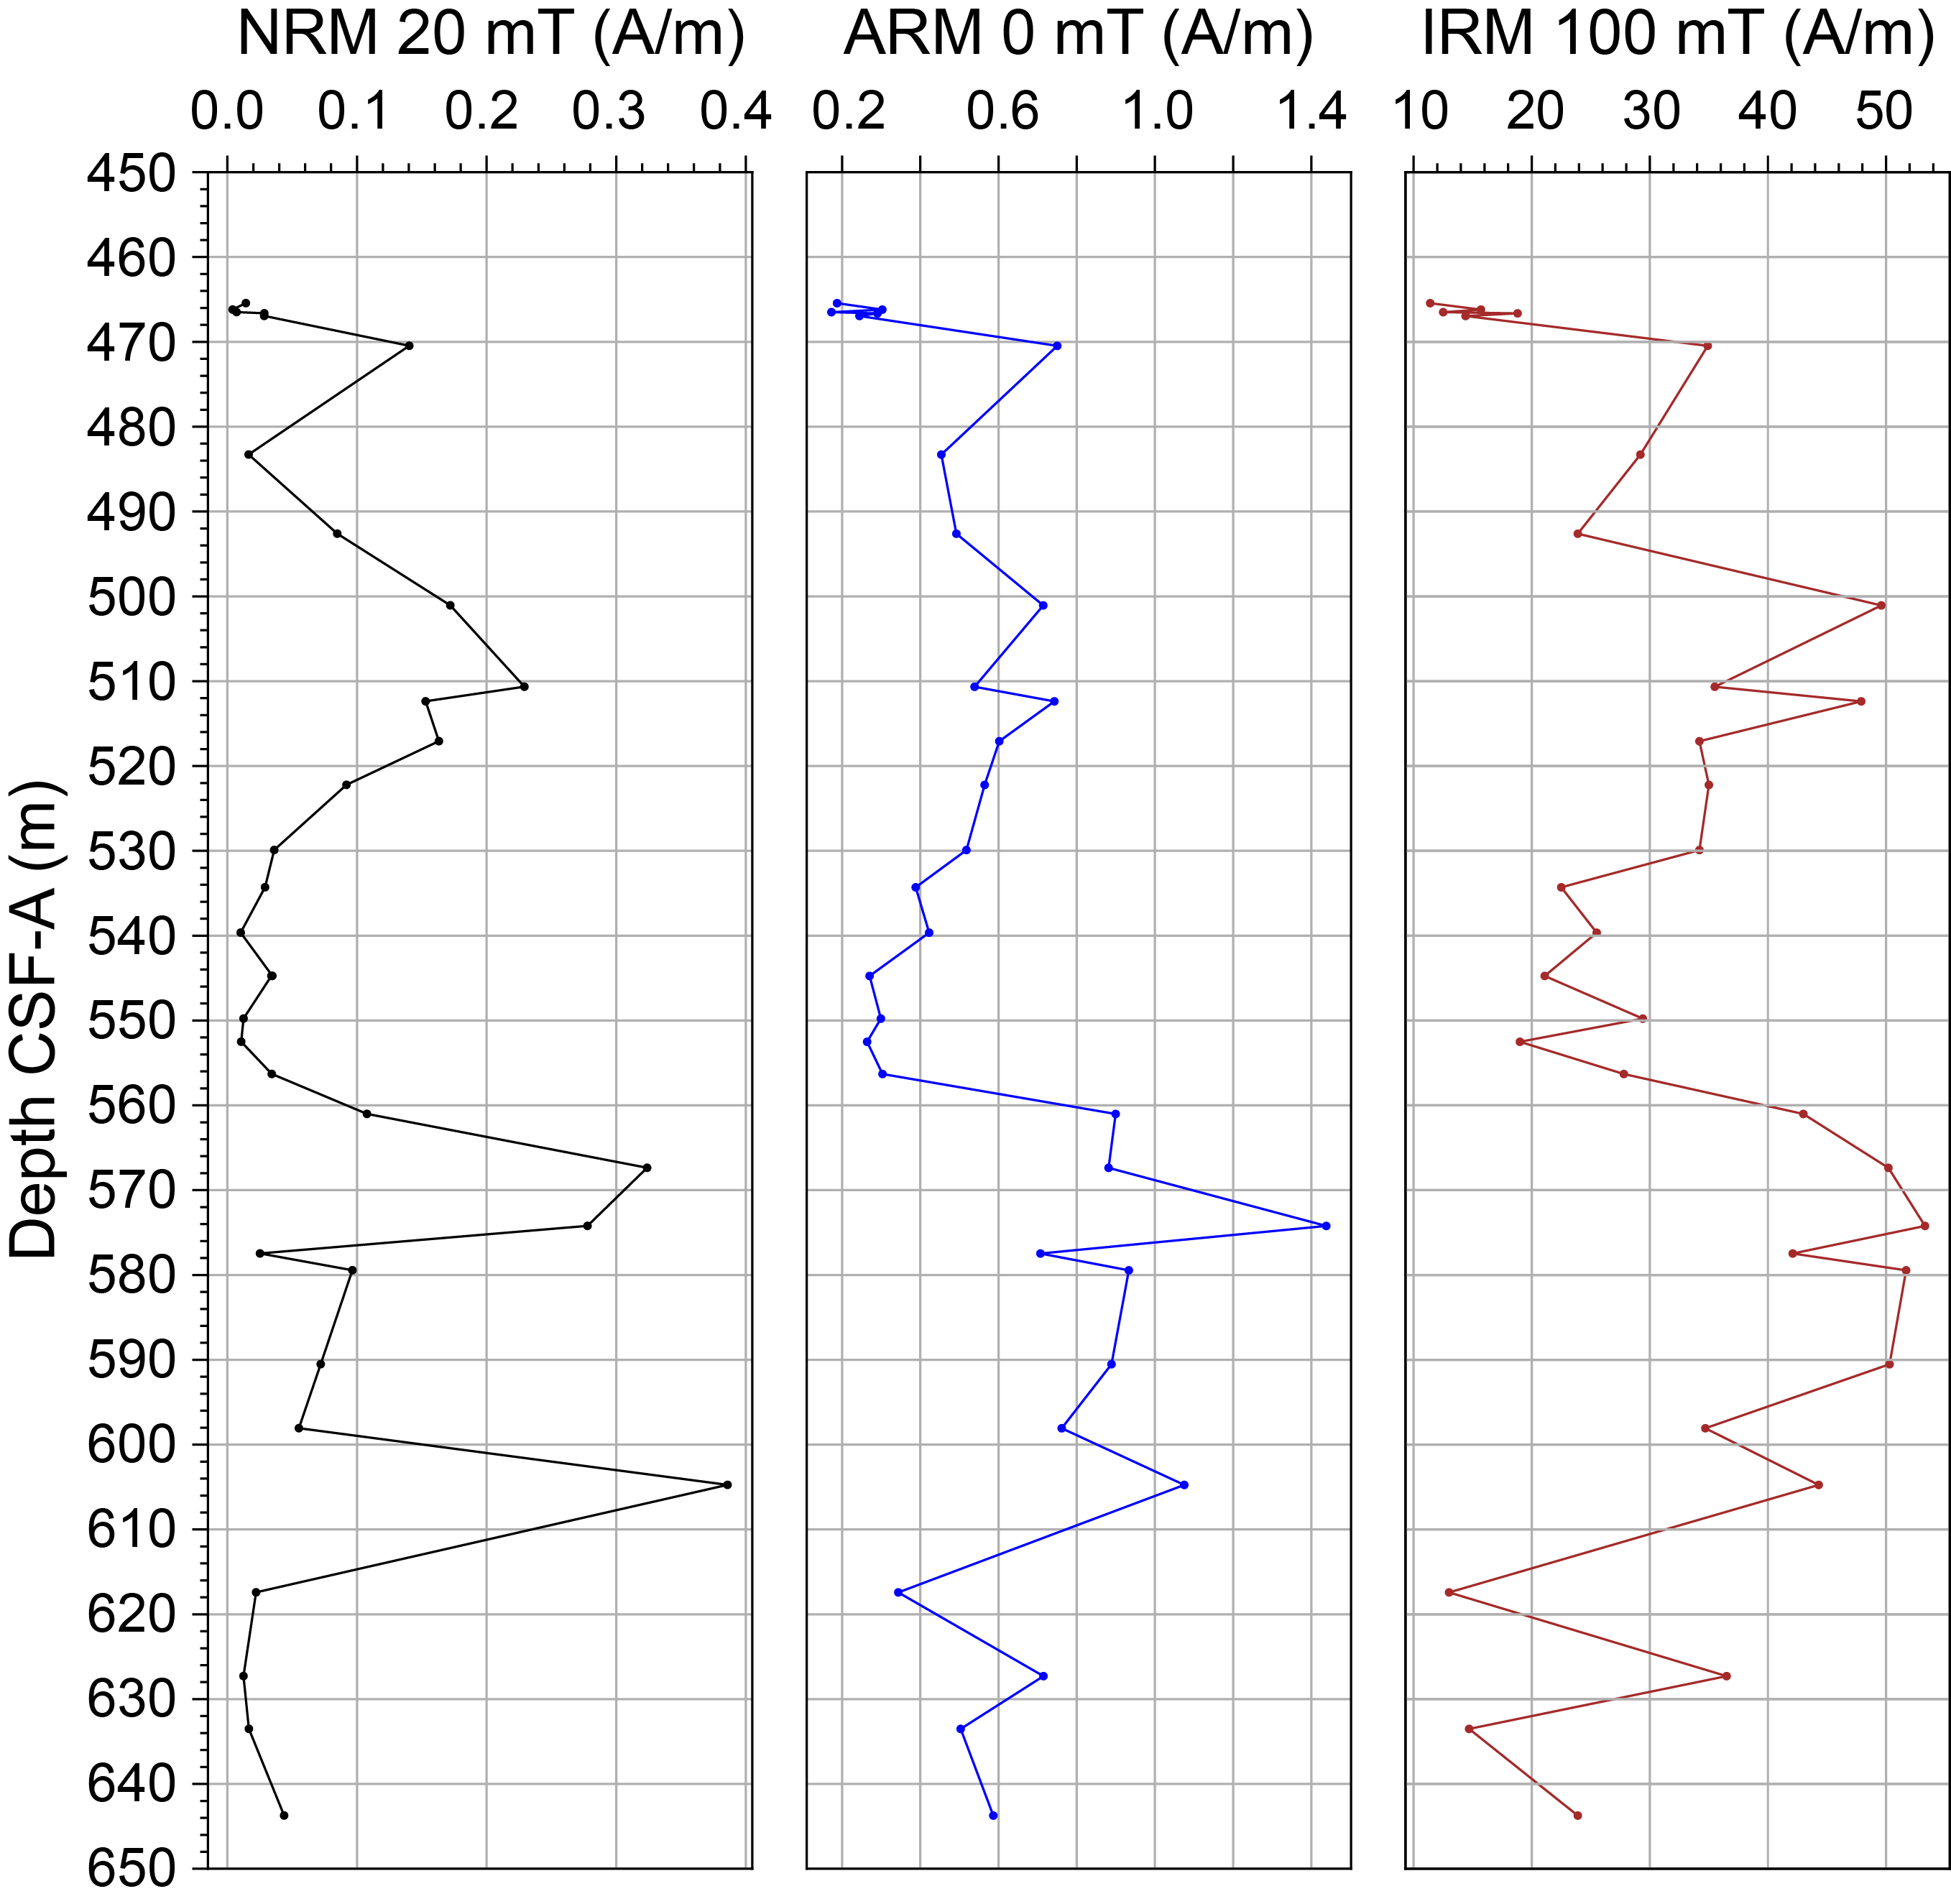
Figure F55. NRM, ARM, and IRM.
9.3. Demagnetization behavior of basalts
The igneous rocks from Hole U1564F consist of various types of basalt (see Igneous petrology). AMS of the basalts shows a scattered anisotropy tensor (for which a fabric could not be recognized) that is likely due to the hydrothermal alteration of the basalts (Figure F48C). The NRM intensity varies from 6.3 × 10⁻⁴ to 1.0 A/m (average=2.6 A/m). The MS of basement rocks measured from Section 395-U1564F-44X-2 to the bottom of the hole ranges 3.6–9941.8 IU (average = 3997.7 IU). In the basement rocks, NRM and MS show variability with depth most likely correlated with the different degrees and types of alteration (Figure F54; see Igneous petrology).
9.4. Magnetostratigraphy
The magnetostratigraphy at Site U1564 is based on the correlation of the polarity assigned to the archive-half cores from Holes U1564D and U1564F (Figure F56; Table T12). The inclinations at the maximum step of demagnetization (Hole U1564D = 20 mT; Hole U1564F = 30 mT) and the polarities reported in the reference geomagnetic polarity timescale (GPTS; Ogg, 2020) were compared (see Table T8 in the Expedition 395 methods chapter [Parnell-Turner et al., 2025a]). Importantly, the magnetic events recognized in Holes U1564B and U1564C are also identified in Hole U1564D. The inclinations in Hole U1564E show a similar pattern but were not used to build the age model of the site because they cover only the uppermost 250 m of the sedimentary succession. An alternation of 19 normal and 19 reverse polarity intervals was recognized and correlated to the GPTS. The magnetostratigraphic tie points are plotted together with the tie points from the shipboard biostratigraphic ages to build a preliminary age model (see Age model).
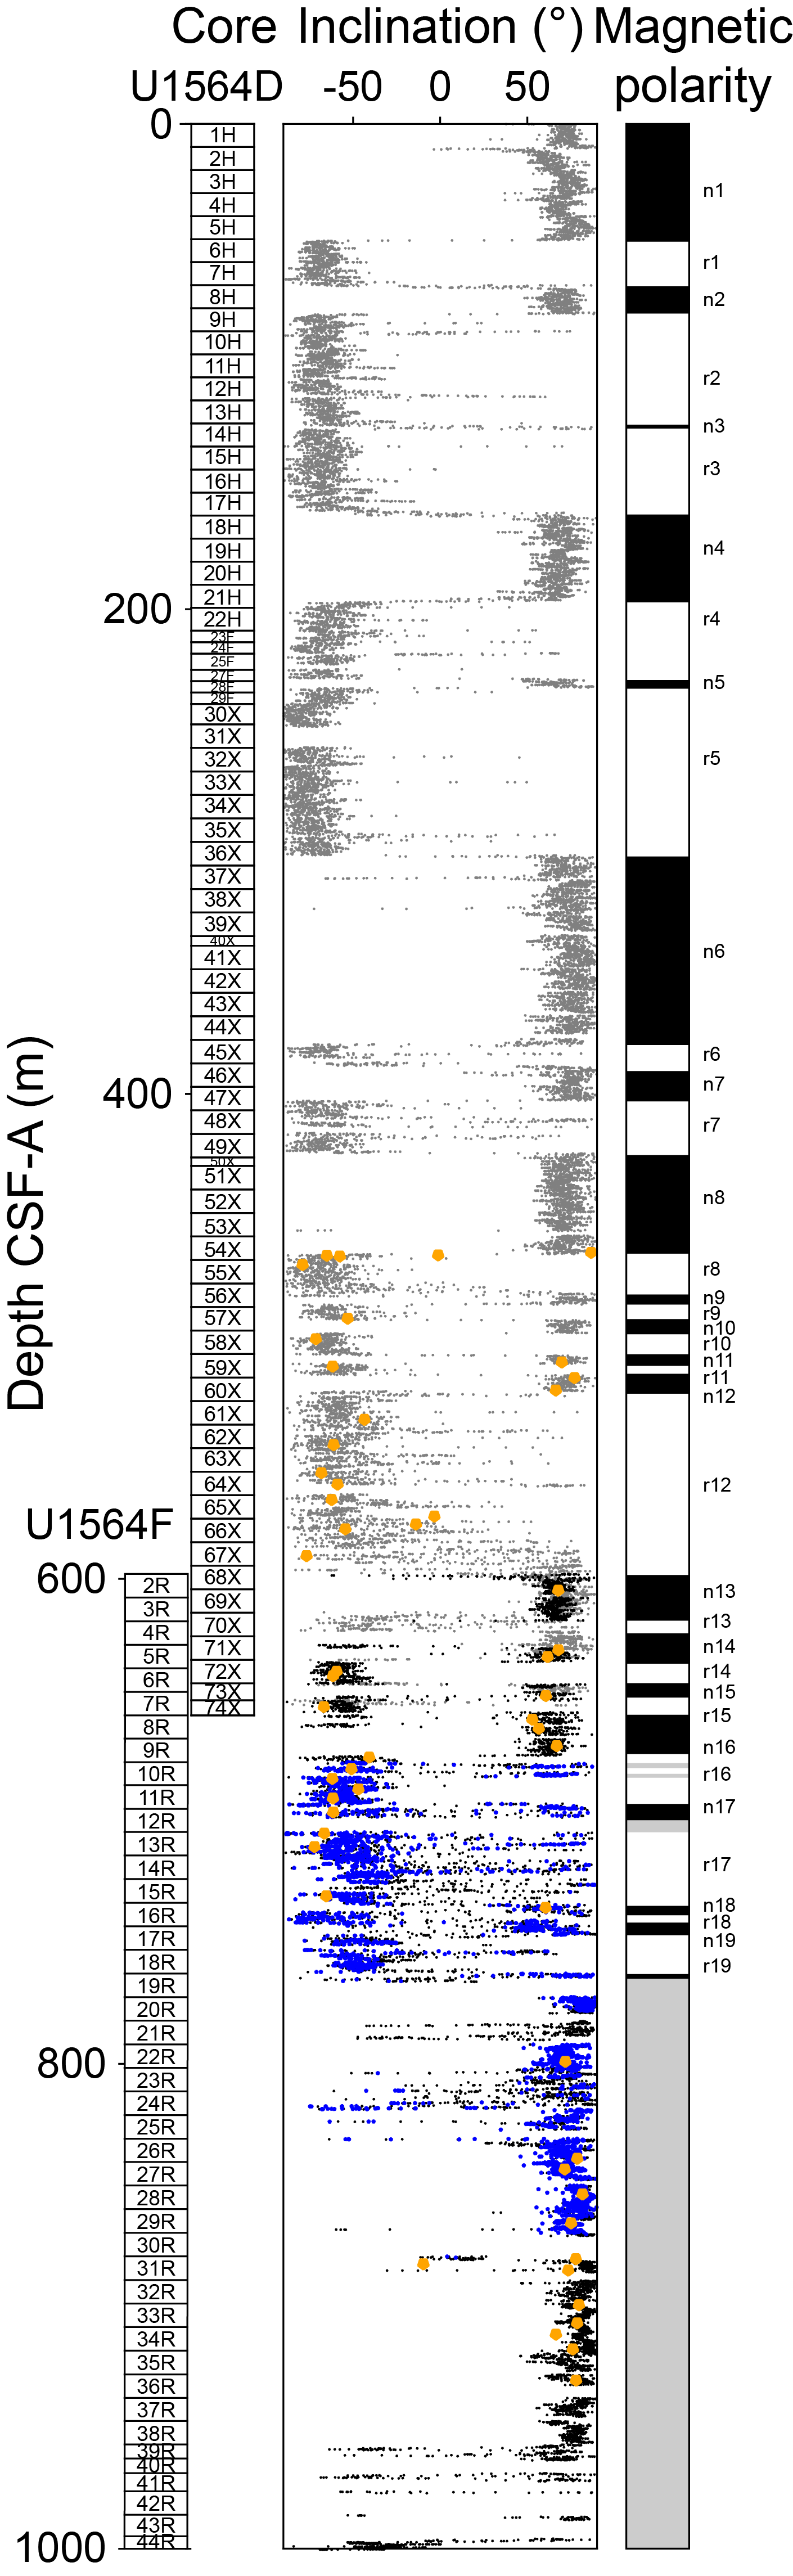
Figure F56. Inclination and interpreted magnetic polarities.
10. Geochemistry and microbiology
Cores taken during Expeditions 395C (Holes U1564A–U1564C) and 395 (Holes U1564D–U1564F) were analyzed for headspace gas, interstitial water (IW) chemistry, and bulk sediment/basalt geochemistry. The geochemistry of basalts at Site U1564 is described in Igneous petrology. Headspace gas analyses were conducted in Holes U1564A–U1564D and U1564F; methane concentrations range between ~0 and 1260 ppmv. Ethane is present at concentrations lower than 94.6 ppmv in Holes U1564C and U1564D and below 510.31 m CSF-A in Hole U1564F. Cores from Holes U1564D–U1564F were analyzed for IW chemistry and bulk sediment geochemistry. IW calcium ion (Ca2+) concentrations generally increase with depth, and magnesium ion (Mg2+) concentrations decrease. Sulfate ion (SO42−) concentrations decrease from seawater-like values at the top of the sediment column to <1 mM at 173.87 m CSF-A, with a small increasing trend in concentration below 607.12 m CSF-A. Calcium carbonate (CaCO3) generally increases downhole, trending from an average of 13.3 ± 9.6 wt% through Sample 395-U1564D-52X-2, 141–151 cm (442.31 m CSF-A), to an average of 35.4 ± 20.6 wt% for the remaining sediment samples to the sediment/basement interface. Bulk sediment generally has low total organic carbon (TOC), total nitrogen (TN), and total sulfur (TS) content.
10.1. Volatile hydrocarbons
Methane concentrations throughout the sedimentary section of Site U1564 (Holes U1564A–U1564D and U1564F) increase from 1 ppmv in the shallowest sample (Section 395C-U1564A-1H-3; 3 m CSF-A) to a maximum concentration of 1263 ppmv in the sample from Section 395C-U1564C-35F-3 (~220 m CSF-A). Below that maximum, methane concentrations decrease with depth but remain above detectable limits with 34.76 ppmv methane measured in the deepest sample (395-U1564F-52R-2, 140–150 cm) collected from a sediment interval within the basalt at 1050.66 m CSF-A (Figure F57). Ethane is present in Holes U1564C, U1564D, and U1564F below 510.31 m CSF-A; the highest concentration is 94.6 ppmv at 853.14 m CSF-A (Section 395-U1564F-28R-2).
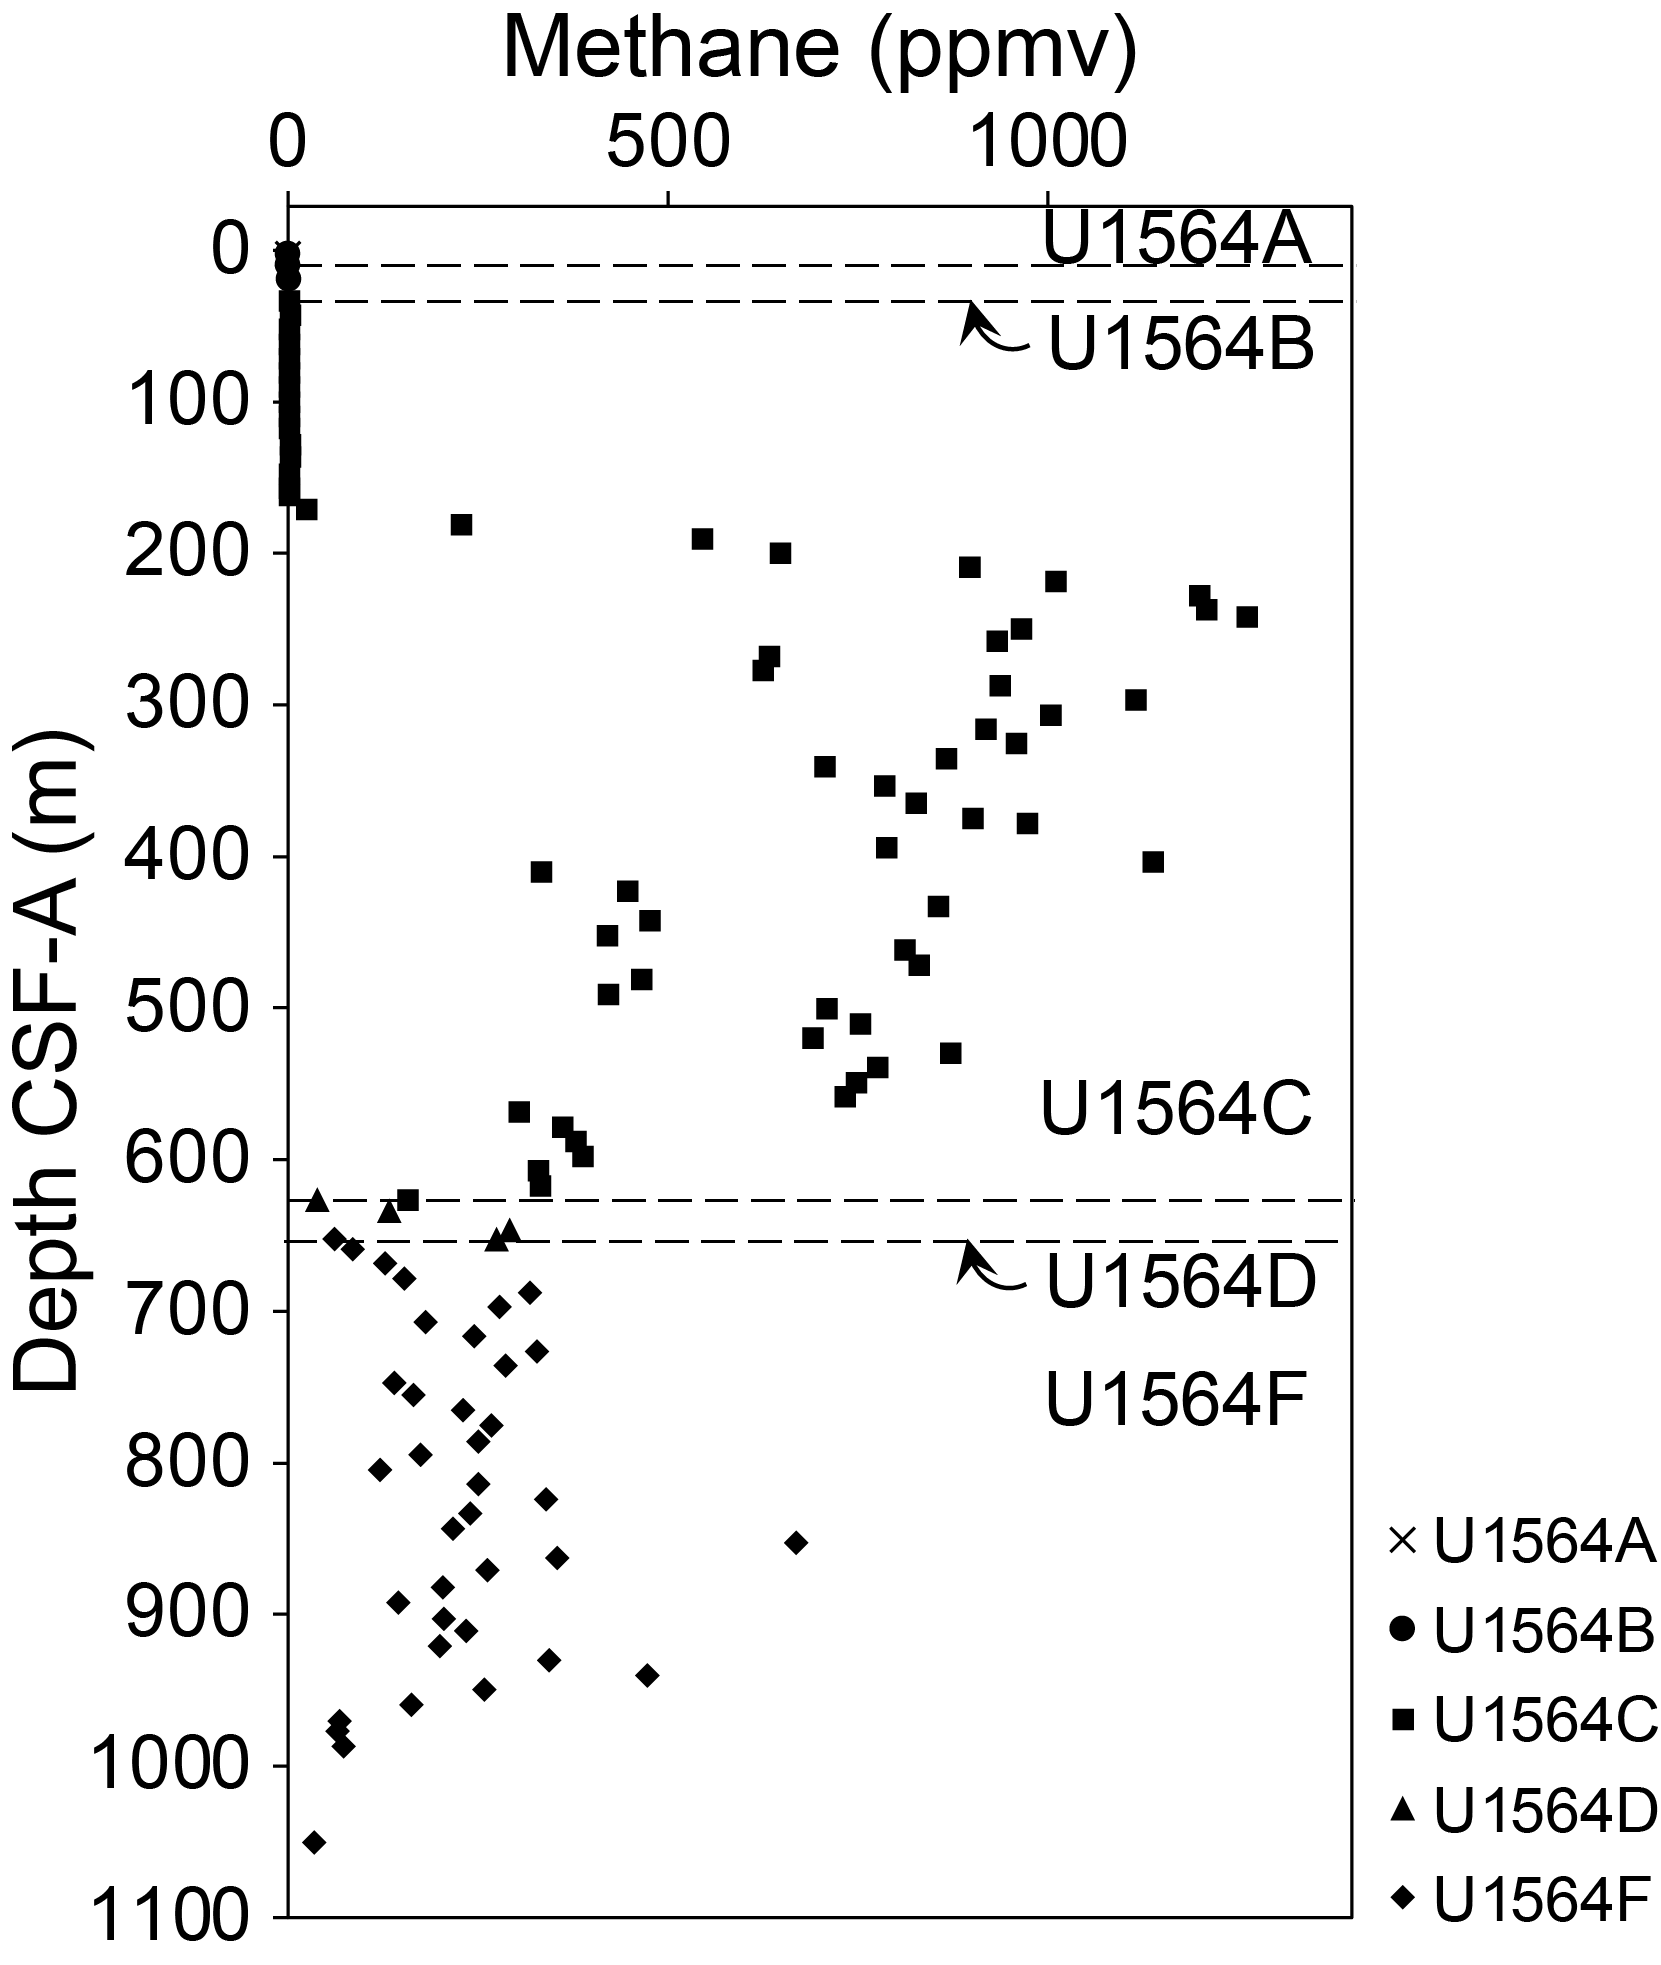
Figure F57. Methane concentrations.
10.2. Interstitial water chemistry
A total of 86 IW samples were squeezed from 5 to 20 cm long whole-round samples from 1.44 to 644.16 m CSF-A in Holes U1564D (Cores 1H–74X), U1564E (mudline), and U1564F (mudline and Cores 6R–22R and 52R). Bottom seawater in Hole U1564F was collected with a Niskin bottle above the sediment/water interface and was also analyzed for water chemistry. In Hole U1564F, the lowermost IW sample was collected from Sample 52R-2, 140–150 cm (1050.66 m CSF-A), which is within a sediment layer between basalts. Selected data acquired from analysis of IW in Holes U1564D and U1564F are shown in Figure F58. pH is near constant throughout the top ~400 m of the sediment column and then increases with depth to 9.039 at 558.67 m CSF-A (Sample 395-U1564F-64X-2, 137–149 cm). Alkalinity varies from near seawater values at the top of the sediment (Sample 395-U1564D-1H-1, 140–150 cm), increases to 10.36 at 145.36 m CSF-A (Sample 16H-2, 140–145 cm), and then decreases to 0.344 in the deepest sampled sediment at 1050.66 m CSF-A (Sample 395-U1564F-52R-2, 140–150 cm). IW Mg2+ concentrations range from 50.1 mM in the top sediments at the site (Sample 395-U1564D-1H-1, 140–150 cm) to 1.51 mM at 587.71 m CSF-A (Sample 67X-2, 130–150 cm). SO42− concentrations range from 28.2 mM at the top of the sediment (Sample 1H-1, 140–150 cm; 1.4 m CSF-A) to 0.5 mM (Sample 28F-2, 145–150 cm; 232.74 m CSF-A). SO42− concentrations trend to slightly increasing values below this depth, and the concentration of sulfate in the deepest sediment sample within the basaltic basement (Sample 395-U1564F-52R-2, 140–150 cm; 1050.66 m CSF-A) is 14.0 mM. Ca2+ concentrations range from 4.8 mM at 116.93 m CSF-A (Sample 395-U1564D-13H-2, 144–149 cm) to 53.1 mM at 1050.66 (Sample 395-U1564F-52R-2, 140–150 cm) and generally display an opposing trend with Mg2+. Sr2+ concentrations range from 76.2 µM at 69.47 m CSF-A (Sample 395-U1564D-8H-2, 146–151 cm) to 506.2 µM at 765.53 m CSF-A (Sample 395-U1564F-19R-2, 141–146 cm).
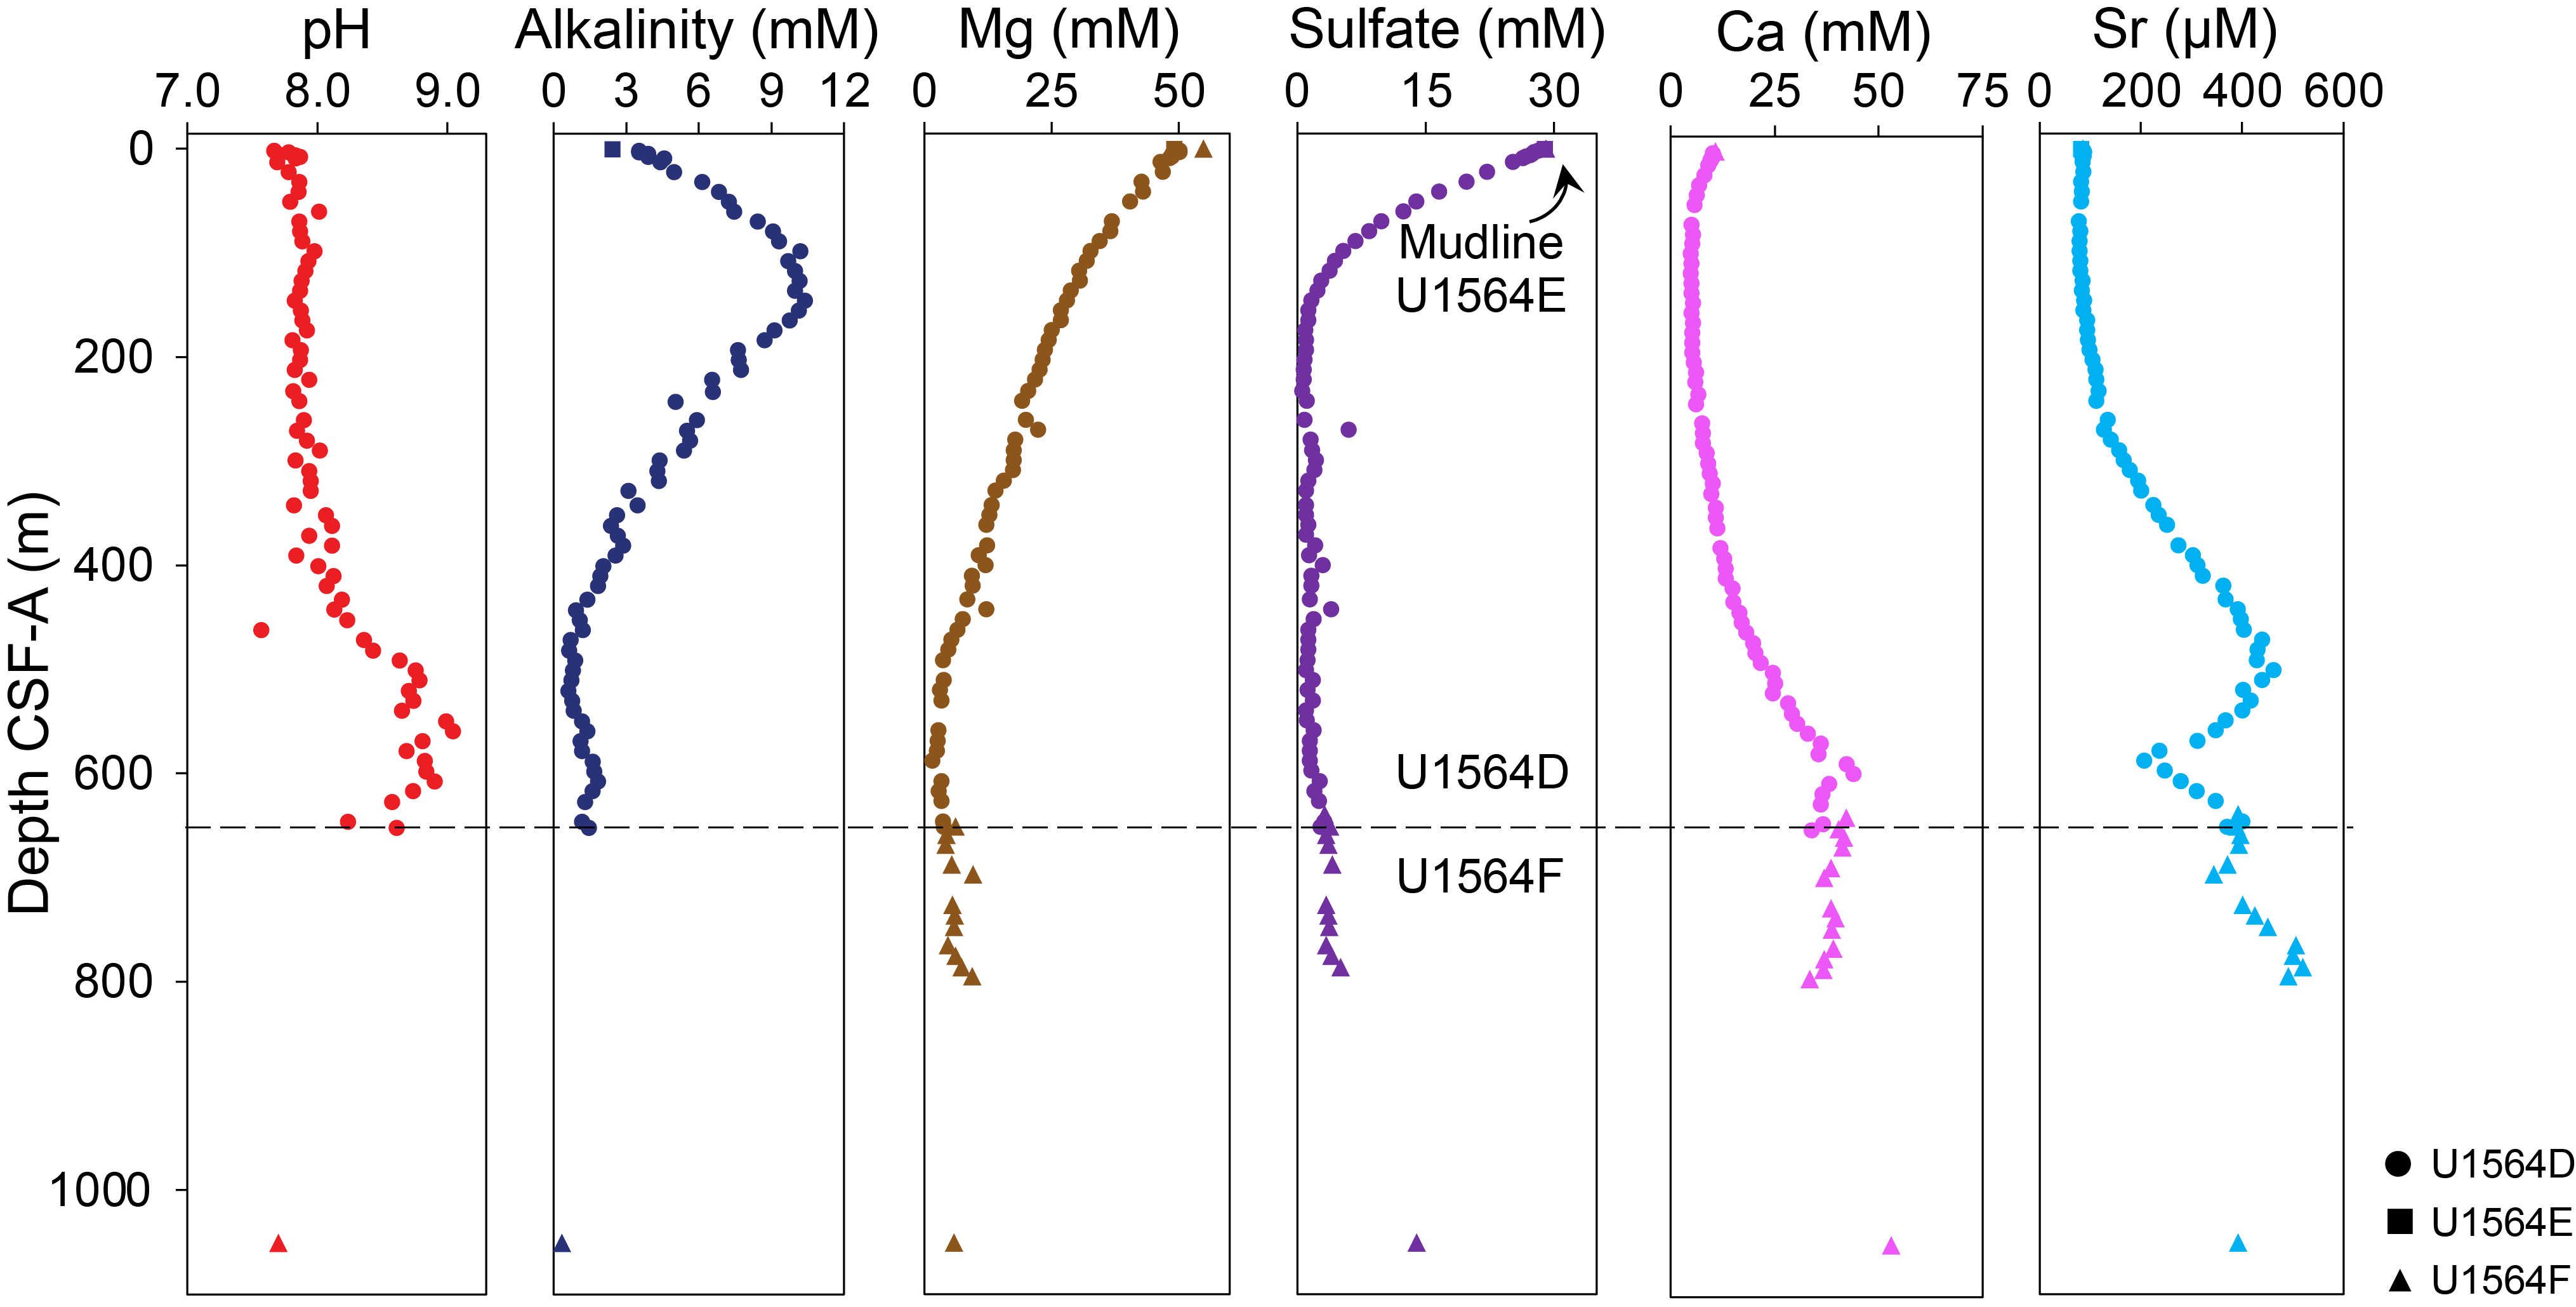
Figure F58. IW pH, alkalinity, and selected ions.
10.2.1. Bulk sediment geochemistry
10.2.1.1. Carbonate, nitrogen, carbon, and sulfur
Discrete sediment samples (n = 235) were collected from squeeze cake residues and working halves during sediment description of Cores 395-U1564D-1H through 73X (above 646.73 m CSF-A) and 395-U1564F-5R through 41X (below 629.15 m CSF-A) and from Sample 53R-1, 30–35 cm, which was collected from a thin sedimentary interval within basaltic basement. Samples were analyzed for total carbon (TC), TN, sedimentary TS, and total inorganic carbon (TIC). TOC and CaCO3 were subsequently calculated from the TIC and TC measurements. TOC content is generally below 0.5 wt% (average = 0.27 ± 0.20 wt%; outliers above 1% were excluded; n = 6). CaCO3 content is variable but increases with depth below ~450 m CSF-A (total range = 0.3–84.8 wt%). The average CaCO3 content is 31.3 ± 20.8 wt%, and the highest CaCO3 content was measured near the sediment/basement interface (Figure F59). Additional sediment samples were chosen so that the resulting geochemical information (e.g., CaCO3 content) could be used to aid in lithologic description. Differences in the CaCO3 content between the sampling strategies (Figure F59; open versus closed circles or triangles) reflects the sampling bias and variable sedimentary CaCO3 content in different lithologic layers. TN ranges from below detection limit to 0.10 wt%. TS ranges from below detection limit to 1.91 wt% and is generally below 1.0 wt%.
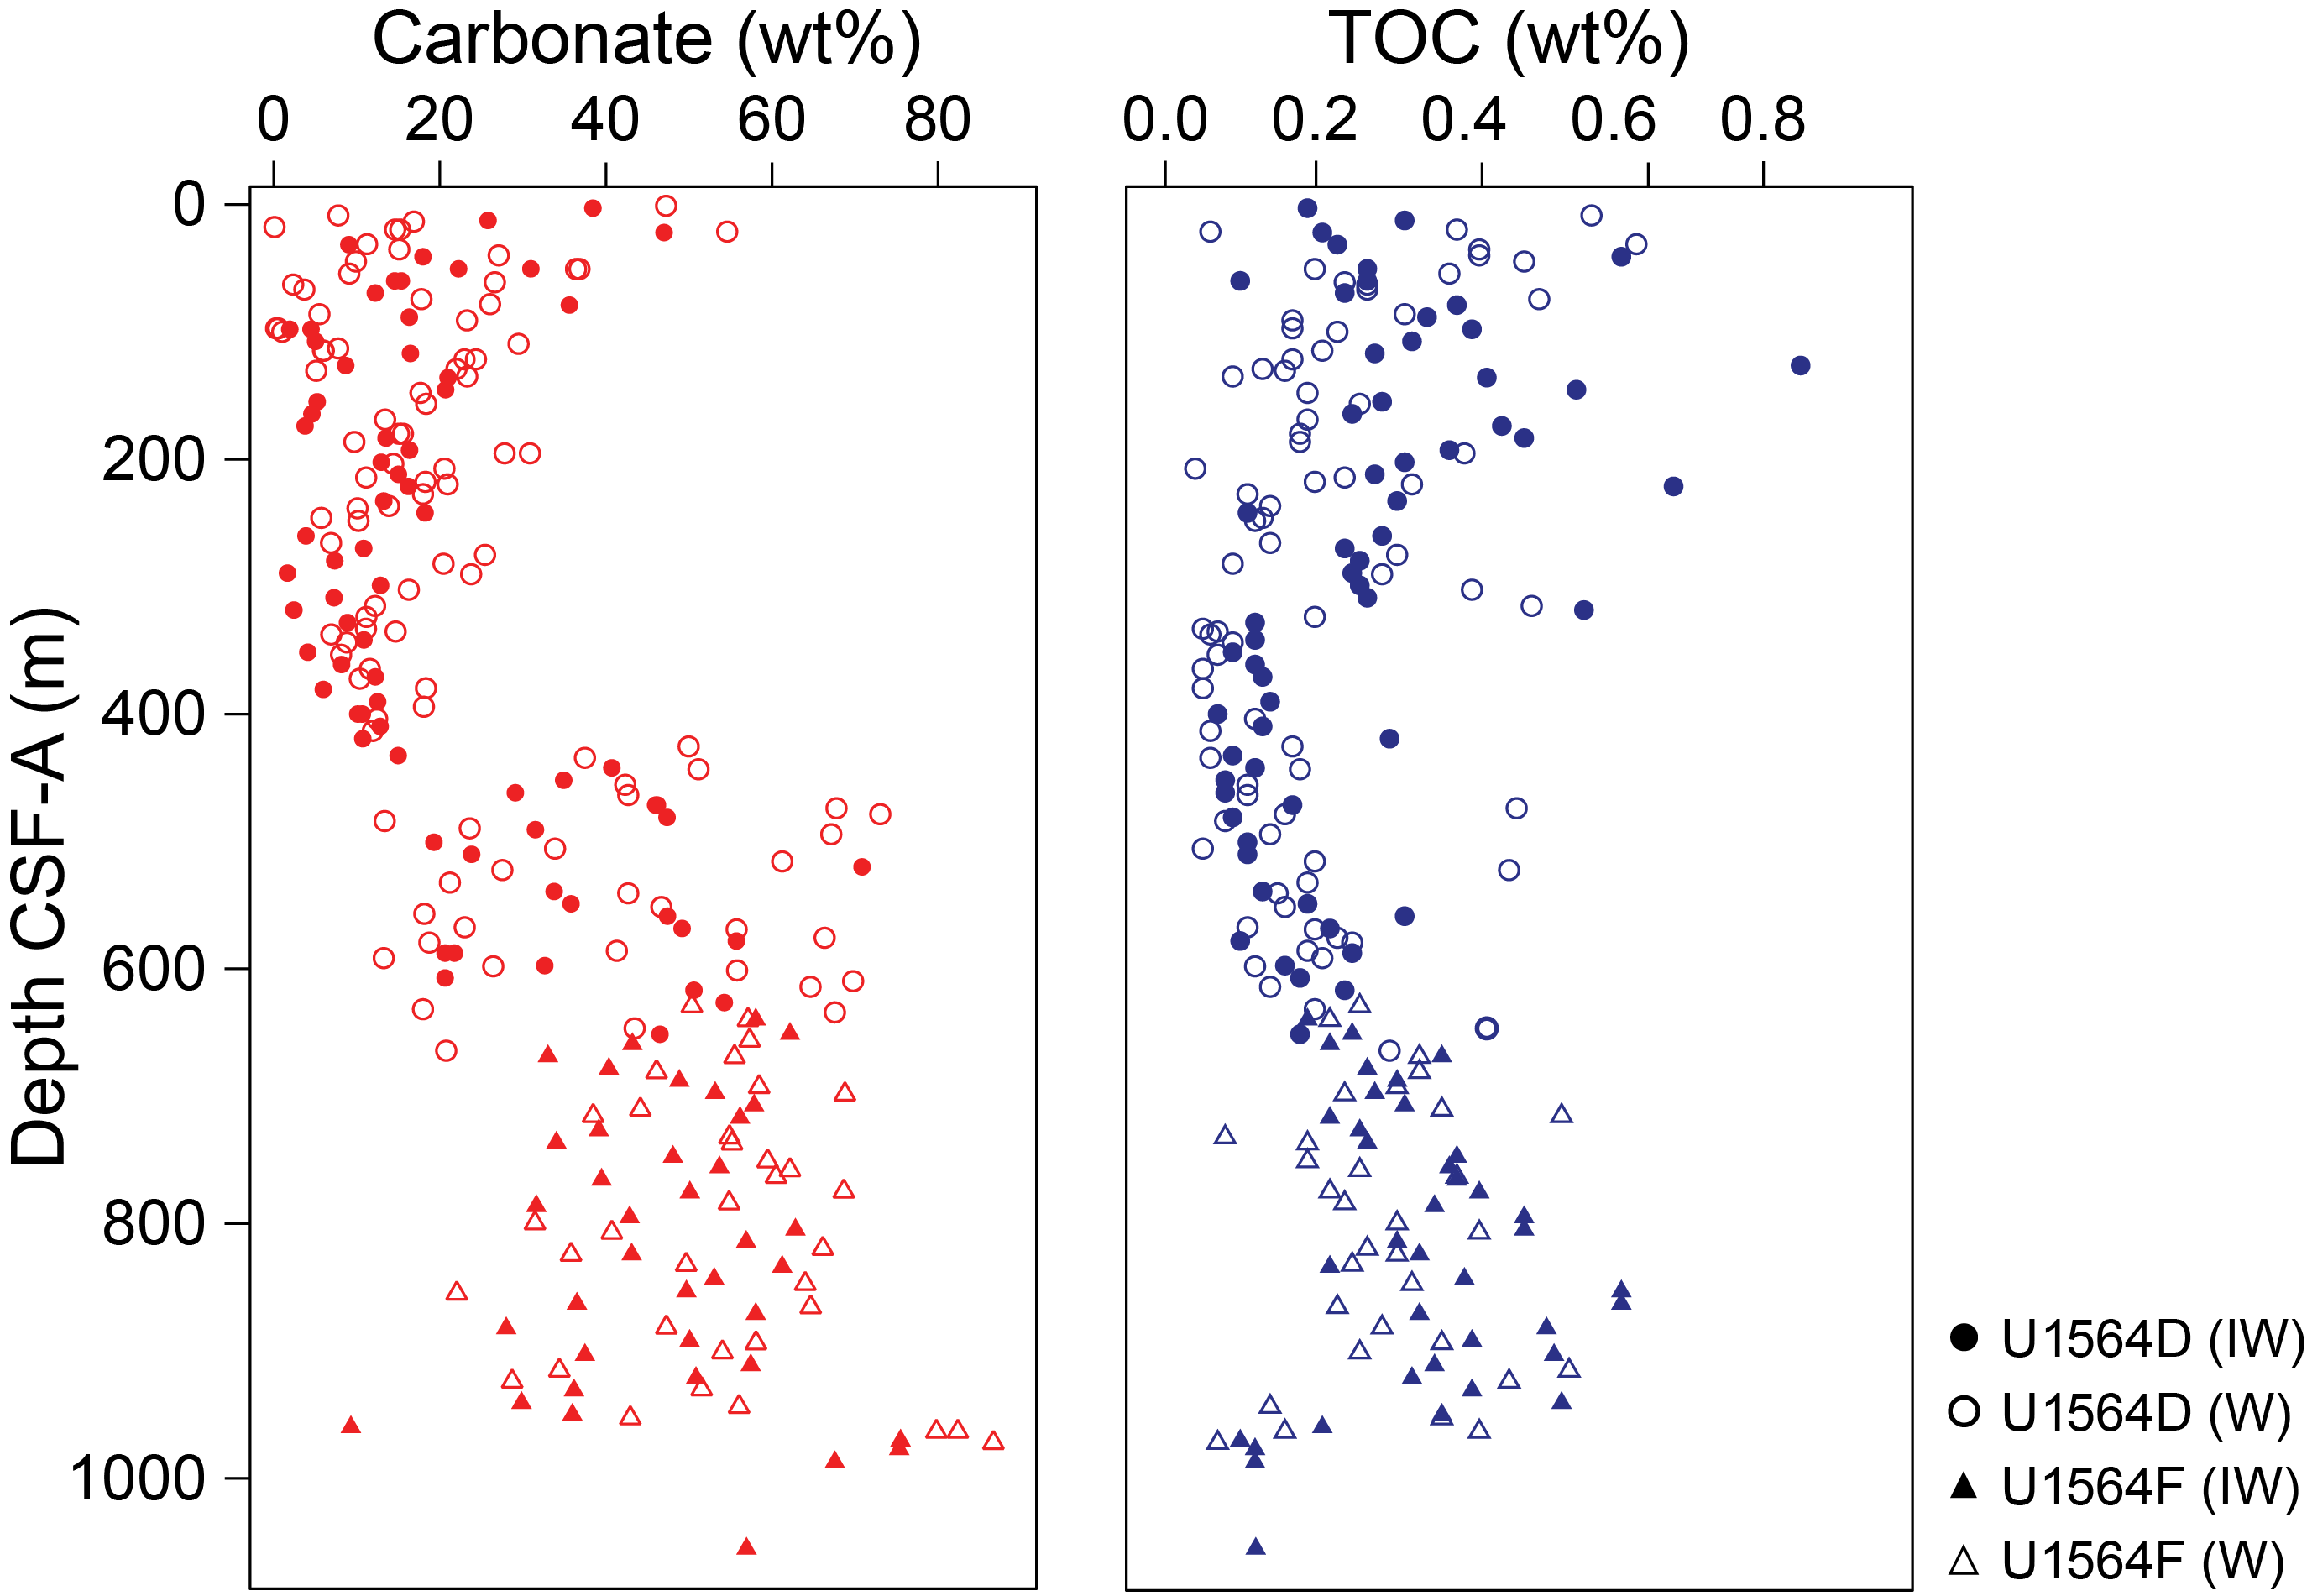
Figure F59. CaCO3 and TOC.
10.3. Microbiology
Microbiological sampling of sediments from Holes U1564D and U1564F was focused on collecting samples for culture-independent approaches. A total of 69 sediment samples from Hole U1564D and 37 sediment samples from Hole U1564F, each 5 cm3, were collected with a sterile cut-end syringe or were aseptically sampled from the interior portion of IW whole-round samples for shore-based analyses. For samples where IW analyses were not conducted because of a lack of available pore water, a 5 cm whole-round sample was collected for microbiological analysis. A total of 36 whole-round samples of basalt were collected in Hole U1564F.
11. Downhole measurements
Details on tools and logging procedures can be found in Downhole measurements in the Expedition 395 methods chapter (Parnell-Turner et al., 2025a), and only hole-specific procedures are detailed here. Downhole logging operations at Site U1564 were conducted in Holes 395C-U1564C and 395-U1564F. Hole U1564C was logged with the triple combo tool string (Magnetic Susceptibility Sonde [MSS], High-Resolution Laterolog Array [HRLA], APS, Hostile Environment Litho-Density Sonde [HLDS], and Hostile Environment Natural Gamma Ray Sonde [HNGS]) and the FMS-sonic tool string (FMS, DSI, General Purpose Inclinometry Tool [GPIT], and HNGS) (Table T13). Hole U1564F was logged with the triple combo tool string, FMS-sonic tool string, and UBI tool string (UBI, GPIT, and HNGS). During drilling in Holes U1564C, 395-U1564D, and 395-U1564E, formation temperature measurements were acquired at four depths per hole (Hole U1564C = 54.5, 92.5, 11.5, and 140.0 m DSF; Hole U1564D = 38.0, 66.5, 95.0, and 123.5 m DSF; Hole U1564E = 34.3, 62.8, 91.3, and 119.8 m DSF) using the APCT-3 tool.
11.1. Logging procedure and log data processing
11.1.1. Hole 395C-U1564C
Hole U1564C downhole logging consisted of a downhole pass (Data Set 016PUP), a repeat uphole logging pass (Data Set 011LUP), and a main uplog pass (Data Set 012LUP) with the triple combo tool string (Table T13). These logging runs were followed by two logging passes with the FMS-sonic tool string, a downhole logging pass (Data Set 038PUP) and the main uphole logging pass (Data Set 025LUP). Hole U1564C was cleaned by circulating the hole with heavy mud (sepiolite and barite), which was then displaced with seawater. The drill pipe was raised to 79 m WSF prior to the downhole logging pass of the triple combo tool string and for all logging runs of the FMS-sonic tool string. For the repeat and main uphole logging passes of the triple combo tool string, the drill pipe was raised slightly higher to 77.5 m WSF. During logging, the wireline heave compensator (WHC) was used to counter the ship's heave, which averaged between 0.25 and 0.5 m. The logging data sets were first depth matched using the natural radiation gamma log from the main uphole logging pass of the triple combo tool string, and then all logs were depth shifted to seafloor, which was determined from the gamma log of the main uphole logging pass of the FMS-sonic tool string (2219 m wireline log matched depth below seafloor [WMSF]). The logging seafloor depth differs by 0.5 m from the driller's seafloor depth (2219.5 m DSF).
The entire length of Hole U1564C is wider than drilling bit size (>12 inches), and caliper data shows the borehole heavily widened or ovalized at various depths. The hole was closest to bit size (~11 inches) between 320 and 630 m WMSF, and intervals of enlargement of as much as 16 inches are observed above 320 m WMSF. Gamma log (HNGS), porosity (APS), and density (HLDS) data were corrected for these observed hole size variations, and APS data were further corrected for tool standoff. Density and porosity data were recorded at sampling intervals of 2.54 and 5.08 cm, respectively, in addition to the standard sampling interval of 15.24 cm. The DSI data between 131 and 593 m WMSF were deemed of acceptable quality by logging data processing carried out by the Lamont-Doherty Earth Observatory Borehole Research Group (LDEO-BRG). Above this depth, interval formation velocities are indistinguishable from that of the drilling mud used during coring. Individual passes of the triple combo and FMS-sonic tool string data were compared to each other and show good repeatability.
11.1.2. Hole 395-U1564F
Hole U1564F downhole logging included three logging passes of the triple combo tool string: one downhole logging pass (Data Set 025PUP), and two uphole logging passes (a repeat pass [Data Set 026PUP] and a main pass [Data Set 027PUP]). All tool strings acquired a gamma log through pipe and casing from the seafloor. Because the casing is narrower in diameter than the drill pipe, the collected gamma log data are more reliable than the data collected through the pipe and show good agreement in large- and small-scale features with the open hole gamma log of nearby Hole U1564C. During the triple combo tool string downlog, the MSS malfunctioned, potentially affecting the APS and causing both tools to return unreliable data; therefore, there are no MS or porosity wireline logs for this hole. The FMS-sonic tool string acquired gamma log measurements, VP and shear wave velocity (VS) data, and a Stoneley wave log in a downhole logging pass (Data Set 060PUP). FMS resistivity image logs were acquired during two uphole logging passes: a main pass (Data Set 039LUP) and a repeat pass (Data Set 040LUP). VP, VS, and Stoneley wave data were only acquired during the downhole logging pass because the DSI was damaged during this logging pass and was unavailable during the uphole logging passes. Finally, logging operations in Hole U1564F ended with the deployment of the UBI tool string, which acquired UBI image logs during a downhole (Data Set 057PUP) and repeat (Data Set 050LUP) pass of the entire basement and sediment–basement transition intervals and an uplog pass (Data Set 051LUP) of the entire open hole. To maximize data collection in the remaining logging time, the UBI tool string downlog and the sediment section of the UBI tool string uplog were collected at a lower resolution, allowing faster logging speeds compared to similar operations in the other holes. The two passes through the basement section and the sediment/basement interface were collected at a similarly high resolution as for the other holes.
11.2. Logging units
Logging units for Site U1564 are defined using logging data from Hole U1564C for Logging Unit L1 through Subunit L4a and logging data from Hole U1564F for Subunit L4b through Unit L8. Where the data sets overlap in open hole between 550 and 600 m WMSF, they show good agreement.
11.2.1. Logging Unit L1
Unit L1 consists of the depth interval logged through the drill pipe in Hole U1564C and through the casing in Hole U1564F (Subunit L1a), as well as 77–108 m WMSF through open hole in Hole U1564C (Subunit L1b). In Hole U1564F, the bottom of Unit L1 is defined by an increase in the gamma log and an increase in Th measurements from the spectral gamma log, although these signals are not observable in Hole U1564F because the gamma log signals are repressed by the casing.
11.2.1.1. Logging Subunit L1a
Logging data collected in the uppermost 77 m of Hole U1564C were acquired through the drill pipe, and therefore only the suppressed gamma log data can be used to assess borehole lithology. Subunit L1a displays an average gamma radiation signal of ~5.3 ± 2.4 American Petroleum Institute gamma radiation units (gAPI) (Figure F60). Subunit L1a is entirely within Lithostratigraphic Subunit IA (0–135 m CSF-A) (see Lithostratigraphy).
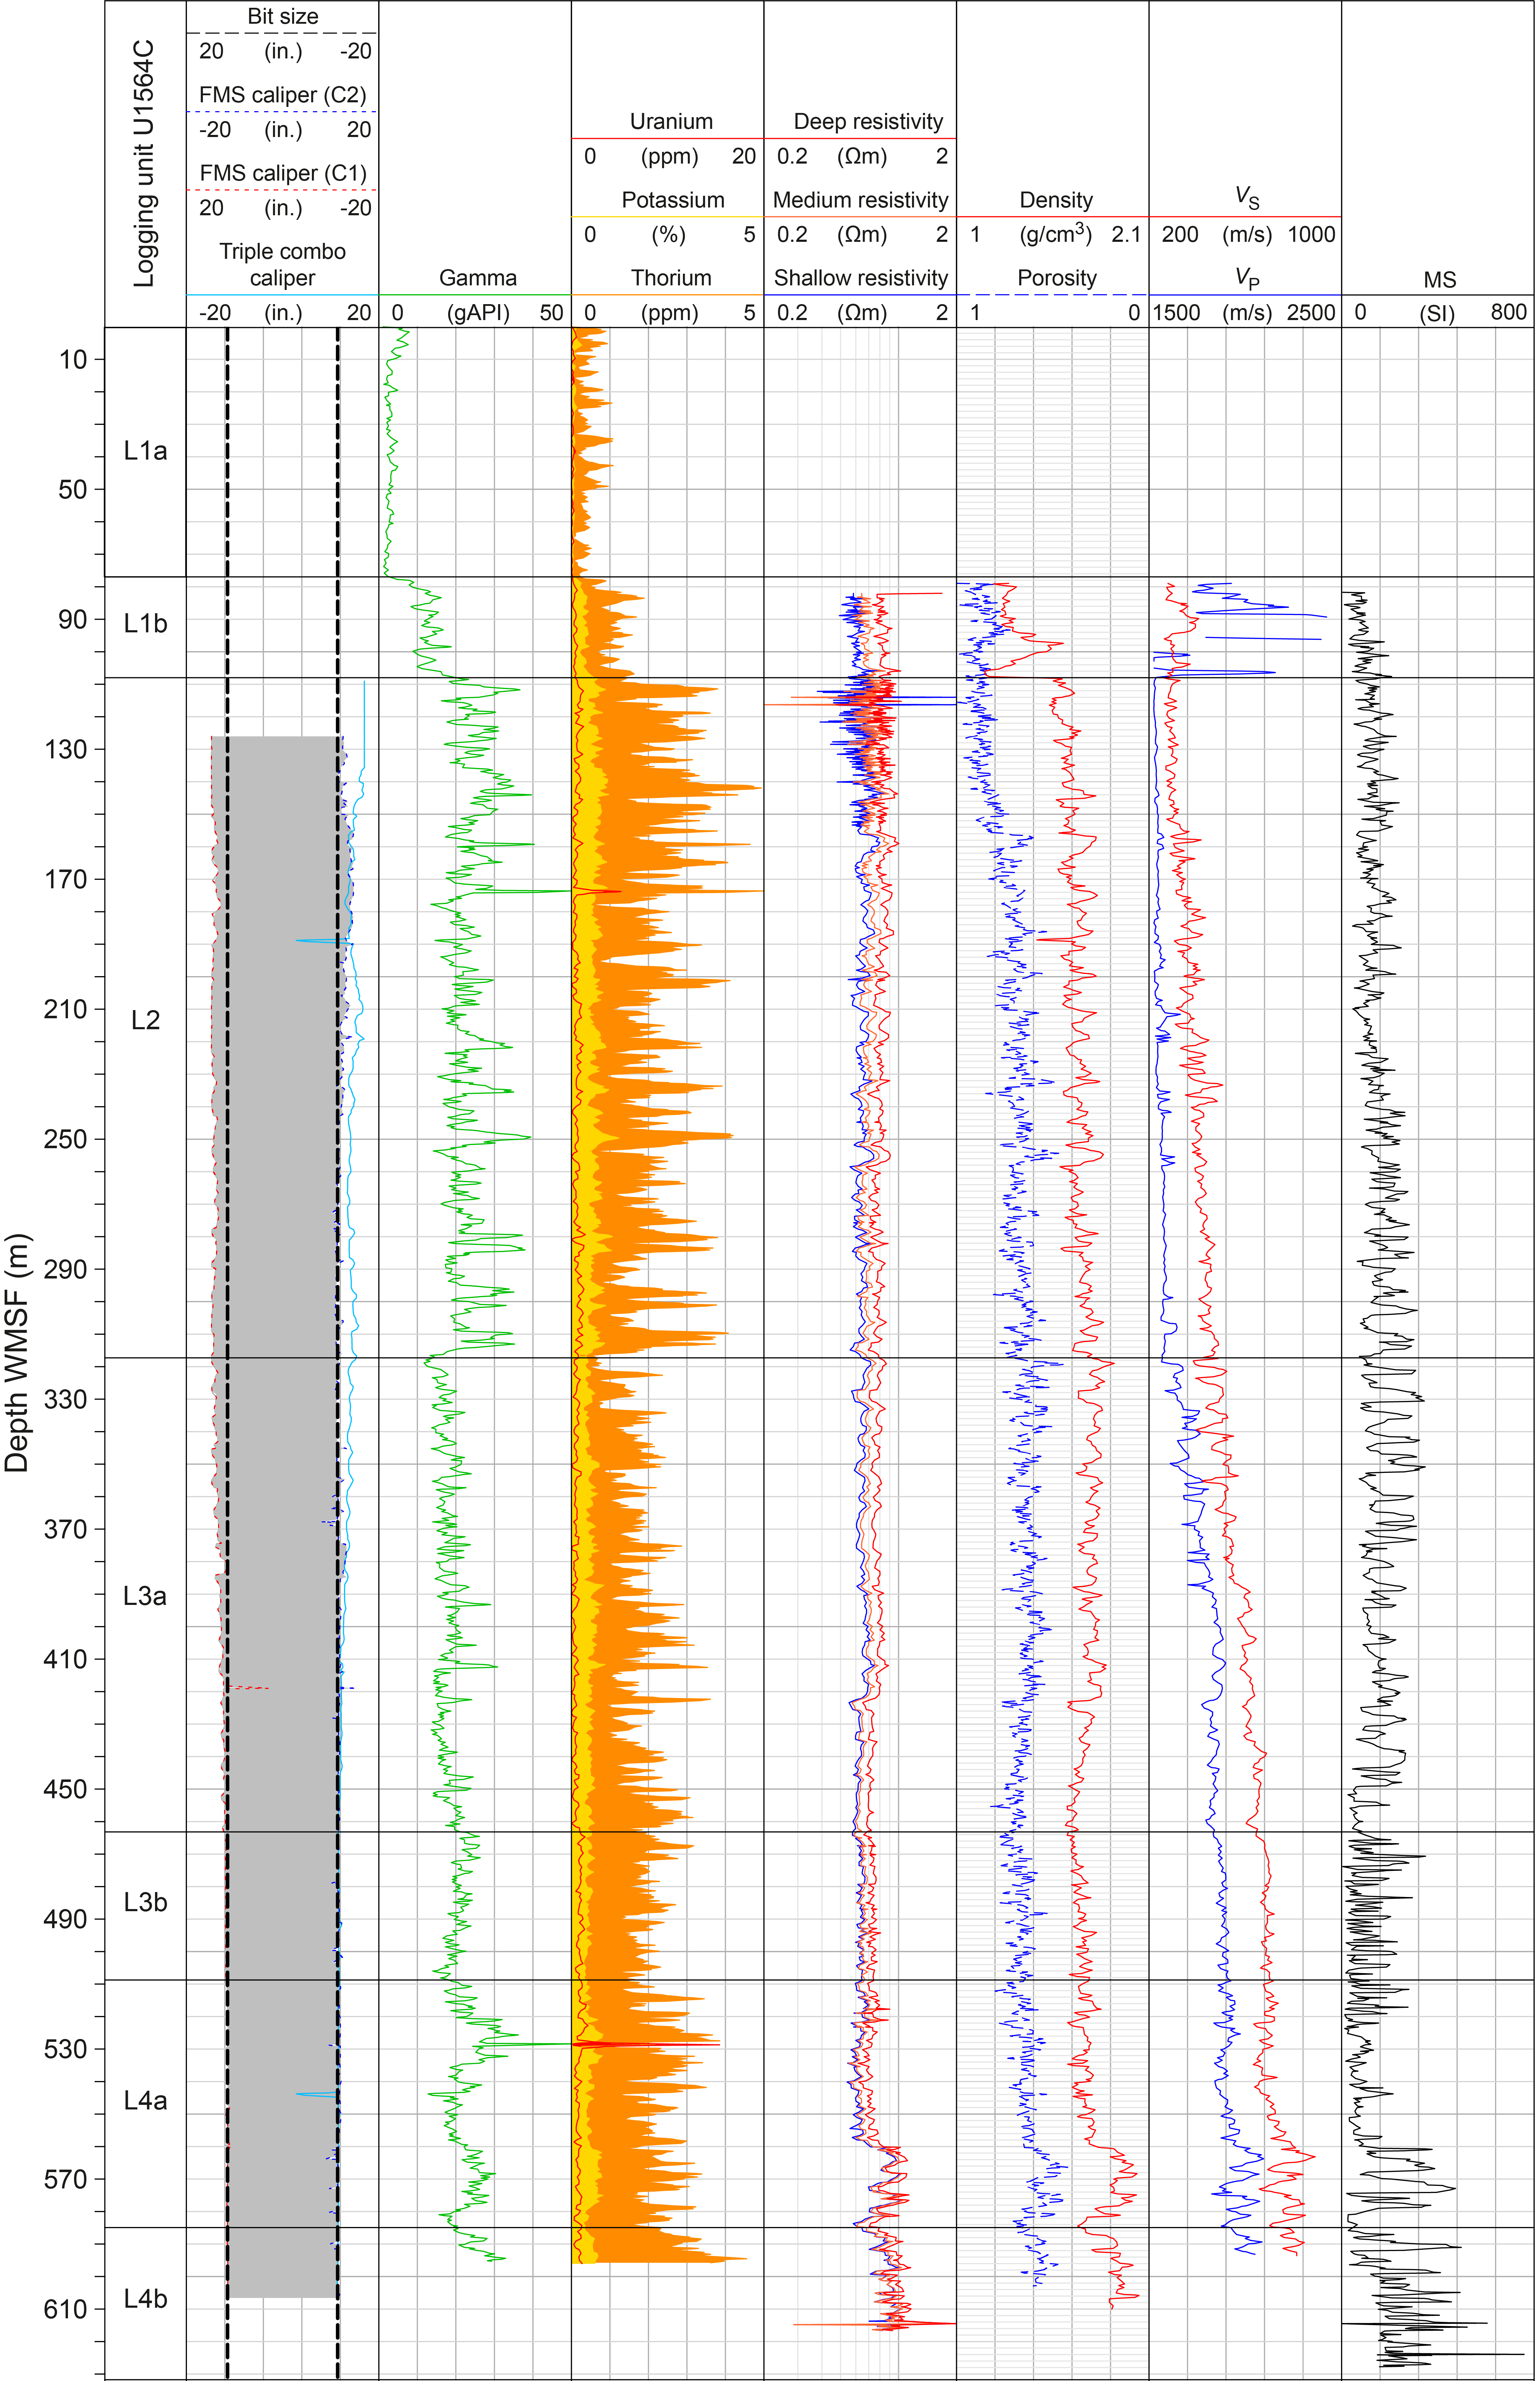
Figure F60. Downhole logging data, Hole U1564C.
11.2.1.2. Logging Subunit L1b
The top of Subunit L1b is marked by an increase in the gamma log (up to ~13 ± 3 gAPI) with respect to Subunit L1a due to the transition to the open hole. Resistivity values are invariant with depth in this subunit at ~0.8 Ωm. Density ranges 1.3–1.6 g/cm3, and porosity measurements are between 1.0 and 0.7. VS averages ~332 m/s. MS typically fluctuates between ~35 and ~160 SI (Figure F60). Subunit L1b is entirely within Lithostratigraphic Subunit IA (see Lithostratigraphy).
11.2.2. Logging Unit L2
The boundary between Unit L1 and Unit L2 is defined by an increase in the gamma log (average = 24 ± 5 gAPI) (Figure F60). The spectral gamma log shows several distinct Th peaks (up to ~5 ppm) in Unit L2, and resistivity is generally low (0.5–1 Ωm). Porosity averages 0.9 at 108–155 m WMSF, below which it decreases to an average of 0.6. Density varies between 1.56 and 1.83 g/cm3 throughout this logging unit. VP and VS steadily increase with depth from 1525 to 1655 m/s and from 300 to 560 m/s, respectively. MS fluctuates in short (2–4 m) wavelength cycles between 40 and 315 SI, with cycle wavelengths becoming longer (6–10 m) in the lowermost ~20 m of this logging unit. Unit L2 corresponds to the lowermost 28 m of Lithostratigraphic Subunit IA and almost the entirety of Lithostratigraphic Subunit IB (136–327 m CSF-A) (see Lithostratigraphy).
11.2.3. Logging Unit L3
The top of Unit L3 is marked by a decrease in the gamma log and absence of the cyclical variability of Unit L2 (Figure F60). Two logging subunits are defined by a change in the MS wireline log. Unit L3 corresponds to Lithostratigraphic Subunit IC and the upper portion of Lithostratigraphic Subunit IIA (427–695 m CSF-A) (see Lithostratigraphy).
11.2.3.1. Logging Subunit L3a
Subunit L3a has variable gamma log measurement ranging 12–31 gAPI, the peaks of which are dominated by a high Th count (up to 3.6 ppm), as shown in the spectral gamma log. Deep electrical resistivity is ~0.8 Ωm in this subunit to 423 m WMSF, where a slight decrease to ~0.7 Ωm is observed. This subunit shows a gradual decrease in density with depth from ~1.9 to 1.7 g/cm3, and porosity shows a gradual increase with depth from 0.46 to 0.7. VP and VS increase throughout the subunit from ~1570 to ~1850 m/s and from ~383 to ~663 m/s, respectively. MS fluctuates throughout this subunit at the meter scale, ranging 24–350 SI.
11.2.3.2. Logging Subunit L3b
Subunit L3b is distinguished from Subunit L3a by the change in scale of fluctuation observed in the MS log, which occurs over submeter scales instead of meter scales. The gamma log and spectral gamma logging responses are similar to Subunit L3a, and deep electrical resistivity remains at 0.7 Ωm, which is consistent with the bottom part of the above Subunit L3a. Density (1.7 g/cm3) and porosity (0.7) in Subunit L3b are similar to those noted for the bottom of Subunit L3a, remaining invariant throughout this subunit. VP and VS increase with depth, reaching 1970 and 728 m/s, respectively.
11.2.4. Logging Unit L4
Unit L4 is distinguished by a marked increase in the gamma log and an increase in spectral gamma K counts compared to the units above and below it (Figures F60, F61). Unit L4 is divided into two subunits and corresponds to the lower portion of Lithostratigraphic Subunit IIA (427–695 m CSF-A) and upper portion of Lithostratigraphic Subunit IIB (695–856 m CSF-A) (see Lithostratigraphy).
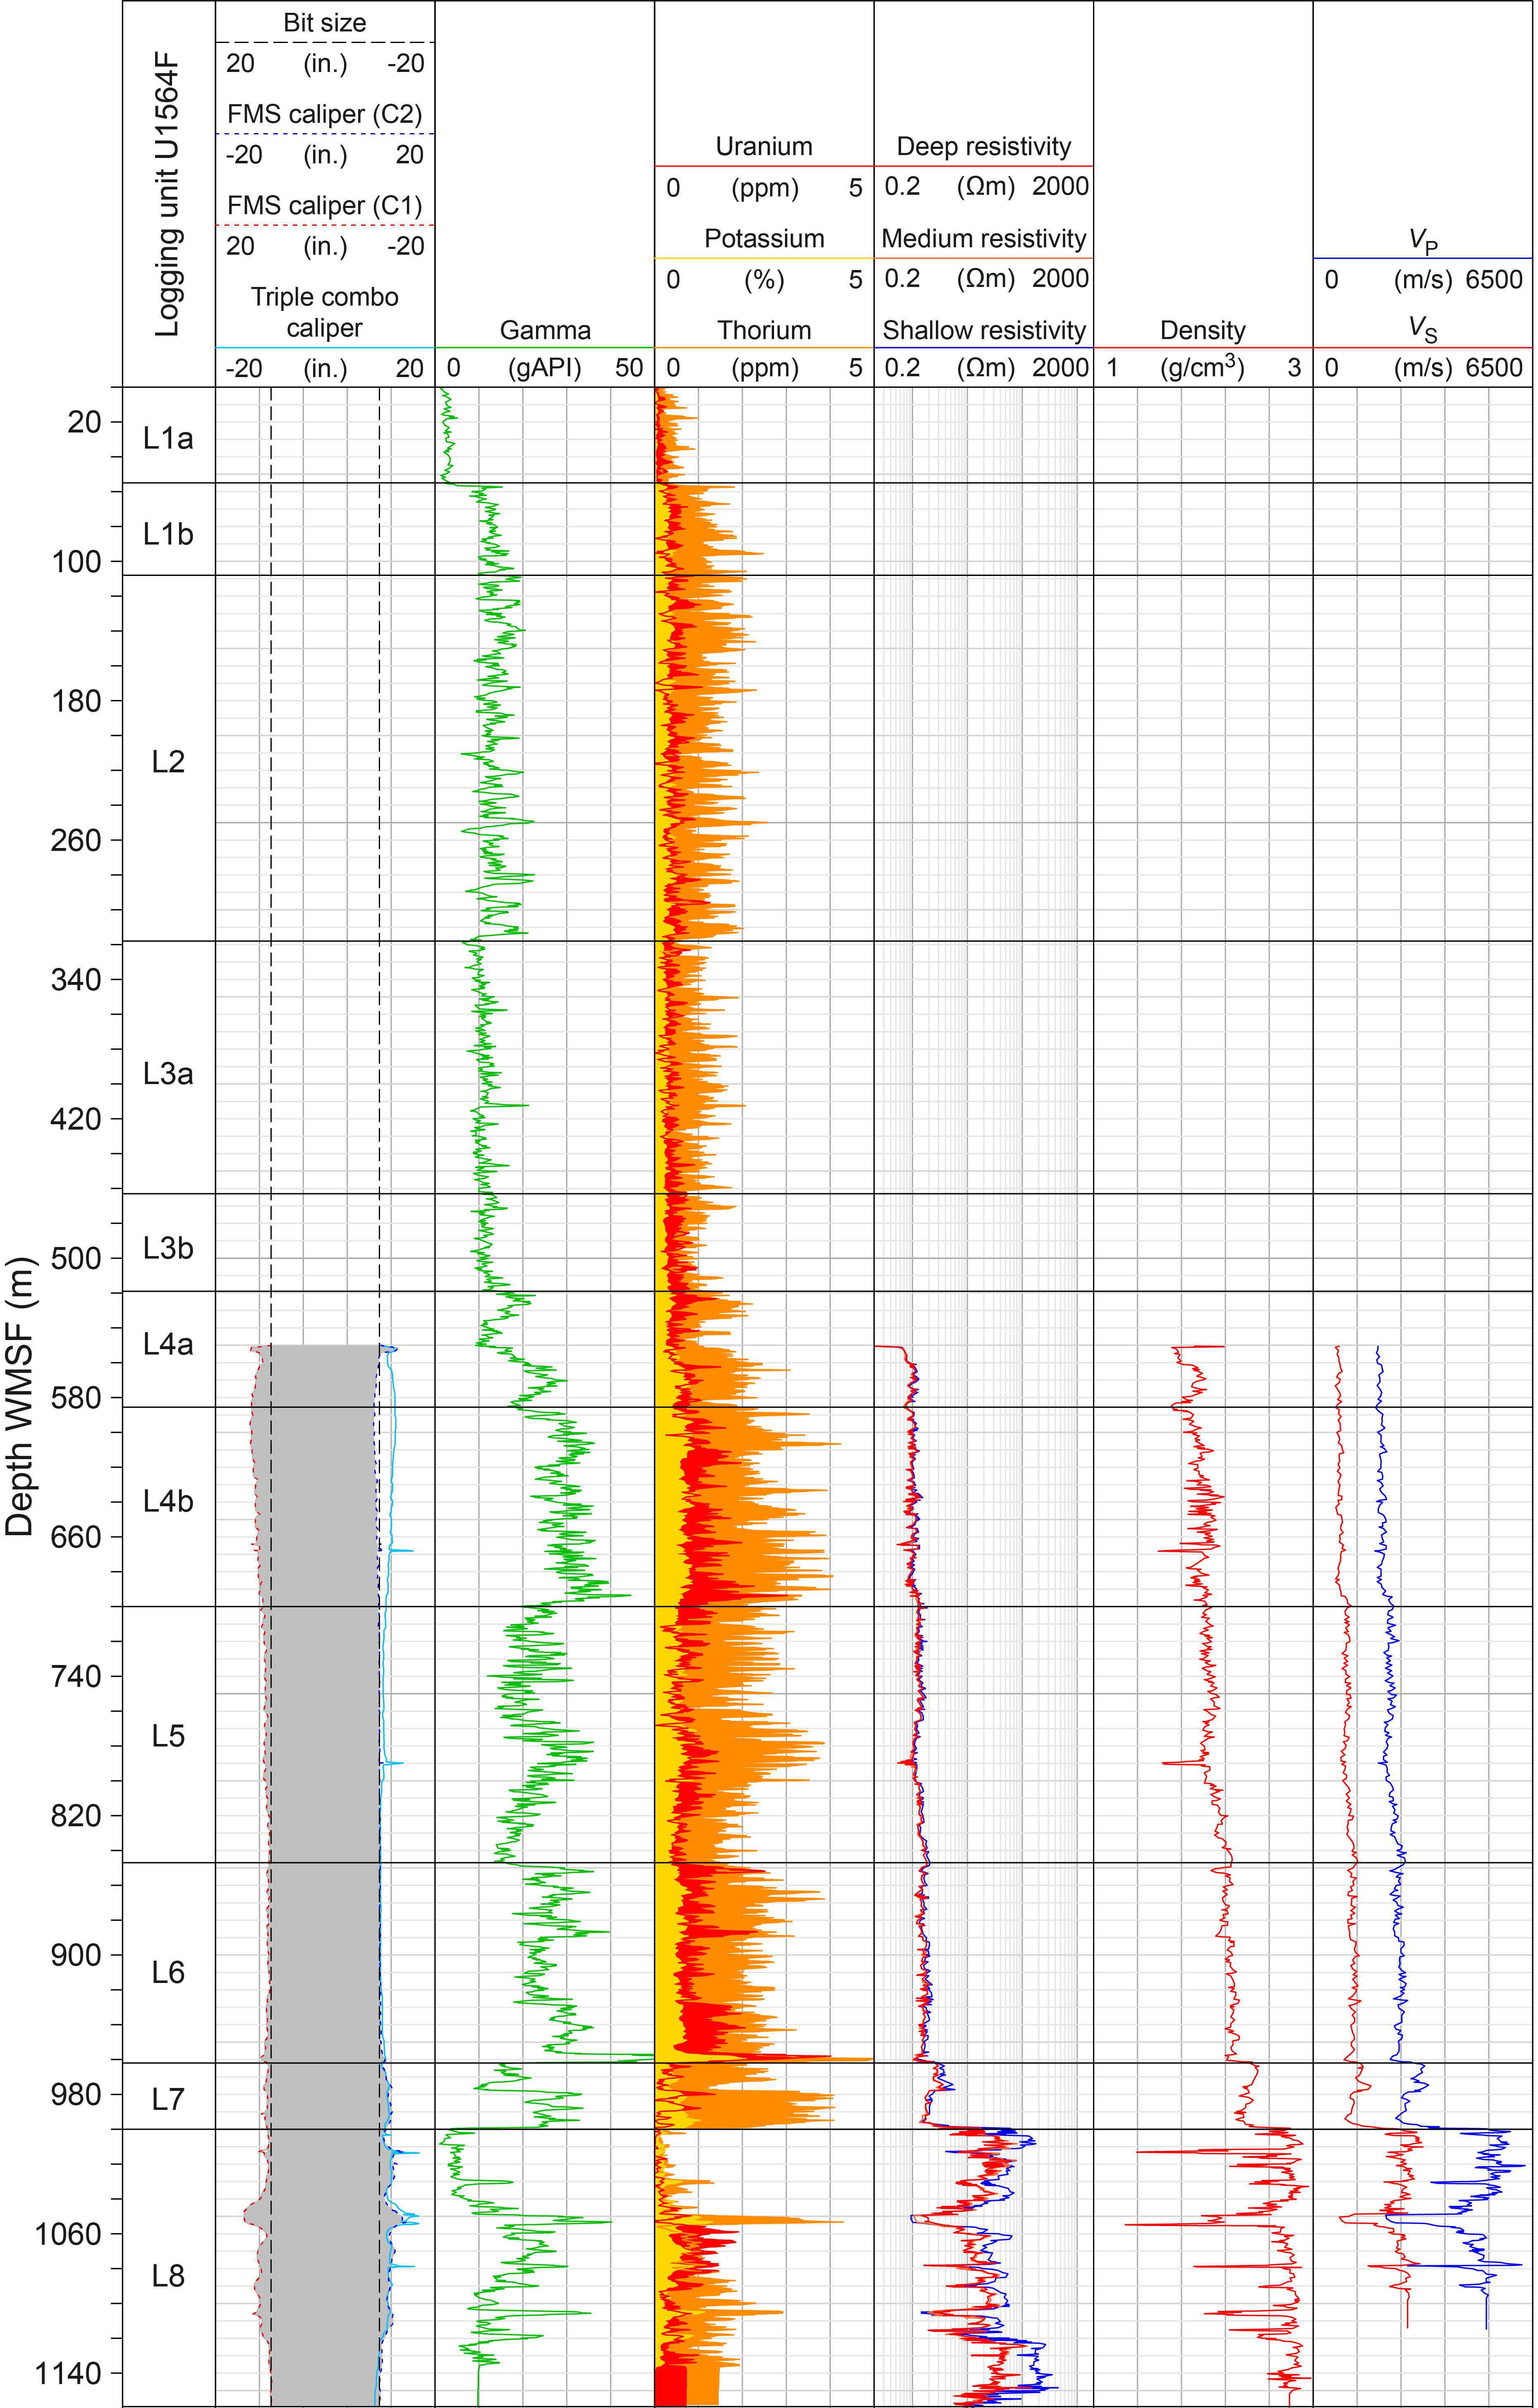
Figure F61. Downhole logging data, Hole U1564F.
11.2.4.1. Logging Subunit L4a
The gamma log shows an initial increase and then decrease with depth in Subunit L4a, including an abrupt peak in gamma radiation that correlates to a sharp increase in spectral gamma U counts (~528 m WMSF). The spectral gamma log also shows fluctuations in Th counts similar to those observed in the logging units above it. Compared to the units above and below, deep electrical resistivity shows a slight decrease to between 0.6 and 0.7 Ωm. Density and porosity values are similar to those in Subunit L3b, as are VP and VS measurements, although the latter two show a slight increase toward the bottom of this subunit. MS is low in this subunit and lacks the large fluctuations noted in logging units above and below (68 ± 37 SI).
11.2.4.2. Logging Subunit L4b
Natural gamma and spectral gamma characters for Subunit L4b are similar to those in Subunit L4a, although more U peaks are noted in the spectral gamma log in this subunit. The top of this subunit is marked by an increase in deep electrical resistivity that fluctuates between 0.7 to 1.2 Ωm, as well as an increase in density and decrease in porosity, both of which also fluctuate in this subunit. VP and VS fluctuate slightly at the top of this subunit before becoming relatively invariant with averages of 2035 and 794 m/s, respectively. MS measurements acquired for the top of this subunit (Hole U1564C) show cyclical fluctuating values ranging 13–498 SI.
11.2.5. Logging Unit L5
The top of Unit L5 is marked by a decrease in the gamma log that is matched by decreases in all three spectral gamma log responses (Figures F61). The gamma log measurements still show fluctuations matched to increases and decreases predominantly in the Th but also noted in the U counts from the spectral gamma logs. A deep electrical resistivity measurement of 1.3 Ωm is reported for this logging unit that is invariant with depth, which is in contrast to the fluctuating resistivity character of Subunit L4b. Density, VP, and VS are also invariant with depth in this logging unit and average 2.1 g/cm3, 2303 m/s, and 1018 m/s, respectively. Unit L5 is entirely within Lithostratigraphic Subunit IIB (see Lithostratigraphy).
11.2.6. Logging Unit L6
The top of Unit L6 is marked by a sharp increase in the gamma log compared to Unit L5 that is reflected in the increase in K, U, and Th counts from the spectral gamma log (Figure F61). In Unit L6, the gamma log fluctuates, with peaks and troughs ranging 15–81 gAPI. Peaks in gamma radiation are related to either peaks in U, Th, or both measurements on the spectral gamma log, and a specifically high peak in gamma log is noted at the bottom of Unit L6, which sees sharp increases in all three spectral gamma log measurements (~960 m WMSF). Deep electrical resistivity, density, VP, and VS are invariant with depth in Unit L6 with average values of 1.5 ± 0.2 Ωm, 2.23 ± 0.04 g/cm3, 2542 ± 120 m/s, and 1173 ± 94 m/s, respectively. Unit L6 covers the lower portion of Lithostratigraphic Subunit IIB and the uppermost 35 m of Lithostratigraphic Subunit IIC (see Lithostratigraphy).
11.2.7. Logging Unit L7
The boundary between Unit L7 and Unit L6 is marked by sharp changes in most of the logging data recorded (Figure F61). The gamma log decreases and is mirrored by decreases in the spectral gamma counts, and formation resistivity, density, VP, and VS increase compared to values in Unit L6. There is variation with depth in all logging responses, and there are fluctuations in the gamma log (3.6–34.1 gAPI) reflecting variable decreases and increases in U and Th counts from the spectral gamma log. Internal unit changes in gamma log are mirrored by formation resistivity, where the lower gamma readings from the top of the unit show increased resistivity and the higher gamma readings in the lower interval of Unit L7 show decreased resistivity. Density fluctuates between 2.3 and 2.8 g/cm3, VP fluctuates between 2440 and 5164 m/s, and VS fluctuates between 938 and 2562 m/s. Unit L7 is entirely within Lithostratigraphic Subunit IIC (see Lithostratigraphy).
11.2.8. Logging Unit L8
The top of Unit L8 is marked by a large drop in the gamma log, a large increase in resistivity, and increases in density, VP, and VS where the wireline tools record the transition from sediments into the basaltic basement in Hole U1564F (Figure F61). The wireline responses in Unit L8 (the basement logging unit) are variable, reflecting the presence of intercalated sediments within the lavas as reported during core logging (see Igneous petrology). In basaltic sections of the logging unit, the gamma log values can be as low as 1 gAPI, with the gamma signal dominated by U and in places the K counts from the spectral gamma log. In the intercalated sediments, gamma log measurements show peaks as high as 40.3 gAPI, which are instead dominated by Th counts from the spectral gamma log, similar to sediment gamma measurements in the sedimentary logging units lying above the basement. The intercalated sediments and lavas are also observed from the formation resistivity logs, with basalt lava showing high resistivity (up to 150 Ωm) and sediments showing lower resistivity (as low as 1.4 Ωm). In basalt intervals, formation resistivity shows separation between shallow and deep measurements. Density, VS, and VP logs all show decreased values for sediment intervals and increased values for basalt intervals.
11.3. Borehole imaging
The image logs from Hole U1564C are of good quality (Figures F62, F63). The data collected in the sedimentary section in Hole U1564C show distinct alternating layers of higher and lower resistivity throughout the logging interval. FMS image logs of the sediments and basalt lavas logged in Hole U1564F are of excellent quality (Figure F61), showing alternating conductive and resistive layers in the sedimentary units. In addition, structural features such as fractures in the basalt lavas are resolved in detail, and somewhat intercalated layers of sediment in the basaltic basement are clearly defined. UBI image logs from Hole U1564F are variable in quality. In the sedimentary parts of the hole, image quality is poor and few geologic features are observable, although in places alternating high- and low-amplitude layering is noted. UBI image quality improves with depth, and more geologic features are observable, particularly from Unit L6 and deeper. In the basaltic basement (Unit L8), UBI image quality improves but still suffers from significant image log artifacts, which obscure the clear observation of geologic features. Despite this issue, a number of geologic features are observable in the basaltic layers of the basement, which may represent fracturing. The UBI image log contains a large number of stick and pull artifacts, which are the main reason for the poor image log quality.
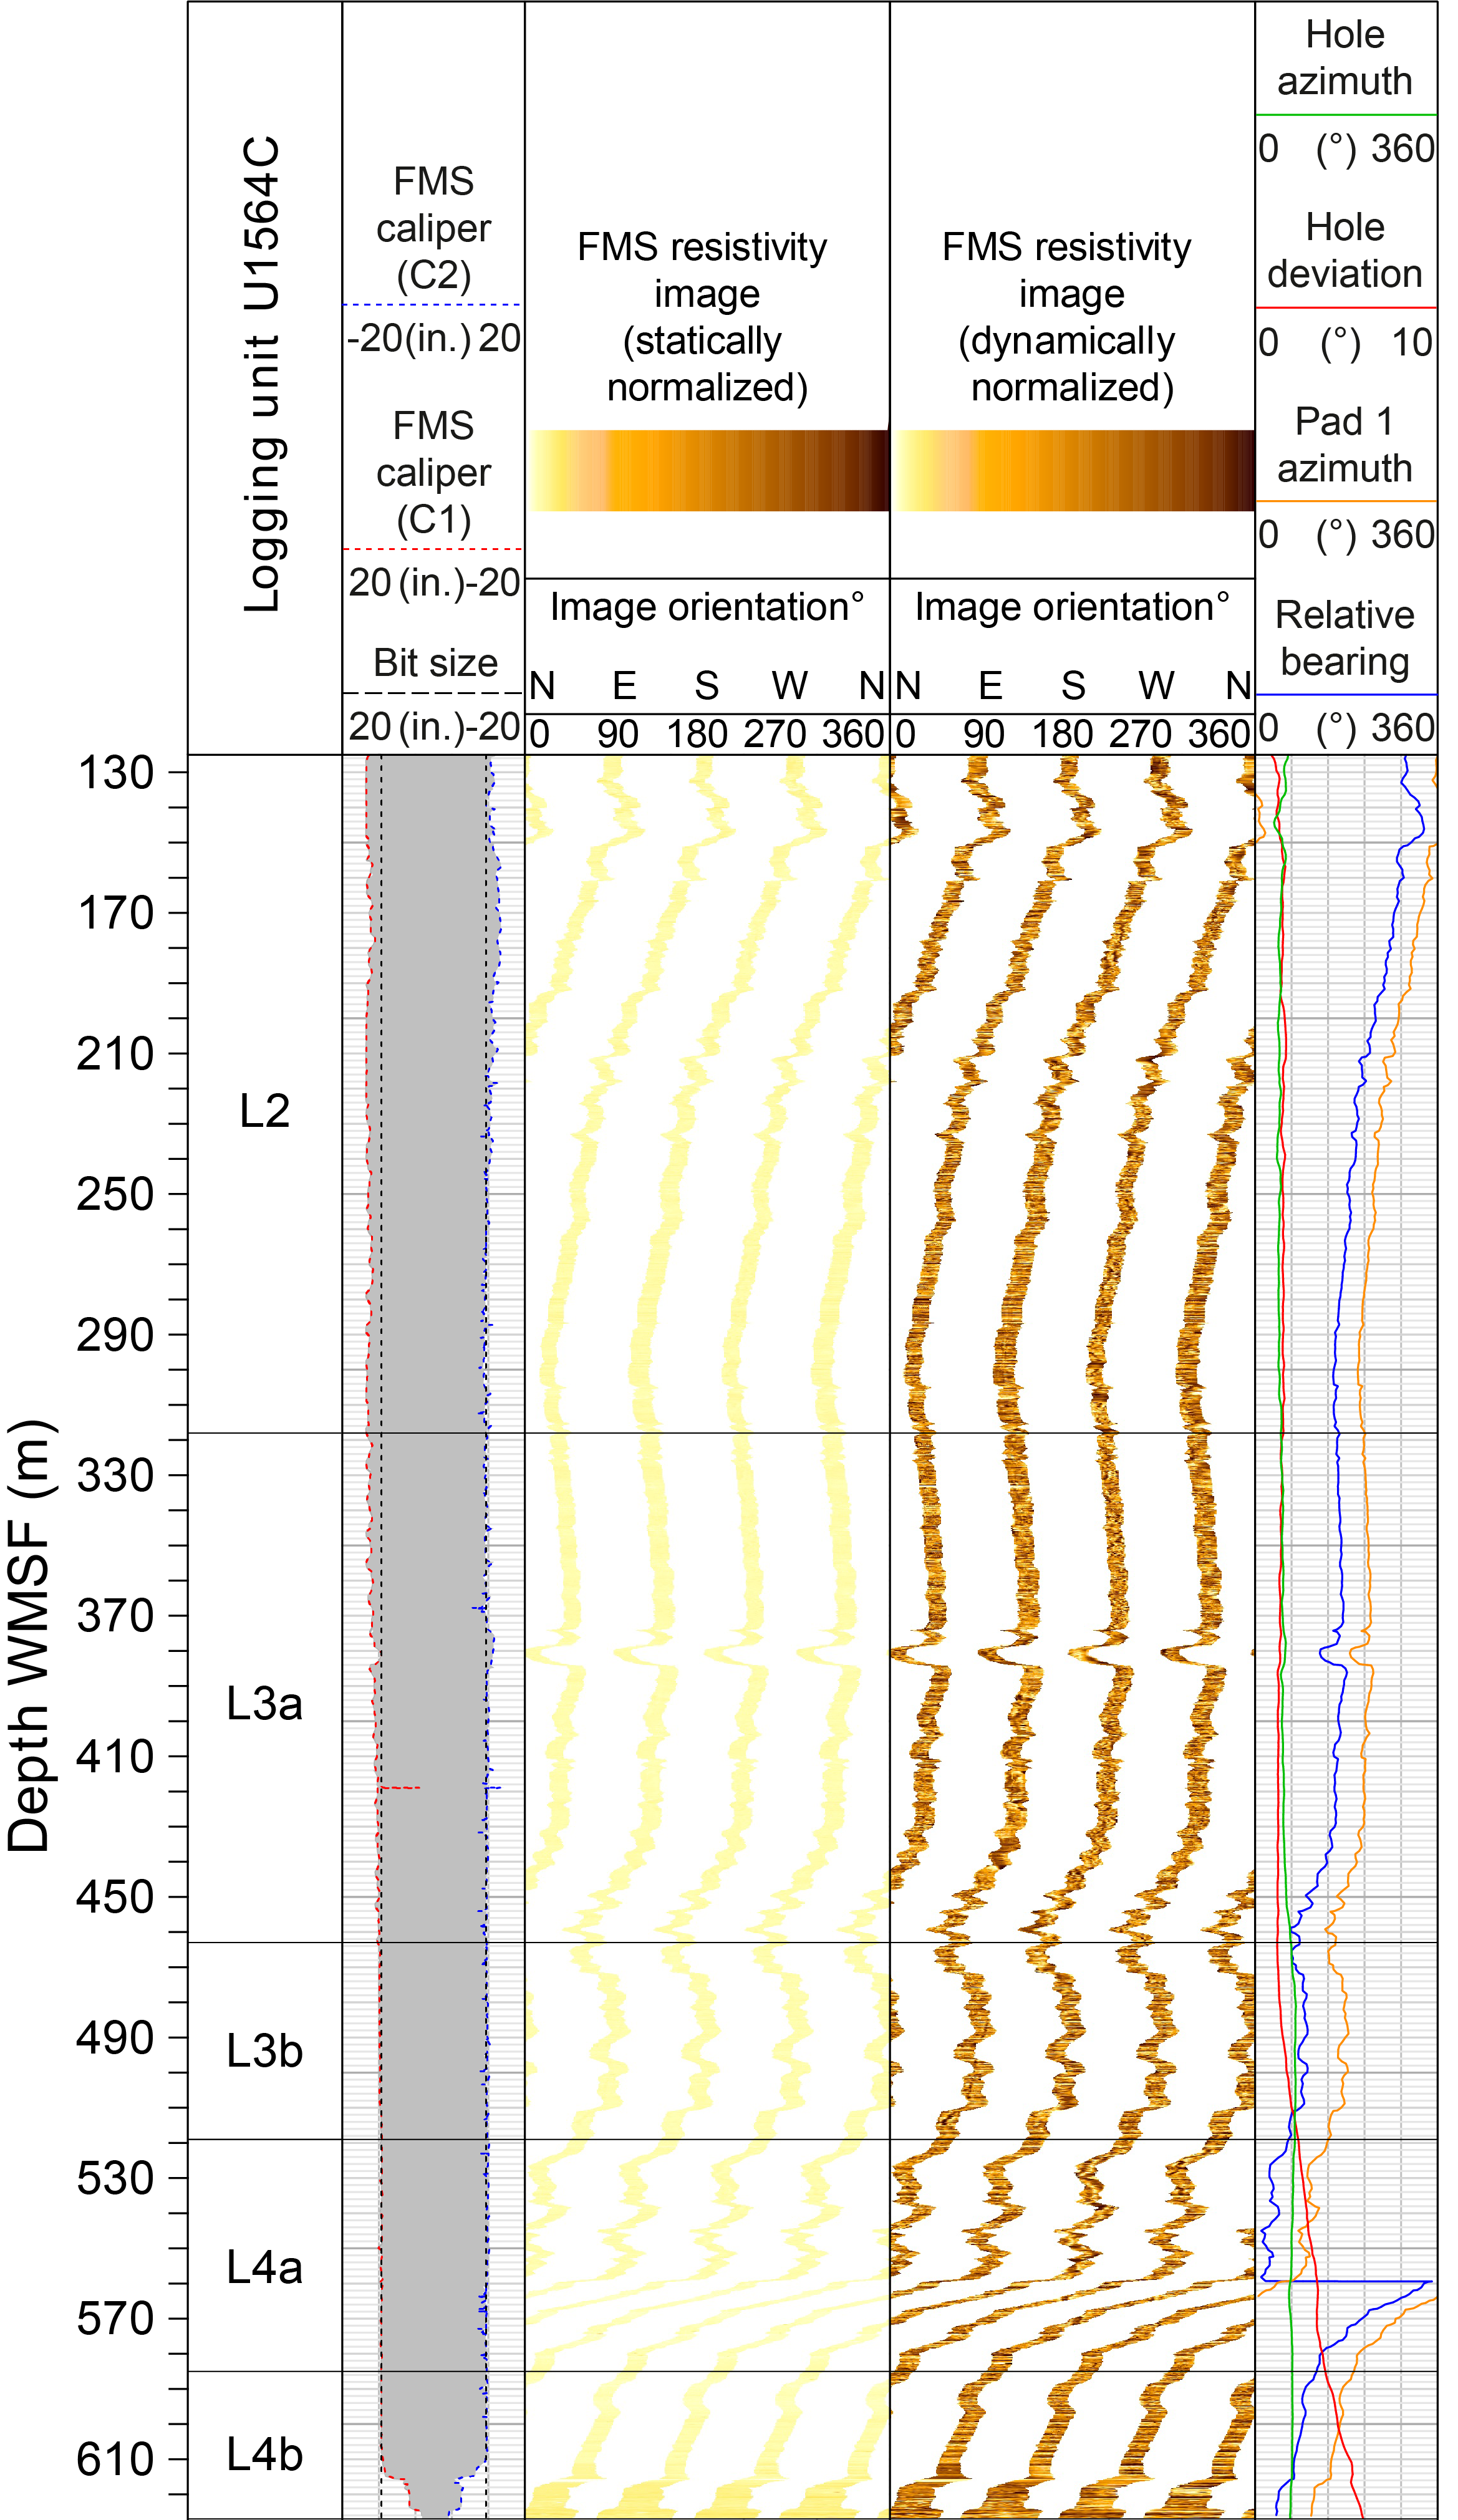
Figure F62. Wireline FMS data, Hole U1564C.
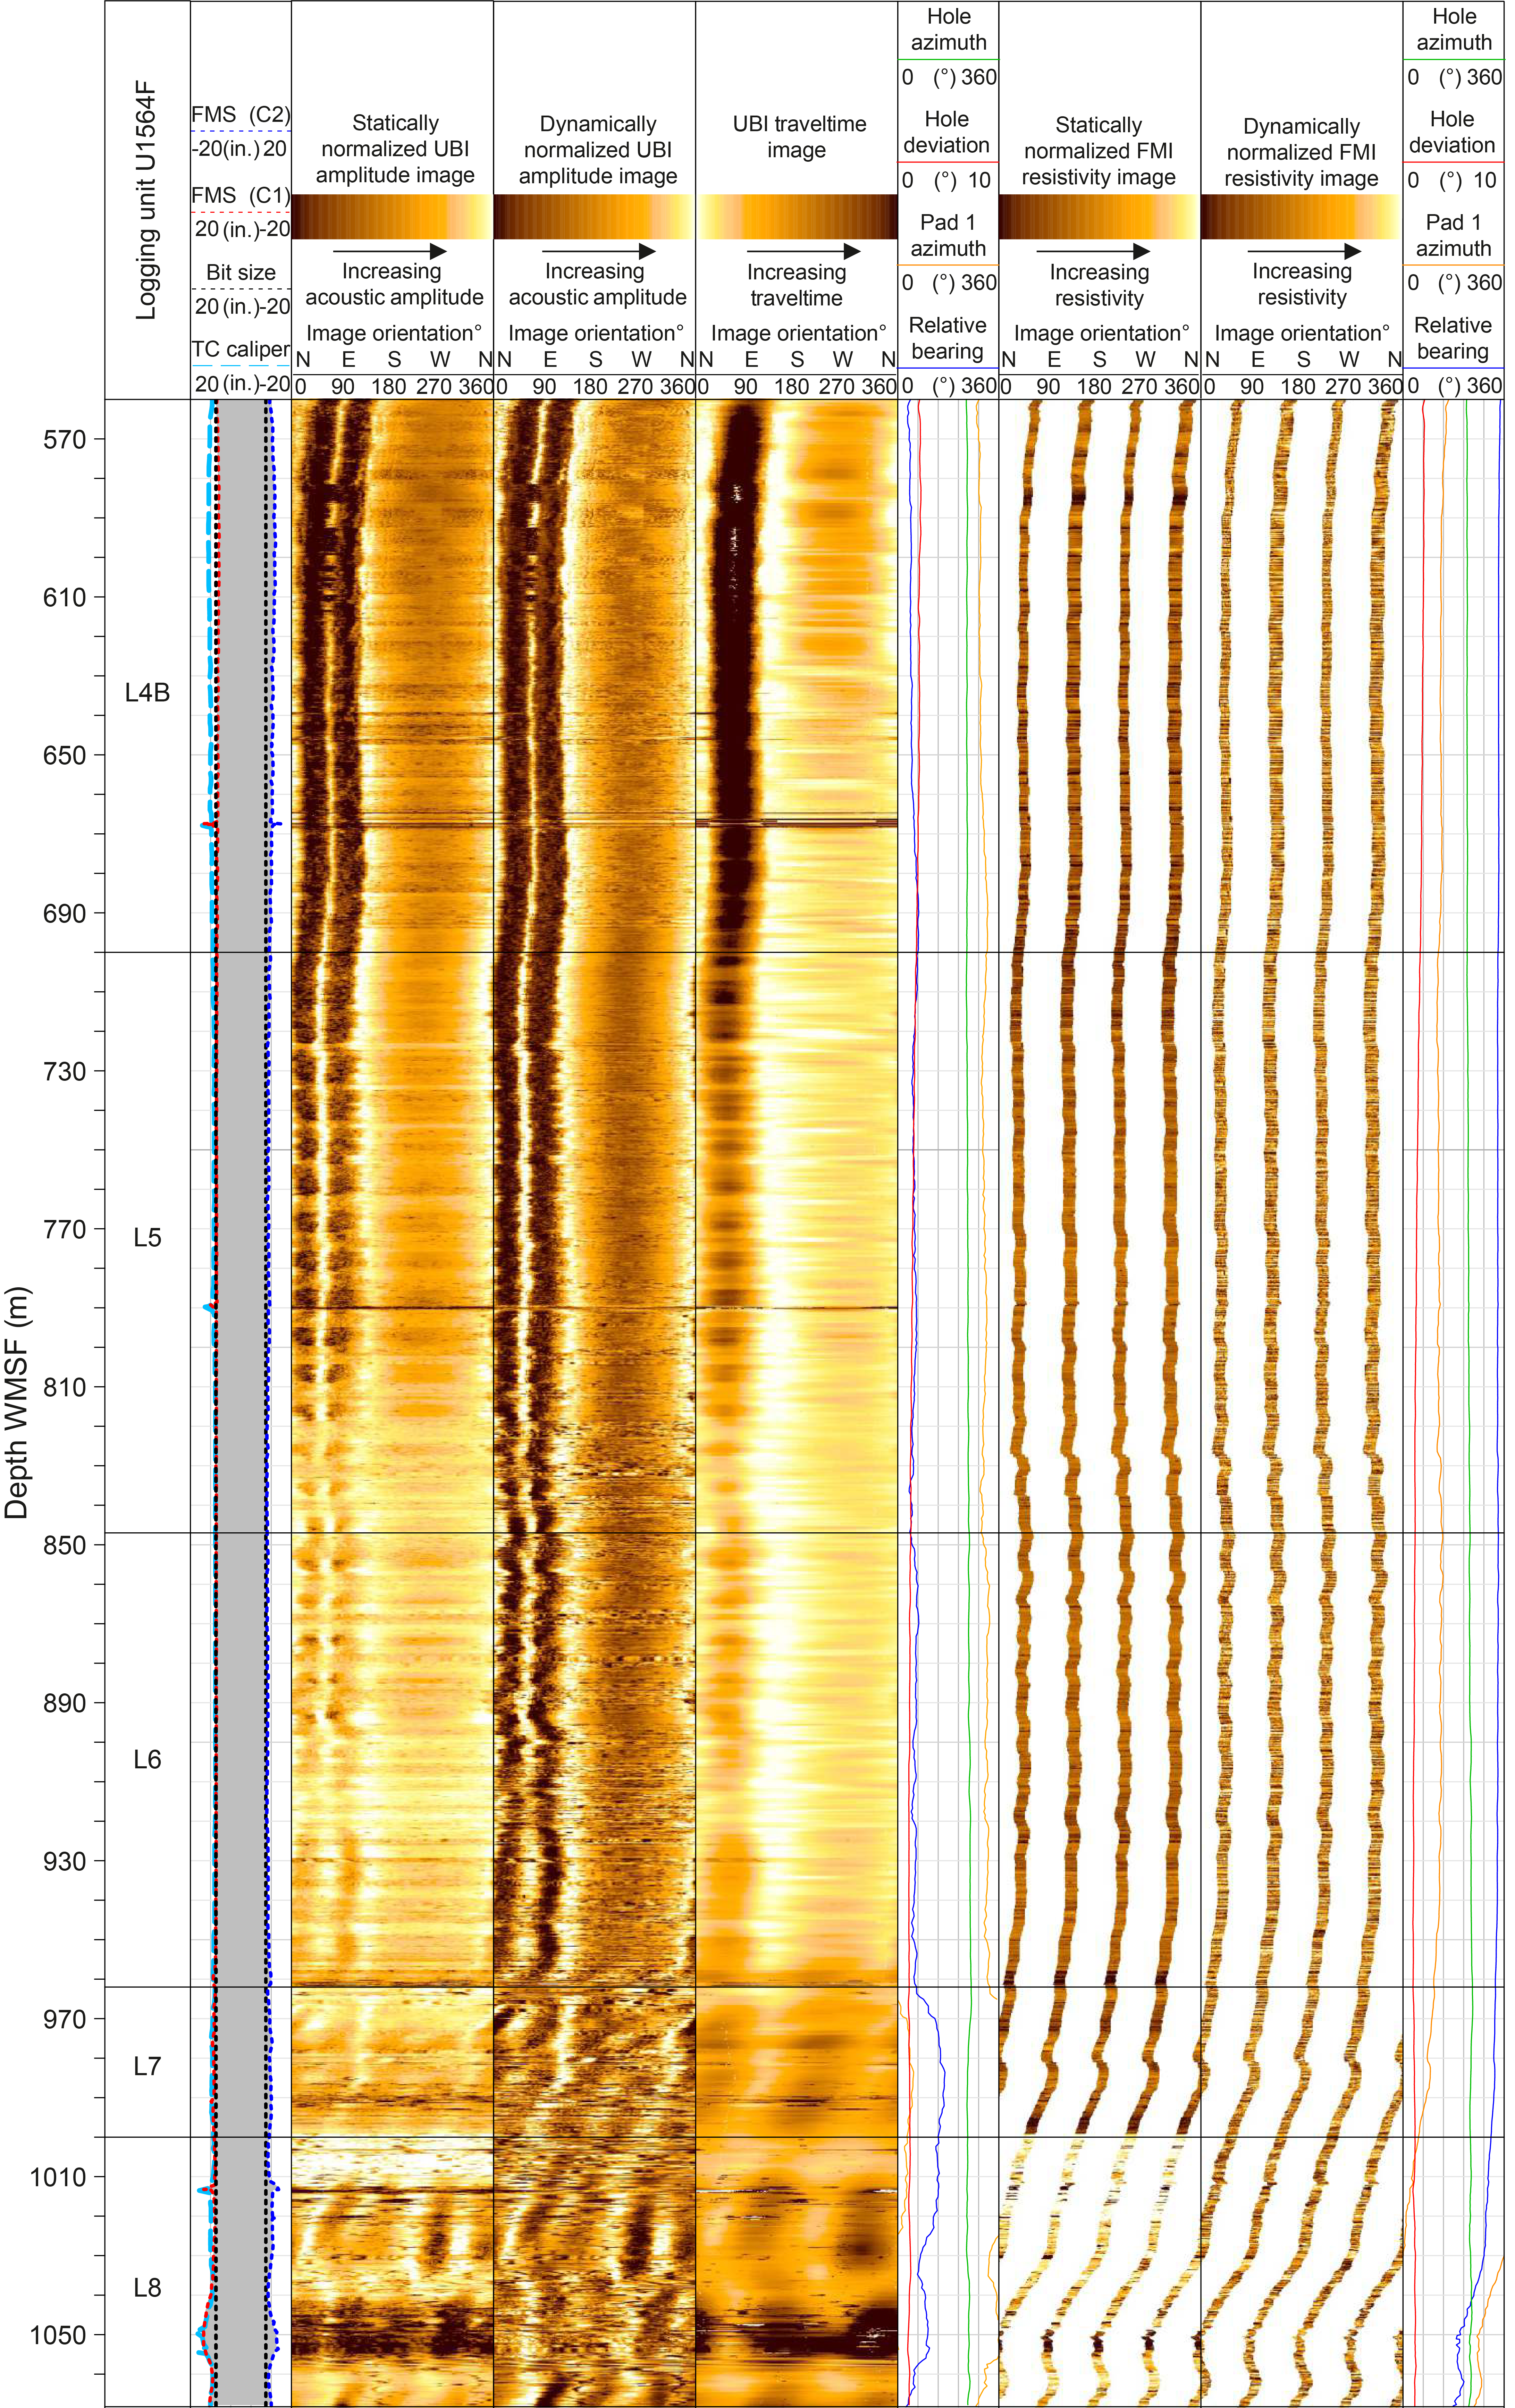
Figure F63. Wireline image data, Hole U1564F.
11.4. Downhole temperature and thermal conductivity
During drilling in Holes U1564C–U1564E, downhole temperature measurements were taken with the APCT-3 tool in Unit L1 and the uppermost portion of Unit L2 (Figures F64; Table T14). The APCT-3 tool provided equilibration temperatures ranging from 6.07°C at 34.3 m DSF to 15.63°C at 130 m DSF (Figure F65A; Table T15). These measurements provide a thermal gradient in the upper sediment section of 36°C/km. Thermal conductivity under in situ conditions (K) was estimated from the combined laboratory-determined thermal conductivity measurements from Holes U1564D and U1564E using the method of Hyndman et al. (1974) (Figure F65B). The thermal conductivity of the sediment measures between ~0.7 and ~1.2 W/(m·K). A linear function for depth-dependent thermal resistance (R) was obtained by integrating the inverse of the thermal conductivity over depth and applying a linear least-squares fit (Figure F65C). This function was used to estimate thermal resistance at each corresponding APCT-3 downhole temperature measurement depth. A heat flow of 33.5 mW/m2 was obtained from a linear least-squares fit of the relationship between temperature and thermal resistance (Bullard, 1939), whose slope is the vertical heat flow (Figure F65D).
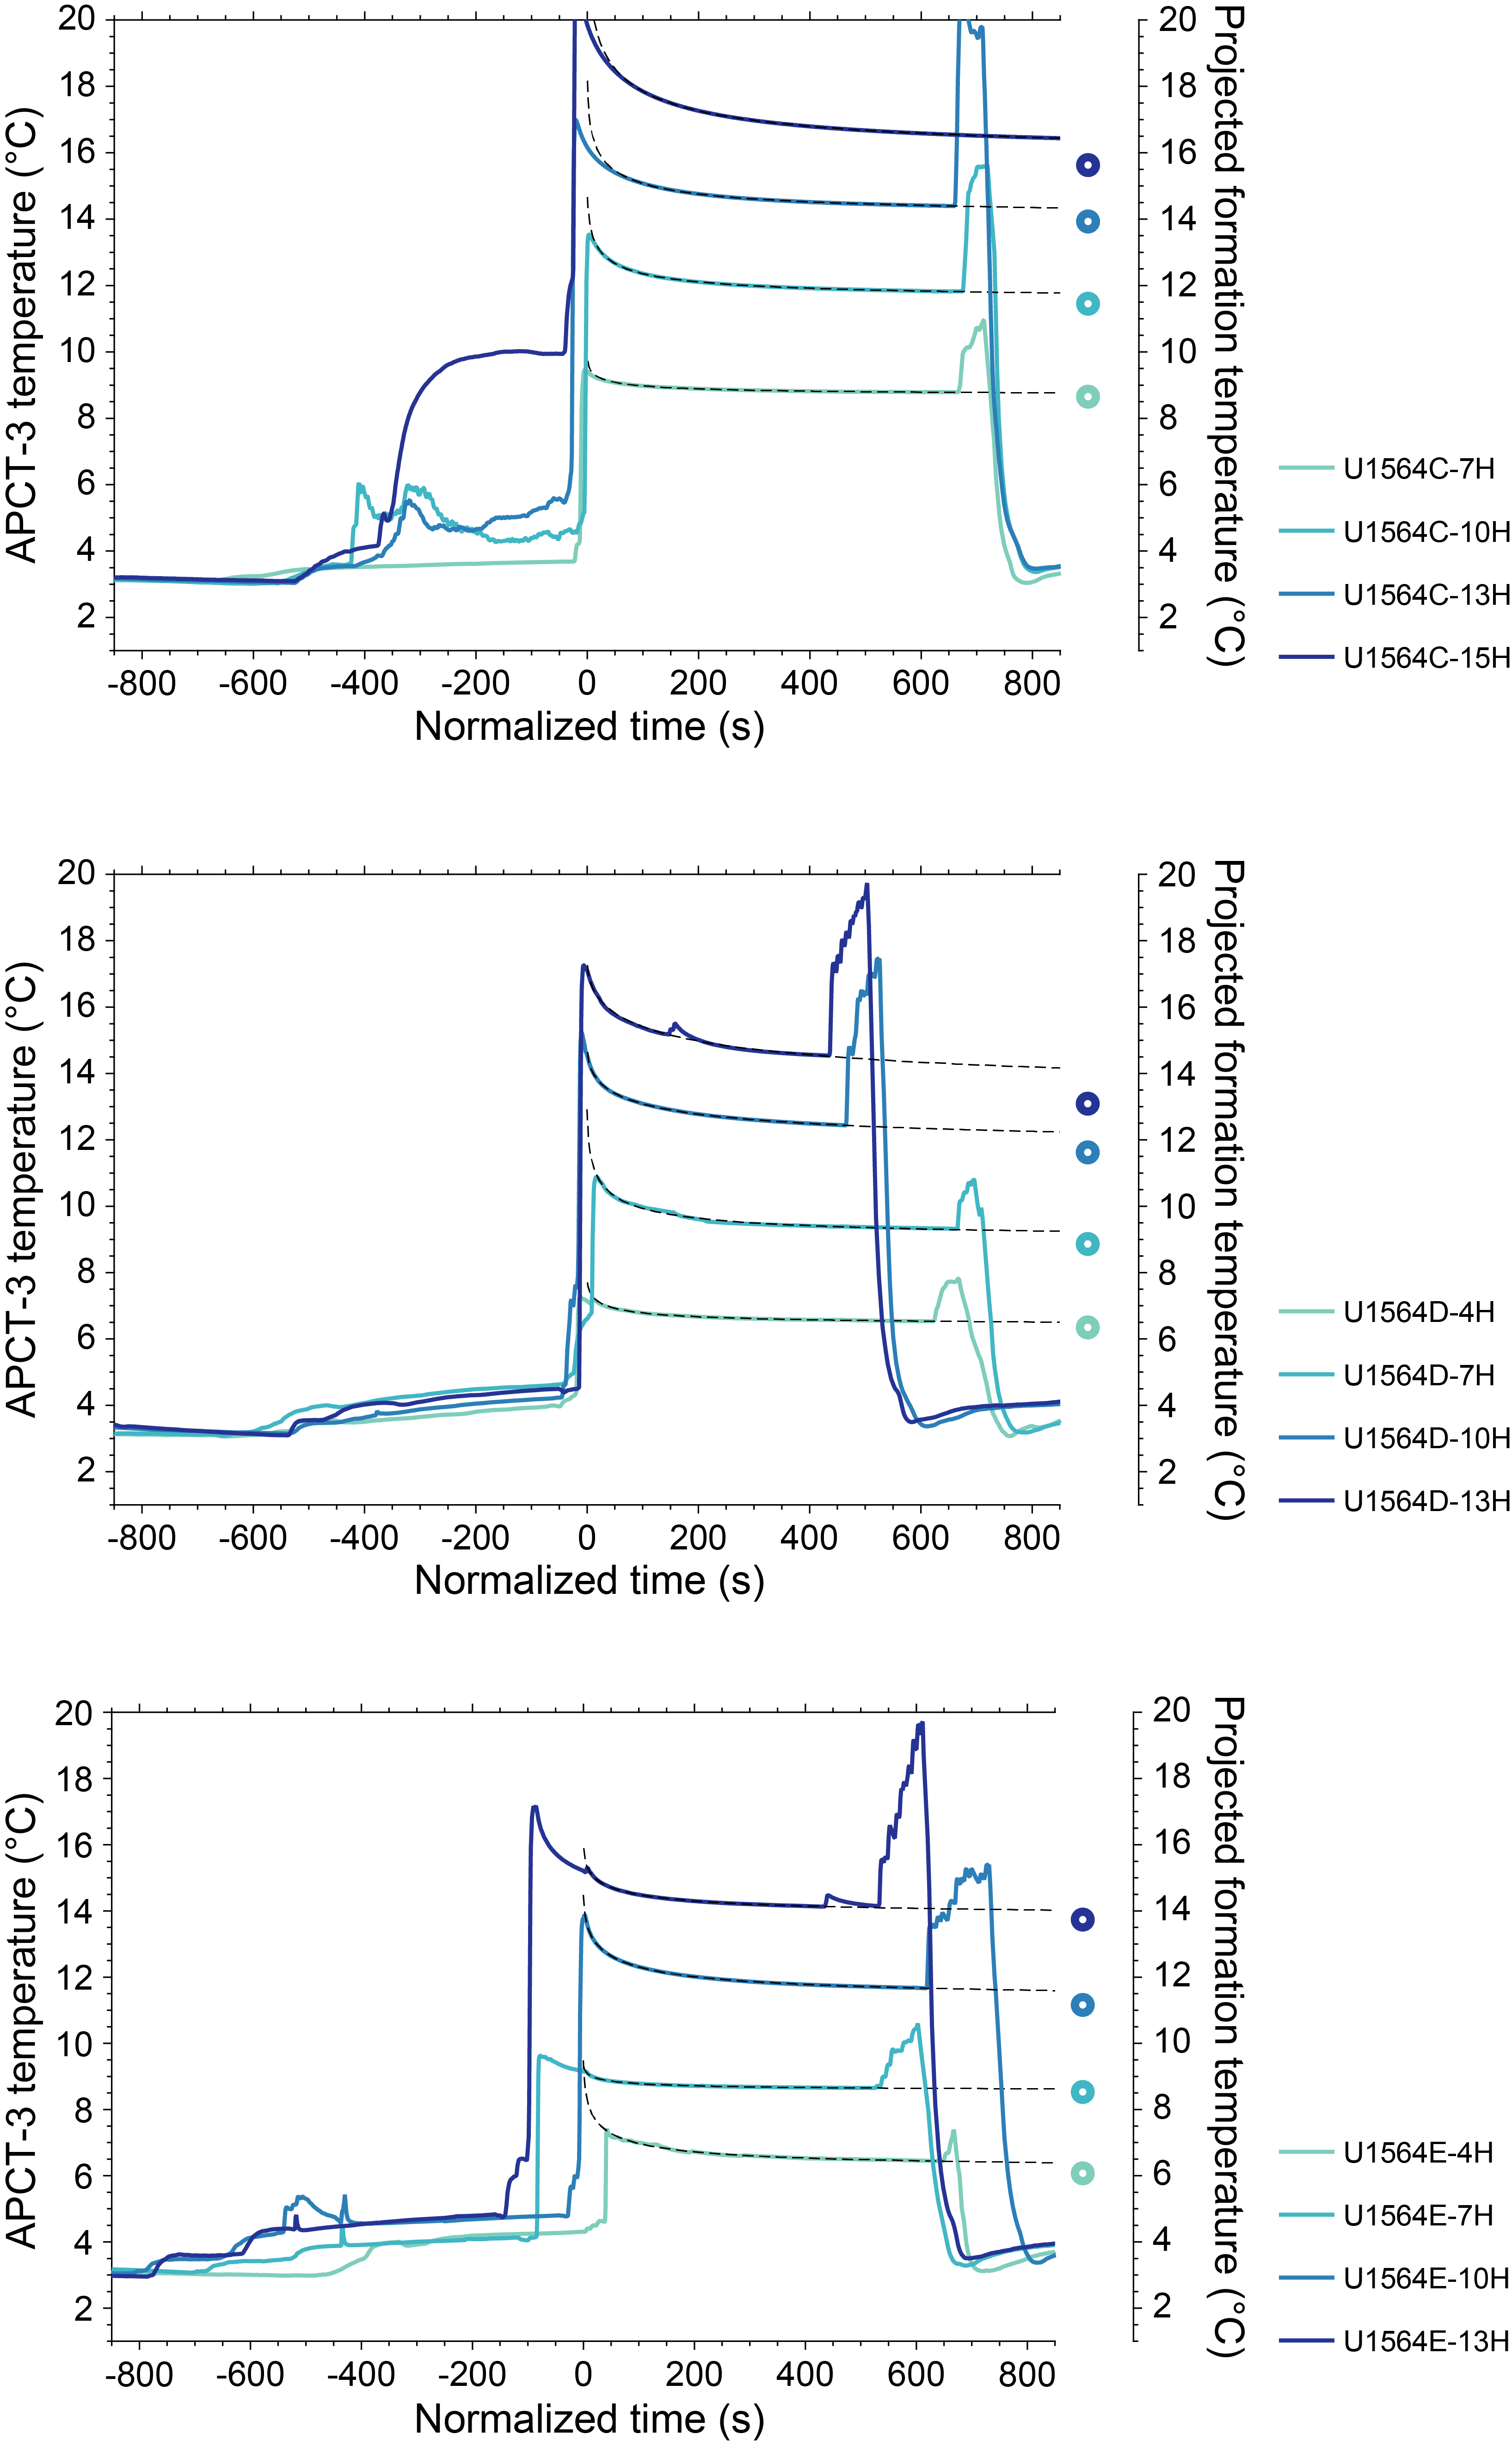
Figure F64. APCT-3 temperature-time series and projected formation temperature estimates.
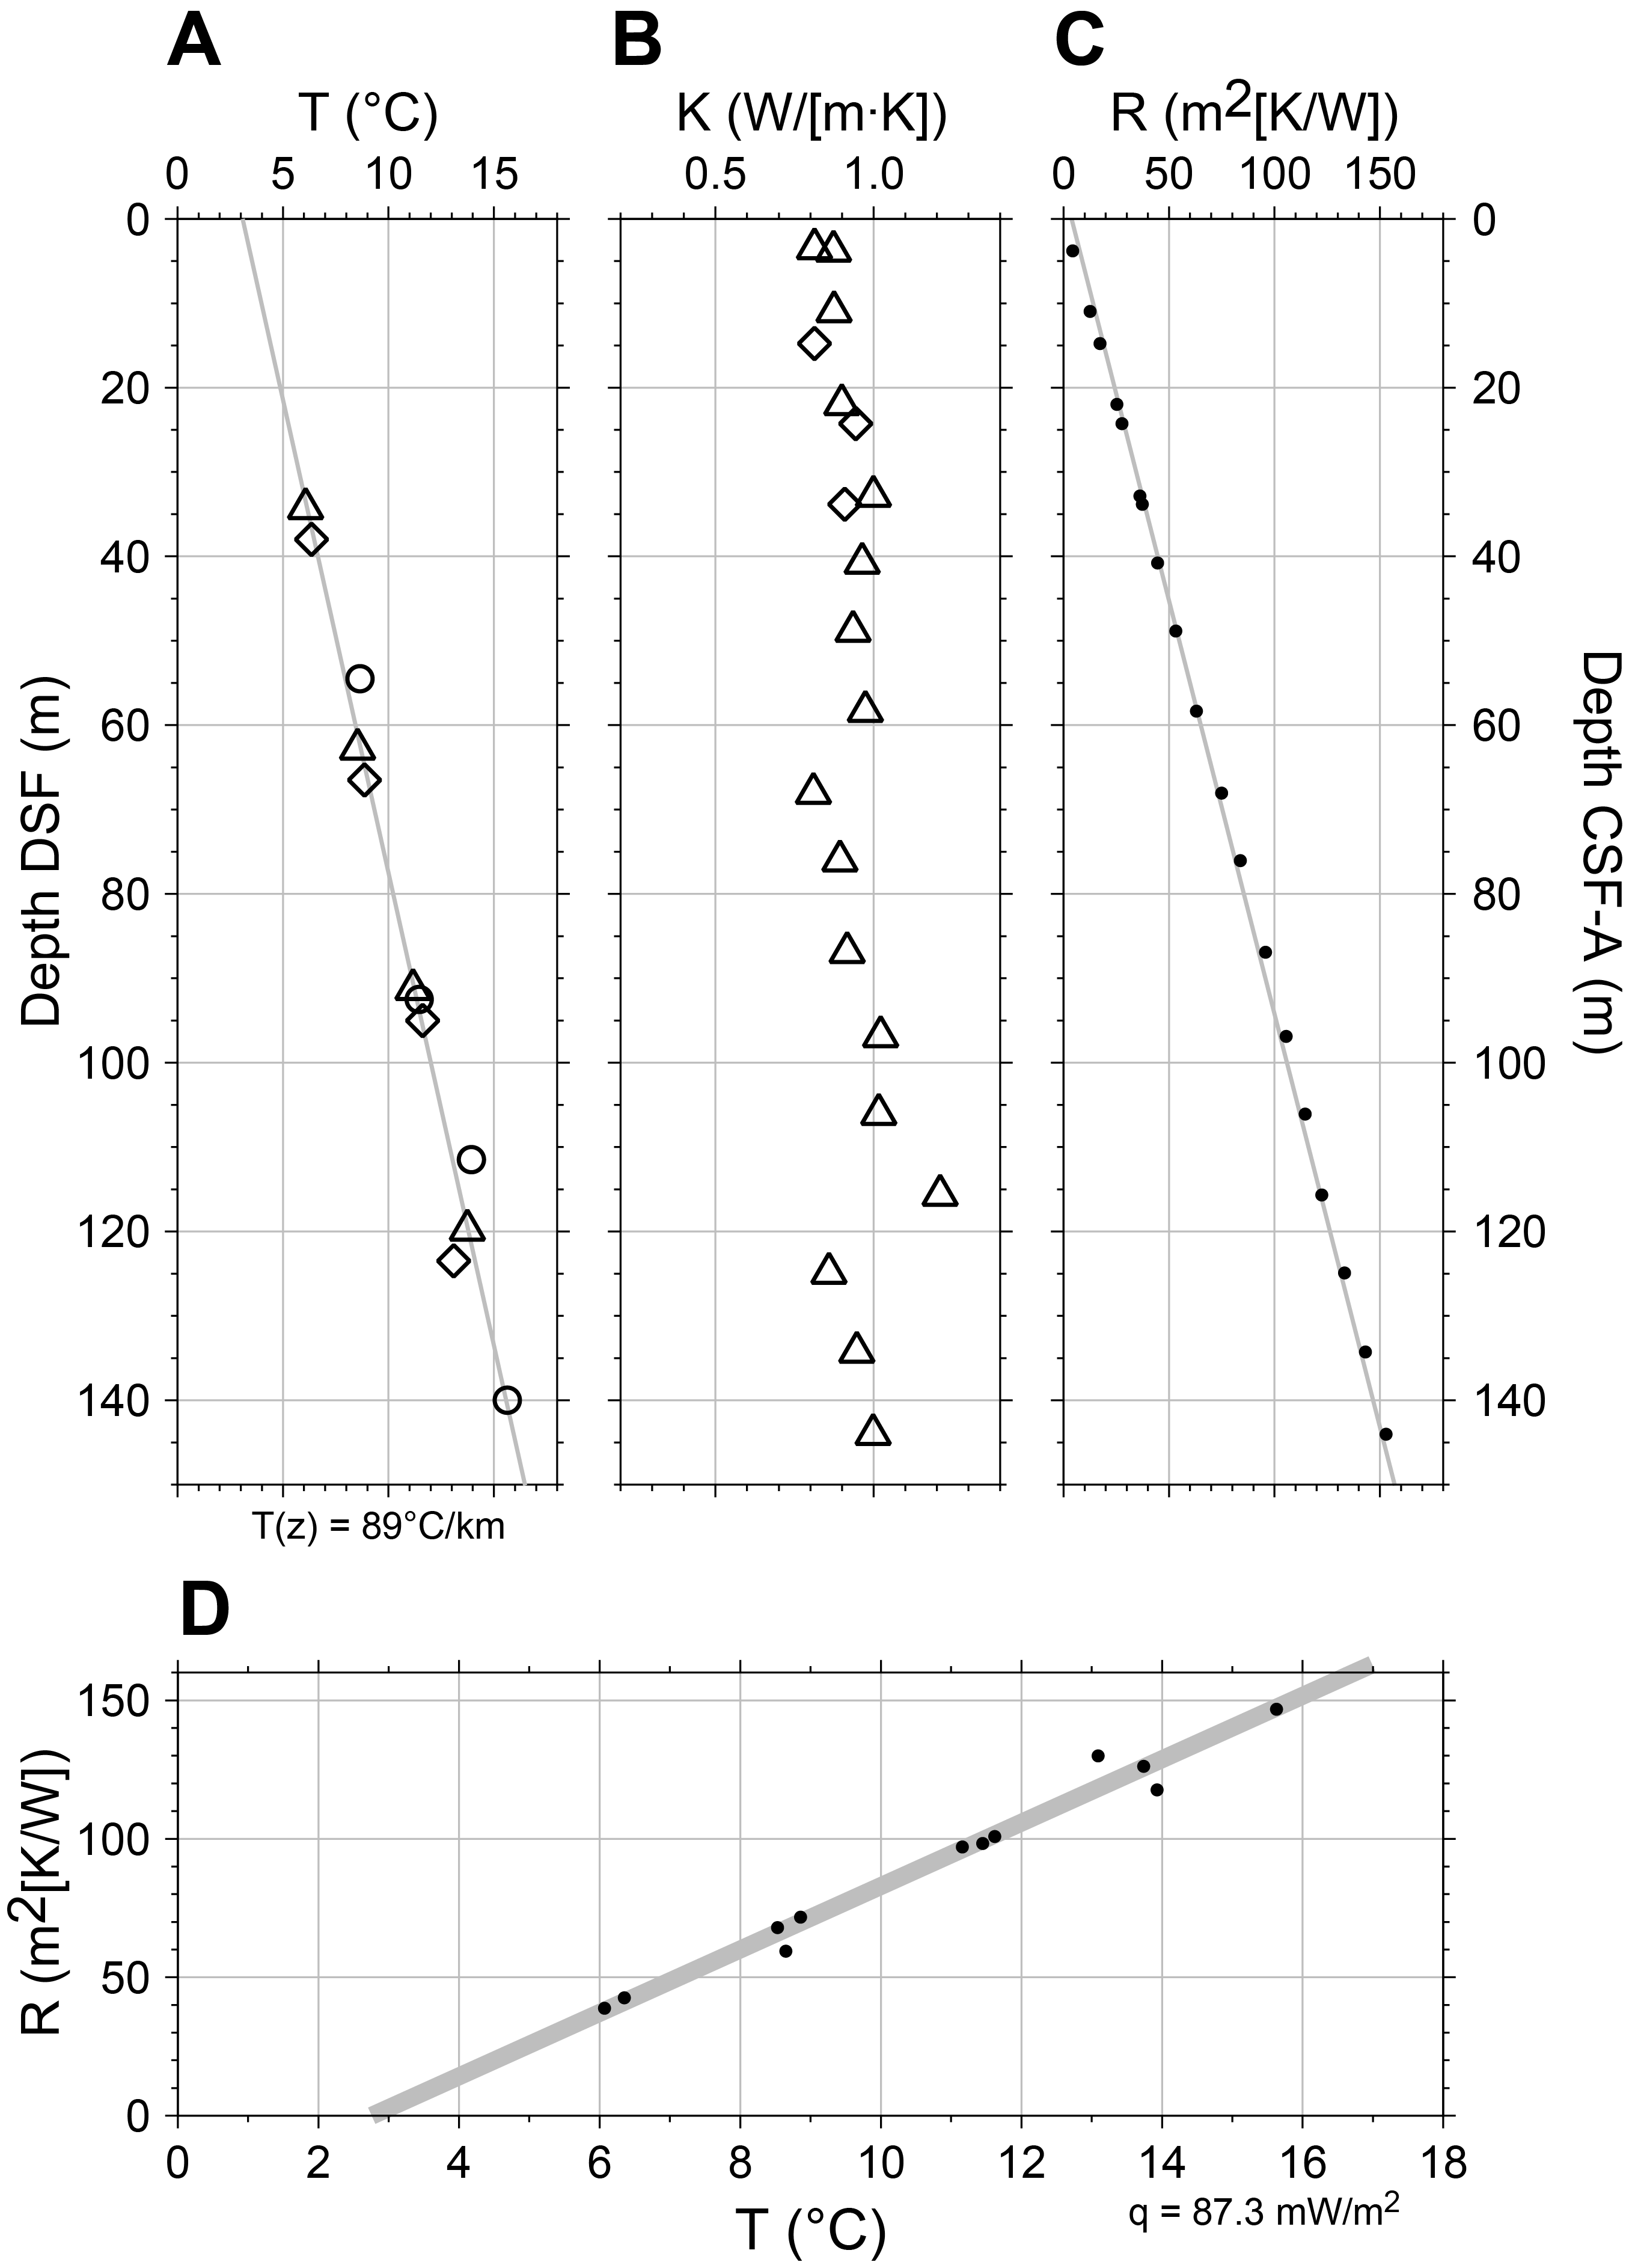
Figure F65. Thermal gradient and heat flow estimates.
12. Age model
Seismic reflection profiles for Site U1564 show a relatively flat and laterally continuous series of reflections (see Background and objectives). The age model (Figure F66) is based mainly on a combination of paleomagnetic and biostratigraphic age determinations from Holes 395-U1564D and 395-U1564F with additional biostratigraphic constraints from Hole 395C-U1564C (see Paleomagnetism and Micropaleontology). A list of age model tie points with interpolated ages for lithostratigraphic unit boundaries and the estimated depths of epoch and subepoch boundaries is given in Table T16.
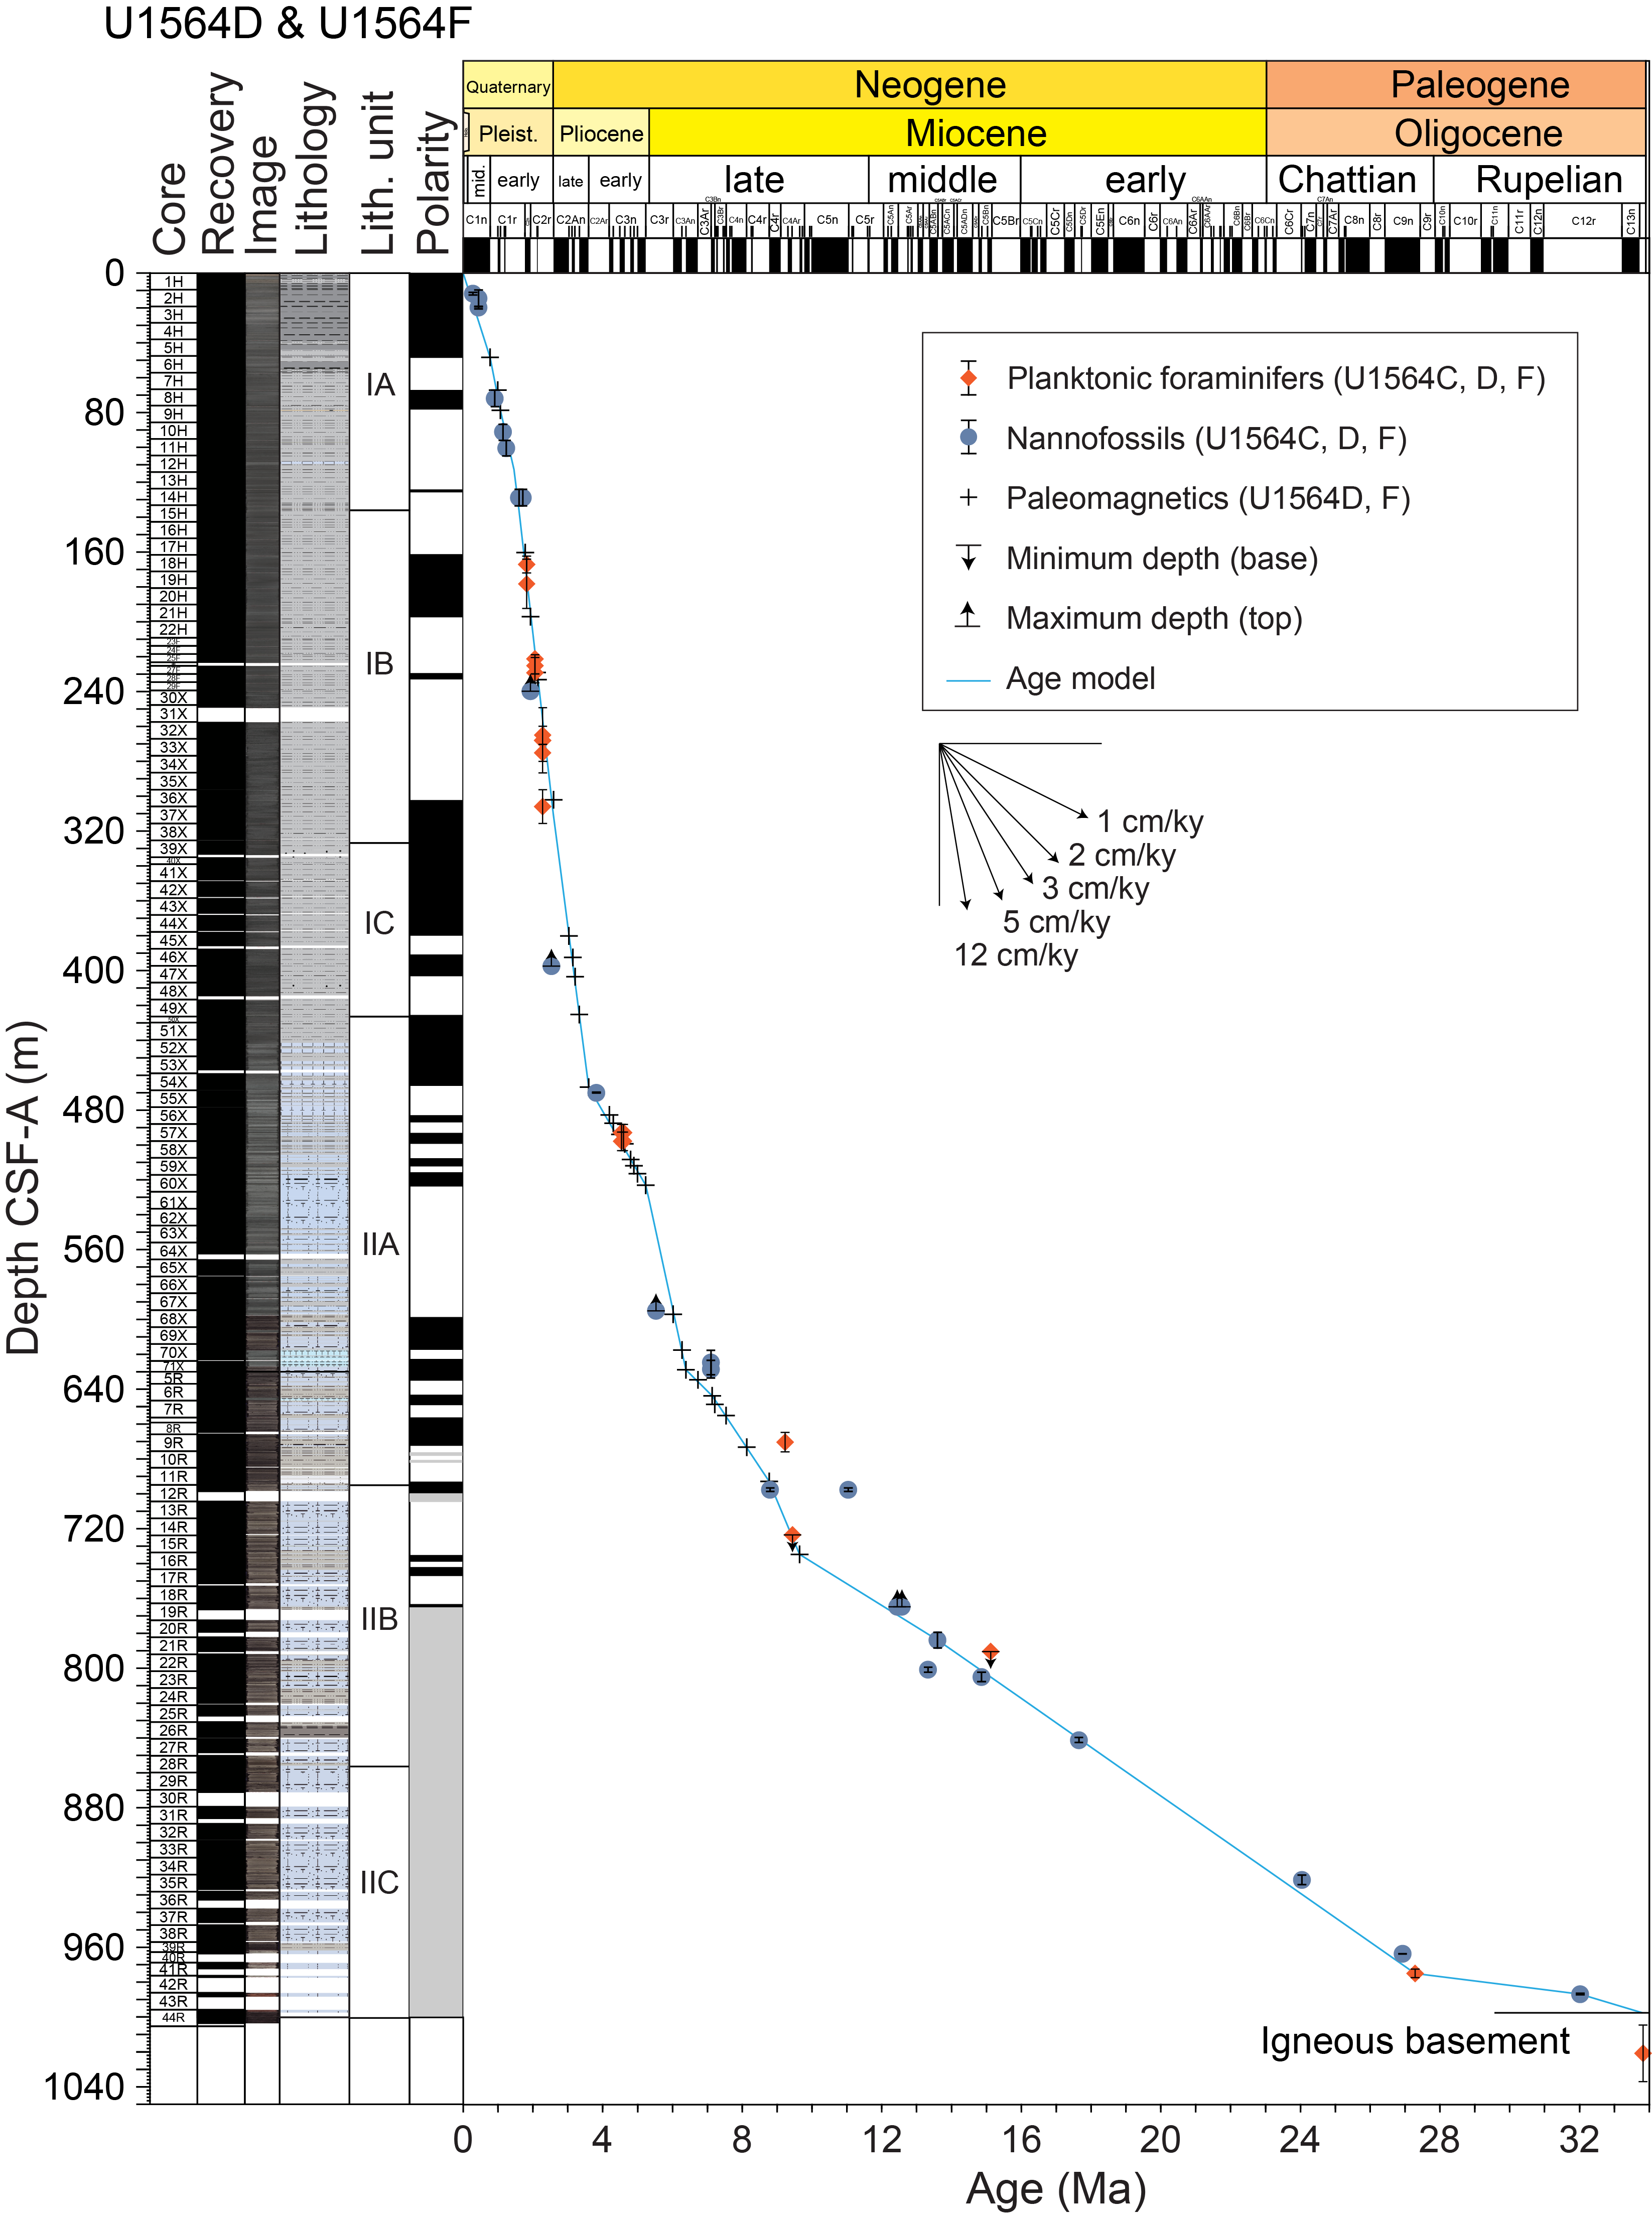
Figure F66. Age model.
Hole U1564D yielded an excellent series of paleomagnetic reversals to the base of Chron C3An.1r (6.386 Ma). This record is in good agreement with biostratigraphic age constraints from calcareous nannofossils and planktonic foraminifers. The paleomagnetic reversal succession continues downward through the upper part of Hole U1564F to the base of Subchron C4Ar.2r (9.647 Ma) at 734.43 m CSF-A. Below this depth, a substantial magnetic drilling overprint prevents the identification of paleomagnetic reversals (see Paleomagnetism).
The paleomagnetic age model tie points help divide the stratigraphy into a series of intervals characterized by variations in estimated sedimentation rates. From the top of the hole to the Jaramillo Chron (1.070 Ma) at 78.56 m CSF-A, the average sedimentation rate is ~7.3 cm/ky. From this depth to the base of Gauss Subchron C2An.1n (3.596 Ma) at 466.53 m CSF-A, the average sedimentation rate is ~15.3 cm/ky. From this depth to the base of Thvera Subchron C3n.4n (5.235 Ma) at 522.80 m CSF-A, the average sedimentation rate is much lower (~3.4 cm/ky). From the base of Subchron C3n.4n to the base of Chron C3Ar (7.14 Ma) at 643.48 m CSF-A, the average sedimentation rate is ~6.3 cm/ky.
The age model for the lower part of the succession from ~730 m CSF-A to the igneous basement at 997.23 m CSF-A is based on selected biostratigraphic tie points. The average sedimentation rate declines downhole. From the base of Chron C3Ar (7.14 Ma) at 643.48 m CSF-A to the top of S. heteromorphus (13.60 Ma) at 783.65 m CSF-A, the average sedimentation rate is ~2.2 cm/ky. From this depth to the top common occurrence of C. cubensis (27.29 Ma) at 974.69 m CSF-A, the average sedimentation rate is ~1.4 cm/ky. From this depth to the top common occurrence of R. umbilicus (32.02 Ma) at 986.61 m CSF-A, the average sedimentation rate is ~0.3 cm/ky.
The age of the sediment in the lowermost part of the regular succession above igneous basement is lower Oligocene (between 32.02 and 32.20 Ma). This finding is in good agreement with the age of the basement estimated from regional magnetic surveys at 32.4 Ma (see Background and objectives). A further ~4 m thick nannofossil chalk unit occurs at 1049.25–1053.09 m CSF-A between basaltic flows in Core 395-U1564F-52R (see Igneous petrology). The chalk appears bedded and bioturbated and is therefore likely to have been deposited on the seafloor rather than injected into subseafloor fissures. Biostratigraphic evidence suggests that this sediment is also lower Oligocene but slightly older than that found at the base of the regular succession, having been deposited between 32.20 and 35.8 Ma (see Micropaleontology).
References
Balsam, W.L., Deaton, B.C., and Damuth, J.E., 1999. Evaluating optical lightness as a proxy for carbonate content in marine sediment cores. Marine Geology, 161(2):141–153. https://doi.org/10.1016/S0025-3227(99)00037-7
Barker, S., Knorr, G., Conn, S., Lordsmith, S., Newman, D., and Thornalley, D., 2019. Early interglacial legacy of deglacial climate instability. Paleoceanography and Paleoclimatology, 34(8):1455–1475. https://doi.org/10.1029/2019PA003661
Berggren, W.A., Kent, D.V., Swisher, C.C., III, Aubry, M.-P., Berggren, W.A., Kent, D.V., Aubry, M.-P., and Hardenbol, J., 1995. A revised Cenozoic geochronology and chronostratigraphy. In Berggren, W.A., Kent, D.V., Aubry, M.-P., and Hardenbol, J. (Eds.), Geochronology, Time Scales and Global Stratigraphic Correlation. SEPM Special Publication, 54. https://doi.org/10.2110/pec.95.04.0129
Bullard, E.C., 1939. Heat flow in South Africa. Proceedings of the Royal Society of London, A: Mathematical and Physical Sciences, 173(955):474–502. https://doi.org/10.1098/rspa.1939.0159
Butterworth, S., 1930. On the theory of filter amplifiers. Experimental Wireless and the Wireless Engineer, 7:536–541. https://www.gonascent.com/papers/butter.pdf
Channell, J.E.T., Hodell, D.A., and Lehman, B., 1997. Relative geomagnetic paleointensity and δ18O at ODP Site 983 (Gardar Drift, North Atlantic) since 350 ka. Earth and Planetary Science Letters, 153(1):103–118. https://doi.org/10.1016/S0012-821X(97)00164-7
Hartmann, A., and Villinger, H., 2002. Inversion of marine heat flow measurements by expansion of the temperature decay function. Geophysical Journal International, 148(3):628–636. https://doi.org/10.1046/j.1365-246X.2002.01600.x
Hyndman, R.D., Erickson, A.J., and Von Herzen, R.P., 1974. Geothermal measurements on DSDP Leg 26. In Davies, T.A., Luyendyk, B.P., et al., Initial Reports of the Deep Sea Drilling Project. 26: Washington, DC (US Government Printing Office), 451–463. https://doi.org/10.2973/dsdp.proc.26.113.1974
Jansen, E., and Raymo, M.E., 1996. Leg 162: new frontiers on past climates. In Jansen, E., Raymo, M.E., Blum, P., et al., Proceedings of the Ocean Drilling Program, Initial Reports. 162: College Station, TX (Ocean Drilling Program), 5–20. https://doi.org/10.2973/odp.proc.ir.162.101.1996
Jones, S.M., Murton, B.J., Fitton, J.G., White, N.J., Maclennan, J., and Walters, R.L., 2014. A joint geochemical–geophysical record of time-dependent mantle convection south of Iceland. Earth and Planetary Science Letters, 386:86–97. https://doi.org/10.1016/j.epsl.2013.09.029
Kirschvink, J.L., 1980. The least-squares line and plane and the analysis of palaeomagnetic data. Geophysical Journal International, 62(3):699–718. https://doi.org/10.1111/j.1365-246X.1980.tb02601.x
Lurcock, P.C., and Florindo, F., 2019. New developments in the PuffinPlot paleomagnetic data analysis program. Geochemistry, Geophysics, Geosystems, 20(11):5578–5587. https://doi.org/10.1029/2019GC008537
Lyons, R.G., 2011. Understanding Digital Signal Processing (Third edition): Upper Saddle River, NJ (Prentice Hall). https://www.iro.umontreal.ca/~mignotte/IFT3205/Documents/UnderstandingDigitalSignalProcessing.pdf
Murton, B.J., Taylor, R.N., and Thirlwall, M.F., 2002. Plume–ridge Interaction: a geochemical perspective from the Reykjanes Ridge. Journal of Petrology, 43(11):1987–2012. https://doi.org/10.1093/petrology/43.11.1987
Ogg, J.G., 2020. Geomagnetic Polarity Time Scale. In Gradstein, F.M., Ogg, J.G., Schmitz, M., and Ogg, G. (Eds.), Geologic Time Scale 2020. Amsterdam (Elsevier), 159–192. https://doi.org/10.1016/B978-0-12-824360-2.00005-X
Parnell-Turner, R., White, N., Henstock, T.J., Jones, S.M., Maclennan, J., and Murton, B.J., 2017. Causes and consequences of diachronous v-shaped ridges in the North Atlantic Ocean. Journal of Geophysical Research: Solid Earth, 122(11):8675–8708. https://doi.org/10.1002/2017JB014225
Parnell-Turner, R.E., Briais, A., LeVay, L.J., Cui, Y., Di Chiara, A., Dodd, J.P., Dunkley Jones, T., Dwyer, D., Eason, D.E., Friedman, S.A., Hemming, S.R., Hochmuth, K., Ibrahim, H., Jasper, C., Karatsolis, B.T., Lee, S., LeBlanc, D.E., Lindsay, M.R., McNamara, D.D., Modestou, S.E., Murton, B., OConnell, S., Pasquet, G.T., Pearson, P.N., Qian, S.P., Rosenthal, Y., Satolli, S., Sinnesael, M., Suzuki, T., Thulasi Doss, T., White, N.J., Wu, T., and Yang Yang, A., 2025a. Expedition 395 methods. In Parnell-Turner, R.E., Briais, A., LeVay, L.J., and the Expedition 395 Scientists, Reykjanes Mantle Convection and Climate. Proceedings of the International Ocean Discovery Program, 395: College Station, TX (International Ocean Discovery Program). https://doi.org/10.14379/iodp.proc.395.102.2025
Parnell-Turner, R.E., Briais, A., LeVay, L.J., and the Expedition 395 Scientists, 2025b. Supplementary material, https://doi.org/10.14379/iodp.proc.395supp.2025. In Parnell-Turner, R.E., Briais, A., LeVay, L.J., and the Expedition 395 Scientists, Reykjanes Mantle Convection and Climate. Proceedings of the International Ocean Discovery Program, 395: College Station, TX (International Ocean Discovery Program).
Raffi, I., Wade, B.S., Pälike, H., Beu, A.G., Cooper, R., Crundwell, M.P., Krijgsman, W., Moore, T., Raine, I., Sardella, R., and Vernyhorova, Y.V., 2020. The Neogene Period. In Gradstein, F.M., Ogg, J.G., Schmitz, M.D., and Ogg, G. (Eds.), Geologic Time Scale 2020. (Elsevier), 1141–1215. https://doi.org/10.1016/B978-0-12-824360-2.00029-2
Raymo, M.E., Ganley, K., Carter, S., Oppo, D.W., and McManus, J., 1998. Erratum: millennial-scale climate instability during the early Pleistocene epoch. Nature, 394(6695):809. https://doi.org/10.1038/29582
Wei, W., and Wise, S.W., Jr., 1990. Biogeographic gradients of middle Eocene-Oligocene calcareous nannoplankton in the South Atlantic Ocean. Palaeogeography, Palaeoclimatology, Palaeoecology, 79(1–2):29–61. https://doi.org/10.1016/0031-0182(90)90104-F
Young, J.R., 1990. Size variation of Neogene Reticulofenestra coccoliths from Indian Ocean DSDP cores. Journal of Micropalaeontology, 9(1):71–85. https://doi.org/10.1144/jm.9.1.71
Young, J.R., 1998. Neogene. In Bown, P.R., Calcareous Nannofossil Biostratigraphy. Dordrecht, Netherlands (Kluwer Academic Publishing), 225–265.
Zijderveld, J.D.A., 1967. AC demagnetization of rocks: analysis of results. In Runcorn, S.K.C., Creer, K.M., and Collinson, D.W. (Eds.), Methods in Palaeomagnetism. Developments in Solid Earth Geophysics, 3: 254–286. https://doi.org/10.1016/B978-1-4832-2894-5.50049-5