Druitt, T.H., Kutterolf, S., Ronge, T.A., and the Expedition 398 Scientists
Proceedings of the International Ocean Discovery Program Volume 398
publications.iodp.org
https://doi.org/10.14379/iodp.proc.398.110.2024
Site U15961
![]() S. Kutterolf,
S. Kutterolf,
![]() T.H. Druitt,
T.H. Druitt,
![]() T.A. Ronge,
T.A. Ronge,
![]() S. Beethe,
S. Beethe,
![]() A. Bernard,
A. Bernard,
![]() C. Berthod,
C. Berthod,
![]() H. Chen,
H. Chen,
![]() S. Chiyonobu,
S. Chiyonobu,
![]() A. Clark,
A. Clark,
![]() S. DeBari,
S. DeBari,
![]() T.I. Fernandez Perez,
T.I. Fernandez Perez,
![]() R. Gertisser,
R. Gertisser,
![]() C. Hübscher,
C. Hübscher,
![]() R.M. Johnston,
R.M. Johnston,
![]() C. Jones,
C. Jones,
![]() K.B. Joshi,
K.B. Joshi,
![]() G. Kletetschka,
G. Kletetschka,
![]() O. Koukousioura,
O. Koukousioura,
![]() X. Li,
X. Li,
![]() M. Manga,
M. Manga,
![]() M. McCanta,
M. McCanta,
![]() I. McIntosh,
I. McIntosh,
![]() A. Morris,
A. Morris,
![]() P. Nomikou,
P. Nomikou,
![]() K. Pank,
K. Pank,
![]() A. Peccia,
A. Peccia,
![]() P.N. Polymenakou,
P.N. Polymenakou,
![]() J. Preine,
J. Preine,
![]() M. Tominaga,
M. Tominaga,
![]() A. Woodhouse, and
A. Woodhouse, and
![]() Y. Yamamoto2
Y. Yamamoto2
1 Kutterolf, S., Druitt, T.H., Ronge, T.A., Beethe, S., Bernard, A., Berthod, C., Chen, H., Chiyonobu, S., Clark, A., DeBari, S., Fernandez Perez, T.I., Gertisser, R., Hübscher, C., Johnston, R.M., Jones, C., Joshi, K.B., Kletetschka, G., Koukousioura, O., Li, X., Manga, M., McCanta, M., McIntosh, I., Morris, A., Nomikou, P., Pank, K., Peccia, A., Polymenakou, P.N., Preine, J., Tominaga, M., Woodhouse, A., and Yamamoto, Y., 2024. Site U1596. In Druitt, T.H., Kutterolf, S., Ronge, T.A., and the Expedition 398 Scientists, Hellenic Arc Volcanic Field. Proceedings of the International Ocean Discovery Program, 398: College Station, TX (International Ocean Discovery Program). https://doi.org/10.14379/iodp.proc.398.110.2024
2 Expedition 398 Scientists’ affiliations.
1. Background and objectives
Site U1596 (proposed Site CSK-06B) is located in the northern basin of the Santorini caldera (Figure F1). It lies at 382 meters below sea level (mbsl) and has a maximum recovery depth in two holes (U1596A and U1596B) of 40.6 meters below seafloor (mbsf) with 87%–91% core recovery (all depths below seafloor are given using the core depth below seafloor, Method A [CSF-A], scale, except in Operations where the drilling depth below seafloor [DSF] scale is used). Site U1597 addresses the same drilling objectives and lies southeast of Site U1596. Two additional sites (U1594 and U1595) lie in the southern caldera basin.
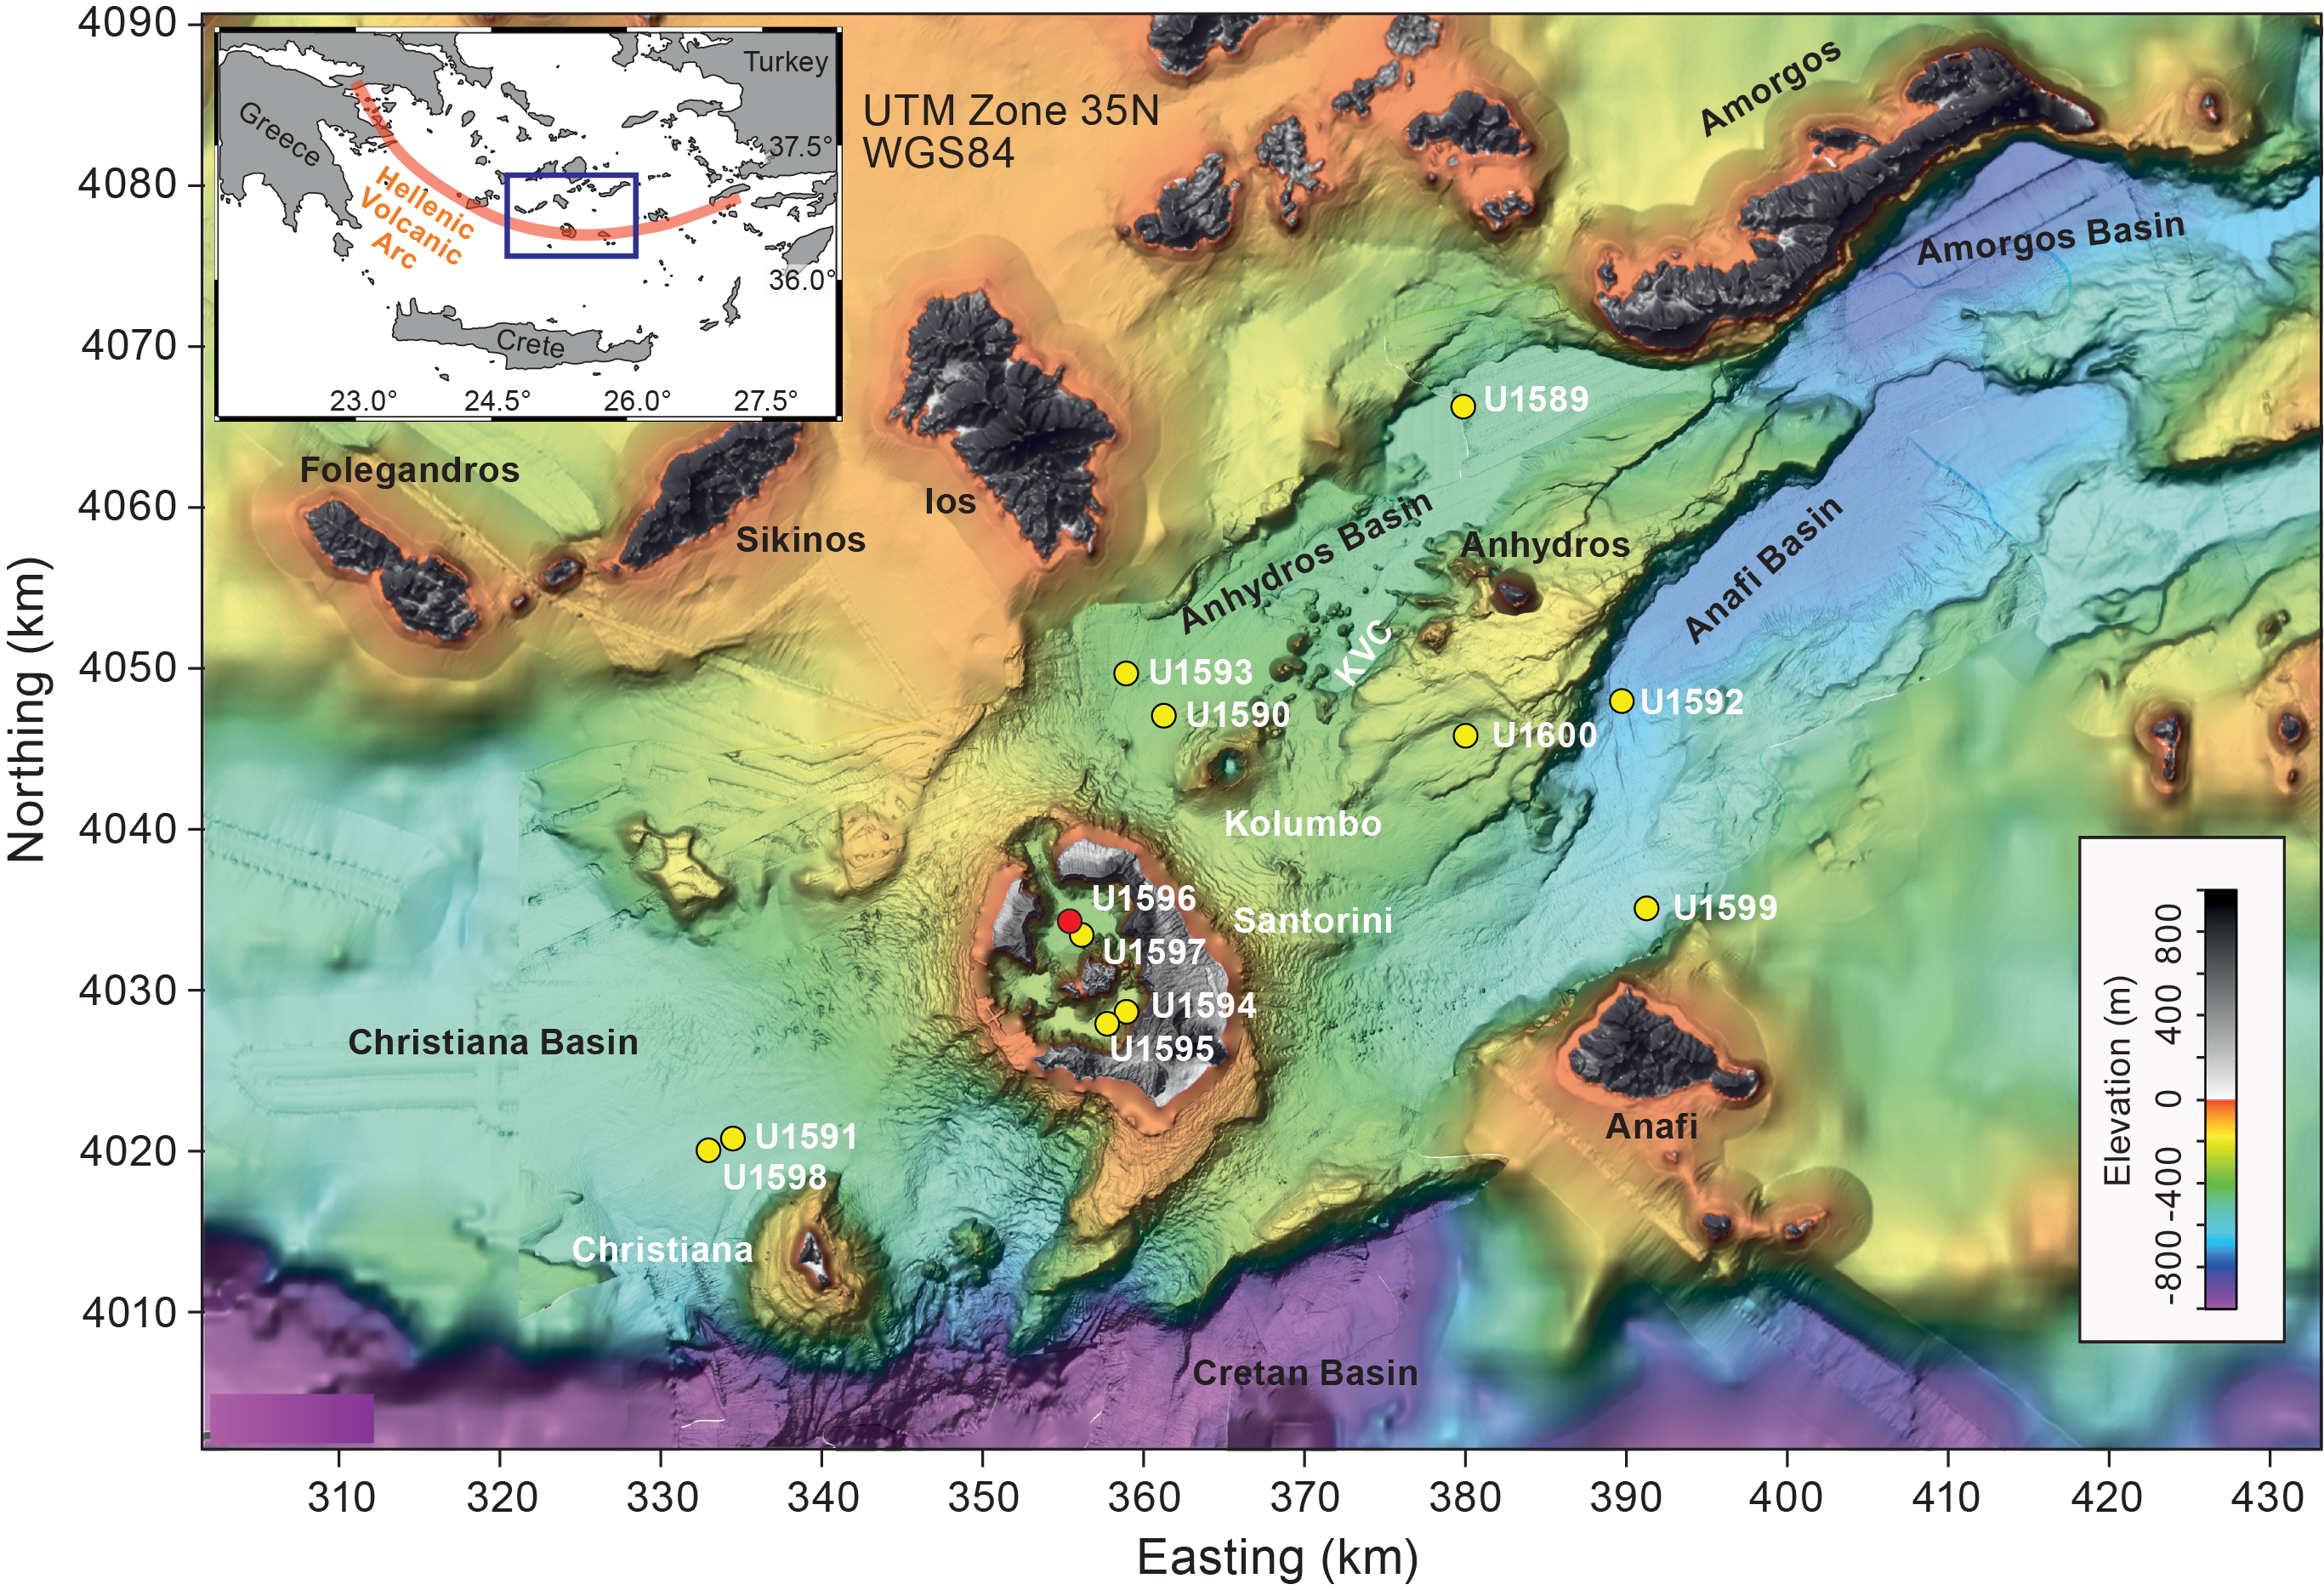
Figure F1. Site map.
Four seismic units were previously recognized in the Santorini caldera (Johnston et al., 2015; Nomikou et al., 2016) (Figure F2). They were thought to consist of muds and sands from cliff mass wasting (Unit S1); compacted (possibly lithified) sandy volcaniclastics from Kameni Volcano (Unit S2); and consolidated coarse blocky intracaldera tuffs, landslide debris, and/or flood gravels (Unit S3). Unit S4 was thought to be intracaldera tuff from the Late Bronze Age eruption. The four caldera sites were planned to sample Units S1–S3; test the published correlations between the two caldera basins; penetrate below Unit S3 into Unit S4; and address scientific Objectives 1, 4, 5, and 7 of the Expedition 398 Scientific Prospectus (Druitt et al., 2022). By drilling both caldera basins and exploiting our dense seismic reflection coverage, we gained access to the 3D architecture of the entire caldera fill. We also targeted the question of why the northern basin is 100 m deeper than the southern one. Finally, we tested whether Unit S3 consisted of flood debris from the caldera-flooding event (Nomikou et al., 2016) or whether it was Late Bronze Age intracaldera tuff (Johnston et al., 2015). The intracaldera sites were used for microbiological work of Objective 7.
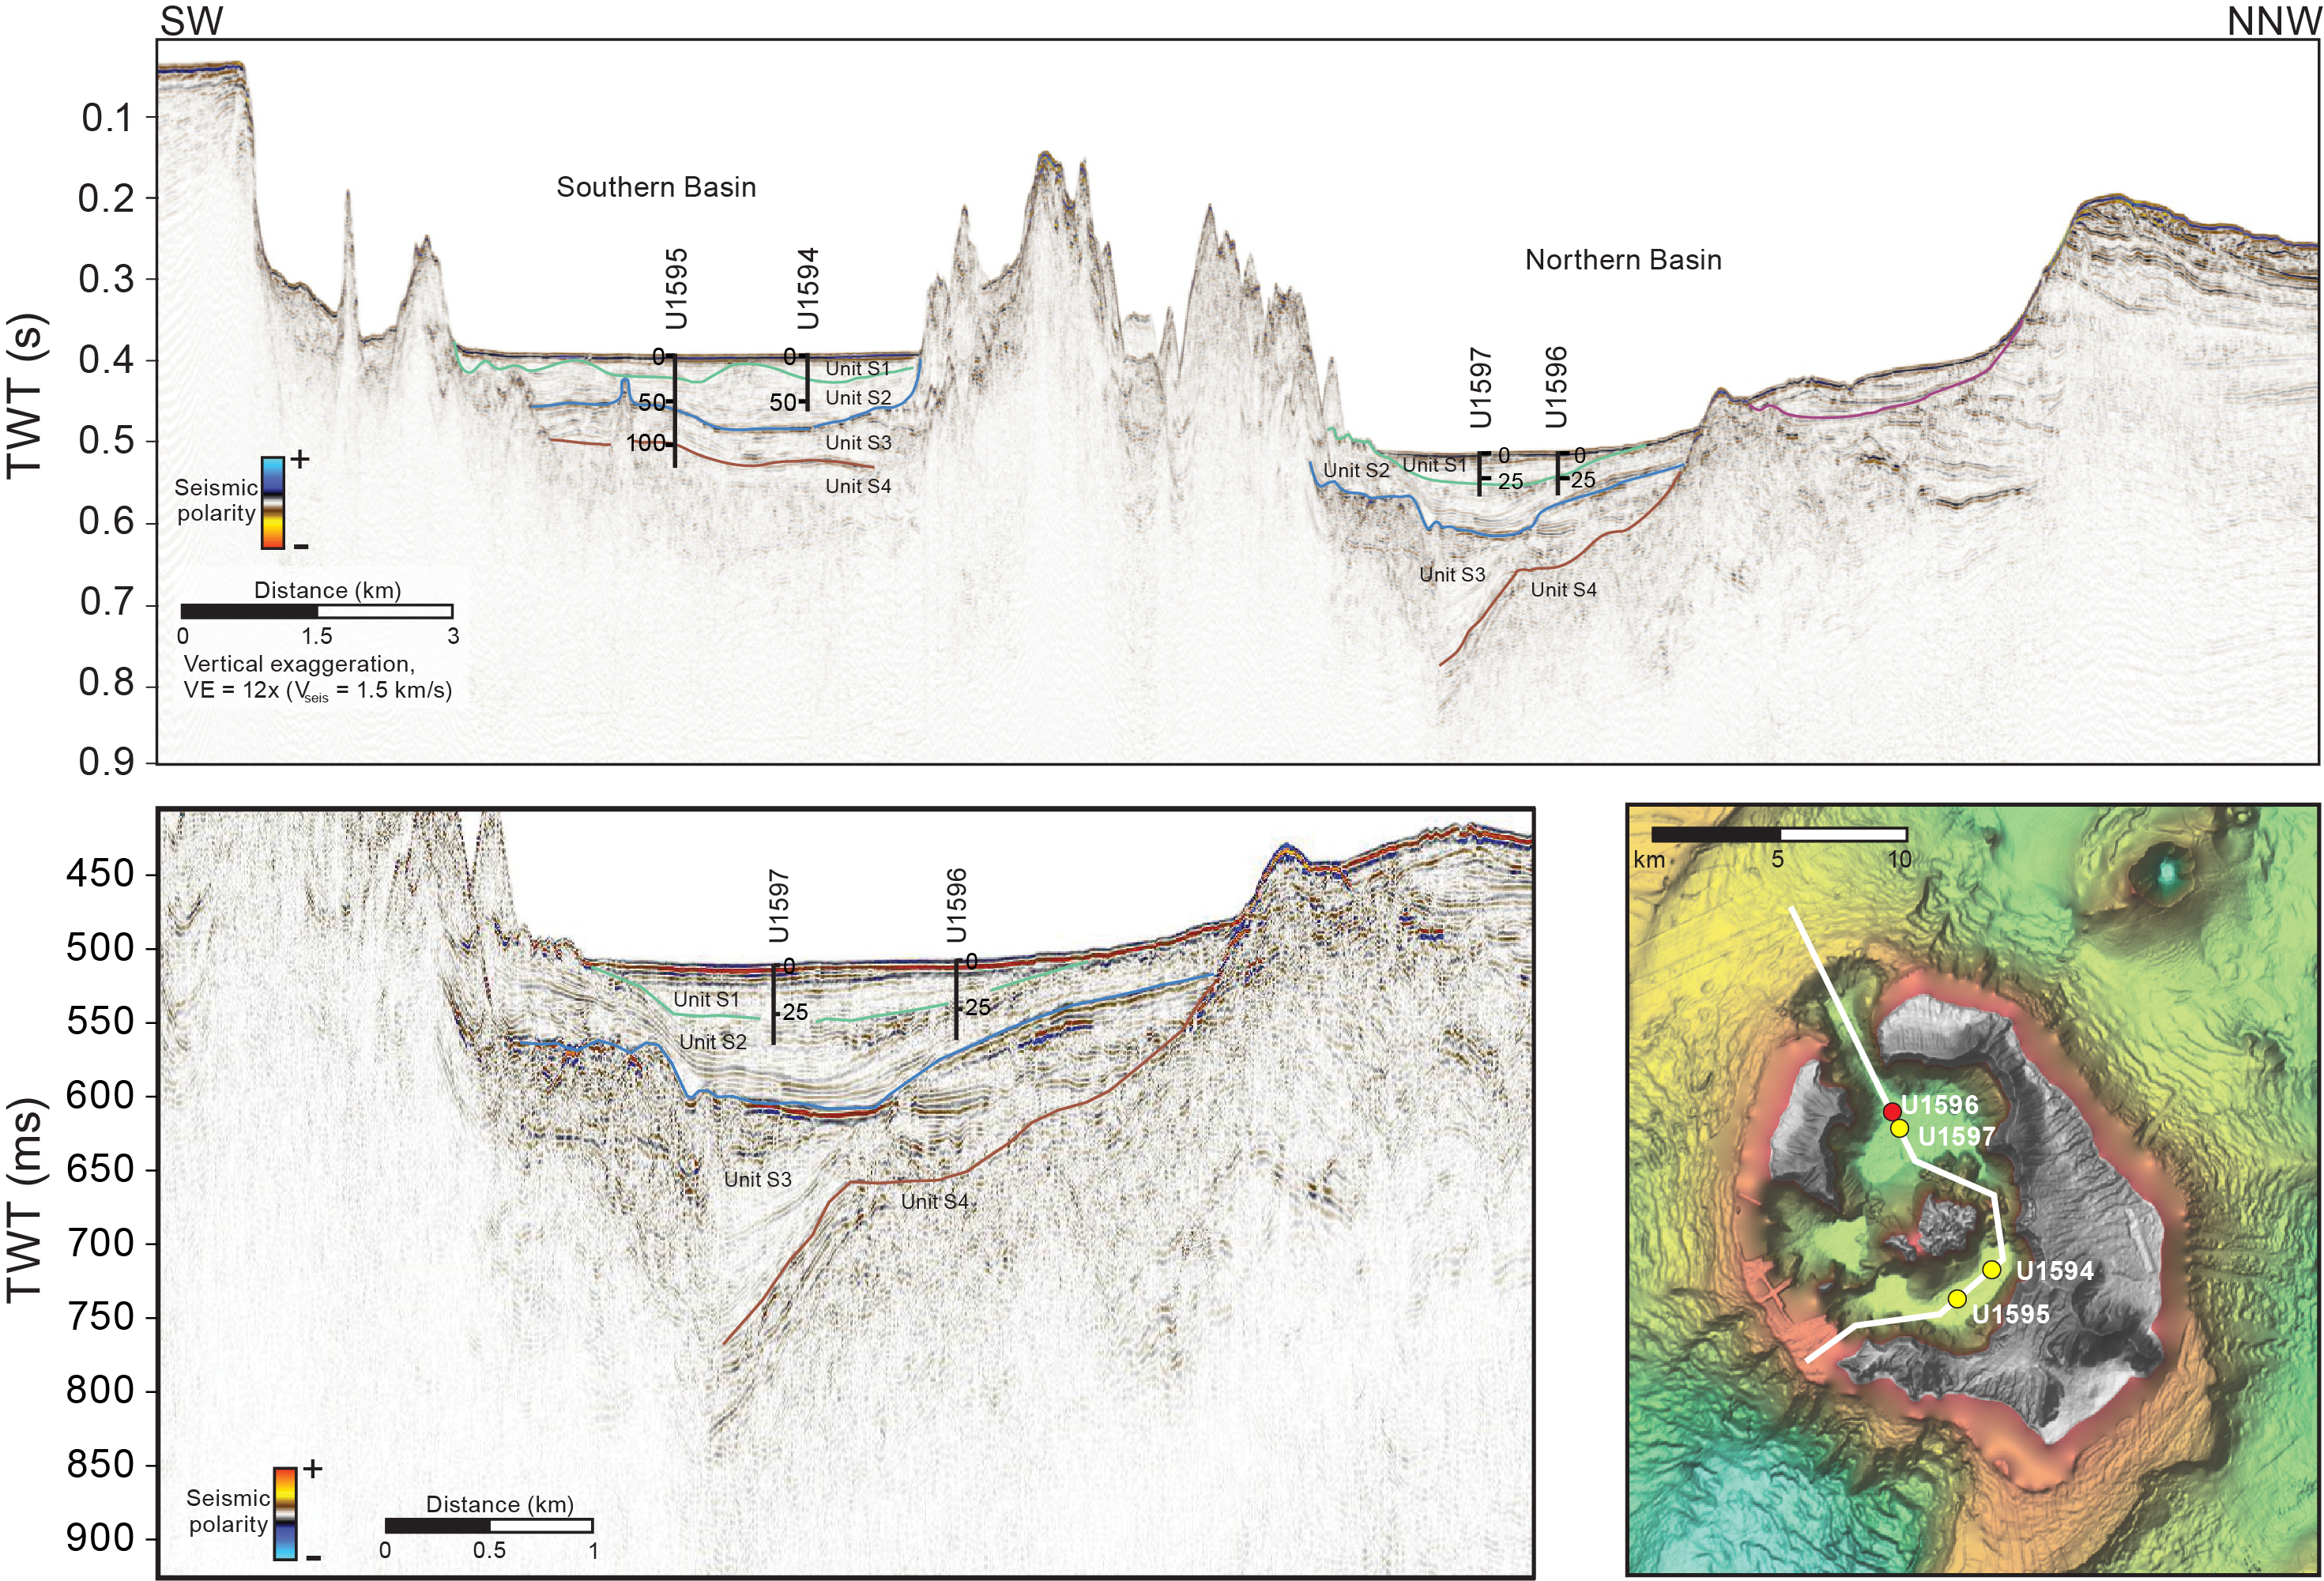
Figure F2. Seismic profile.
2. Operations
2.1. Hole U1596A
The dynamic positioning (DP) move of the vessel to Site U1596 was completed at 0330 h on 24 January 2023 while the crew assembled the bottom hole assembly (BHA). At 0430 h, the BHA was lowered, and Hole U1596A (36°26.5378′N, 25°22.5130′E) was spudded at 0650 h. The recovery of 3.9 m gave a calculated seafloor of 382.0 mbsl (Table T1). Coring continued through Core 5H at 41.9 mbsf, the final depth for Hole U1596A. Excessive torque was encountered before shooting Core 6H, and the decision was made to pull out and move the vessel to an offset location at Site U1597.
The drill string was pulled from 32.4 mbsf to approximately 80 m above the seafloor. The DP move started at 1102 h, ending Hole U1596A.
2.2. Hole U1596B
On 3 February 2023 at 1615 h, the ship revisited Site U1596 at a location 50 m northwest of Hole U1596A. The 4.8 nmi DP move from Site U1595 took 1.7 h at a speed of 2.8 kt. The advanced piston corer/extended core barrel (APC/XCB) BHA was again assembled with a used bit. Hole U1596B (36°26.5568′N, 25°22.4875′E) was spudded at 1915 h. A recovery of 4.2 m gave a calculated mudline as 381.9 mbsl. APC coring continued through Core 5H at 42.2 mbsf, the final depth for the hole.
The drill string was pulled clear of the hole with the top drive. On 4 February at 0105 h, the bit cleared the rotary table, and the drill floor was secured at 0145 h. The vessel was brought under bridge control at 0148 h. All thrusters were brought up and secured. The sea passage to Site U1600 started at 0154 h, ending Site U1596.
3. Lithostratigraphy
Cores from Site U1596 recovered a coherent stratigraphy from 0 to 40.62 mbsf in Holes U1596A (Sections 1H-1 through 5H-CC) and U1596B (Sections 1H-1 through 5H-CC) (Figure F3).
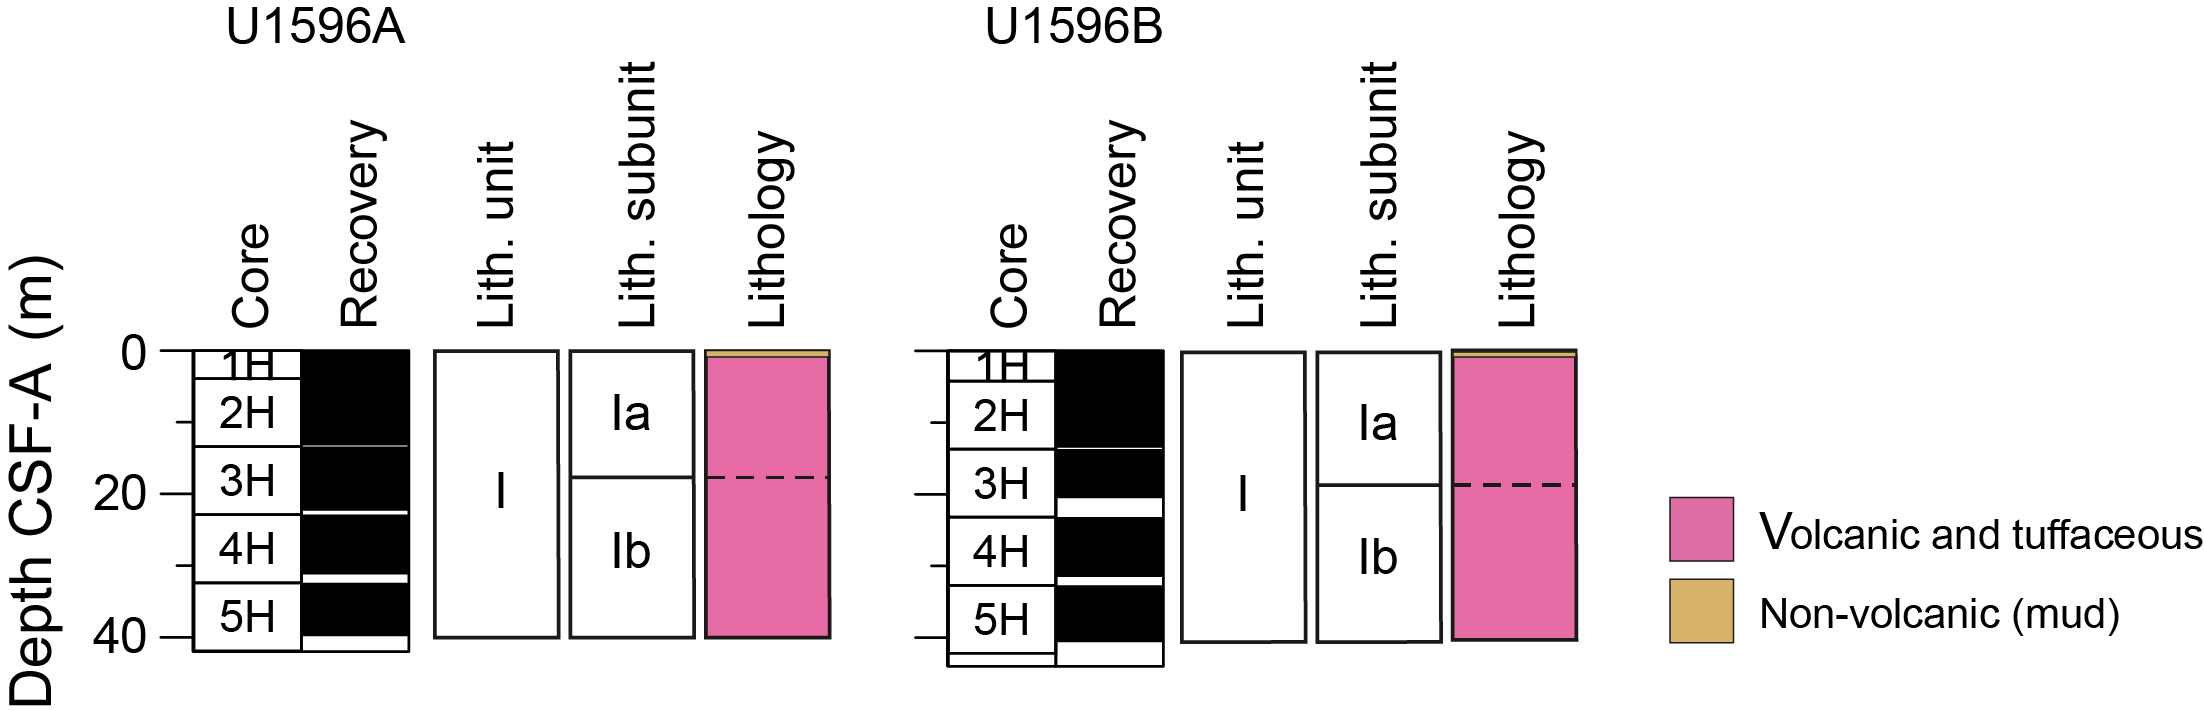
Figure F3. Lithostratigraphy.
The recovered material is unlithified sediment dominated by volcanic material with minor amounts of mud and tuffaceous mud in the uppermost 8 m of Holes U1596A and U1596B. Smear slides for microscopic analyses were prepared to confirm macroscopic descriptions of distinct lithology changes at the section level, such as identification of vitric particles in tuffaceous lithologies or crystals in ash layers. X-ray diffraction (XRD) data were obtained from three interstitial water (IW) squeeze cake sediment residues from Hole U1596A and two IW squeeze cake sediment residues from Hole U1596B.
Figure F3 summarizes the lithostratigraphy of Site U1596, displaying core recovery and lithostratigraphic unit and subunits. Table T2 provides the upper and lower boundaries, thicknesses, biostratigraphic ages (see Biostratigraphy), and lithologic summary of the unit and subunits. Figure F4 graphically presents the relative proportions of volcanic, tuffaceous, and nonvolcanic lithologies in Holes U1596A and U1596B, with the lithostratigraphic unit and subunits labeled. Figure F5 presents the grain size distribution of the sediments, in particular the changes in grain size within the volcanic-dominated unit, to graphically show the distribution of ash, lapilli-ash, and lapilli. Figure F6 displays different types of core disturbance observed at the site.
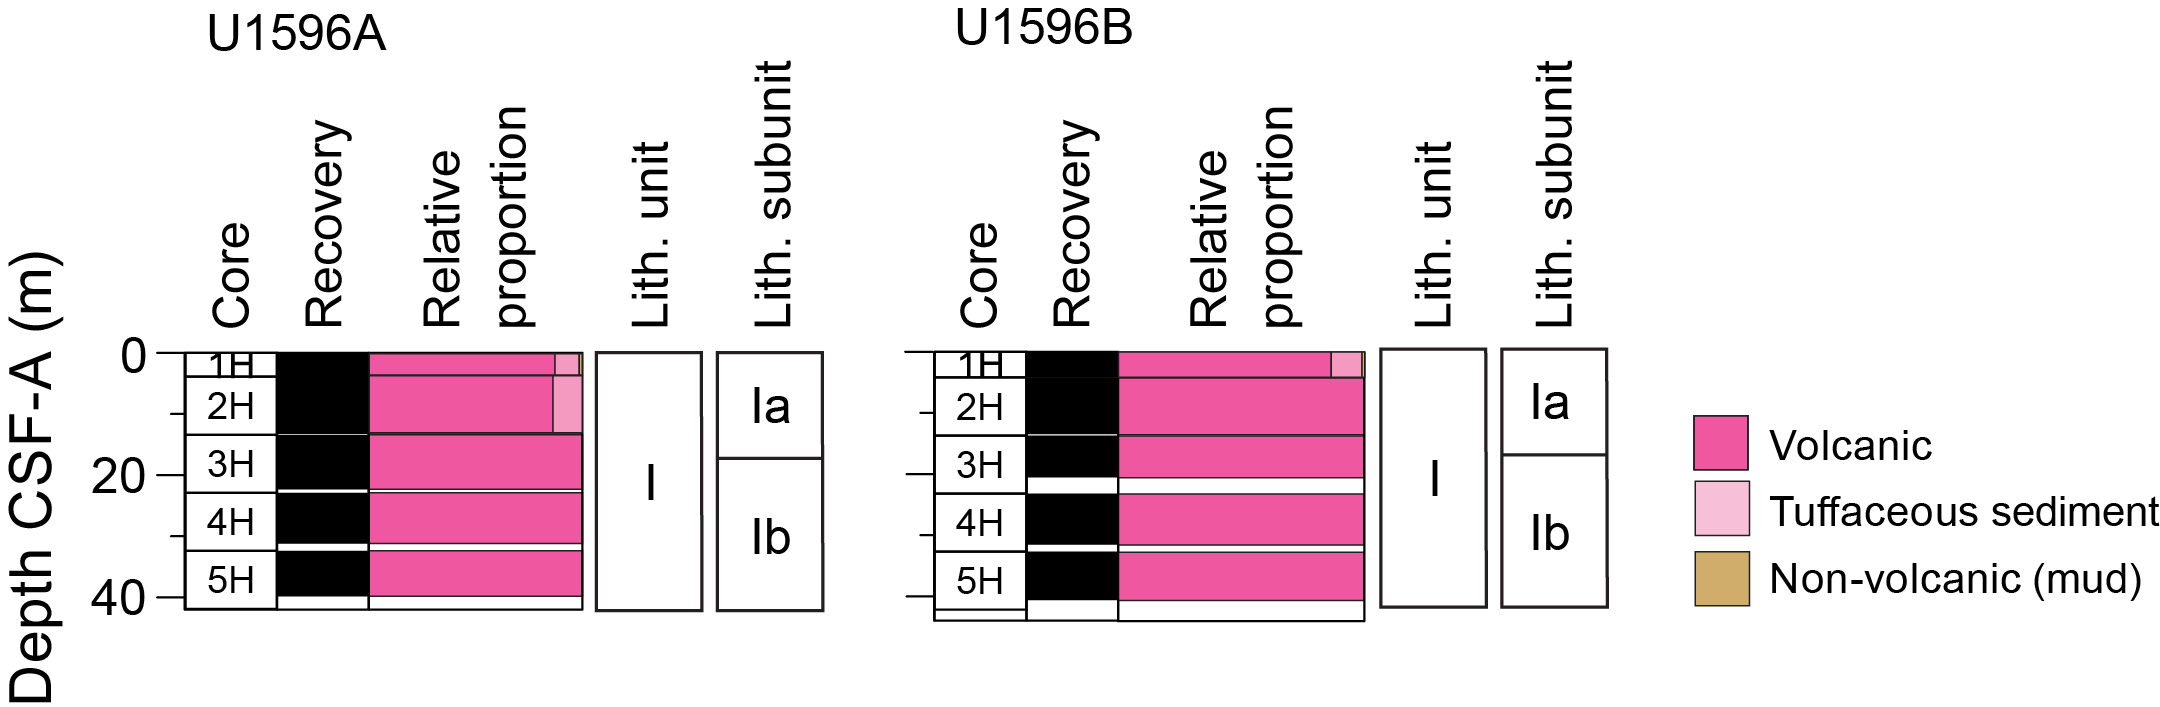
Figure F4. Volcanic, tuffaceous, and nonvolcanic lithologies.
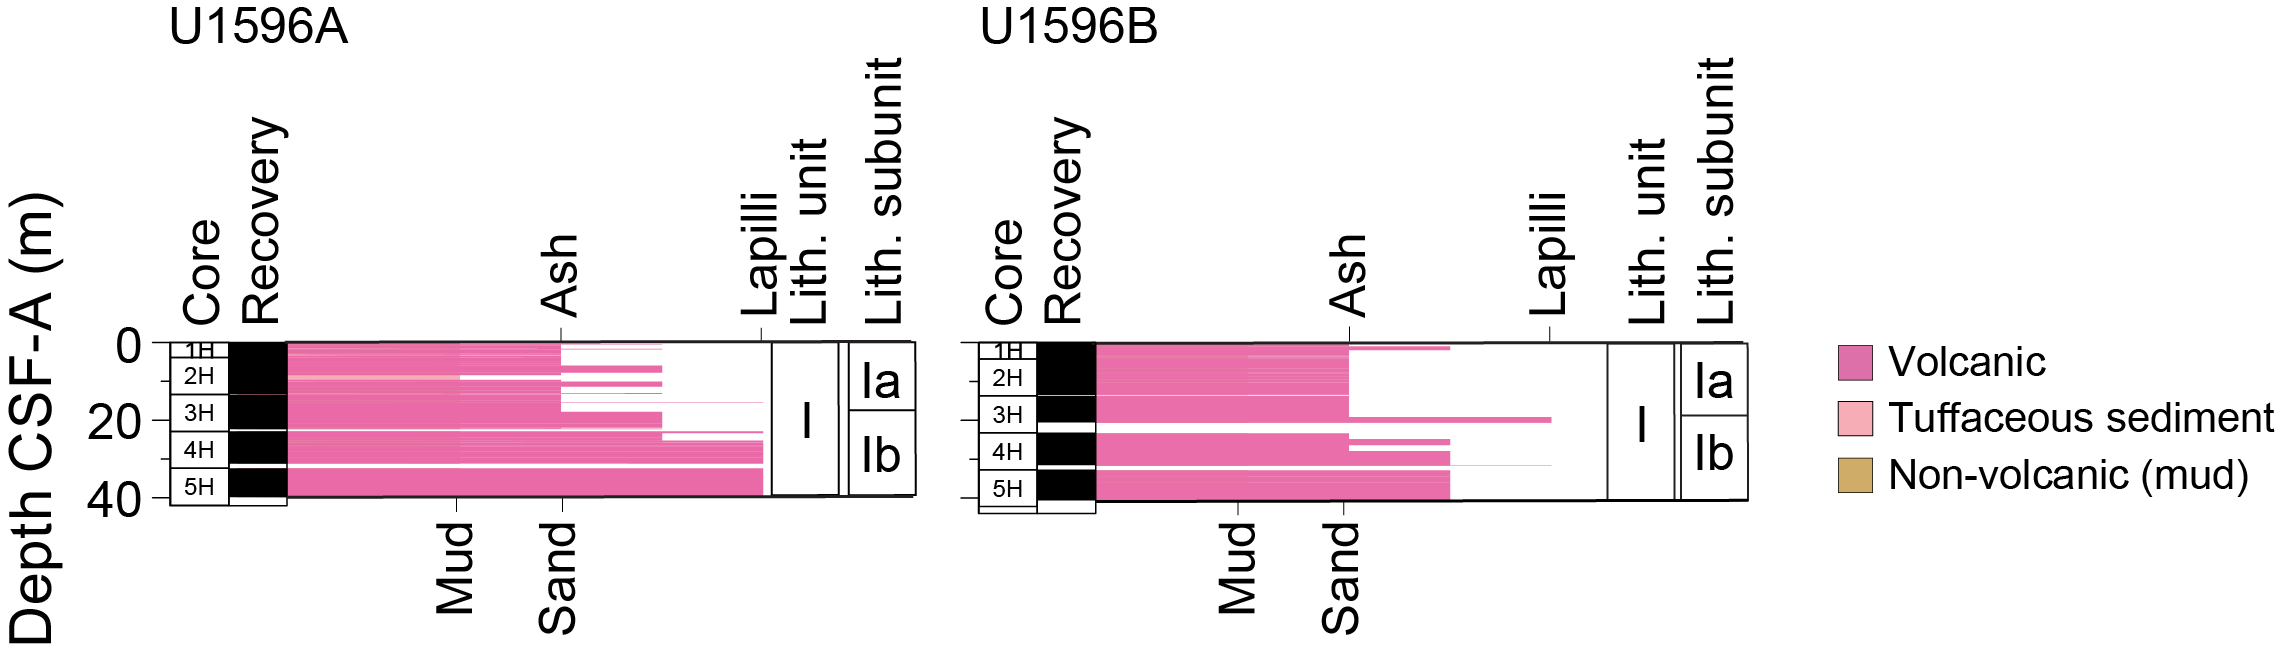
Figure F5. Grain size distribution.
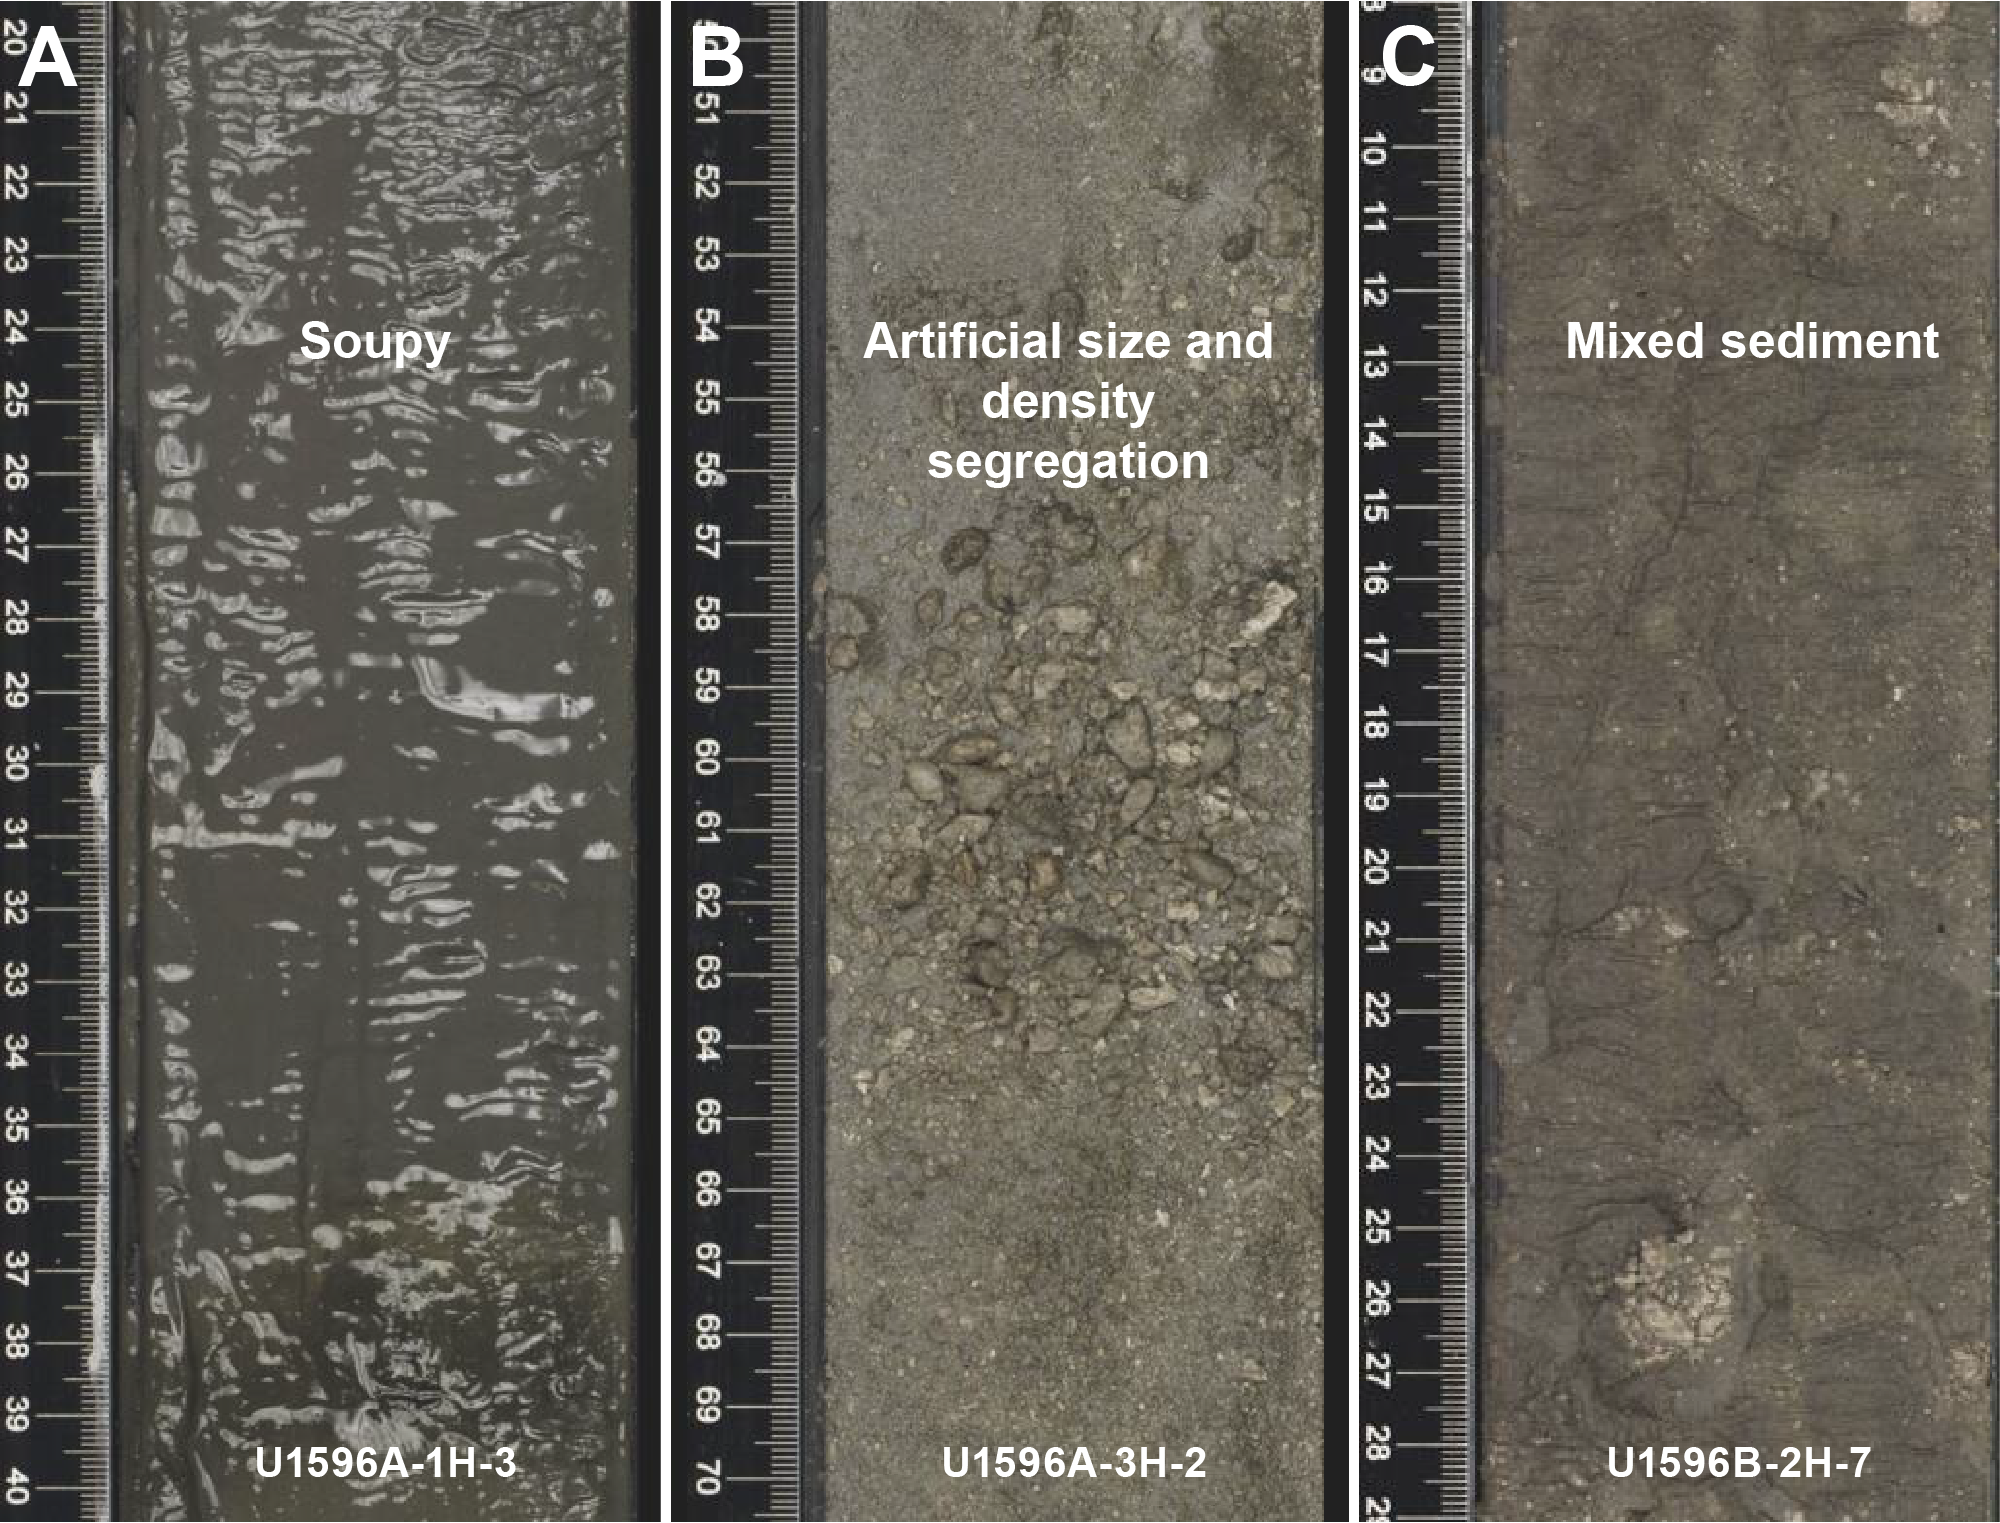
Figure F6. Core disturbances.
The following sections describe (1) the effects of core disturbance, (2) the lithostratigraphic unit and subunits, (3) correlations between Holes U1596A and U1596B, and (4) the XRD results from Site U1596.
3.1. Core disturbance
Site U1596 is affected by three types of core disturbance (Figure F6):
- Soupy: typically restricted to water-saturated intervals of unconsolidated ash overprinting original sedimentary or depositional structures (Figure F6A).
- Artificial size and density segregation: likely occurs during drilling or with postrecovery core handling processes (e.g., inclining, shaking, and plunging cores on the catwalk to compact sediments). Jutzeler et al. (2014) also described pseudohorizontal density grading that may occur while a core is lying flat on deck, resulting in vertical structures once the core is turned upright. Such core disturbances are observed most often in volcanic sediments because increased porosity allows sucking in of seawater during hydraulic piston coring. The resulting soupy texture allows material to flow within the core liner. Secondary normal or reverse grading, or density separation of clasts, may occur as a result of this disturbance and obscure primary sedimentary features (Figure F6B).
- Mixed sediment: occurs in water-saturated, granular core sections, where grains and clasts flow and mix, producing moderately to severely disturbed, partly overprinted, sedimentary structures and stratigraphy (Figure F6C).
3.2. Description of unit and subunits
3.2.1. Unit I
- Intervals: 398-U1596A-1H-1, 0 cm, to 5H-CC, 13 cm (bottom of the hole); 398-U1596B-1H-1, 0 cm, to 5H-CC, 7 cm (bottom of the hole)
- Depths: Hole U1596A = 0.00–39.84 mbsf; Hole U1596B = 0–40.62 mbsf
- Thickness: >40.62 m
- Age: Holocene
- Lithology: volcanic (ash, lapilli, and lapilli-ash) and minor tuffaceous lithologies (tuffaceous mud) and nonvolcanic sediment (mud)
Unit I is the only lithostratigraphic unit in Holes U1596A and U1596B, extending from 0 to 39.84 mbsf in Hole U1596A and from 0 to 40.62 mbsf in Hole U1596B (Table T2). The unit consists of massive fine-grained dark gray ash in the uppermost ~10 m, which transitions into a slightly lighter brownish gray ash with lapilli. This is followed downhole by a lapilli-ash and lapilli sequence in Subunit Ib that continues for the remainder of the hole. Three intervals of tuffaceous mud are observed within the upper section of both holes, along with one interval of mud at the very top.
Volcanic lithologies (>75% volcanic particles; glass shards, pumice, and crystals) comprise ash, lapilli-ash, and lapilli, the description of which was based on the relative abundance of ash-sized (<2 mm) and lapilli-sized (2–64 mm) particles, as described in Lithostratigraphy in the Expedition 398 methods chapter (Kutterolf et al., 2024). Ash and lapilli were used when the proportion of one size was >75%, and lapilli-ash described when both grain sizes were present but at <75% abundance (Fisher and Schmincke, 1984).
Subunits in Unit I were defined by changes in grain size, color, and components and were supported by physical properties (see Physical properties). Subunits are described as follows (Figures F3, F4, F5; Table T2):
- Subunit Ia (Sections 398-U1596A-1H-1, 0 cm, through 3H-3, 150 cm [0–17.9 mbsf], and 398-U1596B-1H-1, 0 cm, through 3H-4, 83 cm [0–19.06 mbsf]): fine-grained ash with minor tuffaceous mud and mud.
- Subunit Ib (Sections 398-U1596A-3H-4, 0 cm, through 5H-CC, 13 cm [17.9–39.84 mbsf], and 398-U1596B-3H-4, 83 cm, through 5H-CC, 7 cm [19.06–40.62 mbsf]): lapilli-ash and lapilli.
3.2.1.1. Subunit Ia
Subunit Ia extends from 0 to 17.9 mbsf in Hole U1596A and from 0 to 19.06 mbsf in Hole U1596B and is dominantly composed of massive, dark gray, fine-grained ash (Figure F7A; Table T2). Three intervals of gray to dark gray tuffaceous muds are observed in both holes at ~5 cm and at ~3.5 m and only in Hole U1596A at ~8 m, increasing in thickness downhole from several centimeters to more than 1 m. Small intervals of ash with mud or lapilli are observed in the uppermost ~3 m of the subunit in addition to lapilli-ash–dominated intervals (Hole U1596A: 1.65–1.83 mbsf and 6.01–7.78 mbsf; Hole U1596B: 0.95–1.92 mbsf). The ash with lapilli contains white and gray subrounded pumice, and the lapilli-ash intervals contain white and gray subangular pumice; the larger sized pumice lapilli is gray. Smear slides taken in ash layers in Subunit Ia show various shapes and degrees of vesicularity of transparent glass shards (e.g., dominantly pumiceous glass shards with rounded and tubular vesicles are observed in an ash layer at 4.95 mbsf; interval 398-U1596A-2H-1, 105–150 cm) and dense, blocky, and cuspate-shaped glass shards are dominant in an observed ash layer at 7.78 mbsf (interval 2H-3, 88–150 cm) (Figure F8).
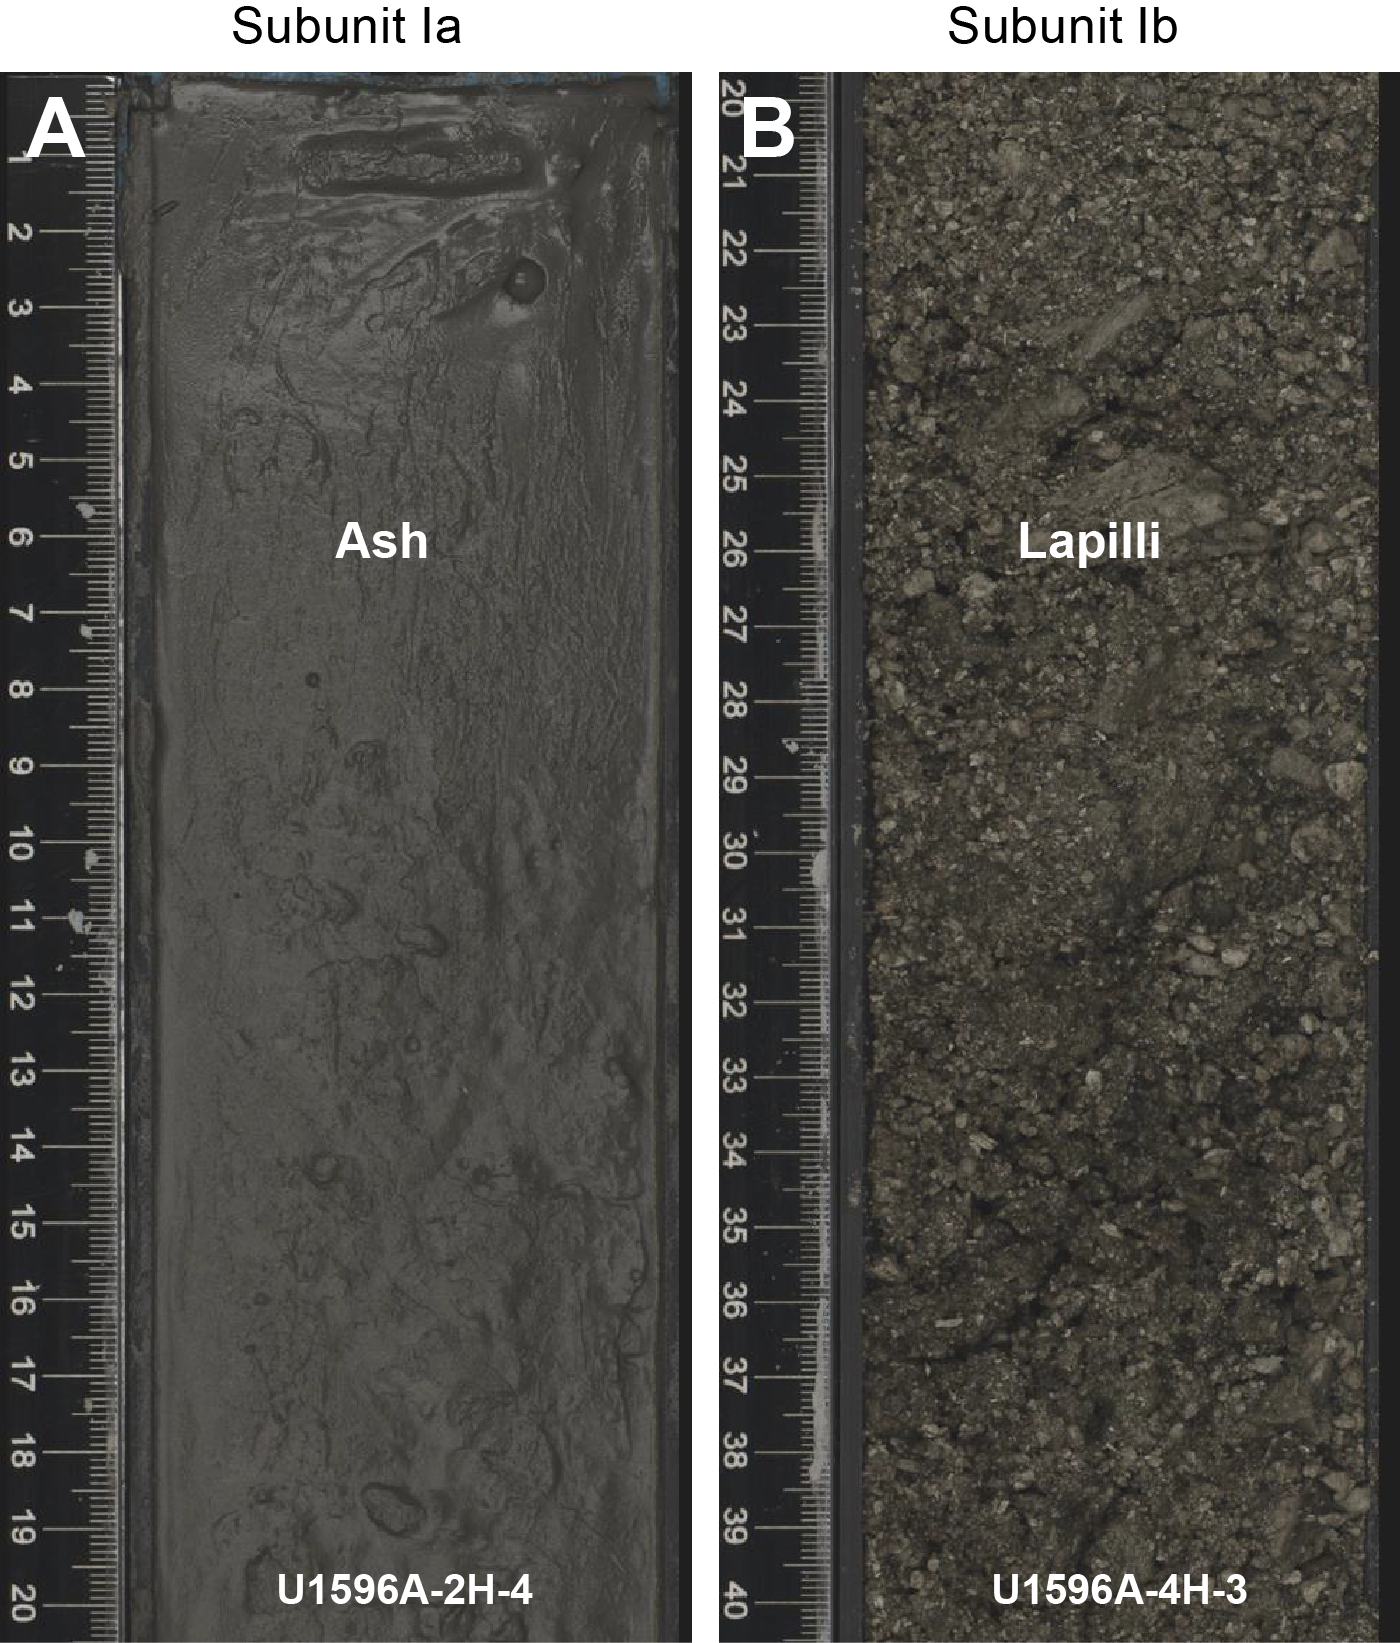
Figure F7. Unit I lithologies.
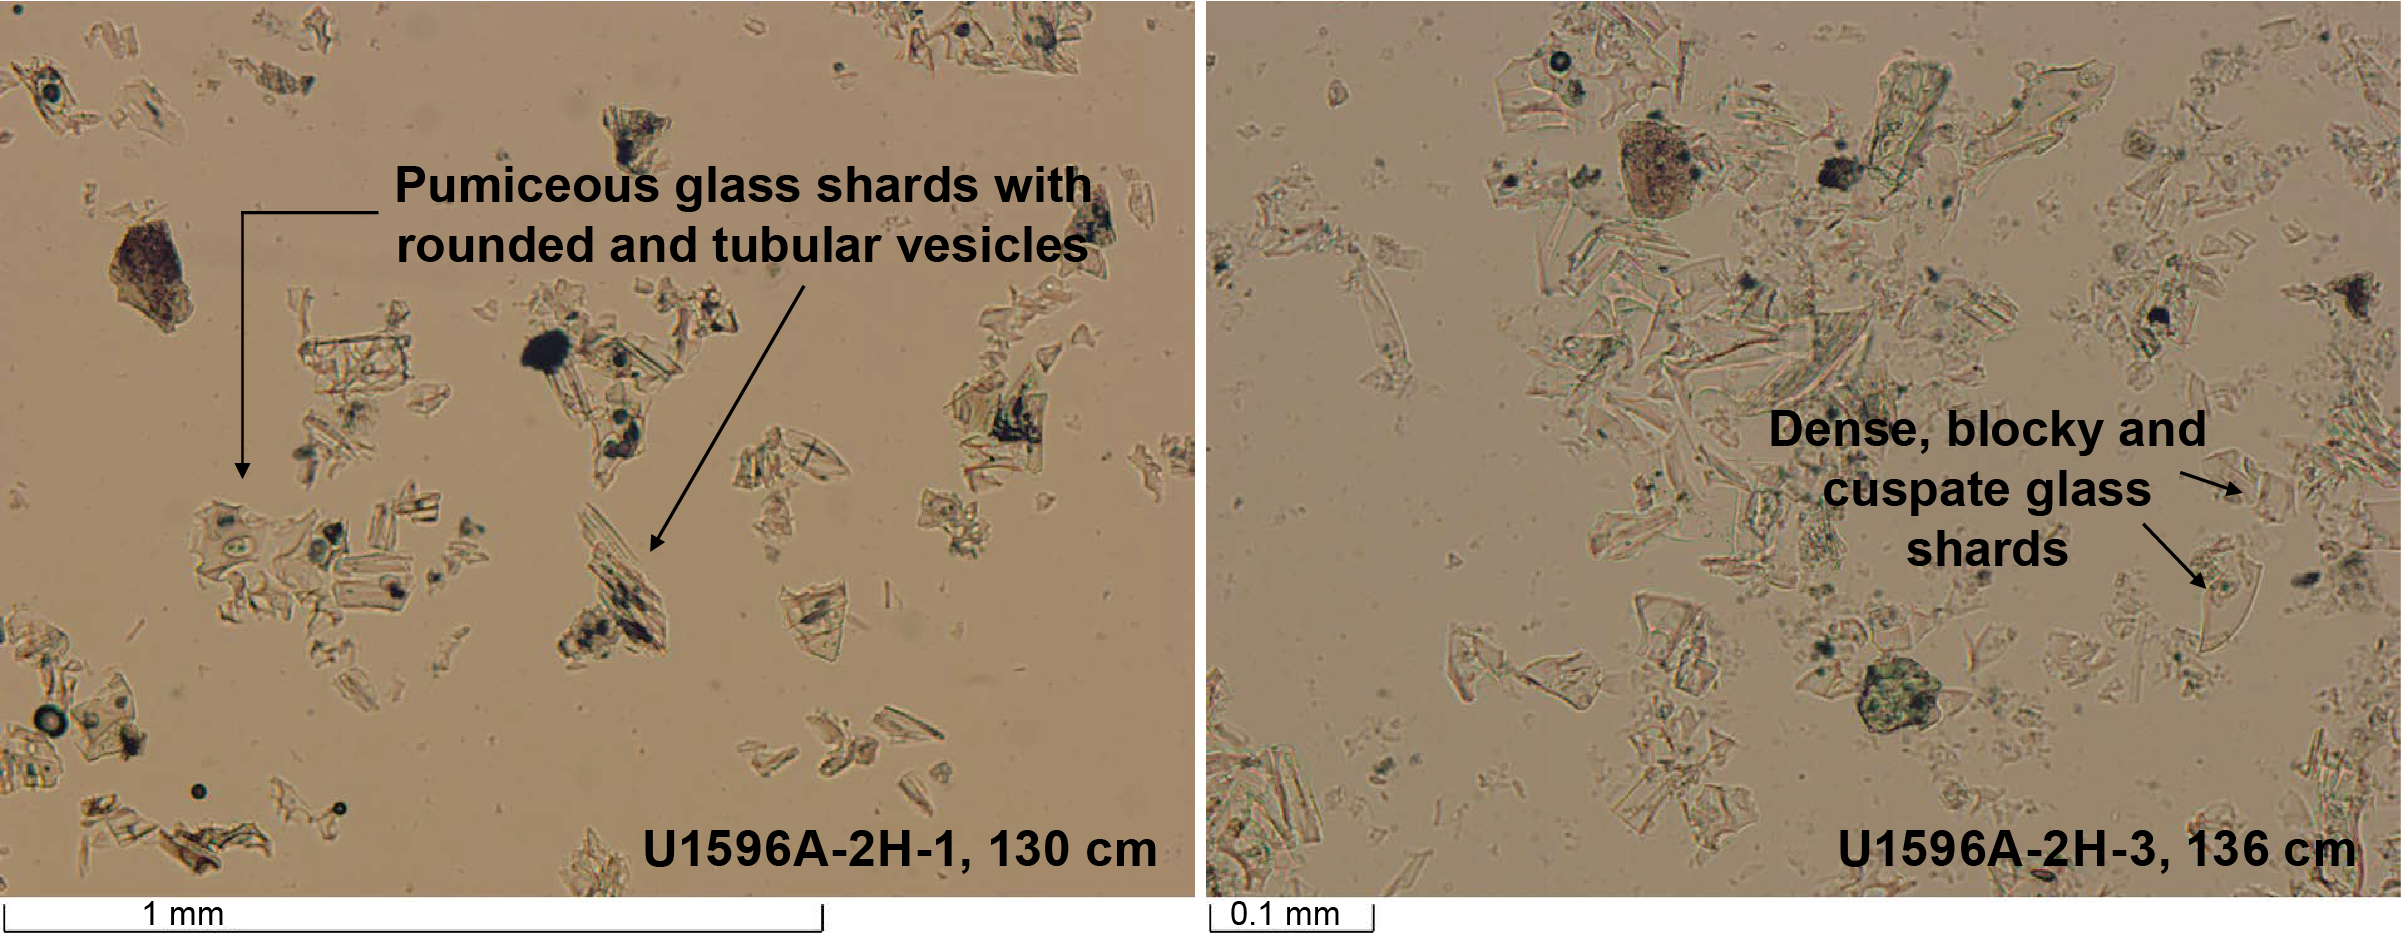
Figure F8. Subunit Ia lithology.
3.2.1.2. Subunit Ib
Subunit Ib extends from 17.9 to 39.84 mbsf in Hole U1596A and from 19.06 to 40.62 mbsf in Hole U1596B and comprises a mixture of dark gray to gray lapilli-ash and lapilli with lesser ash (Figure F7). These intervals range from well to poorly sorted and are not graded. All intervals contain subangular lithics of volcanic origin and pumice lapilli. The pumice lapilli vary in color between white, light and dark gray, and brown. Scoria lapilli are observed toward the bottom of Hole U1596A but are absent in Hole U1596B. Pumice lapilli with mafic enclaves are abundant in this subunit. Organic plant material, probably seaweed, is observed in both holes.
3.3. Correlations between holes
The recovered sediments in Holes U1596A and U1596B allow correlation of sediment-specific features (e.g., ash or lapilli layers) due to high recovery in both holes at overlapping depths. Holes U1596A and U1596B extend from 0 to 39.84 mbsf and 0 to 40.62 mbsf, respectively. Here, we highlight notable lithologic correlations between Holes U1596A and U1596B (Figure F9).
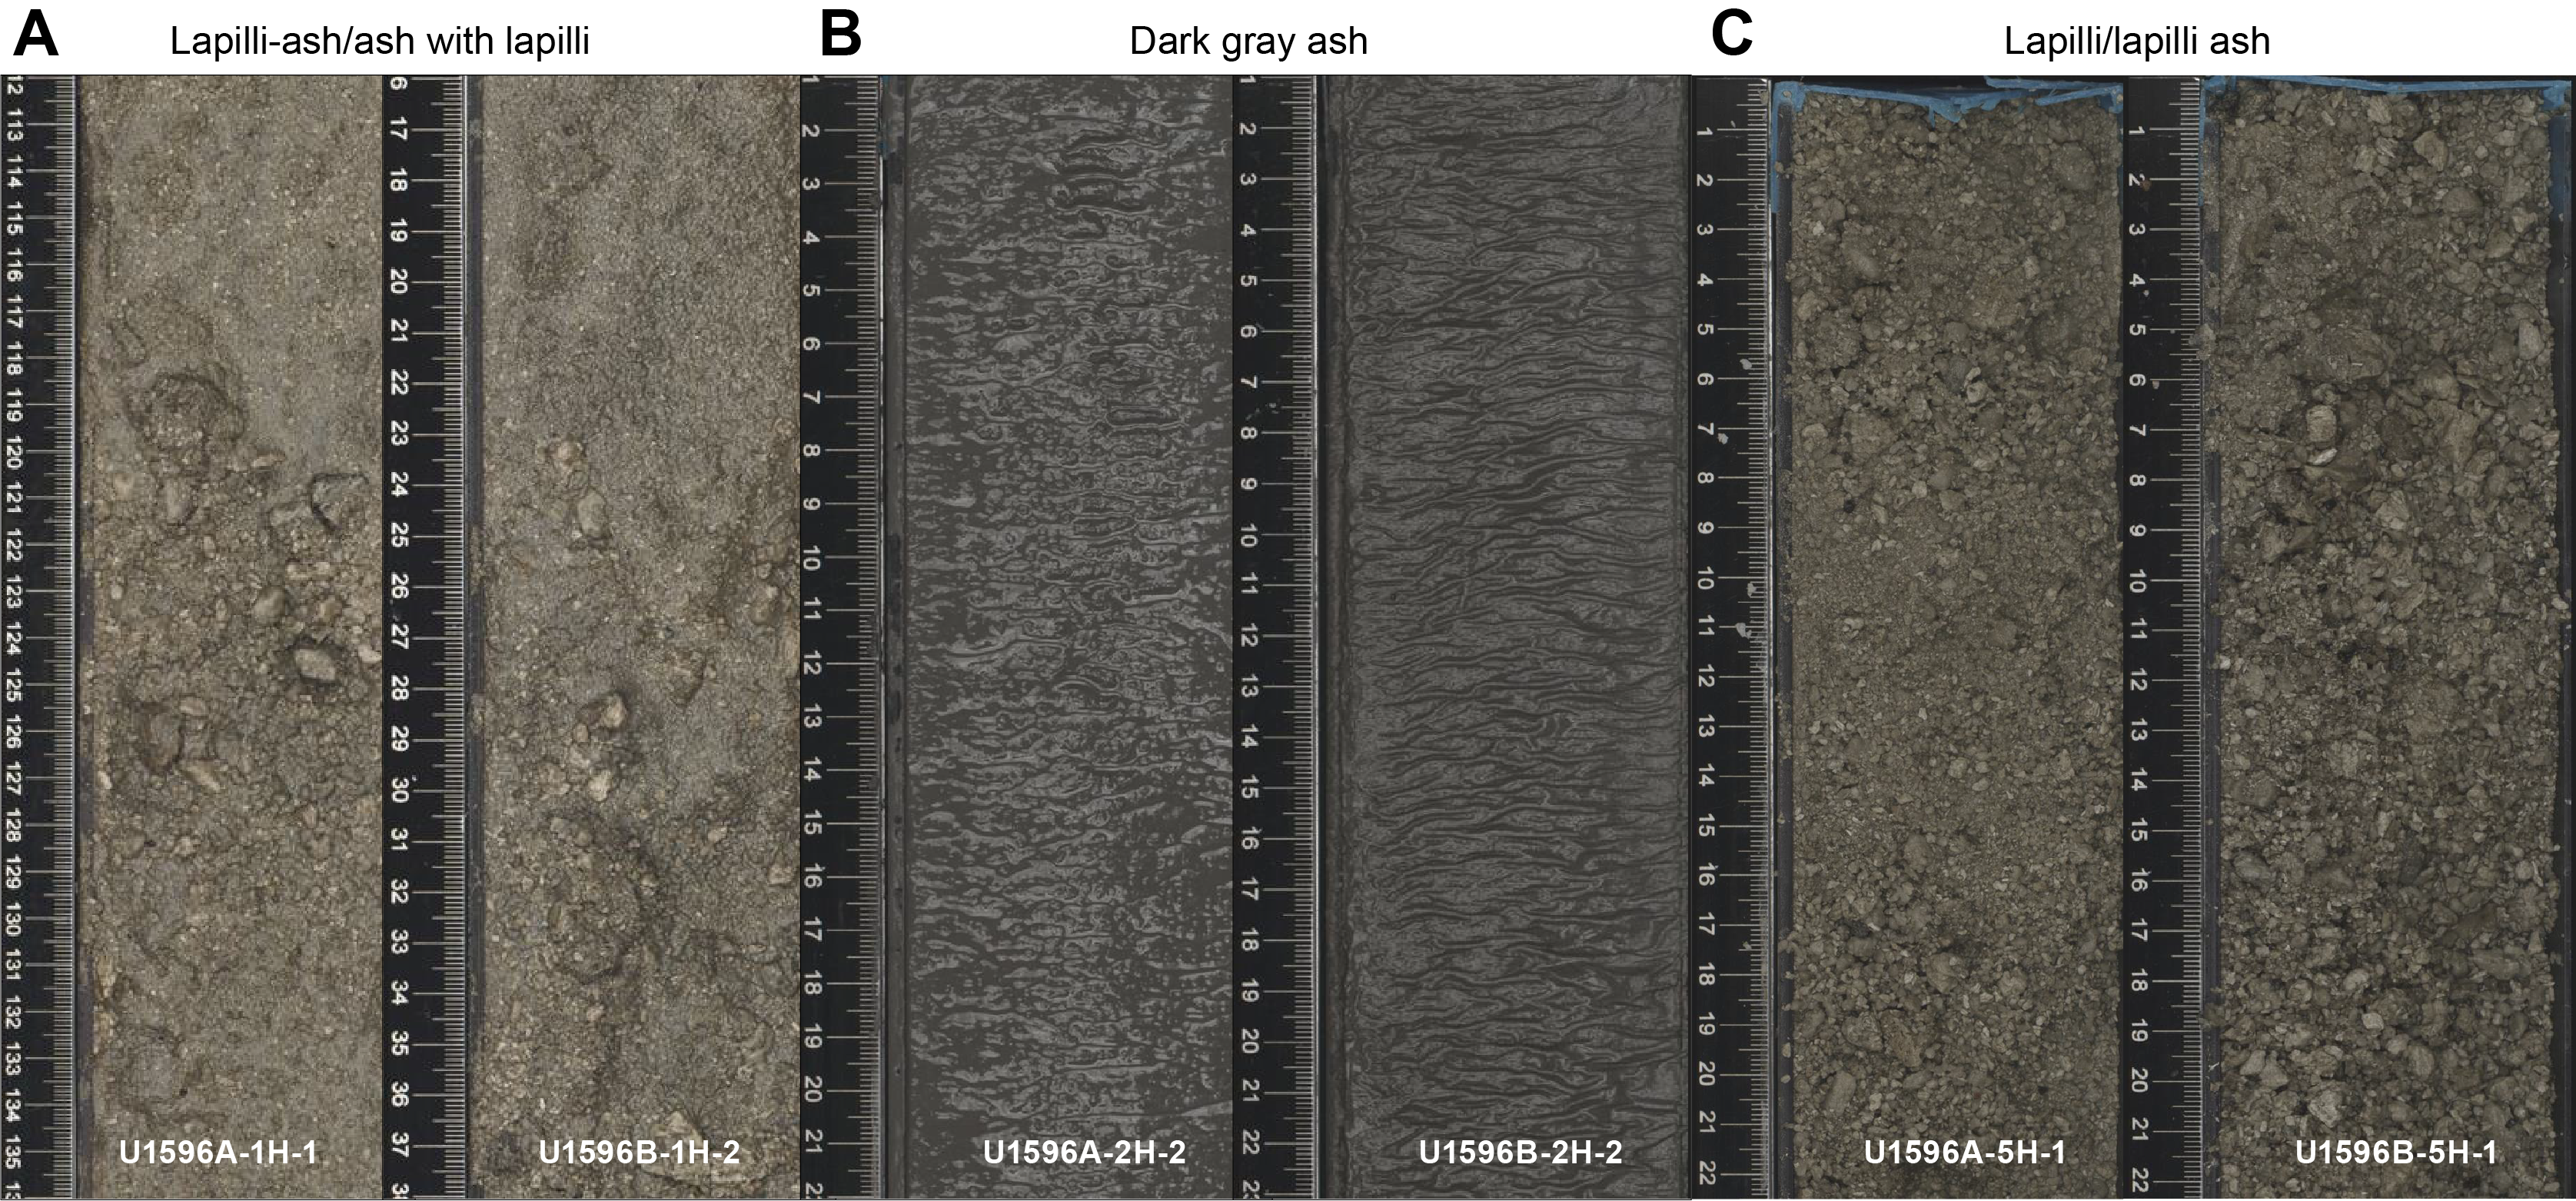
Figure F9. Correlations of sediments.
3.3.1. Notable correlated deposits
- Gray ash with lapilli (interval 398-U1596A-1H-1, 112–136 cm; 0.75–1.5 mbsf) and gray lapilli-ash (interval 398-U1596B-1H-2, 16–38 cm; 0.95–1.92 mbsf) (Figure F9A).
- Dark gray fine ash (interval 398-U1596A-2H-2, 1–22 cm; 5.4–6.01 mbsf) and very dark gray fine ash (interval 398-U1596B-2H-2, 1–23 cm; 5.7–6.45 mbsf) (Figure F9B).
- Gray to very dark grayish brown, moderate to poorly sorted pumice lapilli/lapilli-ash observed for several meters at the base of Holes U1596A and U1596B (~32–40 mbsf) (Figure F9C).
3.4. X-ray diffraction
XRD data were collected from three IW squeeze cake sediment residues from Hole U1596A and two IW squeeze cake sediment residues from Hole U1596B. The analyzed samples comprise volcanic (ash) or volcanic-dominated (ash to tuffaceous mud) lithologies from Subunit Ia. XRD spectra of two of the analyzed samples are shown in Figure F10. Both the ash sample (Figure F10A) and the volcanic-dominated sample (Figure F10B) show a characteristic hump at low °2θ, indicating the presence of volcanic glass. Identified crystalline phases are Ca-rich plagioclase, halite, and clay minerals of the illite group.
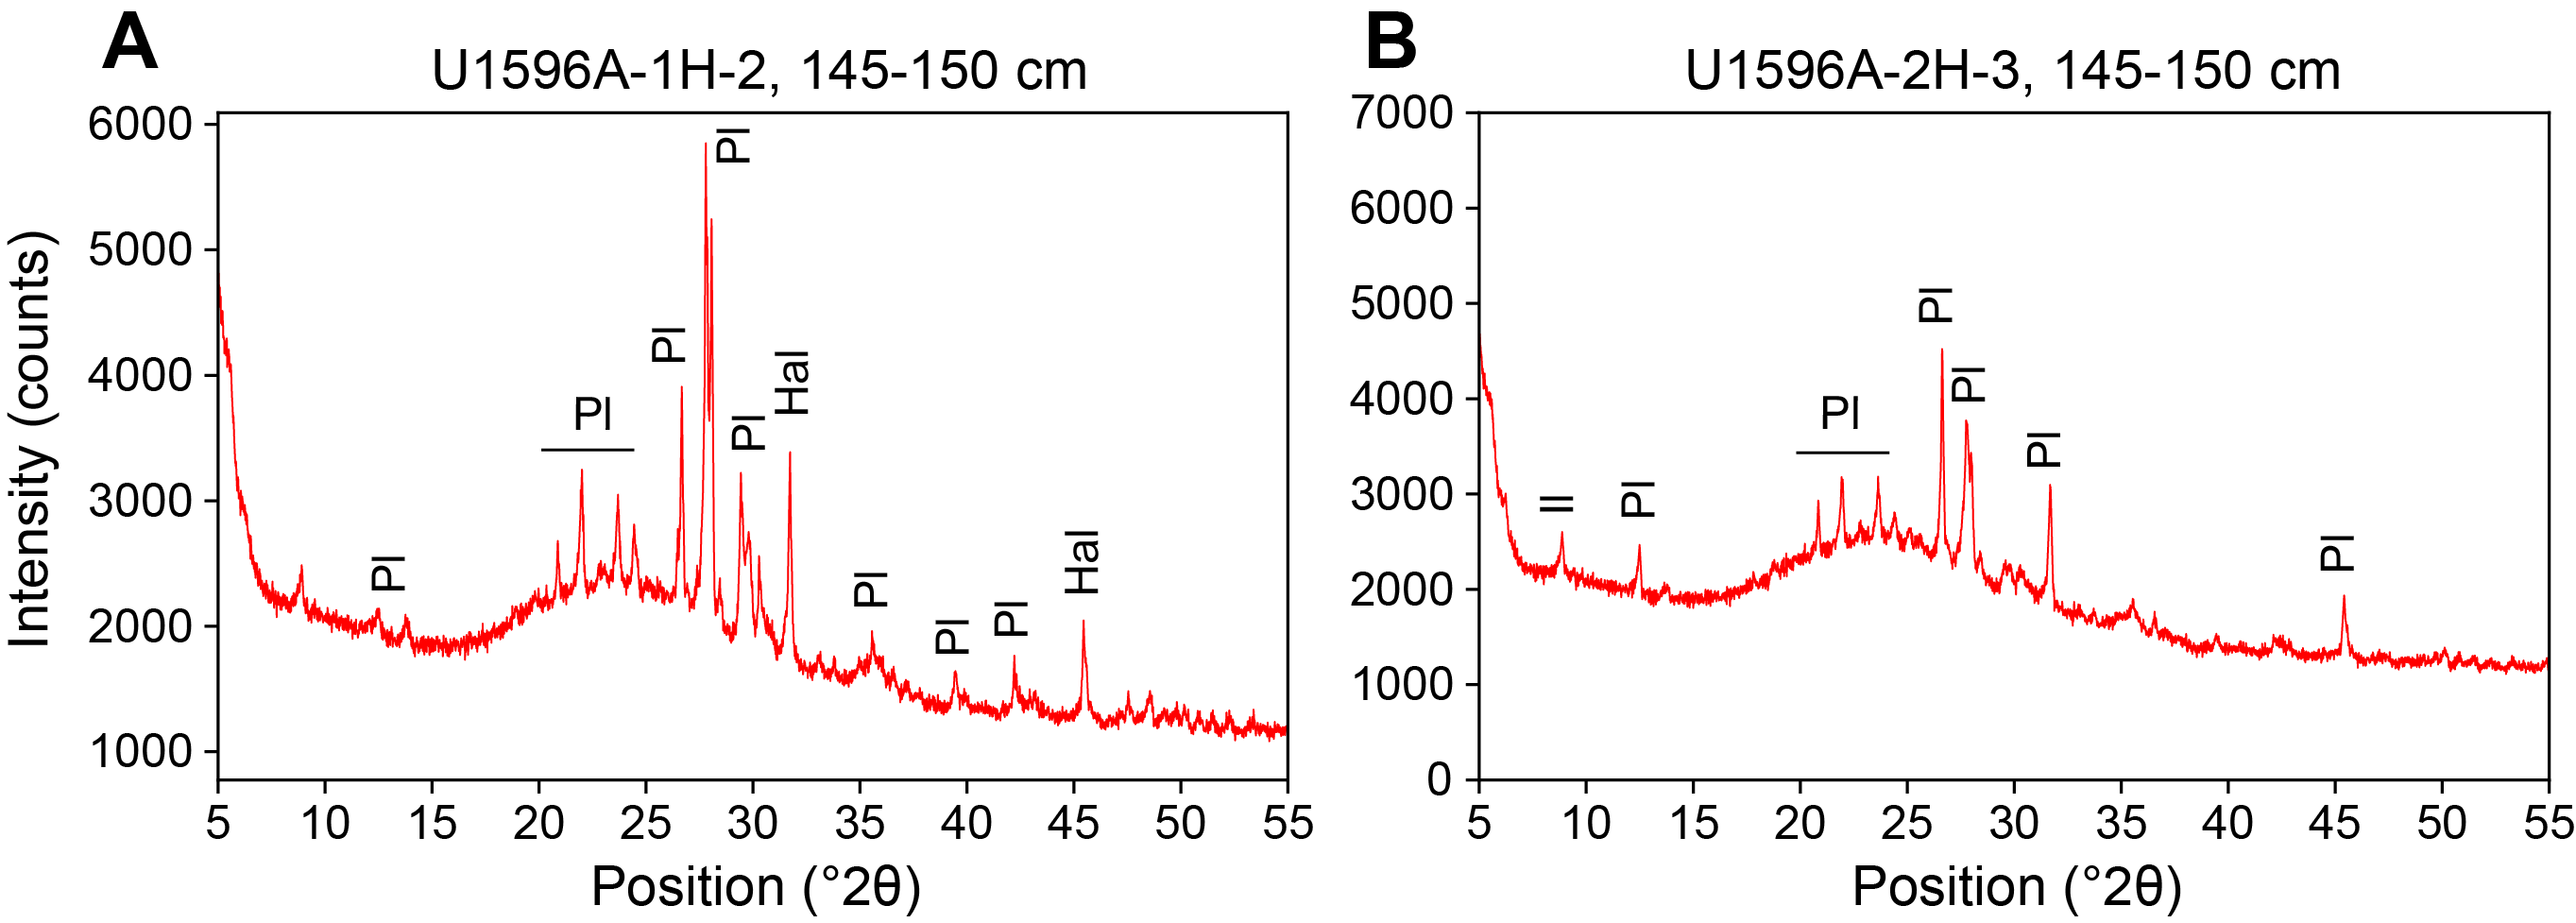
Figure F10. XRD spectra.
4. Stratigraphic correlation
Two holes were drilled at Site U1596. Holes U1596A and U1596B were drilled with the full APC system. Hole U1596A penetrated to 39.84 mbsf, and Hole U1596B penetrated to 40.62 mbsf.
No correlation during coring was required due to the very challenging drilling conditions. Therefore, we did not use the Special Task Multisensor Logger (STMSL) for measurements of physical properties for fast correlations.
4.1. Correlation for establishing CCSF-A depth scale and construction of the splice
To establish the core composite depth below seafloor, Method A (CCSF-A), depth scale, we analyzed Holes U1596A and U1596B for their physical properties using the Whole-Round Multisensor Logger (WRMSL) for magnetic susceptibility (MS) and gamma ray attenuation (GRA) density and the Natural Gamma Radiation Logger (NGRL) for NGR intensity, as well as photos once the cores were split into working and archive halves (see Physical properties; also see Physical properties in the Expedition 398 methods chapter [Kutterolf et al., 2024]). Similar to Site U1595, correlation was very challenging at this site, and only the MS data allowed several reliable correlations, whereas NGR and GRA density measurements were strongly overprinted by the irregular distribution of core material in cores with low recovery and a high water content.
Both holes recovered the mudline, and we used Core 398-U1596B-1H as the initial anchor for stratigraphic correlation. From there, we attempted to determine the relative depth offset of each core by establishing affine ties between the holes based on the maximum correlation of all measured physical properties. These depth offsets are reported in Table T3. Figure F11 shows the MS of the two holes on the resulting CCSF-A scale, in which individual cores are shifted according to the identified correlations. This figure highlights the vertical alignment of characteristic events in the adjacent holes.
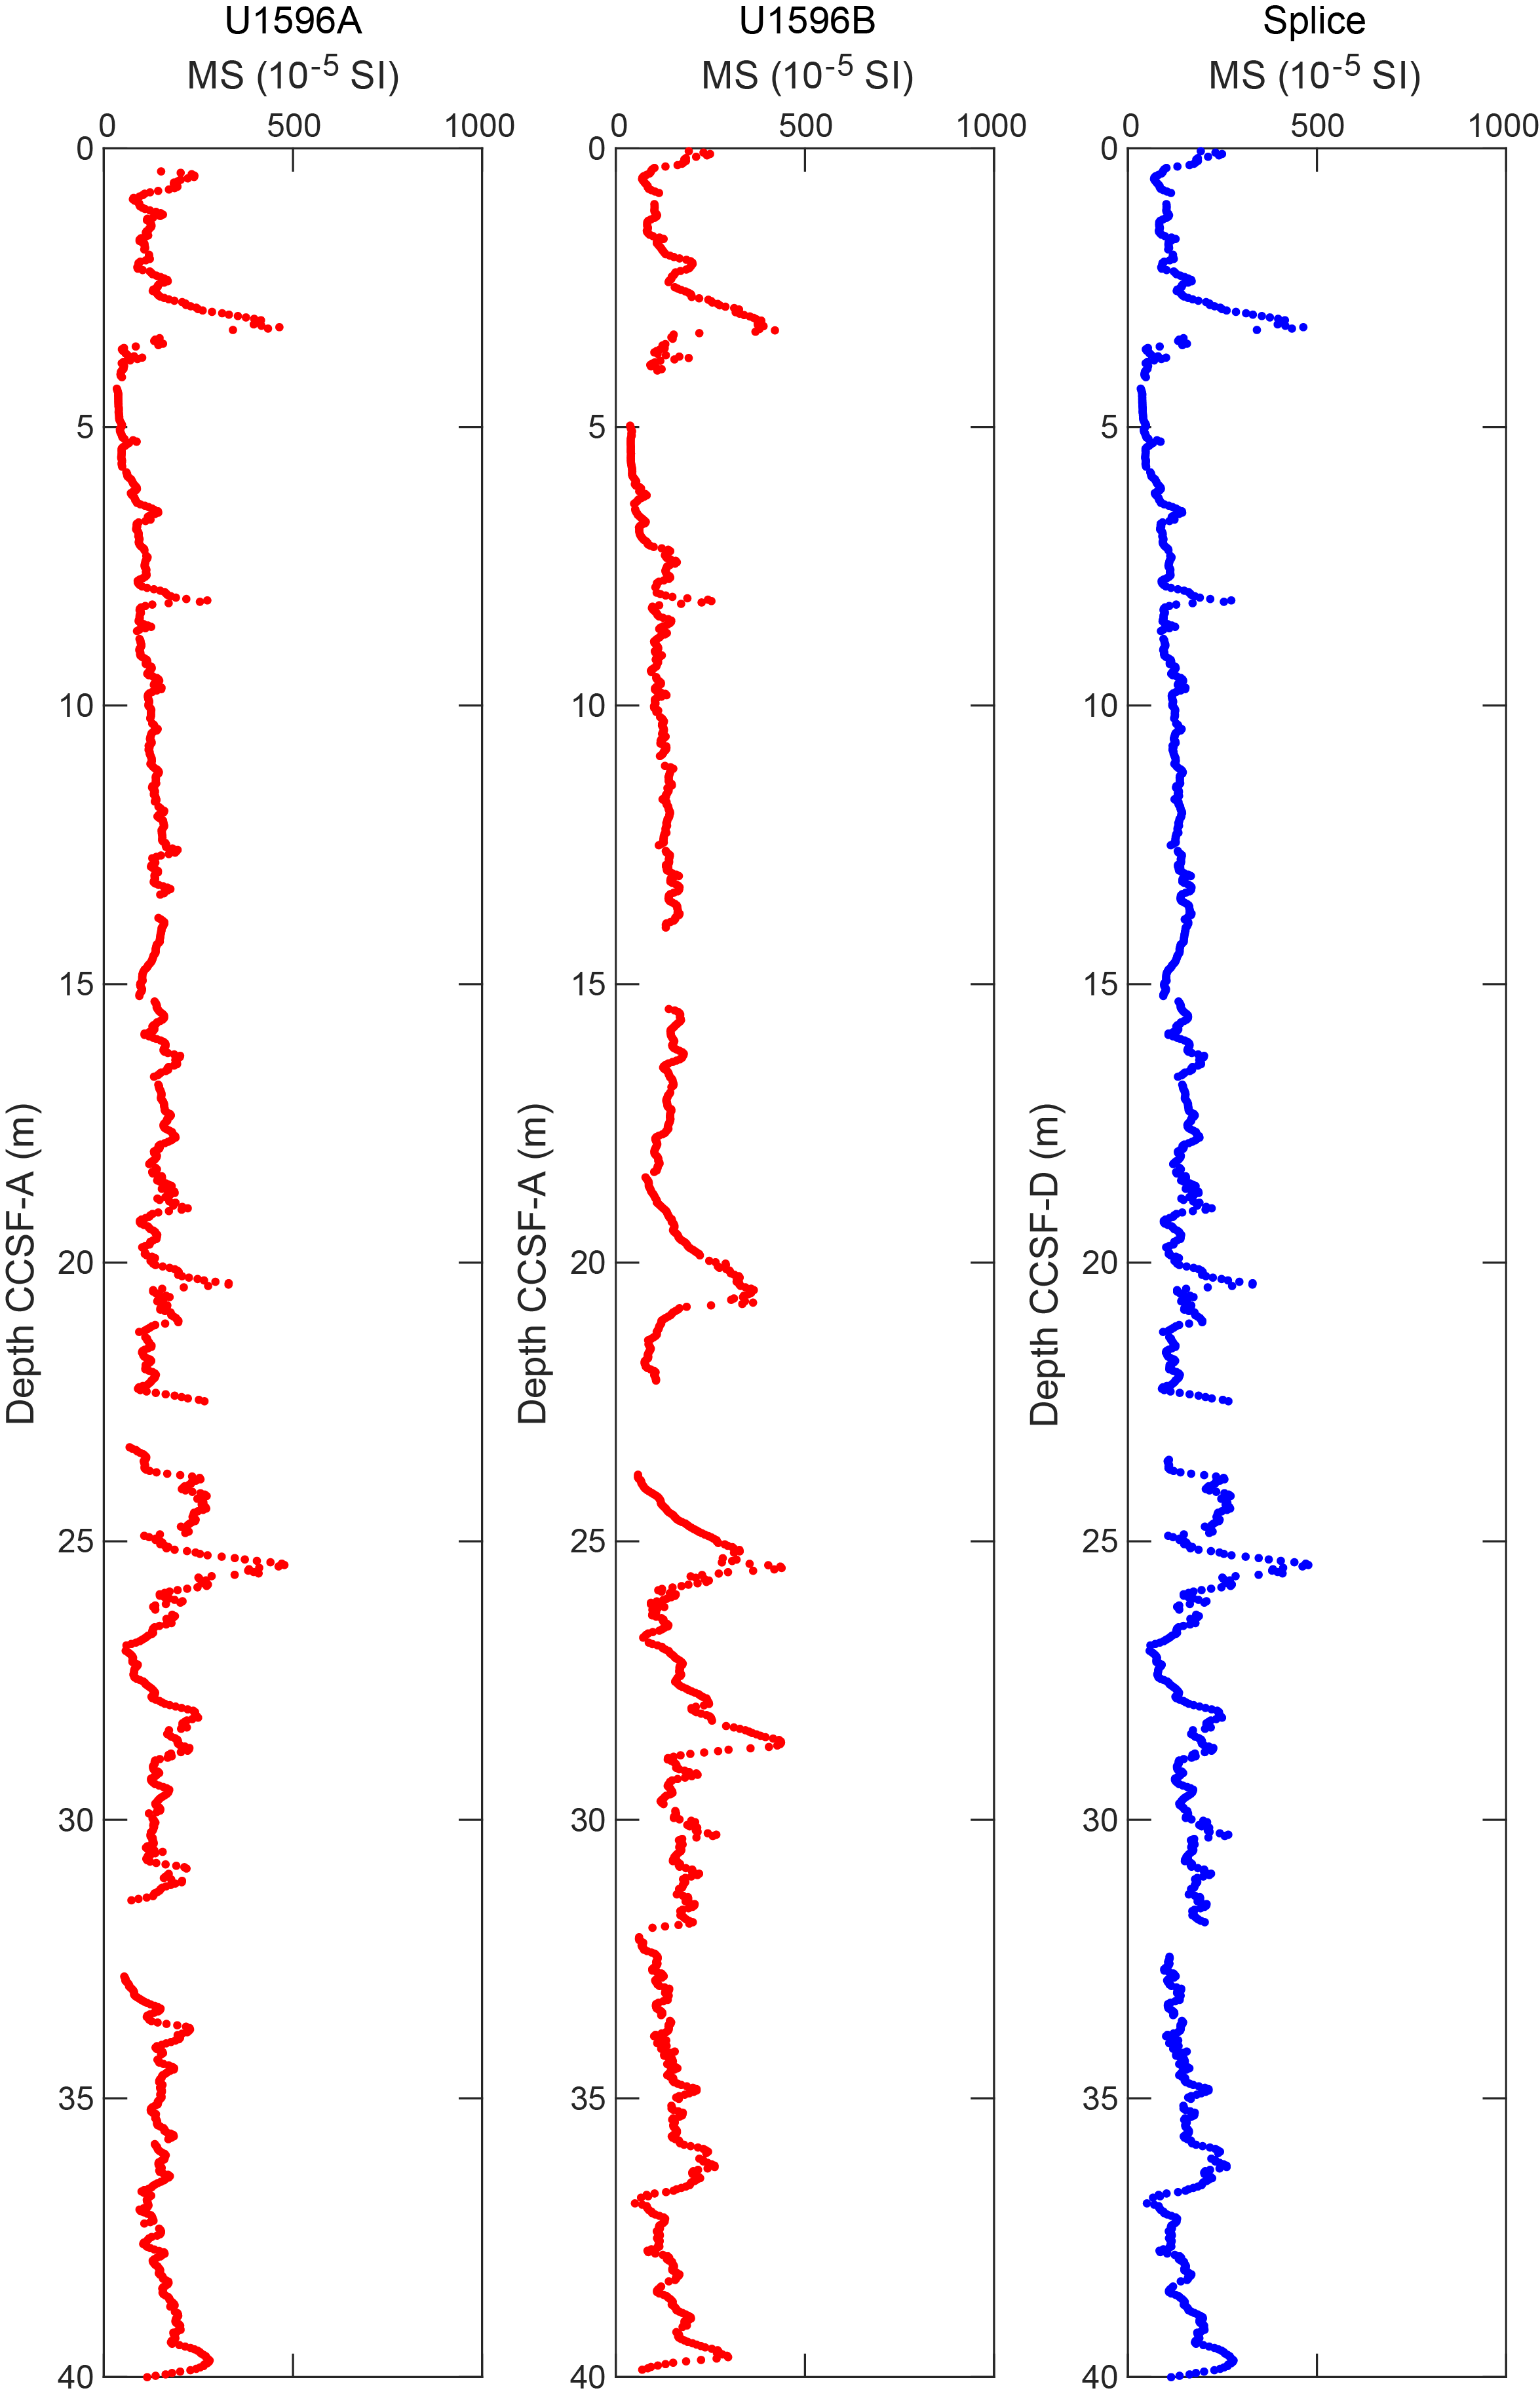
Figure F11. MS data.
Stratigraphic correlation was difficult at this site due to the alignment of gaps and a high lateral variability of lithologies and the soupy nature of the recovered material, which led to the occurrence of interruptions in the stratigraphic correlation. For each of these interruptions, we used the relative offset between untied (uncorrelated) cores derived from the CSF-A scale to keep the composite depth scale as close to the original CSF-A scale as possible.
Once we established the composite depth scale, we spliced selected sequences from Holes U1596A and U1596B to create the most complete and representative section possible. The end product of this process is reported in Table T4 and Figure F12.
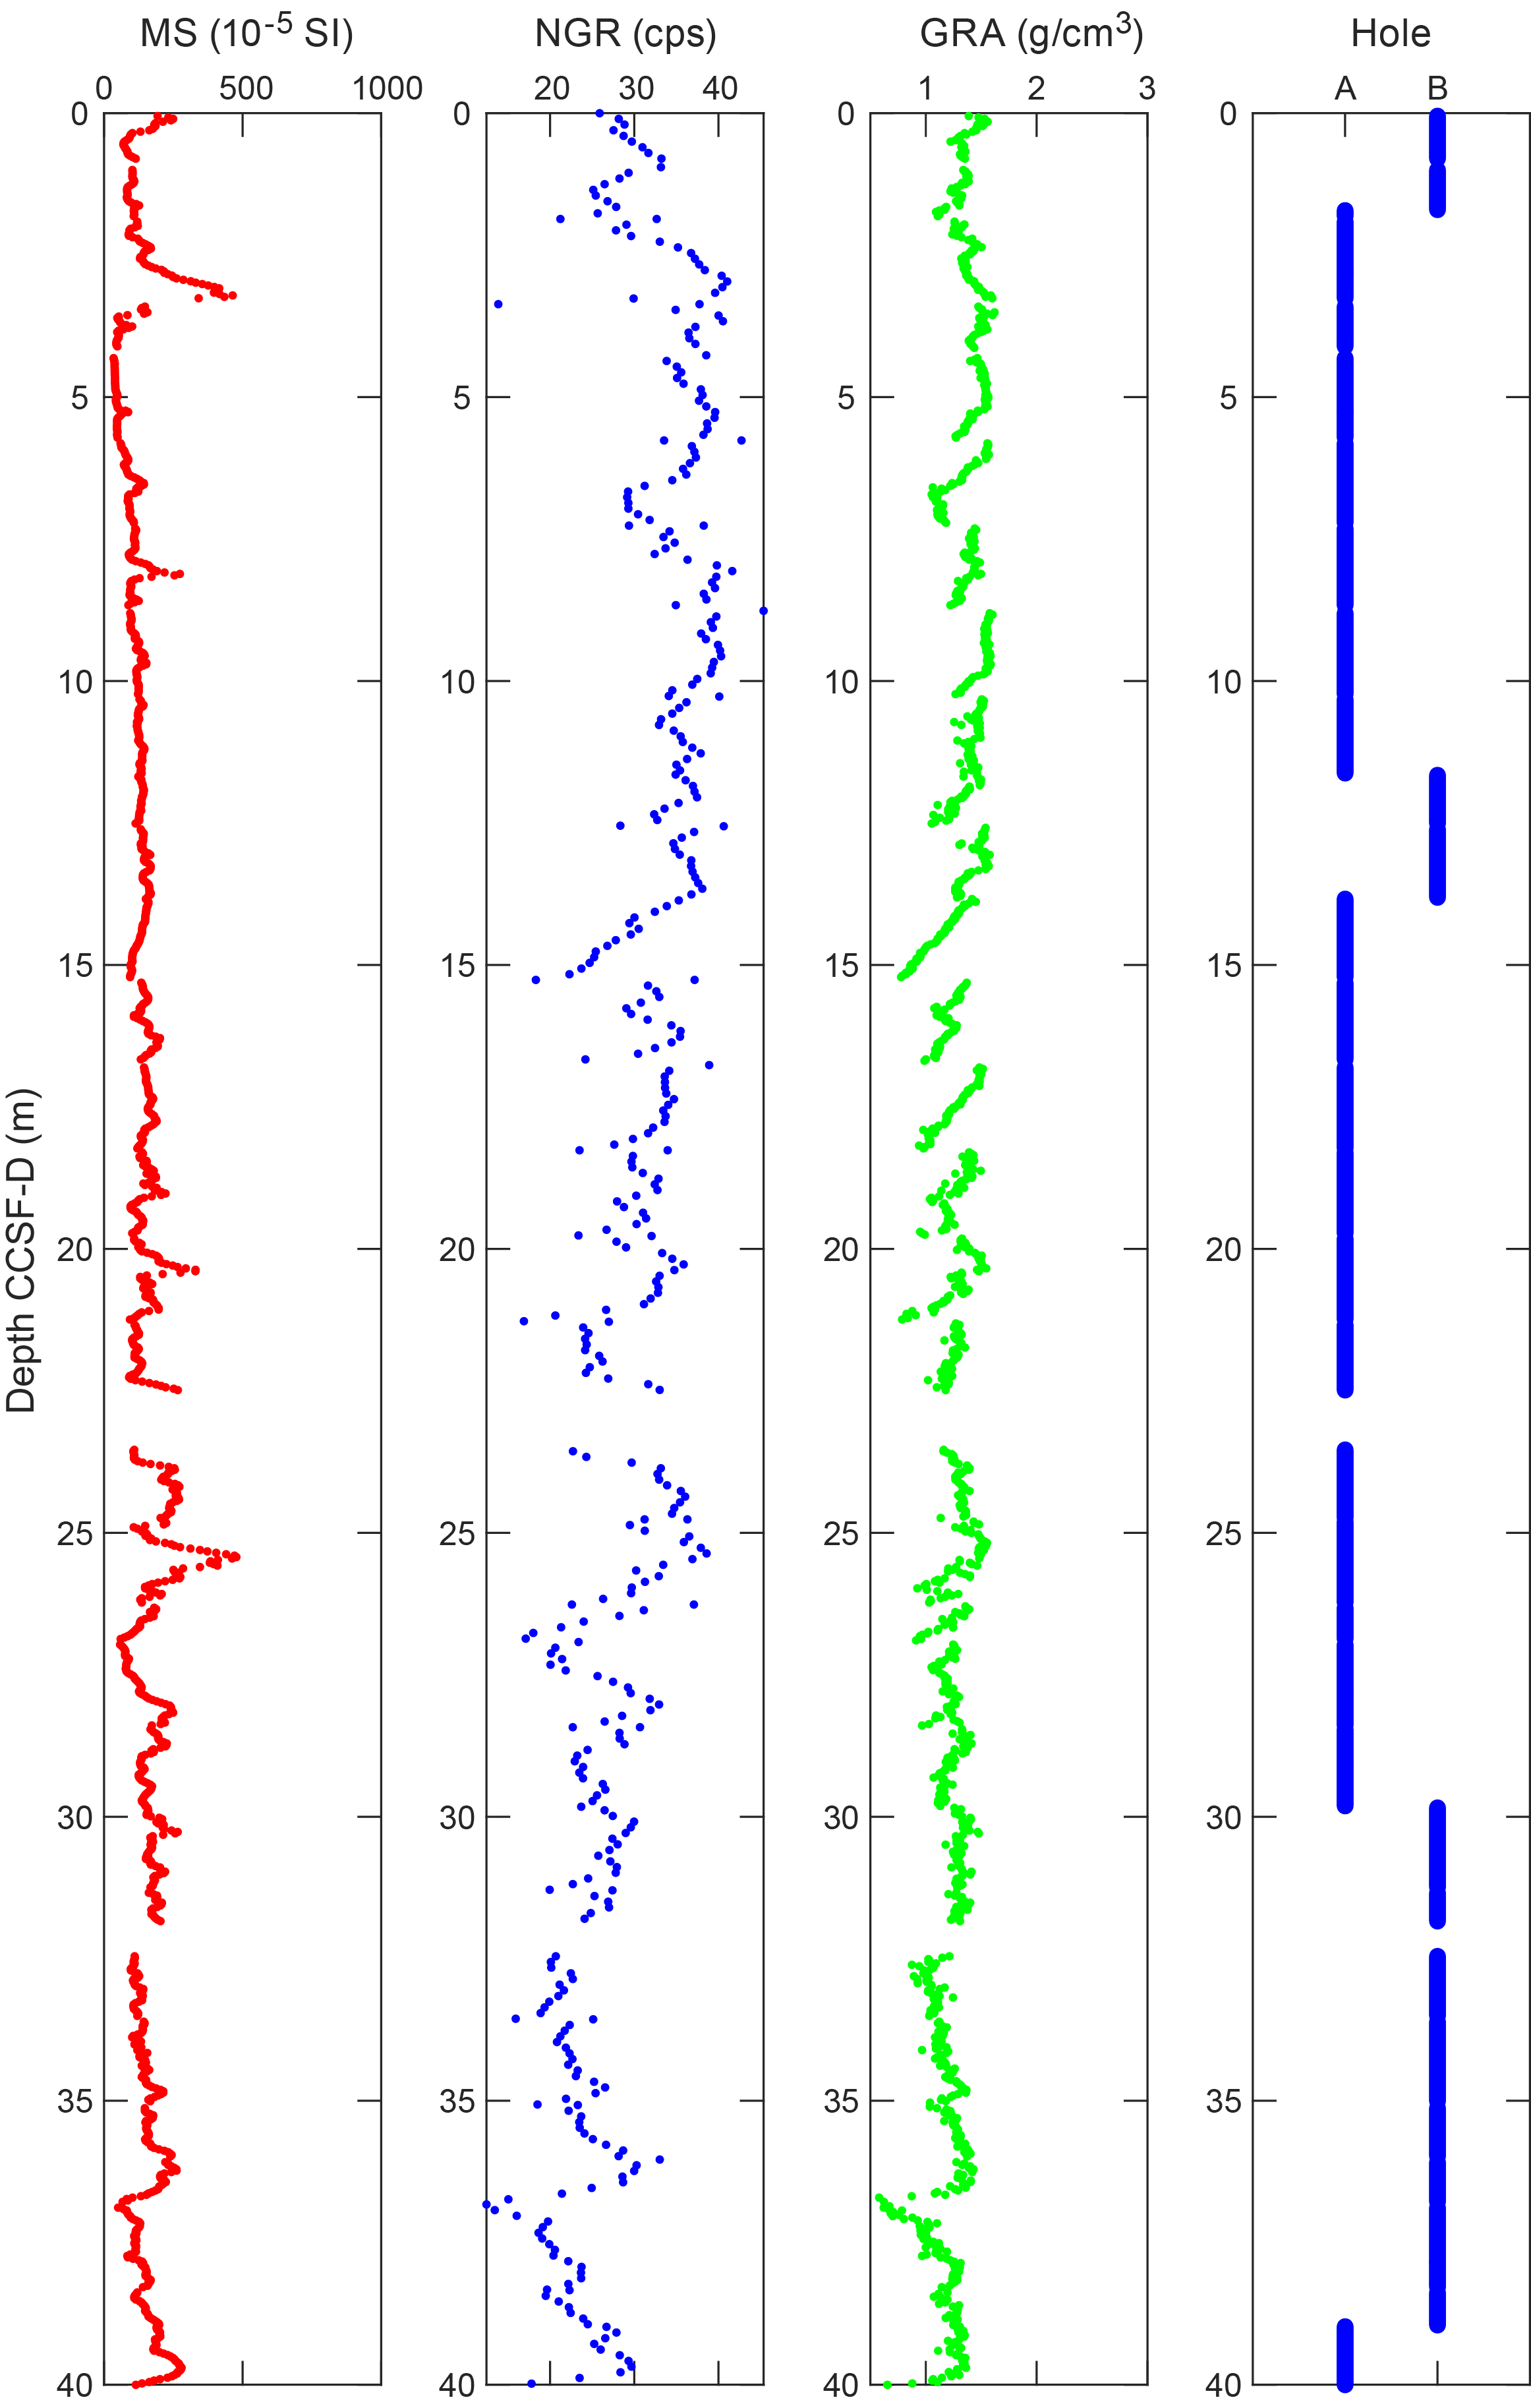
Figure F12. Splice.
As shown in Figure F12, the splice is very continuous until the end of the hole, and only small gaps less than 1 m occurred.
No significant expansion was observed in the cores from Site U1596. Figure F13 shows a plot comparing the CSF-A and CCSF-A scales for Holes U1596A and U1596B and a linear regression curve calculated for both holes together. The deviation from the dotted line indicates an affine growth factor of approximately 1%.
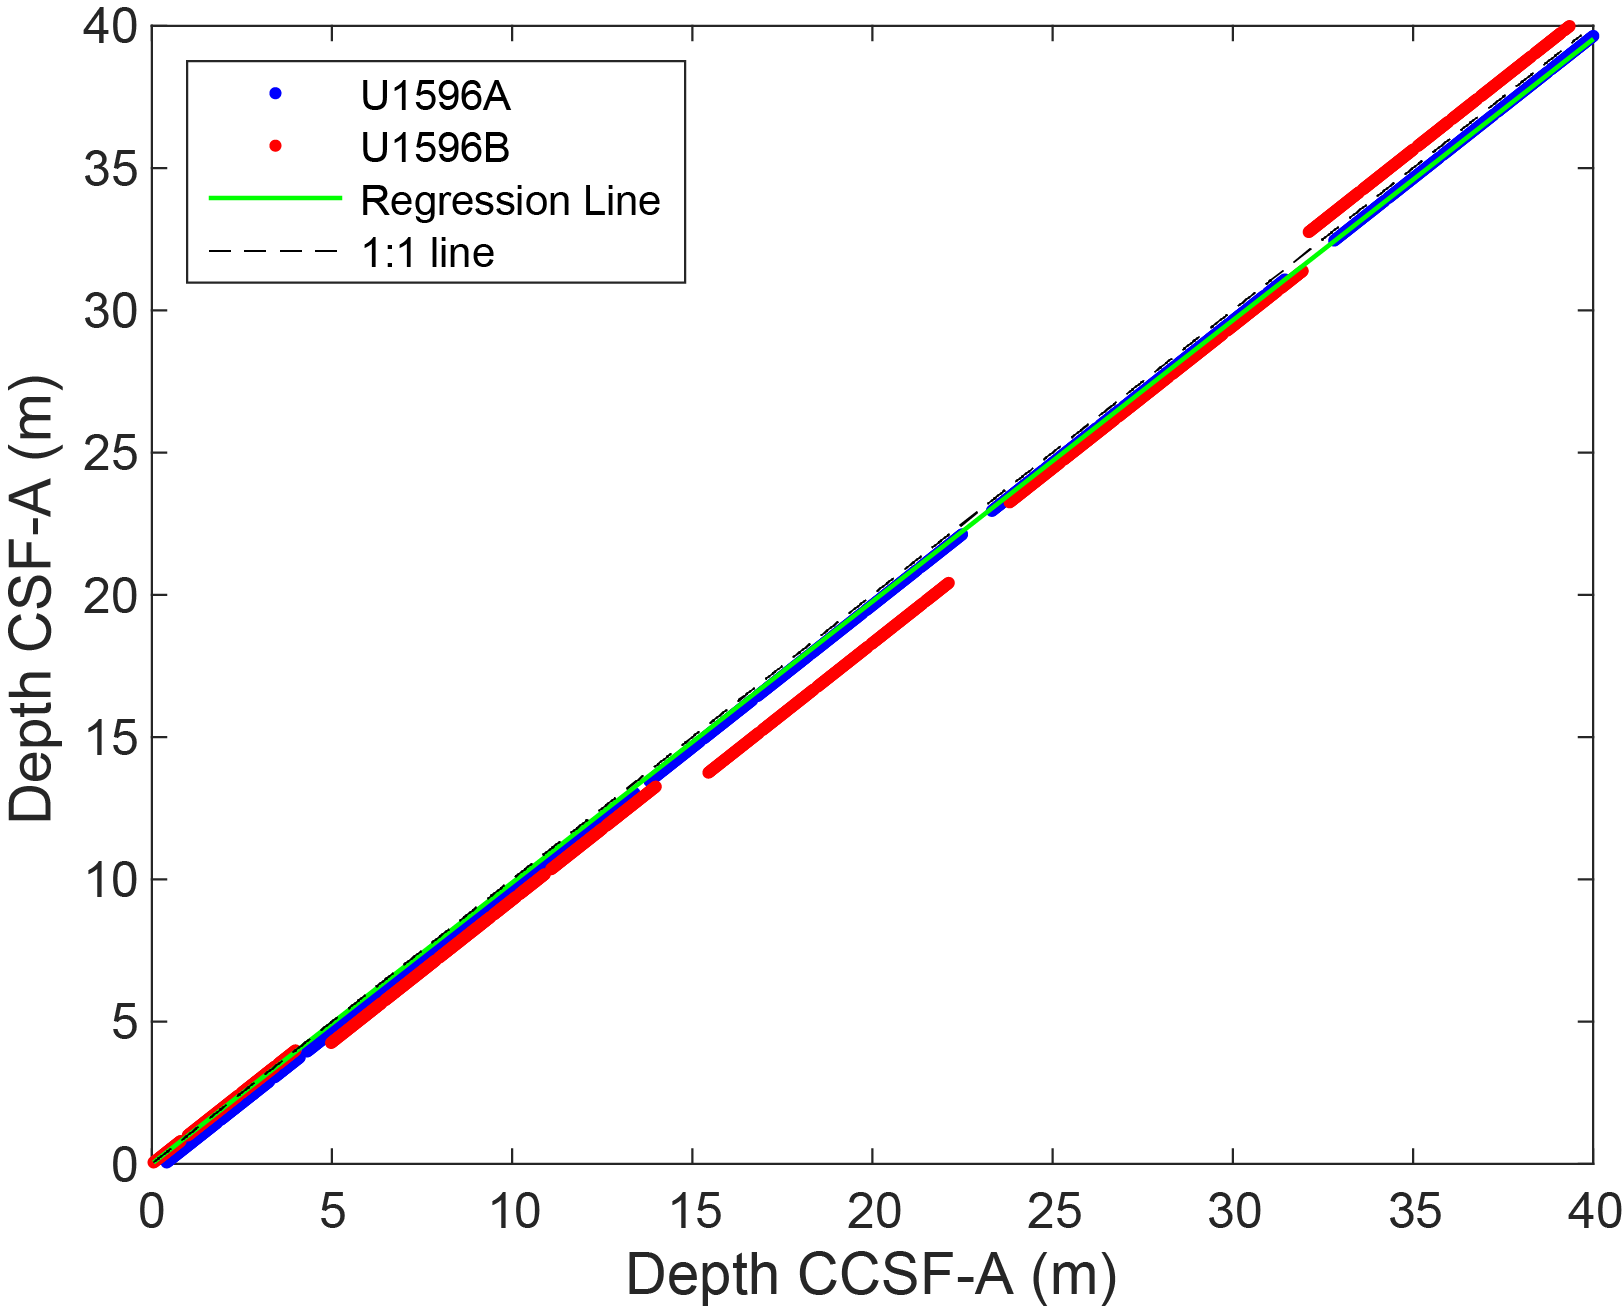
Figure F13. Core top depths.
5. Structural geology
It was not possible to measure orientations of structures at Site U1596. Although there are some bedding planes, core-induced disturbance prevented their measurement.
6. Biostratigraphy
Planktonic and benthic foraminifera and calcareous nannofossils were examined from core catcher samples from Holes U1596A and U1596B to assess the paleoenvironmental conditions of Site U1596.
Site U1596 cored the sedimentary sequence in the northeast portion of the Santorini caldera and recovered a 40.62 m thick sequence comprising primarily volcanogenic sediments. Very rare, very well preserved benthic foraminifera were found in only one core catcher (Sample 398-U1596B-1H-CC, 16–21 cm; 4.24 mbsf) (Table T5), mainly represented by Elphidium spp., Rosalina spp., and Uvigerina peregrina. Very rare, well-preserved planktonic foraminifer specimens of Orbulina suturalis, Globigerina bulloides, Neogloboquadrina pachyderma, and Globoturborotalita sp. were found in Samples 398-U1596A-1H-CC, 13–15 cm (Table T6), and 398-U1596B-1H-CC, 16–21 cm (Figure F14). Additionally, rare Radiolaria, Bryozoa, and Ostracoda were found in Sample 398-U1596A-1H-CC, 13–15 cm, although biological remains were of insufficient quantity to permit paleoenvironmental analyses. Calcareous nannofossils were also recognized in Sample 398-U1596B-1H-CC, 16–21 cm (Table T7; Figure F15), that are similar to living coccolithophore assemblages in the Aegean Sea (Dimiza et al., 2008).
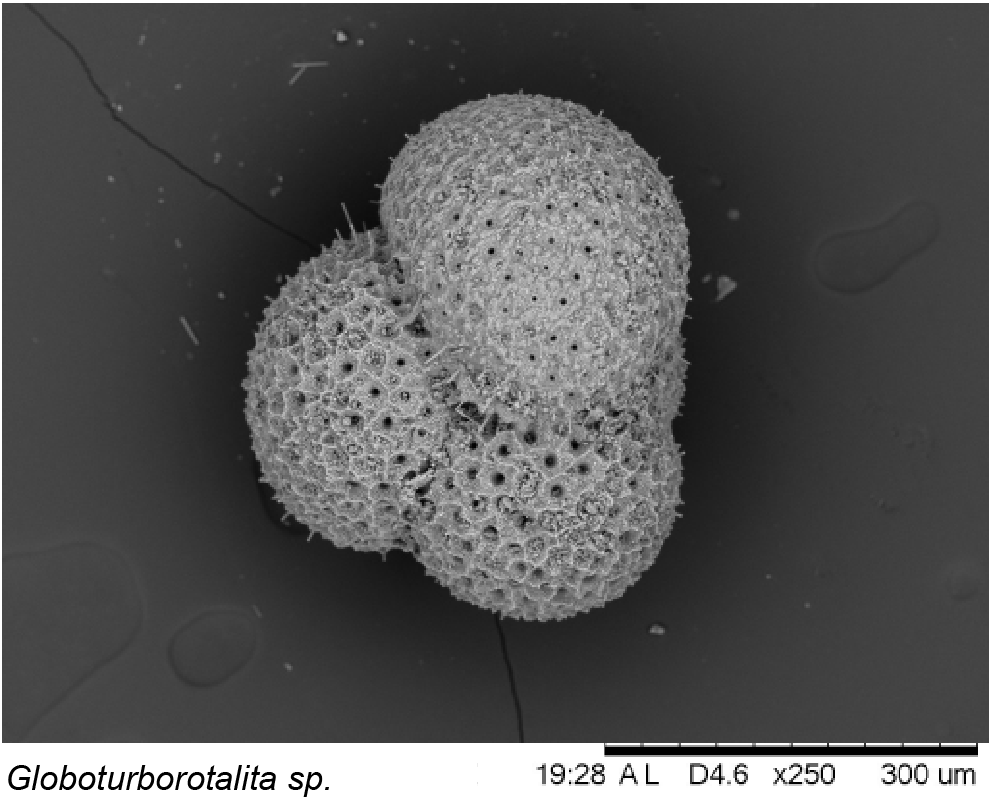
Figure F14. Globoturborotalita sp.
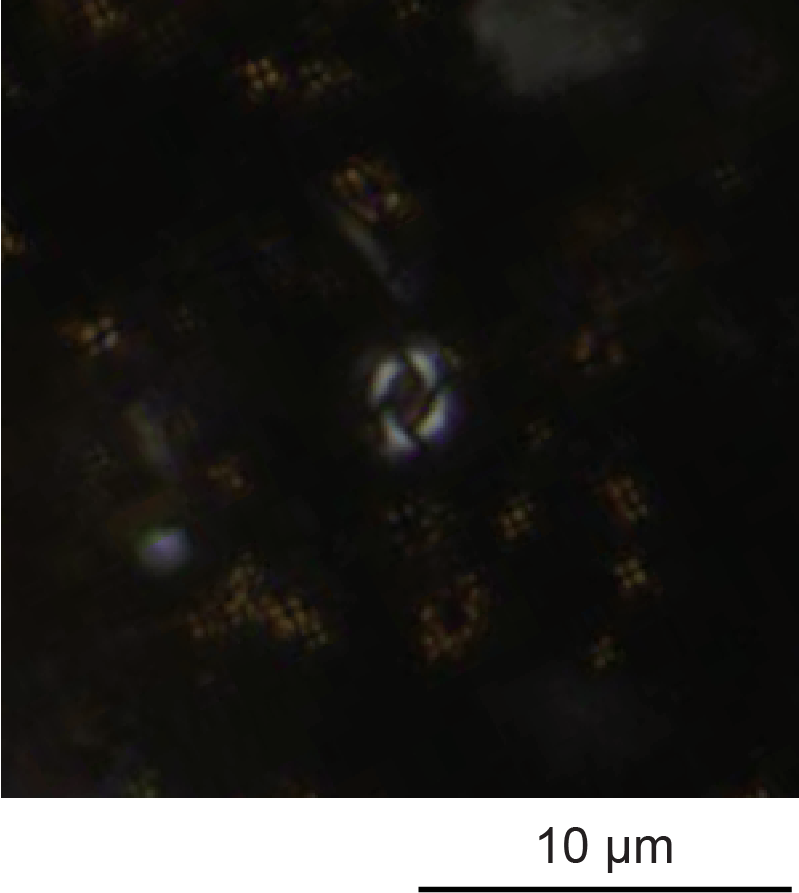
Figure F15. Emiliania huxleyi.
7. Paleomagnetism
None of the cores recovered at Site U1596 were suitable for paleomagnetic analysis.
8. Physical properties
There is a general trend of increasing P-wave velocity with increasing depth at Site U1596. More than 70% of discrete samples have grain densities <2.0 g/cm3. Thermal conductivity is lower than typical values for sediments at similar depths.
8.1. Whole-round GRA density, MS, P-wave velocity, and NGR
Figure F16 summarizes data collected on whole-round cores using the GRA densitometer, MS loop, and P-wave velocity logger on the WRMSL as well as NGR. All cited depths are on the CSF-A scale. Some systematic sources of error were noted in the data measured on the unconsolidated volcaniclastic-rich Hole U1596A formation that should be considered when interpreting absolute values and trends:
- Redistribution of unconsolidated volcaniclastic materials in core liners during coring and on the core retrieving platform can lead to sorting by particle size and density.
- Core liners sometimes contained large amounts of water. As a result, WRMSL measurements of bulk density are systematically lower than discrete measurements at this site.
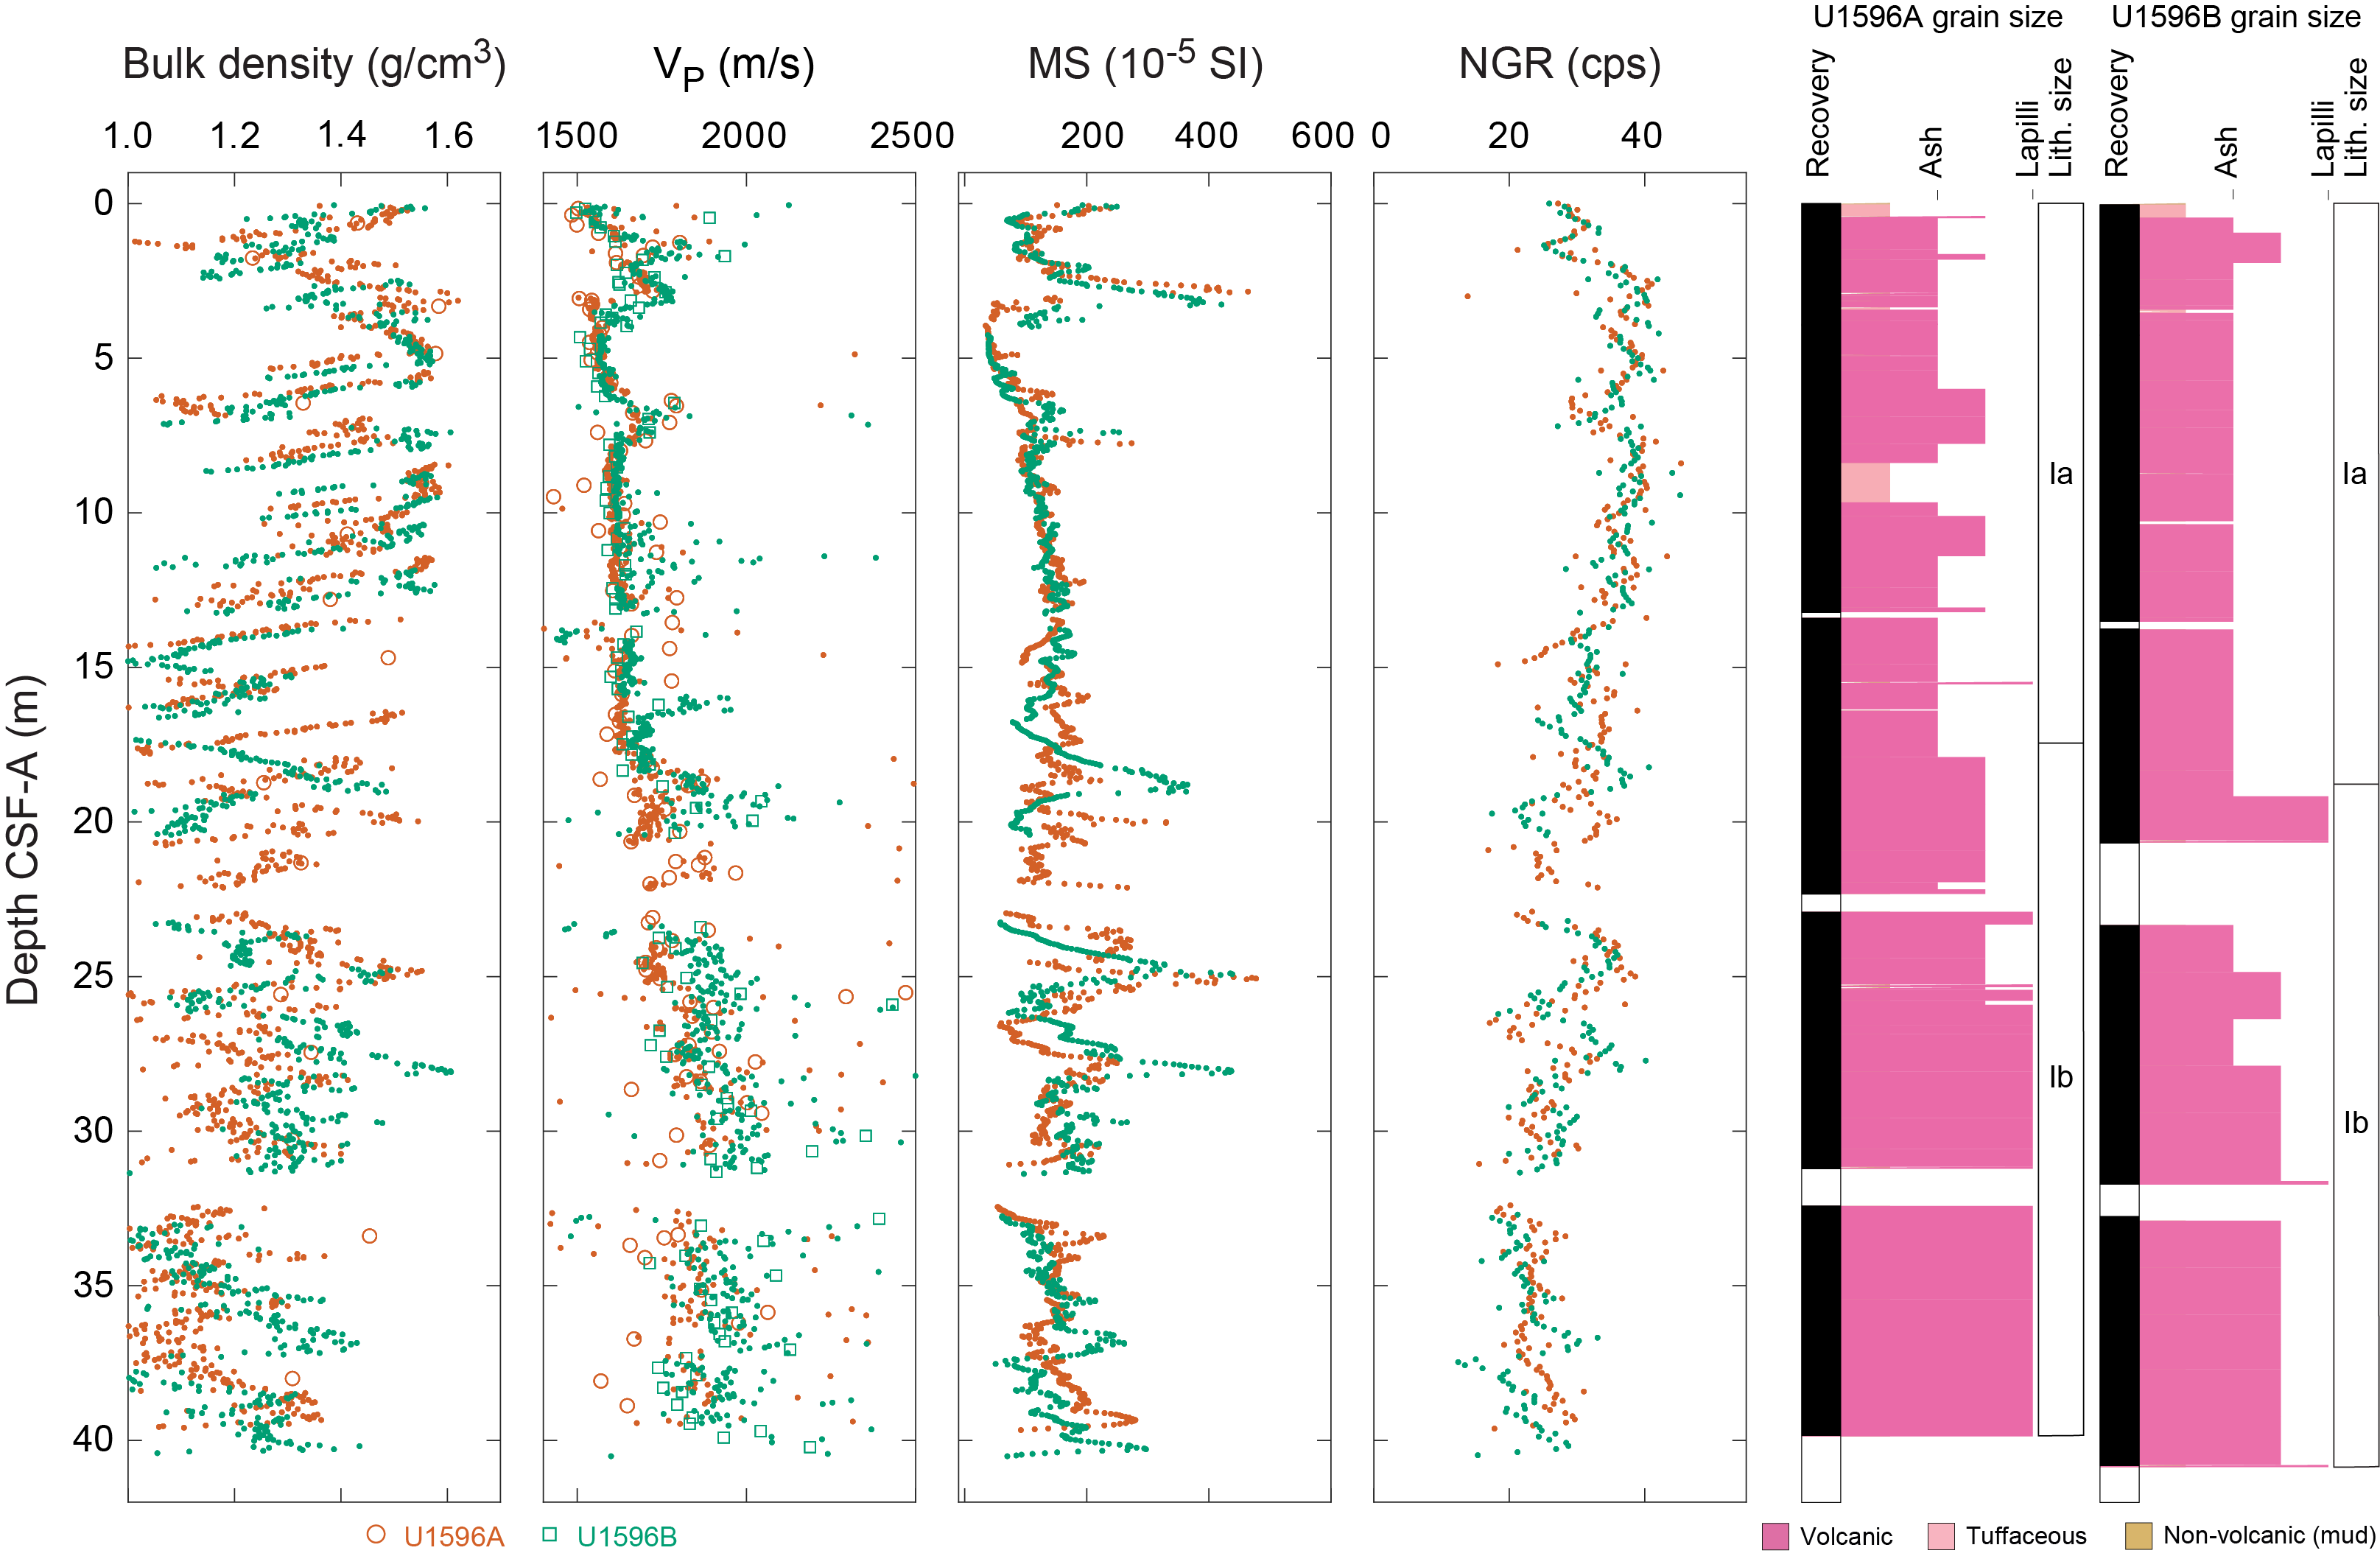
Figure F16. Physical properties.
Whole-round measurements in sections that match discrete measurement values on split cores are thus most reliable.
There is an overall trend of increasing P-wave velocity with increasing depth.
8.2. Discrete measurements
8.2.1. Material strength
Sediment strength was measured with a pocket penetrometer (PP) on the catwalk immediately after section splitting. Automated vane shear (AVS) strength measurements were made on working-half sections. Because volcaniclastic materials are not suitable for these measurements, few measurements could be made (7 AVS and 3 PP) (Figure F17; Table T8).
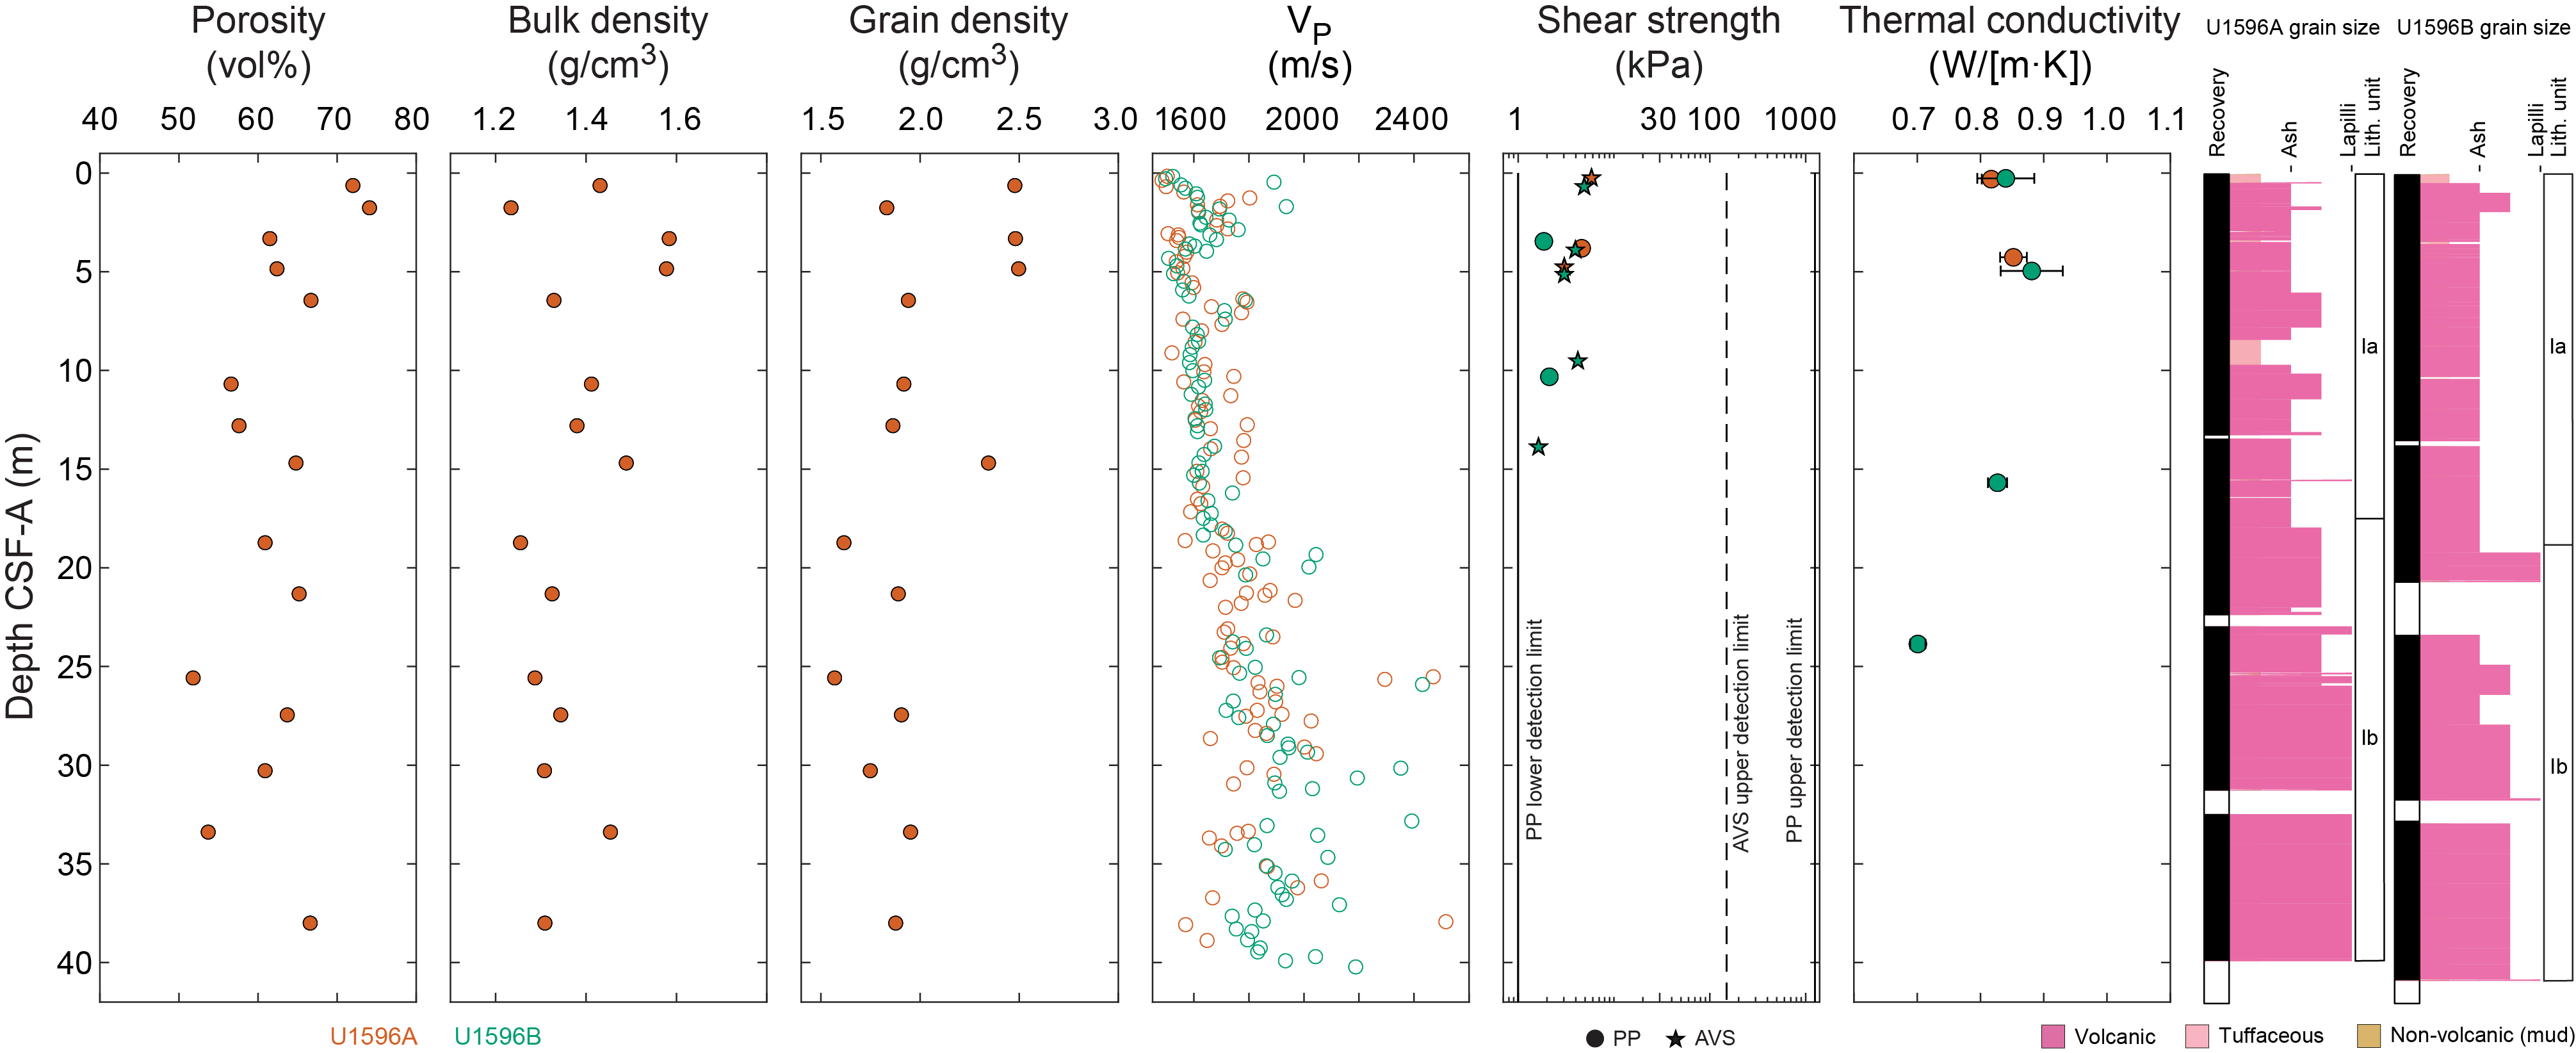
Figure F17. Discrete measurements.
8.2.2. P-wave velocity
Totals of 107 and 110 P-wave velocity measurements were conducted on working-half sections from Holes U1596A and U1596B, respectively (Figure F17; Table T9). Discrete measurements of P-wave velocity on working-half sections are similar to those measured using the WRMSL on whole-round cores (Figure F16). P-wave velocity increases with depth. The large scatter below 20 mbsf arises from a combination of measurements that capture bulk sediment properties (lower values) and measurements made across a small number of lapilli clasts (larger values). For lapilli and larger sized clasts, particle size was a substantial fraction of the distance between the two calipers used to make the measurements; hence, the measurements may not be representative of true bulk properties (i.e., sample size is not much larger than a representative elementary volume).
8.2.3. Moisture and density
A total of 15 discrete samples were collected for moisture and density (MAD) measurements from Hole U1596A (Figure F17; Table T10). Bulk density derived by MAD measurements on discrete samples should be more reliable than GRA data from WRMSL measurements on whole-round cores, although in both cases, coring and recovery disturbances may have impacted measured values. The length of hole cored at this site is too short to identify systematic trends with depth.
Porosity ranges 52–74 vol% (mean = 63 vol%; standard deviation = 6 vol%). Bulk density ranges 1.2–1.6 g/cm3 (mean = 1.38 g/cm3). Bulk density does not obviously increase with depth.
Grain density ranges 1.6–2.5 g/cm3 (mean = 2.0 g/cm3; median = 1.9 g/cm3). A total of 73% of discrete samples have grain densities <2.0 g/cm3.
8.2.4. Thermal conductivity
A total of five thermal conductivity measurements were made on selected working-half sections (Table T11; Figure F17). Measurements could not be made on coarse volcaniclastic materials; hence, the values we report are not representative of the full range of recovered lithologies. Compared to typical sediments in which thermal conductivity is close to 1 W/(m·K) at these depths below seafloor, the mean value of 0.84 W/(m·K) is low in volcaniclastic sediments at Site U1596.
9. Geochemistry
9.1. Interstitial water geochemistry
To determine the inorganic constituents of IW, a total of five water samples were taken from the mudline and whole-round squeezing of sediment intervals at Site U1596. Aliquots of IW were used for shipboard analyses, and the remaining water was taken for shore-based analysis, following protocols specified by individual scientists. The retrieved pore waters were analyzed shipboard for salinity, alkalinity, pH, major anions (Cl−, SO42−, and Br−), major cations (Ca2+, Na+, Mg2+, and K+), and major (S, Ca, Mg, K, and Na) and minor (B, Ba, Fe, Li, Mn, P, Si, and Sr) elements using the methods described in Geochemistry in the Expedition 398 methods chapter (Kutterolf et al., 2024).
9.1.1. Salinity, alkalinity, and pH
Salinity values are 40 in all IW samples (Table T12; Figure F18). No variations were recorded.
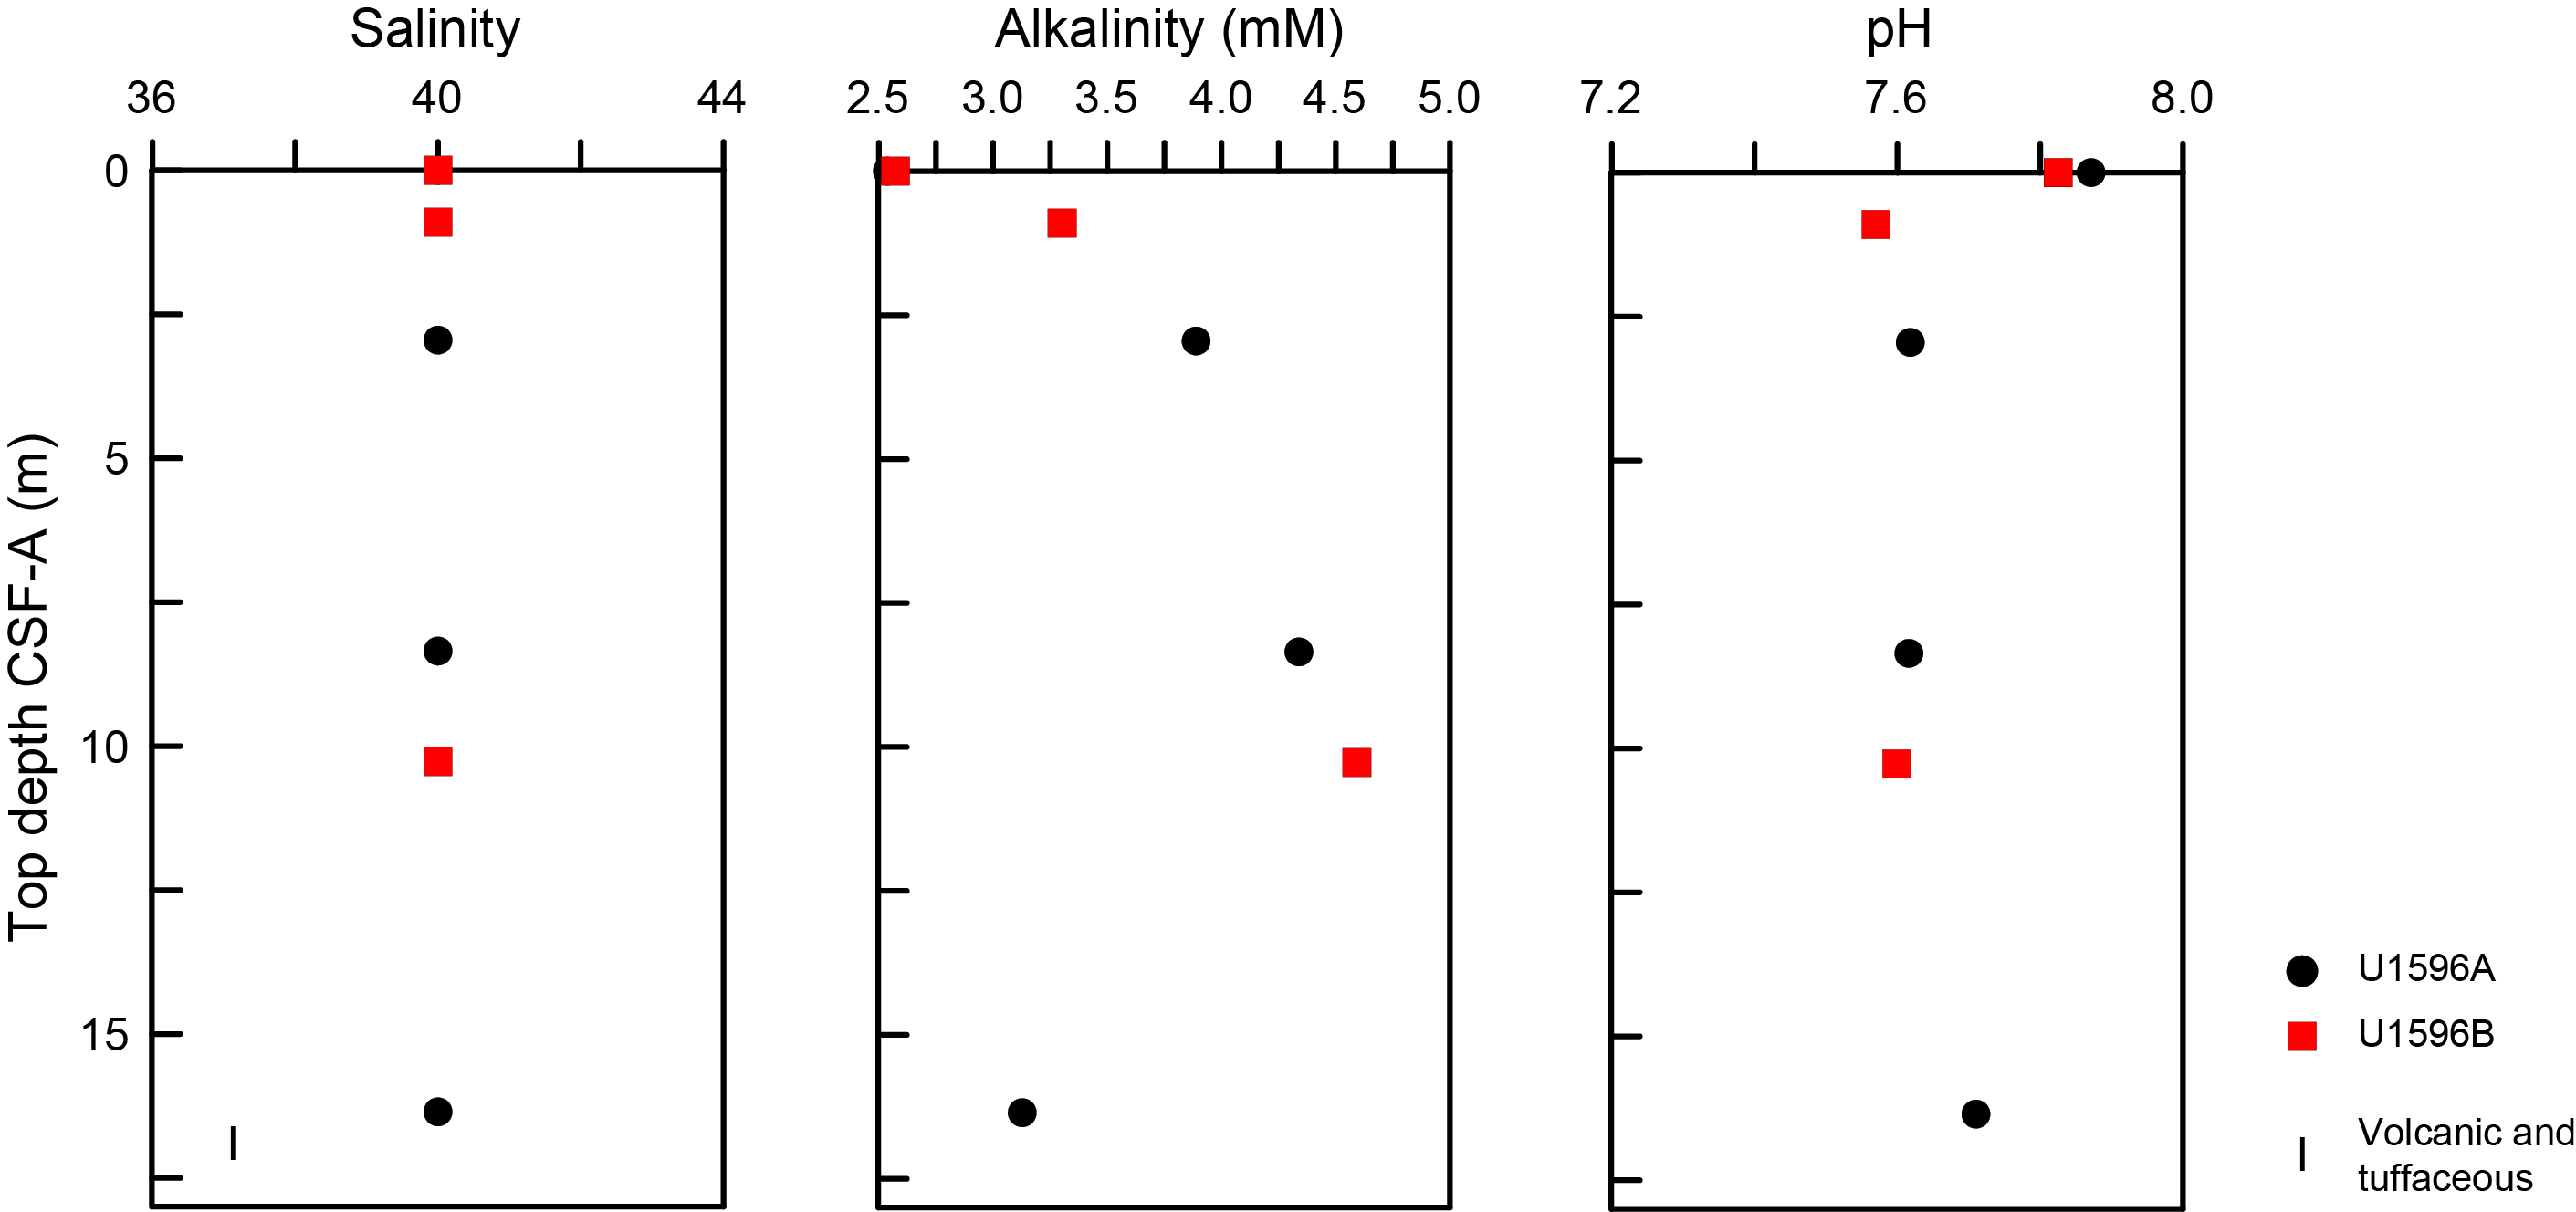
Figure F18. IW salinity, alkalinity, and pH.
Alkalinity increases (2.5–4.6 mM) with depth to 10.3 mbsf before decreasing again to 16.4 mbsf (Table T12; Figure F18).
Values for pH show variation within the sampled depths, ranging 7.6–7.9 with the highest value recorded in the mudline samples (Table T12; Figure F18). IW pH values generally increase with depth.
9.1.2. Bromide, chloride, boron, sodium, potassium, magnesium, calcium, and sulfate
Bromide, Cl−, B, Na+, K+, Mg2+, Ca2+, and SO42− data are plotted in Figure F19 and provided in Table T13. There is noticeable variation in Cl−, B, Mg2+, and Ca2+ concentrations between Holes U1596A and U1596B. In general, Br−, B, and Na+ have similar profiles, especially in samples collected in Hole U1596A. Potassium decreases to a minimum at 10.3 mbsf, whereas SO42− reaches a minimum at 8.4 mbsf.
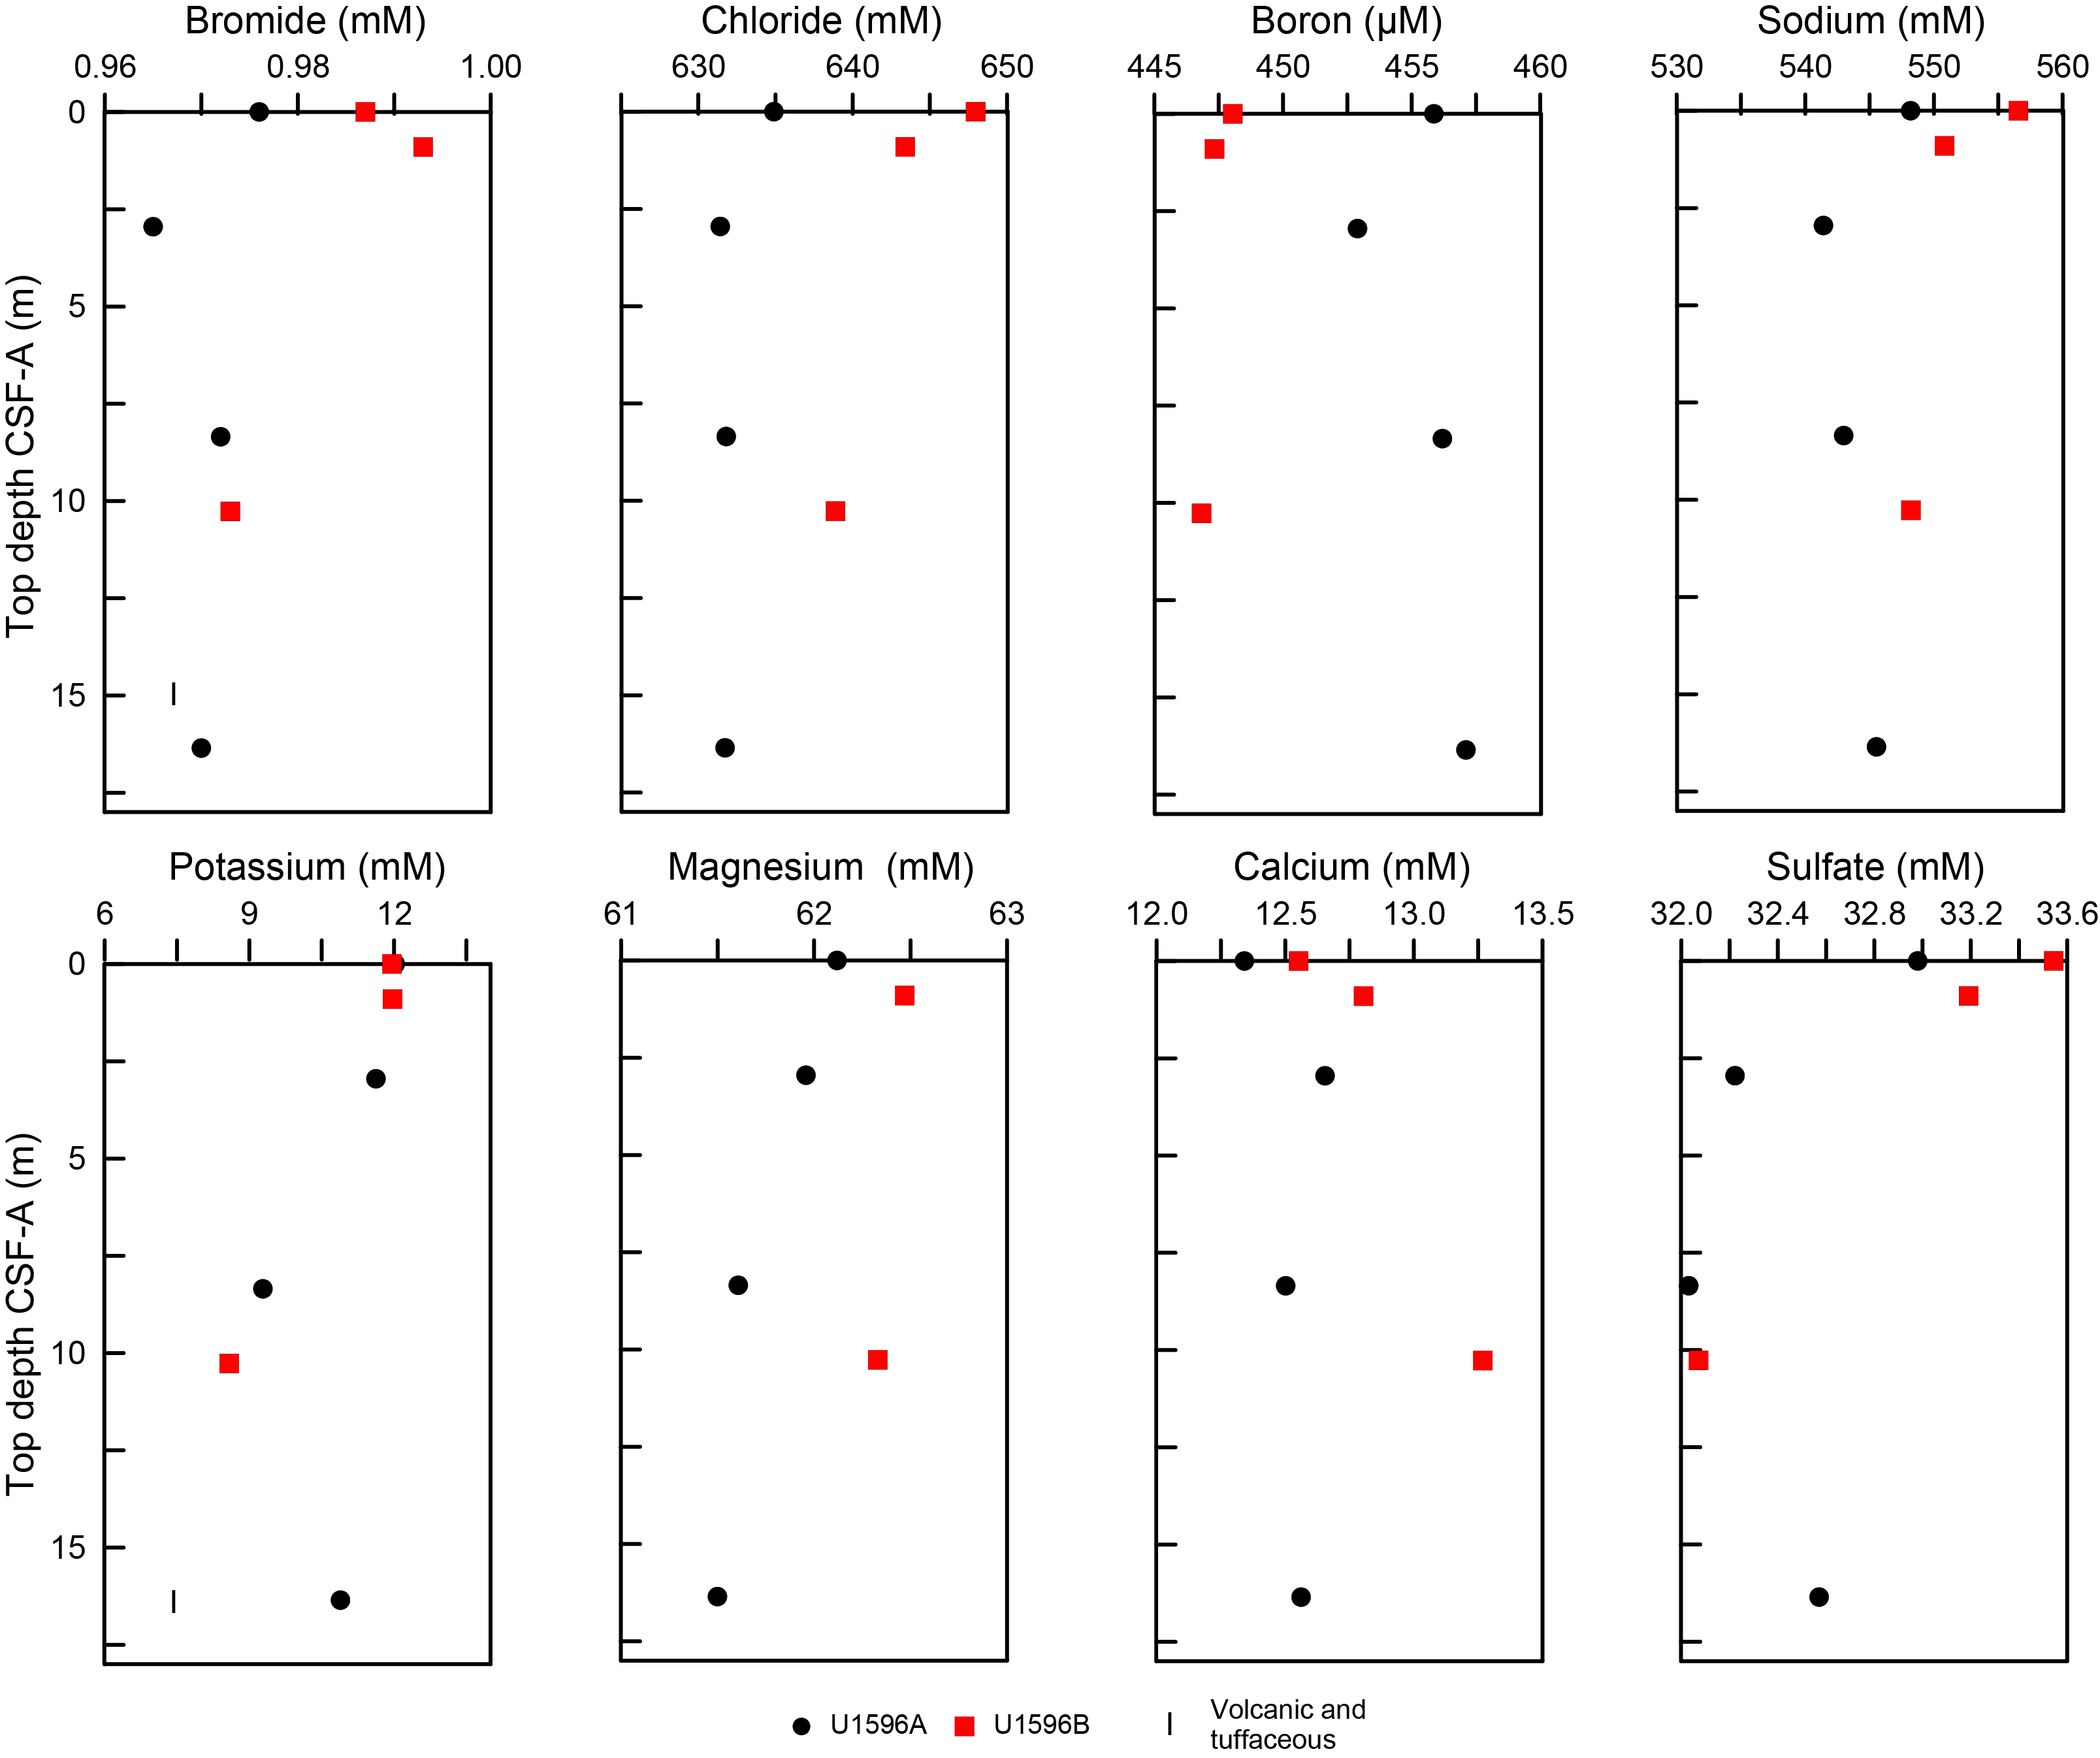
Figure F19. IW Br, Cl, B, Na, K, Mg, Ca, and SO42−.
9.1.3. Lithium, iron, manganese, barium, silicon, and strontium
Lithium, Fe, Mn, Ba, Si, and Sr all initially increase with depth, reaching maxima at either 2.9 mbsf (Sr, Mn, and Ba) or 10.3 mbsf (Li, Fe, and Si) (Table T13; Figure F20). Below each respective maximum, all profiles show a decrease to the bottom of the hole.
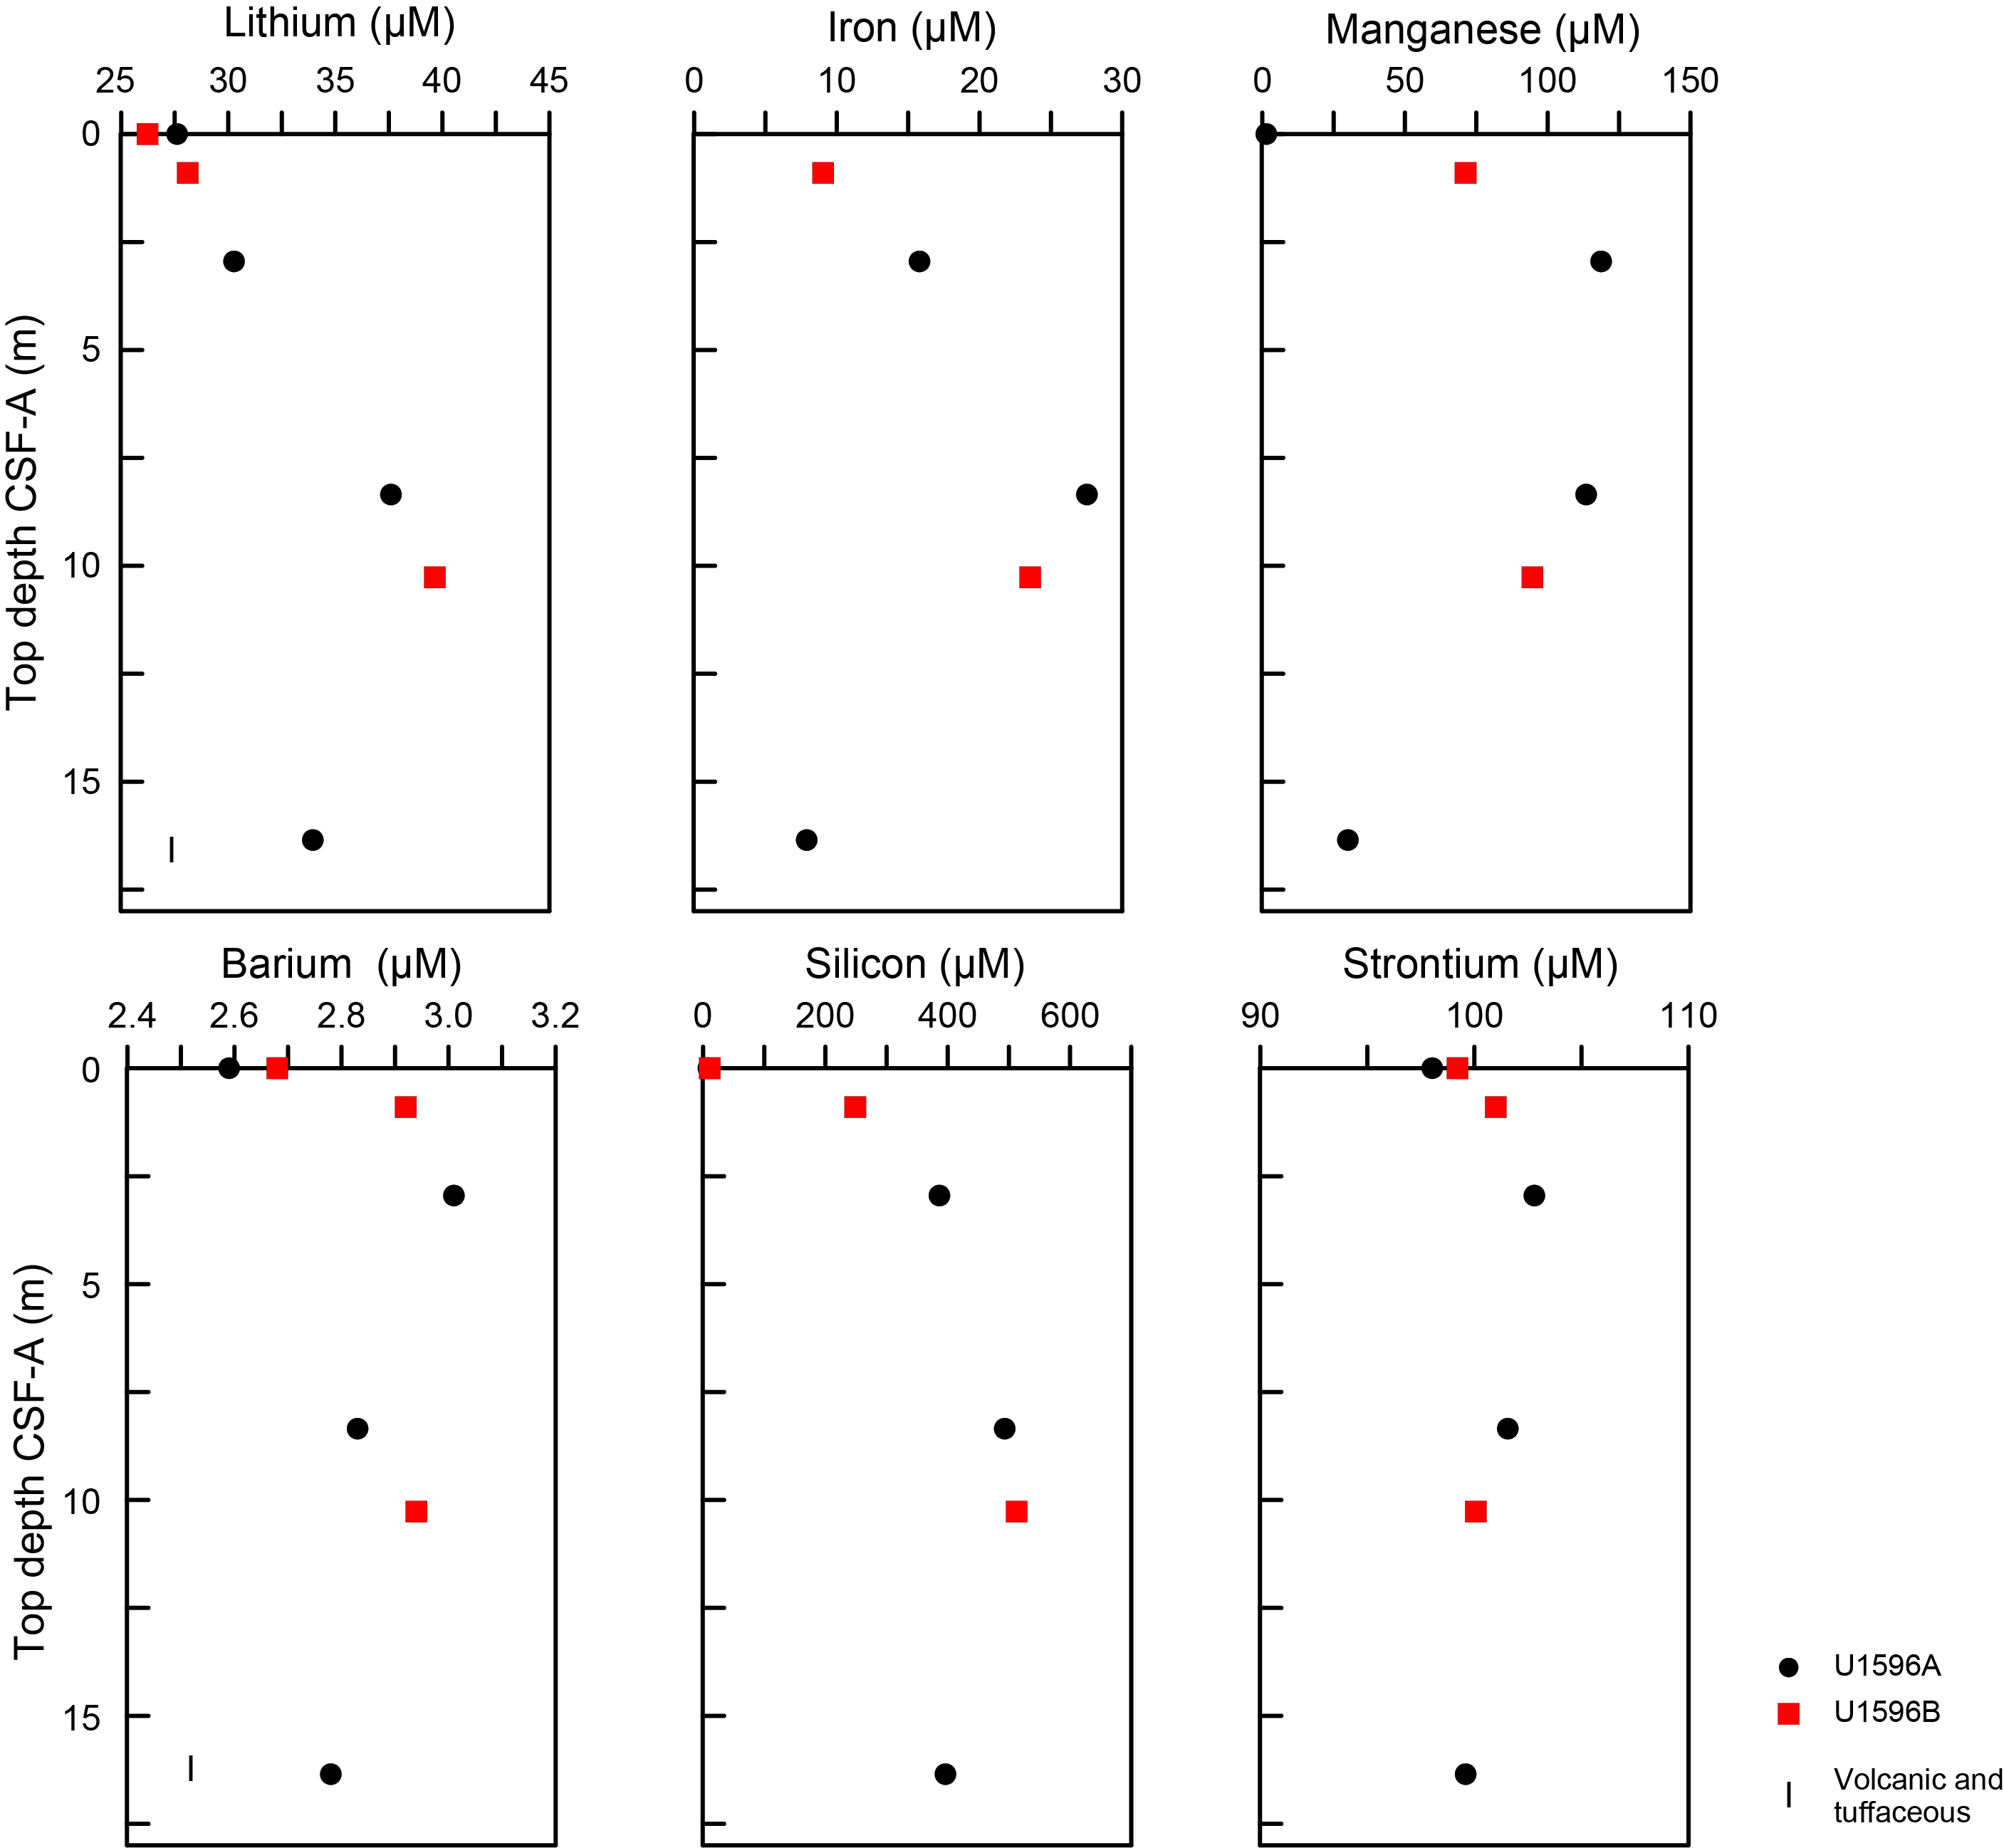
Figure F20. IW Li, Fe, Mn, Ba, Si, and Sr.
9.2. Sediment bulk geochemistry
Five sediment samples were analyzed for bulk geochemistry (Table T14). All were analyzed for total carbon, hydrogen, and nitrogen (CHN) and for inorganic carbon and carbonate content (see Geochemistry in the Expedition 398 methods chapter [Kutterolf et al., 2024]). For CHN analysis, duplicates were run for ~10% of the samples to determine analytical reproducibility (standard deviation: N = 0.01; C = 0.04). Carbonate values peaked at 1.7 wt% (Table T14).
9.2.1. Sapropel identification
Total organic carbon (TOC) was calculated using total carbon and inorganic carbon values. Following the convention set forth by Kidd et al. (1978), units with TOC >2.0 wt% were identified as sapropels and units with TOC values of 0.5–2.0 wt% were identified as sapropelitic. Using these values, no units were identified as sapropels or sapropelitic (Table T14).
9.3. Headspace gas analysis
Headspace gas analyses were performed at a resolution of one sample per full-length core (9.5 m advance) throughout Hole U1596A. The aim was to monitor the presence and abundance of C1–C3 hydrocarbons as part of the standard International Ocean Discovery Program safety protocol (Pimmel and Claypool, 2001). A total of five headspace gas samples from this hole were analyzed using gas chromatography (GC) (see Geochemistry in the Expedition 398 methods chapter [Kutterolf et al., 2024]). Methane, ethane, and propane concentrations were below the detection limit throughout Hole U1596A. Concentrations of heavier hydrocarbons (iso-butane, n-butane, and n-pentane, etc.) were below the detection limit throughout Hole U1596A.
10. Microbiology
In total, two whole-round core samples were collected for microbiological analyses at Site U1596 (Table T15). After the cores were transferred to the core retrieving platform, the whole-round samples were collected based on their color. To choose the appropriate incubation temperature, the core temperature was measured in the section above the sample.
The whole rounds were transferred to the laboratory, and the following subsamples for different analyses were collected: POLYmeta, POLYmicro, POLYanae, POLYcell, POLYFe, POLYmicroscope, and POLYFe-agar. In total, 14 subsamples were collected for microbiological analysis from the whole-round core samples, and 11 samples were collected from the mudline of Core 398-U1596B-1H for microbial community composition analysis.
References
Dimiza, M.D., Triantaphyllou, M.V., and Dermitzakis, M.D., 2008. Seasonality and Ecology of Living Coccolithophores in Eastern Mediterranean Coastal Environment (Andros Island, Middle Aegean Sea). Micropaleontology, 54(2):159–175. http://www.jstor.org/stable/30130910
Druitt, T., Kutterolf, S., and Höfig, T.W., 2022. Expedition 398 Scientific Prospectus: Hellenic Arc Volcanic Field. International Ocean Discovery Program. https://doi.org/10.14379/iodp.sp.398.2022
Druitt, T.H., Kutterolf, S., Ronge, T.A., Beethe, S., Bernard, A., Berthod, C., Chen, H., Chiyonobu, S., Clark, A., DeBari, S., Fernandez Perez, T.I., Gertisser, R., Hübscher, C., Johnston, R.M., Jones, C., Joshi, K.B., Kletetschka, G., Koukousioura, O., Li, X., Manga, M., McCanta, M., McIntosh, I., Morris, A., Nomikou, P., Pank, K., Peccia, A., Polymenakou, P.N., Preine, J., Tominaga, M., Woodhouse, A., and Yamamoto, Y., 2024. Site U1589. In Druitt, T.H., Kutterolf, S., Ronge, T.A., and the Expedition 398 Scientists, Hellenic Arc Volcanic Field. Proceedings of the International Ocean Discovery Program, 398: College Station, TX (International Ocean Discovery Program). https://doi.org/10.14379/iodp.proc.398.103.2024
Fisher, R.V., and Schmincke, H.-U., 1984. Pyroclastic Rocks: Berlin (Springer). https://doi.org/10.1007/978-3-642-74864-6
Johnston, E.N., Sparks, R.S.J., Nomikou, P., Livanos, I., Carey, S., Phillips, J.C., and Sigurdsson, H., 2015. Stratigraphic relations of Santorini’s intracaldera fill and implications for the rate of post-caldera volcanism. Journal of the Geological Society (London, UK), 172(3):323–335. https://doi.org/10.1144/jgs2013-114
Jutzeler, M., White, J.D.L., Talling, P.J., McCanta, M., Morgan, S., Le Friant, A., and Ishizuka, O., 2014. Coring disturbances in IODP piston cores with implications for offshore record of volcanic events and the Missoula megafloods. Geochemistry, Geophysics, Geosystems, 15(9):3572–3590. https://doi.org/10.1002/2014GC005447
Kidd, R.B., Cita, M.B., and Ryan, W.B.F., 1978. Stratigraphy of eastern Mediterranean sapropel sequences recovered during DSDP Leg 42A and their paleoenvironmental significance. In Hsü, K., Montadert, L., et al., Initial Reports of the Deep Sea Drilling Project. 42(1): Washington, DC (US Government Printing Office), 421–443. https://doi.org/10.2973/dsdp.proc.42-1.113-1.1978
Kutterolf, S., Druitt, T.H., Ronge, T.A., Beethe, S., Bernard, A., Berthod, C., Chen, H., Chiyonobu, S., Clark, A., DeBari, S., Fernandez Perez, T.I., Gertisser, R., Hübscher, C., Johnston, R.M., Jones, C., Joshi, K.B., Kletetschka, G., Koukousioura, O., Li, X., Manga, M., McCanta, M., McIntosh, I., Morris, A., Nomikou, P., Pank, K., Peccia, A., Polymenakou, P.N., Preine, J., Tominaga, M., Woodhouse, A., and Yamamoto, Y., 2024. Expedition 398 methods. In Druitt, T.H., Kutterolf, S., Ronge, T.A., and the Expedition 398 Scientists, Hellenic Arc Volcanic Field. Proceedings of the International Ocean Discovery Program, 398: College Station, TX (International Ocean Discovery Program). https://doi.org/10.14379/iodp.proc.398.102.2024
Nomikou, P., Druitt, T.H., Hübscher, C., Mather, T.A., Paulatto, M., Kalnins, L.M., Kelfoun, K., Papanikolaou, D., Bejelou, K., Lampridou, D., Pyle, D.M., Carey, S., Watts, A.B., Weiß, B., and Parks, M.M., 2016. Post-eruptive flooding of Santorini caldera and implications for tsunami generation. Nature Communications, 7(1):13332. https://doi.org/10.1038/ncomms13332
Pimmel, A., and Claypool, G., 2001. Introduction to shipboard organic geochemistry on the JOIDES Resolution. Ocean Drilling Program Technical Note, 30. https://doi.org/10.2973/odp.tn.30.2001