McCaig, A.M., Lang, S.Q., Blum, P., and the Expedition 399 Scientists
Proceedings of the International Ocean Discovery Program Volume 399
publications.iodp.org
https://doi.org/10.14379/iodp.proc.399.103.2025
Site U13091
![]() A.M. McCaig,
A.M. McCaig,
![]() S.Q. Lang,
S.Q. Lang,
![]() P. Blum,
P. Blum,
![]() N. Abe,
N. Abe,
![]() W. Brazelton,
W. Brazelton,
![]() R. Coltat,
R. Coltat,
![]() J.R. Deans,
J.R. Deans,
![]() K.L. Dickerson,
K.L. Dickerson,
![]() M. Godard,
M. Godard,
![]() B.E. John,
B.E. John,
![]() F. Klein,
F. Klein,
![]() R. Kuehn,
R. Kuehn,
![]() K.-Y. Lin,
K.-Y. Lin,
![]() C.J. Lissenberg,
C.J. Lissenberg,
![]() H. Liu,
H. Liu,
![]() E.L. Lopes,
E.L. Lopes,
![]() T. Nozaka,
T. Nozaka,
![]() A.J. Parsons,
A.J. Parsons,
![]() V. Pathak,
V. Pathak,
![]() M.K. Reagan,
M.K. Reagan,
![]() J.A. Robare,
J.A. Robare,
![]() I.P. Savov,
I.P. Savov,
![]() E. Schwarzenbach,
E. Schwarzenbach,
![]() O.J. Sissmann,
O.J. Sissmann,
![]() G. Southam,
G. Southam,
![]() F. Wang, and
F. Wang, and
![]() C.G. Wheat2
C.G. Wheat2
1 McCaig, A.M, Lang, S.Q., Blum, P., Abe, N., Brazelton, W., Coltat, R., Deans, J.R., Dickerson, K.L., Godard, M., John, B.E., Klein, F., Kuehn, R., Lin, K.-Y., Lissenberg, C.J., Liu, H., Lopes, E.L., Nozaka, T., Parsons, A.J., Pathak, V., Reagan, M.K., Robare, J.A., Savov, I.P., Schwarzenbach, E., Sissmann, O.J., Southam, G., Wang, F., and Wheat, C.G., 2025. Site U1309. In McCaig, A.M., Lang, S.Q., Blum, P., and the Expedition 399 Scientists, Building Blocks of Life, Atlantis Massif. Proceedings of the International Ocean Discovery Program, 399: College Station, TX (International Ocean Discovery Program). https://doi.org/10.14379/iodp.proc.399.103.2025
2 Expedition 399 Scientists' affiliations.
1. Background and objectives
Site U1309 is located on the central dome of Atlantis Massif, 14–15 km west of the median valley axis of the Mid-Atlantic Ridge and ~5 km north of the Lost City hydrothermal field. The seafloor is interpreted to be a gently sloping, corrugated detachment fault surface (Figures F1, F2, F3). The site was established by Integrated Ocean Drilling Program Expeditions 304 and 305 in 2004 and 2005, respectively, and two main holes (U1309B and U1309D) were drilled together with five shallow and failed holes (Expedition 304/305 Scientists, 2006b; Blackman et al., 2011). During Expedition 304, a hard rock reentry system comprising 25 m of 13⅜ inch casing was established in Hole U1309D using a hammer drill. A total of 4.5 m of casing was left protruding from the seafloor, and a reentry cone was successfully dropped onto the casing. The hole was then deepened to 131 meters below seafloor (mbsf). After carrying out other operations, Hole U1309D was deepened further to 401 mbsf and logged. Expedition 305 followed directly after Expedition 304 and continued to deepen Hole U1309D to 1415 mbsf in two stages with logging runs in the middle and at the end of coring. The hole was reentered and logged during Integrated Ocean Drilling Program Expedition 340T in 2012 and remained undisturbed from 25 February 2012 until operations during Expedition 399.
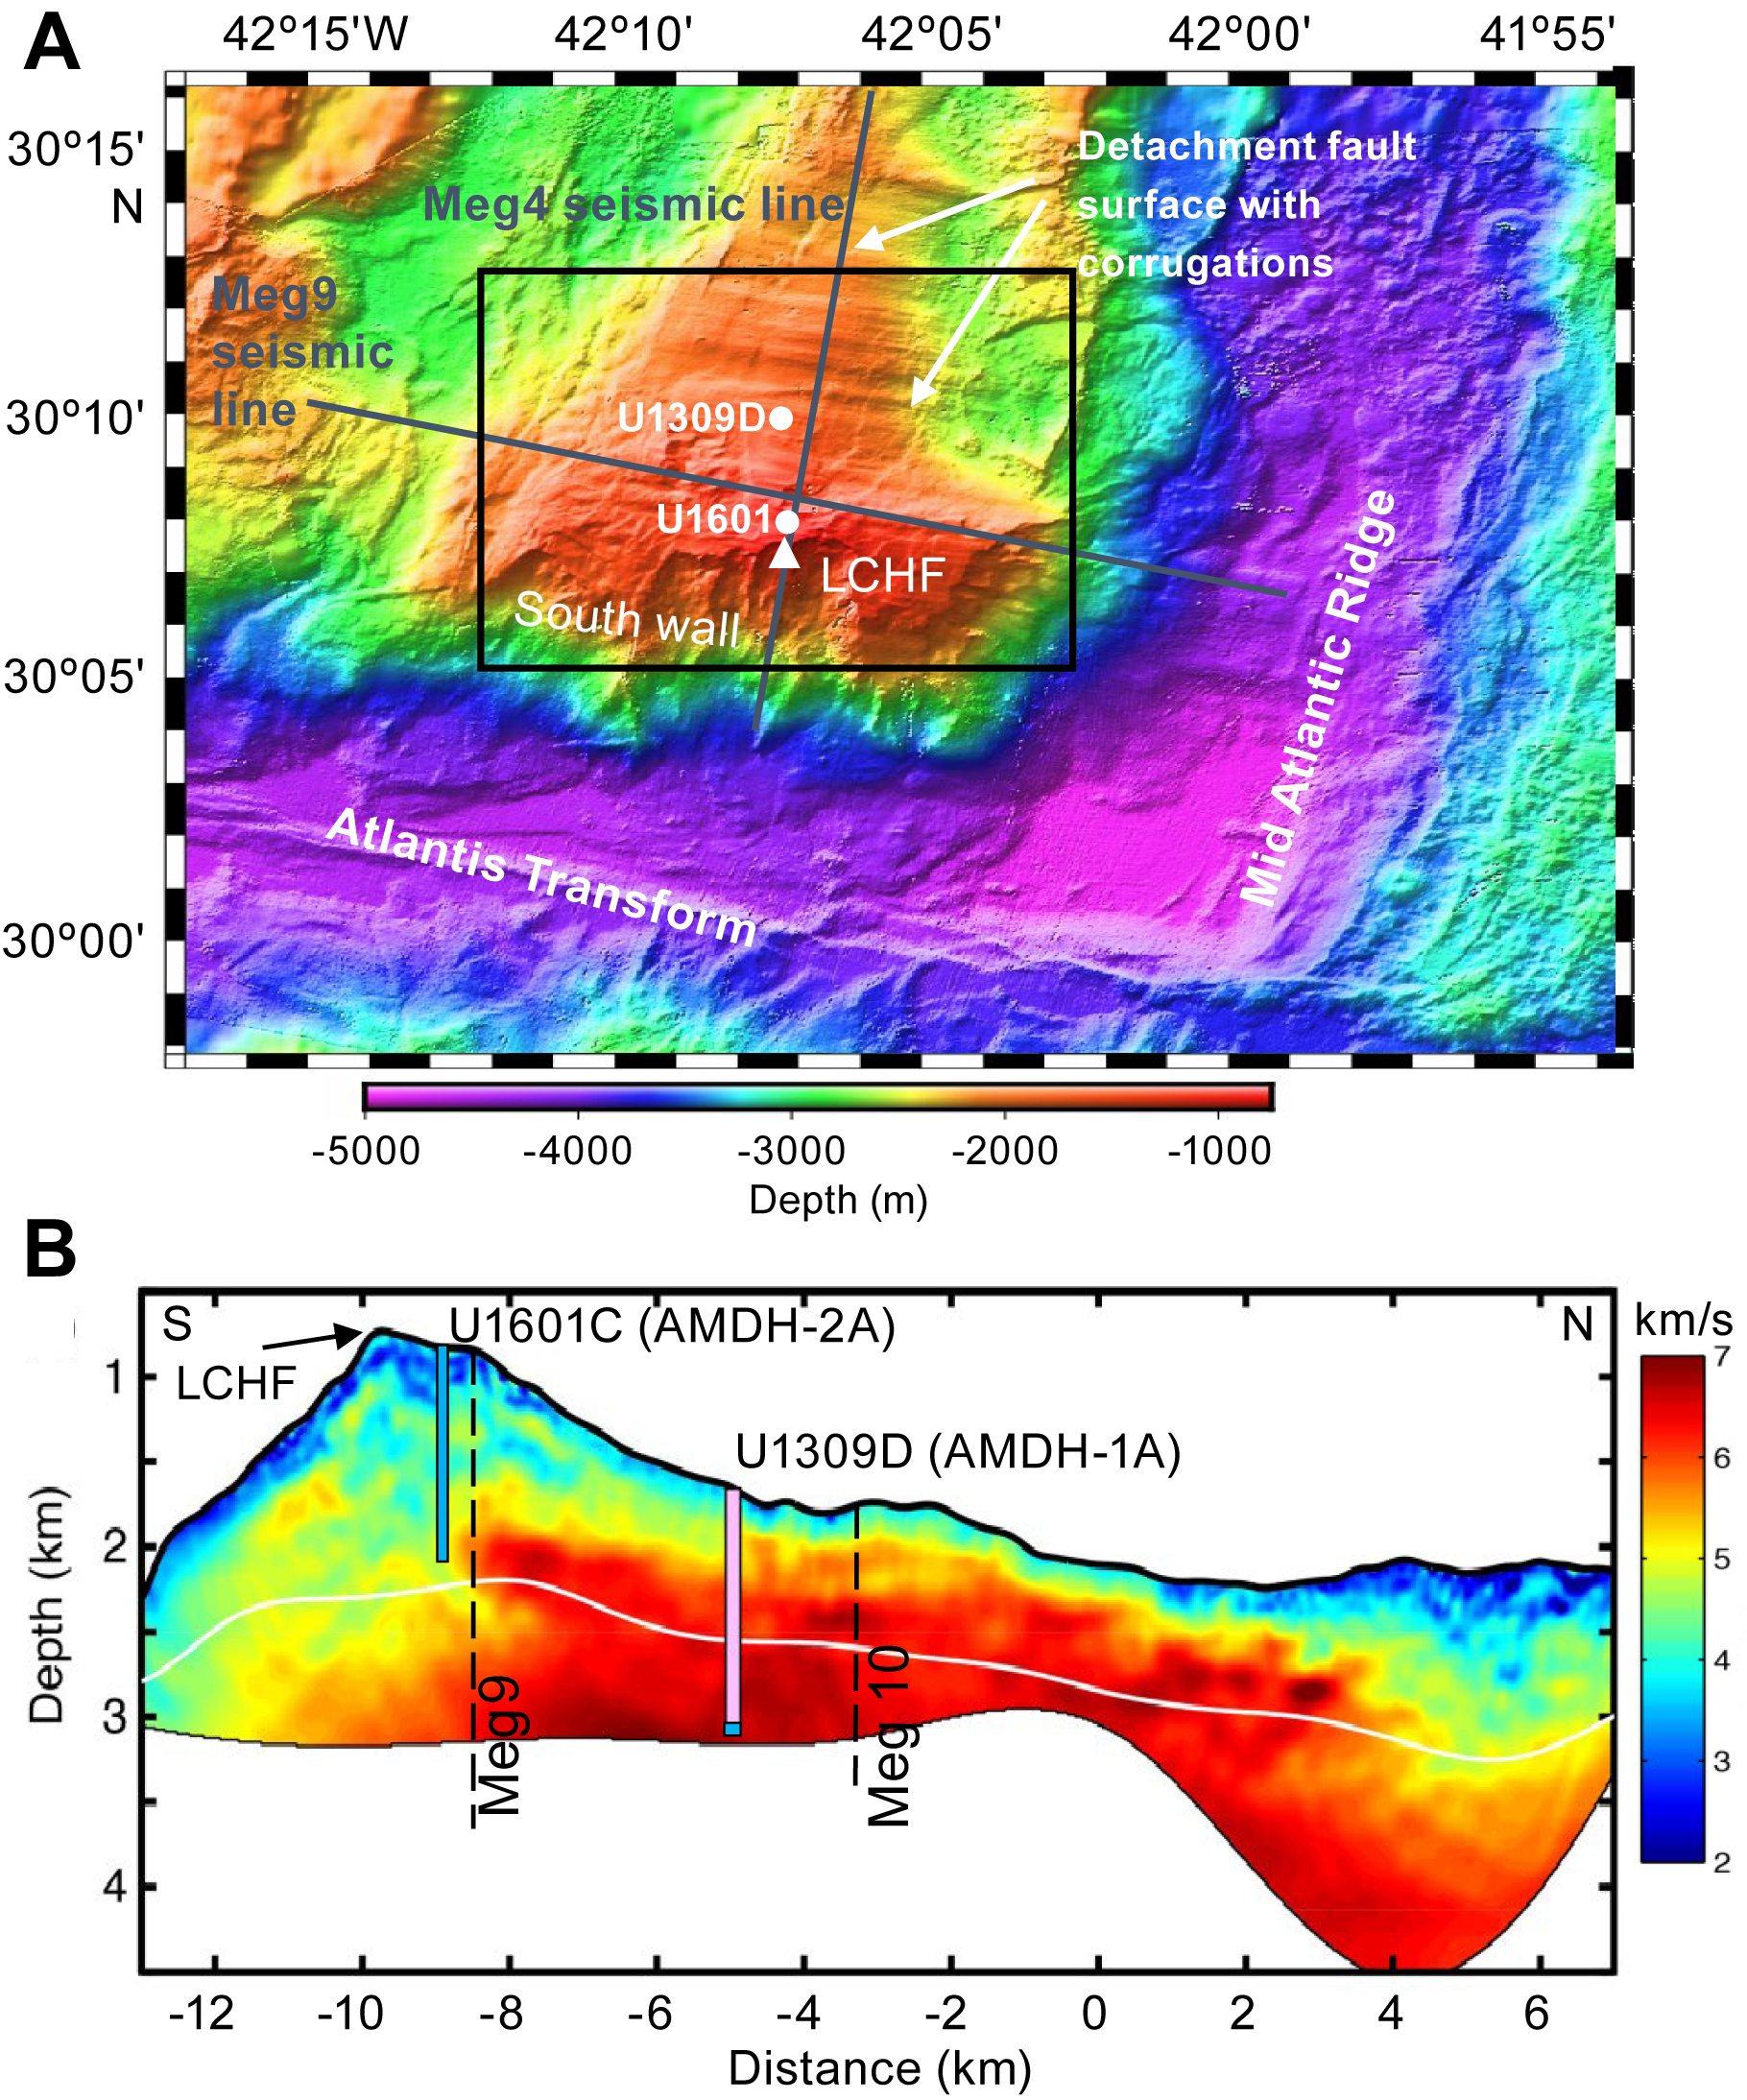
Figure F1. Atlantis Massif.
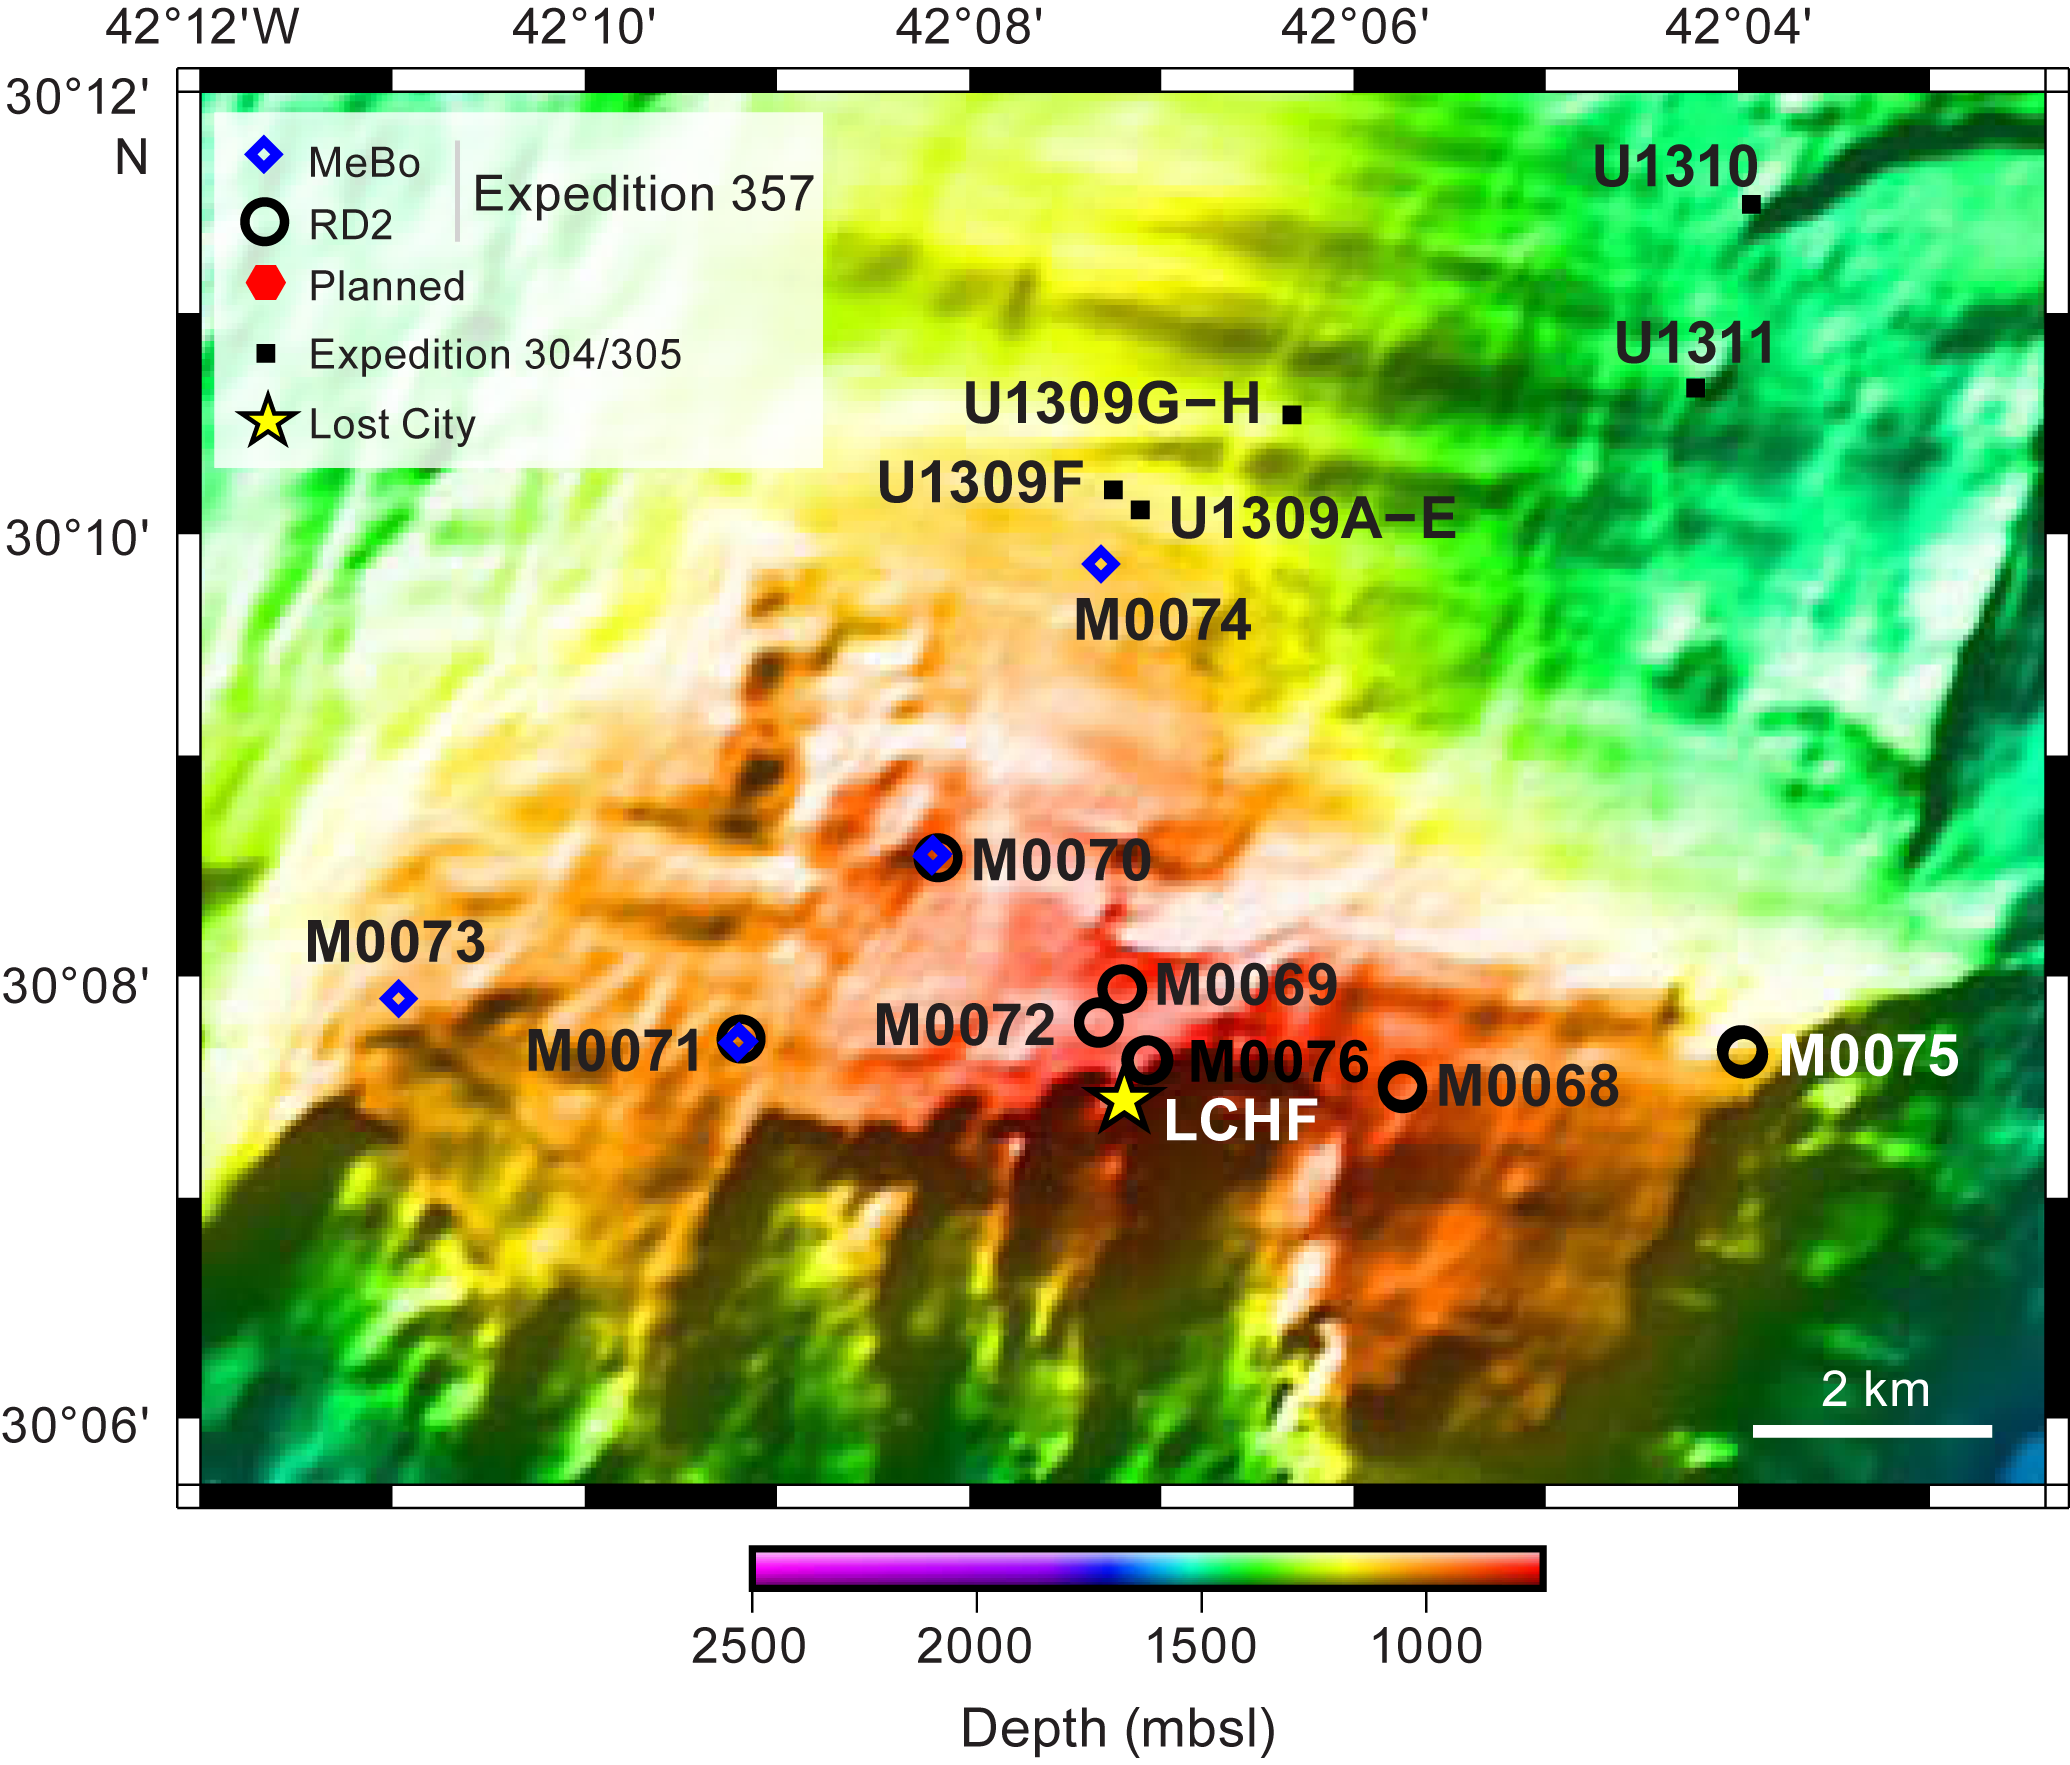
Figure F2. Location of previous drilling.
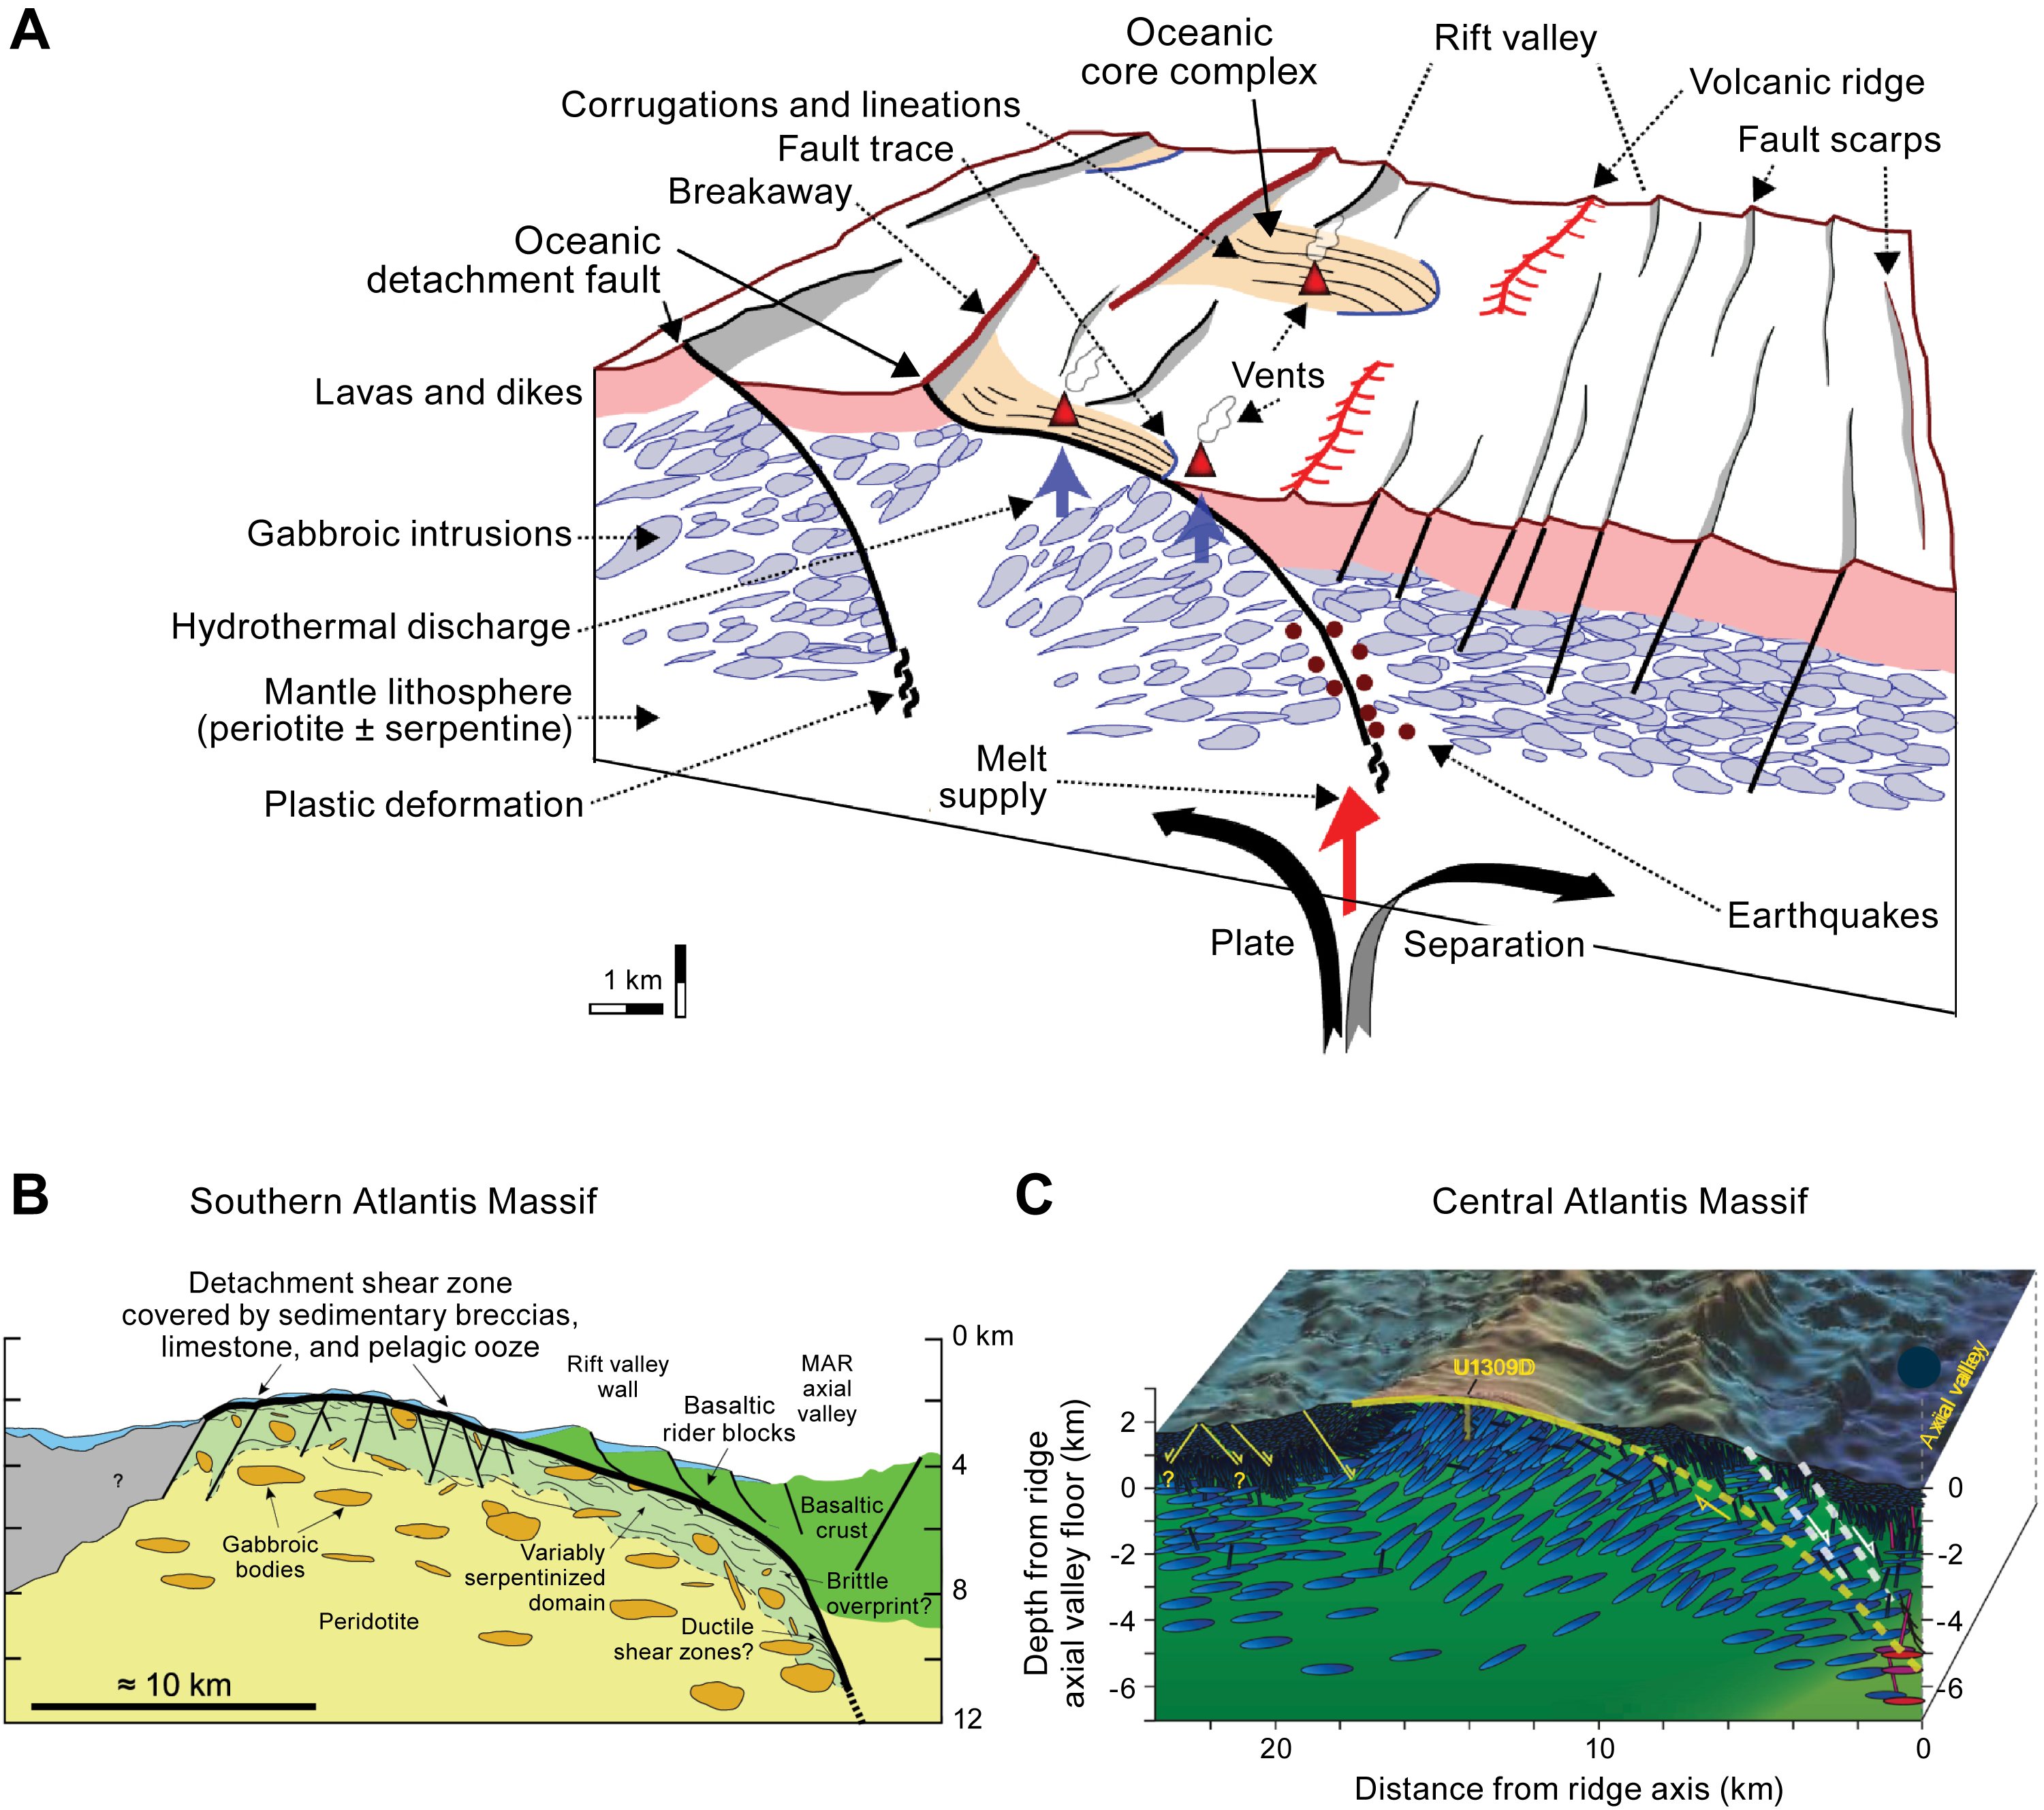
Figure F3. Tectonomagmatic evolution of heterogeneous lithosphere.
A continuous sequence of gabbroic rocks, including troctolites and olivine-rich troctolites, olivine gabbros, oxide gabbros, and rare leucocratic intrusions, was sampled in Hole U1309D (Figure F4). Very minor screens (<1 m thick) of harzburgite are present in the uppermost 300 m of the section (Godard et al., 2009; Tamura et al., 2008). Diabase/basalt intrusions with chilled margins form ~40% of the uppermost 120 m of the sequence, with rare occurrences at greater depths. There are many igneous contacts within the section, with units varying from centimeters to tens of meters (John et al., 2009). More evolved units generally (but not always) intrude into more primitive units.
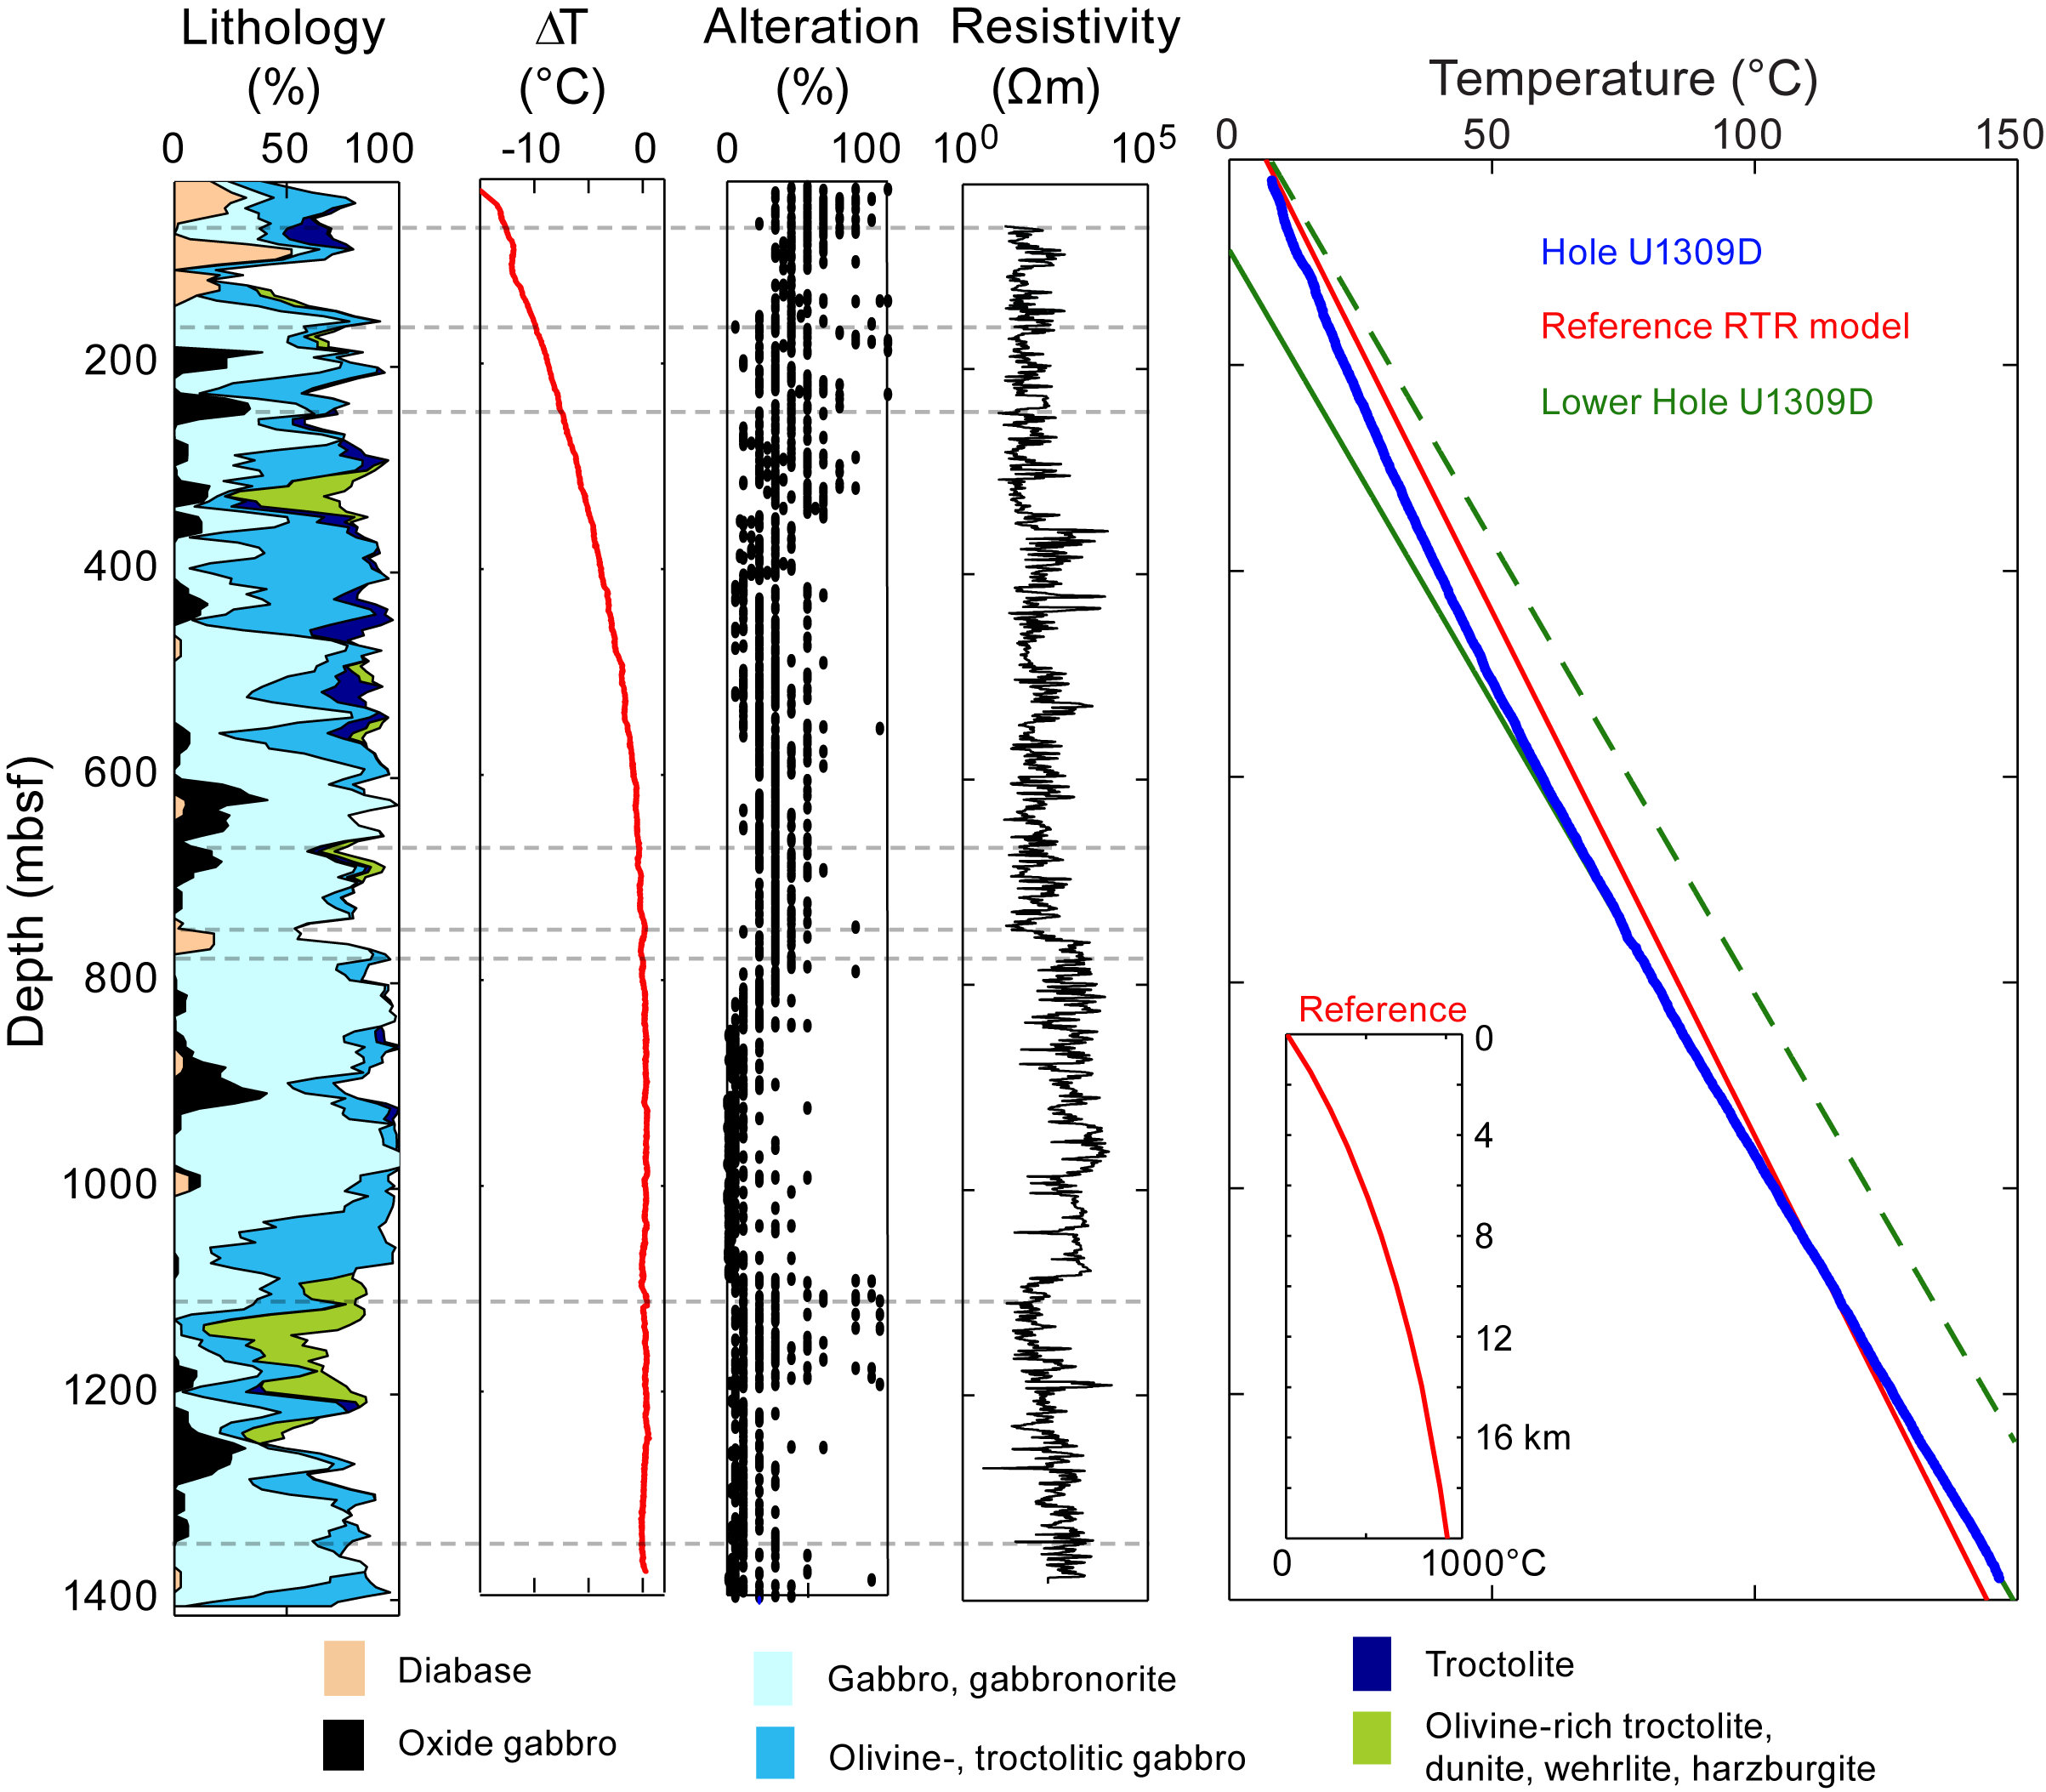
Figure F4. Lithology, temperature, and resistivity logging results.
Crystal-plastic deformation is restricted to narrow zones in the section, mainly above 300 mbsf. Cataclasis and fault breccia are present in several strands in the uppermost 80 m of the section, a fault zone at ~160 mbsf, and a prominent 6 m thick fault zone at 744–750 mbsf within a damage zone at 742–761 mbsf (Michibayashi et al., 2008; John et al., 2009). A zone at 1100 mbsf is suggested by temperature logging (below) and has a weak signal in the core.
Alteration is most intense in the uppermost 300 m of the section, where clinopyroxene is usually at least partly altered to amphibole (hornblende and actinolite) in both gabbro and diabase. In olivine-bearing rocks, a corona reaction between olivine and plagioclase to form tremolite and chlorite goes to completion with either olivine or plagioclase completely replaced. Below 300 mbsf, the corona reaction only goes to completion around faults and gabbro contacts (Nozaka and Fryer, 2011), and rodingitic reactions where olivine is serpentinized and plagioclase is replaced by prehnite ± hydrogarnet are seen (Frost et al., 2008). The latest reactions and veins contain saponite and zeolites (Nozaka et al., 2008) and may be forming in near ambient conditions.
Temperature logging (Figure F4) occurred at the end of Expedition 305 and again during Expedition 340T, 7 y later (Expedition 304/305 Scientists, 2006b; Expedition 340T Scientists, 2012). During Expedition 305, the temperature gradient was strongly affected by drilling, with a steep rise in the lowest part of the hole and a maximum temperature of 118.9°C at 1415 mbsf. During Expedition 340T, the temperature profile in the borehole water was assumed to have equilibrated with the rock and reached 146.2°C at 1405 mbsf. Below ~750 mbsf, the temperature gradient is linear, and a conductive regime is inferred. Above 750 mbsf, the temperature profile is curved, suggesting slow downward movement of fluid in the rock mass (Blackman et al., 2014). Small excursions in temperature, seen at ~750 and 1100 mbsf, are inferred to be the result of the influx of colder fluid.
Samples for microbiology were taken from a range of rock types and depths during Expedition 304/305 (Expedition 304/305 Scientists, 2006b; Mason et al., 2010). Cell counts were below the detection limit (<103 cells/cm3 rock). Microbial diversity was assessed using cloning and sequencing, terminal restriction fragment length polymorphism, and a microarray for metabolic genes (GeoChip). The microbial community consisted of low-diversity lineages closely related to bacteria from hydrocarbon-dominated environments and known hydrocarbon degraders (Mason et al., 2010).
Figure F1B (Harding et al., 2016) shows the most recent processing of the seismic data collected more than 20 y ago and used to select Site U1309. Seismic velocities increase with depth, with velocities of 7 km/s below 1000 mbsf, consistent with the recovered fresh gabbro (Blackman et al., 2011). At shallower depths, lower velocities reflect alteration of gabbro and increased fracturing consistent with slow fluid circulation inferred from the temperature profile (Figure F4). Physical properties measured on the ship and logging data, including vertical seismic profiles collected during Expeditions 305 and 340T, are consistent with the lithologies collected and were used in processing the full waveform inversion model shown in Figure F1B (Harding et al., 2016).
1.1. Objectives of operations at Site U1309
- To sample fluids and obtain temperature data in the undisturbed borehole and study geochemistry and microbiology of fluids at temperatures above and below the current known limit of life;
- To mill out a caliper arm lost during Expedition 340T and believed to be at the bottom of the hole, leaving the hole in good condition for further operations and fluid sampling;
- To deepen the hole by ~650 m to reach temperatures of ~220°C where active serpentinization reactions might be occurring, and an increasing amount of mantle rock might be expected within the gabbroic sequence; and
- To drill an additional single bit hole at Site U1309 with the aim of sampling zones of fault-induced and reaction porosity for microbiology, which were not collected during Expedition 304.
Although our first two objectives were realized, the hole was only deepened by 80 m and a new shallow hole was not drilled. In light of the unexpectedly good results at Site U1601, the science party decided drilling a deep hole in peridotite (the original aim of Expedition 304/305) should be prioritized.
2. Operations
2.1. Hole U1309D (first visit)
After the failure of releasing the reentry system in Hole U1601B on 24 April 2023, the rig crew needed time to assess the situation, identify an alternative method for deploying a reentry system at Site U1601, and build that system. We decided that while this was happening, we would move to Hole U1309D to conduct the fluid sampling program and, depending on conditions, initialize coring (Table T1; Figure F5).
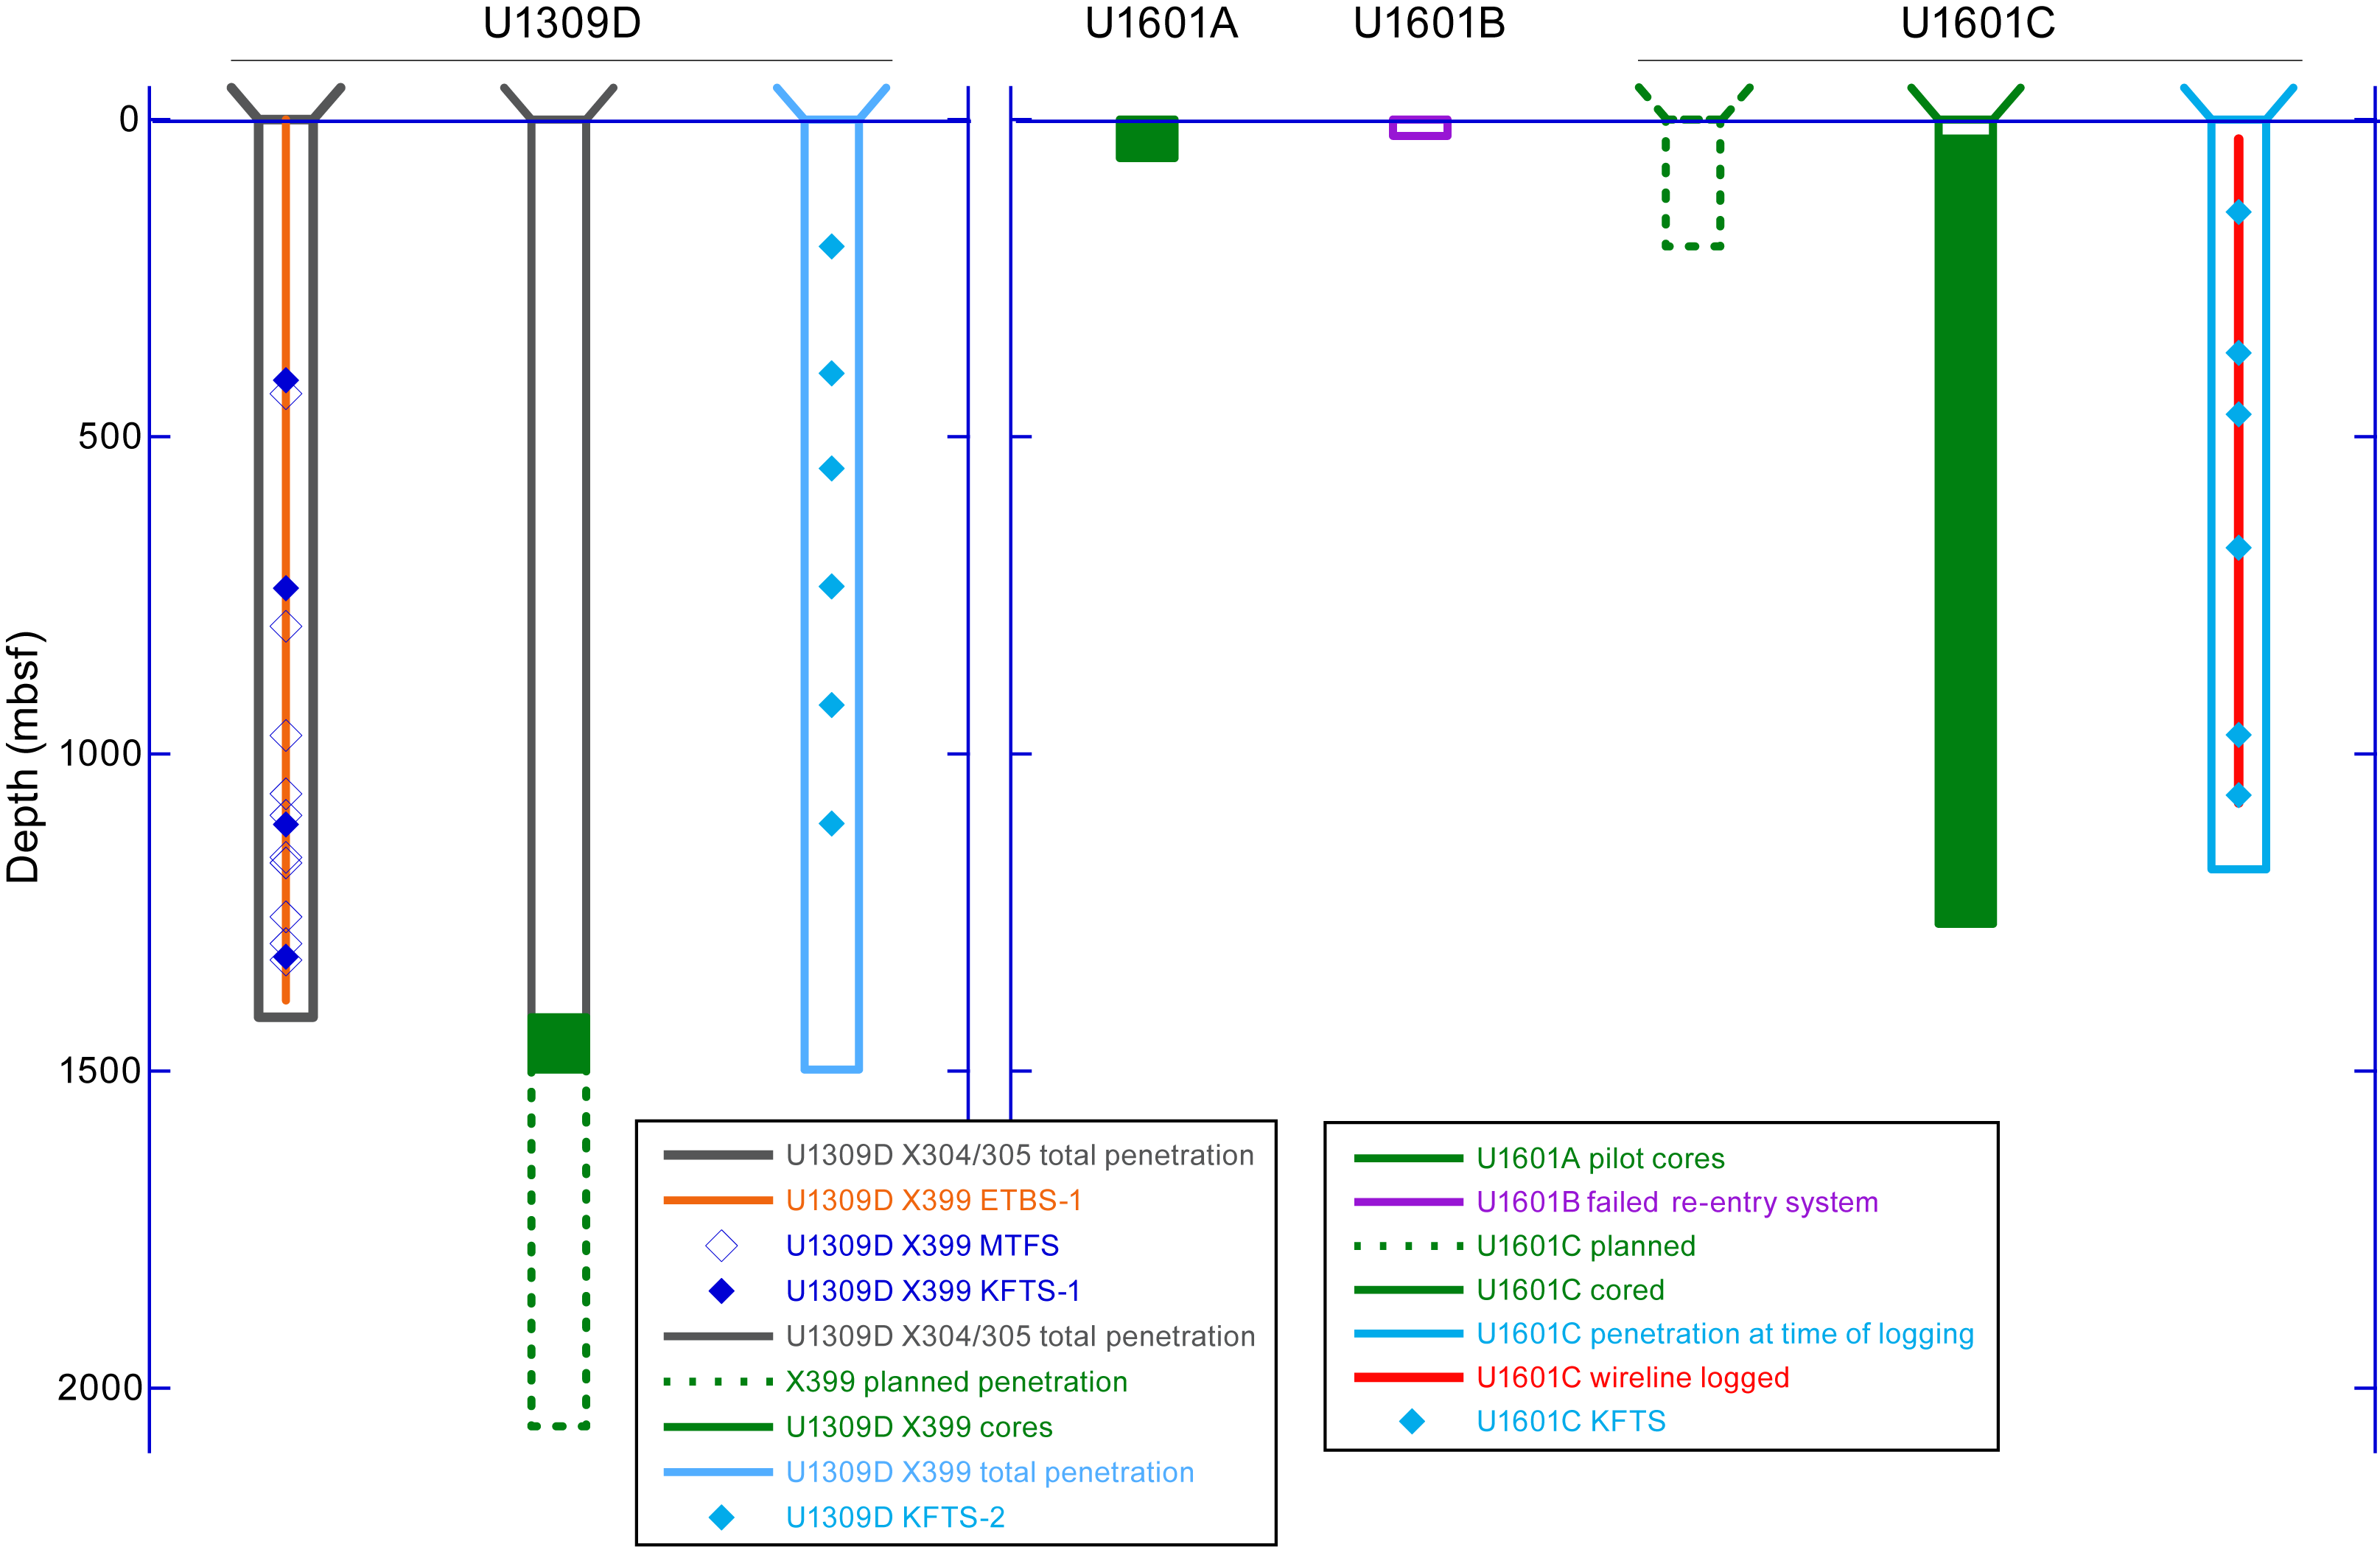
Figure F5. Operations summary.
2.1.1. Bit Run 1: temperature logging and fluid sampling
The ship began its 2 nmi dynamic positioning (DP) move to Hole U1309D at 2353 h on 24 April 2023 and arrived at 0116 h on 25 April. A bottom-hole assembly (BHA) was assembled with a 9¼ inch clean-out bit (4⅛ inch inside diameter) and without a float valve to deploy the novel Multi-Temperature Fluid Sampler (MTFS), the Kuster Flow-Through Sampler (KFTS), and the Elevated Temperature Borehole Sensor (ETBS) on the coring line. Details of these deployments are given below. The drill string was lowered at 0830 h, and the subsea camera with Niskin water sampling bottles attached to its frame was deployed at 1115 h (Table T2). The ship was offset ~20 m from Hole U1309D to pump the "pig" tool to clean rust from the inside of the newly deployed drill string. The bit reentered Hole U1309D at 1455 h. The reentry cone was partly filled and blocked by a soft particulate deposit that was easily displaced upon bit entry into the cone. The deposit descended to the seafloor after being displaced out of the reentry cone. The Niskin bottles were triggered, and the camera frame with the bottles was returned to the rig floor by 1620 h. The MTFS and ETBS were prepared on the catwalk, rigged up, and lowered down the drill pipe at 1815 h. The MTFS assembly descended in the open hole at a rate of 10 m/min, with 3 min temperature check stops every 100 m. The tool string tagged the bottom at 1389 mbsf, indicating a 26 m thick fill at the bottom of Hole U1309D, and then ascended at a rate of 15 m/min in the borehole and 30 m/min in the water column. The tools arrived back on the rig floor at 0043 h on 26 April.
The tools were rigged down, and the ETBS was removed from the MTFS and connected to the two KFTSs. The two KFTS clocks were set to sample at 411 (0310 h) and 739 mbsf (0330 h). The tool assembly was lowered down the drill pipe at 0207 h and was back on the rig floor at 0500 h. A second run of the KFTS-ETBS assembly was configured to sample at 1111 (0823 h) and 1320 mbsf (0846 h). It was lowered down the drill string at 0706 h and was back on the rig floor at 1225 h. On descent, the tool string traveled at a rate of 20 m/min, slowing to 15 m/min within 40 m of the desired sample depth to minimize hole disturbance. The tool was recovered at a rate of 10 m/min with 3 min stops every 100 m for temperature check measurements. The drill string was retrieved with the bit clearing the rig floor at 1620 h on 26 April, ending BHA Run 1 in Hole U1309D during Expedition 399.
2.1.2. Bit Run 2: milling
Next, we needed to remove a few tens of meters of fill from previous drilling in Hole U1309D during Expedition 304/305, as well as a logging caliper arm presumed to have been left in the hole at the end of Expedition 340T. A BHA was made up with a 9⅝ inch concave mill and two junk baskets and lowered to the seafloor at 1845 h. At 2120 h, the subsea camera and two Niskin water samplers were deployed. At 0000 h on 27 April 2023, Hole U1309D was reentered for the second time during this expedition. The camera and Niskin water sample bottles were recovered, and the drill string was run deeper into the hole. At 0800 h, the bit tagged the top of the fill at 1379 mbsf (~37 m of fill). Milling and washing downhole proceeded expeditiously, with the first 7–8 m at 8 m/h and the remainder at 30 m/h. At 1007 h, the bit was ~1.5 m above the previously reported bottom of Hole U1309D (1415.5 mbsf). The first 10 min of milling near the bottom indicated erratic torque, presumed to be the result of encountering metal pieces lost during a previous expedition. The subsequent 3.5 h of milling indicated low and steady torque. The pipe was raised and lowered repeatedly for 1 h to fill the junk baskets, and a 30 bbl mud sweep completed cleaning operations in Hole U1309D. Retrieval of the drill string began at 1515 h, and at 2200 h, the mill bit arrived at the rig floor where the junk baskets were emptied. Amongst dozens of rock pieces and bags of cuttings created during previous drilling during Expedition 304/305, the junk baskets also recovered several metal pieces, including three 5 cm × 5 cm chunks. The metal pieces were identified as parts from the Versatile Seismic Imager (VSI) wireline logging tool that was damaged during Expedition 340T ~11 y previously.
2.1.3. Bit Run 3: coring
At 2315 h, the rig crew began assembling the rotary core barrel (RCB) BHA with a new C-7 bit, which was complete at 0130 h on 28 April 2023. The drill string and subsea camera were deployed, and at 0525 h, Hole U1309D was reentered for the third time during this expedition. The camera was retrieved, and the bit was lowered until it reached a hard tag at 1410.0 mbsf. We dropped a core barrel, washed to 1415.5 mbsf, and began deepening Hole U1309D from where Expedition 305 had ended. Coring proceeded until 1 May, when the bit had accumulated 50 h at the bottom, and we decided to retrieve it. This coring bit run advanced Hole U1309D by 82.5 m from 1415.5 to 1498.0 mbsf. Cores 279R–313R recovered a total of 48.9 m, with core recovery ranging 26%–98% (average recovery of 59%). Every ~5 m 30 bbl mud sweeps were pumped to keep the hole clean. At 1145 h, we began retrieving the drill string, and the bit cleared the seafloor at 1620 h.
This was a good opportunity to test the ETBS, which had malfunctioned during previous runs and had been worked on. With the bit several meters above the seafloor, we installed the top drive again, installed the sinker bars, and deployed the ETBS to the end of the pipe for ~10 min. The test results were negative, and the ETBS required additional repair. At 1900 h, we continued to retrieve the drill string, and the bit cleared the rig floor at 2245 h on 1 May, ending Bit Run 3 in Hole U1309D for this expedition.
During this first period of operations in Hole U1309D, the crew had established a plan and prepared equipment for a second attempt at setting a reentry system at Site U1601. Operations therefore continued in Hole U1601C from 1 May to 2 June.
2.2. Hole U1309D (second visit)
On 2 June 2023, the ship returned to Hole U1309D for the last operations of Expedition 399 to take more borehole fluid samples from Hole U1309D using the KFTS and then flush the hole rigorously. The ship had already moved over to Hole U1309D in DP mode by 1612 h on 2 June while the drill string was being retrieved from Hole U1601C. A BHA was assembled with a clean-out bit, no float valve, and an oversized landing ring (logging configuration). At 1915 h, the drill string was lowered to the seafloor, the subsea camera was deployed at 2130 h, and Hole U1309D was reentered for the fourth time during Expedition 399 at 2317 h. At 0045 h on 3 June, the drill string was positioned at 32 mbsf. Two KFTS bottles were assembled with the ETBS and the Conductivity-Temperature-Depth (CTD) tool. The first run on the coring line was deployed at 0100 h, and it was back on the rig floor at 0315 h. The borehole water samples were taken at 200 and 400 mbsf. The tool string was retrieved and disassembled, the water samples and data were retrieved, and the tools were reassembled for the second run. The CTD was not included on subsequent runs because its temperature rating would have been exceeded at the deeper sampling stations. The second sampling run from 0400 to 0645 h triggered one KFTS at 550 mbsf and the other one at 736 mbsf. Ample time was available to redress the tools and conduct a third run from 0736 to 1100 h. During this final run, the tools were not able to pass an obstruction at 1024 mbsf, so the samples were taken at 923 and 1110 mbsf instead of a deeper planned station. After the conclusion of the sampling runs, the drill string was lowered to 1421 mbsf and washed down to the bottom of the hole at 1498 mbsf. Next, the hole was flushed with seawater seven times the borehole volume to leave behind as clean as possible a hole for potential future water sampling and temperature measurement operations. The final retrieval of the drill string from Hole U1309D began at 1945 h on 3 June and was completed with the bit clearing the rig floor at 0324 h on 4 June. The rig was secured for transit, and the vessel was underway at 0430 h, ending operations at Site U1309 and for Expedition 399. The vessel arrived in Ponta Delgada, Azores (Portugal), on 8 June with the first line ashore at 0748 h.
2.3. Deployment of the MTFS and ETBS
The eleven units of the MTFS were connected in series on the catwalk with multipurpose grease applied to the threads. The target temperatures for tripping the MTFS sample bottles in Hole U1309D are presented in Table T3.
The assembly and temperature tool were lowered into the borehole at a rate of 30 m/min to 1656 meters below rig floor (mbrf) (0 mbsf). Lowering stopped for 3 min and then commenced at 10 m/min, stopping for 3 min every 100 m. The assembly tagged the bottom of the hole, as determined by a drop of 1000 lb on the winch's weight indicator at 3048 mbrf (1382 mbsf). The assembly was retrieved several meters and lowered again twice. Each time weight lessened at 3048 mbrf. The assembly was then retrieved at 15 m/min in the open hole while the pipe was rotating. Once the assembly was in the drill pipe, the rate of recovery increased to 30 m/min.
Upon recovery, the units were detached from each other on deck and then brought into the paleontology laboratory, where they were stored prior to sampling. Sampling commenced by removing the two bolts that hold the spring rod in place to release the tension and provide more control on the fluid output and then removing the intake nut. A cleaned titanium tube and a Kynar valve (methanol and Milli-Q water rinsed) were attached. Because of the mass of particles in the sampler, moving the pistons to expel a sample resulted in the sample cavity leaking. Thus, after the first four samples had been processed, subsampling proceeded by holding the samplers vertically and using gravity to expel samples.
Several issues occurred that resulted in incomplete data and sample collection. First, the ETBS malfunctioned at the bottom of the hole, so no data was collected during the retrieval. Second, two of the MTFS tube-style triggers were set to trigger at approximately 140°C but did not activate because the temperature did not reach 140°C in the samplers. Although the ETBS recorded 141°C, it was situated below the MTFS bottles and therefore encountered warmer conditions than the triggers. The shape memory alloy (SMA) triggers in these two samplers began to respond and return by ~10% to their original length, which was insufficient to break the bolt. Third, the two spring triggers likely did not release the spring and plunger at the target depth. Finally, each MTFS contained more than a centimeter of material (fines, small pieces of rock, rust, and grease) between the piston and the plate that held the trigger. Such material caused additional friction for the pistons, preventing a complete stroke and the collection of the full sample volume. This material also blocked the top valve in the upper KFTS during the second lowering. Most of the collected water drained from the sampler on the rig floor when it was disconnected and horizontal (the bottom valve closed properly).
2.4. Deployments of the KFTS and ETBS
Two KFTSs joined with the ETBS were deployed a total of five times in Hole U1309D (Table T4). The KFTS assemblage was deployed twice on 26 April 2023, immediately after the MTFS sampling, with two bottles triggered at different depths during each lowering. The first lowering targeted shallower borehole depths to minimize disturbance to the hole. During the first lowering, the lower bottle was set to trip at 411 mbsf to correspond with the lowest MTFS target temperature of 38°C. The upper bottle was set to trip at 739 mbsf to correspond to a previously characterized low-velocity zone (Blackman et al., 2014). The second deployment targeted depths associated with a deeper low-velocity zone at 1111 mbsf and one of the hotter target temperatures of the MTFS. The ETBS did not function during these KFTS deployments. Thus, the only reliable temperature data were from the lowering of the MTFS.
The first lowering targeted shallower borehole depths to minimize further disturbance to the hole. The lower bottle was set to trip at 407 mbsf to correspond with the lowest temperature MTFS target temperature of ~38°C. The upper bottle was set to trip at 732 mbsf to correspond to a previously characterized low-velocity zone (Blackman et al., 2013). The second KFTS tool deployment targeted depths associated with a deeper low-velocity zone at 1107 mbsf and one of the hotter target temperatures of the MTFS. The two target KFTS depths were set to align with the MTFS sample collection at 114° and 137°C.
The package was lowered at 50 m/min in the drill string and 20–25 m/min in the open borehole. Descent rates were slowed to 15 m/min within 40 m of the desired sample depth to minimize disturbance in the borehole. Samplers were at the desired depth approximately 8 min prior to the trigger time because sample triggers are set at 6 min intervals. After the first sampler was activated, the wireline was lowered to the second target depth at a rate of approximately 10 m/min (Figure F6).
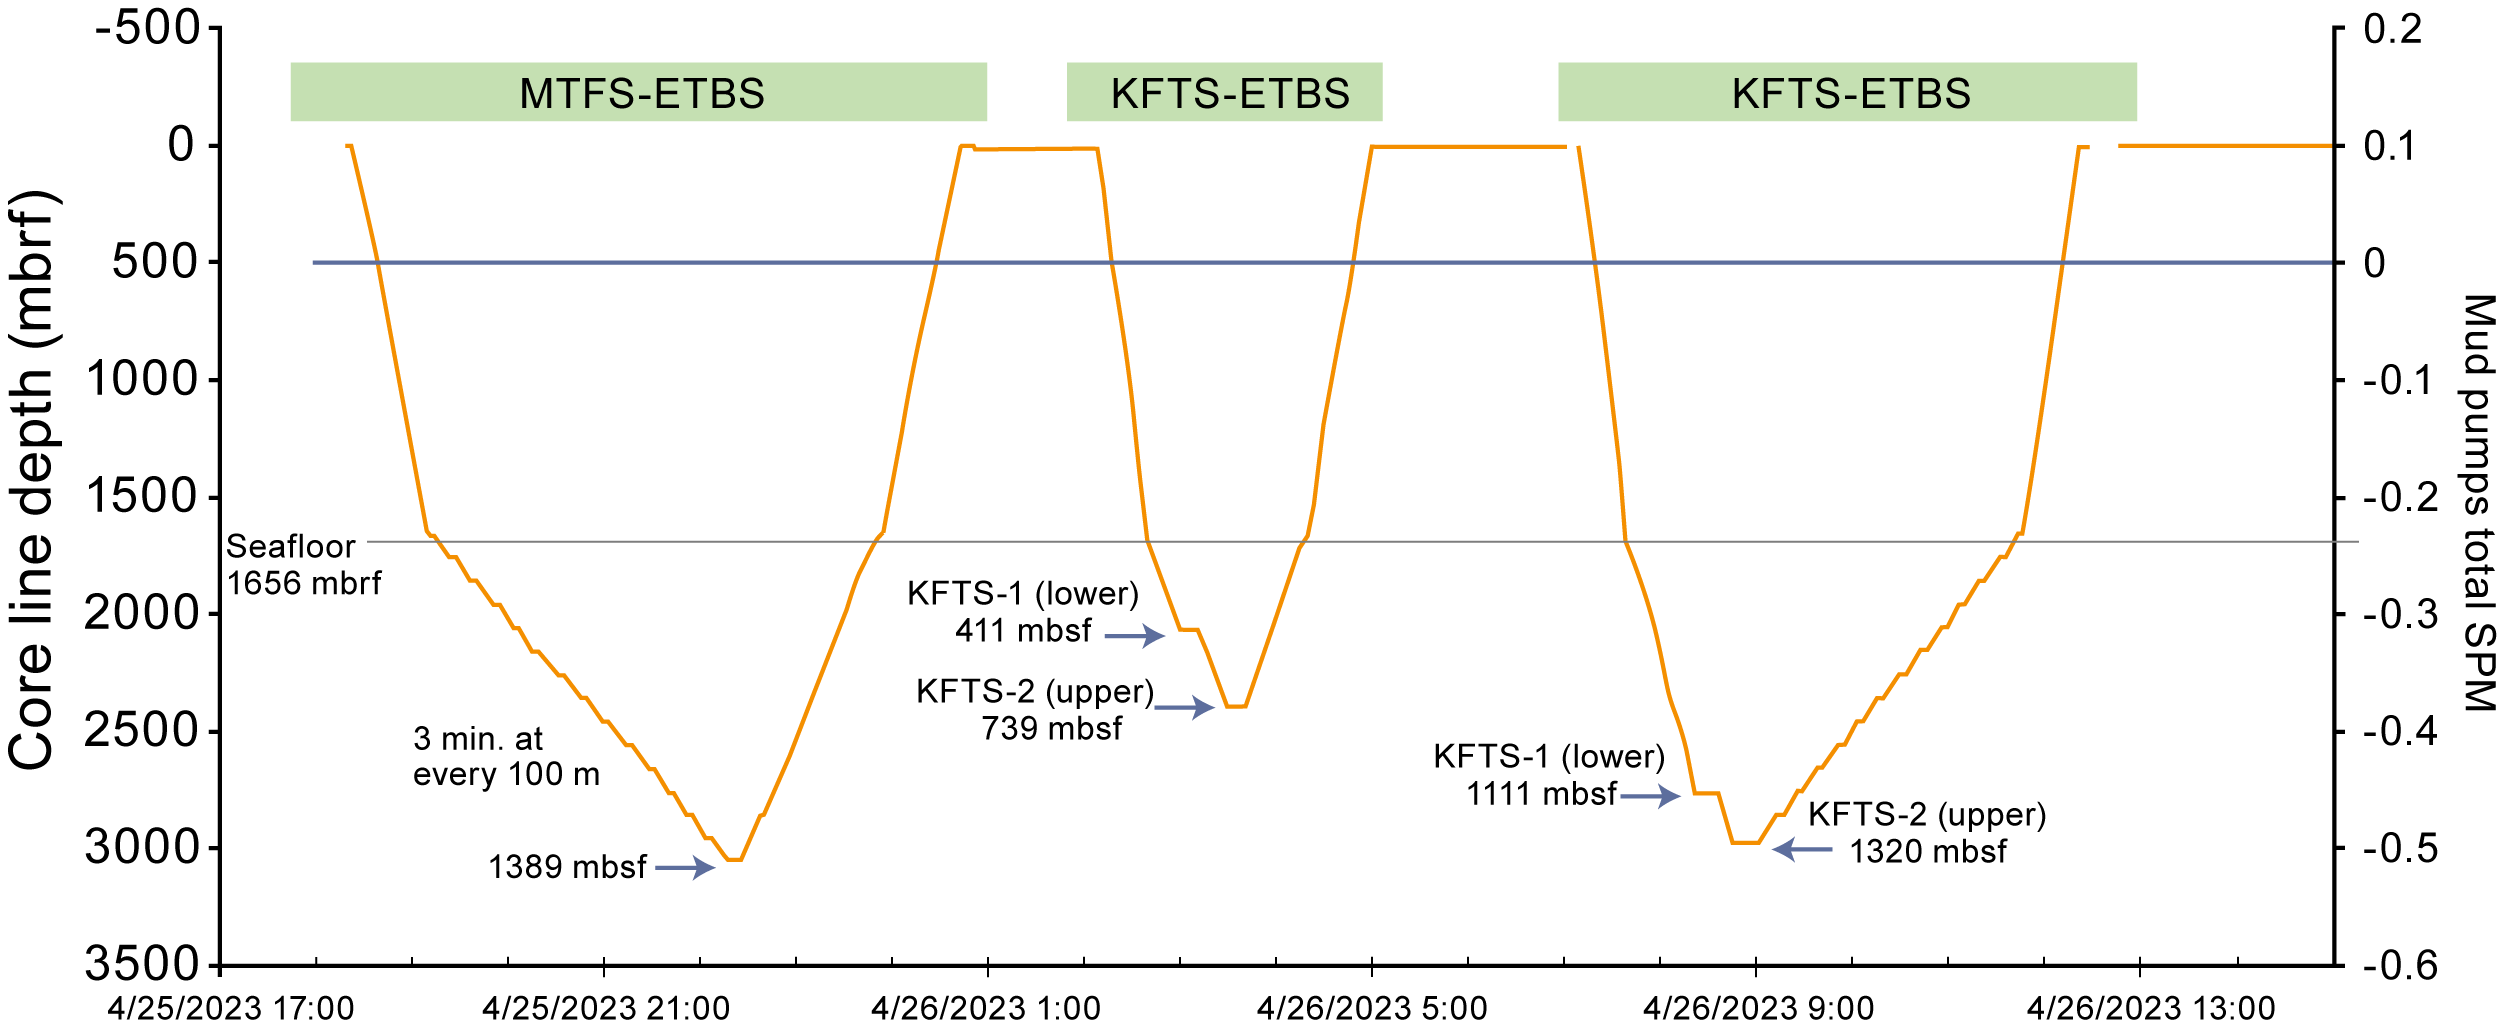
Figure F6. KFTS and ETBS deployments.
After these deployments, Hole U1309D was deepened and extensive operations were carried out in Hole U1601C before further fluid sampling proceeded. Drilling operations in Hole U1309D had ended on 1 May and followed a standard practice of 30 bbl of drilling mud after each 100 m advance. The borehole was not flushed prior to departure. Thus, particle laden surface seawater was expected in the borehole. The KFTS and ETBS were lowered three times into the borehole. The sampling depths for the three runs were chosen to document the potential influx of bottom seawater at the top of the borehole, formation fluid at depths of 400–750 mbsf, and the current status of fluids at the bottom of the borehole. The CTD was added to the assemblage on the first, shallowest lowering but removed for subsequent deployments to prevent exposing it to higher temperatures. The tool assemblies were lowered at 65 m/min in the casing and 20 m/min in the open hole. The KFTS could not reach the full target bottom depth because of a restriction at 1110 mbsf, so it instead sampled at an intermediate depth of 923 mbsf (Table T4).
3. Igneous petrology
The deepening of Hole U1309D recovered a series of predominantly gabbroic rocks, including gabbro (27%), olivine-bearing gabbro (59%), and olivine gabbro (12%), with small proportions of crosscutting diorite and diabase (1% and 2%, respectively) (Figures F7, F8). Ultramafic rocks and troctolite (olivine rich or otherwise) were not observed and neither were leucocratic veins (e.g., tonalite and trondhjemite). The gabbroic rocks were divided into three units, which were designated where significant differences in composition and/or texture were observed. Subunits were defined by differences within individual units (see Igneous petrology in the Expedition 399 methods chapter [Lang et al., 2025]). Unit numbering was continued from Expedition 305, which ended in a unit of medium- to coarse-grained olivine gabbro (Unit 770).
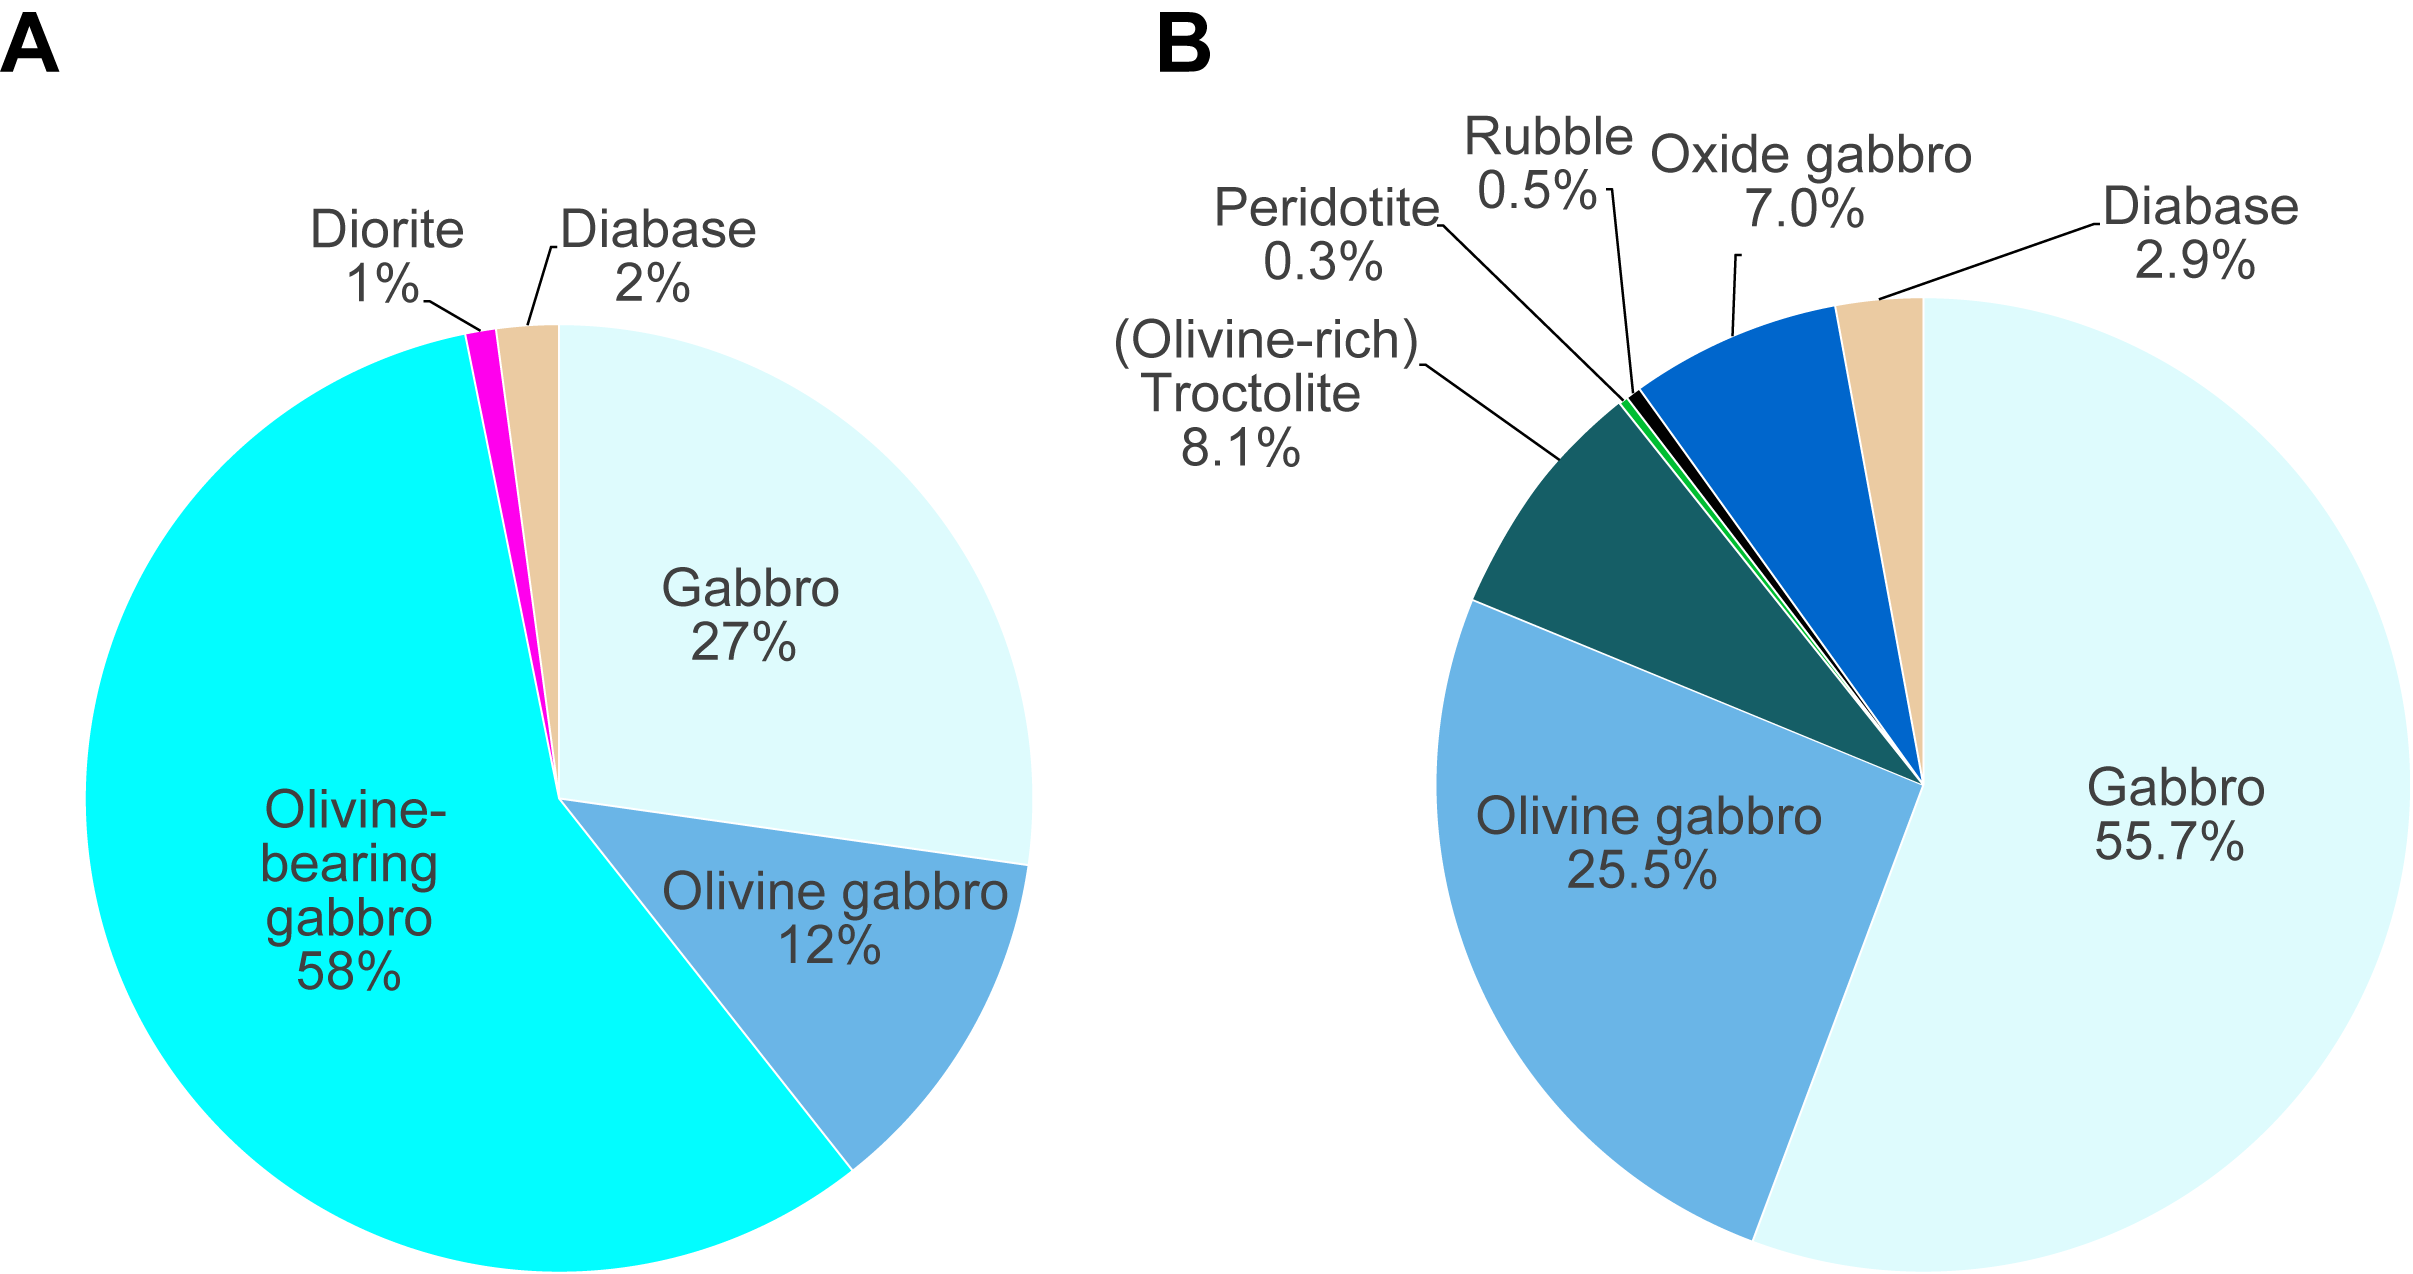
Figure F7. Recovered lithology.
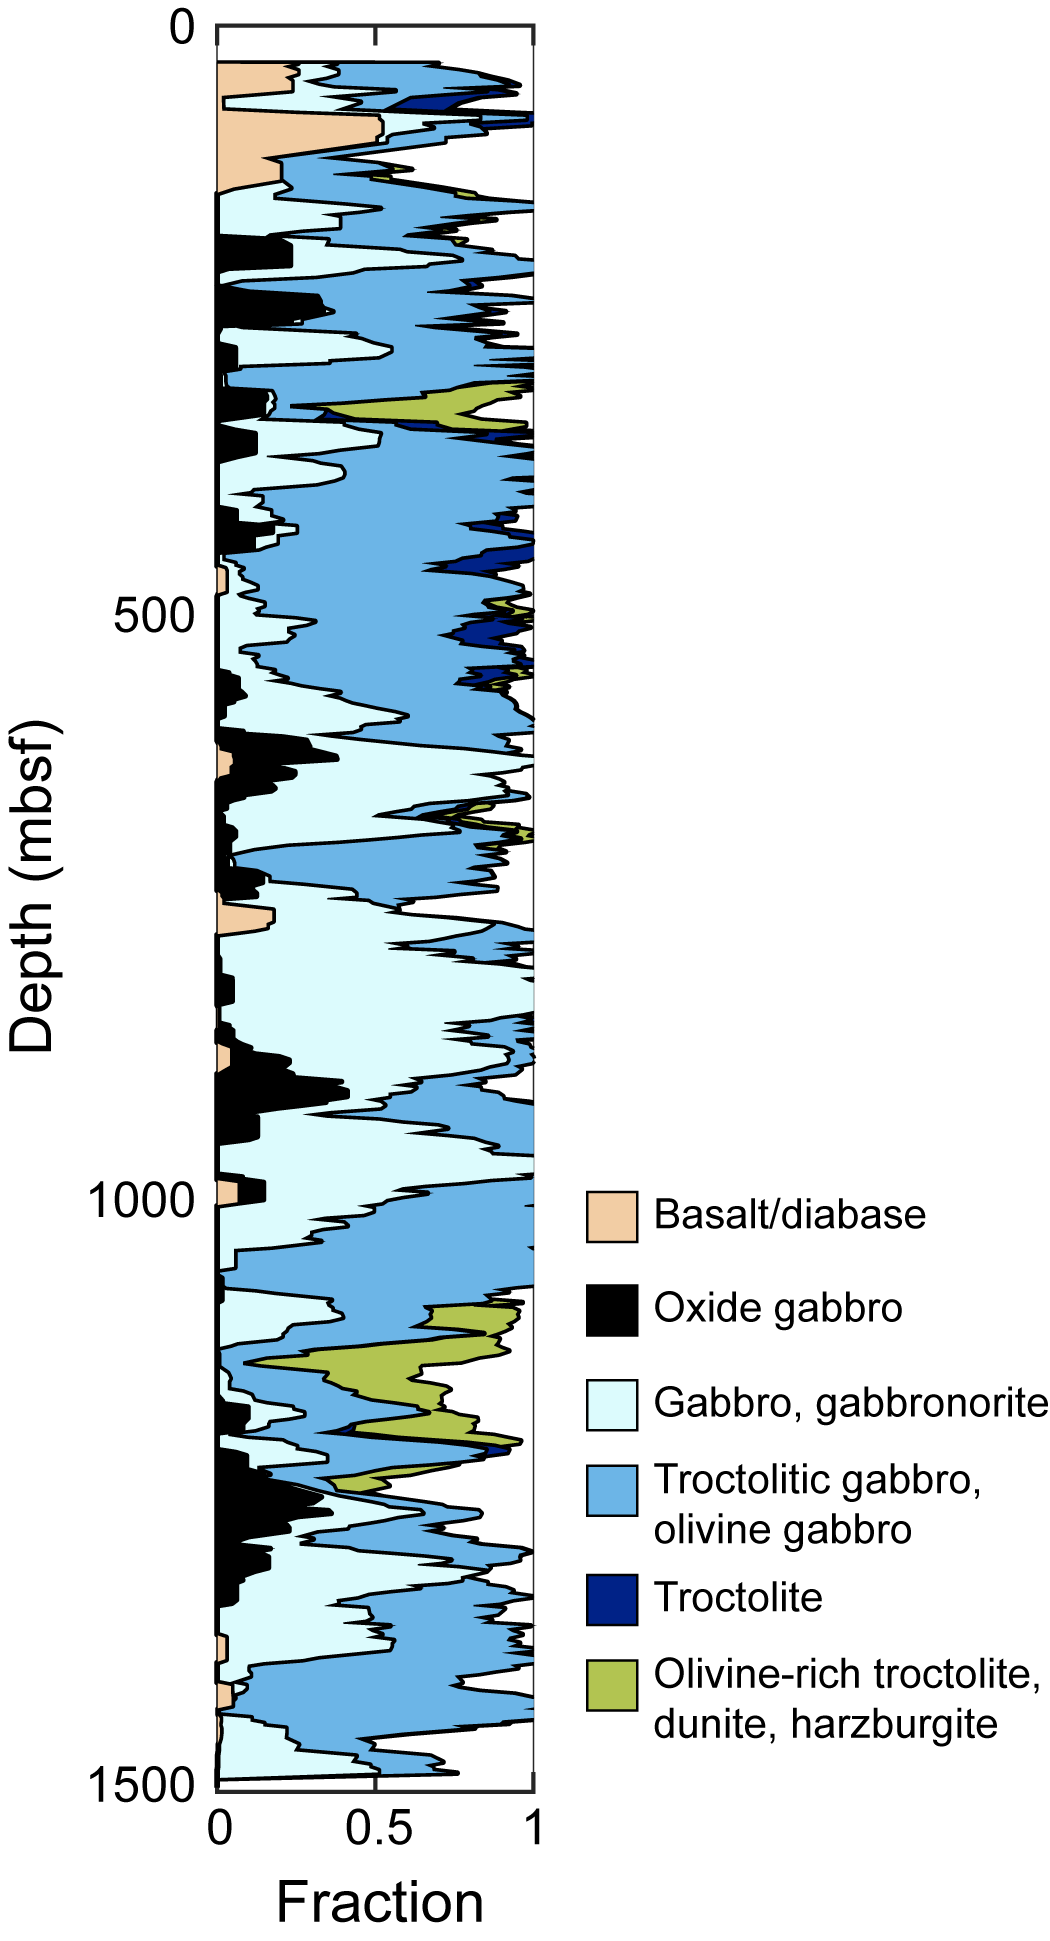
Figure F8. Running average for rocks.
3.1. Macroscopic observations
3.1.1. Gabbroic rocks
3.1.1.1. Unit 771
Unit 771 (Section 399-U1309D-297R-1; 1415.5–1415.6 mbsf) comprises a short interval of medium-grained olivine gabbro with poikilitic clinopyroxene up to 6 mm in size. The grain size and texture contrast with those of the large gabbroic unit below, and the olivine proportion is significantly higher (40%) than that of Unit 770 above (average = 10%; maximum = 20%) (Expedition 304/305 Scientists, 2006b). Hence, this olivine gabbro was designated as a separate unit.
3.1.1.2. Unit 772
Unit 772 (Sections 399-U1309D-297R-1 through 313R-4; 1415.6–1497.9 mbsf) is a 82.3 m thick gabbroic unit with mineralogical, grain size, and textural variation on a range of scales. These variations are gradual where recovered, and the unit is characterized by a similar appearance overall. Definitive intrusive internal contacts were not seen; hence, it was logged as a single gabbroic unit, with intervals characterized by different modal mineralogy, textures, and/or grain sizes designated as subunits.
Mineralogically, the unit is dominated by plagioclase, clinopyroxene, and olivine, with small proportions of orthopyroxene and Fe-Ti oxides. Plagioclase proportions are typically around 50% and nearly always fall between 45% and 55% (Figure F9). Clinopyroxene proportions are typically between 40% and 50%. Olivine is nearly ubiquitous but averages only 3%, with a maximum of 10% (Figure F9); in gabbros (sensu stricto), it is generally present as trace phase. Orthopyroxene was identified in very small amounts in thin sections only (see below). Fe-Ti oxides occur in trace amounts in about half of the samples and never reach more than 0.5% (Figure F9).
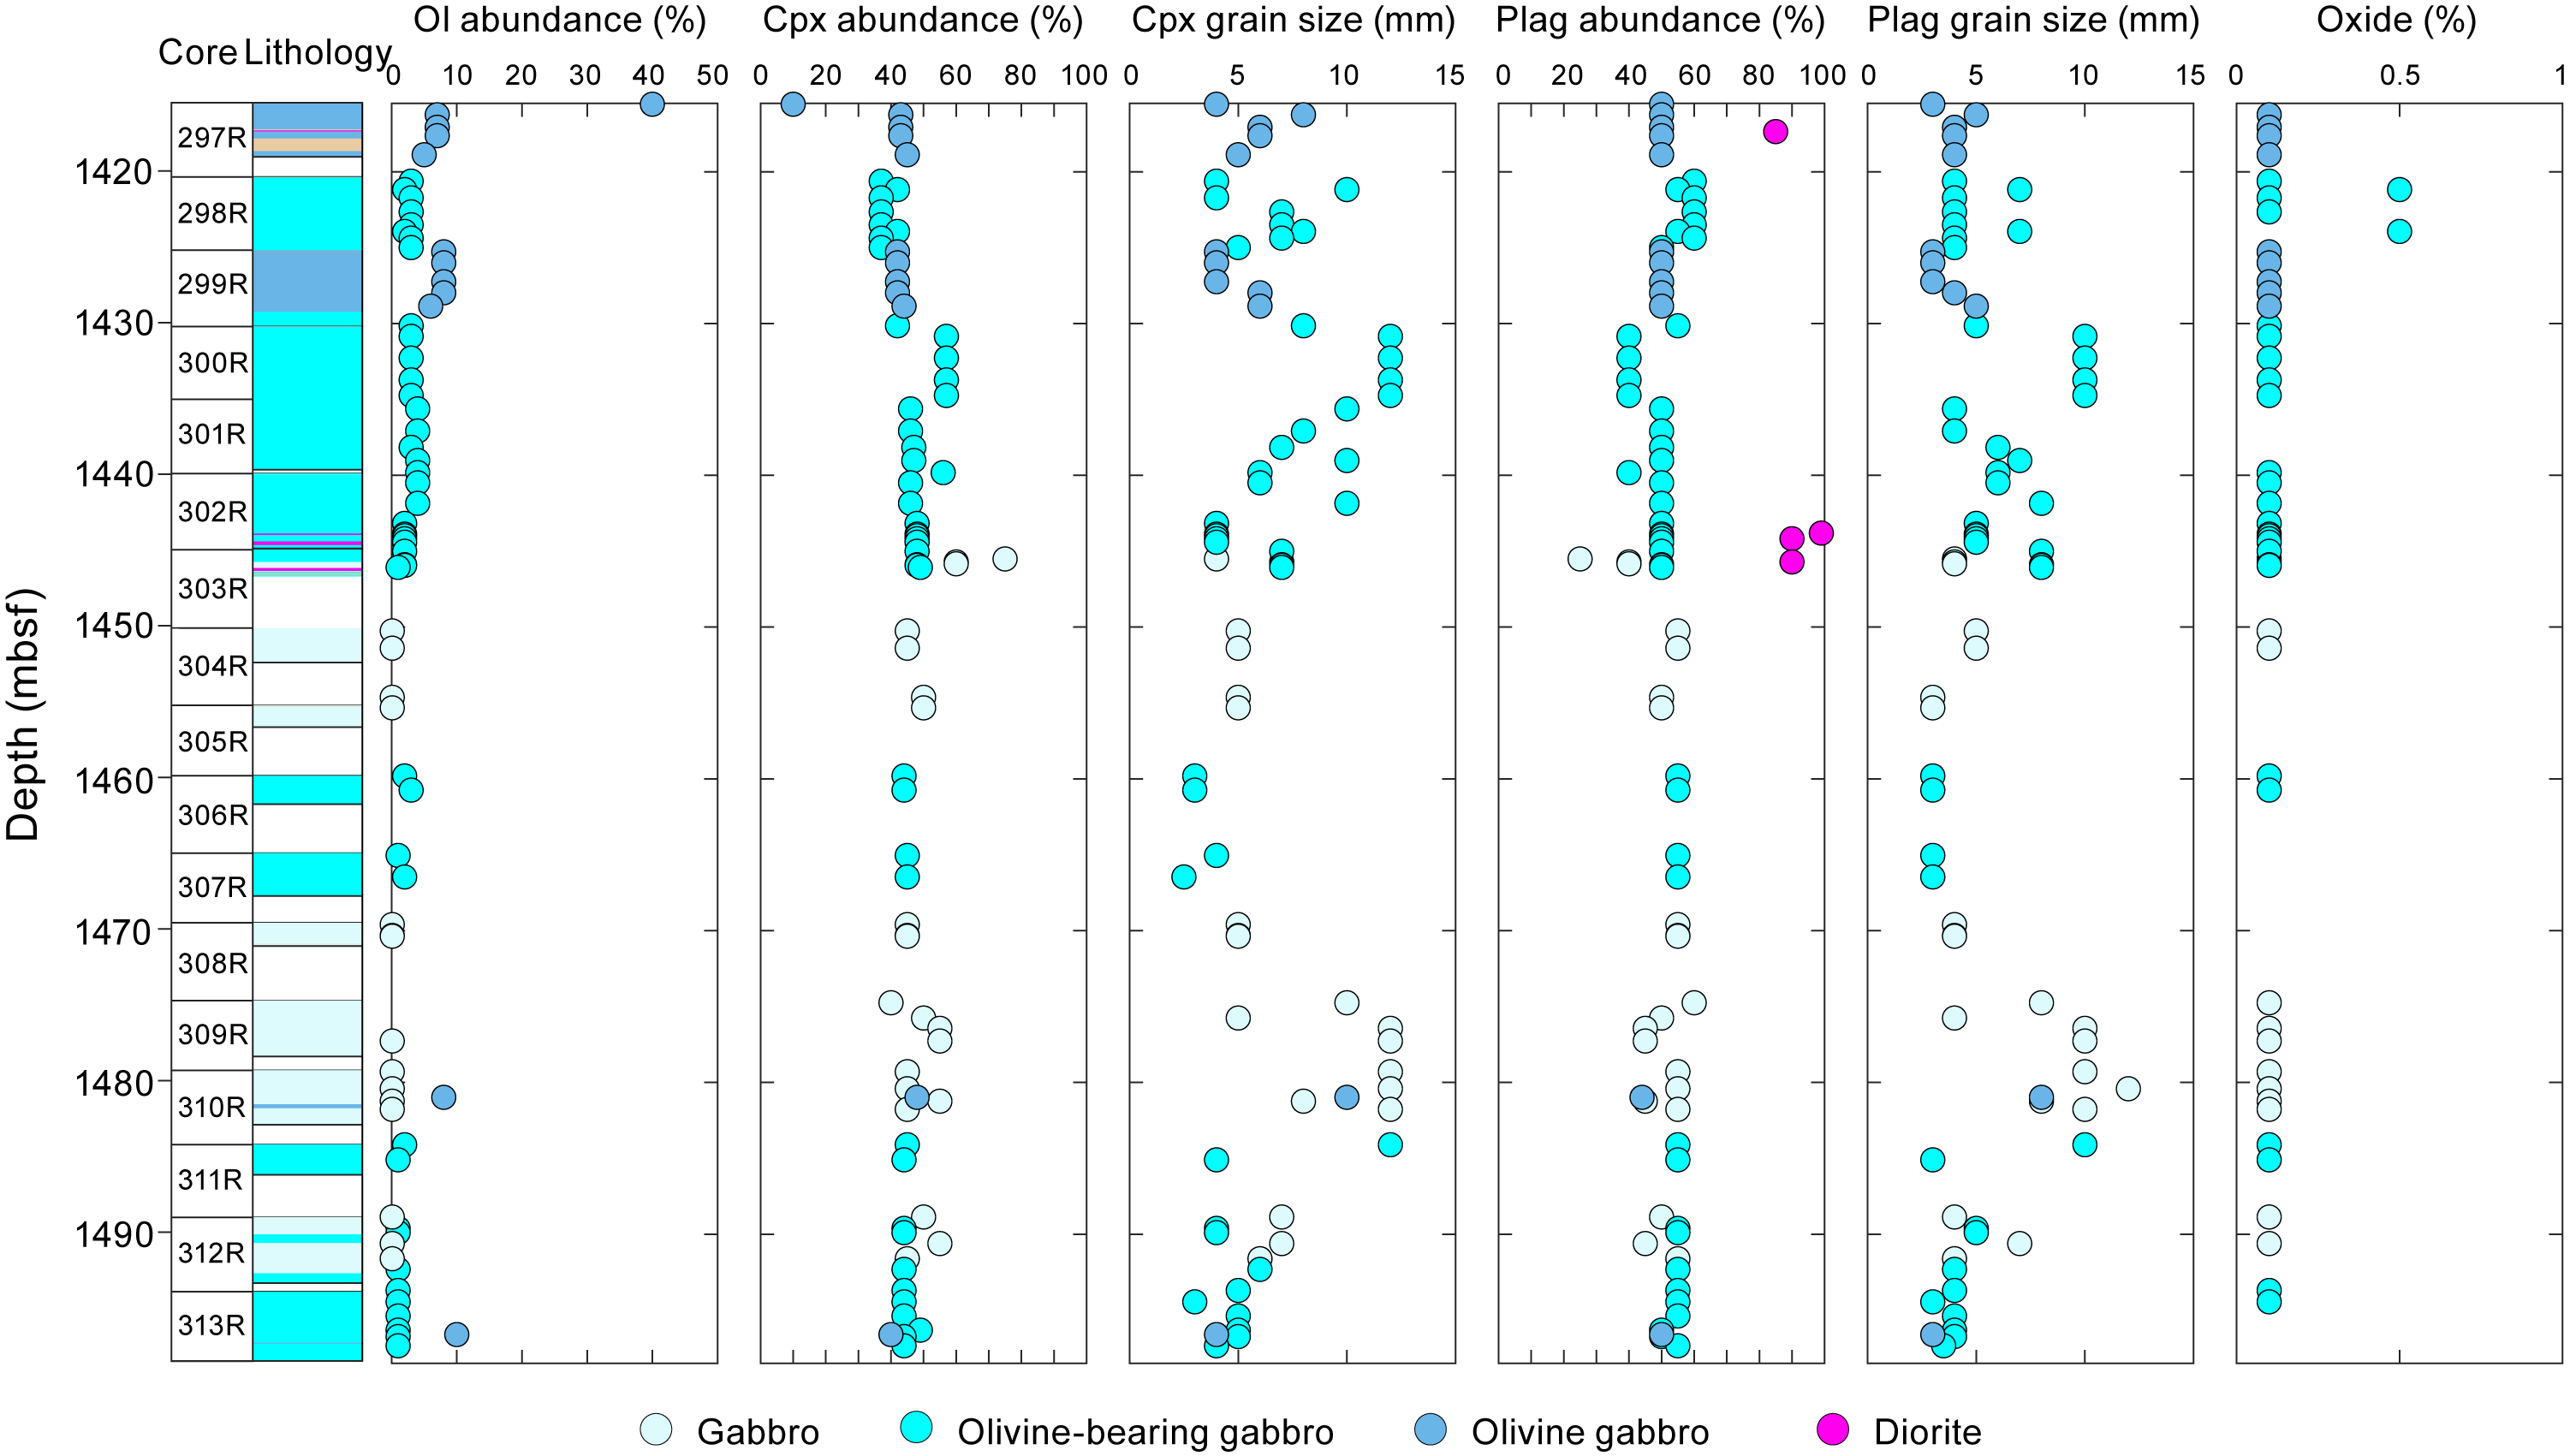
Figure F9. Modal abundance and grain size.
The grain size of the unit ranges from medium to coarse, averaging 6 mm. Clinopyroxene is frequently larger than plagioclase, forming large grains (up to 40 mm) surrounding and/or enclosing numerous plagioclase crystals. Grain size varies on a range of scales. On the unit scale, grain size varies over 10–40 m intervals (Figure F9). On the core scale, grain size variations are evident on the meter to the centimeter scale, with locally well-developed grain size layering and patchy grain size variations (e.g., Section 313R-3) (Figure F10).
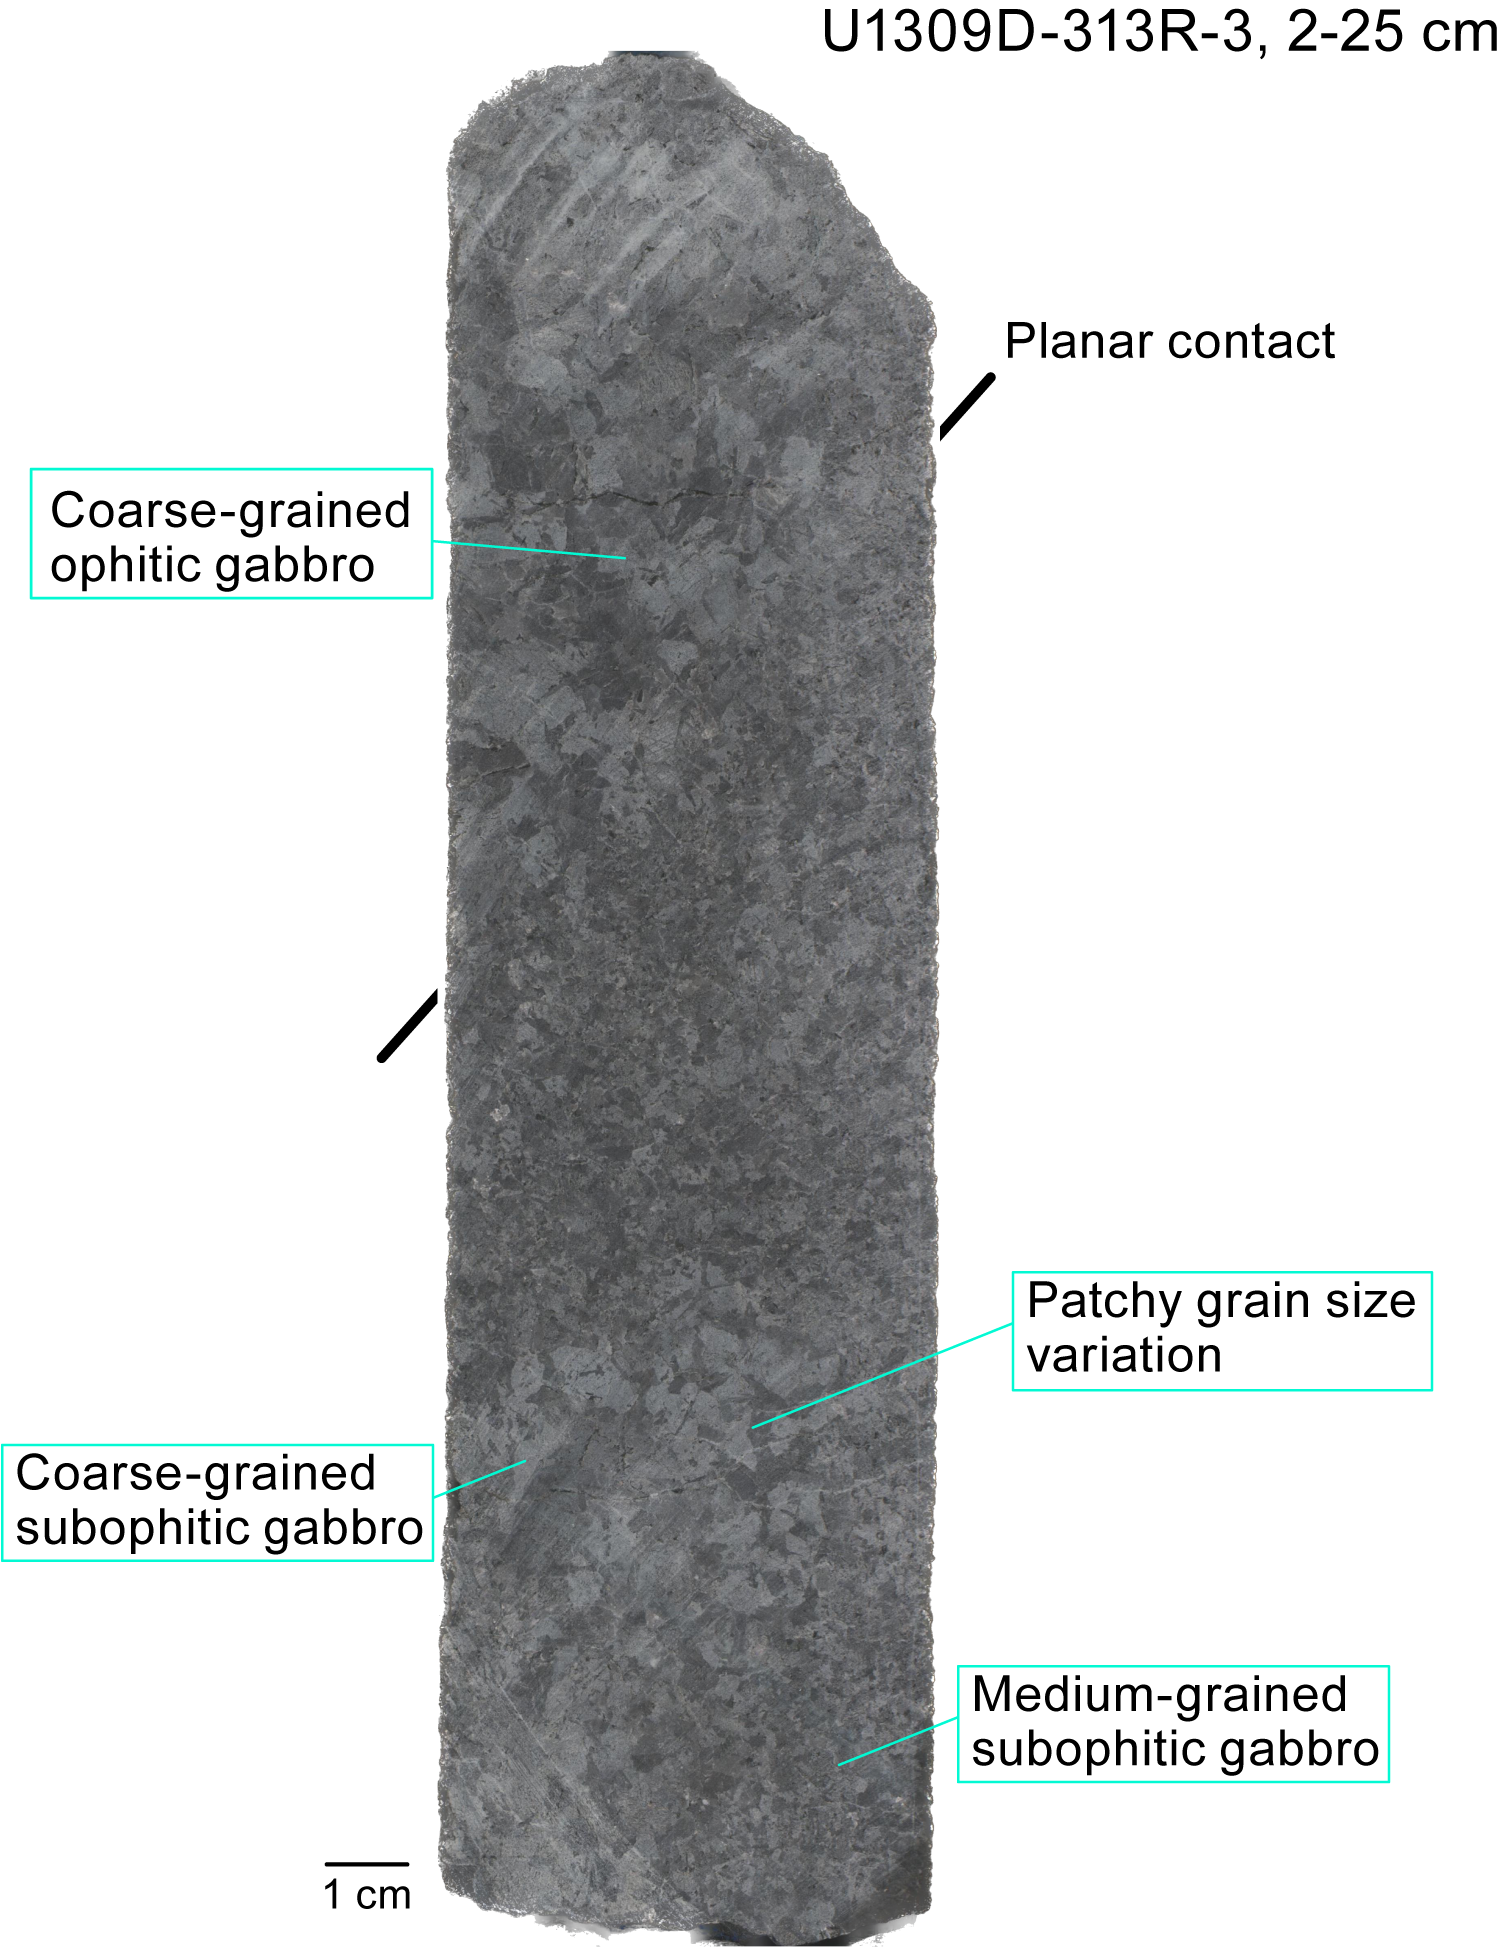
Figure F10. Small scale textural and grain size variation.
The textures of the gabbroic rocks are variable (Figures F11, F12). Gabbro is predominantly subophitic (73%) but ranges to ophitic (9%) and poikilitic (1%). Granular textures also occur (17%) (Figures F12D, F13). These different textures frequently occur together over short distances (centimeter to tens of centimeters) (Figures F10, F12C), with contacts generally being gradational and irregular. Planar contacts do occur between lithologies with differing grain sizes, modes, and textures (Figure F10); however, these are rare. Olivine is generally anhedral and ranges from granular to interstitial.
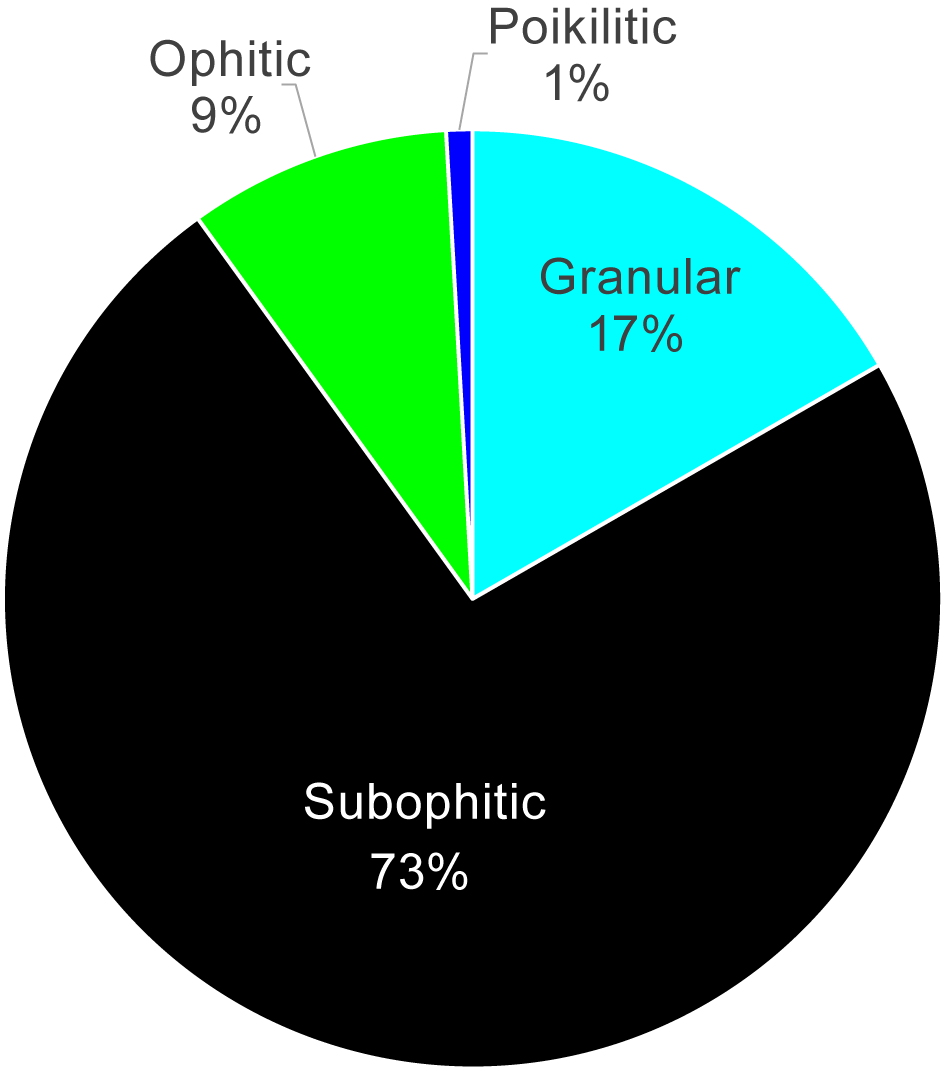
Figure F11. Proportions of textures.
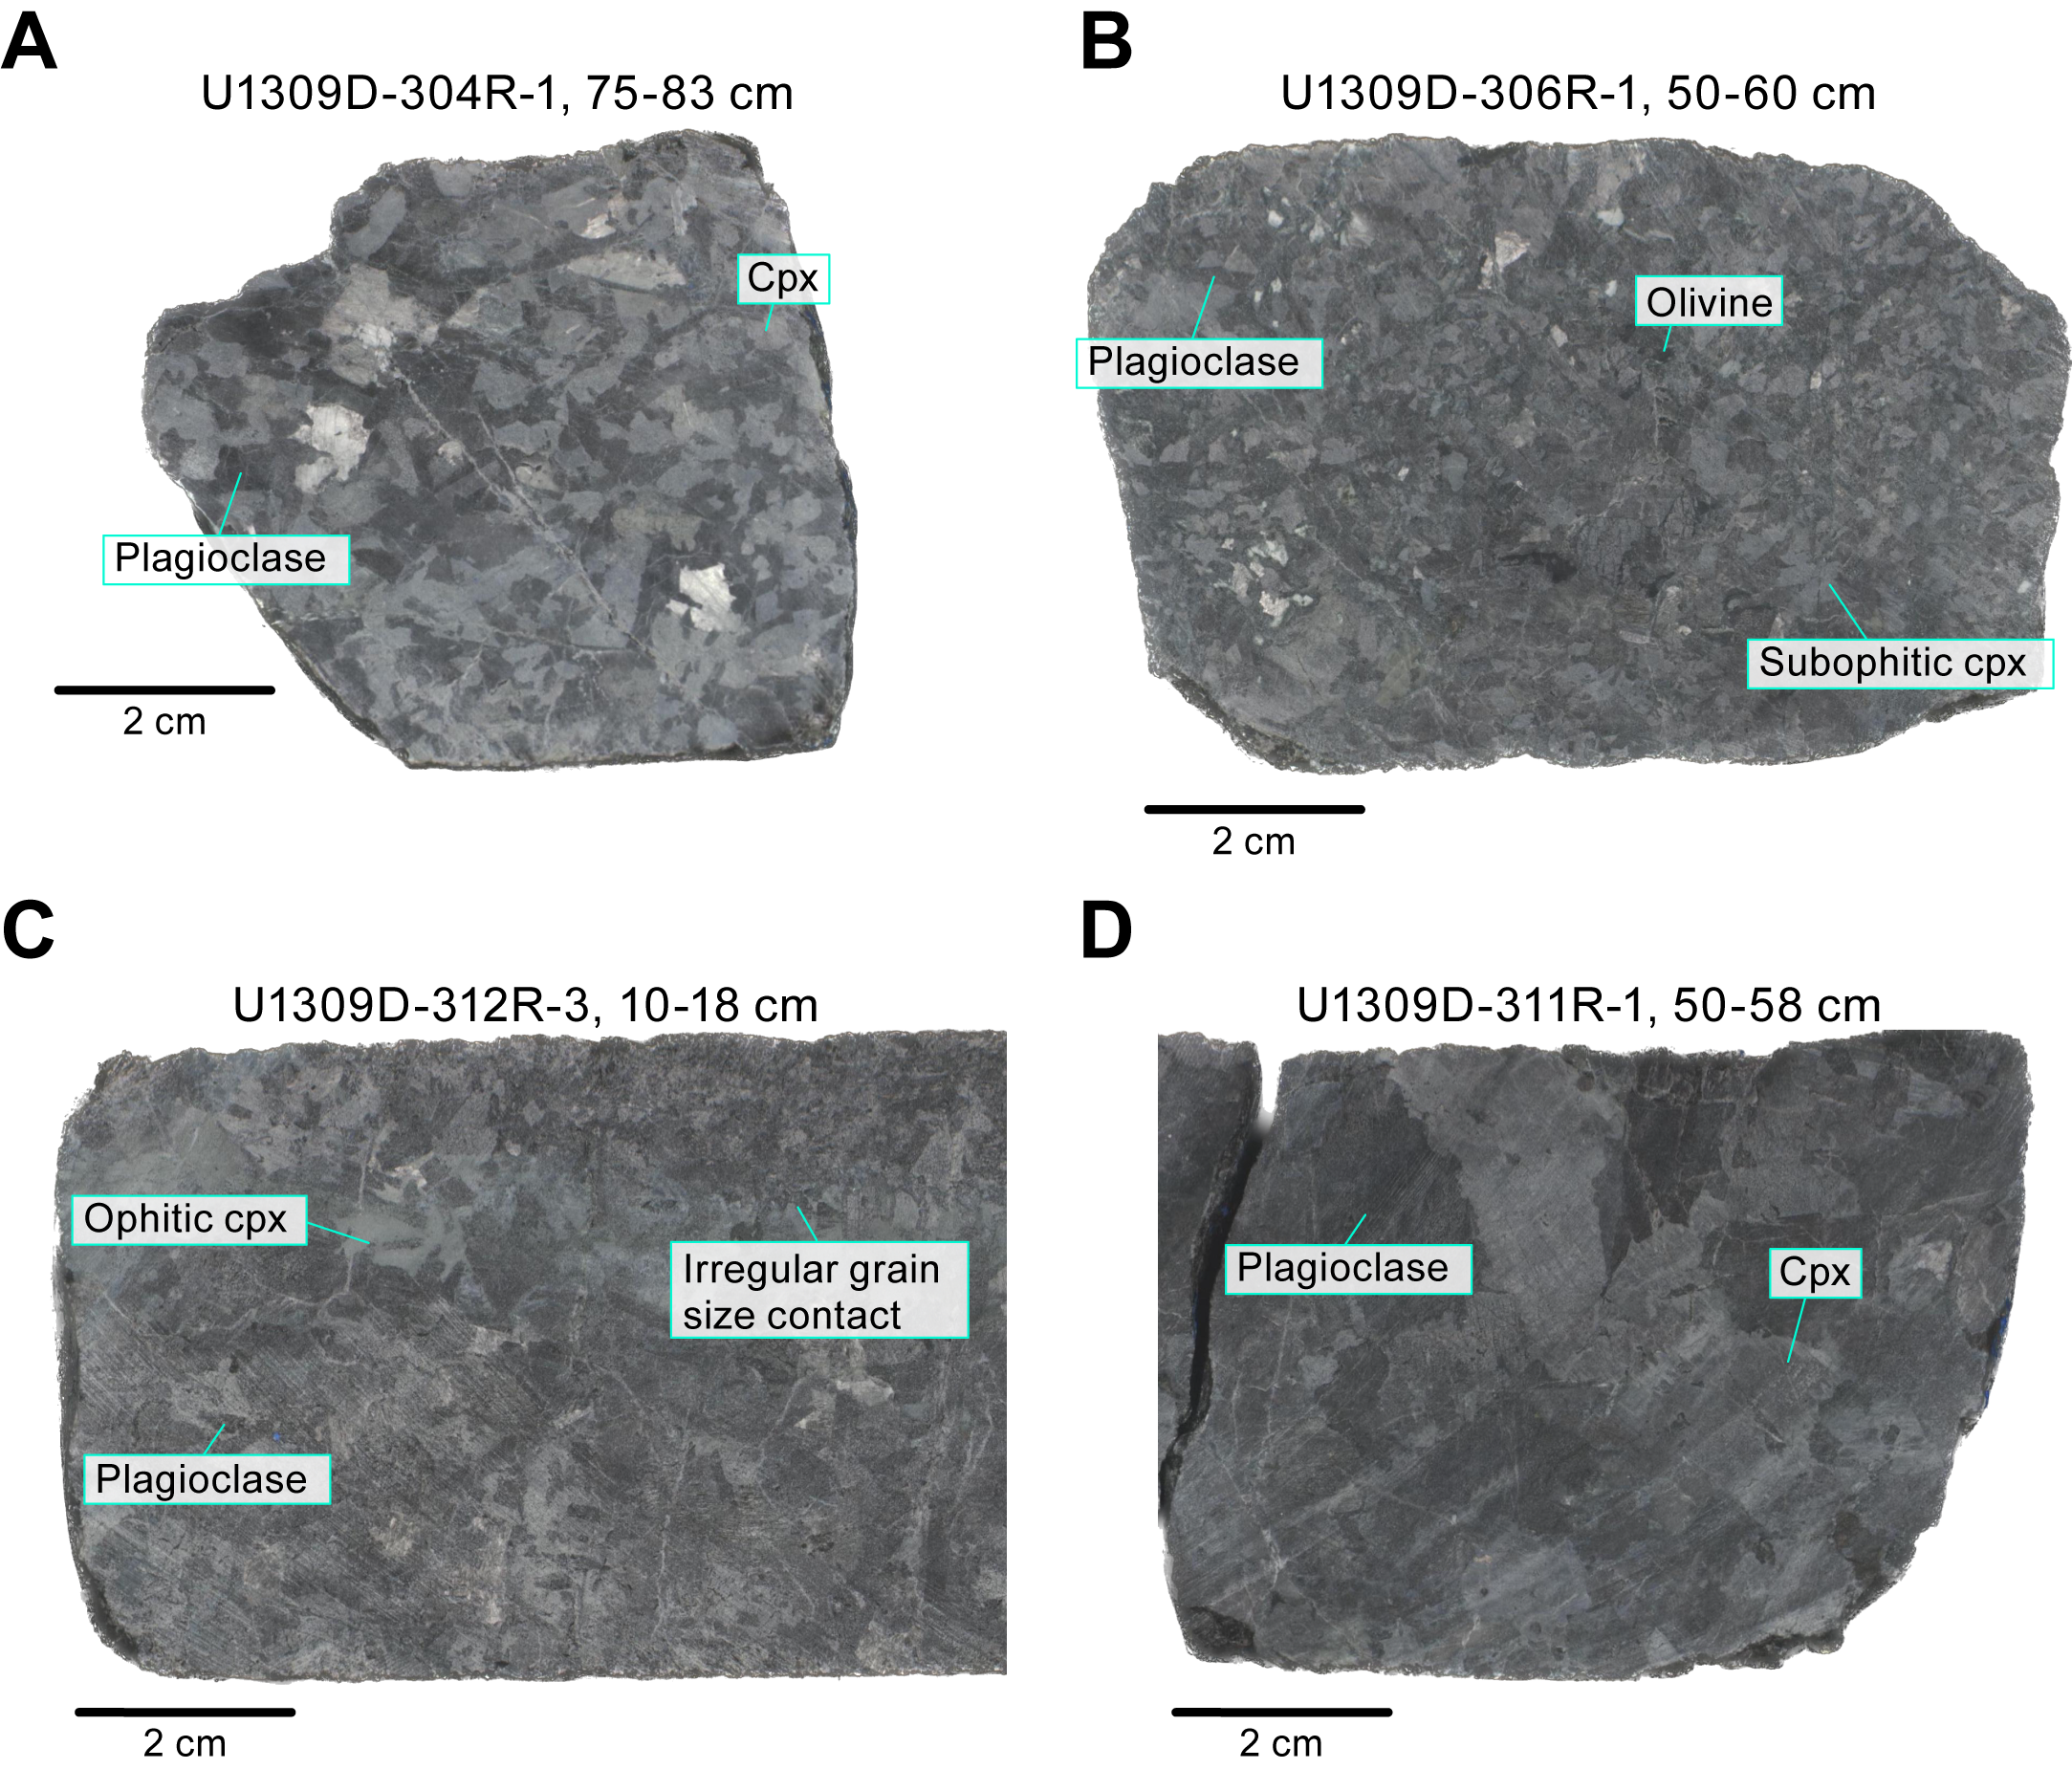
Figure F12. Coarse- and medium-grained gabbro.
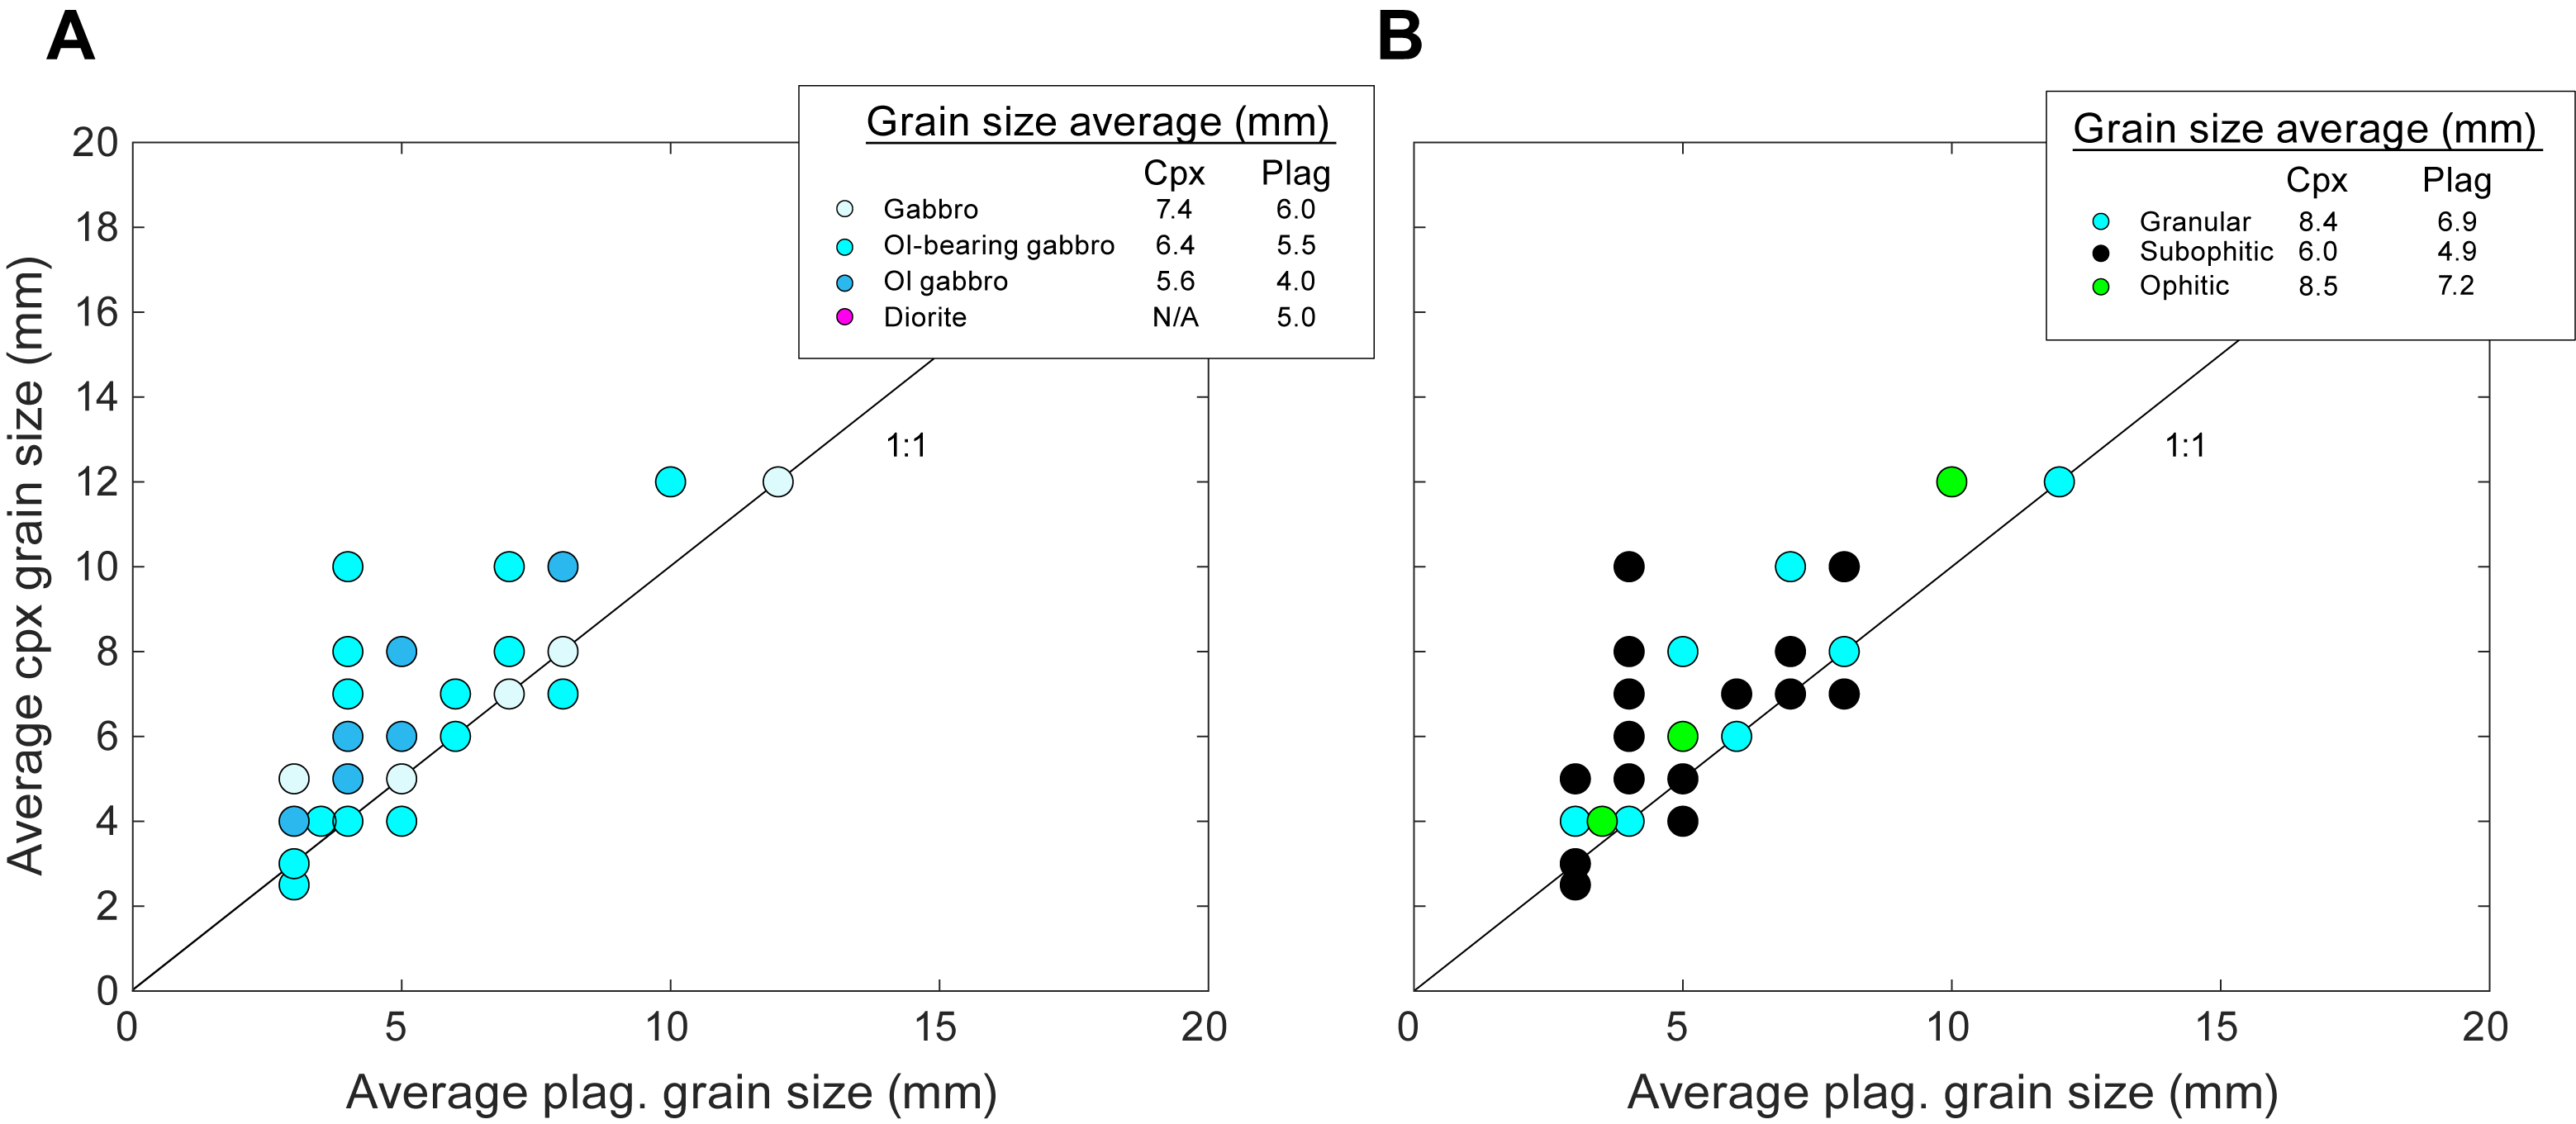
Figure F13. Grain size of plagioclase and clinopyroxene.
Lithologically, the unit is divided into thirteen subunits (772A–772M). Each of these subunits defines a change in mineralogy and/or grain size downsection. Subunits may recur, being present as layers ranging from a few centimeters to ten or more centimeters in thickness in other subunits and hence appear out of sequence. In order downhole, the subunits are as follows:
- Subunit 772A is a predominantly coarse-grained olivine gabbro with grain size and texture varying on a 10 cm scale. Textures include subophitic, ophitic, poikilitic, and granular.
- Subunit 772C is a medium-grained, granular to subophitic olivine-bearing gabbro. Grain size varies on a 10 cm scale, and the subunit contains some coarse-grained intervals. Where these are significant, they are designated as Subunit 772D.
- Subunit 772E marks a transition to medium-grained olivine gabbro, which is predominantly subophitic but ranges in texture to granular.
- Subunit 772F marks a change in the olivine gabbro to coarse grained, with a large range of textures (granular, subophitic, ophitic, and poikilitic). Olivine proportions vary, and it is olivine-bearing gabbro below 1429.6 mbsf.
- Subunit 772G is marked by a decrease in grain size of the olivine-bearing gabbro to medium grained on average but with some coarse-grained intervals on a small scale. Textures are predominantly subophitic to ophitic.
- Subunit 772I is a predominantly medium-grained gabbro, some with trace amounts (≪1%) of olivine and/or of orthopyroxene.
- Subunit 772J is a medium-grained subophitic to granular olivine-bearing gabbro and marks the return of olivine.
- Subunit 772K is defined by a decrease in olivine proportions and concomitant increase in grain size. It is coarse-grained gabbro with predominantly granular and some subophitic textures.
- Subunit 772L comprises two small intervals of medium- to coarse-grained olivine gabbro, marking an overall increase in olivine abundance from Subunit 772K.
- Subunit 772M is medium-grained olivine-bearing gabbro, signifying a decrease in average grain size, and is dominated by subophitic and subordinate ophitic textures.
3.1.1.3. Unit 777
Unit 777 (Section 399-U1309D-303R-1; 1445.4–1445.9 mbsf) is a thin (0.5 m) interval of medium-grained gabbro within Unit 772 that contrasts in grain size (medium grained), mineralogy (clinopyroxene rich, no olivine), and texture (granular) with the surrounding rocks of Subunit 772G (coarse-grained, subophitic olivine-bearing gabbro). On that basis, it was designated as a separate unit. The contact relationships were not recovered.
3.1.2. Diorite
Diorite veins crosscut the gabbroic rocks and are treated as domains; their occurrences are listed in Table T5. The veins are centimeter scale, typically medium grained, and have a seriate grain size distribution, although most of them are strongly altered, obscuring primary textures and mineralogy. Where primary features are preserved, diorite veins are plagioclase rich and contain locally acicular black amphiboles (Figure F14). The contacts with their host gabbro is sutured (Figure F14). Partial replacement of some of the gabbro clinopyroxene by amphibole indicates that the diorite veins have a reactive relationship with their host gabbros.
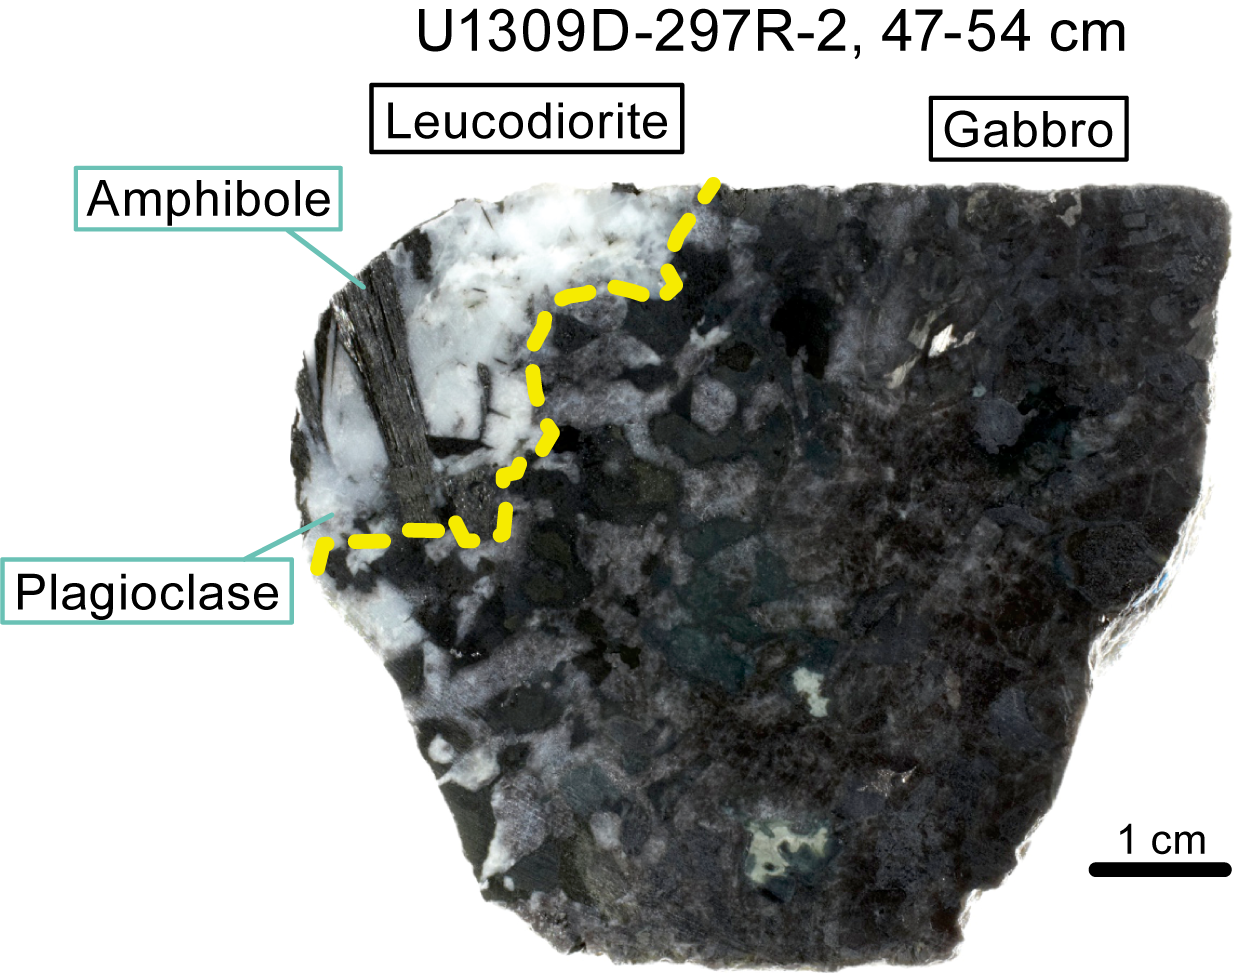
Figure F14. Leucodiorite in contact with gabbro.
3.1.3. Diabase
Diabase occurs throughout Hole U1309D, forming Units 773–776 and 778 as well as domains in Subunits 772G and 772I (Table T6). Where contact relationships are preserved, the diabase frequently has chilled margins, indicative of an intrusive nature. Diabase units range in size from 1 cm to 0.8 m. Where diabase is relatively thick, it may grade in grain size from cryptocrystalline at the margin to fine grained in the core; a good example of this occurs in Section 399-U1309D-297R-2 (Figure F15). Unit 776 diabase is aphyric, but the remaining diabase is olivine or olivine + plagioclase-phyric, with phenocryst proportions ranging from 0.5% in Unit 778 to 5% in Unit 775. None of the units contain vesicles.
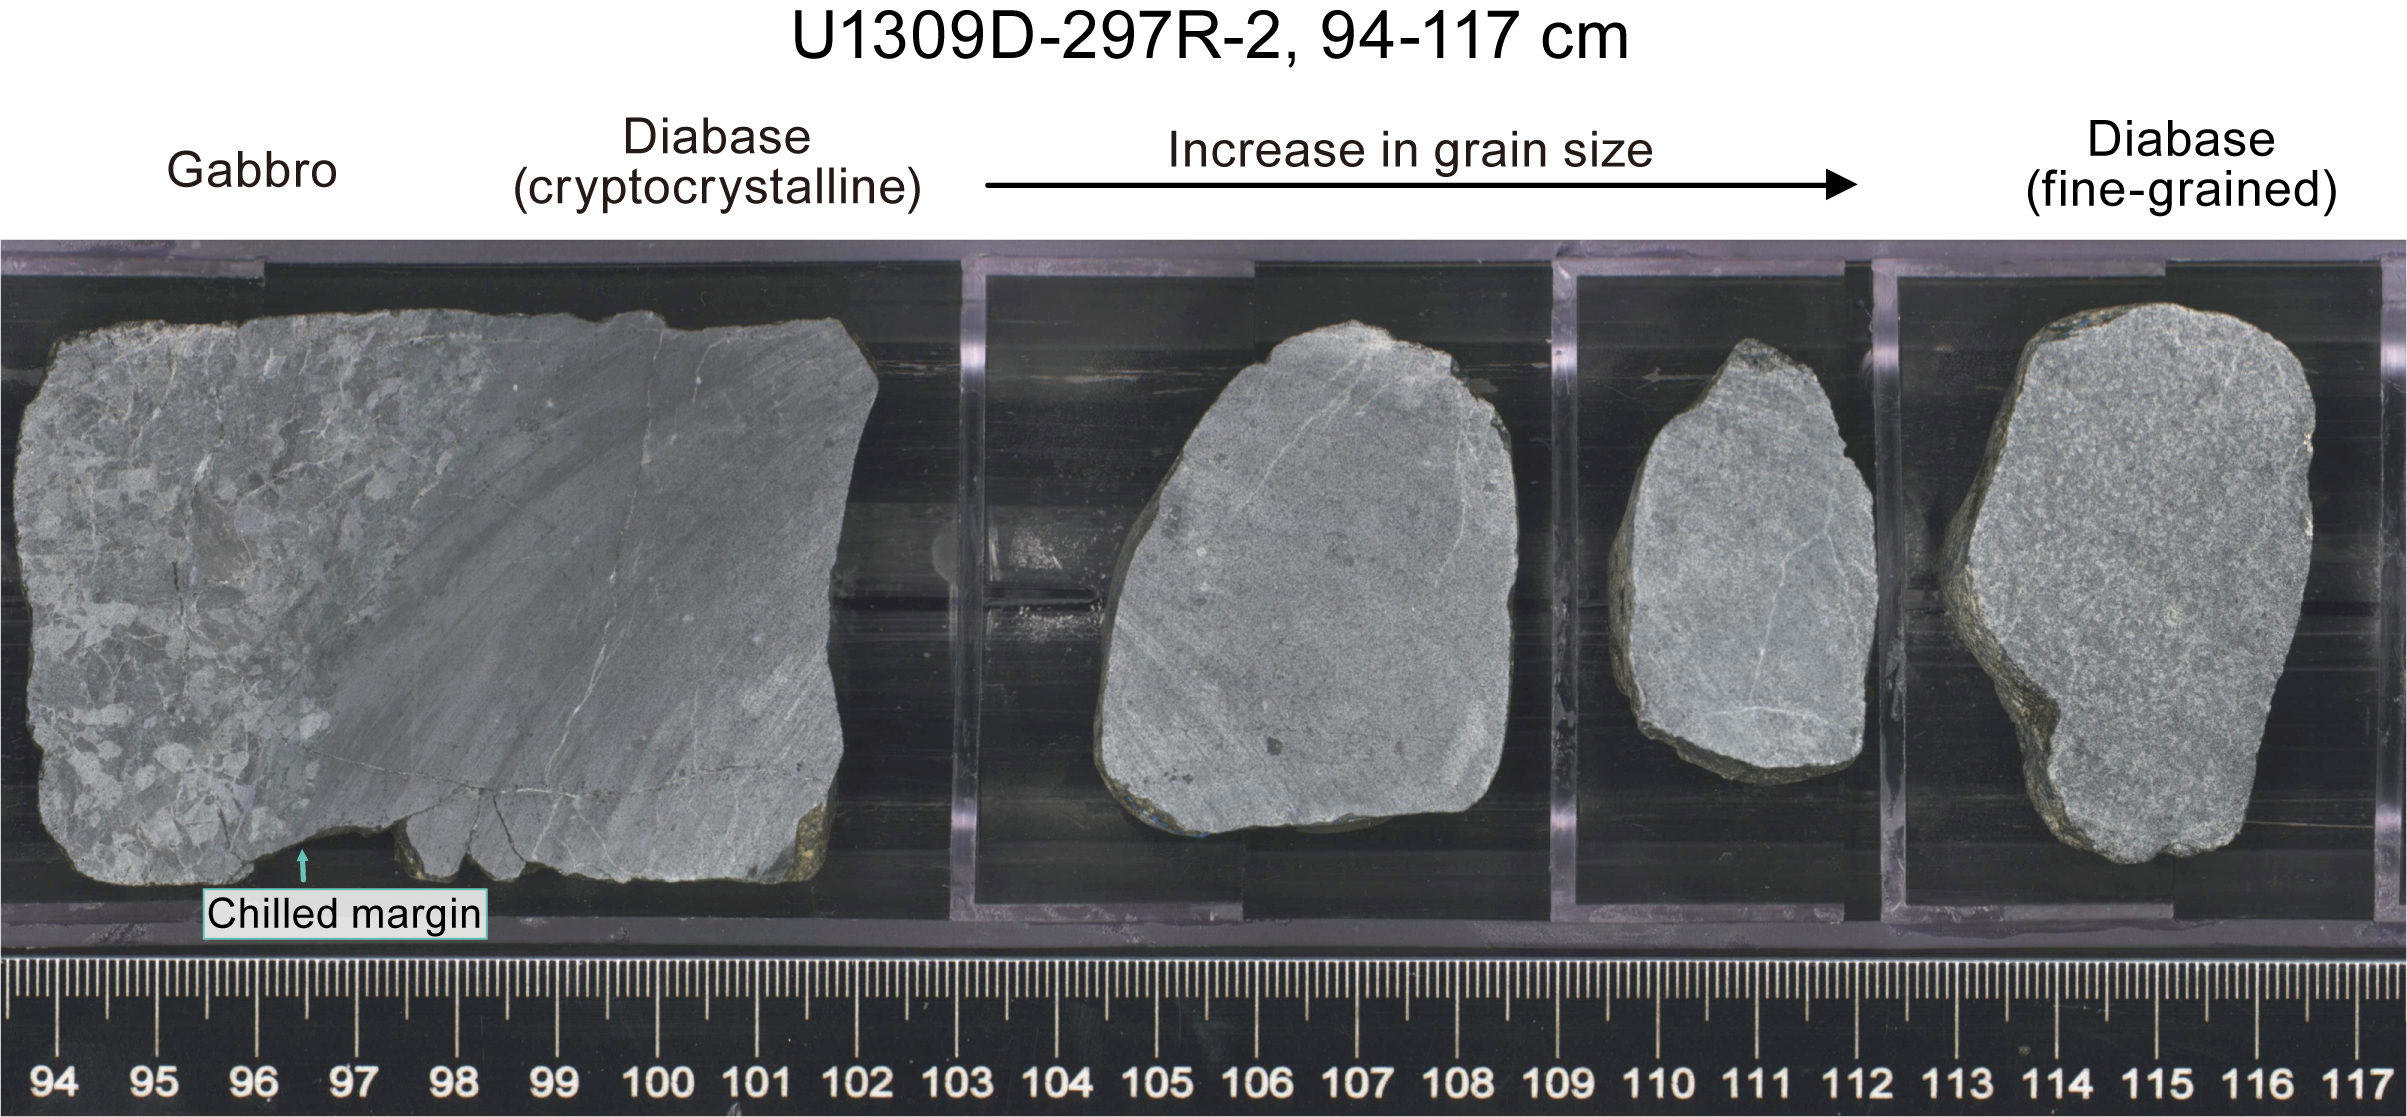
Figure F15. Diabase intrusion in gabbro.
3.2. Microscopic observations
Thin sections of cores recovered from Hole U1309D during Expedition 399 have a subset of textures and mineral modes that were described for cores higher up in the hole that were collected during Expedition 304/305 (e.g., Expedition 304/305 Scientists, 2006b). The original igneous lithologies for the shipboard thin sections of gabbroic rocks are gabbro, olivine-bearing gabbro, and olivine gabbro, with two-phase gabbros being more common toward the central portion of the drilled interval and olivine being more common toward the upper and lower portions. Primary magmatic amphibole was not observed in thin section. Fe-Ti oxides were encountered in several thin sections, but they were typically found in interstices with secondary actinolite, and thus they were not considered primary crystallization products from melts.
Clinopyroxene engulfing plagioclase abounds, and thus the textures for most gabbroic rocks range between ophitic and subophitic (Figure F16). Thin sections with granular textures are rare and are typically highly deformed and altered.
Figure F16. Textures between clinopyroxene and plagioclase.
Clinopyroxene is anhedral and interstitial, with oikocrysts encompassing large portions of some thin sections. More commonly, clinopyroxene is a few to several millimeters across and contains plagioclase chadacrysts. Most clinopyroxene grains have thin exsolution lamellae of orthopyroxene as a result of slow cooling (Figures F17, F18).
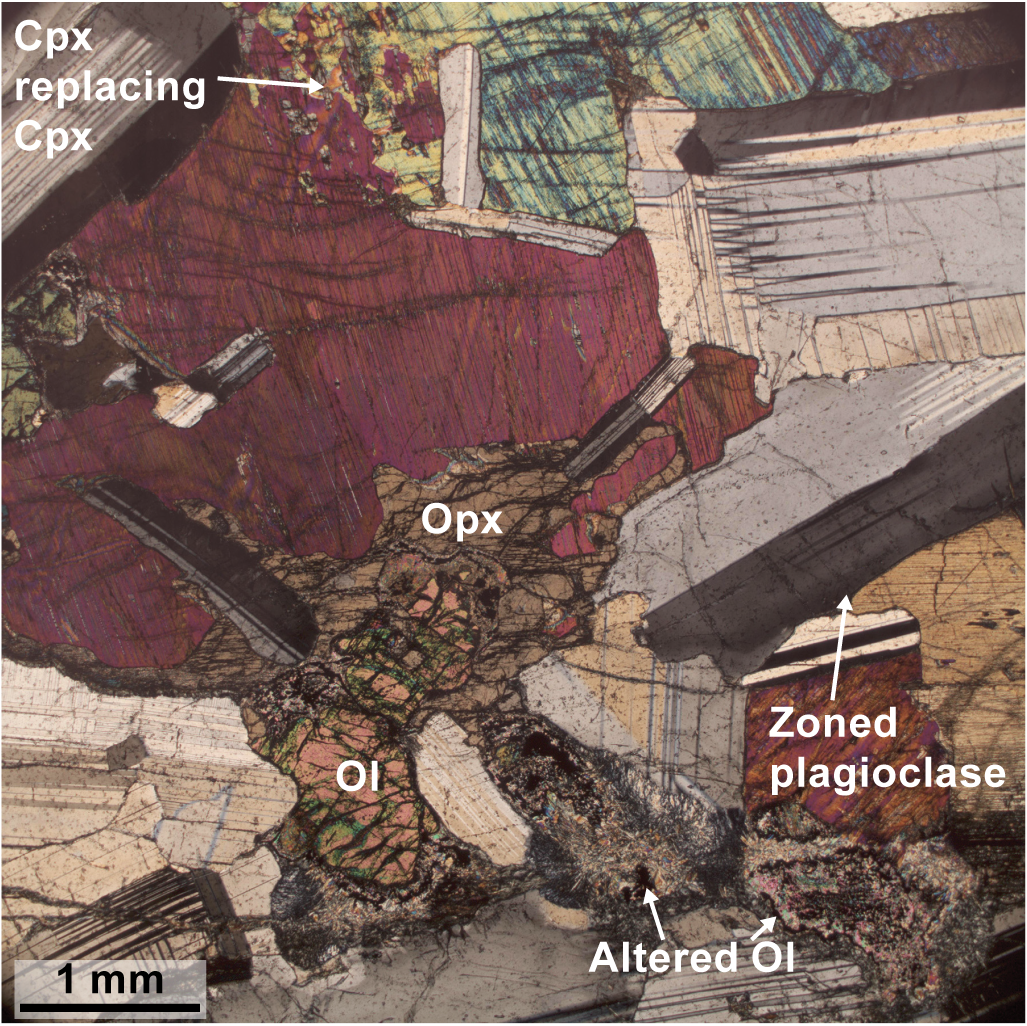
Figure F17. Subophitic texture.
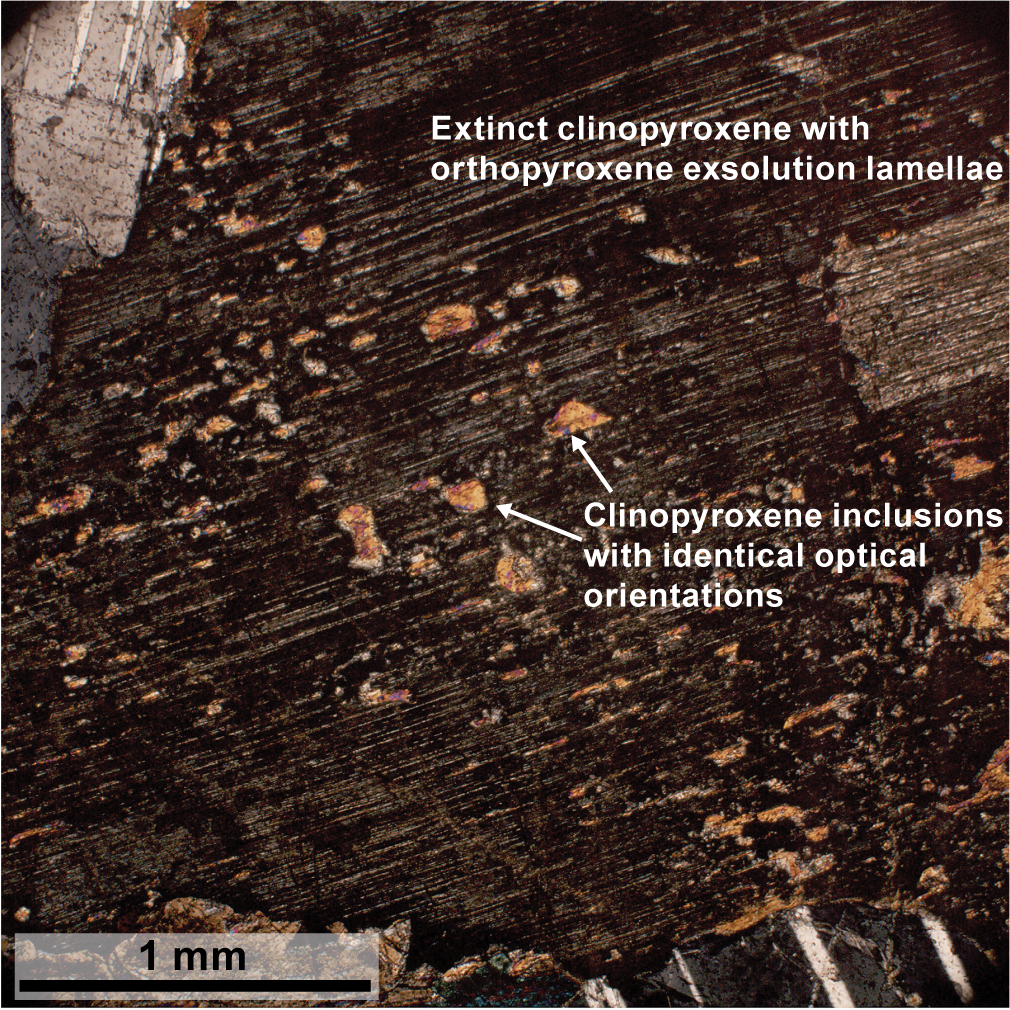
Figure F18. Clinopyroxene with orthopyroxene exsolution lamellae.
Multiple generations of clinopyroxene crystallization are evident in several thin sections. The most common textural evidence is in the form of disequilibrium textures, such as sutured clinopyroxene-clinopyroxene grain boundaries (Figure F17, F19) and complex clinopyroxene-clinopyroxene intergrowth (e.g., a set of optically continuous clinopyroxene inclusions encompassed by a large clinopyroxene grain with a different optical orientation; Figure F18). This type of complex intergrowth was seen in several gabbro thin sections, and it is thus not particularly unusual for the section of Hole U1309D drilled during Expedition 399. Similar textures observed in oceanic gabbros from Ocean Drilling Program (ODP) Hole 735B have been attributed to clinopyroxene replacing preexisting minerals as a result of reactive porous flow processes, where crystal mushes are infiltrated by later melts (Lissenberg and MacLeod, 2017).
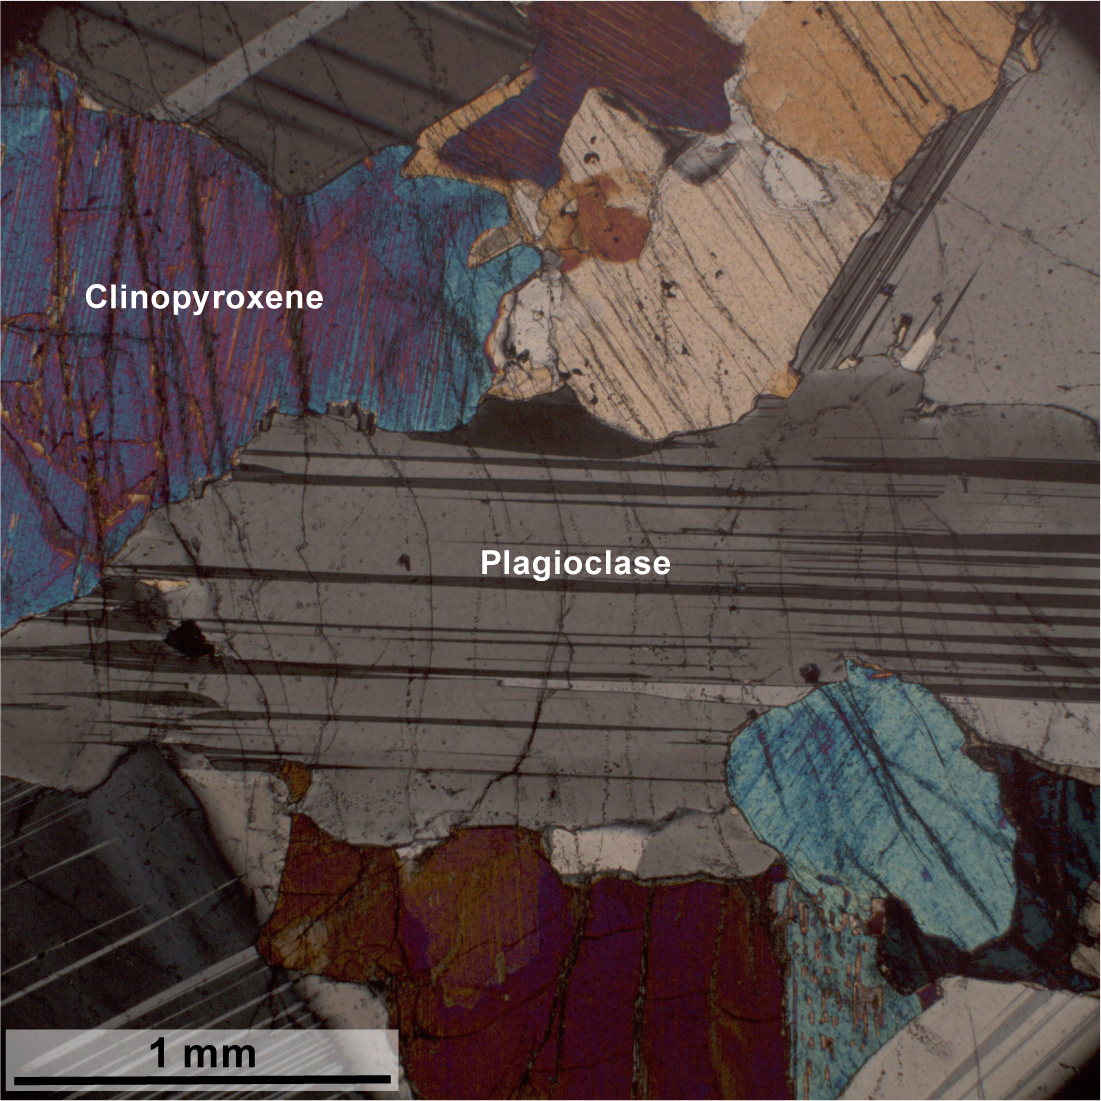
Figure F19. Embayed and sutured contact relationships.
Plagioclase crystals in the gabbros from Hole U1309D are commonly tabular and subhedral with polygonal to sutured borders. The plagioclase in most samples has variable optical orientations within individual grains. Some of this optical zoning is roughly concentric, likely reflecting compositional zoning. In some samples, this zoning is continuous from core to rim, whereas other samples have more complex patterns because of compositional reversals (Figure F17). Plagioclase in some thin sections has patchy zoning resulting from deformation. Overall, the zoning intensity ranged from 0 (none) to 2 (abundant zoning that can range from weak to strong), with an average of 1.2 (Figure F20). Only three thin sections recorded Rank 0 (no zoning), and none recorded Rank 3 (nearly ubiquitous, generally strong zoning).
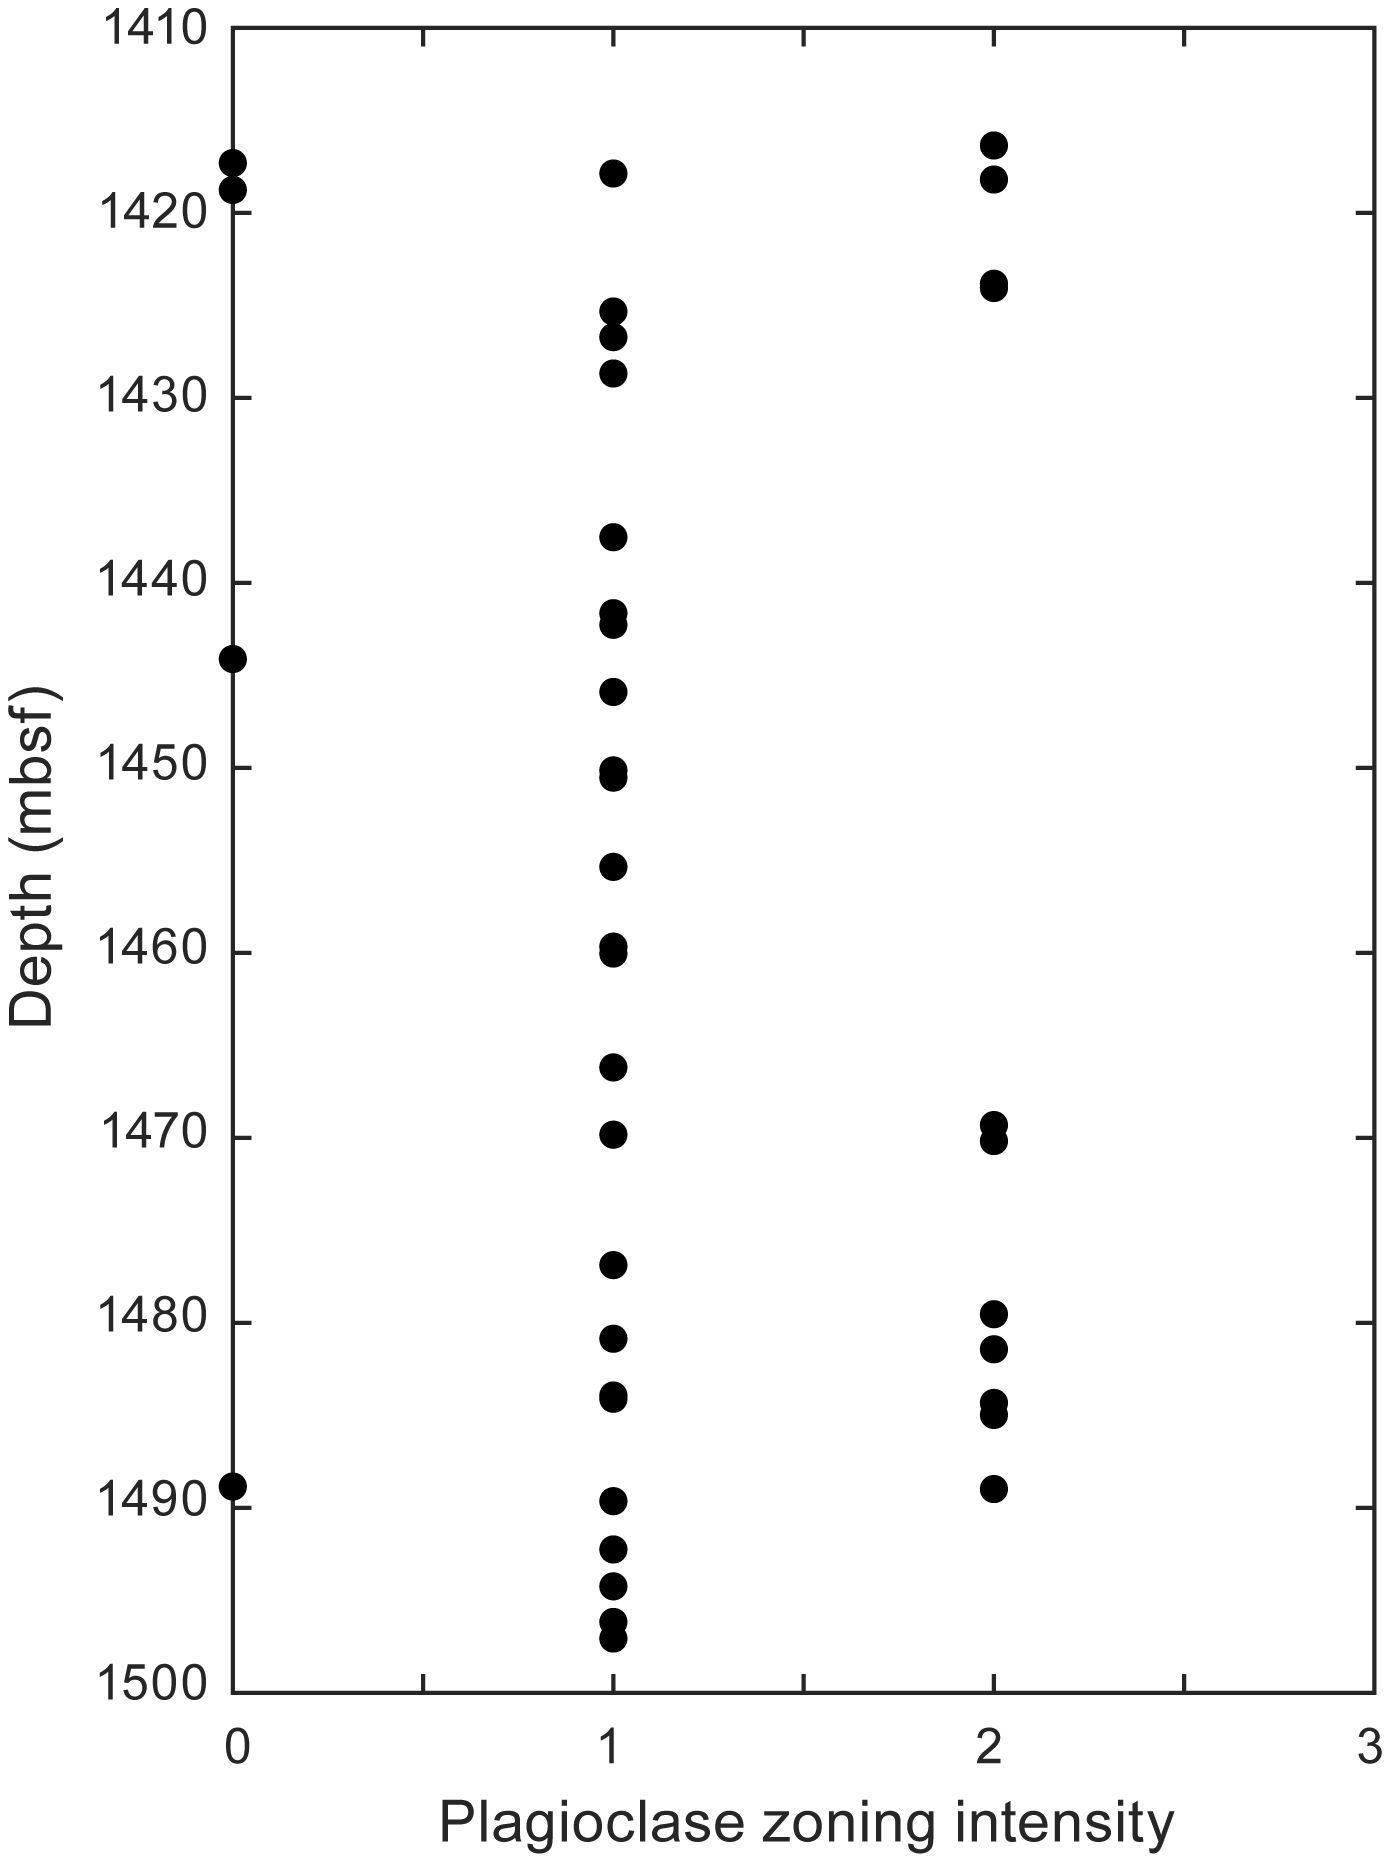
Figure F20. Plagioclase zoning intensity, gabbroic rocks.
Olivine can be identified in thin section even when fully altered (e.g., Figure F17), which allows original percentages to be estimated. Olivine is anhedral, either as discrete grains or as crystal clusters. Kink banding is common. Some crystal clusters have large kink-banded grains and smaller optically homogeneous grains, suggesting crystal fragmentation by deformation followed by annealing (Figure F21).
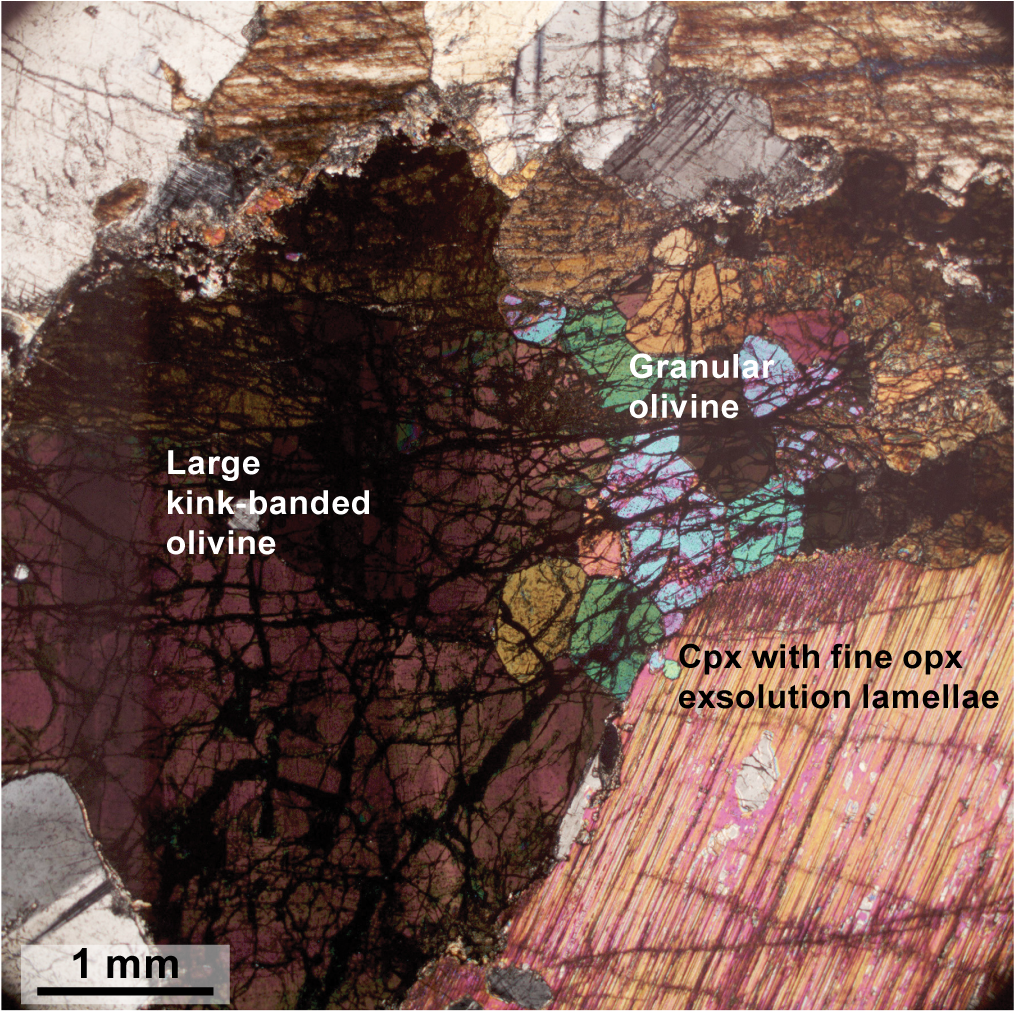
Figure F21. Textural variations in olivine crystals.
Orthopyroxene is rare in the shipboard thin sections from Hole U1309D made during Expedition 399. It is most commonly present as thin exsolution lamellae in clinopyroxene (Figure F18). It also is present as late-stage interstitial grains rimming olivine. These rims commonly thicken at boundaries between olivine and clinopyroxene, and orthopyroxene may partially replace clinopyroxene (Figure F17). One or two discrete grains of orthopyroxene are present in gabbroic thin section (TS) Samples 399-U1309D-302R-2, 52–54.5 cm (TS33); 310R-1, 92–95 cm (TS56); and 313R-3, 7–13 cm (TS68).
Thin sections of diabase dikes show contrasting textures. One is coarse grained and has subophitic intergrowths of plagioclase and (partially altered) clinopyroxene (Figure F22). Olivine phenocrysts that have been replaced entirely by secondary minerals also are present in this sample. Chromite inclusions in the altered olivine remain unaltered. Diabase dikes with microcrystalline to cryptocrystalline grain size cut through altered gabbro in Samples 399-U1309D-297R-2, 97–100 cm (TS22), and 299R-1, 12–15 cm (TS25). These fine-grained diabases have chilled margins against highly altered gabbro hosts. In Sample 297R-2, 97–100 cm (TS22), the margin has brecciated gabbroic material (Figure F23). Fresh, euhedral olivine is present in this diabase. In Sample 299R-1, 12–15 cm (TS25), altered olivine phenocrysts have reaction halos of fine secondary materials (Figure F24). This dike has larger crystals concentrated in its center and flow alignment of crystals. Multiple generations of plagioclase are present in all of the diabase dikes in thin section, as evidenced by the presence of partially resorbed, tabular and acicular crystals. Tabular to acicular plagioclase crystals terminate, and were likely nucleated, on altered gabbroic xenolithic material in the finer grained diabase dikes (Figure F23).
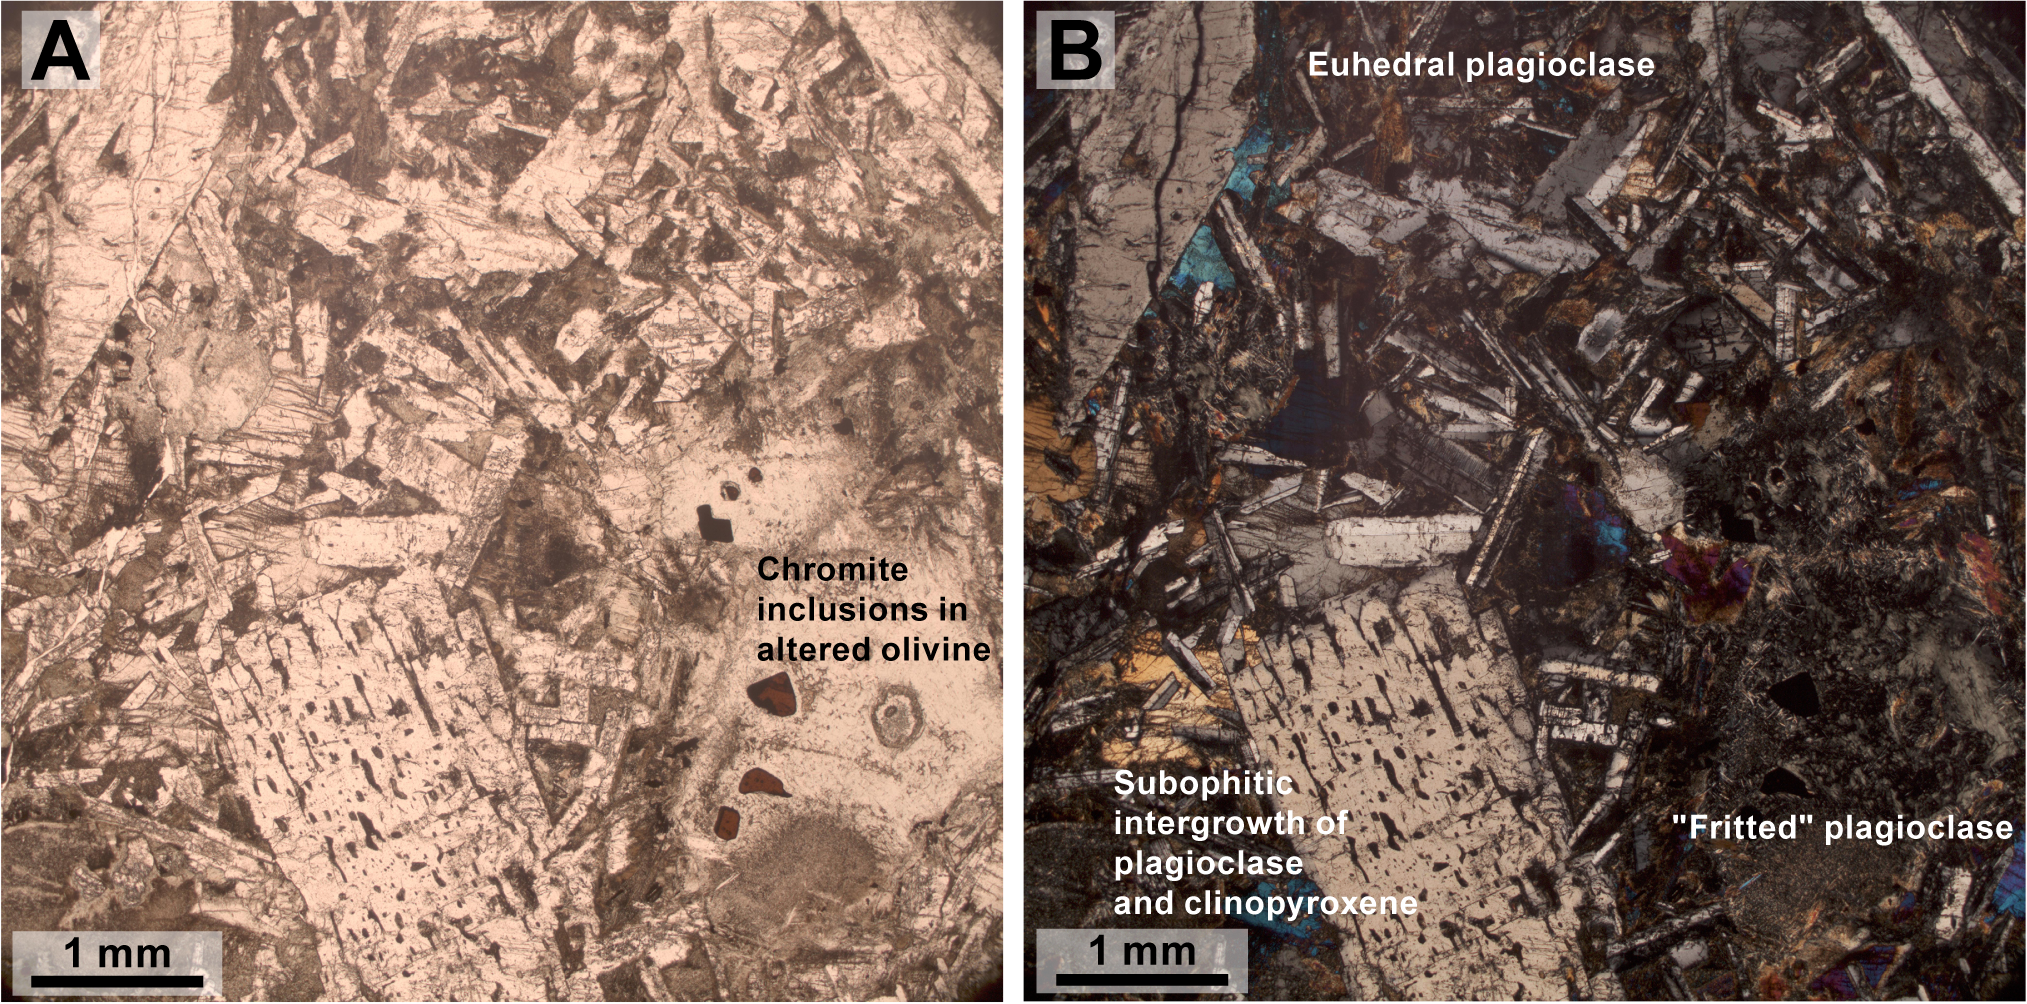
Figure F22. Diabase, igneous features.
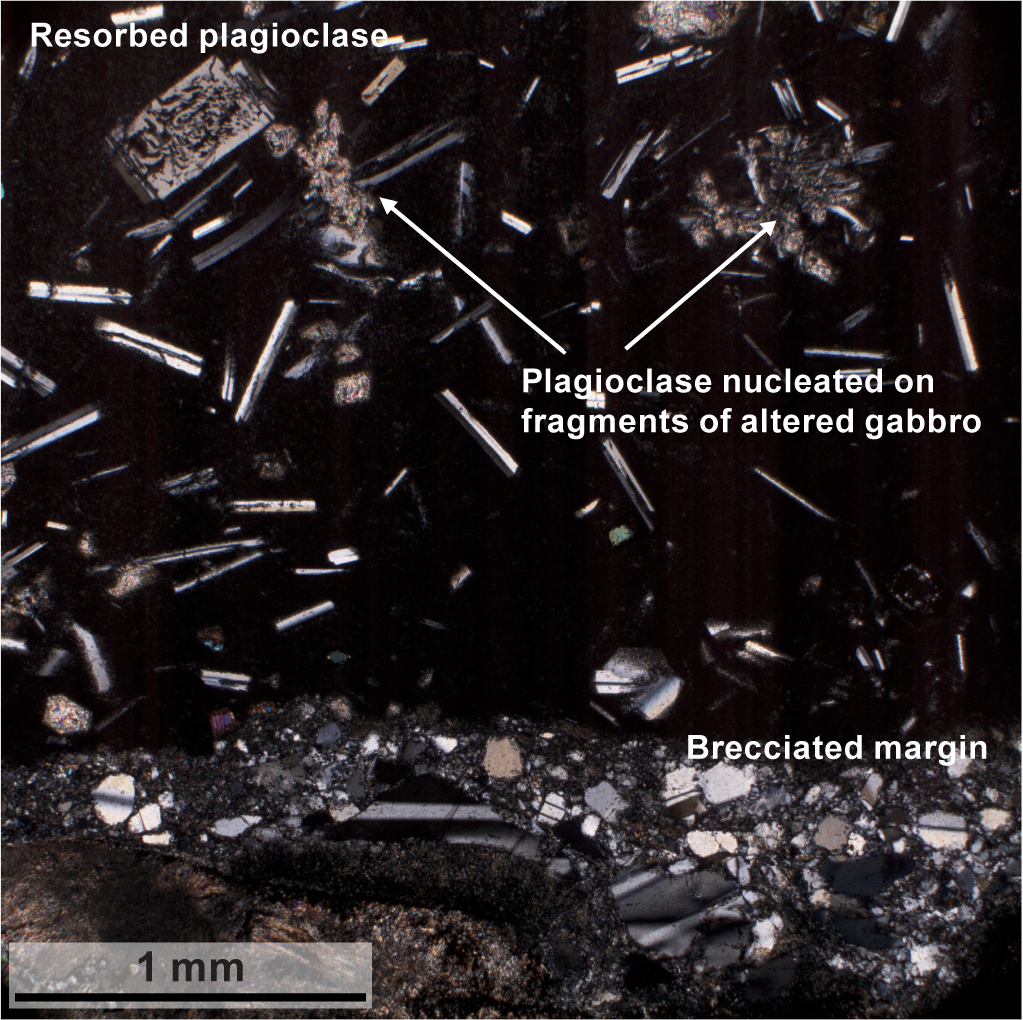
Figure F23. Brecciated border and plagioclase textures.
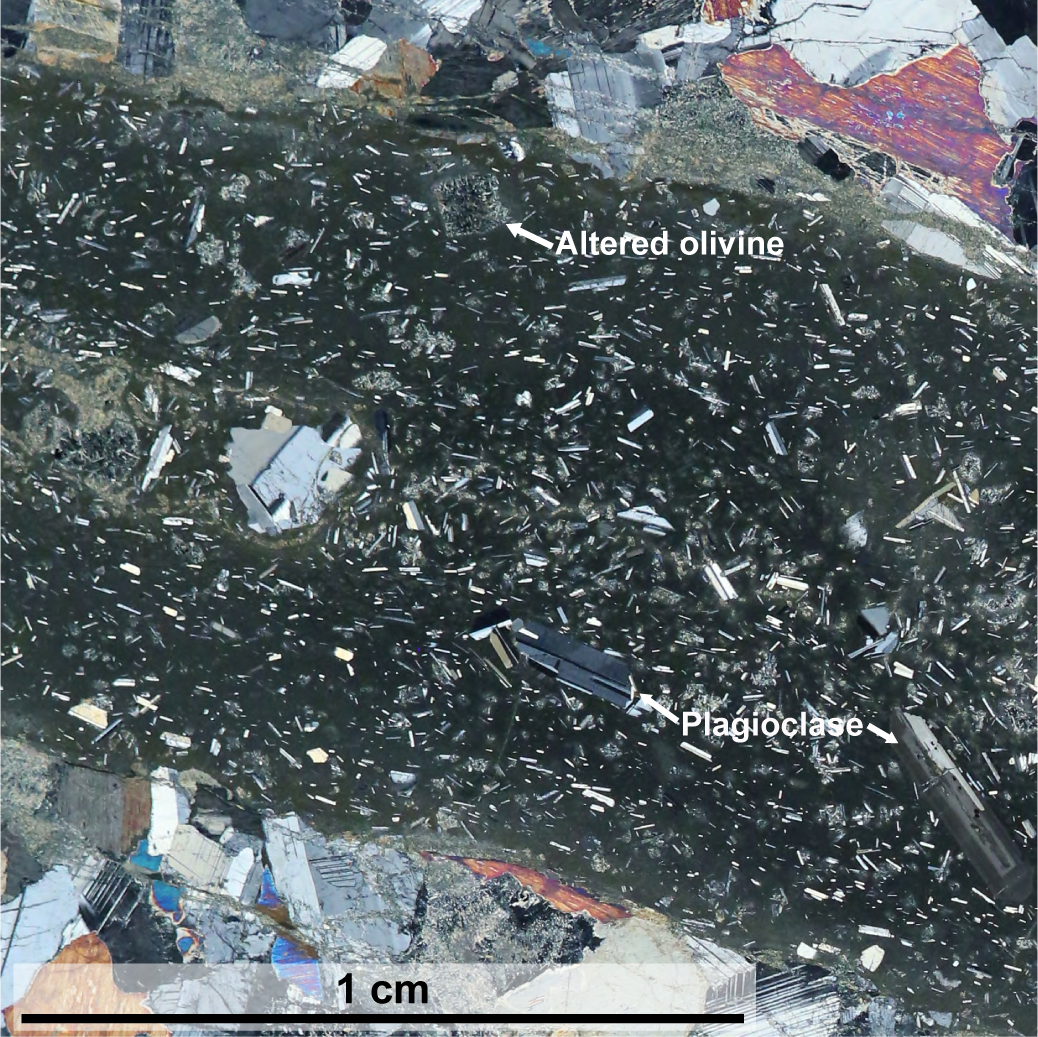
Figure F24. Dike illustrating crystal size distributions.
3.3. Preliminary interpretations
The lithologies recovered during the deepening of Hole U1309D from 1415 to 1489 mbsf during Expedition 399 show both differences and similarities with those recovered in the 0–1415 mbsf interval during Expedition 304/305 (Expedition 304/305 Scientists, 2006b). Both intervals are dominated by gabbro and olivine gabbro (Figure F7). However, the proportion of gabbro is significantly higher and the proportion of olivine gabbro is significantly lower in the deeper interval. Further, no oxide gabbro, troctolite, or peridotite was recovered during Expedition 399, whereas these constitute a combined 15% in the interval drilled during Expedition 304/305 (Expedition 304/305 Scientists, 2006b). The distribution of peridotites, troctolites, and oxide gabbros in Hole U1309D is uneven, with significant concentrations at specific depths. Hence, it may be that the difference in lithologies relates to a sampling bias introduced by the relatively short nature of the interval drilled during Expedition 399 relative to that drilled during Expedition 304/305. Support for this contention comes from the fact that the bottom ~80 m of the Expedition 304/305 section recovered exclusively olivine gabbro, gabbro, and diabase, similar to the section recovered during Expedition 399. Hence, we view the rocks described here as a natural continuation from the bottom of the Expedition 304/305 section.
The section of Hole U1309D drilled during Expedition 399 contains only three gabbroic units, two of which are thin (Units 771 [0.1 m] and 777 [0.4 m]), with the remaining 82 m making up Unit 772. Whether these three units represent separate plutons is uncertain because no contacts were recovered. Within the Unit 772 gabbros, changes in grain size, modal mineralogy, and texture are typically gradual and irregular in nature. This suggests that the different subunits represent intrusion-crystallization cycles within a single plutonic body, rather than representing discrete intrusions into solid country rock. We interpret the textural continuum of subophitic to ophitic to poikilitic to be recording progressive clinopyroxene crystallization between and around a network of subhedral, tabular to elongate plagioclase crystals. This is consistent with the thin section observations.
After the formation of the initial olivine, plagioclase, and clinopyroxene, crystallization progressed from melts with different (evolving?) compositions. This is evidenced by the presence of zoning in plagioclase in many of the thin sections examined, as well as the microscopic evidence for disequilibrium textures in clinopyroxene. The general lack of the characteristic late-stage assemblage of amphibole + Fe-Ti oxide indicates that the late-stage melt was not generally evolved to the point of oxide saturation, as is common in Hole 735B (Dick et al., 2000; Ferrando et al., 2022). It is unclear to what extent similar late-stage crystallization from evolving melts occurred in the gabbroic rocks recovered during Expedition 304/305 above 1415 mbsf because plagioclase zoning is not described in the Proceedings volume (Expedition 304/305 Scientists, 2006a), and the majority of plagioclase zoning observed in Expedition 304/305 shipboard thin sections was in phenocrysts in diabase or basalt. Furthermore, in a detailed study of the interval between 800 and 1300 mbsf, Suhr et al. (2008) found only limited zoning in plagioclase (up to 2 mol%), with many samples lacking in zoning. However, oxide gabbros make up 7% of the gabbroic rocks recovered during Expedition 304/305, occurring as coarse-grained units often associated with ductile deformation, as is the case in Hole 735B (Dick et al., 2000). Furthermore, clinopyroxene compositions in Expedition 304/305 gabbroic rocks show evidence for reactive porous flow in the form of high TiO2 contents at high Cr2O3 contents (Lissenberg and MacLeod, 2016). These observations attest to significant flow, accumulation, and extraction of late-stage melt. Taken together, these observations suggest some degree of late-stage melt flow occurred in the Hole U1309D section. Hence, we interpret the plagioclase zoning in the Expedition 399 gabbros to be the result of melt flow at relatively high temperatures prior to Fe-Ti oxide saturation.
Following the accretion of the gabbroic units, two additional stages of magmatism occurred. First, diorite veins intruded. The sutured and reactive nature of the contacts indicate that intrusion occurred when the gabbroic rocks were still at elevated temperatures. The final igneous activity is marked by the diabase dikes. Their chilled margins attest to intrusion in a relatively cold environment. Furthermore, the thin section observations of entrainment of hydrothermally altered microxenoliths indicate that at least some diabase intrusions occurred after the host gabbroic rocks had already suffered hydrothermal alteration.
4. Alteration petrology
Gabbroic rocks recovered from Hole U1309D during Expedition 399 show low degrees of alteration (<20 vol% secondary replacement) (Figure F25A, F25B). Overall, the degree of alteration tends to slightly decrease downhole. An exceptionally high extent of alteration occurs in intervals where localized alteration associated with cataclastic deformation, prominent hydrothermal or magmatic veining, and patchy bleaching took place. Alteration minerals appear to have formed under static conditions, except for amphibole formation associated with localized ductile deformation in cataclastic zones (Figure F26).
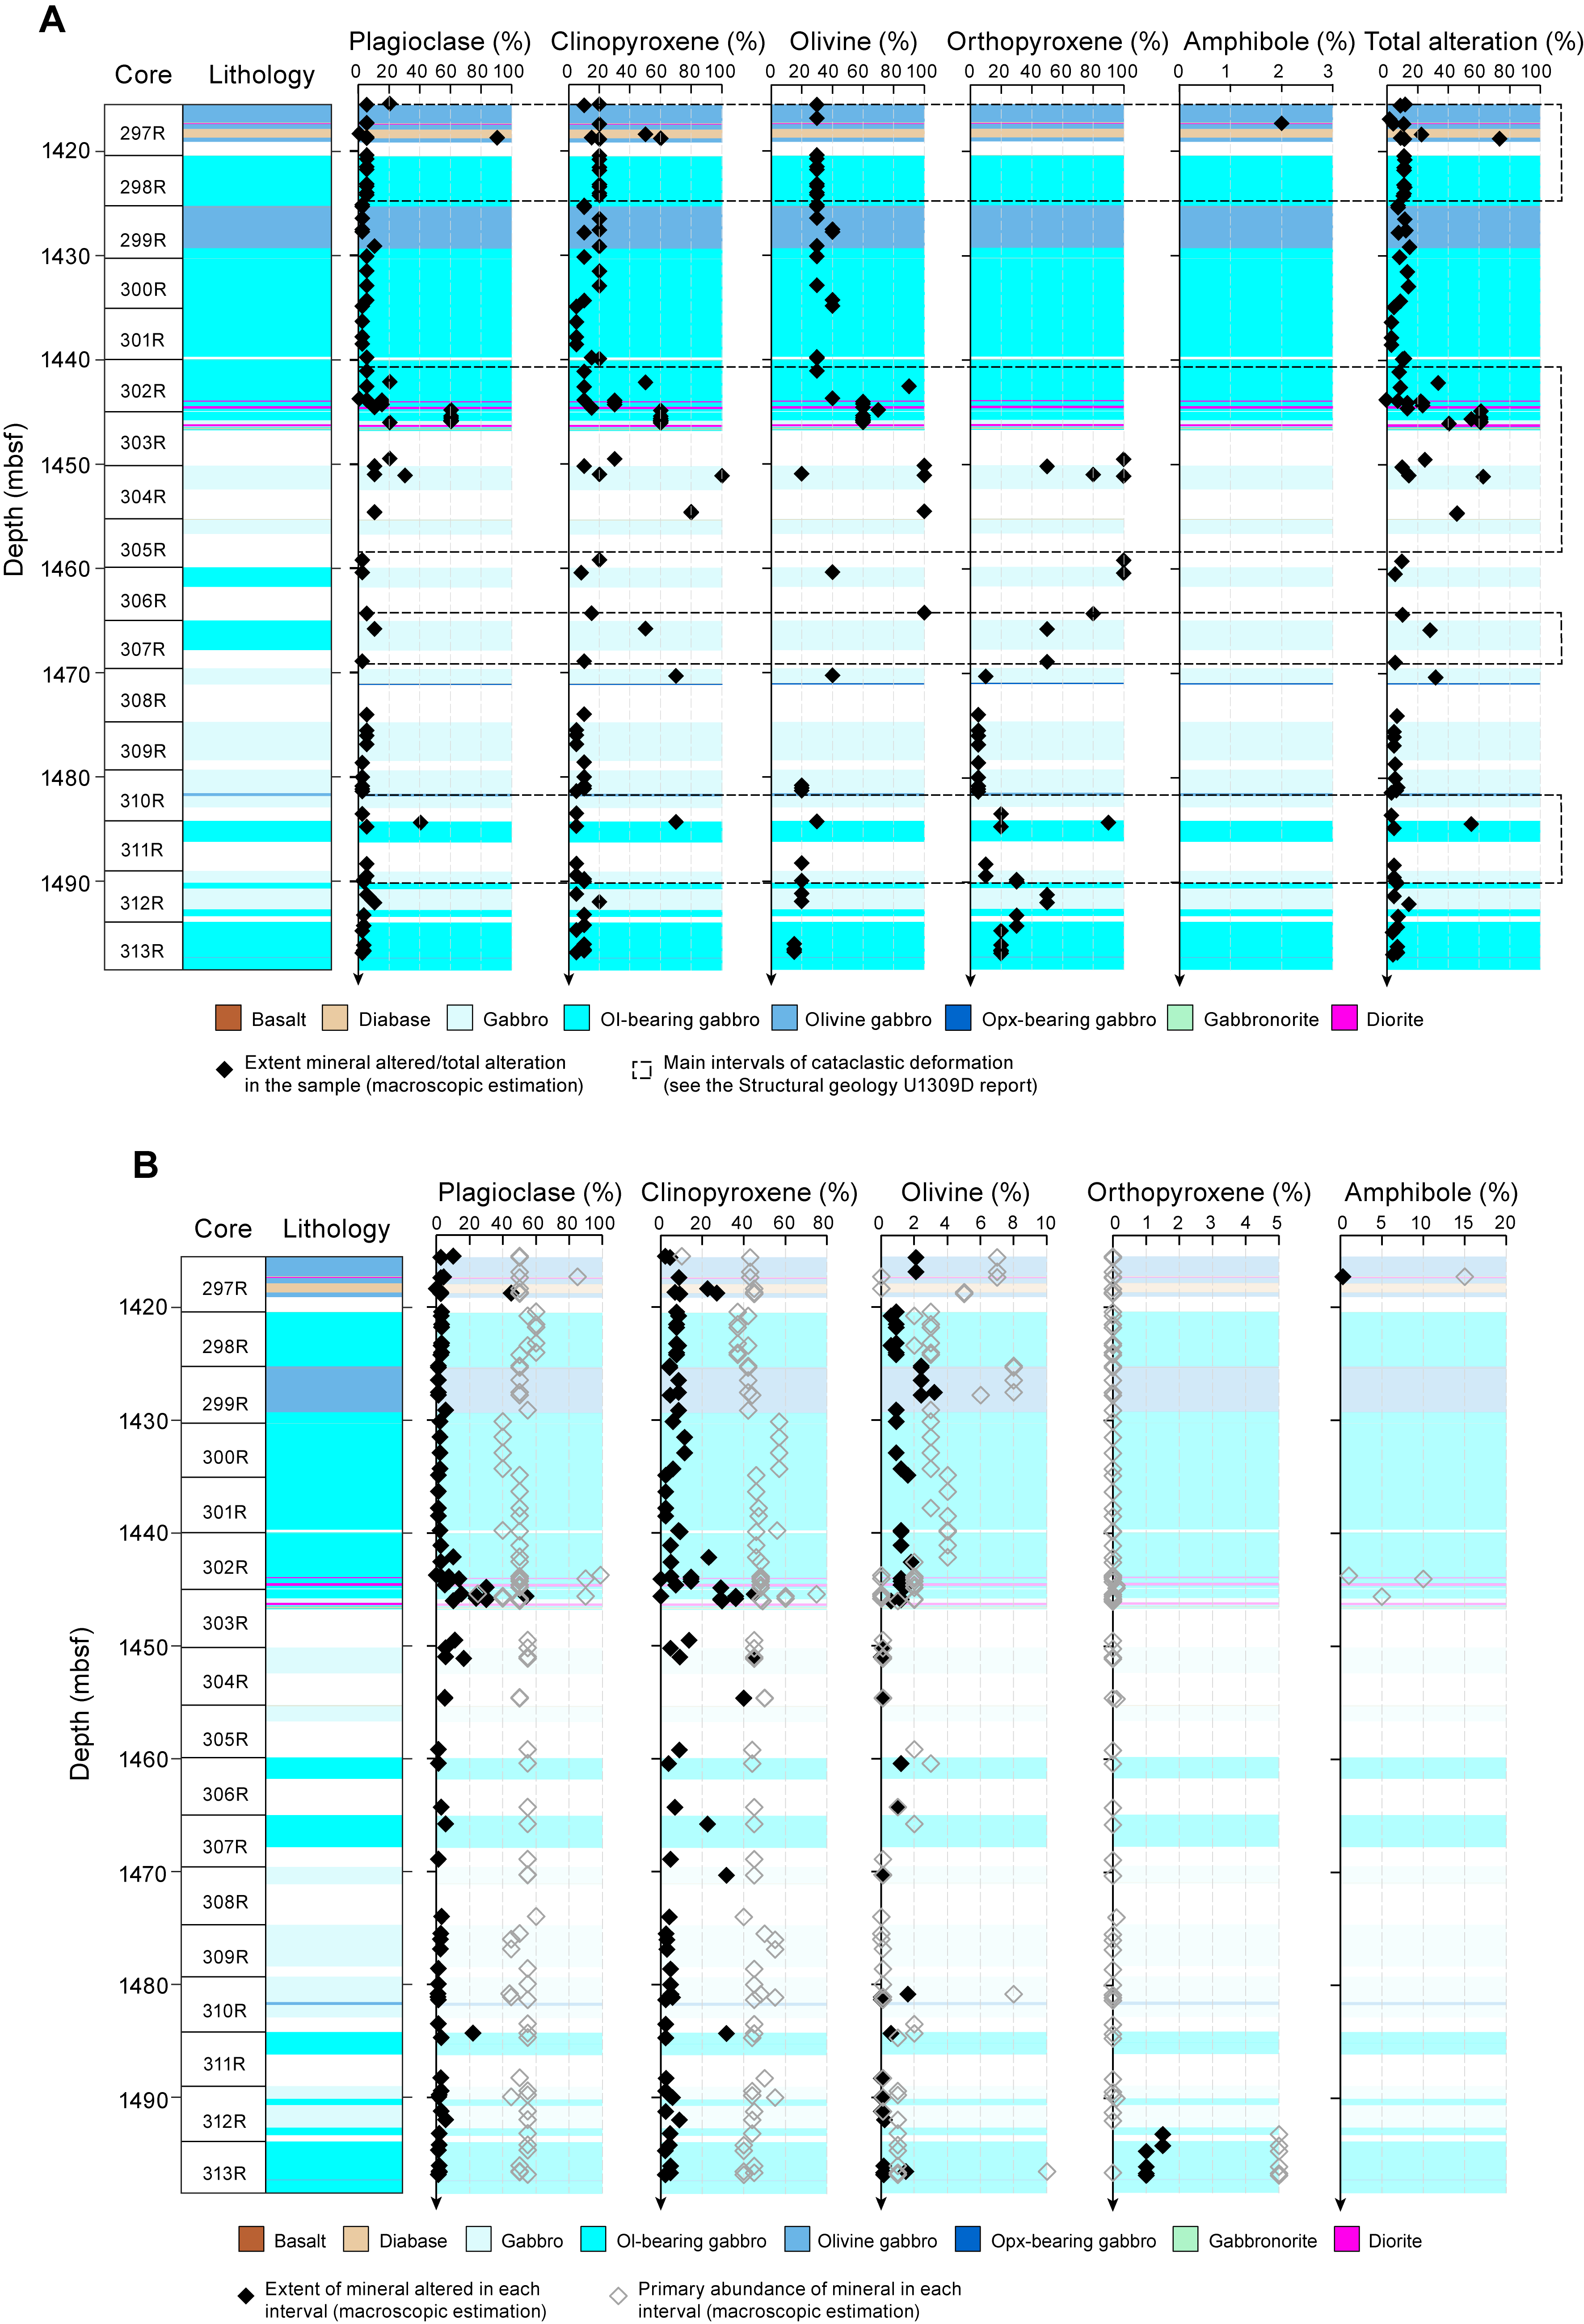
Figure F25. Mineral alteration, intensity, and abundance.
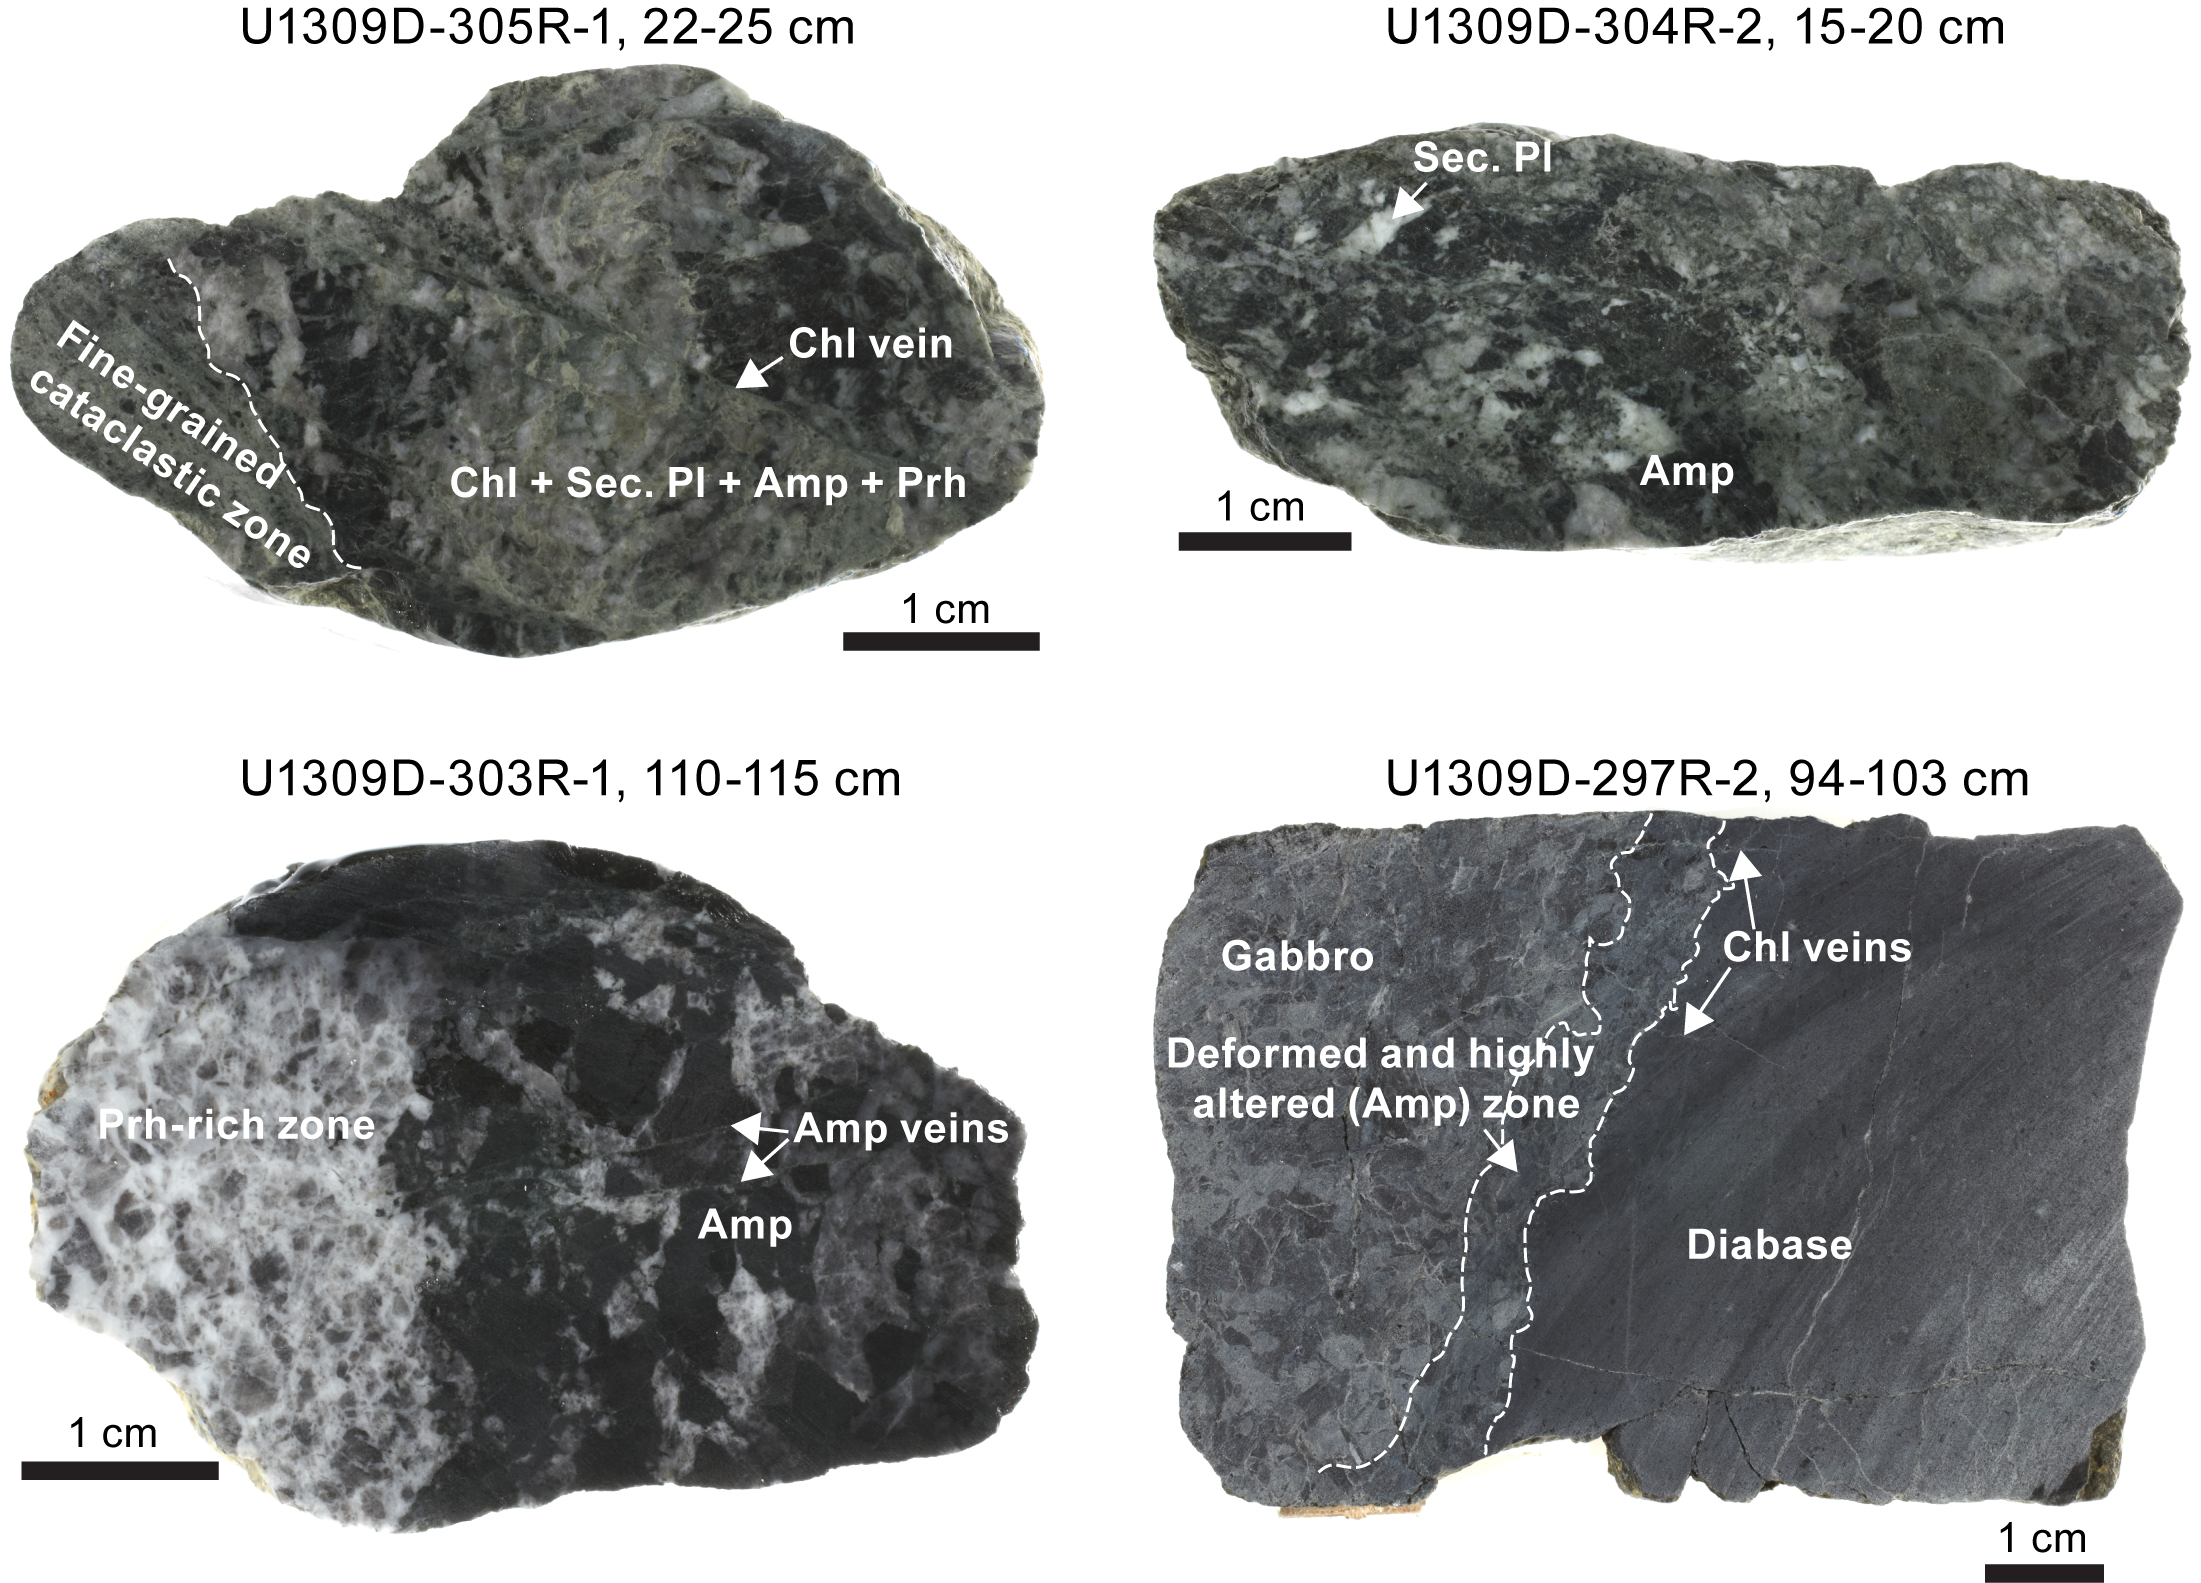
Figure F26. High alteration intensity intervals.
Zeolite, amphibole, chlorite, and composite amphibole-chlorite veins frequently occur throughout cores without systematic downhole distribution. Crosscutting relationships of veins indicate a chronological sequence of generation stages (from older to younger): (1) magmatic vein; (2) amphibole, chlorite, or amphibole + chlorite veins; and (3) prehnite + carbonate and zeolite veins.
The observations of mineral assemblages, microscopic textures, fluid inclusions, and crosscutting relationships between the alteration assemblages and between hydrothermal veins indicate that sequential alteration and deformation took place at conditions ranging from amphibolite through greenschist to subgreenschist facies conditions. Each primary mineral in gabbroic rocks is partially replaced by secondary minerals at grain boundaries, along microcracks, or cleavage surfaces. In some cases, particularly in proximity to hydrothermal veins, complete replacement yields pseudomorphs after primary minerals. Olivine is replaced by distinct mineral assemblages composed of serpentine + oxide/sulfide, talc + sulfide/oxide, clay + oxide/sulfide, amphibole + oxide + chlorite, or a combination of one or more of these assemblages. Fluid inclusions formed during healing of fluid-filled fractures are locally abundant in olivine and plagioclase. Clinopyroxene and orthopyroxene are altered to amphibole, chlorite, and/or talc. Plagioclase is altered to chlorite, amphibole, secondary plagioclase, prehnite, and zeolite. This was confirmed by X-ray diffraction (XRD) analyses, even if it was not always possible to distinguish between talc/prehnite and zeolite in some samples (Table T7).
The interplay among magmatic processes, deformation, and fluid flow is recorded in alteration mineral assemblages of lower crustal lithologies from Hole U1309D. The findings presented here are consistent with those from Expedition 304/305 and provide additional constraints on alteration processes down to 1498 mbsf.
4.1. General aspects of alteration
Gabbroic rocks, including gabbro, olivine gabbro, and olivine-bearing gabbro, show low degrees of alteration except where localized alteration associated with cataclastic deformation, prominent hydrothermal or magmatic veining, and patchy bleaching took place. Diabase is scarce in Hole U1309D cores drilled during Expedition 399, and its green color indicates pervasive alteration. Most alteration minerals appear to have formed under static conditions; however, evidence for alteration during ductile deformation is evident in few samples.
4.2. Downhole variation of background alteration intensity and mineral abundance
Overall, roughly 75% of the lithologic intervals in the recovered sections exhibit slight alteration (here defined as <20 vol% of secondary minerals per interval). Approximately 13% of the intervals are moderately altered (20–50 vol% secondary minerals). The remaining 11% of the recovered intervals are highly altered (50–99 vol% secondary minerals). The degree of alteration tends to increase in intervals of cataclastic deformation, veining, and bleaching (Figures F25A, F26). In cataclastic zones, the gabbroic rock is generally fine grained, likely due to grain size reduction during deformation. Cataclastic zones either occur within gabbroic intervals or at the contact between diabase and gabbro and between diorite and gabbro. The most prominent cataclastic zones occur at ~1417–1424, ~1441–1459, ~1464–1469, and ~1482–1490 mbsf. Locally within and near these intervals, plagioclase, clinopyroxene, and olivine (i.e., the main constituents of gabbro) show a high degree (>50%) of hydrothermal alteration (Figure F25A).
The total alteration intensity is also variable in response to mineralogy. In gabbro, alteration is more prominent in mafic minerals, particularly olivine, than in plagioclase. In typical cases of olivine gabbro or olivine-bearing gabbro, the alteration extent of olivine and clinopyroxene is >30% and >10% of the original modal amounts, respectively, whereas the alteration extent of plagioclase is <2% (Figure F25A). Deeper than ~1470 mbsf, the extent of alteration of the mafic minerals slightly decreases (i.e., <20% and <10% on average for olivine and clinopyroxene, respectively) and remains fairly constant in plagioclase. This results in an overall slight decrease of the total alteration extent downhole.
The abundances of primary minerals in gabbroic rocks are relatively constant (Figure F25B), except for olivine, which is more abundant at levels shallower than 1446 mbsf. Hence, the downhole decrease in the alteration extent of clinopyroxene cannot be simply explained by the variations of modal composition of the gabbro protolith but most likely reflects the decreasing extent of hydrothermal alteration. However, because the modal abundance of olivine in deeper intervals (<2%) is significantly lower than that of clinopyroxene, it cannot be ruled out that uncertainties associated with macroscopic estimates contributed to the apparent decrease of the alteration extent of olivine.
4.3. Veins
Eight vein types can be distinguished in Hole U1309D cores recovered during Expedition 399: veins composed of hydrothermally altered diorite, amphibole, amphibole-chlorite, chlorite, quartz-plagioclase-chlorite-amphibole, talc-chlorite, prehnite-carbonate (only identified in thin section), and zeolite (Figure F27). Among them, the most frequent types are zeolite, amphibole, chlorite, and composite amphibole-chlorite veins (Figure F28). None of these vein types show systematic changes in abundance downhole (Figure F27). However, the proportion of monomineralic chlorite veins is higher at shallower levels and tends to decrease downhole, whereas monomineralic amphibole veins display a reverse relationship. Zeolite veins are abundant in Hole U1309D gabbroic rocks, regardless of the structural position.
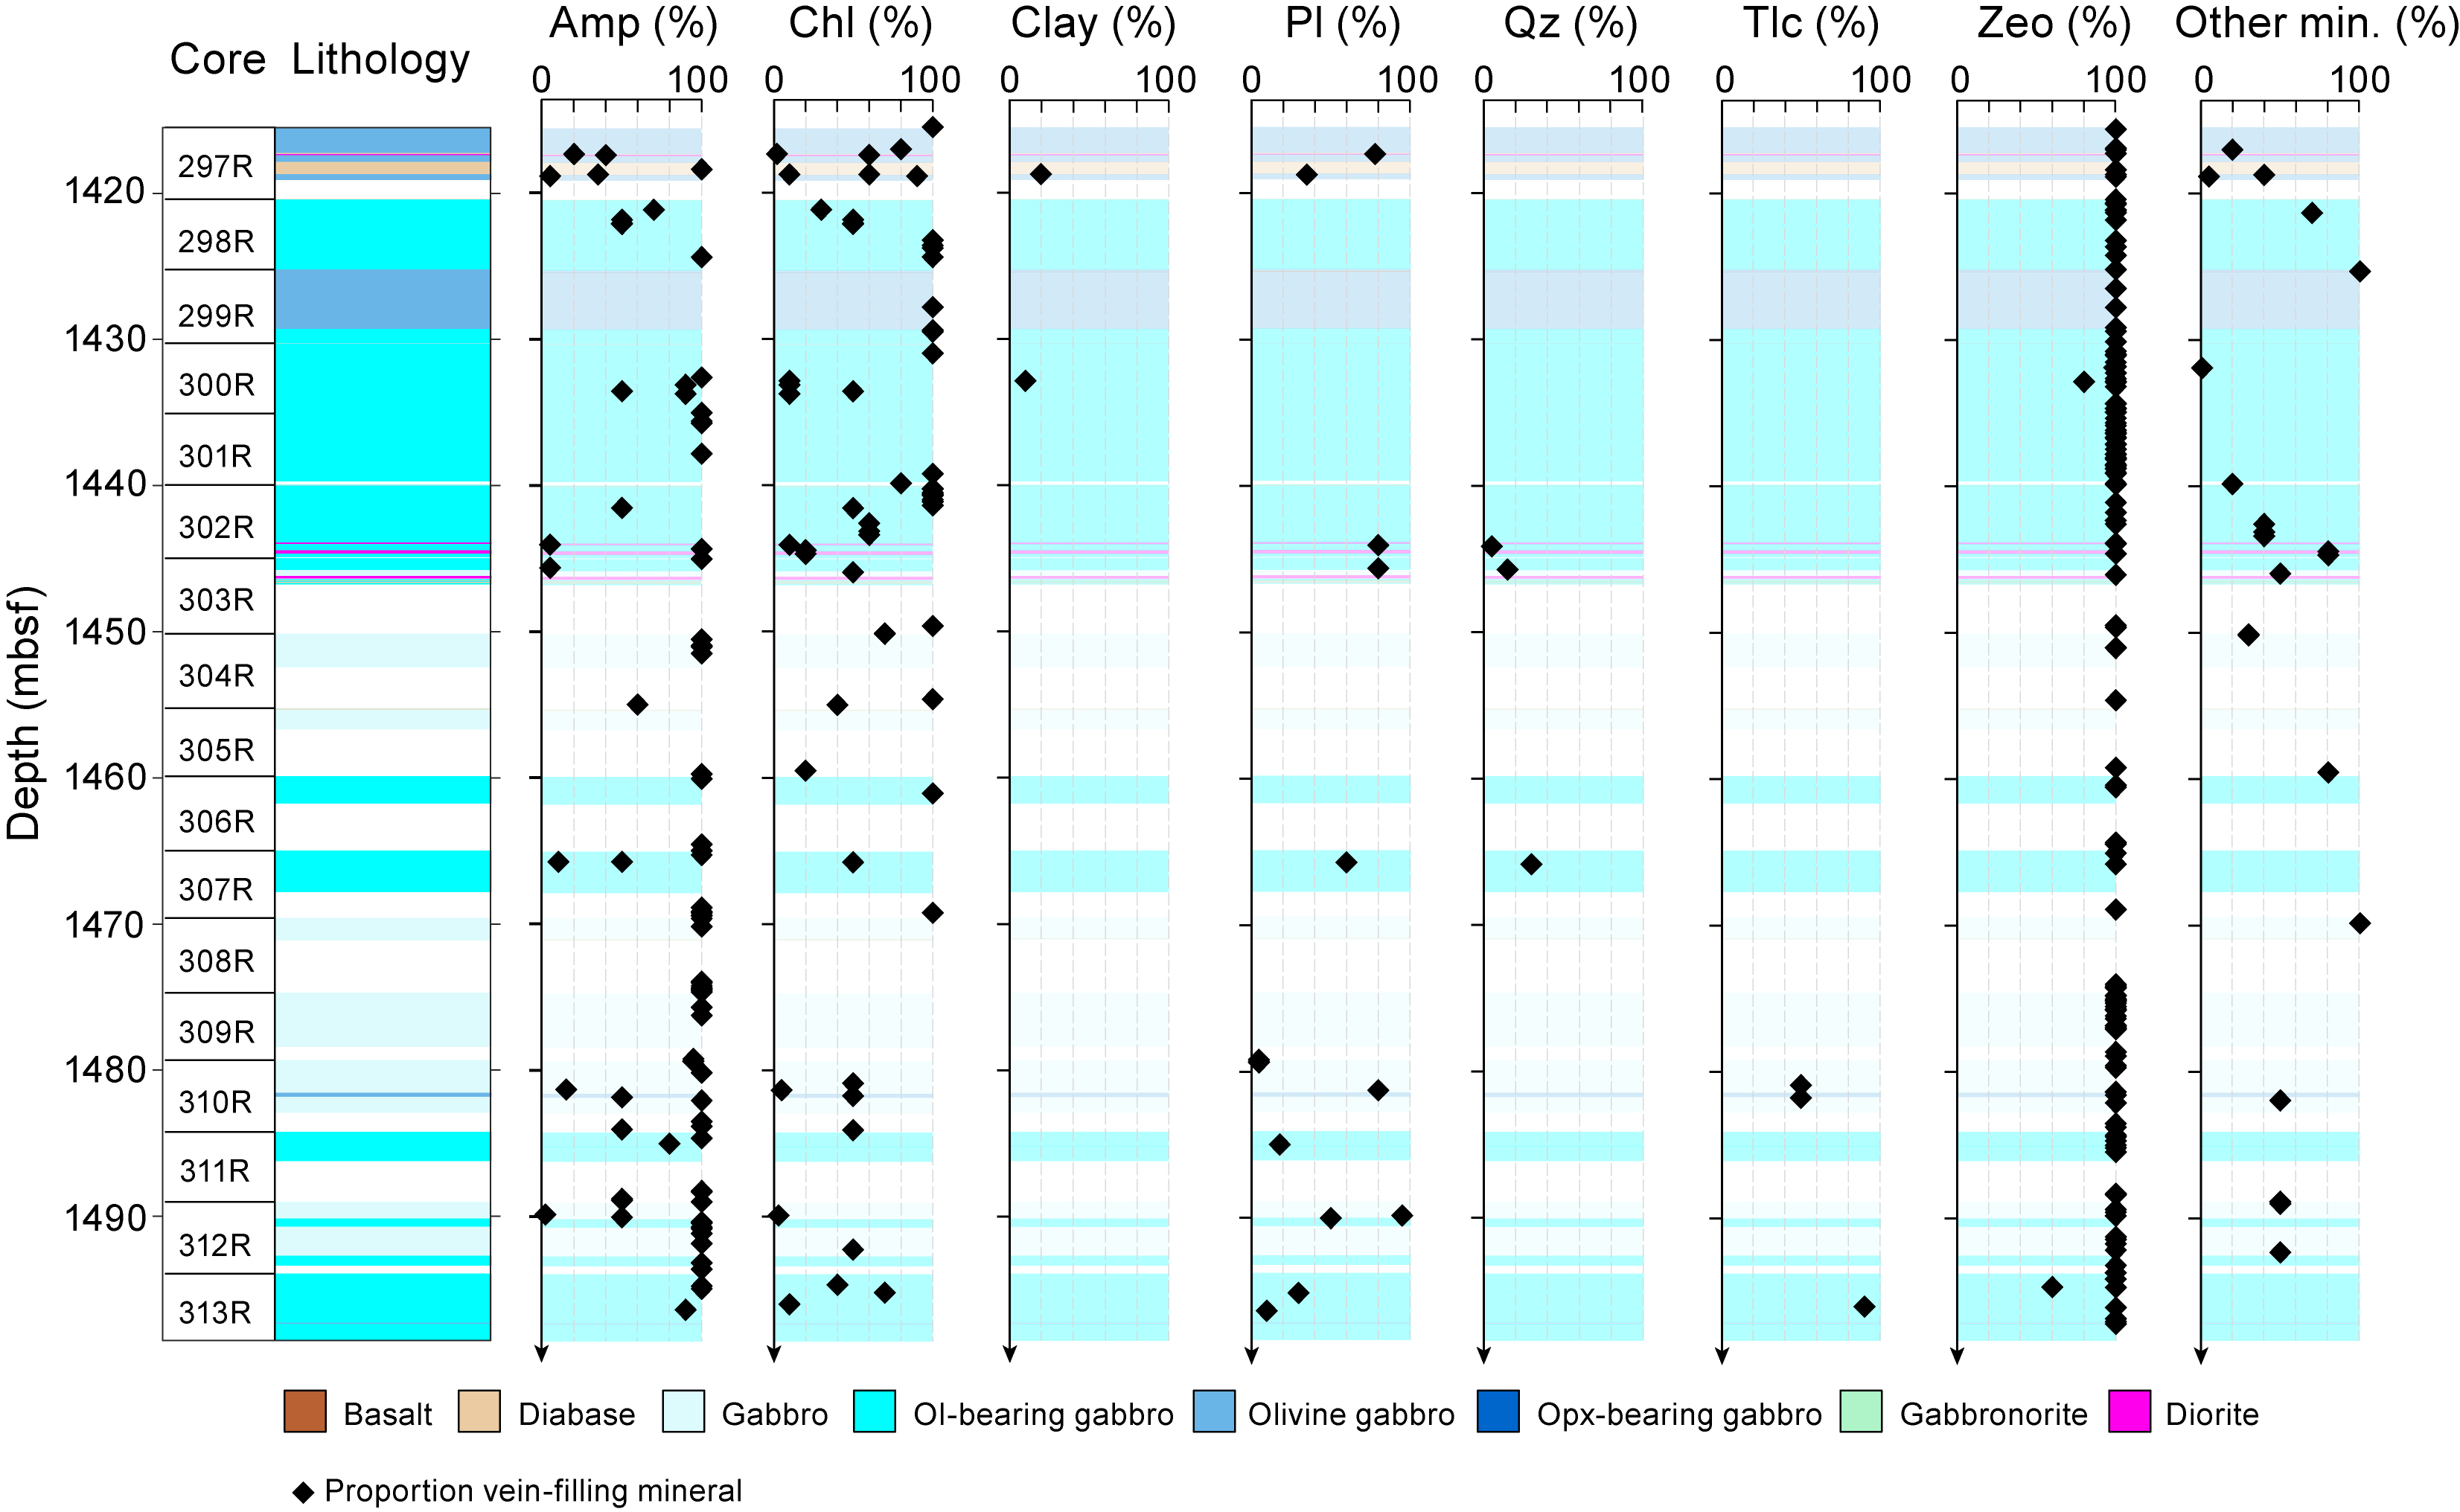
Figure F27. Hydrothermal veins in gabbroic rocks.
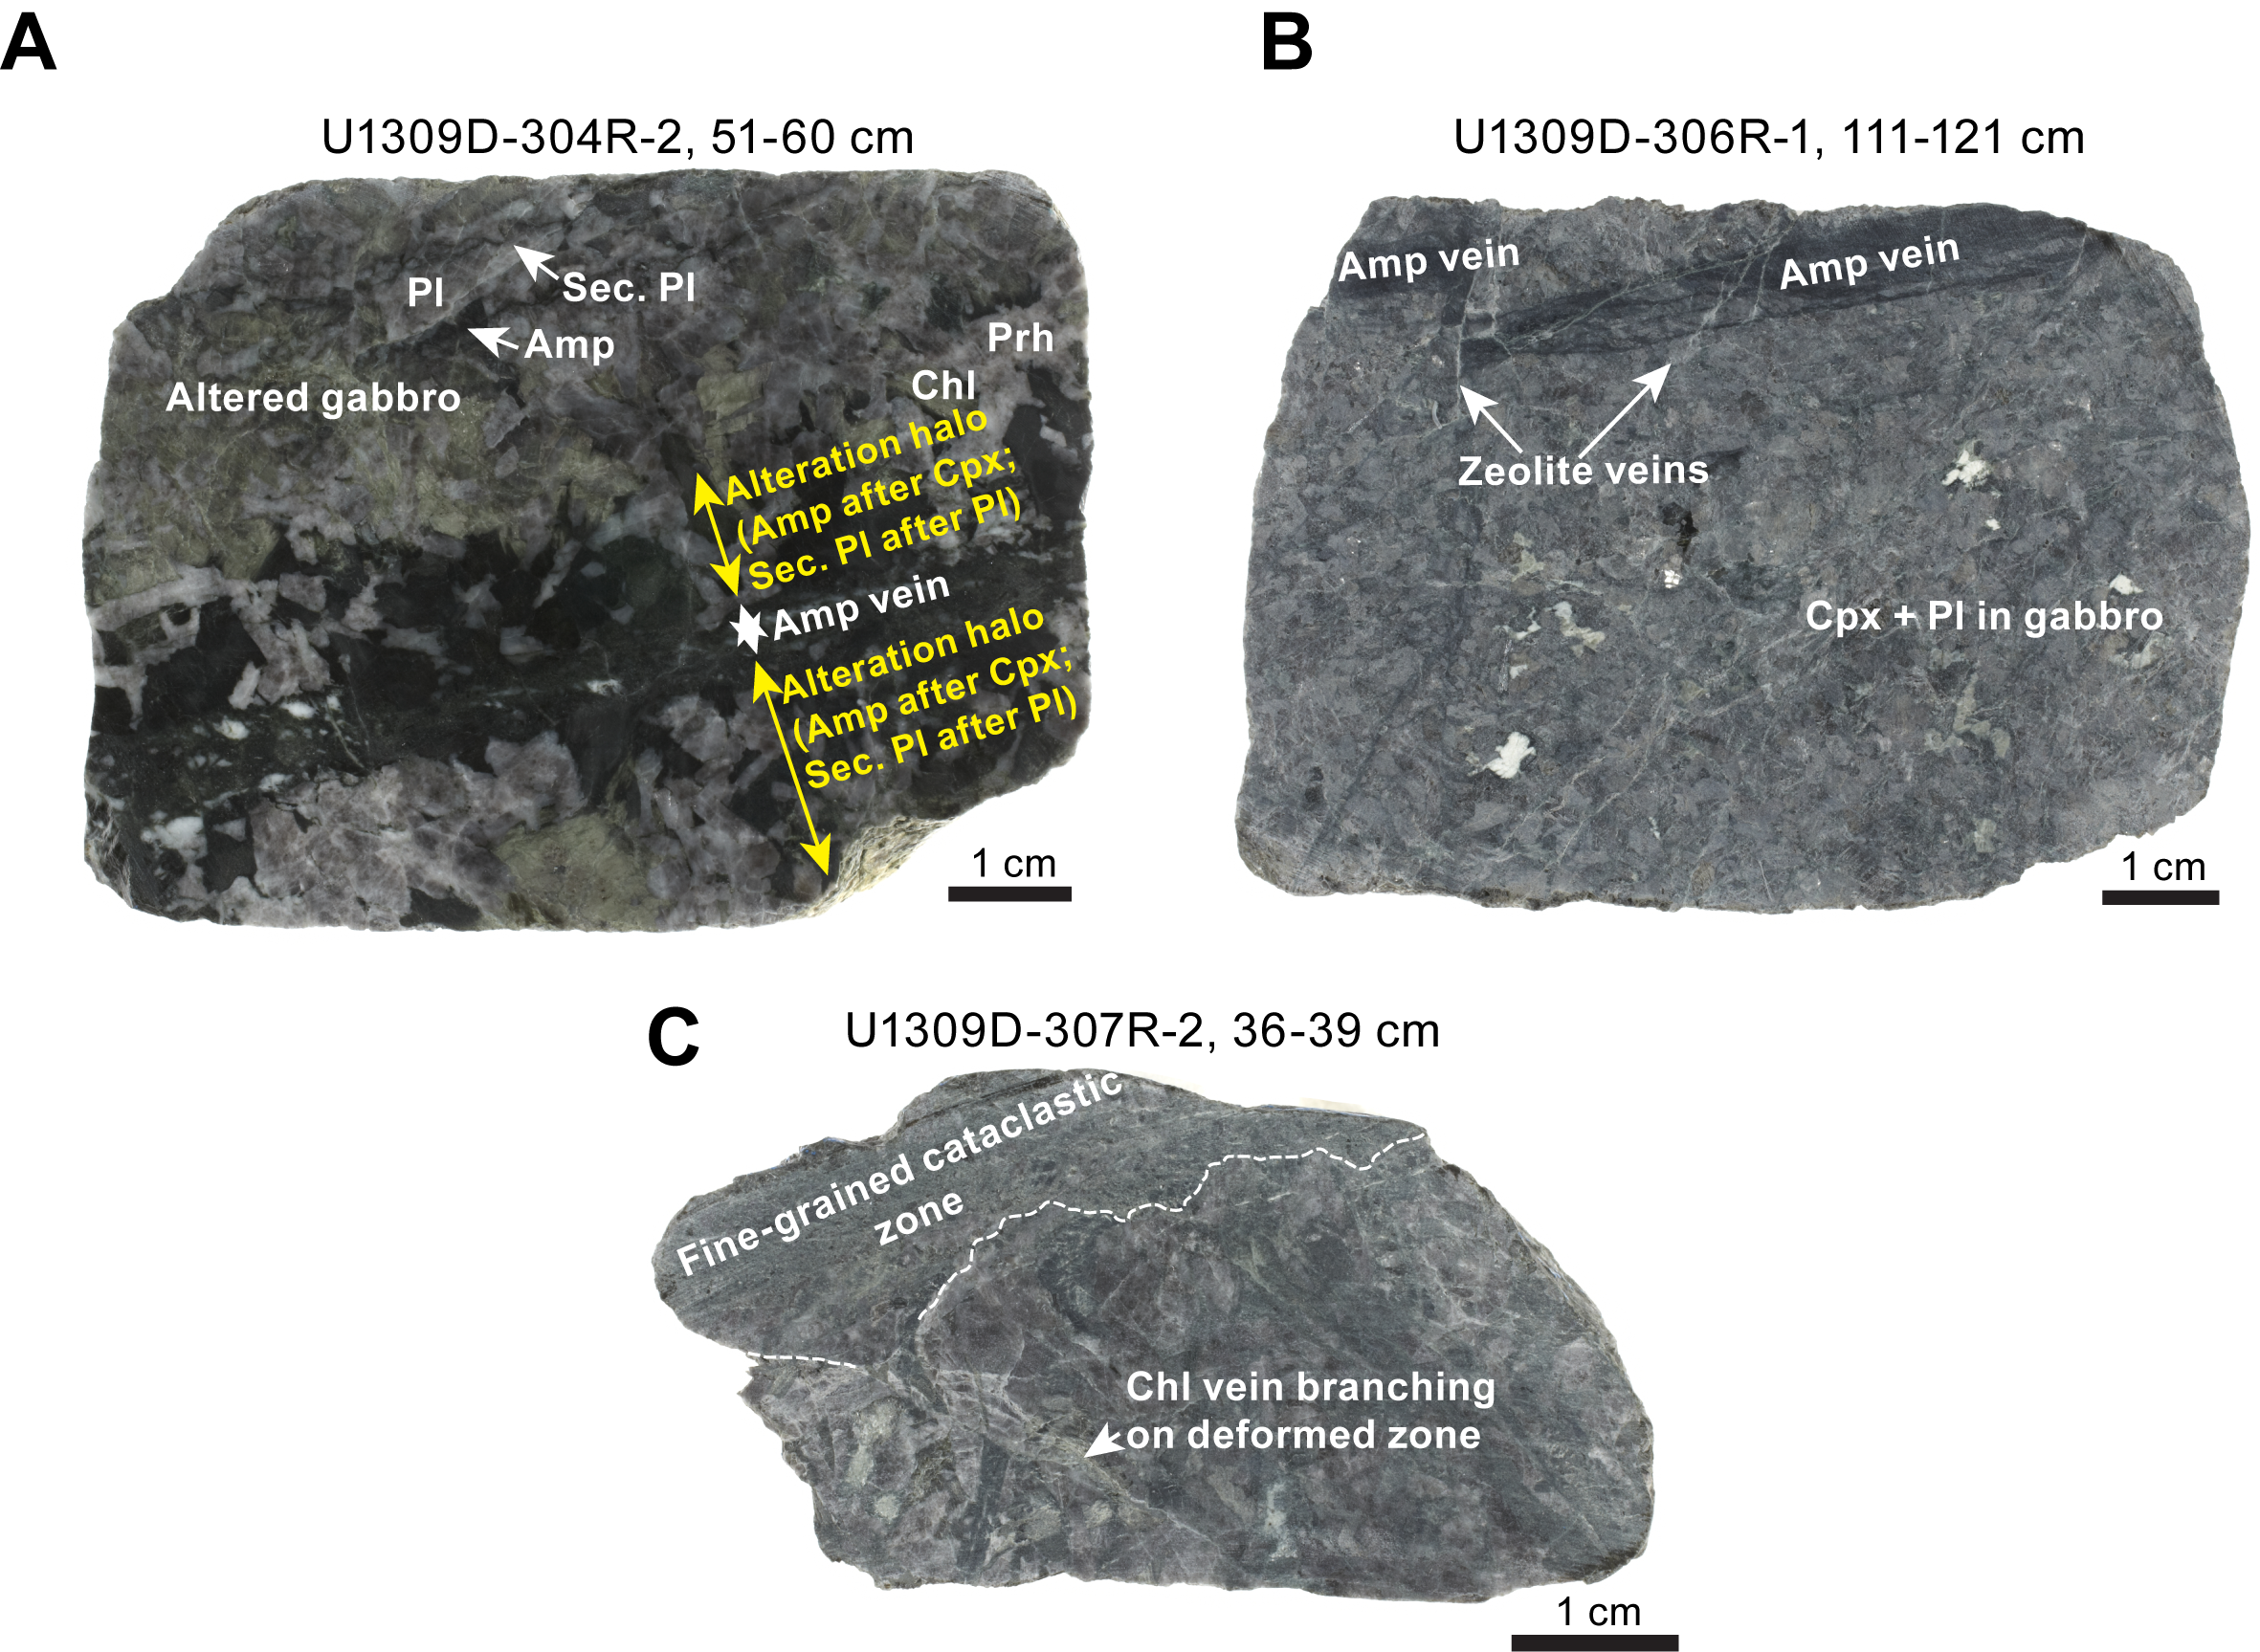
Figure F28. Veins in gabbroic rocks.
All of the logged veins are transgranular (see the Expedition 399 methods chapter [Lang et al., 2025] for vein classifications). Their shapes are dominantly irregular and curved. Straight veins are less abundant and tend to be thicker than irregular or curved veins. The internal structure of most veins is either polycrystalline or massive. Magmatic amphibole and chlorite veins are typically isolated (i.e., they form single veins that are not branched or connected). Amphibole-chlorite veins are commonly branched, whereas zeolite veins form networks. The width is <0.1–0.2 mm for most zeolite veins, 0.2–5 mm for most amphibole and chlorite veins, and 5–40 mm for magmatic veins. Many of the magmatic amphibole and chlorite veins have green and/or white halos that are 1–15 mm wide. In adjacent halos, clinopyroxene, olivine, and plagioclase are extensively altered to amphibole, chlorite, talc, and/or secondary plagioclase (Figure F28A).
The relationships between veining and brittle deformation are variable. Small faults cut amphibole veins and can be filled by zeolite (Figure F28B). In some areas, textural observations suggest that chlorite veins branch on cataclastic zones pointing to fluid-assisted deformation (Figure F28C).
Macroscopic and microscopic crosscutting relationships of veins indicate a chronological sequence of distinct vein generations from older to younger: (1) magmatic veins; (2) amphibole, chlorite, or amphibole-chlorite veins; and (3) zeolite veins. This sequence is further corroborated by brittle displacement of veins where, for instance, millimeter-sized offsets in amphibole veins are occupied by intact zeolite veins (Figure F28B).
4.4. Mineral paragenesis and microscopic textures of statically altered rocks
4.4.1. Gabbroic rocks
Consistent with macroscopic characteristics of the gabbroic rocks, microscopic observations revealed that most primary magmatic minerals are fresh or slightly altered and their alteration degree increases in proximity to hydrothermal veins and cataclastic zones. In order of high to low extent of alteration, olivine is followed by orthopyroxene, clinopyroxene, and plagioclase. For each primary mineral, the alteration paragenesis and texture is described below.
Olivine is replaced by secondary minerals in characteristic textures (Figures F29, F30, F31). These include (in order of decreasing frequency) (1) serpentine + oxide/sulfide forming mesh texture; (2) talc + sulfide/oxide forming partial pseudomorphs, in particular at rims adjacent to pyroxene grains; (3) clay + oxide/sulfide forming pseudomorphs with remnant mesh texture; (4) corona texture with acicular colorless amphibole + oxide altering olivine and chlorite altering plagioclase, and in highly altered cases, aggregates of acicular colorless amphibole with random orientation forming pseudomorphs after olivine; and (5) green amphibole + chlorite forming corona texture replacing olivine and plagioclase.
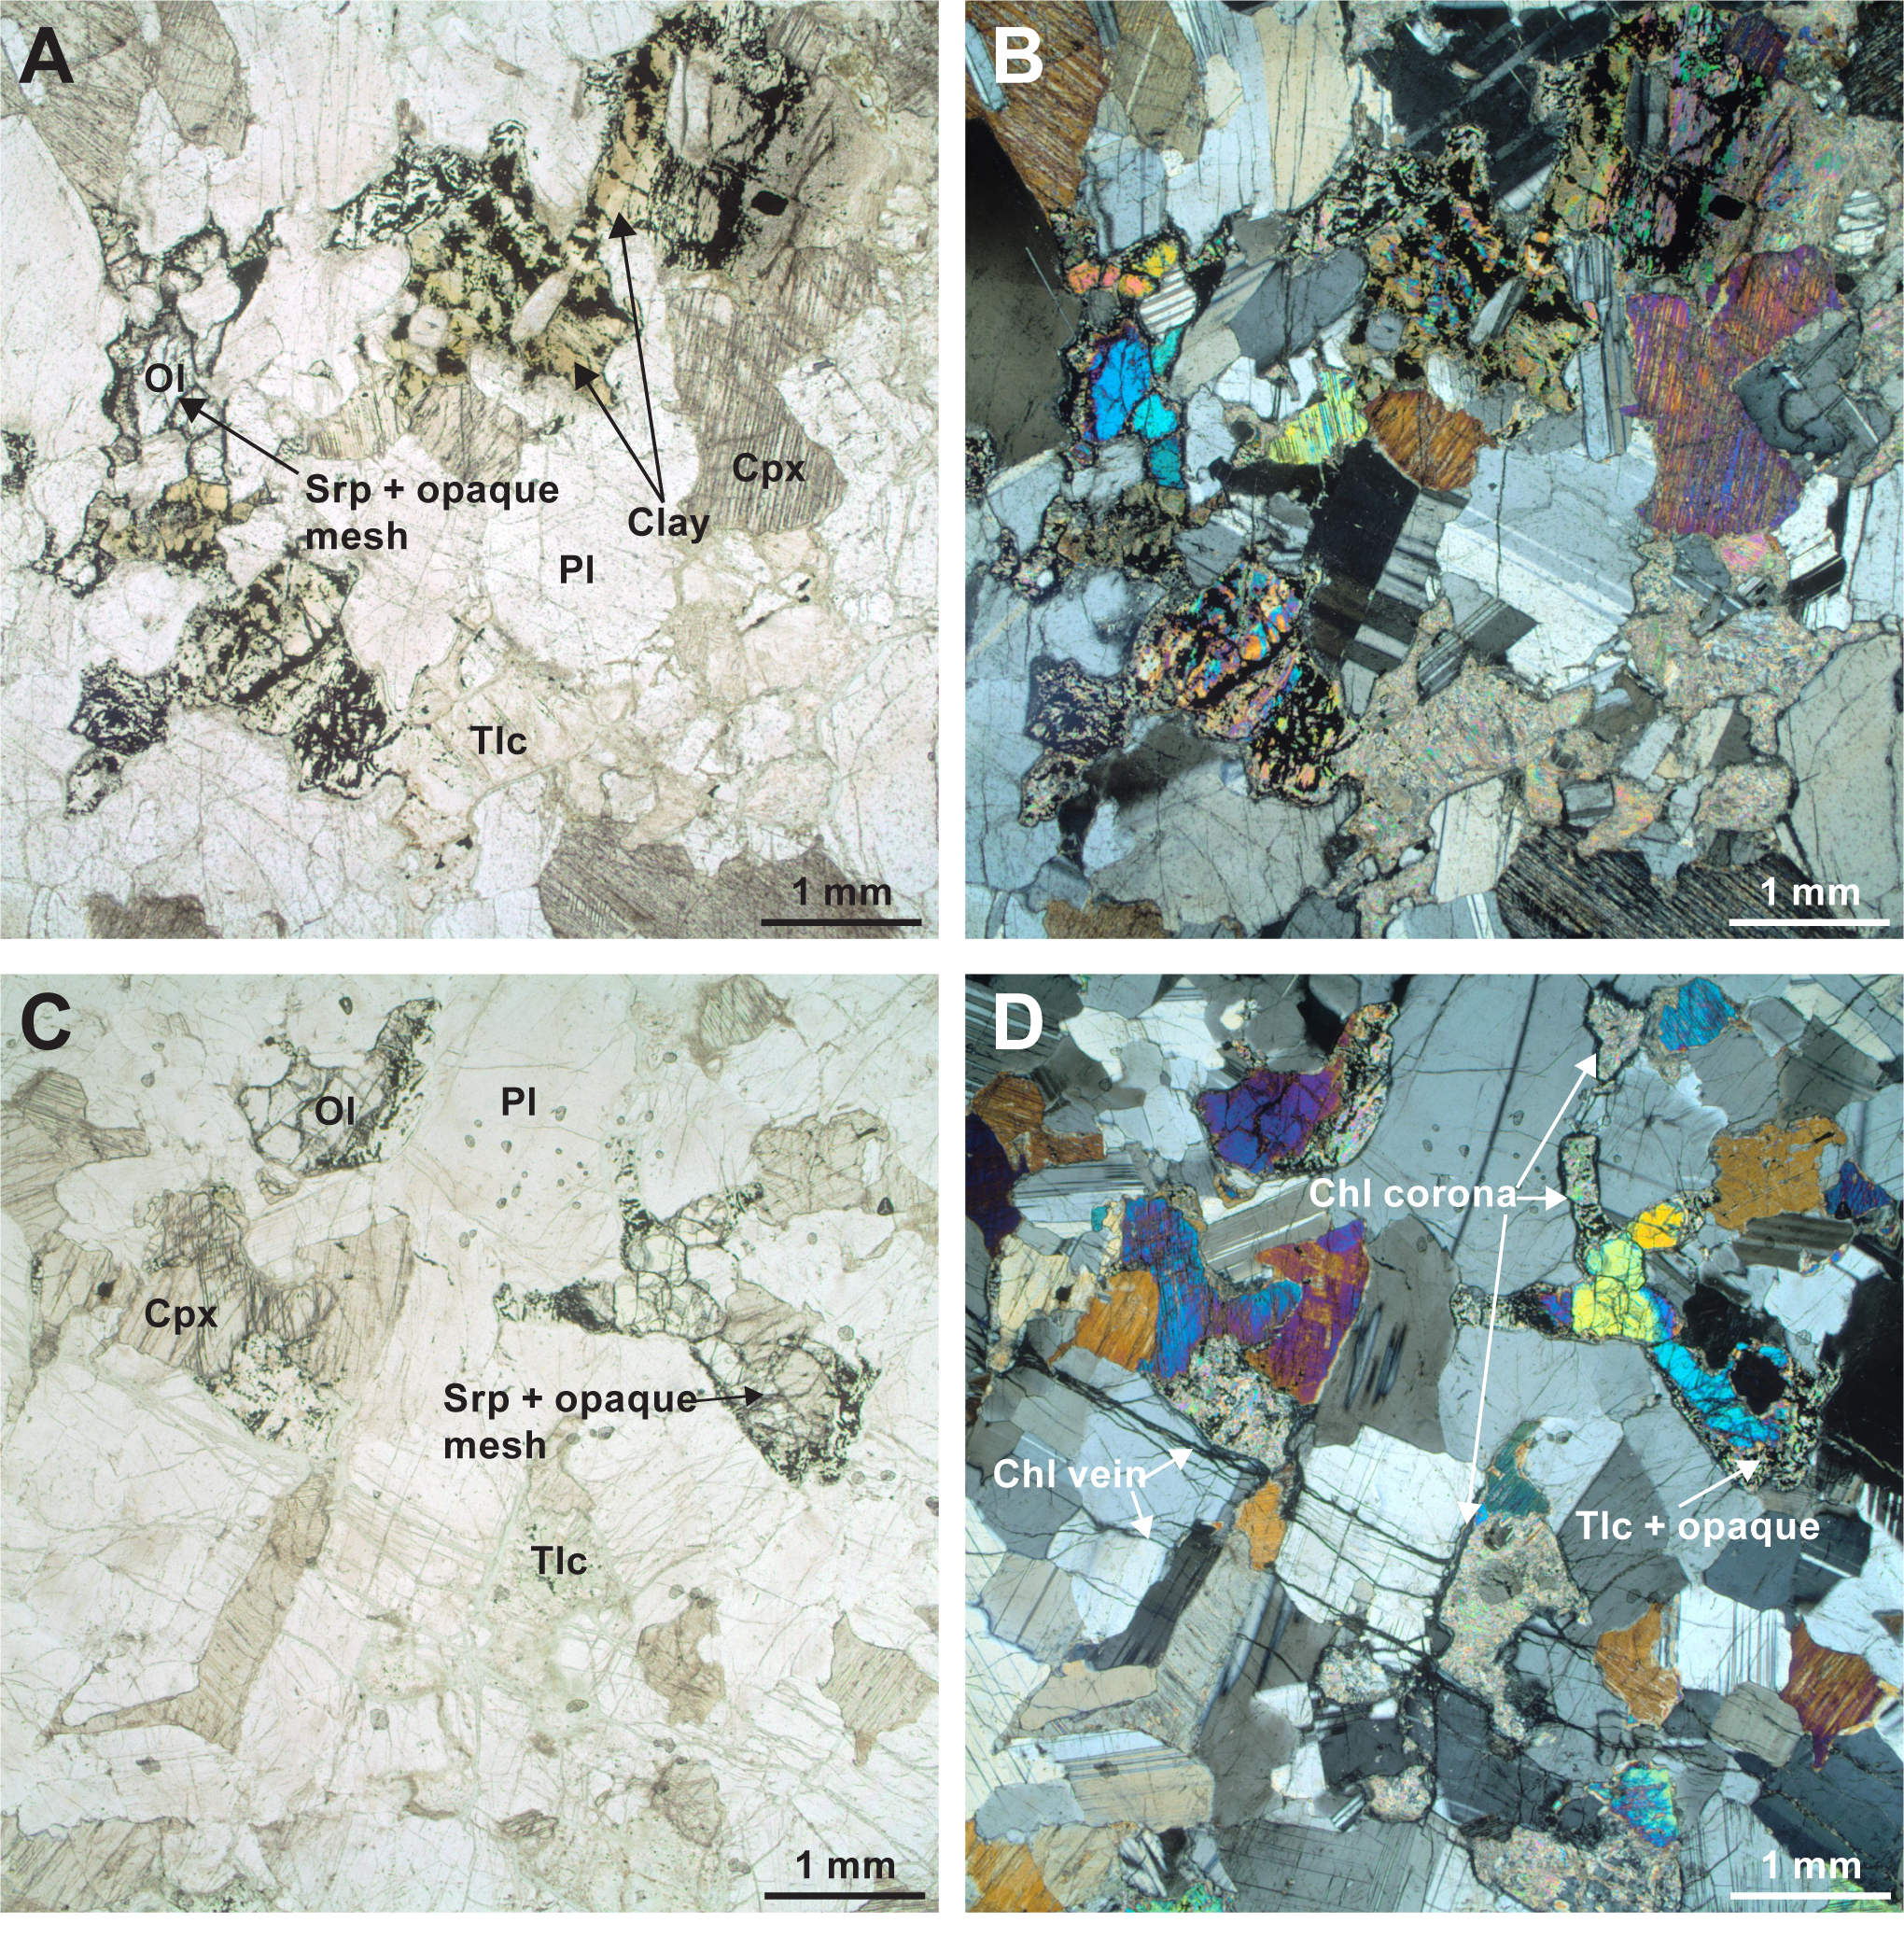
Figure F29. Olivine alteration.
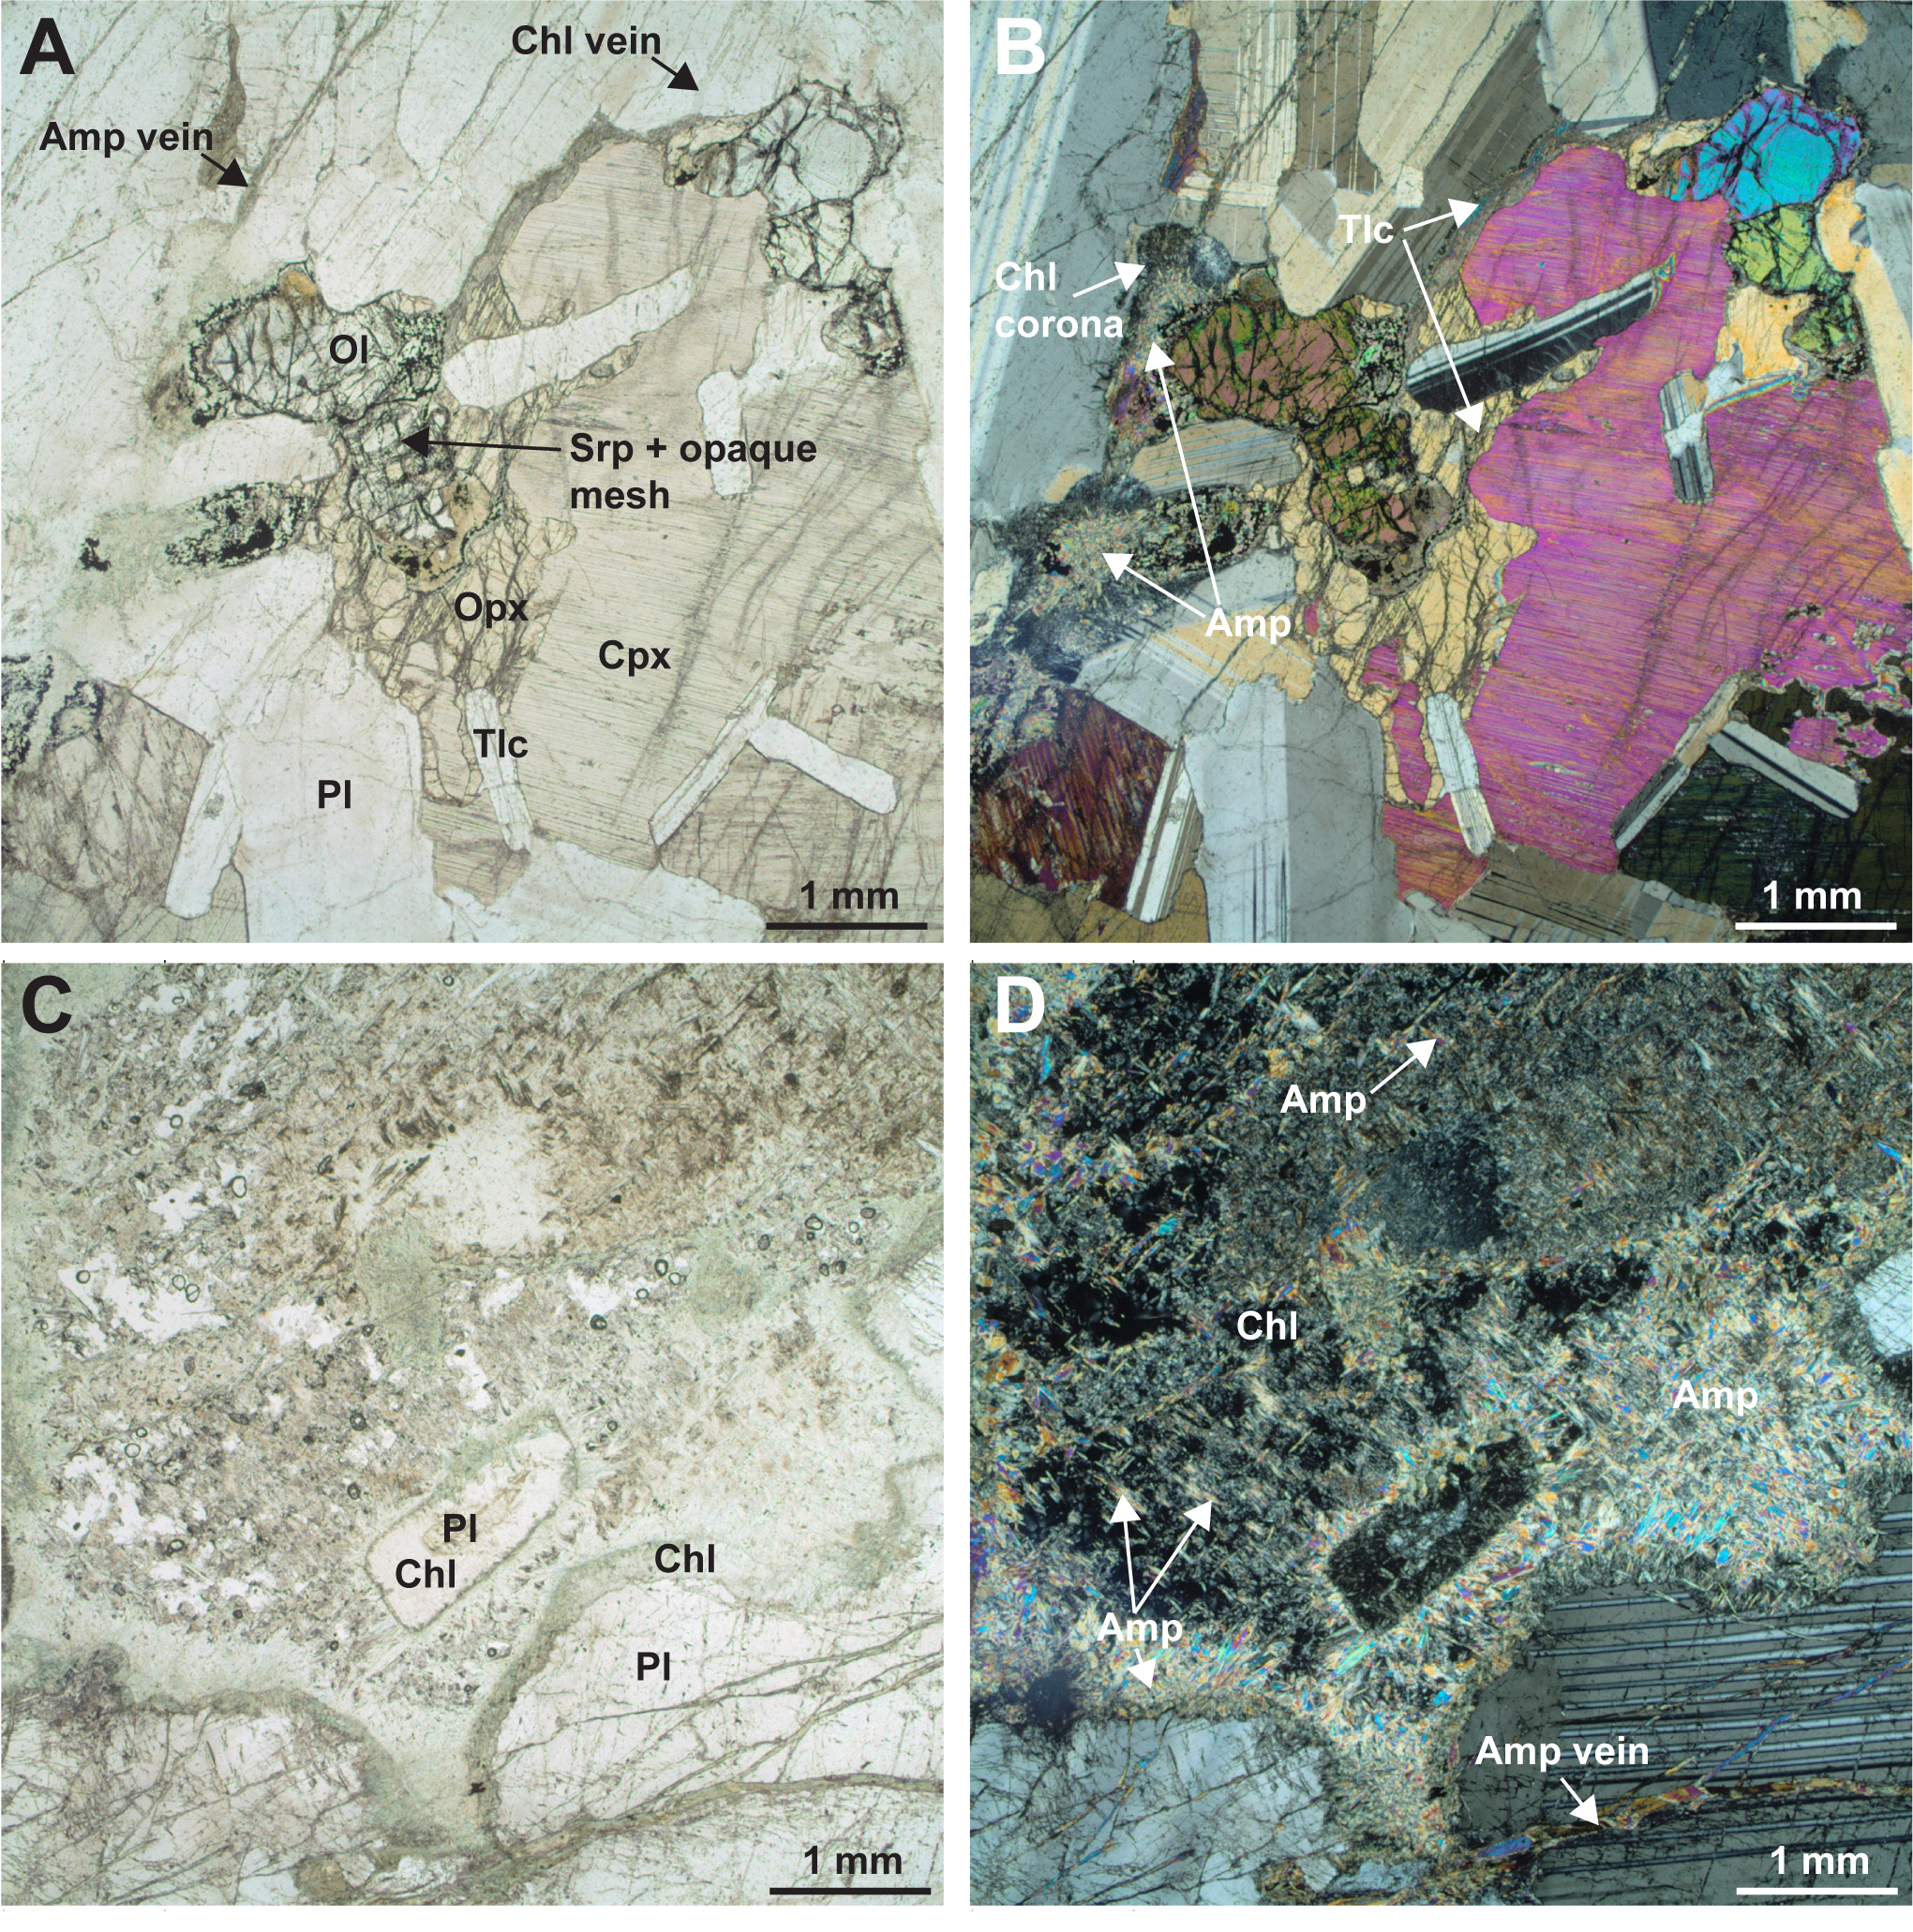
Figure F30. Orthopyroxene alteration.
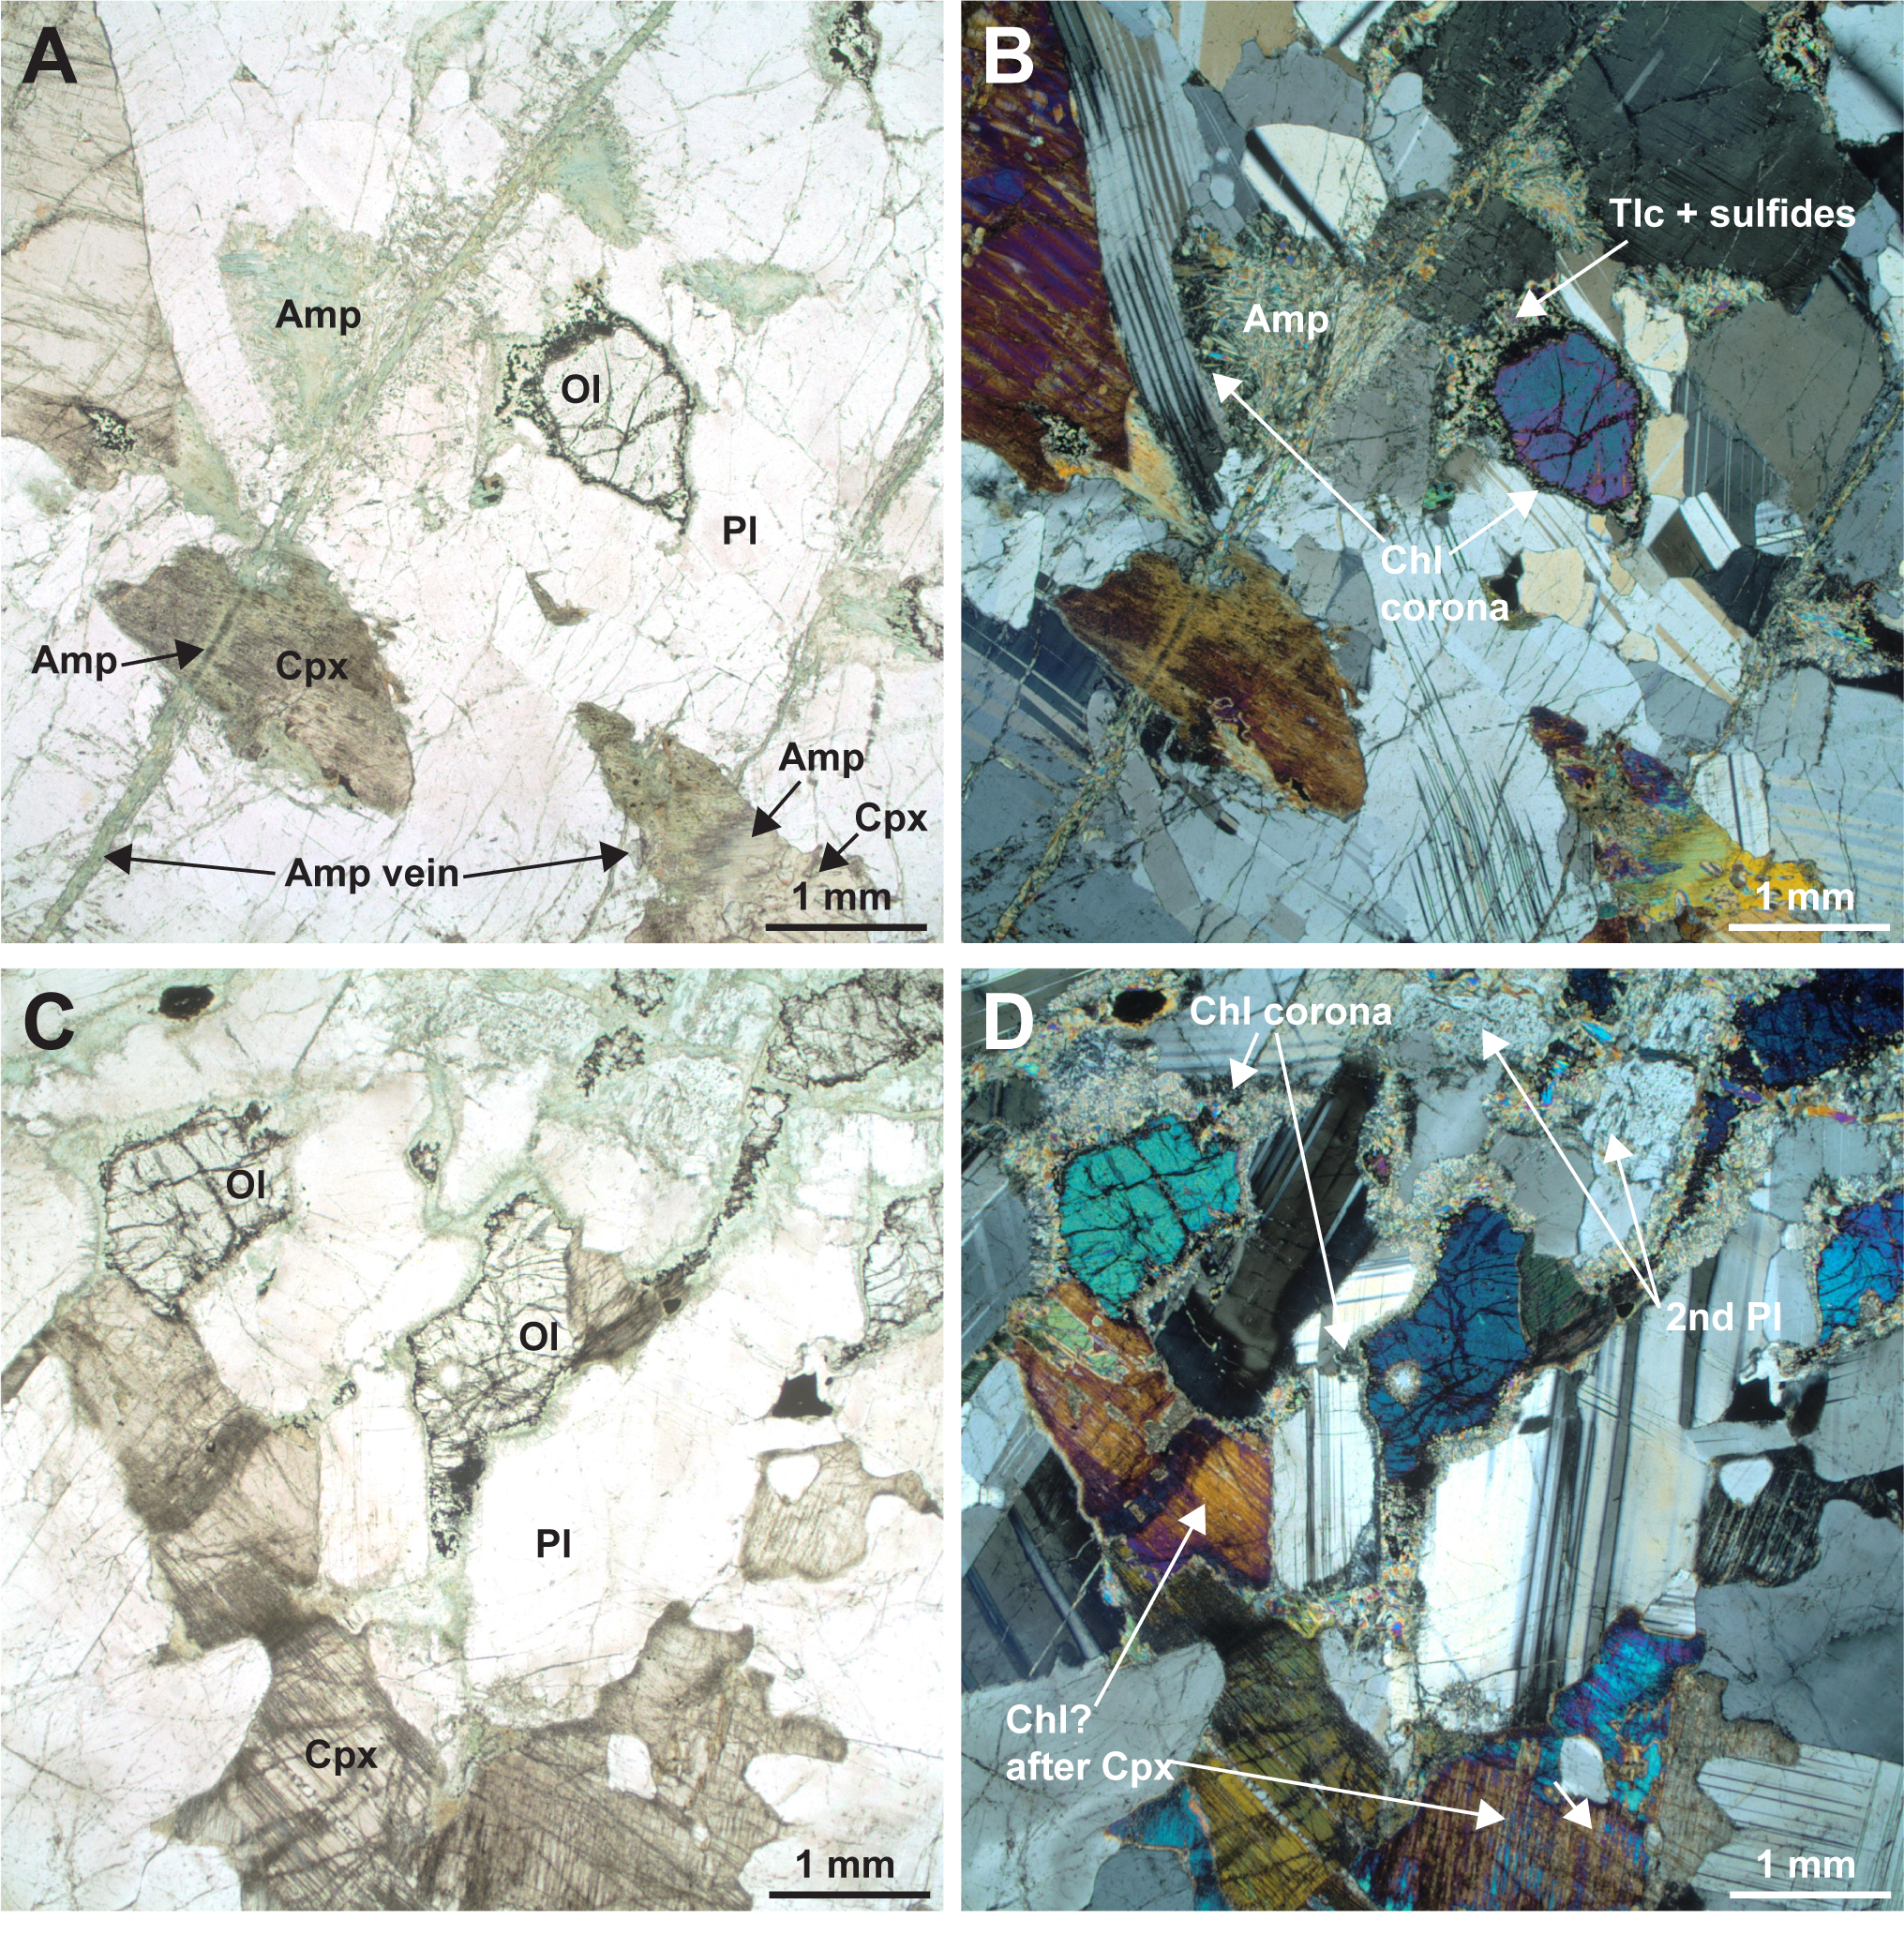
Figure F31. Clinopyroxene alteration.
Olivine in gabbroic rocks features fluid inclusions that can be locally abundant (Figure F32). They form linear trails that cut grain and subgrain boundaries (e.g., in Sample 399-U1309D-299R-2, 7–9 cm [TS26]). Individual fluid inclusions are up to 10 µm in diameter; however, most are smaller than 1 µm. Inclusions appear dark, except for those that were opened during thin section preparation. In some of the micrometer-sized inclusions, daughter minerals can be observed.
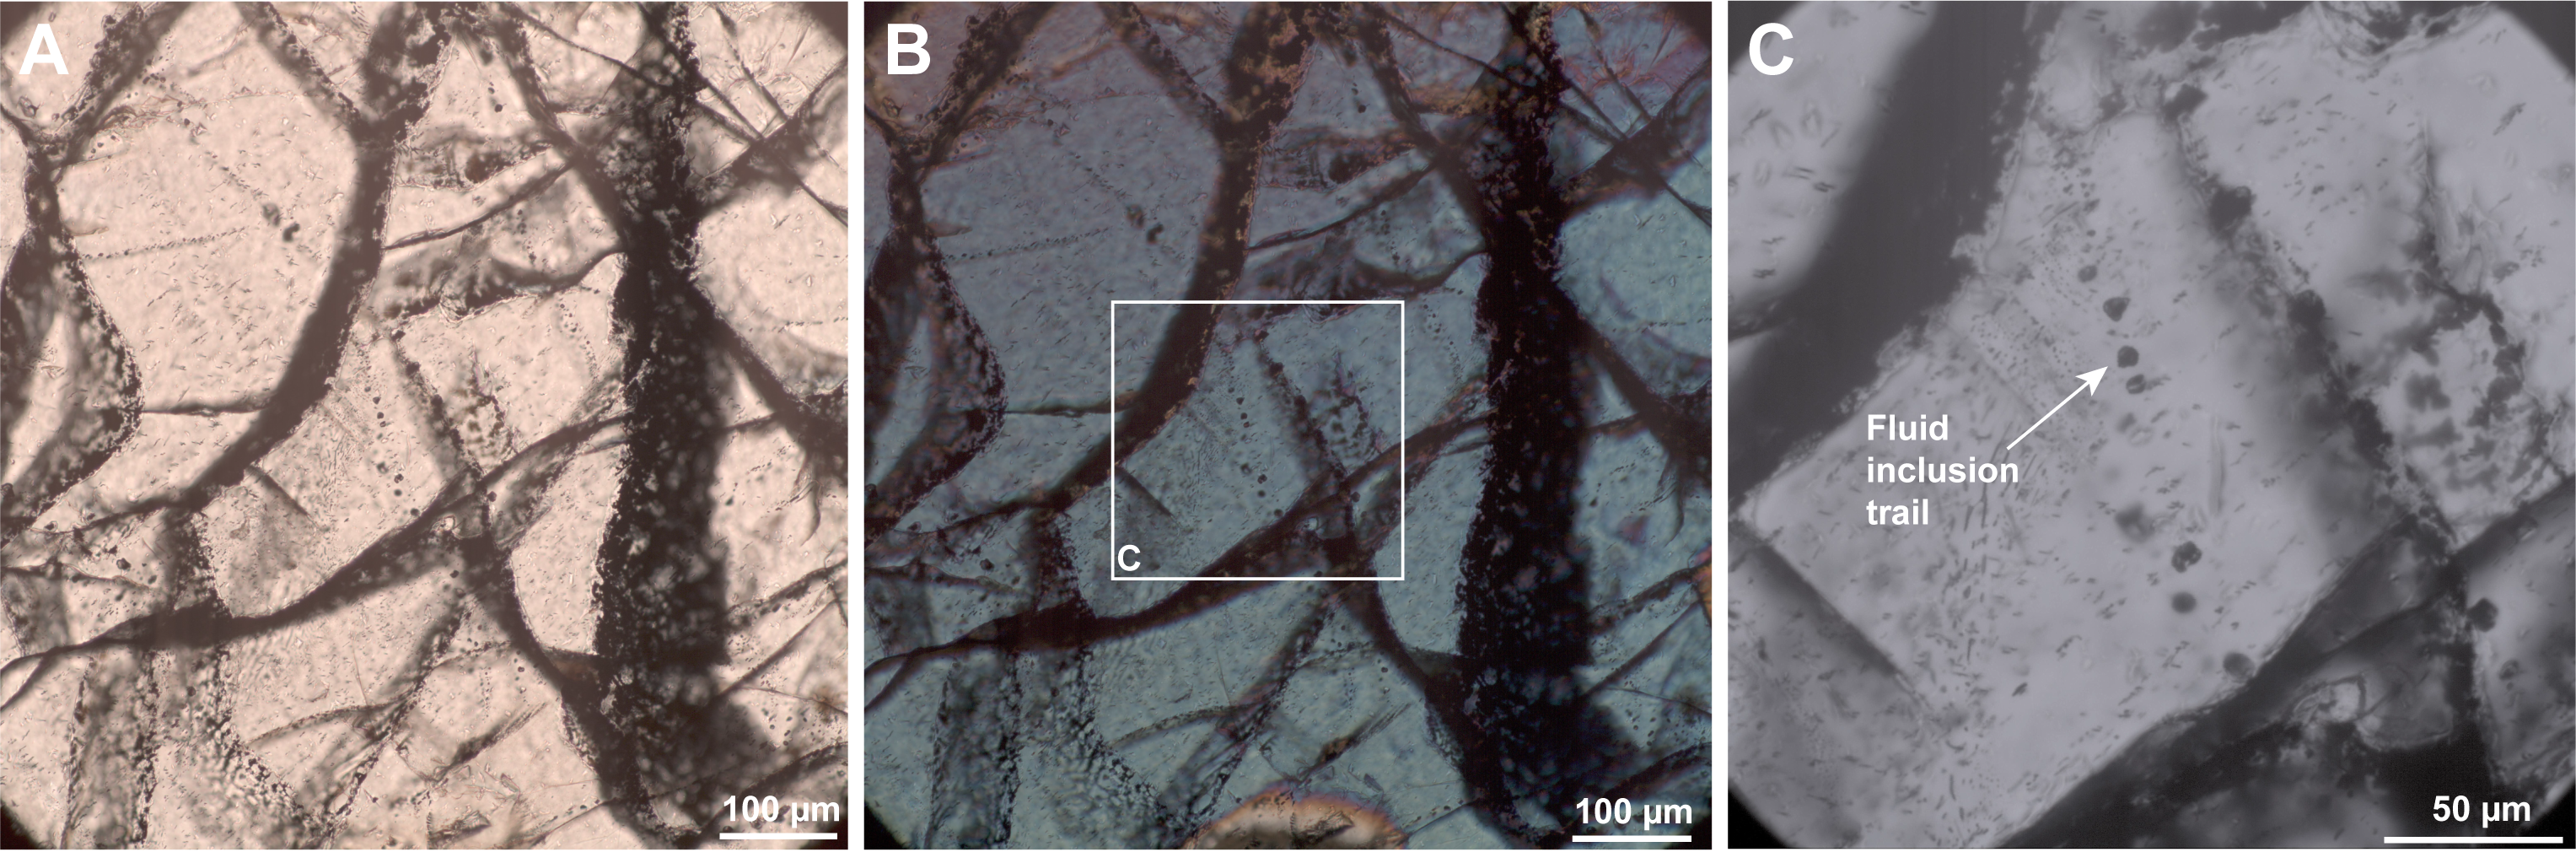
Figure F32. Secondary fluid inclusion trails in olivine.
Orthopyroxene is altered to green to colorless amphibole at grain rims and to talc or chlorite along fractures and cleavage surfaces (Figure F30). In some cases, chlorite and amphibole pseudomorphically replace orthopyroxene, where parallel arrangement of acicular amphibole indicates it replaces clinopyroxene exsolution lamellae.
Clinopyroxene is altered to green to colorless and locally brown amphibole at grain boundaries or along penetrating amphibole veins and to talc or chlorite along fractures and cleavage surfaces (Figure F31).
Plagioclase is altered to chlorite, which forms coronas surrounding olivine and locally pseudomorphic aggregates. Pseudomorphic replacement of plagioclase by prehnite is locally prominent in proximity to prehnite veins. Microscopic veins of chlorite, amphibole, and zeolite within individual plagioclase grains seem to represent alteration products of plagioclase as well. Secondary plagioclase formed along some of the microscopic veins shows a dusty appearance or patchy extinction using crossed polars (Figure F33).
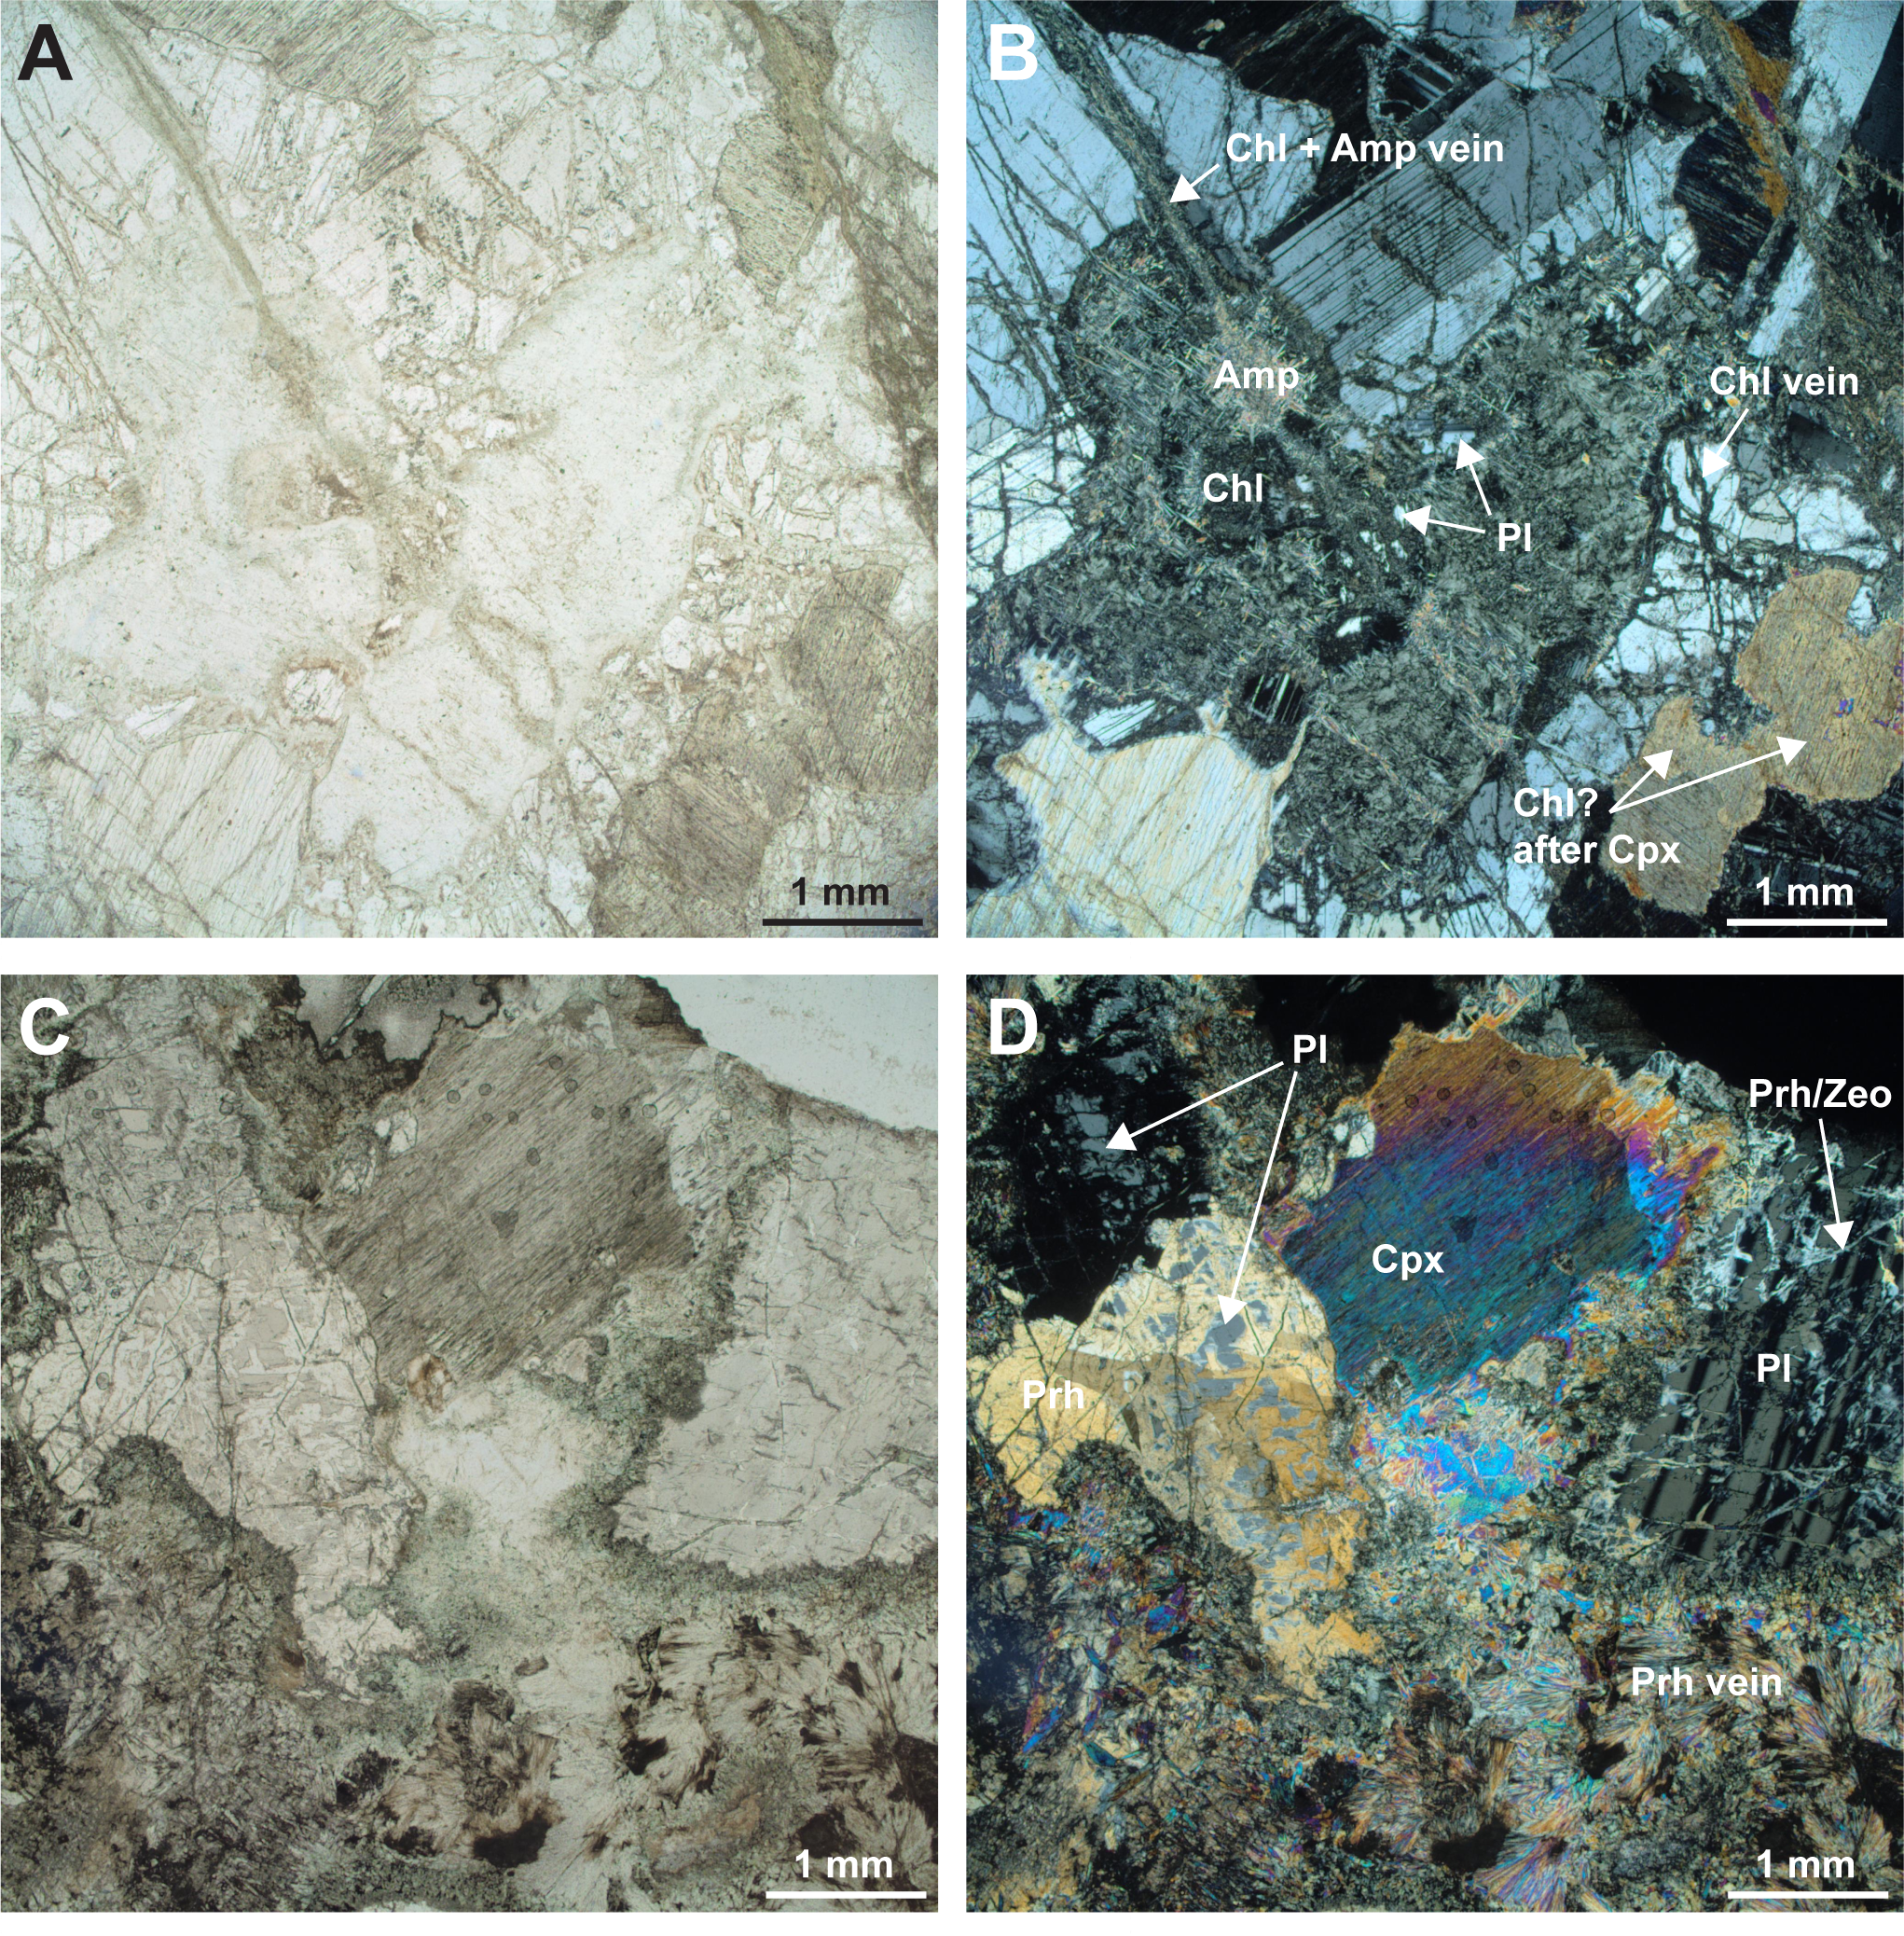
Figure F33. Plagioclase alteration.
4.4.2. Diabase
Alteration minerals after phenocrysts in diabase were observed, but the identification of fine-grained alteration minerals in the groundmass was not always possible. Olivine phenocrysts are pseudomorphically replaced by chlorite and subordinate amounts of colorless amphibole (Figure F34). This is in contrast to gabbroic rocks where chlorite forms after plagioclase or pyroxene but not after olivine. Clinopyroxene is replaced by green amphibole. Plagioclase is relatively fresh and partially replaced by secondary plagioclase, prehnite, and/or zeolite (Figure F34). Rare Ti-Fe oxide is surrounded by and possibly replaced by titanite. In a few instances, rare titanite appears to form at the expense of Ti-bearing clinopyroxene. Brown spinel is partially replaced by an opaque mineral, possibly magnetite or ferrichromite.
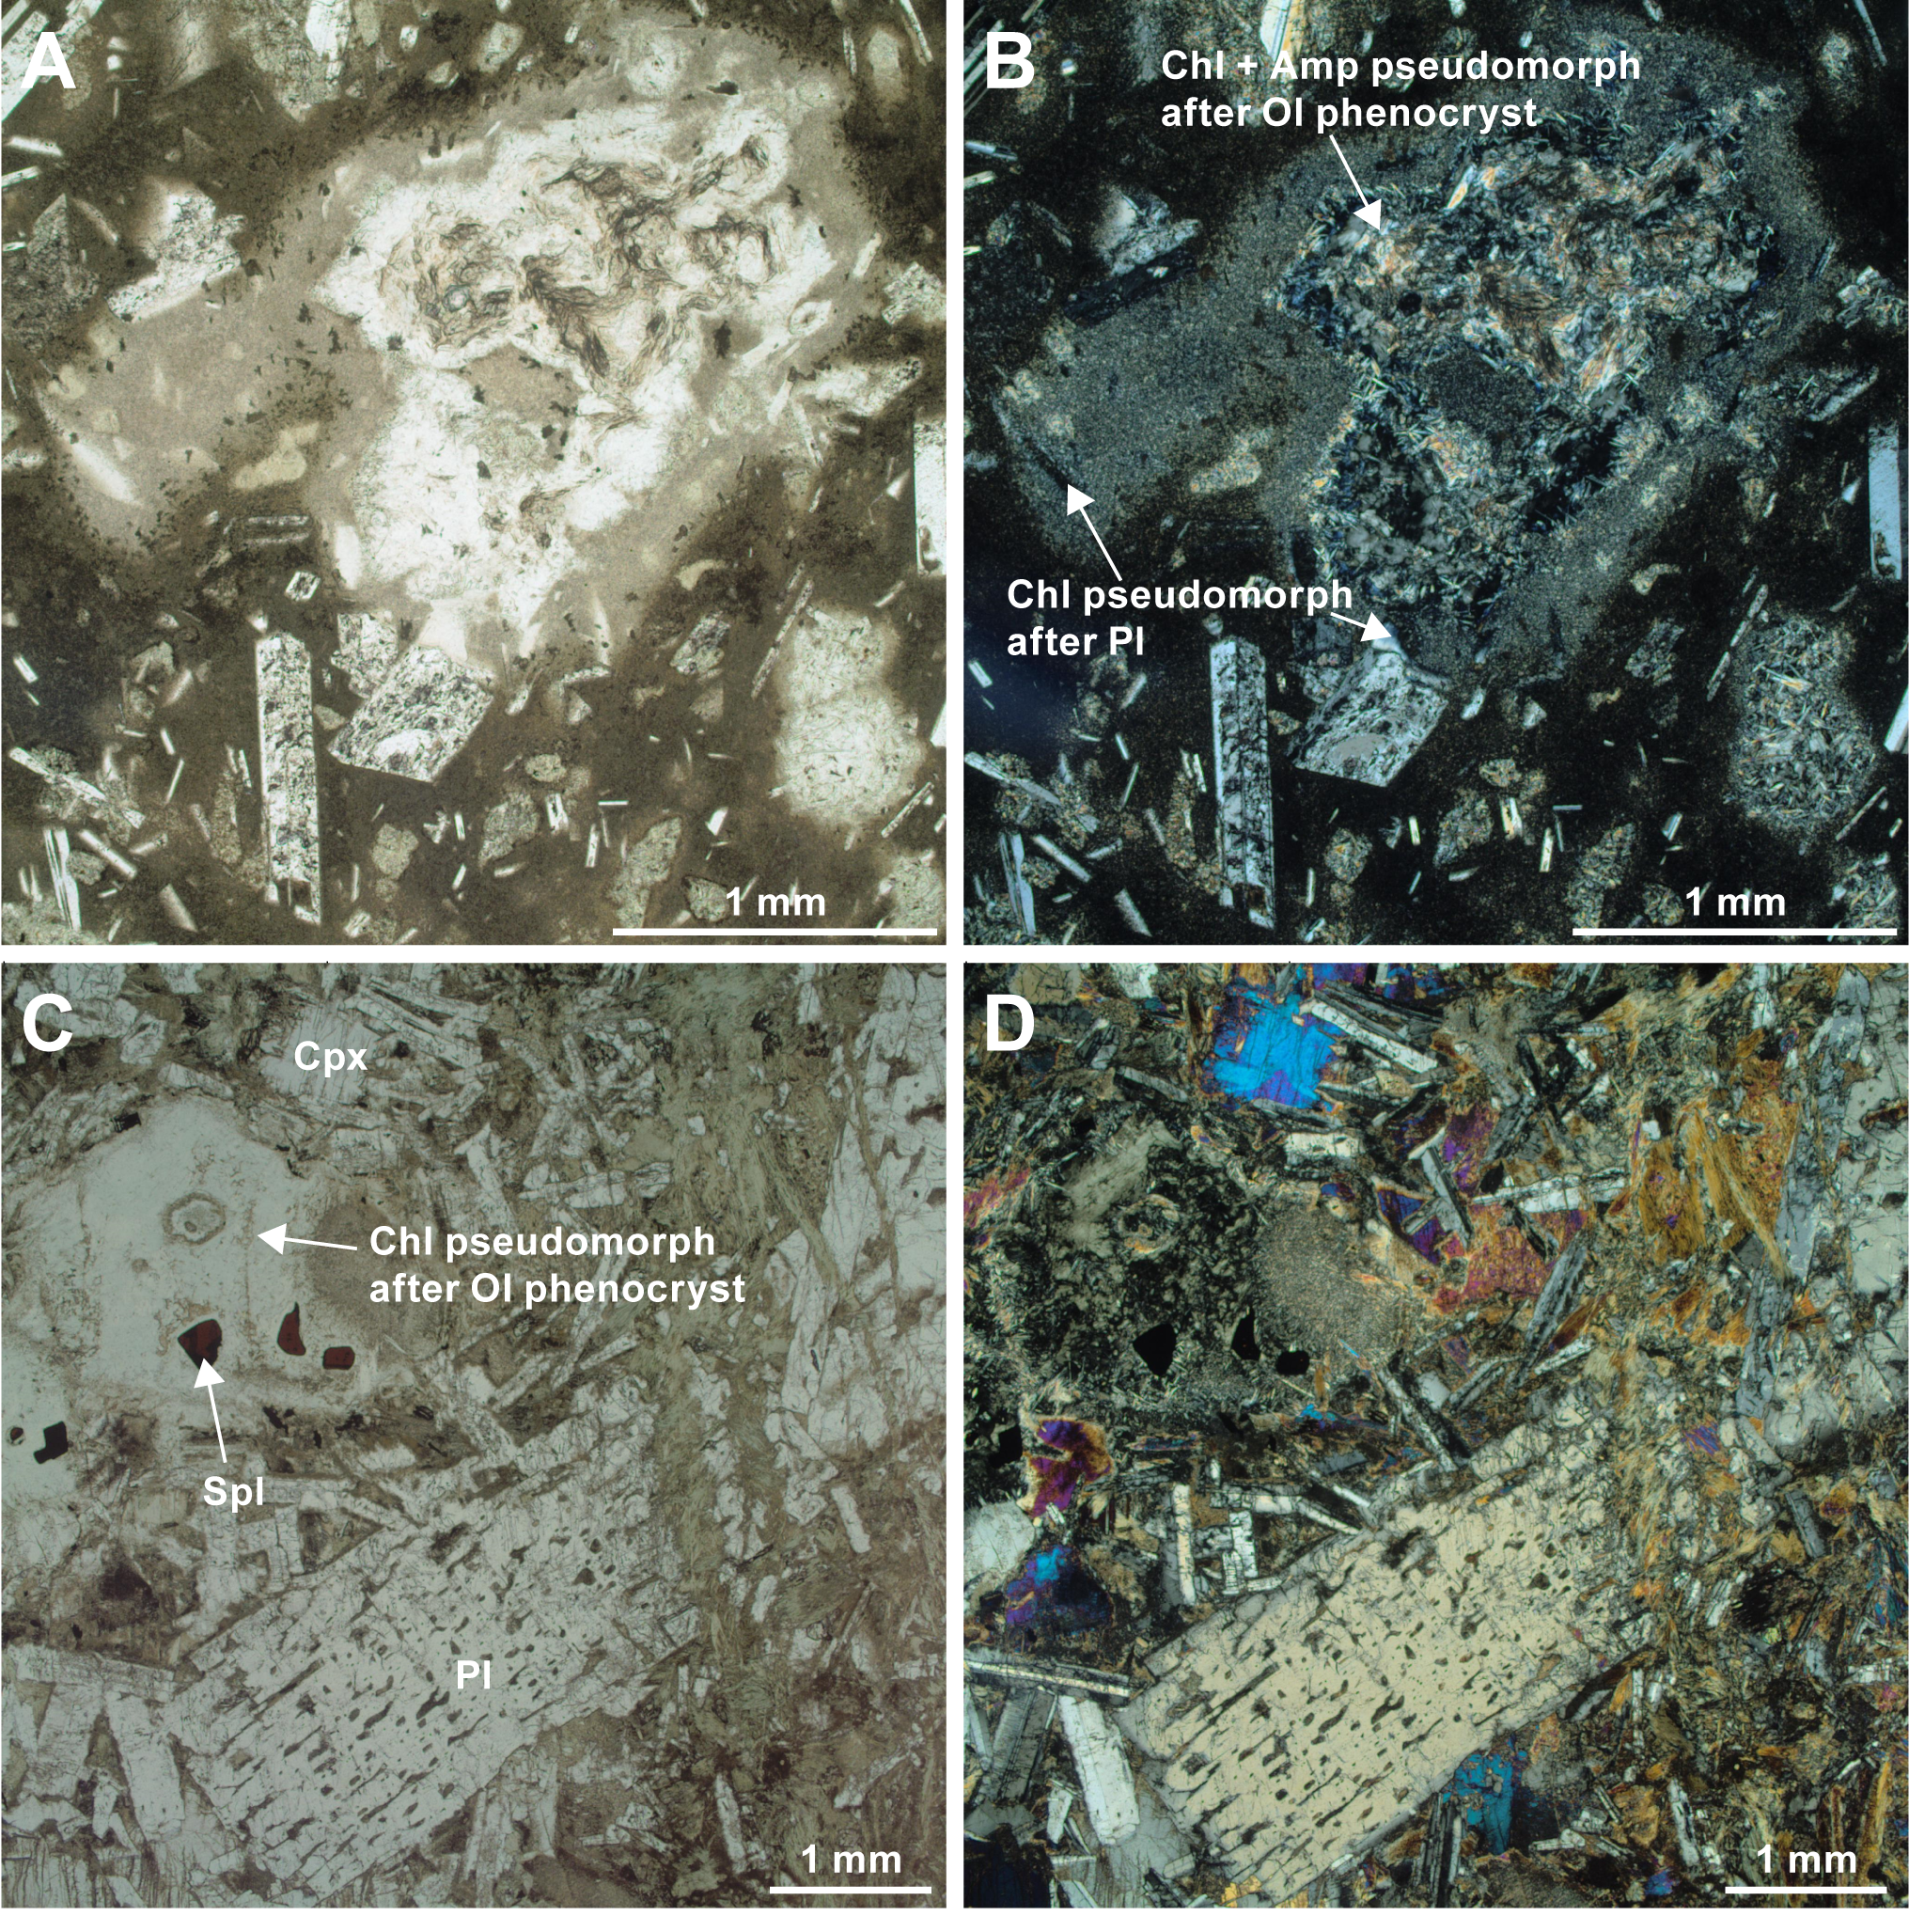
Figure F34. Diabase alteration.
4.5. Alteration associated with deformation
Extensive alteration of gabbroic rocks is apparent in cataclastic zones (Figure F26). Microscopic observations of cataclastic gabbros revealed that abundant brecciated clasts of green amphibole and plagioclase with variable grain size are set in a much finer grained matrix and cut by green amphibole veinlets (Figure F35). In some cases, relict clinopyroxene exists in green amphibole clasts. Relict clinopyroxene, replacing amphibole, and penetrating amphibole veinlets, as well as amphibole and plagioclase clasts, are bent and show undulose extinction (Figure F35C, F35D). The fine-grained matrix is in many cases associated with slip-fiber veins of green amphibole. These observations indicate that brittle and ductile deformation took place contemporaneously with amphibole formation.
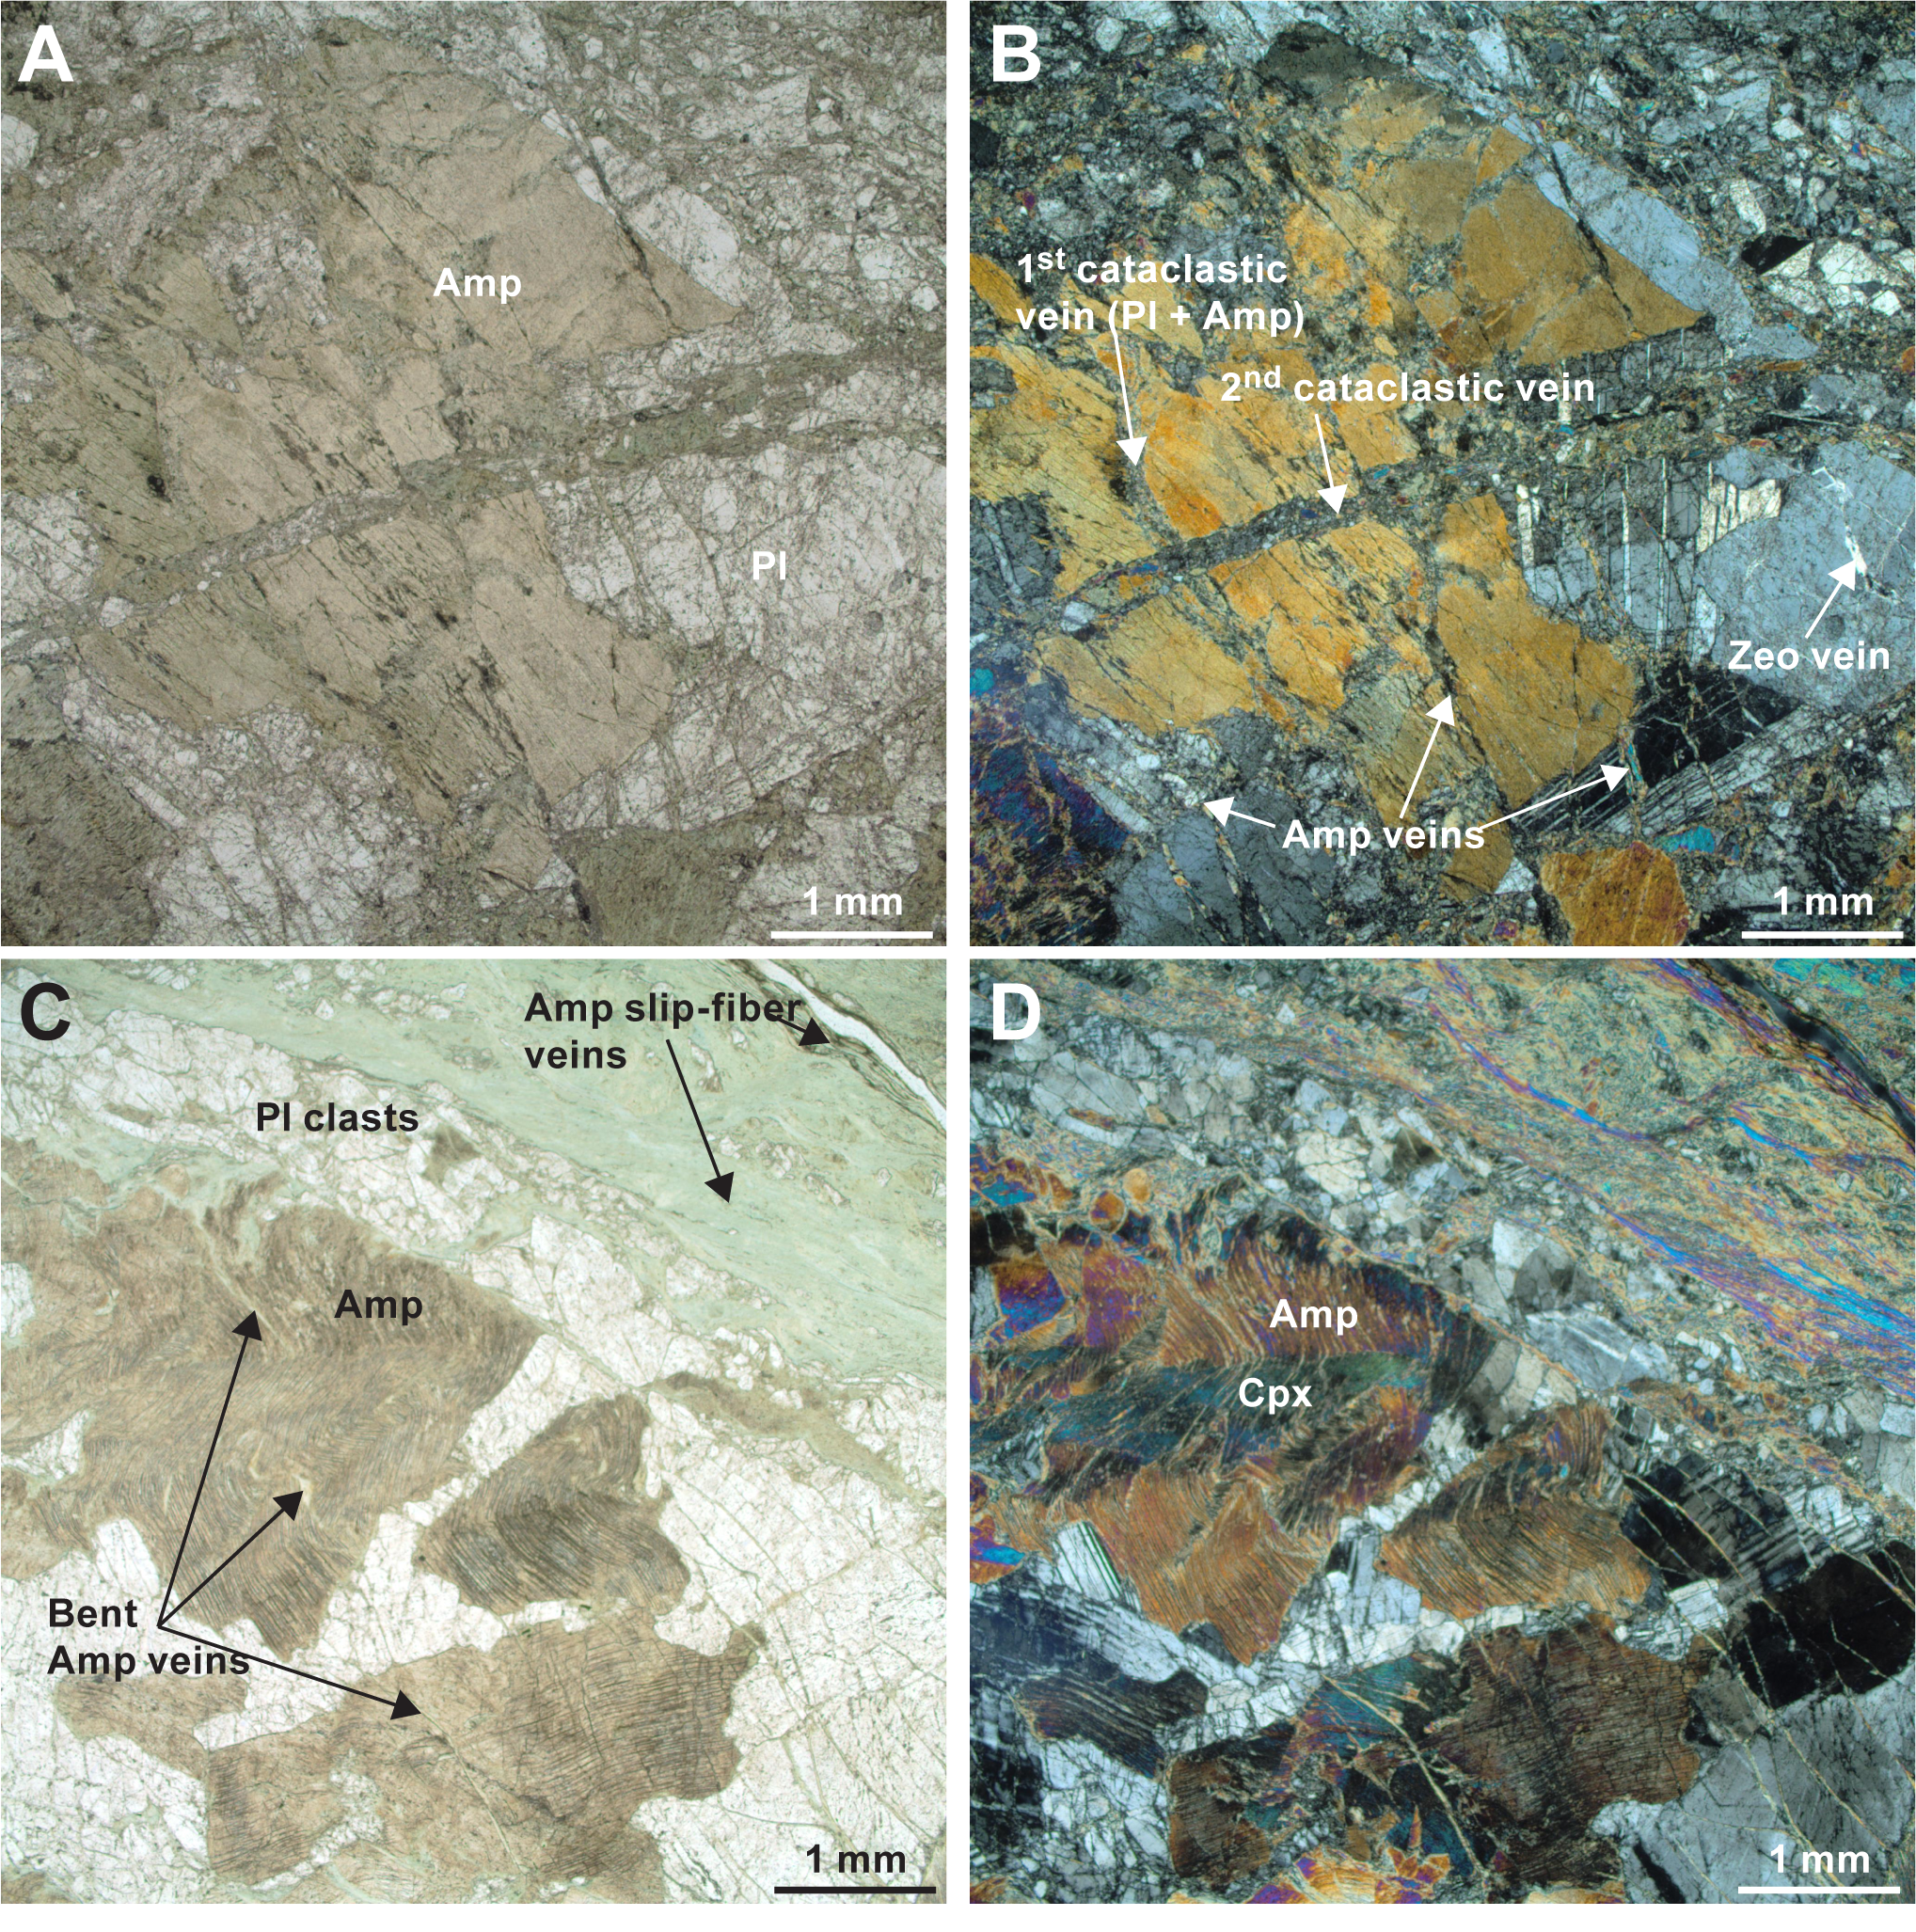
Figure F35. Alteration of deformed gabbro.
4.6. Reaction porosity
Possible macroscopic reaction porosity has been identified in two thin sections from the deepened sequence in Hole U1309D. Reaction porosity and by inference permeability was described in epidotized dikes in the Troodos ophiolite, Cyprus (Cann et al., 2015), and in the upper part of Holes U1309D and U1309B (McCaig et al., 2022). Vugs are inferred to be formed by complete (local) dissolution of the rock or particular primary minerals by flowing reactive fluids, which then are partly to completely filled by secondary minerals. The identifying features are relict porosity (sometimes filled by late low-temperature phases), typically showing euhedral or spherulitic growth of secondary minerals into what was fluid-filled space, and bleaching and intense alteration of plagioclase in halos around the vug (e.g., Section 399-U1309D-297R-2 and interval 310R-1, 92–95 cm).
4.7. Conditions and sequence of alteration and deformation
Alteration mineral assemblages in the examined gabbroic rocks are comparable to those in oceanic lower crustal gabbroic rocks recovered from drill holes at the Atlantis Massif, Atlantis Bank, and Hess Deep rift. Previous studies documented the formation of amphibole + chlorite after olivine and green amphibole after clinopyroxene, as well as serpentinization of olivine, prehnite formation after plagioclase, and clay replacement of olivine (Expedition 304/305 Scientists, 2006a; Blackman et al., 2011; Shipboard Scientific Party, 1999a; Gillis et al., 2014; Dick et al., 2017; Nozaka and Fryer, 2011; Nozaka et al., 2008, 2016, 2017, 2019). Based on crosscutting relationships of such alteration assemblages and hydrothermal veins, these studies suggest that alteration of the lower oceanic crust is a sequential process that can take place during cooling from amphibolite to greenschist and subgreenschist facies conditions.
Fluid inclusions in olivine can provide additional constraints on the conditions of fluid-rock interaction. Olivine-hosted fluid inclusions in rocks from Hole U1309D that were recovered during Expedition 399 are of secondary origin as they cut through grain and subgrain boundaries. These trails can form when minerals hosting fluid-filled fractures heal (Roedder, 1984; Van den Kerkhof and Hein, 2001). Healing of fluid-filled fractures can take place when the host mineral is super-saturated in the fluid. Thermodynamic equilibrium calculations suggest that the minimum temperature at which olivine can stably coexist with water at pressures relevant to mid-ocean ridge environments is roughly 400°C (Klein et al., 2019). At lower temperatures, olivine is unstable in the presence of water (assuming the activity of water is close to 1) and undergoes serpentinization. Thus, the presence of secondary fluid inclusions in Hole U1309D indicates that fluid-rock interaction must have occurred at 400°C or higher. This temperature estimate is consistent with secondary mineral assemblages that indicate amphibolite to greenschist facies conditions. Previous studies of samples from Holes U1309B (Klein et al., 2019) and U1309D (Andreani et al., 2023) revealed the presence of chrysotile, magnetite, and brucite in addition to gaseous H2 and CH4 in fluid inclusions. Although it was not possible to determine the contents of olivine-hosted fluid inclusions during this expedition, the occurrence of daughter minerals and the low refractive index of gaseous fluid inclusions tentatively suggest that the observed inclusions may also contain such compounds.
The overall alteration extent is lower in deeper intervals of Hole U1309D consistent with previous studies (Expedition 304/305 Scientists, 2006b). Relatively intense alteration is localized in zones of cataclastic deformation and dense veining, and this is a new zone of such deformation and alteration in the Hole U1309D core, comparable in intensity to the zone at ~750 mbsf (Michibayashi et al., 2008) and the detachment fault deformation in the uppermost 100 m of the core. Hydrothermal fluid infiltration along fractures in zones of brittle deformation likely promoted alteration and further deformation. The observation that amphibole veins are bent along with clinopyroxene-replacing amphibole, whereas amphibole and plagioclase breccias are set in a matrix including amphibole slip-fiber veins, further corroborates the argument by Michibayashi et al. (2008) that brittle deformation took place at high-temperature amphibolite facies conditions in the gabbroic sequences of the Atlantis Massif.
5. Structural geology
Site U1309 is located on the central dome of Atlantis Massif, 14–15 km west of the median valley axis of the Mid-Atlantic Ridge, where the seafloor coincides with what is interpreted to be a gently sloping, corrugated detachment fault surface. Hole U1309D was initially drilled during Expedition 304/305 to 1415.5 mbsf into the footwall of the detachment system. Renewed drilling during Expedition 399 deepened the hole 84.5 m to a maximum depth of 1497.86 mbsf, comprising 13 cores (58% recovery) hosting gabbroic rocks (olivine and olivine-bearing gabbro, gabbronorite, and gabbro) with thin intervals of diorite and diabase.
The recovered gabbroic cores host structures associated with footwall deformation in an oceanic core complex, including a semibrittle shear zone between 1451 and 1474 mbsf, active at greenschist-facies conditions. Deformation features associated with this shear zone are cut by later, fine-grained diabase indicating magmatism and deformation continued for a significant time.
5.1. Magmatic veins and fabrics
All cores recovered from Hole U1309D (297R–313R) contain gabbroic rocks with rare intervals of diabase. The majority of the recovered gabbroic section is isotropic, with a low degree of deformation and/or alteration, and rare banded intervals, defined by grain size differences, noted in Cores 297R, 298R, 309R–311R, and 313R. The majority of contacts between grain size domains were not recovered, but where observed, domain boundaries are typically diffuse, occurring over centimeter scale with an irregular geometry and a variable dip between subhorizontal to subvertical (Figure F36). A minority of grain size contacts are sharp and relatively planar (Figure F37).
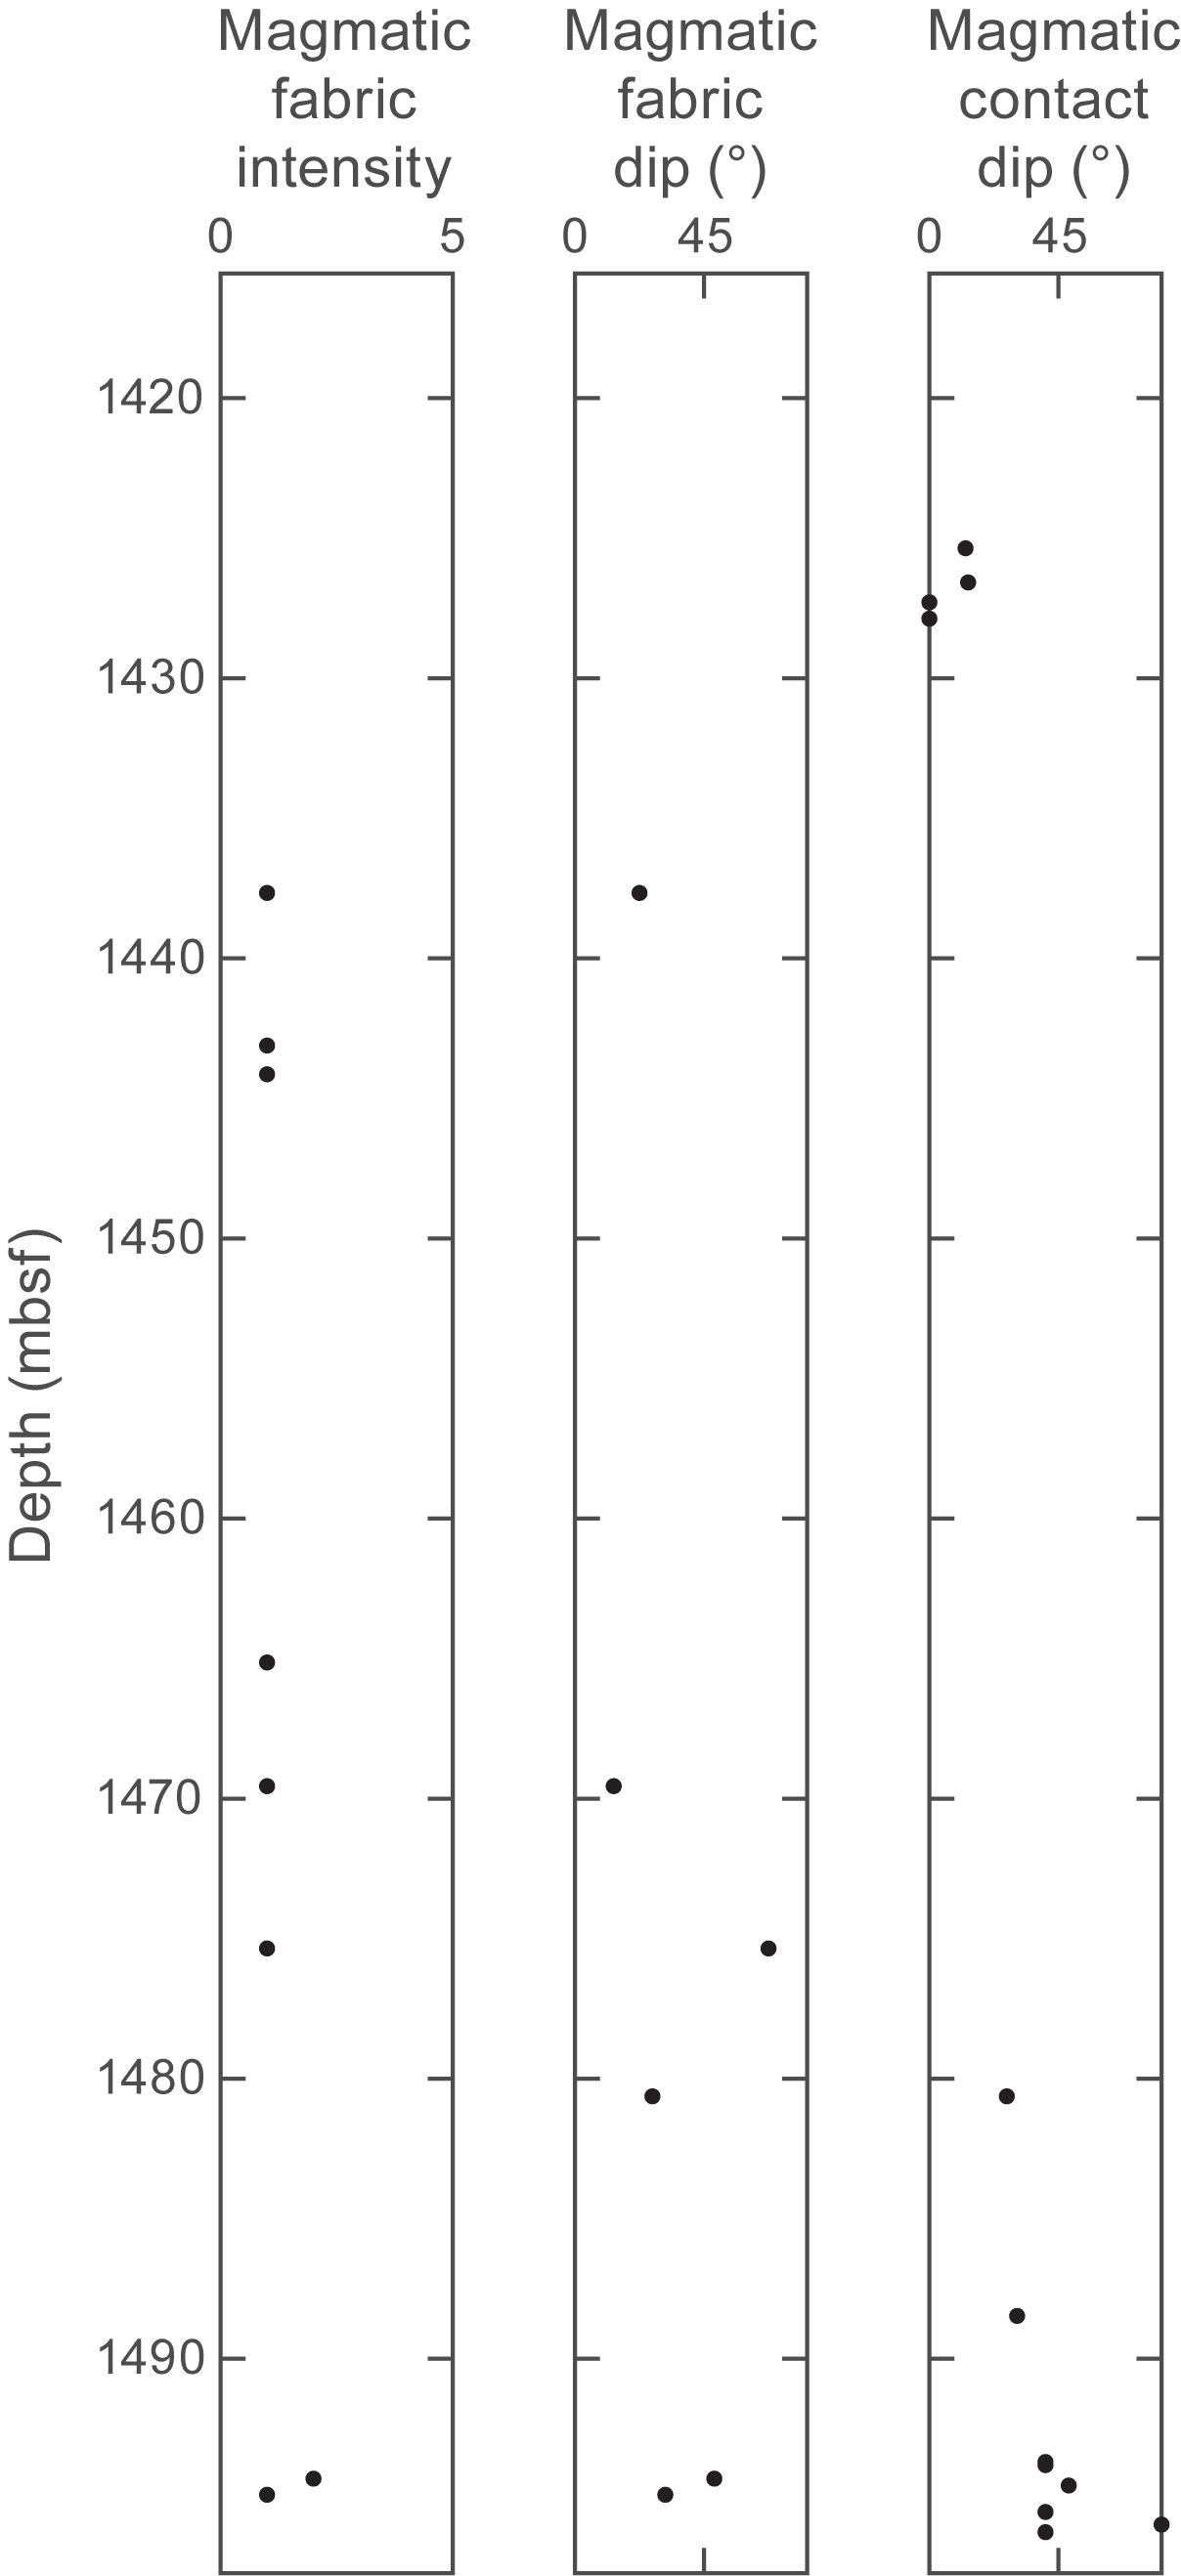
Figure F36. Magmatic fabric.
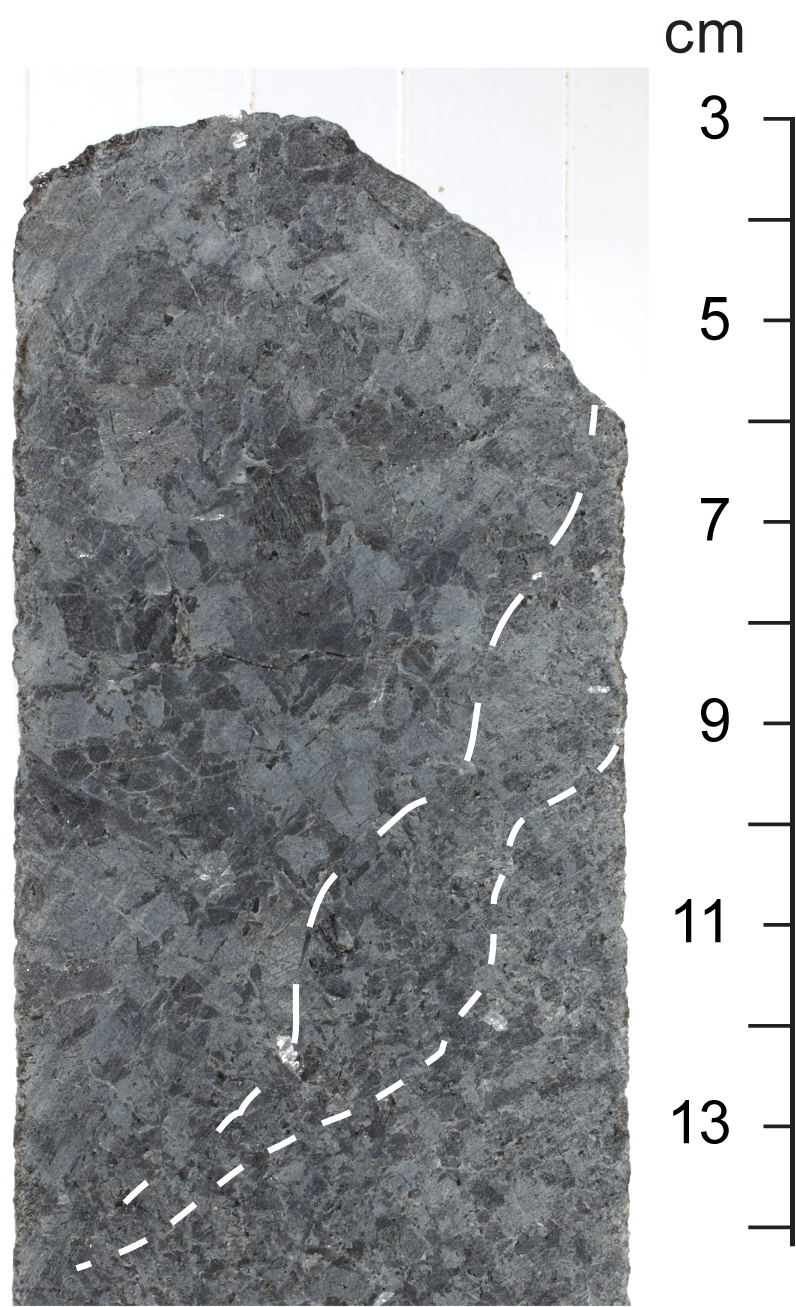
Figure F37. Moderately dipping grain size banding.
Magmatic foliations (defined by a weak planar alignment shape preferred orientation of plagioclase and/or pyroxene) were recorded in a small number of intervals in Sections 399-U1309D-297R-1 through 304R-1 (1415–1451 mbsf), 306R-1 through 307R-1 (1459–1466 mbsf), and 308R-1 through 313R-4 (1469–1497 mbsf) and have gentle to subvertical dips (Figure F36). Microscopic observations of magmatic fabrics are consistent with macroscopic observations and include simple cumulate textures defined by blocky laths of plagioclase (Figure F38B) and modified cumulate textures with cuspate grain boundaries, small dihedral angles formed by interstitial clinopyroxene melt pockets (Figure F38B), grain boundary quadruple junctions, and string-of-beads textures displayed by small grains of plagioclase trapped between larger plagioclase and/or clinopyroxene grains (e.g., Holness et al., 2011), suggesting a more complex and protracted phase or phases of melt-rock interaction.
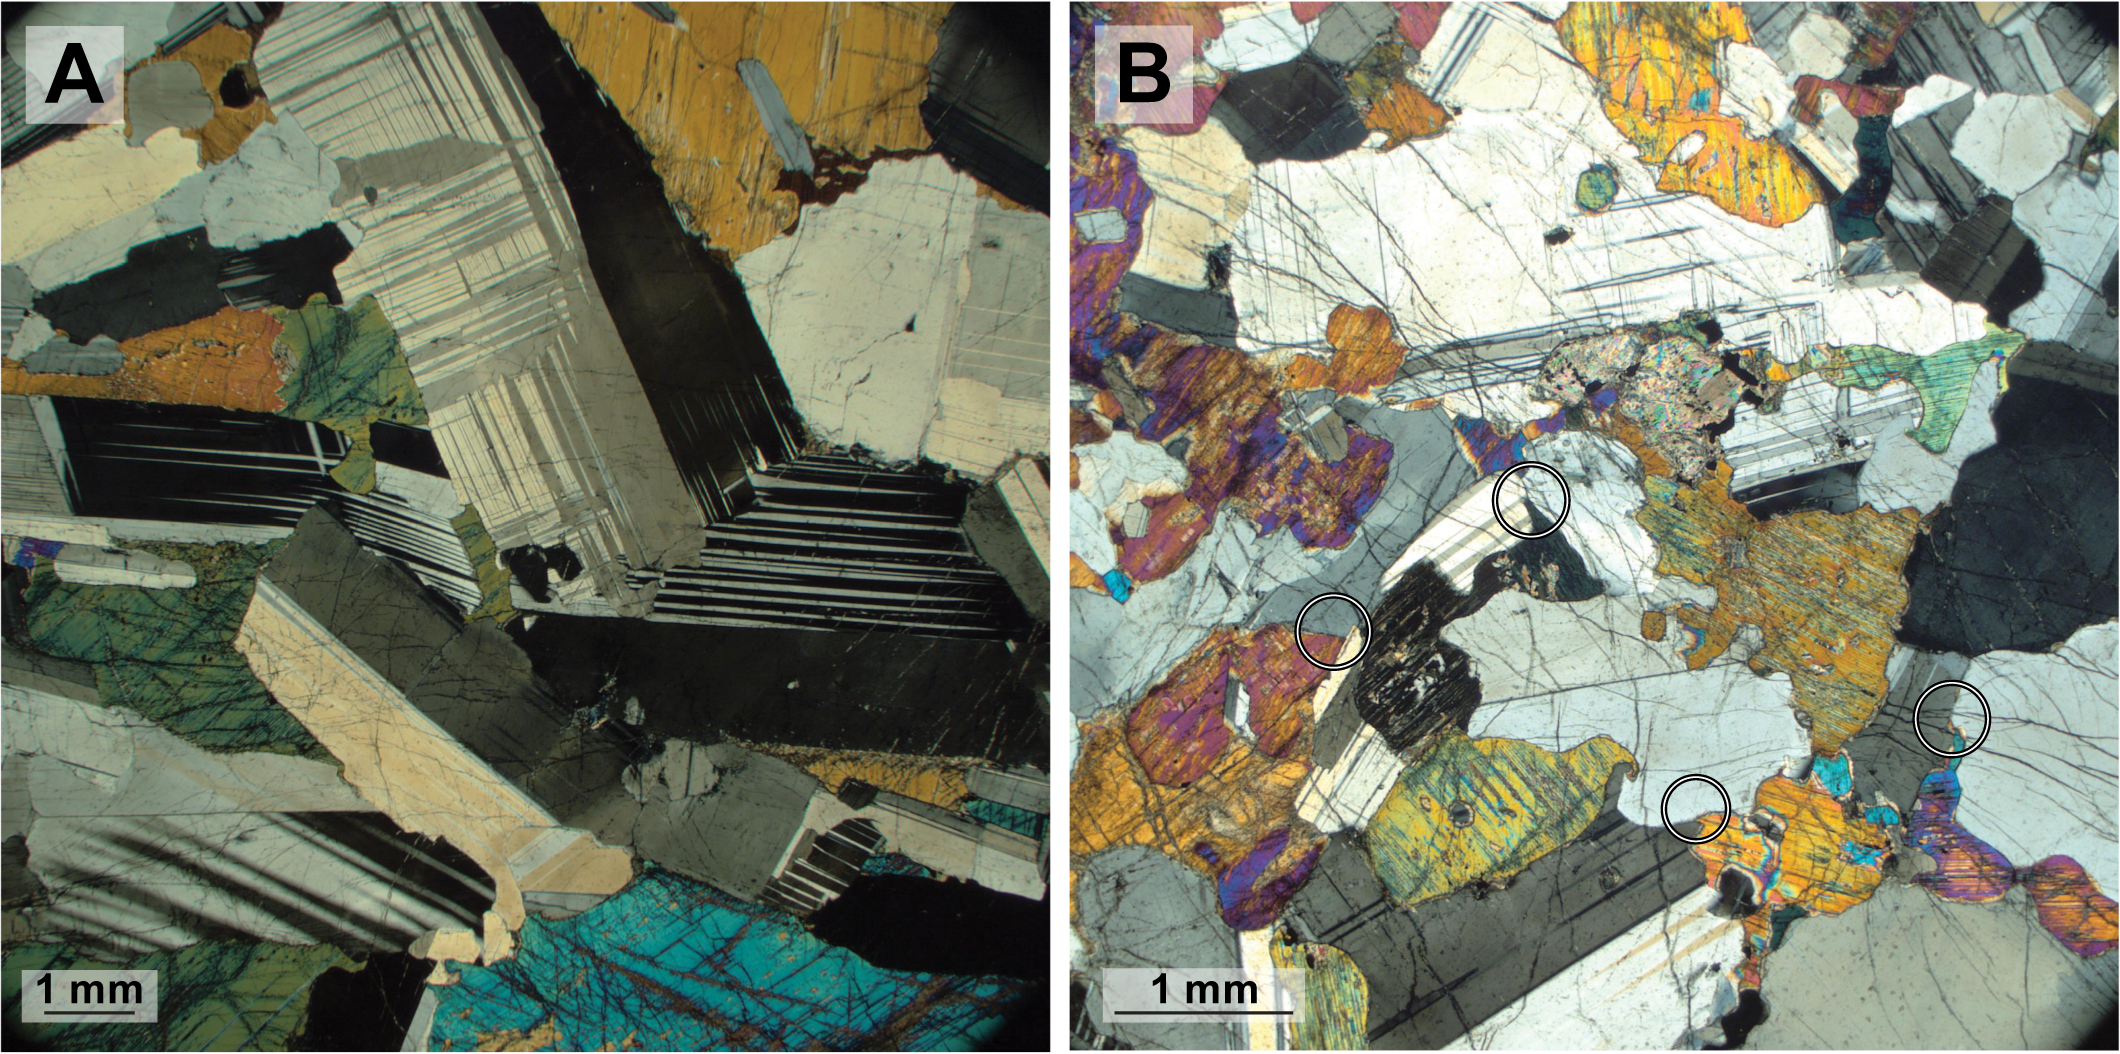
Figure F38. Cumulate texture of plagioclase in olivine gabbro.
Thin intervals of diabase (up to 50 cm thick) were recovered in Cores 399-U1309D-297R through 300R, 302R, 303R, 305R, and 308R (1417–1470 mbsf), with a variable timing of emplacement relative to deformation. Where present, diabase is aphanitic and occasionally displays chilled margins against gabbro, only recovered in unoriented pieces. At the micro scale, recovered diabase has isotropic to foliated magmatic fabrics parallel to recovered intrusive contacts. In Sections 297R-2 and 303R-1, undeformed diabase with a chilled margin truncates fault breccia and cataclasite (Figure F39), indicating emplacement of some diabase bodies after brittle deformation of the gabbro.
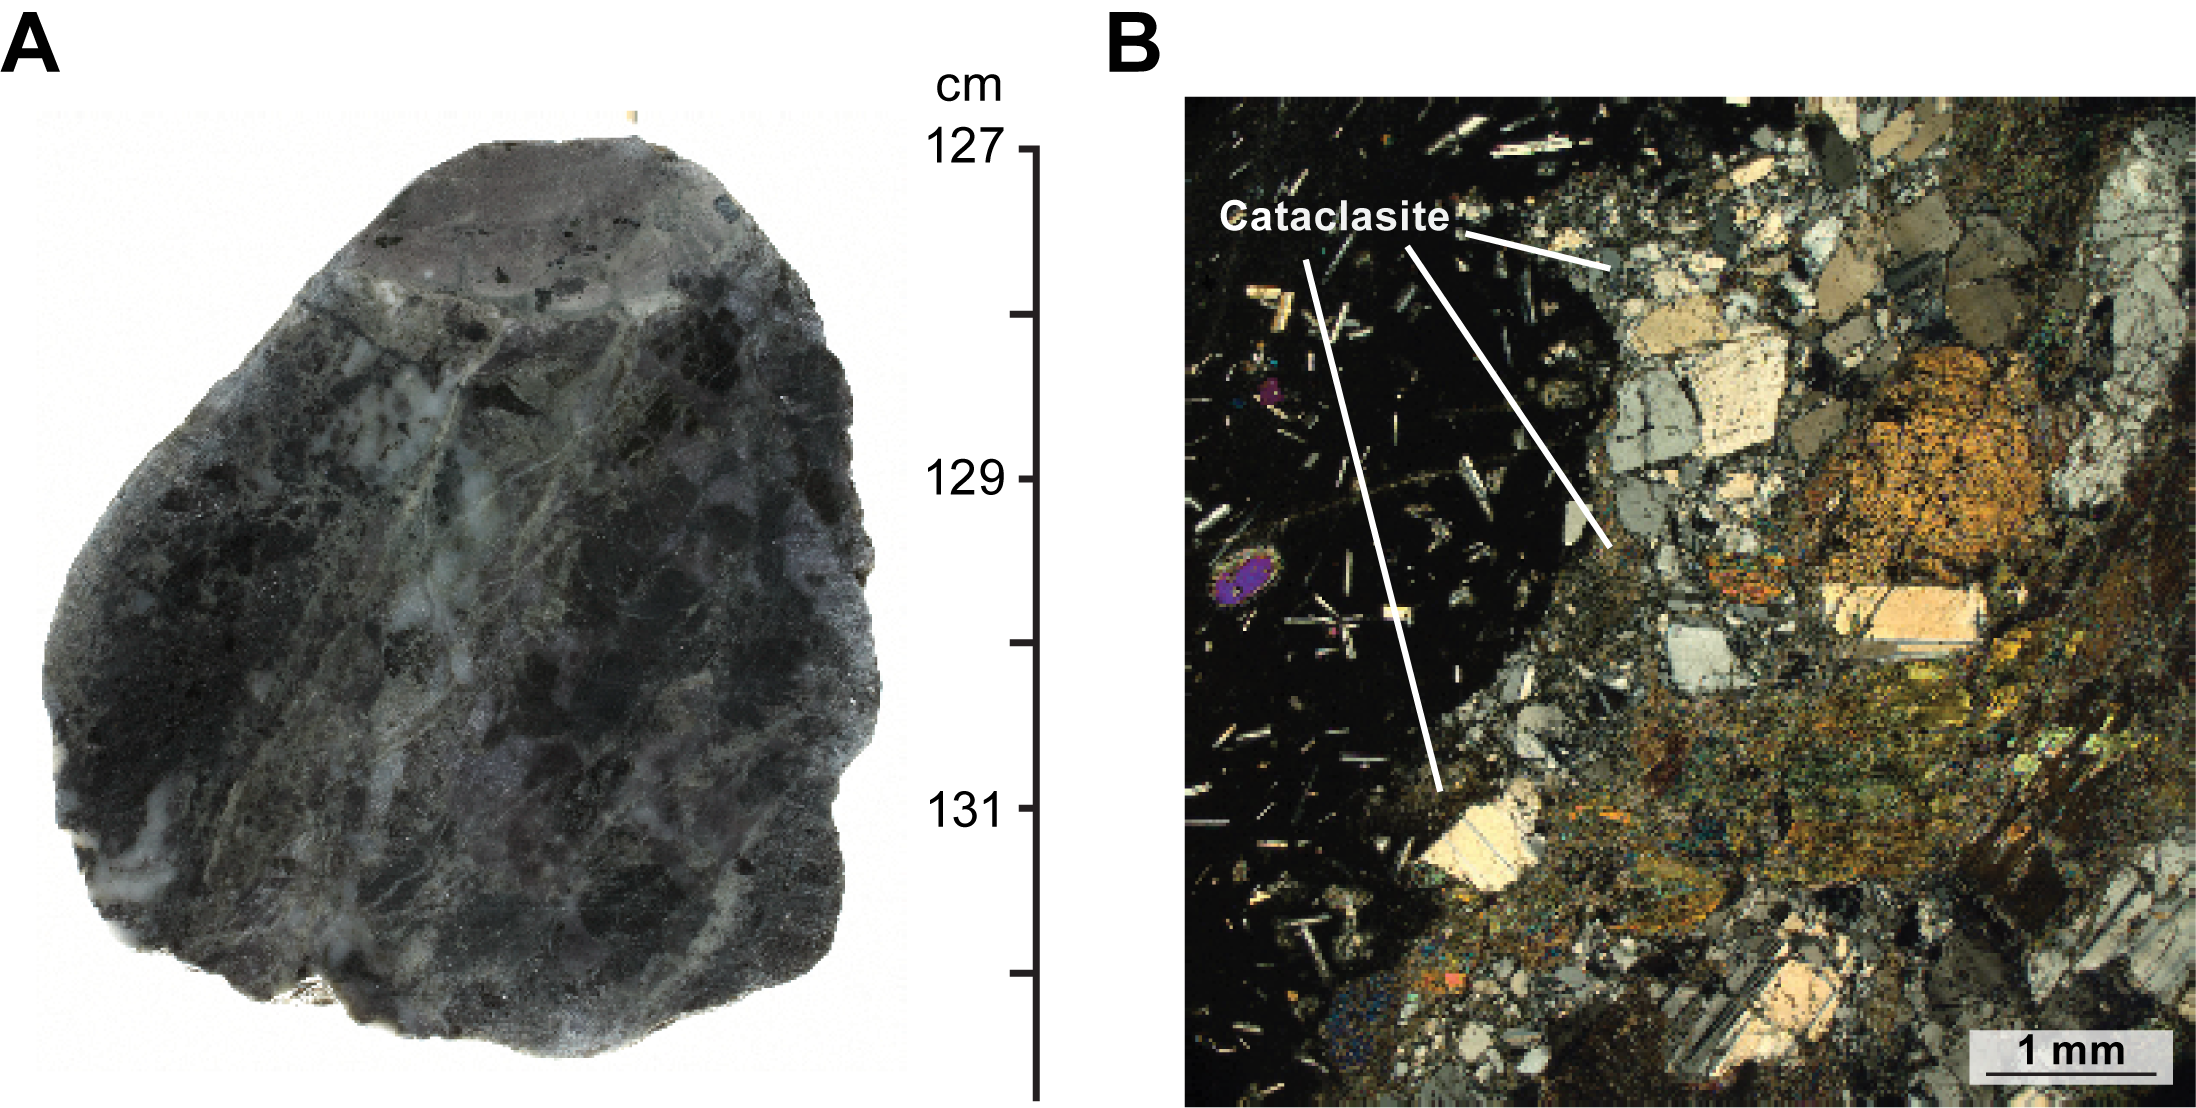
Figure F39. Diabase.
5.2. Crystal-plastic fabrics
Crystal-plastic deformation is largely absent from the newly recovered sections of Hole U1309D; zones of deformation observed in hand sample and thin section are accommodated by brittle and semibrittle processes. In many cases, gabbroic rocks that appear undeformed at the macro scale host very low strain crystal-plastic deformation features including subgrain development in pyroxene, olivine, and plagioclase, deformation twinning, and rare grain boundary bulging dynamic recrystallization textures in plagioclase. A minority of cataclastic fault rocks contain plagioclase with rare subgrains, similar in size to plagioclase clasts hosted in local cataclastic matrix or fault breccia, and are therefore assumed to have formed as part of the wider semibrittle deformation rather than as an earlier higher temperature deformation fabric.
Static recrystallization is generally not observed in Hole U1309D cores recovered during Expedition 399. Undeformed gabbroic rocks retain their original magmatic fabrics with irregular grain boundaries and dihedral triple junctions and quadruple junctions (Figure F38). Most amphibole-chlorite alteration forms mats of fine-grained acicular crystals, with the exception of interval 399-U1309D-308R-1, 92–94 cm, which hosts granoblastic, equant amphibole-after-pyroxene replacement textures, and amphibole veins with coarse (>400 µm) blocky grains. These microstructures indicate a discrete and local episode of grain coarsening occurred after amphibole alteration and veining.
5.3. Schistose fabrics
Schistose fabrics are not observed in Hole U1309D cores recovered during Expedition 399.
5.4. Alteration veins
Alteration veins are found throughout Hole U1309D cores recovered during Expedition 399 (Figure F40). Vein types include monomineralic veins of amphibole, chlorite, calcite, and zeolite. Polymineralic veins of amphibole and chlorite are also common. Calcite, prehnite, and chlorite + prehnite veins are observed at the micro scale (Figure F41).
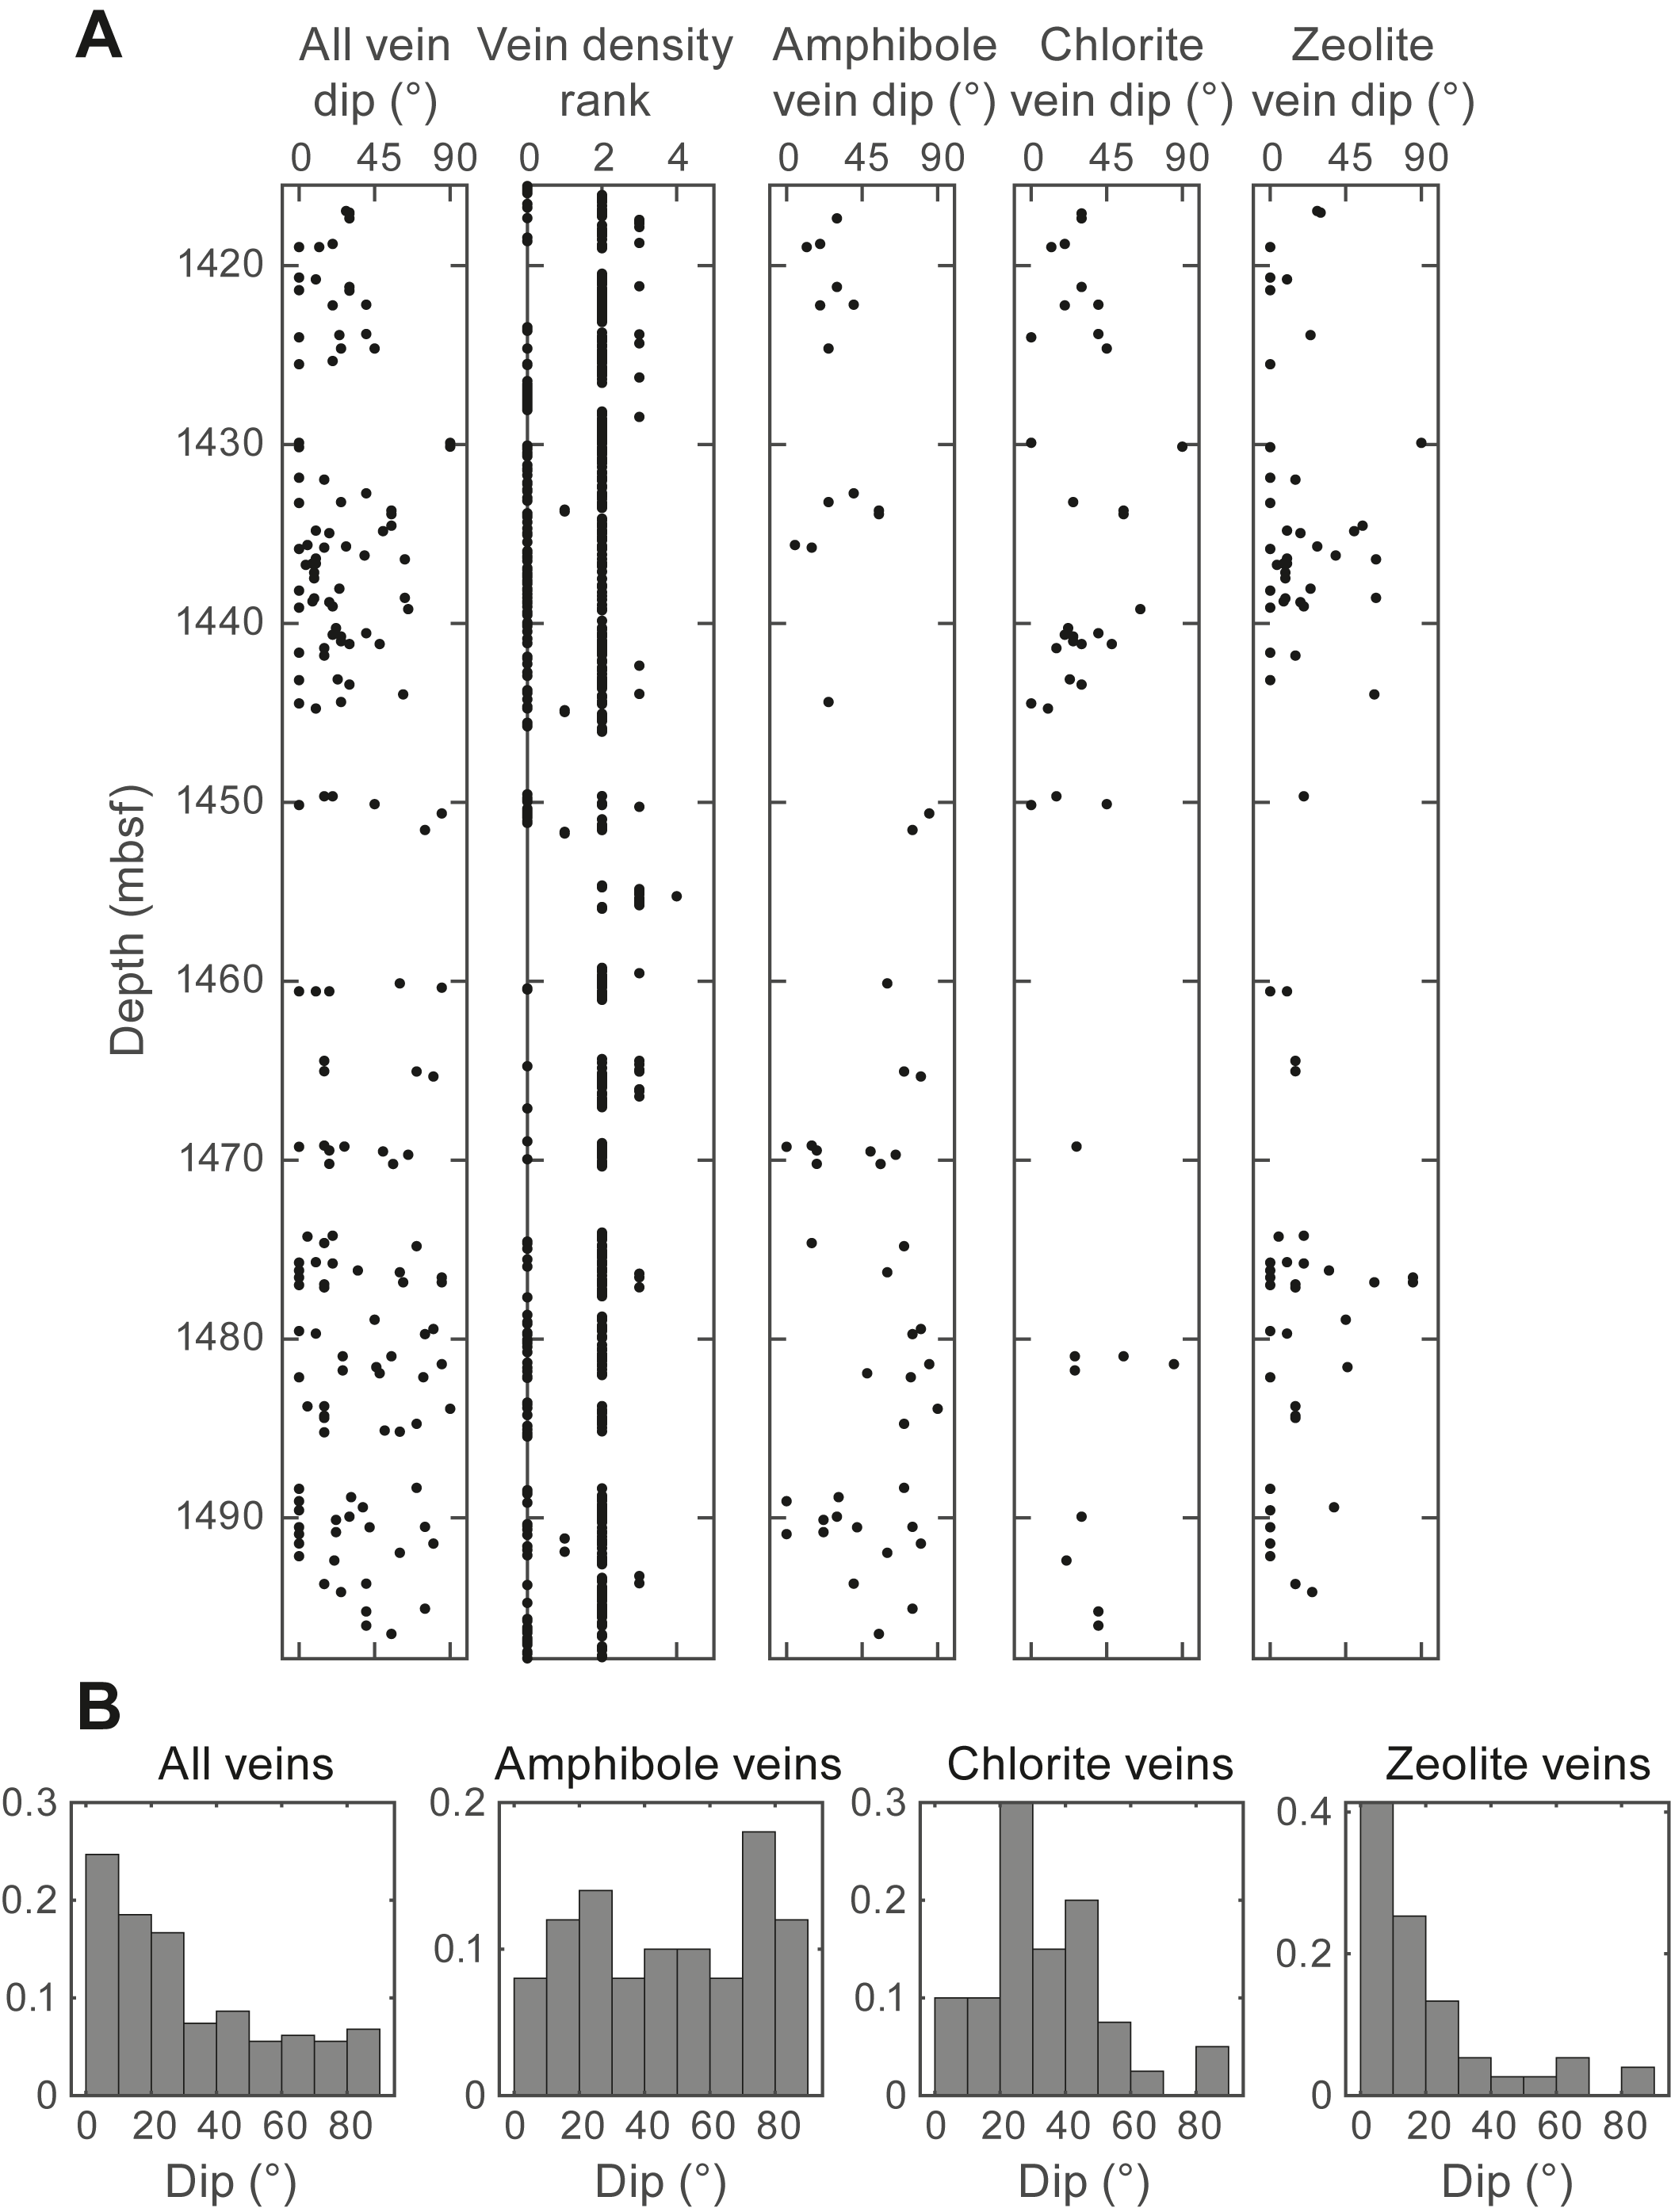
Figure F40. Vein density, type, and dip with depth.
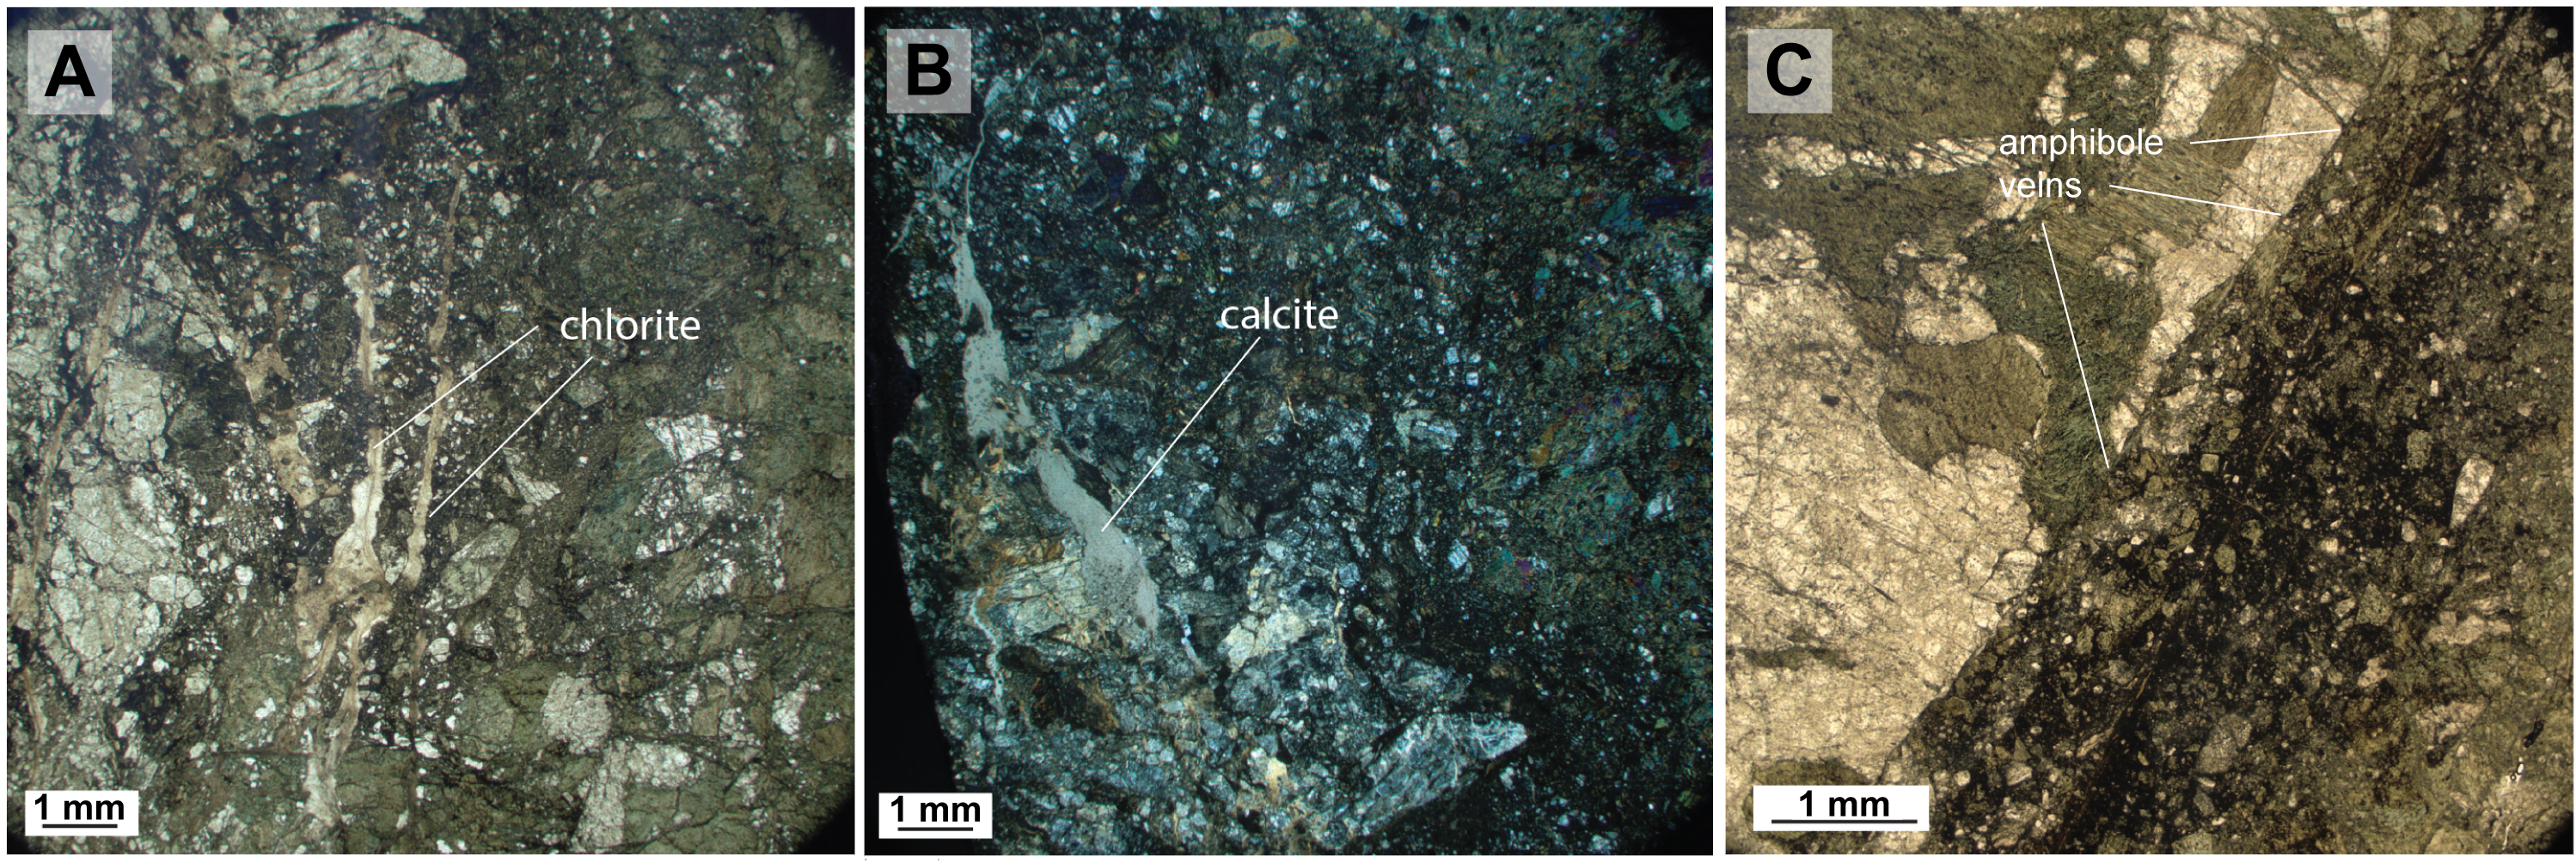
Figure F41. Undeformed irregular chlorite veins.
Vein density in Cores 399-U1309D-297R through 313R (1415–1498 mbsf) varies between 0 veins and 1–5 veins/10 cm. Zones of higher vein density between 1–5 and 6–10 veins/10 cm are recorded in Sections 297R-2 through 298R-2 (1417–1422 mbsf), 306R-1 through 307R-2 (1459–1469 mbsf), and 309R-2 (1476–1477 mbsf). The highest vein density (6–10 and 11–15 veins/10 cm) is recorded in Section 305R-1 (1455–1459 mbsf). Sections 299R-2 (1427–1428 mbsf), 313R-3, and 313R-4 (1496–1497 mbsf) are notable for their lack of alteration veins. Vein orientation irrespective of vein type varies from horizontal to rare vertical dips (Figure F40).
Amphibole veins are reported in all cores except Cores 399-U1309D-299R and 305R (Figure F40). Between Cores 297R and 303R (1415–1450 mbsf), amphibole is frequent in composite chlorite-amphibole veins, whereas monomineralic amphibole veins are more common from Core 304R (1449.4 mbsf) downward, with the highest concentration in Cores 308R (1469–1474 mbsf) and 312R (1488–1493 mbsf). Orientations of amphibole veins are variable throughout Hole U1309D, with a spread of dip from subhorizontal (0°–10°) to subvertical (80°–90°) recorded in Cores 308R (1469–1474 mbsf) and 312R (1488–1493 mbsf) and from moderate (30°–60°) to subvertical (80°–90°) recorded in Cores 304R–307R (1450–1469 mbsf), 309R–311R (1474–1488 mbsf), and 313R (1493–1498 mbsf). At the micro scale, amphibole and chlorite are present as (1) fine-grained mats of acicular amphibole and chlorite in veins or replacing former pyroxene and (2) sheared amphibole ± chlorite veins with a well-developed shape preferred orientation fabric (Figure F42). Fine-grained mats of amphibole and chlorite are commonly observed in deformed rocks from Hole U1309D, particularly in zones of high fracture density and low strain. Where present in veins, grain orientation in these chlorite-amphibole mats are typically random but occasionally have a strong shape preferred orientation consistent with growth while shearing along the vein (Figure F42B). In contrast, amphibole and chlorite grain orientations in replacement textures are random, suggesting growth under static conditions following fracturing and fluid ingress (Figure F42C).
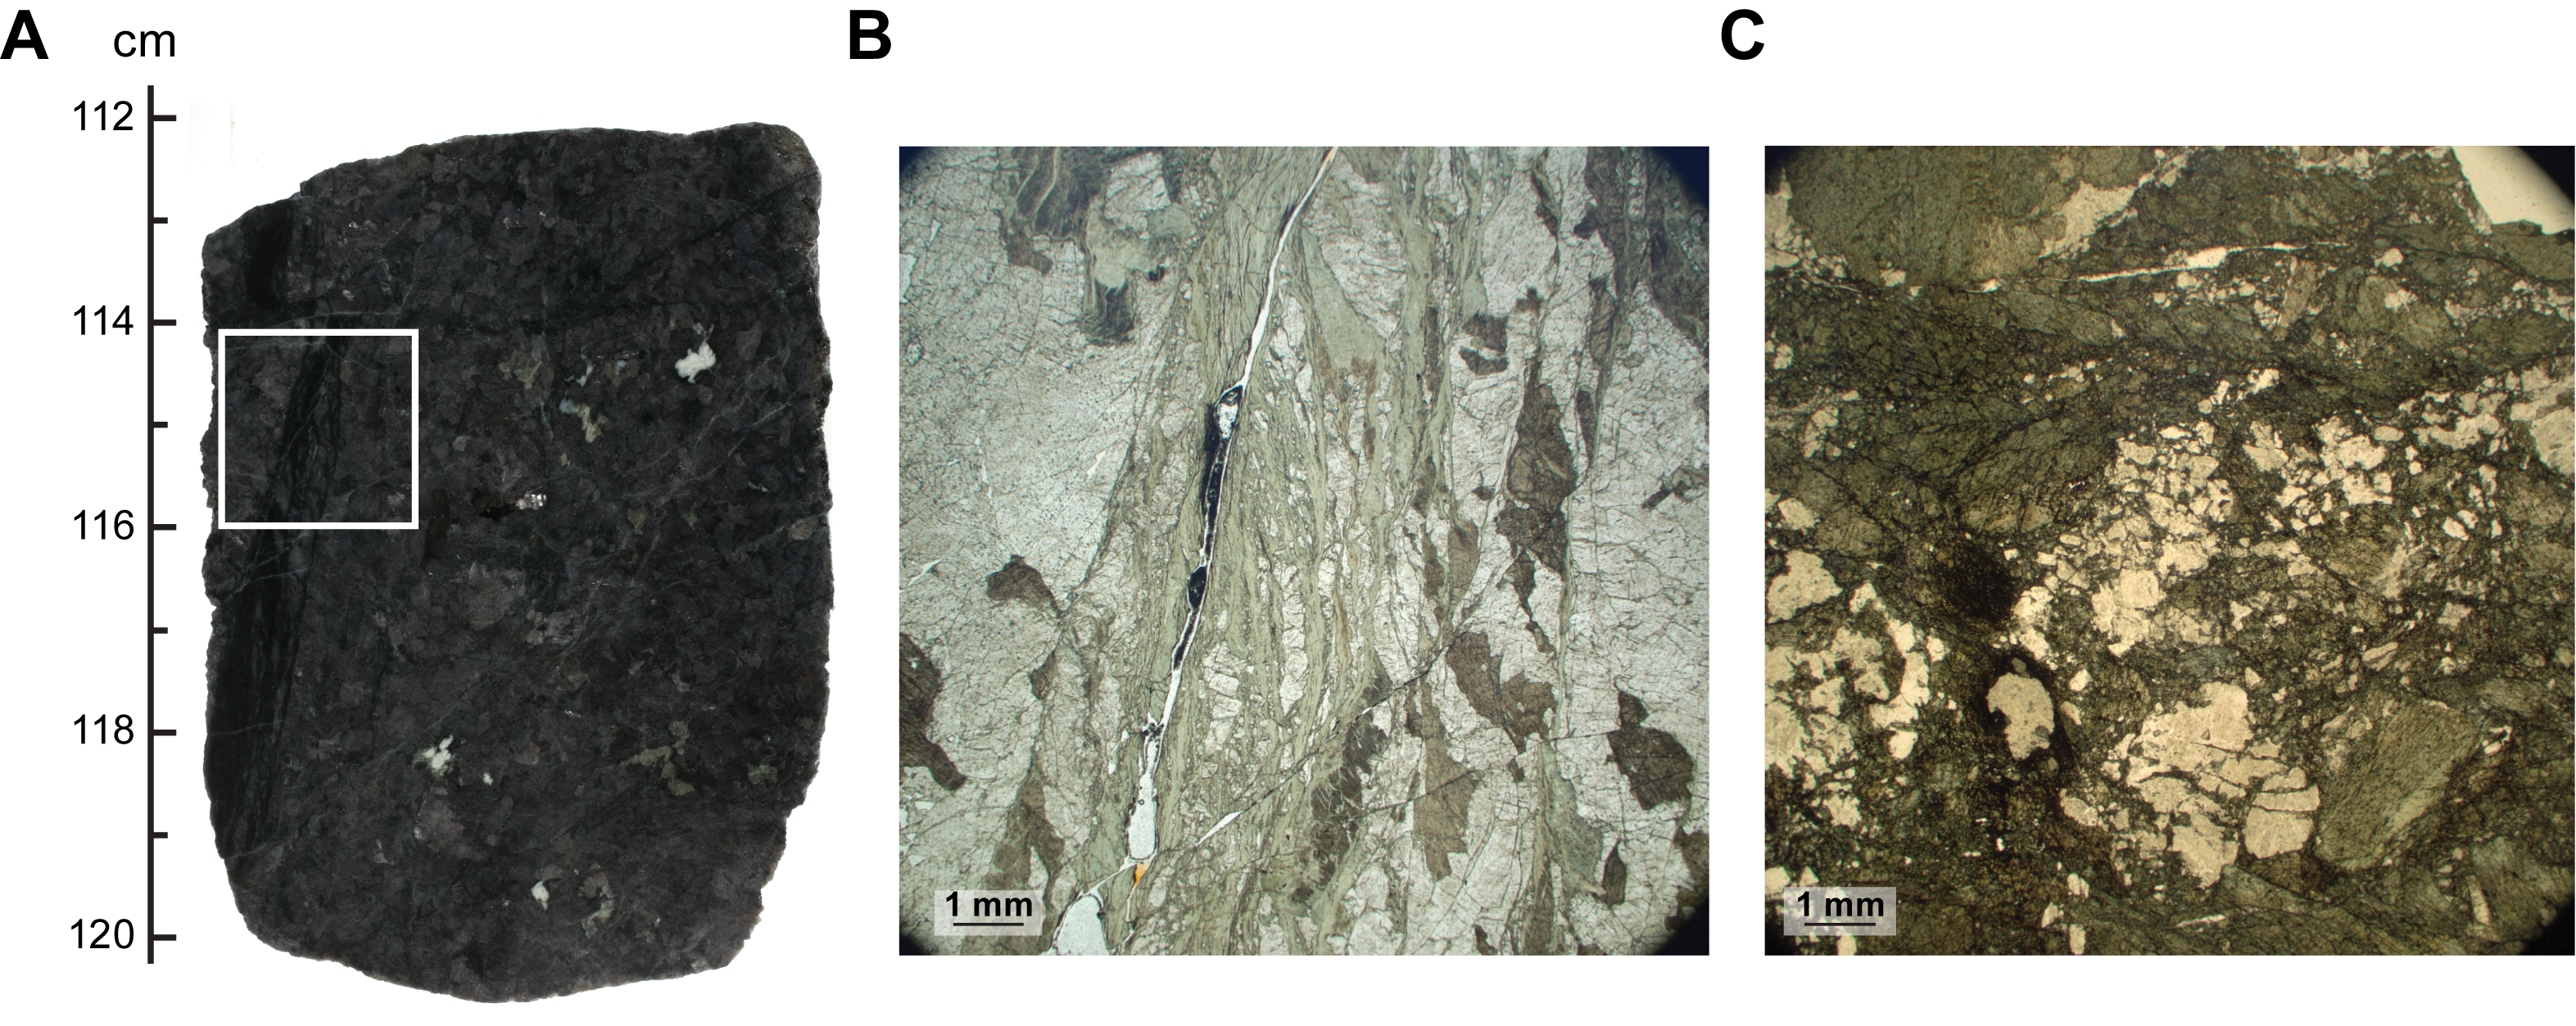
Figure F42. Gabbro cut by deformed amphibole vein.
Deformation of amphibole veins varies. In some samples, amphibole veins are undeformed and truncate fault breccia and zones of cataclasite; in other samples, zones of cataclasite and microfaults clearly truncate or offset preexisting amphibole veins (Figure F41). Similarly, some amphibole veins have been reactivated as minor slip planes (Figure F42A, F42B), and others formed as static features with no subsequent offset. We note a higher proportion of sheared amphibole veins with increasing depth through Hole U1309D, particularly in Sections 399-U1309D-311R-2 through 312R-2.
The highest concentration of chlorite veins are noted in Core 399-U1309D-302R (1440–1445 mbsf), with a lower density in Cores 298R (1420–1425 mbsf), 304R (1450–1455 mbsf), and 310R (1479–1484 mbsf; Figure F40). Chlorite veins typically have gentle (10°–30°) to moderate (30°–60°) dips. At the micro scale, the distribution and deformation of chlorite veins is similar to that of amphibole veins. Chlorite veins were recovered in both undeformed and deformed samples, with both reported throughout the 84 m recovered in Hole U1309D. In deformed samples, chlorite vein orientations are formed parallel and oblique to fractures, microfaults, and zones of cataclasite and can cut or be cut by fault breccias and/or cataclastic fabrics (Figure F41A, F41C).
Low-temperature zeolite veins are recognized in most cores, with the highest density in Cores 399-U1309D-301R (1435–1440 mbsf) and 309R (1474–1479 mbsf) (Figure F40). They commonly form a network of irregular veins that cut between grains rather than through veins and therefore have no consistent, measurable orientation. Where zeolite veins can be measured, their dips vary between subhorizontal (0°–10°) to gently dipping (10°–30°). The distribution of zeolite and chlorite veins appears to be anticorrelated, in particular between Cores 301R and 302R, which show an abrupt change from a high density of zeolite veins (Core 301R) to a high density of chlorite veins (Core 302R). At the micro scale, zeolite veins are found adjacent to prehnite ± chlorite veins and calcite veins, which are collectively undeformed (Figure F41B) and cut brittle and semibrittle deformation fabrics in recovered core.
5.5. Brittle and semibrittle deformation
Brittle and semibrittle deformation are observed throughout Hole U1309D. Open or healed fractures (i.e., with no mineralization) in the deepest part of Hole U1309D are observed in Cores 399-U1309D-297R through 303R, with a density distribution ranging from 0 (Rank 0) to 1–5 fractures/10 cm (Rank 2) (Figure F43). Where present, open fractures typically have a planar to curved geometry, with a thickness of 0.1–0.5 mm (rarely ≥1 mm). These fractures are most commonly isolated but occasionally have branched or networked relationships with each other. Open fracture dips typically range between subhorizontal (0°–10°) and shallow (10°–30°). Below Core 303R (~1445 mbsf), open fracture density decreases.
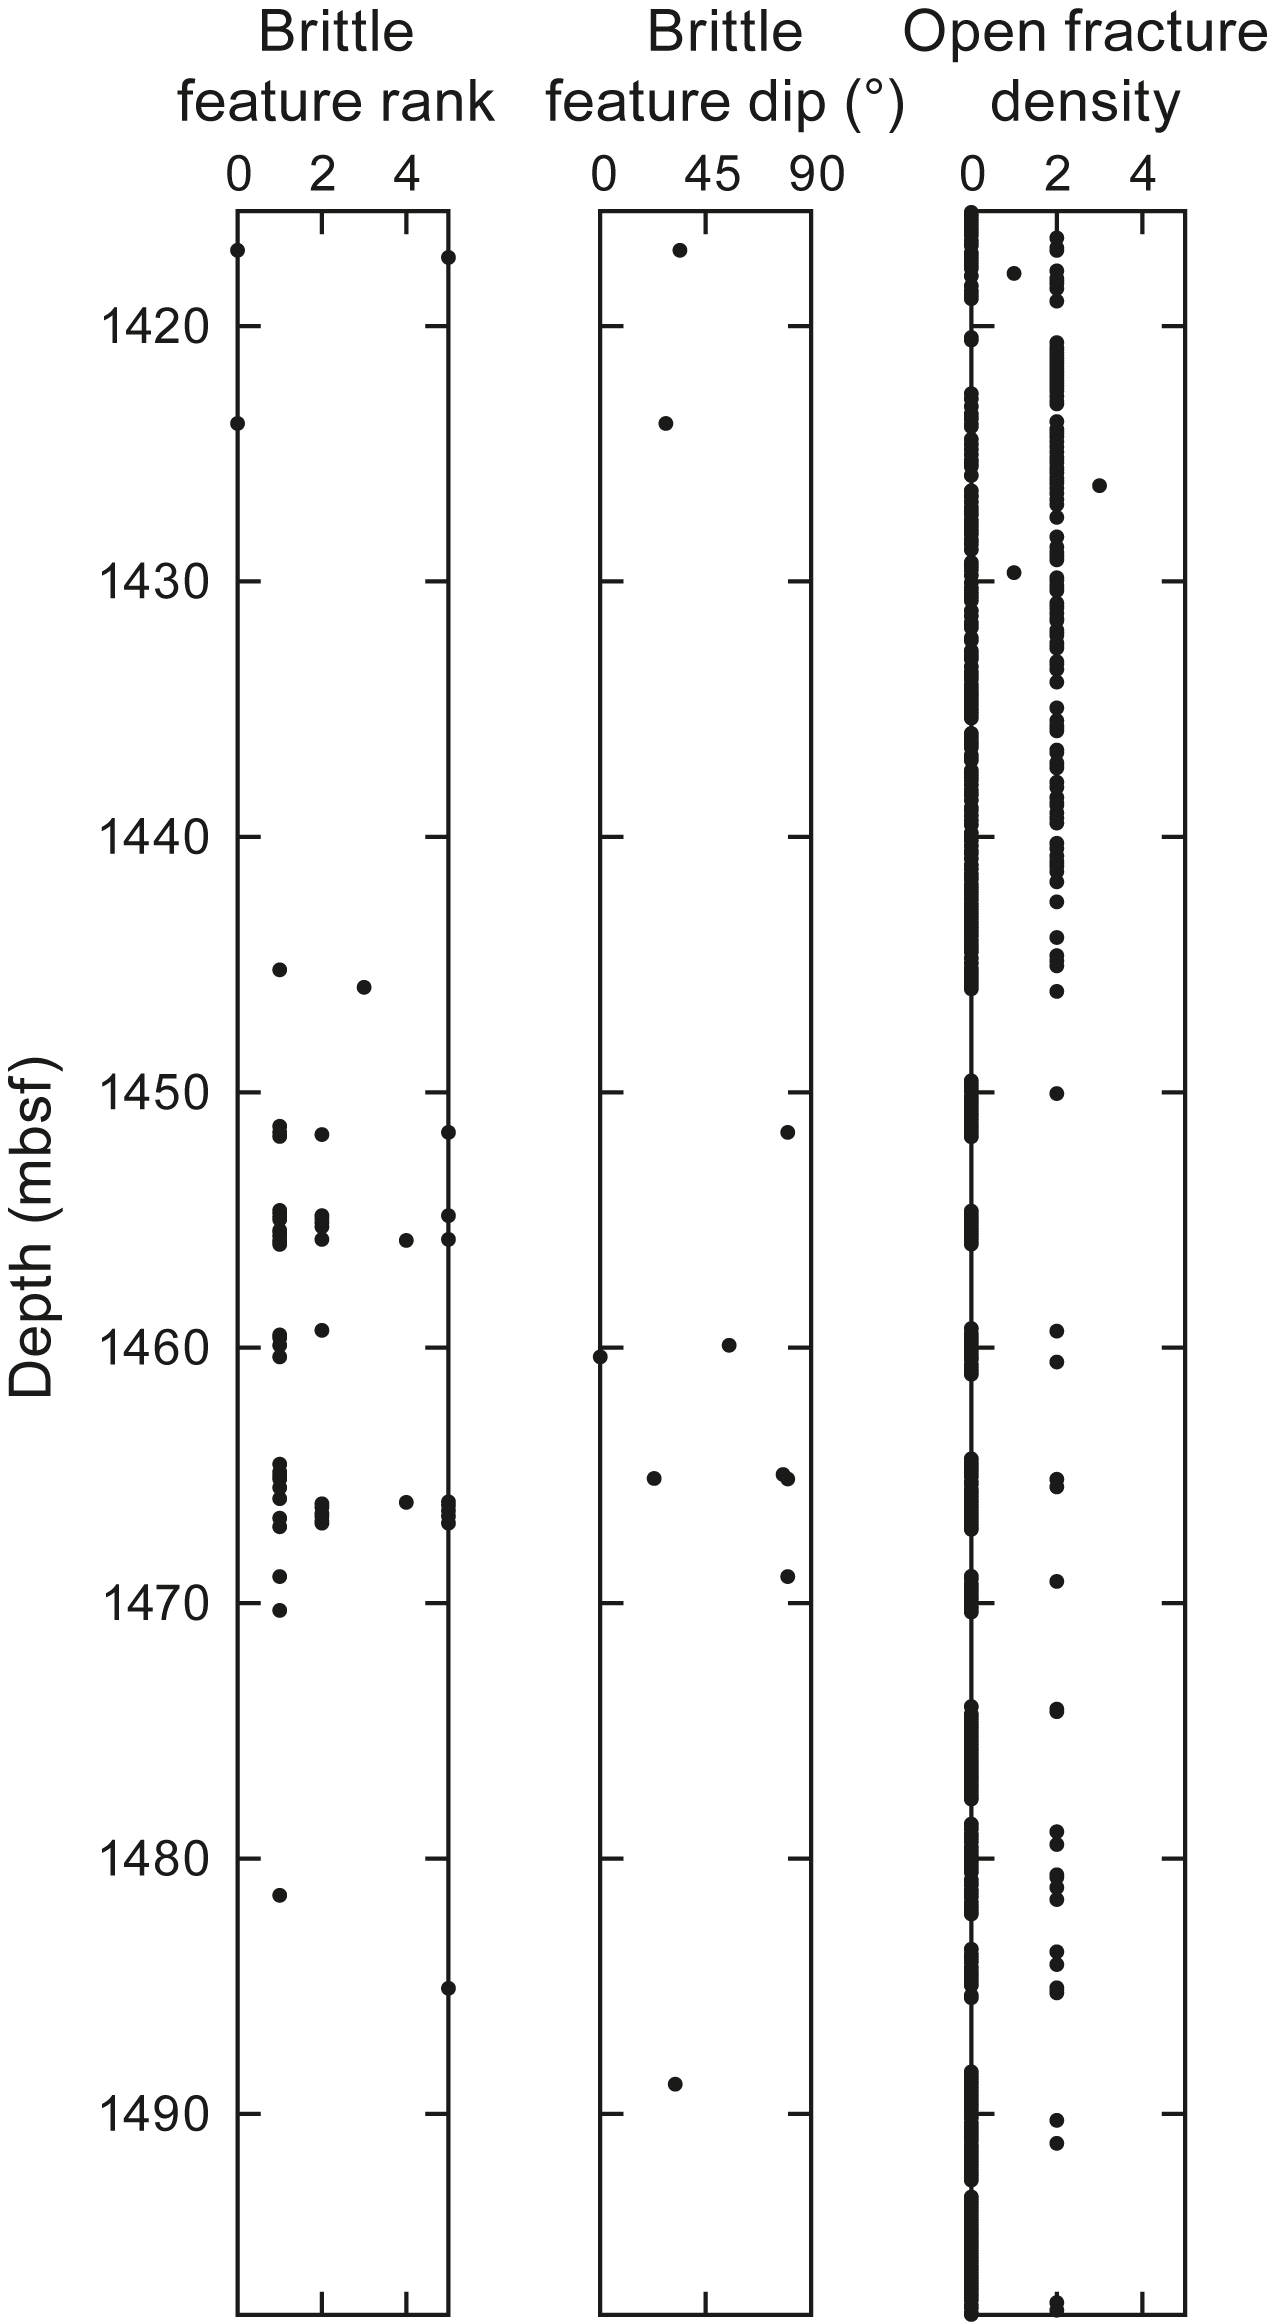
Figure F43. Intensity of brittle deformation.
Very low degrees of brittle deformation are displayed by gabbroic rocks that appear undeformed at the macro scale but can display a range of brittle deformation features at the micro scale. These include undulose extinction, bent grains, intragranular microcracks, and transgranular fractures, as well as crosscutting alteration veins. The degree of strain accommodated by this deformation is, however, very low to negligible.
Higher intensity brittle to semibrittle deformation is observed in Sections 399-U1309D-297R-2 through 297R-3, 298R-1, and 298R-3 (1416.9–1424 mbsf); 302R-2, 302R-4, 303R-1, and 304R-2 through 306R-1 (1441.1–1459.4 mbsf); 307R-1 through 308R-1 (1464.3–1469 mbsf); 310R-3 (1482.35–1483.19 mbsf); 311R-2 (1484.7–1485.5 mbsf); and 312R-1 (1488.3–1489.8 mbsf) and includes dense networks of cemented/healed fractures, brittle fault surfaces and microfaults, faulted/sheared veins, fault breccia, and cataclasite (Figures F43, F44). The distribution of deformation in these sections is spatially variable and defines two zones of high-intensity brittle to semibrittle deformation (i.e., semibrittle shear zones; Sections 304R-2 through 305R-1 [1451.51–1455.71 mbsf] and 307R-2 [1466.03–1466.57 mbsf]) between relatively undeformed intervals with only thin, isolated zones of deformation. Examples of the isolated deformation between zones of relatively undeformed gabbro are presented first, followed by the presentation of the highly deformed zones.
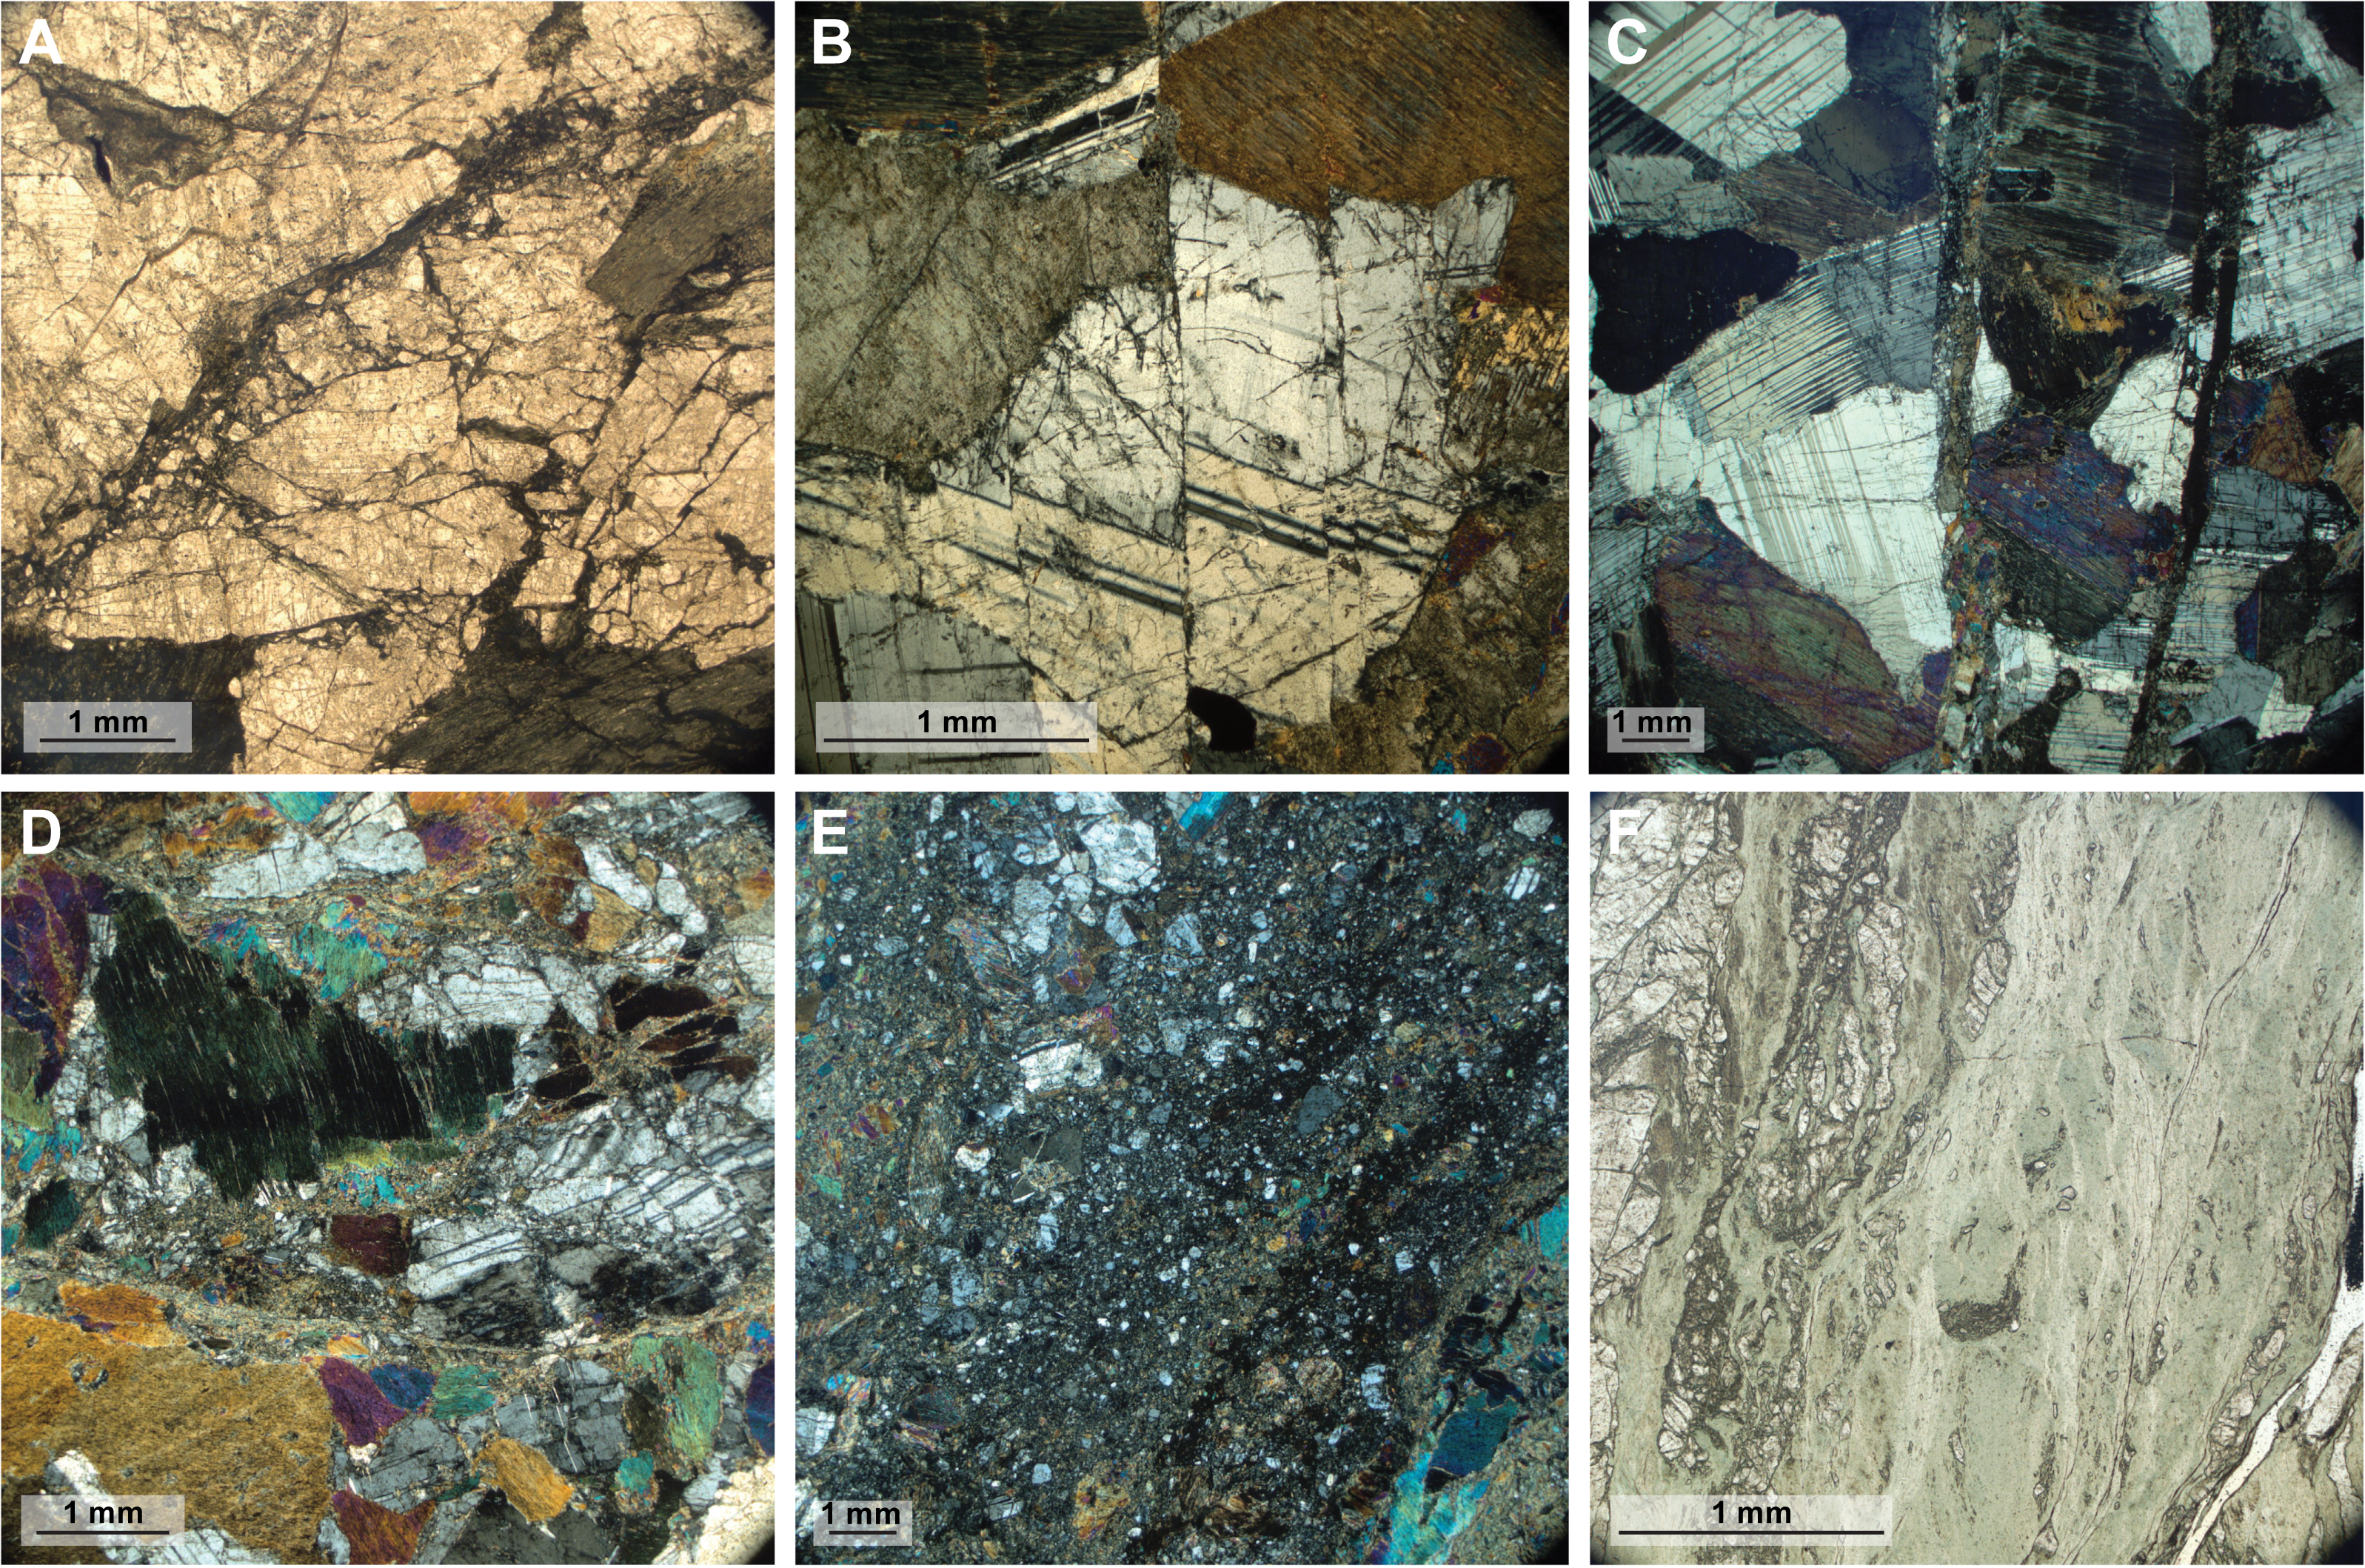
Figure F44. Brittle microstructures.
Sections 399-U1309D-297R-2, 298R-3, 303R-1, 310R-3, 311R-2, and 312R-1 display isolated occurrences of macroscopic brittle to semibrittle deformation in intervals <10 cm thick between relatively undeformed gabbroic rocks. These include thin intervals of microfaulting, fault breccia, and intervals of cataclasite. Fault surfaces exposed at the ends of core pieces (piece-end faults) in these intervals have shallow dips (28°–32°) and slickenfibers that plunge 10°–32° (shear sense undetermined). At the micro scale, brittle to semibrittle deformation in these cores appears to be more widespread based on microstructural deformation observed in Sections 297R-3, 302R-2, and 302R-4, which have no macroscopically reported deformation. In these examples, micro scale deformation is characterized by pervasive fracturing and microfaulting with millimeter scale offsets and to a lesser extent by fault breccia and localized millimeter to submillimeter thick zones of cataclasite to mylonitic shear zones (Figure F44A–F44C). The small scale and isolated spatial distribution of these macro scale and micro scale deformation features indicates that degree of strain localization in these cores is low.
Localized brittle to semibrittle deformation is observed continuously across two ~4–8 m wide zones in Hole U1309D, spanning Sections 304R-2 through 306R-1 (1451–1459 mbsf) and 307R-1 through 308R-1 (1465–1469 mbsf; Figure F43). In Sections 304R-2 through 306R-1, macroscopic deformation is characterized by widespread microfaulting and minor to moderate fracturing with localized cataclasite and fault breccia. In Sections 307R-1 through 308R-1, the intensity of deformation progresses downhole from microfaulting and minor fracturing in Section 307R-1 to microfaulting and moderate fracturing with a high concentration of cataclasite and fault breccia in Section 307R-2 to microfaulting and minor fracturing in Section 308R-1.
Microstructural observations from the zones of concentrated deformation (Sections 399-U1309D-304R-2 through 306R-1 and 307R-1 through 308R-1) highlight additional characteristics of semibrittle to brittle deformation (Figure F44D–F44F). Samples from these core sections show a pervasive background deformation characterized by microfaults with millimeter scale offsets and intense fracturing and brecciation. Microfaults are observed both localized along amphibole and/or chlorite veins and cutting straight across plagioclase and clinopyroxene grains. Plagioclase, pyroxene, and amphibole after pyroxene show moderate intracrystalline deformation, including undulose extinction, deformation twins, microcracks, subgrains, and bent grain shapes. Within this pervasive background deformation, the cracks, fractures, and subgrains can be observed disaggregating large plagioclase grains into smaller clasts of similar sizes to clasts within local fault breccia or cataclasite (Figure F44D). A common feature of this pervasive background deformation is the close association with alteration. In the absence of fault breccia or cataclasite, most fracture networks are filled with either amphibole or chlorite or both. In some cases, the surrounding grains of plagioclase and pyroxene are also altered to a mix of chlorite, amphibole, and/or prehnite. Typically, these fracture fills and replacement textures are undeformed (Figure F42C).
In addition to the pervasive background deformation associated with microfaulting and fracturing, macroscopic observations in Sections 399-U1309D-304R-2 through 306R-1 and 307R-1 through 308R-1 have visibly higher strain faults and shear zones with centimeter or larger offsets and 5–15 mm wide cataclastic or phyllonitic fault cores (Figure F44E, F44F). Microscopic observations indicate the cataclastic fault cores are typically matrix supported with 30%–40% clasts, a matrix grain size of <20 µm, and variable clast size between ~20 and 200 µm. Matrix compositions vary and are often segregated into irregular domains of plagioclase, amphibole, or plagioclase and amphibole. Similarly, clasts of plagioclase and amphibole or pyroxene are observed in both monomineralic and polymineralic domains of cataclasite, and the distribution is sometimes correlated with the composition of the fault core walls. In some cases, reworked clasts of preexisting fault breccia are observed within cataclasite. In general, cataclastic fabrics show no static overprint of alteration (Figure F44E). In a minority of thin sections, curvilinear zones of acicular amphibole ± chlorite with round clasts of amphibole could represent altered cataclasite, but additional evidence of deformation in these samples is lacking. Where present, cataclastic fabrics and fault breccia in Hole U1309D have been observed both cutting and being cut by chlorite veins and amphibole veins (Figure F41). In contrast, zeolite, calcite, and prehnite veins, where observed, are undeformed and always truncate cataclastic fabrics and fault breccia (Figure F41).
Intensely foliated fault cores are observed in sheared amphibole veins in a minority of thin sections from Sections 399-U1309D-304R-2, 305R-1, 306R-1, and 312R-1 (Figures F42, F44F). These cores have a matrix of aligned amphibole with a <50 µm grain size (where measurable) that may also contain larger clasts of amphibole and plagioclase. In Sample 306R-1, 114–117 cm (TS48), a phyllonitic amphibole vein is observed with aligned amphibole matrix grains and ribbons of cataclastic plagioclase, which form an S-C fabric (Figure F44F).
Because of low recovery and the limited number of oriented pieces of deformed core recovered in Hole U1309D between ~1420 and 1474 mbsf, only three measurements of shear sense were made (subhorizontal to steeply dipping) reverse sense motion. These include a macroscopically identified reverse sense S-C fabric in Section 307R-1 (1465.1 mbsf) and microstructurally identified cataclastic and phyllonitic shear zones in Sections 298R-3 and 306R-1 (1423.8 and 1460.3 mbsf, respectively), which include sheared chlorite and amphibole.
Based on the continuity and intensity of semibrittle to brittle deformation structures in Sections 399-U1309D-304R-2 through 306R-1 (1451–1460 mbsf) and 307R-1 through 308R-1 (1464–1474 mbsf), we interpret these zones to be related strands of a 23 m thick semibrittle shear zone between 1451 and 1474 mbsf (Figure F45). This is consistent with a low core recovery from these depths, typical of brittle to semibrittle shear zones. The conditions and rheology of this shear zone is considered further in our discussion below.
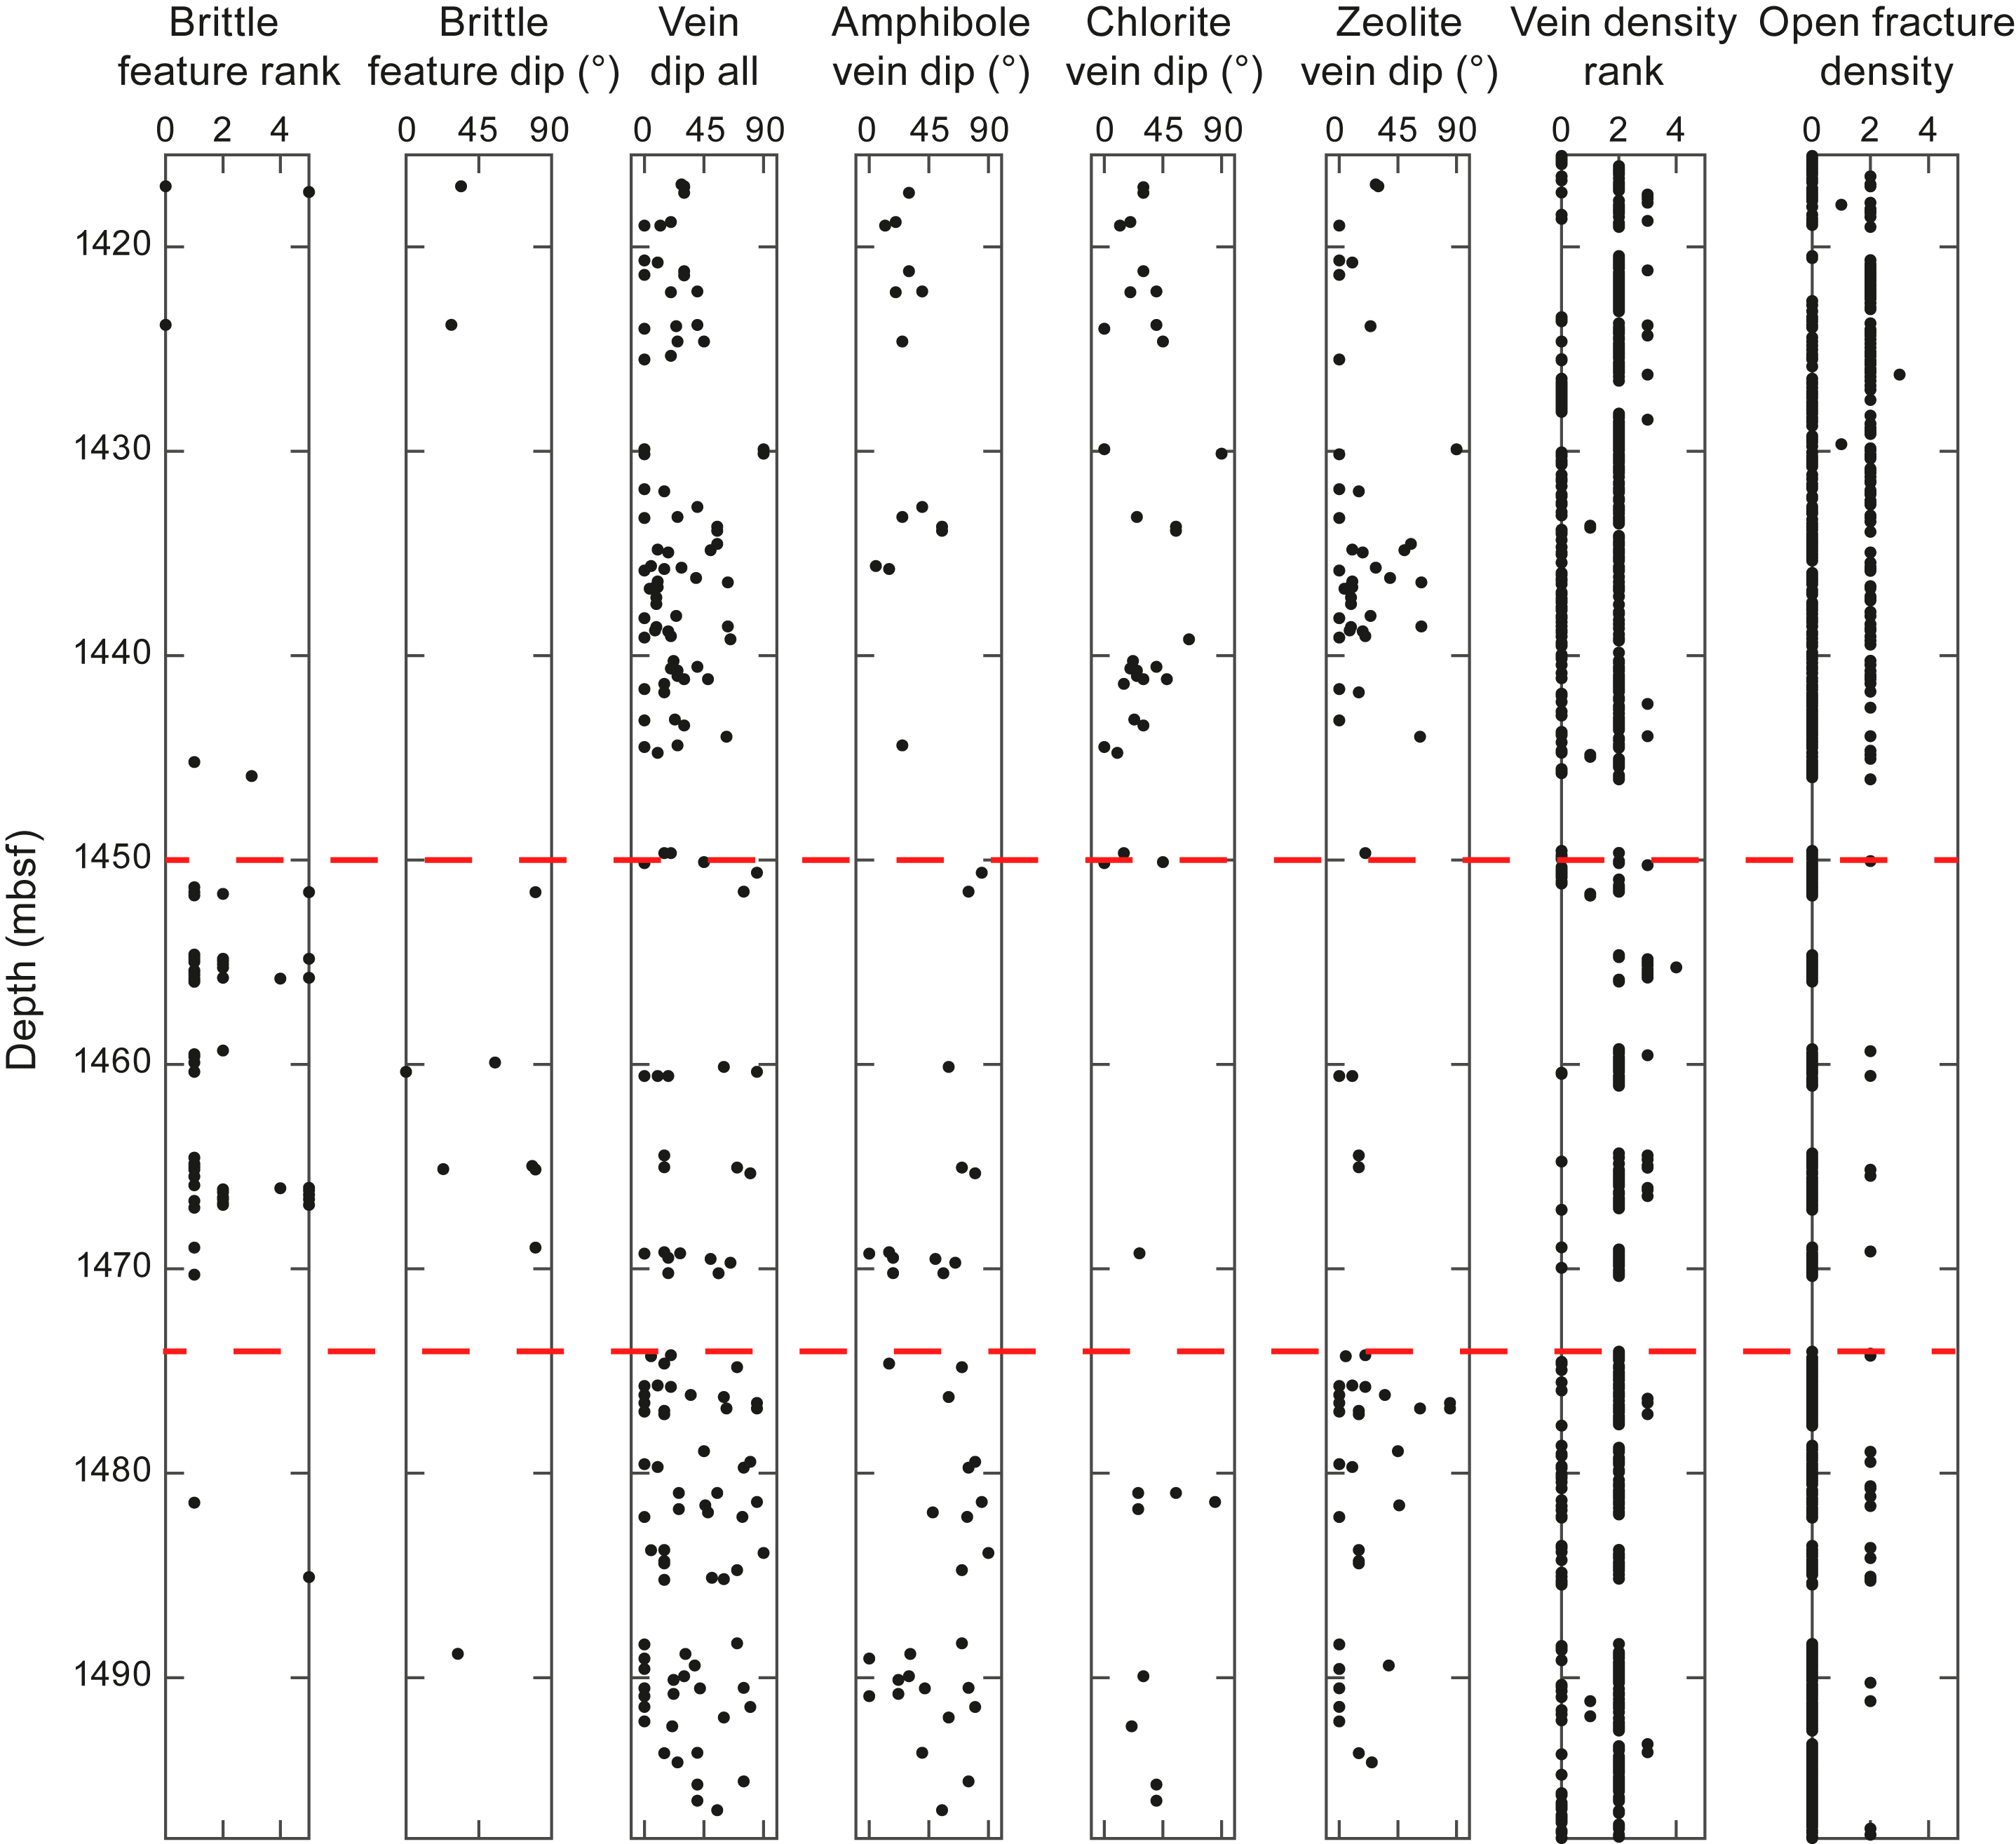
Figure F45. Brittle deformation and veins.
5.6. Discussion
Core recovered from renewed drilling during Expedition 399 in Hole U1309D provides new information on the magmatic construction of slow-spread ocean crust and deformation history of that crust in the footwall to a large-slip oceanic detachment system.
5.6.1. Conditions of brittle and semibrittle deformation in Hole U1309D
The observed semibrittle to brittle deformation clearly occurred well below the crystallization temperatures of gabbroic rocks (sensu lato; ~800°–1100°C), indicating that magmatic intrusion was followed by a period of cooling without deformation at these structural depths. Brittle fracturing and faulting and semibrittle cataclastic and phyllonitic deformation likely reflects a mix of seismic and aseismic deformation associated with plate spreading. Observations of localized subgrain development and grain boundary bulging dynamic recrystallization textures in plagioclase in recovered fault rocks from Hole U1309D suggest that deformation conditions straddled the brittle–ductile transition of plagioclase. This is supported by development of phyllonitic and cataclastic shear zones comprising deformed tremolite-actinolite and chlorite and the presence of deformed and undeformed amphibole and chlorite veins, indicative of deformation during greenschist facies conditions.
Deformation fabrics in core from Hole U1309D are cut by undeformed zeolite, prehnite, and calcite veins and locally by unaltered, undeformed diabase intrusions with chilled margins, suggesting that deformation did not continue below greenschist facies conditions. This does not rule out the possibility that lower temperature deformation was recorded by rocks in unrecovered sections, which account for ~70% of the estimated width of the shear zone. However, the undeformed, static nature of low-temperature zeolite and chlorite-prehnite alteration overprints in the recovered sections does not support this hypothesis.
5.6.2. A subdetachment, semibrittle shear zone in Hole U1309D
The high concentration of deformation reported for Cores 399-U1309D-304R through 308R corresponds to a ≳23 m thick semibrittle shear zone between 1451 and 1474 mbsf (Figure F45). Deformation took place at greenschist facies conditions coeval with a phase of amphibole-chlorite veining and alteration. The mix of brittle and semibrittle deformation fabrics recovered near the bottom of Hole U1309D suggests that this shear zone accommodated some degree of seismic and aseismic deformation. Shear sense indicators suggest a reverse sense of shear along what are now gently dipping (10°–30°) shear planes. Core recovery from this shear zone is low (30%), with 7 m of core collected from the 23 m interval. We suspect that low recovery in this interval is due to the fractured, mechanically weak nature of the shear zone.
Previous reports of deformation in Hole U1309D observed in cores collected during Expedition 304/305 indicate a general absence of both brittle and ductile deformation. Very low strain crystal-plastic deformation without foliation development was reported from macroscopically undeformed gabbroic section with isotropic magmatic fabrics (Expedition 304/305 Scientists, 2006b), as reported here. Discrete submeter scale protomylonitic to mylonitic shear zones were rarely observed, accounting for <3% of the cores recovered between 0 and 1415 mbsf (Expedition 304/305 Scientists, 2006b). The uppermost 300 m of Hole U1309D displayed cataclastic and ultracataclastic deformation, which may represent the damage zone associated with the detachment fault (e.g., figure F182 in Expedition 304/305 Scientists, 2006b). Concentrated brittle deformation below 300 mbsf in Hole U1309D was rare, with occurrences reported at ~695, 720–780, and 1107 mbsf, where intervals of fault gouge less than a few tens of centimeters thick were recovered (Expedition 304/305 Scientists, 2006b; Blackman et al., 2011; Michibayashi et al., 2008). Consequently, our observation of a concentrated semibrittle shear zone at 1451–1469 mbsf (Figure F45) is unprecedented for Hole U1309D. It is unclear whether the observed semibrittle shear zone is structurally linked to the detachment fault (i.e., a splay) or is structurally distinct from the detachment fault and instead related to internal deformation of the footwall. Given the paucity of deformation between the detachment surface at seafloor and the semibrittle shear zone at ~1450–1475 mbsf, we consider the latter hypothesis more likely. Previous analyses of brittle deformation in Hole U1309D from the detachment fault and at 746–751 mbsf argued that brittle deformation took place at amphibolite facies conditions and is therefore related to the higher temperature structural evolution of Atlantis Massif (e.g., Michibayashi et al., 2008; McCaig and Harris, 2012). In contrast, our observations of semibrittle deformation at 1451–1469 mbsf are clearly restricted to greenschist facies pressure-temperature conditions based on the syntectonic relationships between cataclastic and phyllonitic fabrics with deformed and undeformed amphibole-chlorite veins. The occurrence of diabase intrusions with chilled margins that cut greenschist facies cataclastic fabrics also indicates that magmatism at Atlantis Massif continued after significant cooling and likely denudation of Atlantis Massif. Collectively our observations from Cores 399-U1309D-297R through 313R (1415–1498 mbsf) indicate that the structural and magmatic evolution of the Atlantis Massif oceanic core complex continued through lower temperatures beyond its main phase of deformation, magmatism, and cooling through hypersolidus to amphibolite facies conditions.
6. Geochemistry
Shipboard geochemical analyses were performed on fluids and rocks recovered in Hole U1309D. A total of 2 samples of deep seawater and 10 borehole fluids from Hole U1309D were analyzed for pH, alkalinity, volatile content, and inorganic chemical composition. Analyses of major and trace element concentrations and of total carbon and hydrogen contents were conducted on 29 rock samples selected for geochemical and microbiology studies. The analytical procedures are described in Geochemistry in the Expedition 399 methods chapter (Lang et al., 2025).
6.1. Fluid geochemistry
6.1.1. Borehole and Niskin water samples
The last significant operations in the Hole U1309D prior to Expedition 399 occurred during Expedition 305 on 23 February 2005. At that time, the borehole was flushed with fresh, nonpotable water to improve logging results prior to deploying downhole sensors (Expedition 304/305 Scientists, 2006b). The borehole was logged a second time during Expedition 340T in 2011, but there is no indication that the borehole was flushed with water as part of those operations (Expedition 340T Scientists, 2012). The fluids collected during Expedition 399 therefore had 18.2 y to equilibrate and be modified prior to sampling.
The MTFS was deployed first, followed by three lowerings of the KFTS. Both samplers returned with substantial solid material (fines, small pieces of rock, rust, and grease) that prevented triggering and/or valve closing, leading to incomplete fluid recovery. The presence of material in borehole samplers was observed previously in multiple lowerings of borehole samplers in Deep Sea Drilling Project (DSDP) Hole 504B. This was a direct result of insufficient flushing of the borehole after drilling operations ceased (Gieskes et al., 1986; Shipboard Scientific Party, 1993). Typically, a mud sweep is undertaken to remove cuttings followed by a surface seawater flush of 1.5 times the volume of the borehole. When ~7 times the hole volume is used to flush the borehole, there are no particles during subsequent sample collections. Material found in Hole 504B included drilling mud, rusty colored iron oxide flakes, amorphous material, shiny steel metal shavings, foraminifera, anhydrite, and diabase and gabbro from above, and the samplers and material from the borehole smelled of petroleum (Shipboard Scientific Party, 1992). Similar material (except for the foraminifera and metal shavings) were found in Hole U1309D in the samplers and in the junk basket that occurred immediately after fluid sampling. Borehole particles and material were collected on the MTFS unions and sample pistons. For the latter, particles entered the opening where the trigger is located and down through the small holes in the trigger platform. Given that many of the samplers had a partial stroke, this suggests that the material entered prior to the depth (temperature) at activation, but it does not preclude continued deposition during further descent or ascent. Note that this material was not from the fill at the bottom of the hole because the temperature tool is more than 3 m long and at most an additional meter of wire was released after the release of weight on the wireline. Future lowerings of the MTFS will require a screen that will allow water to leave the trigger area in response to plunger movement yet keep particles out.
Solid material collected in the MTFS and KFTS included sepiolite, anhydrite, amorphous minerals, flakes of iron oxide, and materials that were coated with a fine grease. Sepiolite was used as a drilling mud to clear cuttings from the borehole and was not sufficiently displaced after Expedition 304/305. Similar conditions were observed in Hole 504B when the standard 1.5 times the volume of the borehole was used to flush the borehole after drilling (Gieskes et al., 1986; Shipboard Scientific Party, 1993). The junk basket that was deployed immediately after the second KFTS lowering included greater than centimeter-sized pieces of anhydrite and volcanic rock consistent with drilled sections above. In addition, particles from Hole U1309D effervesced the smell of hydrogen sulfide when dilute HCl was applied.
The chemical composition of water samples from the MTFS, KFTS, and Niskin samplers are provided in Tables T8 and T9. A subset of these data was used to highlight collection issues and processes that occurred within the borehole. Sulfate (SO42−) and calcium (Ca) concentrations in borehole water are shown for all samples to highlight issues with the samplers (Figure F46). The KFTS samples are considered the highest quality samples even though the top valve did not close on the deepest sample during the second lowering. Of the 11 MTFS sample units, 4 of them collected more than 90 mL and are considered high quality. Four of the MTFS sample units collected <33 mL and are considered unusable, but they highlight two important aspects of the sampling procedure. Lastly, one sample unit was collected with a spring-based SMA trigger; however, this unit triggered somewhere during descent. The only other spring-based trigger collected 179 mL of seawater, probably a result of rattling the trigger system loose while in the drill string, allowing the plunger to be released prematurely. The remaining two MTFS sample units were set to deploy at temperatures of approximately 140°C but did not break the bolt to release the spring (Table T3).
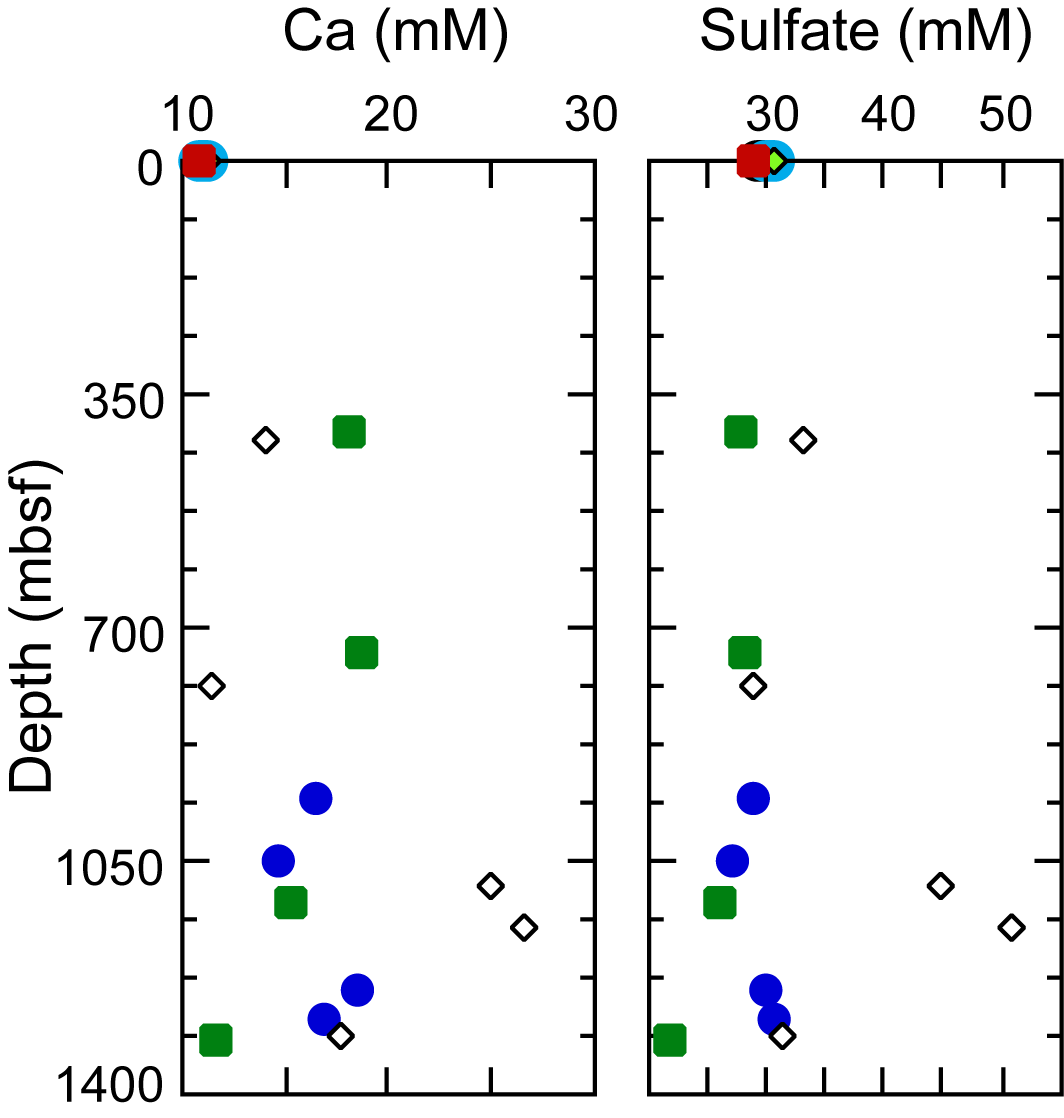
Figure F46. Fluid Ca and sulfate concentrations.
A second issue with the MTFS sample units, especially the low-volume sample units, is the effect of reaction on sampled waters during ascent and prior to filtration and acidification. The reacted material is likely the sepiolite, anhydrite, amorphous minerals, and flakes of iron oxide that formed a layer about 1 cm thick above the piston within the MTFS. This layer was sufficient to provide enough resistance to stop the piston from advancing in all of the sample units. Within the sampler, reactions occurred as demonstrated by the two low-volume samples that have high Ca and sulfate, consistent with the dissolution of anhydrite during sample recovery (Figure F46). Anhydrite is observed as small rocks (2 cm in width) that were collected in the junk basket and within the fine mud that was interspersed with sepiolite and other materials in the sampler. As a result of these reactions, we consider the four KFTS samples, two MTFS samples (960 and 1060 mbsf), and two reaction-corrected (when possible) MTFS samples (1280 and 1360 mbsf) the best quality samples. This result is consistent with previous success rates of retrieving borehole water samples attempted during DSDP and ODP operations (about 50%) (Shipboard Scientific Party, 1993).
Using the good quality data, concentrations of many of the major cations in seawater increase or decrease with depth to 400 mbsf, remain uniform to 750 mbsf, and then return toward the seawater value (Figure F47). In contrast, concentrations of sulfate are uniform with depth except for the deepest sample, which has a lower concentration. Concentrations of other trace solutes (e.g., lithium [Li] and ammonium [NH4+]) generally increase with depth and are indicative of contamination with grease and drilling mud (e.g., Mottl et al., 1983; Shipboard Scientific Party, 1992). The fluids did not smell of hydrogen sulfide.
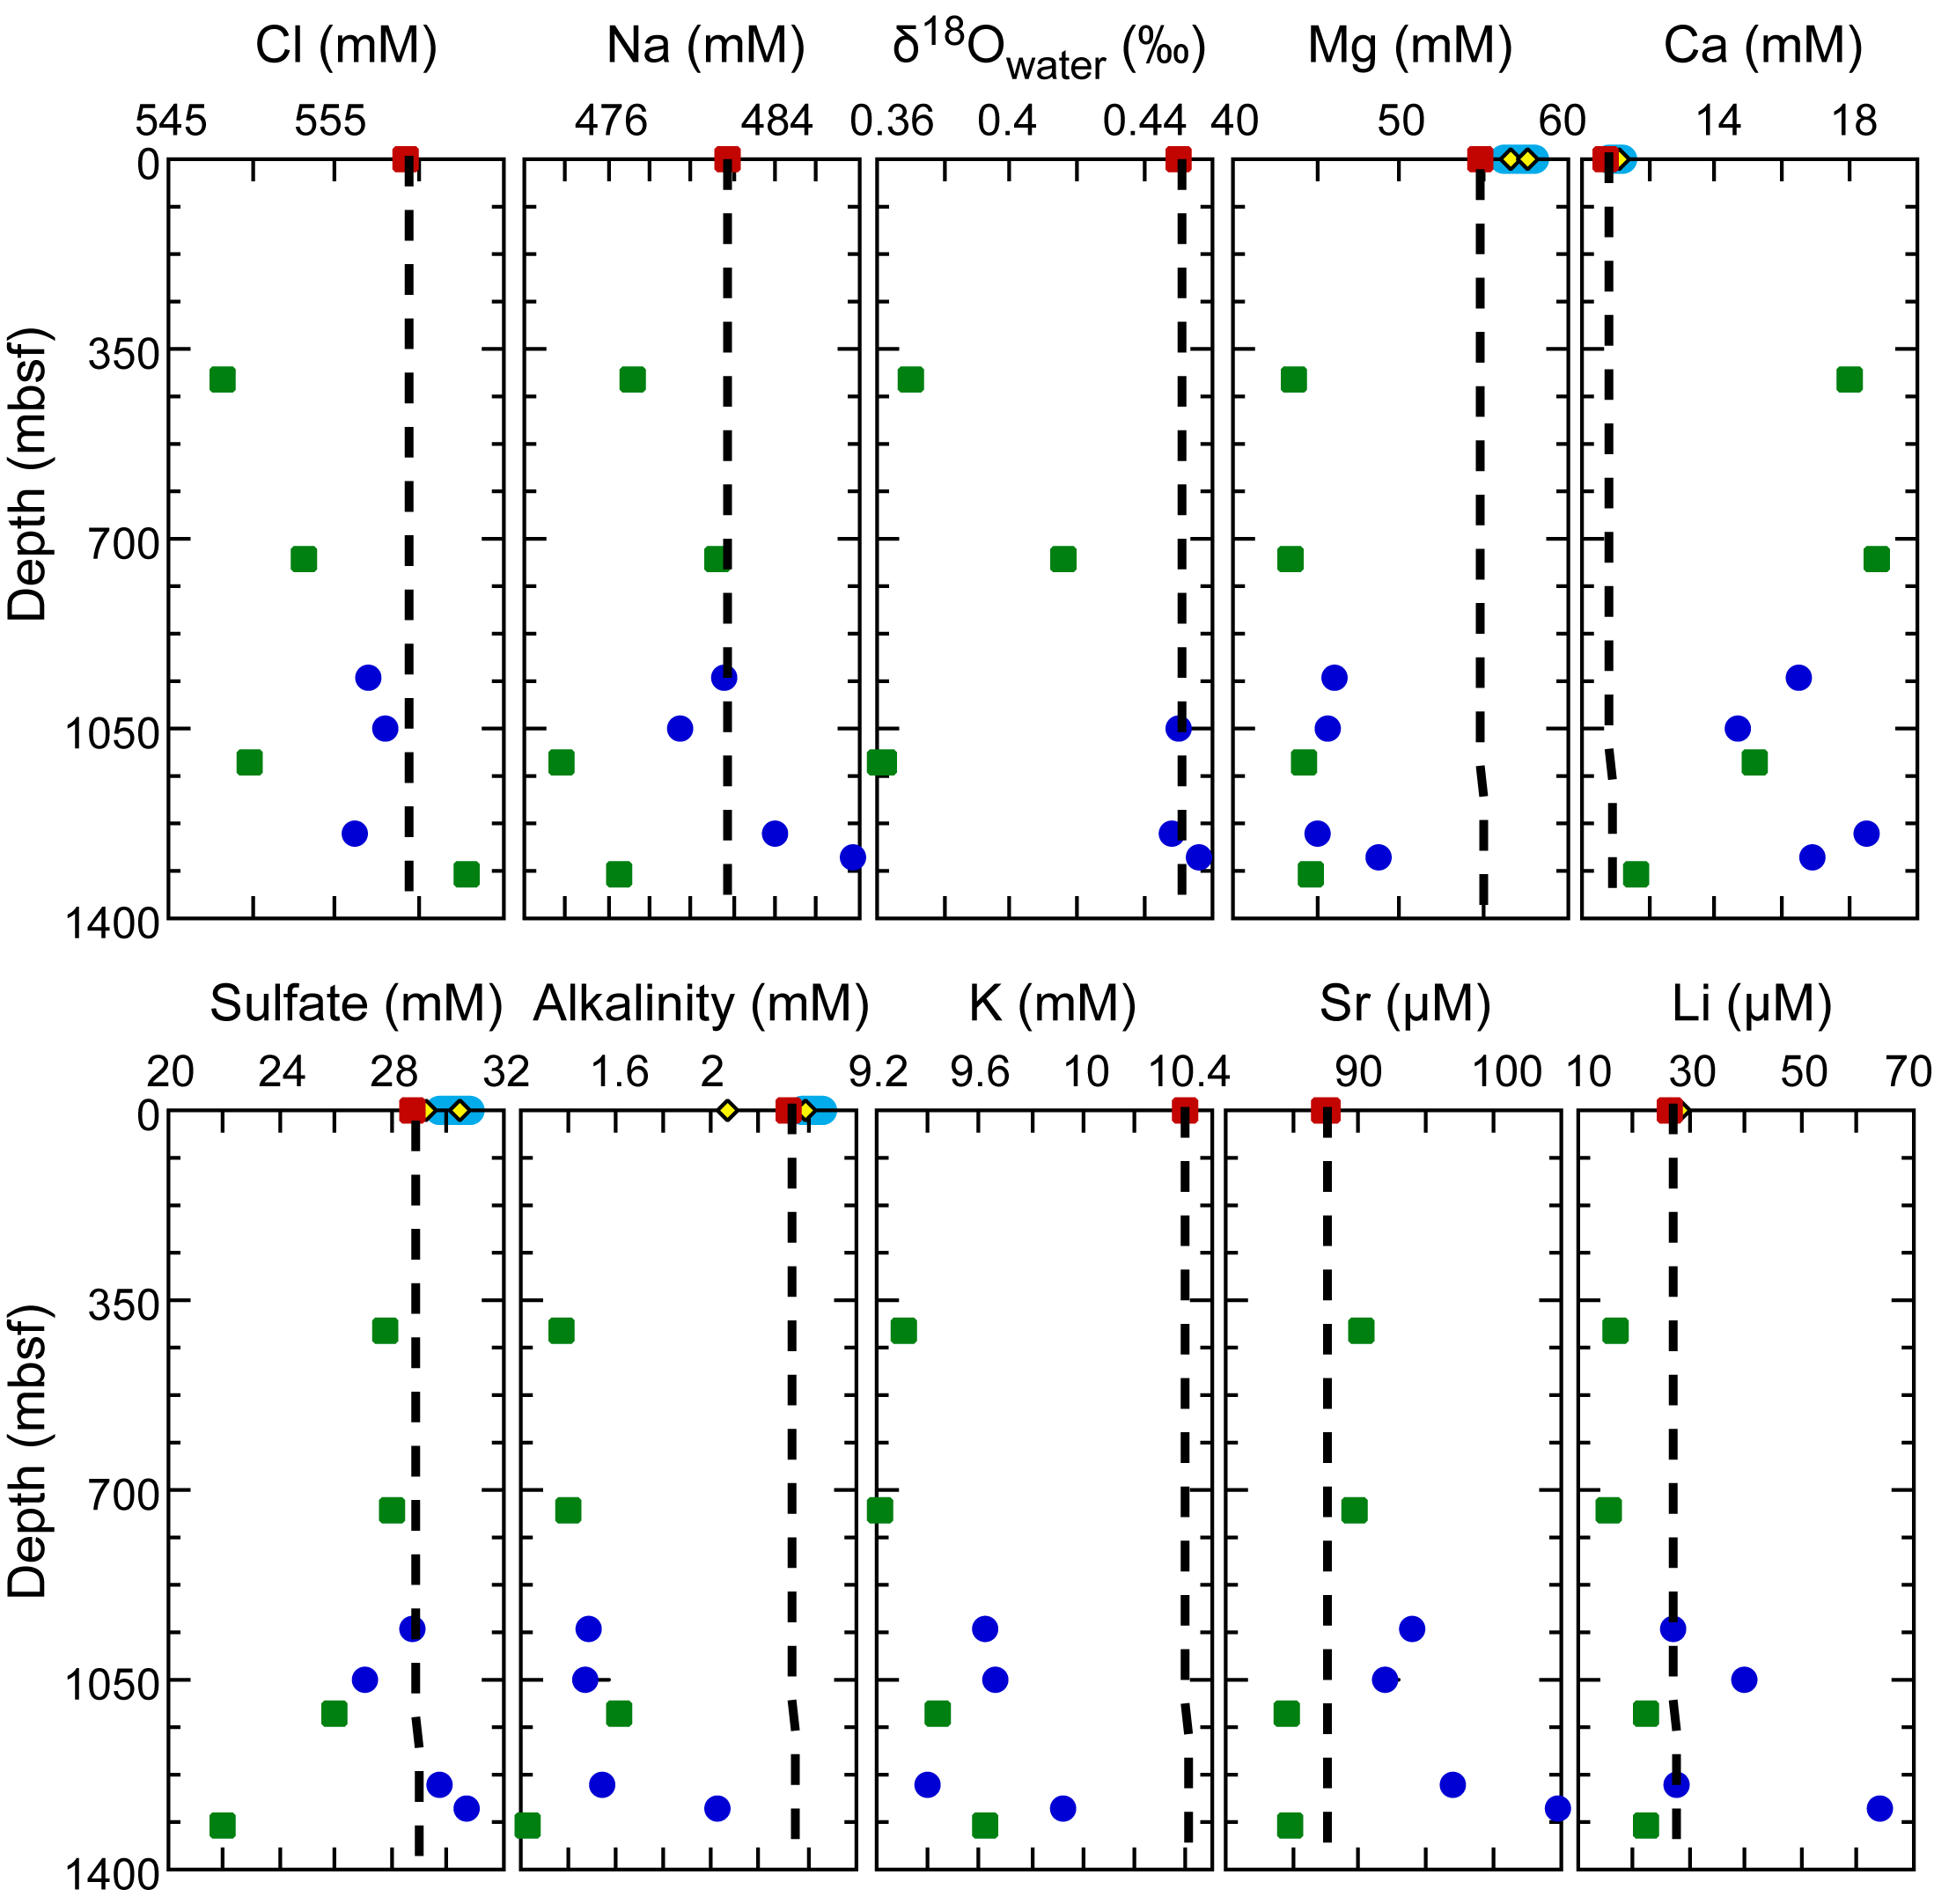
Figure F47. Fluid geochemistry prior to drilling operations.
The shapes of these profiles are consistent with mixing among three end-members (listed as a function of depth): seawater, formation water, and a reacted water from the base of the fill. The latter is consistent with conclusions reached from Hole 504B, where reactions must occur at the base of the borehole and not along borehole walls (Magenheim and Gieskes, 1996). Further, because of convection within the borehole, one typically gets a linear mixing relationship between the composition of this water and seawater. In contrast to Hole 504B, chemical data from borehole waters in Hole U1309D are consistent with these two sources mixing with an additional third source, formation water. This composition of the third fluid is consistent with typical ridge flank fluids in the range of 50°–70°C (Wheat et al., 2022).
During drilling operations, Hole U1309D was flushed with surface seawater and drilling mud to flush cuttings from the borehole. Once drilling operations ceased, there was no additional flushing with surface seawater. The hole was reentered 33 days later for three deployments of the KFTS assemblage (Table T8; Figure F48). Solutes that are slow to react in this setting (Cl and Na) show concentrations at the base of the borehole that are similar to surface seawater concentrations. At depths shallower than 600 mbsf, the concentrations of these solutes generally fall along a mixing line with deep seawater, indicating replacement and overturning is occurring at the top of the borehole. Below 600 mbsf, concentrations of Ca increase but Mg and alkalinity decrease. These features could indicate intrusion of formation fluids and/or reactions with rubble at the base of the borehole.
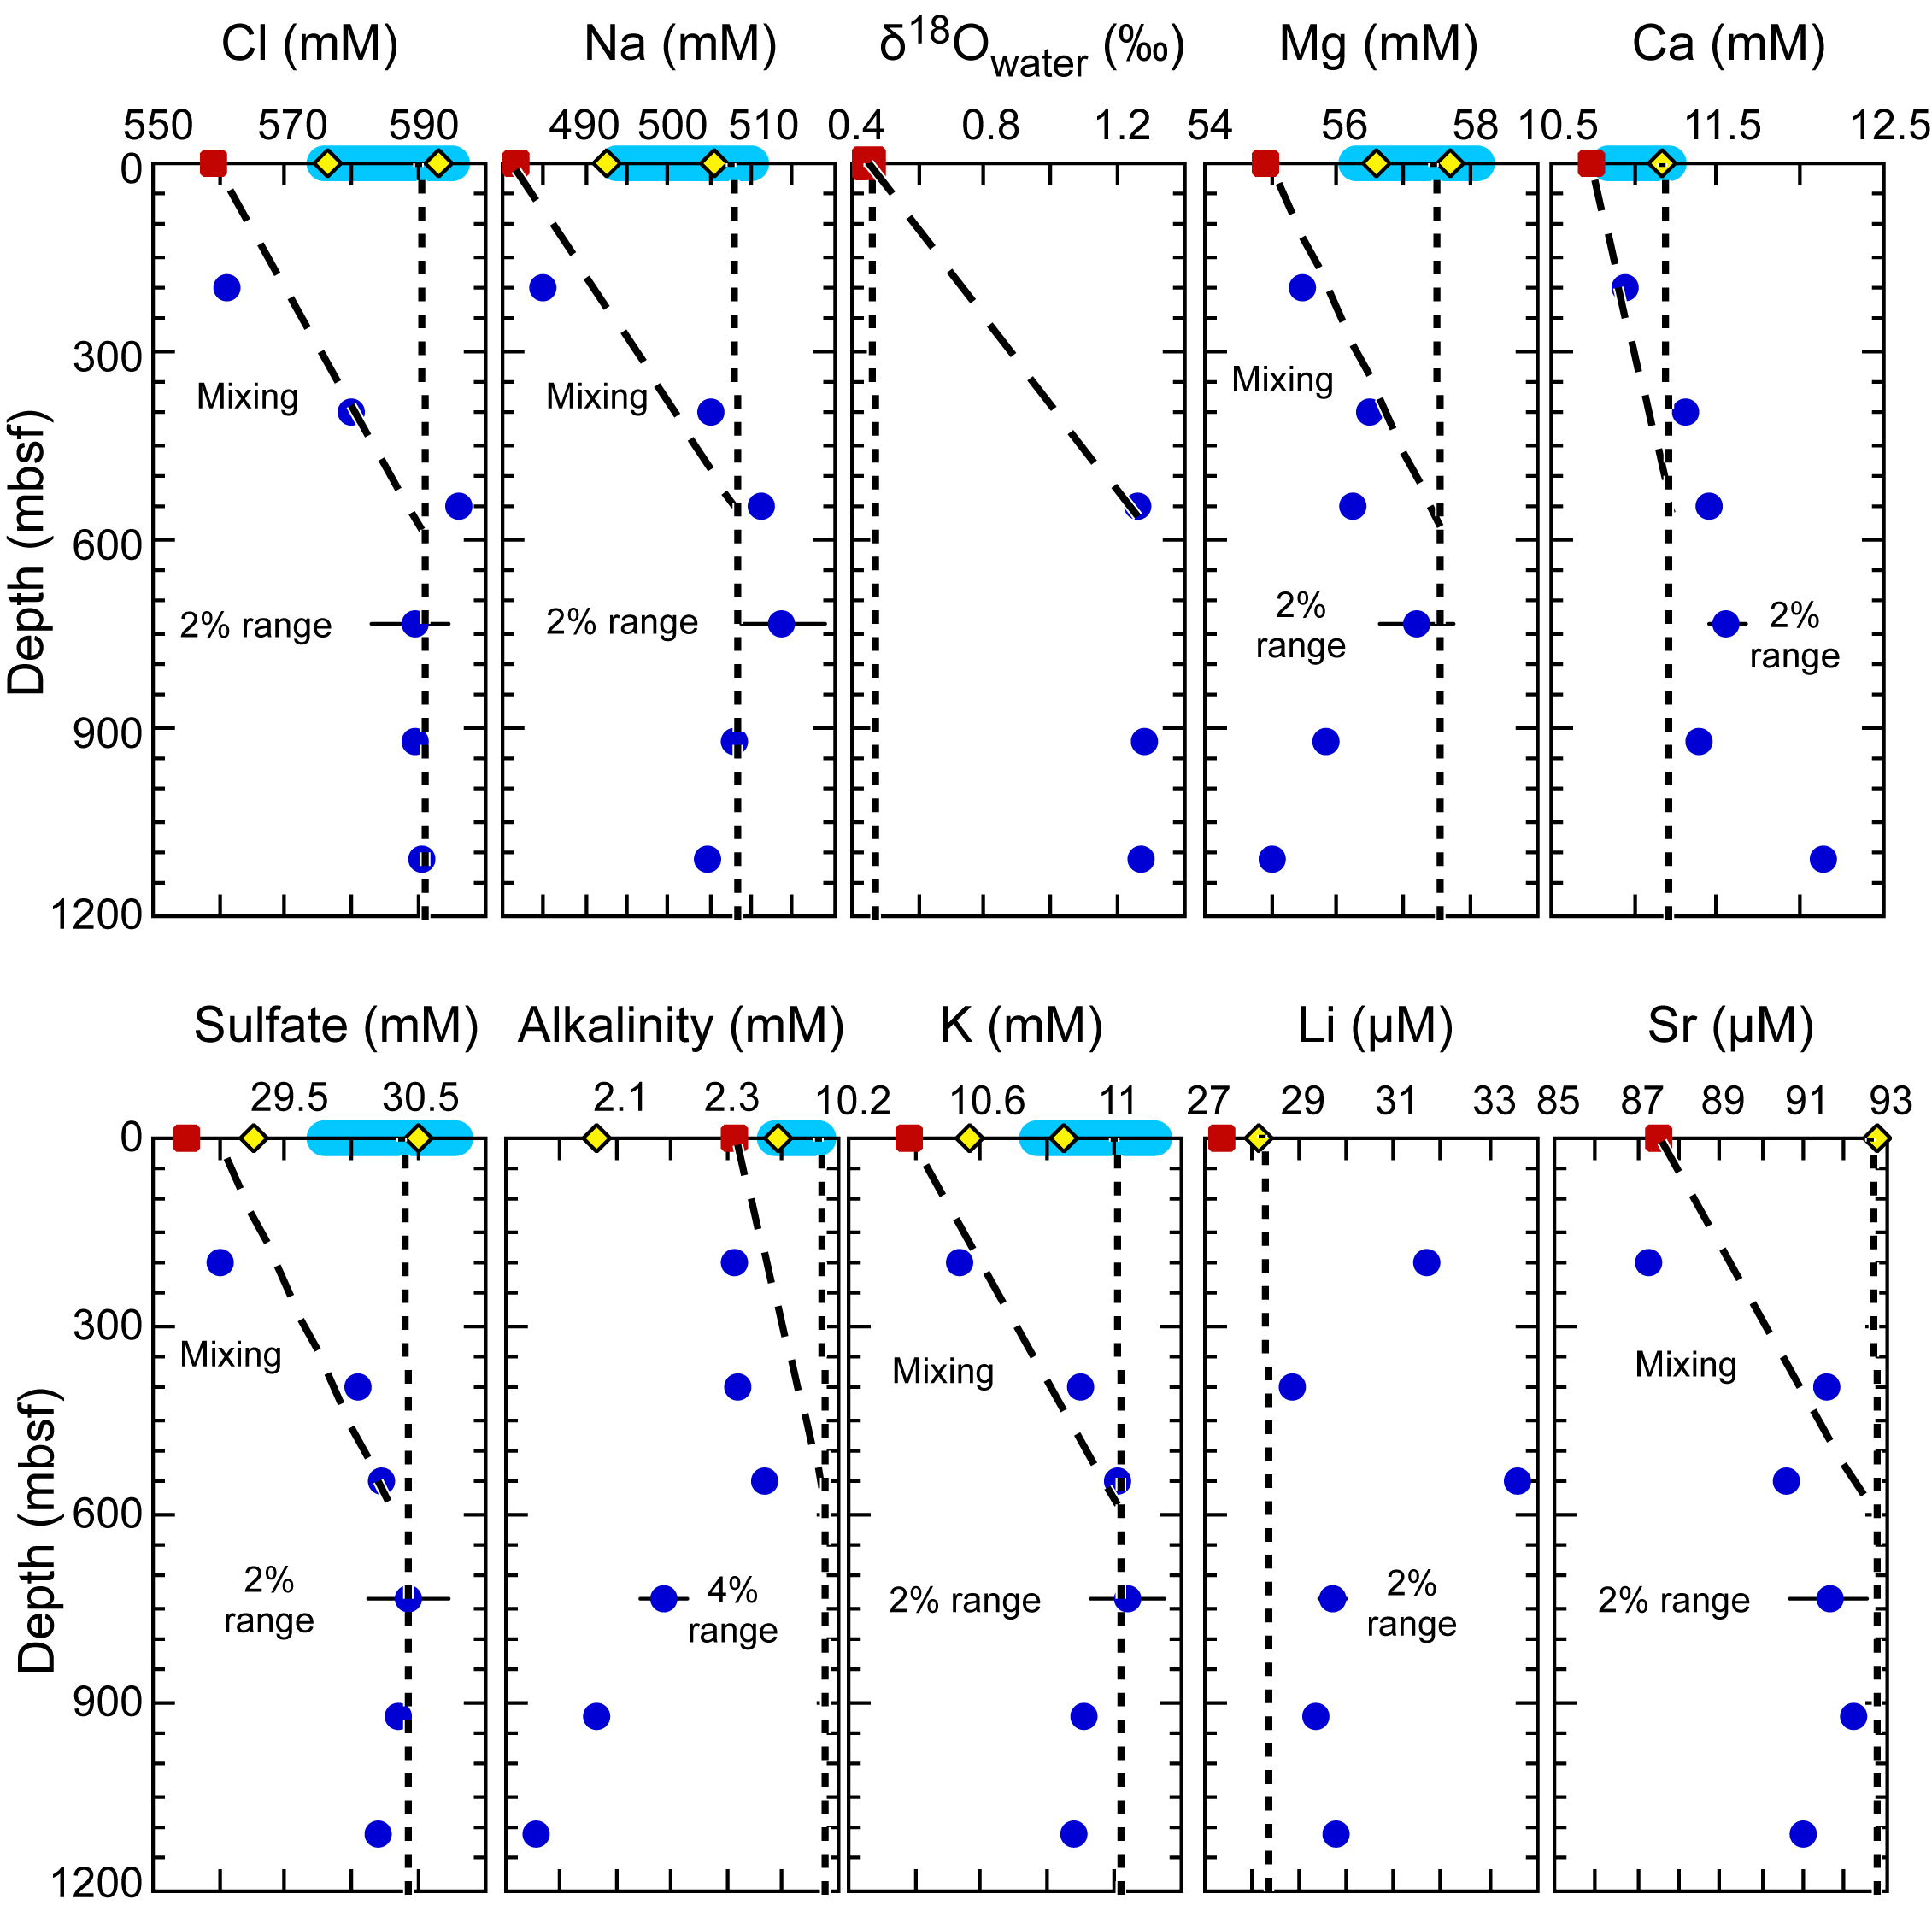
Figure F48. Fluid geochemistry after drilling operations.
6.2. Igneous and metamorphic rock geochemistry
Whole rock chemical analyses were performed on 29 samples representative of the different lithologic units recovered from Hole U1309D during Expedition 399 for geochemical and microbiological studies (see Igneous petrology for unit demarcations). The mineralogy of the rock samples selected for geochemistry was evaluated using XRD, and a thin section was located next to each sample to precisely determine its modal composition and degree of alteration (see Igneous petrology and Alteration petrology). An aliquot of all rocks samples selected for microbiology was set aside for mineralogical characterization using XRD and geochemical analyses.
Predominantly gabbroic rocks were collected from Hole U1309D (see macroscopic description in Igneous petrology). The 20 geochemistry samples comprised 1 diabase, 1 leucodiorite, 3 olivine gabbros, and 15 gabbros (including 10 olivine-bearing gabbros). The 9 microbiology samples comprised 1 olivine gabbro and 8 olivine-bearing gabbros.
The 29 samples were analyzed for major and trace element concentrations using inductively coupled plasma–atomic emission spectroscopy (ICP-AES) and for their volatile element concentrations using gas chromatographic separation (CO2 and H2O). The analytical procedures, precision, and accuracy of the methods are described in detail in Geochemistry in the Expedition 399 methods chapter (Lang et al., 2025). The chemical compositions of samples collected for geochemistry and microbiology studies are reported in Tables T10 and T11, respectively.
6.2.1. Loss on ignition, H2O, and CO2
The total carbon and hydrogen concentrations of geochemistry samples were measured on nonignited powder splits of ICP-AES samples, except for leucodiorite Sample 399-U1309D-302R-3, 126–128 cm, which was too small to undergo the loss on ignition (LOI) procedure. The total carbon and hydrogen measurements were conducted on powders that were heated for 12 h at 110°C for geochemistry samples and freeze-dried for 24 h for microbiology samples to eliminate pore and surface water from the samples. Thereafter, the total carbon and hydrogen concentrations are recalculated as H2O and CO2 to provide direct information on the contribution of the hydrous and carbon-bearing phases to the bulk rock volatile budget.
LOI values were correlated positively to the sum of H2O and CO2 concentrations obtained for Hole U1309D geochemistry diabase and gabbroic rocks (Figure F49), although they were systematically lower (LOI = 0.01–1.08 wt%; H2O + CO2 = 0.49–1.30 wt%). This difference is accounted for by the increase of sample mass due to the oxidation of the ferrous iron during sample ignition (see Geochemistry in the Expedition 399 methods chapter [Lang et al., 2025]).
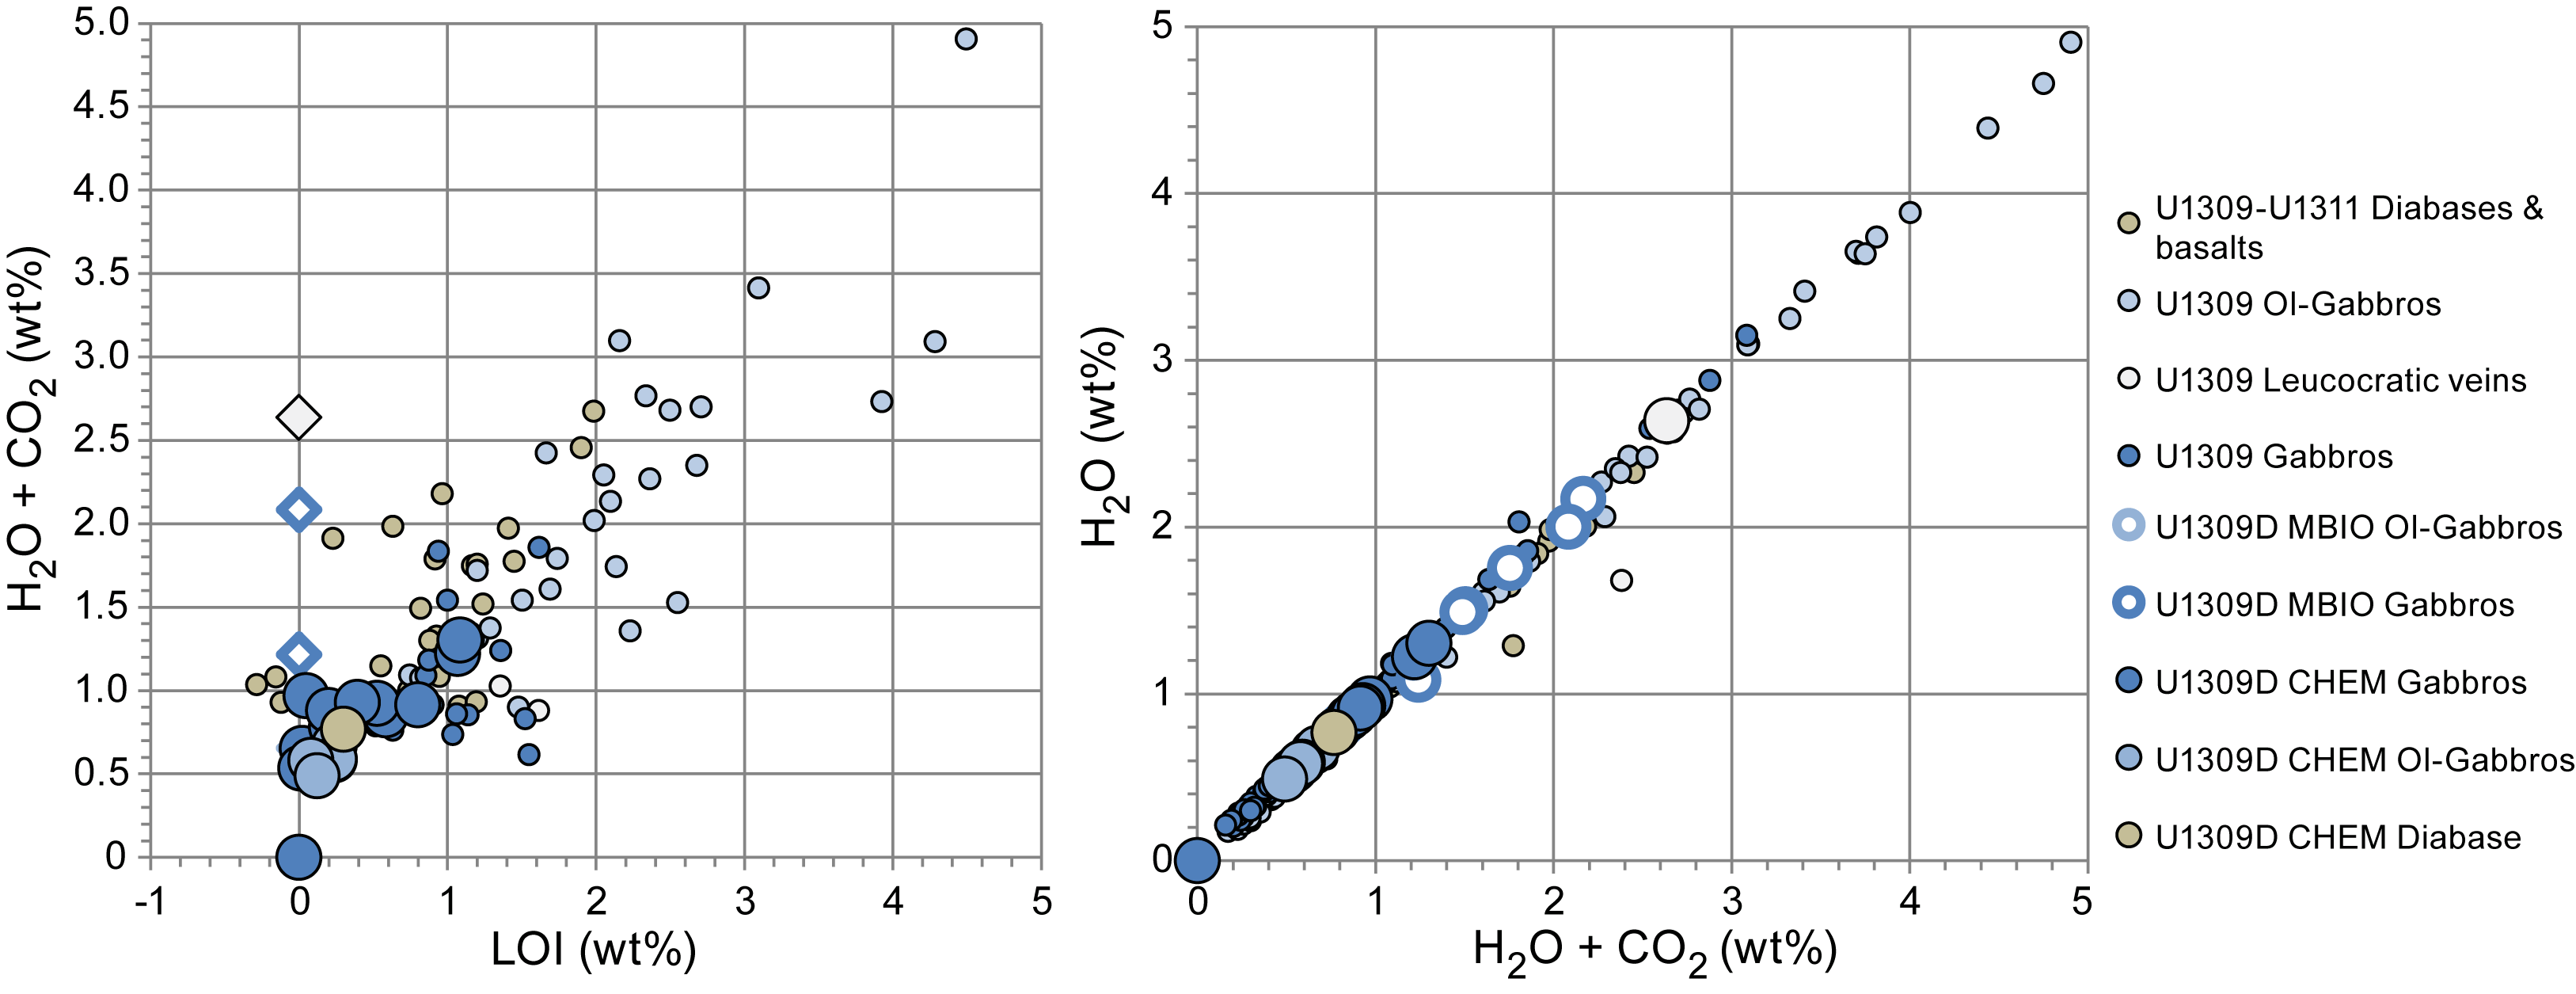
Figure F49. H2O + CO2 versus LOI and H2O versus H2O + CO2.
The volatile element content of Hole U1309D rocks sampled during Expedition 399 comprised mainly H2O (Figure F49) hosted by variable fractions of hydrous minerals (prehnite, zeolite, chlorite, and amphibole) (see XRD measurements in Alteration petrology). Only two samples had measurable carbon concentrations (CO2 = 0.16 and 0.09 wt% in microbiology olivine-bearing gabbro Samples 399-U1309D-300R-2, 96.5–106 cm, and 311R-1, 67.5–78 cm, respectively) suggesting the presence of carbon-bearing minerals, although none were identified by XRD analysis in these samples. It should be noted also that no carbon-bearing phases such as carbonates were identified in Hole U1309D rock samples studied during Expedition 399 (see Alteration petrology). This low abundance of carbon in Hole U1309D gabbroic rocks and diabases was also documented during Expedition 304/305 (Expedition 304/305 Scientists, 2006b).
When compared to Hole U1309D samples of similar lithology collected during Expedition 304/305 (Expedition 304/305 Scientists, 2006b), Expedition 399 rock samples have on average low H2O concentrations. Olivine gabbros have H2O concentrations ranging 0.49–0.67 wt% (geochemistry) to 0.66 wt% (microbiology). Gabbros have H2O concentrations ranging 0.53–1.30 wt% (geochemistry) to 0.59–2.17 wt% (microbiology). Geochemistry gabbros and olivine gabbros overlap in composition with the least altered olivine gabbros and gabbros recovered in the deeper parts of the hole (below ~850 mbsf) during Expedition 304/305 (Figure F49) (Expedition 304/305 Scientists, 2006b; Godard et al., 2009). Microbiology olivine gabbros and gabbros have more variable and higher H2O concentrations, suggesting higher fractions of secondary hydrous minerals.
Diabase Sample 399-U1309D-297R-2, 104–108 cm, has low H2O contents (0.77 wt%) compared to the diabases recovered during Expedition 304/305 at Site U1309 (0.79–2.66 wt%), suggesting a lower degree of alteration even though amphibole, talc, and chlorite were identified by XRD (see Alteration petrology).
Leucodiorite Sample 399-U1309D-302R-3, 126–128 cm, displays the highest H2O concentration (2.64 wt%) of Hole U1309D rocks analyzed during Expedition 399. This concentration is significantly higher than that measured in the leucocratic dikes and veins previously recovered at Site U1309 (0.6–1.7 wt%).
6.2.2. Major and trace element compositions
Analyses of major and trace element compositions were conducted using ICP-AES on ignited and nonignited powders for geochemistry and microbiology rock samples, respectively. The major and trace element composition of microbiology rock samples was recalculated as volatile-free (normalized to the sum of major oxides plus H2O and CO2 contents) to be comparable to geochemistry analyses in the text and figures.
6.2.2.1. Diabase
Sample 399-U1309D-297R-2, 104–108 cm, is a fine-grained diabase. It has a basaltic composition according to the classification of Le Maitre (1989) with SiO2 of 48.6 wt% and alkali contents (Na2O + K2O) of 1.83 wt%. It has 9.76 wt% MgO, 8.82 wt% Fe2O3, 16.16 wt% Al2O3, and 12.48 wt% CaO and overlaps in composition with the most primitive basalts and diabases recovered during Expedition 304/305 at Sites U1309–U1311 (5.7–10.4 wt% MgO, 7.1–15.8 wt% Fe2O3, 12.6–16.8 wt% Al2O3, and 9.5–12.8 wt% CaO) (Figure F50). When compared to Expedition 304/305 basalts and diabases, diabase Sample 297R-2, 104–108 cm, also has high Cr (435 versus 131–433 ppm) and Ni (191 versus 82–199 ppm) concentrations and low concentrations of fluid-immobile incompatible elements TiO2 (0.79 versus 0.6–2.6 wt%), V (226 versus 178–403 ppm), and Y (19.4 versus 22–71 ppm) and fluid-mobile incompatible elements Sr (55 versus 78–126 ppm) and Ba (3.2 versus 7–38 ppm) (Figures F51, F52, F53). The range of chemical compositions for Site U1309 is within the range of mid-ocean-ridge basalts (MORBs) (Expedition 304/305 Scientists, 2006b; Godard et al., 2009). Diabase Sample 297R-2, 104–108 cm, represents one of the most primitive, depleted, and least altered end-members of the MORB suite sampled at this site.
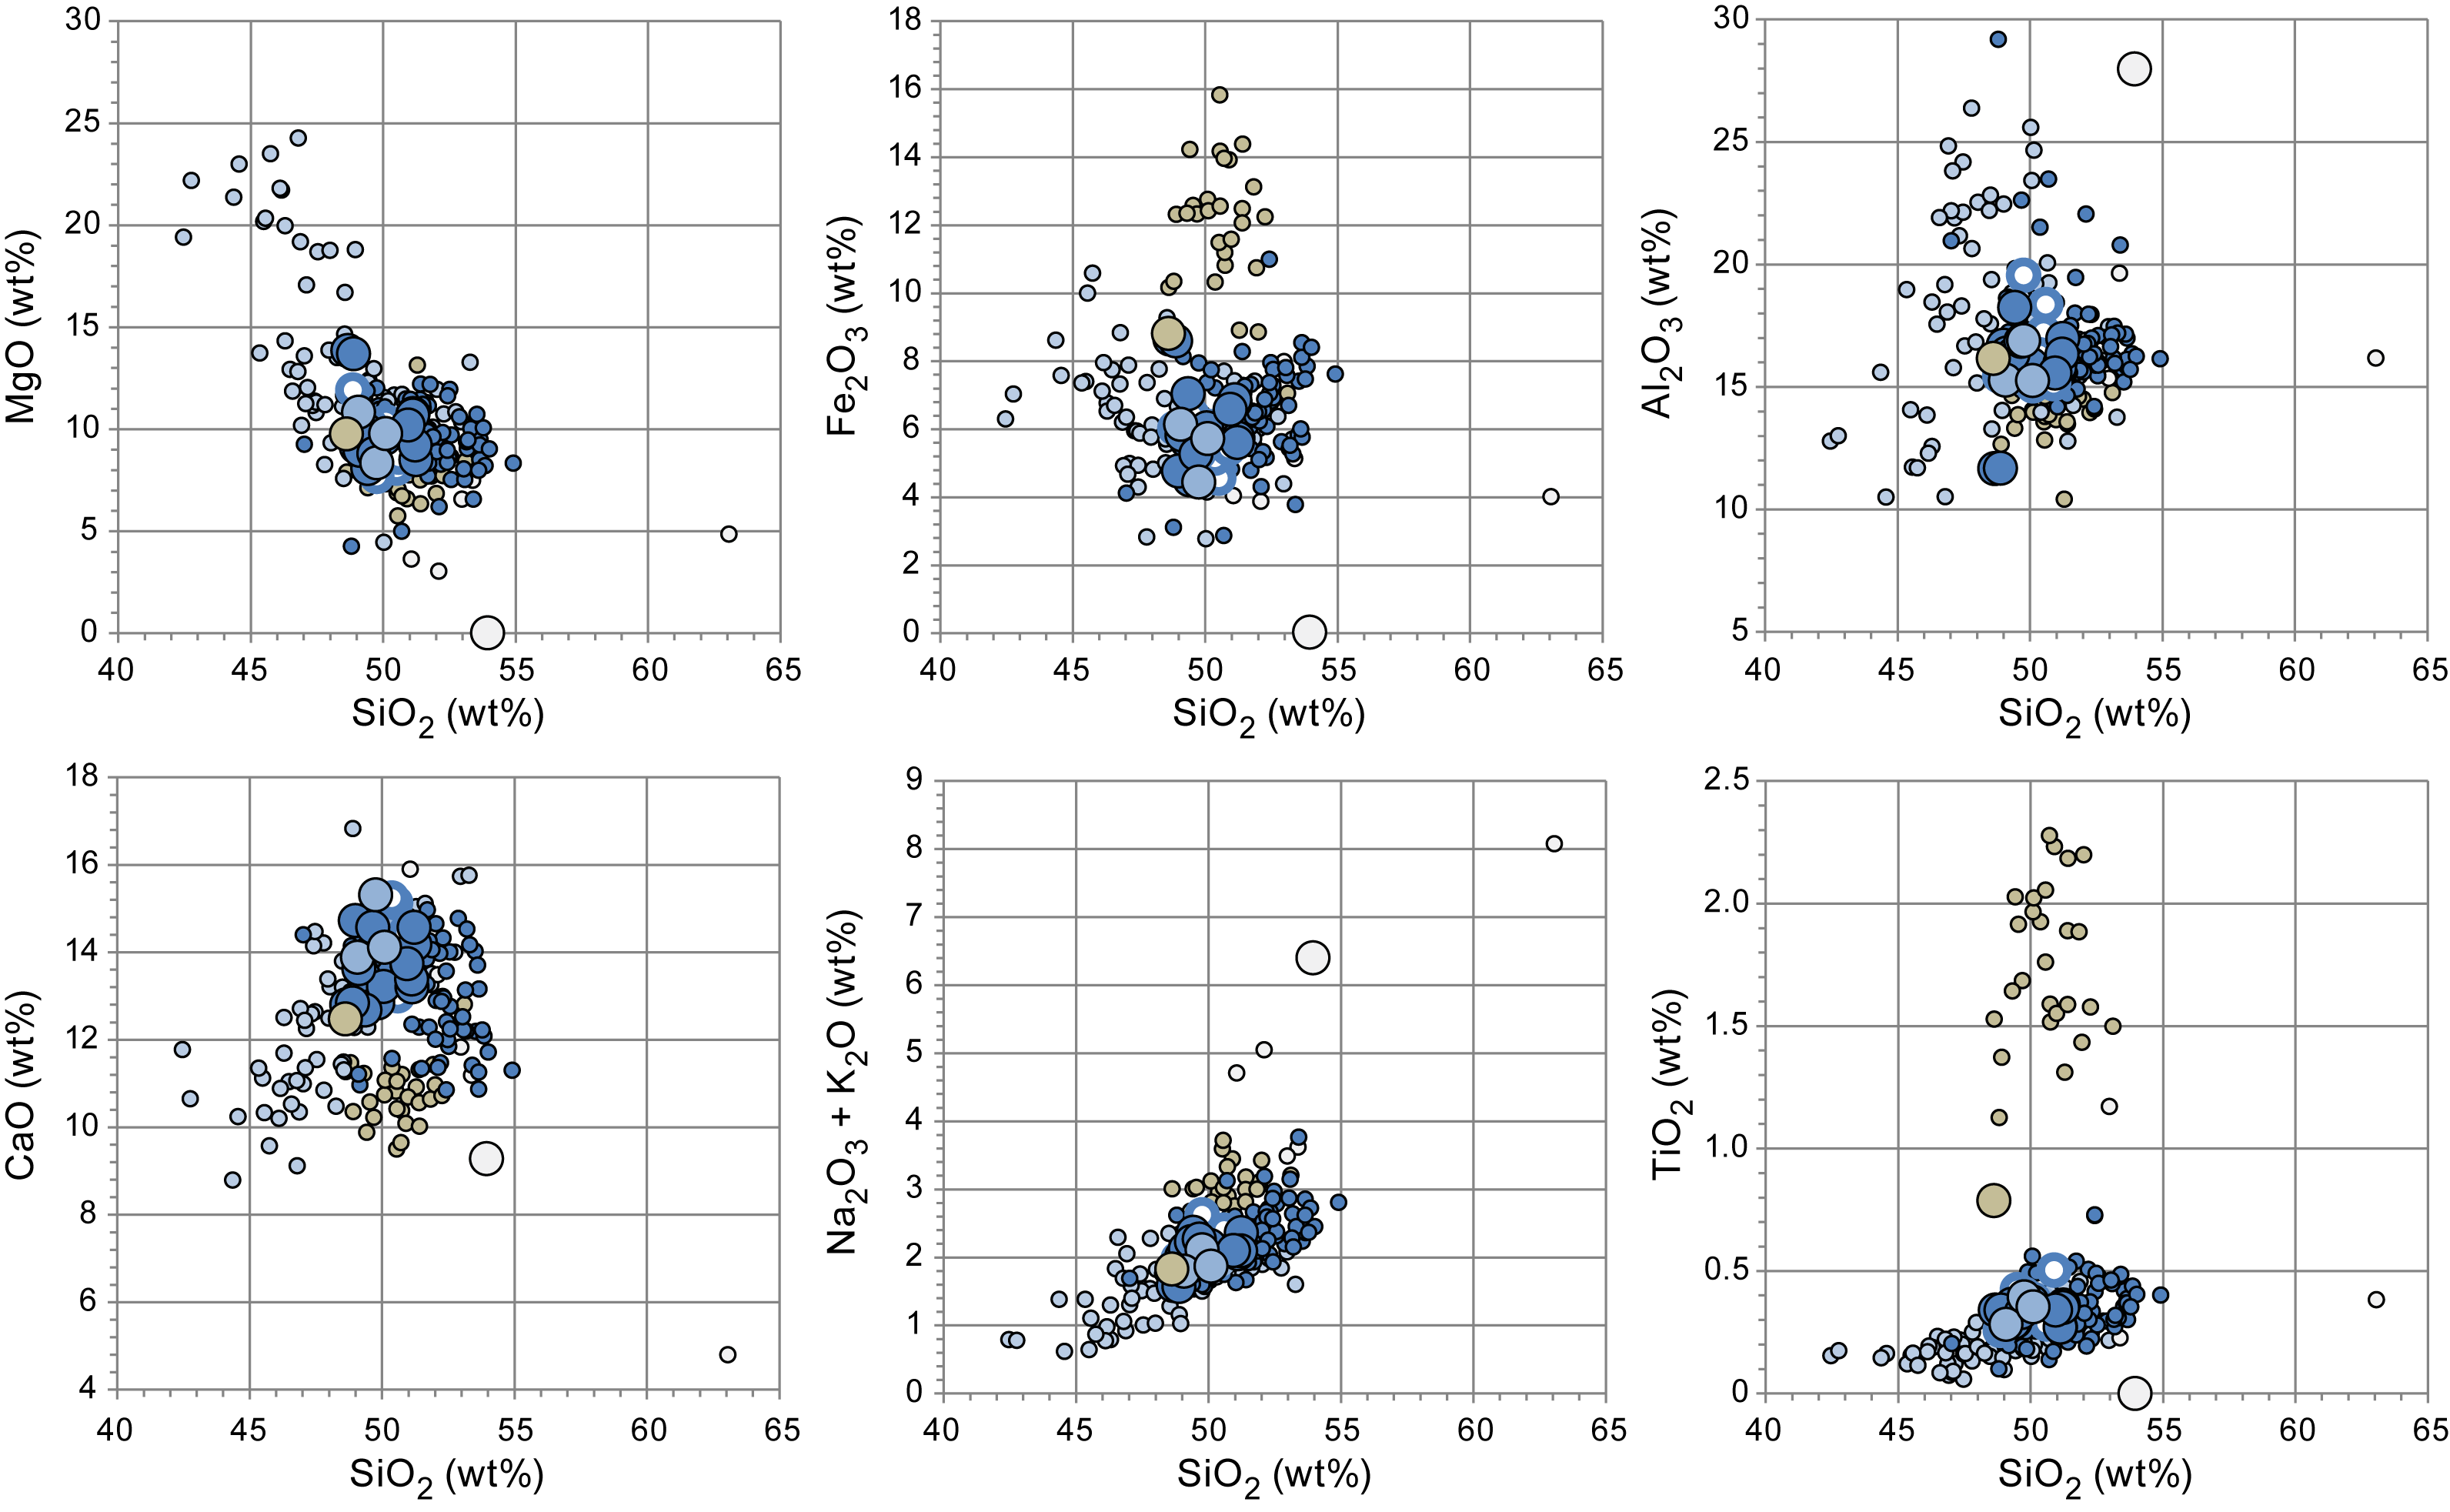
Figure F50. MgO, Fe2O3, Al2O3, CaO, Na2O, and TiO2.
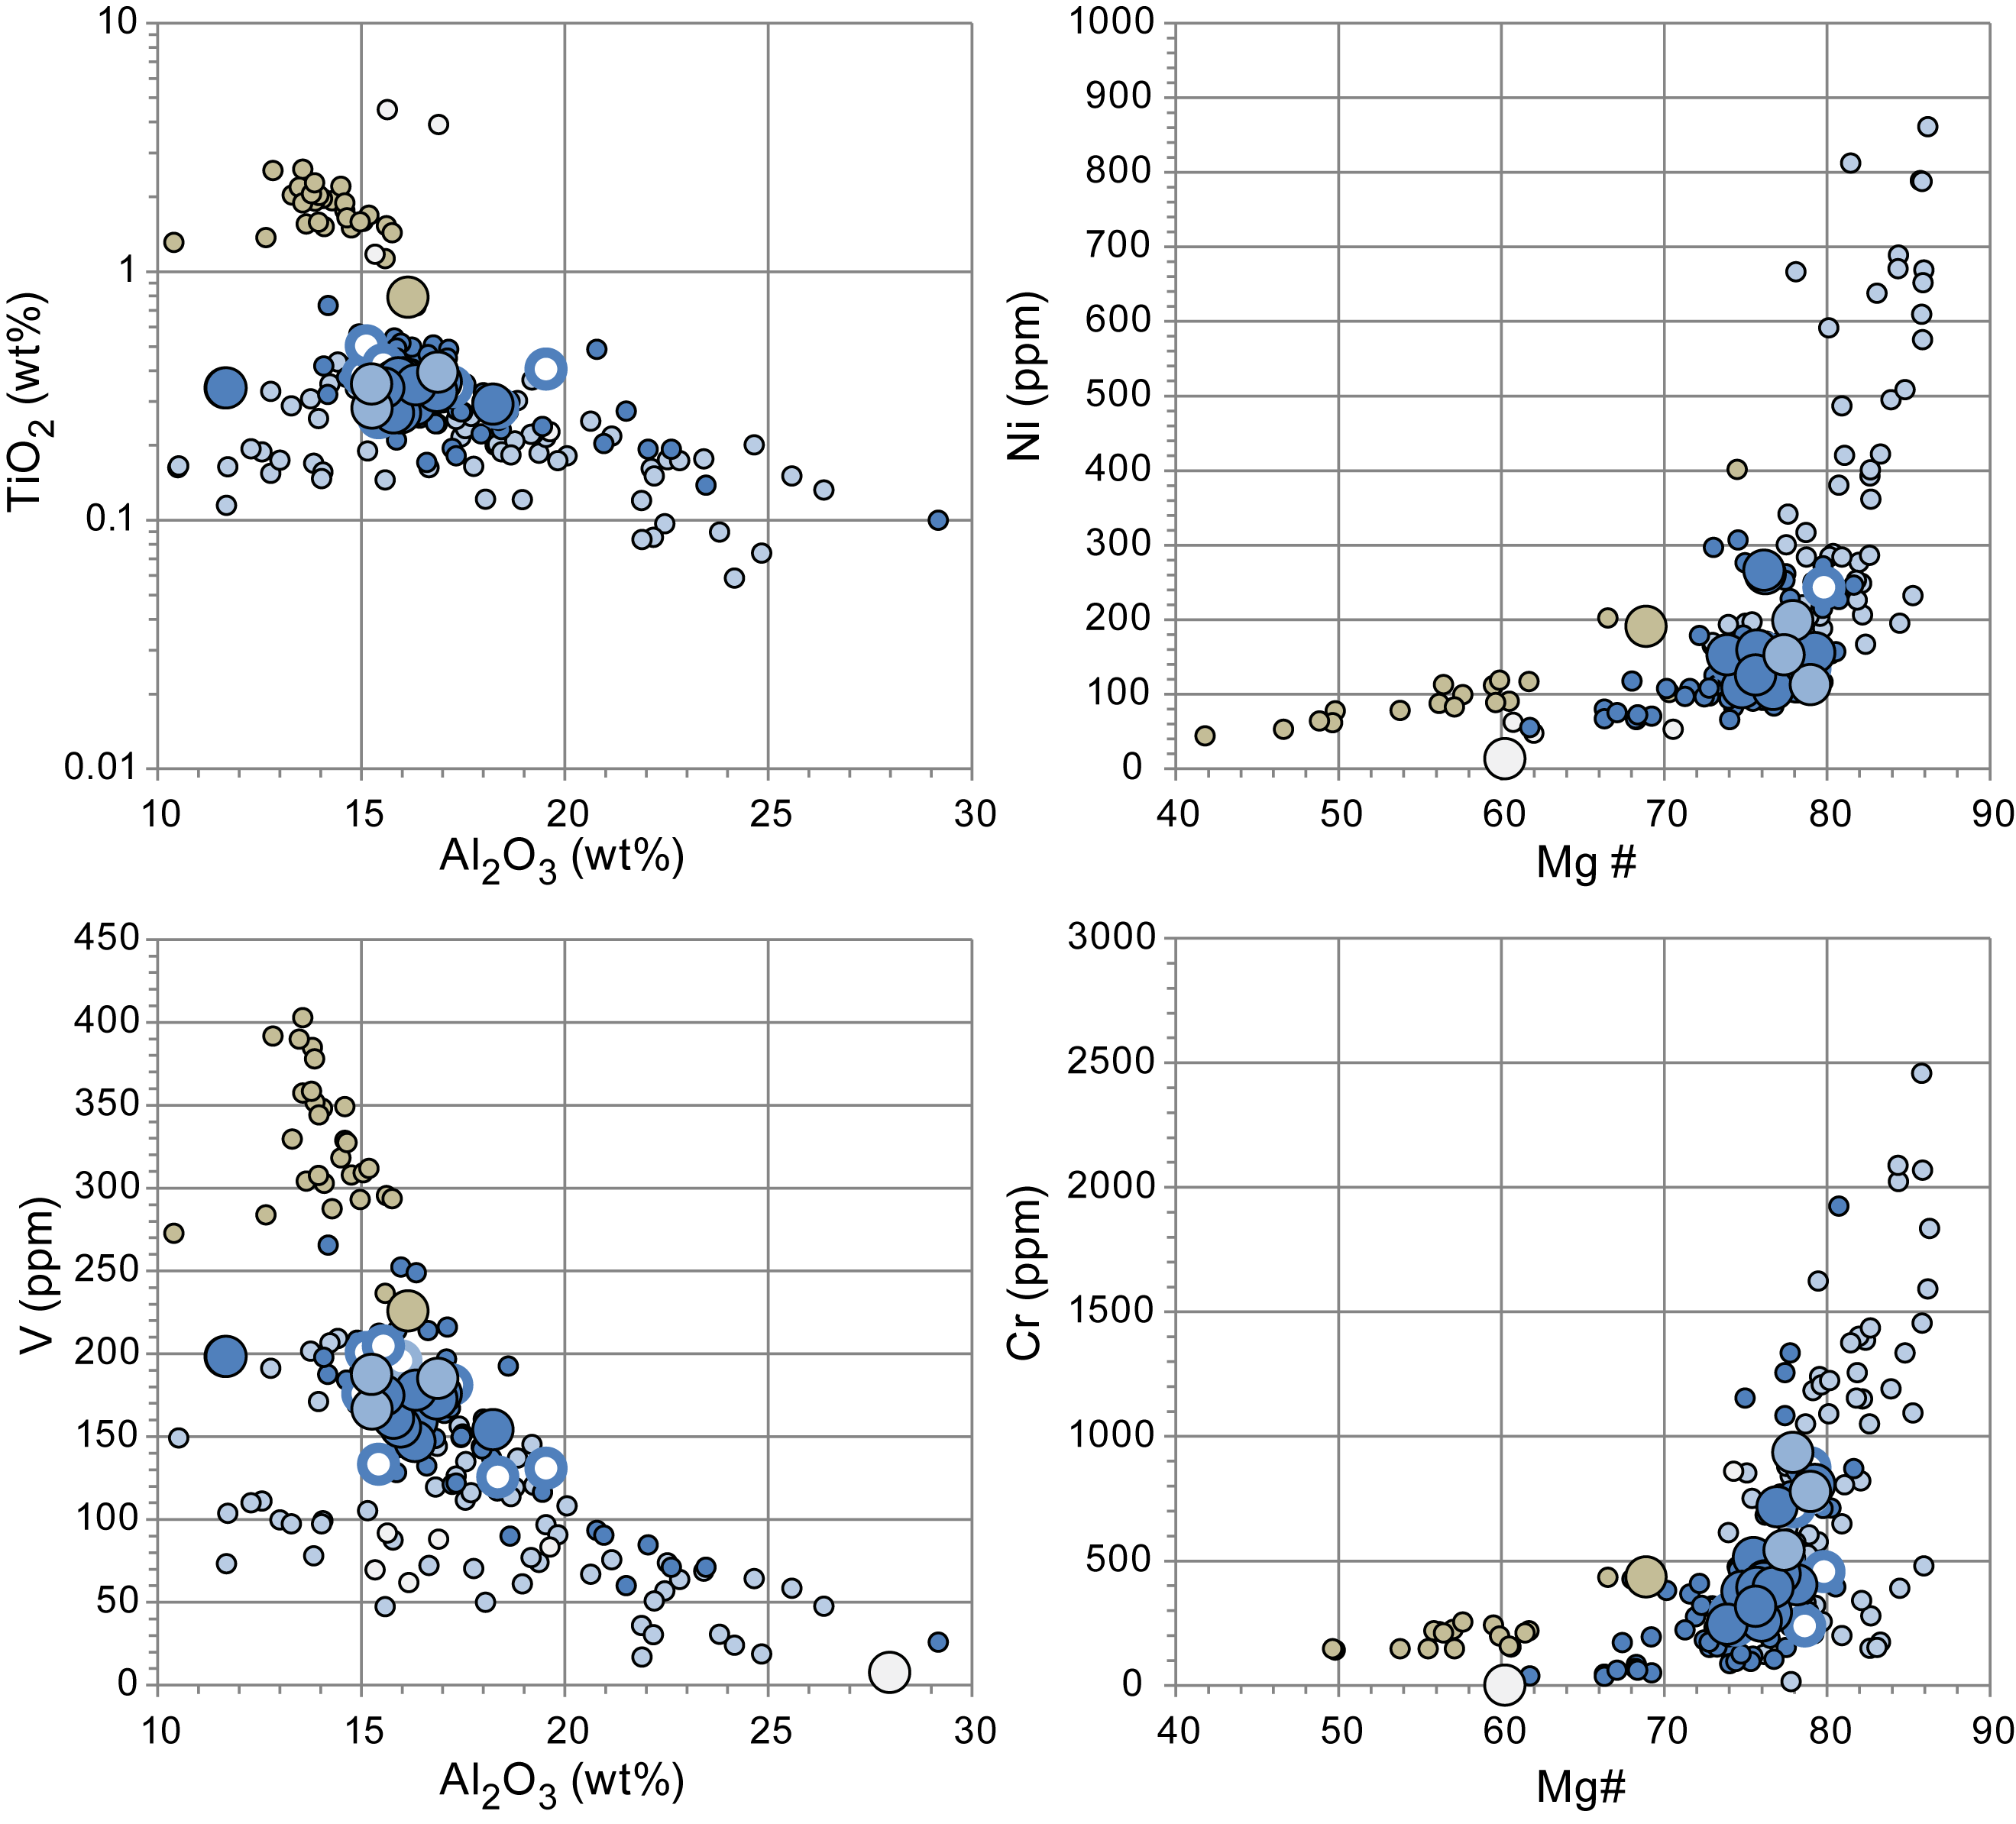
Figure F51. TiO2 and V versus Al2O3 and Ni and Cr versus Mg#.
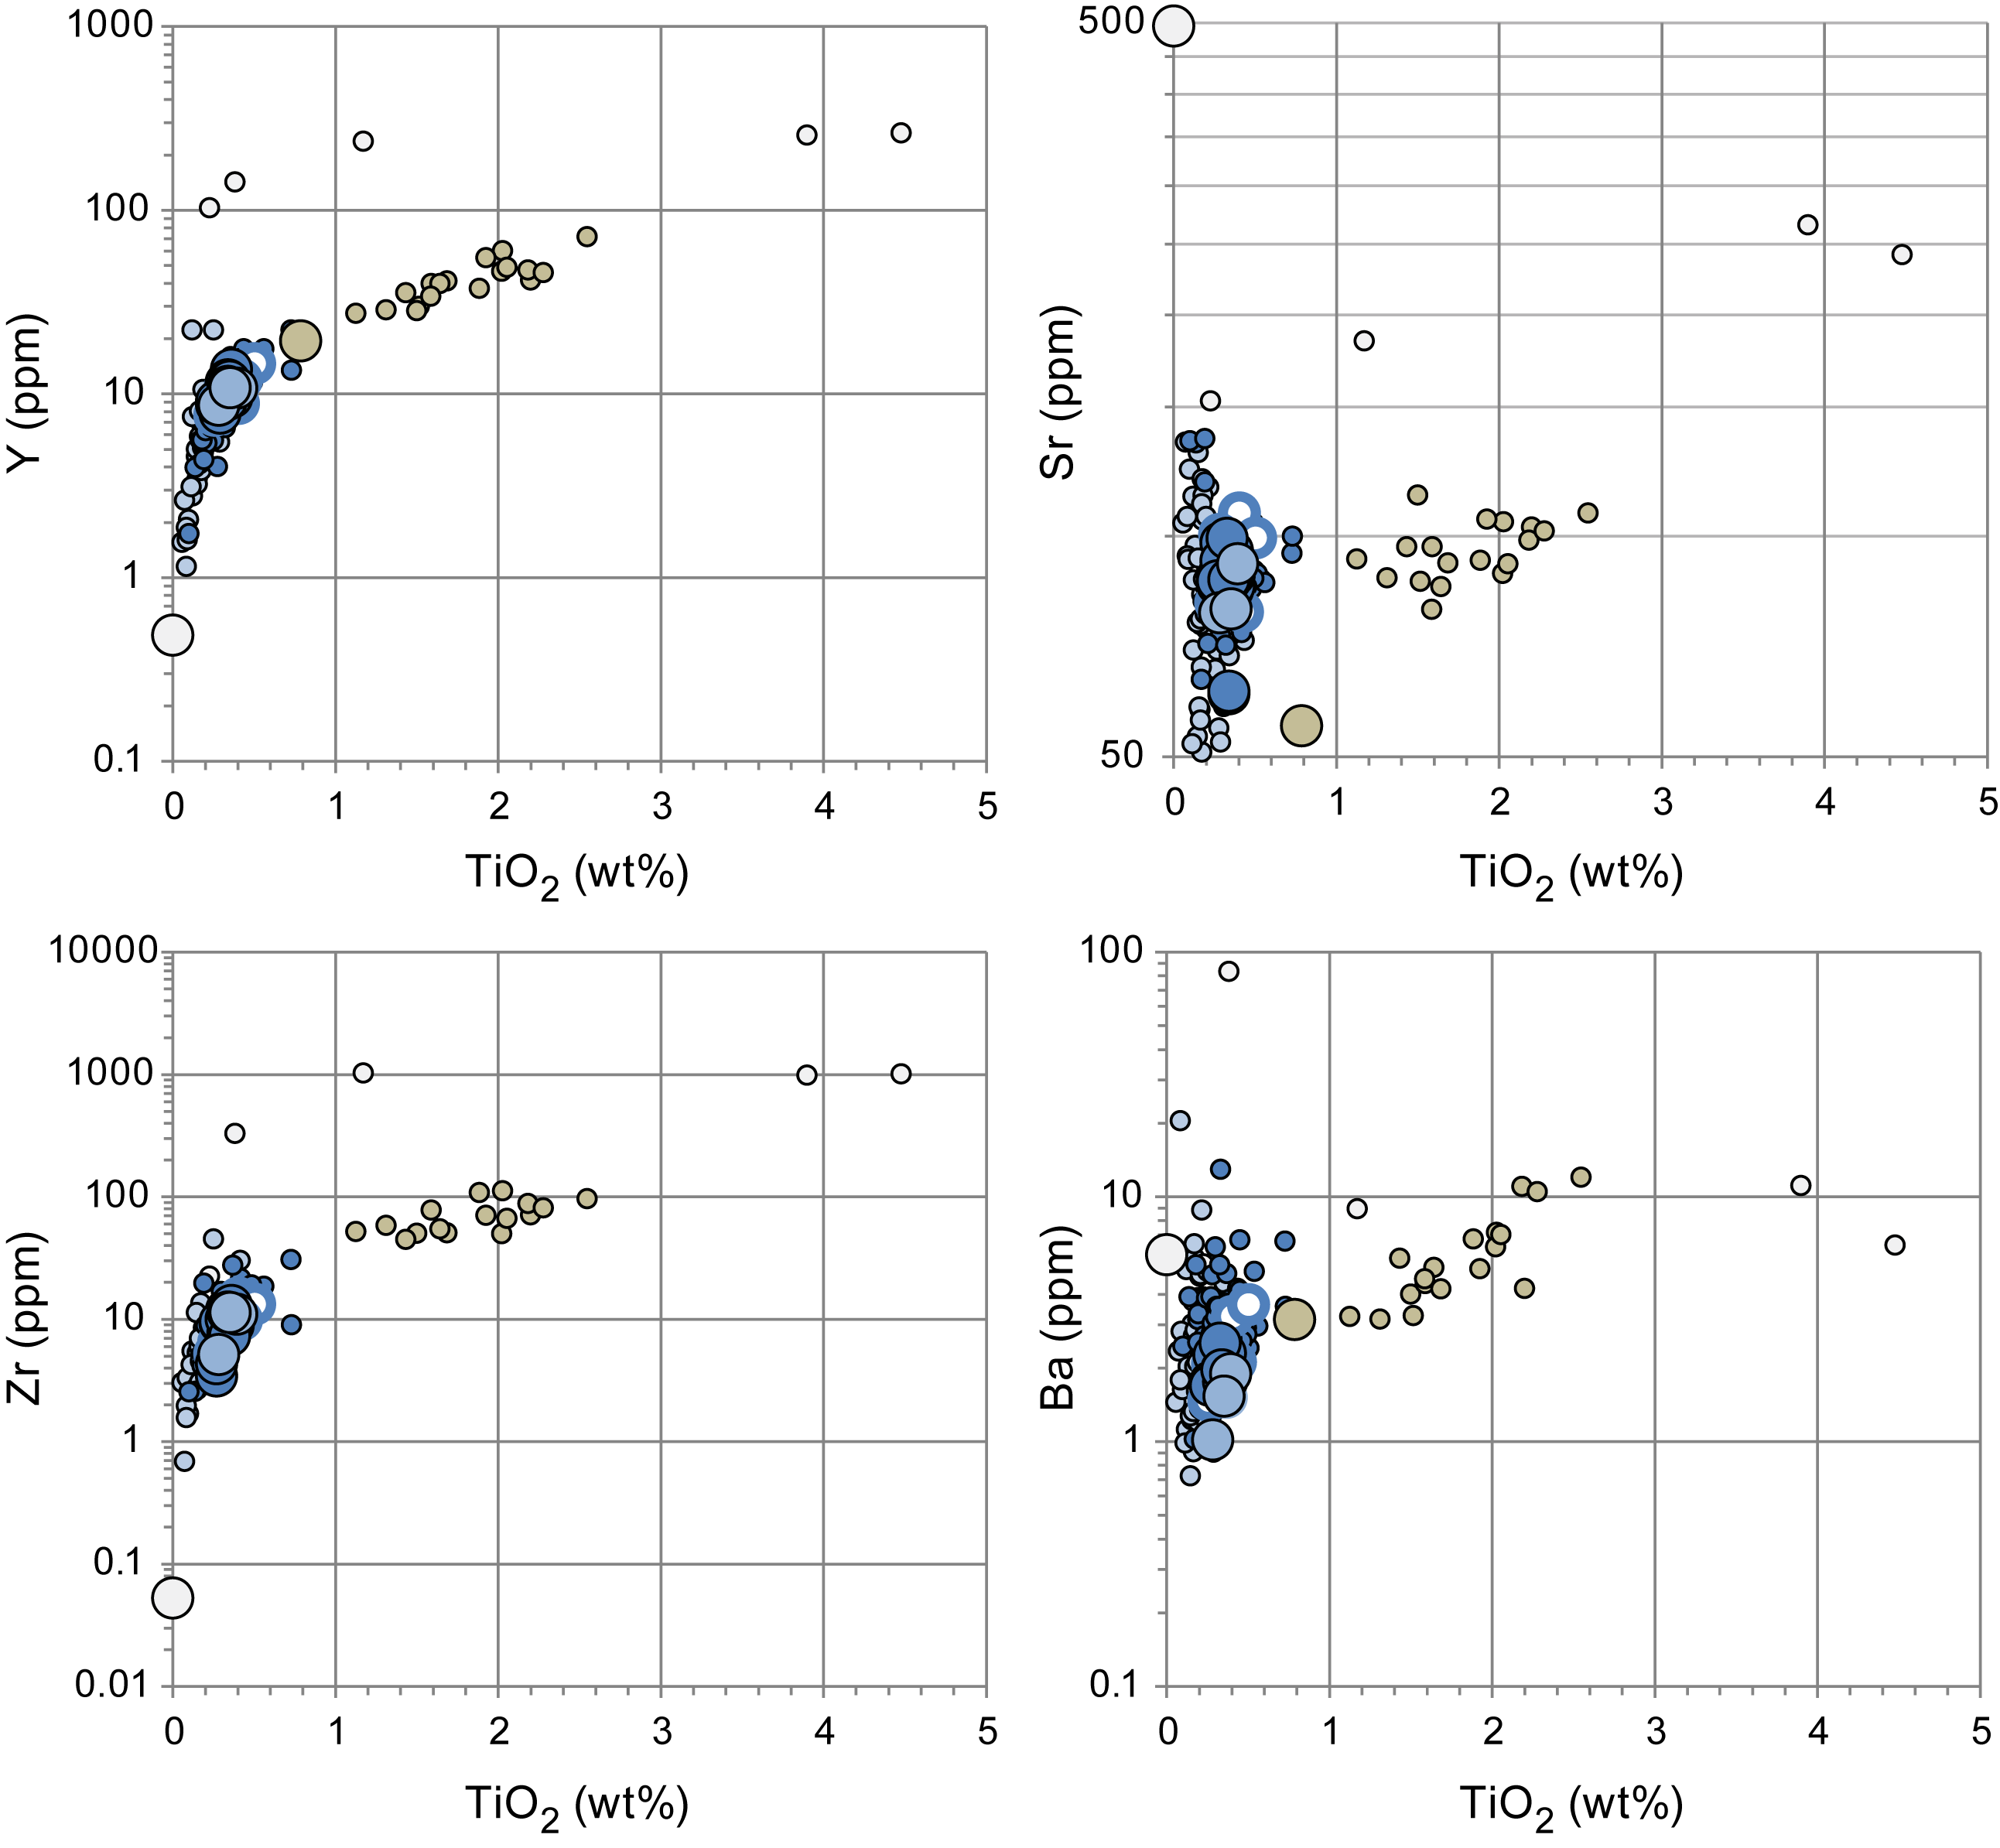
Figure F52. Y, Zr, Sr, and Ba versus TiO2, log scale.
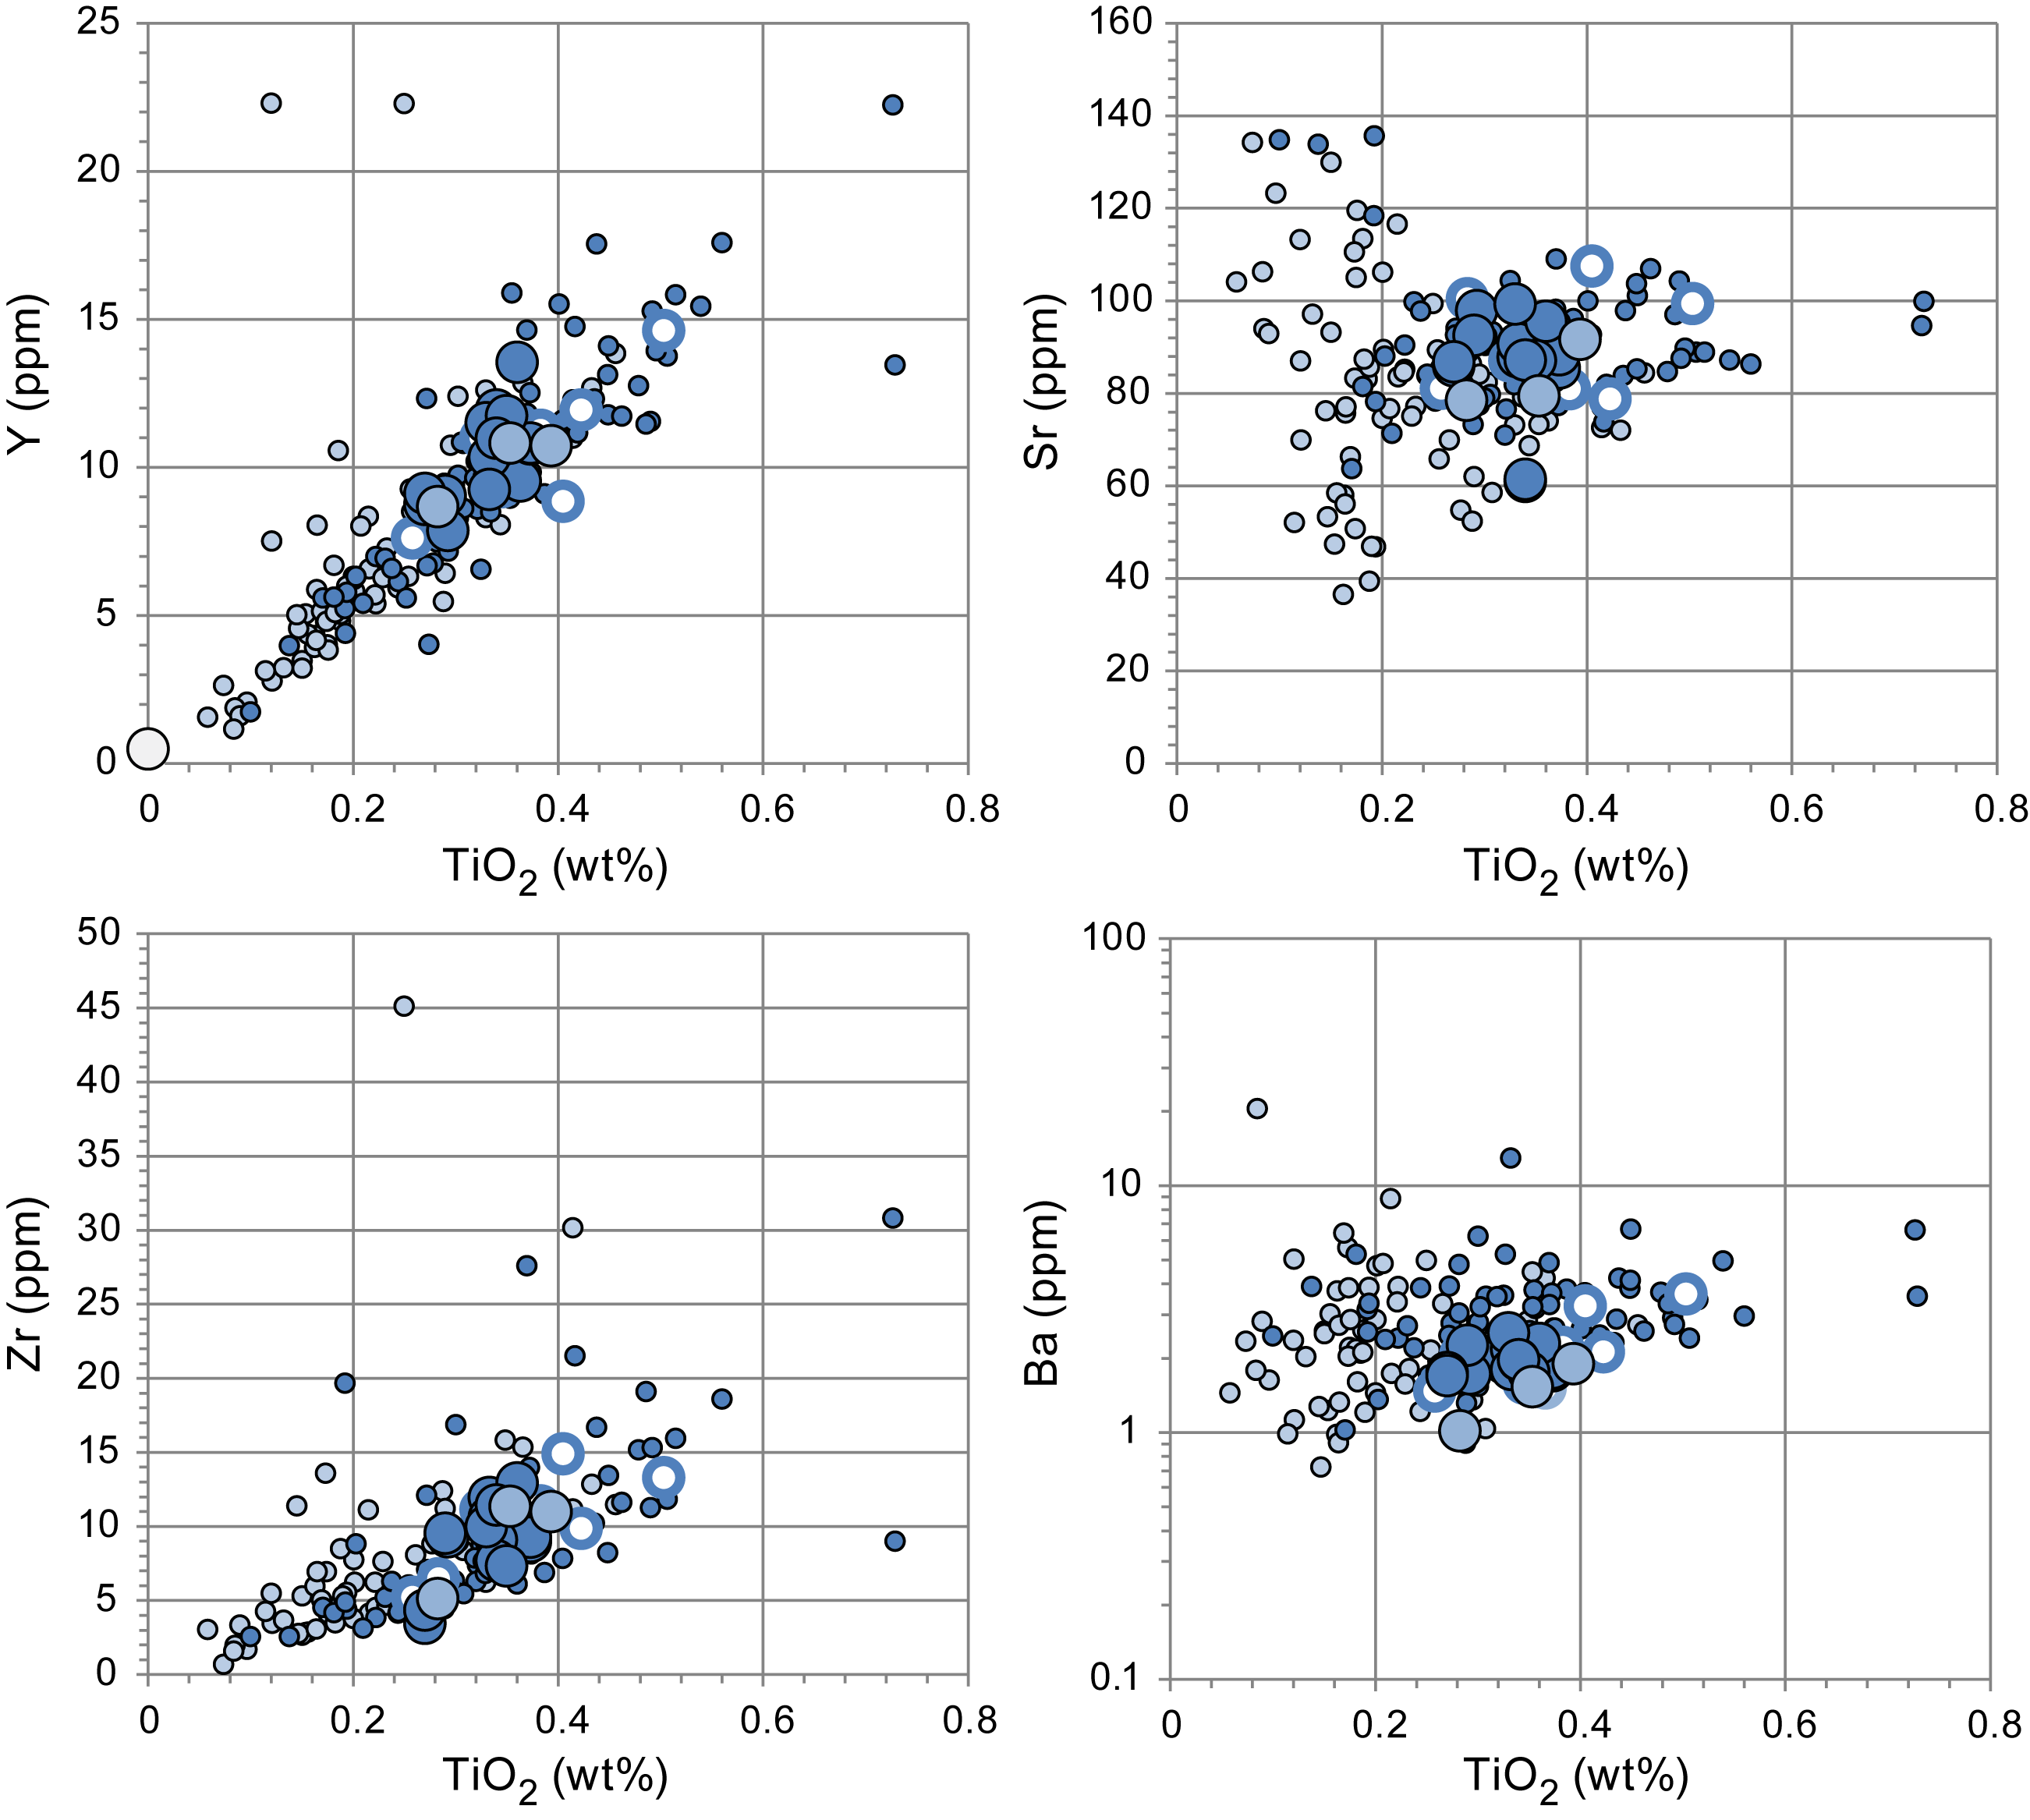
Figure F53. Y, Zr, Sr, and Ba versus TiO2, linear scale.
6.2.2.2. Gabbros and olivine gabbros
Hole U1309D olivine gabbros and gabbros recovered during Expedition 399 overlap in major and trace element compositions. The compositions of microbiology samples do not differ from those of the geochemistry samples (Figures F50, F51, F52, F53).
Olivine gabbros have SiO2 of 49.1–51.2 wt% (geochemistry) to 50.4 wt% (microbiology), Mg# (Mg# = 100 × cationic Mg/[Mg + Fe]) of 77.4–79.0 (geochemistry) to 78.9 (microbiology), Al2O3 of 15.3–16.9 wt% (geochemistry) to 16.0 wt% (microbiology), and Ca# (Ca# = 100 × cationic Ca/(Ca + Na)) of 80.2–81.1 (geochemistry) to 81.0 (microbiology). Gabbros have SiO2 of 48.9–51.2 wt% (geochemistry) to 48.9–50.9 wt% (microbiology), Mg# of 73.9–79.3 (geochemistry) to 74–79.8 (microbiology), Al2O3 of 11.7–18.2 wt% (geochemistry) to 15.0–19.5 wt% (microbiology), and Ca# of 76.0–82.1 (geochemistry) to 73.2–80.5 (microbiology). This overlap in composition suggests that variations in the mode of the main primary phases constituting olivine gabbros and gabbros (plagioclase, clinopyroxene, and olivine) are minor from the gabbros to the olivine gabbros recovered during Expedition 399. These compositions are similar to those of Site U1309 olivine gabbros and gabbros recovered during Expedition 304/305, although they are significantly more clustered (Figure F50) (Expedition 304/305 Scientists, 2006b; Godard et al., 2009).
Overlaps in compositions are observed also for compatible elements Ni and Cr and moderately incompatible elements Ti, V, and Sc (Figures F51, F52, F53). Olivine gabbros have concentrations in Cr of 543–935 ppm (geochemistry) to 771 ppm (microbiology), Ni of 113–199 ppm (geochemistry) to 150 ppm (microbiology), TiO2 of 0.3–0.4 wt% (geochemistry and microbiology), Sc of 41–45 ppm (geochemistry) to 47 ppm (microbiology), and V of 167–187 ppm (geochemistry) to 196 ppm (microbiology). Gabbros have concentrations in Cr of 245–807 ppm (geochemistry) to 238–874 ppm (microbiology), Ni of 106–266 ppm (geochemistry) to 134–243 ppm (microbiology), TiO2 of 0.3–0.5 wt% (geochemistry and microbiology), Sc of 34–46 ppm (geochemistry) to 27–46 ppm (microbiology), and V of 147–198 ppm (geochemistry) to 125–205 (microbiology). The bulk rock composition of these elements is mainly controlled by their distribution between the main primary minerals forming olivine gabbros and gabbros, and similar to major elements, these variations from one gabbroic rock sample to the other primarily reflect minor differences in their modal contents. Their relatively high Cr, Ni, Ti, V, and Sc compositions cluster in the narrow compositional field where the compositions of the most primitive gabbros and the most evolved olivine gabbros recovered at Site U1309 during Expedition 304/305 overlap (Figure F51).
Similar to their compositions in major and compatible to moderately incompatible trace elements, Expedition 399 olivine gabbros and gabbros overlap in composition for incompatible trace elements. Olivine gabbros have concentrations in Y of 9–11 ppm (geochemistry and microbiology), Zr of 5–11 ppm (geochemistry) to 9 ppm (microbiology), Sr of 78–92 ppm (geochemistry) to 84 ppm (microbiology), and Ba of 1–2 ppm (geochemistry) to 1.5 ppm (microbiology). Gabbros have concentrations in Y of 8–14 ppm (geochemistry) to 8–15 ppm (microbiology), Zr of 3–13 ppm (geochemistry) to 5–15 ppm (microbiology), Sr of 61–99 ppm (geochemistry) to 78–107 ppm (microbiology), and Ba of 2–3 ppm (geochemistry) to 2–4 ppm (microbiology). There is no evidence of selective Ca and Sr enrichments that would have indicated significant Ca-carbonate precipitation in the two samples in which carbon has been measured (microbiology olivine-bearing gabbro Samples 399-U1309D-300R-2, 96.5–106 cm, and 311R-1, 67.5–78 cm). Also, although microbiology gabbroic rock samples have on average high concentrations in volatile elements compared to geochemistry samples, no significant differences in the compositions of fluid-mobile incompatible elements, such as Ba and Sr, are observed between geochemistry and microbiology samples. This suggests that there were no significant differences in the chemical remobilization associated with the alteration of the studied gabbroic rocks, even for fluid mobile elements. Alternatively, the lack of change of compositions from volatile-rich microbiology to volatile-poor geochemistry samples may simply reflect the differences in the methods in the preparation of the sample (freeze-dried for microbiology samples and oven-dried for geochemistry samples; see Geochemistry in the Expedition 399 methods chapter [Lang et al., 2025]). The incompatible trace element compositions of Expedition 399 gabbros and olivine gabbros plot in the compositional fields defined by Site U1309 olivine gabbros and gabbros from Expedition 304/305 (Figures F52, F53) (Expedition 304/305 Scientists, 2006b; Godard et al., 2009). Site U1309 olivine gabbros and gabbros sampled during Expeditions 304/305 and 399 form a coherent magmatic crystallization series.
6.2.2.3. Leucocratic diorite
Sample 399-U1309D-302R-3, 126–128 cm, is the white part of a leucocratic diorite recovered at ~1444 mbsf in Hole U1309D. It is composed of 53.9 wt% SiO2, 28 wt% Al2O3, 9.3 wt% CaO, and 6.4 wt% Na2O. This composition is that of an An45 plagioclase.
Except for Sr (495 ppm), an element typically enriched in plagioclase, Sample 399-U1309D-302R-3, 126–128 cm, is depleted in almost all compatible and incompatible trace elements; it has 13 ppm Ni, 7.5 ppm V, 0.2 ppm Sc, 0.5 ppm Y, <0.1 ppm Zr, and 6 ppm Ba, and Ti and Cr concentrations were below the detection limits (Figures F51, F52, F53). These depleted compositions differ significantly from those of previously analyzed Site U1309 leucocratic veins and dikes that typically represent the most enriched end-members of the rocks recovered during Expedition 304/305, with up to 170 ppm Ni, 92 ppm V, 46 ppm Sc, 300 ppm Y, 1180 ppm Zr, 83 ppm Ba, 4.5 wt% TiO2, and 859 ppm Cr (Expedition 304/305 Scientists, 2006b; Godard et al., 2009).
6.2.3. Summary
A total of 29 samples from Hole U1309D were analyzed for major and trace element concentrations and volatile element concentrations. These samples comprised (1) 1 diabase, 1 leucodiorite, 3 olivine gabbros, and 15 gabbros (including 10 olivine-bearing gabbros) collected for geochemical studies and (2) 1 olivine gabbro and 8 olivine-bearing gabbros analyzed as part of an interdisciplinary study of rock samples collected for microbiological studies.
The analyzed samples do not display systematic chemical variations with depth except for those associated to the crosscutting diabase at 1417.93 mbsf and leucocratic diorite at 1443.84 mbsf (Figure F54).
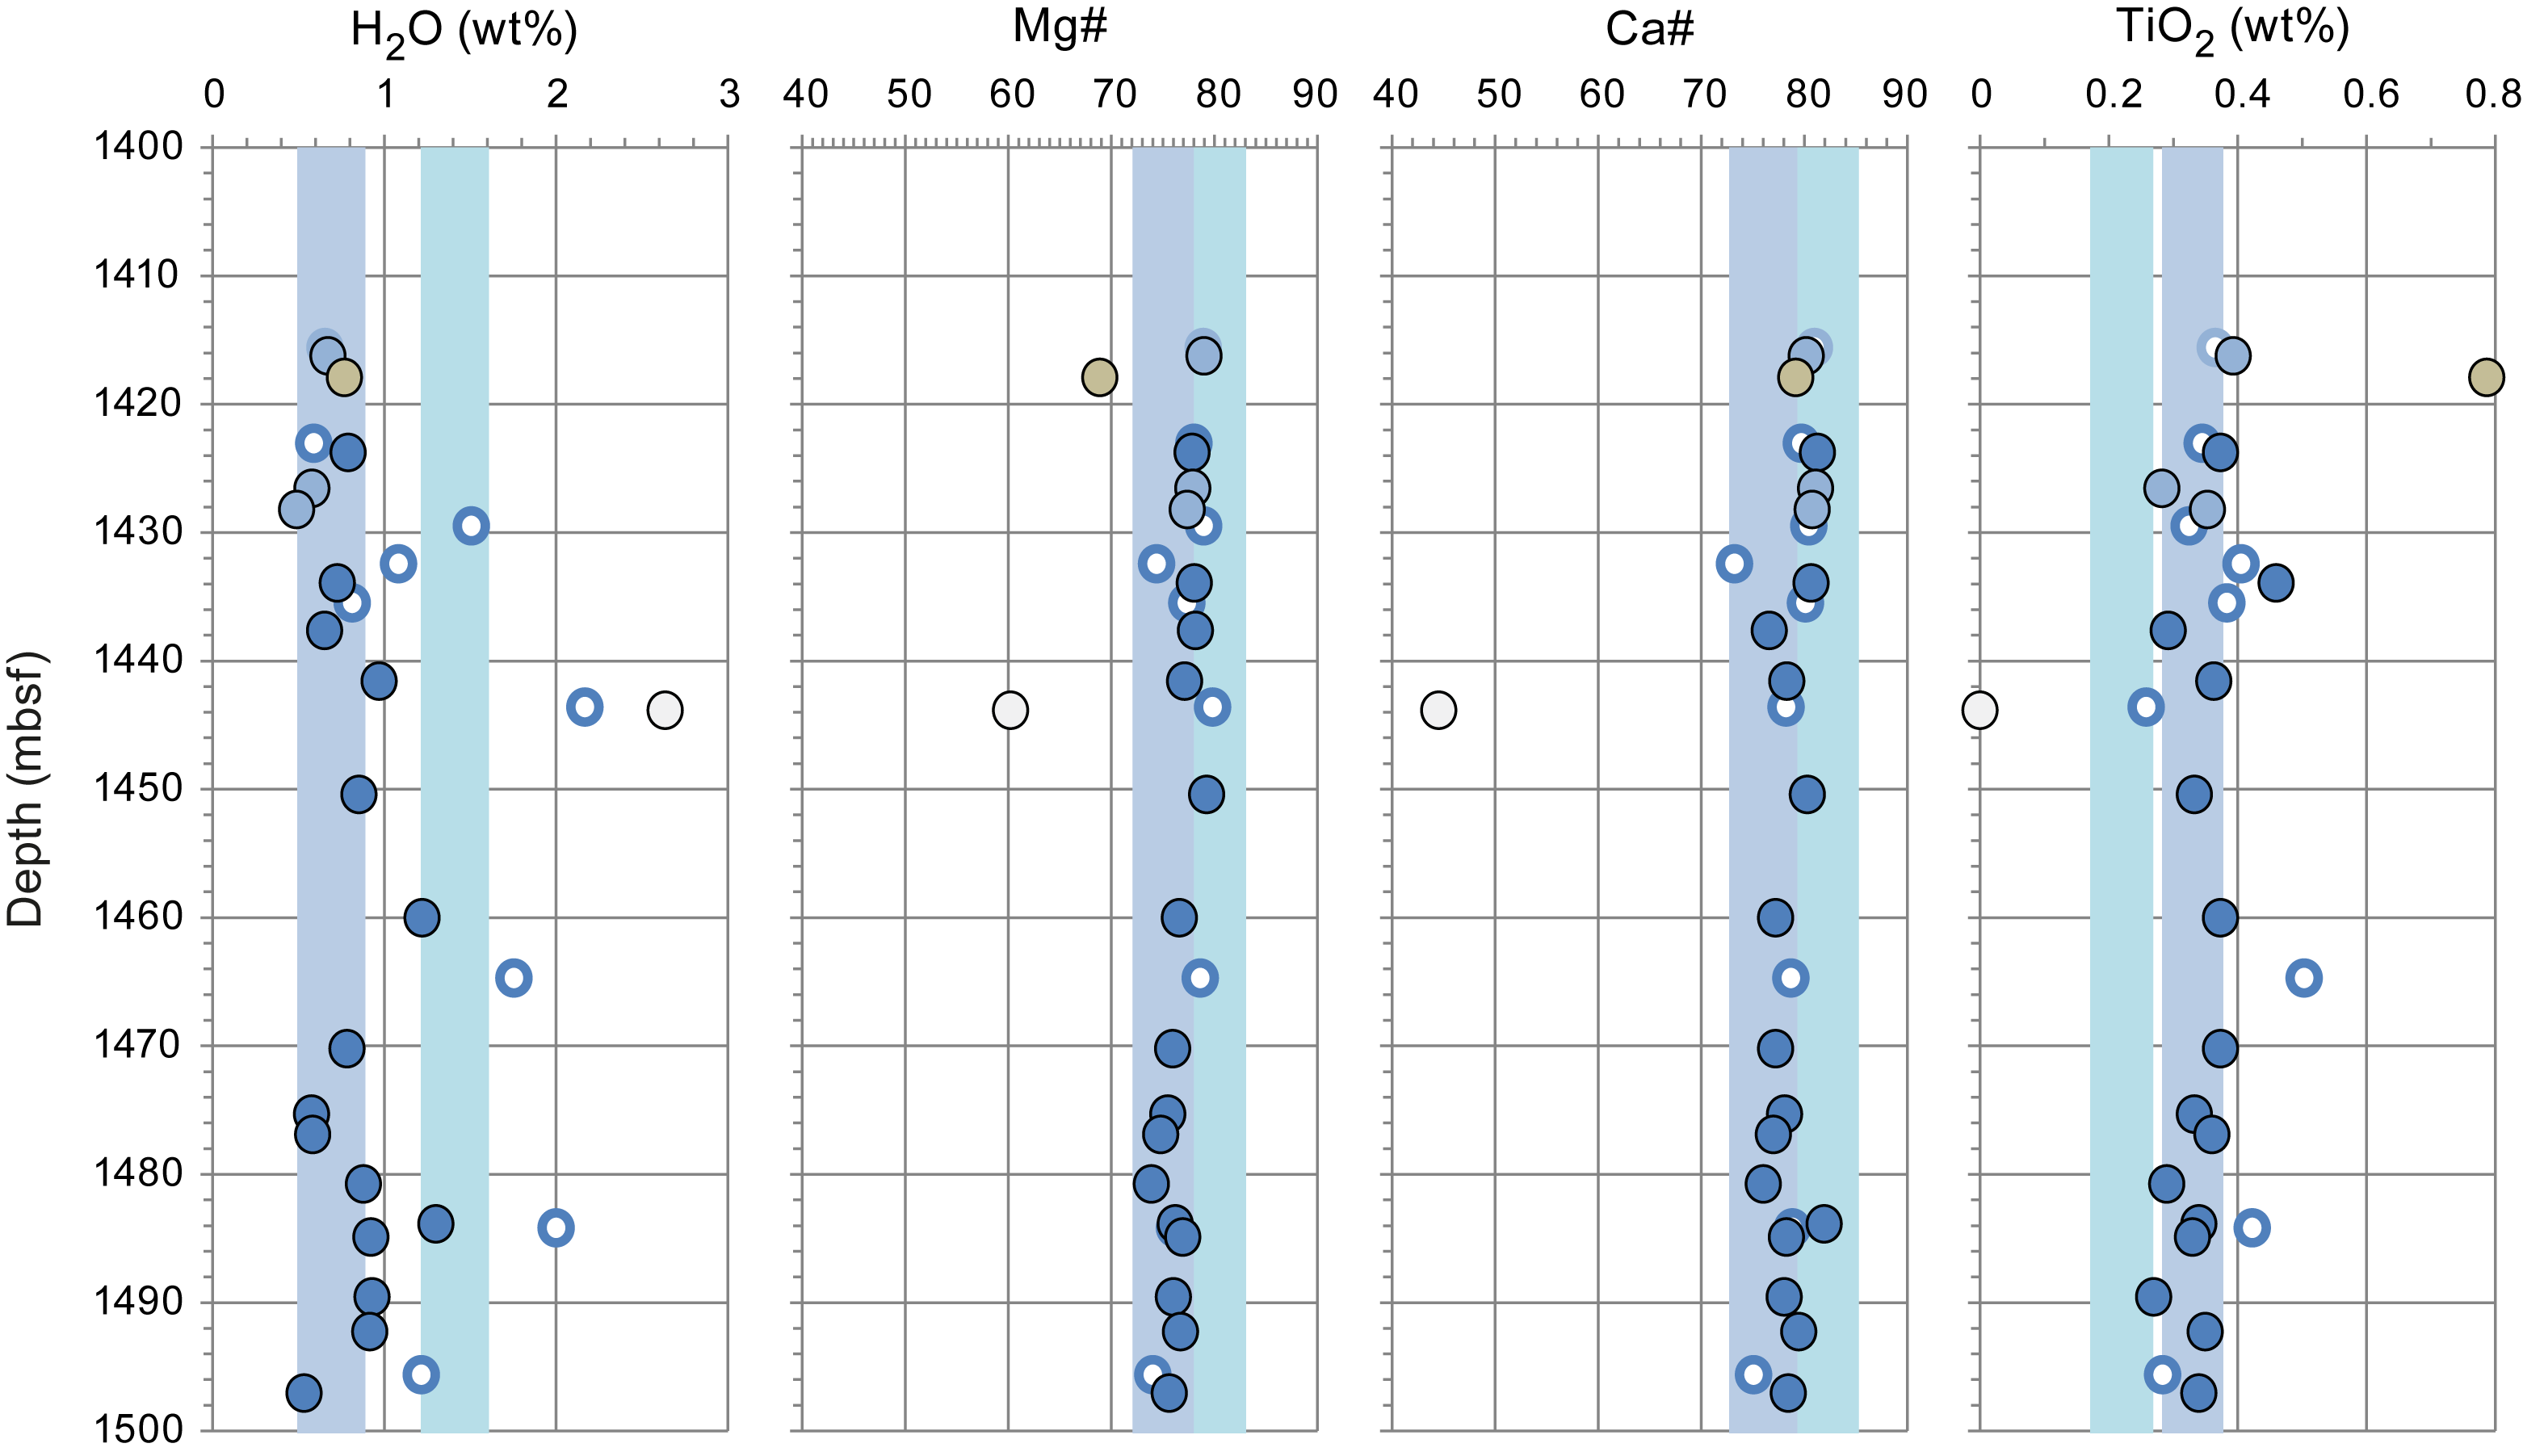
Figure F54. H2O, Mg#, Ca#, and TiO2.
Expedition 399 olivine gabbros and gabbros have major and trace element compositions similar to those of the most primitive gabbros and the most evolved olivine gabbros recovered at Site U1309 during Expedition 304/305 (Expedition 304/305 Scientists, 2006b; Godard et al., 2009). They overlap in composition and are characterized by high Mg# (74–80) and Ca# (73–82) and low TiO2 concentrations (0.26–0.50 wt%). Except for some microbiology samples that have H2O up to 2.17 wt%, they have low H2O contents similar to Hole U1309D gabbroic rocks sampled below 850 mbsf. The presence of H2O indicates the replacement of primary minerals by hydrous minerals during hydrothermal alteration and weathering. The major and trace element compositions of Expedition 399 olivine gabbros and gabbros provide no evidence of elemental remobilization associated with H2O concentration variations, even for fluid mobile elements.
The analyzed leucocratic sample is the white part of a leucocratic diorite recovered at ~1444 mbsf in Hole U1309D. Its composition is that of an An45 plagioclase (Ca# 45), and except for Sr, an element typically enriched in plagioclase, it is depleted in almost all trace elements. In that respect, it differs significantly from the previously analyzed Site U1309 leucocratic veins and dikes that represented the most enriched end-members of the rocks recovered during Expedition 304/305 (Expedition 304/305 Scientists, 2006b; Godard et al., 2009).
The fine-grained diabase intruding the gabbroic rocks at 1417.93 mbsf has a basaltic composition characterized by high Mg# (69) and low TiO2 concentrations (0.79 wt%). It represents one of the most primitive, depleted, and least altered end-members of the MORB magmatic suite at Site U1309 (Expedition 304/305 Scientists, 2006b; Godard et al., 2009).
Based on their major and trace element compositions, Expedition 399 Hole U1309D diabase and gabbroic rocks form a coherent suite with the diabases, basalts, and gabbroic rocks sampled at the same site during Expedition 304/305, suggesting a cogenetic origin for these mafic rocks.
7. Microbiology
Microbiological investigations in Hole U1309D were designed to explore potential signs of recent or past life at extreme temperatures, especially the shallowest rocks that may have been exposed to borehole water during the 18 y since Expedition 305. Microbiology samples were collected for conventional analyses such as cell counts, cultivation, and DNA sequencing, as well as organic geochemistry analyses. A total of nine microbiology whole-round samples were collected from Hole U1309D (Cores 297R–313R). Eight of the samples are olivine-bearing gabbro, and one sample is an olivine gabbro (Figure F55).
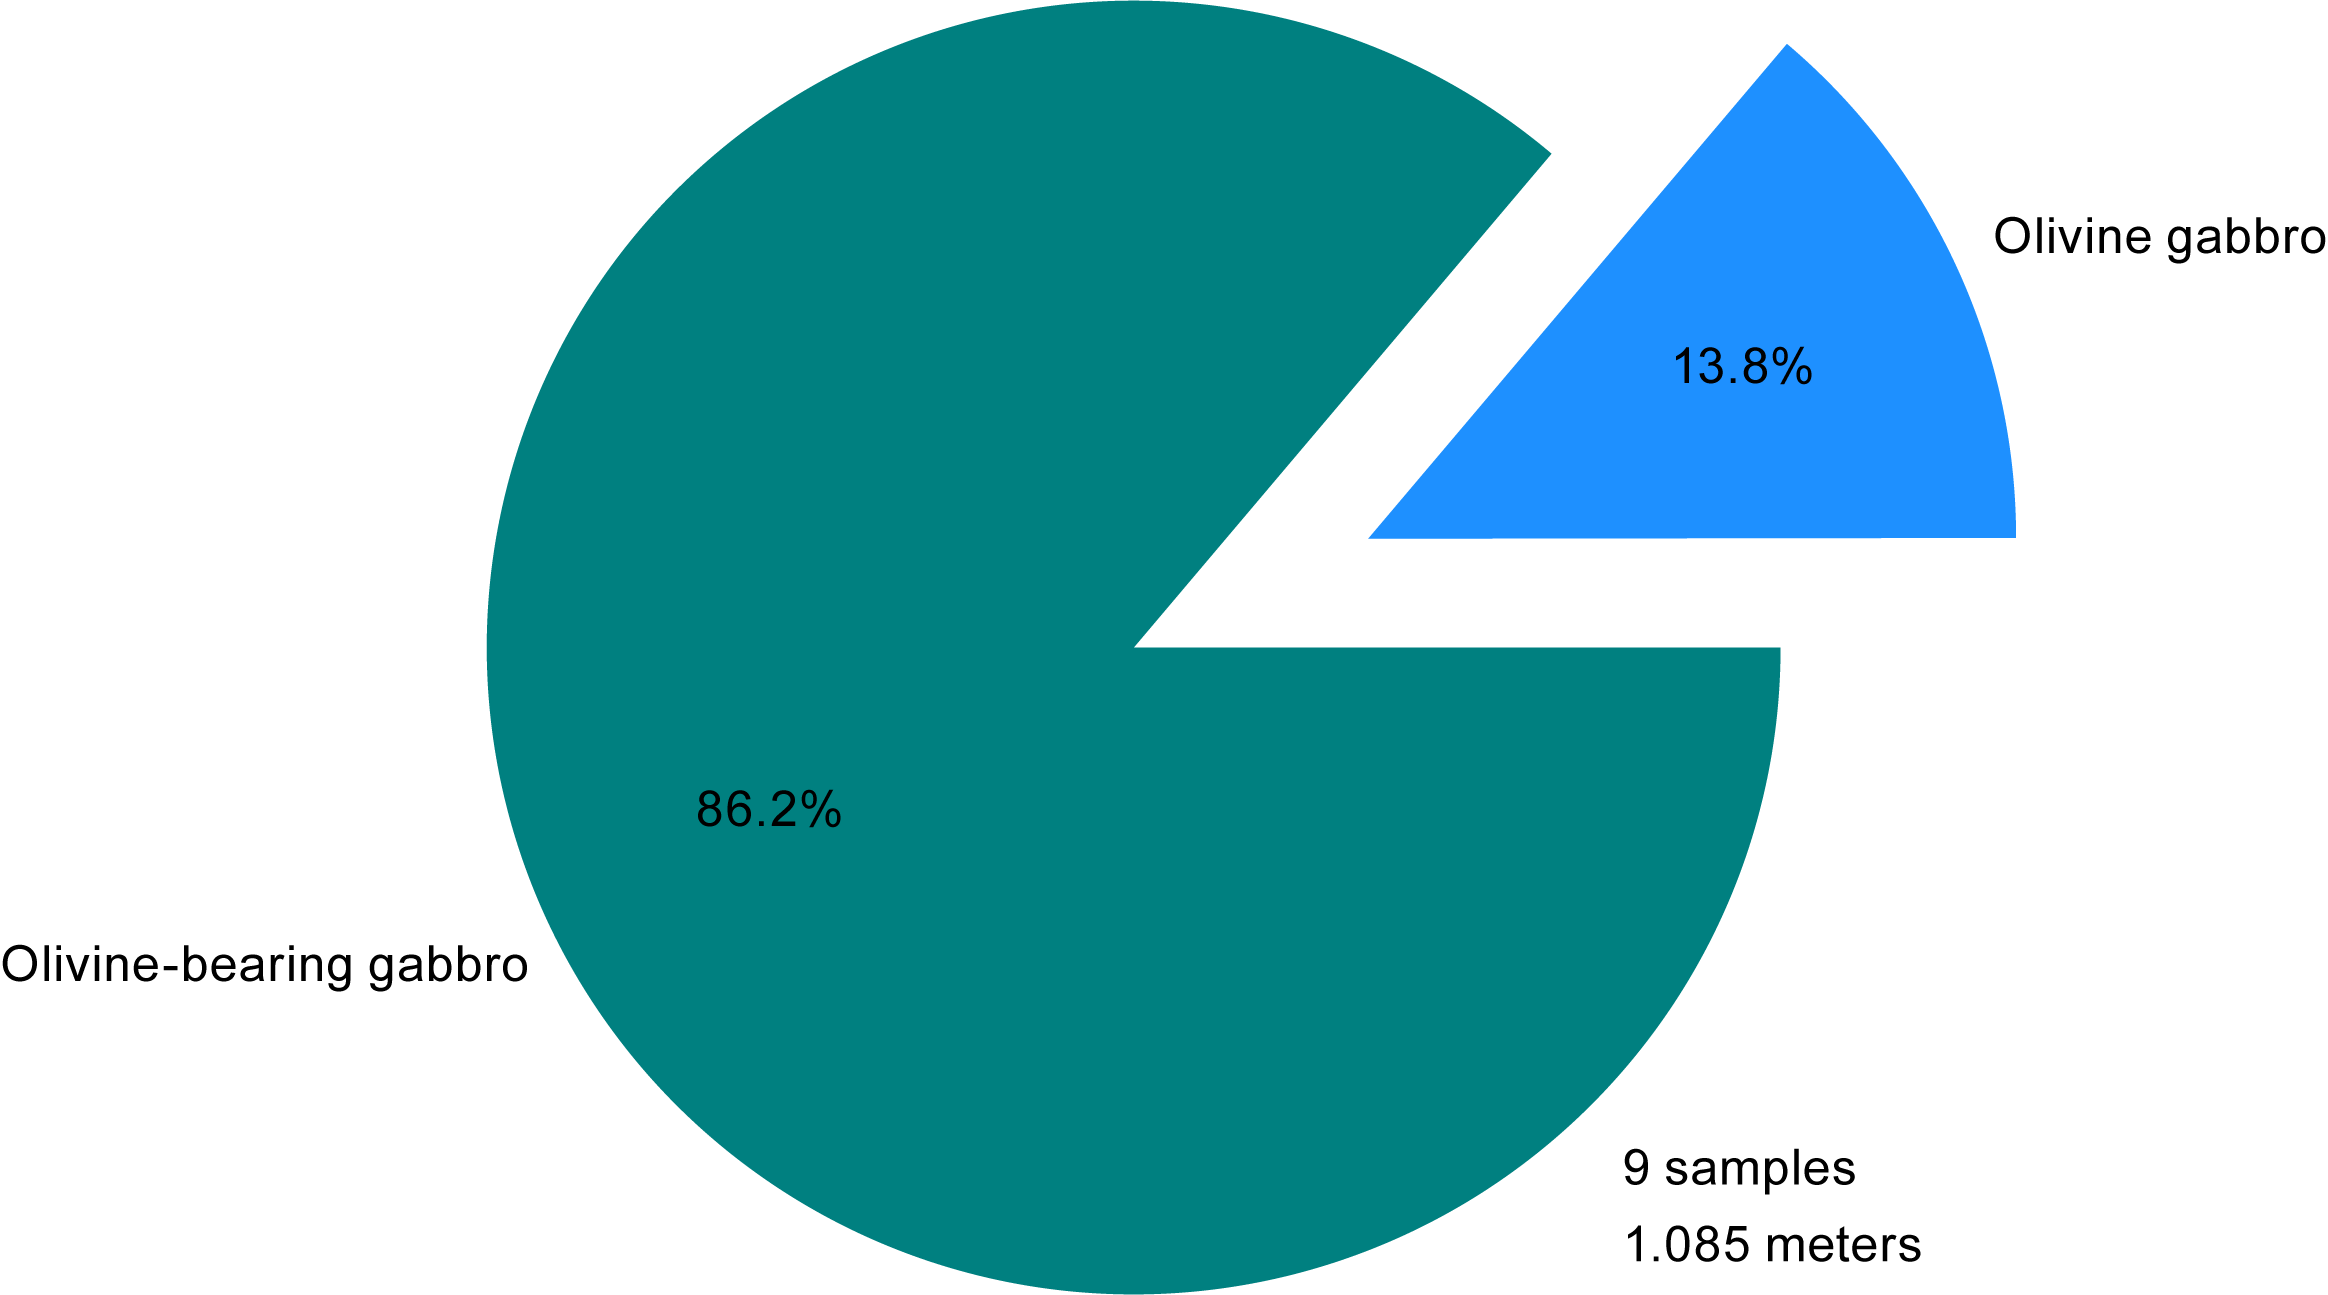
Figure F55. General lithologies, microbiology whole-rounds.
Each of the nine Hole U1309D samples was rinsed, photographed, and separated into exterior and interior materials according to our standard methodology. Subsamples from each of the nine whole-round samples were collected for cell counts, DNA sequencing, lipid characterization, and organic carbon analyses. Subsamples for single-cell activity assays were collected from six of the nine Hole U1309D samples. Stable isotope tracer experiments were conducted with four of the samples. Subsamples for virus counts, enrichment cultivations, and scanning electron microscope (SEM) imaging were collected from the first five cores. High-pressure cultivation experiments were conducted with subsamples collected from the first two cores (399-U1309D-297R and 298R).
Perfluorocarbon tracer (PFT) levels in the interior sections of all nine Hole U1309D microbiology whole-round samples were below detection or at very low levels (maximum = 0.1 parts per billion [ppb]) (Figure F56). In contrast, PFT was detectable in the exterior shavings of all microbiology whole-round samples except one, ranging from trace levels to 22 ppb. Samples of core rubble were also collected from five of the cores, and these contained the highest levels of PFT, ranging 3–23 ppb. PFT levels were generally higher in Hole U1309D samples compared to Hole U1601A samples because of an accidental increase in the rate of PFT delivery while drilling at the site. Nevertheless, the consistent reduction of PFT levels from rubble to exterior zones to interior zones indicates the efficacy of our procedures for limiting contamination into the interior zones of the core samples.
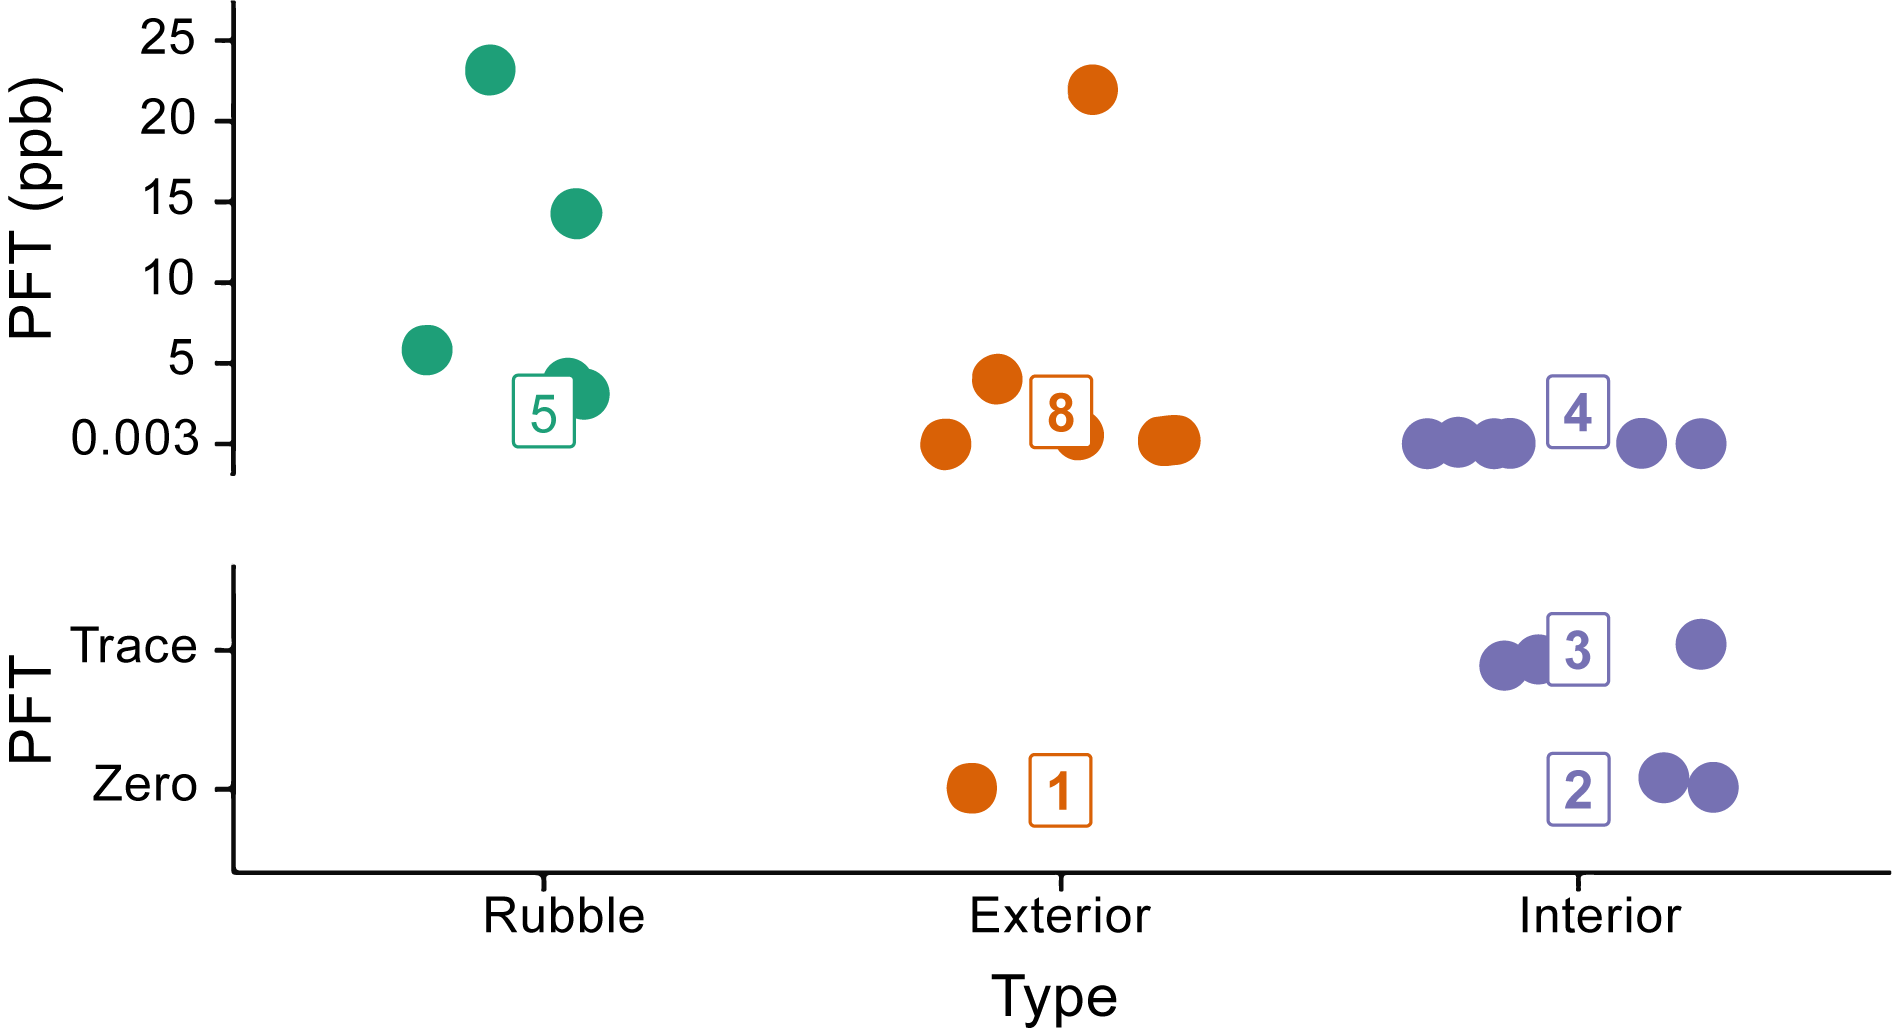
Figure F56. Concentrations of PFT detected in samples.
Water samples collected with the Niskin bottles, MTFS, and KFTS were subsampled for microbiological analyses intended to characterize the extent, diversity, and activity of microbial communities within Hole U1309D (see Geochemistry in the Expedition 399 methods chapter [Lang et al., 2025]). Subsamples for cell counts and single-cell activity assays were collected from all four of the high-volume MTFS samples (Bottles 1, 2, 4, and 5) and all KFTS and Niskin samples. In addition, MTFS Bottle 2 was subsampled for virus counts, enrichment cultivations, high-pressure cultivations, and stable isotope tracer experiments. Water from MTFS Bottle 4 (260 mL), the three KFTS bottles (250 mL each), and all Niskin bottles (3–5 L) were filtered through a 0.2 µm Sterivex filter cartridge intended for DNA sequencing.
The MTFS system also recovered blackened materials (mud, possessing a sulfidic smell) and rock fragments partially coated in iron oxides (Figure F57). Suspending these materials in sterile seawater (399-U1309D-MTFS-#1-04-solids) demonstrated the fine-grained nature of the black materials, which became easily suspended in seawater (Figure F58 inset), as well as the presence of potentially fossilized filamentous iron-oxidizing bacteria in solution (Figure F58). This fine-grained metal sulfide-containing mud is inconsistent with sampling the wall of the pipe versus the wall of the borehole. Nonetheless, the iron oxide–coated clasts need to be examined using petrology to confirm that they are consistent with the gabbro lithology of Hole U1309D. With this confirmation, the material will be interpreted to have come from the wall of the borehole. Subsamples were collected in 10 mL serum bottles (~5 cm3 solids) and topped with sterile seawater for SEM imaging, enrichments, and DNA sequencing analyses.
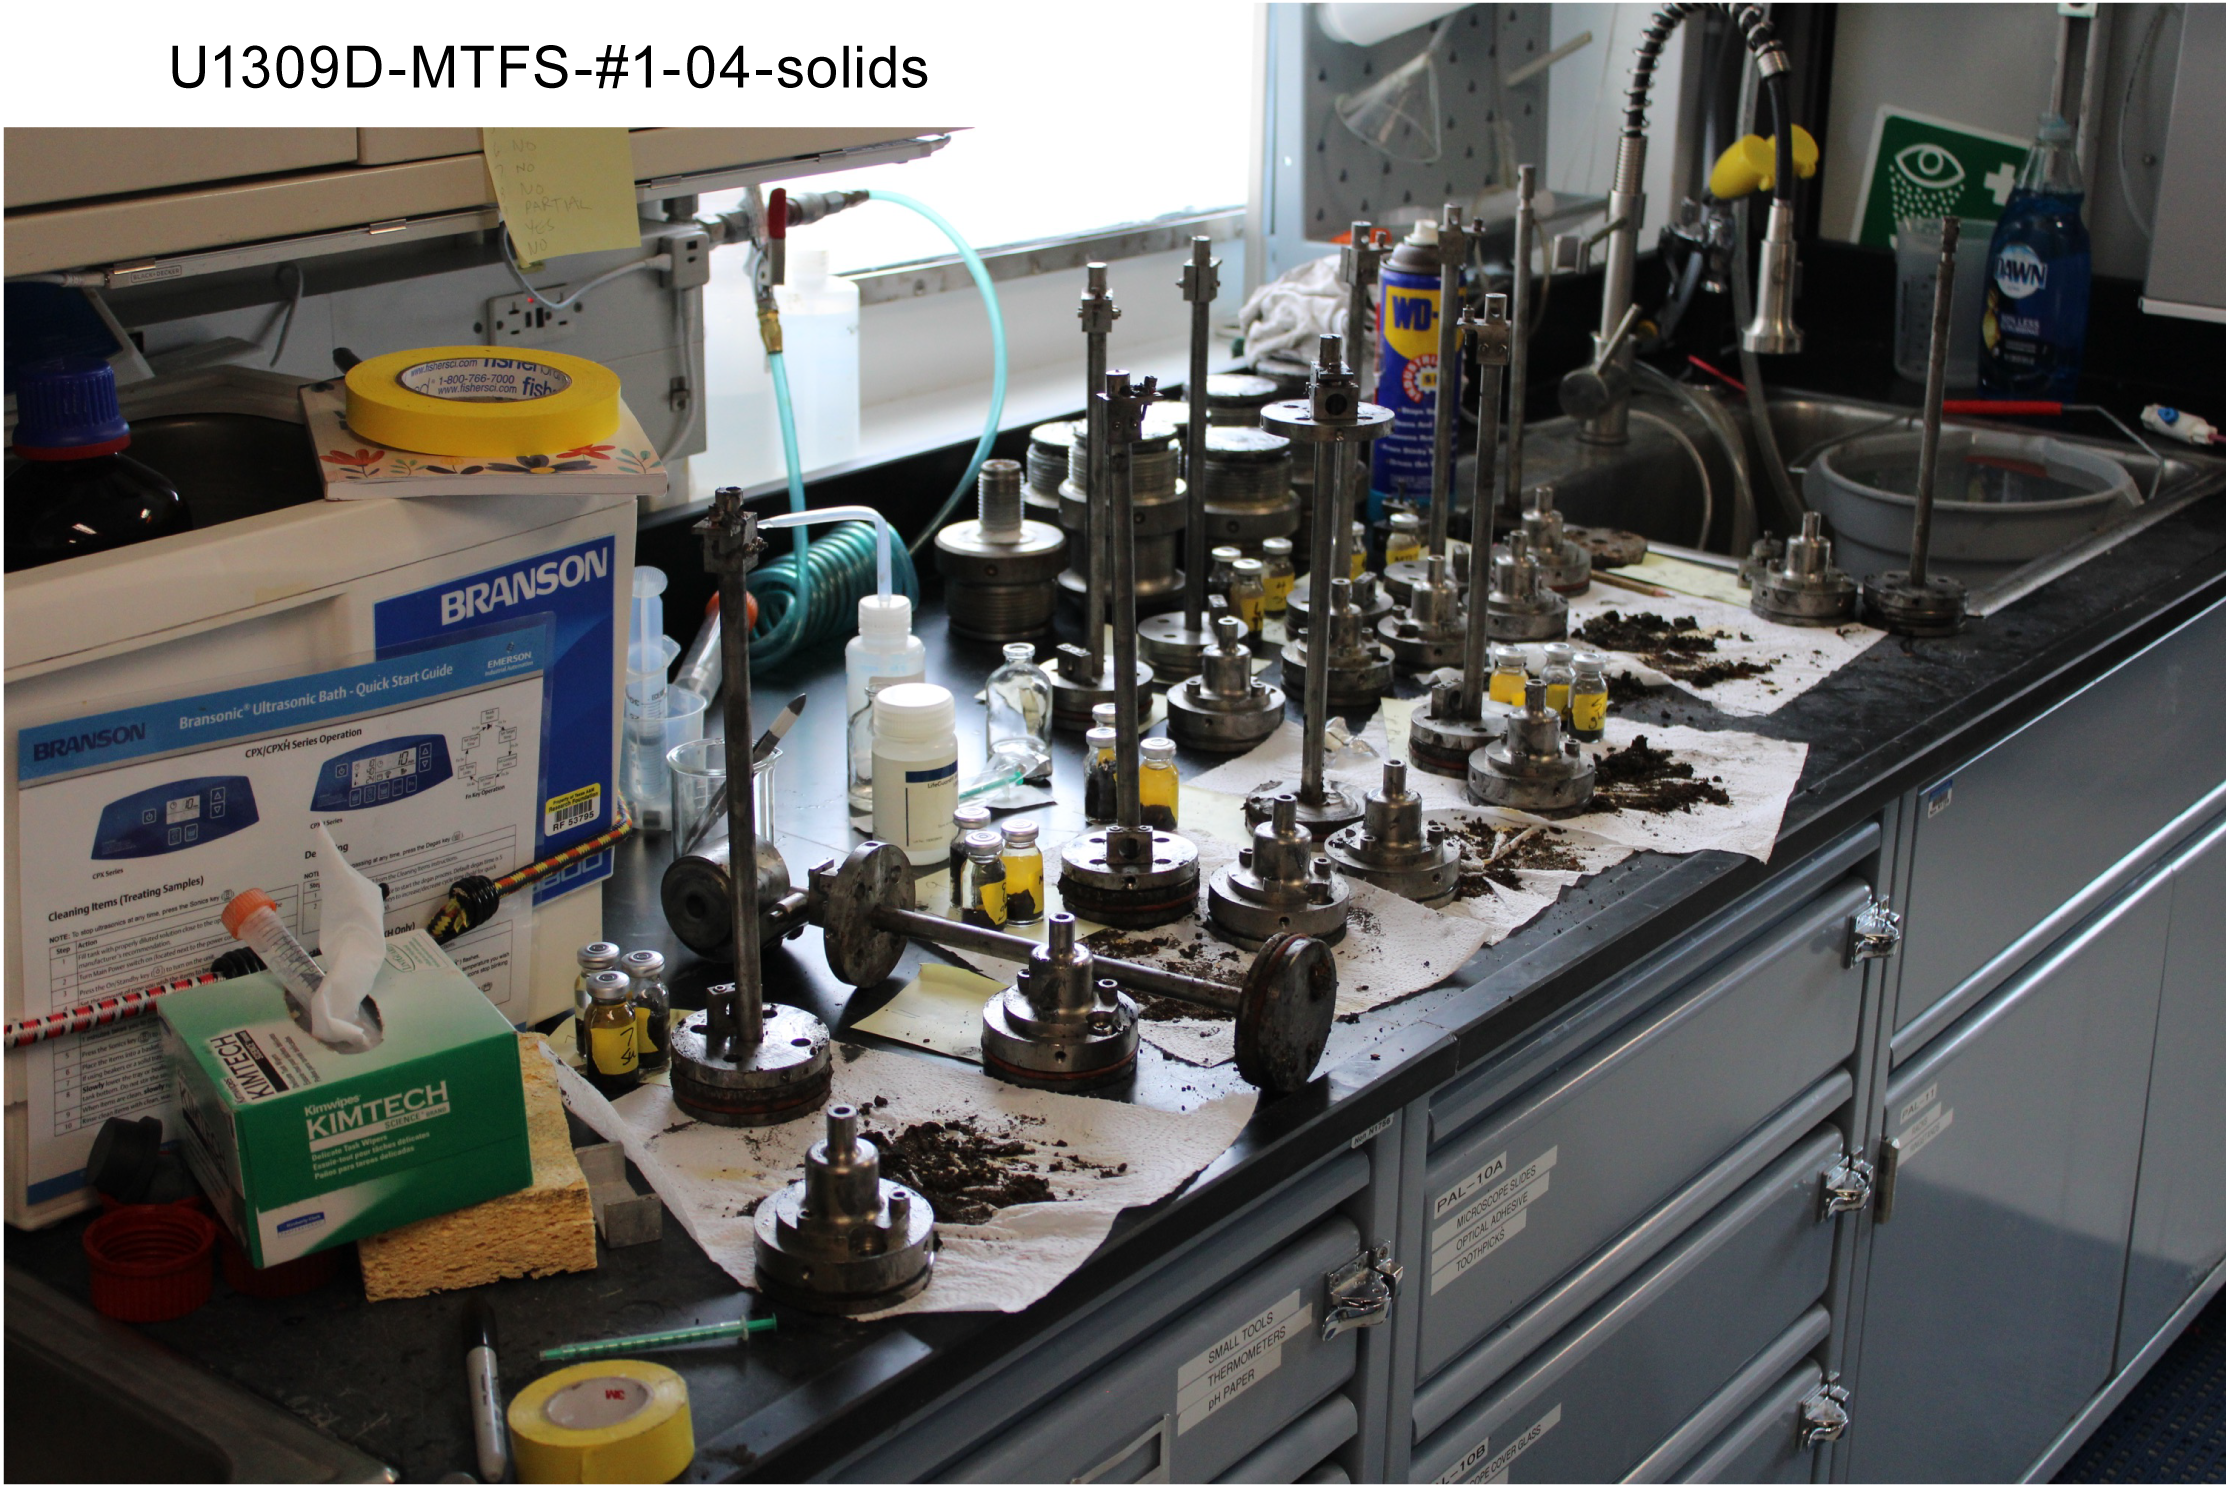
Figure F57. After MTFS was disassembled.
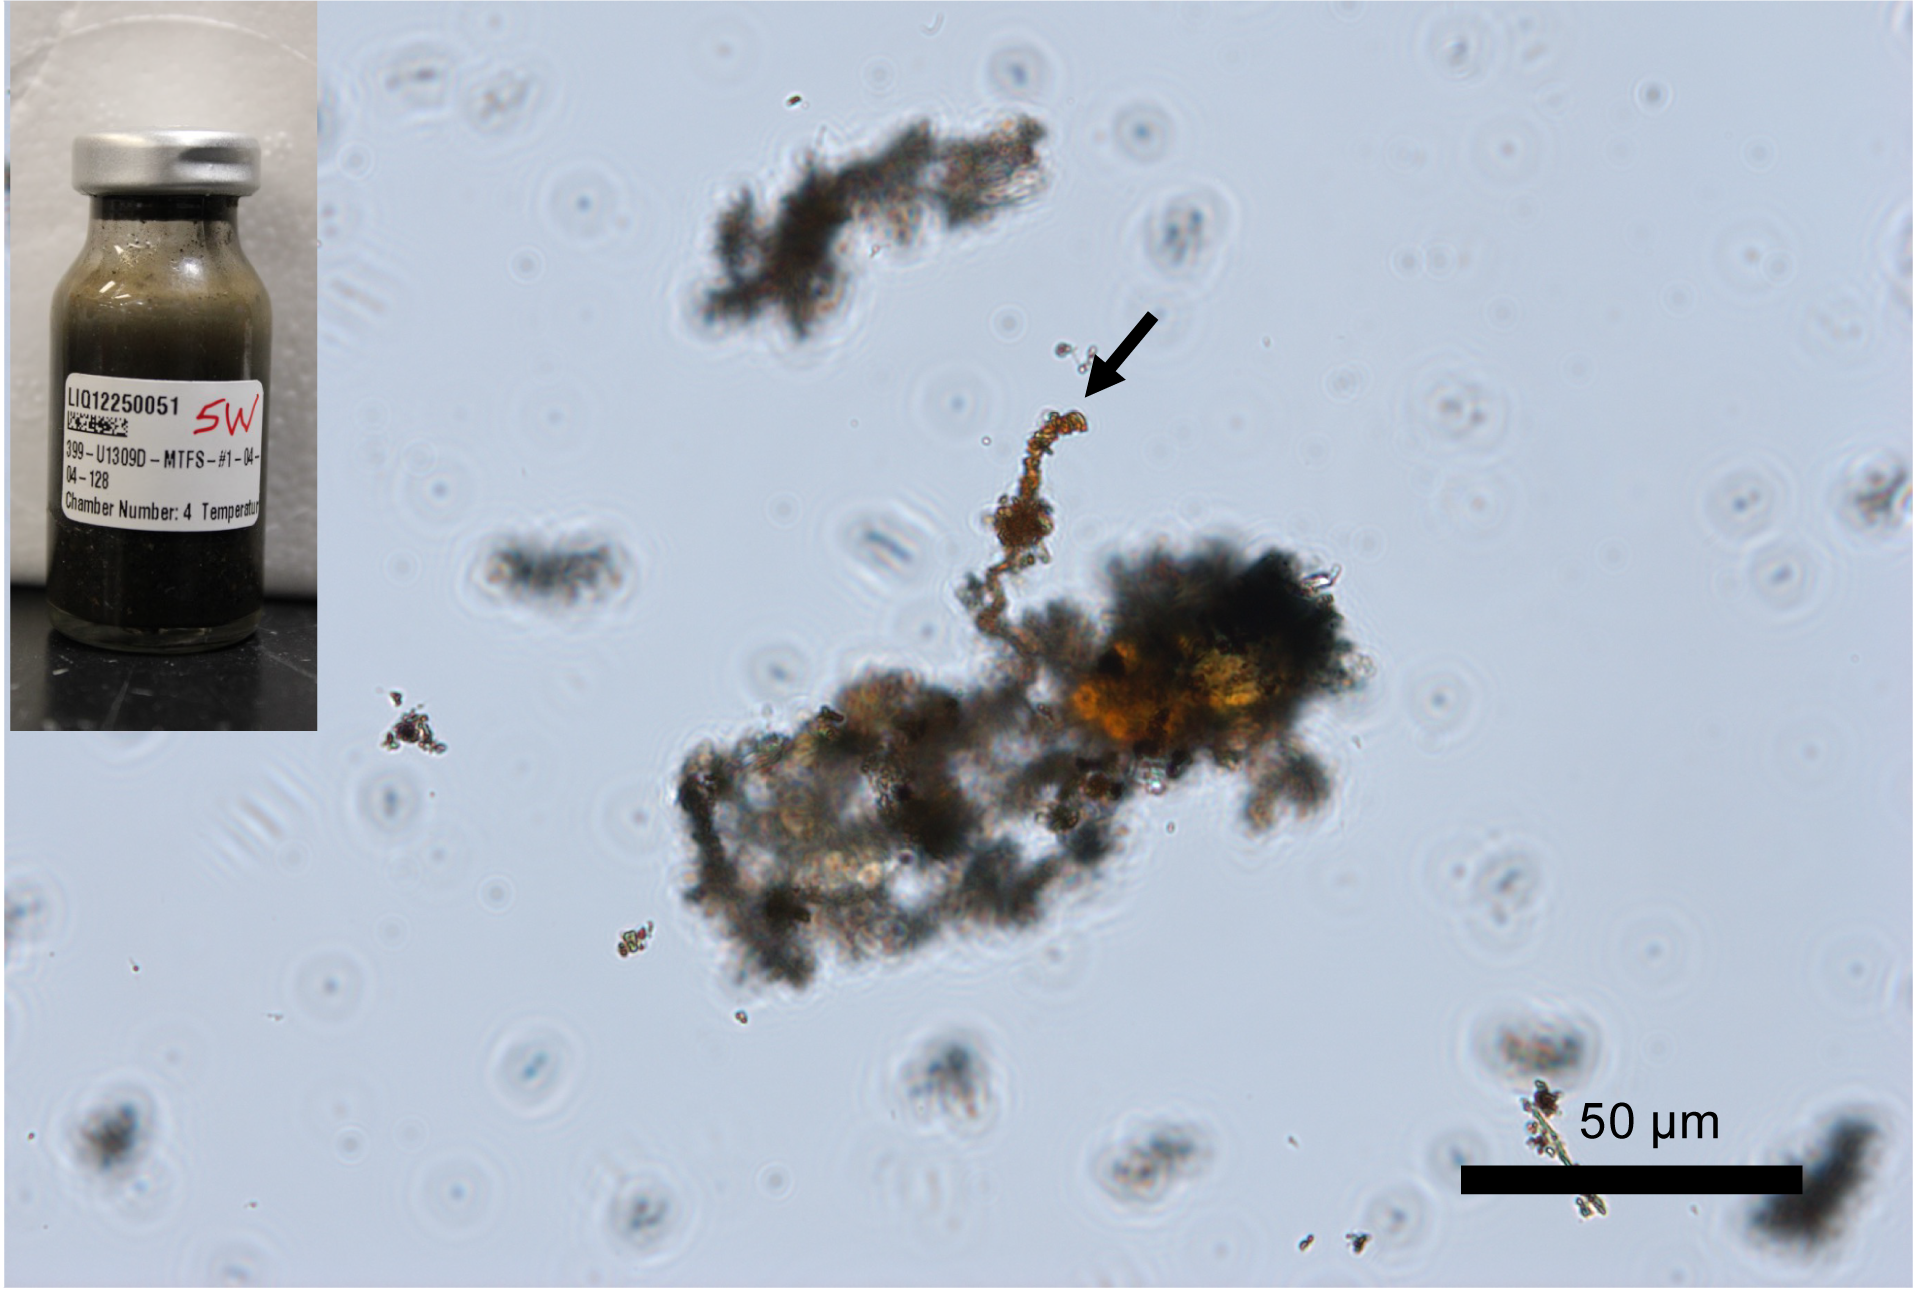
Figure F58. Seawater enrichment culture.
Washed solids revealed more extensive iron oxide precipitates (Figure F59 inset), possessing filamentous bacterial fossils, observed using secondary electron scanning electron microscopy (Figure F59). The combined occurrences of metal sulfides and ferric oxyhydroxides demonstrate varied redox conditions in the borehole.
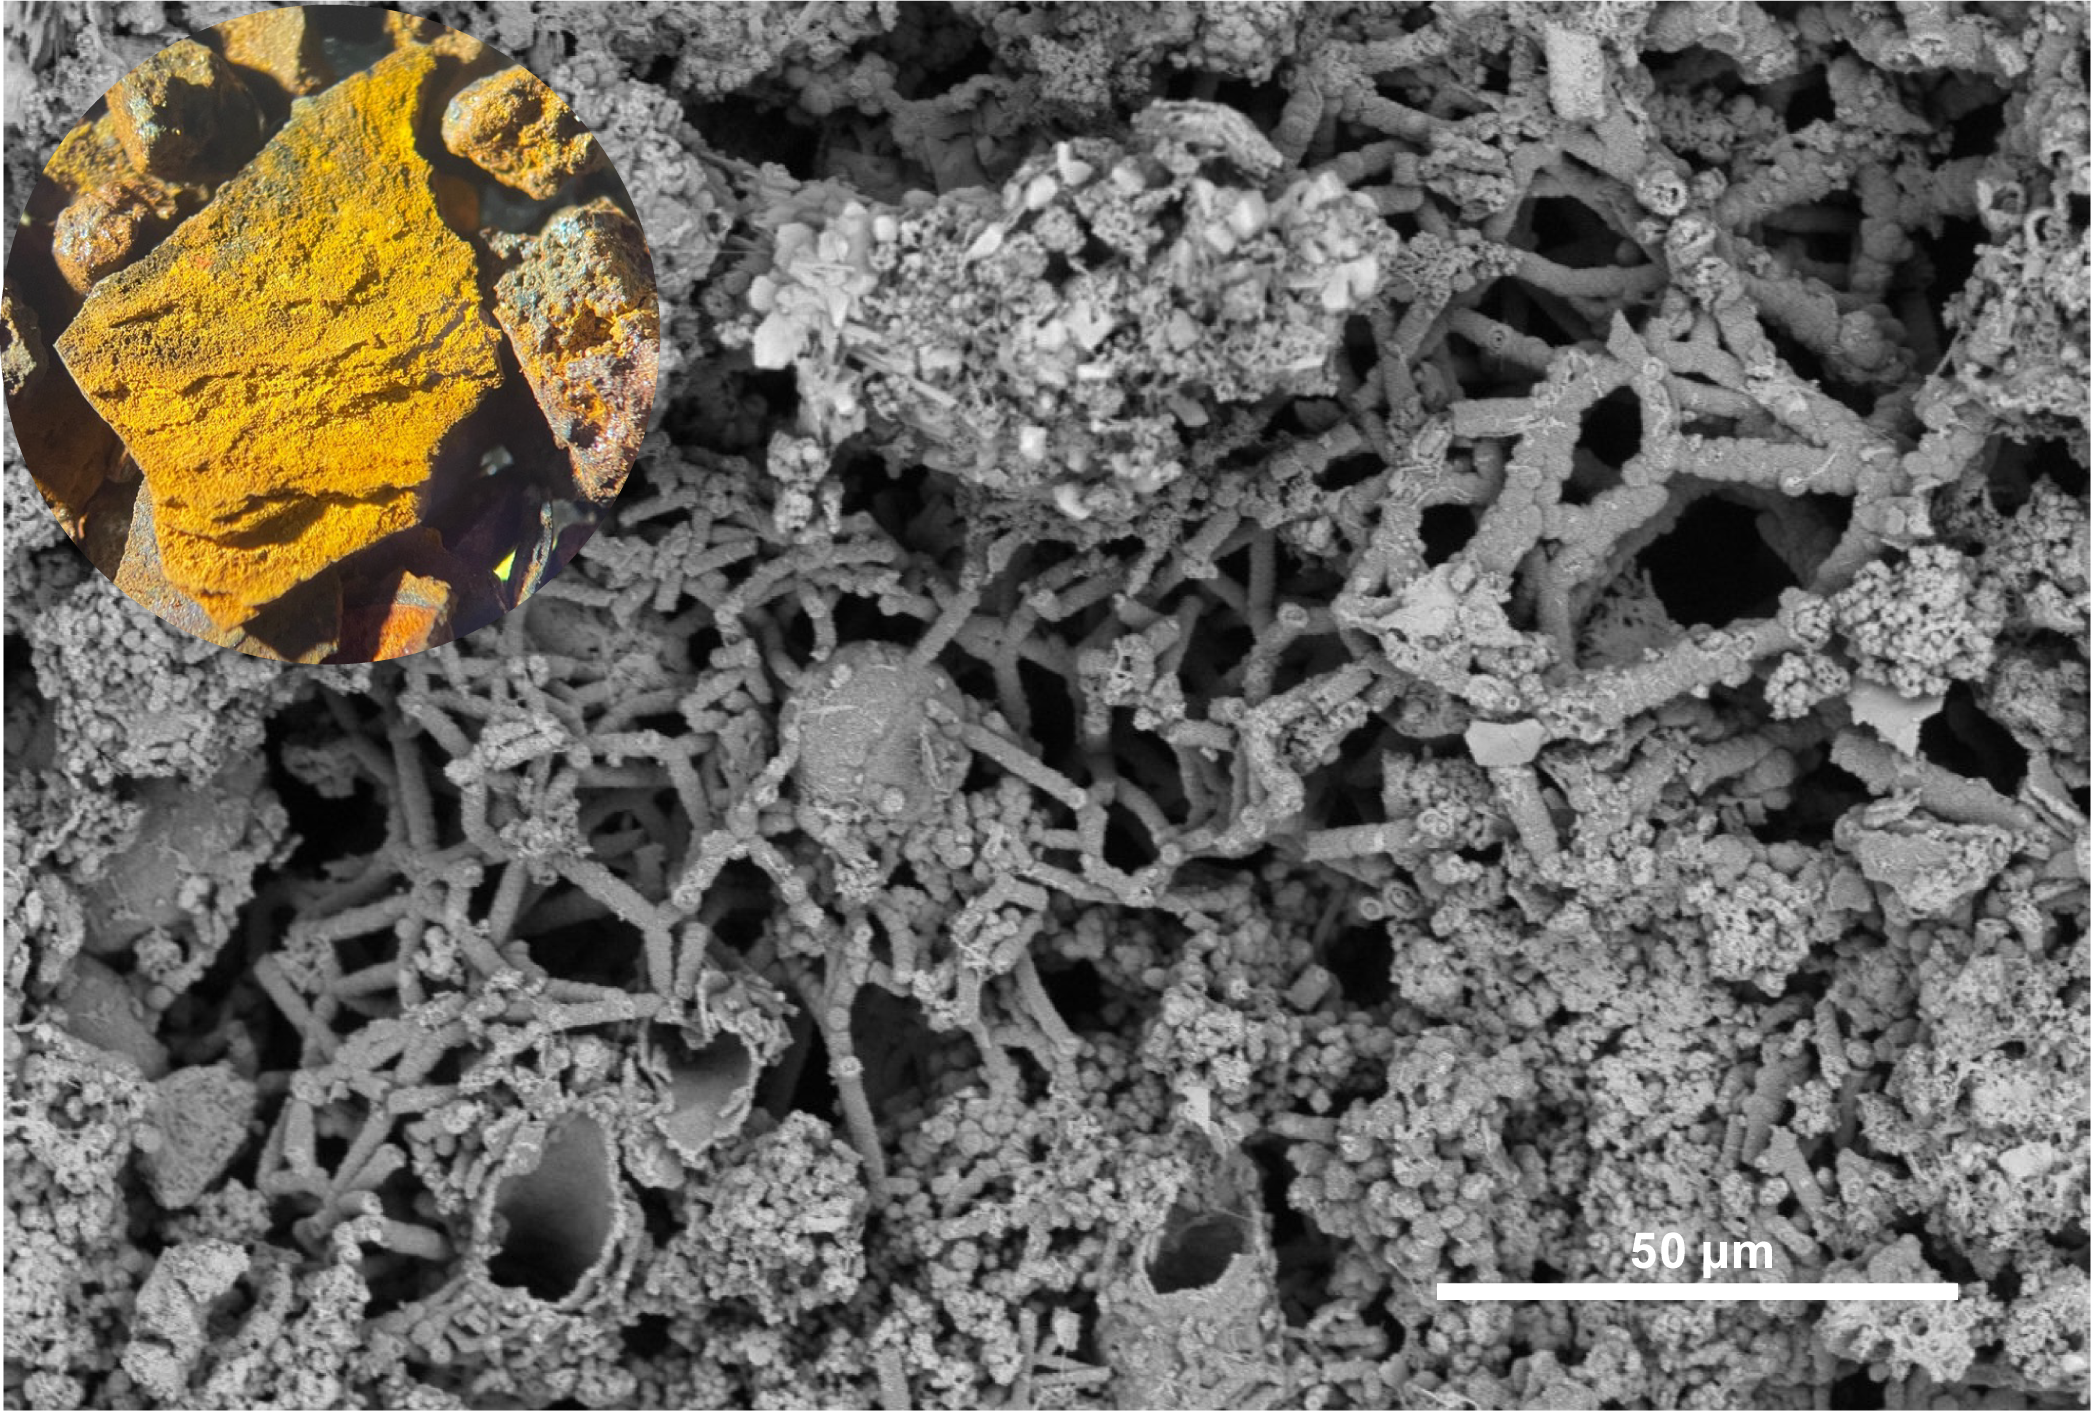
Figure F59. Iron oxide.
After incubation for ~5 weeks at 20°C, acridine orange-stained (0.1% wt/vol), rod-shaped, and vibrioid bacteria became readily visible in the enrichment culture (Figure F60A) where they were primarily associated with the iron oxyhydroxide aggregates observed using co-located transmitted light microscopy images (Figure F60B).
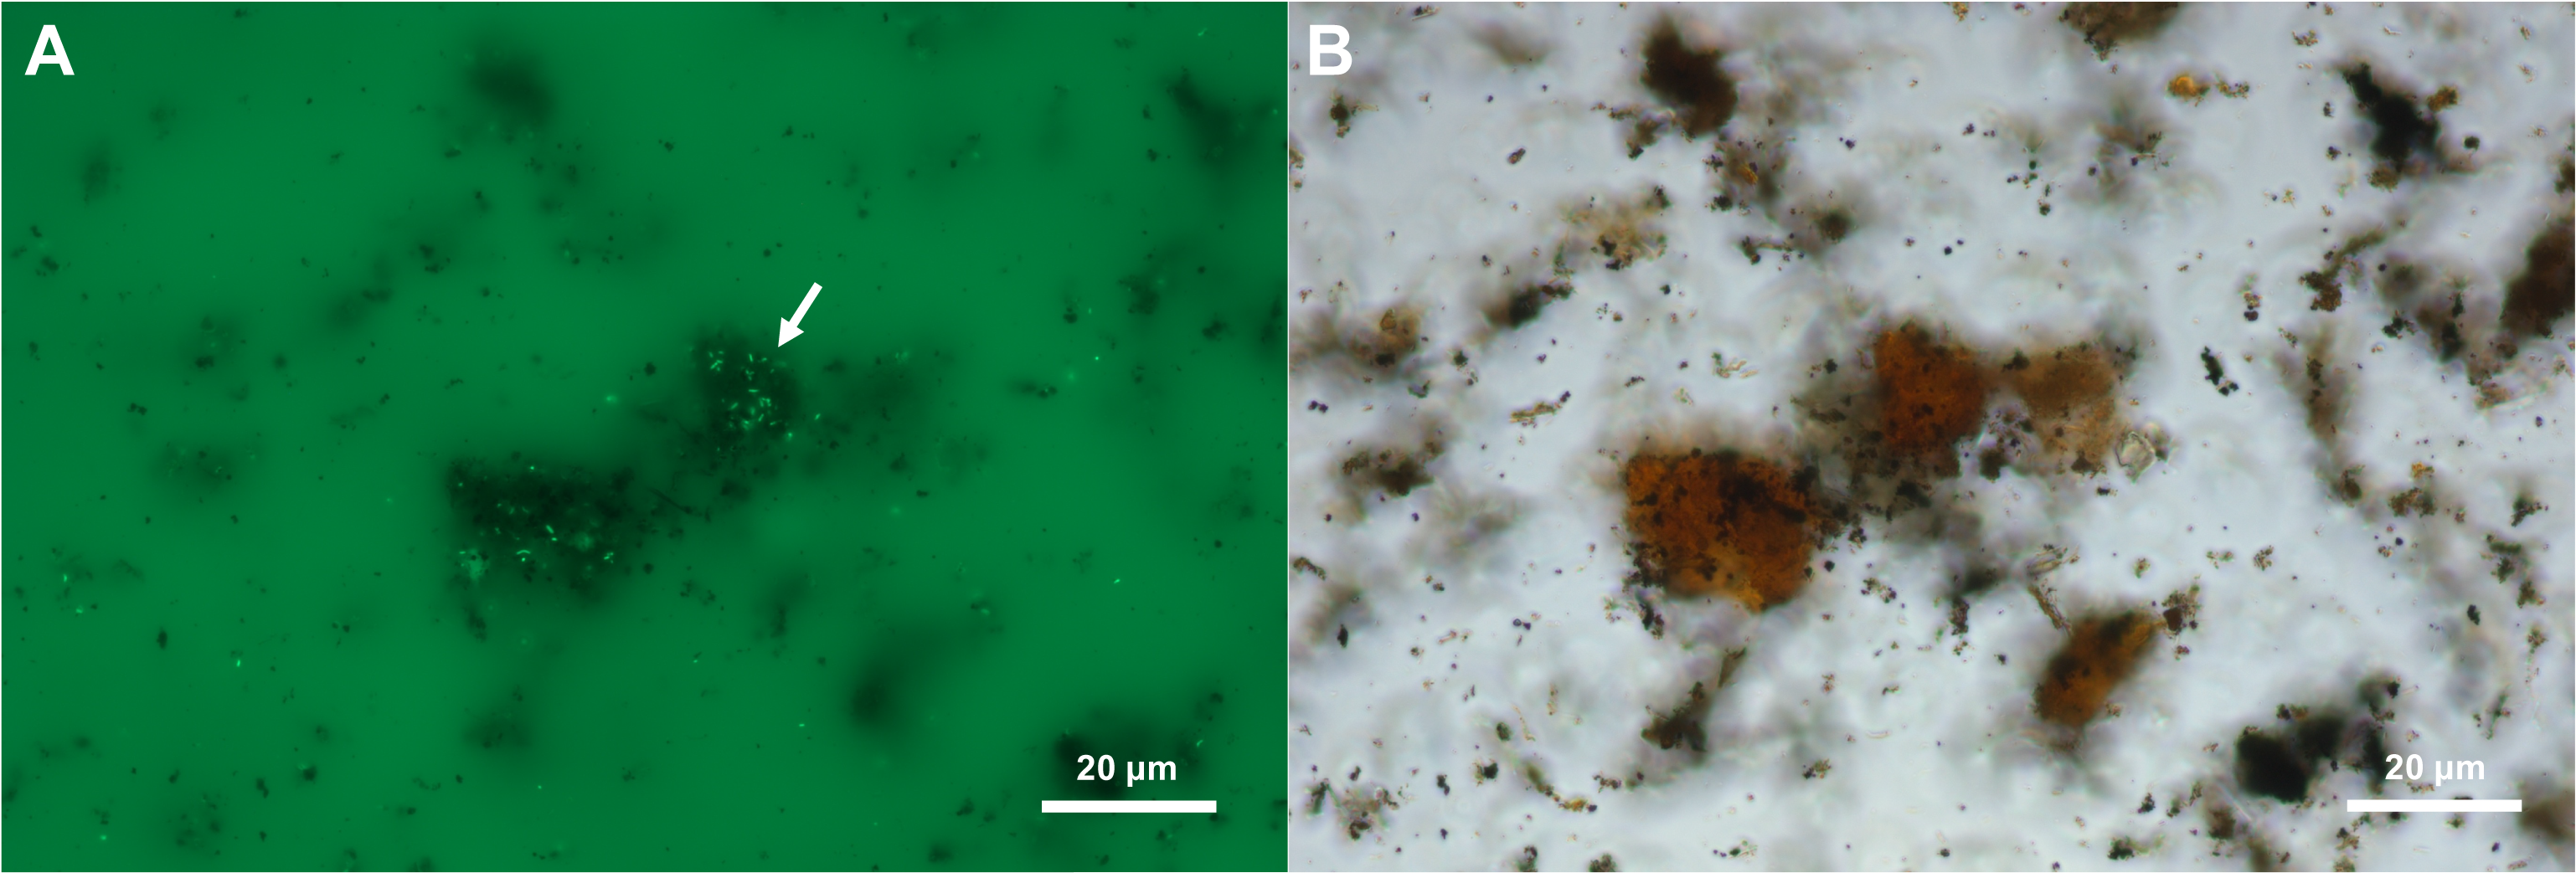
Figure F60. Acridine orange-stained sample.
8. Petrophysics
The petrophysical properties of gabbro in Expedition 399 Hole U1309D were characterized with measurements on whole-round sections, section halves, and discrete samples from Cores 399-U1309D-297R through 313R (1415–1498 mbsf). A total of 48 whole-round sections and section halves were measured for natural gamma radiation (NGR), magnetic susceptibility (MS), and gamma ray attenuation (GRA) density. Discrete measurements were completed on rock cubes and included wet mass, dry mass, dry volume, and P-wave velocity. Bulk density, grain density, and porosity were calculated from the mass and volume measurements. A total of 31 discrete cube samples were analyzed. Additionally, 17 archive half core pieces >10 cm in length were selected for thermal conductivity measurements. All methods are described in Petrophysics in the Expedition 399 methods chapter (Lang et al., 2025). Rock names reported in this section were assigned by the igneous petrology team (see Igneous petrology). Data for all measurements are summarized in Table T12 and plotted in Figure F61 as a function of depth. Downhole temperature logs were completed; no wireline logging was attempted in this hole. Downhole fluid sampling results are reported in Geochemistry.
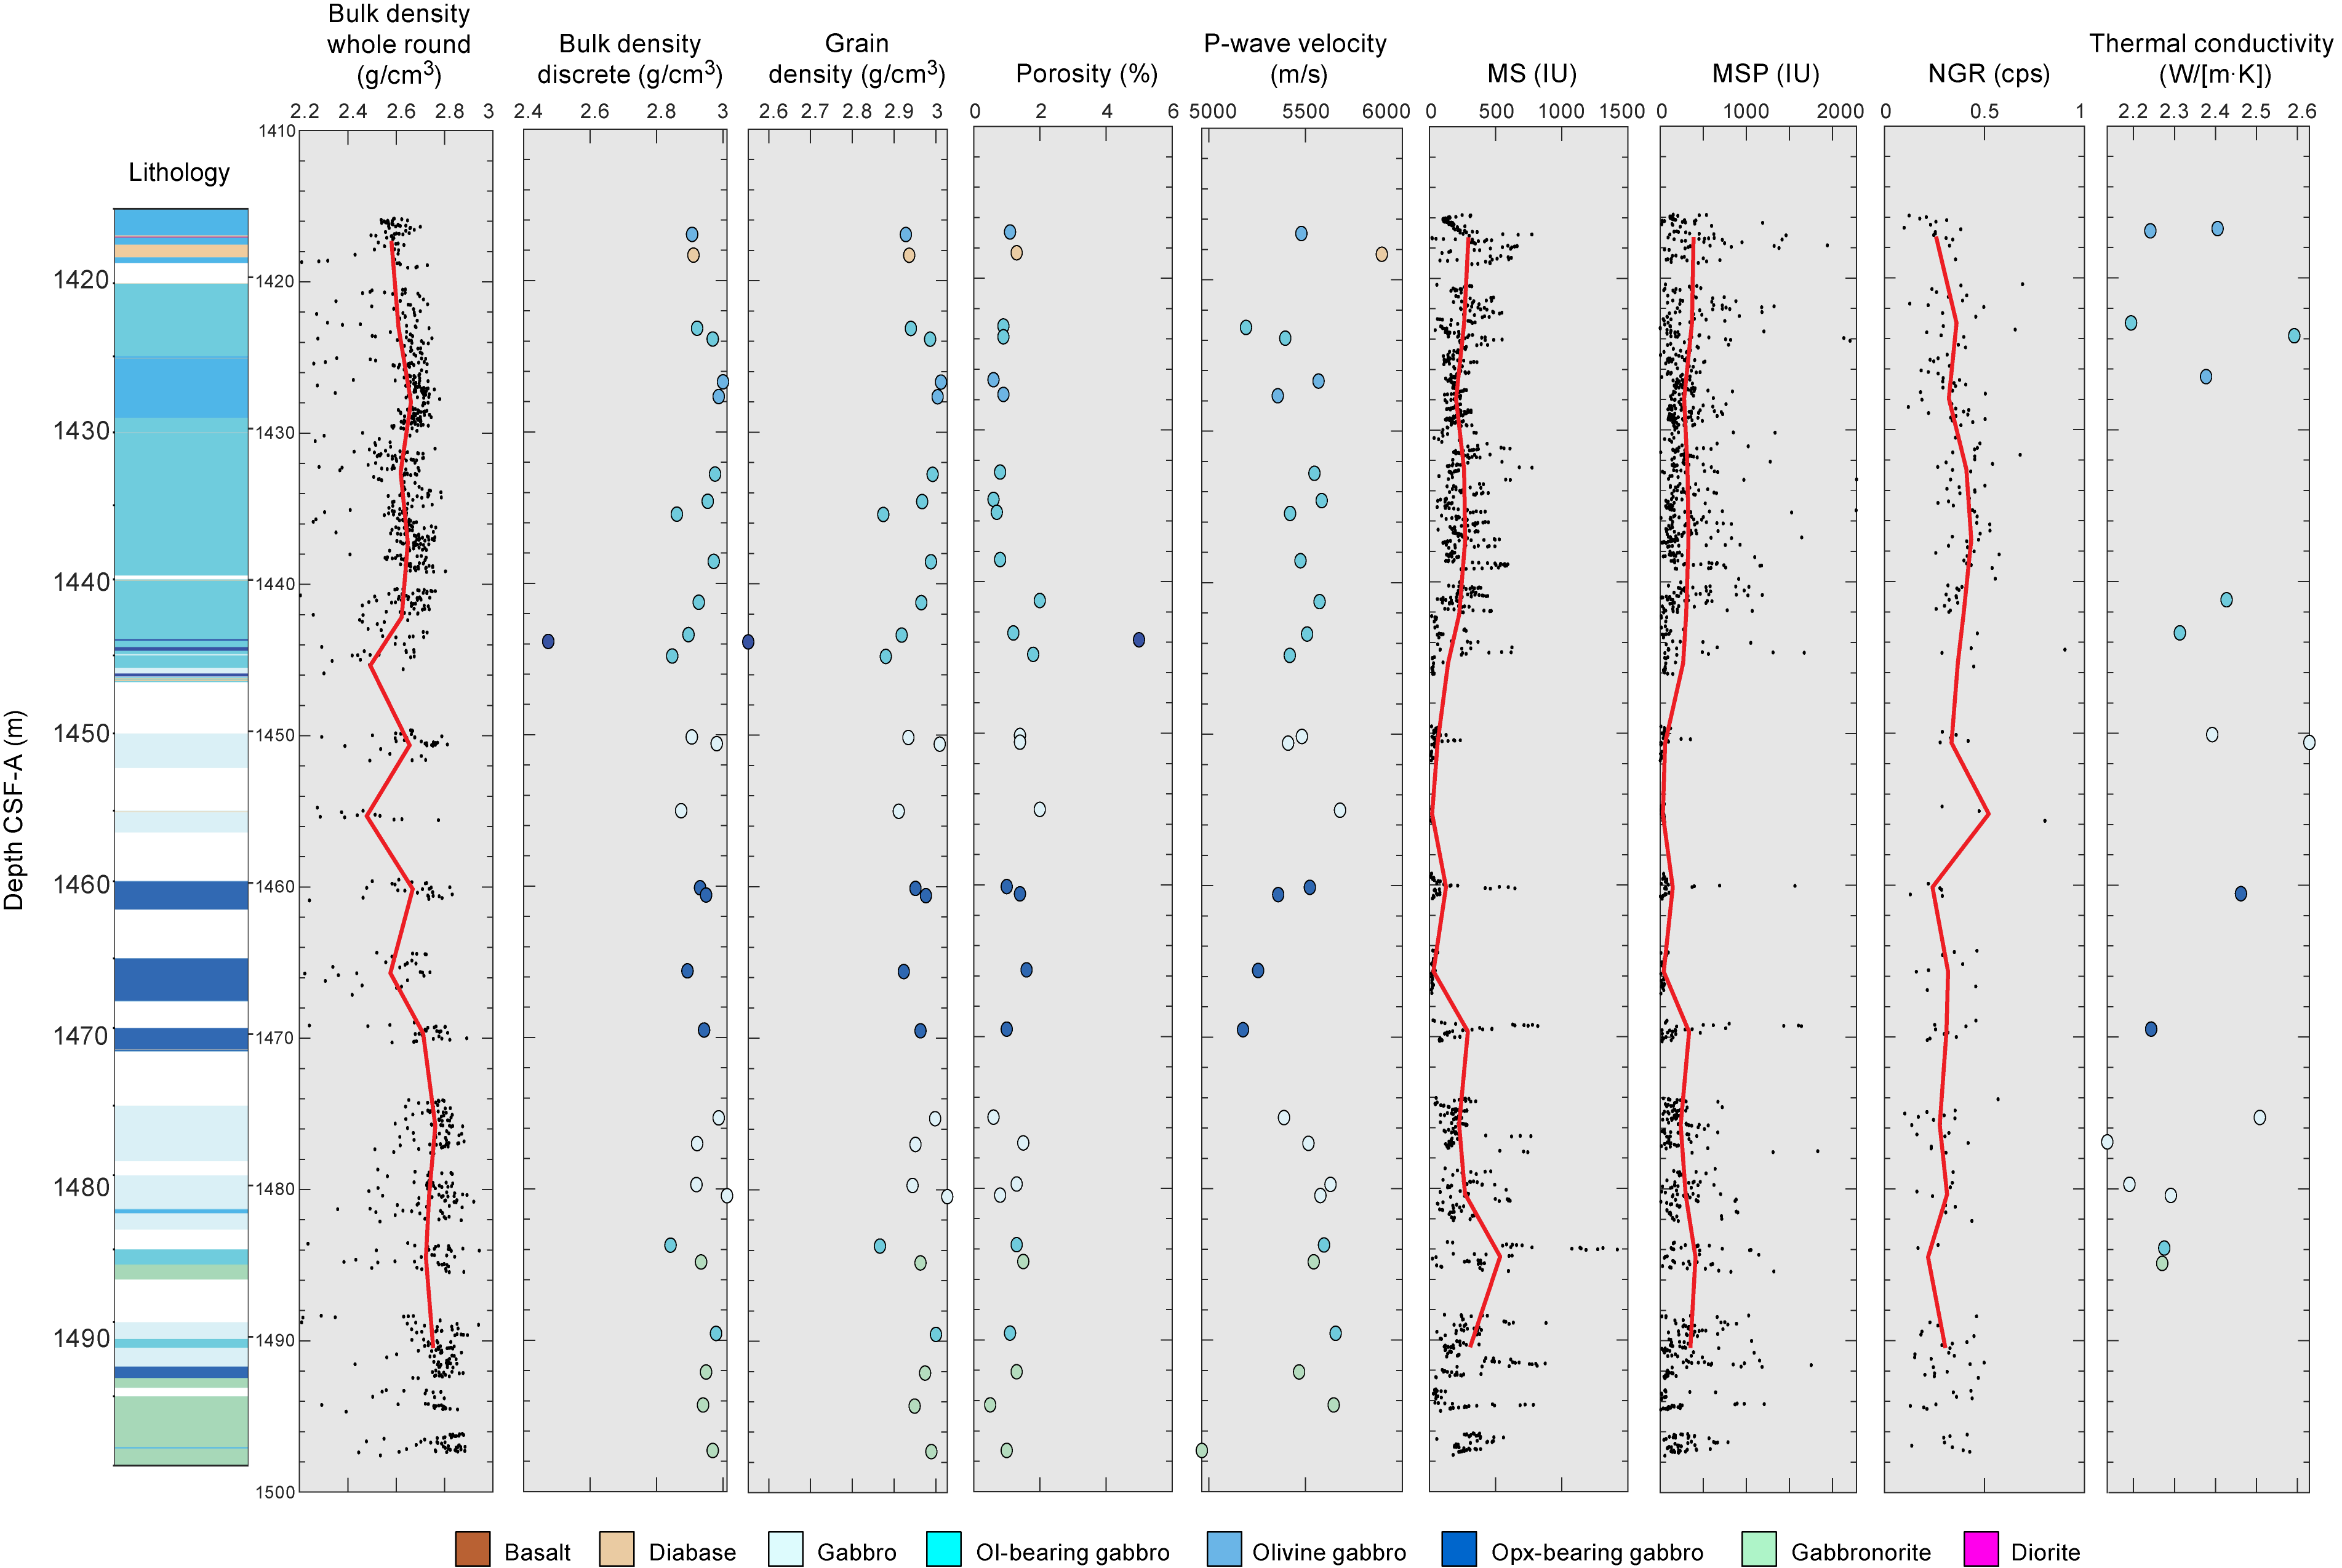
Figure F61. All petrophysical properties.
Whole-round section measurements required filtering because of spaces between pieces, to some extent fractures, and edge effects on many of the measurements. Filtering was mainly done through a semiautomated MATLAB GUI where data was viewed and clipped section by section (see U1309-H-ST1.xlsx in PETROPHYS in Supplementary material; see also Petrophysics in the Expedition 399 methods chapter [Lang et al., 2025]).
8.1. Hole U1309D
8.1.1. Density and porosity
Bulk density measured on discrete samples ranges 2.5–3.0 g/cm3 with an average and standard deviation of 2.9 ± 0.1 g/cm3 (Table T12). GRA bulk density measured on whole-round sections generally increases with depth, which is not as obvious in bulk density measured on discrete samples (Figure F61; see filtered data in U1309-H-ST1.xlsx in PETROPHYS in Supplementary material). Some intervals deviate from this trend, including a general decrease in density in Cores 399-U1309D-302R through 303R (1441–1445 mbsf) that is also mirrored in the grain density measured on discrete cube samples. Grain density ranges 2.87–3.03 g/cm3 with an average and standard deviation of 2.94 ± 0.08 g/cm3 (Table T12).
Porosity ranges 0.5%–2% and has an average and standard deviation of 1.27 ± 0.79% (Table T12). The highest porosity is in Cores 399-U1309D-302R through 305R (1441.2–1455.0 mbsf), which also includes an altered felsic dike that has a grain density of 2.55 g/cm3 and a porosity of 5%. This interval has poor recovery (~30%; hole average = ~60%), reduced torque on the pipe during coring, higher percent of alteration (see Alteration petrology) and cataclastic zones, likely indicating a fault zone (see Structural geology).
Bulk density, grain density, and porosity from Expedition 399 fall in line with the main trend in Hole U1309D cored during Expedition 304/305 (Figures F62, F63) (Expedition 304/305 Scientists, 2006b). At the base of the interval cored during Expedition 305, bulk density decreases, which is followed by the top of the interval cored during Expedition 399, and then bulk density increases to the bottom of the hole. Grain density follows the general increase with depth.
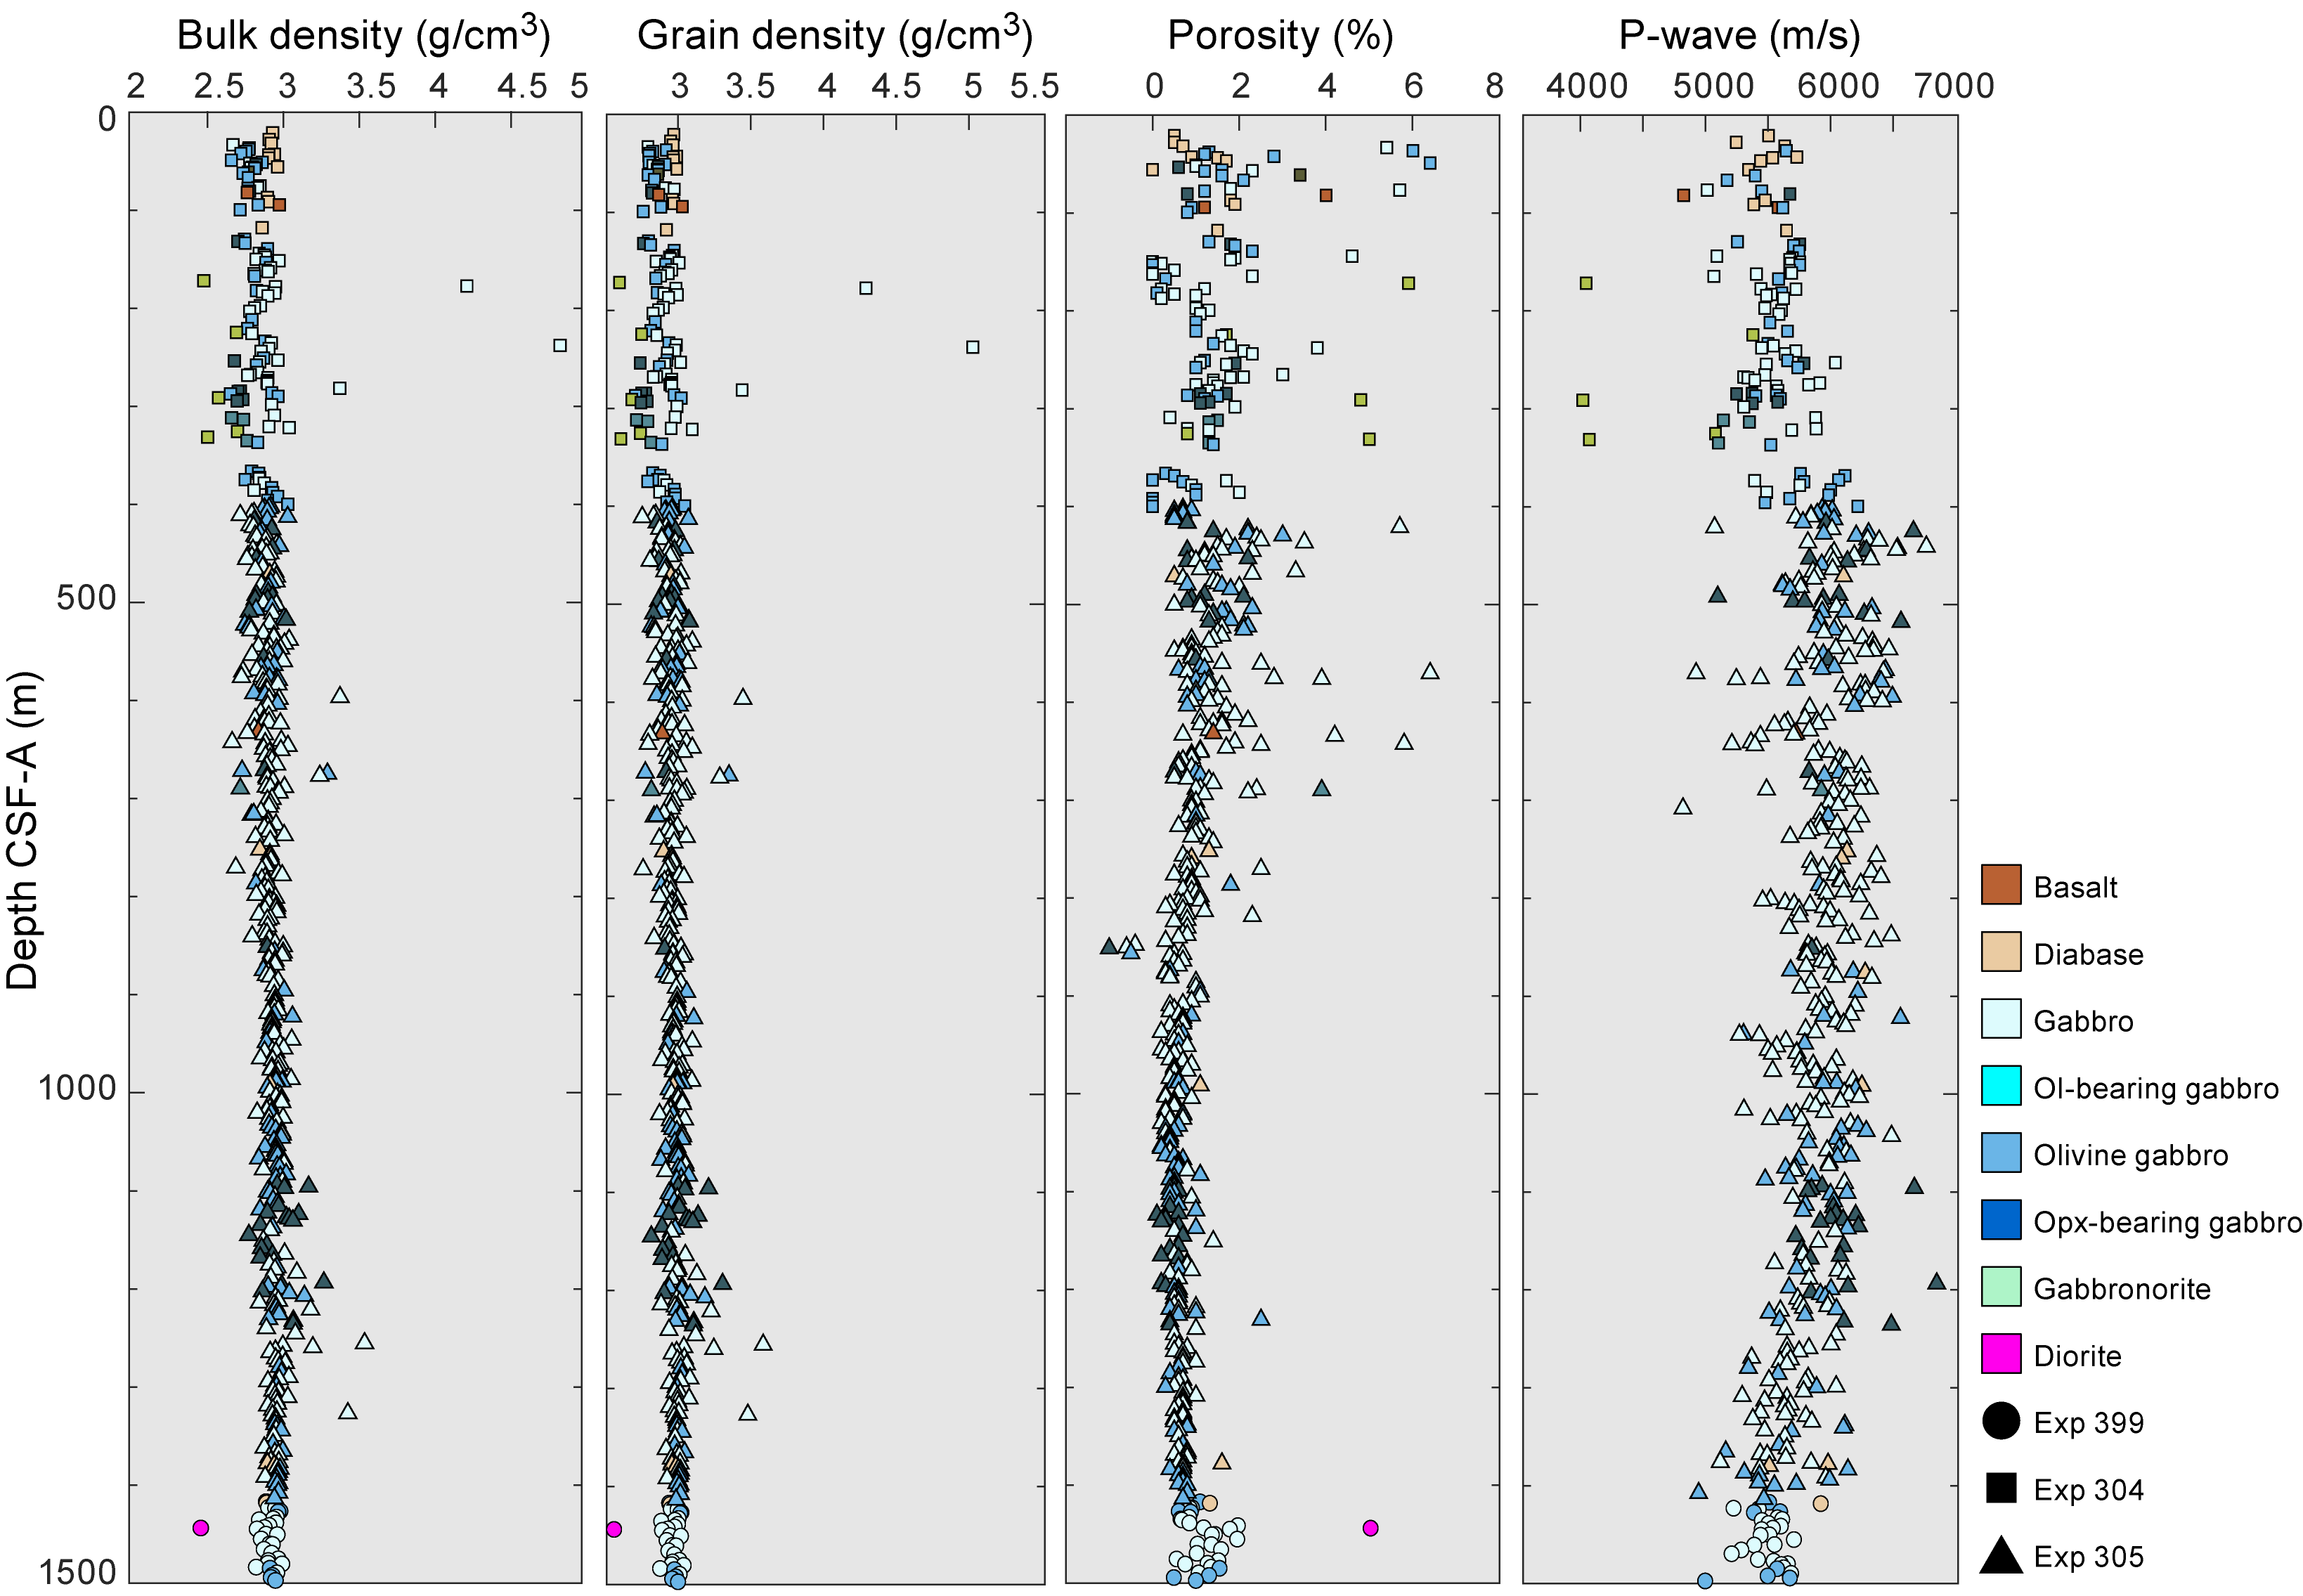
Figure F62. Physical properties, discrete samples.
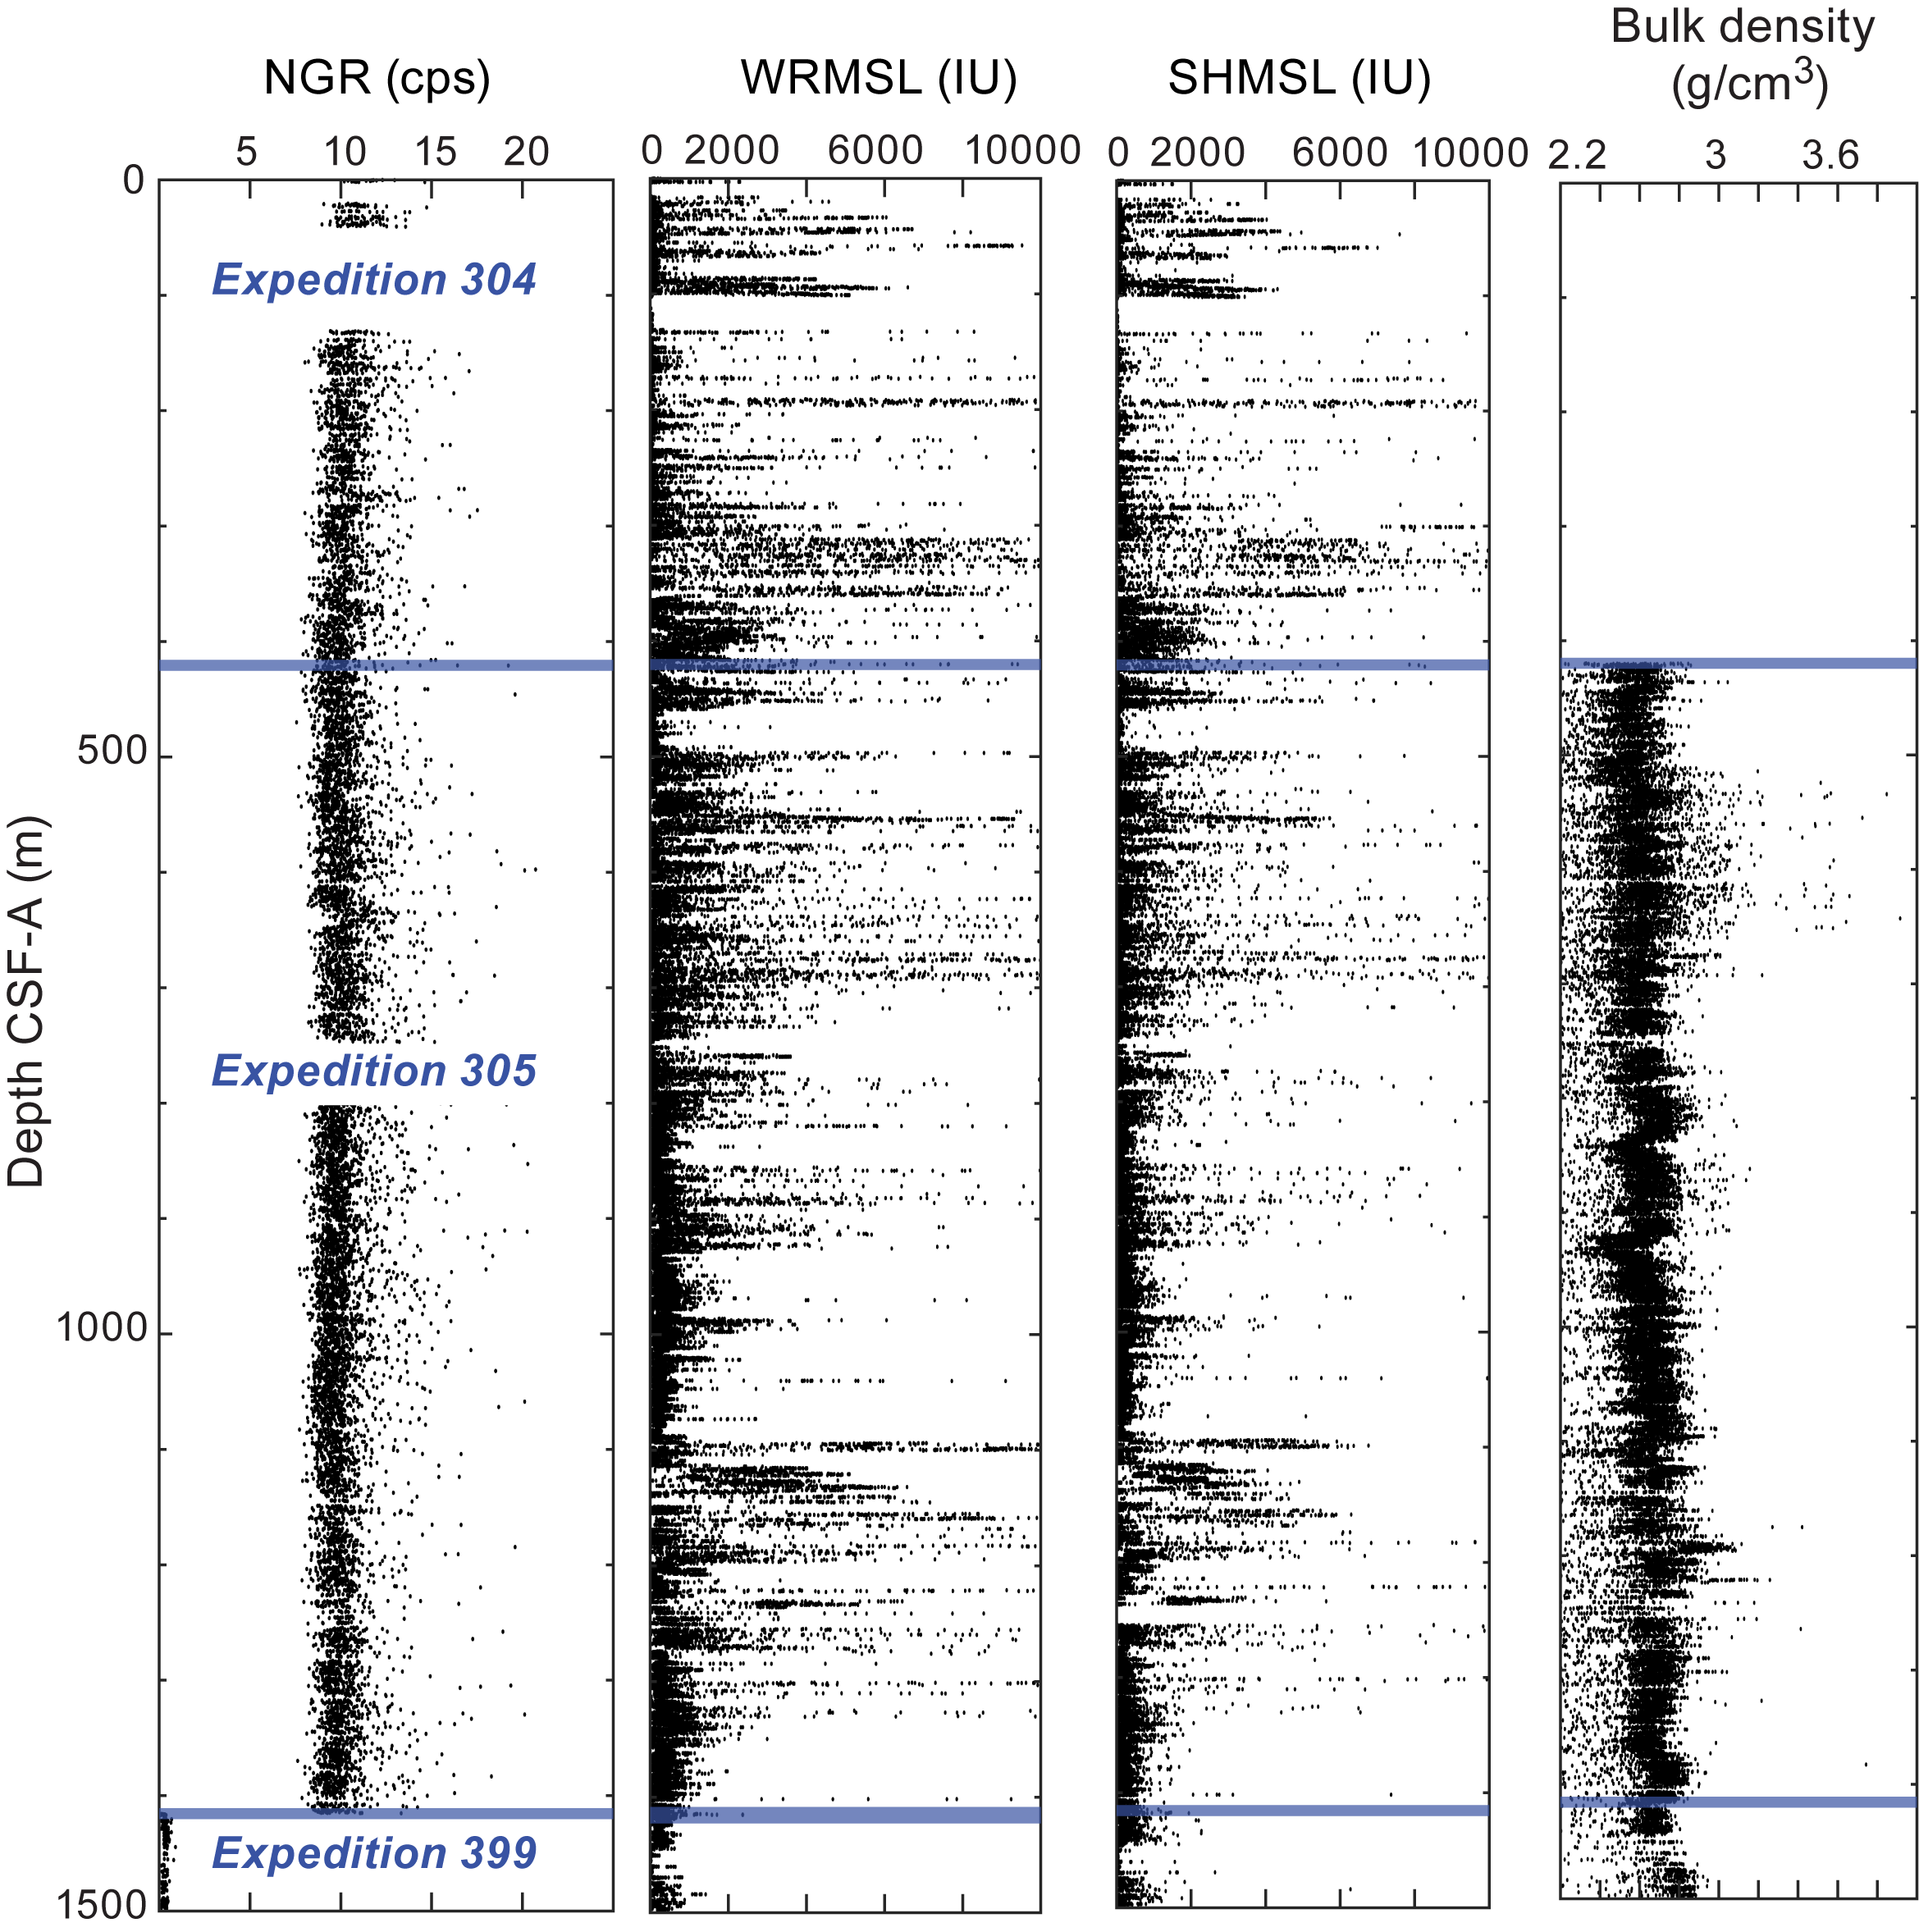
Figure F63. Physical properties, whole rounds.
Gabbro from International Ocean Discovery Program (IODP) Expedition 360 Hole U1473A (Atlantis Bank, Southwest Indian Ridge) has grain densities measured on discrete cubes that range 2.88–3.13 g/cm3 and average 2.97 g/cm3 (MacLeod et al., 2017). This is an almost exact match of the grain density in gabbro from Expedition 399 Hole U1309D (average of 2.94 g/cm3). Porosity measured in Hole U1473A in gabbro ranges 0.1%–4.2% and has an average of 0.6% (MacLeod et al., 2017). This is a larger range but a smaller average in porosity compared to Expedition 399 Hole U1309D.
8.1.2. Sonic velocity
Sonic velocity (P-wave velocity) was measured on 30 discrete cube samples (1 diabase, 3 olivine gabbro, and 26 gabbro) along the three principal directions x, y, and z in the core reference frame (see Figure F2 in the Expedition 399 methods chapter [Lang et al., 2025]). Results are listed in Table T12 and plotted in Figures F61, F62, and F64. The average P-wave velocity of the three axes on each sample ranges 4965–5895 m/s, the average is 5476 m/s, and the apparent anisotropy of P-wave velocity ranges 4.1%–7.0%.
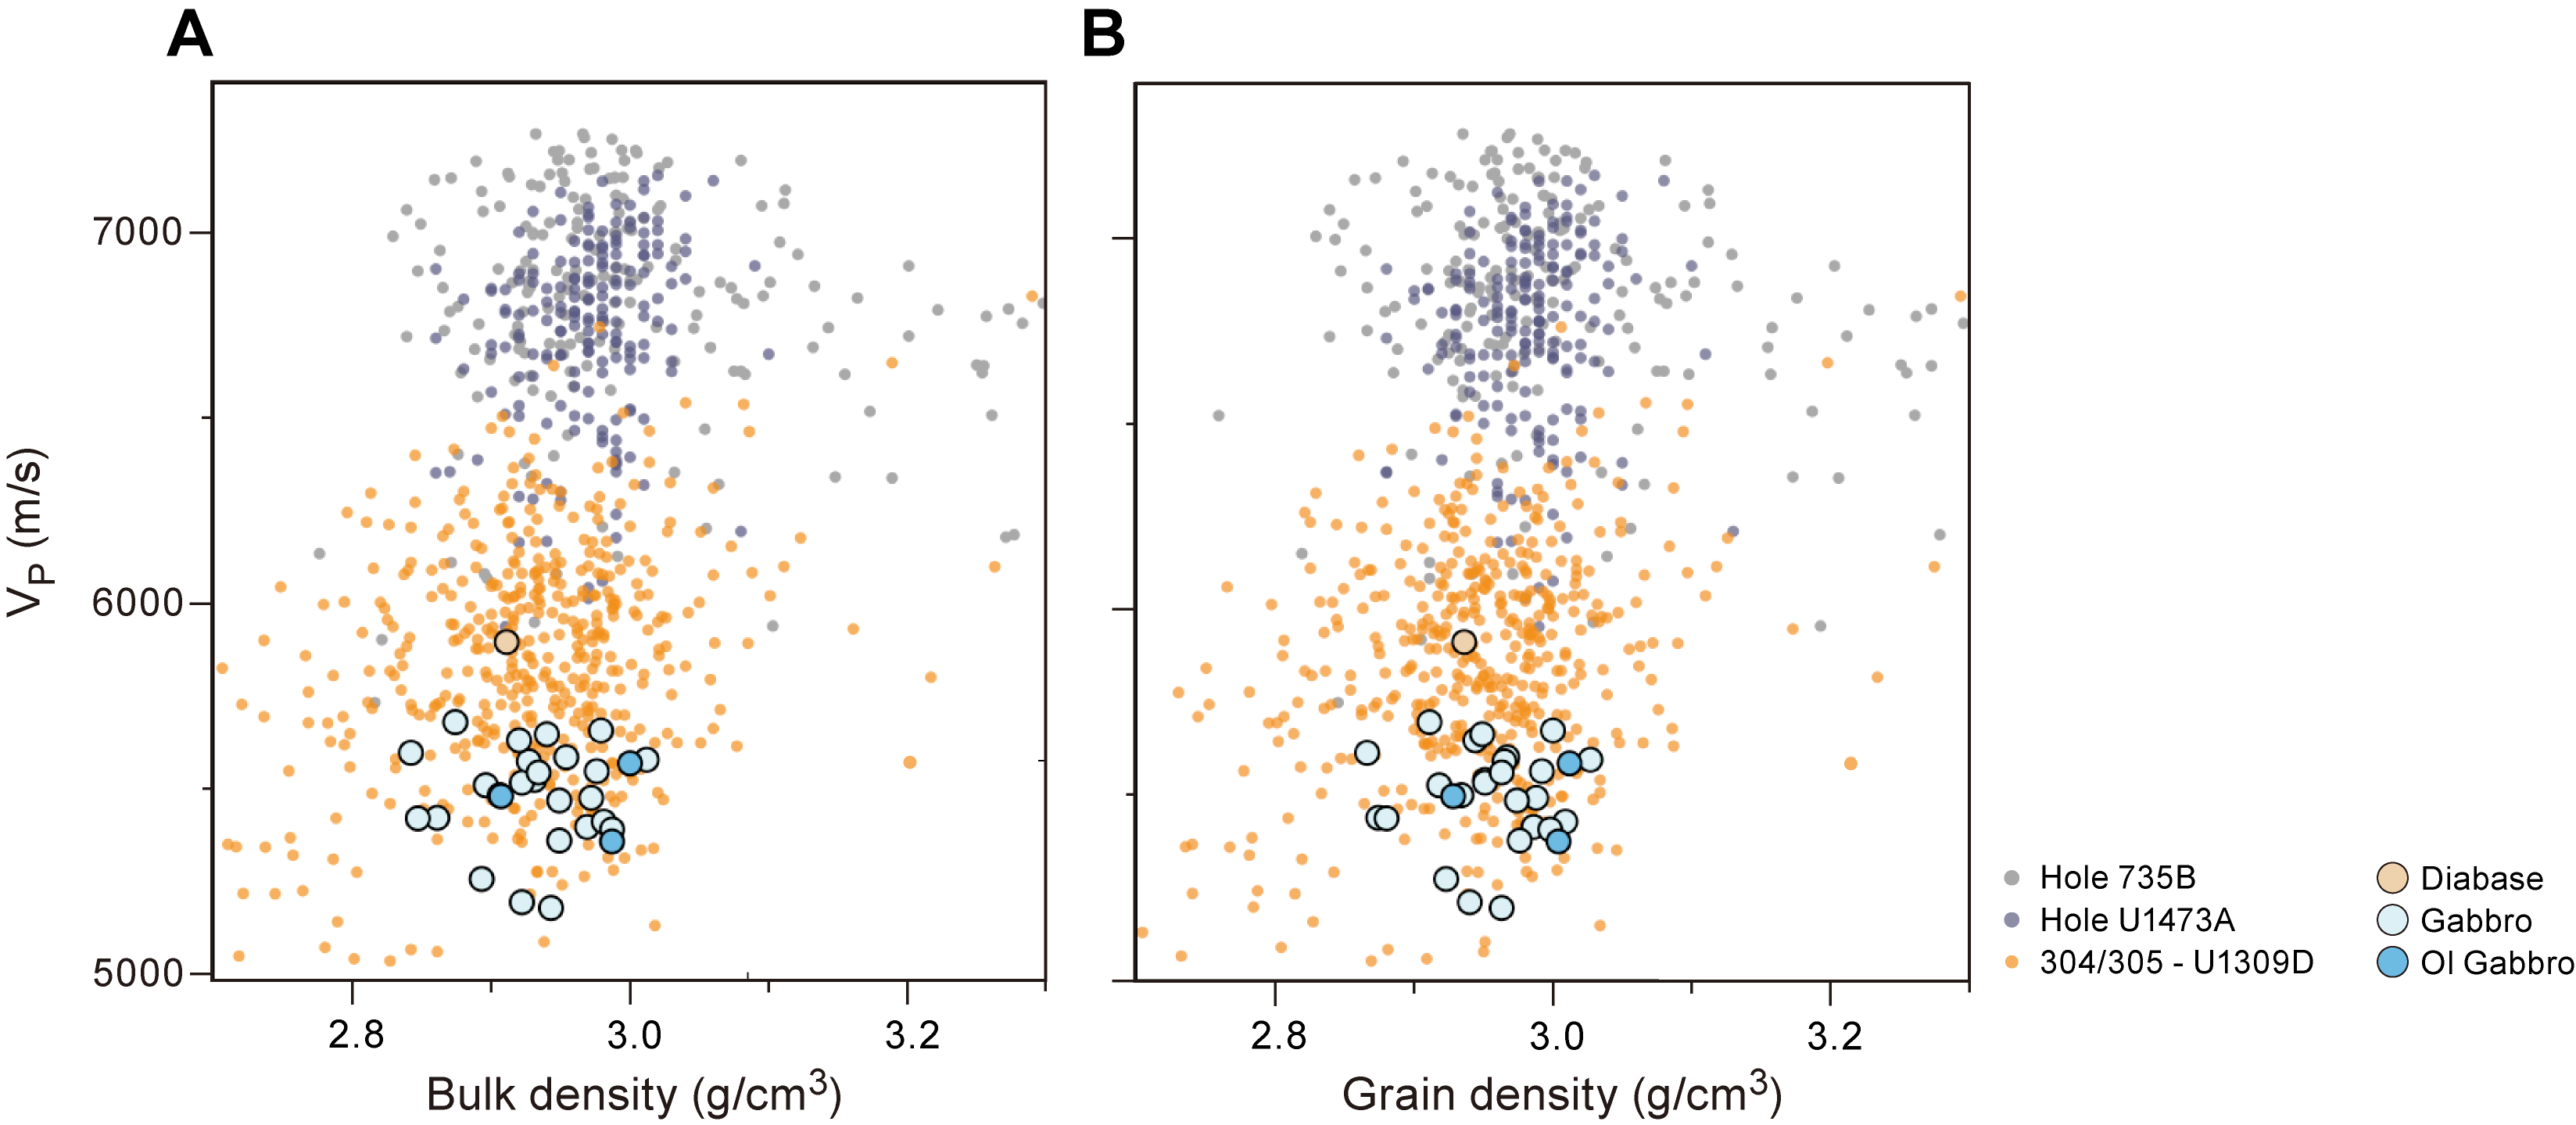
Figure F64. VP vs. bulk and grain density.
Sonic velocity data from Hole U1309D are plotted against bulk and grain density in Figure F64 together with the data from the shallower part of Hole U1309D measured during Expedition 304/305 (Expedition 304/305 Scientists, 2006b), as well as data from Holes 735B (Shipboard Scientific Party, 1989, 1999a) and U1473A (Atlantis Bank, Southwest Indian Ridge) (MacLeod et al., 2017). VP values from Expedition 399 Hole U1309D are consistent with previous measurements on gabbroic rocks at Atlantis Massif, although the average is about 500 m/s slower than the previous data. P-wave velocity in Hole 735B is about 900 m/s higher than in Hole U1309D (Figure F64) (Shipboard Scientific Party, 1989, 1999a; Expedition 304/305 Scientists, 2006b; MacLeod et al., 2017), although they have similar bulk density and porosity values. Sonic wireline logging data from Expeditions 304/305 and 340T, compared with those from Expedition 360, indicate that VP also differs downhole for in situ measurements between Atlantis Bank and Atlantis Massif, respectively, with the latter having lower velocities in general.
8.1.3. Magnetic susceptibility
MS on whole-round sections using the pass-through loop (magnetic susceptibility loop [MSL]) and on section halves using the point sensor (point magnetic susceptibility [MSP] on the Section Half Multisensor Logger [SHMSL]) have relatively low values, reflecting a low proportion of magnetite in these rocks (Figure F61). MSL is typically <500 instrument units (IU) and MSP is typically <1000 IU. The highest MS values are in Section 399-U1309D-311R-1, with a MSL value of ~1500 IU and ~6500 IU for MSP, indicating more abundant magnetite. Very low MS values were measured in the middle of the drilled interval including Cores 304R–305R and 307R, with most MSL values <20 IU and MSP values <50 IU.
MS values are less variable in the interval cored during Expedition 399 compared to Expedition 304/305 (Figure F63) but do follow the generally decreasing trend in the deepest part of the interval cored by Expedition 305 (Expedition 304/305 Scientists, 2006b). This likely indicates a general decrease in the proportion of magnetic phases with depth.
MS values are less variable and lower compared to gabbro in ODP Holes 735B and 1105A and Hole U1473A at Atlantis Bank (Shipboard Scientific Party, 1989, 1999a, 1999b; MacLeod et al., 2017). However, MS does decrease with depth, consistent with a decreasing proportion of magnetic phases observed in the cores.
8.1.4. Natural gamma radiation
NGR is very low with most values being <0.5 counts/s (Figures F61, F63). Few peaks are up to 2 counts/s, and most of these values are at core section or core piece edges, which likely indicates false values (see Petrophysics in the Expedition 399 methods chapter [Lang et al., 2025]).
During Expedition 304/305, NGR was measured with an older device with significantly less precision, which resulted in greater random noise compared with the current instrument (Expedition 304/305 Scientists, 2006b). Background counts reported by Expedition 304/305 are upward of 30 counts/s. Background counts were not subtracted from the reported data, which explains the large offset between Expeditions 304/305 and 399 (Figure F63). NGR is extremely low in Hole U1309D, <1 counts/s above background on average. NGR is also extremely low in Hole U1473A (Atlantis Bank, Southwest Indian Ridge), with values typically <2 counts/s.
8.1.5. Thermal conductivity
Samples of representative lithologies, consisting of gabbro, olivine-bearing gabbro, or orthopyroxene-bearing gabbro, were chosen at semiregular intervals, and a total of 17 samples were analyzed. An average of six thermal conductivity measurements were taken for each piece (see Petrophysics in the Expedition 399 methods chapter [Lang et al., 2025]). Results from Expedition 399 samples are shown in Figures F61 and F65 and Table T13. Values for all pieces range 2.14–2.63 W/(m·K) with a mean and standard deviation of 2.35 ± 0.14 W/(m·K). No obvious trend with depth or lithology is observed in this gabbroic interval. The exceptions are two gabbro samples with slightly higher thermal conductivity values at ~1450 mbsf, which possibly correlate with a zone of higher alteration.
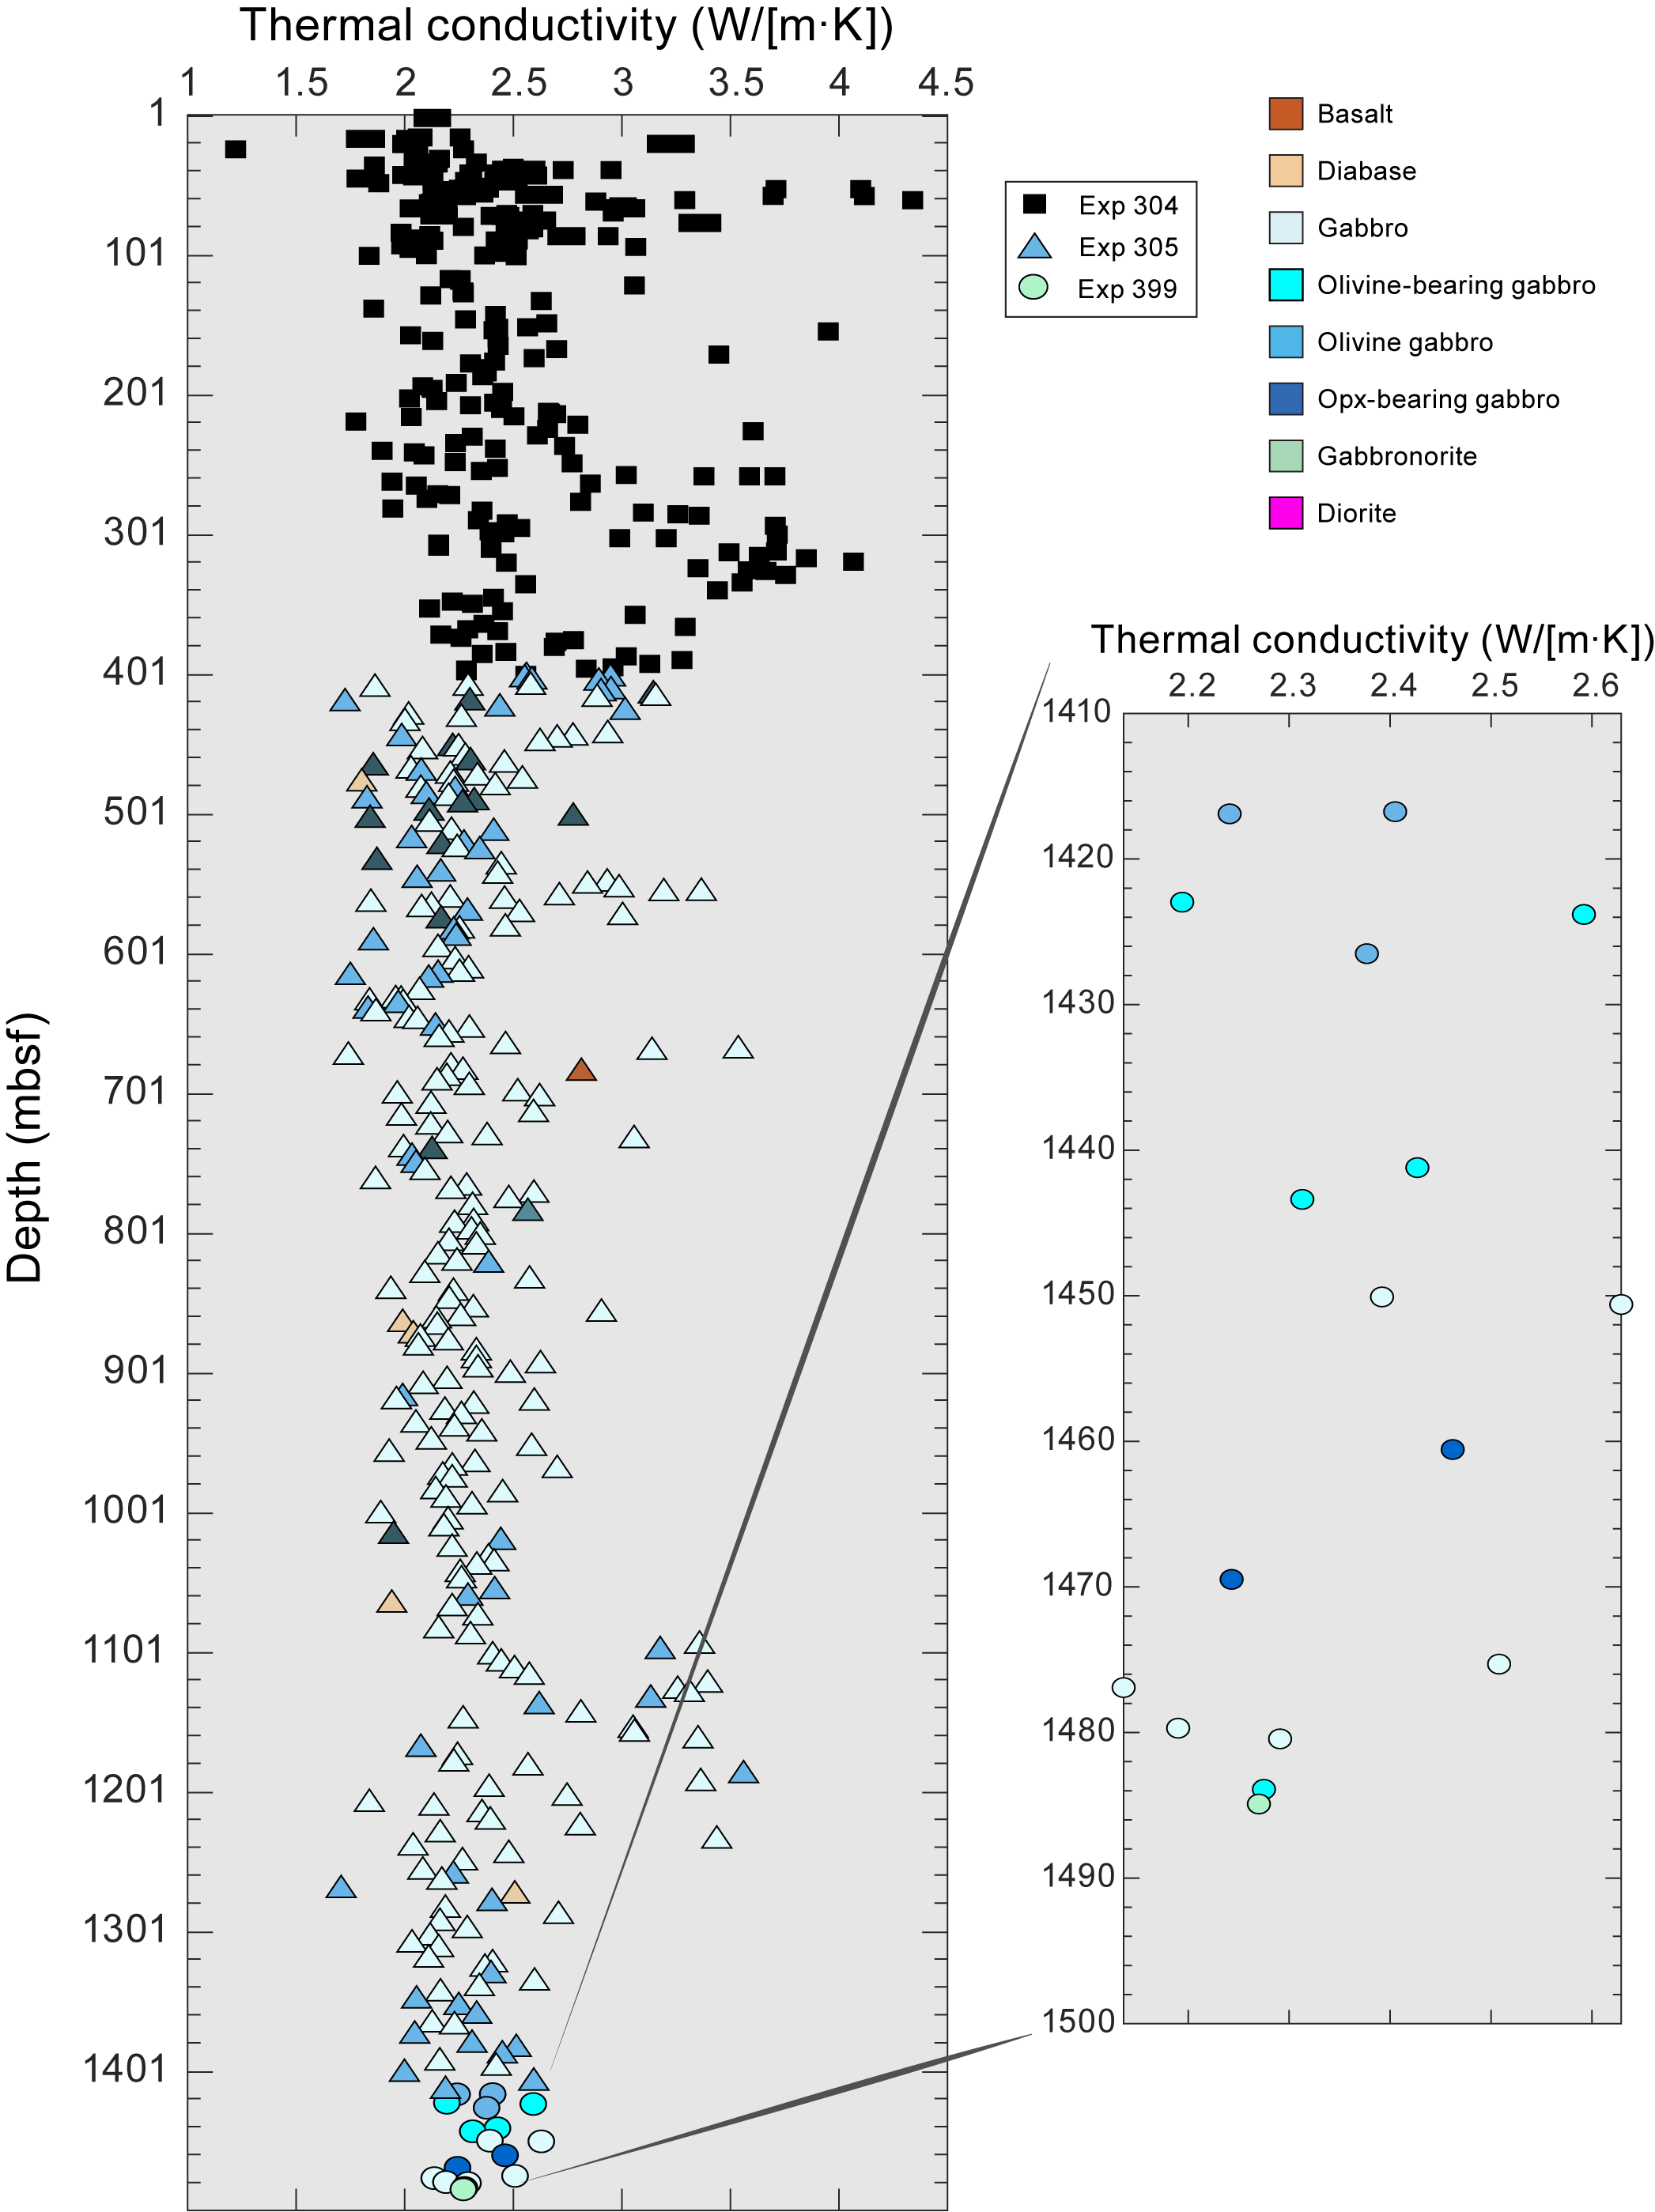
Figure F65. Thermal conductivity.
Thermal conductivity measurements throughout Hole U1309D, including measurements made during Expeditions 399 and 304/305 (Expedition 304/305 Scientists, 2006b), are shown in Figure F65. Values range 1.22–4.34 W/(m·K) with a mean and standard deviation of 2.42 ± 0.45 W/(m·K). Measurements from Expedition 399 show much less scatter than those from the rest of the hole, which could be due to less lithologic variation with depth.
8.1.6. Temperature logging
Borehole fluid temperatures were measured in Hole U1309D prior to coring. The ETBS was attached to the bottom of the MTFS for one run and attached to the bottom of the KFTS for two subsequent runs (see Operations; see also Petrophysics in the Expedition 399 methods chapter [Lang et al., 2025]). Results shown are from the first run when the ETBS was attached to the MTFS (Figure F66) because the ETBS tool failed during the KFTS runs. Temperatures were recorded while the tool was lowered down the hole and again while it was pulled back up the hole (Figure F66). Values recorded during the down run are the most representative of the system because the borehole was the least disturbed, and therefore the down run is considered the primary temperature profile. Values for the entire borehole during the down run range from 6.7°C at the seafloor to 139.6°C near the bottom of the hole (1340.9 mbsf). To account for the sensors' response time, the run was stopped for 3 min every ~100 m to allow the sensors to partially equilibrate to the borehole fluid temperature. As a result, temperature recordings increased roughly 2°–3°C during each of these stops but never fully equilibrated. The maximum value recorded at each stop is considered the most representative of the formation temperature at the corresponding depth (dotted blue line in Figure F66). The resulting borehole temperature profile shows slight curvature in the upper ~580 mbsf and transitions into a more linear gradient of ~114°C/km below 580 mbsf.
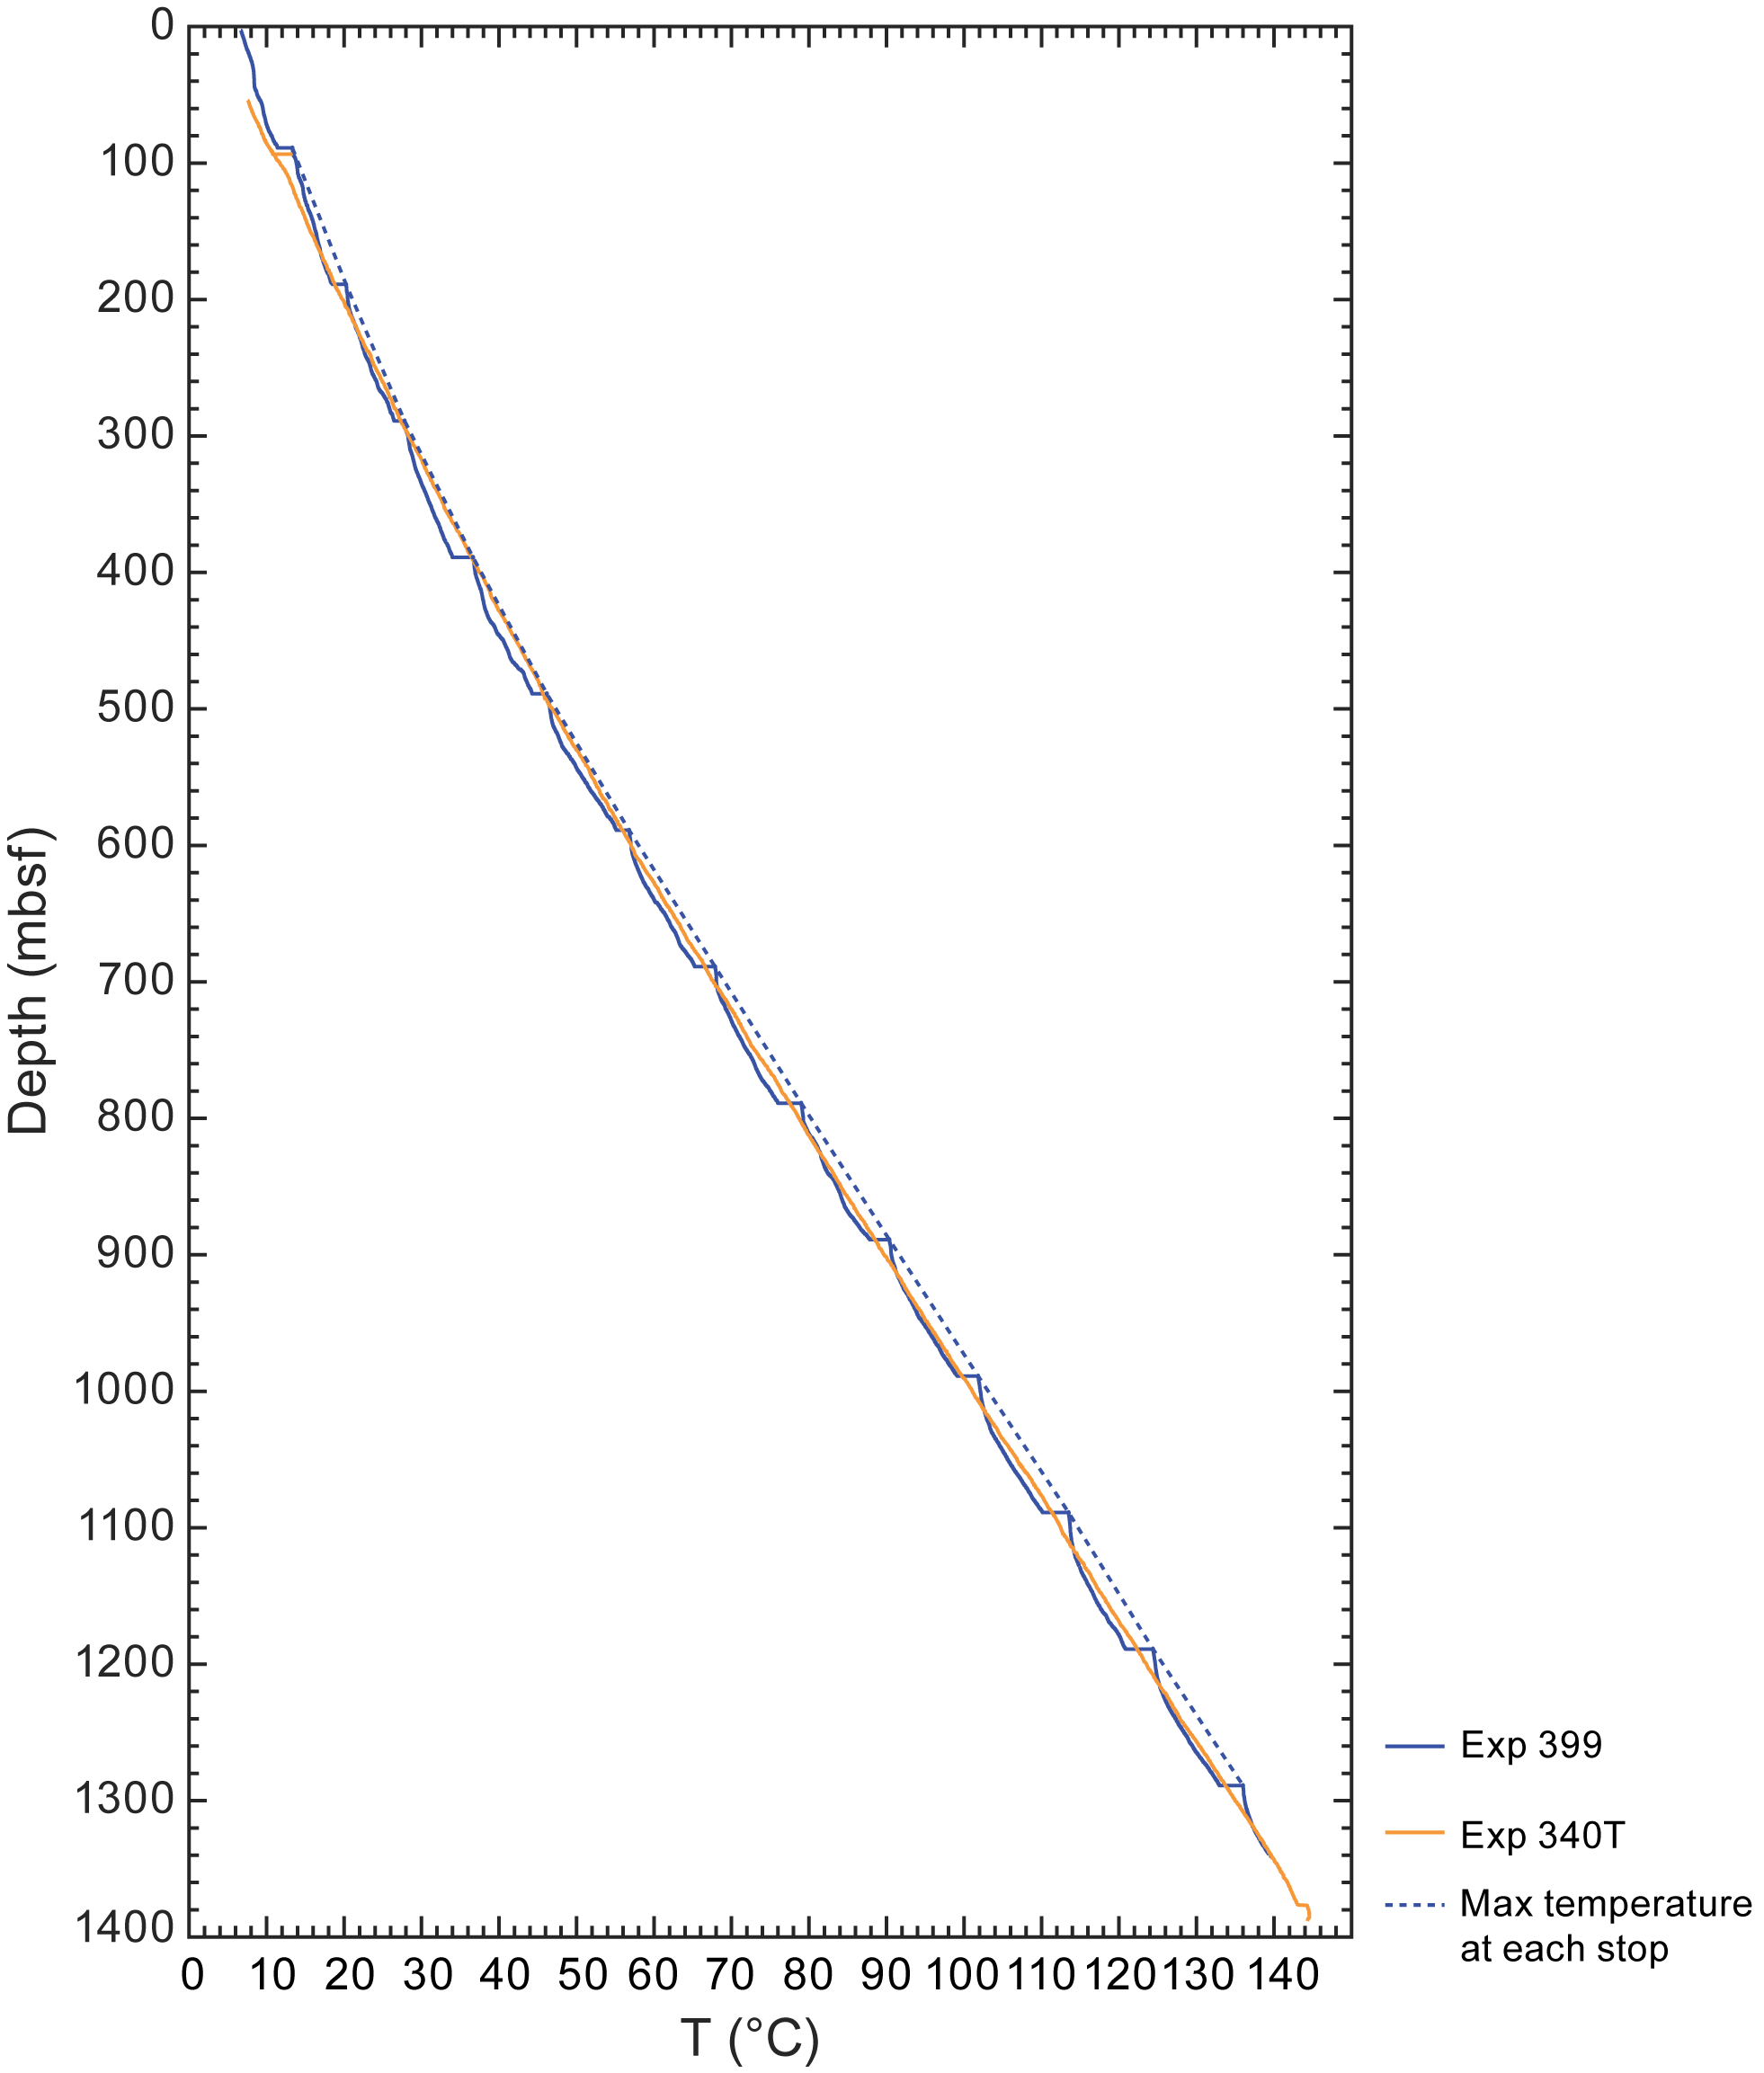
Figure F66. Temperature logs.
Temperature profiles in Hole U1309D were obtained during two previous expeditions, including Expedition 305 (Expedition 304/305 Scientists, 2006b), during which temperature was measured following drilling using the Temperature/Acceleration/Pressure (TAP) tool, and Expedition 340T (Expedition 340T Scientists, 2012), during which the hole was logged and temperature was measured using the Modular Temperature Tool (MTT) and the Schlumberger logging equipment head-mud temperature (LEH-MT) tool. Results from Expedition 305 are highly disturbed from drilling and flushing of the hole with cool seawater. Results from Expedition 340T are >20°C higher than the maximum recorded during Expedition 305 and should be more representative of formation temperatures because the borehole fluids had ~7 y to thermally equilibrate with the formation following drilling during Expedition 304/305. The temperature profile obtained in Hole U1309D during Expedition 399 has a similar trend to the profile recorded by Expedition 340T (Figure F66). During Expedition 399, both the raw temperature profile and the profile obtained using the maximum values recorded while stopping every ~100 m show curvature in the upper sections of the hole and more linearity in the lower sections of the hole. This trend closely resembles that recorded during Expedition 340T, although the linear gradient in the profile recorded during Expedition 399 appears steeper. The transition from curved to linear gradients appears to also occur at a shallower depth in the Expedition 399 profile compared to the Expedition 340T profile (~580 and ~750 mbsf, respectively).
8.1.7. Summary
The results from Expedition 399 Hole U1309D match well with the observations from Expedition 304/305 and compare well with other gabbro-dominated holes. Below are the principal conclusions of physical properties in this interval:
- Density generally increases with depth.
- Porosity generally decreases with depth.
- MS is overall low but variable.
- NGR shows very low counts.
- The higher porosity zone occurs at the same depth interval as lower recovery, lower torque on the coring bit, higher alteration intensity, and recovered cataclasites, indicating a fault zone.
- Similar trends are shown in all data in comparison with the upper interval cored during Expedition 304/305.
- VP is similar to the interval cored during Expedition 304/305 but lower compared to VP of gabbro from Atlantis Bank, Southwest Indian Ridge.
9. Paleomagnetism
Site U1309, originally drilled during Expedition 304, was revisited, and Hole U1309D was deepened from 1415 (Expedition 304/305 Scientists, 2006b) to 1489 mbsf. Core recovery was sufficient such that both archive and working half section measurements could be made, with sampled lithologies broadly consisting of gabbro and diabase variants (see Igneous petrology). Paleomagnetic measurements were made on 39 archive core sections and 26 discrete cube samples. Measurements were supplemented by natural remanent magnetization (NRM) and alternating field (AF) demagnetizations of 24 moisture and density (MAD) samples shared with the petrophysics team (refer to Table T14 for all abbreviations; Table T15). The combined remanence data from archive halves and discrete samples yielded well-defined remanence values used to estimate average inclination and intensity values.
9.1. Remanence sections
All remanence measurements of archive sections were taken on the superconducting rock magnetometer (SRM), with measurements made at 2 cm intervals for pieces longer than ~7 cm. Pieces were subjected to stepwise AF demagnetizations starting from 5 mT and ending at 50 mT. Whole-round MS measurements taken by the petrophysics team provided a foundational basis for comparing SRM magnetization intensity measurements.
Qualitatively, lithology emerged as one of the most meaningful descriptors for correlating with NRM intensity and MS. Diabase samples were characterized by consistently low susceptibilities and natural remanent intensities. In contrast, gabbroic samples exhibited significant variation in intensity, ranging 0.02–3.81 A/m with a mean of 0.90 A/m. No significant correlation with remanence direction was observed for any of the qualitative descriptors.
NRM inclinations were generally clustered at shallower inclinations than the expected inclination value of −49° (Figure F67), with a mean of −32° (Figure F68). This value, however, is slightly skewed toward the positive because of isothermal remanent drilling overprints and misoriented pieces. Thorough filtering for high fidelity values will occur postcruise and will present a more in-depth view of the real behavior of the NRM inclinations.
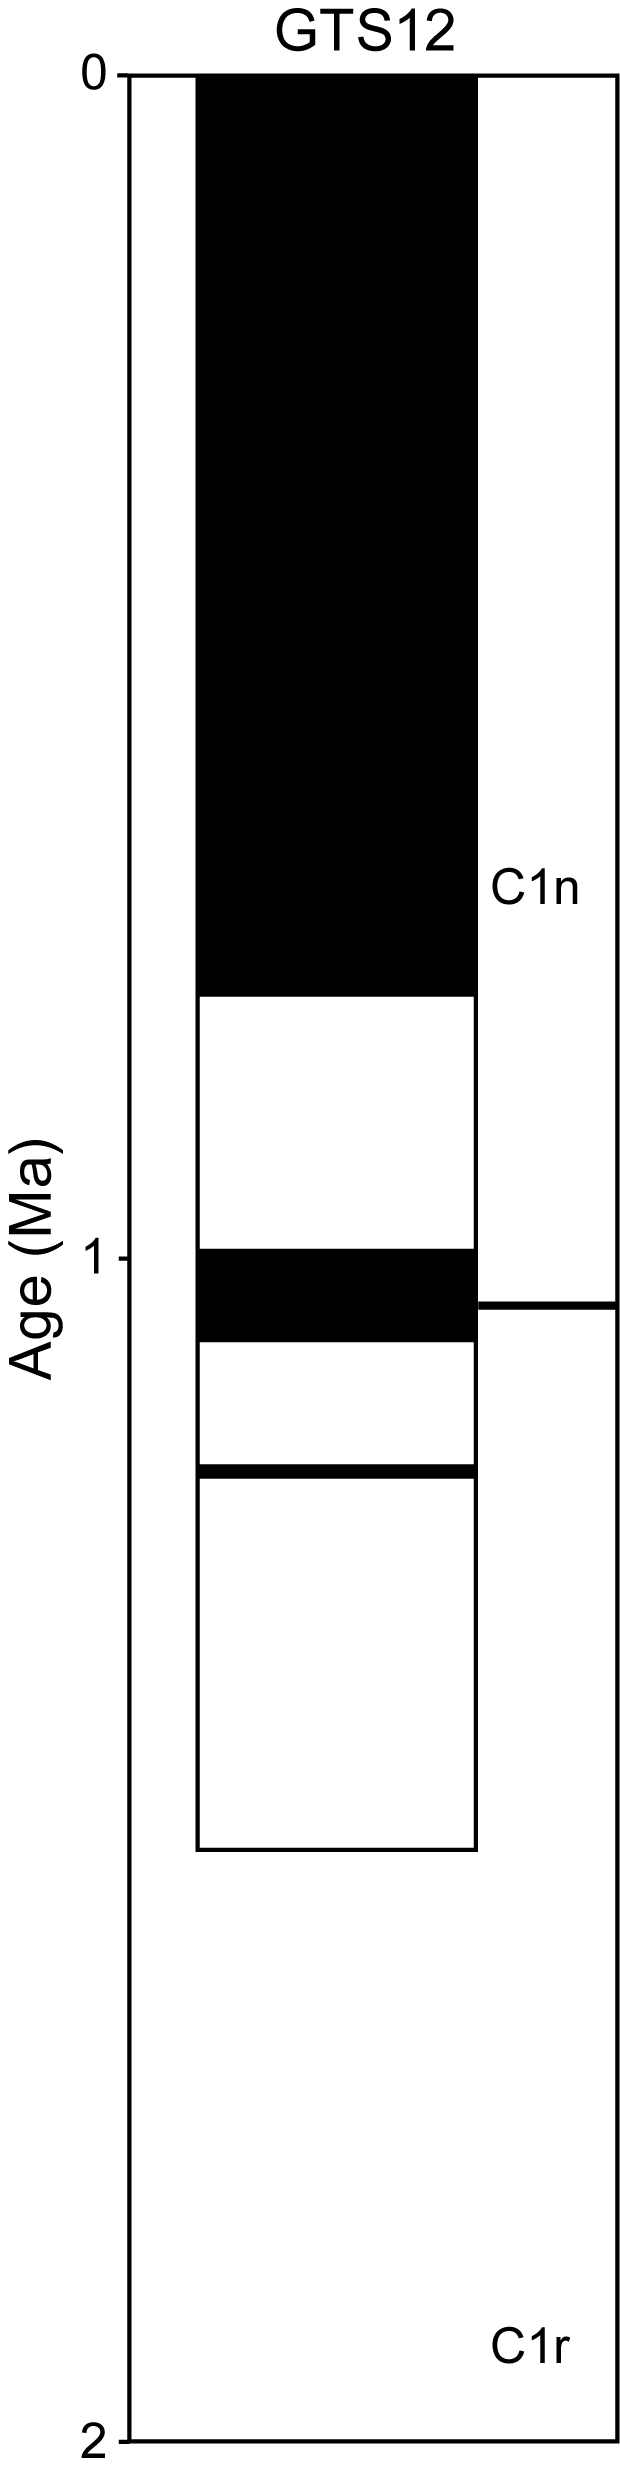
Figure F67. Predicted chrons and subchrons.
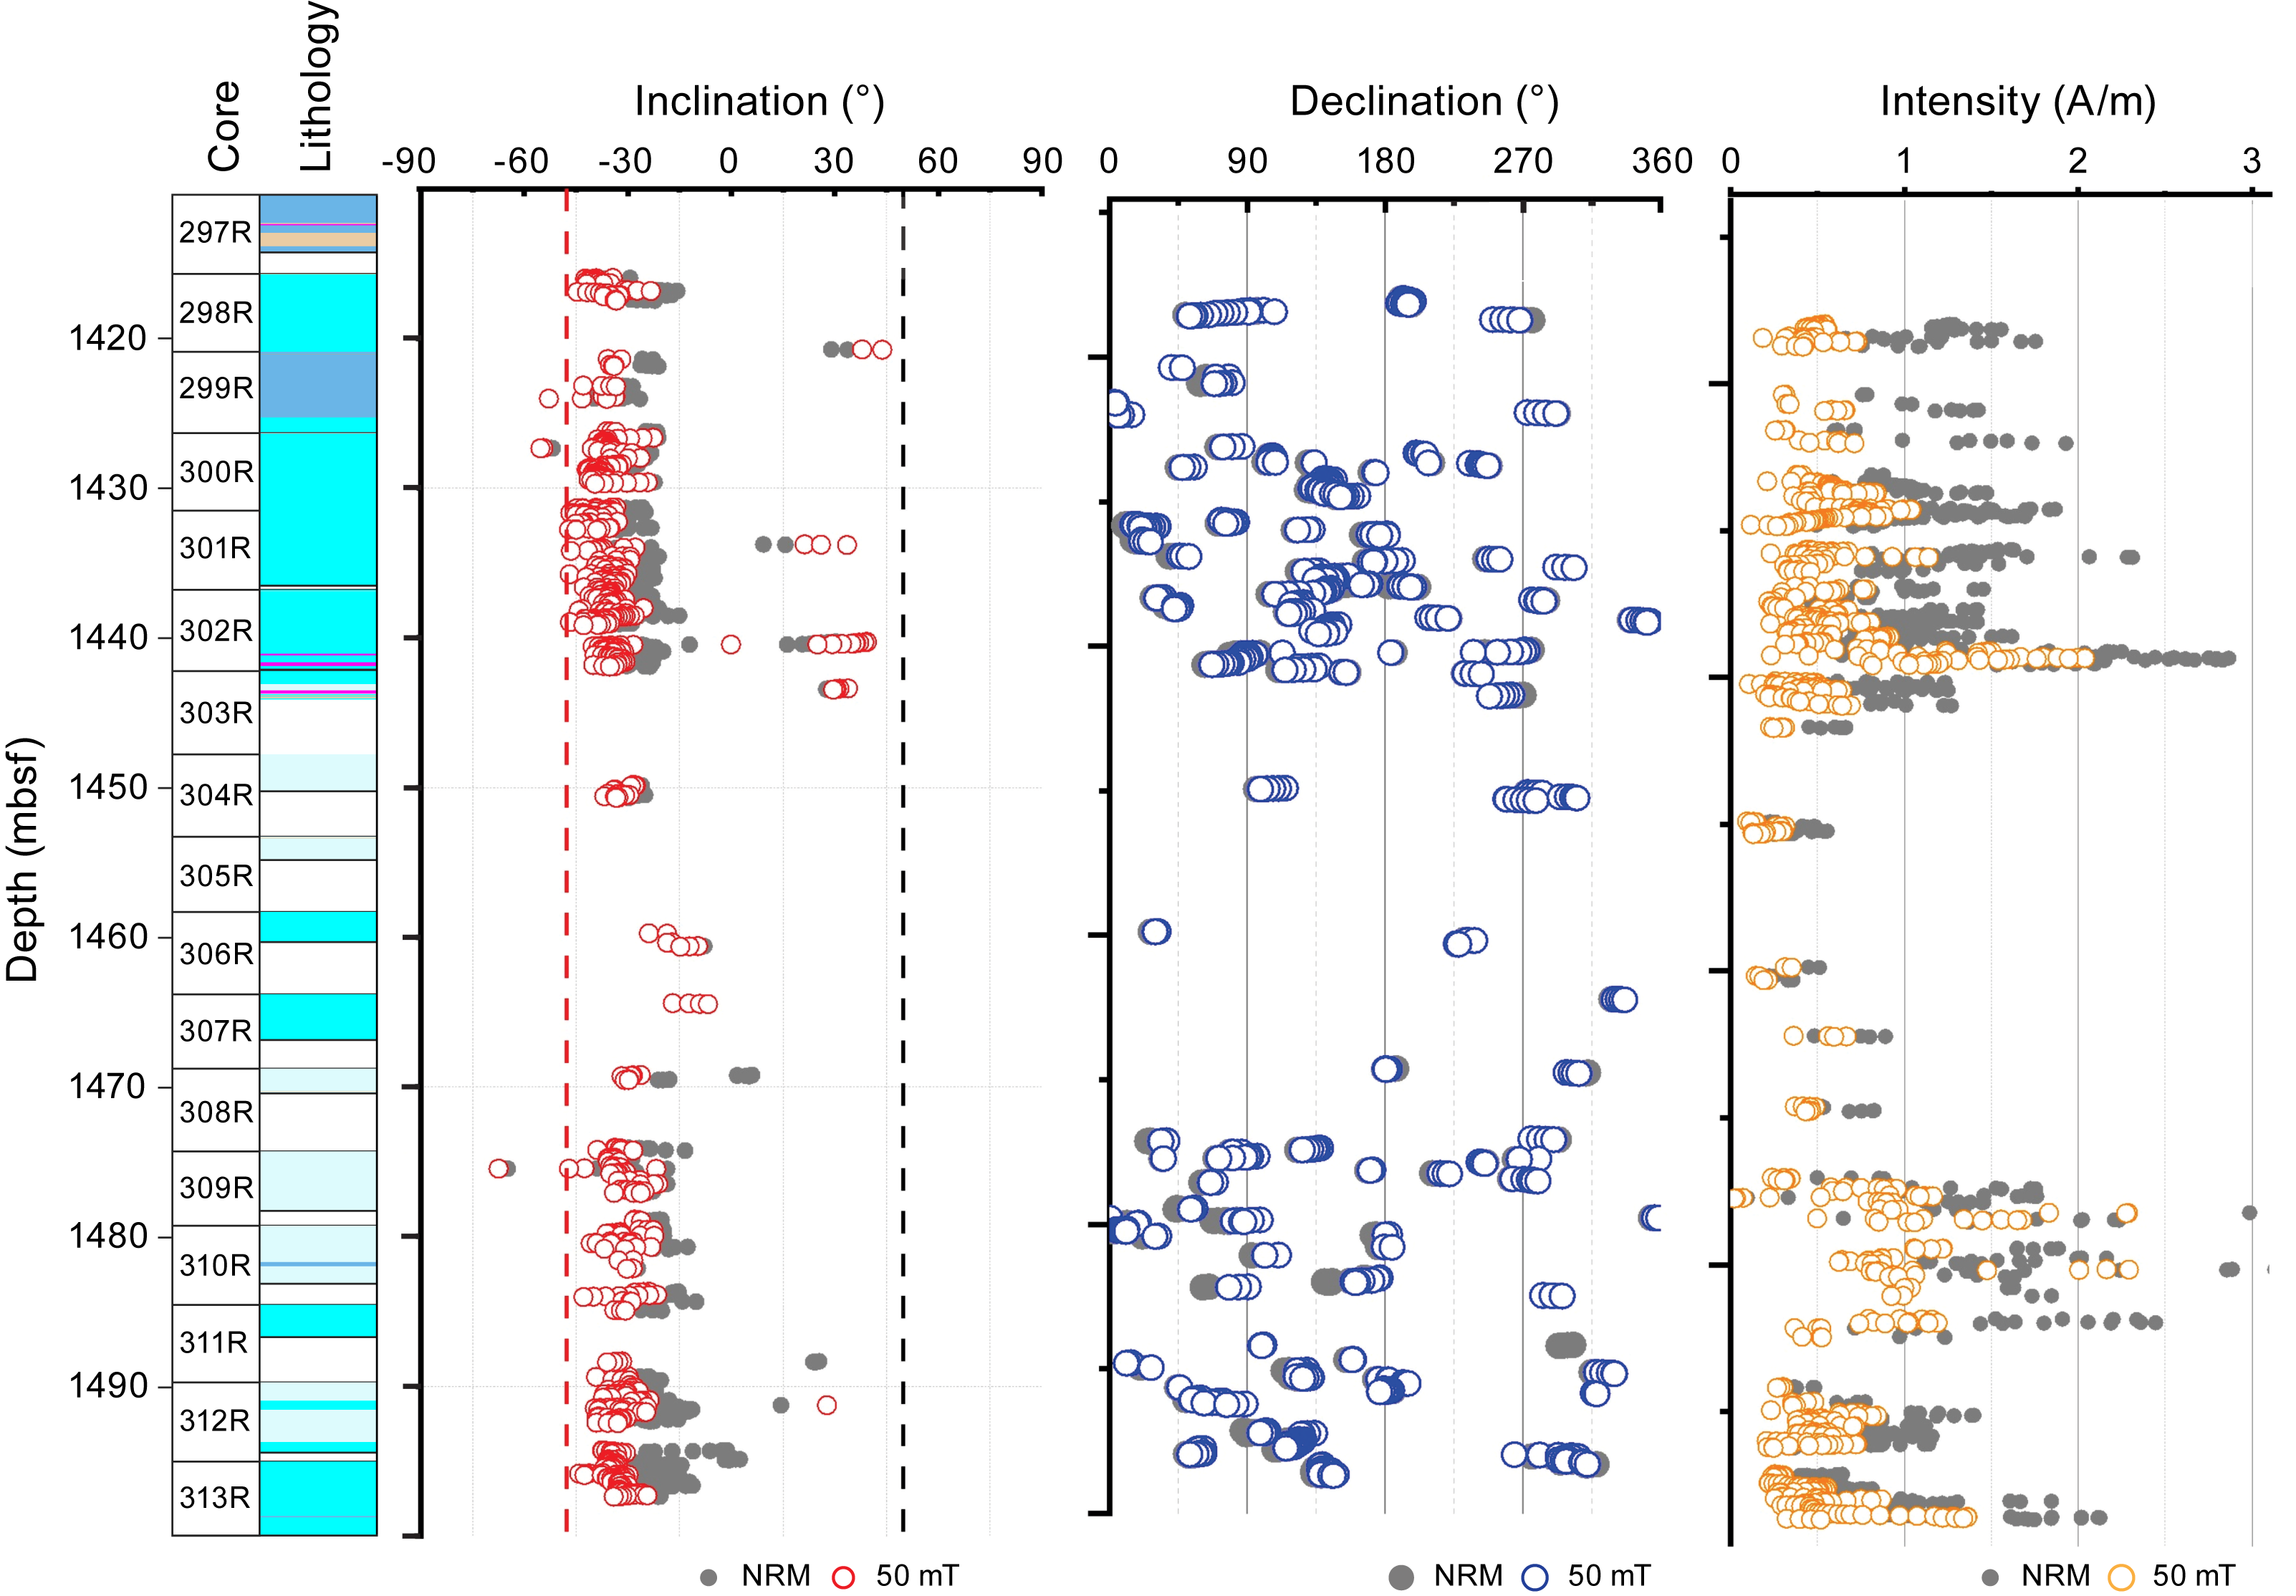
Figure F68. NRM and AF 50 mT inclination, declination, and intensity.
Inclination clustering became narrower and more pronounced with increasing demagnetization steps. By 15 mT, 95% of the inclination values clustered within 5° of the mean inclination value. Inclination values also shifted more toward the expected value with increasing AF demagnetization, suggesting that drilling overprints were generally more positive than the mean inclination value, consistent with the positive polarity of the present-day magnetic field (Figure F69). However, the extent to which the drilling overprints contributed to the NRM was dependent on the coercivities of the samples' magnetic minerals. AF demagnetizations of the archive half samples proved to be effective in reducing most of their magnetization intensity (Figure F70). Qualitatively, it was observed that gabbros with high magnetization intensity components tended to have lower coercivity components than gabbros with lower magnetization intensities; thus, the higher magnetization intensity gabbros had a stronger drilling overprint contribution to their NRM relative to their lower magnetization intensity counterparts. Coercivities and other magnetization properties of the hole were further characterized using discrete samples.
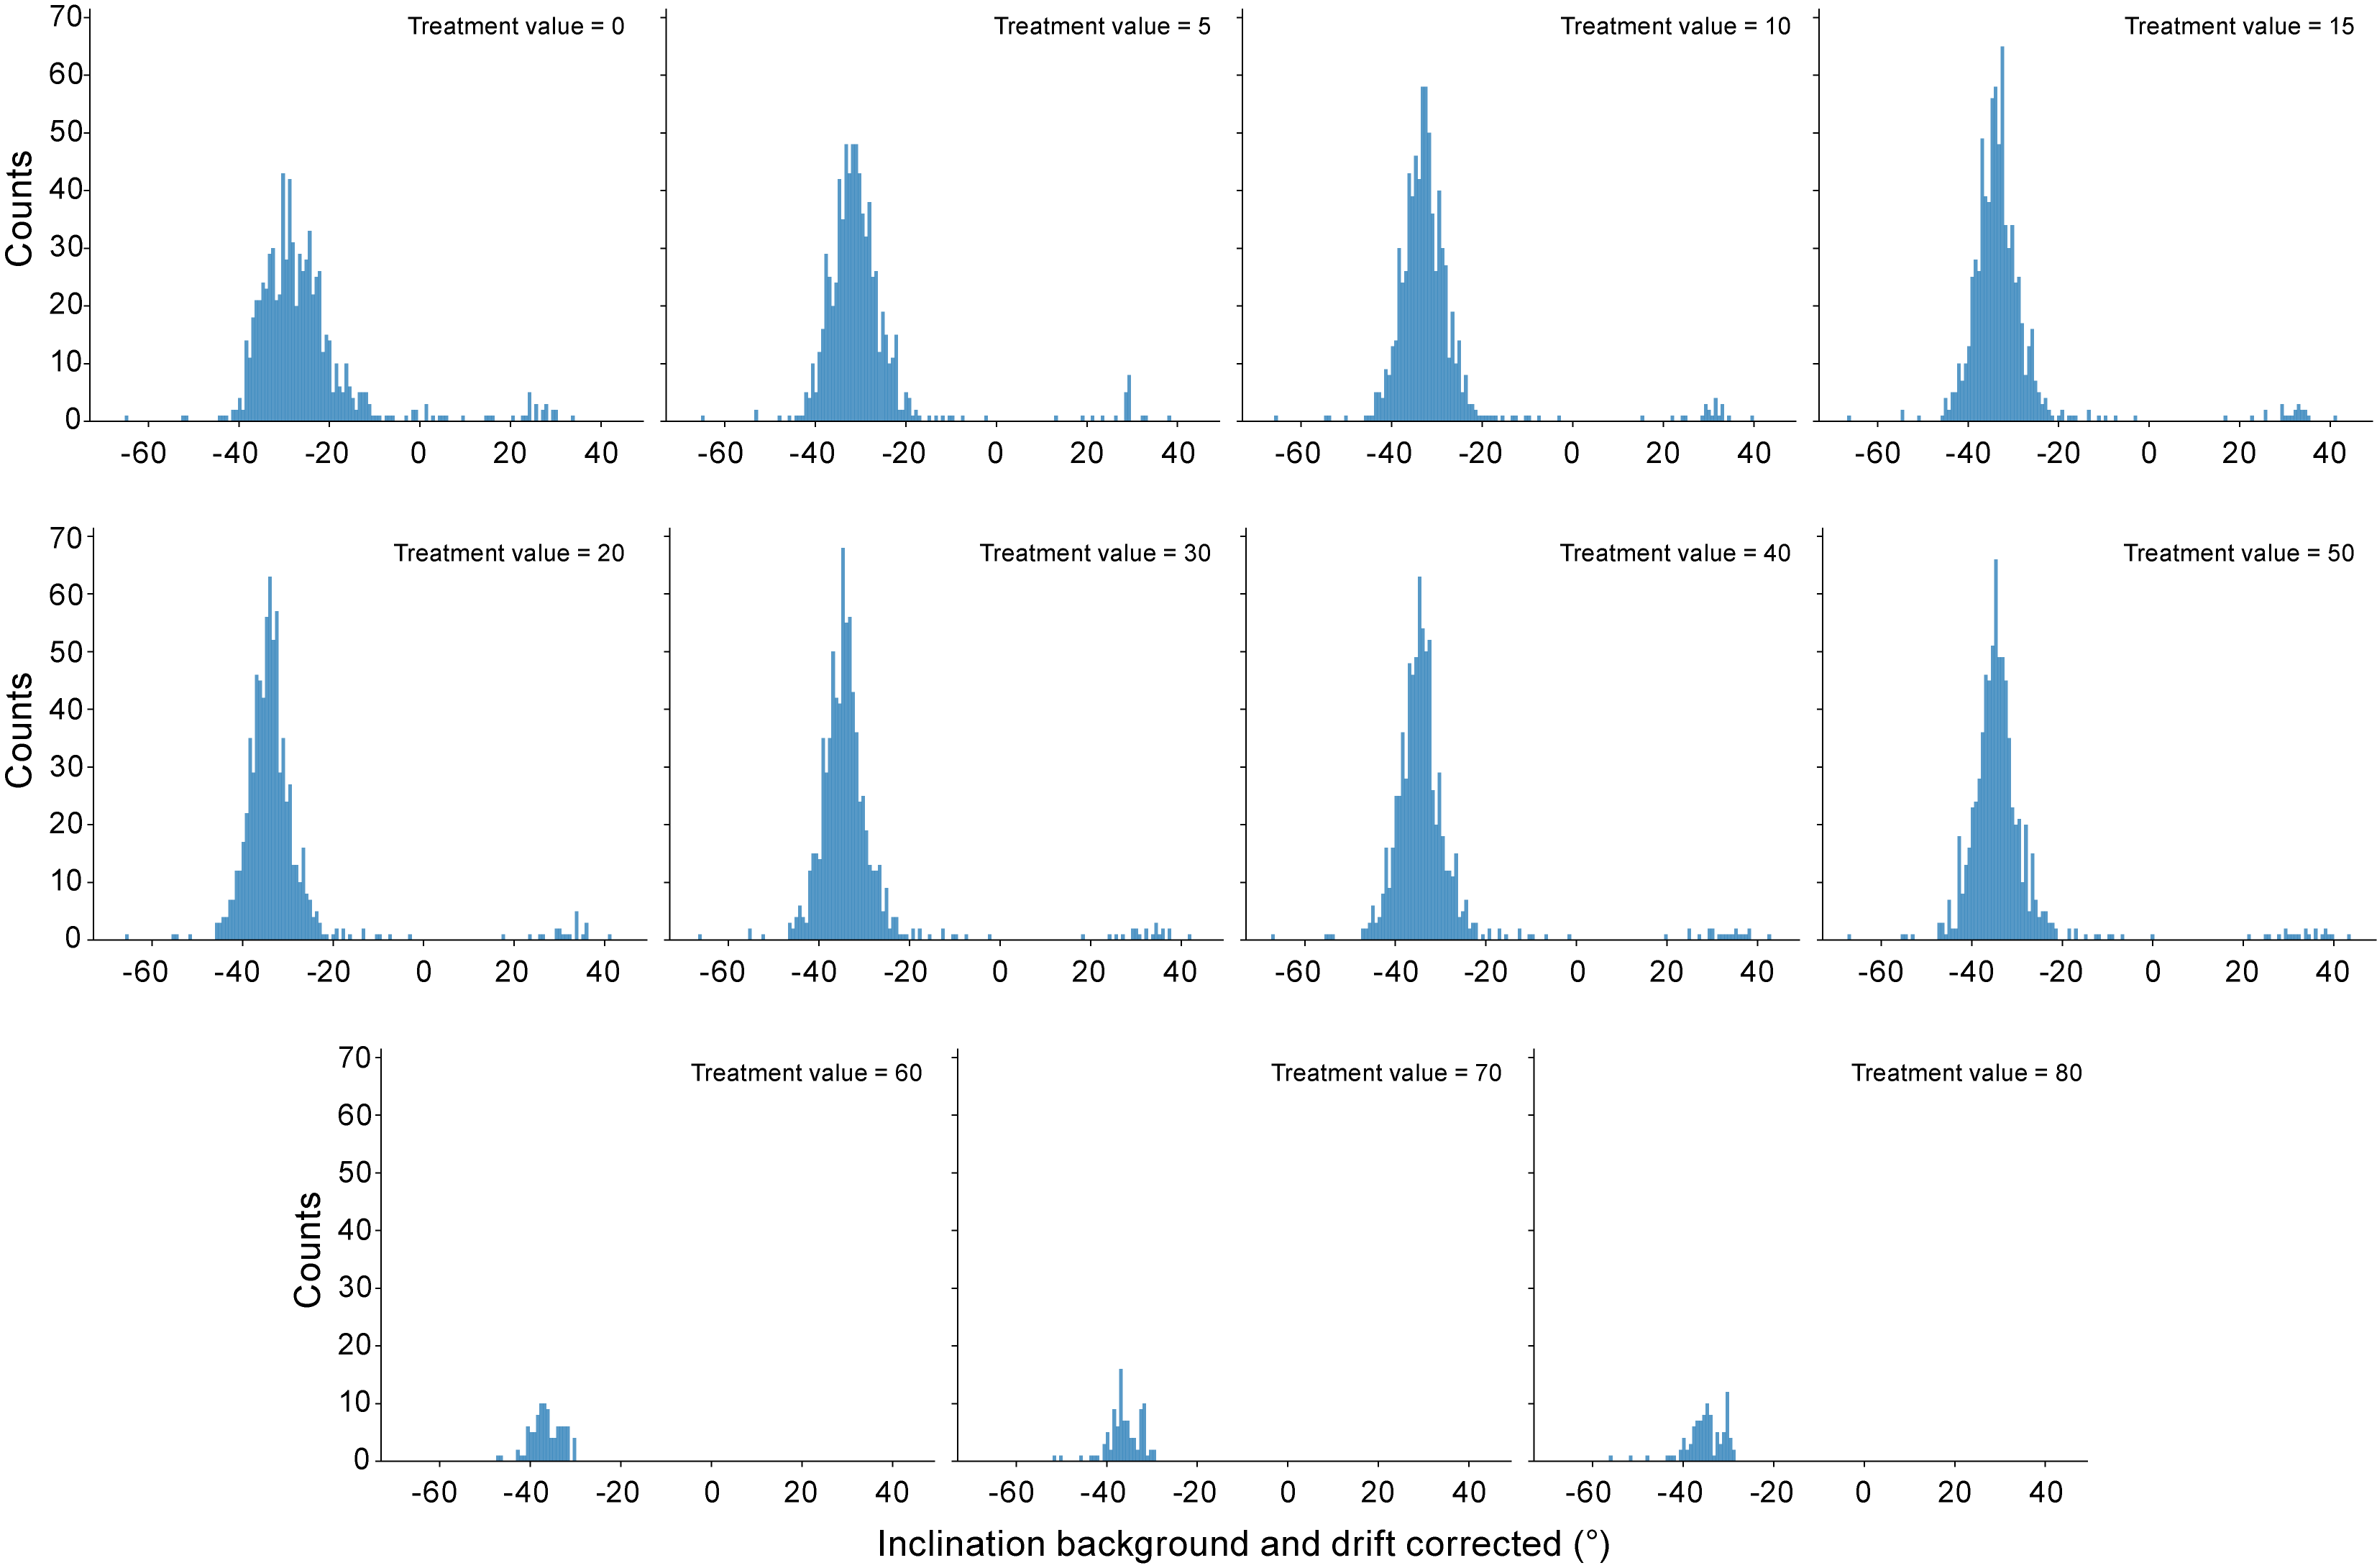
Figure F69. Inclination distributions for each AF step.
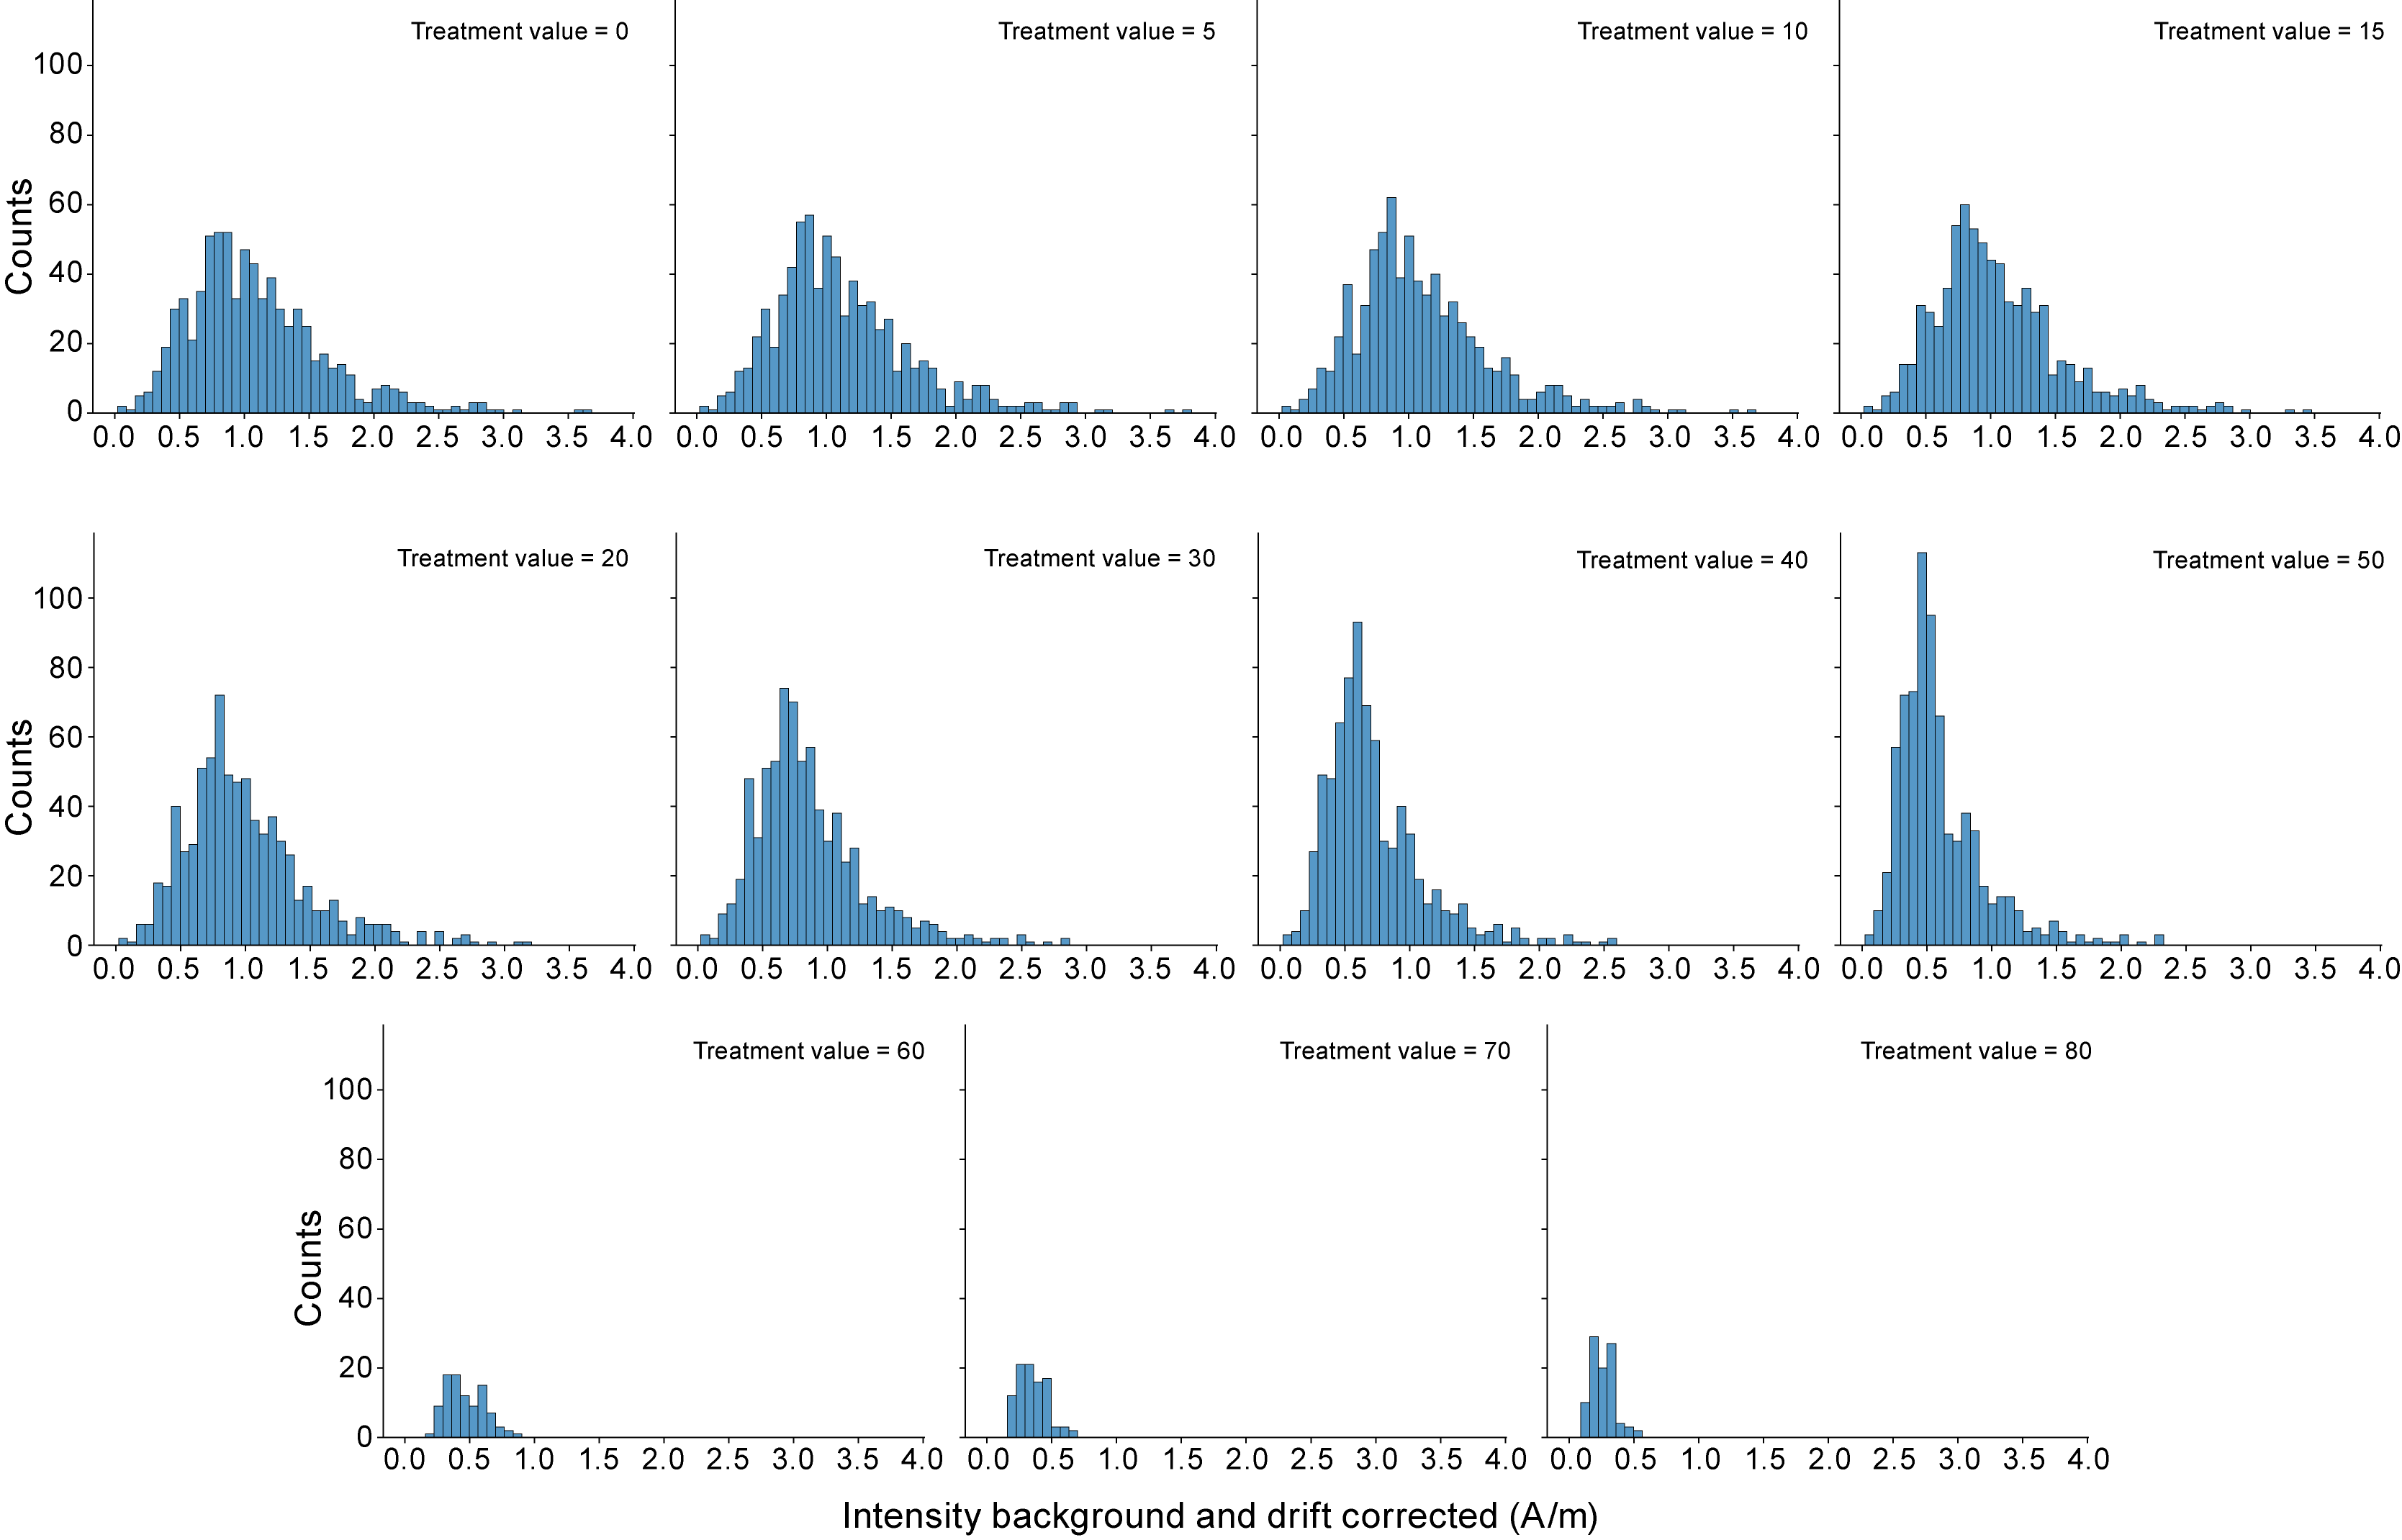
Figure F70. Intensity of remanence distributions for each AF step.
9.2. Discrete samples
In total, 50 discrete cubes were taken from the working halves of Hole U1309D for discrete analysis. Their NRM and demagnetization behaviors were assessed using an AGICO JR-6A spinner magnetometer. All samples shared with petrophysics were solely subjected to AF demagnetization. All other samples underwent low-temperature pretreatments (see Paleomagnetism in the Expedition 399 methods chapter [Lang et al., 2025]). It is worth noting that the petrophysics samples were measured after the samples were dried for 24 h in an oven at 105°C, likely acquiring a thermoviscous overprint in the process.
A preliminary analysis looking into the characteristic remanent magnetization (ChRM) directions of the discrete samples was calculated by principal component analysis (PCA) (Kirschvink, 1980) using the PmagPy graphical user interface (Tauxe et al., 2016) (see Paleomagnetism in the Expedition 399 methods chapter [Lang et al., 2025]). All measurement points along the core pieces, where stable vector components were identified on Zijderveld plots (Zijderveld, 1967), underwent this PCA analysis (Tables T16, T17, T18, T19, T20).
Low-temperature pretreatment proved effective in reducing the drilling overprint and enhancing what is likely the true NRM strength. Samples were measured after each liquid nitrogen bath and compared with their initial strength and direction (Figure F71). The effects on the first step were typically the most significant, changing by up to 15% (in either direction) of the original magnetic intensity. The second step typically changed intensity by ~5% relative to the original magnetic intensity. After the first dunk, the inclination value would trend toward the expected direction of the least coercive PCA component. After the second dunk, the inclination agreed well with the PCA direction of the least coercive component.
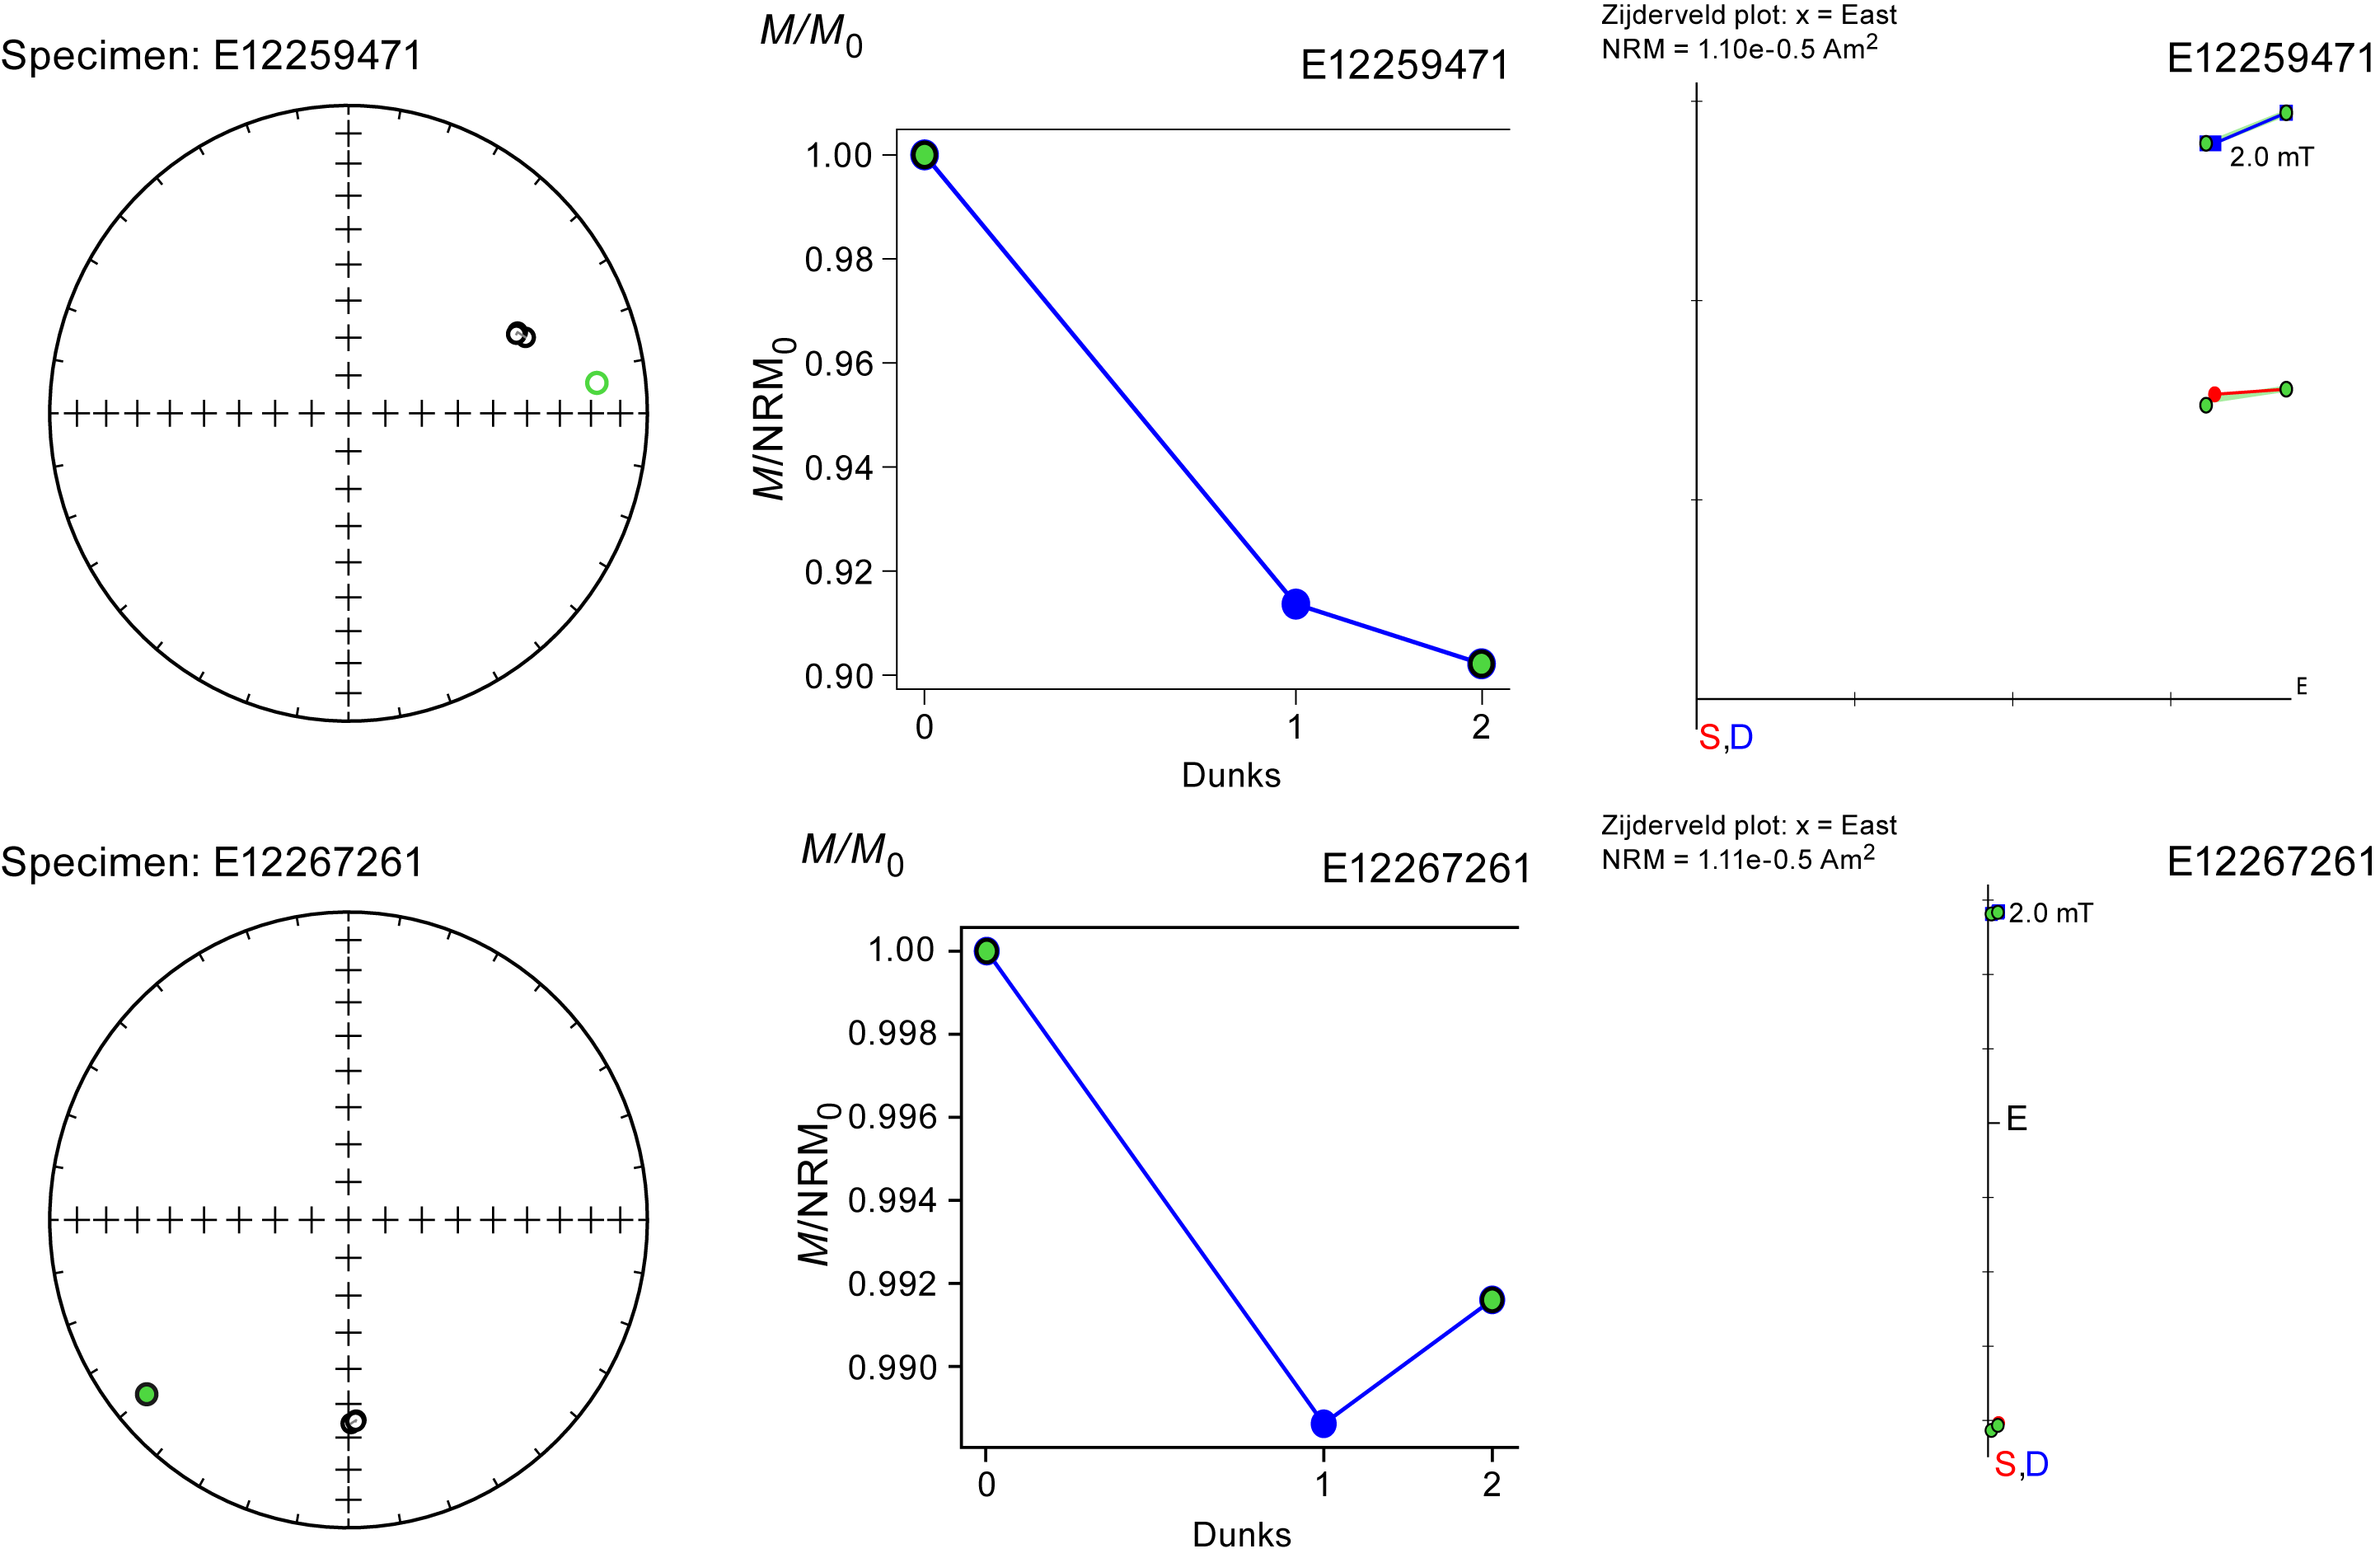
Figure F71. Progressive low temperature dunks.
Samples subjected to stepwise AF demagnetizations of up to 200 mT typically revealed two components within the samples (Figure F72). The inflection point between the different directions usually occurred between 50 and 70 mT. It has been proposed that the origin of the multicomponent system is due to partial thermal resetting of the magnetization from the rotation of the massif over three polarity chrons. However, this interpretation primarily applies for samples taken from near the top of this hole (Morris et al., 2009).
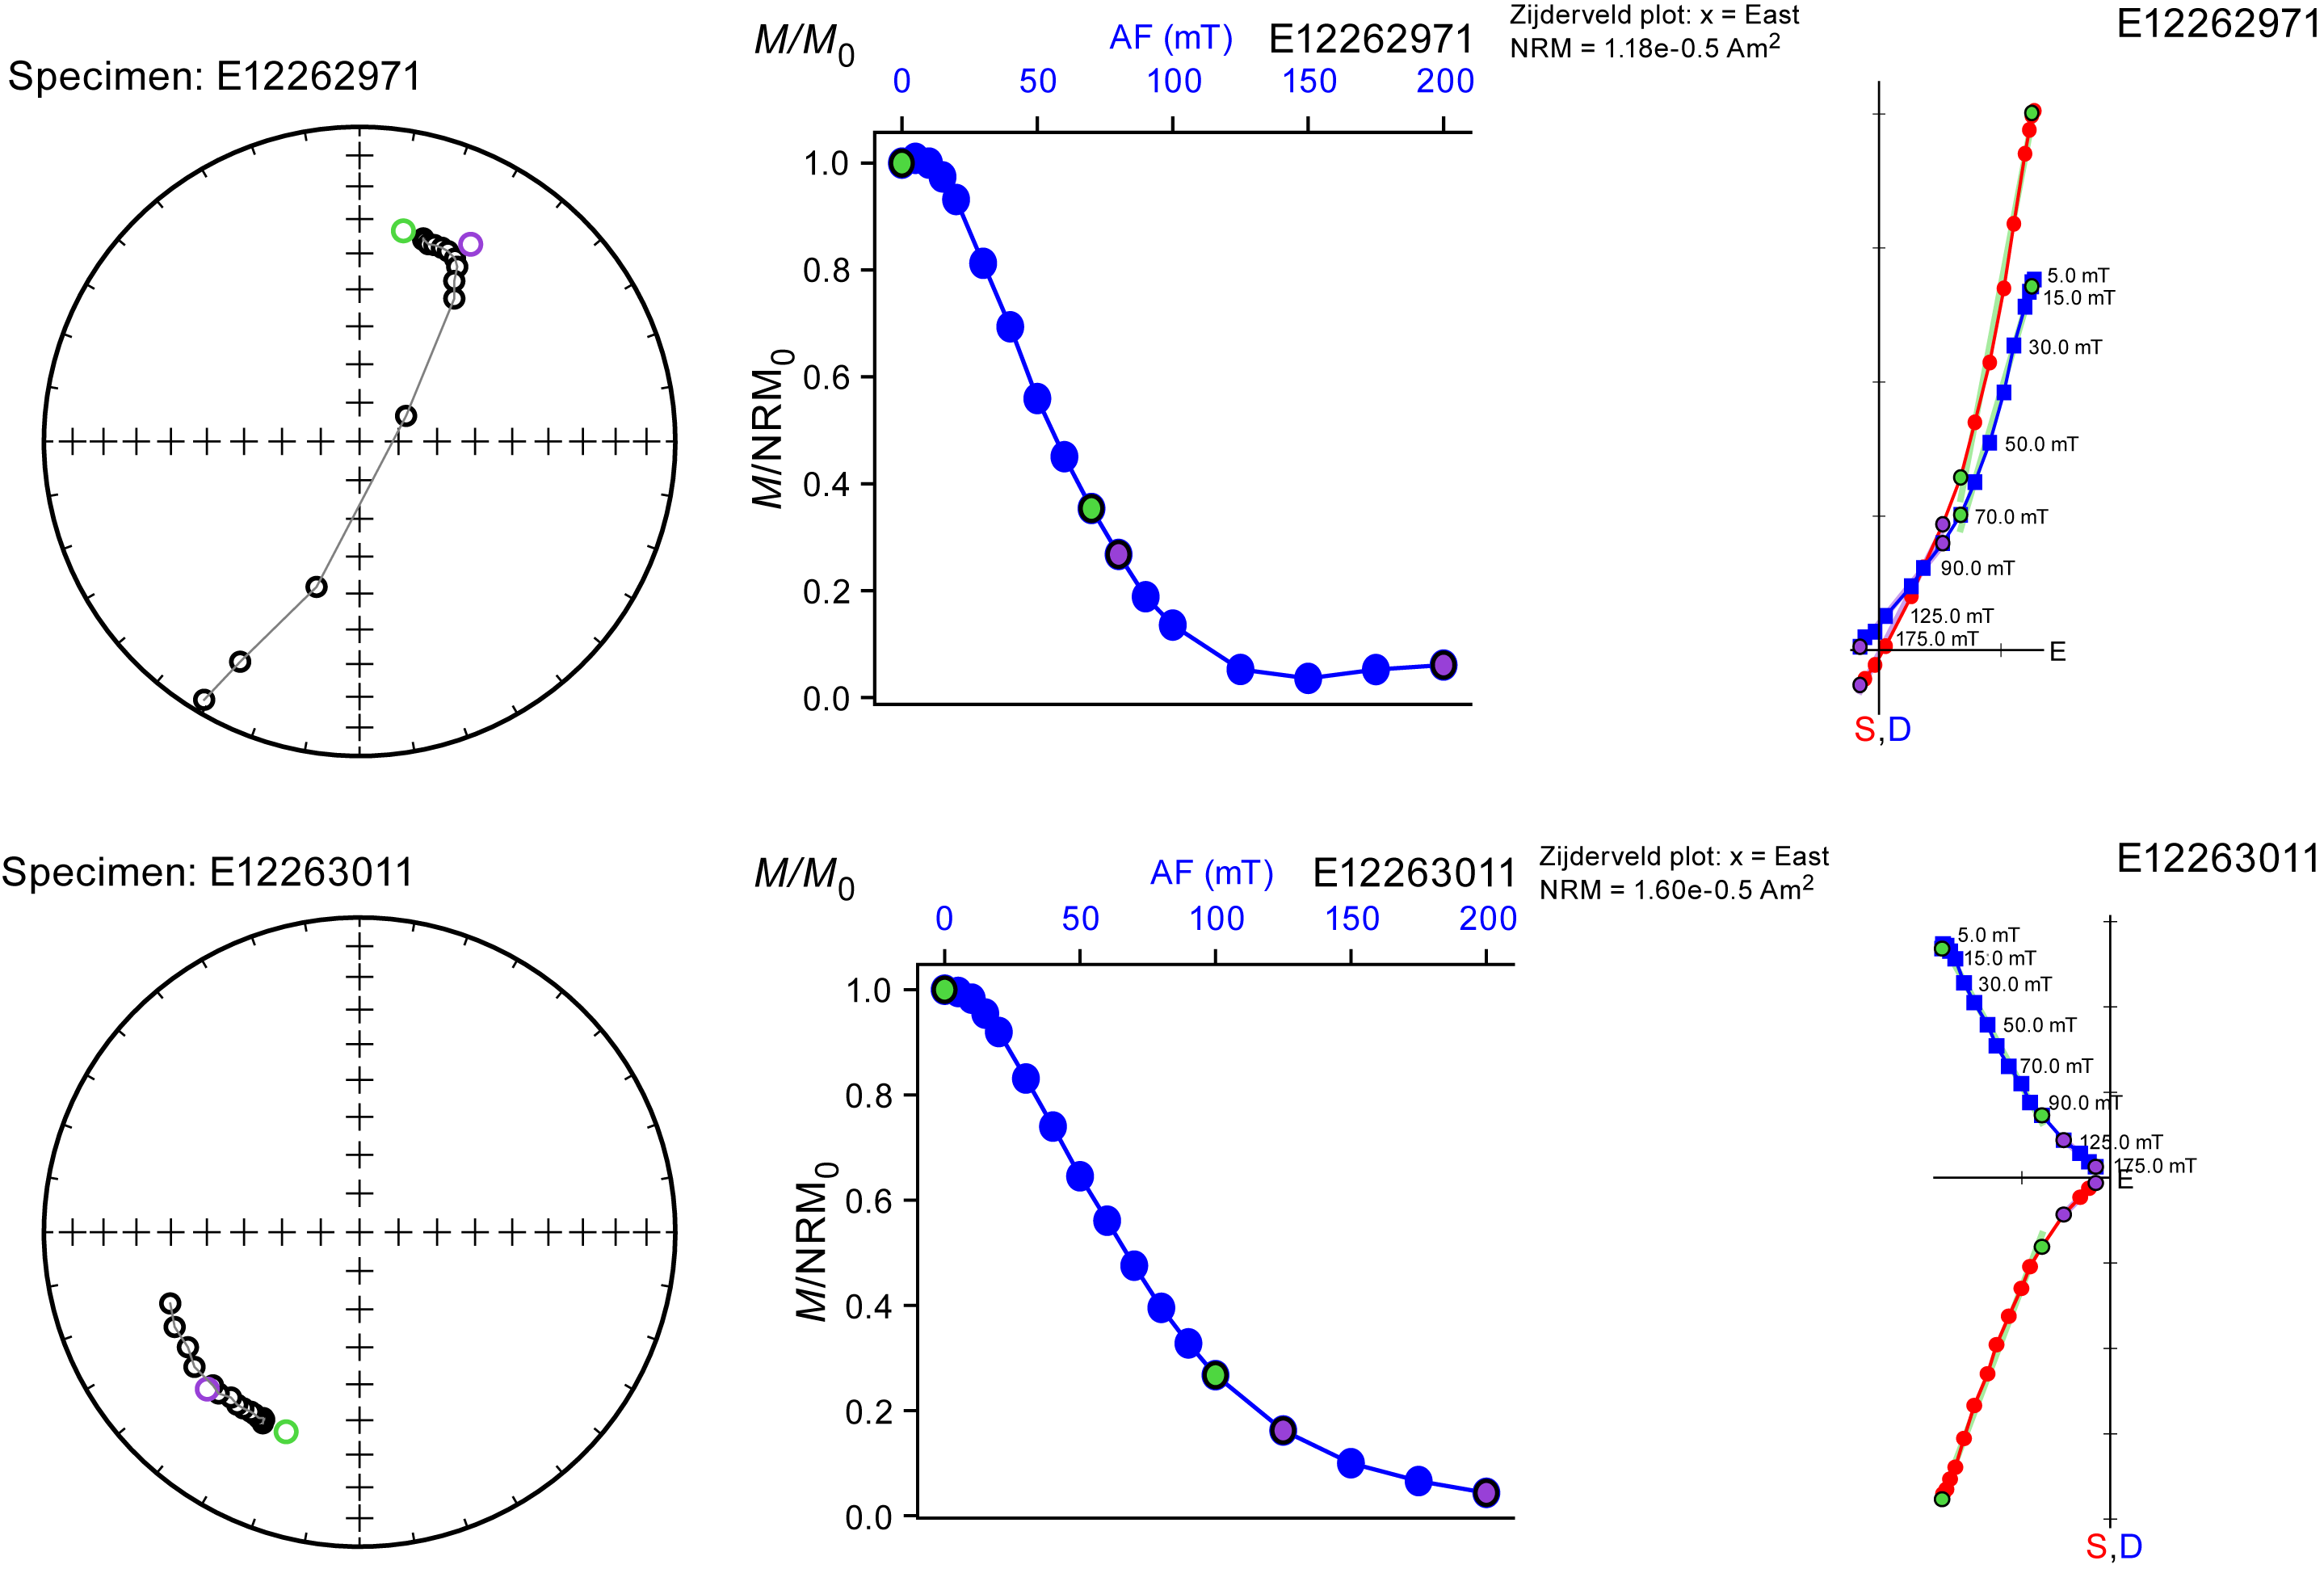
Figure F72. Progressive AF demagnetization.
Samples subjected to stepwise thermal demagnetizations of up to 700°C showed characteristic remanence directions that were in good agreement with their AF counterparts, albeit less constrained (Figure F73). Sample remanence directions were typically isolated just below the Curie temperature, around 500°–550°C. Most samples showed a characteristic drop in magnetization at the Curie temperature, but a few samples had a gradual decrease in magnetization. Bulk susceptibility measurements taken after each temperature step began to notably change above 450°C, indicating that some oxidation had occurred (Table T21).
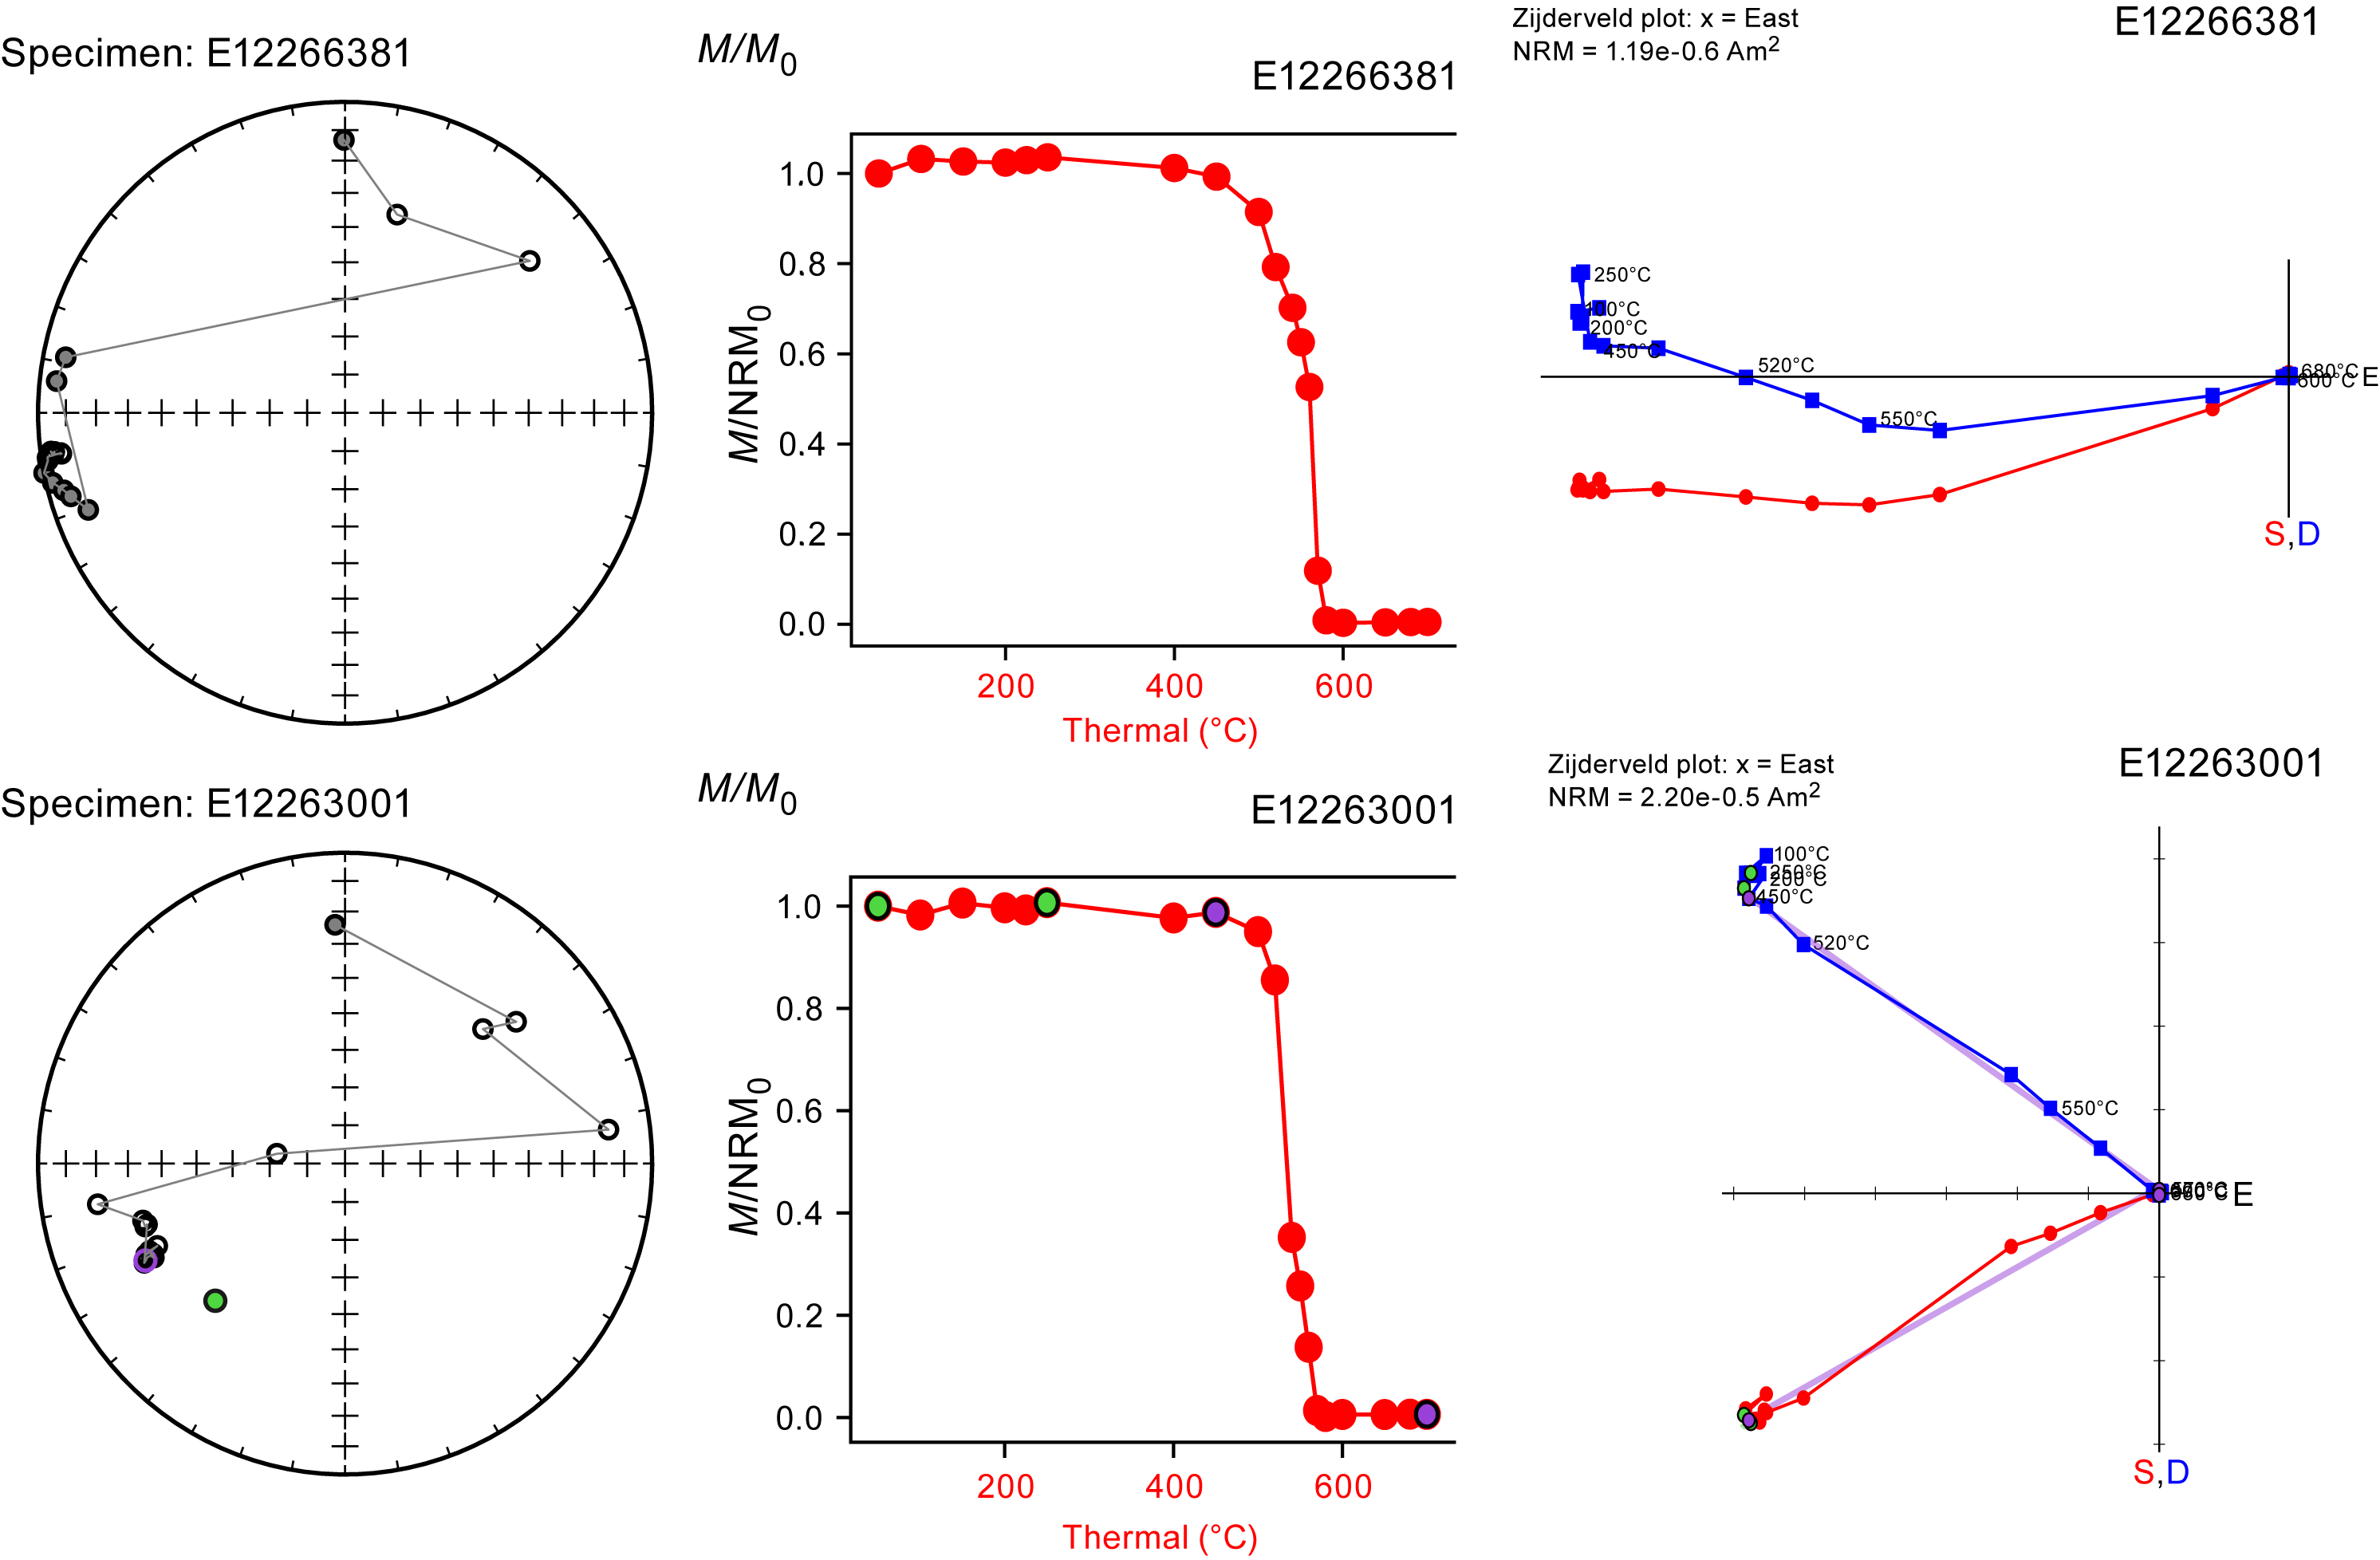
Figure F73. Progressive thermal demagnetization, 50°–700°C.
Although a low-stability (presumably drilling related) component was evident in nearly all samples, this drilling component represented a relatively small fraction of the remanence (<20%) for the gabbroic samples. For most samples, the overprint was easily removed around an AF intensity of 10 mT or an unblocking temperature of 150°C. Although samples were not fully demagnetized, the demagnetization data eventually show a smooth decay toward the origin, indicating that the ChRM directions were captured. Comparisons of the petrophysics samples taken near the paleomagnetism samples showed reasonable agreement, supporting the hypothesis that the viscous overprint from heating of the petrophysics samples did not change the characteristic remanence direction.
Results from the hybrid AF and thermal demagnetization suite were rather mixed (Figure F74). The hybrid experiment began with thermal demagnetizations with temperature steps from 450°C under the assumption that lower coercivity magnetic components had already been demagnetized by the AF 200 mT step, potentially leaving behind higher coercivity components that could be thermally unblocked. Most samples exhibited a distinct Curie temperature, as evidenced by sharp drops in magnetization intensity around 570°–580°C, confirming magnetite as the primary magnetic carrier. However, despite providing evidence for magnetite as the dominant magnetic mineral, the signal remained largely unconstrained for the samples, especially after 580°C. This lack of constraint may be due to significant magnetization (>10−3 A/m) prior to the thermal treatment. Although some samples showed better constrained ChRM directions, this protocol is not recommended because of both the shipboard timing constraints and the limited, useful, additional information it provided.
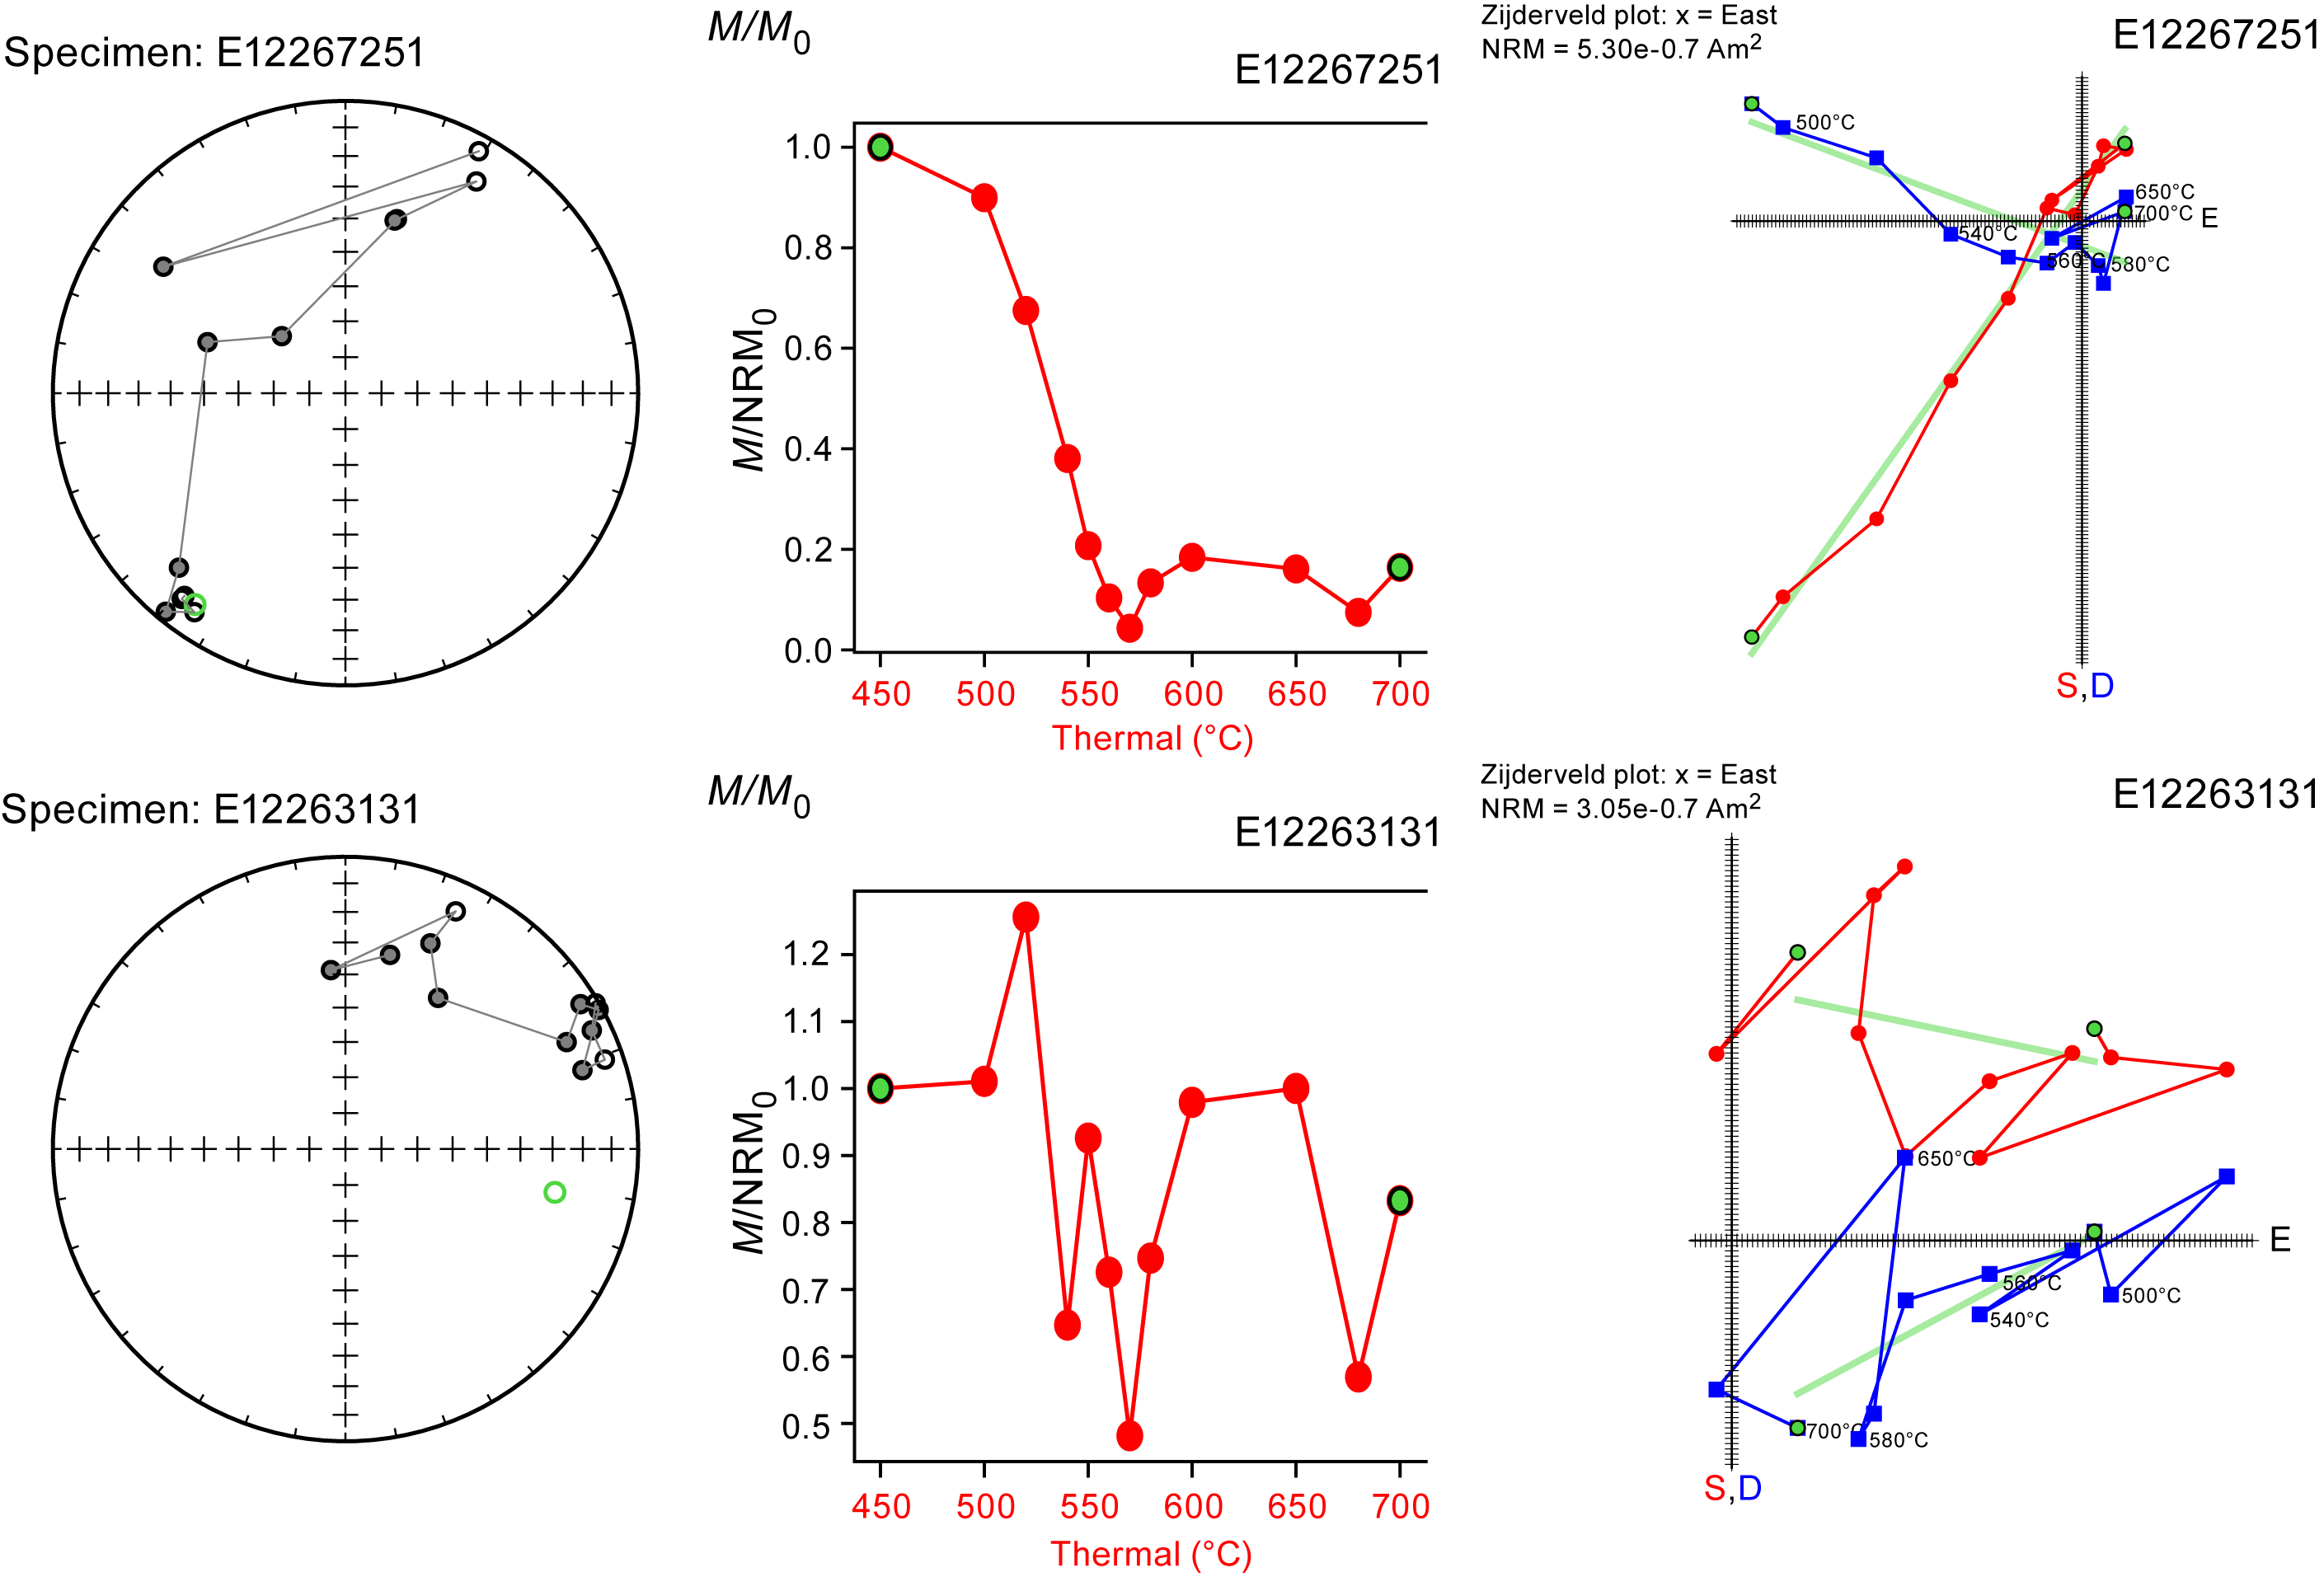
Figure F74. Progressive thermal demagnetization, 450°–700°C.
Combined together, the ChRM directions of discrete samples were in general agreement with the results from archive halves. Discrete samples reveal a strong clustering of inclinations near −30° to −40°. For this section of the hole, the average inclination values were calculated using the inclination only method of McFadden and Reid (1982), which averaged −34.4° (±2.2°; n = 50; α95 = 0.375).
Much like the archive half, the magnetic intensity behavior for the gabbroic samples varied considerably throughout demagnetization. Statistically significant comparisons of magnetic behavior with other lithologic types could not be made because the majority of these discrete samples were gabbroic. Inclinations for the gabbroic samples, however, were quite uniform and consistent with reversed polarity. Discrete samples from the working half data agreed nicely with the continuous archive half data; inclination values were within ~10° of each other.
9.3. Rock magnetic characterizations
9.3.1. Königsberger ratio
The Königsberger ratio (Q) is a proxy of magnetic stability used to determine a rock's stable remanence (Koenigsberger, 1938). A Q value of ≥1 indicates that a rock is capable of maintaining a stable remanence. The ratio is calculated by taking the NRM intensity over the product of the magnetic susceptibility with the local H field, which for Hole U1309D is predicted to be 32.56 A/m (Expedition 304/305 Scientists, 2006b). In general, the Königsberger ratios throughout the hole were >1.0 (Figure F75), indicating that the remanent magnetization was greater than the induced magnetization.
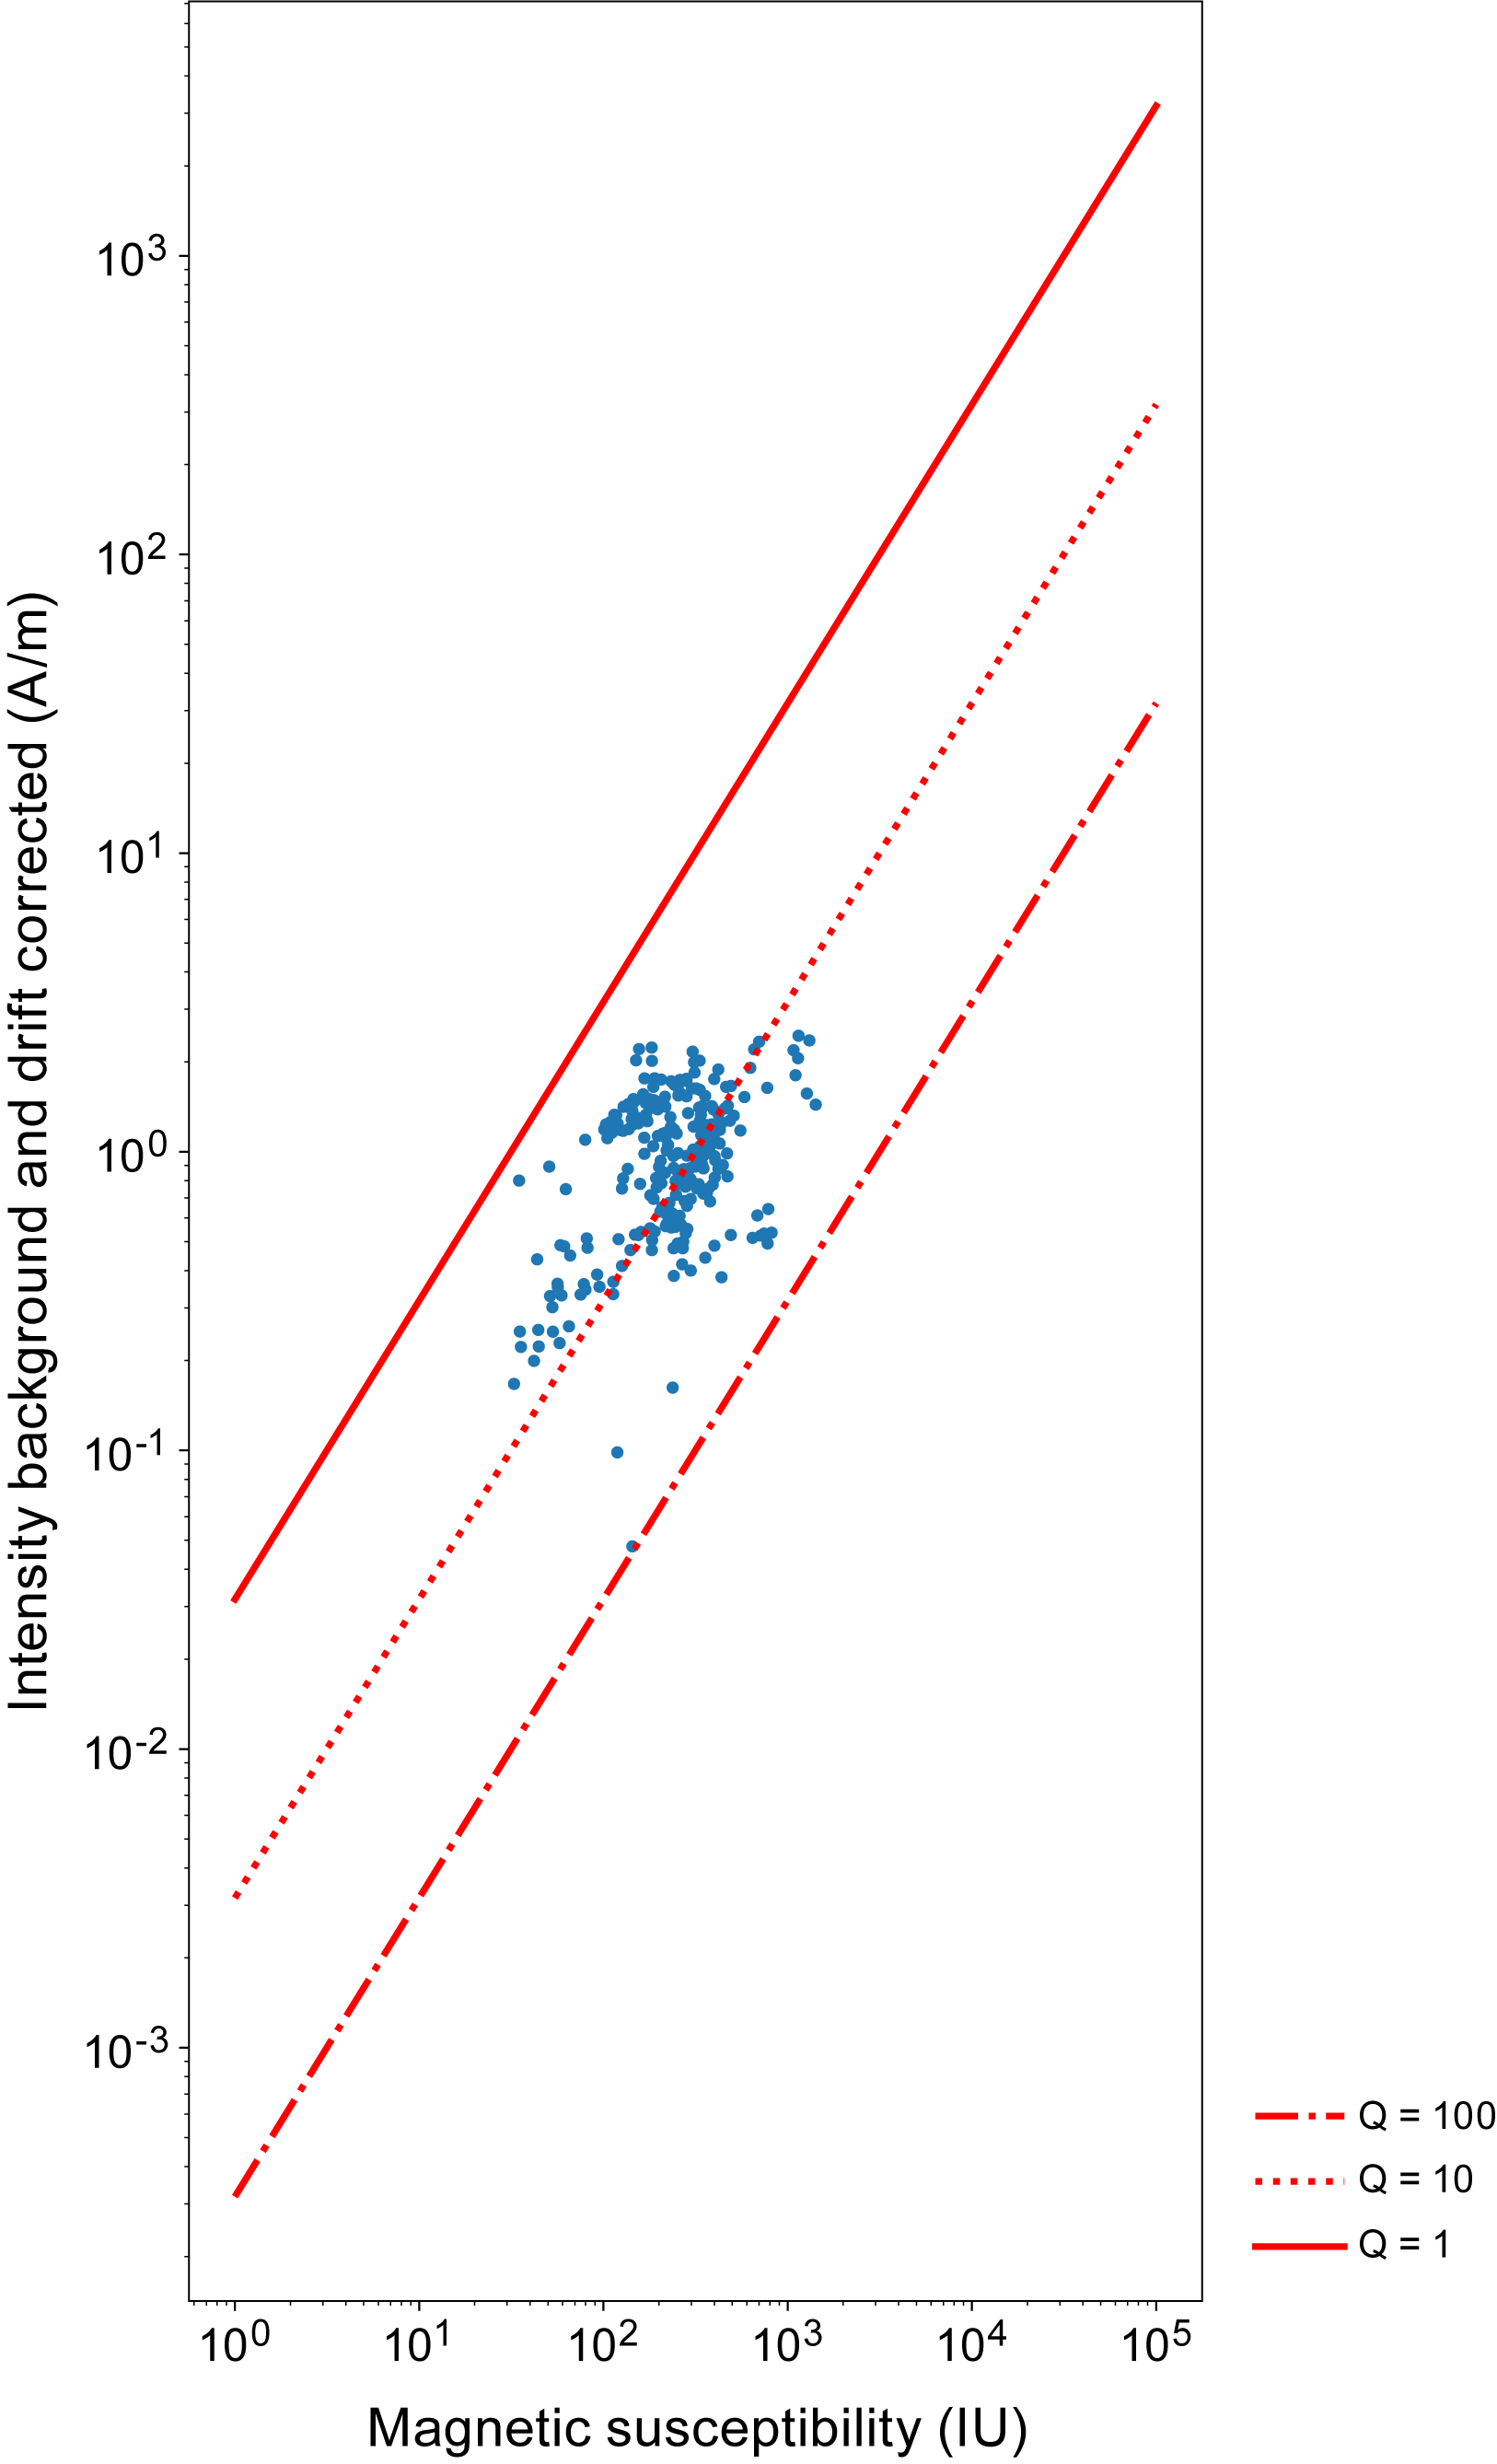
Figure F75. NRM versus magnetic susceptibility.
9.3.2. IRMs
Isothermal remanent magnetization (IRM) experiments, both acquisition and backfield, were carried out following demagnetization experiments (Tables T22, T23). Because of time constraints, only 15 of the 24 samples shared with petrophysics underwent IRM experiments. Samples were subjected to an impulse field along the +z-axis using an ASC impulse magnetizer (model IM-10), with a progressively increasing field from 5 mT to 1.2 T. Afterward, coercivity spectra were unmixed using the MAX UnMix program (Maxbauer et al., 2016), which is based off of a Cumulative Log Gaussian Function of magnetic carriers (Robertson and France, 1994):
- B = given field value,
- Bh = mean coercivity of an individual grain population,
- DP = dispersion parameter, and
- Mr = component saturation magnetic remanence.
From the coercivity spectra, one can observe that the magnetic remanence is likely held by two primary magnetic mineral populations, which have slightly different coercivities (Figure F76). These components were interpreted to represent (1) high magnetizing, low coercivity multidomain magnetite/titanomagnetite and (2) high magnetizing, higher coercivity of pseudo-single domain-like magnetite (Egli, 2004).
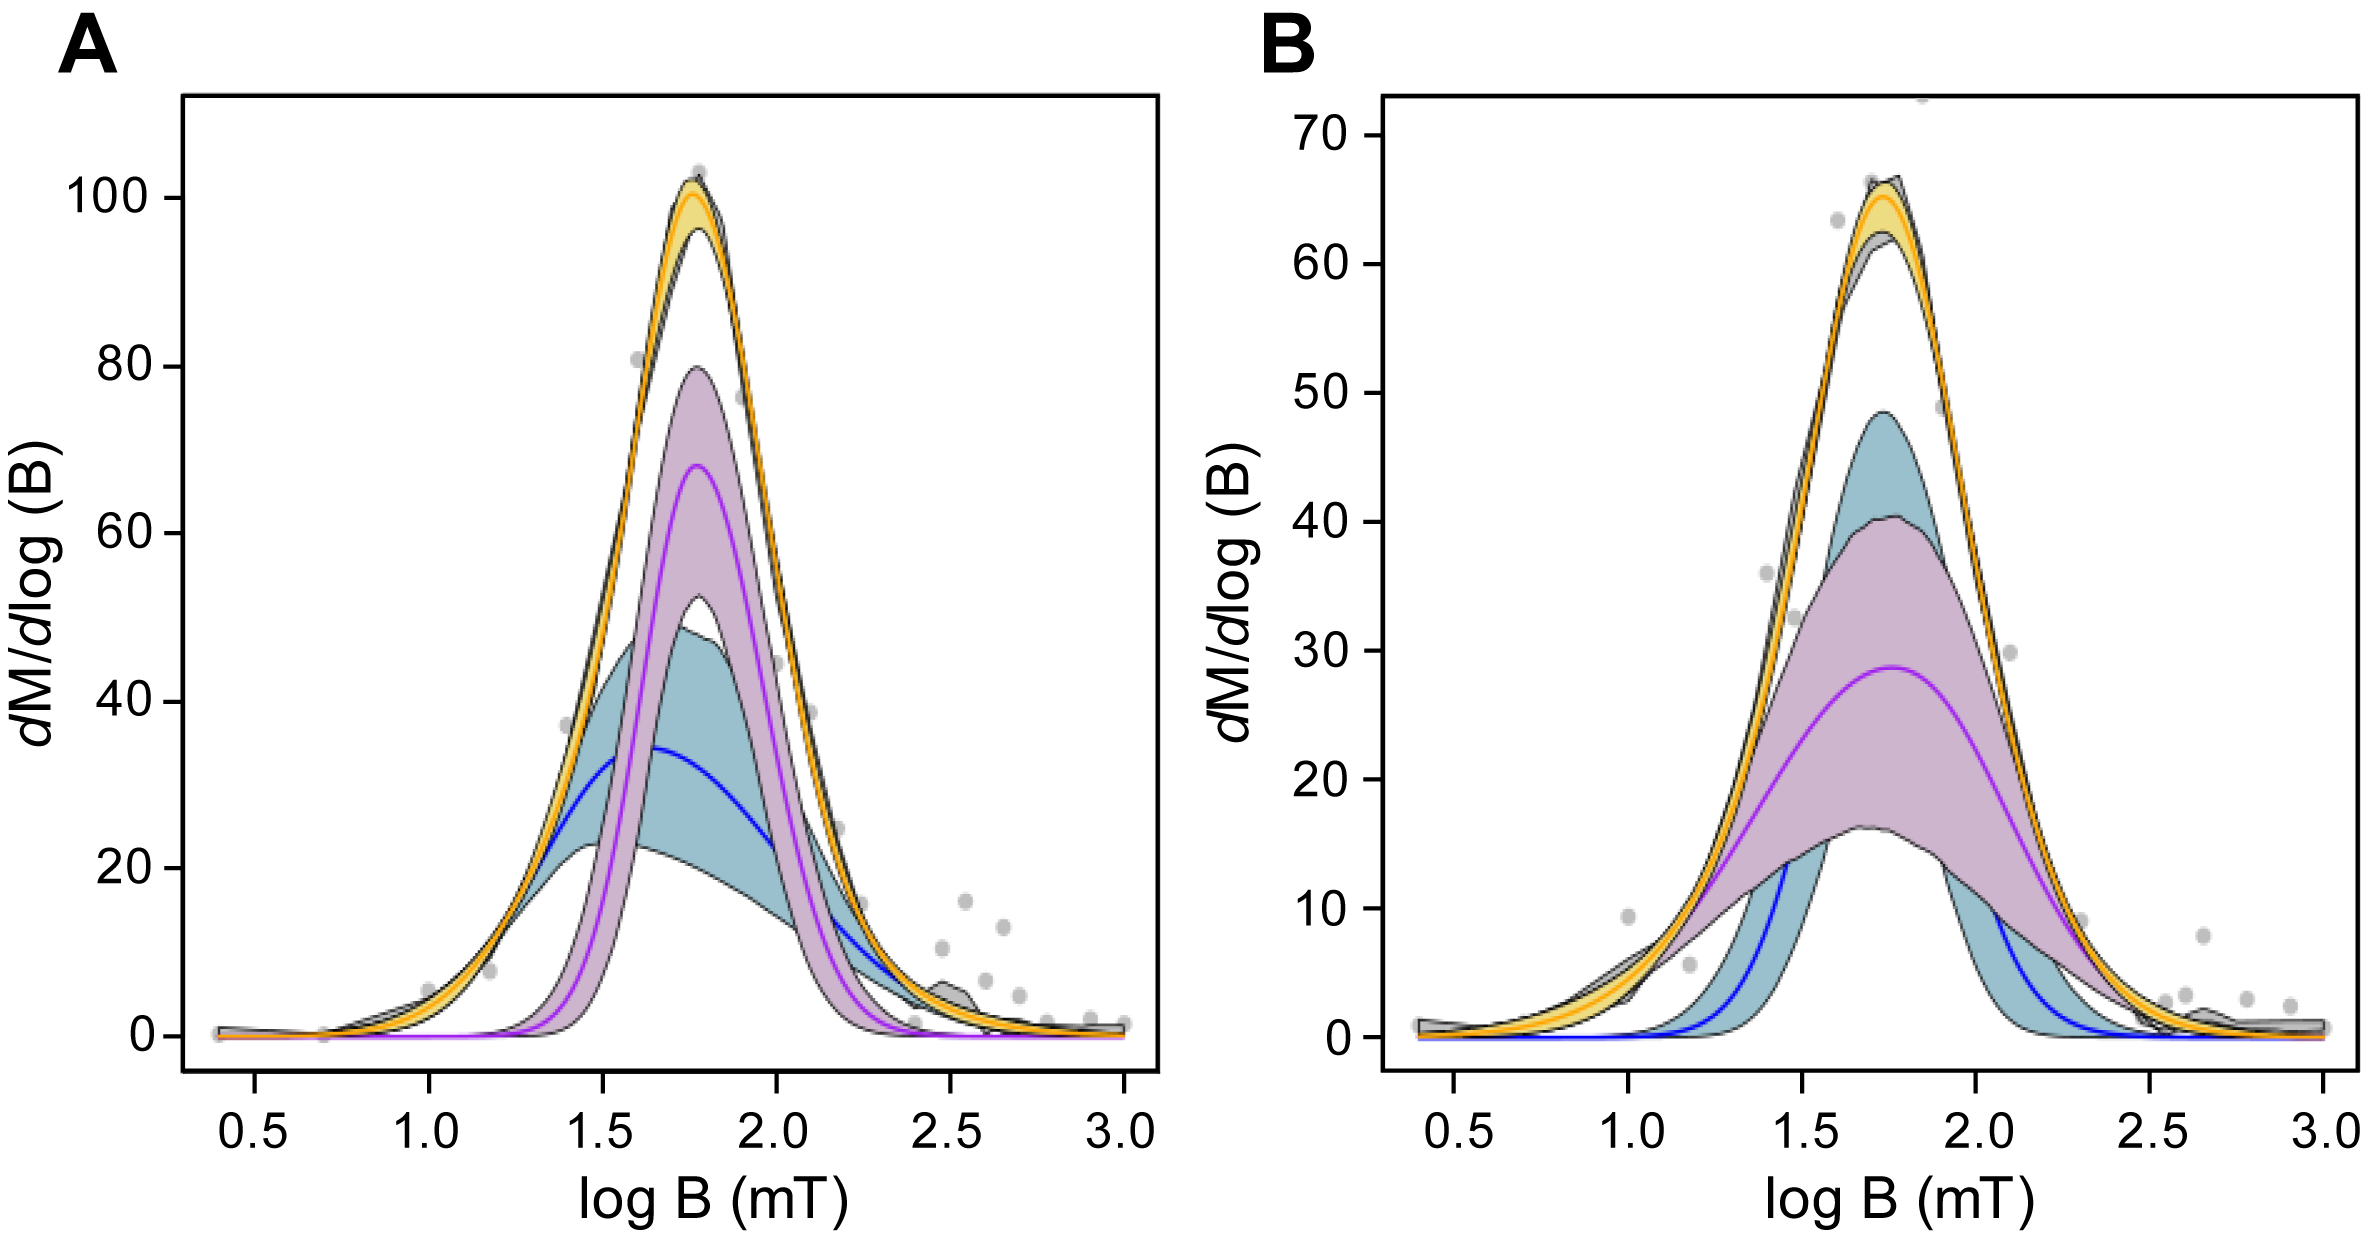
Figure F76. Coercivity spectras of sample cubes.
IRM backfield measurements place further constraints on the most coercive magnetic populations. Samples for both holes have characteristic H values that range 23–72 mT, with the distribution skewing more toward lower values (Table T24). These results provide evidence for predominantly multidomain and pseudo-single domain-like magnetite with minimal single domain grain populations.
9.3.3. Anisotropy of magnetic susceptibility
In total, magnetic anisotropy measurements were carried out on 50 discrete cube samples (26 paleomagnetism and 24 physical properties) from Hole U1309D (Table T25). Rock fabric through magnetic anisotropy is described by the triaxial ellipsoid with principal axes K1 ≥ K2 ≥ K3 referring to maximum (Kmax), intermediate (Kint), and minimum (Kmin) susceptibility axes, respectively (Borradaile, 1991; Tarling and Hrouda, 1993). Identifying relationships between the different susceptibility axes is important for understanding the depth-wise magnetic petrofabric behavior. In this study, the main parameters include the mean magnetic susceptibility (Km), calculated as Km = (Kmax + Kint + Kmin)/3. The ratios of Kmax/Kint and Kint/Kmin are used to infer the degrees of linear and planar magnetic fabric, respectively. The ratios are commonly referred to as the degree of magnetic lineation (L) and foliation (F). The other parameters used are the corrected anisotropy degree (Pj) and the shape parameter (T), which are derived from the relationships among Km, Kmax, Kint, and Kmin (Hrouda, 1982; Jelinek, 1981; Yang et al., 2019). The parameter Pj is useful in identifying ellipsoid eccentricity for directional alignment, and the parameter T reflects the shape of the anisotropy ellipsoids. The parameter T ranges −1 to +1, indicating prolate or oblate shapes, respectively. The average magnetic susceptibility of the measured discrete cube samples is 3.378 × 10⁻³ SI, ranging 1.95 × 10⁻² to 4.03 × 10⁻⁴ SI. The interface between minimum susceptibility (olivine gabbro) and maximum susceptibility (gabbro) is identified within a very close interval (Figure F77) between 1432.78 and 1434.8 mbsf, respectively. Additionally, the lowest values for L, F, and Pj were observed at ~1432–1438 mbsf (Figure F77). Values for the parameters F and L moderately increase between ~1440 and 1470 mbsf and are dominated by oblate magnetic fabrics. These data can be integrated into the larger Expedition 304/305 anisotropy of magnetic susceptibility (AMS) data set. The average degree of anisotropy for Hole U1309D is 1.121 ± 0.075 (n = 50) with values ranging 1.029–1.424. The average value of the parameter Pj suggests that most susceptibility tensors are moderately anisotropic, yet significantly higher degrees of anisotropy were noted in many coarse-grained gabbroic samples. The Jelinek and Flinn plots demonstrate a fair amount of scatter with a correlation indicating that the shapes are generally oblate. (Figure F78). Values for the parameter T support this claim, ranging from the positive range of 0.017–0.907 in most of the discrete samples (n = 30). Samples from this hole predominantly exhibit an undeformed, slightly oblate magnetic fabric; however, some samples do show indications of localized deformation and compaction (Figure F78).
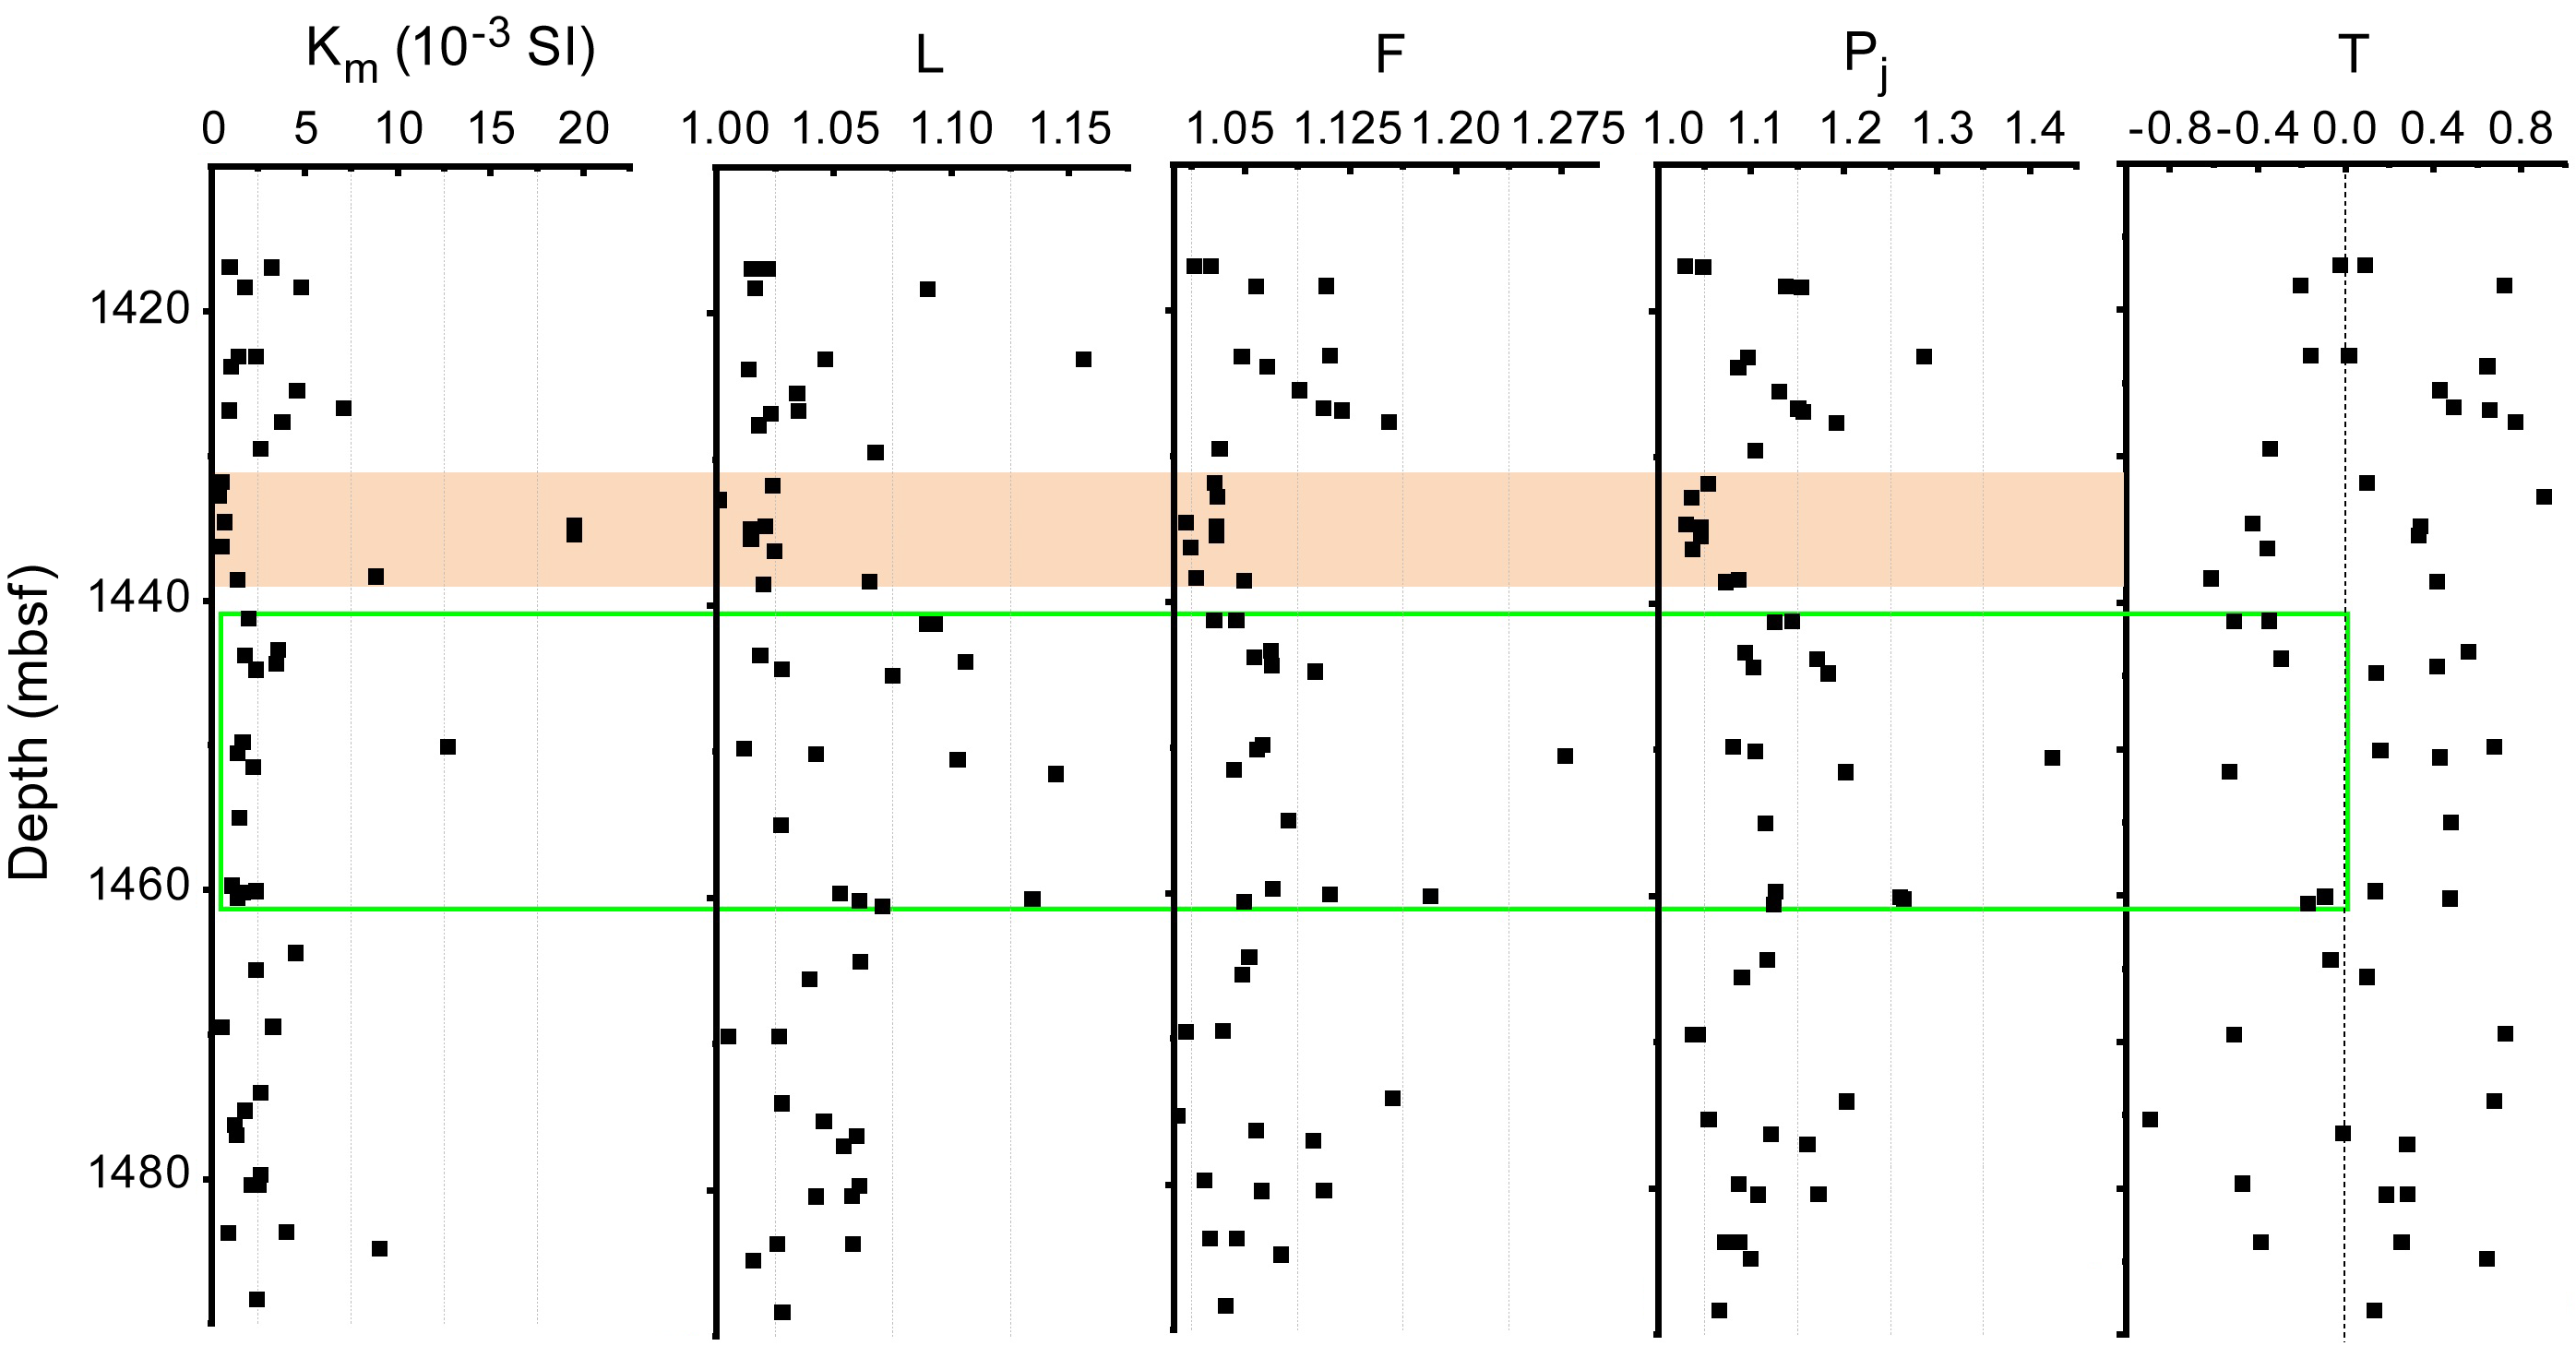
Figure F77. Downhole AMS parameters.
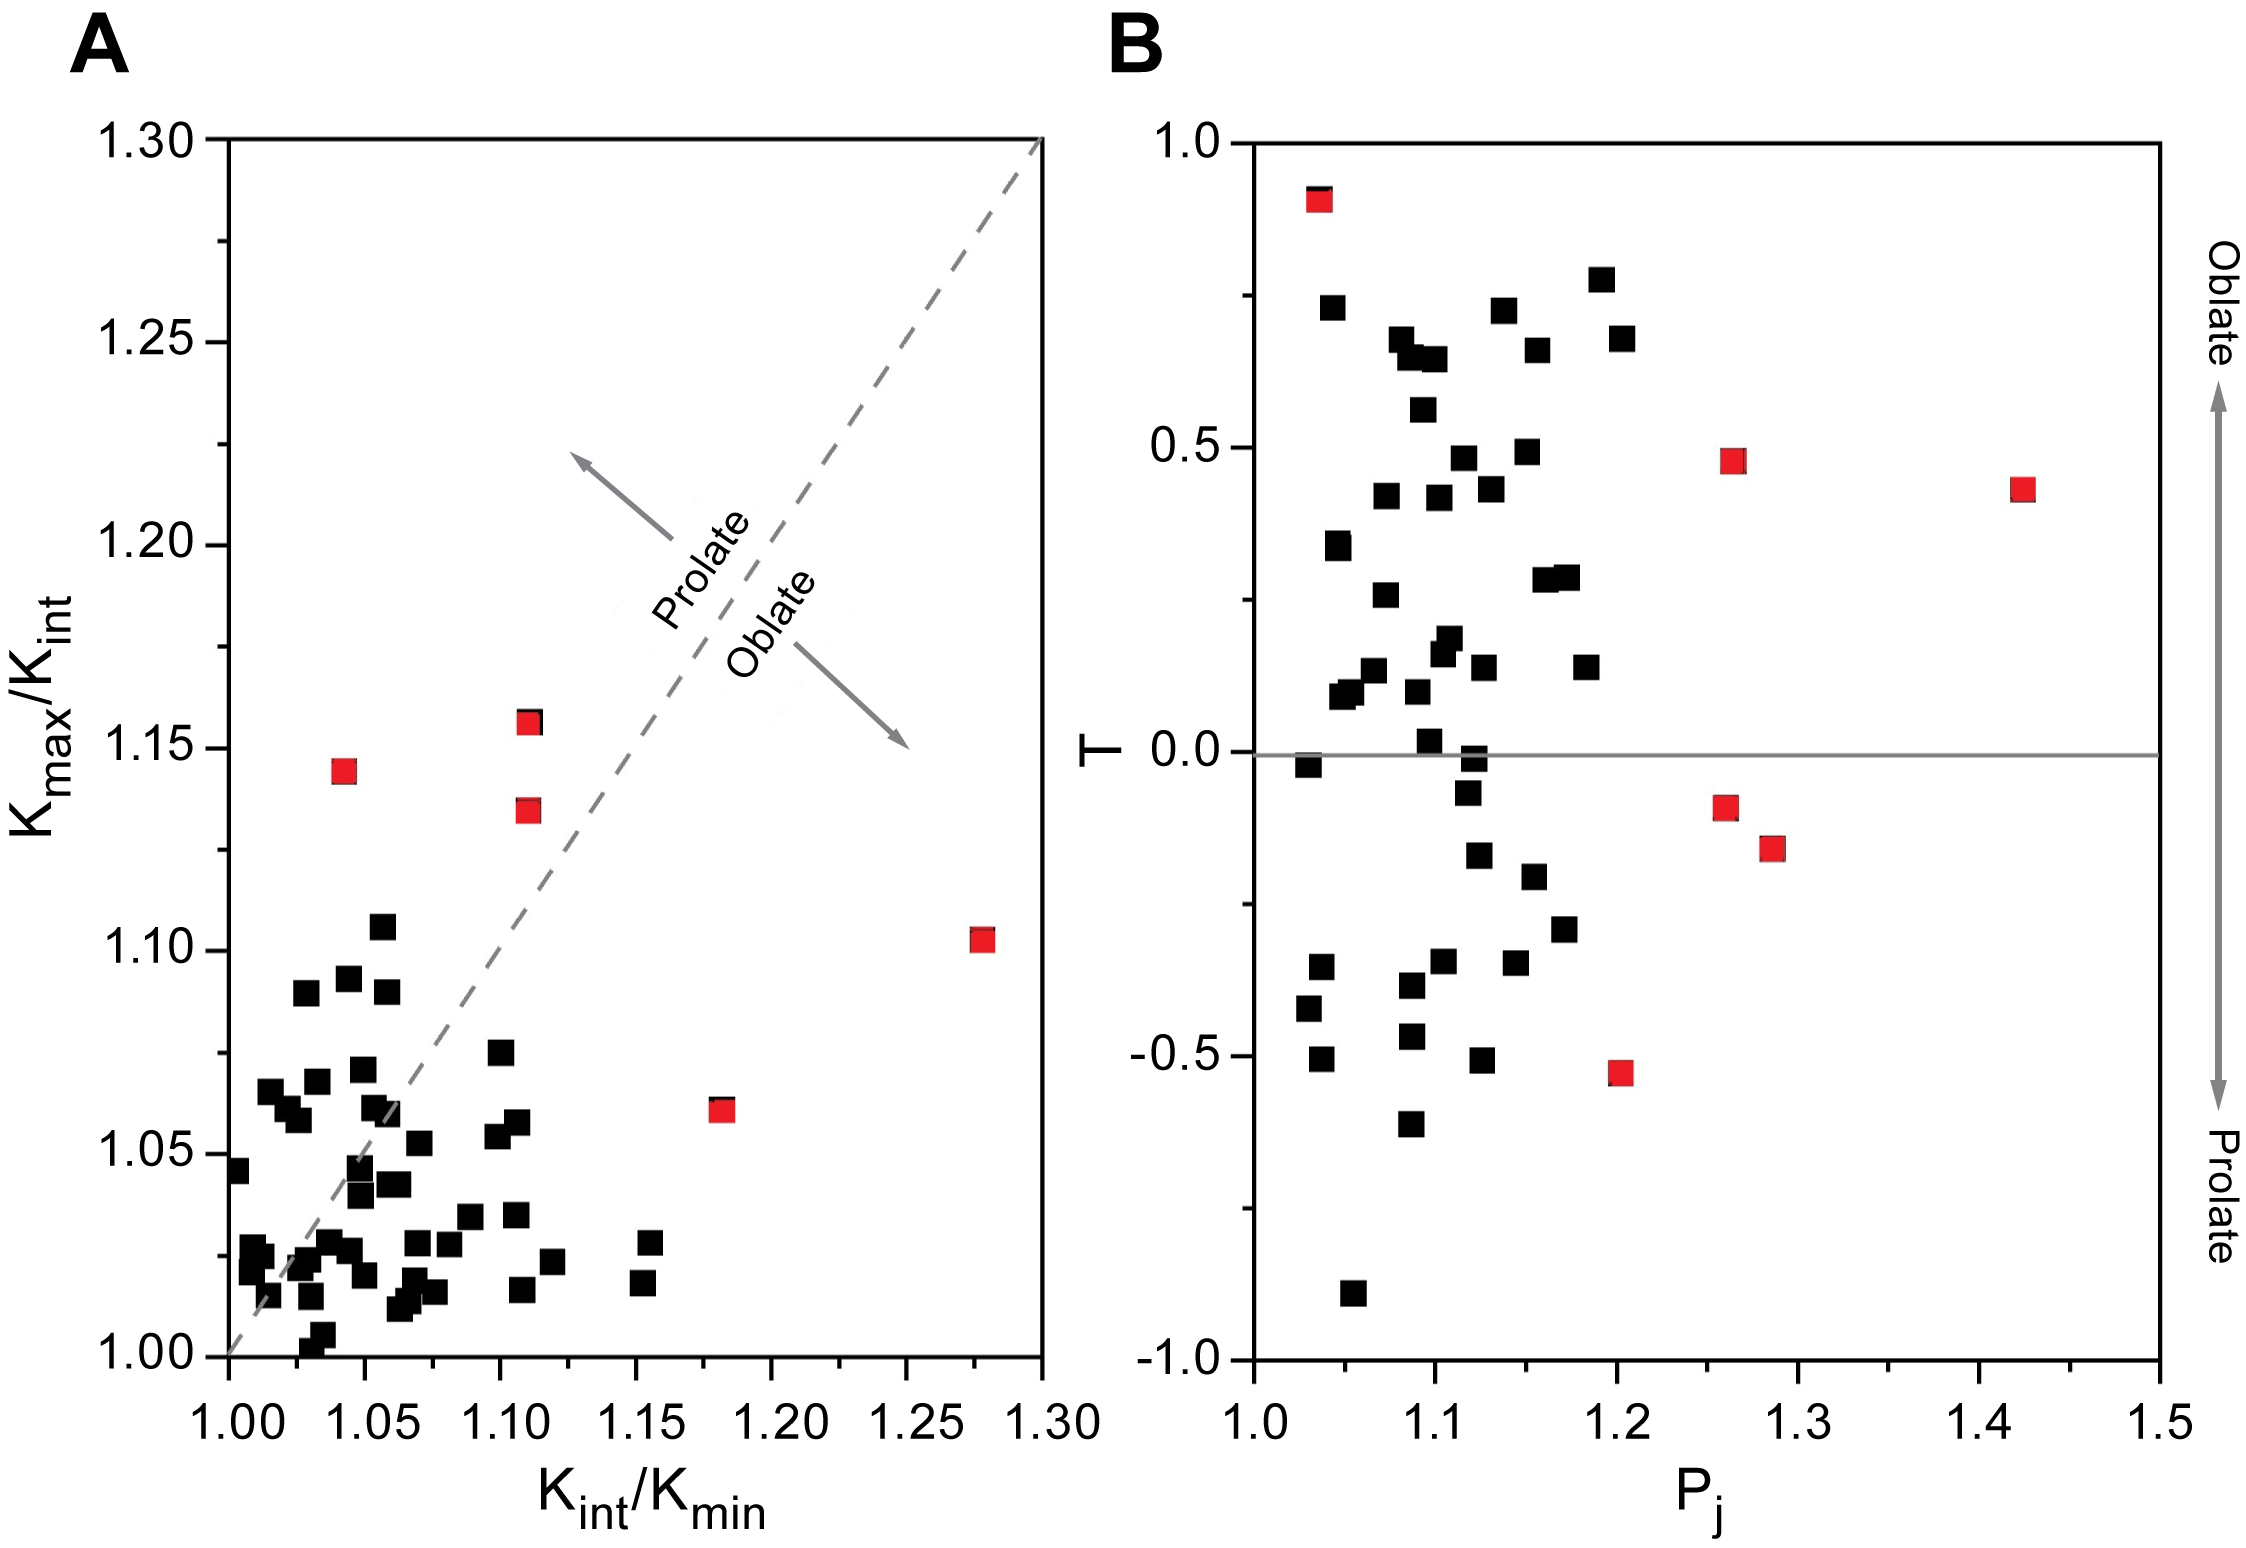
Figure F78. Kmax/Kint versus Kint/Kmin.
It was found that the sample Kmax axes form a broadly girdle distributed among a horizontal plane, the Kint axes are randomly scattered, and the Kmin axes are grouped subvertically (Figure F79A). The mean tensor and bootstrap calculated with Anisoft 5.2.02 version indicated that Kmin has a near vertical plunge. (Figure F79B). The loose azimuthal clustering of Kmax and Kint is likely an artifact because the core reference frame has no azimuthal significance. The distribution pattern of principal axes and recorded degrees of anisotropy are consistent with previous reported AMS data for this hole (see figure F249 and table T18 in Expedition 304/305 Scientists, 2006b). It is important to note that like Expedition 305, the directional data from this expedition's AMS work are in the core reference frame and have not been reoriented to the geographic reference frame.
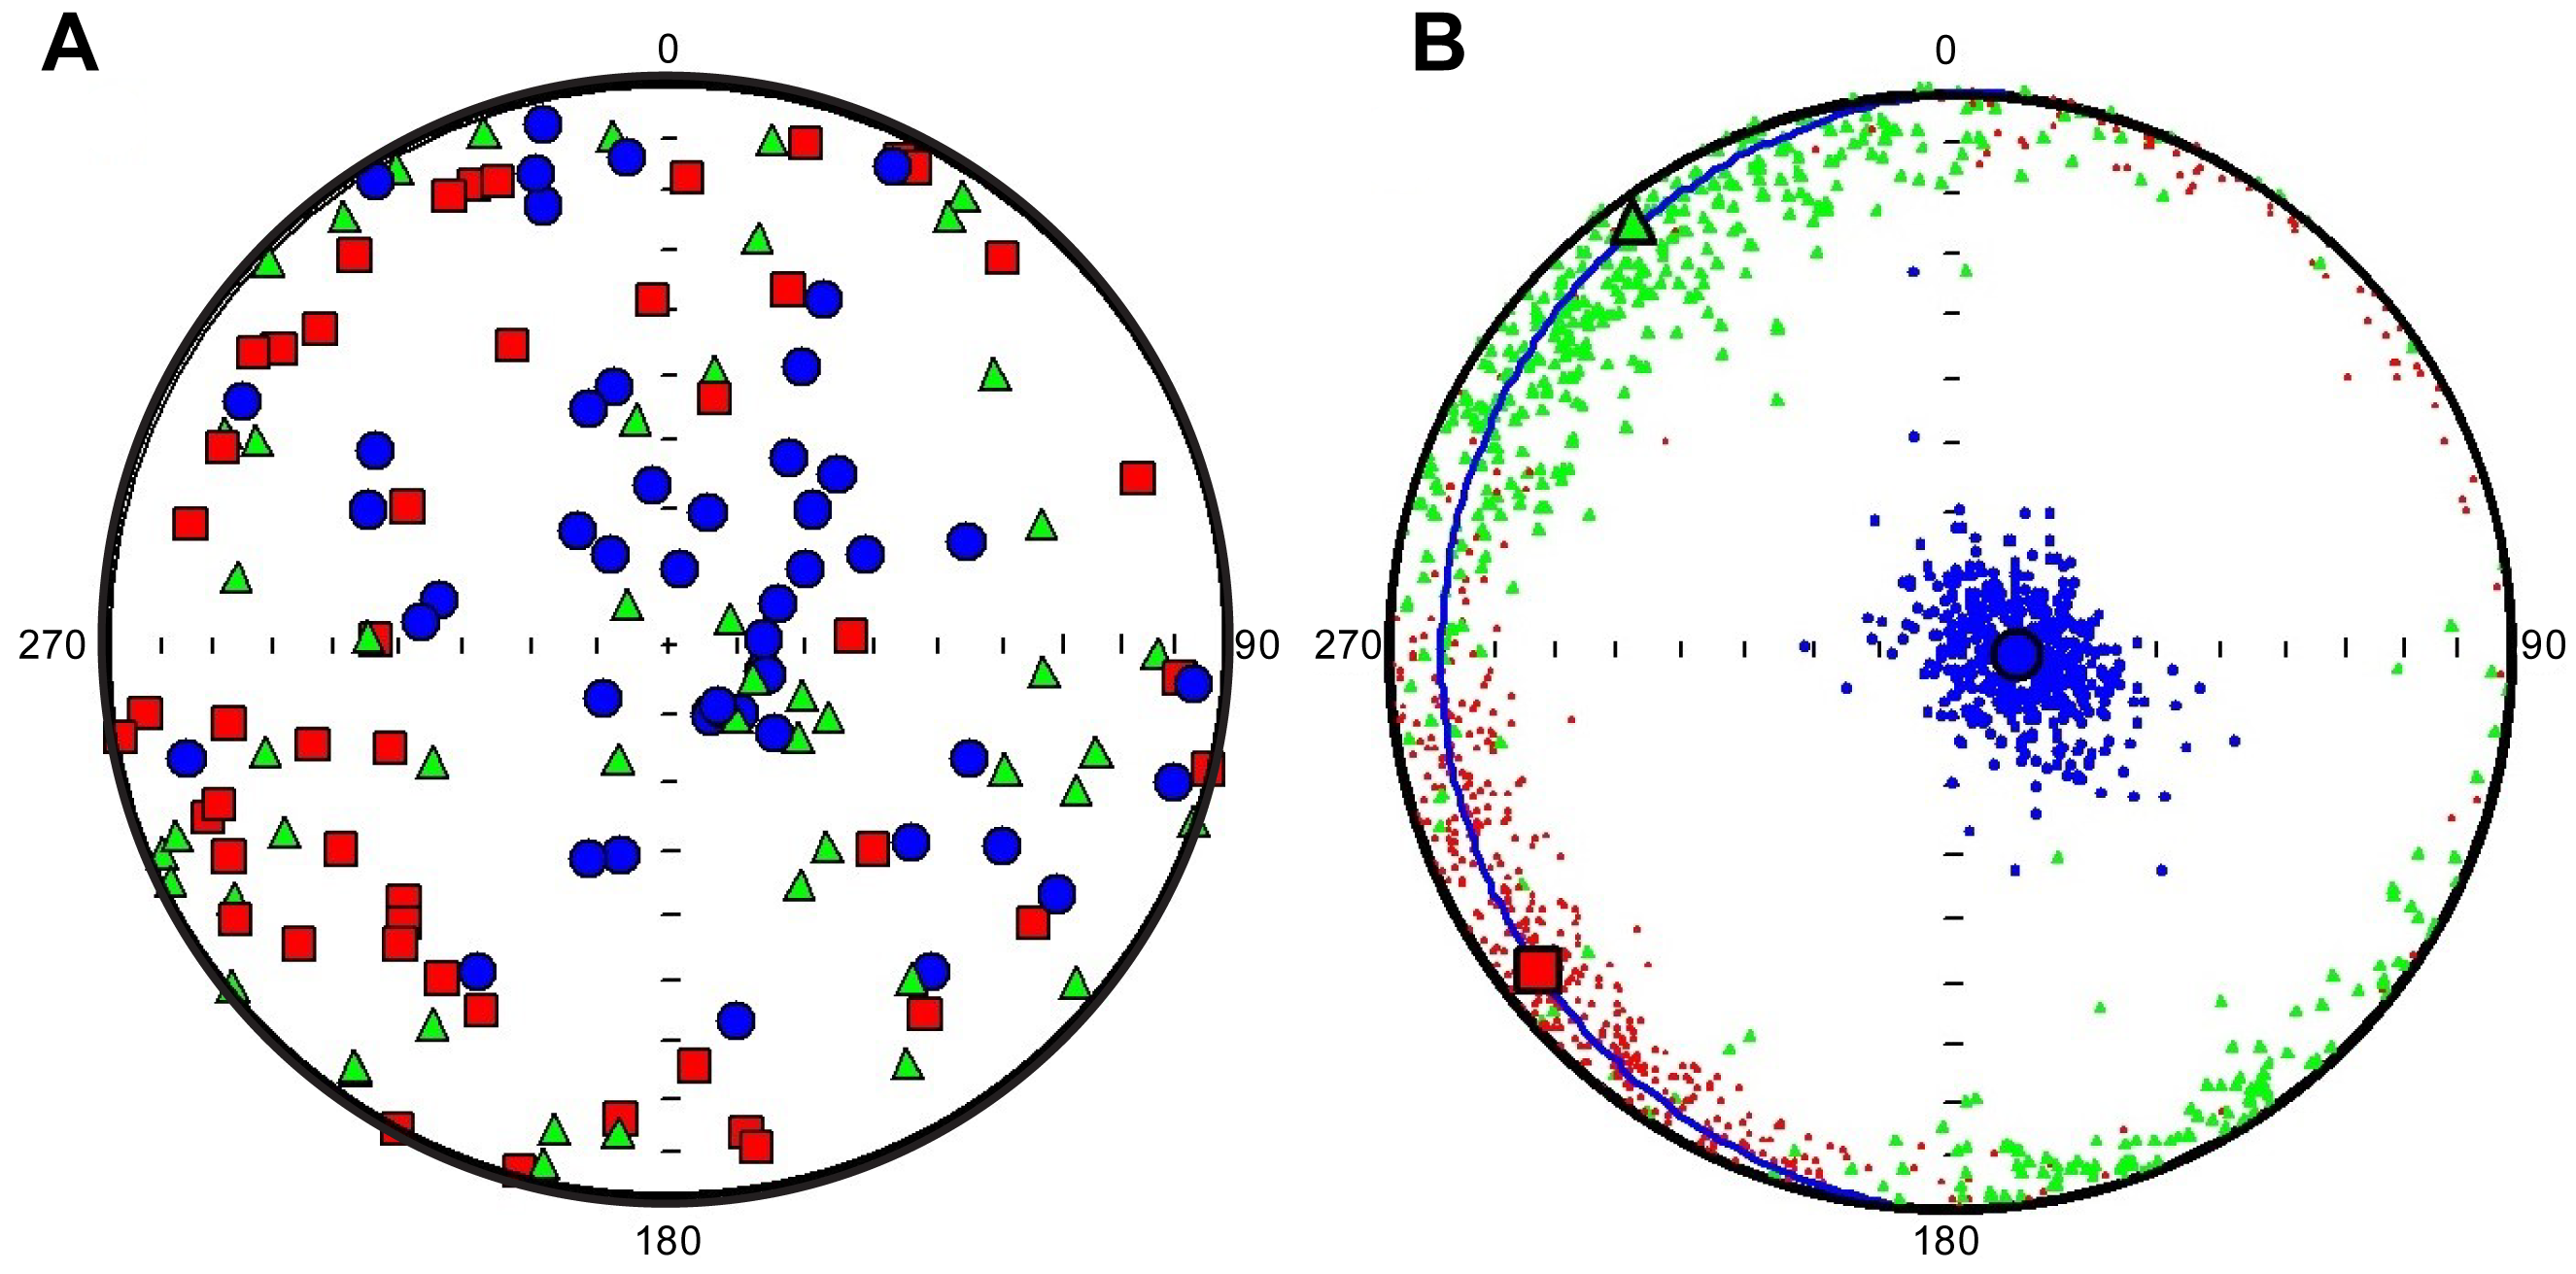
Figure F79. Distribution and clustering, principal susceptibility axes.
References
Andreani, M., Montagnac, G., Fellah, C., Hao, J., Vandier, F., Daniel, I., Pisapia, C., Galipaud, J., Lilley, M.D., Früh Green, G.L., Borensztajn, S., and Ménez, B., 2023. The rocky road to organics needs drying. Nature Communications, 14(1):347. https://doi.org/10.1038/s41467-023-36038-6
Blackman, D.K., Ildefonse, B., John, B.E., Ohara, Y., Miller, D.J., Abe, N., Abratis, M., Andal, E.S., Andreani, M., Awaji, S., Beard, J.S., Brunelli, D., Charney, A.B., Christie, D.M., Collins, J., Delacour, A.G., Delius, H., Drouin, M., Einaudi, F., Escartin, J., Frost, B.R., Früh-Green, G., Fryer, P.B., Gee, J.S., Godard, M., Grimes, C.B., Halfpenny, A., Hansen, H.E., Harris, A.C., Tamura, A., Hayman, N.W., Hellebrand, E., Hirose, T., Hirth, J.G., Ishimaru, S., Johnson, K.T.M., Karner, G.D., Linek, M., MacLeod, C.J., Maeda, J., Mason, O.U., McCaig, A.M., Michibayashi, K., Morris, A., Nakagawa, T., Nozaka, T., Rosner, M., Searle, R.C., Suhr, G., Tominaga, M., von der Handt, A., Yamasaki, T., and Zhao, X., 2011. Drilling constraints on lithospheric accretion and evolution at Atlantis Massif, Mid-Atlantic Ridge 30°N. Journal of Geophysical Research: Solid Earth, 116(B7):B07103. https://doi.org/10.1029/2010JB007931
Blackman, D.K., Slagle, A.L., Guerin, G., and Harding, A., 2014. Geophysical signatures of past and present hydration within a young oceanic core complex. Geophysical Research Letters, 41(4):1179–1186. https://doi.org/10.1002/2013GL058111
Borradaile, G.J., 1991. Correlation of strain with anisotropy of magnetic susceptibility (AMS). pure and applied geophysics, 135(1):15–29. https://doi.org/10.1007/BF00877006
Boschi, C., Früh-Green, G.L., Delacour, A., Karson, J.A., and Kelley, D.S., 2006. Mass transfer and fluid flow during detachment faulting and development of an oceanic core complex, Atlantis Massif (MAR 30°N). Geochemistry, Geophysics, Geosystems, 7(1):Q01004. https://doi.org/10.1029/2005GC001074
Cann, J.R., McCaig, A.M., and Yardley, B.W.D., 2015. Rapid generation of reaction permeability in the roots of black smoker systems, Troodos ophiolite, Cyprus. Geofluids, 15(1–2):179–192. https://doi.org/10.1111/gfl.12117
Dick, H.J.B., MacLeod, C.J., Blum, P., Abe, N., Blackman, D.K., Bowles, J.A., Cheadle, M.J., Cho, K., Ciazela, J., Deans, J.R., Edgcomb, V.P., Ferrando, C., France, L., Ghosh, B., Ildefonse, B.M., Kendrick, M.A., Koepke, J.H., Leong, J.A.M., Chuanzhou, L., Qiang, M., Morishita, T., Morris, A., Natland, J.H., Nozaka, T., Pluemper, O., Sanfilippo, A., Sylvan, J.B., Tivey, M.A., Tribuzio, R., and Viegas, L.G.F., 2017. Expedition 360 summary. In MacLeod, C.J., Dick, H.J.B., Blum, P., and the Expedition 360 Scientists, Southwest Indian Ridge Lower Crust and Moho. Proceedings of the International Ocean Discovery Program, 360: College Station, TX (International Ocean Discovery Program). https://doi.org/10.14379/iodp.proc.360.101.2017
Dick, H.J.B., Natland, J.H., Alt, J.C., Bach, W., Bideau, D., Gee, J.S., Haggas, S., Hertogen, J.G.H., Hirth, G., Holm, P.M., Ildefonse, B., Iturrino, G.J., John, B.E., Kelley, D.S., Kikawa, E., Kingdon, A., LeRoux, P.J., Maeda, J., Meyer, P.S., Miller, D.J., Naslund, H.R., Niu, Y.-L., Robinson, P.T., Snow, J., Stephen, R.A., Trimby, P.W., Worm, H.-U., and Yoshinobu, A., 2000. A long in situ section of the lower ocean crust; results of ODP Leg 176 drilling at the Southwest Indian Ridge. Earth and Planetary Science Letters, 179(1):31–51. https://doi.org/10.1016/S0012-821X(00)00102-3
Egli, R., 2004. Characterization of individual rock magnetic components by analysis of remanence curves: 2. Fundamental properties of coercivity distributions. Physics and Chemistry of the Earth, Parts A/B/C, 29(13):851–867. https://doi.org/10.1016/j.pce.2004.04.001
Escartín, J., and Canales, J.P., 2011. Detachments in oeanic lithosphere: deformation, magmatism, fluid flow, and ecosystems. Eos, Transactions American Geophysical Union, 92(4):31. https://doi.org/10.1029/2011EO040003
Escartín, J., John, B., Cannat, M., Olive, J.-A., Cheadle, M., Früh-Green, G., and Cotterill, C., 2022. Tectonic termination of oceanic detachment faults, with constraints on tectonic uplift and mass wasting related erosion rates. Earth and Planetary Science Letters, 584:117449. https://doi.org/10.1016/j.epsl.2022.117449
Expedition 304/305 Scientists, 2006a. Expedition 304/305 summary. In Blackman, D.K., Ildefonse, B., John, B.E., Ohara, Y., Miller, D.J., MacLeod, C.J., and the Expedition 304/305 Scientist, Proceedings of the Integrated Ocean Drilling Program. 304/305: College Station, TX (Integrated Ocean Drilling Program Management International, Inc.). https://doi.org/10.2204/iodp.proc.304305.101.2006
Expedition 304/305 Scientists, 2006b. Site U1309. In Blackman, D.K., Ildefonse, B., John, B.E., Ohara, Y., Miller, D.J., MacLeod, C.J., and the Expedition 304/305 Scientists, Proceedings of the Integrated Ocean Drilling Program. 304/305: College Station, TX (Integrated Ocean Drilling Program Management International, Inc.). https://doi.org/10.2204/iodp.proc.304305.103.2006
Expedition 340T Scientists, 2012. Atlantis Massif Oceanic Core Complex: velocity, porosity, and impedance contrasts within the domal core of Atlantis Massif: faults and hydration of lithosphere during core complex evolution. Integrated Ocean Drilling Program Preliminary Report, 340T. https://doi.org/10.2204/iodp.pr.340T.2012
Ferrando, C., Tribuzio, R., Lissenberg, C.J., France, L., MacLeod, C.J., Basch, V., Villeneuve, J., Deloule, E., and Sanfilippo, A., 2022. Brown amphibole as tracer of tectono-magmatic evolution of the Atlantis Bank Oceanic Core Complex (IODP Hole U1473A). Journal of Petrology. https://doi.org/10.1093/petrology/egac089
Frost, B.R., Beard, J.S., McCaig, A., and Condliffe, E., 2008. The formation of micro-rodingites from IODP Hole U1309D: key to understanding the process of serpentinization. Journal of Petrology, 49(9):1579–1588. https://doi.org/10.1093/petrology/egn038
Früh-Green, G.L., Orcutt, B.N., Rouméjon, S., Lilley, M.D., Morono, Y., Cotterill, C., Green, S., Escartin, J., John, B.E., McCaig, A.M., Cannat, M., Ménez, B., Schwarzenbach, E.M., Williams, M.J., Morgan, S., Lang, S.Q., Schrenk, M.O., Brazelton, W.J., Akizawa, N., Boschi, C., Dunkel, K.G., Quéméneur, M., Whattam, S.A., Mayhew, L., Harris, M., Bayrakci, G., Behrmann, J.-H., Herrero-Bervera, E., Hesse, K., Liu, H.-Q., Ratnayake, A.S., Twing, K., Weis, D., Zhao, R., and Bilenker, L., 2018. Magmatism, serpentinization and life: insights through drilling the Atlantis Massif (IODP Expedition 357). Lithos, 323:137–155. https://doi.org/10.1016/j.lithos.2018.09.012
Gieskes, J.M., Kastner, M., Erzinger, J., Boulègue, J.J., and Hart, S.R., 1986. Geochemical studies in Hole 504B, Leg 92. In Thiede J., V., T.L., et al., Initial Reports of the Deep Sea Drilling Project. 92: Washington, DC (US Government Printing Office), 547–562. https://doi.org/10.2973/dsdp.proc.92.136.1986
Gillis, K.M., Snow, J.E., Klaus, A., Guerin, G., Abe, N., Akizawa, N., Ceuleneer, G., Cheadle, M.J., Adrião, Á., Faak, K., Falloon, T.J., Friedman, S.A., Godard, M.M., Harigane, Y., Horst, A.J., Hoshide, T., Ildefonse, B., Jean, M.M., John, B.E., Koepke, J.H., Machi, S., Maeda, J., Marks, N.E., McCaig, A.M., Meyer, R., Morris, A., Nozaka, T., Python, M., Saha, A., and Wintsch, R.P., 2014. Expediton 345 summary. In Gillis, K.M., Snow, J.E., Klaus, A., and the Expedition 345 Scientists, Proceedings of the Integrated Ocean Drilling Program. 345: College Station, TX (Integrated Ocean Drilling Program). https://doi.org/10.2204/iodp.proc.345.101.2014
Godard, M., Awaji, S., Hansen, H., Hellebrand, E., Brunelli, D., Johnson, K., Yamasaki, T., Maeda, J., Abratis, M., Christie, D., Kato, Y., Mariet, C., and Rosner, M., 2009. Geochemistry of a long in-situ section of intrusive slow-spread oceanic lithosphere: results from IODP Site U1309 (Atlantis Massif, 30°N Mid-Atlantic-Ridge). Earth and Planetary Science Letters, 279(1–2):110–122. https://doi.org/10.1016/j.epsl.2008.12.034
Grimes, C.B., John, B.E., Cheadle, M.J., and Wooden, J.L., 2008. Protracted construction of gabbroic crust at a slow spreading ridge; constraints from 206Pb/238U zircon ages from Atlantis Massif and IODP Hole U1309D (30°N, MAR). Geochemistry, Geophysics, Geosystems, 9(8):Q08012. https://doi.org/10.1029/2008GC002063
Harding, A.J., Arnulf, A.F., and Blackman, D.K., 2016. Velocity structure near IODP Hole U1309D, Atlantis Massif, from waveform inversion of streamer data and borehole measurements. Geochemistry, Geophysics, Geosystems, 17(6):1990–2014. https://doi.org/10.1002/2016GC006312
Holness, M.B., Cesare, B., and Sawyer, E.W., 2011. Melted rocks under the microscope: microstructures and their interpretation. Elements, 7(4):247–252. https://doi.org/10.2113/gselements.7.4.247
Hrouda, F., 1982. Magnetic anisotropy of rocks and its application in geology and geophysics. Geophysical surveys, 5(1):37–82. https://doi.org/10.1007/BF01450244
Jelinek, V., 1981. Characterization of the magnetic fabric of rocks. Tectonophysics, 79(3–4):T63–T67. https://doi.org/10.1016/0040-1951(81)90110-4
John, B.E., Cheadle, M.J., Gee, J.S., Grimes, C.B., Morris, A., and Pressling, N., 2009. Data report: spatial and temporal evolution of slow spread oceanic crust; graphic sections of core recovered from IODP Hole U1309D, Atlantis Massif, 30°N, MAR (including Pb/U zircon geochronology and magnetic remanence data). In Blackman, D.K., Ildefonse, B., John, B.E., Ohara, Y., Miller, D.J., MacLeod, C.J., and the Expedition 304/305 Scientists, Proceedings of the Integrated Ocean Drilling Program 304/305: College Station, TX (Integrated Ocean Drilling Program Management International, Inc.). https://doi.org/10.2204/iodp.proc.304305.205.2009
Karson, J.A., Früh-Green, G.L., Kelley, D.S., Williams, E.A., Yoerger, D.R., and Jakuba, M., 2006. Detachment shear zone of the Atlantis Massif core complex, Mid-Atlantic Ridge, 30°N. Geochemistry, Geophysics, Geosystems, 7(6):Q06016. https://doi.org/10.1029/2005GC001109
Kirschvink, J.L., 1980. The least-squares line and plane and the analysis of palaeomagnetic data. Geophysical Journal International, 62(3):699–718. https://doi.org/10.1111/j.1365-246X.1980.tb02601.x
Klein, F., Grozeva, N.G., and Seewald, J.S., 2019. Abiotic methane synthesis and serpentinization in olivine-hosted fluid inclusions. Proceedings of the National Academy of Sciences of the United States of America, 116(36):17666–17672. https://doi.org/10.1073/pnas.1907871116
Koenigsberger, J.G., 1938. Natural residual magnetism of eruptive rocks. Terrestrial Magnetism and Atmospheric Electricity, 43(3):299–320. https://doi.org/10.1029/TE043i003p00299
Lang, S.Q., McCaig, A.M, Blum, P., Abe, N., Brazelton, W., Coltat, R., Deans, J.R., Dickerson, K.L., Godard, M., John, B.E., Klein, F., Kuehn, R., Lin, K.-Y., Lissenberg, C.J., Liu, H., Lopes, E.L., Nozaka, T., Parsons, A.J., Pathak, V., Reagan, M.K., Robare, J.A., Savov, I.P., Schwarzenbach, E., Sissmann, O.J., Southam, G., Wang, F., and Wheat, C.G., 2025. Expedition 399 methods. In McCaig, A.M., Lang, S.Q., Blum, P., and the Expedition 399 Scientists, Building Blocks of Life, Atlantis Massif. Proceedings of the International Ocean Discovery Program, 399: College Station, TX (International Ocean Discovery Program). https://doi.org/10.14379/iodp.proc.399.102.2025
Le Maitre, R.W., 1989. A Classification of Igneous Rocks and Glossary of Terms: Boston (Blackwell).
Lissenberg, C.J., and MacLeod, C.J., 2017. A reactive porous flow control on mid-ocean ridge magmatic evolution. Journal of Petrology, 57(11-12):2195–2220. https://doi.org/10.1093/petrology/egw074
MacLeod, C.J., Dick, H.J.B., Blum, P., Abe, N., Blackman, D.K., Bowles, J.A., Cheadle, M.J., Cho, K., Ciazela, J., Deans, J.R., Edgcomb, V.P., Ferrando, C., France, L., Ghosh, B., Ildefonse, B.M., Kendrick, M.A., Koepke, J.H., Leong, J.A.M., Chuanzhou, L., Qiang, M., Morishita, T., Morris, A., Natland, J.H., Nozaka, T., Pluemper, O., Sanfilippo, A., Sylvan, J.B., Tivey, M.A., Tribuzio, R., and Viegas, L.G.F., 2017. Site U1473. In MacLeod, C.J., Dick, H.J.B., Blum, P., and the Expedition 360 Scientists, Southwest Indian Ridge Lower Crust and Moho. Proceedings of the International Ocean Discovery Program, 360: College Station, TX (International Ocean Discovery Program). https://doi.org/10.14379/iodp.proc.360.103.2017
Magenheim, A.J., and Gieskes, J.M., 1996. Simulation of borehole fluid mixing on the basis of geochemical observations, Hole 504B. In Alt, J.C., Kinoshita, H., Stokking, L.B., and Michael, P.J. (Eds.), Proceedings of the Ocean Drilling Program, Scientific Results. 148: College Station, TX (Ocean Drilling Program), 111–118. https://doi.org/10.2973/odp.proc.sr.148.116.1996
Mason, O.U., Nakagawa, T., Rosner, M., Van Nostrand, J.D., Zhou, J., Maruyama, A., Fisk, M.R., and Giovannoni, S.J., 2010. First investigation of the microbiology of the deepest layer of ocean crust. PloS One, 5(11):e15399. https://doi.org/10.1371/journal.pone.0015399
Maxbauer, D.P., Feinberg, J.M., and Fox, D.L., 2016. MAX UnMix: a web application for unmixing magnetic coercivity distributions. Computers & Geosciences, 95:140–145. https://doi.org/10.1016/j.cageo.2016.07.009
McCaig, A., Lang, S.Q., and Blum, P., 2022. Expedition 399 Scientific Prospectus: Building Blocks of Life, Atlantis Massif. International Ocean Discovery Program. https://doi.org/10.14379/iodp.sp.399.2022
McCaig, A.M., and Harris, M., 2012. Hydrothermal circulation and the dike-gabbro transition in the detachment mode of slow seafloor spreading. Geology, 40(4):367–370. https://doi.org/10.1130/G32789.1
McCaig, A.M., Lang, S.Q., Blum, P., and the Expedition 399 Scientists, 2025. Supplementary material, https://doi.org/10.14379/iodp.proc.399supp.2025. In McCaig, A.M., Lang, S.Q., Blum, P., and the Expedition 399 Scientists, Building Blocks of Life, Atlantis Massif. Proceedings of the International Ocean Discovery Program, 399: College Station, TX (International Ocean Discovery Program).
McFadden, P.L., and Reid, A.B., 1982. Analysis of palaeomagnetic inclination data. Geophysical Journal International, 69(2):307–319. https://doi.org/10.1111/j.1365-246X.1982.tb04950.x
Michibayashi, K., Hirose, T., Nozaka, T., Harigane, Y., Escartin, J., Delius, H., Linek, M., and Ohara, Y., 2008. Hydration due to high-T brittle failure within in situ oceanic crust, 30°N Mid-Atlantic Ridge. Earth and Planetary Science Letters, 275(3–4):348–354. https://doi.org/10.1016/j.epsl.2008.08.033
Morris, A., Gee, J.S., Pressling, N., John, B.E., MacLeod, C.J., Grimes, C.B., and Searle, R.C., 2009. Footwall rotation in an oceanic core complex quantified using reoriented Integrated Ocean Drilling Program core samples. Earth and Planetary Science Letters, 287(1–2):217–228. https://doi.org/10.1016/j.epsl.2009.08.007
Mottl, M.J., Anderson, R.N., Jenkins, W.J., and Lawrence, J.R., 1983. Chemistry of waters sampled from basaltic basement in Deep Sea Drilling Project Holes 501, 504B, and 505B. In Cann, J.R., Langseth, M.G., Honnorez, J., Von Herzen, R.P., White, S.M., et al., Initial Reports of the Deep Sea Drilling Project. 69: Washington, DC (US Government Printing Office), 475–483. https://doi.org/10.2973/dsdp.proc.69.122.1983
Nozaka, T., Akitou, T., Abe, N., and Tribuzio, R., 2019. Biotite in olivine gabbros from Atlantis Bank: evidence for amphibolite-facies metasomatic alteration of the lower oceanic crust. Lithos, 348–349:105176. https://doi.org/10.1016/j.lithos.2019.105176
Nozaka, T., and Fryer, P., 2011. Alteration of the oceanic lower crust at a slow-spreading axis: insight from vein-related zoned halos in olivine gabbro from Atlantis Massif, Mid-Atlantic Ridge. Journal of Petrology, 52(4):643–664. https://doi.org/10.1093/petrology/egq098
Nozaka, T., Fryer, P., and Andreani, M., 2008. Formation of clay minerals and exhumation of lower-crustal rocks at Atlantis Massif, Mid-Atlantic Ridge. Geochemistry, Geophysics, Geosystems, 9(11):Q11005. https://doi.org/10.1029/2008GC002207
Nozaka, T., Meyer, R., Wintsch, R.P., and Wathen, B., 2016. Hydrothermal spinel, corundum and diaspore in lower oceanic crustal troctolites from the Hess Deep rift. Contributions to Mineralogy and Petrology, 171(6):53. https://doi.org/10.1007/s00410-016-1266-4
Nozaka, T., Wintsch, R.P., and Meyer, R., 2017. Serpentinization of olivine in troctolites and olivine gabbros from the Hess Deep rift. Lithos, 282–283:201–214. https://doi.org/10.1016/j.lithos.2016.12.032
Robertson, D.J., and France, D.E., 1994. Discrimination of remanence-carrying minerals in mixtures, using isothermal remanent magnetisation acquisition curves. Physics of the Earth and Planetary Interiors, 82(3–4):223–234. https://doi.org/10.1016/0031-9201(94)90074-4
Roedder, E., 1984. Fluid inclusions. In Swainson, I., Reviews in Mineralogy and Geochemistry. 12. https://doi.org/10.1515/9781501508271
Shipboard Scientific Party, 1989. Site 735. In Robinson, P.T., Von Herzen, R. P., et al., Proceedings of the Ocean Drilling Program, Initial Reports. 118: College Station, TX (Ocean Drilling Program), 89–222. https://doi.org/10.2973/odp.proc.ir.118.107.1989
Shipboard Scientific Party, 1992. Site 504. In Becker, K., Foss, G., et al., Proceedings of the Ocean Drilling Program, Initial Reports. 137: College Station, TX (Ocean Drilling Program), 15–55. https://doi.org/10.2973/odp.proc.ir.137.102.1992
Shipboard Scientific Party, 1993. Site 504. In Alt, J.C., Kinoshita, H., Stokking, L.B., et al., Proceedings of the Ocean Drilling Program, Initial Reports. 148: College Station, TX (Ocean Drilling Program), 27–121. https://doi.org/10.2973/odp.proc.ir.148.102.1993
Shipboard Scientific Party, 1999a. Leg 176 summary. In Dick, H.J.B., Natland, J.H., Miller, D.J., et al., Proceedings of the Ocean Drilling Program, Initial Reports, 176. College Station, TX (Ocean Drilling Program), 1–70. https://doi.org/10.2973/odp.proc.ir.176.101.1999
Shipboard Scientific Party, 1999b. Leg 179 summary. In Pettigrew, T.L., Casey, J.F., Miller, D.J., et al., Proceedings of the Ocean Drilling Program, Initial Reports. 179: College Station, TX (Ocean Drilling Program). https://doi.org/10.2973/odp.proc.ir.179.101.1999
Suhr, G., Hellebrand, E., Johnson, K., and Brunelli, D., 2008. Stacked gabbro units and intervening mantle; a detailed look at a section of IODP Leg 305, Hole U1309D. Geochemistry, Geophysics, Geosystems, 9(10):Q10007. https://doi.org/10.1029/2008GC002012
Tamura, A., Arai, S., Ishimaru, S., and Andal, E.S., 2008. Petrology and geochemistry of peridotites from IODP Site U1309 at Atlantis Massif, MAR 30°N: micro- and macro-scale melt penetrations into peridotites. Contributions to Mineralogy and Petrology, 155(4):491–509. https://doi.org/10.1007/s00410-007-0254-0
Tarling, D.H., and Hrouda, F., 1993. The Magnetic Anisotropy of Rocks: London (Chapman and Hall).
Tauxe, L., Shaar, R., Jonestrask, L., Swanson-Hysell, N.L., Minnett, R., Koppers, A.A.P., Constable, C.G., Jarboe, N., Gaastra, K., and Fairchild, L., 2016. PmagPy: software package for paleomagnetic data analysis and a bridge to the Magnetics Information Consortium (MagIC) Database. Geochemistry, Geophysics, Geosystems, 17(6):2450–2463. https://doi.org/10.1002/2016GC006307
Van den Kerkhof, A.M., and Hein, U.F., 2001. Fluid inclusion petrography. Lithos, 55(1):27–47. https://doi.org/10.1016/S0024-4937(00)00037-2
Wheat, C.G., Mottl, M.J., Fisher, A.T., and Hulme, S., 2022. Formation waters delineate diverse hydrogeologic conditions at a plate scale: eastern flank of the Juan de Fuca Ridge. Geochemistry, Geophysics, Geosystems, 23(11):e2022GC010665. https://doi.org/10.1029/2022GC010665
Yang, T., Zhao, X., Petronotis, K., Dekkers, M.J., and Xu, H., 2019. Anisotropy of magnetic susceptibility (AMS) of sediments from Holes U1480E and U1480H, IODP Expedition 362: sedimentary or artificial origin and implications for paleomagnetic studies. Geochemistry, Geophysics, Geosystems, 20(11):5192–5215. https://doi.org/10.1029/2019GC008721
Zijderveld, J.D.A., 1967. AC demagnetization of rocks: analysis of results. In Runcorn, S.K.C., Creer, K.M., and Collinson, D.W. (Eds.), Methods in Palaeomagnetism. Developments in Solid Earth Geophysics. J.R. Balsley (Series Ed.), 3: 254–286. https://doi.org/10.1016/B978-1-4832-2894-5.50049-5