Knutz, P.C., Jennings, A.E., Childress, L.B., and the Expedition 400 Scientists
Proceedings of the International Ocean Discovery Program Volume 400
publications.iodp.org
https://doi.org/10.14379/iodp.proc.400.105.2025
Site U16051
![]() P.C. Knutz,
P.C. Knutz,
![]() A.E. Jennings,
A.E. Jennings,
![]() L.B. Childress,
L.B. Childress,
![]() R. Bryant,
R. Bryant,
![]() S.K. Cargill,
S.K. Cargill,
![]() H.K. Coxall,
H.K. Coxall,
![]() T.D. Frank,
T.D. Frank,
![]() G.R. Grant,
G.R. Grant,
![]() R.E. Gray,
R.E. Gray,
![]() L. Ives,
L. Ives,
![]() V. Kumar,
V. Kumar,
![]() S. Le Houedec,
S. Le Houedec,
![]() J. Martens,
J. Martens,
![]() F. Naim,
F. Naim,
![]() M. Nelissen,
M. Nelissen,
![]() V. Özen,
V. Özen,
![]() S. Passchier,
S. Passchier,
![]() L.F. Pérez,
L.F. Pérez,
![]() J. Ren,
J. Ren,
![]() B.W. Romans,
B.W. Romans,
![]() O. Seki,
O. Seki,
![]() P. Staudigel,
P. Staudigel,
![]() L. Tauxe,
L. Tauxe,
![]() E.J. Tibbett,
E.J. Tibbett,
![]() Y. Yokoyama,
Y. Yokoyama,
![]() Y. Zhang, and
Y. Zhang, and
![]() H. Zimmermann2
H. Zimmermann2
1 Knutz, P.C., Jennings, A.E., Childress, L.B., Bryant, R., Cargill, S.K., Coxall, H.K., Frank, T.D., Grant, G.R., Gray, R.E., Ives, L., Kumar, V., Le Houedec, S., Martens, J., Naim, F., Nelissen, M., Özen, V., Passchier, S., Pérez, L.F., Ren, J., Romans, B.W., Seki, O., Staudigel, P., Tauxe, L., Tibbett, E.J., Yokoyama, Y., Zhang, Y., and Zimmermann, H., 2025. Site U1605. In Knutz, P.C., Jennings, A.E., Childress, L.B., and the Expedition 400 Scientists, NW Greenland Glaciated Margin. Proceedings of the International Ocean Discovery Program, 400: College Station, TX (International Ocean Discovery Program). https://doi.org/10.14379/iodp.proc.400.105.2025
2 Expedition 400 Scientists' affiliations.
1. Background and objectives
Site U1605 (proposed Site MB-31A) was cored at 73°33.6421′N, 62°09.0687′W at 529 meters below sea level (mbsl) on the outermost part of the northwest Greenland shelf margin into Baffin Bay (Figure F1). Constrained by high-quality seismic data, the main objective was to recover potential marine intervals within packages of flat-lying, semicontinuous reflections developed between strong reflections that are interpreted as glacial unconformities within the topset strata succession of the Melville Bugt Trough Mouth Fan (Figure F2) (Knutz et al., 2019; Newton et al., 2021). Site U1605 captures Seismic Units 7–10 with a target depth just below Seismic Horizon 6, corresponding to 282 meters below seafloor (mbsf; based on an average P-wave velocity of 2200 m/s). The sequence is considered to extend to Early Pleistocene age and thus overlaps seismic-stratigraphically with deepwater Sites U1603 and U1604. The primary lithology was assumed to be compacted diamicton with intervals of sand and pebbly mud and possibly marine to glaciomarine deposits (Figure F3). As such, low but variable recoveries were expected at Site U1605.
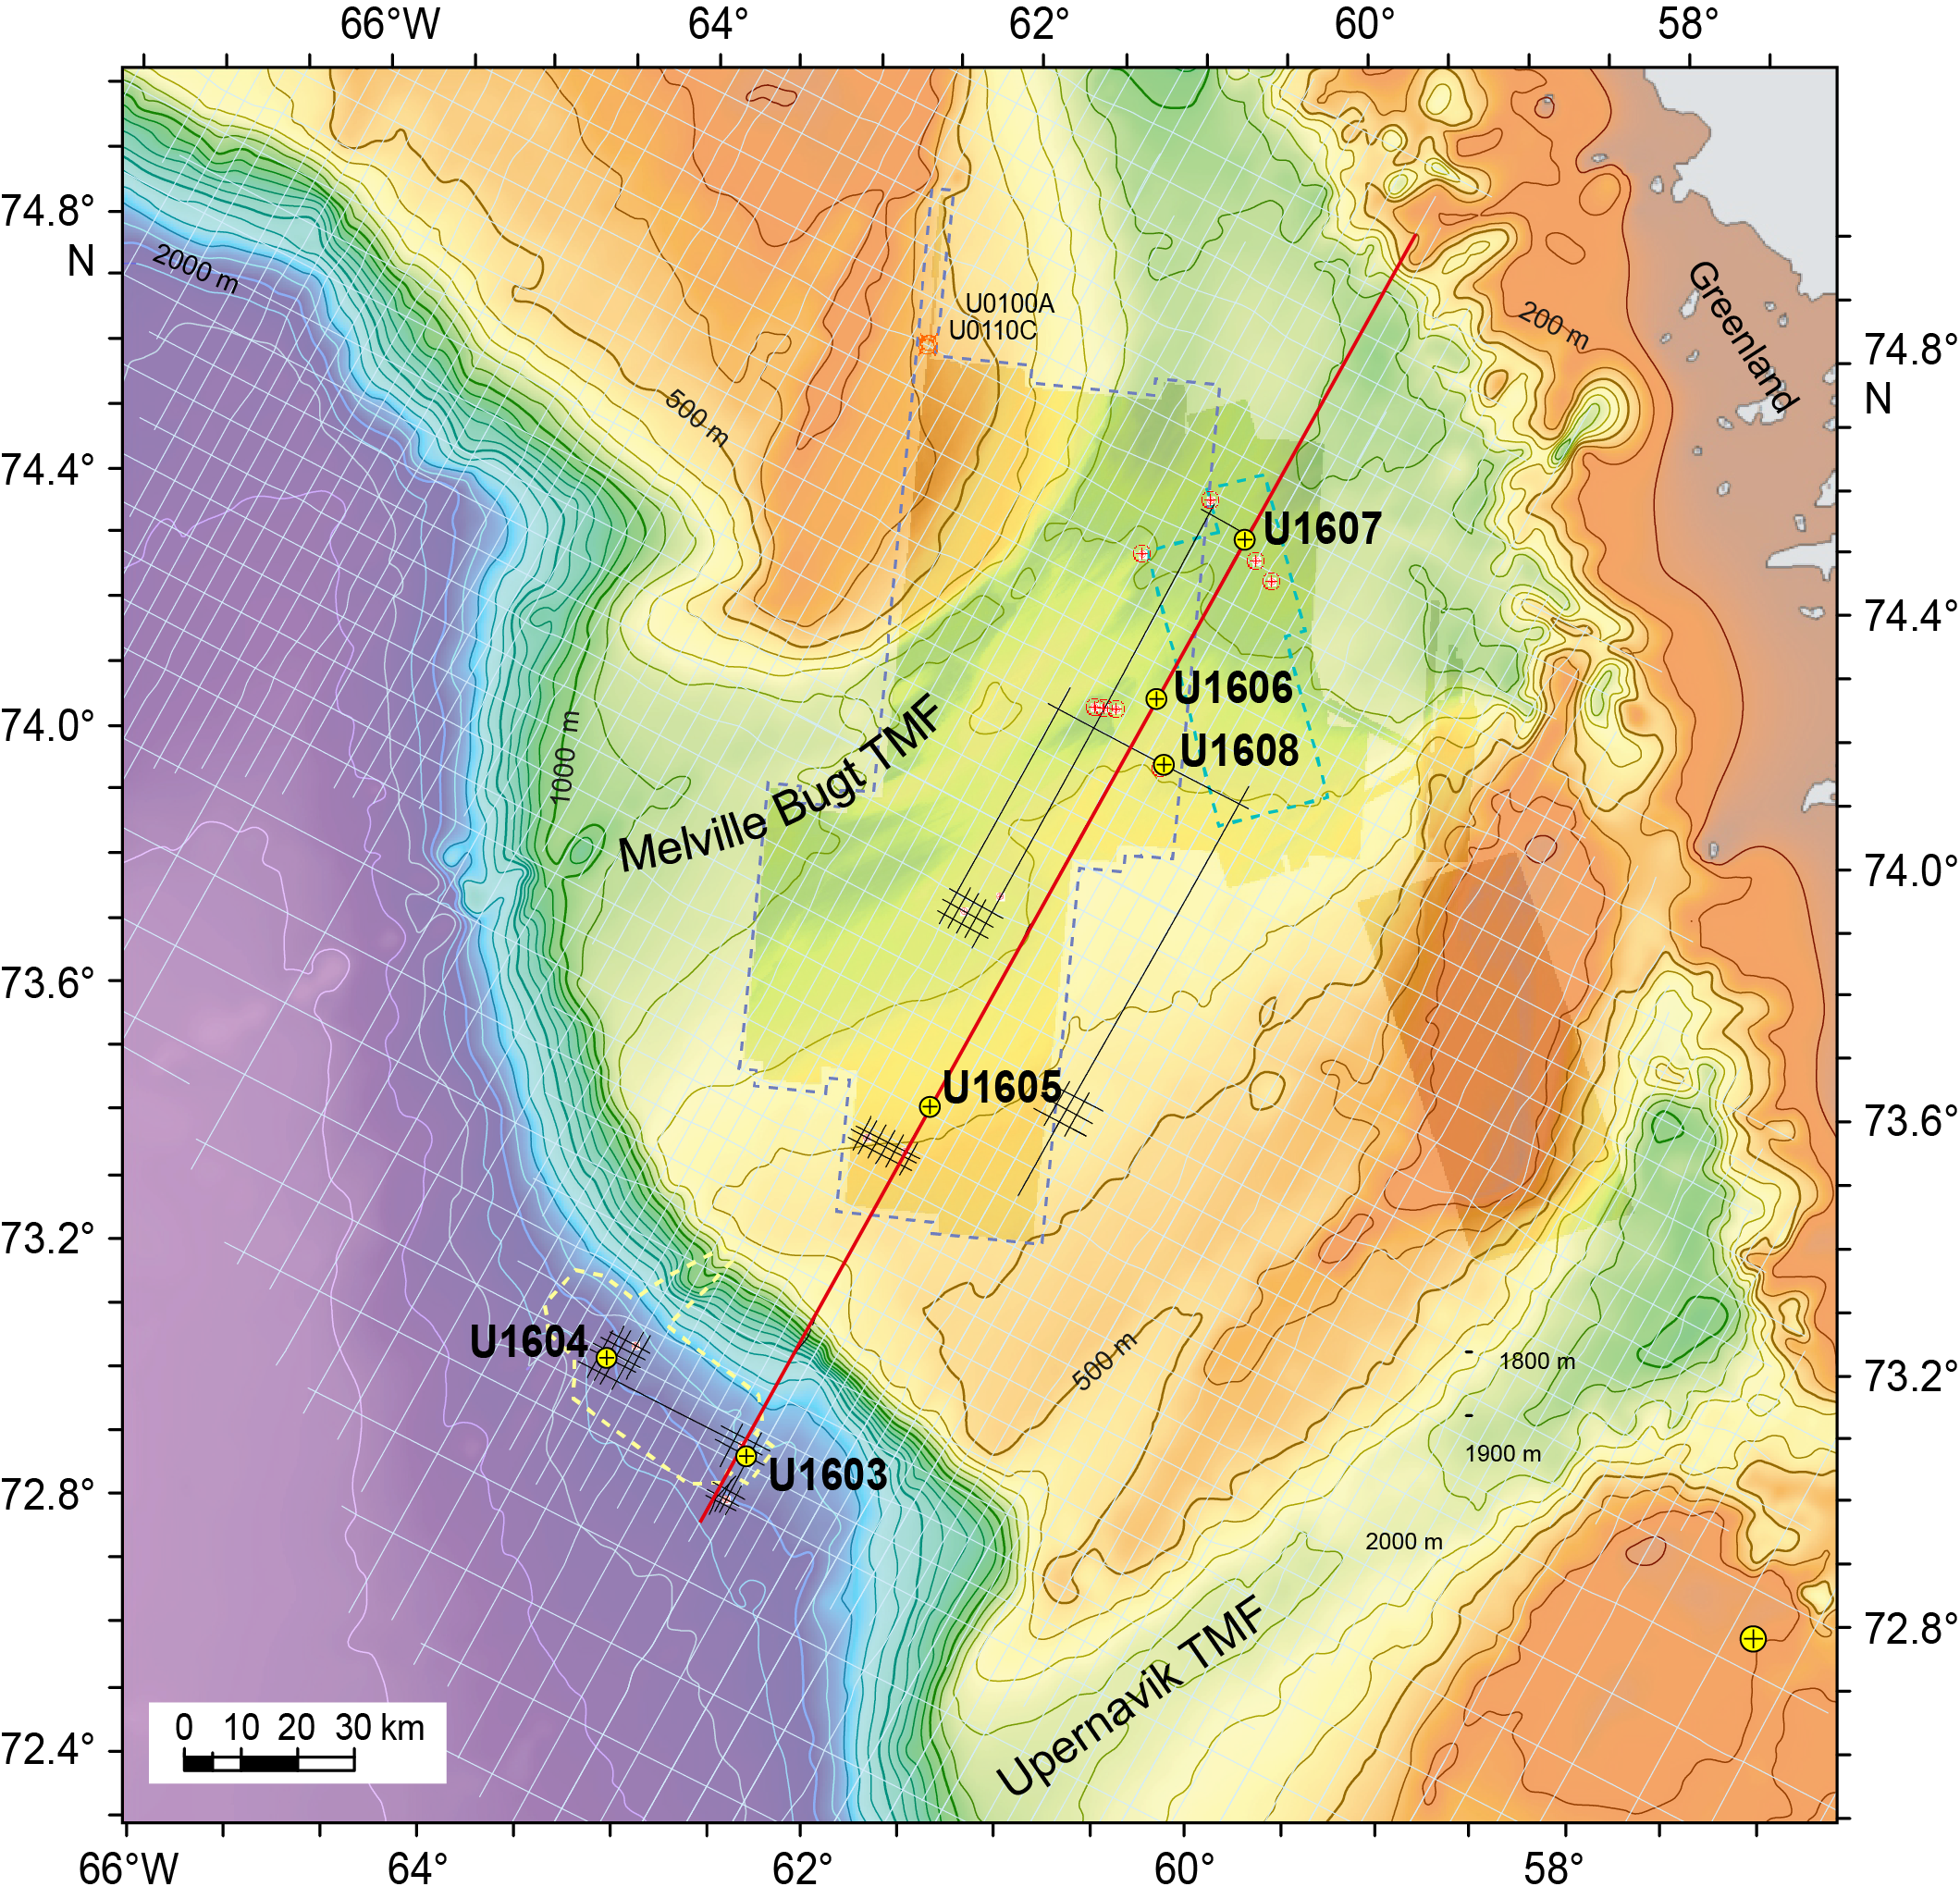
Figure F1. Bathymetry map.
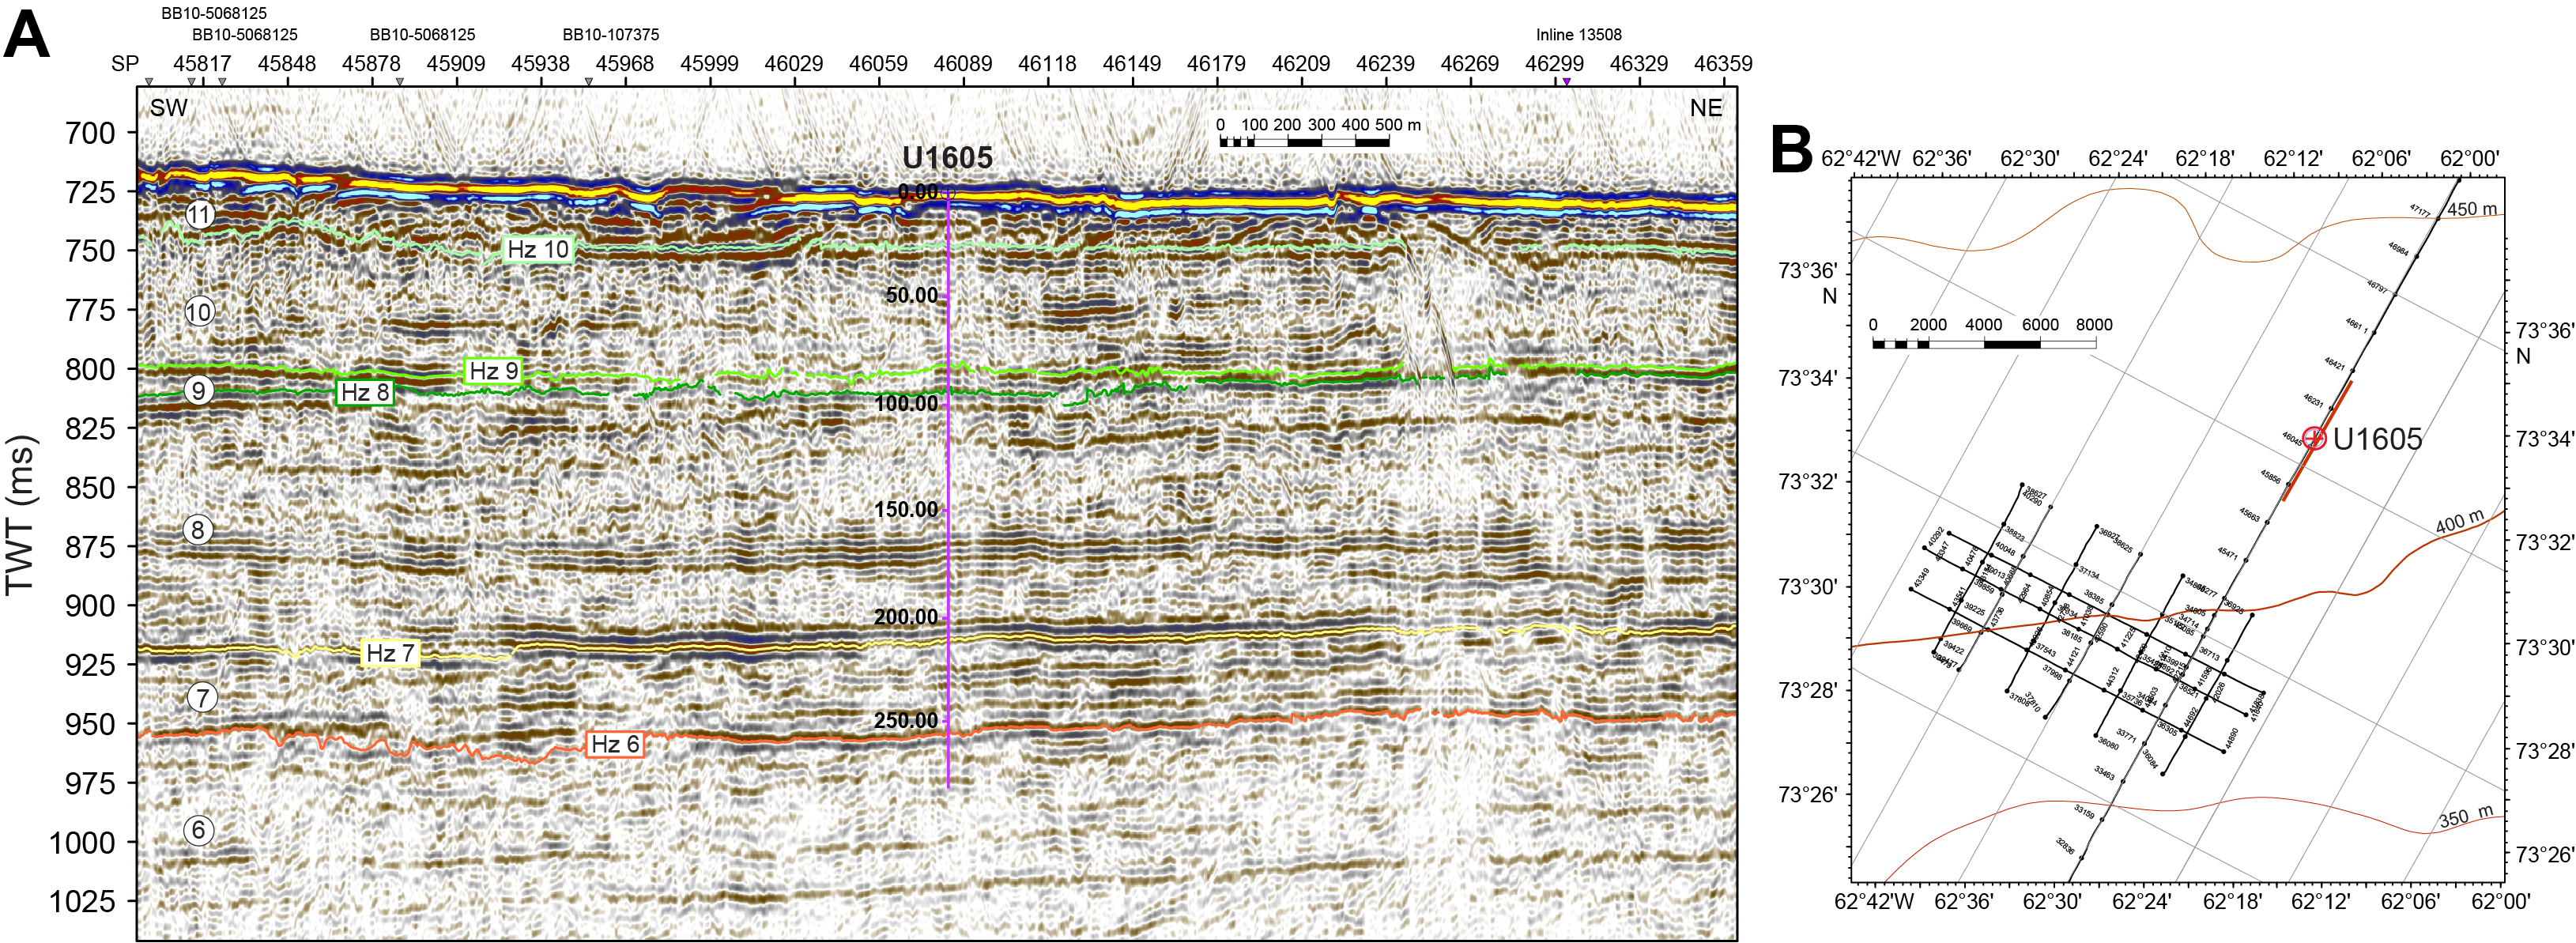
Figure F2. Seismic profile and close-up bathymetry map.

Figure F3. Diagnostic template for ice sheet evolution.
Site U1605 is mainly influenced by the West Greenland Current, which overflows the site as a subsurface water mass (temperature from >0° to 3°–5°C; salinity >34) below a cold, fresh surface layer sourced by Arctic water with contributions from Greenland freshwater in the uppermost 100 m (temperature <0°C; salinity ~33.7 at the temperature minimum) (Tang et al., 2004; Münchow et al., 2015).
The scientific objectives for drilling Site U1605 are complementary to Sites U1603 and U1604 but emphasize testing the hypothesis that the northern Greenland ice sheet underwent significant deglaciation, potentially related to exceptionally warm or prolonged super-interglacials (Schaefer et al., 2016; Christ et al., 2023). Additionally, multiproxy data from Site U1605 can assess the regolith hypothesis for the change in orbital insolation frequency across the mid-Pleistocene transition (Clark and Pollard, 1998).
Planned drilling at Site U1605 included using the rotary core barrel (RCB) system from the seafloor to 282 m core depth below seafloor, Method A (CSF-A), in the first hole (U1605A). If intervals of special interest (e.g., marine mud) were encountered, a second hole would be attempted by wash-down drilling followed by coring using the advanced piston corer (APC) system. Downhole logging was planned for the first hole, including the triple combo tool string, Formation MicroScanner (FMS), and Versatile Seismic Imager (VSI) check shots.
2. Operations
Site U1605 hole location, water depth, and number of cores recovered are listed in Table T1. All times are local ship time (UTC − 3 h) unless otherwise noted.
2.1. Hole U1605A
The vessel transited 39 nmi from Site U1604 to Site U1605, arriving on location at 2200 h on 9 September 2023. Observing that ice was a sufficient distance away from the vessel, the thrusters were lowered and secured at 2224 h, and the ship was fully in dynamic positioning mode at 2229 h. An RCB bottom-hole assembly (BHA) was made up and tripped down. We initially attempted to spud Hole U1605A based on a water depth of 524.1 mbsl. Following a 3 m advance, the core barrel returned empty. The pipe was lowered, and Hole U1605A was spudded at 0340 h on 10 September and recovered 3.2 m from an 8.0 m advance. The seafloor was established as 528.66 mbsl. Cores 1R–47R advanced from 0 to 282.0 m CSF-A and recovered 38.45 m (13.6%). We then began pulling the drill string out of the hole, clearing the seafloor at 1535 h on 13 September. The drill string was tripped up with the bit at the surface at 1720 h. The drill floor was secured for transit, and the thrusters were raised and secured for transit at 1748 h, ending Hole U1605A and Site U1605.
The rate of penetration at Site U1605 was highly variable (0.16–28.8 m/h) and averaged 4.56 m/h. A total of 47 cores were taken in Hole U1605A over a 282.0 m interval with 13.6% recovery. Total time on Hole U1605A was 91.2 h (3.8 days).
3. Lithostratigraphy
Site U1605 consists of one hole (U1605A) cored to a total depth of 282.0 m CSF-A with 13.6% recovery. Site U1605 is on the northwest Greenland outer continental shelf at a modern water depth of ~530 m with low-angle, seaward-dipping seismic stratigraphy underlying inferred gravel at the seafloor. Because of low recovery, reporting lithostratigraphy and depositional history is limited at Site U1605. Magnetostratigraphy and biostratigraphy were restricted by discontinuous sampling and require further interpretation. The recovered sediment is tentatively interpreted as Pleistocene based on seismic stratigraphic constraint.
The stratigraphy of Site U1605 is described as one lithostratigraphic unit comprising two subunits (IA and IB; younger to older) (Figure F4; Table T2). Named sedimentary lithofacies include massive diamicton and stratified diamicton. A significant proportion of core recovered contains washed gravel (a core disturbance term) (see Lithostratigraphy in the Expedition 400 methods chapter [Knutz et al., 2025]) with lithologies consistent with clasts present in the diamicton. Of the ~13% recovered, ~8% (~23 m cumulative) is diamicton, with the remaining ~5% made up of washed gravel.
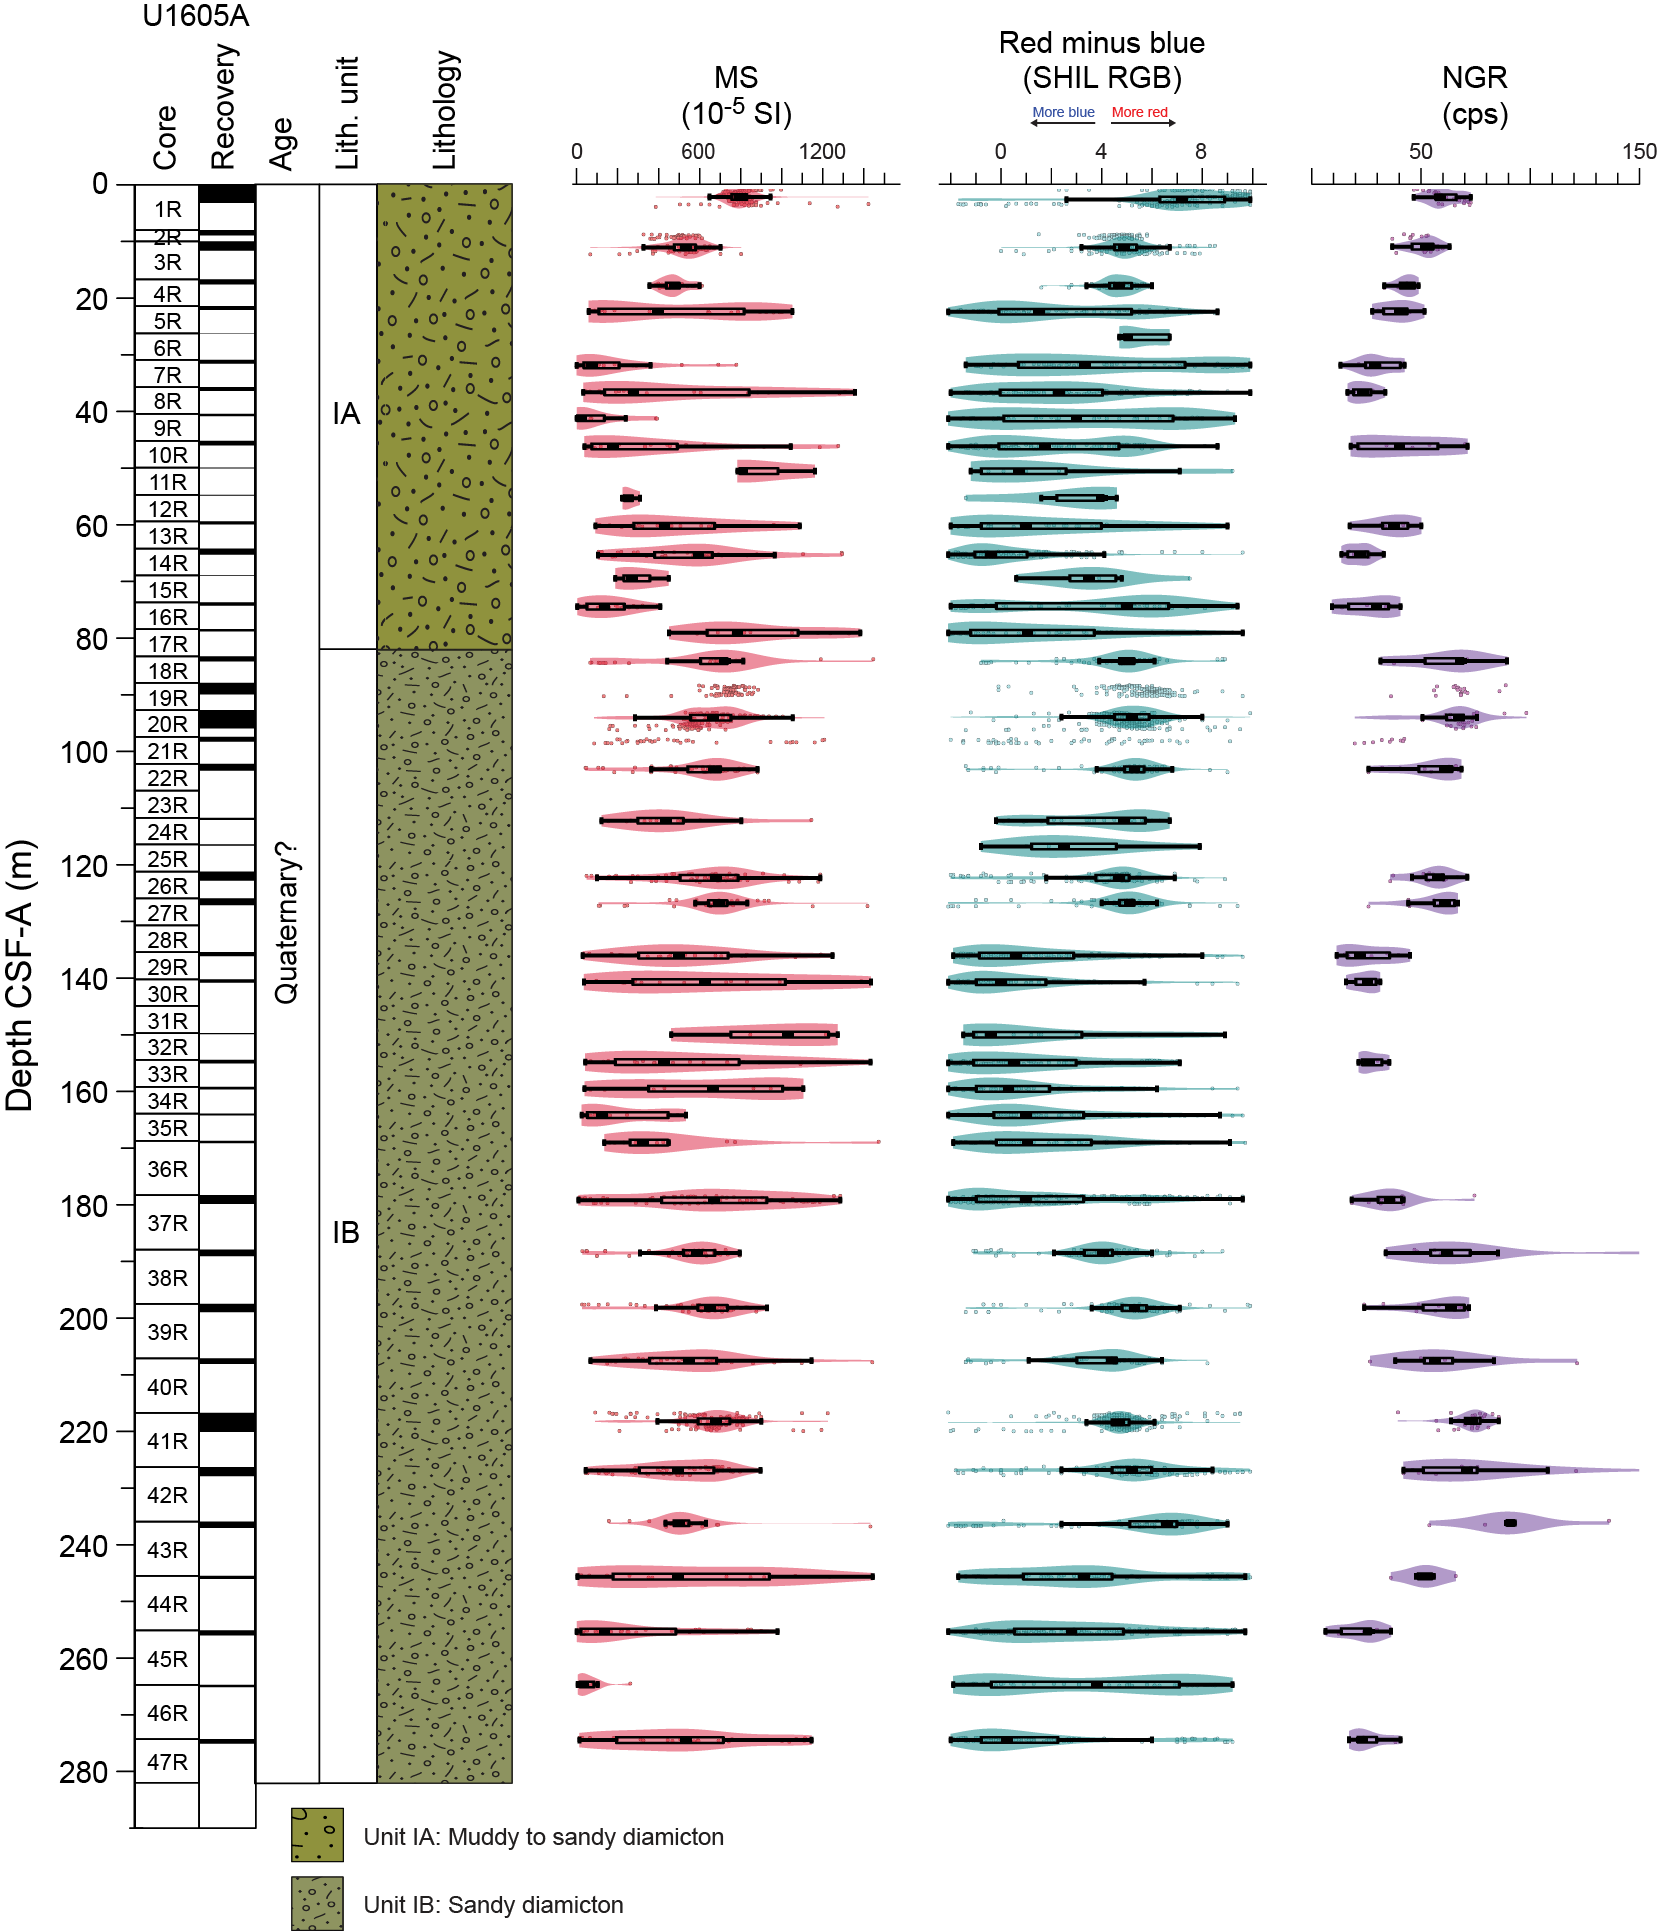
Figure F4. Lithostratigraphic summary.
Lithostratigraphic Subunit IA contains the uppermost ~83 m and is composed of massive diamicton and washed gravel. Subunit IB extends from 83 to 275.1 m CSF-A (deepest recovery) and consists of massive diamicton, stratified diamicton, and washed gravel.
Overall, the sedimentary succession collected at Site U1605 is consistent with an ice-proximal, subglacial, or proglacial glaciomarine depositional environment.
3.1. Unit descriptions
Site U1605 is summarized as one lithostratigraphic unit comprising two subunits (IA and IB; younger to older) (Figure F4; Table T2). Downhole changes in lithology were determined using a combination of visual core description, microscopic characterization (using smear slides, grain mounts, and thin sections), reflectance spectroscopy and colorimetry, physical property logs (magnetic susceptibility [MS], natural gamma radiation [NGR], and gamma ray attenuation [GRA] density), and bulk and clay mineralogical analyses by X-ray diffraction (XRD) (see Lithostratigraphy in the Expedition 400 methods chapter [Knutz et al., 2025]). Both subunits contain intervals of poor recovery and recovery of washed gravel that is inferred to represent the coarse clastic components of sediments with an unconsolidated matrix.
3.1.1. Unit I
3.1.1.1. Subunit IA
- Interval: 400-U1605A-1R-1, 0 cm, to 18R-1, 0 cm
- Depth: 0–83.20 m CSF-A
- Thickness: 83.2 m
- Age: Pleistocene?
- Lithology: clast-poor to clast-rich, muddy to sandy diamicton, washed gravel
Lithostratigraphic Subunit IA is characterized by clast-poor, muddy to sandy diamicton that is predominantly massive in structure. Drilling this subunit also yielded large quantities of up to cobble-sized clasts of predominantly igneous and metamorphic lithologies, including weakly banded granitic gneisses, amphibolite, garnet-bearing lithologies, strongly foliated metamorphic rocks, and felsic and mafic plutonic igneous lithologies. Rare occurrences of sedimentary and metasedimentary rocks (e.g., marble and sandstone clasts) are also observed. The surfaces of some pebbles and cobbles are covered in a mud matrix.
3.1.1.2. Subunit IB
- Interval: 400-U1605A-18R-1, 0 cm, to 47R-1, 80 cm CSF-A (bottom of the hole)
- Depth: 83.2–275.1 m CSF-A
- Thickness: 191.9 m
- Age: Pleistocene?
- Lithology: clast-rich sandy diamicton, sandy mud, washed gravel
Lithostratigraphic Subunit IB is characterized by clast-rich sandy diamicton that is predominantly massive in structure, with thin intervals containing mud laminae and soft-sediment deformation features. Drilling this lithostratigraphic unit also yielded large quantities of up to boulder-sized clasts of igneous, metamorphic, and sedimentary rock lithologies, including granite, weakly banded granitic gneisses, amphibolite, garnet-bearing and strongly foliated metamorphic rocks, and limestone. The surfaces of some pebbles and cobbles are covered in a mud matrix.
3.2. Lithofacies descriptions
At Site U1605, two diamicton lithofacies are distinguished primarily by the presence and degree of stratification.
3.2.1. Lithofacies 1: massive diamicton
Lithofacies 1 consists of a predominantly dark gray to dark grayish brown massive clast-poor to clast-rich, sandy diamicton with rare muddy intervals and clast clusters (Figure F5). Massive diamicton intervals that do not have strong or severe coring disturbance are consolidated and do not show any signs of cementation. In macroscopic observation, the diamicton matrix (<2 mm) is poorly sorted and predominantly sand rich. The gravel (>2 mm) component of the diamicton is polymict and consists of clast sizes ranging up to boulder size (>30 cm). Pebbles are subrounded to angular in shape. Pebbles and cobbles consist of felsic and mafic plutonic igneous lithologies, banded and foliated granitic gneisses, amphibolite, and garnet-bearing metamorphic lithologies. Rare cemented sedimentary rock clasts are also observed and consist of fine sandstones and carbonates. The smear slide analyses show that the matrix of massive diamicton consists of very poorly sorted sand and silt with angular to subangular grains of quartz and feldspar, with accessory minerals including amphibole and muscovite.
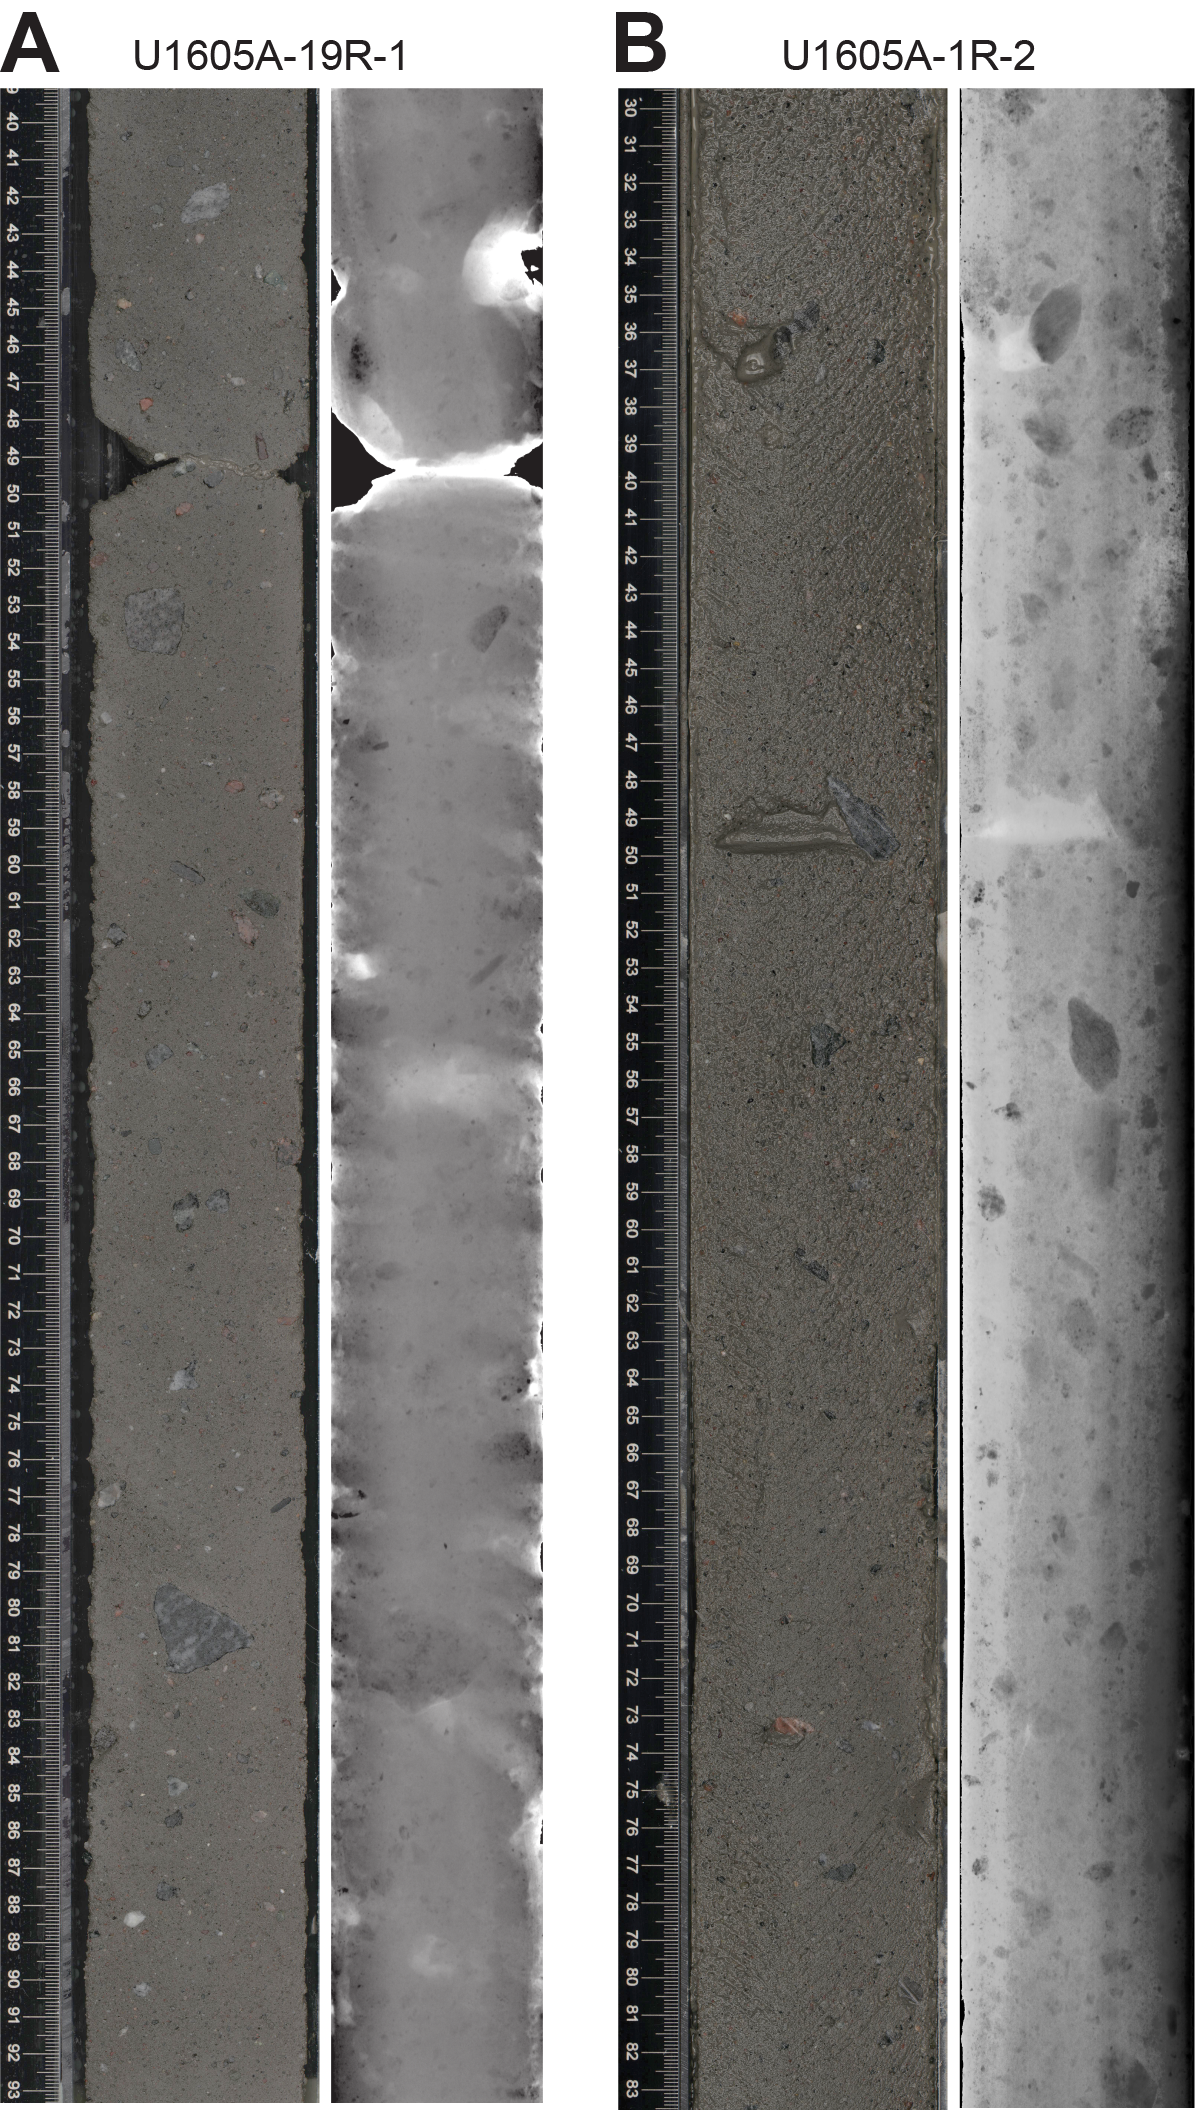
Figure F5. Lithofacies 1.
Lithofacies 1 represents deposition in an ice-proximal depositional environment either in a subglacial to proglacial or proximal glaciomarine setting. The upper and lower contacts of this lithofacies with other lithofacies were not recovered, and its depositional relationship with other facies cannot be inferred.
3.2.2. Lithofacies 2: weakly stratified diamicton
Lithofacies 2 consists of dark grayish brown weakly stratified, clast-poor, muddy to sandy diamicton with variations in matrix grain size over decimeter-scale intervals, as well as wispy mud laminae and mud beds up to 2 cm thick. There are intervals of stratification in Cores 400-U1605A-16R, 18R, 22R, and 40R. Mud laminae are affected by soft-sediment deformation (Figure F6). Clasts are up to cobble size (6–30 cm). Granules and pebbles locally appear as clusters and are subrounded to angular in shape. In smear slides, the matrix is rich in fine silt with silt- and sand-sized grains of quartz, feldspar, amphibole, and mica composition.
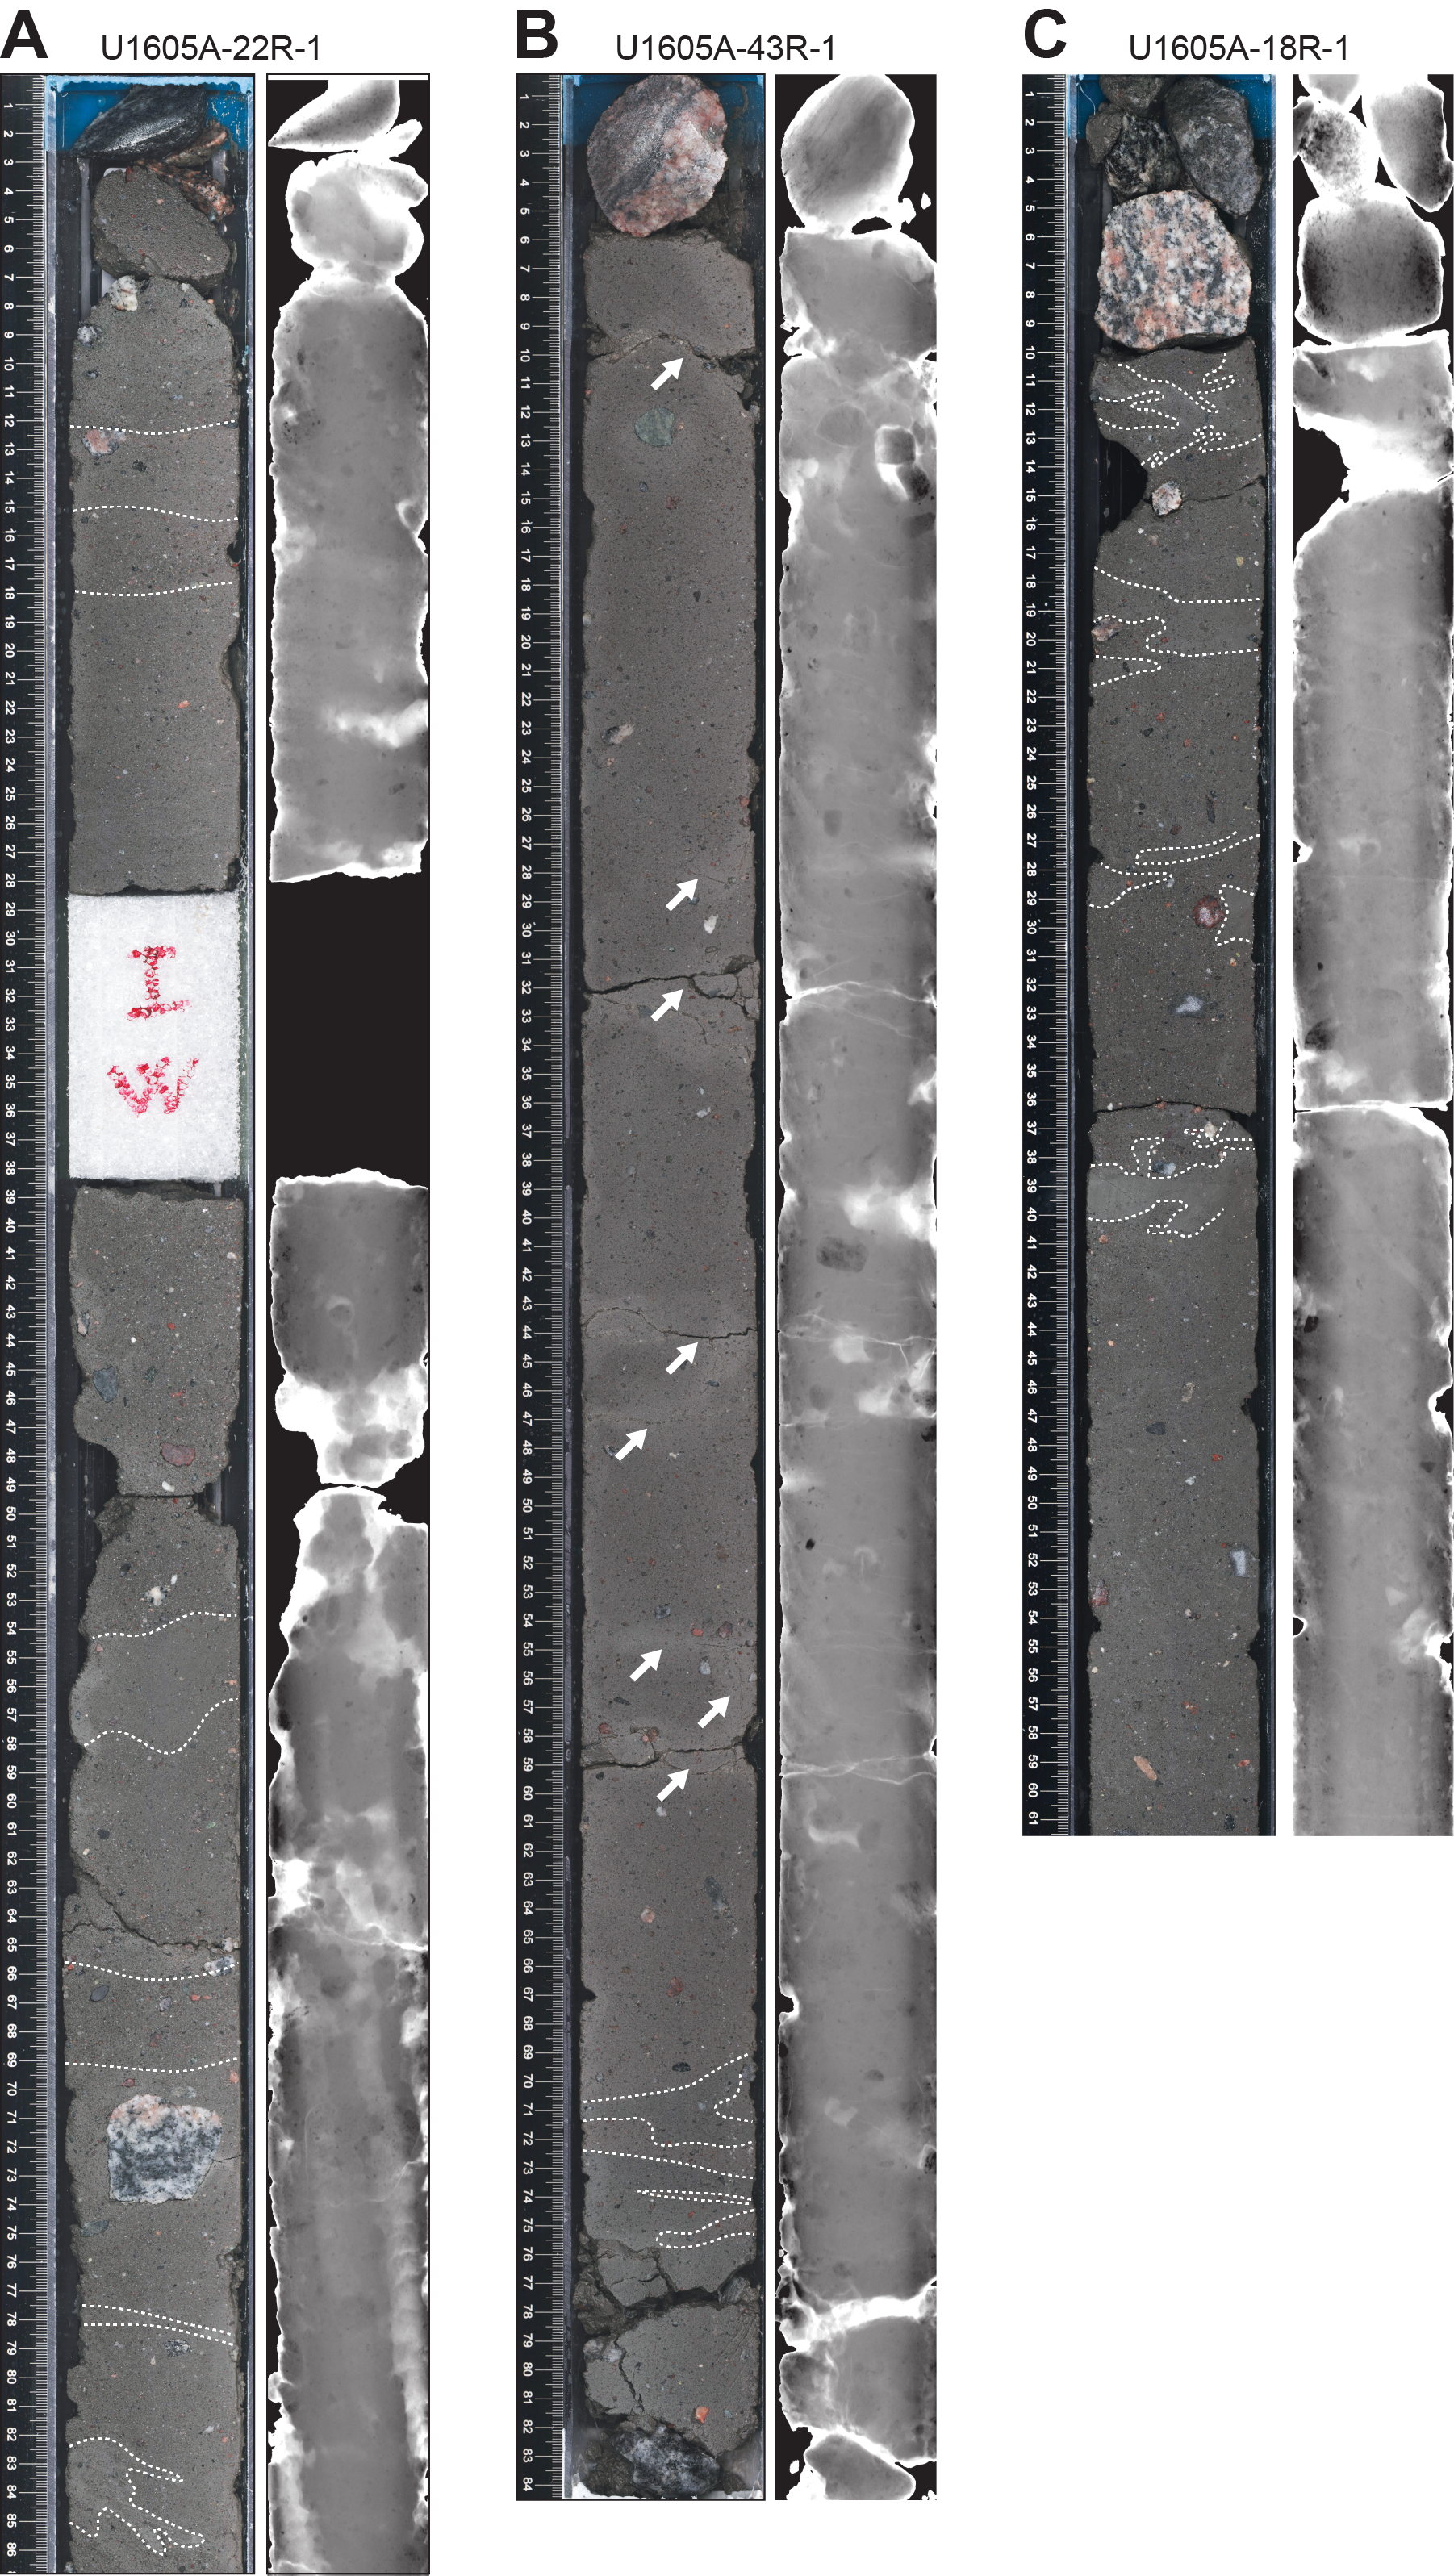
Figure F6. Lithofacies 2.
Lithofacies 2 likely represents deposition from floating ice in an ice-proximal glaciomarine depositional environment. Mud laminae may result from suspension settling of fine material out of meltwater plumes, and changes in diamicton matrix grain size may signal current activity or variations in deposition from floating ice. Soft-sediment folding may result from gravitational instability due to high pore water pressures in rapidly accumulating sediment. Deformation in a subglacial environment is also a possibility, but mud laminae such as those observed in Lithofacies 2 would be unlikely to survive high strain rates.
3.3. Gravel lithologies
A substantial amount of gravel-grade (ranging to boulder-sized) material was recovered throughout Hole U1605A. Some gravel clasts occurred within diamicton, but substantial amounts of washed gravel were also recovered. Washed gravel often results when coring unconsolidated sediments with considerable coarse-grained content, such as diamicton, sand, or conglomerate. In these intervals, sand and mud material is inferred to have been lost during drilling.
Gravel-grade lithologies are dominated by a wide range of crystalline rock types derived from plutonic igneous and metamorphic sources (Figure F7). The most common igneous rock type is granite, with lesser amounts of granodiorite, amphibolite, and gabbro. Metamorphic lithologies are dominated by various types of granitic gneiss, with minor contributions of schist, quartzite, and marble. Only two clasts of sedimentary origin were recorded, one limestone and one sandstone (see Smear slide and thin section analysis). Although the degree of rounding for washed gravel was difficult to determine due to damage incurred during drilling, pebble-sized and larger clasts within diamictons range from angular to subrounded (Figure F8).
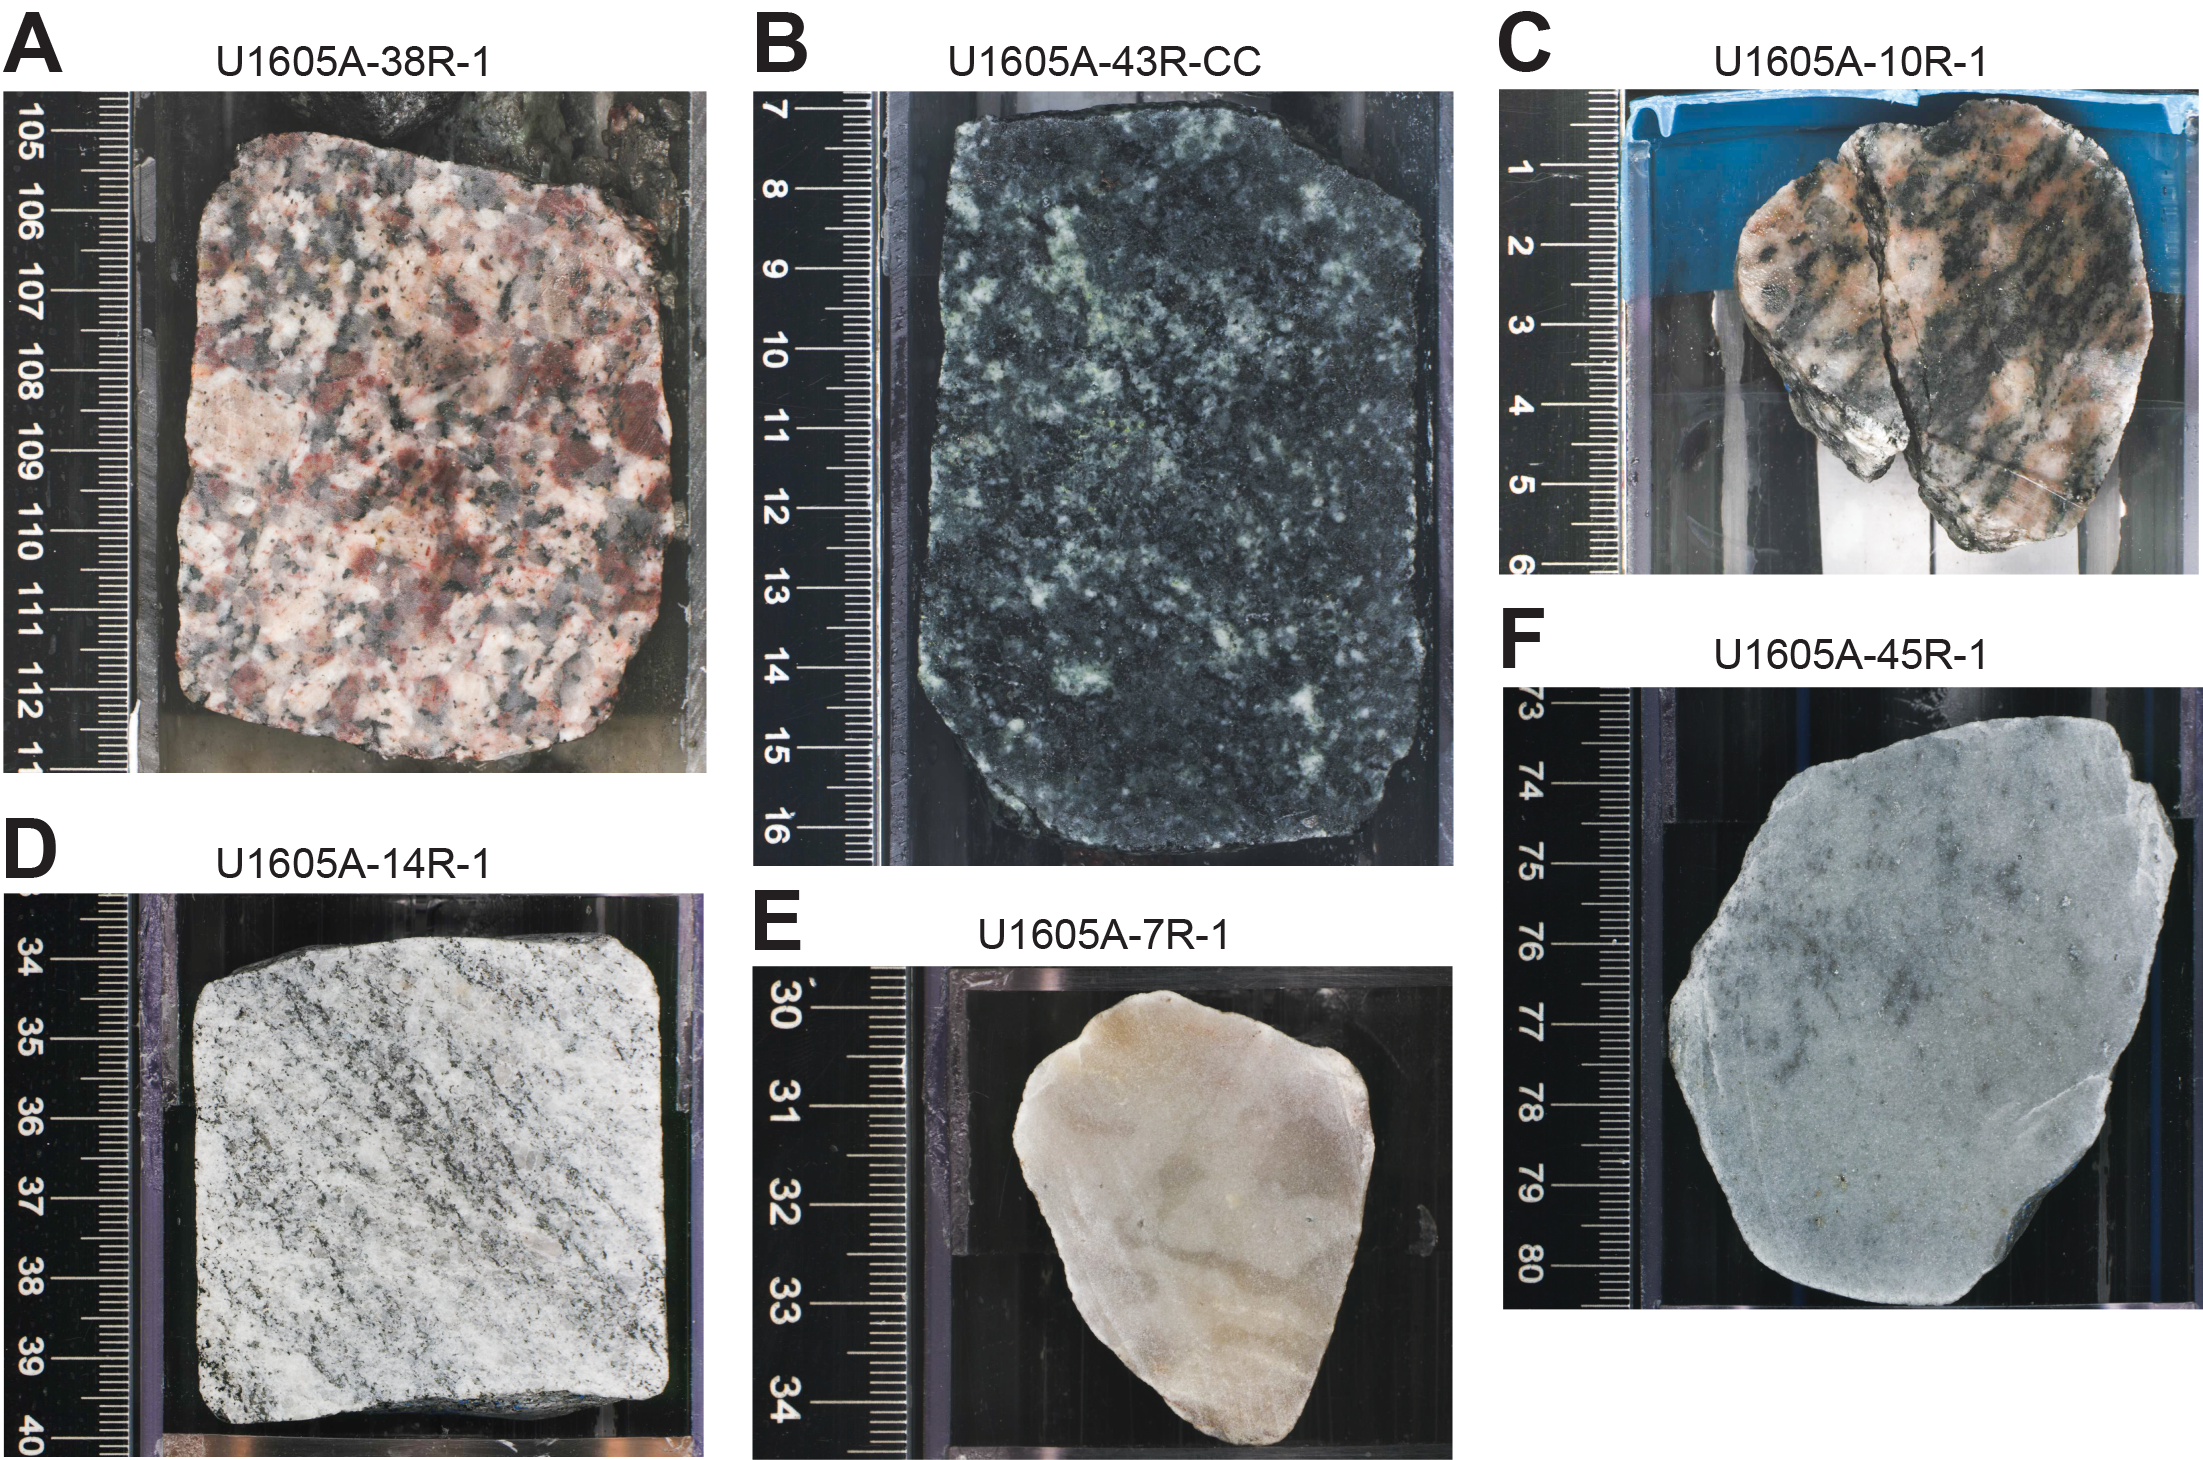
Figure F7. Washed gravel.
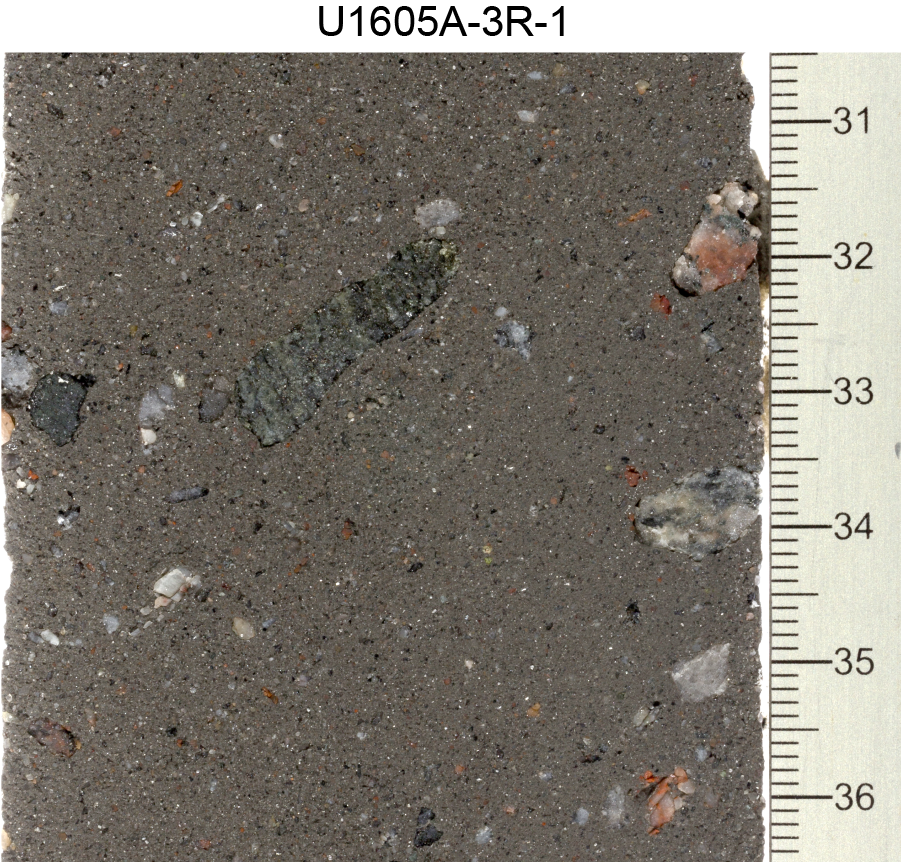
Figure F8. Clast-poor, sandy diamicton.
3.4. Smear slide and thin section analysis
Eight smear slides were taken during core description to ascertain the matrix composition of diamicton lithologies. Clay, contributing 5%–40% of the matrix, is too fine grained for mineralogical identification using petrographic methods. Silt (50%–80% of matrix) and sand-sized (typically 25% of grains in smear slides) grains are of terrigenous origin. Silt and sand compositions are dominated by quartz and feldspar minerals. Rare accessory grains include muscovite, chlorite, amphibole, pyroxene, olivine, and opaque minerals. Trace amounts of garnet, biotite, tourmaline, sillimanite, rutile, and igneous rock fragments were also observed. The angularity of grains ranges from angular to subrounded, with the degree of rounding increasing with increasing grain size.
Three diamictons were sampled for thin sectioning (Samples 400-U1605A-2R-1, 21–24 cm, 3R-CC, 11–15 cm, and 27R-1, 36–39 cm) to examine internal texture. Unfortunately, this effort was unsuccessful due to the friable nature of the sediment upon drying and a lack of suitable facilities for vacuum impregnation of mud-rich sediment. Two thin sections were prepared from sedimentary pebbles, including one clast of limestone (Sample 29R-1, 32–33 cm) and one of sandstone (Sample 38R-1, 0–2 cm). The limestone pebble is fine grained with a silty matrix and contains rounded intraclasts of carbonate mudrock. The sandstone pebble is a coarse-grained lithic sandstone with coarse, blocky calcite cement filling intergranular pore space. Framework grains are dominated by plutonic igneous rock fragments, quartz, and feldspar, with minor metamorphic rock fragments, chert, and biotite.
3.5. Clay and bulk mineralogy results
Bulk XRD analyses were performed on three samples from Hole U1605A to determine the mineral compositions of the two lithostratigraphic subunits (Table T3): Samples 1R-2, 94–95 cm (Subunit IA), 27R-1, 84–85 cm, and 43R-1, 33–34 cm (Subunit IB). The measurements do not indicate any difference in the mineralogical composition between the two subunits. Both are dominated by quartz, which is the most abundant component, along with common phases such as feldspar, plagioclase, and illite.
Clay XRD analyses were performed on nine samples from Hole U1605A from both lithostratigraphic subunits and from the two lithofacies. A qualitative and ratio-based summary of XRD results is given in Table T4 for clay compositions. The clay XRD measurements do not indicate any change downhole, with a clay composition dominated by chlorite and illite and no significant variation in the chlorite/illite ratio.
3.6. Preliminary depositional interpretation
Site U1605 recovered a sequence tentatively interpreted as Pleistocene sediment from the outer continental shelf. Where recovery is present, Lithostratigraphic Subunits IA and IB record subglacial and/or ice-proximal glaciomarine depositional environments. Where weak stratification occurs, it could suggest possible current activity, changes in deposition attributed to floating ice, and/or meltwater plume influence. Poor recovery at Site U1605 limits the ability to interpret the full scope of depositional environments.
4. Biostratigraphy
4.1. Biostratigraphy and paleoenvironment
Site U1605, situated ~39 nmi northwest of Site U1604 on the Greenland shelf at a water depth of 528.7 m, was the first of the shelf targets. The goal was to recover an outer shelf sedimentary sequence extending to the early Pleistocene. Recovery of the muddy to sandy and muddy diamictons characteristic of Site U1605 was consistently poor throughout the ~280 m rotary cored interval. Some cores were empty, and others only contained hard rock clasts (gravel to boulder sized), including granites, gneiss, marble, and quartzite lithologies (see Lithostratigraphy) and did not produce core catcher sediment samples. Where sediment was recovered, core catcher samples consisted of dark gray, clast-rich massive to weakly stratified diamicton. Despite the indurated nature of the diamicton, the material disaggregated relatively easily. A total of 12 core catcher samples from the 47 cores of Hole U1605A were prepared and examined for foraminifera, diatoms, dinoflagellate cysts (dinocysts), and other palynomorphs. Mudline samples were also examined for all microfossil groups. A mudline sample (~10 g) was also collected as a modern DNA reference for Hole U1605A. No samples other than the mudline were collected for sedimentary ancient DNA analysis.
The analyzed samples from Hole U1605A are largely barren of foraminifera and diatoms. Diatoms are visually absent in the majority of the samples observed, except in the mudline sample (400-U1605A-1R-1, 0 cm), which contains rare, poorly preserved diatoms typical of modern Arctic marine environments. Dinocysts and other palynomorphs, including Leisopheres (a group of acritarchs), were observed in multiple samples (Figure F9).
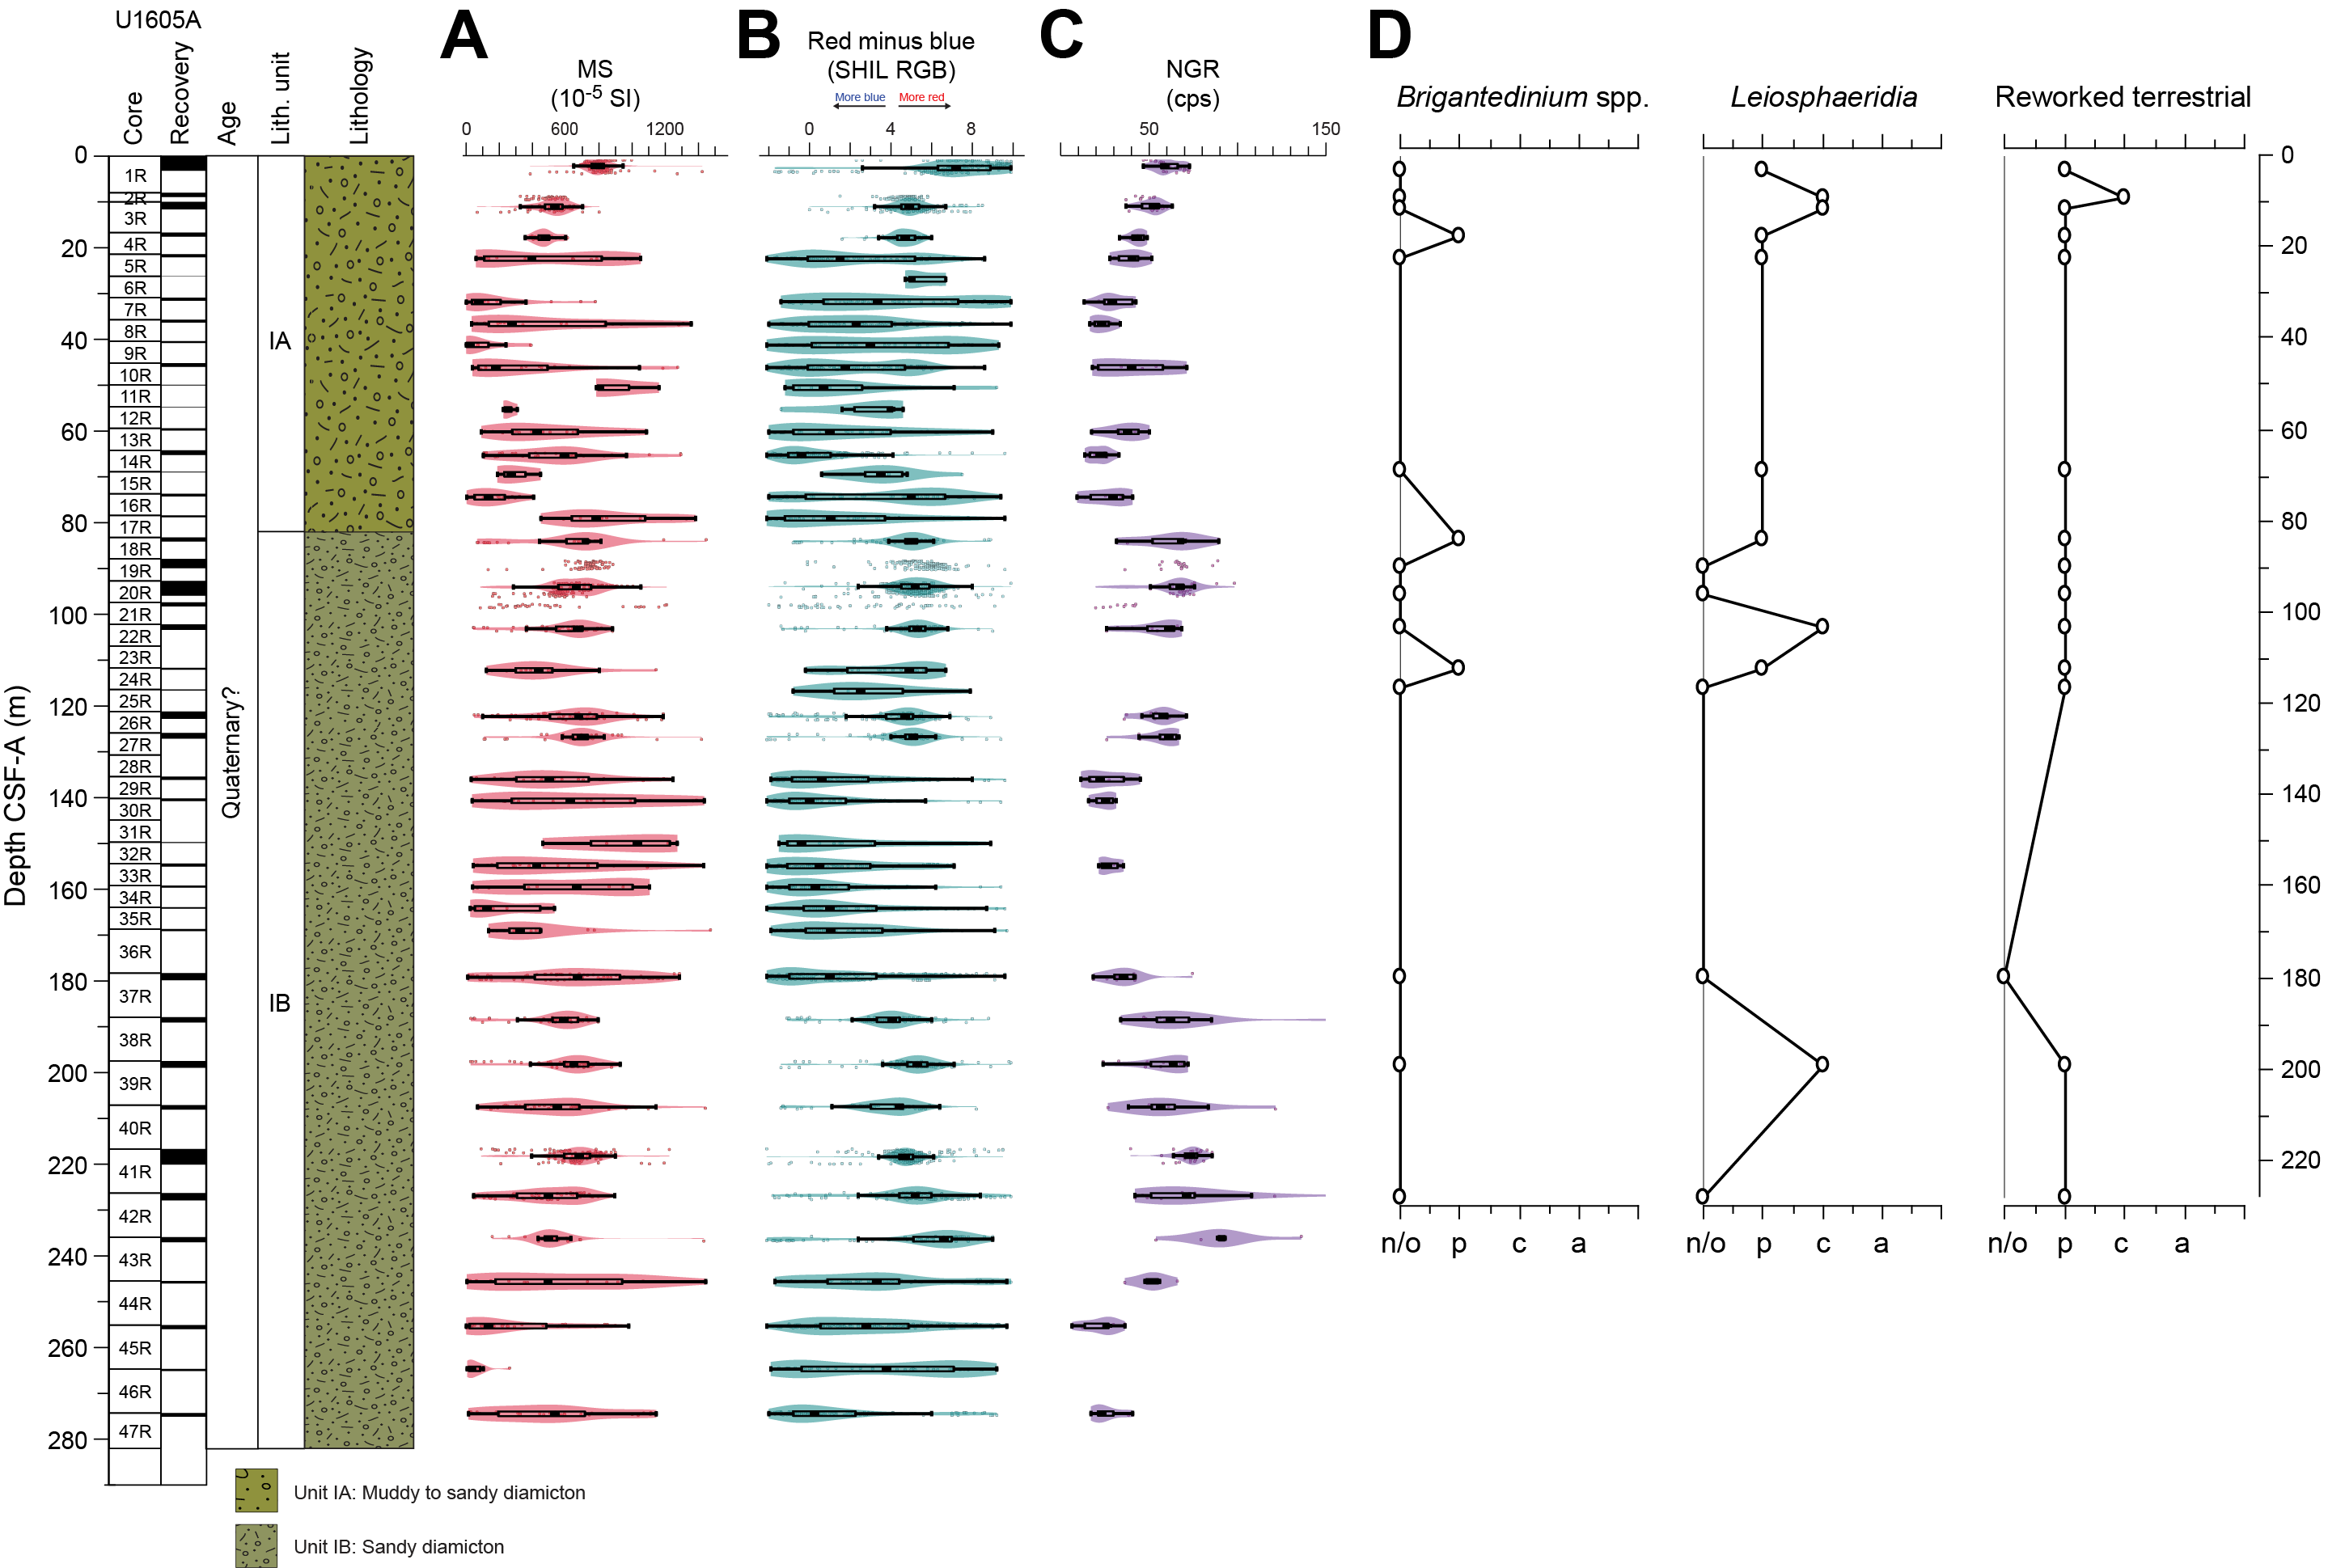
Figure F9. Palynomorph trends.
4.1.1. Foraminifera
In contrast to Sites U1603 and U1604, the >63 µm fraction of the Hole U1605A mudline sample is dominated by fine sand and silt and almost barren of biological remains. Additional sieving using a 20 µm mesh sieve revealed fine silt and scarce needlelike diatom fragments. The diatom preparation revealed one benthic foraminifera in the mudline sample. A single, poorly preserved specimen of a planktonic foraminifera was found in Section 400-U1605A-1R-CC. No other planktonic or benthic foraminifera were found. The >63 µm residues comprise sand and gravel up to 2 cm in diameter (Figure F10A). Sand grains include angular igneous and metamorphic rock fragments with little variability in composition downhole (Figure F10B, F10D–F10H). Grains of garnet, amphibole, and hornblende are notable (Figure F10C). Quantities of sand vary among core catchers but are consistently larger than those in the slope site environment represented in Site U1603 (Figure F10I).
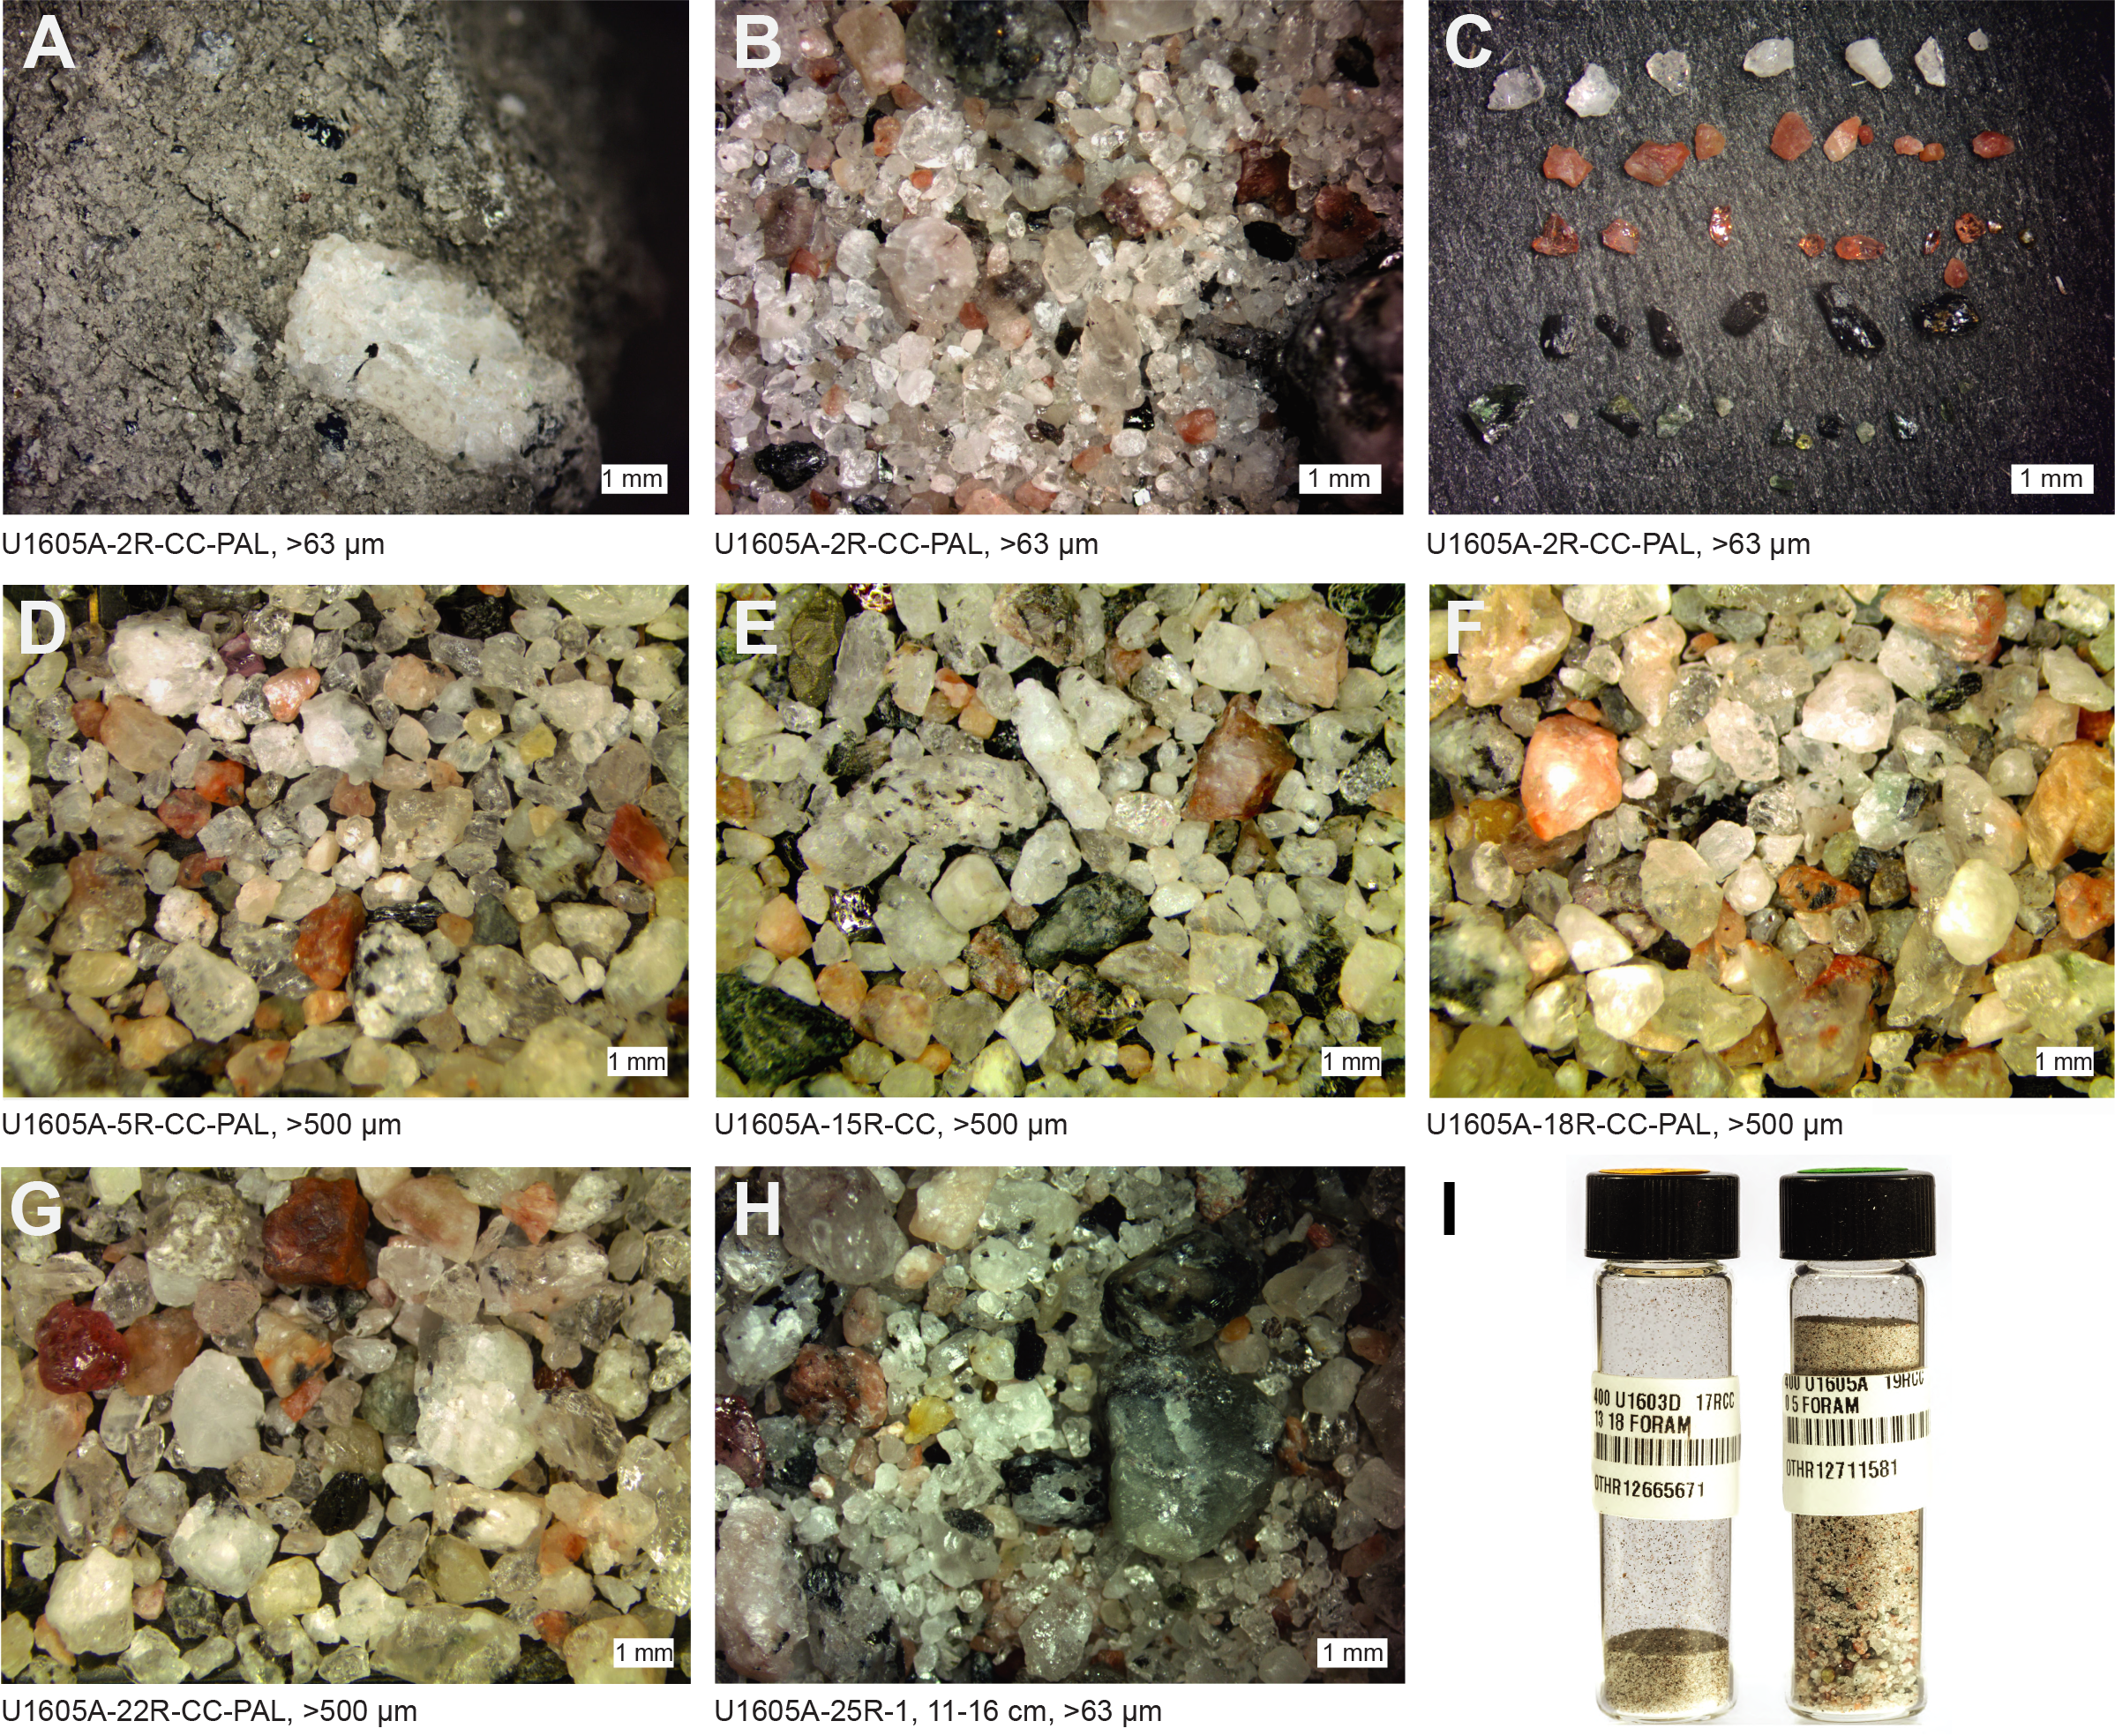
Figure F10. Coarse grain fractions from foraminifera sample residues.
4.1.2. Diatoms
We examined 17 samples, primarily from core catcher sections, for diatoms. Diatoms were observed only in the mudline sample (400-U1605A-1R-1, 0 cm), with trace to rare amounts and poor preservation. Species observed include Actinocyclus curvatulus, Asteromphalus robustus, Chaetoceros spp. resting spores, Coscinodiscus oculus-iridis, Rhizosolenia hebetata f. hebetata, Rhizosolenia hebetata f. semispina, and Thalassiothrix longissima. The specimens observed are typical of the modern assemblages living in the Arctic region.
4.1.3. Palynology
In total, 15 samples, primarily from core catcher sections, were processed and analyzed following the procedure described in Biostratigraphy in the Expedition 400 methods chapter (Knutz et al., 2025). Overall, palynomorphs, and notably the dinocysts among them, were found to be scarce, and no quantitative analysis was conducted. Occurrences of palynofacies categories and palynomorphs for all Site U1605 samples are shown in Table T5 and Figure F9. Compared to the palynomorph assemblages of Sites U1603 and U1604, concentrations of in situ dinocysts and pollen, as well as reworked material, are much lower at Site U1605.
All dinocyst species observed in the analyzed material are consistent with a Pleistocene age. Preservation of in situ dinocysts is good where they occur, although abundances are very low across the entire studied interval. Rarity of palynomorphs during the Quaternary in the Arctic Ocean can be explained by the small number of dinoflagellates around the Arctic that form fossilizable cysts (Okolodkov, 1998) and the general ecological preference of dinoflagellates for warmer waters (e.g., Matthiessen et al., 2005).
Dinocyst species belonging to the genus Brigantedinium spp. are present in 3 out of 15 samples (Sections 400-U1605A-4R-CC, 18R-CC, and 24R-1).
In addition to in situ palynomorphs, varying abundances of reworked palynomorphs were recorded in 14 out of 15 samples. These reworked palynomorphs consist of pollen and spores (Figure F11A–F11C). Unlike Sites U1603 and U1604, no marine reworked palynomorphs were recorded in these sediments. A small foraminifera was recorded in Sample 400-U1605A-37R-CC (Figure F11D).
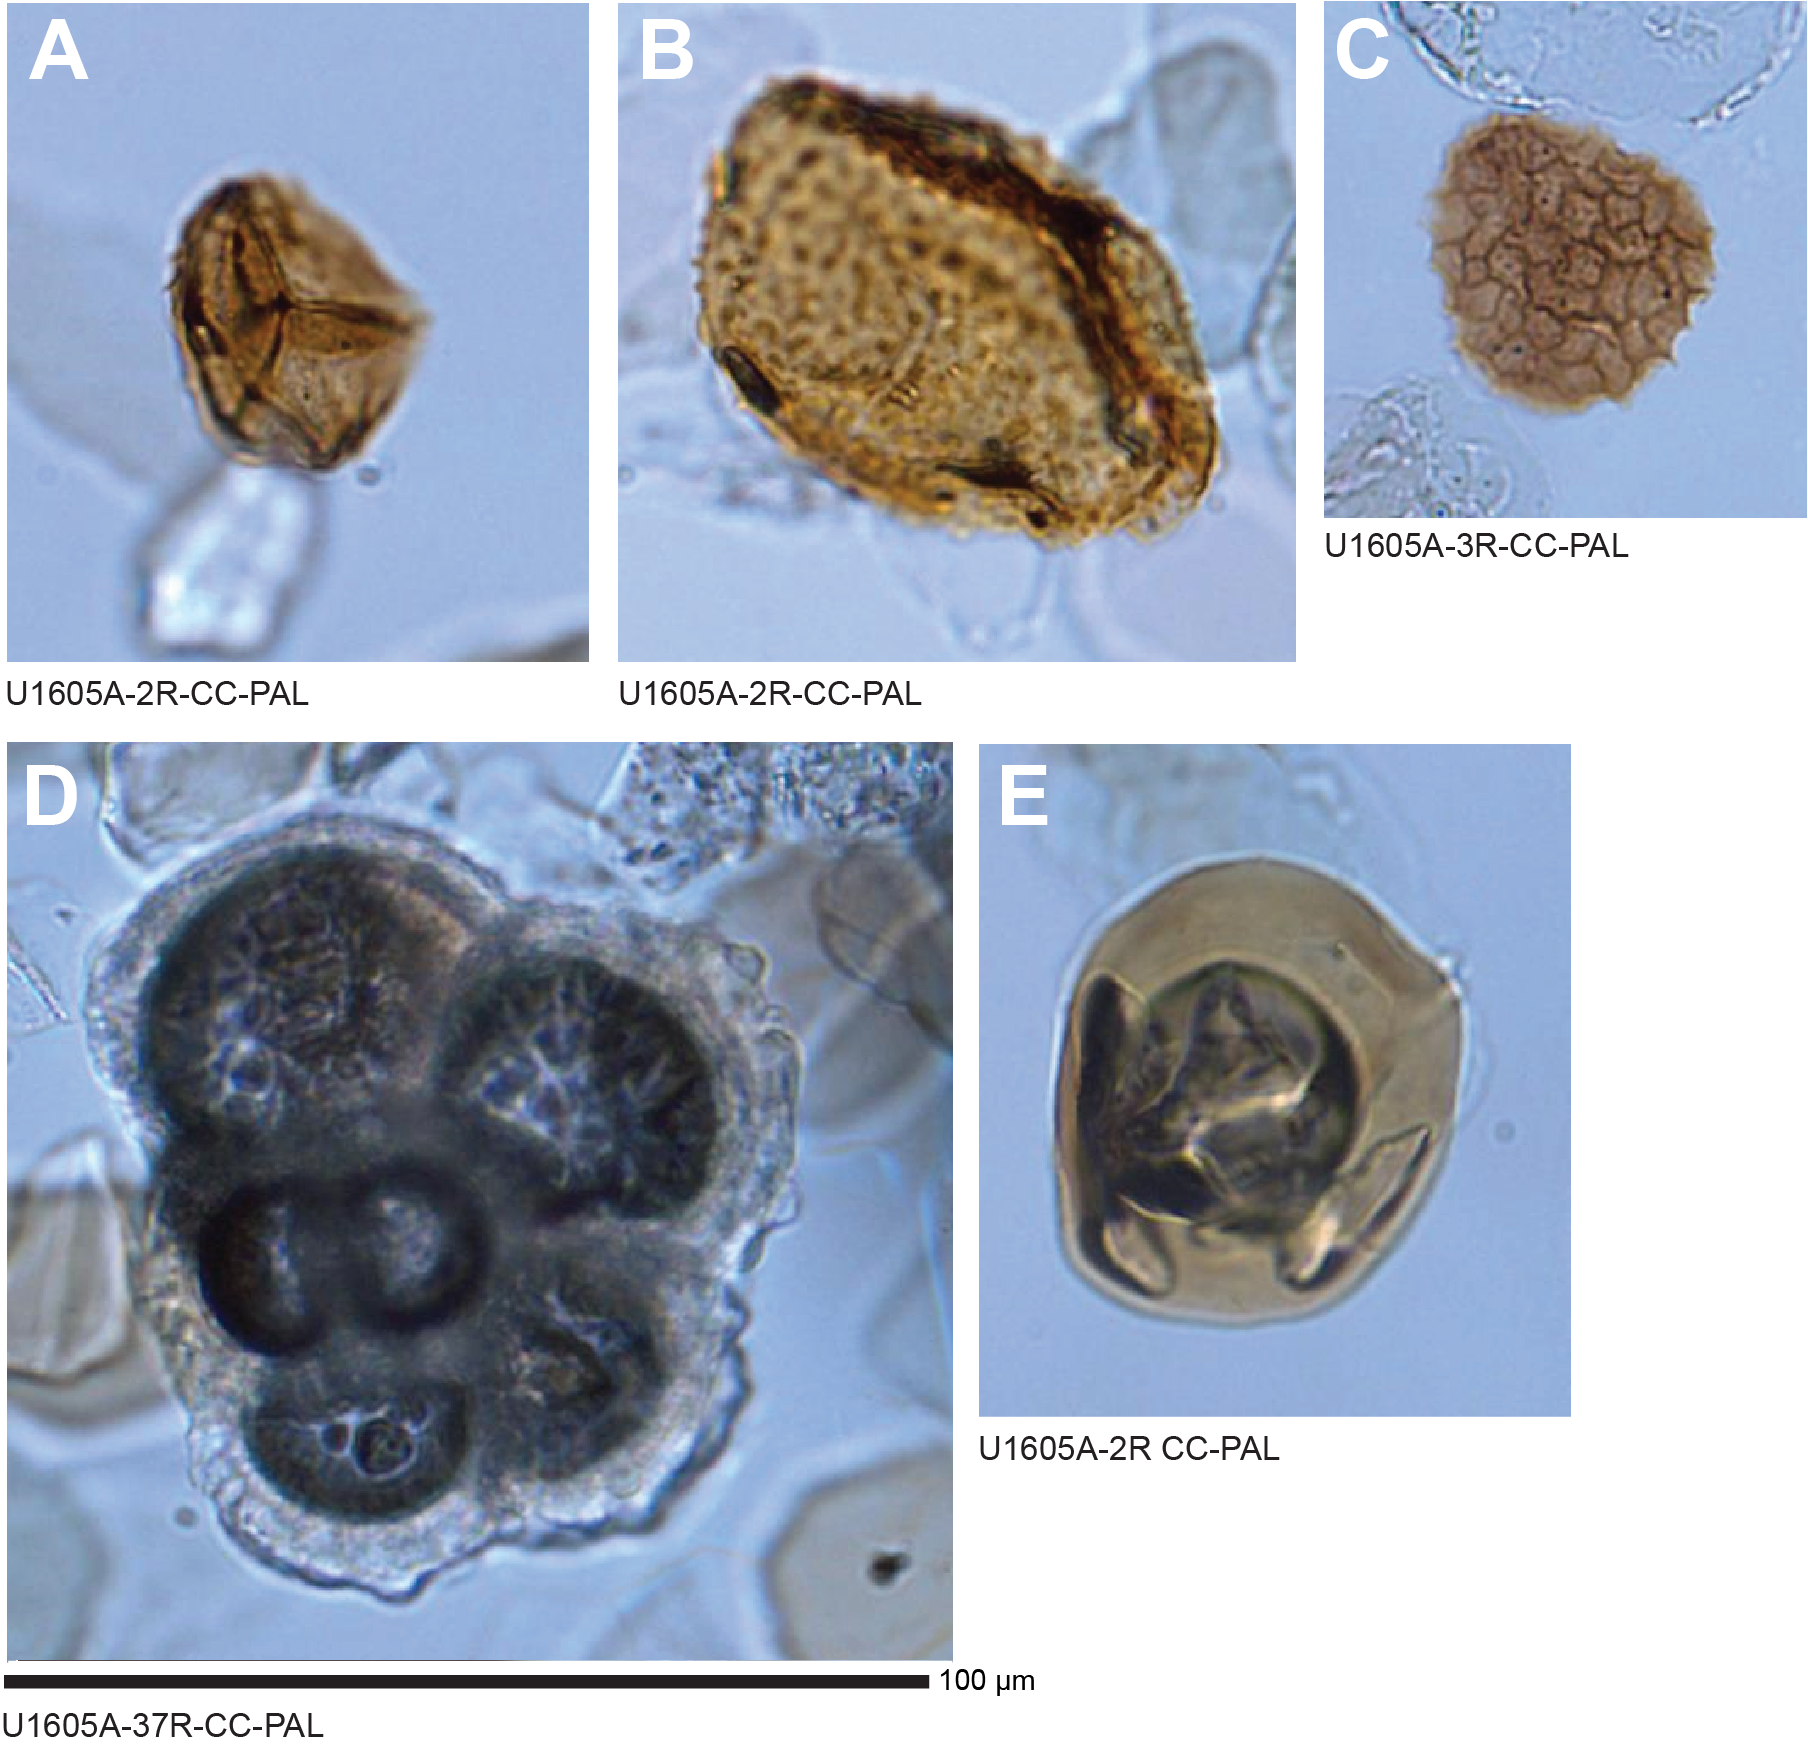
Figure F11. Palynomorphs and other fossils.
Notably, the acritarch Leiosphaeridia (Figure F11E) is present in 10 of 15 samples, with its highest occurrences in samples from Sections 400-U1605A-2R-CC, 3R-CC, 22R-CC, and 39R-CC. At present in the Arctic, this acritarch is found at the seasonal sea ice edge (Mudie, 1992) and is therefore often used as a proxy to indicate the presence of sea ice (Hartman et al., 2021; Hannah, 2006). Abundances of Leiosphaeridia are higher and more consistent at Site U1605 compared to Sites U1604 and U1603.
5. Paleomagnetism
Recovery from Site U1605 was generally poor, and the recovered material contains many intervals of only large clasts. Some cores also contain intervals of diamicton (see Lithostratigraphy). We measured the diamicton intervals on the superconducting rock magnetometer (SRM) wherever they appeared as relatively cohesive sections of at least 40 cm. We also collected 11 discrete cube samples from this site, which were measured on the SRM.
5.1. Discrete sample measurements
We collected 11 discrete cube samples from Hole U1605A. Of these, eight cubes were cut from the diamicton intervals using a parallel saw, and three were collected using "Japanese" Natsuhara-Giken cubes (J-cubes) pushed into the diamicton. All specimens were measured after stepwise demagnetization up to an 80 mT peak alternating field (AF) demagnetization. Demagnetization behavior is shown in Zijderveld diagrams (Zijderveld, 1967) in Figure F12. The drill string overprint is typically removed by the 15 mT AF demagnetization step. Several discrete specimens behaved in a manner consistent with normal (Figure F12A, F12E) and reversely (Figure F12B, F12F) magnetized specimens, whereas others (Figure F12C, F12D) were demagnetized at such low coercivities (Figure F12G, F12H) that their polarity is in doubt.

Figure F12. AF demagnetization behavior.
Anisotropy of MS (AMS) and volume-normalized bulk MS were measured on nine discrete specimens. The data are reduced to a 3 × 3 tensor with eigenvalues (τ1, τ2, and τ3) and eigenvectors (V1, V2, and V3), where τ1 is the maximum eigenvalue associated with eigenvector V1 and τ1 > τ2 > τ3. We plot the eigenvector directions in Figure F13. The inclination of the minimum axis (V3; blue circles) is expected to be vertical in most sediments, which is the case for only a few of the specimens. Most show sedimentary fabrics that may indicate disturbance.
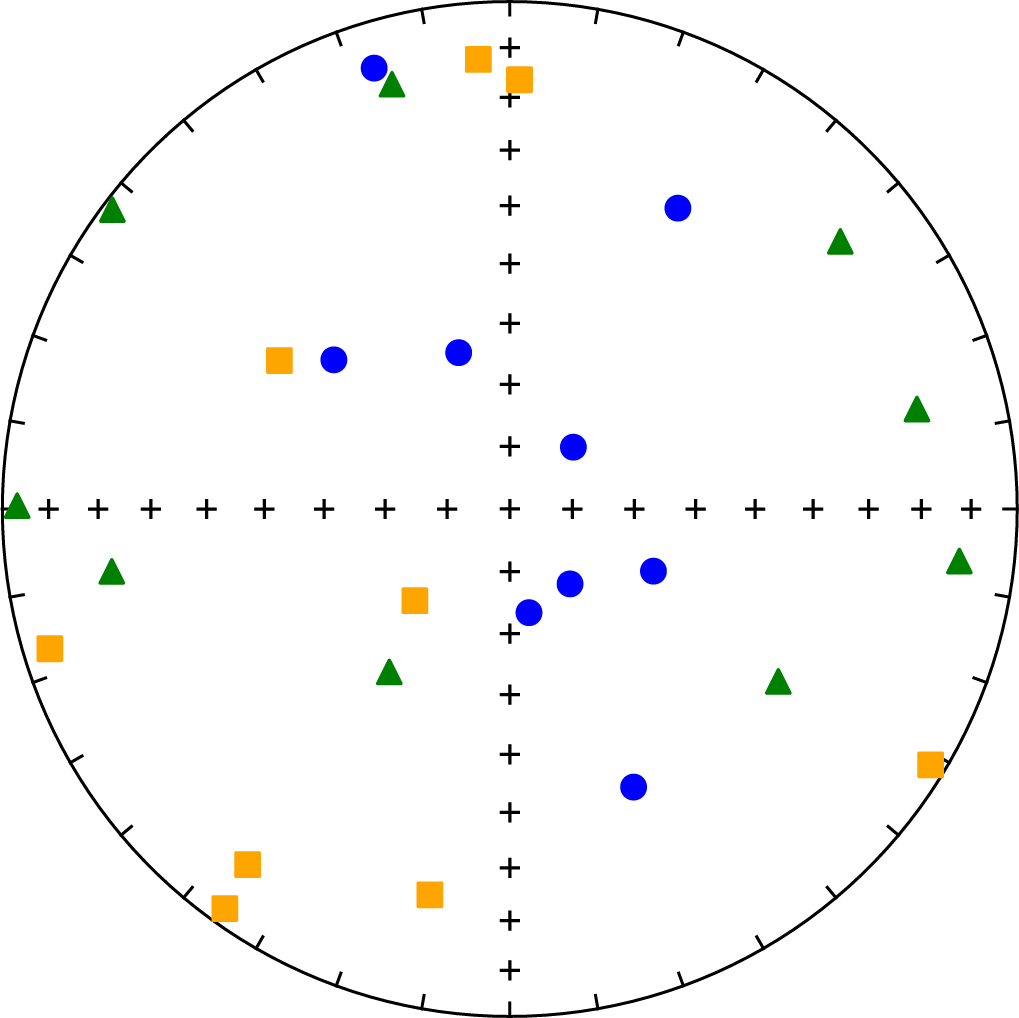
Figure F13. AMS data.
5.2. Archive-half measurements
The natural remanent magnetization and the remanence after 10 and 20 mT peak AF demagnetization were measured on 16 archive section halves. The measured sections consisted of continuous intervals of diamicton at least 40 cm in length. Data were filtered as follows:
- All measurements within 10 cm of section ends were deleted to remove the edge effects associated with pass-through measurements.
- Intervals with drilling disturbances as defined by the disturbance intensity code of "moderately disturbed" or greater (see Lithostratigraphy in the Expedition 400 methods chapter [Knutz et al., 2025]) were removed.
- Core linescan images and X-radiographs in intervals of suspect directions were examined to assess where lithologic features such as dropstones or concretions necessitated removal of intervals.
Data from the 20 mT demagnetization step are shown in Figure F14. Unfiltered data are plotted with gray dots, and filtered data are plotted with black dots. Inclination and declination calculated from the 20 mT demagnetization step on the discrete specimens are shown as red stars. The data above about 217 m CSF-A have steeply downward directions consistent with normal polarity, and below that, they are steeply upward directed, which is consistent with reversed polarity.
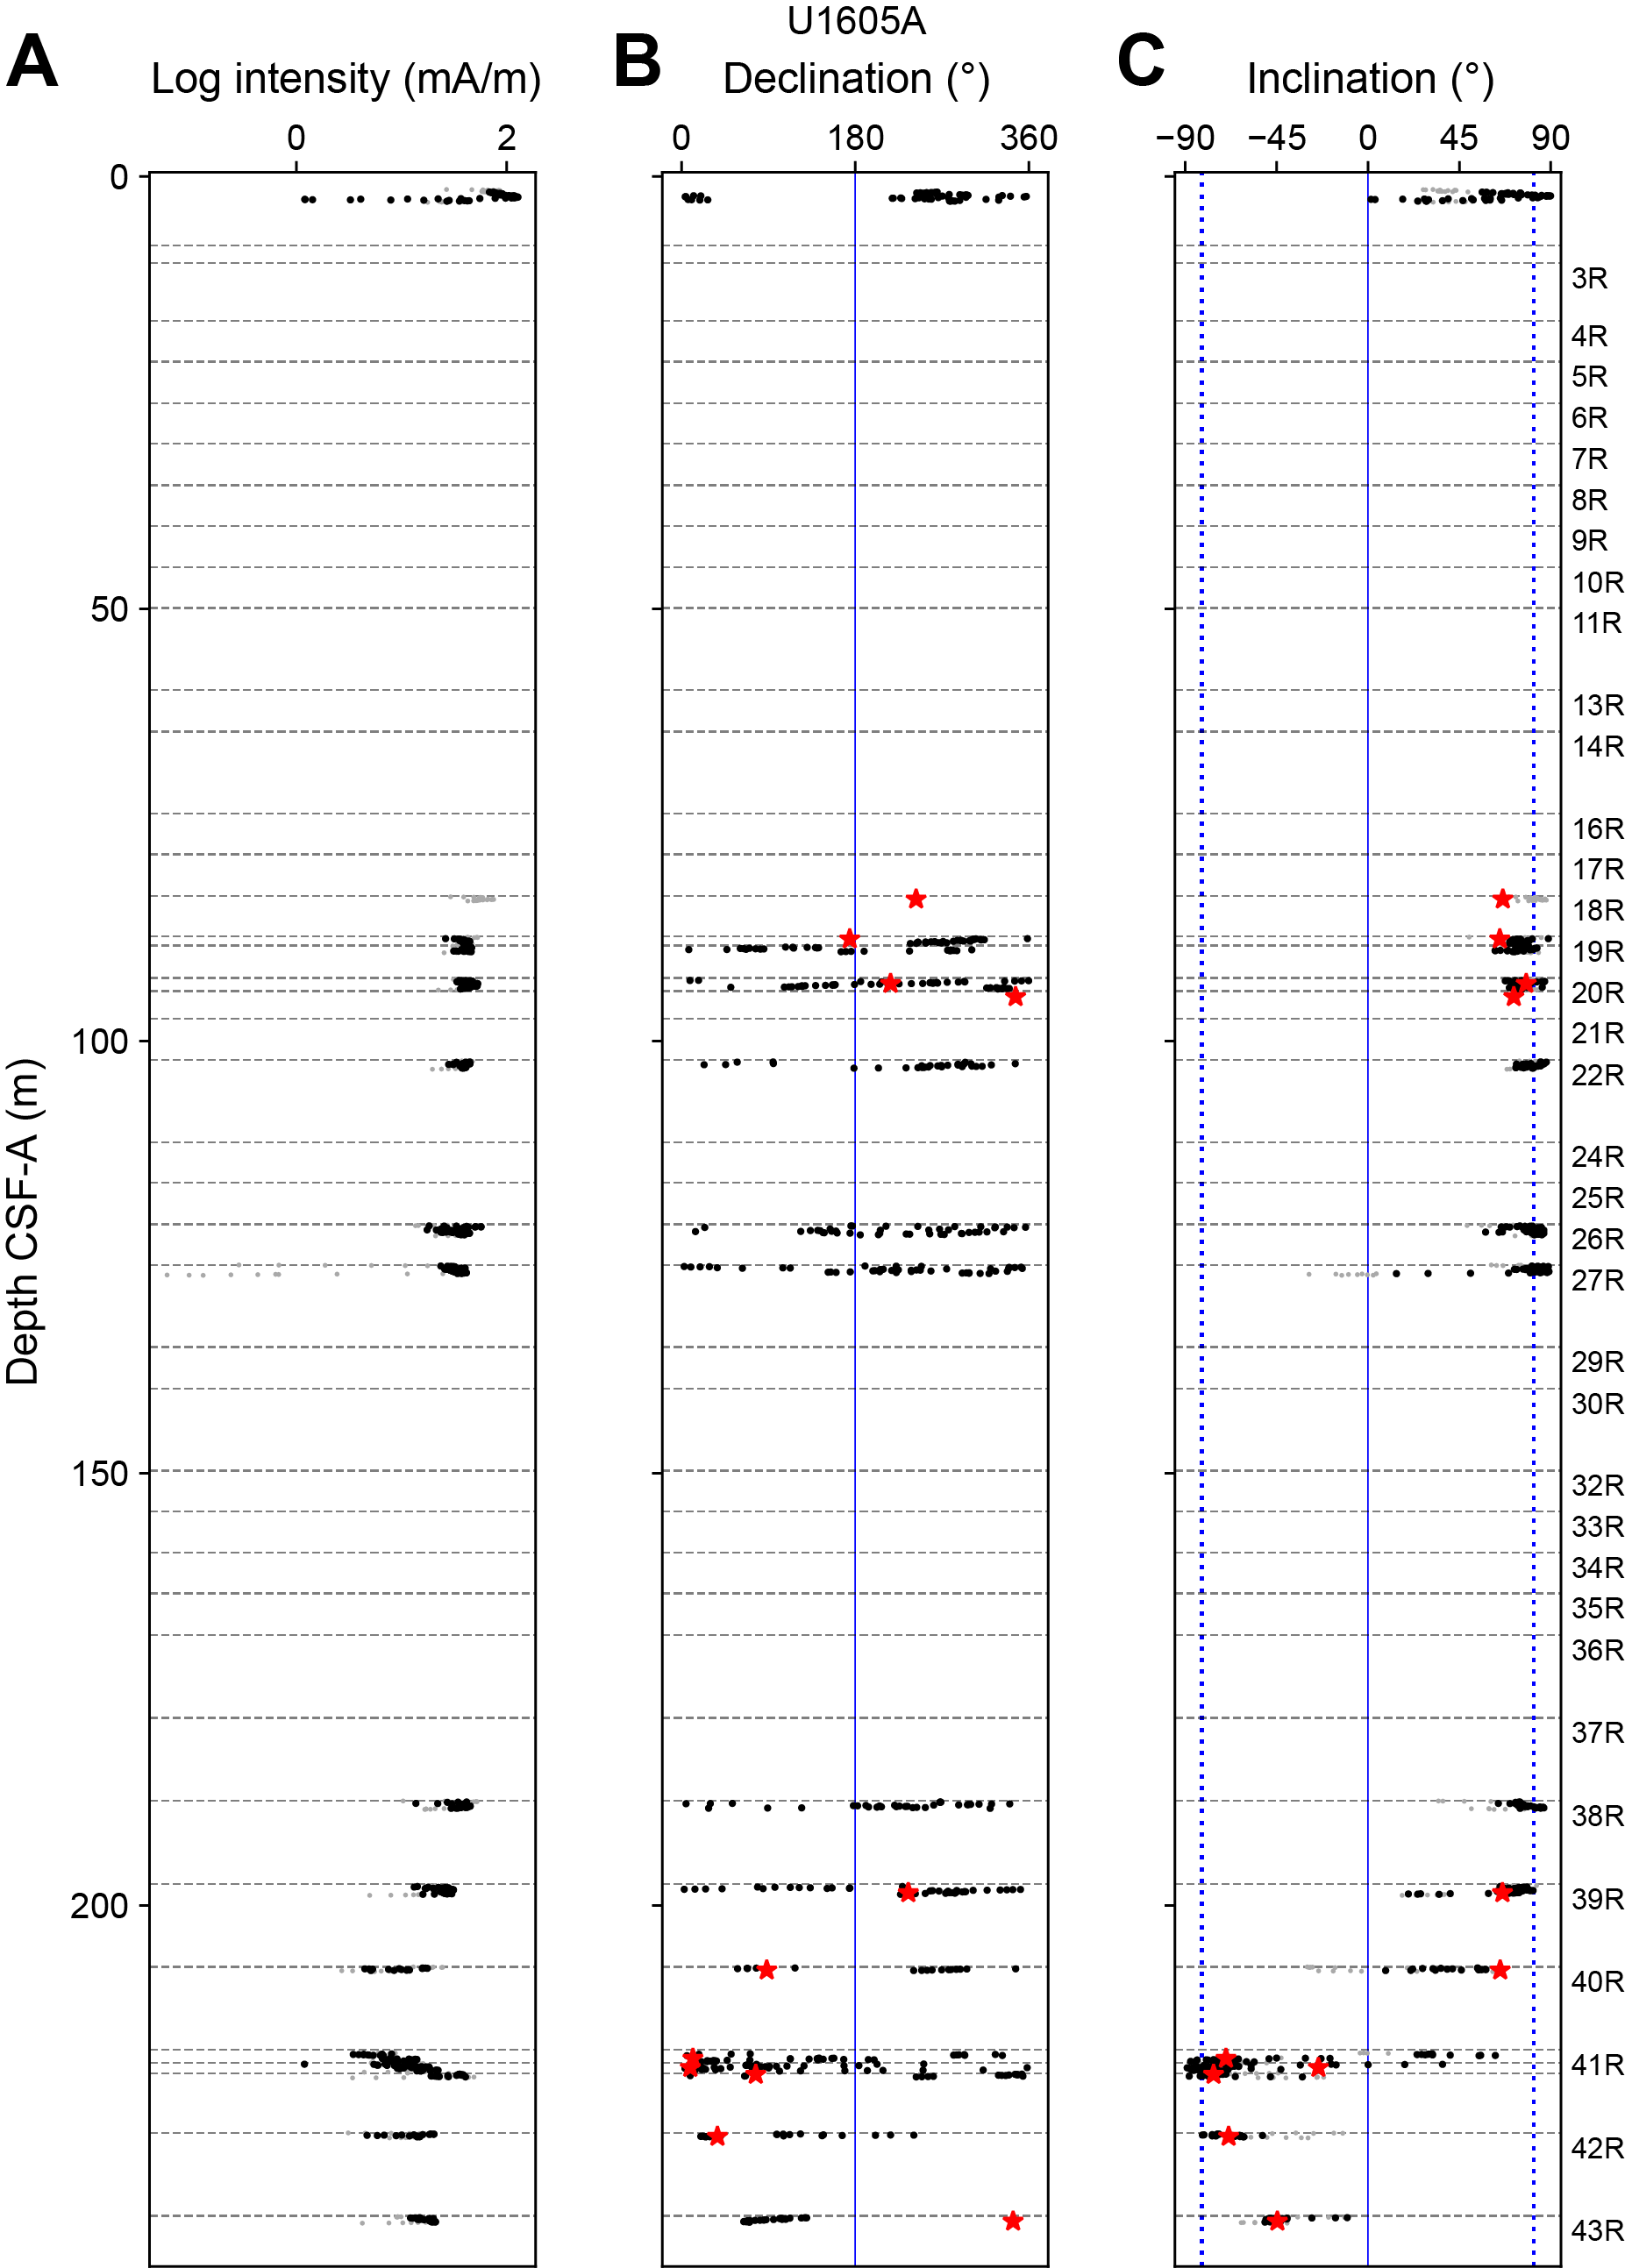
Figure F14. Intensity, declination, and inclination.
We plot the kernel density estimate of the inclination data in Figure F15. There are two distinct humps, but many inclinations are in the indeterminate region between steeply down (normal) and steeply up (reversed). It is possible that the change from normal to reversed polarity is the Brunhes/Matuyama boundary (0.773 Ma; Ogg, 2020), but the discontinuous recovery and lack of other context make this interpretation tentative.
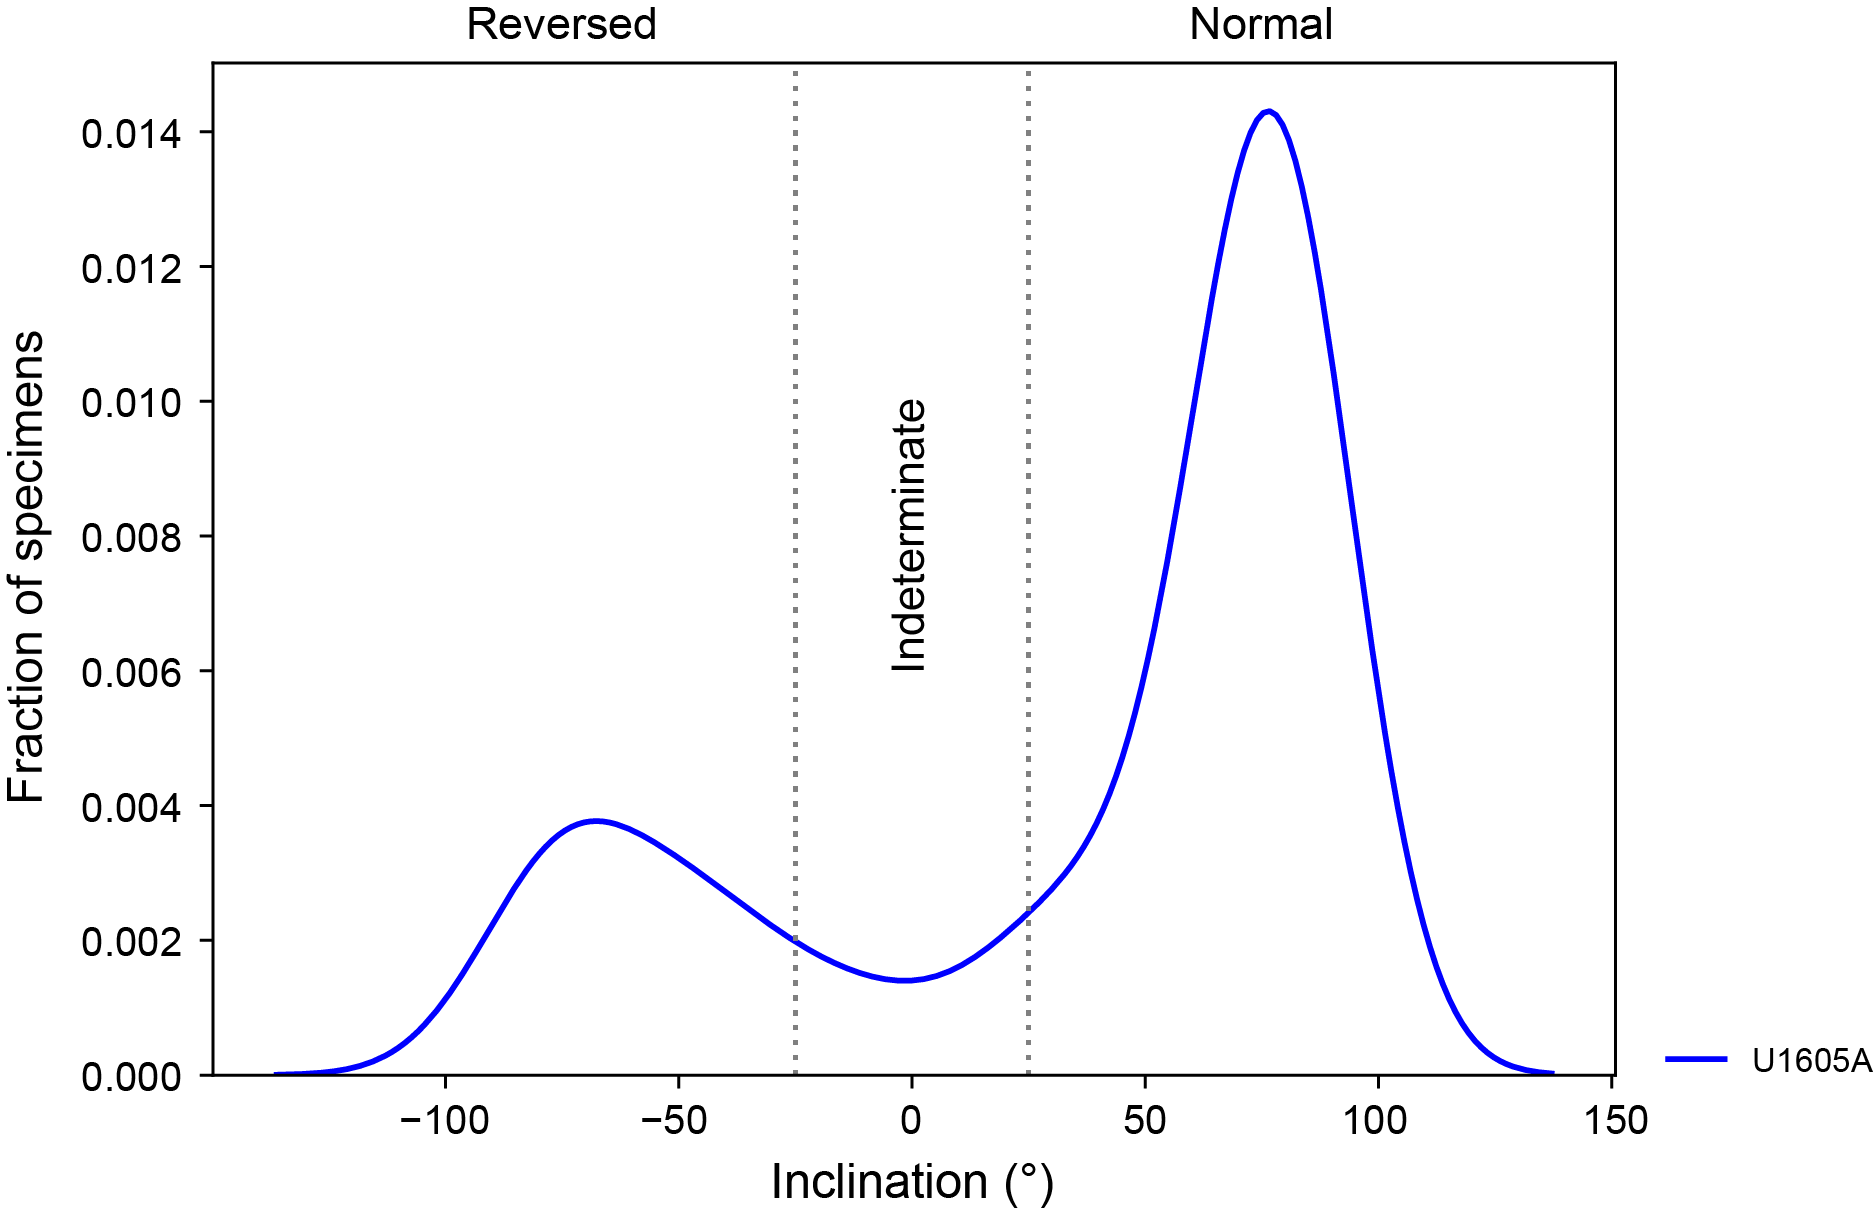
Figure F15. Inclination.
6. Physical properties
Physical property data were acquired on all cores from Hole U1605A using the Whole-Round Multisensor Logger (WRMSL) for wet bulk density from GRA, MS, and P-wave velocity (using the P-wave logger [PWL]). We also measured NGR in all sections longer than 50 cm. NGR measurements were taken upon arrival in the laboratory, whereas WRMSL logging was done after equilibration to room temperature.
After the whole rounds were split into halves, we acquired X-ray imaging of the archive halves of every core. Thermal conductivity was measured in one working section half per core. The Section Half Multisensor Logger (SHMSL) was used to measure point MS (MSP) and color reflectance using the L*a*b* color system, and the red-green-blue color space (RGB) of the sediments was captured with the Section Half Imaging Logger (SHIL). In addition, we determined P-wave velocities at discrete points on the working section halves for almost all cores at Site U1605. In general, we measured P-wave velocity in one section per core, but measurements were taken at variable intervals to accommodate lithologic variations. P-wave values at Site U1605 are strongly influenced by the presence of abundant clasts. Samples for moisture and density (MAD) were taken wherever possible; however, the abundance of gravel recovered at Site U1605 limited MAD sampling to compacted diamicton intervals. Nevertheless, discrete wet bulk density, dry bulk density, grain density, and porosity were obtained for the sedimentary intervals of Site U1605. The sensors worked correctly, and the data are of good quality. All analyses described in this section are reported in meters CSF-A, unless otherwise stated.
Prominent variations in physical property values occur at similar depths to those in the NGR, density, and MS signals and are associated with major lithologic changes in the cores. However, the low recovery obtained at this site prevents further interpretation of the physical properties.
6.1. Physical property measurements and measurement intervals
High-resolution physical property measurements were made on all cores from Hole U1605A to provide basic information on sediment composition and variability. Low recovery, coupled with washed gravel indicating core disturbance (see Lithostratigraphy), resulted in low-quality physical property data downhole. The WRMSL measured bulk density by GRA, MS, and compressional P-wave velocity on the PWL at 2 cm intervals. Core gaps and cracks yielded generally poor-quality data on all WRMSL measurements. In particular, PWL readings are not robust because material recovered with the RCB system has a slightly smaller core diameter and does not fill the liner entirely. The lack of proper contact between the caliper and the sediment leads to large standard deviations in the measurements. Thus, PWL values are only of use in correlation with PWC velocities. NGR was measured with a counting period of 300 s at 10 cm intervals (see Physical properties in the Expedition 400 methods chapter [Knutz et al., 2025]) on one section per core from Site U1605.
After the cores were split, the archive section halves were X-rayed. Thermal conductivity was measured using the TK04 (Teka Bolin) system with a puck probe from the working section halves. P-wave caliper (PWC) velocity was acquired in one working section half per core. PWC measurements were occasionally obtained on individual rocks in the washed gravel intervals, which biases the values toward high velocities not representative of the formation. However, those high values on the PWC help enhance the velocity model on intervals with common clasts. MSP and color reflectance were measured at 2 cm intervals using the SHMSL, and section-half images were collected with the SHIL on all archive section halves. Additionally, discrete samples were taken for MAD measurements on those cores that recovered sedimentary material. They were processed on board to determine water content, wet bulk density, dry bulk density, grain density, and porosity.
All physical property analyses were carried out. Low-quality measurements were noted and associated with poor recovery and the lithology, which shows abundant igneous rocks and gravel at Site U1605.
6.1.1. Whole-Round Multisensor Logger measurements
Results from the Natural Gamma Radiation Logger (NGRL) and WRMSL measurements for Hole U1605A are compiled in Figure F16. We measured high-resolution data (2 cm intervals) for all the cores using the WRMSL. The cores rested for around 4 h before logging to equilibrate to room temperature (~19°C). The logs described in this chapter (Figure F16; Table T6) have undergone preliminary processing including clipping, despiking, and smoothing. Low recovery, together with abundant gravel and igneous rocks, resulted in scattered core logs. However, a positive correlation is found between density and NGR counts, governing all measurements collected for Site U1605 (Figures F16, F17). Such correlation remains when addressing purely sedimentary intervals after filtering out the washed gravel intervals that represent coring disturbance. The correlation between these physical properties distinguishes four physical properties units (I–IV) at Site U1605; the main signatures of those units are summarized in Table T6.
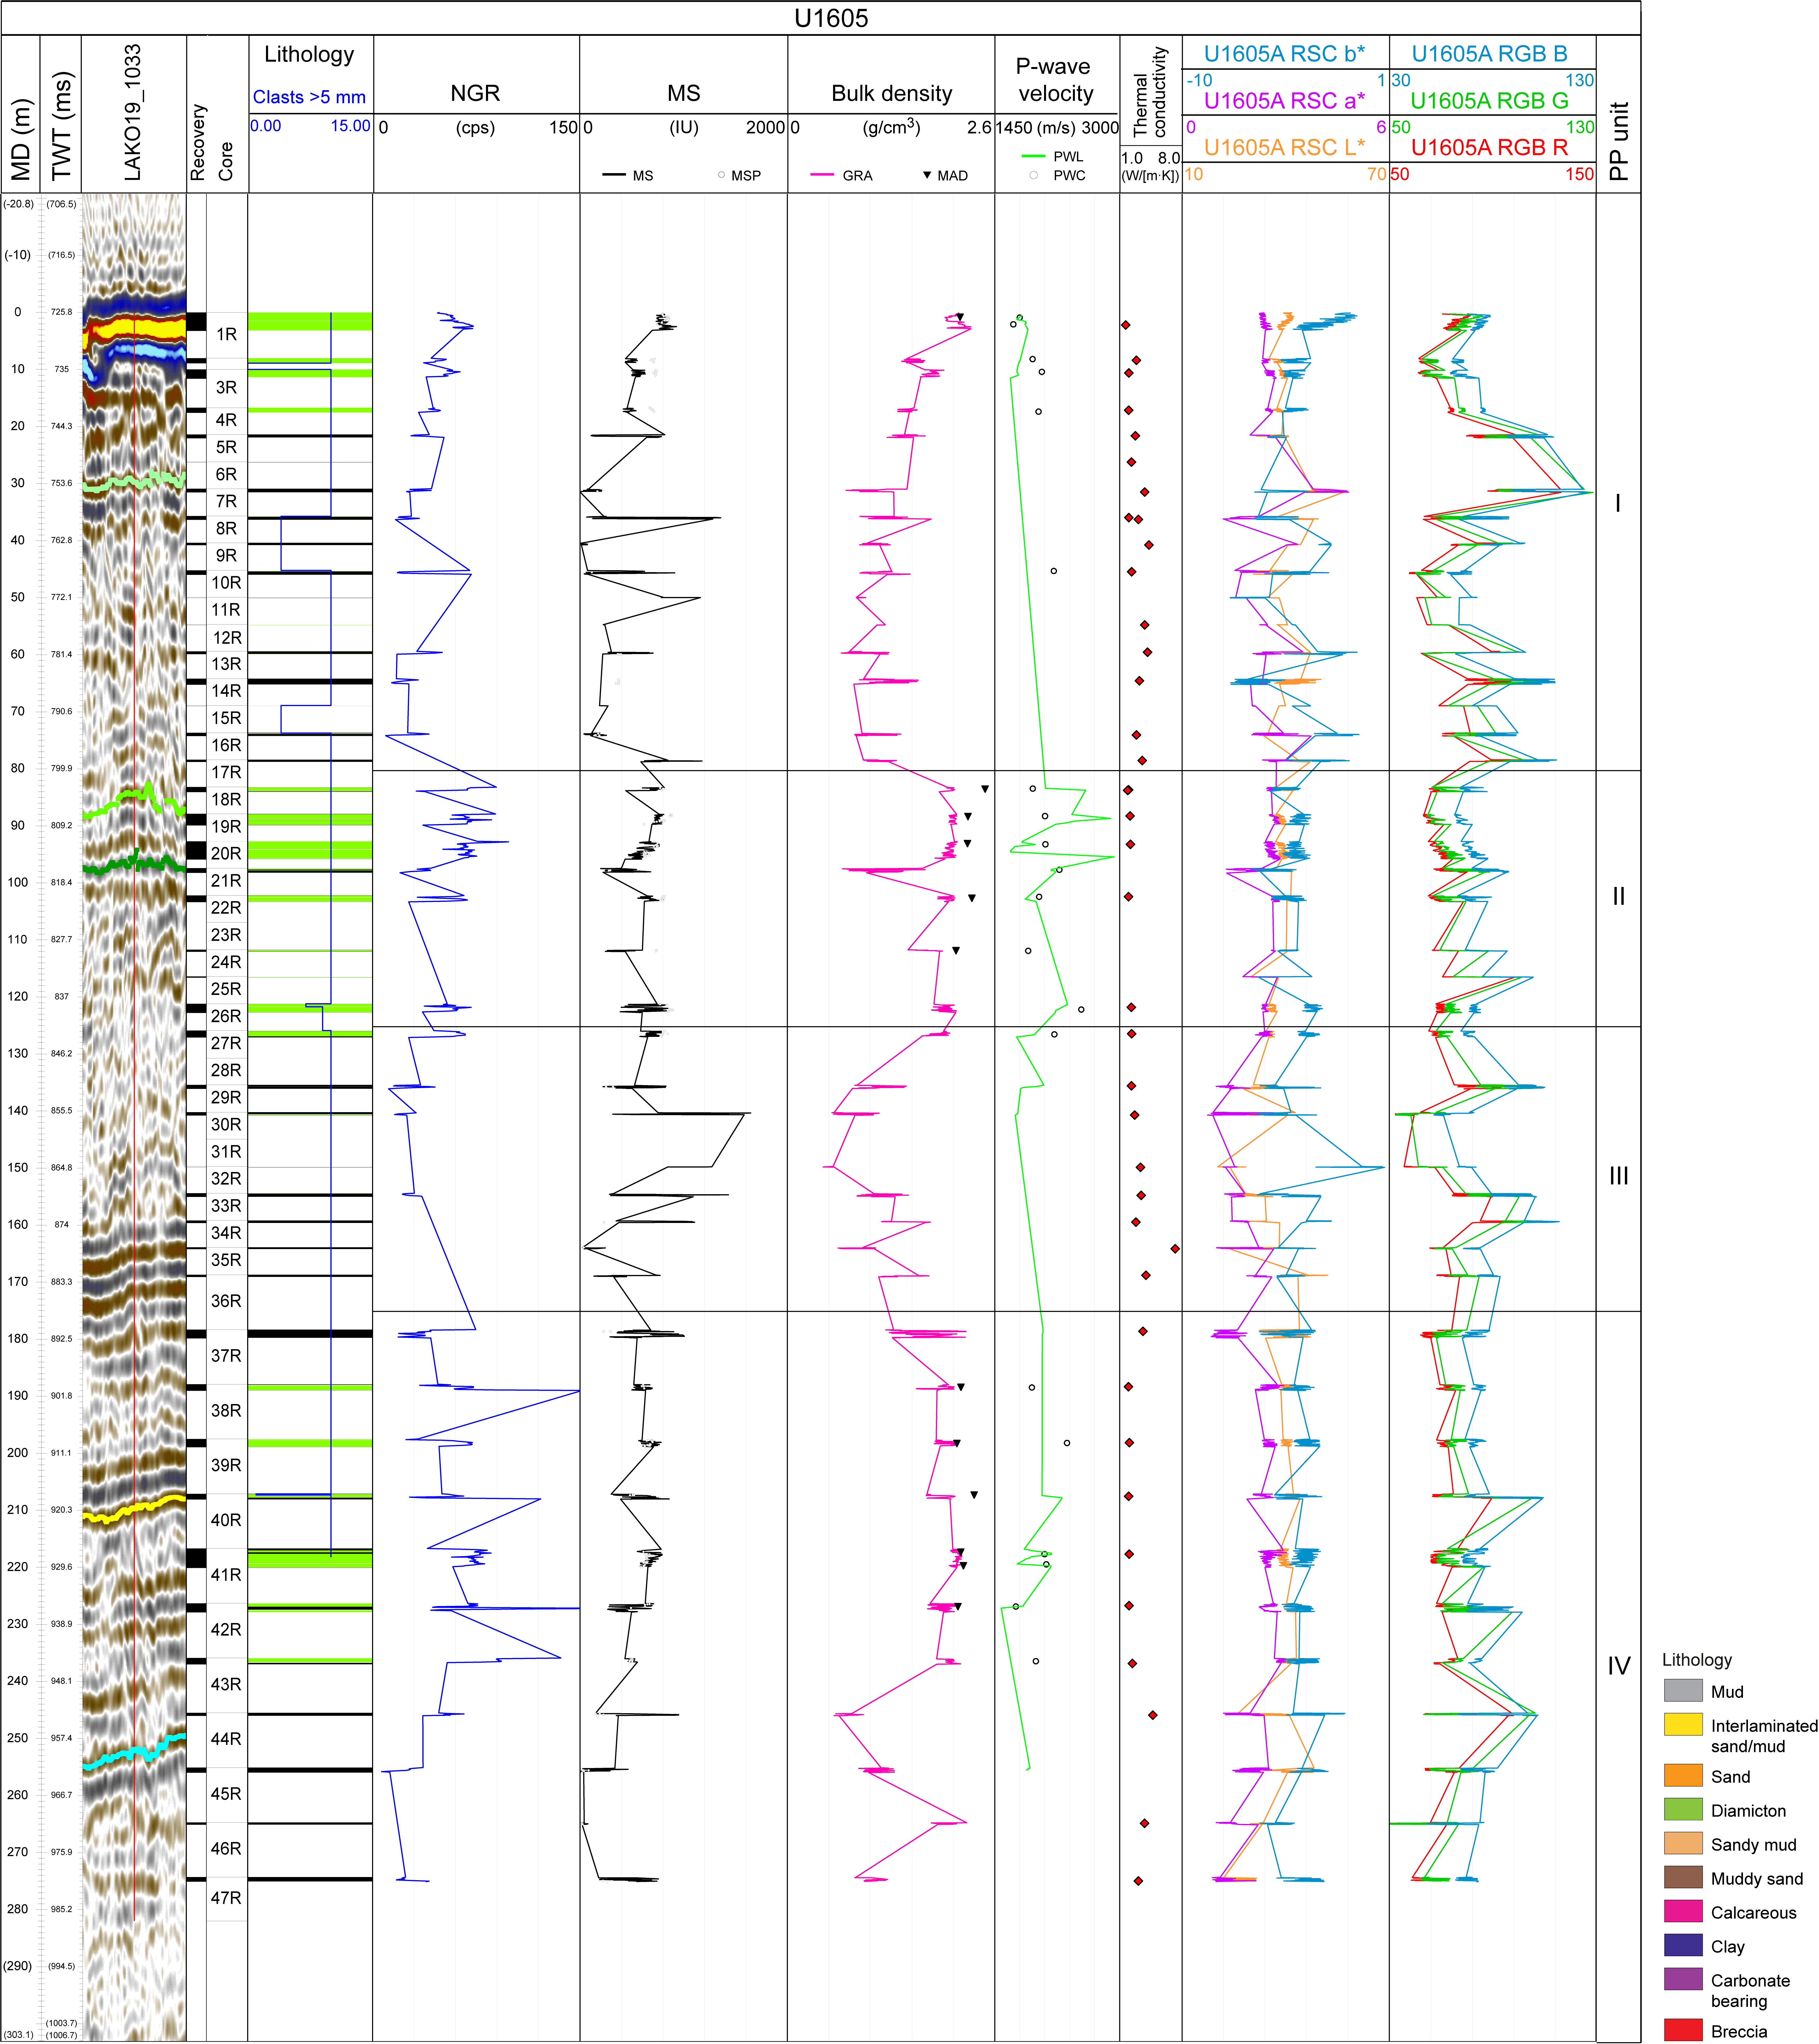
Figure F16. Physical properties.
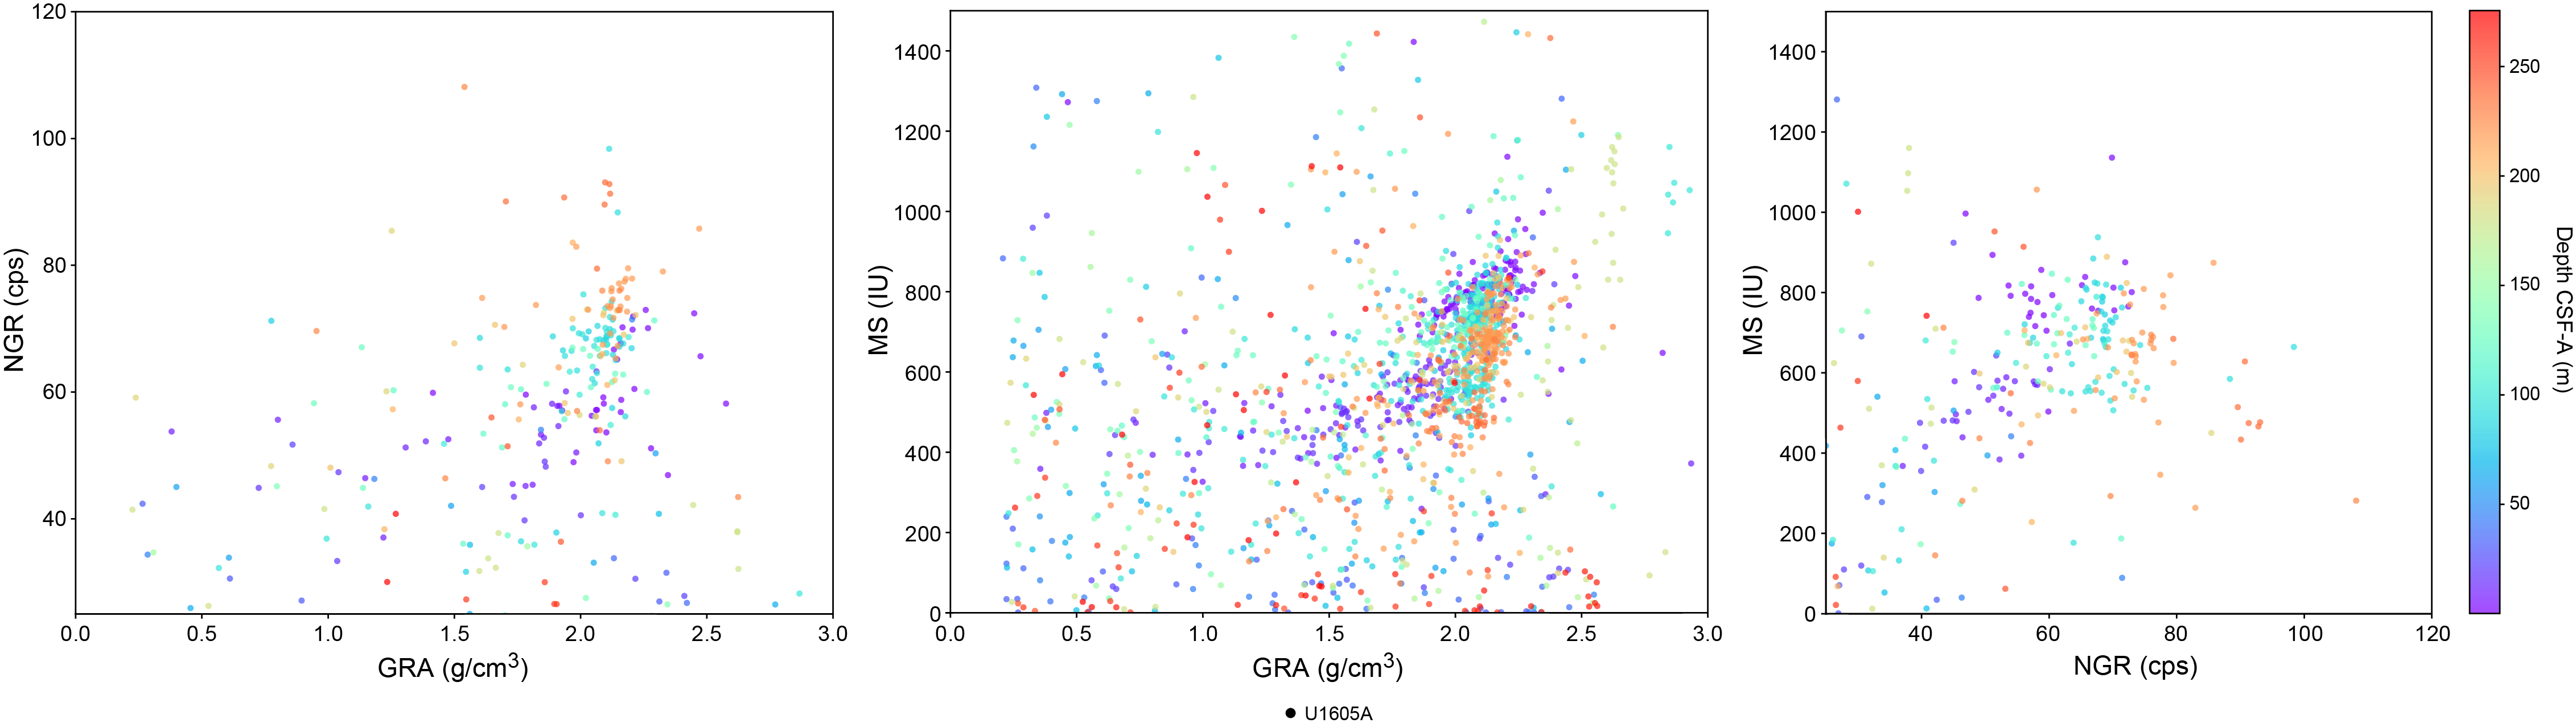
Figure F17. NGR, GRA bulk density, and MS.
6.1.1.1. Gamma ray attenuation bulk density
Wet bulk densities at Site U1605 range 0.5–2.3 g/cm3 with a mean value of 1.7 g/cm3. Overall, GRA values increase downhole. From top to bottom, a decrease in bulk density is observed from the seafloor through Core 400-U1605A-17R (~80 m CSF-A). This is followed downhole by a steep increase in density values in Cores 18R–27R (~125 m CSF-A). Density then sharply decreases in Cores 29R and 30R (~150 m CSF-A). GRA values show an increasing trend for Cores 32R–43R (~150 through ~237 m CSF-A). Below this depth, GRA values decrease to the base of the hole (Figure F16). GRA bulk density values are slightly lower than densities calculated from the MAD samples (Figure F16). A positive correlation is found between density and NGR counts and between density and depth downhole, with a lot of scattered points on the plot (Figures F16, F17).
6.1.1.2. Magnetic susceptibility
MS is sensitive to the concentration and type of magnetic minerals deposited in the sediments. Although it usually appears as sharp peaks of high-amplitude variability, MS also tracks lithologic changes. Values at Site U1605 range 0.7 × 10⁻⁵ to 1647 × 10−5 SI with a mean of 577 × 10−5 SI (Figures F16, F17). The highest MS values are found in Cores 400-U1605A-8R and 30R (>1100 × 10−5 SI), and the lowest values are observed in Cores 7R and 9R (<10 × 10−5 SI). There is an overall decrease of the baseline value of MS downhole.
6.1.1.3. P-wave velocity using the P-wave logger
PWL measurements for Site U1605 are potentially unreliable because all sections have cracks and poor contact between the sediment and the liner. Thus, the absolute values should be interpreted within the context of the lithology and other measurements collected at the site. The measurements show high-amplitude variability, and after removing anomalous values, PWL ranges 1530–2931 m/s. Overall, PWL values show a slight increase downhole (Figure F16). The lowest velocity values were observed below the seafloor in Core 400-U1605A-3R, and the highest are located between 85 and 100 m CSF-A in Cores 18R–21R.
6.1.2. Natural gamma radiation
NGR values at Site U1605 show high-amplitude variability (Figure F16). NGR values oscillate between ~6 and 182 counts/s with a mean of 53 counts/s. High NGR values occur between Cores 400-U1605A-18R and 20R (83–95 m CSF-A) and between Cores 38R and 43R (190–135 m CSF-A). The NGR baseline shows a slight decreasing trend downhole.
6.1.3. Thermal conductivity
Thermal conductivity varies between 1.6 and 10.4 W/(m·K) at Site U1605 (Figure F16). The mean value of thermal conductivity is 3.0 W/(m·K). There is a general decreasing trend in values with depth through Core 400-U1605A-43R (~245 m CSF-A). The observed thermal conductivity does not present a clear dependence on sediment facies.
6.1.4. Point magnetic susceptibility
MSP measurements are reasonably equivalent to values obtained from the WRMSL (Figure F16). However, higher variability is observed within MSP data due to the smaller integration volume of the sensor (~1 cm; 1σ) compared to the loop (~18 cm; 1σ) used for the WRMSL (Weber et al., 1997).
6.1.5. Color reflectance
L* and b* are relatively constant at Site U1605, whereas a* shows a slight decreasing trend downhole (Figure F16). The lowest L* values match an interval of high b* and low a* values between 140 and 150 m CSF-A.
6.1.6. Gantry
Results of section-half gantry measurements for Hole U1605A are compiled in Figure F18. Correlation between GRA and MAD density values confirms the high quality of the data (Figure F16).
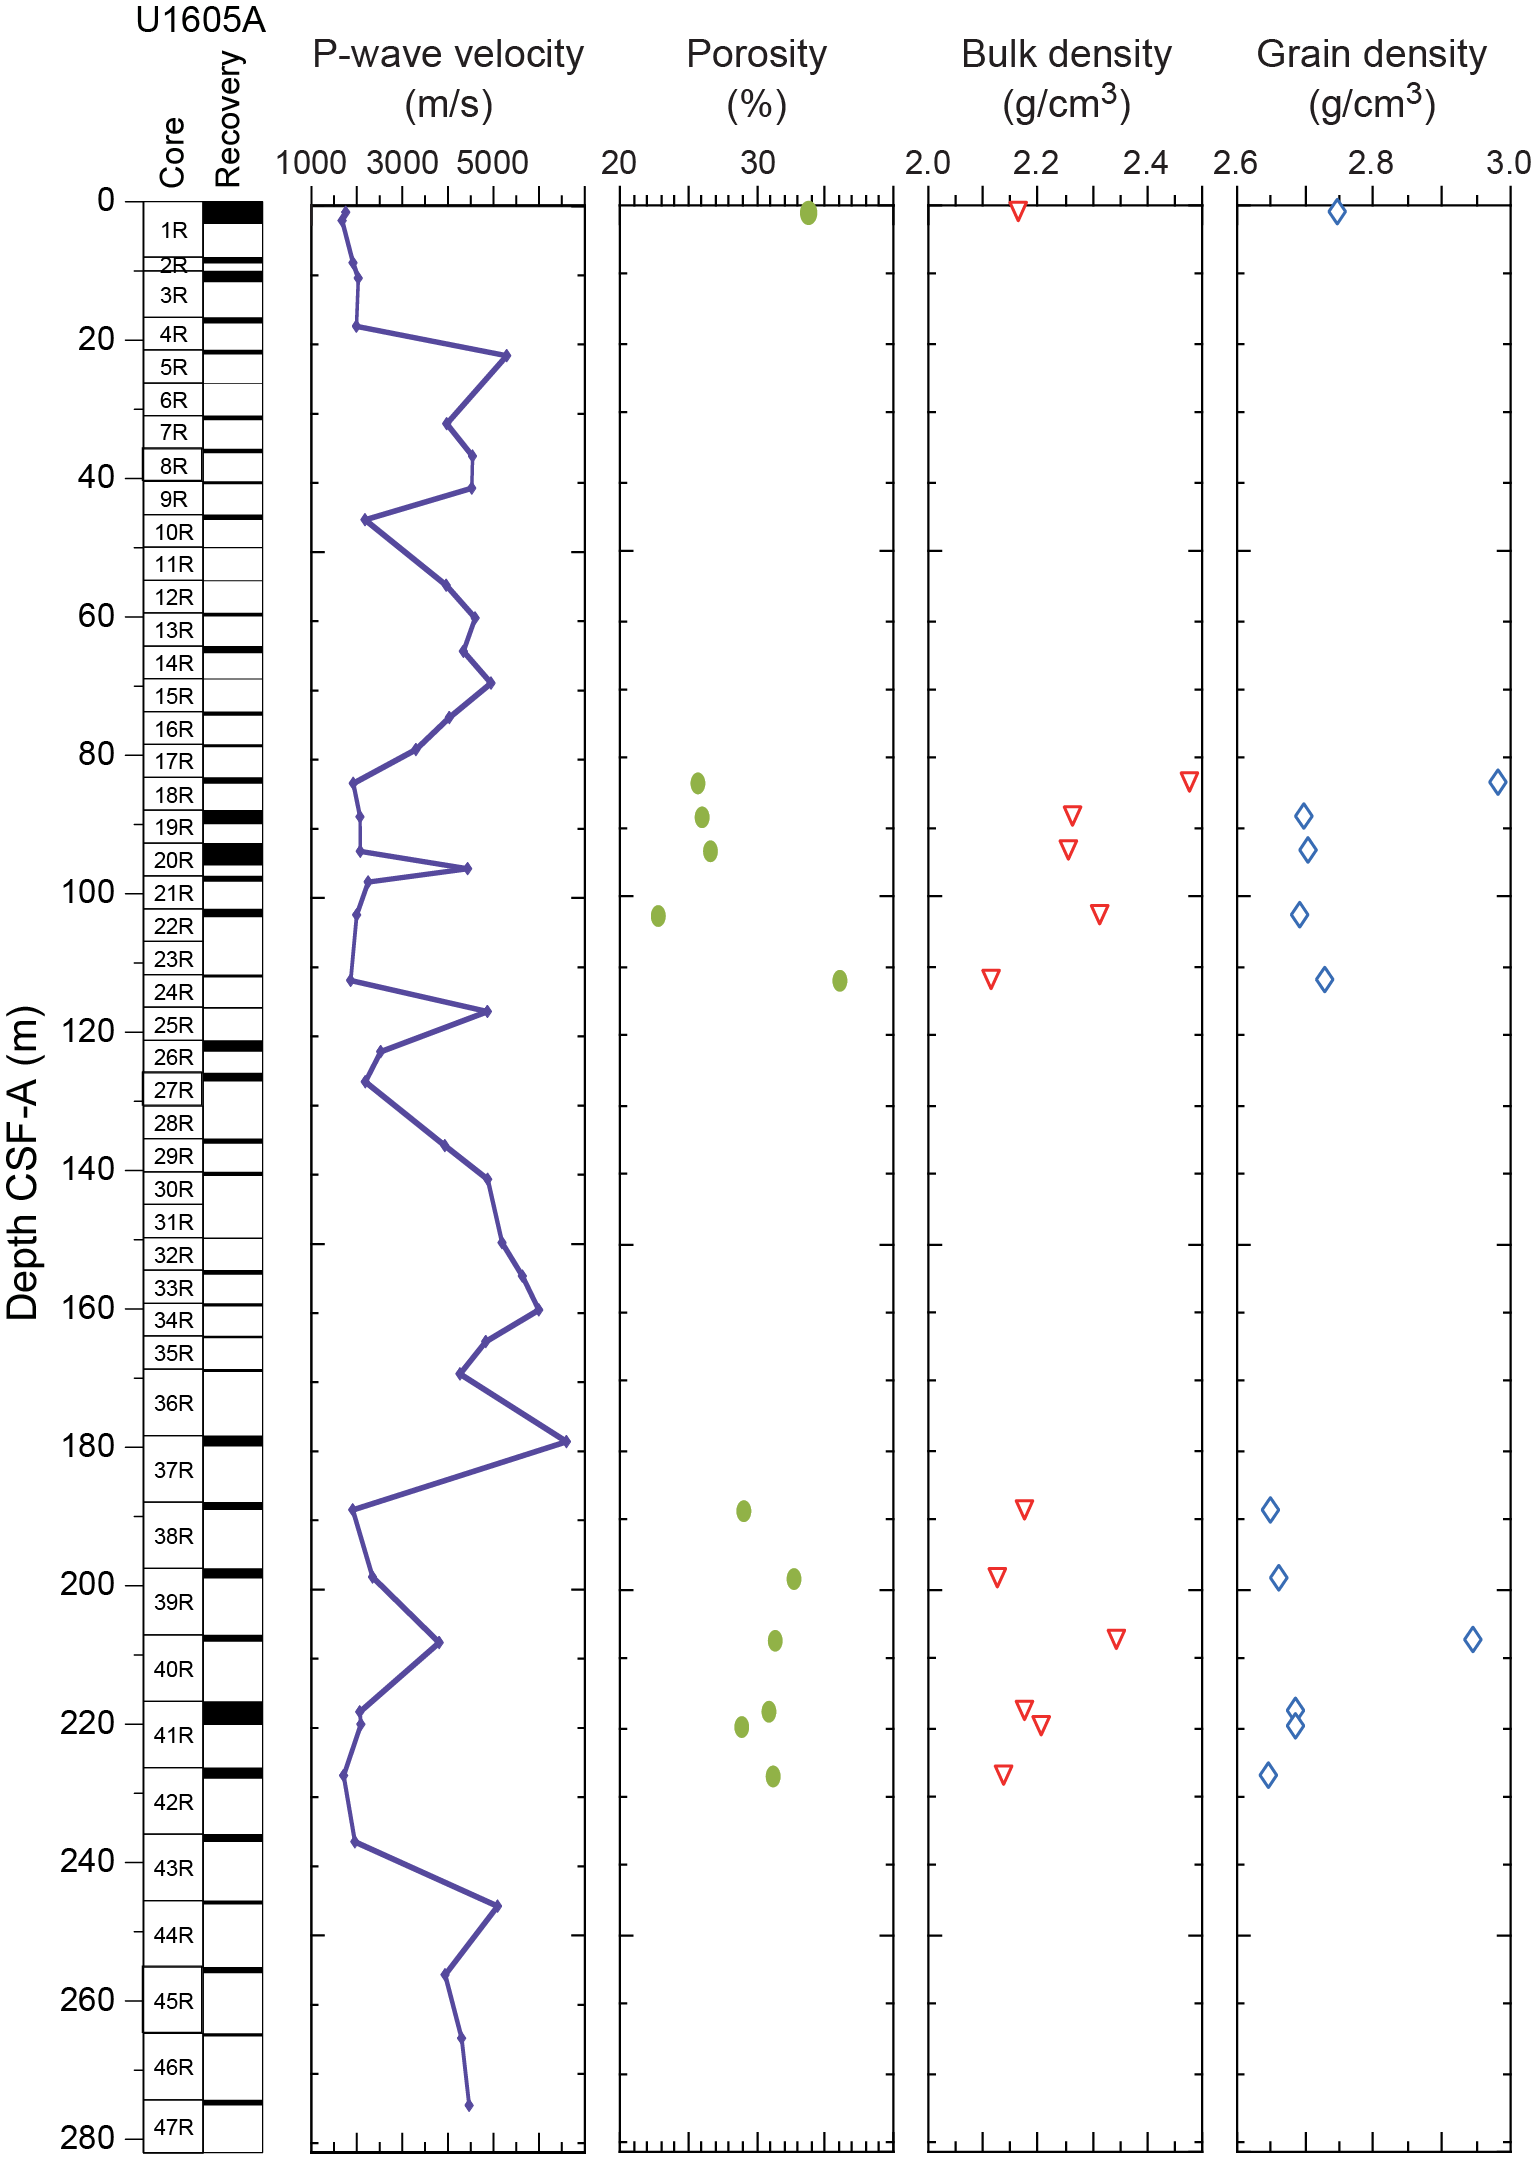
Figure F18. Gantry and MAD analyses.
6.1.6.1. P-wave velocity using the P-wave caliper
Discrete P-wave measurements were carried out using the PWC (see Physical properties in the Expedition 400 methods chapter [Knutz et al., 2025]). Measurement resolution within each core varied depending on lithology, recovery, and quality, with at least one measurement per core. The PWC measurements provide a correlation for PWL values measured on the whole-round cores with the WRMSL (Figure F16). PWC measurements were made on every core with recovery from Site U1605. Low recovery and the absence of sedimentary intervals in the cores resulted in PWC values measured on the recovered clasts that are likely not representative of the entire formation. Upon discarding PWC measurements of igneous rocks in sections of washed gravel, values range ~1680 to ~2600 m/s and are consistent with the trends observed in the PWL values from the WRMSL (Figures F16, F18).
6.1.6.2. Moisture and density
Sediment samples were taken from the working halves of split cores for measuring MAD on those cores from Hole U1605A where sedimentary formations were found. Sample resolution varied depending on lithology, recovery, and core quality. Bulk density values were calculated from moisture and volume measurements (see Physical properties in the Expedition 400 methods chapter [Knutz et al., 2025]). MAD samples were taken adjacent to the PWC measurement when possible so that a correlation between P-wave velocity and bulk density can be made. A total of 12 samples were taken for MAD measurements for Hole U1605A.
MAD density values generally correlate with GRA bulk density measured on the WRMSL (Figure F16). This likely reflects the grain density of the major lithologic components at this site: quartz (2.65 g/cm3), biotite (~3 g/cm3), common clays, and feldspars (~2.56 g/cm3). However, MAD bulk density values are slightly (up to 0.5 g/cm3) higher than GRA bulk density for Hole U1605A. Bulk density values for Site U1605 range 2.1–2.5 g/cm3 with a mean of 2.2 g/cm3.
Porosity represents the percent of pore space of wet sediment volume and generally decreases downhole as the sediments compact (Figure F18). Discrete porosity values at Site U1605 range ~23%–36% with an average porosity of 30%.
6.2. Core-log-seismic correlation
The distinct seismic facies of the units defined by physical properties are described in Table T6. General changes in seismic facies in the seismic profile correspond to changes in the physical properties and lithologic units. Correlation of the seismic signal in two-way traveltime with depth in meters was achieved using the discrete P-wave velocity measurements from the PWC as the velocity model for the physical properties measured on the cores in the laboratory. PWC measurements for Hole U1605A were implemented on intervals of sedimentary nature. However, several high PWC values were obtained due to the high density of clasts in the recovered material. A manual filtering of the PWC values was implemented before developing the velocity model that was applied in the seismic correlation. Average PWC velocity of sedimentary intervals is 2028 m/s. We weight the velocity on purely sedimentary intervals with a 5% gravel-boulder velocity of about 4630 m/s. Thus, the time-depth relationship at Site U1605 is based on the weighted-average seismic velocity known as 2158 m/s.
7. Geochemistry
Samples for headspace gas, interstitial water (IW) chemistry, and bulk sediment geochemistry were analyzed at Site U1605. Headspace hydrocarbon gas measurements showed low concentrations in the uppermost 130 m and increasing concentrations at depth, with a low yet consistent presence of ethane below 180 m CSF-A. Although low recovery and sporadic sampling led to a discontinuous pore water record, the main findings from IW analysis include decreases in lithium and potassium with depth, possibly suggesting clay formation. A decrease in sulfate with depth to a minimum around 190 m CSF-A provides evidence for a sulfate–methane transition zone. Elemental analysis of solid material revealed very low concentrations of carbon and nitrogen throughout the hole.
7.1. Volatile hydrocarbons
As part of routine environmental protection and safety monitoring, headspace hydrocarbons were analyzed for Hole U1605A (Figure F19). Because of overall low recovery and availability of soft sediment, only 36 headspace samples were collected across the 47 cores retrieved from Hole U1605A. Among those collected, methane (CH4) concentrations were low (2–10 ppm) in the uppermost 130 m and then gradually increased to concentrations of 1,800–12,600 ppm below 190 m CSF-A. Ethane (C2H6) was consistently detected below 180 m CSF-A, with concentrations ranging 0.2–3.5 ppm. The resulting C1/C2 ratios were between 2800 and 8700.
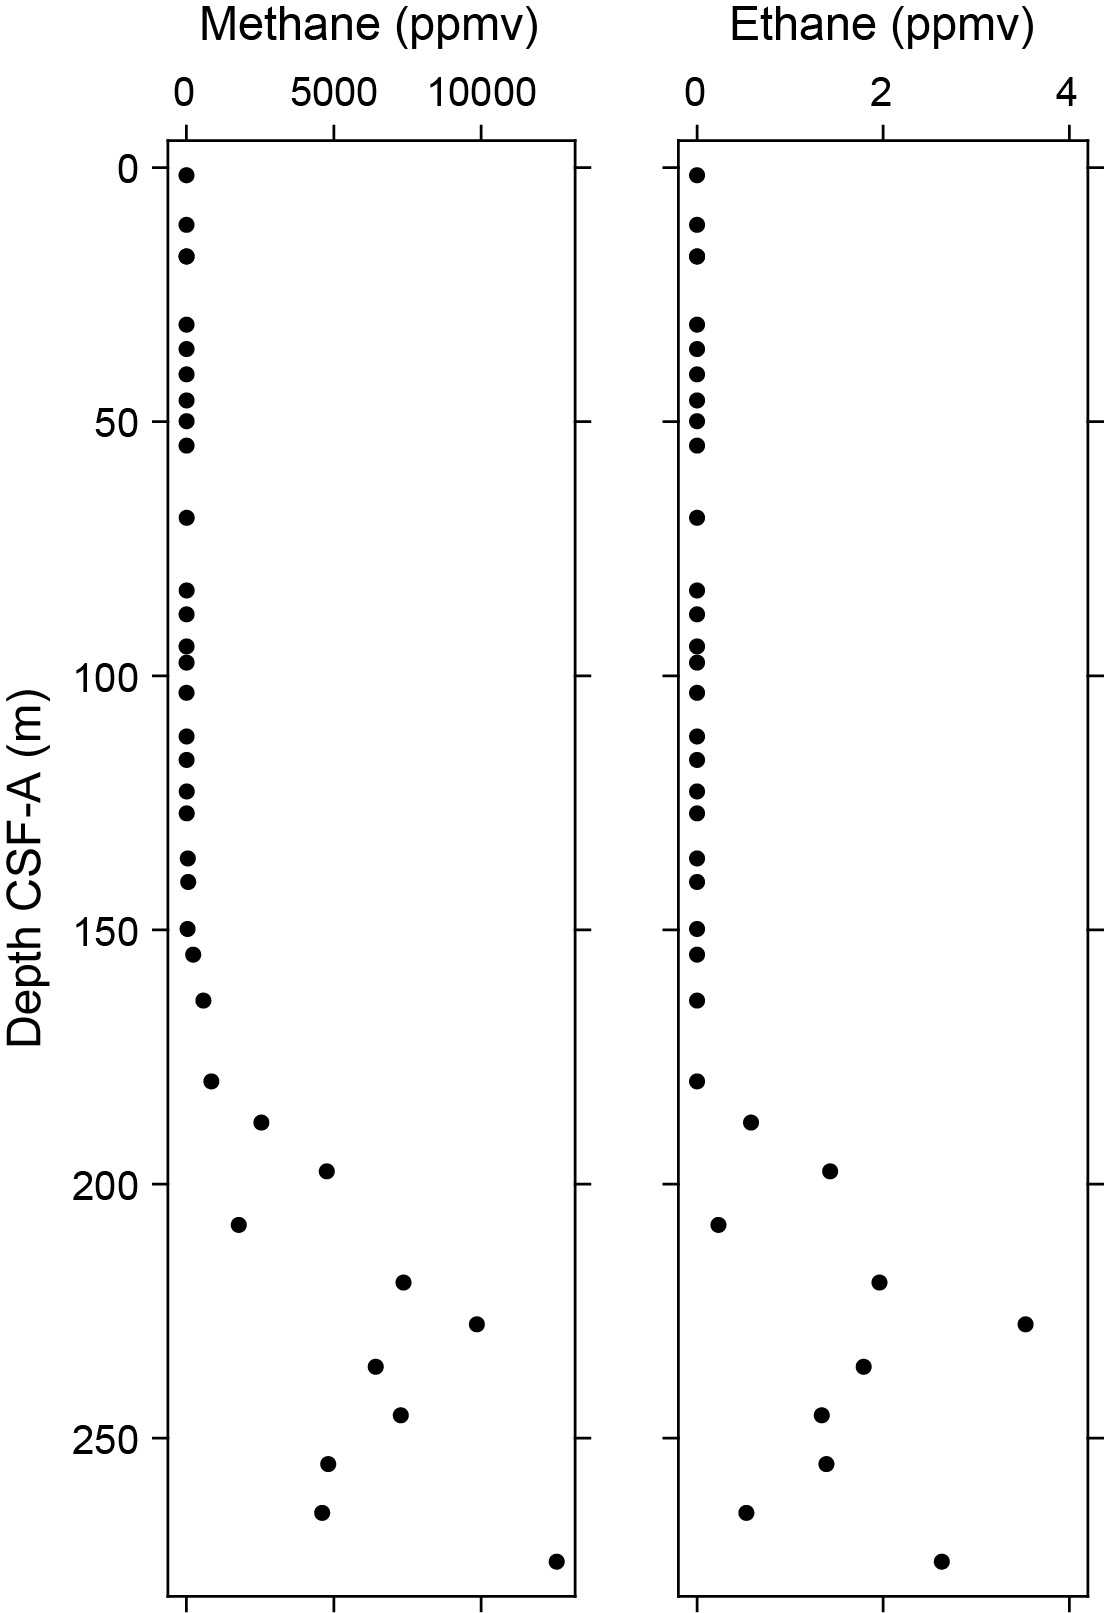
Figure F19. Hydrocarbon gas concentrations.
7.2. Interstitial water chemistry
A total of 22 IW samples were squeezed from 5 or 10 cm whole-round samples. Typical samples yielded 15–30 cm3 of water for subsequent analysis. Samples from poorly lithified horizons and intervals with significant dropstones often resulted in lower yields because much of the material was discarded to mitigate contamination with drilling fluid. Two additional samples were collected and analyzed, one from the mudline of Hole U1605A and one from the surface seawater. Because of low recovery, significant gaps exist in the IW record. No IW samples were taken from 21.96–83.83 or 121.62–188.10 m CSF-A. High-resolution (approximately one per meter) Rhizon water samples were taken from Hole U1605A in the uppermost 3 m; further Rhizon sampling planned for the uppermost 20 m was not completed due to low recovery and poor material for sampling.
7.2.1. pH and alkalinity
The results of pH and alkalinity measurements are shown in Figure F20. The measured pH values range 7.65–8.74. The mudline sample of Hole U1605A has a pH of 7.75. The pH increases with depth to a maximum of 8.74 at 219 m CSF-A. Alkalinity values increase from 2.3 mM at the sediment/water interface to a maximum of 3.0 mM at 1.45 m CSF-A. Values generally decrease downhole to a minimum of 1.16 mM at the bottom of Hole U1605A.
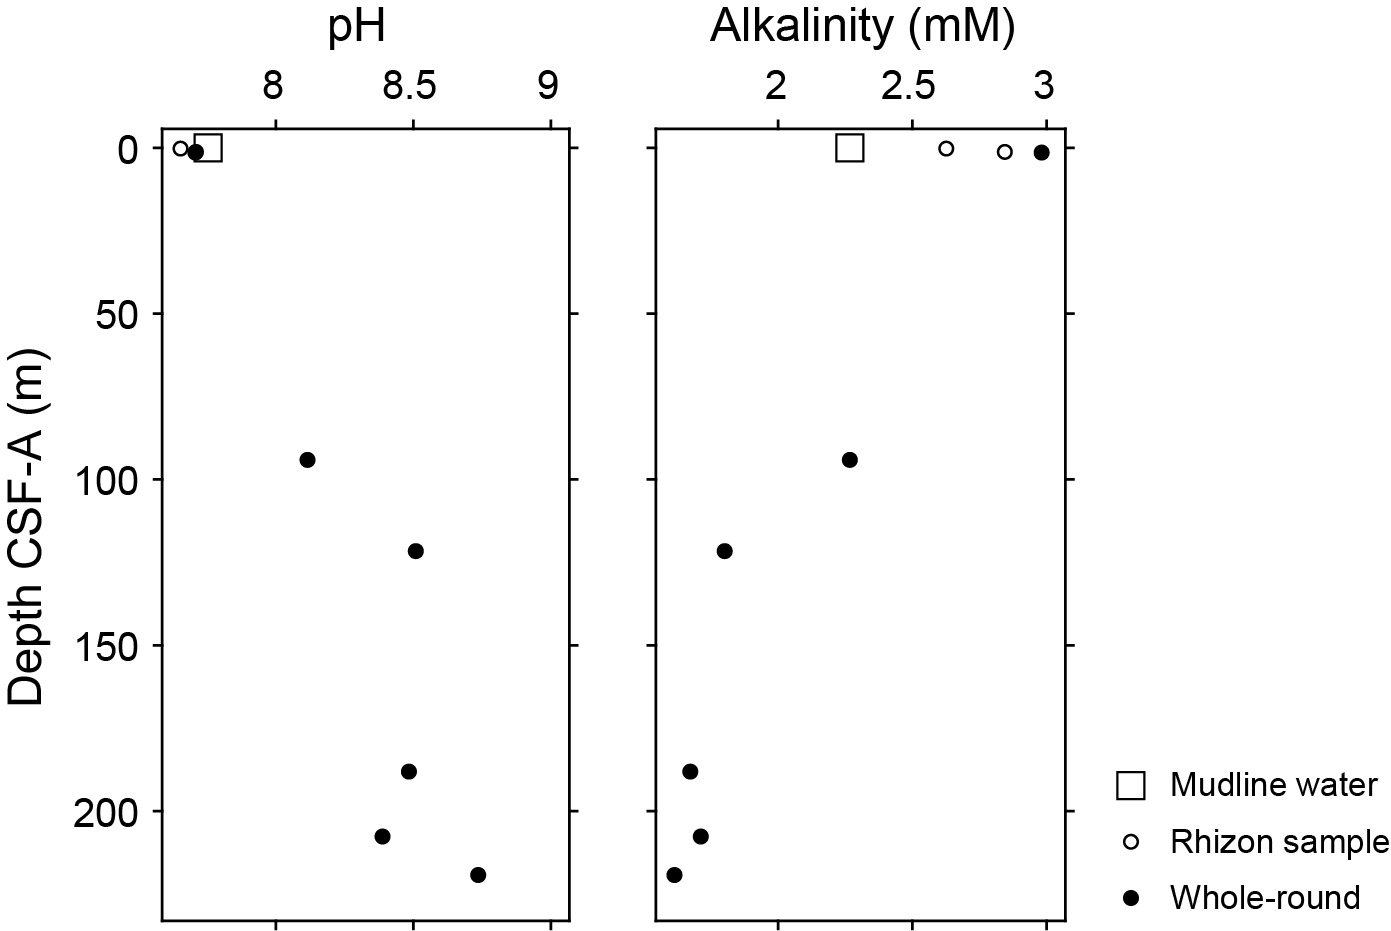
Figure F20. IW pH and alkalinity.
7.2.2. Salinity, sodium, chloride, lithium, potassium, and bromide
Salinity and dissolved sodium, chloride, lithium, potassium, and bromide concentrations are shown in Figure F21. IW salinity decreases downhole from 34 to a minimum of 28 at the bottom of Hole U1605A. Sodium concentration (as measured by ion chromatography) increases from 451 mM at the sediment/water interface to 481 mM at 2.24 m CSF-A and decreases to the bottom of Hole U1605A, where it reaches a minimum of 419 mM at 219.28 m CSF-A.
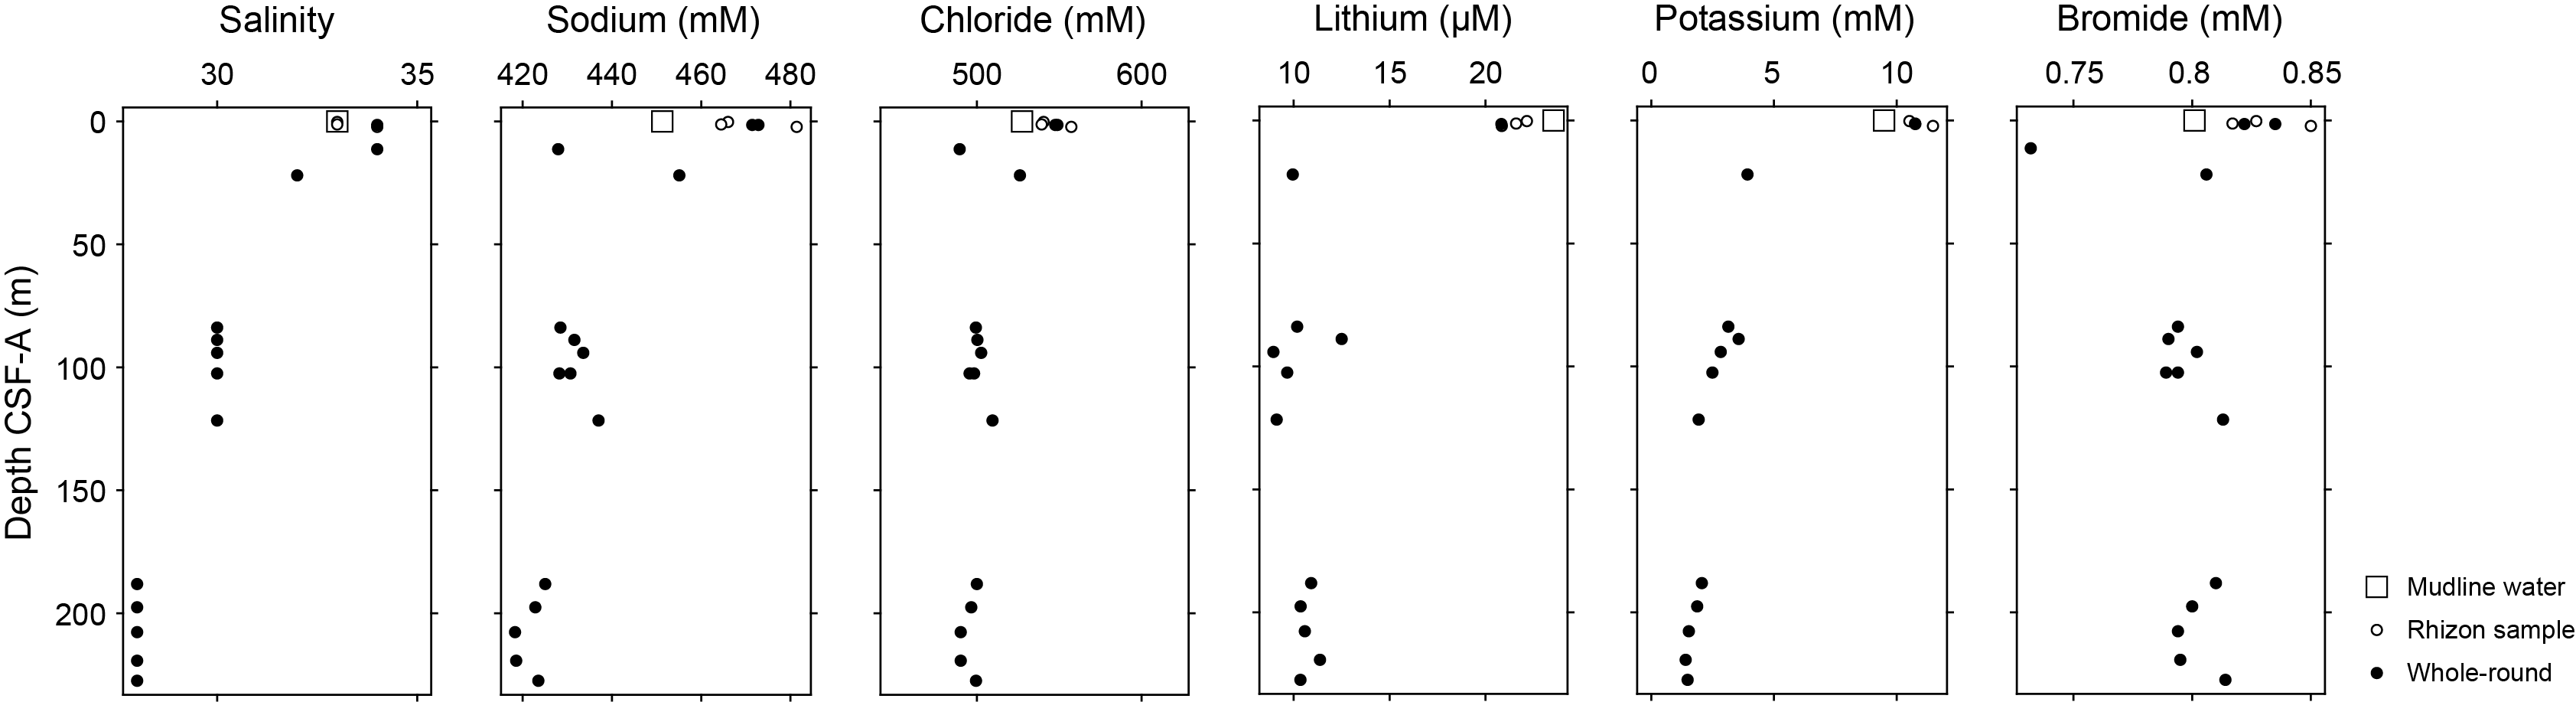
Figure F21. IW salinity, Na, Cl, Li, K, and Br.
Lithium decreases downhole from a maximum of 23.6 µM at the mudline to 10.0 µM at 21.96 m CSF-A. The profile for dissolved lithium changes little below this depth.
Potassium (as measured by ion chromatography) changes little from the mudline to 2.24 m CSF-A but decreases between 2.24 and 11.31 m CSF-A from 12.1 to 5.9 mM and continues to decrease downhole to a minimum value of 1.38 mM at 219.28 m CSF-A.
Bromide does not change significantly in concentration downhole and ranges 0.73–0.85 mM.
7.2.3. Ammonium, manganese, iron, sulfate, phosphate, and boron
Ammonium, manganese, iron, sulfate, phosphate, and boron concentrations are shown in Figure F22. Ammonium increases from 31 µM in the mudline water to a maximum of 487 µM at 21.96 m CSF-A. Ammonium concentrations below this depth range 167–298 µM with no apparent trend. Dissolved manganese increases from 5 µM at the sediment/water interface to a maximum of 30 µM at 1.25 m CSF-A. Below this depth, it shows a decrease in concentration. Manganese concentrations range 3–15 µM below 21.96 m CSF-A. Downhole trends are difficult to distinguish due to sporadic sampling. Iron concentrations are generally below the detection limit of the inductively coupled plasma–atomic emission spectroscopy (ICP-AES); however, iron shows a concentration of 12.2 µM at 0.25 m CSF-A. Sulfate concentrations decrease downcore from mudline concentrations of 27 mM. Below 188.1 m CSF-A, sulfate concentrations are consistently between 3 and 4 mM.
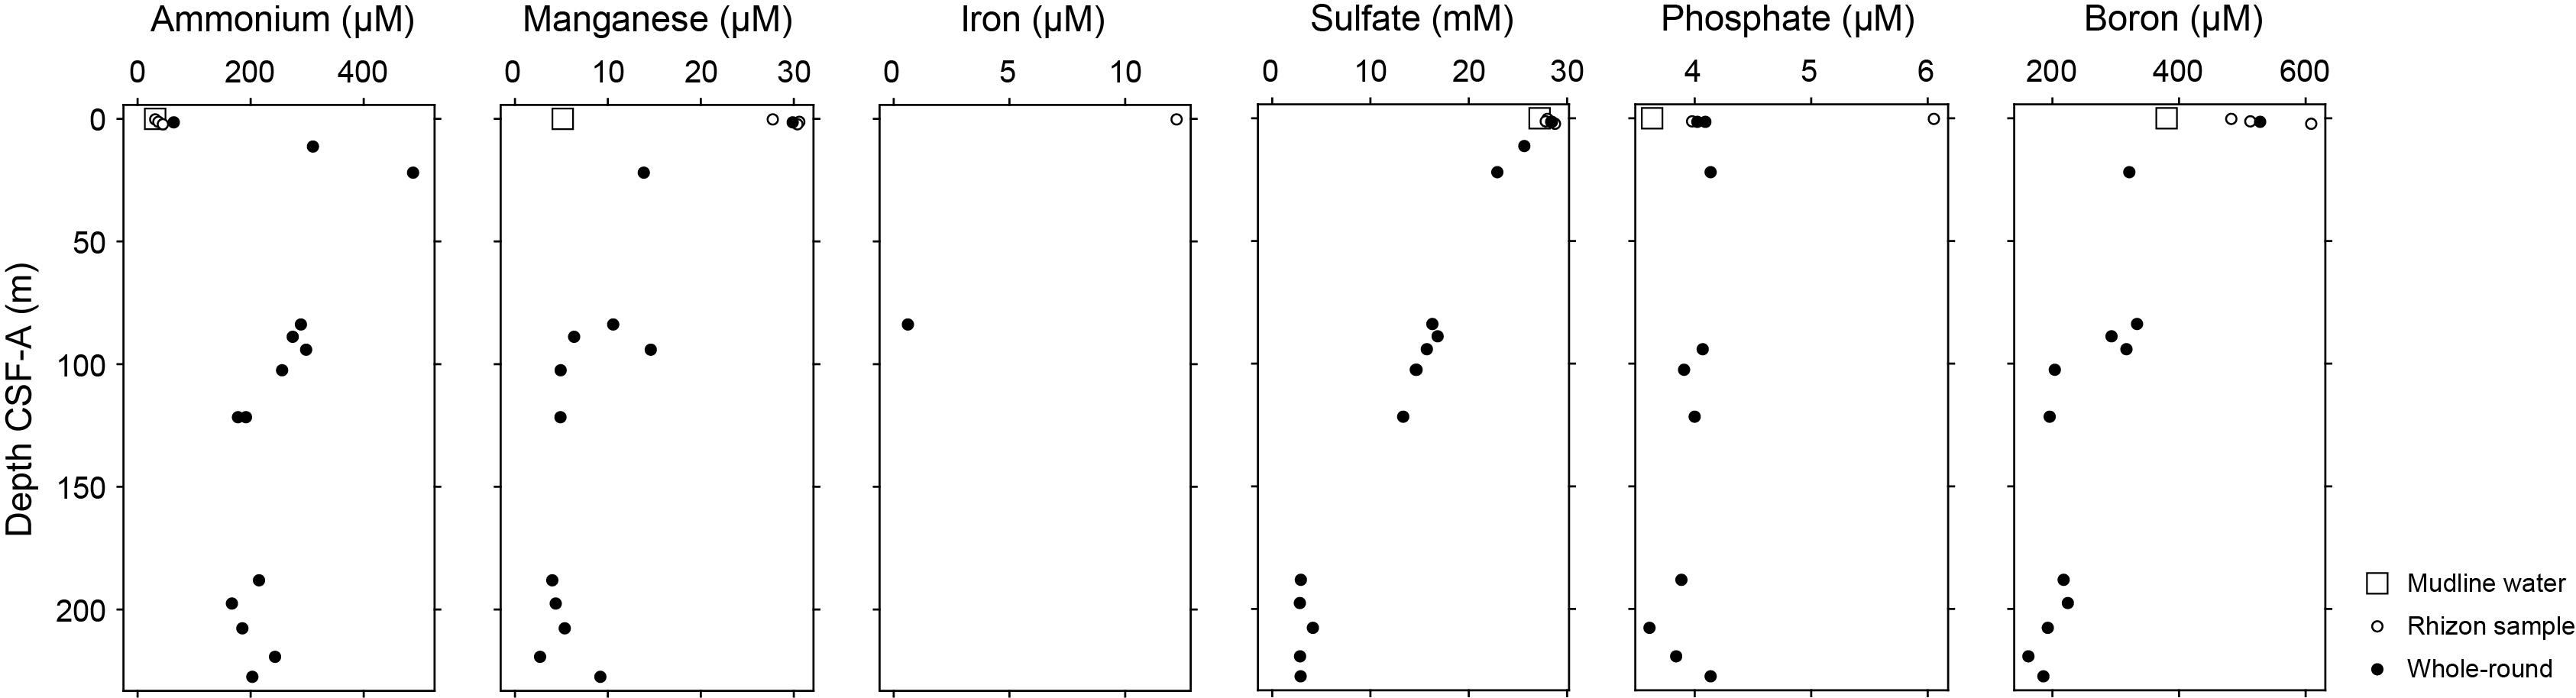
Figure F22. IW ammonium, Mn, Fe, sulfate, phosphate, and B.
Phosphate concentrations generally range 3–4 µM throughout Hole U1605A, with a maximum value of 6.1 µM at 0.25 m CSF-A.
Boron increases from a seawater concentration of 380 µM at the mudline to a maximum value of 609 µM at 2.24 m CSF-A. Below this peak value, boron values show a general decrease to the bottom of the hole, with a minimum concentration of 162 µM at 219.28 m CSF-A.
7.2.4. Calcium, magnesium, strontium, silicon, and barium
Calcium, magnesium, strontium, silicon, and barium concentrations are shown in Figure F23. Calcium concentrations (measured by ICP-AES) increase from a measured seawater value of 9.6 mM at the mudline to a maximum measured value of 17.6 mM at 121.26 m CSF-A. Calcium concentrations increase from 15.3 to 17.8 mM between 188.10 and 227.43 m CSF-A.
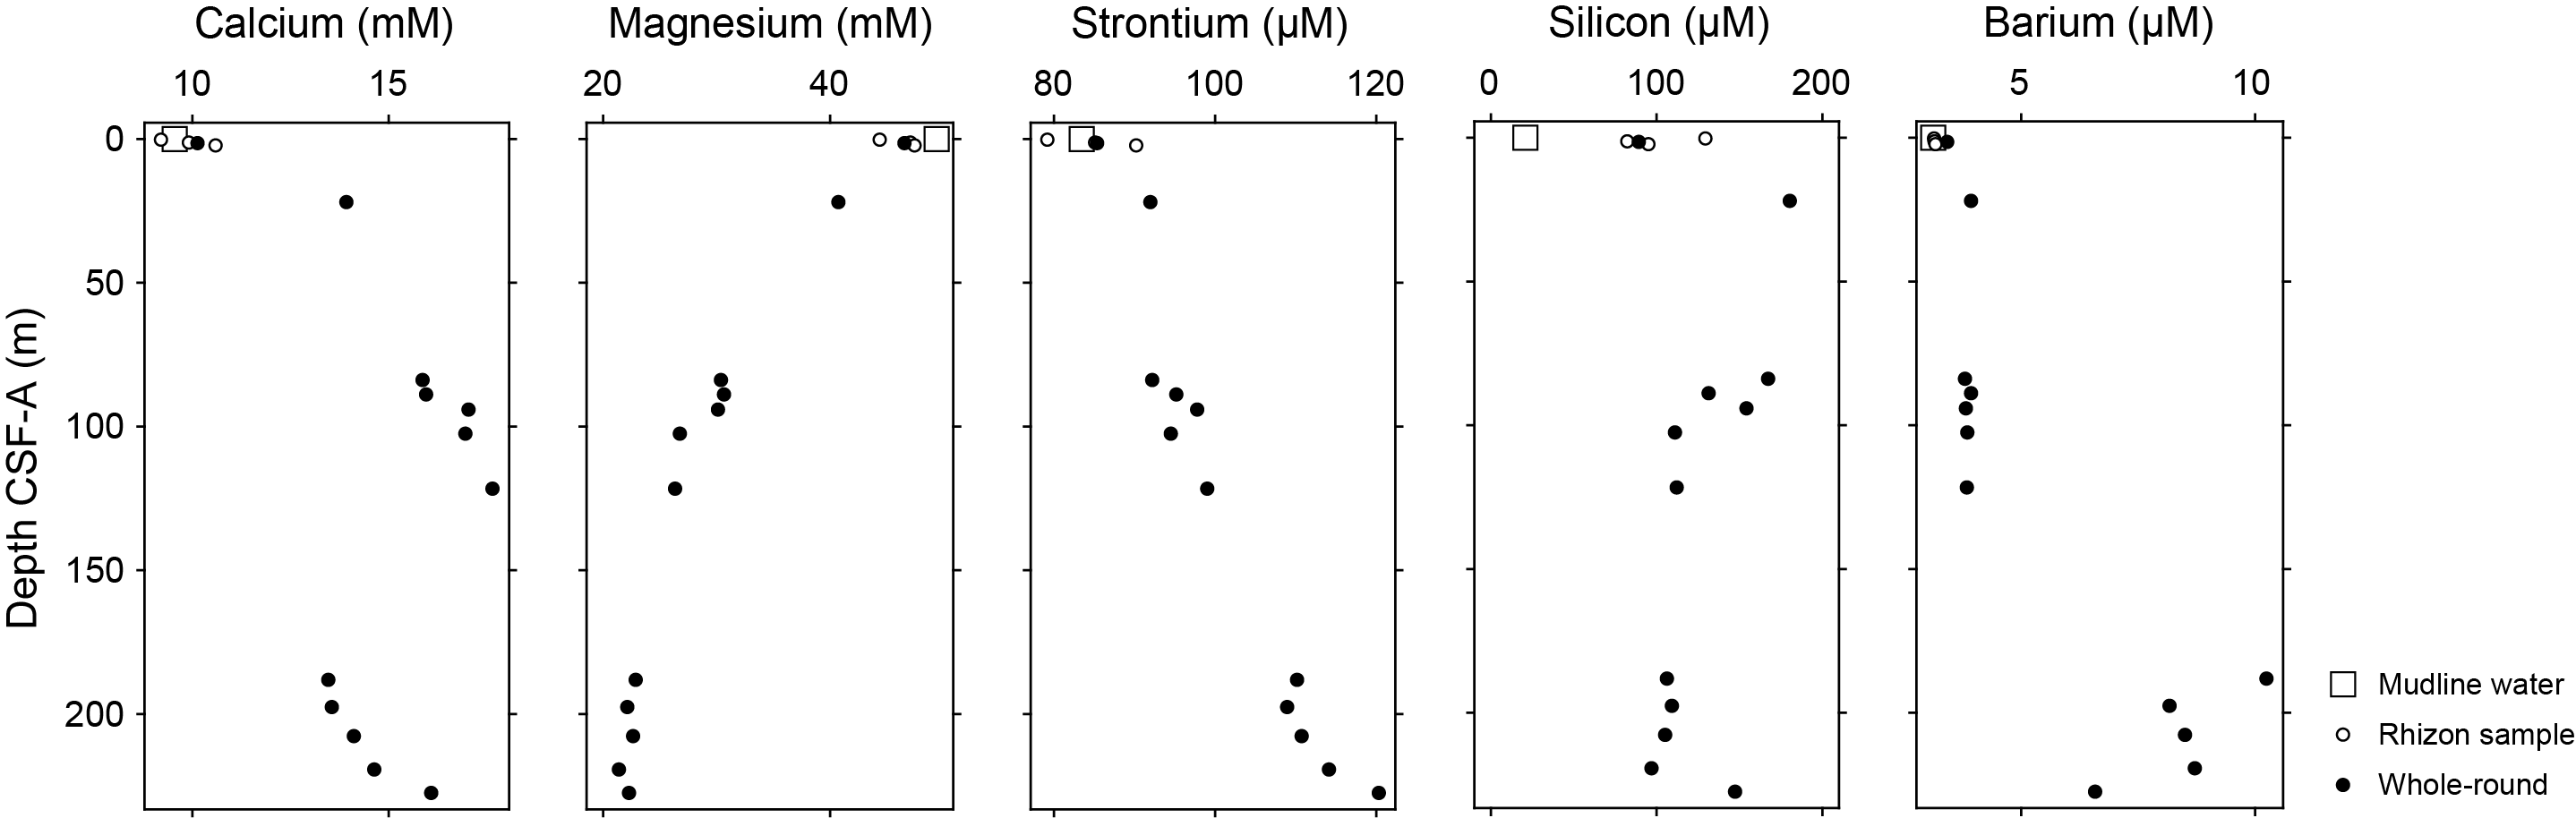
Figure F23. IW Ca, Mg, Sr, Si, and Ba.
Magnesium concentrations (as measured using ICP-AES) decrease consistently from a seawater concentration of 49.4 mM at the mudline to a minimum of 21.4 mM at 219.28 m CSF-A. Strontium values increase in the upper sediment from a minimum concentration of 83.4 µM at the mudline to a maximum concentration in the deepest IW sample of 120.3 µM at 227.43 m CSF-A. Dissolved silicon concentrations increase from a measured bottom water value of 20.8 µM at the mudline to 21.96 m CSF-A, reaching a maximum of 180.4 µM. Below this depth, dissolved silicon ranges 97–167 µM.
Dissolved barium concentrations range ~3–4 µM from the mudline to 121.62 m CSF-A. Below this depth, barium concentrations increase, reaching a maximum of 10.2 µM at 188.10 m CSF-A and decreasing to 6.9 µM at the bottom of Hole U1605A.
7.3. Bulk sediment geochemistry
7.3.1. Carbon, nitrogen, and carbonate
The shipboard solid phase analysis at Site U1605 from all major lithostratigraphic units identified consisted of measurements of CaCO3, total carbon (TC), and total nitrogen (TN) using shipboard plastic cylinder sampling. With the low recovery, only 13 samples were collected from Hole U1605A. Total organic carbon (TOC) was calculated from measurements of CaCO3 and TC. Downhole profiles of CaCO3, TC, and TOC contents (weight percent) for Hole U1605A are shown in Figure F24. The CaCO3 and TOC contents are below 0.4% and 0.1% throughout Hole U1605A, respectively. TN content is below detection limit for all samples.
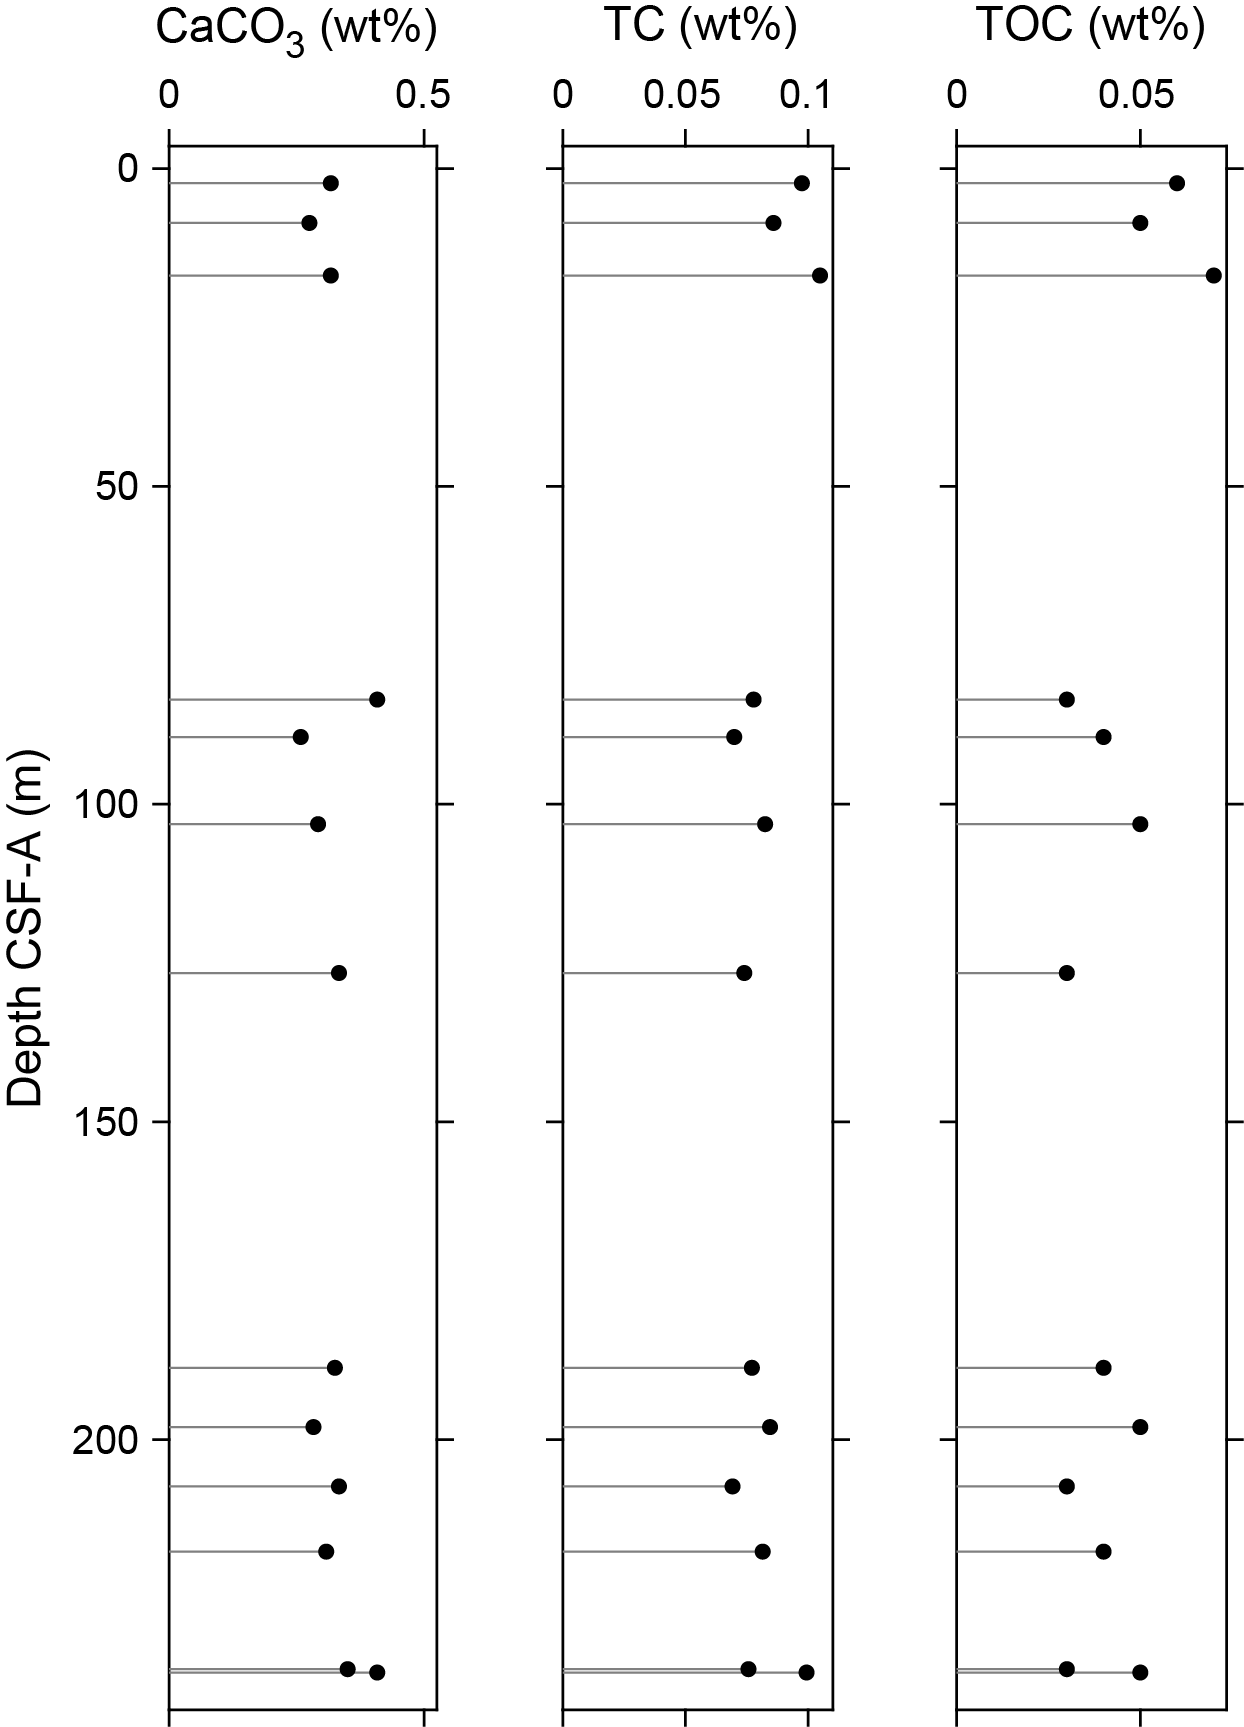
Figure F24. CaCO3, TC, and TOC.
References
Christ, A.J., Rittenour, T.M., Bierman, P.R., Keisling, B.A., Knutz, P.C., Thomsen, T.B., Keulen, N., Fosdick, J.C., Hemming, S.R., Tison, J.-L., Blard, P.-H., Steffensen, J.P., Caffee, M.W., Corbett, L.B., Dahl-Jensen, D., Dethier, D.P., Hidy, A.J., Perdrial, N., Peteet, D.M., Steig, E.J., and Thomas, E.K., 2023. Deglaciation of northwestern Greenland during Marine Isotope Stage 11. Science, 381(6655):330–335. https://doi.org/10.1126/science.ade4248
Clark, P.U., and Pollard, D., 1998. Origin of the Middle Pleistocene transition by ice sheet erosion of regolith. Paleoceanography, 13(1):1–9. https://doi.org/10.1029/97PA02660
Cox, D.R., Huuse, M., Newton, A.M.W., Sarkar, A.D., and Knutz, P.C., 2021. Shallow gas and gas hydrate occurrences on the northwest Greenland shelf margin. Marine Geology, 432:106382. https://doi.org/10.1016/j.margeo.2020.106382
Hannah, M.J., 2006. The palynology of ODP Site 1165, Prydz Bay, East Antarctica: a record of Miocene glacial advance and retreat. Palaeogeography, Palaeoclimatology, Palaeoecology, 231(1–2):120–133. https://doi.org/10.1016/j.palaeo.2005.07.029
Hartman, J.D., Sangiorgi, F., Barcena, M.A., Tateo, F., Giglio, F., Albertazzi, S., Trincardi, F., Bijl, P.K., Langone, L., and Asioli, A., 2021. Sea-ice, primary productivity and ocean temperatures at the Antarctic marginal zone during late Pleistocene. Quaternary Science Reviews, 266:107069. https://doi.org/10.1016/j.quascirev.2021.107069
Jakobsson, M., Mayer, L., Coakley, B., Dowdeswell, J.A., Forbes, S., Fridman, B., Hodnesdal, H., Noormets, R., Pedersen, R., Rebesco, M., Schenke, H.W., Zarayskaya, Y., Accettella, D., Armstrong, A., Anderson, R.M., Bienhoff, P., Camerlenghi, A., Church, I., Edwards, M., Gardner, J.V., Hall, J.K., Hell, B., Hestvik, O., Kristofferson, Y., Marcussen, C., Mohammad, R., Mosher, D., Nghiem, S.V., Pedrosa, M.T., Travaglini, P.G., and Weatherall, P., 2012. The International Bathymetric Chart of the Arctic Ocean (IBCAO) Version 3.0. Geophysical Research Letters, 39(12):L12609. https://doi.org/10.1029/2012GL052219
Knutz, P.C., Jennings, A.E., Childress, L.B., Bryant, R., Cargill, S.K., Coxall, H.K., Frank, T.D., Grant, G.R., Gray, R.E., Ives, L., Kumar, V., Le Houedec, S., Martens, J., Naim, F., Nelissen, M., Özen, V., Passchier, S., Pérez, L.F., Ren, J., Romans, B.W., Seki, O., Staudigel, P., Tauxe, L., Tibbett, E.J., Yokoyama, Y., Zhang, Y., and Zimmermann, H., 2025. Expedition 400 methods. In Knutz, P.C., Jennings, A.E., Childress, L.B., and the Expedition 400 Scientists, NW Greenland Glaciated Margin. Proceedings of the International Ocean Discovery Program, 400: College Station, TX (International Ocean Discovery Program). https://doi.org/10.14379/iodp.proc.400.102.2025
Knutz, P.C., Newton, A.M.W., Hopper, J.R., Huuse, M., Gregersen, U., Sheldon, E., and Dybkjær, K., 2019. Eleven phases of Greenland Ice Sheet shelf-edge advance over the past 2.7 million years. Nature Geoscience, 12(5):361–368. https://doi.org/10.1038/s41561-019-0340-8
Matthiessen, J., de Vernal, A., Head, M., Okolodkov, Y., Zonneveld, K., and Harland, R., 2005. Modem organic-walled dinoflagellate cysts in arctic marine environments and their (paleo-) environmental significance. Paläontologische Zeitschrift, 79(1):3–51. https://doi.org/10.1007/BF03021752
Mudie, P.J., 1992. Circum-Arctic Quaternary and Neogene marine palynofloras: paleoecology and statistical analysis. In Head, M.J., and Wrenn, J.H. (Eds.), Neogene and Quaternary dinoflagellate cysts and acritarchs. 10: Houston, TX (American Association of Stratigraphic Palynologists Foundation), 347–390.
Münchow, A., Falkner, K.K., and Melling, H., 2015. Baffin Island and West Greenland current systems in northern Baffin Bay. Progress in Oceanography, 132:305–317. https://doi.org/10.1016/j.pocean.2014.04.001
Newton, A.M.W., Huuse, M., Cox, D.R., and Knutz, P.C., 2021. Seismic geomorphology and evolution of the Melville Bugt trough mouth fan, northwest Greenland. Quaternary Science Reviews, 255:106798. https://doi.org/10.1016/j.quascirev.2021.106798
Newton, A.M.W., Knutz, P.C., Huuse, M., Gannon, P., Brocklehurst, S.H., Clausen, O.R., and Gong, Y., 2017. Ice stream reorganization and glacial retreat on the northwest Greenland shelf. Geophysical Research Letters, 44(15):7826–7835. https://doi.org/10.1002/2017GL073690
Ogg, J.G., 2020. Geomagnetic Polarity Time Scale. In Gradstein, F.M., Ogg, J.G., Schmitz, M., and Ogg, G. (Eds.), Geologic Time Scale 2020. Amsterdam (Elsevier), 159–192. https://doi.org/10.1016/B978-0-12-824360-2.00005-X
Okolodkov, Y.B., 1998. A checklist of dinoflagellates recorded from the Russian Arctic seas. Sarsia, 83(4):267–292. https://doi.org/10.1080/00364827.1998.10413687
Schaefer, J.M., Finkel, R.C., Balco, G., Alley, R.B., Caffee, M.W., Briner, J.P., Young, N.E., Gow, A.J., and Schwartz, R., 2016. Greenland was nearly ice-free for extended periods during the Pleistocene. Nature, 540(7632):252–255. https://doi.org/10.1038/nature20146
Tang, C.C.L., Ross, C.K., Yao, T., Petrie, B., DeTracey, B.M., and Dunlap, E., 2004. The circulation, water masses and sea-ice of Baffin Bay. Progress in Oceanography, 63(4):183–228. https://doi.org/10.1016/j.pocean.2004.09.005
Weber, M.E., Niessen, F., Kuhn, G., and Wiedicke, M., 1997. Calibration and application of marine sedimentary physical properties using a multi-sensor core logger. Marine Geology, 136(3–4):151–172. https://doi.org/10.1016/S0025-3227(96)00071-0
Zijderveld, J.D.A., 1967. AC demagnetization of rocks: analysis of results. In Runcorn, S.K.C., Creer, K.M., and Collinson, D.W. (Eds.), Methods in Palaeomagnetism. Developments in Solid Earth Geophysics. J.R. Balsley (Series Ed.), 3: 254–286. https://doi.org/10.1016/B978-1-4832-2894-5.50049-5