Flecker, R., Ducassou, E., Williams, T., and the Expedition 401 Scientists
Proceedings of the International Ocean Discovery Program Volume 401
publications.iodp.org
https://doi.org/10.14379/iodp.proc.401.106.2025
Site U16111
![]() R. Flecker,
R. Flecker,
![]() E. Ducassou,
E. Ducassou,
![]() T. Williams,
T. Williams,
![]() U. Amarathunga,
U. Amarathunga,
![]() B. Balestra,
M.A. Berke,
B. Balestra,
M.A. Berke,
![]() C.L. Blättler,
S. Chin,
M. Das,
C.L. Blättler,
S. Chin,
M. Das,
![]() K. Egawa,
K. Egawa,
![]() N. Fabregas,
N. Fabregas,
![]() S.J. Feakins,
S.J. Feakins,
![]() S.C. George,
S.C. George,
![]() F.J. Hernández-Molina,
F.J. Hernández-Molina,
![]() W. Krijgsman,
W. Krijgsman,
![]() Z. Li,
Z. Li,
![]() J. Liu,
D. Noto,
J. Liu,
D. Noto,
![]() F. Raad,
F. Raad,
![]() F.J. Rodríguez-Tovar,
F.J. Rodríguez-Tovar,
![]() F.J. Sierro,
F.J. Sierro,
![]() P. Standring,
P. Standring,
![]() J. Stine,
J. Stine,
![]() E. Tanaka,
E. Tanaka,
![]() M. Teixeira,
M. Teixeira,
![]() X. Xu,
X. Xu,
![]() S. Yin, and
S. Yin, and
![]() M.Z. Yousfi2
M.Z. Yousfi2
1 Flecker, R., Ducassou, E., Williams, T., Amarathunga, U., Balestra, B., Berke, M.A., Blättler, C.L., Chin, S., Das, M., Egawa, K., Fabregas, N., Feakins, S.J., George, S.C., Hernández-Molina, F.J., Krijgsman, W., Li, Z., Liu, J., Noto, D., Raad, F., Rodríguez-Tovar, F.J., Sierro, F.J., Standring, P., Stine, J., Tanaka, E., Teixeira, M., Xu, X., Yin, S., and Yousfi, M.Z., 2025. Site U1611. In Flecker, R., Ducassou, E., Williams, T., and the Expedition 401 Scientists, Mediterranean–Atlantic Gateway Exchange. Proceedings of the International Ocean Discovery Program, 401: College Station, TX (International Ocean Discovery Program). https://doi.org/10.14379/iodp.proc.401.106.2025
2 Expedition 401 Scientists' affiliations.
1. Background and objectives
Site U1611 is located in the Mediterranean just east of the Gibraltar Strait in the Alborán Sea (36°18.7537′N, 4°34.2717′W) (Figure F1). It marks the eastern end of the Expedition 401 transect of sites that track Mediterranean Overflow Water (MOW) from its source, through the Atlantic–Mediterranean gateway into the Gulf of Cádiz, and around to the west of the Iberian margin (Figure F2). Today, the Alborán Basin is a relatively narrow (150 km wide), shallow (maximum depth = 1800 m), and elongate (350 km long) area that links the much deeper Mediterranean Sea to the Atlantic. Atlantic water flows in through the Gibraltar Strait at the surface as a coherent layer of warm and relatively fresh marine water, whereas deeper, cooler, and more saline water generated in the Mediterranean flows through the Alborán Sea and out into the Atlantic at depth (Figure F3). The stratified water mass structure in the Alborán Sea reflects both this exchange and the densities of the different water masses generated in the Mediterranean, principally the Levantine Intermediate Water and the Western Mediterranean Deep Water (Ercilla et al., 2016). Site U1611 is located on the north side of the Alborán Basin on the Spanish continental slope at a water depth of ~800 m (Figure F1). Today, this area is bathed in Western Mediterranean Deep Water with a temperature of ~12.9°C and a salinity of ~38.45 (Figure F4) (Ercilla et al., 2016). It is directly impacted by both westward flowing currents that produce contourite deposition along the Spanish margin (Figure F2) and downslope gravity deposits (Ercilla et al., 2016).
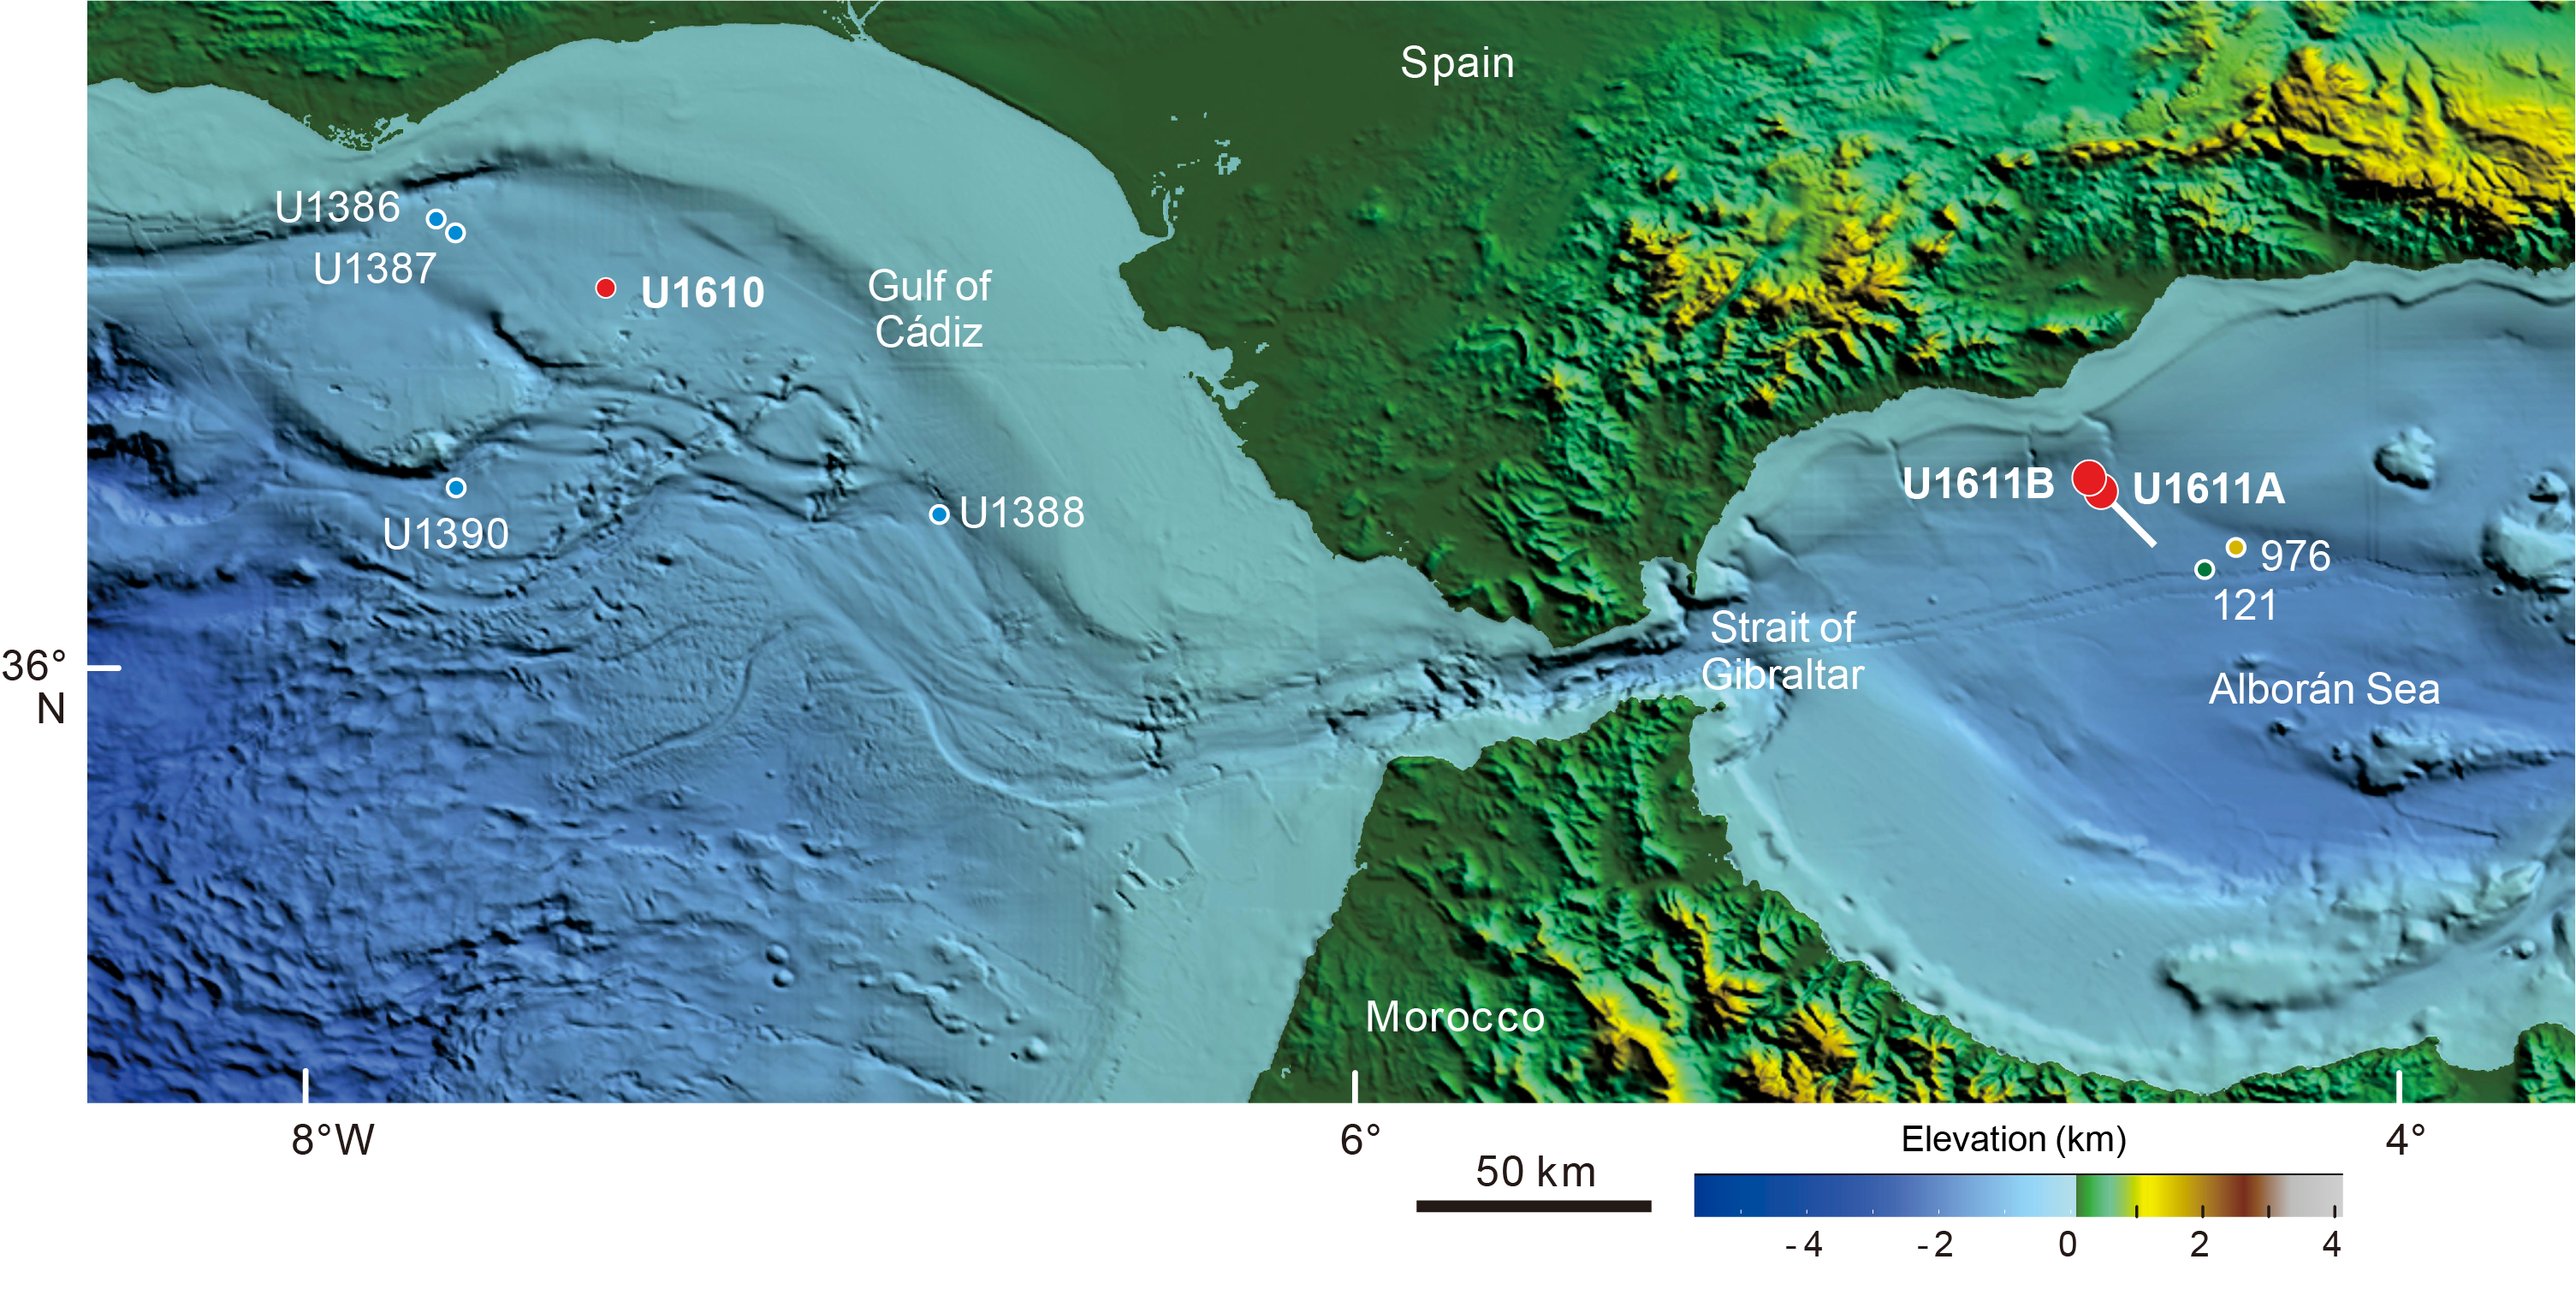
Figure F1. Location map.
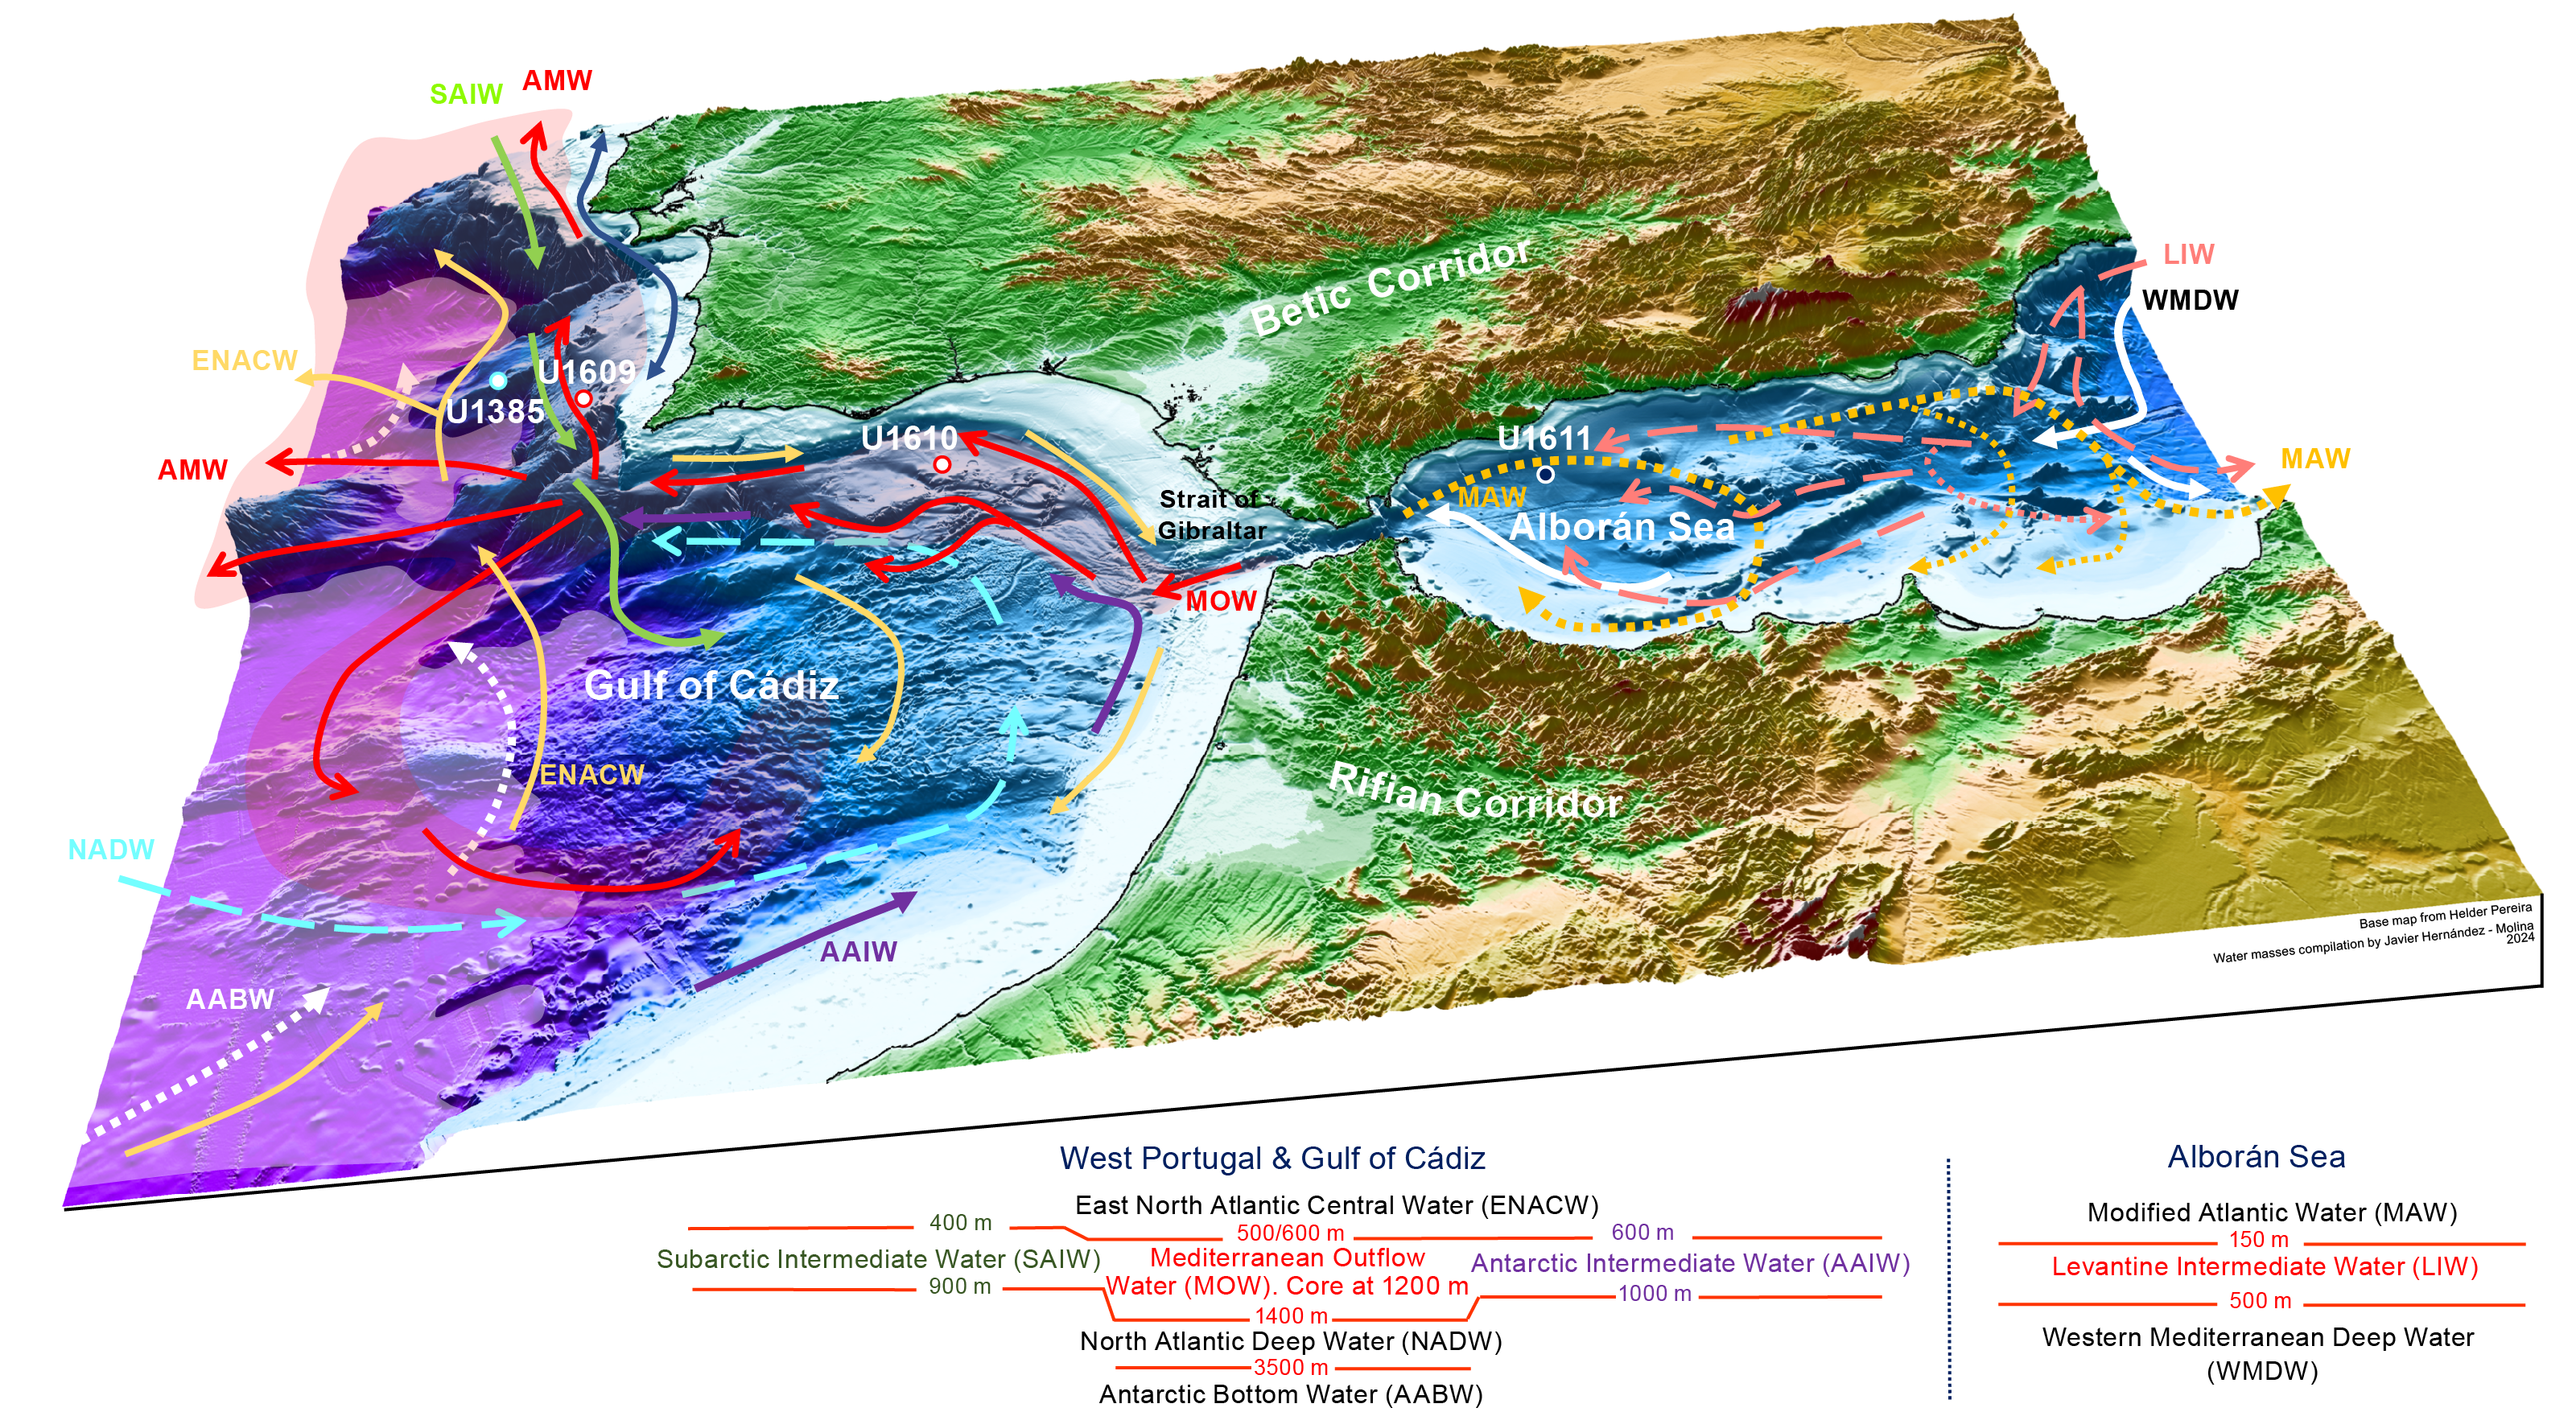
Figure F2. Present-day water mass circulation patterns.
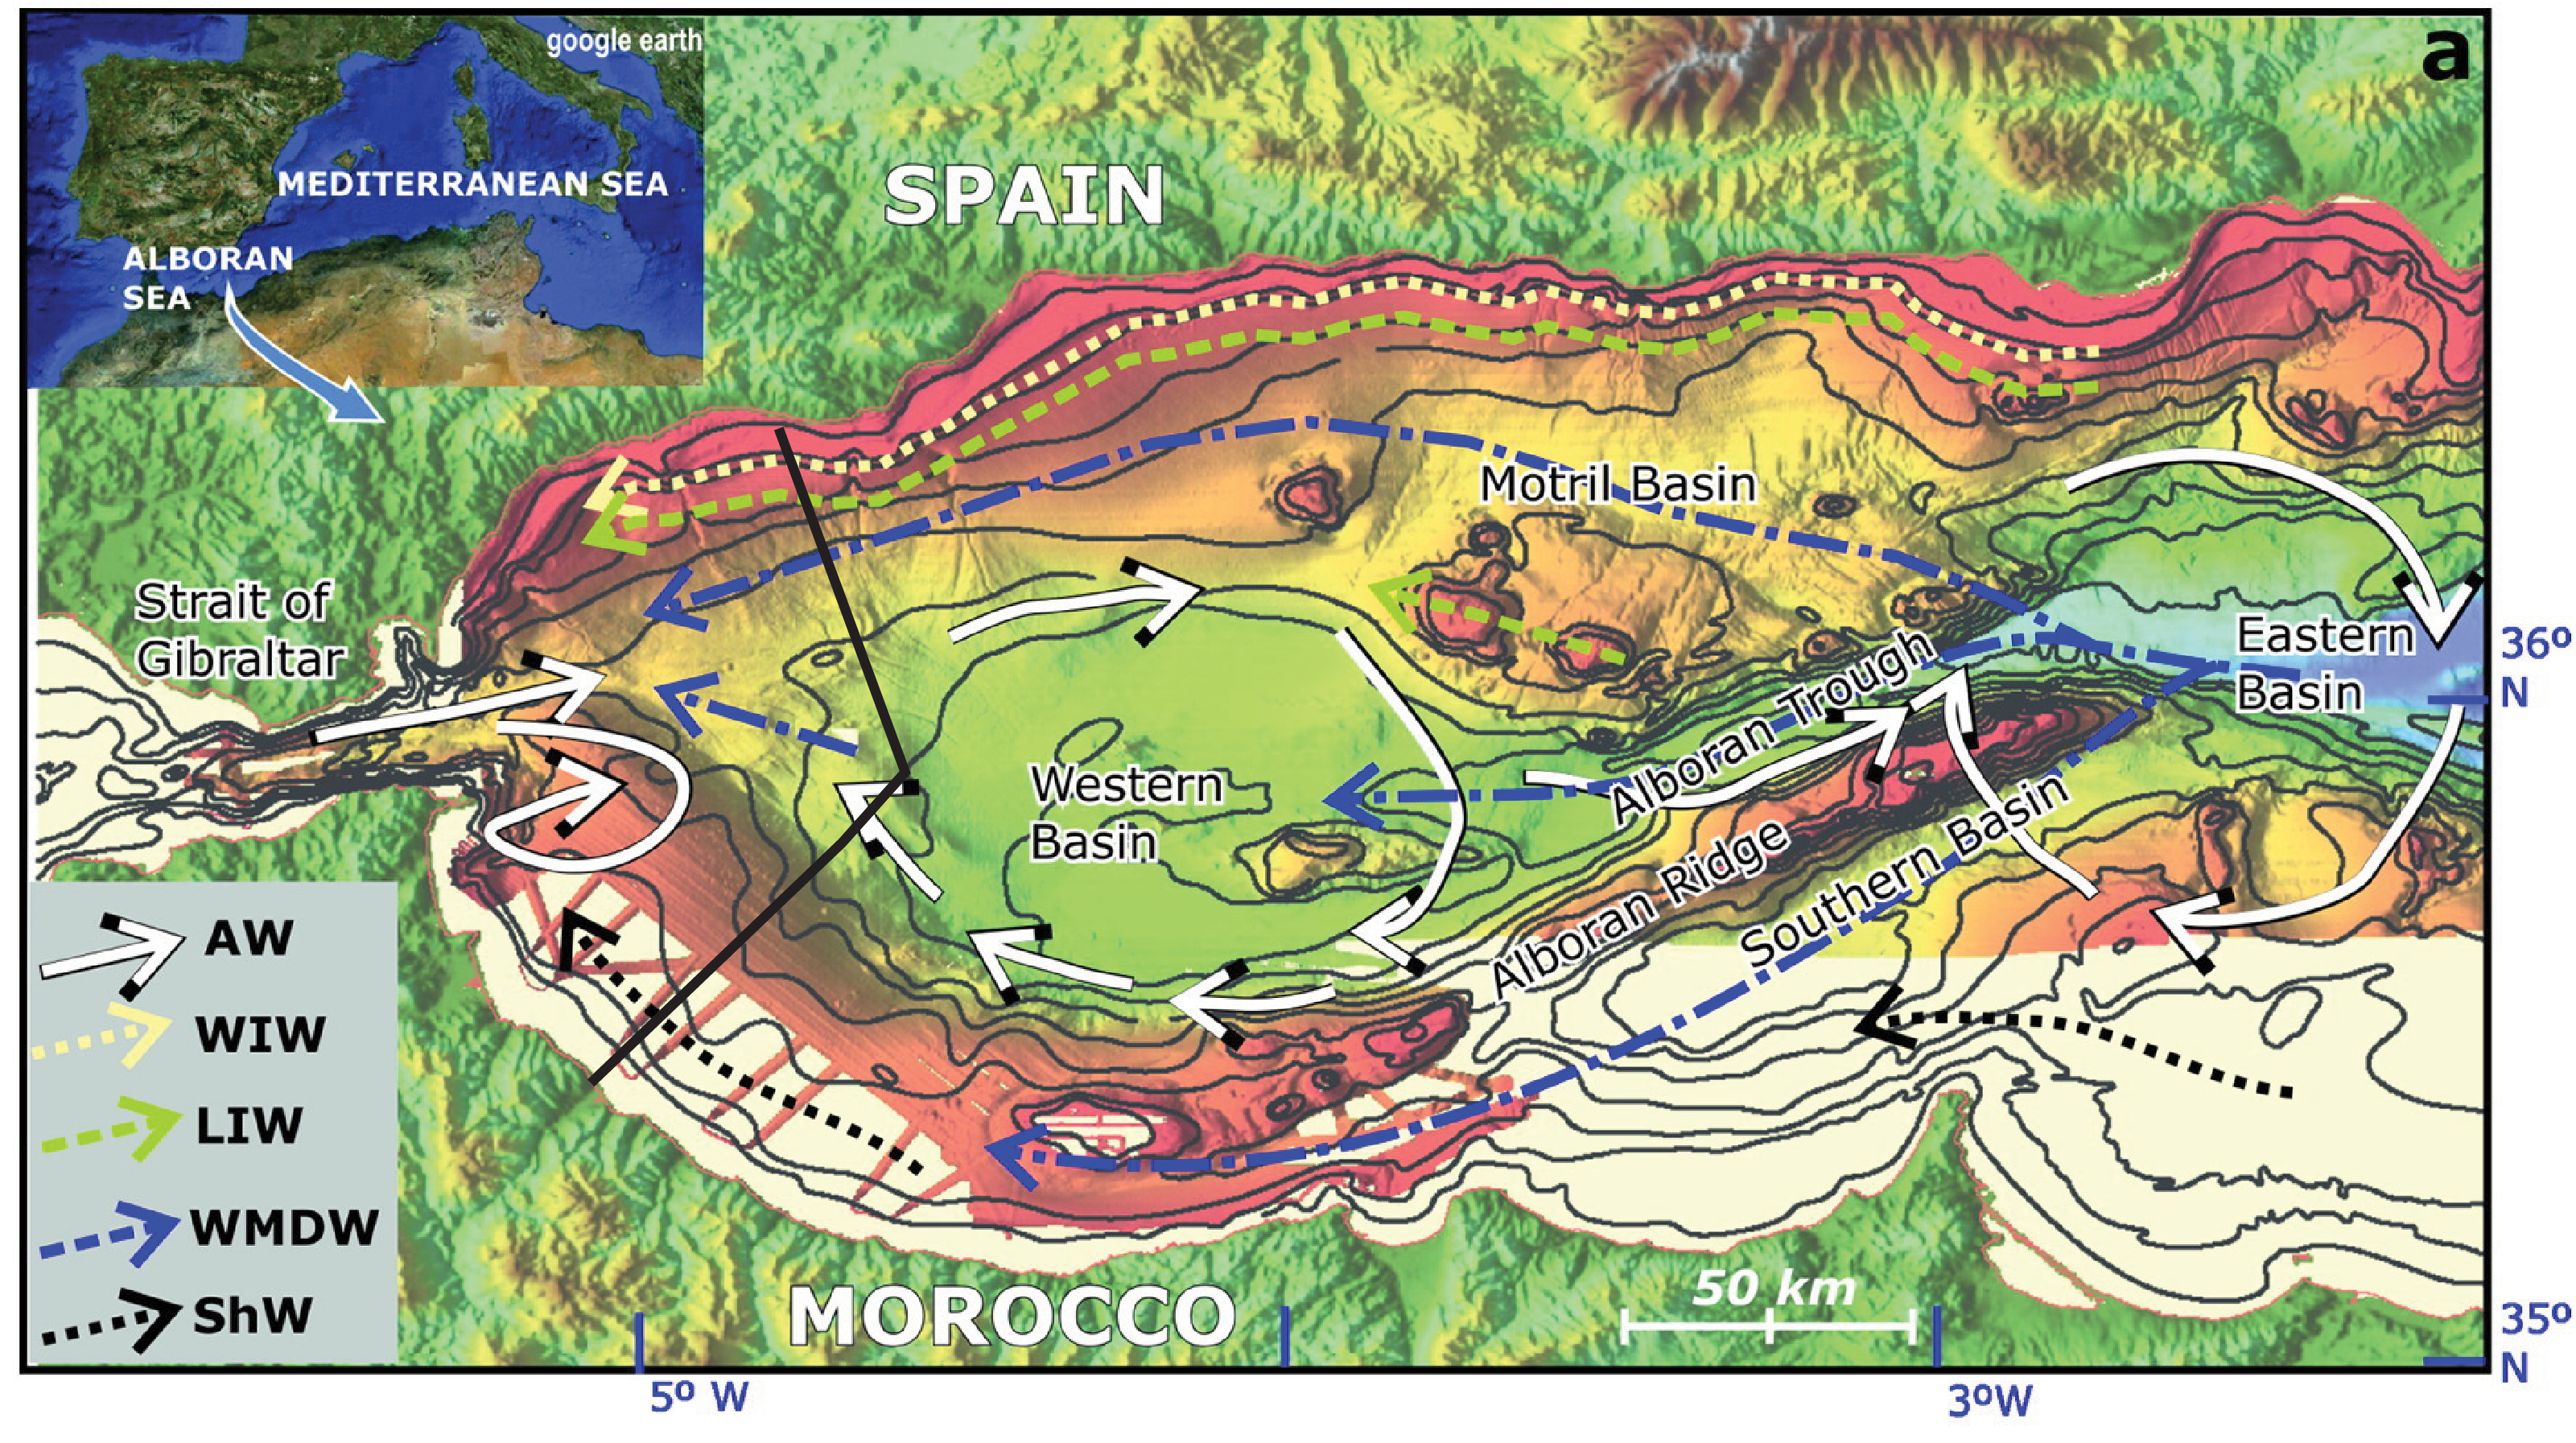
Figure F3. Bathymetric map with regional circulation model.
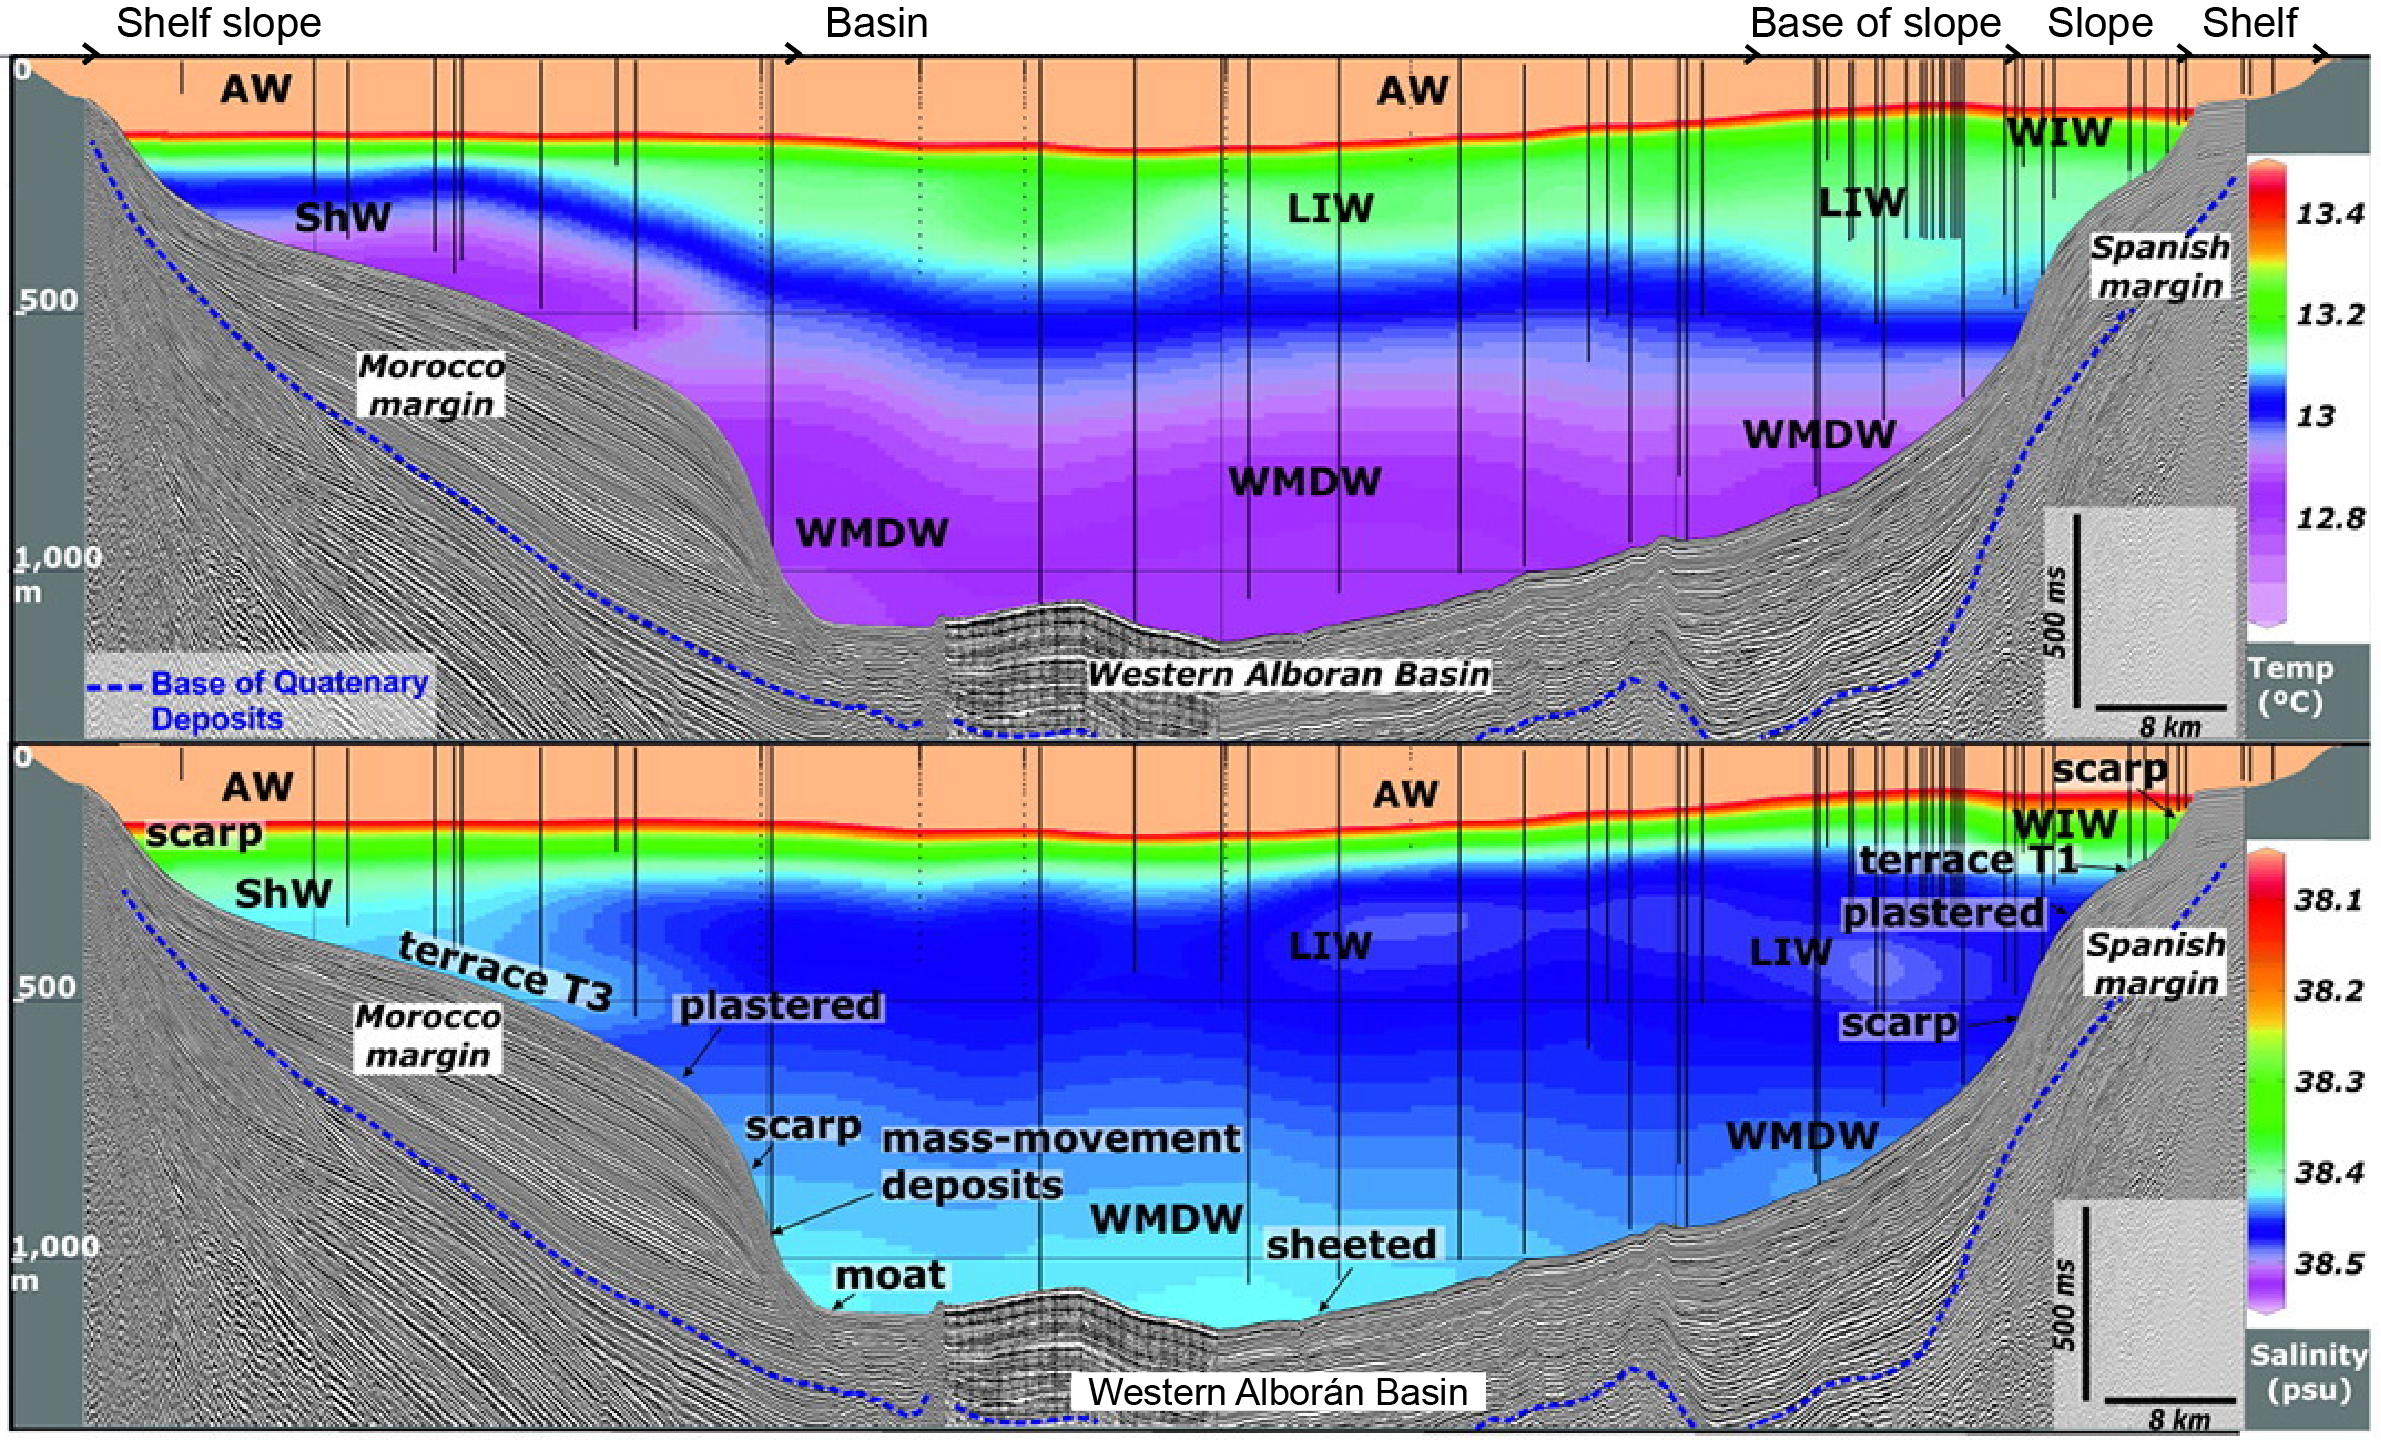
Figure F4. Seismic–hydrographic intersections of margins and basins.
Exchange through a single gateway at Gibraltar is a relatively recent phenomenon (Hernández Molina et al., 2014; van der Schee et al., 2016; García-Gallardo et al., 2017; Flecker et al., 2015). As a result of Africa–Eurasia convergence, westward docking of the Alborán plate, and simultaneous slab retreat (Jolivet and Faccenna, 2000; Faccenna et al., 2004; van Hinsbergen et al., 2014), the Atlantic–Mediterranean connection evolved from a single, wide-open seaway (see Figure F3 in the Expedition 401 summary chapter [Flecker et al., 2025b]) linking a Mediterranean that was more of an embayment of the Atlantic than a distinct marginal marine system (Flecker et al., 2015) to two narrow corridors: one in northern Morocco and the other in southern Spain (Figure F5; Martín et al., 2014).
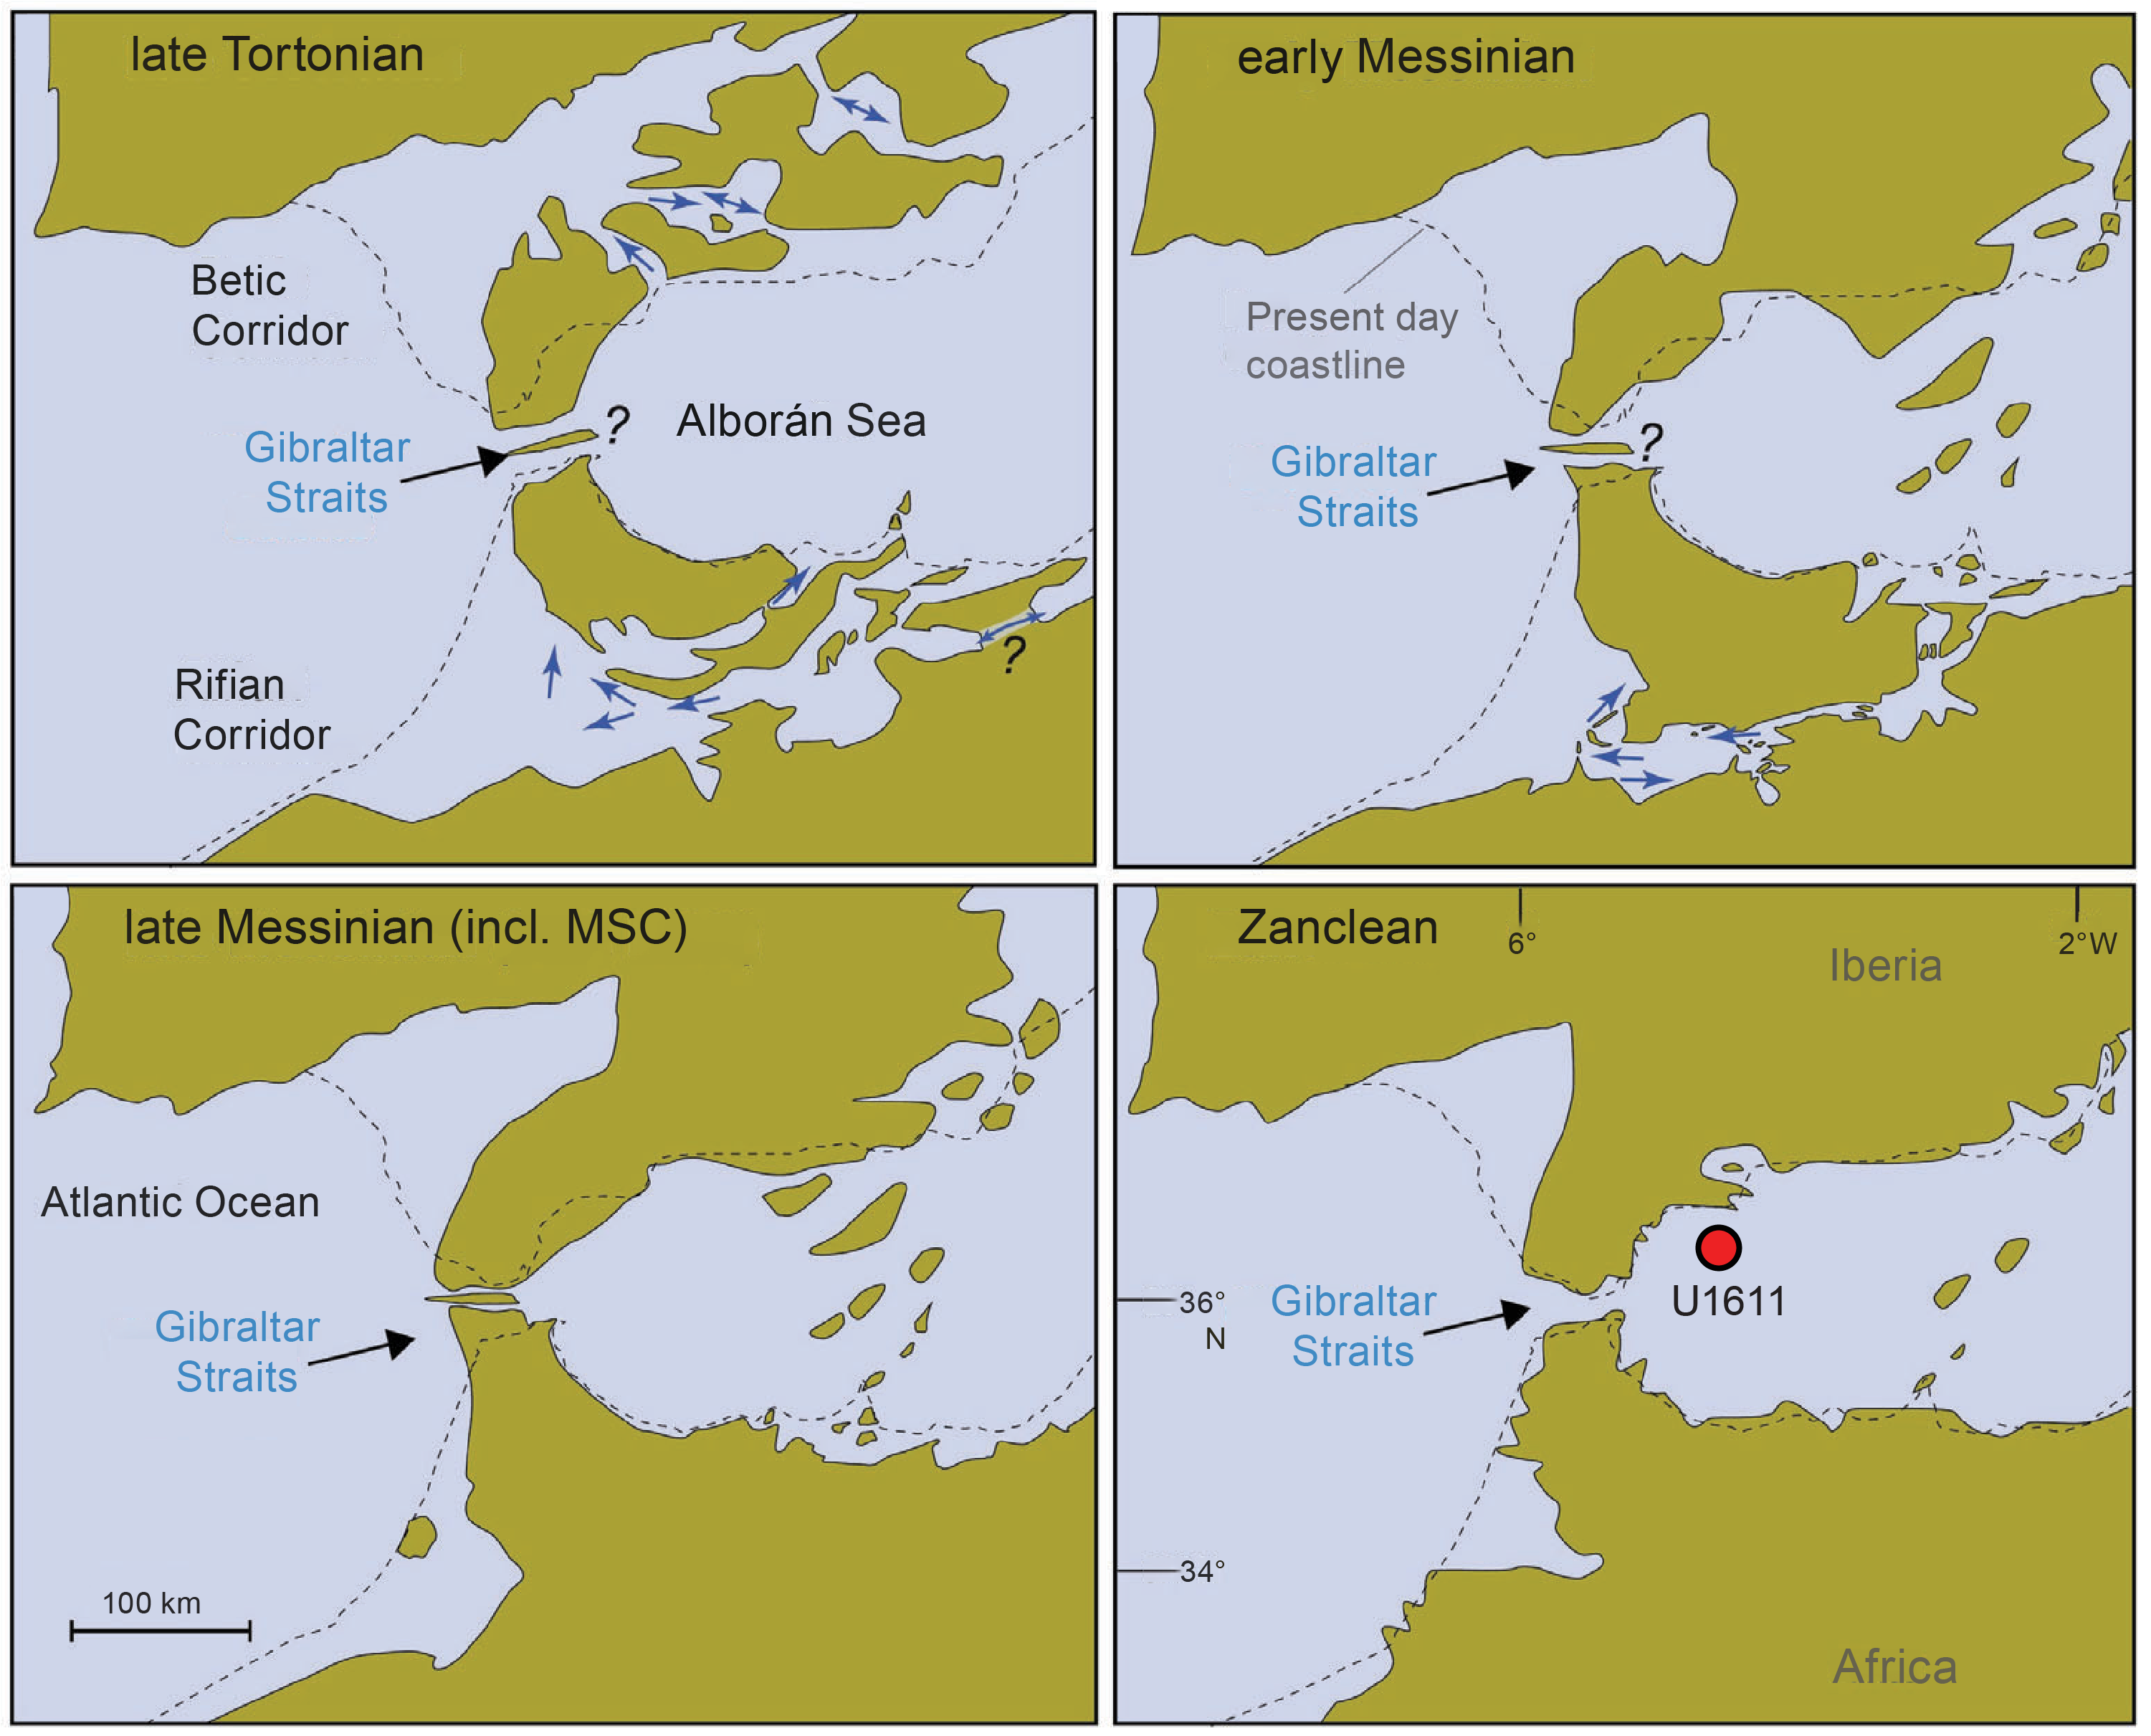
Figure F5. Paleogeographic reconstruction of Betic and Rifian Corridors.
Ongoing restriction of the marine corridors permitted Mediterranean salinity to rise, and a distinct, dense water mass formed. Ultimately, the narrowing and closure of these connections resulted in extreme salinity fluctuations in the Mediterranean, leading to the precipitation of more than 1 million km3 of salt, equivalent to ~6% of the total dissolved oceanic NaCl in the latest Miocene (Blanc, 2006; Ryan, Hsü, et al., 1973). This event is known as the Messinian Salinity Crisis (MSC) (Hsü et al., 1973). Progressive tectonic convergence coupled with isostatic rebound related to lithospheric mantle dynamics (Duggen et al., 2003) not only severed these earlier marine connections but also uplifted and exposed them on land (Capella et al., 2017). In the Early Pliocene (Figure F5), two-way exchange was established through a single conduit, the Gibraltar Strait. This reconnection event is known as the Zanclean deluge. Catastrophic failure of the Atlantic–Mediterranean is commonly thought to have occurred at Gibraltar, resulting in rapid refilling of the Mediterranean associated with major erosion in the Alborán Basin (Estrada et al., 2011; Garcia-Castellanos et al., 2009, 2020).
1.1. Objectives
Site U1611 targets one of the few thick late Messinian sedimentary successions in the Alborán Basin that are sufficiently shallowly buried to be accessible to R/V JOIDES Resolution drilling. The record recovered from this location provides key constraints on the chemistry and physical properties of Mediterranean overflow during the Late Miocene. The major objective for Site U1611 was to recover an 8–4 Ma succession that records the evolution of the Alborán Sea before, during, and after the MSC to test the following hypotheses:
- The Alborán Basin was an intermediate marine system influenced by the Atlantic and separated from the Mediterranean by the Alborán volcanic arc during the MSC.
- Mediterranean–Atlantic exchange occurred through the Gibraltar Strait before the start of the MSC.
- Extreme environmental fluctuations in the Mediterranean are mirrored by both environmental conditions in the Alborán Sea and observable perturbations to the Mediterranean overflow plume in the Atlantic.
The original plan was to wash down to the early Pliocene and then drill a single deep hole at Site U1611 with the aim of penetrating to the intra-Tortonian inversion (Flecker et al., 2023). However, as a consequence of the high sedimentation rate encountered below the MSC, it became clear that we were unlikely to reach this target within the permitted 1.7 km depth. Instead of drilling to this depth, we opted to use the time to drill a second hole to try and recover a more complete record of the MSC. Hole U1611B was located ~1.3 km northwest of Hole U1611A, shoreward of the chaotic facies visible on the seismic line (Figure F6). Half-advance coring was used from the Lower Pliocene downward in Hole U1611B because this approach produced higher core recovery than the full-advance coring used in Hole U1611A.
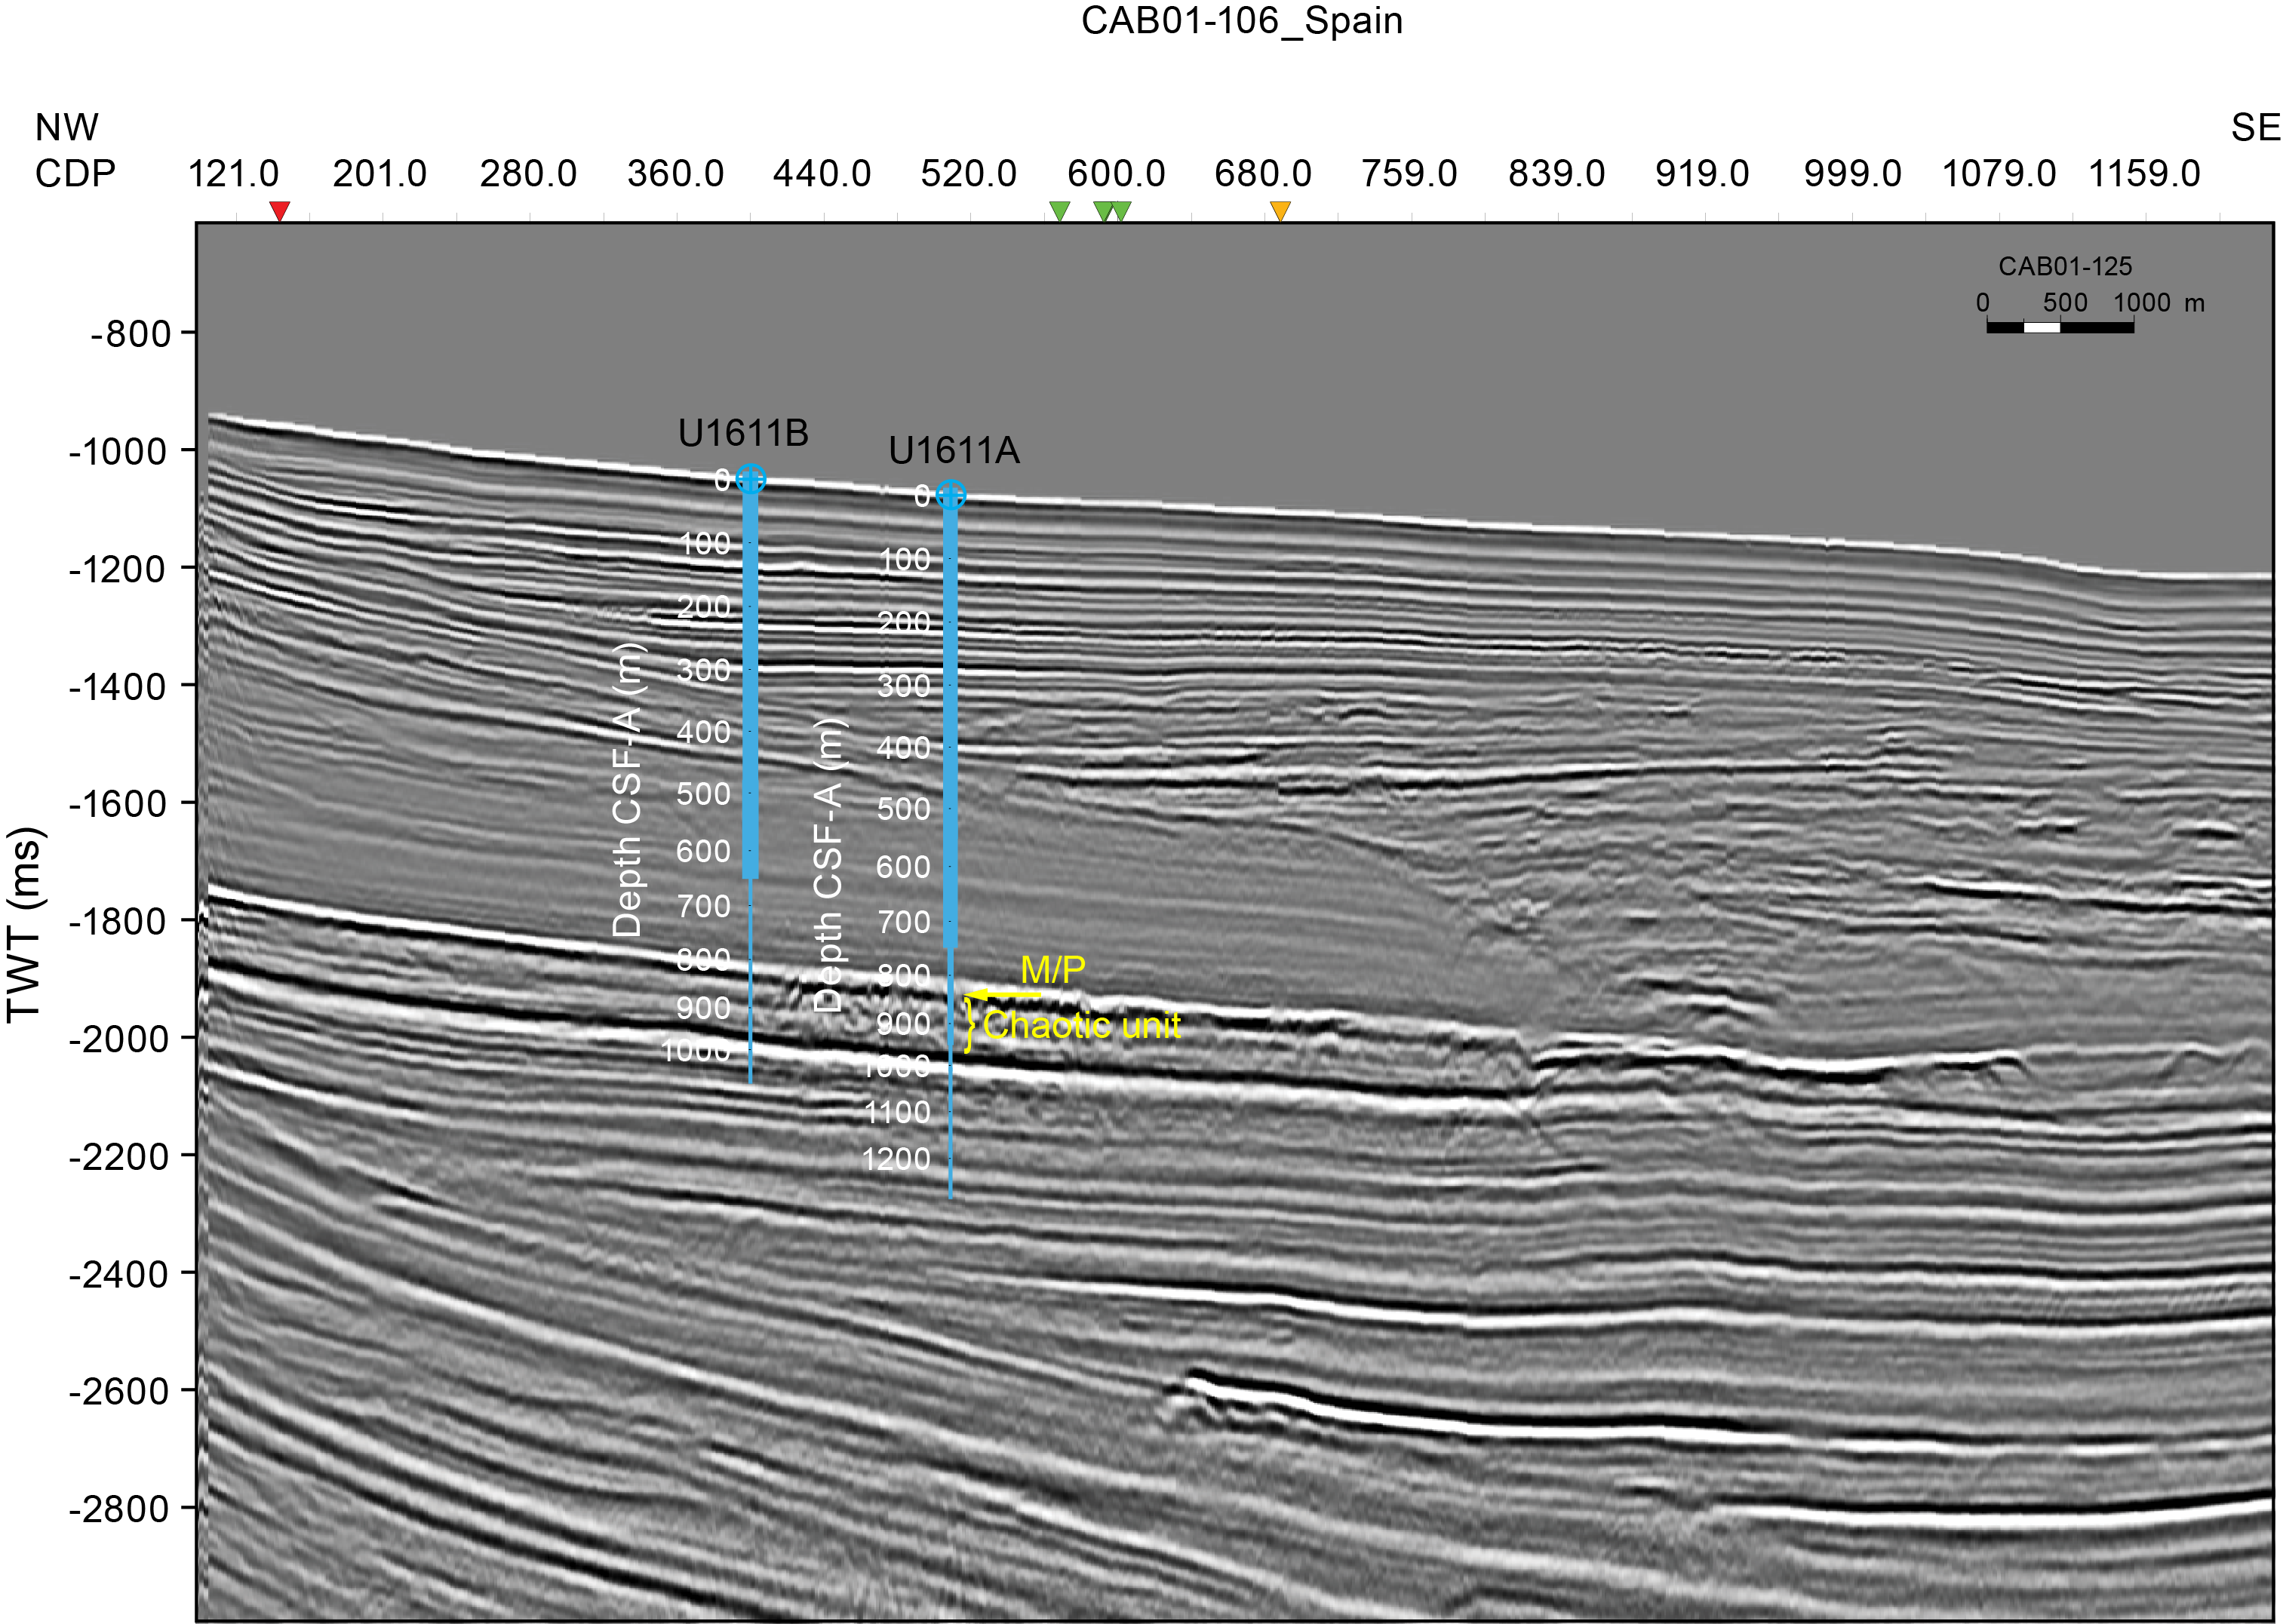
Figure F6. Seismic Line CAB01-125.
2. Operations
On the morning of 19 January 2024, JOIDES Resolution sailed through the Gibraltar Strait, one of the Mediterranean–Atlantic gateways in the title of Expedition 401. The 333 nmi transit to Site U1611 in the Alborán Basin of the Mediterranean Sea took 29.8 h at an average speed of 11.2 kt. We arrived on site at 1315 h on 19 January. We lowered the thrusters at 1324 h and switched to dynamic positioning mode at 1338 h, starting operations at Site U1611.
2.1. Hole U1611A
The rig crew performed a slip and cut of the drilling line and picked up the drill collars. At 1745 h on 19 January 2024, high winds made it unsafe for the derrickman to work at the monkey board in the derrick. We waited until 2015 h for the wind to drop before resuming operations (2.5 h delay).
The hydraulic release tool (HRT) running tool was assembled (Figure F7), the upper guide horn was set aside, and the rig floor team assembled ~650 m of 10¾ inch casing and hung it below the ship. From 0900 to 1200 h on 20 January, they made up the casing stinger bottom-hole assembly (BHA), including the bit, underreamer bit, and mud motor. The underreamer and mud motor were tested and found to operate well. The BHA and drill pipe were lowered through the casing until the bit and underreamer extended below the casing by 3 m. The HRT running tool was attached to the casing, and the funnel was welded on. The funnel was lowered through the moonpool at 1540 h, and the entire casing system was lowered to 792.1 meters below sea level (mbsl) before installing the top drive. Hole U1611A (36°18.7537′N, 4°34.2717′W) was started at 1730 h, and we continued to drill the casing into Hole U1611A until the reentry cone base landed on the seafloor at 810.1 mbsl with the bit at 654.6 meters below seafloor (mbsf) and the casing shoe at 652.6 mbsf. The subsea camera was deployed to observe the release of the casing, and at 0405 h on 22 January the casing assembly was released from the pipe and BHA. The bit was raised back to the ship, clearing the rig floor at 1103 h and completing the casing portion of operations in Hole U1611A. The rig floor team then assembled the rotary core barrel (RCB) BHA with a polycrystalline diamond compact (PDC) bit, lowered it to 584.9 mbsl, and deployed the subsea camera again to guide reentry into the hole.
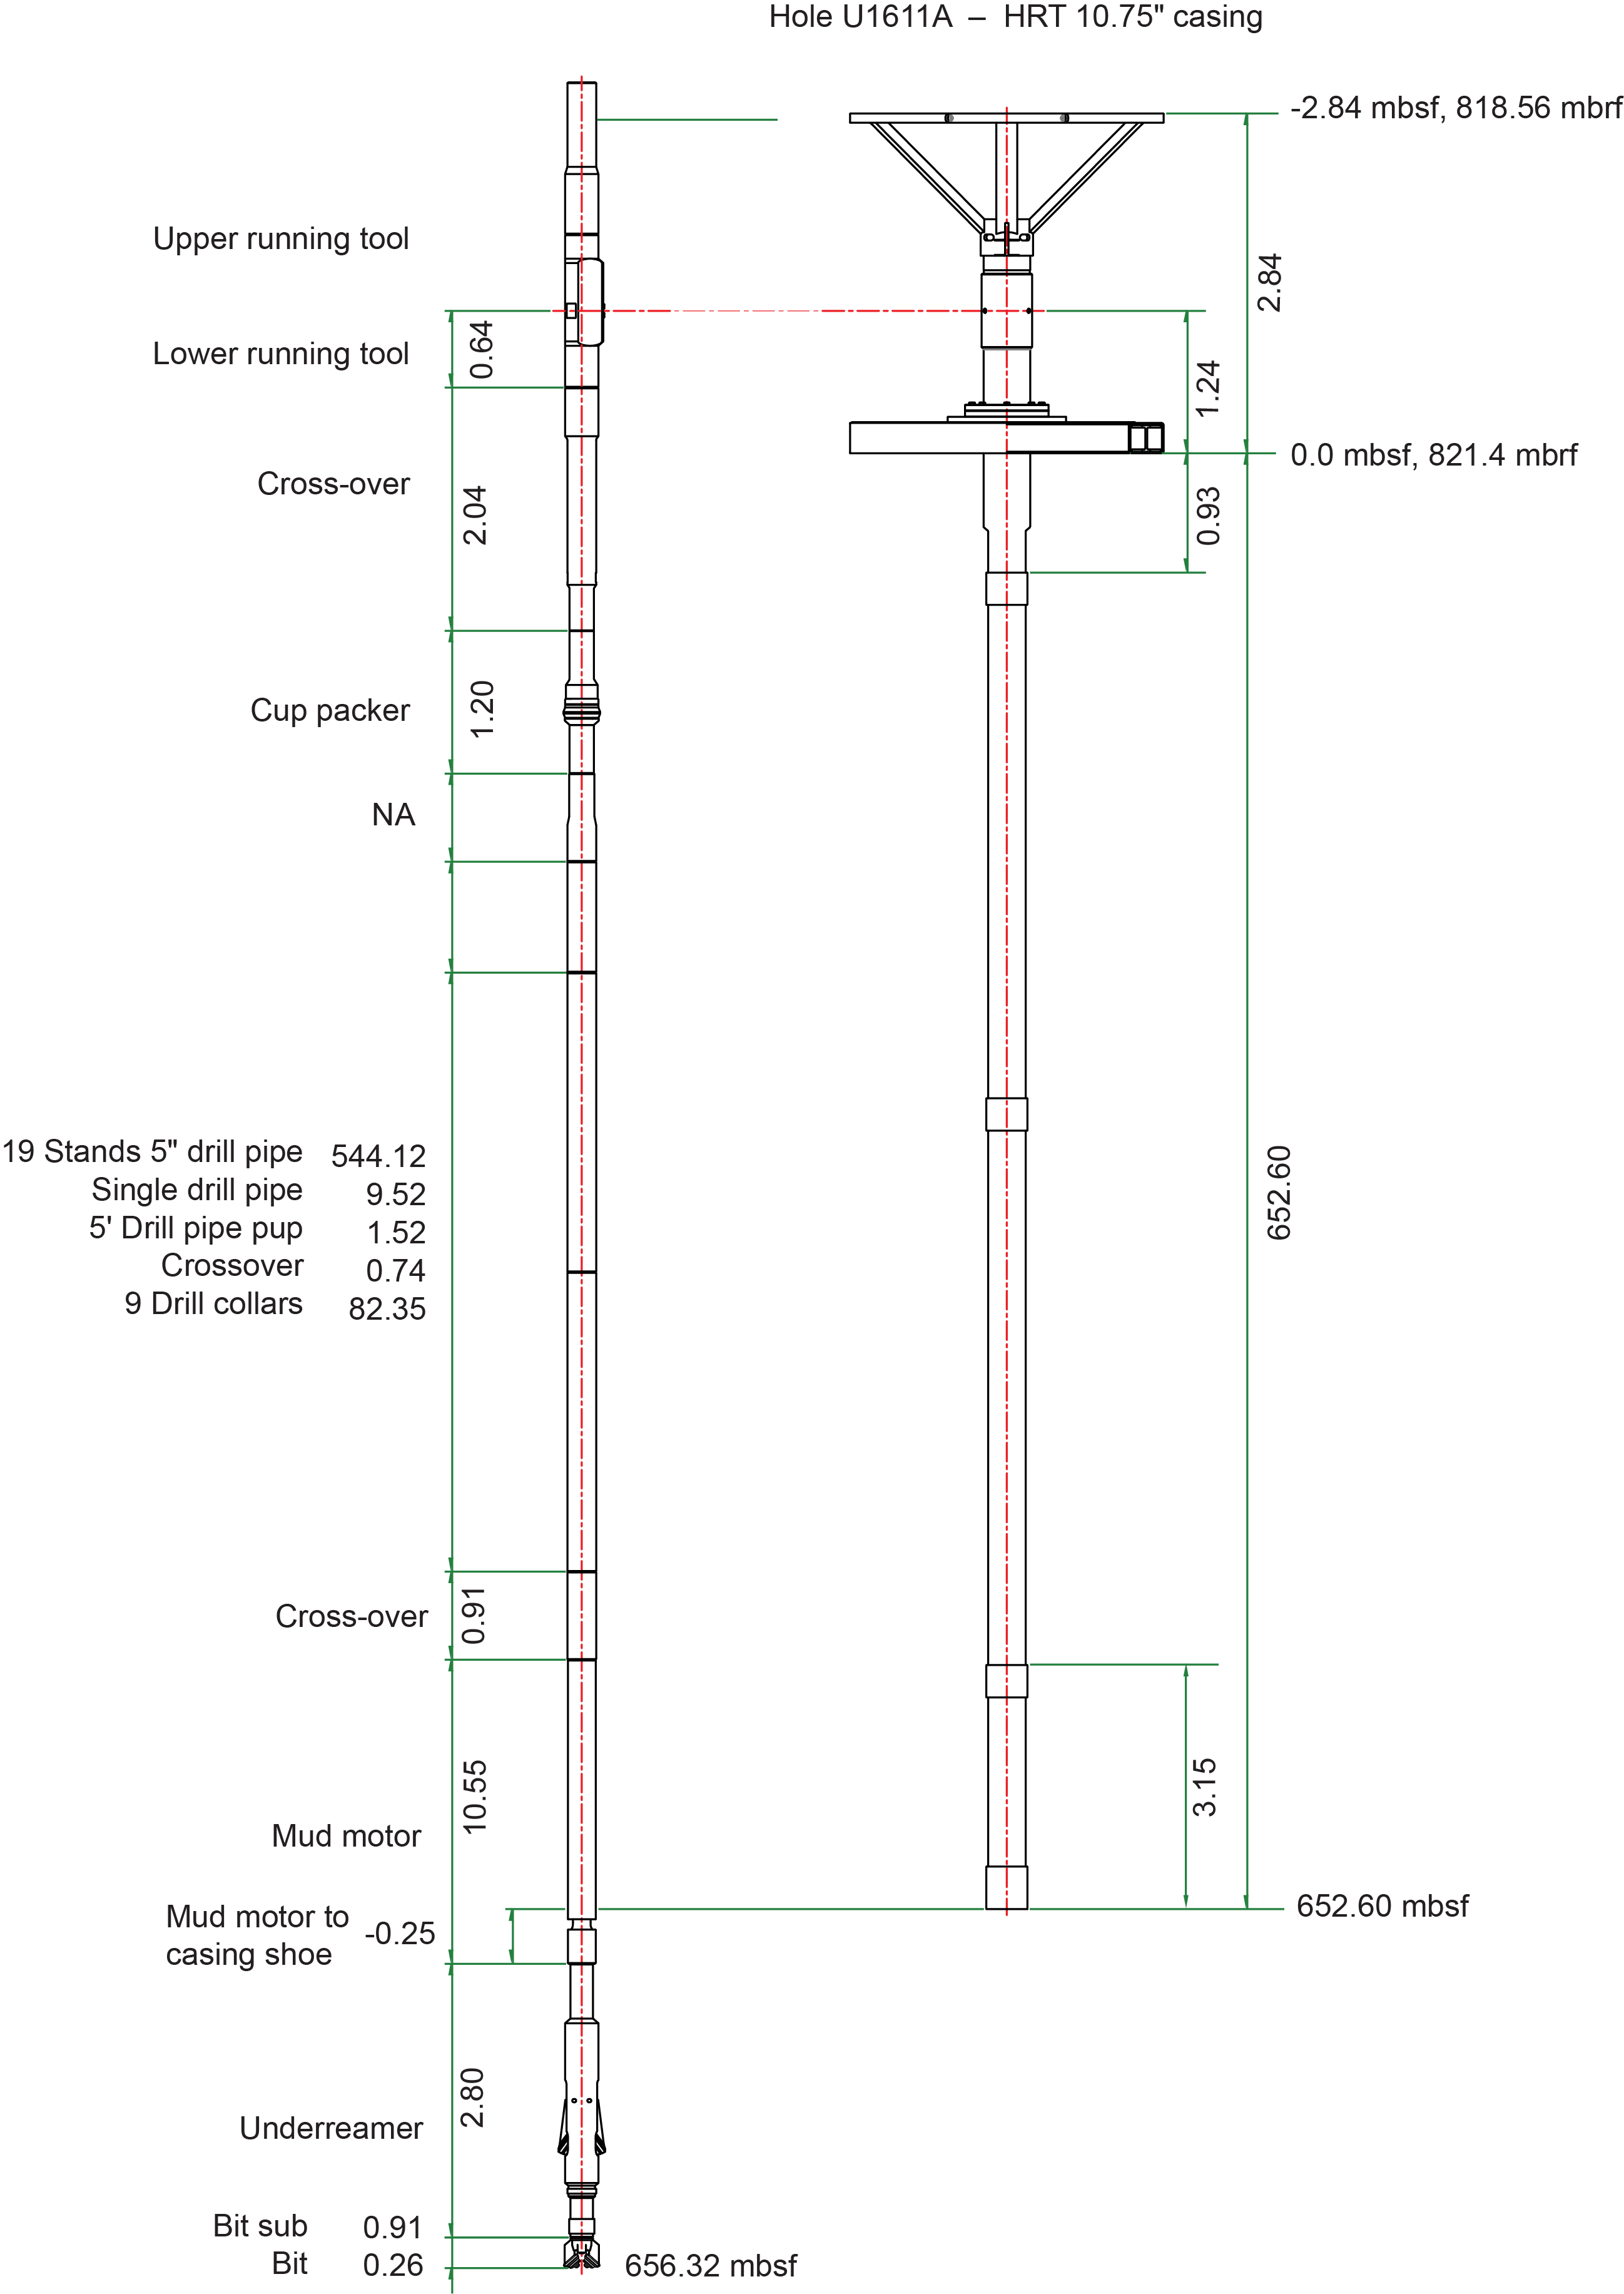
Figure F7. Casing and reentry system.
Hole U1611A was reentered at 1832 h, and the top of the cone was confirmed to be at 807.3 mbsl and the seafloor at 810.1 mbsl, very close to the precision depth recorder estimate of the seafloor depth at 810.2 mbsl. The bit was lowered down the casing to 613 mbsf, where it took weight, probably from sediments that had come up into the casing. The top drive was installed, and the bit was washed down to 656.3 mbsf, followed by a 30 bbl mud sweep to clear any remaining loose sediment from the casing. At 0000 h on 23 January, the core line winch electrical controller failed, specifically the Veeder-Root counter in the unit. It was replaced, and the winch was back online by 0545 h. The first run on the core line was the Sediment Temperature 2 (SET2) tool. The Icefield MI-5 core orientation tool, usually run to orient advanced piston corer (APC) cores, was run by piggybacking on the SET2 tool deployment to estimate any deviation of the casing from vertical. It showed a small angle at the top of the casing, deviating to approximately 10° at the base of casing. This result was subsequently confirmed by the downhole logging inclinometer. Coring started at 0815 h with Core 2R, but it recovered only 3 cm of sediment, so we ran the bit deplugger. Recovery improved for subsequent cores. Cores 2R–24R penetrated from 656.3 to 879.4 mbsf and recovered 223.1 m (74%) (Table T1). Cores 25R and 26R returned nearly empty, probably because coarse-grained sediments in the formation are difficult to recover and can enter the base of the pipe. The bit deplugger was deployed again. We typically made five 30 bbl mud sweeps per day to flush cuttings and loose sediment out of the borehole, and coring continued with moderate to good recovery. At 0815 h on 26 January, following Core 44R, we switched to half-core advances, which improved core recovery (on 26 January full-core advances yielded 69% recovery and half-core advances yielded 87% recovery).
On 28 January, we switched from half-length to full-length RCB core advances with Core 401-U1611A-77R. Core 79R returned empty, so we ran the bit deplugger and switched back to half-length advances for Cores 80R–83R, each of which recovered less than 10 cm. At 1945 h, we started a wiper trip to clear bridges in the hole prior to further coring and downhole logging. Overpulls of 20,000–30,000 lb were observed at 1104.9, 949.4, 881.7, and 872.0 mbsf before the bit could be raised to the casing shoe. On washing down, 12 tight spots were encountered and 6 m of fill was found at the base of the hole. From 0730 to 1030 h on 29 January, we washed out the fill and swept the hole with 30 bbl sepiolite mud in preparation for coring. Cores 84R–86R penetrated to 1281.9 mbsf, the final depth of the hole, and recovered 13.2 m (68%). Cores 2R–86R penetrated from 656.3 to 1281.9 mbsf and recovered 431.2 m of core (68.9%) (Table T1).
At 1545 h, we started to prepare the hole for downhole logging. The bit was released at the base of the hole, the hole was displaced with barite-weighted mud, and the end of the pipe was raised to 672.7 mbsf. The rig floor team assembled the triple combo logging tool string, without the source, and started lowering it down the pipe at 2145 h. The tool string reached an impassable obstruction at 909.6 mbsf and made a repeat and main pass, which together covered 672.7–909.6 mbsf. Borehole diameter varied between narrower than 6 inches to wider than the maximum extent of the caliper measurement (17 inches), and the logged interval of the borehole was inclined from the vertical by between 10° and 15°. The triple combo tool string was back on deck at 0410 h on 30 January, and a sonic-inclinometry tool string was assembled for the second logging run. This tool string was lowered into the borehole but could not pass below 743.6 mbsf. It recorded data for the short interval up to the bit and was back on deck by 0910 h, and the logging equipment was disassembled by 1100 h. The BHA was raised back to the ship, clearing the rotary table at 1400 h and ending Hole U1611A. A new mechanical bit release (MBR) and PDC RCB bit were added to the BHA and were lowered below the ship.
2.2. Hole U1611B
The ship was offset northwest about 1.3 km, and Hole U1611B (36°19.3779′N, 4°34.7520′W) was started at 1725 h on 30 January 2024 at 784 mbsl. We drilled ahead to 744.9 mbsf and pumped 30 bbl sepiolite mud sweeps after adding every two stands of pipe to keep the hole clear. When the center bit was retrieved, 1.7 m of sediment was found behind it in the core barrel, which was curated as a wash core (401-U1611B-2W). Coring started at 1830 h on 31 January. Cores 3R and 4R had an average recovery of 91%; however, the following two cores, 5R and 6R, returned nearly empty, so we ran the bit deplugger and then switched to half-core RCB advances. Coring proceeded with half-core advances for the next 3 days until operations needed to stop to start preparing for the transit to Napoli, Italy. Core 66R arrived on the catwalk at 2330 h on 4 January and was the last core of the site and the expedition. Cores 3R–66R penetrated from 744.9 to 1069.9 mbsf and recovered 255.1 m (78%) (Table T1). Cores 6R–66R were half-core RCB advances out of choice.
3. Lithostratigraphy
Four main lithologies were described at Site U1611: (calcareous) mud, (calcareous) silty mud, sandy silt, and silty sand. Minor lithologies include sandy mud, conglomerate, breccia, and cemented carbonate (e.g., dolostone and limestone) (Figures F8; see HANDDRAWN in Supplementary material). Based on lithologic changes, Holes U1611A and U1611B are divided into three stratigraphic units (Figures F9, F10, F11). In Hole U1611A, the three units are divided into subunits, but no such division was made for Hole U1611B because of differences between the lithologic successions in the two holes, which are 1.3 km apart. Contacts between these units and the lithologies within them are mainly gradational in the upper parts, characterized by subtle changes in color and grain size, and become more commonly sharp with depth, associated with distinct color changes and frequent lamination (Figure F9). The coarser silts and sandier beds typically have sharp to erosive basal contacts.
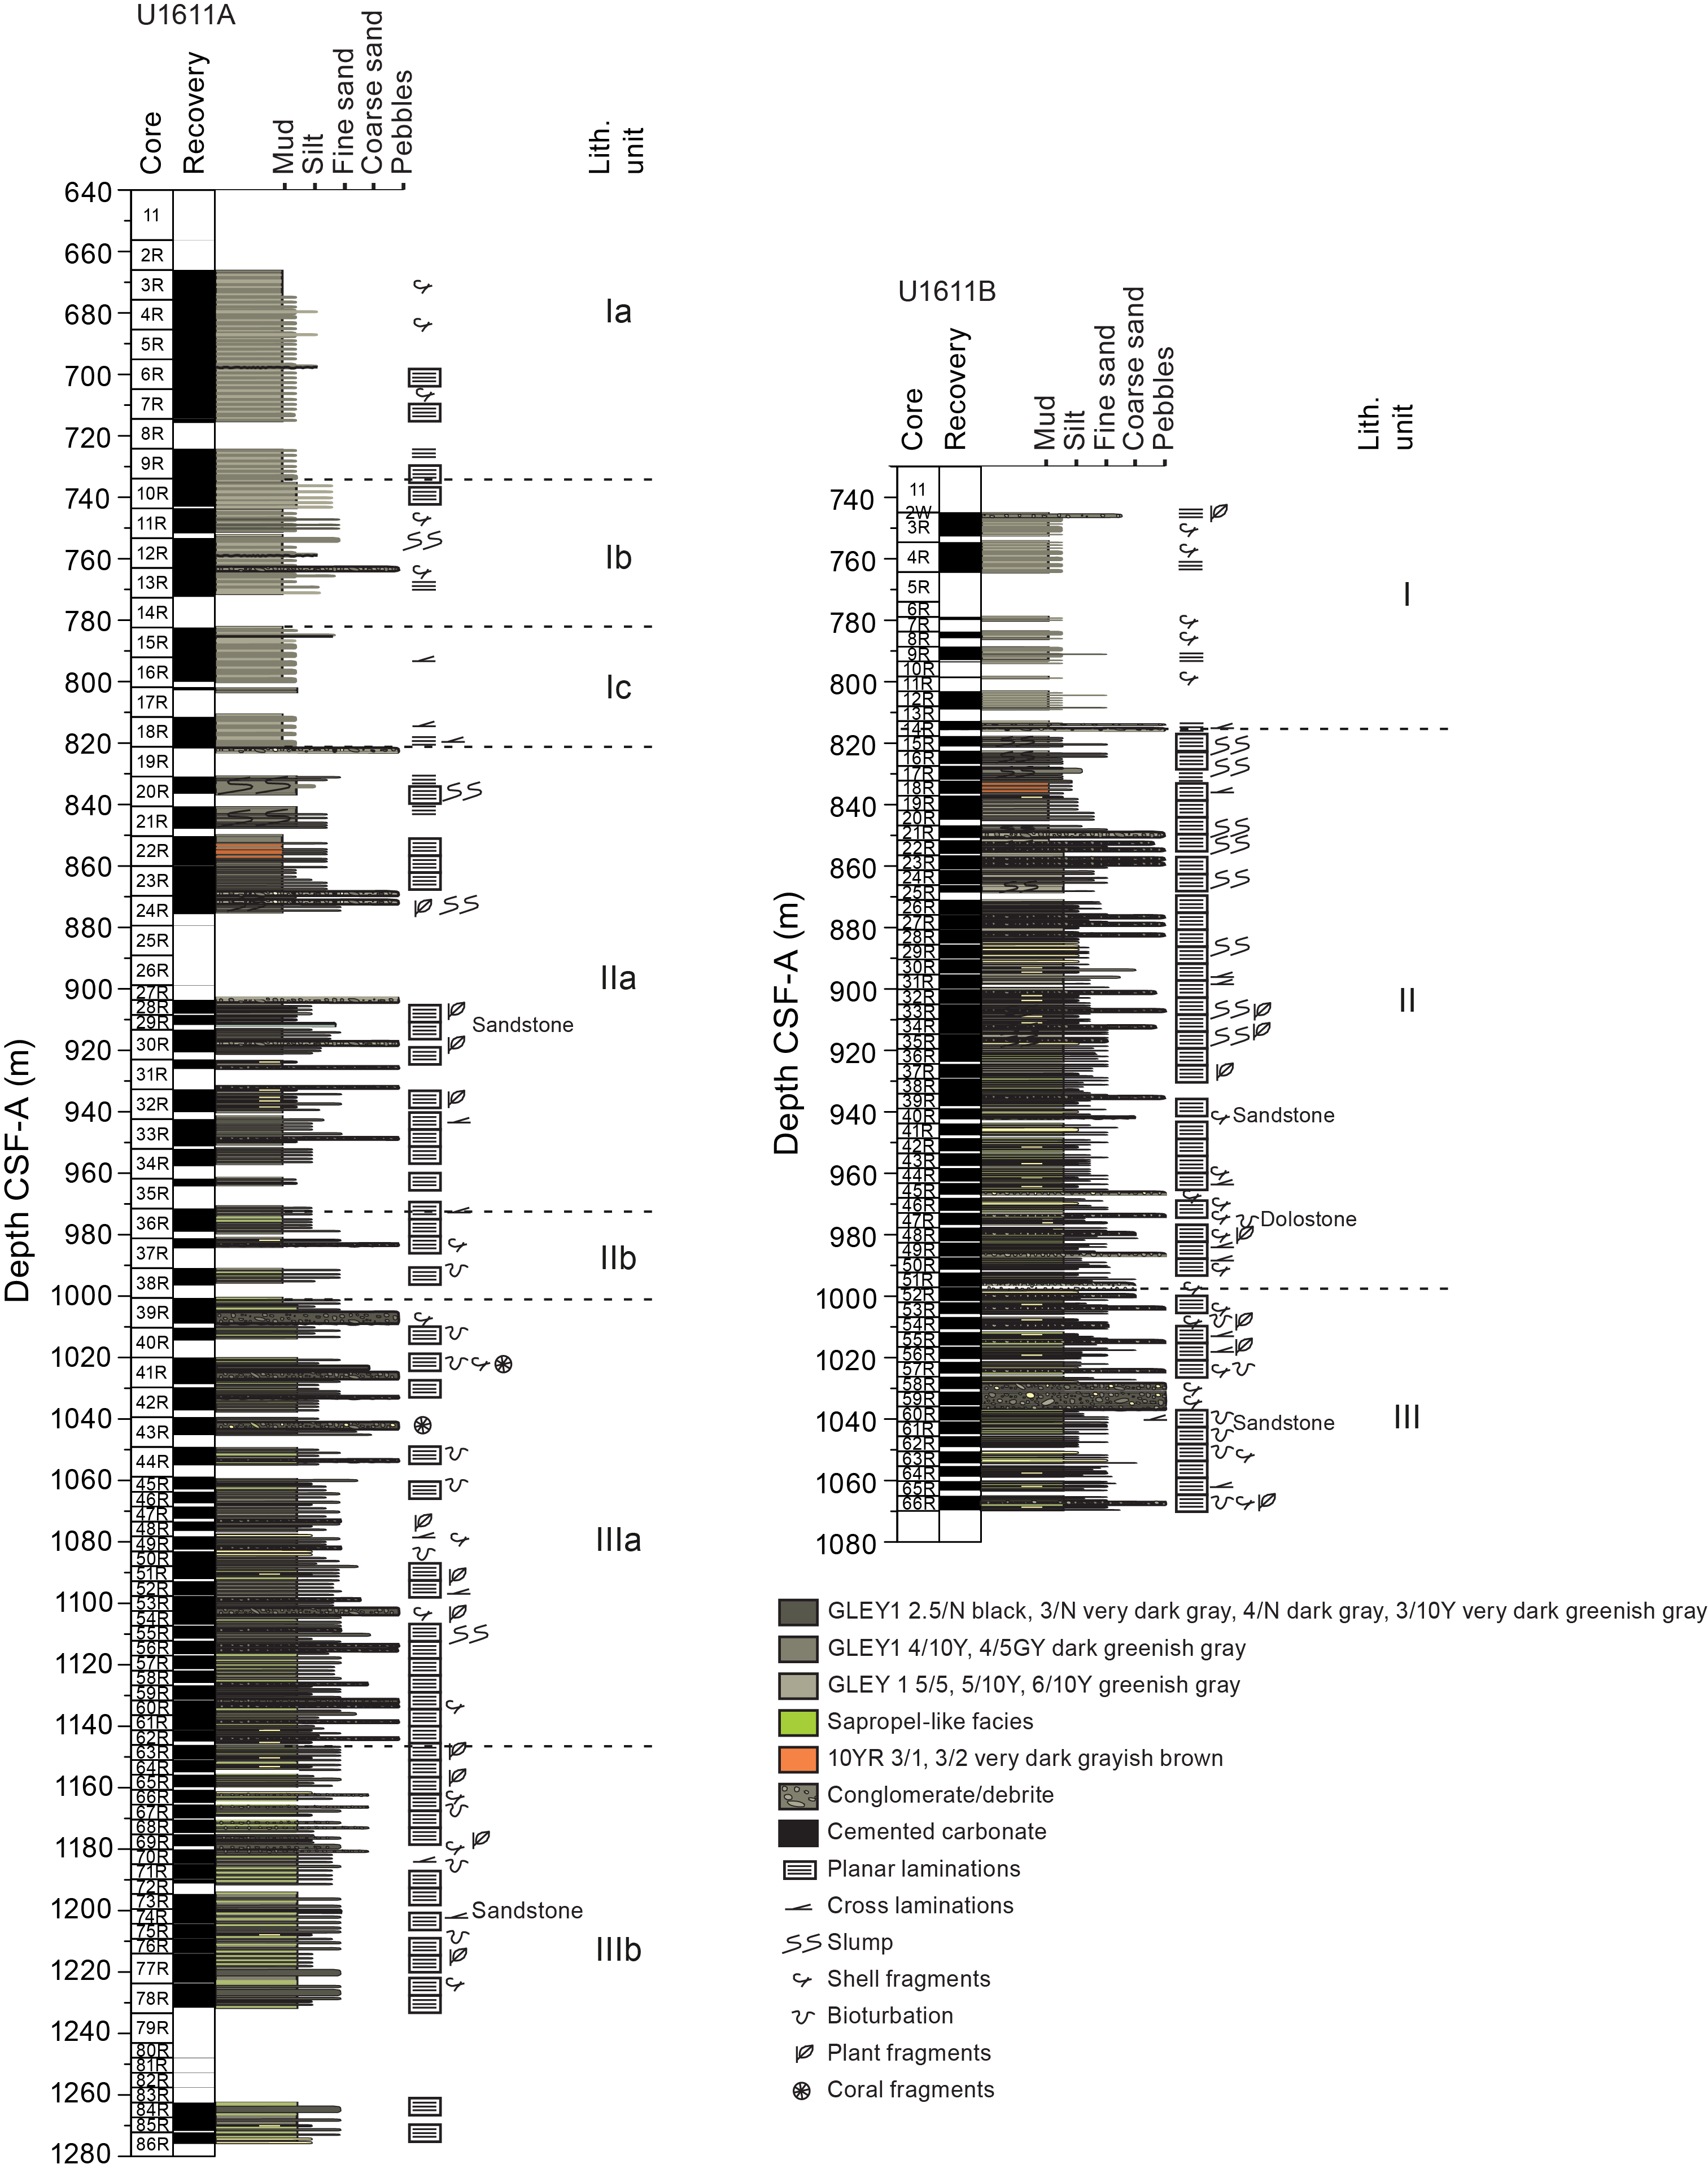
Figure F8. Lithologic synthesis.
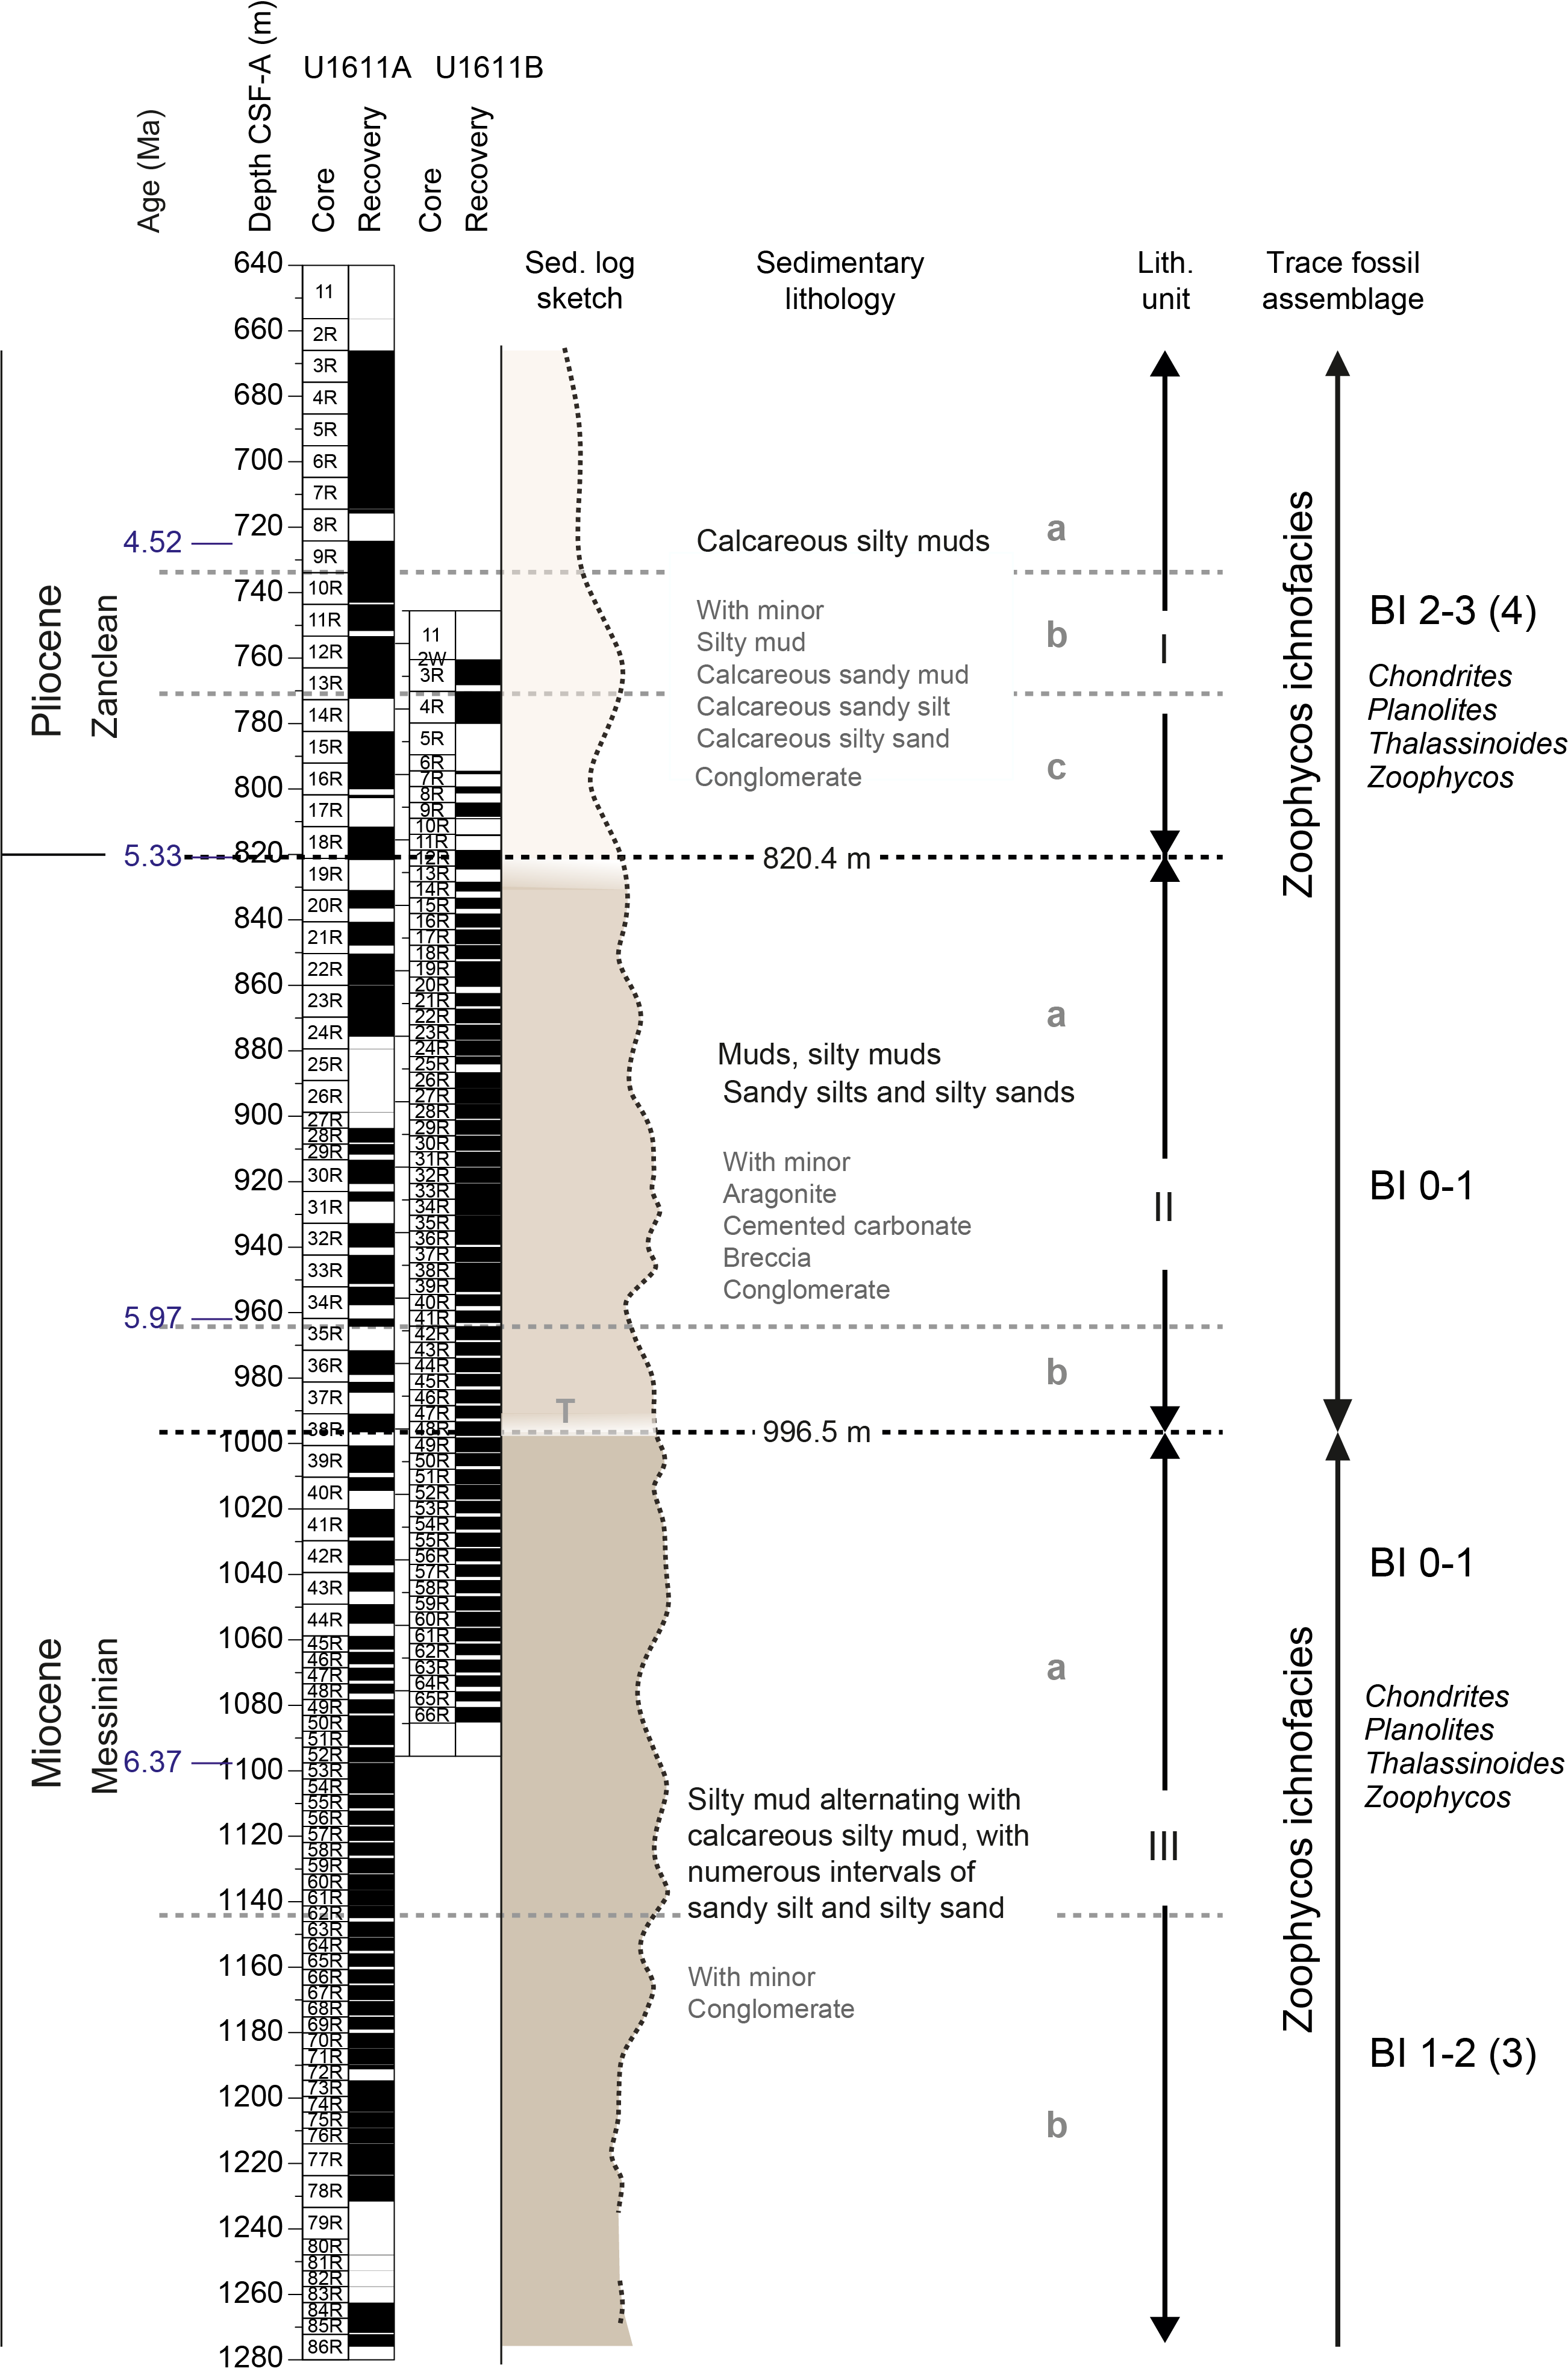
Figure F9. Lithologic summary.
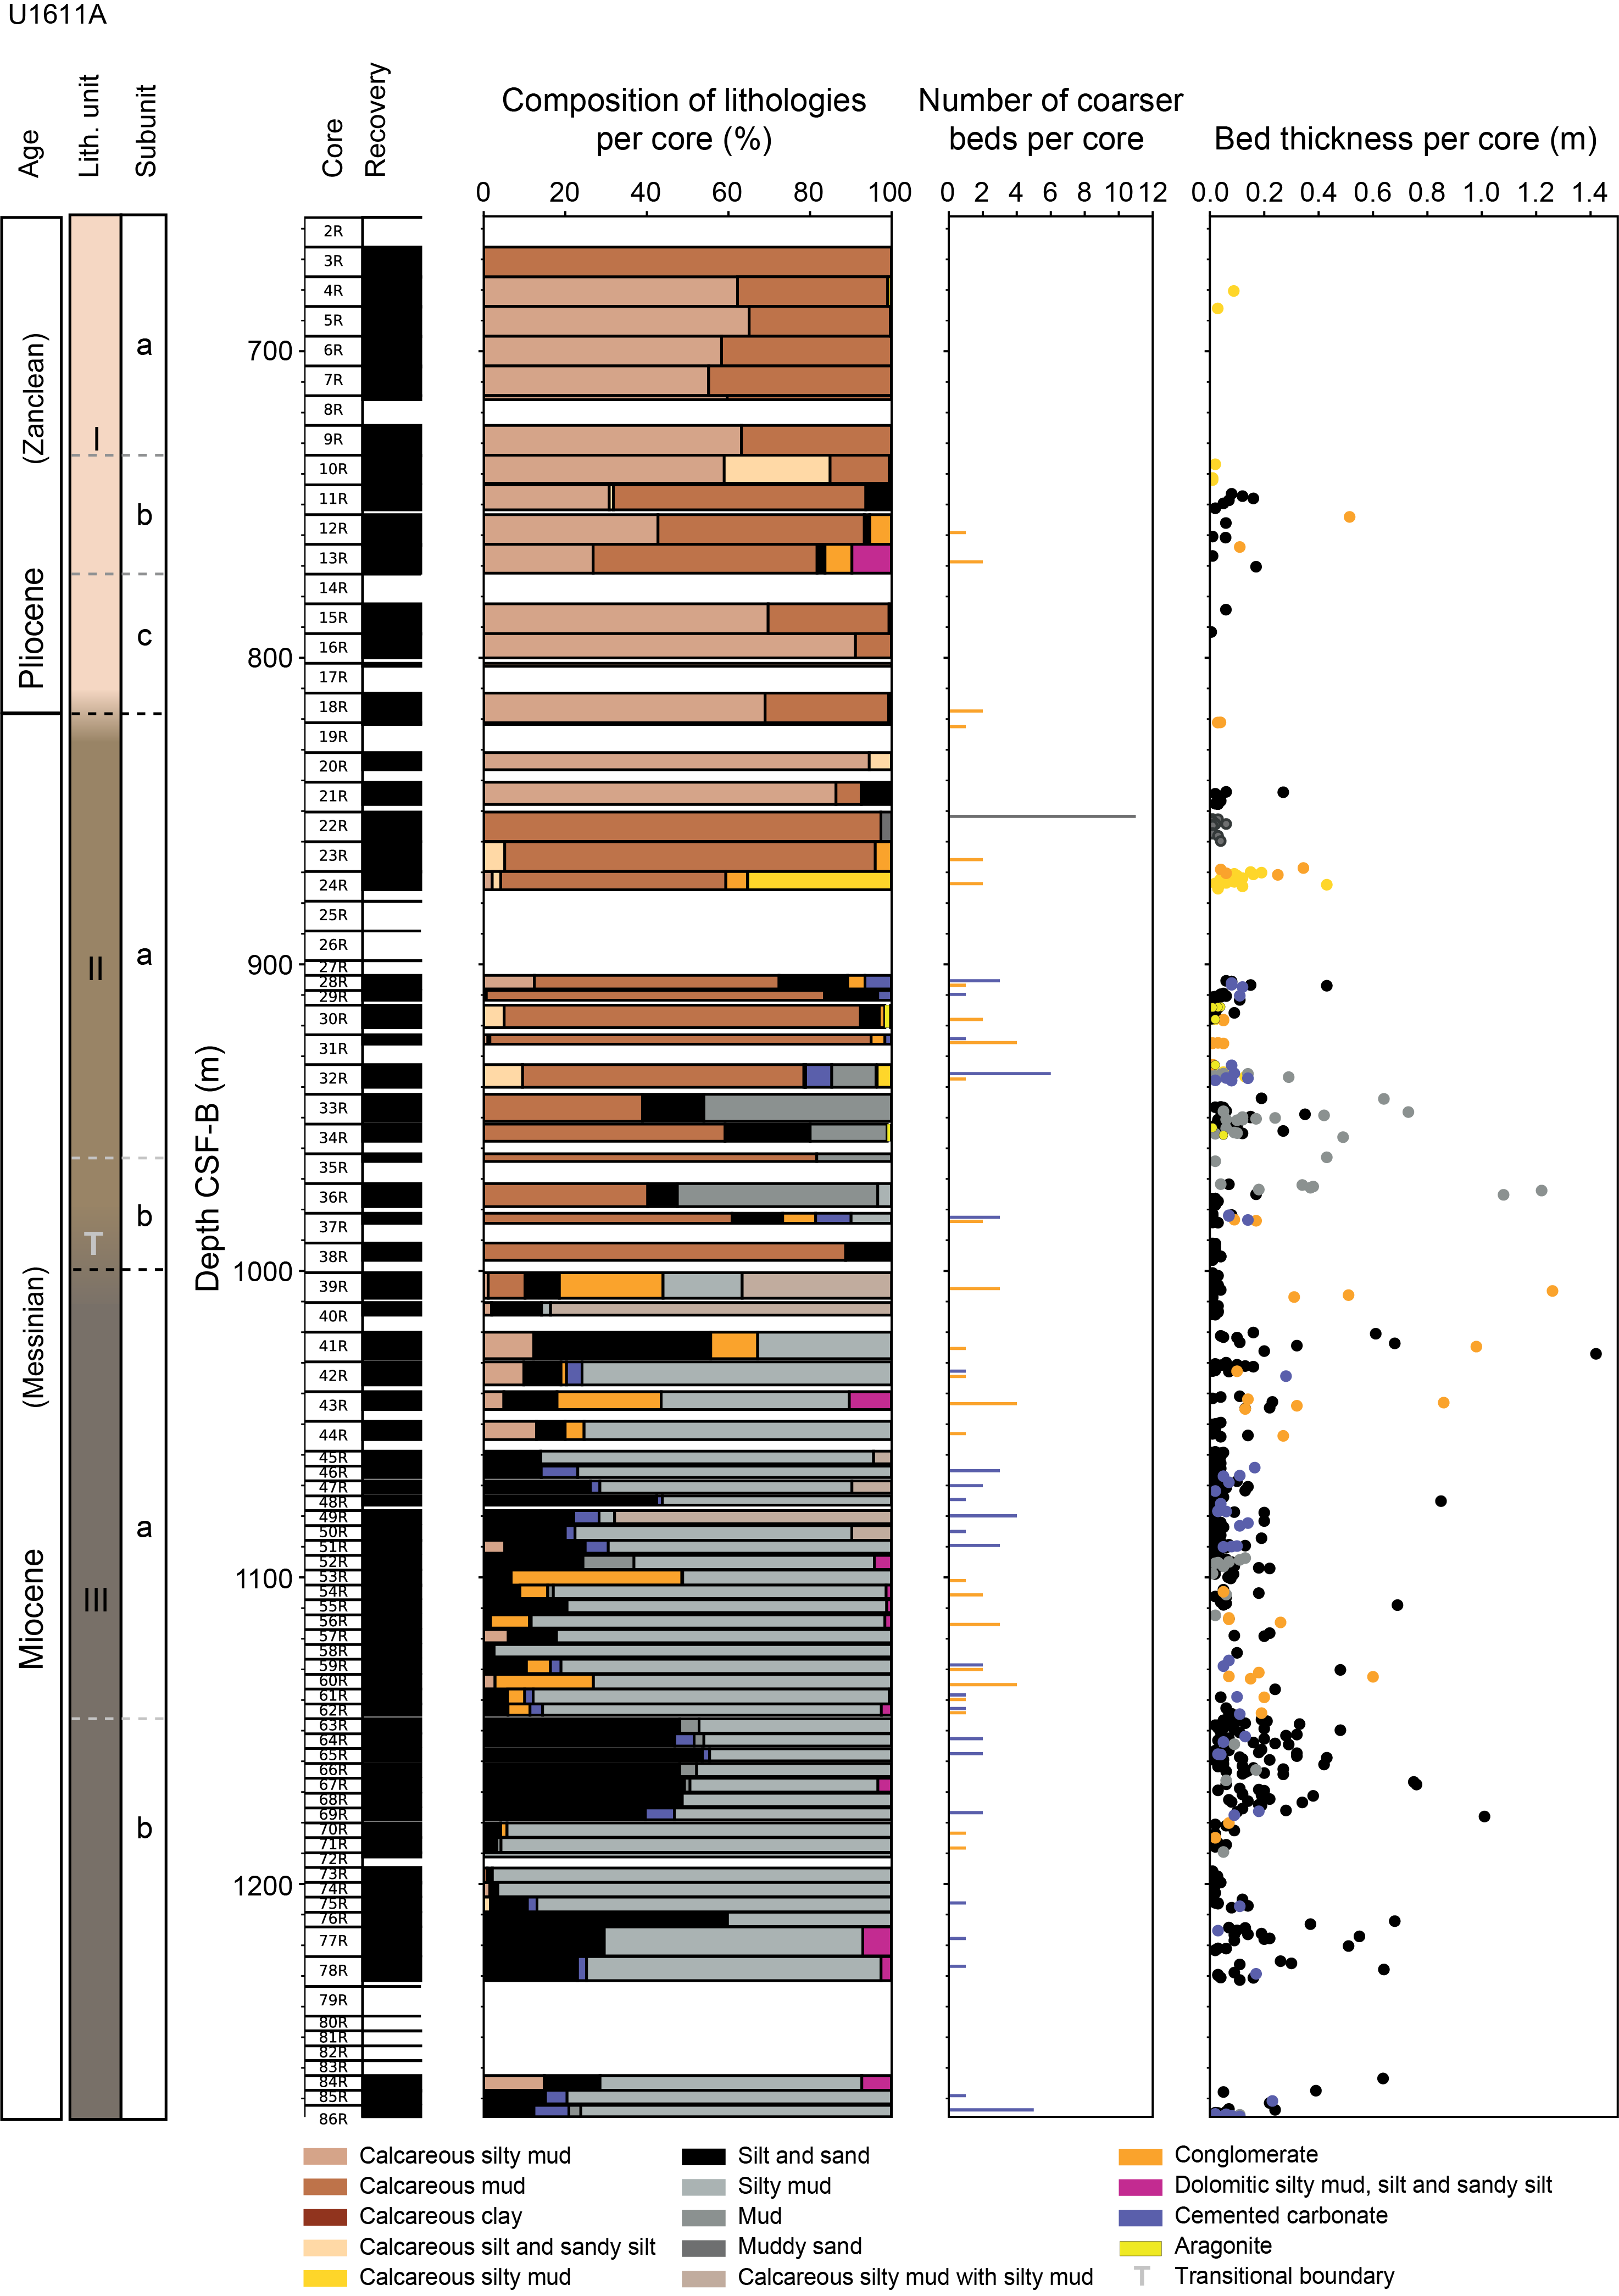
Figure F10. Core and bed thickness by lithology, Hole U1611A.
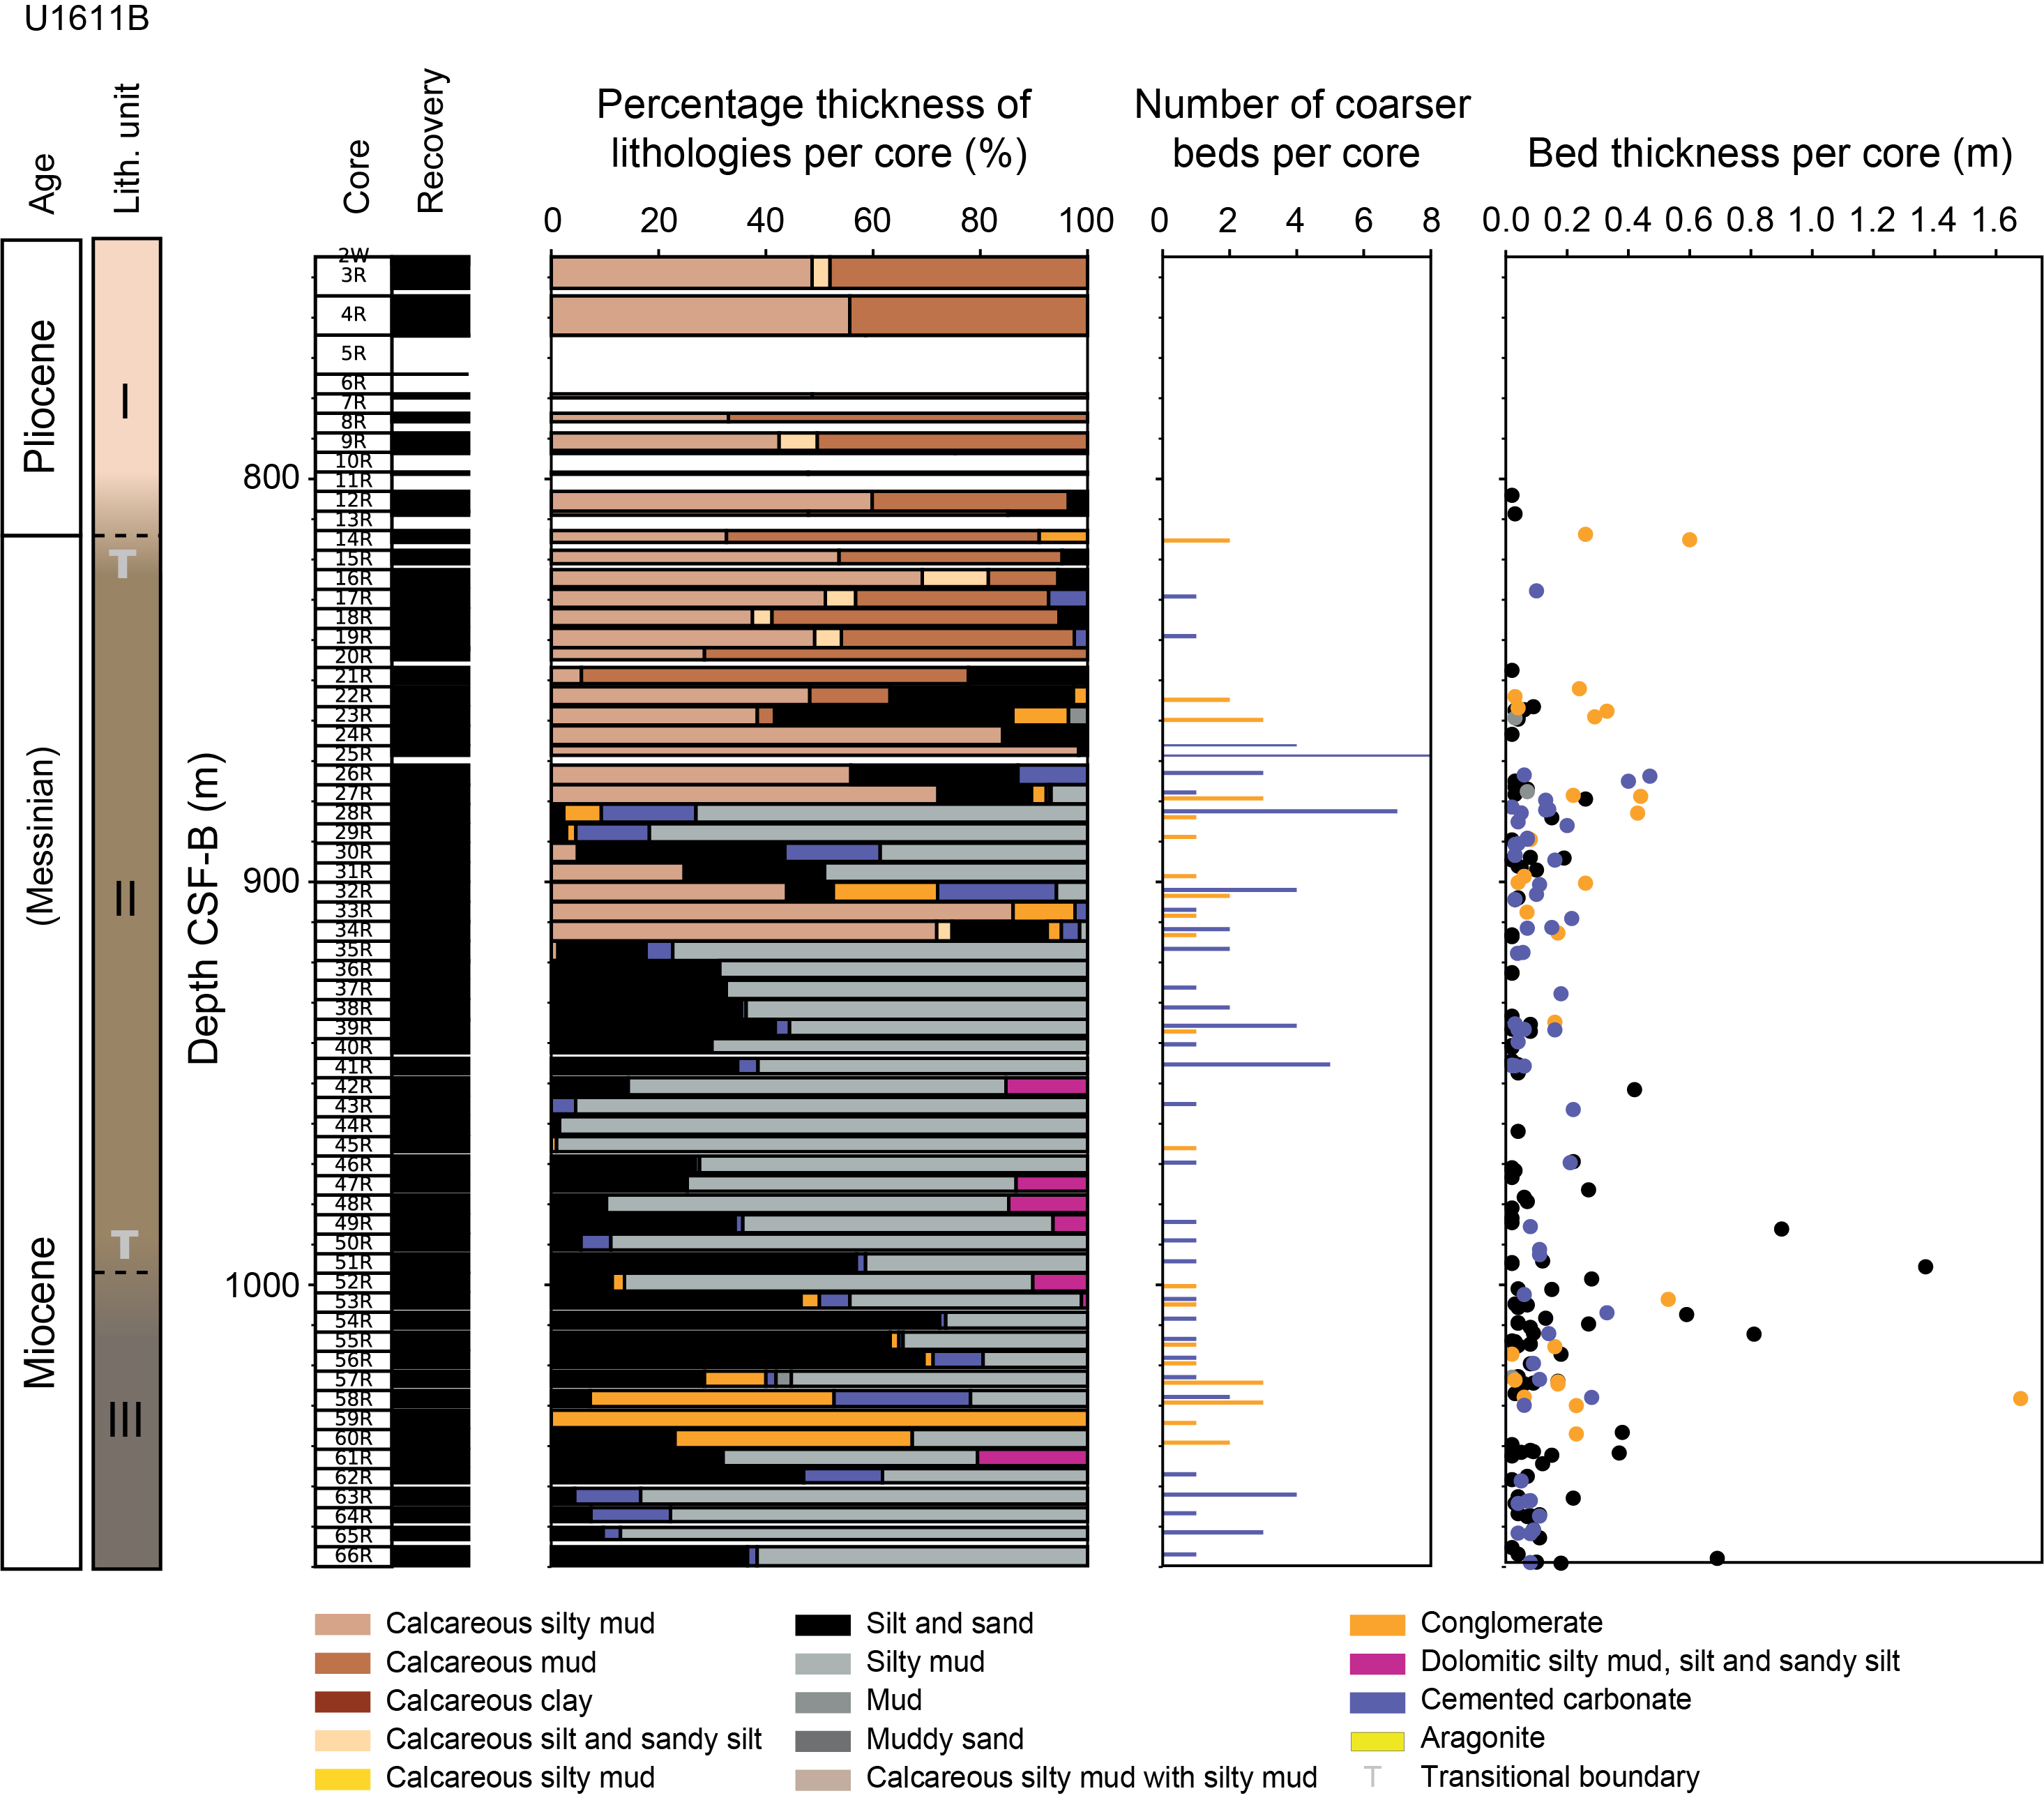
Figure F11. Core and bed thickness by lithology, Hole U1611B.
Unit I ranges 656.3–820.4 m core depth below seafloor, Method A (CSF-A), in Hole U1611A and 746.4–814.2 m CSF-A in Hole U1611B. In Hole U1611A, Unit I comprises three subunits. Subunit Ia (656.3–733.9 m CSF-A) consists of alternating calcareous mud and calcareous silty mud, with one interval of calcareous sandy mud. Subunit Ib (733.9–772.3 m CSF-A) also consists of alternating calcareous mud and calcareous silty mud, with more occurrences of coarser lithologies including conglomerates and calcareous sandy silt. Subunit Ic (782.4–820.4 m CSF-A) is similar to Subunit Ia, predominantly composed of calcareous silty mud and calcareous mud, but the proportion of calcareous silty muds is greater than the calcareous muds (Figure F10). In Unit I in Hole U1611B, calcareous muds also alternate with calcareous silty muds, with the frequency of coarser lithologies increasing with depth (Figure F11).
Unit II ranges 820.4–996.5 m CSF-A in Hole U1611A and 814.2–996.9 m CSF-A in Hole U1611B. In Hole U1611A, Unit II consists of two subunits. Subunit IIa (820.4–964.3 m CSF-A) is composed of lithologies with variable carbonate content, including mud, calcareous mud, calcareous silty mud, sandy silt, and silty sand, with minor aragonite, cemented carbonate, breccia, and conglomerate (Figure F10). Subunit IIb (971.5–996.5 m CSF-A) is composed of lithologies similar to those in Subunit IIa but with a lower carbonate content, with beds of calcareous muds and calcareous silty muds alternating with muds, sandy silts, and sands. In Hole U1611B, Unit II mostly consists of the same lithologies as in Hole U1611A, with a generally lower calcareous content with increasing depth. However, in Hole U1611B, more silty muds were described in the deeper part of Unit II, and in general there are more coarser beds (Figure F11). Unit II is characterized by the presence of laminated beds alternating with nonlaminated and graded beds.
Unit III ranges 1000.6–1275.9 m CSF-A in Hole U1611A and 997.1–1069.69 m CSF-A in Hole U1611B. In Hole U1611A, Unit III consists of two subunits. Subunit IIIa (1000.6–1144.9 m CSF-A) consists of frequent alternations of silty mud and calcareous silty mud in the shallower parts, with numerous intervals of sandy silt and silty sand. The proportion of calcareous silty mud is lower in the deeper part of Subunit IIIa. There are also minor cemented carbonate and minor conglomerate typically associated with contorted, slump-like sediment deformation (Figure F10). Subunit IIIb (1146.1–1275.9 m CSF-A) consists of lithologies similar to those in Subunit IIIa, except that Subunit IIIb lacks the rapid interbedding of calcareous silty mud and silty mud and contains more frequent coarser grained intervals (e.g., sandy silt and silty sand). In Hole U1611B, Unit III is similar to the upper part of Subunit IIIa in Hole U1611A, except that there is a notable thick conglomerate (8.5 m) that was not recovered in Hole U1611A (Figure F11). Unit III is characterized by the presence of laminated beds alternating with nonlaminated and normally graded beds, but the lamination is more subtle than in Unit II.
Bed thickness for each primary lithology was calculated for both holes (Figures F10, F11). However, the top and bottom of each core were excluded because they represent only a portion of the bed and, therefore, the minimum value of bed thickness. For cores entirely composed of a single lithology, the calculated thickness represents the minimum bed thickness. It is important to note that the boundaries between lithologies are predominantly gradational in Unit I, so the contacts are placed within the transitional intervals and are not entirely representative of the true bed thickness, which can only be determined by integrating visual core description with physical properties data (e.g., magnetic susceptibility [MS] and natural gamma radiation [NGR]) (Figure F12A). For Units II and III, in which there are rapid lithologic changes, some lithologic intervals of beds were grouped together under a representative lithology name in GEODESC; therefore, bed thickness and bed count of these grouped intervals are not representative and are not plotted in Figures F10 and F11. In these intervals, thin (1 to ~5–10 cm thick, depending on the frequency) normally graded beds with silt or sand bases are often grouped with the main lithologies with which they are intercalated. These grouped beds are not plotted in Figures F10 and F11.
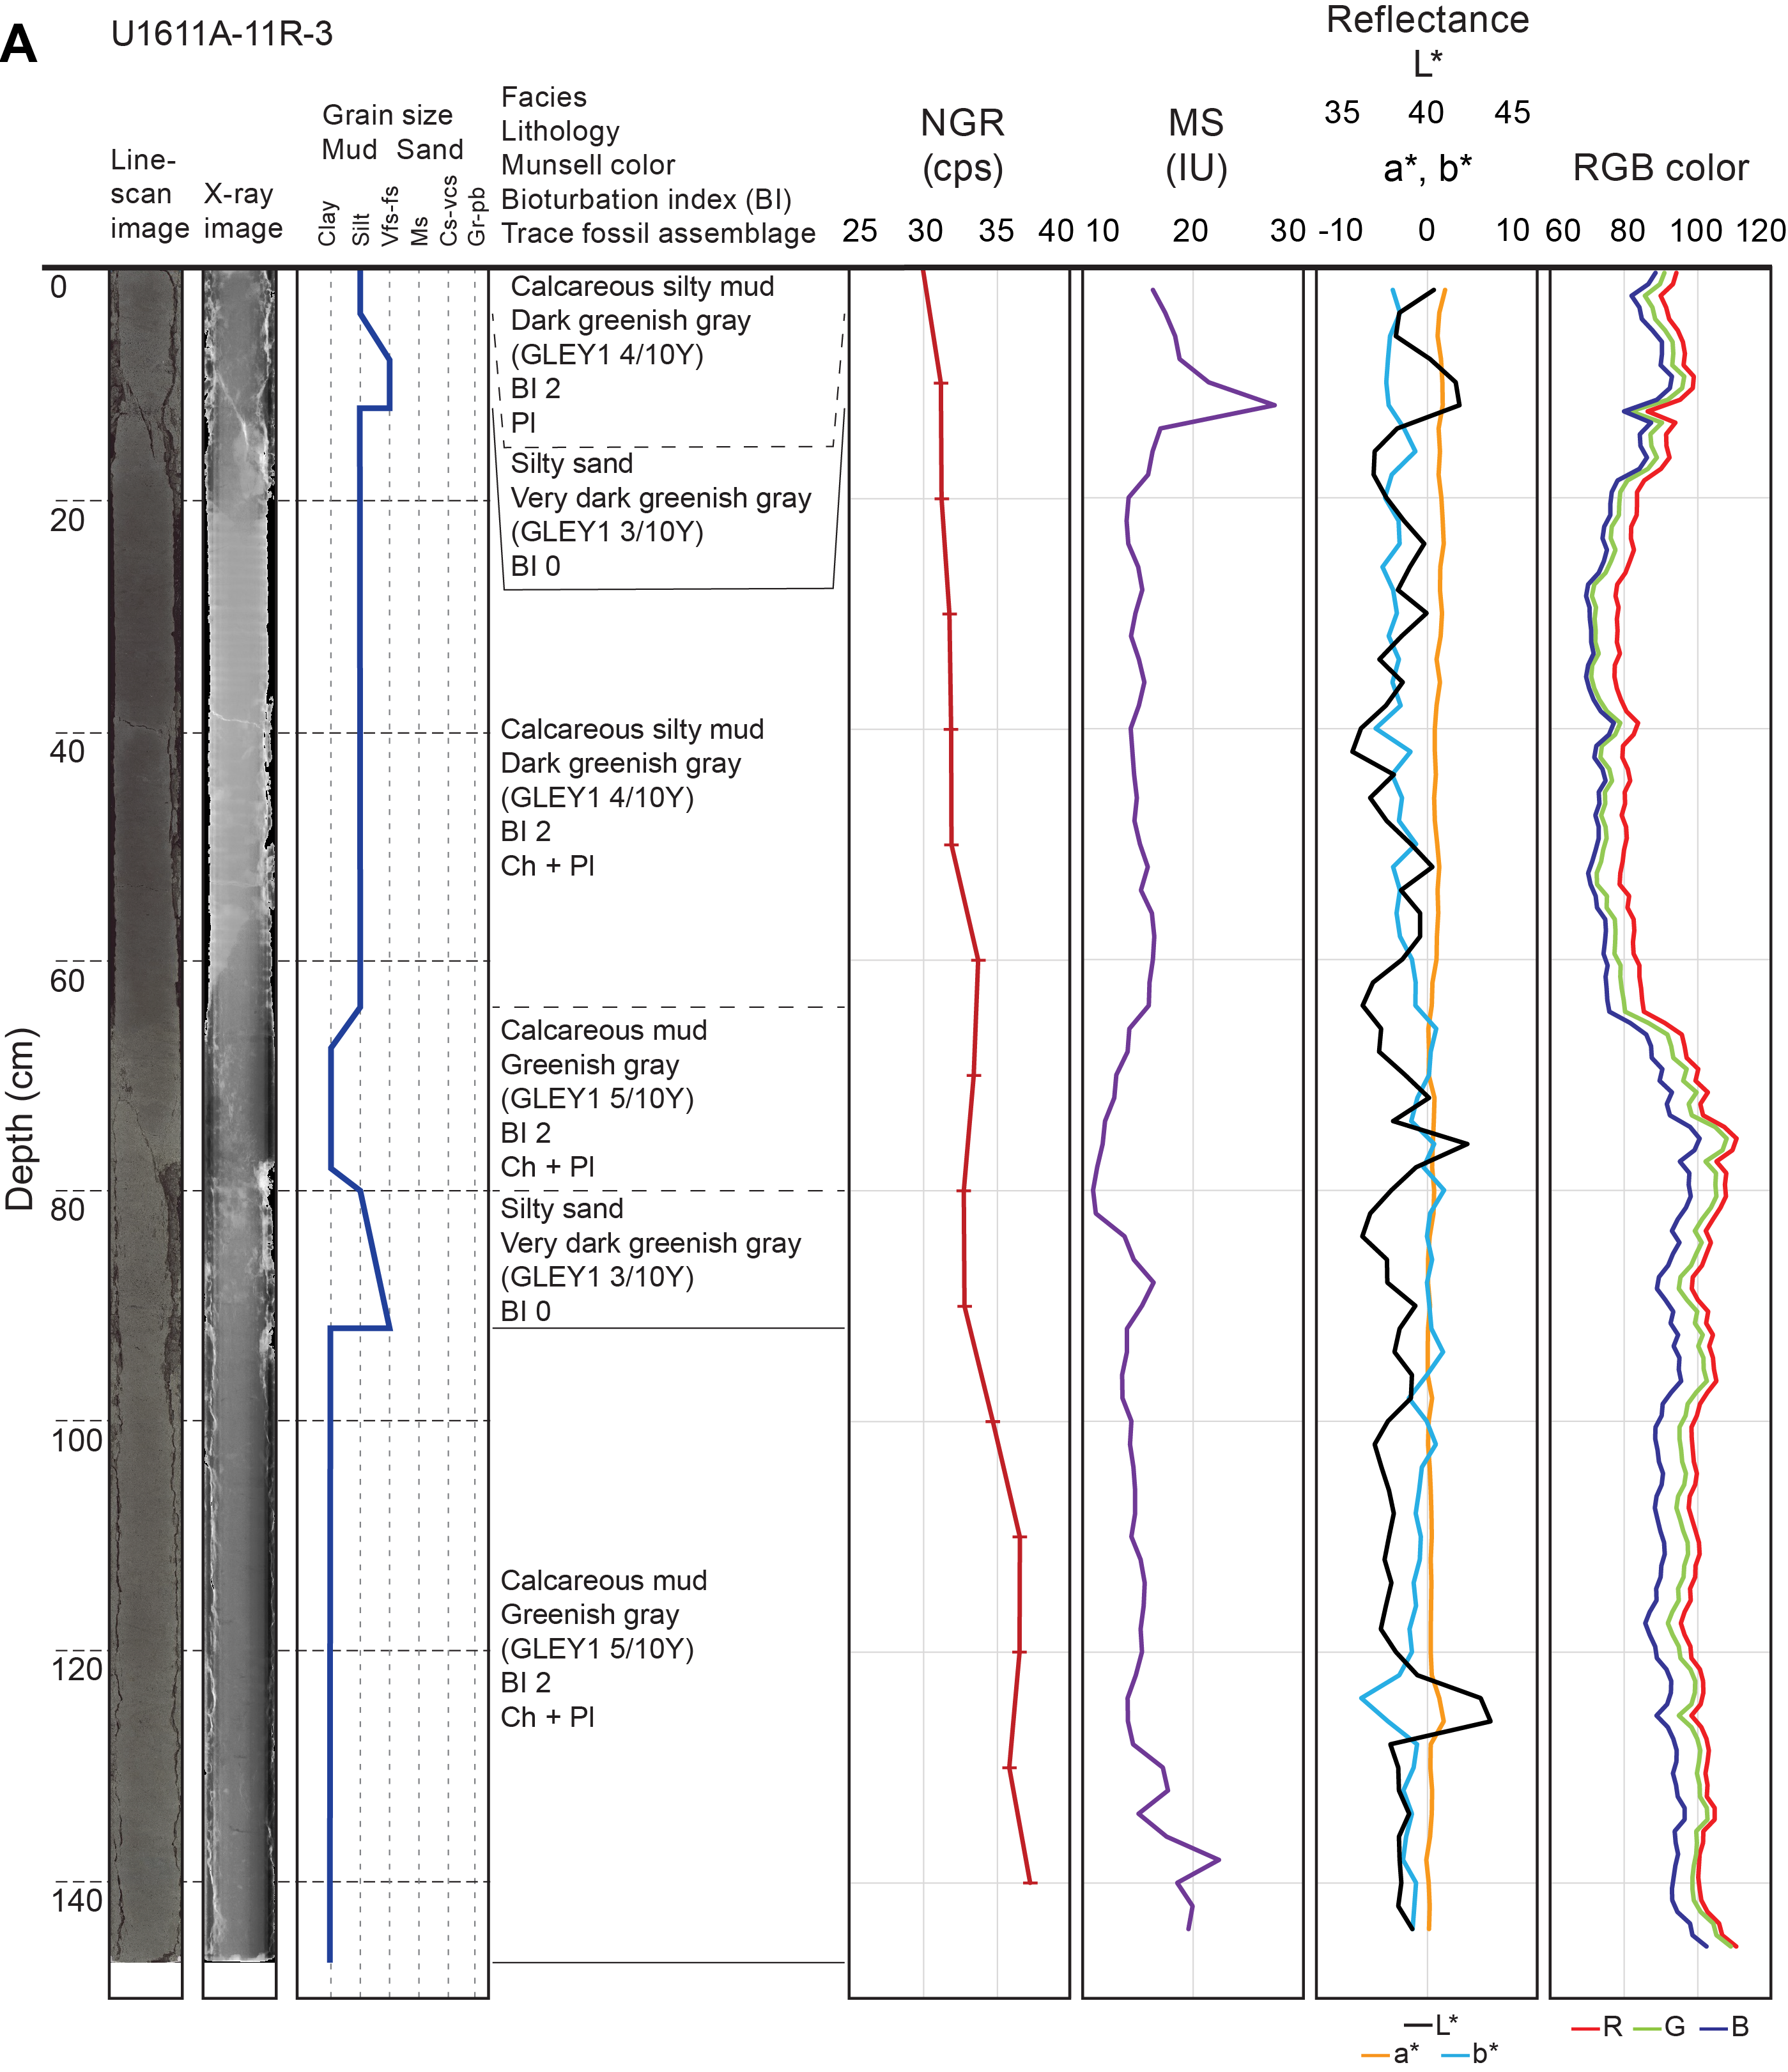
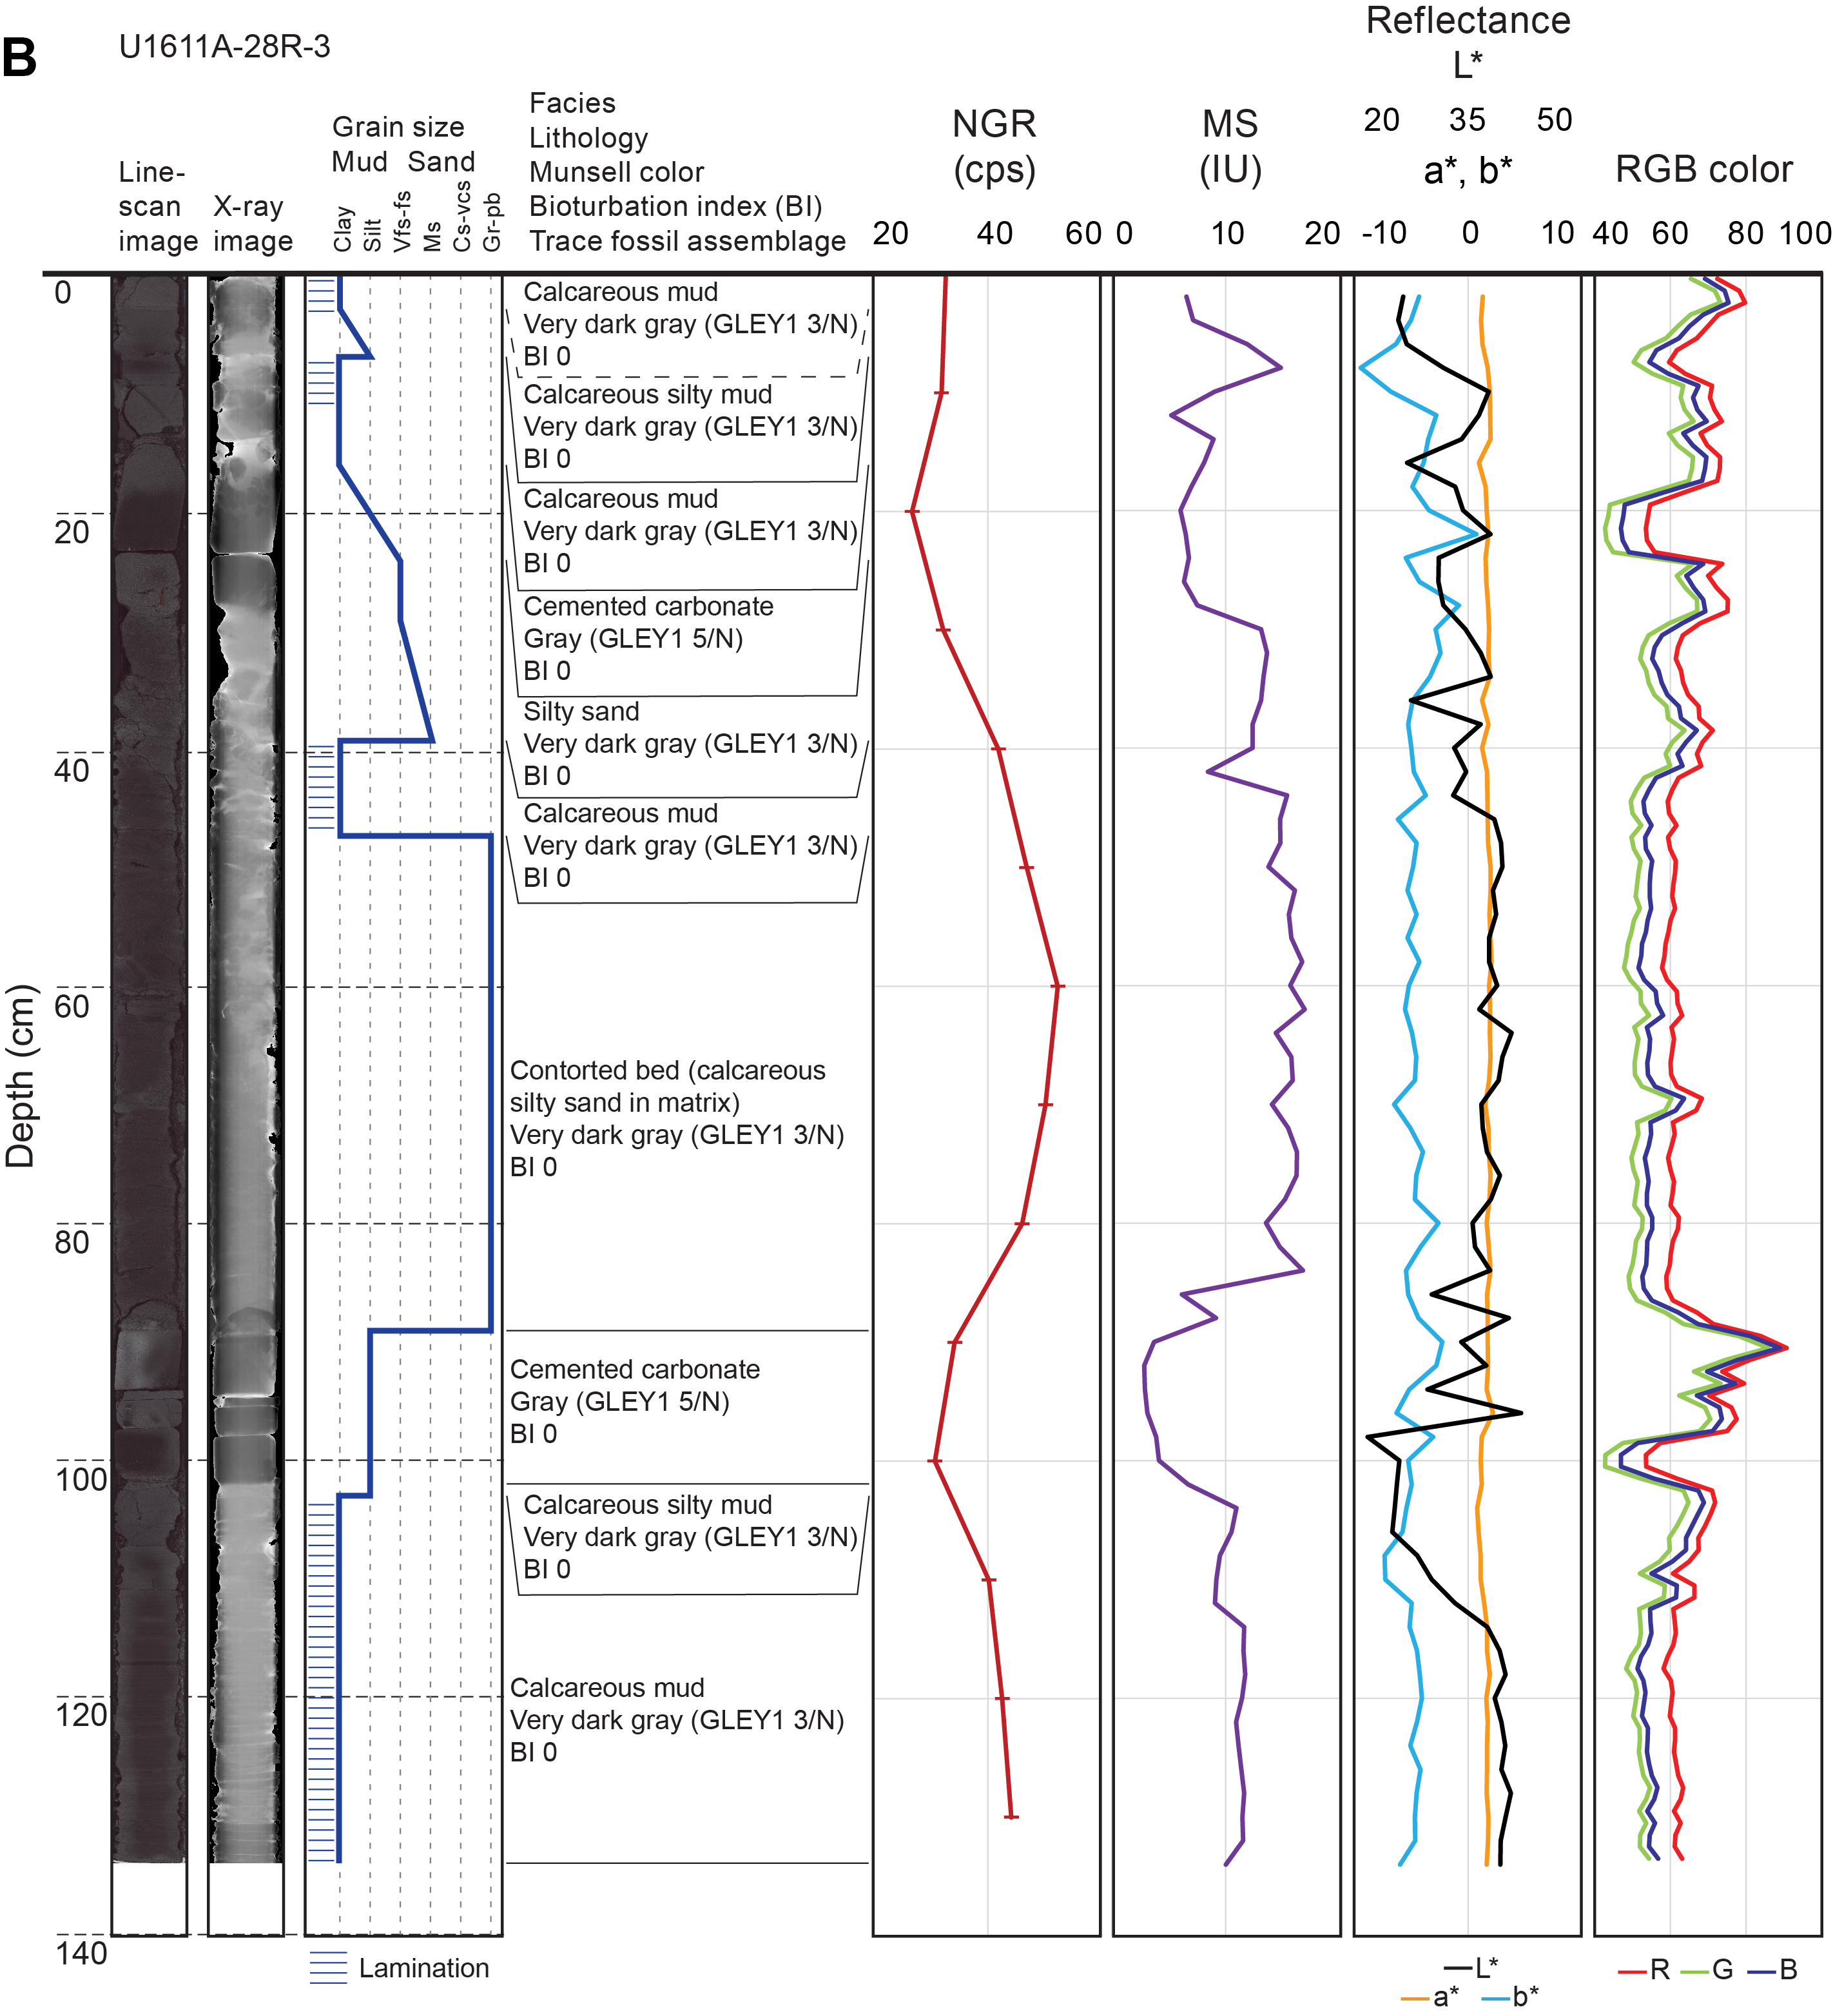
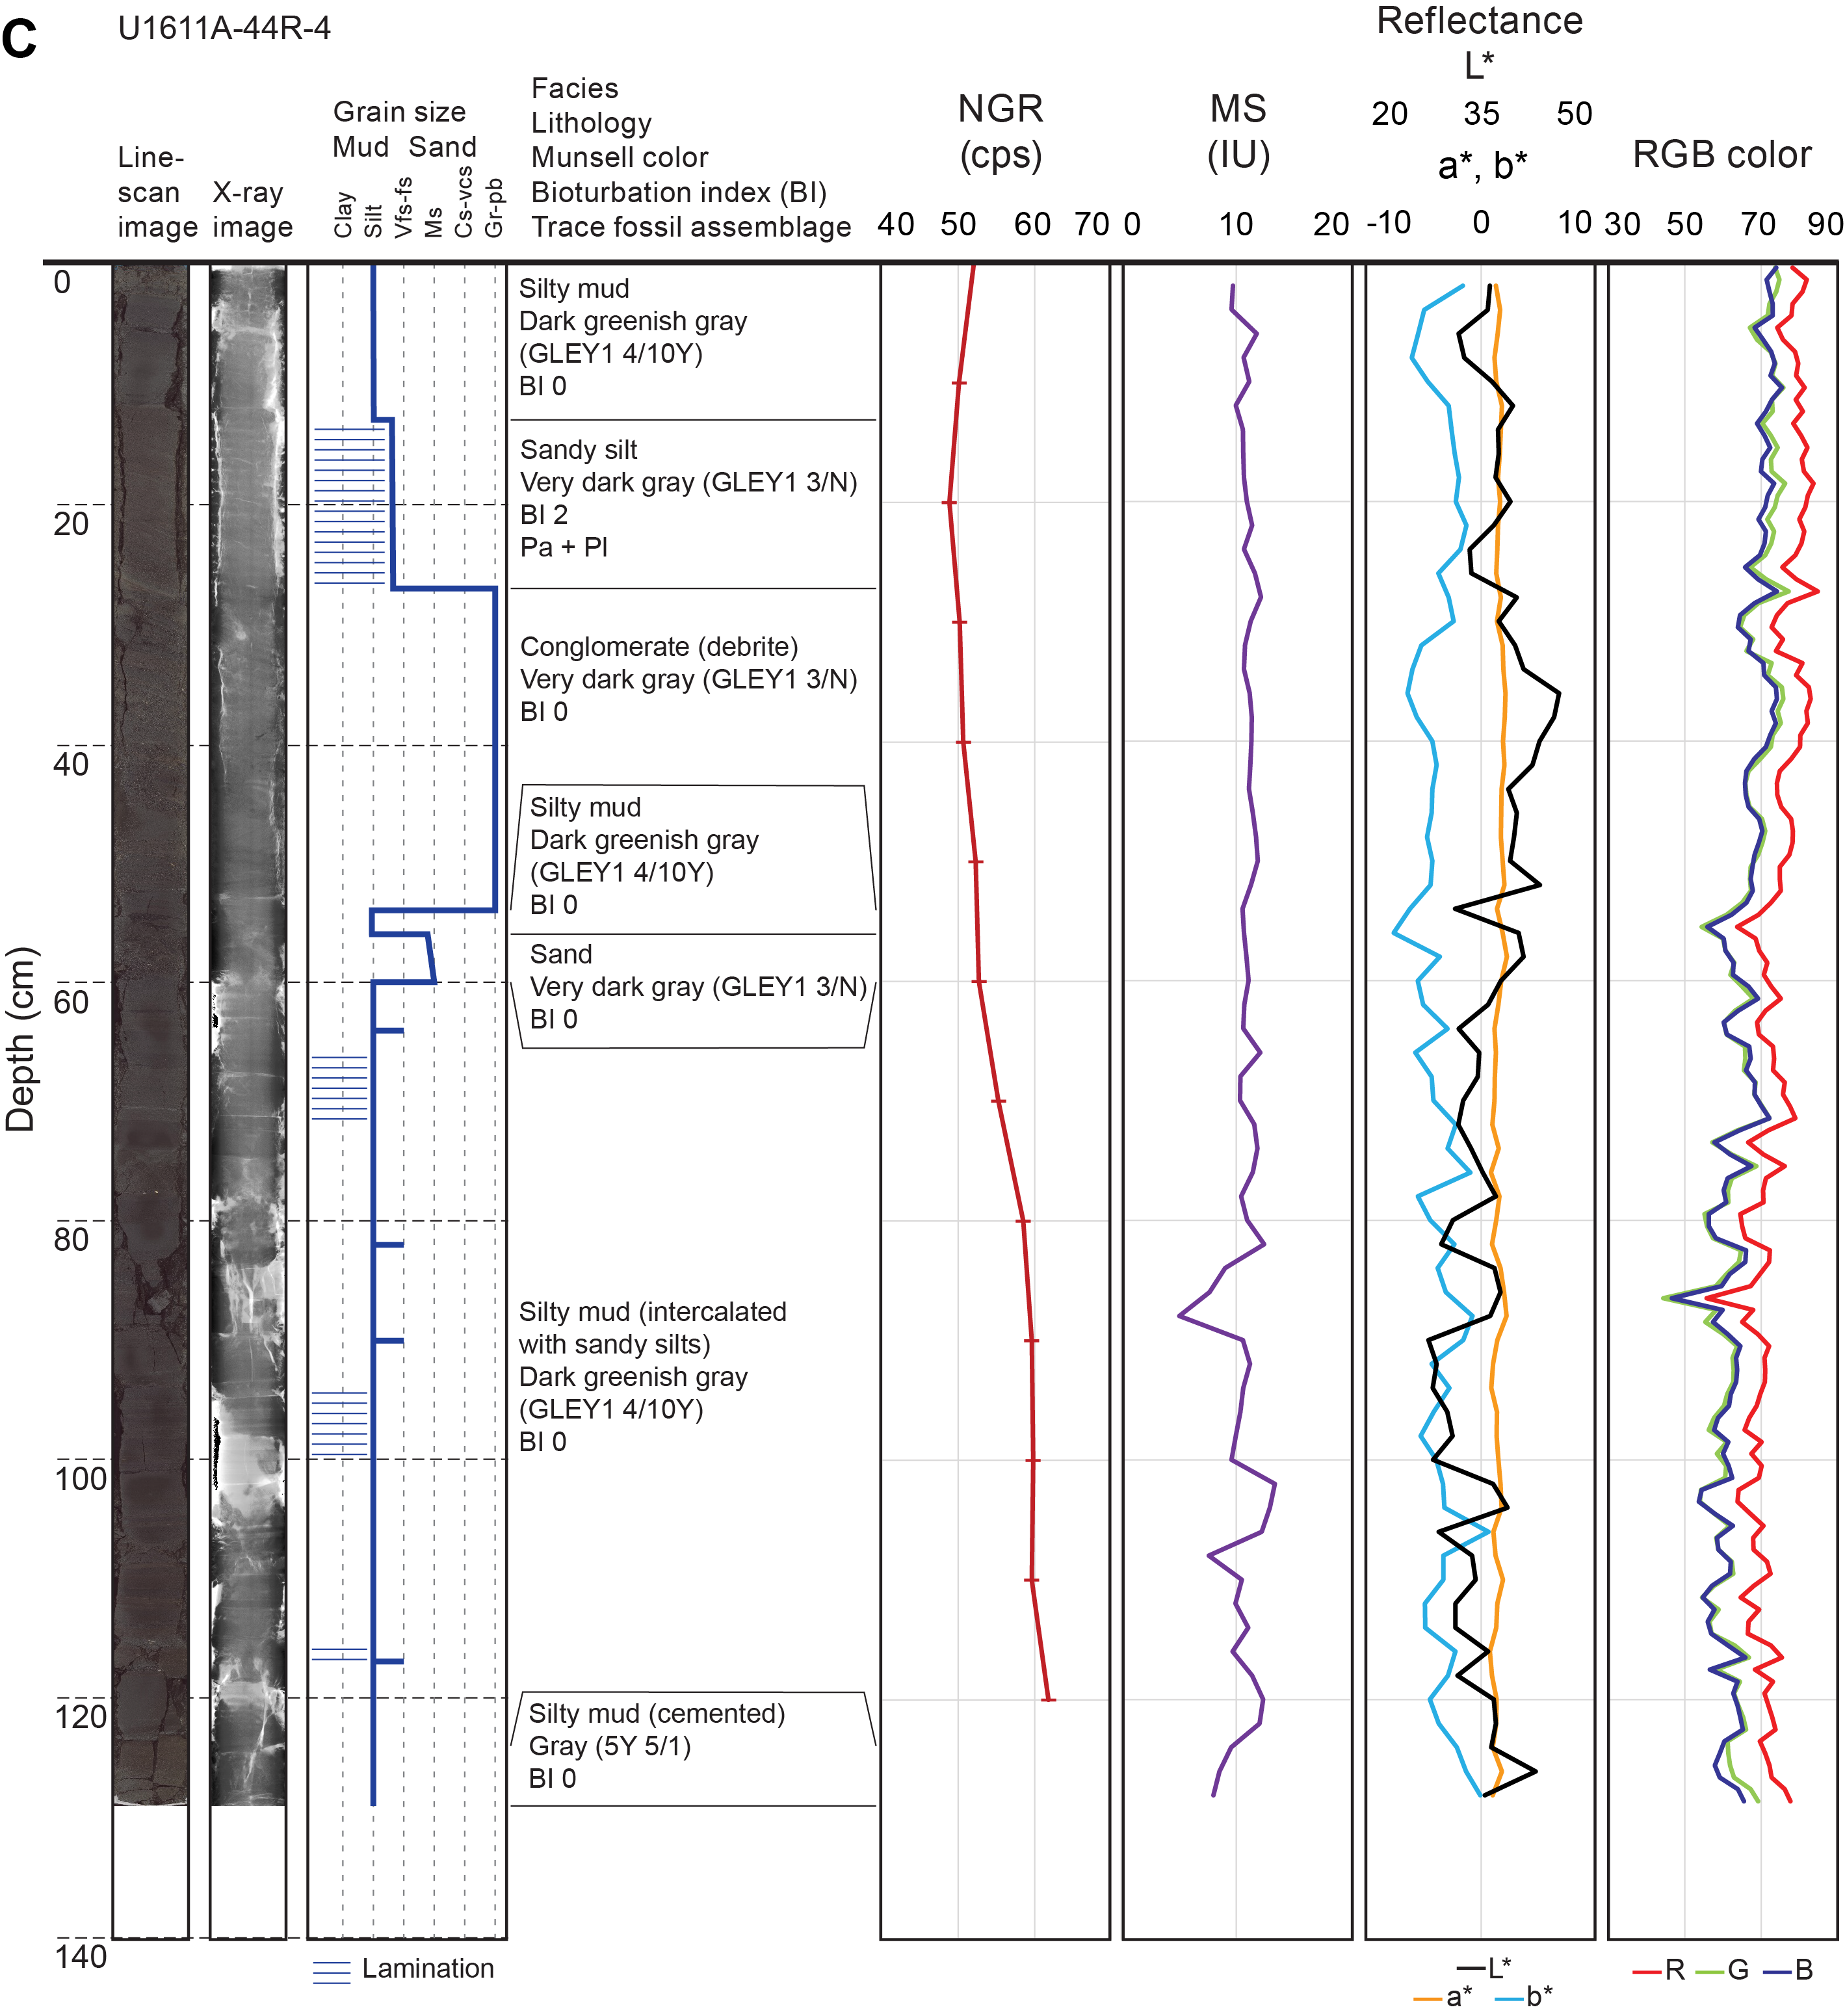
Figure F12. Facies description for each unit.
The trace fossil assemblage at Site U1611 reveals significant variations throughout the cores with respect to abundance and diversity, with some intervals having moderate–abundant trace fossils (bioturbation index [BI] = 3–4) and other intervals lacking bioturbation entirely (BI = 0). Seven ichnotaxa were recognized at the ichnogenus level, including abundant Chondrites and Planolites, common Thalassinoides, rare Palaeophycus and Zoophycos, and occasional Asterosoma and Phycosiphon (Figure F13). Moreover, vertical and horizontal undifferentiated traces were observed. Crosscutting relationships are frequent among the ichnotaxa.
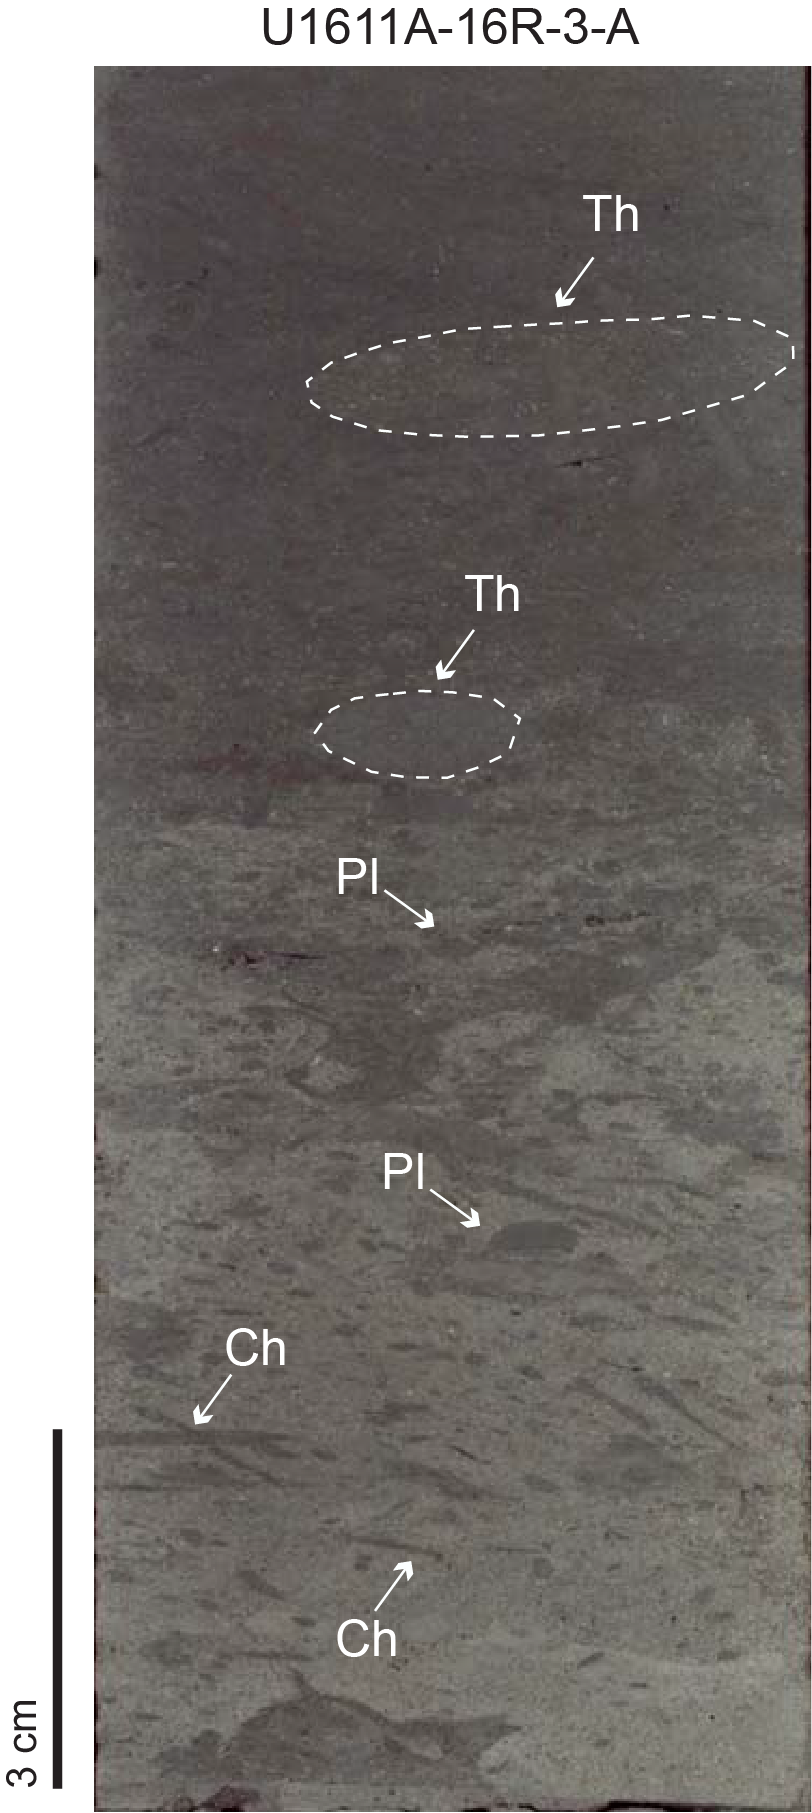
Figure F13. Trace fossil assemblage.
Petrographic analysis of smear slides was carried out regularly on samples from Hole U1611A (n = 146). Smear slides prepared from Hole U1611B (n = 37) were analyzed to confirm the sediment classifications determined from Hole U1611A (Table T2). A total of eight thin sections (TS18, TS19, and TS22–TS26 from Hole U1611A and TS27 from Hole U1611B) were made to gain a general understanding of the sediment composition at the particle scale (i.e., provenance of sediments), texture (e.g., grain size distribution and roundness), and abundance and types of cement in some relatively well lithified or indurated intervals. Two grain mounts (20 and 21) were made from Hole U1611A to determine the type of minerals or clasts using the scanning electron microscope (SEM) equipped with energy dispersive spectrometry (EDS).
Based on shipboard analyses for Holes U1611A and U1611B, the total carbonate content in these cores ranges 5%–94% (see Geochemistry). X-ray diffraction (XRD) analyses were conducted on 23 squeeze cake residues and 25 spot samples collected from the working halves in Hole U1611A and 15 squeeze cake residues in Hole U1611B to gain a general understanding of the bulk mineralogy of different lithologies and identify any large-scale trends with depth. Representative diffraction patterns of the bulk mineralogy of the primary lithologies in all three lithostratigraphic units are shown in Figure F14. The diffraction patterns of XRD samples from Hole U1611B were used to confirm the mineral assemblage identified in samples from Hole U1611A. Based on these XRD data, downhole variations in mineralogical composition were interpreted (see Lithostratigraphy in the Expedition 401 methods chapter [Flecker et al., 2025a]).
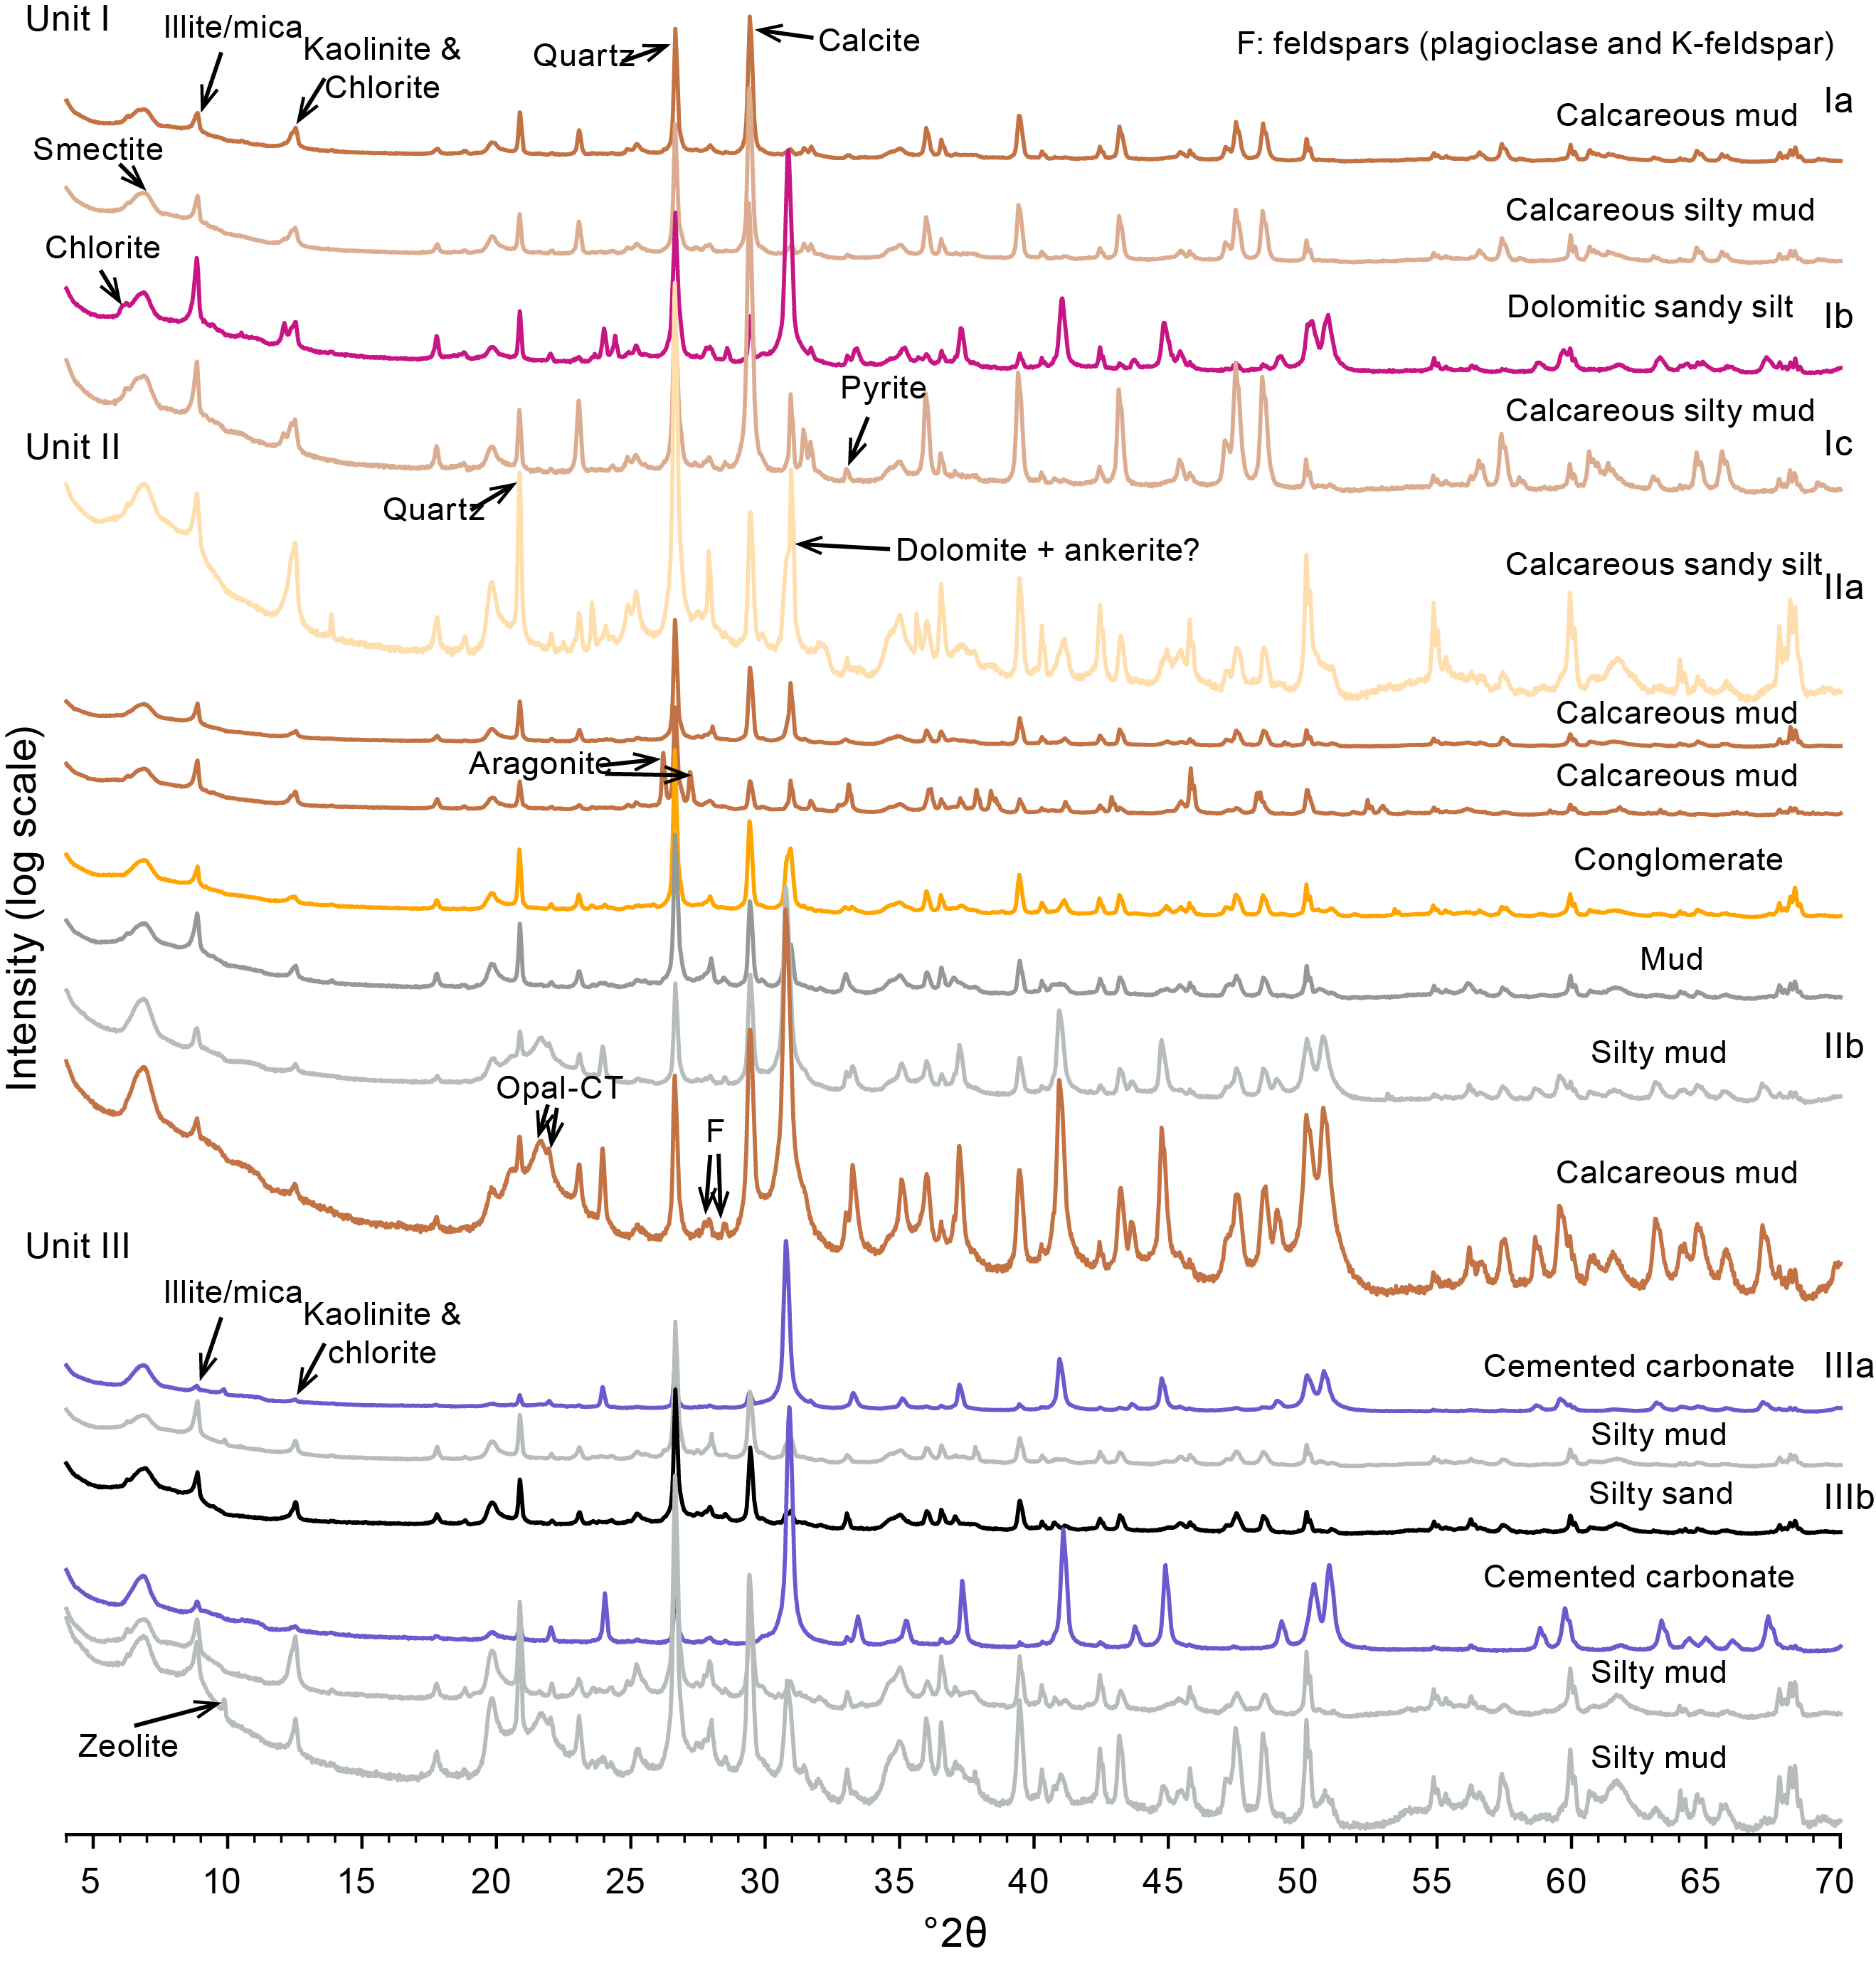
Figure F14. Powder XRD patterns.
The primary minerals identified in Unit I include quartz, calcite, plagioclase, K-feldspar, dolomite, and clay minerals including chlorite, illite (or mica), kaolinite, and mixed-layer illite/smectite (I/S) and minor pyrite (Figure F14). These minerals are also present in Units II and III. Additionally, aragonite was detected in two samples from Unit II (401-U1611A-30R-1, 62–63 cm [913.92 m CSF-A], and 34R-3, 83–84 cm [955.77 m CSF-A]). Two other samples from Unit II (37R-1, 39–40 cm [981.59 m CSF-A], and 38R-1, 107–108 cm [991.97 m CSF-A]) contain opal-CT (tridymite and cristobalite). Zeolite is detected in a Unit II sample at 981.59 m CSF-A in Hole U1611A and in Unit III Sample 60R-1, 29.5–31 cm (1131.895 m CSF-A). Sample 84R-2, 139–149 cm (1265.37 m CSF-A), in Unit III contains both zeolite and opal-CT. Aragonite was not detected in Unit III.
Where total carbonate content was analyzed using both coulometry (see Geochemistry) and XRD on samples from the same stratigraphic intervals, the results are largely consistent with each other (Figure F15). The downhole variation in relative abundance of different primary minerals and mineral groups based on Hole U1611A XRD analysis is shown in Figure F16. In general, the total carbonate content in the sediments is relatively high (~40%) in Unit I. Units II and III are generally characterized by relatively lower total carbonate and calcite content (10%–20%). However, a few thin horizons in Unit II are characterized by 30%–40% aragonite content, and some spot samples taken from Subunit IIb and Unit III are characterized by >50% total carbonate content. XRD analysis indicates that these high-carbonate samples contain dominantly dolomite with minor calcite. Because of the large sampling interval for interstitial water (IW) squeeze cakes and the lithology-driven sampling strategy for XRD analysis, the variations in total carbonate content shown in Figure F15 likely do not fully capture the shorter term variations in total carbonate content in Units II and III.
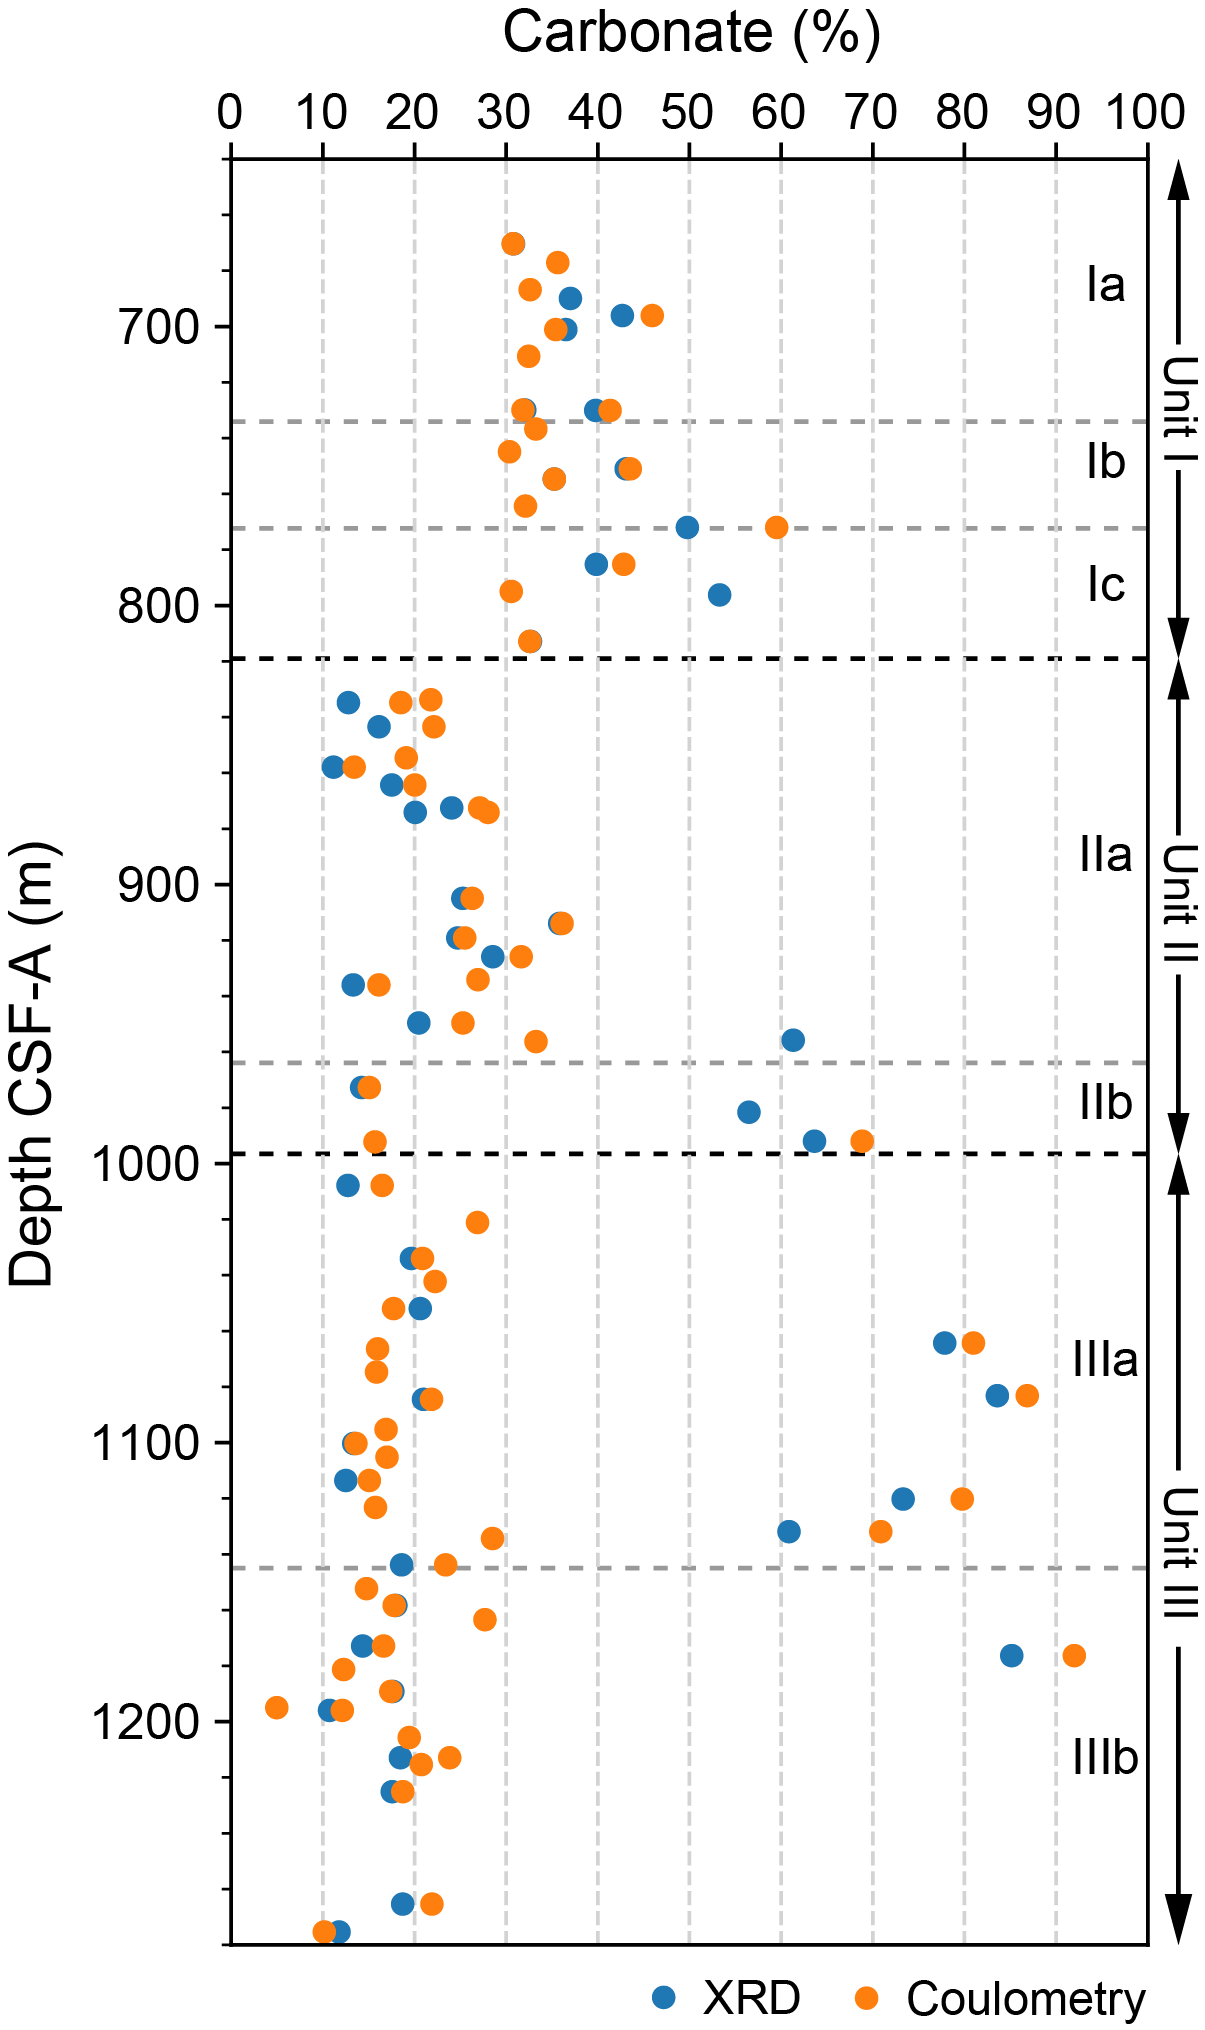
Figure F15. Variation in total carbonate content.
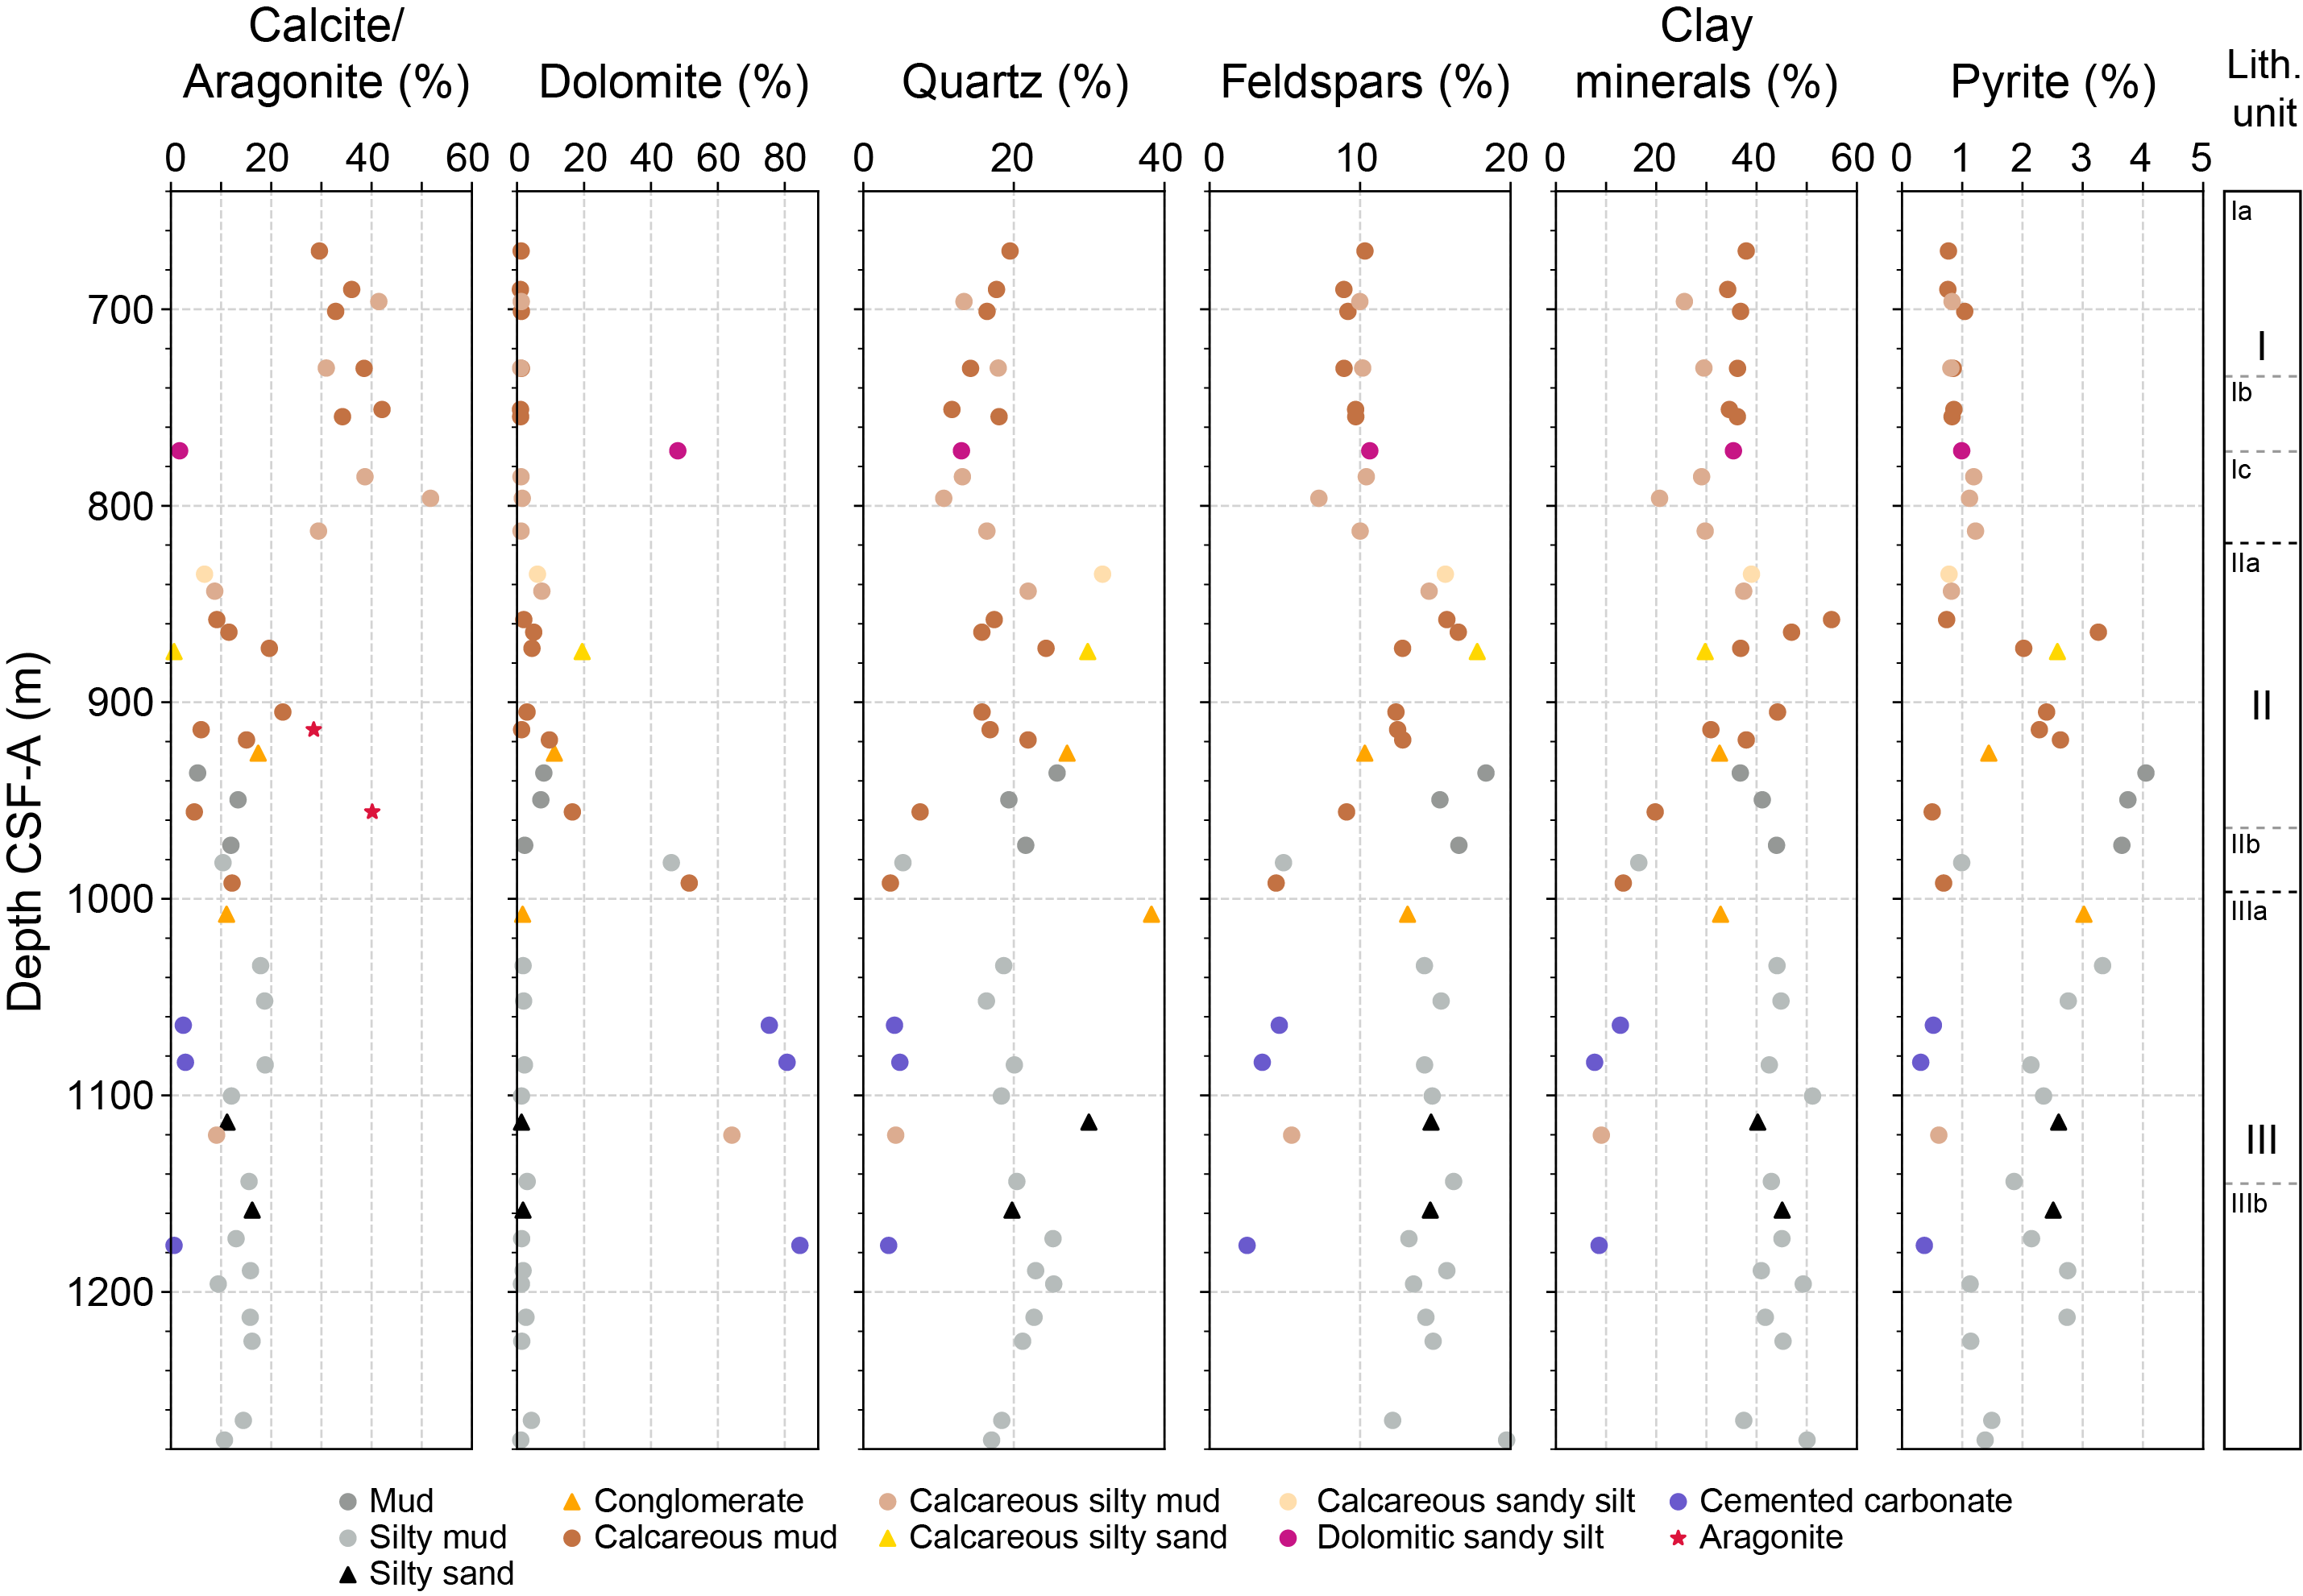
Figure F16. Variations in sediment composition.
3.1. Unit I description
- Intervals: 401-U1611A-3R-1 through 18R-7; 401-U1611B-3R-1 through 14R-1
- Depths: Hole U1611A = 656.3–820.4 m CSF-A; Hole U1611B = 746.4–814.2 m CSF-A
- Age: late Zanclean to late Messinian
- Subunit Ia interval: 401-U1611A-3R-1 through 9R-CC
- Subunit Ia depth: 656.3–733.9 m CSF-A
- Subunit Ib interval: 401-U1611A-10R-1 through 13R-7
- Subunit Ib depth: 733.9–772.3 m CSF-A
- Subunit Ic interval: 401-U1611A-15R-1 through 18R-7
- Subunit Ic depth: 782.4–820.4 m CSF-A
3.1.1. Lithologies, bedding, and color
Unit I is composed of calcareous mud and calcareous silty mud, with minor silty mud, calcareous sandy mud, calcareous sandy silt, calcareous silty sand, and conglomerate (Figures F10A, F11A). These beds alternate and vary in thickness. The average bed thickness in Hole U1611A Unit I is 35 cm for both calcareous mud and calcareous silty mud. Average bed thickness for Hole U1611B Unit I is 30 cm for calcareous mud and 40 cm for calcareous silty mud. Contacts between lithologies are typically gradual and occasionally sharp or erosional, particularly at the base of the coarser grained layers (e.g., sandy silt, silty sand, and conglomerate lithologies) (Figure F12A). Conglomerate beds range in thickness from 3 to ≥60 cm.
Subunit Ia consists of alternating calcareous mud and calcareous silty mud, with one interval of calcareous sandy mud. Calcareous mud is typically greenish gray (GLEY1 5/5GY) and occasionally dark greenish gray (GLEY1 4/5GY), particularly in the upper part of Subunit Ia. Calcareous silty mud and calcareous sandy mud are dark greenish gray (GLEY1 4/5GY). Contacts between lithologies are gradational and occasionally sharp and associated with a distinct color change.
Subunit Ib also consists of alternating calcareous mud and calcareous silty mud. Compared to Subunit Ia, there are more frequent coarser grained intervals in Subunit Ib, including sandy silt and silty sand with varying amounts of carbonate and conglomerate. Calcareous mud is typically greenish gray (GLEY1 5/10Y), and the coarser grained lithologies are typically a darker shade of greenish gray (GLEY1 4/10Y and GLEY1 3/10Y) or a very dark grayish brown (2.5Y 3/2). Conglomerate intervals contain clasts of calcareous mud, calcareous silty mud, and silty sand. Contacts between lithologies are typically gradational and occasionally sharp.
Subunit Ic is composed predominantly of calcareous silty mud with thinner intervals of calcareous mud and occurrences of calcareous sandy mud, sandy silt, and conglomerate. Calcareous silty mud is typically dark greenish gray (GLEY1 4/10Y) and occasionally a lighter shade of greenish gray (GLEY1 6/10Y), and calcareous mud is greenish gray (GLEY1 5/10Y). Coarser grained lithologies such as sandy silt, calcareous sandy mud, and conglomerate range in color from dark greenish gray (GLEY1 4/10Y) to gray (5Y 5/1). Contacts between lithologies are predominantly gradational, except for many of the coarser grained intervals and at the base of the calcareous mud, where contacts are sharp and sometimes bioturbated.
Maximum grain size is typically fine to medium sand with occasional pebble-sized clasts in the conglomerate. A distinctive conglomerate was recovered in both holes near the Miocene/Pliocene boundary in Unit I, overlain by calcareous silty mud with parallel and cross lamination (Figure F17). This potentially provides a means of correlation between Holes U1611A and U1611B.
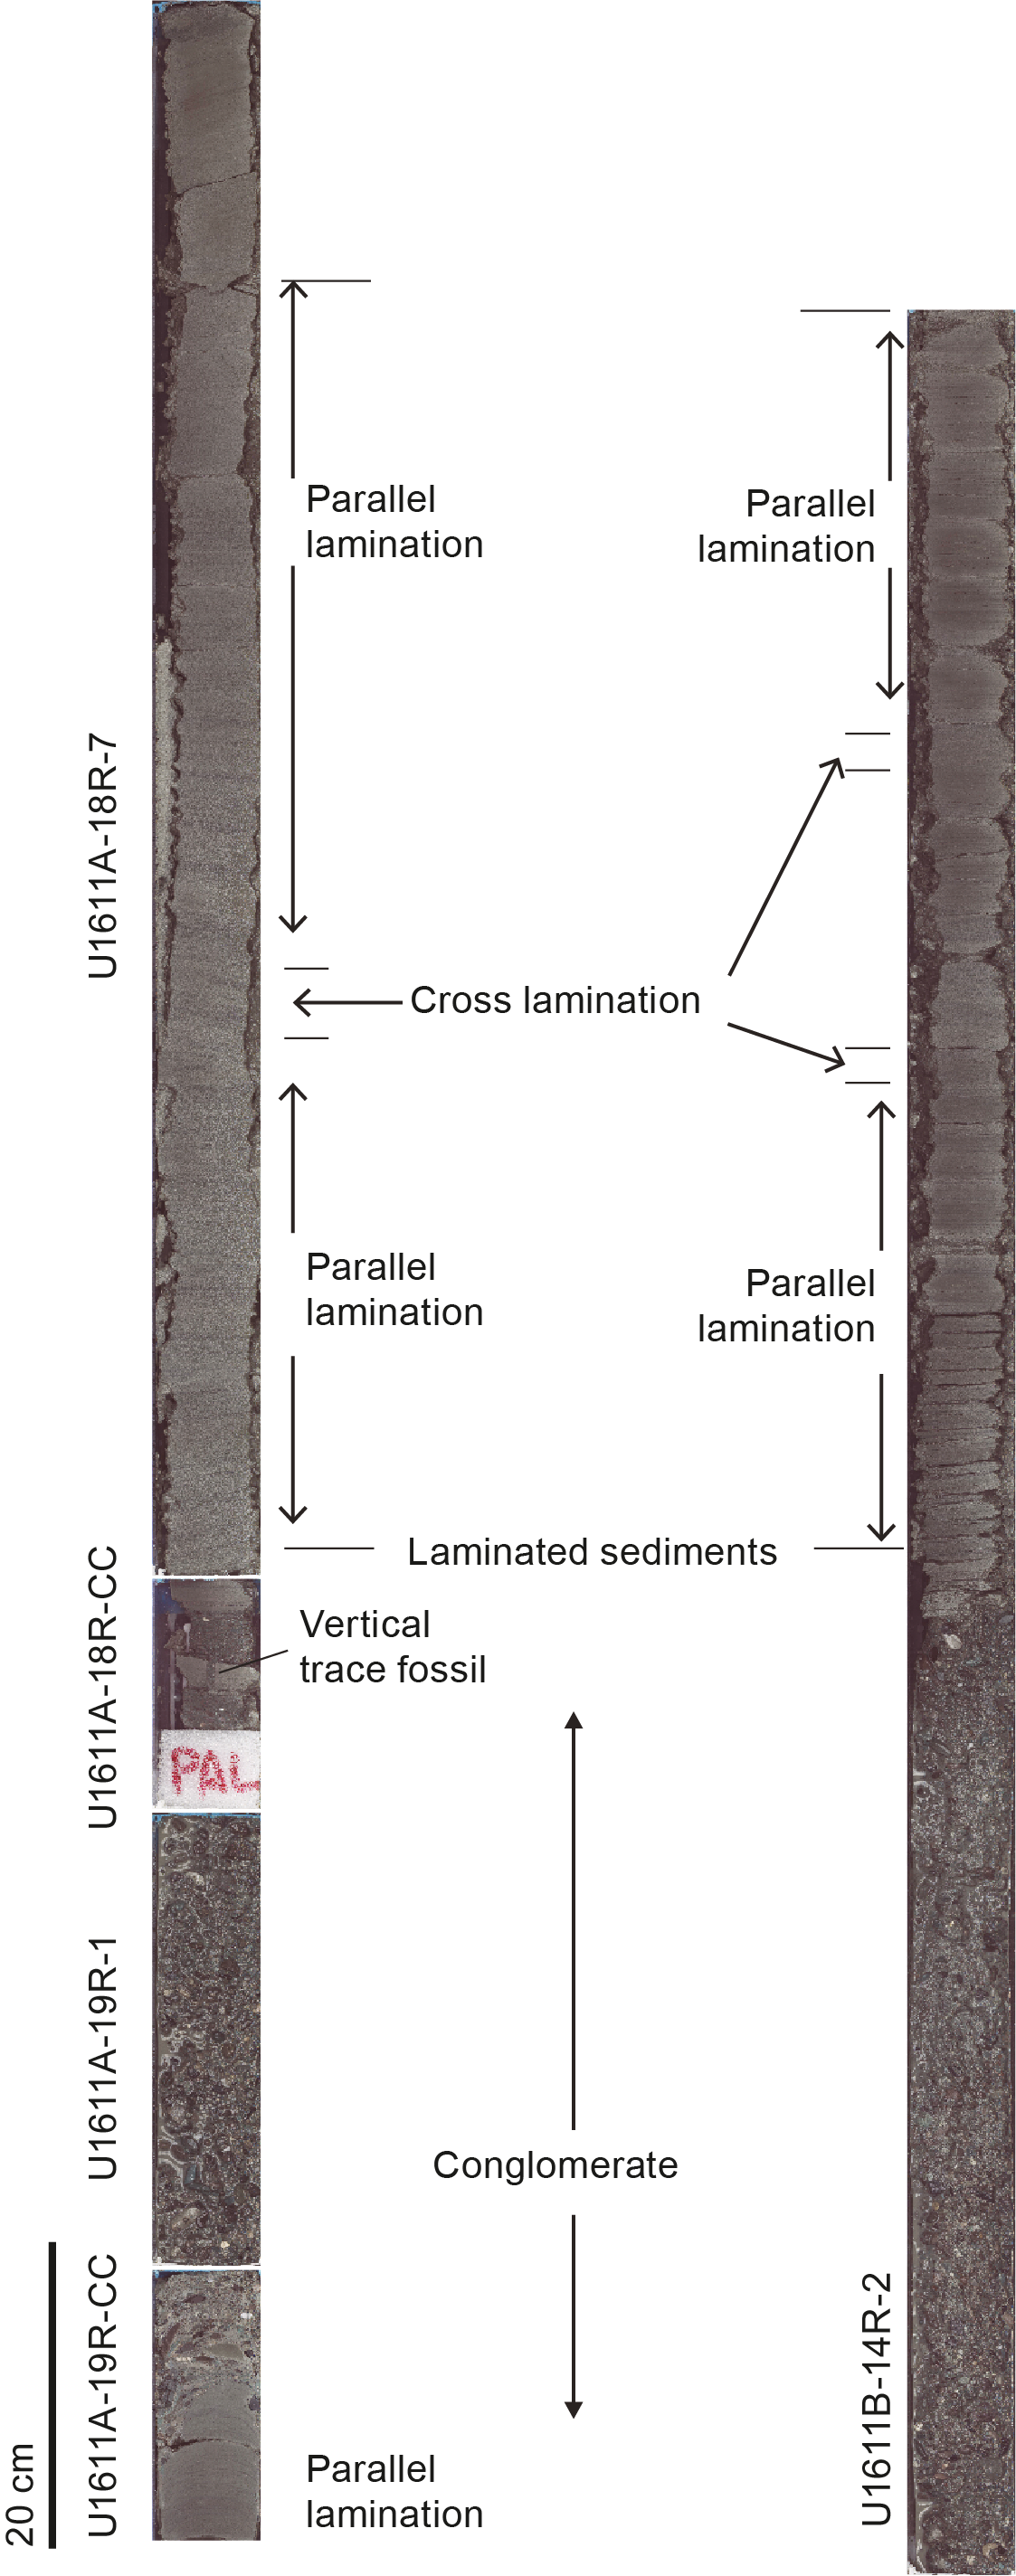
Figure F17. Miocene/Pliocene boundary.
3.1.2. Structure and texture
The calcareous muds and silty muds commonly have gradational contacts, but sometimes the basal contact of calcareous mud with silty mud is sharper and the transition between silty mud and mud is more gradational (especially in Subunit Ia). In other cases, the contact of calcareous mud with silty mud is gradational but the transition between silty mud and mud is sharper (especially in Subunit Ic). The facies association between these two lithologies represents bigradational sequences (e.g., Section 401-U1611A-4R-4; Figure F18); rarely, the central interval contains silty sand rather than silty mud. Silty mud occasionally has lamination, color banding (e.g., Section 7R-1; Figure F18), and rarely, low-angle cross lamination (Section 18R-7).
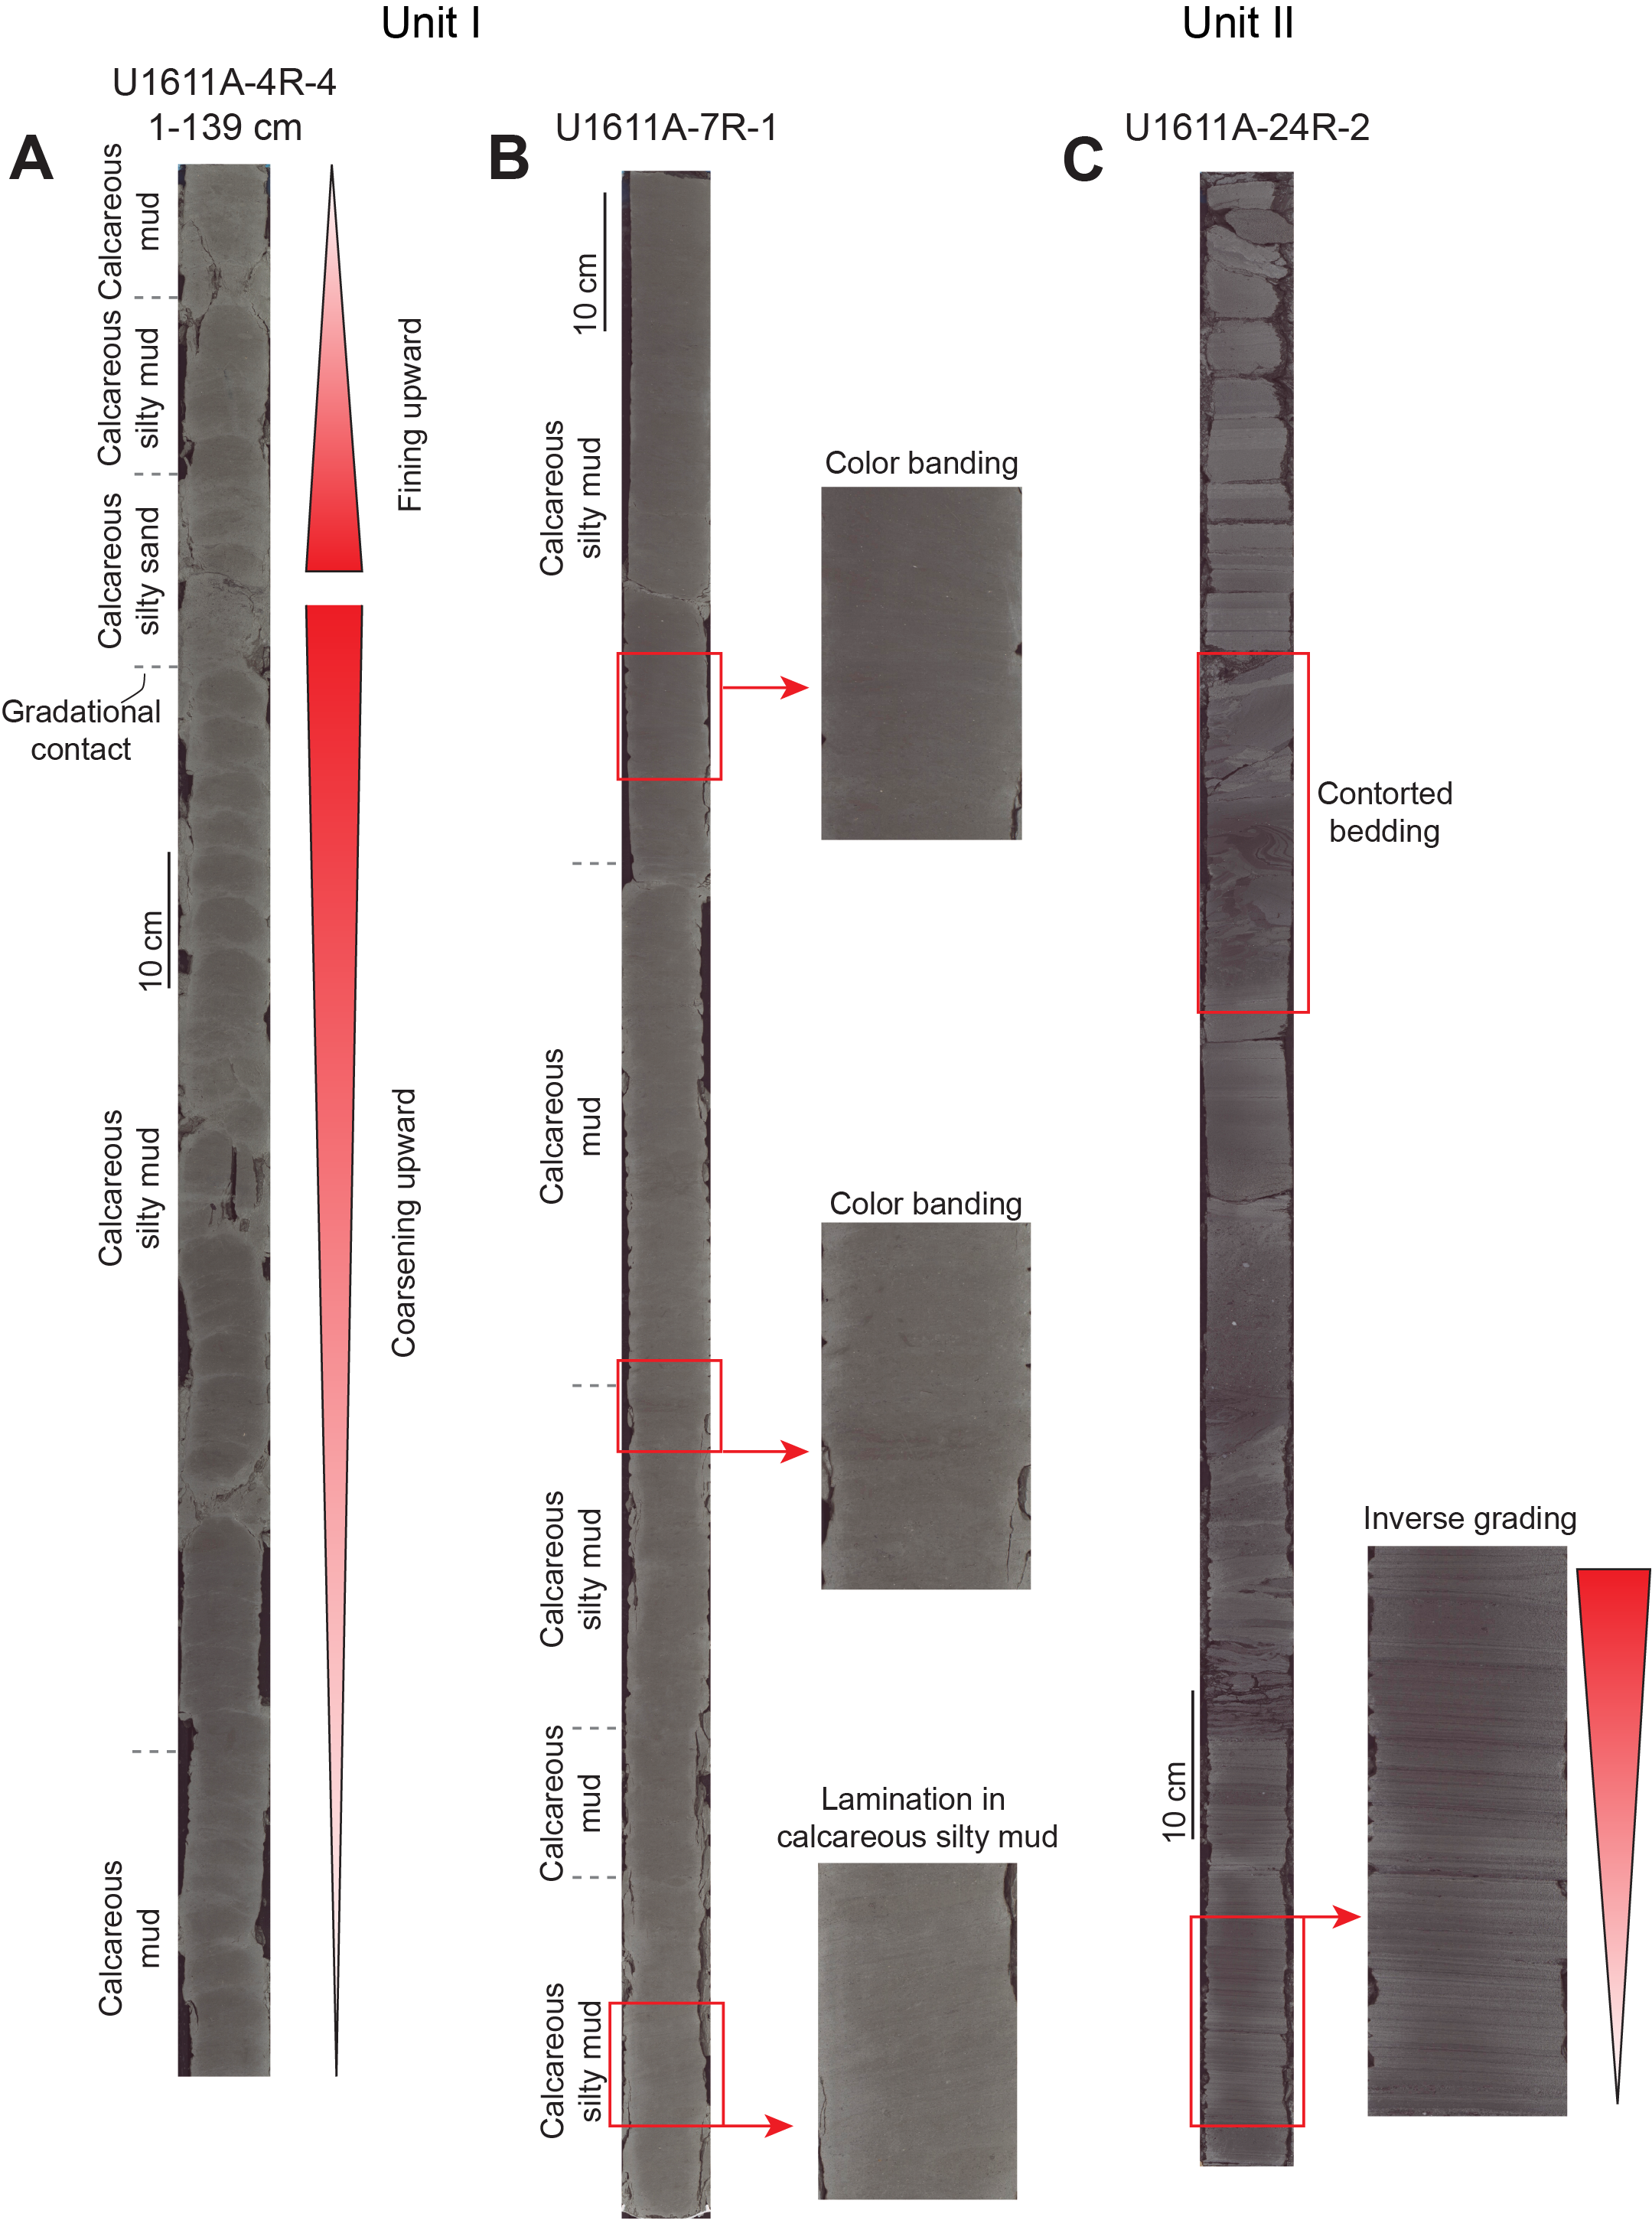
Figure F18. Grading and color banding.
Calcareous sandy mud, sandy silt, silty sand, and fine sand deposits have sharp basal contacts, have massive and/or normal grading, and are parallel laminated. Sometimes these beds are bioturbated at the top and contain organic matter. There are occasional microfaults and contorted bedding in the Unit I sediments (Figure F19).
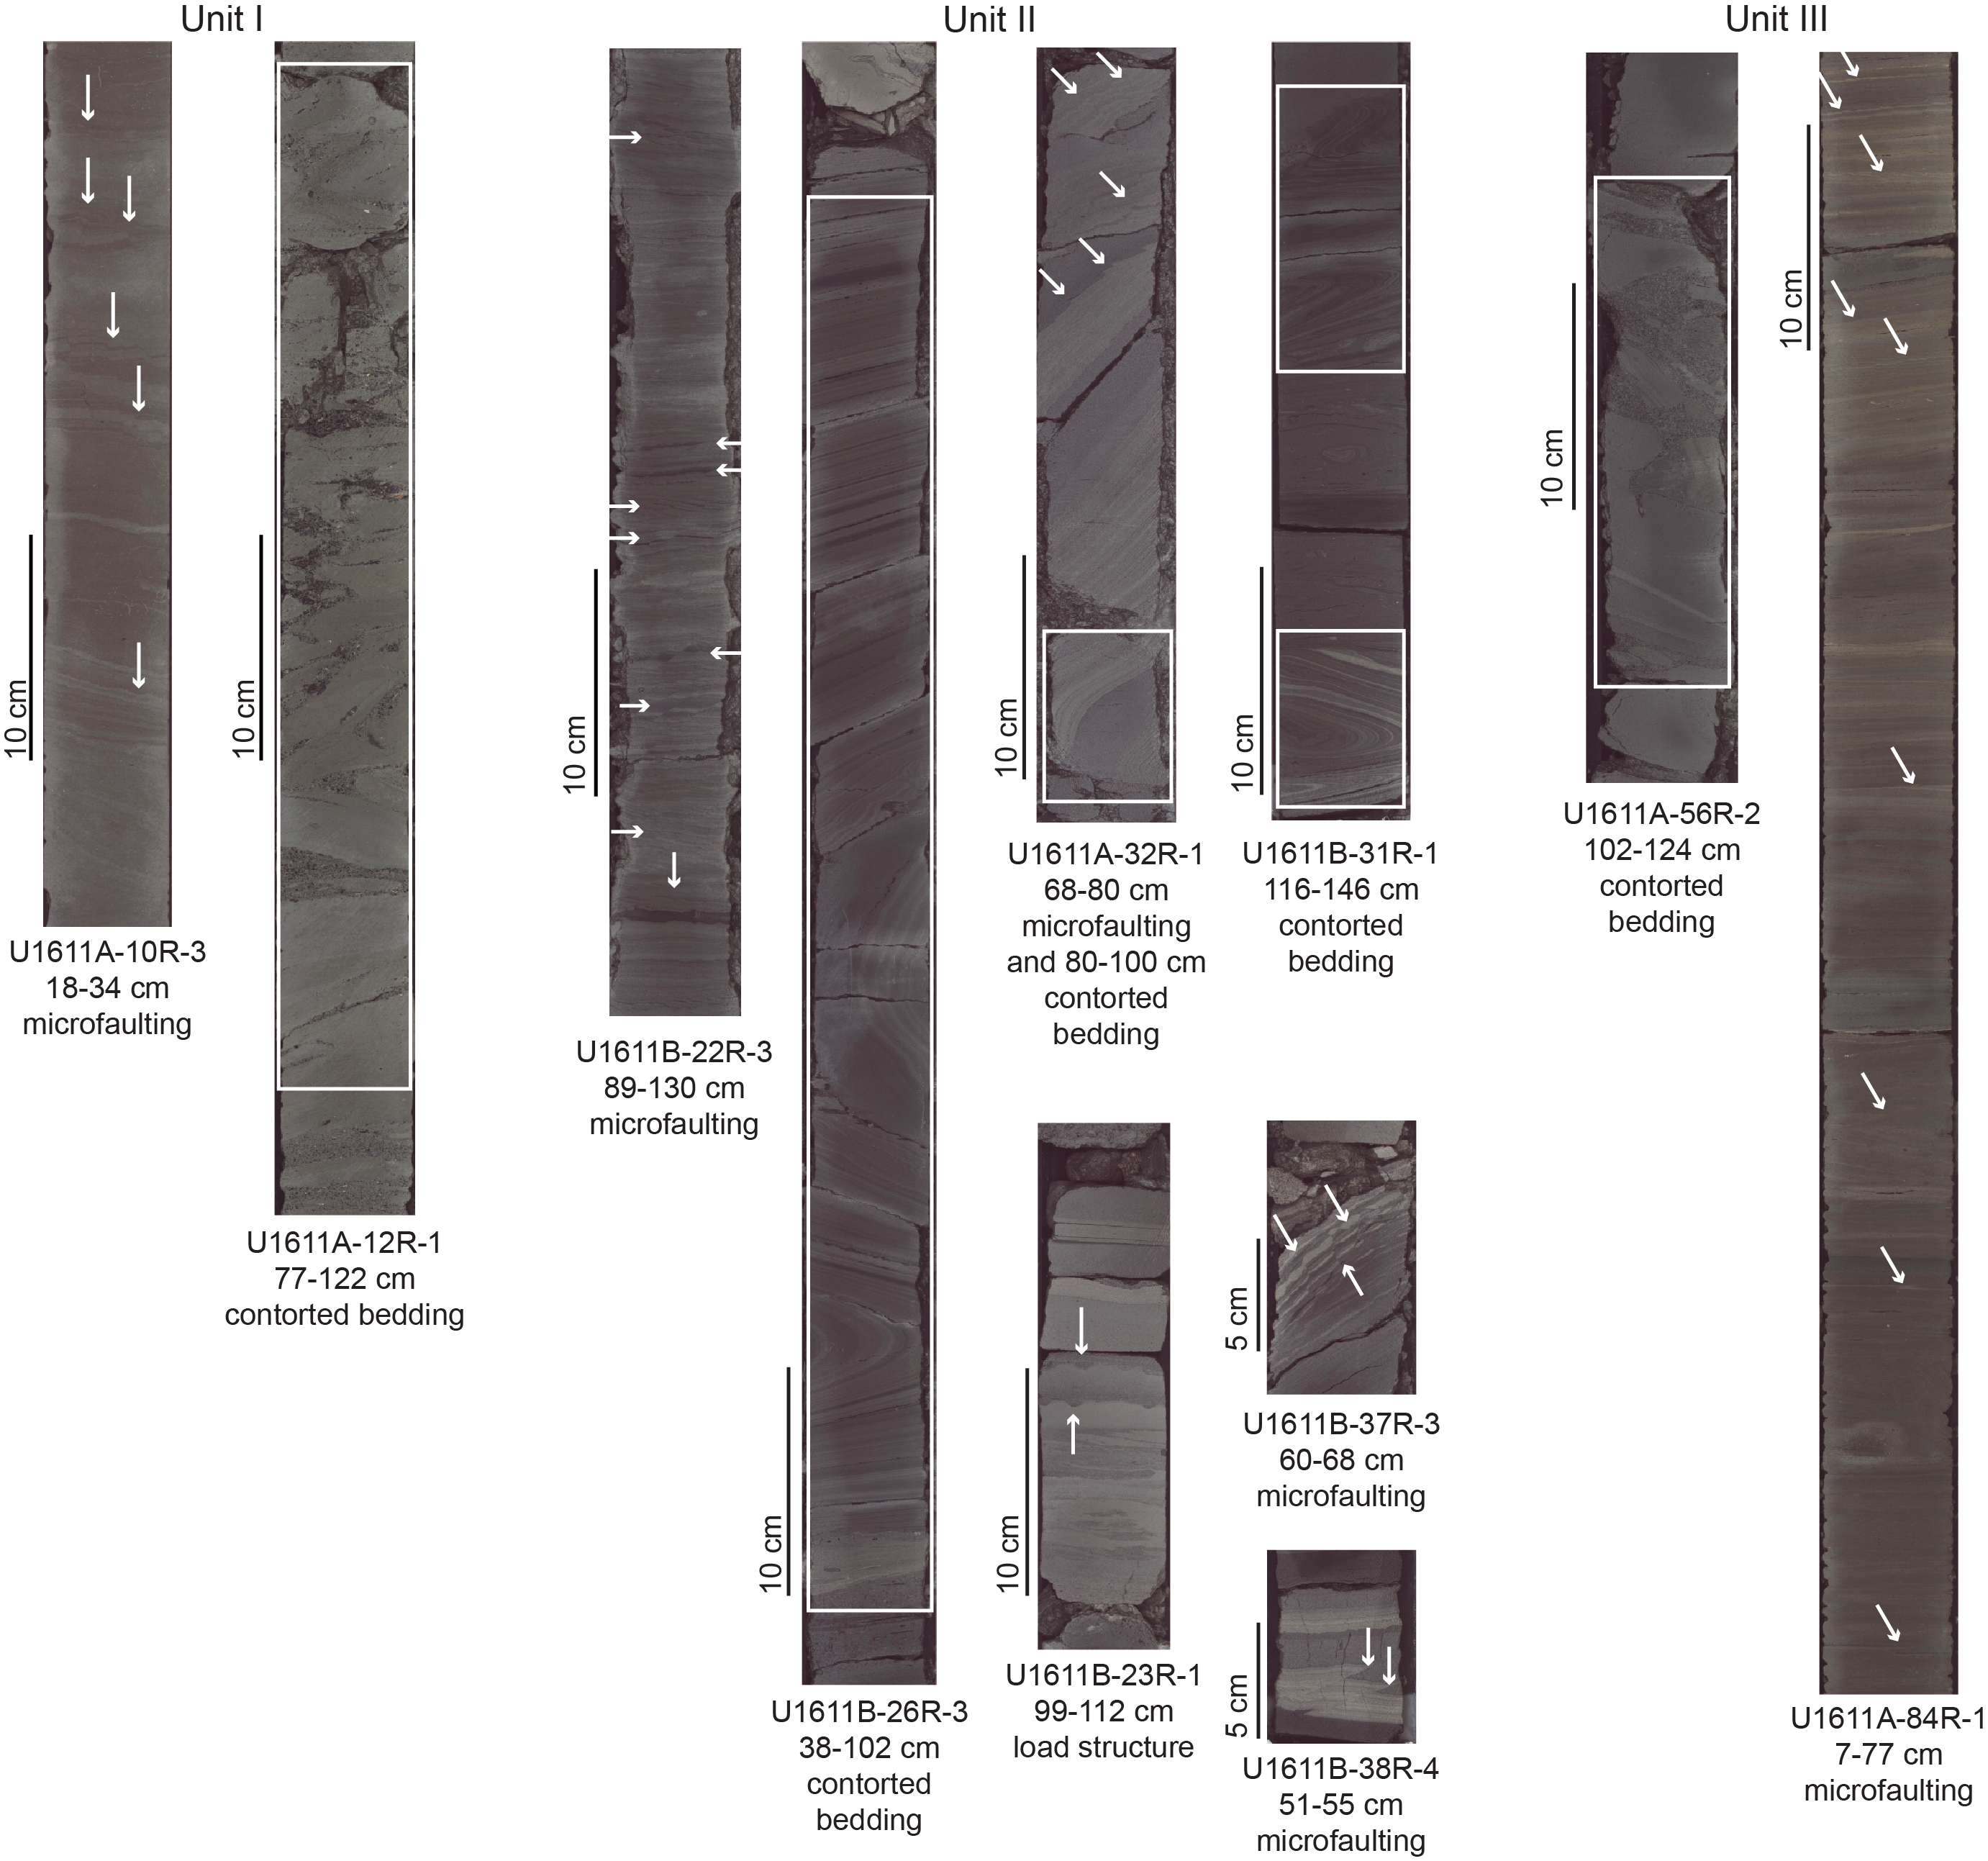
Figure F19. Deformational structures.
Based on smear slide analysis (Figure F20; Table T2), Unit I calcareous mud has an average texture of 2% sand, 35% silt, and 60% clay, and calcareous silty mud has an average of 5% sand, 50% silt, and 50% clay (Figure F21); the silt and sand contents of these lithologies are variable and overlap, with 0%–5% sand and 20%–45% silt in calcareous mud and 0%–25% sand and 30%–70% silt in calcareous silty mud (Figure F22). Coarser grained lithologies (e.g., sandy silt and silty sand) in Unit I contain averages of 25% sand, 40% silt, and 30% clay (Figure F21), with more grain size variability (Figure F22).
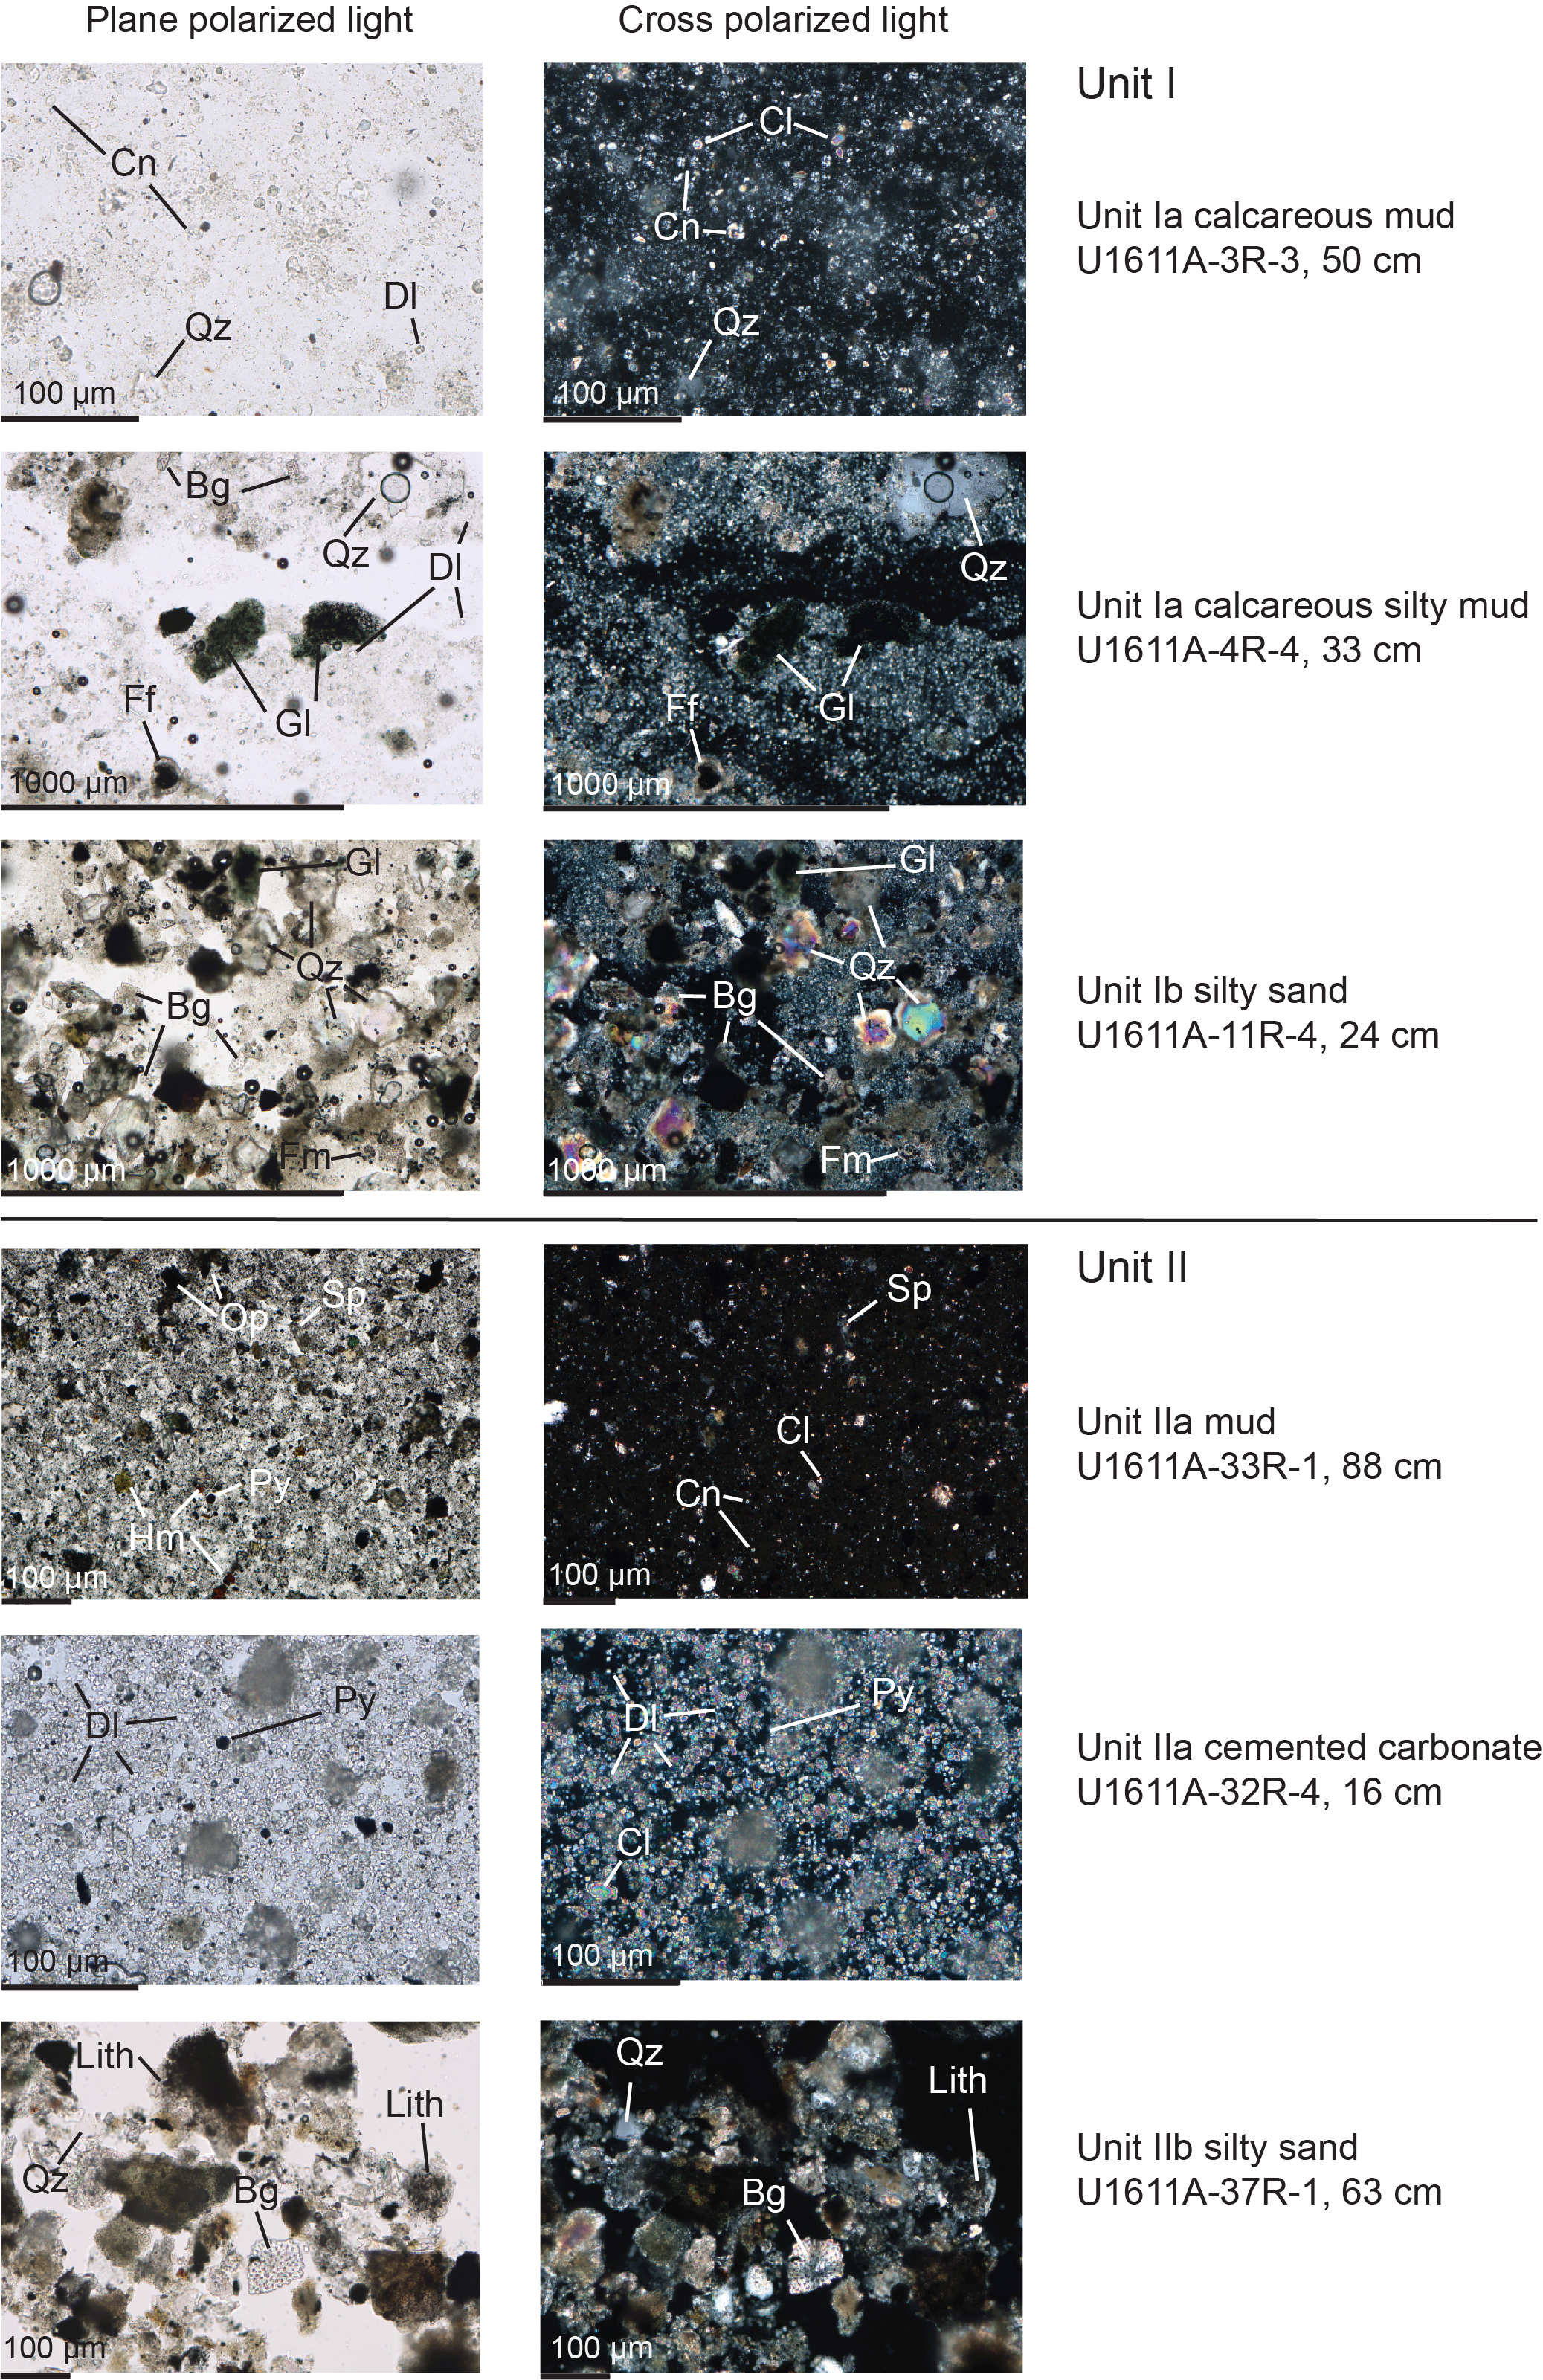
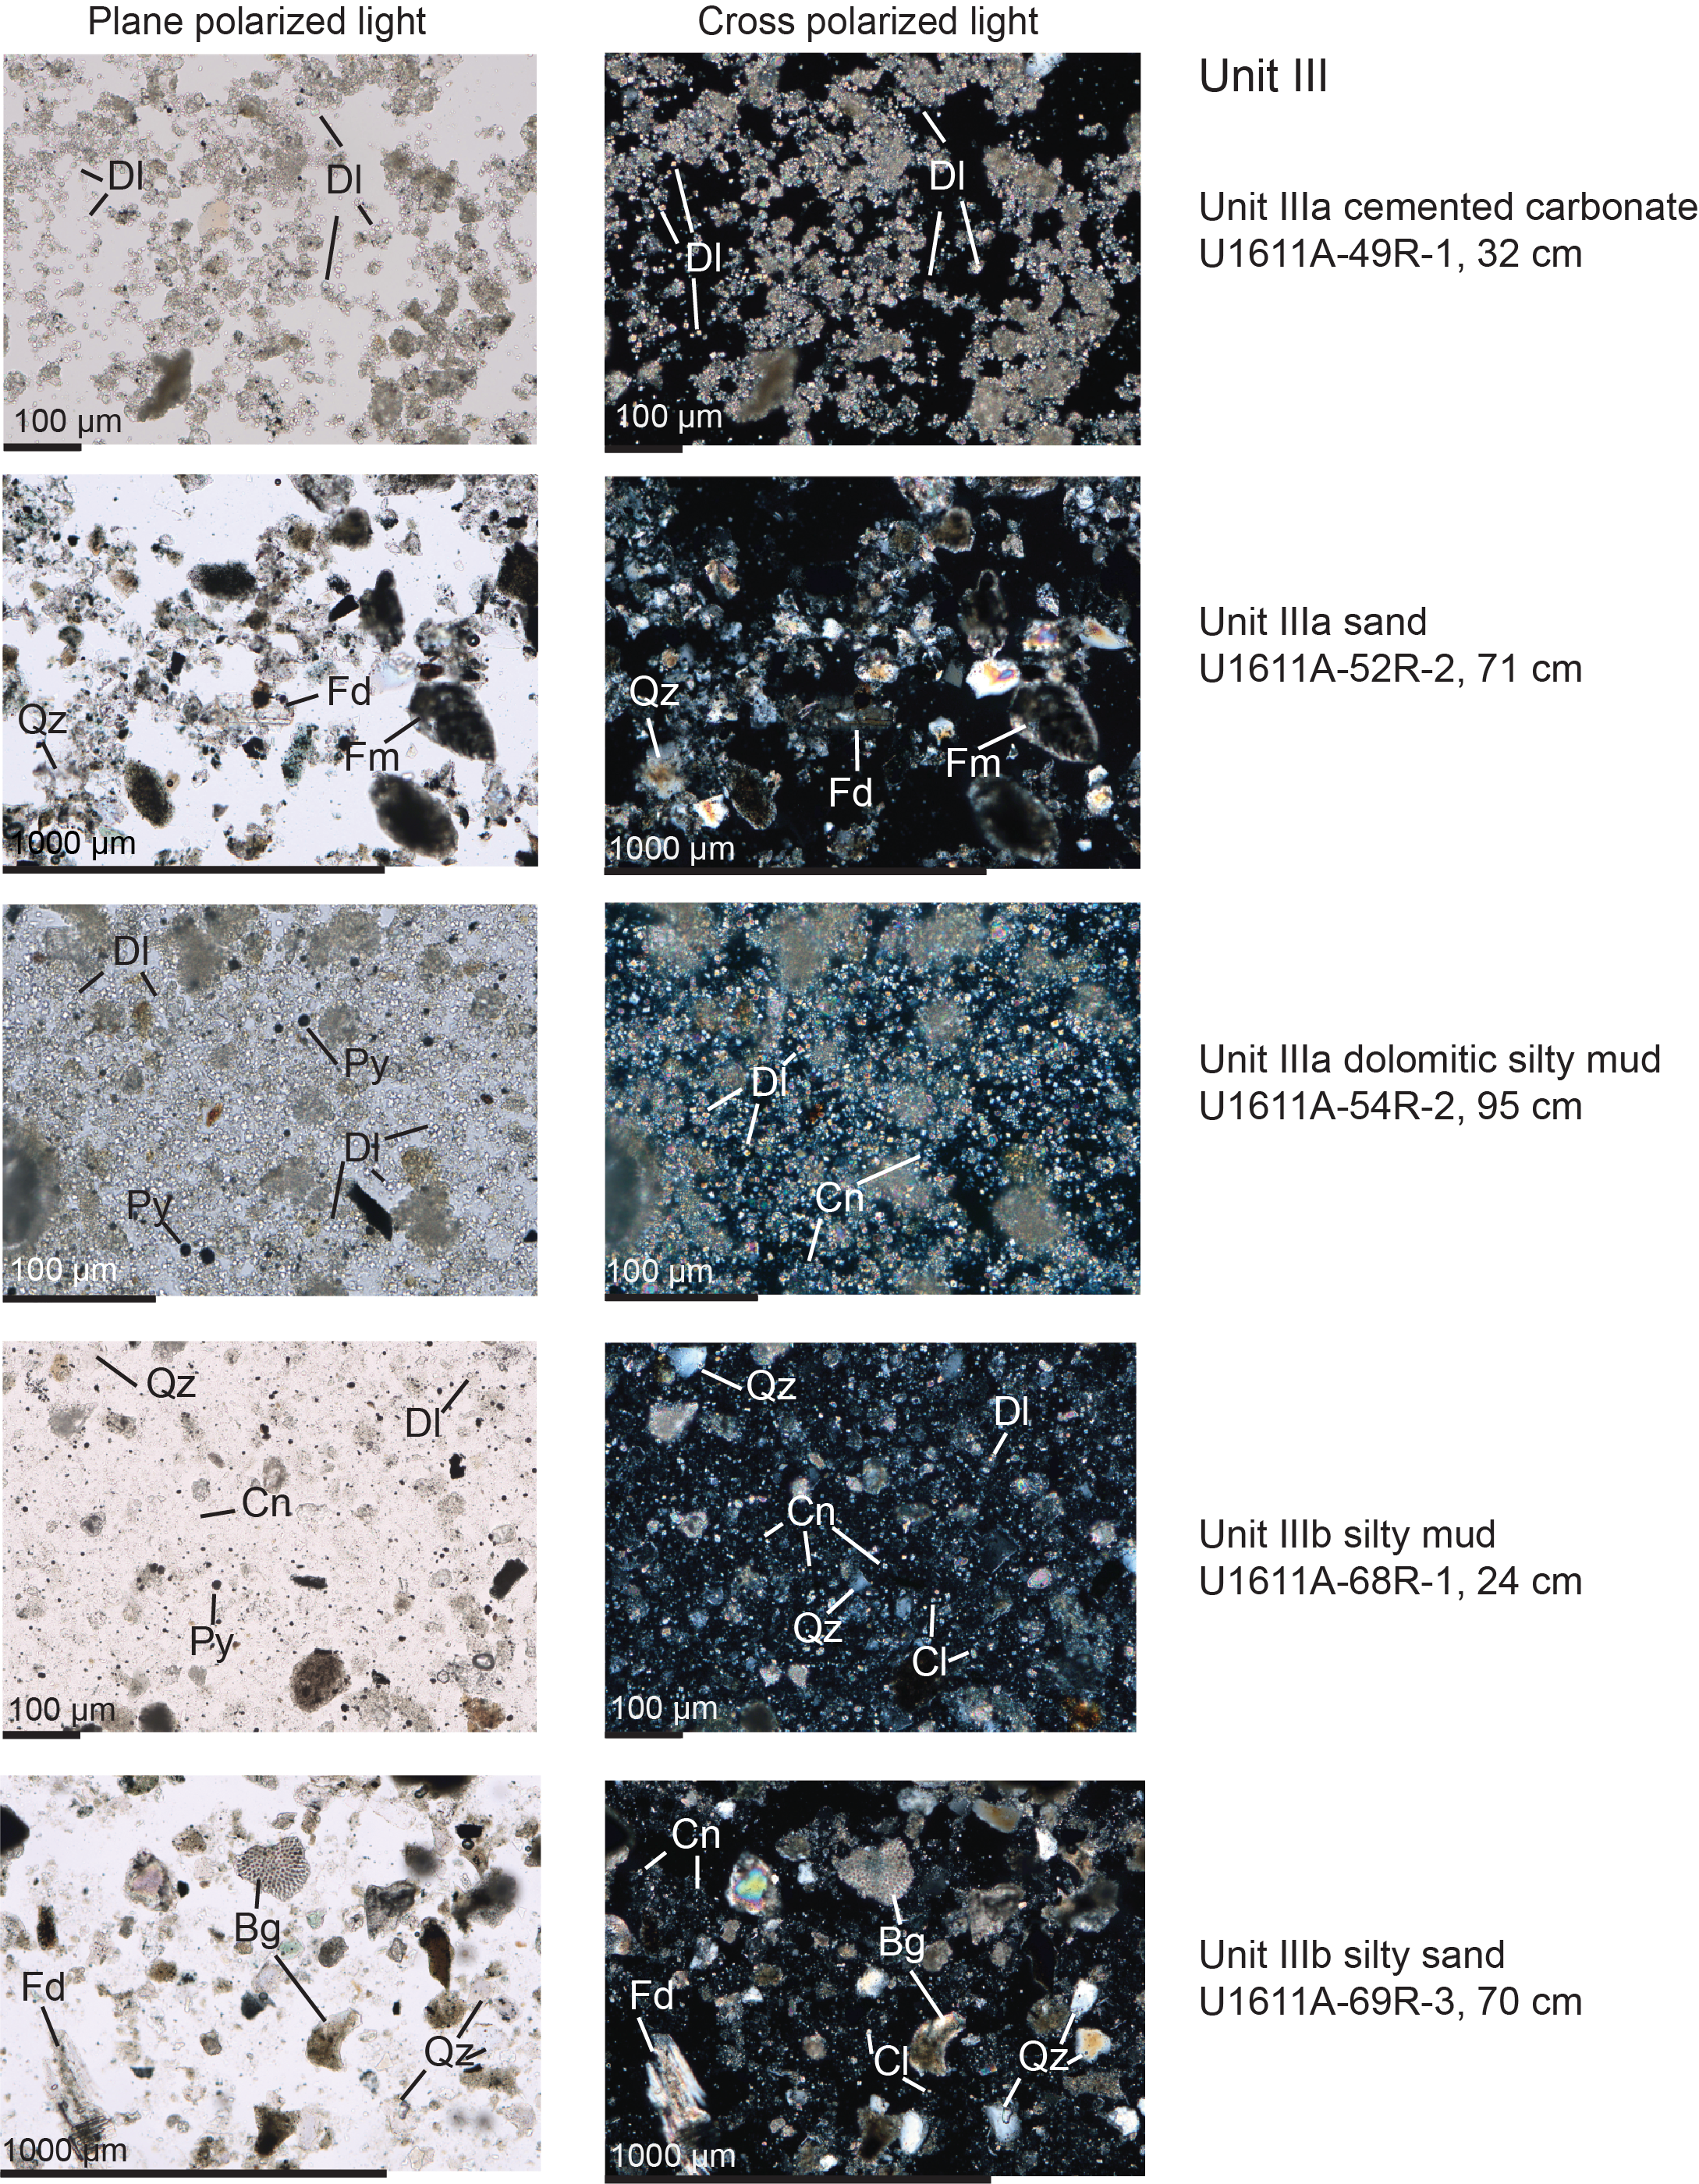
Figure F20. Major lithologies, Units I–III.
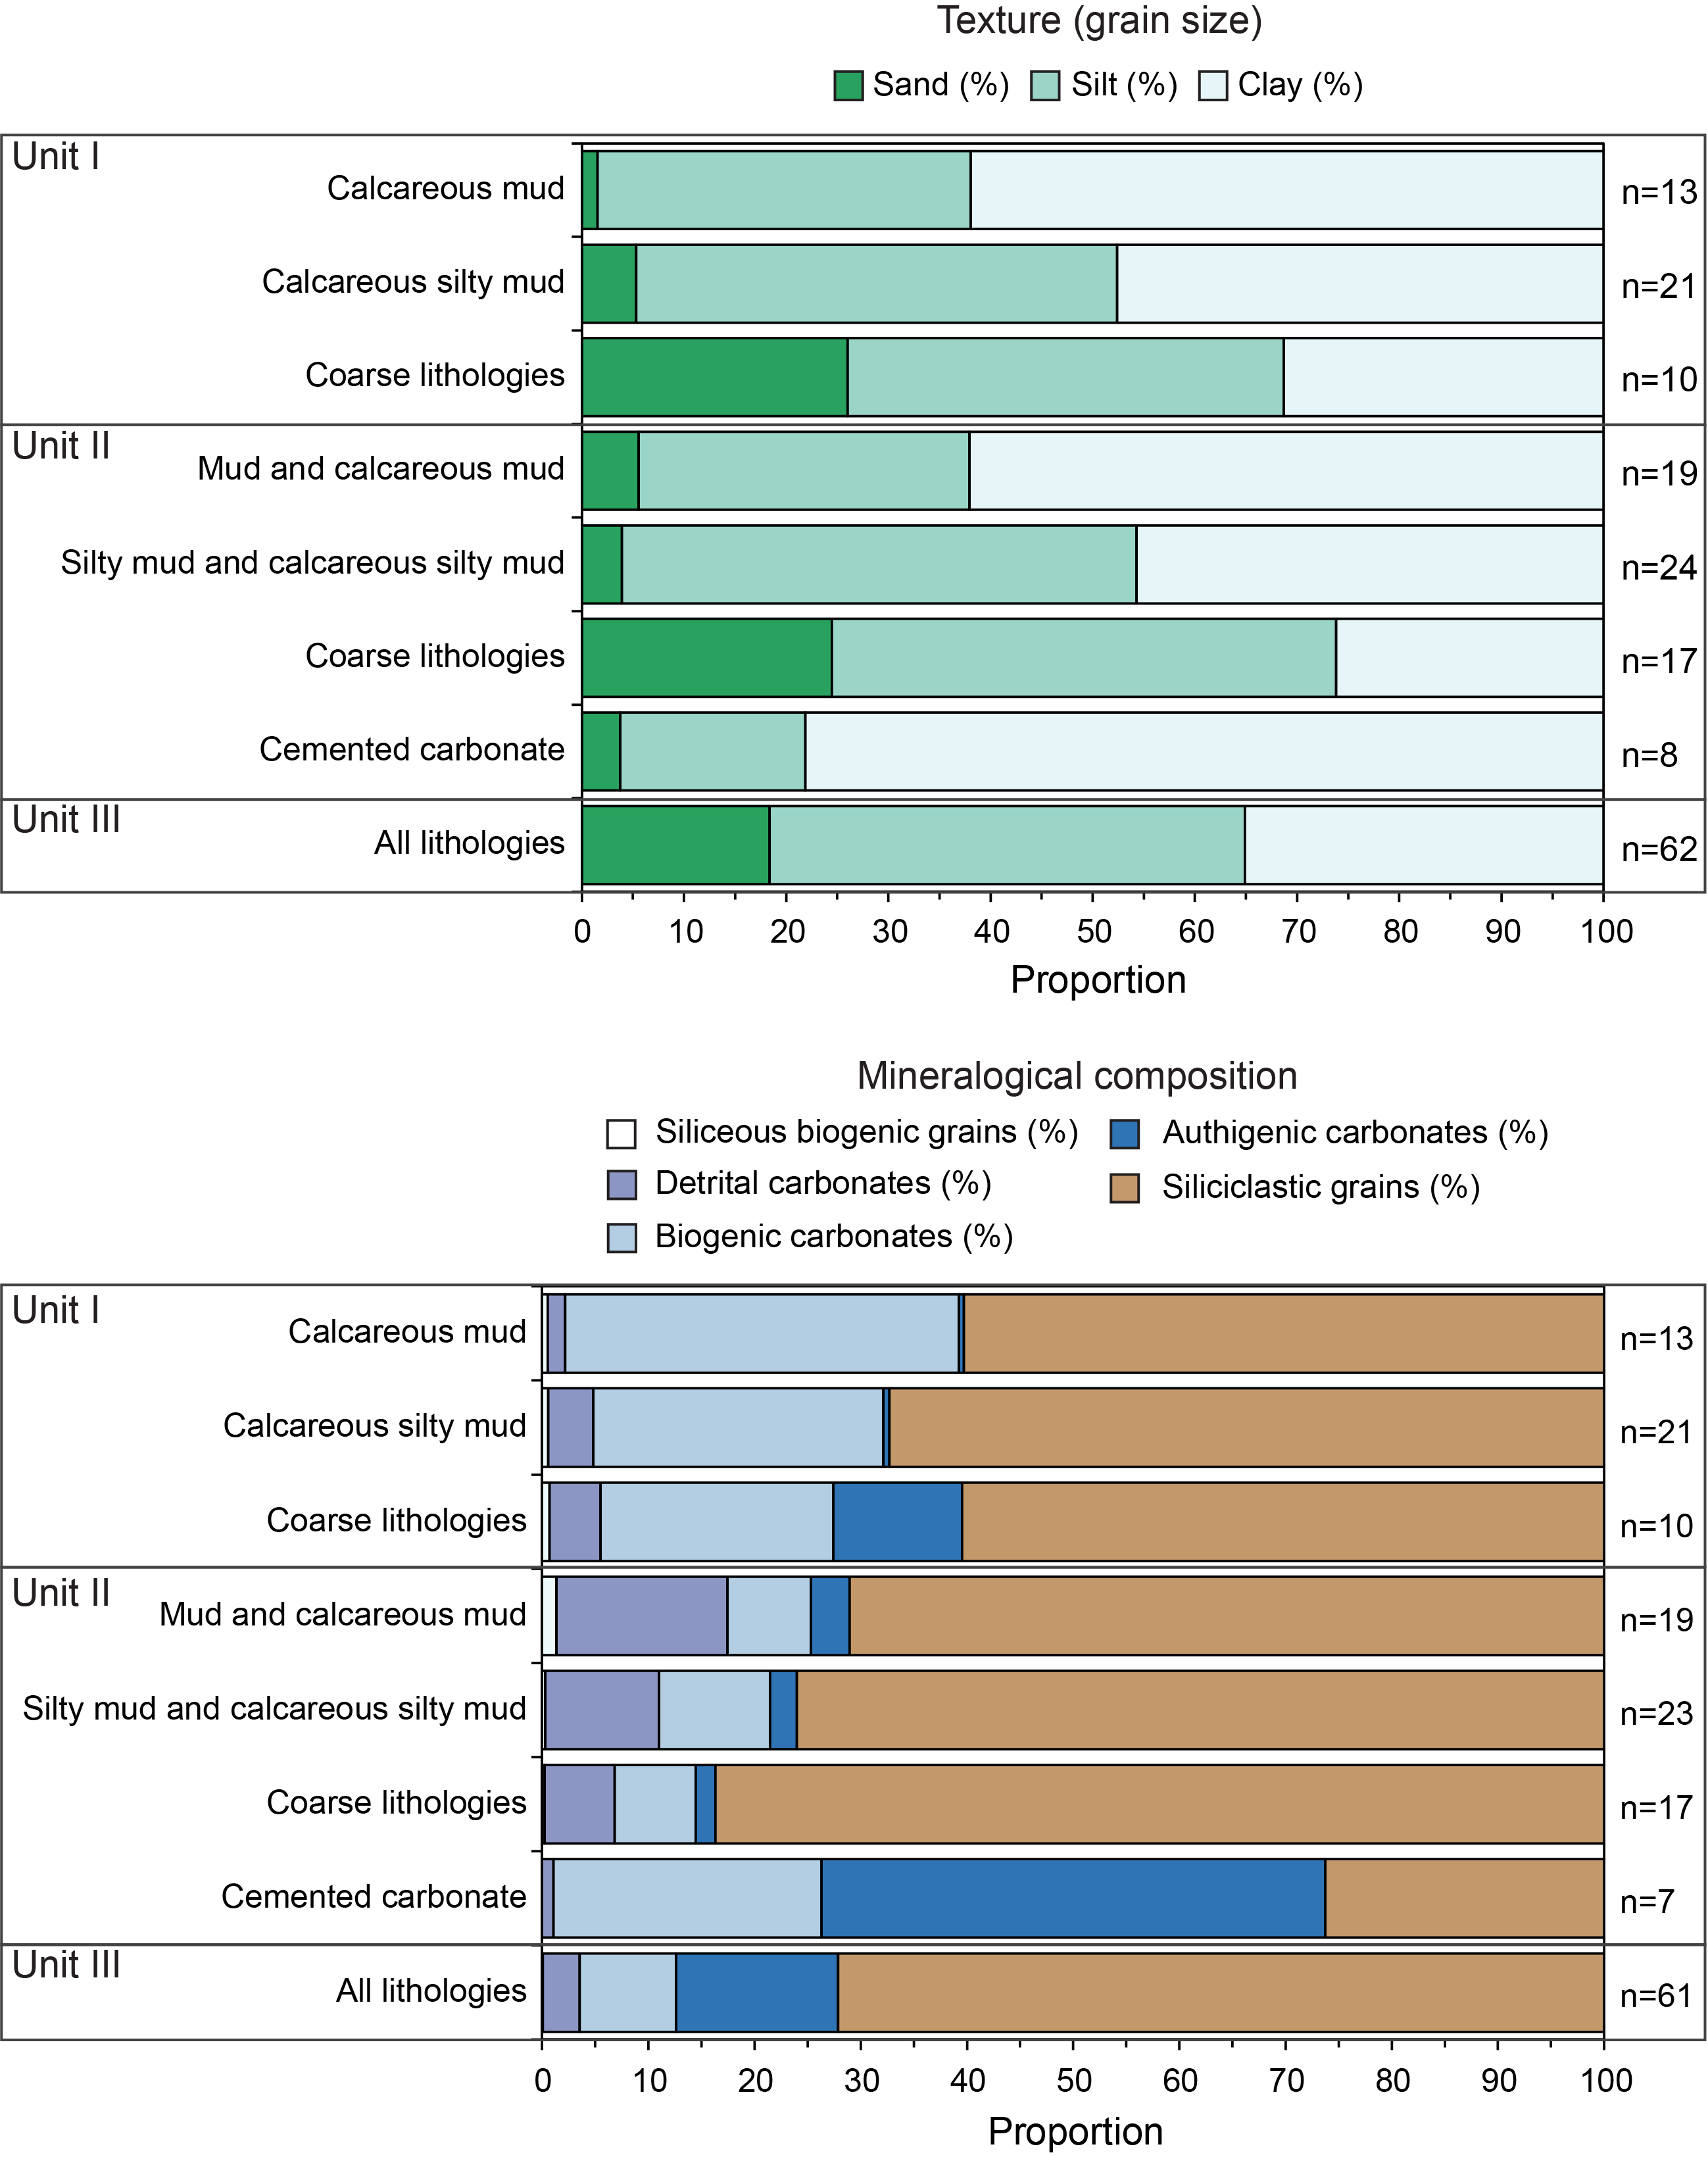
Figure F21. Texture and mineralogical composition in main lithologies.
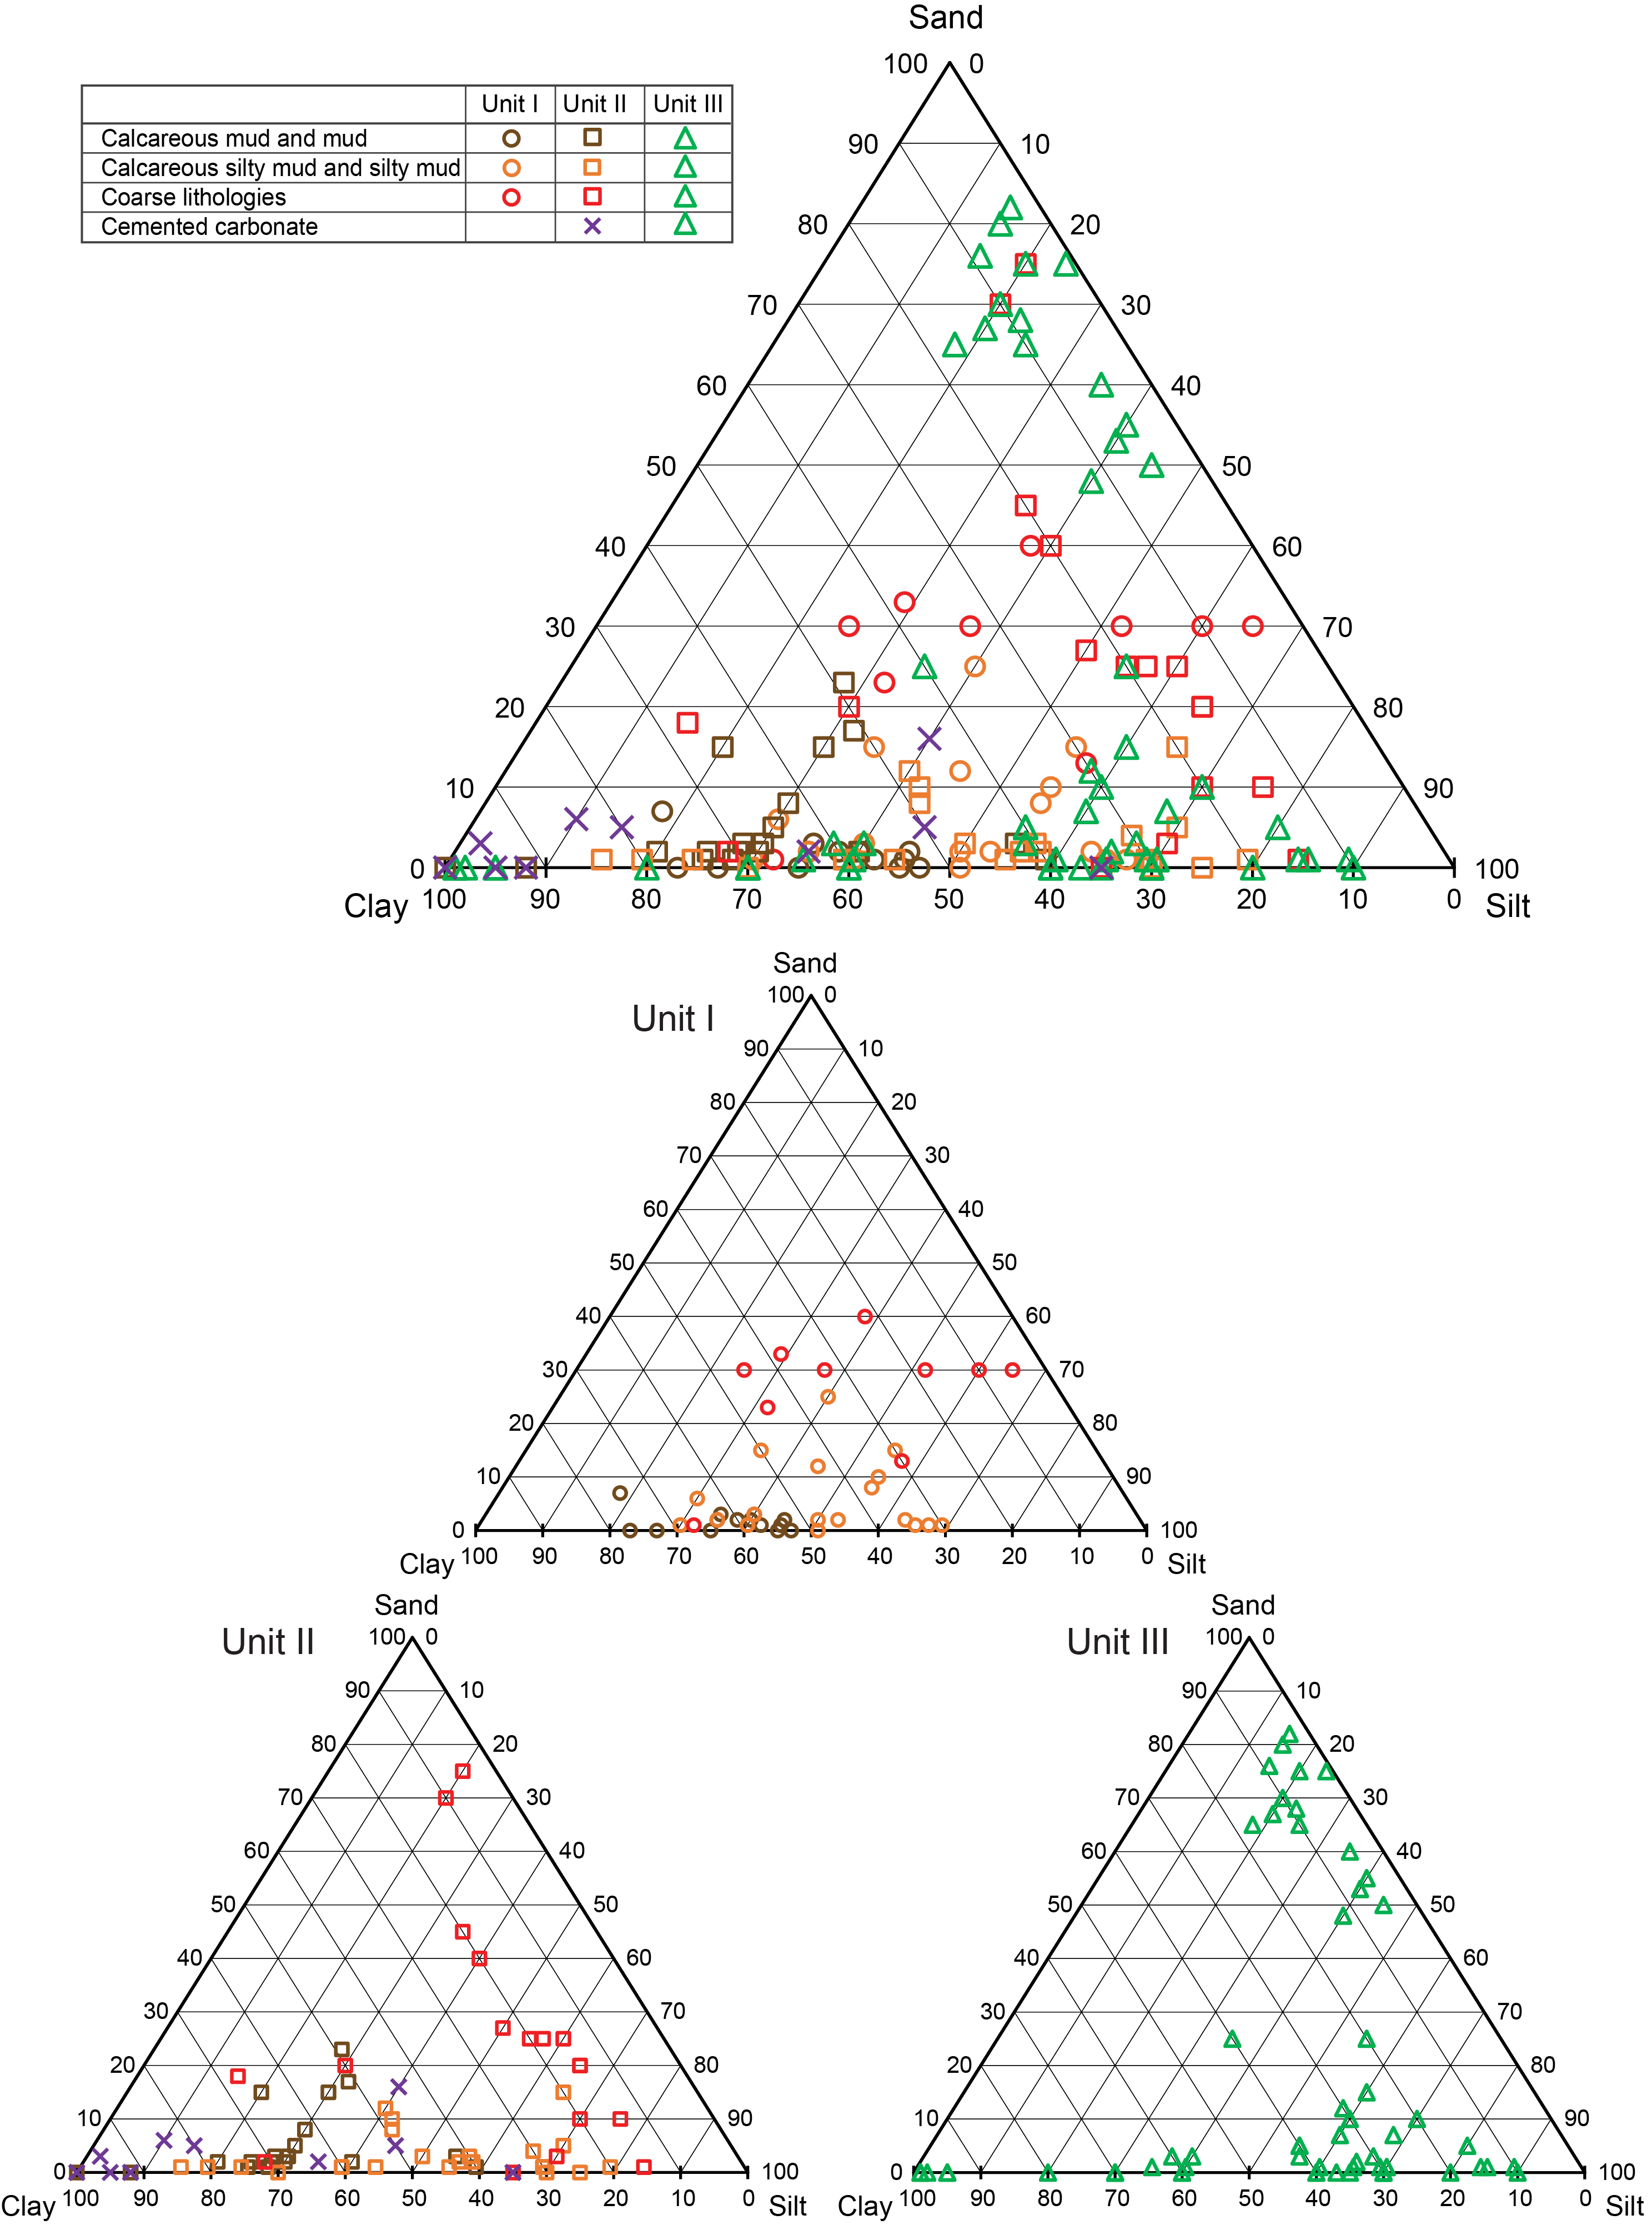
Figure F22. Texture of main lithologies, Units I–III.
3.1.3. Bioturbation and trace fossils
The relative abundance of discrete trace fossils in Unit I is moderate (mainly BI = 2) and occasionally moderate to abundant (BI = 3–4) or absent (BI = 0). There is a clear decrease in the bioturbation index from the top to the bottom of the interval. The trace fossil assemblage mainly consists of abundant Chondrites and Planolites, common Thalassinoides, and rare Palaeophycus and Zoophycos (Figures F13, F23). Other ichnotaxa (i.e., Asterosoma and Phycosiphon) were only occasionally observed.
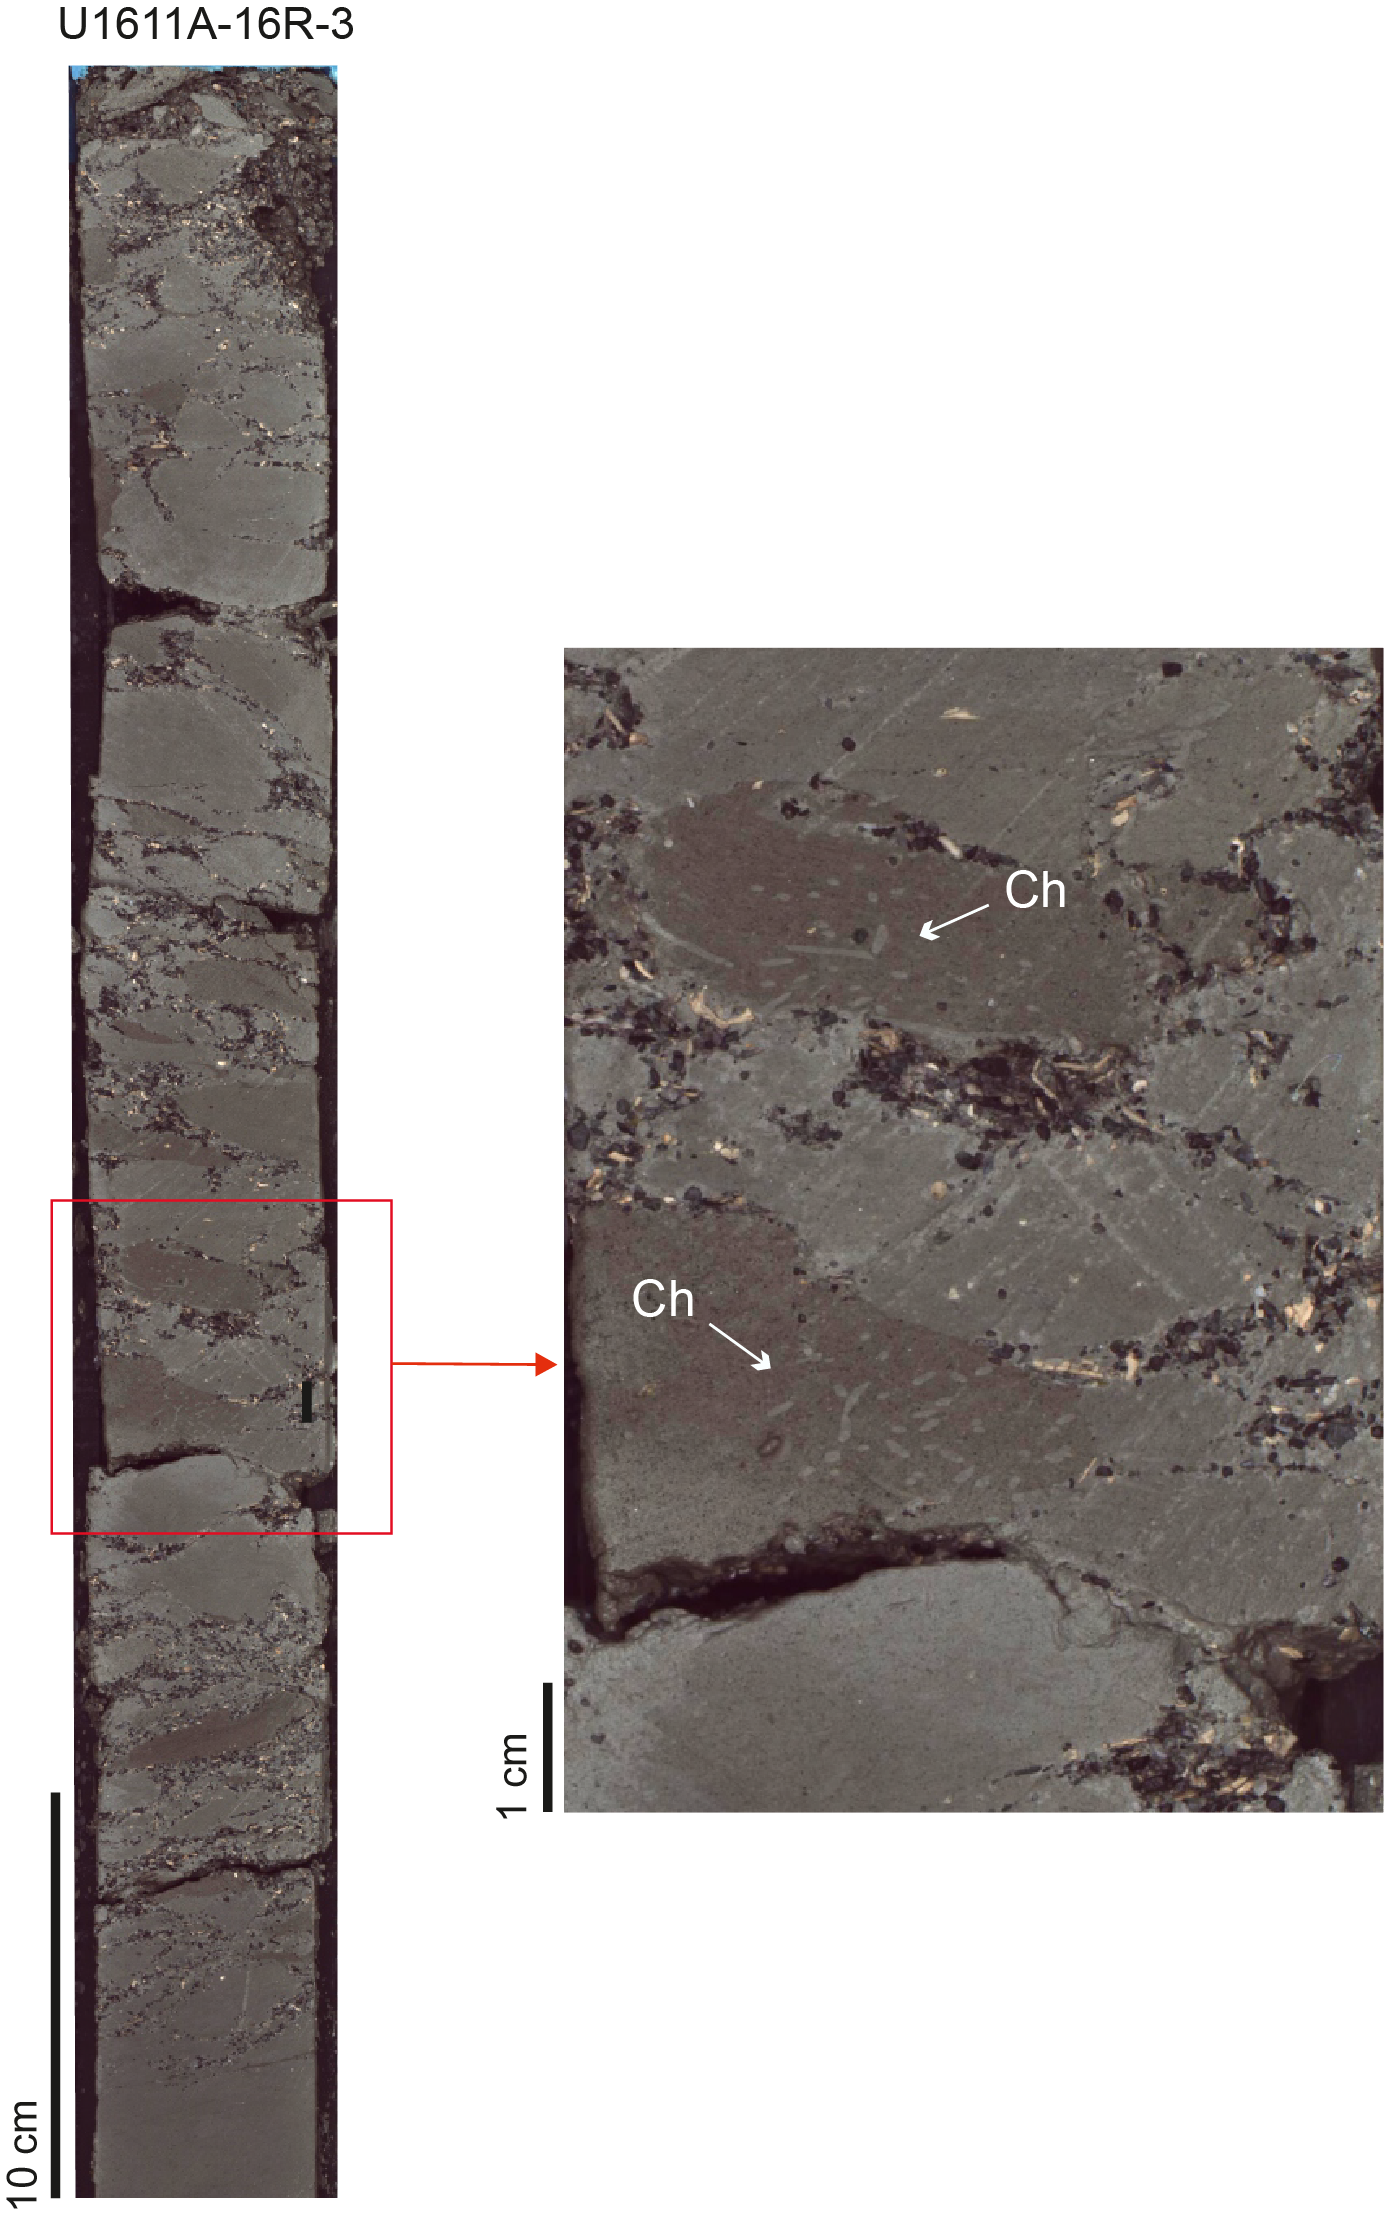
Figure F23. Trace fossils in breccia in Unit I, Hole U1611A.
3.1.4. Composition and bulk mineralogy
Smear slides show that Unit I calcareous mud and calcareous silty mud contain mainly siliciclastic grains. The calcareous mud contains 35%–75% siliciclastic grains (average = 60%) with variable contents of biogenic carbonates (25%–55%; average = 40%), a small amount of detrital carbonate (0%–5%; average = 2%), and minor amounts of authigenic carbonate (0%–3%) (Figures F21, F24). The calcareous silty mud contains 4%–85% siliciclastic grains (average = 65%) with variable contents of biogenic carbonates (5%–45%; average = 25%), a generally smaller quantity of detrital carbonates (1%–25%; average = 4%), and mostly minor amounts of authigenic carbonate (0%–3%) (Figures F21, F24). The coarser units in Unit I (n = 10) are variable in composition, although mainly siliciclastic dominated. These lithologies include sandy silt, calcareous sandy silt, silty sand, calcareous silty sand, and calcareous sandy mud.
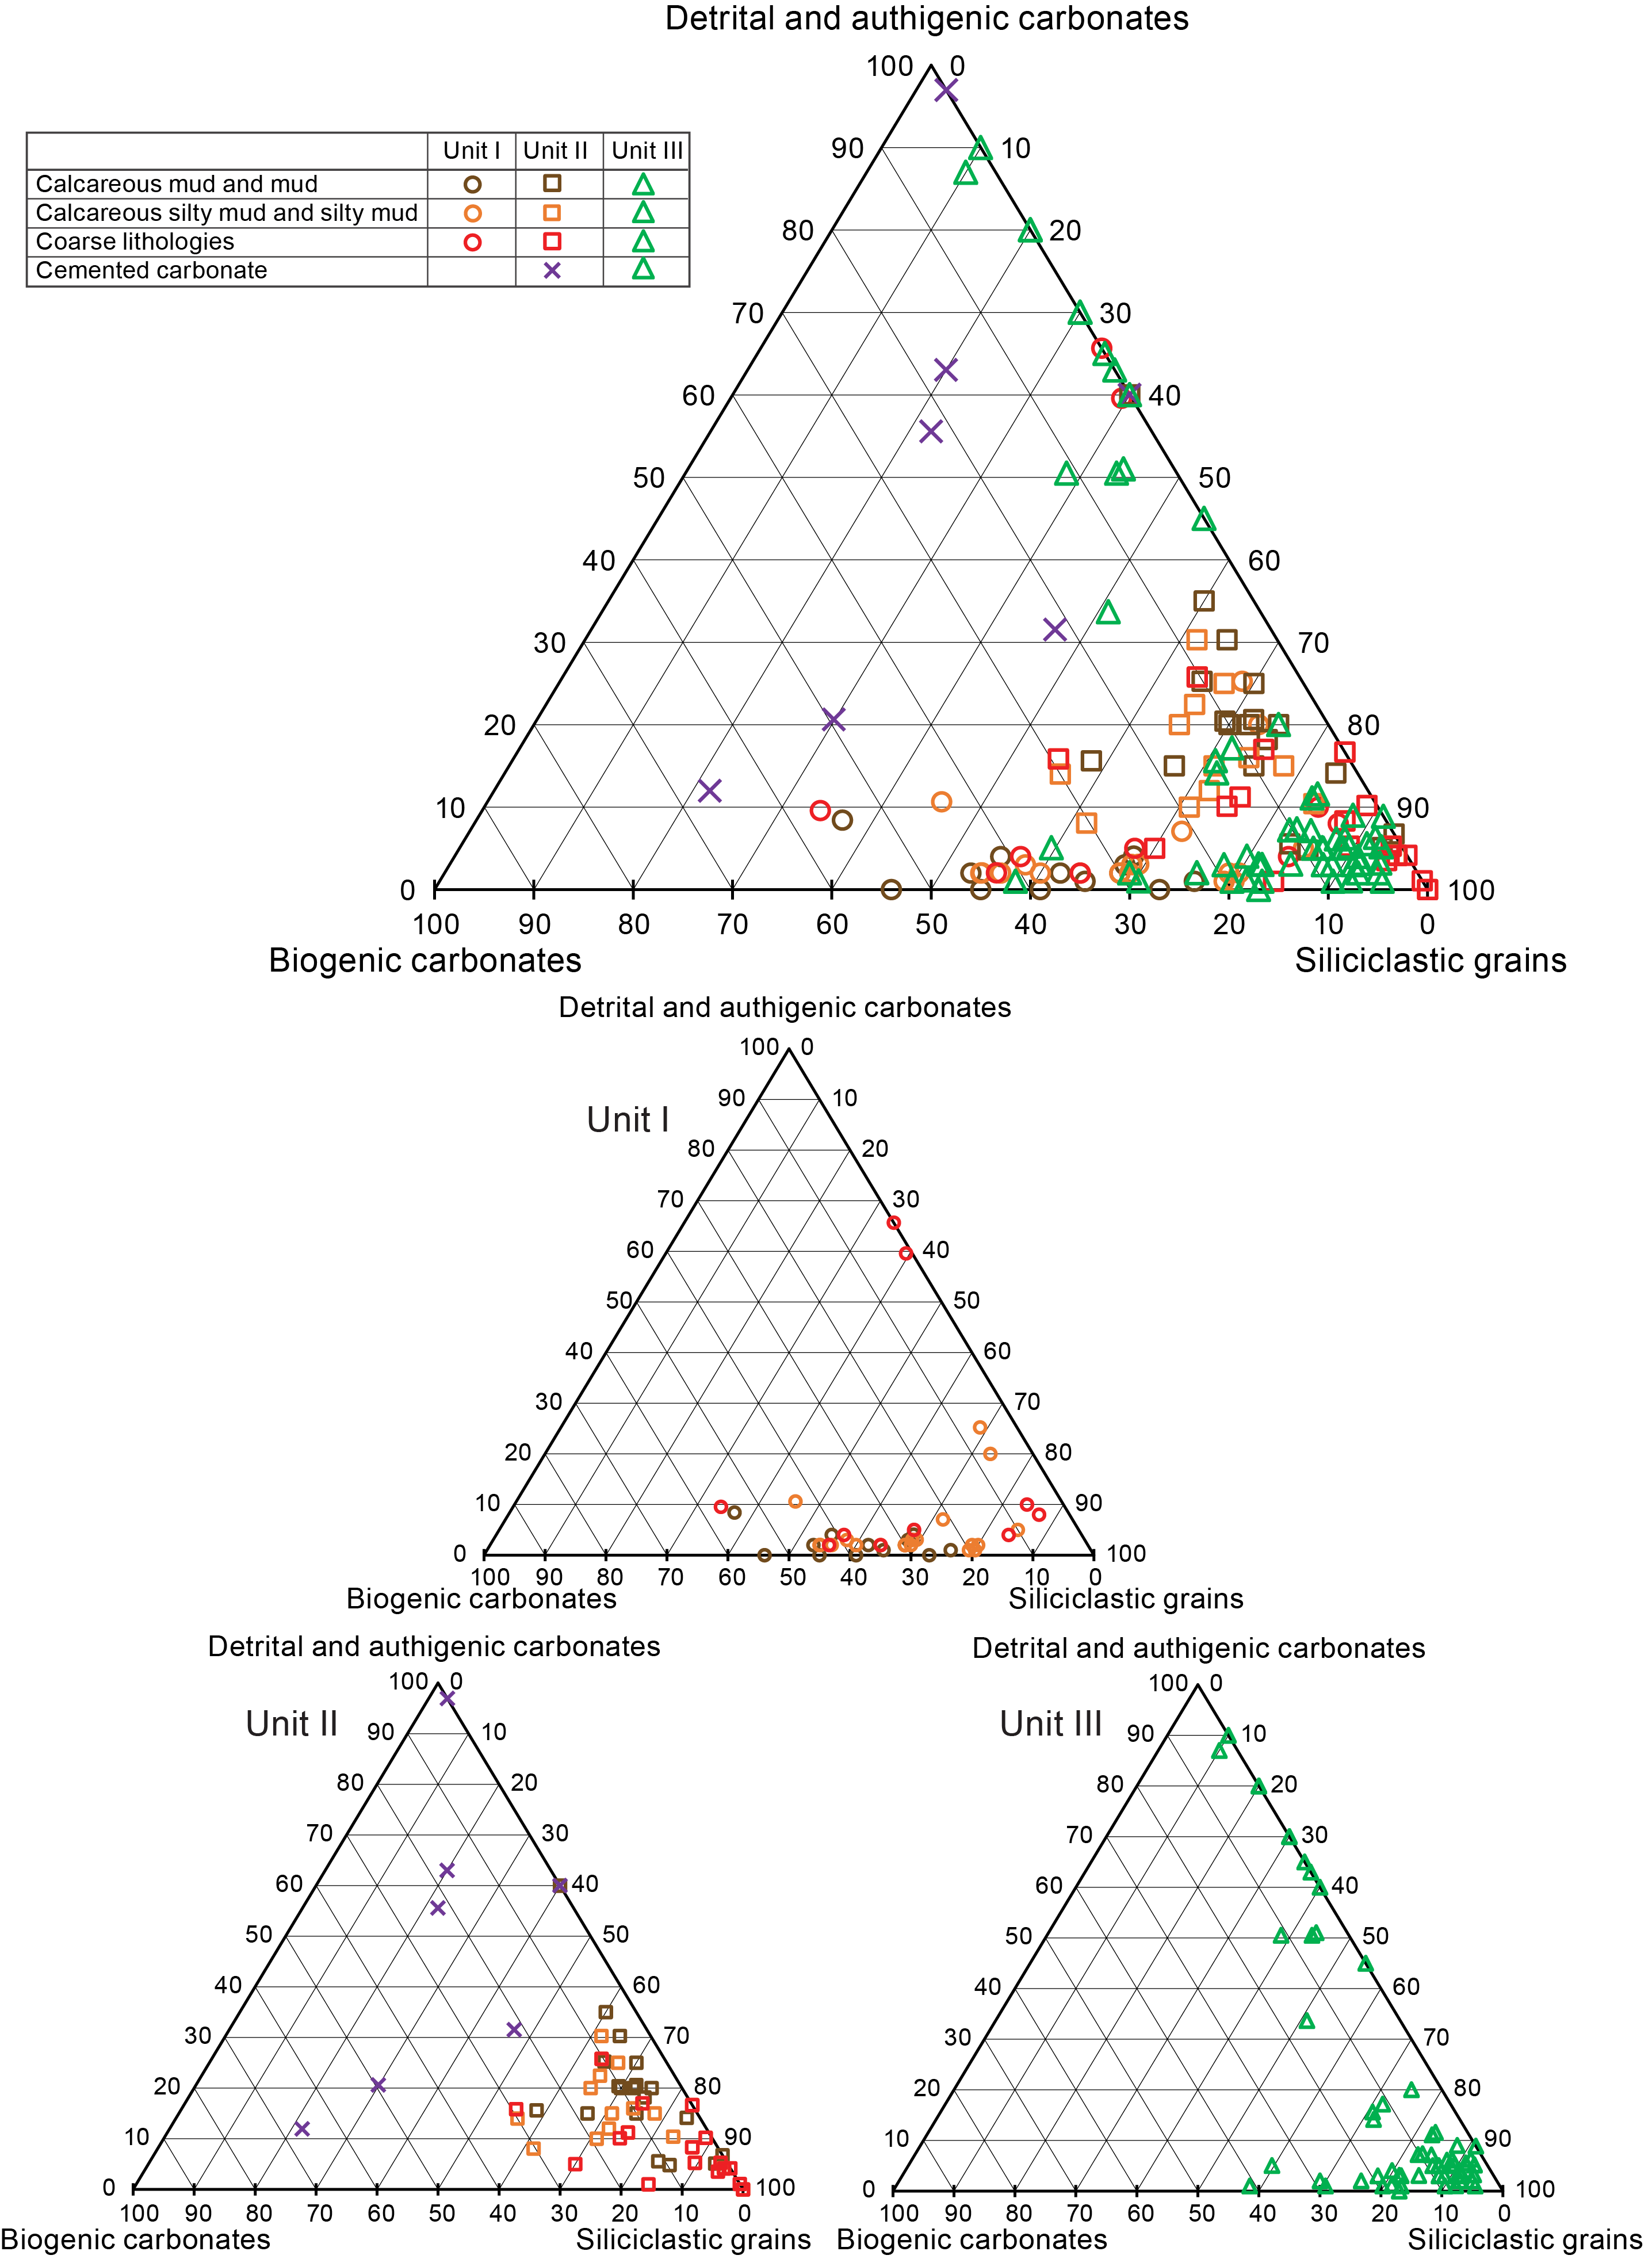
Figure F24. Mineralogical composition of main lithologies.
Based on XRD analyses of 12 samples from Unit I (Figure F16), the calcite content of Unit I ranges 2%–52% (average = 34%). The quartz content ranges 11%–19% (averages = 15%). The average content of feldspars, including plagioclase and K-feldspar, is 10%. On average, clay minerals make up 35% of the sediments. The dolomite content is commonly low, on average 1% except for a single dolomitic sandy silt sample, which contains 48% dolomite and 2% calcite. The two primary lithologies in Unit I—calcareous mud and calcareous silty mud—are very similar in terms of mineralogical composition, with the calcareous mud having an overall higher content of clay minerals.
3.2. Unit II description
- Intervals: 401-U1611A-18R-7 through 38R-CC; 401-U1611B-14R-1 through 51R-CC
- Depths: Hole U1611A = 820.4–996.5 m CSF-A; Hole U1611B = 814.2–996.9 m CSF-A
- Age: Messinian
- Subunit IIa interval: 401-U1611A-18R-7 through 35R-2
- Subunit IIa depth: 820.4–964.3 m CSF-A
- Subunit IIb interval: 401-U1611A-36R-1 through 38R-CC
- Subunit IIb depth: 971.5–996.5 m CSF-A
3.2.1. Lithologies, bedding, and color
Unit II consists of lithologies with variable carbonate content, including mud, silty mud, sandy silt, and silty sand, with minor aragonite, cemented carbonate, breccia, and conglomerate. Lithologies in Unit II are noticeably darker compared to those in Unit I and are predominantly very dark gray (GLEY1 3/N), dark gray (GLEY1 4/N), very dark grayish brown (10YR 3/2), and very dark gray (10YR 3/1) and occasionally greenish gray (GLEY1 5/10Y), very dark greenish gray (GLEY1 3/10Y), dark greenish gray (GLEY1 4/10Y), gray (5Y 5/1, GLEY1 5/N), and black (GLEY1 2.5/N). Aragonite intervals are white (7.5YR 8/1). Contacts between lithologies are dominantly sharp and typically accompanied by a distinct color change and lamination (Figure F12B). Subunits IIa and IIb consist of similar lithologies. However, carbonate content is lower in Subunit IIb (Figure F15), so lithologies are not always calcareous. Convoluted slump-like deformed sediments occur frequently in Subunit IIa (Figure F19). Mud clasts are common in the conglomerates (Figure F25), and slumped deposits are commonly followed by conglomerates overlain by normally graded beds.
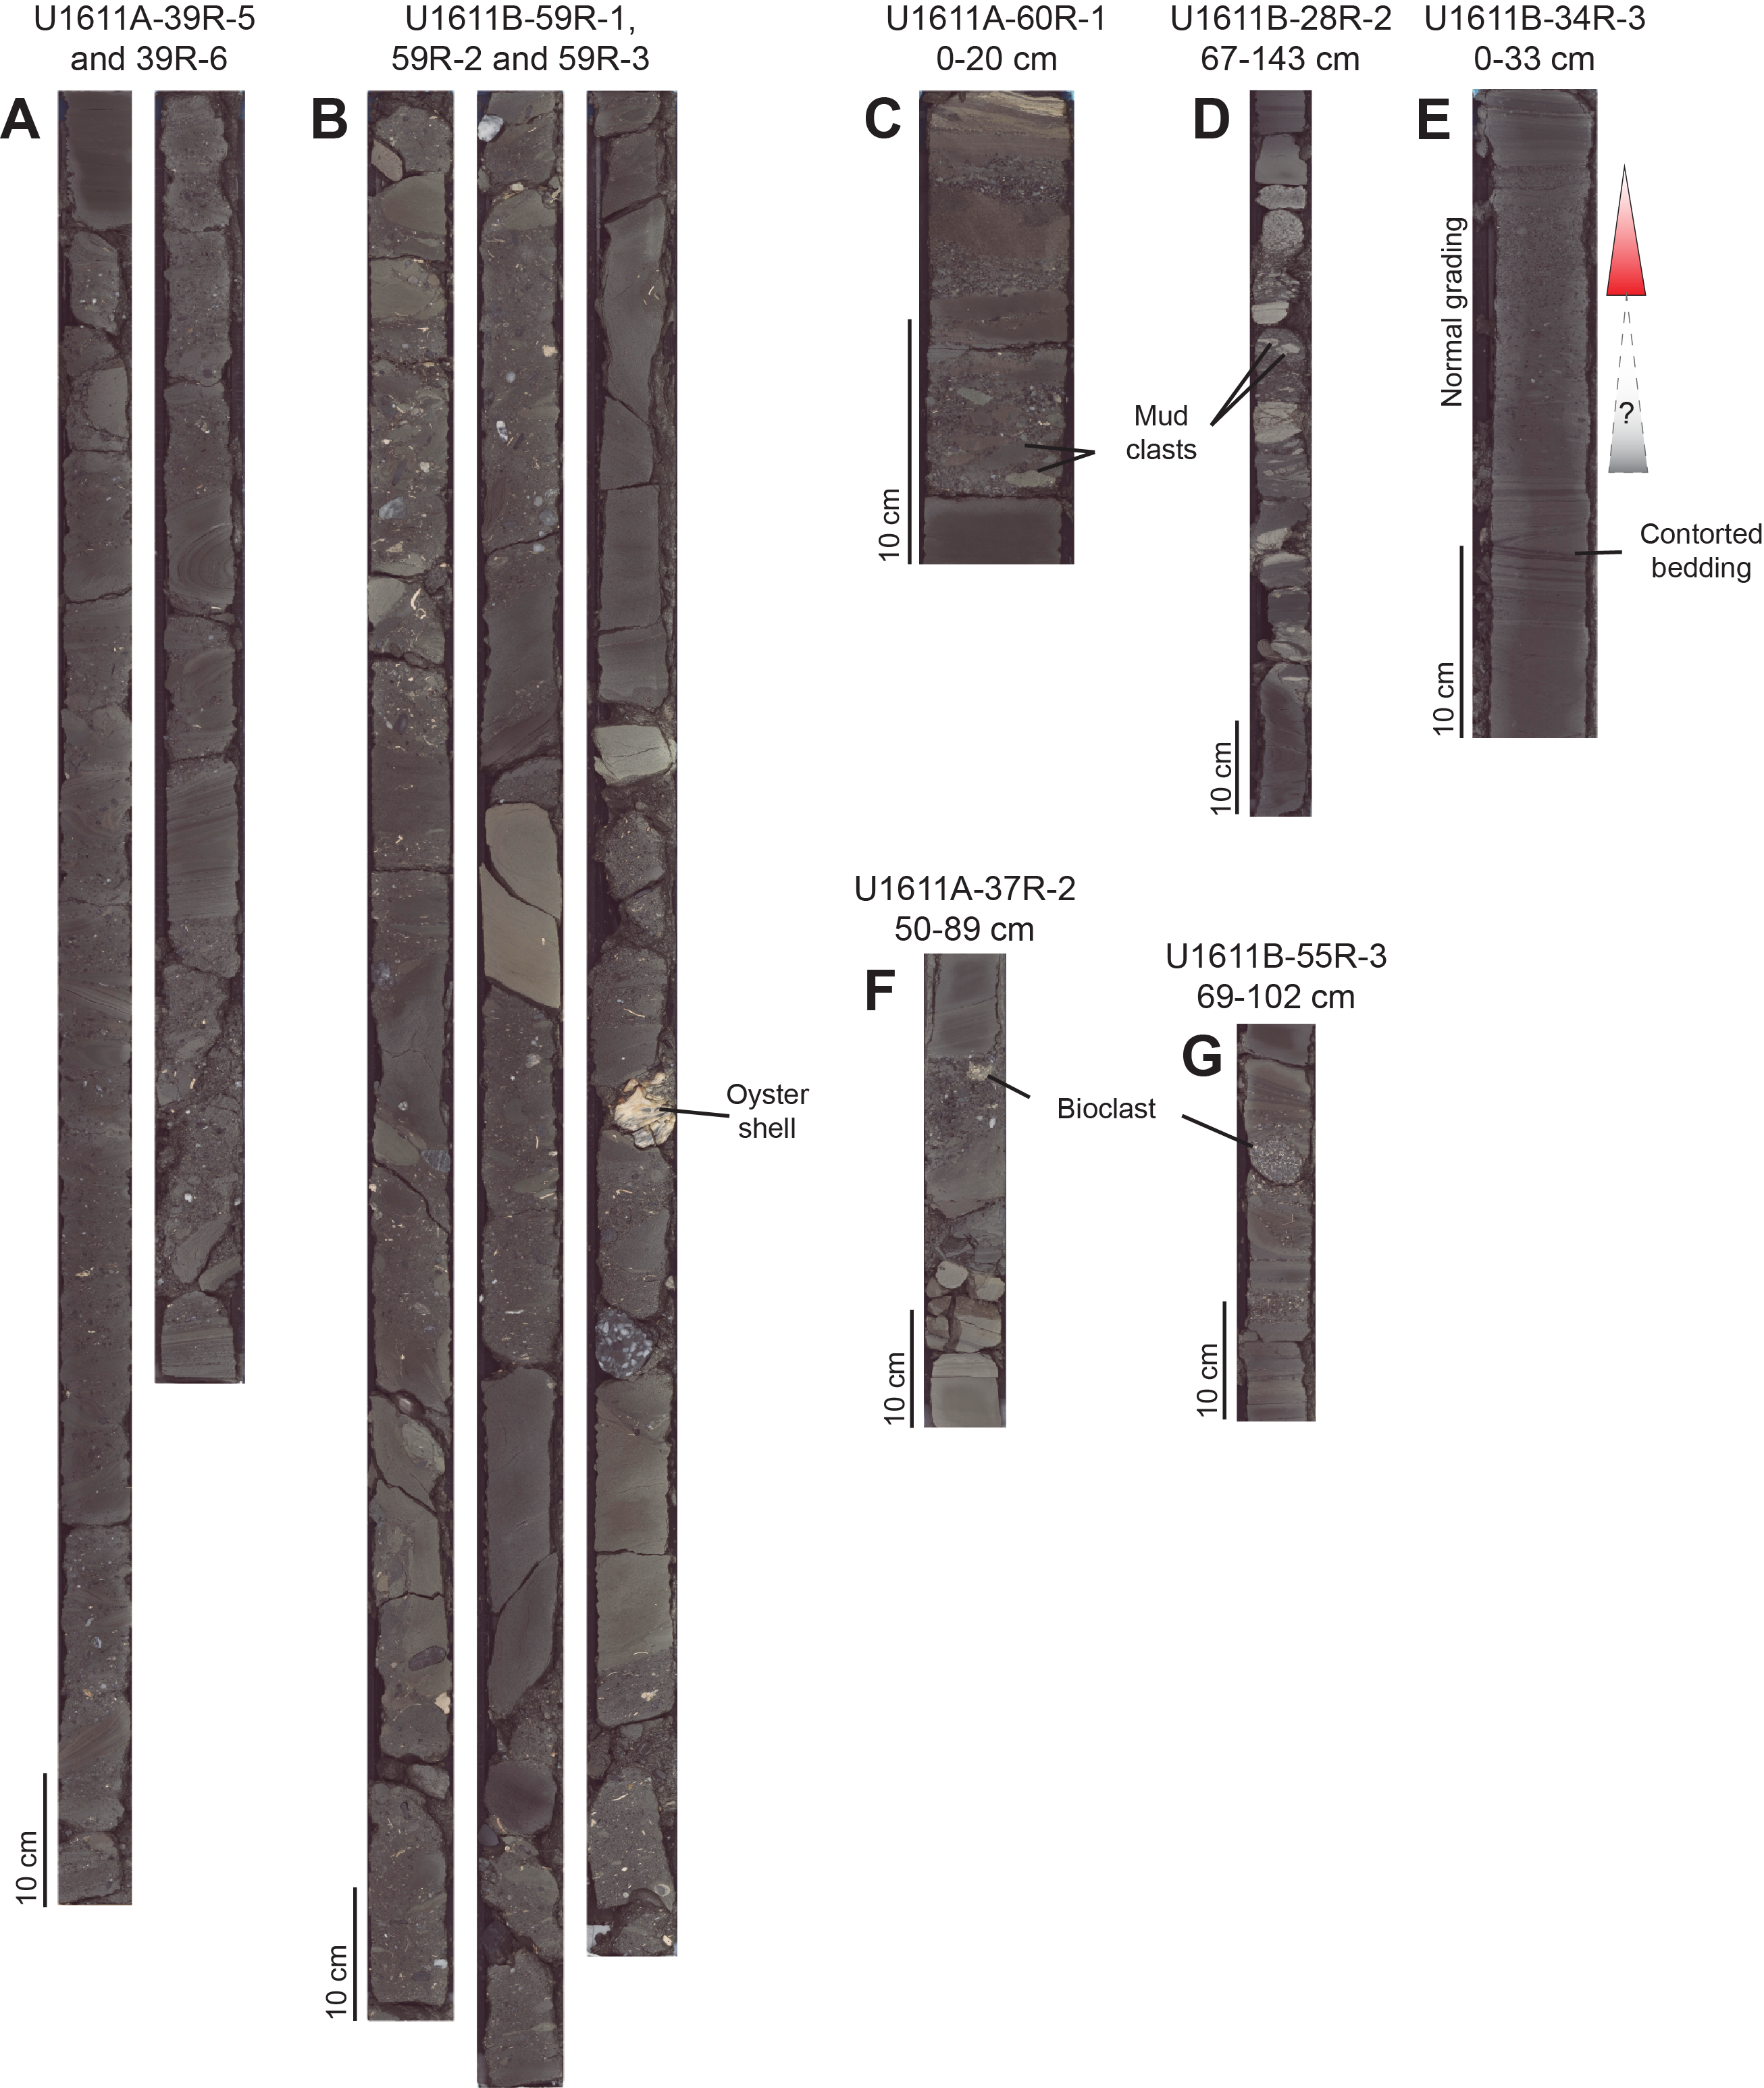
Figure F25. Conglomerates in Units II and III.
Bed thickness in Unit II is variable, but calcareous mud and mud are the most abundant. Cemented carbonate beds are on average 9 cm thick, with a maximum thickness of 45 cm in Hole U1611B (13 beds in Hole U1611A and 49 beds in Hole U1611B). Layers comprising very light aragonite lamination are also present (7 beds in Hole U1611A). Conglomerates range in thickness from 9 to ≥45 cm because the lower part of conglomerate beds was often not recovered.
3.2.2. Structure and texture
Calcareous mud, mud, and silty mud are commonly laminated, with millimeter-scale lamination and pervasive color banding (Figure F26A–F26C). There are infrequent microfaults (e.g., Sections 401-U1611A-33R-4 and 33R-5). Calcareous silt, silt, sandy silt, and fine sand are usually interbedded with the finer lithologies and have sharp or erosional basal contacts, normal grading, parallel lamination, and rare inverse grading (e.g., Section 24R-2) or load structures (e.g., Section 401-U1611B-23R-1, 102–105 cm). All lithologies exhibit contorted bedding as slump deposits (Figure F19).
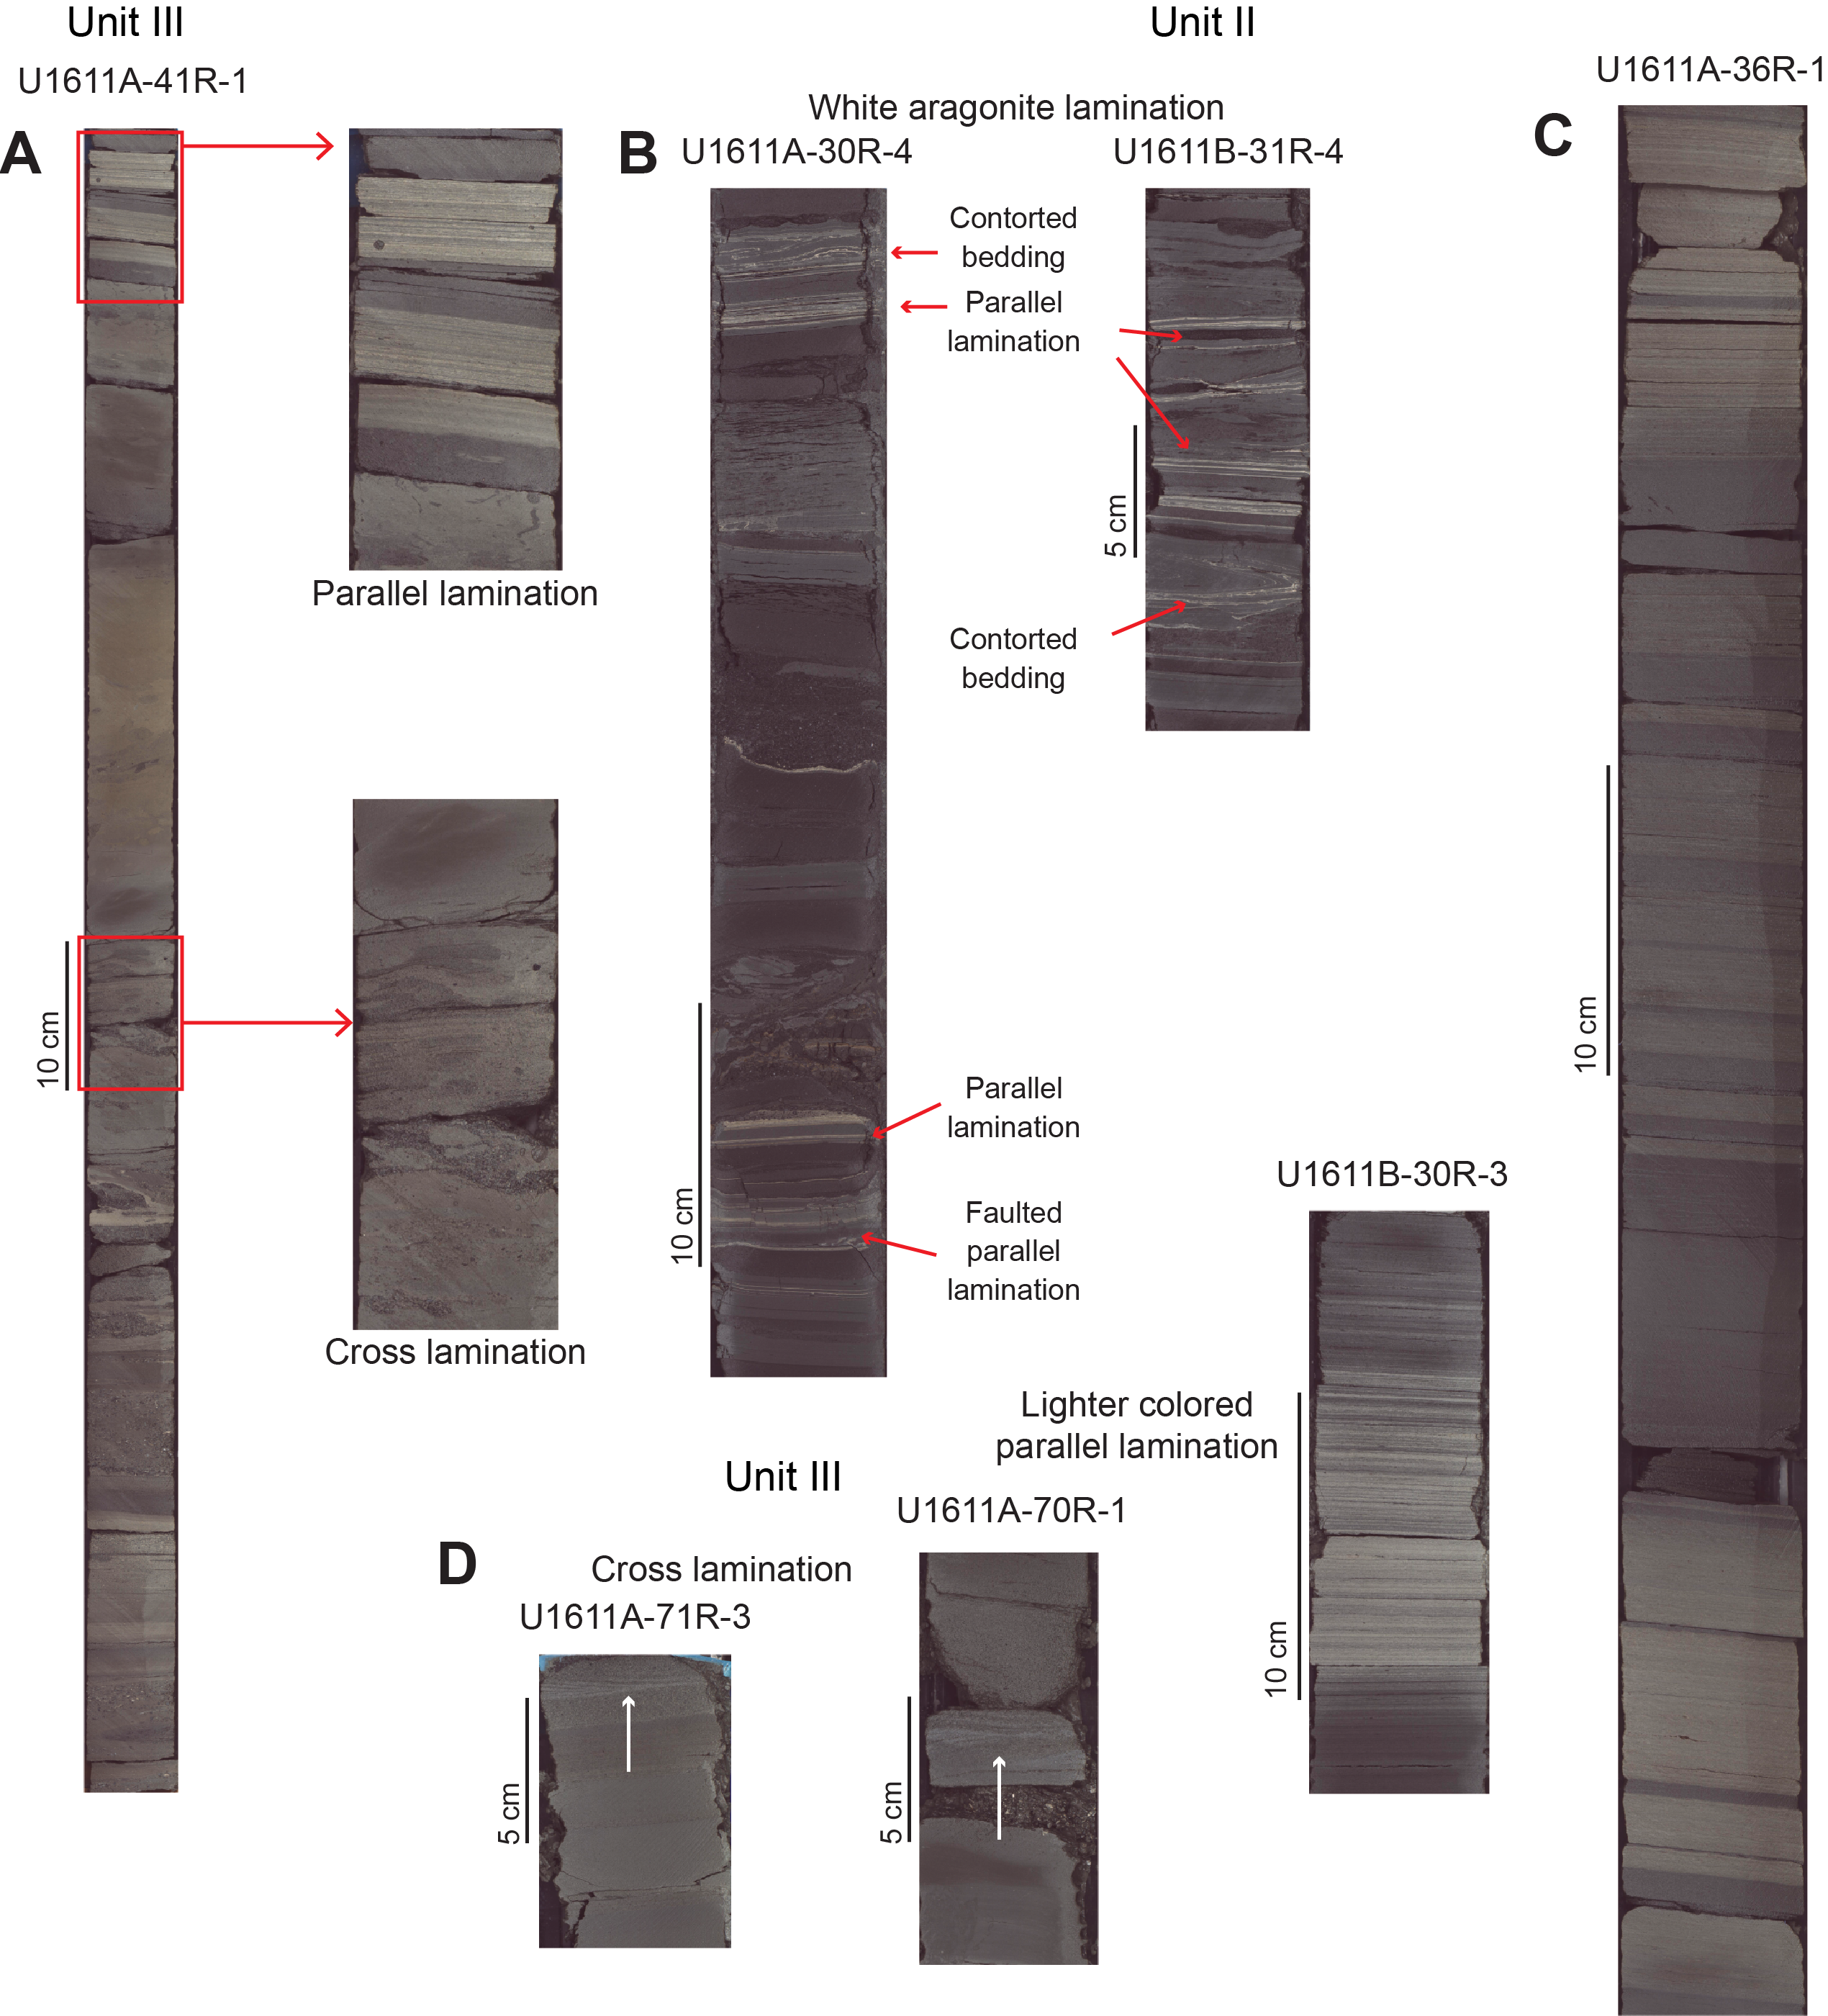
Figure F26. Lamination observed in Units II–III.
Based on smear slide analysis, the Unit II calcareous mud and mud contain an average of 5% sand, 30% silt, and 60% clay (Figures F21, F22). The Unit II calcareous silty mud and silty mud contains an average of 4% sand, 50% silt, and 45% clay. Coarser grained lithologies (e.g., sandy silt and silty sand) contain an average of 25% sand, 50% silt, and 25% clay and have a much more varied grain size distribution. The cemented carbonate intervals are finer grained compared to other lithologies in Unit II and contain on average 5% sand, 20% silt, and 80% clay.
3.2.3. Bioturbation and trace fossils
Trace fossils are nearly absent in Unit II (BI = 0), but there is a local, scarce presence (BI = 1) of some possible Planolites.
3.2.4. Composition and bulk mineralogy
Smear slides show that the Unit II mud, calcareous mud, silty mud, and calcareous silty mud contain mainly siliciclastic grains, with only one sample having >50% carbonate (Figure F24). The Unit II mud and calcareous mud contain 40%–90% siliciclastic grains (average = 70%), with variable quantities of biogenic carbonates (0%–25%; average = 8%), detrital carbonates (0%–35%; average = 15%), and mostly minor amounts of authigenic carbonate (0%–5%), except for one sample that is partially dolomitized (Figures F21, F24). The Unit II silty mud and calcareous silty mud contain 50%–100% siliciclastic grains (average = 75%), with variable contents of biogenic carbonates (0%–30%; average = 10%), detrital carbonates (0%–30%; average = 10%), and mostly minor amounts of authigenic carbonate (0%–20%). The coarser units in Unit II (silt, sandy silt, and silty mud; n = 17) are mainly siliciclastic dominated (Figures F21, F24). The cemented carbonate samples contain a lot of authigenic carbonate, which is mainly dolomite (Figure F16).
Based on XRD analysis of 16 samples from Unit II, the calcite content ranges 1%–22% and averages 11% (Figure F16). The quartz content ranges 4%–32% and averages 19%. The average content of feldspars is 13%, and clay minerals make up an average of 36% of the sediments. Quartz and feldspars generally have higher average contents than in Unit I. The dolomite content in Unit II ranges 1%–51% and averages 13%, higher than in Unit I (Figure F16). Unit II is also distinct from Unit I in its relatively higher pyrite content (average = 2%) and more significant variations in the pyrite content among lithologies. The two samples containing >40% dolomite contain significantly fewer siliciclastic minerals, which could be additional evidence for an authigenic origin of dolomite in these samples.
Two samples in Unit II (401-U1611A-30R-1, 62–63 cm [913.92 m CSF-A], and 34R-3, 83–84 cm [955.77 m CSF-A]) contain 30%–40% aragonite (Figure F16). On the core surface, the aragonite is concentrated in very thin laminae, which sometimes have sedimentary structures (Figure F26B). The fibrous texture and identification of the aragonite was confirmed by smear slides and SEM with EDS of Grain Mount 20 (Sample 30R-1, 63–64 cm; Figure F27G, F27H). The high calcium content of the mineral determined from EDS indicates that the thin light-colored laminae consist almost exclusively of aragonite. The formation conditions of aragonite (e.g., water column chemistry) and its preservation in the sediments at this depth (e.g., pore water chemistry evolution) will require detailed investigations on the relationship between the aragonite laminae and the adjacent sediments.
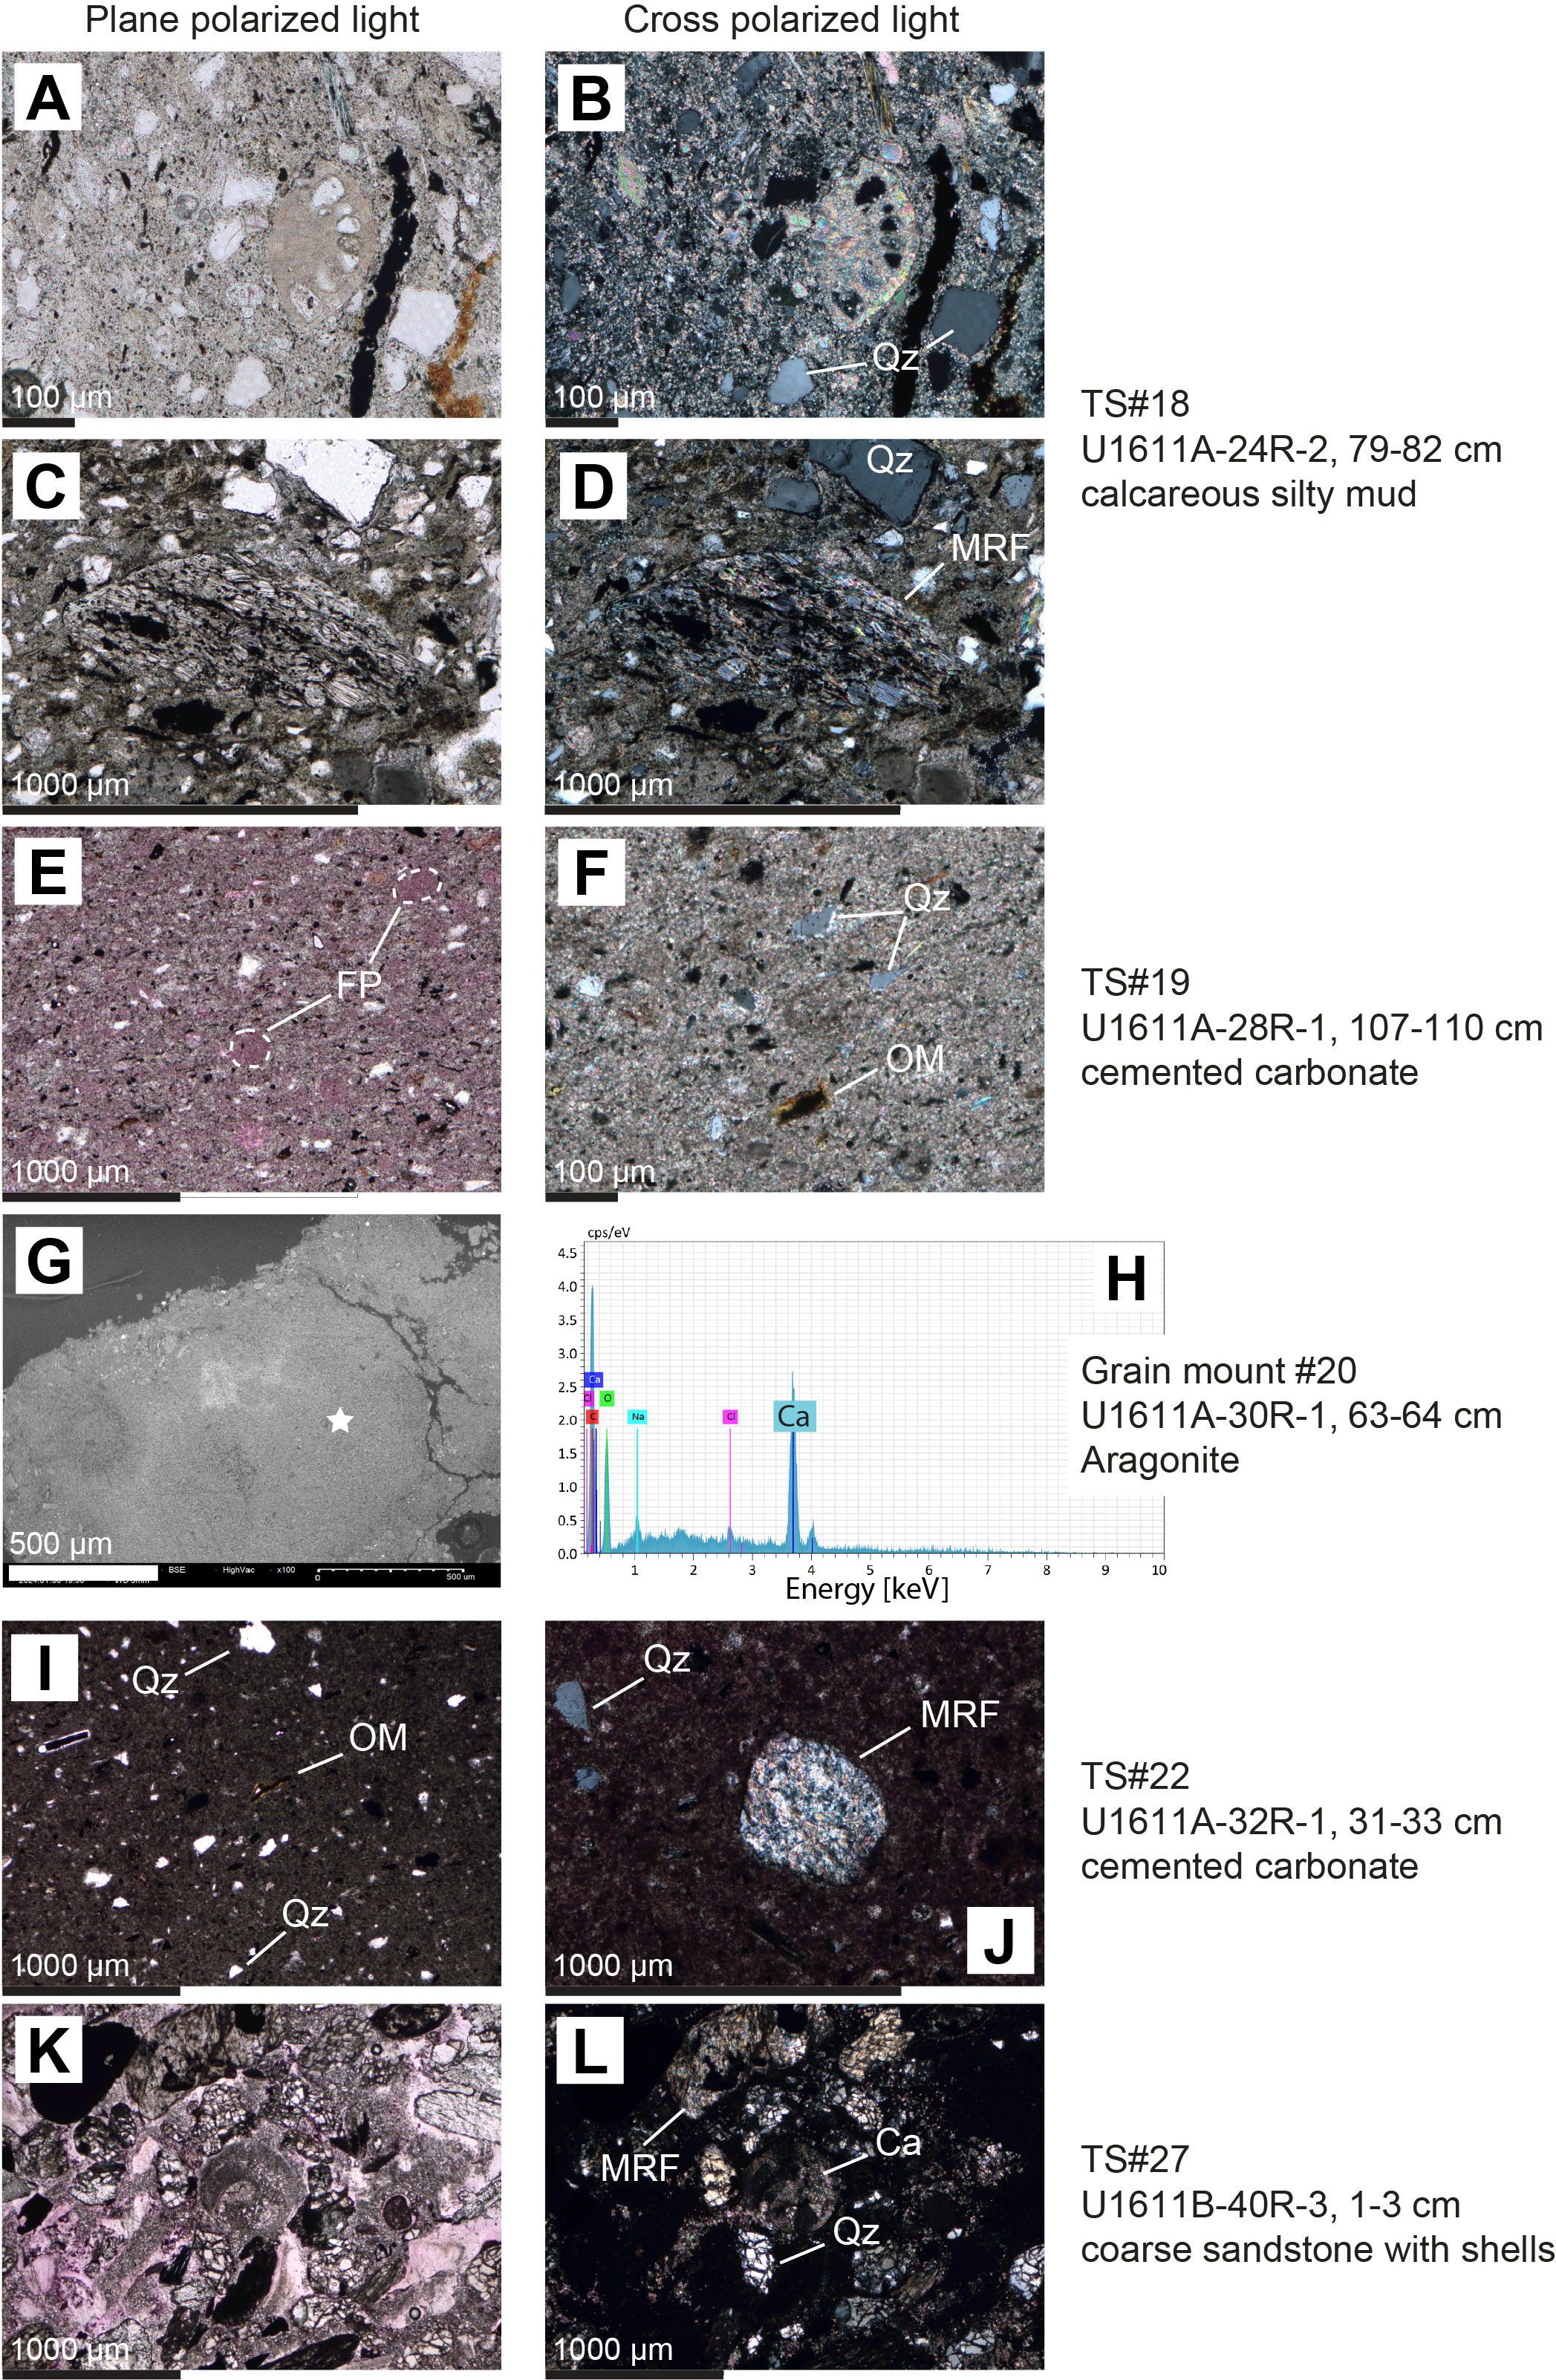
Figure F27. Calcareous silty mud, cemented carbonate, aragonite, and sandstone.
Two other samples from Unit II (401-U1611A-37R-1, 39–40 cm [981.59 m CSF-A], and 38R-1, 107–108 cm [991.97 m CSF-A]) contain 14%–15% opal-CT (tridymite and cristobalite), which may be linked to influx of siliceous biogenic fragments. This is also consistent with ~5% siliceous biogenic fragments documented in the smear slide of Sample 37R-3, 55 cm (Table T2). Sample 37R-1, 39–40 cm (981.59 m CSF-A), also contains zeolite, a common mineral resulting from the alteration of volcanic material, particularly volcanic glass (Hesse and Schacht, 2011).
Based on observations of Thin Section TS18, the calcareous silty sand in Section 401-U1611A-24R-2, 79–82 cm, contains poorly sorted, subangular to subrounded particles with an average grain size of fine sand (Figure F27A–F27D). This sample contains quartz, which has strongly undulose extinction. In addition, other minerals in Thin Section TS18 include feldspars, micas, clays, lithic fragments (such as the schist fragment in Figure F27C, F27D), some opaque minerals, glauconite, and a variety of biogenic particles including shell and foraminifer fragments, fish debris, and fecal pellets (Figure F27A, F27B). The framework particles are dispersed in a matrix that is rich in clays and likely nannofossils (the birefringence of the matrix indicates it is calcareous). Little cementation was observed in this sample.
Observations of the cemented carbonate in Thin Section TS19 (Sample 401-U1611A-28R-2, 107–110 cm) indicate that it contains subangular to subrounded particles including siliciclastics that are on average coarse silt-sized biogenic particles such as fecal pellets and shell fragments, as well as organic matter cemented by carbonate (Figure F27E, F27F). The largely uncompacted nature of the fecal pellets (rounded pellets with pink carbonate stain indicating calcite in Figure F27E) indicates early cementation occurred before significant compaction. The cement is probably dolomitic in composition, which is largely unstained.
The cemented carbonate in Thin Section TS22 (Sample 401-U1611A-32R-1, 31–33 cm) consists of silt- to fine sand–sized siliciclastic minerals, rock fragments (particularly metamorphic rock fragment), and organic matter cemented by early diagenetic dolomite (Figure F27I, F27J).
Based on observations of Thin Section TS27, the coarse sandstone in Sample 401-U1611B-40R-3, 1–3 cm, contains moderately sorted, subrounded to rounded particles (Figure F27K, F27L). The coarse sandstone is dominated by quartz, feldspars, lithic fragments (mostly metamorphic rock fragments), some opaque minerals, and phosphatic particles, along with minor biogenic particles including shell and foraminifer fragments. The type of matrix or cement in Thin Section TS27 could not be appraised because of material lost during thin section making.
In general, the common presence of metamorphic quartz and metamorphic rock fragments in the relatively coarse grained (and better lithified) samples in Unit II indicate erosion of a metamorphic hinterland.
3.3. Unit III description
- Intervals: 401-U1611A-39R-1 through 86R-CC; 401-U1611B-52R-1 through 66R-CC
- Depths: Hole U1611A = 1000.6–1275.9 m CSF-A; Hole U1611B = 997.1–1069.69 m CSF-A
- Age: Messinian
- Subunit IIIa interval: 401-U1611A-39R-1 through 62R-CC
- Subunit IIIa depth: 1000.6–1144.9 m CSF-A
- Subunit IIIb interval: 401-U1611A-63R-1 through 86R-CC
- Subunit IIIb depth: 1146.1–1275.9 m CSF-A
3.3.1. Lithologies, bedding, and color
Unit III predominantly consists of frequent alternations of silty mud and calcareous silty mud in the shallower parts, with numerous intervals of sandy silt and silty sand (Figures F9, F10, F11). Sandy silt and silty sand intervals are predominantly thinly bedded but are occasionally as thick as 1.4 m. Minor lithologies include conglomerate typically associated with contorted, slump-like sediment deformation (Figure F19) and cemented carbonate. Conglomerates reach up to 8.5 m thick in Hole U1611B. Cemented carbonates have an average thickness of 10 cm (maximum thickness = 30 cm), with 34 horizons in Hole U1611A and 16 horizons in Hole U1611B.
Subunits IIIa and IIIb are compositionally similar; however, thin centimeter-scale interbeds of calcareous silty mud and silty mud only occurs in Subunit IIIa (Figures F10, F11, F12C). Coarser grained intervals (e.g., sandy silt and silty sand) occur more commonly in Subunit IIIb. However, there are very few conglomerates in Subunit IIIb, and they are never more than 20 cm thick.
3.3.2. Structure and texture
Calcareous silty mud, silty mud, and mud are commonly laminated, but lamination is less prominent than in Unit II. There are infrequent occurrences of microfaults (Section 401-U1611A-84R-1; Figure F19). Sandy silt, silty sand, and sand (fine, medium, and coarse) are typically interstratified with the finer lithologies and usually have sharp or erosional basal contacts, normal grading, parallel and cross lamination (e.g., Section 41R-1; Figures F28, F29), and rare inverse grading (e.g., Section 43R-2, 4–15 cm). Coarser grained intervals (e.g., sand) occasionally contain soft clasts at the base of the beds. There is occasional slump-like deformation of sediments involving contorted and microfaulted bedding (e.g., Section 56R-2; Figure F19). Conglomerates are often composed of mud clasts and contain abundant shell fragments (Figure F25).
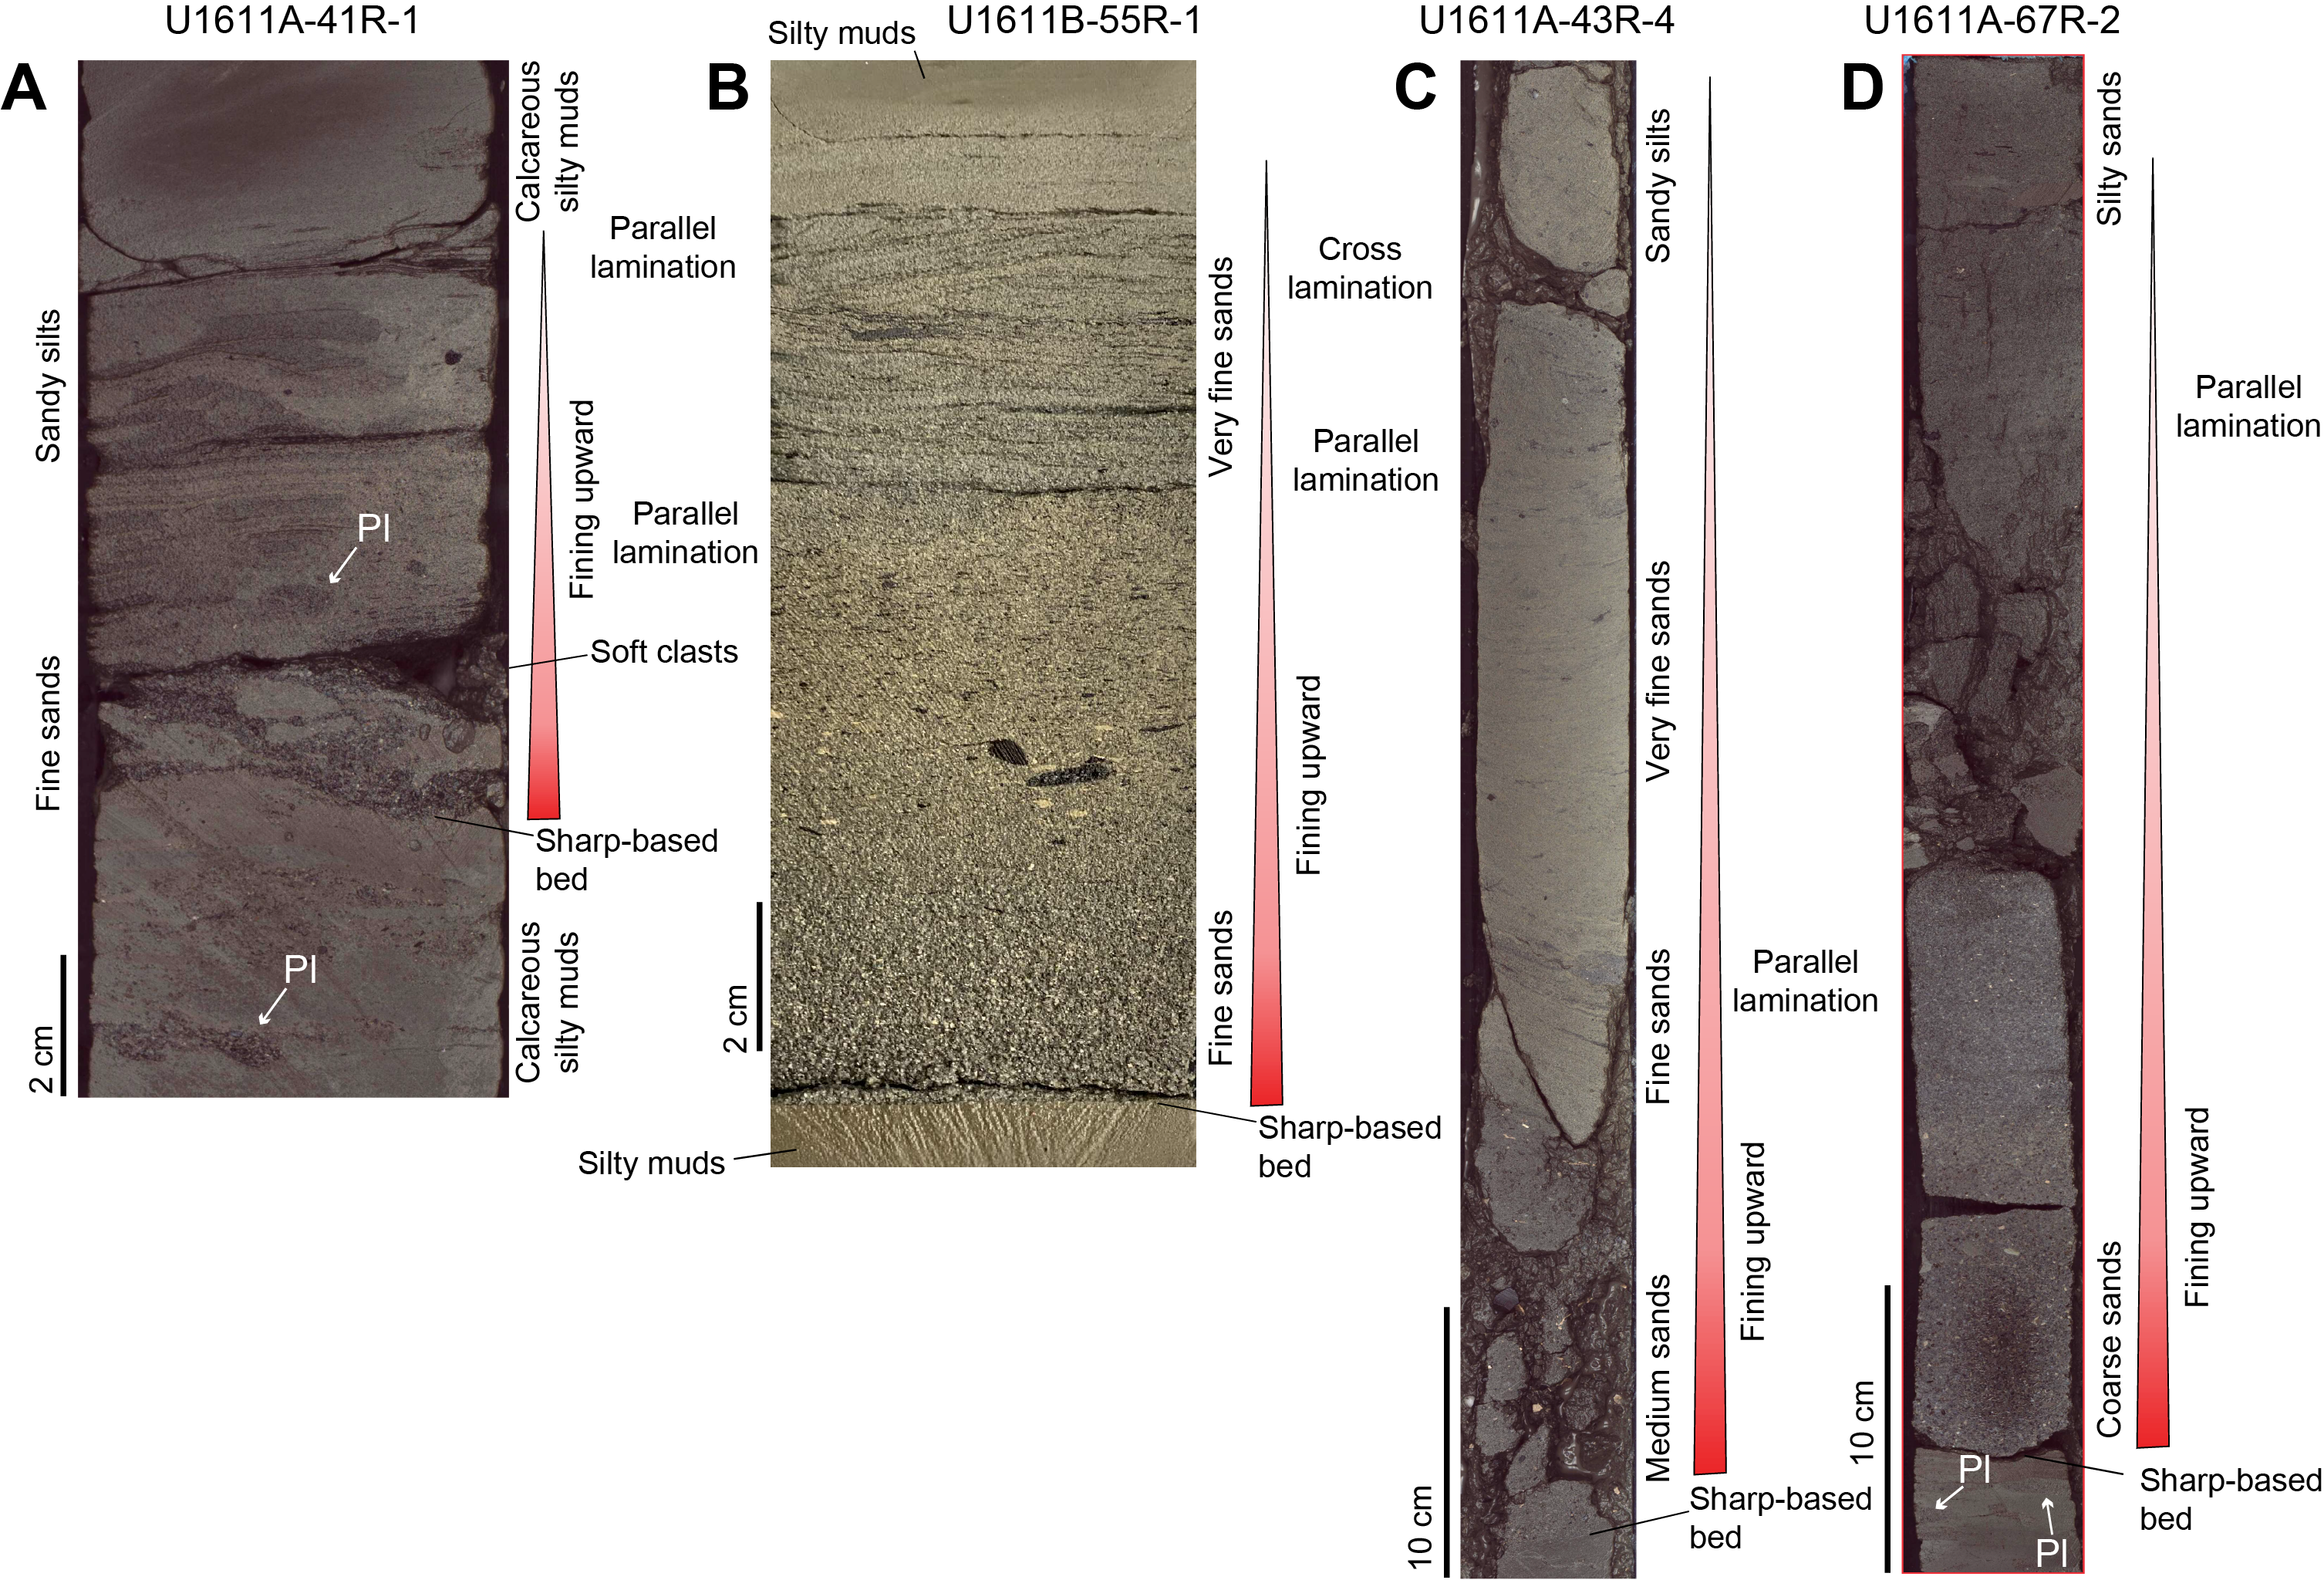
Figure F28. Turbiditic deposits, Unit III.
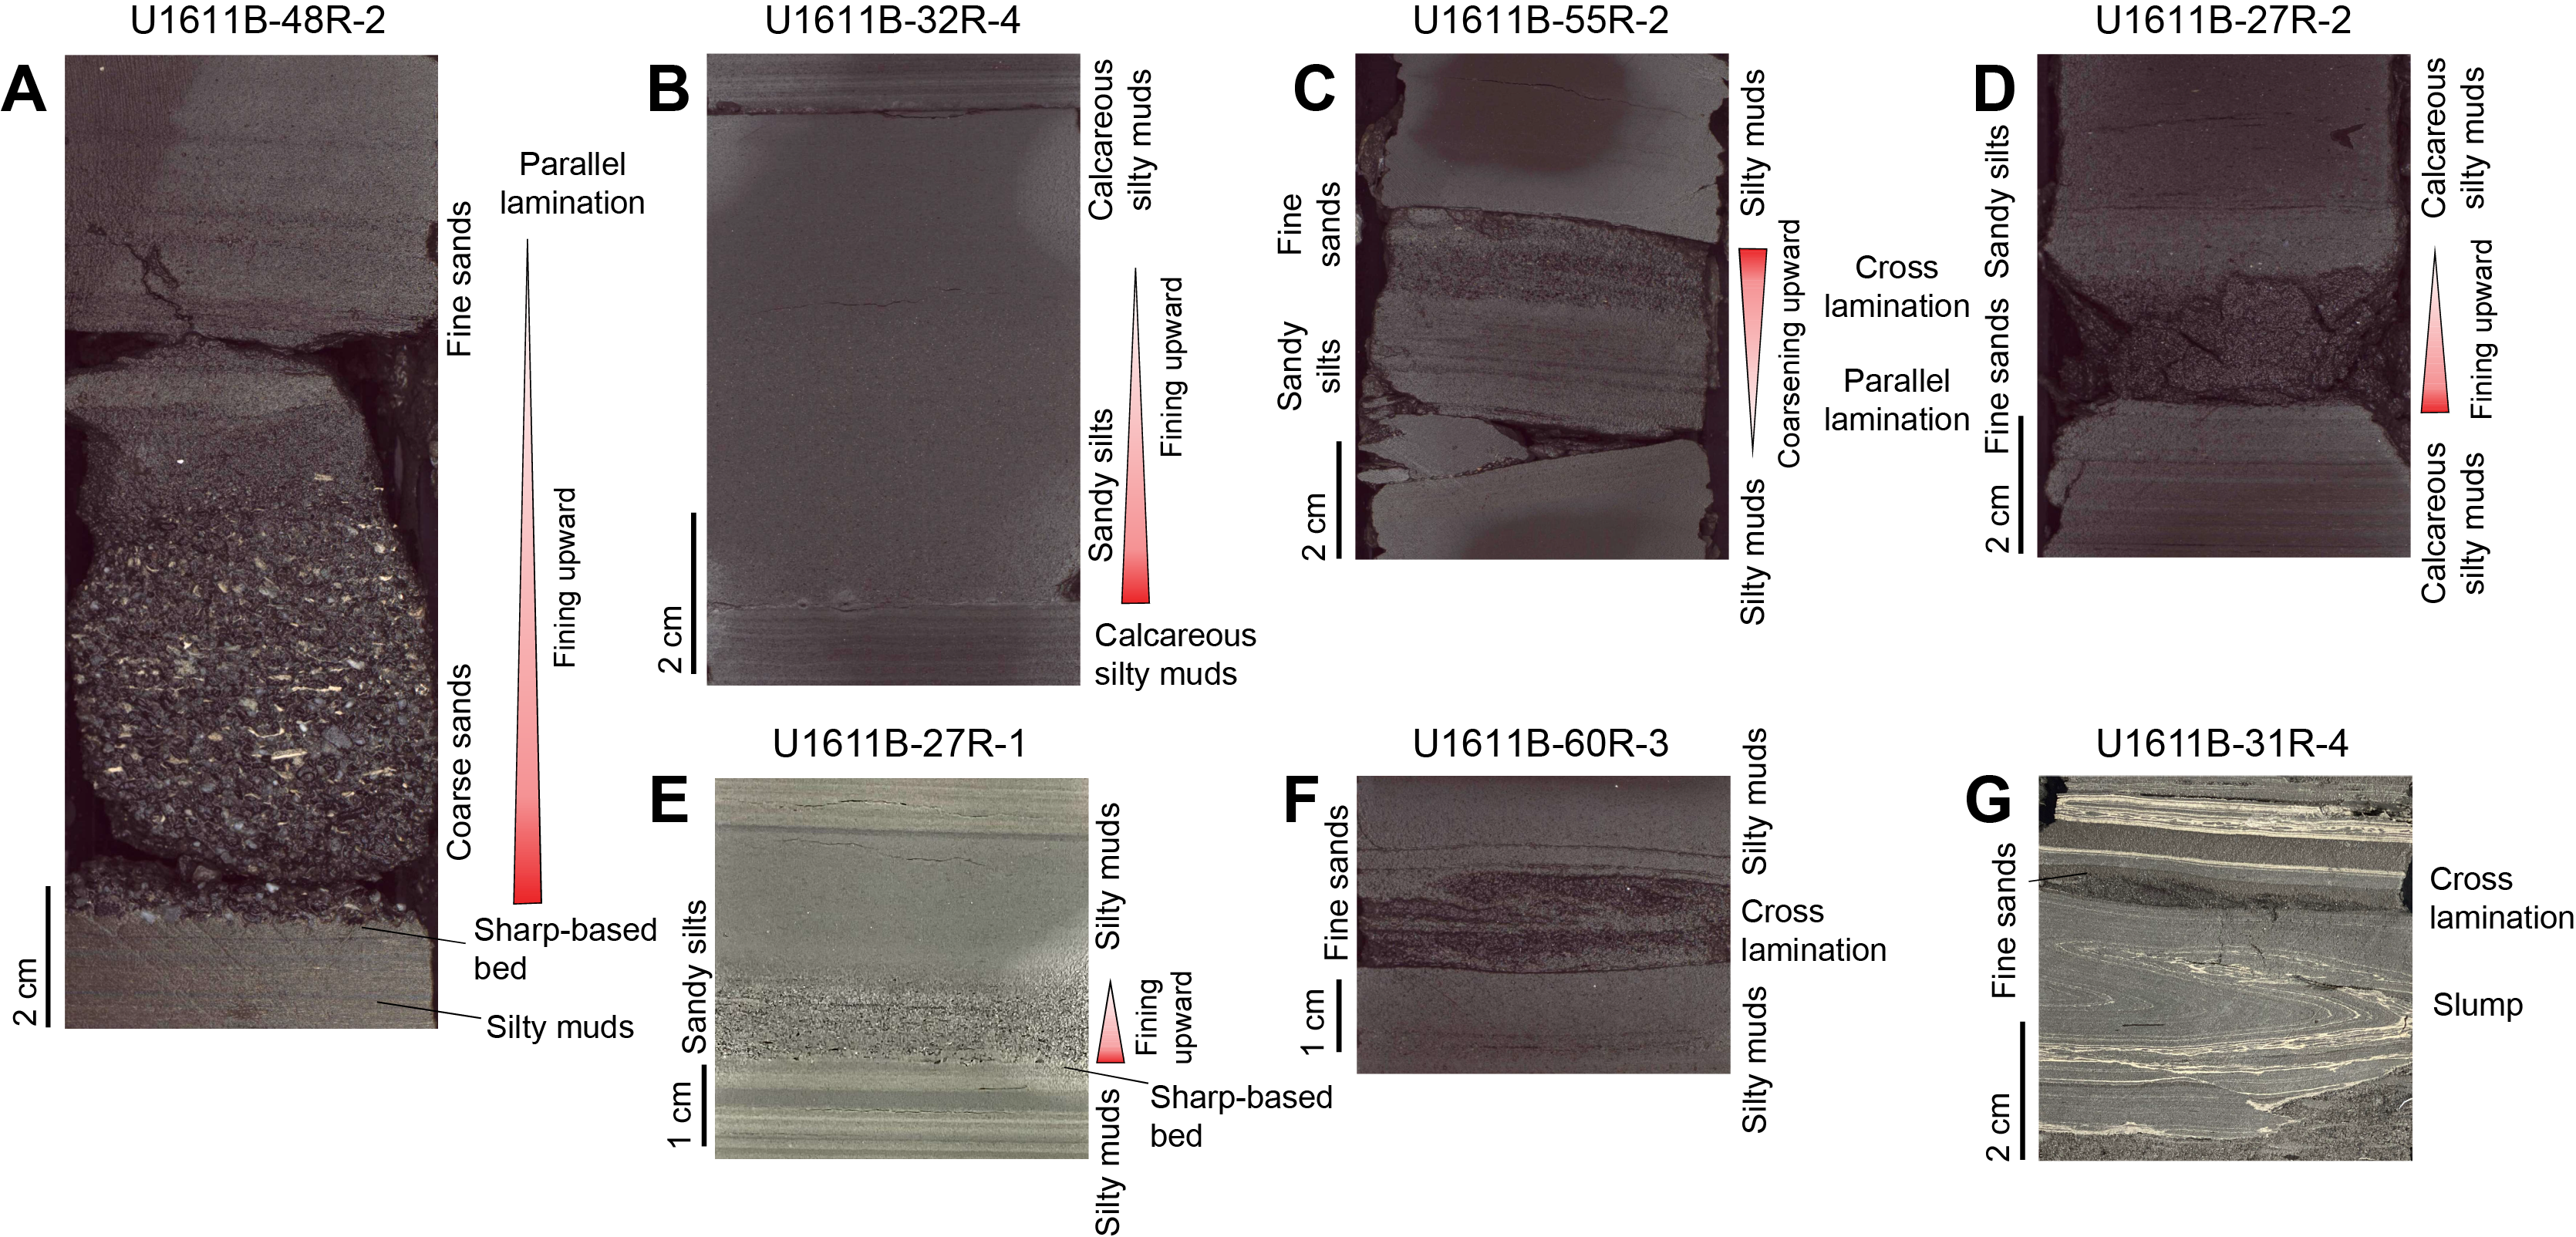
Figure F29. Thin turbidites.
Unit III lithologies are generally coarser grained compared to Units I and II. Smear slide analysis shows that averages for all Unit III lithologies are 18% sand, 47% silt, and 35% clay (Figure F21). The ternary diagram of the texture of Unit III smear slide data shows a very broad range of grain sizes (Figure F22). These were not broken up by lithology because frequently the described lithologies in Unit III were aggregations of multiple lithologies that varied on too fine a scale to be recorded in the data capture system.
3.3.3. Bioturbation and trace fossils
Unit III is characterized by a greater abundance and diversity of trace fossils than Unit II. The abundance and diversity increase progressively downcore from the upper part of Unit III, characterized by absent (BI = 0) or scarce (BI = 1) bioturbation, to the lower part of Unit III, in which moderate bioturbation was observed (mainly BI = 2 and occasionally BI = 3). The trace fossil assemblage mainly consists of Chondrites and Planolites, with common Thalassinoides and rare Palaeophycus (Figure F30).
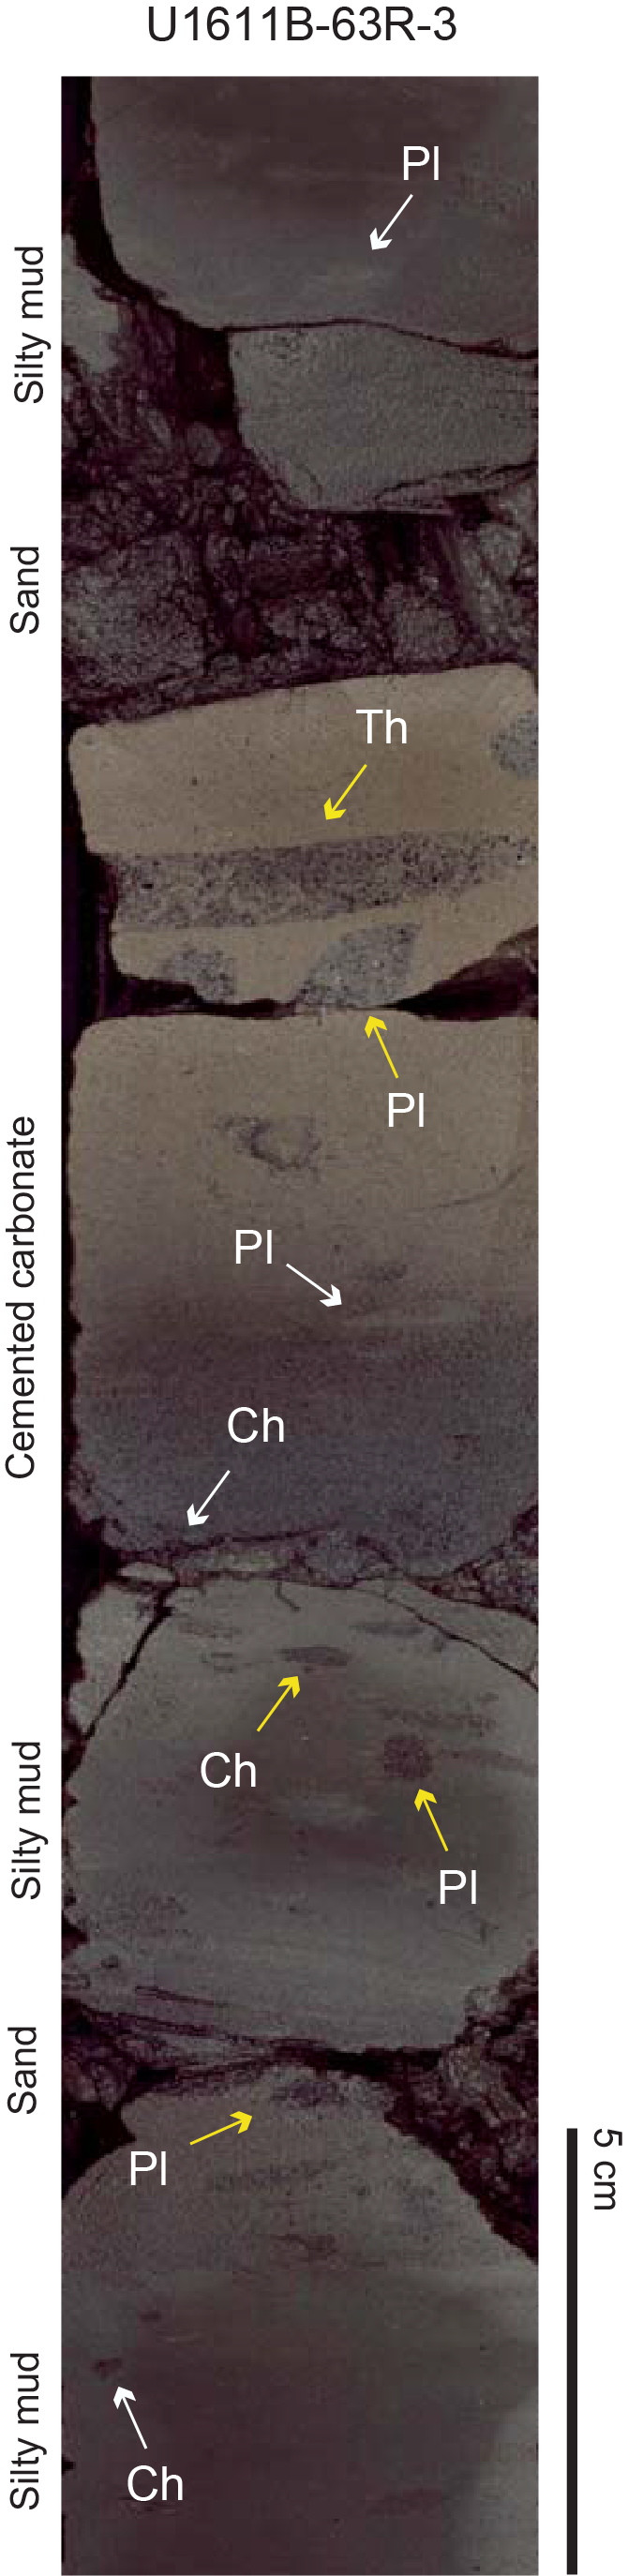
Figure F30. Trace fossil assemblage, Unit III.
3.3.4. Composition and bulk mineralogy
Smear slides of Unit III lithologies (n = 62) have a wide variety of compositions that are dominated by siliciclastic grains, with biogenic carbonate <45% (Figures F21, F24). Some Unit III samples contain quantities of authigenic carbonate (Figure F24). Siliceous biogenic grain content is negligible (<1%), and detrital carbonate varies from 0% to 15%.
Based on XRD analyses of 20 samples from Unit III, the calcite content ranges 1%–19% (average = 12%) (Figure F16). The quartz content ranges 3%–38% (average = 18%). The average content of feldspars is 12%, and clay minerals make up an average of 36% of the sediments. The dolomite content is very variable, ranging 1%–85% (average = 17%). Unit III is also characterized by distinct variations in pyrite content that averages 2% (Figure F16). The bulk mineral composition of Unit III is overall similar to that of Unit II, except the dolomite-rich samples in Unit III contain even higher dolomite content, consistent with the pervasive authigenic dolomite observed in the thin sections (Figure F31).
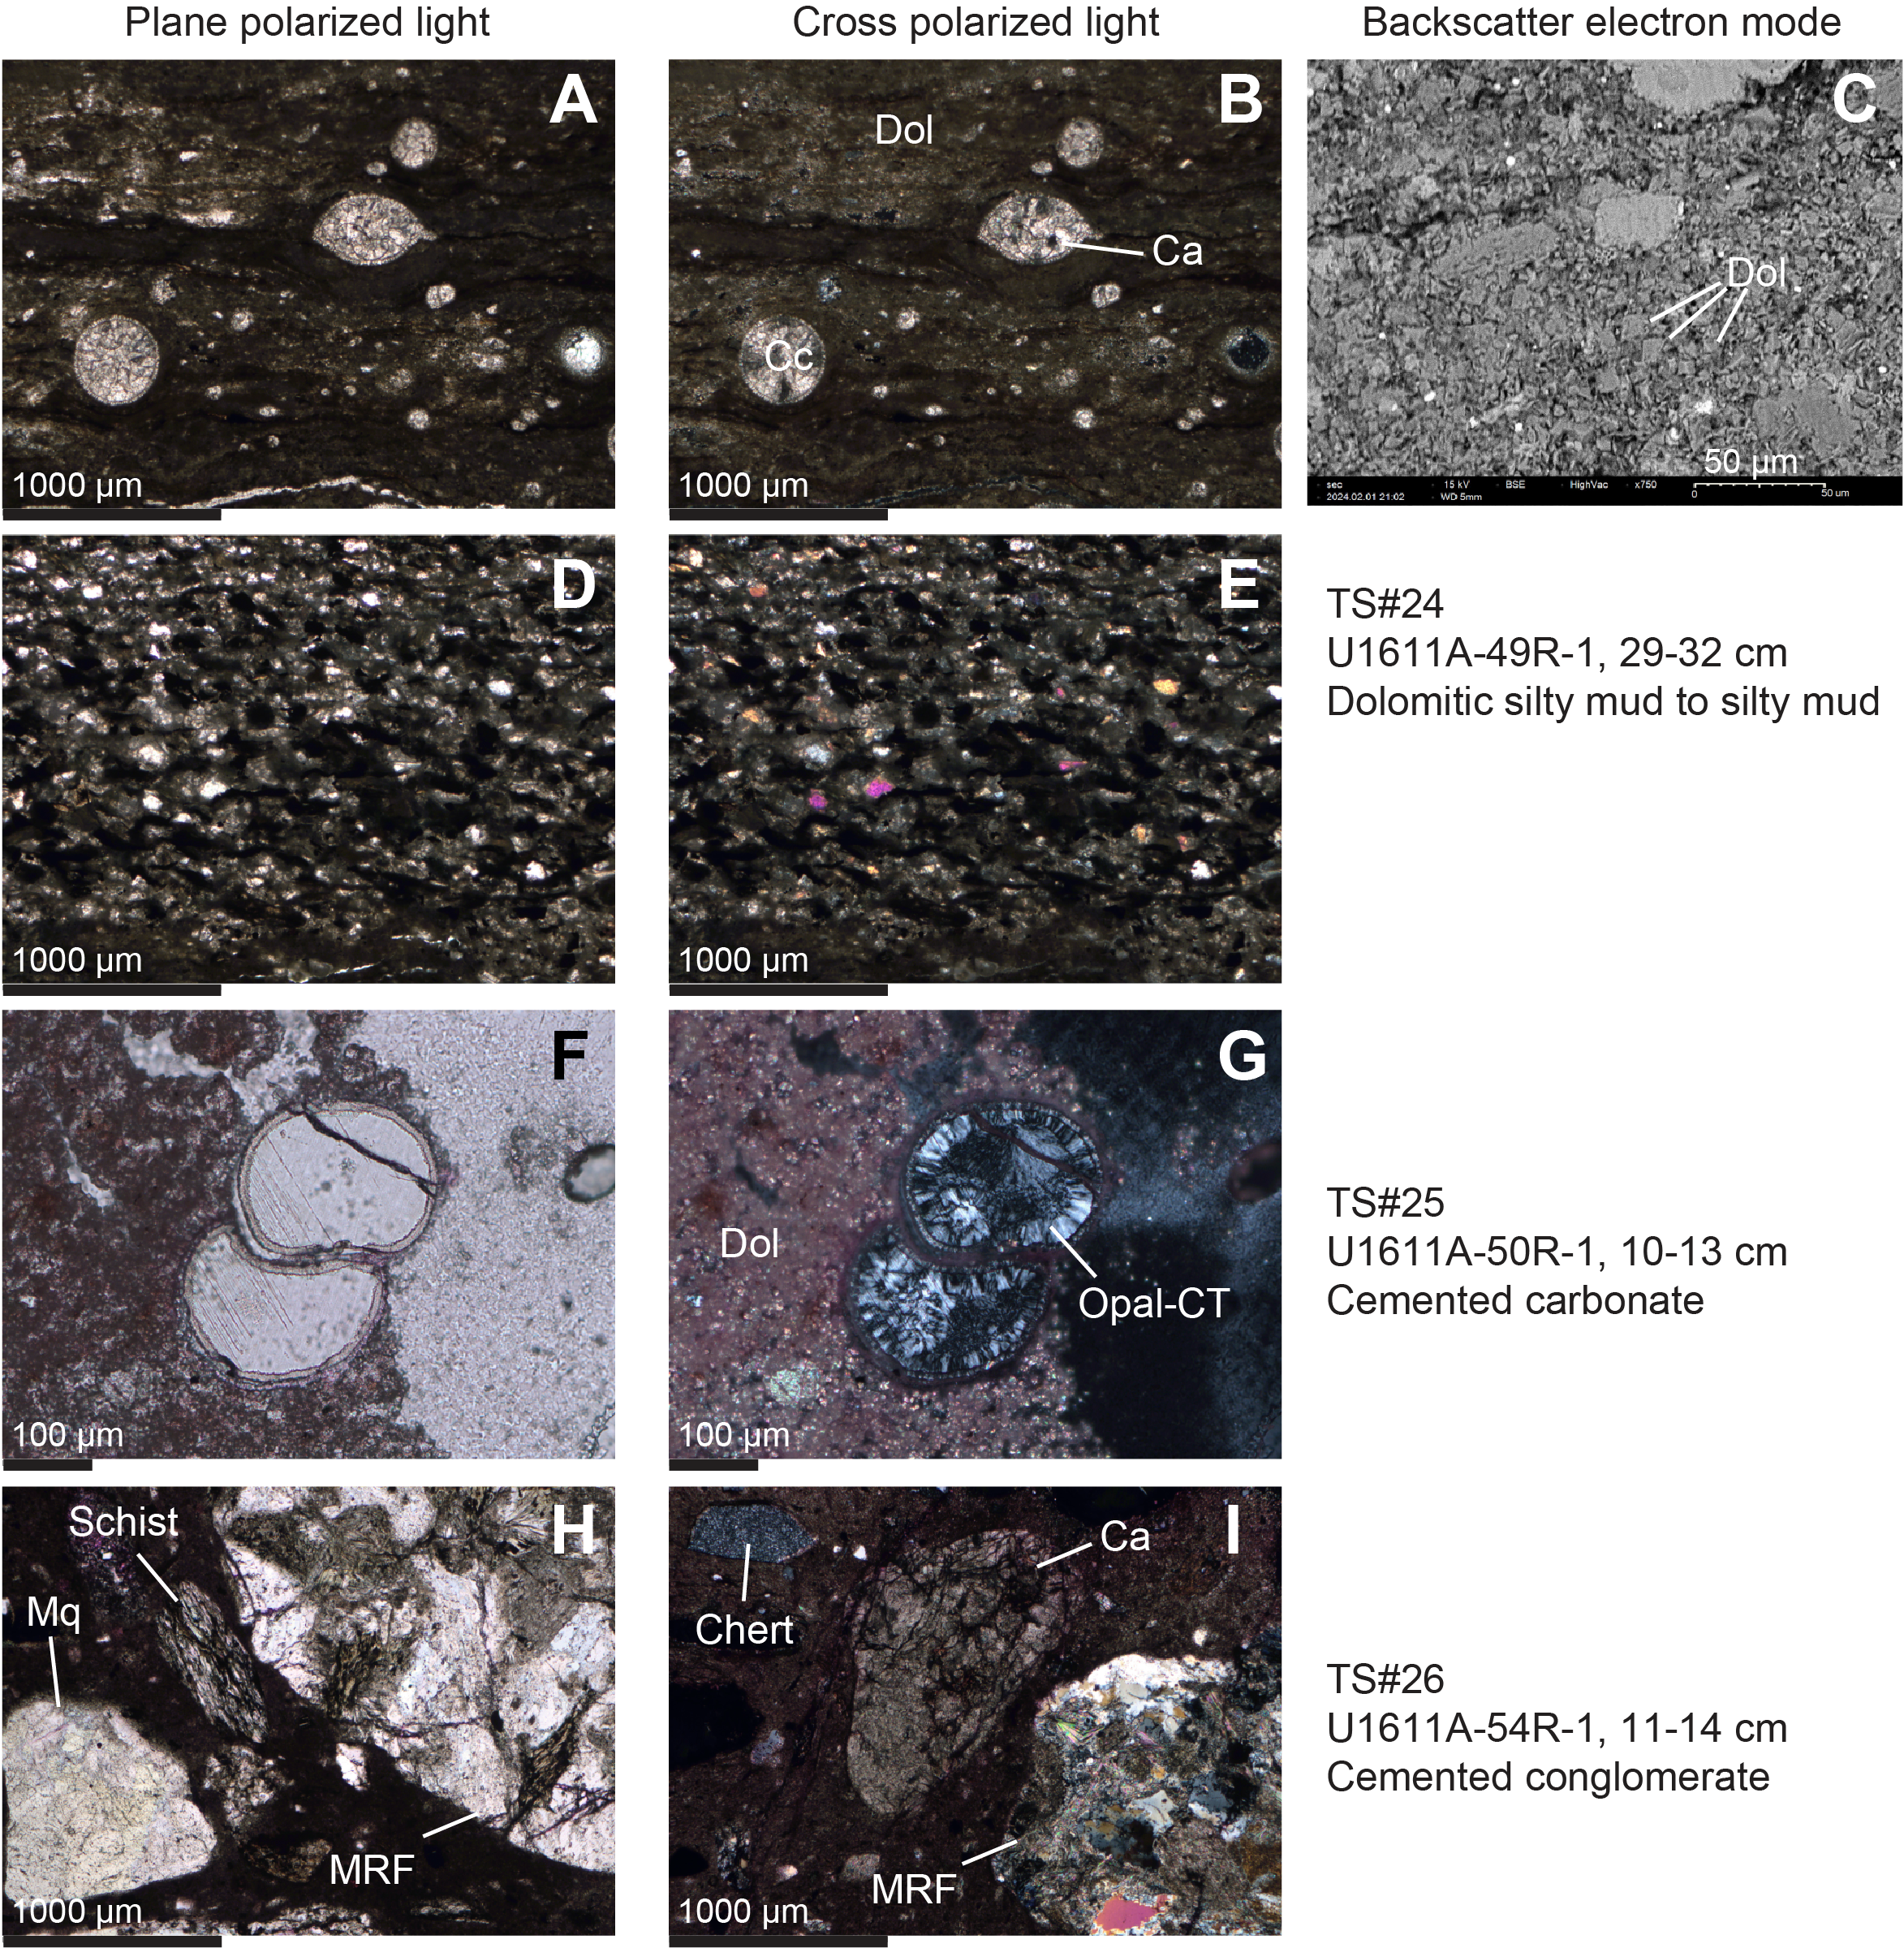
Figure F31. Unit III samples, Hole U1611A.
Zeolite is present in Sample 401-U1611A-60R-1, 29.5–31 cm (1131.895 m CSF-A), and Sample 84R-2, 139–149 cm (1265.37 m CSF-A), contains both zeolite and opal-CT (~12%). Opal-CT is also present in Sample 50R-1, 10–13 cm (1083 m CSF-A) (Figure F31F, F31G). The occurrence of zeolite and opal-CT may indicate a possible source of silica because opal-CT forms from the devitrification of volcanic glass (Kiipli et al., 2007). Detailed petrographic analysis (e.g., SEM) is needed to confirm the diagenetic history in these sediments.
Thin Section TS24 (Sample 401-U1611A-49R-1, 29–32 cm) contains laminated mud overlain by silty mud (Figure F31A–F31E). The lower laminated mud has an apparent average grain size of clay and contains mostly carbonate particles (foraminifers and carbonate mud), a small amount of siliciclastic particles, and organic matter. The foraminifer tests are filled with calcite (confirmed with EDS) and have differential compaction around them (Figure F31A, F31B). The matrix surrounding the foraminifer tests is pervasively dolomitized (Figure F31C). The differential compaction and pervasive dolomitization in the matrix indicates very early diagenesis, probably microbially driven diagenetic reactions allowing accumulation of carbonate cements in pore spaces of surficial sediments, which can be linked to intervals of very slow sedimentation or breaks in sedimentation (Raiswell and Fisher, 2000; Aplin and Macquaker, 2011; Li and Schieber, 2020). The upper silty mud interval contains subangular to subrounded quartz, clays, common elongated dark particles, and minor foraminifer tests, feldspars, metamorphic rock fragments, as well as some glauconite cemented by calcite (Figure F31D, F31E). Because the thin section is relatively thick and not finely polished, it was challenging to determine the composition of these dark particles. Nevertheless, they seem to show imbrication and possible alignment along foresets (Figure F31D, F31E), pointing to the possible role of bottom water currents during deposition. Thinner and more polished thin sections are needed to confirm the characteristics of these dark particles.
Thin Section TS25 (Sample 401-U1611A-50R-1, 10–13 cm) is from a cemented carbonate interval and contains foraminifer tests and minor amounts of siliciclastic particles (e.g., quartz and metamorphic rock fragments) dispersed in a pervasively dolomitized matrix (confirmed with EDS) (Figure F31F, F31G). The foraminifer tests in Thin Section TS25 are filled with fibrous silica cement (Figure F31D, F31E), which was confirmed with EDS and identified as opal-CT based on the XRD diffraction patterns on other samples in Unit III.
Thin Section TS26 (Sample 401-U1611A-54R-1, 11–14 cm) is from a cemented conglomerate (Figure F31H, F31I) that contains poorly sorted, subrounded to well-rounded quartz (with metamorphic quartz), common metamorphic rock fragments (schist and quartzite fragments), some opaque clasts, a few chert fragments, mica (muscovite), and some phosphatic particles. Minor biogenic fragments include a few rounded shell fragments and foraminifer tests filled with calcite. The cement of this conglomerate seems to be calcite, which needs further confirmation.
Unit III thin sections contain common metamorphic quartz and different types of metamorphic rock fragments and minor chert fragments, which indicates significant sedimentary input from a metamorphic hinterland, and minor sedimentary input from recycled sedimentary rocks.
3.4. Discussion
3.4.1. Dominant sedimentary facies and depositional processes
3.4.1.1. Hemipelagic deposits
The calcareous mud, mud, and calcareous silty mud deposits identified in the three lithostratigraphic units represent a deepwater sedimentary facies association, which corresponds to sedimentation in a hemipelagic setting (Hüneke and Henrich, 2011; Stow and Smillie, 2020; de Castro et al., 2021). These facies are likely to be the background sedimentation at the Site U1611 location during the Messinian to Early Pliocene (Figure F10) from Unit III to Unit I, although they are interstratified with the other lithologies.
3.4.1.2. Contourite deposits
Evidence of bottom current (contouritic) processes and the occurrence of contourites are visible in Unit I, with the vertical association of calcareous mud and calcareous silty mud showing gradational contacts and bigradational sequences (Figure F18). In the central division of these sequences, there is occasional lamination, color banding, and rarely low-angle cross lamination, which are common characteristics of very fine grained contourites (Gonthier et al., 1984; Stow and Faugères 2008; Stow and Smillie, 2020; Hüneke et al., 2021; Hernández-Molina et al., 2022; Rodríguez-Tovar, 2022; Rodrigues et al., 2022a, 2022b). A remarkable example of parallel and cross lamination is in Sections 401-U1611A-18R-7 and 401-U1611B-14R-2, close to the Miocene/Pliocene boundary. There is no evidence of bottom water current processes or contourites in Unit II and Unit III. Detailed postcruise analyses need to evaluate the possible occurrence of cryptic contourites.
3.4.1.3. Turbidites
The calcareous sandy mud, calcareous silty mud, sandy silt, silty sand, and sand deposits found in Units I–III commonly have sharp basal contacts, normal grading, and planar lamination that evolves to cross lamination, all of which are indicative of deposition from decelerating turbulent flows followed by suspension fallout (e.g., Bouma et al., 1962). The common preservation of wood fragments and shallow marine bioclasts (such as corals, shell fragments, etc.) can be attributed to rapid deposition by turbidity currents originated from a shallow-marine environment, although the possibility of turbidites with different sources is not excluded. These deposits are interpreted to be deposits from low- to medium-density turbidity currents (Lowe, 1982; Postma, 1986; Stanley, 1988; Stow and Wetzel, 1990; de Castro et al., 2020, 2021; Hüneke et al., 2021; de Weger et al., 2021). There is no evidence even of partial reworking of the turbidite deposits by bottom currents, and postcruise research should further investigate this.
3.4.1.4. Debrites and slumps
The frequent conglomerates are likely to be debris flow deposits that commonly coexist with slumps, turbidites, and hemipelagic/pelagic deposits along continental margins. Deformed beds are interpreted to be slumps indicative of a coherent mass of sediment transitions between noncohesive and cohesive behaviors or superimposed mass transport processes (Einsele, 2000; Shanmugam, 2019, 2021; Shipp et al., 2011; Pickering and Hiscott, 2015; Rotzien et al., 2022a, 2022b). Slumps can evolve to debris flows or turbidity currents because of ambient water entrainment or when they encounter hydraulic jumps along the margin (Shanmugam, 2019). Postcruise research should determine the source of these slumps and debrites, but their occurrence certainly denotes occasional synsedimentary instabilities along the margin.
3.4.1.5. Trace fossils
Variable bioturbation intensity (BI = 4–0) can be interpreted in relation to variations in paleoenvironmental conditions in the context of the deep-sea environment. The lower part of Site U1611 (Unit III) shows a trace fossil assemblage mainly characterized by Chondrites and Planolites and common Thalassinoides, revealing relatively favorable paleoenvironmental conditions that progressively worsen upward. The near-absence of bioturbation in Unit II can be interpreted to be related to significant changes in ecological and depositional conditions, with unfavorable habitats for macrobenthonic trace fossil makers in the context of the MSC. After that, the upper part of Site U1611 (Unit I) reveals a slow recovery to a more favorable habitat (normal marine conditions) for the macrobenthonic trace fossil community in terms of paleoenvironmental conditions such as organic matter supply, sedimentation rate, and oxygenation (Rodríguez-Tovar, 2022).
The relatively moderate and diverse trace fossil assemblage, mainly in Unit I, consisting of abundant Chondrites and Planolites, common Thalassinoides, rare Palaeophycus and Zoophycos, and occasional Asterosoma and Phycosiphon could be assigned to the Zoophycos ichnofacies, usually associated with fine-grained, low sedimentation rate, pelagic and hemipelagic, nonturbiditic sediments (MacEachern et al., 2007; Rodríguez-Tovar and Dorador, 2014; Dorador and Rodríguez-Tovar, 2015; Rodríguez-Tovar, 2022). However, the scarcity of Zoophycos is significant and may be related to the common occurrence of turbiditic intervals.
3.4.2. General sedimentary model
Hole U1611A is located in the Malaga Basin at the northern part of the West Alborán Basin, (see Background and objectives; Figure F1). This basin includes deepwater systems on a tectonic graben very close to a very narrow shelf (e.g., Comas et al., 1999; Martínez del Olmo and Comas, 2008). The sedimentary model is different for the three units, but there are some common aspects.
During the Messinian, but particularly during deposition of Unit III, there was an interplay of gravitational and pelagic/hemipelagic processes that determined the evolution of a complex depositional system, where the slumps, debrites, and turbiditic deposits are volumetrically the most important deposits in the area, indicating a high sedimentation rate for the basin. The hemipelagic/pelagic deposits are the general background when the gravitational processes were not active. These turbidites have been described in previous papers for the same-aged deposits (e.g., Jurado and Comas, 1992; Martínez del Olmo and Comas, 2008; Martínez del Olmo, 2011). Slumps, debrites, and turbidites characterize a Mass Transport Sedimentary Complex (Shipp et al., 2011; Pickering and Hiscott, 2015; Rotzien et al., 2022a, 2022b), and postcruise analysis of the sedimentary stacking pattern and facies associations should determine the different depositional elements and their evolution.
During deposition of Unit II, an important change in the depositional style with respect to Unit III took place with the development of lamination throughout, aragonite, and dark muds. During this time, the basin likely became more restricted, and the relatively high sedimentation rate and depleted dissolved oxygen level in the bottom water led to a benthonic depauperate habitat, limiting the macrobenthos trace fossil maker community persistently enough to prevent bioturbation and aiding in the formation and preservation of finely laminated sediments (Schimmelmann et al., 2016). These processes, and the precipitation of aragonite, are possible in stratified marine lakes with restricted seawater access and with water mass stratification (Schimmelmann et al., 2016). Turbidite and debrite deposits are also present in Unit II. In the literature on this sector of the Alborán Sea, these deposits are considered as chaotic mass transport deposits that accumulated during the MSC (Martínez del Olmo and Comas, 2008; Estrada et al., 2011; Martínez del Olmo, 2011; Bulian et al., 2021). Based on the results from this expedition, Unit II has less common, thinner, and finer gravitational deposits compared to Unit III.
During deposition of Unit I in the Pliocene, another important change in the depositional style occurred, and bottom water current (contouritic) and pelagic/hemipelagic sediments dominate the succession. Similar Pliocene sequences observed elsewhere in the Alborán Basin are considered to result mainly from regional circulation of the deep, intermediate, and surface Mediterranean water mass currents (e.g., Juan et al., 2016, 2020; Ercilla et al., 2016; Llave et al., 2020; among others).
4. Biostratigraphy
Cores recovered from Site U1611 contain diverse lithologies, including muds, silts, sands, conglomerates, and cemented carbonates. Some intervals are poor in microfauna, particularly benthonic and planktonic foraminifers. However, some of these same samples are rich in fish teeth and scales, wood fragments, and shell fragments, providing valuable understanding of the site's paleoenvironment.
In Holes U1611A and U1611B, a distinctive pattern in microfossil composition was observed. In certain intervals, the planktonic foraminifers are predominantly small in size and are mostly found in the fine sediment (>63 µm), whereas the coarse fraction (>150 µm) is completely barren. Based on calcareous nannoplankton and foraminifer assemblages recovered at the top of both sequences, an Early Pliocene age is estimated for the uppermost core catchers. The presence of Nicklithus amplificus and Reticulofenestra pseudoumbilicus gives an age younger than 6.82 Ma at the bottom of the holes.
4.1. Calcareous nannofossils
At Site U1611, the calcareous nannofossil assemblages are not continuously present, varying from abundant to barren. Preservation varies between good and poor. We relied on existing literature for the Mediterranean area to constrain events (Bertini et al., 2024; Lozar and Negri, 2019; Manzi et al., 2007). Selected samples other than core catchers were analyzed to constrain different events. Small placolith species (<3 µm) dominate most of the assemblages. Discoasters occur randomly throughout the sedimentary succession, so we could not use them. At this Mediterranean site, we used the species Reticulofenestra cisnerosii, which is considered a good regional marker for its lowest occurrence (LO) (at 5.33 Ma) because it marks the Miocene/Pliocene boundary (Lancis and Flores, 2006). Input of fragmented siliceous fossils, siliciclastic grains, and pyrite framboids as sedimentary components varies from rare to common, whereas reworked (mainly Cretaceous and Paleogene) species vary from rare to few throughout (Figure F32; Table T3).
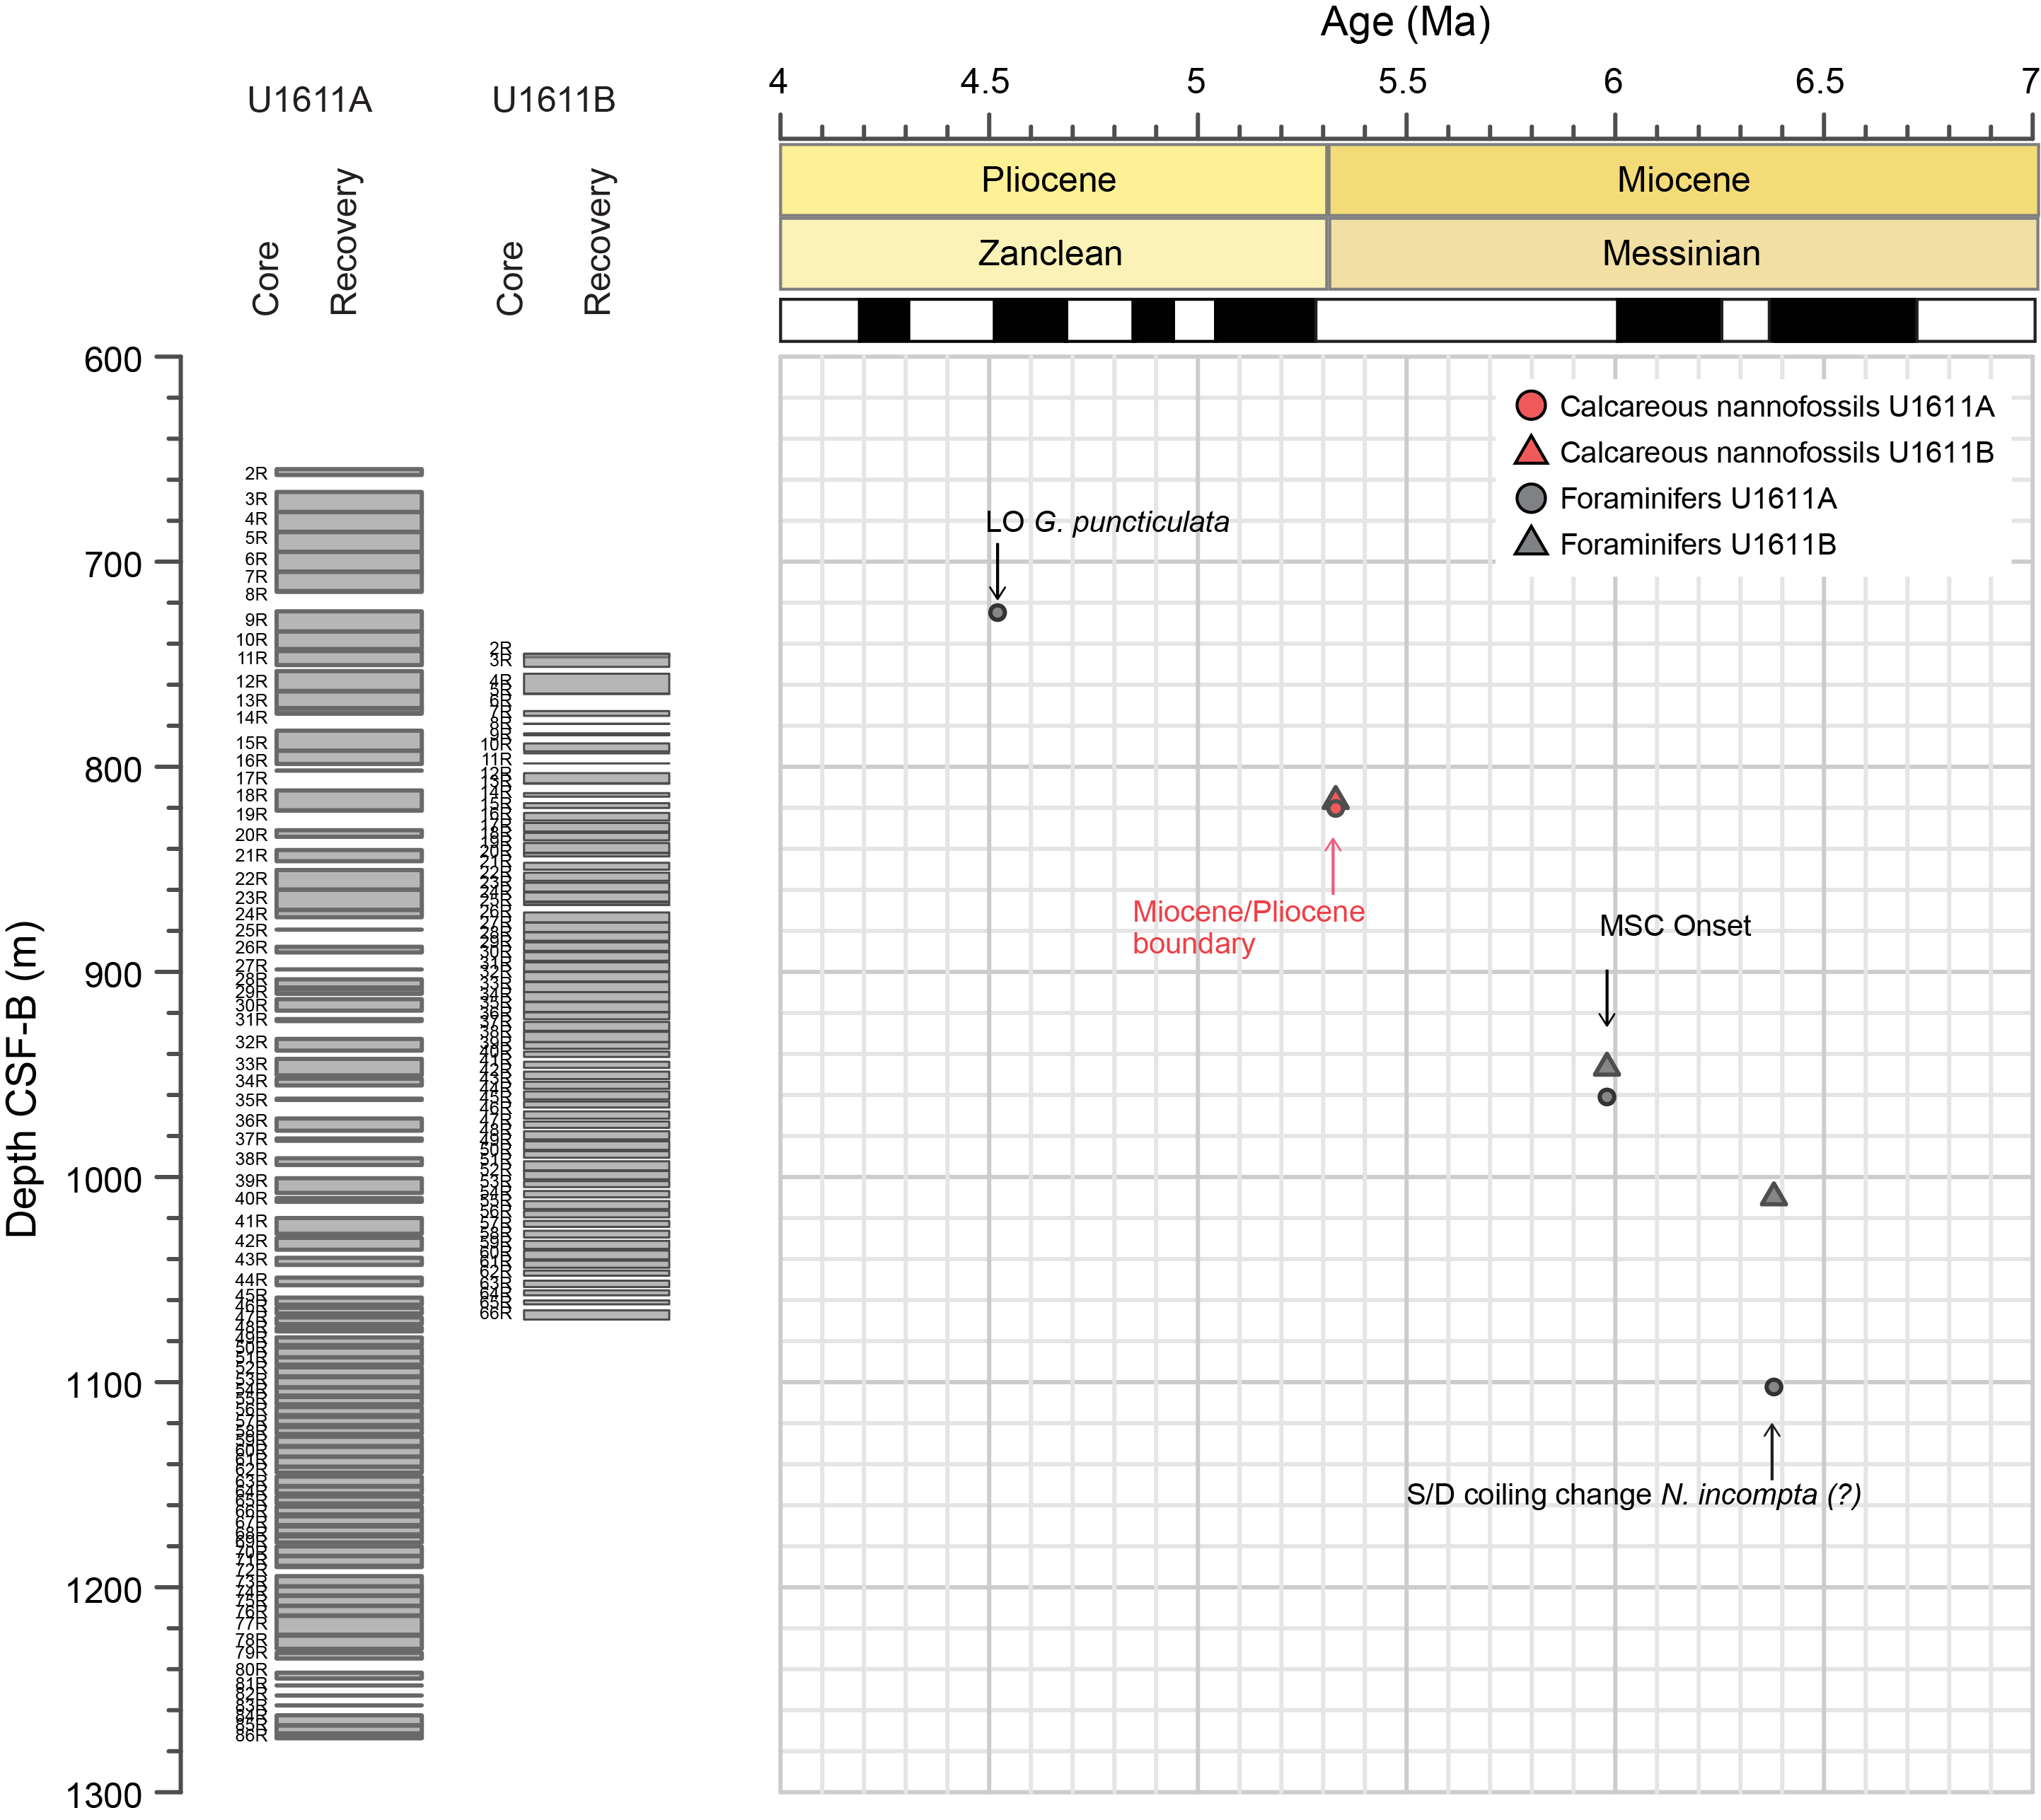
Figure F32. Planktonic foraminifer and nannofossil biostratigraphic events.
For Hole U1611A, we examined 86 core catcher samples (Table T4). The presence of species such as Ceratolithus acutus and Amaurolithus spp. together with R. cisnerosii shows a typical Pliocene assemblage between Samples 401-U1611A-2R-CC and 17R-CC (656.315–802.765 m core depth below seafloor, Method B [CSF-B]). Several samples from Section 18R-7 were analyzed to constrain the Pliocene/Miocene boundary, which was constrained using the LO of R. cisnerosii and is placed between 18 and 24 cm in Section 18R-7 (820.30 m CSF-B). In Sample 18R-CC, a change in coccolith abundances concomitant with the increasing presence of clay minerals was recorded. In Samples 19R-CC to 29R-CC (821.685–911.695 m CSF-B), the coccolith assemblage is characterized by medium diversity and the presence of several Reticulofenestra species. Samples 30R-CC to 34R-CC (920.635–957.685 m CSF-B) contain either no coccoliths or rare specimens with poor preservation. Sample 35R-CC contains a high abundance of diatoms (mostly monospecific). Sample 36R-CC presents a monospecific coccolith assemblage consisting mainly of Helicosphaera carteri. In the lower part of the section, coccolith abundance varies, ranging from abundant to rare. Some of the core catchers are dominated by Reticulofenestra spp., Sphenolithus spp., and H. carteri. Between Samples 41R-CC and 42R-CC, we observed the highest occurrence (HO) of N. amplificus (mean depths = 1037.165 and 1045.205 m CSF-B, respectively), giving an age of 5.98 Ma. This species was recorded sporadically to the bottom of Hole U1611A. The presence of N. amplificus and R. pseudoumbilicus gives an age younger than 6.82 Ma at the bottom of the holes.
For Hole U1611B, we examined 64 core catcher samples (Table T5). The Pliocene/Miocene boundary was also constrained for this hole by the LO of R. cisnerosii found between Samples 401-U1611B-14R-1, 140 cm, and 14R-1, 146 cm (mean depth = 815 m CSF-B). As in Hole U1611A, the core catchers below the Miocene/Pliocene boundary were characterized by a less abundant coccolith assemblage and an increase in mineral content. Sample 40R-CC recovered the same monospecific diatom assemblage (mean depth = 942.405 m CSF-B) that was found in Hole U1611A. In Sample 41R-CC, the monospecific coccolith assemblage continues. An abundant assemblage with good diversity was recovered from Sample 42R-CC to the bottom of the hole. Finally, as in the previous hole, the species N. amplificus from Sample 42R-CC was recovered sporadically. The presence of N. amplificus gives an age younger than 6.82 Ma at the bottom of this hole, as in Hole U1611A.
4.2. Planktonic foraminifers
The analysis of planktonic foraminifers at this site allowed identification of the LO of Globorotalia puncticulata in Hole U1611A in the Pliocene (Table T6). Coring started below the LO of G. puncticulata in Hole U1611B (Table T7). Except for this event, the biochronology for this site is based on changes in the foraminifer assemblages that can be compared with records from other Mediterranean areas, although these changes could in some cases be diachronous.
An Early Pliocene–late Messinian succession was recovered in both holes at this site, although some samples lack planktonic foraminifers, especially in the late Messinian. In these samples, we looked at the 63–150 µm fraction to investigate the presence or absence of small planktonic foraminifers. We will also discuss the possible presence of reworked planktonic foraminifers in the late Messinian, a topic that has been widely debated in the past.
For Hole U1611A, the first occurrence of G. puncticulata was identified between Samples 401-U1611A-8R-CC and 9R-CC (mean depth = 724.8 CSF-B), whereas in Hole U1611B, coring started below this depth.
From Samples 401-U1611A-18R-CC (821.2 m CSF-B) and 401-U1611B-14R-CC (815.7 CSF-B) downward, a major change in the planktonic foraminifer assemblage was recognized; with rare exceptions, planktonic foraminifers are not present in the coarse fraction (>150 µm), although they continue to be present in the fine fraction. There is also a significant change in the type of sediments because there are almost no particles in the coarse fraction except for some fish bones and/or wood fragments. We relate this change to the Miocene/Pliocene boundary.
With the aim of investigating this major change in the foraminifer assemblages, detailed sampling was carried out in Sections 401-U1611A-18R-6 and 18R-7 to more precisely locate the Miocene/Pliocene boundary, which was placed between Samples 18R-7, 17–18 cm, and 18R-6, 27–29 cm (mean depth = 819.6 CSF-B), toward the top of a laminated interval overlying a breccia at the base of Core 18R. The base of this laminated interval (Samples 18R-7, 96–97 cm, and 18R-7, 73–74 cm) is devoid of planktonic foraminifers coarser than 150 µm. Large planktonic foraminifers start to be present but rare in Sample 18R-7, 17–18 cm, and the assemblage is rich and diverse in Sample 18R-6, 22–24 cm.
A close inspection of the sediments in the uppermost part of Section 401-U1611A-18R-7 with an amplifier lens reveals that a major increase in abundance of the coarse foraminifers probably occurs at around Sample 18R-7, 10–12 cm. For Hole U1611B, the Miocene/Pliocene boundary was identified between Sample 401-U1611B-14R-1, 146–147 cm (mean depth = 814.2 CSF-B), in which the residue >150 µm is barren and only one specimen of planktonic foraminifer was recovered, and Sample 14R-1, 131–132 cm (mean depth = 814.2 CSF-B), which is characterized by a rich assemblage of planktonic foraminifers and the abundant presence of benthonic foraminifers. In both holes, Globorotalia margaritae is not present and the acme of Sphaeroidinellopsis, which is typically abundant at the base of the Pliocene, was not recognized.
To investigate the continuity or discontinuity of the record of planktonic foraminifers in the late Messinian, we looked at the fine fraction in Hole U1611B to investigate the presence or absence of planktonic foraminifers in the residues and especially to identify the levels or intervals that are barren. Small planktonic foraminifers are present in most of the samples. Planktonic foraminifers were not observed in Samples 401-U1611B-18R-CC, 28R-CC to 31R-CC, and 37R-CC, although the poor disaggregation of these samples could have prevented their recognition. Planktonic foraminifers in the large fraction are frequent again in Sample 42R-CC, characterized by dominant Orbulina universa in an almost monospecific assemblage. From here downward, layers containing abundant planktonic foraminifers alternate with horizons in which foraminifers are absent. Therefore, we tentatively correlate the disappearance of large planktonic foraminifers between Samples 42R-CC and 41R-CC with the disappearance of planktonic foraminifers prior to the onset of the MSC, but this event could be slightly diachronous. The Abad and Fanantello sections planktonic foraminifers disappeared at 5.97 Ma, immediately below the base of gypsum deposits (Sierro et al., 2003; Manzi et al., 2007), but in other sections like the Govone section the disappearance of planktonic foraminifers occurred two precession cycles before at approximately 6.02 Ma (Gennari et al., 2020). The last occurrence of Turborotalita multiloba has been used as an event to approximate the onset of the MSC (Gennari et al., 2020; Lozar et al., 2018). However, the presence of a foraminifer assemblage dominated in most of the samples by warm/oligotrophic species with a very scarce presence of cold-water species does not allow recognition of this event in this study.
In the lower part of the section, the samples that contain planktonic foraminifers are, overall, dominated by subtropical species, including the group of Globigerinoides quadrilobatus-sacculifer, Globigerinoides extremus, or O. universa, and the Neogloboquadrinids or T. multiloba are rare or absent. This is consistent with the continuous presence of laminated sediments probably related to water column stratification and the growth of warm-water species at the surface (Sierro et al., 2003). As a consequence, the coiling change in Neogloboquadrina incompta was difficult to identify because of the absence or scarcity of this species in the sediments. This species, however, becomes a common element of the foraminifer assemblages from Sample 401-U1611A-53R-CC downward in Hole U1611A and from Sample 401-U1611B-54R-CC downward in Hole U1611B, showing a consistently sinistral coiling pattern. Although the coiling change was not clearly identified, we used these two levels as an approximation for this event because sinistral neogloboquadrinids in the Sorbas Basin became more common at this time (Sierro et al., 2003).
4.3. Benthonic foraminifers
A total of 66 core catcher samples from Hole U1611A were processed and studied for the abundance of more than 98 species of benthonic foraminifers. The level of preservation of the benthonic foraminifers was noted along with their abundance with respect to planktonic foraminifers. The presence or absence of other calcareous microfossils and detrital grains were also noted. The combined information from all studied samples documents the entire succession recovered at Site U1611 (Table T8).
Foraminifer preservation is good at shallower depths to Sample 401-U1611A-17R-CC (mean depth = 802.765 m CSF-B), and abundant planktonic and benthonic foraminifers are present in the coarse fraction (>150 µm size). However, there are no planktonic or benthonic foraminifers present in the coarse fraction from Samples 18R-CC to 35R-CC (mean depth = 821.127–964.275 m CSF-B). Detailed examination of their finer fractions, ranging 63–149 µm, showed that few planktonic and benthonic foraminifer species are present in most of them, and Samples 32R-CC, 34R-CC, and 35R-CC (mean depths = 940.085, 957.685, and 964.275 m CSF-B, respectively) are completely barren (Figure F33; Table T8). The benthonic foraminifer size and abundance remains low to Sample 45R-CC (mean depth = 1062.895 m CSF-B). The finer fraction of processed samples was analyzed for benthonic foraminifers from Samples 18R-CC to 45R-CC (mean depth = 821.176–1062.905 m CSF-B), although planktonic foraminifers were observed in the coarse fraction from Sample 36R-CC downward. It was also noted that there are very few or no benthonic foraminifers present in Samples 38R-CC, 40R-CC, 41R-CC, 42R-CC, 44R-CC, and 45R-CC (mean depths = 996.435, 1014.31, 1028.565, 1037.115, 1054.95, and 1062.845 m CSF-B, respectively). There were a few lithified horizons that could not be processed properly for foraminifer study (Figure F33; Table T8).
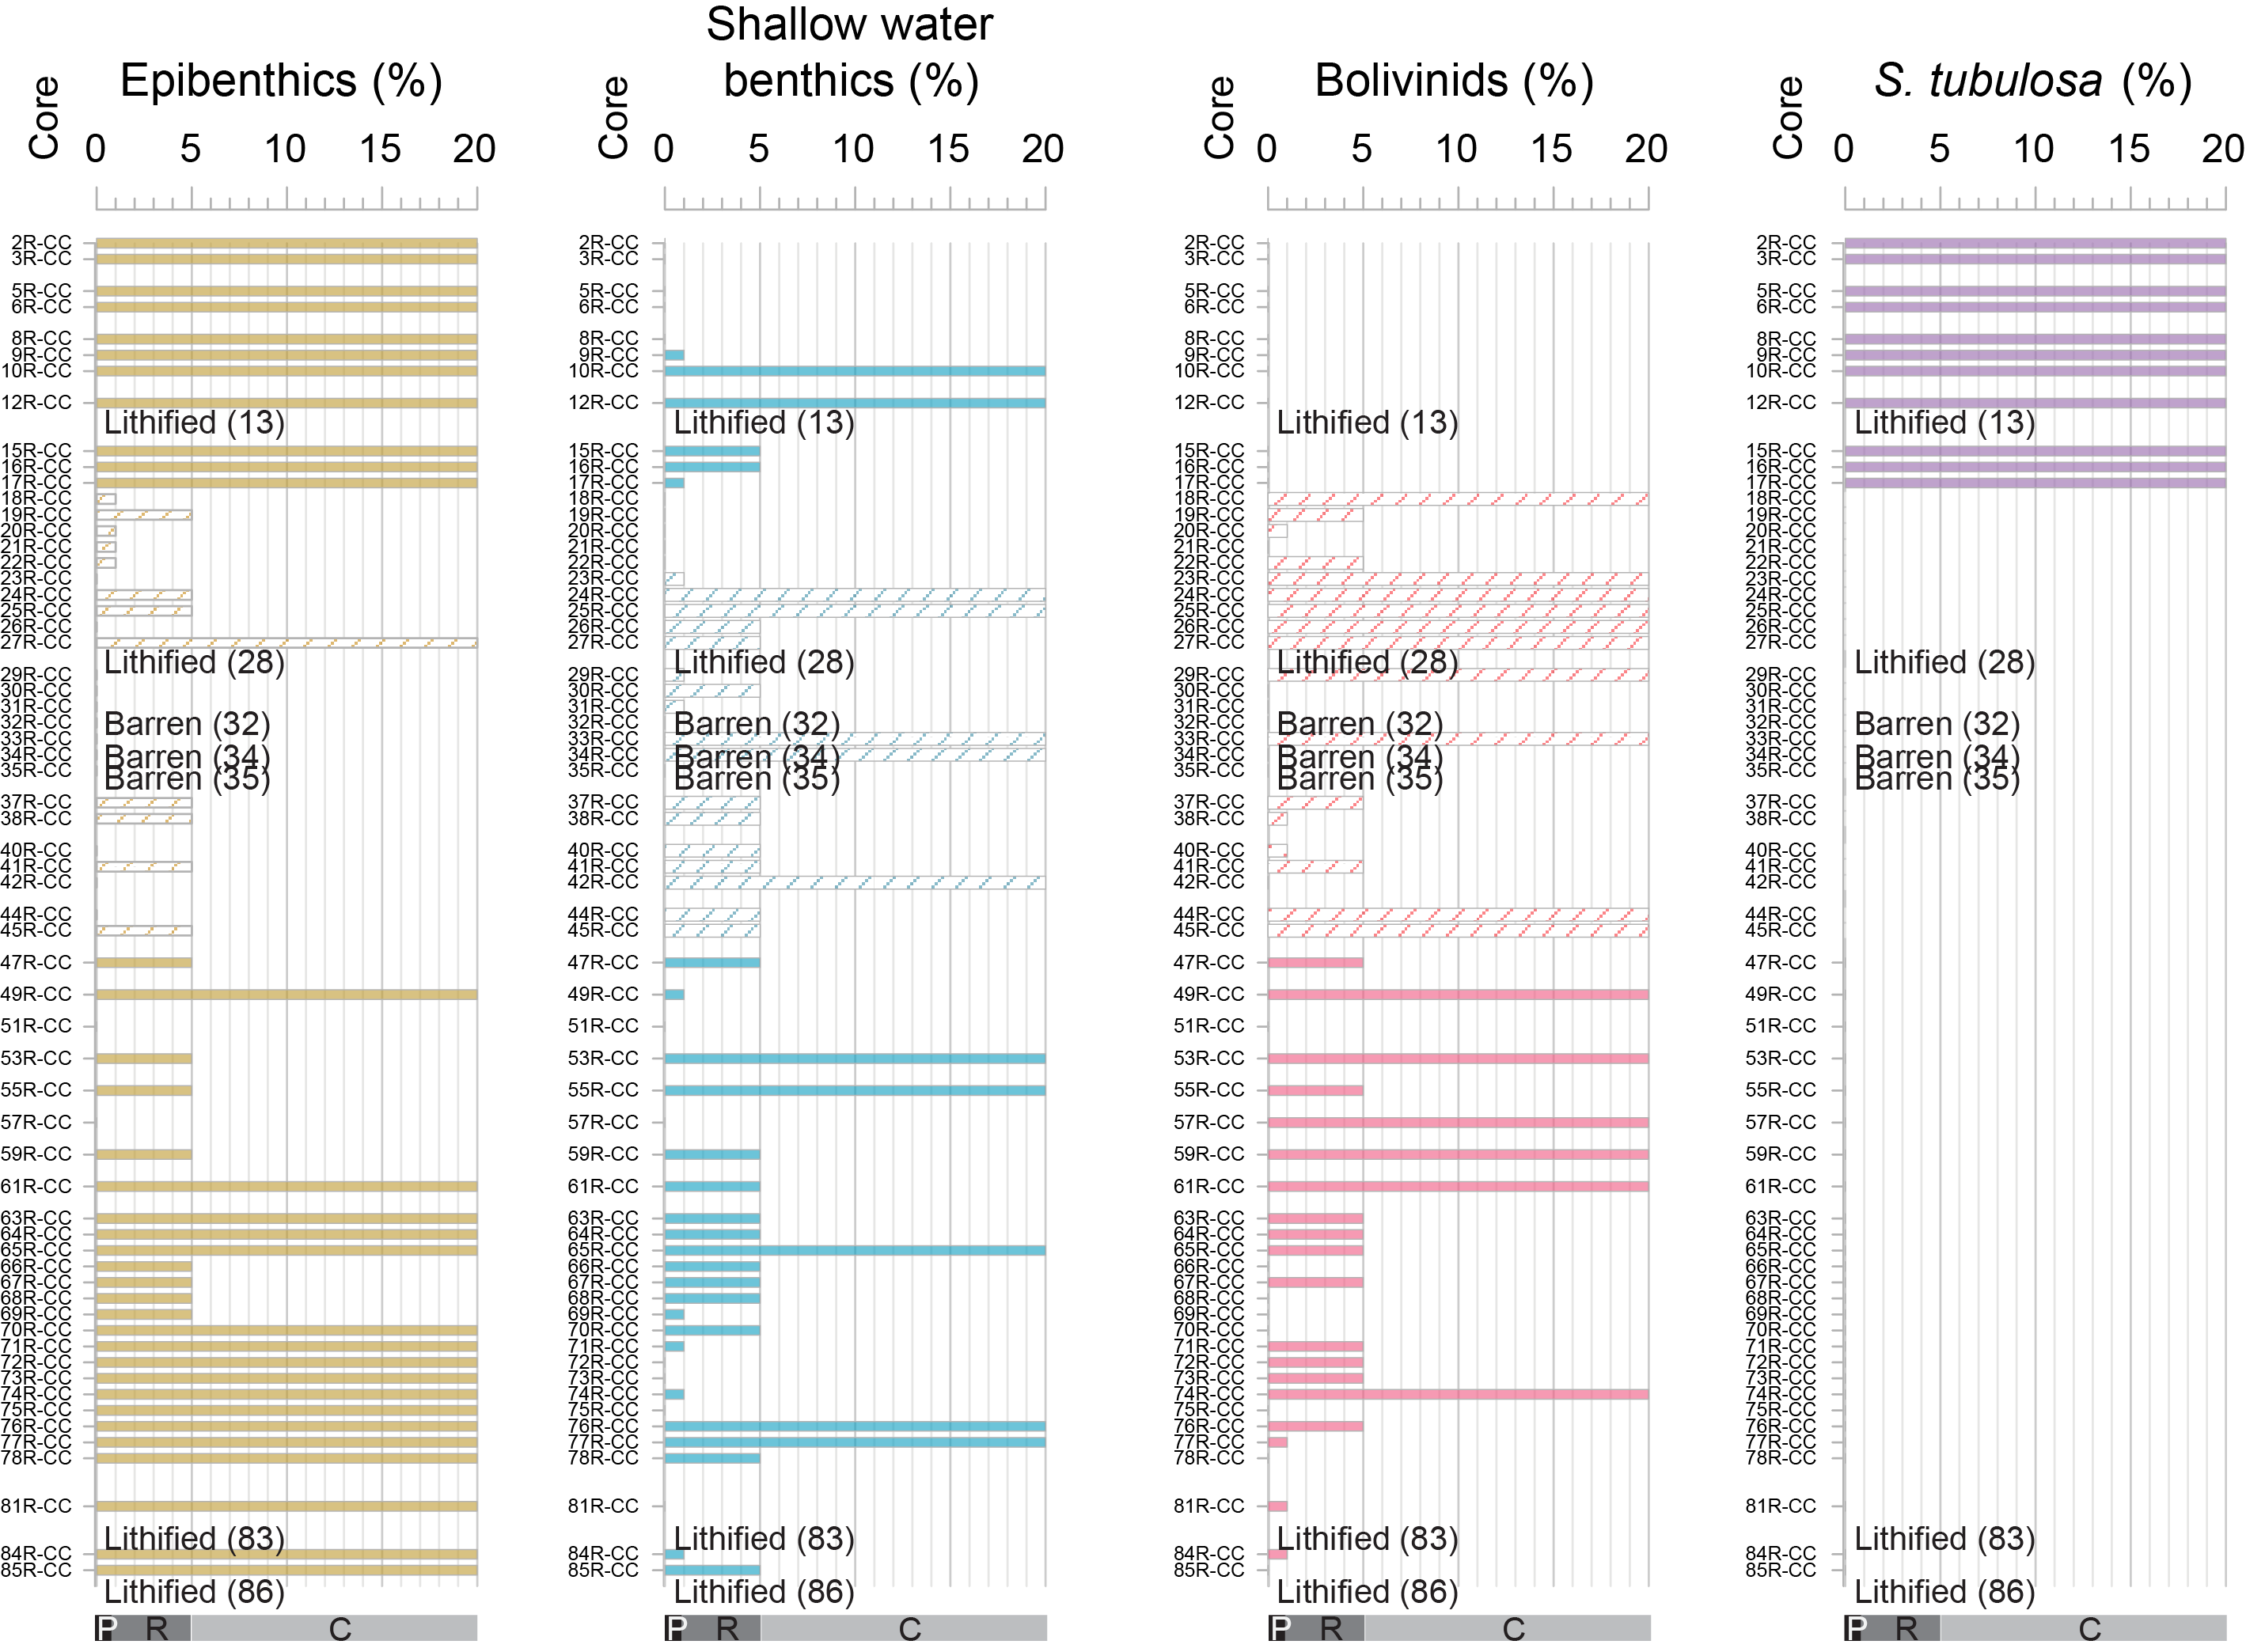
Figure F33. Benthonic foraminifer abundance.
The common benthonic foraminifer species in Hole U1611A belong to the genera Bolivina, Cibicidoides, Globocassidulina, Melonis, Siphonina, Trifarina, and Uvigerina in varying proportions. The species abundance of individual benthonic foraminifer species varies from abundant (>20%) to present (<1%). The epibenthonic species, such as Cibicidoides spp., Planulina spp., and Textularia spp., are common in most samples (abundance = 5%–20%), but they are noticeably rare (1%–5%) in the finer fractions between Samples 401-U1611A-18R-CC and 45R-CC (mean depth = 821.176–1062.905 m CSF-B). Among the shallow-water benthonics, Elphidium macellum is more common, although other species of the genera Elphidium and Ammonia are also noted. The presence of these shallow-water benthonic species along with other shallow-water fauna like echinoid spines and coral fragments are more abundant in the deeper Miocene sediments from Samples 59R-CC to 70R-CC (mean depth = 1131.315–1184.785 m CSF-B) (Figure F33; Table T8).
The benthonic species Siphonina tubulosa is very common in the shallower Pliocene sediments to Sample 401-U1611A-17R-CC and then completely disappears in the deeper Miocene sediments (Figure F33; Table T8). S. tubulosa has been previously reported from the eastern Mediterranean as an Indo-Pacific originated marine alien species (Meriç et al., 2016, 2018) that occurs in warm, oligotrophic, comparatively well-oxygenated intermediate waters with an epifaunal to shallow infaunal habitat (Szarek et al., 2007). This species has also been reported from the Atlantic Ocean near the Gulf of Cádiz, where it shows a marked increase after the Miocene/Pliocene boundary (García-Gallardo et al., 2017).
Bolivinids (species of related genera Bolivina and Brizalina), especially Brizalina spathulata, are common in the Miocene sediments of Hole U1611A, noticeably in the finer fraction (63–149 µm) (Figure F33; Table T8). These infaunal species are known to occur in oxygen-deficient sediments rich in organic matter (Thomas, 1986; Donnici and Serandrei Barbero, 2002). Their absence in the shallower Pliocene sediments (to Sample 401-U1611A-17R-CC) indicates that the oxygen-poor bottom waters during the Miocene changed to become well oxygenated during Pliocene times.
5. Paleomagnetism
Paleomagnetic investigation of 83 cores from Hole U1611A and 64 cores from Hole U1611B focused on demagnetization of the natural remanent magnetization (NRM) of archive-half split core sections and discrete samples from the working-half split core sections. Pass-through paleomagnetic measurements were performed using the superconducting rock magnetometer (SRM) to investigate the NRM on a total of 518 archive section halves (315 section halves from Hole U1611A and 203 section halves from Hole U1611B). No pass-through measurements were made on core catcher sections. Alternating field (AF) demagnetization was performed on the SRM by applying stepwise peak fields of 5, 10, 15, and 20 mT, with measurement of the remaining magnetization taken at a 2 cm resolution. SRM measurements were sporadically disturbed by the occurrence of artificial flux-jumps, and these results were removed from the database. The SRM data were processed to remove all measurements that were made within 5 cm of the section ends, which are biased by measurement edge effects. A smoothing window of 1 m was applied to the inclination values to suppress the influence of data points that deviate significantly from the expected geocentric axial dipole (GAD) inclinations (+56°) at the site latitude (36.2°N). Processed NRM, inclination, and intensity data after 20 mT peak field AF demagnetization for Hole U1611A are shown in Figure F34 and Table T9, and results from Hole U1611B are shown in Figure F35 and Table T10.
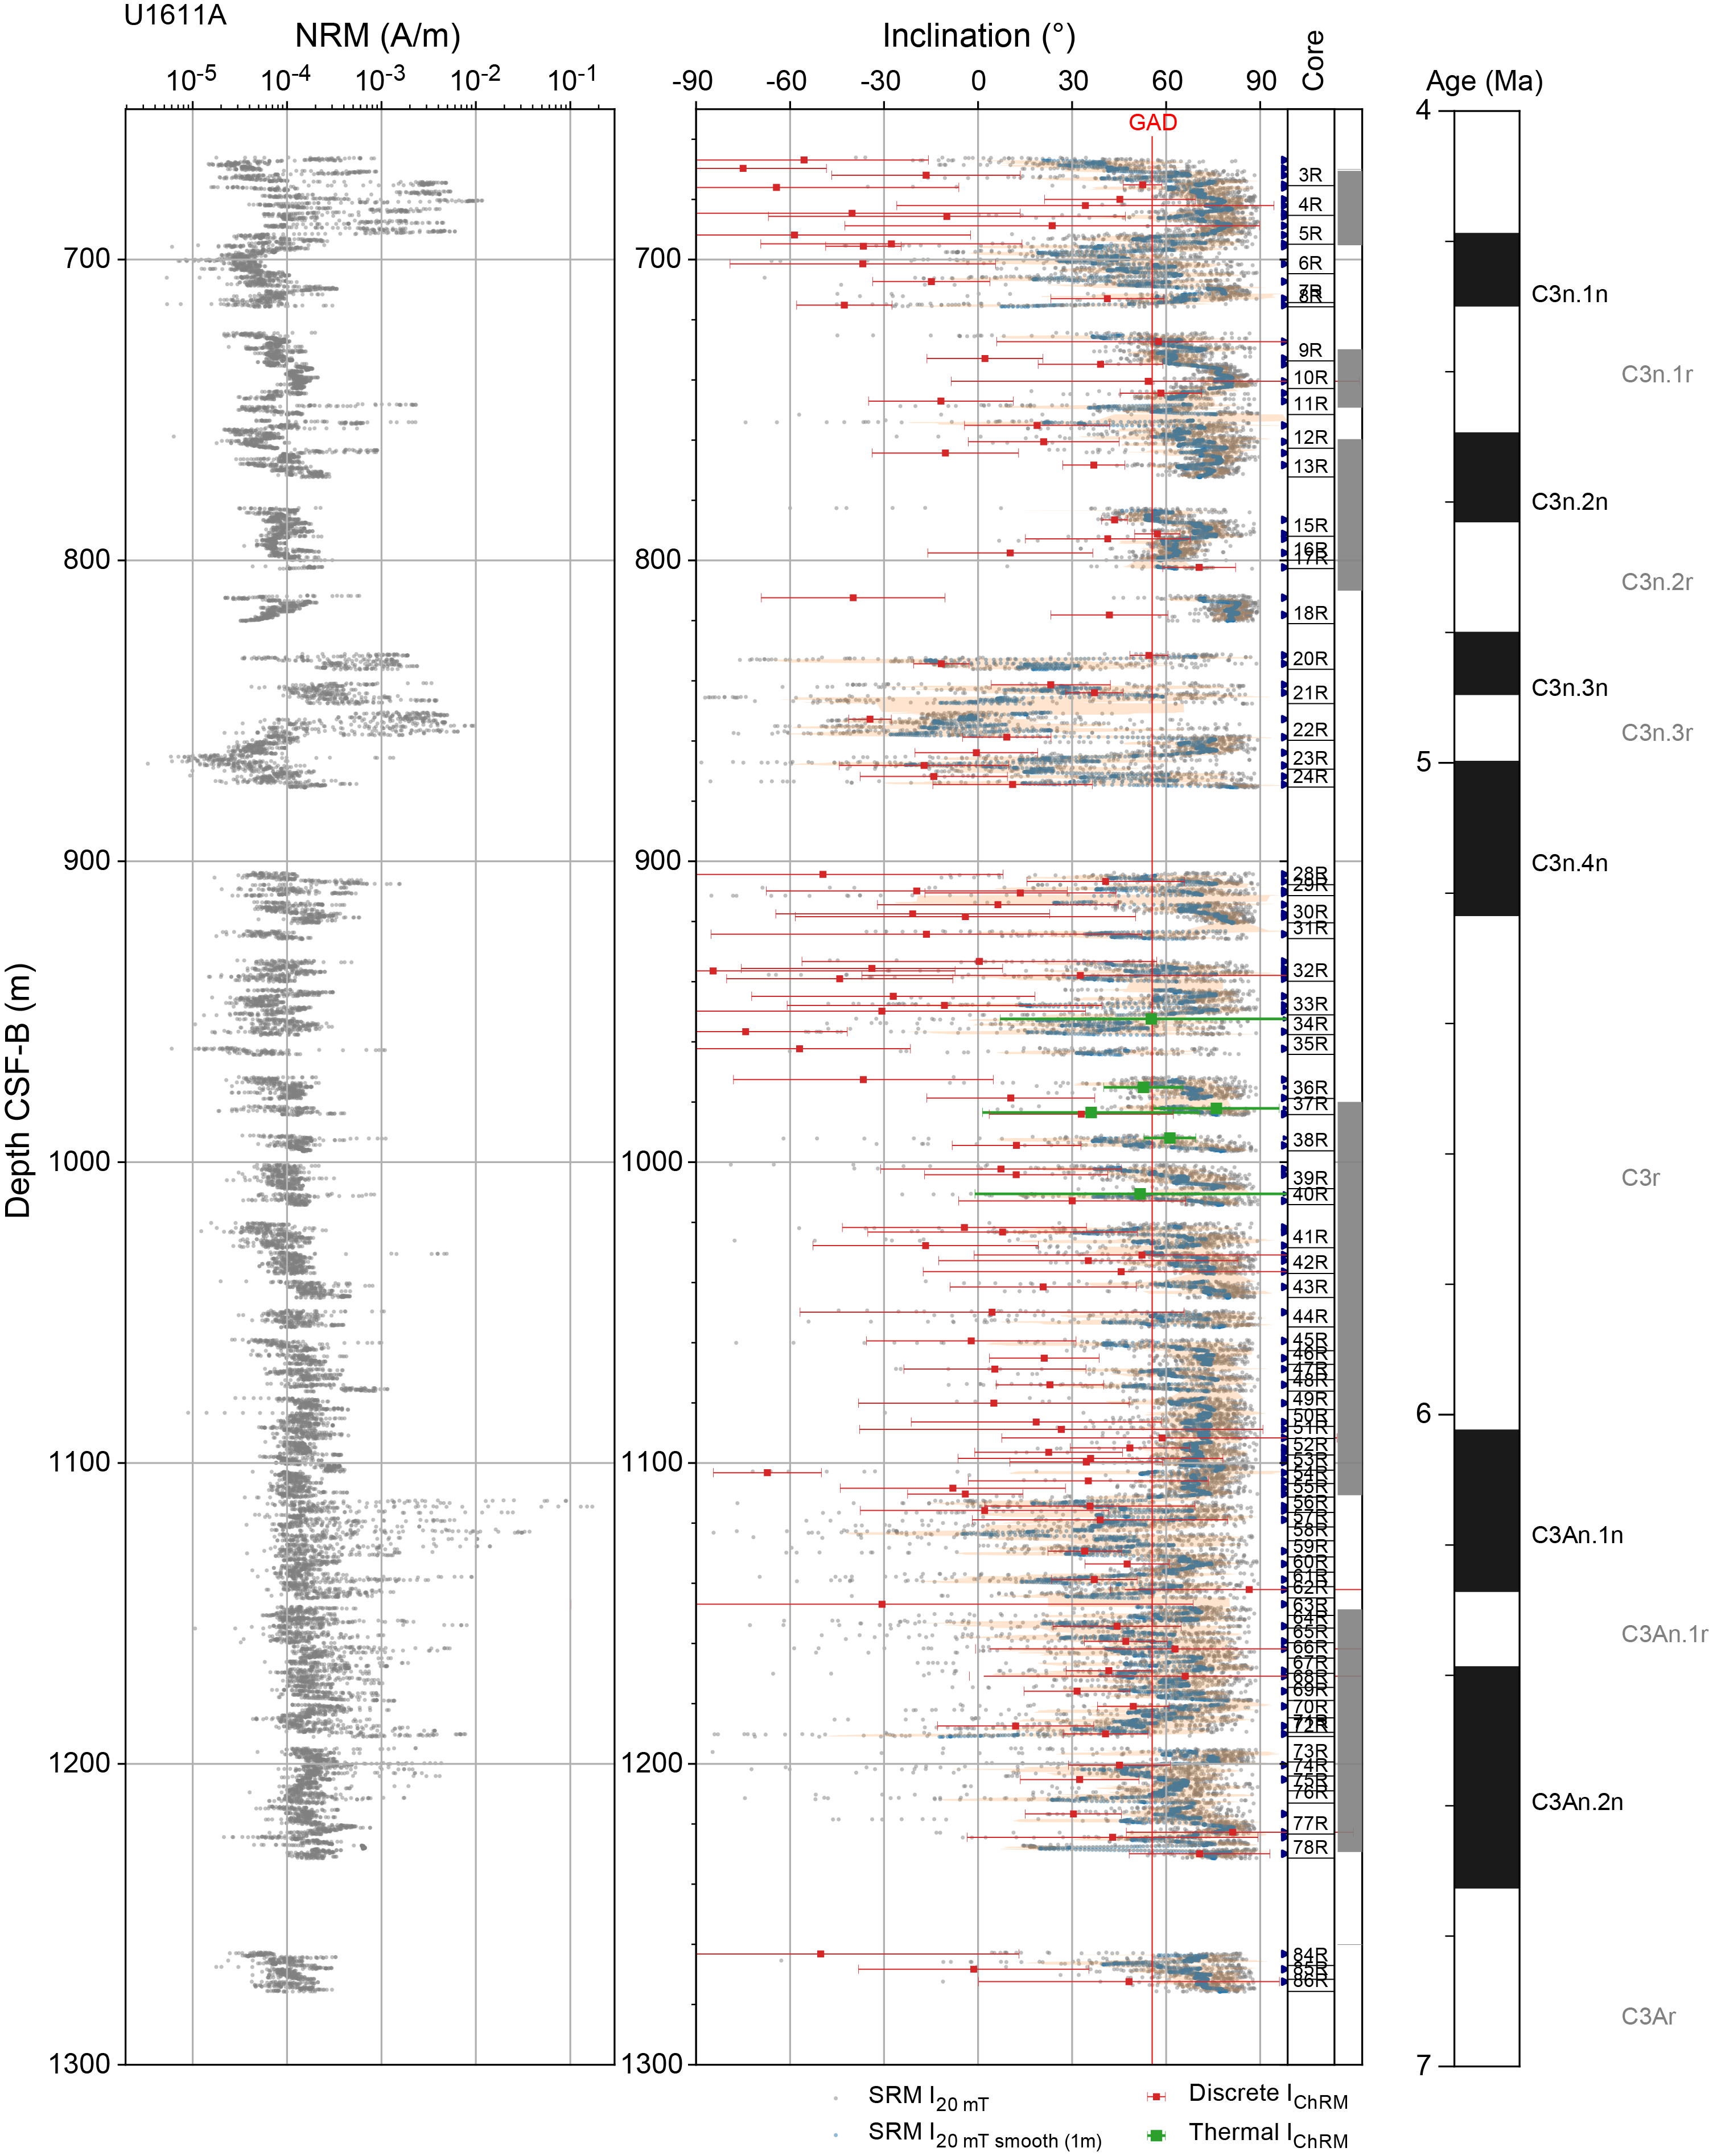
Figure F34. Paleomagnetic results, Hole U1611A.
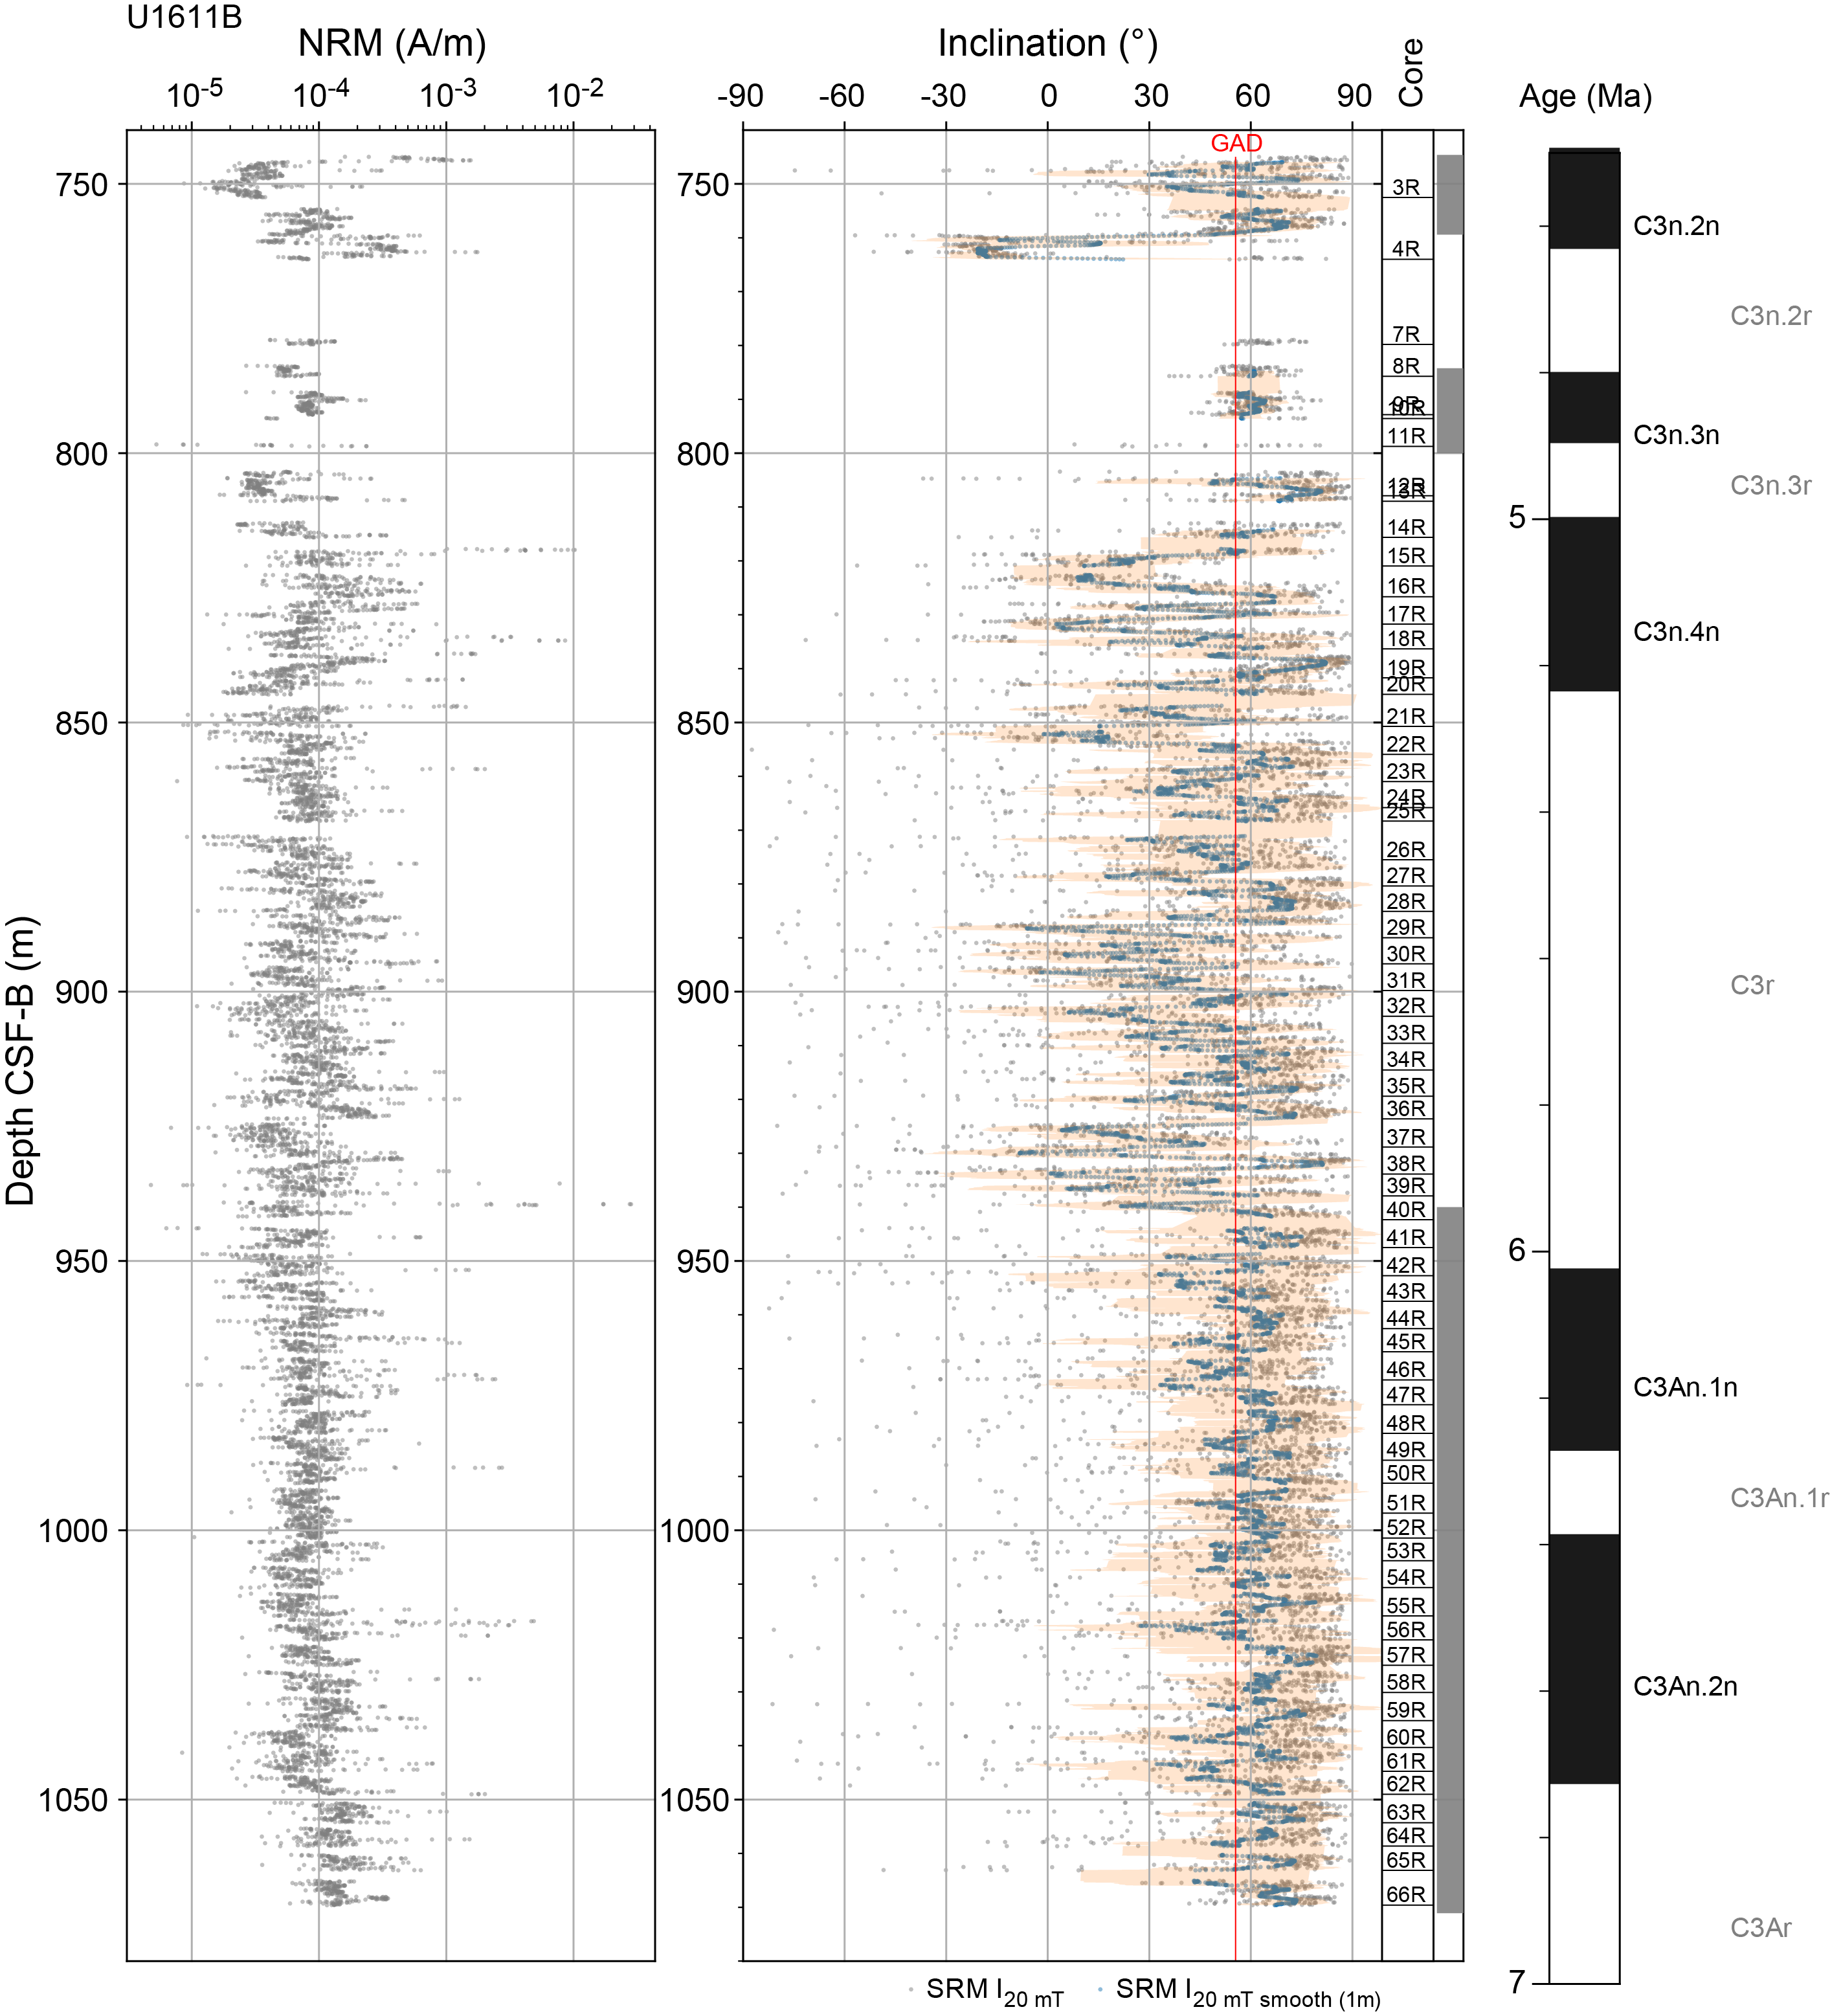
Figure F35. Paleomagnetic results, Hole U1611B.
A total of 129 discrete oriented plastic cube (7 cm3) samples were collected from the working halves of Cores 401-U1611A-6R through 24R, 43R–50R, and 55R–86R using an extruder, and 60 cubes (8 cm3) were cut from the more indurated parts of Cores 3R–5R, 28R–42R, and 51R–54R with a double-bladed saw. For each core, 2–5 discrete samples were taken, avoiding visually disturbed intervals. The anisotropy of magnetic susceptibility (AMS) and bulk MS were measured on all samples using the MFK2 KappaBridge unit. The NRM of all plastic cube samples was measured on the AGICO JR-6A spinner magnetometer. Stepwise AF demagnetization was performed at successive peak fields of 0, 5, 10, 15, 20, 30, 40, 50, 60, and 70 mT to a maximum of 100 mT (Figure F36). When magnetization became erratic, demagnetization was stopped. The NRM of the sawed cubes was AF demagnetized using the SRM by applying stepwise peak fields of 5, 10, 15, 20, 30, 40, 50, 60, 70, and 80 mT. Six sturdy cubes were selected for thermal demagnetization by applying temperature steps of 30°C to a maximum temperature of 600°C (Figure F37). The inclination data after 20 mT peak field AF demagnetization or after 240°C thermal demagnetization of the discrete samples are shown in Figure F34 and Tables T11 and T12.
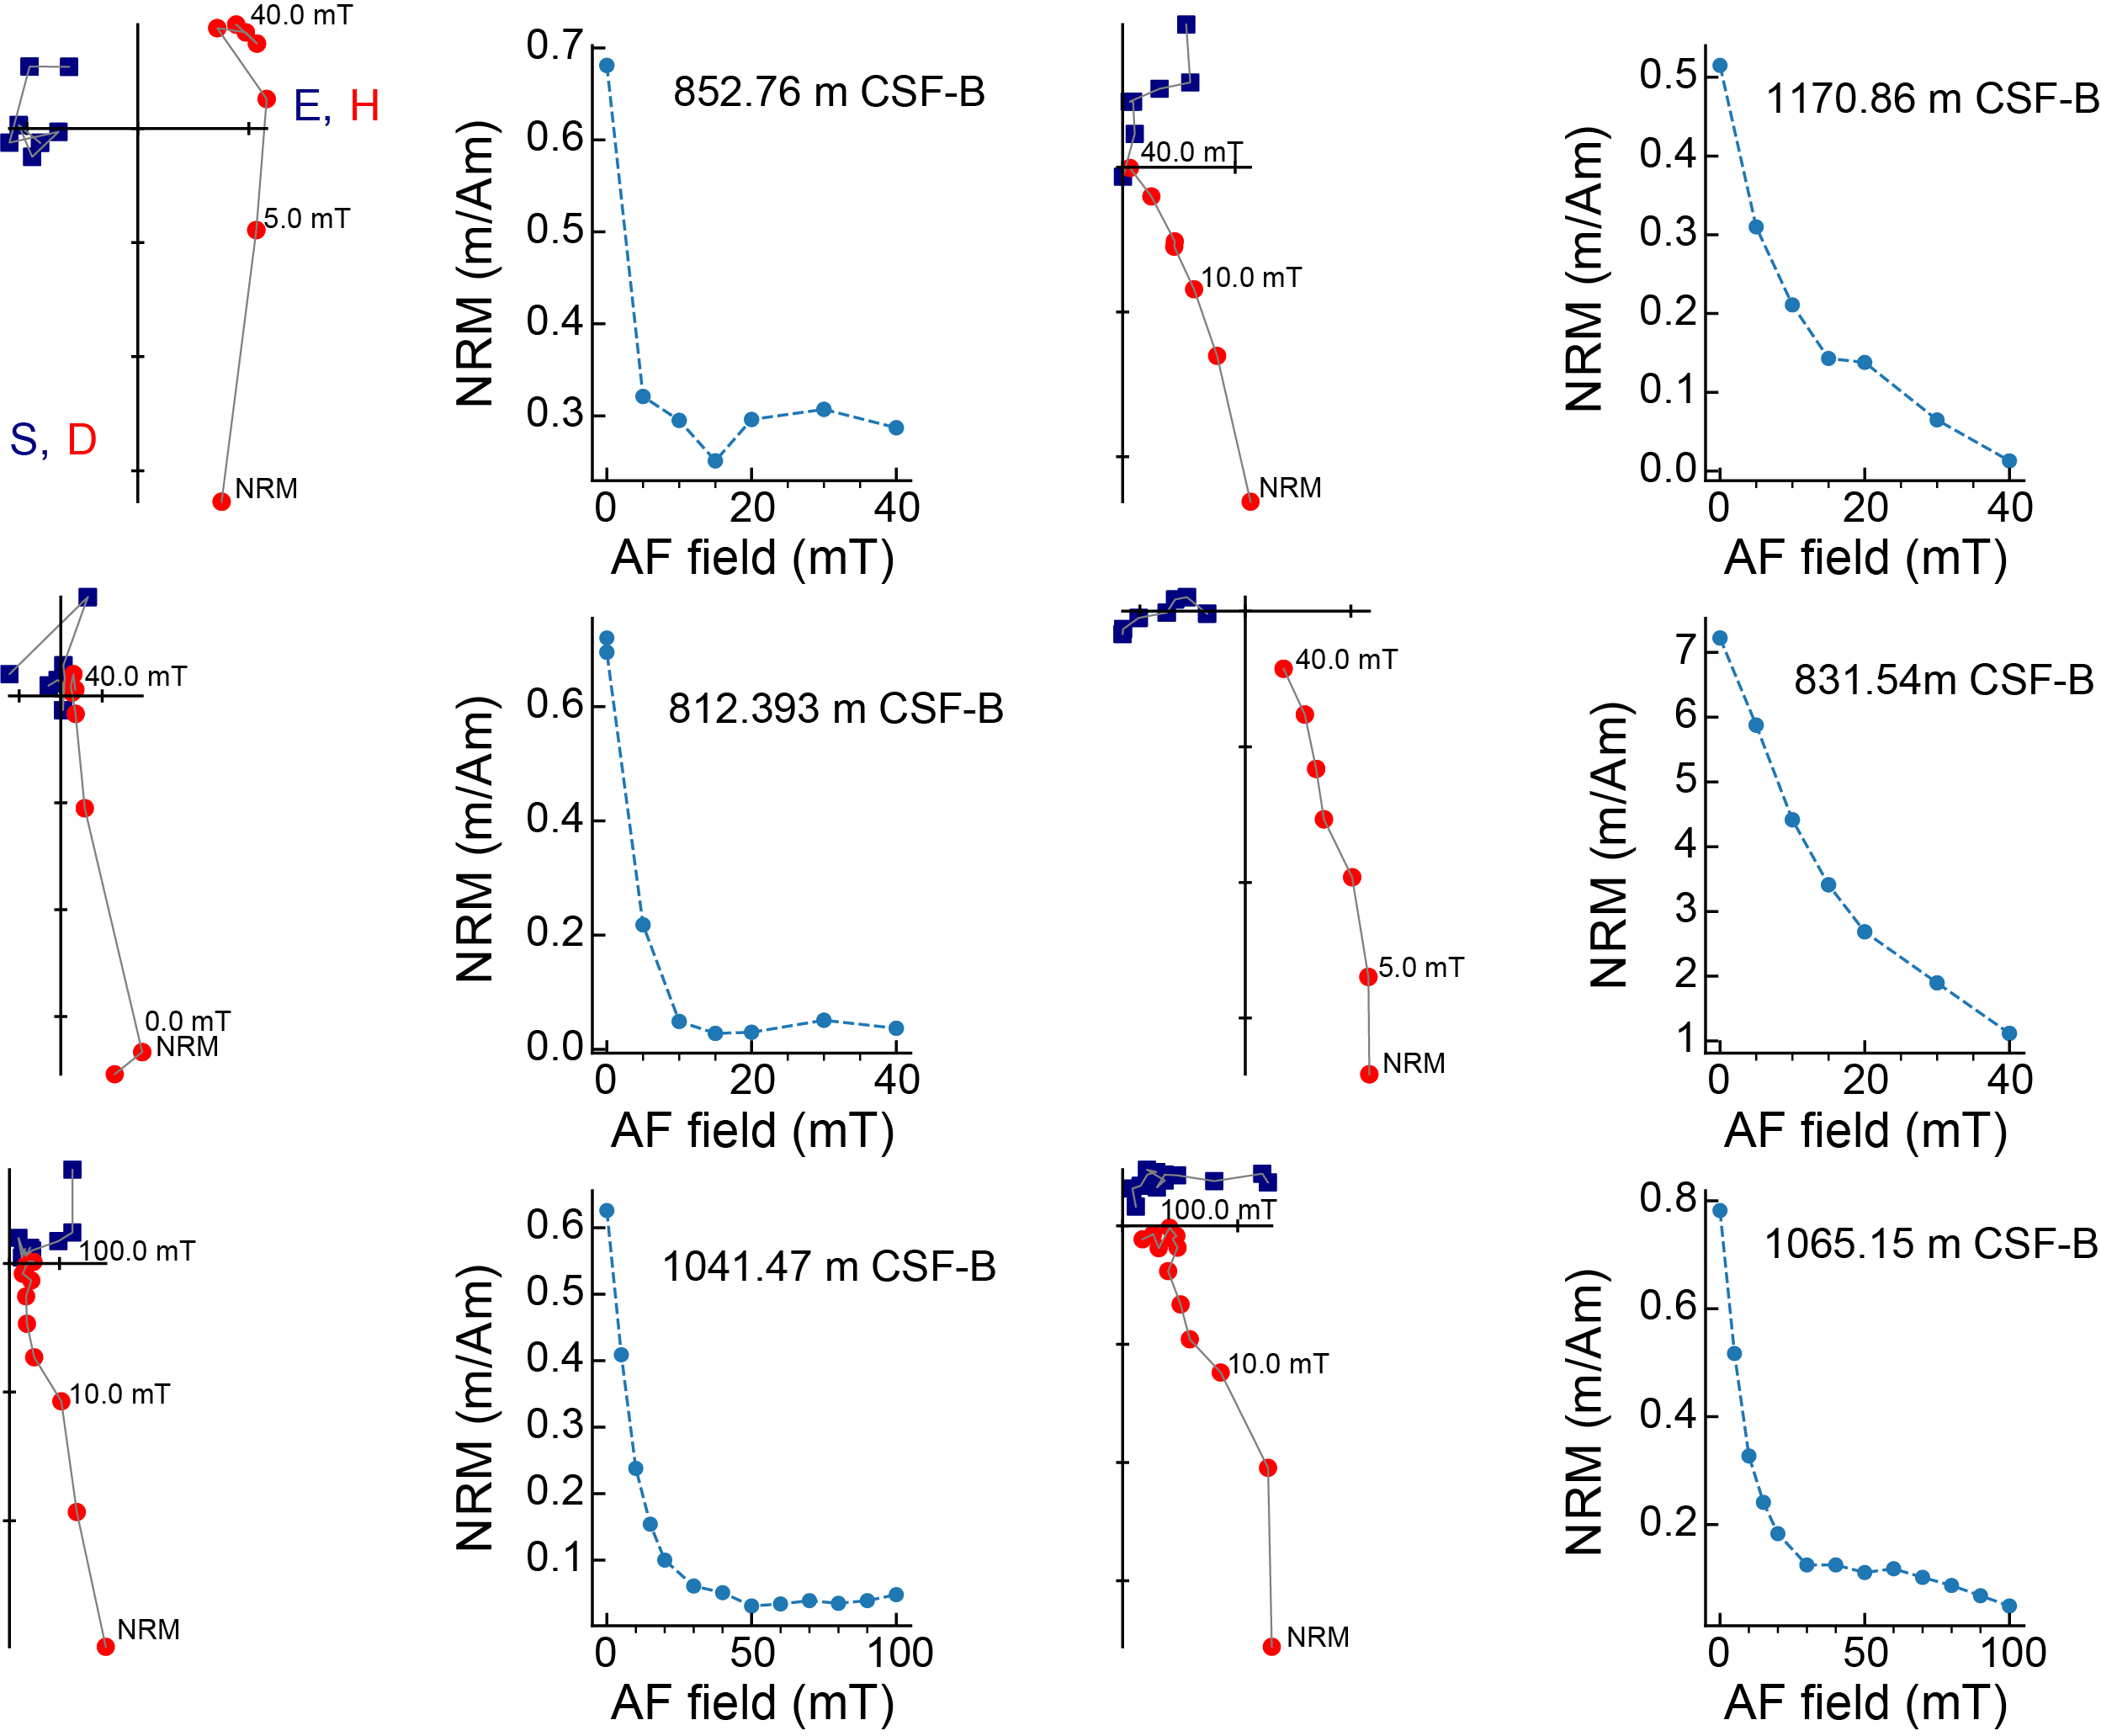
Figure F36. AF demagnetization results.
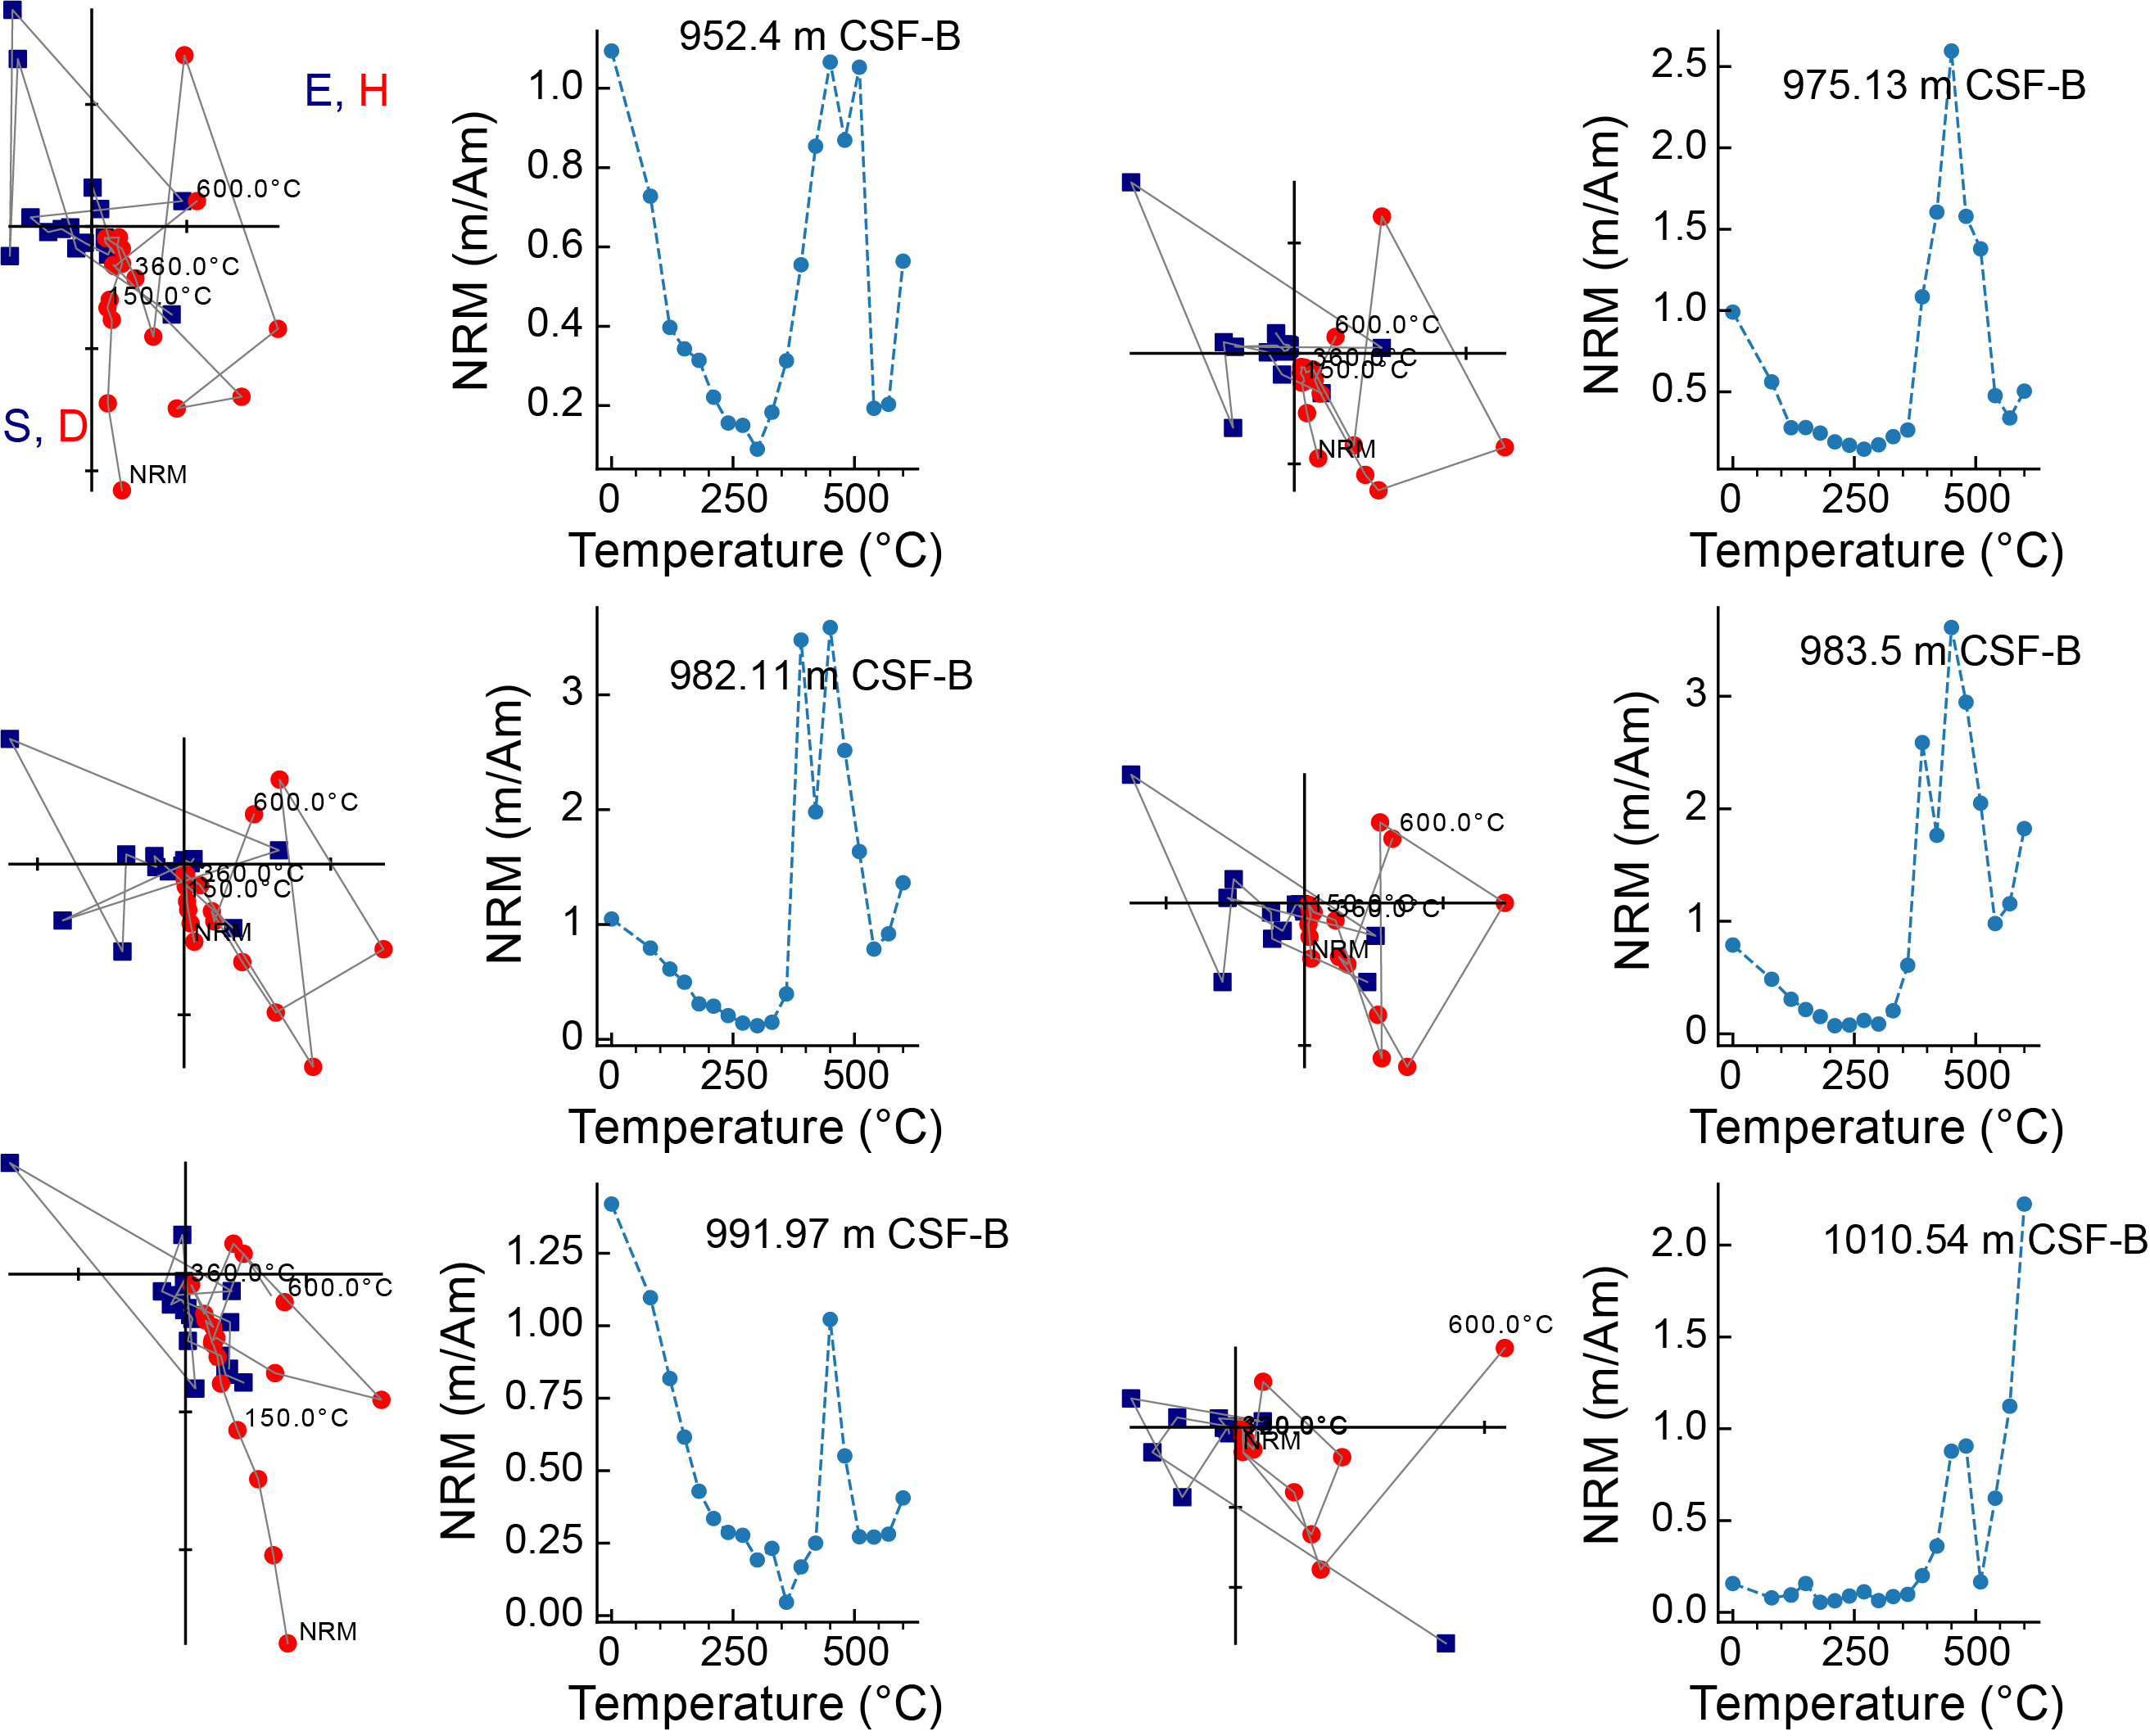
Figure F37. Thermal demagnetization results.
5.1. Paleomagnetic signals
AMS results for Hole U1611A indicate a steep vertical direction of the Kmin axis, in agreement with sedimentary fabric and subhorizontal strata (Figure F38).
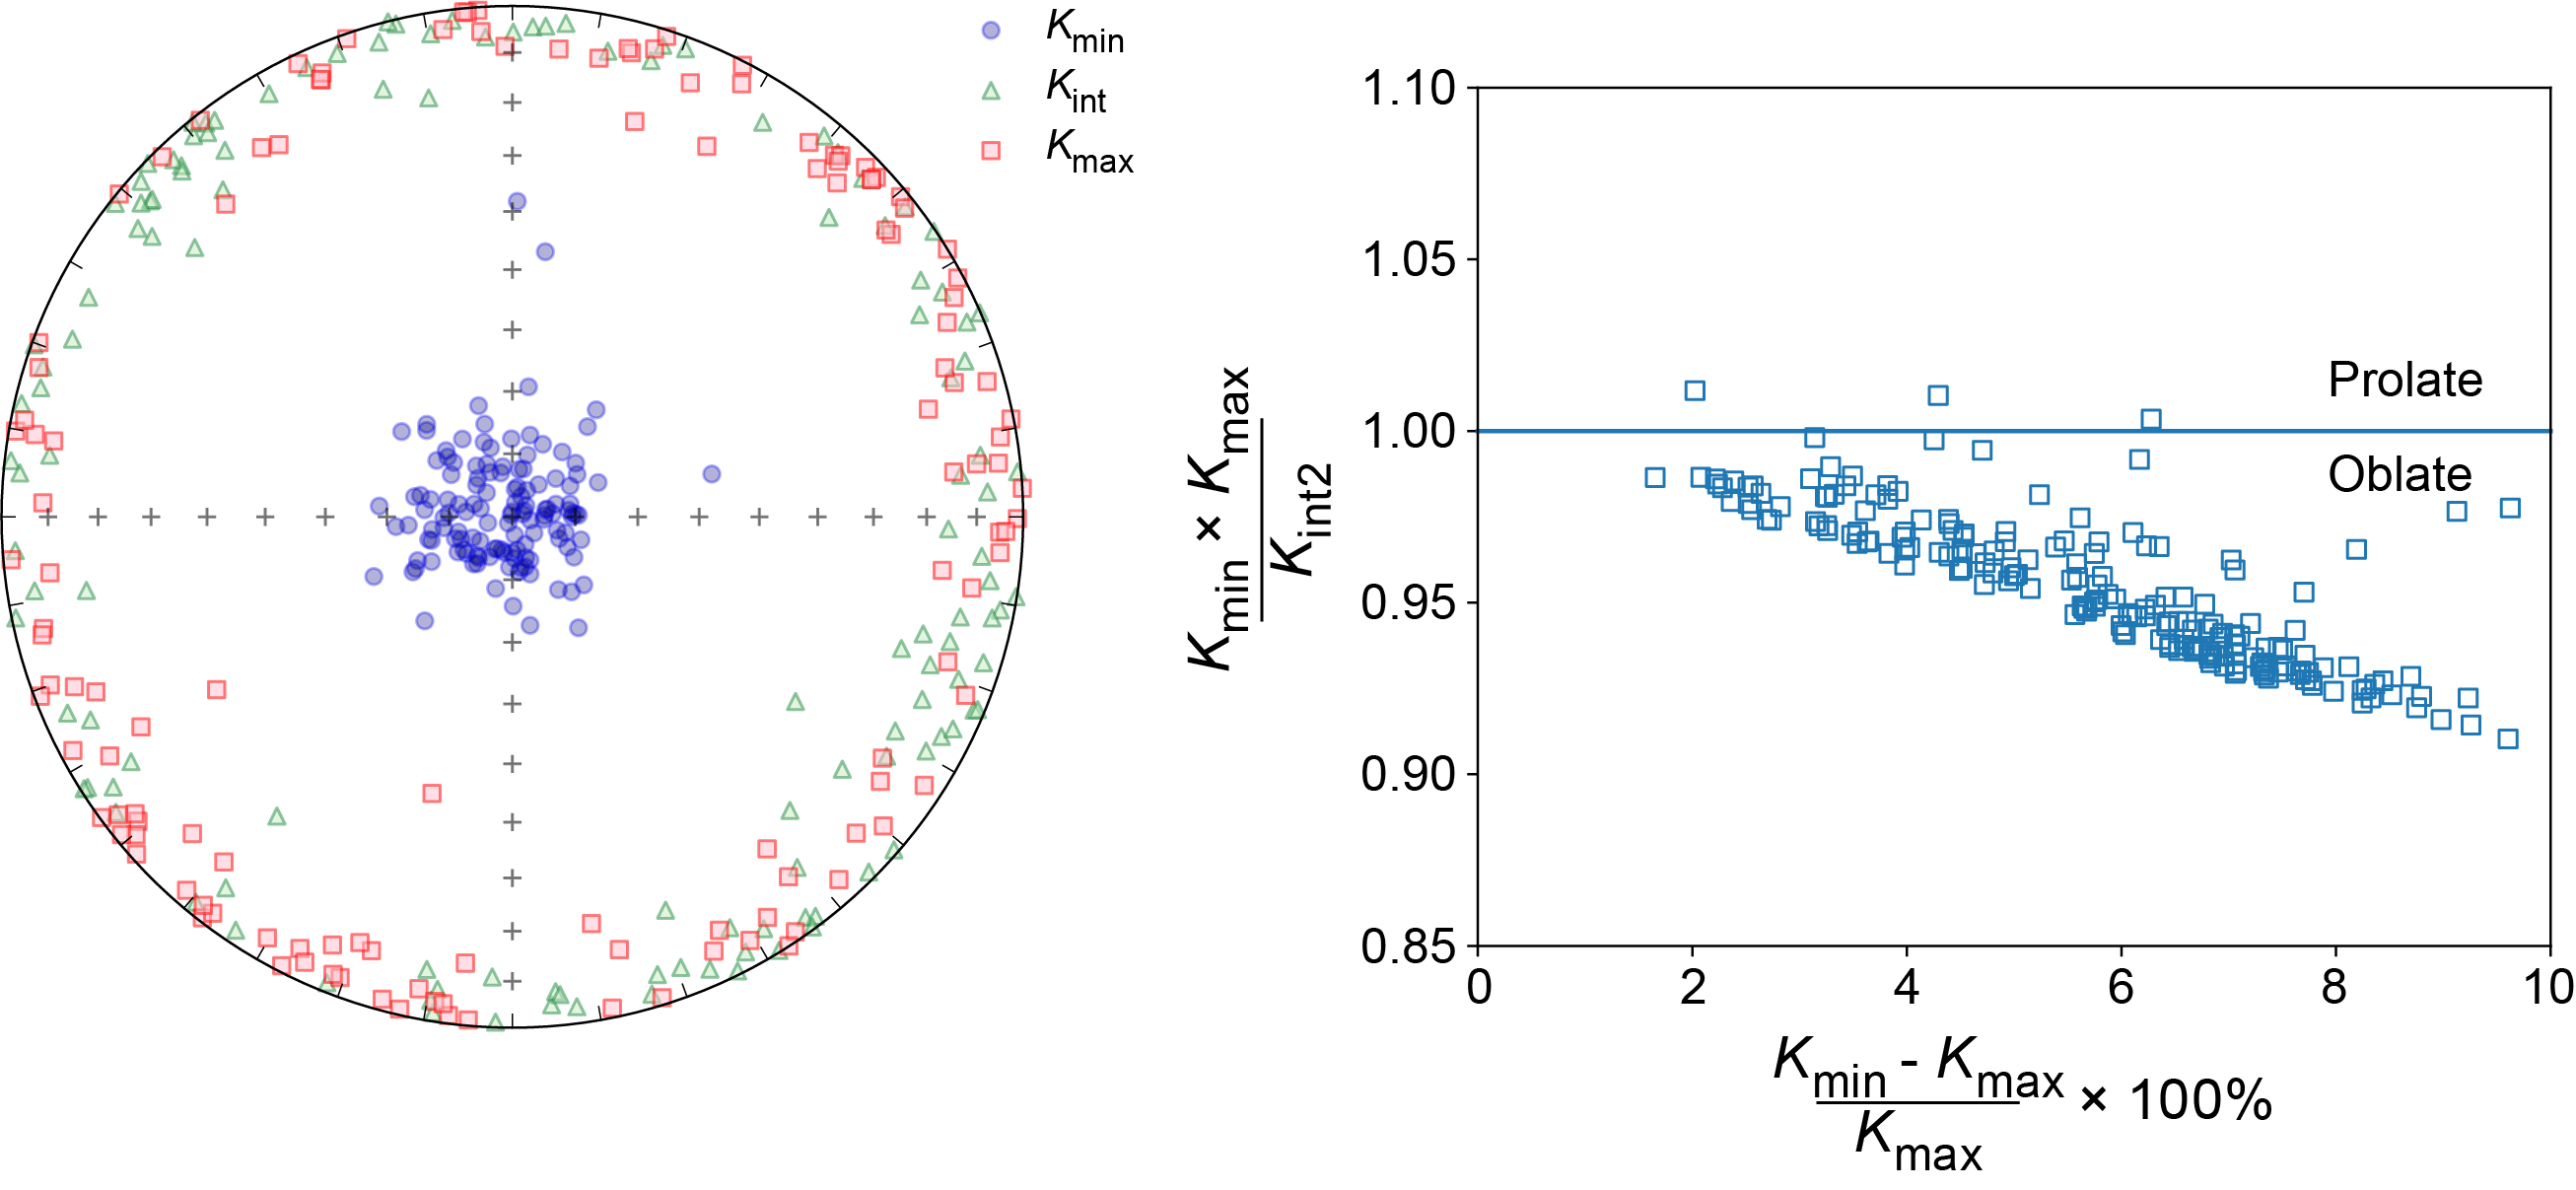
Figure F38. AMS determinations.
The NRM intensity measured on the SRM for Hole U1611A ranges about 1.0 × 10⁻⁵ to 1.0 × 10⁻² A/m (Figure F34). The SRM inclination records at 20 mT predominantly reveal normal polarities, but values are generally significantly steeper than the expected GAD inclination. This suggests the steep coring overprint was not fully removed at 20 mT. In some intervals (e.g., 820–880 m CSF-B), the inclination values are consistently negative but very shallow; reversed polarity intervals are not clearly resolved in Hole U1611A. NRM intensities of the discrete samples of Hole U1611A range 1.1 × 10⁻⁵ to 2.6 × 10⁻³ A/m. Demagnetization diagrams (Z-plots) show that a normal polarity component was in some cases removed between 0 and 10 mT, but in other cases AF peak fields of 40 mT were not sufficient to completely demagnetize this component (Figure F36). Some samples demagnetized up to peak fields of 100 mT show progressive decay of the magnetization toward the origin, suggesting titano-/magnetite as main magnetic mineral (Figure F36). Thermal demagnetization results show an increase in magnetization during heating at temperatures between 330° and 480°C, followed by a decrease between 480° and 540°C. This thermal behavior is characteristic for iron sulfides (e.g., pyrite) and iron carbonates (e.g., siderite/ankerite) that oxidize to magnetite by heating in air. The inclination values calculated from the discrete samples are generally not in agreement with the SRM inclination values (Figure F34) and indicate that magnetic overprints are not properly removed or that the entire magnetic signal is lost at maximum peak fields of 20 mT.
SRM measurements for Hole U1611B show NRM intensity ranging 1 × 10⁻⁵ to 5 × 10⁻³ A/m, similar to Hole U1611A. The inclination record at 20 mT shows normal values that are generally steeper than the expected GAD field at the drilling location alternating with intervals of shallow and negative values, indicating that primary magnetic components are also not properly resolved in Hole U1611B (Figure F35).
5.2. Magnetostratigraphy
Inclination values of both SRM measurements after 20 mT and JR-6A measurements after 20 mT are merged and plotted in stratigraphic order against CSF-B depth (Figures F34, F35). The magnetic signal in Holes U1611A and U1611B is not clear enough to determine a robust magnetostratigraphic pattern. At this stage, no clear polarity pattern is revealed for Site U1611, and the proper characterization of the magnetic mineralogy should be evaluated by additional shore-based demagnetization and rock magnetic experiments.
6. Geochemistry
6.1. Volatile hydrocarbons
Headspace gas analysis was performed as part of the standard protocol required for shipboard safety and pollution prevention monitoring. In total, 65 headspace samples from Hole U1611A (sampling resolution of one per core or one every other half advance) were analyzed (Figure F39; Table T13). Because Hole U1611B was located >1 km away from Hole U1611A, we also performed headspace analyses on 35 samples from Hole U1611B (sampling resolution of one every other half-advance core). Methane (C1), ethane (C2), and propane (C3) were detected in most samples. Methane concentrations range 1,718–82,195 parts per million by volume (ppmv) but are typically <30,000 ppmv and generally decrease downcore. Heterogeneity between samples is likely due to sediment composition, porosity, and sampling variability, and patterns are similar in Holes U1611A and U1611B (Figure F39). Ethane concentrations are <446 ppmv, and propane concentrations are <244 ppmv. Overall, C1:C2 ratios decline with depth. Additional constituents ethene (C2=), iso-butane, iso-pentane, and iso-hexane are noted in one or more samples, all at trace abundances <22 ppmv. Headspace gases in Hole U1611B follow broadly similar patterns (Table T13), as illustrated for methane only for Hole U1611B (Figure F39), with a depth offset of <20 m (roughly the same stratigraphy is recovered at a shallower depth in Hole U1611B).
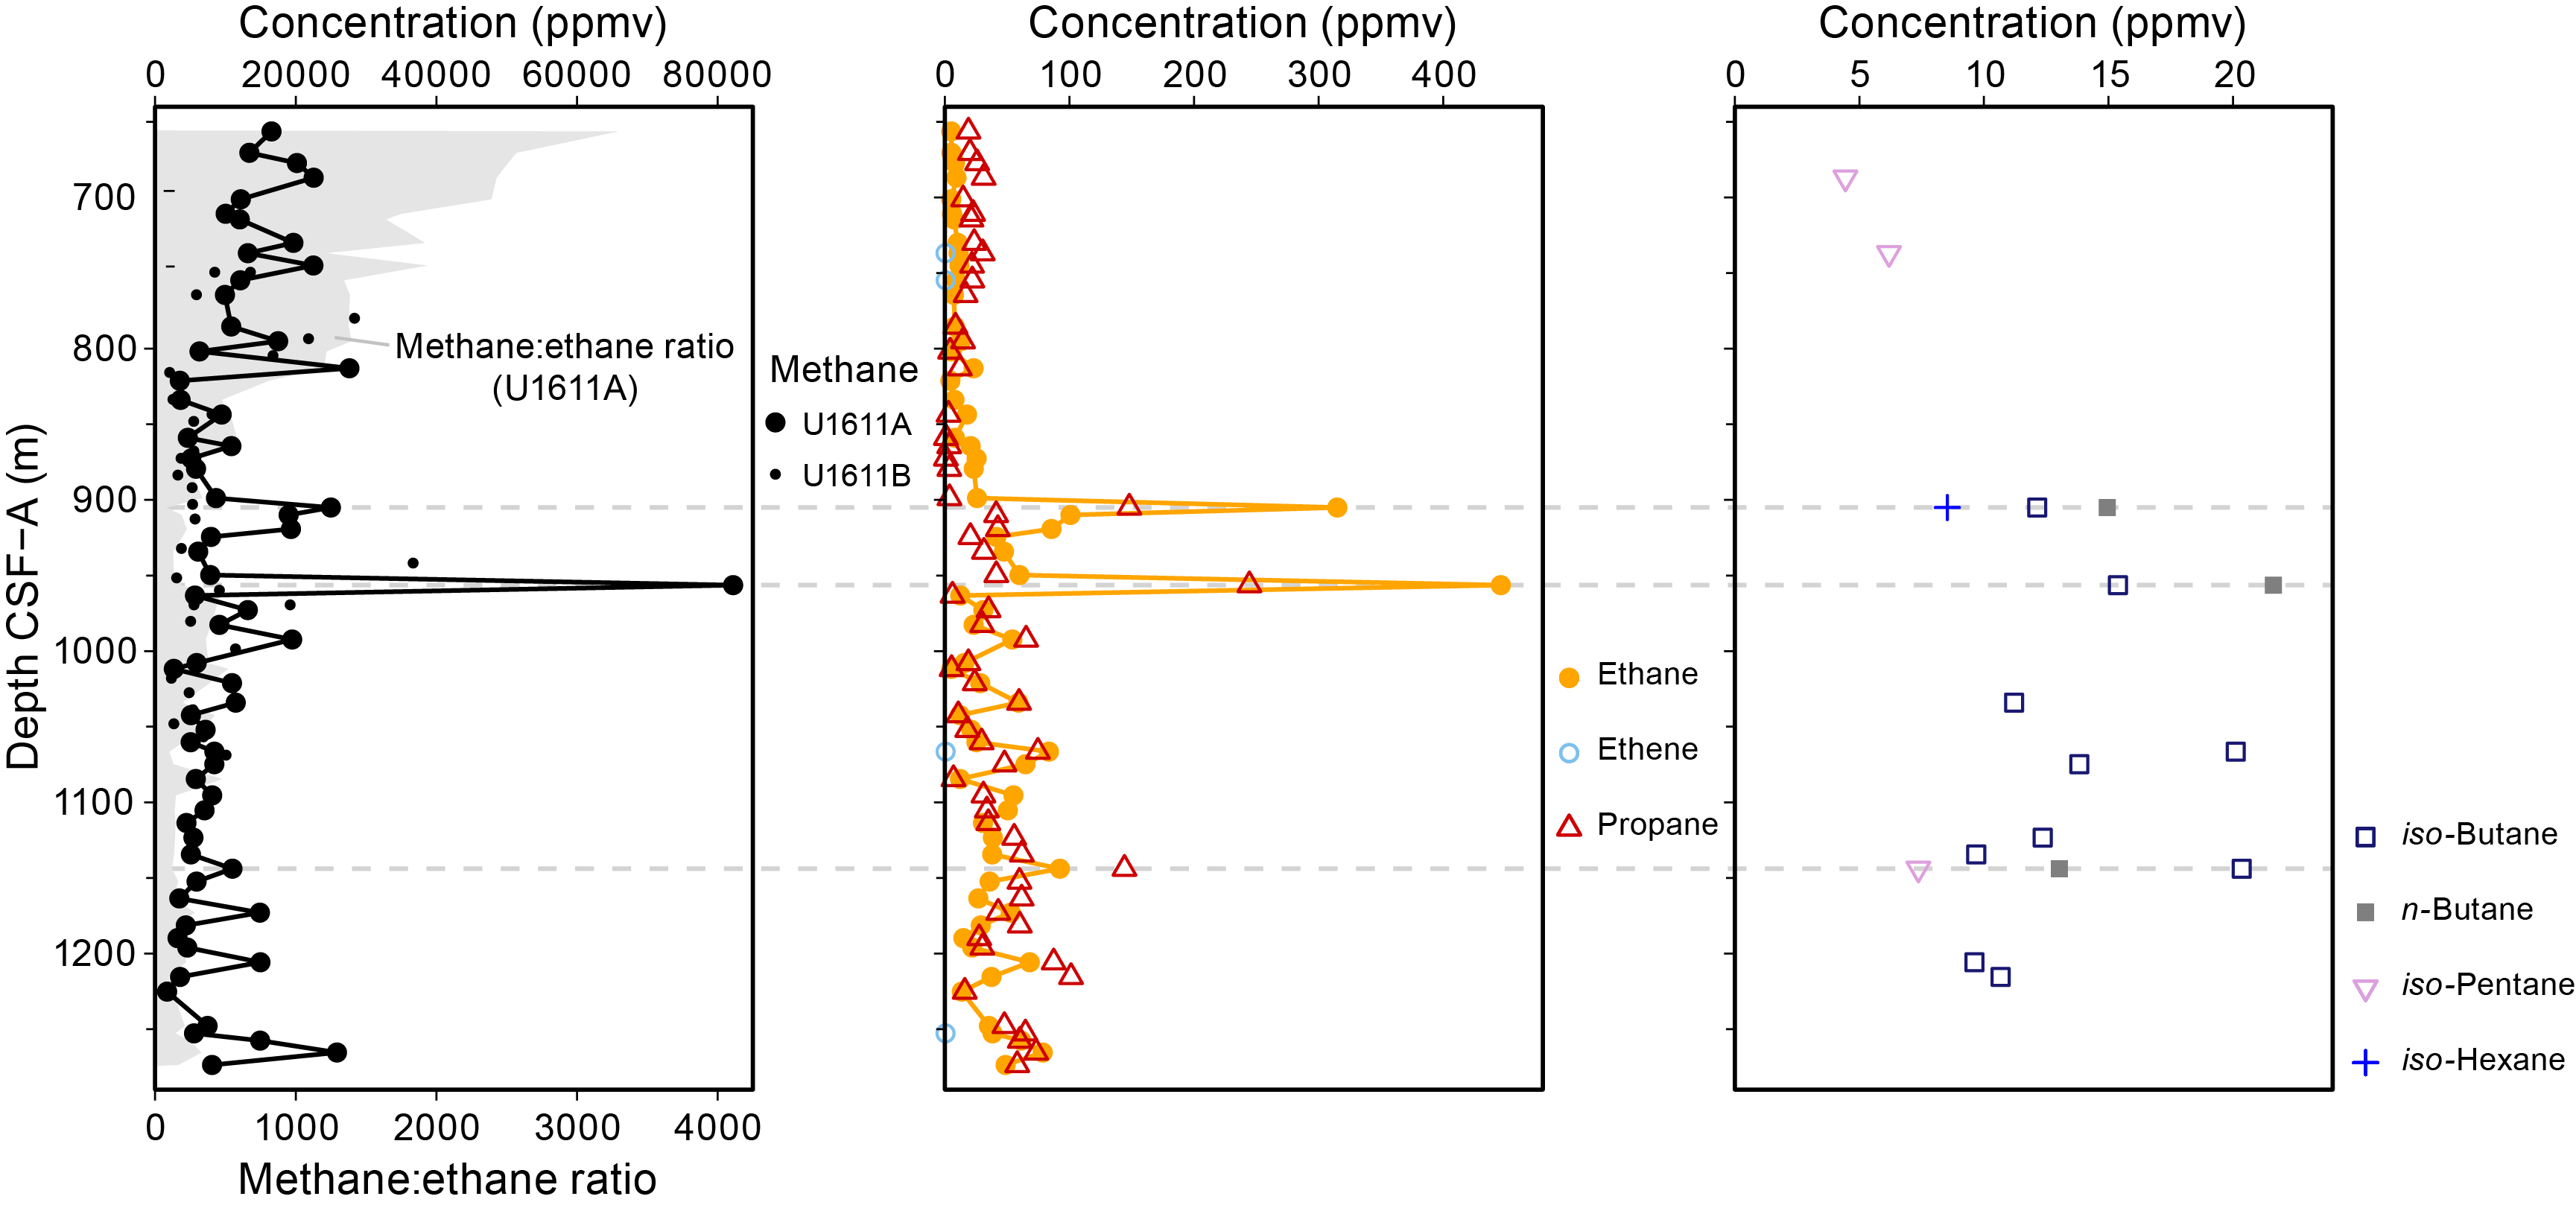
Figure F39. Methane, ethane, ethene, propane, iso- and n-butane, iso-pentane, and iso-hexane.
These concentrations of volatile hydrocarbons did not present a drilling concern. One high methane concentration was recorded at 956.4 m CSF-A (Section 401-U1611A-34R-4) with a C1:C2 ratio of 184; this sample was below safety thresholds, and such levels were not replicated in any other sample. Another sample at 905.1 m CSF-A (Section 28R-2) yielded a low C1:C2 ratio of 79; however, the methane concentration was 25,000 ppmv and thus not of concern. The distribution of gases in the profile is consistent with in situ microbial degradation and is similar to the other sites sampled during Expedition 401 (Oremland et al., 1988; Hinrichs et al., 2006; Weniger et al., 2019). We did not detect n-pentane or n-hexane distributions that would be associated with thermogenic cracking of higher molecular weight compounds in the oil window.
6.2. Interstitial water chemistry
A bottom water sample was collected in Hole U1611A because no mudline cores were collected at this site. IW was extracted from a total of 48 whole-round samples from Hole U1611A at a sampling resolution of one per core or one every other half advance (Tables T14, T15). Some IW samples yielded only small amounts of water, which limited the analyses that could be performed on them; the deepest sample taken (Sample 84R-2, 139–149 cm) yielded no water; therefore, only solid-phase analyses were performed on its residual squeeze cake. For Hole U1611B, lower resolution sampling of IW was performed (approximately one sample per 20 m drilling advance) to provide context for whole-round samples taken for microbiological analysis (see Microbiology sampling); 16 whole-round samples were taken from this hole. Comparison of IW chemistry from Holes U1611A and U1611B shows generally similar trends, with minor differences in the magnitude and depth (partly because of the offset in depth of correlated stratigraphy between the two holes) of identifiable features in the profiles.
6.2.1. Alkalinity, pH, and salinity
Alkalinity of the bottom water is 2.5 mM, but the first IW sample taken at 670.4 m CSF-A (Section 401-U1611A-3R-3) has approximately half the alkalinity (1.3 mM). Alkalinity decreases to 0.83 mM at 812.9 m CSF-A (Section 18R-1) before rising to a peak of 3.1 mM at 934.1 m CSF-A in Hole U1611A (Section 32R-1) and 5.6 mM at 891.8 m CSF-A in Hole U1611B (Section 30R-1) (Table T14). The true alkalinity maximum may be missing in Hole U1611A, where a 47 m gap exists in the IW results as a result partly of poor core recovery as well as low IW water recovery from Section 401-U1611A-28R-1 (904.5 m CSF-A) that did not permit analysis of alkalinity or pH. Below this peak, alkalinity declines back to 0.7–1.2 mM below 1034.0 m CSF-A (Section 42R-3). The pH of the bottom water is 7.9, whereas pH in the IW ranges 7.5–7.8 from 670.4 to 854.6 m CSF-A (Sections 3R-3 through 42R-3) and then declines to less than 7.3 between 864.3 and 1021.1 m CSF-A (Sections 23R-3 and 41R-1). The minimum value of pH in Hole U1611B is 7.1 at 912.5 m CSF-A (Section 401-U1611B-34R-2). pH values fluctuate from 7.3 to 7.8 below 1034 m CSF-A in Hole U1611A. Salinity of the bottom water sample is 38, matching the expectations of elevated salinity of the Mediterranean Sea. The first IW sampled from Section 401-U1611A-3R-3 at 670.4 m CSF-A has salinity of 45. Salinities increase almost linearly to maxima of 70 in Section 401-U1611A-41R-1 (1021.1 m CSF-A) and 66 in Section 401-U1611B-38R-2 (931.9 m CSF-A). Below the peak salinity, values decline linearly to 53 in the deepest IW sample taken from the site (Section 401-U1611A-78R-1; 1225.1 m CSF-A) (Table T14). The inverse relationship between alkalinity and pH shows the close connection between these two properties. Based on the correlation to other elements (i.e., the closer affinity of Li to Si than Ca, see below), these profiles are likely to reflect silicate mineral dissolution rather than carbonate mineral reactions. The maximum alkalinity and minimum pH are above the depth of the salinity peak.
High salinity values were expected at this site given high-salinity IW reported from Ocean Drilling Program (ODP) Leg 161 Site 976 (Shipboard Scientific Party, 1996). In Hole 976B, salinities increase toward the bottom of the hole, reaching a maximum of 77 a short distance above the basement contact. During Leg 161, three possibilities were suggested to explain the high-salinity waters: (1) a remnant paleobrine, possibly of Messinian age; (2) dissolved evaporites migrating from deeper parts of the basin; and (3) hydrothermal activity associated with basement rocks. The location of the salinity maximum at Site U1611 within Miocene sediments, far from a basement contact, and with a decreasing trend toward the bottom of the hole, supports the first explanation—that the IW bears a residual signal of evaporitic brines from the MSC, although diffusion has now decreased the salinity to a fraction of its initial value. Previous suggestions that the sediment/basement contact could channel fluids laterally from areas with halite evaporites or hydrothermal activity (Shipboard Scientific Party, 1996) are not consistent with the location of the high-salinity waters at Site U1611. Projection of the linear trend of salinity above the depth of its maximum value (Section 401-U1611A-41R-1; 1021.1 m CSF-A) suggests that bottom water salinities would be reached at approximately 600 mbsf and implies a barrier to vertical diffusion in the interval that was not recovered. Additional chemical analyses of the IW, including Br/Cl ratios, support the interpretation of a paleobrine at both Sites U1611 and 976 (Bernasconi, 1999) and are discussed further below.
6.2.2. Major ions
Major ion concentrations (Na+, Cl−, Ca2+, Mg2+, K+, SO42−, and Br−) of IW were analyzed using ion chromatography (IC) (Table T14). Because the data show good consistency between Holes U1611A and U1611B (Figure F40), this section describes the trends only in Hole U1611A. Sodium and chloride mirror the pattern of salinity; both ions show linear increases downhole to the depth of the salinity maximum although the magnitudes of the increases are different. Sodium increases 45% from a minimum at 677.1 m CSF-A (Section 4R-1) to a maximum at 1021.1 m CSF-A (Section 41R-1) before a 15% decrease to the bottom of the hole. Chloride increases 57% over the same interval before a 24% decrease to the bottom of the hole. This difference was observed in a shift in the Na/Cl ratios toward lower values, which reach a minimum of 0.74 at 919.1 m CSF-A (Section 30R-4). This minimum occurs close to the maximum and minimum values for alkalinity and pH, respectively. An inflection point in the Na/Cl ratio can also be seen coincident with the maximum in salinity, Na, and Cl concentrations (Section 43R-2; 1042.3 m CSF-A). If sodium and chloride behave conservatively during evaporation and brine concentration, Na/Cl should be equal to the ratio in seawater (0.86); if halite is precipitating from the brine, lower Na/Cl ratios will develop in the brine. If halite dissolves, it should move Na/Cl toward a ratio of 1. In addition to these processes, authigenic silicate minerals can be a sink for sodium and decrease the Na/Cl ratio. Because halite deposits are only known from deeper parts of the Mediterranean and are absent in the Alborán Basin (Rouchy and Caruso, 2006; Ryan, 2009), it is likely that the combined effects of conservative evaporation and a silicate sink for sodium are the main influences on the Na/Cl ratio at Site U1611. Lateral diffusion of a halite-precipitating brine seems unlikely given the shallower bathymetry of the Alborán Sea relative to the known halite deposits in the Mediterranean and the existence of the salinity maximum at Site U1611 within the Miocene aged sedimentary deposits with no obvious structure associated with preferential fluid migration at those depths. The initial salinity of the proposed paleobrine is unknown, but reconstructions may be possible if constraints on the time history of local salinity in the basin, sedimentary porosity and diffusivity, and regional advection (including by compaction) can be determined.

Figure F40. IW sodium, chloride, and Na/Cl.
Calcium and magnesium have similar profiles for Hole U1611A: an increase to a maximum of 61.0 (calcium) and 86.3 mM (magnesium) at 919.1 m CSF-A (Section 30R-4), a plateau between 919.1 and 1042.3 m CSF-A (Sections 30R-4 and 43R-2), and a decrease to the bottom of the profile (Figure F41). The two inflection points correspond to the depths of the alkalinity maximum and salinity maximum, similar to the features in the Na/Cl profile (Figure F42). The correlation with high concentrations of sodium and chloride suggests net carbonate mineral dissolution may have occurred within the highly saline intervals, with diffusion controlling the profiles of calcium and magnesium above and below the plateau between 920 and 1050 m CSF-A (Figure F41). Potassium increases from 6.1 mM at 686.8 m CSF-A (Section 5R-1) to 10.4 mM at 919.1 m CSF-A (Sample 30R-4), followed by a decline to a minimum of 4.7 mM at the bottom of the hole (Figure F42). The inverse relationship between the potassium concentrations and Na/Cl ratios suggests that exchange of potassium and sodium during clay mineral diagenesis may be occurring (Figure F42).
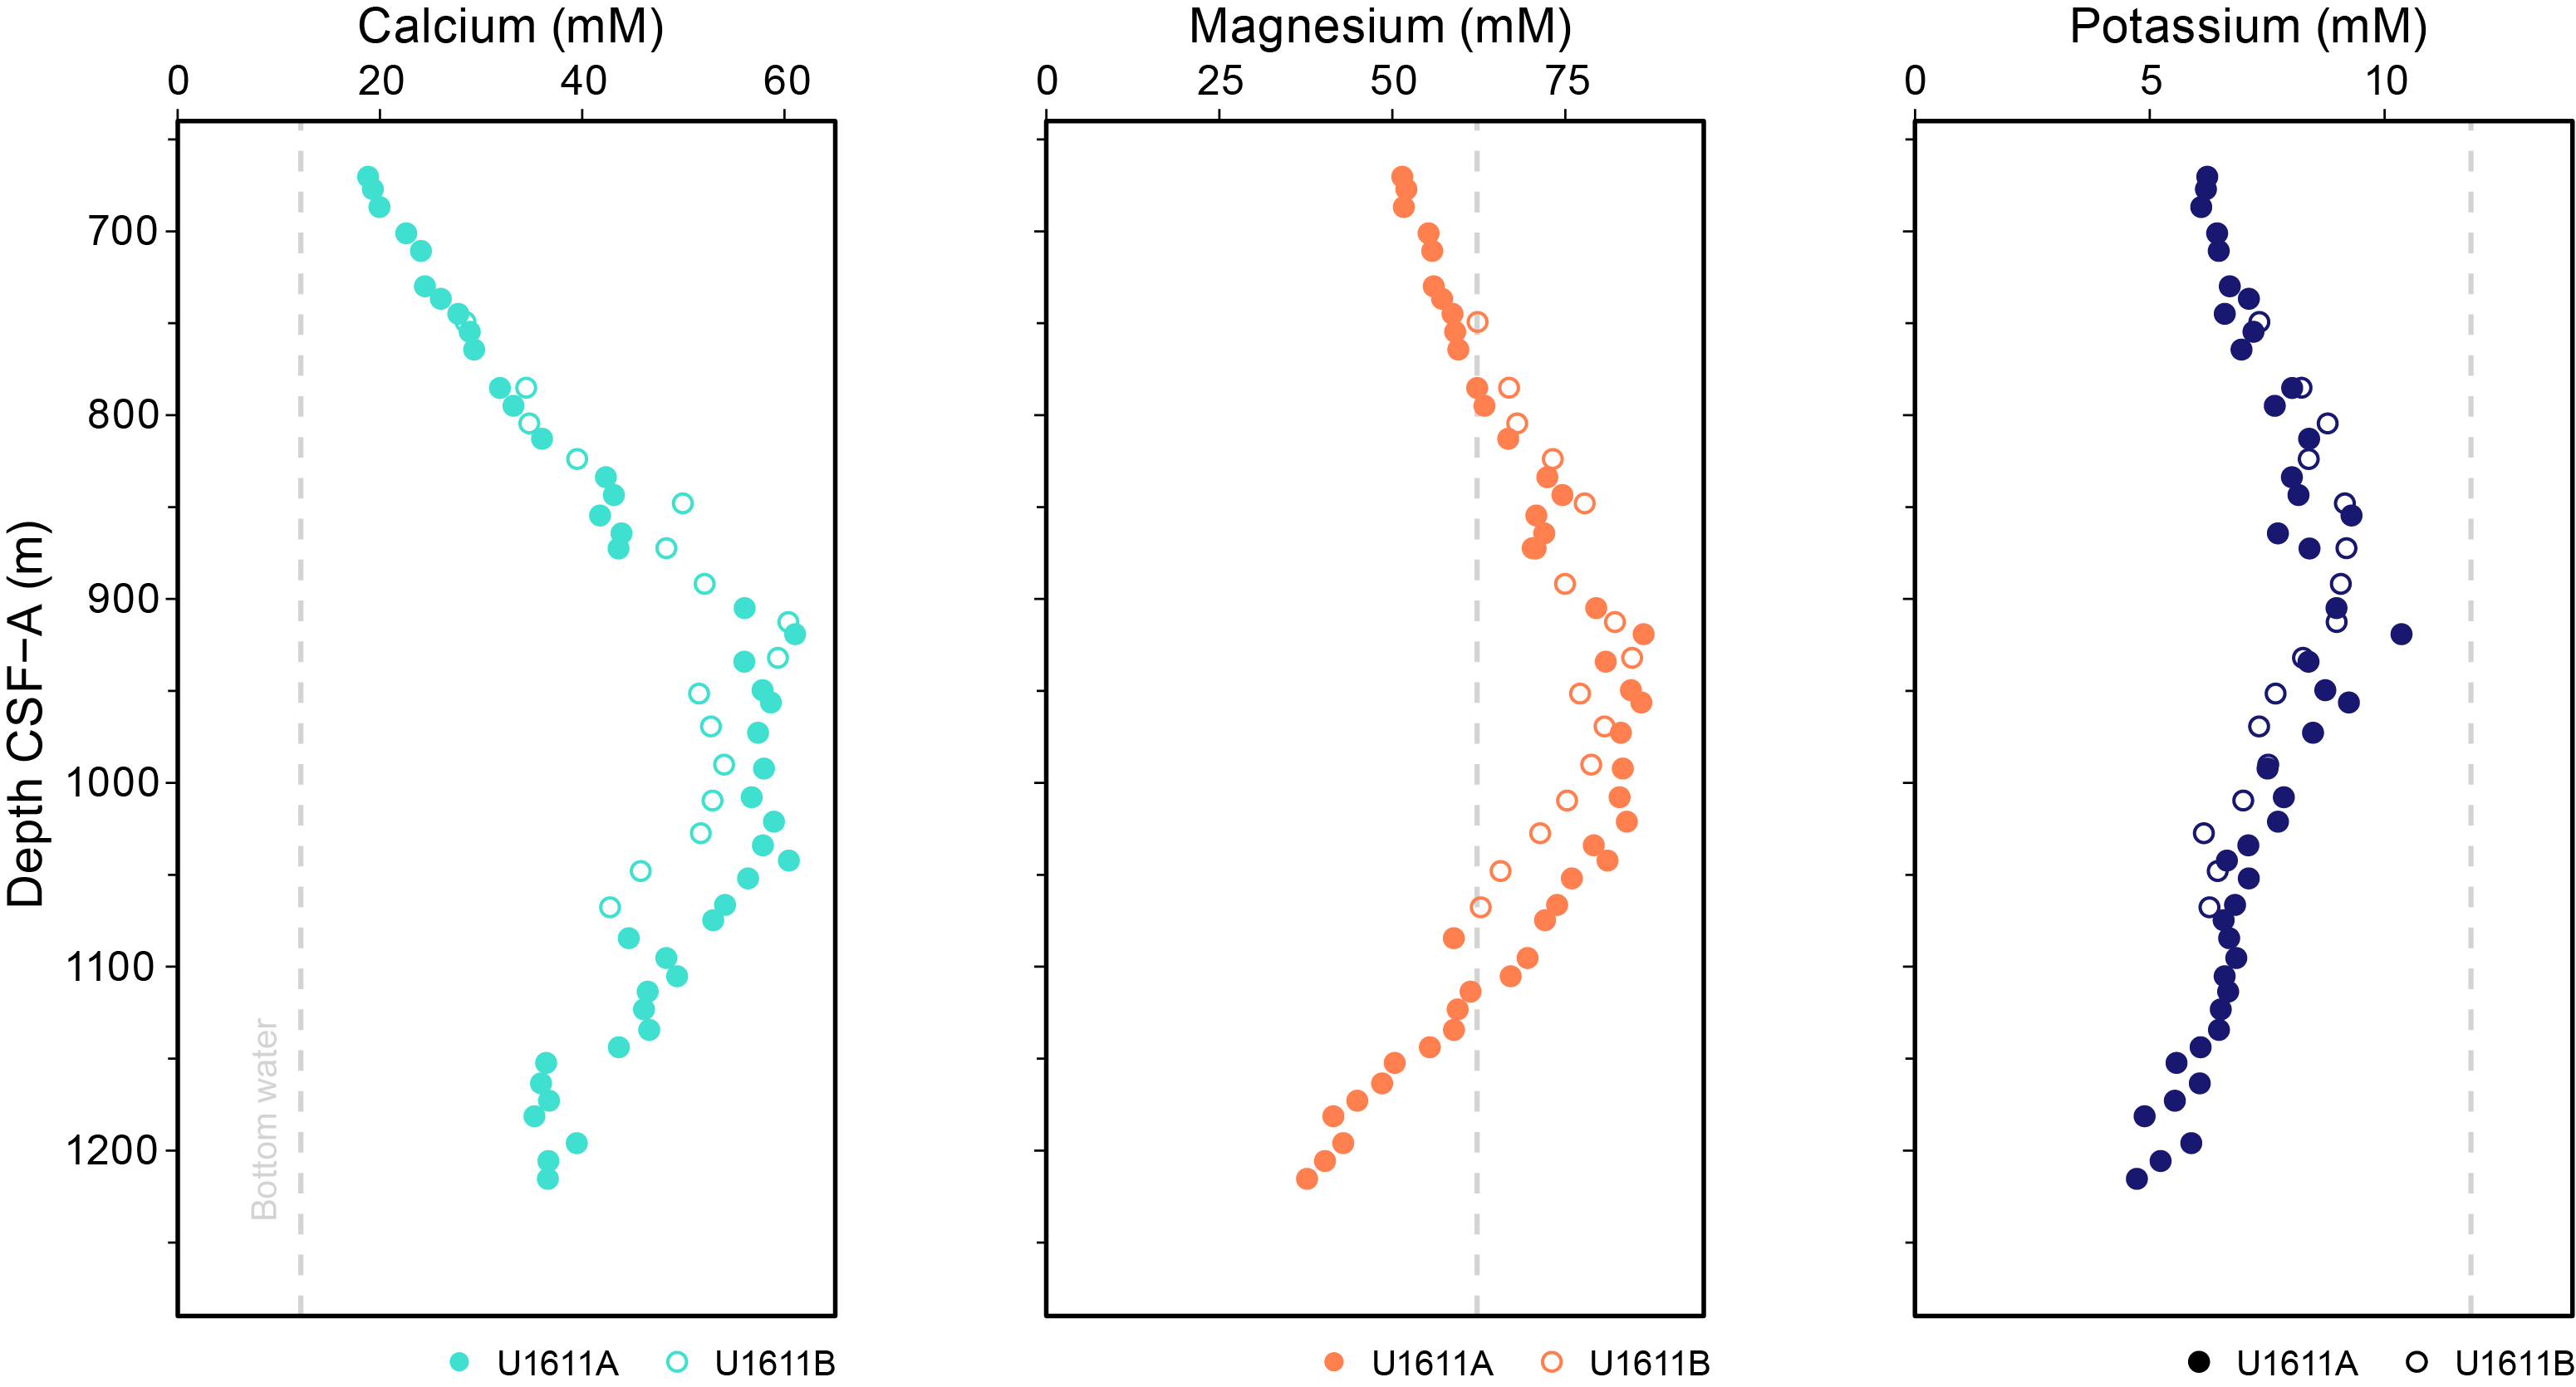
Figure F41. IW major cation concentrations.
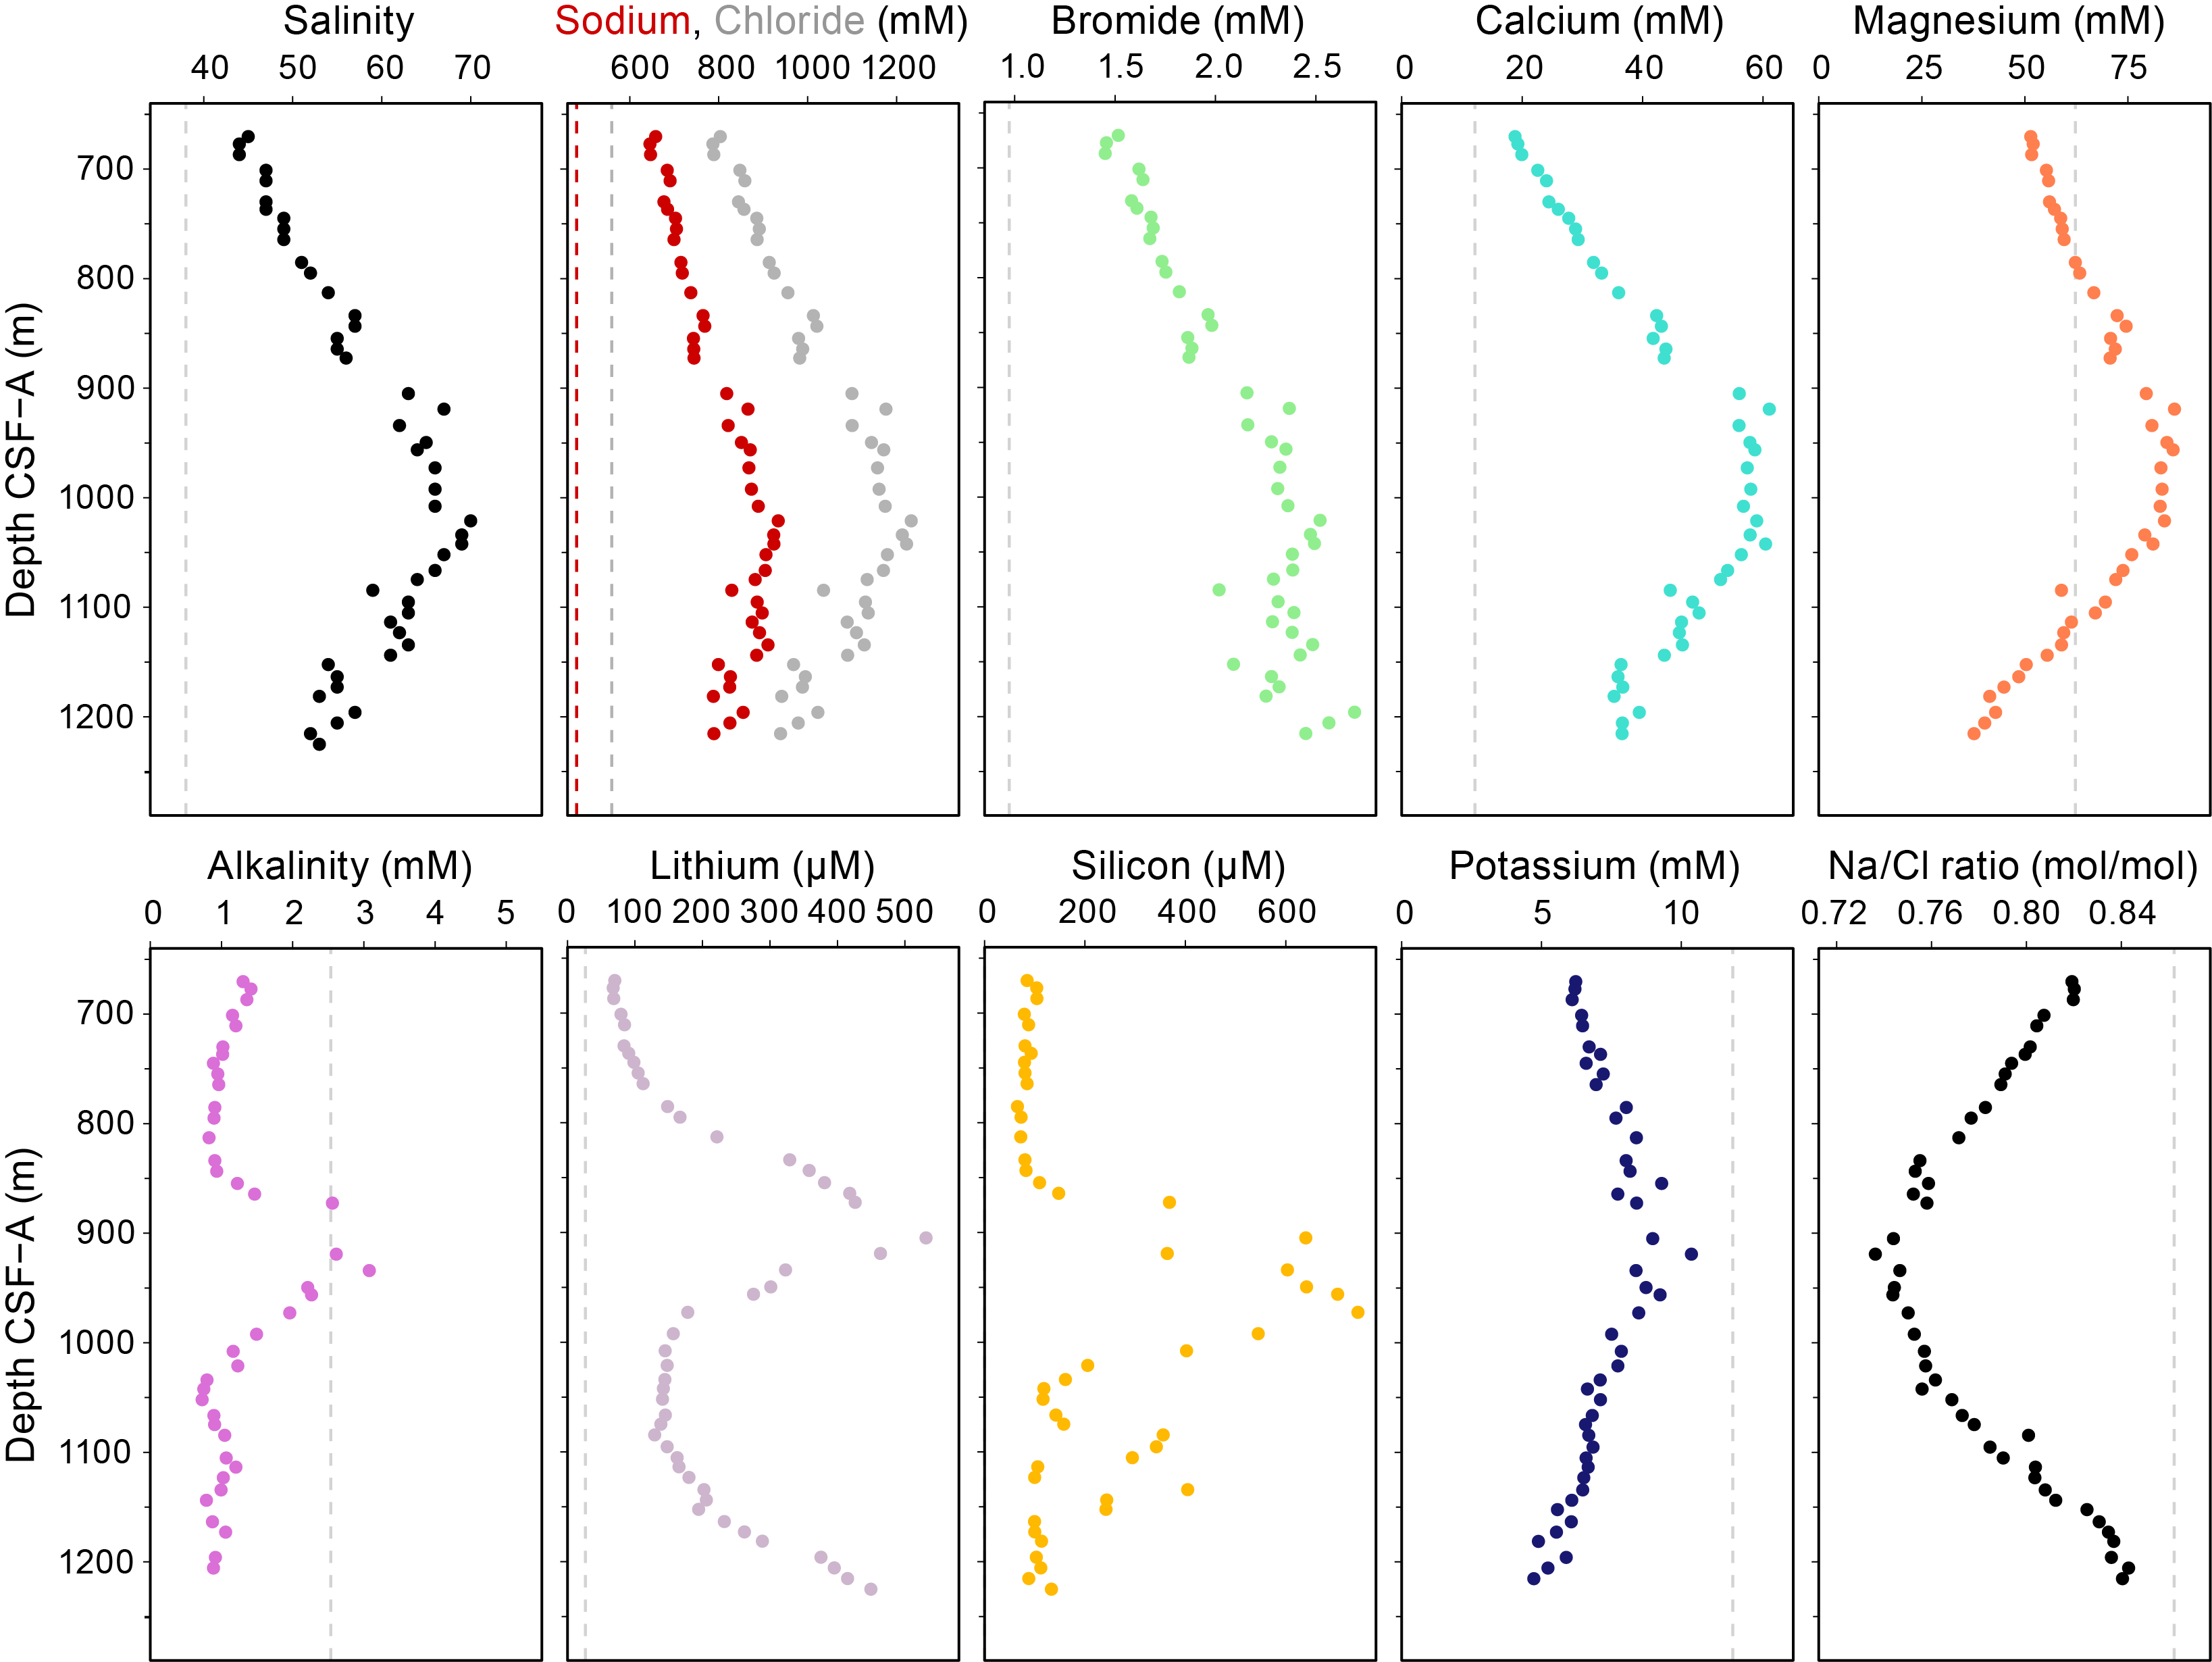
Figure F42. Comparison of chemical profiles from IW.
Sulfate concentrations range 0.5–6.4 mM throughout Hole U1611A with a mean of 2.6 mM (Figure F43). Bromide concentrations increase approximately linearly from a minimum of 1.5 mM at 686.8 m CSF-A (Section 5R-1) to 2.5 mM near where the salinity peak occurs (Section 43R-2; 1042.3 m CSF-A). Below this inflection point, there is a slight increase and increased scatter in the Br concentrations to a maximum of 2.7 mM at 1196.0 m CSF-A (Section 73R-1). Because bromide behaves largely conservatively, with the main exception being the bromide source from degradation of marine organic matter, the Br/Cl ratio can help determine the origin of a fluid phase.
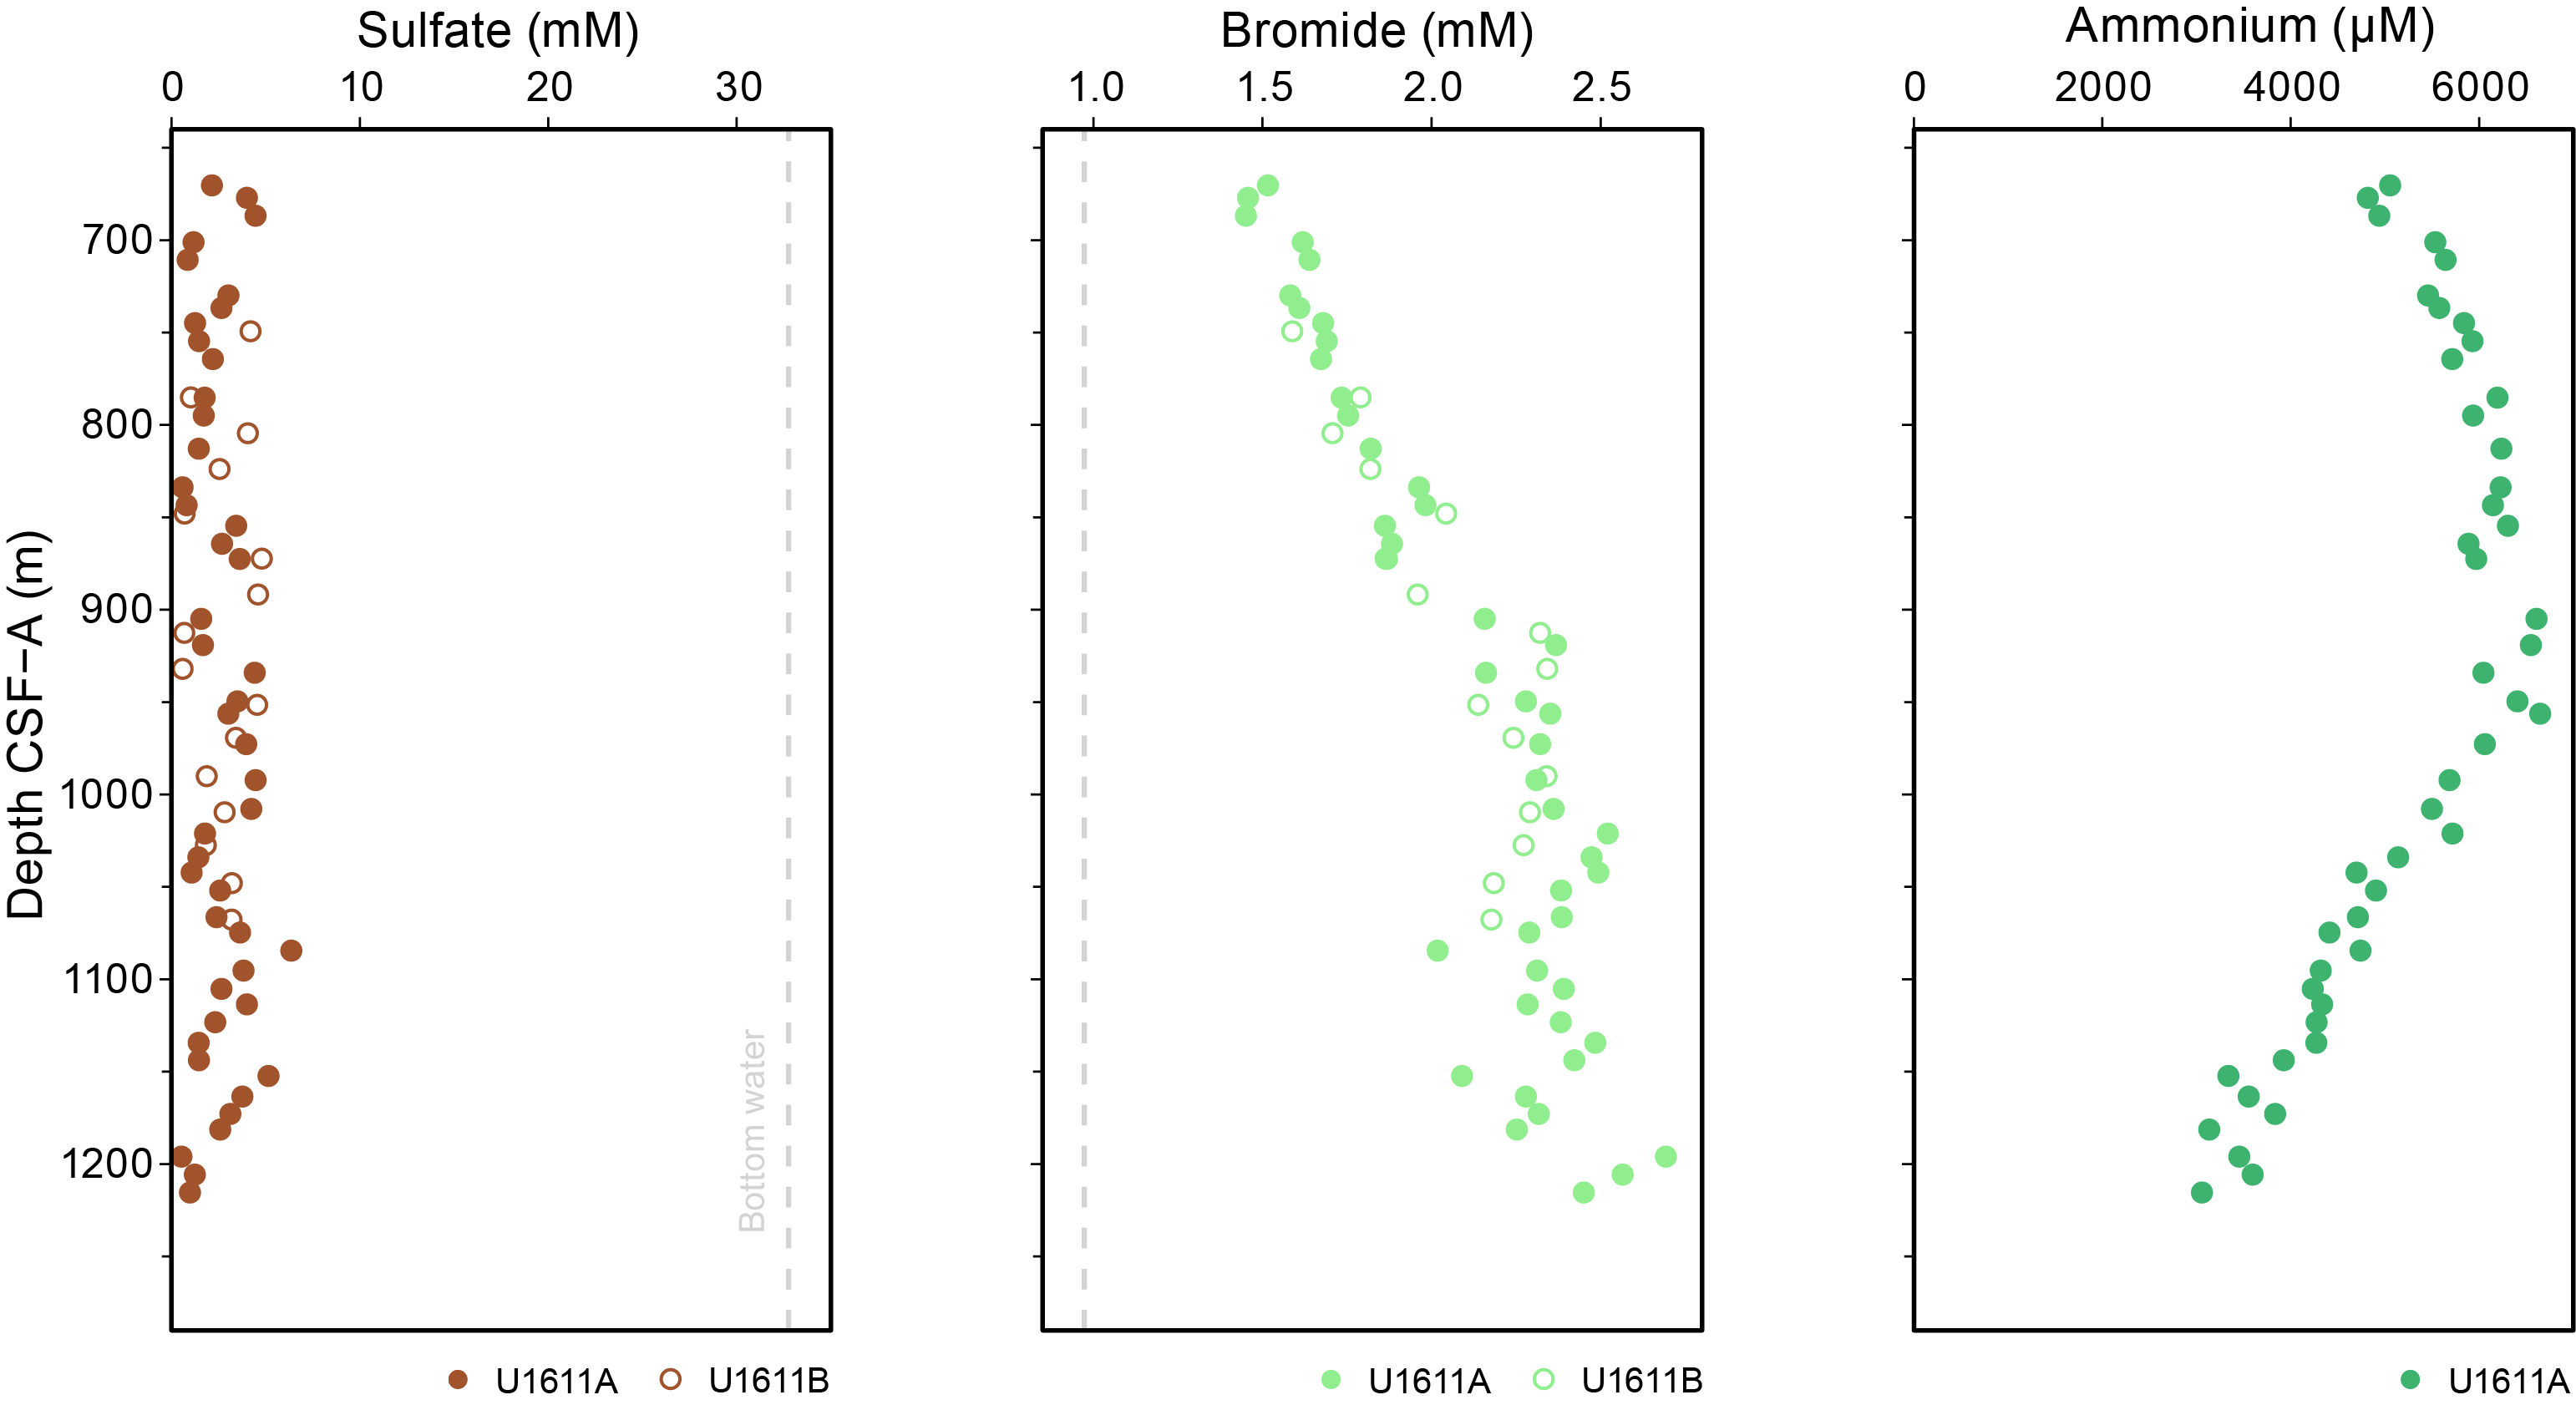
Figure F43. IW major anion concentrations.
Figure F44 shows the relationship between Na, Cl, and Br at Sites U1611 and 976 (where the sum of Br + I ions was analyzed rather than just Br—the contribution of iodine is negligible; Shipboard Scientific Party, 1996) in the Alborán Sea and Site U1610 in the Gulf of Cádiz. The two sites in the Alborán Sea (Sites U1611 and 976) have stable or increasing Br/Cl ratios, whereas Site U1610 has decreasing Br/Cl ratios. At Sites U1611 and 976, the Br/Cl ratio of the IW is higher than the expected ratio for simple evaporation of seawater, indicating that either organic matter degradation or halite precipitation influenced these fluids. Given that Messinian halite is not present in the sediments of the Alborán Sea, we interpret the fluids to reflect the former option, in contrast to earlier interpretations for Site 976 (Bernasconi, 1999). The signature of a paleobrine is reflected in the dominantly conservative species (sodium, chloride, and bromide), although other major ions (e.g., sulfate, calcium, magnesium, and potassium) do not match the expectations of an evaporative brine. The reactive behavior of these elements with other sedimentary components (organic matter, clay minerals, and carbonate minerals) is likely the dominant control on their concentrations, overprinting the initial signal of the paleobrine.
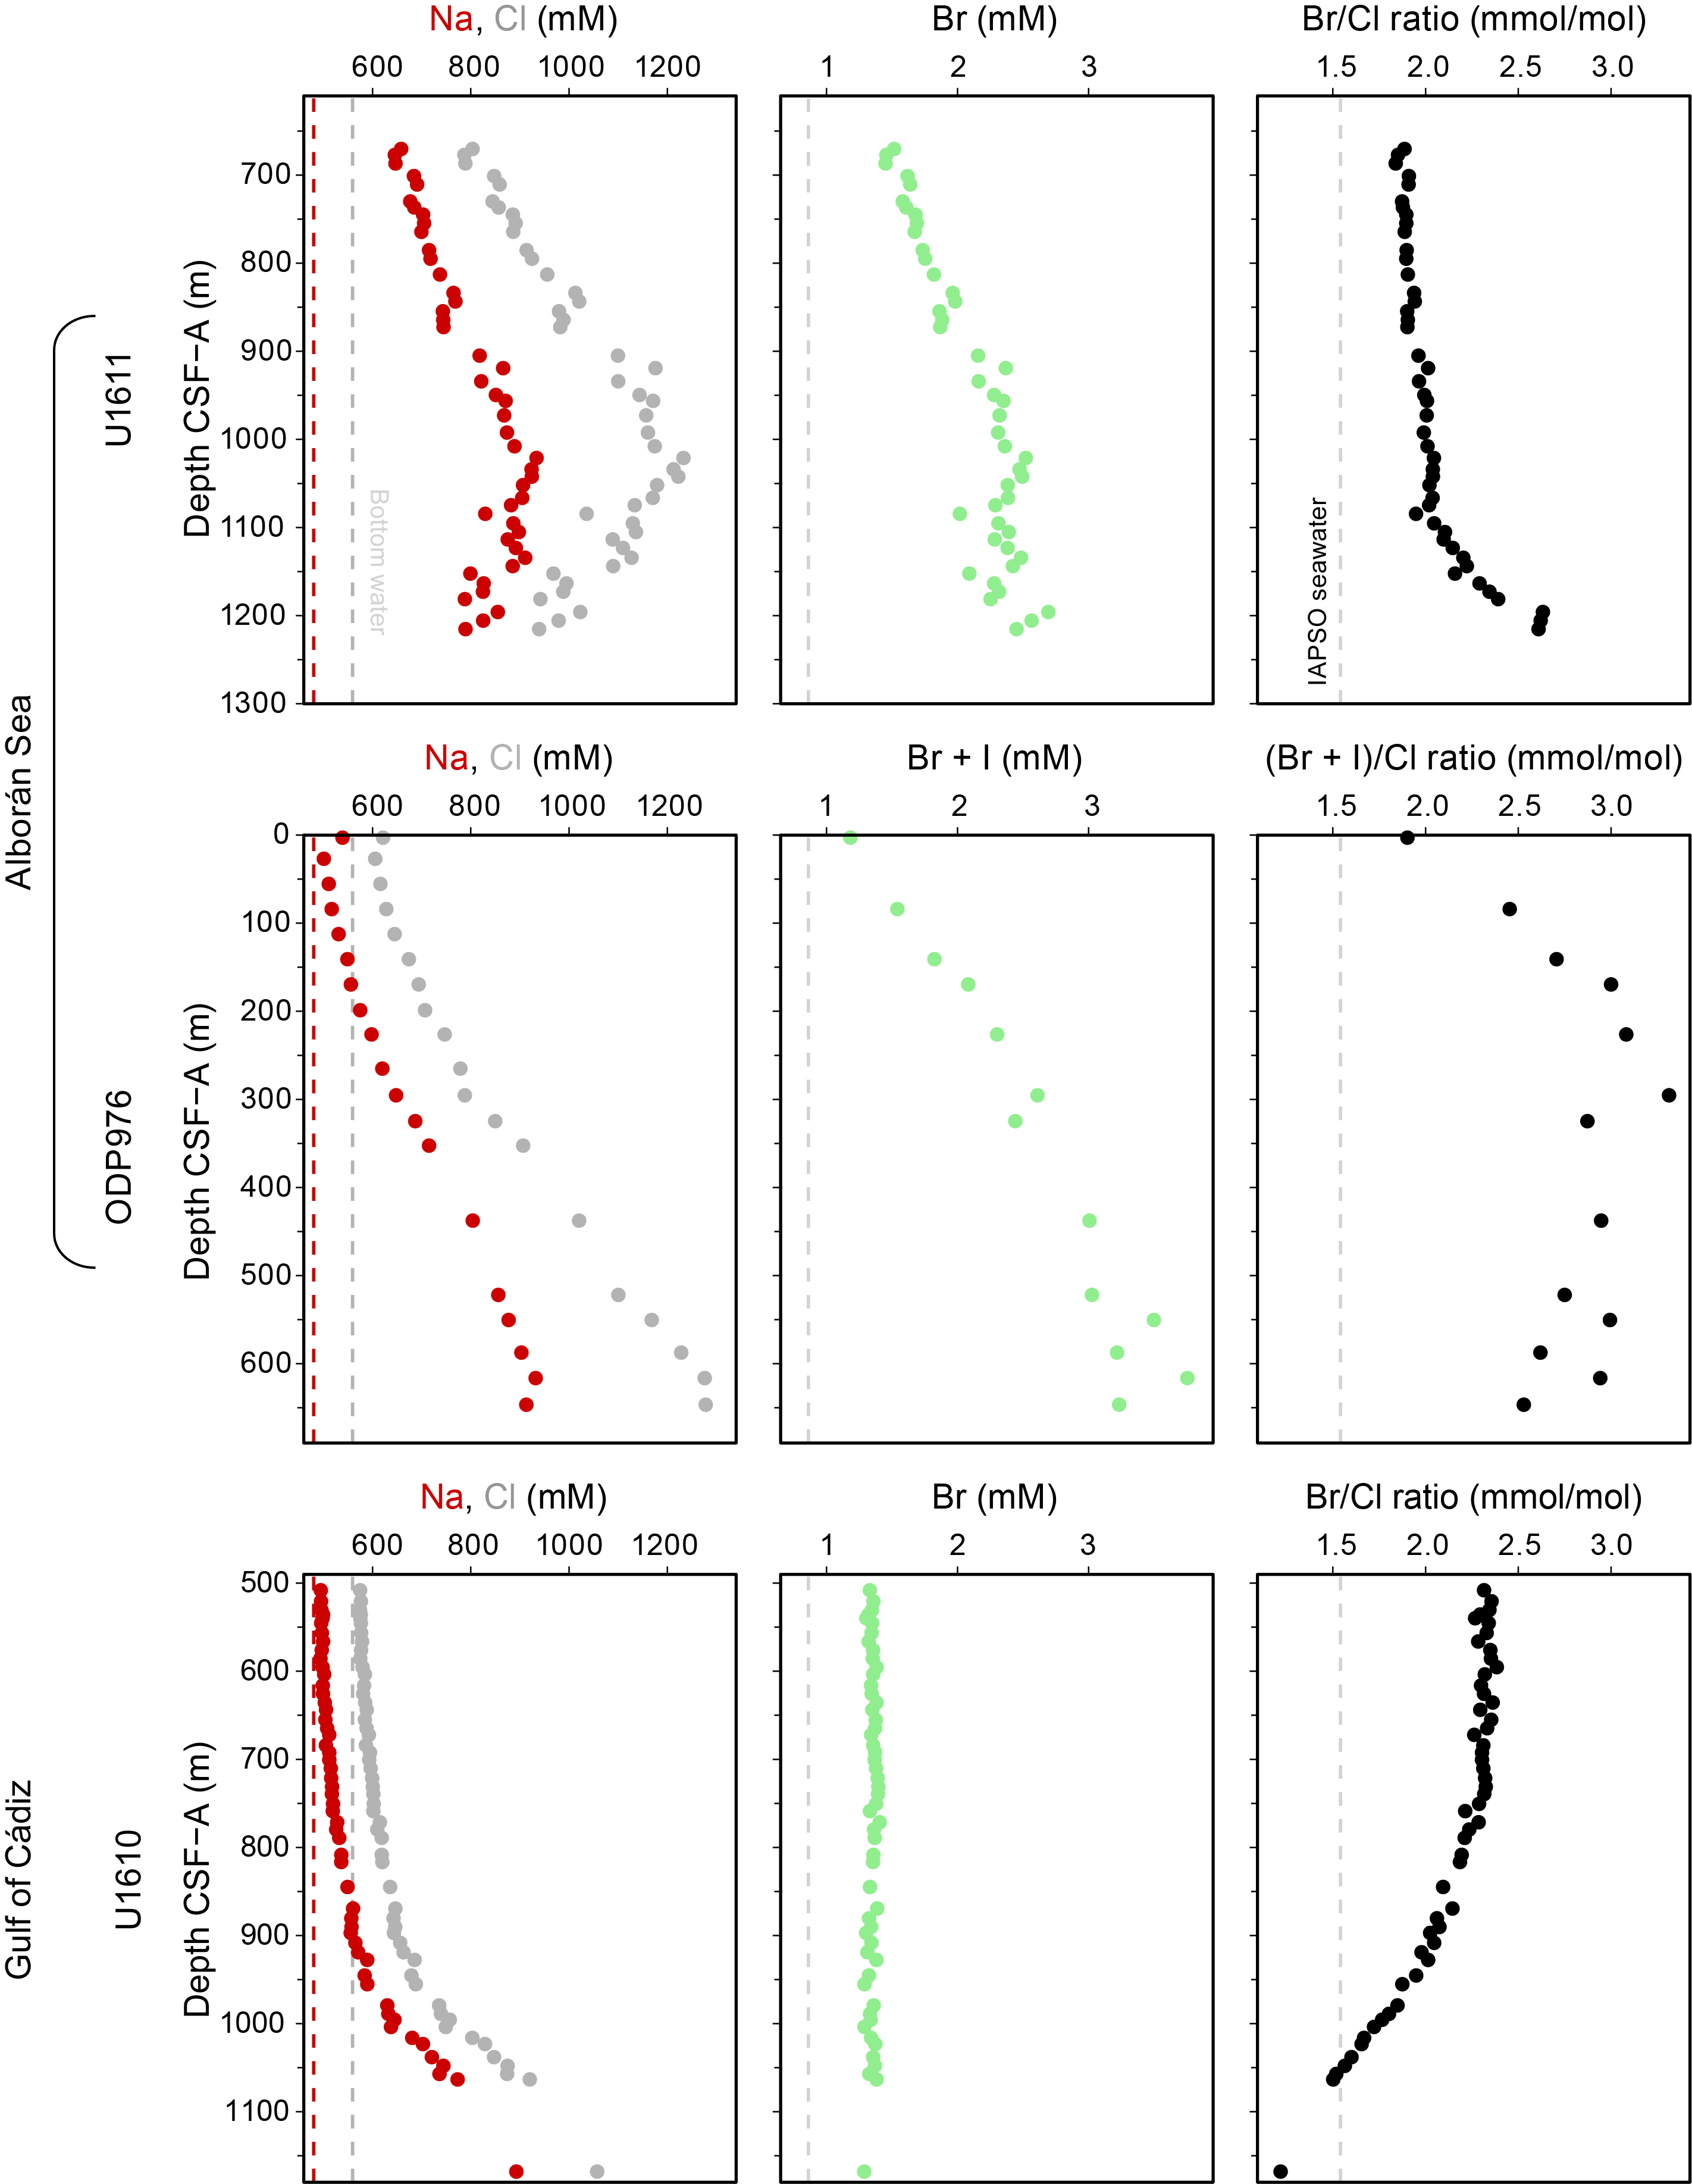
Figure F44. Sodium, chloride, bromide, and Br/Cl.
6.2.3. Ammonium, phosphate, and total phosphorus
Ammonium and phosphate were analyzed only in Hole U1611A. Ammonium concentrations in IW were analyzed using spectrophotometry (Figure F43; Table T14). Ammonium concentrations are high, with a maximum of 6648 µM at 956.3 m CSF-A (Section 34R-3) and a linear decrease below that interval to a minimum of 3058 µM at 1225.1 m CSF-A (Section 78R-1). High ammonium concentrations in this interval are attributed to degradation of organic matter by methanogens, added to any ammonium released at shallower depths within the zone of sulfate reduction (not recovered because of the wash down interval). Phosphate and total P concentrations measured by spectrophotometry and inductively coupled plasma–atomic emission spectroscopy (ICP-AES), respectively, are below the detection limit throughout (Tables T14, T15).
6.2.4. Trace elements (Li, Si, Ba, B, Sr, Fe, and Mn)
Trace element concentrations in IW were analyzed using ICP-AES (Table T15). Because both Holes U1611A and U1611B show consistent downhole trends (Figures F45, F46, F47), this section mainly describes the trends in Hole U1611A with some notable features in Hole U1611B. Lithium increases from a minimum of 67 µM at 677.1 m CSF-A (Section 401-U1611A-4R-1) to a maximum of 531 µM at 904.9 m CSF-A (Section 28R-1). Lithium then decreases to <150 µM between 1007.8 and 1095.3 m CSF-A (Sections 39R-5 and 52R-2), followed by a second increase to 450 µM at the bottom of the hole. The high Li concentrations at ~900 m CSF-A correlate well with the peak in alkalinity, although the overall shapes of the profiles are not perfectly matched (Figure F42). The peak is slightly shallower in Hole U1611B, paralleling the shallower depths of the alkalinity peak relative to Hole U1611A. Li concentrations are likely controlled by primary and authigenic silicate reactions (Bernasconi, 1999). The increase toward the bottom of the hole may be related to diffusion of fluids influenced by silicate basement rocks. High Li concentrations were also observed at the bottom of Hole 976B and were initially thought to be in conflict with the existence of a paleobrine (Shipboard Scientific Party, 1996); however, additional sources of Li from hydrothermal activity within basement rocks could easily overwhelm the Li signal from the brine (Hathorne and James, 2006). The silicon profile is more similar to the alkalinity profile with an inverse relationship to pH (Figures F45, F48), showing that it is likely caused by changing silica solubility and authigenic clay precipitation/dissolution.
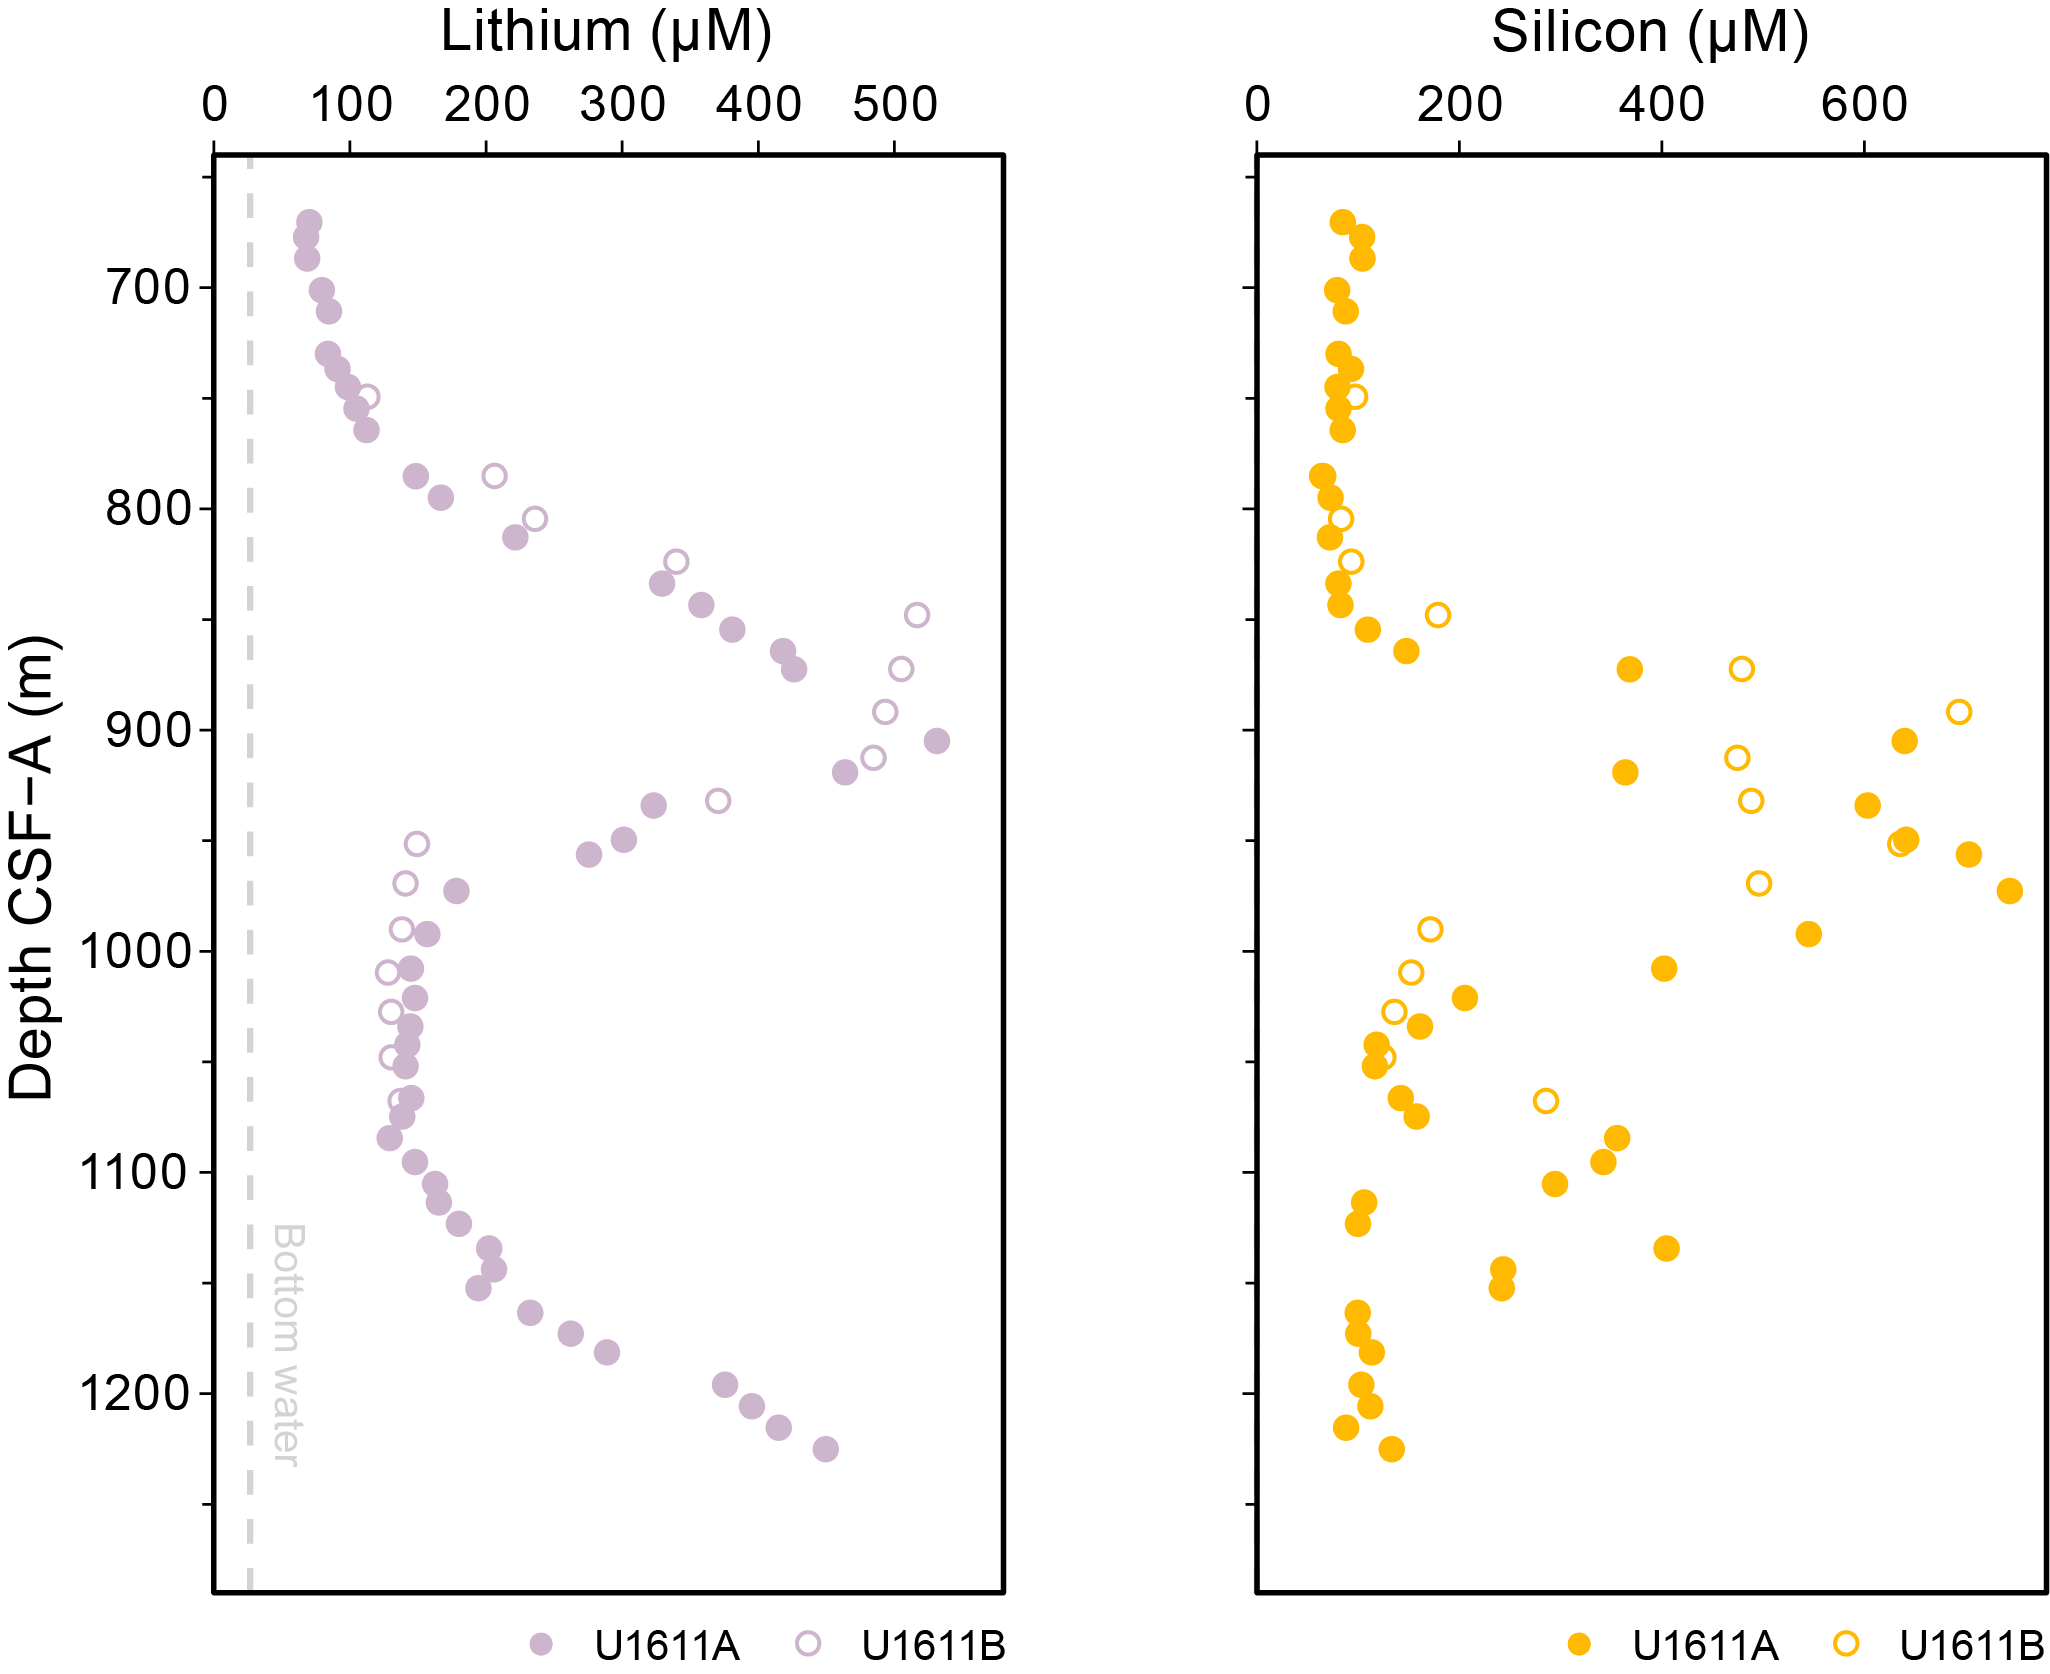
Figure F45. IW minor element concentrations.
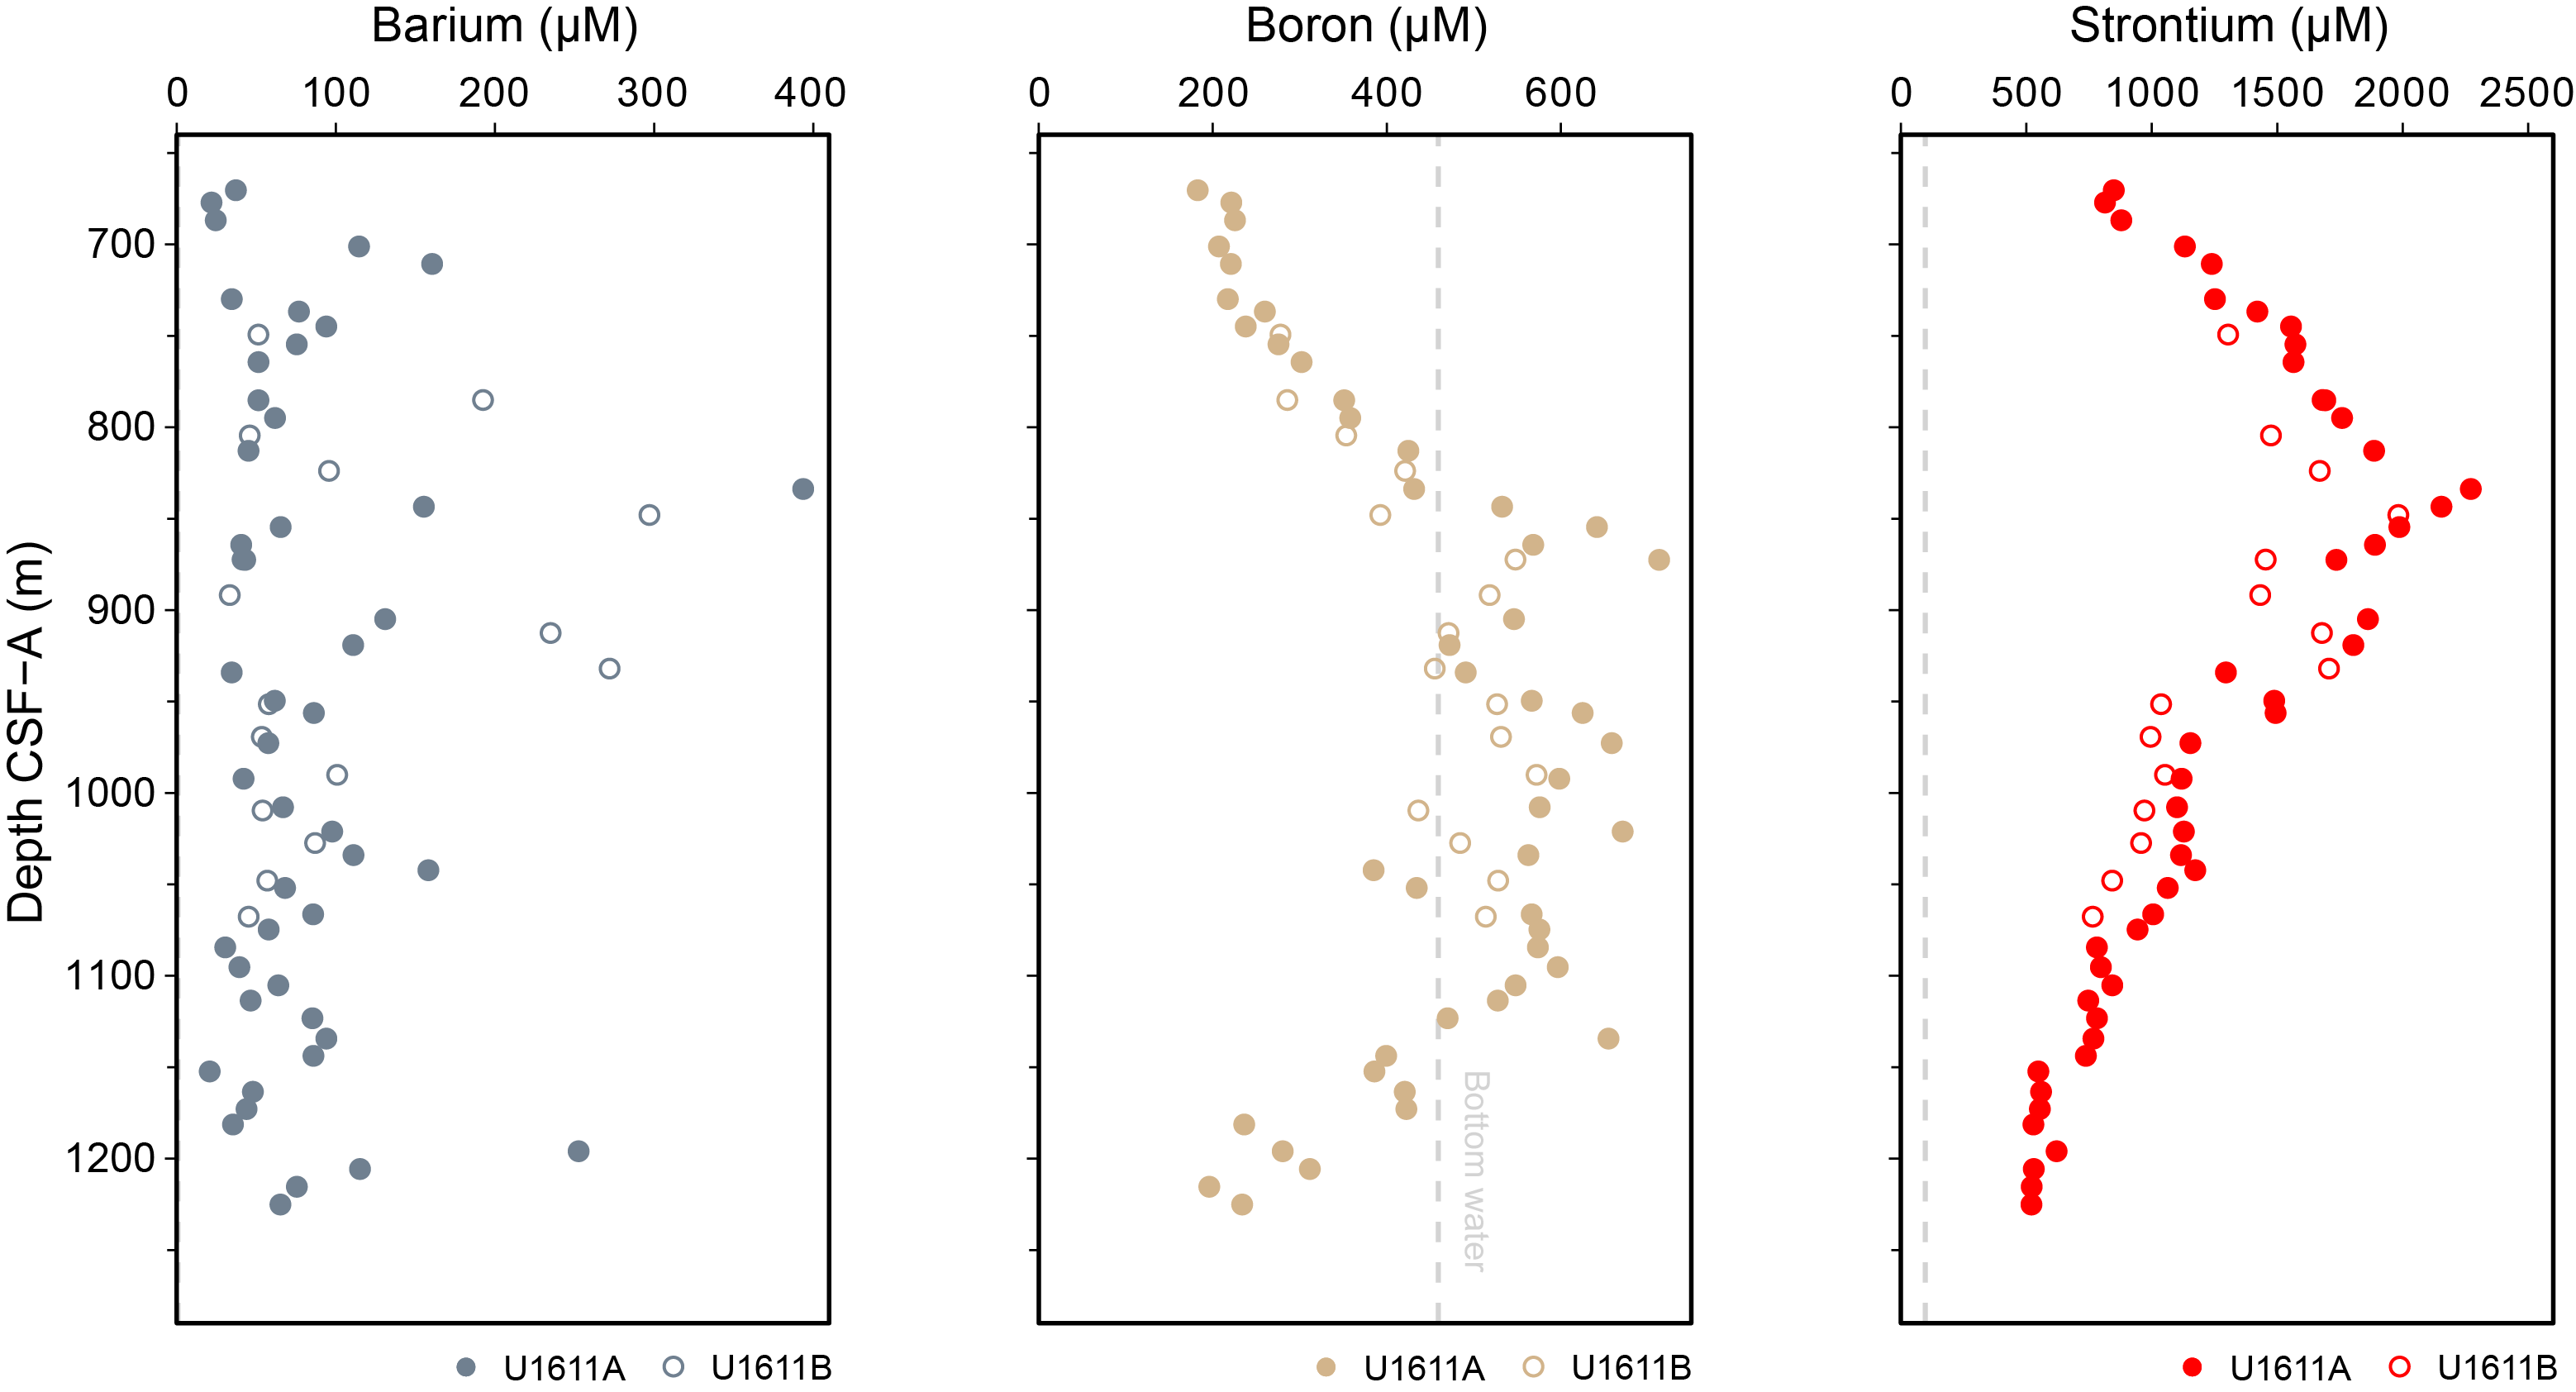
Figure F46. IW minor and trace element concentrations.
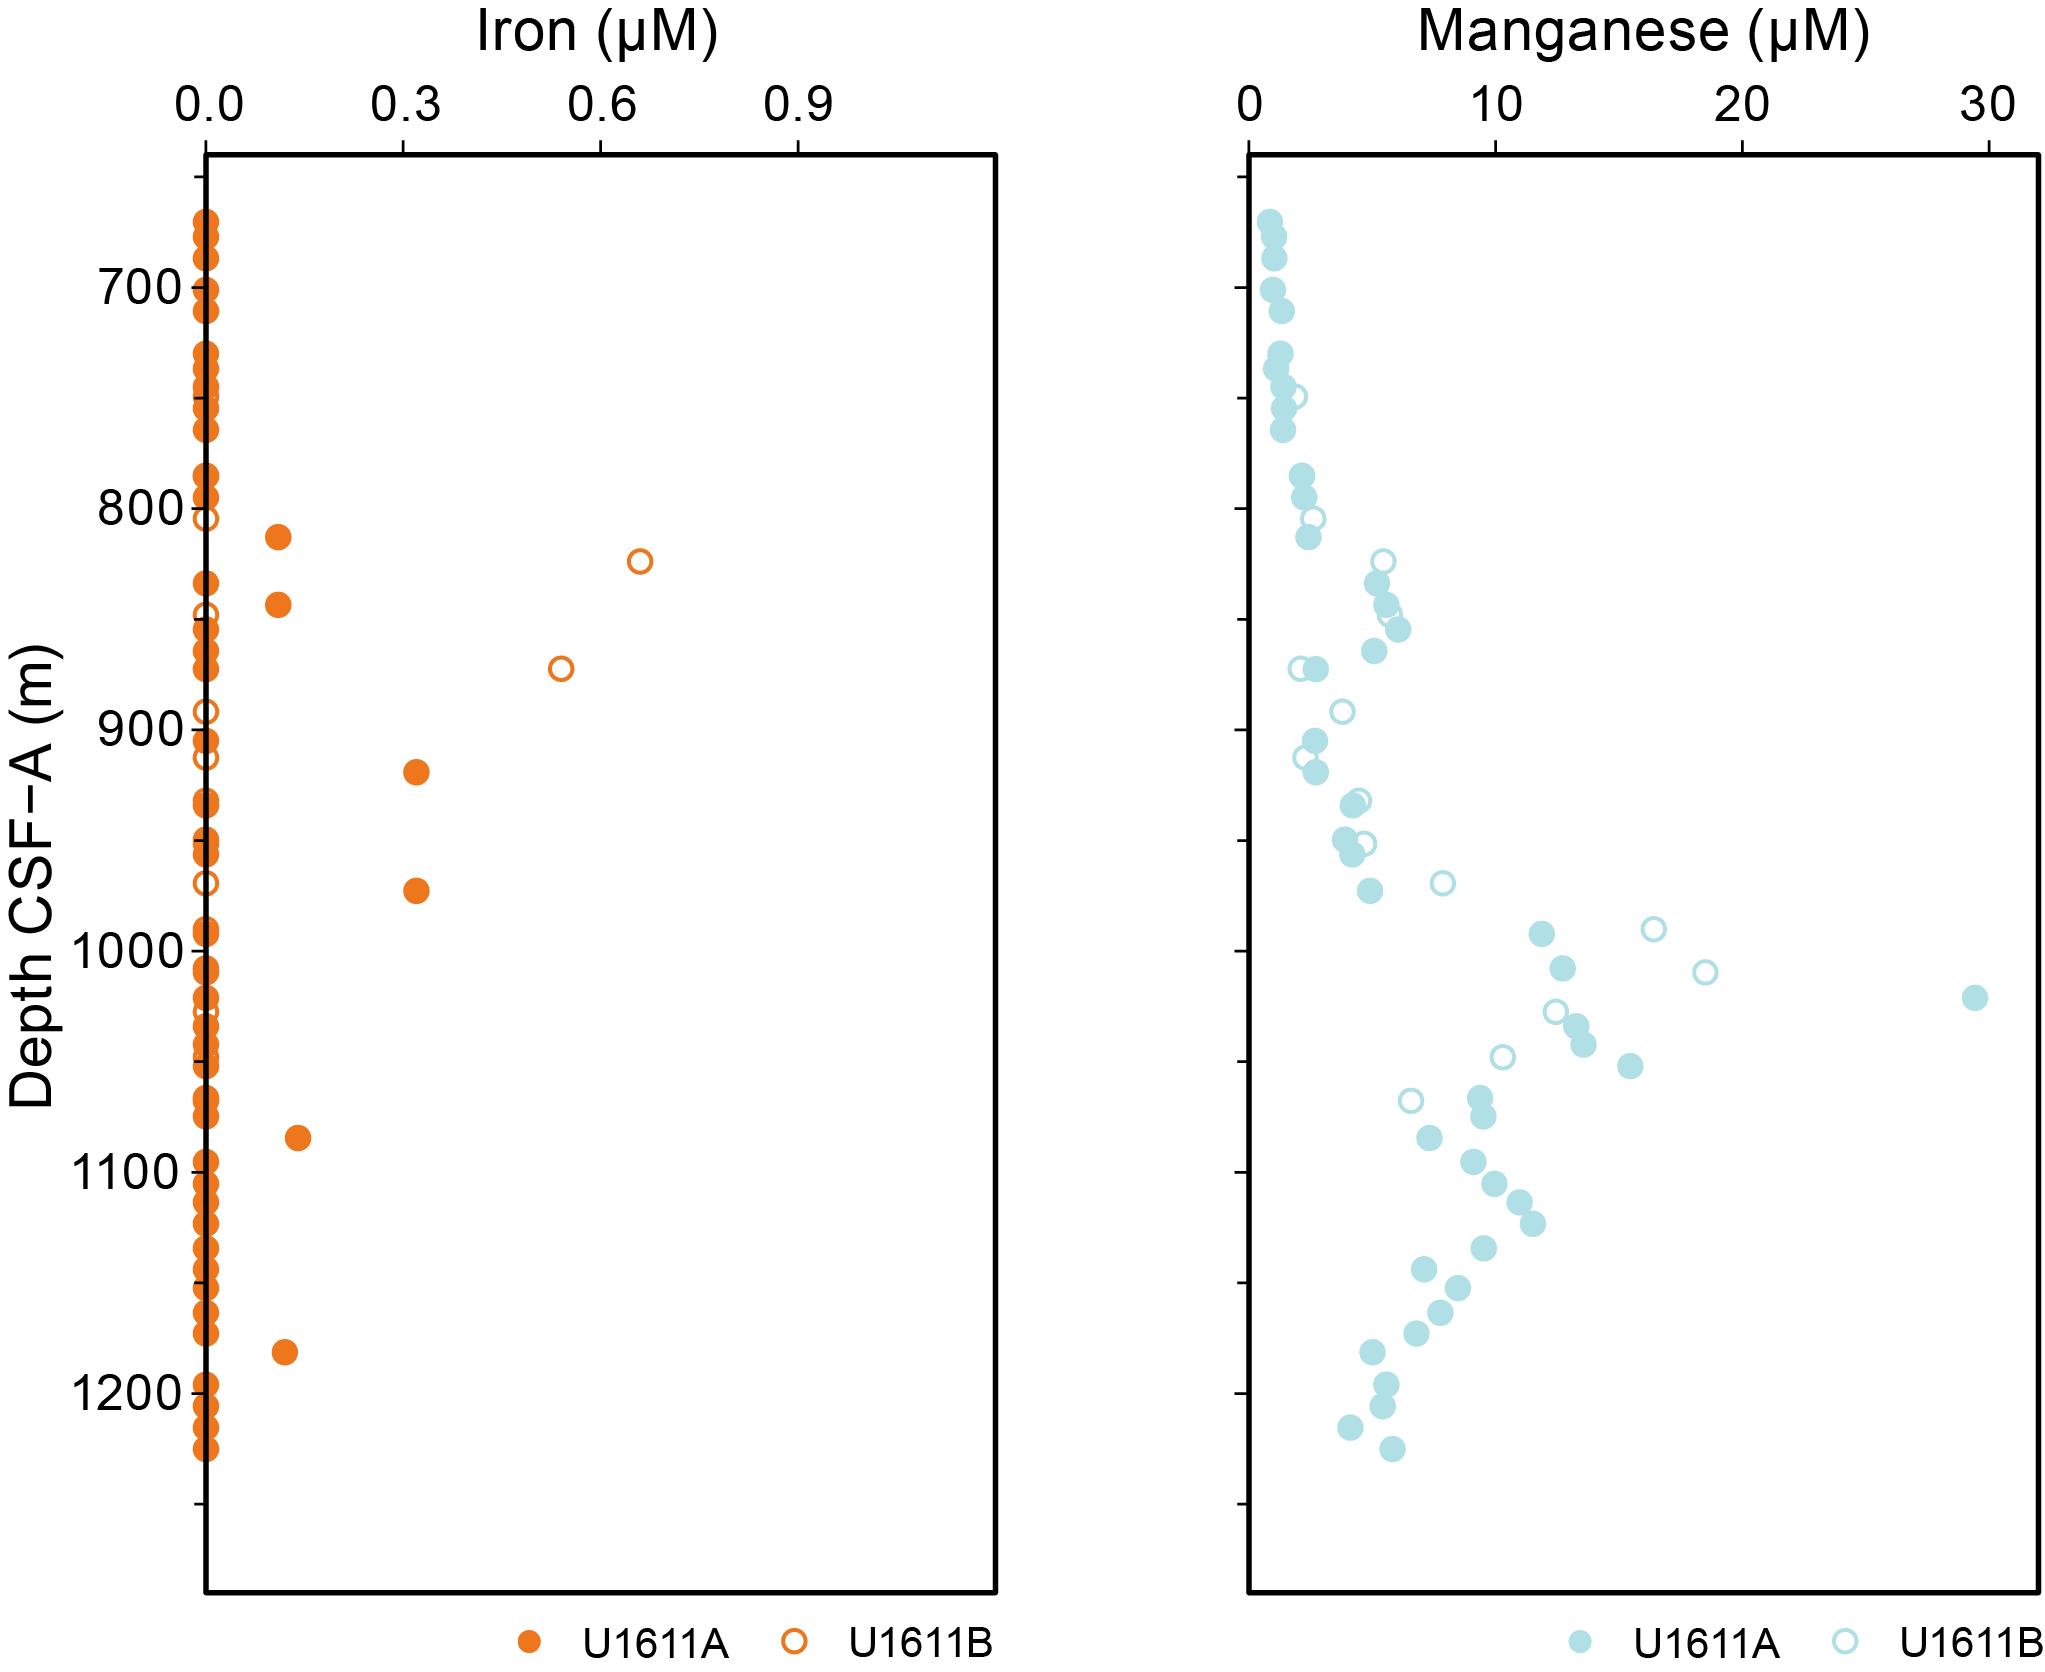
Figure F47. IW trace element concentrations.
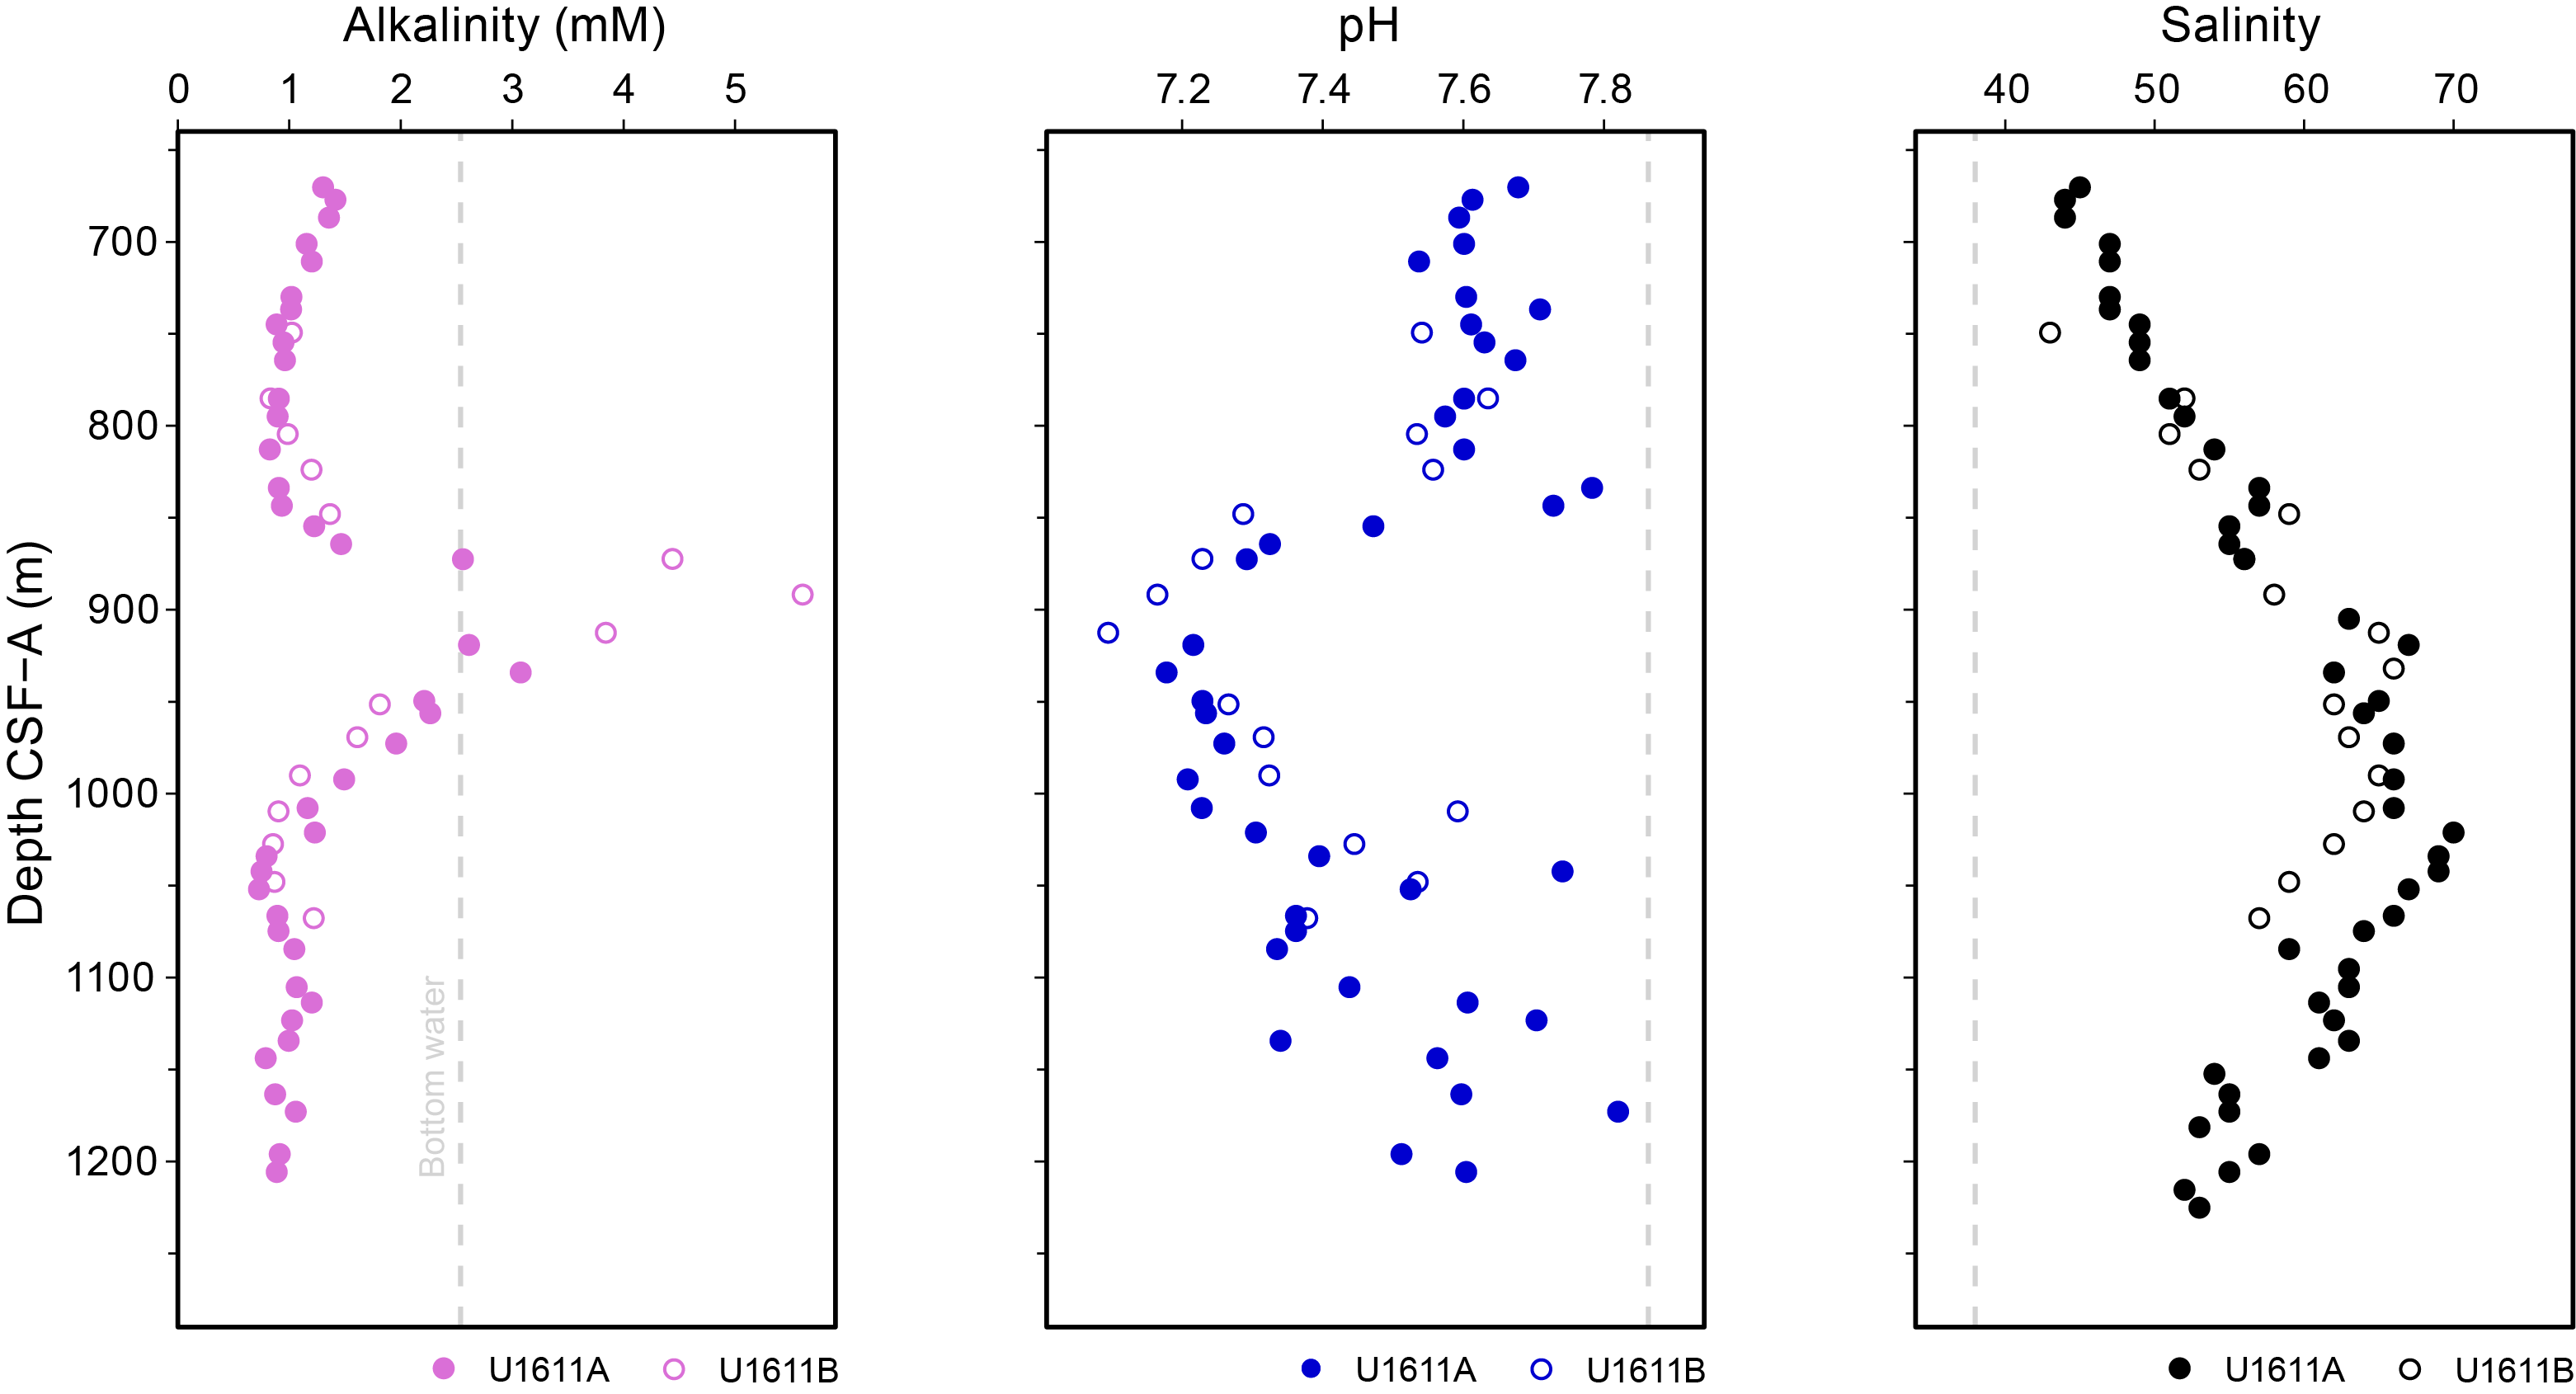
Figure F48. IW alkalinity, pH, and salinity.
Barium concentrations range 21–192 µM throughout, except for two samples from Hole U1611A and three samples from Hole U1611B with relatively high Ba concentrations (235–394 µM) (Figure F46). The five samples with high Ba also have the lowest recorded sulfate concentrations at this site (<1.0 mM sulfate), showing that the Ba depth profile predominantly reflects variation in barite solubility. Boron increases from 182 µM at 670.4 m CSF-A (Section 401-U1611A-3R-3) to >400 µM between 812.9 and 1172.9 m CSF-A (Sections 18R-1 and 68R-2) before a decline to 196 µM at 1215.4 m CSF-A (Section 21R-2). The interval with high concentrations of boron corresponds to that with lower pH values and generally higher Si, suggesting that boron is influenced by clay mineral precipitation/dissolution.
Strontium concentrations increase from 829 µM at 686.8 m CSF-A (Section 401-U1611A-5R-1) to a maximum of 2271 µM at 833.8 mbsf CSF-A (Section 20R-2) and then decline to 520.6 µM at 1225.1 m CSF-A (Section 78R-1) (Figure F46). In contrast to other sites from this expedition, the main features of the strontium profile do not match well with the main features in the calcium profile: there is only a slight inflection in the calcium and magnesium profiles where the strontium peak occurs, and strontium concentrations are not elevated at the same level as the salinity maximum. This difference suggests that additional factors related to reactivity and mineralogy of carbonate minerals within the high-salinity waters may be controlling the behavior of these elements at Site U1611, whereas the profiles at other sites are dominantly controlled by carbonate diagenesis of primary carbonate components.
Iron concentrations are less than 0.7 µM throughout Holes U1611A and U1611B, with many samples below the detection limit of our analytical methods (Figure F47). Manganese concentrations are <6.1 µM above 972.7 m CSF-A (Section 401-U1611A-36R-1) and below 1181.3 m CSF-A (Section 70R-1) but show a clear increase between 992.2 and 1172.9 m CSF-A (Sections 38R-1 and 68R-1) to a maximum of 29.5 µM at 1021.1 m CSF-A (Section 41R-1). The highest Mn concentrations coincide with the salinity maximum, although the overall shapes of the profiles are very different. The mineral ankerite was detected in the XRD spectra of a few samples above and below the peak in Mn concentrations; it is possible that dissolution of ankerite in the high-salinity IW contributes to the profile or that changes in the redox condition drive these patterns.
6.3. Microbiology sampling
Microbiological sampling was not initially planned for Expedition 401. However, after detecting high-salinity waters in Hole U1611A, whole-round samples were collected from Hole U1611B to enable future shore-based microbiological analysis. A total of 16 samples were taken at a resolution of approximately one sample per 20 m following modified sampling protocols (see Geochemistry in the Expedition 401 methods chapter [Flecker et al., 2025a]) and immediately frozen at −86°C to maximize the preservation potential of microbial life. Postcruise work may consider whether the unusual conditions recorded in the IW and organic-rich sediments might be associated with distinct microbial communities.
6.4. Sedimentary geochemistry
Sediment samples were collected for analysis of solid-phase geochemistry at a resolution of one sample per core or one sample every other half-length core for Hole U1611A (Table T16). These samples came from a fraction of the IW squeeze cake residue. Additional samples were taken from split cores to identify the geochemical variation across different lithologies identified by the shipboard sedimentologists. Squeeze cake residues were also analyzed from Hole U1611B at the lower resolution of one sample per 20 m (every fourth half-advanced core).
6.4.1. Calcium carbonate
CaCO3 ranges 5.0–92.0 wt% (Figure F49; Table T16) with a mean of 28.3 wt% and a standard deviation of 17.0 wt% overall in both holes at Site U1611. In Hole U1611A, CaCO3 is generally 30–60 wt% in the uppermost 812.9 m (to Section 401-U1611A-18R-1), including a dolomitic sandy silt in Section 13R-7 (772.0 m CSF-A) that has 59.5 wt% carbonate, which may reflect an authigenic carbonate component. Carbonate then varies between 14 and 36 wt% between 833.8 and 956.3 m CSF-A (Sections 20R-2 and 34R-3). Below this interval, CaCO3 is generally low, ranging 15–25 wt%. Discrete high values >60 wt% (seven samples) were obtained for targeted lithologies, many of which are identified as dolomitic or cemented carbonate lithologies and six of which were collected in the generally low carbonate interval between 956.3 and 1200 m CSF-A. For example, a cemented carbonate lithology in Section 50R-1 (1083.2 m CSF-A) has 86.9 wt% carbonate, and the highest analyzed carbonate content (92.0 wt%) is in a banded concretion from Section 69R-1 (1176.3 m CSF-A). The trend in Hole U1611B parallels the general trend observed in Hole U1611A, with the absence of the higher carbonate weight percent samples taken from targeted carbonate-cemented samples in Hole U1611A because these were not sampled in Hole U1611B.
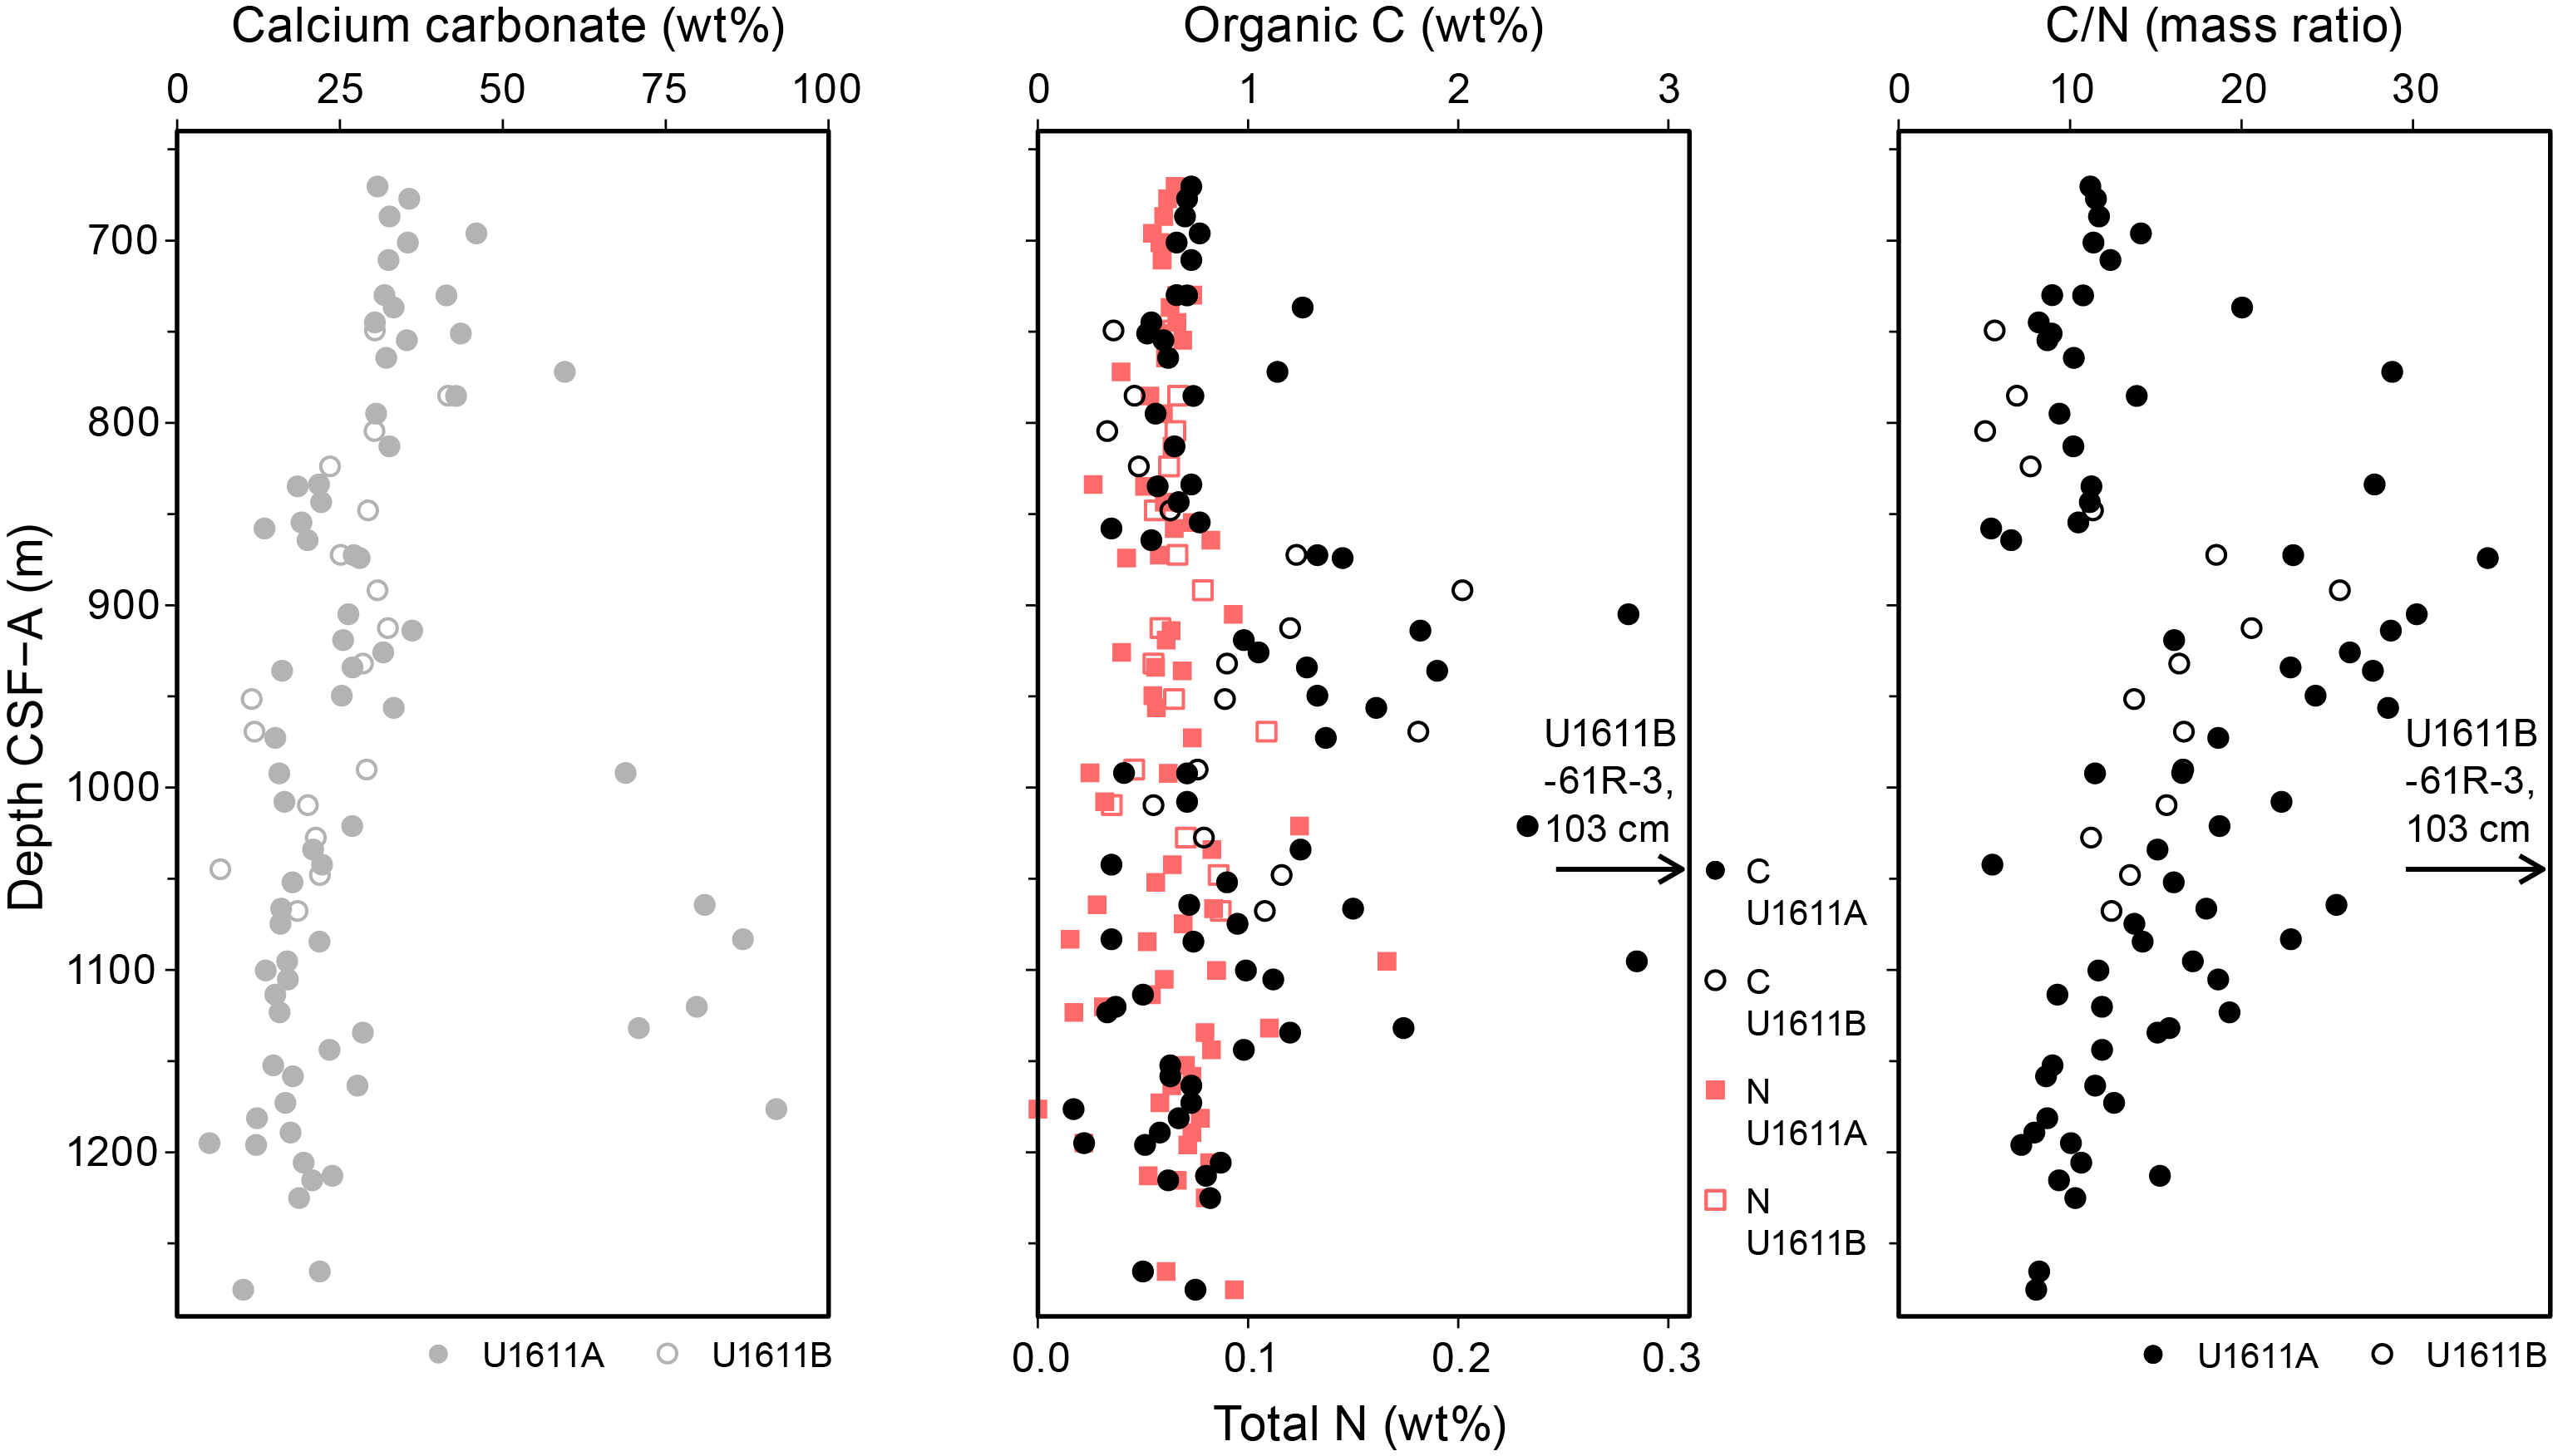
Figure F49. CaCO3, organic carbon, nitrogen, and C/N.
The highest carbonate concentrations at the top of Hole U1611A are in the Pliocene section (see Biostratigraphy), which presumably reflects higher carbonate productivity and/or lower dilution or dissolution during this interval compared to the lower sediments. The lower CaCO3 below may indicate decreased production and/or increased dissolution during a period that is thought to correspond to the MSC interval and the earlier Messinian period. Decreased production is likely because small foraminifers are present but coarse fraction foraminifers are absent. Variable preservation is also noted from visual inspection (see Biostratigraphy). For samples containing dolomite rather than calcite, the standard coulometry calculations assuming a composition of calcium carbonate will overestimate the weight percent carbonate by approximately 8% because of the lower mass of magnesium relative to calcium. For other samples containing a mixture of dolomite and calcite (dolomite is generally <10% of the total carbonate fraction; see Lithostratigraphy), the correction is minor.
A weak negative correlation (R2 = 0.38) exists between the CaCO3 weight percent and the raw NGR measurements taken closest to the IW samples from Hole U1611A (Figure F50). Samples from targeted carbonate-cemented samples generally lie off the main trend with higher carbonate content relative to their NGR value. The correlation improves (R2 = 0.50) when NGR is normalized for dry bulk density. The linear regression of bulk density and dry bulk density are determined from discrete moisture and density (MAD) data, and this linear regression is applied to the gamma ray attenuation (GRA) measurements to generate dry bulk density data at the GRA resolution. These dry bulk density data at GRA resolution are then interpolated to the NGR resolution for Hole U1611A for the NGR/dry bulk density correction. For Hole U1611B, MAD density data were not measured and the GRA data appear to be of lower quality because they do not show the expected downcore increase and have many low values due to gaps between the sediment and core liner. These issues result in a high bias in the normalized NGR data for Hole U1611B compared to Hole U1611A relative to carbonates and a weaker correlation relative to the raw NGR data. For these reasons, the NGR/dry bulk density correction is not considered robust in Hole U1611B, and the carbonate-NGR/dry bulk density relationship is not reported because it diverges from the general relationship at most sites where carbonate concentrations are the principal driver of NGR variations. The generally weaker correlation at this site between NGR and carbonate content shows that the proportion of the carbonate sedimentary fraction only explains a portion of the variability in NGR here. At lower carbonate concentrations, as in the deeper sediments at this site, the proportional mixture of other sedimentary components such as clays and silica likely determine the NGR signal, although siliciclastic dilution is less than at Site U1610.
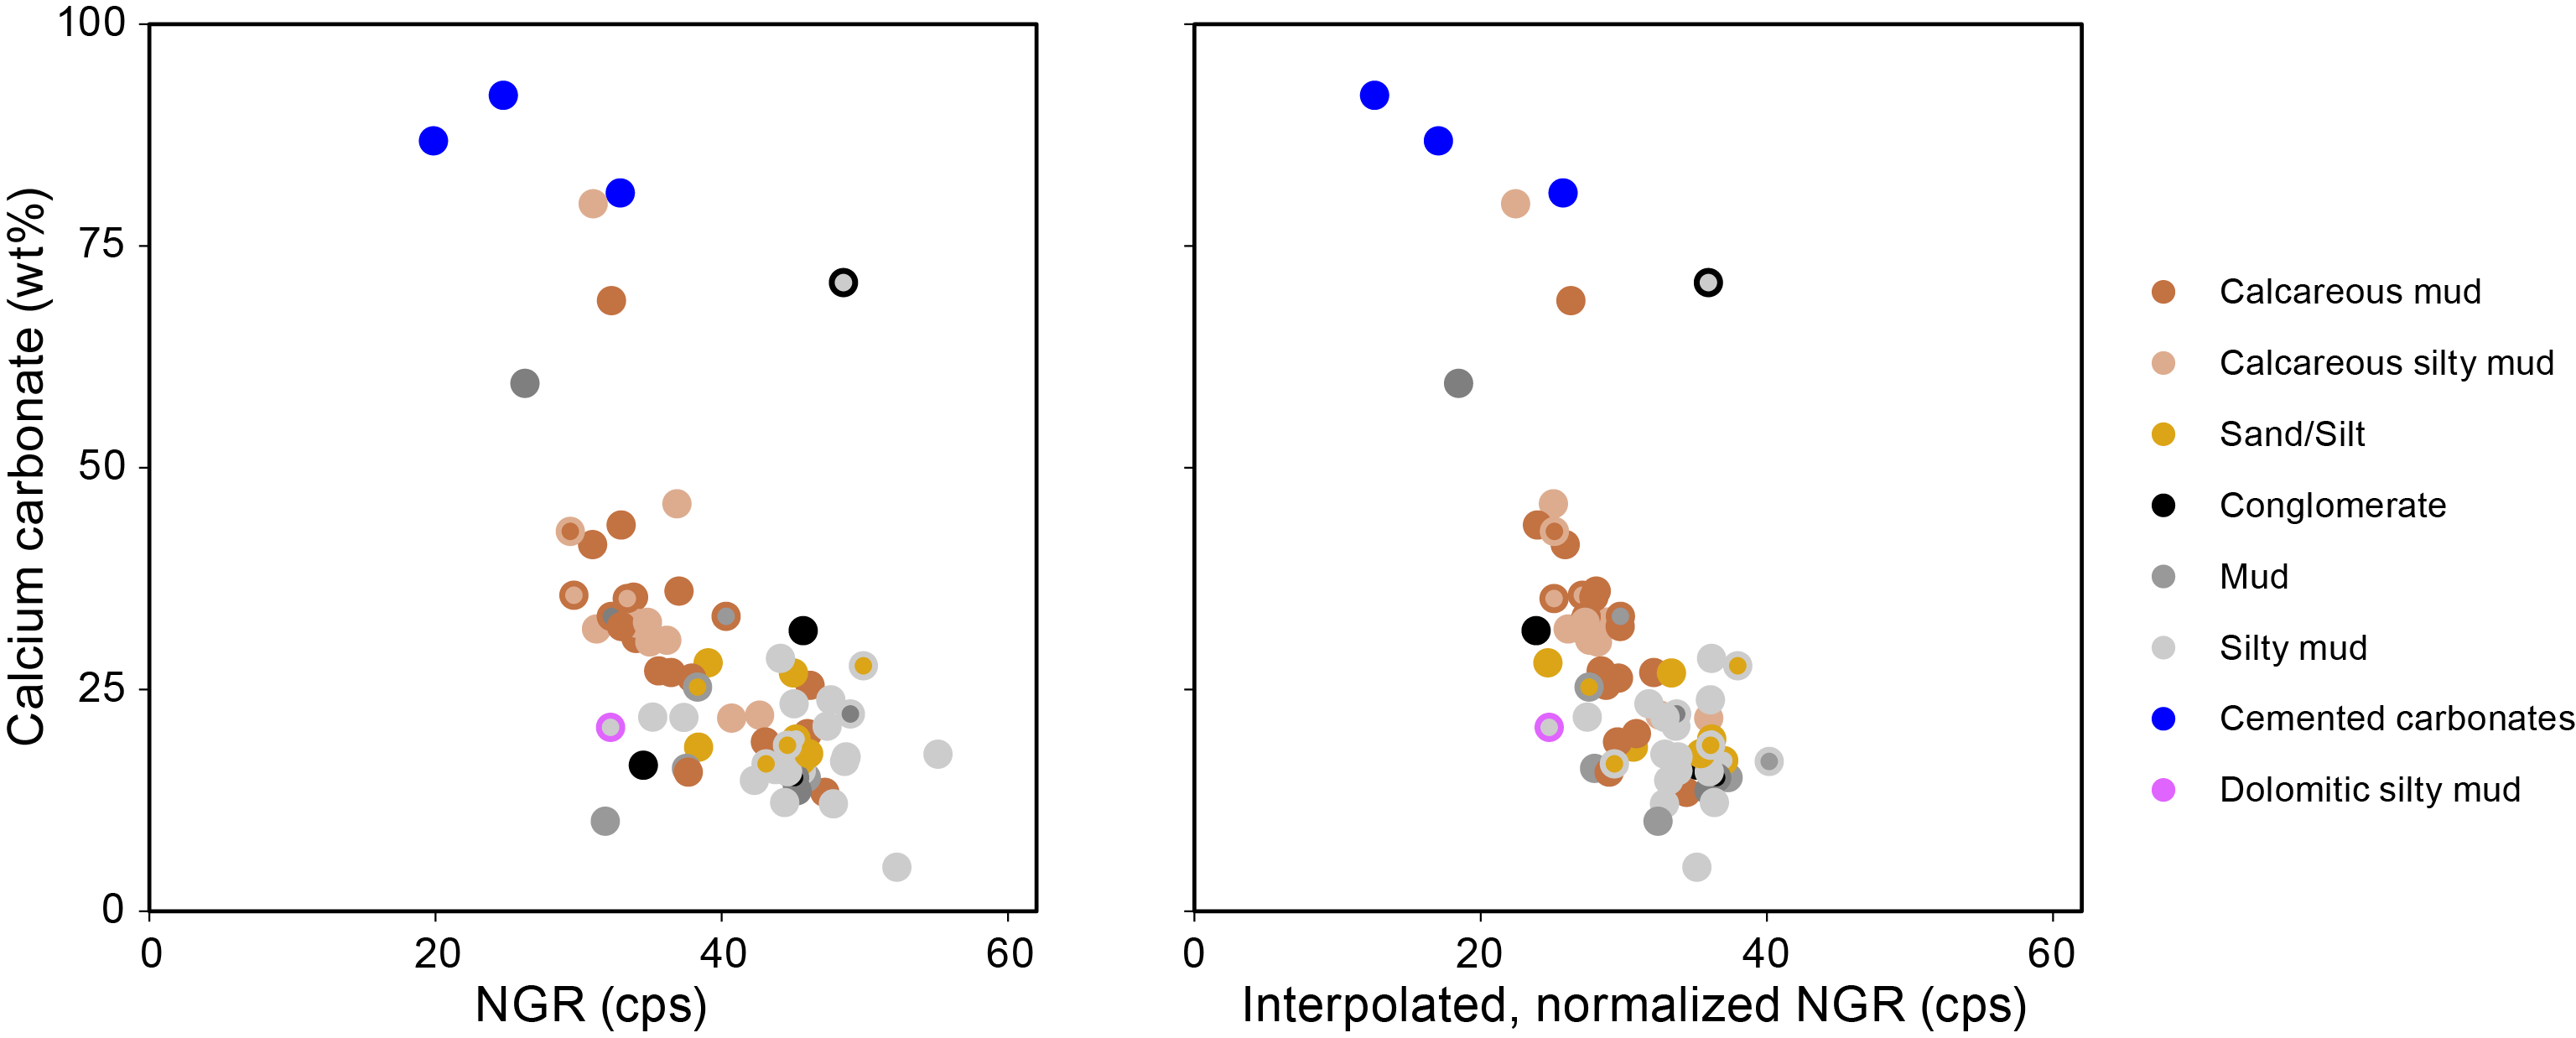
Figure F50. Carbonate weight percent and NGR.
6.4.2. Carbon and nitrogen
Overall, the total organic carbon (TOC) for the sampled intervals of Hole U1611A ranges 0.2–2.9 wt% with a mean of 0.9 wt% and a standard deviation of 0.5 wt% (Figure F49; Table T16), excluding one discrete high TOC sample with 51.9 wt% TOC. TOC is calculated based on the difference between total carbon (TC) and total inorganic carbon (TIC) (TOC = TC − TIC) and is prone to uncertainties associated with the large mass of TIC typical in marine samples. However, there is a clearly resolved shift in the characteristics of organic matter downcore that is robust to these more minor uncertainties. We observe low TOC (<1.25 wt%) in the upper part of Hole U1611A (above ~865 m CSF-A) with a mean of 0.7 wt% and a standard deviation of 0.5 wt% in sediments that appear to be dominated by marine organic inputs (see C/N ratios below). Below this is a sharp transition to higher TOC (up to 3 wt%) averaging 1.1 wt% with a standard deviation of 0.7 wt%. After the sharp transition, the lower interval of the core has generally decreasing TOC downcore from ~3 to 1 wt%, indicating decreasing productivity and/or preservation. We suspect preservation is a primary control on organic matter at this site associated with increasing stratification and anoxia of the water column. Within this interval of generally elevated TOC, there are also discrete horizons with organic fossils including fish, leaves, and wood. One discrete black sedimentary layer sampled to determine its composition and origin yielded a TOC of 51.9 wt%, consistent with an accumulation of biomass (Sample 401-U1611B-61R-3, 103 cm; 1044.8 m CSF-A). Additional such deposits were noted but were not sampled shipboard.
Weight percent nitrogen (Figure F49; Table T16) measured downcore in Holes U1611A and U1611B ranges 0.02–0.17 wt% with no detectable downcore trend. The highly organic rich sample (401-U1611B-61R-3, 103 cm) yielded 0.75 wt% nitrogen, higher than that of the surrounding sediments.
The C/N mass ratio (using TOC and TN) is used to distinguish the origin of organic matter (marine versus terrestrial) in sediment (Emerson and Hedges, 1988; Meyers, 1997). The data set has a mean C/N ratio of 14.7 and a standard deviation of 6.7, indicating that the organic carbon is dominantly of terrestrial origin with a lesser contribution from marine production, which is consistent with the location of Site U1611 relatively close to land (Figure F49; Table T16). Some heterogeneity between samples shows that the inputs are somewhat variable between dominantly marine and dominantly terrestrial influences. Downcore, we see clear trends in C/N ratios that indicate mode shifts. Above 865 m CSF-A in Hole U1611A, the C/N ratio indicates dominantly marine organic matter with a mean of 12.8, suggesting the Alborán Sea was connected to the Atlantic Ocean. There is a sharp transition between samples at 864.3 (Section 401-U1611A-23R-3) and 874.1 m CSF-A (Section 24R-4), coincident with the rise in TOC, and below this transition the mean is 19.2, indicating elevated terrestrial input. This sharp transition in organic matter within the late Messinian likely indicates a significant basinal change; for example, it may signify the Alborán Basin's isolation from the Mediterranean during the MSC. In the earlier Messinian, the mean C/N ratio of 14.9 indicates mixed terrestrial and aquatic production. A trend in the Messinian toward increasing C/N as TOC increases (upward in the core) implies increasingly terrestrial inputs and increasing organic matter preservation. In addition to productivity changes, preservation changes can also influence C/N ratios, so the higher TOC content of the MSC strata would also support improved preservation of the terrestrial component, which may be more substantially degraded under the more oxic conditions that followed in the Pliocene. Fewer samples were collected from Hole U1611B, and the value range is similar to that in Hole U1611A.
The most organic-rich sample (401-U1611B-61R-3, 103 cm) has a C/N ratio of 69, indicating it is dominantly terrestrial organic matter or it has significantly matured and lost primary nitrogen. Smear slide observations appear to confirm the former explanation, given observations of likely lignin with a brown to yellow color, suggesting immature terrestrial biomass.
6.4.3. Carbonate fraction geochemistry
In addition to the standard shipboard measurements of calcium carbonate concentrations in sediments, we performed geochemical analyses on the acid-soluble (carbonate) fraction of the sediment (Table T17). Because variable amounts of carbonate are present in each sample, the carbonate geochemistry data are reported as elemental ratios relative to calcium.
The carbonate Mg/Ca ratios are generally <15 mmol/mol for the uppermost 813 m of Hole U1611A, with a single outstanding value of 558 mmol/mol (Sample 13R-7, 40–41 cm) (Figures F51, F52). The Mg/Ca ratios increase to >50 mmol/mol in the deeper part of the hole (below 992.2 m CSF-A; Section 38R-1). Samples with >200 mmol/mol Mg/Ca generally correspond to targeted sampling of carbonate-cemented lithologies identified by the sedimentologists. Carbonate Sr/Ca ratios generally respond in the opposite direction to Mg/Ca ratios: the baseline Sr/Ca is around 2.0 mmol/mol above 813 m CSF-A and then decreases to 1.0–1.5 mmol/mol in intervals of higher Mg/Ca (Cores 20R–34R) (Figure F51). In the deeper part of the hole, the baseline Sr/Ca ratios decline from 2.3 mmol/mol at 1000 m CSF-A to 1.6 mmol/mol at the bottom of the hole. One very high Sr/Ca ratio of 8.7 mmol/mol stands out (Sample 30R-1, 62–63 cm), where XRD analysis indicates that the carbonate fraction is dominated by the mineral aragonite. Carbonate-cemented samples dominated by dolomite (Mg/Ca ratios generally greater than 500 mmol/mol) generally have lower Sr/Ca ratios than the surrounding lithologies. These geochemical patterns in Mg/Ca and Sr/Ca represent the combined effects of carbonate diagenesis on primary sedimentary components as well as the presence of different authigenic carbonate minerals (primarily dolomite and aragonite).
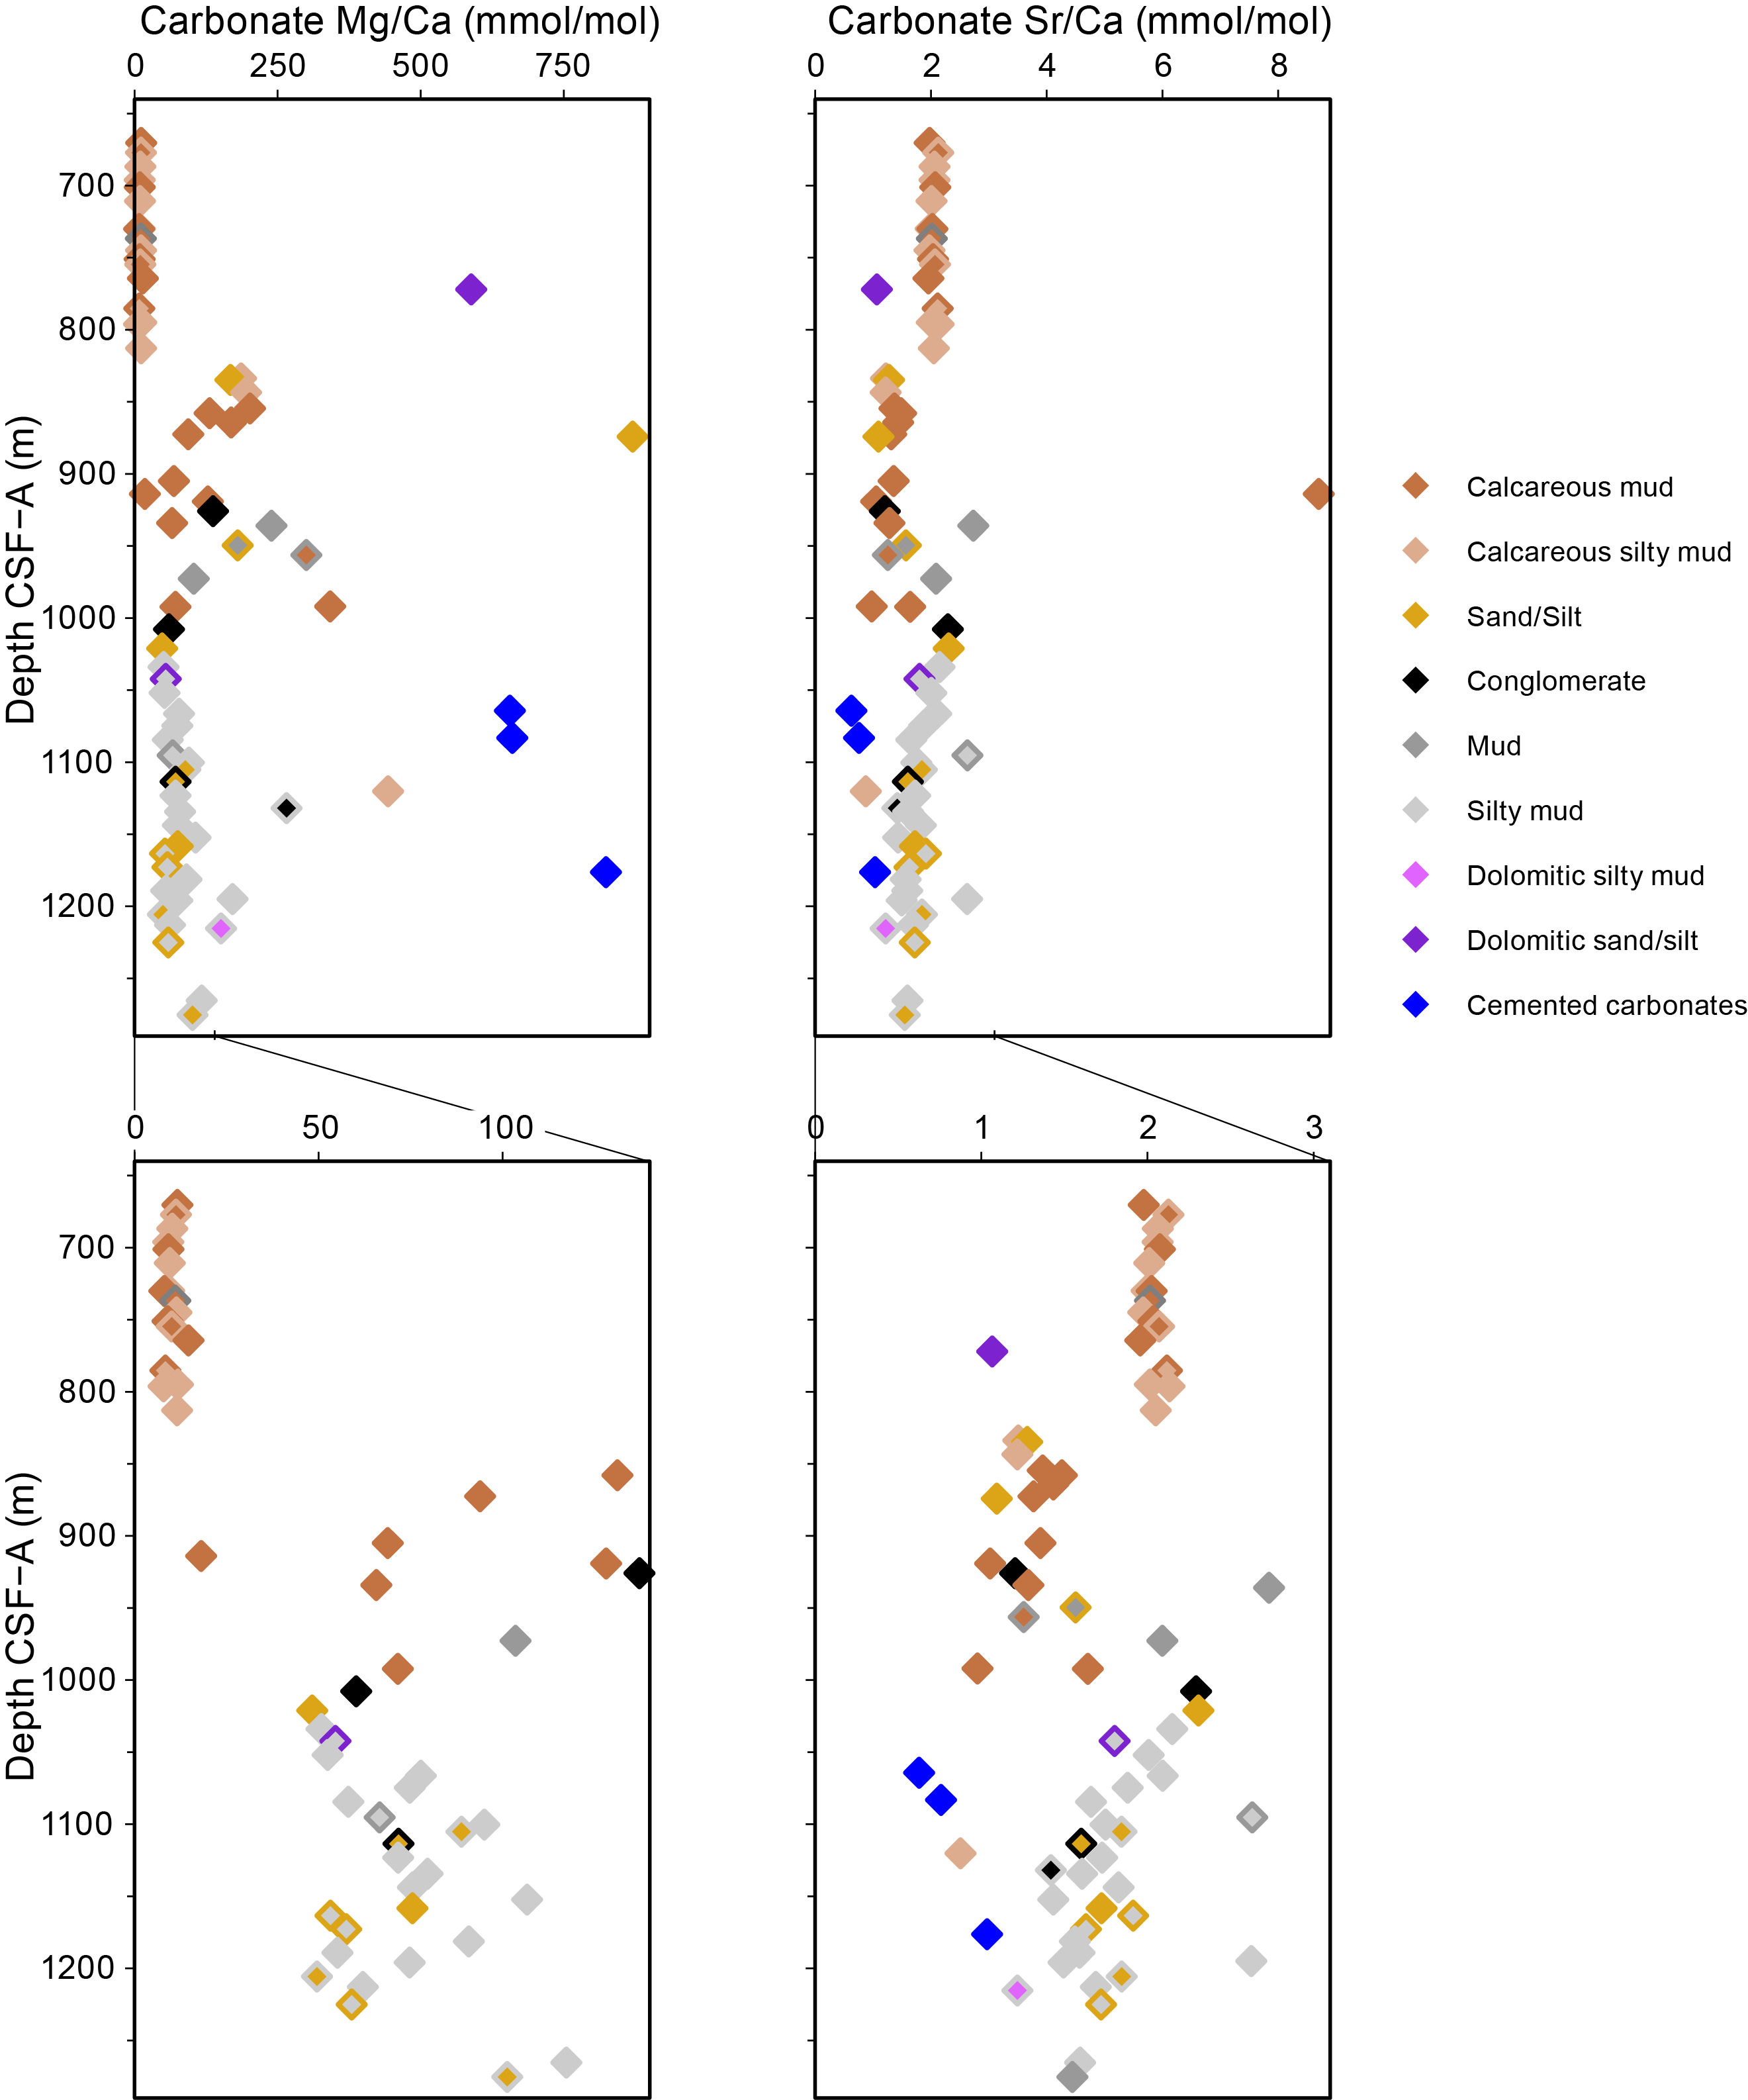
Figure F51. Carbonate Mg/Ca and Sr/Ca.
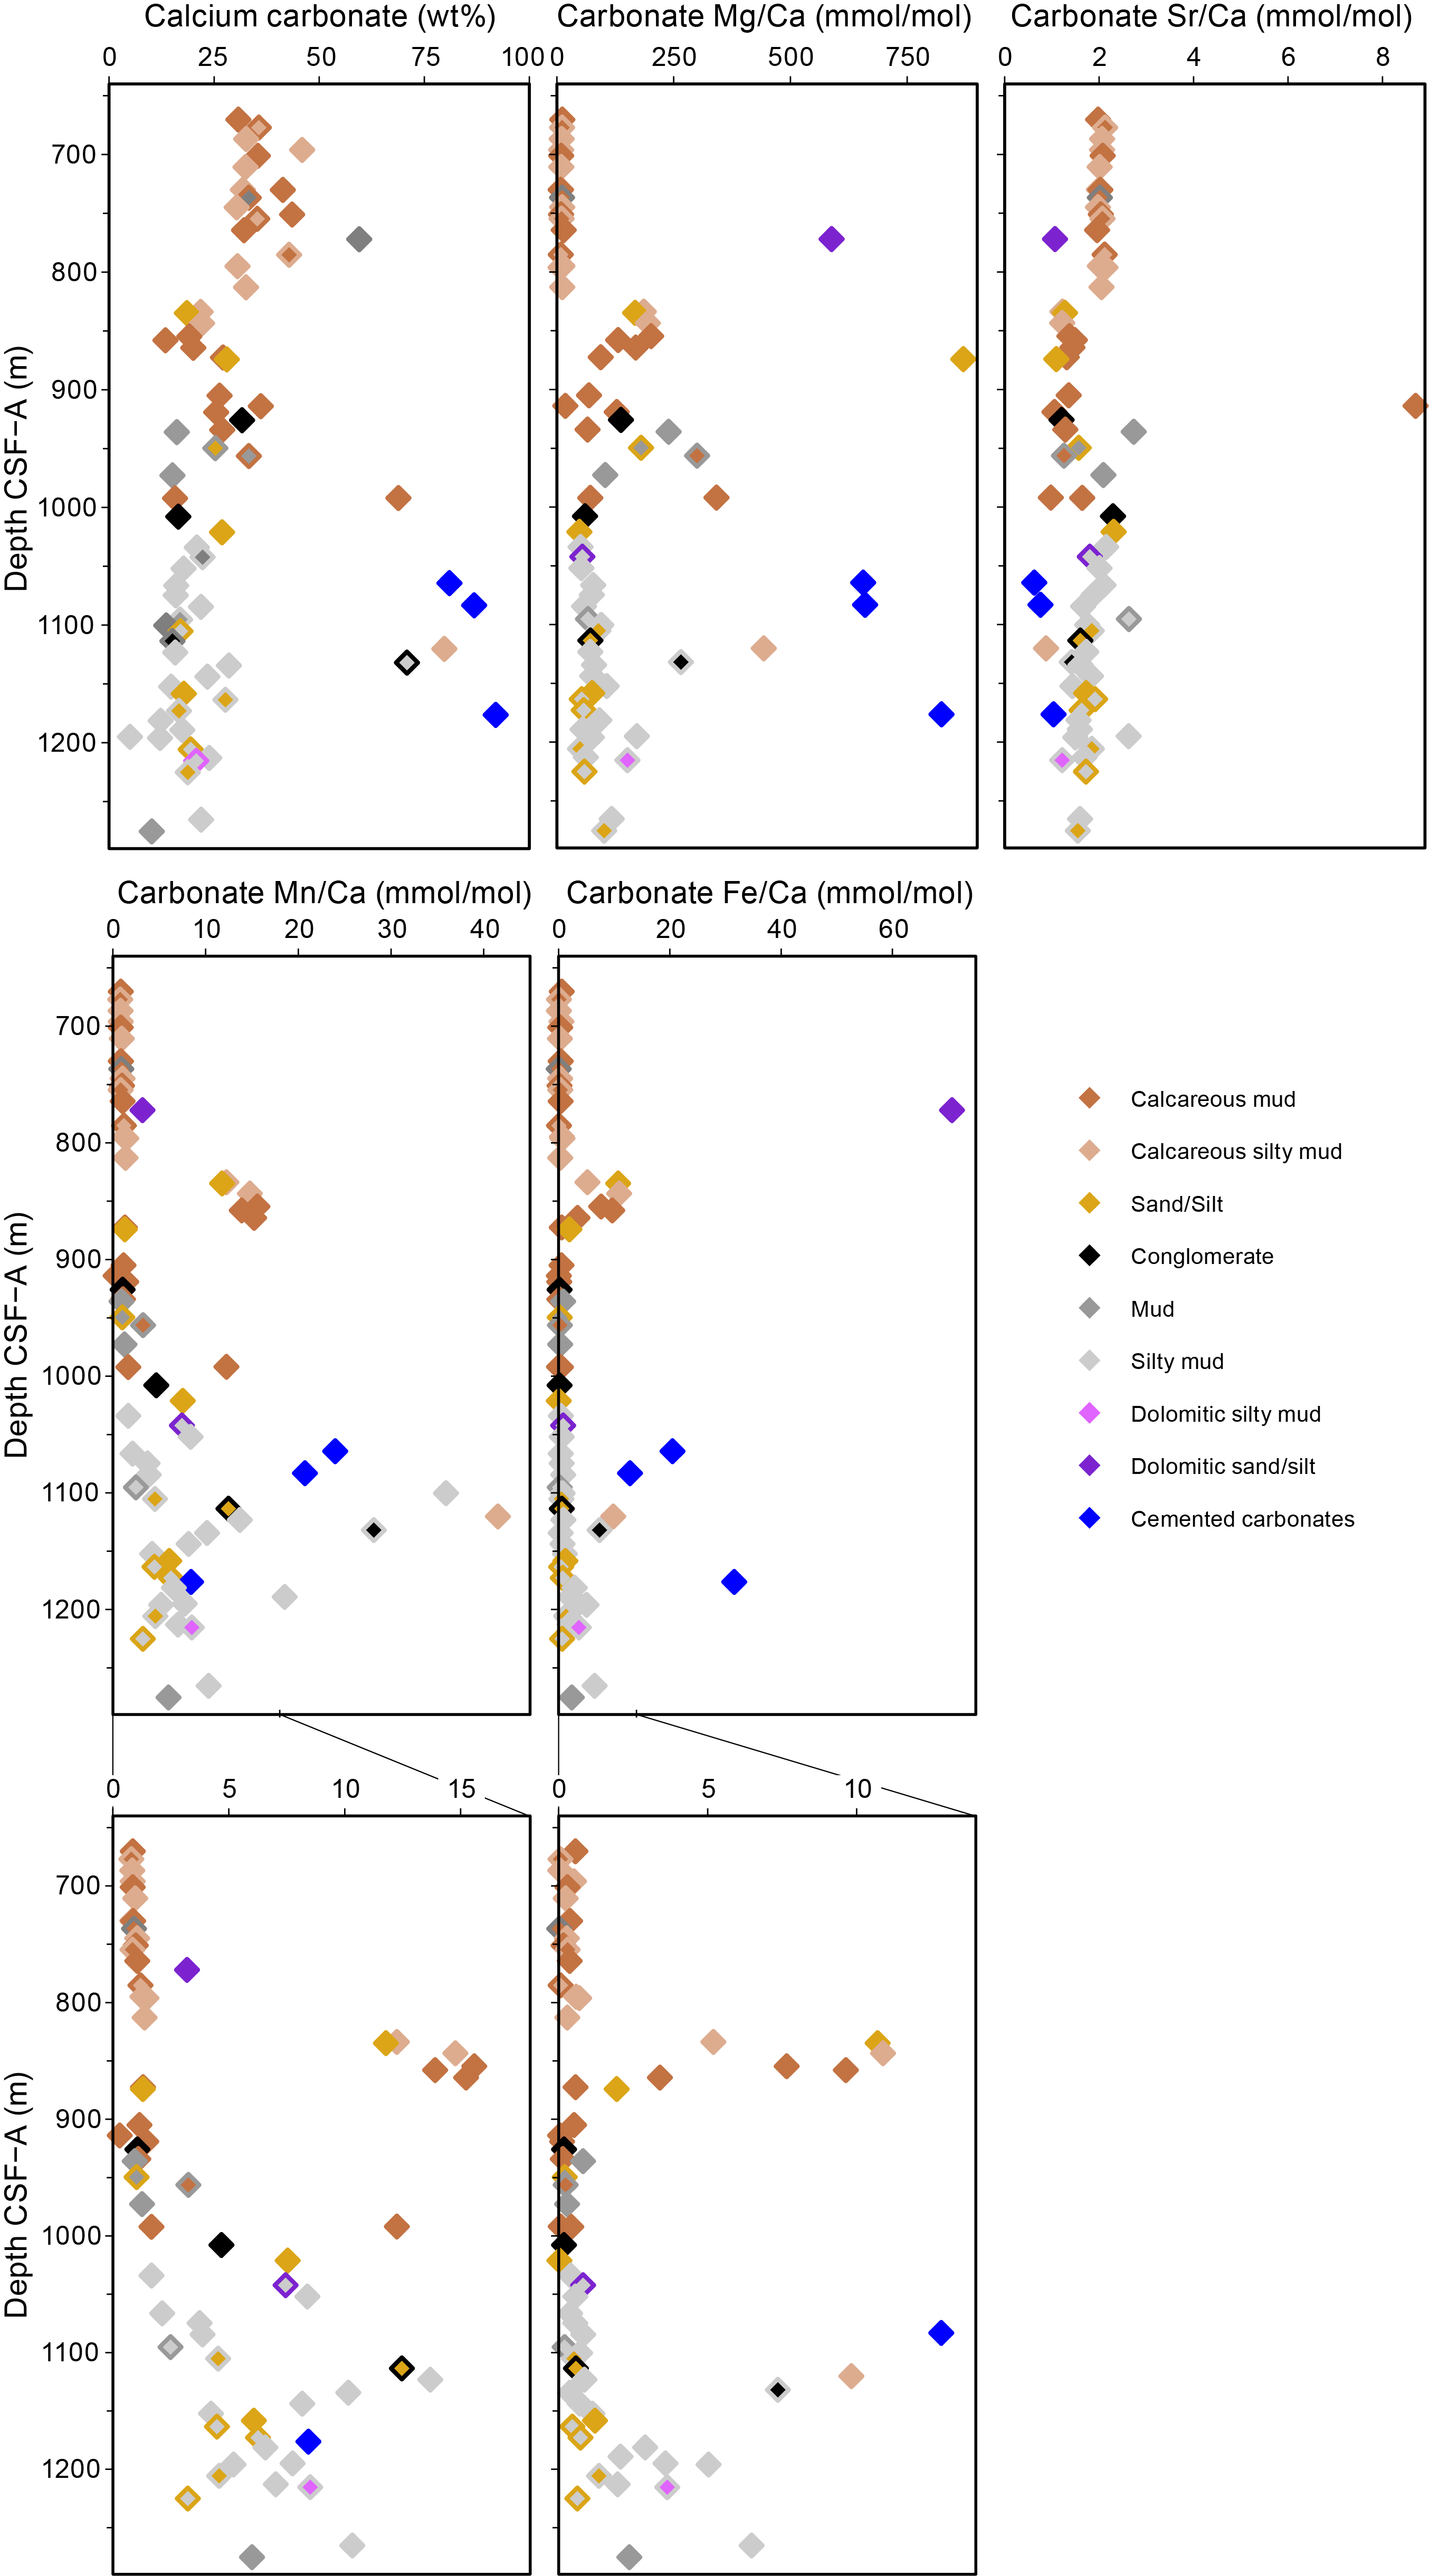
Figure F52. Carbonate geochemistry results.
Carbonate Mn/Ca and Fe/Ca ratios have downhole profiles similar to that of carbonate Mg/Ca above approximately 900 m CSF-A but different profiles in the deeper part of the hole (Figure F52). Carbonate Mn/Ca ratios generally range 0.3–1.5 mmol/mol for the uppermost 990 m of Hole U1611A before increasing to approximately 1.7–18.5 mmol/mol in the deeper part (Cores 401-U1611A-38R to the base of the hole). Within the upper interval, several samples between 833.8 and 864.3 m CSF-A (Sections 20R-2 through 23R-3) have significantly higher Mn/Ca ratios between 11.8 and 15.6 mmol/mol. In the deeper part of the core, a few samples, especially ad hoc samples taken specifically from split cores targeting interesting lithologies, have Mn/Ca ratios of >20 mmol/mol. Carbonate Fe/Ca ratios are generally less than 1.2 mmol/mol throughout the hole. Several samples between 833.8 and 864.3 m CSF-A (Sections 20R-2 through 23R-3) have significantly higher Fe/Ca ratios between 3.4 and 10.9 mmol/mol (similar to the pattern in Mn/Ca), and increases are also noted below 1181 m CSF-A between 1.4 and 6.5 mmol/mol. A sample of dolomitic sandy silt has the highest Fe/Ca ratio of 70.7 mmol/mol (Sample 13R-7, 40–41 cm). Three carbonate-cemented samples rich in dolomite also have high Fe/Ca ratios. Several samples below 925 m CSF-A have the mineral ankerite detected by XRD analysis; however, none of these samples have high Mn/Ca ratios. No other clear lithologic patterns are present for the Mn and Fe contents of the carbonate sedimentary fraction at this site, but the high variability and elevated values for Mn/Ca and Fe/Ca ratios are consistent with an anoxic environment associated with laminated intervals of the core. The contributions of primary marine, detrital, and authigenic carbonate phases cannot be distinguished by these analyses but may be studied in the future by microscale work linked with petrography.
7. Physical properties
Physical properties at Site U1611 were determined in Holes U1611A and U1611B at 2.5 cm spacing on the Whole-Round Multisensor Logger (WRMSL) and Section Half Multisensor Logger (SHMSL) and at 10 cm spacing on the Natural Gamma Radiation Logger (NGRL) (see Physical properties in the Expedition 401 methods chapter [Flecker et al., 2025a]). Whole core P-wave measurements for Hole U1611A proved to be highly scattered and unreliable, and no further WRMSL whole core P-wave measurements were taken from Hole U1611B after the data from Cores 401-U1611B-3R and 4R proved to be just as poor. This change in measuring procedure resulted in acquiring the data from the WRMSL faster and earlier because it was no longer necessary to wait 3–4 h for the core to stabilize for P-wave measurements. Therefore, with the exception of Cores 3R and 4R, it was decided that first measuring the cores from Hole U1611B on the Special Task Multisensor Logger (STMSL) was not necessary for initial stratigraphic correlation with Hole U1611A.
For Hole U1611A, P-wave velocity measurements of the split core section (working half) were determined at two different positions (depending on the integrity and condition of the sediment) in each core section. Additionally, one or two discrete cylindrical samples were taken from each core for MAD measurements for Hole U1611A. Finally, thermal conductivity measurements were conducted on cohesive sediments from at least one section per core for Hole U1611A. No discrete samples were taken from the working-half section of Hole U1611B, nor were measurements conducted on the working-half section of Hole U1611B.
There is cyclicity in the Pliocene, but in the Miocene any astronomically forced cycles are difficult to discern because the stratigraphy contains downslope deposits and quite variable lithologies. Lithostratigraphic Unit I is characterized by relatively lower amplitude cycles than Units II and III. A prominent rise in MS and NGR at ~860 m CSF-B corresponds to just below the Lithostratigraphic Unit I/II boundary (Figure F53; see Lithostratigraphy). Consistently higher amplitude cycles are common throughout Unit II, whereas Unit III has more variable amplitudes depending on the data set.
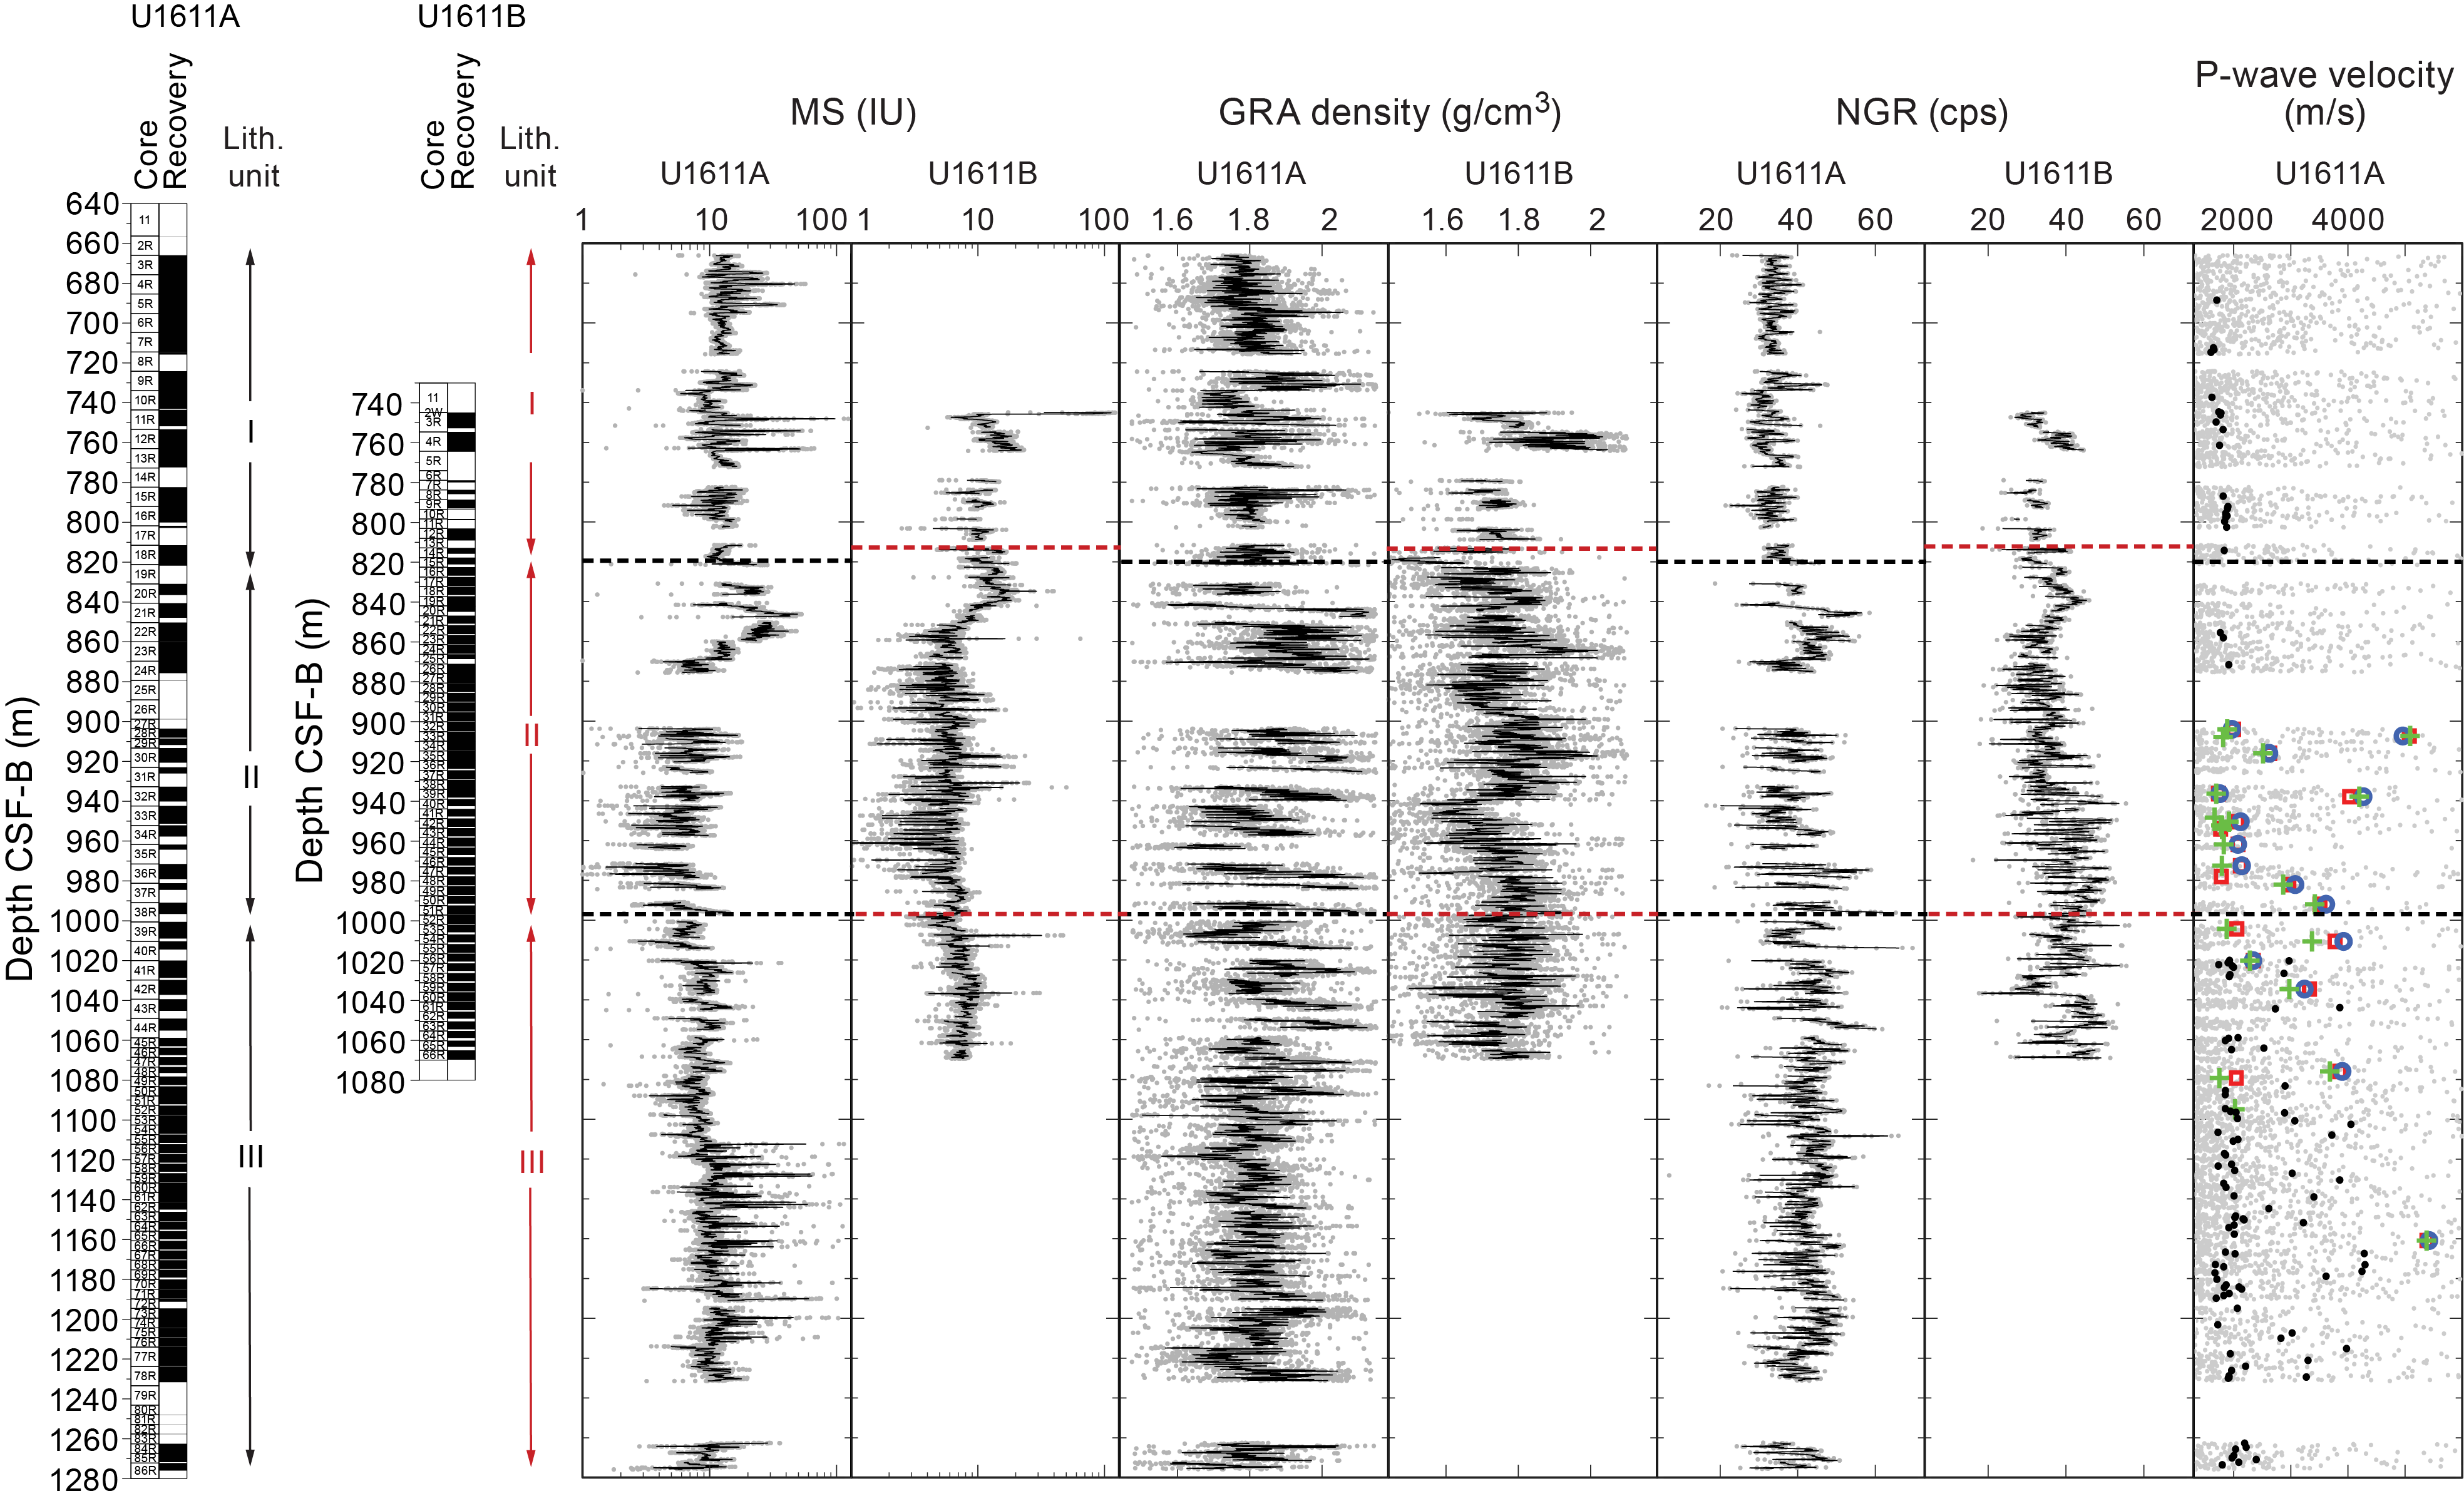
Figure F53. MS, GRA density, NGR, and P-wave velocity.
7.1. Magnetic susceptibility
MS ranges ~1.4–54.5 instrument units (IU) for Site U1611 (Figure F53). Four large-scale trends that broadly correlate to lithostratigraphic units (see Lithostratigraphy; Figure F9) are evident in the MS data set. From approximately 680 to 1000 m CSF-B, MS displays prominent trends of two distinct types: distinct sharp peaks observed in Unit I, succeeded by a transition to sharp troughs in Unit II. These two sections are separated by a large broad peak (~20 m long) that decreases in value at its base at ~860 and ~850 m CSF-B in Holes U1611A and U1611B, respectively. The final two major shifts occur in Unit III and involve an initial transition to lower amplitude cycles (~1000 to ~1100 m CSF-B), with a high-frequency sequence of sharp peaks dominating the data set from ~1100 m CSF-B to the bottom of the core.
In Unit I, the peaks in MS values correlate fairly well with thin units of coarser grained sediments (see Lithostratigraphy) and are likely caused by a brief influx of more highly magnetic material, potentially sourced from exposed igneous rock on land (Gómez de la Peña et al., 2018). By contrast, the large ~20 m long peak is relatively evenly divided between mainly calcareous silty muds in the uppermost half and mainly calcareous muds in the lower half (Figure F10), making textural correlation more ambiguous.
The sharp troughs of Unit II primarily correspond to thin intervals of cemented carbonates and dolostone, as well as small sections of calcareous muds and clays. This correlation implies that these low values reflect higher concentrations of diamagnetic calcite and/or dolomite, both of which would be expected to decrease bulk MS. Nevertheless, higher resolution geochemical analysis in addition to rock magnetic experiments are required to prove this hypothesis.
The transition to lower amplitude MS values in Unit III corresponds fairly well to the onset of silty muds characteristic of that section (see Lithostratigraphy). However, despite the abundance of conglomeratic layers in the lower half of Unit III, these coarser units only occasionally correspond to the high-frequency peaks in the MS data set. To further complicate interpretations, these peaks, which were identified in the whole-round data, are completely absent in the section-half point MS measurements (conducted on the archive halves using the SHMSL) (Figure F54). However, NRM intensity measurements on the same archive halves produced high values that appear to correspond to those identified in the whole-round MS data.
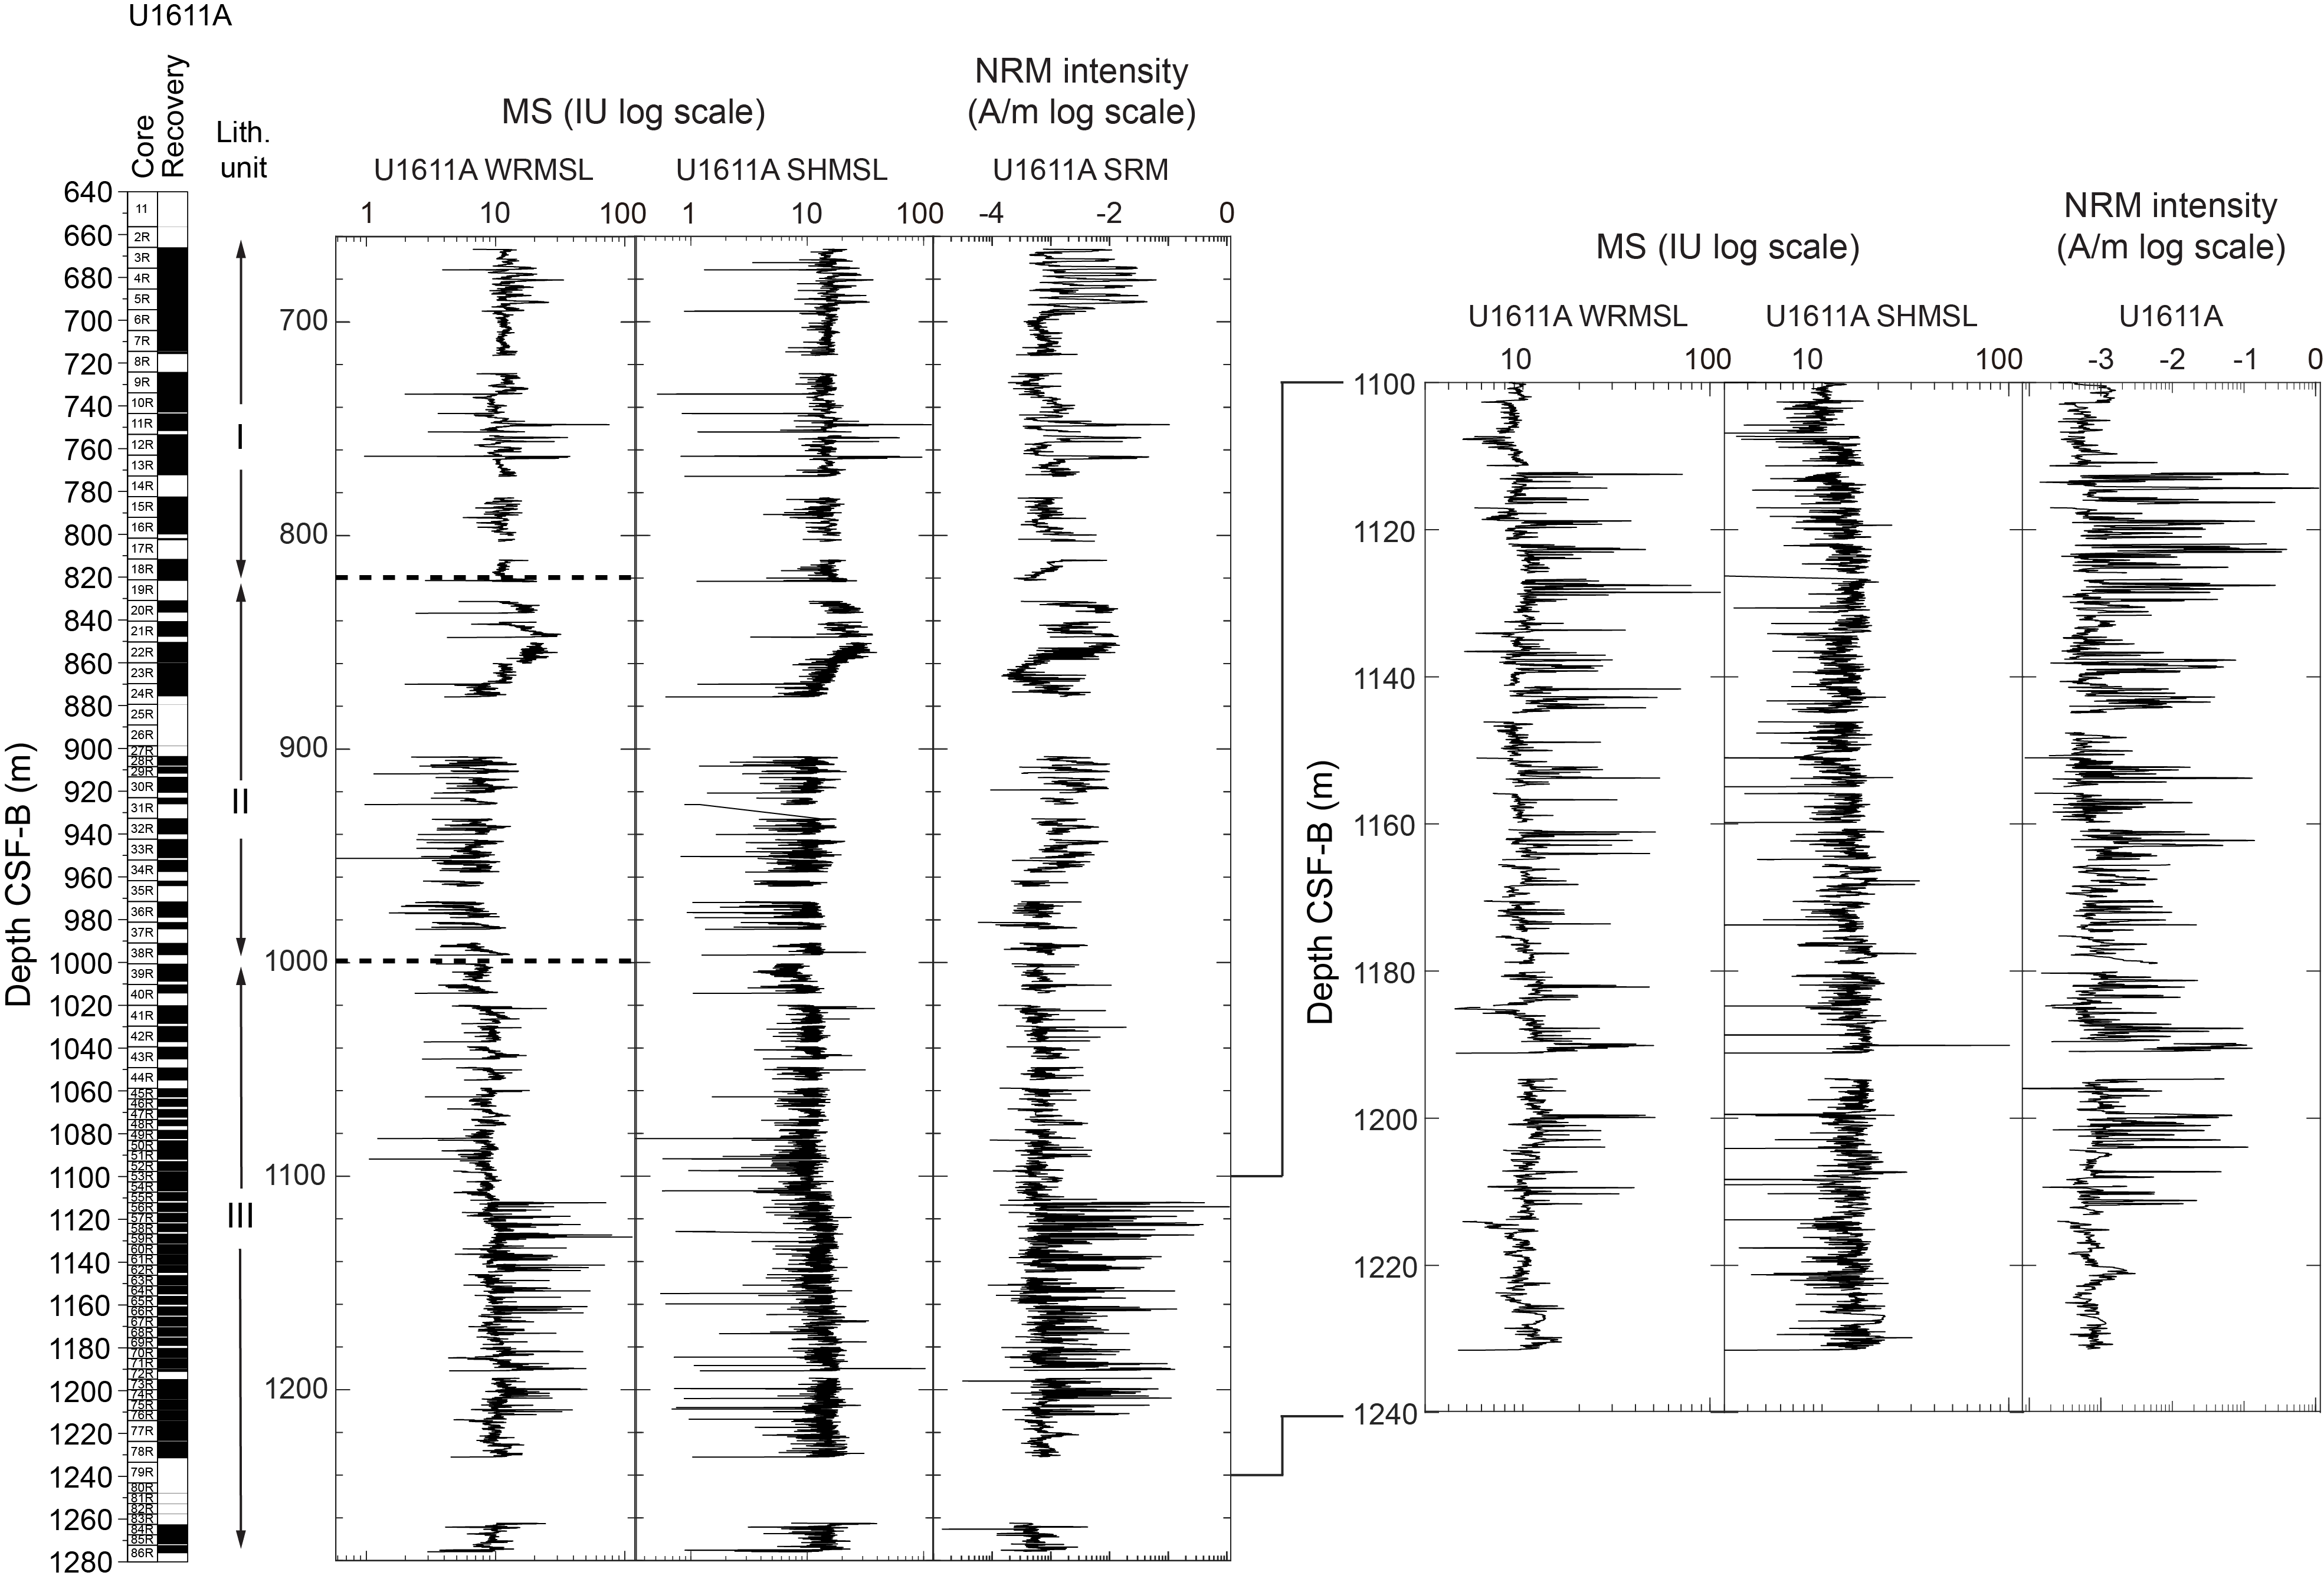
Figure F54. MS and NRM.
To better understand this discrepancy in the three data sets, both the archive and working halves of Section 401-U1611A-56R-1 were remeasured on the WRMSL and SHMSL, and peaks were identified in the former instrument but not the latter (Figure F55). A peak was only identified on the SHMSL after flipping the working half upside down so that the instrument made contact with the underside of the core section. Overall, this suggests that in some cases these peaks might be related to more local features (such as nodules) rather than a distinct change in magnetic mineralogy of whole beds. This is supported by the X-ray images of Section 56R-1, which show no distinct change corresponding to the peaks. However, because of the abundance of these high peaks in the lower half of Unit III, it is highly recommended that more detailed rock magnetic experiments be conducted to better segregate between peaks caused by laterally continuous lithologic changes and those caused by more local features.
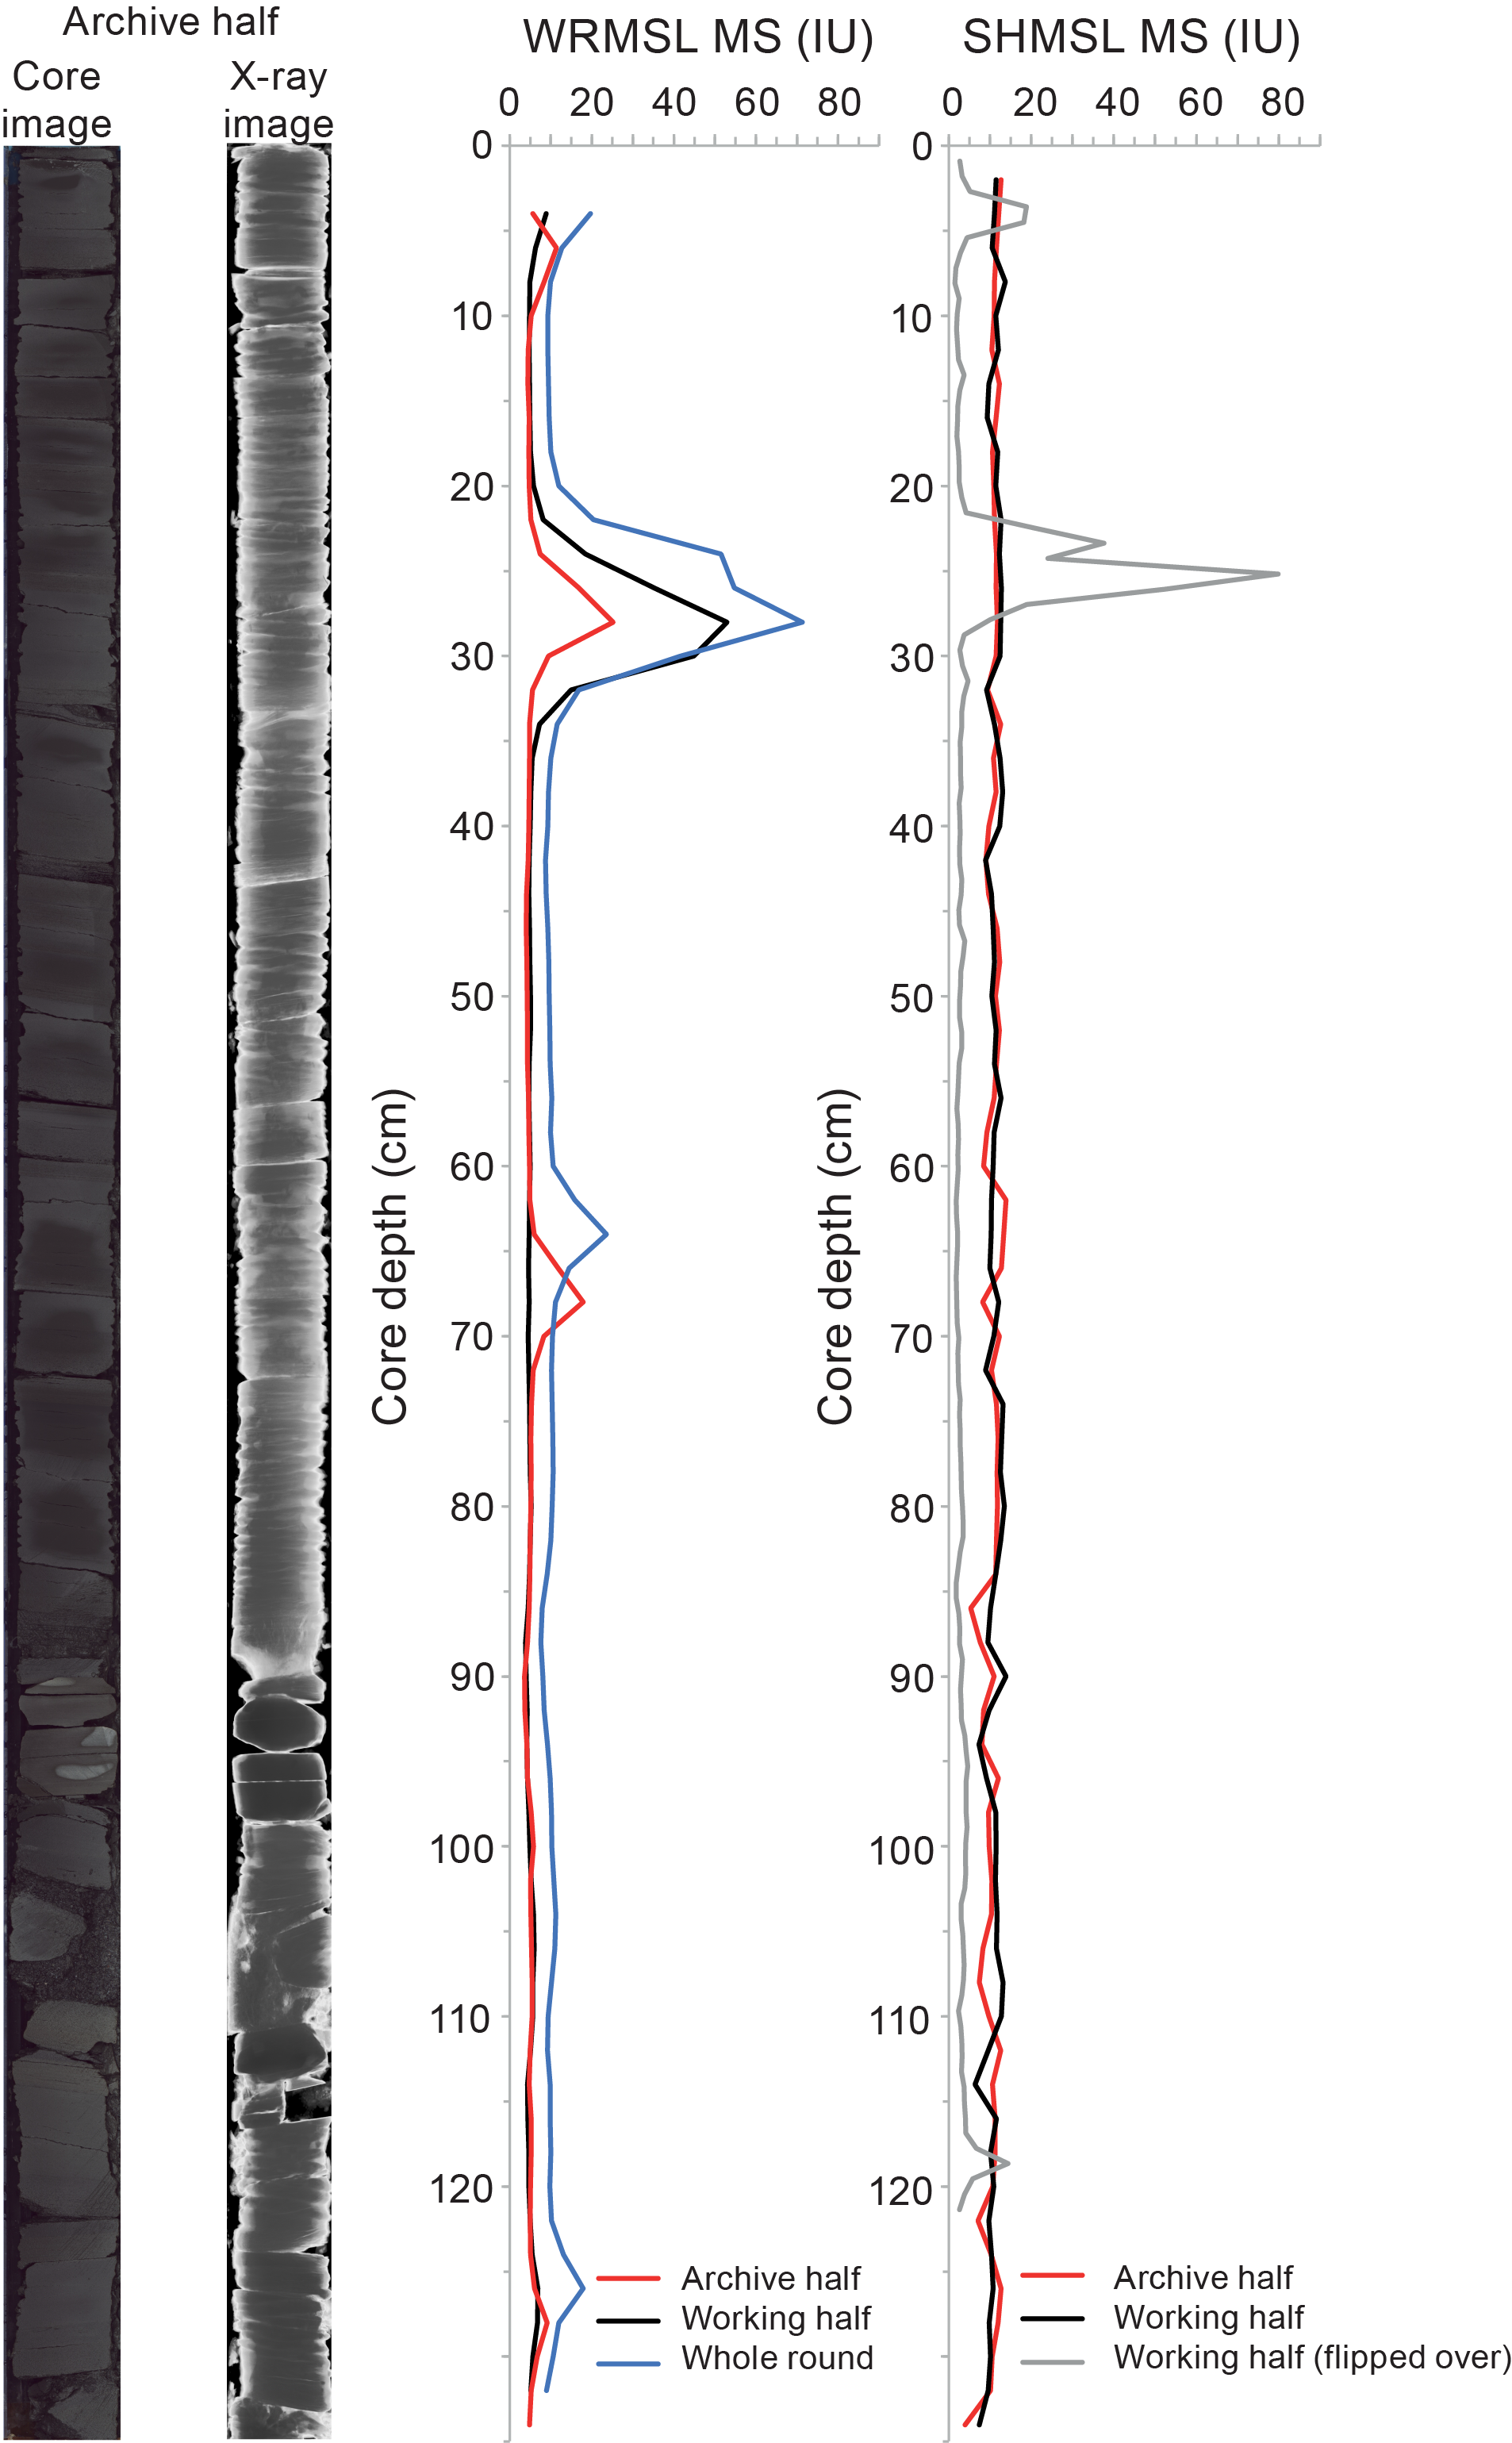
Figure F55. MS tests.
7.2. Gamma ray attenuation bulk density
GRA density varies from ~1.68 to 2.1 g/cm3 at Site U1611 (Figure F53). However, gaps between sediments and surrounding core liners for the RCB cores cause apparent reductions in the bulk density values measured with the WRMSL. The scale of the deviation of the GRA bulk density values from the real value depends on the scale of the gap, and wider sediment liner gaps result in lower GRA densities. For this reason, there is an overall large difference between GRA and MAD bulk density values, implying large sediment liner gaps throughout Hole U1611A (Figure F56). This probably explains the lack of obvious compaction-driven increasing trends with depth in the GRA density values despite their presence in the MAD bulk density values (Figures F53, F57). This indicates that GRA bulk density values are less reliable than MAD bulk density.
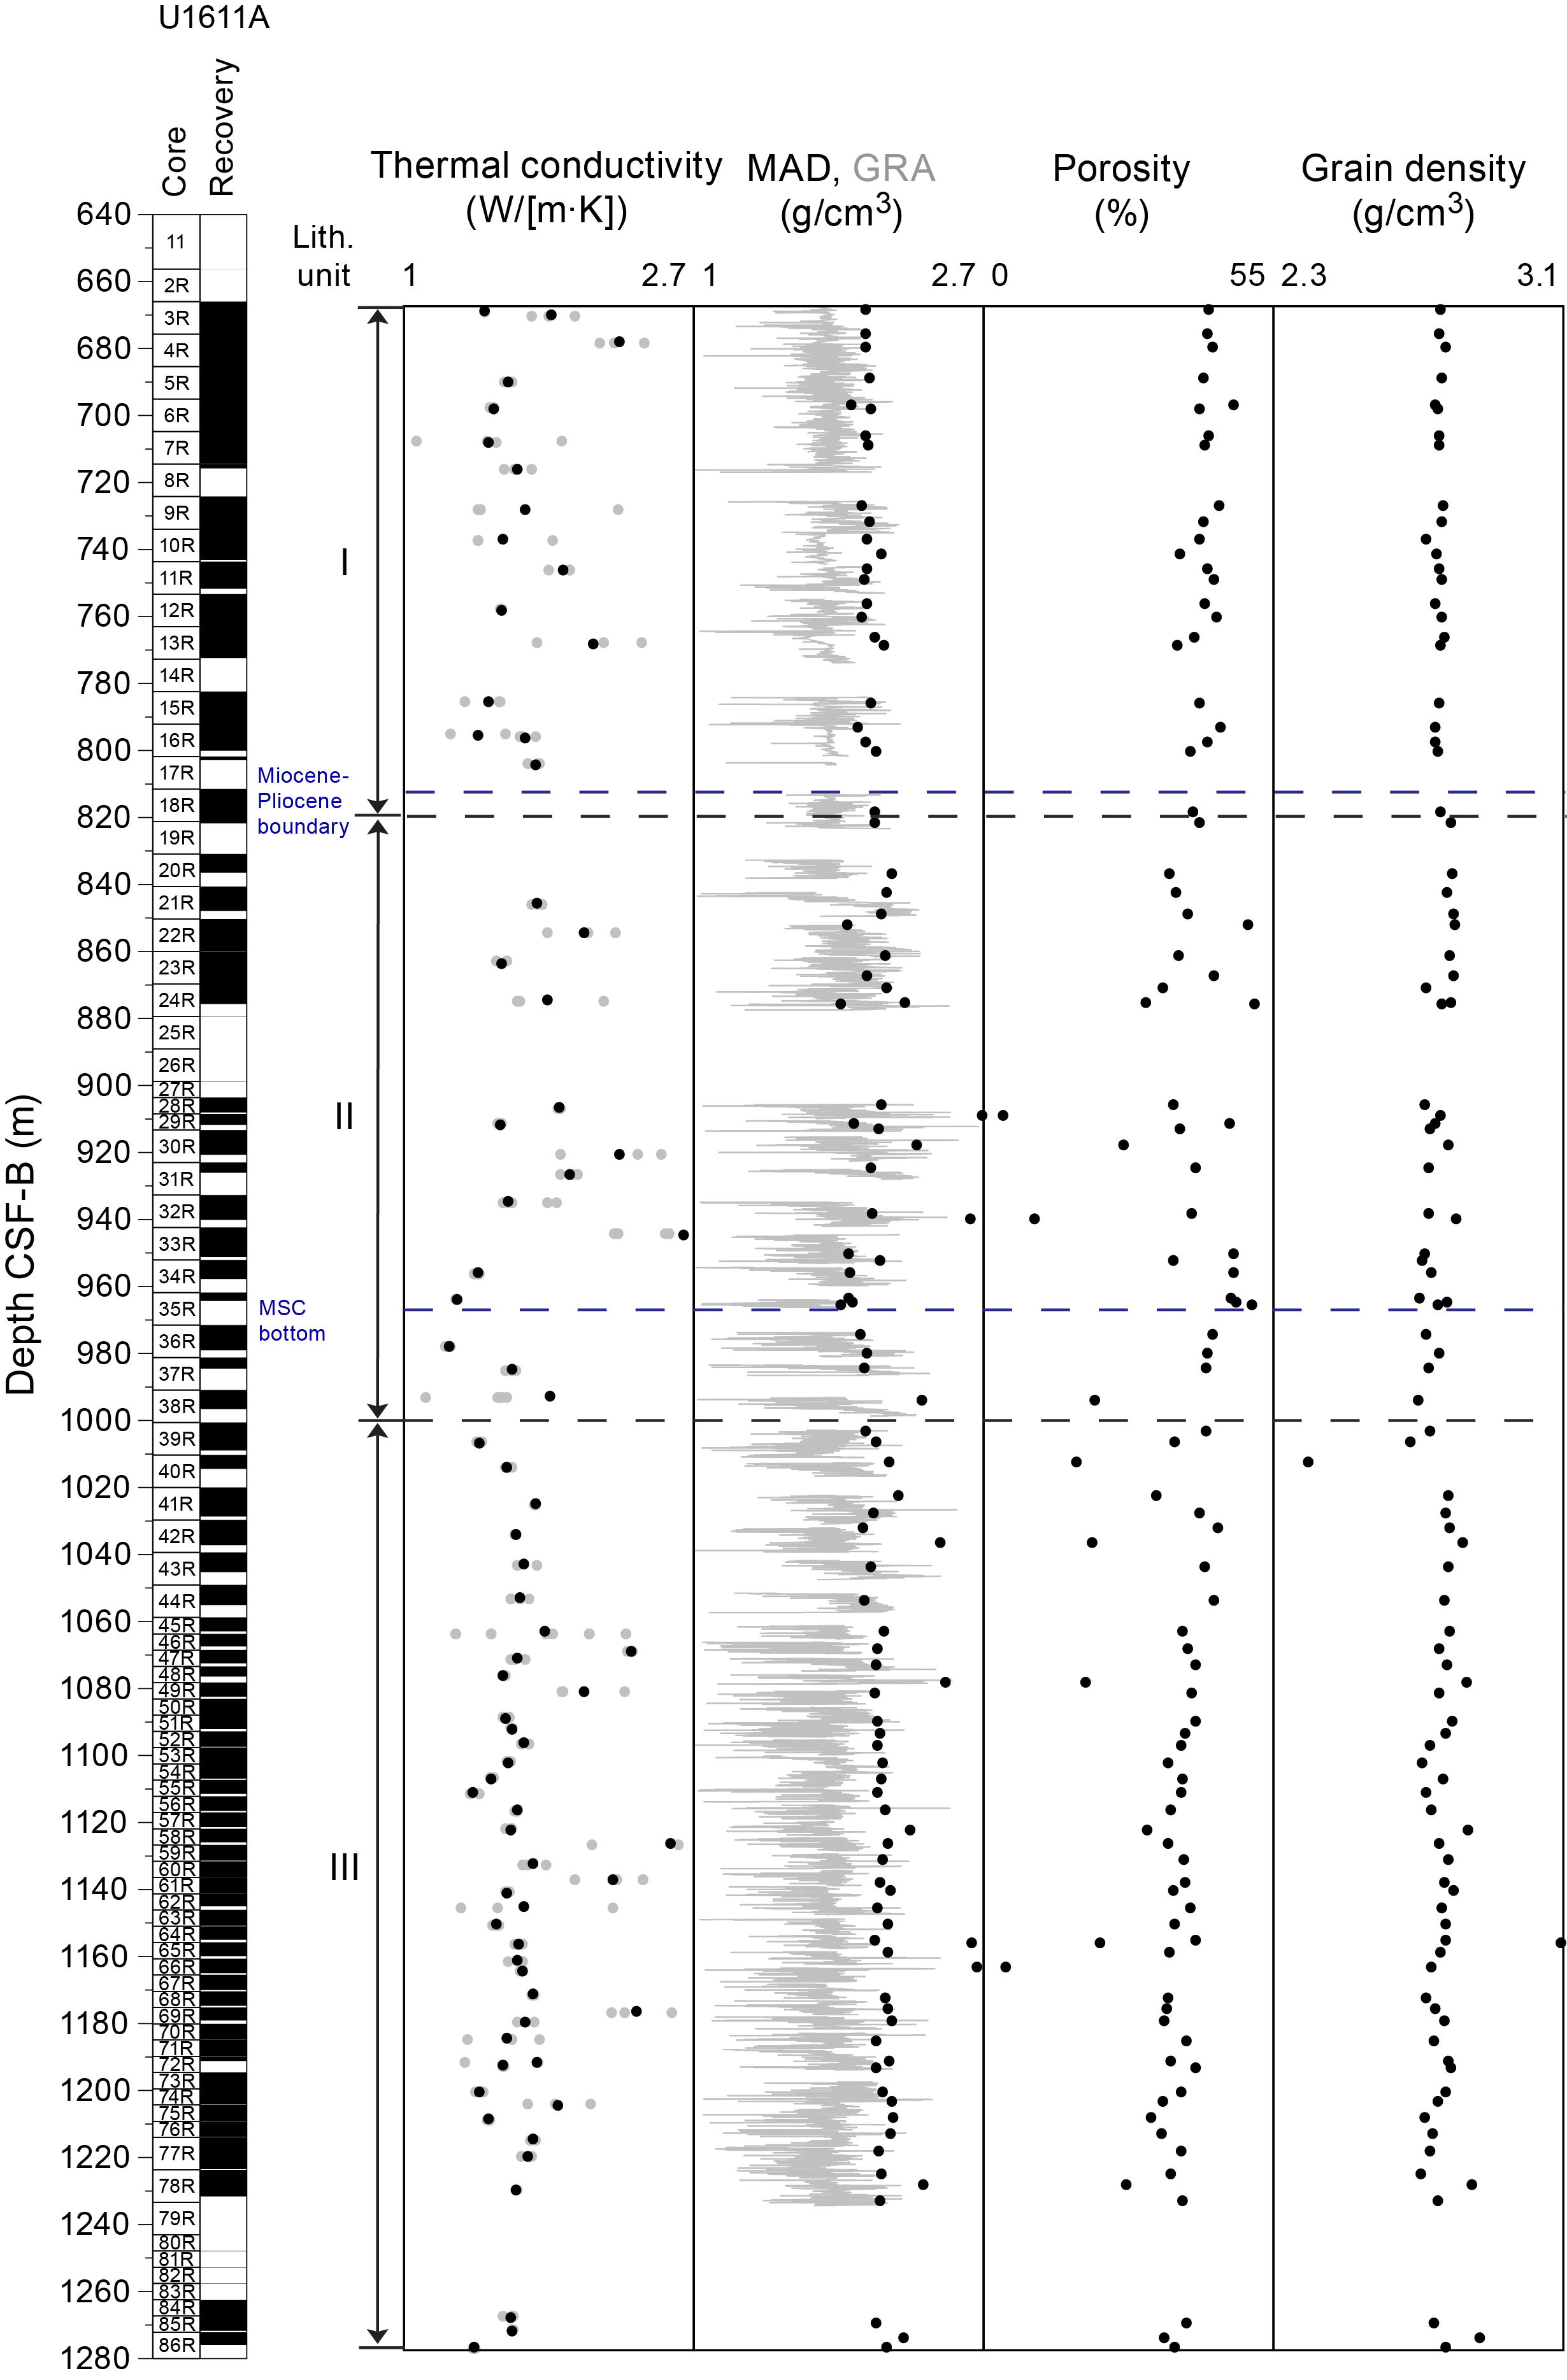
Figure F56. Thermal conductivity, bulk density, porosity, and grain density.
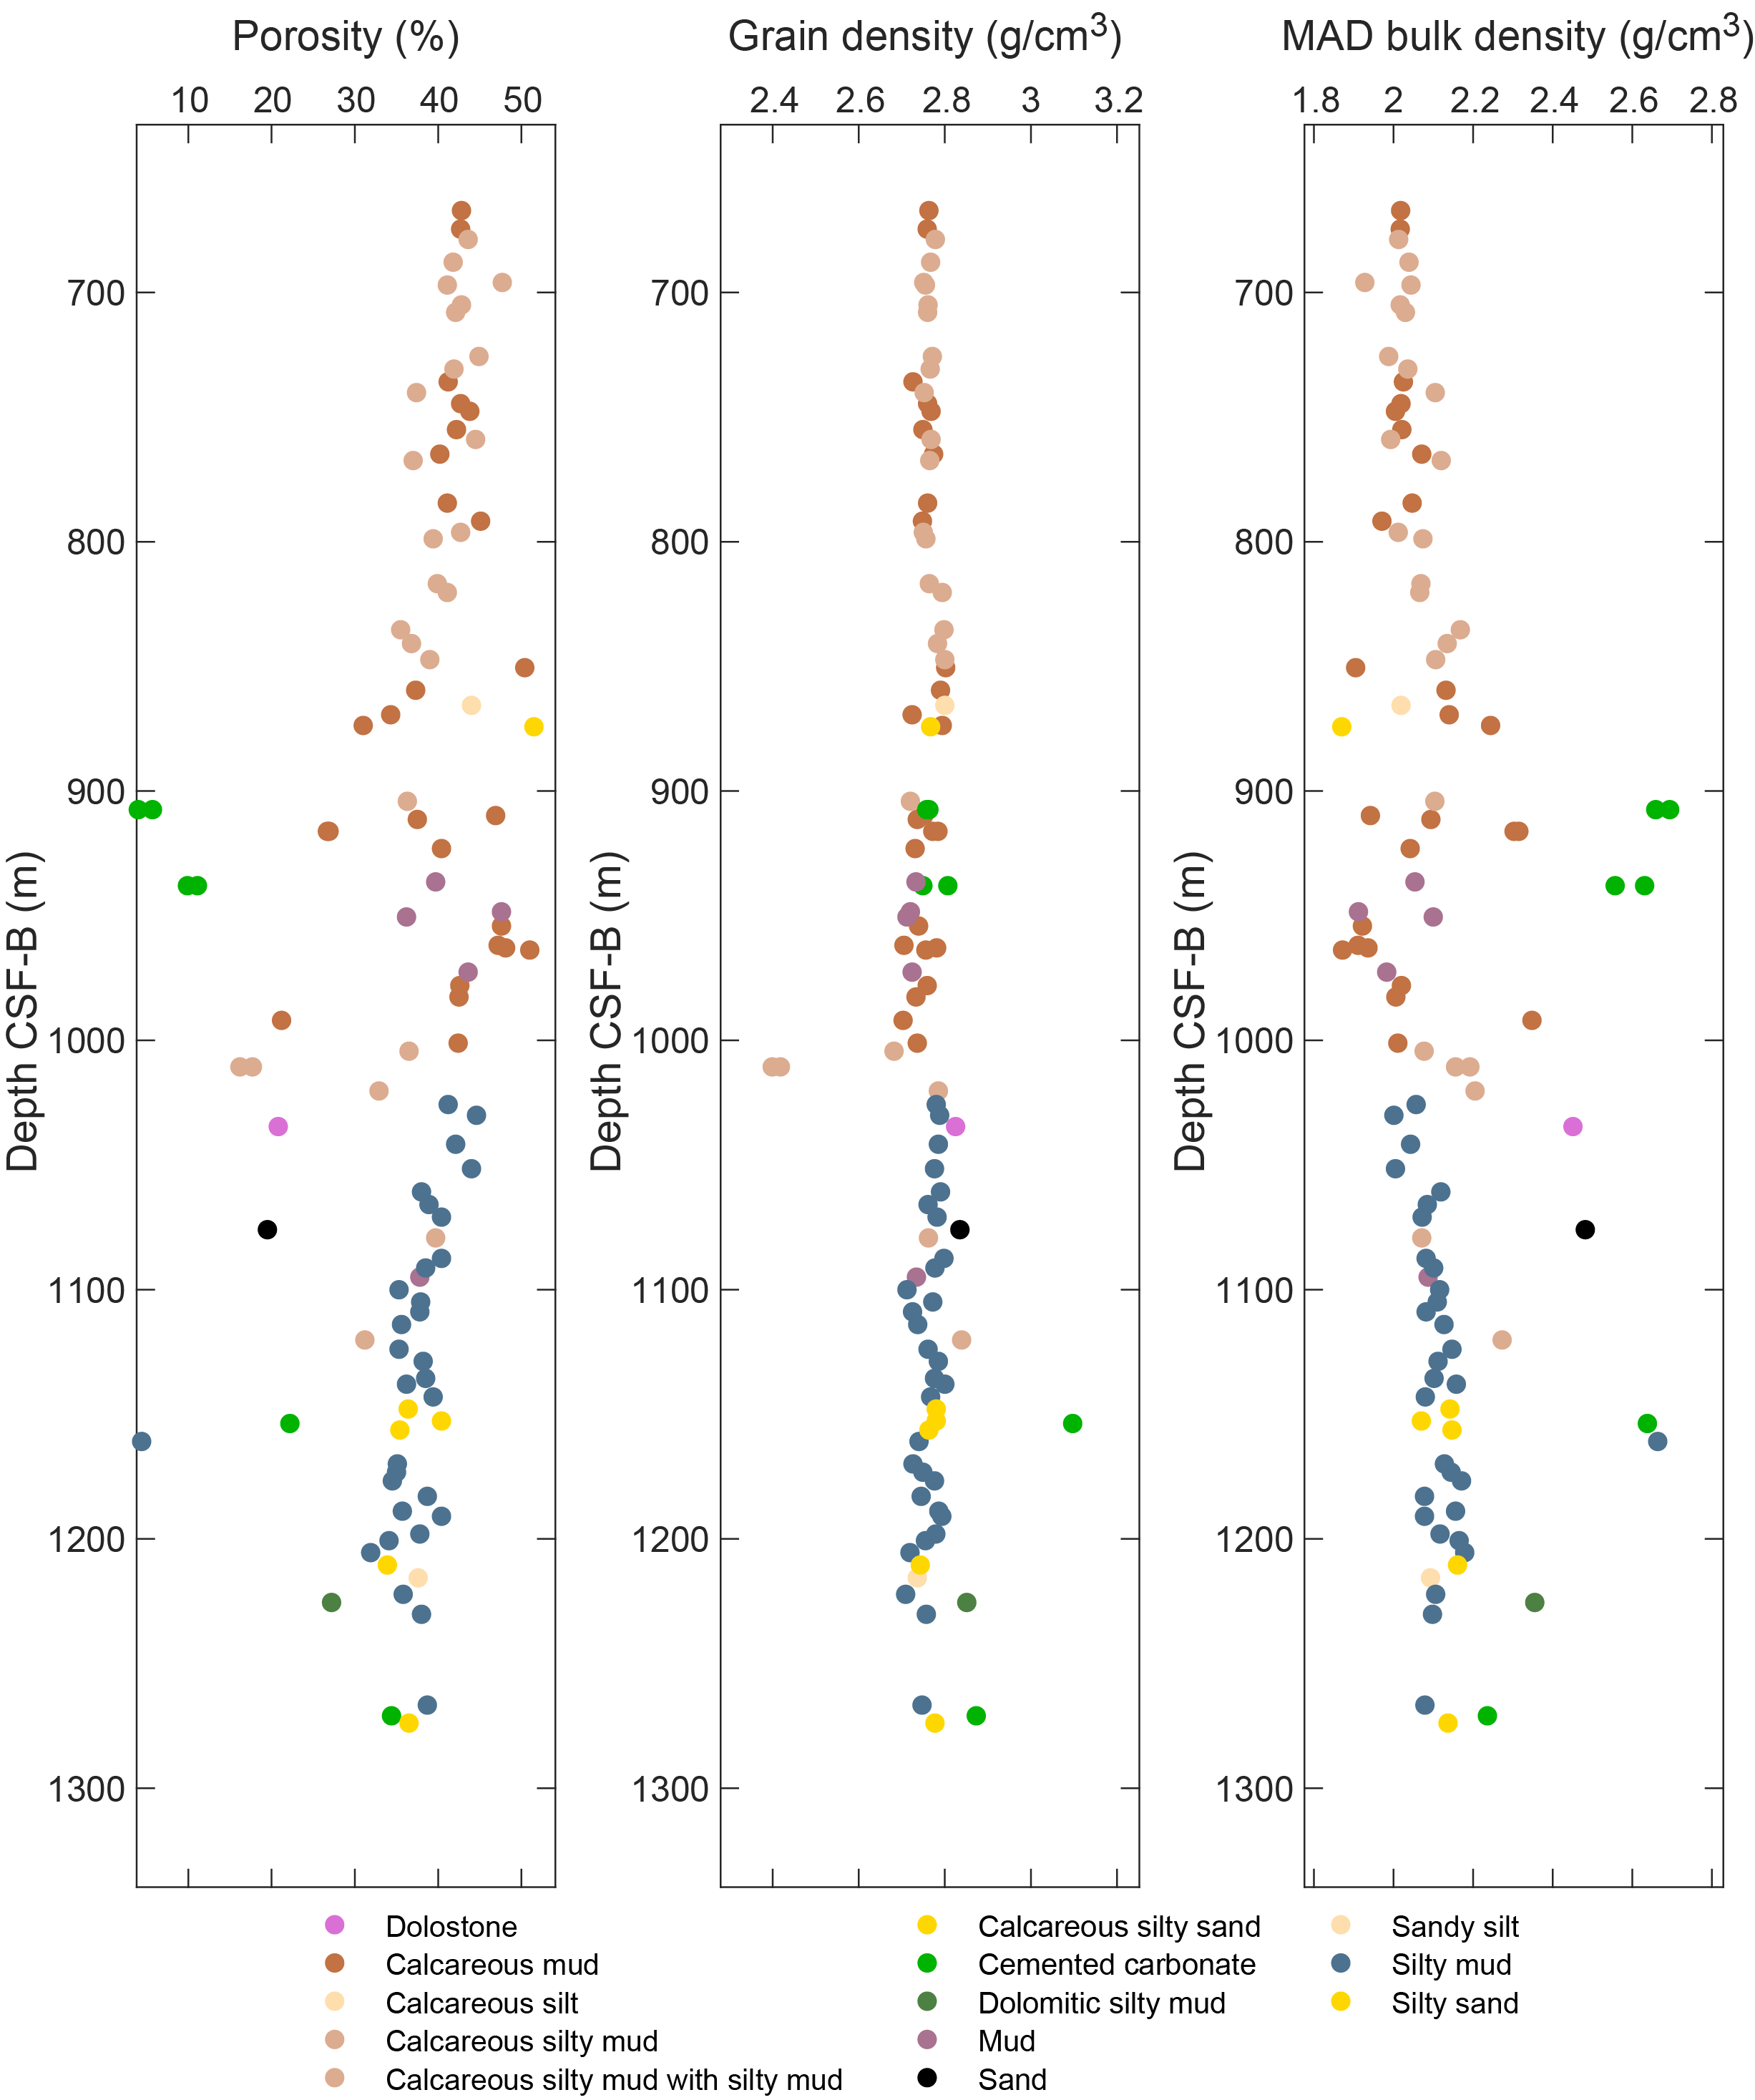
Figure F57. Porosity, grain density, and bulk density by lithology.
7.3. Natural gamma radiation
NGR trends match well in Holes U1611A and U1611B at the large scale (Figure F53). The record fluctuates between 20 and 60 counts/s with a cycle thickness of 1–2 m in Holes U1611A and U1611B (Figure F58). NGR in the two holes shows an overall very gentle increasing trend with depth. The record fluctuates around ~35 counts/s between ~666 (top of coring depth) and 860 m CSF-B in Hole U1611A and between 745 (top of coring depth) and ~840 m CSF-B in Hole U1611B. It reaches a peak of 58 counts/s in Hole U1611A and 44 counts/s in Hole U1611B (Figure F58).
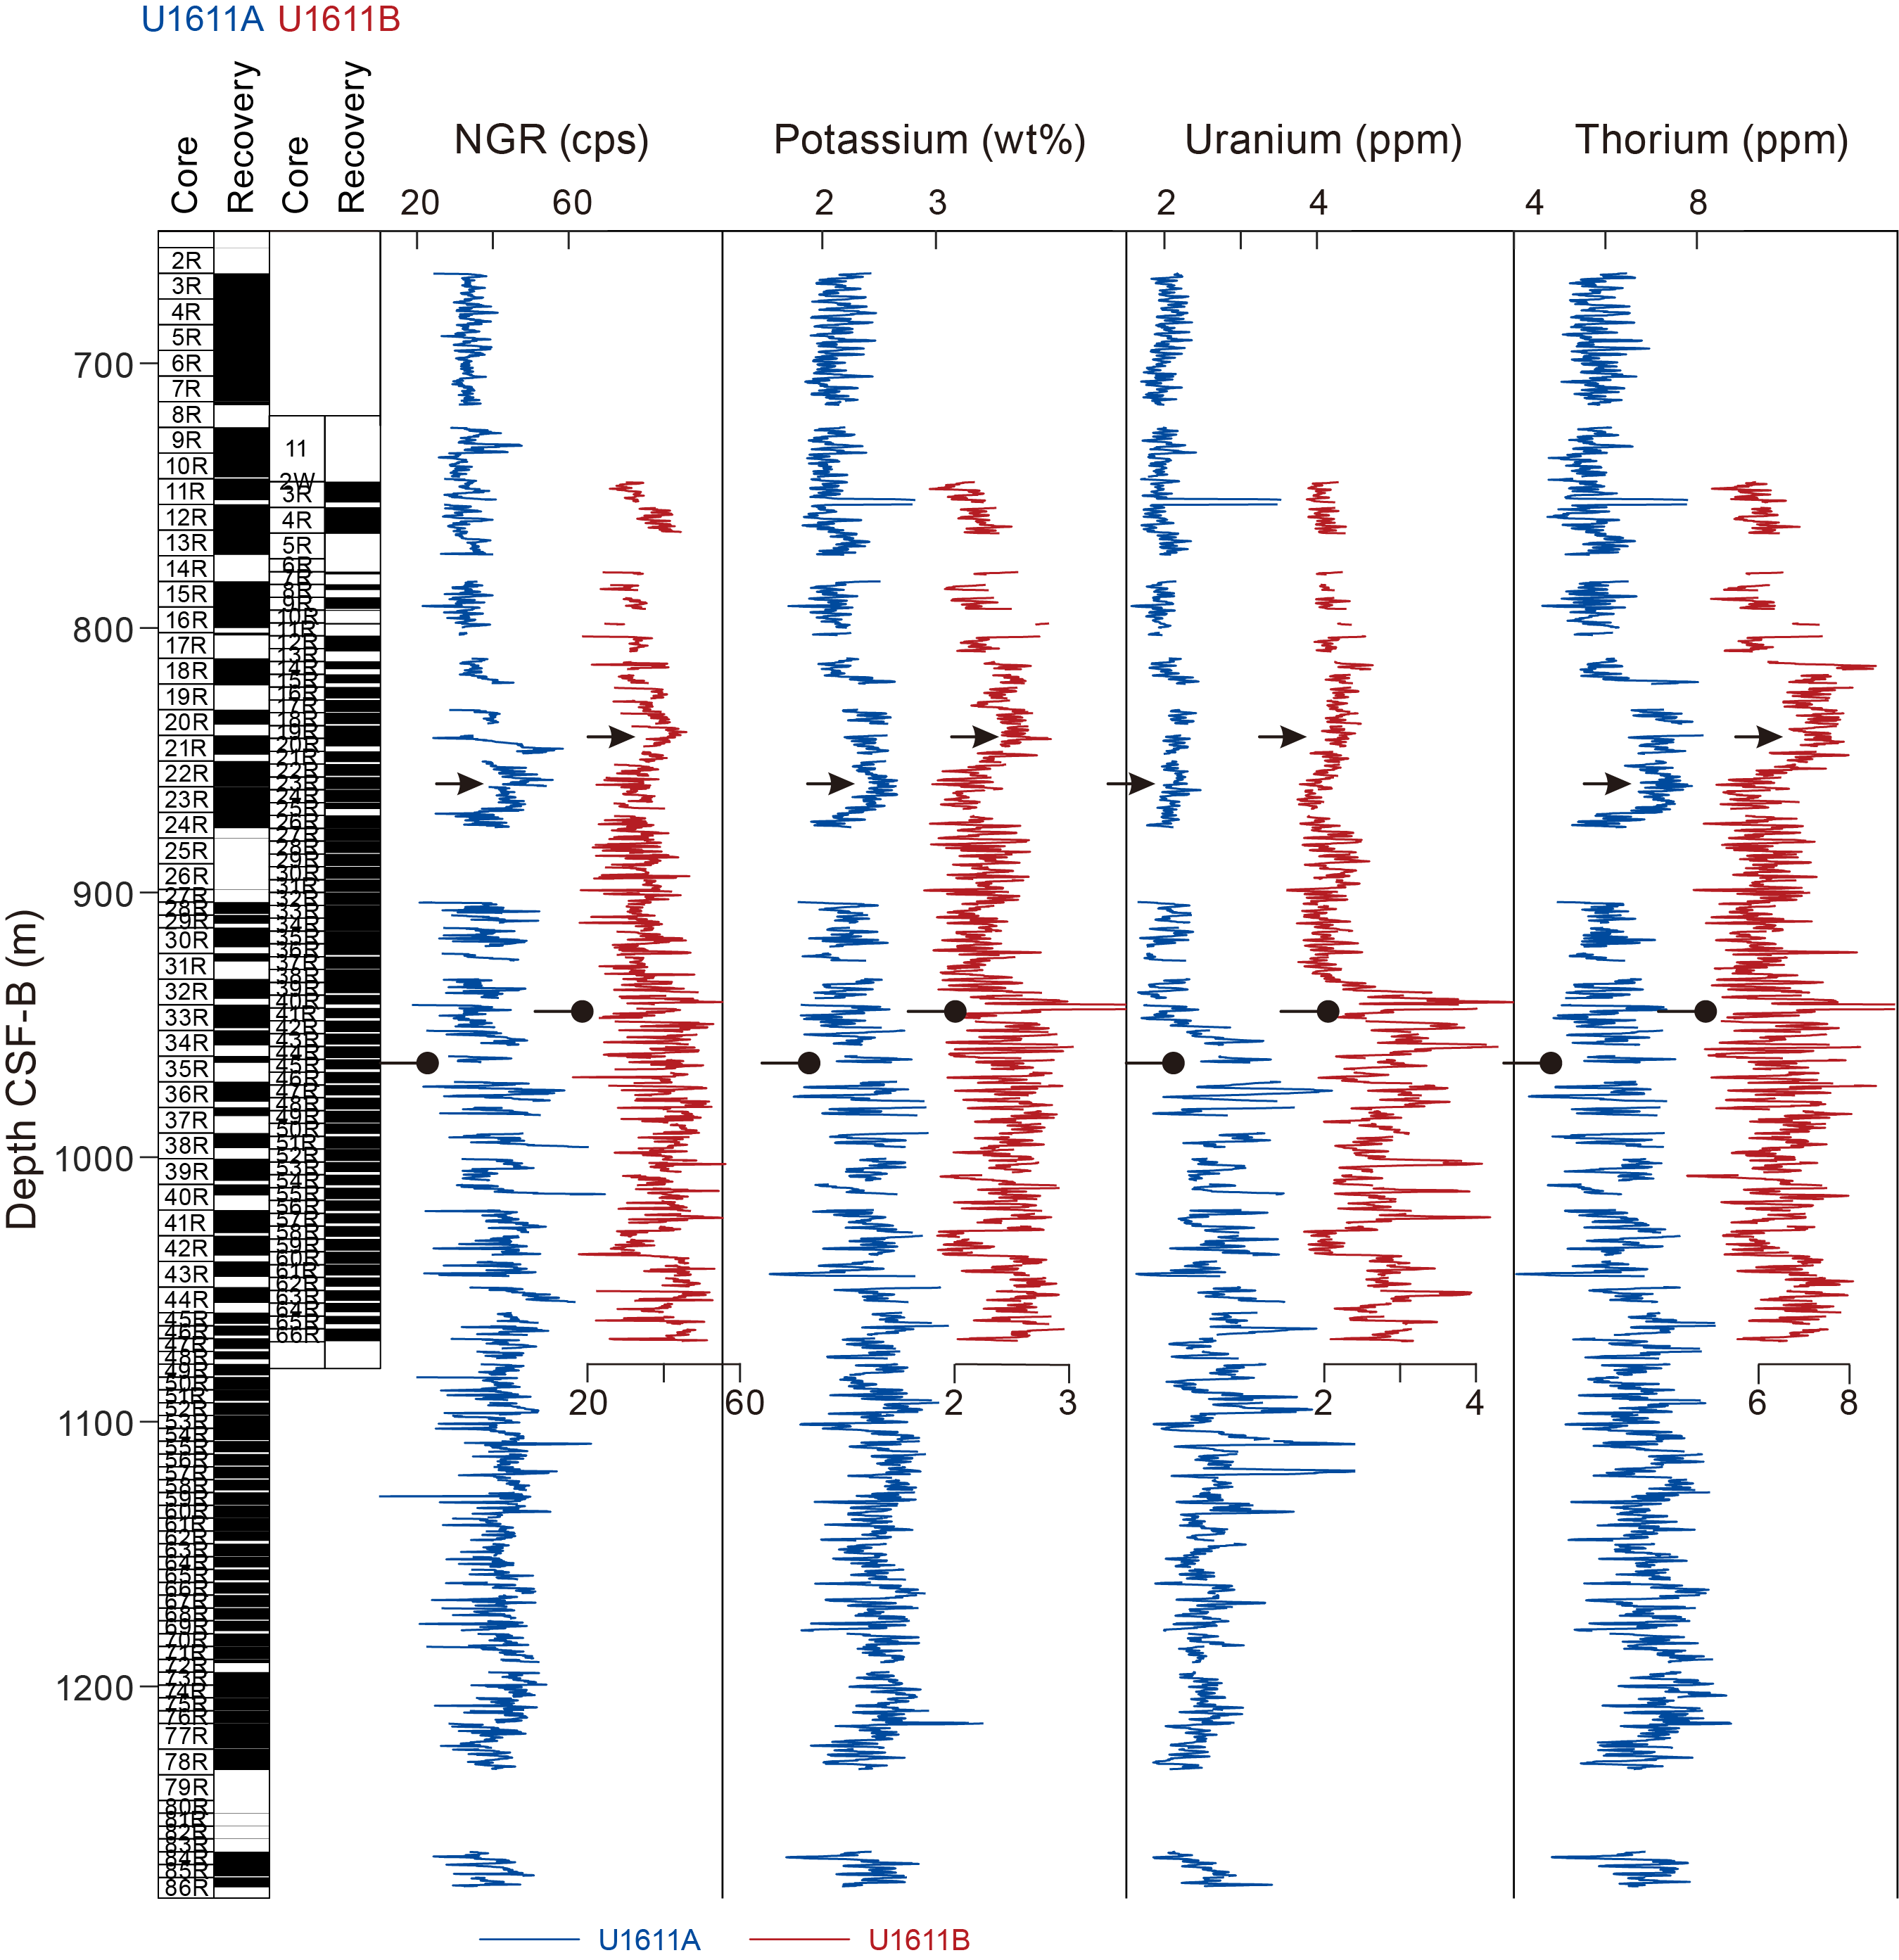
Figure F58. NGR measurements.
The spectral components of NGR (potassium, uranium, and thorium) were extracted from the total counts using the MATLAB code developed by De Vleeschouwer et al. (2017). Potassium and thorium values show similar long-term variations to the total NGR values (Figure F58). However, the uranium values do not show an obvious response of the peak recorded by the total NGR, potassium, and thorium at ~860 m CSF-B in Hole U1611A and ~840 m CSF-B in Hole U1611B. The uranium record increases sharply and shows much higher cycle amplitude below 954 m CSF-B in Hole U1611A and 938 m CSF-B in Hole U1611B (Figure F58). This character is not very clearly shown either by the total NGR or by the potassium and thorium components. This prominent shift of uranium signal could indicate a fundamental change of the basin environment, which requires in-depth study of the driving factors.
7.4. Spectrophotometry
Lightness (L*), green–red (a*), and blue–yellow (b*) color is highly cyclic, consisting of regular cycles that range ~2–3 m in wavelength (Figure F59). The records for L* and b* closely correspond with the MS and NGR signals, whereas a* exhibits a more inversely proportional relationship. Specifically, only a* and b* display a broad trough and peak, respectively, at the boundary between Units I and II. However, L* becomes darker below 860 m CSF-B, corresponding to darker intervals in the visual core description (see Figure F8). In other areas, the variability appears to be on a smaller scale and more irregular, possibly reflecting the gradational nature of many lithologic contacts.
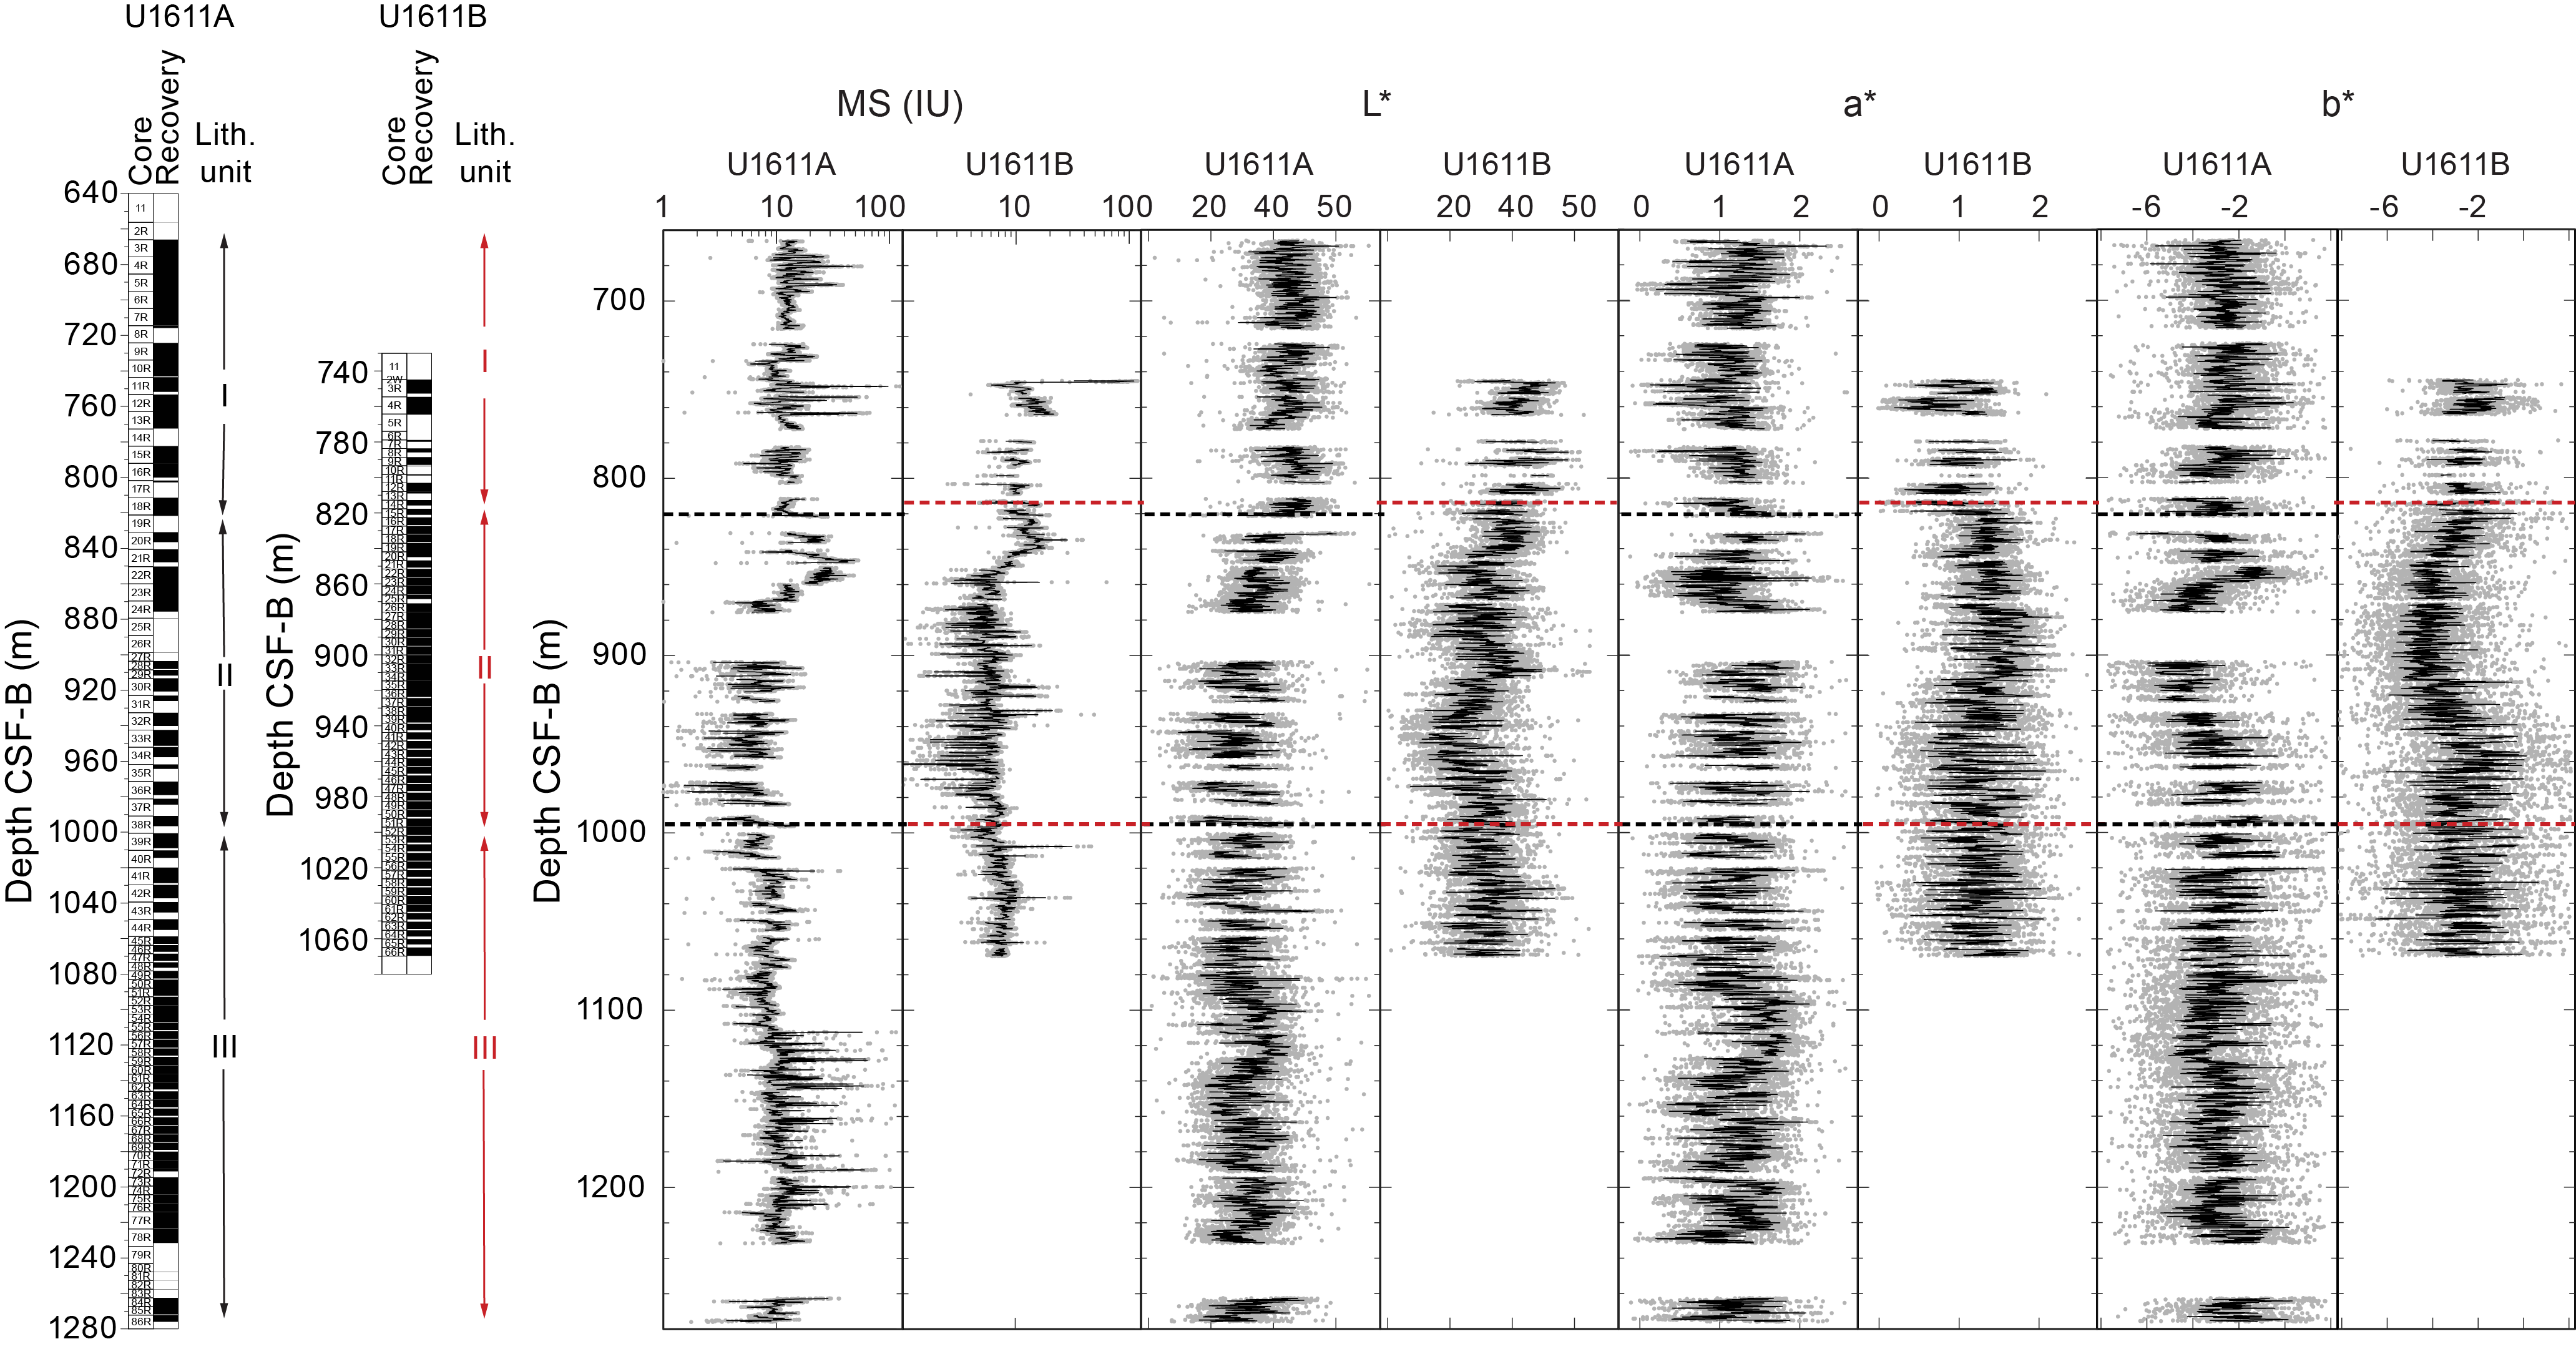
Figure F59. MS and L*, a*, and b* color variation.
7.5. Thermal conductivity
At Site U1611, thermal conductivity was measured in triplicate at one position per core, typically in Section 2, using a half-space probe (H51027 or H51033). When Section 2 had cracks or other malformations that precluded good measurements, the measurement was conducted on another suitable section. The average thermal conductivity for this site is 1.76 W/(m·K) (black dots in Figure F56), with minimum and maximum values ranging 1.08–2.98 W/(m·K). These values are quite scattered between ~660 and 950 m CSF-B, depending on porosity and composition, showing higher variations in the depth range of ~900–950 m CSF-B. Below this depth, values become more consistent, probably due to the presence of harder sediment. However, there are five outliers greater than 2 W/(m·K) that might correspond to the presence of highly consolidated material. Below 950 m CSF-B, there is a lithologic change from dominantly calcareous muds and silty muds to sandy silt, sand, dolomitic sandy silts, and conglomerates (see Lithostratigraphy; Figure F9).
Three lithostratigraphic units were defined based on sedimentologic facies (see Lithostratigraphy; Figure F9). Unit I shows some average dispersion of thermal conductivity (Figure F56), which increases toward the base of the unit. Unit II follows the same pattern as the values are also scattered in this unit. Unit III shows more consistent values.
The general trend for Site U1611 shows that the average thermal conductivity values are more scattered above ~950 m CSF-B, and below this depth more compact sediment yields thermal conductivities that are, in general, more consistent and regular (Figure F56). Porosity decreases slightly downhole because of compaction, showing a scattered pattern between ~850 and 1050 m CSF-B that is similar to the rest of the physical properties (Figure F56). Below this depth, both porosity and grain density continue to decrease, whereas MAD density continues to slightly increase.
7.6. P-wave velocity
The P-wave logger (PWL) data are very scattered and thus unreliable, mainly because of the gap between the recovered core and the core liner. Good-quality P-wave caliper (PWC) values for Hole U1611A were not obtained above Core 401-U1611A-5R (688.5 m CSF-B), most probably due to the poor lithification of the sediment at shallower depths.
The PWC data were obtained from 1 or 2 measurement points on the working halves and/or discrete cubic samples (later used for MAD measurements) from Cores 401-U1611A-5R through 86R (688.5–1273.6 m CSF-B). PWC results from these sections show typical increase-with-depth velocities from ~1590 m/s at 688.5 m CSF-B to ~4300 m/s at 1273.6 m CSF-B. Discrete cubic specimens for the measurement of P-wave velocity in the x-, y-, and z-directions (Figure F53) show values varying from 1663 to 5418 m/s. P-wave velocity responds better to hard sediments than soft ones, so more reliable data were obtained from the well-cemented intervals (e.g., below 900 m CSF-B; Figure F9). There is a general trend toward higher values with depth, but in situ PWC velocities are still underestimated, especially for the values measured on working half sections.
7.7. Moisture and density measurements
Bulk density values were calculated from MAD measurements made on discrete samples (Cores 401-U1611A-3R through 86R), among which were 28 cubic discrete samples (out of a 103 total samples) taken from the working halves of Hole U1611A for both MAD and P-wave velocity measurement. Sampling resolution varied depending on lithology, recovery, and quality of the individual core sections.
MAD density values increase with depth and are commonly higher than GRA values at the same depth (Figure F56). MAD measurements on geometrically uniform and discrete samples are able to reflect downhole compaction (Figure F57) and are free from the impact of sediment liner gaps. MAD results are therefore able to provide more reliable density values than the GRA density data set.
7.7.1. Bulk density, grain density, and porosity
Bulk density from MAD measurements typically ranges 1.87–2.69 g/cm3 in Hole U1611A (Figure F57). Grain density in Hole U1611A typically ranges 2.7–2.8 g/cm3 except for two anomalous values of 2.4 g/cm3 measured at ~1010 m CSF-B and 3.1 g/cm3 measured at ~1154 m CSF-B. Porosity generally slightly declines with depth because of compaction (Figure F56). Disrupting this trend, discrete porosity values range from a maximum of 51.5% at 1148.2 m CSF-B to a minimum of 4% at 907.5 m CSF-B (cemented carbonate) in Hole U1611A.
Trends in porosity, grain density, and bulk density (Figure F56) can be compared with Lithostratigraphic Units I–III (Figure F9). Linear relationships of these parameters with depth occur in both Units I and III and are more scattered in Unit II. Porosity variations in Unit II might partly be the result of deformation (e.g., slumping) but also is likely controlled by variable diagenesis.
8. Downhole measurements
Following coring in Hole U1611A, the hole was prepared for downhole logging on 29 January 2024 (see Operations). For the first logging run, a 33.29 m long triple combo tool string (see Figure F20 in the Expedition 401 methods chapter [Flecker et al., 2025a]) consisting of the Magnetic Susceptibility Sonde (MSS), High-Resolution Laterolog Array (HRLA), Hostile Environment Litho-Density Sonde (HLDS), Hostile Environment Natural Gamma Ray Sonde (HNGS), and logging equipment head-pressure temperature (LEH-PT) tool was deployed, which measures MS, electrical resistivity, density, natural gamma ray, and formation temperature, respectively. As the tool string was being lowered down the hole, the triple combo encountered obstructions just below the casing and had to be worked down through bridges and ledges. The tool string reached ~914 m CSF-B; however, after more than 10 unsuccessful attempts to penetrate deeper, a decision was made to log up (see Operations) through the open hole and casing to the seafloor. A second tool run was attempted with a 31.5 m long sonic tool consisting of the General Purpose Inclinometry Tool (GPIT), Dipole Sonic Imager (DSI), HNGS, Enhanced Digital Telemetry Cartridge (EDTC), and LEH-PT. This time, the tool string encountered an obstruction at an even shallower depth of ~750 m CSF-B, and after more than 10 unsuccessful attempts to penetrate deeper, the tool was brought back up to the rig floor without logging. The logged open hole interval was late Messinian to Early Pliocene in age, consisting mostly of calcareous silty mud with 2–6 m scale repeating cycles in core NGR, MS, and density (see Lithostratigraphic Unit I in Lithostratigraphy and Physical properties; Figures F9, F53).
8.1. Borehole conditions and downhole data set quality
Borehole wall conditions were very rough, characterized by washouts, bridges, and ledges (Figure F60). According to the GPIT data set, the borehole was inclined ~9° from vertical at the end of the pipe (~675 m CSF-B) and inclination increased with depth to more than 12° at 750 m CSF-B (Figure F60). The GPIT and LEH-PT inclination data show an oscillation in the deviation curve that reflects repeated angles and/or bridging inside the borehole. Such angles and inclinations may explain the difficulty encountered in lowering the tool strings down the borehole past ledges. The inclination of the borehole influences the two-way traveltime (TWT) to depth conversion because the true vertical depth will be shallower than the measured depth along the borehole path (CSF scale). Unless the inclination decreases again with depth, such high angles of inclination will probably be visible even on the scale of the seismic profile when tied to the borehole.
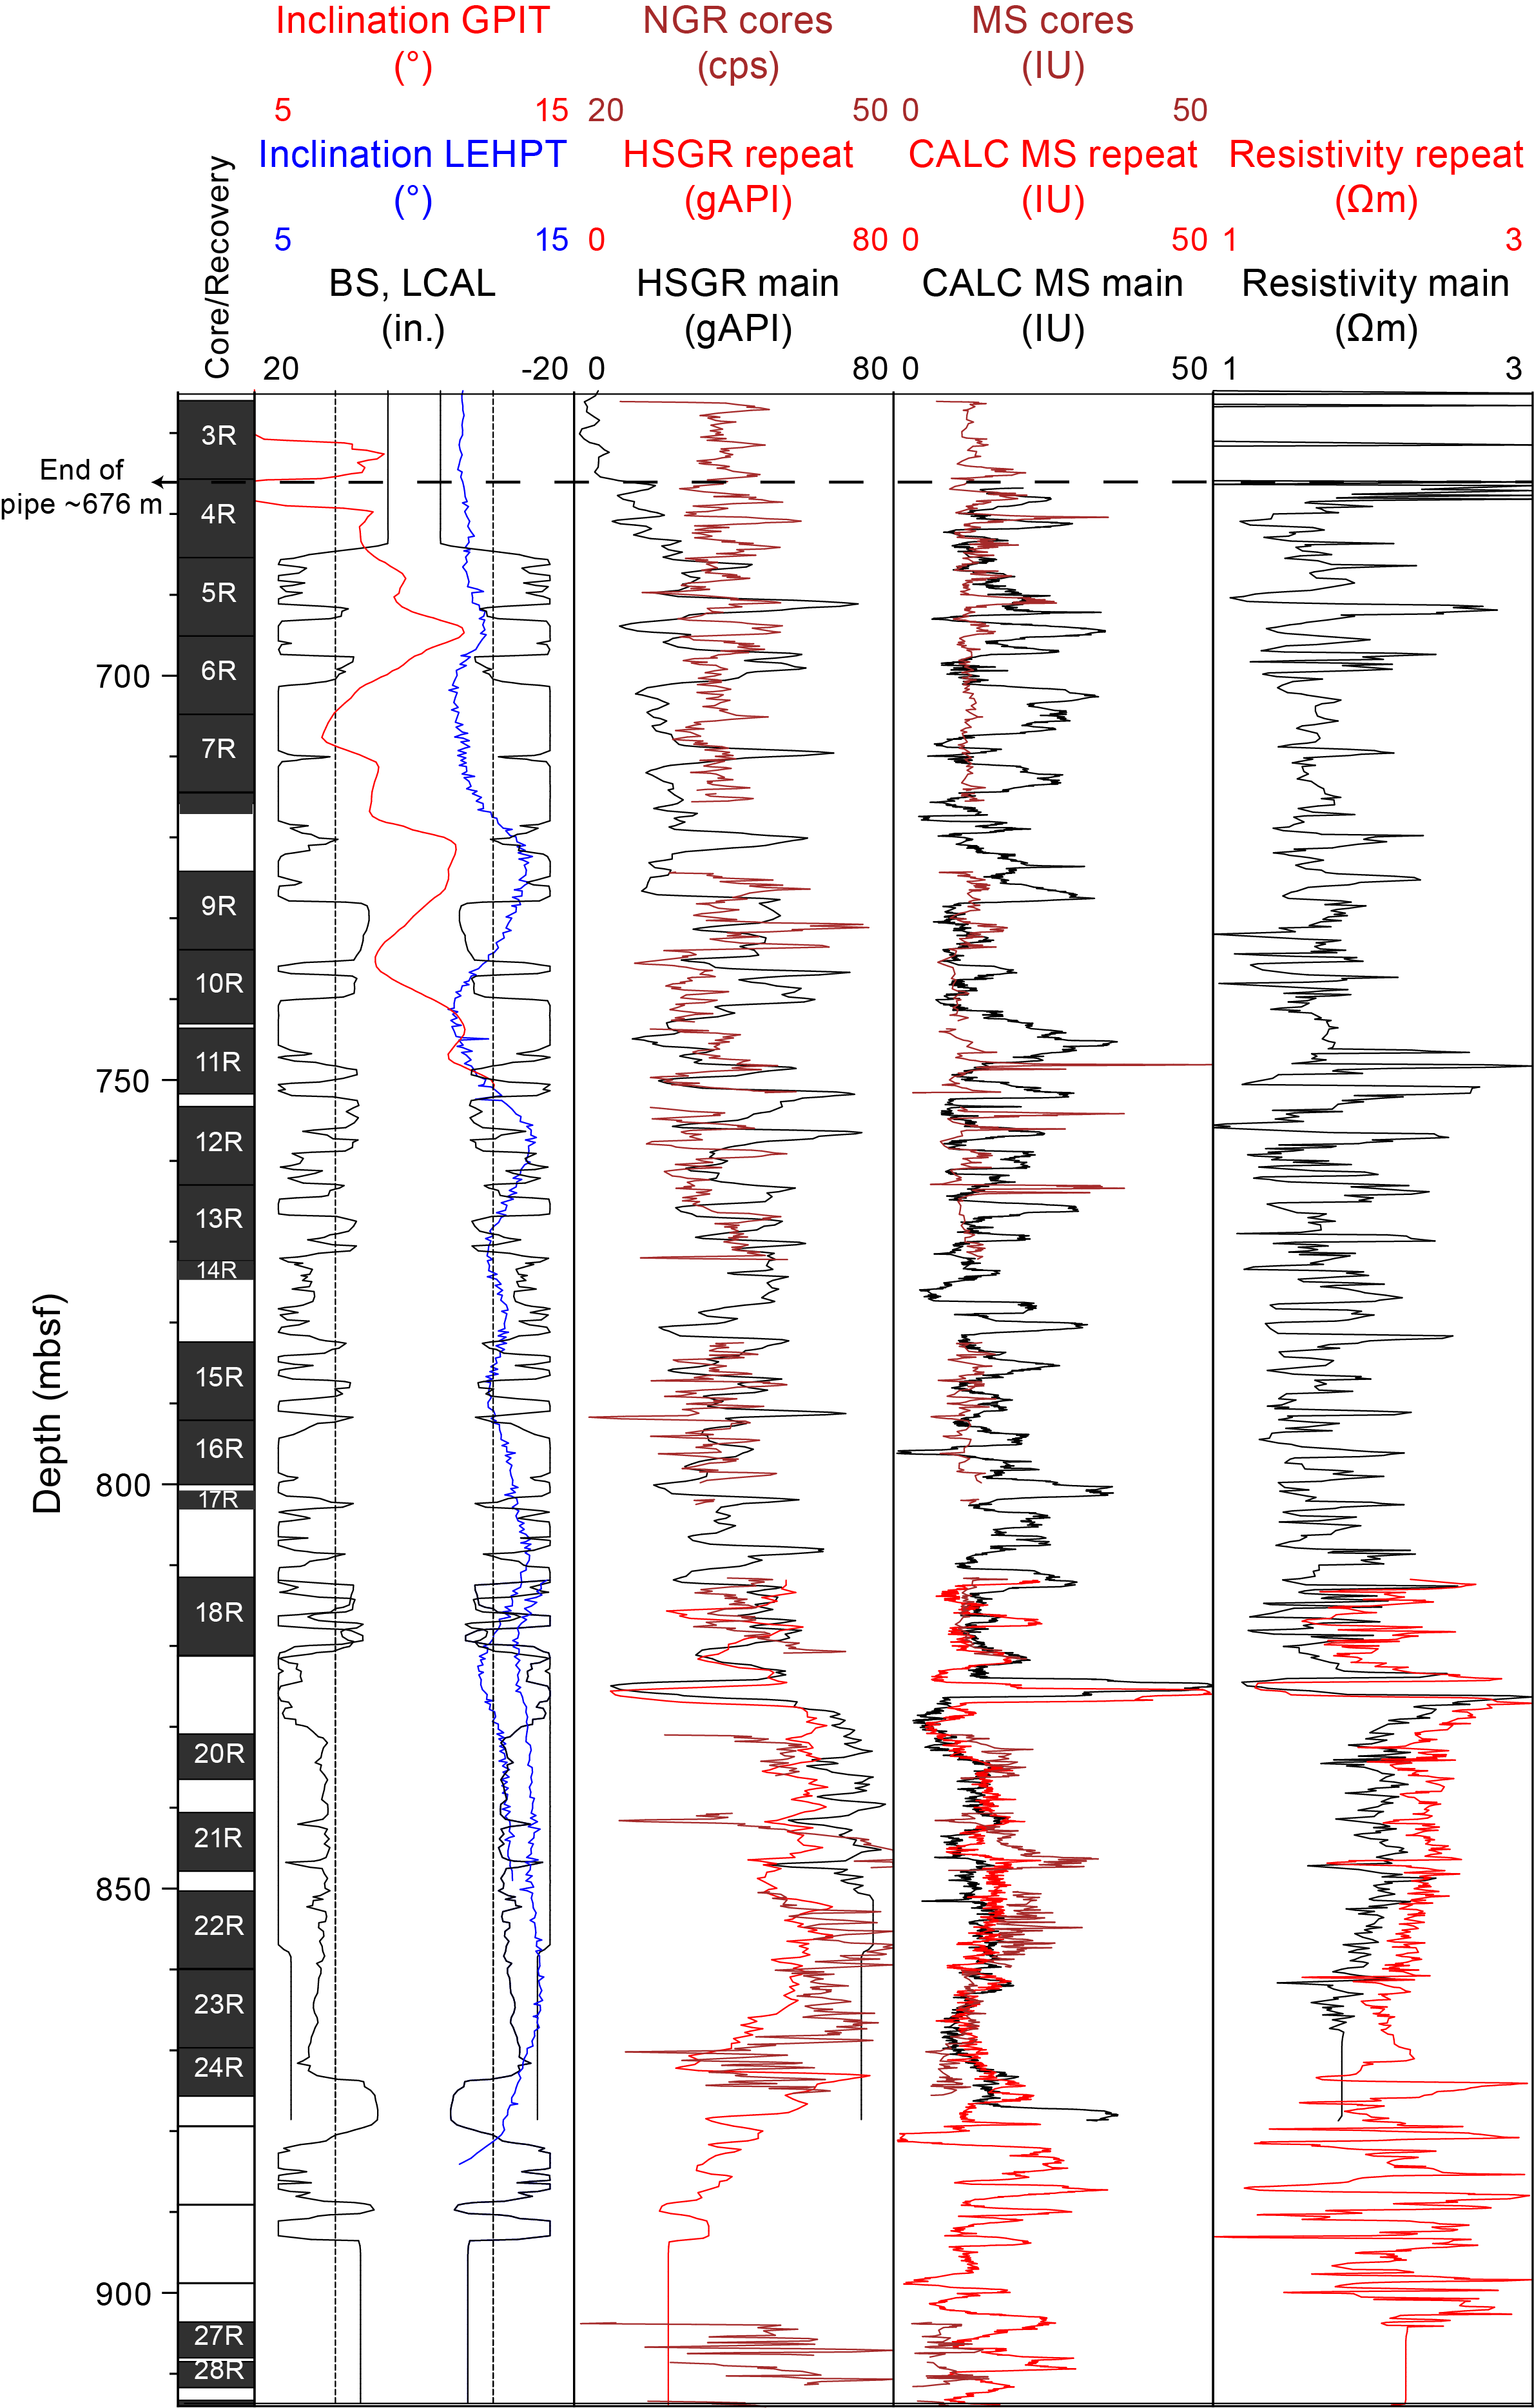
Figure F60. Downhole logging data summary.
The HNGS gives formation gamma ray data inside the casing and the drill pipe, albeit attenuated. The HNGS logs show that the base of the pipe is at 676 m wireline log depth below seafloor (WSF) (Figure F60) and the seafloor is at ~818 m wireline log depth below sea level (WSL). It may still be possible to use this data to study the Pliocene–Quaternary cyclicity after applying the necessary correction factors for the additional attenuation at thicker pipe joints.
Comparison of the total spectral gamma ray (HSGR) downhole gamma ray signal with equivalent NGR data measured on the cores shows that the HSGR data are highly affected by the bad borehole conditions, especially the washouts, resulting in anomalous troughs that do not reflect true geologic variations (e.g., washouts between ~693 and 697 m CSF-B and between ~700 and 710 m CSF-B; Figure F60).
Resistivity log values range ~1 to ~3 Ωm and are also substantially impacted by hole conditions, as evidenced by the mimicking of this log to the caliper log (Figure F60).
The repeat and main path of the MS logs repeat reasonably well in the interval where they overlap (~810 to ~875 m CSF-B; Figure F60). Comparison of the MS log curve with the data measured on the cores only occasionally appears to have similar features (e.g., 680–700 m CSF-B). The interval between 750 and 905 m CSF-B, where core recovery was nil, is fairly well covered by the MS downhole log, which could be useful for lithology prediction.
8.2. Downhole temperature
The SET2 tool was run before taking Core 401-U1611A-3R at 657.3 m CSF-B. It gave a clean 10 min temperature equilibration curve, and from this a formation temperature of 28.3°C was derived. Using this result and a seafloor temperature of 13.3°C (based on the Conductivity-Temperature-Depth [CTD] measurement in this hole), the geothermal gradient at the site is 22.8°C/km.
8.3. Core-downhole-seismic integration
Time-depth relationships are crucial for correlating seismic profiles to drill hole information. One important challenge of Expedition 401 was to establish the age and lithologic origin of the seismic reflections previously identified in seismic profiles covering the study area. Three available data sets could be used to correlate the stratigraphy with the seismic units interpreted on the seismic profiles at Site U1611A: (1) vertical seismic profile (VSP) check shot traveltimes acquired from the industrial borehole Andalucia G1 (Bulian et al., 2021), (2) traveltime derived from sonic logs acquired from Site 976, and (3) synthetic seismograms (preliminary seismograms produced on the ship during the expedition using MAD and PWC measurements). Figure F61 shows the different time-depth relationships available in Hole U1611A. Each of these results in a different seismic-downhole-core tie. For Holes U1611A and U1611B, the time-depth relationship derived from the Andalucia G1 borehole VSP was used for a preliminary core-downhole-seismic tie (Seismic Profile CAB01-125). Figure F61 shows the result of the tie of the borehole to the seismic profile. Even though it is preliminary, the borehole to seismic tie appears reasonable because the encountered depth of the Miocene/Pliocene boundary as dated by the biostratigraphy team in the cores coincides very well with the M reflector (also known as the Top Erosion Surface) interpreted to be the Miocene/Pliocene boundary elsewhere in the Alborán and the rest of the Mediterranean area (Lofi et al., 2011) (see Biostratigraphy; Figure F61).
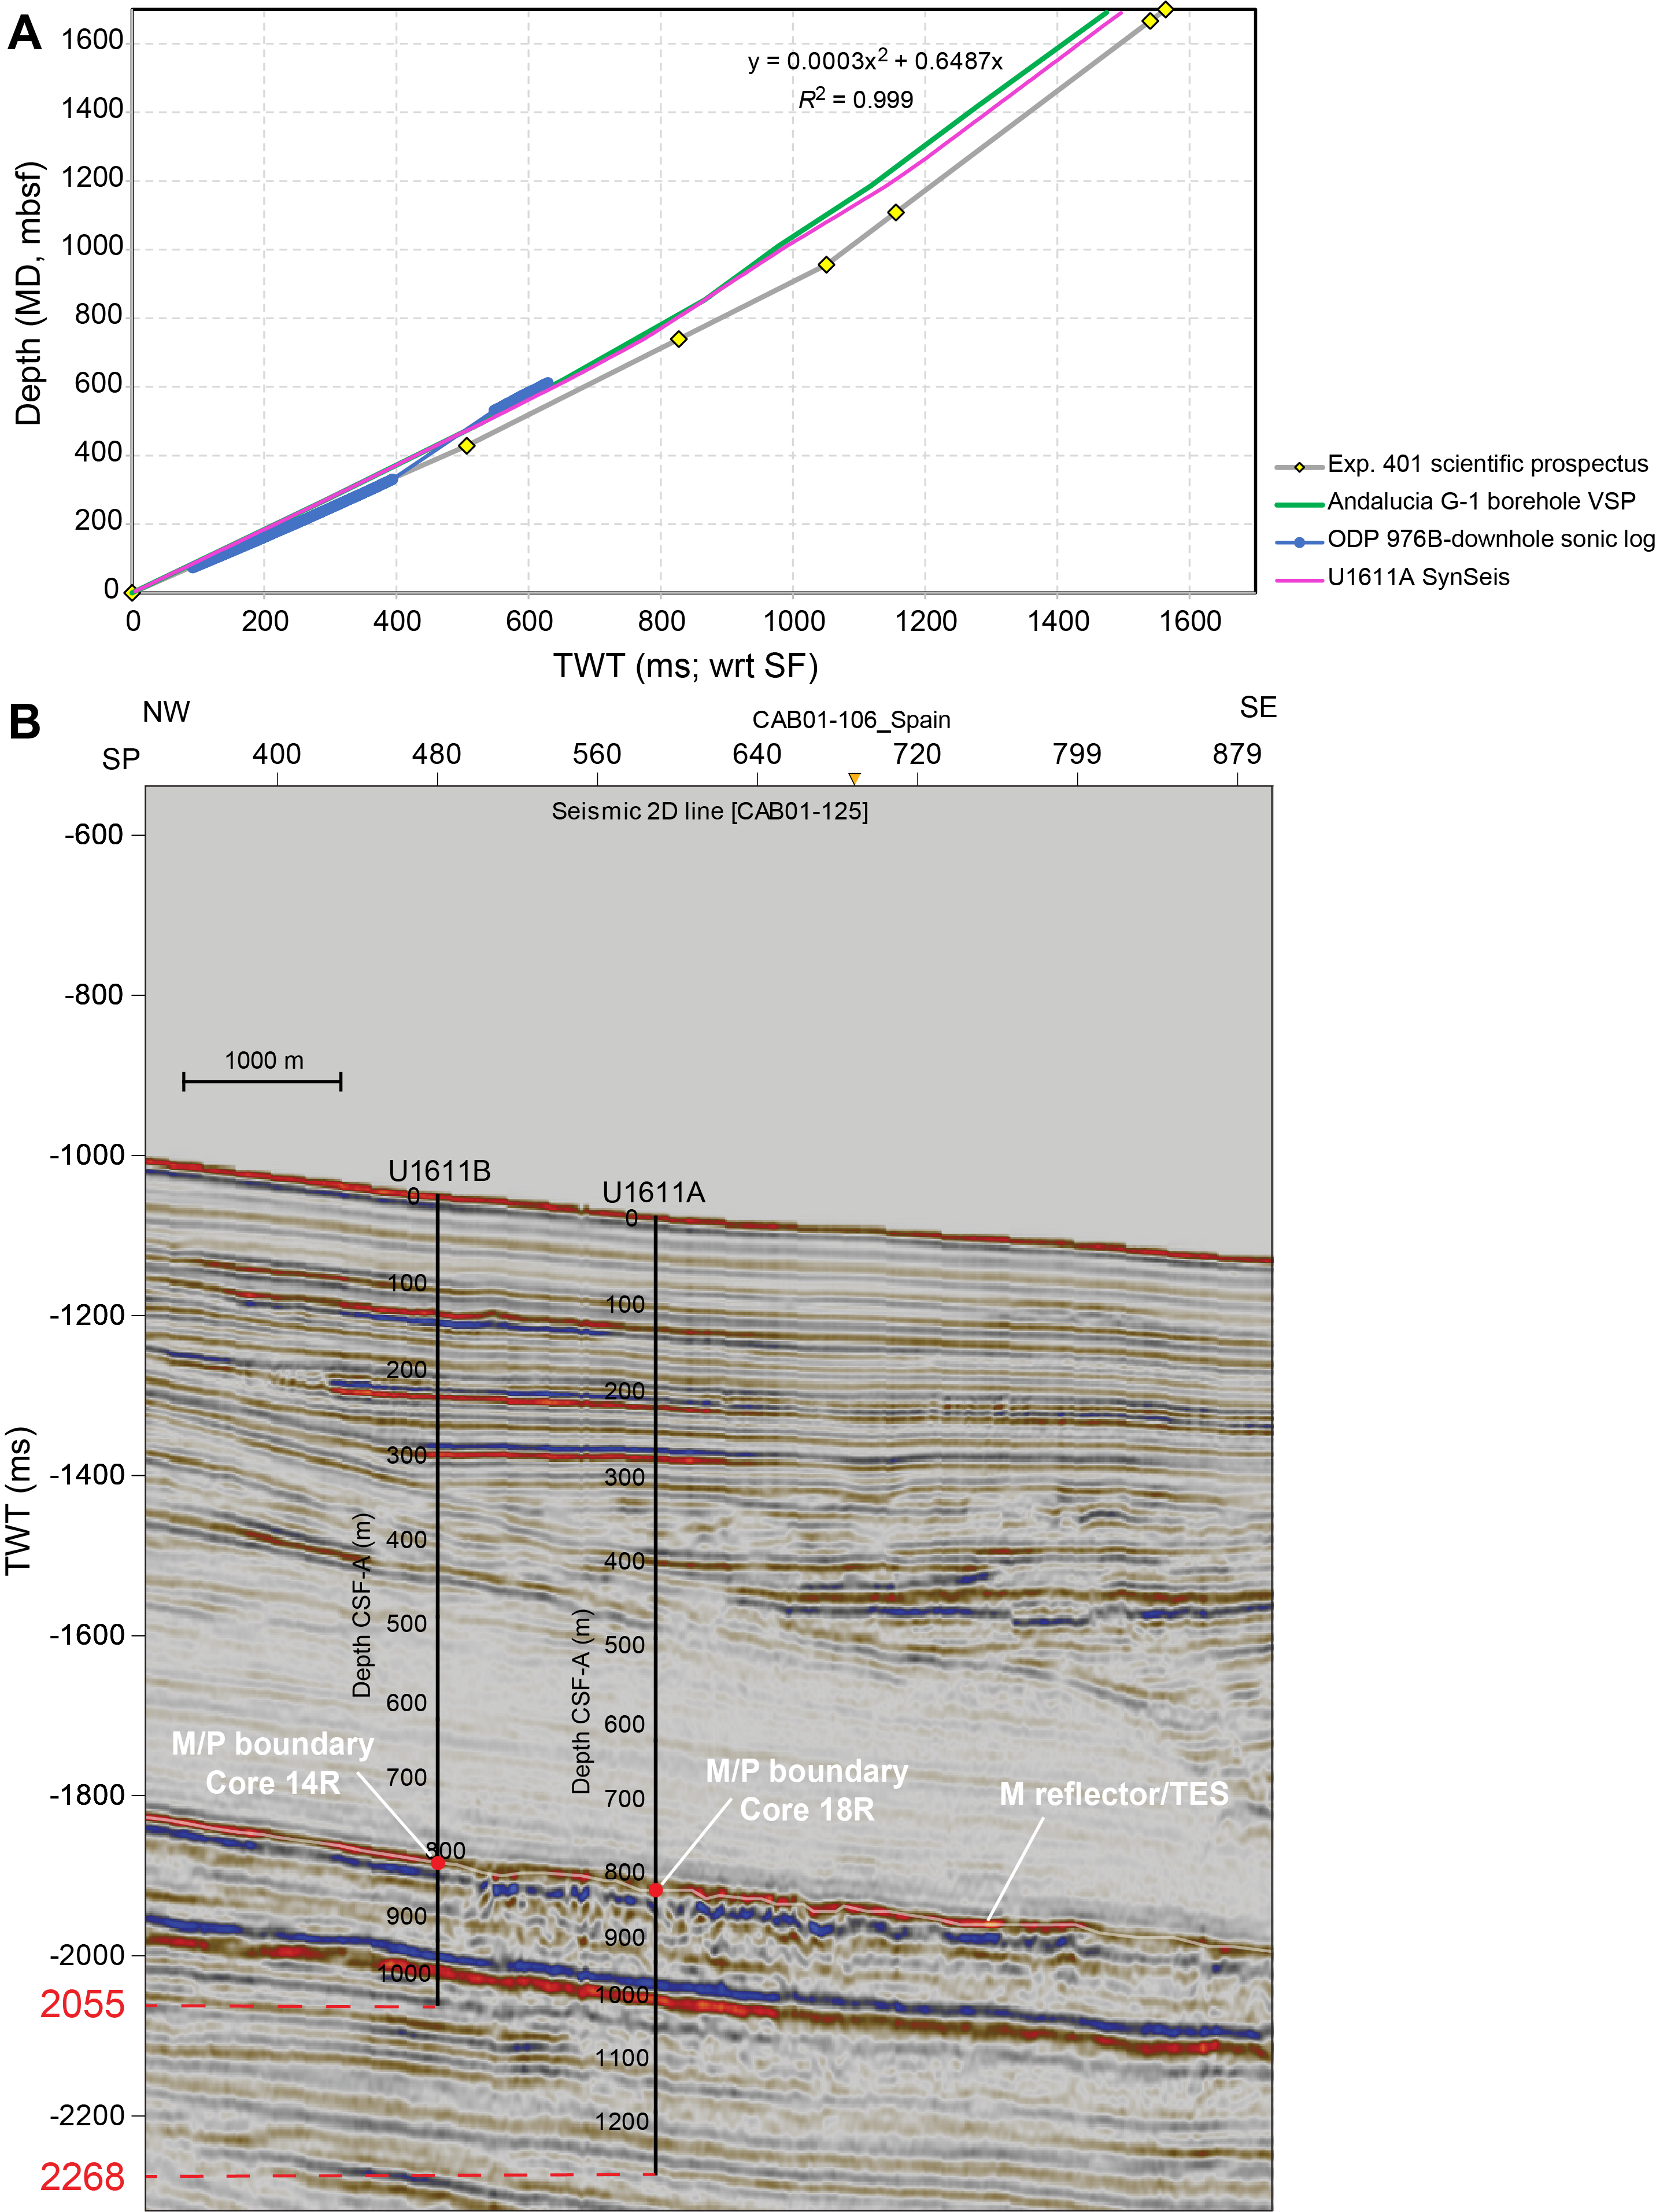
Figure F61. Depth to TWT conversions and Seismic Line CAB01-125.
According to this hole-seismic tie, the maximum drilled depth in Hole U1611A reached 2.26 and 2.05 s TWT on the seismic profile (Figure F61). This tie does not yet include the inclination of the borehole, which may change considerably depending on how that inclination proceeded with depth. In the absence of downhole measurements, paleomagnetism data analysis will be necessary to determine the inclination along the rest of the borehole. However, it is worth mentioning that the perfectly horizontal sediment lamination observed in the cores (see Lithostratigraphy), hints to a perfectly vertical borehole, unless the recovered beds are perfectly perpendicular to the direction of inclination of the borehole. This is unlikely because such bed inclination is not observed in the seismic data, meaning it is likely that the borehole inclination returned to nearly vertical with depth.
9. Age model
Only two bioevents are unambiguously identified in Holes U1611A and U1611B (Figure F62; see Biostratigraphy). Additionally, based on foraminifer assemblages and lithostratigraphy, we identified the top and bottom of the MSC, which is well dated (5.33–5.97 Ma; Roveri et al., 2014, and references therein) and thus provide two more chronostratigraphic control points. The paleomagnetic signals measured during the expedition are not clear enough to determine chron boundaries with any certainty, so there are no additional magnetostratigraphic age constraints at this stage (see Paleomagnetism). The cyclicity in the physical properties data is obscured by the intercalation of coarse-grained clastic sediments and slumps and does not show the simple, regular lithologic cycles that characterize the Atlantic sites. Consequently, they cannot be used at this stage to help with age dating, sedimentation rate changes, or correlation as was possible with the Atlantic Expedition 401 sites.
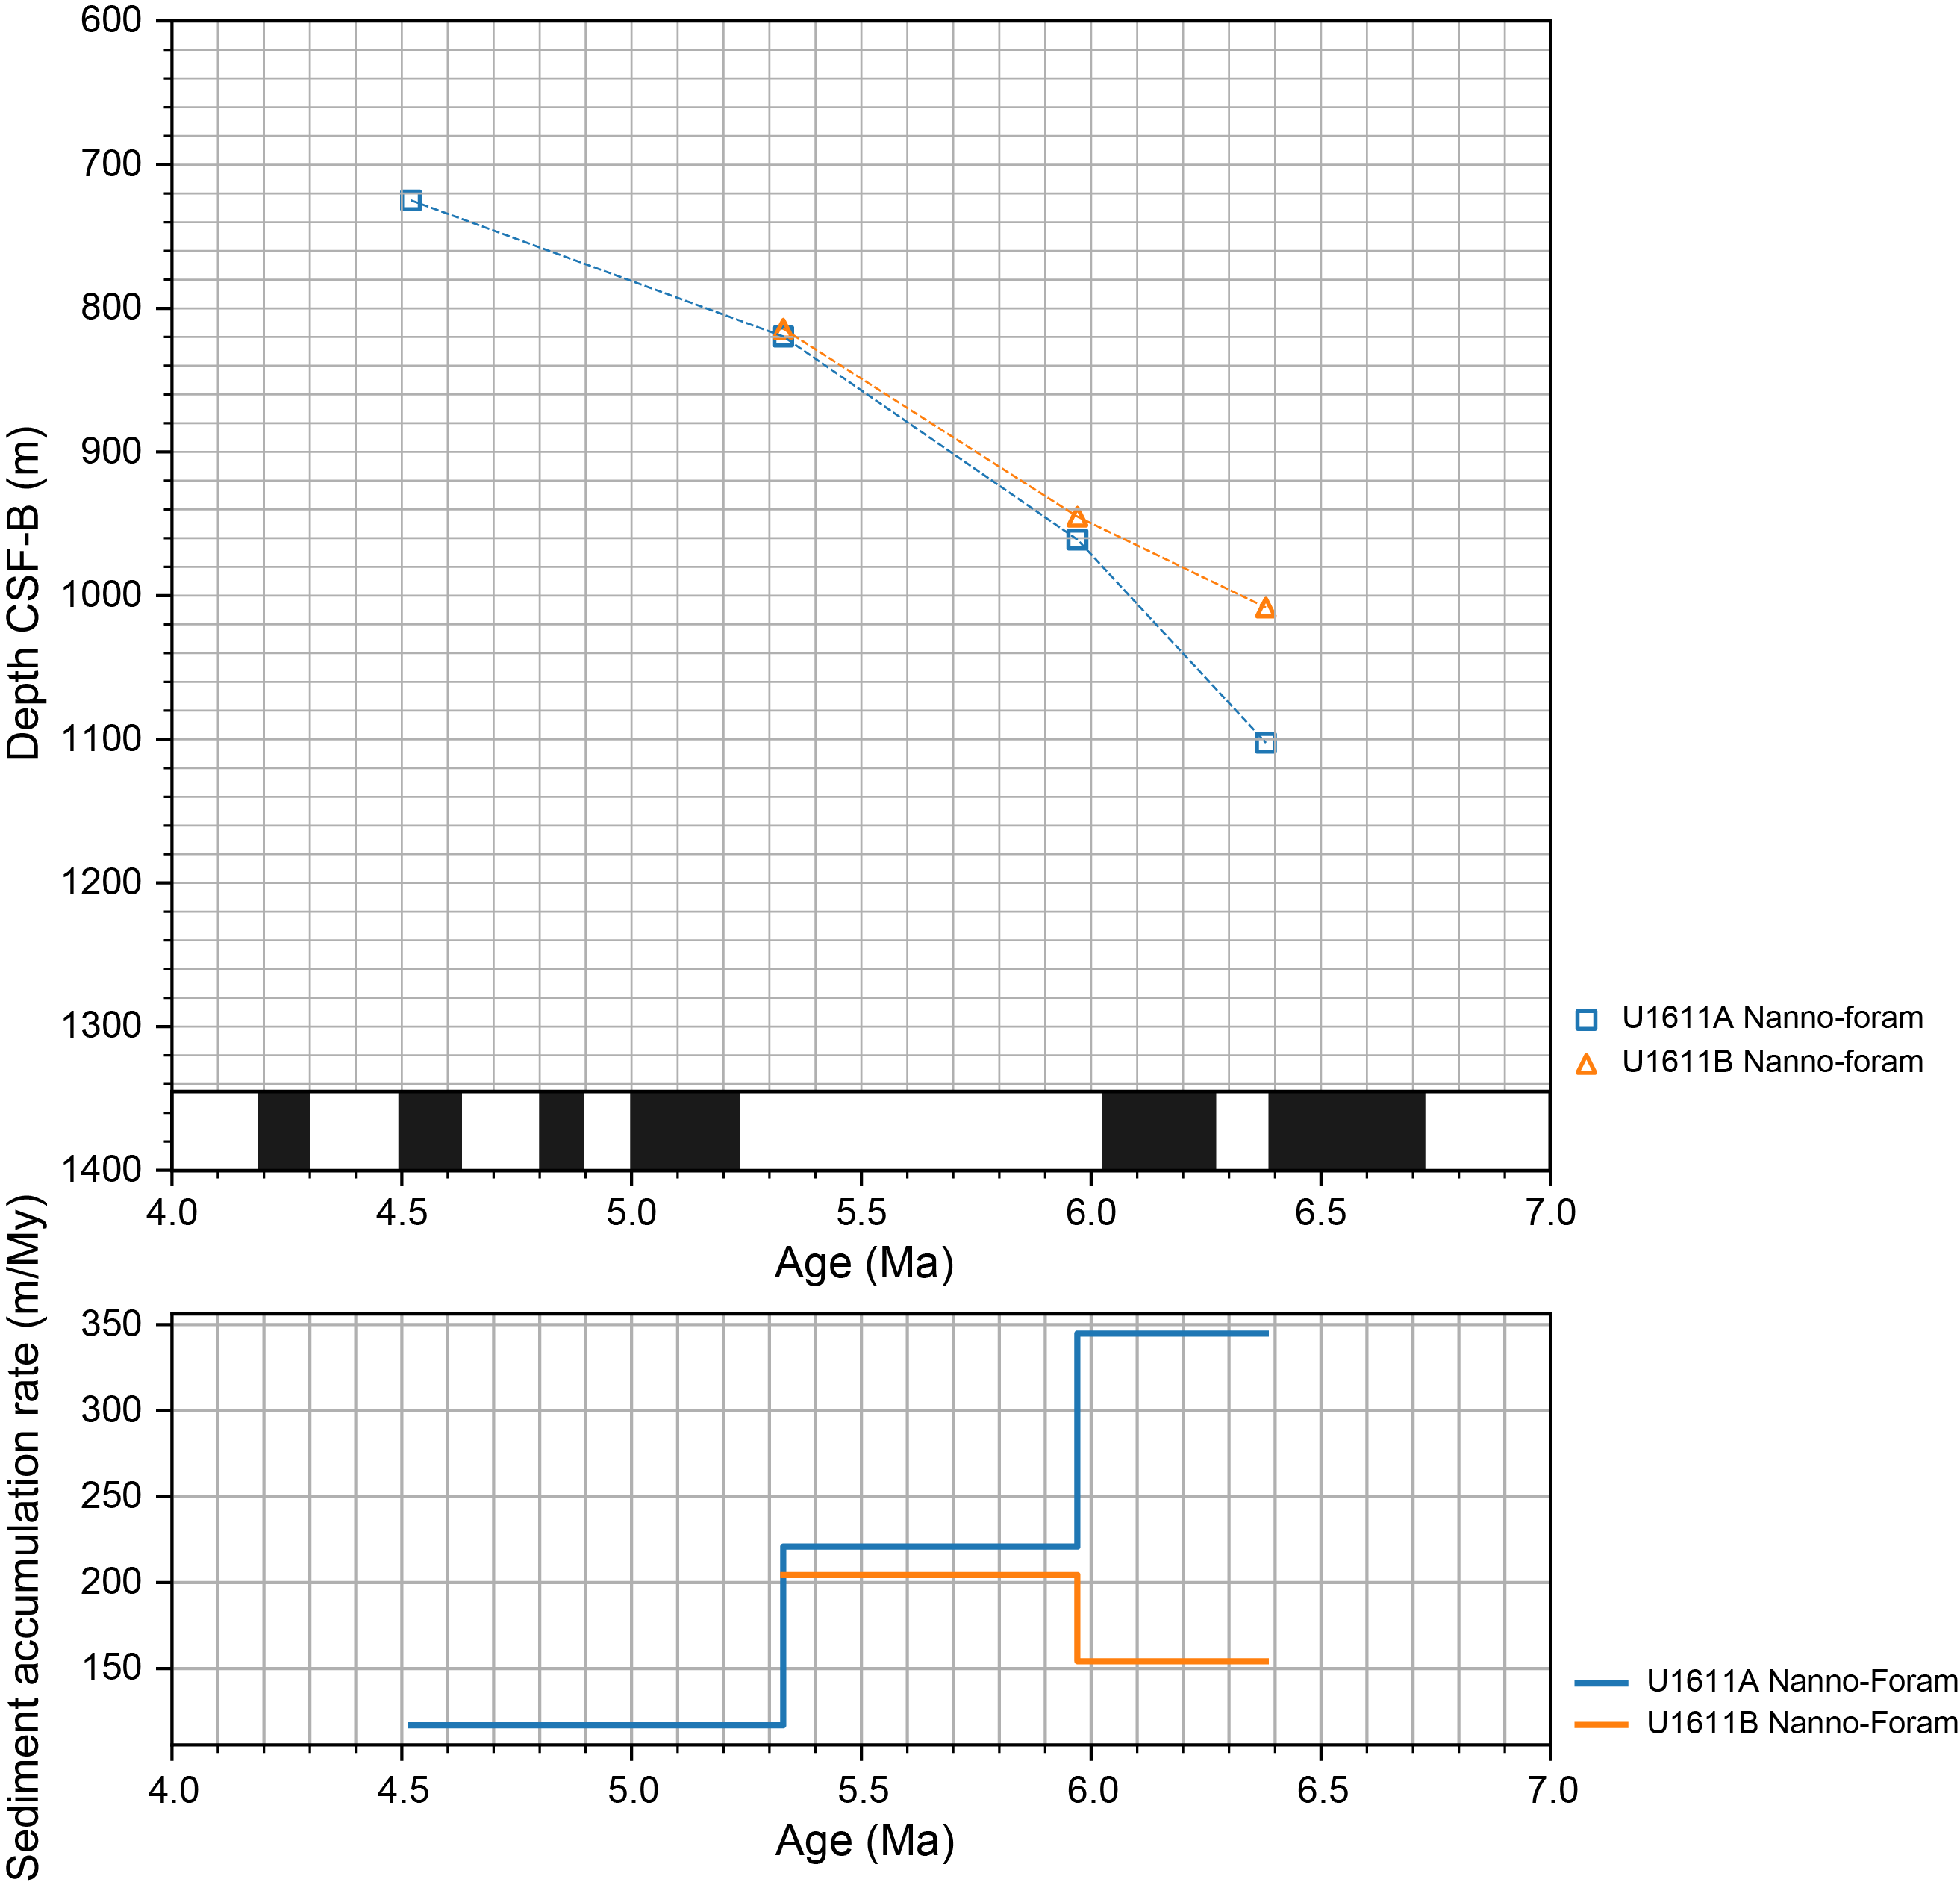
Figure F62. Age model tie points.
What the four age constraints do indicate is that there is reasonably good depth agreement between Holes U1611A and U1611B to the base of the MSC (5.97 Ma). Below that, the substantially deeper occurrence of the 6.38 Ma bioevent in Hole U1611A than in Hole U1611B suggests that the stratigraphy in the two holes is different (see Figure F6 in the Expedition 401 summary chapter [Flecker et al., 2025b]). This is consistent with the different lithostratigraphic succession and with the thickening of this seismic unit from Hole U1611B to U1611A (see Lithostratigraphy).
References
Aplin, A.C., and Macquaker, J.H., 2011. Mudstone diversity: origin and implications for source, seal, and reservoir properties in petroleum systems. AAPG Bulletin, 95(12):2031–2059. https://doi.org/10.1306/03281110162
Benson, R.H., Rakic-El Bied, K., and Bonaduce, G., 1991. An important current reversal (influx) in the Rifian Corridor (Morocco) at the Tortonian-Messinian boundary: the end of Tethys Ocean. Paleoceanography, 6(1):165–192. https://doi.org/10.1029/90PA00756
Bernasconi, S.M., 1999. Interstitial water chemistry in the western Mediterranean: results from Leg 161. In Zahn, R., Comas, M.C., and Klaus, A. (Eds.), Proceedings of the Ocean Drilling Program, Scientific Results. 161: College Station, TX (Ocean Drilling Program). https://doi.org/10.2973/odp.proc.sr.161.228.1999
Bertini, A., Niccolini, G., Gennari, R., Lozar, F., Menichetti, E., Natalicchio, M., and Dela Pierre, F., 2024. Terrestrial and marine dynamics on the brink of the Messinian salinity crisis: a wet scenario from the northern Mediterranean. Global and Planetary Change, 233:104362. https://doi.org/10.1016/j.gloplacha.2024.104362
Blanc, P.-L., 2006. Improved modelling of the Messinian salinity crisis and conceptual implications. Palaeogeography, Palaeoclimatology, Palaeoecology, 238(1):349–372. https://doi.org/10.1016/j.palaeo.2006.03.033
Bouma, A.H., Keunen, P.H., and Shepard, F.P., 1962. Sedimentology of Some Flysch Deposits: a Graphic Approach to Facies Interpretation: Amsterdam (Elsevier).
Bulian, F., Sierro, F.J., Ledesma, S., Jiménez-Espejo, F.J., and Bassetti, M.-A., 2021. Messinian West Alboran Sea record in the proximity of Gibraltar: Early signs of Atlantic-Mediterranean gateway restriction. Marine Geology, 434:106430. https://doi.org/10.1016/j.margeo.2021.106430
Capella, W., Hernández-Molina, F.J., Flecker, R., Hilgen, F.J., Hssain, M., Kouwenhoven, T.J., van Oorschot, M., Sierro, F.J., Stow, D.A.V., Trabucho-Alexandre, J., Tulbure, M.A., de Weger, W., Yousfi, M.Z., and Krijgsman, W., 2017. Sandy contourite drift in the late Miocene Rifian Corridor (Morocco): reconstruction of depositional environments in a foreland-basin seaway. Sedimentary Geology, 355:31-57. https://doi.org/10.1016/j.sedgeo.2017.04.004
Comas, M.C., Platt, J.P., Soto, J.I., and Watts, A.B., 1999. The origin and tectonic history of the Alboran Basin: insights from Leg 161 results. In Zahn, R., Comas, M.C., and Klaus, A. (Eds.), Proceedings of the Ocean Drilling Program, Scientific Results. 161: College Station, TX (Ocean Drilling Program). https://doi.org/10.2973/odp.proc.sr.161.262.1999
de Castro, S., Hernández-Molina, F.J., de Weger, W., Jiménez-Espejo, F.J., Rodríguez-Tovar, F.J., Mena, A., Llave, E., and Sierro, F.J., 2021. Contourite characterization and its discrimination from other deep-water deposits in the Gulf of Cadiz contourite depositional system. Sedimentology, 68(3):987–1027. https://doi.org/10.1111/sed.12813
de Castro, S., Hernández-Molina, F.J., Rodríguez-Tovar, F.J., Llave, E., Ng, Z.L., Nishida, N., and Mena, A., 2020. Contourites and bottom current reworked sands: bed facies model and implications. Marine Geology, 428:106267. https://doi.org/10.1016/j.margeo.2020.106267
De Vleeschouwer, D., Dunlea, A.G., Auer, G., Anderson, C.H., Brumsack, H., de Loach, A., Gurnis, M.C., Huh, Y., Ishiwa, T., Jang, K., Kominz, M.A., März, C., Schnetger, B., Murray, R.W., Pälike, H., and Expedition 356 Shipboard Scientists, 2017. Quantifying K, U, and Th contents of marine sediments using shipboard natural gamma radiation spectra measured on DV JOIDES Resolution. Geochemistry, Geophysics, Geosystems, 18(3):1053–1064. https://doi.org/10.1002/2016GC006715
de Weger, W., Hernández-Molina, F.J., Miguez-Salas, O., de Castro, S., Bruno, M., Chiarella, D., Sierro, F.J., Blackbourn, G., and Manar, M.A., 2021. Contourite depositional system after the exit of a strait: case study from the late Miocene South Rifian Corridor, Morocco. Sedimentology, 68(7):2996–3032. https://doi.org/10.1111/sed.12882
Donnici, S., and Serandrei Barbero, R., 2002. The benthic foraminiferal communities of the northern Adriatic continental shelf. Marine Micropaleontology, 44(3):93–123. https://doi.org/10.1016/S0377-8398(01)00043-3
Dorador, J., and Rodríguez-Tovar, F.J., 2015. Application of digital image treatment to the characterization and differentiation of deep-sea ichnofacies. Spanish Journal of Palaeontology, 30(2):265–274. https://doi.org/10.7203/sjp.30.2.17256
Duggen, S., Hoernle, K., van den Bogaard, P., Rüpke, L., and Phipps Morgan, J., 2003. Deep roots of the Messinian salinity crisis. Nature, 422(6932):602–606. https://doi.org/10.1038/nature01553
Einsele, G., 2000. Sedimentary Basins: Evolution, Facies, and Sediment Budget: Berlin (Springer). https://doi.org/10.1007/978-3-662-04029-4
Emerson, S., and Hedges, J.I., 1988. Processes controlling the organic carbon content of open ocean sediments. Paleoceanography, 3(5):621–634. https://doi.org/10.1029/PA003i005p00621
Ercilla, G., Juan, C., Hernández-Molina, F.J., Bruno, M., Estrada, F., Alonso, B., Casas, D., Farran, M.l., Llave, E., García, M., Vázquez, J.T., D'Acremont, E., Gorini, C., Palomino, D., Valencia, J., El Moumni, B., and Ammar, A., 2016. Significance of bottom currents in deep-sea morphodynamics: an example from the Alboran Sea. Marine Geology, 378:157–170. https://doi.org/10.1016/j.margeo.2015.09.007
Estrada, F., Ercilla, G., Gorini, C., Alonso, B., Vázquez, J.T., García-Castellanos, D., Juan, C., Maldonado, A., Ammar, A., and Elabbassi, M., 2011. Impact of pulsed Atlantic water inflow into the Alboran Basin at the time of the Zanclean flooding. Geo-Marine Letters, 31(5):361–376. https://doi.org/10.1007/s00367-011-0249-8
Faccenna, C., Piromallo, C., Crespo-Blanc, A., Jolivet, L., and Rossetti, F., 2004. Lateral slab deformation and the origin of the western Mediterranean arcs. Tectonics, 23(1):TC1012. https://doi.org/10.1029/2002TC001488
Flecker, R., Ducassou, E., and Williams, T., 2023. Expedition 401 Scientific Prospectus: Mediterranean Atlantic Gateway Exchange. International Ocean Discovery Program. https://doi.org/10.14379/iodp.sp.401.2023
Flecker, R., Ducassou, E., Williams, T., Amarathunga, U., Balestra, B., Berke, M.A., Blättler, C.L., Chin, S., Das, M., Egawa, K., Fabregas, N., Feakins, S.J., George, S.C., Hernández-Molina, F.J., Krijgsman, W., Li, Z., Liu, J., Noto, D., Raad, F., Rodríguez-Tovar, F.J., Sierro, F.J., Standring, P., Stine, J., Tanaka, E., Teixeira, M., Xu, X., Yin, S., and Yousfi, M.Z., 2025a. Expedition 401 methods. In Flecker, R., Ducassou, E., Williams, T., and the Expedition 401 Scientists, Mediterranean–Atlantic Gateway Exchange. Proceedings of the International Ocean Discovery Program, 401: College Station, TX (International Ocean Discovery Program). https://doi.org/10.14379/iodp.proc.401.102.2025
Flecker, R., Ducassou, E., Williams, T., Amarathunga, U., Balestra, B., Berke, M.A., Blättler, C.L., Chin, S., Das, M., Egawa, K., Fabregas, N., Feakins, S.J., George, S.C., Hernández-Molina, F.J., Krijgsman, W., Li, Z., Liu, J., Noto, D., Raad, F., Rodríguez-Tovar, F.J., Sierro, F.J., Standring, P., Stine, J., Tanaka, E., Teixeira, M., Xu, X., Yin, S., and Yousfi, M.Z., 2025b. Expedition 401 summary. In Flecker, R., Ducassou, E., Williams, T., and the Expedition 401 Scientists, Mediterranean–Atlantic Gateway Exchange. Proceedings of the International Ocean Discovery Program, 401: College Station, TX (International Ocean Discovery Program). https://doi.org/10.14379/iodp.proc.401.101.2025
Flecker, R., Ducassou, E., Williams, T., and the Expedition 401 Scientists, 2025c. Supplementary material, https://doi.org/10.14379/iodp.proc.401supp.2025. In Flecker, R., Ducassou, E., Williams, T., and the Expedition 401 Scientists, Mediterranean–Atlantic Gateway Exchange. Proceedings of the International Ocean Discovery Program, 401: College Station, TX (International Ocean Discovery Program).
Flecker, R., Krijgsman, W., Capella, W., de Castro Martíns, C., Dmitrieva, E., Mayser, J.P., Marzocchi, A., Modestou, S., Ochoa, D., Simon, D., Tulbure, M., van den Berg, B., van der Schee, M., de Lange, G., Ellam, R., Govers, R., Gutjahr, M., Hilgen, F., Kouwenhoven, T., Lofi, J., Meijer, P., Sierro, F.J., Bachiri, N., Barhoun, N., Alami, A.C., Chacon, B., Flores, J.A., Gregory, J., Howard, J., Lunt, D., Ochoa, M., Pancost, R., Vincent, S., and Yousfi, M.Z., 2015. Evolution of the Late Miocene Mediterranean–Atlantic gateways and their impact on regional and global environmental change. Earth-Science Reviews, 150:365–392. https://doi.org/10.1016/j.earscirev.2015.08.007
Garcia-Castellanos, D., Estrada, F., Jiménez-Munt, I., Gorini, C., Fernàndez, M., Vergés, J., and De Vicente, R., 2009. Catastrophic flood of the Mediterranean after the Messinian salinity crisis. Nature, 462(7274):778–781. https://doi.org/10.1038/nature08555
Garcia-Castellanos, D., Micallef, A., Estrada, F., Camerlenghi, A., Ercilla, G., Periáñez, R., and Abril, J.M., 2020. The Zanclean megaflood of the Mediterranean – searching for independent evidence. Earth-Science Reviews, 201:103061. https://doi.org/10.1016/j.earscirev.2019.103061
García-Gallardo, Á., Grunert, P., Van der Schee, M., Sierro, F.J., Jiménez-Espejo, F.J., Alvarez Zarikian, C.A., and Piller, W.E., 2017. Benthic foraminifera-based reconstruction of the first Mediterranean-Atlantic exchange in the early Pliocene Gulf of Cadiz. Palaeogeography, Palaeoclimatology, Palaeoecology, 472:93–107. https://doi.org/10.1016/j.palaeo.2017.02.009
Gennari, R., Lozar, F., Natalicchio, M., Zanella, E., Carnevale, G., and dela Pierre, F., 2020. Chronology of the Messinian events in the northernmost part of the Mediterranean: the Govone section (Piedmont Basin, NW Italy). Rivista Italiana Di Paleontologia E Stratigrafia, 126(2). https://doi.org/10.13130/2039-4942/13705
Gómez de la Peña, L., Ranero, C.R., and Gràcia, E., 2018. The crustal domains of the Alboran Basin (western Mediterranean). Tectonics, 37(10):3352–3377. https://doi.org/10.1029/2017TC004946
Gonthier, E.G., Faugères, J.-C., and Stow, D.A.V., 1984. Contourite facies of the Faro Drift, Gulf of Cadiz. Geological Society, London, Special Publications, 15(1):275–292. https://doi.org/10.1144/GSL.SP.1984.015.01.18
Hathorne, E.C., and James, R.H., 2006. Temporal record of lithium in seawater: a tracer for silicate weathering? Earth and Planetary Science Letters, 246(3):393–406. https://doi.org/10.1016/j.epsl.2006.04.020
Hernández-Molina, F.J., de Castro, S., de Weger, W., Duarte, D., Fonnesu, M., Glazkova, T., Kirby, A., Llave, E., Ng, Z.L., Mantilla Muñoz, O., Rodrigues, S., Rodríguez-Tovar, F.J., Thieblemont, A., Viana, A.R., and Yin, S., 2022. Contourites and mixed depositional systems: A paradigm for deepwater sedimentary environments. In Rotzien, J.R., Yeilding, C.A., Sears, R.A., and Hernández-Molina, F.J., and Catuneanu, O. (Eds.), Deepwater Sedimentary Systems. Amsterdam (Elsevier), 301–360. https://doi.org/10.1016/B978-0-323-91918-0.00004-9
Hernández-Molina, F.J., Stow, D.A.V., Alvarez-Zarikian, C.A., Acton, G., Bahr, A., Balestra, B., Ducassou, E., Flood, R., Flores, J.-A., Furota, S., Grunert, P., Hodell, D., Jimenez-Espejo, F., Kim, J.K., Krissek, L., Kuroda, J., Li, B., Llave, E., Lofi, J., Lourens, L., Miller, M., Nanayama, F., Nishida, N., Richter, C., Roque, C., Pereira, H., Sanchez Goñi, M.F., Sierro, F.J., Singh, A.D., Sloss, C., Takashimizu, Y., Tzanova, A., Voelker, A., Williams, T., and Xuan, C., 2014. Onset of Mediterranean outflow into the North Atlantic. Science, 344(6189):1244–1250. https://doi.org/10.1126/science.1251306
Hesse, R., and Schacht, U., 2011. Early diagenesis of deep-sea sediments. In HüNeke, H., and Mulder, T. (Eds.), Deep-Sea Sediments. Developments in Sedimentology, 63: 557–713. https://doi.org/10.1016/B978-0-444-53000-4.00009-3
Hinrichs, K.-U., Hayes, J.M., Bach, W., Spivack, A.J., Hmelo, L.R., Holm, N.G., Johnson, C.G., and Sylva, S.P., 2006. Biological formation of ethane and propane in the deep marine subsurface. Proceedings of the National Academy of Sciences of the United States of America, 103(40):14684–14689. https://doi.org/10.1073/pnas.0606535103
Hsü, K.J., Ryan, W.B.F., and Cita, M.B., 1973. Late Miocene desiccation of the Mediterranean. Nature, 242(5395):240–244. https://doi.org/10.1038/242240a0
Hüneke, H., and Henrich, R., 2011. Pelagic sedimentation in modern and ancient oceans. In Hüneke, H., and Mulder, T. (Eds.), Deep-Sea Sediments. Developments in Sedimentology, 63: 215–351. https://doi.org/10.1016/B978-0-444-53000-4.00004-4
Hüneke, H., Hernández-Molina, F.J., Rodríguez-Tovar, F.J., Llave, E., Chiarella, D., Mena, A., and Stow, D.A.V., 2021. Diagnostic criteria using microfacies for calcareous contourites, turbidites and pelagites in the Eocene–Miocene slope succession, southern Cyprus. Sedimentology, 68(2):557–592. https://doi.org/10.1111/sed.12792
Jolivet, L., and Faccenna, C., 2000. Mediterranean extension and the Africa-Eurasia collision. Tectonics, 19(6):1095–1106. https://doi.org/10.1029/2000TC900018
Juan, C., Ercilla, G., Estrada, F., Alonso, B., Casas, D., Vázquez, J.T., d'Acremont, E., Medialdea, T., Hernández-Molina, F.J., Gorini, C., El Moumni, B., and Valencia, J., 2020. Multiple factors controlling the deep marine sedimentation of the Alboran Sea (SW Mediterranean) after the Zanclean Atlantic mega-flood. Marine Geology, 423:106138. https://doi.org/10.1016/j.margeo.2020.106138
Juan, C., Ercilla, G., Hernández-Molina, F.J., Estrada, F., Alonso, B., Casas, D., García, M., Farran, M.l., Llave, E., Palomino, D., Vázquez, J.-T., Medialdea, T., Gorini, C., D'Acremont, E., El Moumni, B., and Ammar, A., 2016. Seismic evidence of current-controlled sedimentation in the Alboran Sea during the Pliocene and Quaternary: palaeoceanographic implications. Marine Geology, 378:292–311. https://doi.org/10.1016/j.margeo.2016.01.006
Jurado, M.J., and Comas, M.C., 1992. Well log interpretation and seismic character of the cenozoic sequence in the northern Alboran Sea. Geo-Marine Letters, 12(2):129–136. https://doi.org/10.1007/BF02084923
Kiipli, T., Kiipli, E., Kallaste, T., Hints, R., Somelar, P., and Kirsimäe, K., 2007. Altered volcanic ash as an indicator of marine environment, reflecting pH and sedimentation rate - example from the Ordovician-Kinnekulle bed of Baltoscandia. Clays and Clay Minerals, 55:177–188. https://doi.org/10.1346/CCMN.2007.0550207
Lancis, C., and Flores, J.-A., 2006. A new biostratigraphically significant calcareous nannofossil species in the Early Pliocene of the Mediterranean. Micropaleontology, 52(5):477–481. https://doi.org/10.2113/gsmicropal.52.5.477
Li, Z., and Schieber, J., 2020. Application of sequence stratigraphic concepts to the upper Cretaceous Tununk Shale Member of the Mancos Shale Formation, south-central Utah: parasequence styles in shelfal mudstone strata. Sedimentology, 67(1):118–151. https://doi.org/10.1111/sed.12637
Llave, E., Hernández-Molina, F.J., García, M., Ercilla, G., Roque, C., Juan, C., Mena, A., Preu, B., Rooij, D.V., Rebesco, M., Brackenridge, R., Jané, G., Gómez-Ballesteros, M., and Stow, D., 2020. Contourites along the Iberian continental margins: conceptual and economic implications. Geological Society, London, Special Publications, 476(1):403–436. https://doi.org/10.1144/SP476-2017-46
Lofi, J., Sage, F.o., Déverchère, J., Loncke, L., Maillard, A.s., Gaullier, V., Thinon, I., Gillet, H., Guennoc, P., and Gorini, C., 2011. Refining our knowledge of the Messinian salinity crisis records in the offshore domain through multi-site seismic analysis. Bulletin de la Société Géologique de France, 182(2):163–180. https://doi.org/10.2113/gssgfbull.182.2.163
Lowe, D.R., 1982. Sediment gravity flows; II, Depositional models with special reference to the deposits of high-density turbidity currents. Journal of Sedimentary Research, 52(1):279–297. https://doi.org/10.1306/212F7F31-2B24-11D7-8648000102C1865D
Lozar, F., and Negri, A., 2019. A review of basin-wide calcareous nannofossil bioevents in the Mediterranean at the onset of the Messinian salinity crisis. Marine Micropaleontology, 151:101752. https://doi.org/10.1016/j.marmicro.2019.101752
Lozar, F., Violanti, D., Bernardi, E., Dela Pierre, F., and Natalicchio, M., 2018. Identifying the onset of the Messinian salinity crisis: a reassessment of the biochronostratigraphic tools (Piedmont Basin, NW Italy). Newsletters on Stratigraphy, 51(1):11–31. https://doi.org/10.1127/nos/2017/0354
MacEachern, J.A., Bann, K.L., Pemberton, S.G., Gingras, M.K., MacEachern, J.A., Bann, K.L., Gingras, M.K., and Pemberton, S.G., 2007. The Ichnofacies Paradigm: high-resolution paleoenvironmental interpretation of the rock record. In MacEachern, J.A., Bann, K.L., Gingras, M.K., and Pemberton, S.G. (Eds.), Applied Ichnology. SEPM Short Course Notes, 52:27–64. https://doi.org/10.2110/pec.07.52.0027
Manzi, V., Roveri, M., Gennari, R., Bertini, A., Biffi, U., Giunta, S., Iaccarino, S.M., Lanci, L., Lugli, S., Negri, A., Riva, A., Rossi, M.E., and Taviani, M., 2007. The deep-water counterpart of the Messinian Lower Evaporites in the Apennine foredeep: the Fanantello section (Northern Apennines, Italy). Palaeogeography, Palaeoclimatology, Palaeoecology, 251(3):470–499. https://doi.org/10.1016/j.palaeo.2007.04.012
Martín, J., Puga-Bernabéu, Á., Aguirre, J., and Braga, J., 2014. Miocene Atlantic-Mediterranean seaways in the Betic Cordillera (southern Spain). Revista de la Sociedad Geológica de España, 27:175–186.
Martín, J.M., Braga, J.C., and Betzler, C., 2001. The Messinian Guadalhorce corridor: the last northern, Atlantic–Mediterranean gateway. Terra Nova, 13(6):418–424. https://doi.org/10.1046/j.1365-3121.2001.00376.x
Martínez del Olmo, W., 2011. El Messiniense en el Golfo de Valencia y el Mar de Alborán: implicaciones paleogeográficas y paleoceanográficas. Revista de la Sociedad Geológica de España, 24(3-4):237–257.
Martínez del Olmo, W., and Comas, M.C., 2008. Arquitectura sísmica, olistostromas y fallas extensionales en el norte de la cuenca oeste del Mar de Alborán. Revista de la Sociedad Geológica de España, 21(3–4):151–167. https://dialnet.unirioja.es/servlet/articulo?codigo=3112411
Meriç, E., Öner, E., Avşar, N., Nazik, A., Güneyli, H., İslamoğlu, Y., Yokeş, M.B., and Dinçer, F., 2016. Did the Red Sea – Mediterranean connection over the Dead Sea Fault Zone end in the Late Pliocene? Quaternary International, 401:123–131. https://doi.org/10.1016/j.quaint.2015.08.067
Meriç, E., Yokeş, M.B., Avşar, N., and Dinçer, F., 2018. Did Spiroloculina antillarum, Articulina carinata, Coscinospira hemphrichii, Peneroplis pertusus, P. planatus, Sorites orbiculus, Astacolus insolithus, Siphonina tubulosa, Amphistegina lessonii and A. lobifera reach the Mediterranean via the Suez Canal? International Journal of Environment and Geoinformatics, 5(3):378–385. https://doi.org/10.30897/ijegeo.469760
Meyers, P.A., 1997. Organic geochemical proxies of paleoceanographic, paleolimnologic, and paleoclimatic processes. Organic Geochemistry, 27(5–6):213–250. https://doi.org/10.1016/S0146-6380(97)00049-1
Oremland, R.S., Whiticar, M.J., Strohmaier, F.E., and Kiene, R.P., 1988. Bacterial ethane formation from reduced, ethylated sulfur compounds in anoxic sediments. Geochimica et Cosmochimica Acta, 52(7):1895–1904. https://doi.org/10.1016/0016-7037(88)90013-0
Pickering, K.T., and Hiscott, R.N., 2015. Deep Marine Systems: Processes, Deposits, Environments, Tectonics and Sedimentation: Hoboken, NJ (John Wiley & Sons).
Postma, G., 1986. Classification for sediment gravity-flow deposits based on flow conditions during sedimentation. Geology, 14(4):291–294. https://doi.org/10.1130/0091-7613(1986)14<291:CFSGDB>2.0.CO;2
Raiswell, R., and Fisher, Q.J., 2000. Mudrock-hosted carbonate concretions: a review of growth mechanisms and their influence on chemical and isotopic composition. Journal of the Geological Society (London, UK), 157(1):239–251. https://doi.org/10.1144/jgs.157.1.239
Rodrigues, S., Hernández-Molina, F.J., Fonnesu, M., Miramontes, E., Rebesco, M., and Campbell, D.C., 2022a. A new classification system for mixed (turbidite-contourite) depositional systems: examples, conceptual models and diagnostic criteria for modern and ancient records. Earth-Science Reviews, 230:104030. https://doi.org/10.1016/j.earscirev.2022.104030
Rodrigues, S., Hernández-Molina, F.J., Hillenbrand, C.-D., Lucchi, R.G., Rodríguez-Tovar, F.J., Rebesco, M., and Larter, R.D., 2022b. Recognizing key sedimentary facies and their distribution in mixed turbidite–contourite depositional systems: the case of the Pacific margin of the Antarctic Peninsula. Sedimentology, 69(4):1953–1991. https://doi.org/10.1111/sed.12978
Rodríguez-Tovar, F.J., 2022. Ichnological analysis: a tool to characterize deep-marine processes and sediments. Earth-Science Reviews, 228:104014. https://doi.org/10.1016/j.earscirev.2022.104014
Rodríguez-Tovar, F.J., and Dorador, J., 2014. Ichnological analysis of Pleistocene sediments from the IODP Site U1385 "Shackleton Site" on the Iberian margin; approaching paleoenvironmental conditions. Palaeogeography, Palaeoclimatology, Palaeoecology, 409:24–32. https://doi.org/10.1016/j.palaeo.2014.04.027
Rotzien, J.R., Hernández-Molina, F.J., Fonnesu, M., and Thieblemont, A., 2022a. Deepwater sedimentary processes. In Rotzien, J.R., Yeilding, C.A., Sears, R.A., and Hernández-Molina, F.J., and Catuneanu, O., (Eds.), Deepwater Sedimentary Systems. Amsterdam (Elsevier), 179–202. https://doi.org/10.1016/B978-0-323-91918-0.00021-9
Rotzien, J.R., Hernández-Molina, F.J., Fonnesu, M., and Thieblemont, A., 2022b. Deepwater sedimentation units. In Rotzien, J.R., Yeilding, C.A., Sears, R.A., and Hernández-Molina, F.J., and Catuneanu, O. (Eds.), Deepwater Sedimentary Systems. Amsterdam (Elsevier), 203–249. https://doi.org/10.1016/B978-0-323-91918-0.00009-8
Rouchy, J.M., and Caruso, A., 2006. The Messinian salinity crisis in the Mediterranean basin: a reassessment of the data and an integrated scenario. Sedimentary Geology, 188–189:35-67. https://doi.org/10.1016/j.sedgeo.2006.02.005
Roveri, M., Flecker, R., Krijgsman, W., Lofi, J., Lugli, S., Manzi, V., Sierro, F.J., Bertini, A., Camerlenghi, A., De Lange, G., Govers, R., Hilgen, F.J., Hübscher, C., Meijer, P.T., and Stoica, M., 2014. The Messinian salinity crisis: past and future of a great challenge for marine sciences. Marine Geology, 352:25–58. https://doi.org/10.1016/j.margeo.2014.02.002
Ryan, W.B.F., 2009. Decoding the Mediterranean salinity crisis. Sedimentology, 56(1):95–136. https://doi.org/10.1111/j.1365-3091.2008.01031.x
Ryan, W.B.F., Hsü, K.J., et al., 1973. Initial Reports of the Deep Sea Drilling Project, 13: Washington, DC (US Government Printing Office). https://doi.org/10.2973/dsdp.proc.13.1973
Santisteban, C., and Taberner, C., 1983. Shallow marine and continental conglomerates derived from coral reef complexes after desiccation of a deep marine basin: the Tortonian-Messinian deposits of the Fortuna Basin, SE Spain. Journal of the Geological Society (London, UK), 140(3):401–411. https://doi.org/10.1144/gsjgs.140.3.0401
Schimmelmann, A., Lange, C.B., Schieber, J., Francus, P., Ojala, A.E.K., and Zolitschka, B., 2016. Varves in marine sediments: A review. Earth-Science Reviews, 159:215–246. https://doi.org/10.1016/j.earscirev.2016.04.009
Shanmugam, G., 2019. Slides, slumps, debris flows, turbidity currents, hyperpycnal flows, and bottom currents. In Cochran, J.K., Bokuniewicz, H.J., and Yager, P.L. (Eds.), Encyclopedia of Ocean Sciences (Third Edition). 4: Amsterdam (Elsevier), 228–257.
Shanmugam, G., 2021. Mass Transport, Gravity Flows, and Bottom Currents: Downslope and Alongslope Processes and Deposits: Amsterdam (Elsevier).
Shipboard Scientific Party, 1996. Site 976. In Comas, M.C., Zahn, R., Klaus, A., et al., Proceedings of the Ocean Drilling Program, Initial Reports. 161: College Station, TX (Ocean Drilling Program), 179–297. https://doi.org/10.2973/odp.proc.ir.161.106.1996
Shipp, R.C., Weimer, P., and Posamentier, H.W., 2011. Mass-transport deposits in deepwater settings. SEPM Special Publication, 96. https://doi.org/10.2110/sepmsp.096.003
Sierro, F.J., Flores, J.A., Francés, G., Vazquez, A., Utrilla, R., Zamarreño, I., Erlenkeuser, H., and Barcena, M.A., 2003. Orbitally-controlled oscillations in planktic communities and cyclic changes in western Mediterranean hydrography during the Messinian. Palaeogeography, Palaeoclimatology, Palaeoecology, 190:289–316. https://doi.org/10.1016/S0031-0182(02)00611-9
Stanley, D.J., 1988. Turbidites Reworked by Bottom Currents: Upper Cretaceous Examples from St. Croix, U.S. Virgin Islands: Washington, DC (Smithsonian Institution Press). https://doi.org/10.5479/si.01960768.33
Stow, D., and Smillie, Z., 2020. Distinguishing between deep-water sediment facies: turbidites, contourites and hemipelagites. Geosciences, 10(2):68. https://doi.org/10.3390/geosciences10020068
Stow, D.A.V., and Faugères, J.C., 2008. Contourite facies and the facies model. In Rebesco, M., and Camerlenghi, A. (Eds.), Contourites. Developments in Sedimentology, 60: (Elsevier), 223–256. https://doi.org/10.1016/S0070-4571(08)10013-9
Stow, D.A.V., and Wetzel, A., 1990. Hemiturbidite: a new type of deep-water sediment. In Cochran, J.R.S., D.A.V., et al., Proceedings of the Ocean Drilling Program, Scientific Results. 116: College Station, TX (Ocean Drilling Program), 25–34. https://doi.org/10.2973/odp.proc.sr.116.152.1990
Szarek, R., Nomaki, H., and Kitazato, H., 2007. Living deep-sea benthic foraminifera from the warm and oxygen-depleted environment of the Sulu Sea. Deep Sea Research Part II: Topical Studies in Oceanography, 54(1):145–176. https://doi.org/10.1016/j.dsr2.2006.02.017
Thomas, E., 1986. Early to Middle Miocene benthic foraminiferal faunas from DSDP Sites 608 and 610, North Atlantic. Geological Society, London, Special Publications, 21(1):205–218. https://doi.org/10.1144/GSL.SP.1986.021.01.15
van der Schee, M., Sierro, F.J., Jiménez-Espejo, F.J., Hernández-Molina, F.J., Flecker, R., Flores, J.A., Acton, G., Gutjahr, M., Grunert, P., Garcia-Gallardo, A., and Andersen, N., 2016. Evidence of early bottom water current flow after the Messinian Salinity Crisis in the Gulf of Cadiz. Marine Geology, 380:315–329. https://doi.org/10.1016/j.margeo.2016.04.005
van Hinsbergen, D.J.J., Vissers, R.L.M., and Spakman, W., 2014. Origin and consequences of western Mediterranean subduction, rollback, and slab segmentation. Tectonics, 33(4):393–419. https://doi.org/10.1002/2013TC003349
Weniger, P., Blumenberg, M., Berglar, K., Ehrhardt, A., Klitzke, P., Krüger, M., and Lutz, R., 2019. Origin of near-surface hydrocarbon gases bound in northern Barents Sea sediments. Marine and Petroleum Geology, 102:455–476. https://doi.org/10.1016/j.marpetgeo.2018.12.036