Zitellini, N., Malinverno, A., Estes, E.R., and the Expedition 402 Scientists
Proceedings of the International Ocean Discovery Program Volume 402
publications.iodp.org
https://doi.org/10.14379/iodp.proc.402.103.2025
Site U16121
![]() A. Malinverno,
A. Malinverno,
![]() N. Zitellini,
N. Zitellini,
![]() E.R. Estes,
E.R. Estes,
![]() N. Abe,
N. Abe,
![]() N. Akizawa,
N. Akizawa,
![]() M. Bickert,
M. Bickert,
![]() E.H. Cunningham,
E.H. Cunningham,
![]() A. Di Stefano,
A. Di Stefano,
![]() I.Y. Filina,
I.Y. Filina,
![]() Q. Fu,
Q. Fu,
![]() S. Gontharet,
S. Gontharet,
![]() L.E. Kearns,
L.E. Kearns,
![]() R.K. Koorapati,
R.K. Koorapati,
![]() C. Lei,
C. Lei,
![]() M.F. Loreto,
M.F. Loreto,
![]() L. Magri,
L. Magri,
![]() W. Menapace,
W. Menapace,
![]() T. Morishita,
T. Morishita,
![]() A. Pandey,
A. Pandey,
![]() V.L. Pavlovics,
V.L. Pavlovics,
![]() P.A. Pezard,
P.A. Pezard,
![]() E.M. Poulaki,
E.M. Poulaki,
![]() M.A. Rodriguez-Pilco,
M.A. Rodriguez-Pilco,
![]() A. Sanfilippo,
A. Sanfilippo,
![]() B.D. Shuck,
B.D. Shuck,
![]() P. Vannucchi, and
P. Vannucchi, and
![]() X. Zhao2
X. Zhao2
1 Malinverno, A., Zitellini, N., Estes, E.R., Abe, N., Akizawa, N., Bickert, M., Cunningham, E.H., Di Stefano, A., Filina, I.Y., Fu, Q., Gontharet, S., Kearns, L.E., Koorapati, R.K., Lei, C., Loreto, M.F., Magri, L., Menapace, W., Morishita, T., Pandey, A., Pavlovics, V.L., Pezard, P.A., Poulaki, E.M., Rodriguez-Pilco, M.A., Sanfilippo, A., Shuck, B.D., Vannucchi, P., and Zhao, X., 2025. Site U1612. In Zitellini, N., Malinverno, A., Estes, E.R., and the Expedition 402 Scientists, Tyrrhenian Continent–Ocean Transition. Proceedings of the International Ocean Discovery Program, 402: College Station, TX (International Ocean Discovery Program). https://doi.org/10.14379/iodp.proc.402.103.2025
2 Expedition 402 Scientists' affiliations.
1. Background and objectives
Site U1612 is located in the Vavilov Basin, which lies near the center of the Tyrrhenian Sea and includes its deepest parts (about 3600 m depth; Figure F1). The basin contains the prominent Vavilov volcano, which is composed of intraplate basalts (Peccerillo, 2017), and the De Marchi, Flavio Gioia, and Farfalla Seamounts, which contain a variety of continental basement rocks including granites, gneisses, quartzites, schists, phyllites, and shallow-water carbonates (Heezen et al., 1971; Colantoni et al., 1981). Mid-ocean-ridge basalts were sampled at Deep Sea Drilling Program (DSDP) Leg 42 Site 373 (Shipboard Scientific Party, 1978) and Ocean Drilling Program (ODP) Leg 107 Site 656 on the Gortani Ridge (Kastens and Mascle, 1990). ODP Leg 107 Site 651 also recovered island arc basalts above 30 m of serpentinized peridotite (Beccaluva et al., 1990; Bonatti et al., 1990).
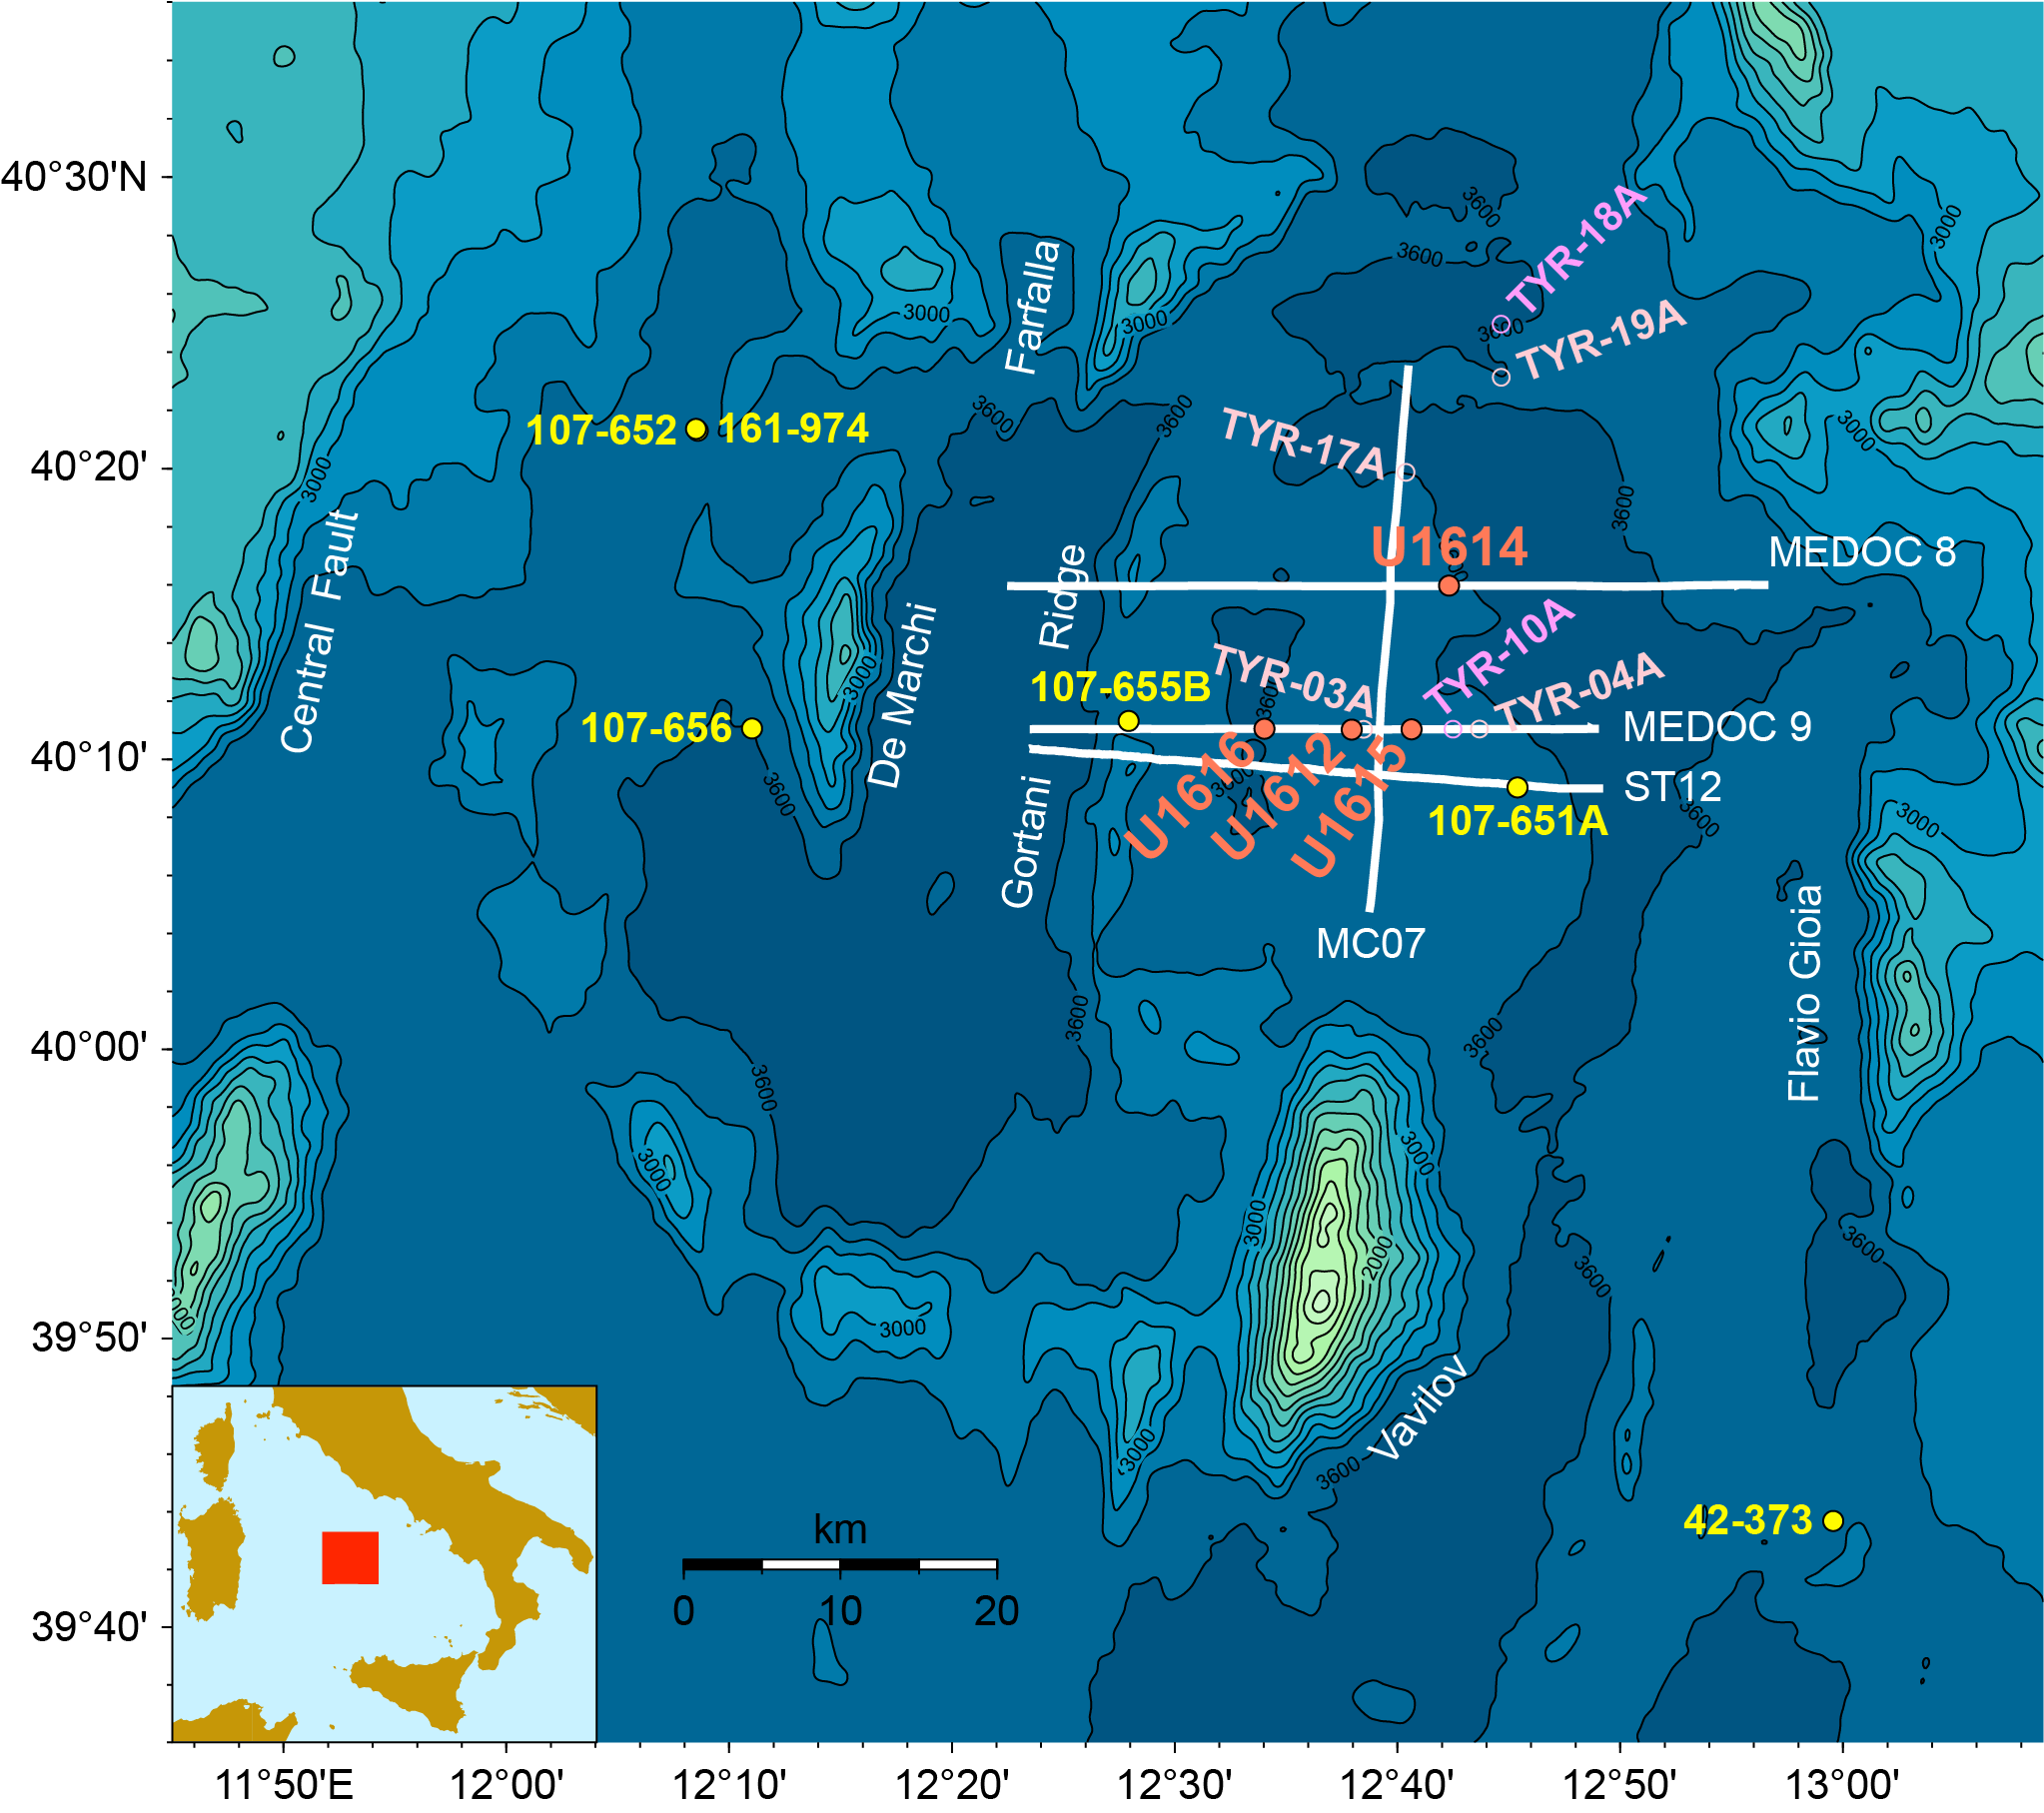
Figure F1. Location map.
Recent analyses of high-quality seismic data show a seismic velocity structure in the Vavilov Basin similar to that of continent–ocean transitions (COTs) where peridotitic mantle has been exhumed by low-angle normal faults and serpentinized by interaction with seawater (Prada et al., 2014). This finding led to the suggestion that most of the basement rocks in the deep Vavilov Basin consist of mantle peridotites (Prada et al., 2015), whereas previous interpretations considered it to be basaltic oceanic crust (e.g., Kastens and Mascle, 1990). A major goal of International Ocean Discovery Program (IODP) Expedition 402 is to test these hypotheses by directly sampling the geological basement of the Vavilov Basin and to improve our still incomplete understanding of the COT evolution.
The overall plan for Expedition 402 was to drill a total of six sites forming two transects: an east–west transect targeting the progression from magmatic crust to exposed mantle and a north–south transect mapping the area of inferred exhumed mantle. Site U1612 in the Vavilov Basin is located on the flank of an irregular basement high interpreted to be the uplifted footwall of a long-offset low-angle detachment fault that exhumed the mantle (Figures F1, F2). Similar low-angle normal faults have been proposed to expose deep-seated continental crust rocks in metamorphic core complexes (Lister and Davis, 1989) and mantle peridotites in the Galicia Atlantic margin (Boillot and Winterer, 1988) and along the axis of the Mid-Atlantic Ridge (Tucholke et al., 1998). Drilling the east–west transect sites aimed to clarify the nature and variation of the geologic basement exposed along the inferred detachment fault. Site U1612 was considered the highest priority site because it is located at the intersection of the east–west and north–south transects in the Vavilov Basin and was therefore drilled first during Expedition 402. The specific scientific objective of Site U1612 was to test whether the geologic basement in this part of the Vavilov Basin is indeed composed of mantle peridotites, as proposed by Prada et al. (2014, 2015).
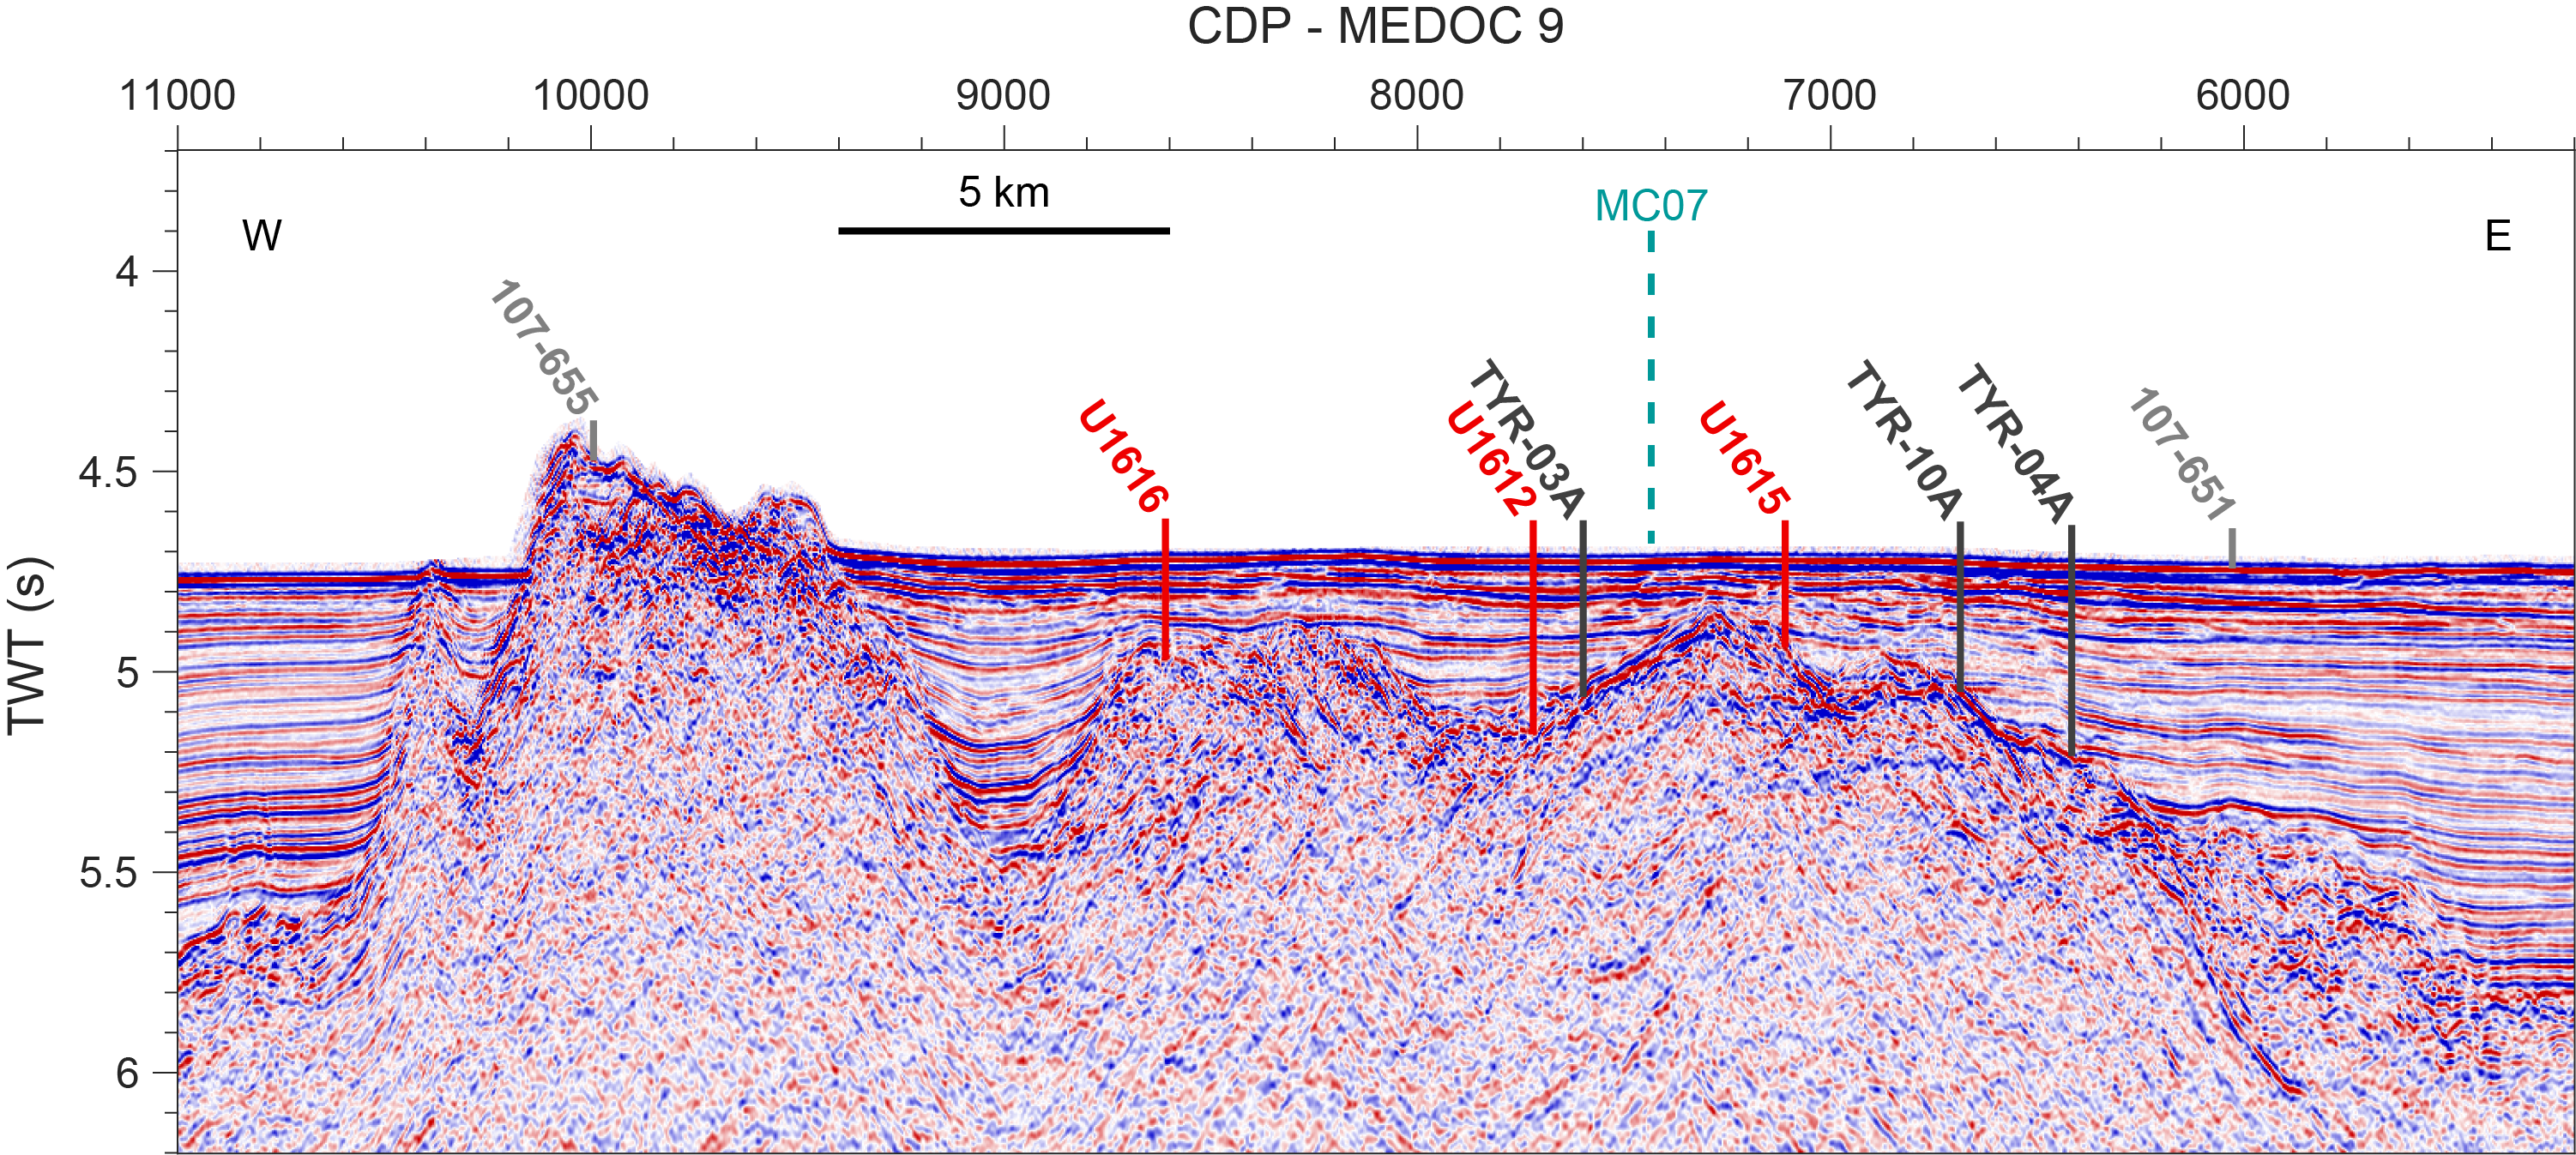
Figure F2. Seismic Reflection Line MEDOC 9.
The original plan for Site U1612 was to first drill Hole A using the rotary core barrel (RCB) coring system to a total penetration of 418 meters below seafloor (mbsf), including an estimated 278 m of sediment and 140 m of basement to ensure crossing of the exhumation fault zone (estimated to be about 100 m thick). Recovery would be particularly important in the few tens of meters above the basement to determine the age of the oldest sediment (and hence the timing of basaltic magmatism and/or mantle exhumation) from bio- and magnetostratigraphy and to collect biogeochemical evidence of fluid-rock interactions resulting from active serpentinization at depth. After coring, downhole geophysical logging was planned to complement core recovery and correlate borehole depth with traveltimes in seismic reflection images. Depending on how well the sediment/basement interface was recovered in Hole A, the plan was to also drill a second Hole B using the advanced piston corer/extended core barrel (APC/XCB) coring system to ensure adequate sampling of the lowermost 50 m of sediment and the sediment/basement interface.
2. Operations
Table T1 lists hole locations, water depths, and coring statistics for Site U1612. All times are provided in local ship time (UTC + 1 h).
2.1. Expedition 402 port call and transit to Site U1612
Expedition 402 began in Napoli, Italy, at Berth 5 Molo Angioino at 0818 h on 9 February 2024. Offgoing scientists and staff disembarked, and oncoming staff joined the vessel. The oncoming science party and ship's crew boarded the vessel on 10 February. Port call activities included receiving refrigerated and frozen chemical shipments, loading additional sepiolite and barite drilling mud, and bunkering 1000 metric tons of marine gas oil. Catering supplies and surface and air freight deliveries were also loaded, and IODP Expedition 401 cores were offloaded. All personnel took a Coronavirus Disease 2019 (COVID-19) antigen test on 13 February as part of the COVID-19 mitigation protocol. One staff member who had previously tested positive for COVID-19 after developing symptoms was already in a quarantine berth. A second staff member tested positive several days later and was also quarantined.
The research vessel (R/V) JOIDES Resolution departed Napoli on 14 February; the pilot boarded at 0651 h, and the last line was released at 0724 h. The pilot disembarked at 0755 h, and the ship completed the 86.6 nmi transit to Site U1612. During the transit, all personnel participated in a fire and boat drill. The ship arrived on site at 1530 h and transitioned from cruise mode to dynamic positioning (DP) mode.
2.2. Hole U1612A
A 181.1 m long bottom-hole assembly (BHA) for the RCB system was assembled and deployed with a C-4 RCB bit. The precision depth recorder (PDR) readings determined the seafloor to be at 3572.6 meters below sea level (mbsl). The pipe was tripped to 3543 meters below rig floor (mbrf), the top drive was picked up, and a pig was pumped through the drill pipe to remove any internal rust or debris. With this step completed, the pipe was tripped to just above the PDR depth, and Hole U1612A was spudded at 0800 h on 15 February. The mudline Core 1R determined the water depth to be 3573.8 m.
RCB drilling in Hole U1612A advanced through the sediment column to the basement at ~333 mbsf in Core 35R. Core recovery was poor throughout the sediment column (72.5 m; 22% recovery). A total of 17 cores had no recovery or recovery of <0.5 m of core material, including Cores 1R and 2R at the seawater/sediment interface. Recovery improved near the basement; Cores 32R–34R had an average of 98% recovery. During sediment coring, the Sediment Temperature 2 (SET2) tool was run three times, following Cores 11R, 17R, and 21R. The measurement attempted after Core 17R did not provide a good reading, likely because of poor contact between the probe and the formation. Cores 35R–39R entered the basement. Including the ~0.5 m of basement recovered in Core 34R, we penetrated 15.7 m of basement and recovered 3.45 m of material (22%). Nonmagnetic core barrels were used on all cores.
While drilling Core 402-U1612A-40R, the drill pipe became stuck and lost rotation and vertical movement. The decision was made to sever the pipe at the top of the BHA. A severing charge was lowered into the hole to 207 mbsf and detonated. A decrease in string weight was not observed, indicating that the pipe was stuck farther up in the sediment column. A second severing charge was lowered to the sediment/water interface and detonated at 0235 h on 19 February. An immediate drop in string weight indicated that the pipe was successfully severed and set free (Figure F3). The pipe was tripped back to the surface. The decision was made to cease operations in Hole U1612A.
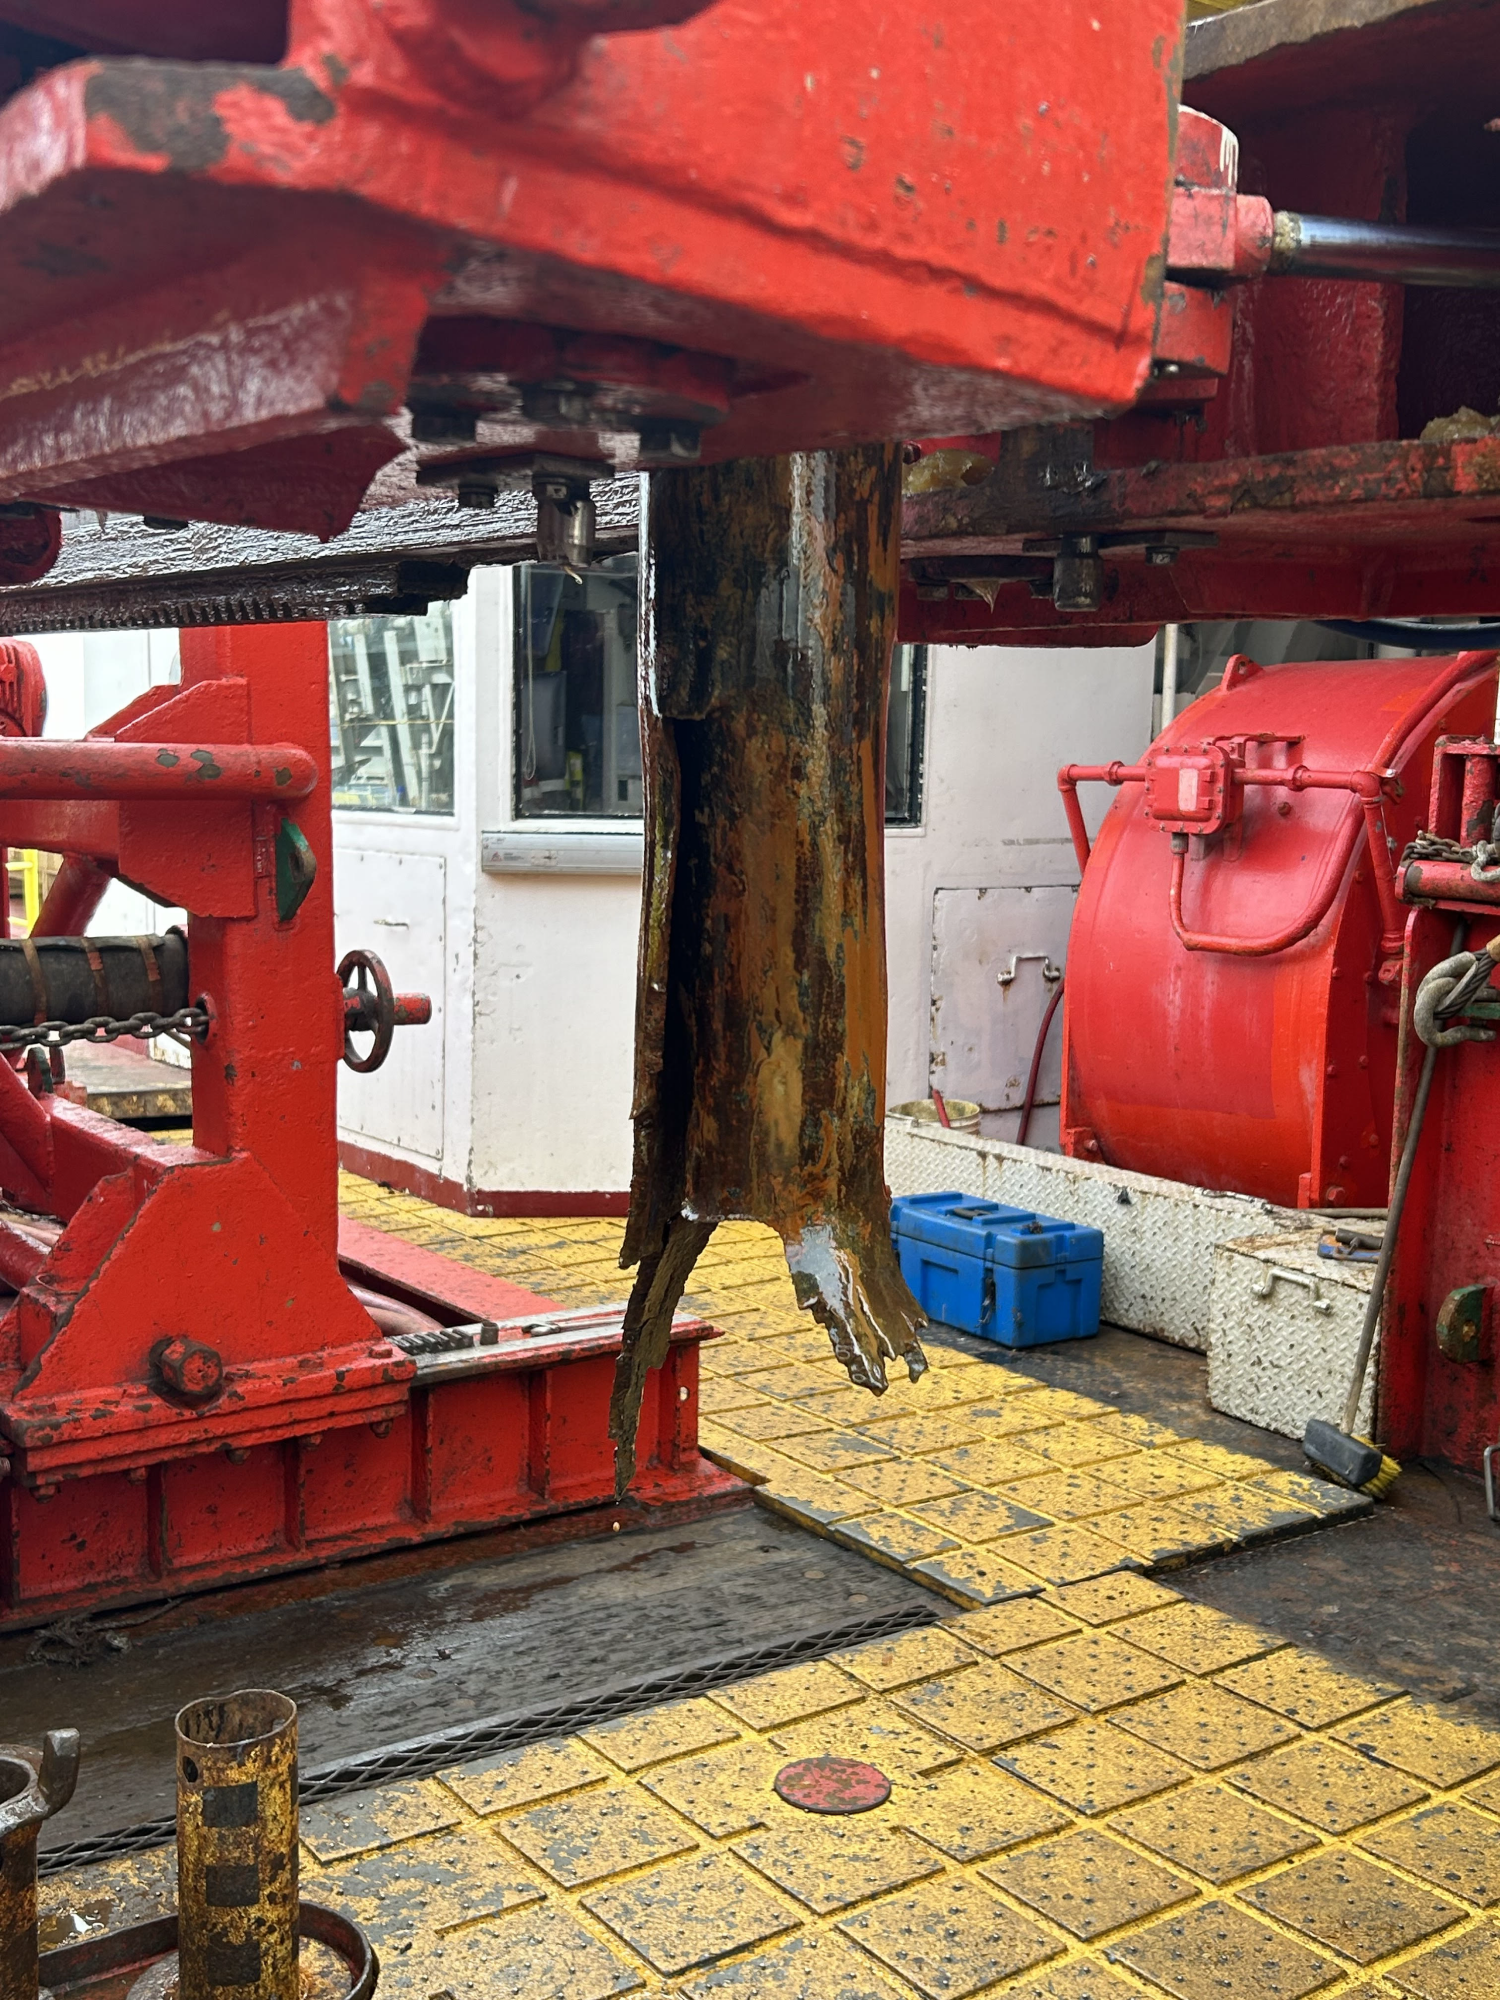
Figure F3. Severed drill pipe.
2.3. Hole U1612B
Site U1612 was revisited at the very end of the expedition, following operations in Hole U1616E. The vessel completed the 3 nmi transit between Sites U1616 and U1612 in DP mode while still tripping the pipe up from the seafloor. The logging bit used in Hole U1616E was recovered onto the rig floor at 0630 h on 6 April 2024. A new RCB BHA was set up, and the pipe was tripped to the seafloor while the drillship continued the transit. We arrived on site at 1242 h, picked up the top drive, filled the pipe, and deployed the center bit. Hole U1612B was spudded at 1921 h on 6 April with the goal of drilling down through the sediment column and collecting as many basement cores as possible in the time available.
The drill ahead in Hole U1612B (drilled interval 11) reached 318.1 mbsf before contacting a hard layer. The center bit was recovered, and RCB coring proceeded with Cores 2R–4R. These three cores advanced 16.8 m to a total hole depth of 334.9 mbsf and recovered 3.80 m of breccia, granitoids, and peridotite (23% recovery). The rate of penetration was ~5.0 m/h.
Following recovery of Core 402-U1612B-4R, the pipe was tripped back to the surface and the rig floor was secured for the transit to Napoli, Italy. At 2126 h on 7 April, the vessel switched from DP to cruise mode, ending Hole U1612B and operations for Expedition 402. The 89.5 nmi transit was completed at a speed of 10.2 kt. The first line ashore was at 0750 h on 8 April 2024, ending Expedition 402.
3. Lithostratigraphy
Drilling operations in Hole U1612A cored a ~348.7 m thick sequence of sediments and rocks, with a total core recovery of 75.41 m (22%). The sediment/basement interface was encountered at 324.4 m core depth below seafloor, Method A (CSF-A). Basement was drilled for 24.3 m with a total recovery of ~14% (Units IV and V). Hole U1612A is in the northernmost location of the Vavilov Basin sites and contains thick, unconsolidated clastic deposits from the Campanian margin. As a result, RCB drilling was not effective at this site. The sediments recovered from Hole U1612A are divided into three lithostratigraphic units. Unit I consists of volcaniclastic-rich nannofossil ooze, volcaniclastic-rich fine sand, nannofossil ooze with volcaniclastics, and tuff. Unit I can be further divided into Subunits IA and IB to distinguish a decrease of the volcaniclastic component in the deeper Subunit IB. Unit II consists of nannofossil ooze/chalk, foraminifera-rich nannofossil chalk, and nannofossil chalk with radiolarians. Unit III is dolomitic mud (Figure F4) and is the deepest sedimentary unit above the basement. Bioturbation, absent in the sediments of the upper half of the cored interval, increases in intensity and frequency in the lower half of Unit III (Figure F5). Site U1612 was also reoccupied at the end of the expedition; however, because the recovered material from Hole U1612B consists of basement rocks, the lithologies are described in their entirety in Igneous and metamorphic petrology.
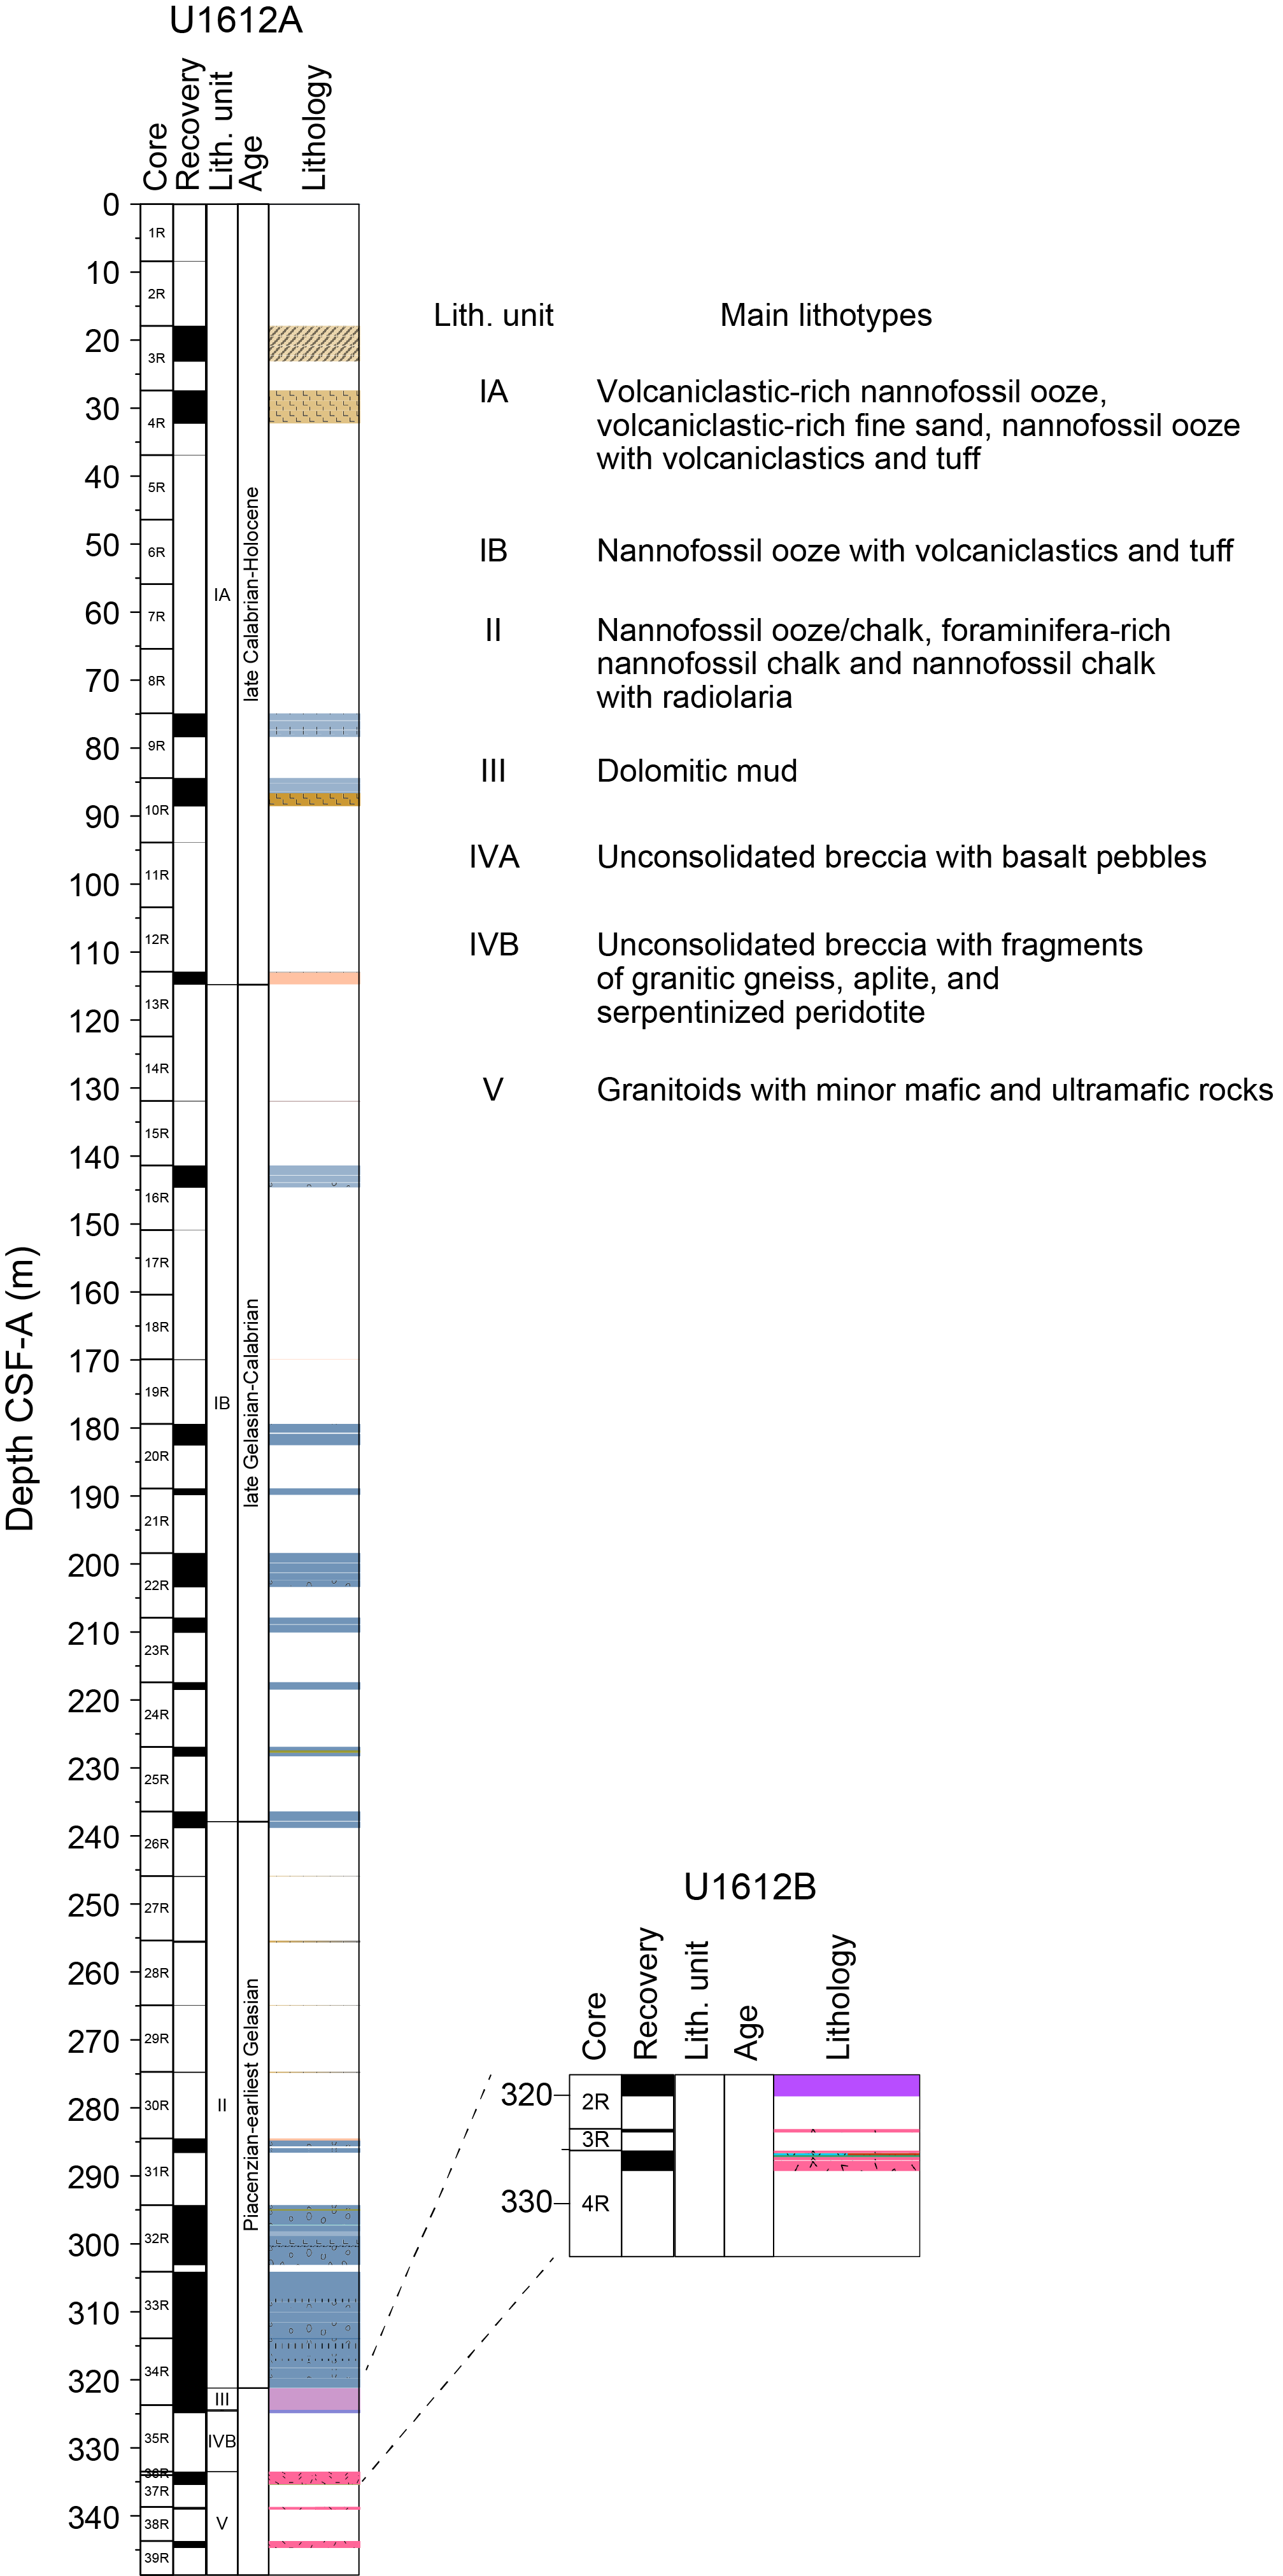
Figure F4. Lithostratigraphic summary.
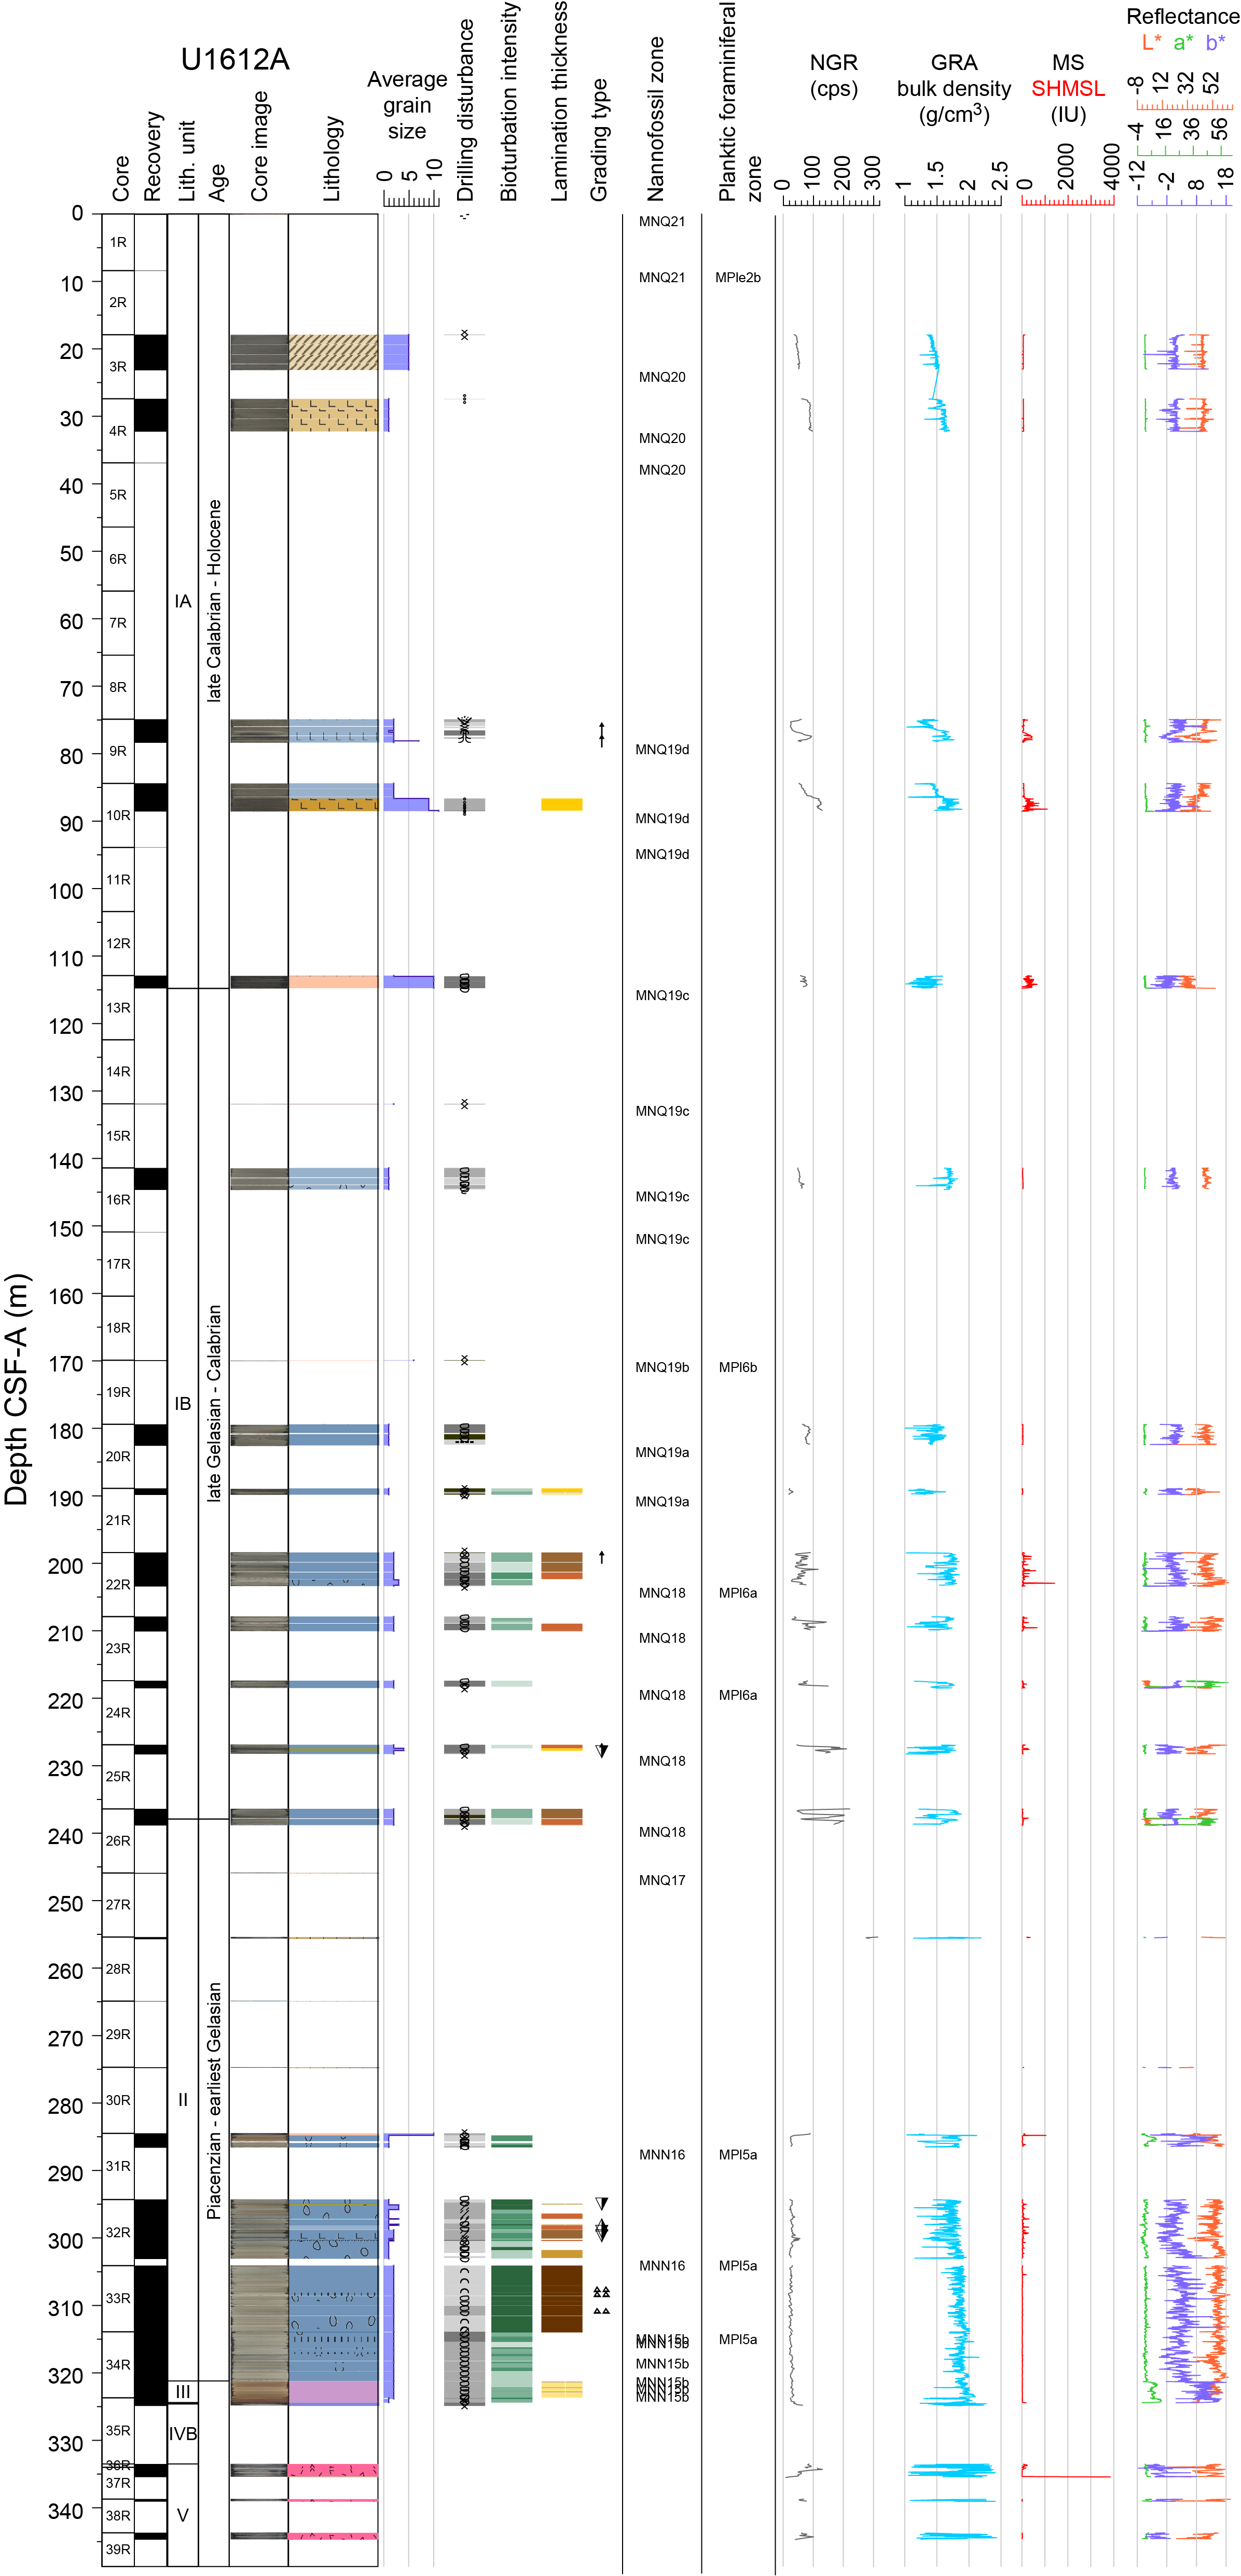
Figure F5. Visual core description.
The lithostratigraphic units were described on the basis of visual observations of sediment characteristics (color, grain size, bioturbation, and general appearance), microscopic examination of smear slides, bulk mineralogical analysis by X-ray diffraction (XRD), biostratigraphy, physical properties, and carbonate chemistry (see Lithostratigraphy in the Expedition 402 methods chapter [Malinverno et al., 2025]; see also Sediment and interstitial water geochemistry). The age of the sediment was determined using biostratigraphy of nannofossil and planktic foraminifera (see Biostratigraphy) and magnetostratigraphy (see Paleomagnetism). The definition of the basement lithostratigraphic units in Hole U1612A was based on the occurrence of different associations of igneous lithologies, classified on the basis of mineralogy, texture, and grain size. Degree of alteration and deformation structures (see Structural geology) were also considered to define subunits. Macroscopic evaluations were confirmed by microscopic observation on thin sections and portable X-ray fluorescence (pXRF) analysis.
3.1. Unit descriptions
3.1.1. Lithostratigraphic Unit I
- Interval: 402-U1612A-1R-1 through 26R-2
- Depth: 0–237.9 m CSF-A
- Age: Holocene to Early Pleistocene (present to Calabrian/Gelasian)
- Major lithologies: volcaniclastic-rich nannofossil ooze, volcaniclastic-rich fine sand, nannofossil ooze with volcaniclastics, and tuff
Unit I (0–237.9 m CSF-A) consists of nannofossil ooze interbedded with volcaniclastic sediments (Figure F6). Overall, sediments decrease in average grain size toward the base of the unit, giving way to finer grained, more calcareous facies in Unit II. Recovery in most cores was minimal, sometimes only the core catcher. Subunit IA (0–114.8 m CSF-A) contains soupy mud from the seafloor to 27 m CSF-A, followed below by the first appearance of a homogeneous sand that is largely volcaniclastic but also contains siliciclastic components. There was no recovery from 32 to 74 m CSF-A. Below this depth, the recovered lithologies include tuff and volcaniclastic-rich nannofossil ooze. The lack of sedimentary structures in the unconsolidated coarse-grained clastic sediments may be due to drilling disturbance. From shipboard analyses, volcaniclastic sediments typically have carbonate contents < 10%.
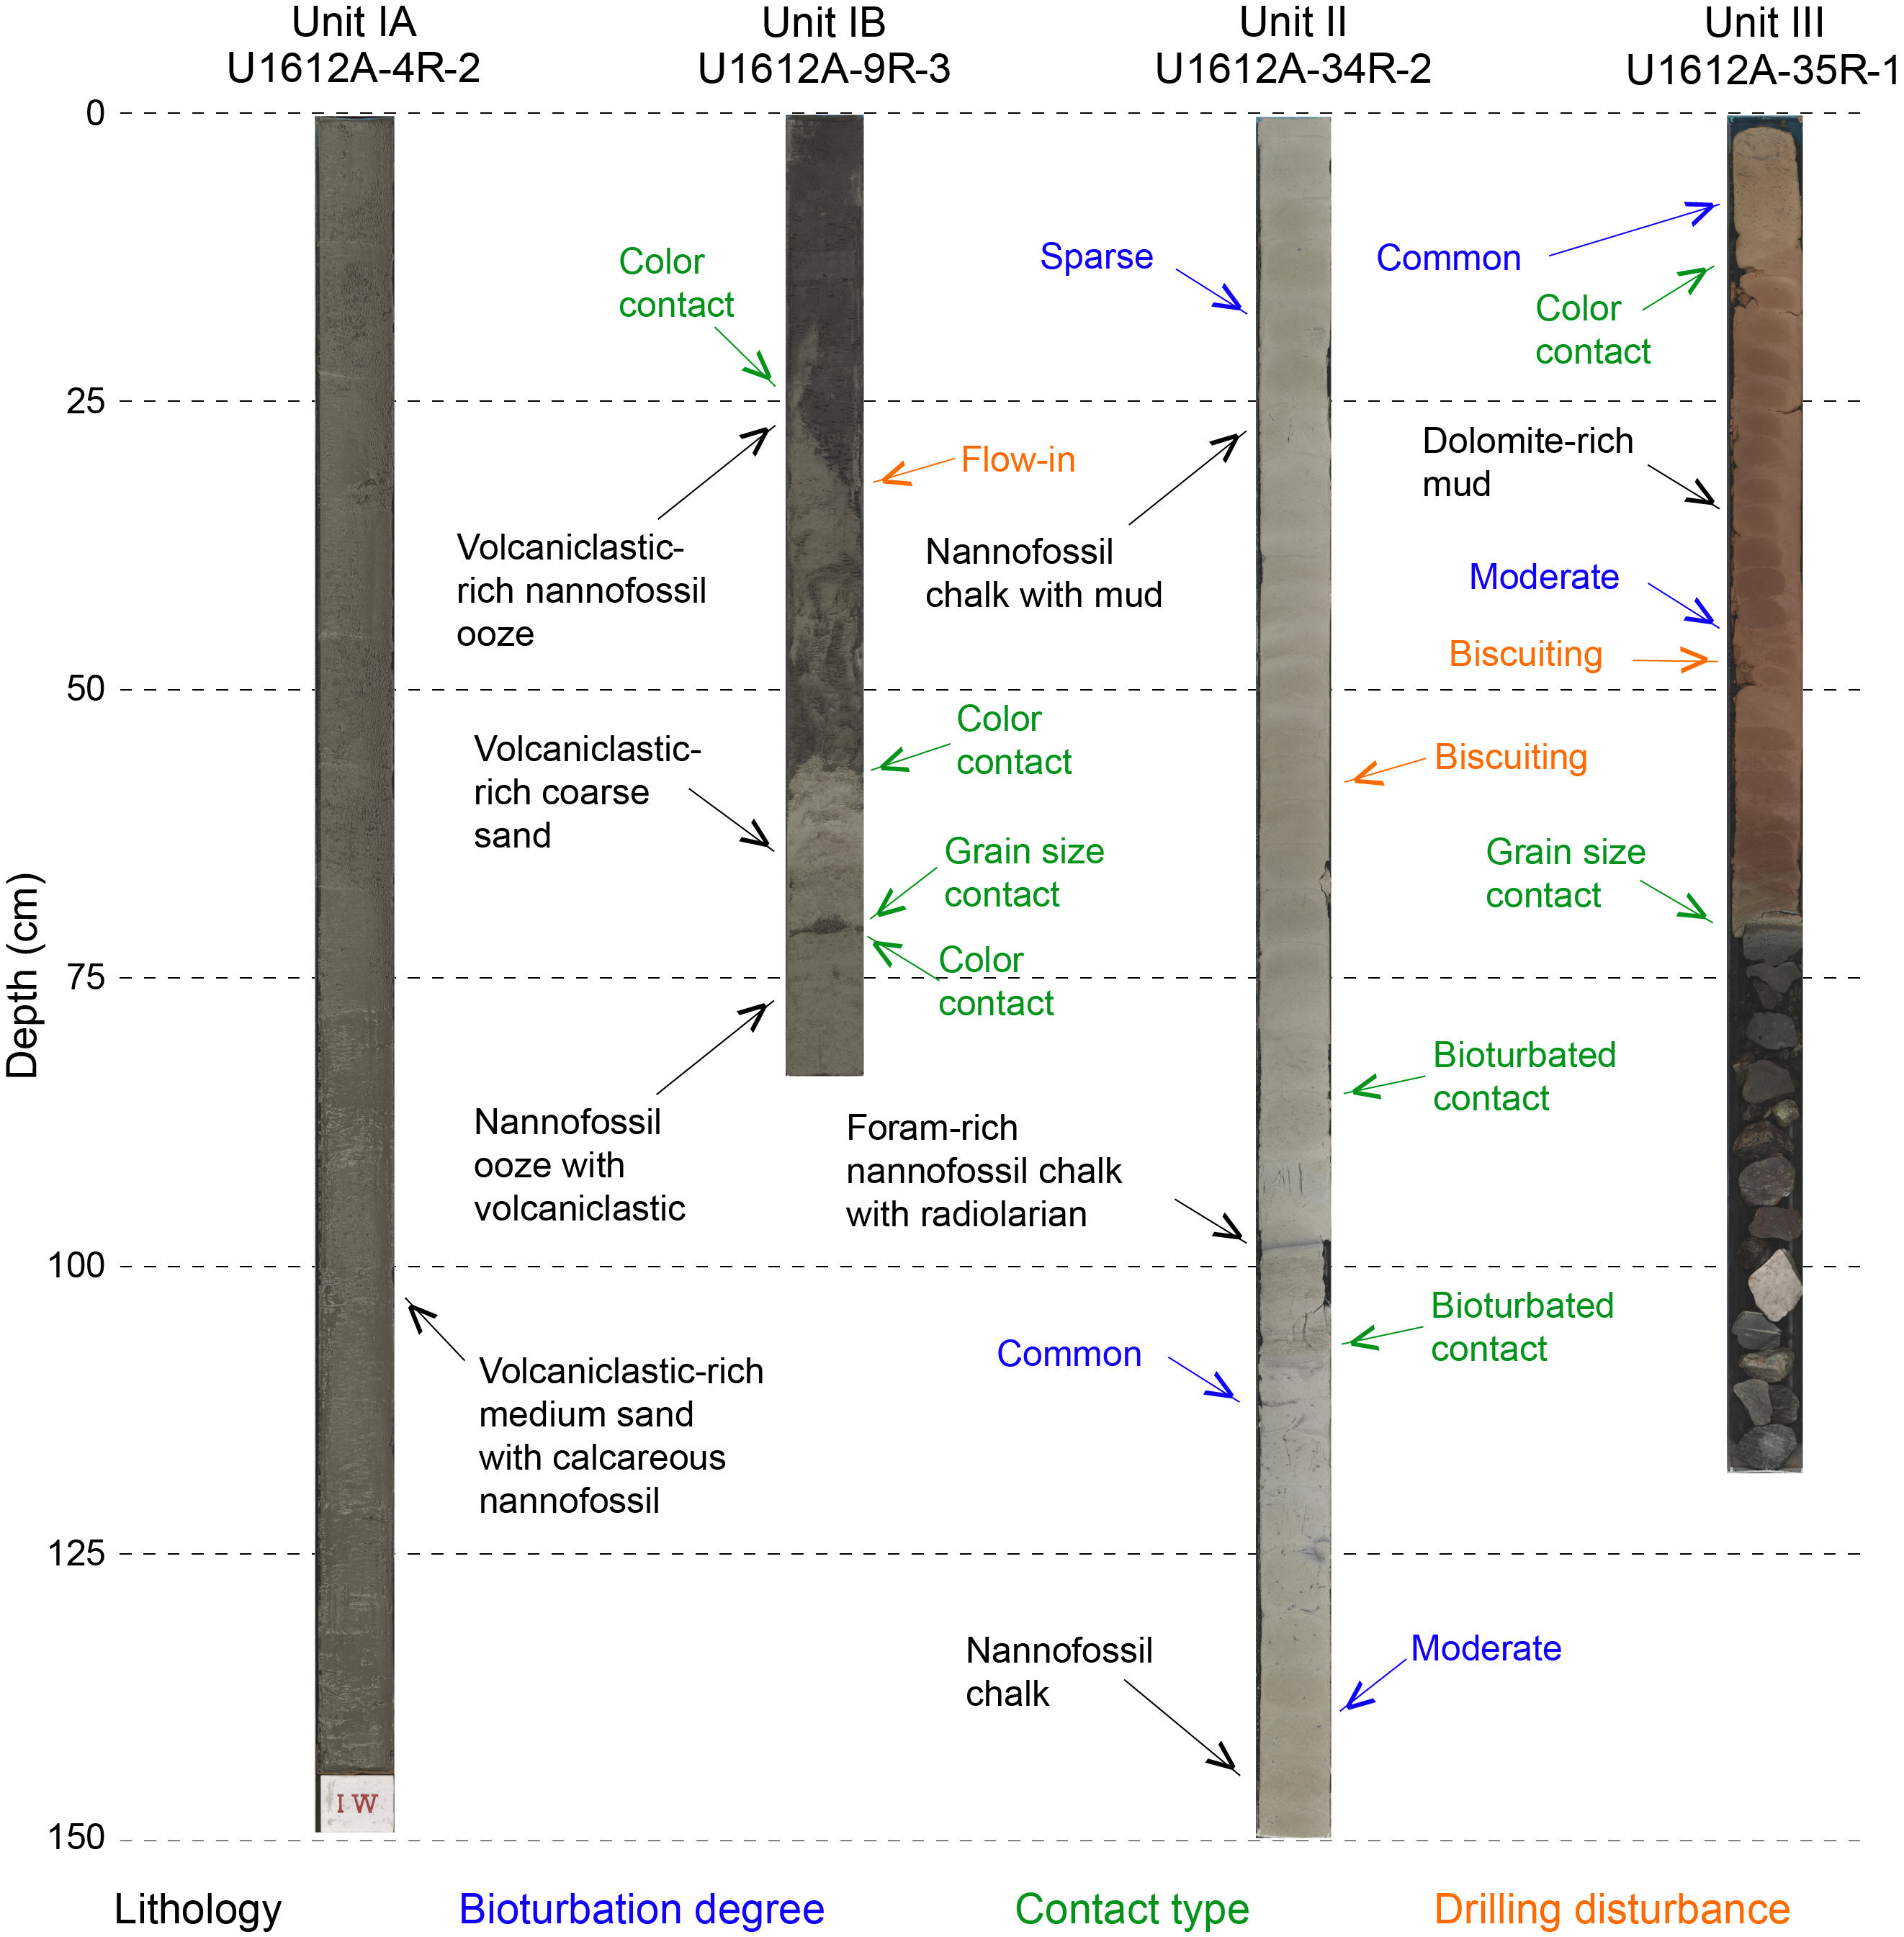
Figure F6. Sections of main lithologies.
From 114.8 to 237.9 m CSF-A (Subunit IB), the clastic sediments become slightly less coarse grained and are interbedded with fine-grained clay-rich sediments. Some centimeter-thick sediment packages are interpreted to be turbidites, mainly on the basis of graded bedding, laminations, and erosive basal contacts. Below 179 m CSF-A, Subunit IB sediments are more lithified, intercalated with less consolidated intervals that may include material washed from above. Given the extreme variability of the recovered material, sediments in this interval have been grouped into a single subunit of Unit I.
3.1.2. Lithostratigraphic Unit II
- Interval: 402-U1612A-27R-1 through 34R-5
- Depth: 237.9–321.2 m CSF-A
- Age: Early Pleistocene to Late Pliocene (Calabrian/Gelasian to Piacenzian)
- Major lithologies: nannofossil ooze/chalk, foraminifera-rich nannofossil chalk, and nannofossil chalk with radiolarians
Unit II (237.9–321.2 m CSF-A) consists mainly of nannofossil chalk, foraminifera-rich nannofossil chalk, and nannofossil chalk with radiolarians (Figure F6). Unit II differs from Unit I in that the recovered sediments have a finer grain size, more clay, more calcium carbonate, and a greatly reduced volcaniclastic component. Dark brown sapropelic horizons with sharply defined white laminations are encountered at various depths and have the highest sulfur content measured at this site (~1 wt%) (Figure F7; see Sediment and interstitial water geochemistry).
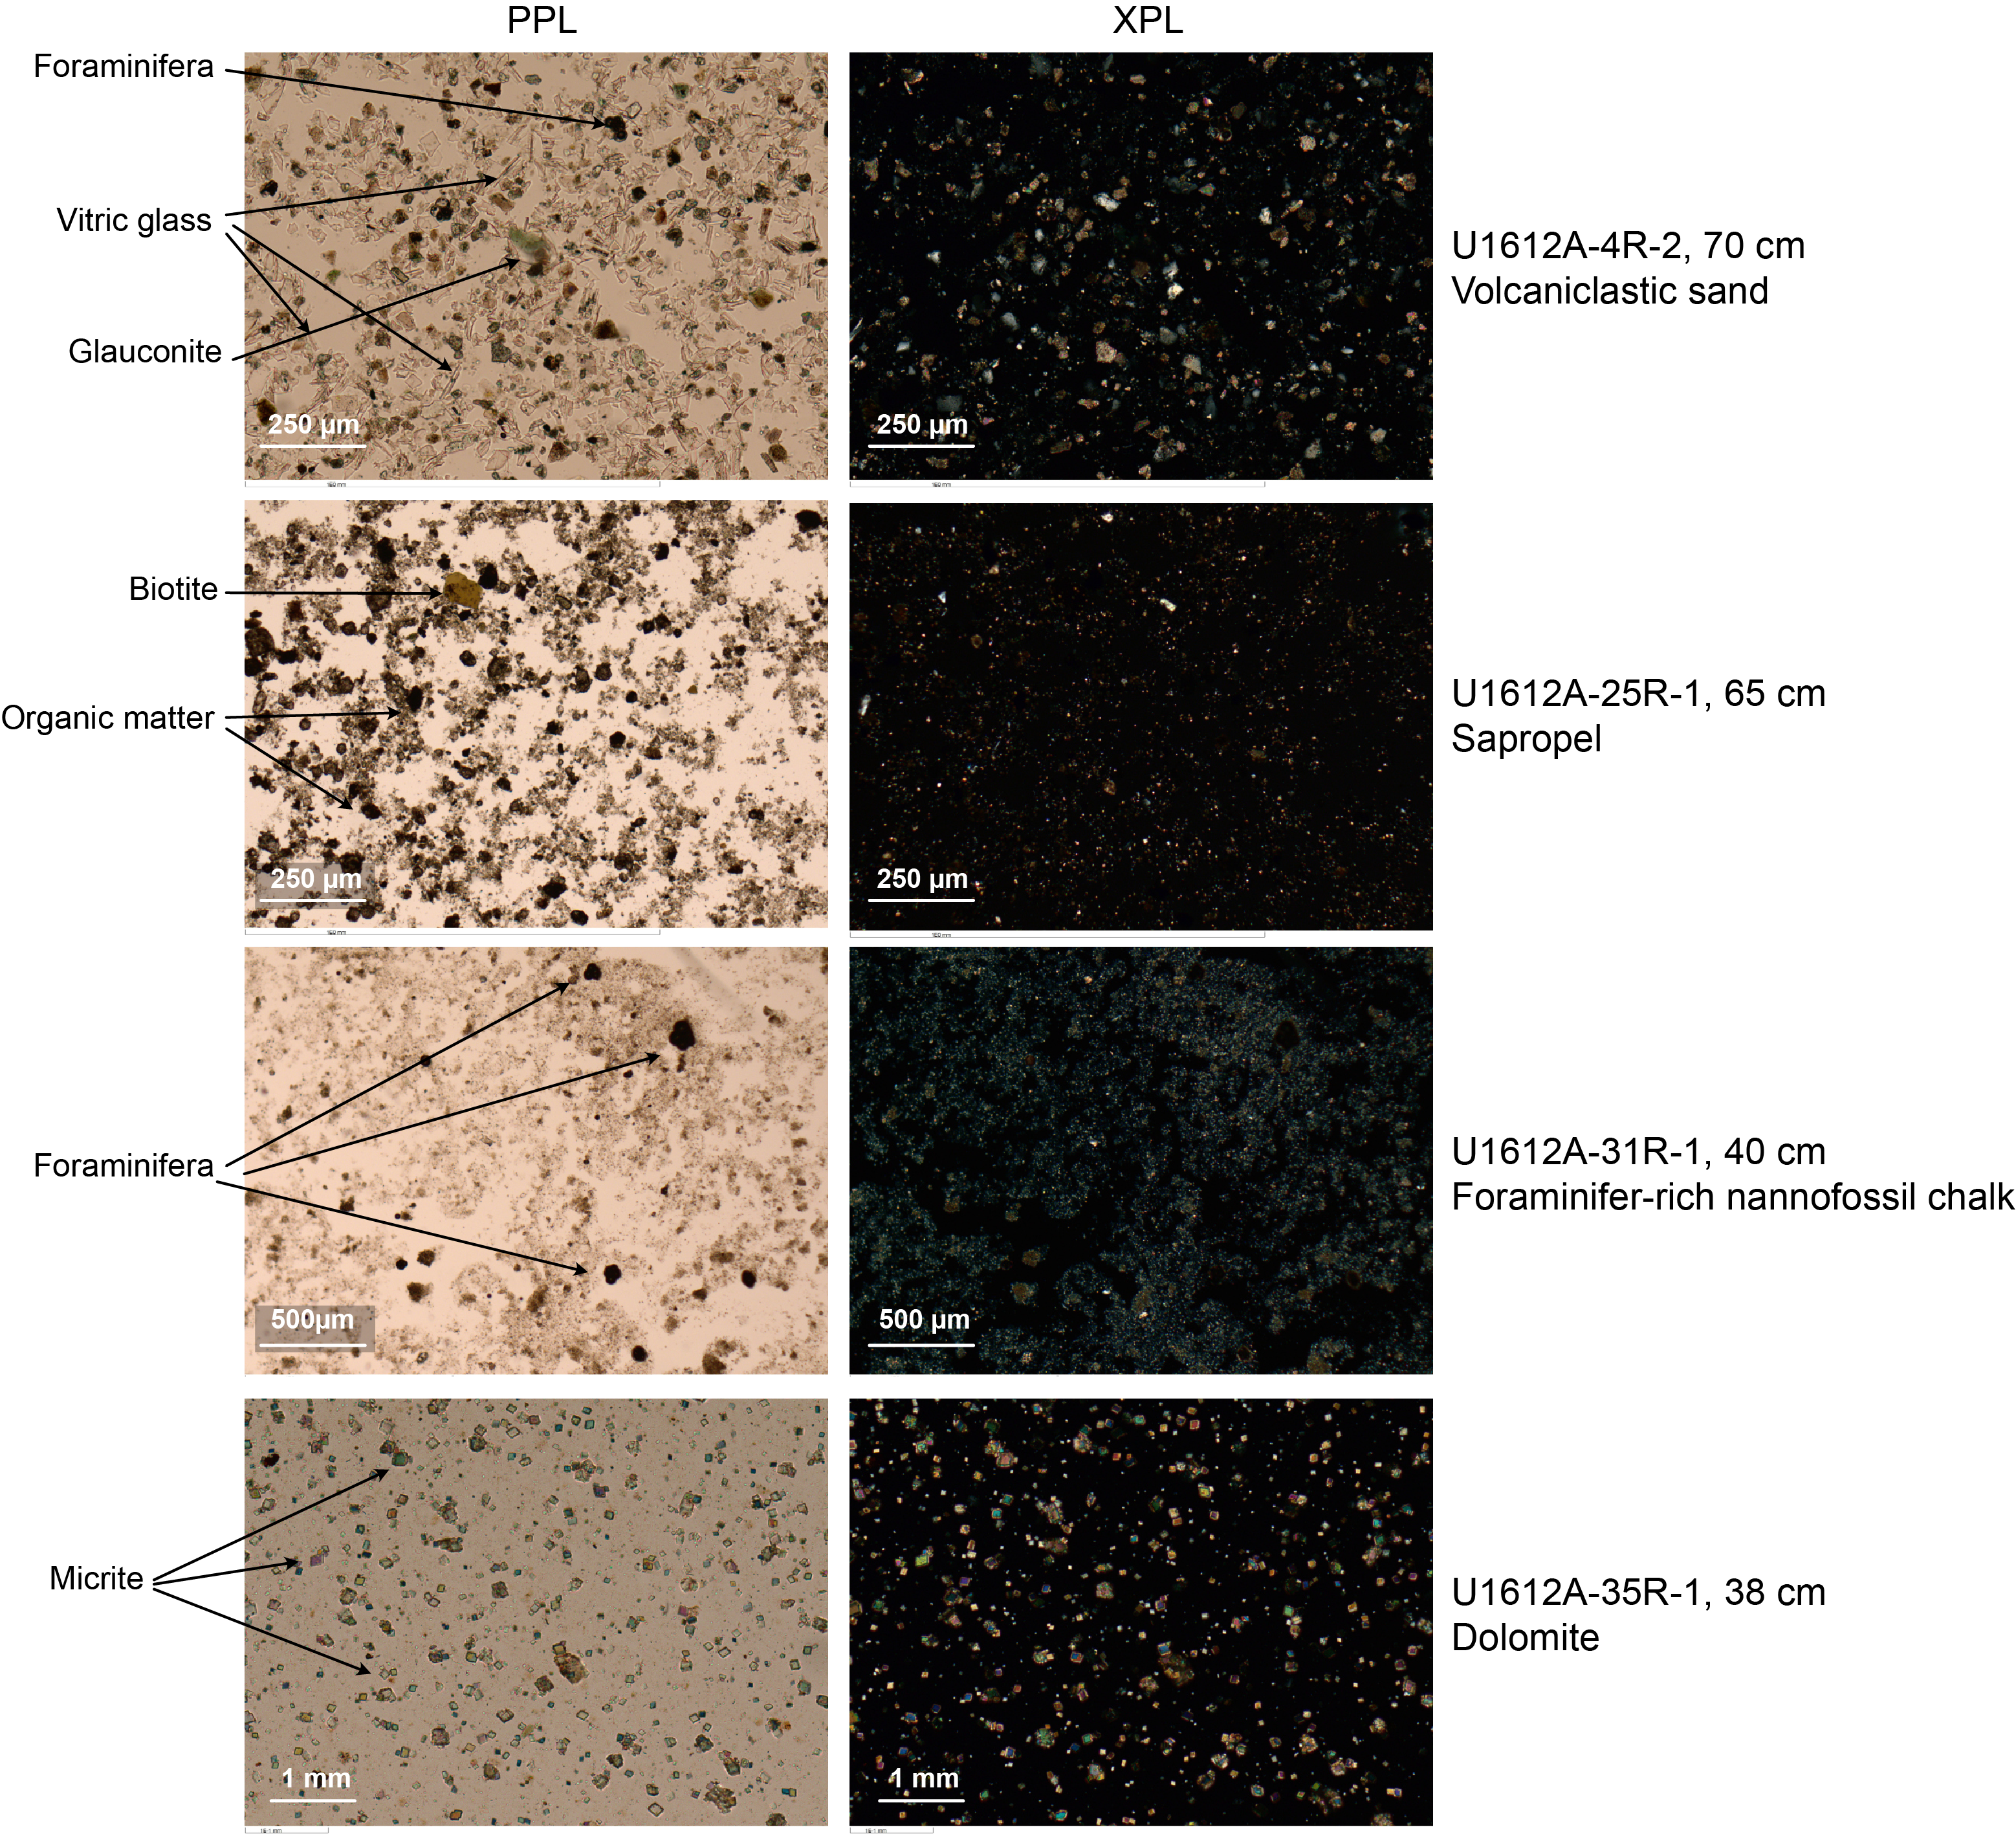
Figure F7. Main lithologic units, components.
The highest core recovery in Hole U1612A was obtained toward the base of Unit II, possibly reflecting the more consolidated and finer texture of the sediments. The succession is much more uniform than in Unit I and is dominated by nannofossil chalk interbedded with laminated siliciclastic silts. Below 285 m CSF-A, the sediment mostly consists of nannofossil chalk rich in planktic foraminifera with minor radiolarians occurring. Pyrite is also occasionally present. Bioturbation is abundant and ranges from weak to locally intense.
3.1.3. Lithostratigraphic Unit III
- Interval: 402-U1612A-34R-6 through 35R-1
- Depth: 321.2–324.4 m CSF-A
- Age: Late Pliocene (Piacenzian)
- Major lithologies: dolomitic mud
Unit III (321.2–324.4 m CSF-A) differs from Unit II in that it contains abundant dolomite, usually in the form of sharp euhedral rhombohedra (Figure F7). The dolomitic sediments fizz weakly in dilute HCl. In contrast to the subdued colors of Units I and II, the recovered sediments of Unit III are dominated by brightly reddish colored dolomitic muds, probably enriched in Fe, Mn, and trace metals (Figure F6). We interpret the dolomite to be formed within the basal carbonate sediments, in association with low-temperature hydrothermal alteration of the igneous basement. Sediments rich in radiolarians and diatoms generally appear reddish brown, whereas those rich in nannofossils are typically gray (Figures F5, F6). High glauconite content in the core is reflected in bands of greenish gray sediments.
Bioturbation is very common, ranging from weak to locally intense (Figure F8). Primary lamination is usually visible, but in some cases the lamination may be a diagenetic effect. The colors of the metal-enriched sediments vary gradationally between orange, greenish, yellowish, and reddish to brownish hues. Patches of black manganese oxides are present in burrow fills and as disseminated dendritic patterns (“chondrites”) up to several centimeters in diameter (Figure F8). The lower boundary of Unit III is a basalt/sediment contact recovered at 324.4 m CSF-A.
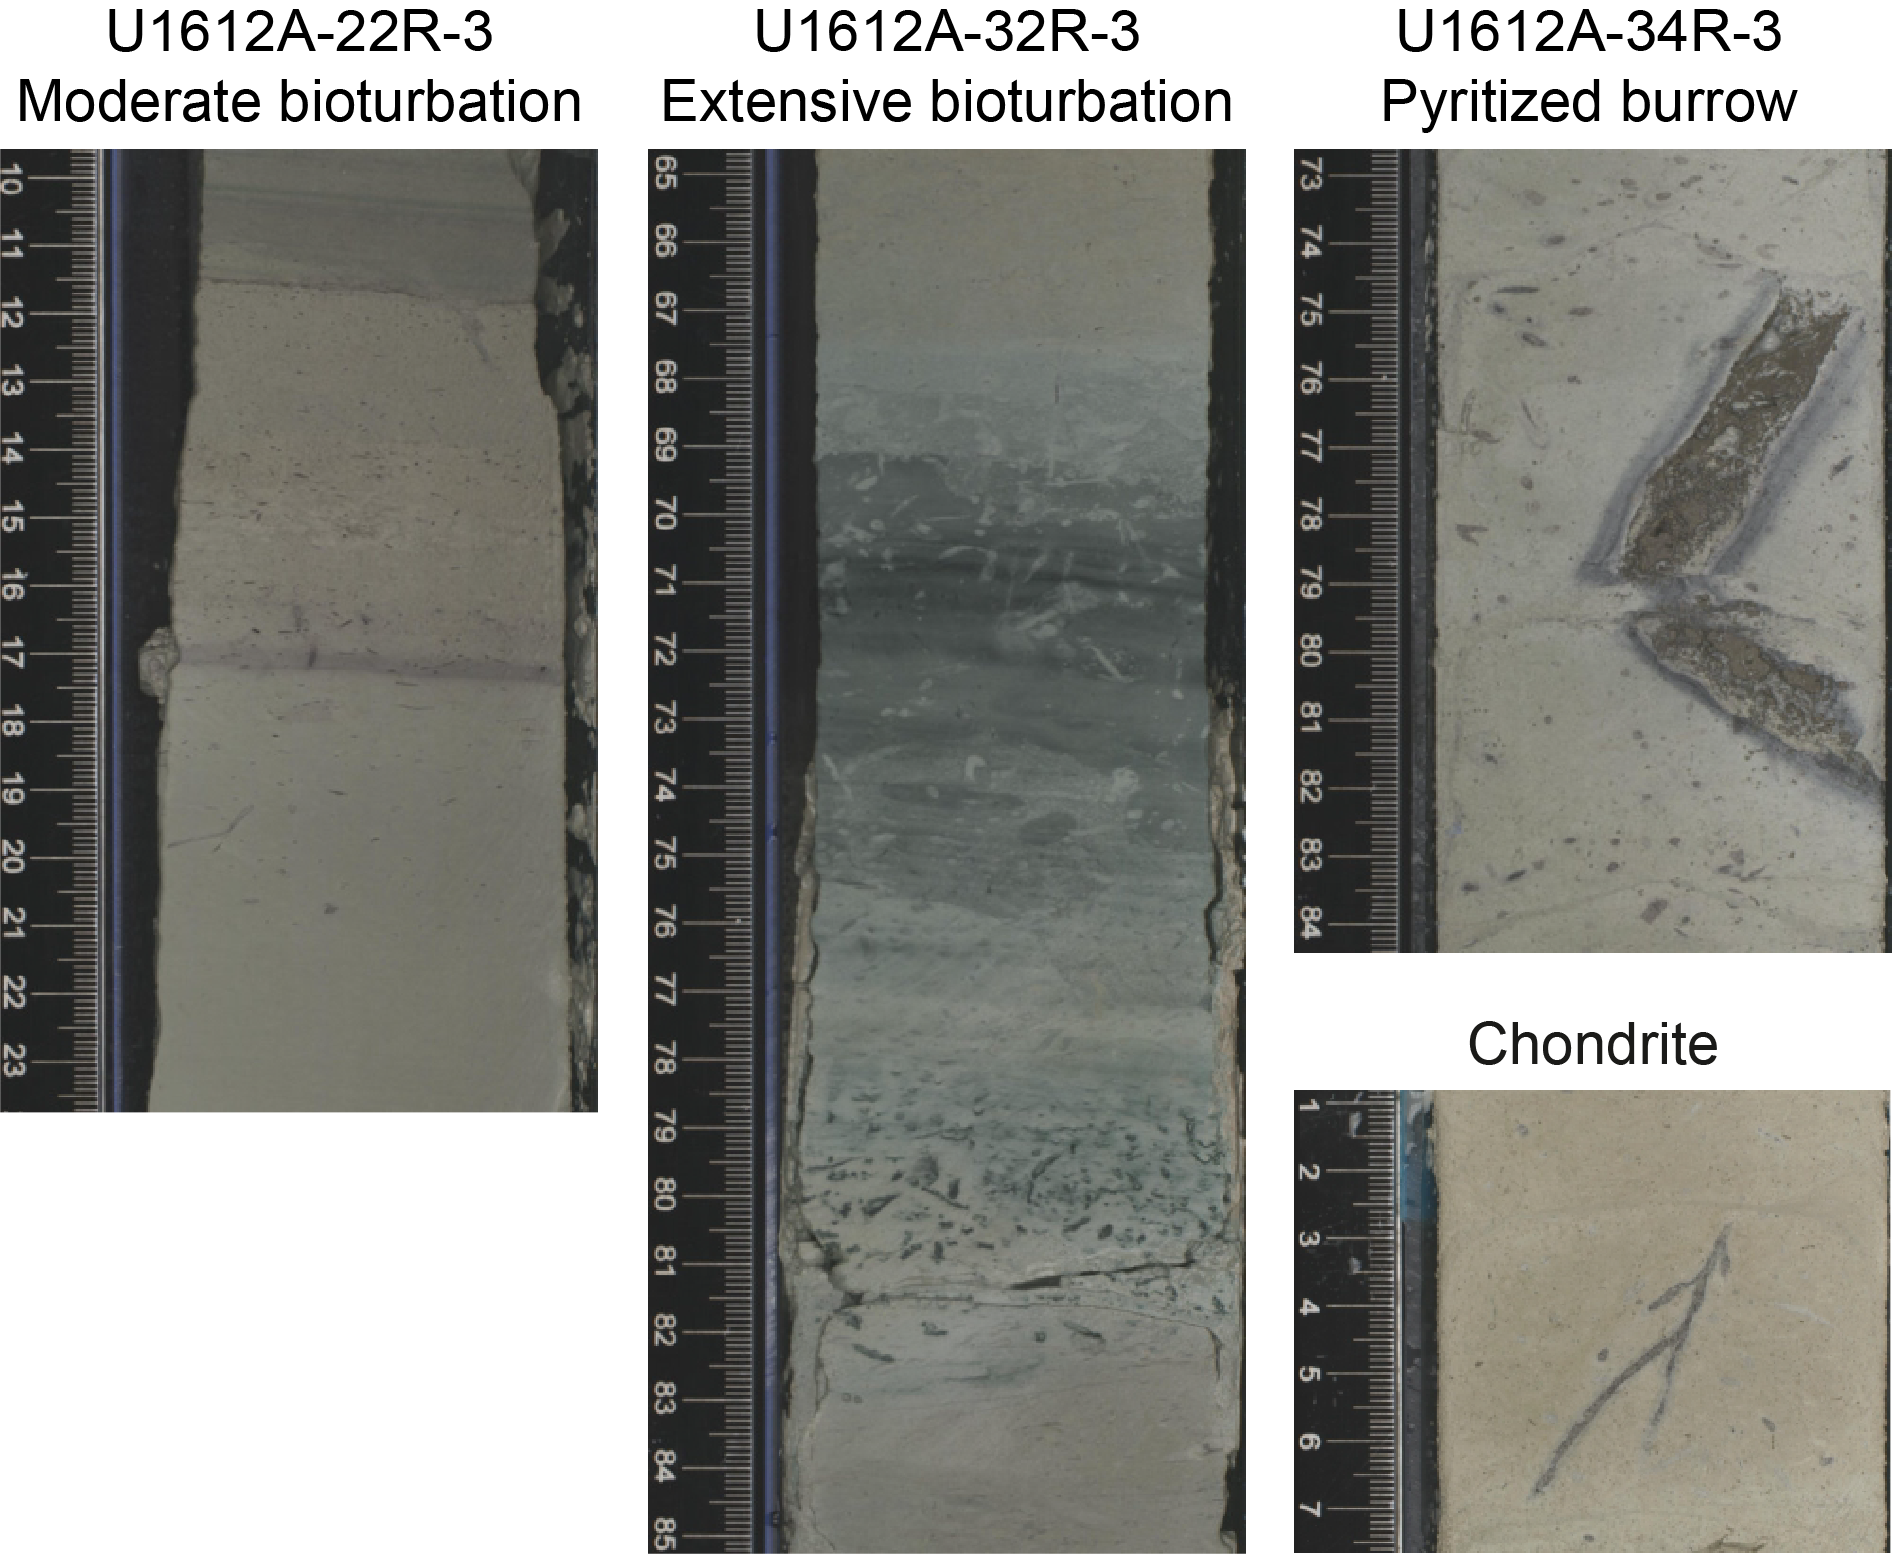
Figure F8. Bioturbation and diagenetic precipitates.
3.2. Igneous and metamorphic units
Lithostratigraphic Units IV and V are described in Igneous and metamorphic petrology.
4. Biostratigraphy
A preliminary biostratigraphic framework was developed for Hole U1612A by analyzing calcareous nannofossil and planktic foraminifera specimens extracted from core catcher samples. The age constraints and biozonal boundaries across the sedimentary successions at this site were established by analyzing the semiquantitative assemblage data from well-preserved calcareous nannofossils and planktic foraminifera species. The Mediterranean biozonation schemes of Di Stefano et al. (2023) and Lirer et al. (2019) were used for this purpose.
4.1. Planktic foraminifera
4.1.1. Sedimentary compositions of collected samples
Sedimentary intervals from the Upper Pliocene to the Holocene were recognized at this site using planktic foraminiferal biohorizons following the Mediterranean biozonation scheme (Lirer et al., 2019). The analysis was conducted on core catcher Samples 402-U1612A-1R-CC to 33R-CC. The sediment samples were washed using a <63 µm sieve to remove clay/silty particles. The residues were dried in an oven and further sieved using a 125 µm sieve. The extracted residues (>125 µm) from samples contain volcaniclastic sedimentary particles and/or planktic foraminiferal assemblages in calcareous ooze sediments. Foraminifera abundance varies greatly and is commonly the primary sedimentary component (>125 µm) in nannofossil oozes, whereas it is low in the volcaniclastic layers. In fact, coarser intervals of volcaniclastic sediment with median grain size greater than 2 mm were widespread at this site and frequently devoid of foraminifera. The remaining few nannofossil ooze layers contained moderately to well-preserved planktic foraminifera. Benthic foraminifera, ostracod, and radiolarian species along with broken molluscan shell fragments were also observed. Although the taxonomy and abundance of these species were not recorded because of time constraints, their presence provides valuable information for future analyses.
Sediments younger than 0.78 Ma were found in Samples 402-U1612A-1R-CC (0–0.14 mbsf) and 2R-CC (8.4–8.43 mbsf). Because of the volcanic nature of the sediment, the residues (>125 µm) from most of the washed samples were often dominated by volcaniclastic particles such as pumice, scoria, and ash that reduced the microfossil content to a minimum level. The core catcher Samples 3R-CC (23–23.17 mbsf) to 16R-CC (144.48–144.65 mbsf) exclusively contain volcanogenic clastic sediments and/or volcanic glass (Figure F9). Planktic foraminifera species are absent with the exceptions of few well preserved Globigerinoides bulloides and Orbulina universa found in core catcher Samples 5R-CC (36.9–36.95 mbsf) and 15R-CC (131.9–131.96 mbsf). As these fossil species are predominantly present in all late Neogene sediments observed at this site, it is challenging to assign a biozone to these specific layers. The sediment intervals below these layers are continuous and are Lower Pleistocene–Upper Pliocene in age.
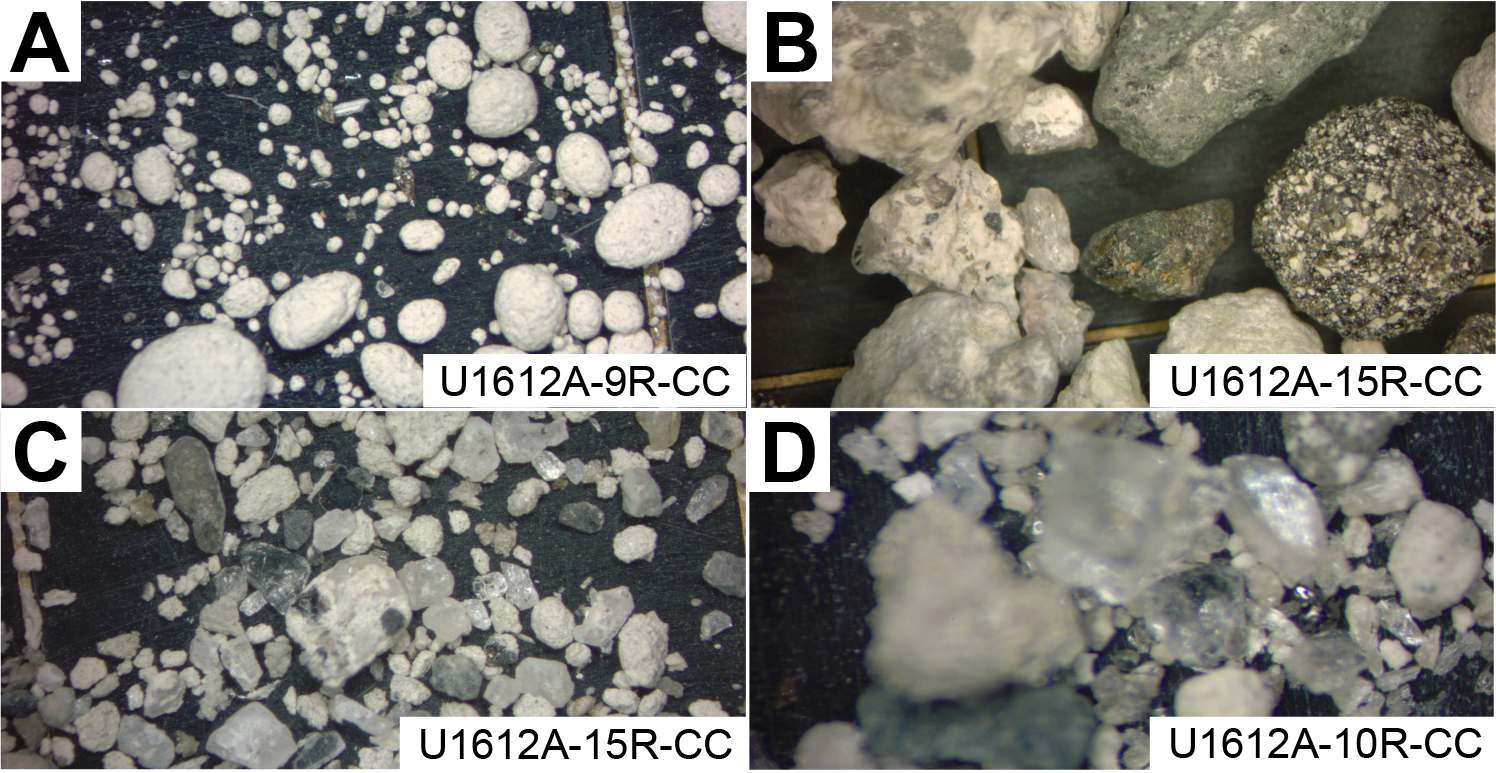
Figure F9. Volcanogenic sediments.
4.1.2. Planktic foraminifera biozone assignments
Planktic foraminifera marker species were examined from core catcher samples from Hole U1612A, and biozones were assigned according to the biozonation scheme described in Lirer et al. (2019). The biostratigraphic zonation scheme recognized at Site U1612 is provided in Table T2.
The fauna in the fossiliferous calcareous ooze zones in Samples 402-U1612A-1R-CC to 33R-CC are typical of Mediterranean biostratigraphic Zones MPle2b–MPl5a, primarily composed of G. bulloides, Trilobatus quadrilobatus, Globigerinoides ruber var. white, Globoconella inflata, Globorotalia scitula, Globorotalia truncatulinoides, Globigerinoides extremus, Globigerinoides obliquus, Globoconella bononiensis, Globorotalia crassaformis, Neogloboquadrina incompta, Neogloboquadrina spp. (sinistral coiling), Neogloboquadrina acostaensis, and O. universa (Figures F10, F11, F12).
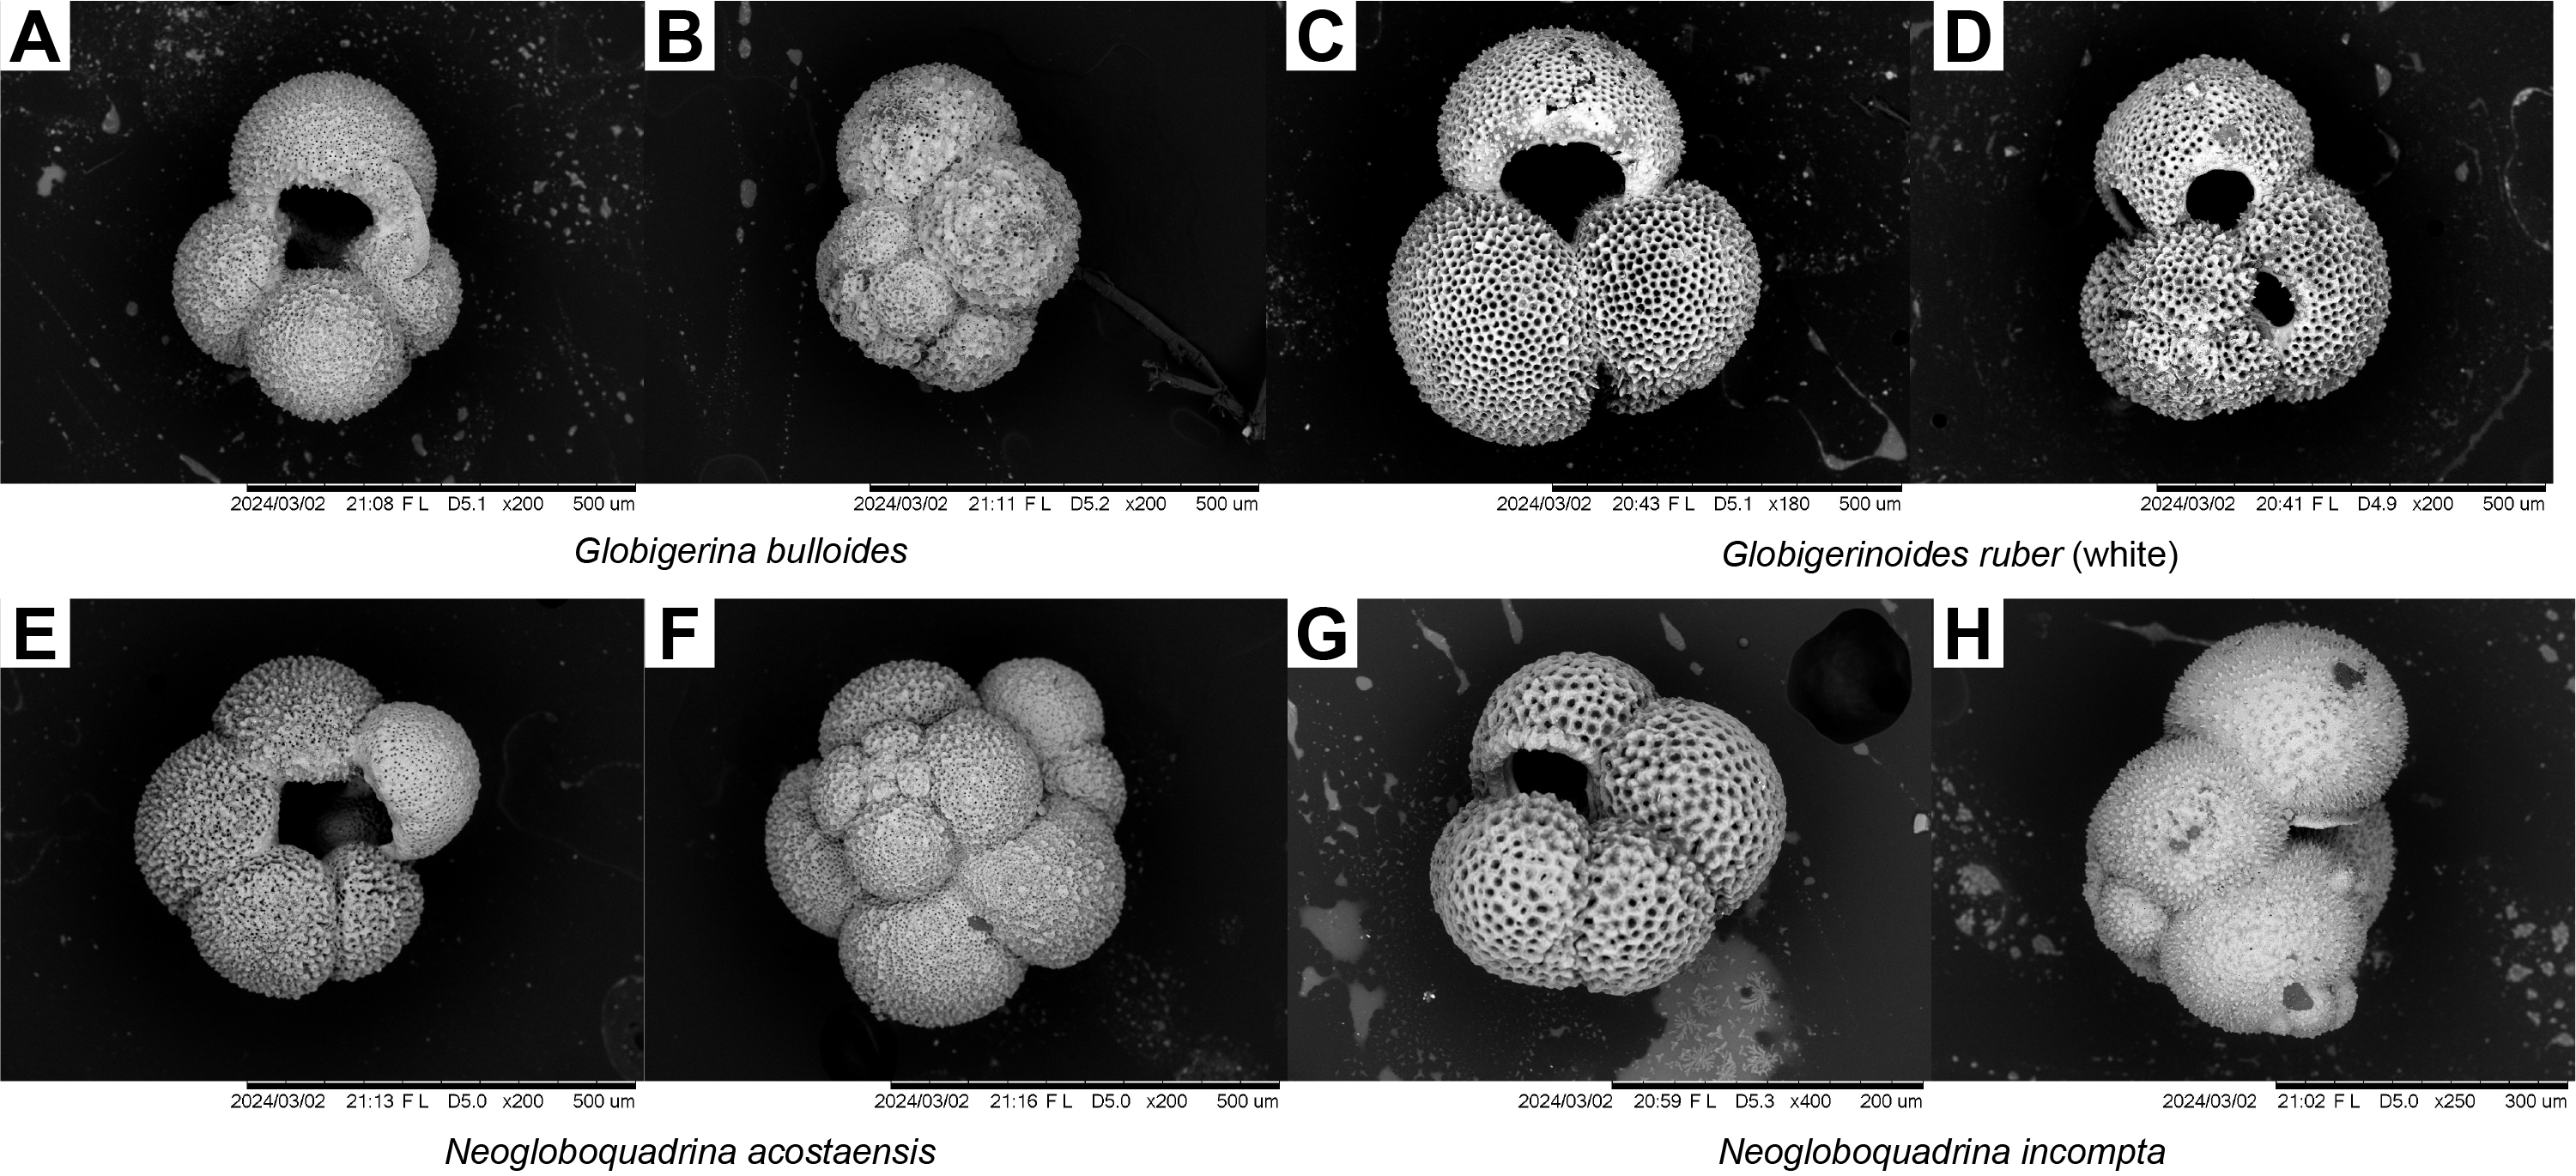
Figure F10. Globigerina, Globigerinoides, and Neogloboquadrina.
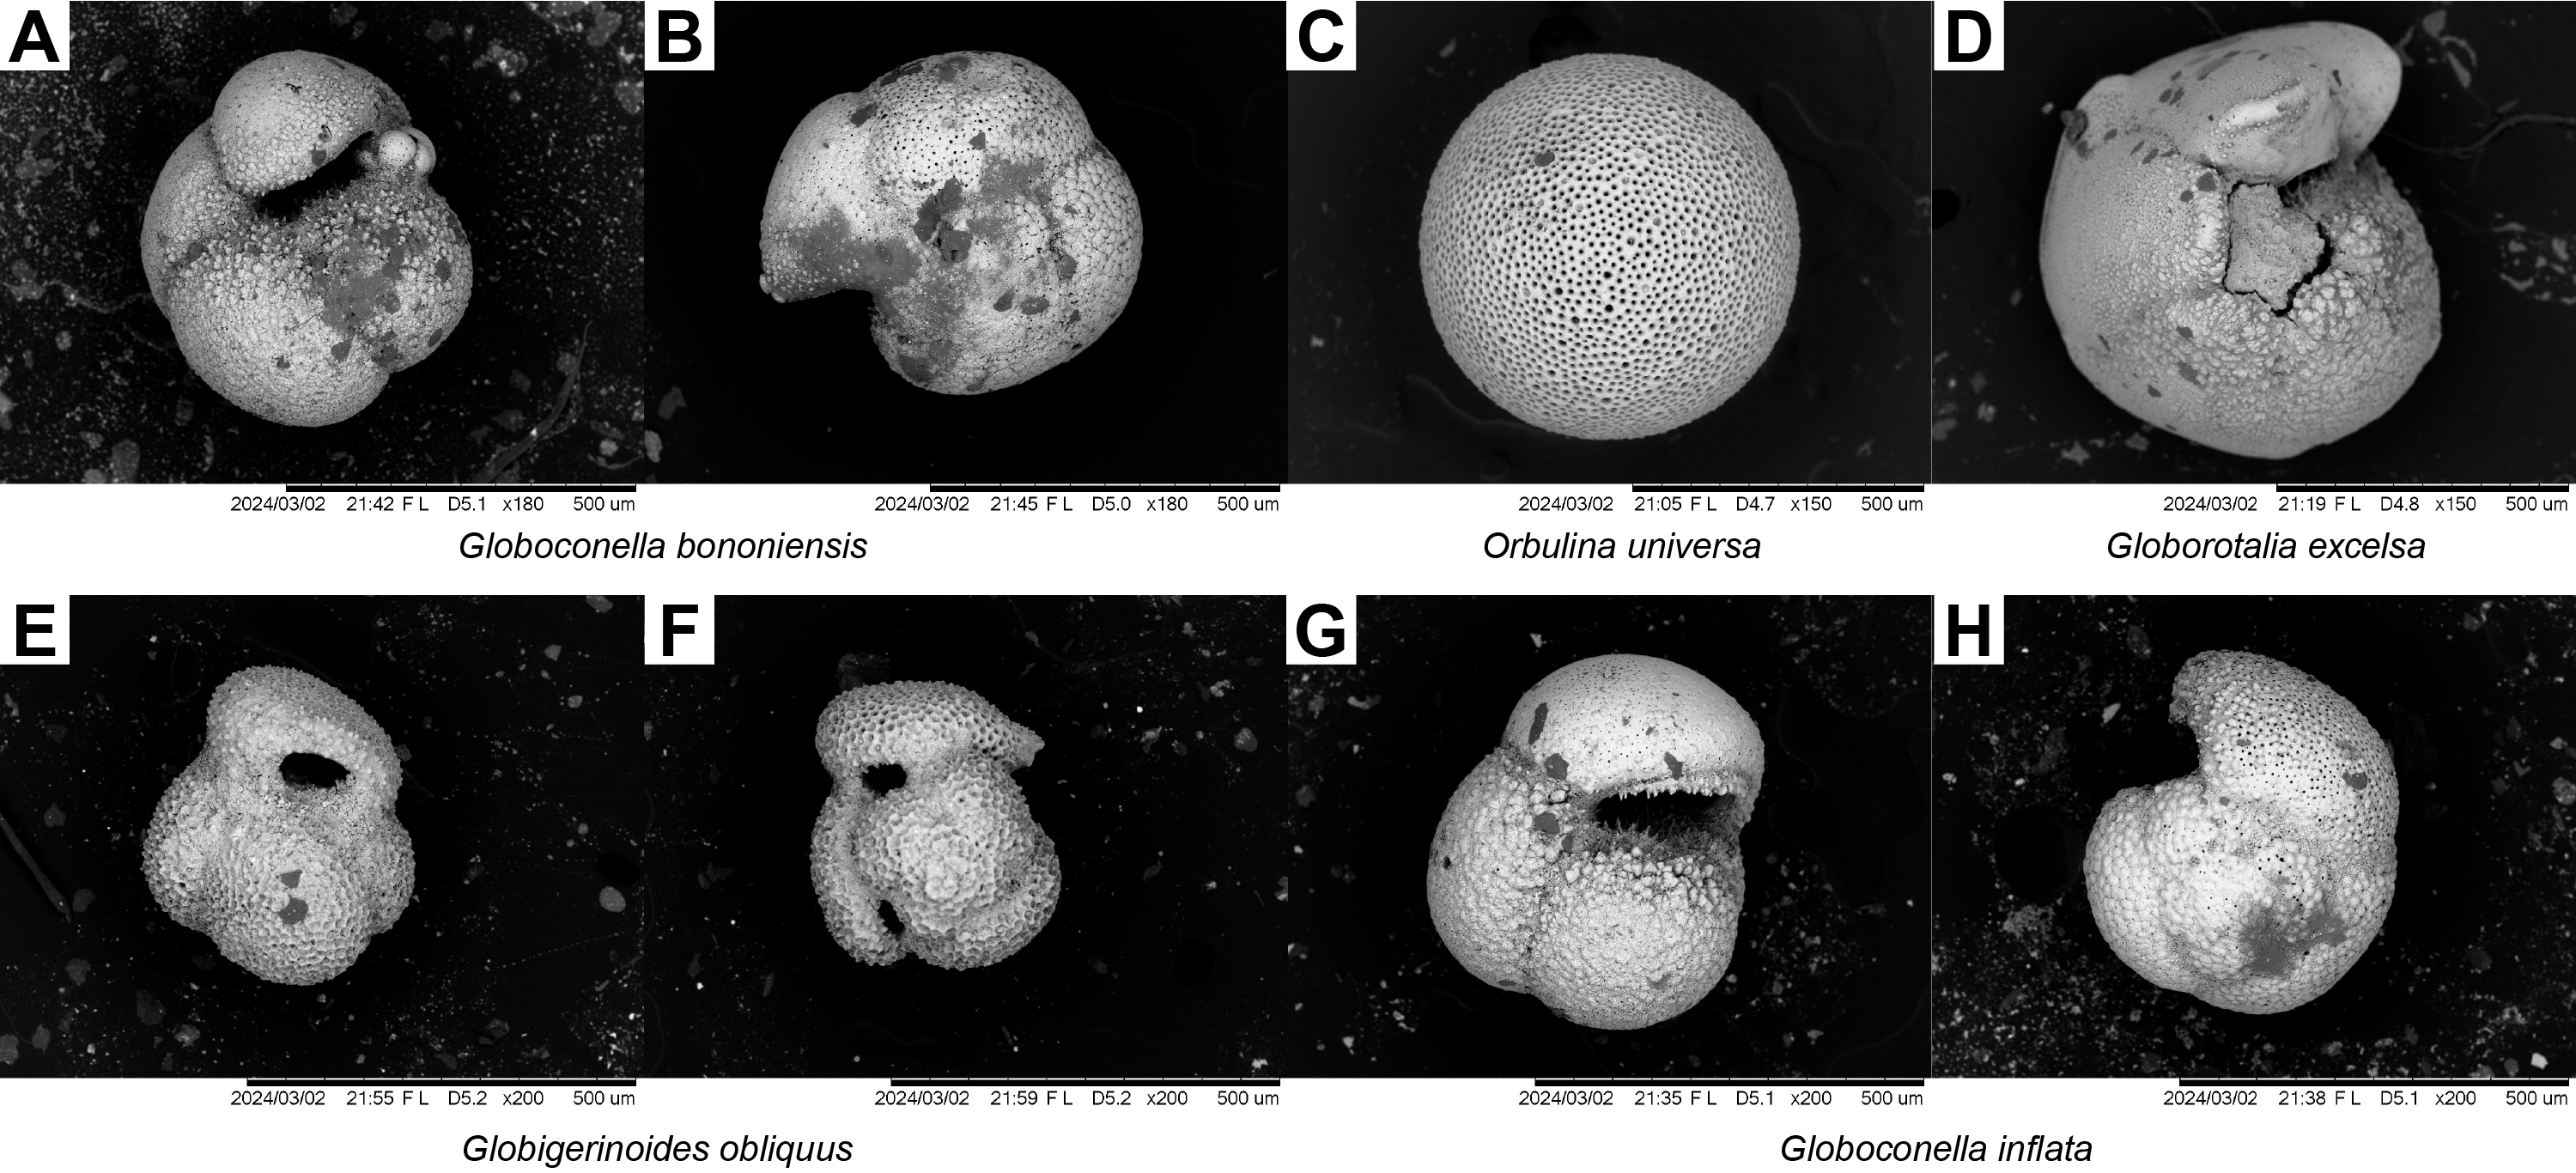
Figure F11. Globoconella, Orbulina, Globorotalia, and Globigerinoides.
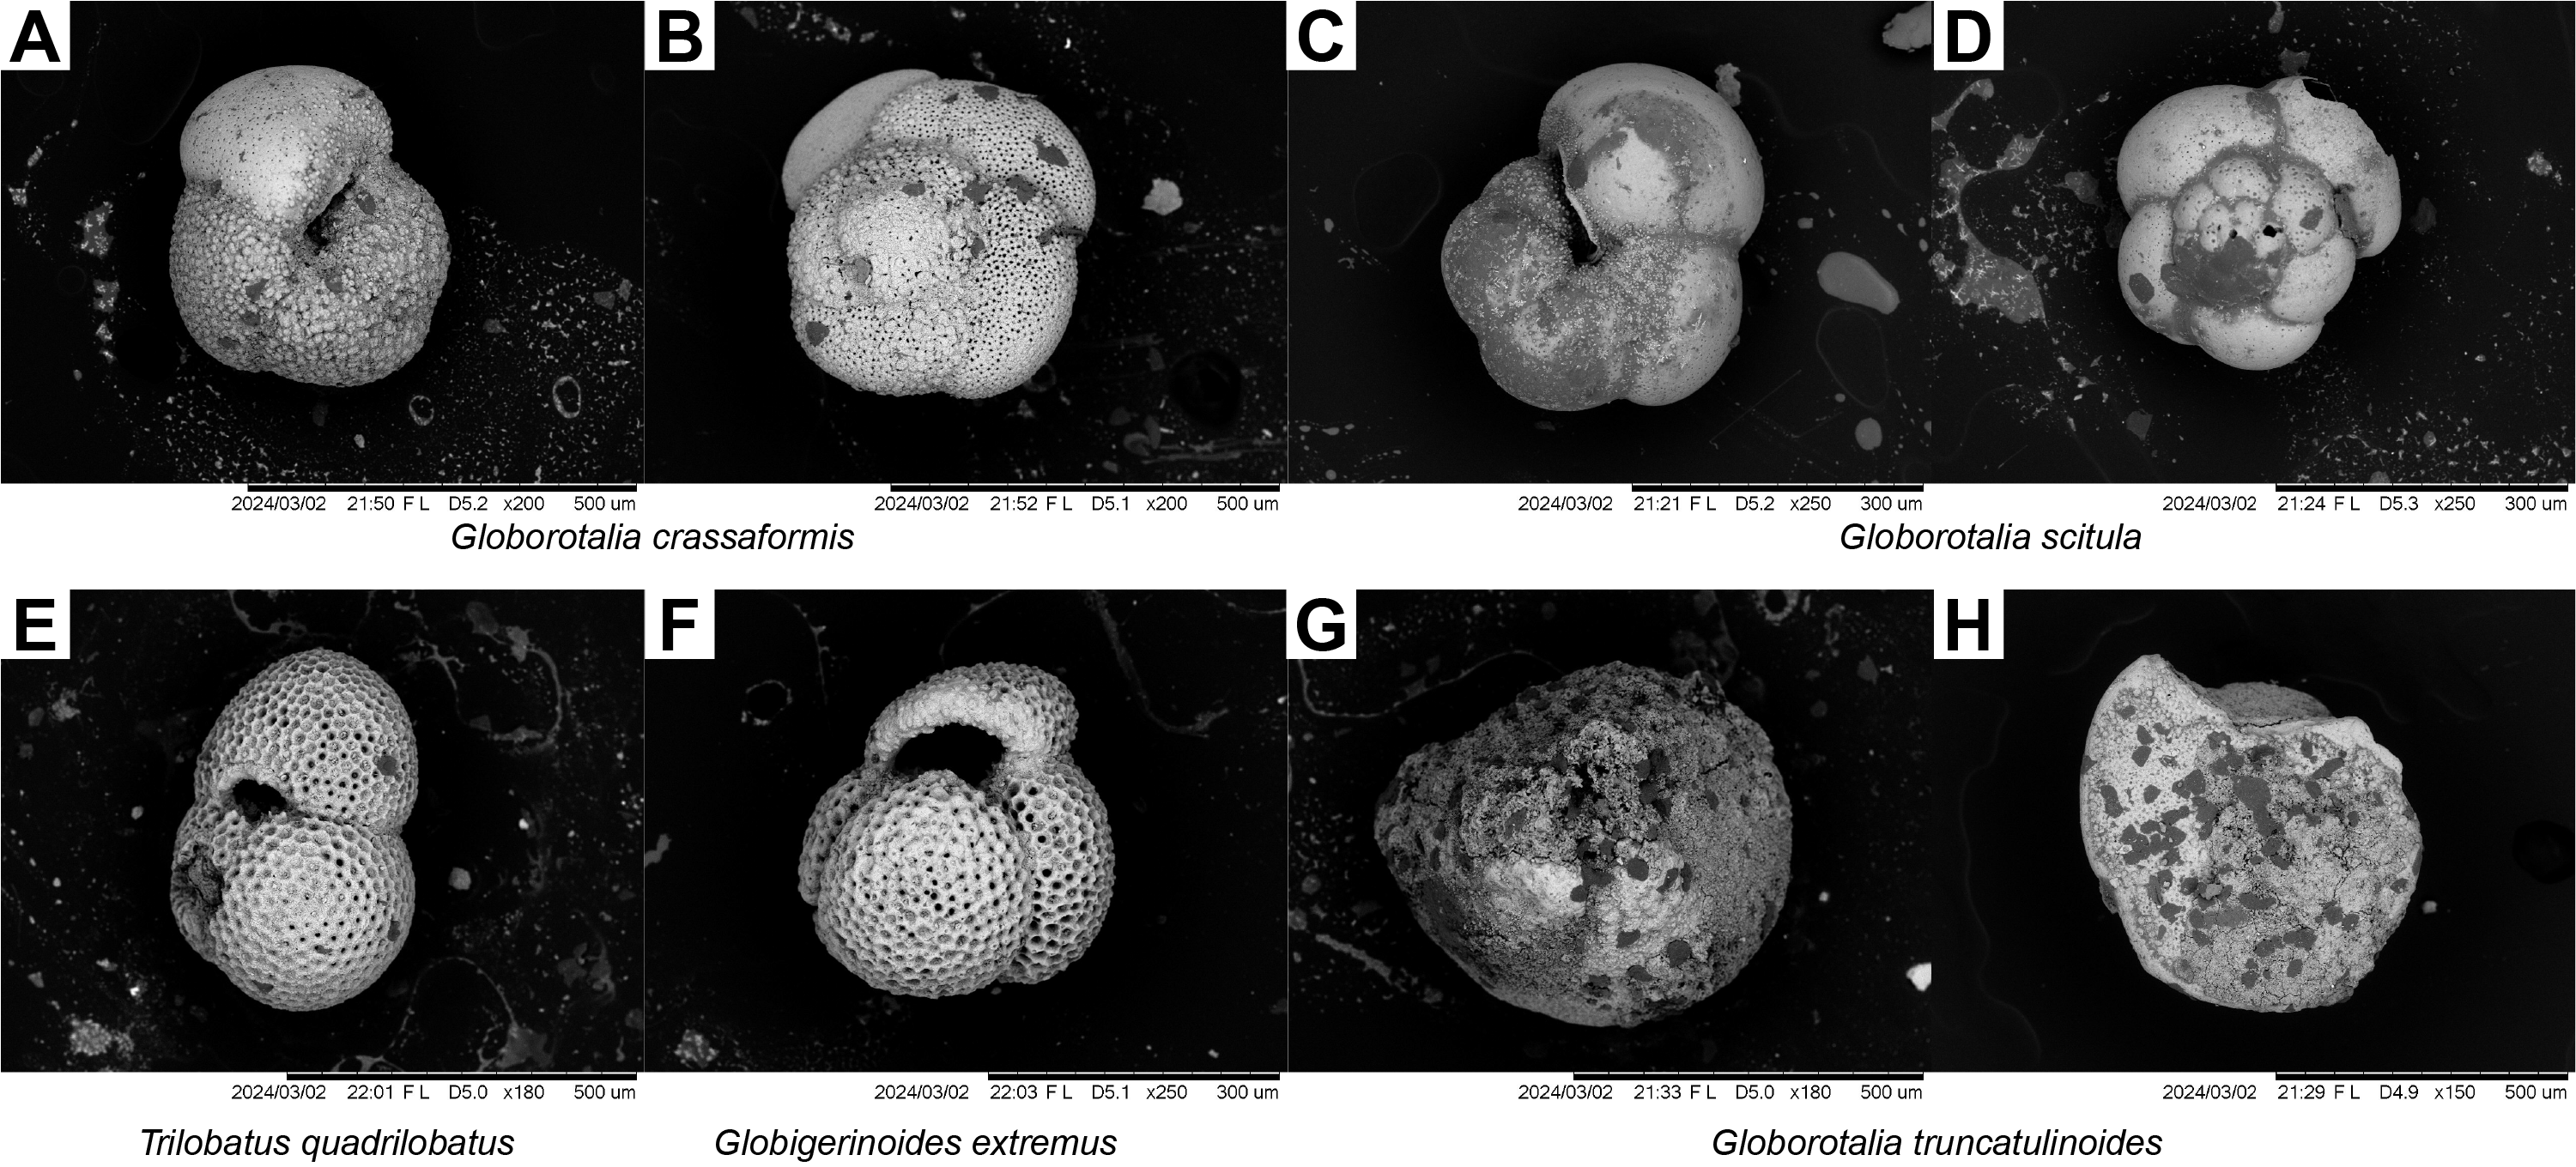
Figure F12. Globorotalia, Trilobatus, and Globigerinoides.
Biozones were delineated based on faunal succession of marker species as described below.
4.1.2.1. Zone MPle2b
Samples 402-U1612A-1R-CC (0.09–0.14 mbsf) to 2R-CC (8.4–8.43 mbsf) were assigned to Zone MPle2b based on the paracme top of sinistrally coiled Neogloboquadrina spp. (<0.51 Ma) and the occurrence of Globorotalia excelsa (<0.51 Ma) (Figure F11).
4.1.2.2. Zones MPle2a–MPle1a
In the interval between Samples 402-U1612A-3R-CC (23.12–23.145 mbsf) and 17R-CC (150.9–150.92 mbsf), no foraminifera marker species were observed as the sediment was all volcanogenic. In Samples 5R-CC and 15R-CC, few well-preserved species of O. universa (Figure F11) and G. bulloides (Figure F10) were present. Based on the foraminiferal faunal succession observed in the core catcher samples, it appears that the MPle2a–MPle1a foraminiferal zones were missing from the record at this site (Calabrian stage).
4.1.2.3. Zones MPl6b–MPl6a
G. inflata (Figure F11) was very common in Sample 402-U1612A-19R-CC (169.93–169.95 mbsf), and the sample was associated with the first occurrence of the G. truncatulinoides species (Figure F12). This sample was therefore assigned to Zone MPl6b.
Sediments in Samples 402-U1612A-20R-CC (182.53–182.555 mbsf) and 21R-CC (189.82–189.845 mbsf) contain volcanogenic clastic grains, making it challenging to assign these layers to any foraminiferal biozones.
Samples 402-U1612A-22R-CC (203.38–203.43 mbsf) to 24R-CC (218.48–218.53 mbsf) were assigned to the MPl6a biozone because of the presence of abundant G. inflata in these sedimentary layers. These biohorizons are concurrent with the detected nannofossil zones.
Samples 402-U1612A-25R-CC (228.27–228.32 mbsf) to 27R-CC (245.96–246.01 mbsf) cannot be assigned to foraminiferal biozones because of the prevalence of abundant volcanogenic components and the absence of planktic foraminifera species.
4.1.2.4. Zone MPl5a
Samples 402-U1612A-31R-CC (286.58–286.63 mbsf) to 33R-CC (314–314.05 mbsf) were assigned to the MPl5a planktic foraminiferal biozone because of the abundant presence of G. obliquus (Figure F11), G. extremus (Figure F12), and G. bononiensis (Figure F11) (G. bononiensis recognized by Lirer et al. [2019] is a subvariant currently identified as Globoconella puncticulata according to the Pforams Mikrotax database) along with some commonly occurring G. crassaformis species.
4.2. Calcareous nannofossils
Calcareous nannofossils were analyzed in 25 core catcher samples from Hole U1612A and on additional toothpick samples from Cores 402-U1612A-33R and 34R to improve the age determination of the recovered sediments near the basement contact. The biozones were assigned according to the calcareous nannofossils biozonation scheme described in Di Stefano et al. (2023).
Figure F13 contains the list of the examined samples and associated biozonal assignment.
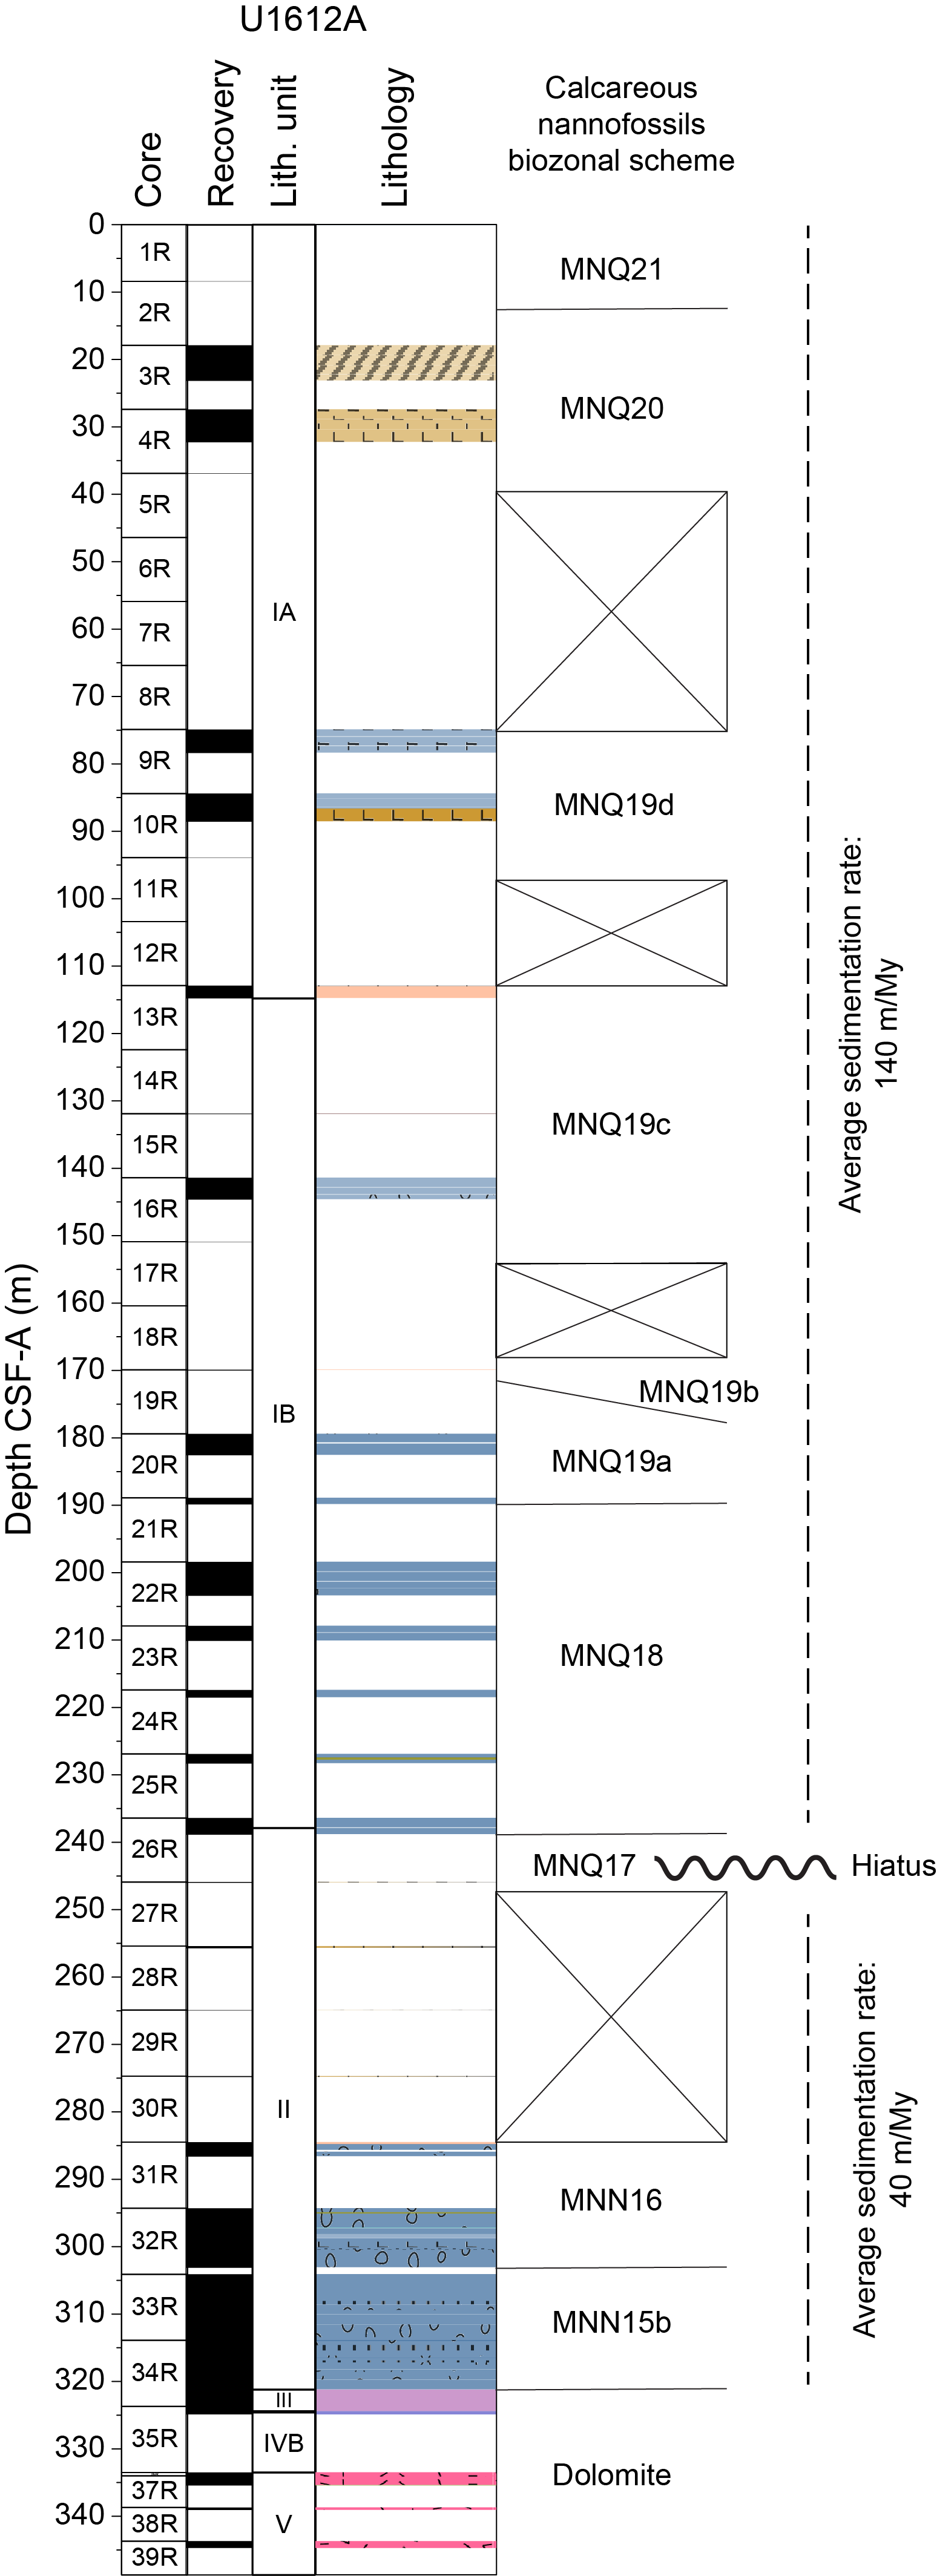
Figure F13. Calcareous nannofossil analysis and biozones.
Samples 402-U1612A-1R-CC to 5R-CC were assigned to the Middle–Upper Pleistocene MNQ20–MNQ21 biozones (<0.46 Ma) because of the presence of abundant and well-preserved nannofossil assemblages predominantly composed of Emiliania huxleyi (in Samples 1R-CC and 2R-CC), small-sized Gephyrocapsa, middle-sized Gephyrocapsa, Helicosphaera carteri, Helicosphaera inversa, Calcidiscus leptoporus, Coccolithus pelagicus, Coronosphaera spp., and Syracosphaera pulchra.
Samples 402-U1612A-9R-CC to 11R-CC were assigned to the upper Lower Pleistocene MNQ19d subzone (0.46–0.96 Ma) based on the presence of Pseudoemiliania lacunosa and Gephyrocapsa omega in addition to the others listed above.
Samples 402-U1612A-13R-CC to 17R-CC were assigned to the upper Calabrian MNQ19c subzone (0.96–1.24 Ma), characterized by the presence of abundant small-sized Gephyrocapsa, H. carteri, Helicosphaera sellii, C. leptoporus, Calcidiscus macintyrei, P. lacunosa, and Geminilithella (Umbilicosphaera) rotula.
Sample 402-U1612A-19R-CC was assigned to MNQ19b subzone (1.24–1.61 Ma), characterized by the presence of large-sized Gephyrocapsa, H. carteri, H. sellii, C. leptoporus, C. macintyrei, P. lacunosa, and G. (Umbilicosphaera) rotula.
Samples 402-U1612A-20R-CC and 21R-CC were assigned to the lower Calabrian MNQ19a biozone (1.61–1.71 Ma), and Samples 402-U1612A-22R-CC to 26R-CC were assigned to the MNQ18 zone at the Gelasian–Calabrian transition (1.95–1.71 Ma), characterized by the presence of abundant small-sized Gephyrocapsa, H. carteri, H. sellii, C. leptoporus, C. macintyrei, P. lacunosa, and G. (Umbilicosphaera) rotula.
Sample 402-U1612A-27R-CC yielded only sporadic nannofossils, among which were rare specimens of Discoaster brouweri, tentatively assigned to Biozone MNQ17 (Gelasian).
No useful data were available in Samples 402-U1612A-28R-CC to 30R-CC.
Sample 402-U1612A-31R-CC contained very well preserved and abundant nannofossil assemblages characterized by many species of the Discoaster genus, such as D. brouweri, Discoaster pentaradiatus, and Discoaster surculus, assigned to Biozone MNN16 (2.82–2.51 Ma) at the Pliocene–Pleistocene transition (Figure F13).
Samples 402-U1612A-32R-CC and 33R-CC were found to belong to the Upper Pliocene MNN16 zone (2.82–3.56 Ma), characterized by well-preserved nannofossil assemblages that include Discoaster asymmetricus and Discoaster tamalis among the other Discoaster species also occurring in Sample 31R-CC.
In Sample 402-U1612A-34R-CC, nannofossils were not observed but dolomite granules were identified. Additional samples were analyzed to define the level below which nannofossils were no longer present. In Sample 33R-6, 127 cm, a highly intact nannofossil assemblage was found, which can be assigned to the MNN15b biozone.
4.3. Synthesis from microfossil data
The biostratigraphy data imply a high sedimentation rate, especially in the upper part of the Site U1612 succession, where about 170 m of sediments were deposited in about 1.20 Ma (sedimentation rate ≈ 141.67 m/My). This is followed downhole by a temporal hiatus corresponding to Zone MNQ17 (about 0.6 Ma). The lower part of the succession is characterized by a much lower sedimentation rate, estimated at about 40 m/My.
5. Paleomagnetism
5.1. Sediment
5.1.1. Paleomagnetic results
Hole U1612A was completed with an overall core recovery of 22%. Recovery was poor in the uppermost cores and nearly complete in the lowermost three sediment cores above the basement (Cores 32R–34R; 294.3–323.91 m CSF-A). Natural remanent magnetization (NRM) was measured at 2 cm intervals on section halves. The NRM of the sediments (to ~284.5 m CSF-A) shows normal polarity (Figure F14), with mean inclination values (Ic_mean = 75.0°) steeper than the predicted inclination assuming a geocentric axial dipole (GAD) field (Ic_GAD = 59.2°) at the hole latitude (40°11.0320′N), indicating that the NRM was imprinted by the drill string. The NRM after demagnetization at 20 mT (NRM@20mT), has a mean inclination value of Ic_mean = 69.1°. In addition, intervals of negative inclination were detected at approximately 285 (Core 31R) and 300 m CSF-A (Core 32R) (Figure F15).
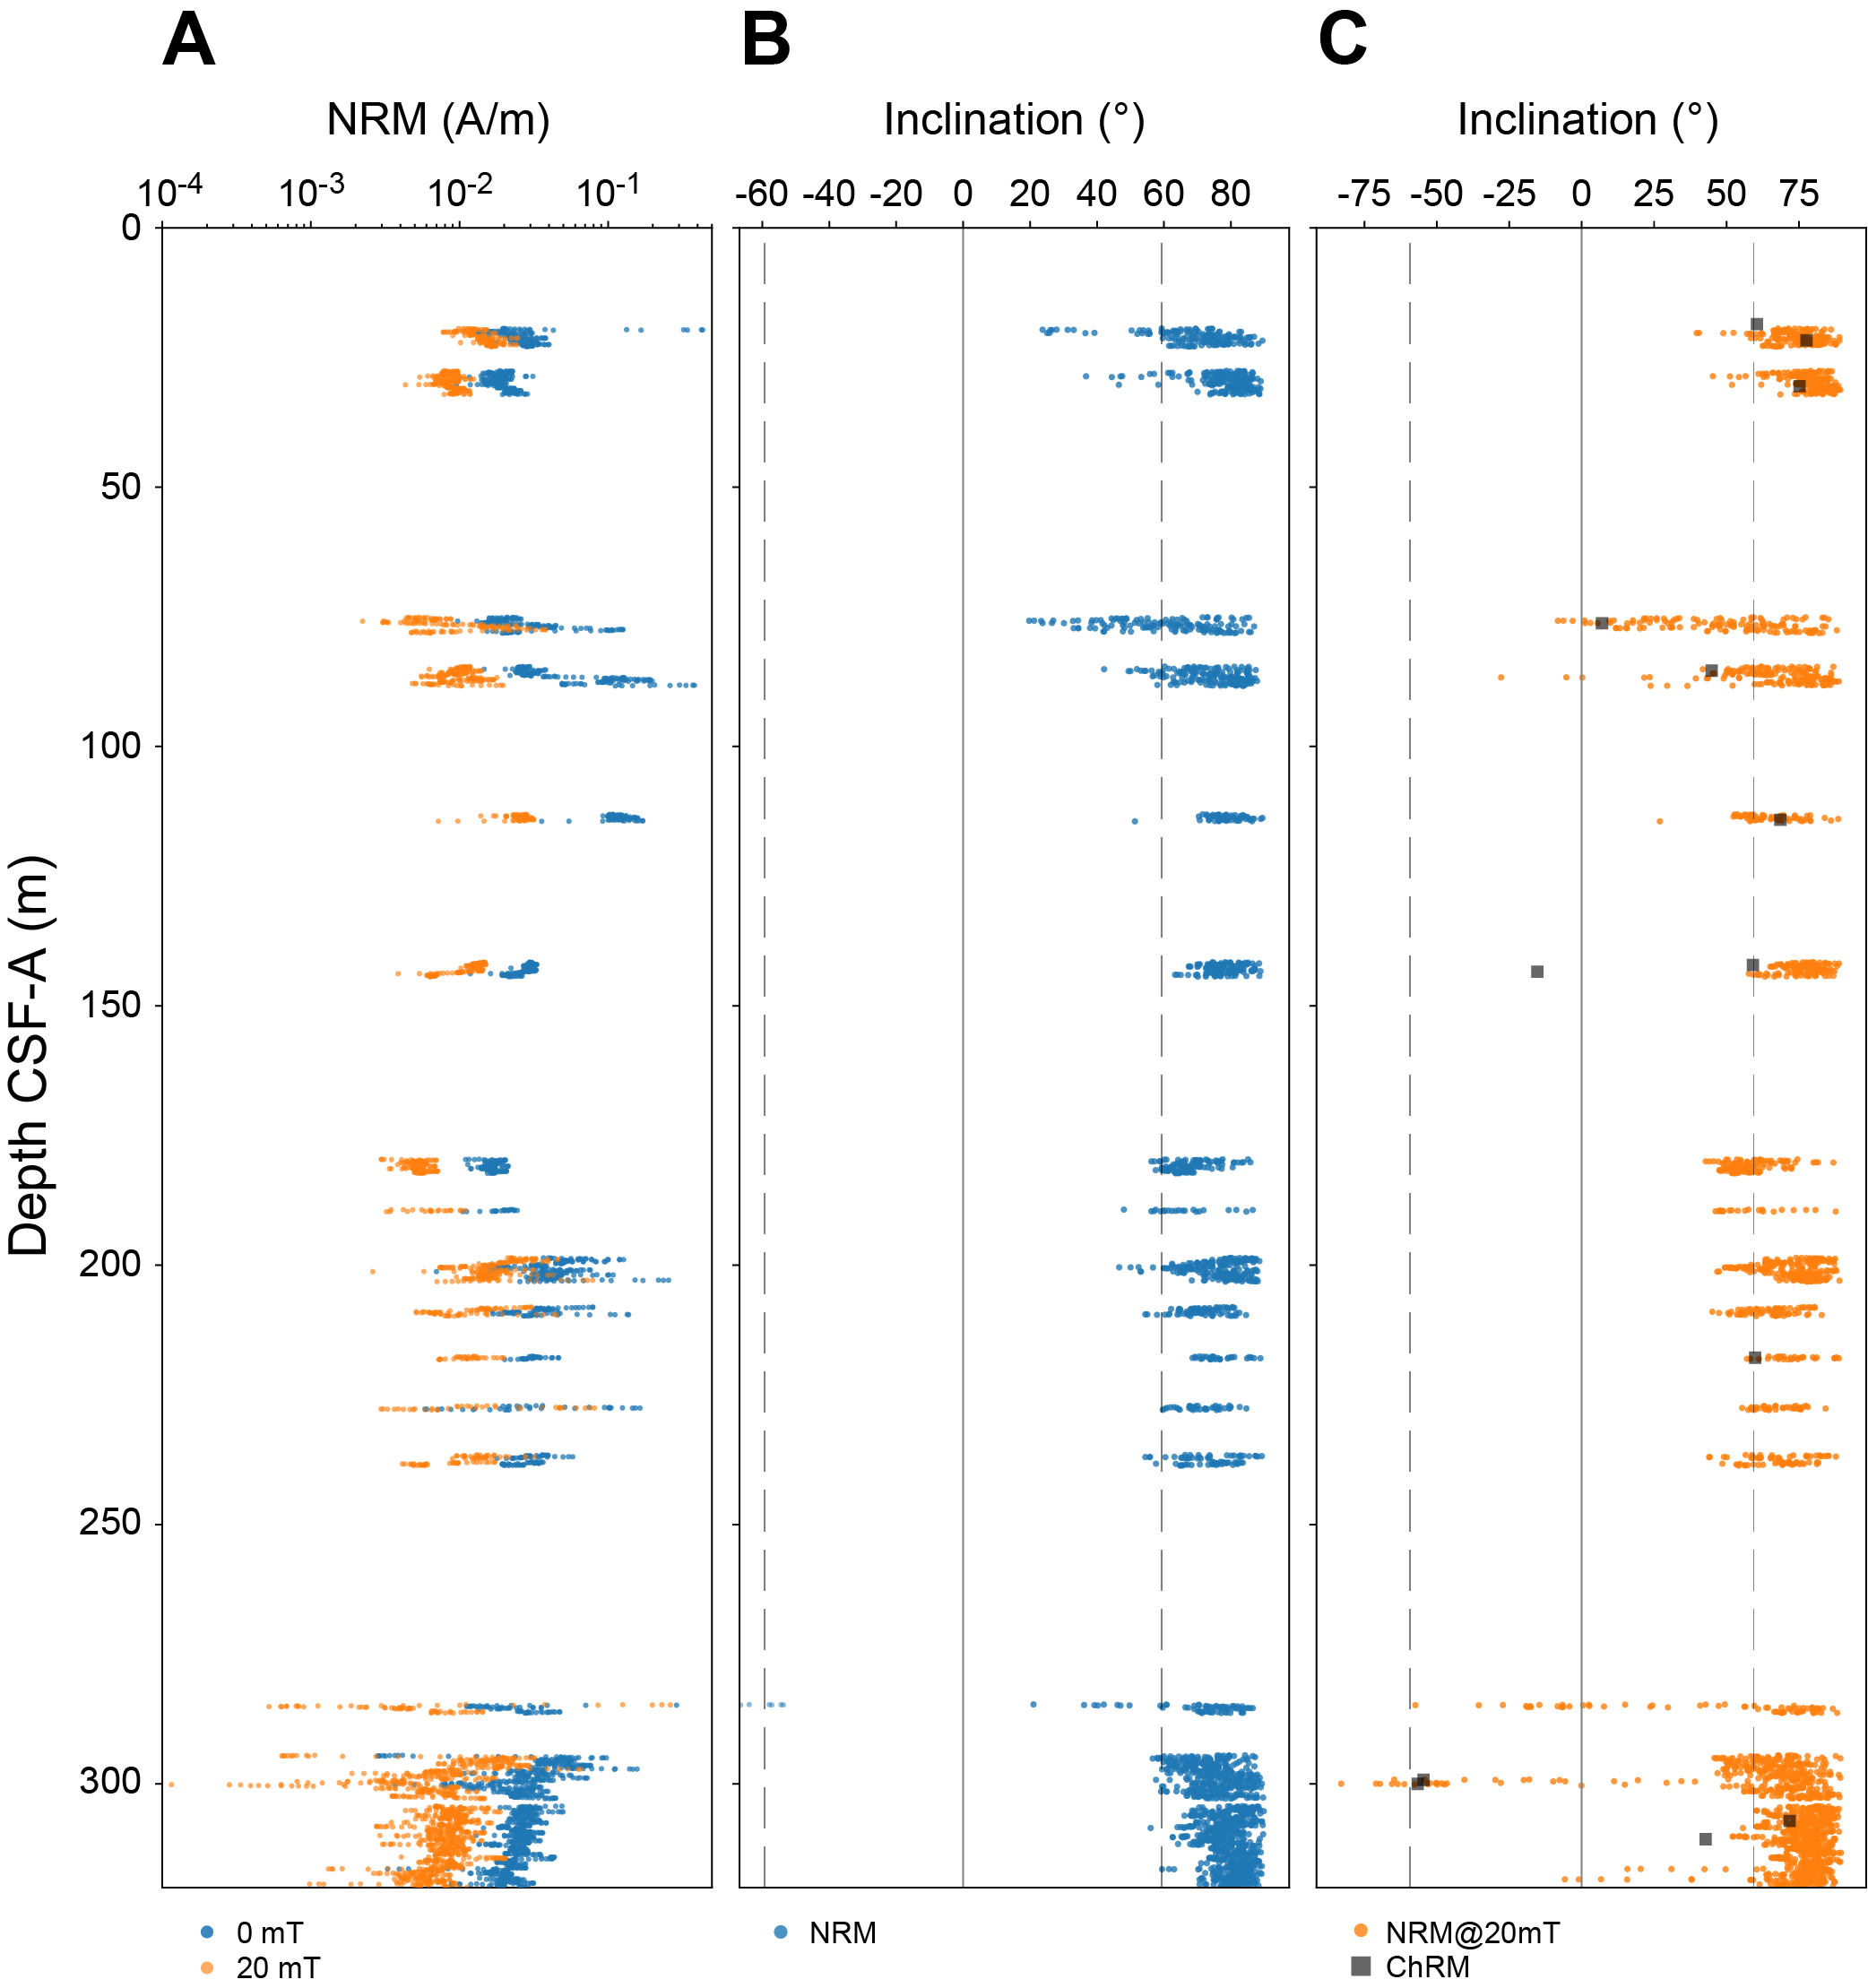
Figure F14. NRM variation.
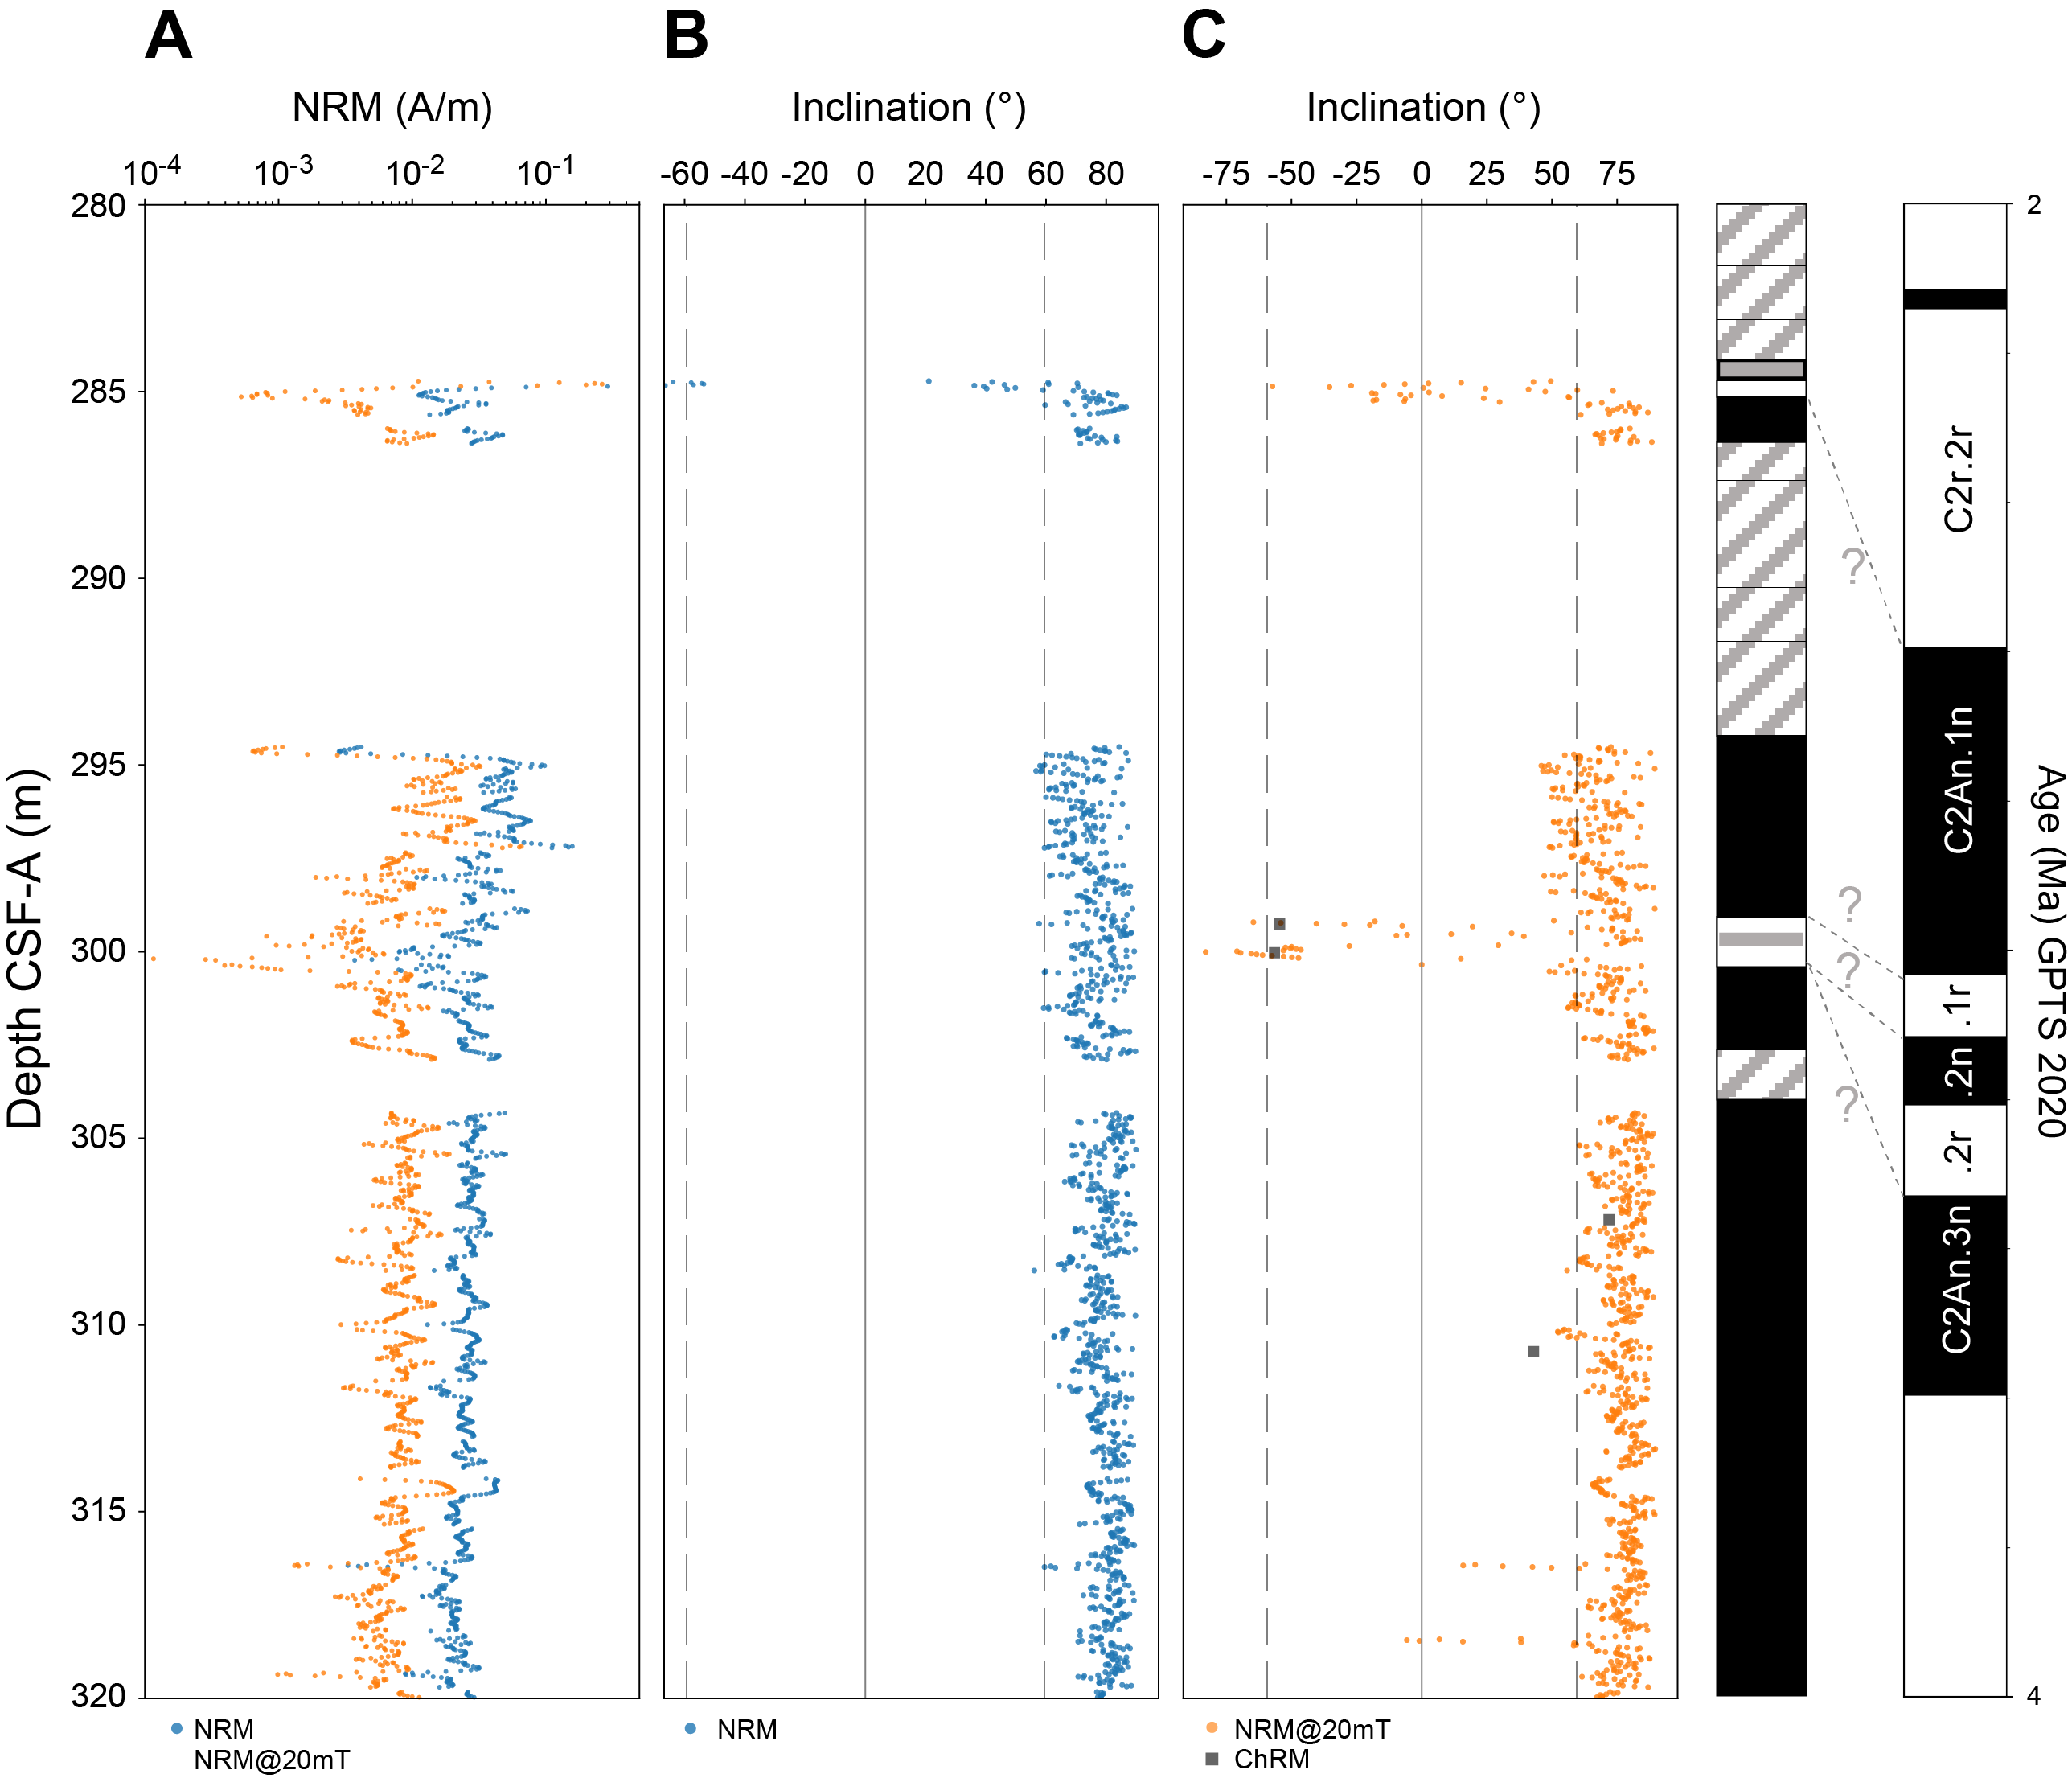
Figure F15. Preliminary magnetostratigraphy.
A total of 27 discrete samples from representative lithostratigraphic units were measured for anisotropy of magnetic susceptibility (AMS). The magnetic minerals in 24 discrete samples have a positive shape parameter (T) value, indicating an oblate shape of magnetic grains. The other three samples have negative T values, indicating a prolate shape. These differences do not correspond to lithologic changes and therefore indicate an effect of drilling disturbance.
Alternating field (AF) demagnetization up to 100 mT peak AF was performed on 27 discrete samples to preliminarily evaluate the quality of NRM data from archive-half sections. The results suggest that a secondary NRM component, likely because of rhombohedra drill string overprinting, can be effectively removed at 20 mT peak AF. The NRM data between 20 and 80 mT AF tends to progress linearly toward the origin during demagnetization. Principal component analysis was then applied to this linear progression to determine the characteristic remanent magnetization (ChRM) of the discrete samples (Kirschvink, 1980). The ChRM inclination of discrete samples, although at a much lower resolution, is consistent with the inclination of archive-half sections after demagnetization at 20 mT (average ChRM = 58.7°; average maximum angular deviation = 8.7°), suggesting that the NRM@20mT of archive-half sections provides reliable primary geomagnetic polarity data.
5.1.2. Magnetostratigraphy
We used the NRM@20mT inclination of archive-half sections to establish a shipboard magnetostratigraphy. Although the inclination profile is discontinuous, the recovered samples show normal polarity to Core 402-U1612A-31R, where a 40 cm interval with reverse polarity is observed. Biostratigraphy provides useful age constraints (see Biostratigraphy), suggesting that the lower boundary of this reversed interval at ~284.77 m CSF-A corresponds to the Gauss/Matuyama boundary at 2.595 Ma (geomagnetic polarity timescale [GPTS] 2020; Gradstein et al., 2020). However, the upper boundary of this polarity zone is unlikely to correspond to the Chron C2r.1n (Reunion)/C2r.2r boundary because the overlying volcaniclastic layer indicates a hiatus and/or postdepositional reworking in its vicinity (Figure F15; Table T3).
Two other thin reverse polarity zones were found in Section 402-U1612A-32R-4 (~298.790–300.290 m CSF-A), confirmed by the ChRM of discrete samples from the interval (Figure F14). However, if these polarity zones were correlated with the Keana (C2An.1r) and Mammoth (C2An.2r) Subchrons, the sedimentation rate would be 0.2–0.5 cm/ky, which is an order of magnitude lower than the average sedimentation rate determined by biostratigraphy for the depth interval of Cores 31R–35R. It is not yet known whether these reversed intervals are related to diagenetic processes that formed secondary magnetic minerals with reverse polarity. Alternatively, the NRM records between these two reverse polarity zones may be secondary overprinting inside a single reverse polarity interval. In this case, the two reverse polarity zones could correspond to the Keana Subchron with a sedimentation rate of about 1 cm/ky. Either interpretation is compatible with the shipboard biostratigraphy; postcruise rock magnetic and sedimentologic studies are needed to test whether the NRM of this interval is primary.
5.1.3. Rock magnetism
Discrete samples were subjected to more rigorous remanence analysis and additional rock magnetic experiments. Isothermal remanent magnetization (IRM) was applied to samples with characteristic lithology. Samples were selected from three major sediment packages to determine the main magnetic carriers. Magnetizing fields of 5, 10, 20, 40, 80, 150, 300, 500, 700, and 1000 mT were applied. Results showed that a large portion of the core, consisting of two separate packages of nannofossil ooze (Core 402-U1612A-3R through Section 34R-5; 17.9–321.2 CSF-A), was saturated between 300 and 500 mT, indicating magnetite as the dominant magnetic mineral. The lower portion of the dolomitic mud (~3 m of sediment above the recovered hard rock in Section 34R-6 and Core 35R; 321.2–324.8 CSF-A) did not saturate at the highest applied field of 1 T, indicating the presence of hematite.
Anhysteretic remanent magnetization (ARM) was applied to discrete samples and AF was demagnetized in 11 steps from 5 to 80 mT. Both IRM and ARM data suggest that sediments of different lithologies exhibit similar coercivity variations, except for the dolomite-rich sediment.
5.2. Basement rocks
The five cores recovered at the base of Hole U1612A (Cores 35R–39R) consisted of various granitic rocks (see Igneous and metamorphic petrology). Following the procedure for the sediment archive halves, these hard rock sections were measured for NRM at a resolution of 2 cm and demagnetized in steps of 5, 10, 15, and 20 mT. A 20 cm long rock piece of rock in Section 37R-1 (334–334.2 m CSF-A) gives a clear normal polarity. However, the rest of the material in the cores was broken into pieces about 2–3 cm long. Because of this, the instrumentation could not pick up a clear signal because of the resolution of the measurements on the superconducting rock magnetometer (SRM), resulting in unclear polarity data.
Three discrete basement samples from Cores 402-U1612A-36R, 37R, and 39R, all of which are granitoid in nature, were measured for AMS, NRM, and ARM. The AMS data show a positive shape parameter attributed to oblate magnetic grain shape. The NRM of these three samples was measured, and then the samples were demagnetized stepwise to a field of 100 mT. The sample from Core 36R (333.8 m CSF-A) shows normal polarity, but the NRM is associated with a rather low-coercivity range and the inclination is steep, indicating that the remanence could be due to a drill string overprint. The sample from Core 37R (334.4 m CSF-A) also shows a low-coercivity NRM component that is likely an overprint, whereas the NRM of the sample from Core 39R (343.9 m CSF-A) is resistant to demagnetization from 20 to 100 mT peak AF.
Hole U1612B recovered 3.8 m of variably altered granitoids across three cores (402-U1612B-2R through 4R; 318.1–334.9 m CSF-A). Because of the nature of these rocks and time limits at the end of the expedition, no discrete samples were taken. Similar to the basement rocks from Hole U1612A, the cores were broken into pieces too small to reliably measure a clear inclination signal because of the resolution of the SRM.
6. Igneous and metamorphic petrology
Holes U1612A and U1612B recovered a variety of lithologies ranging from volcaniclastic sediments to basalts, mantle peridotite, and intrusive rocks interpreted to represent the local geologic basement. Both holes show consistent petrologic, alteration, and deformation patterns. Volcaniclastic layers encountered at several depths were poorly recovered (Figure F16). Although the recovery was sufficient to define volcaniclastic units, low recovery means that the nature of the boundaries between the different lithologies were not clearly defined. In Core 402-U1612A-31R (~284 mbsf), a basalt clast marks the transition between a volcaniclastic layer and the sediments. The sediment/basement interface was encountered at ~324 mbsf, and it begins with an unconsolidated breccia containing clasts of lithologies including basalt, peridotite, and granite (Figures F16, F17). The nature of this basal breccia (e.g., a sedimentary deposit or the result of displacement along a fault) remains uncertain because of the poor recovery. However, the primary contact with the sediments is exceptionally well preserved in a ~10 cm thick interval of pillow basalt that still contains slightly altered glassy rims (Section 35R-1, ~324.4–325.2 cm). Below the breccia, a crystalline interval was cored from ~333 to ~345 mbsf in Hole U1612A and from ~323 to ~334.9 mbsf in Hole U1612B. These rocks consist mainly of a variably deformed granitoid with a predominantly quartz-diorite composition. Two peridotite pebbles were found in the basal breccia of Core 402-U1612A-35R, and an 8 cm cobble of mantle peridotite was recovered at the bottom of Core 37R without a preserved contact with the granitoids. Notably, in Hole U1612B mantle peridotites form a ~37 cm thick sliver between the granitoids at ~327 mbsf that is physically associated with basalts. These observations suggest that the granitoids and the associated mantle peridotites were exposed on the seafloor either prior to or during sediment deposition.
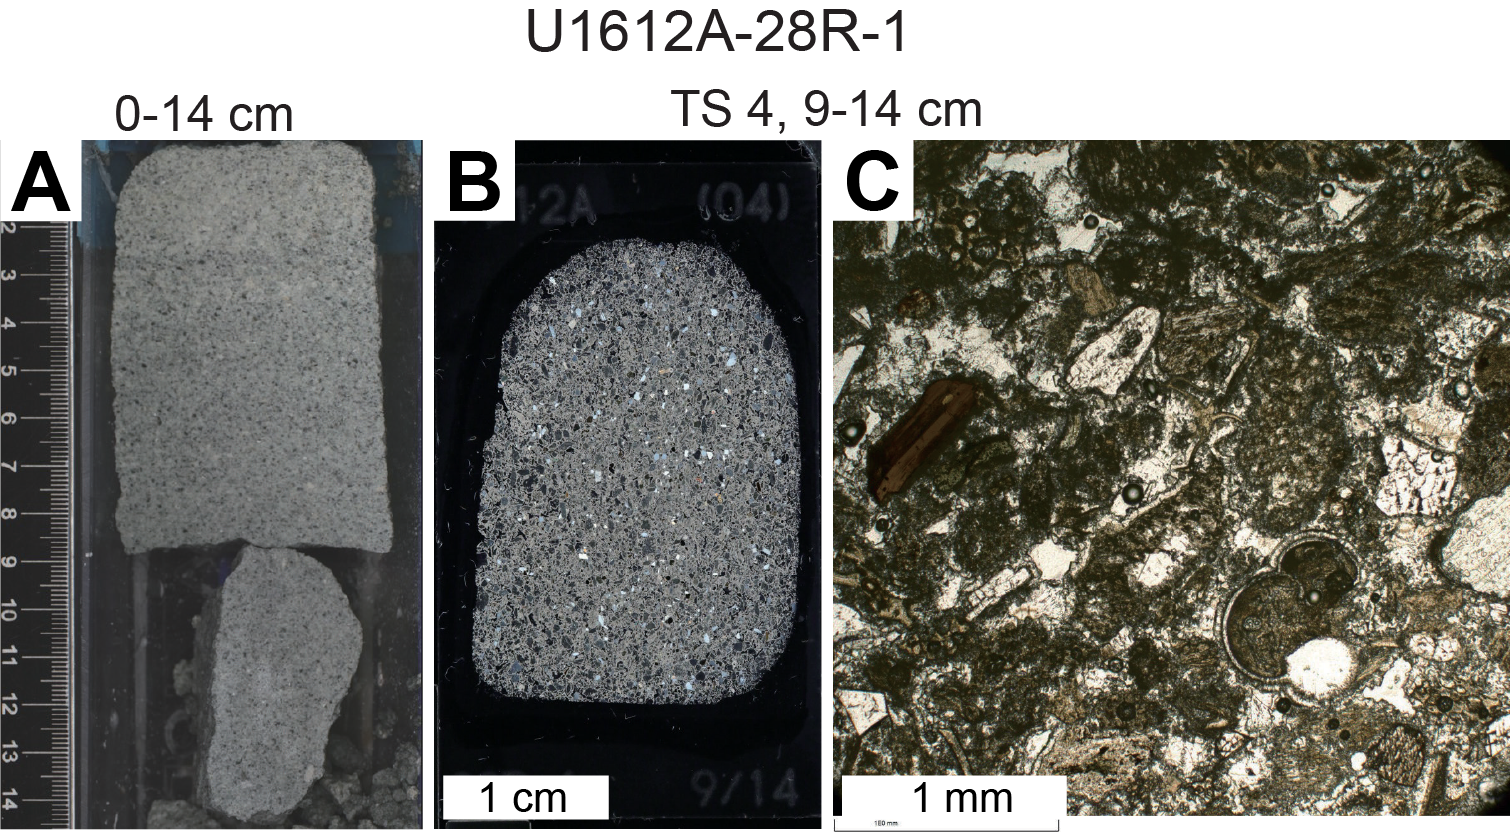
Figure F16. Volcaniclastic rock.
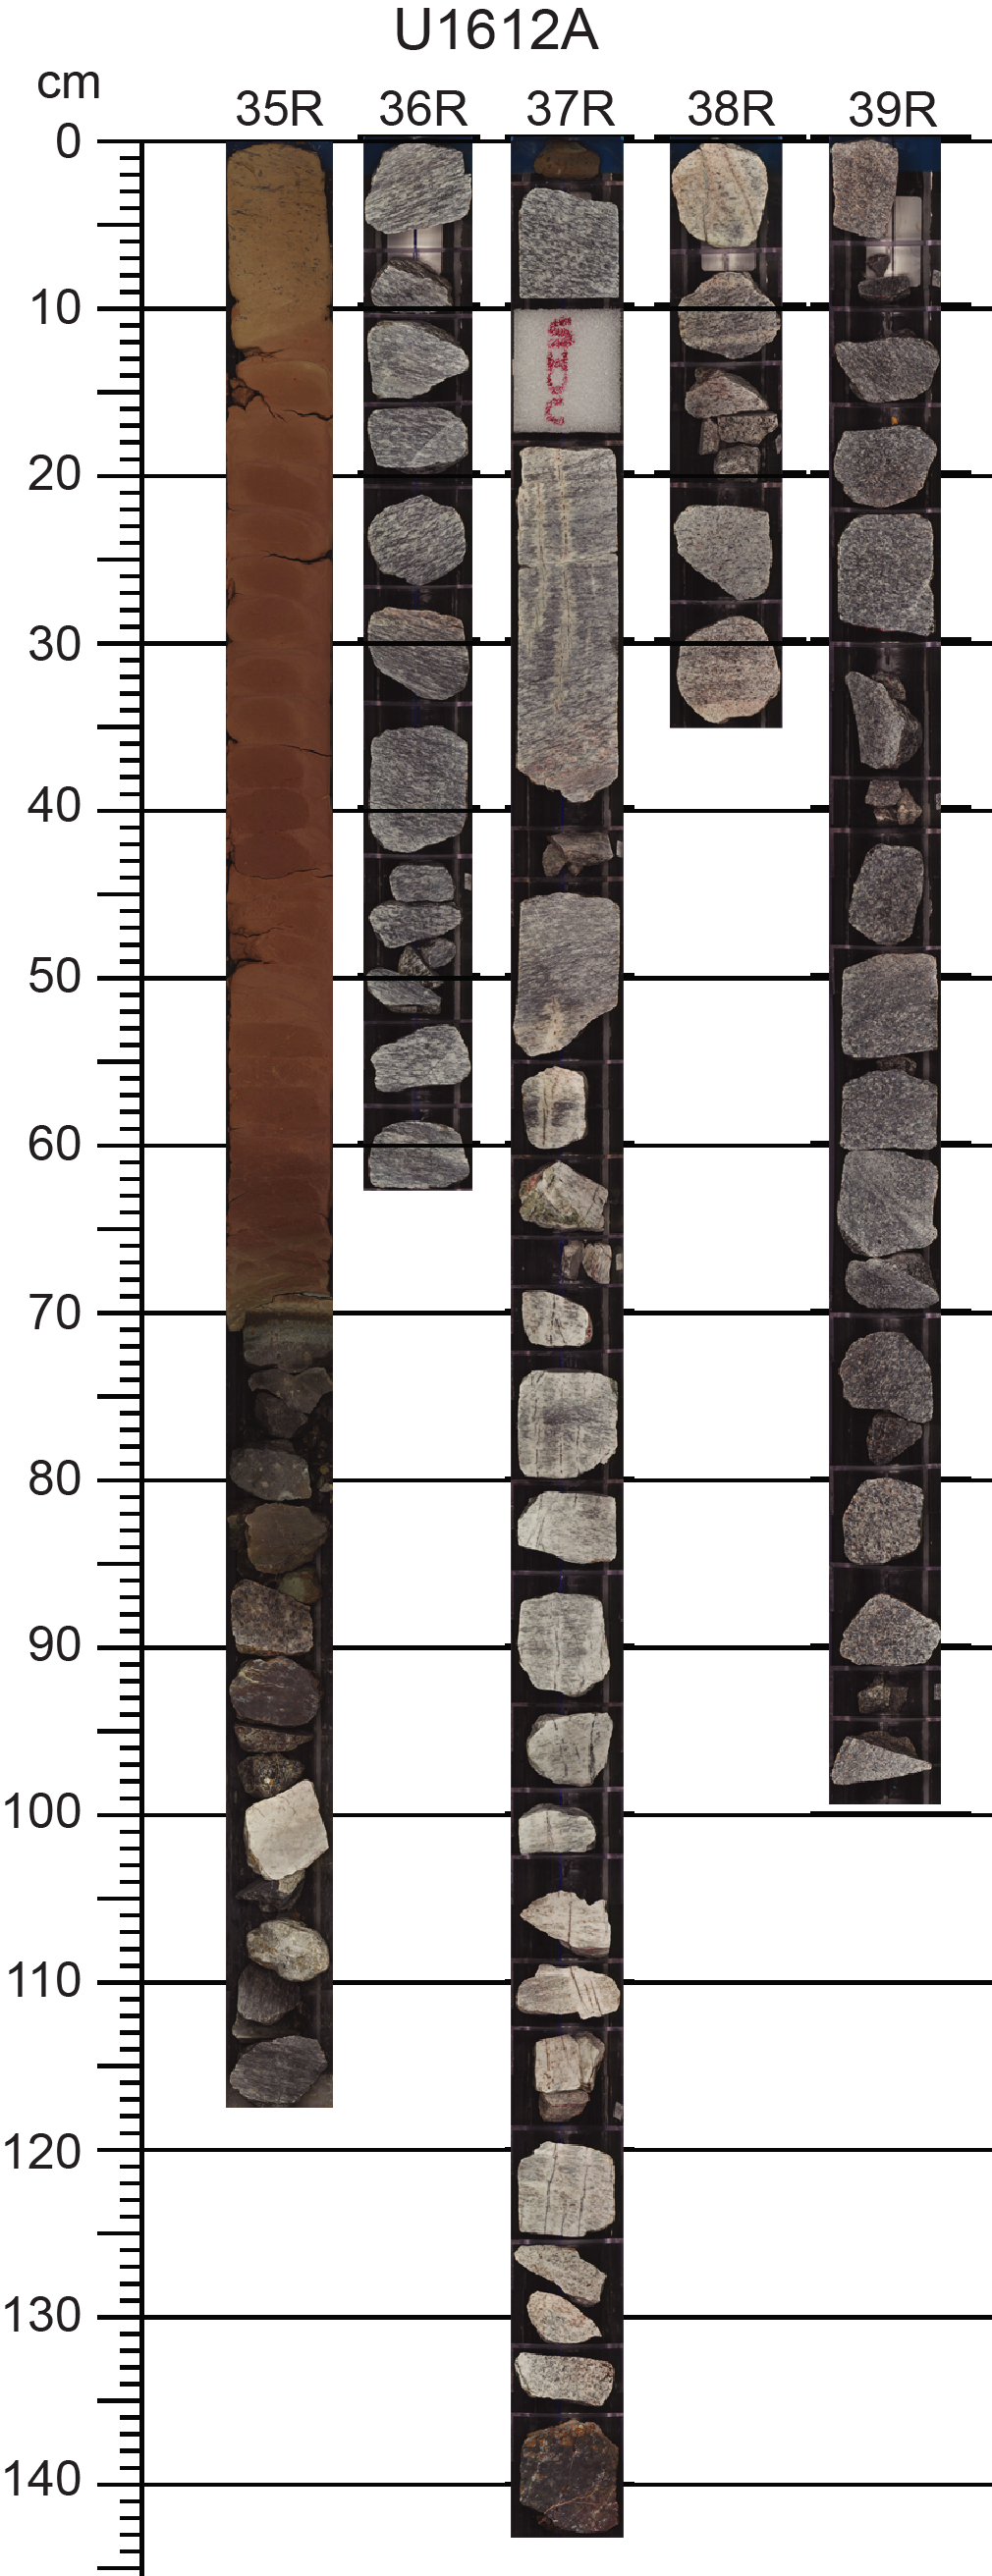
Figure F17. Basement contact.
6.1. Rock lithologies
6.1.1. Volcaniclastic layers
Several volcaniclastic rocks were found in the sedimentary interval (e.g., Cores 402-U1612A-13R, 27R, 28R, and 31R). Some of these samples were examined under the petrologic microscope to determine their mineralogy and texture (Figure F16). In Core 13R (~113 mbsf), highly vesicular volcaniclastic rock consists of coarse grains of orthopyroxene, amphibole, mica, and plagioclase set in a highly altered glassy groundmass. In Core 27R at ~246 mbsf, we encountered a volcaniclastic rock with amphibole, mica, and plagioclase along with the shells of planktic foraminifera (Globigerina sp. and Globorotalia sp.) in a very fine, highly altered matrix. A volcaniclastic rock sampled in Core 28R at ~256 mbsf consists of clasts of mica, quartz, amphibole, pyroxene, and plagioclase along with foraminiferal shells in a calcite matrix. Another volcaniclastic rock from Core 31R at ~284 mbsf contains clasts of pyroxene, amphibole, biotite, and plagioclase. The rock is strongly vesicular with a highly altered matrix.
In addition to these volcaniclastic rocks, a fragment of plagioclase phyric basalt composed of clinopyroxene, plagioclase, amphibole, and opaque minerals (oxides) was found in Core 402-U1612A-31R. Thin veins of epidote and pale green amphibole, which are usually formed during low-grade metamorphism or alteration, were also observed in this fragment.
6.1.2. Definition of the basement at the sediment/basalt interface (Subunit IVA)
At ~324 mbsf in Core 402-U1612A-35R, reddish basal sediments are in primary contact with basalt that retains an altered glassy rim (Figure F18). The basalt rim shows subrounded features that may represent altered spherules. In analogy to nearby Site 651 (Shipboard Scientific Party, 1987b), we interpret this basalt to be a remnant of a pillow formed in situ. The basalt clast is broken into several pieces that were probably part of a larger block, as seen in the X-ray scan image. This interpretation is consistent with the physical properties analysis, which shows a subtle increase in rock density and seismic wave velocity at ~324 mbsf. The 40 cm interval below the basalt (35R-1, 80–120 cm) contains large igneous and metamorphic pebbles of variable composition, ranging from mantle peridotites to continental igneous and metamorphic rocks. In Hole U1612B, the breccia was well cemented with clasts ranging ~0.2–4 cm in scale. These observations suggest that the breccia could be either a polymictic breccia formed during deposition or a syntectonic, fault-zone breccia associated with the unroofing of the basement.
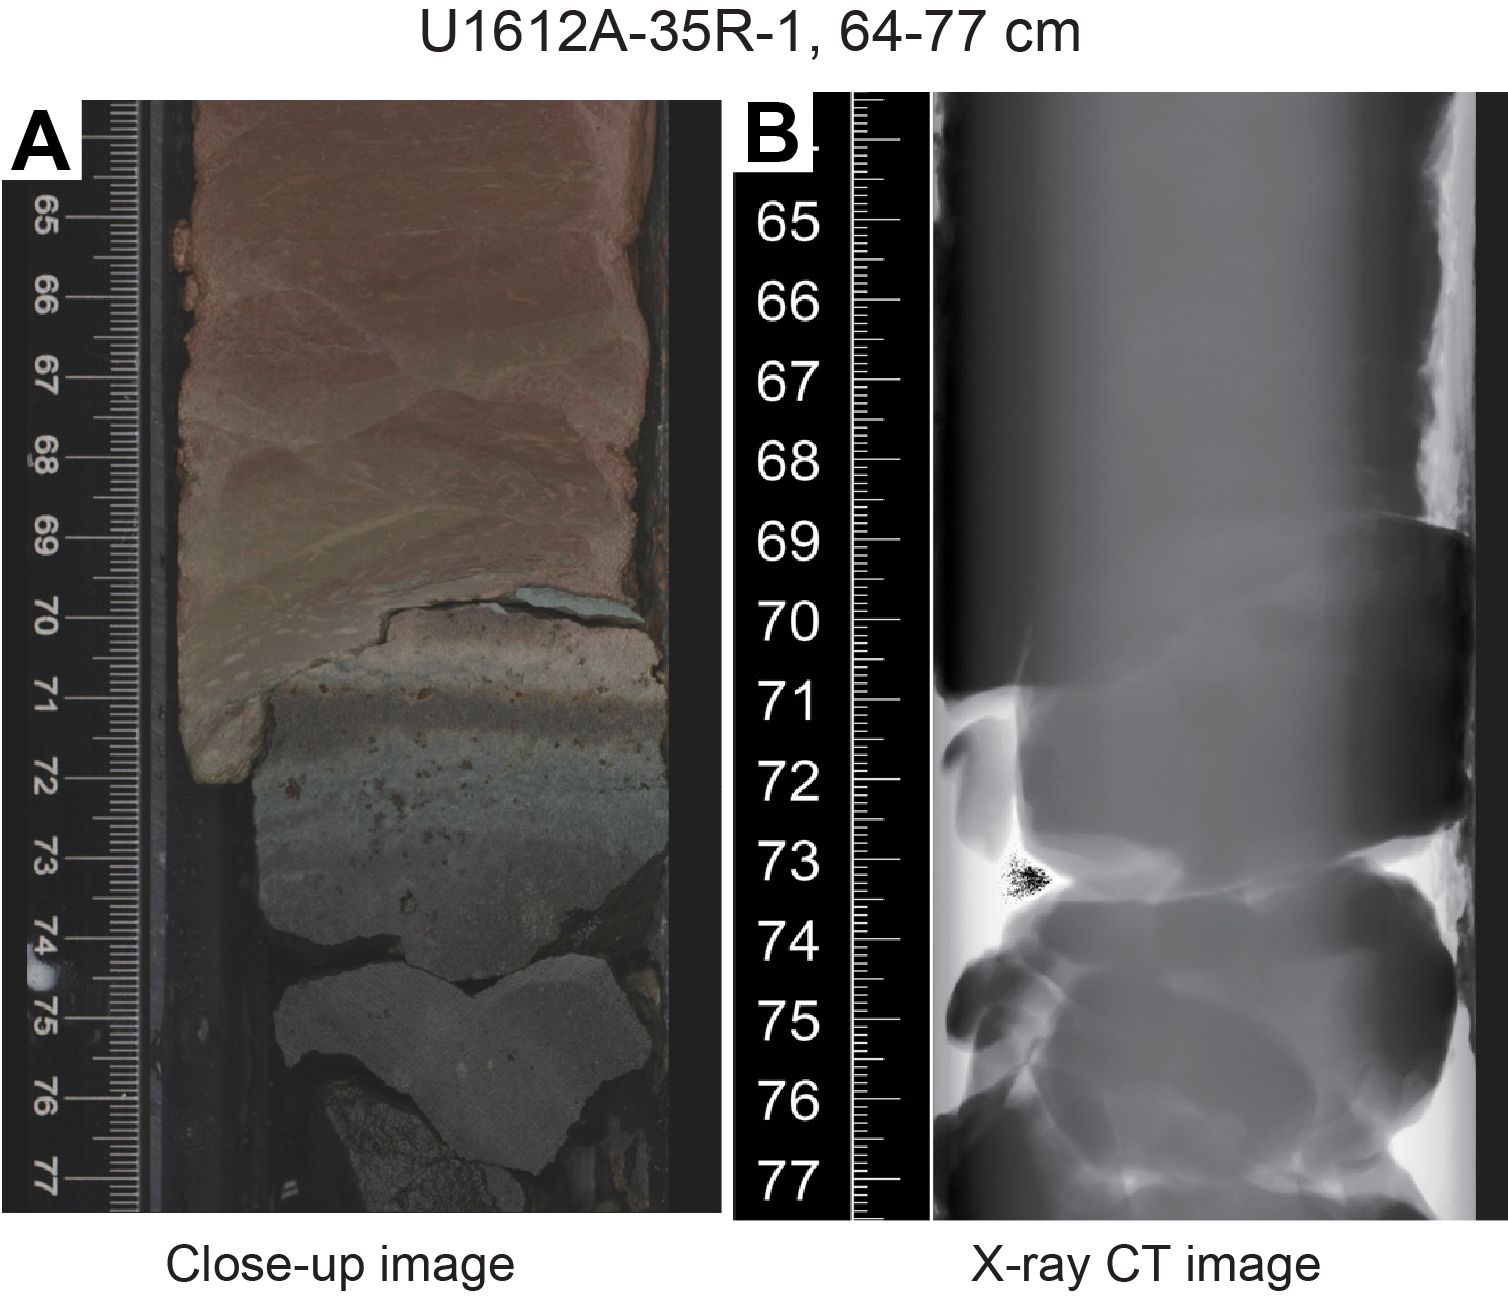
Figure F18. Contact between dolomitic sediments and basalt.
Reddish dolomitic sediments with a composition similar to that of Unit III at Site U1612 were also documented just above the contact between the sedimentary cover and the volcanic sequence at ODP Sites 650 and 651 and are probably related to the circulation of Mg-rich fluids from the basement rocks (Robertson, 1990; McKenzie et al., 1990).
6.1.3. Igneous rocks from the unconsolidated breccia below the basement/sediment interface (Subunit IVB)
Cores 402-U1612A-35R and 402-U1612B-2R contain several types of pebbles that make up the basal breccia (Figure F19). The basalt breccia recovered in Hole U1612B is >1 m thick and has a consolidated matrix with clasts ranging 0.1–5 cm. The uppermost pebble in Core 35R is a basalt with 1 cm of altered glass in contact with the sediment (Subunit IVA). This basalt is vesicular and olivine-phyric with elongated plagioclase grains in the groundmass. The weathered olivine is replaced by reddish clay minerals. The vesicles are sometimes filled with secondary minerals such as carbonates and clays. Below the alteration zone, the basalt appears crystalline and fresh. Whole rock analyses reveal relatively primitive compositions (~6.7 wt% MgO; 51 wt% SiO2) associated with high concentrations of alkalis (NaO + K2O = 5.1 wt%) and TiO2 (1.4 wt%) (see Igneous geochemistry).
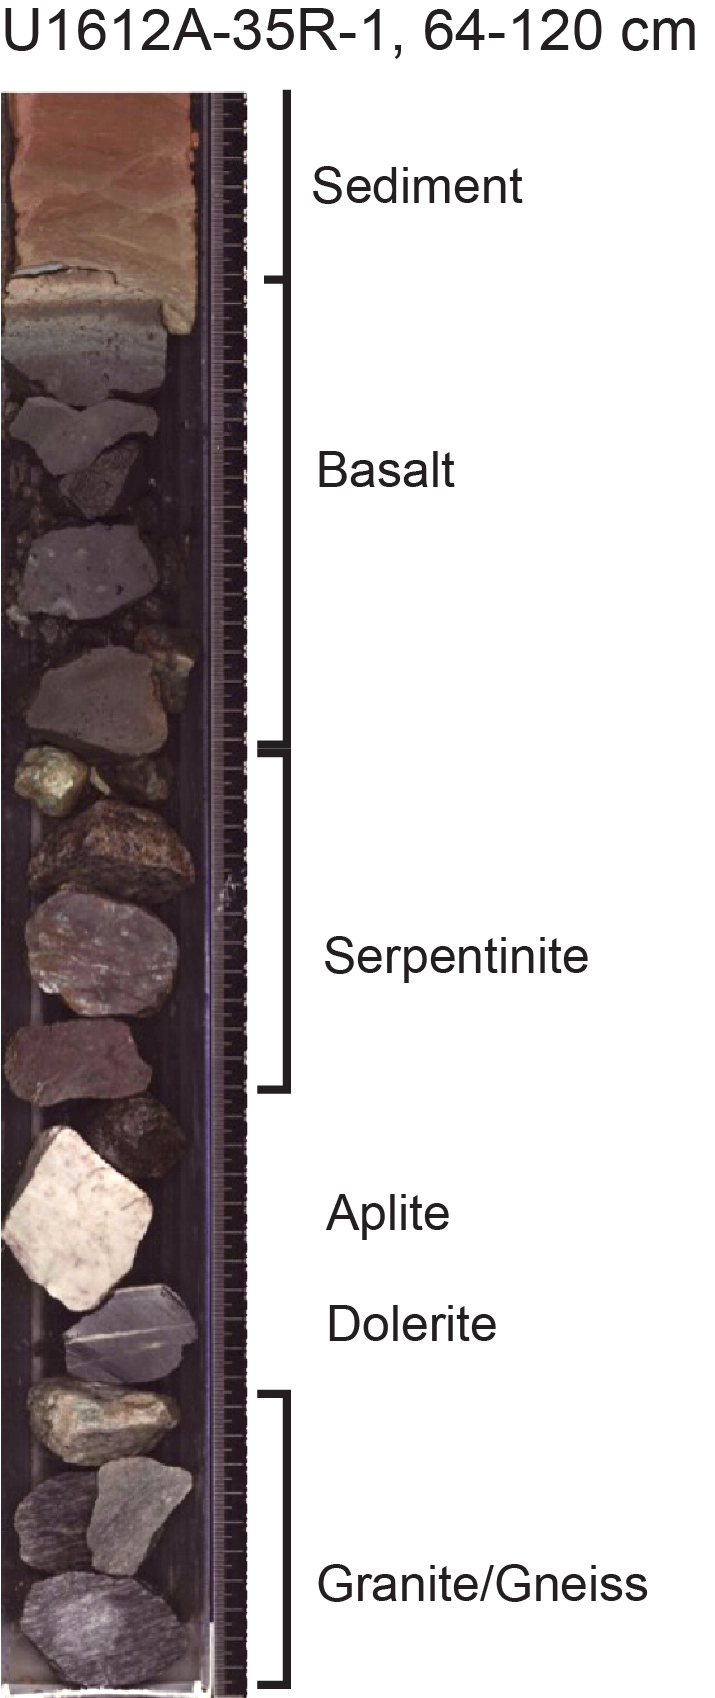
Figure F19. Dolomitic sediment/basalt contact and breccia.
The top of Subunit IVB is a 4 cm long granite clast found in the basal breccia just below the basalt. The granite consists mainly of quartz, plagioclase, K-feldspar, and biotite and can be distinguished from the basement granitoids by the modal abundance of K-feldspar. The basal breccia also contains serpentinized peridotite clasts identified as clinopyroxene-poor lherzolite to harzburgite with moderate to high degrees of serpentinization. Reddish patches delineate areas where olivine was weathered and replaced by clay minerals and hematite. The mesh texture of the serpentine can be seen in the black areas of the hand specimen. Pyroxenes are rounded to anhedral and are locally preserved from low-temperature alteration. Notably, patches and veins of white to gray mafic material crosscut the original fabric and appear to be composed mainly of saussuritized plagioclase. Millimeter-sized spinel is locally preserved in the serpentinized matrix.
Leucocratic rock (aplite), a holocrystalline basalt/dolerite pebble with white veins, gneiss, and granitoid pebbles, was also recovered in Subunit IVB (Figure F19). A mylonitic/ultramylonitic granitic gneiss shows a deformation texture well defined by amphibole stretching lineation, biotite and amphibole foliation, sigma clasts formed by plagioclase, and an overall strong S-C fabric. Aplite and fine-grained metamorphic pebbles occur below the serpentinized peridotite in the basal breccia. The aplite consists of coarse-grained quartz and feldspars. The fine-grained metamorphic rock has a crystalline texture, lacks visible evidence of original igneous features, and quartz veins crosscut the sample. The peridotite intercalated between granitoids from Section 402-U1612B-4R-1, 41–59 cm, also possesses relatively high modal abundance of plagioclase showing evidence of plagioclase impregnation in these rocks. The olivine in these plagioclase-bearing peridotite samples is completely altered to serpentine and clay minerals.
6.1.4. Granitoids and minor mafic/ultramafic rocks (Unit V)
Beneath the basal breccia of Subunit IVB, Cores 402-U1612A-35R through 39R contain the granitic gneisses of Unit V. Strong mylonitic fabric is observed in the gneisses recovered in the upper part of Cores 36R, 37R, 38R, and 39R. The foliation is defined by the orientation of biotite and amphibole grains and the mylonitic intensity decreases in the structurally lower parts of the section (Figure F20), transitioning from various degrees of mylonites to protomylonite. The ultramylonites and mylonites show a strong lineation defined by the orientation of the amphiboles. In some cases, two distinct intersecting lineation fabrics are observed, indicating multiple stages of deformation and metamorphism. The cores with the recovered gneisses have been cut parallel to the most pervasive lineation fabric, allowing us to observe kinematic indicators. Plagioclase forms sigma clasts with top to the right shearing direction. In collaboration with the paleomagnetism team, we attempted to reconstruct the magnetic north; however, the declination data was unreliable, so the original sense of shear direction remains unclear. An S-C fabric is defined by mica and amphibole. In Section 37R-1 at 334.4–335.4 mbsf, the mylonites are cut by two large perpendicular veins filled with amphibole in the core of the vein and quartz and albite in the outer part of the vein. The mica and amphibole that surround the vein and define the main foliation are offset and sheared. In Core 39R, the granite shows a weak mylonitic texture and preserves the initial magmatic fabric.
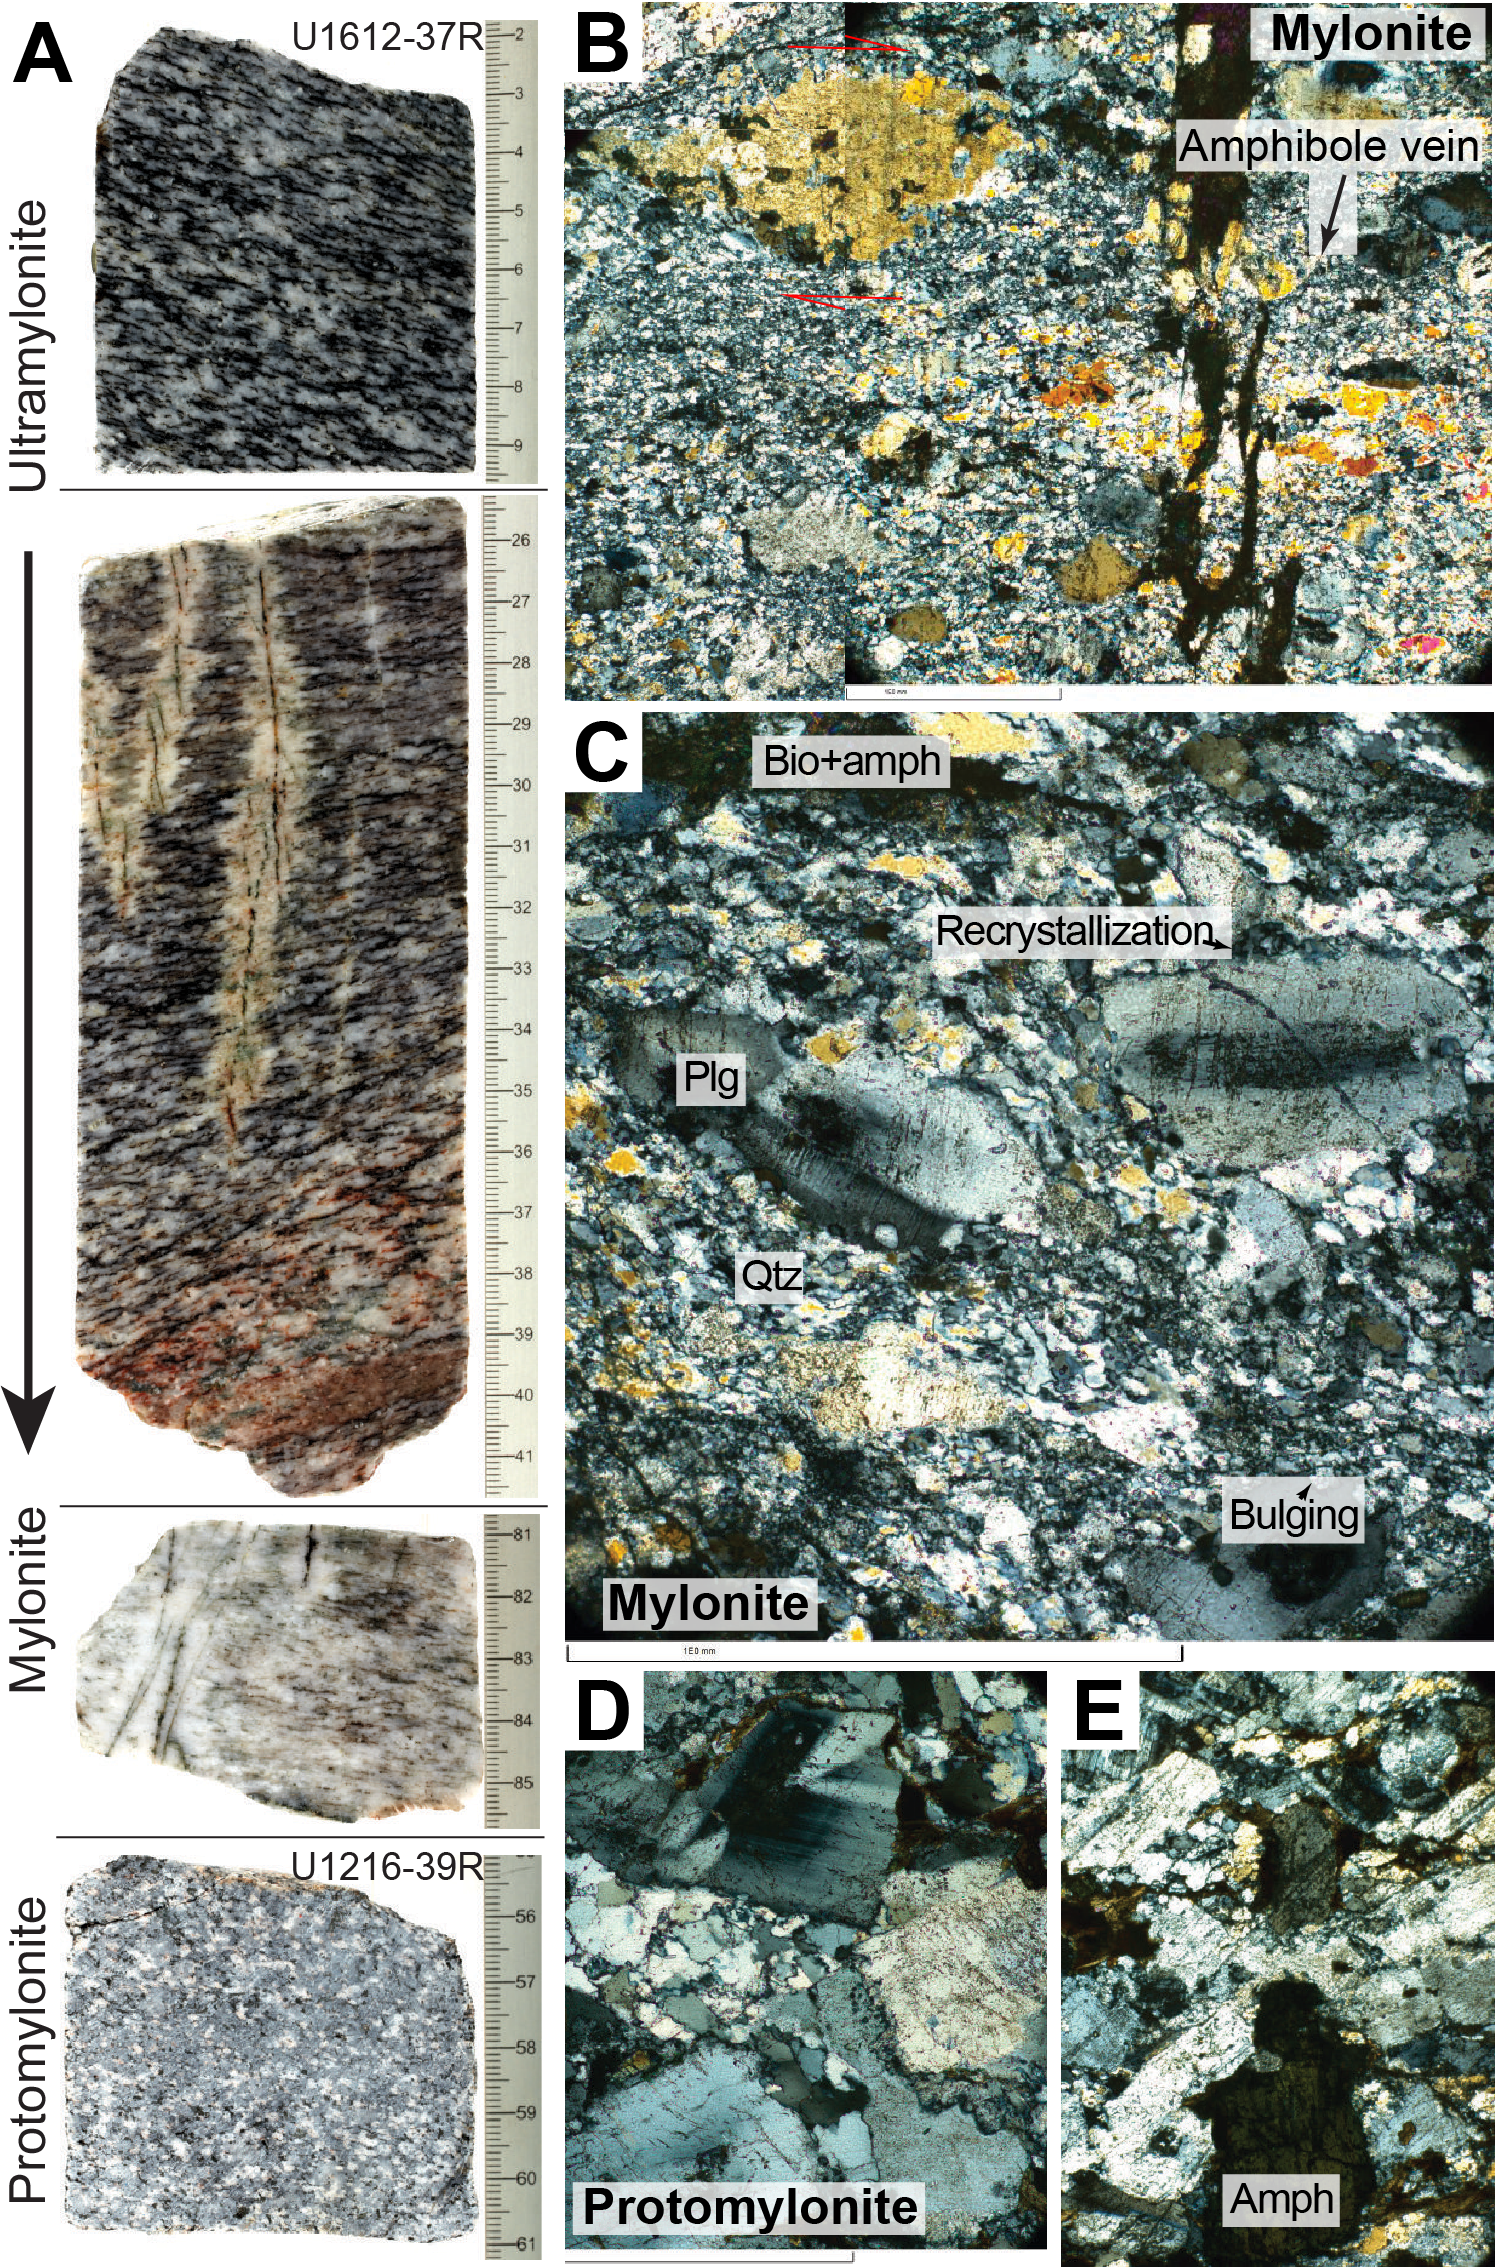
Figure F20. Ultramylonite to protomylonite.
The decrease in the mylonitization intensity from shallow to deeper sections in Hole U1612A is observed both macroscopically and microscopically. Notably, a correlation of mylonitization with the lithologic variation is clear in Section 402-U1612B-4R-1, in which mylonitization in peridotites increases above and below the peridotites/basalt sliver. At the thin section scale, the mylonitic intervals show layers of elongated quartz ribbons with grain boundary migration and recrystallization and the feldspar shows undulatory extinction and bulging (Figure F20B, F20C). These observations suggest that the mylonitic fabric was formed at temperatures higher than ~550°C and deformed by dynamic recrystallization. Microscopically, the protomylonites preserve mostly euhedral amphibole and plagioclase grains, further supporting the macroscopic observations suggesting a weak mylonitic fabric. Although the quartz grains show some bulging, they appear to have developed polygonal grain boundaries (Figure F20D) suggesting some static recrystallization or annealing. The granitoids below the mantle peridotite and the mylonites in Hole U1612B have a pinkish tinge probably imparted by a relatively high abundance of alkali feldspar and likely indicating lower alteration.
The lithologic characteristics of the basement drilled in Holes U1612A and U1612B are overall consistent, but Hole U1612B has better recovery and offers a clearer picture of the relationship between the existing mafic and ultramafic rocks and the granitoids. Interval 402-U1612A-37R-1 contains a 3 cm long sample of altered basalt at 0–3 cm and a peridotite sample at 137–144 cm located at the bottom of the section; however, the contact between the granites and the peridotite is not preserved. The plagioclase-bearing peridotite is highly serpentinized and locally weathered and is similar in appearance to the peridotite clasts recovered in the unconsolidated breccia above (Figure F21A, F21B). The peridotite is cut by two generations of veins; the first is filled with serpentine, and the second is filled with clay minerals and possibly carbonaceous material. Section 402-U1612B-4R-1 is composed of variably deformed granitoids with a sliver of mafic and ultramafic rocks in an interval ranging 22–81 cm, which contains peridotites and basalts/diorites (see visual core description for Section 4R-1 in Core descriptions). Two pieces of pseudotachylytes ~4 cm thick were recovered in Section 4R-1 (27–31 and 36–40 cm) above an 18 cm thick interval of peridotite. Although the intrusive contact between peridotites and granitoids is not preserved, it is likely that the peridotite intervals were originally sandwiched in between the granitoids.
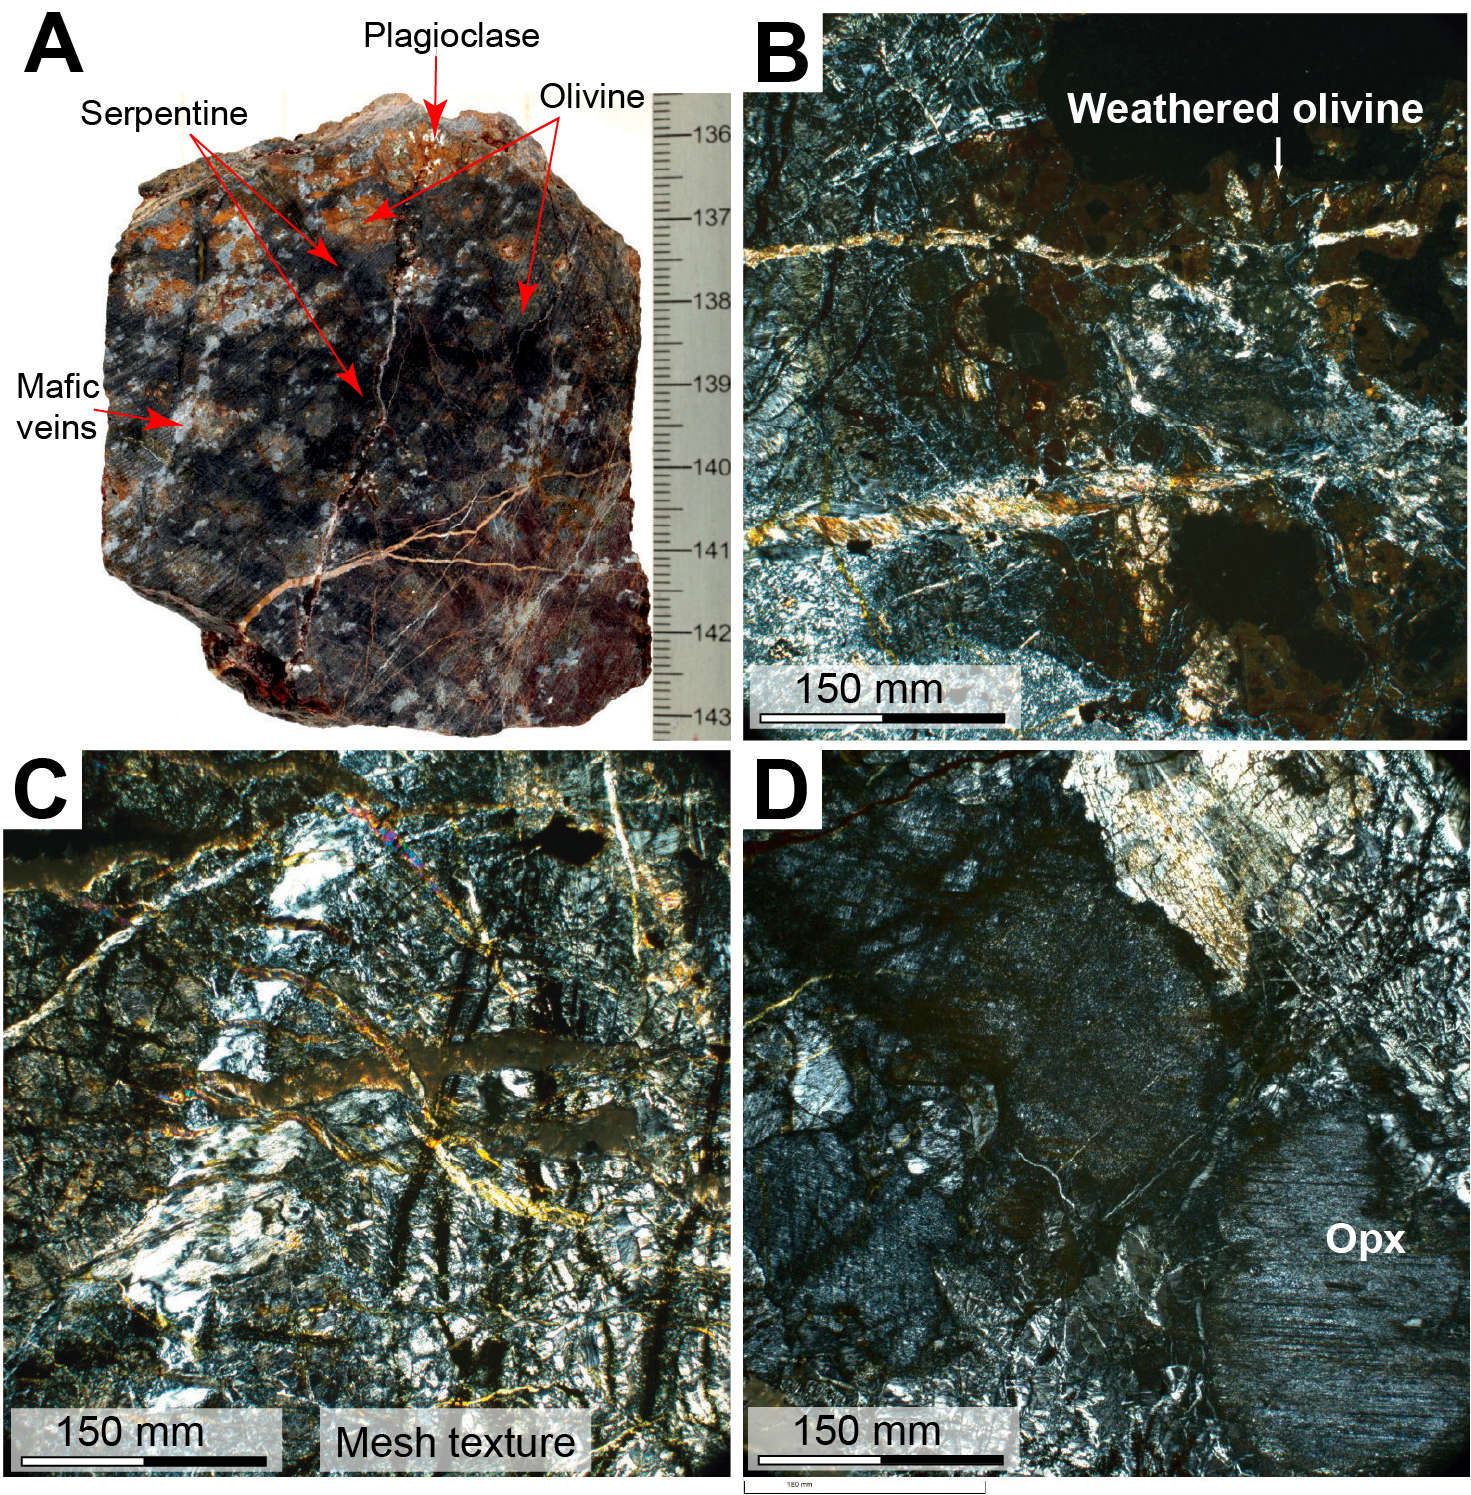
Figure F21. Serpentinized peridotite and weathered olivine.
7. Structural geology
Structural measurements and microstructural observations were made on cores from Holes U1612A and U1612B. For Hole U1612A, our observations are divided into sedimentary structures for the upper interval of 323.7 m (Core 402-U1612A-1R to Section 35R-1, 70 cm) and basement structures for the lower 21.01 m (Section 35R-1, 70 cm, through Core 402-U1612A-39R), which consists mostly of variably deformed gneisses and granites and minor mafic/ultramafic rocks. A polymictic breccia composed of a variety of rock types (basalt, peridotite, gneiss, and granite) marks the contact between sedimentary and basement units. Hole U1612B, which was drilled through the sediments to reach the basement structure before starting coring, confirmed the observations from Hole U1612A, specifically, the presence of a polymictic breccia marking the sediment/basement interface, followed by variably deformed gneisses and granitoids with minor mafic/ultramafic components.
In sedimentary structures, we mostly measured bedding and brittle structures such as faults and fractures, with minor folds usually associated with faults. In hard rocks, we measured primary foliation and veins.
7.1. Sedimentary structures
Measurements of bedding in sediments cored at Site U1612 were made only below ~200 mbsf in Hole U1612A in sections where we could exclude drilling disturbance as a factor. From ~200 to 220 mbsf, sediments show subhorizontal, parallel lamination with an average dip of ~5° (Figure F22). Bedding was measured again at ~300 mbsf, where it maintained the same inclination as above. Starting from ~315 mbsf, tilted beds become more common (Cores 402-U1612A-22R through 34R), and dip varies between 3° and 24° with an average of ~10° (Figure F22).
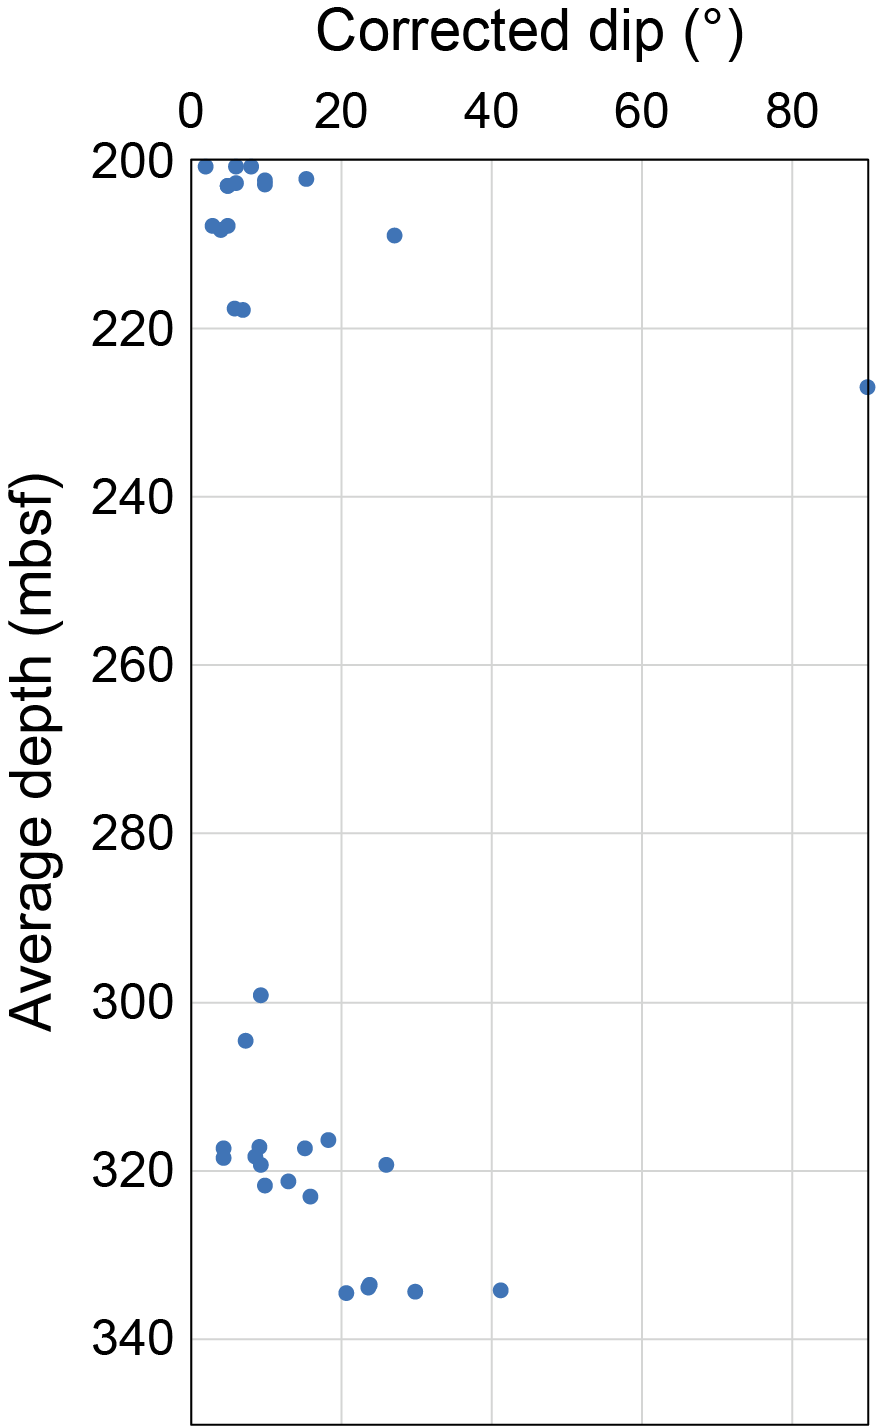
Figure F22. Dip variations of lamination.
Deformation structures were mainly encountered in the intervals 218–219, 227–228, and 321–322 mbsf in Cores 402-U1612A-22R through 34R. These structures include faulted and folded laminations (Core 25R; 227–228 mbsf; Figure F23A), reverse faulting (Core 25R; 227–228 mbsf; Core 34R; 321 mbsf; Figure F23A, F23B), boudinage (Core 24R; 218–219 mbsf; Figure F23C), and normal faulting in the dolomite subunit (Core 25R; 227–228 mbsf; Figure F23D). The centimeter-scale faults show dips of 30°–52° and offset the finely laminated sediments by 1–2 mm (Figure F23). The color variations associated with the lamination highlight the presence of these small-scale faults and folds.
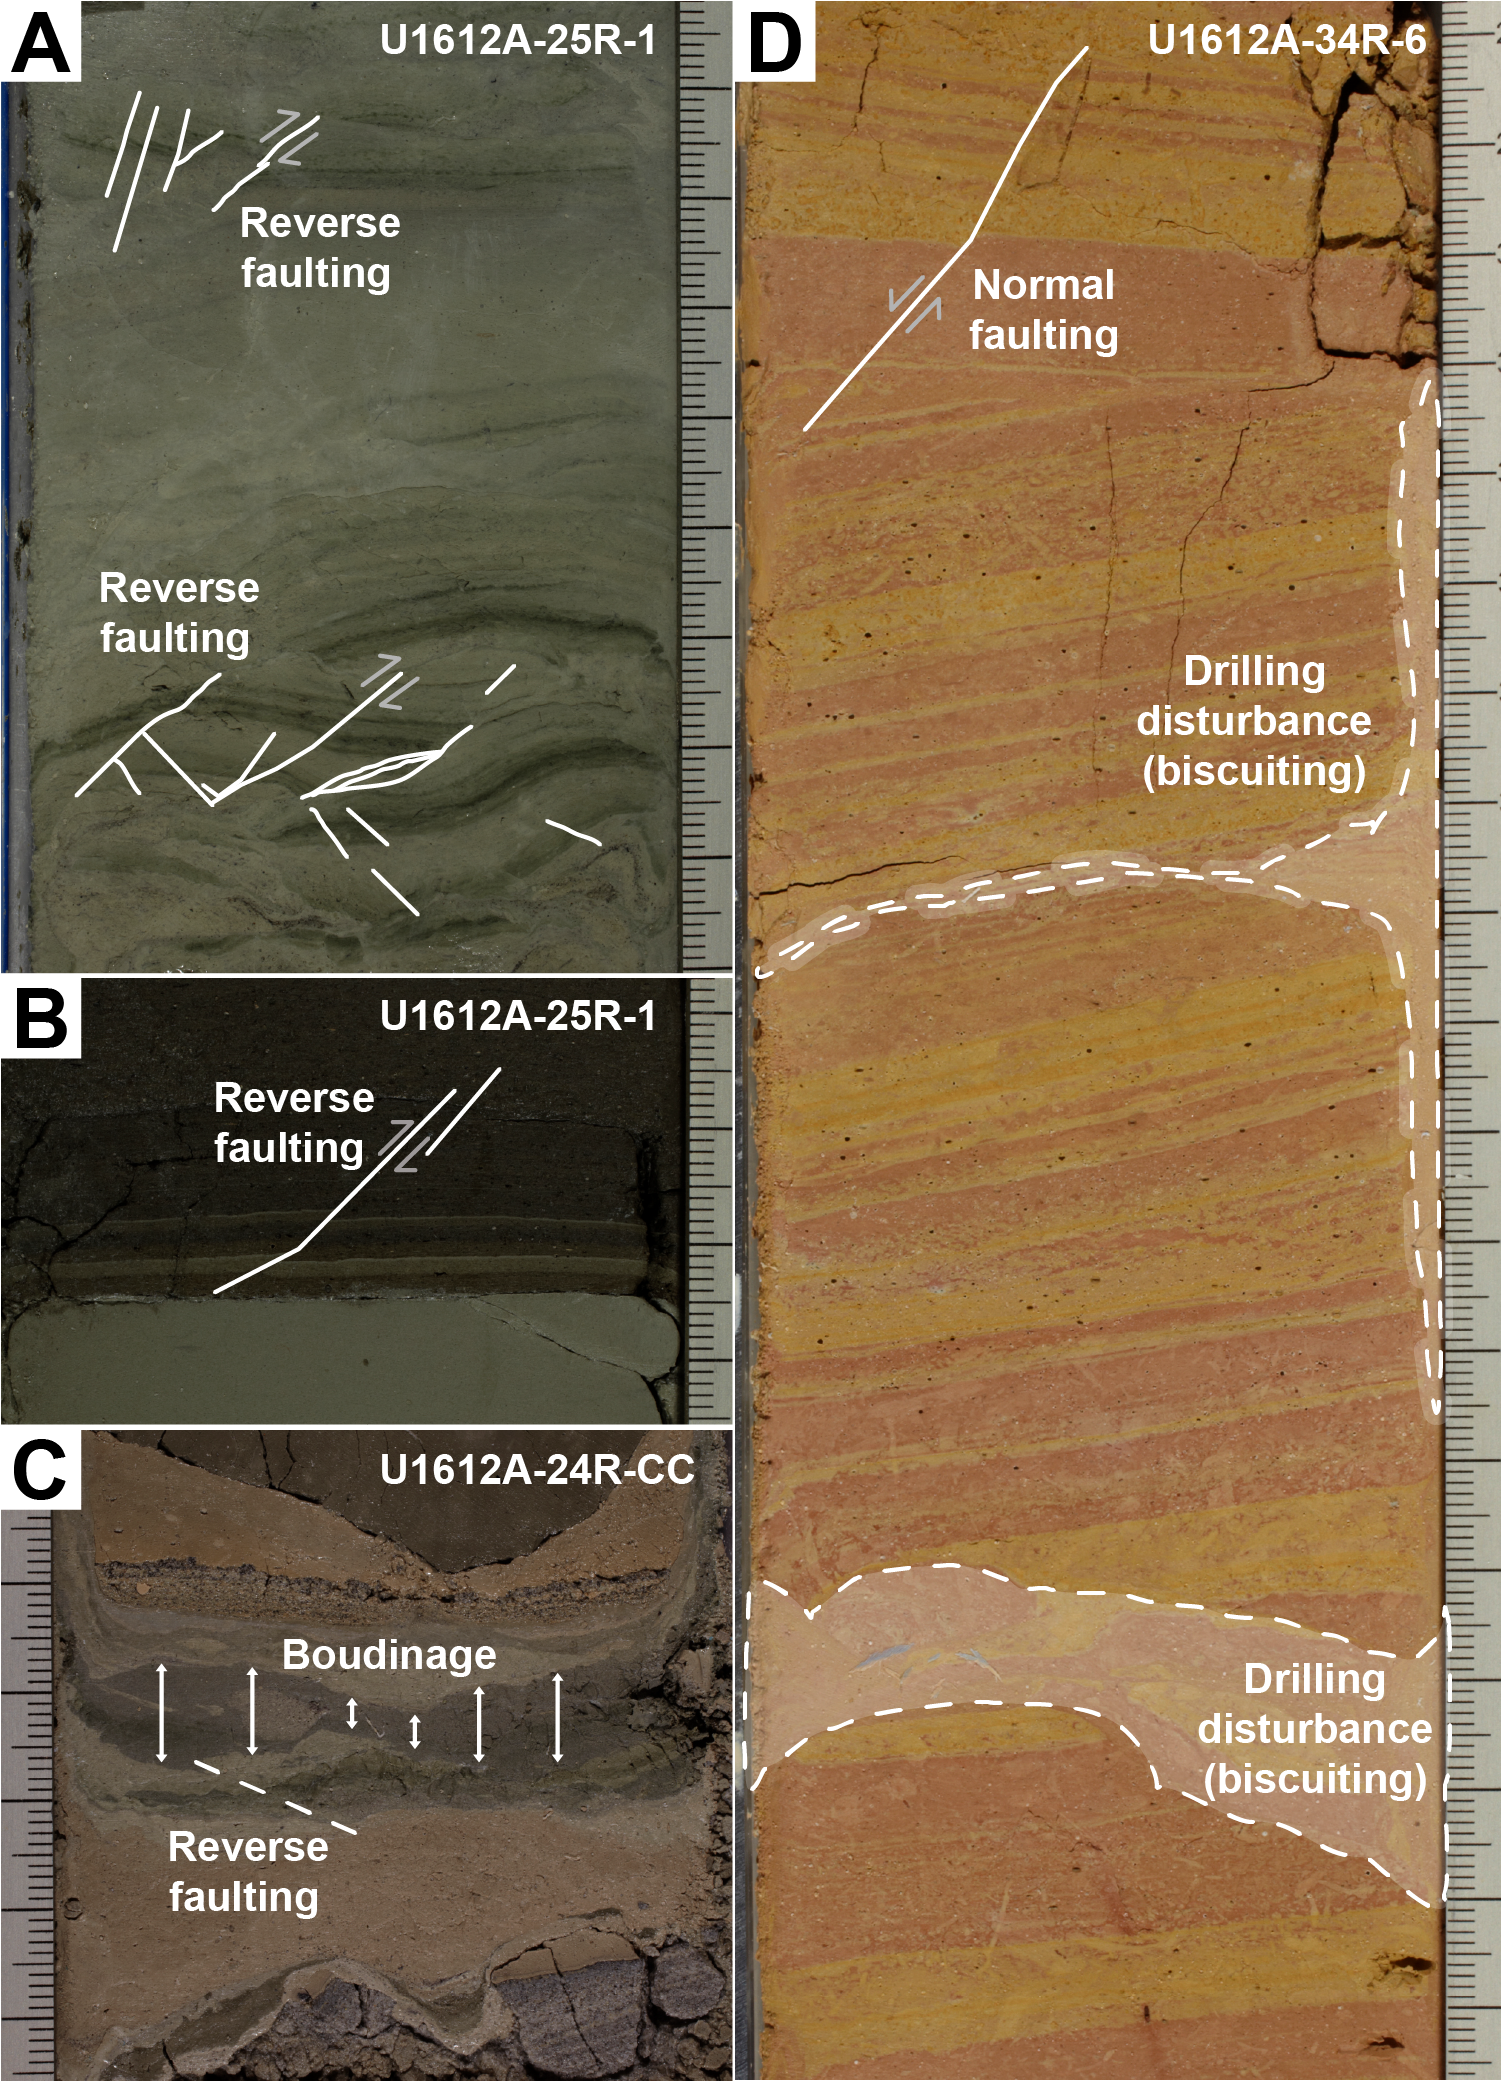
Figure F23. Deformational structures.
7.2. Hard rock structures
At 323.7 mbsf in Hole U1612A (Section 35R-1, 70 cm), the contact between the sedimentary structures and hard rock structures is subhorizontal, although it may have been deformed by drilling operations (Figure F19). From the contact at 323.7 to 324.8 mbsf (interval 35R-1, 70–117 cm), the recovered rocks consist of clasts of granite, serpentinized peridotite, feldspathic rock, and gneiss (Figures F17, F19). These fragments, some of which are rounded, show deformation features such as a mylonitic fabric or veins. However, they do not retain their original orientation in the core reference frame. The nature of the clasts suggests that they might have been part of a polymictic breccia, in which the matrix was washed away during drilling. Hole U1612B recovered the same polymictic breccia from ~318 to ~323 mbsf.
In Holes U1612A and U1612B, the polymictic breccia is underlain by variably deformed gneisses (Figure F20) from 333.5 to 344.7 mbsf for Hole U1612A and from ~323 to ~334.9 mbsf for Hole U1612B. In Hole U1612A, the gneisses are interrupted at 334 mbsf by a 2 cm long piece of rounded phyric olivine basalt and at 335.7 mbsf by a 6 cm long piece of plagioclase-bearing weakly foliated lherzolite (Figure F21). A similar interruption is found in Hole U1612B, where a ~37 cm thick section of peridotites and basalts is found between the granitoids at ~327 mbsf.
The deformation structures observed are described below in chronological order, following the progression of alteration from high-temperature fabric to low-temperature alteration. The interval 333.5–339 mbsf (Hole U1612A) contains mylonitic (crystal-plastic fabric [CPF] = 4) to ultramylonitic gneiss (CPF = 5) with clear S-C fabrics (Figure F20A). The mylonitic foliation dips at 16°–22°, and dip seems to slightly increase toward depth, reaching 40° (Figure F22). The mylonitic and ultramylonitic gneiss section is cut by a series of parallel vertical veins with a branching shape that is almost perpendicular to the foliation and the core reference frame (Figure F20A). These veins are 0.1–1 cm wide and filled with plagioclase (albite) with a central line of dark material constituted by amphibole. The veins have a Mode I opening, although some weak evidence of shearing is visible. Below 343.7 mbsf, the crystal-plastic fabric progressively decreases to weak foliation and is classified as protomylonites along with an increase in feldspar content. Hole U1612B provided a clearer correlation between mylonitization and the presence of mafic/ultramafic rocks by showing an increase in mylonitization near this lithologic contact. This is consistent with structural measurements in Hole U1612A at ~325 mbsf that show a change in dip in the mylonitic fabric that corresponds to the appearance of the mafic/ultramafic rocks in Hole U1612B (Figure F16). Feldspar-rich layers are locally present (e.g., Core 402-U1612A-38R). With respect to mantle peridotites, the few peridotites recovered in Hole U1612A are weakly deformed (CPF < 1; Figure F21). Interestingly, those recovered in Hole U1612B show strongly oriented deformation microstructures (CPF > 3) despite intense serpentinization overprinting the primary microstructures. Further onshore microstructural analyses will verify these observations. Because most of the mantle rocks in both Holes U1612A and U1612B were not oriented, we could not measure a reliable CPF orientation.
8. Sediment and interstitial water geochemistry
The samples collected from Hole U1612A included (1) sediment plugs, small pieces of concretion, and/or rocks from all cores (402-U1612A-1R through 35R) to measure hydrocarbon gas concentrations and distribution to ensure drilling safety; (2) 5 cm long sediment whole-round samples, collected from 13 cores to extract the interstitial water (IW) by incrementally applying pressure in a squeezer; and (3) representative sediments or sediment layers of particular interest to sedimentologists during the sampling parties. A variety of analytical techniques, including gas chromatography (GC), ion chromatography (IC), and inductively coupled plasma–atomic emission spectrometry (ICP-AES) were used to better understand sediment and IW chemistry and potential interactions between them. All the depths reported here are in meters on the CSF-A depth scale.
8.1. Interstitial water geochemistry
8.1.1. Alkalinity, pH, and salinity
The measured alkalinity of IW ranges 0.84–8.71 mM (Figure F24; Table T4). Alkalinity decreases from 8.71 mM (20.9 m CSF-A), reaching 0.93 mM at approximately 209 m CSF-A. Below this depth, alkalinity is always greater than 1.120 mM, reaching 1.5 mM at 286 m CSF-A and 1.56 mM at 310.06 m CSF-A before decreasing to 1.09 mM at the bottom of the cored interval. Alkalinity values are slightly higher in Hole U1612A than those collected from Site 974 during ODP Leg 161 in the Tyrrhenian Sea (Bernasconi, 1999).
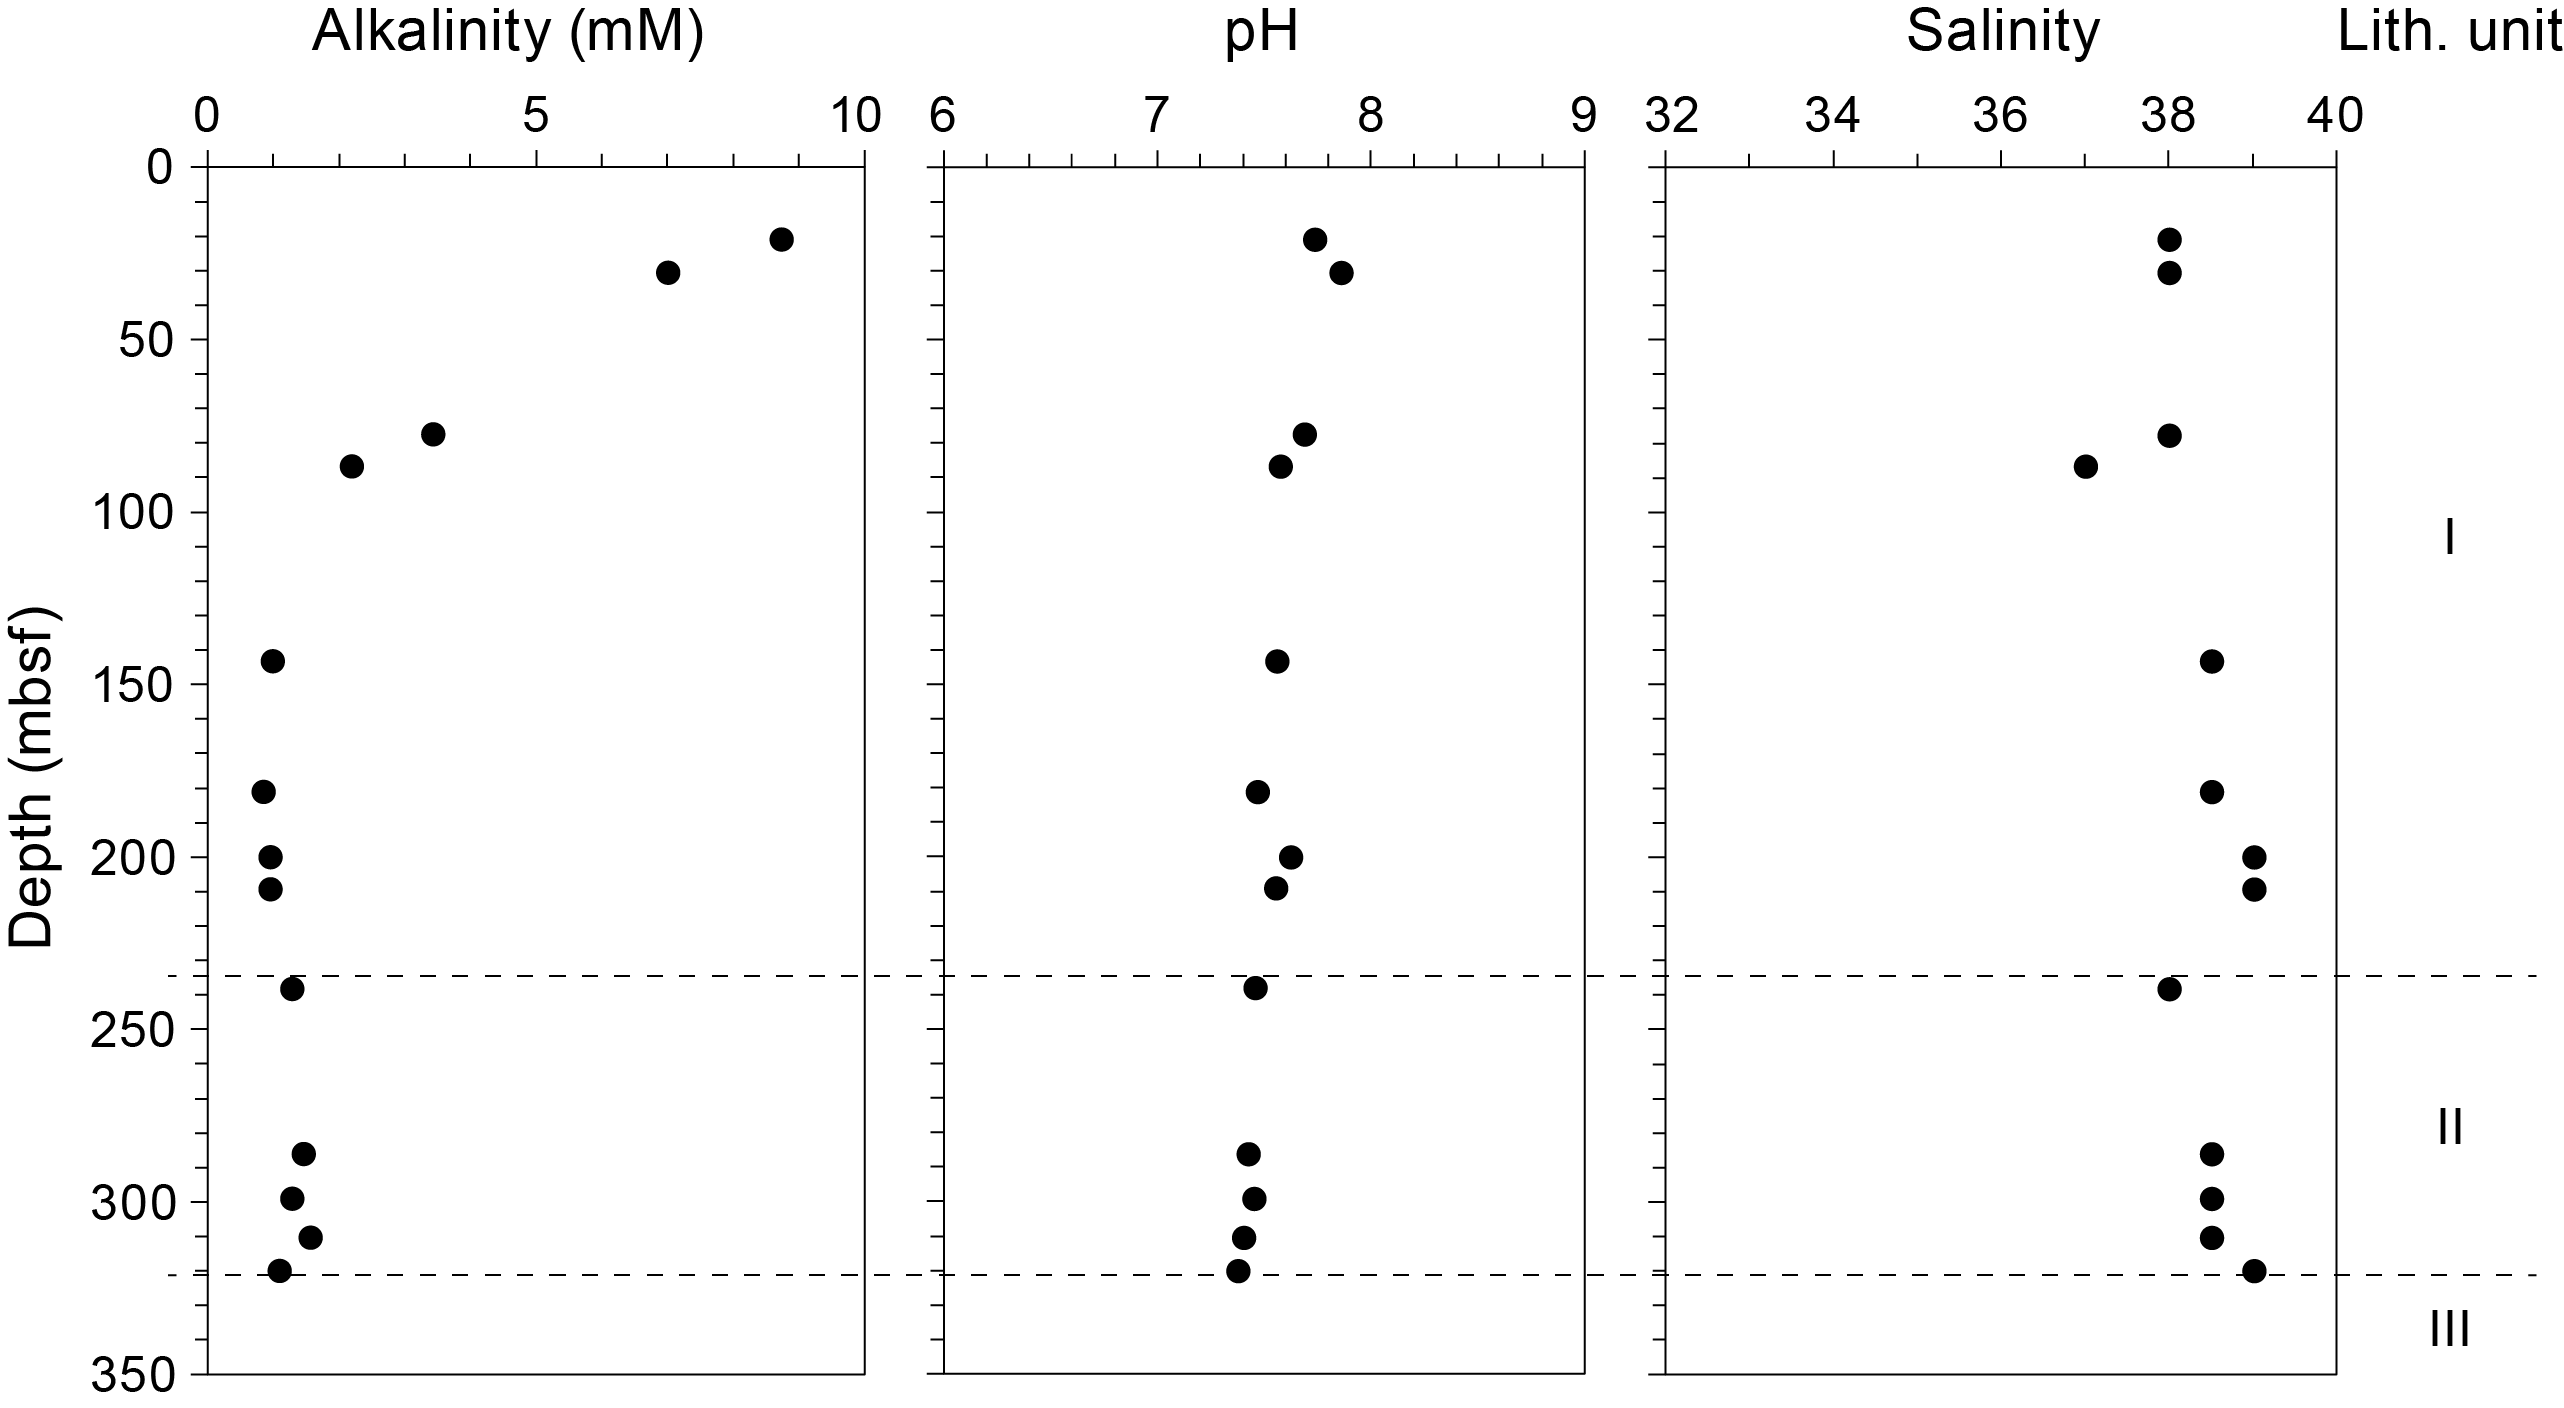
Figure F24. IW basic chemistry.
The pH value of IW ranges 7.4–7.9 (Figure F24; Table T4). In the uppermost 100 m where alkalinity is greater than 2.2 mM, the pH value (7.6–7.9) is also higher than in the lower sections. These high pH values suggest that the dominant inorganic carbon species are in bicarbonate ion form (HCO3−).
IW salinity remains approximately constant in a narrow range of 37–39 for sediments collected between 21 and 320 m CSF-A (Table T4). Its average value of 38.3 ± 0.6 is close to the values of 38.5–38.6 previously measured from the Mediterranean bottom seawater (Roether et al., 1996; Tsimplis and Baker, 2000; Tanhua et al., 2013).
8.1.2. Major elements
Concentration of sodium ion (Na+), the predominant cation species, varies from 520.3 to 563.0 mM (Table T4), although its average value is lower below 240 m CSF-A (Figure F25). Other cations, including magnesium (Mg2+), calcium (Ca2+), and potassium (K+), are also abundant but in lower concentrations. However, each cation shows a different profile shape downhole (Figure F25). Mg2+ concentration is highest (48.5 mM) at shallow depths and decreases to its minimum value of 12.1 mM at 142.9 m CSF-A. It then gradually increases to 33.4 mM near the sediment/basement interface of this site. Ca2+ concentration increases from a minimum of 11.3 mM to a maximum of 40.1 mM in the upper 142.9 m CSF-A. Below this depth, it is consistently above 31.7 mM throughout the whole section. K+ concentration mostly shows the opposite trend (Figure F25; Table T4). K+ concentrations are high in the upper 86.4 m CSF-A and then decrease downhole (5.6 mM at the bottom of Hole U1612A), which can be attributed to either ion exchange in clays or the formation of K-rich clays (e.g., Sayles and Mangelsdorf, 1977; Kastner, 1981).
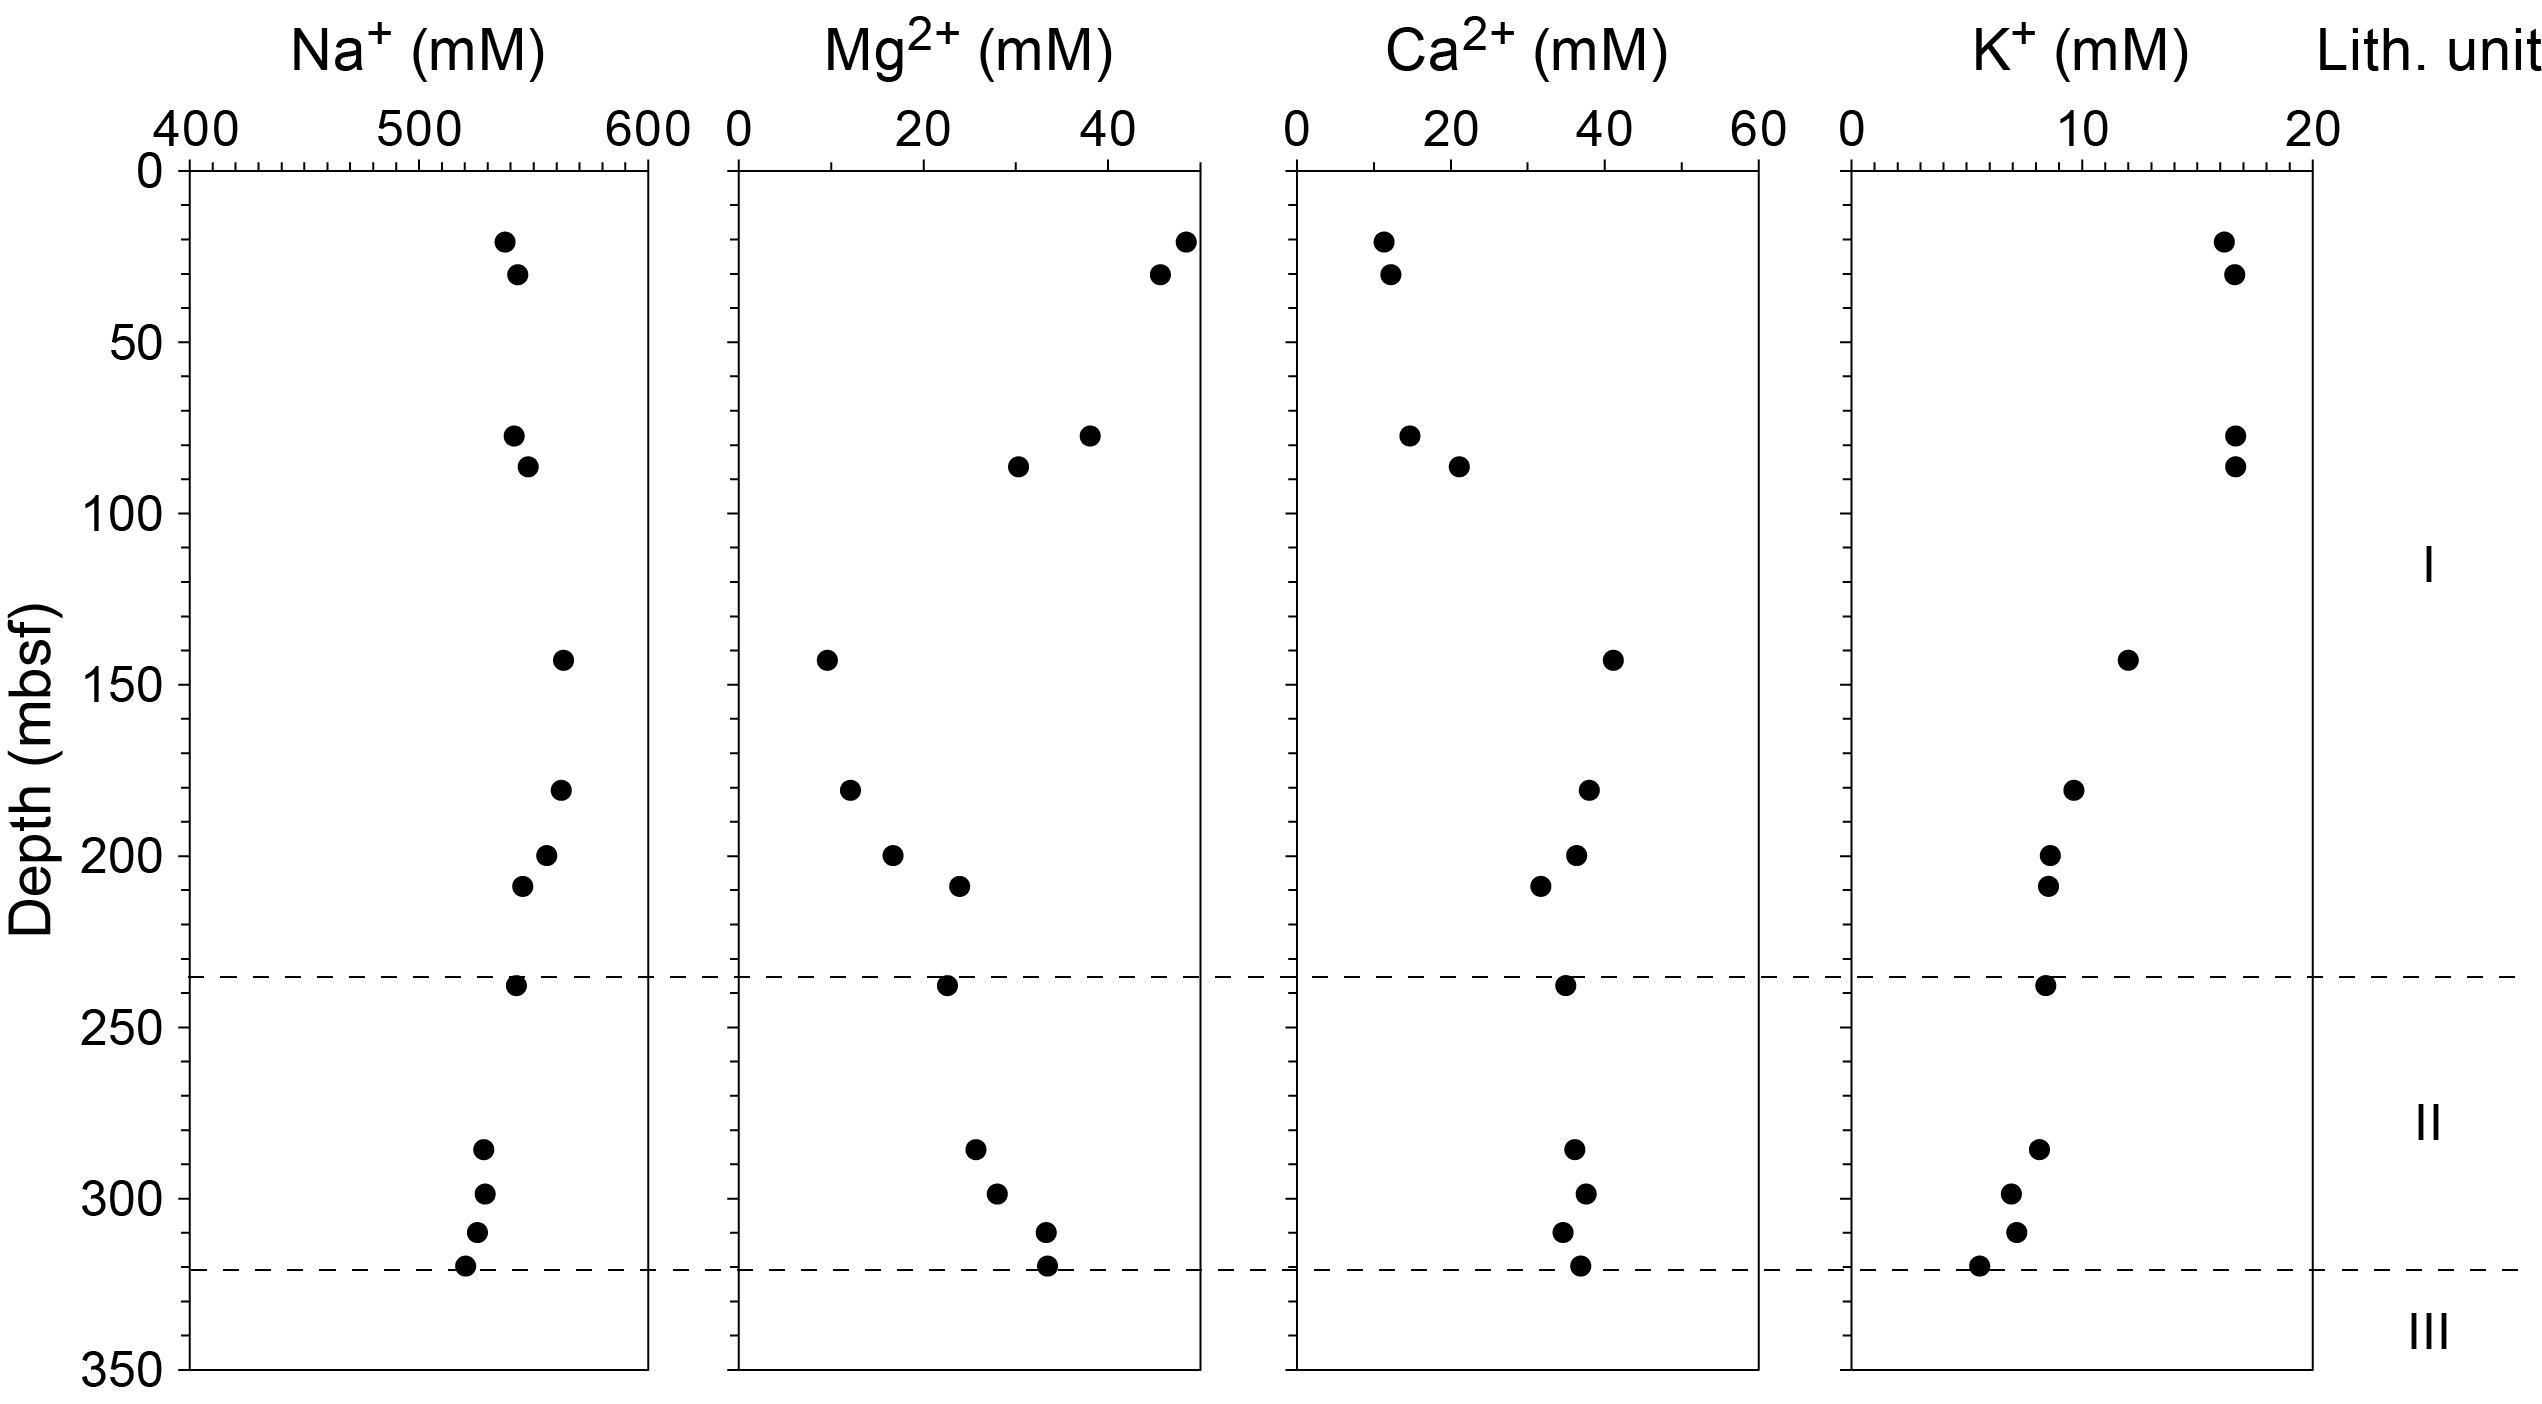
Figure F25. IW major cation concentrations.
Cl− concentration ranges 604.8–634.1 mM (Table T4), correlating positively with Na+ concentration (Figure F26). The Na/Cl ratio varies from 0.86 to 0.90. It is always slightly higher than the seawater ratio (value = 0.86), except below 298.7 m CSF-A. The highest value of 0.90 is observed at 180.8–199.9 m CSF-A.
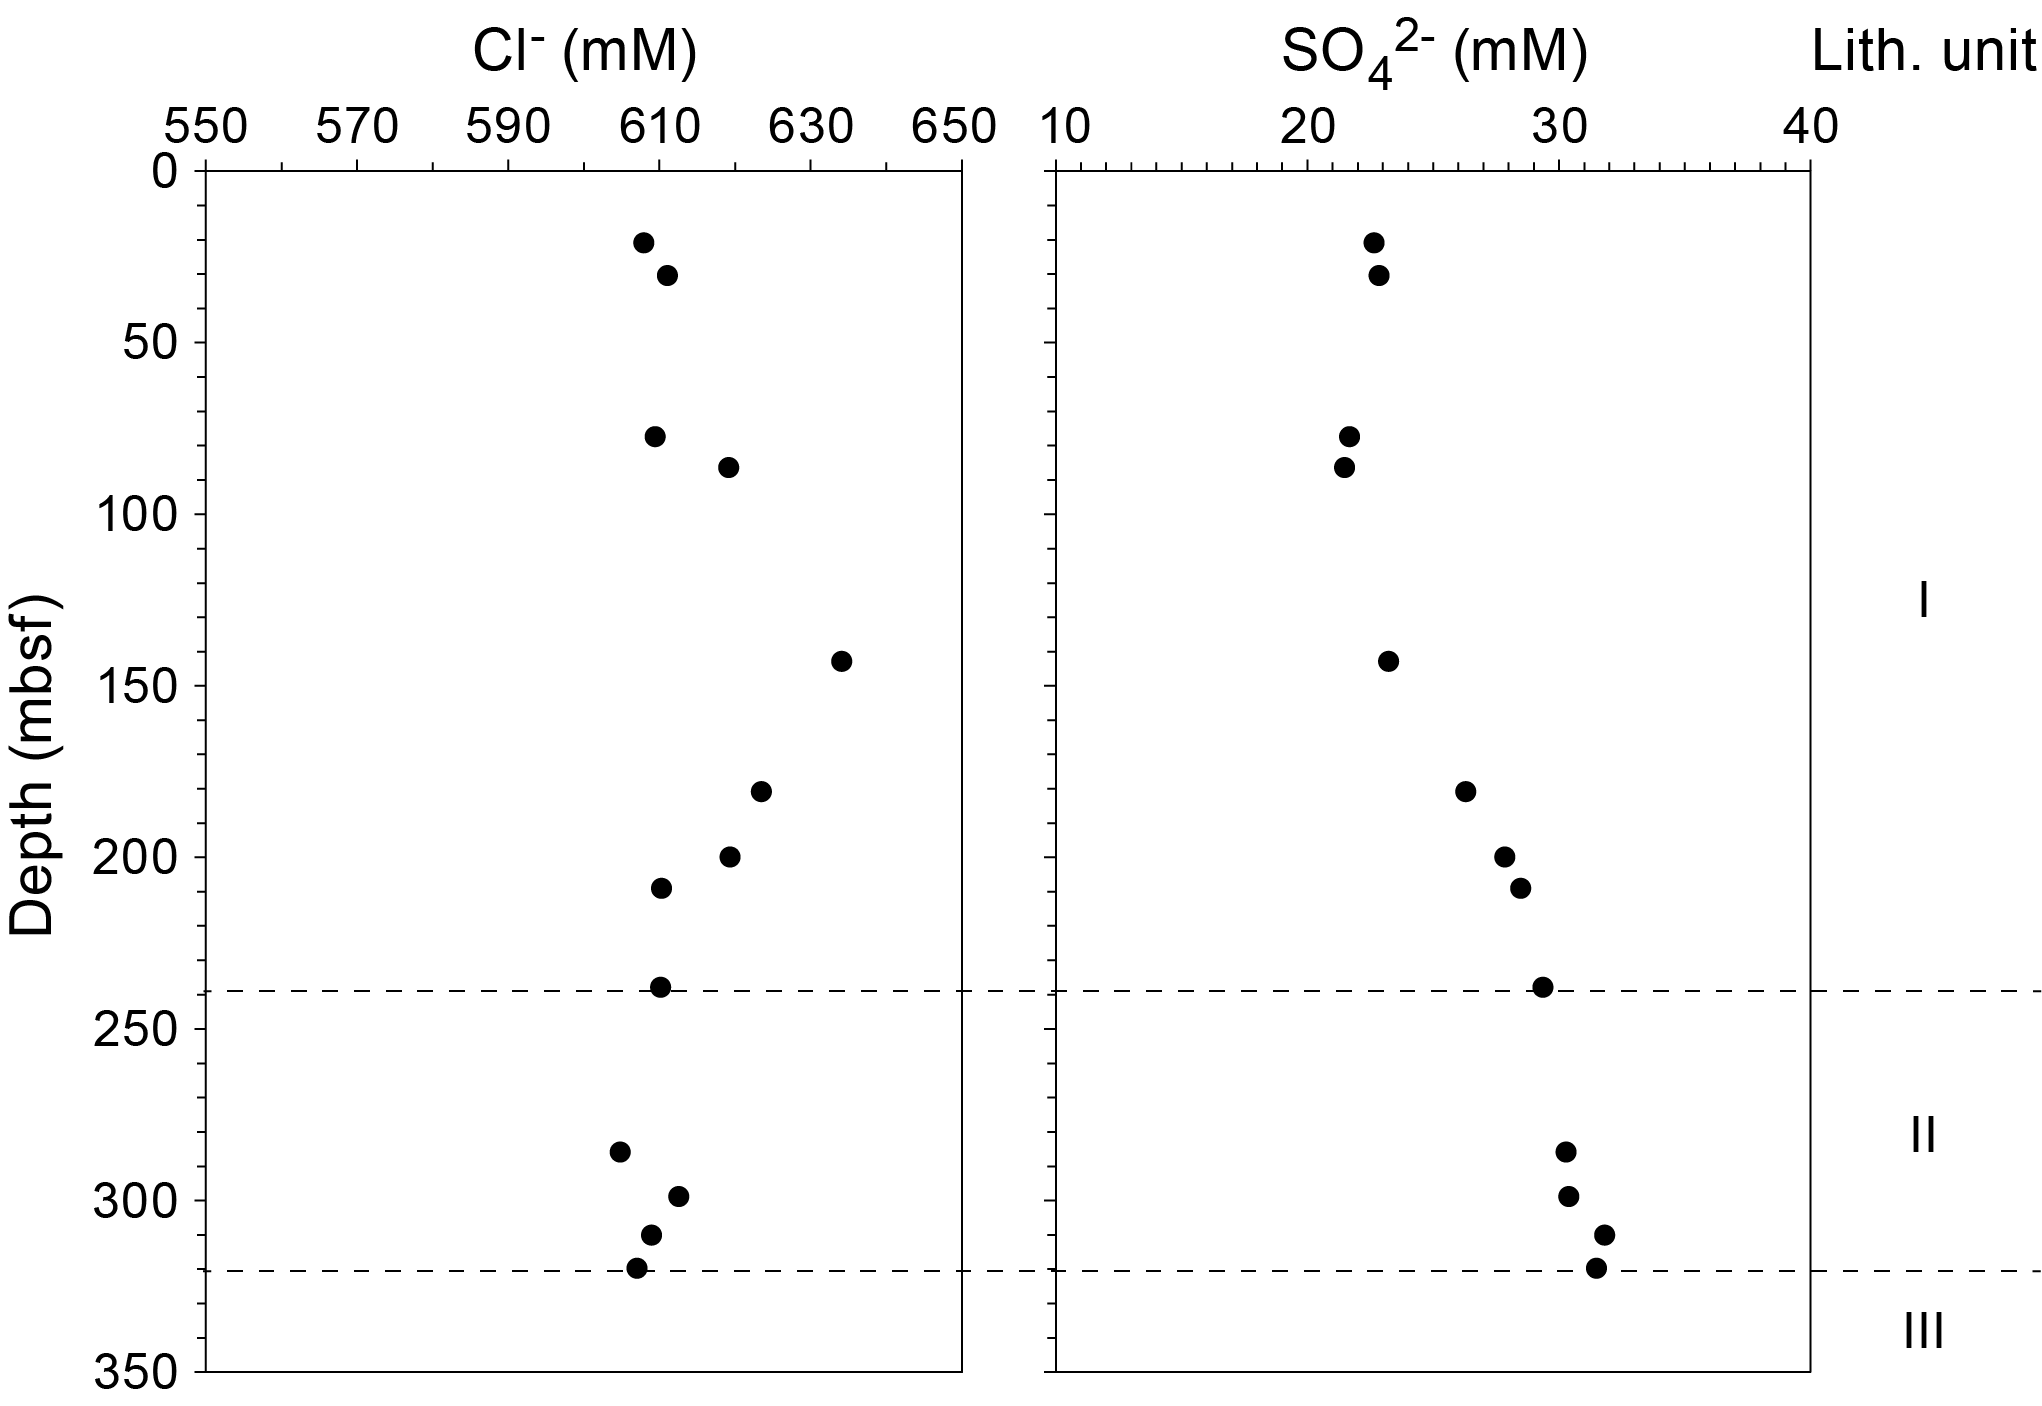
Figure F26. IW major anion concentrations.
The concentration of another major anion, sulfate, varies from 21.5 to 31.8 mM (Table T4). The average sulfate concentration is about 22 mM above 100 m CSF-A and increases downhole (Figure F26), indicating that there is no microbial sulfate reduction in the studied sediments and that diffusion of sulfate occurs from below. The strong positive correlation (R = 0.7034) between the concentrations of Ca2+ and SO42− might indicate the dissolution of gypsum at depths.
The total amount of sulfides (ΣH2S = S2 + HS− + H2S) in IW is extremely low, less than 0.04 µM or undetectable (Table T4).
8.1.3. Minor elements
Elements present at lower concentrations in the IW at this site include boron (B), strontium (Sr), and barium (Ba) (Table T5). B3+ concentration ranges 259–1099 µM, and Sr2+ varies from 118 to 546 µM. Both cations show a similar trend, increasing downhole to the middle part of the cored interval, where a maximum value is recorded between 140 and 180 m CSF-A (Figure F27). This trend is also observed for Ca2+, Na+, and Cl− ions, suggesting close correlation between those cations. Ba2+ concentration ranges 1.05–3.29 µM, with a weak decrease downhole to the bottom of the cored interval. There is no apparent correlation between Ba and sulfate, suggesting that the source of Ba2+ is not the dissolution of barite.
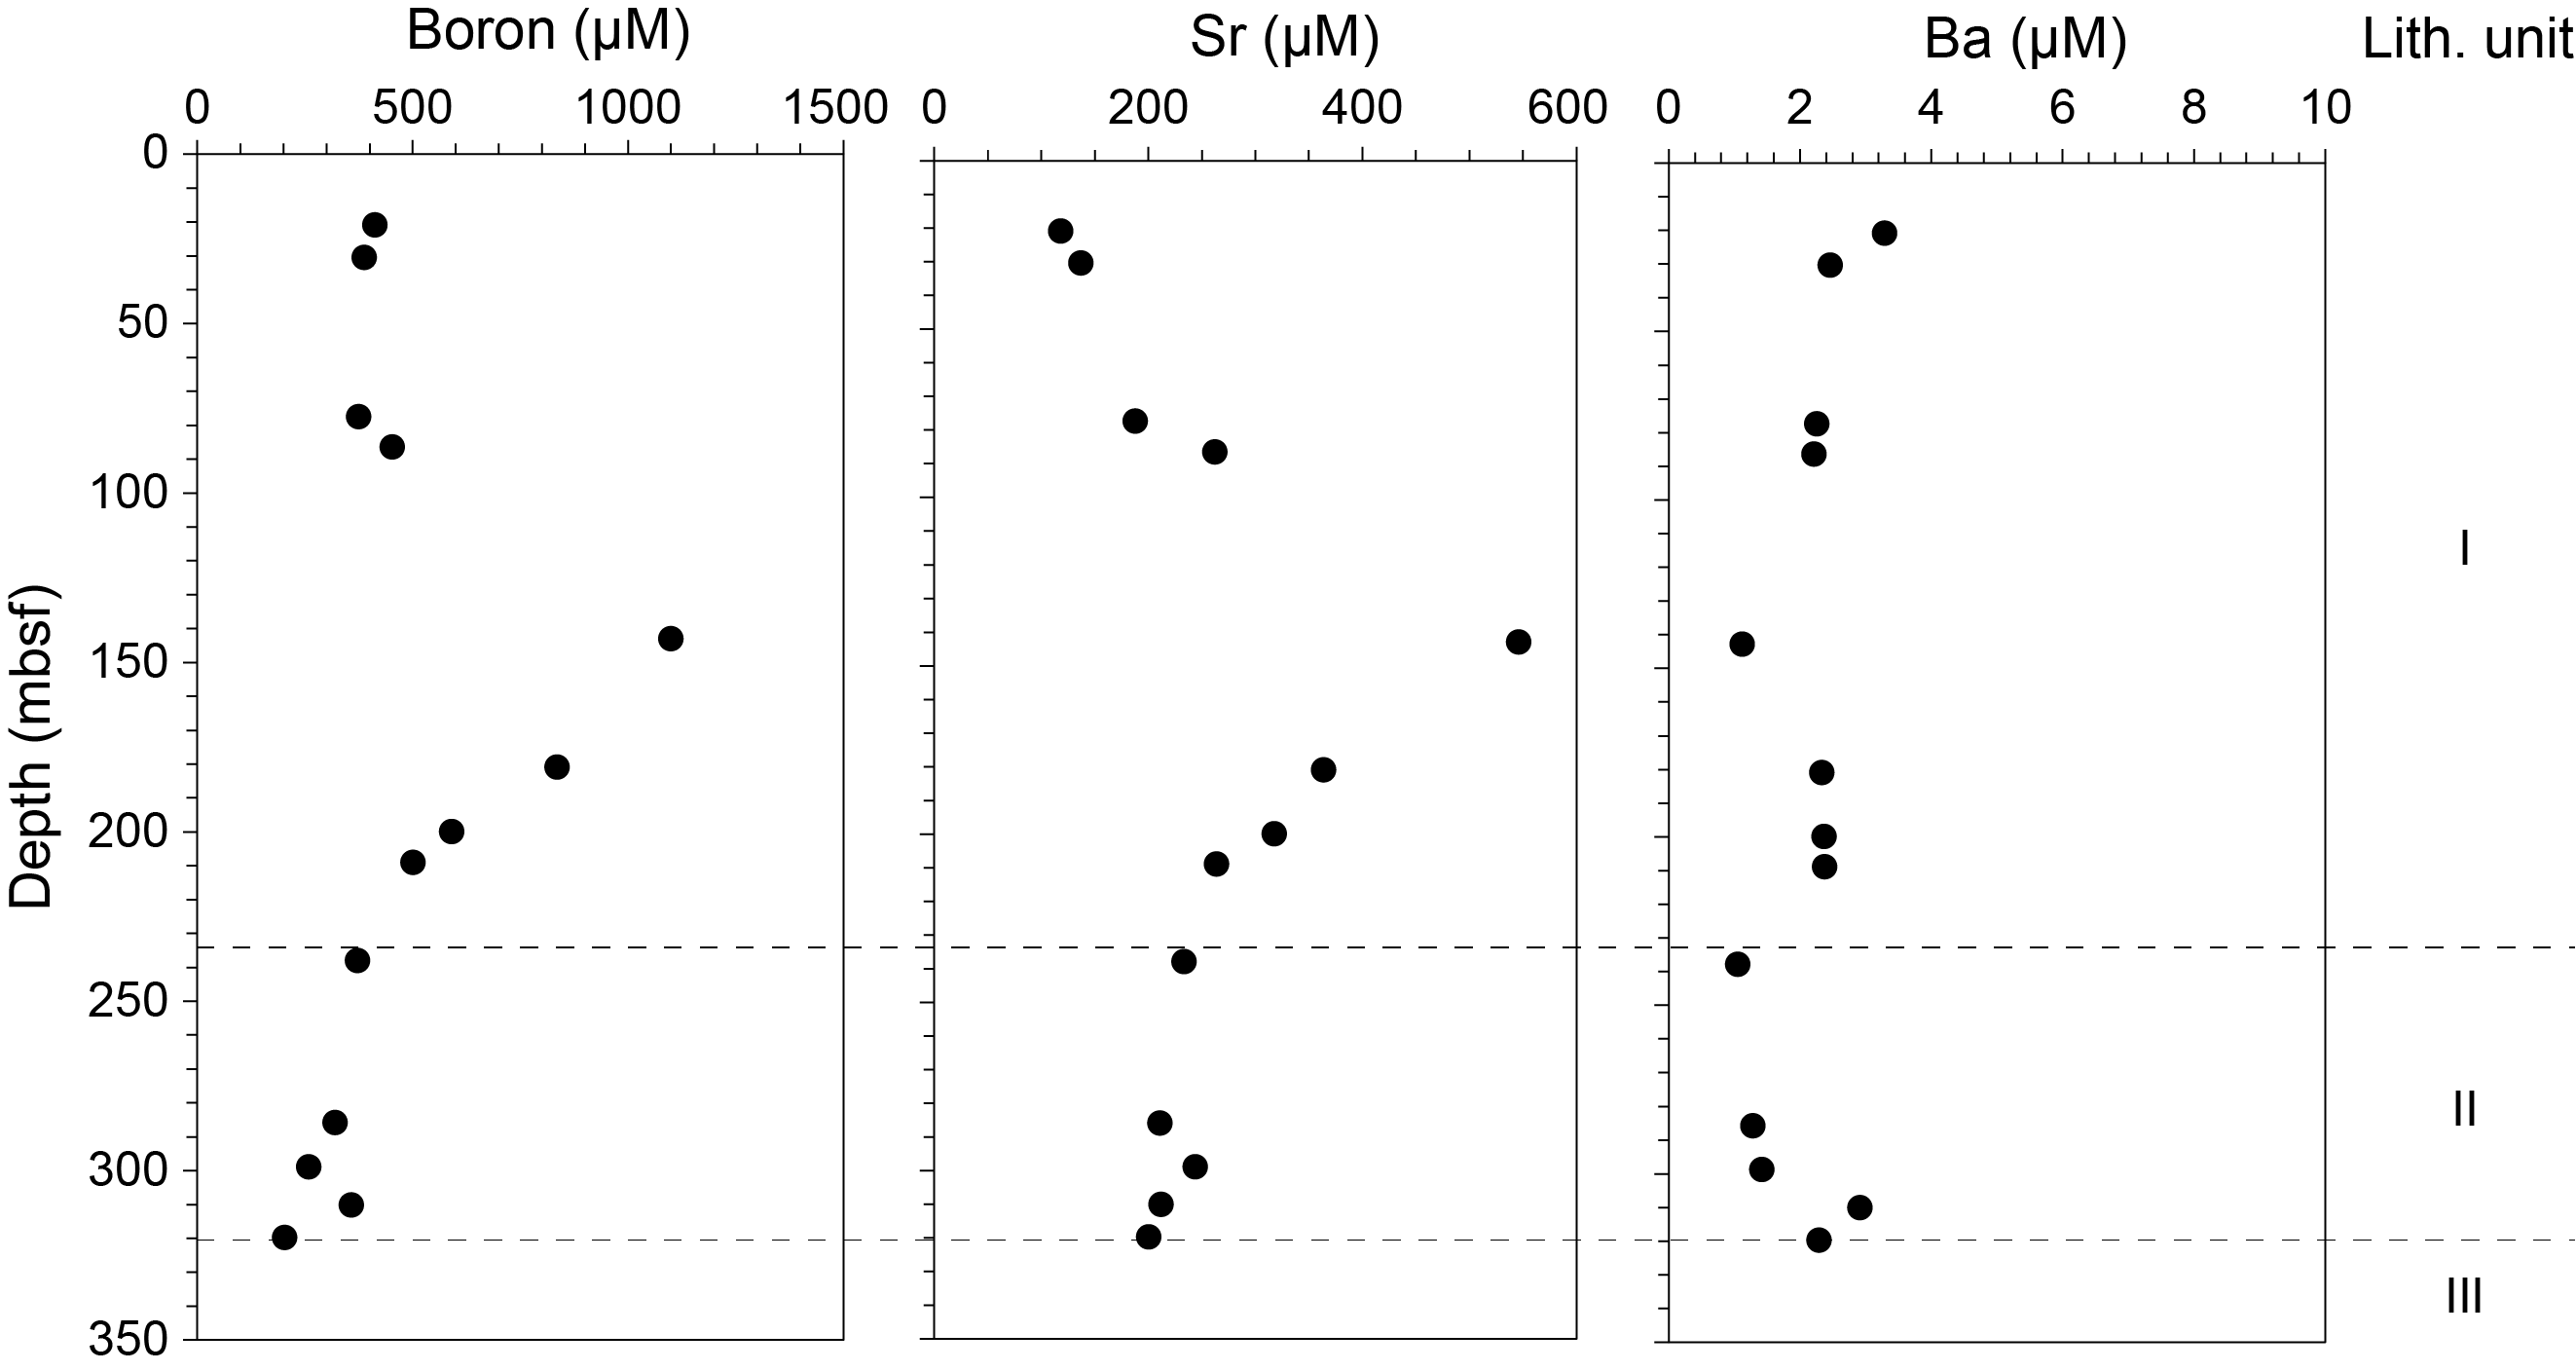
Figure F27. IW minor elemental compositions.
Bromide concentrations, ranging 0.9–1.0 mM, show a strong positive correlation with chloride concentrations (R2 = 0.96).
8.1.4. Nutrients
There is a clear trend in ammonium (NH4+) content, which decreases with depth from 831 to 48 µM in the upper 250 m CSF-A (Figure F28; Table T5). It remains relatively constant at approximately 51.0 µM downhole. Combined with low alkalinity values, the low measured ammonium concentrations at Site U1612 may reflect the low levels and slow rates of organic matter degradation. However, the ratios of alkalinity to ammonium (alkalinity/NH4+) are mostly not close to the Redfield ratio (C/N = 6.6; Burdige, 2006), suggesting that the increase in ammonium content is not related to organic matter mineralization but most likely to processes unrelated to microbially mediated organic matter degradation such as mineral diagenesis.
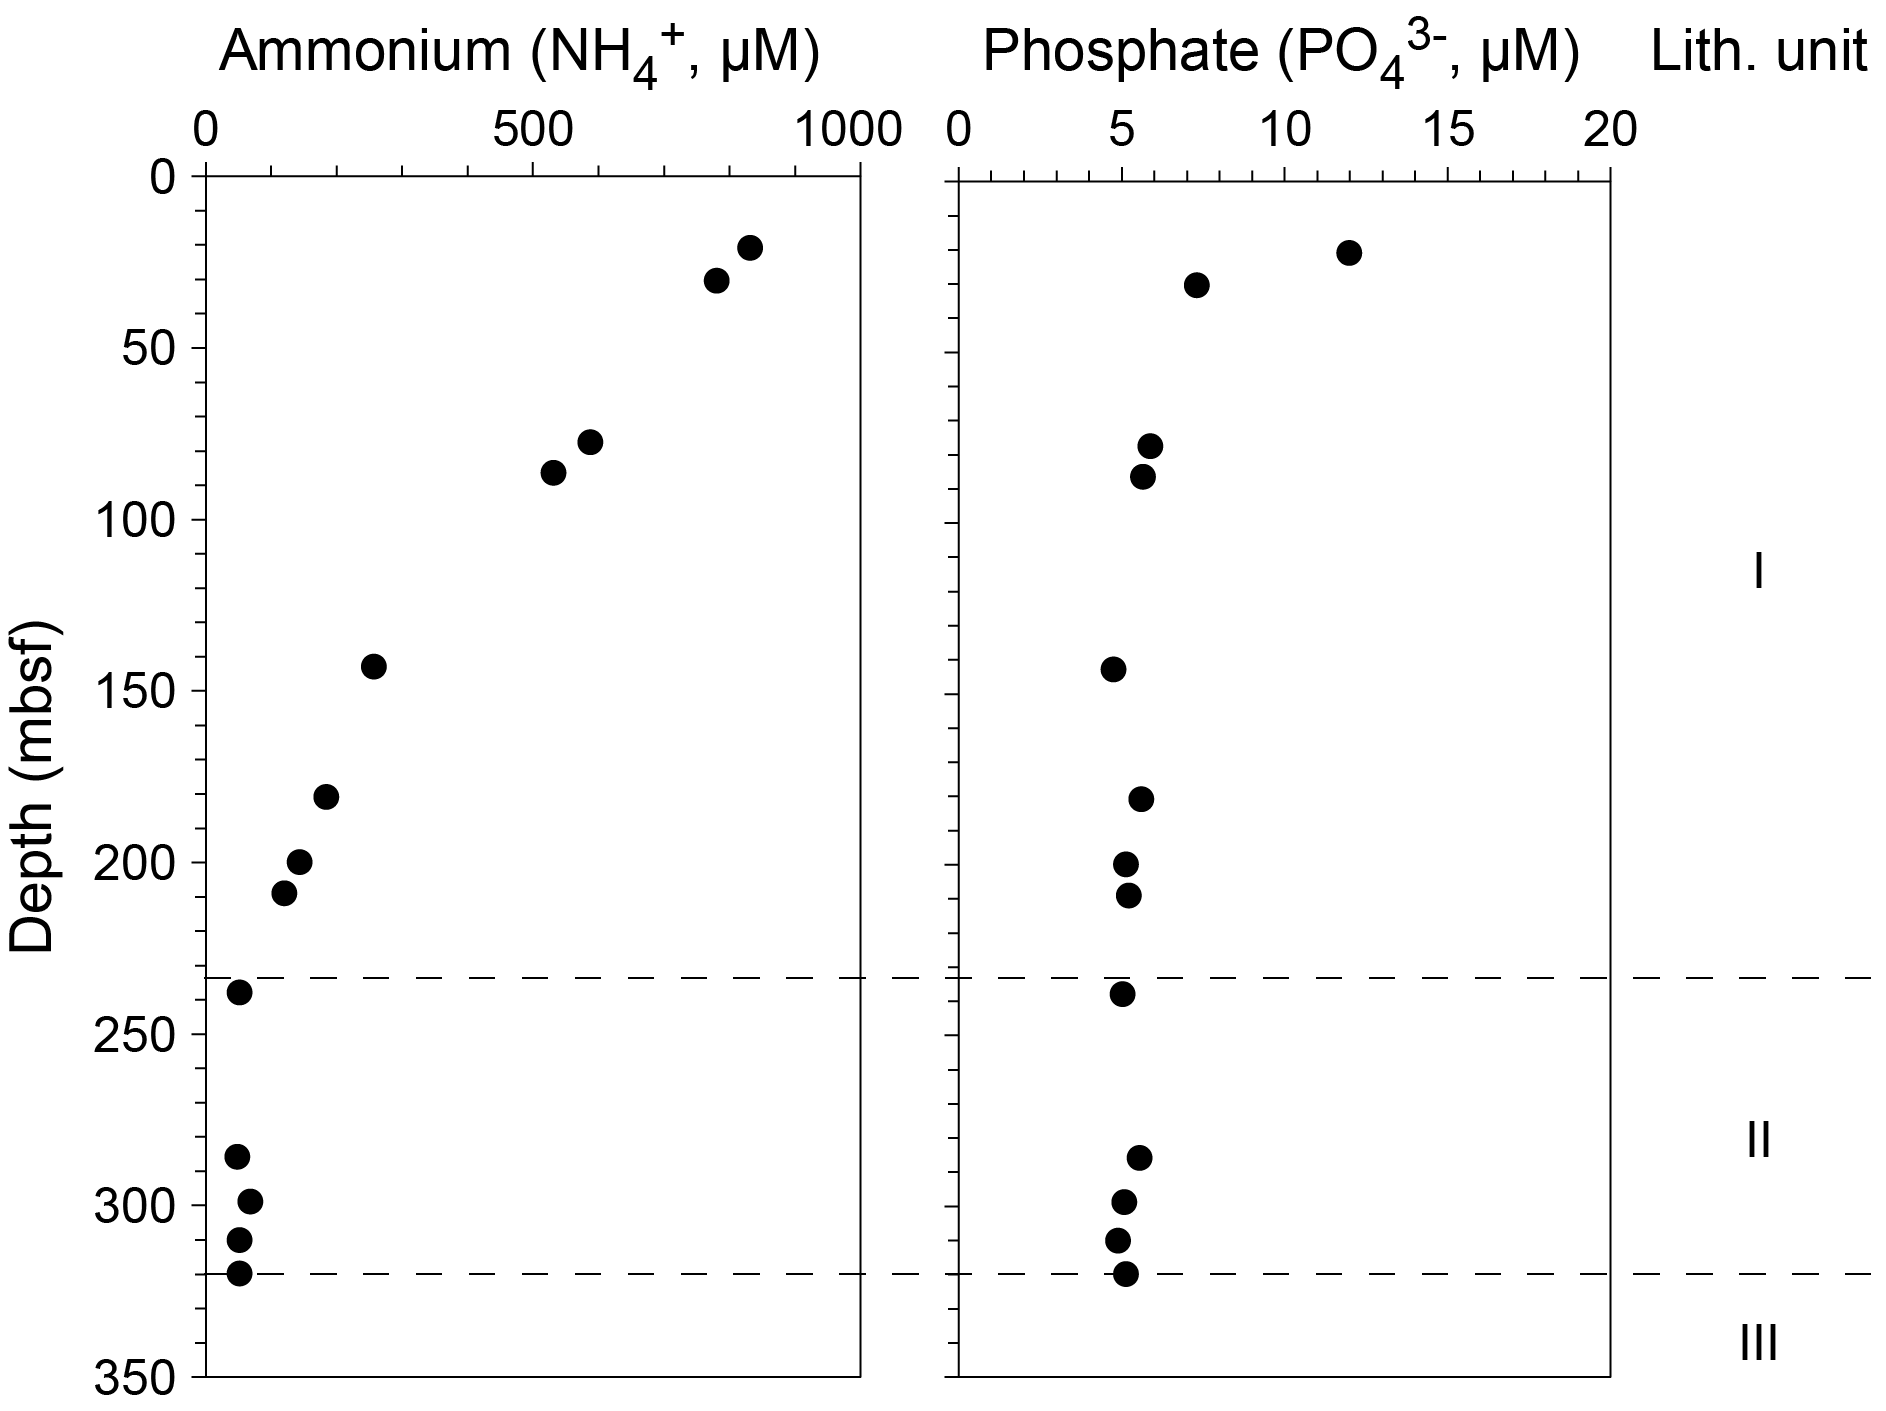
Figure F28. IW ammonium and phosphate.
Phosphate concentration shows a sharp decline at the top, from 12 to 4.7 µM in the uppermost 150 m CSF-A. Below this depth, phosphate concentration remains constant with an average above 5.0 µM (Figure F28).
8.2. Bulk sediment geochemistry
Solid-phase sediment samples were analyzed to determine (1) the weight percentage of calcium carbonates (CaCO3); (2) the percentage of total carbonate contents (including both calcium carbonates and other carbonate phases); (3) the percentage of total organic matter; and (4) total organic carbon (TOC), total nitrogen (TN), and total sulfur (TS). In Hole U1612A, samples analyzed included the squeeze cake from each IW whole round (13 samples) and an additional 20 samples selected by the core description team from the sediment lithologies of interest.
8.2.1. Carbonates
Table T6 and Figure F29 show the results obtained for CaCO3 contents and percentage of total carbonate contents. CaCO3 contents of the bulk sediments from Hole U1612A vary from 2.3 to 65.4 wt% and depend on lithology (see Lithostratigraphy). The average CaCO3 content is 21.9 ± 15.9 wt% for Unit I, 50.7 ± 7.0 wt% for Unit II, and 57.6 ± 6.8 wt% for Unit III. The highest CaCO3 contents are observed at 310 m CSF-A in a foraminifera-rich nannofossil chalk (Unit II; CaCO3 = 65.4 wt%) and 324.1 m CSF-A in a dolomite layer (Unit III; CaCO3 = 62.4 wt%), whereas the lowest measured value of 2.4 wt% occurs at 77.3 m CSF-A in a volcaniclastic-rich nannofossil ooze (Unit I). Compared to the CaCO3 contents, the percentage of total carbonate contents shows higher values, ranging 6.7% (Section 402-U1612A-9R-2; 77.5 m CSF-A) to 96.3% (Section 34R-6; 321.3 m CSF-A) because of the occurrence of carbonates other than calcium carbonates. XRD patterns show that the d(104) values of calcite vary in the range of 3.043–2.992 Å; a low-Mg calcite group, mostly from calcite of pelagic or detrital sediment, predominates between 3.043 and 3.015 Å; and a high-Mg calcite group, probably authigenic, predominates between 3.010 and 2.992 Å. Two groups of dolomites are identified: one group, characterized by d(104) values between 2.900 and 2.885 Å, is considered to be near stoichiometric dolomite and the second group, with d(104) values between 2.930 and 2.901 Å, corresponds to dolomites in which some Mg2+ is replaced by larger cations such as Fe2+ or Ca2+. Based on both the XRD data and percentage of total carbonate contents, low-Mg calcite is the dominant carbonate phase occurring in the sediments from Hole U1612A, most likely derived from biogenic precipitation (Figure F29; Table T6). In Units I and II, high-Mg calcite, Fe-rich and/or Ca-rich dolomite, as well as stoichiometric dolomite are also present in minor amounts ranging 0%–4%, 0%–5%, and 0%–5%, respectively. Fe-rich and/or Ca-rich dolomite is the only carbonate phase present at 321.9 m CSF-A in Unit III.
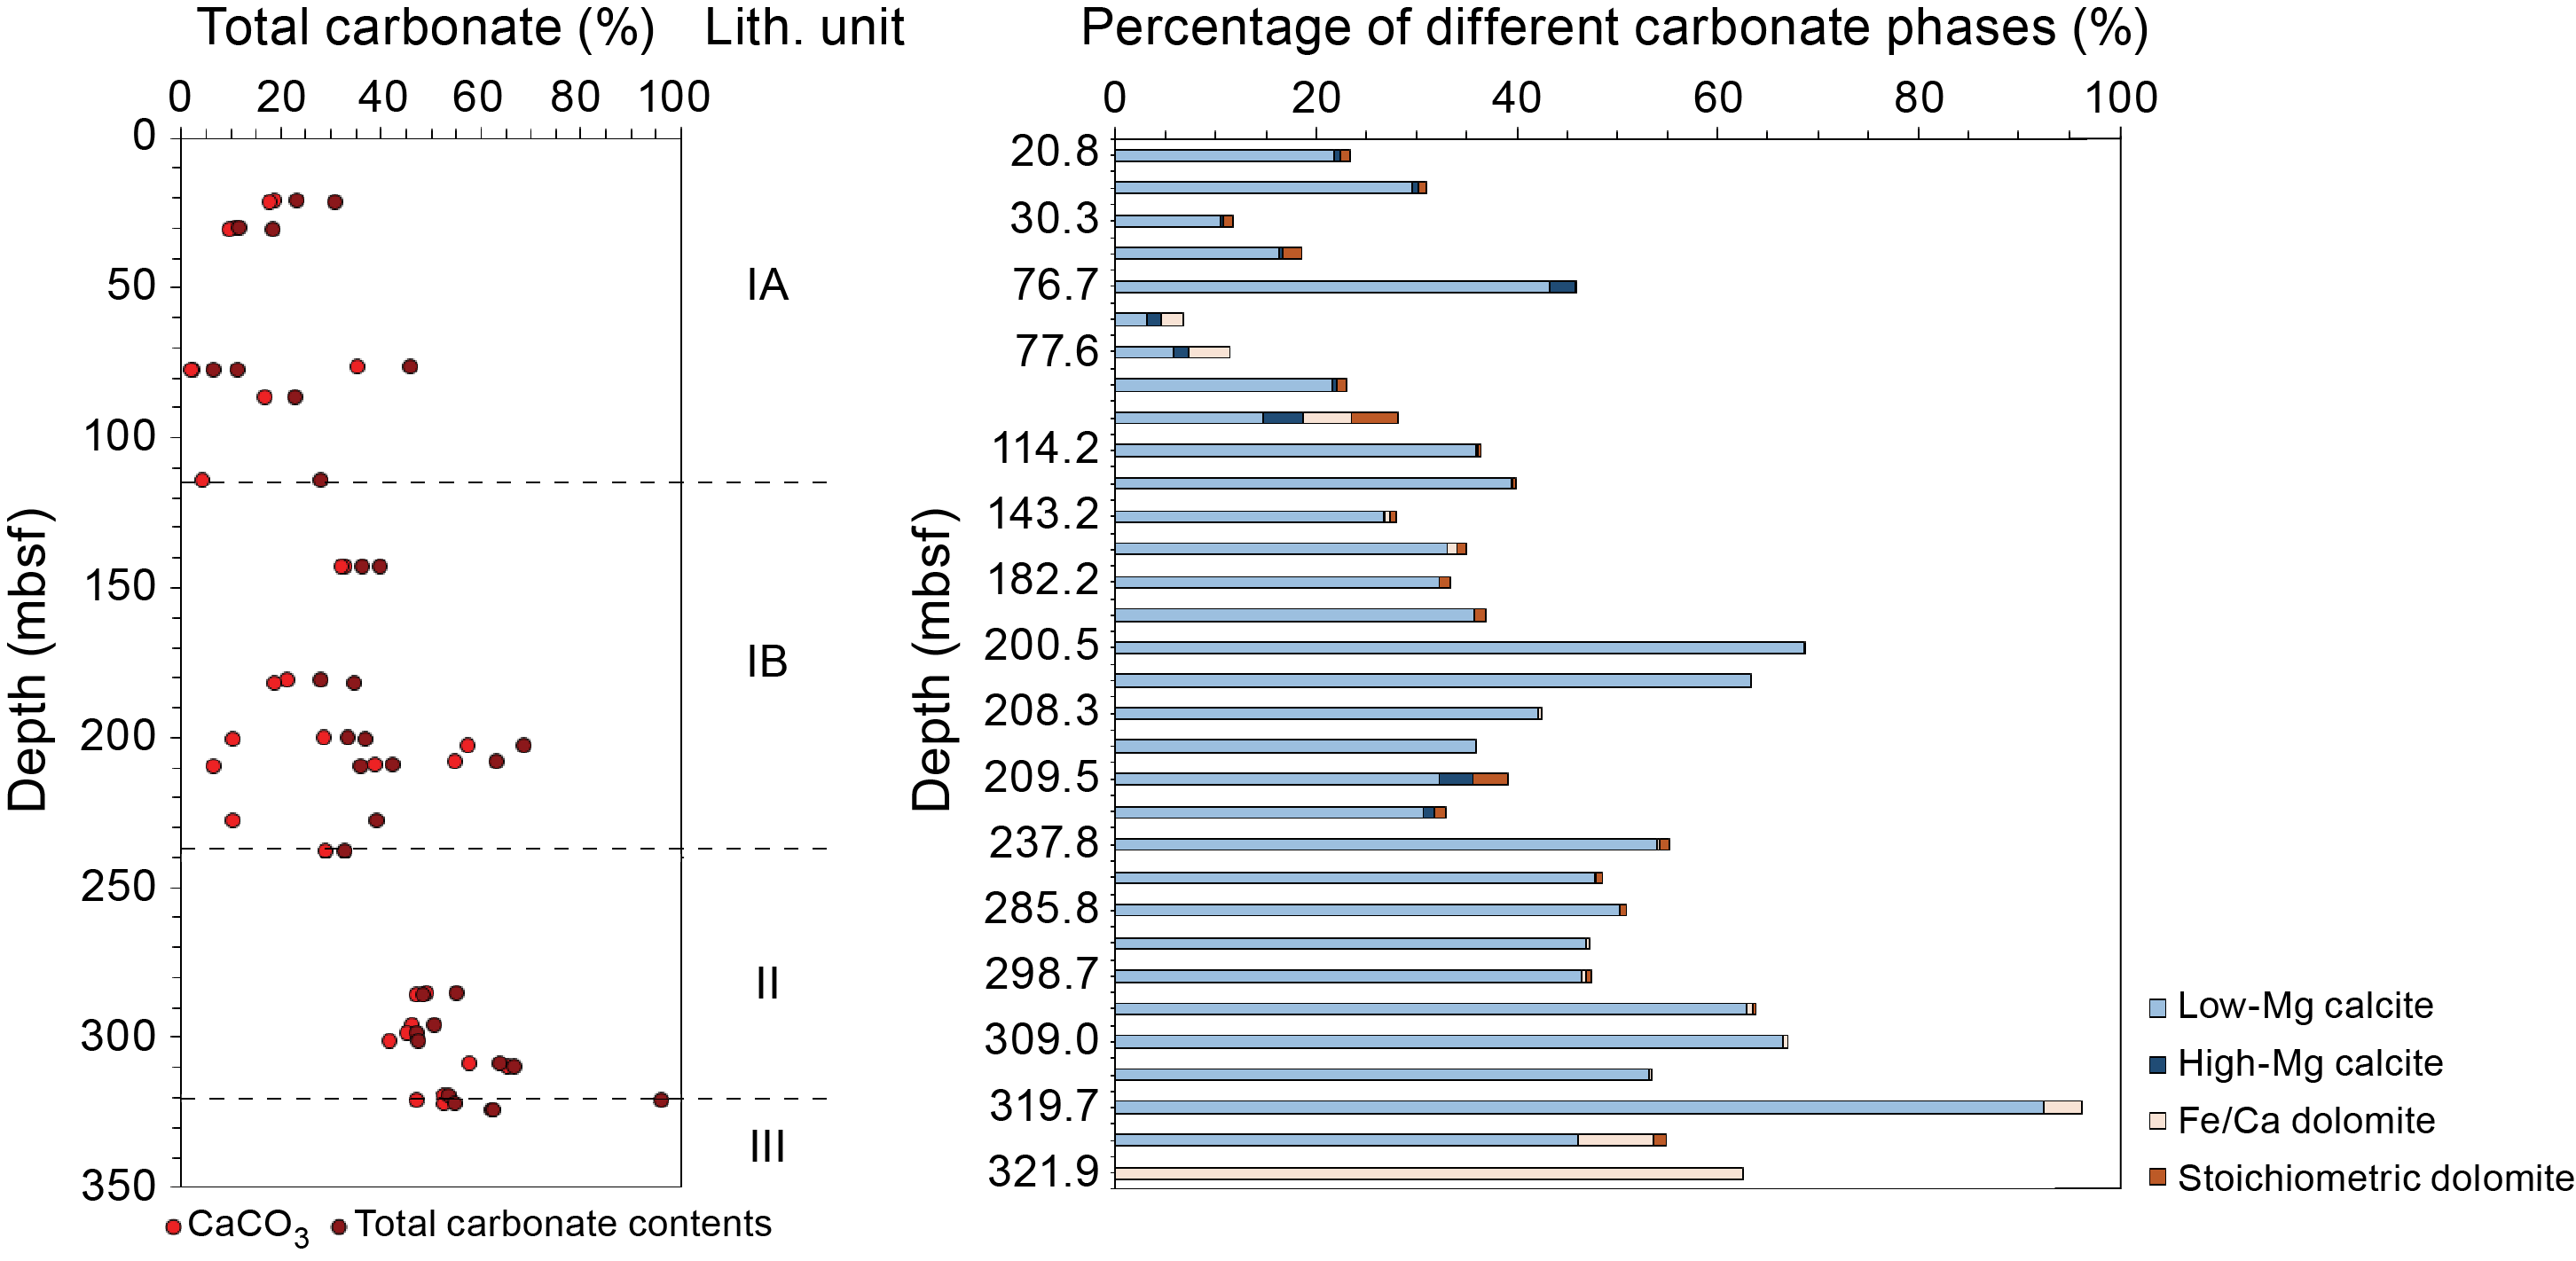
Figure F29. Carbonate, and carbonate phases.
8.2.2. Total organic matter, organic carbon, nitrogen, and sulfur in the solid-phase samples
Data from total organic matter, organic carbon, nitrogen, and sulfur in the solid-phase samples are shown in Figure F30 and Table T7. The percentage of total organic matter varies between 4.5% and 10.4%. The mean values are 6.5% ± 1.6% in Unit I, 6.1% ± 1.3% in Unit II, and 6.1% ± 0.8% in Unit III. TOC values decrease from 0.5 wt% to undetectable between the top of the core and 77.4 m CSF-A. Between 86.4 and 319.7 m CSF-A, TOC values fluctuate around a mean value of 0.2 ± 0.1 wt%. Higher TOC values, ranging 0.3–0.5 wt%, occur at 20.8–21.4, 30.8–76.7, 142.9–143.2, and 208.3–227.6 m CSF-A. TN values are low, ranging from undetectable to 0.06 wt%. Atomic TOC/TN ratios vary from 2.1 to 47.2. Atomic TOC/TN ratios with values close to ~9 are indicative of higher input of marine-derived organic matter (Meyers, 1994). However, as sediments contain clay minerals, TN contents might be affected by the presence of inorganic nitrogen bound to surface mineral particles, especially on the clay mineral species (Faganeli et al., 1991). The presence of a non-negligible amount of inorganic nitrogen might result in overestimation of marine organic matter source and also in atomic TOC/TN ratios less than 5. On the other hand, atomic TOC/TN ratios of ~12 or higher are indicative of higher input of terrestrial-derived organic matter (Meyers, 1994) and/or a preferential remineralization of N relative to C during organic matter diagenesis (Goldman et al., 1987; Hopkinson et al., 1997). TS content varies from undetectable to 1.0 wt%, with the highest value observed at 227.6 m CSF-A; below this interval, the average TS drops to 0.09 wt%. The TOC/TS ratio is generally close to the mean value found in most fine-grained normal marine siliciclastic sediments (TOC/TS ratios of 2.8 ± 0.8; Goldhaber and Kaplan, 1974; Berner, 1982), except at 208.3 m CSF-A (TOC/TS = 4.1), indicating an excess of TS.
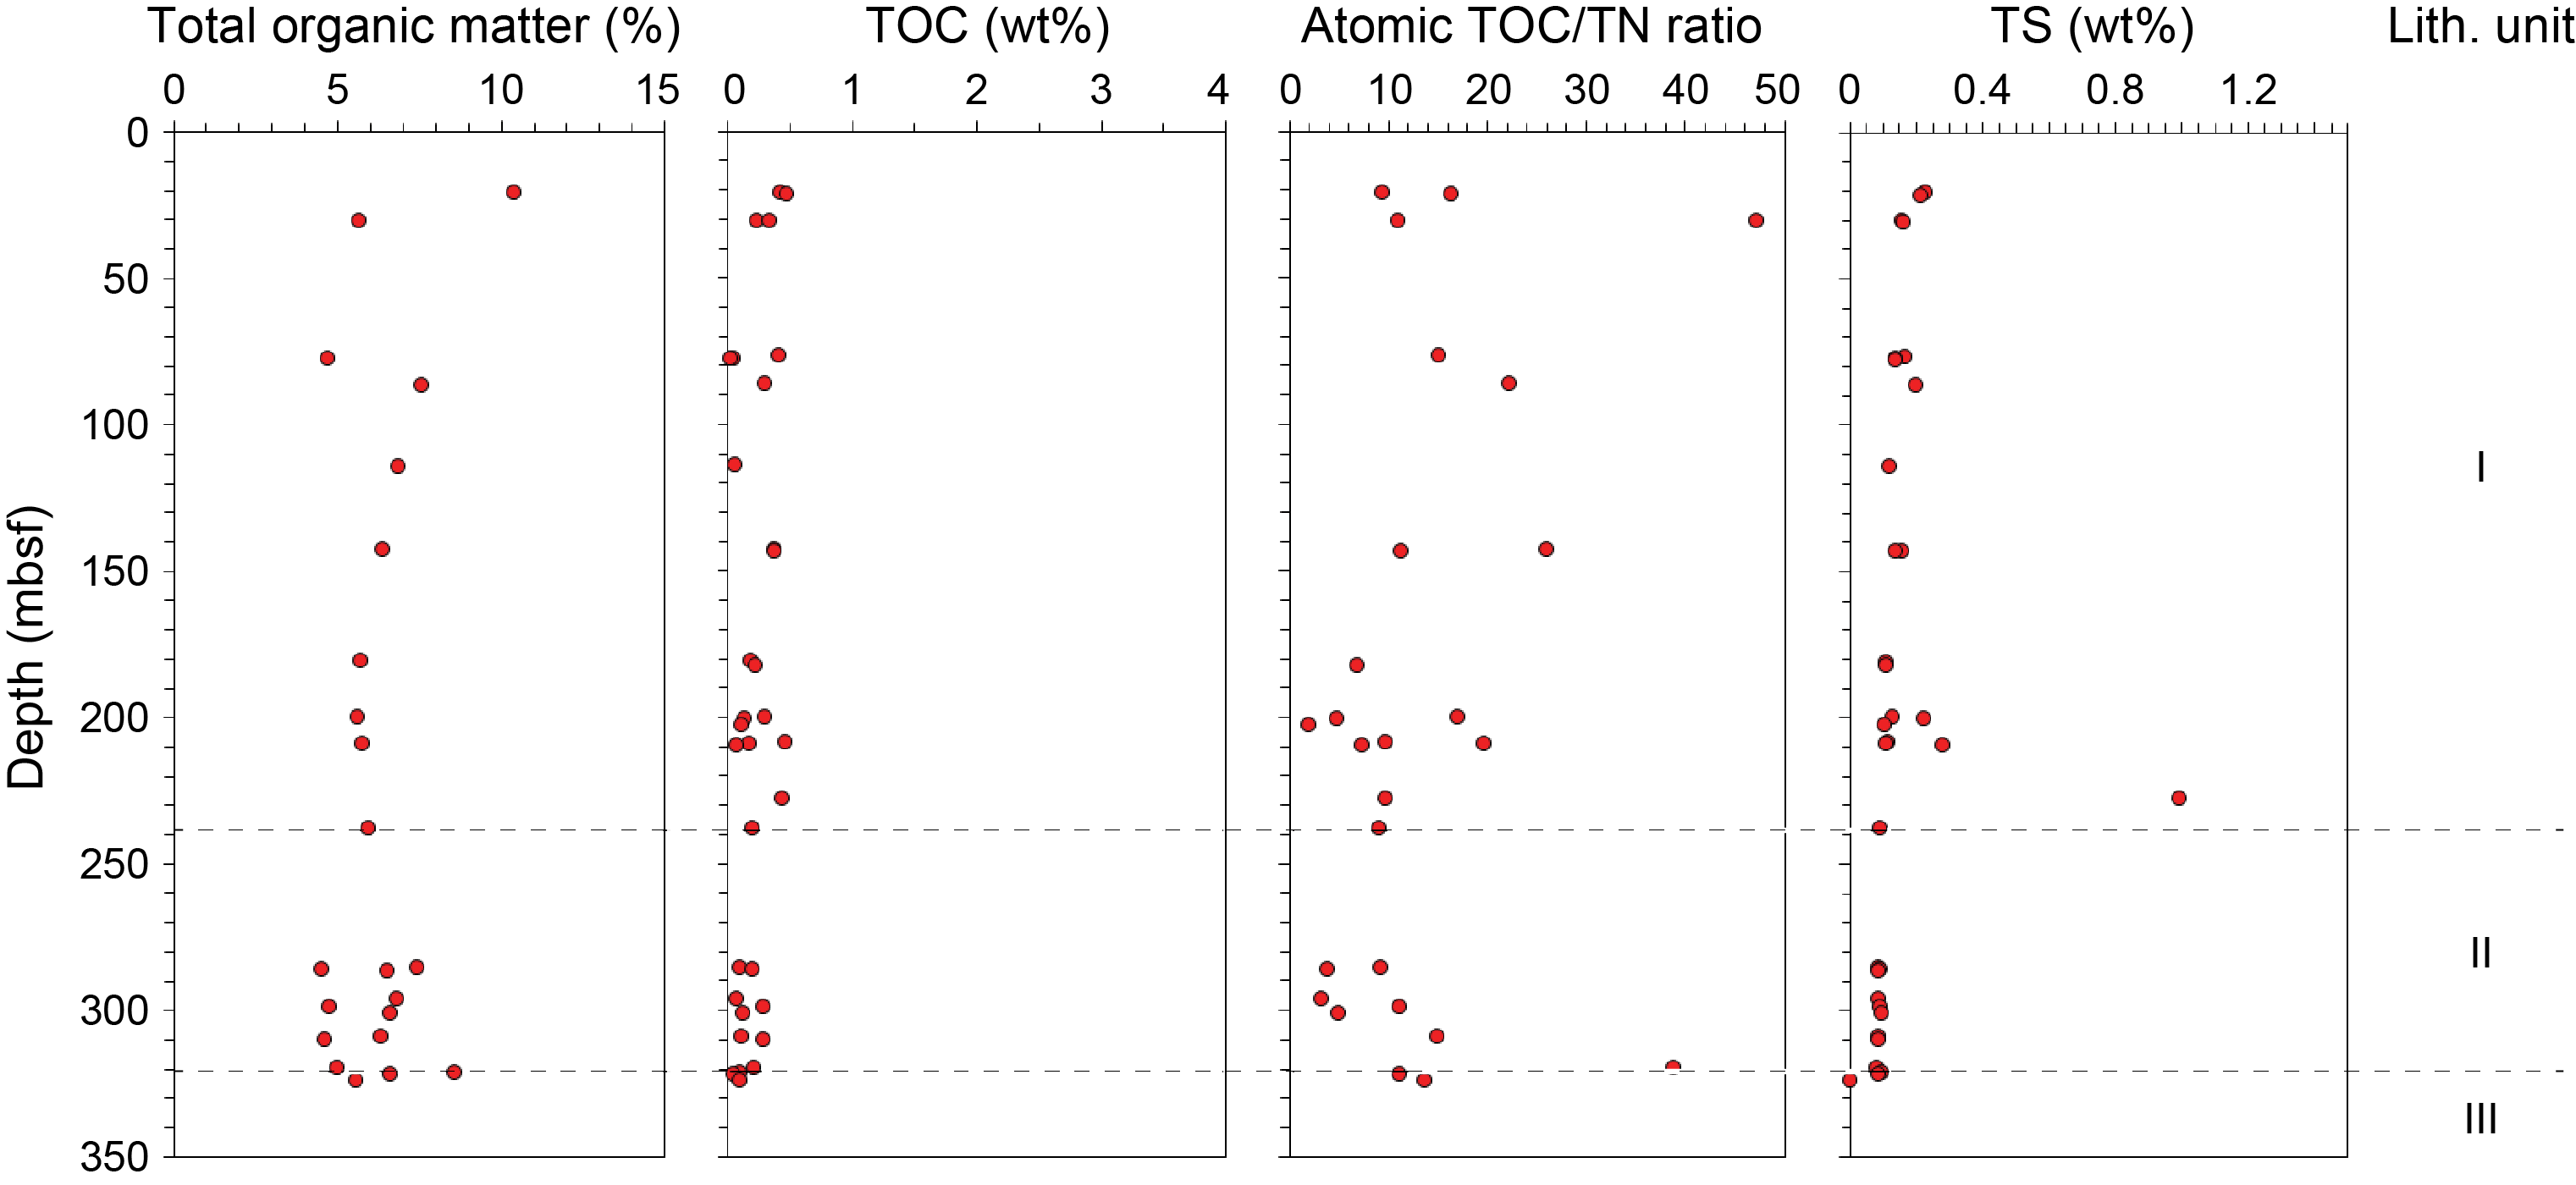
Figure F30. Total organic matter, C, N, and S.
8.2.3. Major, minor, and trace element content of sediments
A total of 12 IW squeeze cakes and their adjacent 12 intervals in the same section halves were analyzed using pXRF. The corrected and raw values for these analyses are shown in Tables T8 and T9, respectively. Four samples from sediment cores were ignited and analyzed using ICP-AES and are summarized in Table T10. Loss on ignition (LOI) values for sediments are also given in Table T10.
The sediments show a gradual change in chemical composition approaching the sediment/basement interface, where an unconsolidated breccia lies beneath a sedimentary layer (Core 402-U1612A-34R). CaO and Sr contents increase and K2O and Rb contents decrease toward the sediment/basement interface (Figure F31).
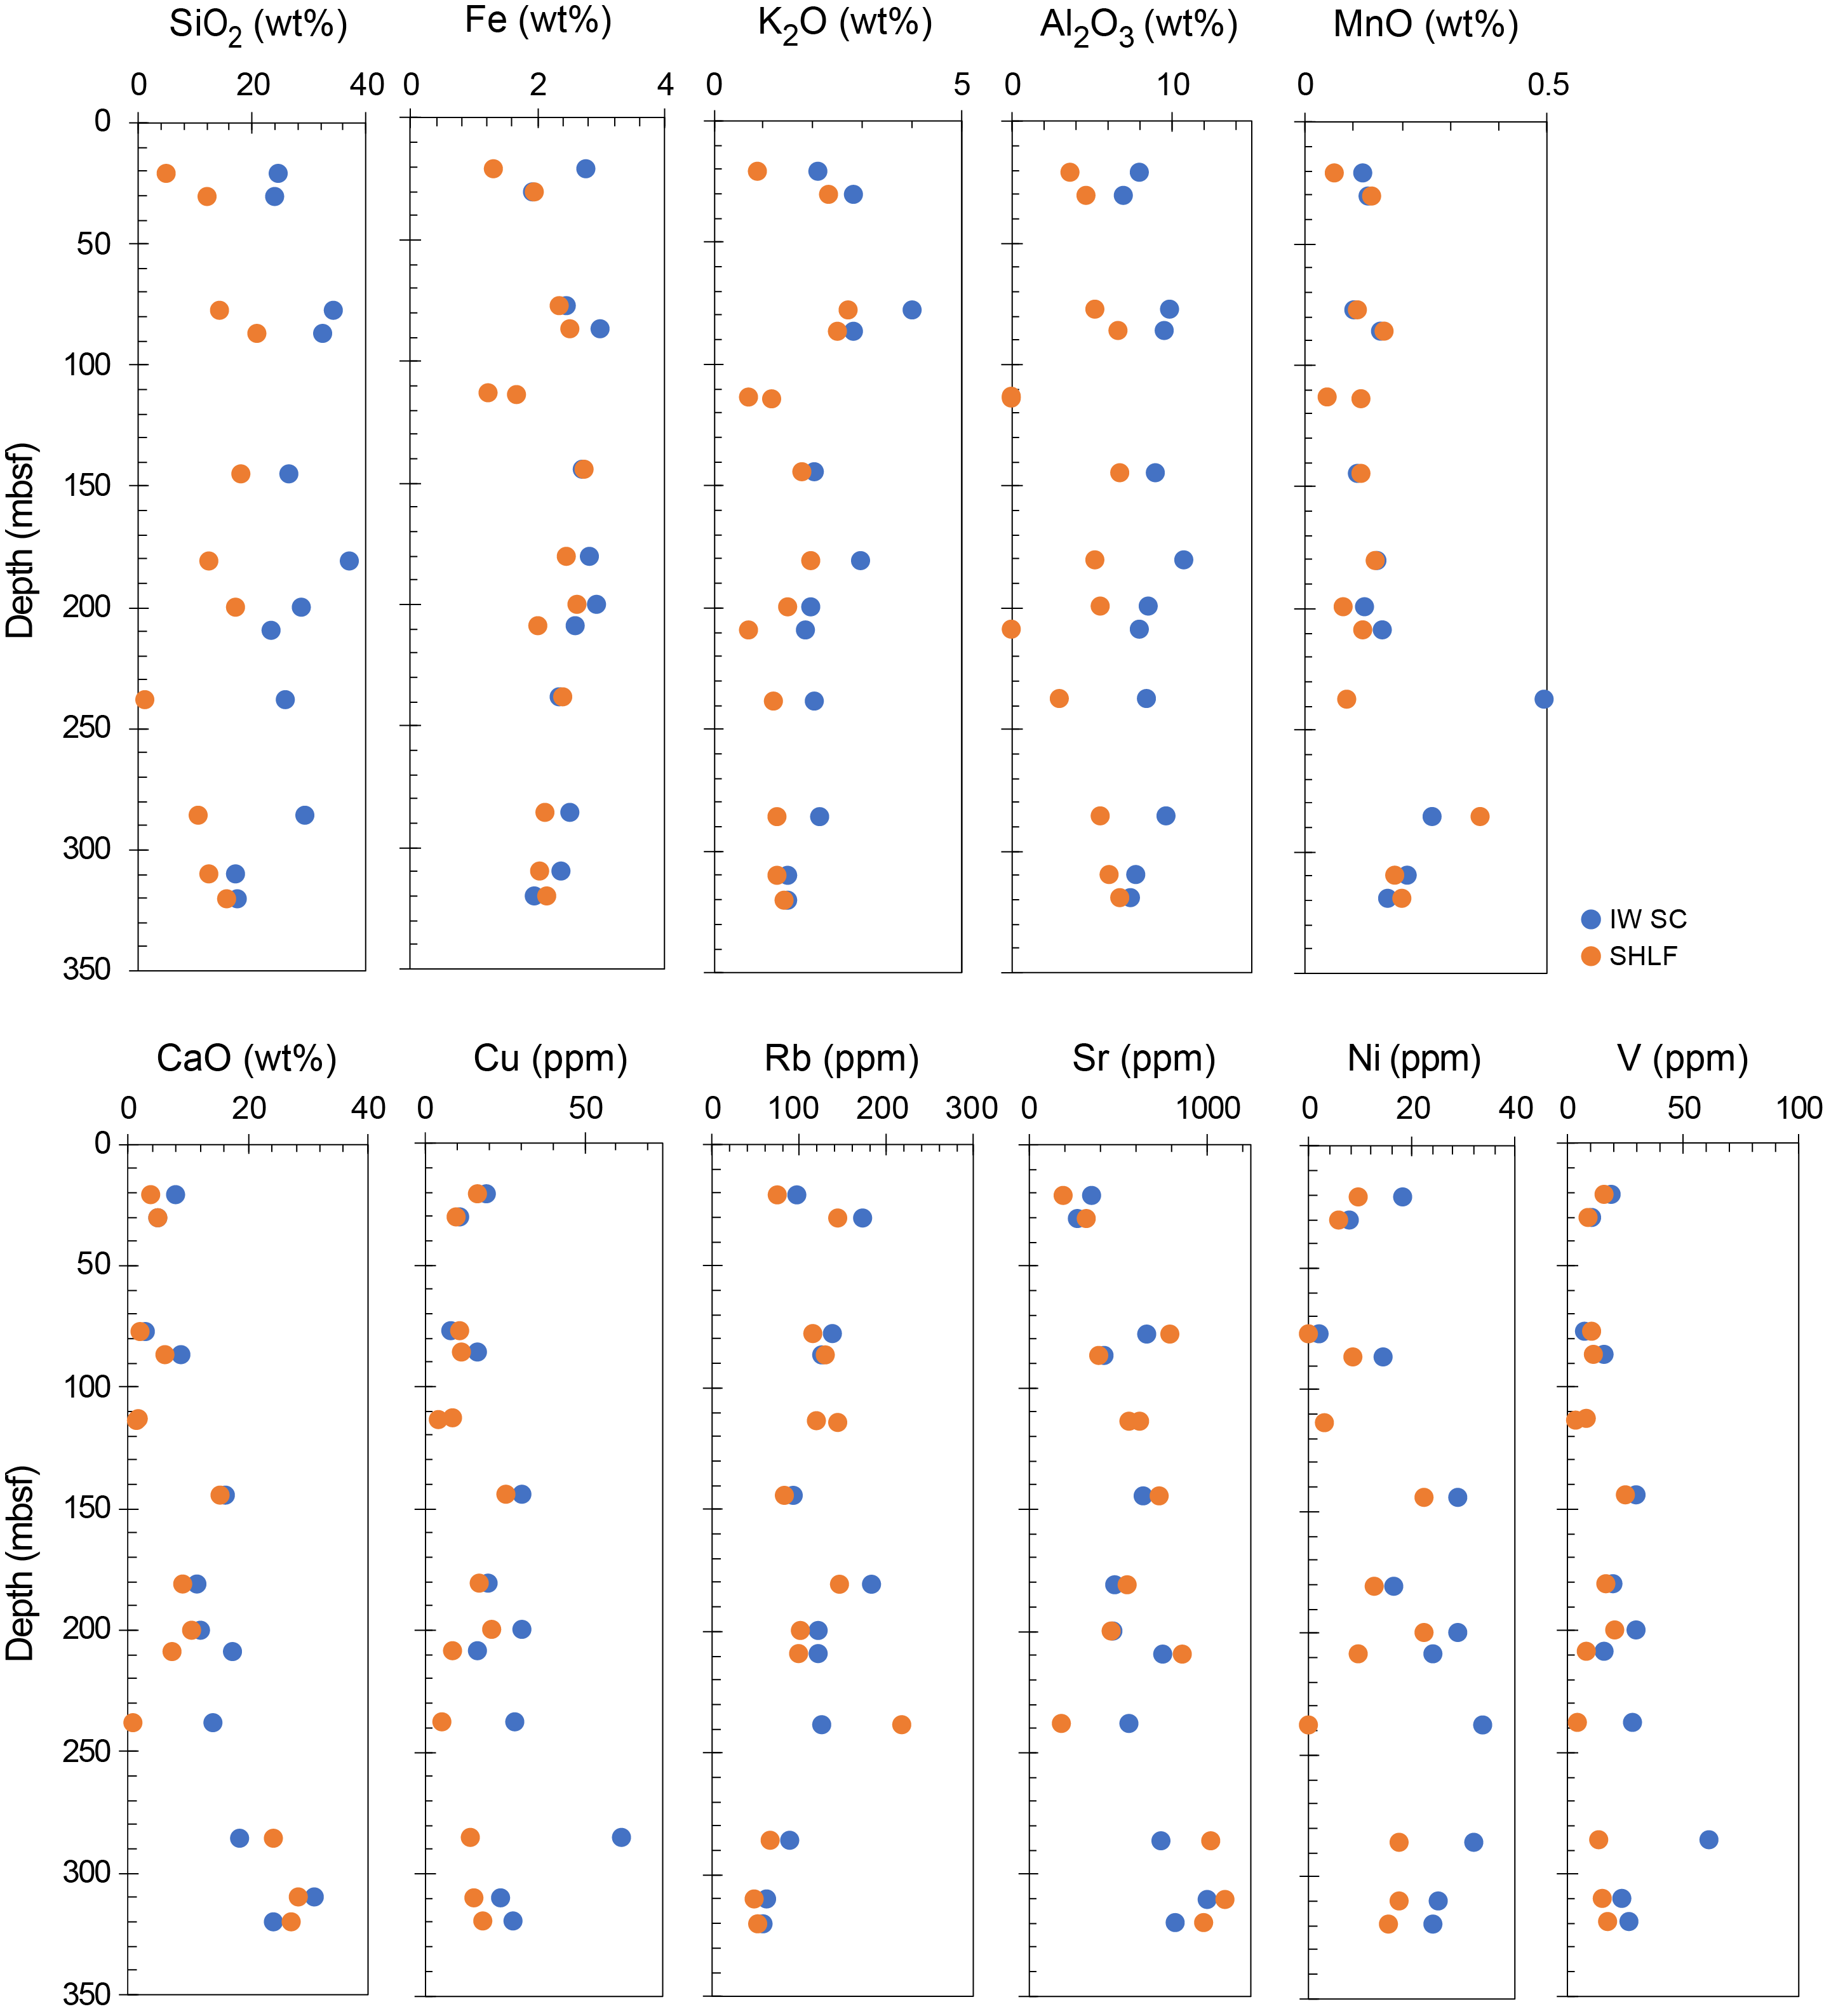
Figure F31. Trends in geochemistry, pXRF.
8.3. Headspace gas sample analysis
Gas sampling and analysis were performed in Hole U1612A, with one headspace gas sample per core analyzed to monitor C1–C6 hydrocarbons in accordance with the standard safety protocol during drilling (Pimmel and Claypool, 2001). In Hole U1612A, 26 headspace samples were analyzed to determine their concentrations in parts per million by volume (ppmv) (Figure F32; Table T11). In Hole U1612A, methane (CH4) is the only hydrocarbon gas detected in all cores (1R–35R). The amount of methane is negligible, ranging 0.2–4.3 ppmv between 0 and 323.70 m CSF-A. Methane concentrations are greater than 2.5 ppmv at 8.4, 142.9, 199.9, 207.9 and 319.7 m CSF-A.
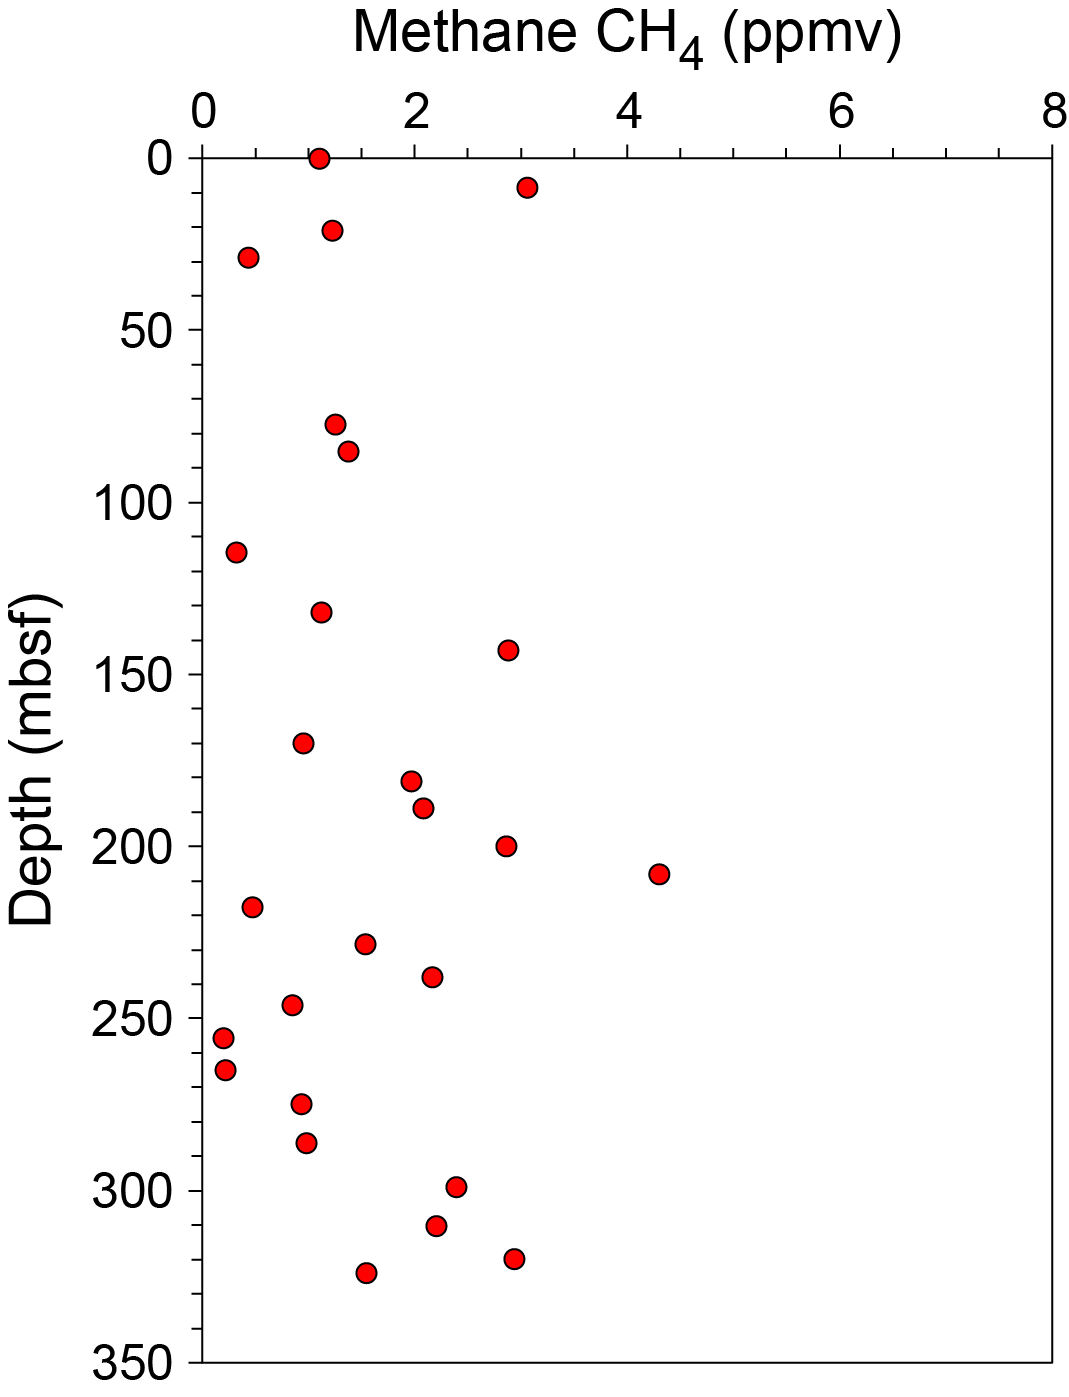
Figure F32. Dissolved methane concentrations.
9. Igneous geochemistry
Preliminary chemical characterization of basalts, felsic rocks, and sediments from Site U1612 was performed by pXRF, followed by LOI measurements and analysis by ICP-AES. Two holes were drilled at Site U1612 (U1612A and U1612B); because of the lack of time at the end of the expedition, geochemical analyses were only performed on cores recovered from Hole U1612A. A total of 13 chemical analyses were performed using pXRF for igneous rocks from Hole U1612A. Three igneous rocks were analyzed using ICP-AES. Igneous rocks were recovered in nine cores at Site U1612, where many samples consisted of clasts in unconsolidated breccias and thus were not recovered at their original emplacement or intrusion site. All igneous rocks that are believed to have been recovered in situ are in Unit V (see Igneous and metamorphic petrology). In the recovered igneous units, 13 intervals were selected for pXRF analysis. Corrected and raw pXRF values are summarized in Tables T12 and T13, respectively. One basalt and two granitoids representative of the range of igneous rocks recovered were analyzed by ICP-AES, and the results are presented in Table T14. The LOI, which can be used as a first-order measure of the extent of alteration, is 4.8 wt% for the basalt and ranges 0.17–0.29 wt% for the granitoids (Table T14).
The MgO content of the basalt samples appears to be variable at the sample scale and varies depending on the analytical method used. When analyzed by pXRF, the basalts show a range of MgO content with a minimum value of 3.1 wt% and a maximum value of 8.7 wt% (Table T12). However, the basalt with the highest MgO content in the pXRF analysis (interval 402-U1612A-35R-1, 79–80 cm) had a lower MgO content of ~6.6 wt% when analyzed via ICP-AES (Table T14). The basalt with the lowest MgO measured using pXRF (interval 37R-1, 1 cm) (Table T12) has probably experienced a high degree of alteration, which is further supported by its reddish color. The basalt interval 35R-1, 79–80 cm, is high in alkalis (Na2O + K2O = ~4.8 wt%; Table T14) and is classified as basalt to trachybasalt according to the total alkali-silica (TAS) classification diagram of Le Bas et al. (1986) (Figure F33). The basalt samples recovered from Site U1612 are similar in major element composition to those recovered from the Sardinian Rift margin during ODP Leg 107 at Site 654 (Figure F33), whereas they have lower SiO2 contents than those recovered from the Vavilov Basin at Sites 651 and 655 (Beccaluva et al., 1990). However, complete trace element compositions are required to clarify their origin.
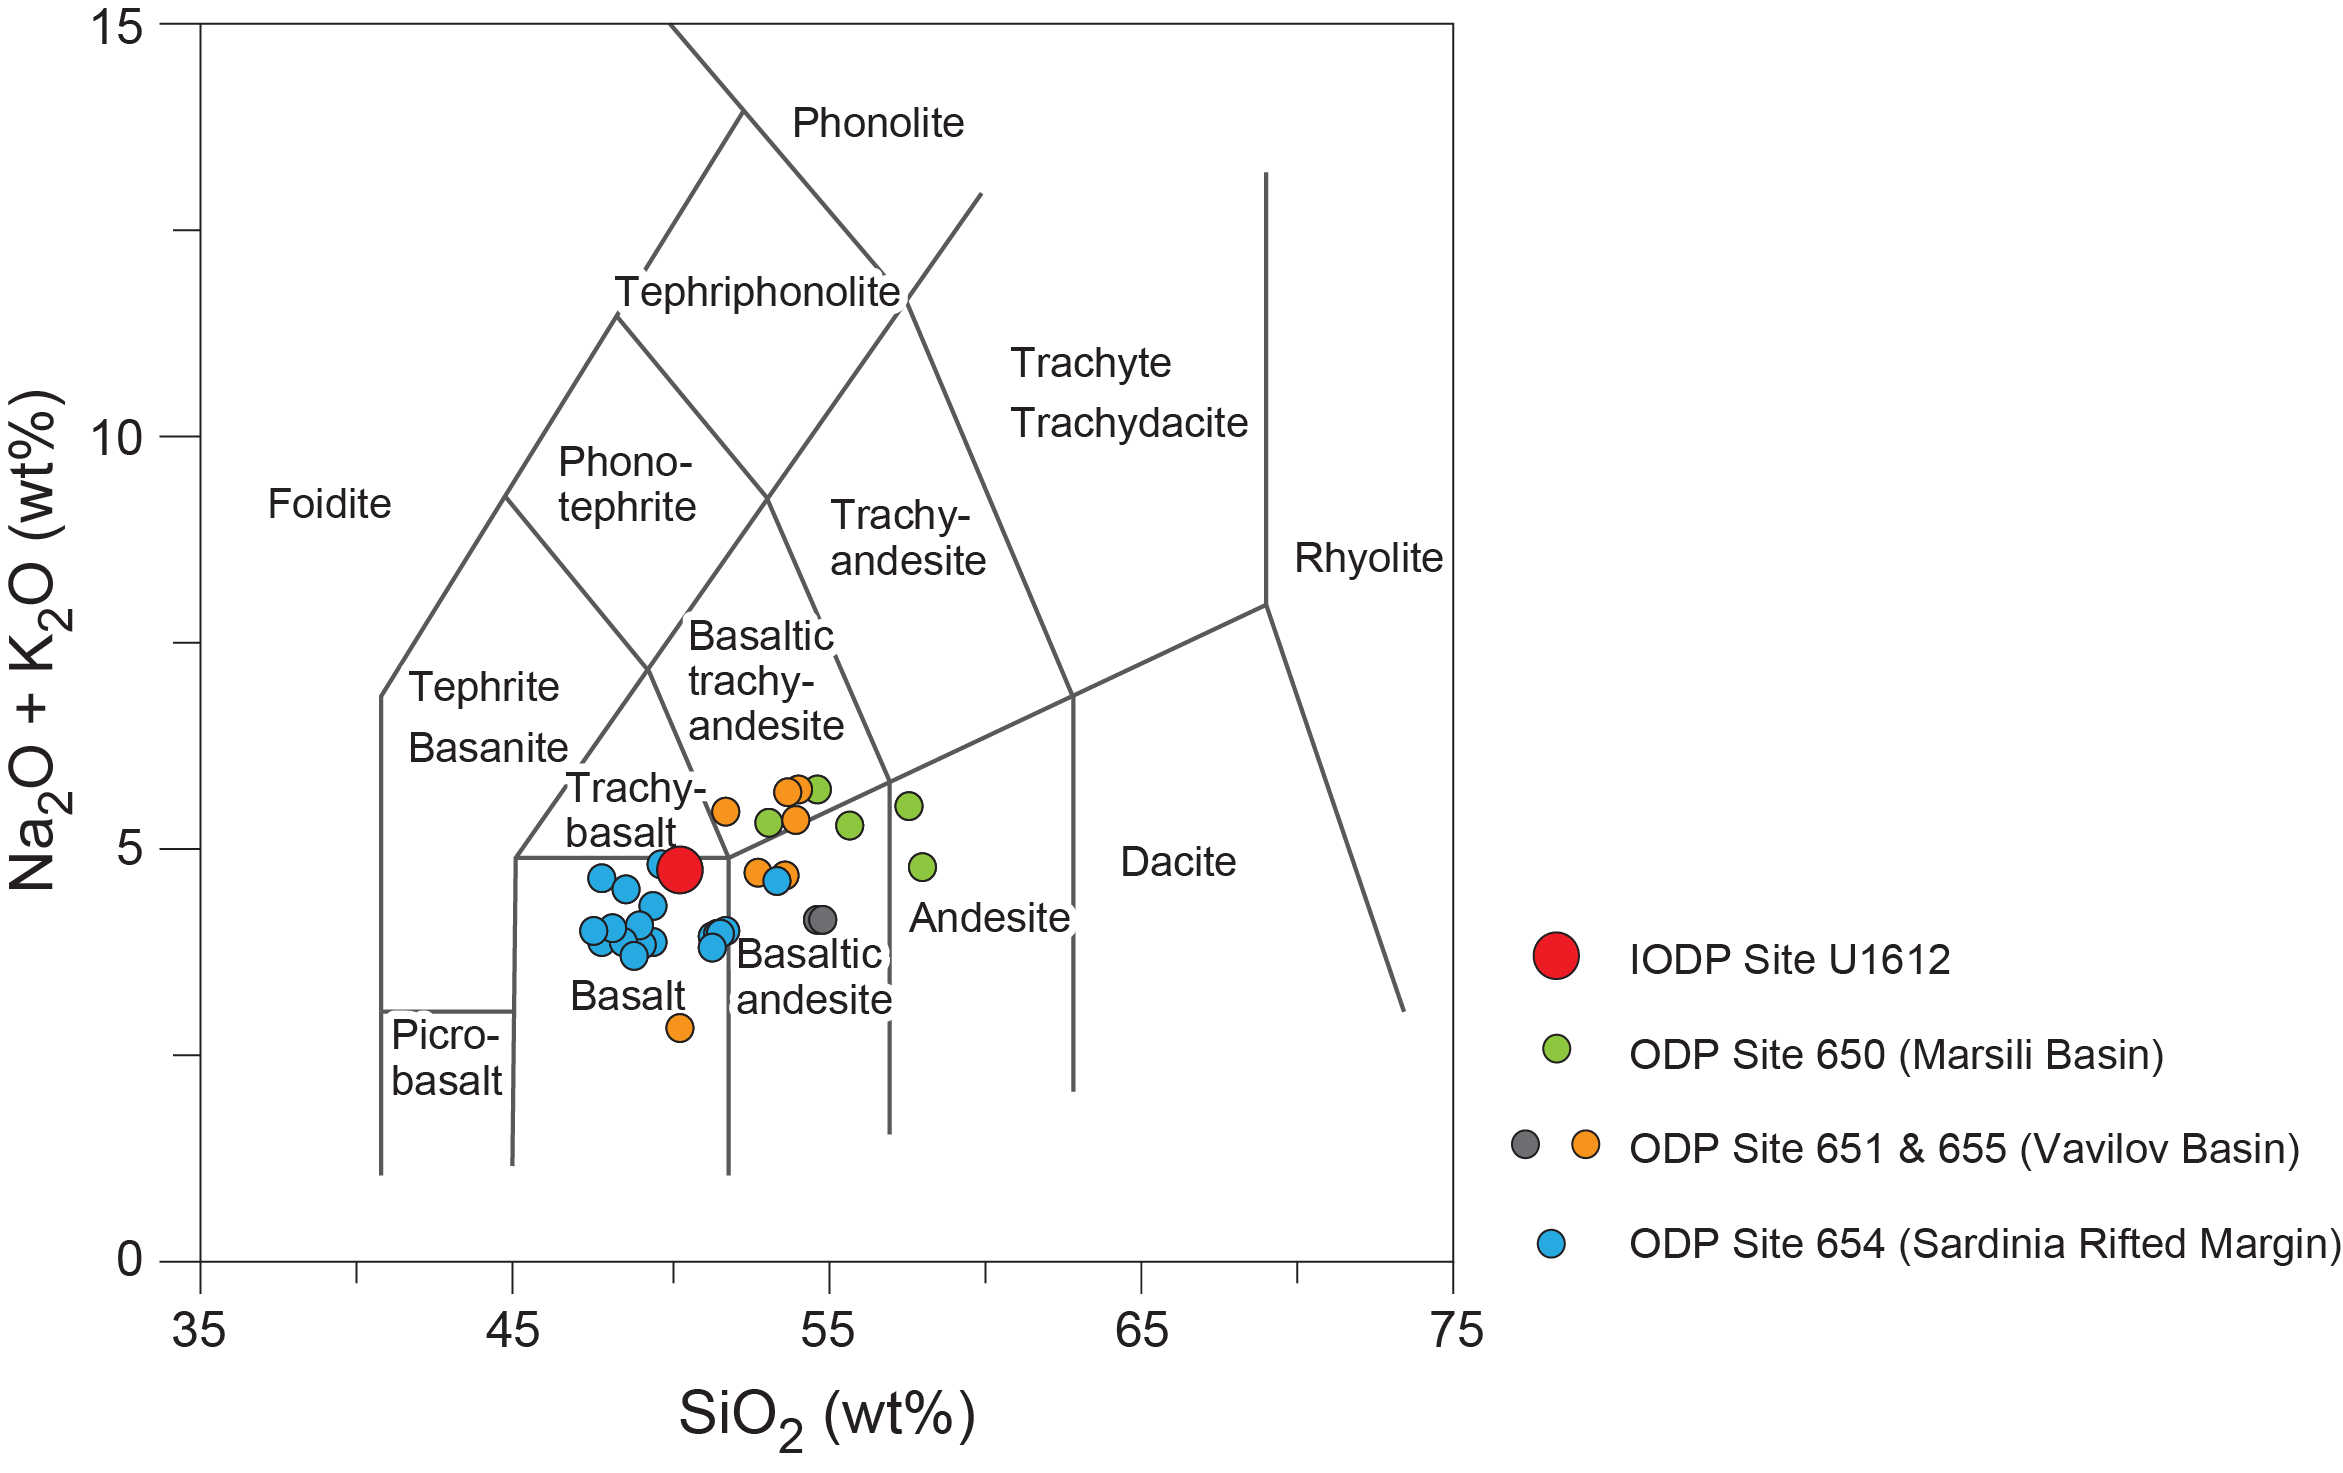
Figure F33. TAS plot for basalt.
The bulk geochemistry of two granitoids (Samples 402-U1612A-37R-1, 8–10 cm, and 39R-1, 27–28 cm) analyzed by ICP-AES indicates that they are granite to granodiorite in composition, based on plotting on a TAS diagram (Middlemost, 1994) (Figure F34). Peridotite clasts that were measured using pXRF (intervals 35R-1, 94 cm, and 37R-1, 140 cm) show variation in their chemical composition that is likely due to the coarse grain size and the heterogeneous mineral distribution on the surface. Three volcanic rock compositions (Samples 13R-1, 7 cm; 13R-1, 78 cm; 27R-CC, 3 cm) could not be measured using pXRF, probably because of a porous cut surface (Table T12).
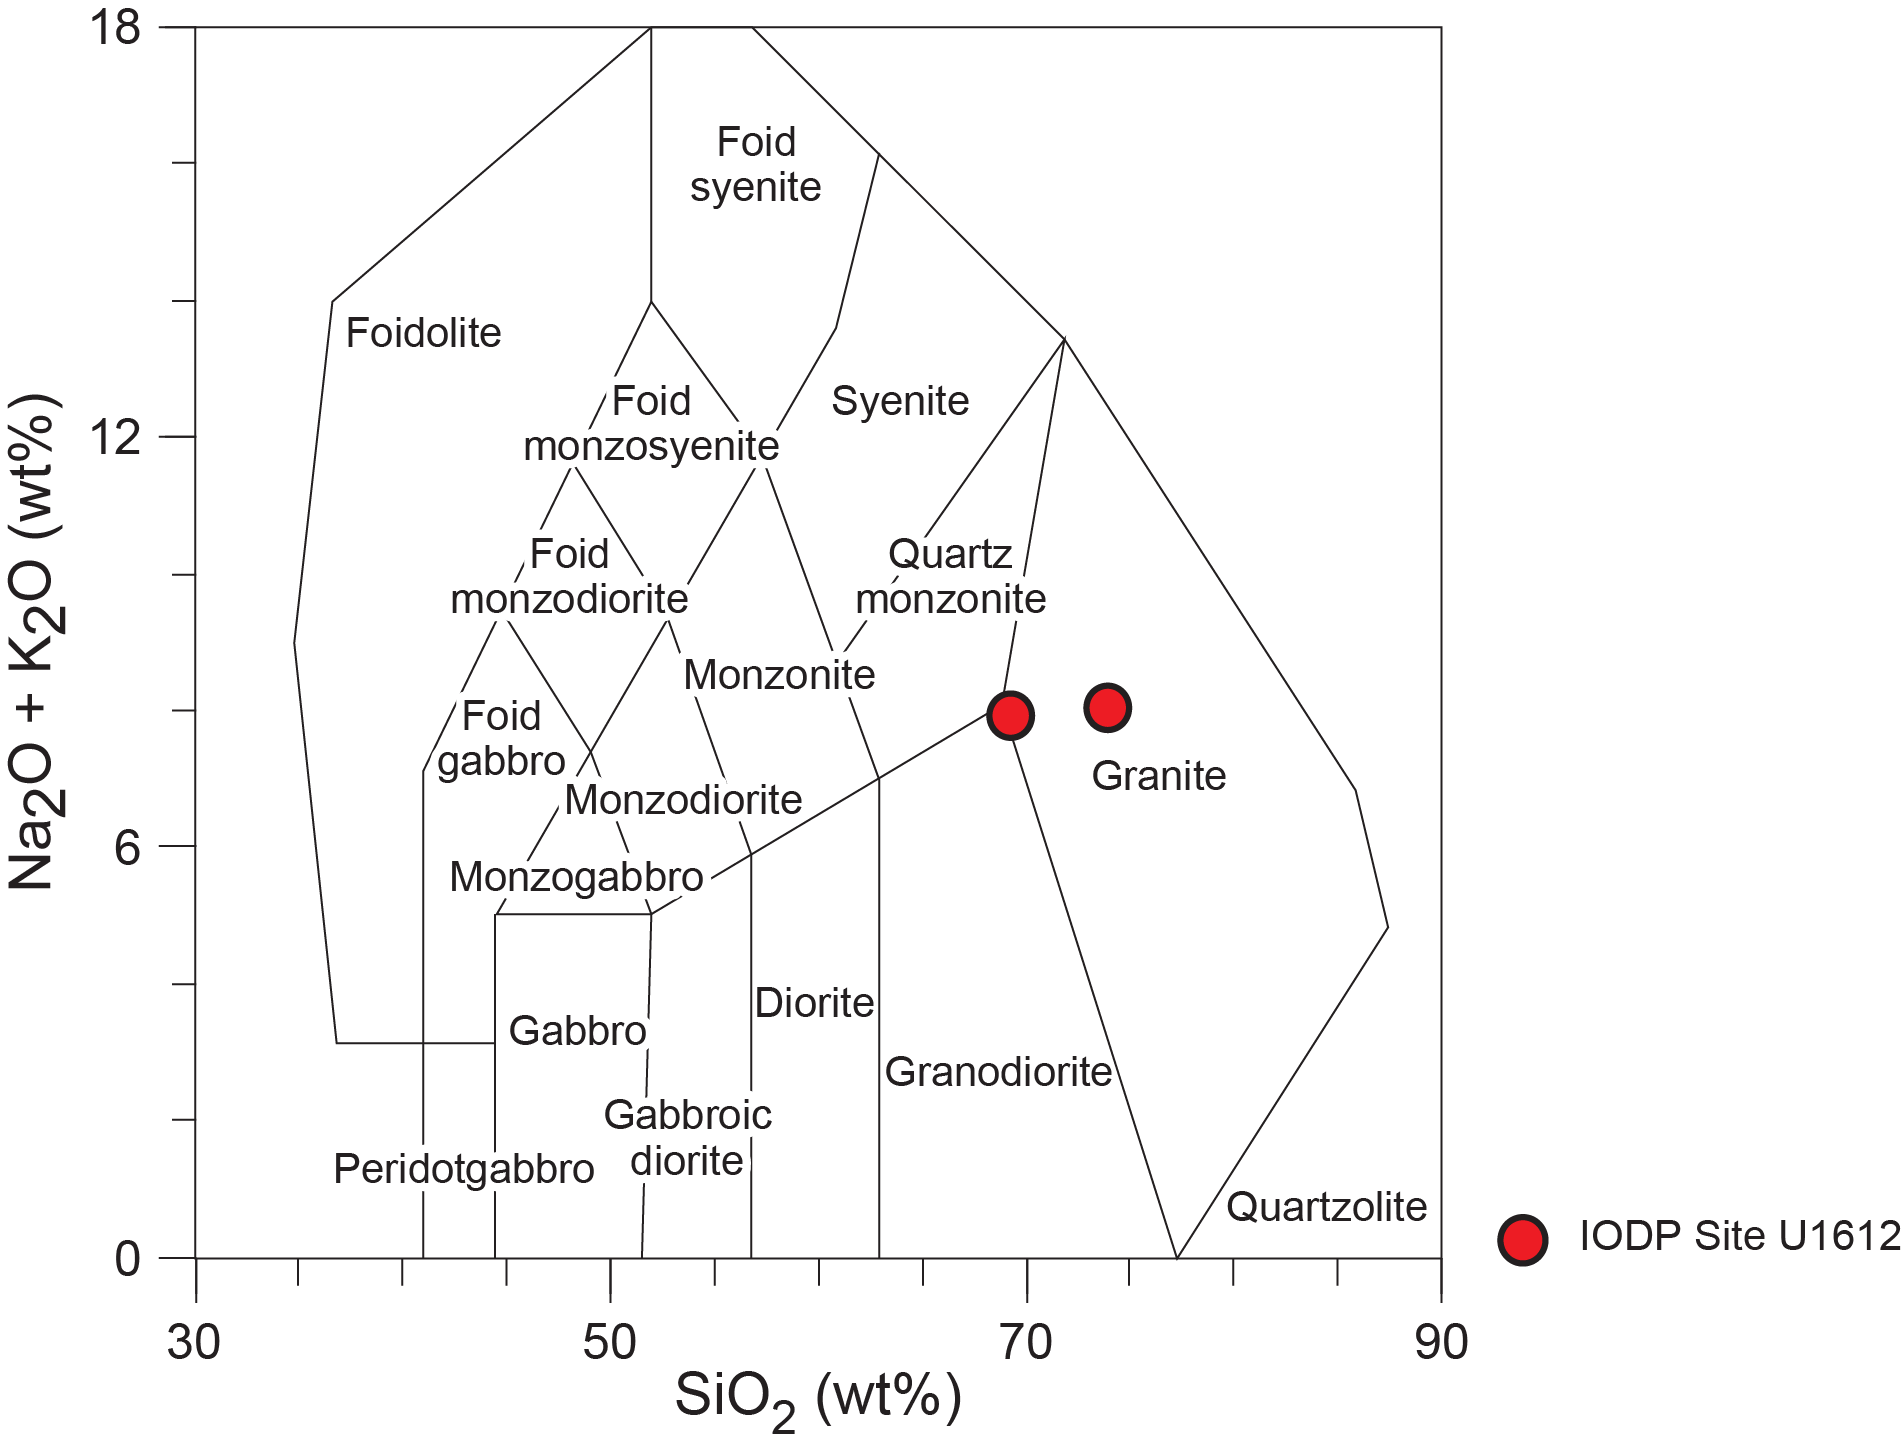
Figure F34. TAS plot for felsic rocks.
10. Physical properties
Two holes were drilled at Site U1612. Hole U1612A cored the sedimentary and basement sequence, and Hole U1612B drilled through sediments without recovery and targeted primarily basement rocks. However, because Hole U1612B was drilled on the last day of the expedition, only nondestructive measurements of physical properties were done on the recovered basement rocks and no samples for moisture and density (MAD) were collected except for three MAD measurements that were carried out with nonstandard procedures on dry hard rock fragments because of time constraints (Table T15). Physical properties of the sedimentary sequence in Hole U1612A were measured on 69 recovered core sections (see Physical properties in the Expedition 402 methods chapter [Malinverno et al., 2025]). For both holes, measurements on whole-round sections included natural gamma radiation (NGR), gamma ray attenuation (GRA) bulk density, and magnetic susceptibility (MS). P-wave velocity (VP) was measured on both whole-round sections with the Whole-Round Multisensor Logger (WRMSL) and section halves with the Gantry system. For the basement rocks recovered from Holes U1612A and U1612B, WRMSL velocities were inaccurate because of incompletely filled core liners on the whole-round sections; the VP data from the WRMSL were therefore disregarded or not collected, and instead accurate VP data were acquired on section halves with the Gantry system. Because Hole U1612A was the first hole of the expedition, we tested different instrument settings to determine optimal parameters for the rest of the expedition. In particular, for sediments recovered in Hole U1612A, we tested 1, 2, and 2.5 cm intervals in the acquisition of WRMSL measurements to see if there was an improved data resolution at the expense of increased instrument run time. We found that a 2 cm sampling interval for WRMSL measurements was ideal for best characterizing variations in physical properties and for comparisons with Section Half Multisensor Logger (SHMSL) measurements and paleomagnetic data, which were also acquired at 2 cm intervals. We obtained X-ray images for whole-round sections at four different orientations (0°, 45°, 90°, and 135°) and on all split-core sections of sediment. For basement rocks below Core 402-U1612A-35R, we only collected X-ray images for whole-round cores. For both sediment and hard rocks recovered from Hole U1612A, split-core section measurements included discrete measurements of VP in three directions with the Gantry system (using a bayonet on soft sediments and a caliper for stiff sediments and hard rocks), MAD measurements, and thermal conductivity measurements (Table T15).
Despite the poor core recovery in Hole U1612A (22% of the total drilled interval), the measured physical properties show distinct variations that can be related to lithologic changes in different lithostratigraphic units. In the sedimentary section (Cores 1R–35R), WRMSL VP increases with depth from ~1500 to ~1700 m/s, which is consistent with the expected compaction trend for deepwater sediments. Similarly, bulk density increases from ~1.6 to ~2.0 g/cm3 and porosity decreases from ~75% to ~45% just above the basement (Figure F35). In Hole U1612B, seismic velocities range from 1728 m/s in the shales just above the basement contact to 5918 m/s in an altered gabbro fragment sampled at 325.5 mbsf in Core 4R.
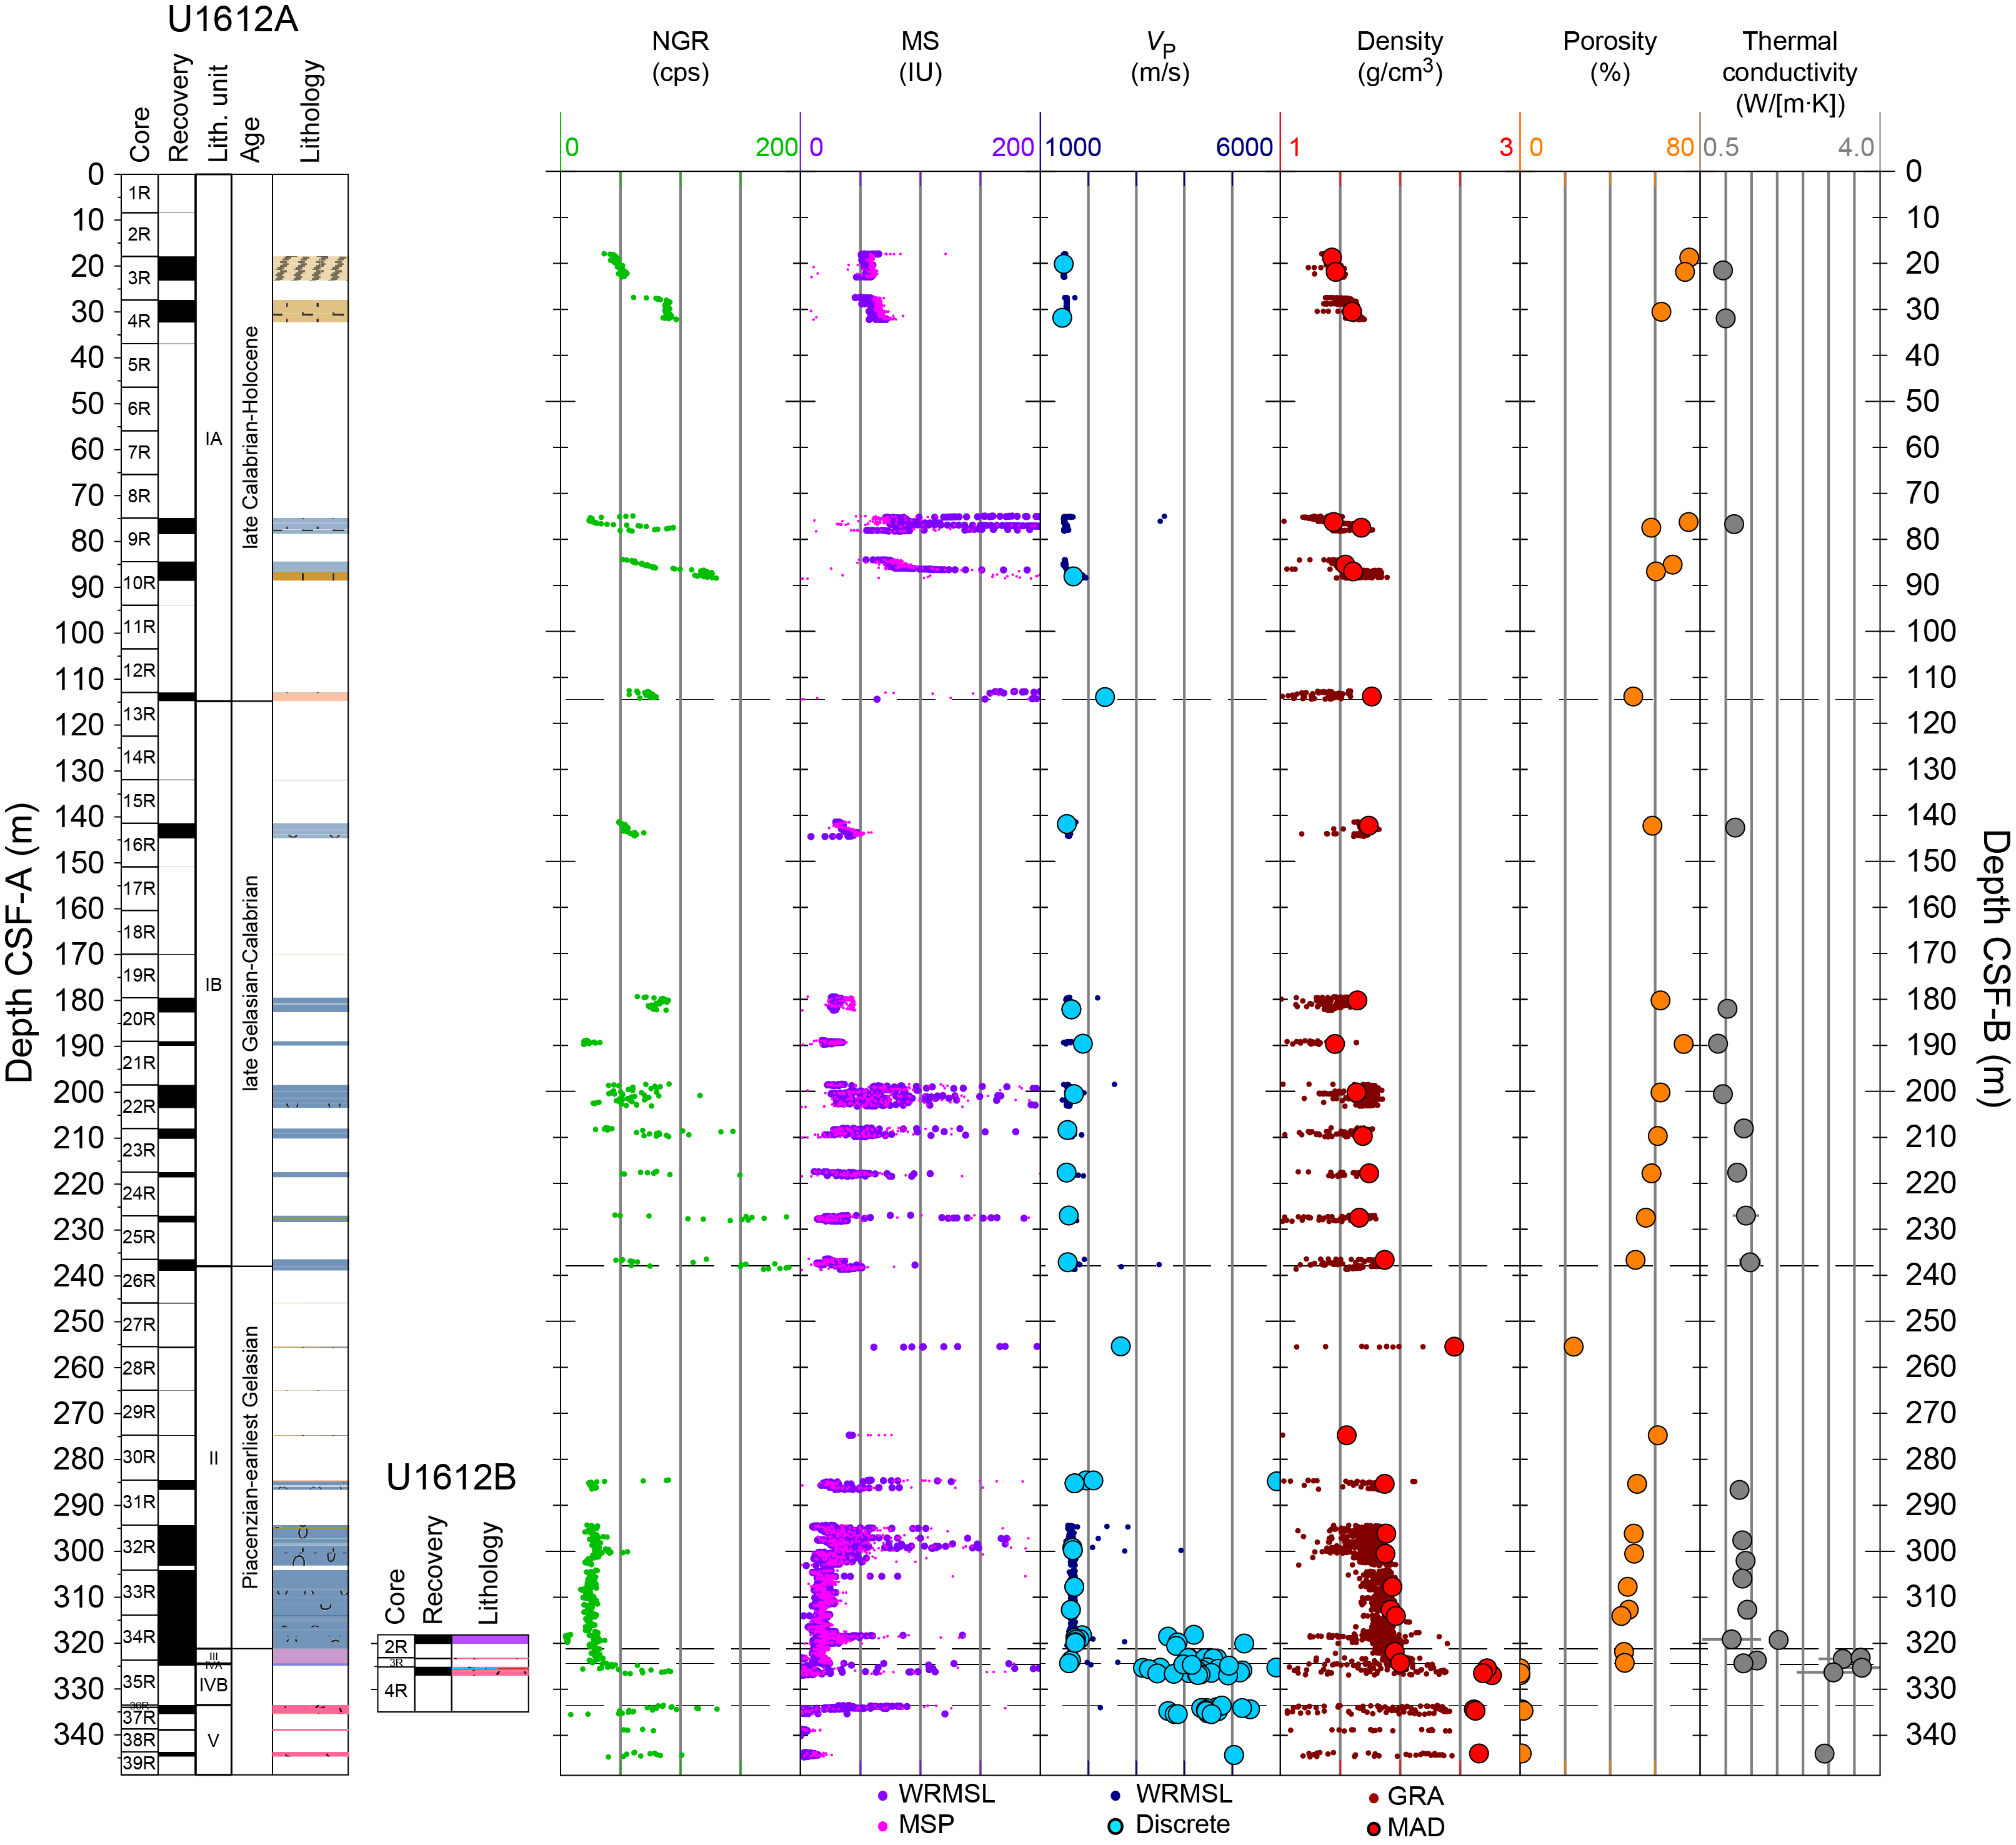
Figure F35. Physical properties, Site U1612.
The 51 discrete VP measurements collected for rocks from Hole U1612A agree with the WRMSL measurements, confirming the increase in velocity associated with an increase in consolidation with depth. MAD measurements on 28 discrete samples from Hole U1612A also show good agreement with the GRA bulk densities measured using the WRMSL. MS of the sedimentary section is generally very low, ranging 0–3850 instrument units (IU), with local peaks corresponding to volcaniclastic layers interlayered with the sediments and to serpentinized peridotite in the polymictic breccia above the basement in Hole U1612A. In Hole U1612B, MS varies from 0 to 1429 IU with the maximal value recorded over a diorite sample in Core 4R. In Hole U1612A, NGR varies from 10 to 223 counts/s with higher values in volcanic-rich sedimentary intervals and in the basement, and in Hole U1612B the range is 30–90 counts/s. Thermal conductivity increases with depth and varies from ~0.8 to 1.6 W/(m∙K) in the sediments before increasing to 2.921 W/(m∙K) in the crystalline basement in Hole U1612A. Out of six thermal conductivity measurements in Hole U1612B, only one measurement was from the shale layer overlying the basement (1.114 W/[m∙K]) in Core 2R. The remaining thermal conductivity measurements for Hole U1612B were done on dry basement fragments (i.e., no soaking was done because of the time constraints), resulting in thermal conductivity values varying from 3.093 to 3.624 W/(m∙K).
Physical properties for the three lithostratigraphic units in the sedimentary section (Units I–III), the polymictic breccia layer (Unit IV), and the basement (Unit V) recovered from Holes U1612A and U1612B are shown in Figure F35 and listed in Table T16.
10.1. Lithostratigraphic Unit I
10.1.1. Lithostratigraphic Subunit IA
Lithostratigraphic Subunit IA includes the interval from the seafloor to the base of Core 402-U1612A-13R (0–114.8 mbsf). Sediment porosity in this interval varies from ~75% to as low as 50% based on eight MAD samples, and bulk density varies from 1.43 to 1.76 g/cm3. Samples from the volcaniclastic-rich intervals have higher MS values (based on WRMSL measurements and SHMSL point MS [MSP] measurements) and generally higher bulk densities and lower porosities (1.68 g/cm3 and 56%, respectively, based on three MAD samples from Sections 9R-3, 10R-2, and 13R-2) compared to the average density of 1.57 g/cm3 and porosity of 65% for the other samples from this interval of the sedimentary column. A MAD sample from Section 10R-3 had white crystals on the top after it was baked for 24 h at 105°C (see Physical properties in the Expedition 402 methods chapter [Malinverno et al., 2025]), indicating salt crystallization during drying. The pXRF test on this sample confirmed abundant Cl (23 vol%). Two samples from the shallower cored interval (from Sections 3R-3 and 4R-3) were also tested using pXRF analysis as background measurements, revealing 21 and 20 vol% Cl, respectively. Despite a high Cl content, only one sample from this site (from Section 10R-3) showed evidence of salt crystallization after MAD processing.
VP increases with depth from 1500 m/s near the seafloor to 2348 m/s in the volcanic tuff encountered in Core 402-U1612A-13R. Six discrete velocity measurements in three different directions in Sections 3R-2 and 4R-3 show directional velocity variations (1488–1500 m/s for Section 3R-2 and 1426–1506 m/s for Section 4R-3), but the anisotropy pattern was not consistent between these two experiments. For the rest of the samples in Hole U1612A, velocity was measured only in one direction (X-axis) because the bayonets that are used to measure velocity in other directions did not provide reliable results and damaged the core.
NGR values are stable with depth, mostly ranging 85–90 counts/s for the uppermost 70 m of this interval (Cores 402-U1612A-1R through 8R) and increasing to 130 counts/s at the bottom part of the subunit (Cores 9R–13R). Thermal conductivity measurements in Sections 3R-3 and 4R-4 were close, with a range of 0.943–0.993 W/(m∙K) and increasing over the volcanic-rich intervals in Cores 9R–13R (1.16 W/[m∙K]) from Section 9R-2.
10.1.2. Lithostratigraphic Subunit IB
Lithostratigraphic Subunit IB extends from the base of Core 402-U1612A-13R to the base of Section 26R-1 (114.8–238 mbsf). Bulk density in this interval varies from 1.46 to 1.87 g/cm3 based on eight MAD samples, and porosity ranges 73%–51%. Physical properties in this subunit show several distinct trends. All physical properties in the interval between Cores 14R and 23R show general decreasing trends downhole, except for VP. Bulk densities decrease from 1.738 g/cm3 in Section 16R-1 to 1.456 g/cm3 in Section 21R-1, and MS remains relatively low around 25 IU without the spikes observed in the upper part of this subunit. Thermal conductivity decreases to its minimum value of 0.852 W/(m∙K) in Core 21R, and NGR drops to ~30 counts/s. In contrast, VP measured in Section 21R-1 is high (1887 m/s) compared to the 1552 m/s obtained from Section 16R-1.
Density increases toward the base of Subunit IB (Cores 402-U1612A-22R through 26R) to 1.871 g/cm3 in Section 26R-1, and VP measurements are stable in the range of 1546–1591 m/s. NGR and MS data become noisier as the amount of volcanic material in the cores increases with depth throughout the subunit. NGR increases overall with increasing depth. Thermal conductivities increase downhole from 0.944 W/(m∙K) in Section 22R-7 to 1.472 W/(m∙K) in Section 26R-1.
10.2. Lithostratigraphic Unit II
Lithostratigraphic Unit II extends from Core 402-U1612A-27R through Section 34R-5 (238–321.2 mbsf). Recovery is very low in the upper part of this unit with very limited volcaniclastic material recovered in Cores 28R and 31R. In general, the volcaniclastic samples have high density, low porosity (2.451 g/cm3 and 24%, respectively, in Section 28R-1), and relatively fast acoustic velocity (2677 m/s in Section 28R-1 and 2106 m/s in the volcanic tuff from Section 31R-1). The volcaniclastic samples also have relatively high MS (up to 197 IU on the WRMSL and 362 IU for MSP from the SHMSL in Core 28R) and high NGR with a maximum value of 90 counts/s in Core 31R compared to 20 counts/s for the underlying clastic rocks. Recovery substantially improved in Cores 32R–34R, allowing for more detailed physical properties measurements. Density in this interval increases from 1.877 (Section 32R-5) to 1.964 g/cm3 (Section 34R-1), porosity changes from 51% to 45%, thermal conductivity increases from 1.321 (Section 32R-3) to 1.419 W/(m∙K) (Section 33R-6), and NGR remains stable in a range of 30–40 counts/s.
10.3. Lithostratigraphic Unit III: dolomitic mud
Unit III is the thinnest sedimentary lithostratigraphic unit (Sections 402-U1612A-34R-6 through 35R-1; 321.2–324.4 mbsf) and consists of dolomitic mud with a characteristic reddish color. Two MAD samples were collected from this interval with densities of 1.95 and 2.0 g/cm3 (Sections 34R-6 and 35R-1), porosity of ~46%, and a relatively high VP of 1639 m/s (Section 34R-CC) and 1597 m/s just above the basement (Section 35R-1). In contrast, NGR and MS remain relatively low (20–30 counts/s and 10–20 IU, respectively).
10.4. Lithostratigraphic Unit IV: polymictic breccia
Lithostratigraphic Unit IV consists of a variety of hard rock fragments. In Hole U1612A, the contact between Lithostratigraphic Units III and IV was reached in Section 35R-1, where dolomitic mud was directly underlain by a thin interval of basalt. Below, rock fragments of different lithology were found, namely a granitic fragment next to serpentinized peridotite next to a quartz clast and a metamorphic rock (Figure F36). VP was measured in the X-direction for these fragments. In Section 35R-1, we measured velocities of 3981 m/s on a granitic fragment, 4260 m/s on a quartz fragment, and 4155 m/s on a peridotite fragment.
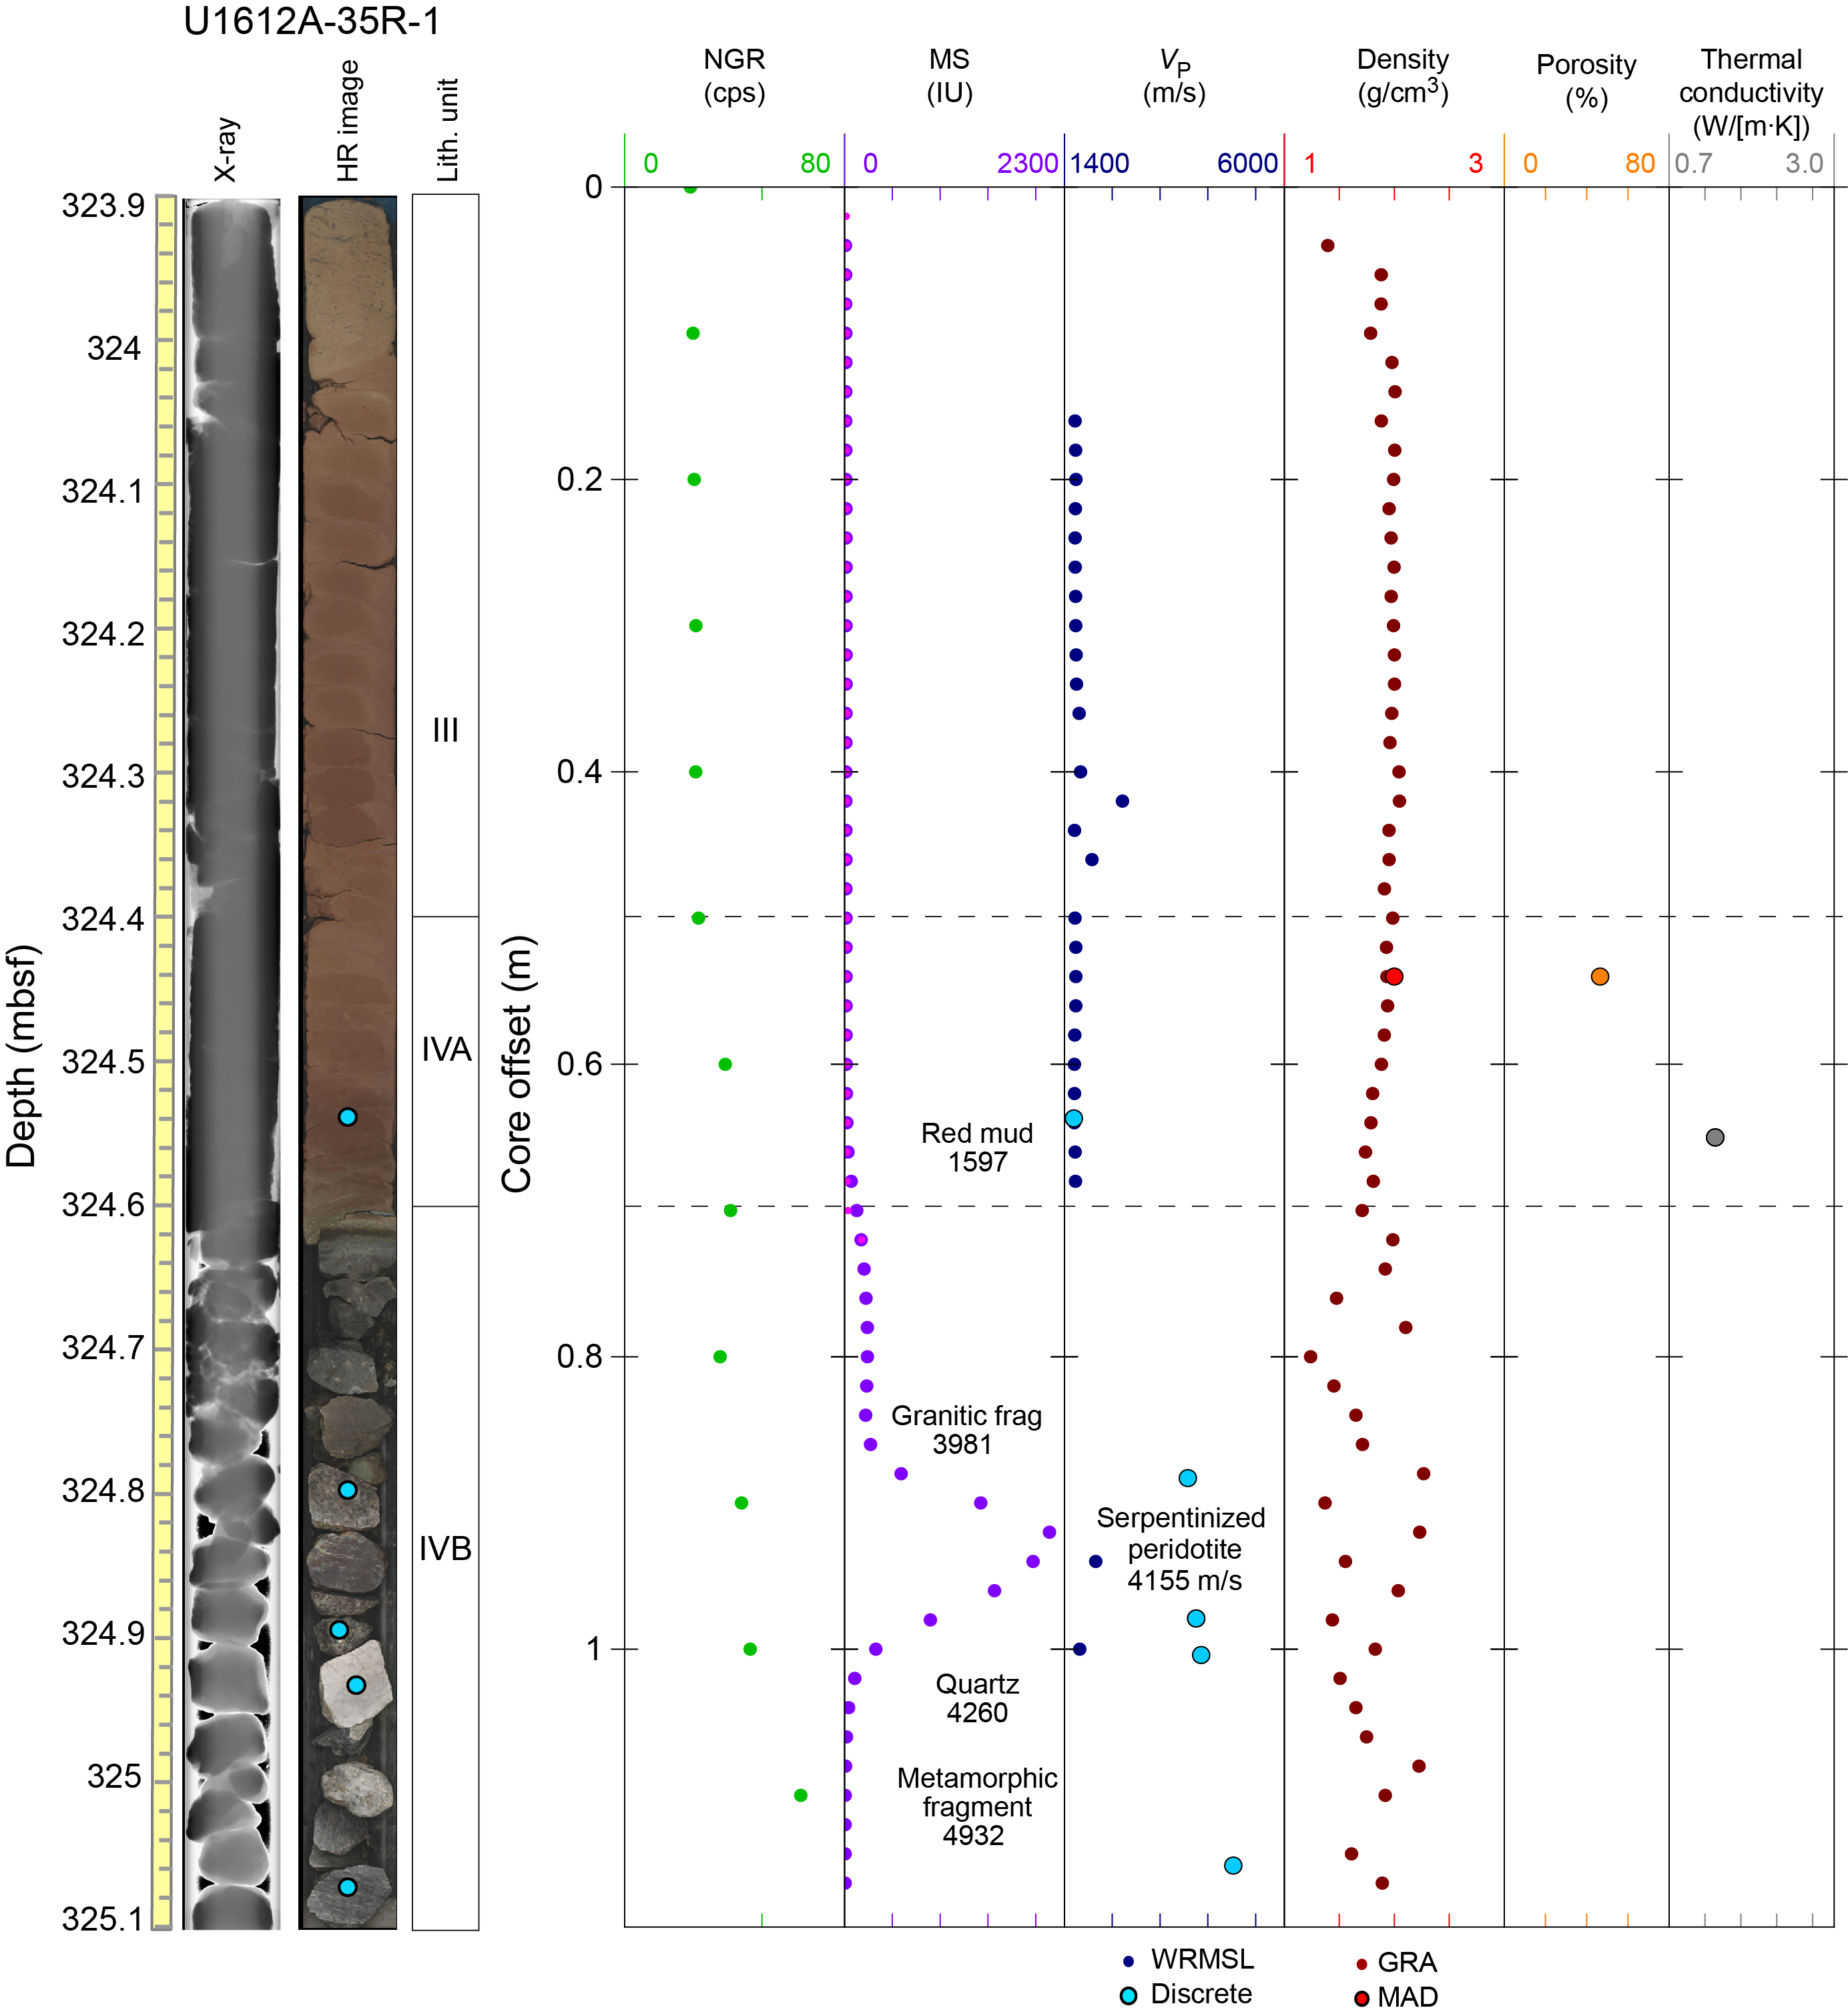
Figure F36. Physical properties, Unit III–IV transition.
In Hole U1612B, only two rock fragments (serpentinized peridotite and basalt) within the mud-supported matrix were encountered in Core 2R. The VP values measured with the Gantry system were 4201 m/s for peridotite and 3661 m/s for basalt. The average of six velocity measurements over the matrix rocks was 1770 m/s. MS of the matrix is generally low with spikes to 1298 IU (WRMSL) and 3299 IU (SHMSL) over peridotite. The WRMSL does not record elevated MS over the basaltic fragment, most likely because it is too small to be resolved, whereas the SHMSL shows a general increase in MS from ~30 IU over the matrix to 136 IU over the interval that contains the basaltic fragment.
10.5. Lithostratigraphic Unit V
Lithostratigraphic Unit V at Site U1612 was penetrated at 333.5 mbsf in Hole U1612A and corresponds to the crystalline basement, composed of granitoids and minor peridotite slivers. A preliminary depth-time relationship was produced from VP measurements of the recovered core. The basement depth corresponds to ~418 m/s two-way traveltime (TWT) beneath seafloor, which agrees well with the TWT of the basement reflection in the Mediterràneo Occidental (MEDOC) project seismic reflection data (Ranero and Sallarès, 2017) for Hole U1612A (Figure F37). The metamorphic basement rocks recovered from Cores 36R–39R generally have high density and low porosity (2.628 g/cm3 and 1.5%, respectively, measured in the granitoid from Section 37R-1). VP measurements are generally high (typically >3800 m/s), and MS is low with notable sharp increases over the serpentinized peridotite fragments (Figures F35, F36). VP measurements in the X-direction were also performed on individual metamorphic rock fragments from Sections 37R-1, 38R-1, and 39R-1, yielding a very high velocity (the average of eight measurements is 4741 m/s) compared with the sediments above (Vx = 1597 m/s in the reddish dolomitic mud of Unit III; Figure F36). Two samples of serpentinized peridotite (from Sections 35R-1 and 37R-1) yielded an average VP of 4174 m/s. A cube cut from the deformed granitoids in Section 37R-1 yielded Vx = 5442 m/s, Vy = 5269 m/s, and Vz = 5107 m/s. The fastest Vx measurement for this cube is recorded for P-waves traveling subparallel to the mylonitic fabric. MS values spike to 2300 IU (WRMSL) in the upper part of the basement interval (brecciated section of Core 35R) and remain relatively low (<10 IU) for most of Cores 36R–39R with a prominent spike up to 1500 IU in the serpentinized peridotite fragment at the base of Section 39R-1. NGR remains relatively stable in the range of 30–120 counts/s, with the majority of measurements <70 counts/s. A single thermal conductivity measurement on a metamorphic rock fragment from Section 39R-1 yielded a value of 2.921 W/(m∙K).
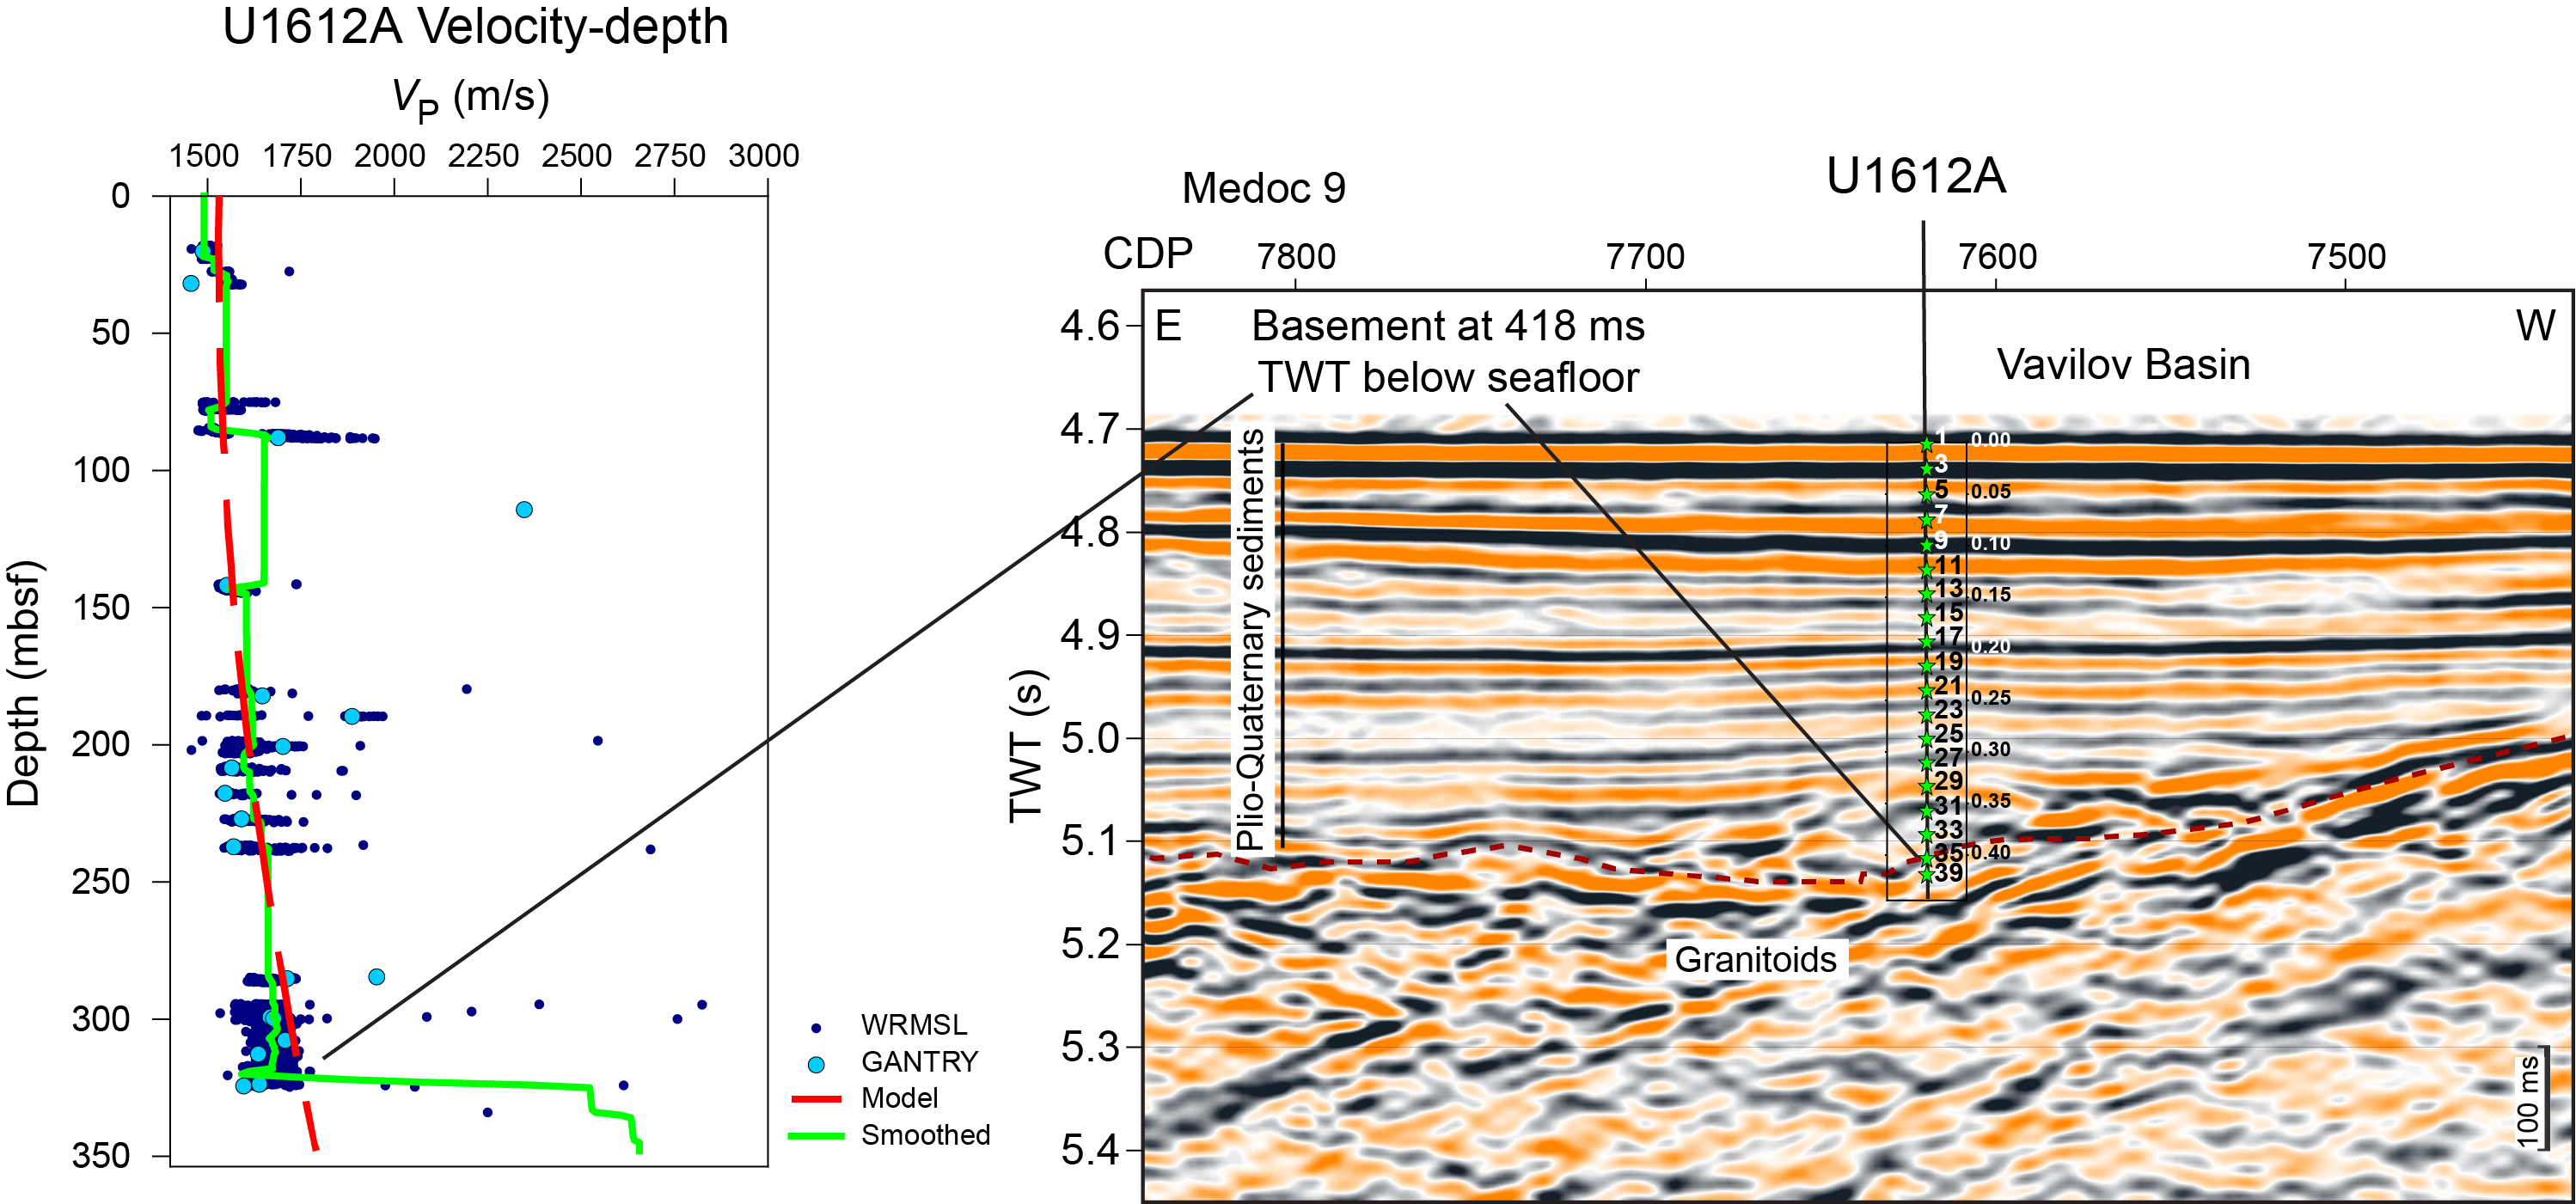
Figure F37. VP profile and TWT plot of core tops.
In Hole U1612B, the first granitoid fragment was encountered in Section 2R-CC at 320.04 mbsf. A total of 34 VP measurements were completed on granitoid fragments from the section halves of Cores 3R and 4R, yielding an average value of 4381 m/s. MS values are generally low over the granitoids (~10 IU) and spike up to 1429 and 239 IU (WRMSL) over diorite and altered gabbro fragments, respectively, in Core 4R. In Hole U1612B, NGR is higher in the basement rocks (average = 58 counts/s) than in the overlying basal breccia (6 counts/s). Density values of the basement rocks measured with the WRMSL are not reliable because of the fragmentary nature of the samples, and no standard MAD measurements were performed because of time constraints. Three discrete density estimates were completed on the fragments from Core 4R (dry mass and volume were measured without preliminary soaking and without following the formal MAD protocol). A density of 2.724 g/cm3 was estimated for a basaltic fragment from Section 4R-1, and two estimated values for granitoid fragments were 2.69 g/cm3 for Section 4R-1 and 2.765 g/cm3 for Section 4R-2. The average of four thermal conductivity measurements of the basement fragments from Sections 3R-1 and 4R-1 was 3.41 W/(m∙K).
11. Downhole measurements
Downhole measurements at Site U1612 consisted of in situ sediment temperatures in Hole U1612A and seafloor temperature measurements. The downhole geophysical measurements planned for Hole U1612A could not be carried out after the pipe became stuck and was severed near the seafloor. For Hole U1612B, downhole geophysical measurements could not be carried out because of time limits at the end of the expedition.
11.1. Heat flow
The SET2 downhole instrument was deployed three times in the upper part of Hole U1612A to measure temperature in the sediment formation. Two measurements were successful at 103.4 mbsf (after Core 402-U1612A-11R) and 198.4 mbsf (after Core 21R) with the SET2 Probe Number 449. Equilibrium temperatures of 32.30° and 48.26°C, respectively, were calculated by applying the shipboard correction factor (Table T17; see Downhole measurements in the Expedition 402 methods chapter [Malinverno et al., 2025]). The second SET2 measurement, made at 160.9 mbsf (after Core 17R), gave a temperature of 15.92°C, which is well below the expected value for this depth below seafloor. This result may be due to poor contact of the temperature probe with the granular material recovered at that depth in Hole U1612A, and this anomalous temperature value was not used to determine the temperature gradient.
Although the initial mudline temperatures measured for both SET2 runs were identical (14.95°C), they differed significantly from the average temperature measured near the seafloor during Leg 107 (13.30° ± 0.2°C; Table T18) and deep oceanographic measurements in the Vavilov Basin area archived in the National Oceanic and Atmospheric Administration (NOAA) World Ocean Database (13.30°C; Boyer et al., 2018). This observation led to our applying a shipboard correction factor to all temperature measurements (see Downhole measurements in the Expedition 402 methods chapter [Malinverno et al., 2025]). For the SET2 Probe Number 449 used at Site U1612, this calibration yielded a seafloor value of 12.75°C, which is still different from but closer to that of Leg 107 values and those in the NOAA World Ocean Database. Because of these discrepancies, it was decided to use a different SET2 probe to measure sediment temperatures for the rest of Expedition 402.
Linear regression of the Site U1612 temperature data with depth yields a thermal gradient of 17.91°C/100 m (Figure F38). Hence, a heat flow of 184 mW/m2 was calculated using the thermal gradient and an average thermal conductivity of 1.029 W/(m∙K) measured on cores at Site U1612 for the depth range of temperature measurements (see Physical properties; Table T17). This result is comparable to that obtained during Leg 107 at Site 651 (131 mW/m2) in the Vavilov Basin and Site 650 (132 mW/m2) in the Marsili Basin (Shipboard Scientific Party, 1987a, 1987b) and is within the range of heat flow values measured by near-seafloor probes in the central Tyrrhenian (Della Vedova et al., 2001).
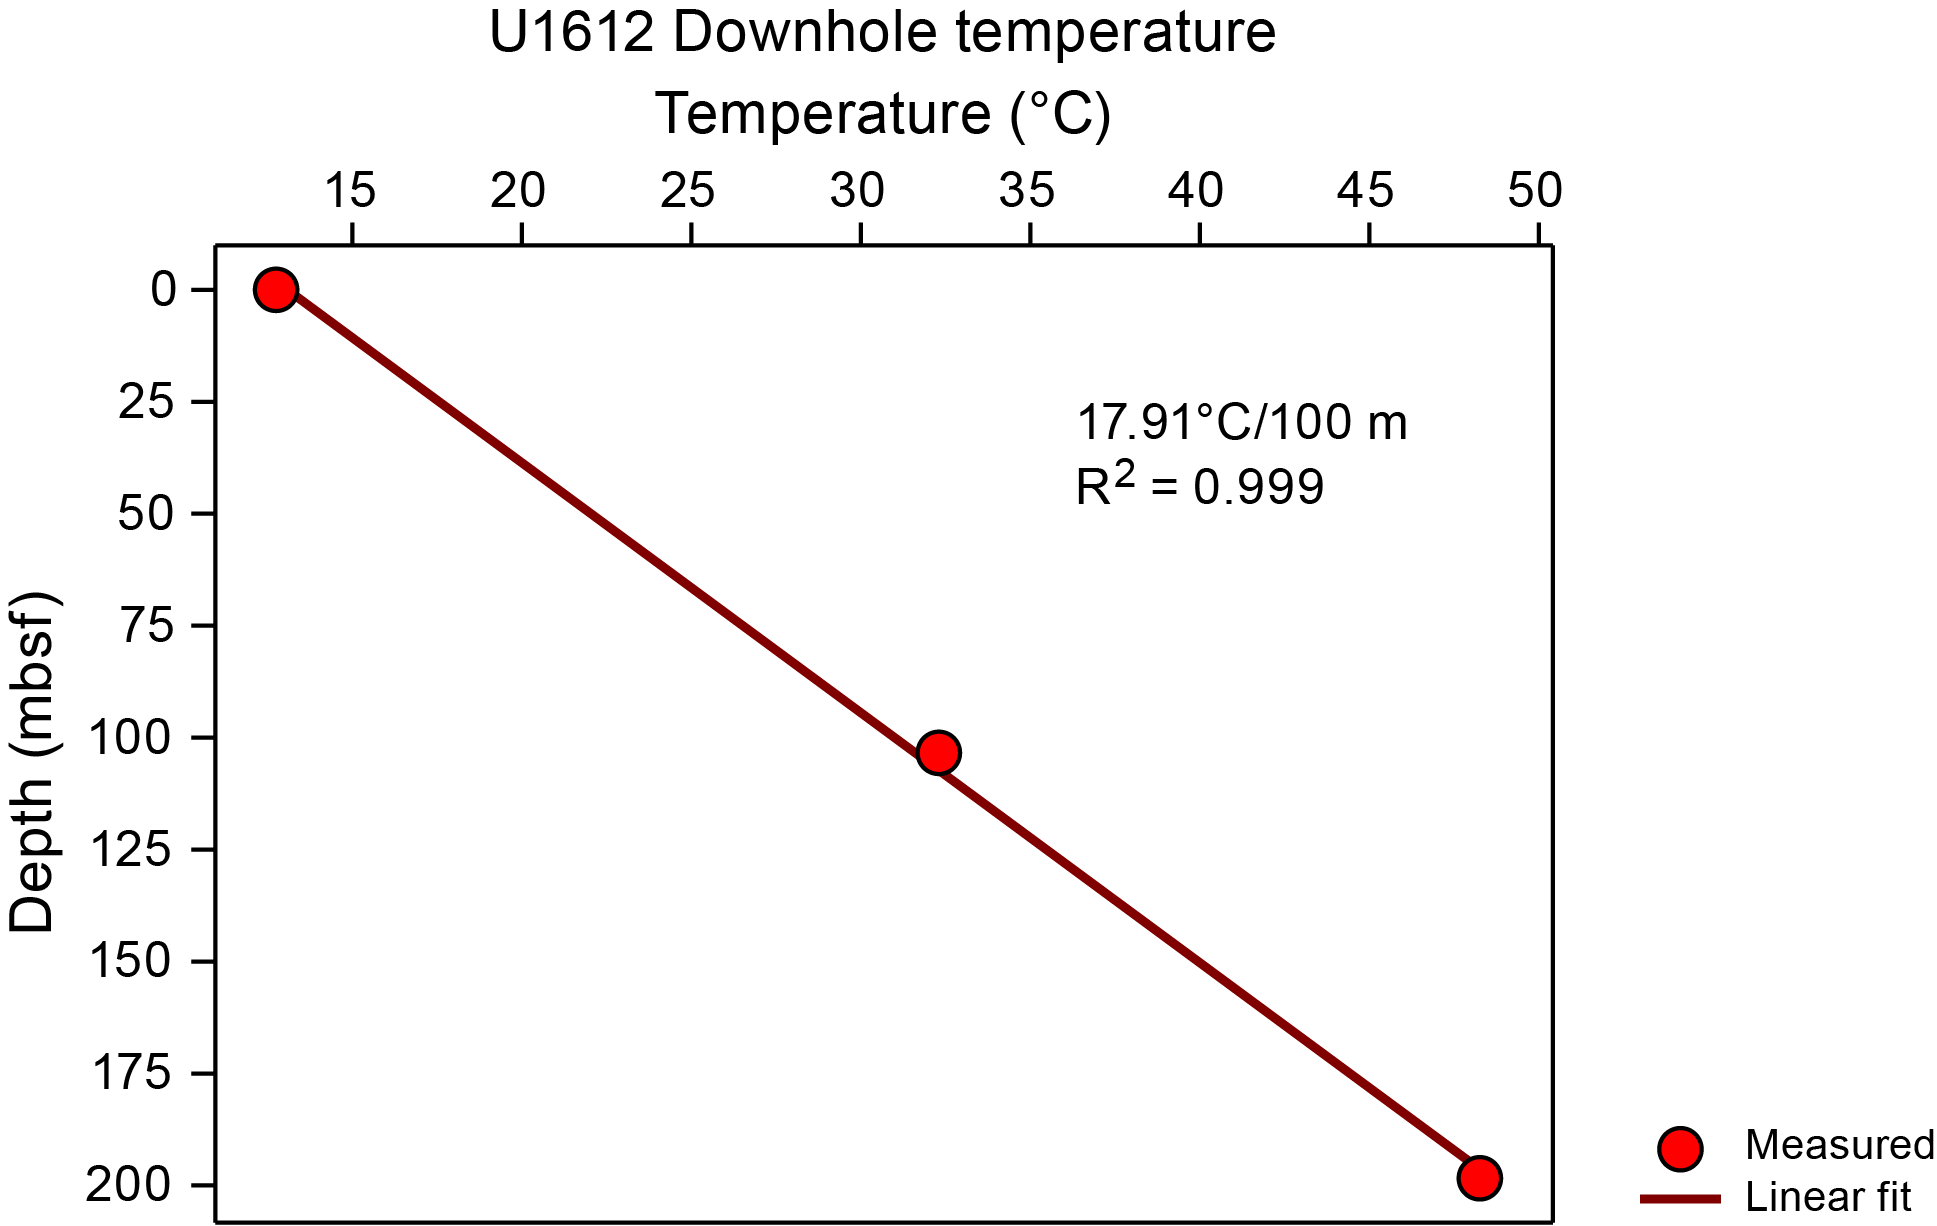
Figure F38. Temperatures in Vavilov Basin and local temperature gradient.
12. Microbiology
12.1. Sediment
12.1.1. Oxygen profiles
Oxygen concentrations in Hole U1612A were measured at irregular intervals because of low or no recovery in many cores, including Cores 402-U1614A-1R and 2R. Starting from Core 3R, concentrations were measured immediately after recovery. Measurements were only conducted on core sections at least 80 cm long so that both the oxygen and temperature probes could be inserted and separated by at least 20 cm. Low oxygen concentrations were detected in the core, peaking at 2.7 µM at 150.9 mbsf (Figure F39; Table T19). An attempt was made to measure oxygen in Core 22R, but the quality was compromised by excessive noise and no measurements were made below this depth.
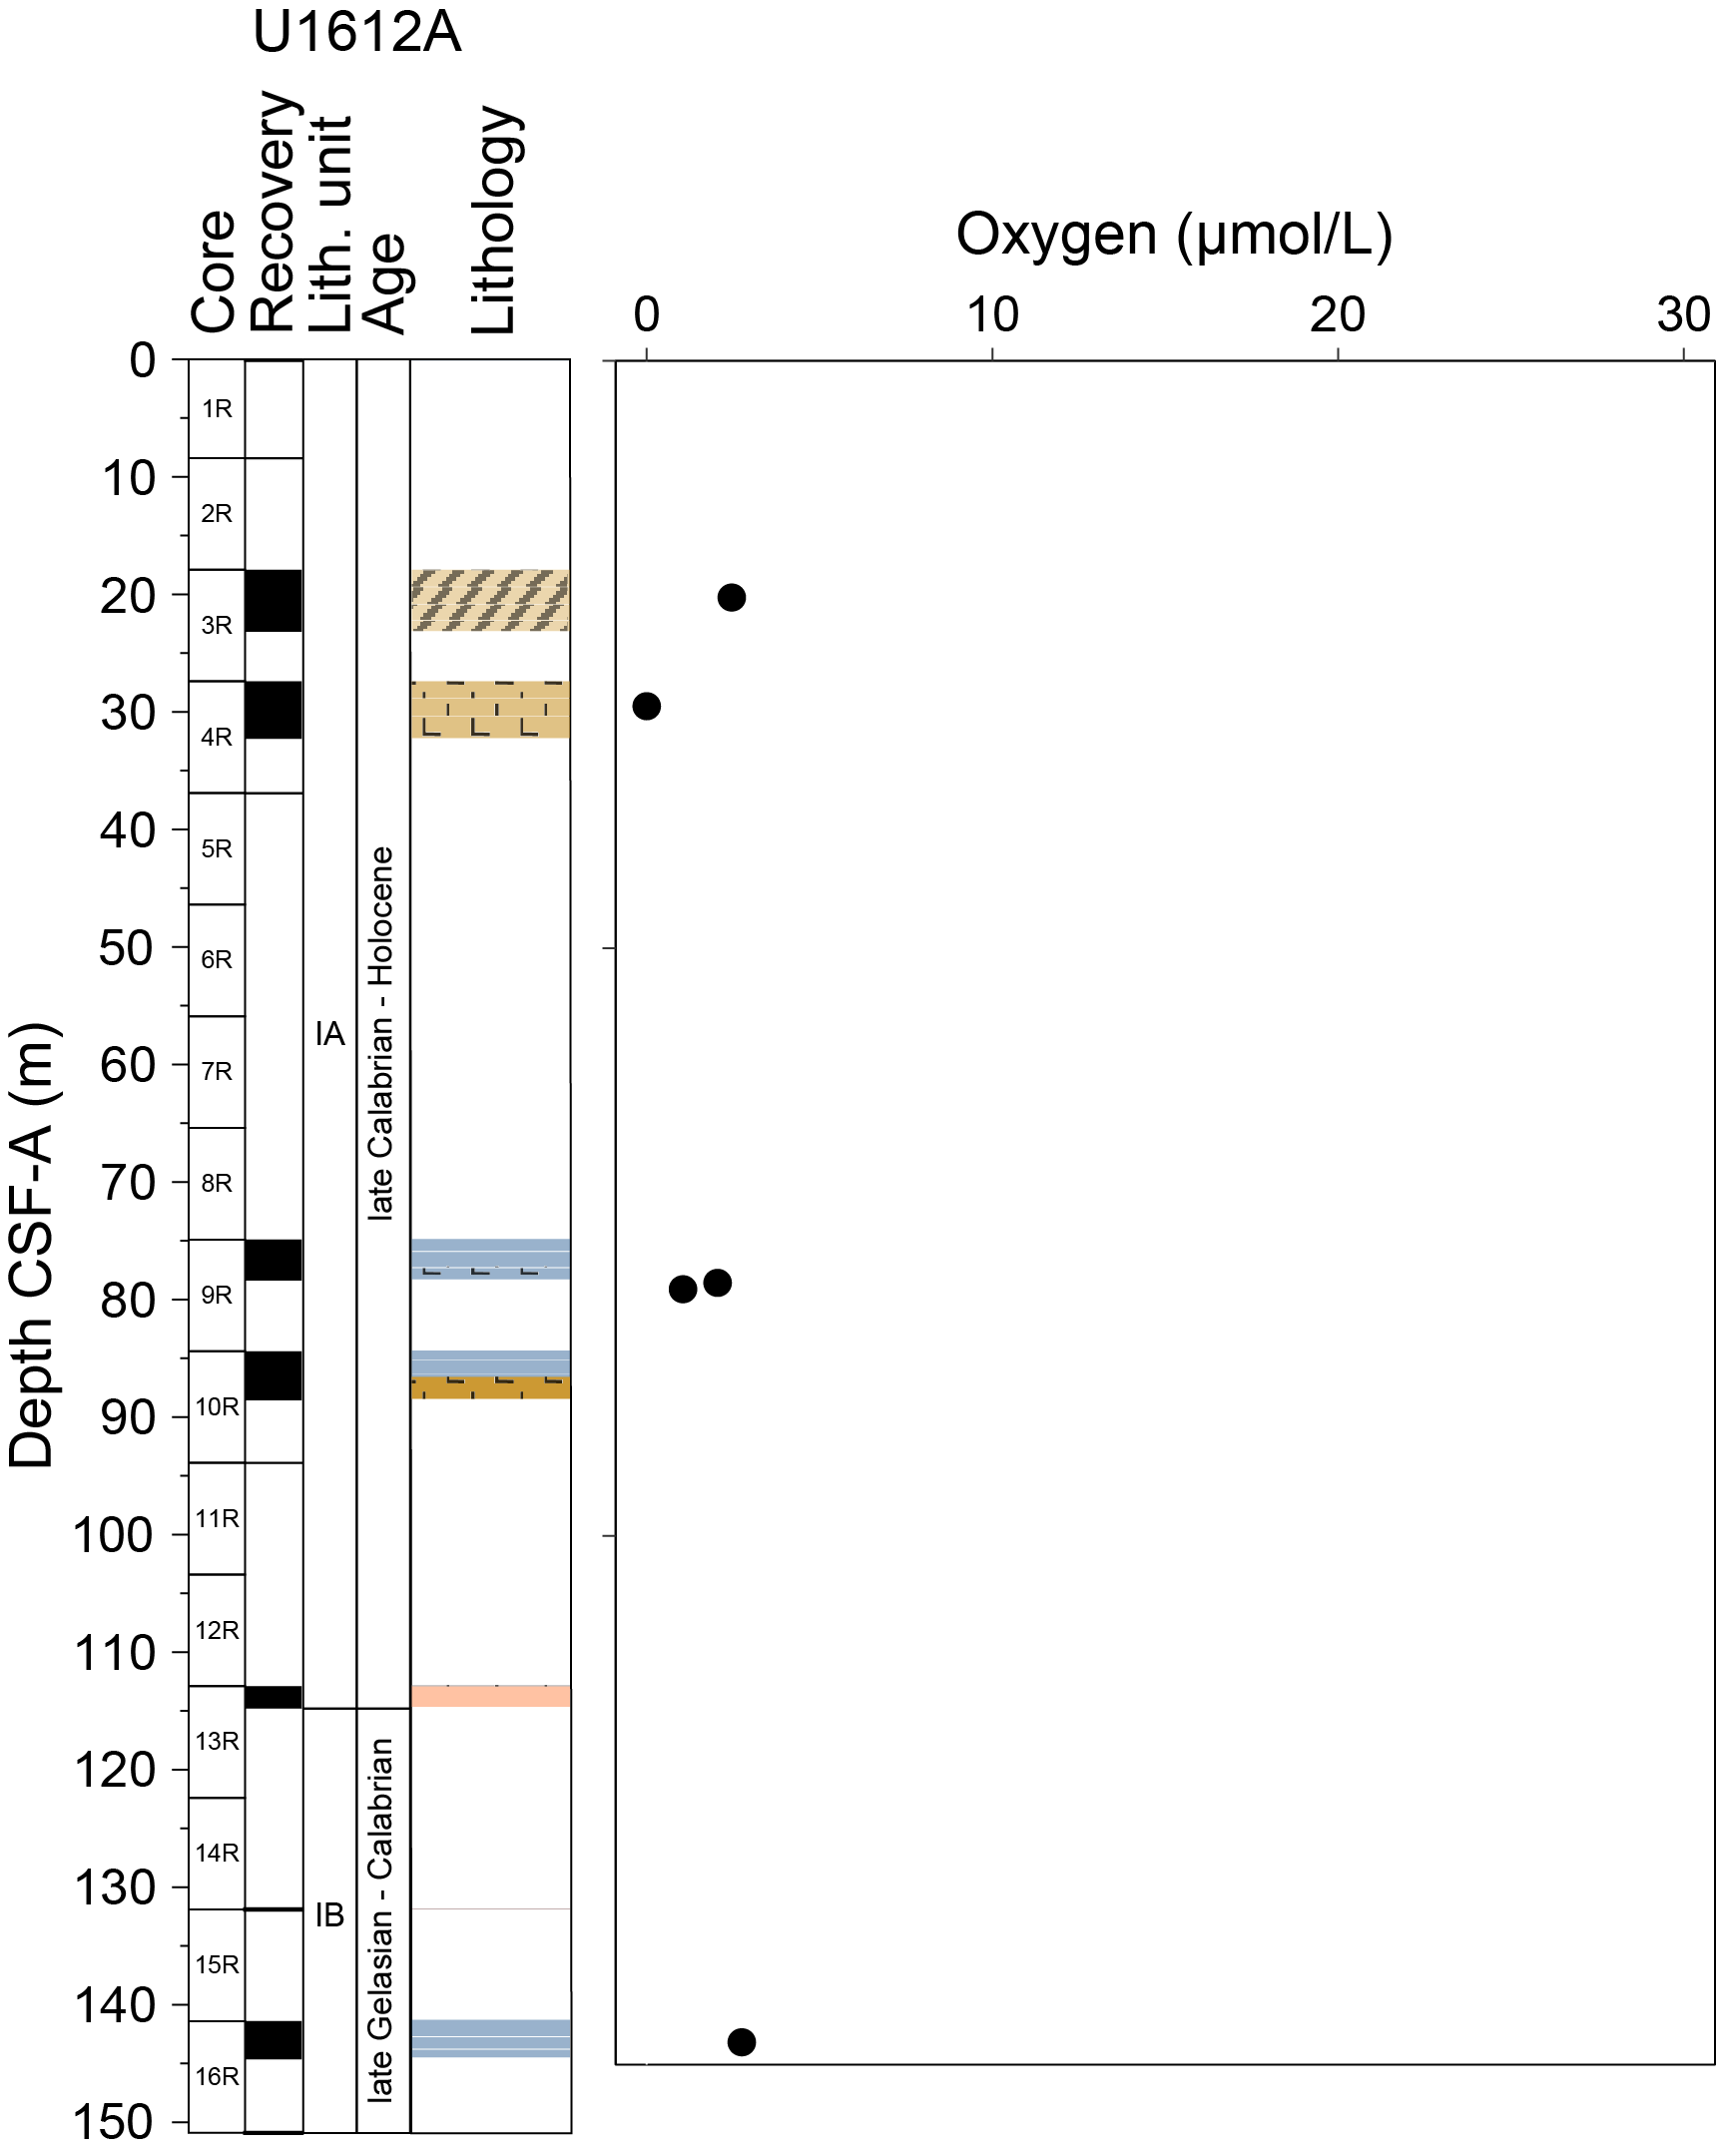
Figure F39. Oxygen concentration profile.
12.1.2. Microbiological sampling
12.1.2.1. Microbial community
Sediment samples were collected in Hole U1612A to analyze the resident microbial communities. For this analysis, 5 cm whole rounds were taken every 20 m for metagenomic analysis, and a 10 mL plug was extracted from the center of each core (9.5 m advance) for 16S rRNA gene amplification and sequencing. These samples were bagged and frozen at −80°C immediately after collection for onshore analysis.
12.1.2.2. Microbial experiments
One additional whole round was collected on the catwalk from 3–5 cores to conduct microbial experiments on samples from geochemical transition zones. Samples were processed in the anaerobic chamber under 0% oxygen conditions.
For experiments detecting viral activity, samples from Section 402-U1612A-3R-4 were incubated in the dark under anaerobic headspace and subsampled at t = 0, 4, 8, 12, and 24 h. An aliquot of 1 mL of sample was collected in triplicate, fixed with 54 µL of 37% formaldehyde, and stored at −80°C. The experiment was initiated in the anaerobic chamber, and the subsampling was performed in the clean air chamber using syringe needles to perforate the rubber without opening the incubation bottles.
In addition, two samples from Cores 402-U1612A-9R and 16R were used to prepare enrichment cultures using two anaerobic culture media (MMJHS and MJYPGS; see Microbiology in the Expedition 402 methods chapter [Malinverno et al., 2025]), which were stored in the dark at room temperature. The sediment was slurried with anaerobic synthetic seawater to facilitate transfer to the vials without altering the sample geochemistry.
12.1.2.3. Viral counts
Additional plug samples (1 cm3) were taken from each core (9.5 m) and then fixed with 4 mL of formaldehyde and stored at 4°C for further analysis. Because of the time required to separate the viruses from the sediment and filter out the microbial cells, these analyses will be performed on shore.
References
Beccaluva, L., Bonatti, E., Dupuy, C., Ferrara, G., Innocenti, F., Lucchini, F., Macera, P., Petrini, R., Rossi, P.L., Serri, G., Seyler, M., and Siena, F., 1990. Geochemistry and mineralogy of volcanic rocks from ODP Sites 650, 651, 655, and 654 in the Tyrrhenian Sea. In Kastens, K.A., Mascle, J., et al., Proceedings of the Ocean Drilling Program, Scientific Results. 107: College Station, TX (Ocean Drilling Program), 49–47. https://doi.org/10.2973/odp.proc.sr.107.140.1990
Bernasconi, S.M., 1999. Interstitial water chemistry in the western Mediterranean: results from Leg 161. In Zahn, R., Comas, M.C., and Klaus, A. (Eds.), Proceedings of the Ocean Drilling Program, Scientific Results. 161: College Station, TX (Ocean Drilling Program). https://doi.org/10.2973/odp.proc.sr.161.228.1999
Berner, R.A., 1982. Burial of organic carbon and pyrite sulfur in the modern ocean: its geochemical and environmental significance. American Journal of Science, 282(4):451–473. https://doi.org/10.2475/ajs.282.4.451
Boillot, G., and Winterer, E.L., 1988. Drilling on the Galicia margin: retrospect and prospect. In Boillot, G., Winterer, E. L., et al., Proceedings of the Ocean Drilling Program, Scientific Results. 103: College Station, TX (Ocean Drilling Program), 809–828. https://doi.org/10.2973/odp.proc.sr.103.180.1988
Bonatti, E., Seyler, M., Channell, J.E.T., Giraudeau, J., and Mascle, G., 1990. Peridotites drilled from the Tyrrhenian Sea, ODP Leg 107. In Kastens, K.A., Mascle, J., et al., Proceedings of the Ocean Drilling Program, Scientific Results. 107: College Station, TX (Ocean Drilling Program), 37–47. https://doi.org/10.2973/odp.proc.sr.107.141.1990
Boyer, T.P., Baranova, O.K., Coleman, C., Garcia, H.E., Grodsky, A., Locarnini, R.A., Mishonov, A.V., Paver, C.R., Reagan, J.R., Seidov, D., Smolyar, I.V., Weathers, K., and Zweng, M.M., 2018. World Ocean Database 2018. National Centers for Environmental Information. https://www.ncei.noaa.gov/products/world-ocean-database
Burdige, D.J., 2006. Geochemistry of Marine Sediments: Princeton, NJ (Princeton University Press). https://digitalcommons.odu.edu/oeas_books/1
Colantoni, P., Fabbri, A., Gallignani, P., Sartori, R., and Rehault, J.P., 1981. Carta Litologica e Stratigrafica dei Mari Italiani, scala 1/1.500.000. Italy: Litografia Artistica Cartografica.
Della Vedova, B., Bellani, S., Pellis, G., and Squarci, P., 2001. Deep temperatures and surface heat flow distribution. In Vai, G.B. and Martini, I.P., Anatomy of an Orogen: the Apennines and Adjacent Mediterranean Basins. (Springer), 65–76. https://doi.org/10.1007/978-94-015-9829-3_7
Di Stefano, A., Baldassini, N., Raffi, I., Fornaciari, E., Incarbona, A., Negri, A., Negri, A., Bonomo, S., Villa, G., Di Stefano, E., and Rio, D., 2023. Neogene-Quaternary Mediterranean calcareous nannofossil biozonation and biochronology: a review. Stratigraphy, 20(4):259–302. https://www.micropress.org/microaccess/check/2342
Faganeli, J., Planinc, R., Pezdič, Smodiš, B., Stegnar, P., and Ogorelec, B., 1991. Marine geology of the Gulf of Trieste (northern Adriatic): geochemical aspects. Marine Geology, 99(1):93–108. https://doi.org/10.1016/0025-3227(91)90085-I
Goldhaber, M.B., and Kaplan, I.R., 1974. The sulfur cycle. In Goldberg, E.D., The Sea (Volume 5): Marine Chemistry. New York (Wiley), 569–655.
Goldman, J.C., Caron, D.A., and Dennett, M.R., 1987. Regulation of gross growth efficiency and ammonium regeneration in bacteria by substrate C: N ratio. Limnology and Oceanography, 32(6):1239–1252. https://doi.org/10.4319/lo.1987.32.6.1239
Gradstein, F.M., Ogg, J.G., Schmitz, M.D., and Ogg, G.M. (Eds.), 2020. Geologic Time Scale 2020: Amsterdam (Elsevier BV). https://doi.org/10.1016/C2020-1-02369-3
Heezen, B.C., Gray, C., Segre, A.G., and Zarudski, E.F.K., 1971. Evidence of foundered continental crust beneath the central Tyrrhenian Sea. Nature, 229(5283):327–329. https://doi.org/10.1038/229327a0
Hopkinson, C.S., Fry, B., and Nolin, A.L., 1997. Stoichiometry of dissolved organic matter dynamics on the continental shelf of the northeastern U.S.A. Continental Shelf Research, 17(5):473–489. https://doi.org/10.1016/S0278-4343(96)00046-5
Kastens, K.A., and Mascle, J., 1990. The geological evolution of the Tyrrhenian Sea; an introduction to the scientific results of ODP Leg 107. In Kastens, K.A., Mascle, J., et al., Proceedings of the Ocean Drilling Program, Scientific Results. 107: College Station, TX (Ocean Drilling Program), 3–26. https://doi.org/10.2973/odp.proc.sr.107.187.1990
Kastner, M., 1981. Authigenic silicates in deep sea sediments: formation and diagenesis. In Emiliani, C., The oceanic lithosphere. The Sea, 7: New York (Wiley), 915–980.
Kirschvink, J.L., 1980. The least-squares line and plane and the analysis of palaeomagnetic data. Geophysical Journal International, 62(3):699–718. https://doi.org/10.1111/j.1365-246X.1980.tb02601.x
Le Bas, M.J., Le Maitre, R.W., Streickeisen, A., Zanettin, B., the IUGS Subcommission on the Systematics of Igneous Rocks, 1986. A chemical classification of volcanic rocks based on the total alkali-silica diagram. Journal of Petrology, 27(3):745–750. https://doi.org/10.1093/petrology/27.3.745
Lirer, F., Foresi, L.M., Iaccarino, S.M., Salvatorini, G., Turco, E., Cosentino, C., Sierro, F.J., and Caruso, A., 2019. Mediterranean Neogene planktonic foraminifer biozonation and biochronology. Earth-Science Reviews, 196:102869. https://doi.org/10.1016/j.earscirev.2019.05.013
Lister, G.S., and Davis, G.A., 1989. The origin of metamorphic core complexes and detachment faults formed during Tertiary continental extension in the northern Colorado River region, U.S.A. Journal of Structural Geology, 11(1):65–94. https://doi.org/10.1016/0191-8141(89)90036-9
Malinverno, A., Zitellini, N., Estes, E.R., Abe, N., Akizawa, N., Bickert, M., Cunningham, E.H., Di Stefano, A., Filina, I.Y., Fu, Q., Gontharet, S., Kearns, L.E., Koorapati, R.K., Lei, C., Loreto, M.F., Magri, L., Menapace, W., Morishita, T., Pandey, A., Pavlovics, V.L., Pezard, P.A., Poulaki, E.M., Rodriguez-Pilco, M.A., Sanfilippo, A., Shuck, B.D., Vannucchi, P., and Zhao, X., 2025. Expedition 402 methods. In Zitellini, N., Malinverno, A., Estes, E.R., and the Expedition 402 Scientists, Tyrrhenian Continent–Ocean Transition. Proceedings of the International Ocean Discovery Program, 402: College Station, TX (International Ocean Discovery Program). https://doi.org/10.14379/iodp.proc.402.102.2025
McKenzie, J.A., Isern, A., Karpoff, A.M., and Swart, P.K., 1990. Basal dolomitic sediments, Tyrrhenian Sea, Ocean Drilling Program Leg 107. In Kastens, K.A., Mascle, J., et al., Proceedings of the Ocean Drilling Program, Scientific Results. 107: College Station, TX (Ocean Drilling Program), 141–152. https://doi.org/10.2973/odp.proc.sr.107.124.1990
Meyers, P.A., 1994. Preservation of elemental and isotopic source identification of sedimentary organic matter. Chemical Geology, 114(3–4):289–302. https://doi.org/10.1016/0009-2541(94)90059-0
Middlemost, E.A.K., 1994. Naming materials in the magma/igneous rock system. Earth-Science Reviews, 37(3–4):215–224. https://doi.org/10.1016/0012-8252(94)90029-9
Peccerillo, A., 2017. Cenozoic Volcanism in the Tyrrhenian Sea Region: (Springer). https://doi.org/10.1007/978-3-319-42491-0
Pimmel, A., and Claypool, G., 2001. Introduction to shipboard organic geochemistry on the JOIDES Resolution. Ocean Drilling Program Technical Note, 30. https://doi.org/10.2973/odp.tn.30.2001
Prada, M., Sallares, V., Ranero, C.R., Vendrell, M.G., Grevemeyer, I., Zitellini, N., and de Franco, R., 2014. Seismic structure of the Central Tyrrhenian basin: Geophysical constraints on the nature of the main crustal domains. Journal of Geophysical Research: Solid Earth, 119(1):52–70. https://doi.org/10.1002/2013JB010527
Prada, M., Sallares, V., Ranero, C.R., Vendrell, M.G., Grevemeyer, I., Zitellini, N., and de Franco, R., 2015. The complex 3-D transition from continental crust to backarc magmatism and exhumed mantle in the Central Tyrrhenian basin. Geophysical Journal International, 203(1):63–78. https://doi.org/10.1093/gji/ggv271
Ranero, C.R., and Sallarès, V., 2017. Seismic Data from MEDOC-2010 cruise [dataset]. Pangaea. https://doi.org/10.1594/PANGAEA.880761
Robertson, A.H.F., 1990. Pliocene basal dolomitic and Fe-Mn sediments from the Tyrrhenian Sea, western Mediterranean, ODP Leg 107. In Kastens, K.A., Mascle, J., et al., Proceedings of the Ocean Drilling Program, Scientific Results. 107: College Station, TX (Ocean Drilling Program), 129–139. https://doi.org/10.2973/odp.proc.sr.107.126.1990
Roether, W., Manca, B.B., Klein, B., Bregant, D., Georgopoulos, D., Beitzel, V., Kovačević, V., and Luchetta, A., 1996. Recent changes in eastern Mediterranean deep waters. Science, 271(5247):333–335.
https://doi.org/10.1126/science.271.5247.333
Sayles, F.L., and Mangelsdorf, P.C., 1977. The equilibration of clay minerals with sea water: exchange reactions. Geochimica et Cosmochimica Acta, 41(7):951–960. https://doi.org/10.1016/0016-7037(77)90154-5
Shipboard Scientific Party, 1978. Site 373: Tyrrhenian Basin. In Hsü, K., Montadert, L., et al., Initial Reports of the Deep Sea Drilling Project. 42(1): Washington, DC (US Government Printing Office), 151–174. https://doi.org/10.2973/dsdp.proc.42-1.104.1978
Shipboard Scientific Party, 1987a. Site 650: Marsili Basin. In Kastens, K.A., Mascle, J., Auroux, C., et al., Proceedings of the Ocean Drilling Program, Initial Reports. 107: College Station, TX (Ocean Drilling Program). https://doi.org/10.2973/odp.proc.ir.107.106.1987
Shipboard Scientific Party, 1987b. Site 651: Tyrrhenian Sea. In Kastens, K.A., Mascle, J., Auroux, C., et al., 1987. Proceedings of the Ocean Drilling Program, Initial Reports. 107: College Station, TX (Ocean Drilling Program). https://doi.org/10.2973/odp.proc.ir.107.107.1987
Tanhua, T., Hainbucher, D., Schroeder, K., Cardin, V., Álvarez, M., and Civitarese, G., 2013. The Mediterranean Sea system: a review and an introduction to the special issue. Ocean Science, 9(5):789–803. https://doi.org/10.5194/os-9-789-2013
Tsimplis, M.N., and Baker, T.F., 2000. Sea level drop in the Mediterranean Sea: an indicator of deep water salinity and temperature changes? Geophysical Research Letters, 27(12):1731–1734. https://doi.org/10.1029/1999GL007004
Tucholke, B.E., Lin, J., and Kleinrock, M.C., 1998. Megamullions and mullion structure defining oceanic metamorphic core complexes on the Mid-Atlantic Ridge. Journal of Geophysical Research: Solid Earth, 103(B5):9857-9866. https://doi.org/10.1029/98JB00167