Zitellini, N., Malinverno, A., Estes, E.R., and the Expedition 402 Scientists
Proceedings of the International Ocean Discovery Program Volume 402
publications.iodp.org
https://doi.org/10.14379/iodp.proc.402.104.2025
Site U16131
![]() N. Zitellini,
N. Zitellini,
![]() A. Malinverno,
A. Malinverno,
![]() E.R. Estes,
E.R. Estes,
![]() N. Abe,
N. Abe,
![]() N. Akizawa,
N. Akizawa,
![]() M. Bickert,
M. Bickert,
![]() E.H. Cunningham,
E.H. Cunningham,
![]() A. Di Stefano,
A. Di Stefano,
![]() I.Y. Filina,
I.Y. Filina,
![]() Q. Fu,
Q. Fu,
![]() S. Gontharet,
S. Gontharet,
![]() L.E. Kearns,
L.E. Kearns,
![]() R.K. Koorapati,
R.K. Koorapati,
![]() C. Lei,
C. Lei,
![]() M.F. Loreto,
M.F. Loreto,
![]() L. Magri,
L. Magri,
![]() W. Menapace,
W. Menapace,
![]() T. Morishita,
T. Morishita,
![]() A. Pandey,
A. Pandey,
![]() V.L. Pavlovics,
V.L. Pavlovics,
![]() P.A. Pezard,
P.A. Pezard,
![]() E.M. Poulaki,
E.M. Poulaki,
![]() M.A. Rodriguez-Pilco,
M.A. Rodriguez-Pilco,
![]() A. Sanfilippo,
A. Sanfilippo,
![]() B.D. Shuck,
B.D. Shuck,
![]() P. Vannucchi, and
P. Vannucchi, and
![]() X. Zhao2
X. Zhao2
1 Zitellini, N., Malinverno, A., Estes, E.R., Abe, N., Akizawa, N., Bickert, M., Cunningham, E.H., Di Stefano, A., Filina, I.Y., Fu, Q., Gontharet, S., Kearns, L.E., Koorapati, R.K., Lei, C., Loreto, M.F., Magri, L., Menapace, W., Morishita, T., Pandey, A., Pavlovics, V.L., Pezard, P.A., Poulaki, E.M., Rodriguez-Pilco, M.A., Sanfilippo, A., Shuck, B.D., Vannucchi, P., and Zhao, X., 2025. Site U1613. In Zitellini, N., Malinverno, A., Estes, E.R., and the Expedition 402 Scientists, Tyrrhenian Continent–Ocean Transition. Proceedings of the International Ocean Discovery Program, 402: College Station, TX (International Ocean Discovery Program). https://doi.org/10.14379/iodp.proc.402.104.2025
2 Expedition 402 Scientists' affiliations.
1. Background and objectives
Site U1613 is located on the Cornaglia Terrace about 100 km east of the Sardinian coast (Figure F1). Terrace is an apt name for this part of the Tyrrhenian seafloor because it lies at a water depth of 2600–3000 m with a slight eastward slope and is separated from the 3400–3600 m deep Magnaghi-Vavilov Basin to the east by a steep SSW–NNE lineament (referred to here as the Central Fault or Selli Line). Dredging of the Baronie, Cornaglia, and Secchi Seamounts and the steep slopes of the Central Fault have sampled a variety of continental basement rocks, including granite, phyllite, quartzite, schist, marble, and shallow-water carbonates (Colantoni et al., 1981). Some of these rocks are similar to formations known in Sardinia, such as the Verrucano red sandstones and conglomerates with white quartzite clasts dredged off the Baronie Seamount (Selli and Fabbri, 1971). Previous Deep Sea Drilling Project (DSDP) and Ocean Drilling Program (ODP) sites in the Cornaglia Terrace area did not penetrate below the top of the Messinian evaporites, except for ODP Site 654, which was drilled in a tilted normal fault block and reached Tortonian (Late Miocene) nannofossil oozes over conglomerates and sandstones of uncertain age (Kastens and Mascle, 1990).
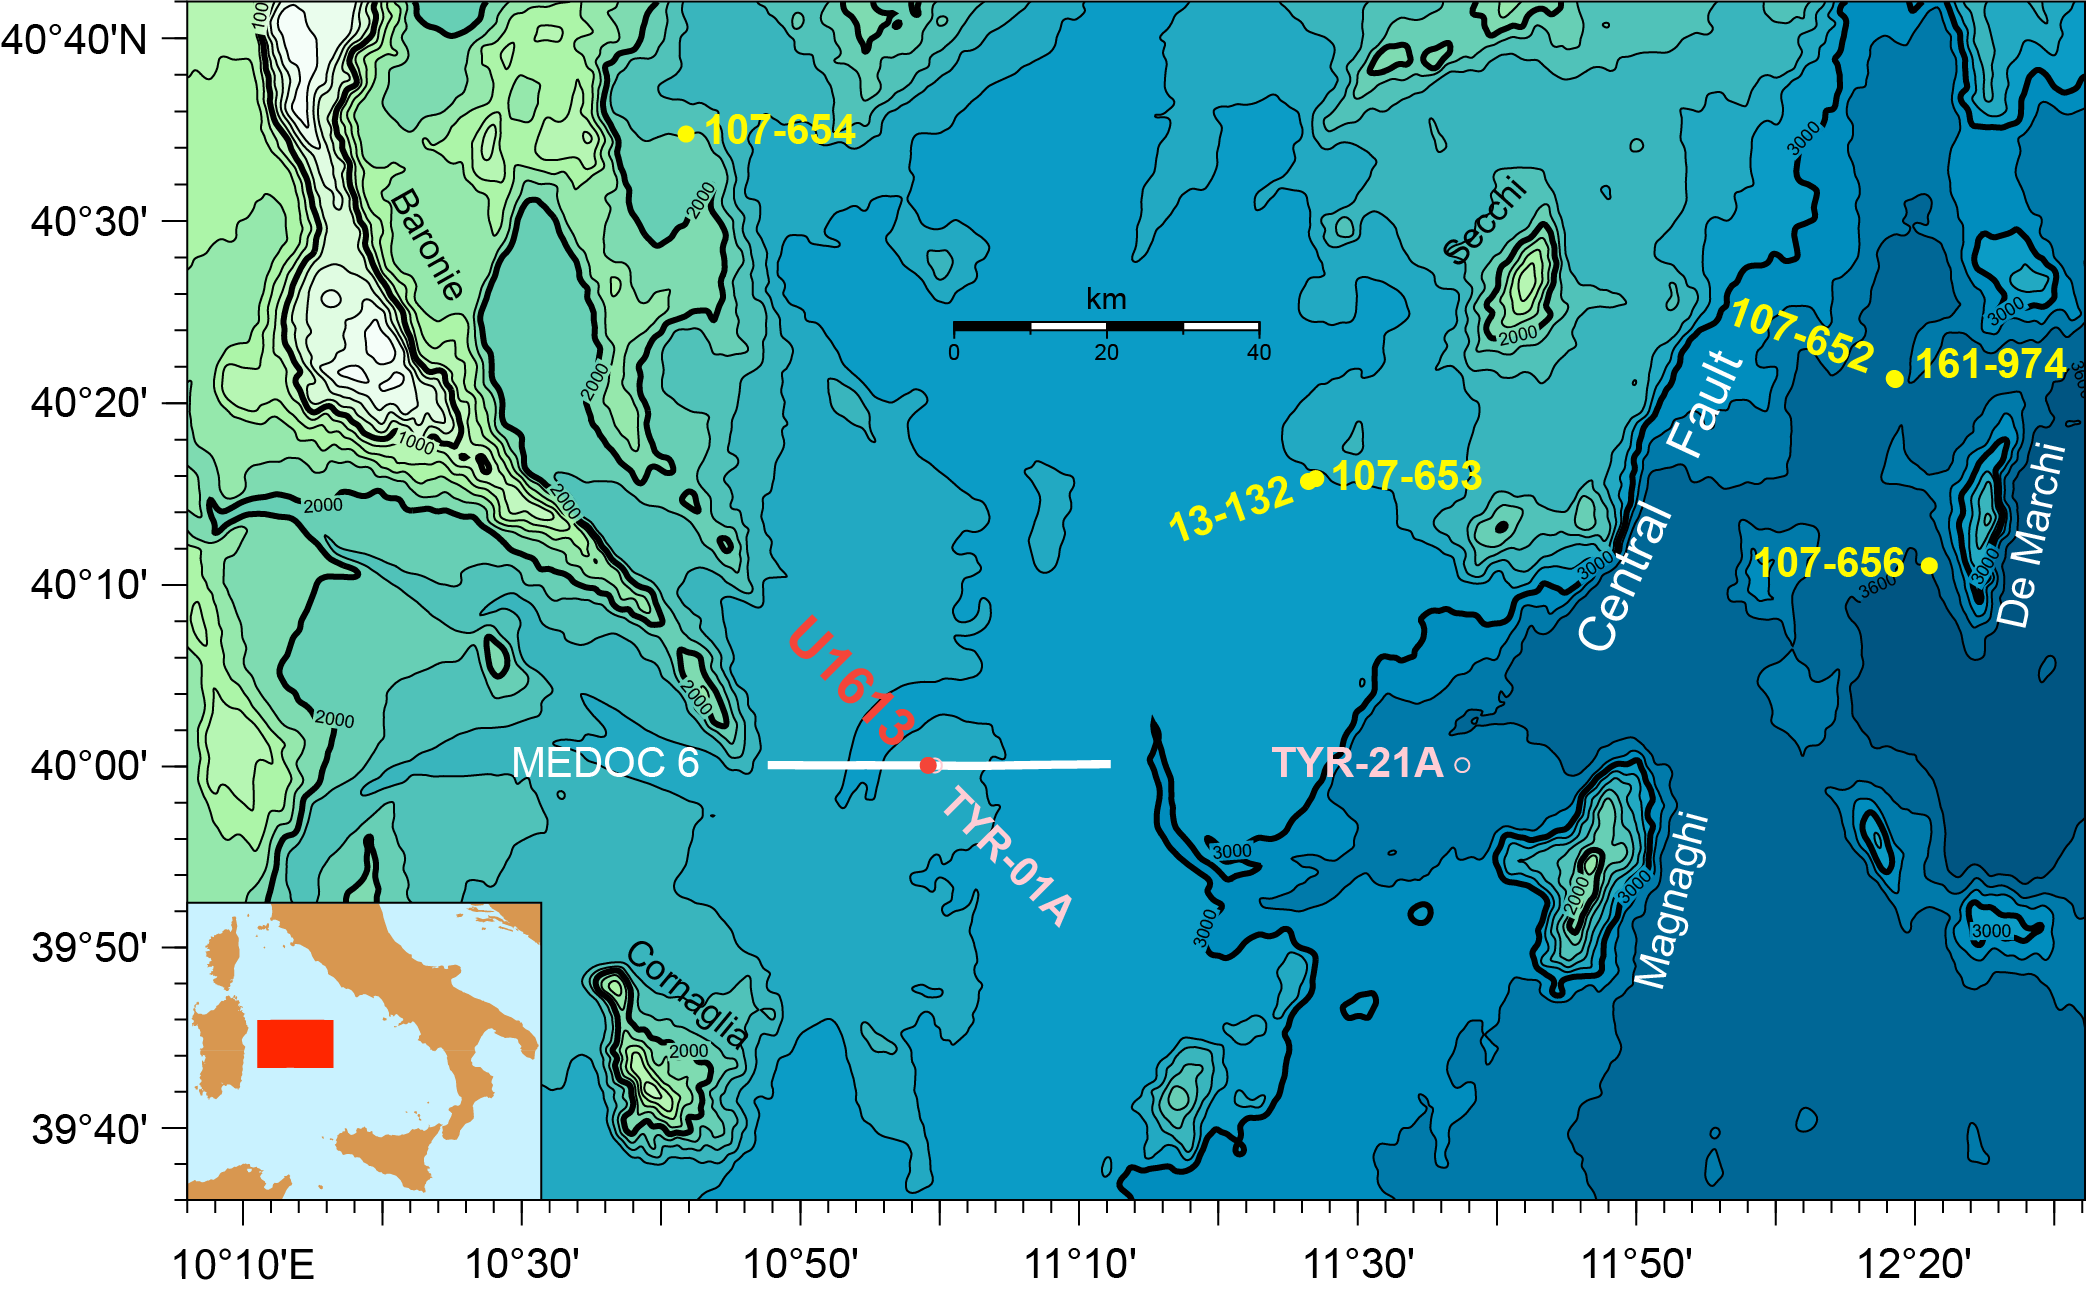
Figure F1. Site U1613, Expedition 402 alternate drilling locations, and DSDP Leg 42 and ODP Leg 107 and 161 sites.
In the Cornaglia Terrace, seismic reflection records show clear evidence of diapiric structures of Messinian salt and of pre-Messinian sediments (Fabbri and Curzi, 1979). Salt was deposited in the deepest parts of the Mediterranean, suggesting that the Cornaglia Terrace is the original site of Middle–Late Miocene rifting in the Tyrrhenian Sea and that the deeper Magnaghi-Vavilov Basin to the east, which lacks seismic evidence of Messinian evaporites, formed in the Pliocene or later (Kastens and Mascle, 1990).
In contrast to the busy pattern of magnetic highs and lows in the Magnaghi-Vavilov Basin, magnetic anomalies in the Cornaglia Terrace are subdued (Caratori Tontini et al., 2004). Given the absence of magnetic anomaly variations and the widespread outcrops of continental basement in fault-bounded blocks, the Cornaglia Terrace has been generally interpreted to be an area of extended continental crust, with the Central Fault marking the boundary to oceanic crust in the Magnaghi-Vavilov Basin (Mascle and Rehault, 1990; Sartori et al., 2004). This widely held interpretation was challenged by Prada et al. (2014), who proposed that the Cornaglia Terrace crust is oceanic based on the velocity structure determined from the Mediterràneo Occidental (MEDOC) seismic experiment. Later, Prada et al. (2015) noted that the velocity structure of the Cornaglia Terrace crust is also quite similar to that of thinned continental crust; however, they still preferred the oceanic crust hypothesis because the offsets on the normal faults observed in seismic reflection profiles across the Cornaglia Terrace seemed insufficient to account for the extensional deformation necessary to thin the original continental crust.
Generally accepted models of the development of continent–ocean transitions (COTs) start with the extension of continental crust, followed by a possible phase of mantle exhumation and ending with the formation of magmatic oceanic crust (e.g., Pérez-Gussinyé et al., 2006; Davis and Lavier, 2017). However, Prada et al. (2014) noted that if magmatic oceanic crust formed in the Cornaglia Terrace before the mantle exhumation they detected in the Vavilov Basin, the existing models of COT development would have to be turned around.
A major goal of Expedition 402 was to obtain new evidence from the young Tyrrhenian Sea rift to improve our general understanding of COT development. To this end, Site U1613 was positioned on a basement high in the central part of the Cornaglia Terrace at a water depth of about 2700 m (Figures F1, F2) with the primary objective of determining the nature of the Tyrrhenian Sea basement. A secondary objective was to sample, if present, Messinian deposits at an elevated position above deeper deposits that are expected to be evaporites. Examples of Messinian reflectors typical of evaporite deposits are visible east and west of Site U1613 on the seismic reflection profile shown in Figure F2. The location of Site U1613 was specifically chosen away from the Messinian evaporites to minimize hole stability issues and safety risks and to avoid drilling through a thick sedimentary cover to reach the basement. The initial plan for Site U1613 was to drill a single hole using the rotary core barrel (RCB) coring system through a sediment column that was expected to be approximately 200 m thick and sample as much as 70 m of basement rocks. After coring, downhole geophysical logging was planned in the same hole to complement the core recovery and collect in situ measurements of formation physical properties.
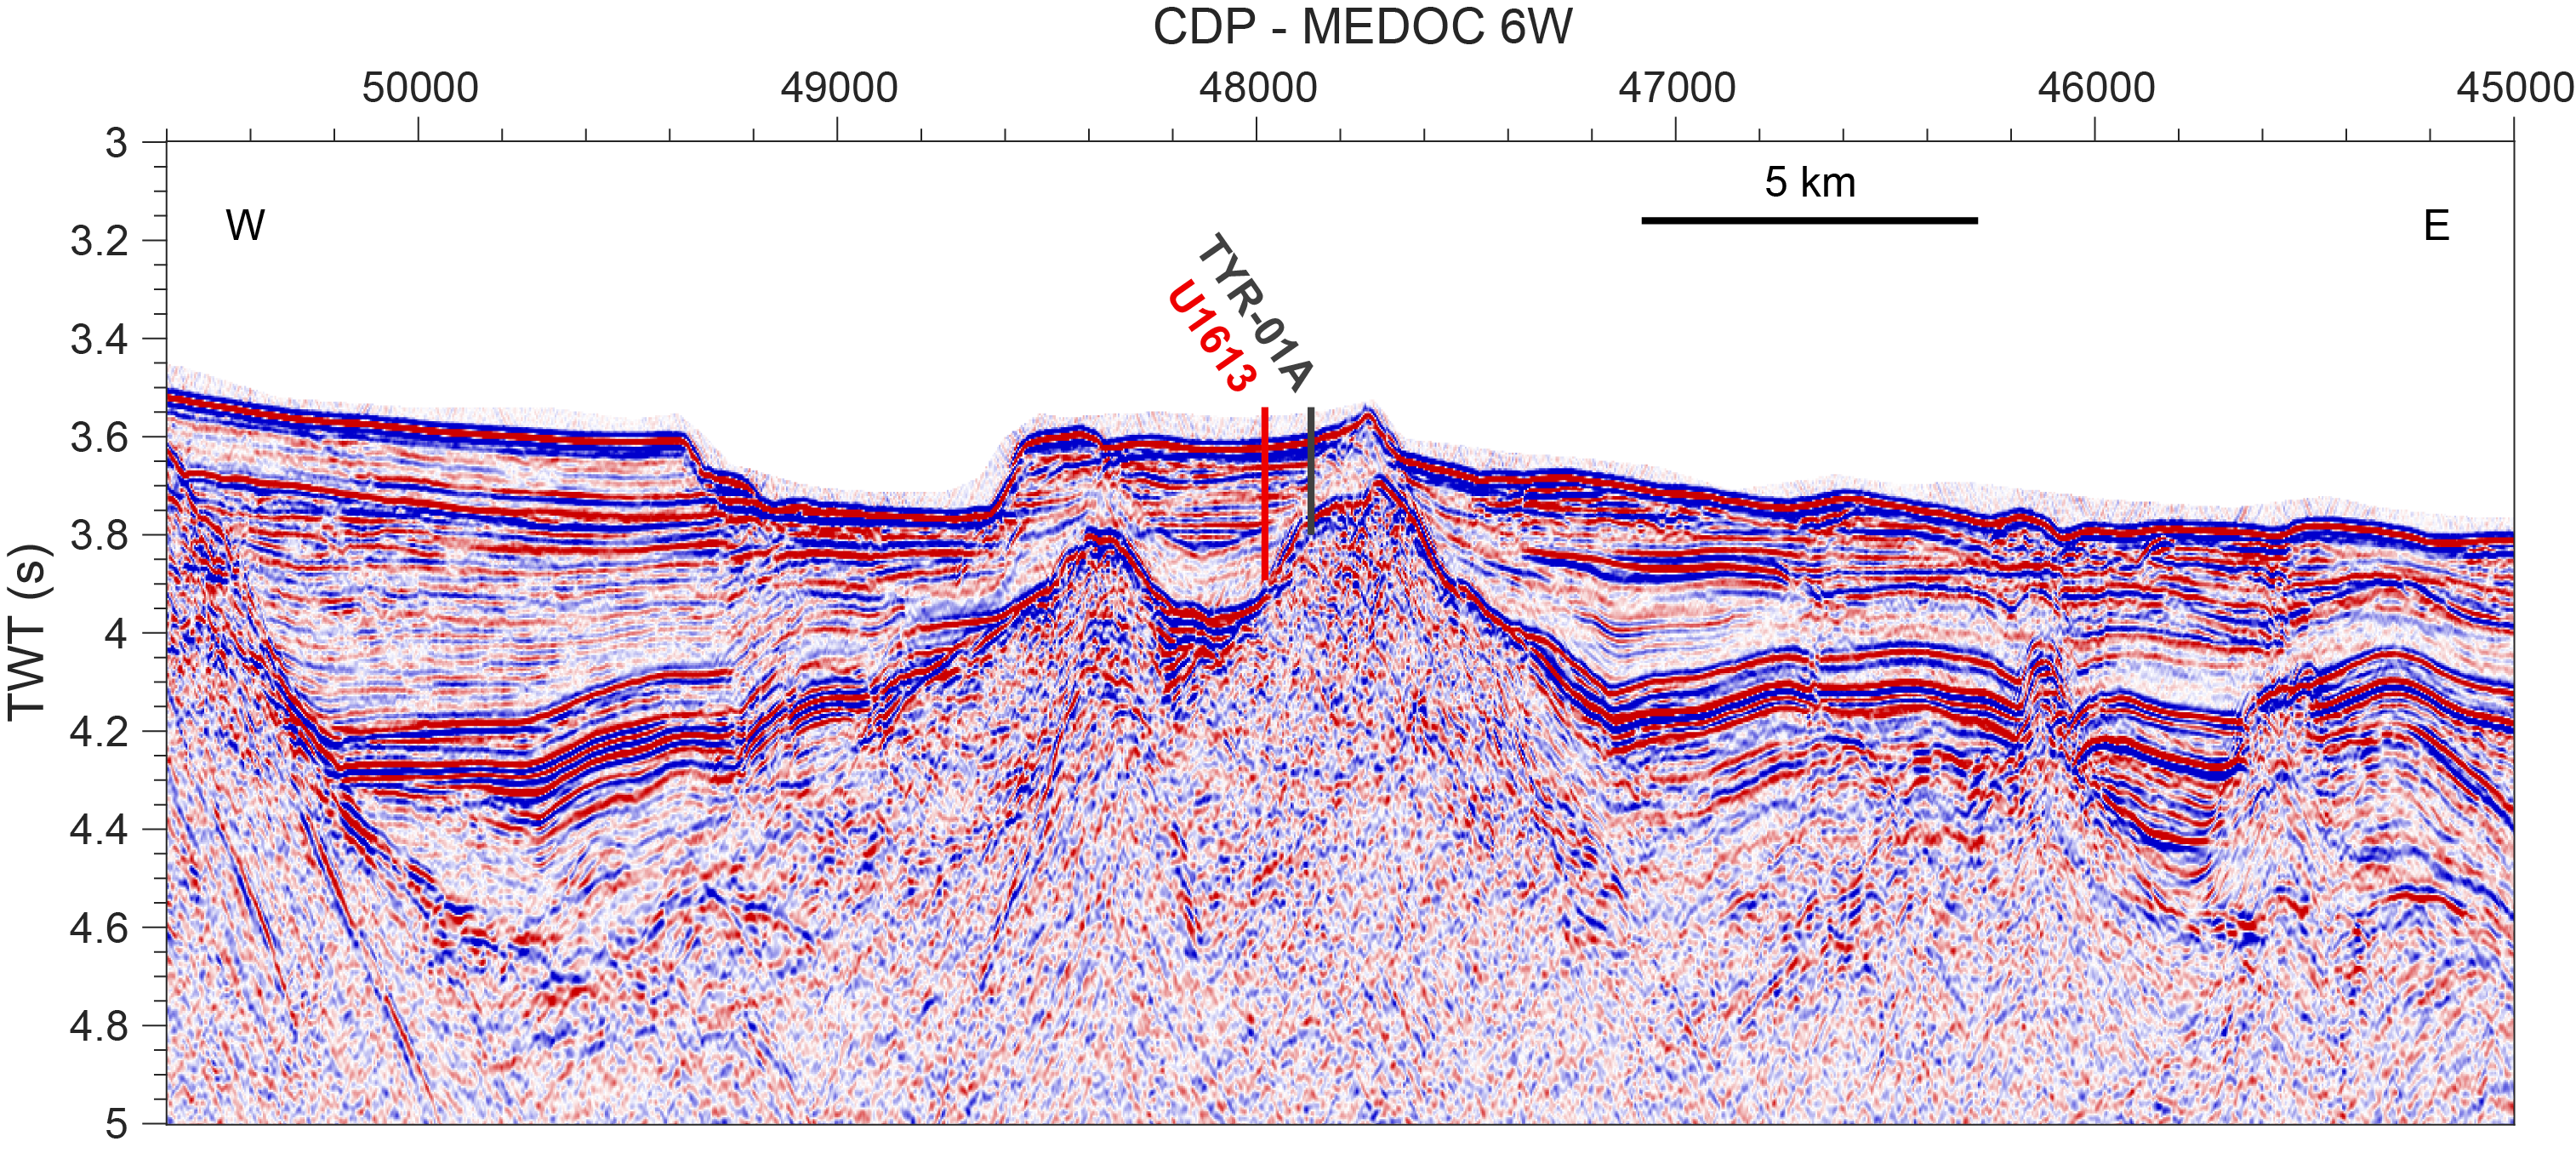
Figure F2. Site U1613 location.
2. Operations
Hole locations, water depths, and coring statistics for Site U1613 are listed in Table T1. All times are provided in local ship time (UTC + 1 h).
2.1. Hole U1613A
The ship completed the 76.4 nmi transit to Site U1613 at an average speed of 11.75 kt, arriving at 1930 h on 19 February 2024 and switching to dynamic positioning (DP) mode at 2007 h. A new bottom-hole assembly (BHA) with a C-7 RCB bit was set up to better recover hard formations such as the basalt basement lithology expected at Site U1613. The pipe was tripped to the seafloor, and Hole U1613A was spudded at 0830 h on 20 February, with a seafloor depth of 2706.8 meters below sea level (mbsl) determined by the mudline core. Coring reached a total depth of 223.6 m core depth below seafloor, Method A (CSF-A), in Core 24R, recovering 99.63 m of material (44%).
Core 402-U1613A-2R had no recovery, which was later attributed to a malfunctioning core catcher that was subsequently removed and repaired. A hard layer identified as conglomerate and sandstone was encountered in the core catcher of Core 16R. The rate of penetration decreased significantly below this depth, varying between 14.7 m/h in Core 17R and 1.2 m/h in Core 22R compared to an average of 80.2 m/h for Cores 1R–16R. The conglomerate in Section 16R-CC was preliminarily determined to be at the top of continental basement, suggesting that the target basalt layer is not present at this location, and the decision was made to stop coring after Core 24R.
Temperature measurements using the Sediment Temperature 2 (SET2) tool were taken at 67.1, 95.6, and 125.9 m CSF-A, following the recovery of Cores 402-U1613A-7R, 10R, and 13R. The third-generation advanced piston corer temperature (APCT-3) tool was also run to the seafloor depth to verify the calibration of the SET2. Nonmagnetic core barrels were used for all cores in Hole U1613A.
Logging was planned in Hole U1613A to better characterize the intervals of low recovery and the borehole physical properties. To prepare for logging, we swept the hole with 90 bbl of high-viscosity sepiolite. We then ran the rotary shifting tool (RST) to drop the RCB bit at the bottom of the hole. The knobbies were laid out, the top drive set back, and the pipe tripped to 74 m CSF-A. The first logging run was made with the triple combination (triple combo) tool string starting at 1430 h on 22 February. The tool string encountered a ledge at 127 m CSF-A but was able to work through it. A second ledge at 197 m CSF-A could not be worked through. Because of the poor hole conditions, only a single pass was made with the triple combo tool string. The Formation MicroScanner (FMS) was removed from the standard FMS-sonic tool string due to concerns about the hole conditions, and a single pass was then made with just the Dipole Sonic Imager (DSI). This modified tool string was deployed at 2100 h and reached 188 m CSF-A. The tool string was recovered at 0100 h on 23 February, and the pipe was tripped back to surface. Hole U1613A, and Site U1613, ended at 0935 h on 23 February. The drillship then entered cruise mode and began the transit to Site U1614. Operations at Site U1613 lasted a total of 3.6 days.
3. Lithostratigraphy
Hole U1613A cored a 223.6 m thick sequence of sediments and rocks, with a total recovery of 44% (Figure F3). Lithostratigraphic Units I–III (Figure F4) range in age from Pleistocene to Messinian, as determined by calcareous nannofossil and planktic foraminifera stratigraphy (see Biostratigraphy). The lithostratigraphic units below the Messinian interval consist of sedimentary rocks that are analogous to formations found on land in Sardinia and represent the local geologic basement that predates the initial Late Miocene rifting of the Tyrrhenian area. Most of the recent sedimentation derives from turbiditic deposits, which are possibly spillover from the submarine Orosei Canyon because Site U1613 sits about 5 km from the canyon axis. Unit I consists of light brown nannofossil-rich sands of Pleistocene age (Figure F5). Unit II is composed of Pleistocene–Pliocene age nannofossil ooze, which is typically light colored (Figure F5). The recovered sediments of Unit III consist of Messinian silts varying in color from light gray to red and thinly laminated, oxide-rich sand (Figure F5). Units IV–VI consist of sedimentary rocks representing the continental basement (see Igneous and metamorphic petrology).
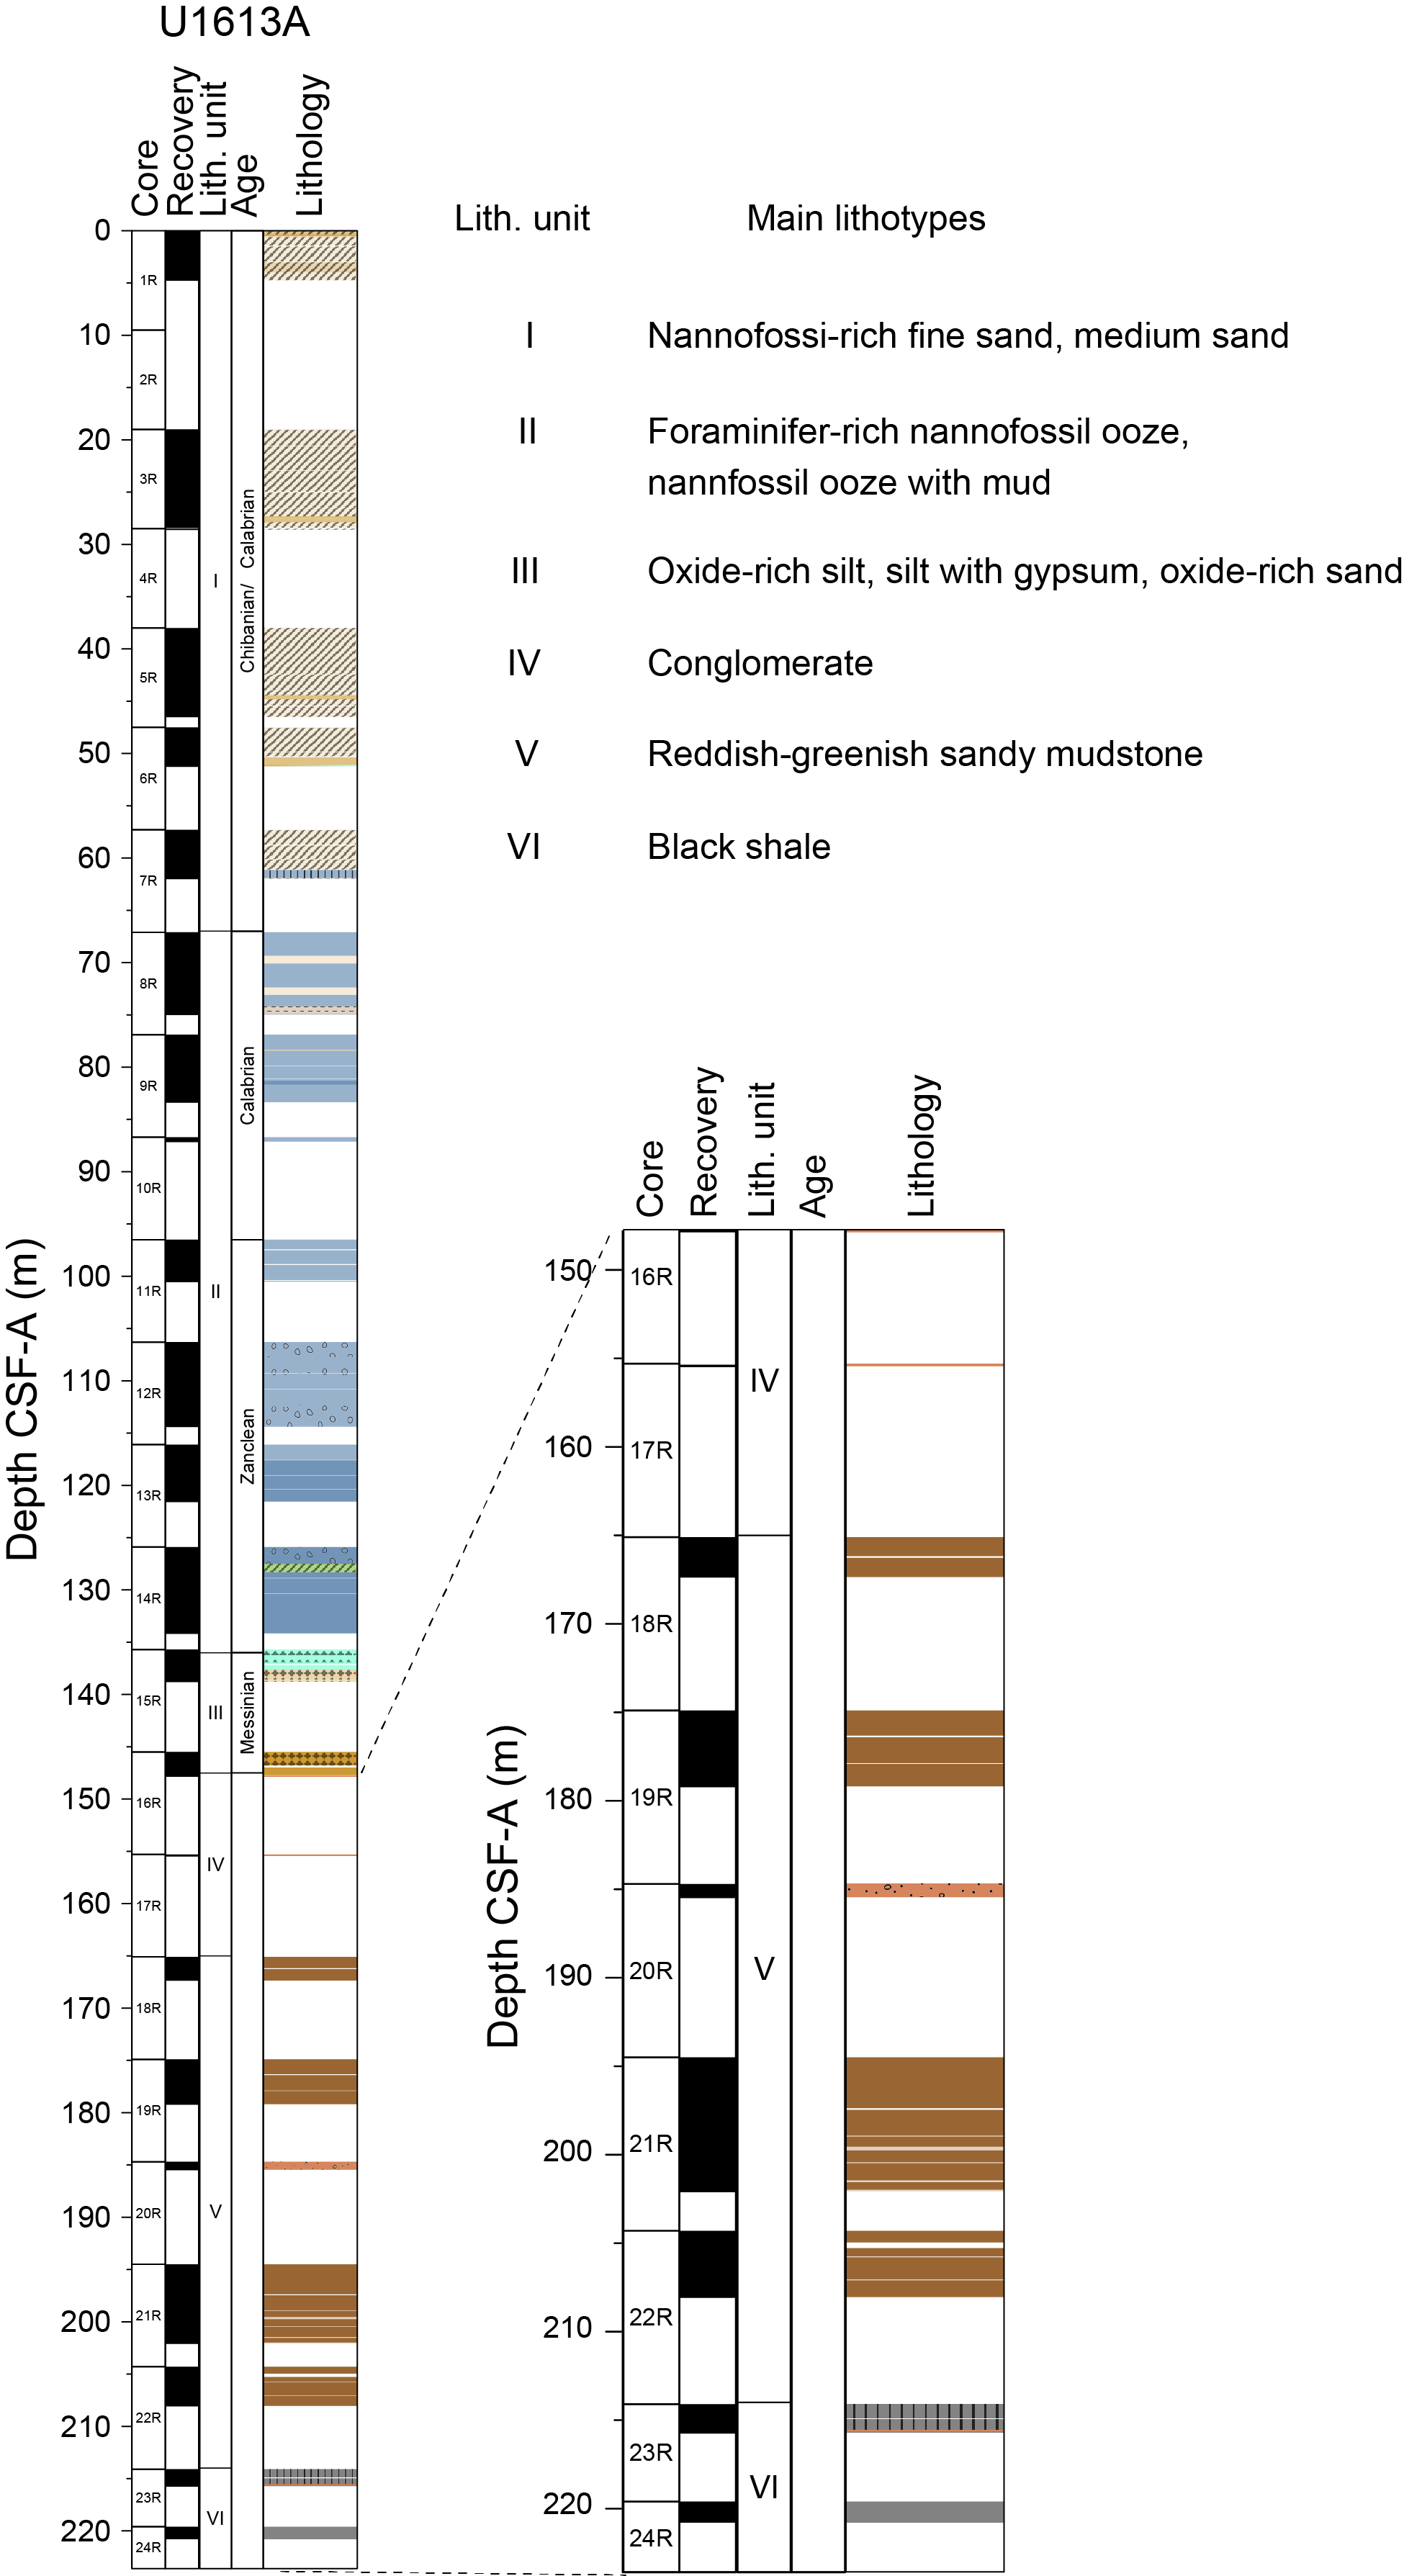
Figure F3. Lithostratigraphic summary.
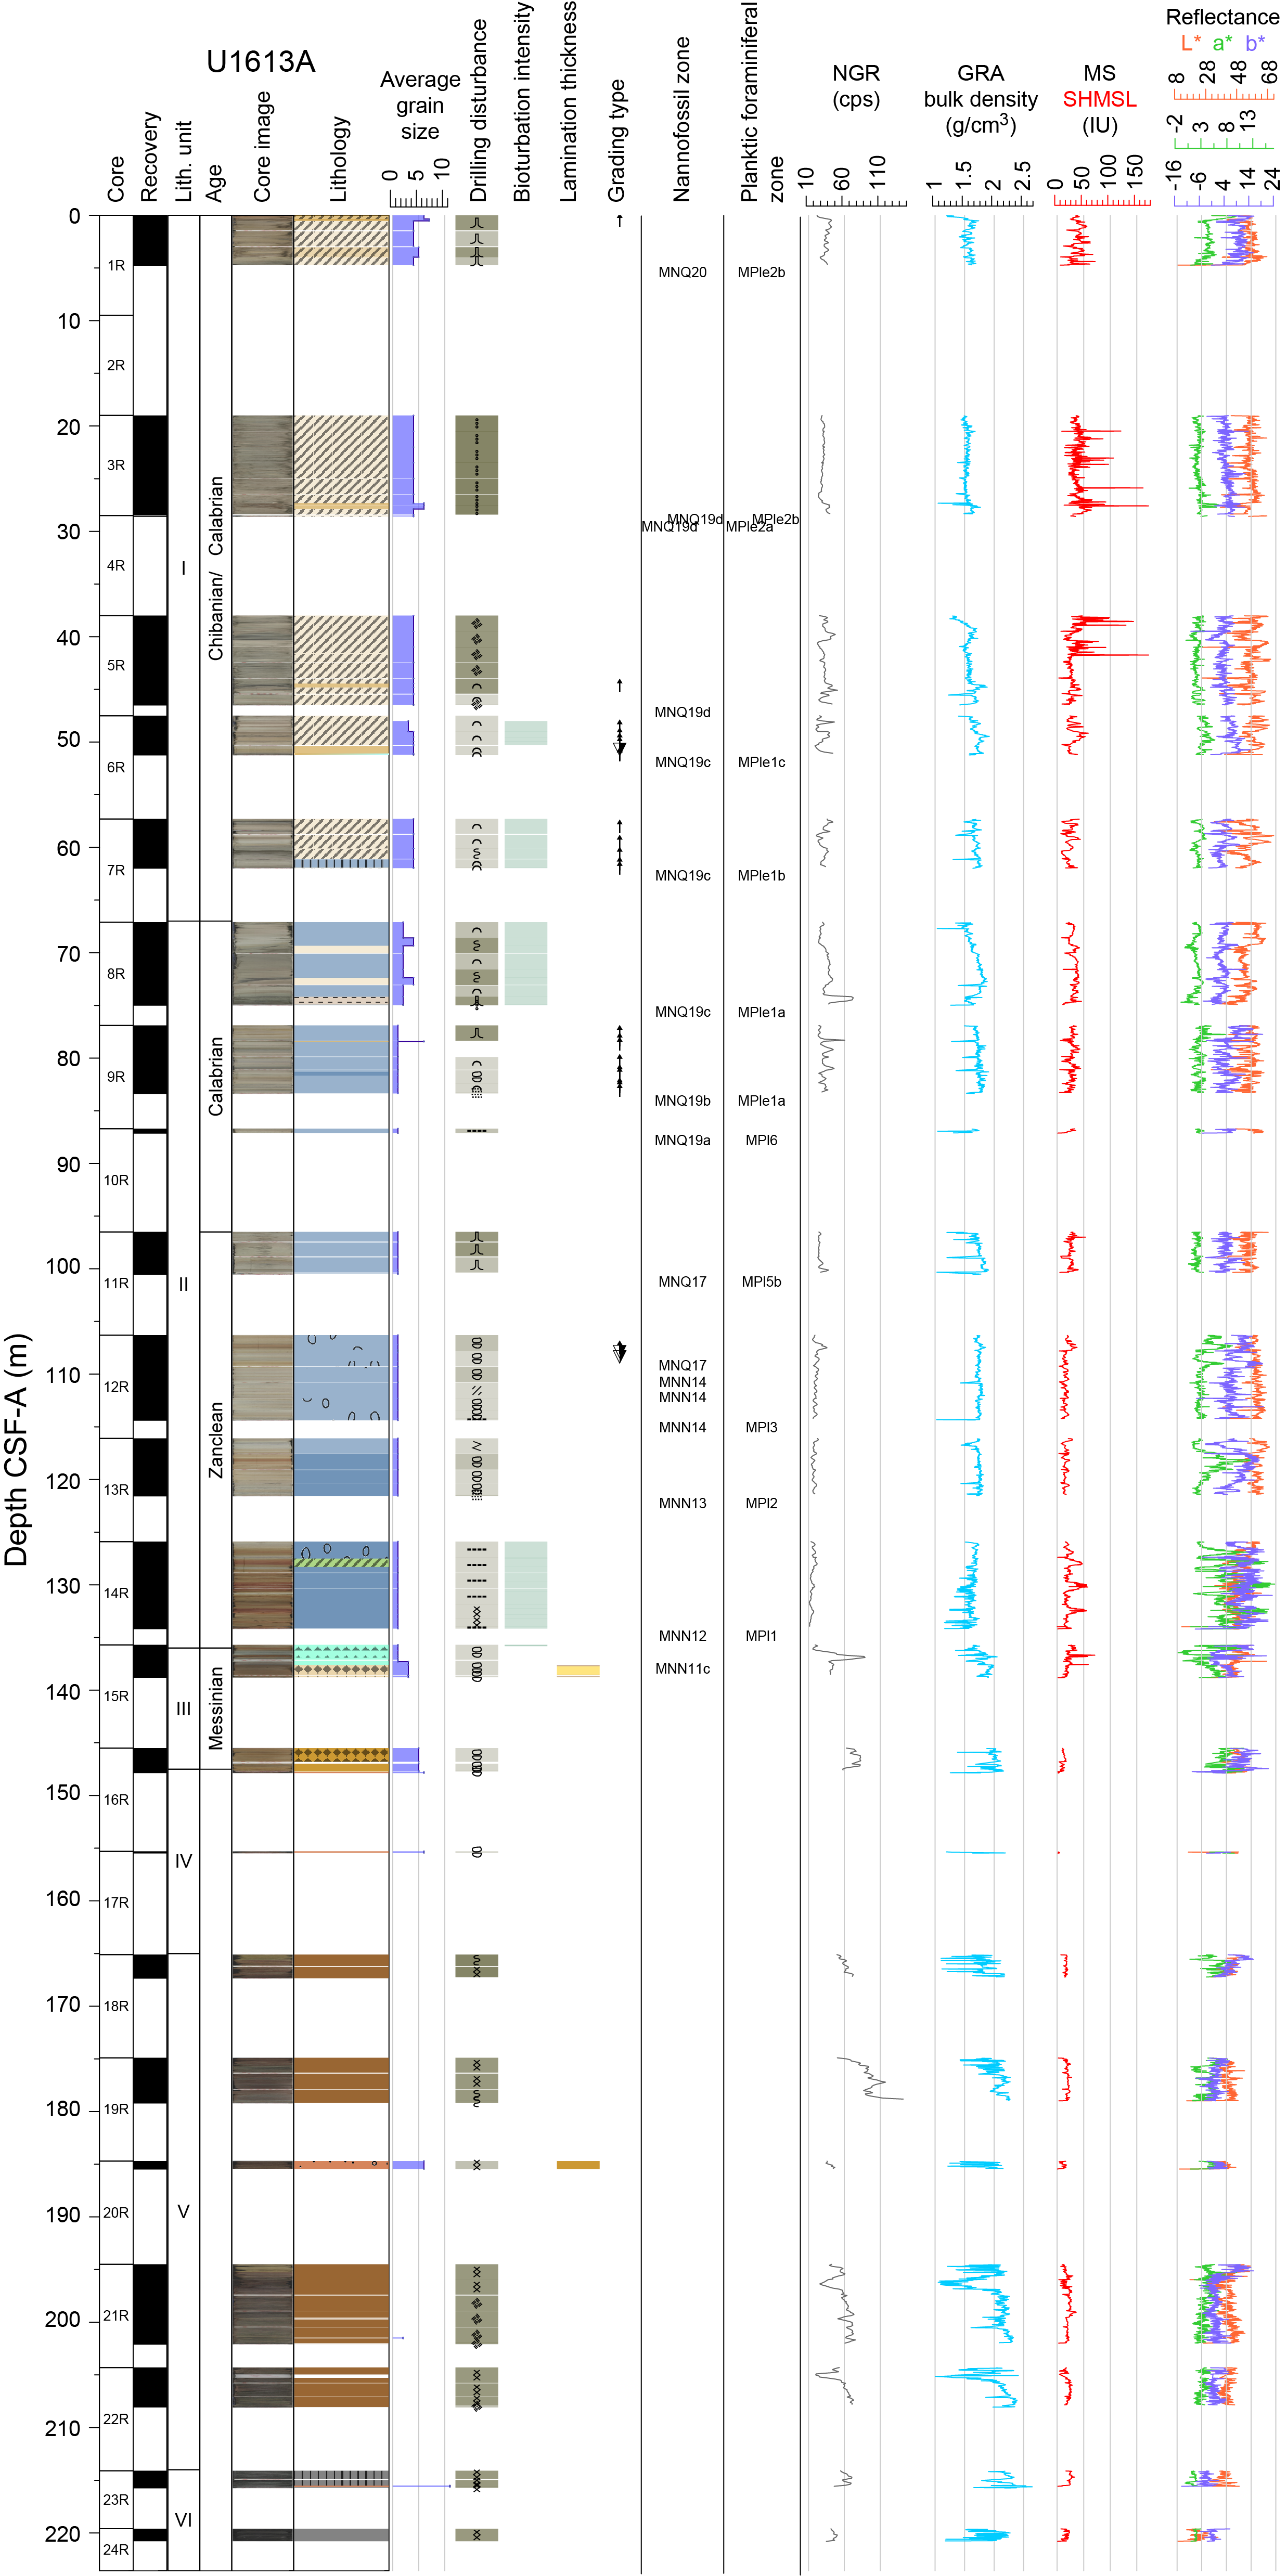
Figure F4. VCD.
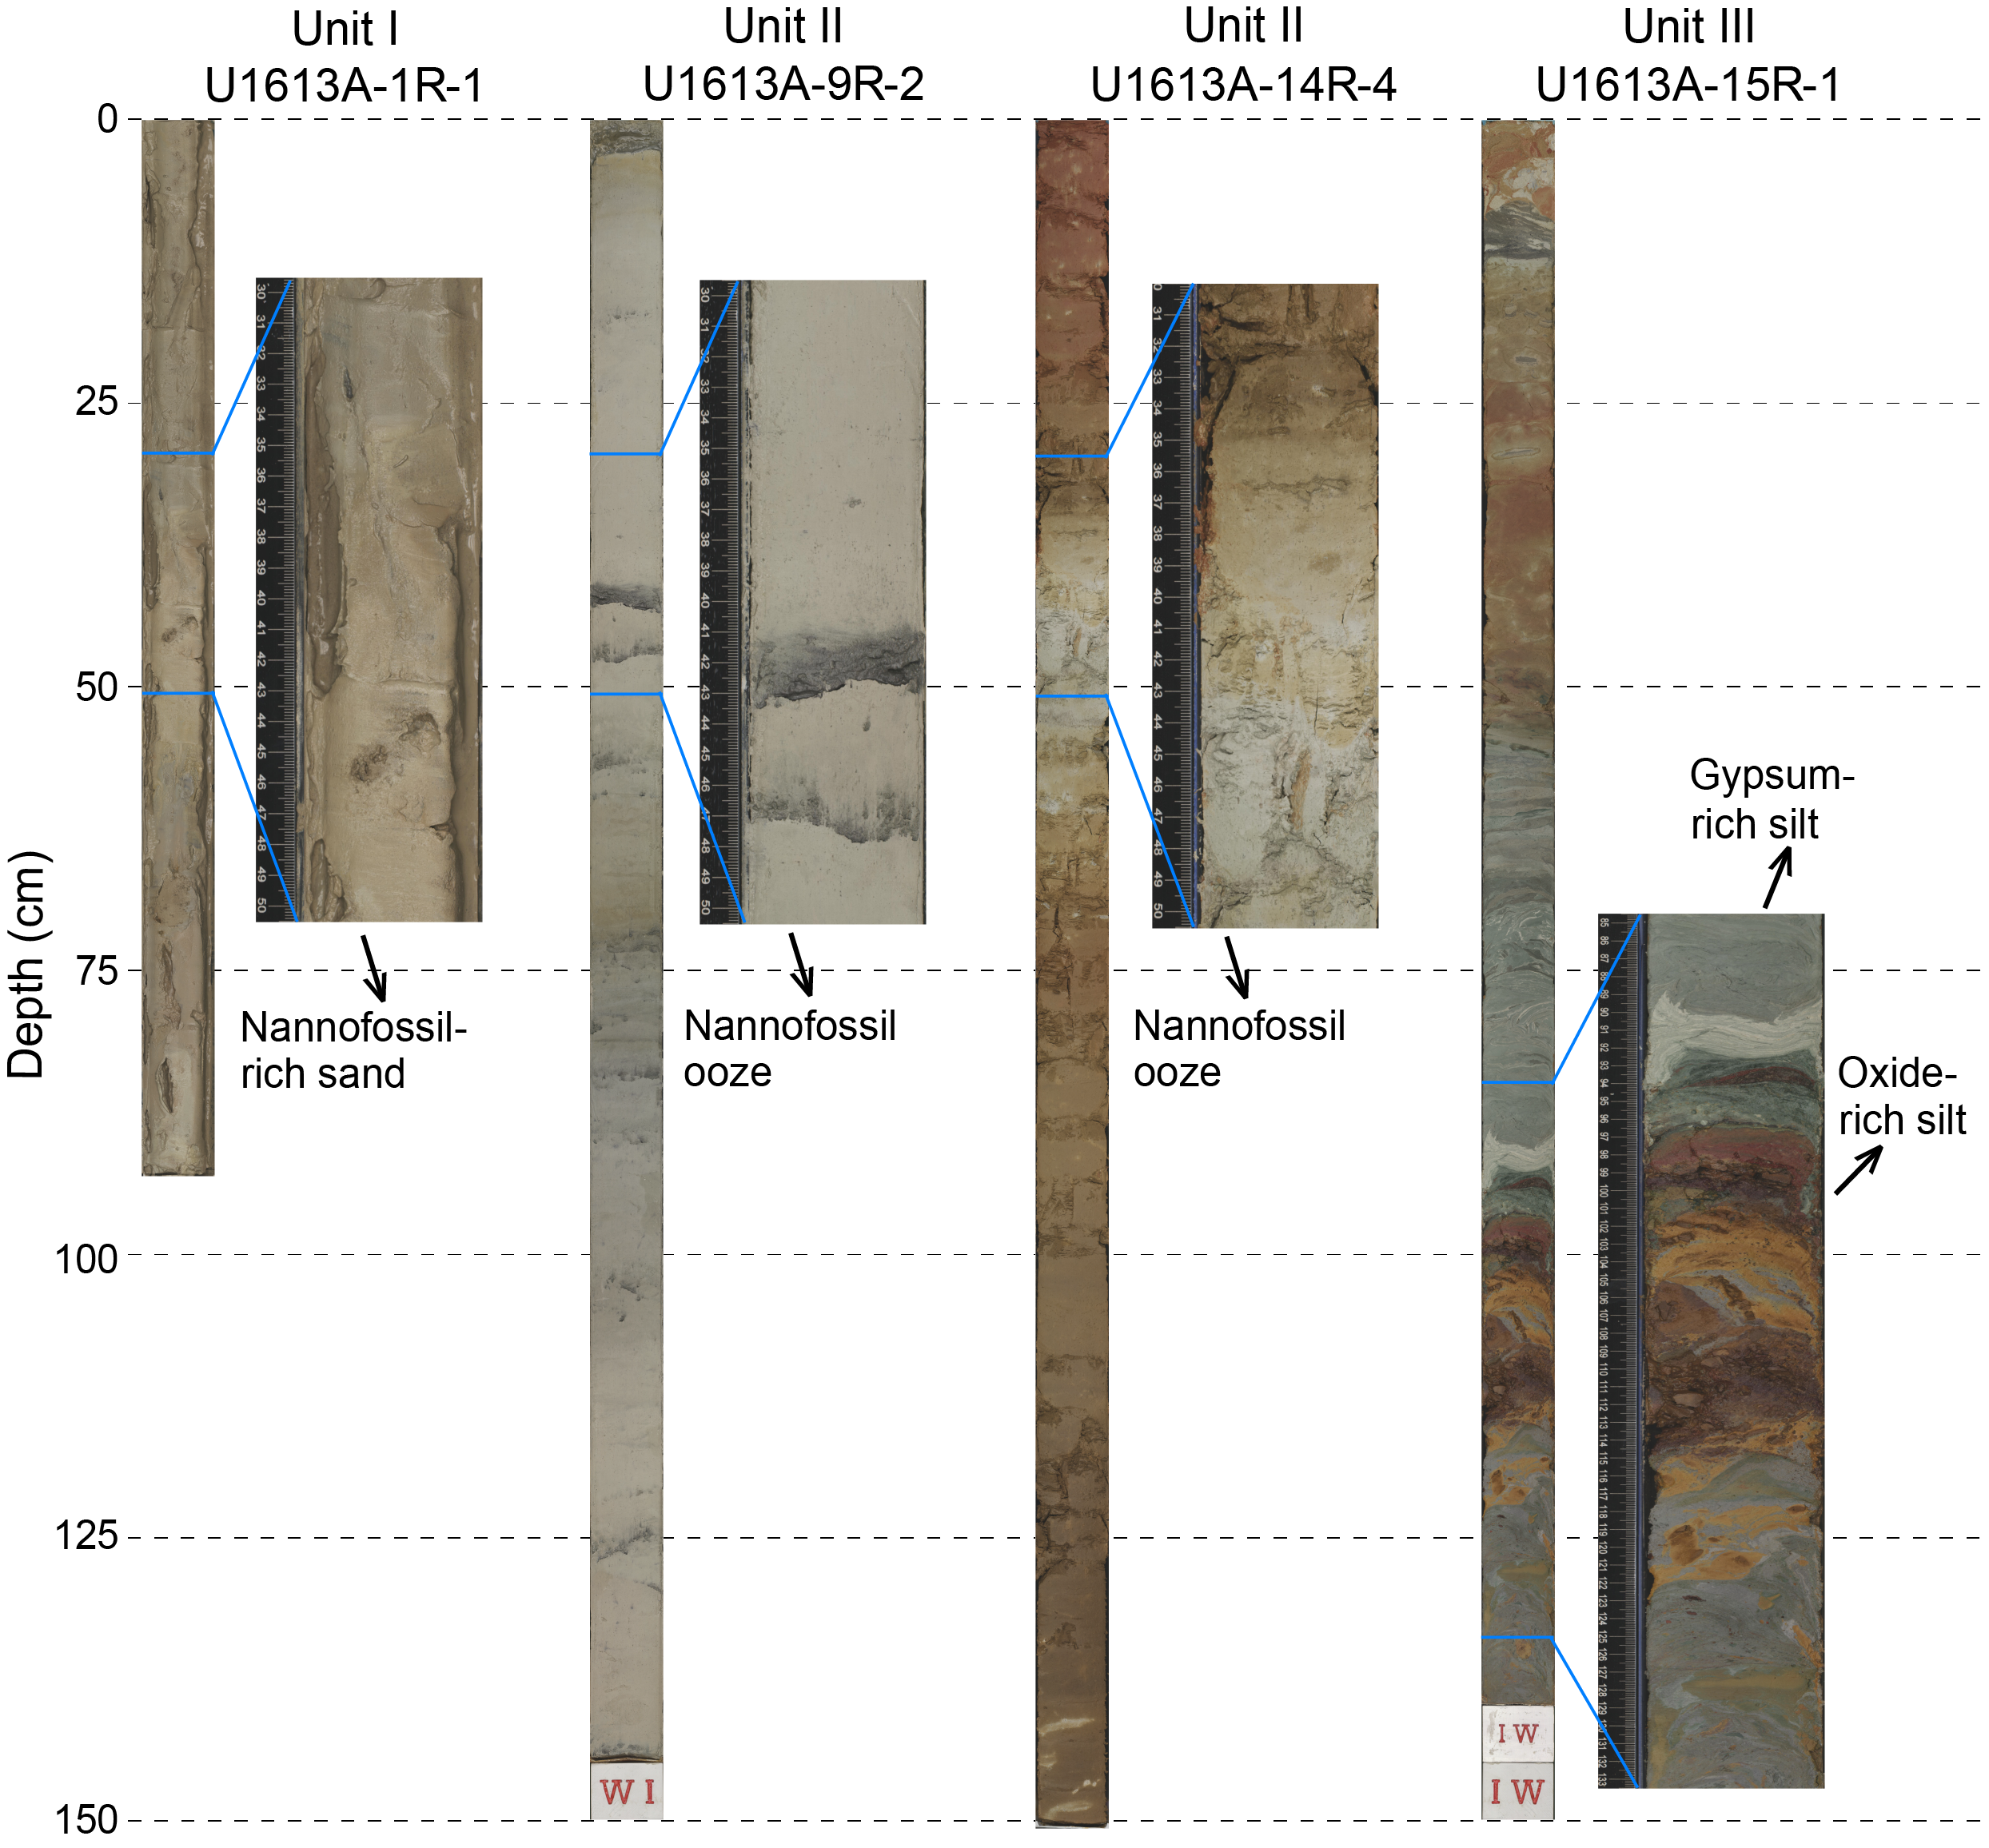
Figure F5. Main lithology core images.
Lithostratigraphic units are based on changes in lithology identified in visual core description (VCD) forms (Figure F4), smear slides (Figure F6), thin section observations, physical properties, and mineralogy obtained using X-ray diffraction (XRD) analysis. The observed lithologic differences are primarily the result of variable grain size. Internal color changes (identified using the Munsell Color Chart) reflect minor mineralogical and/or biogenic component changes. Because of poor core recovery, lithologic primary contacts were not captured in the sedimentary column where biostratigraphy indicated hiatuses within the sedimentary column (see Biostratigraphy). The basement recovered at the base of the Messinian most likely consists of a Triassic to Paleozoic sedimentary succession similar to those outcropping in Sardinia.
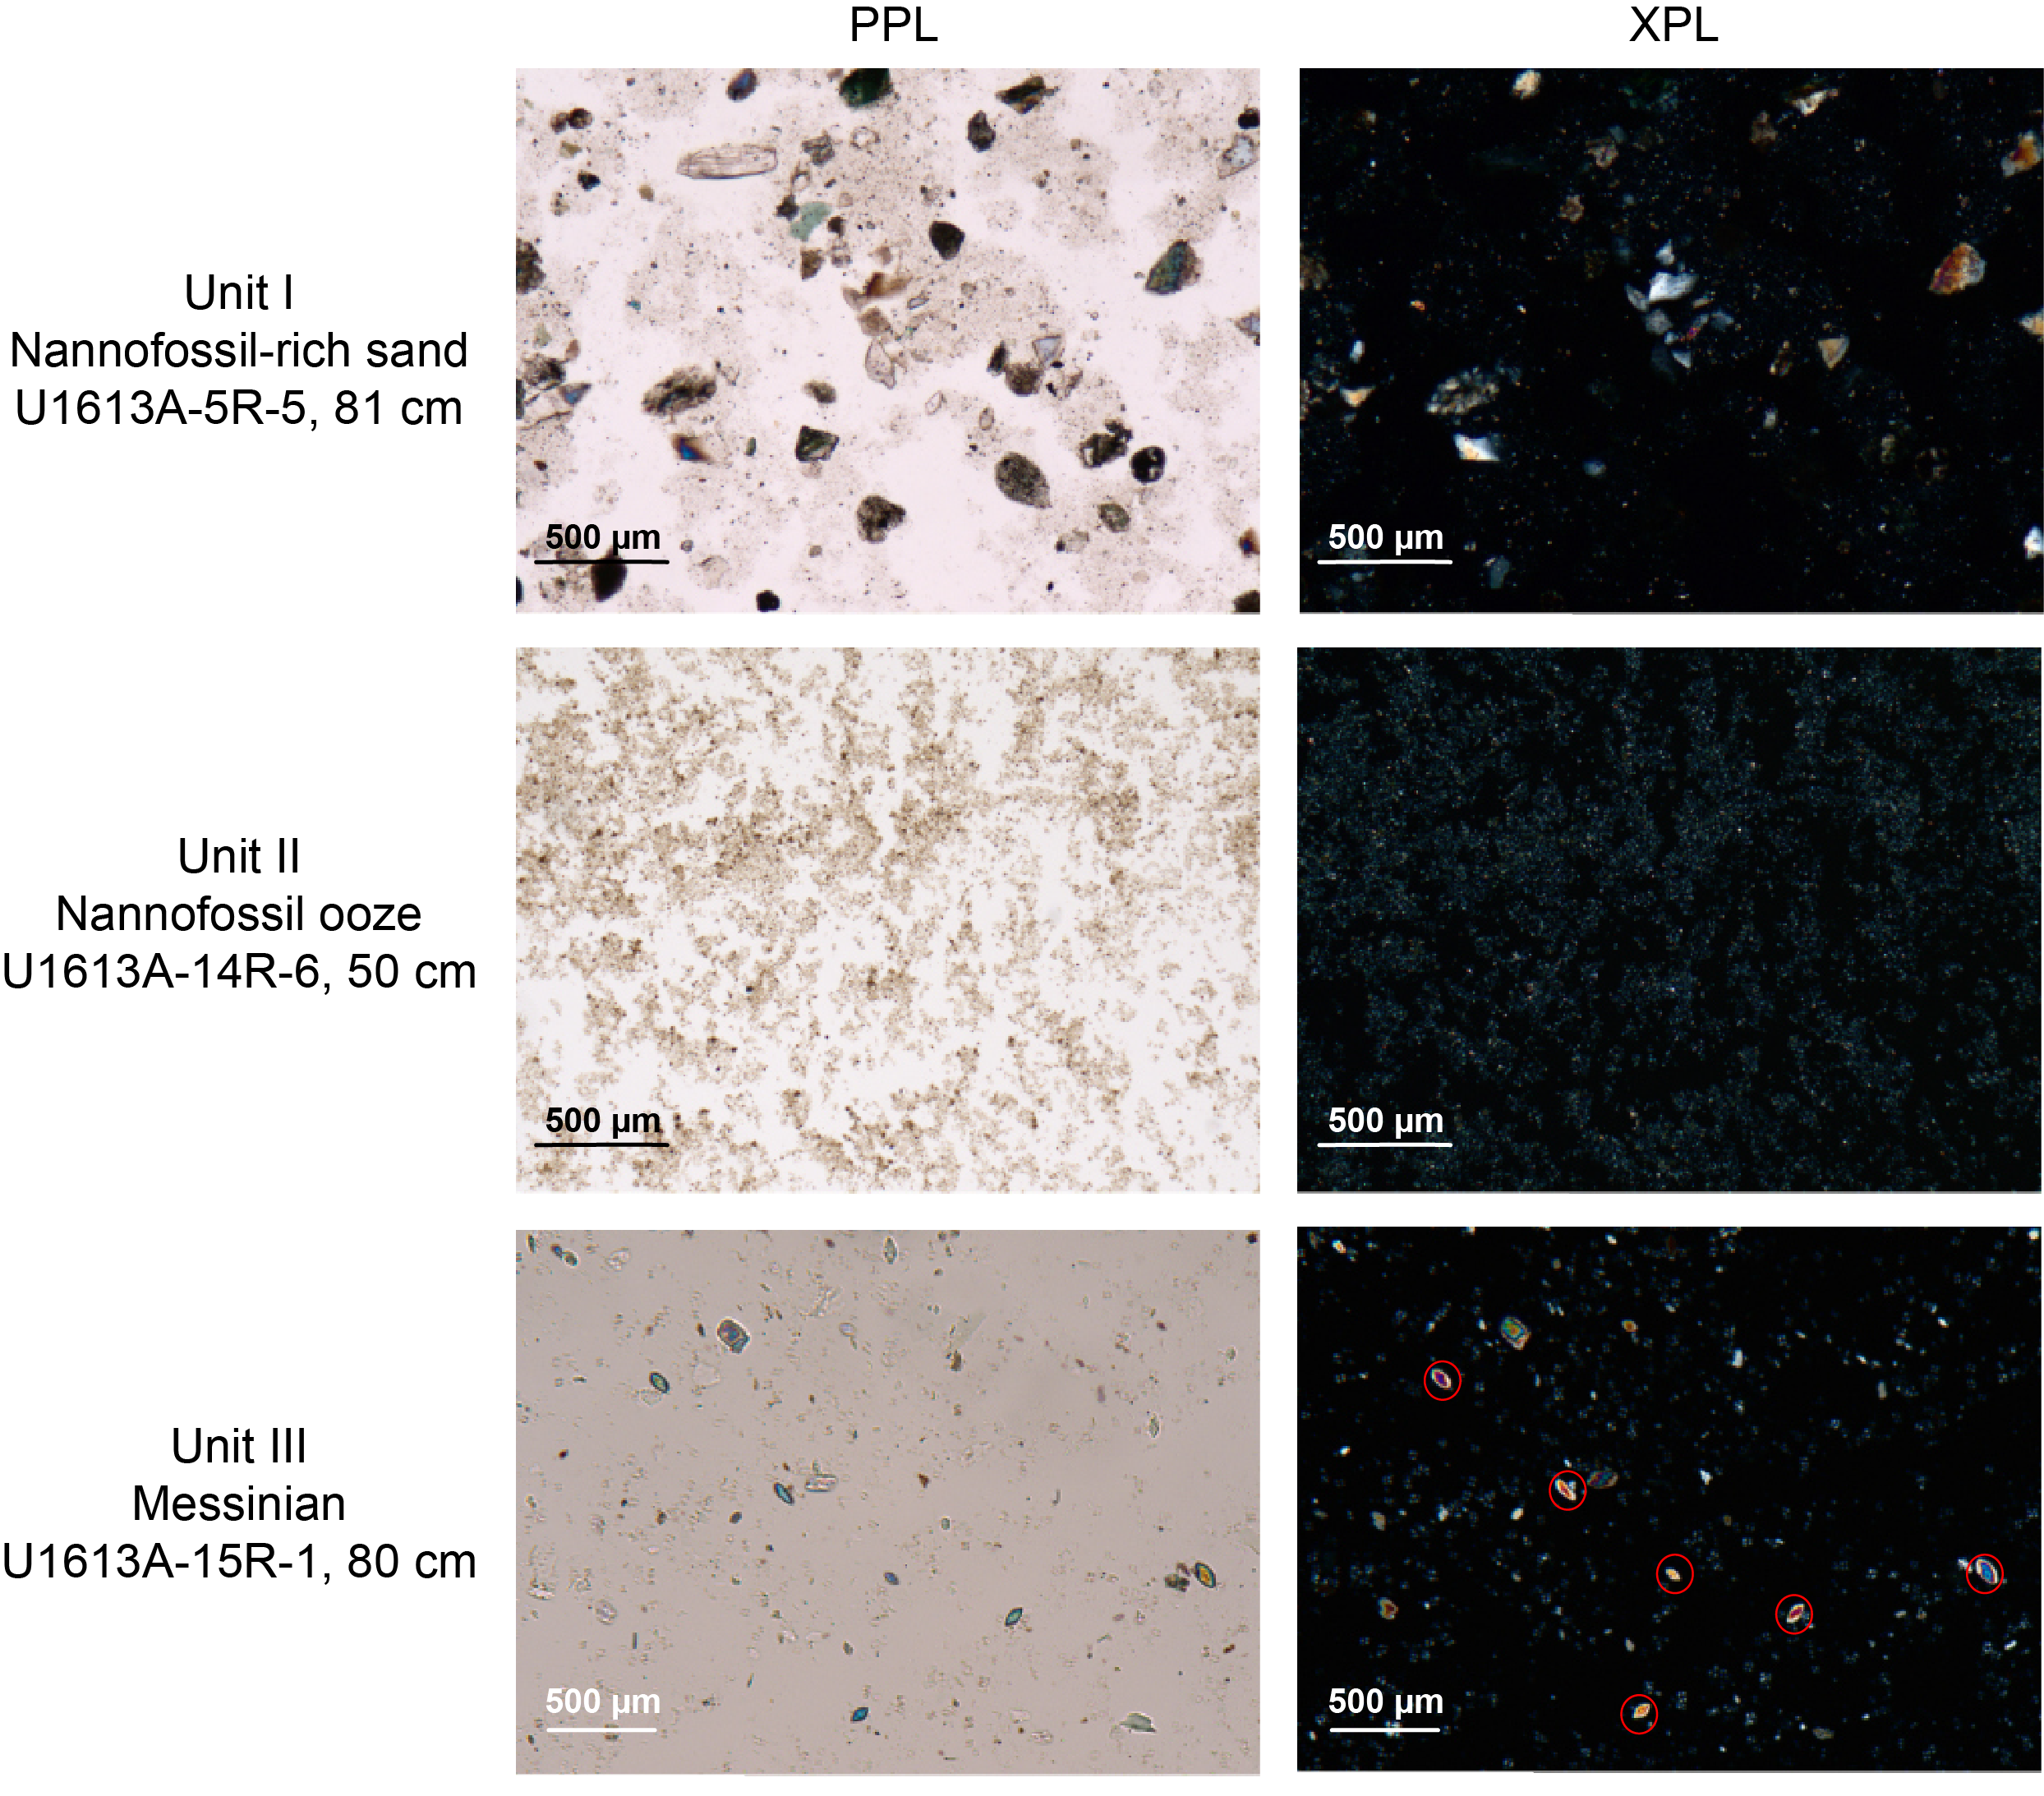
Figure F6. Main lithology smear slides.
3.1. Lithostratigraphic unit descriptions
3.1.1. Lithostratigraphic Unit I
- Interval: 402-U1613A-1R-1 through 7R-4
- Depth: 0–67.1 m CSF-A
- Age: Holocene to Early Pleistocene (Present to Chibanian/Calabrian)
- Major lithologies: nannofossil-rich fine sand, medium sand
Unit I consists of a succession of very fine to fine sands with varying amounts of foraminifera and intervals of coarse sand. The overall carbonate content measured shipboard increases downcore (see Sediment and interstitial water geochemistry), indicating that the terrigenous component decreases toward the base of this unit. The shallowest cores (402-U1613A-1R through 4R) are characterized by a soupy appearance with extensive drilling disturbance that distributed coarse sand throughout the interval (Figure F5). The prevalent color of the unit is light gray (2.5Y 7/2), with color changes to brown (10Y 4/3) and yellowish brown (10YR 5/4) reflecting foraminifera-rich intervals (Figure F7A). Several organic-rich blackish layers with coarser texture are found throughout this unit, as well as glauconite-rich layers, with the highest abundance in Core 6R. Bioturbation is absent in this unit, and macrofossils are extremely rare.
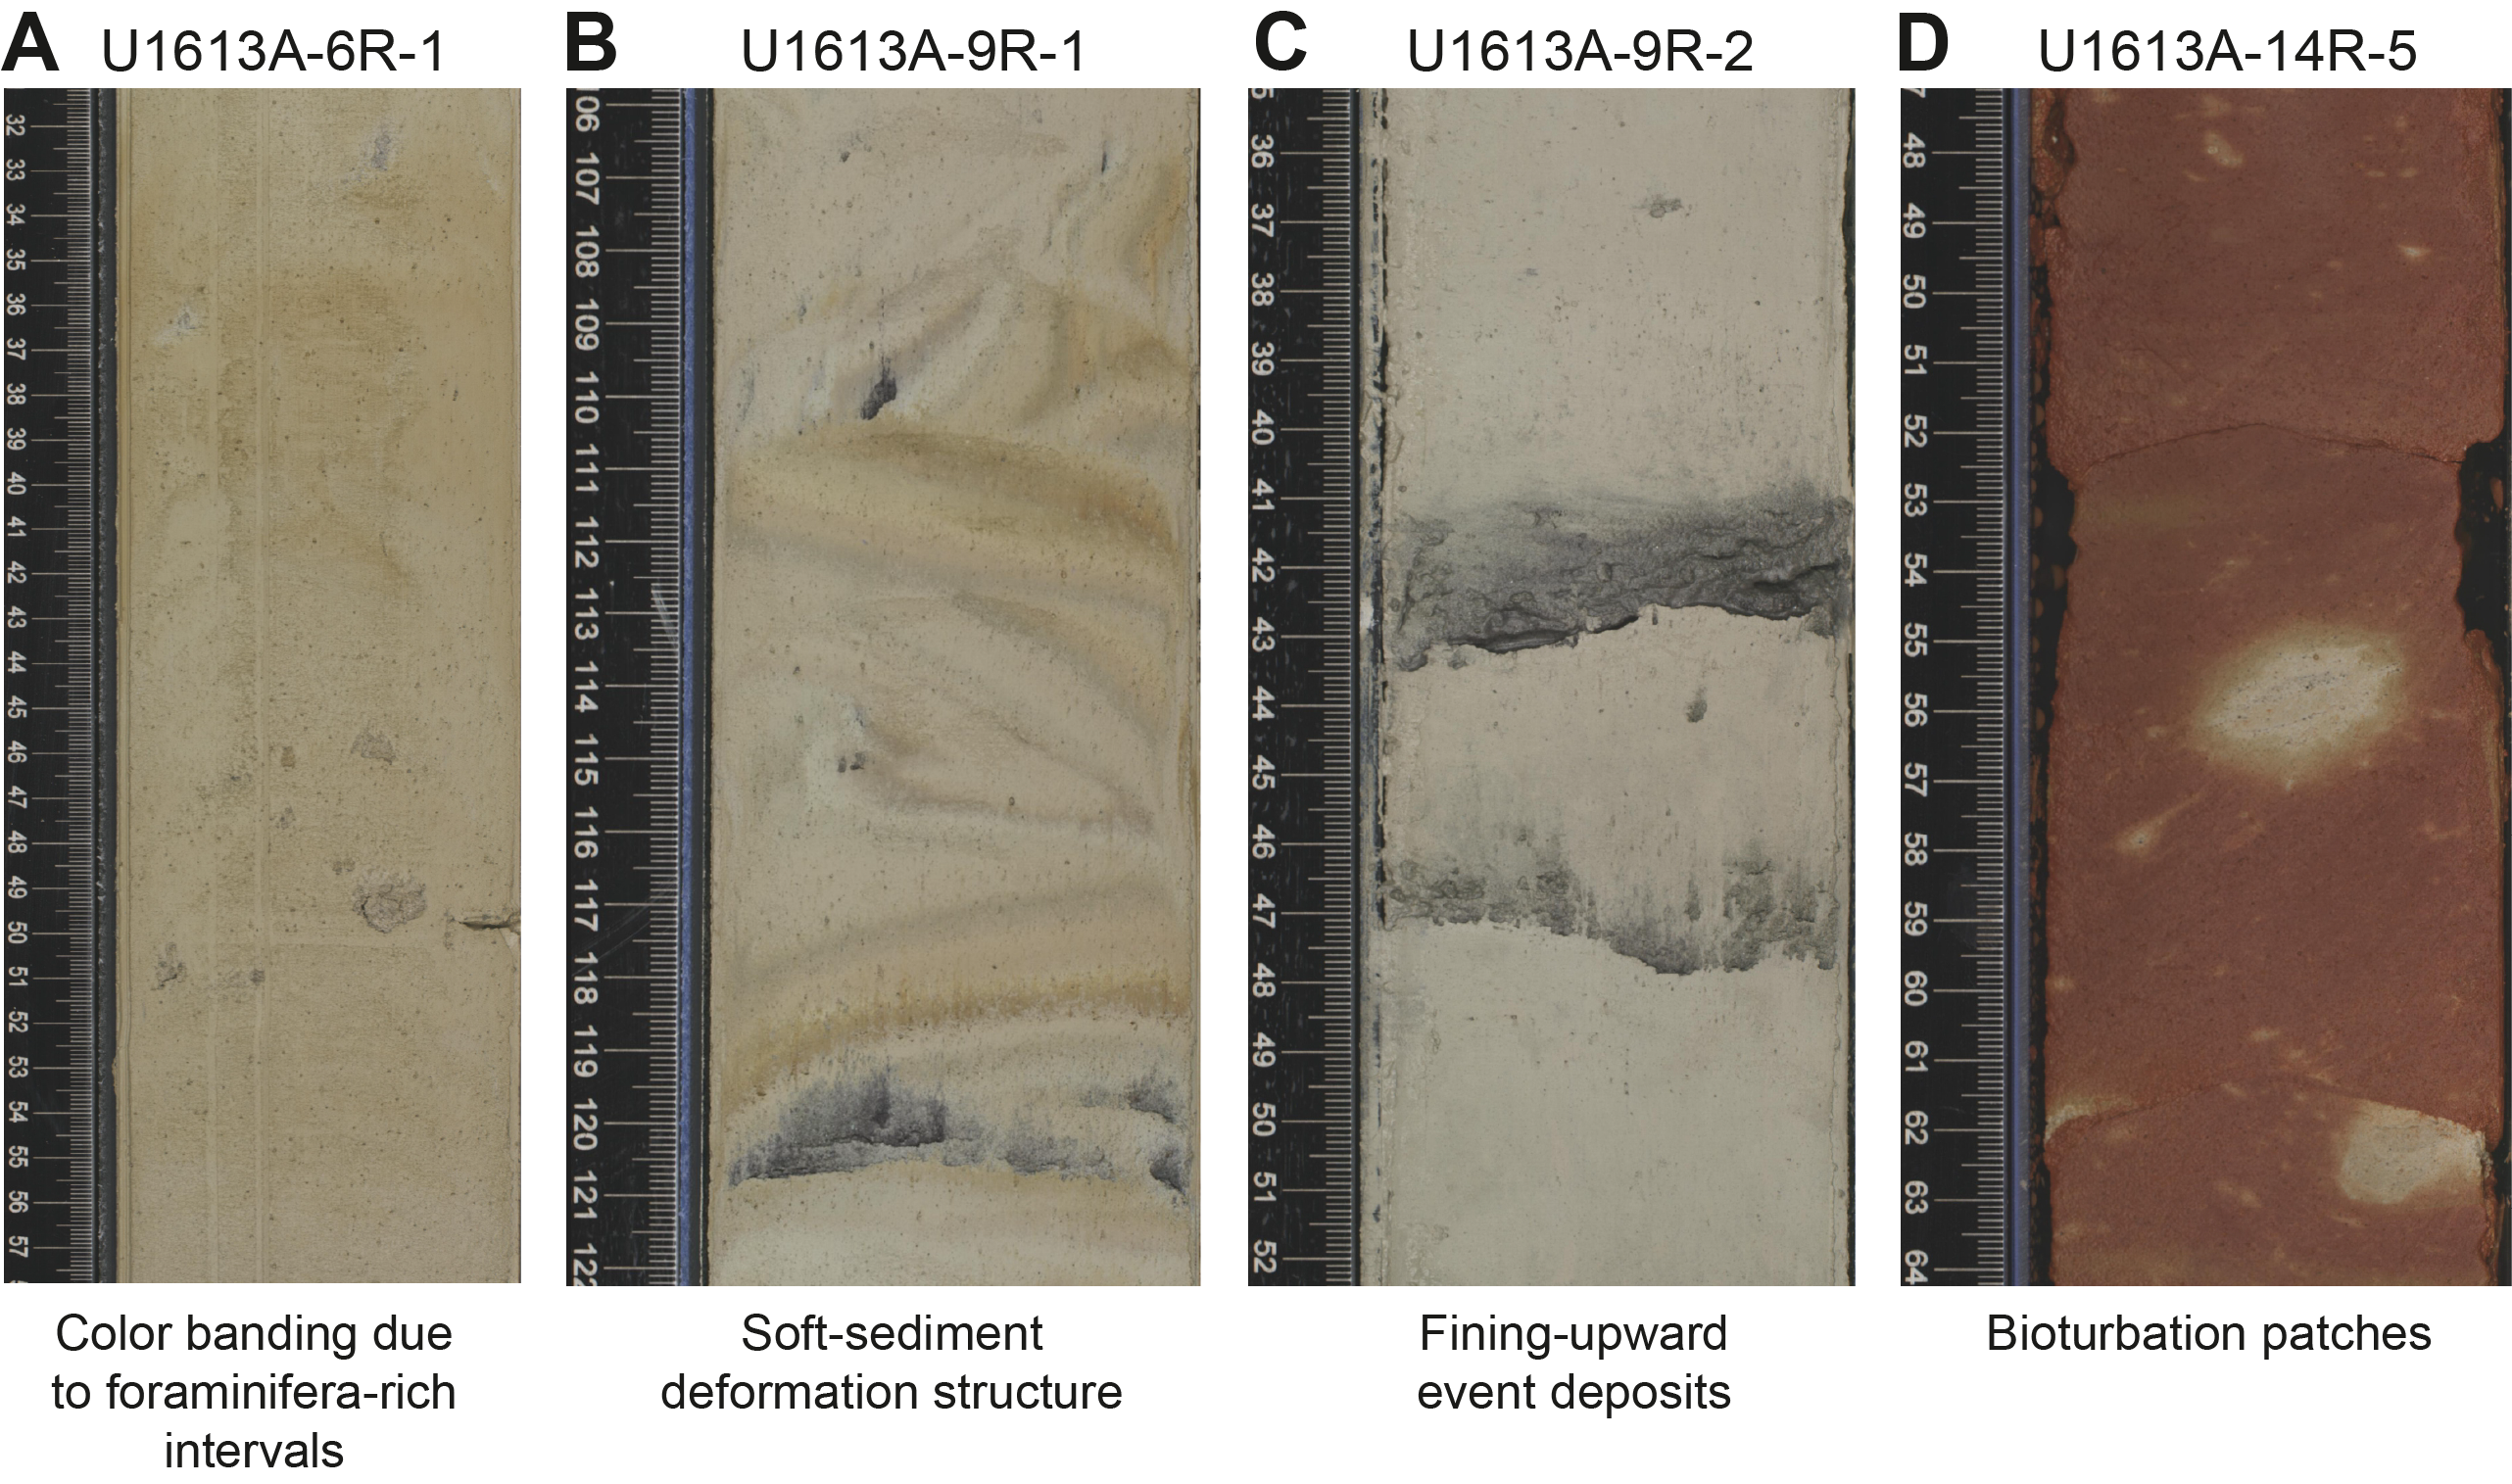
Figure F7. Distinctive features and sedimentary structures.
3.1.2. Lithostratigraphic Unit II
- Interval: 402-U1613A-8R-1 through 14R-6
- Depth: 67.1–135.8 m CSF-A
- Age: Middle–Early Pleistocene to Early Pliocene (Chibanian/Calabrian to Zanclean)
- Major lithologies: foraminifera-rich nannofossil ooze, nannofossil ooze with mud
Most of Unit II consists of a light gray (5Y 7/1) nannofossil ooze made up of multiple finely laminated intervals with an erosive base (Figures F5, F7C). Color changes to lighter or darker tones reflect foraminifera-rich and siliciclastic-rich intervals, respectively. Soft-sediment deformation structures (convoluted beds) are observed, especially in Cores 402-U1613A-9R and 11R (Figure F7B). Toward the base of the unit there is a color transition to reddish brown (5YR 4/4) (Figure F7D) that is the result of an increased content of iron-bearing minerals (Figure F8). Despite this color change documented by the spectrophotometer data (Figure F9), smear slide analysis revealed a similar matrix composition, ruling out a major lithologic change. Within this red layer are black and white patches, indicating diagenetic alteration of organic material (bioturbation pellets) (Figure F7D). In addition, sparse bioturbation was observed through the red interval (Figure F7D), but no macrofossils were found. Drilling disturbance in this unit is low, and only some horizontal cracks and slight biscuiting are observed.
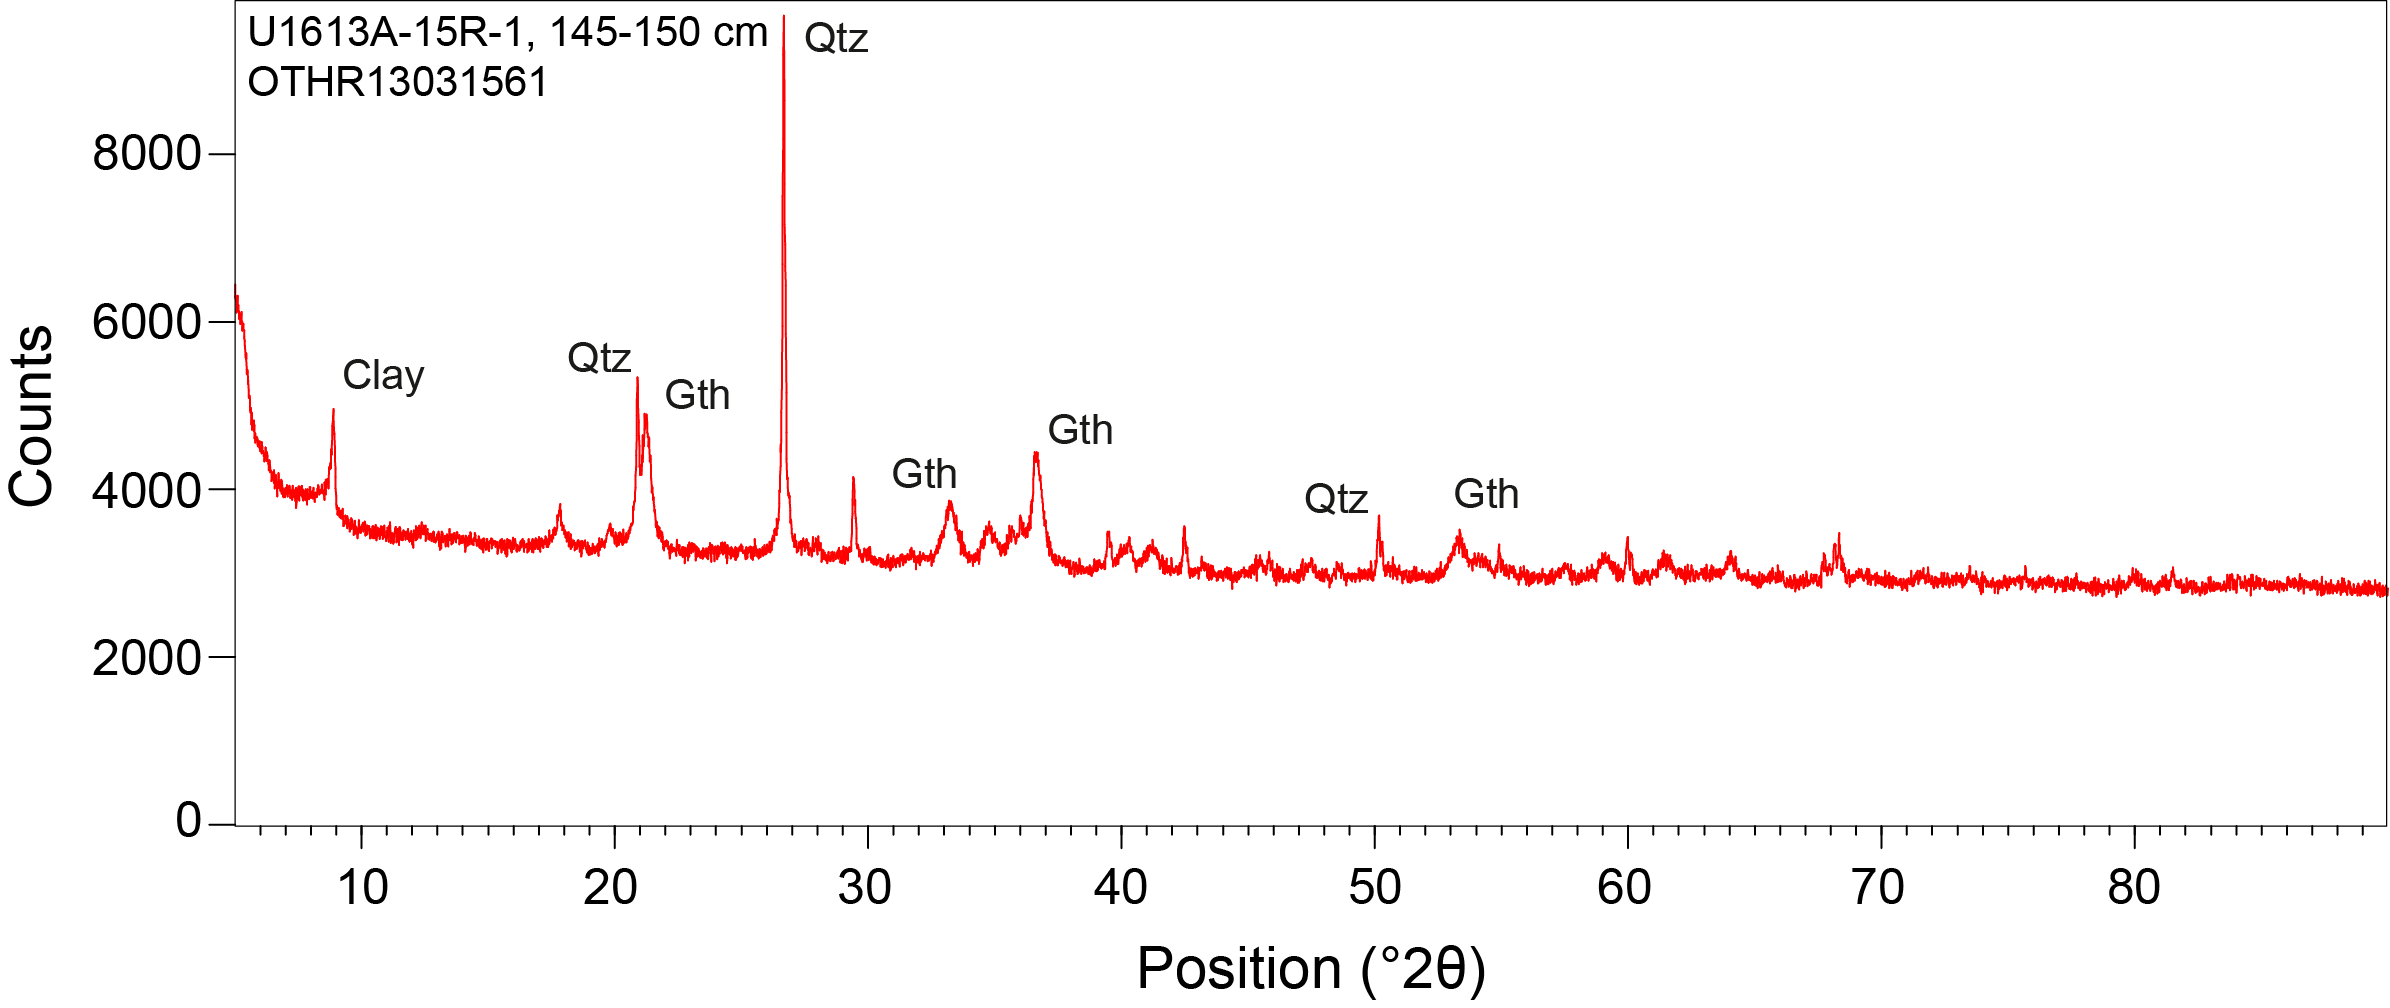
Figure F8. XRD diffractogram.
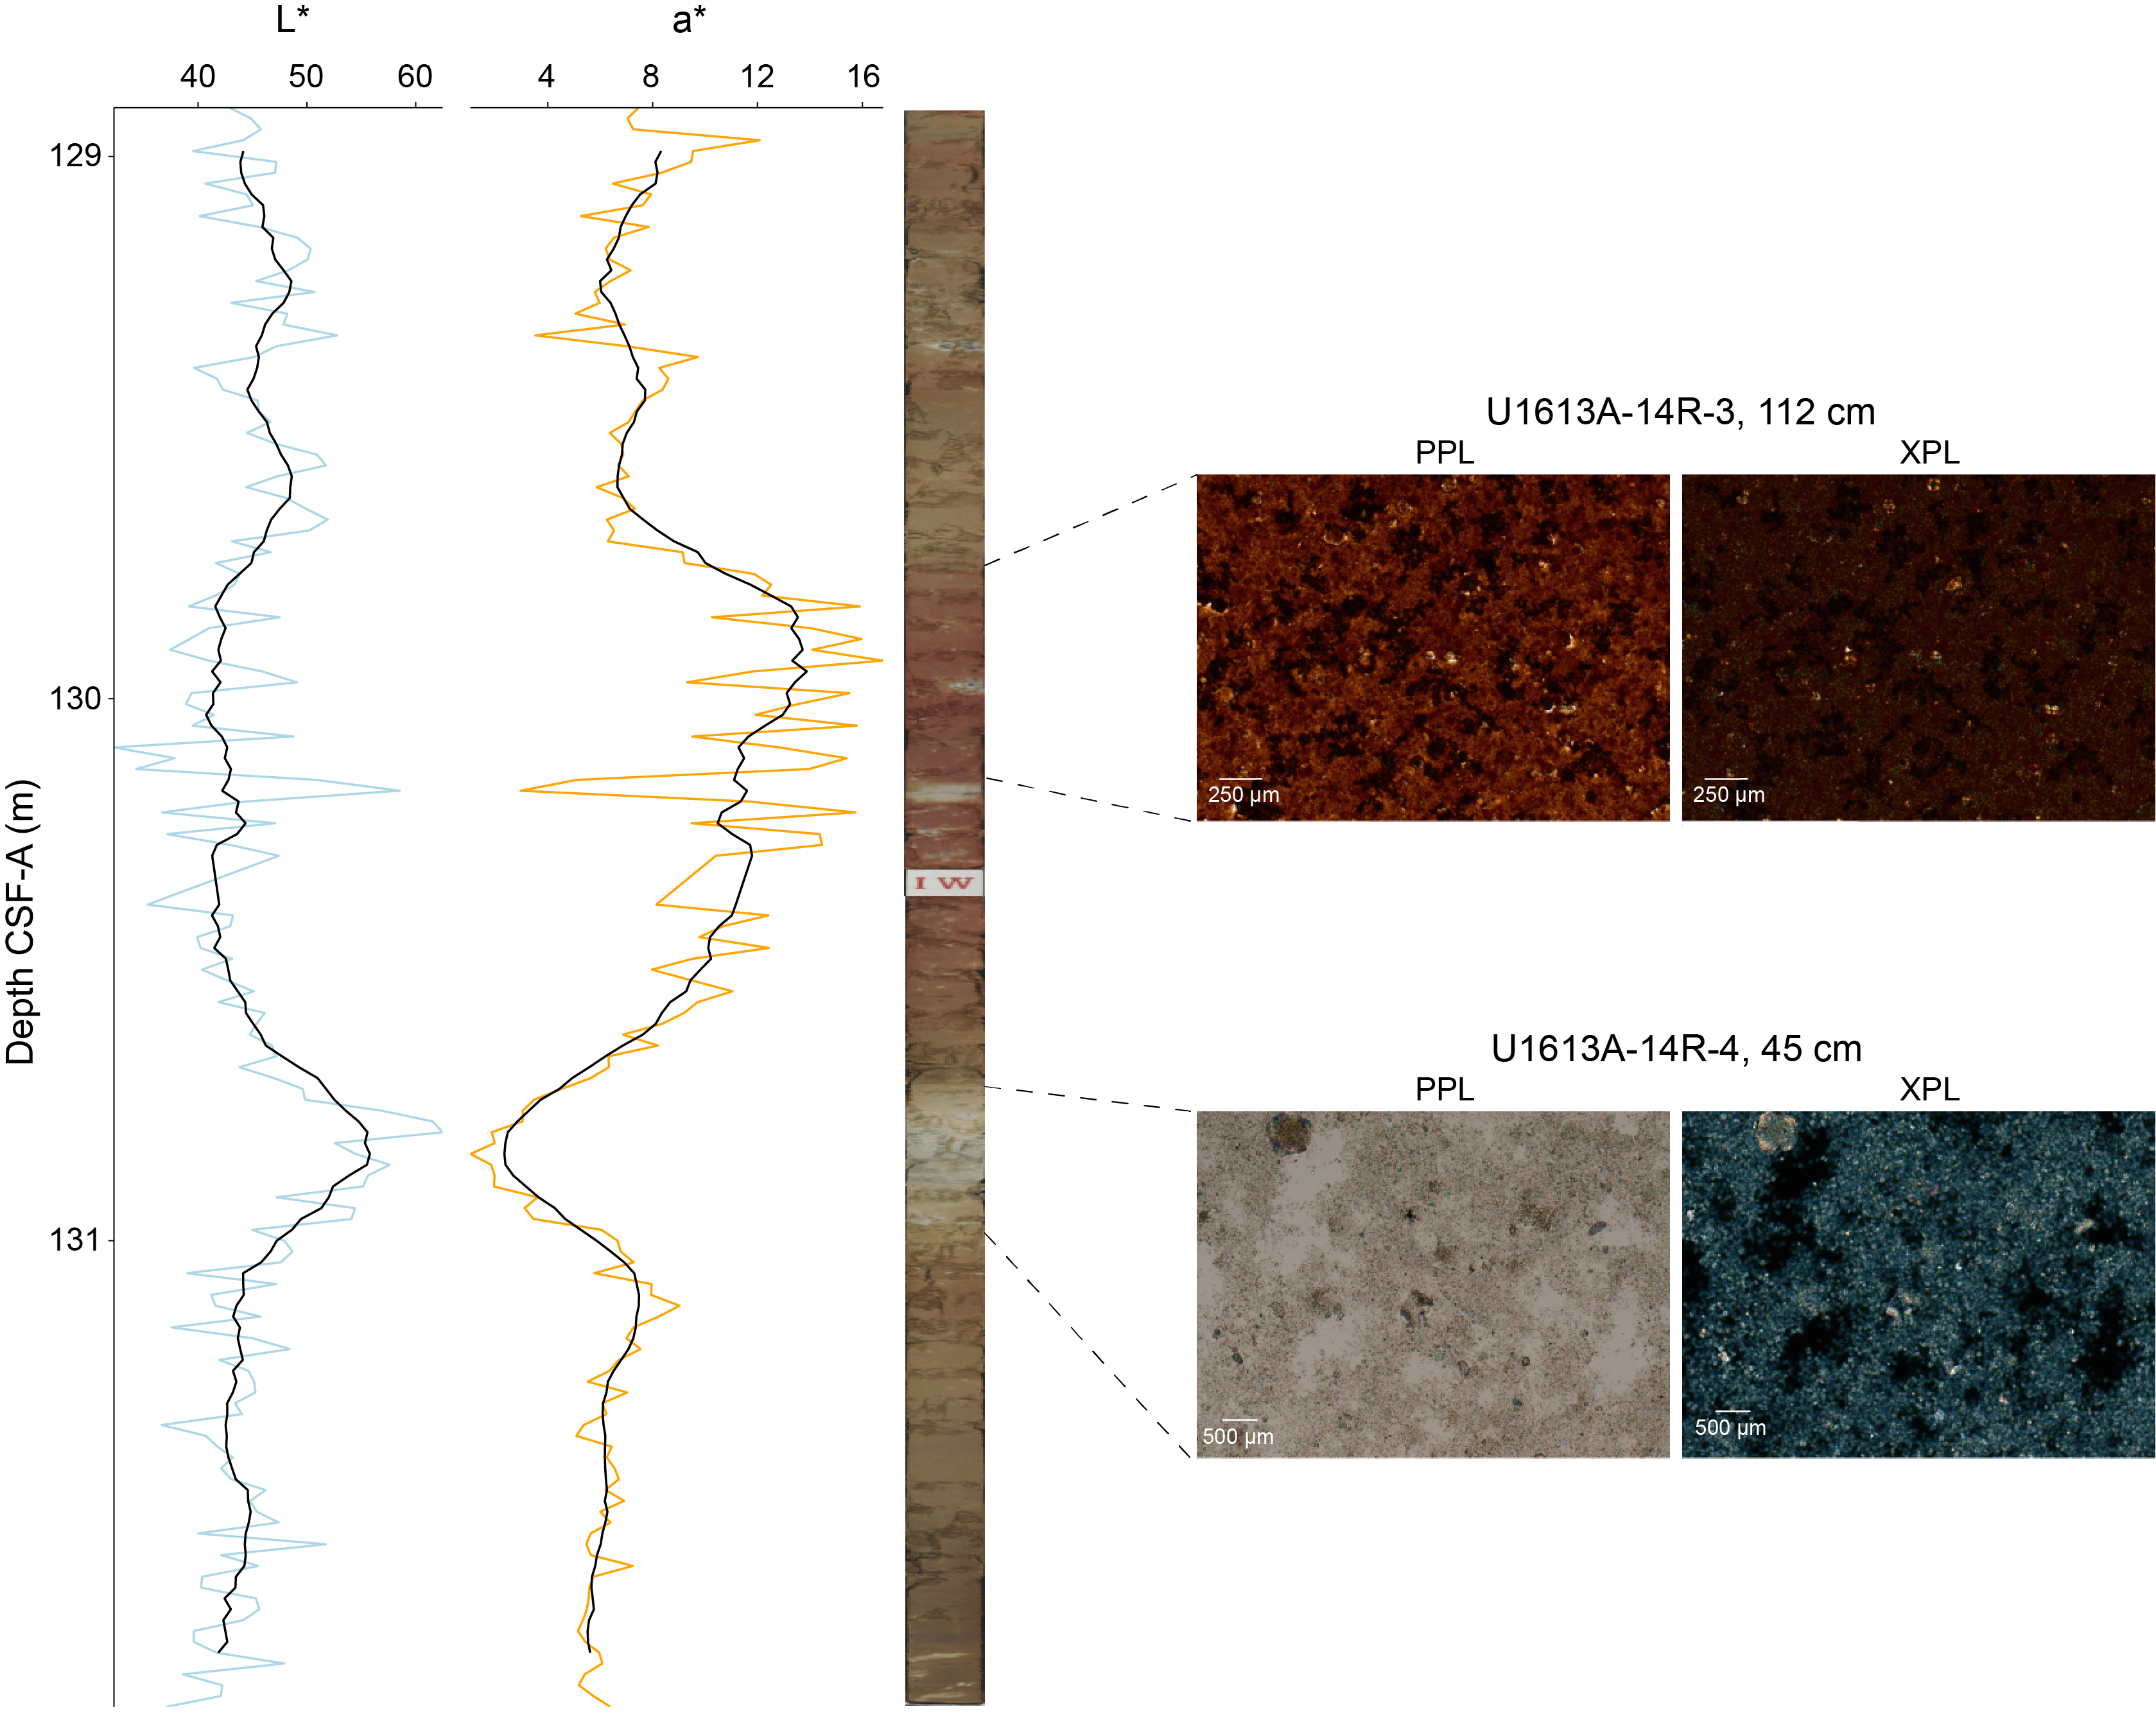
Figure F9. L* and a* plots.
3.1.3. Lithostratigraphic Unit III
- Interval: 402-U1613A-15R-1 through 16R-CC
- Depth: 135.8–147.5 m CSF-A
- Age: Late Miocene (Messinian)
- Major lithologies: oxide-rich silt, silt with gypsum, oxide-rich sand
Unit III is a ~12 m thick interval showing alternating bands of light greenish gray (GLEY 1 7/1) silt layers with gypsum and reddish brown (5YR 4/4) oxide-rich silt with a band of thinly laminated oxide-rich sand at the base of the unit (Figure F5). The presence of gypsum (Figure F6) indicates evaporite deposition, and well-constrained nannofossil dates (see Biostratigraphy) suggest that this unit covers the late stages of the Messinian. Only one consolidated clast was recovered from this interval, in Section 402-U1613A-15R-CC, and it shows tiny (millimeter-scale) cracks between the layering that could be dissolution cracks or possibly desiccation cracks. Above this clast, a fine sand interval shows millimeter-scale laminations resembling varves (15R-2). The evaporite-bearing interval is thin because the site is on a structural high and thus experienced more limited evaporite deposition.
3.1.4. Lithostratigraphic Unit IV
- Interval: 402-U1613A-16R-CC through 17R-CC
- Depth: 147.5–165 m CSF-A
- Age: Permian–Triassic (pre-Messinian)
- Major lithologies: conglomerate
Unit IV consists of a conglomerate containing rounded to subrounded clasts of quartz (up to few centimeters) and volcanic rocks in a red-colored, fine-grained matrix. The clasts are variable in size and moderately to poorly sorted. Overall, this reddish rock may be equivalent to the Permian–Triassic conglomerate (Verrucano) exposed in western Sardinia and is remarkably similar to the conglomerate of Unit VI that was described in ODP Leg 107 Hole 654A.
3.1.5. Lithostratigraphic Unit V
- Interval: 402-U1613A-18R through 22R
- Depth: 165–214 m CSF-A
- Age: Permian–Triassic (pre-Messinian)
- Major lithologies: sandy mudstone
Unit V consists of sandy mudstone with variable colors, ranging from greenish and yellowish to reddish. The cored material shows complex structures mainly due to intense drilling disturbances. This unit is divided into three subunits (VA–VC). Subunit VA (165–184.7 m CSF-A) is a sandy mudstone. Subunit VB (184.7–194.5 m CSF-A) is a polymictic conglomerate consisting of clasts of quartz, pumice, and unidentified volcanic material in a sandy matrix. Subunit VC (194.5–214 m CSF-A) consists of yellowish to reddish sandy mudstones with minor dark layers.
3.1.6. Lithostratigraphic Unit VI
- Interval: 402-U1613A-23R through 24R
- Depth: 214–224 m CSF-A
- Age: ?late Permian
- Major lithologies: shale
Lithostratigraphic Unit VI consists of a silt-rich black shale with weak foliation defined by elongated clasts. The rock is very fine grained and low in organic matter but contains carbonates (calcite and dolomite), titanite, and sulfide minerals. Pollen spores identified in thin section provide a tentative late Permian age for Unit VI.
4. Biostratigraphy
Calcareous nannofossil and planktic foraminifera specimens extracted from core catcher samples were analyzed to develop a biostratigraphic framework for Site U1613. Overall sediment core recovery at this site (44%) was better than in Hole U1612A (22%). The age constraints and biozonal boundaries across the sedimentary successions recovered in Hole U1613A were established by analyzing the semiquantitative data from moderately to well-preserved calcareous nannofossil and planktic foraminifera assemblages. The Mediterranean biozonation schemes of Di Stefano et al. (2023) and Lirer et al. (2019) were used for this purpose.
4.1. Planktic foraminifera
4.1.1. Sedimentary compositions of collected samples
The sediment samples collected from Sections 402-U1613A-1R-CC (4.73–4.78 meters below seafloor [mbsf]) through 15R-CC (138.62–138.82 mbsf) were washed using a 63 µm sieve to remove clay and/or silty particles. The residues were dried and further sieved using a 125 µm sieve to filter out any juvenile microfossil species and analyzed under the microscope. The extracted residues (>125 µm) contain well-preserved planktic foraminiferal assemblages that dominate the biogenic content of the primary sedimentary material within each sample. Benthic foraminifera, ostracods, and fragmented remains of molluscan shells were also observed. Although the taxonomy and abundance of these species were not recorded due to time constraints, their presence provides valuable information for future analysis.
The ~140 m nannofossil ooze sedimentary intervals recovered at Site U1613 were determined to be Holocene–Lower Pliocene. These sedimentary sequences were continuous between Samples 402-U1613A-1R-CC (4.73–4.78 mbsf) and 11R-CC (100.45–100.56 mbsf), followed below by a temporal hiatus of ~1.5 My with the early Gelasian–late Zanclean stages missing, as determined from the planktic foraminiferal record. The sedimentary succession above the basement between Samples 12R-CC (114.22–114.42 mbsf) and 14R-CC (133.96–134.2 mbsf) was again continuous and determined to be ~5.332 Ma at its base. The last core catcher, Sample 15R-CC (138.62–138.82 mbsf), was devoid of any planktic foraminiferal species.
4.1.2. Planktic foraminifera biozonation
Planktic foraminiferal marker species were examined from the core catcher samples of Hole U1613A, and biozones were assigned according to the Mediterranean biozonation scheme described in Lirer et al. (2019). The biostratigraphic zonation scheme recognized at Site U1613 is presented in Table T2.
The planktic foraminiferal fauna within the fossiliferous calcareous ooze zones (Samples 402-U1613A-1R-CC to 15R-CC) is typical of Mediterranean biostratigraphic Zones MPle2b–MPl1, primarily composed of marker species Neogloboquadrina spp. (sin), Globigerina bulloides, Globigerinoides ruber var. white, Globoconella inflata, Globorotalia margaritae, Globorotalia truncatulinoides, Globorotalia excelsa, Globigerinella calida, Globigerinoides extremus, Globigerinoides obliquus, Globorotalia crassaformis, Neogloboquadrina acostaensis, Sphaeroidinellopsis seminulina, and Orbulina universa (Figures F10, F11, F12, F13).
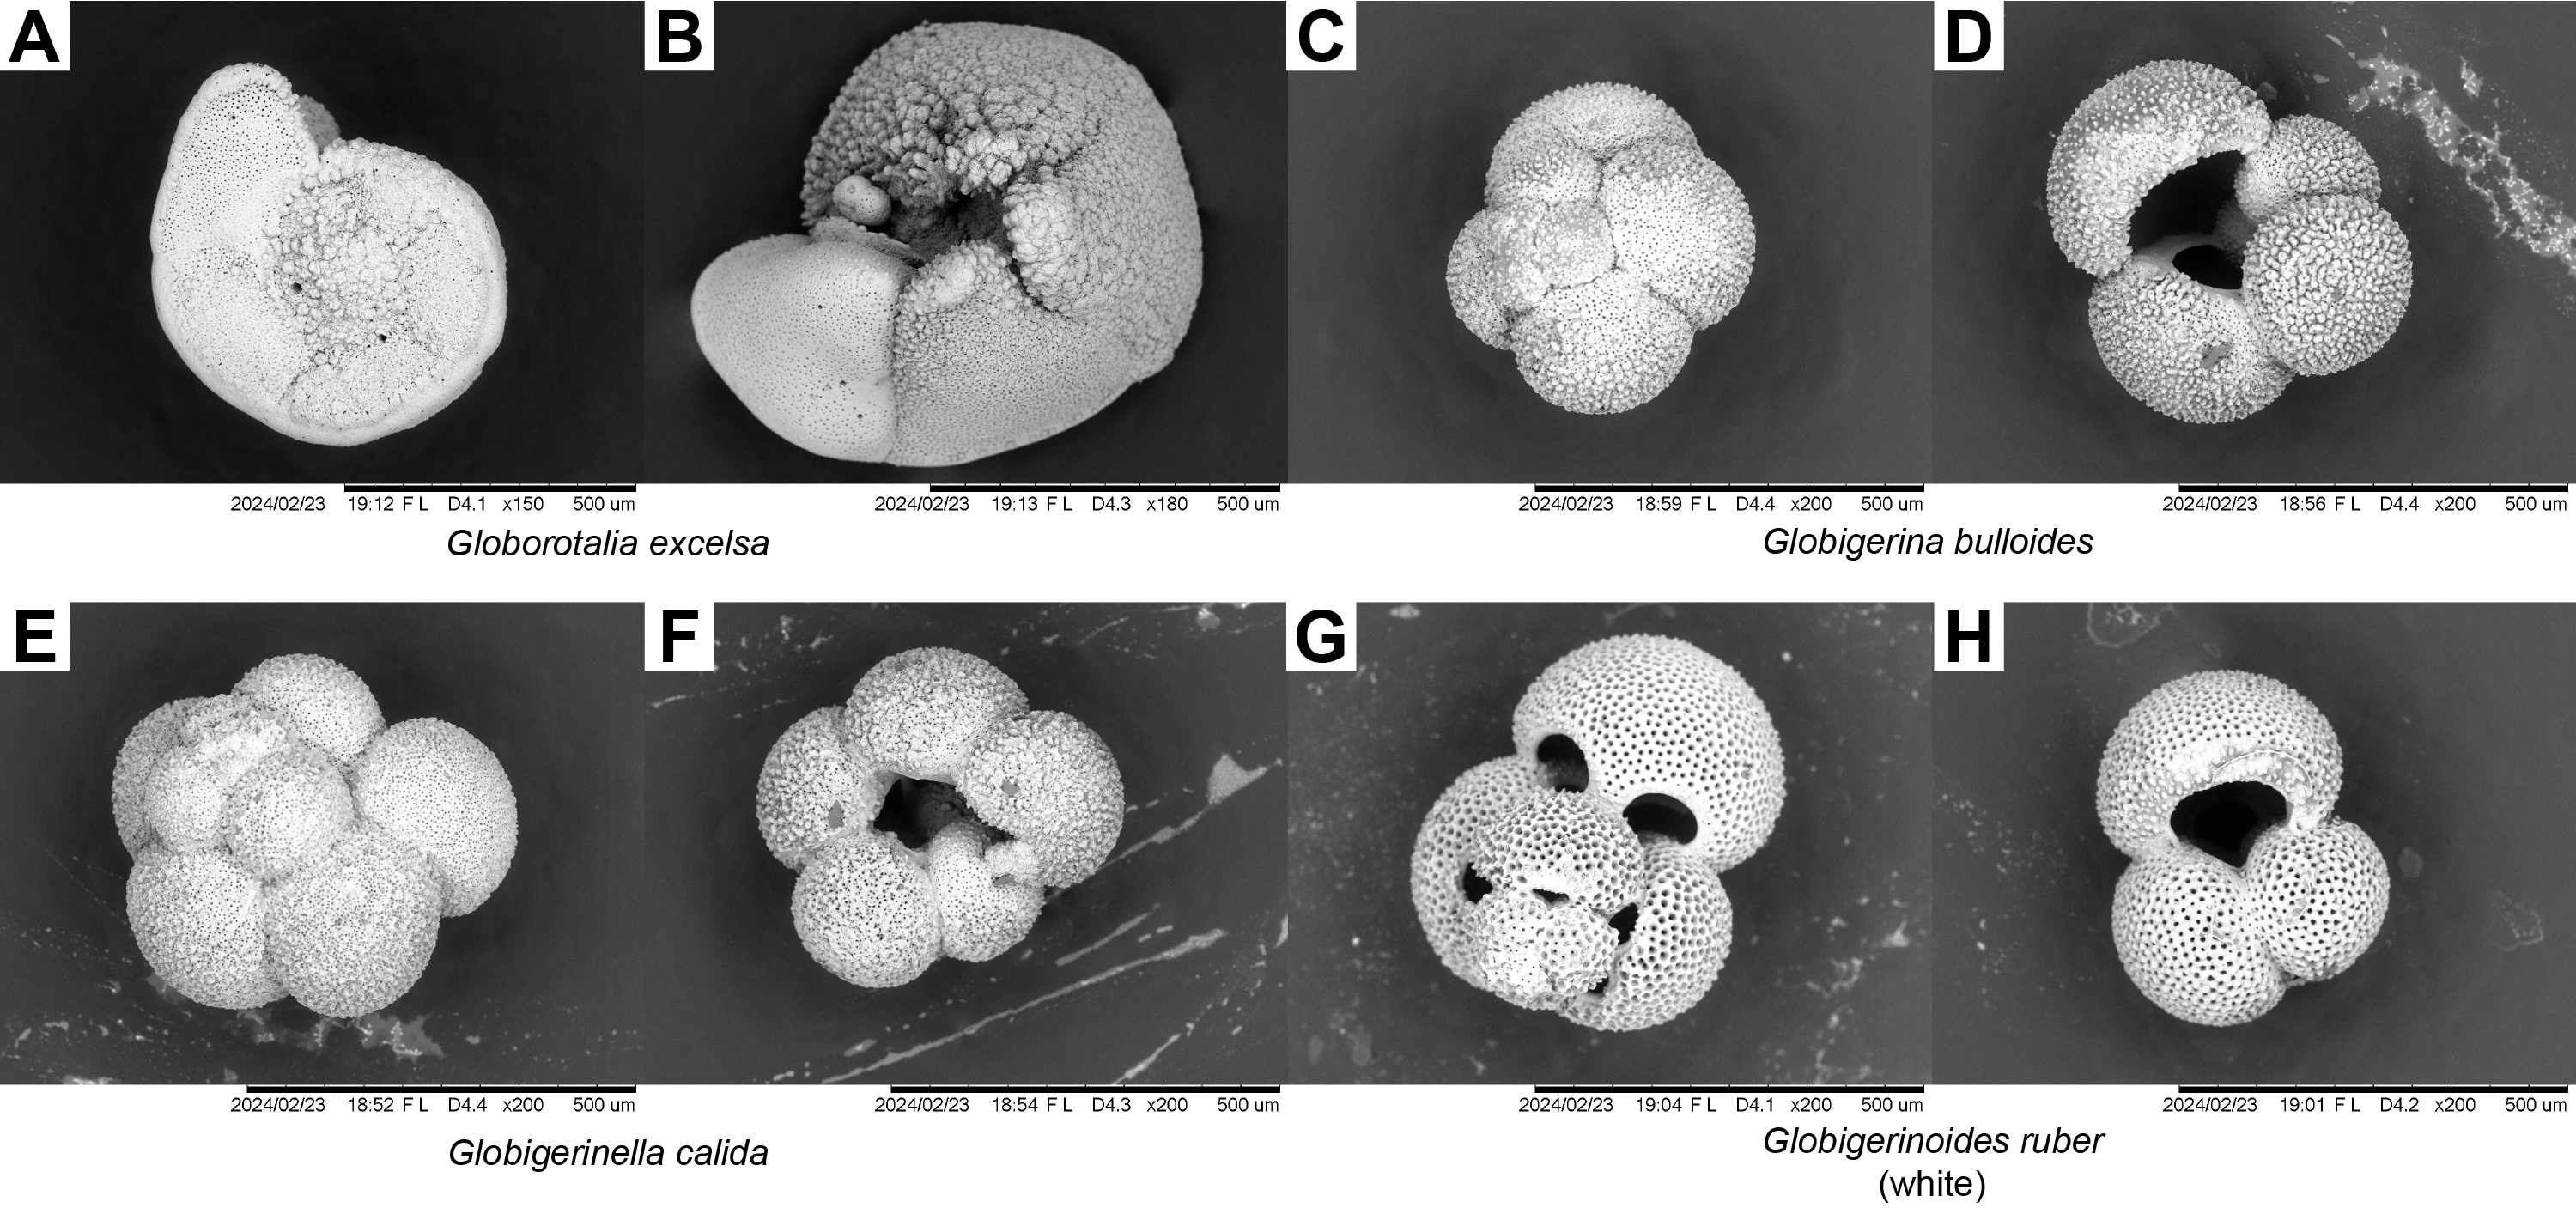
Figure F10. Planktic foraminifera.
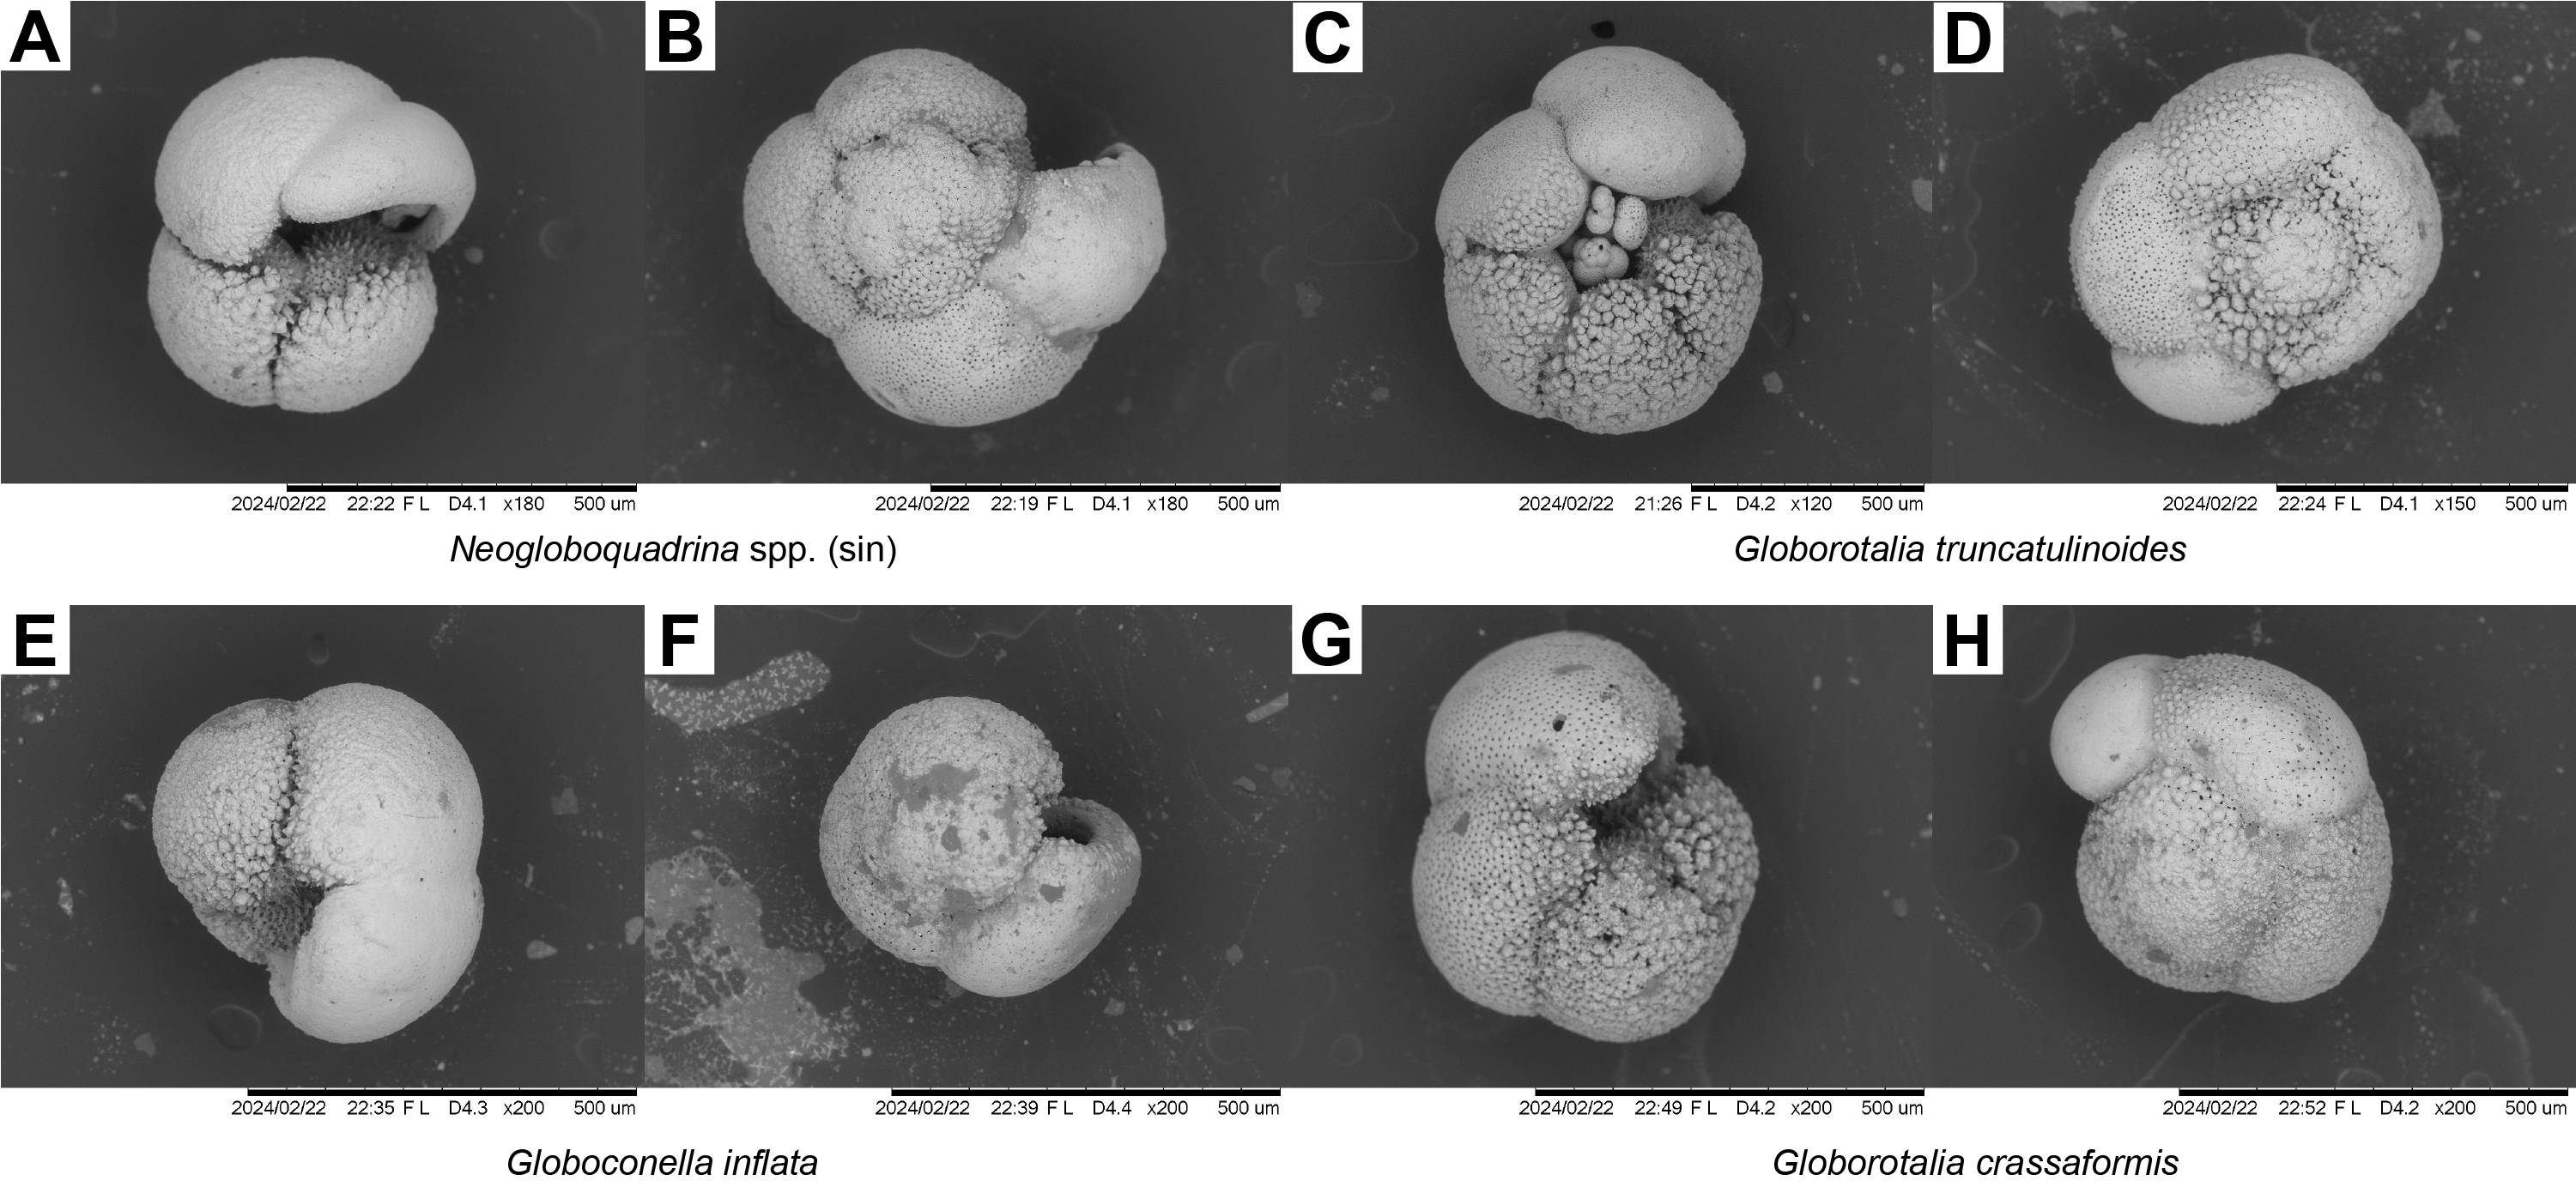
Figure F11. Planktic foraminifera.
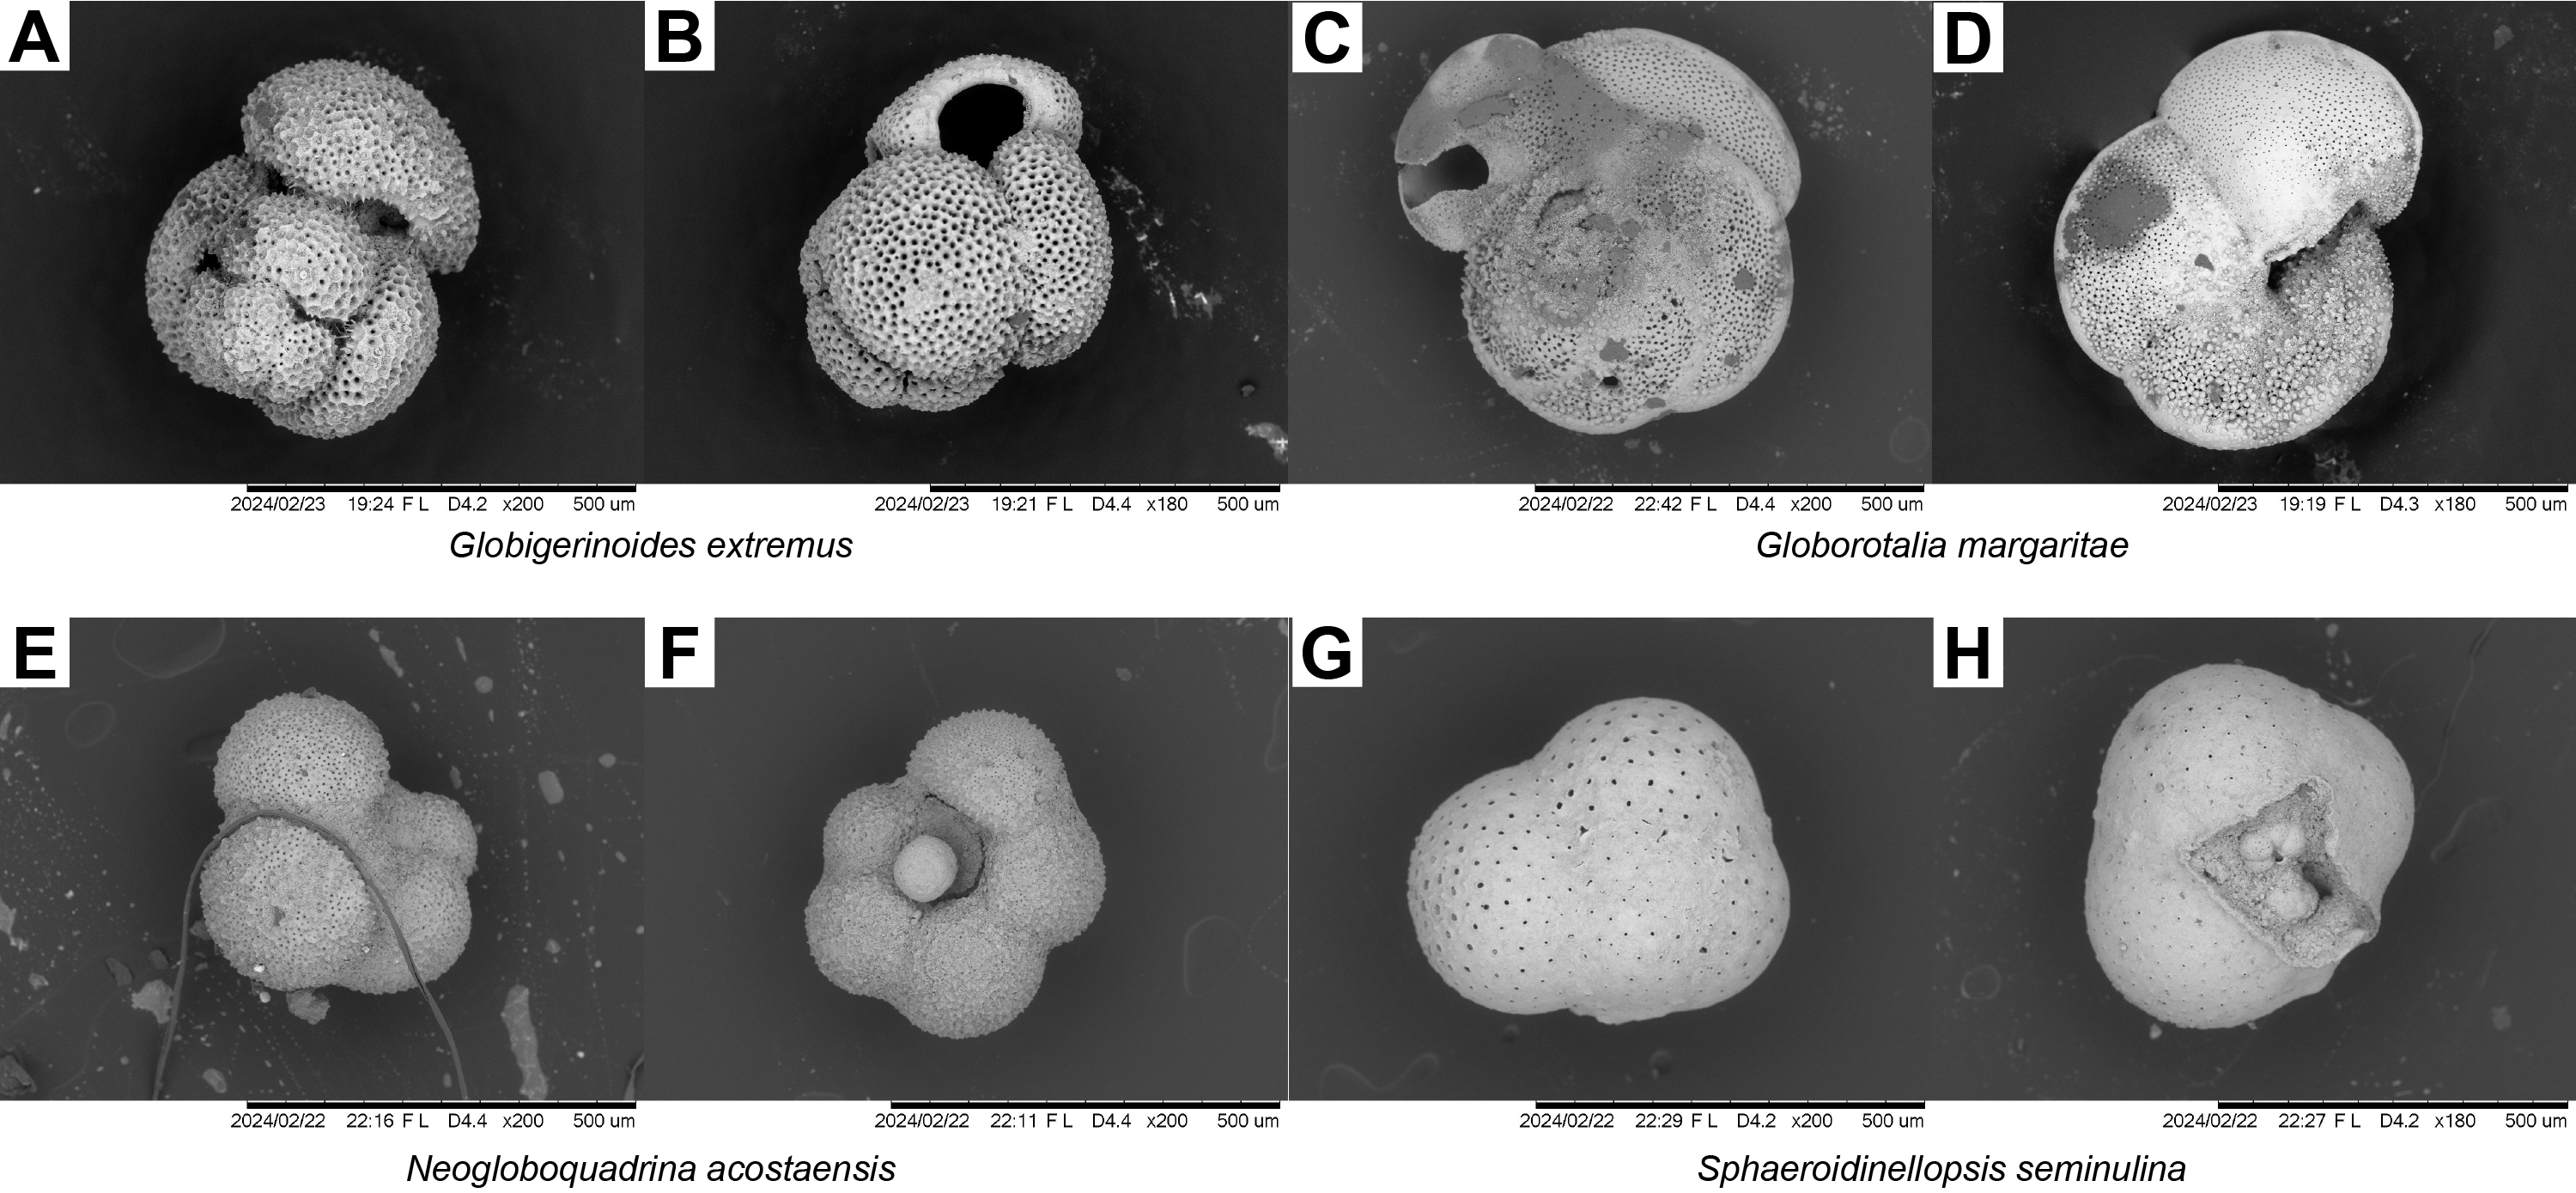
Figure F12. Planktic foraminifera.
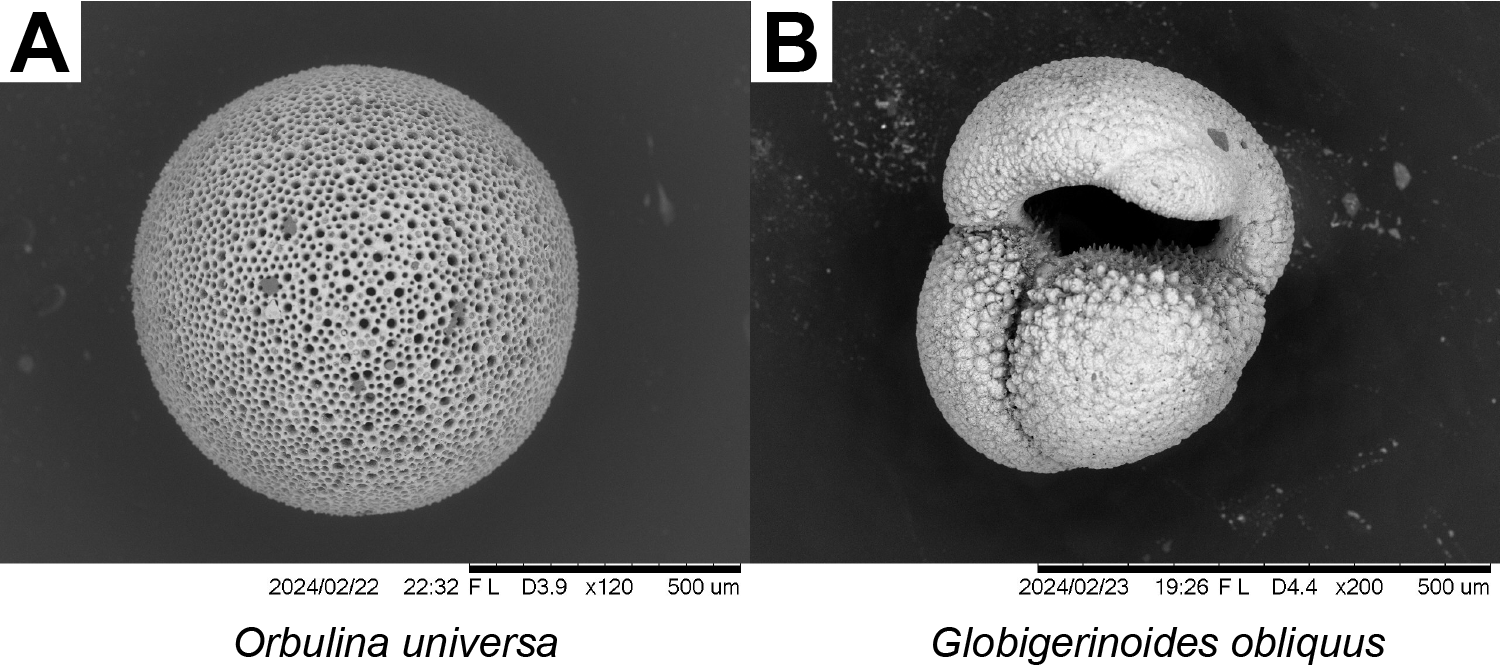
Figure F13. Planktic foraminifera.
Biozones were delineated based on faunal succession of planktic foraminiferal marker species, as defined below.
4.1.2.1. Zone MPle2b
Samples 402-U1613A-1R-CC (4.73–4.78 mbsf) to 3R-CC (28.38–28.43 mbsf) were assigned to the MPle2b subzone because of the dominant presence (acme occurrences) of G. calida (Figure F10) species along with the very commonly occurring late Neogene G. bulloides (Figure F10) and O. universa (Figure F13) species.
4.1.2.2. Zone MPle2a
Sample 402-U1613A-4R-CC (28.5–28.62 mbsf) was assigned to the MPle2a subzone coinciding with the influx of G. excelsa species (~0.78 Ma) (Figure F10).
No marker species were observed in Sample 402-U1613A-5R-CC (46.49–46.540 mbsf) because the observed sediment was all volcaniclastic in nature.
4.1.2.3. Zone MPle1
Samples 402-U1613A-6R-CC (51.22–51.27 mbsf) to 9R-CC (83.35–83.4 mbsf) were assigned to the MPle1 zone (MPle1c–MPle1a subzones, successively) concurrent with the abundant occurrence of Neogloboquadrina spp. (sin), common occurrences of G. truncatulinoides (Figure F11) and G. inflata (Figure F11), and the last rare occurrence of G. obliquus species (~1.82 Ma) (Figure F13).
4.1.2.4. Zone MPl6
Sample 402-U1613A-10R-CC (83.35–83.4 mbsf) was assigned to the MPl6 zone because G. inflata (Figure F11) and G. crassaformis species were very abundant in these sedimentary layers. G. extremus (Figure F12) and G. obliquus (Figure F13) species also have their last common occurrences in these sedimentary layers.
4.1.2.5. Zone MPl5b
Sample 402-U1613A-11R-CC (100.51–100.56 mbsf) was assigned to the upper MPl5b zone coinciding with the common occurrence of Globorotalia bononiensis species (G. bononiensis recognized by Lirer et al., 2019, is a subvariant currently identified as Globoconella puncticulata according to the Pforams Mikrotax database).
4.1.2.6. Zones MPl5b (majority of the zone)–MPl4
A ~1.5 Ma hiatus is present below the upper MPl5b zone (latest Zanclean–early Gelasian; what would have been the MPl5–MPl4 zones) because the planktic foraminifera marker species bioevents occurring in these layers are not observed in the core catcher samples of the site.
4.1.2.7. Zones MPl3–MPl2
Samples 402-U1613A-12R-CC (114.38–114.43 mbsf) and 13R-CC (121.55–121.6 mbsf) are assigned to the lower MPl3 and MPl2 zones concurrent with abundant occurrences of G. margaritae (Figure F12) species and the second influx of N. acostaensis (Figure F12) species, respectively.
4.1.2.8. Zone MPl1
Core 402-U1613A-14R-CC (134.15–134.2 mbsf) is assigned to the MPl1 biozone coinciding with the abundant (acme) occurrences of S. seminulina (Figure F12) and first influx of N. acostaensis (Figure F12) species.
This sedimentary layer (~5.332 Ma) is deposited directly above an interval devoid of planktic foraminifera species observed in Sample 402-U1613A-15R-CC (138.77–138.82 mbsf).
4.2. Calcareous nannofossils
Calcareous nannofossils were analyzed from 14 core catcher samples from Hole U1613A (Core 2R had no recovery) and additional toothpick samples collected from Cores 12R and 15R to identify a possible temporal hiatus and refine the age of the oldest sediments, respectively. The assigned biozones follow the biozonation scheme described in Di Stefano et al. (2023). The list of the examined samples and the biozonal assignment is provided in Figure F14.
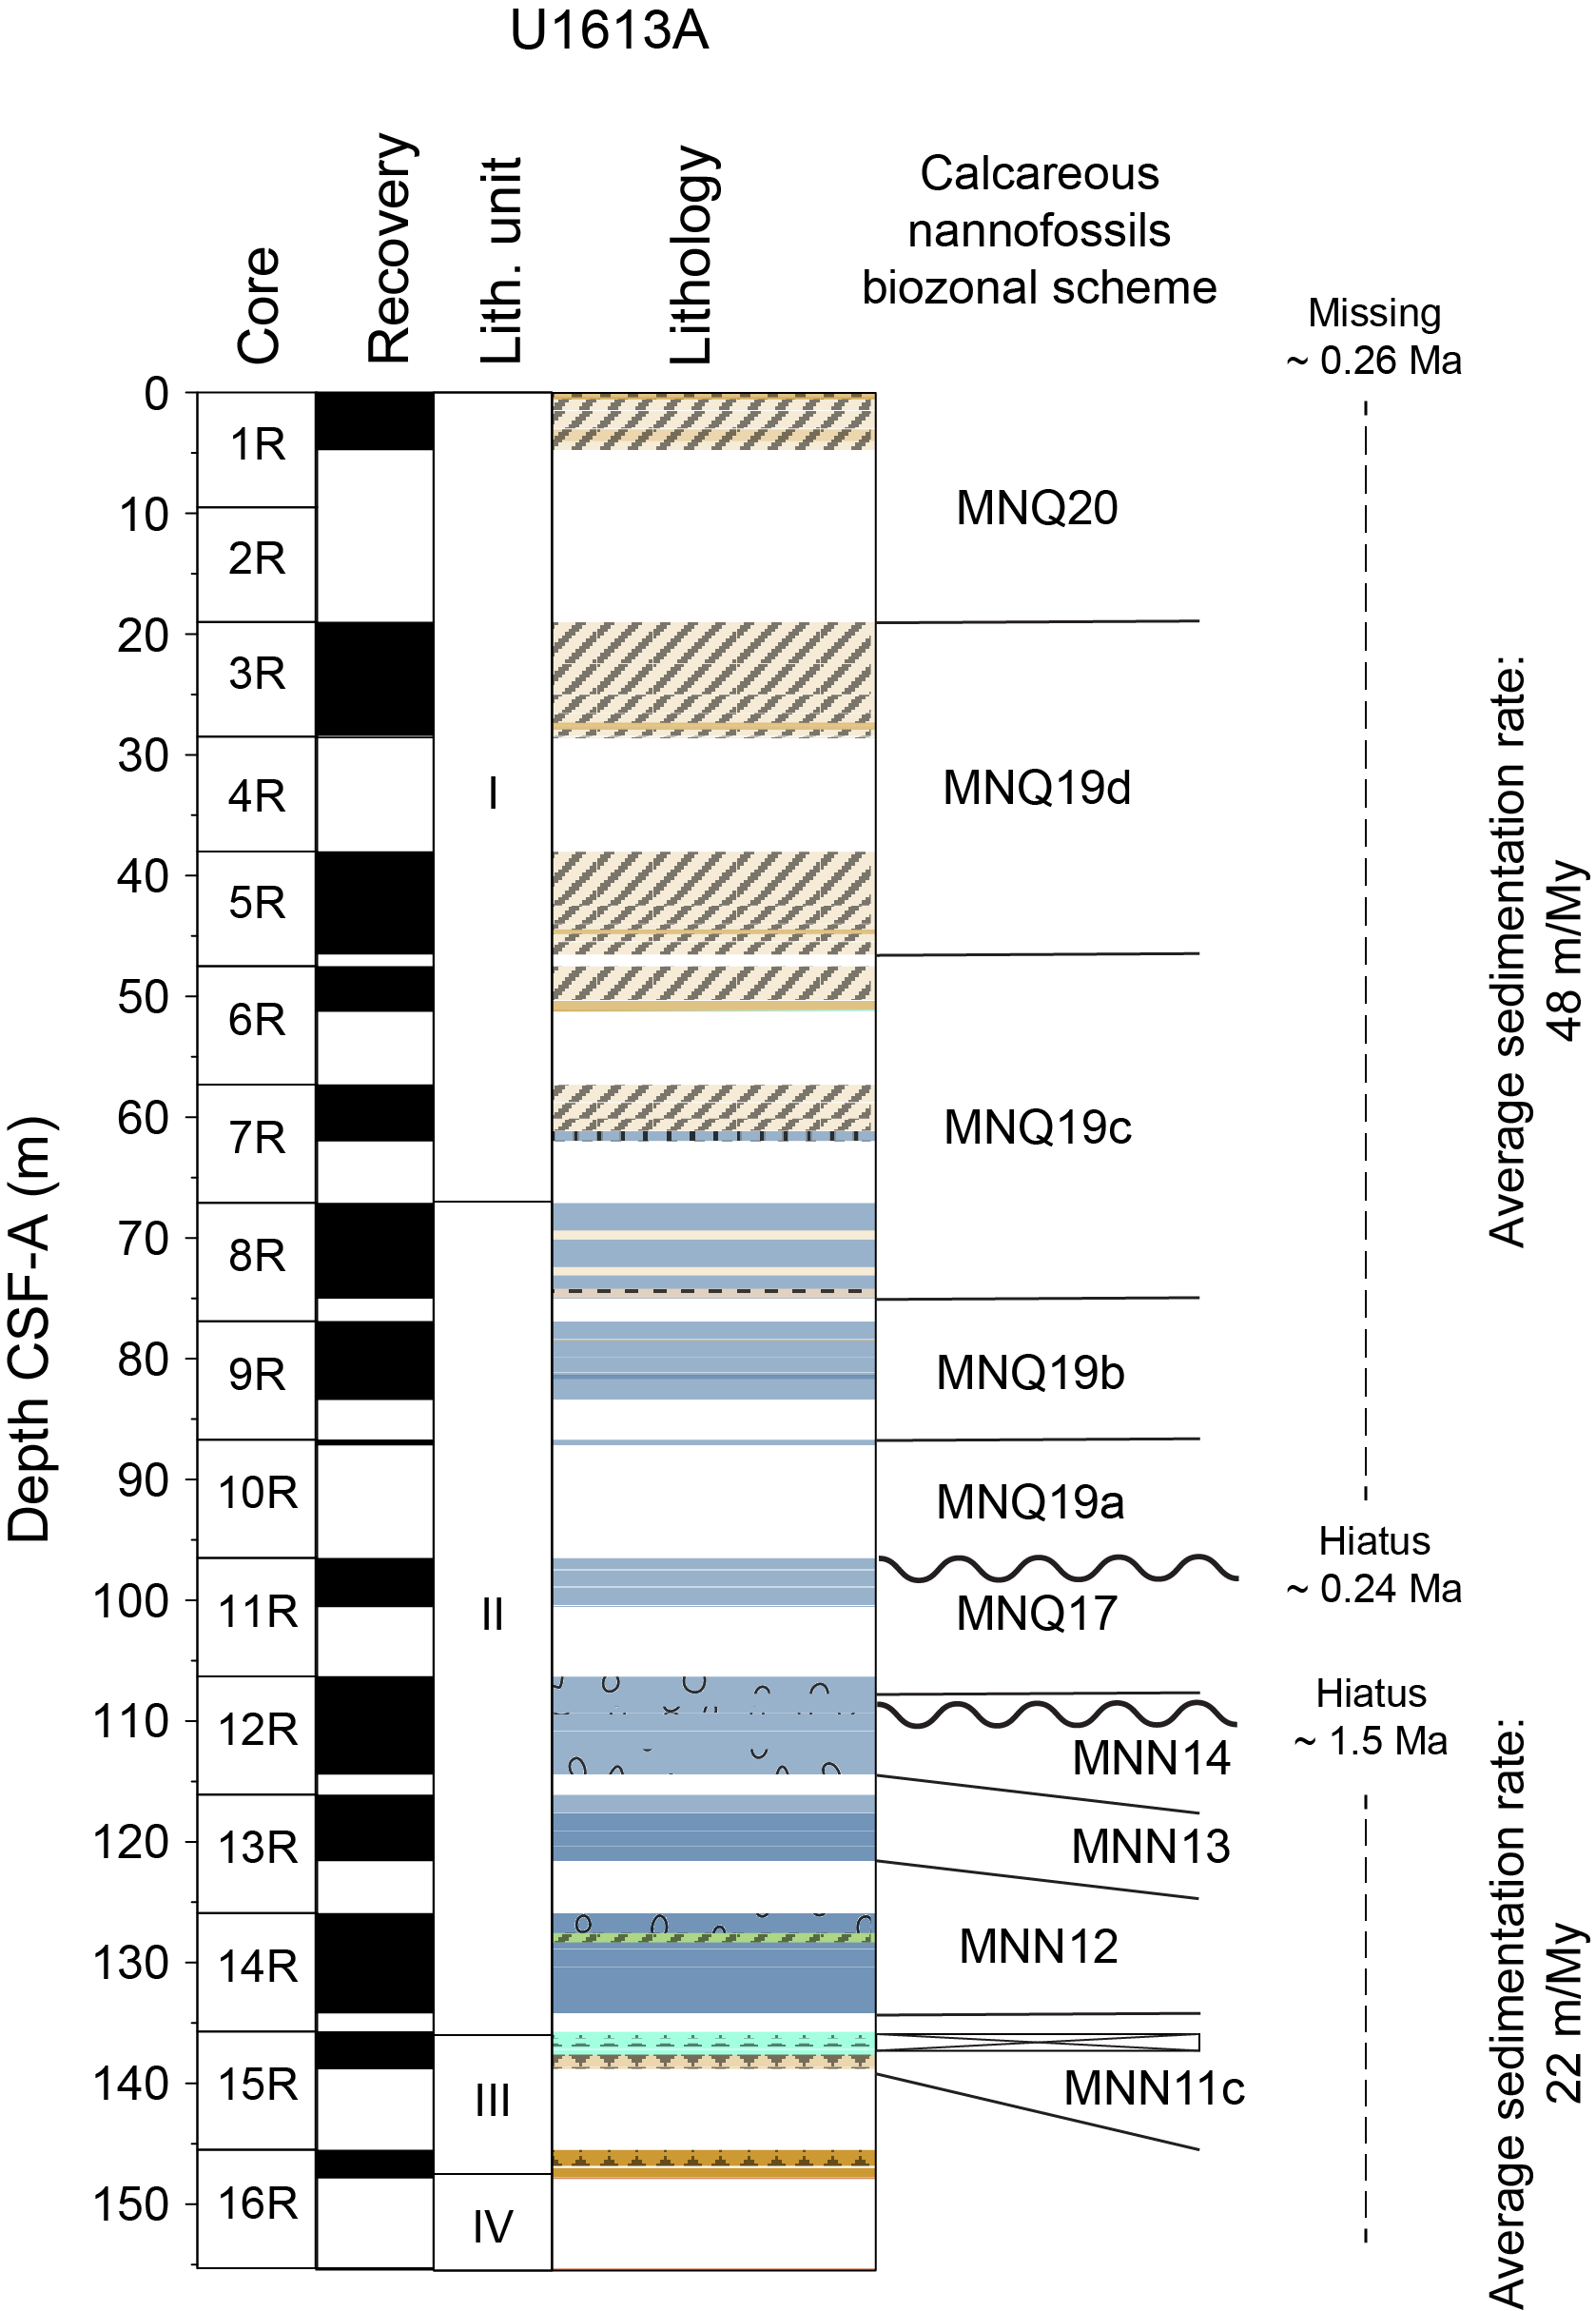
Figure F14. Calcareous nannofossil biozonal assignment.
According to nannofossil data, sediments younger than 0.26 Ma are missing in Hole U1613A. Samples 1R-CC and 3R-CC have been assigned to the Middle–Upper Pleistocene MNQ20 biozone (0.26–0.46 Ma) based on the presence of abundant and well-preserved assemblages consisting mainly of small- and medium-sized Gephyrocapsa, Helicosphaera carteri, Helicosphaera inversa, Calcidiscus leptoporus, Coccolithus pelagicus, Coronosphaera spp., Syracosphaera pulchra.
Samples 402-U1613A-4R-CC and 5R-CC were assigned to the upper Lower Pleistocene MNQ19d subzone (0.46–0.96 Ma) because of the presence of Pseudoemiliania lacunosa and Gephyrocapsa omega in addition to the others listed above.
Samples 402-U1613A-6R-CC to 8R-CC were assigned to the late Calabrian MNQ19c subzone (0.96–1.24 Ma), which is characterized by the presence of abundant small-sized Gephyrocapsa, H. carteri, Helicosphaera sellii, C. leptoporus, Calcidiscus macintyrei, P. lacunosa, and Geminilithella (Umbilicosphaera) rotula.
Sample 402-U1613A-9R-CC was assigned to the MNQ19b subzone (1.24–1.61 Ma; Calabrian), which is characterized by the short-ranging large Gephyrocapsa, and Sample 10R-CC was assigned to the MNQ19a zone (1.61–1.71 Ma; Calabrian), the basal boundary of which is defined by the first occurrence of medium-sized Gephyrocapsa.
None of the samples were assigned to the approximately 0.24 My long MNQ18 zone (1.71–1.95 Ma; Gelasian–Calabrian transition). So far, in the succession above, the nannofossil data indicate an almost continuous sedimentary succession with a very high sedimentation rate estimated to about 48 m/My with a probable short hiatus at about 90 mbsf (between Samples 402-U1613A-10R-CC and 11R-CC).
Sample 402-U1613A-11R-CC was assigned to the MNQ17 zone (1.95–2.51 Ma; Calabrian), which is characterized by the presence of Discoaster brouweri, Discoaster triradiatus, H. carteri, H. sellii, C. leptoporus, C. macintyrei, P. lacunosa, Pontosphaera spp., Sciphosphaera spp., and Syracosphaera spp.
Samples 402-U1613A-12R-CC, 13R-CC, and 14R-CC were respectively assigned to the Early Pliocene (Zanclean) MNN14 (3.85–4.11 Ma; assemblage: Amaurolithus delicatus, C. pelagicus, C. leptoporus, Discoaster asymmetricus, D. brouweri, Discoaster tamalis, Discoaster pentaradiatus, G. (U.) rotula, H. carteri, H. sellii, Reticulofenestra pseudoumbilicus, and Sphenolithus spp.), MNN13 (4.11–4.62 Ma; assemblage: C. pelagicus, C. leptoporus, D. brouweri, Discoaster surculus, D. pentaradiatus, Discoaster variabilis, G. (U.) rotula, H. carteri, H. sellii, R. pseudoumbilicus, and Sphenolithus spp.), and MNN12 zones (4.62–5.33 Ma; assemblage: C. pelagicus, C. leptoporus, D. brouweri, D. surculus, D. pentaradiatus, D. variabilis, G. (U.) rotula, H. carteri, H. sellii, Reticulofenestra zancleana, and Sphenolithus spp.).
4.3. Synthesis of microfossil data
Both foraminifera and nannofossil data indicate a temporal hiatus of ~1.5 My between Samples 402-U1613A-12R-CC and 11R-CC, where assemblages from the early Zanclean to the late Gelasian stage are absent (MNN16 and MNN15 nannofossil zones; MPl5b–MPl4a planktic foraminifera biozones). Nannofossil analyses from additional samples in Core 12R confirm that the hiatus lies between Sections 12R-2 and 12R-3 (~108 mbsf). The sedimentation rate is estimated to be ~22 m/My in the lower sedimentary interval (Samples 12R-CC to 15R-CC).
Additional samples were analyzed from Core 402-U1613A-15R to estimate the age of the oldest sediments encountered above the basement. Sample 402-U1613A-15R-2, 8 cm, identified the MNN11c biohorizon with Sphenolithus spp. acme occurrences (Figure F15) comparable to one of the late Messinian Salinity Crisis Onset Events (Maniscalco et al., 2023), which ranges 5.97–5.85 Ma.
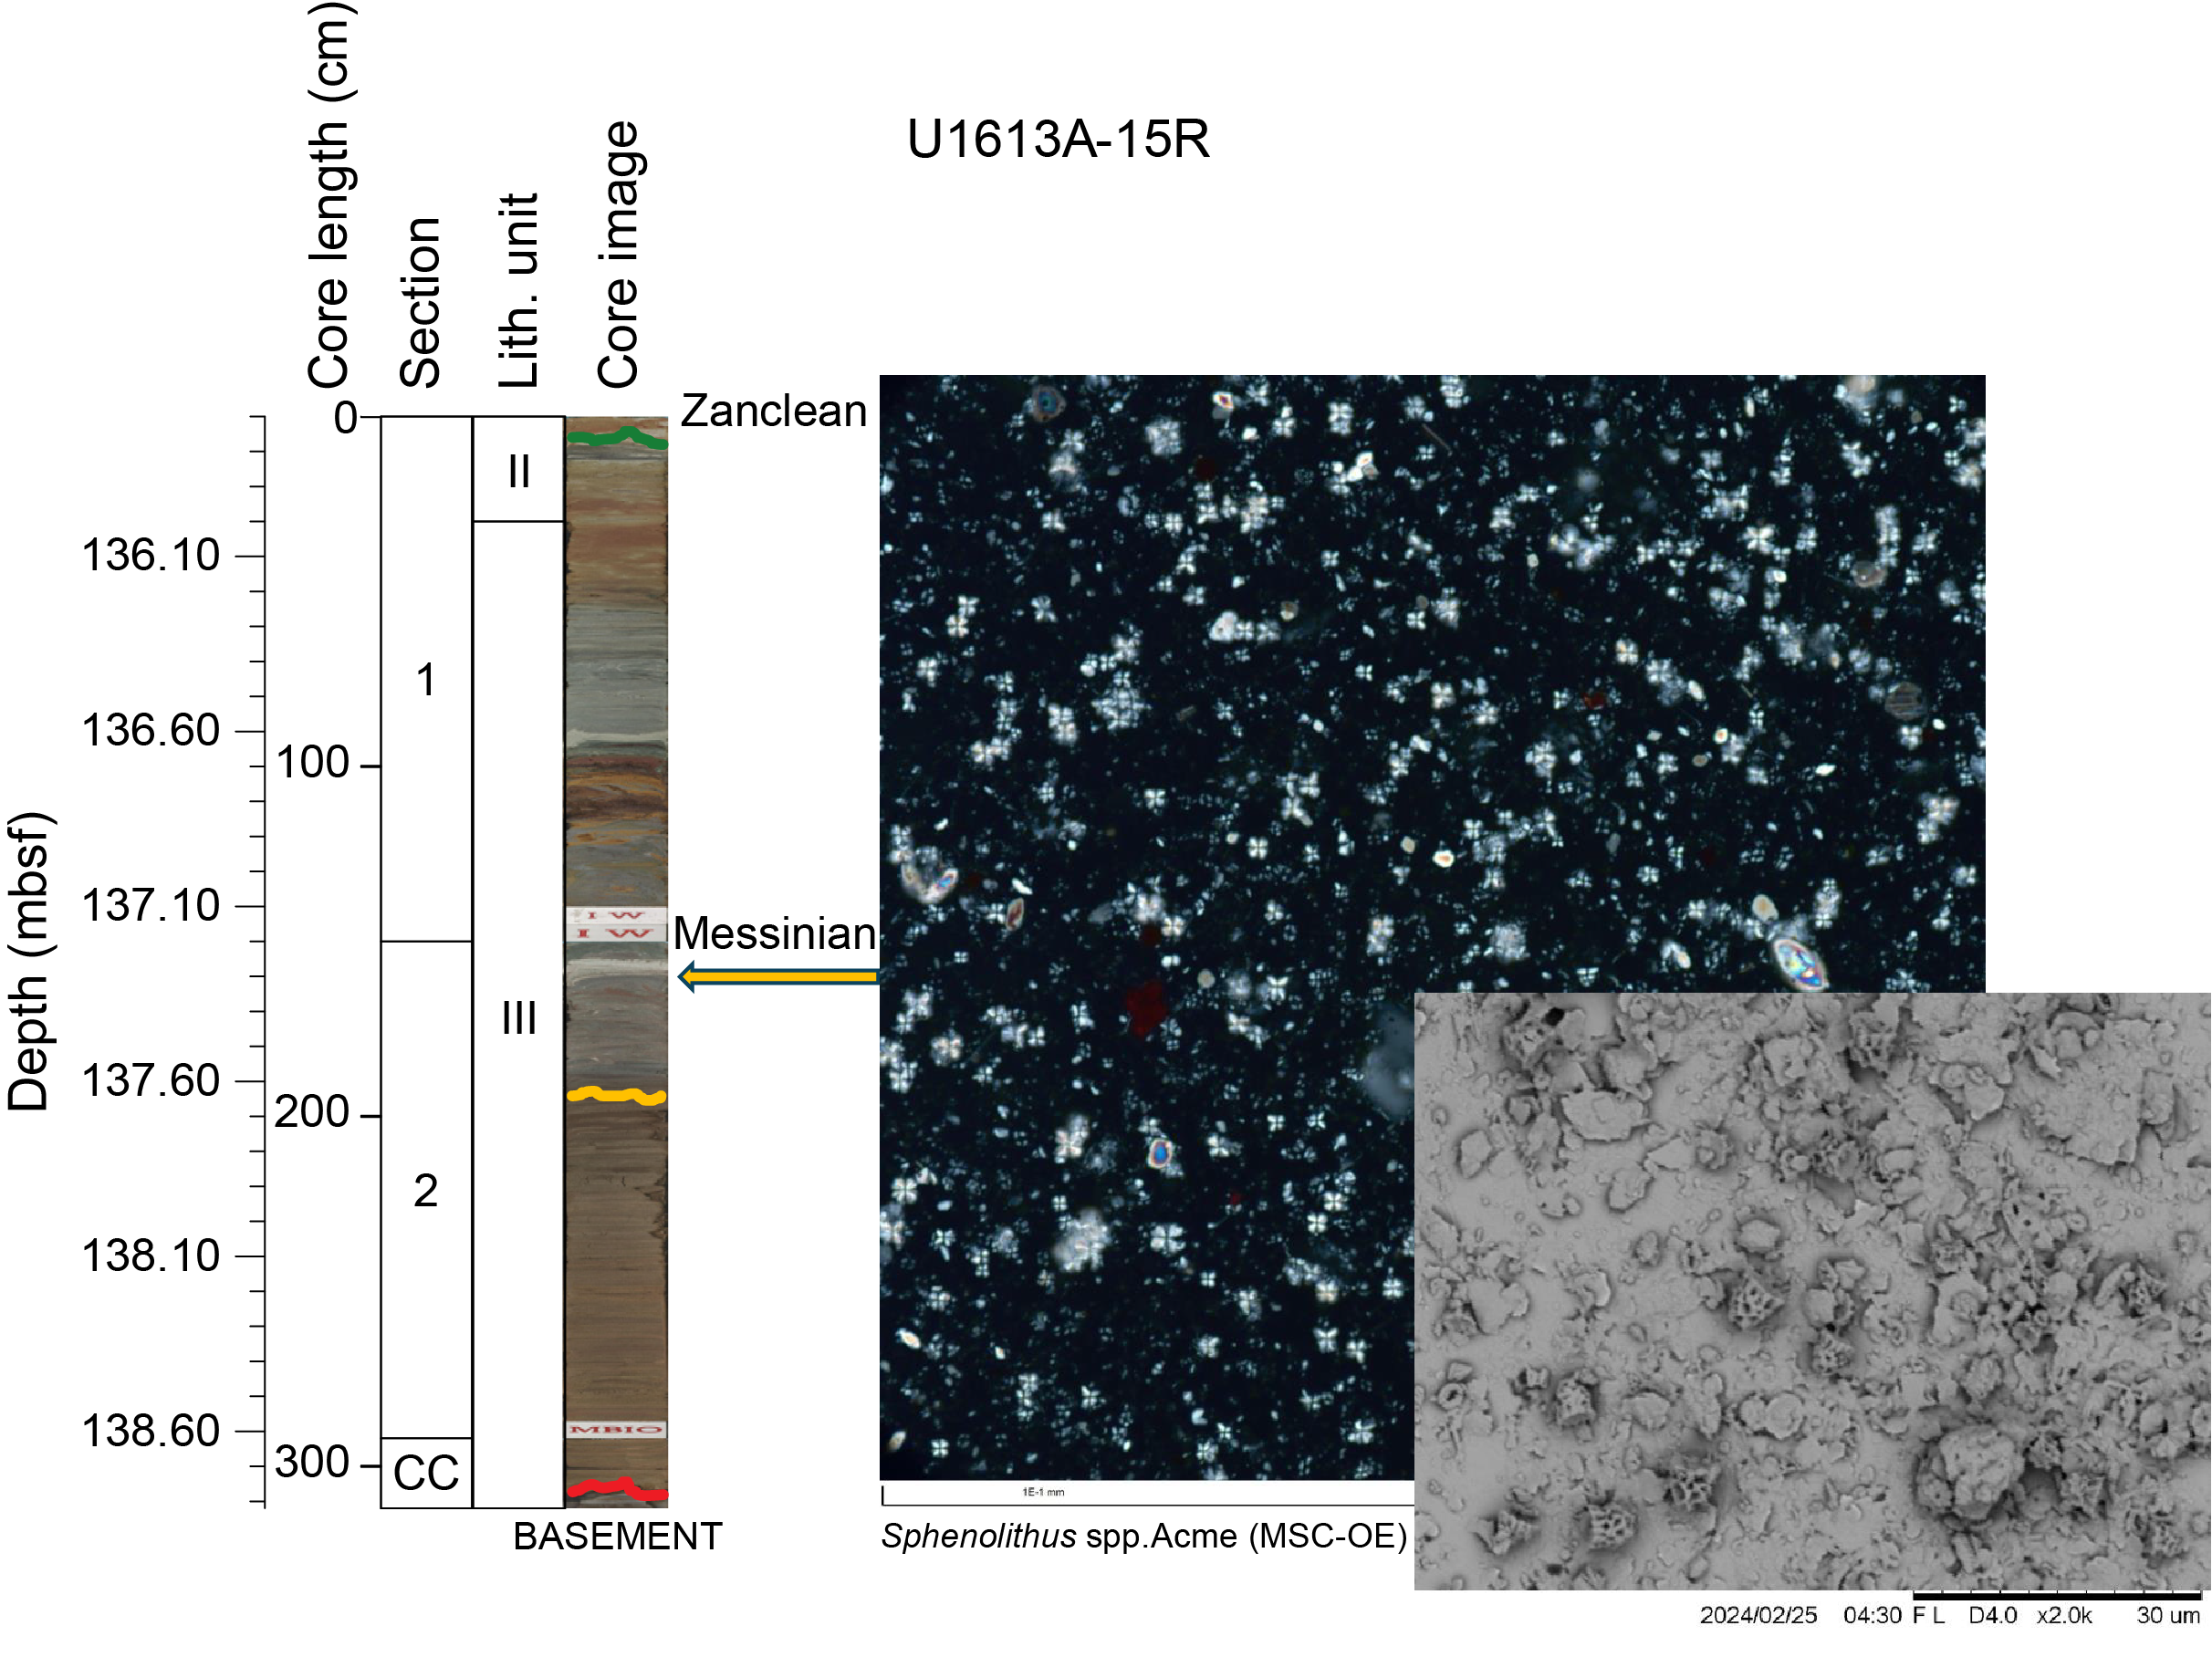
Figure F15. Detail of nannofossil assemblage.
Sediments and sedimentary rocks below Core 402-U1613A-16R were correlated to units outcropping on Sardinia and correspond to a continental basement. In particular, a middle to late Permian palynomorph (Klausipollenites schaubergerii) was detected in a scanning electron microscope (SEM) photograph from a sample taken in the black shale of Core 24R (A. Spina, pers. comm., 2024). These bisaccate pollen grains have been observed in Permian sedimentary rocks that outcrop in the northern Apennines (Spina et al., 2019).
5. Paleomagnetism
5.1. Sediment
Hole U1613A was completed with an overall core recovery of 44%. The archive-half sections were measured for natural remanent magnetization (NRM) at 2 cm intervals on the superconducting rock magnetometer (SRM). Although the recovery is much improved compared with Hole U1612A, strong drilling disturbance is pervasive in the uppermost five cores and Core 402-U1613A-11R. Heavily disturbed intervals of these cores were skipped for NRM measurement. The results show some reverse polarity intervals in Cores 3R and 4R; however, the biostratigraphy suggests that this interval is within the Brunhes Chron (see Biostratigraphy). Given the severity of the drilling disturbance in these cores, the reverse polarity is probably unreliable.
The most continuous and informative paleomagnetic profiles are obtained from Cores 402-U1613A-12R through 14R (106.3–135.7 m CSF-A), where multiple reversals are observed within relatively thin intervals (<50 cm). The mean inclination of NRM demagnetized at 20 mT peak alternating field (AF) (NRM@20mT) is close to the geocentric axial dipole (GAD) inclination for both polarities (Figure F16). Because drill string overprinting generally results in steep inclinations, it may not be the primary cause of the secondary NRM. Alternatively, some reversal records correspond to lithologic variations in these cores, suggesting an influence of diagenesis on the NRM.
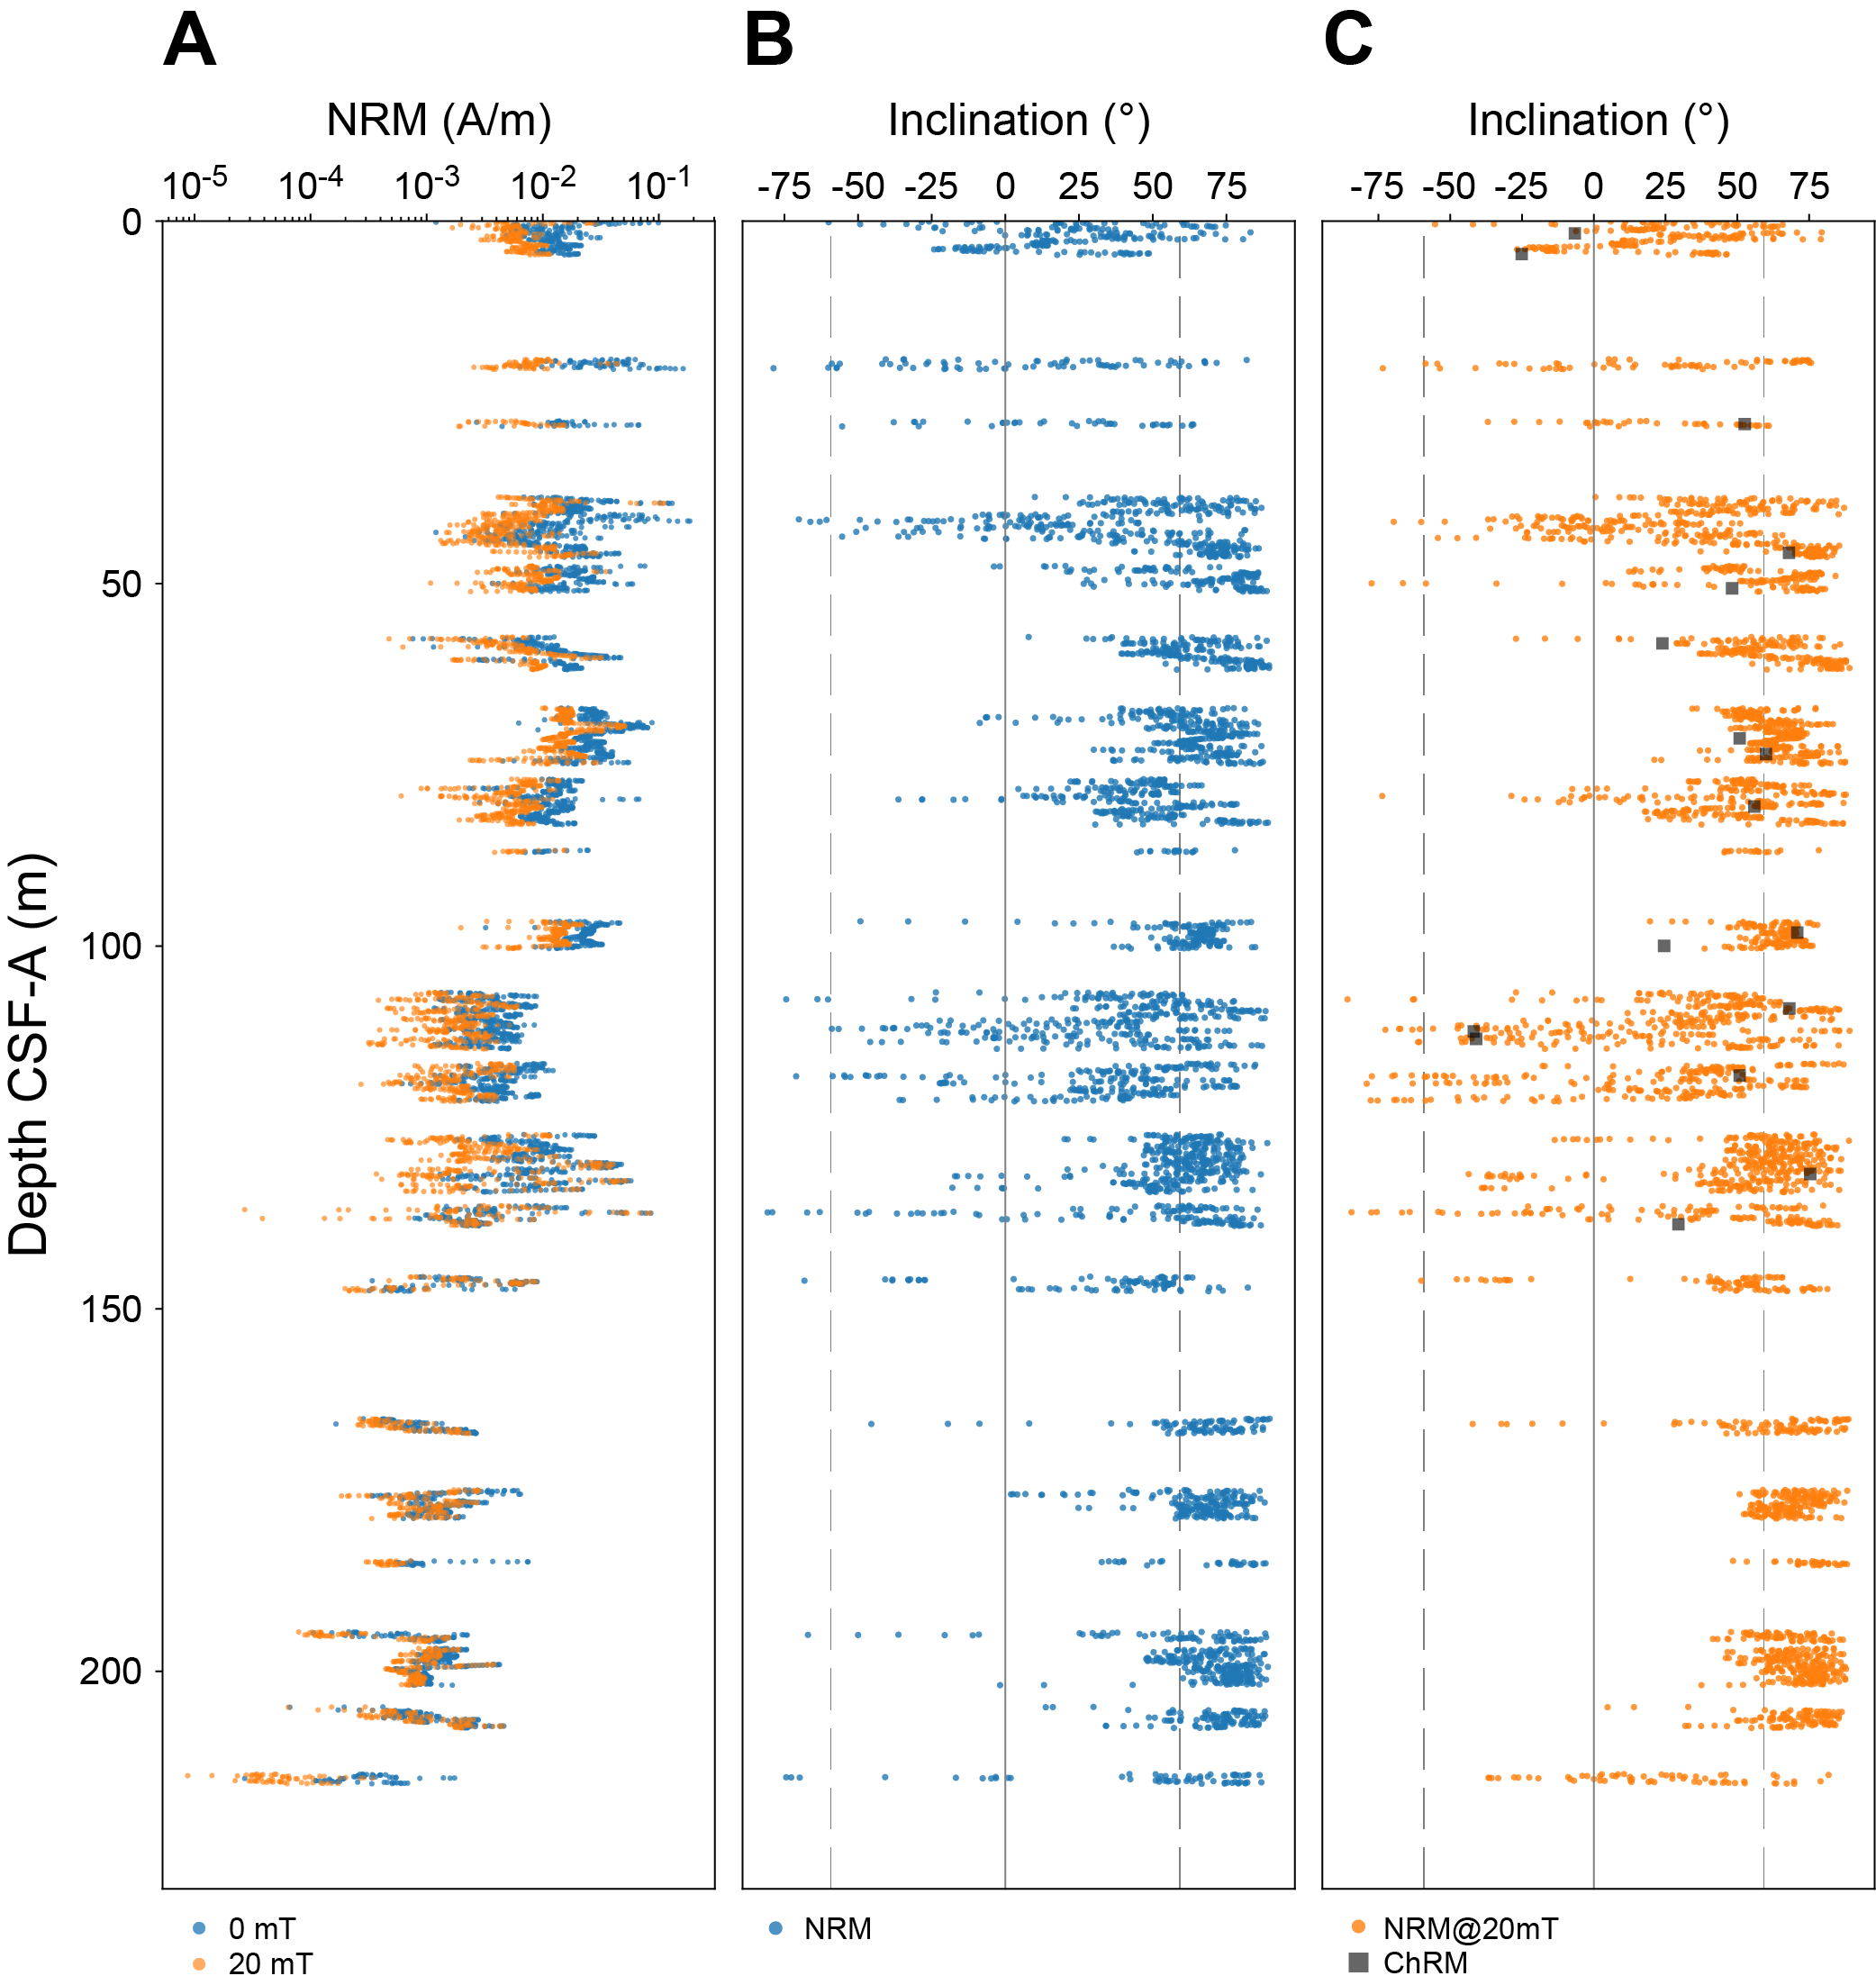
Figure F16. NRM variation.
A total of 31 discrete samples from Cores 402-U1613A-1R through 19R were collected to study the magnetic fabric present (anisotropy of magnetic susceptibility) and NRM behavior during AF demagnetization up to 100 mT. These magnetization experiments were performed on a total of 22 discrete samples, avoiding sampling heavily disturbed intervals.
Demagnetization data suggests that drill string overprint can be removed at a field of 20 mT. A total of 9 of the 22 samples had the expected inclinations (within an error of ±10°) for this latitude in the Mediterranean (inclination of ±60°). Together, they have an average characteristic remanent magnetization (ChRM) of 60° and an average maximum angular deviation of 8.5° (Kirschvink, 1980). Two of these samples, from Cores 402-U1613A-12R and 13R, display reverse polarity, agreeing with the SRM archive-half data for these cores. A total 28% of the samples exhibited prolate magnetic grain fabrics, and the remaining samples exhibited oblate grain fabric. There is no lithologic correlation to these grain shapes, and these differences could be attributed to sediment alteration.
5.1.1. Magnetostratigraphy
When correlated with biostratigraphic results (see Biostratigraphy), the reversal pattern revealed by the NRM@20mT inclination of the archive-half sections resembles the reversal sequence of the Early Pliocene geomagnetic polarity timescale (GPTS2020) (Gradstein et al., 2020). However, the short (20–40 cm) reversed intervals in Sections 402-U1613A-12R-4 (110.8–112.3 m CSF-A) and 13R-2 (117.61–119.11 m CSF-A) outnumber the reported reversal events in this period. There are also several similarly short, reversed intervals in Cores 14R and 15R (125.9–138.82 m CSF-A) often associated with lithology changes. Because there is no clear indication of how to distinguish primary and secondary NRM from the available shipboard data, the correlation between the magnetic polarity zones of Hole U1613A and the GPTS2020 timescale remains uncertain.
5.2. Basement rocks
Lithostratigraphic Unit IV (165–223.6 m CSF-A) is composed of continental rocks (see Lithostratigraphy). The NRM of this unit has lower intensity than the other units (Figure F16). The low NRM intensity is ascribed to the low concentration of magnetic minerals as well as drilling disturbance. The inclination of NRM@20mT is mostly normal and provides little magnetostratigraphic information.
6. Igneous and metamorphic petrology
The lowermost units (IV–VI) of Hole U1613A contain rocks of sedimentary origin with a variety of colors, probably due to different oxidation states and different degrees of weathering. Core samples were affected by drilling disturbance, making the description of the petrologic and structural features difficult. These sedimentary rocks are interpreted as the pre-Messinian basement because of their analogies with sedimentary formations exposed in Sardinia (e.g., Menegoni et al., 2024).
The basement units begin with Lithostratigraphic Unit IV (147.5–165 mbsf), which is a matrix-supported polymictic conglomerate containing centimeter-scale quartz clasts in a reddish matrix that suggests a continental sedimentary environment. Lithostratigraphic Unit V (165–214 mbsf) consists of reddish to greenish sandy mudstone with complex textures that are mostly the result of drilling disturbance. The ratio of greenish to reddish portions is higher in the deeper parts of the core. Sporadic sandy pebbles to cobbles are observed in interval 402-U1613A-22R-1, 0–65 cm, and within the reddish to greenish shales. In interval 23R-2, 52–60 cm, polymictic conglomerates are found within the greenish-rich shale. Section 22R-3 through Core 24R contains a continuous black shale that forms Lithostratigraphic Unit VI. The black shale is cut by thin (approximately millimeter-scale) white-colored carbonate-bearing veins. The black shale consists of calcite, dolomite, clay minerals, microfossils, and a small amount of sulfides.
6.1. Lithostratigraphic Unit IV: conglomerate (147.5–165 mbsf)
Conglomerates of Unit IV were recovered in Sections 402-U1613A-16R-CC and 17R-CC (Figure F17). They consist of rounded to subrounded clasts of quartz (locally centimeter sized) and volcanic material in a reddish fine-grained matrix. No obvious sedimentary features can be observed, but we note that different clasts vary in grain size and sorting. The very low recovery (13%) hampers our understanding of the total thickness of this layer, which could be as much as 19 m. This unit could correspond to the Verrucano conglomerates that outcrop in Western Sardinia (e.g., Porticciolo conglomerate and the Cala del Vino sandstones), where they mark the Permian–Triassic transition (~250 Ma). This clastic succession from Sardinia shows field structures typical of fluvial to eolian environments (Menegoni et al., 2024) and shares the petrographic assemblages of our drilled Unit IV. However, further work is needed to accurately determine the age and origin of this unit.
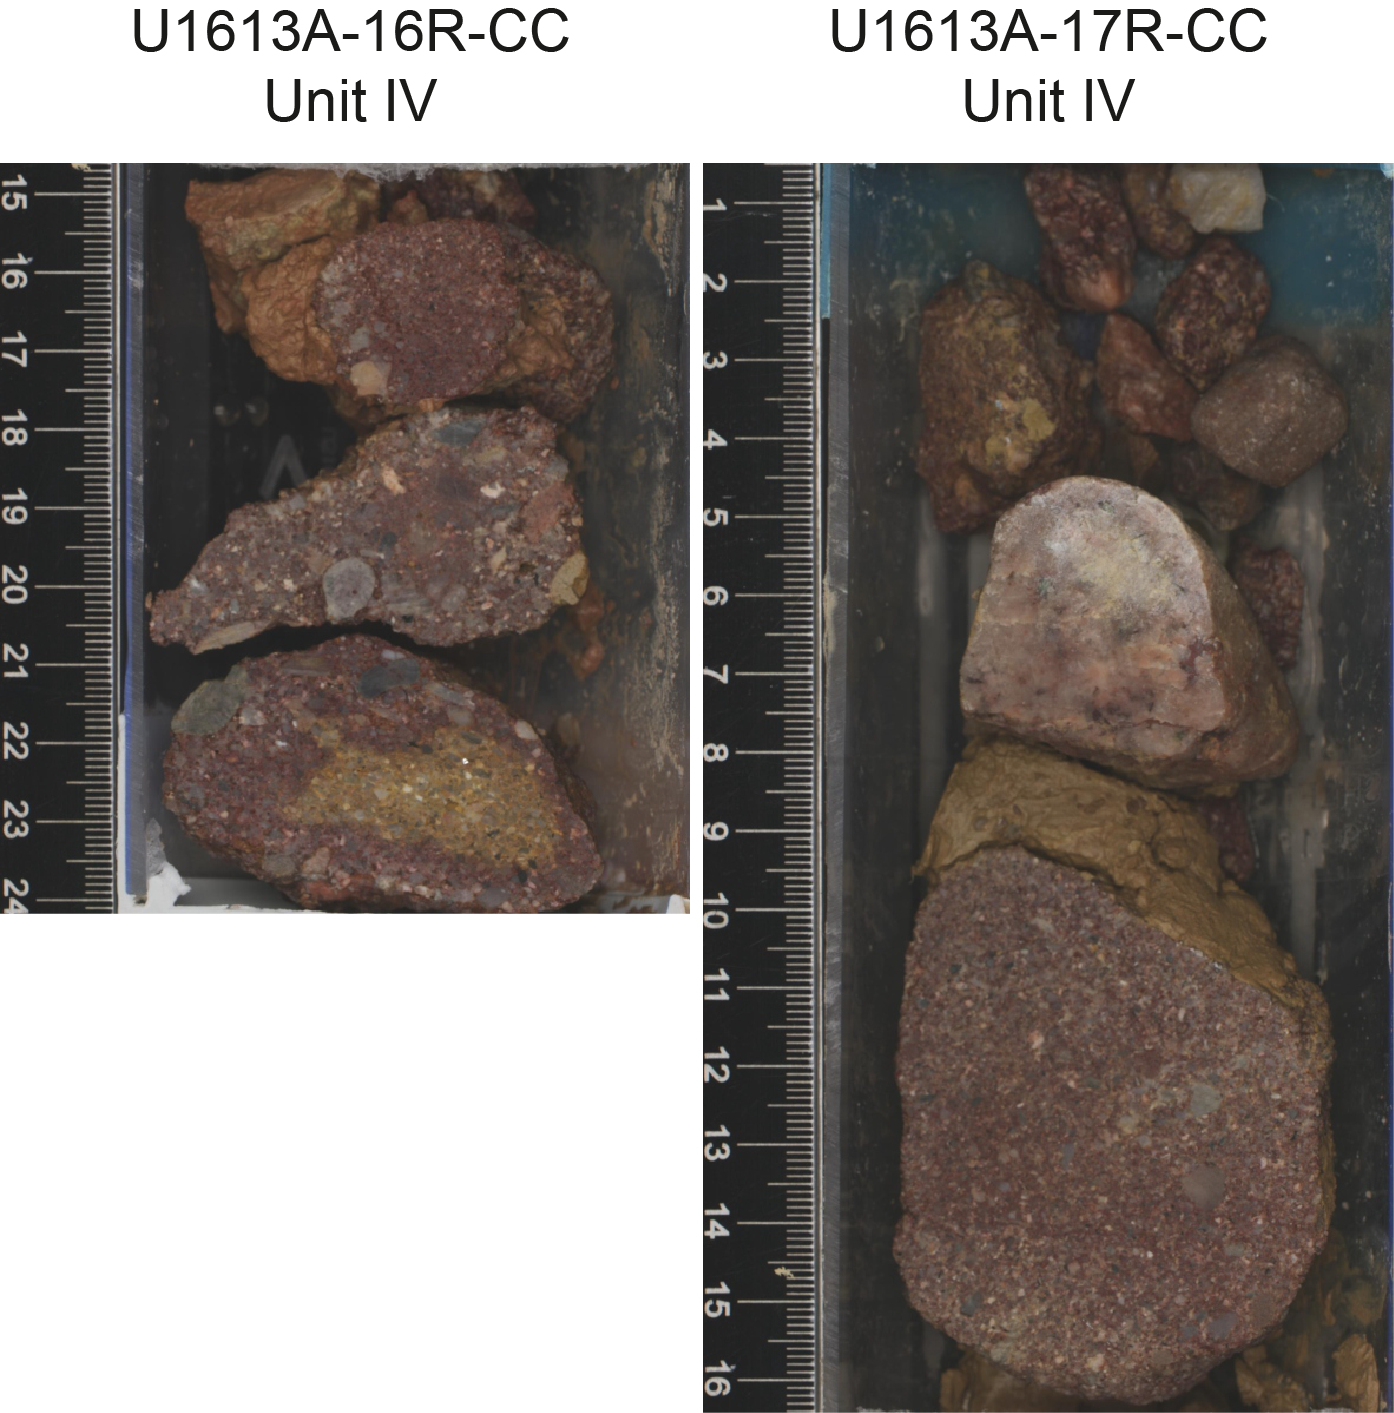
Figure F17. Reddish conglomerates.
6.2. Lithostratigraphic Unit V: reddish-greenish sandy mudstone (165–214 mbsf)
Unit V consists of sandy mudstone with variable colors, ranging from greenish and yellowish to reddish. This sandy mudstone unit is frequently interbedded with thin, muddy beds. Sandy layers seem to be quartzitic in composition, and the color of the muddy layers may reflect in part changing oxidizing conditions during deposition and weathering. The rocks exhibit complex structures mostly due to drilling disturbance. However, this succession can be divided into three subunits based on grain size, color, and degree of lithification. Subunit VA contains sandy mudstone from 165 to 184.7 mbsf (Cores 402-U1613A-18R and 19R) (Figure F18). Subunit VB contains a ~10 m thick polymictic conglomerate consisting of rounded clasts of quartz, pumice, and unidentified reddish volcanic material in a sandy matrix (Figure F19). Only ~75 cm of this rock is recovered in Core 20R (184.7–185.5 mbsf). Subunit VC (Cores 21R and 22R; 194.5–214 mbsf) (Figure F20) consists of yellowish to reddish sandy mudstones with a weak bedding that locally contains several gray to black layers.
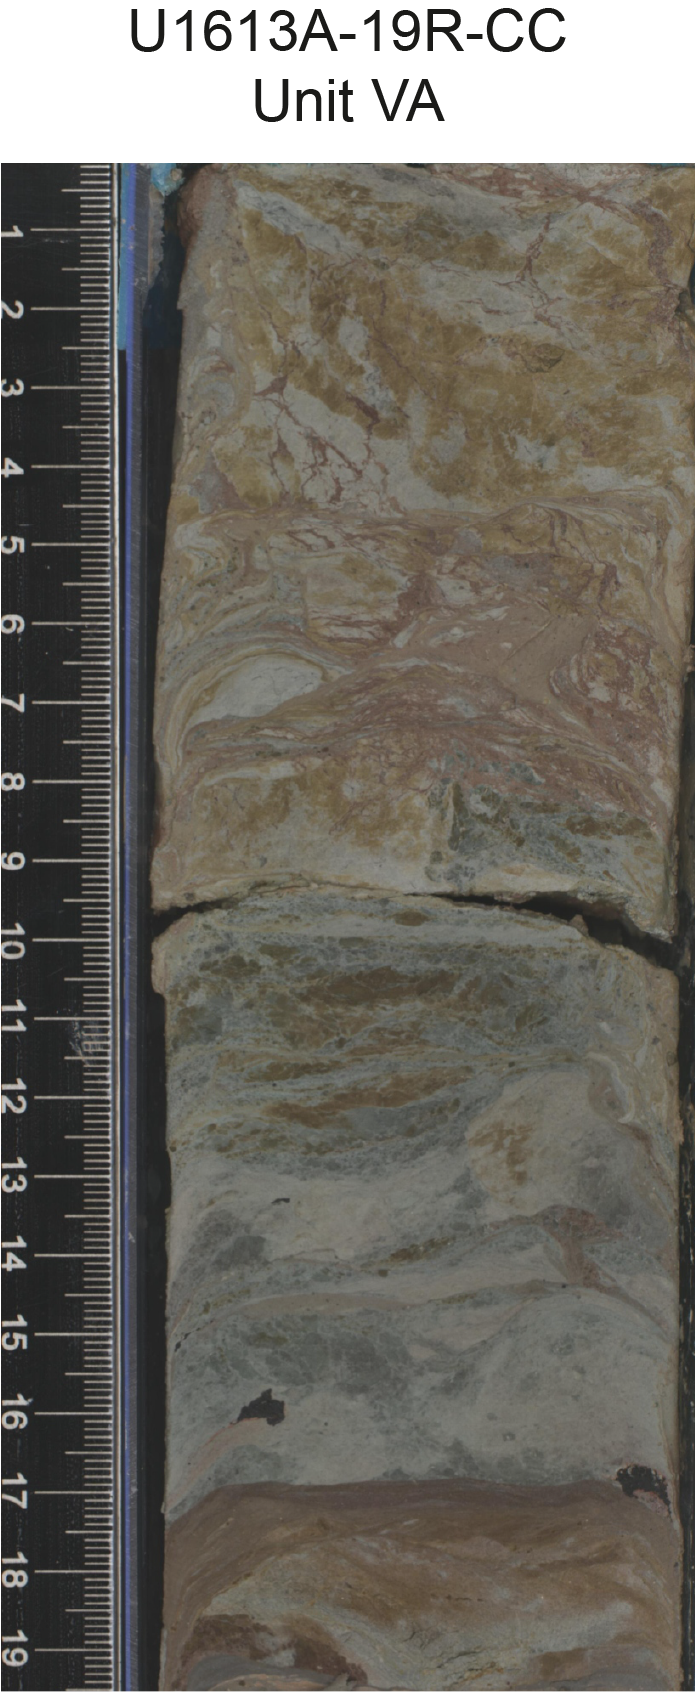
Figure F18. Yellow-reddish mudstone.
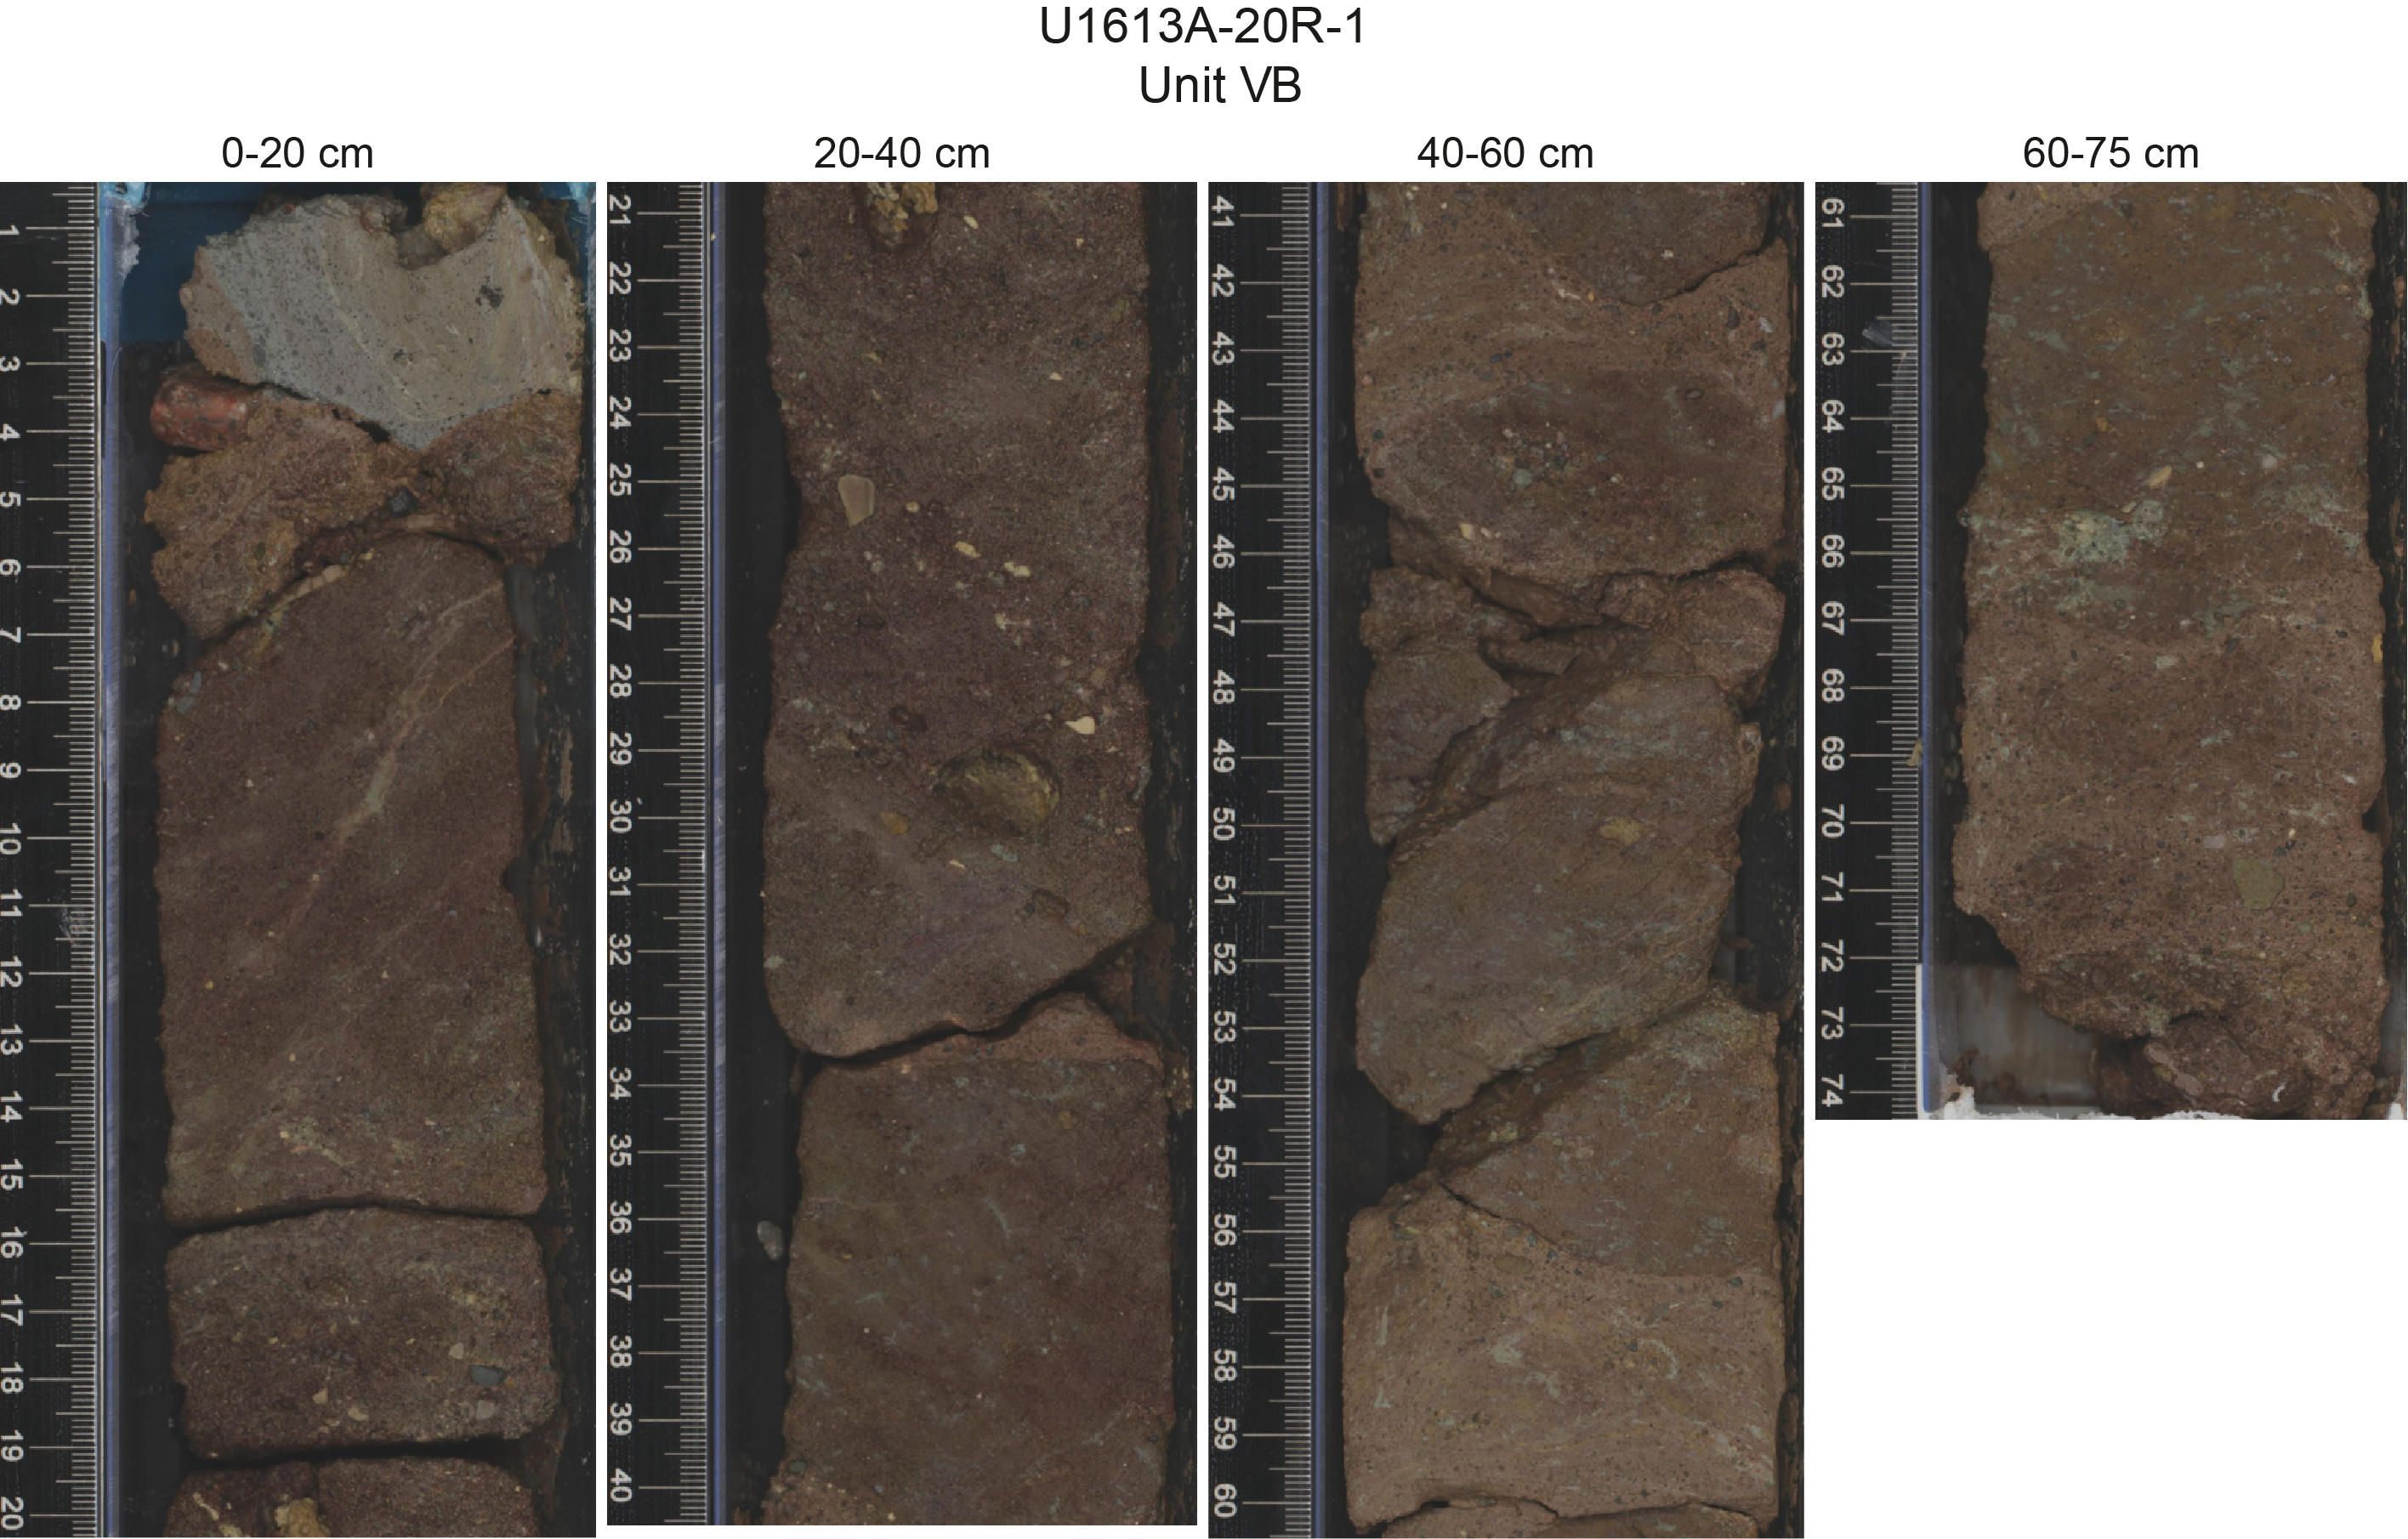
Figure F19. Reddish polymictic conglomerate.
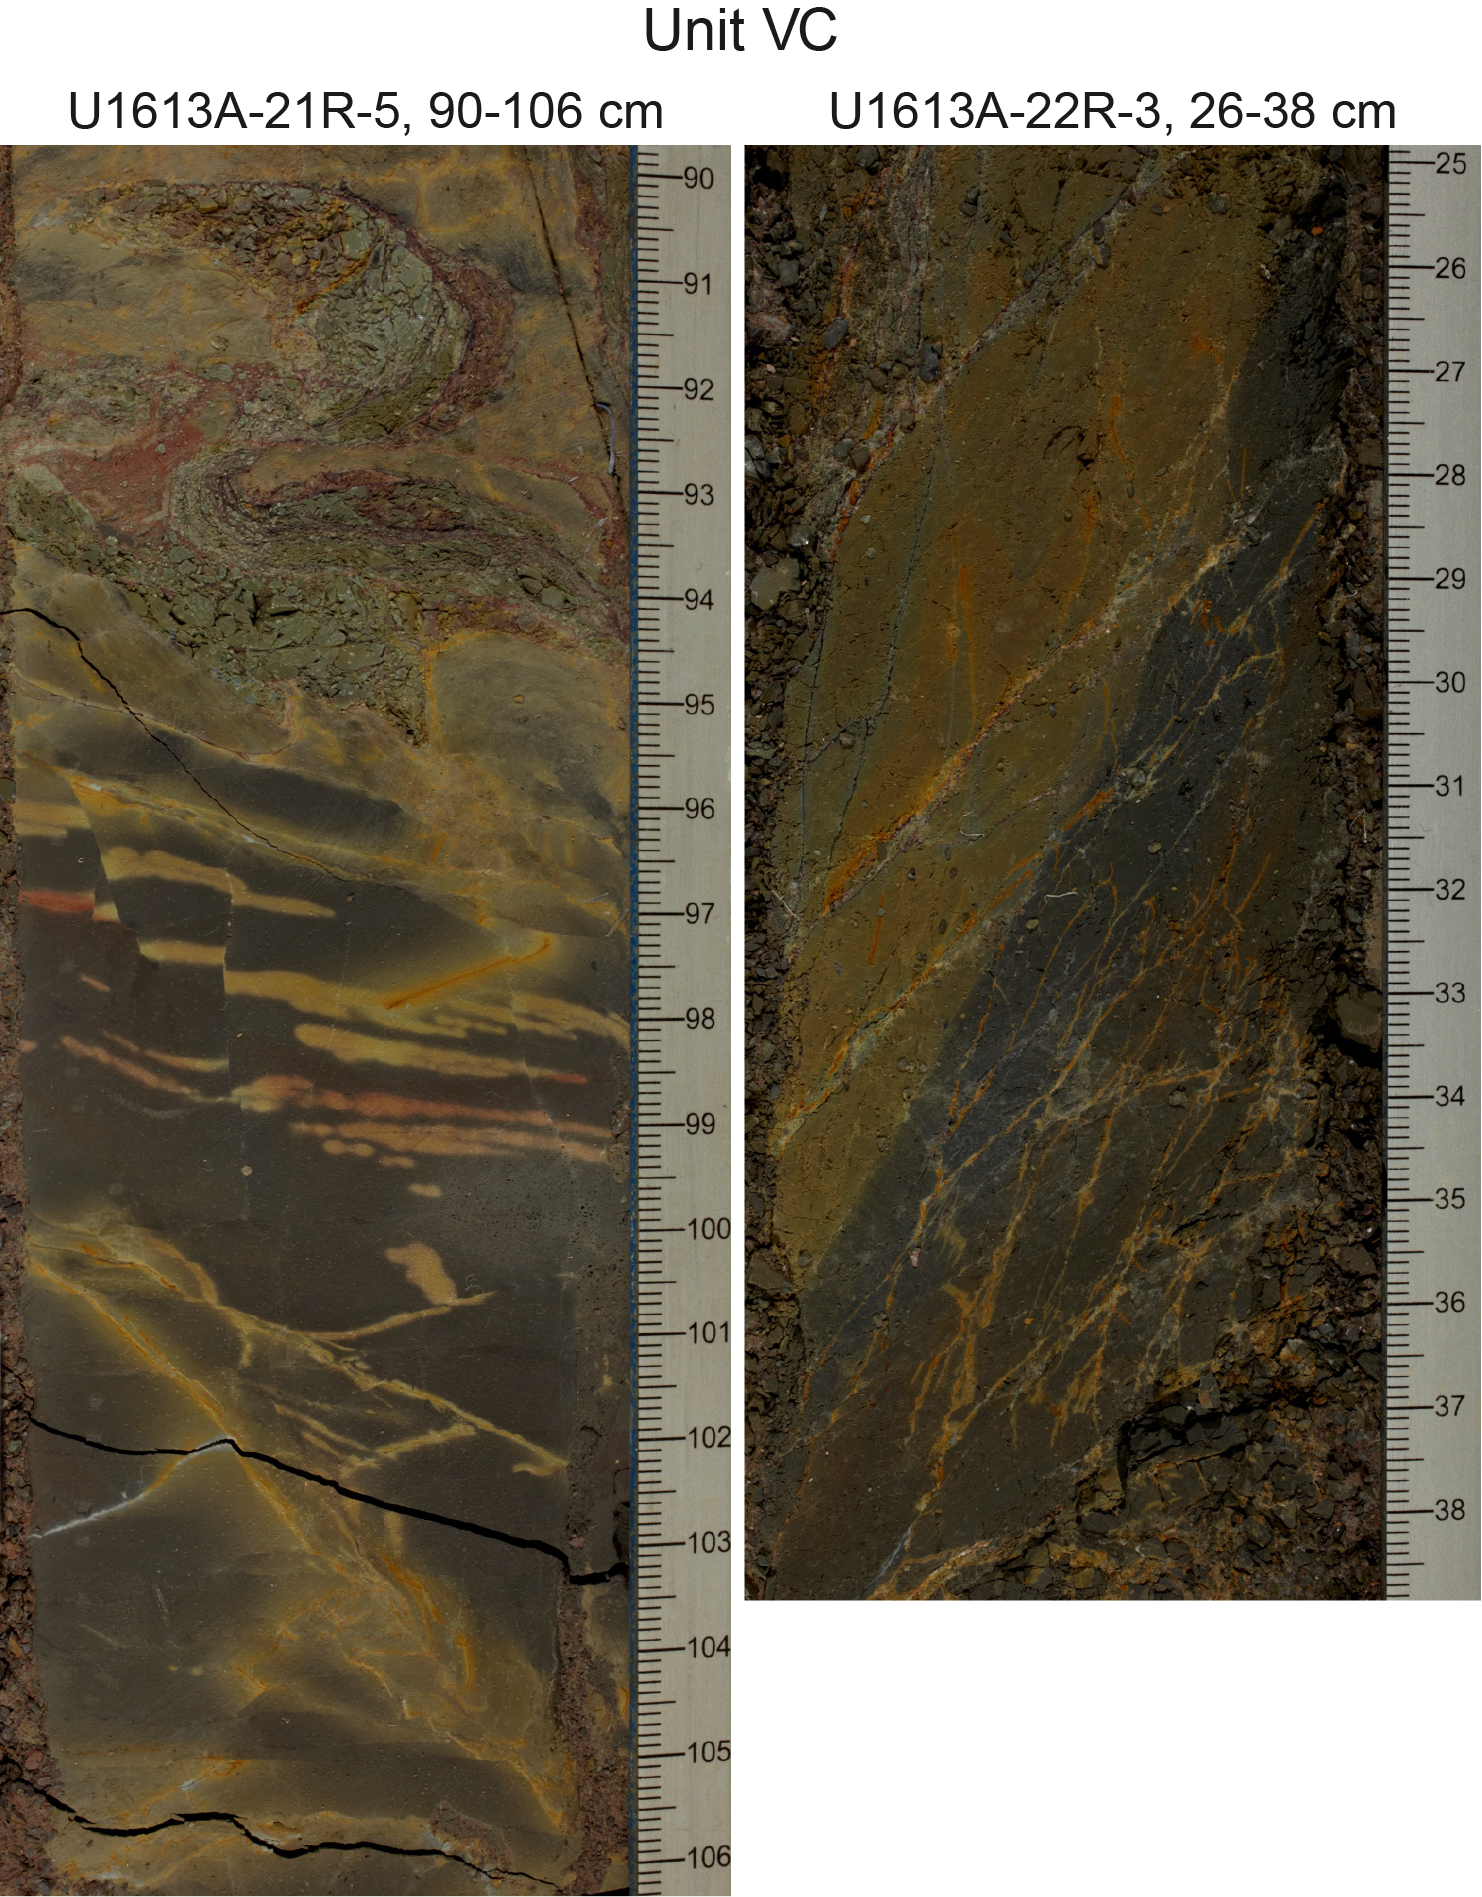
Figure F20. Yellowish sandy mudstone.
6.3. Lithostratigraphic Unit VI: black shale (214–224 mbsf)
Unit VI consists of silt-rich black shale recovered from Section 402-U1613A-23R-1 (214 mbsf) through the base of Core 24R (224 mbsf) (Figure F21). The rock preserves weak bedding attributed to lithification, and in places it is crosscut by thin (millimeter-scale) carbonate veins, mostly consisting of calcite. Microscopic thin section observations show that the black shale is composed of very fine grained carbonate minerals (calcite and dolomite), clay minerals, and layers of opaque minerals (mainly pyrite) and Ti-bearing phases (rutile) and nannofossils. This mineralogy is consistent with the high sulfur content of these lithologies compared to the rest of the core (see Sediment and interstitial water geochemistry). Despite the black color and the presence of pyrite, which may indicate anoxic to euxinic depositional conditions, the low total organic carbon (TOC) content of these shales (<1 wt%) suggests low preservation of organic matter. Preliminary thin section observations of pollen spores in the shales could be attributed to K. schaubergerii (A. Spina, pers. comm., 2024) and indicate that the black shale interval is late Permian in age.
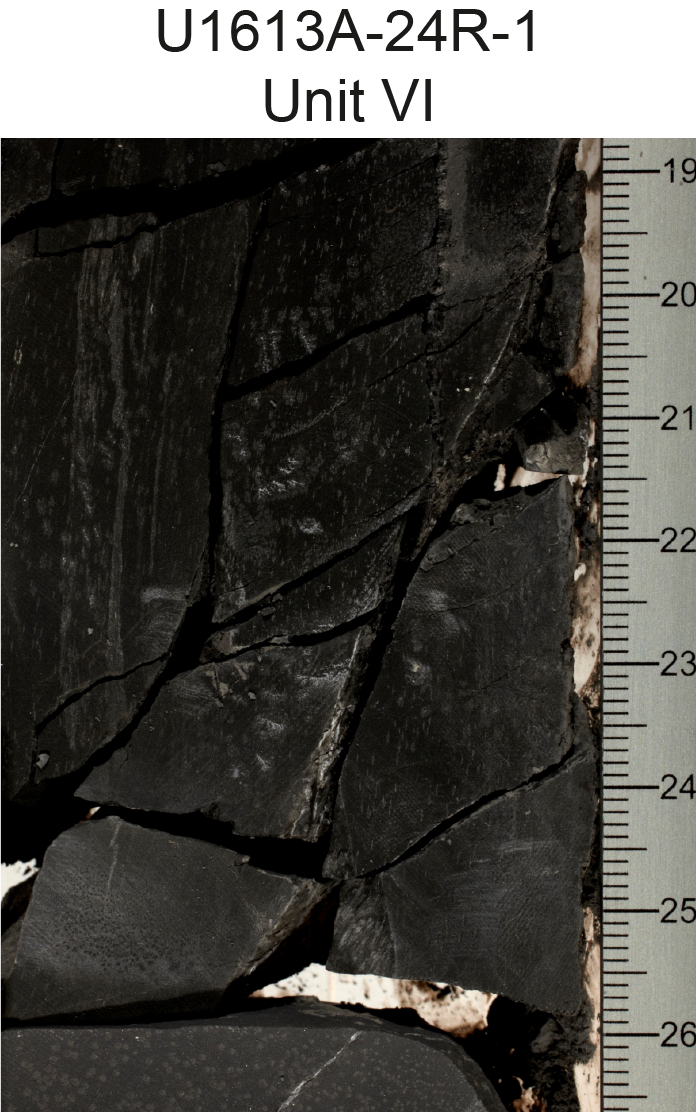
Figure F21. Black shale.
7. Structural geology
At Site U1613, structural measurements and microstructural observations were made on sediments and sedimentary rocks. The cores recovered from Hole U1613A can be divided into two domains: sedimentary cover and basement. The two domains are separated by an angular unconformity. Our focus was primarily on bedding features in addition to brittle structures like faults and fractures, with the occasional identification of minor folds associated with seafloor gravitational instabilities.
7.1. Structures in sedimentary cover
The sedimentary sequence at Site U1613 was measured from 0 to 147.5 mbsf (Core 402-U1613A-1R through Section 16R-CC). Natural deformation features were documented along this interval. The reflection seismic data indicate that Site U1613 is away from any major faults; the tectonic structures observed and described in the cores confirm that the drilling did not intersect any major faults in the sedimentary sequence. The bedding dip is subhorizontal to 10° from the seafloor to 135.8 mbsf (Section 14R-CC), where it shows convoluted laminations with an average dip of 20° and a maximum of 45° (Figure F22). Mesoscale reverse and subordinate normal faults (<1 mm and with displacements of a few millimeters to 2 cm) are primarily present in the lower part of the drilled section at depths below 135.8 mbsf (Core 15R and below), except for a few features in Core 9R. Both parallel and convolutional laminations show centimeter-scale folding and reverse faulting (Figure F23A, F23B).
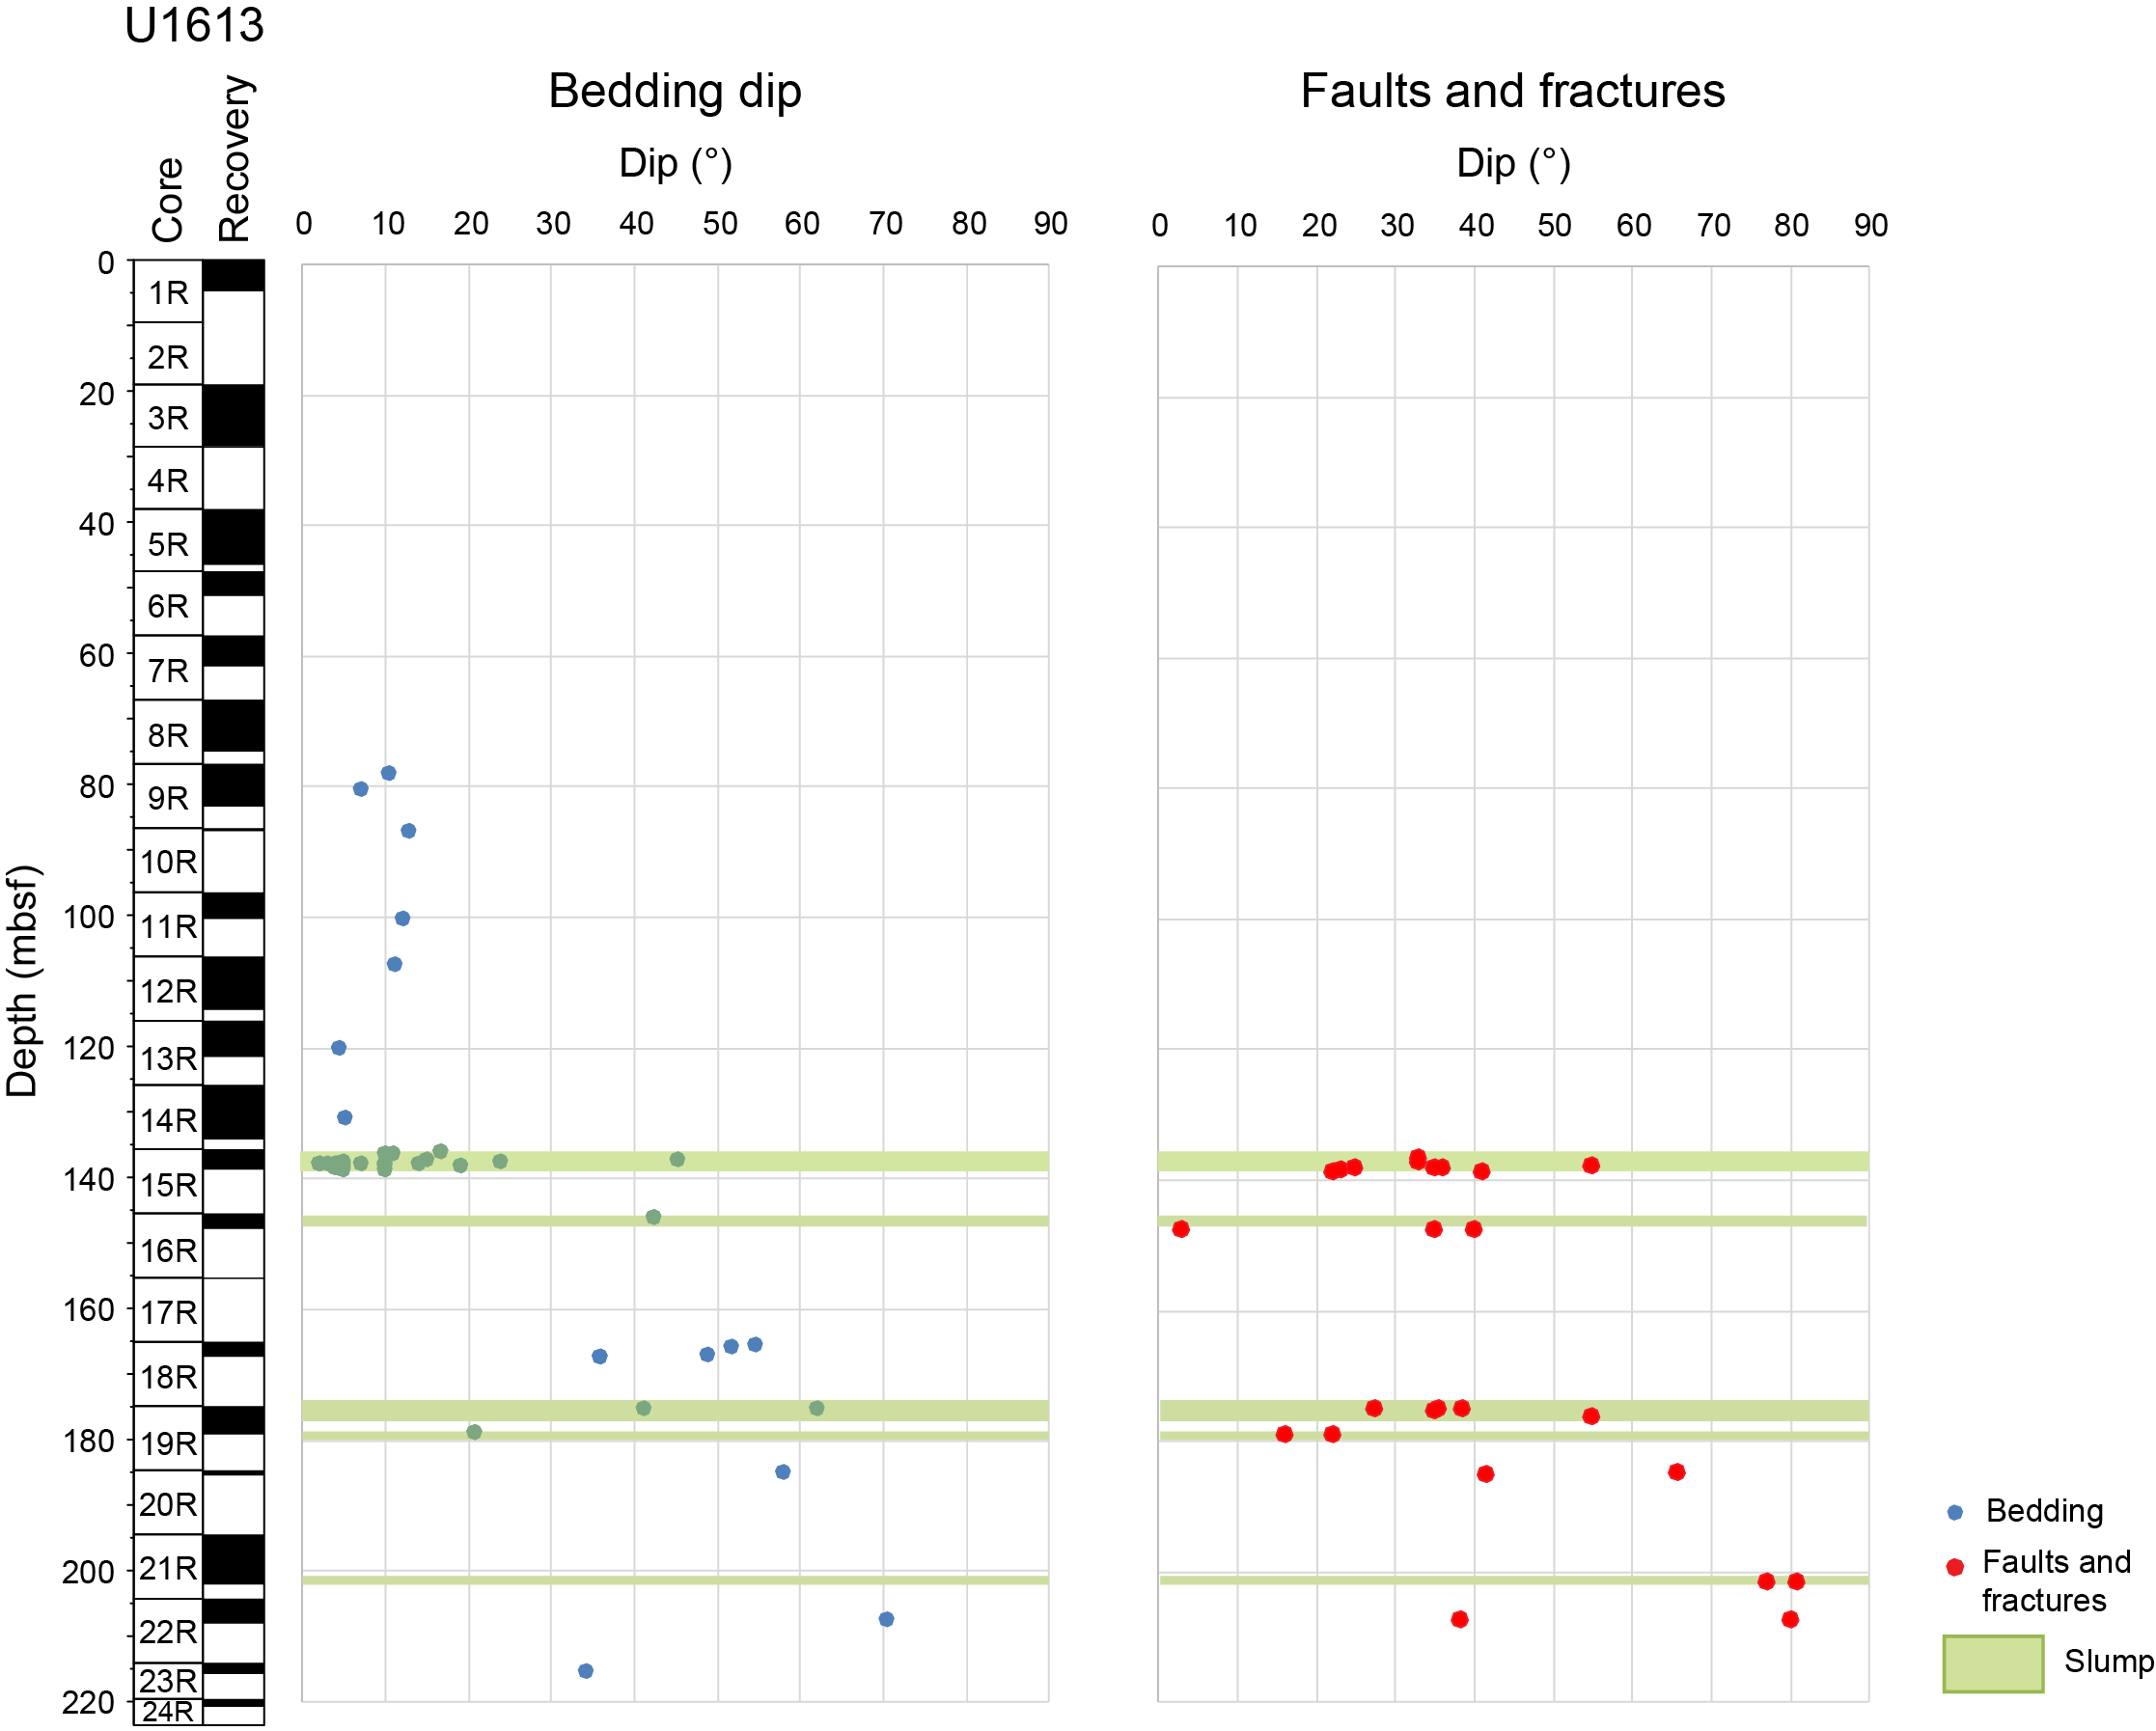
Figure F22. Dip variations of lamination and faults and fractures.
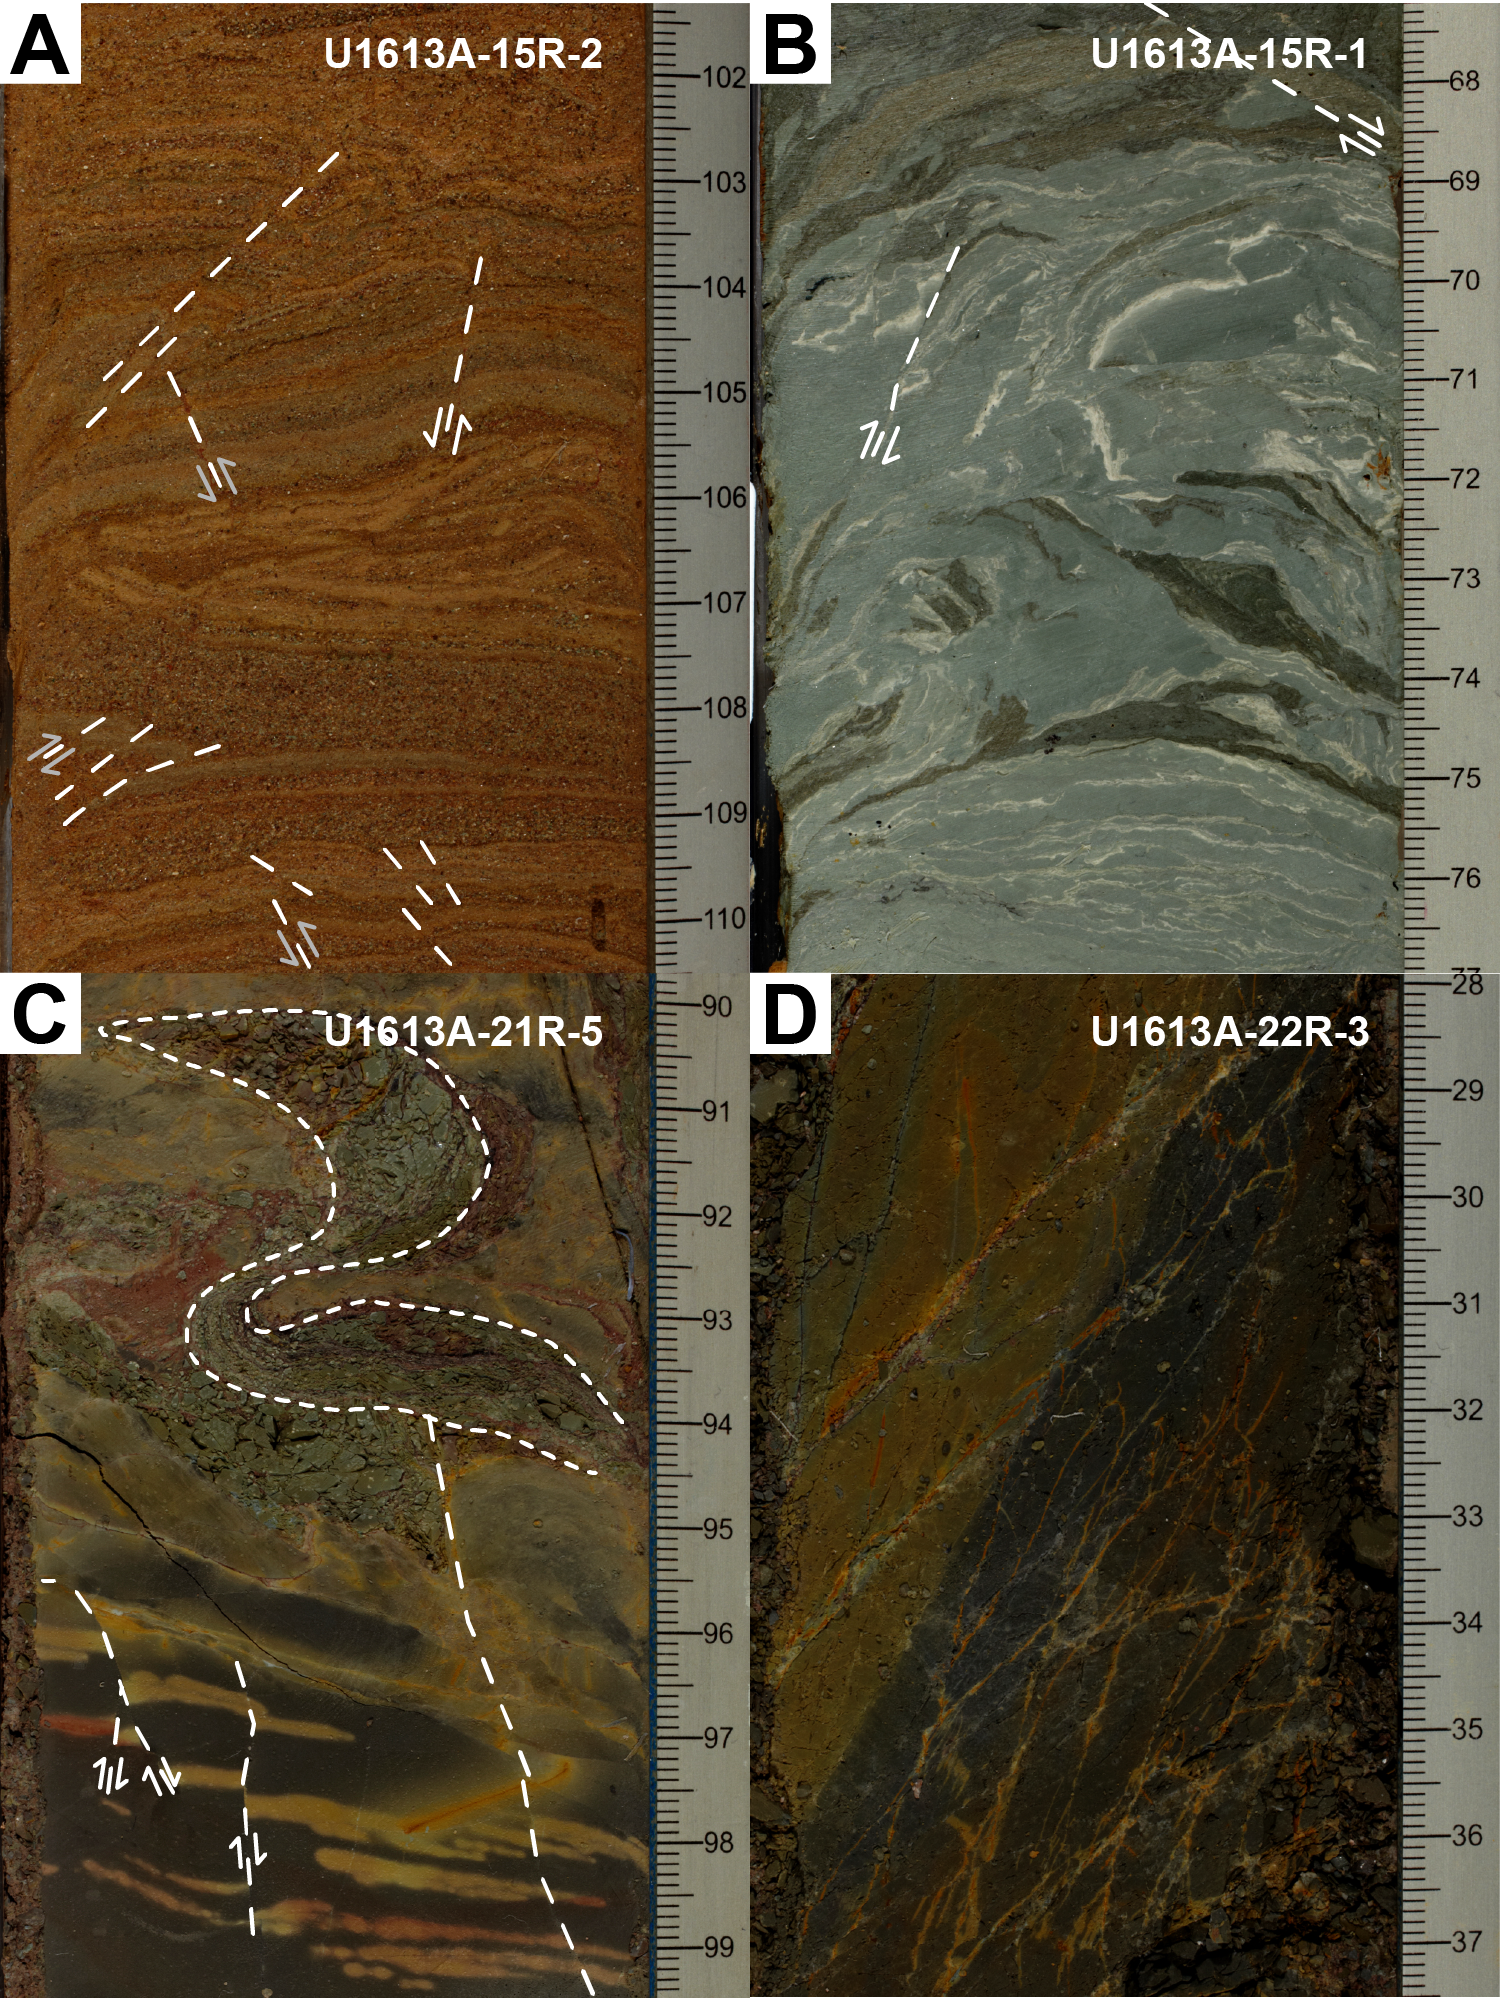
Figure F23. Deformation structures in sediments and breccias.
The interval from 0 to 135.8 mbsf (Cores 402-U1613A-1R through 14R), with subhorizontal bedding and little evidence of convoluted laminations and mesoscale folding, corresponds to Lithostratigraphic Units I and II (see Lithostratigraphy). Lithostratigraphic Unit III corresponds to the interval from Core 15R through Section 16R-CC (135.8–147.5 mbsf), with moderately dipping beds and relatively abundant mesoscale folding. The change in bedding dip at the base of Lithostratigraphic Unit II indicates an angular unconformity or the transition from a gravitationally unstable seafloor to a relatively stable depositional environment.
7.2. Basement structures
The basement reached at 147.5 mbsf (Section 402-U1613A-16R-CC) is defined by the contact between sedimentary polymictic breccia and conglomerate. Interestingly, the dip of the structures increases with depth, shifting from 1°–20° in the sediments (Lithostratigraphic Units I–III) to 21°–70° in the basement (Lithostratigraphic Units IV–VI), indicating the presence of an angular unconformity. The number of fractures and reverse faults also increases with depth. Few structures are reported from 147.5 to 167 mbsf because this interval contains polymictic, poorly consolidated breccia that is severely affected by drilling disturbance. Occasional low-grade metamorphic rocks are observed with a foliation at high angle to the core reference frame (Sections 18R-2 and 18R-CC; 167–167.4 mbsf). From 184.7 to 185.5 mbsf, the breccia is locally interrupted by volcaniclastic deposits dipping at 58° from the core reference frame (Section 20R-1A). Flow direction is indicated by clast alignment. Below, the breccia changes progressively from reddish to darker hues, with increasing proportions and sizes of black shale clasts. The larger clasts are highly fractured and faulted (Sections 21R-1 through 21R-5; Figure F23C). Below 207 mbsf, the breccia contains only angular black shale clasts (Section 22R-3; Figures F23D, F24). Section 24R-1 (219.6 mbsf) marks the transition from brecciated/fractured to intact, isotropic black shale, with occasional calcite veins (Figure F24).
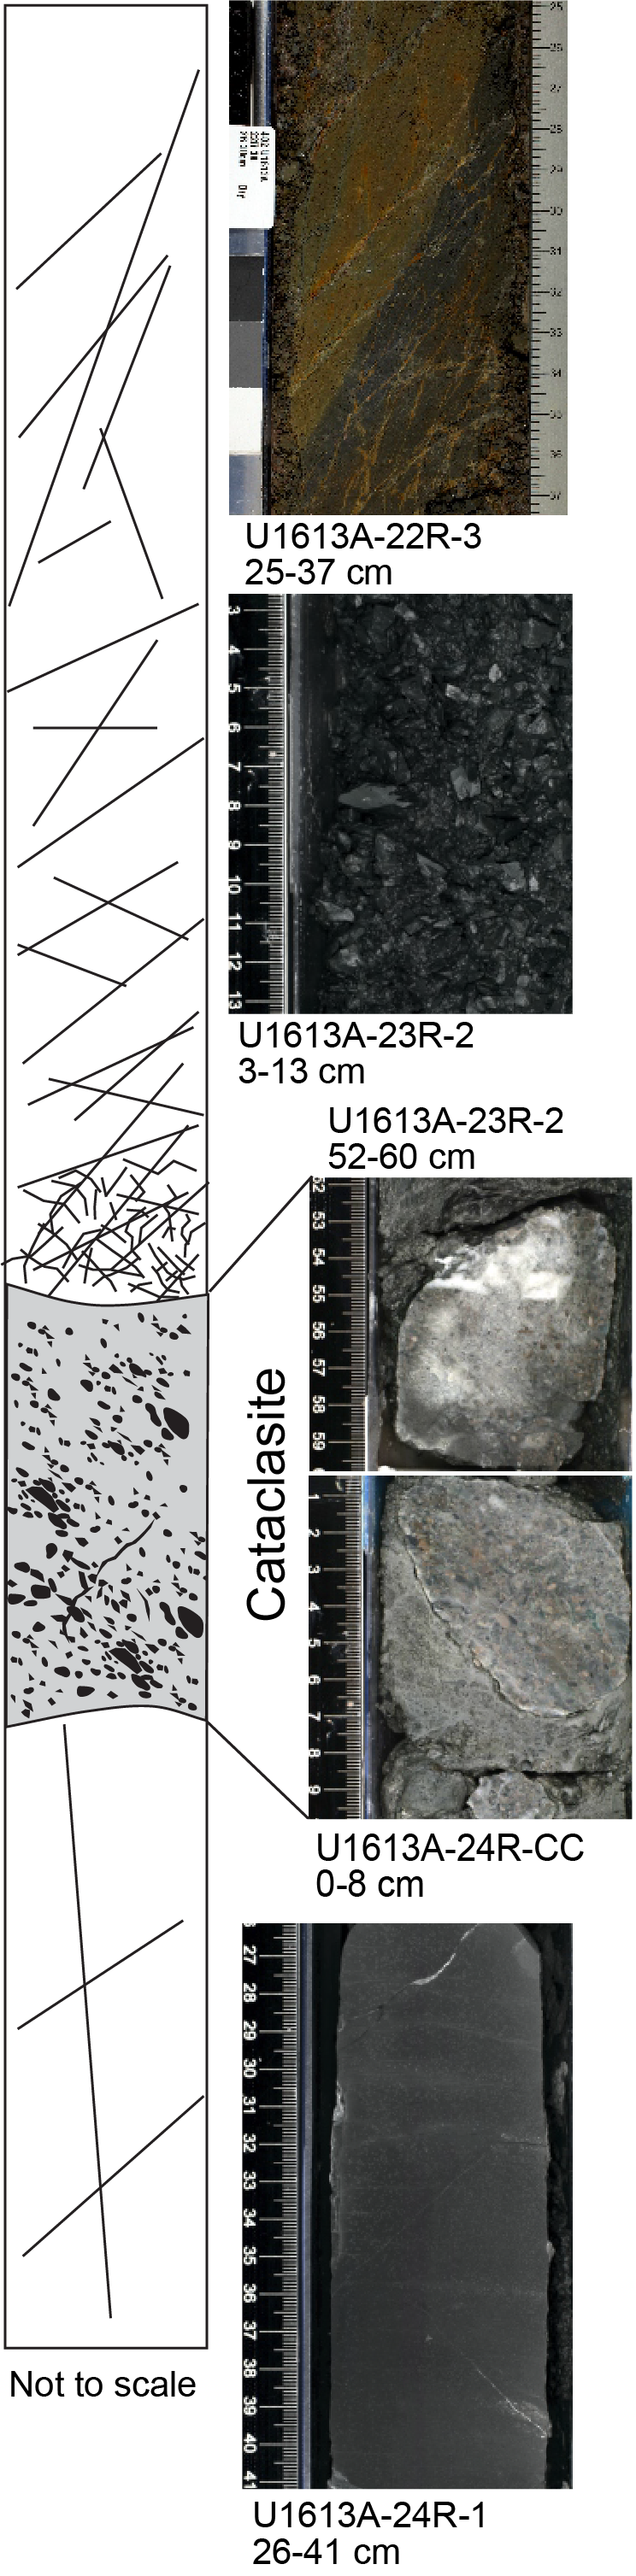
Figure F24. Tectonic interpretation.
In Core 402-U1613A-23R from 215.50 to 217.66 mbsf, the black shale contains an interval of well-cemented conglomerate/breccia with mostly rounded clasts but also with a few angular grains (Figure F24). We interpreted this interval as a cataclastic zone. Unfortunately, we cannot establish the kinematic of the faults that originated the cataclastic interval, which may be associated with normal or reverse faulting.
8. Sediment and interstitial water geochemistry
In Hole U1613A, interstitial water (IW) and sediment samples were collected from 1.4 to 214.9 mbsf. The IW samples extracted from the sediments were subjected to a series of routine chemical analyses for chemical properties and major and minor element composition. The sediments were processed for the determination of total carbon (inorganic and organic), total nitrogen (TN), and total sulfur (TS), in addition to other mineralogical analyses described in other sections of this report.
8.1. Inorganic geochemistry
8.1.1. Alkalinity, pH, and salinity
IW alkalinity varies from 1.5 to 3.3 mM with a maximum value occurring near to the seafloor (Table T3). Alkalinity decreases with increasing depth, reaching a minimum of 1.5 mM at 119.1 mbsf (Figure F25). Below this depth, alkalinity increases again, reaching more than 2.1 mM near the bottom of the cored interval. Alkalinity values are low but in the same interval range as found in IW collected from Site 974 in the Tyrrhenian Sea during the ODP Leg 161 (Bernasconi, 1999).
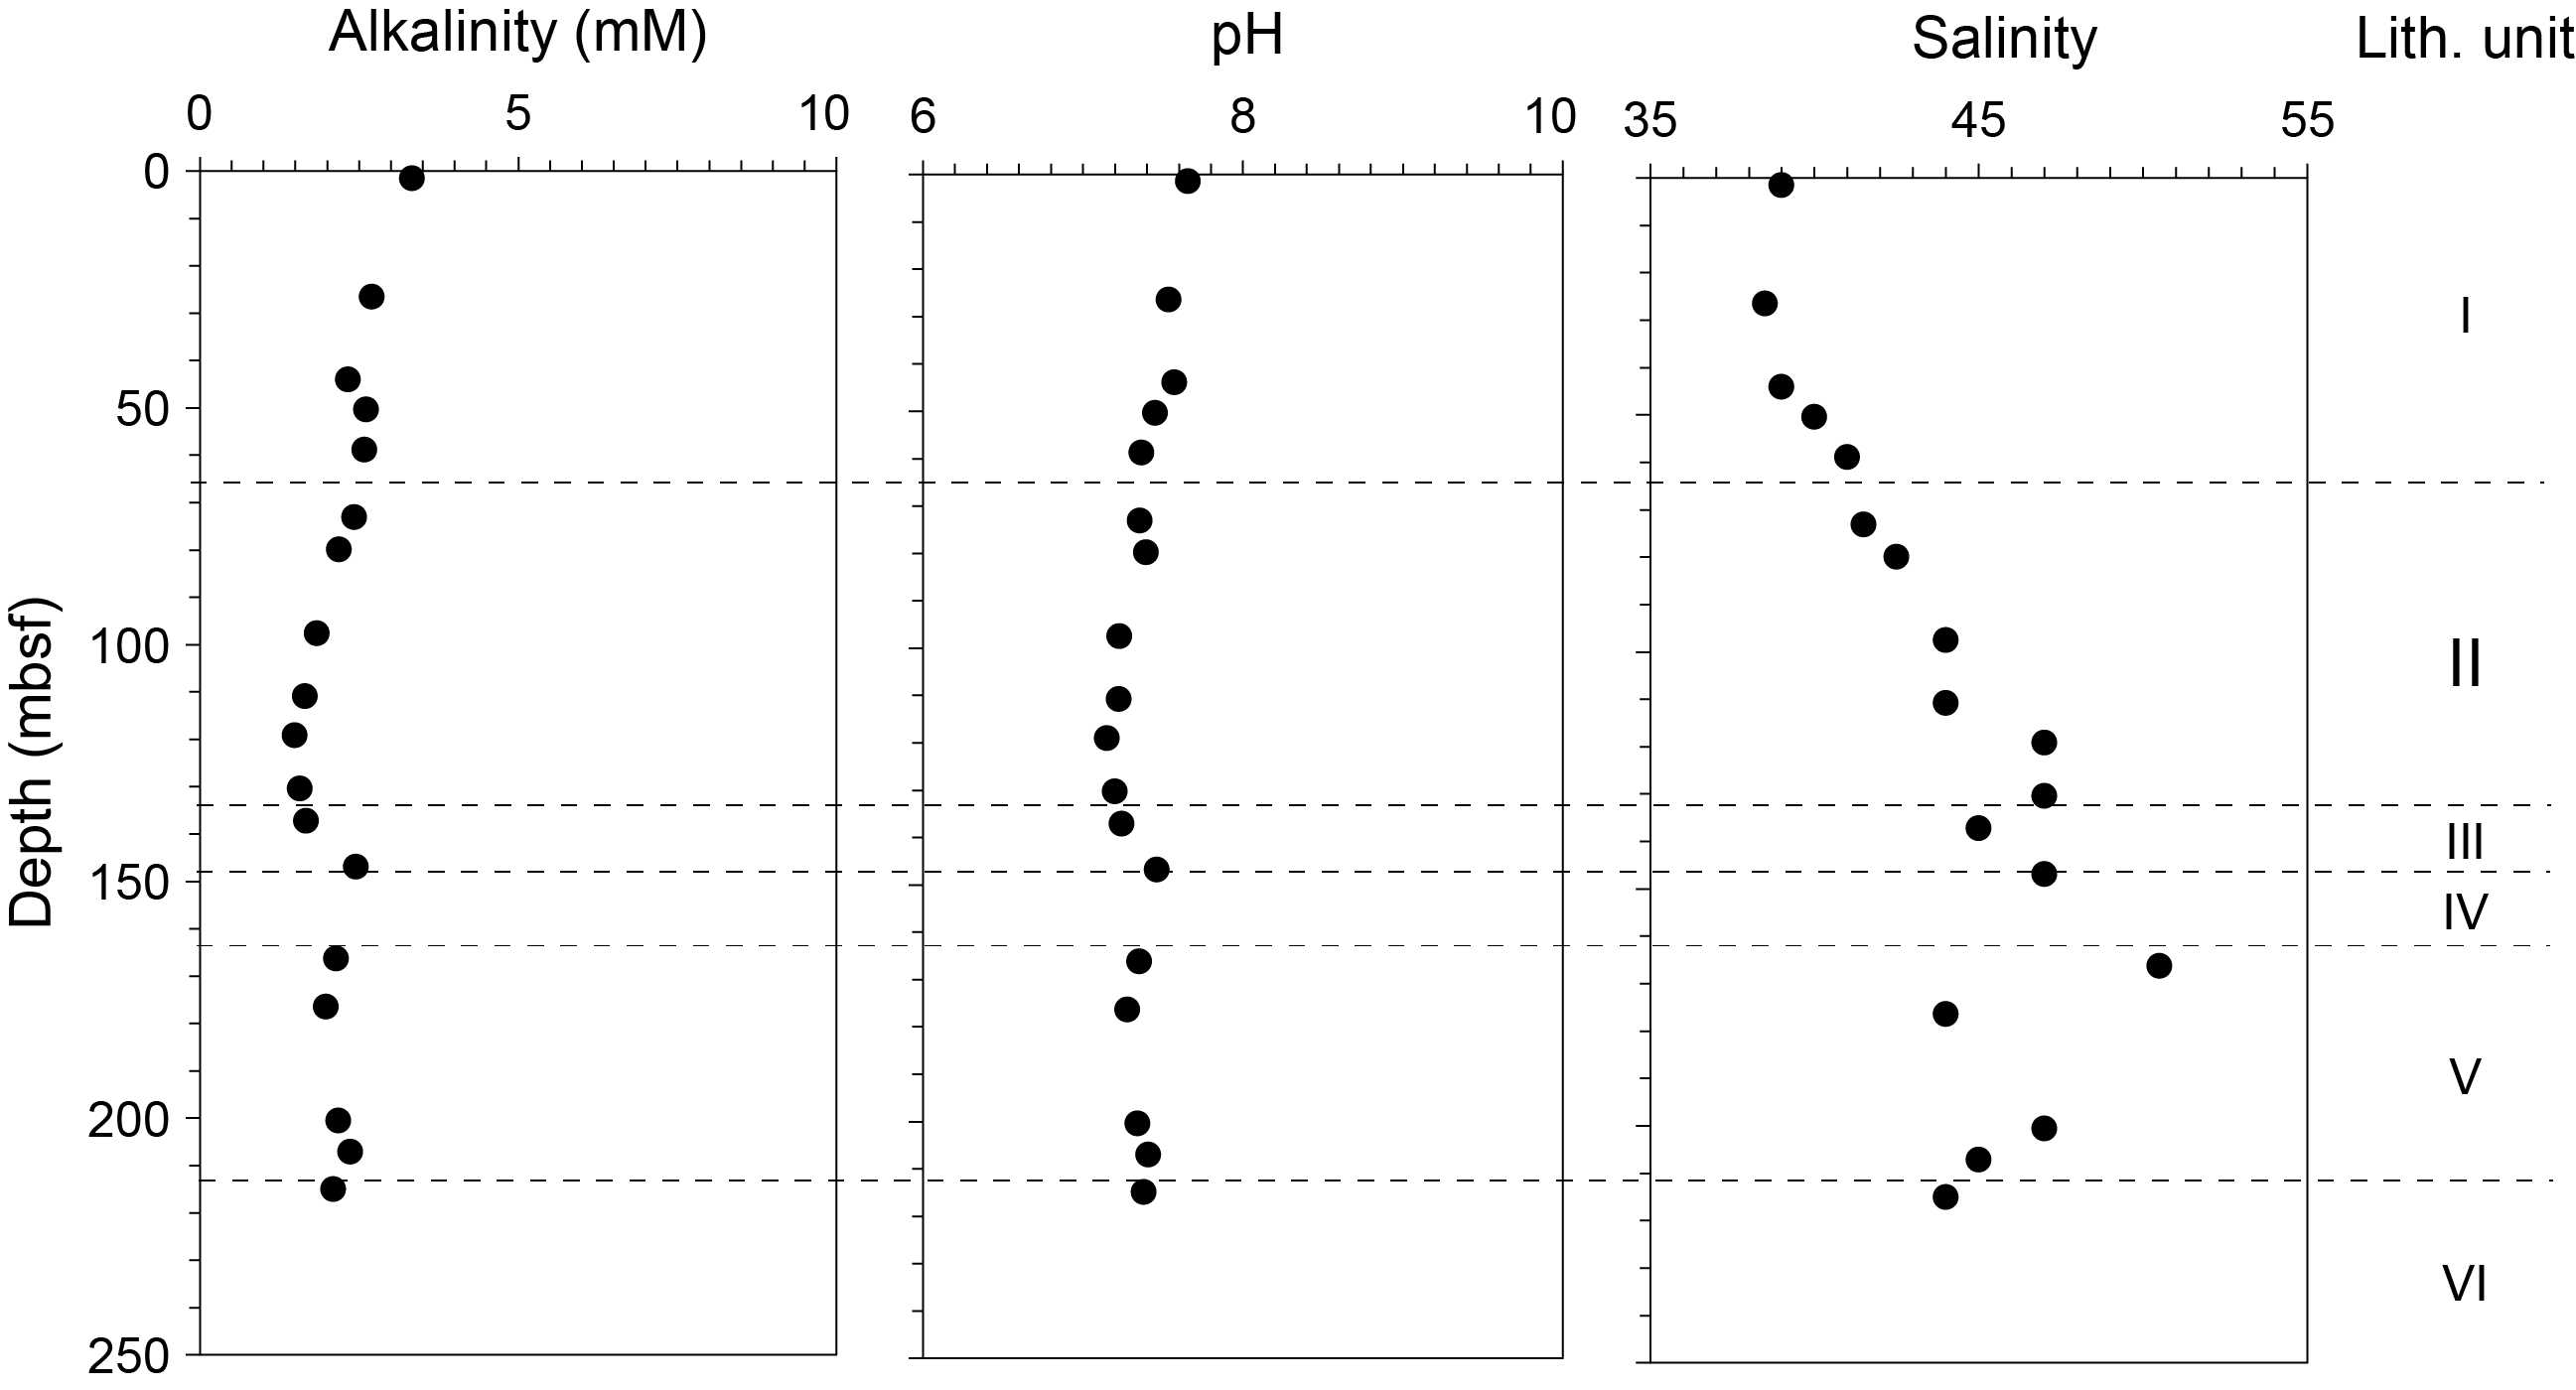
Figure F25. Alkalinity, pH, and salinity in IW.
The pH value varies between 7.1 and 7.7. The pH shows a similar depth profile to alkalinity, with lower pH corresponding to lower alkalinity (Figure F25; Table T3). This pattern is attributed to the varying concentration of bicarbonate ions (HCO3−), the dominant carbon species in this pH range.
The IW salinity ranges 38.5–50.5 and generally increases downhole (Figure F25; Table T3). Below 50 mbsf, the salinity is significantly higher than the value of 38.5–38.6 that was previously obtained for the bottom seawater of the Mediterranean Sea (Roether et al., 1996; Tsimplis and Baker, 2000; Tanhua et al., 2013). The Messinian layer (Unit III) is characterized by a salinity of 45–47. In the lower core interval below 97.5 mbsf (Section 402-U1613A-11R-1), the salinity is always greater than 44.0, reaching a maximum value of 50.5 at 166.2 mbsf (Section 18R-1) in the upper part of a pre-Messinian sandy mudstone layer (Unit V). Higher salinity values observed throughout the core may be largely due to the dissolution of evaporites observed at this site and the diffusion of the resulting solutes.
8.1.2. Major and minor elements
Concentrations of Na+ and Cl−, the predominant cation and anion species, respectively, are higher than in seawater (Figure F26; Table T3). The Na+ content varies from 529.4 to 619.5 mM, and Cl− ranges 619.4–792.3 mM (Table T4). As expected, the concentration of both ions is linked by a strong positive linear correlation (R2 = 0.99) and generally follows the depth profile of salinity, exhibiting an increasing pattern toward the base of the cored interval (Figure F26). Except at 1.4 mbsf, the Na/Cl ratio is lower than the value of the seawater ratio, probably indicating that halite has precipitated from highly saline IWs (brines) (Bernasconi, 1999).
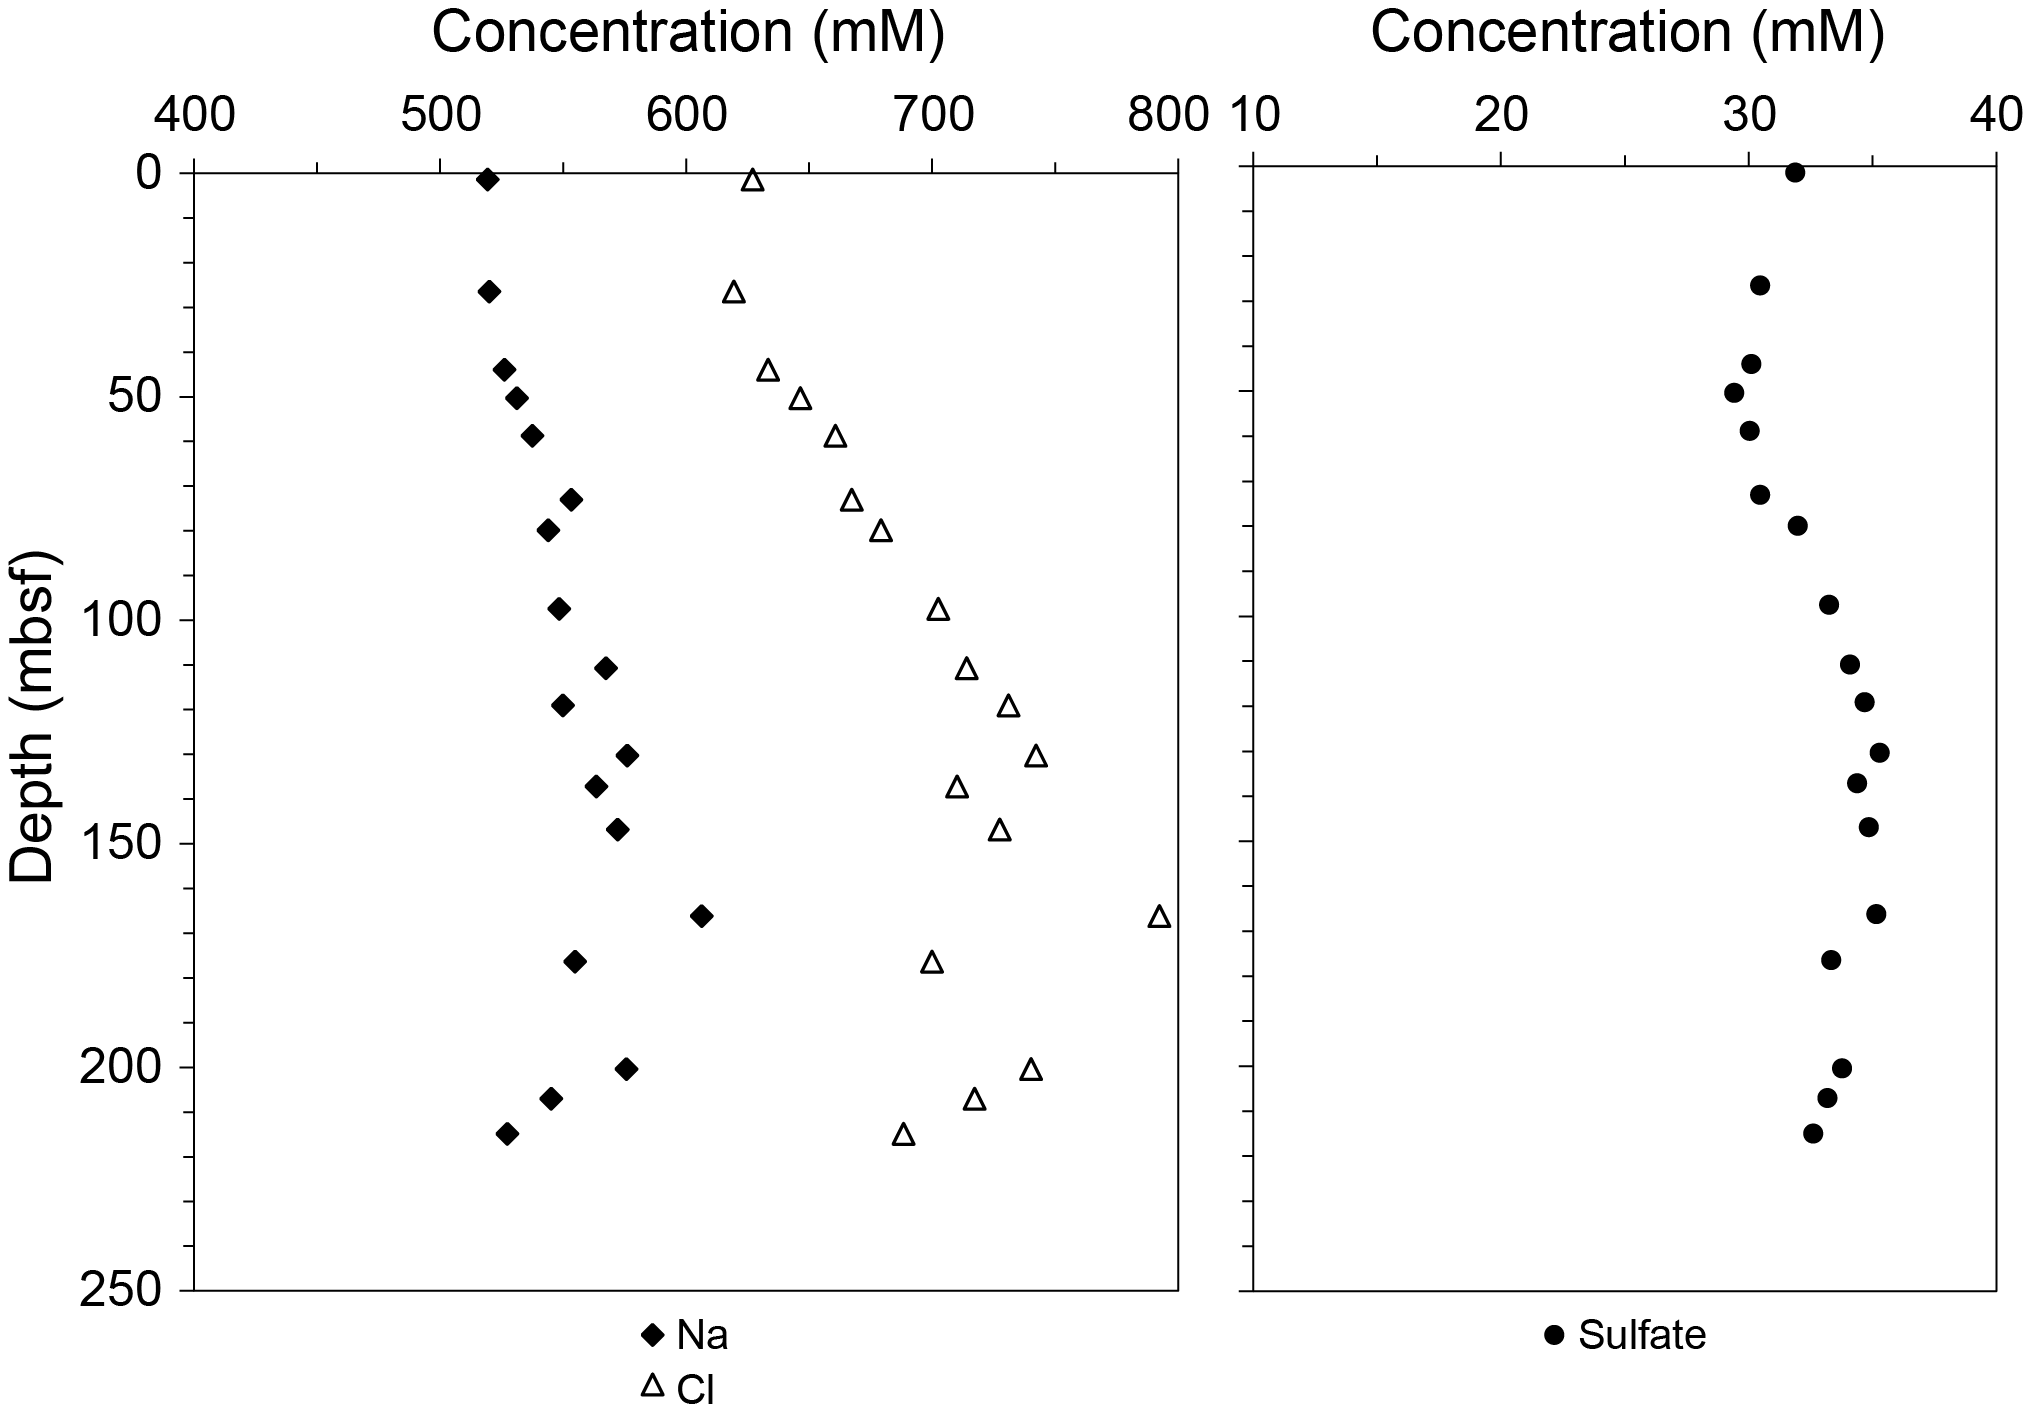
Figure F26. Na+, Cl–, and sulfate in IW.
The SO42− content in IW varies within a limited range, 29.4–35.2 mM, with slightly higher values in the lower part of the cored interval (Figure F26; Table T3). The bromide concentration in IW, ranging 1.0–1.2 mM, is positively correlated with Cl− concentration, probably indicating an evaporitic origin of this element even if inputs from organic matter decomposition (Martin et al., 1993) could not be excluded. Other cations, including Mg2+, Ca2+, and K+, show different concentration profiles downhole (Figure F27). In particular, the variation in Ca2+ concentration closely follows that of Na+, Cl−, SO42−, and salinity. The Ca2+ concentration reaches a maximum of 58.5 mM at 166.2 m (Section 402-U1613A-18R-1) and is almost five times its minimum value (12.3 mM) at 26.5 mbsf (Section 3R-5). A strong positive linear correlation (R2 = 0.71) between the concentration of Ca2+ and SO42− might indicate that the increase in concentrations of these both elements can be attributed to dissolution of gypsum that precipitated during the Messinian. Indeed, the presence of gypsum-rich silt is observed in interval 15R-1, 50–105 cm, confirming the formation of evaporites.
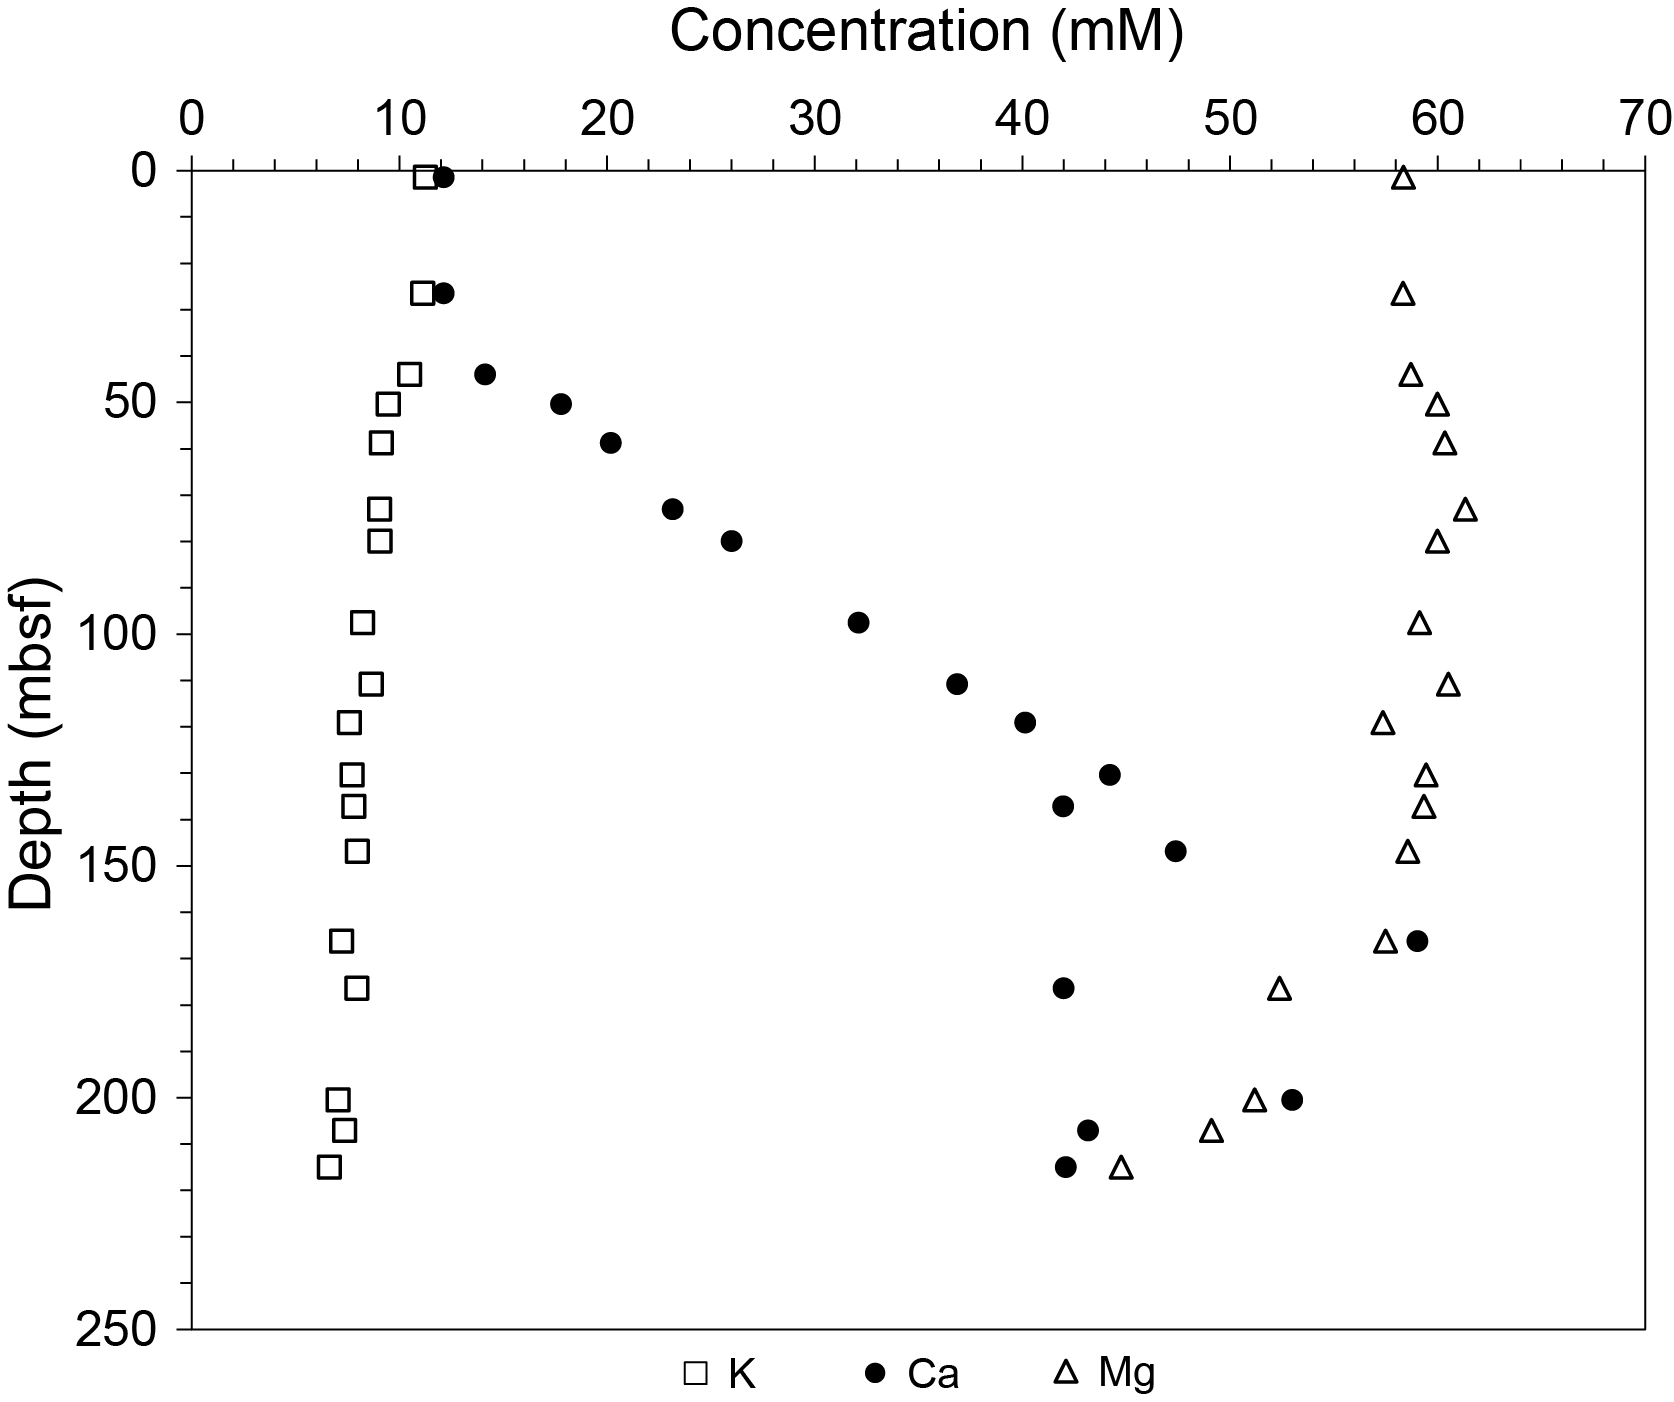
Figure F27. Major elements Mg2+, Ca2+, and K+ in IW.
In contrast, the concentrations of Mg2+ and K+ decrease with depth. There is an abrupt decrease of approximately 20% in Mg2+ in the lower part of the cored interval, from 57.8 to 45.6 mM, which corresponds most probably to the diagenetic formation of dolomite (see Carbonates) and is confirmed by a slight decrease in alkalinity. The decrease of K+ concentration with depth could be attributed either to ion exchange in clays or to the formation of K-rich clays (e.g., Sayles and Mangelsdorf, 1977; Kastner, 1981).
Elements with lower concentrations in IW were also identified using inductively coupled plasma–atomic emission spectrometry (ICP-AES), including Li, B, Si, Mn, Fe, Sr, and Ba (Table T4). No obvious pattern with depth is observed for most of these elements. However, both Li and Sr have higher concentrations in the lower part of the cored interval, consistent with the dissolution of minerals precipitating in dry environments. The increase in Sr concentration could also result from the dissolution of gypsum, although the impact of carbonate diagenesis cannot be excluded. The concentrations of iron (Fe = Fe2+ + Fe3+) and manganese (Mn = Mn2+ + Mn4+) range from undetectable to 104.9 µM and 4.0 to 64.9 µM, respectively. The highest concentration occurs at 97.5 mbsf for Fe and 130.3 mbsf for Mn. The vertical variations of these two elements could be due to biologically mediated reactions such as organic matter mineralization using (oxy)hydroxides (Jørgensen, 2000), oxidation, and solubilization of metal sulfides (Jørgensen et al., 2004).
8.1.3. Nutrients and sulfide
The level of essential nutrients in aqueous systems (ammonium [NH4+] and phosphate [PO43−]) were determined with a UV-Vis spectrophotometer (Figure F28; Table T4). The concentration of PO43− is very low and constant throughout the whole sediment profile with a mean of 5.5 ± 0.5 µM, whereas NH4+ shows higher levels in the middle portion of the cored interval. Because alkalinity generally decreases with depth and the ratios of alkalinity to ammonium (alkalinity/NH4+) are not close to the Redfield ratio characterized by a value of 6.6 (Burdige, 2006), the increasing values of NH4+ are most probably due to processes unrelated to microbially mediated organic matter degradation, such as mineral diagenesis. Sulfide concentration (ΣH2S = S2 + HS− + H2S) is low and ranges 0–2.2 µM. The highest values (0.8–2.2 µM) are observed in sandy mudstone and shale layers below 200 mbsf.
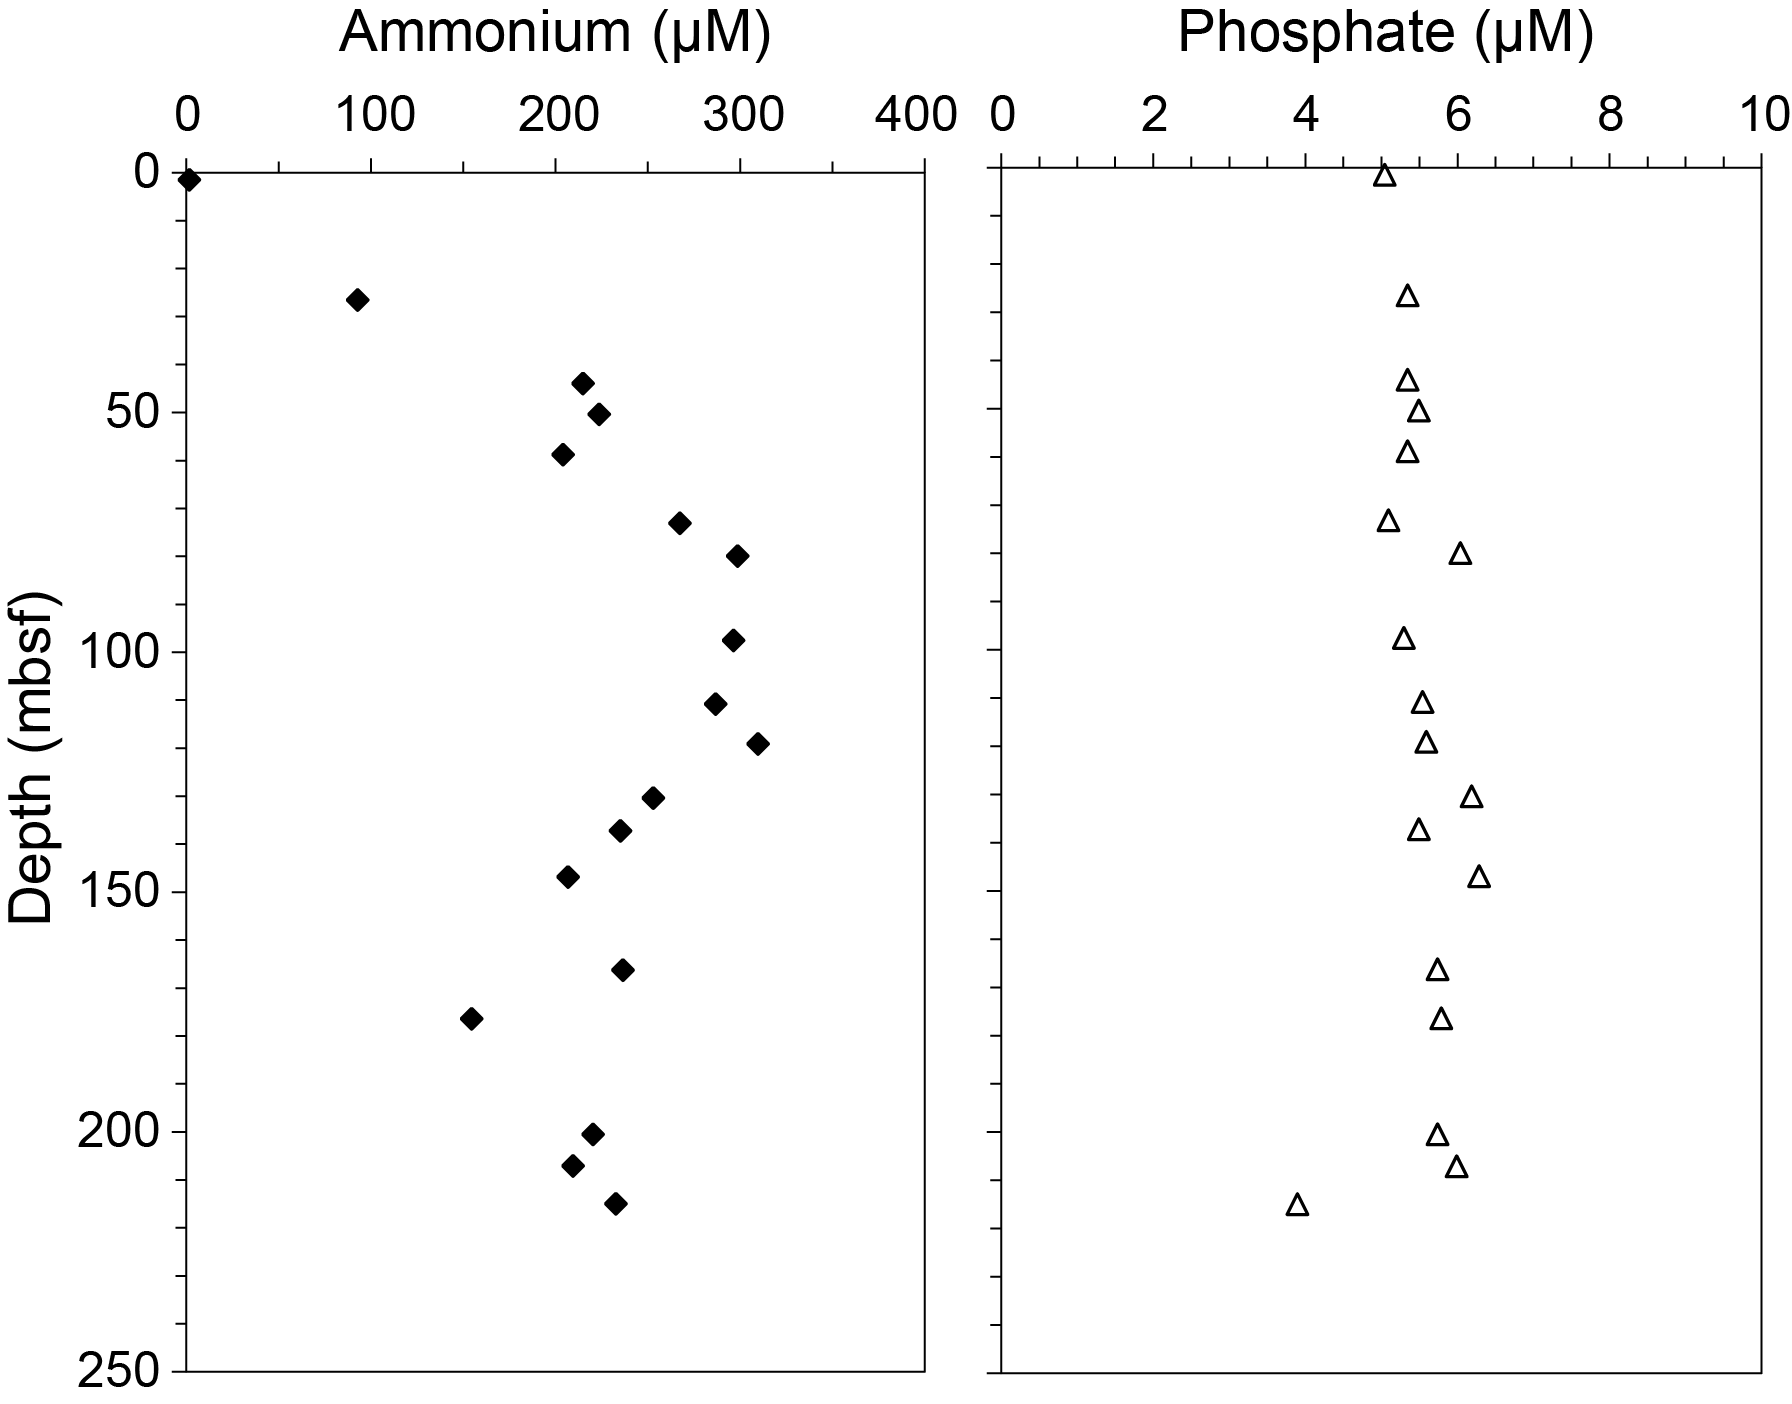
Figure F28. Ammonium and phosphate in IW.
8.2. Bulk sediment geochemistry
Solid-phase samples from Hole U1613A were analyzed to determine (1) the weight percentage of calcium carbonates (CaCO3), (2) the percentage of total carbonate contents (including both calcium carbonates and other carbonate phases), (3) the percentage of total organic matter, and (4) TOC, TN, and TS contents. These samples included 18 squeeze cakes and 21 additional sediment samples collected from primary and secondary sedimentary lithologies identified by sedimentologists. In Hole U1613A, the sampling frequencies ranged from one to three samples per core (Table T5), with the exception of five cores where no samples were collected (Cores 2R, 4R, 10R, 17R, and 20R).
8.2.1. Carbonates
Table T5 and Figure F29 show the results obtained for CaCO3 contents and percentage of total carbonate contents. CaCO3 contents of the bulk sediments from Hole U1613A vary from 0.3 to 69.3 wt% and depend on lithology (see Lithostratigraphy). CaCO3 is higher in Units I and II, which consist of nannofossil- and foraminifera-rich sediments with a mean value of 47.0 ± 14.6 wt% (1.4–130.3 mbsf), but it decreases in other layers (oxide-rich sand, sandy mudstone, and conglomerate) with a mean value of 12.8 ± 12.6 wt% between 130.3 and 214.9 mbsf. A black shale layer, occurring at 214.9–220.7 mbsf, contains 3.2 to 38.2 wt% of CaCO3. Total carbonate contents are consistently high at 146.8–200.4 mbsf, indicating the presence of carbonate phases other than calcium carbonates (such as dolomite). The XRD patterns show that the d(104) values of calcite vary in the range of 3.036–2.989 Å; a low-Mg calcite group, mostly from calcite of pelagic or detrital sediment, is predominant between 3.036 and 3.017 Å; and a high-Mg calcite group, probably authigenic, predominates in the range of 3.009–2.989 Å. Two groups of dolomite are identified: one group, characterized by d(104) values between 2.899 and 2.887 Å, is considered to be near stoichiometric dolomite; the second group, with d(104) values between 2.931 and 2.902 Å, corresponds to dolomites in which some Mg2+ is substituted by larger cations such as Fe2+ or Ca2+. Based on both XRD data and the percentage of total carbonate contents, low-Mg calcite is generally the dominant carbonate phase in the sediments from Hole U1613A, most probably originating from biogenic precipitation (Figure F29; Table T5). However, at 146.8–200.4 mbsf (Units III, IV, and V), high-Mg calcite and stoichiometric dolomite are the two only carbonate phases observed. Very small amounts of Fe- and/or Ca-rich dolomite (0.2%–0.4%) occur at 26.5 (Unit I), 79.9 (Unit II), 107.3 (Unit II), and 207.1 mbsf (Unit V).
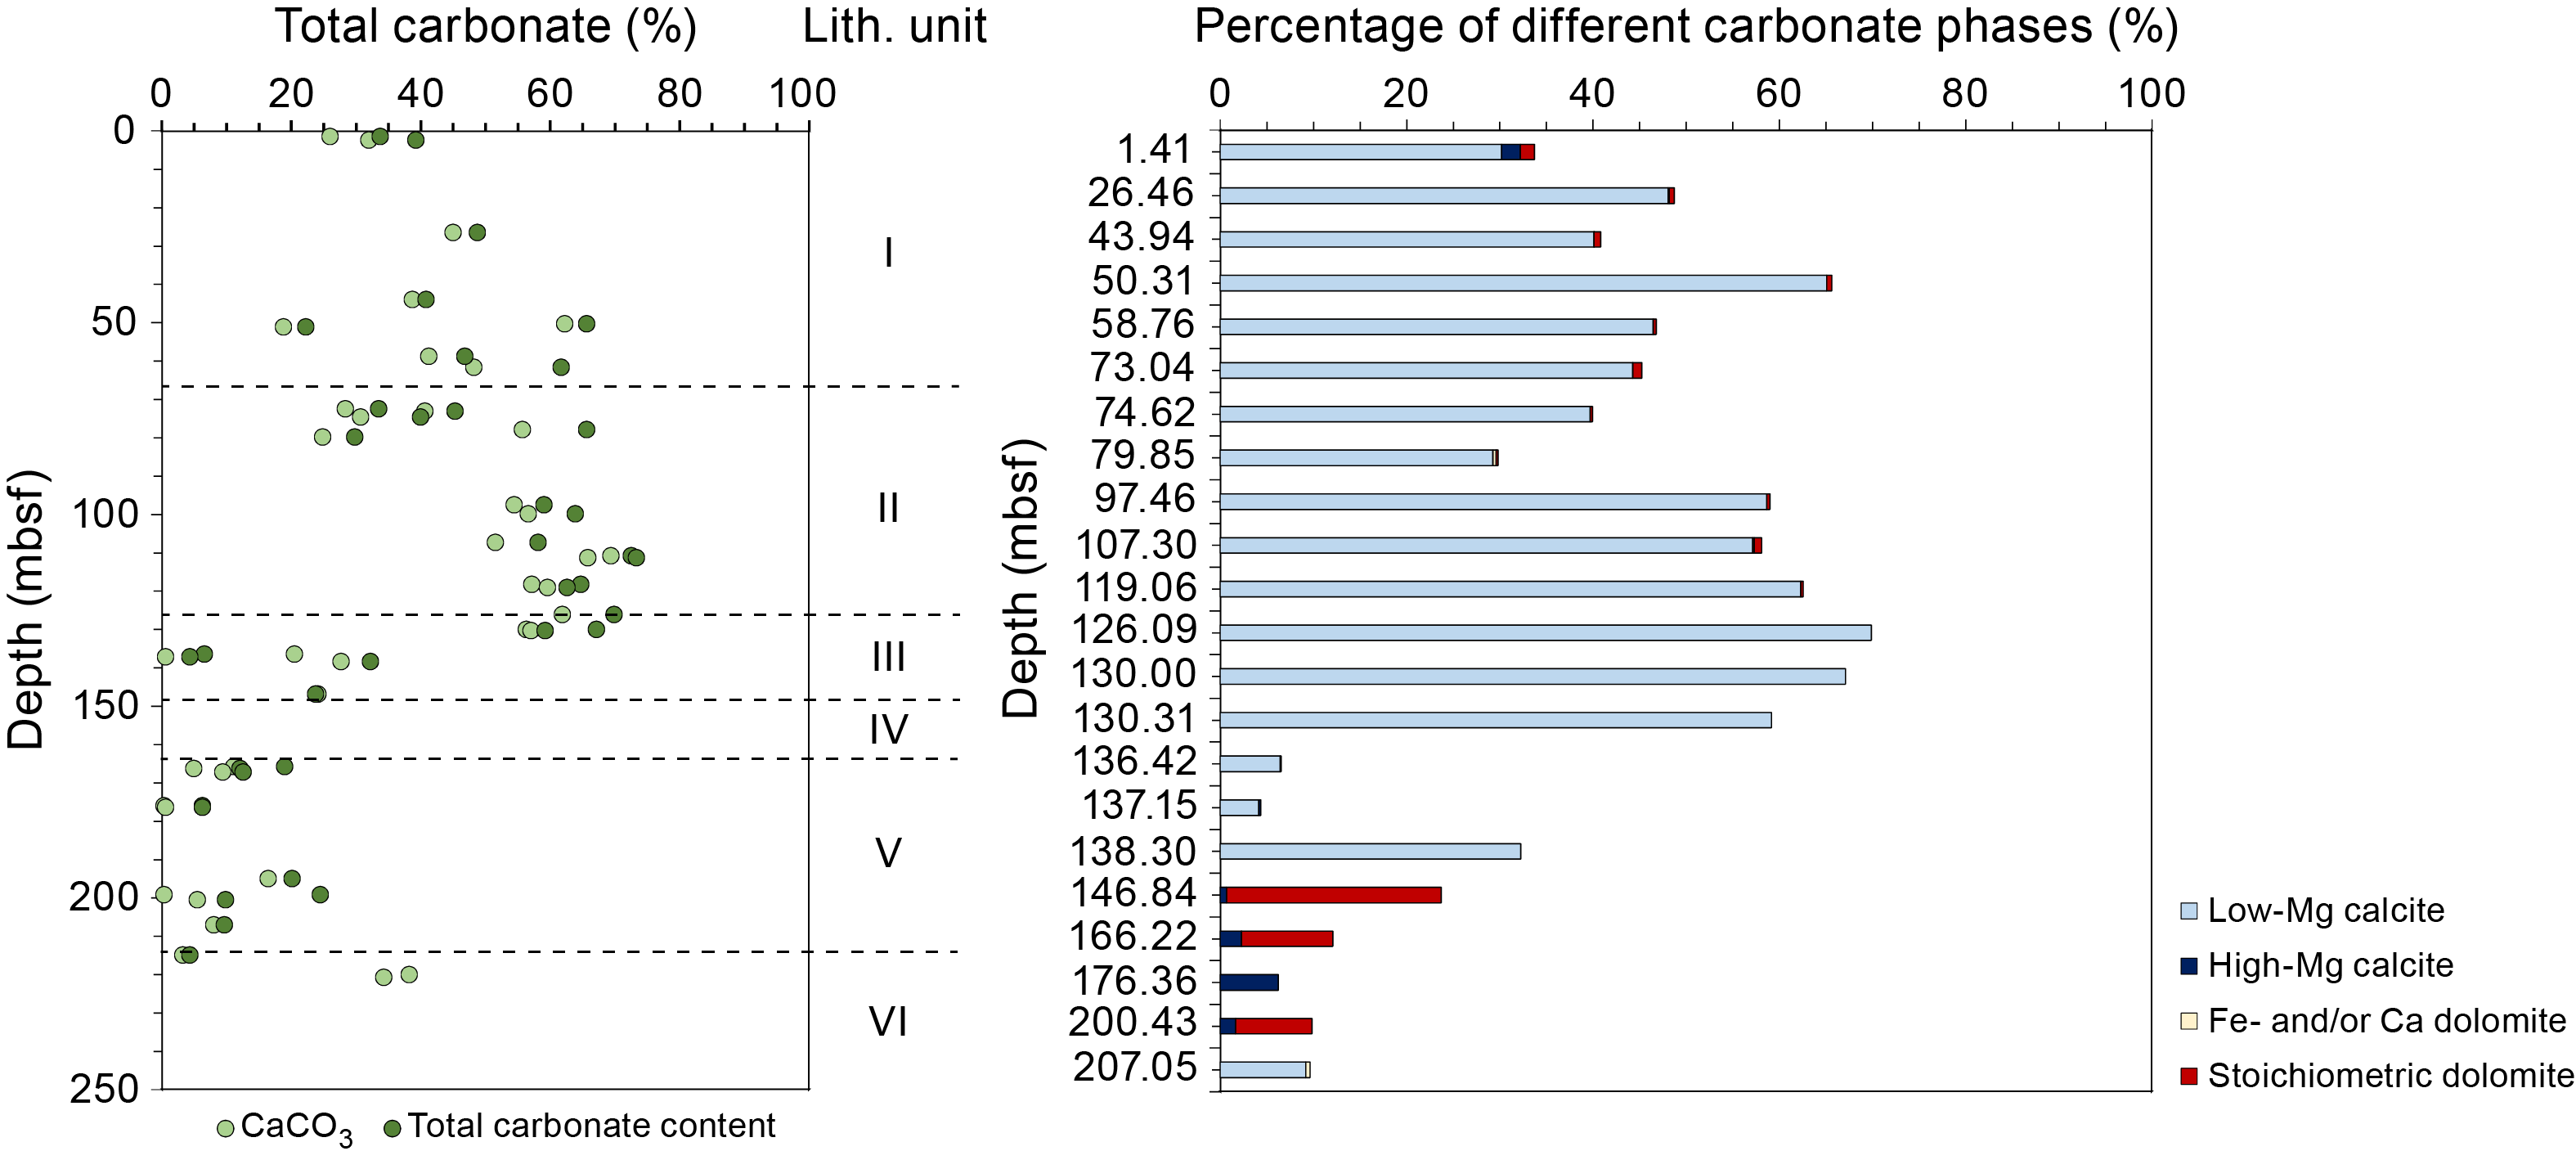
Figure F29. Carbonate.
8.2.2. Total organic matter, organic carbon, nitrogen, and sulfur in the solid-phase samples
Data for total organic matter, TOC, TN, and TS contents in solid-phase samples are shown in Table T6 and Figure F30. TOC values generally ranged 0.03–0.33 wt% throughout the sedimentary column, except at three depths (73.0, 219.9, and 220.7 mbsf), which were characterized by higher TOC contents of >0.71 wt% and correspond to a nannofossil ooze with mud and to a black shale layer. TN contents were low and varied from undetectable to 0.14 wt% with a mean value of 0.04 ± 0.03 wt%. Atomic TOC/TN ratios range 0.2–37.2. Atomic TOC/TN values close to 8–9 may indicate the dominance of organic matter derived from marine algal source (Meyers, 1994). Atomic TOC/TN ratios lower than 5 are generally associated with higher TN contents that probably result from the presence of nitrogen in the mineral phase, especially bound to surface clay mineral species (Faganeli et al., 1991). TS contents vary from 0.0 to 0.4 wt% and show values higher than 0.3 wt% in three samples with the highest TOC contents. TS levels are positively correlated with TOC levels (Figure F31).
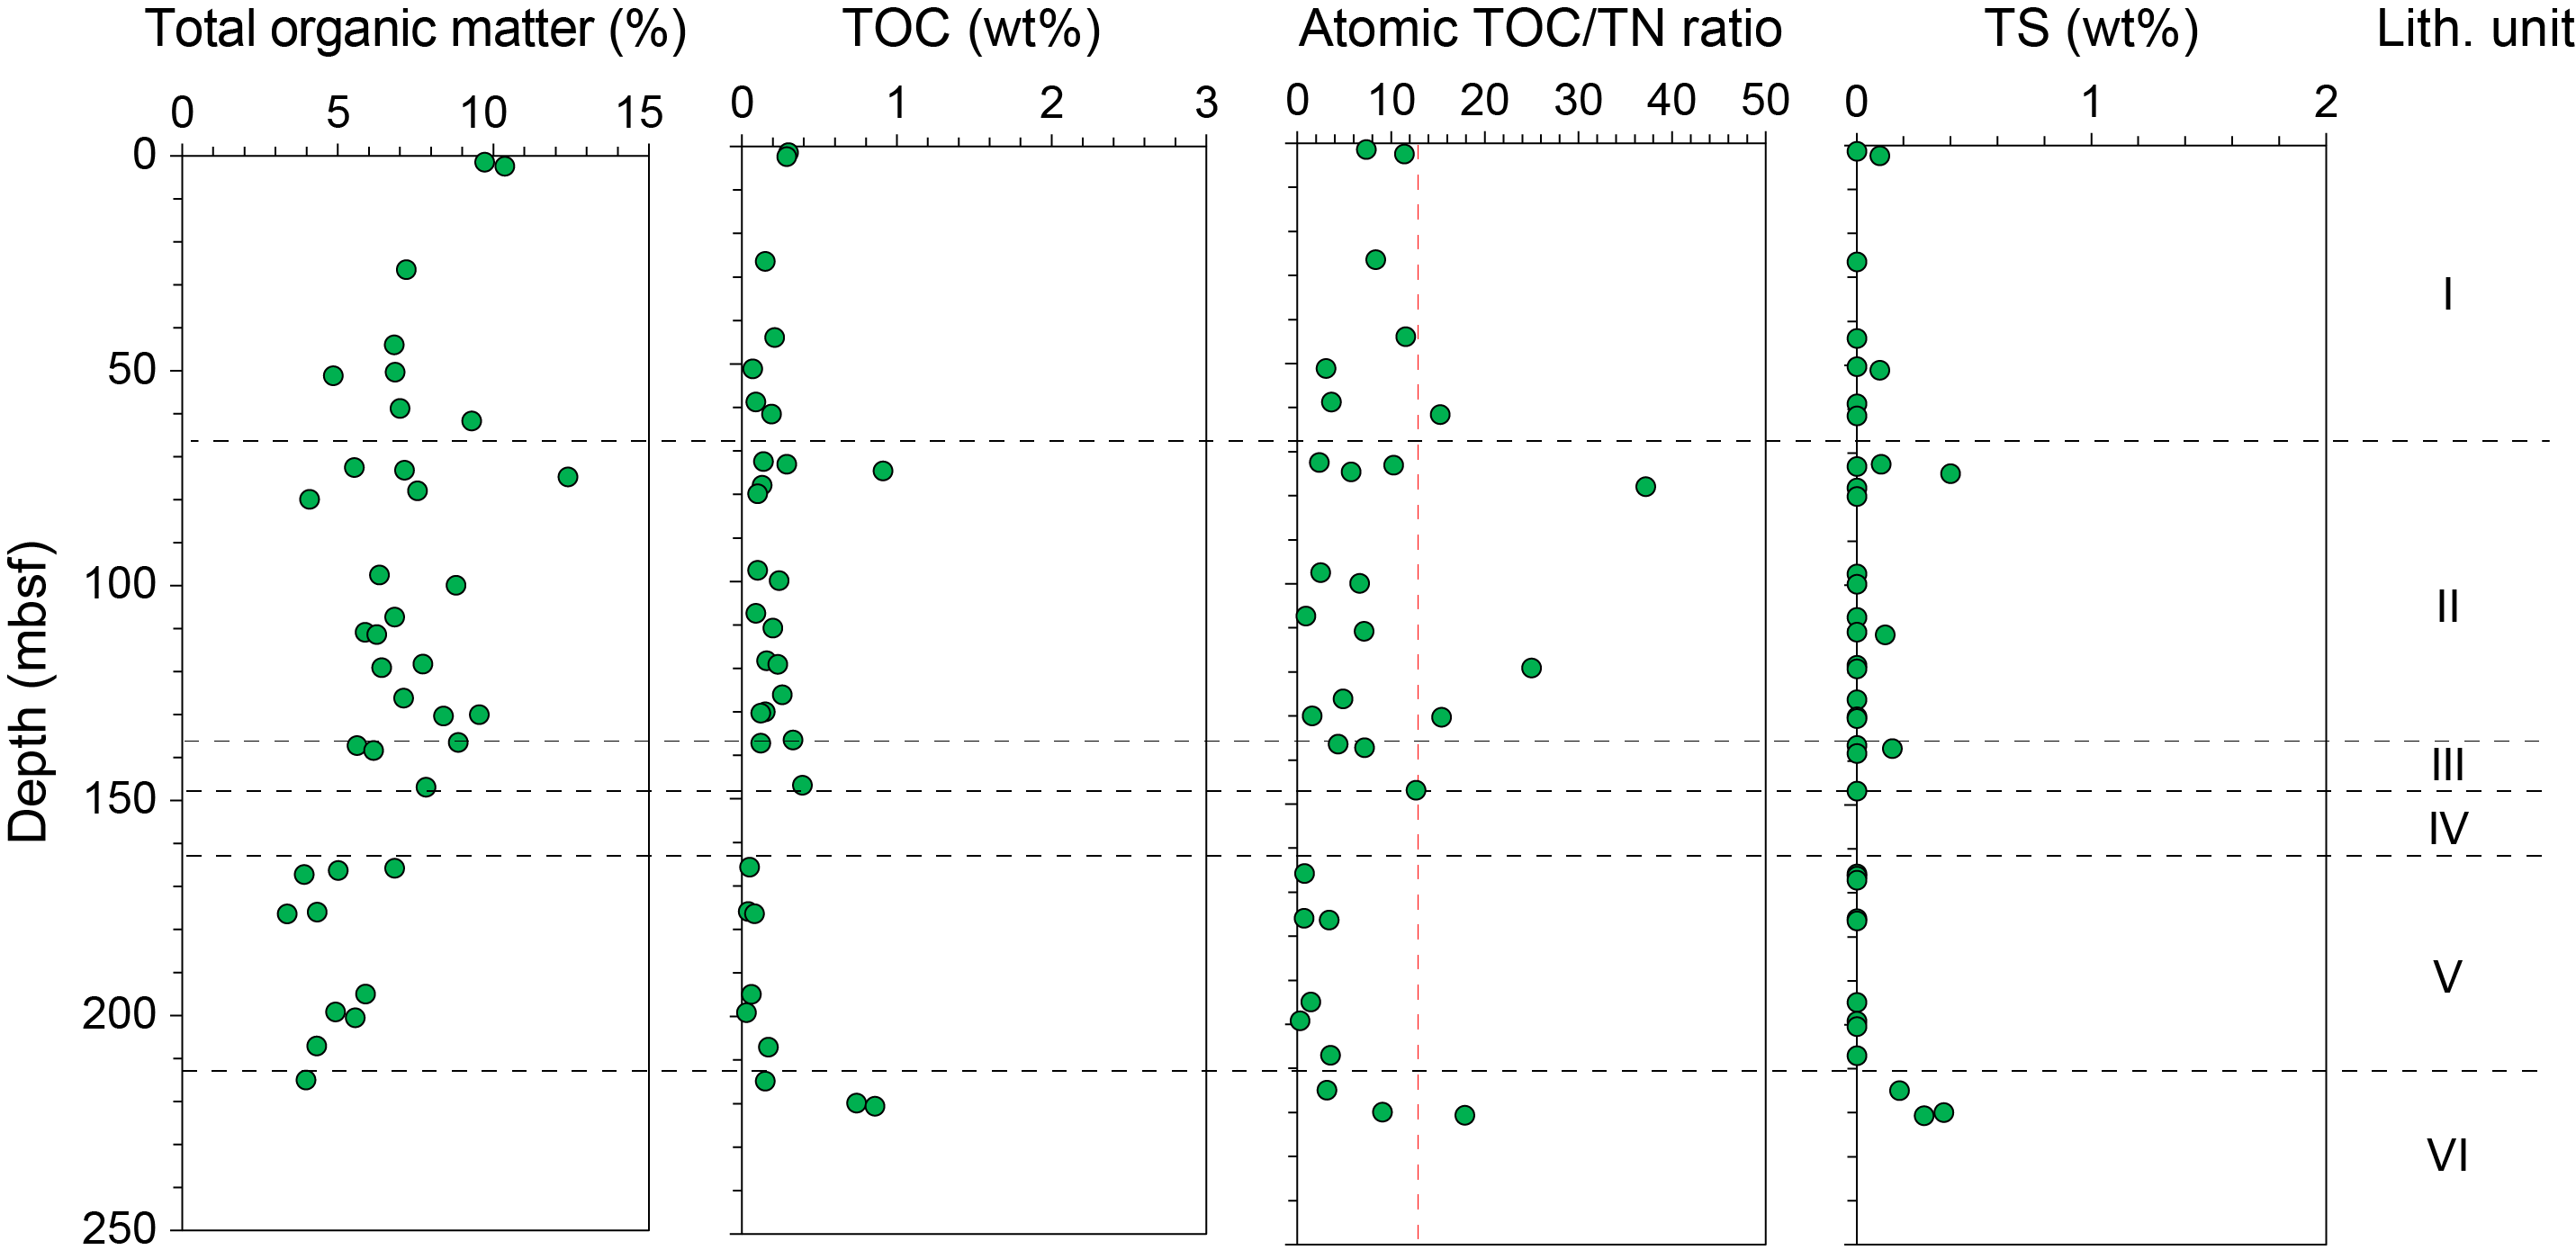
Figure F30. Total organic matter, TOC, atomic TOC/TN ratio, and TS.
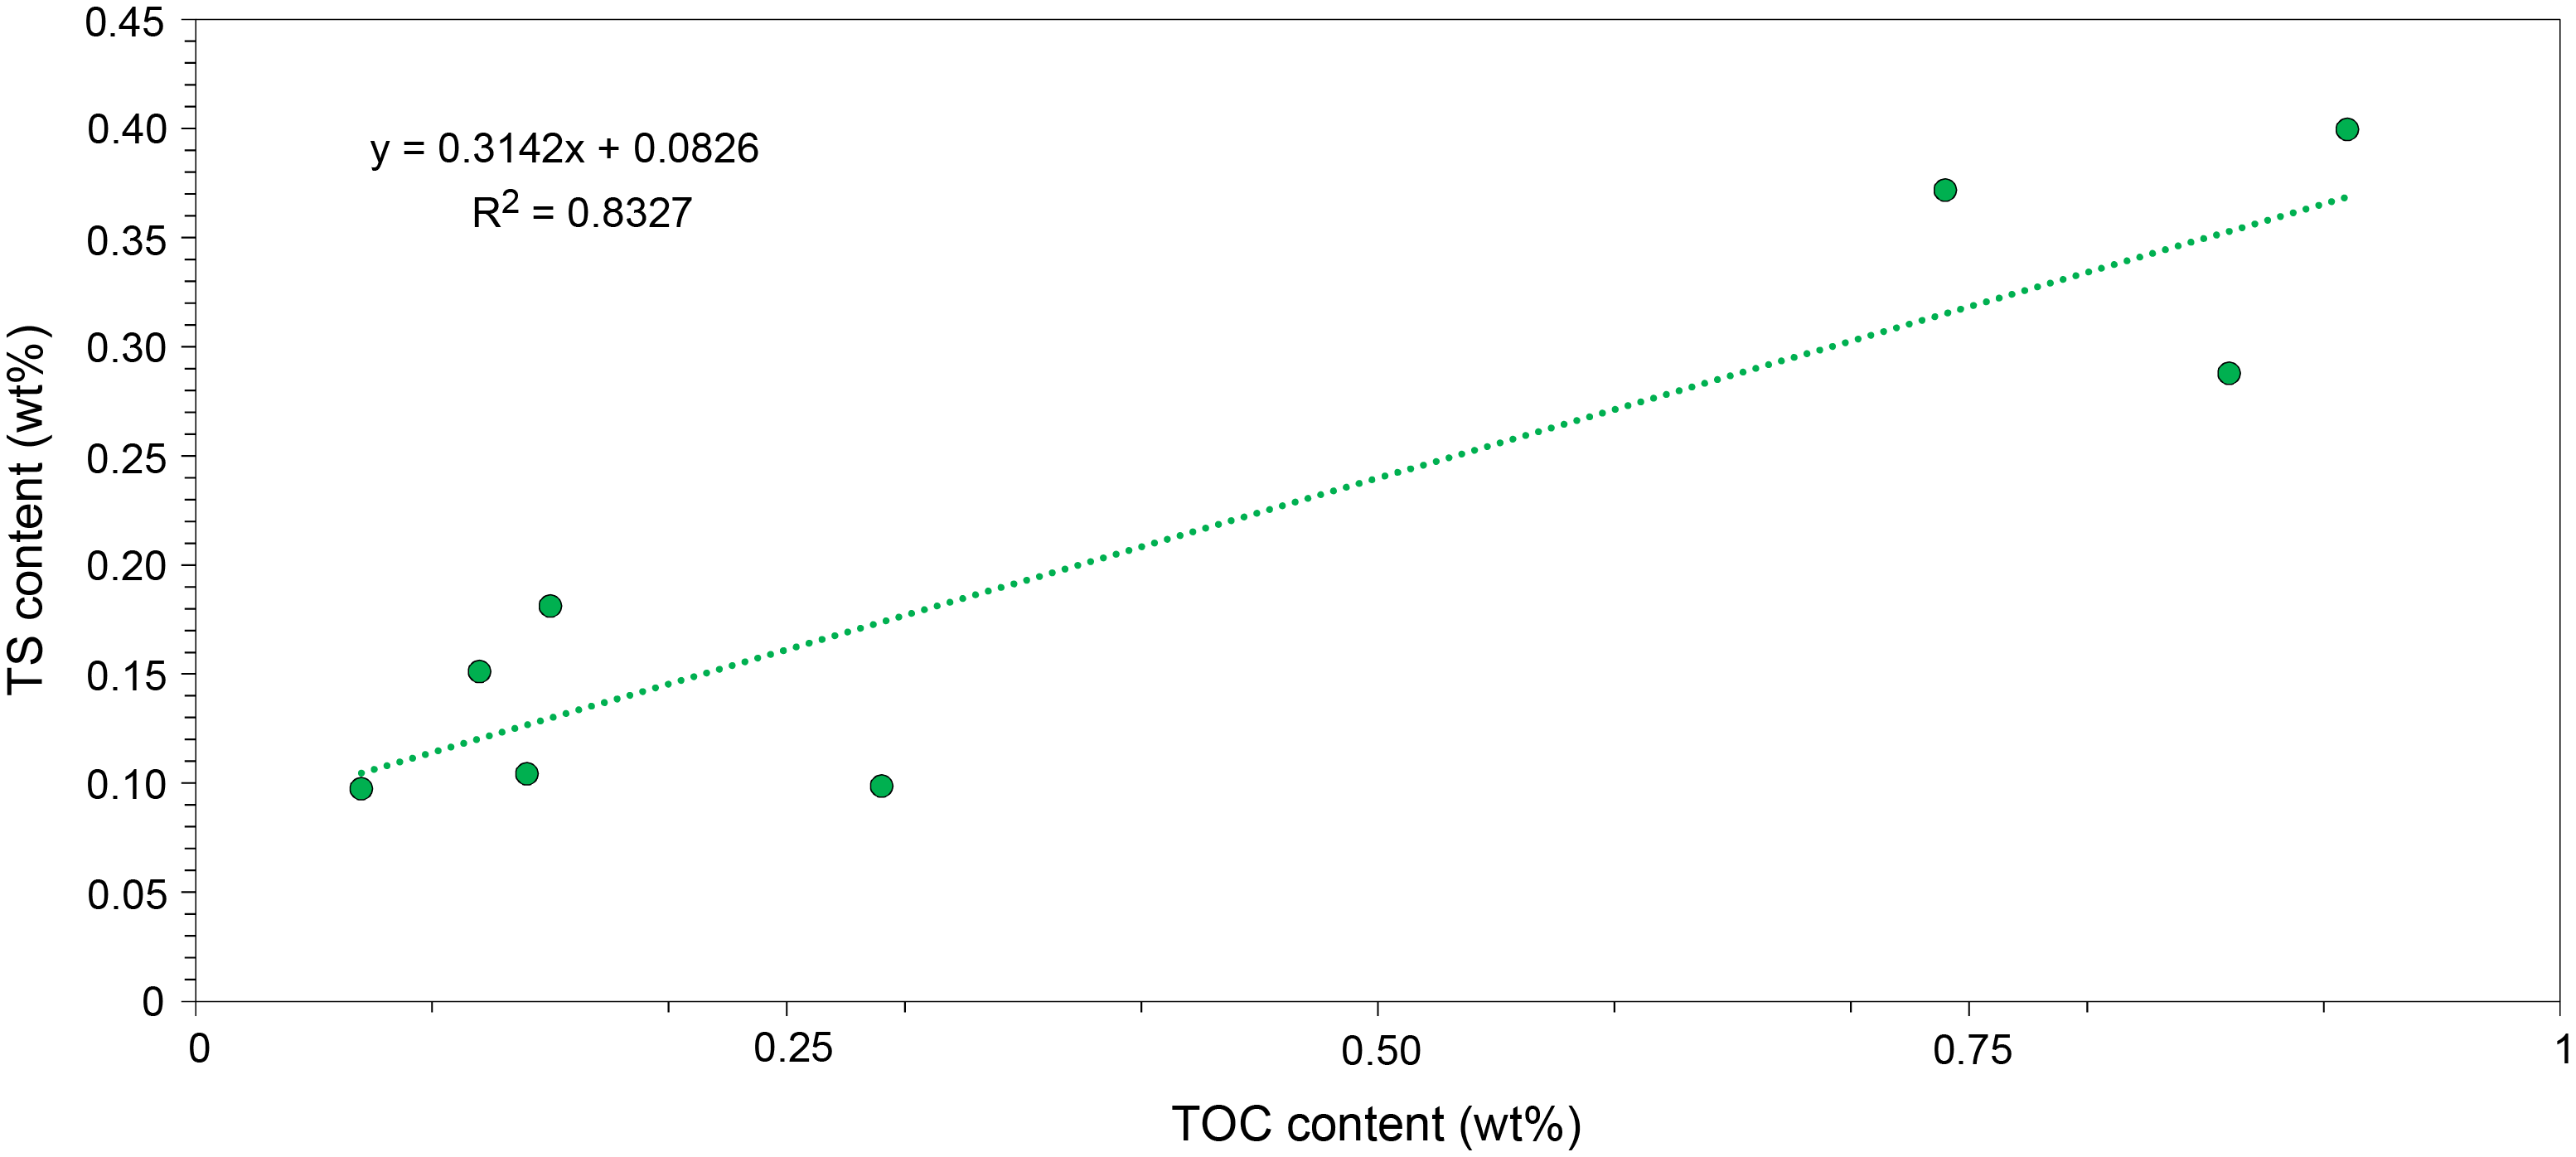
Figure F31. TOC vs. TS.
8.2.3. Major, minor, and trace element content of sediments
To better understand the major, minor, and trace element composition of Site U1613 sediment, 37 intervals were analyzed using portable X-ray fluorescence spectrometry (pXRF) and 9 samples were analyzed using ICP-AES. For the pXRF analyses, 17 IW squeeze cakes and their adjacent 16 intervals in the same section halves were analyzed to increase measurement resolution. In addition, 4 intervals containing black shale were analyzed using pXRF. Corrected and raw pXRF data of sediments are compiled in Tables T7 and T8, respectively. Nine sediment samples taken from five cores were analyzed using ICP-AES, and the results are compiled with loss on ignition (LOI) values in Table T9.
The chemical composition of the sediments shows a drastic change at ~136 mbsf between Cores 402-U1613A-14R and 15R, where oxide abundances increase and the lithologic classification changes from muddy ooze to silt or sand downhole (Figure F32). The SiO2, Al2O3, Fe, and Rb contents increase from Core 14R to Core 15R, whereas the CaO, MnO, and Sr contents decrease (Figure F32). The black shale of Core 24R at the bottom of Hole U1613A is higher in Ca and Mn (~21 wt% CaO and ~0.12 wt% MnO) than the sections above composed of silt and sand (~4.2 wt% CaO and <0.1 wt% MnO) (Table T9).
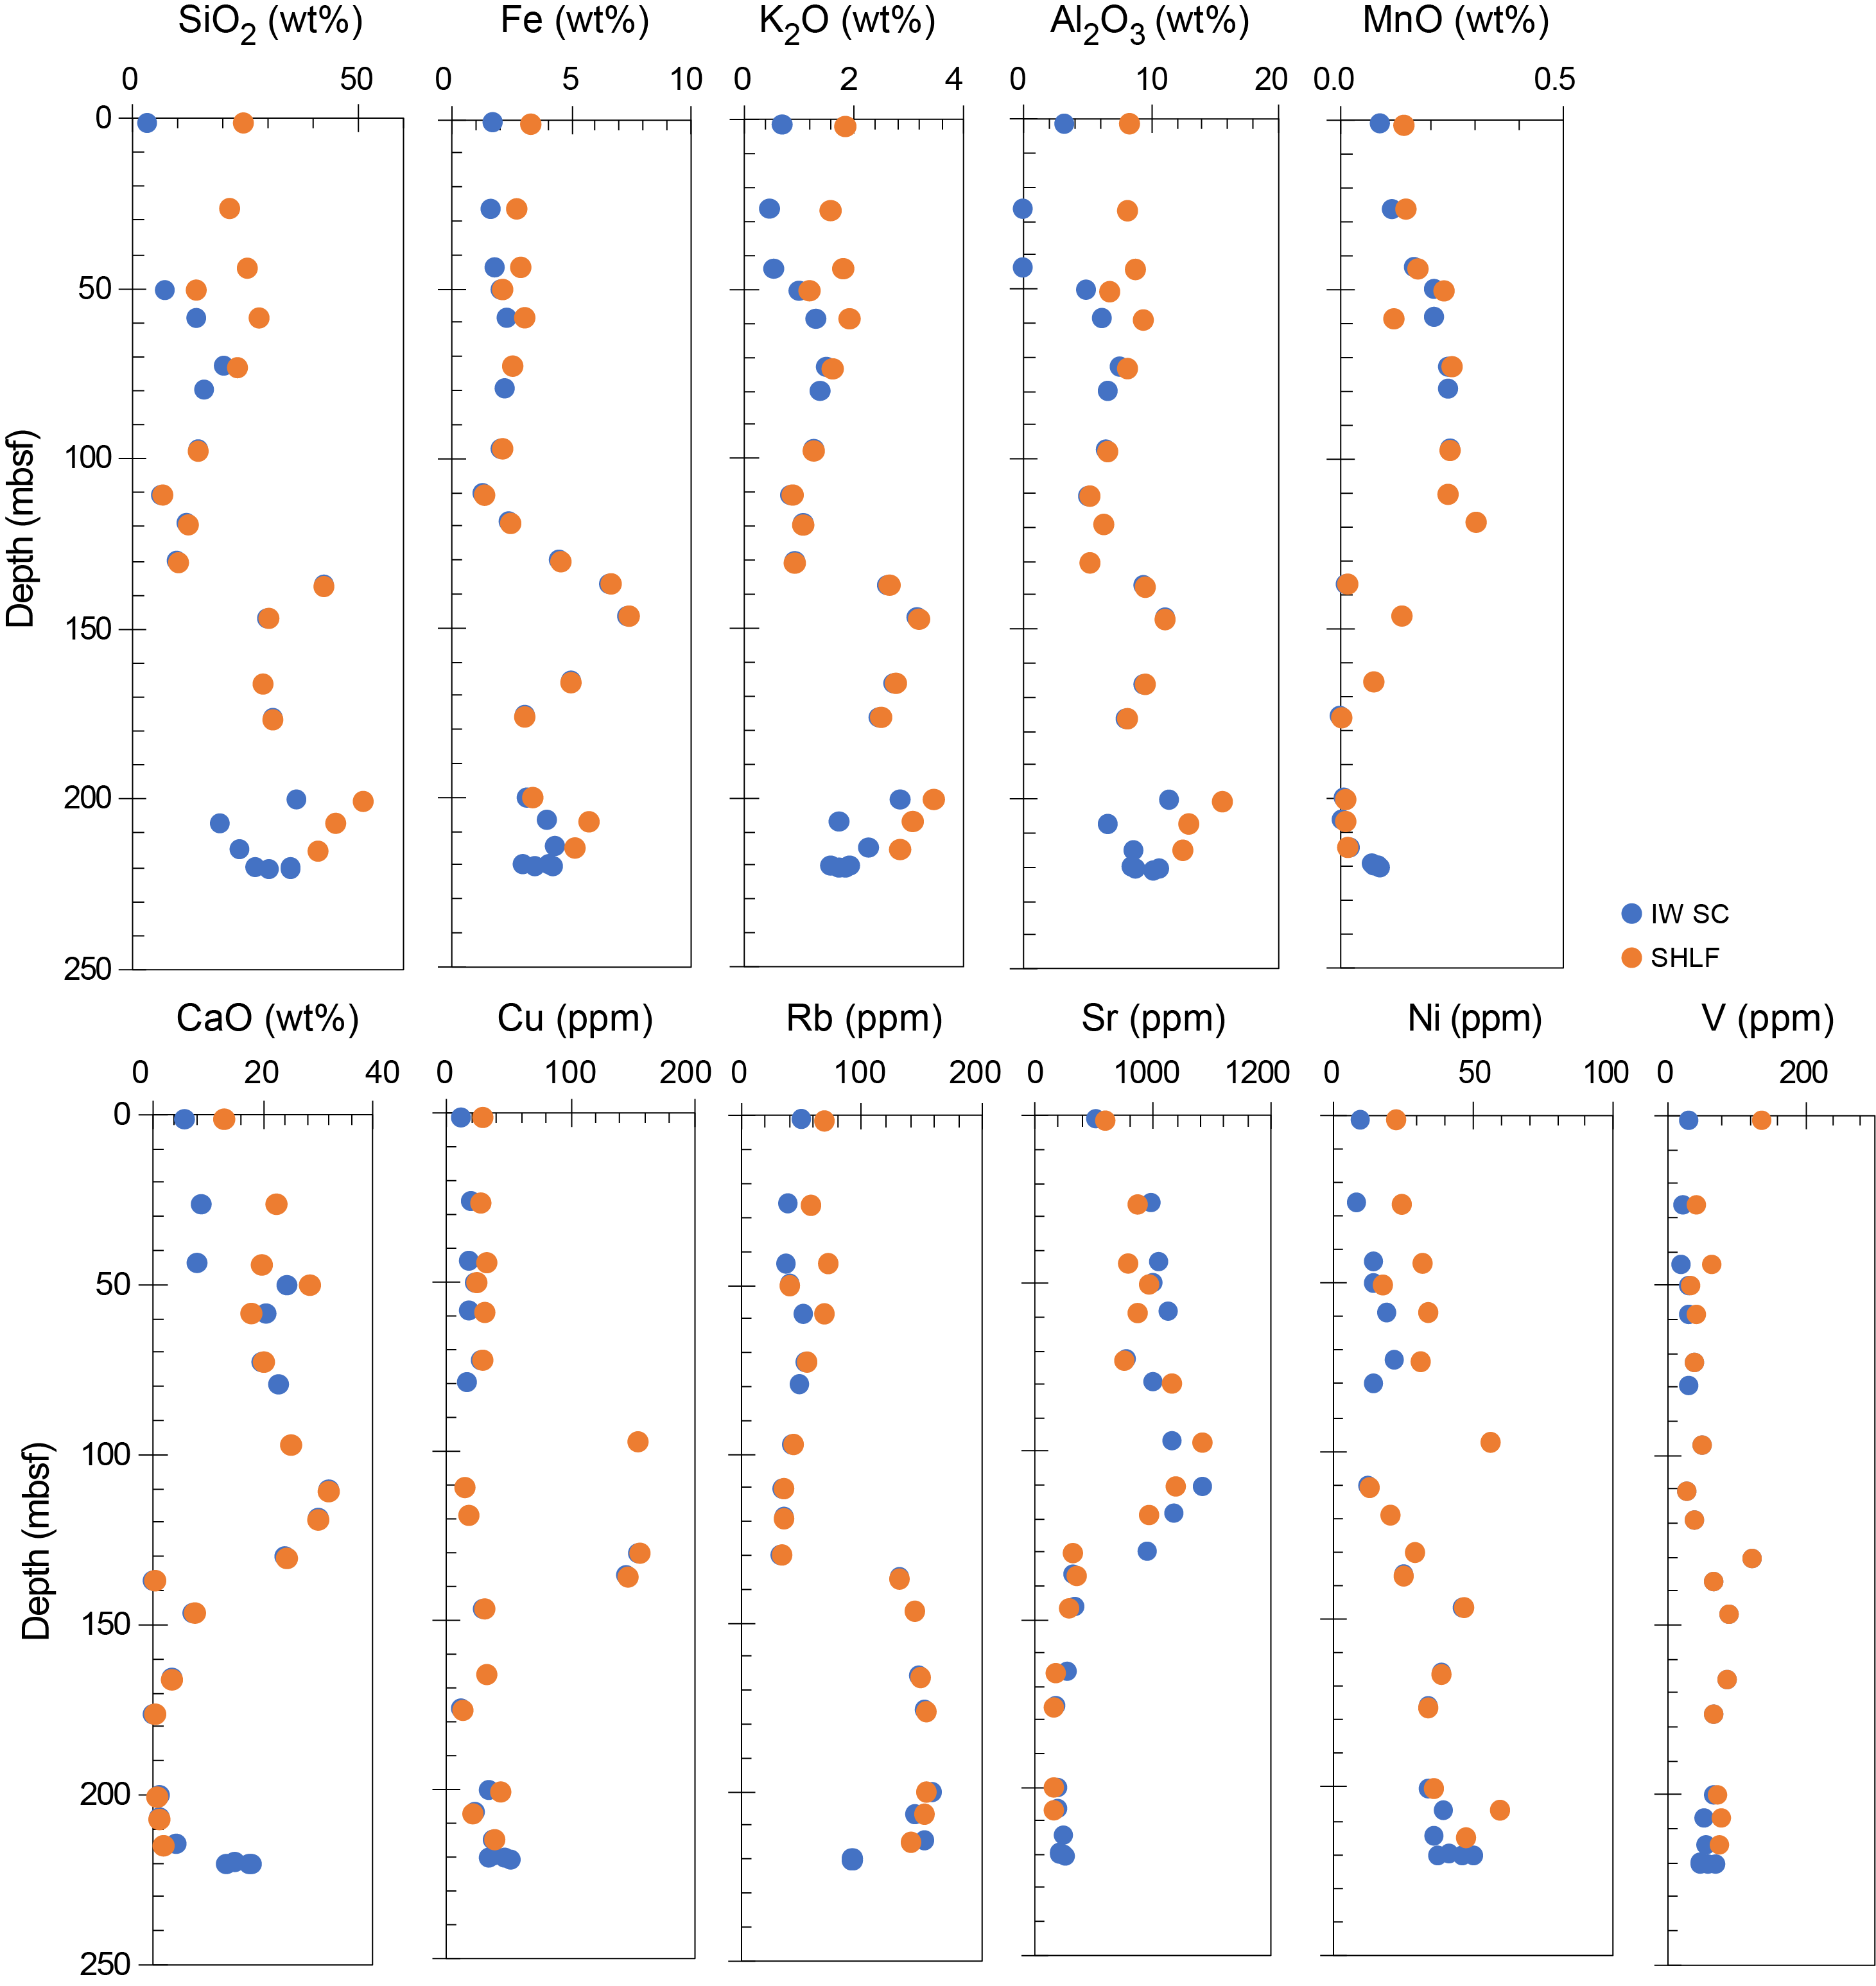
Figure F32. pXRF elemental concentration.
8.2.4. Hydrocarbon gases
Headspace samples were collected from Cores 402-U1613A-1R through 18R (except Cores 2R, 4R, and 16R) to monitor for C1–C6 hydrocarbons in accordance with the standard safety protocol during drilling (Pimmel and Claypool, 2001). In Hole U1613A, hydrocarbon concentrations in parts per million by volume were measured in 16 headspace samples (Figure F33; Table T10). Methane (CH4) is the only hydrocarbon gas detected in the cores at this site. The amount of methane is trivial, varying from 0.1 to 2.1 ppmv between 1.5 and 166.3 mbsf. Overall, methane concentrations are relatively stable around a mean value of 0.7 ± 0.2 ppmv from 1.5 to 79.9 mbsf and then increase to 2.1 ppmv at ~87.1 mbsf in a nannofossil ooze with foraminifera characterized by horizontal cracks. At 97.5 mbsf, methane concentrations drop to 0.1 ppmv and then vary from 0.3 to 1.6 ppmv. Because C2 to C6 hydrocarbon gases were absent in this hole, the C1/C2 and C1/C+ values were not calculated.
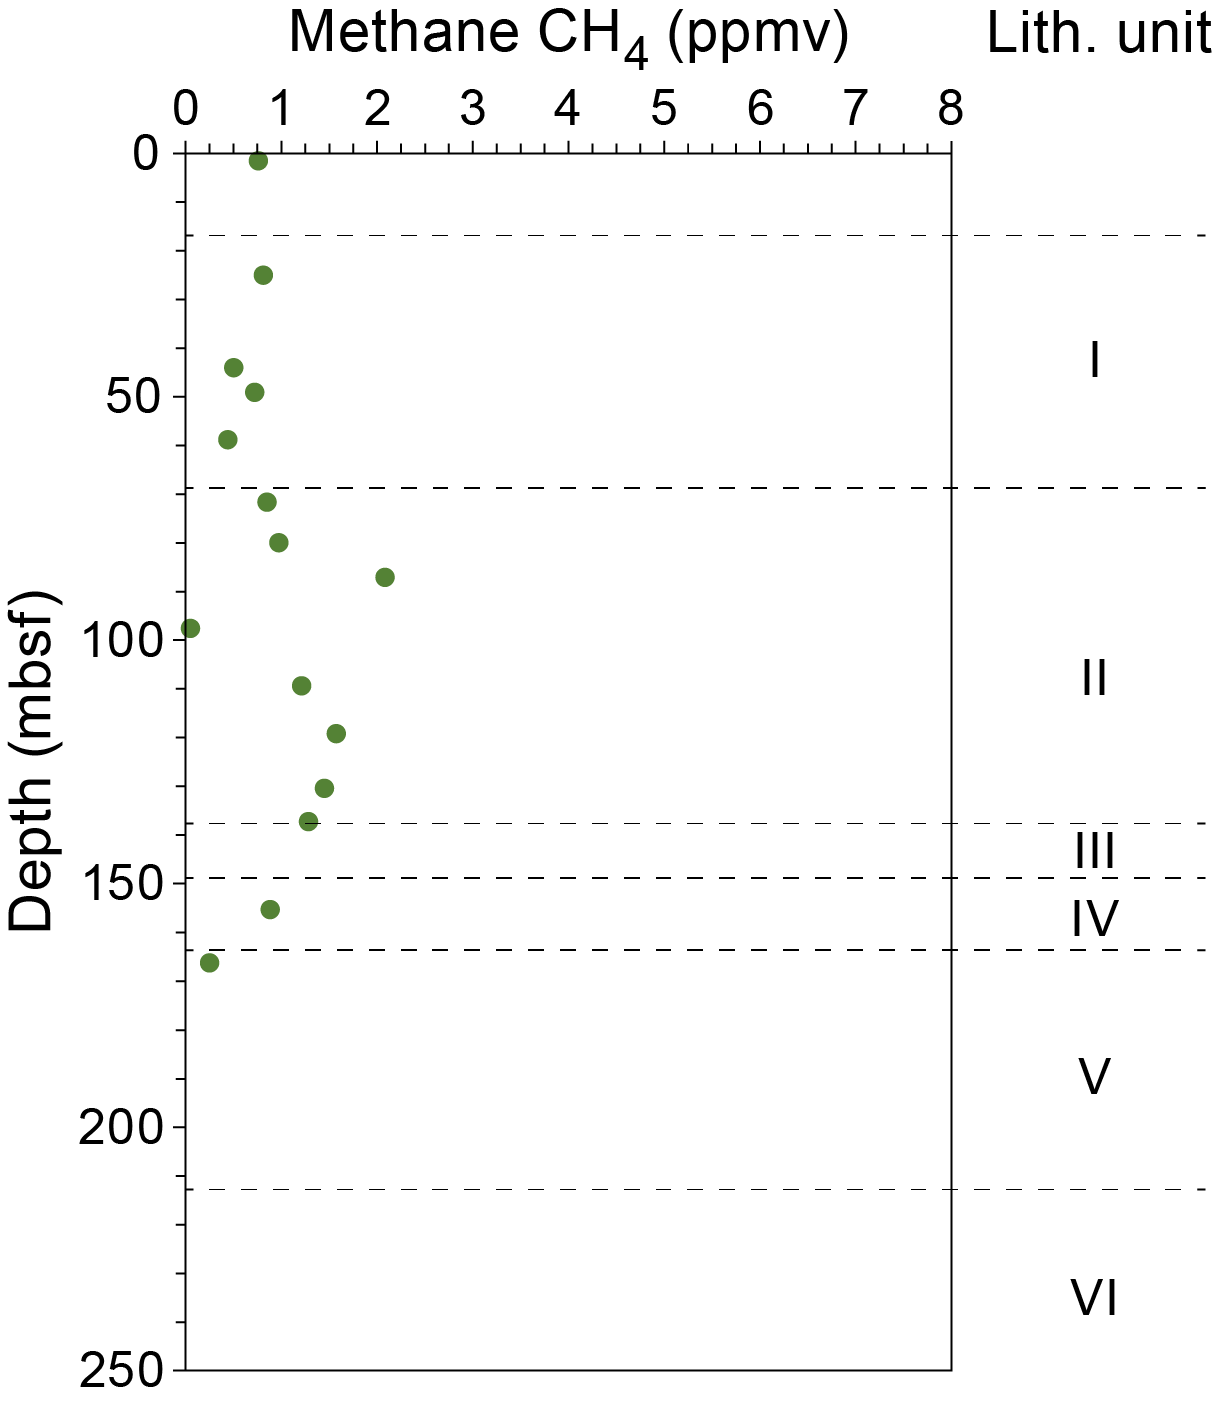
Figure F33. Methane concentrations.
9. Physical properties
Physical properties of the sedimentary sequence were measured on 90 core sections recovered from Hole U1613A. Whole-round measurements included natural gamma radiation (NGR) and gamma ray attenuation (GRA) bulk density, magnetic susceptibility (MS), and P-wave velocity (VP) obtained with the Whole-Round Multisensor Logger (WRMSL). We also X-ray imaged all split core sections in the sediment interval from Cores 1R–15R and all whole-round sections for basement rocks (Cores 16R–24R). In addition, we collected discrete measurements on section halves, including VP with the Gantry system (using the bayonet on soft sediments and the caliper on stiff sediments and hard rocks), moisture and density (MAD), and thermal conductivity (Table T11).
Hole U1613A was drilled to a total depth of 223.6 mbsf with a total recovery of 99.63 m (44%). Despite not recovering some intervals, physical properties measurements define two primary domains: a present day through Messinian sedimentary interval (Lithostratigraphic Units I–III; Sections 1R-1 through 16R-2; 0–147.5 mbsf) and the pre-Messinian basement (Lithostratigraphic Units IV–VI; Sections 16R-CC through 24R-1; 147.5–224 mbsf). A thin gypsum-bearing silt layer is found just above the contact between these two domains. Figure F34 shows a complete plot of all physical properties measurements combined with the lithostratigraphic and chronostratigraphic information provided by the other teams, and Table T12 summarizes physical properties statistics for each lithostratigraphic unit.
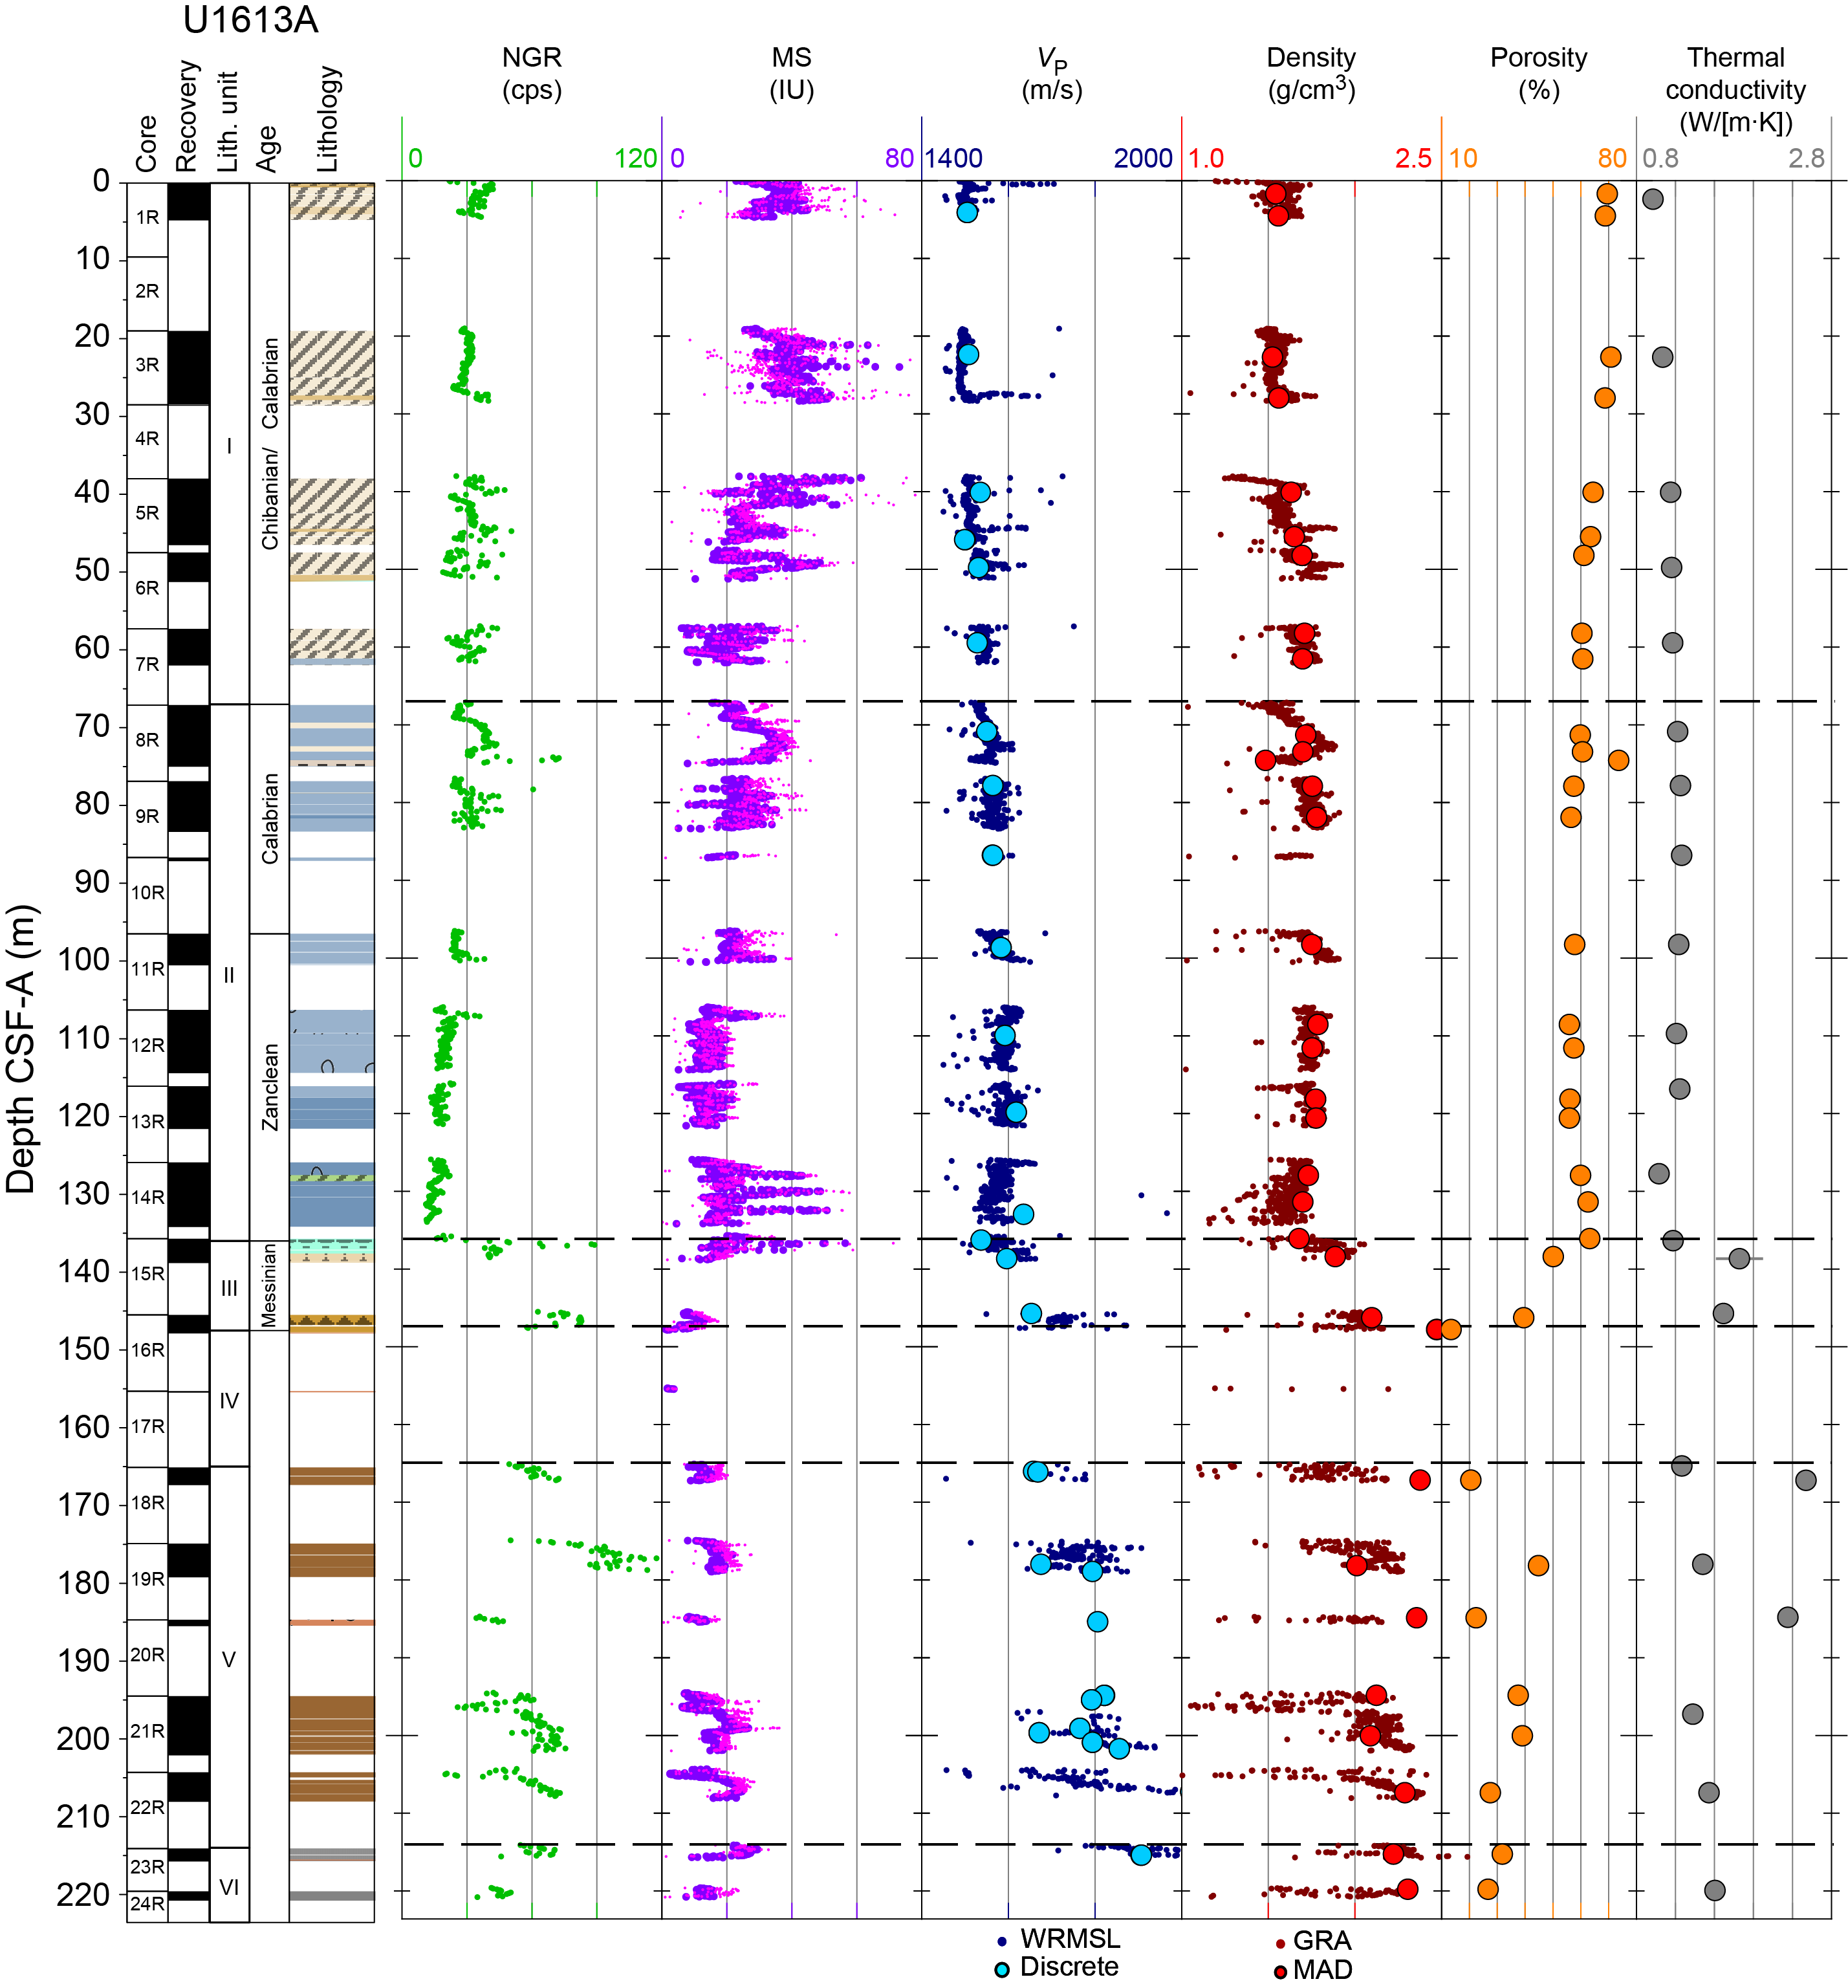
Figure F34. Physical properties.
9.1. Present day through Messinian sediment interval
The top sediment interval extends from Core 402-U1613A-1R to the base of Section 16R-CC (0–147.5 mbsf). Based on combined results from the WRMSL and discrete measurements, VP in this interval ranges 1480–1708 m/s. Discrete 3D velocity measurements were only performed on the top core (Section 1R-4), yielding Vx = 1504 m/s, Vy = 1441 m/s, and Vz = 1473 m/s. However, the bayonet did not provide reliable measurements in other cores. Therefore, only discrete X-axis VP data were measured with the caliper starting from Core 3R. Three sedimentary units were identified by the sedimentology team, some of which show consistent trends in physical properties (Figure F34).
9.2. Lithostratigraphic Unit I
Nine MAD samples were collected from Lithostratigraphic Unit I (Cores 402-U1613A-1R through 7R) (see Lithostratigraphy). The samples returned bulk density measurements from 1.54 g/cm3 at the top (Section 1R-2) to 1.7 g/cm3 (Section 7R-4), and porosity decreases from ~70% to ~56%. MS ranges 20–40 IU with several peaks of about 75 IU (WRMSL) in the uppermost five cores but remains stable in the rest of this unit. Thermal conductivity increases from 0.969 W/(m·K) in Core 1R to 1.171 W/(m·K) in Core 7R. NGR generally decreases from ~42 to ~27 counts/s in the uppermost 26 m (Cores 1R–3R), with the data oscillating between ~30 to 40 counts/s in the rest of this unit. A layer of medium-grained sand with higher bulk density, VP, NGR, and MS is observed in Sections 3R-6 and 3R-7. Similar physical properties variations in Sections 5R-1 and 5R-2 do not correspond to any identified lithologic changes.
9.3. Lithostratigraphic Unit II
The sedimentary rocks of Unit II (Cores 402-U1613A-8R through 14R; 67–136 mbsf) show a nearly constant VP trend of ~1550 m/s. Bulk density slightly increases from ~1.5 to ~1.8 g/cm3 in the uppermost five sections of Core 8R and then drops dramatically in Section 8R-6 over a grayish green glauconite-rich mud interval. This interval shows a significant drop in bulk density from ~1.8 to ~1.5 g/cm3, a VP drop from ~1560 to ~1510 m/s, and an increase in NGR from ~30 to 50 counts/s. A MAD sample from this interval (Section 8R-6) has an anomalously low bulk density of 1.484 g/cm3 (the lowest among all the measurements in the entire hole) and a high porosity of 74% compared to 1.677 g/cm3 and 60% measured in Section 8R-5. A total of 12 discrete MAD samples from this interval have an average bulk density of 1.725 g/cm3 and average porosity of 59%. MS remains in the range 10–20 IU, NGR decreases from ~20 to 15 counts/s, and thermal conductivity remains around 1.25 W/(m·K). All physical properties values decrease dramatically in Core 14R, which contains the minimum values for most properties measured, except for bulk density, which was lowest in the glauconite-rich layer (Core 8R).
9.4. Lithostratigraphic Unit III
This sedimentary unit (the Messinian interval) is characterized by sharp changes in physical properties in the upper part of Core 402-U1613A-15R through 16R (136–147.5 mbsf). Based on discrete measurements (Figure F35), gypsum-bearing sediments with oxidized intervals (see Lithostratigraphy) correspond to a significant increase in bulk density to 2.1 g/cm3, a decrease in porosity to 40%, and an increase in thermal conductivity to reach 1.85 W/(m·K). WRMSL VP increases downhole from ~1570 to ~1700 m/s, and NGR increases from ~15 to more than 80 counts/s (Figure F34). MS generally shows low or constant values except for two peaks, the shallowest of which corresponds to a highly oxidized 20 cm thick layer with a characteristic reddish color (Figure F35). After drying, the MAD sample from the Messinian layer contained a small number of white salt crystals on top, a phenomenon that was not observed in other samples from the sediments above. The pXRF analysis of MAD samples from this interval revealed up to 12% of sulfur (S) and up to 20% of chlorine (Cl), which is consistent with the presence of evaporites. Otherwise, much of this interval is composed of terrigenous sediments, as suggested by the low VP compared to higher VP typical for evaporites (4.85–4.9 km/s, measured at nearby DSDP Leg 13 Site 132; Schreiber et al., 1973). The pXRF analysis of the background samples from Cores 8R and 15R showed significantly smaller amounts of S and Cl (not exceeding 1% for each).
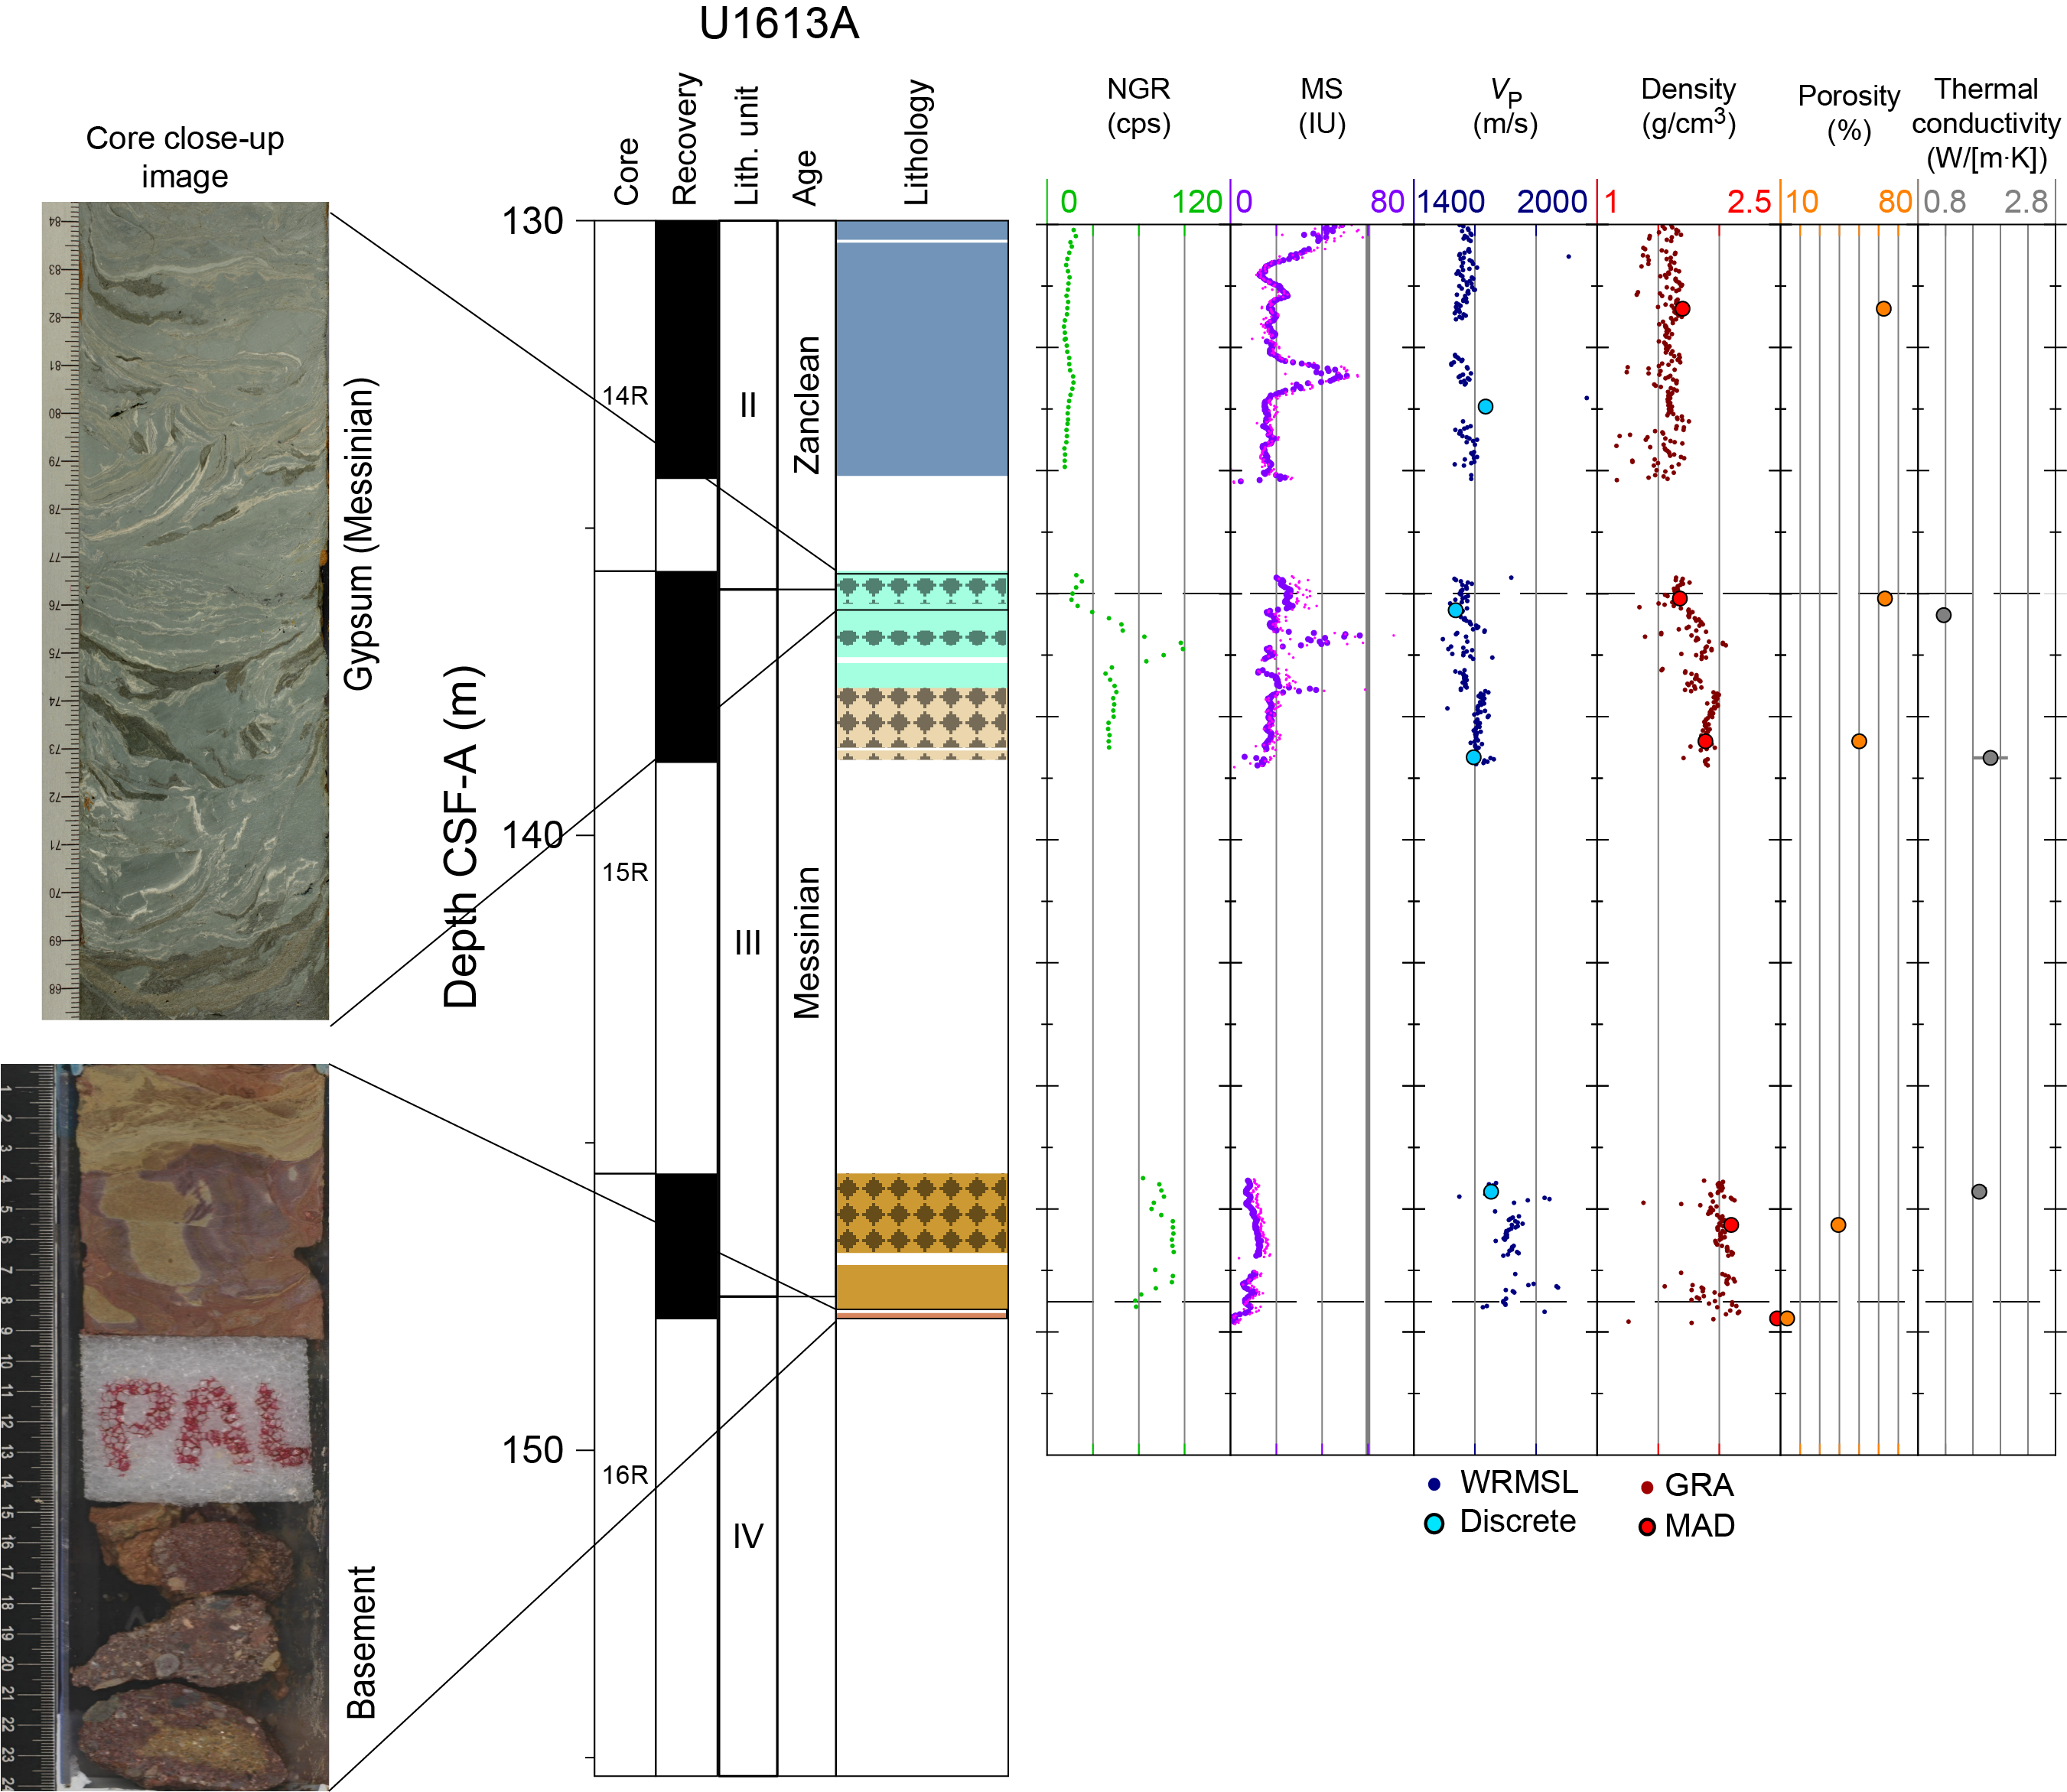
Figure F35. Physical properties for the sediment–basement transition.
9.5. Pre-Messinian basement (Lithostratigraphic Units IV–VI)
Pre-Messinian basement rocks were recovered from 147.5 mbsf to the bottom of the hole at 224 mbsf (Section 402-U1613A-16R-CC through Core 24R). The boundary between Messinian oxidized siltstone and underlying coarse-grained breccia was encountered in Section 16R-CC. Below this boundary, discrete measurements (Figure F34) show an increase in VP, density, and thermal conductivity downhole, and porosity decreases with increasing depth. Maximum values of bulk density of 2.47 g/cm3, VP of 3630 m/s, and thermal conductivity of 4.2 W/(m·K) were registered in this interval. In contrast, porosity strongly decreases from 39% to 13%. These trends are also supported by WRMSL measurements. MS is low (5–13 counts/s) and remains constant throughout the basement interval. Coarse-grained polymictic conglomerate/breccia (Figure F35) interbedded with dark shale layers is the primary lithology throughout the basement interval, transitioning to homogeneous black shale at the bottom of the hole.
VP in the pre-Messinian interval varies between very slow and fast (1650–5350 m/s). Thermal conductivity, bulk density, and porosity are also highly variable, ranging 1.2–4.1 W/(m·K), 2–2.47 g/cm3, and 45%–20%, respectively (Table T12). Elevated VP, thermal conductivity, and bulk density values are typically associated with hard rocks, whereas low values correspond to soft sandy rocks or intervals heavily affected by drilling disturbance (Figures F34, F35). Although a few quality VP measurements (WRMSL) were obtained in the pre-Messinian interval, the vast majority of these data were unreliable due to poor transducer coupling when the cores incompletely filled the liner. In addition, recovered conglomerates showed evidence of drilling-induced fracturing and mixing, and the severe drilling disturbance may have resulted in artificially low VP and bulk density and high porosity compared to the in situ formation. Finally, Core 402-U1613A-24R, which contains black shales, has low porosity (26%), high bulk density (2.3 g/cm3), and surprisingly low VP (~2800 m/s). NGR and MS are similar to the rest of the basement section.
9.6. Core-seismic integration
VP measurements from Site U1613 were used to create a depth-time conversion to facilitate a correlation between depth at Site U1613 and two-way traveltime (TWT) in the MEDOC Seismic Profile 6. All velocity data from WRMSL and Gantry discrete measurements were combined. Anomalous VP measurements (below 1450 m/s and above 7000 m/s) were removed to avoid contamination. A three-degree polynomial trendline, representing an ultrasmooth end-member, and a five-degree polynomial Savitzky-Golay filter, representing a slightly smoothed function, were fit to the velocity-depth data from 0 to 250 mbsf with 1 m increments. The resulting VP depth functions fit very well the primary clustering of WRMSL and discrete measurements (Figure F36). Depth-TWT conversion tables were calculated from these VP depth models. We consider the slightly smoothed Savitzky-Golay curve as the most reliable because it filters out erroneous measurements but captures high-frequency VP fluctuations in the sediment column better than the ultrasmooth three-degree polynomial model. The conversion results in a TWT below the seafloor of 0.273 s for the maximum penetration depth of Hole U1613A. Additionally, the depth to the top of each core was converted to TWT and superimposed on the seismic profile (Figure F36). Cores 1R–14R correspond to horizontal and continuous reflectors in the small subbasin adjacent to the Orosei submarine canyon to the west and bounded to the east by the uplifted block of the pre-Messinian basement. These reflectors onlap against a seismically transparent unit and agree with lithologic interpretations of alternating layers of hemipelagic mud and nannofossil ooze with coarser silt and sandstone layers, likely derived from overflow events that spilled over the levee of the Orosei canyon. Cores 15R–16R, which contain the Messinian interval, are associated with an unconformity that separates the highly reflective subparallel beds above from a transparent interval below that runs subparallel to the tilted acoustic basement.
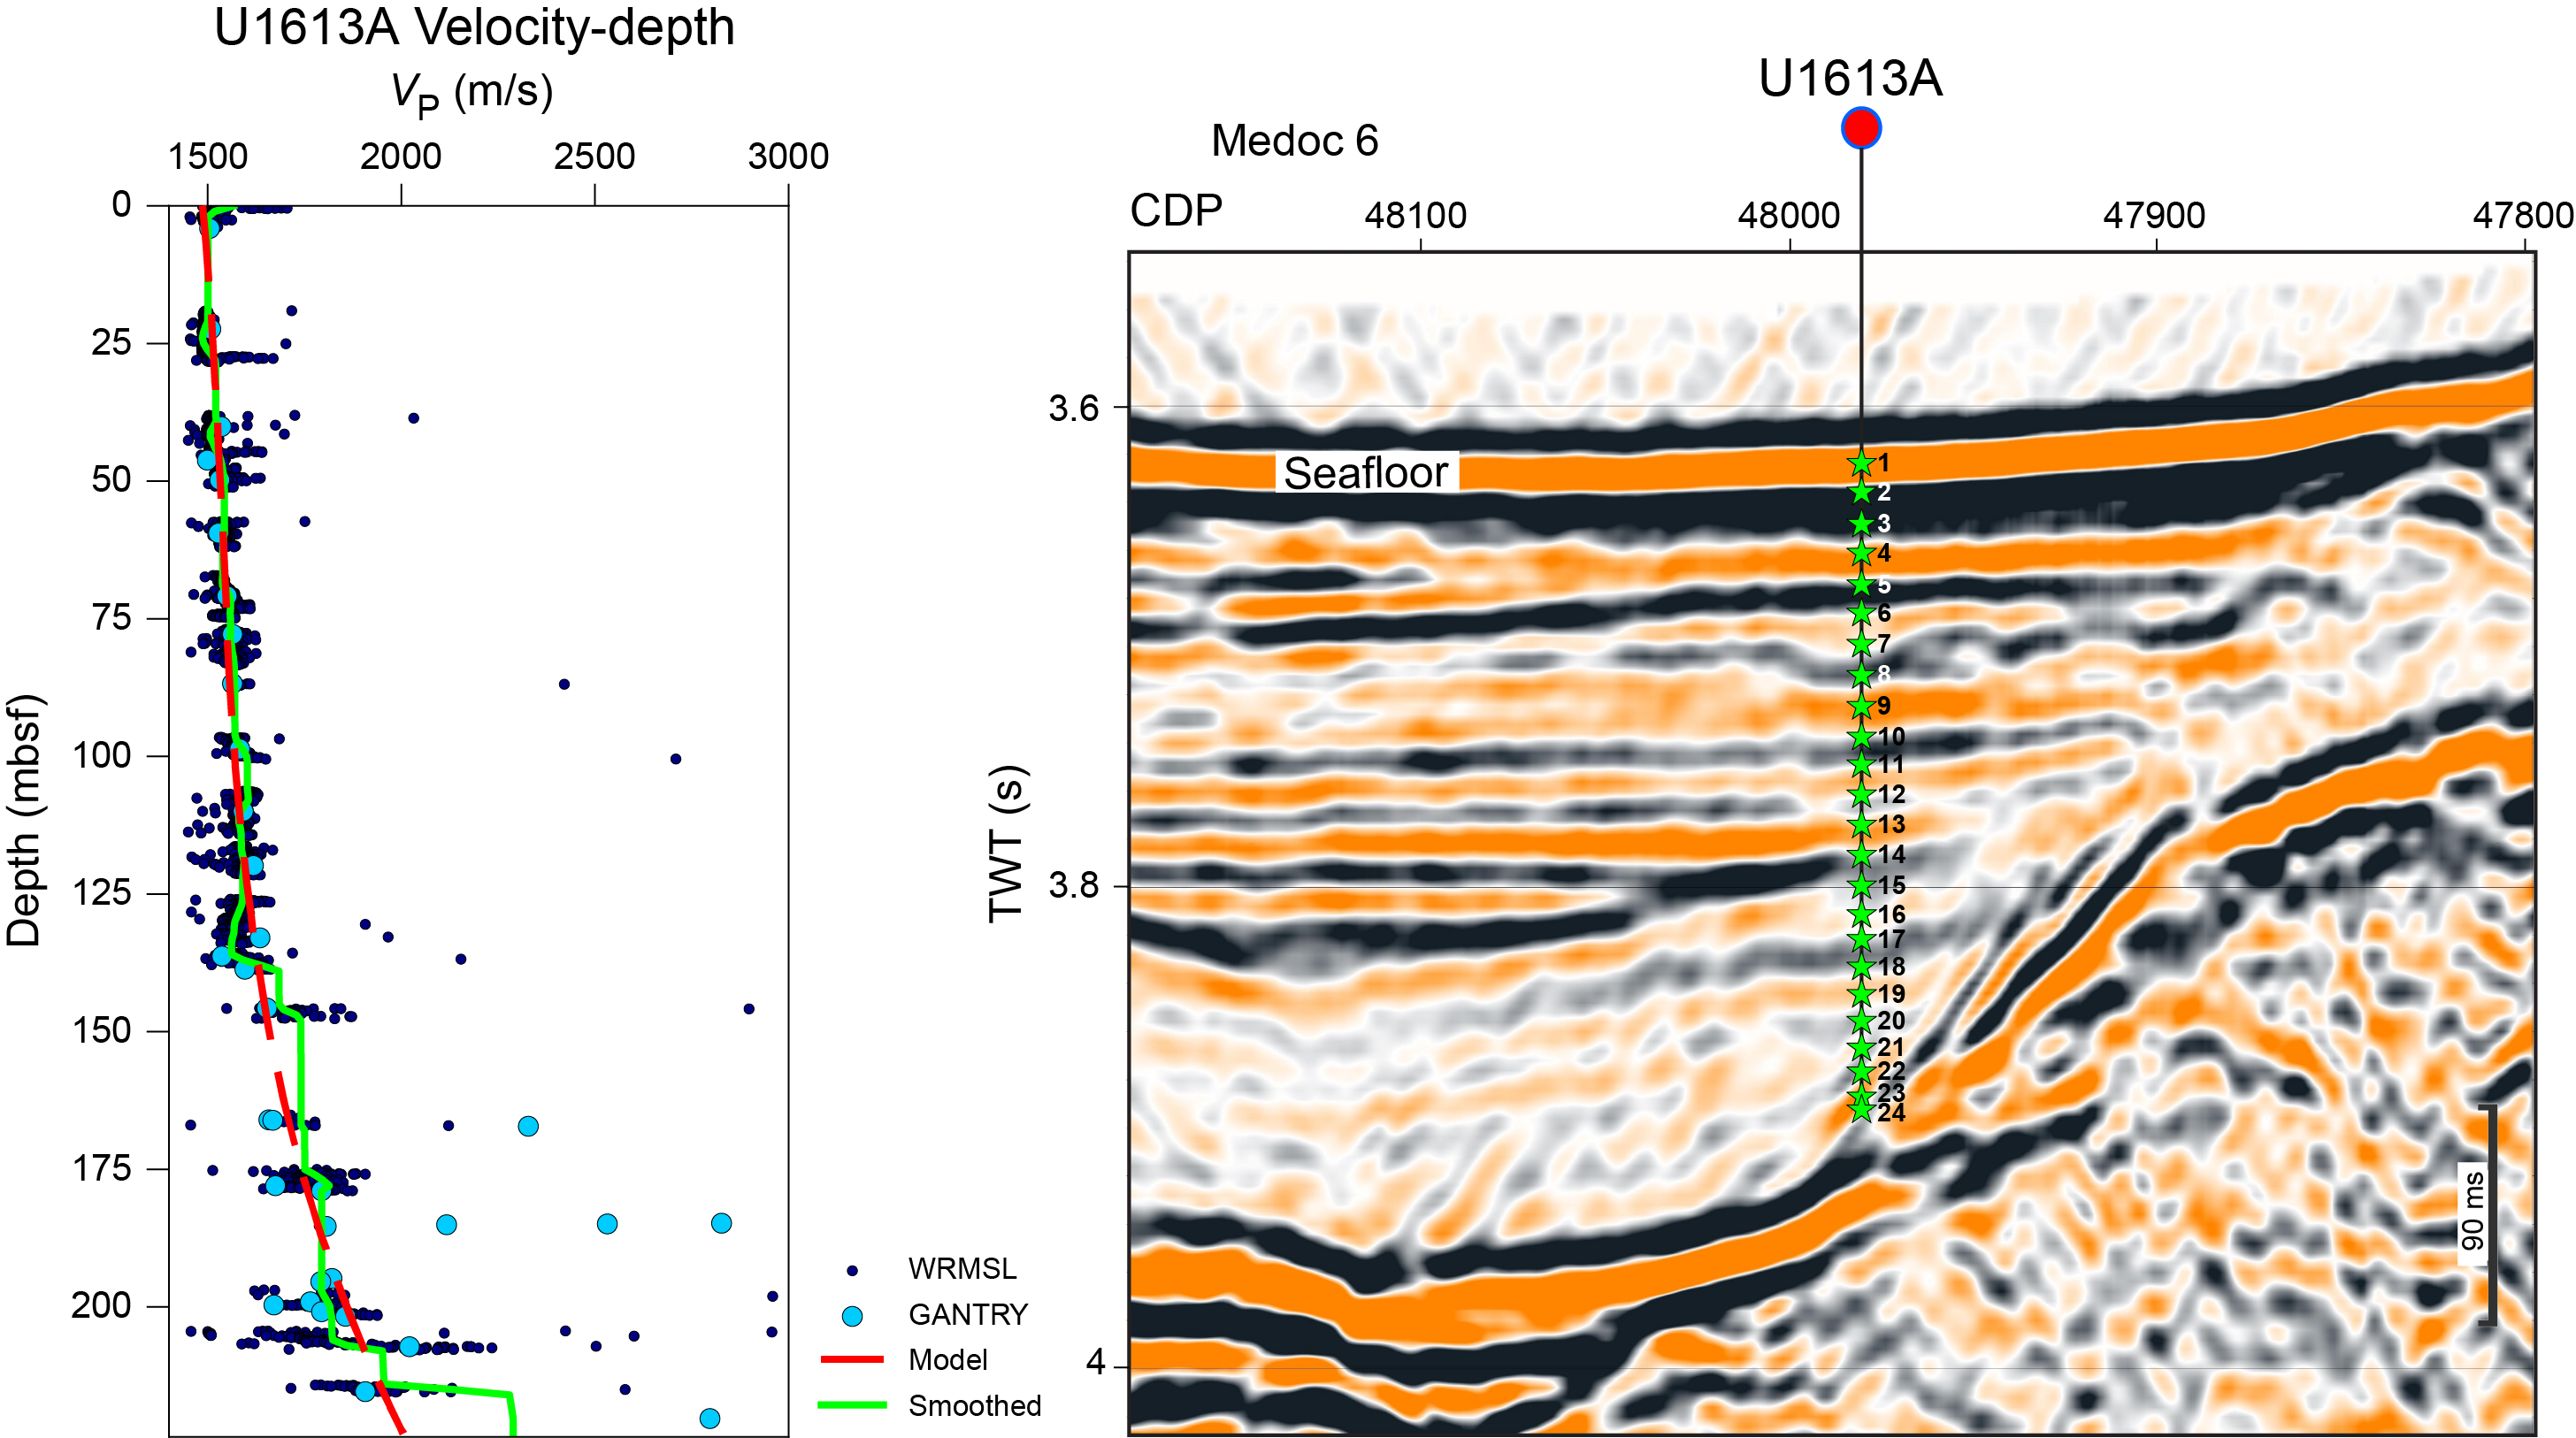
Figure F36. VP and plot of Site U1613 core tops.
10. Downhole measurements
Downhole measurements at Site U1613 consisted of in situ sediment temperatures measured with the SET2 tool and logging runs with two tool strings.
Logging operations began after the completion of RCB coring in Hole U1613A to 223.6 mbsf. We swept the hole with 90 bbl of high-viscosity sepiolite mud to clear up debris, followed by circulating seawater (see Operations). After dropping the RCB bit at the bottom of the hole, the base of the drill pipe was set at 74 mbsf.
A first logging pass was made with the triple combo tool string, which included the logging equipment head-tension and mud temperature (LEH-PT) for borehole fluid temperature and borehole fluid electrical resistivity; the Enhanced Digital Telemetry Cartridge (EDTC) for total natural gamma ray; the Hostile Environment Natural Gamma Ray Sonde (HNGS); the Hostile Environment Litho-Density Sonde (HLDS) for bulk density, photoelectric factor, and a one-arm caliper; the High-Resolution Laterolog Array (HRLA); and the Magnetic Susceptibility Sonde (MSS). During the down log, obstructions were encountered at 127 and 197 mbsf (97 and 27 m above bottom, respectively), where the tool was not able to pass the second obstruction.
The second tool string consisted of the LEH-PT for borehole fluid temperature and borehole fluid electrical resistivity, the EDTC, and the DSI for acoustic velocities. Because of the large and variable size of the hole measured by the density tool caliper over most of the sedimentary interval, it was decided not to include the FMS in the second tool string. Although the density caliper often opens to a maximum of 18 inches during the first run, especially in the sediments, the FMS opens to a maximum of 14 inches and requires good pad contacts with the borehole wall to produce quality images. The FMS would therefore not provide quality data. The DSI tool string reached 188 mbsf, which is shallower than the first run, before stopping its descent. As with the first run, the decision was made to only do a single pass with the DSI.
10.1. Downhole temperature measurements and heat flow
10.1.1. Downhole temperature measurements
The SET2 tool was deployed three times in the upper part of Hole U1613A to measure in situ sediment temperatures (Figure F37; Table T13). Two measurements were successful at 67.1 (after Core 7R) and 125.9 mbsf (after Core 13R) and resulted in equilibrium temperatures of 22.80° and 30.22°C, respectively. A run to the seafloor with the APCT-3 tool (see Operations) also measured a seafloor temperature of 13.49°C. The shipboard correction factor was applied to all measured temperature values (see Downhole measurements in the Expedition 402 methods chapter [Malinverno et al., 2025]).
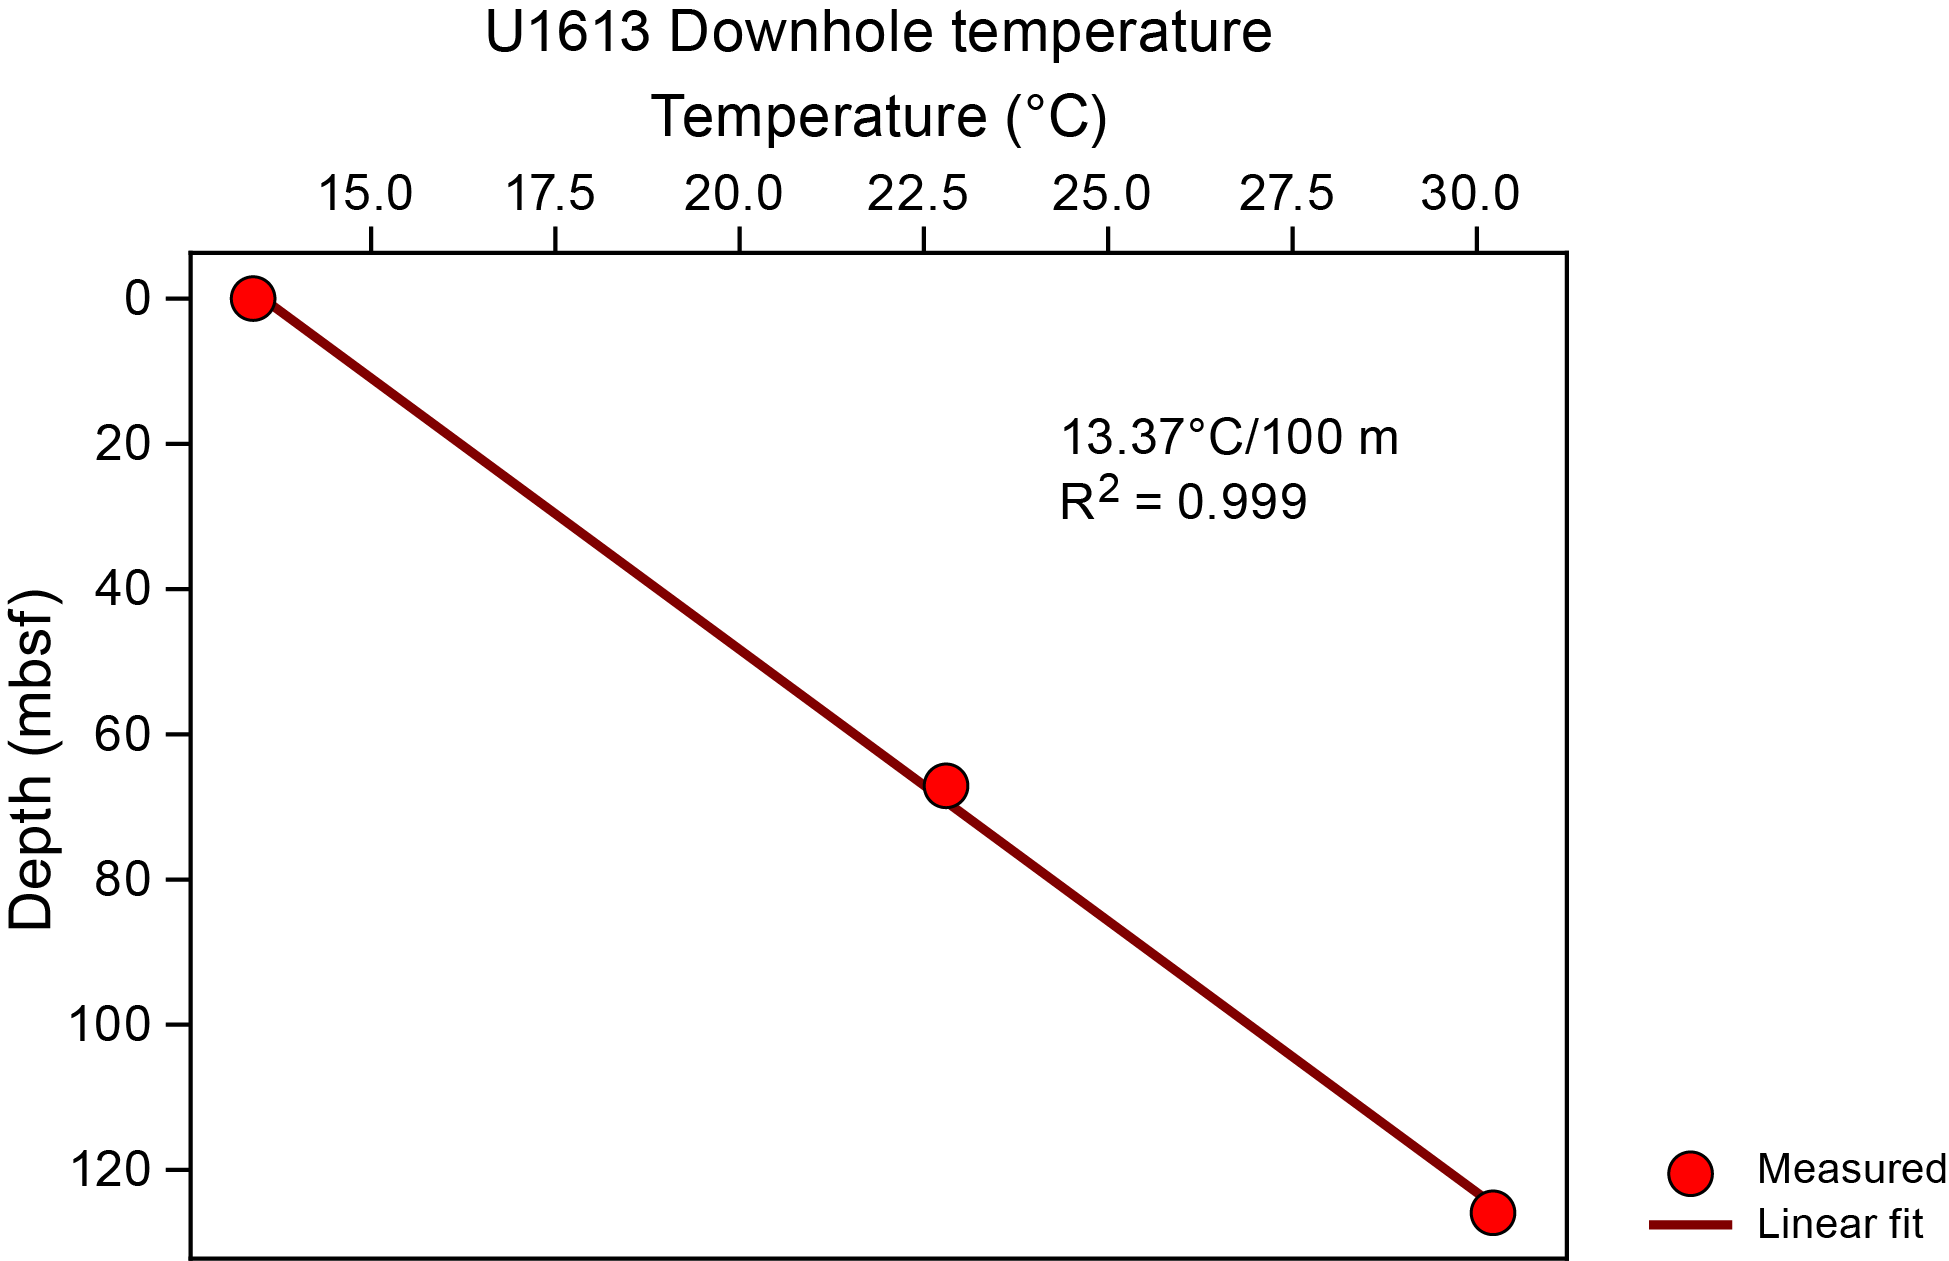
Figure F37. Downhole temperatures.
Borehole fluid temperature measurements were also taken during geophysical logging operations in Hole U1613A using the Schlumberger LEH-PT sensor in the cable head. The down log provided a reliable seafloor temperature of 13.4°C, which is consistent with that measured by the APCT-3 tool. However, the data recorded while descending below the seafloor were affected by the obstructions encountered (Figure F38). Consequently, only the up logs were suitable to estimate equilibrium temperatures in the hole (Lachenbruch and Brewer, 1959; Förster, 2001). A bottom hole temperature of 19.49°C was measured at 160 mbsf during Logging Run 1, 5 h after the end of seawater and sepiolite mud circulation in the hole. At the same depth 6 h later, the bottom hole temperature went up to 20.42°C when measured during Logging Run 2. The temperature data recorded during both logging runs outline the lack of precision of the LEH-PT sensor (Figure F38). However, the 13.40°C recorded over more than 100 m above seafloor demonstrates that this instrument is accurate, although not very precise. The second down log run into the drill pipe to 72 mbsf is surprisingly nearly identical to that recorded on the way down during the first run. Also, with several ledges encountered near the bottom of the hole during the second logging run, the DSI measurement took some time, during which the borehole fluid hole was heating up (Figure F38). Consequently, the equilibrium temperature could not be calculated from the bottom hole temperature data set at Site U1613.
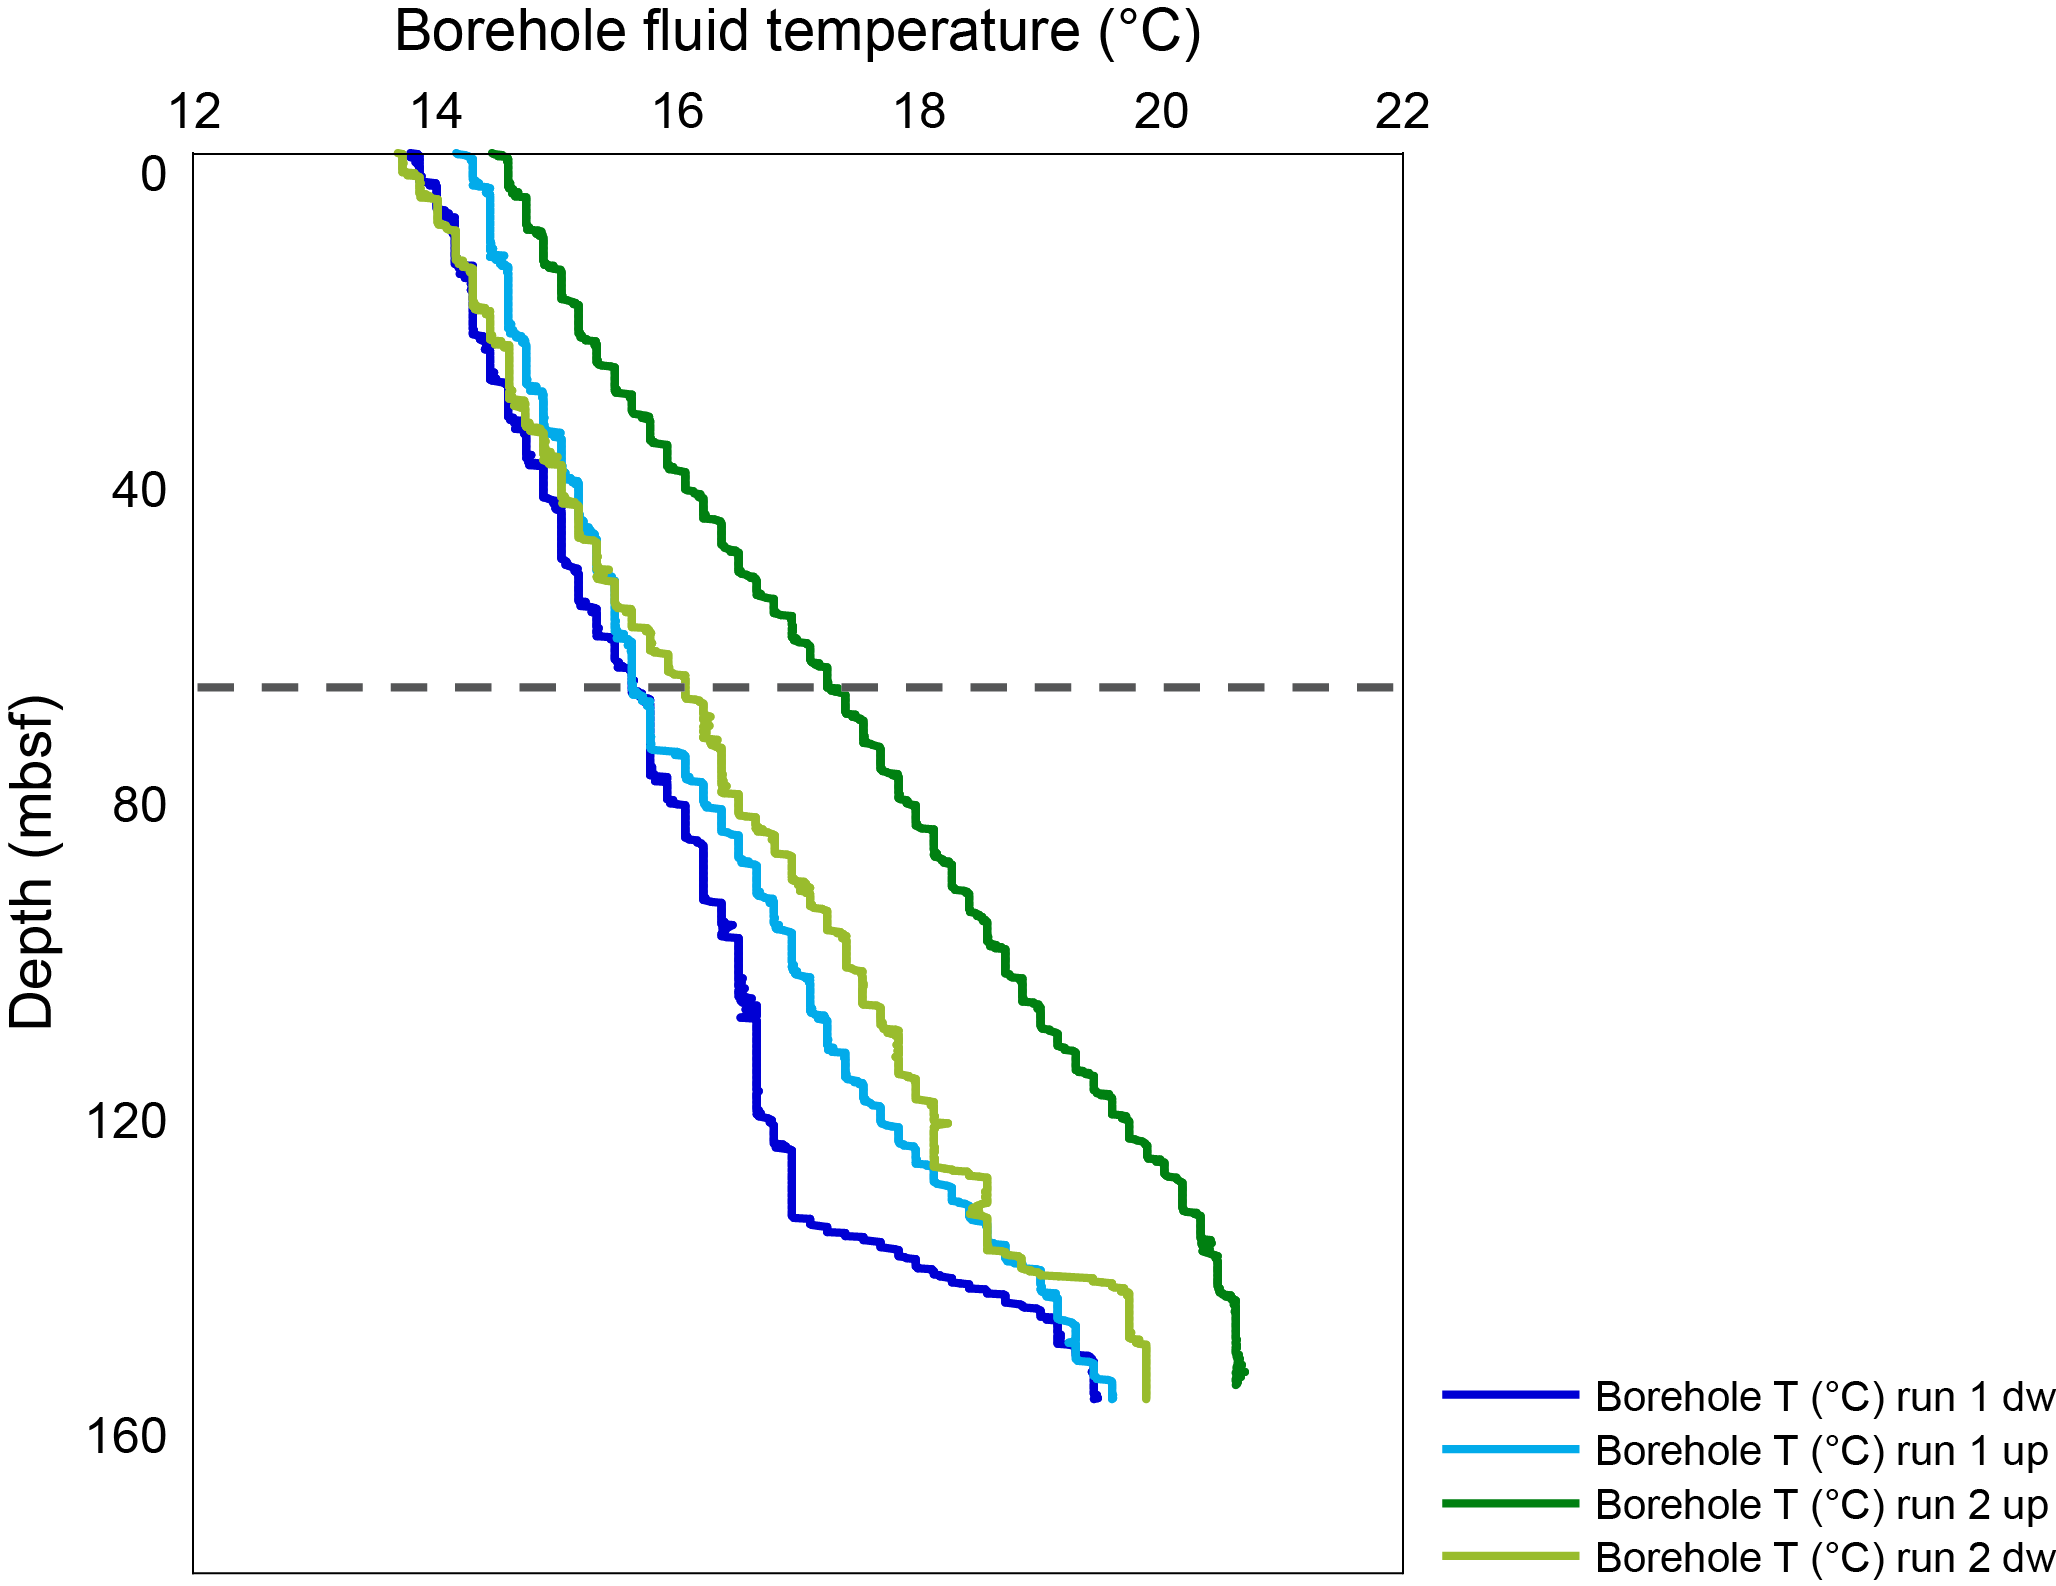
Figure F38. LEH-PT temperature measurements.
10.1.2. Heat flow
Linear regression of the sediment temperature data at Site U1613 yields a thermal gradient of 13.37°C/100 m (Figure F37). This thermal gradient combined with an average thermal conductivity measured in Hole U1613A samples of 1.177 W/(m·K) over the uppermost 125.9 m (see Physical properties; Table T13) gives a heat flow of 157 mW/m2 at Site U1613. This result is comparable to the values obtained from near-seafloor measurements in the Vavilov Basin (Della Vedova et al., 2001), ODP Leg 107 Site 652 (121 mW/m2; Kastens, Mascle, Auroux et al., 1987), and ODP Leg 161 Site 974 (121 mW/m2; Comas, Zahn, Klaus et al., 1996).
10.2. Borehole geophysics
Because of hole instabilities encountered during coring operations, the base of the drill pipe was set at 74 mbsf for borehole geophysical operations, just below the base of Lithostratigraphic Unit I. The large hole size measured over most of the sedimentary section (Figure F39) has a strong impact on log quality for all sensors (sonic, density, electrical resistivity, spectral gamma ray, and MS) (Figure F40). Consequently, the downhole measurements can be considered mostly qualitative in the upper part of the logged interval. Additionally, the spectral gamma ray is highly attenuated through the pipe and shows some small-scale variability corresponding to lithologic changes. The data quality improves in the lower part of the hole due to a decrease in hole size that stays consistently close to the drill bit diameter.
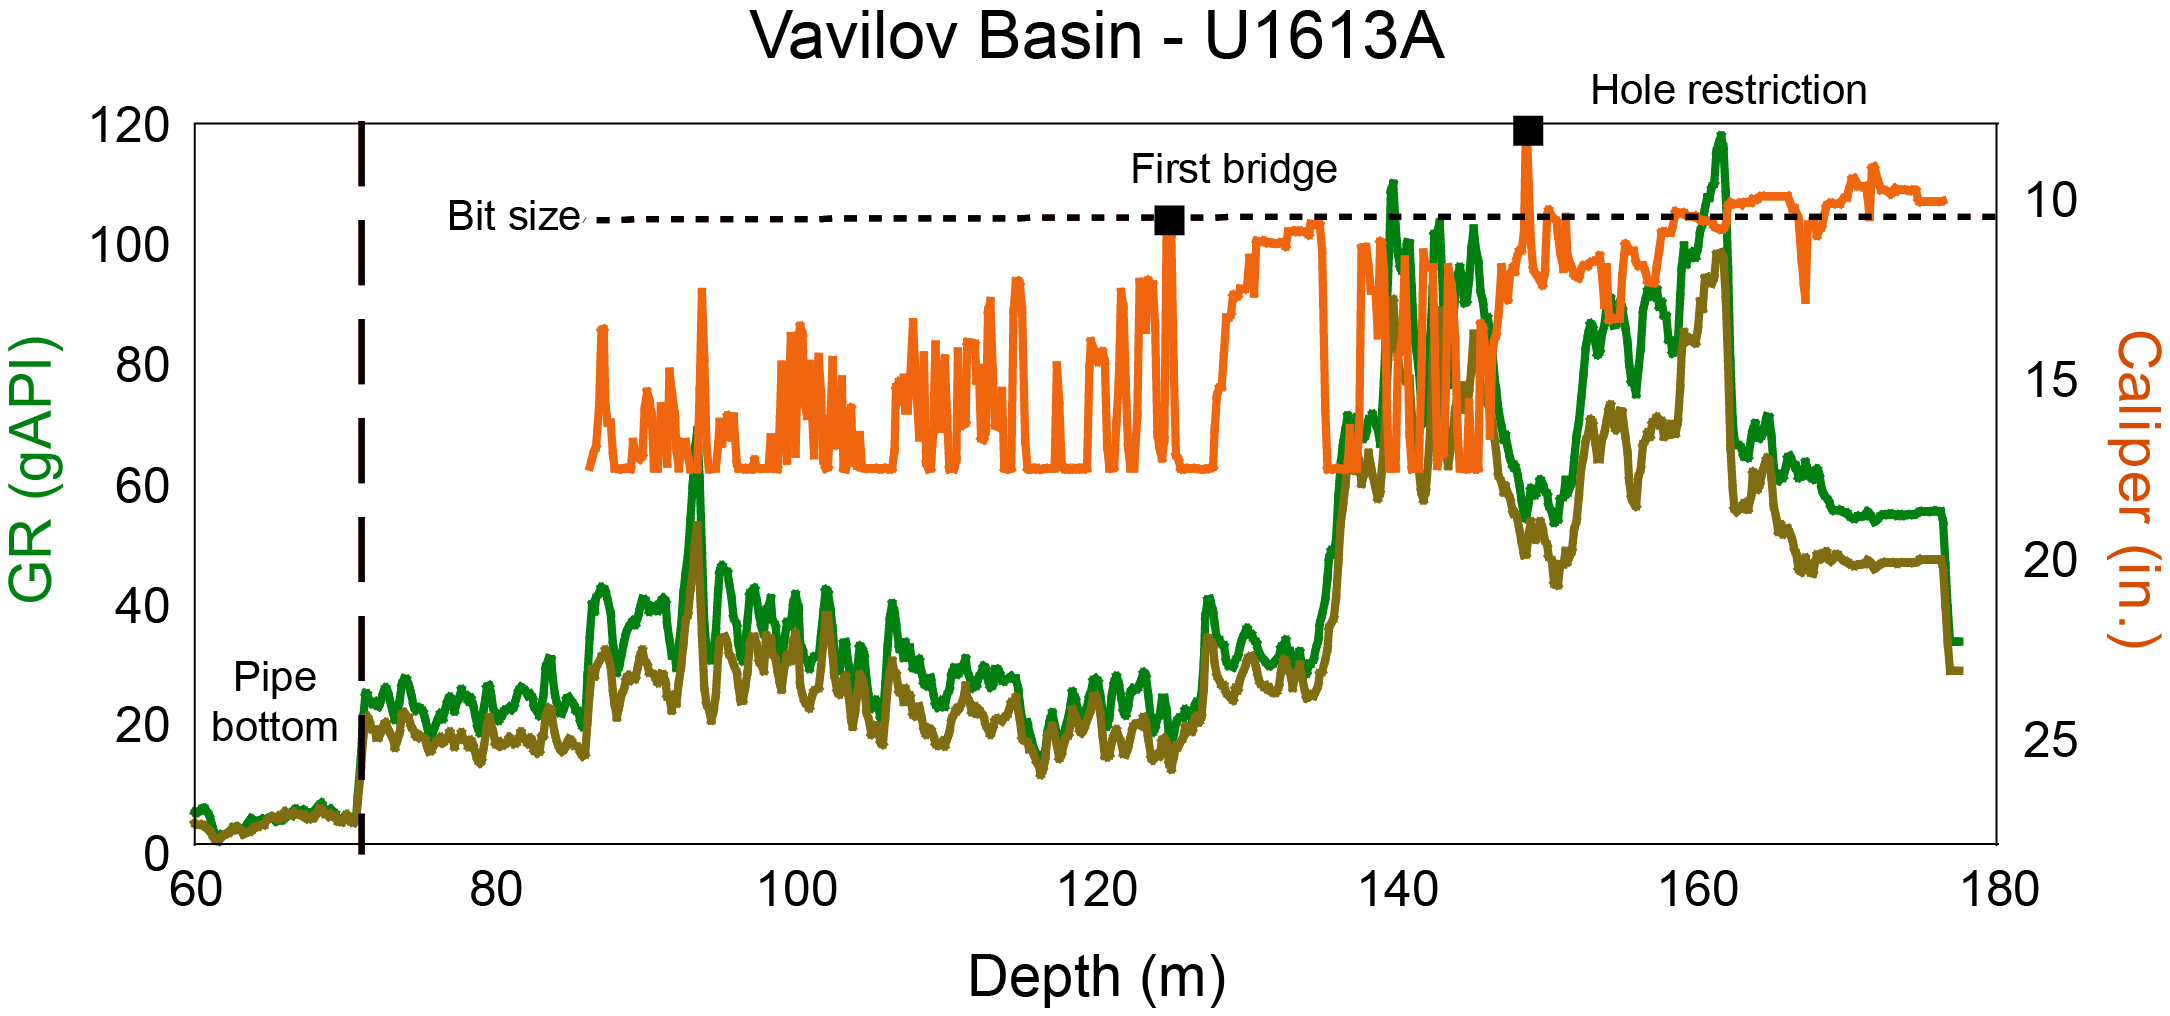
Figure F39. Natural gamma ray and caliper data.
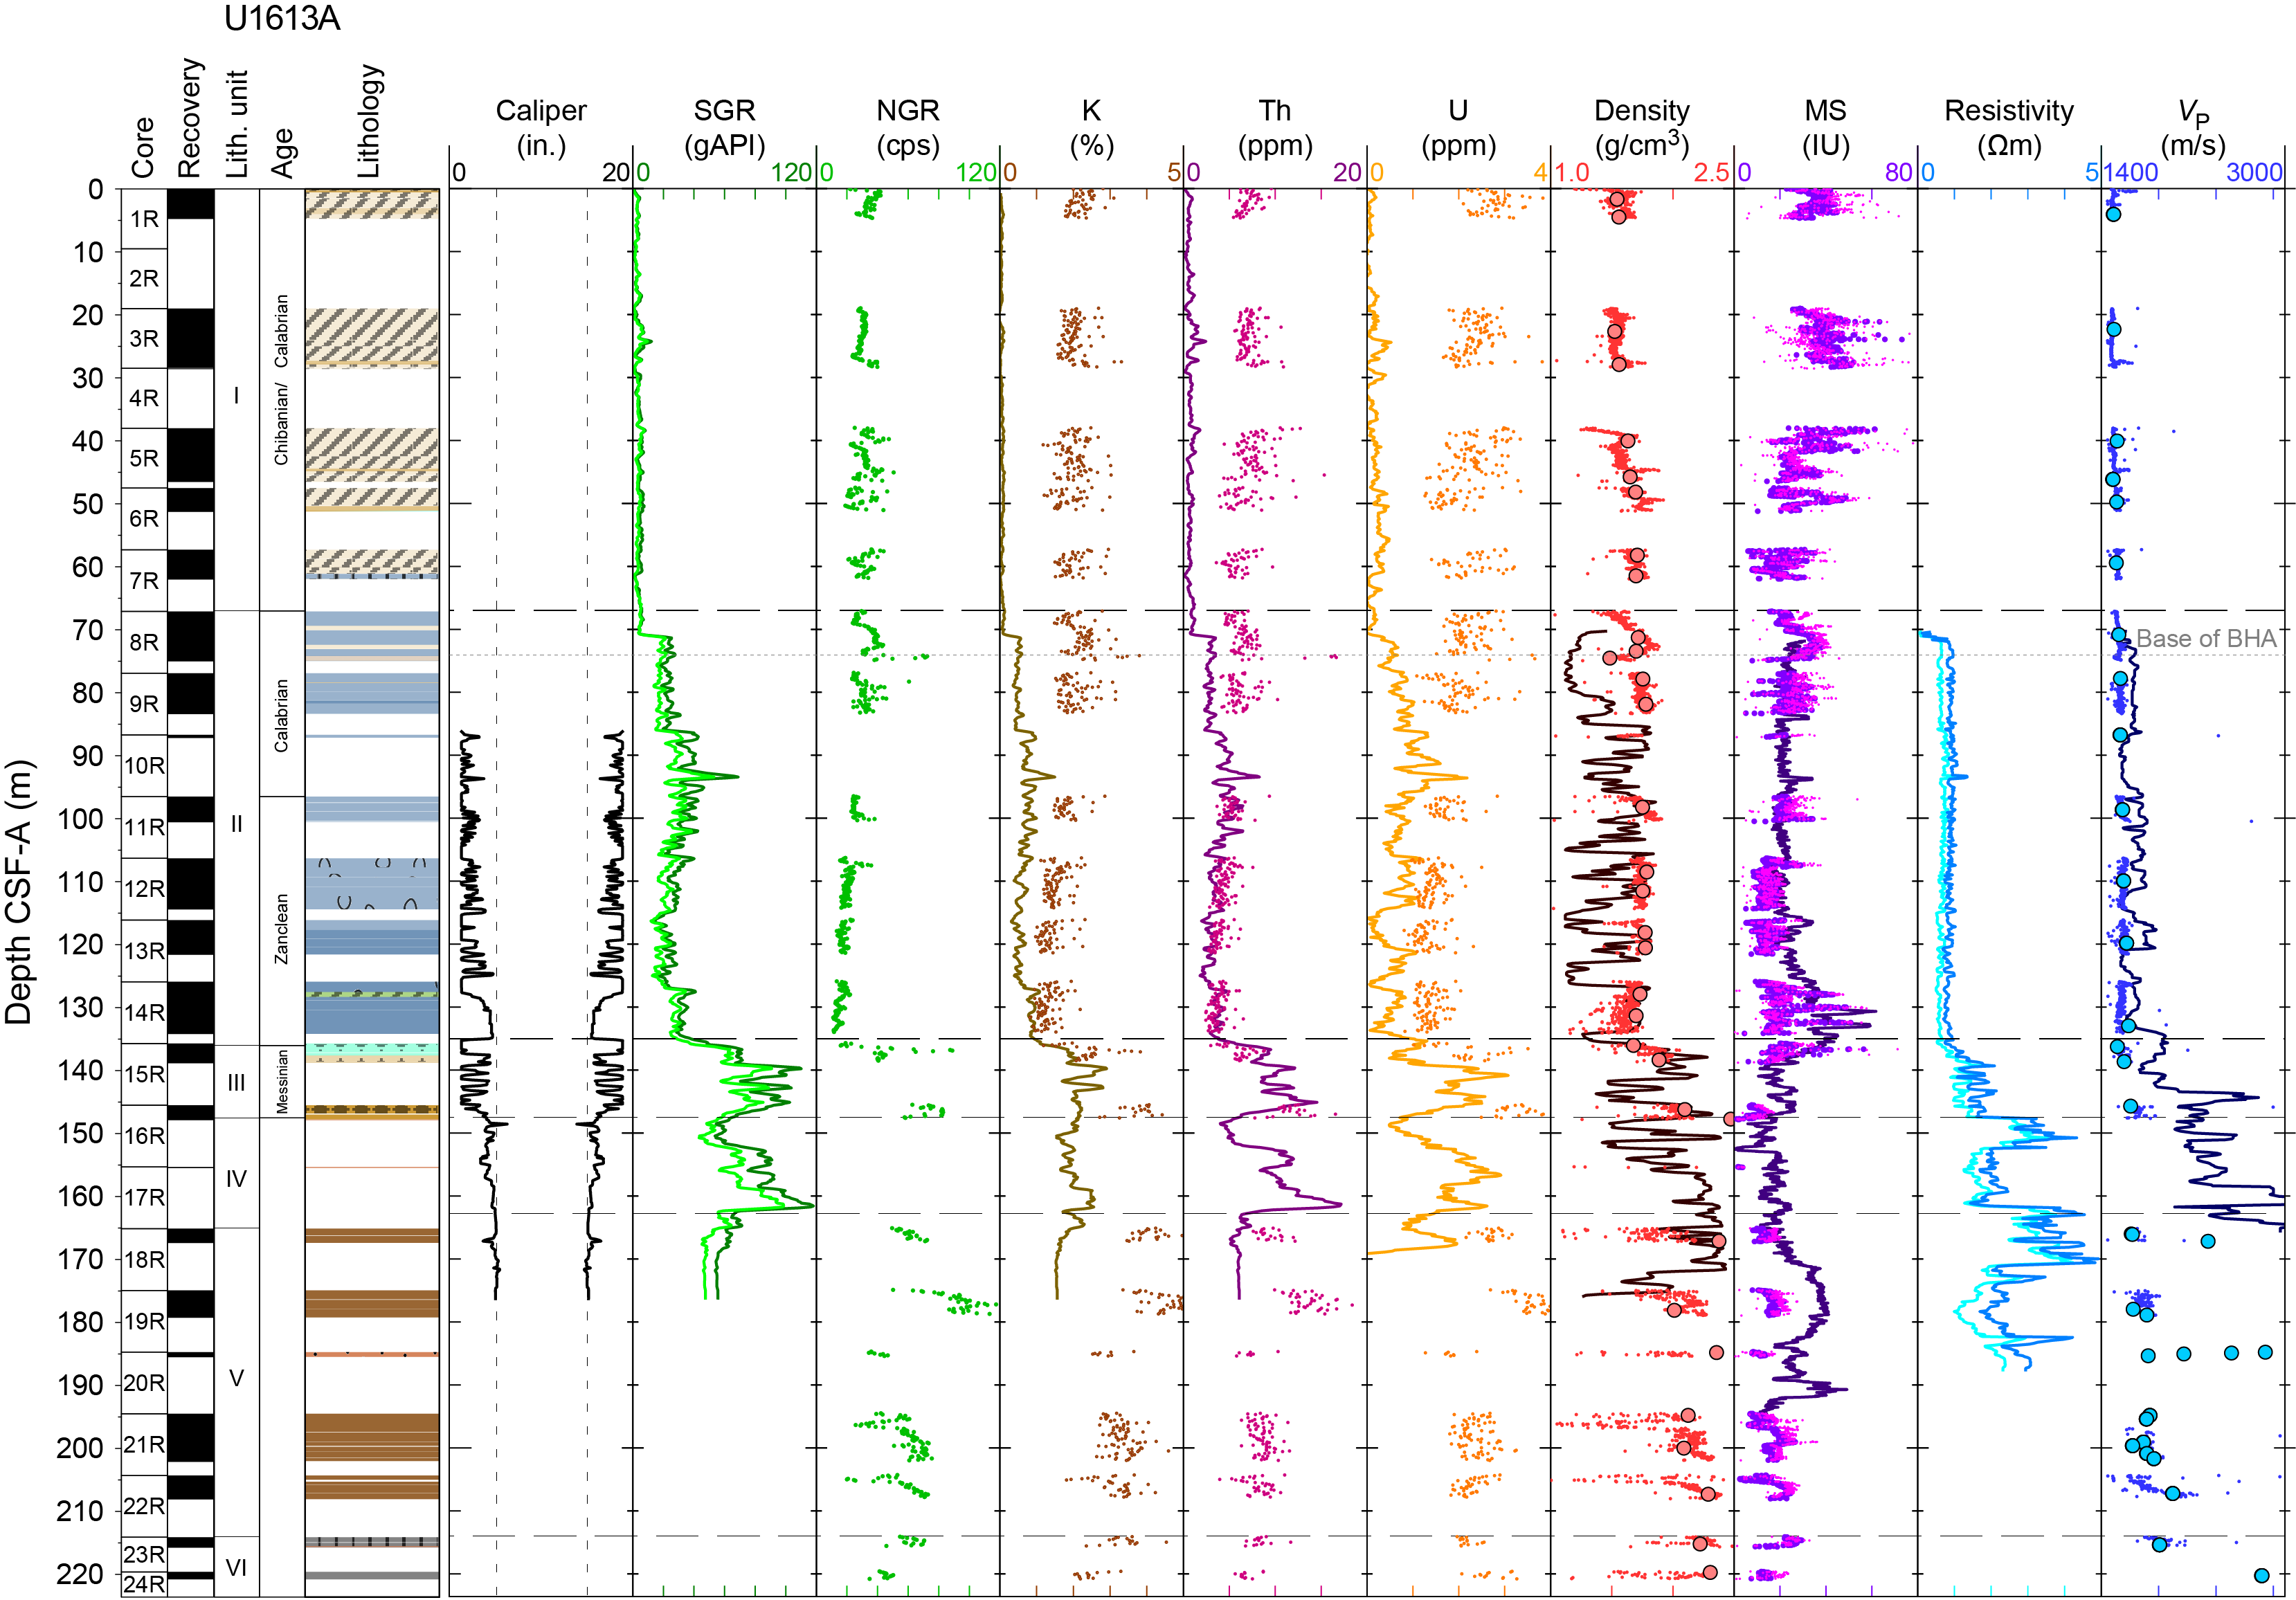
Figure F40. Downhole logging and physical properties measurements.
10.2.1. Borehole geophysics and lithostratigraphy
In Lithostratigraphic Unit II (67–136 mbsf), the hole size varies considerably and is close to the maximum caliper measurement diameter of 18 inches throughout the unit. Near the base of the unit, the hole tapers to the bit diameter (9⅞ inches). Spectral gamma ray values are relatively low (20–40 American Petroleum Institute gamma radiation units [gAPI]) throughout Unit II but increase slightly near the base of Unit II, where there is a greater amount of terrigenous input in a dominant nannofossil ooze/chalk lithology. Potassium (K) and uranium (U) profiles derived from the spectral gamma ray downhole profile are significantly lower than the values measured on core (see Physical properties). In contrast, the higher energy natural gamma values related to the presence of thorium (Th), which is less affected by hole size, fit well with those measured from cores (Figure F40). The bulk density profile is generally in good agreement with core data when not affected by large hole size, where excessively low densities are obtained. The upper envelope of the downhole density profile fits very well with GRA bulk density and MAD bulk density data from WRMSL and discrete measurements, respectively. The MS profile is somewhat flat throughout Unit II and in good agreement with WRMSL and Section Half Multisensor Logger (SHMSL) core data (Figure F40). A slight increase in MS near the base of the unit is measured by the down log but not captured in the shipboard MS measurements made on the recovered core. The electrical resistivity profiles appear flat with little character and low values throughout the unit. The logged VP profile tends to show more variability than core data with overall slightly higher values than measured on the WRMSL and gantry systems. This likely reflects the difference between surface and in situ measurements made at a higher effective pressure.
The boundary between Lithostratigraphic Units II and III associated with the top of the Messinian sediments is sharp and appears in all downhole measurements (Figure F41) at the same depth as that identified from core (135.8 mbsf). Below this boundary, although the caliper increases to large diameter values (on the order of 18 inches), almost all downhole geophysical properties (spectral gamma ray, bulk density, electrical resistivity, and VP) increase (Figure F40). A step in the spectral gamma ray profile that is correlated with a sharp increase in hole size corresponds to the top of the Messinian sediments; this transition is measured downhole at 136.0–139.5 mbsf (3.5 m thick). Below this depth, the largely unrecovered Lithostratigraphic Unit III has a greater clay content than that measured in Messinian sediments.
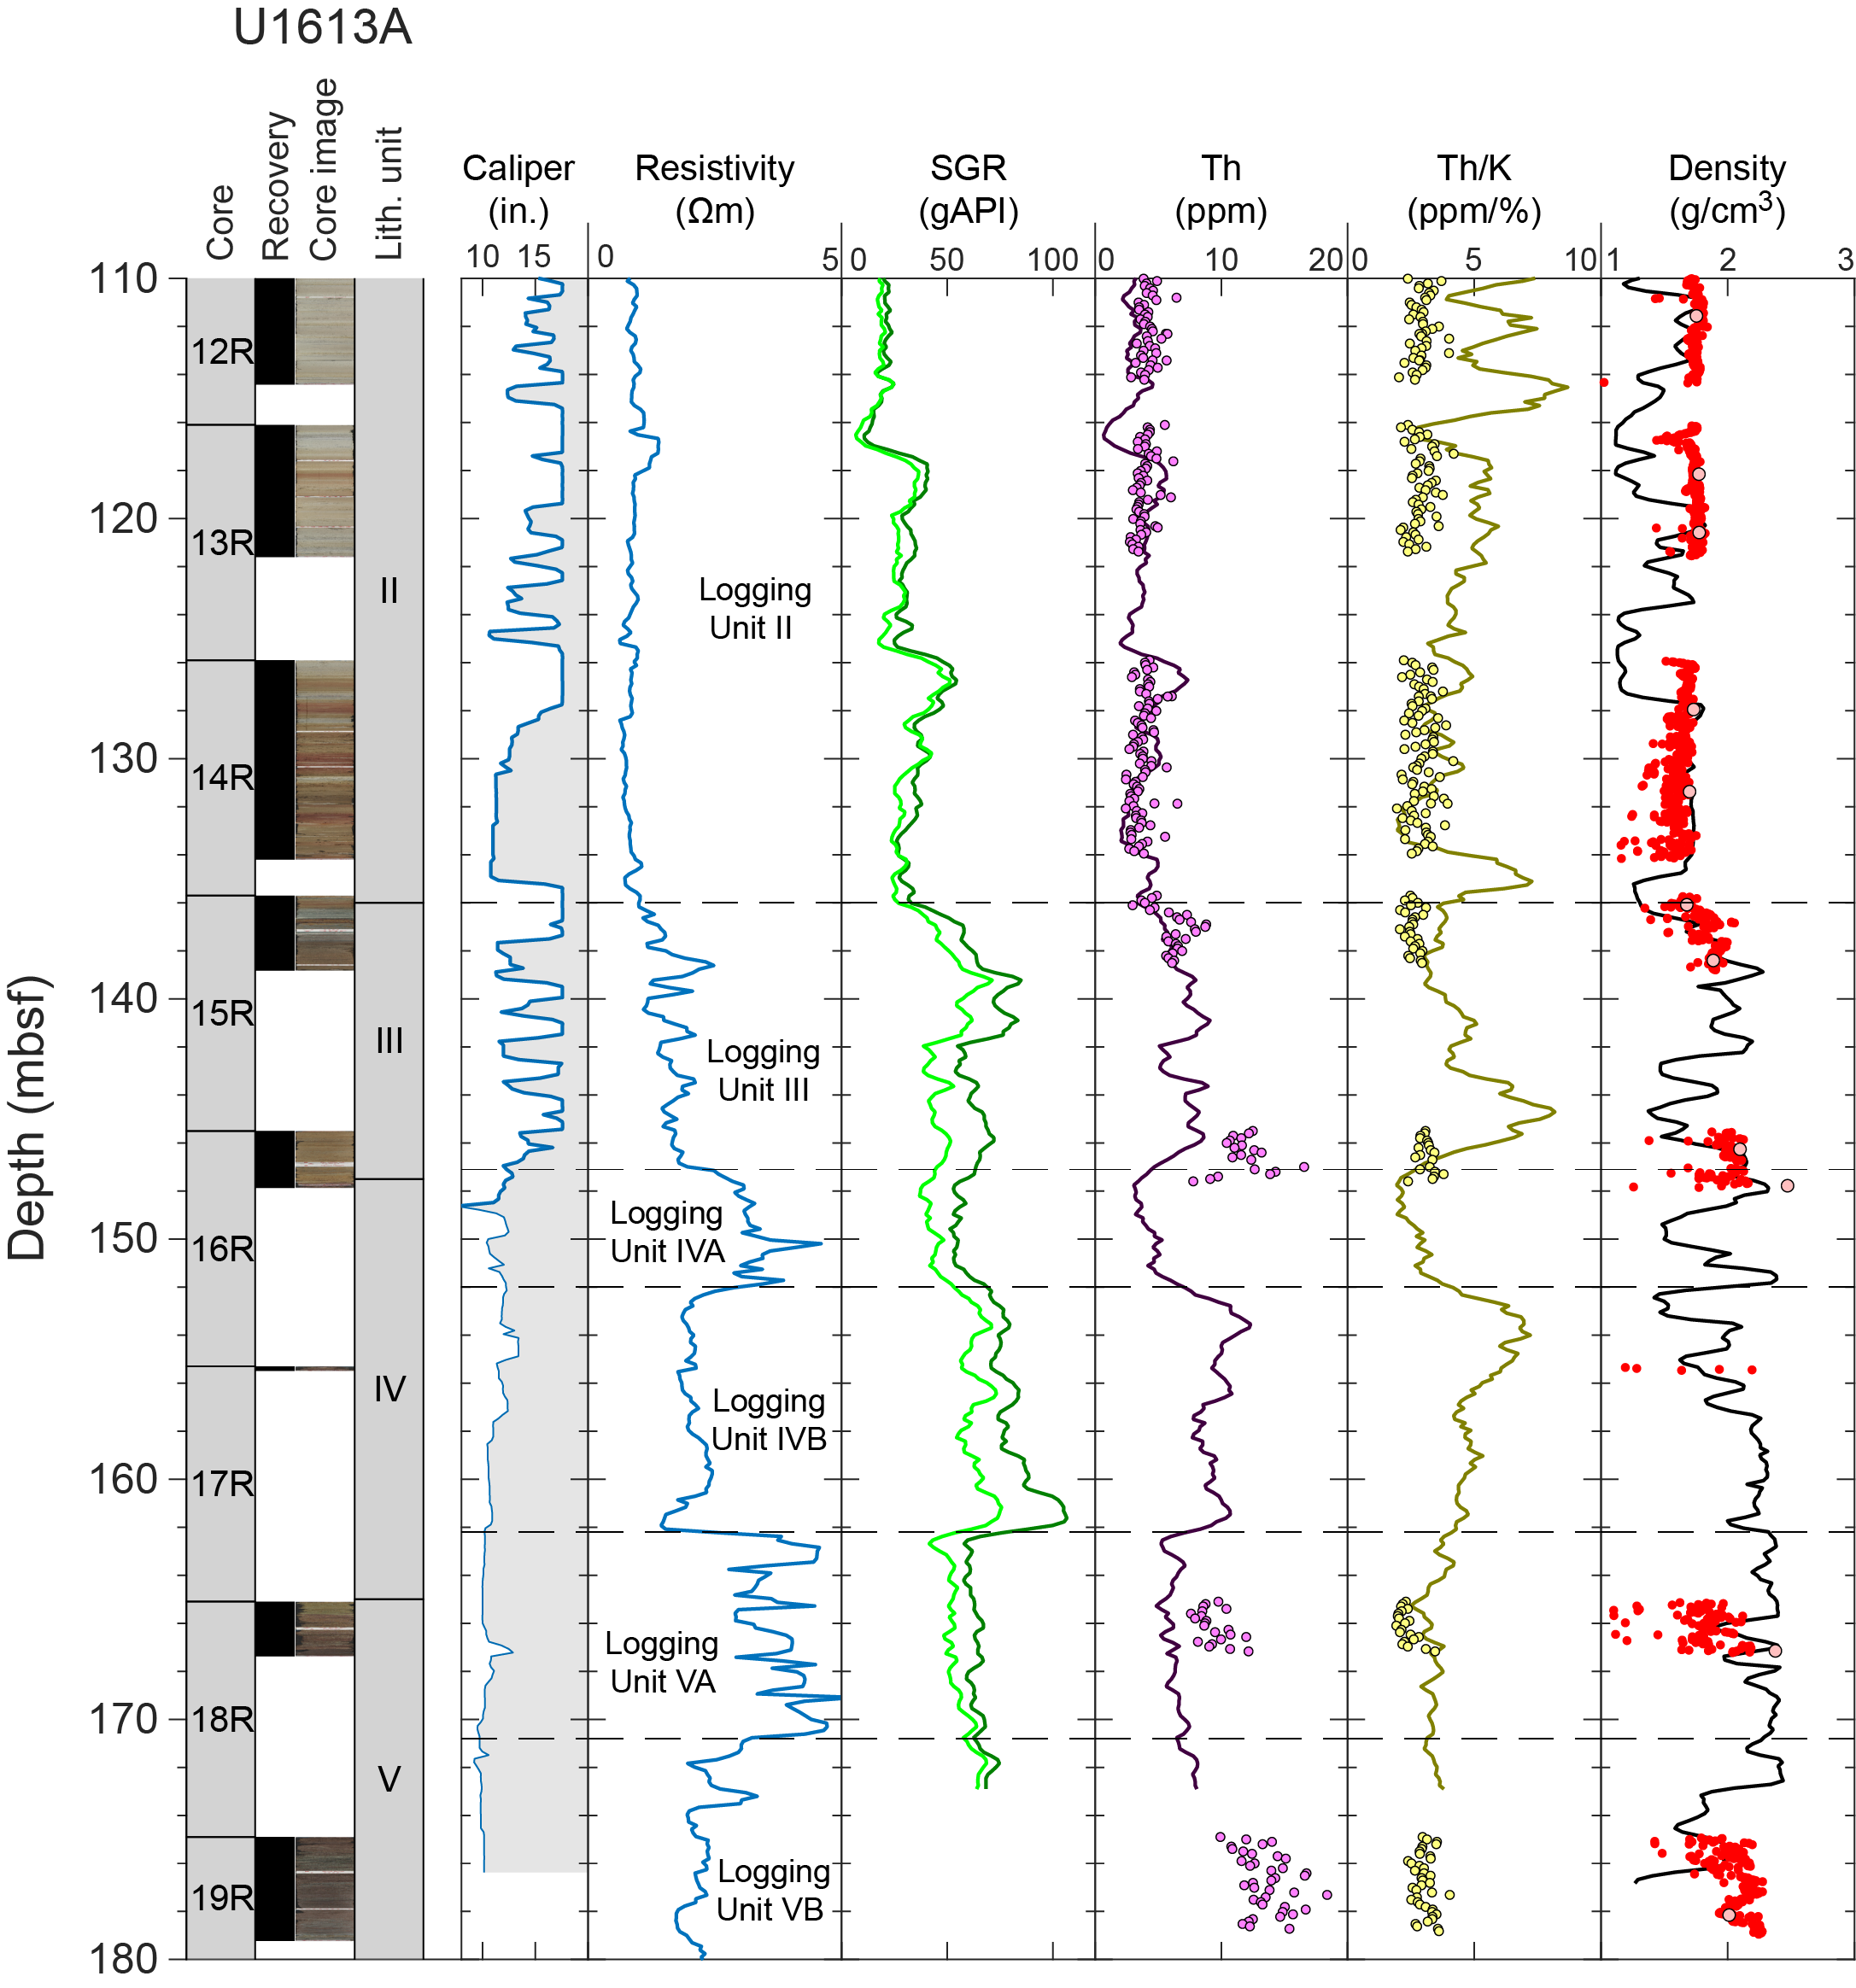
Figure F41. Downhole logging near the sediment/basement interface.
Logging data were not obtained in Lithostratigraphic Unit I. In Lithostratigraphic Unit II, the logging data support the unit definition from lithologic core observations. In contrast, for deeper layers with poor recovery the logging data allow some refinement of unit boundaries, which we refer to as logging units (Figure F41).
The transition between Lithostratigraphic Units III and IV was described in the core at 147.5 mbsf and corresponds to the top of a conglomerate interval. It is identified in the downhole records by a sharp decrease in hole size and a sharp increase in electrical resistivity at 147.1 mbsf with respect to the overlying Messinian clays (Figure F41). This yields a thickness of 11.1 m for Logging Unit III.
From the base of Lithostratigraphic Unit II and from 136 to 175 mbsf in Hole U1613A (Cores 15R–18R), the downhole geophysical profiles precisely identify the thicknesses of different units where core recovery was particularly low. The electrical resistivity and spectral gamma ray downhole data are found to be the most accurate for this purpose (Figure F41), providing thicknesses of 4.9 m for the conglomerate interval at the top of the basement (147.1–152.0 mbsf; Logging Subunit IVA), 10.2 m for the mostly unrecovered clays located just below (152.0–162.2 mbsf; Logging Subunit IVB), and 8.6 m for the sandy formation identified in Core 18R (162.2–170.8 mbsf; Logging Subunit VA).
Consequently, the logging data suggest that the base of Lithostratigraphic Unit IV should be moved to 152.0 mbsf, a new clay-rich unit should be defined to 162.2 mbsf, and the top of Lithostratigraphic Unit V should be moved up by about 3 m to 162.2 mbsf. Below 170.8 mbsf, a decrease in electrical resistivity and an increase in spectral gamma ray and Th are associated with the transition to black shale lithology (Figures F40, F41). Thus, this zone is distinct and redefined as Logging Subunit VB, which persists to the bottom of the hole.
10.2.2. Clay mineralogy from spectral gamma ray data
Potassium (K) and uranium (U) data are found to underestimate the natural gamma ray signal in intervals with very large hole diameter with respect to core data (Figure F40) and remain qualitative only. However, the thorium (Th) signal measured with the spectral gamma ray is found to match the core data and is therefore considered more reliable. Because K is underestimated in the spectral gamma ray log, the Th/K ratio obtained downhole is often too large, whereas the ratio measured on cores is somewhat constant (Figure F41), with values between 2.0 and 3.5 ppm/% on average (Figure F42). With an average value of 2.55, this trend is indicative of the presence of illite in clay layers (Schlumberger, 2013), not only in the Neogene sediments above 147.1 mbsf, but also in the basement rocks located below.
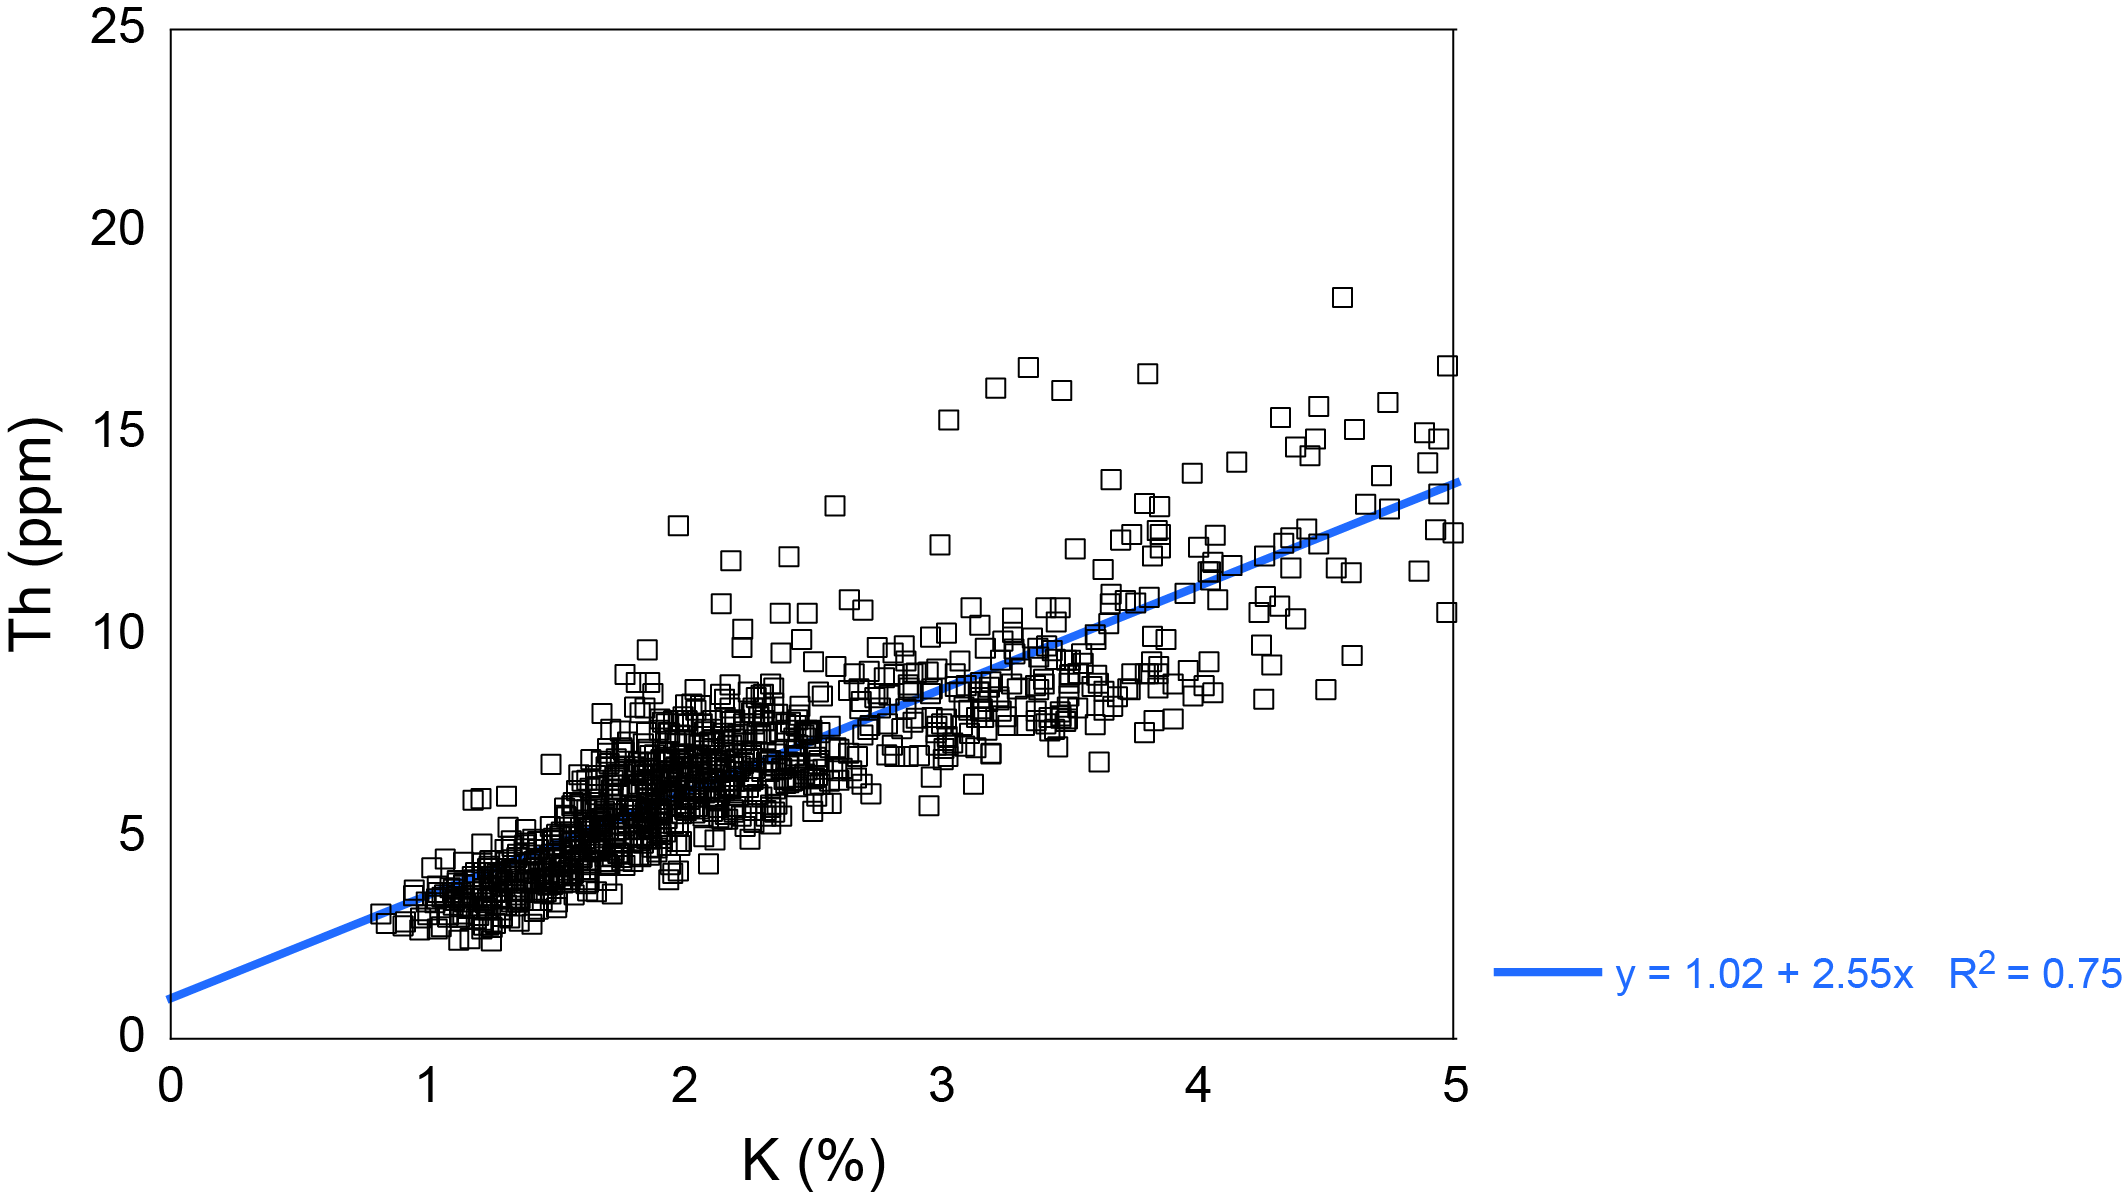
Figure F42. Th vs. K.
11. Microbiology
11.1. Sediment
At Site U1613, drilling operations reached 223.6 mbsf. As part of the research, microbiological analyses were performed, including the assessment of dissolved oxygen levels in the sediment IW and the collection of samples for further molecular biology and culture studies.
11.1.1. Oxygen profiles
Oxygen concentrations in Hole U1613A were measured immediately after core recovery, starting with Core 3R. Core 1R was severely disturbed, resulting in compromised data. Measurements were made only on core sections that were at least 80 cm in length so that both the oxygen and temperature probes could be inserted and separated by a minimum distance of 20–30 cm. Low concentrations of oxygen were detected downcore, with the minimum value of 0.15 µM detected at 47.5 mbsf (Figure F43; Table T14). We attempted to continue measuring oxygen below Core 13R, but these measurements were prevented either by the sediments having a very sandy composition or becoming too lithified for probe insertion.
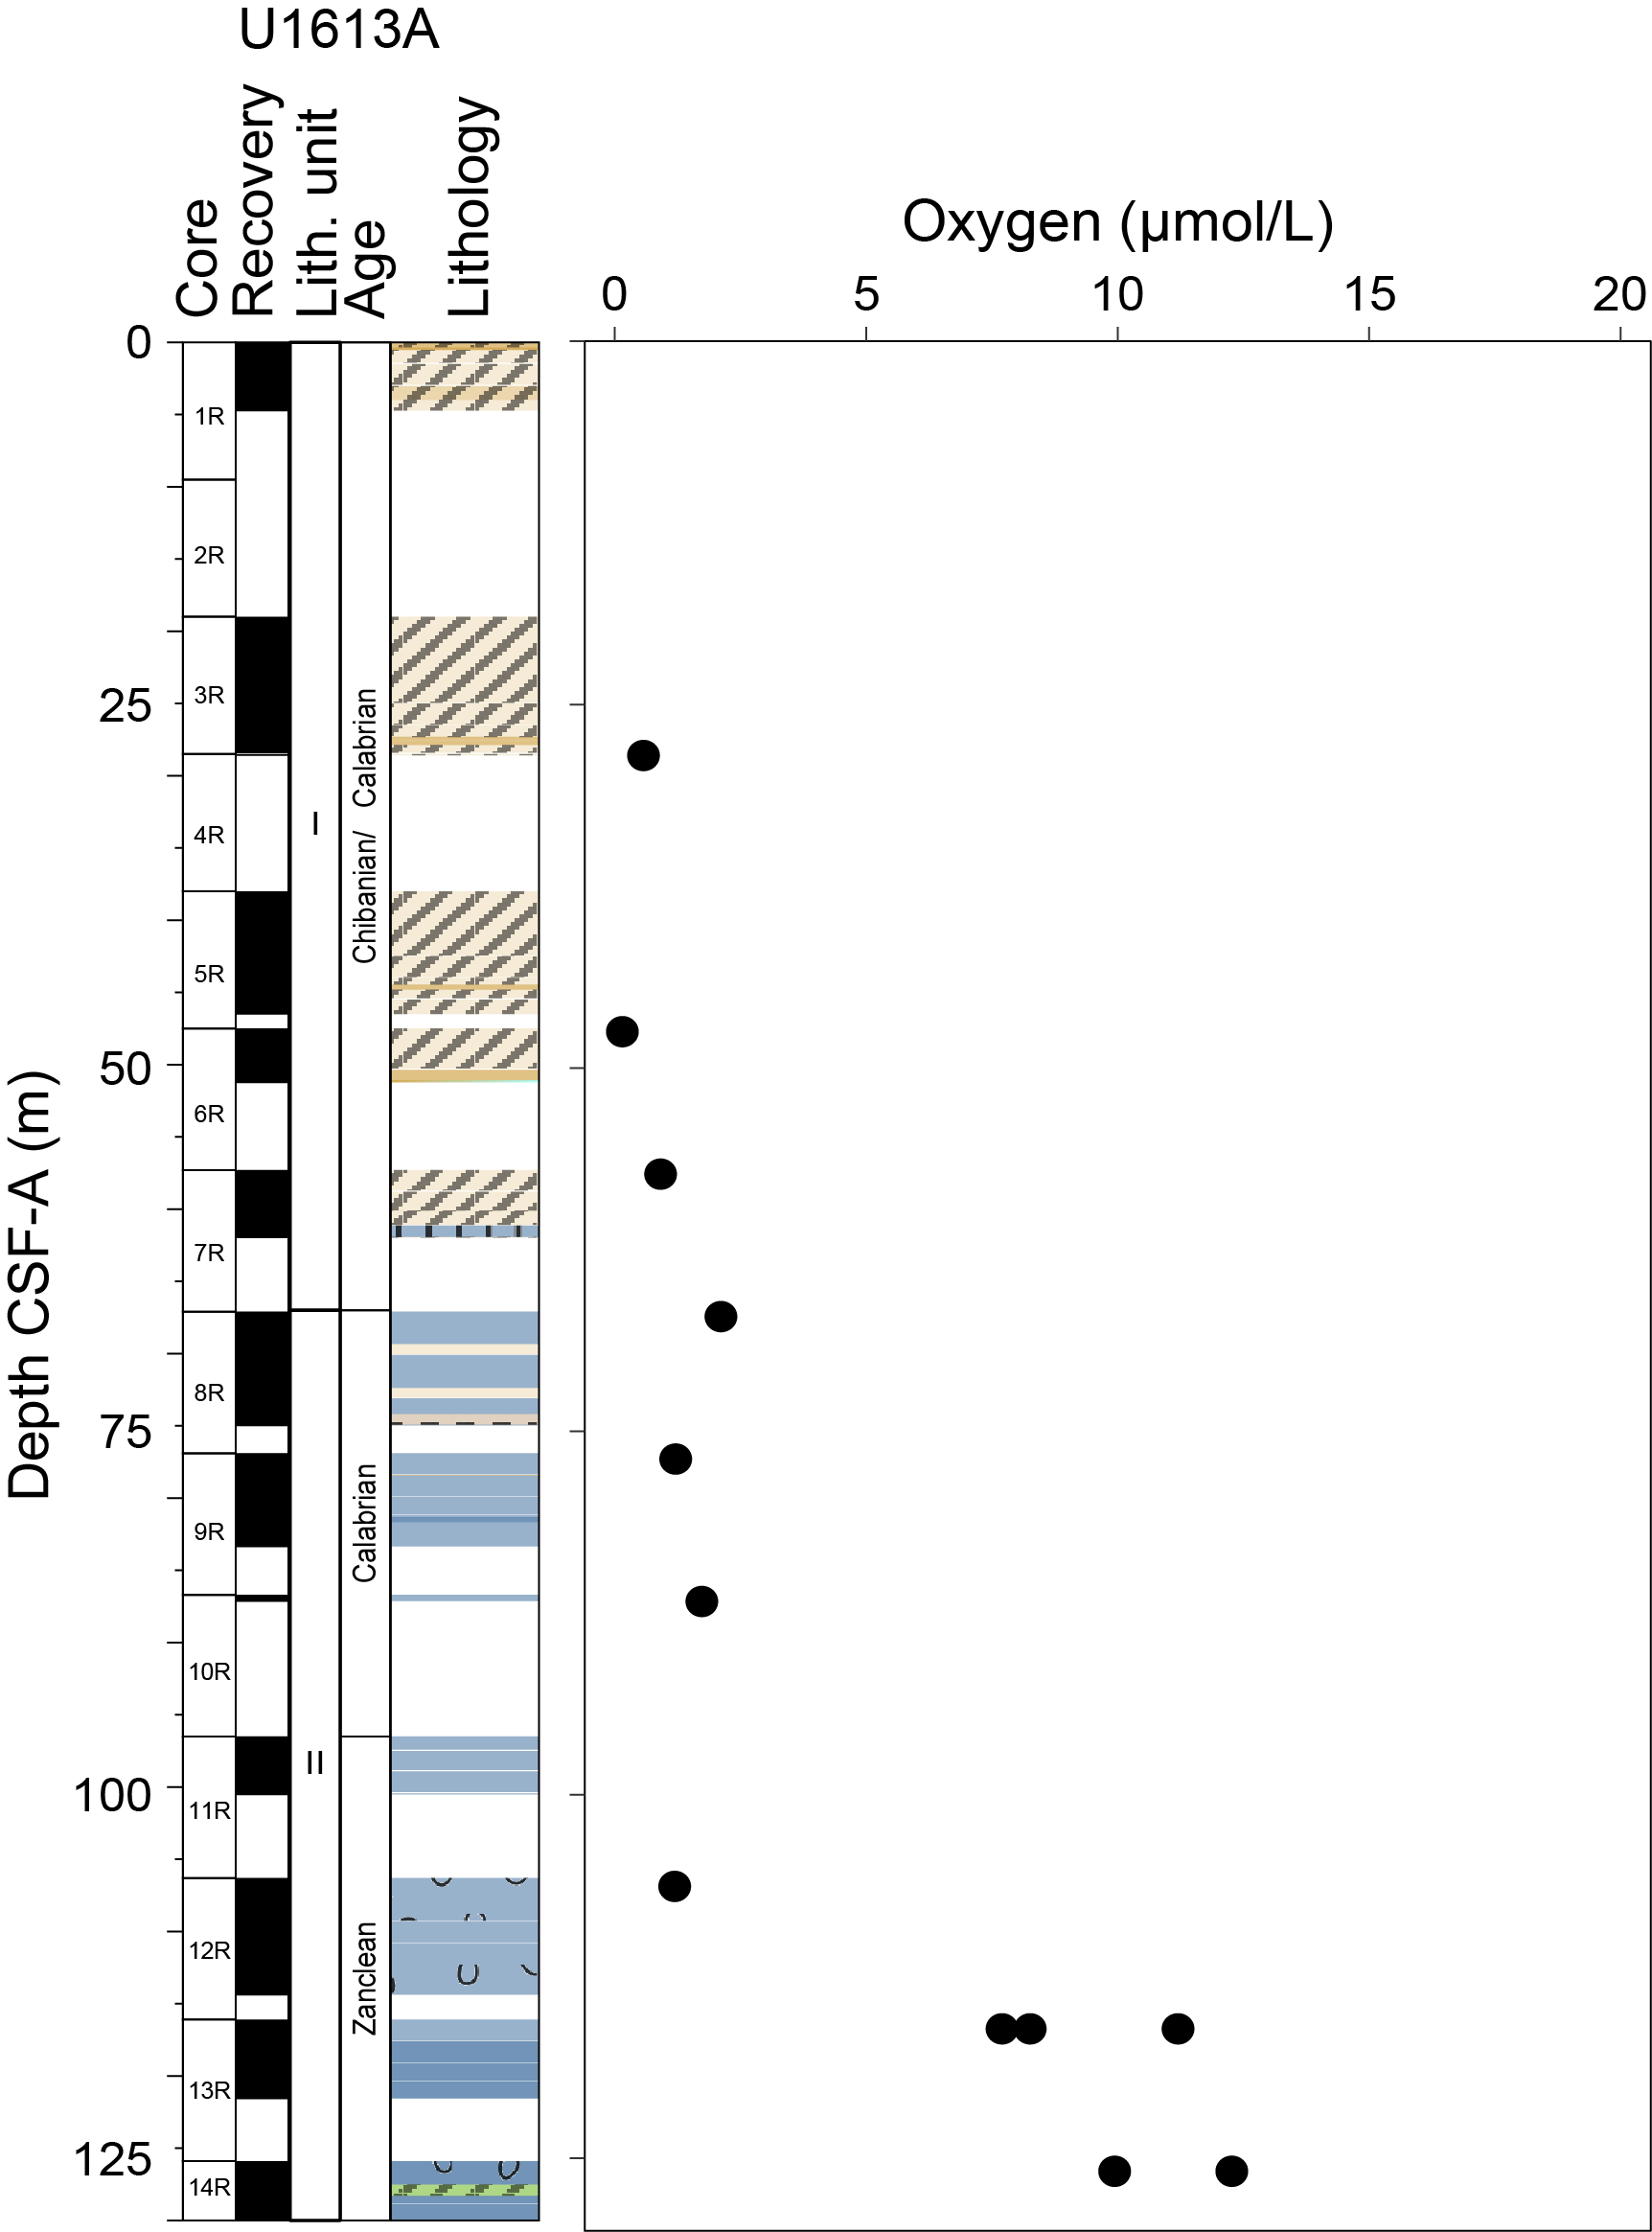
Figure F43. Oxygen concentration profile.
11.1.2. Microbiological sampling
11.1.2.1. Microbial community
Sediment samples were collected in Hole U1613A for analysis of the resident microbial communities. For this analysis, 5 cm long whole rounds were collected every 20 m for metagenomic analysis and a 10 mL plug was extracted from the center of each core for 16S rRNA gene amplification and sequencing. These were bagged and frozen at −86°C immediately after collection for onshore analysis.
11.1.2.2. Microbial experiments
An additional whole-round sample was taken from Sections 402-U1613A-1R-2, 5R-5, and 11R-2. These whole rounds were collected from possible geochemical transition zones, where there may be important changes in the chemical composition of the sediment or IW that influences the distribution and availability of nutrients and elements essential for life. Samples were processed in the anaerobic chamber and maintained at a temperature of 11°C before and during processing, and then they were stored in the dark at room temperature.
To detect viral activity, samples from Sections 402-U1613A-1R-2 and 11R-2 were incubated in the dark using 100 mL serum vials while maintaining an anaerobic headspace. Incubations were subsampled at t = 0, t = 4, t = 8, t = 12, and t = 24 h. For each subsample, 1 mL of sample was collected in triplicate, fixed with 54 µL of 37% formaldehyde, and stored at −86°C. Incubations were performed in the anaerobic chamber, and the subsampling was performed in the biosafety cabinet without opening the incubation bottles.
In addition, one sample from Section 402-U1613A-5R-5 was used to prepare enrichment cultures using two anaerobic culture media (MMJHS and MJYPGS) (see Microbiology in the Expedition 402 methods chapter [Malinverno et al., 2025]), which were then stored in the dark at room temperature. The sediment was diluted in synthetic anaerobic seawater to facilitate transfer of the sediment to the vials.
11.1.2.3. Viral counts
Plug samples (1 cm3) were taken from each core and then fixed with 4 mL of 37% formaldehyde and stored at 4°C. Because of the time required to separate the viruses from the sediment and filter out the microbial cells, these analyses will be performed on shore.
References
Bernasconi, S.M., 1999. Interstitial water chemistry in the western Mediterranean: results from Leg 161. In Zahn, R., Comas, M.C., and Klaus, A. (Eds.), Proceedings of the Ocean Drilling Program, Scientific Results. 161: College Station, TX (Ocean Drilling Program). https://doi.org/10.2973/odp.proc.sr.161.228.1999
Burdige, D.J., 2006. Geochemistry of Marine Sediments: Princeton, NJ (Princeton University Press). https://digitalcommons.odu.edu/oeas_books/1
Caratori Tontini, F., Stefanelli, P., Giori, I., Faggioni, O., Carmisciano, C., 2004. The revised aeromagnetic anomaly map of Italy. Annals of Geophysics, 47(5). https://doi.org/10.4401/ag-3358
Colantoni, P., Fabbri, A., Gallignani, P., Sartori, R., and Rehault, J.P., 1981. Carta Litologica e Stratigrafica dei Mari Italiani, scala 1/1.500.000. Italy: Litografia Artistica Cartografica.
Comas, M.C., Zahn, R., Klaus, A., et al., 1996. Proceedings of the Ocean Drilling Program, Initial Reports, 161: College Station, TX (Ocean Drilling Program). https://doi.org/10.2973/odp.proc.ir.161.1996
Davis, J.K., and Lavier, L.L., 2017. Influences on the development of volcanic and magma-poor morphologies during passive continental rifting. Geosphere, 13(5):1524–1540. https://doi.org/10.1130/GES01538.1
Della Vedova, B., Bellani, S., Pellis, G., and Squarci, P., 2001. Deep temperatures and surface heat flow distribution. In Vai, G.B. and Martini, I.P., Anatomy of an Orogen: the Apennines and Adjacent Mediterranean Basins. (Springer), 65–76. https://doi.org/10.1007/978-94-015-9829-3_7
Di Stefano, A., Baldassini, N., Raffi, I., Fornaciari, E., Incarbona, A., Negri, A., Negri, A., Bonomo, S., Villa, G., Di Stefano, E., and Rio, D., 2023. Neogene-Quaternary Mediterranean calcareous nannofossil biozonation and biochronology: a review. Stratigraphy, 20(4):259–302. https://www.micropress.org/microaccess/check/2342
Fabbri, A., and Curzi, P., 1979. The Messinian of the Tyrrhenian Sea: seismic evidence and dynamic implications. Giornale di Geologia, 43:215–248.
Faganeli, J., Planinc, R., Pezdič, Smodiš, B., Stegnar, P., and Ogorelec, B., 1991. Marine geology of the Gulf of Trieste (northern Adriatic): geochemical aspects. Marine Geology, 99(1):93–108. https://doi.org/10.1016/0025-3227(91)90085-I
Förster, A., 2001. Analysis of borehole temperature data in the northeast German Basin: continuous logs versus bottom-hole temperatures. Petroleum Geoscience, 7(3):241–254. https://doi.org/10.1144/petgeo.7.3.241
Gradstein, F.M., Ogg, J.G., Schmitz, M.D., and Ogg, G.M. (Eds.), 2020. Geologic Time Scale 2020: Amsterdam (Elsevier BV). https://doi.org/10.1016/C2020-1-02369-3
Jørgensen, B.B., 2000. Pathways of organic matter degradation. In Schulz, H.D., and Zabel, M. (Eds.), Marine Geochemistry (2nd edition). Berlin (Springer-Verlag).
Jørgensen, B.B., Nelson, D.C., Amend, J.P., Edwards, K.J., and Lyons, T.W., 2004. Sulfide oxidation in marine sediments: geochemistry meets microbiology. In Amend, J.P., Edwards, K.J., and Lyons, T.W. (Eds.), Sulfur Biogeochemistry - Past and Present. 379: Special Paper - Geological Society of America. https://doi.org/10.1130/0-8137-2379-5.63
Kastens, K.A., and Mascle, J., 1990. The geological evolution of the Tyrrhenian Sea; an introduction to the scientific results of ODP Leg 107. In Kastens, K.A., Mascle, J., et al., Proceedings of the Ocean Drilling Program, Scientific Results. 107: College Station, TX (Ocean Drilling Program), 3–26. https://doi.org/10.2973/odp.proc.sr.107.187.1990
Kastens, K.A., Mascle, J., Auroux, C., et al., 1987. Proceedings of the Ocean Drilling Program, Initial Reports: College Station, TX (Ocean Drilling Program). https://doi.org/10.2973/odp.proc.ir.107.1987
Kastner, M., 1981. Authigenic silicates in deep sea sediments: formation and diagenesis. In Emiliani, C., The oceanic lithosphere. The Sea, 7: New York (Wiley), 915–980.
Kirschvink, J.L., 1980. The least-squares line and plane and the analysis of palaeomagnetic data. Geophysical Journal International, 62(3):699–718. https://doi.org/10.1111/j.1365-246X.1980.tb02601.x
Lachenbruch, A.H., and Brewer, M.C., 1959. Dissipation of the temperature effect of drilling a well in Arctic Alaska. USGS Bulletin, 1083C:73–109. https://doi.org/10.3133/b1083C
Lirer, F., Foresi, L.M., Iaccarino, S.M., Salvatorini, G., Turco, E., Cosentino, C., Sierro, F.J., and Caruso, A., 2019. Mediterranean Neogene planktonic foraminifer biozonation and biochronology. Earth-Science Reviews, 196:102869. https://doi.org/10.1016/j.earscirev.2019.05.013
Malinverno, A., Zitellini, N., Estes, E.R., Abe, N., Akizawa, N., Bickert, M., Cunningham, E.H., Di Stefano, A., Filina, I.Y., Fu, Q., Gontharet, S., Kearns, L.E., Koorapati, R.K., Lei, C., Loreto, M.F., Magri, L., Menapace, W., Morishita, T., Pandey, A., Pavlovics, V.L., Pezard, P.A., Poulaki, E.M., Rodriguez-Pilco, M.A., Sanfilippo, A., Shuck, B.D., Vannucchi, P., and Zhao, X., 2025. Expedition 402 methods. In Zitellini, N., Malinverno, A., Estes, E.R., and the Expedition 402 Scientists, Tyrrhenian Continent–Ocean Transition. Proceedings of the International Ocean Discovery Program, 402: College Station, TX (International Ocean Discovery Program). https://doi.org/10.14379/iodp.proc.402.102.2025
Maniscalco, R., Forzese, M., Barbagallo, V., Borzì, L., D'Andrea, N.M., Distefano, S., Giustolisi, C., Nádudvari, Á., Pellegrino, A.G., Foresi, L.M., and Di Stefano, A., 2023. Toward an astrochronology-based age-model for a Messinian pre-evaporitic succession: the example of Torrente Vaccarizzo section in Sicily (Italy). Journal of Marine Science and Engineering, 11(5):915. https://doi.org/10.3390/jmse11050915
Martin, J.B., Gieskes, J.M., Torres, M., and Kastner, M., 1993. Bromine and iodine in Peru margin sediments and pore fluids: implications for fluid origins. Geochimica et Cosmochimica Acta, 57(18):4377–4389. https://doi.org/10.1016/0016-7037(93)90489-J
Mascle, J., and Rehault, J.-P., 1990. A revised seismic stratigraphy of the Tyrrhenian Sea: implications for the basin evolution. In Kastens, K.A., Mascle, J., et al., Proceedings of the Ocean Drilling Program, Scientific Results. 107: College Station, TX (Ocean Drilling Program), 617–636. https://doi.org/10.2973/odp.proc.sr.107.181.1990
Menegoni, N., Cipriani, A., Scarani, R., Stori, L., Citton, P., Romano, M., Nicosia, U., and Ronchi, A., The Cala Viola-Torre del Porticciolo coastal area: a key tectono-stratigraphic site to unravel the polyphase tectonics in NW Sardinia. Italian Journal of Geosciences, 143:75–104. https://doi.org/10.3301/IJG.2024.05
Meyers, P.A., 1994. Preservation of elemental and isotopic source identification of sedimentary organic matter. Chemical Geology, 114(3–4):289–302. https://doi.org/10.1016/0009-2541(94)90059-0
Pérez-Gussinyé, M., Morgan, J.P., Reston, T.J., and Ranero, C.R., 2006. The rift to drift transition at non-volcanic margins: insights from numerical modelling. Earth and Planetary Science Letters, 244(1–2):458–473. https://doi.org/10.1016/j.epsl.2006.01.059
Pimmel, A., and Claypool, G., 2001. Introduction to shipboard organic geochemistry on the JOIDES Resolution. Ocean Drilling Program Technical Note, 30. https://doi.org/10.2973/odp.tn.30.2001
Prada, M., Sallares, V., Ranero, C.R., Vendrell, M.G., Grevemeyer, I., Zitellini, N., and de Franco, R., 2014. Seismic structure of the Central Tyrrhenian basin: Geophysical constraints on the nature of the main crustal domains. Journal of Geophysical Research: Solid Earth, 119(1):52–70. https://doi.org/10.1002/2013JB010527
Prada, M., Sallares, V., Ranero, C.R., Vendrell, M.G., Grevemeyer, I., Zitellini, N., and de Franco, R., 2015. The complex 3-D transition from continental crust to backarc magmatism and exhumed mantle in the Central Tyrrhenian basin. Geophysical Journal International, 203(1):63–78. https://doi.org/10.1093/gji/ggv271
Ranero, C.R., and Sallarès, V., 2017. Seismic Data from MEDOC-2010 cruise [dataset]. Pangaea. https://doi.org/10.1594/PANGAEA.880761
Roether, W., Manca, B.B., Klein, B., Bregant, D., Georgopoulos, D., Beitzel, V., Kovačević, V., and Luchetta, A., 1996. Recent changes in eastern Mediterranean deep waters. Science, 271(5247):333–335. https://doi.org/10.1126/science.271.5247.333
Sartori, R., Torelli, L., Zitellini, N., Carrara, G., Magaldi, M., and Mussoni, P., 2004. Crustal features along a W–E Tyrrhenian transect from Sardinia to Campania margins (Central Mediterranean). Tectonophysics, 383(3):171–192. https://doi.org/10.1016/j.tecto.2004.02.008
Sayles, F.L., and Mangelsdorf, P.C., 1977. The equilibration of clay minerals with sea water: exchange reactions. Geochimica et Cosmochimica Acta, 41(7):951–960. https://doi.org/10.1016/0016-7037(77)90154-5
Schlumberger, 2013. Log Interpretation Charts: Houston, TX (Schlumberger).
Schreiber, E., Fox, P.J., and Peterson, J.J., 1973. Compressional wave velocities in selected samples of gabbro, schist, limestone, anhydrite, gypsum and halite. In Initial Reports of the Deep Sea Drilling Project. 7: Washington, DC (US Government Printing Office), 595–597. https://doi.org/10.2973/dsdp.proc.13.118.1973
Selli, R., and Fabbri, A., 1971. Tyrrhenian: a Pliocene deep sea. Atti della Accademia Nazionale dei Lincei. Classe di Scienze Fisiche, Matematiche e Naturali. Rendiconti, 50(5):580–592. http://eudml.org/doc/295987
Spina, A., Capezzuoli, E., Brogi, A., Cirilli, S., and Liotta, D., 2019. Mid- to late Permian microfloristic evidence in the metamorphic successions of the Northern Apennines: insights for age-constraining and palaeogeographical correlations. Journal of the Geological Society, 176(6):1262–1272. https://doi.org/10.1144/jgs2018-202
Tanhua, T., Hainbucher, D., Schroeder, K., Cardin, V., Álvarez, M., and Civitarese, G., 2013. The Mediterranean Sea system: a review and an introduction to the special issue. Ocean Science, 9(5):789–803. https://doi.org/10.5194/os-9-789-2013
Tsimplis, M.N., and Baker, T.F., 2000. Sea level drop in the Mediterranean Sea: an indicator of deep water salinity and temperature changes? Geophysical Research Letters, 27(12):1731–1734. https://doi.orfg/10.1029/1999GL007004