Zitellini, N., Malinverno, A., Estes, E.R., and the Expedition 402 Scientists
Proceedings of the International Ocean Discovery Program Volume 402
publications.iodp.org
https://doi.org/10.14379/iodp.proc.402.106.2025
Site U16151
![]() A. Malinverno,
A. Malinverno,
![]() N. Zitellini,
N. Zitellini,
![]() E.R. Estes,
E.R. Estes,
![]() N. Abe,
N. Abe,
![]() N. Akizawa,
N. Akizawa,
![]() M. Bickert,
M. Bickert,
![]() E.H. Cunningham,
E.H. Cunningham,
![]() A. Di Stefano,
A. Di Stefano,
![]() I.Y. Filina,
I.Y. Filina,
![]() Q. Fu,
Q. Fu,
![]() S. Gontharet,
S. Gontharet,
![]() L.E. Kearns,
L.E. Kearns,
![]() R.K. Koorapati,
R.K. Koorapati,
![]() C. Lei,
C. Lei,
![]() M.F. Loreto,
M.F. Loreto,
![]() L. Magri,
L. Magri,
![]() W. Menapace,
W. Menapace,
![]() T. Morishita,
T. Morishita,
![]() A. Pandey,
A. Pandey,
![]() V.L. Pavlovics,
V.L. Pavlovics,
![]() P.A. Pezard,
P.A. Pezard,
![]() E.M. Poulaki,
E.M. Poulaki,
![]() M.A. Rodriguez-Pilco,
M.A. Rodriguez-Pilco,
![]() A. Sanfilippo,
A. Sanfilippo,
![]() B.D. Shuck,
B.D. Shuck,
![]() P. Vannucchi, and
P. Vannucchi, and
![]() X. Zhao2
X. Zhao2
1 Malinverno, A., Zitellini, N., Estes, E.R., Abe, N., Akizawa, N., Bickert, M., Cunningham, E.H., Di Stefano, A., Filina, I.Y., Fu, Q., Gontharet, S., Kearns, L.E., Koorapati, R.K., Lei, C., Loreto, M.F., Magri, L., Menapace, W., Morishita, T., Pandey, A., Pavlovics, V.L., Pezard, P.A., Poulaki, E.M., Rodriguez-Pilco, M.A., Sanfilippo, A., Shuck, B.D., Vannucchi, P., and Zhao, X., 2025. Site U1615. In Zitellini, N., Malinverno, A., Estes, E.R., and the Expedition 402 Scientists, Tyrrhenian Continent–Ocean Transition. Proceedings of the International Ocean Discovery Program, 402: College Station, TX (International Ocean Discovery Program). https://doi.org/10.14379/iodp.proc.402.106.2025
2 Expedition 402 Scientists' affiliations.
1. Background and objectives
Site U1615 is located in the Vavilov Basin, which lies near the center of the Tyrrhenian Sea and includes its deepest parts at about 3600 m water depth (Figure F1). The basin is named after the prominent Vavilov Volcano, which is composed of intraplate basalts (Peccerillo, 2017). Mid-ocean-ridge basalts were cored at Ocean Drilling Program (ODP) Site 656 on the Gortani Ridge (Kastens and Mascle, 1990) and Deep Sea Drilling Project (DSDP) Site 373 (Shipboard Scientific Party, 1978) and island arc basalts were recovered at ODP Site 651 above 30 m of serpentinized peridotite (Beccaluva et al., 1990; Bonatti et al., 1990). In addition, continental basement outcrops are found in several locations within the Vavilov Basin; dredging the steep escarpments of the Central Fault and of the De Marchi, Flavio Gioia, and Farfalla Seamounts returned a variety of continental rocks, including granites, gneisses, quartzites, schists, phyllites, and shallow-water carbonates (Heezen et al., 1971; Colantoni et al., 1981).
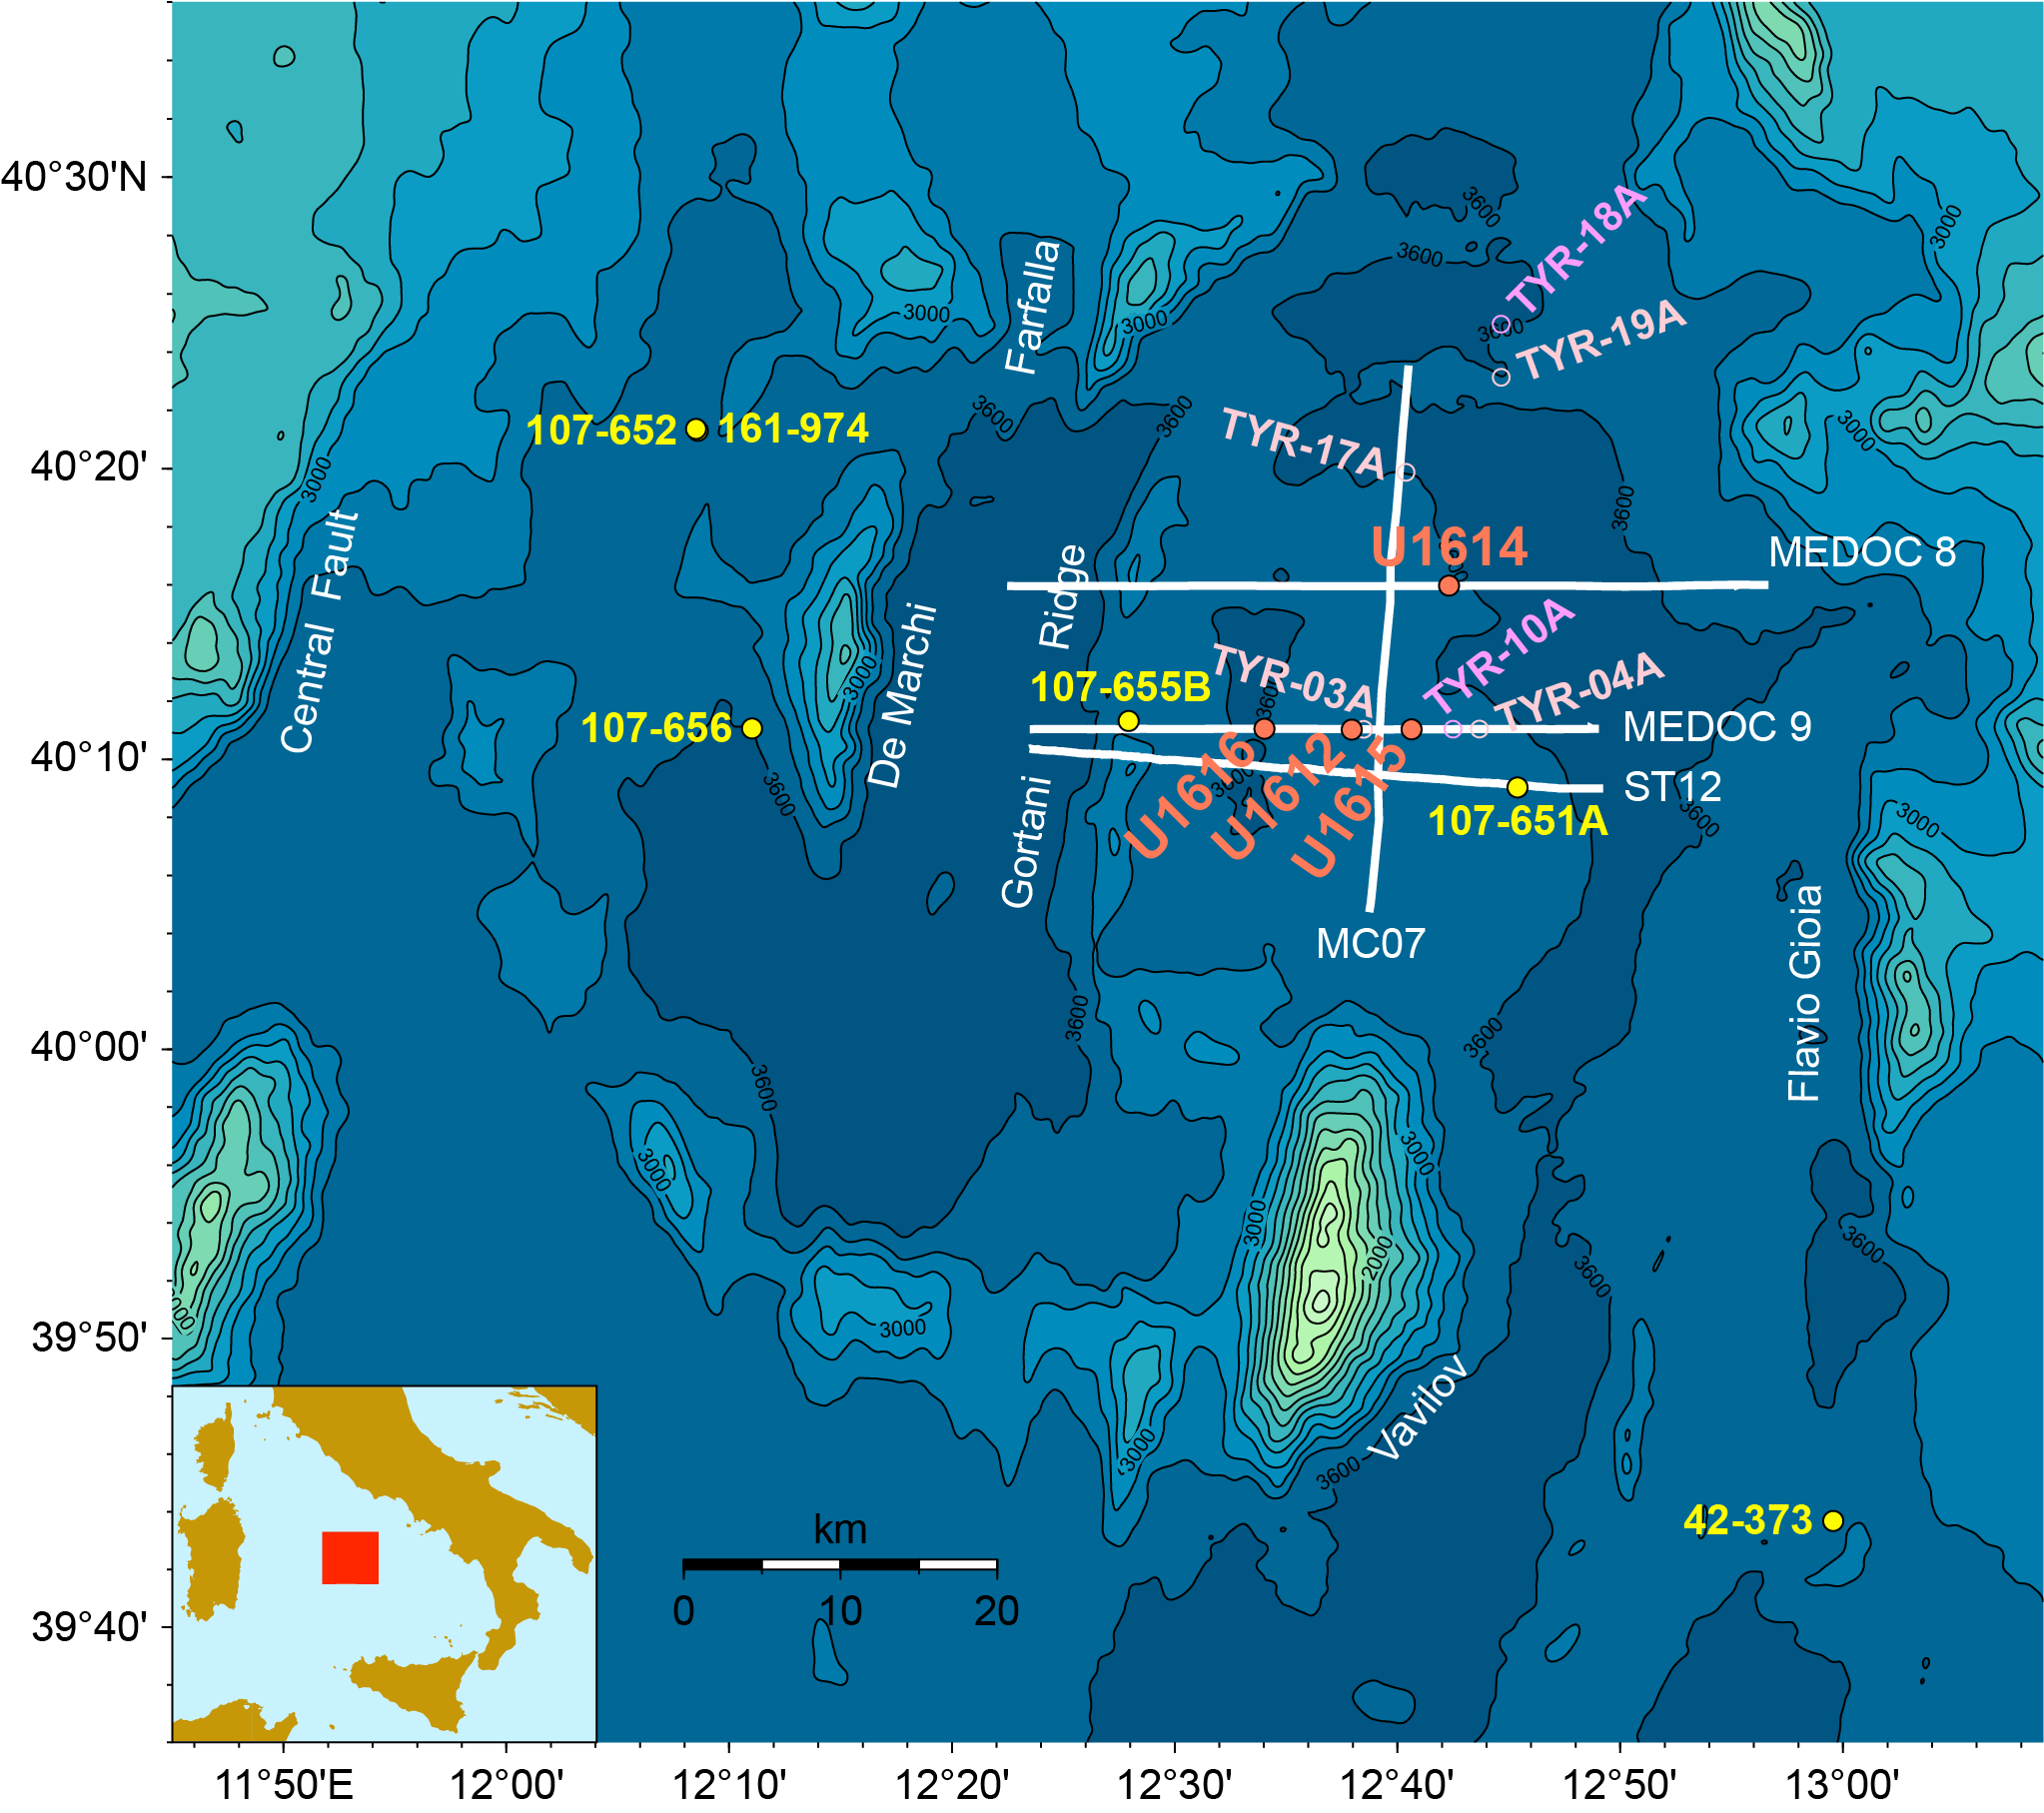
Figure F1. Sites U1612, U1614, U1615, and U1616; Expedition 402 proposed drilling locations; and DSDP Leg 42 and ODP Leg 107 and 161 sites.
Recent analyses of high-quality seismic data show a seismic velocity structure in the Vavilov Basin similar to that of continent–ocean transitions (COTs) where peridotitic mantle has been exhumed by low-angle normal faults and serpentinized by interaction with seawater (Prada et al., 2014). This finding led to the suggestion that most of the basement in the deep Vavilov Basin is composed of mantle peridotite (Prada et al., 2015), whereas previous interpretations considered it to be basaltic oceanic crust (e.g., Kastens and Mascle, 1990). A major goal of Expedition 402 is to test these alternative hypotheses by directly sampling the geologic basement of the Vavilov Basin and advance our still incomplete understanding of COT evolution.
The plan for Expedition 402 was to drill a total of six sites forming two transects: an east–west transect targeting the progression from continental crust to magmatic basaltic crust and exhumed mantle, and a north–south transect mapping the area of inferred mantle basement. Site U1615 is one of four proposed sites targeting mantle peridotites and is located at the eastern end of the east–west transect in the Vavilov Basin, which also includes Sites U1612 and U1616 (Figures F1, F2). Site U1615 is located on the flank of an irregular basement high, which is interpreted to be the uplifted footwall of a long-offset low-angle detachment fault that exhumed the mantle. Similar low-angle normal faults have been proposed to expose deep-seated continental crustal rocks in metamorphic core complexes (Lister and Davis, 1989) and mantle peridotites in the Galicia Atlantic margin (Boillot and Winterer, 1988) and along the axis of the Mid-Atlantic Ridge (Tucholke et al., 1998). Drilling of the east–west transect sites aimed to clarify the nature and variation of the geologic basement exposed along the inferred detachment fault. As for the other sites in the Vavilov Basin, the scientific objectives of Site U1615 were to date the oldest sediment above the basement contact using biostratigraphy and magnetostratigraphy to constrain the timing of mantle exhumation; to sample sediments and pore fluids above the basement contact to investigate fluid-rock interactions; and to recover basement samples to determine the heterogeneous composition of the exhumed mantle, its degree of serpentinization and alteration, and its pattern of structural deformation.
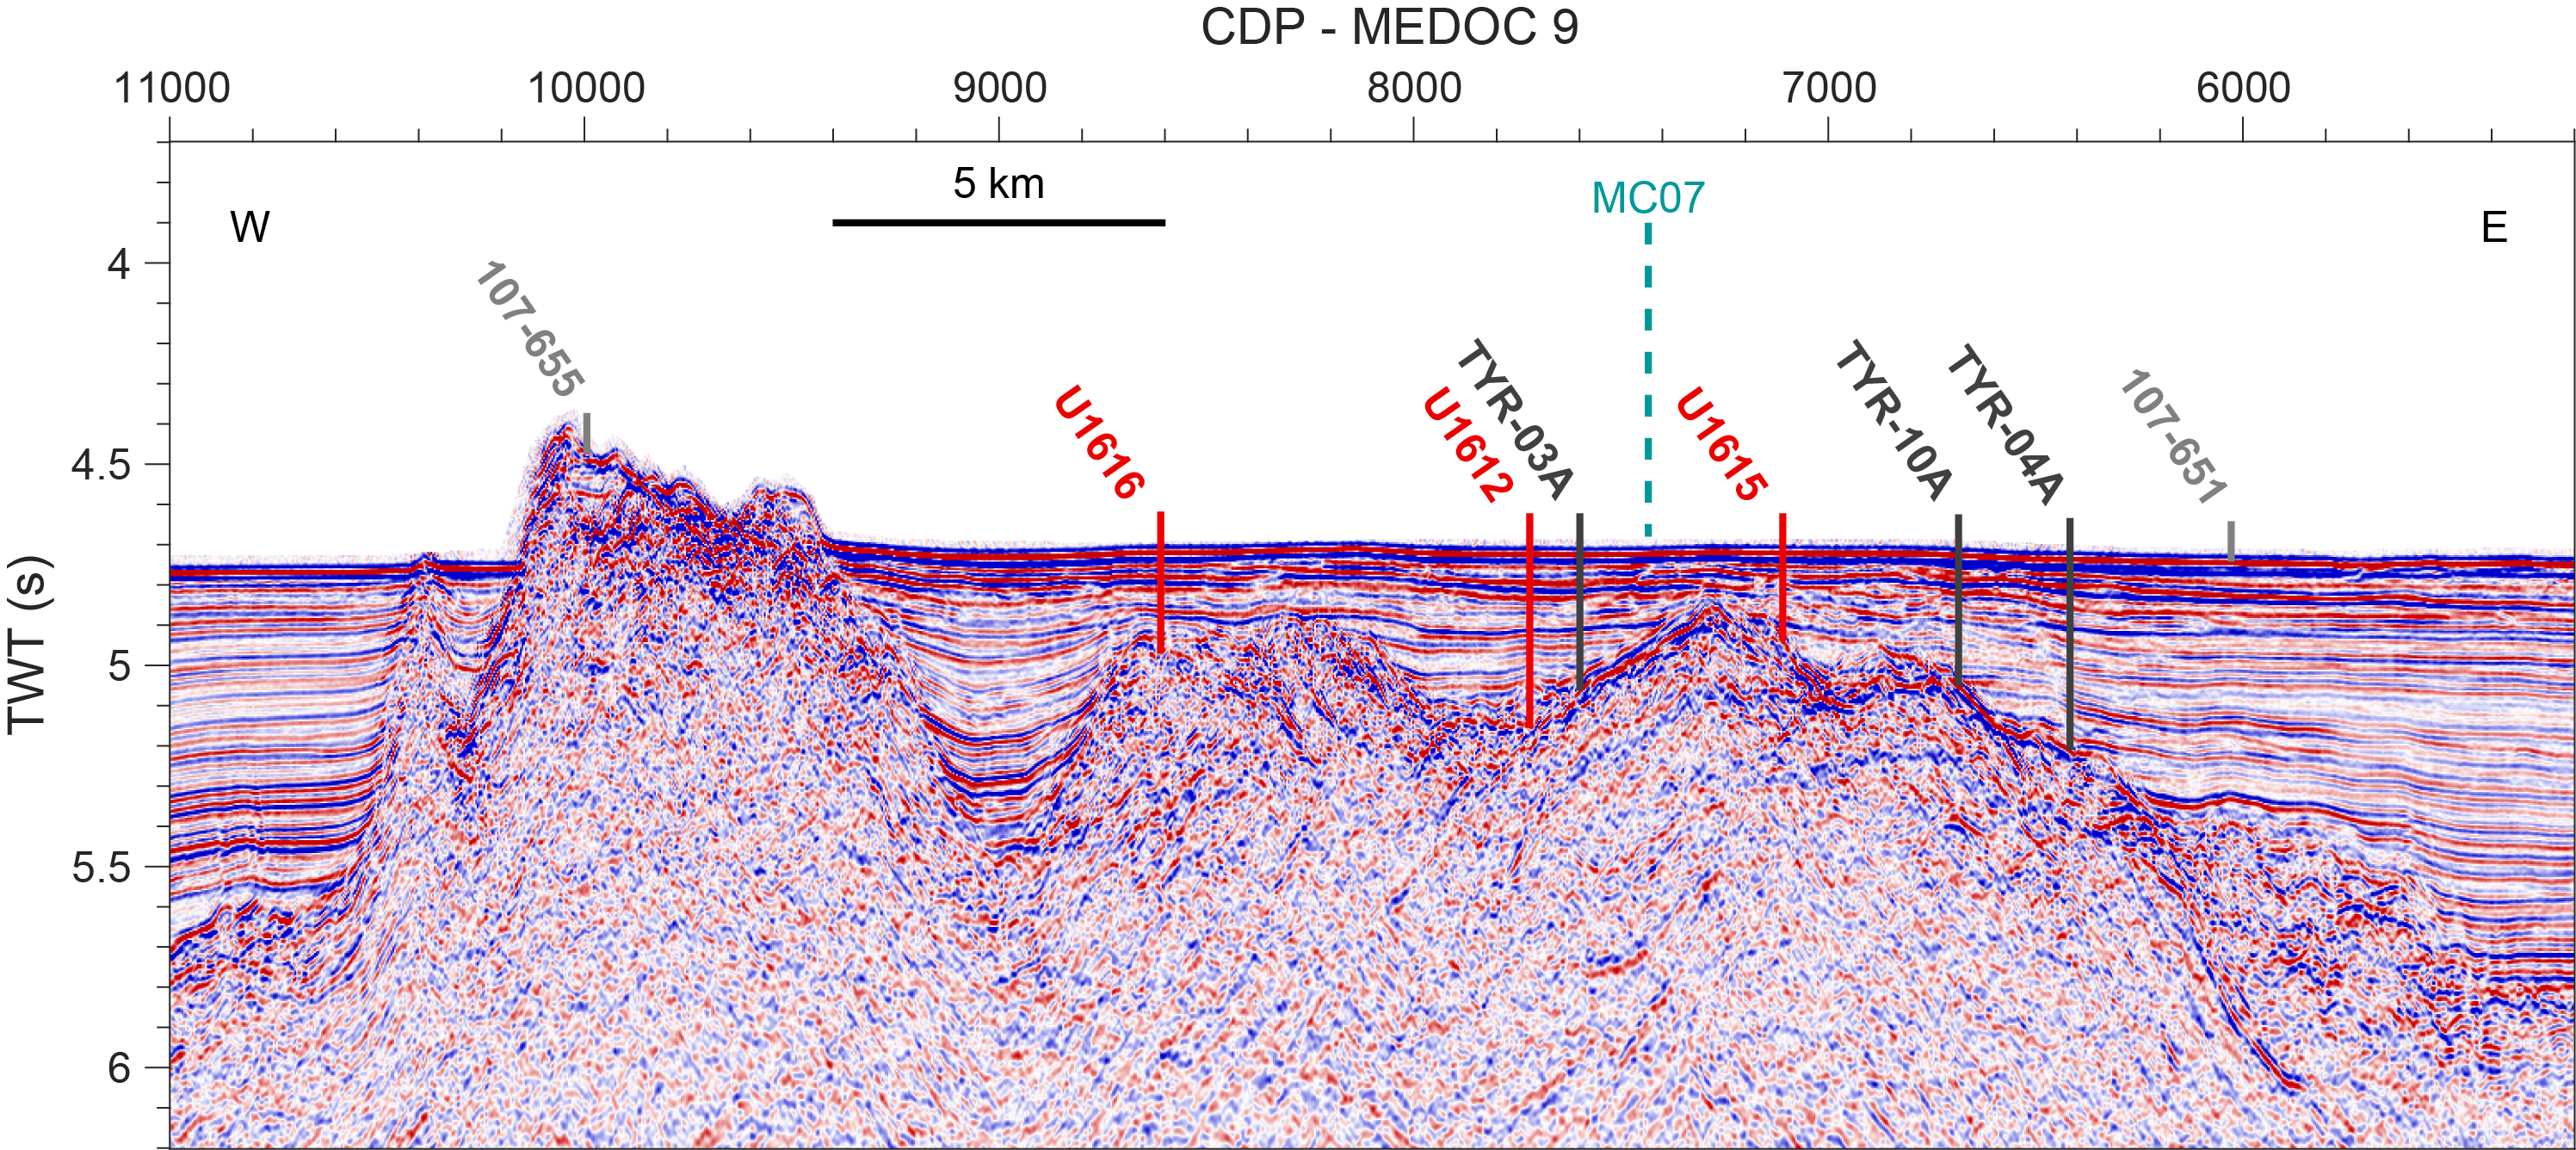
Figure F2. Site U1615 location and estimated penetration.
The original plan for Site U1615 was to drill a first hole using the rotary core barrel (RCB) system to a total depth of 320 core depth below seafloor, Method A (CSF-A), including an estimated 180 m of sediment and 140 m of basement to ensure crossing of the exhumation fault zone (estimated to be 100 m thick). Recovery would be particularly important in the few tens of meters above the basement to determine the age of the oldest sediment (and hence the timing of basaltic magmatism or mantle exhumation) and to collect biogeochemical evidence of rock-fluid interactions due to serpentinization at depth. Depending on the sediment recovery in the RCB hole, the plan also allowed for a second hole drilled using the advanced piston corer (APC)/extended core barrel (XCB) system to ensure adequate sampling of the lowermost sediment interval and the sediment/basement interface.
After the loss of two RCB bottom-hole assemblies (BHAs) when they became irremediably stuck in Holes U1612A and U1614C in the Vavilov Basin, we were forced to reevaluate the original drilling plan. We decided not to drill at the northern end of the north–south transect of the Vavilov Basin (proposed Sites TYR-17A, TYR-18A, and TYR-19A) because their thick sediment cover (~500–1000 m) was likely to contain unstable volcaniclastics. We concentrated instead on Sites U1615 and U1616 (proposed Sites TYR-16A and TYR-15A, respectively), located on basement highs in the east–west transect where the estimated sediment cover was much thinner (~200 m). The original order of drilling operations was reversed so that an APC/XCB hole was drilled first. The expected high recovery of the sediment interval in this hole would provide a high-quality record above the sediment/basement interface and would allow determination of the extent and depth distribution of unconsolidated volcaniclastics.
We would then compare the results with those from a similar APC/XCB hole to be drilled at Site U1616, also located on the east–west transect approximately 10 km west of Site U1615. Based on the observations from the two APC/XCB holes, we would then select either Site U1615 or U1616 to drill a second hole and install a casing string that would reach below the base of the problematic volcaniclastics. This second hole would be cored with the RCB system starting above the sediment/basement interface with the goal of recovering the target 140 m thick basement interval. After coring, downhole geophysical logging was planned in the RCB hole with a focus on obtaining electrical and ultrasonic borehole wall images to complement core recovery and provide key input to the interpretation of the drilled basement interval.
2. Operations
Hole locations, water depths, and coring statistics for Site U1615 are listed in Table T1. All times are provided in local ship time (UTC + 1 h).
2.1. Hole U1615A
The 5.1 nmi transit from Site U1614 to Site U1615 was completed in dynamic positioning (DP) mode at 1608 h on 7 March 2024. Tripping pipe to the seafloor began during the transit with a 163.5 m long BHA for the APC/XCB coring system and a 9⅞ inch polycrystalline diamond compact (PDC) drill bit. Hole U1615A was spudded at 2230 h with the bit positioned 5 m above the precision depth recorder (PDR) water depth of 3571.4 m. Core 1H recovered the mudline and 7.49 m of material from a 7.3 m advance (103%), confirming the water depth as 3568.6 m. Coring in Hole U1615A continued through Core 34X, reaching a total depth of 300.0 CSF-A and recovering 115.09 m of sediment (38%). Recovery was high in the first five cores (97%) but low throughout much of the rest of the hole, including six cores with no recovery.
Formation temperature measurements using the third-generation advanced piston corer temperature (APCT-3) tool were taken during the coring of Cores 402-U1615A-4H, 7H, and 10H. Cores 8H and 10H experienced partial strokes, likely caused by the sandy formation; therefore, Cores 11F–13F were taken as half-length APC (HLAPC) cores before switching to the XCB system for the remainder of the hole. In total, the APC system was used for 10 cores over an interval of 86.4 m with 79% recovery, the HLAPC system was used for 3 cores over an interval of 14.1 m with a recovery of 24%, and the XCB system was used for 21 cores over an interval of 199.5 m with a recovery of 22%. Nonmagnetic core barrels were used for all APC and HLAPC cores, and all APC cores were oriented. The microbial contamination tracer perfluorodecalin (PFD) was pumped along with the drilling fluid during coring operations.
Because of the poor core recovery in the sediment and because the basement contact appeared to be deeper than predicted, we determined that this site would not be a suitable location for the next casing installation and ended operations at Site U1615 at 1500 h on 9 March after the recovery of Core 402-U1615A-34X. At midnight, the vessel began the 4.8 nmi transit in DP mode to Site U1616 at a speed of 0.5 kt. Operations at Site U1615 lasted 2.3 days.
3. Lithostratigraphy
Site U1615 cored a 300 m thick sediment sequence with a total recovery of 38% in Hole U1615A (Figure F3). Sedimentary Lithostratigraphic Subunit IA through Unit II (Figure F4) range in age from Holocene to Early/Middle Pleistocene, as determined by calcareous nannofossil and planktic foraminifera biostratigraphy (see Biostratigraphy). Unit I consists of nannofossil ooze interbedded with volcaniclastic material ranging from ash to gravel and is divided into Subunits IA–IC, defined by the abundance of volcaniclastic gravel (Figure F5). Unit II consists of nannofossil chalk and nannofossil ooze interbedded with small volcaniclastic layers and organic-rich sapropel layers.
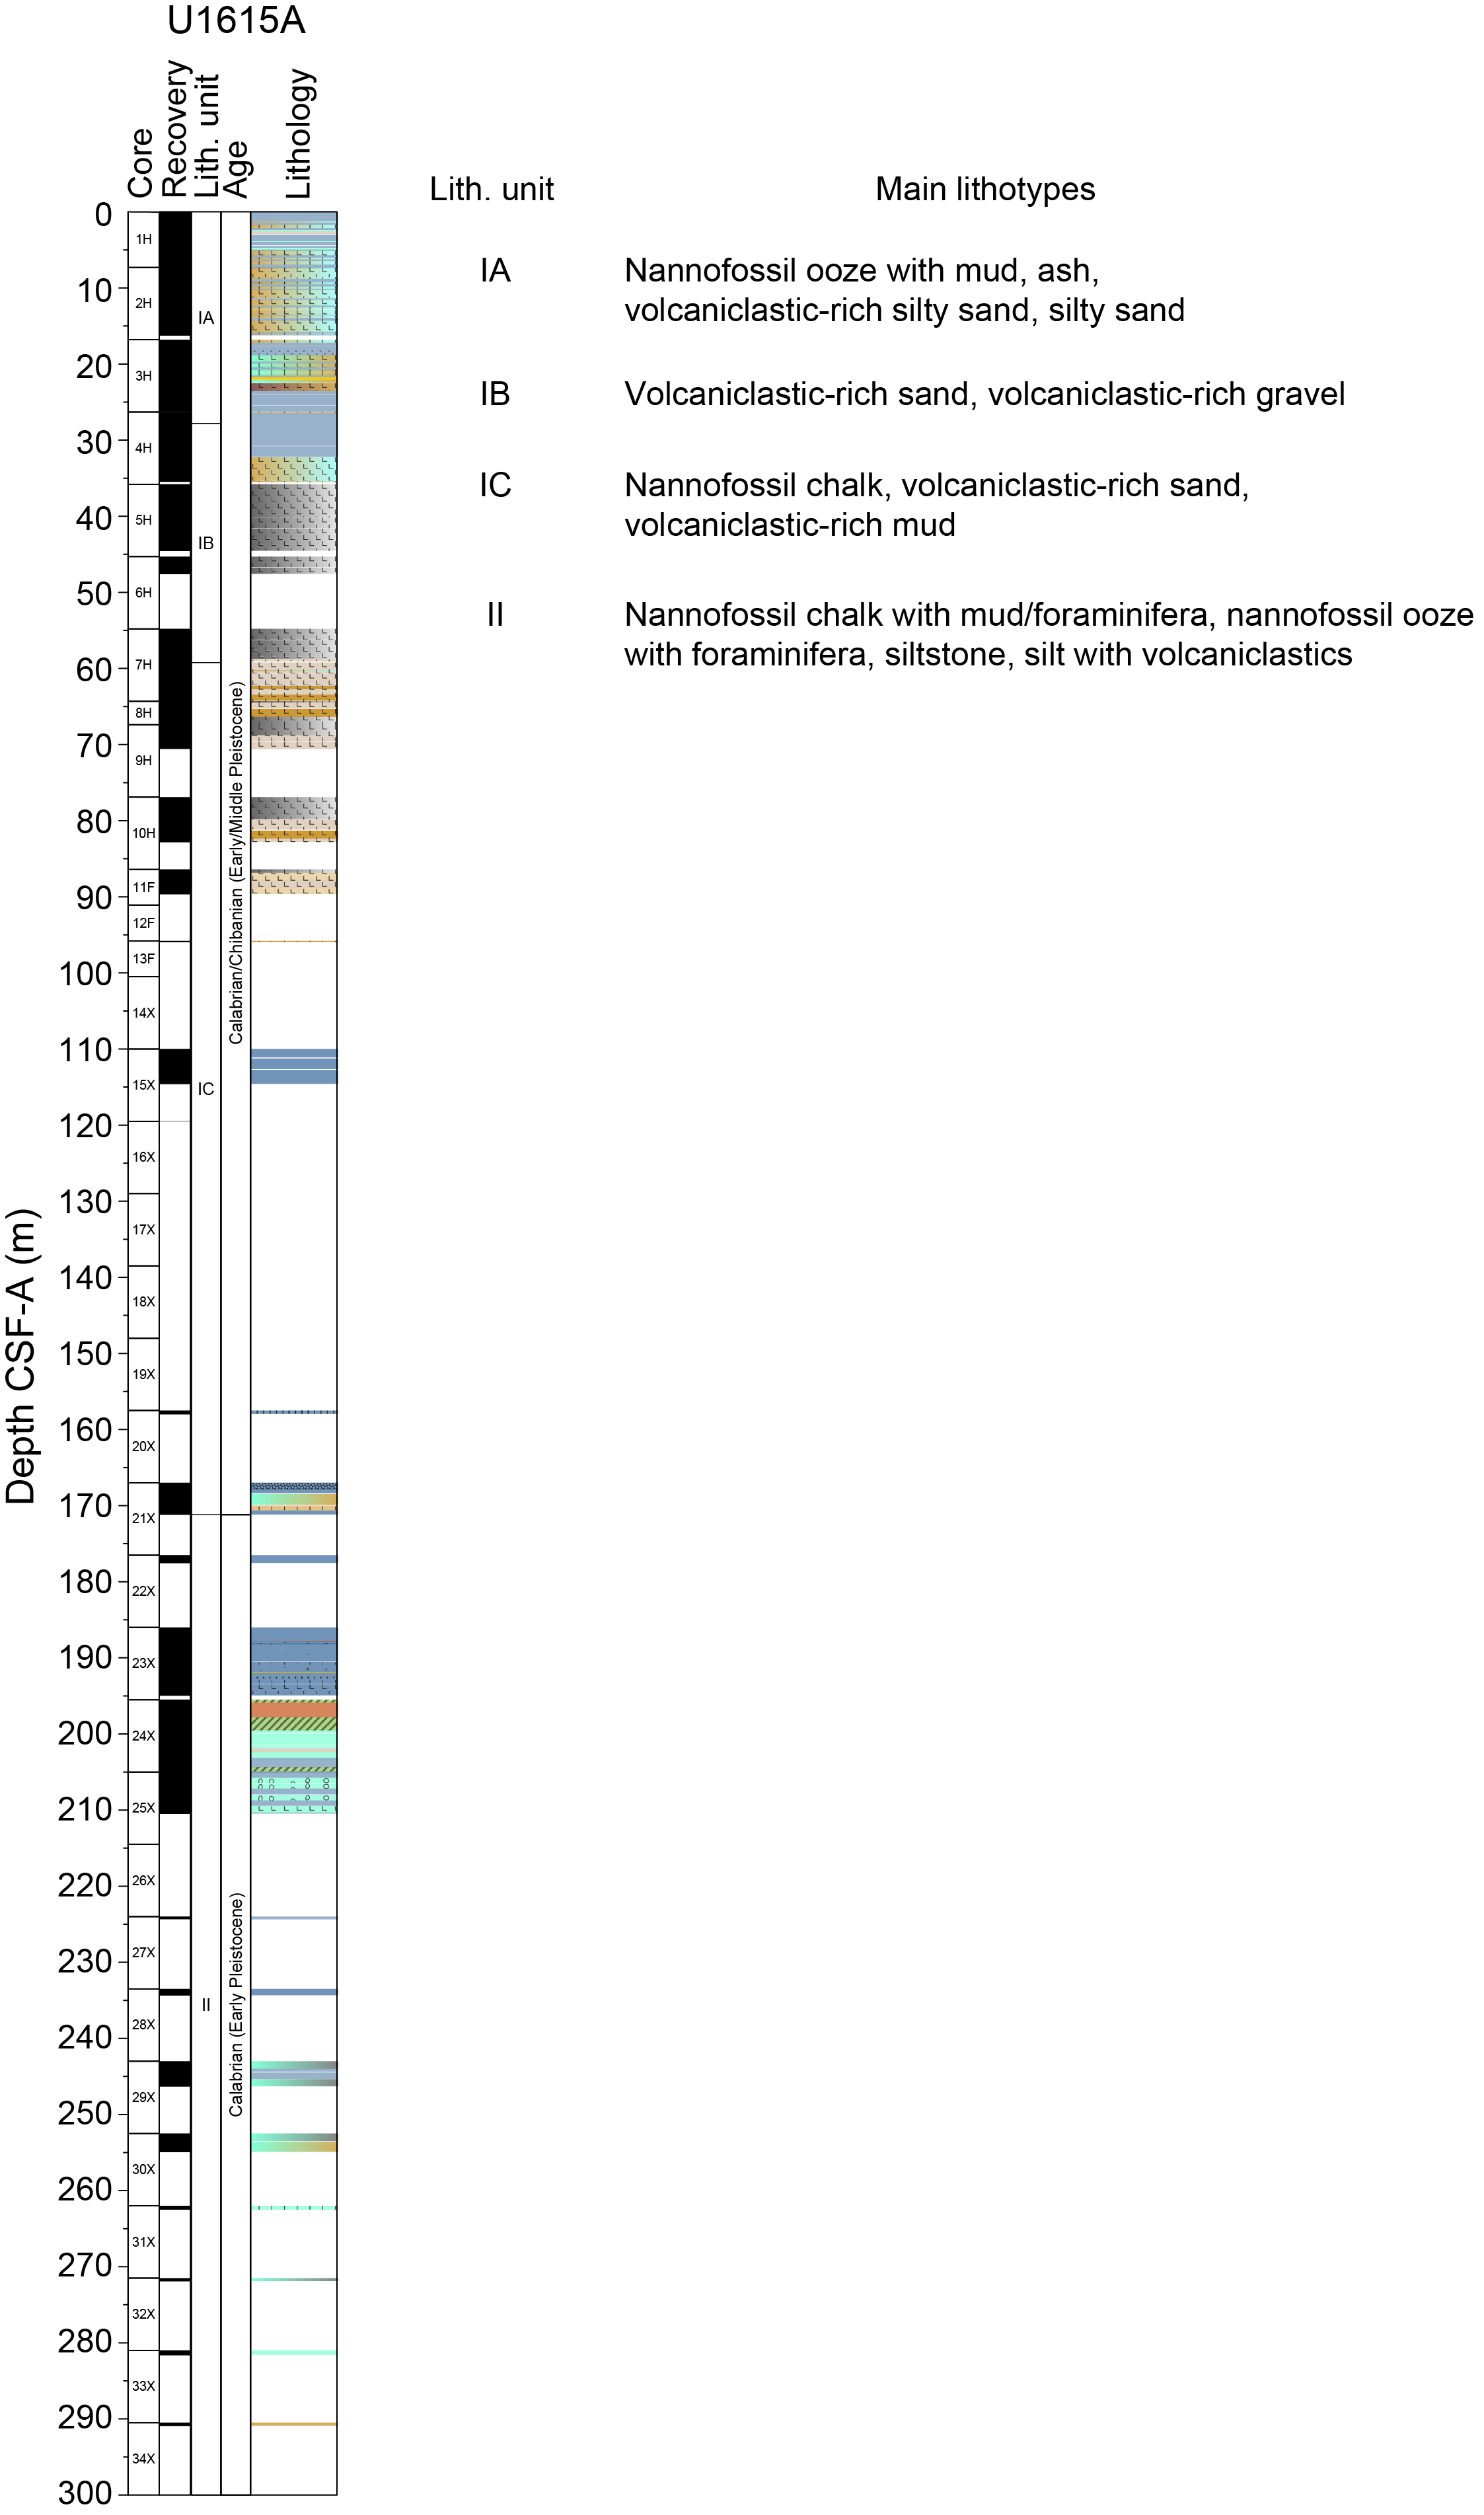
Figure F3. Lithostratigraphic summary.
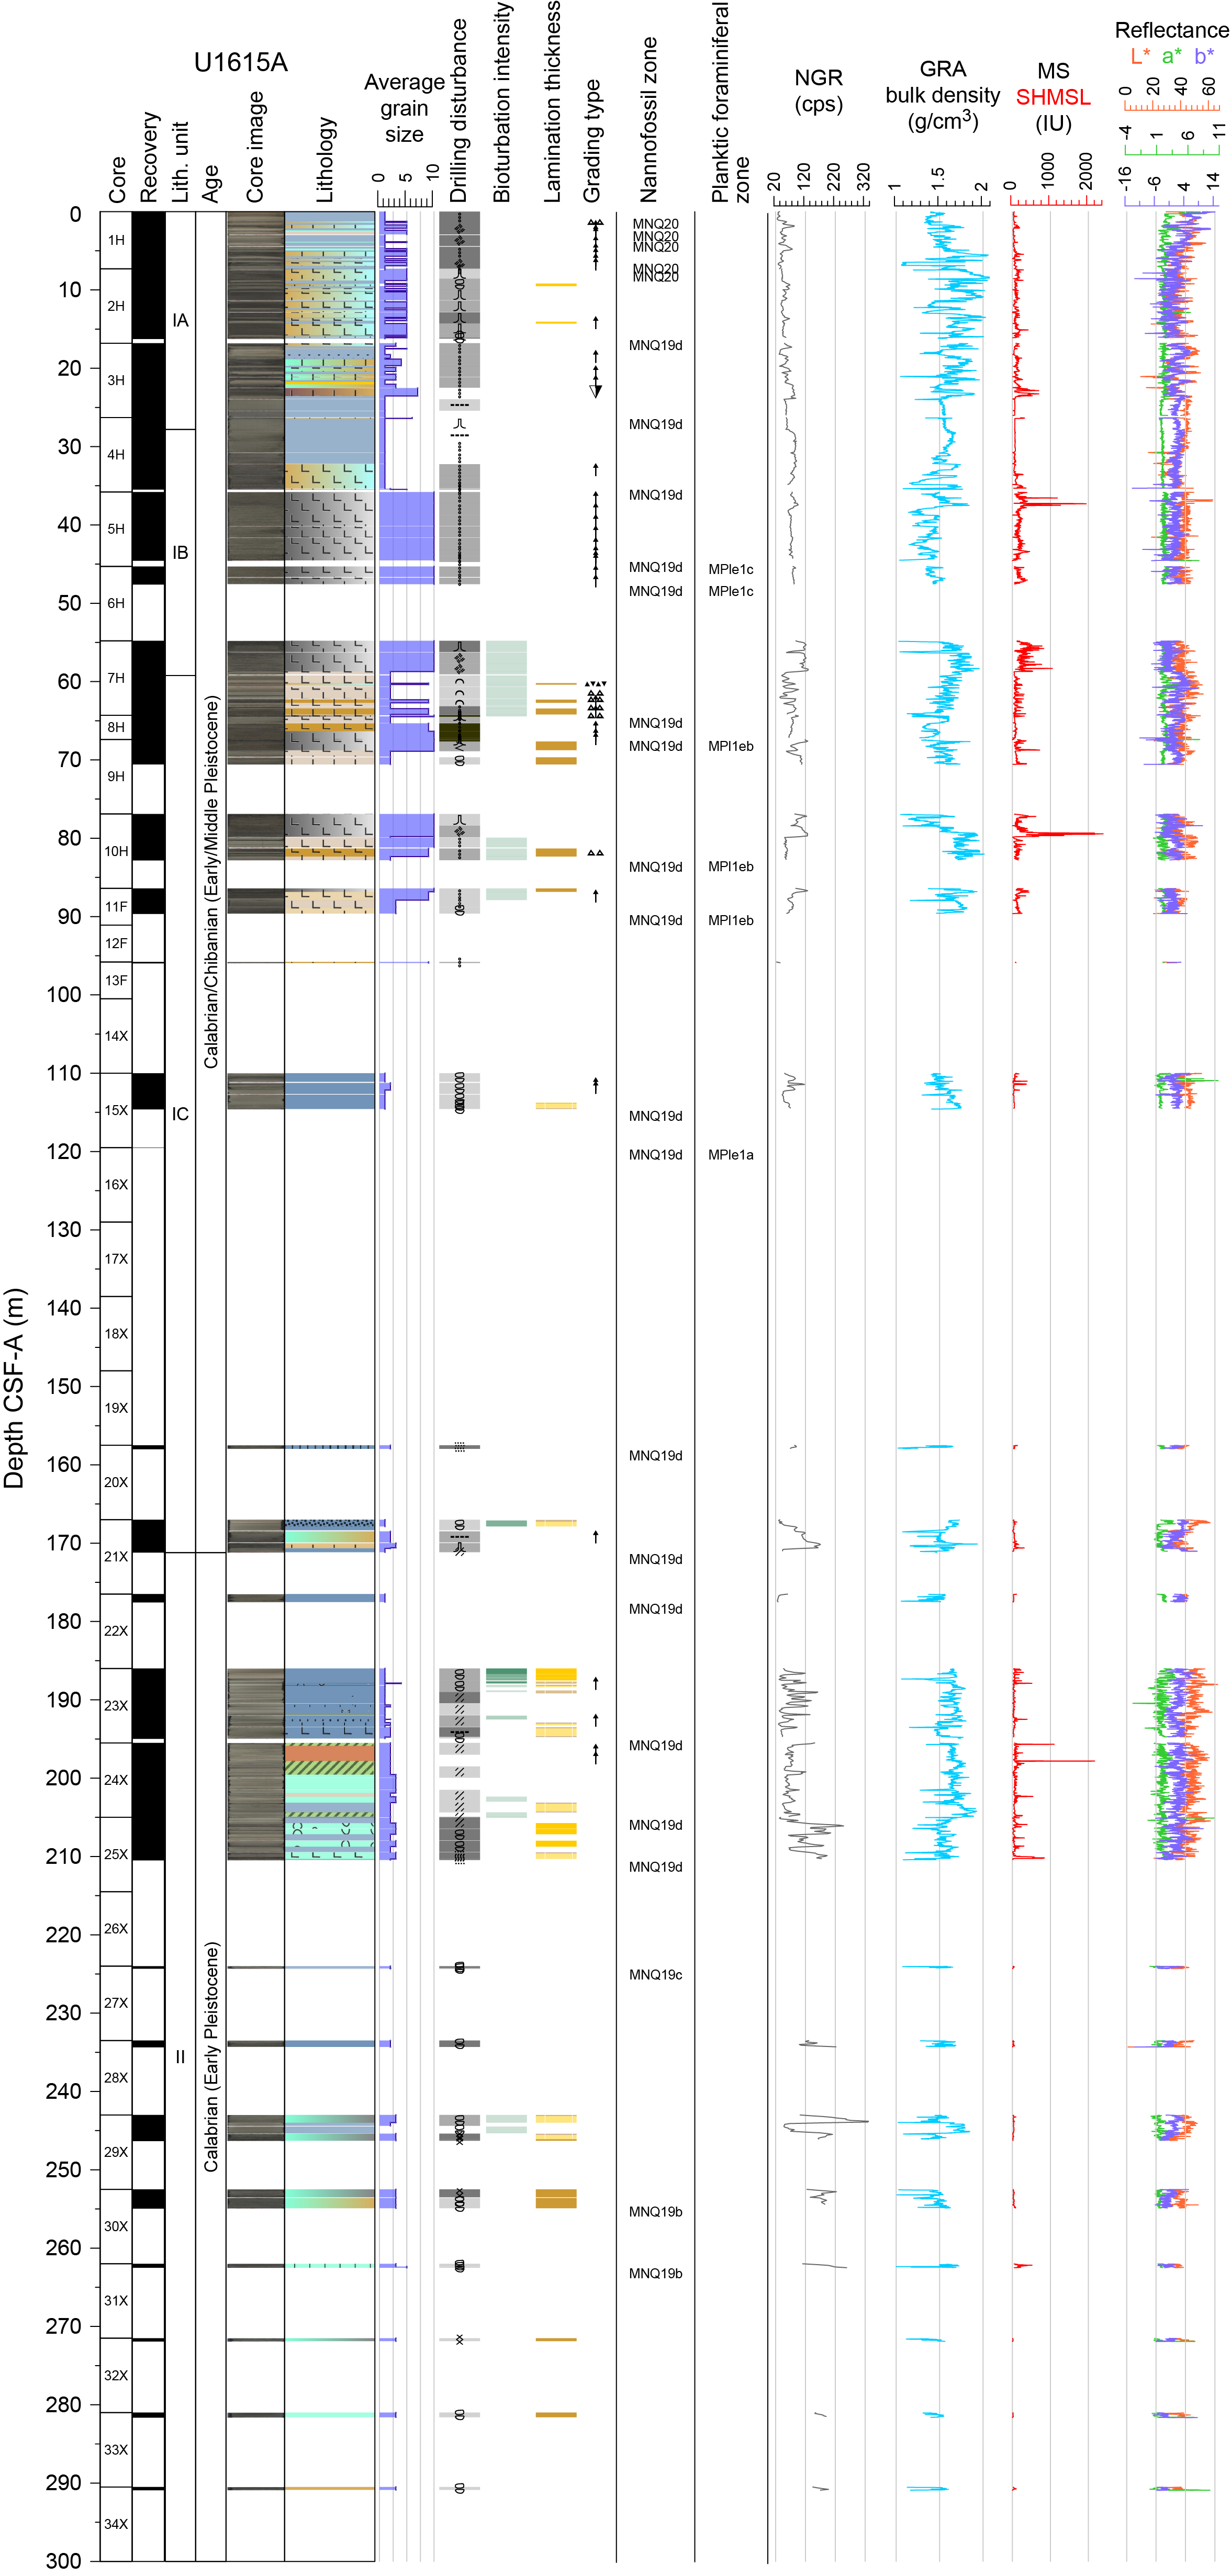
Figure F4. VCD.
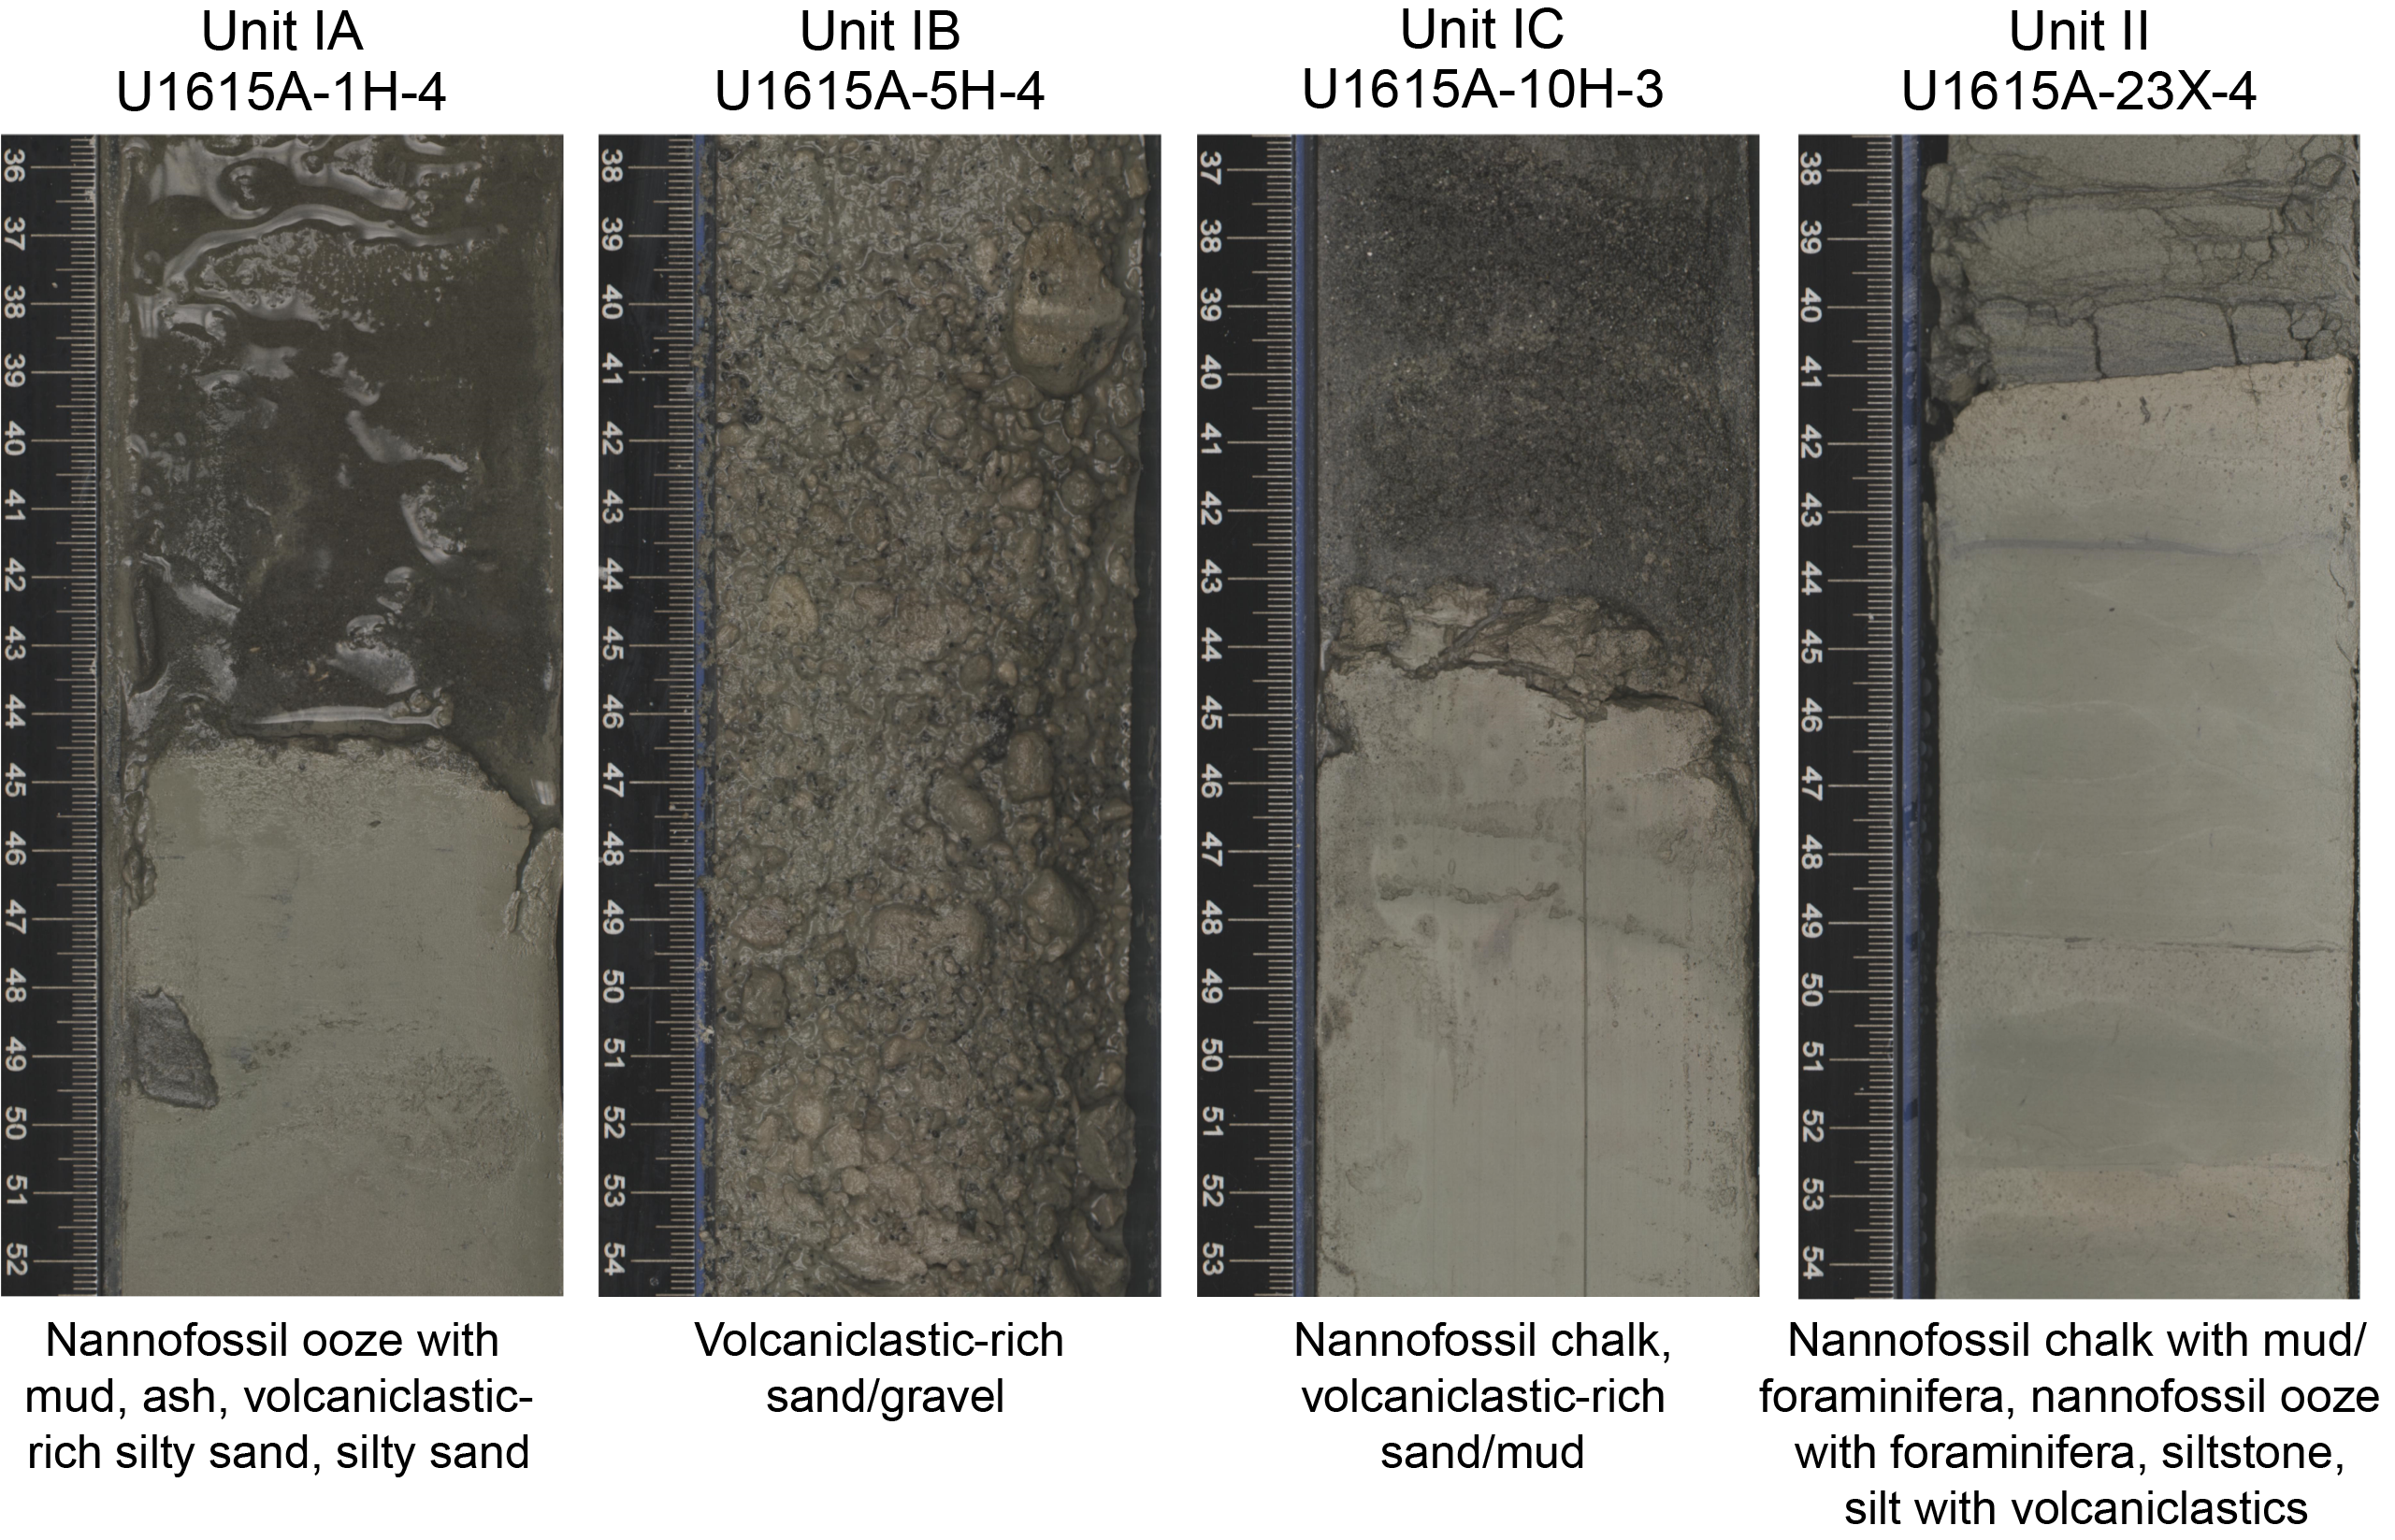
Figure F5. Main lithology core images.
Lithostratigraphic units were defined based on lithologic changes identified in visual core description (VCD) forms (Figure F4), smear slide observations (Figure F6), physical properties, and mineralogy as measured by X-ray diffraction (XRD). The observed lithologic differences are primarily the result of grain size variations and internal color changes (recognized by the Munsell color chart), reflecting major changes in mineralogical and/or biogenic components. XRD measurements mostly provided a way to evaluate the amount (and type) of calcite and quartz and were therefore described in Sediment and interstitial water geochemistry together with the carbonate (CARB) data.
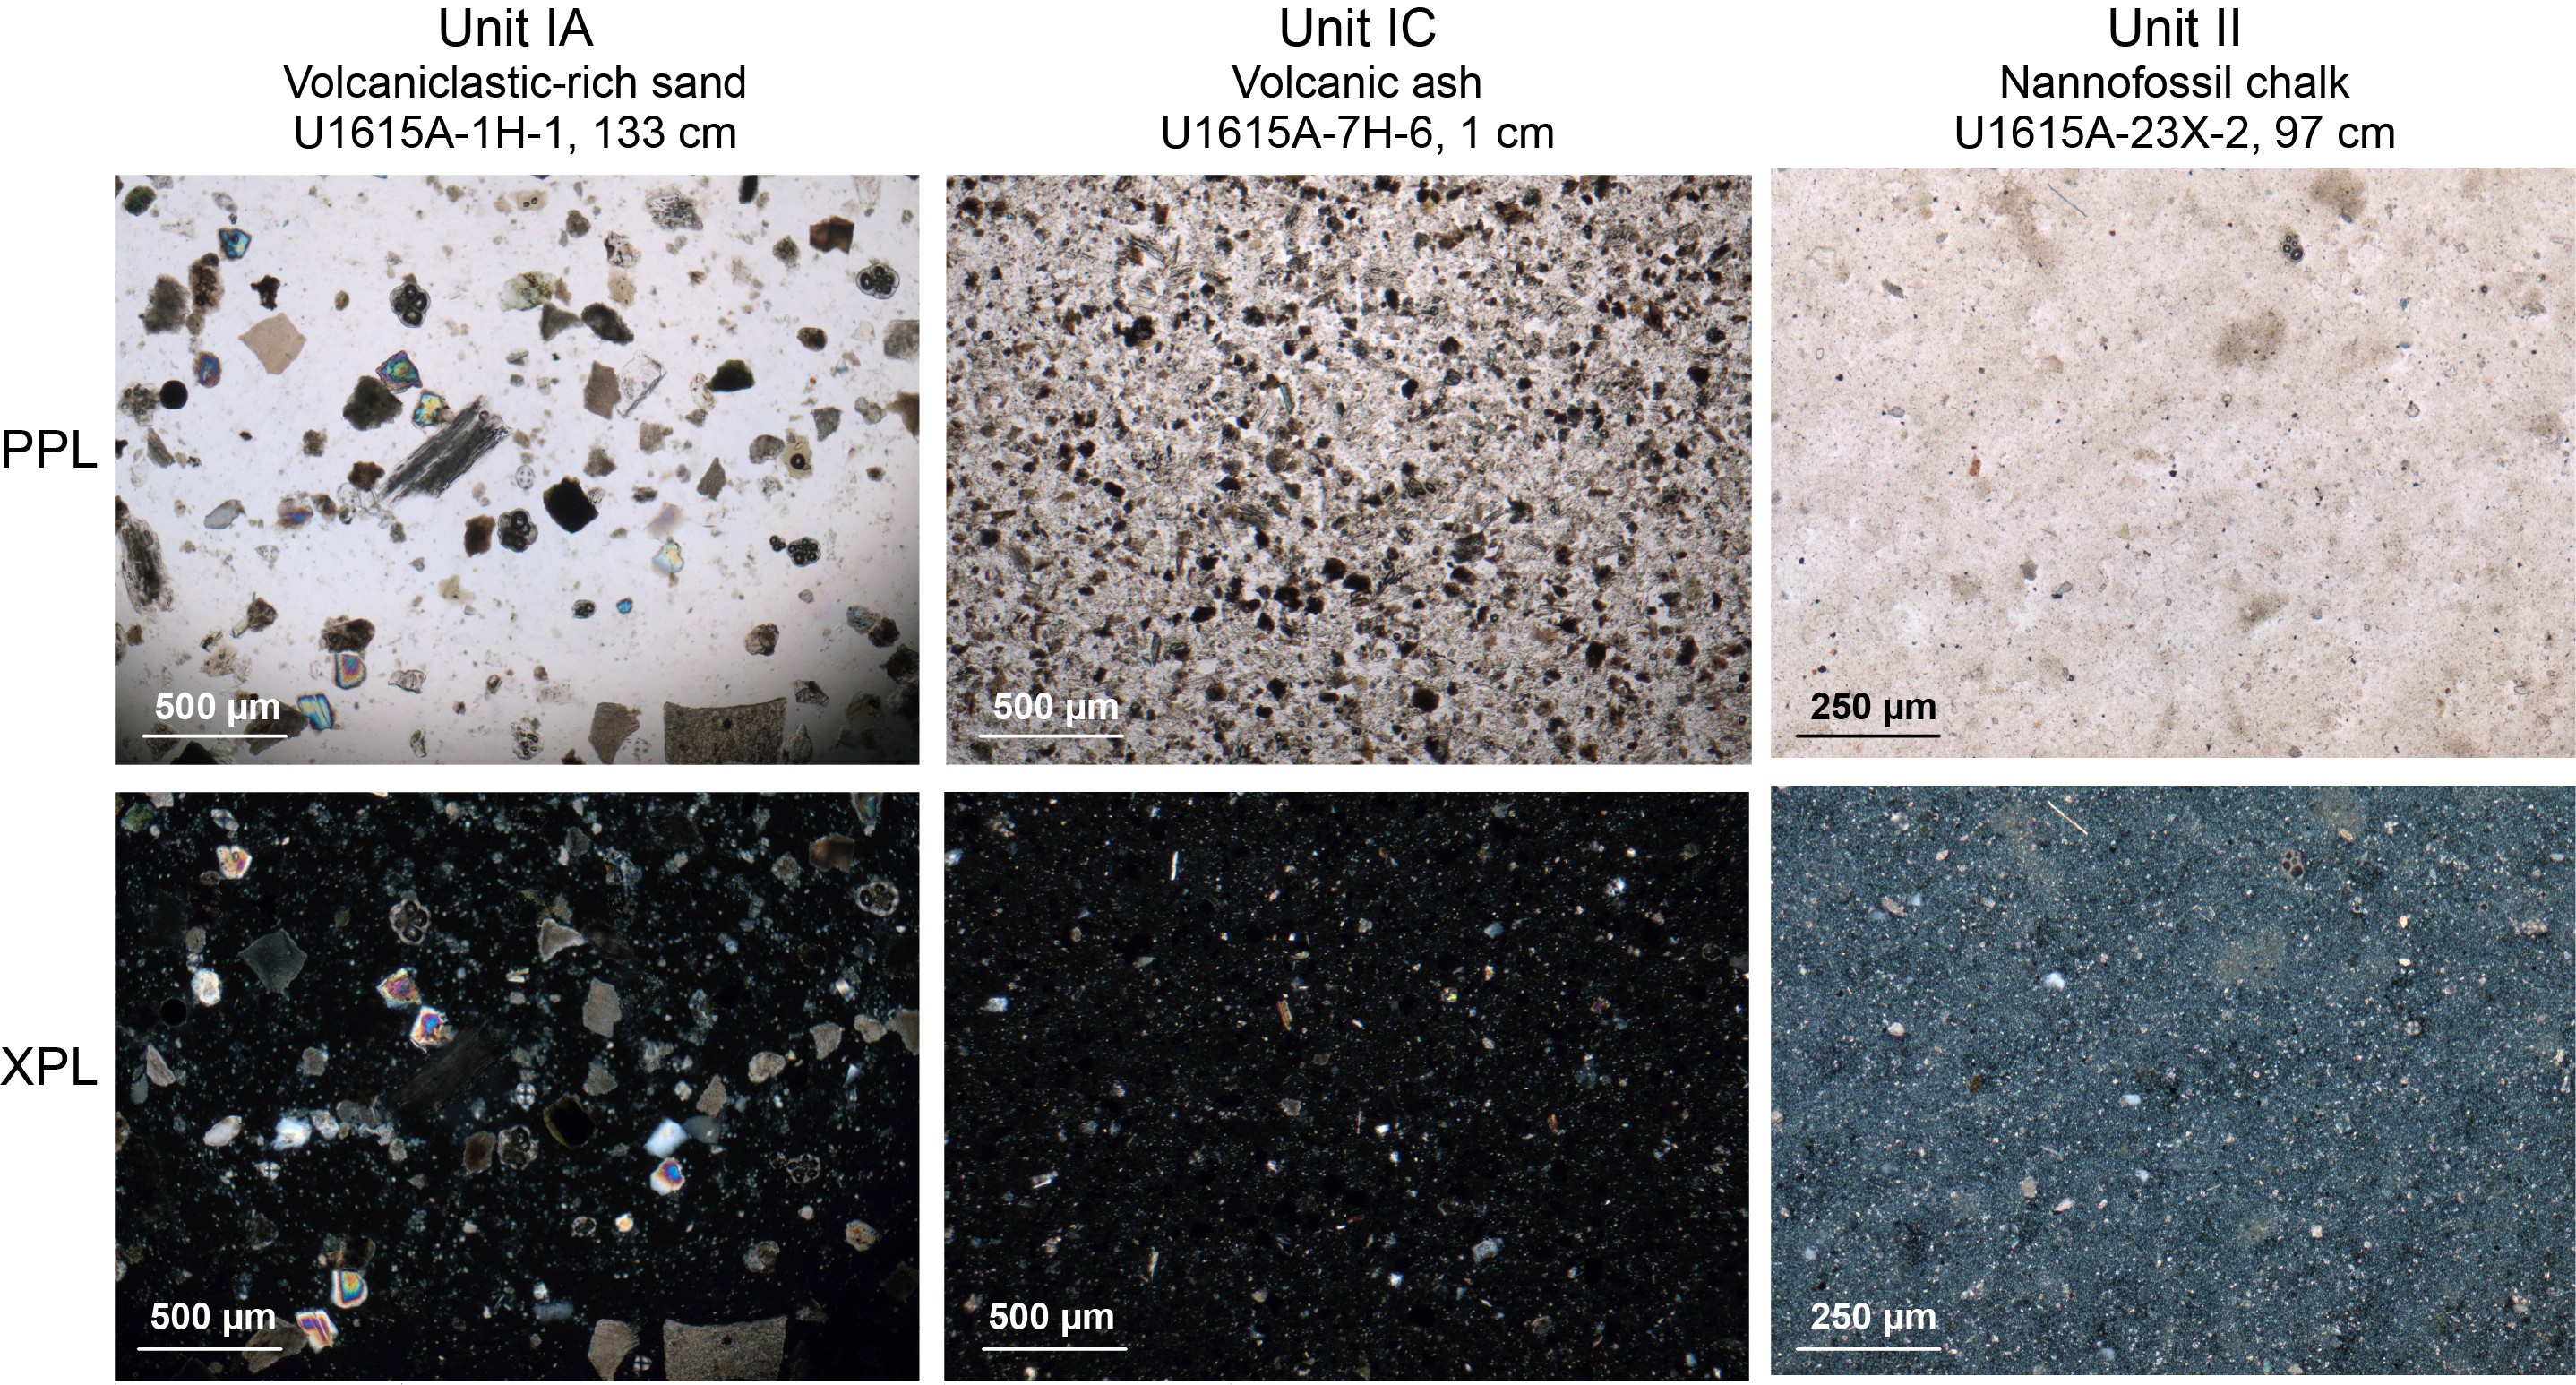
Figure F6. Main lithology smear slides.
3.1. Lithostratigraphic unit descriptions
3.1.1. Lithostratigraphic Unit I
3.1.1.1. Lithostratigraphic Subunit IA
- Interval: 402-U1615A-1H-1 through 4H-1
- Depth: 0–27.81 m CSF-A
- Age: Holocene to Middle/Early Pleistocene (present to Chibanian/Calabrian)
- Major lithologies: nannofossil ooze with mud, ash, volcaniclastic-rich silty sand, silty sand
Subunit IA consists of a mixture of dark gray to light olive-brown nannofossil ooze, volcaniclastic-rich silty sand, and silty sand (Figure F5). Some horizons in Core 402-U1615A-1H contain shell fragments. Pelagic sedimentation alternates with turbidite deposits rich in both volcaniclastic material (darker color) and bioclasts (shells and foraminifera; lighter color). Few ash layers and pumice clasts are present, and occasional wood remains are scattered throughout the turbidites.
3.1.1.2. Lithostratigraphic Subunit IB
- Interval: 402-U1615A-4H-2 through 7H-3
- Depth: 27.81–59.22 m CSF-A
- Age: Middle/Early Pleistocene (Chibanian/Calabrian)
- Major lithologies: volcaniclastic-rich sand, volcaniclastic-rich gravel
The major lithologies that make up Subunit IB are volcaniclastic-rich sand and volcaniclastic-rich gravel (Figure F5). There is an apparent fining-upward sequence through the subunit, but it is difficult to interpret how much of the grading is real as opposed to being produced by drilling disturbance. Many core intervals are soupy because of extensive drill fluid intrusion that likely reworked the sediments and redistributed material, possibly creating a false grading effect.
3.1.1.3. Lithostratigraphic Subunit IC
- Interval: 402-U1615A-7H-4 through 21X-CC
- Depth: 59.22–171.20 m CSF-A
- Age: Middle/Early Pleistocene (Chibanian/Calabrian)
- Major lithologies: nannofossil chalk, volcaniclastic-rich sand, volcaniclastic-rich mud
Throughout the top of Subunit IC (Cores 402-U1615A-8H through 11F) there are several occurrences of the volcaniclastic-rich gravel described in Subunit IB. This gravel is considered to have fallen from above during drilling rather than being in situ because it occurs only in the upper part of each core and lacks the mud matrix otherwise found in this subunit. Most of Subunit IC is otherwise composed of volcaniclastic-rich sands and muds (Figure F4) with some ash deposition observed in smear slide analysis (Figure F6). Pelagic sedimentation begins to dominate downhole of Core 15X with the occurrence of gray (5Y 5/1) consolidated nannofossil chalk with some volcanic and terrigenous material still present. Occasional pyrite clusters and color banding are also observed toward the base of this subunit. We observe a few dark gray layers of organic-rich material that may be classified as sapropel.
3.1.2. Lithostratigraphic Unit II
- Interval: 402-U1615A-22X-1 through 34X-CC
- Depth: 171.2–300.0 m CSF-A
- Age: Middle/Early Pleistocene (Chibanian/Calabrian)
- Major lithologies: nannofossil chalk with mud/foraminifera, nannofossil ooze with foraminifera, siltstone, silt with volcaniclastics
Pelagic sedimentation in the form of nannofossil chalk is dominant in Unit II, with alternating layers that are rich in mud, volcaniclastic material, or foraminifera. In Core 402-U1615A-24X, there is evidence of soft-sediment deformation mainly in the form of clast-supported polymictic conglomerate and slump deposits (Figure F7), which have a greenish gray (GLEY 1 5/10Y) coloration indicating the presence of glauconite. The remainder of the unit consists of alternating layers of light greenish gray silt (GLEY 1 7/10Y) and light brownish gray (2.5Y 6/2) mud with background sedimentation of pelagic nannofossil ooze. The silt layers are either rich in foraminifera or contain volcaniclastic material, and the muds are rich in calcareous nannofossils. The background pelagic sedimentation in the lower half of the unit is less consolidated and is described as a nannofossil ooze rather than chalk. This decrease in consolidation is reflected in the types of drilling disturbance observed, with horizontal cracking common at the top of the unit, whereas biscuiting is common toward the base. Bioturbation is sparse in this unit.
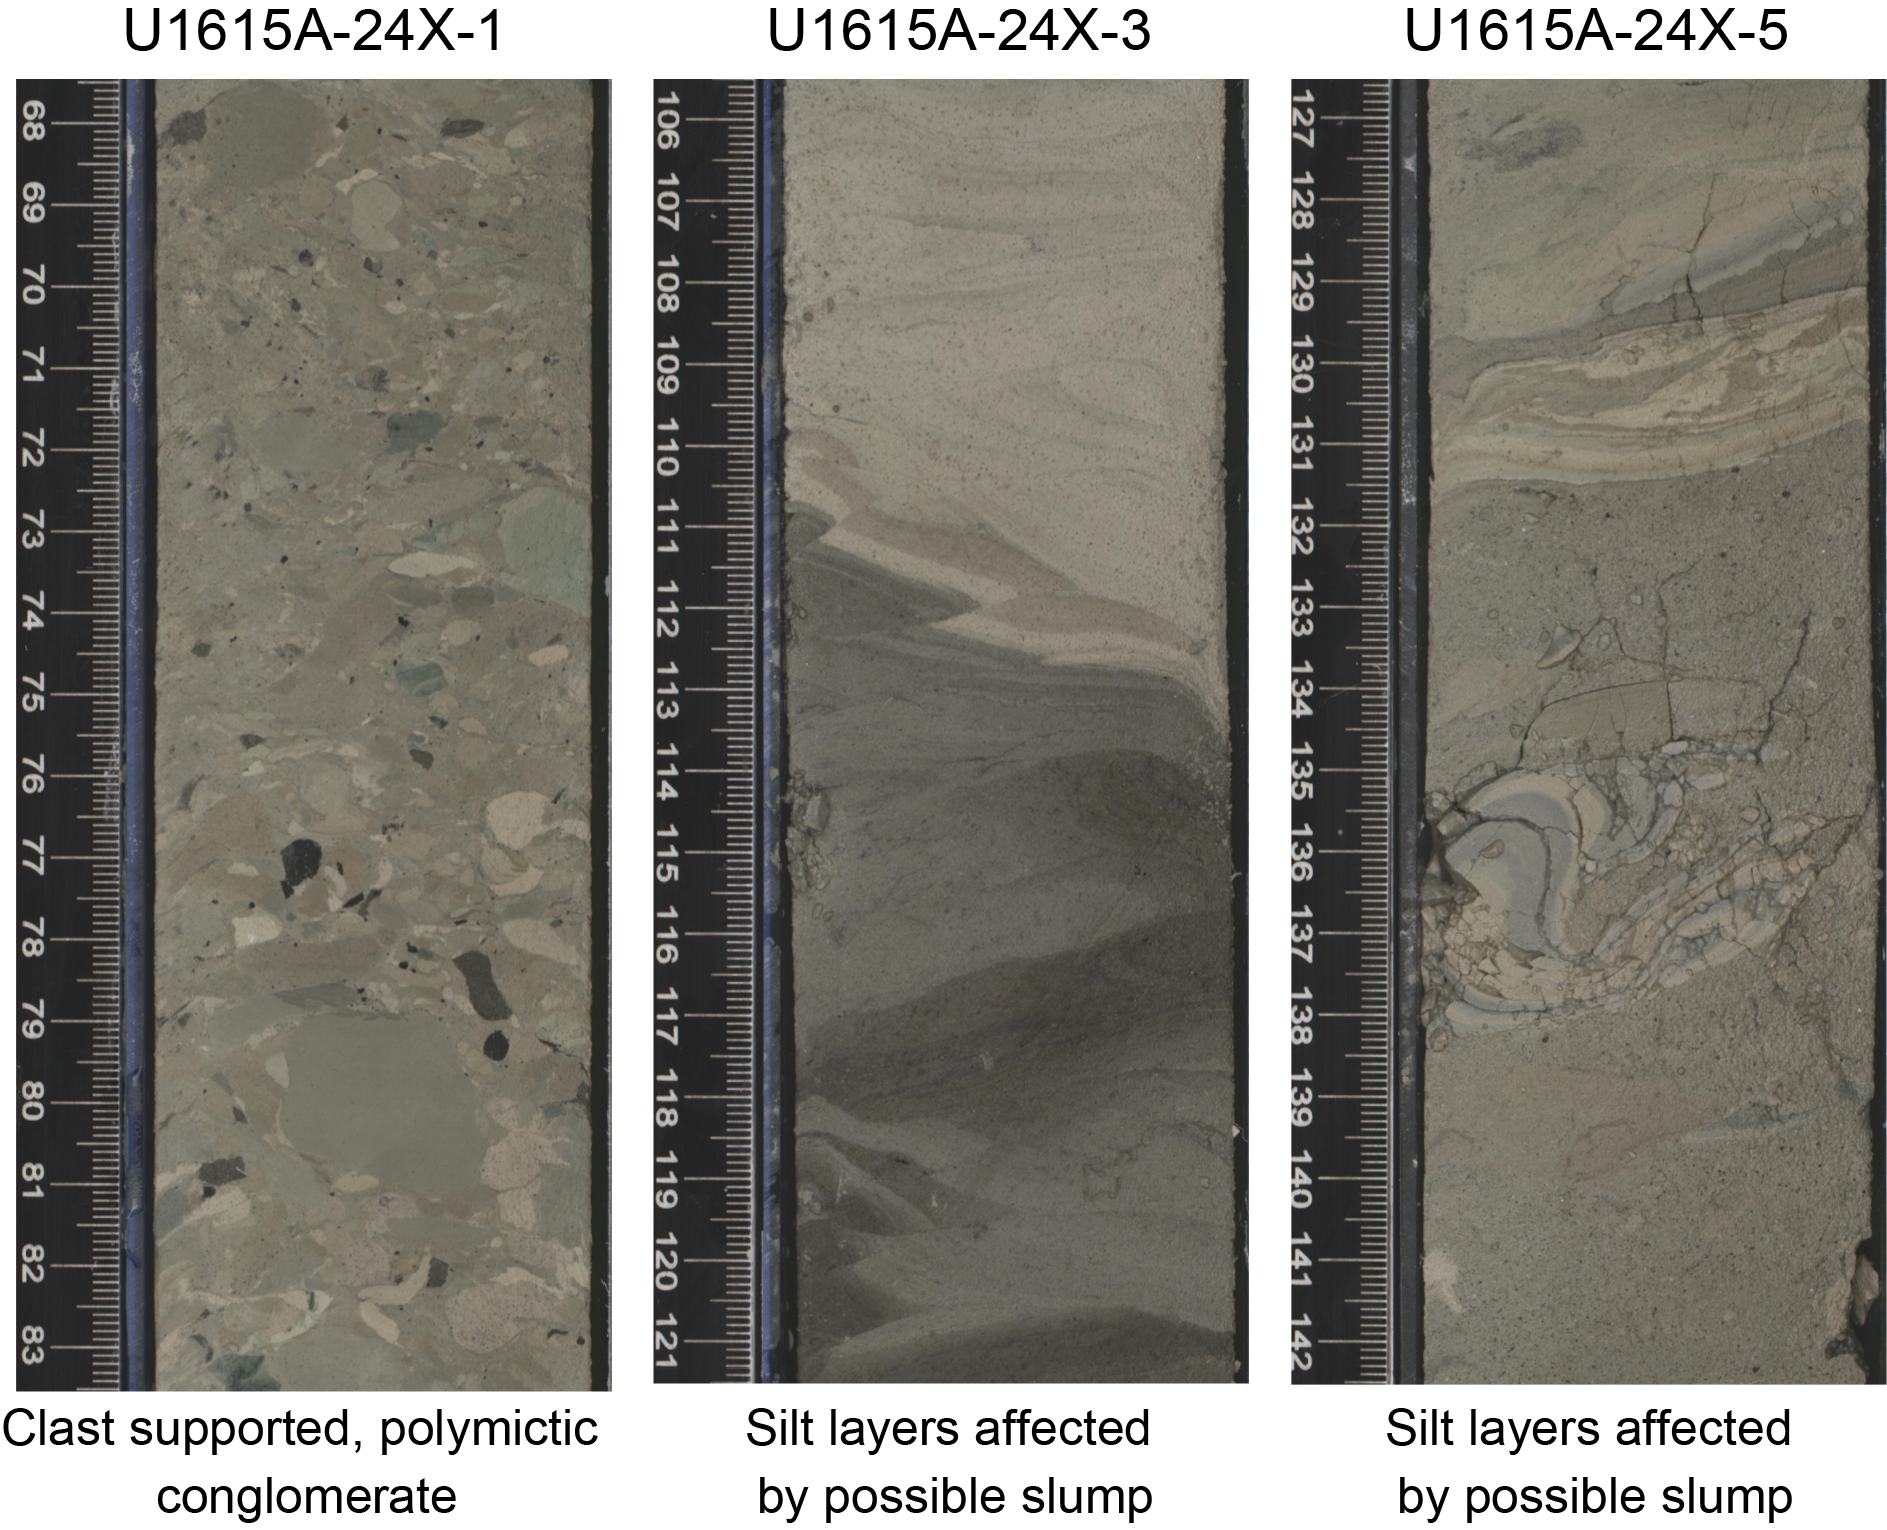
Figure F7. Soft-sediment deformation and evidence of mass transport deposits.
4. Biostratigraphy
Calcareous nannofossil and planktic foraminifera specimens extracted from core catcher samples were analyzed to develop a biostratigraphic framework for Site U1615. The sediment recovery in this hole was 38%. The age constraints and biozonal boundaries across the sedimentary successions were established by analyzing the semiquantitative data from very well preserved calcareous nannofossil and planktic foraminiferal assemblages. The Mediterranean biozonation schemes of Di Stefano et al. (2023) and Lirer et al. (2019) were used for this purpose.
4.1. Planktic foraminifera
4.1.1. Sedimentary compositions of collected samples
Sediment samples were collected primarily from core catchers from Sample 402-U1615A-1H-CC (7.44–7.49 meters below seafloor [mbsf]) to 34X-CC (290.87–290.92 mbsf). Some additional samples were selected to refine ages, particularly in cores where the core catcher sample was unlikely to contain abundant foraminifera. All samples were washed using a 63 µm sieve to remove clay and/or silt particles. The residues were dried, further sieved through a 125 µm sieve to filter out any juvenile microfossil species, and examined under the microscope. The extracted residues (>125 µm) from the samples contain dominantly volcaniclastic sedimentary particles and/or planktic foraminiferal assemblages within the few nannofossil ooze layers. Volcaniclastic sedimentary layers with a median grain size greater than 2 mm were widespread at this site and devoid of foraminifera. The remaining few nannofossil ooze layers contain moderately to well-preserved planktic foraminifera. Foraminiferal abundances were observed to be low compared to all other sites of Expedition 402. Benthic foraminifera, ostracod, and radiolarian species were also observed along with broken molluscan shell fragments. Although the taxonomy and abundance of these species were not recorded because of time constraints, their presence provides valuable information for future analysis.
Sedimentary intervals were dated from Early Pleistocene (Calabrian stage) to Holocene based on biohorizons of planktic foraminiferal events. Out of the total 27 samples collected, 18 yielded residues that mostly contain volcanogenic sediments dominated by particles such as pumice, scoria, and volcanic glass that reduced the microfossil content to a minimum level (Figure F8). Planktic foraminifera species are almost completely absent from these samples, except for a few intervals of poorly preserved Orbulina universa, Neogloboquadrina spp. (sin), Globoconella inflata, and Globigerina bulloides species with rare abundance. Because the individuals of these species occur in very low numbers (≤5) in intervals dominated by volcanogenic sediments, it is difficult to assign a biozone to these layers.
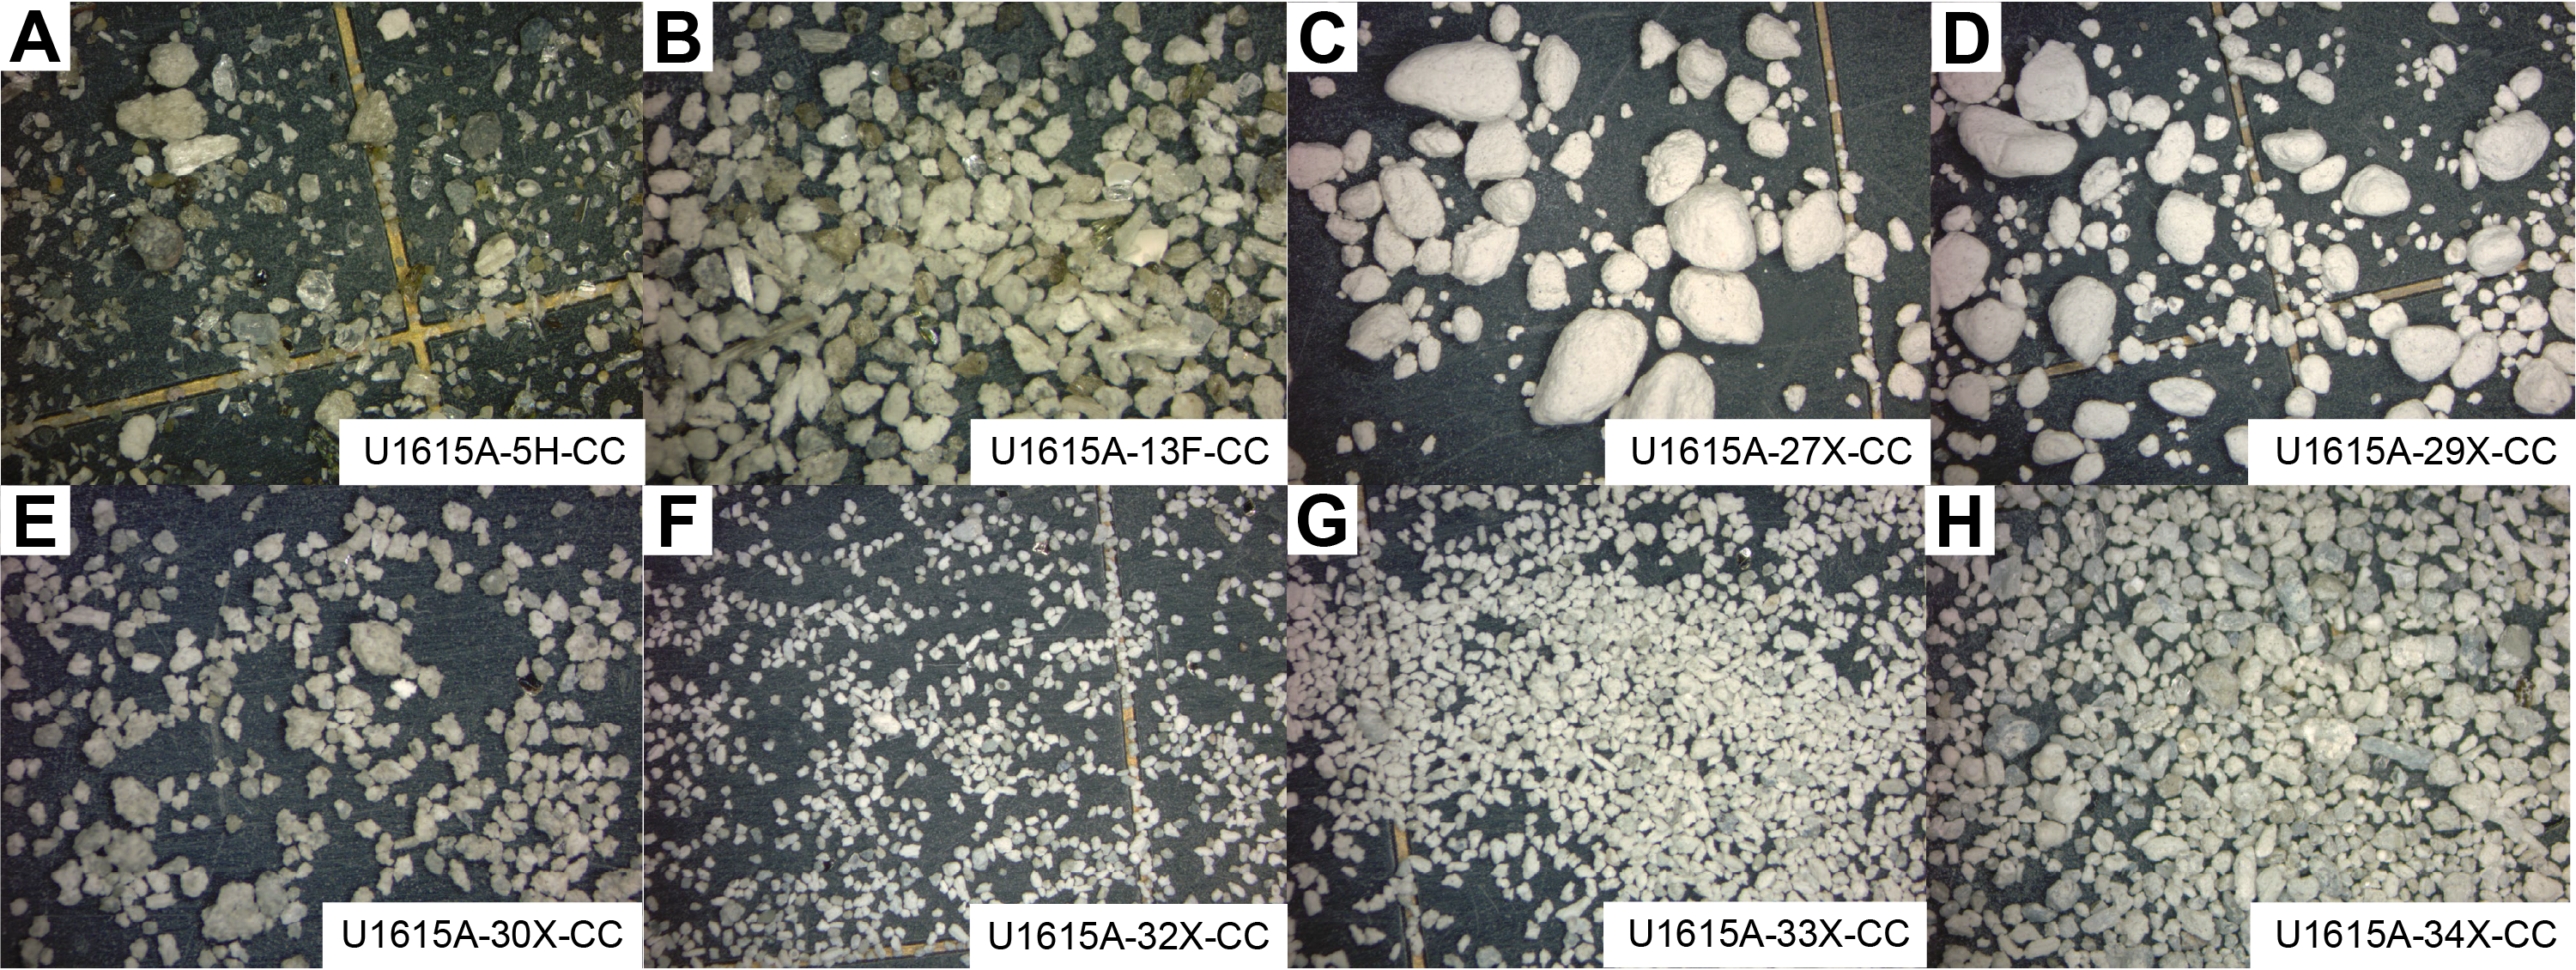
Figure F8. Sediments.
The remaining nine samples from nannofossil ooze intervals contain poorly to well-preserved planktic foraminifera species that were helpful in recognizing the biostratigraphic zonations at this site. However, we observe that foraminiferal marker events are not completely ordered in geologic time across the sedimentary succession. This suggests that this area may have undergone slumping of sediments along a slope, resulting in reworking of sediments and microfossil species.
4.1.1.1. Planktic foraminifera biozonation
Planktic foraminifera marker species were examined from samples collected in Hole U1615A, and biozones were assigned according to the biozonation scheme described in Lirer et al. (2019) (Table T2).
The planktic foraminifera fauna between Samples 402-U1615A-1H-CC (7.44–7.49 mbsf) and 34X-CC (290.87–290.92 mbsf) is typical of the Mediterranean biostratigraphic MPle2b–base MPle1a zones and consists mainly of G. bulloides, Globigerinoides obliquus, O. universa, G. inflata, Globigerinoides ruber var. white, Globigerinella calida, Globorotalia scitula, Globorotalia excelsa, Globorotalia crassaformis, Neogloboquadrina spp. (sin), Neogloboquadrina incompta, and Turborotalia quinqueloba (Figures F9, F10, F11).
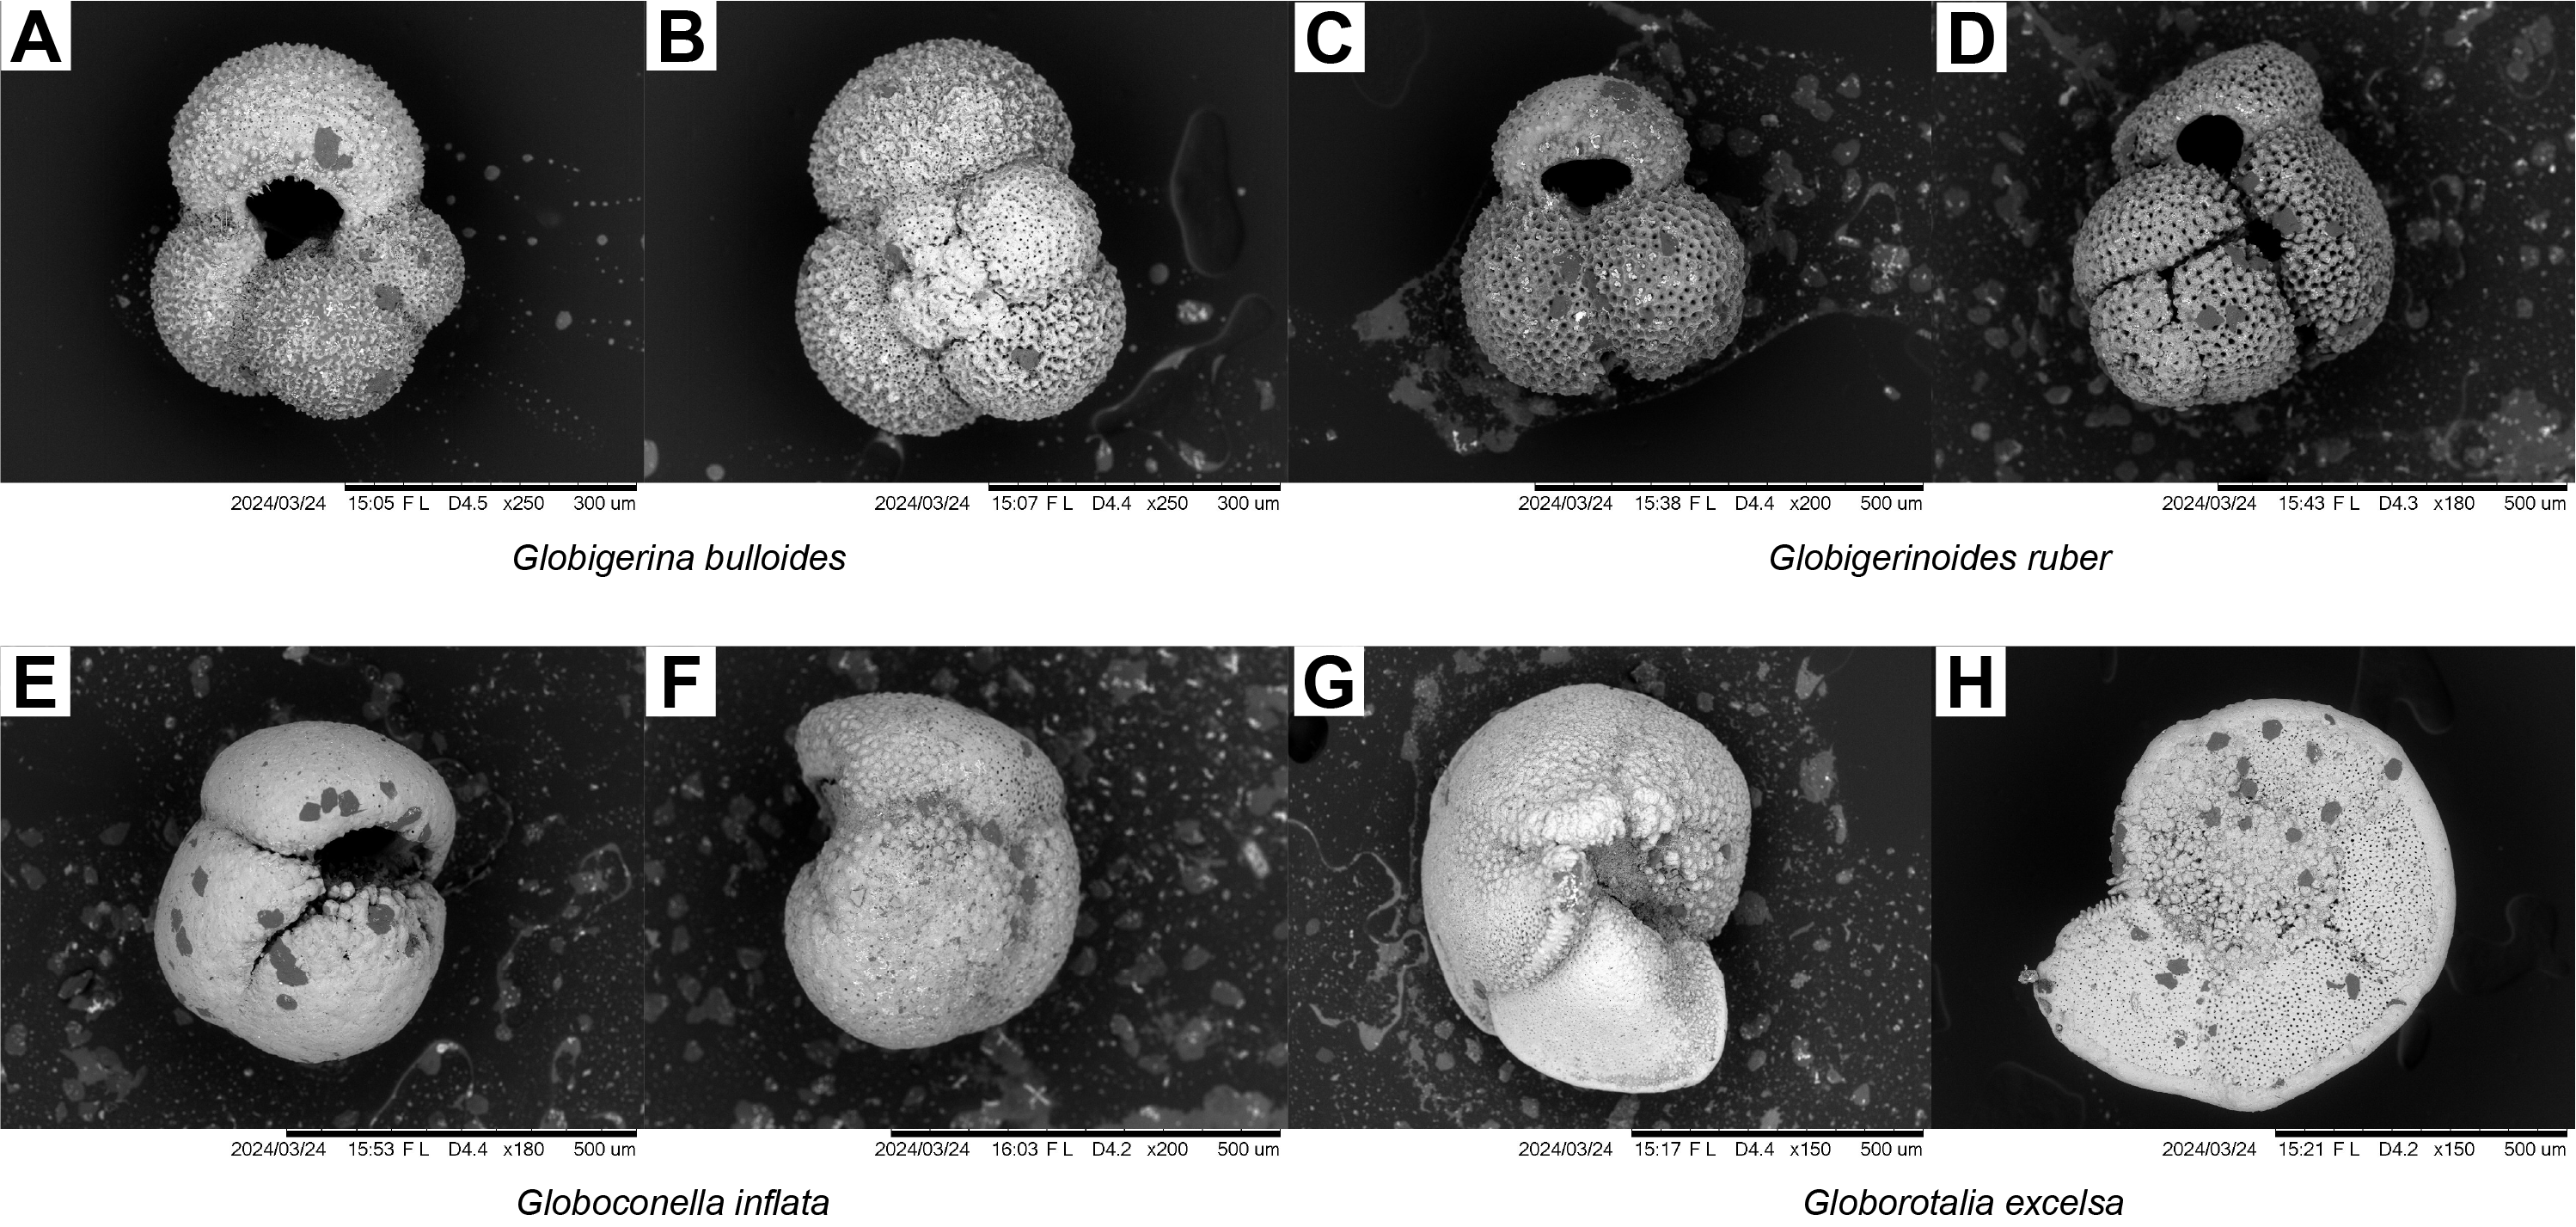
Figure F9. Planktic foraminifera.
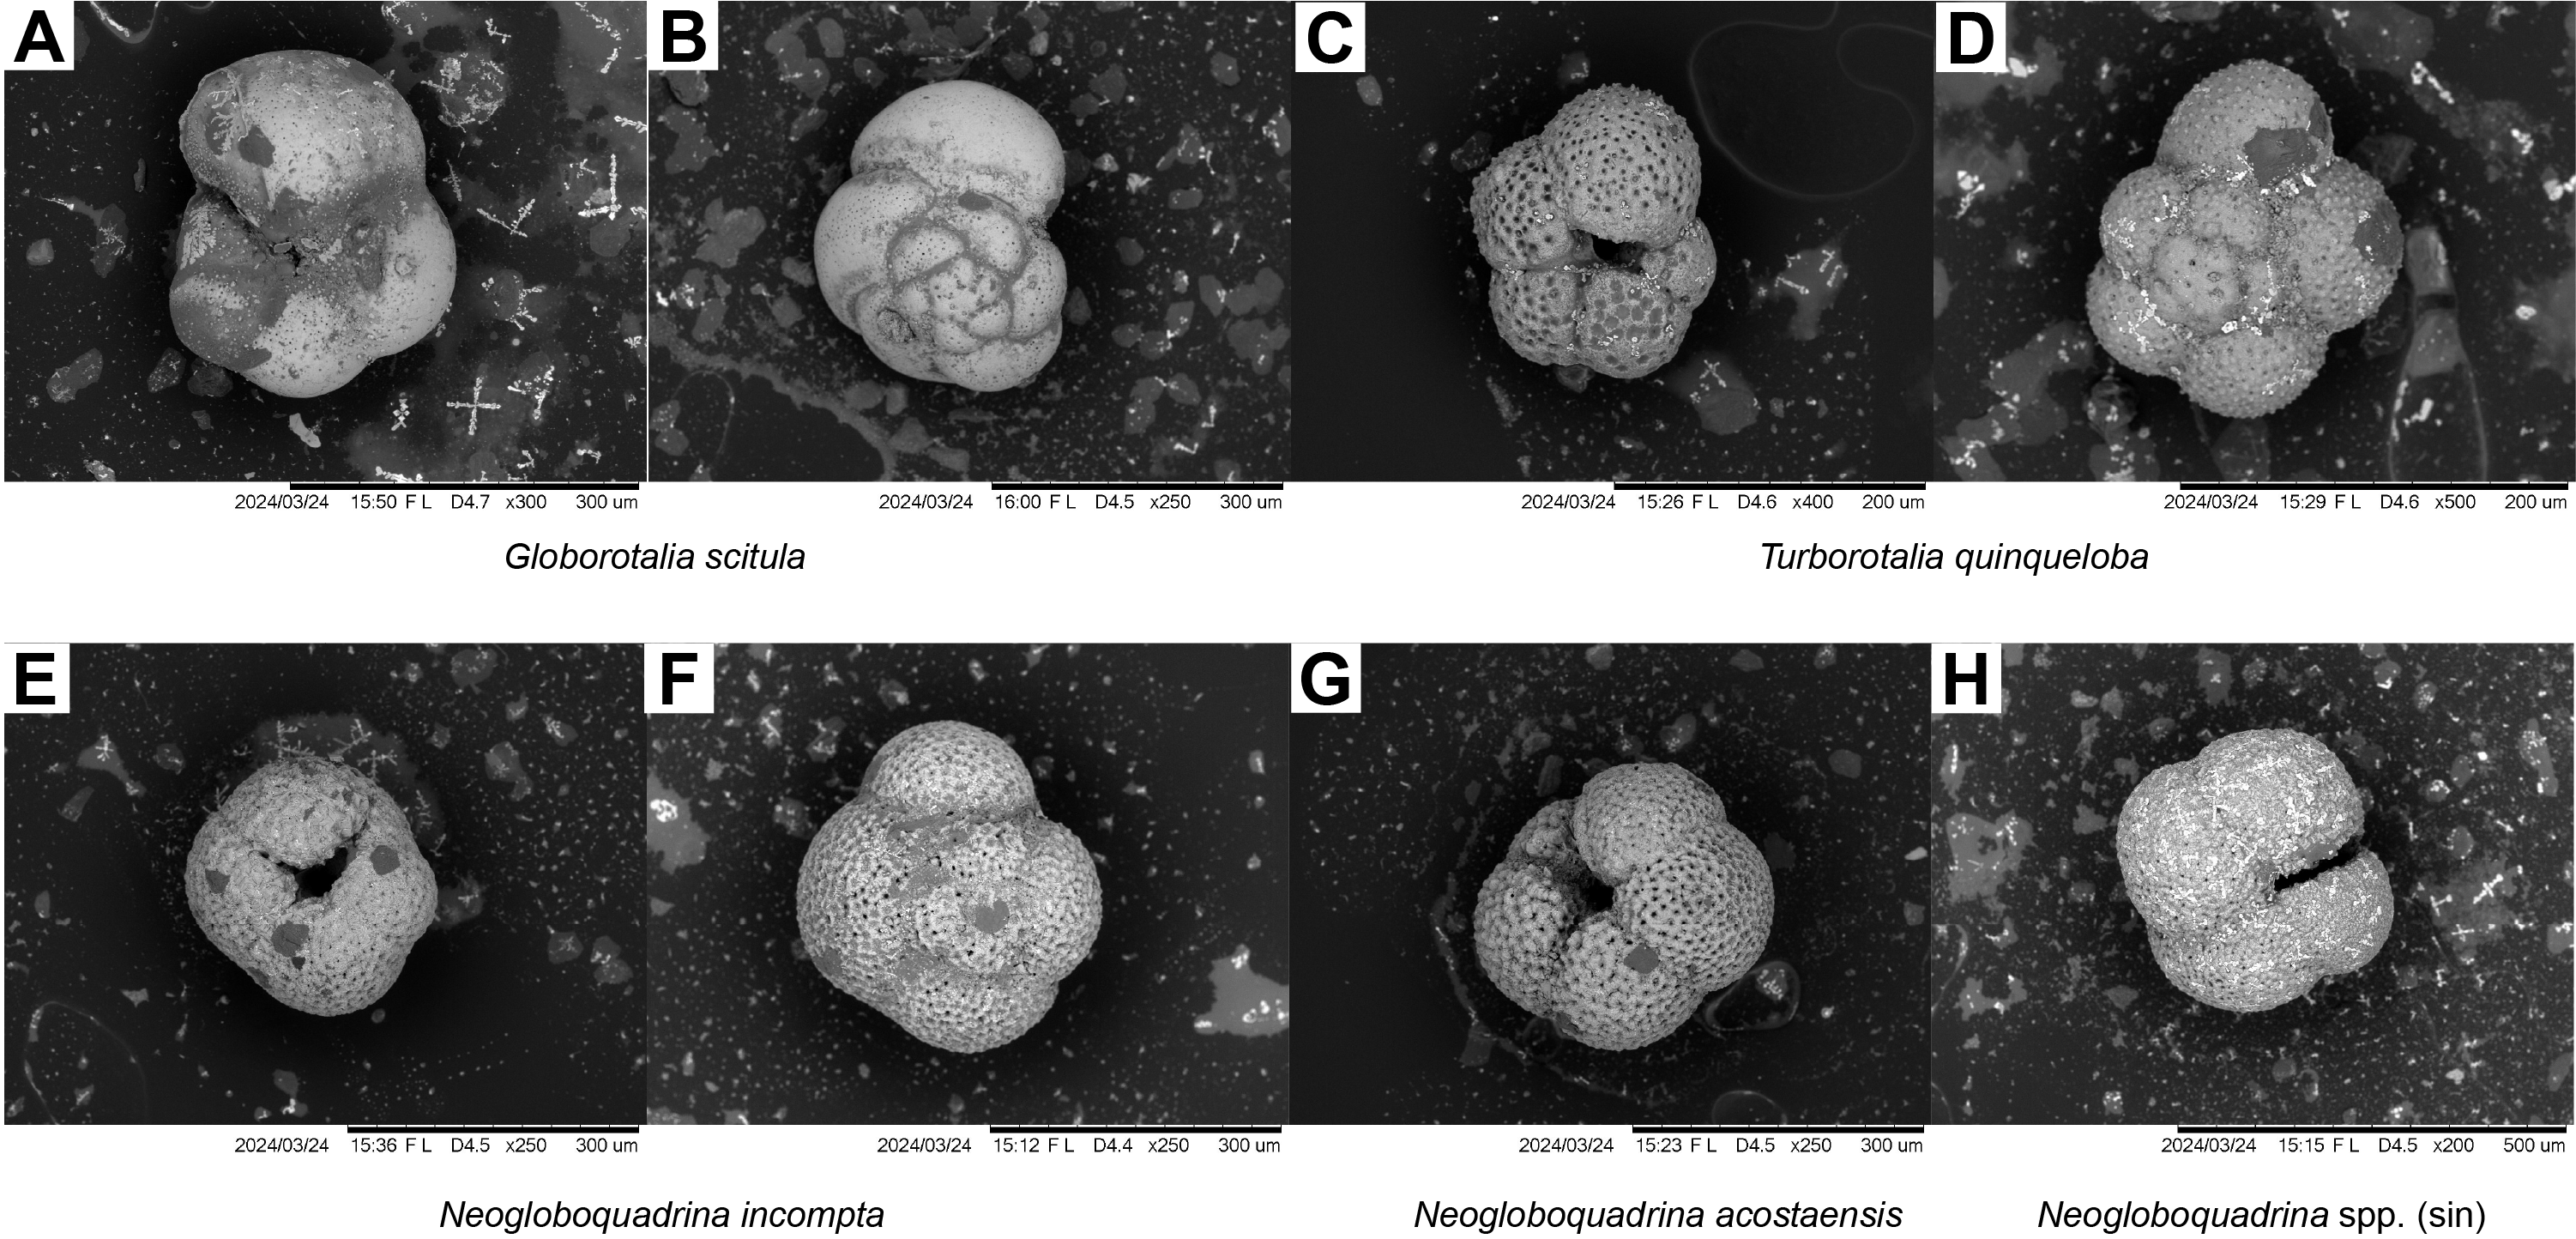
Figure F10. Planktic foraminifera.
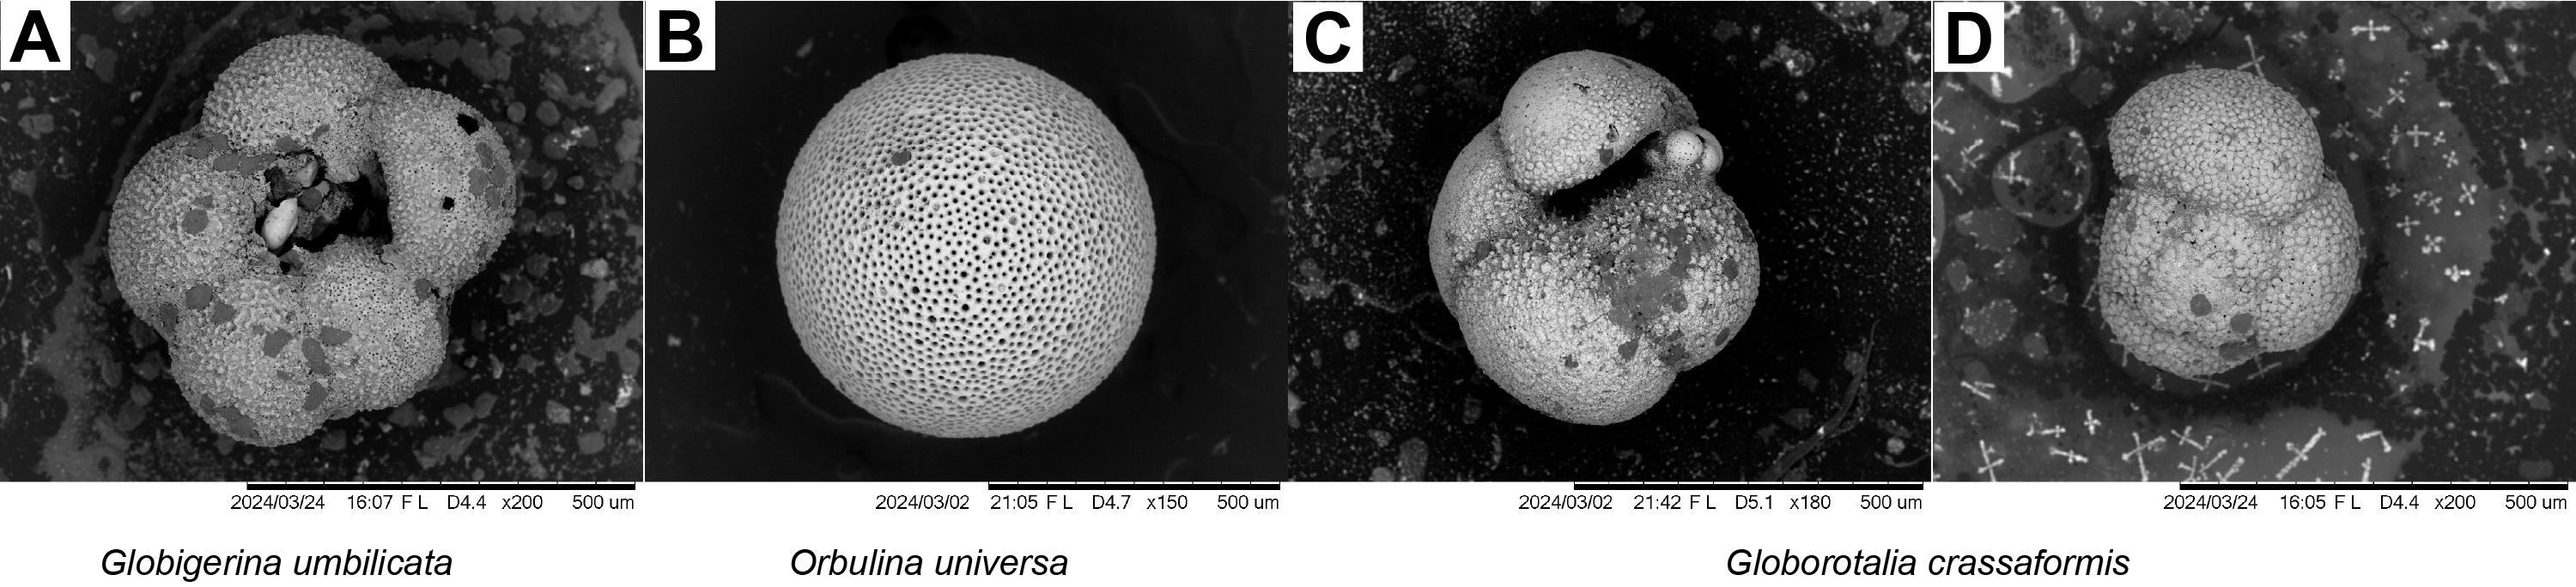
Figure F11. Planktic foraminifera.
Biozones were delineated based on the faunal succession of marker species as defined below.
4.1.1.1.1. Zone MPle2b
Samples 402-U1615A-1H-CC (7.44–7.49 mbsf) to 3H-CC (26.24–26.29 mbsf) were assigned to the MPle2b biozone based on the common occurrence of G. calida and the common Late Neogene O. universa (Figure F11), G. bulloides (Figure F9), and G. scitula (Figure F10).
4.1.1.1.2. Zone MPle2a
Samples 402-U1615A-4H-CC (35.32–35.37 mbsf) to 13F-CC (95.92–95.97 mbsf) contain prominent volcaniclastic sediments. However, Samples 5H-CC (44.76–44.81 mbsf) to 7H-CC (64.44–64.49 mbsf) contain few planktic foraminifera marker events associated with paracme top (~0.51 Ma) and paracme base (~0.91 Ma) occurrences of Neogloboquadrina spp. (sin) (Figure F10) species. These layers are therefore assigned to the MPle2a biozone. The sedimentary layers below, between Samples 8H-CC (67.38–67.43 mbsf) and 13F-CC (95.92–95.97 mbsf), were full of volcaniclastic sediments, barren of any marker species, and are therefore not assigned to any biozone.
4.1.1.1.3. Zone MPle1b
Samples 402-U1615A-15X-CC (114.57–114.62 mbsf) and 16X-CC (119.5–119.52 mbsf) were assigned to the MPle1b zone based on the last occurrence (~1.28 Ma) of G. obliquus and common occurrences of G. ruber var. white, Neogloboquadrina spp. (sin), G. inflata (Figure F9), and G. crassaformis (Figure F11) species.
No core catcher samples were collected in Cores 402-U1615A-17X through 19X. Samples 20X-CC (157.95–158 mbsf) to 22X-CC (177.51–177.56 mbsf) were full of volcaniclastic sediments and barren of planktic foraminifera marker species. Therefore, these layers were not assigned to any biozone.
4.1.1.1.4. Zone MPle1a
Samples 402-U1615A-23X-CC (194.93–194.98 mbsf) and 24X-CC (205.07–205.12 mbsf) were assigned to the MPle1a zone based on the abundant presence (50–100 individuals) of Neogloboquadrina spp. (sin) species (~1.79 Ma), common G. inflata and G. crassaformis, and few (<10 individuals) G. ruber var. white (Figure F9) species.
Sections 402-U1615A-25X-CC (210.44–210.49 mbsf) through 34X-CC (290.87–290.92 mbsf) were full of volcaniclastic sedimentary particles, barren of planktic foraminifera species, and were therefore not assigned to any biozones.
4.2. Calcareous nannofossils
A total of 25 core catcher samples from Hole U1615A were analyzed for calcareous nannofossils.
According to nannofossil data, sediments younger than 0.26 Ma are missing in Hole U1615A. Sample 1H-CC was assigned to the Middle Pleistocene (Chibanian) MNQ20 biozone (0.26–0.46 Ma) based on the presence of abundant nannofossil assemblage consisting mainly of small- and medium-sized Gephyrocapsa, Helicosphaera carteri, Helicosphaera inversa, Calcidiscus leptoporus, Coccolithus pelagicus, Coronosphaera spp., and Syracosphaera pulchra.
The approximately 210 m thick interval from Samples 402-U1615A-2H-CC to 24H-CC was assigned to the Lower–Middle Pleistocene (Calabrian–Chibanian) MNQ19d subzone (0.46–0.96 Ma) based on the presence of small- and medium-sized Gephyrocapsa, H. carteri, H. inversa, C. leptoporus, C. pelagicus, Coronosphaera spp., S. pulchra, Pseudoemiliania lacunosa, and Gephyrocapsa omega, the last basal marker of the biozone. This part of the section, as mentioned above, is characterized by a large amount of volcaniclastic material (e.g., Cores 12H–14H and 17H–19H), where nannofossils were absent.
Samples from the lower part of the sedimentary section, especially between Samples 402-U1615A-16X-CC and 34X-CC, contain mixed nannofossil assemblages where taxa from older intervals are found together with younger ones. The oldest reliable sample examined at Site U1615 (402-U1615A-30X-CC) was assigned to the Lower Pleistocene (Calabrian) MNQ19b biozone (1.24–1.61 Ma) because of the presence of the marker large-sized Gephyrocapsa.
The very high sedimentation rate that characterizes the succession, together with the presence of mixed microfossil assemblage, indicate episodes of sedimentary mass transport and make the succession unsuitable for further biostratigraphic studies.
5. Paleomagnetism
5.1. Paleomagnetic results
Paleomagnetic analysis was conducted on 24 cores recovered from Hole U1615A using the APC/XCB system, including 9 HLAPC cores. Cores and sections containing coarse volcaniclastic gravel (see Lithostratigraphy) were omitted from the measurements because of their unconsolidated nature and erratic paleomagnetic behavior. Natural remanent magnetization (NRM) was measured at 2 cm intervals on section halves before and after demagnetization at 5, 10, 15, and 20 mT peak alternating field (AF). Sediment archive halves all showed normal polarity behavior at the expected geocentric axial dipole (GAD) field value (Ic_GAD = 59.21°) (Figure F12) at the latitude for this site (40°11.0430′N) with little variation between NRM and NRM@20mT.
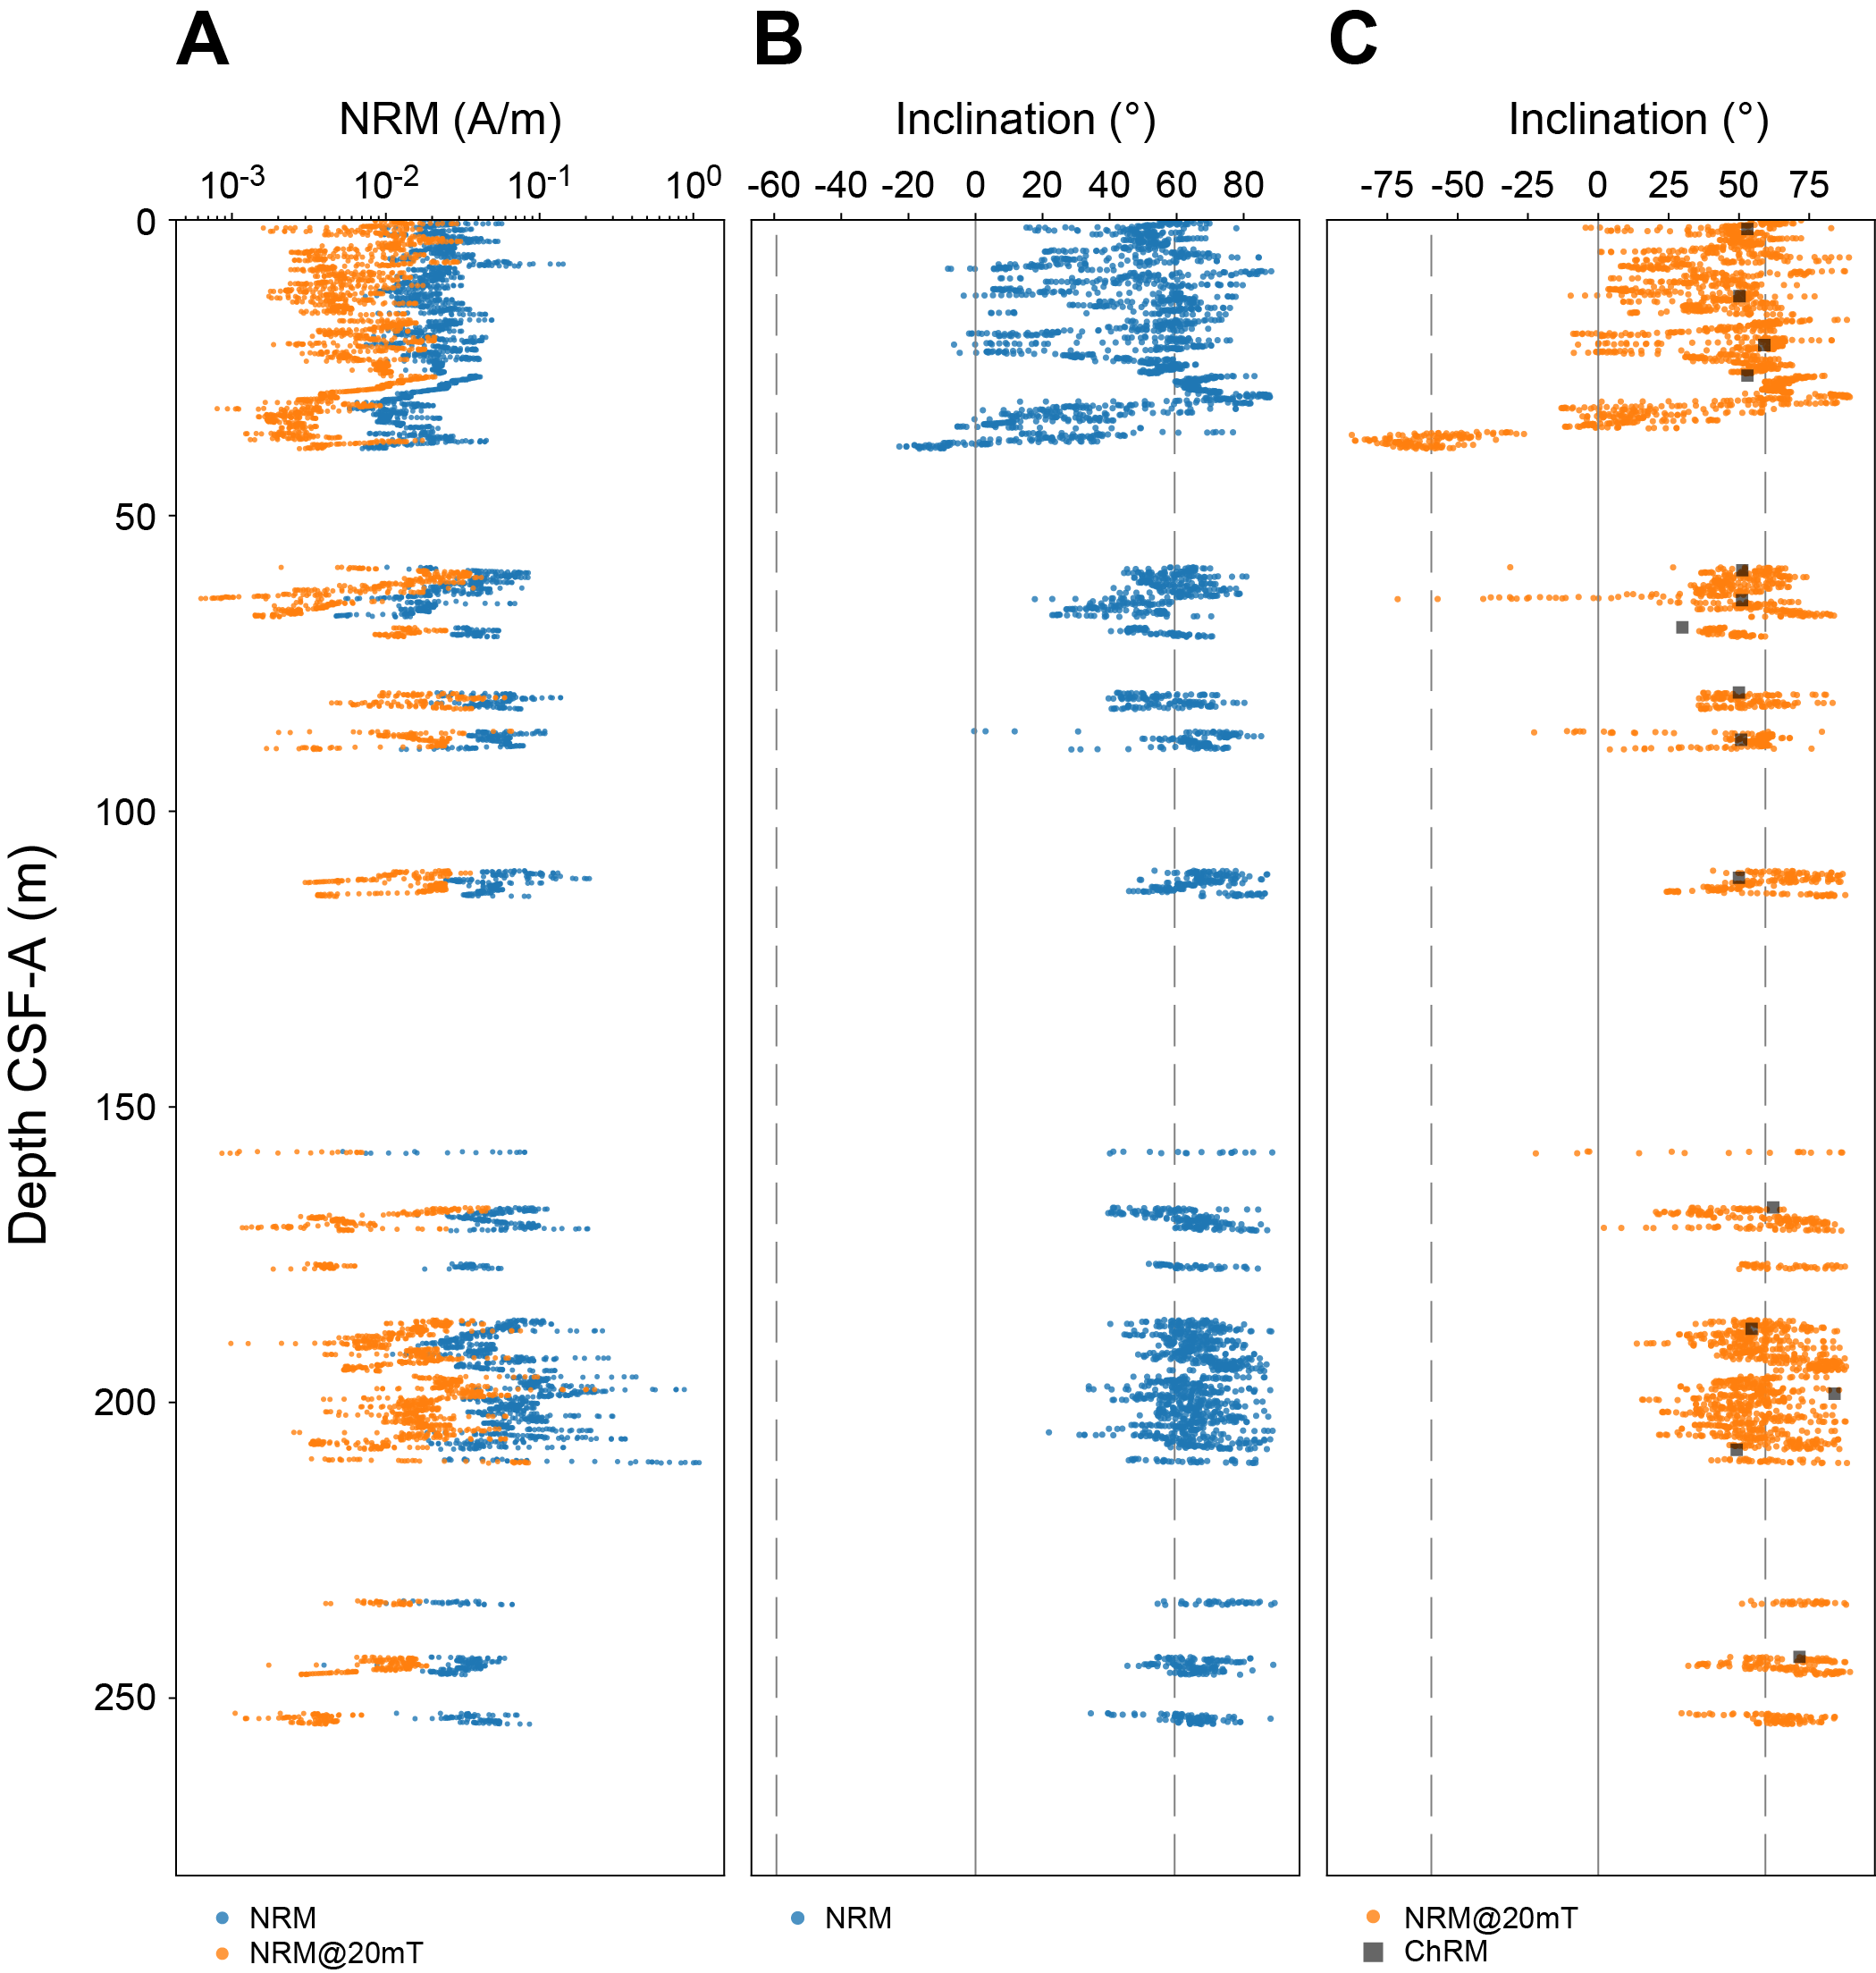
Figure F12. NRM variation.
A total of 17 discrete cube samples were subjected to AF demagnetization up to 120 mT peak AF to evaluate NRM data obtained from archive-half sections. Principal component analysis of demagnetization steps from 20 to 60 mT was used to define the characteristic remanent magnetization (ChRM) (Kirschvink, 1980). The associated maximum angular deviation indicates the quality of the ChRM; all but two cores (associated with volcaniclastic rich mud; Cores 402-U1615A-9H [~67.4–76.9 m CSF-A] and 24X [~195.5–205.0 m CSF-A]) at this site show the expected inclination for this latitude along with a maximum angular deviation of <13 (average ChRM = 54°; average maximum angular deviation = 5.4°). Anisotropy of magnetic susceptibility (AMS) results show that minimum principal axes of AMS ellipsoids are well clustered without a preferred orientation (Figure F13), indicating a flattened sedimentary fabric (Tauxe, 2010) and minimal sediment and drilled deformation (Rosenbaum et al., 2000).
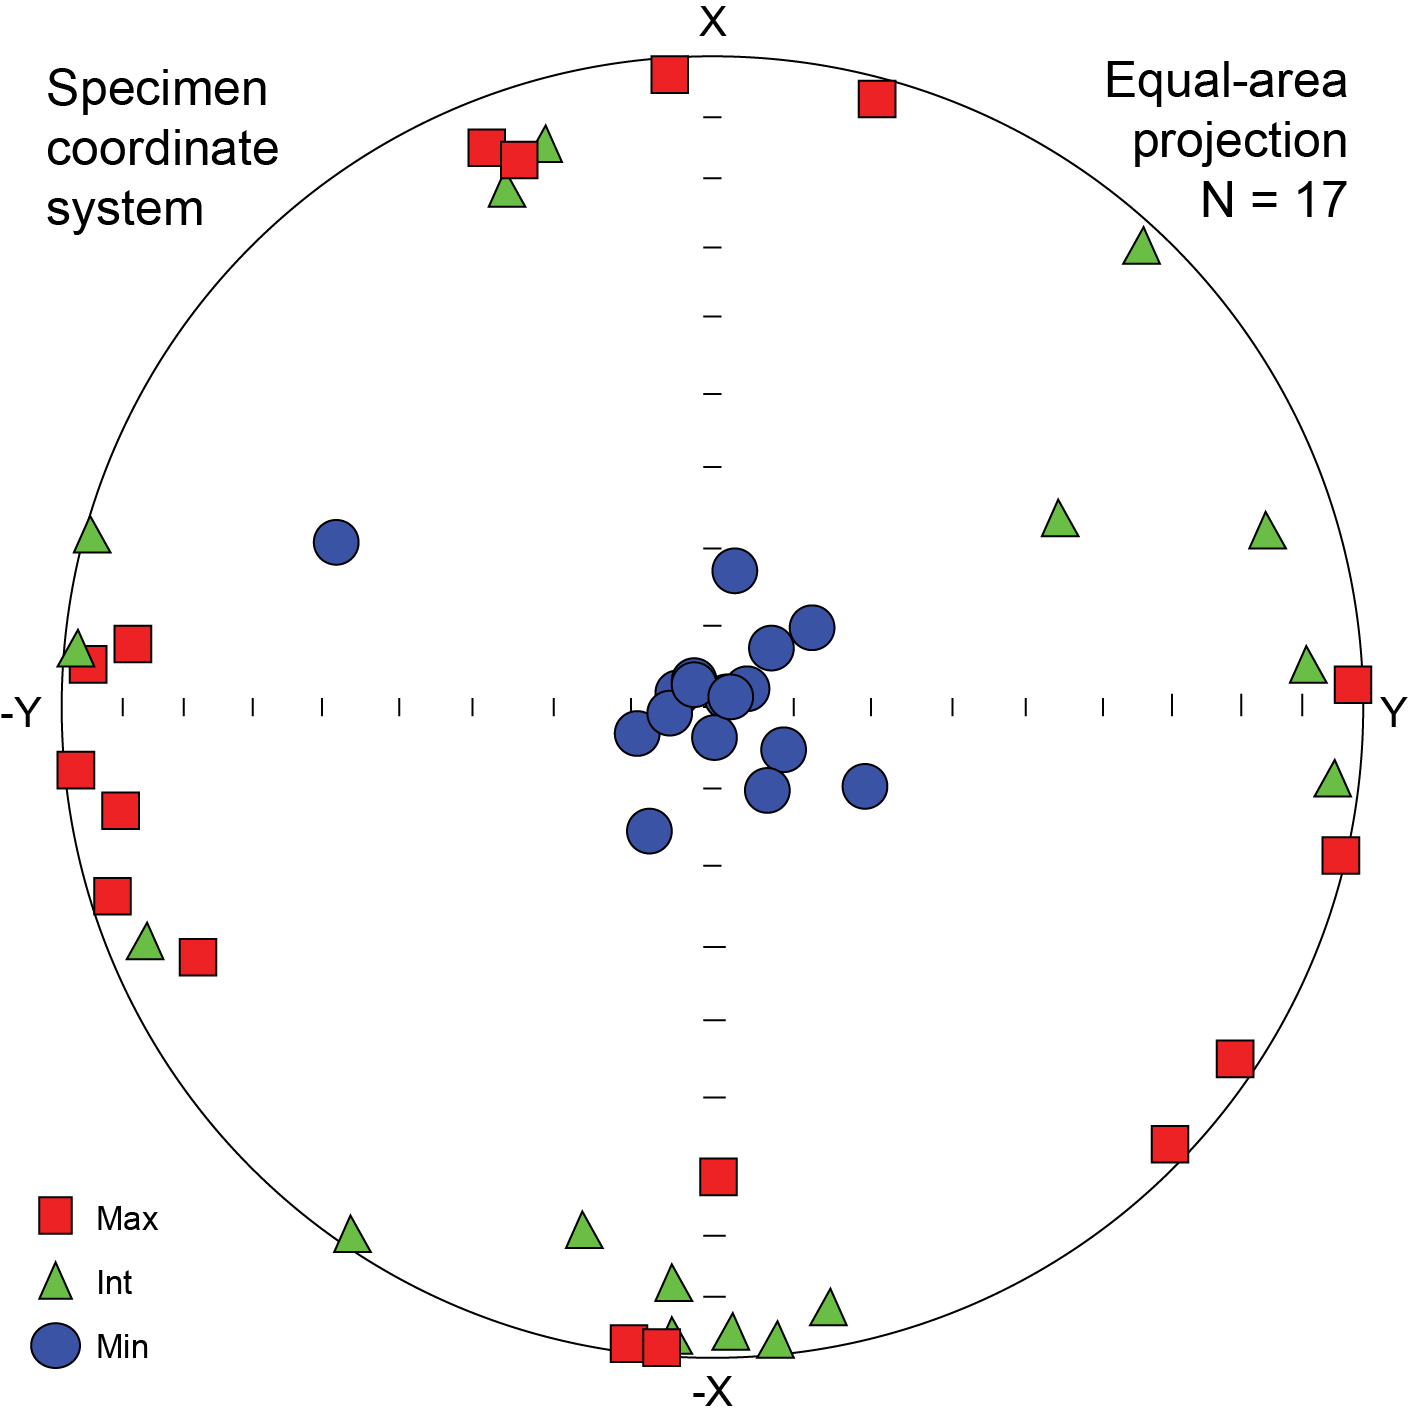
Figure F13. AMS.
6. Structural geology
Site U1615 consisted of a single hole drilled to 300 mbsf in sediments and sedimentary rocks. Structural geology measurements included bedding orientation, fractures, faults, and folds. The poor recovery at this site is responsible for the scattering of the acquired data. Throughout the hole, the bedding dip rarely exceeds 20° (Figure F14). The variation of bedding dip slightly increases in the vicinity of the slumps (see Lithostratigraphy). The measured bedding dips are concentrated at the depths of 59.37–87.68 and 186.22–208.76 mbsf, corresponding to intervals in the volcaniclastic-rich layer and in the preliminarily identified mass transport deposits, respectively.
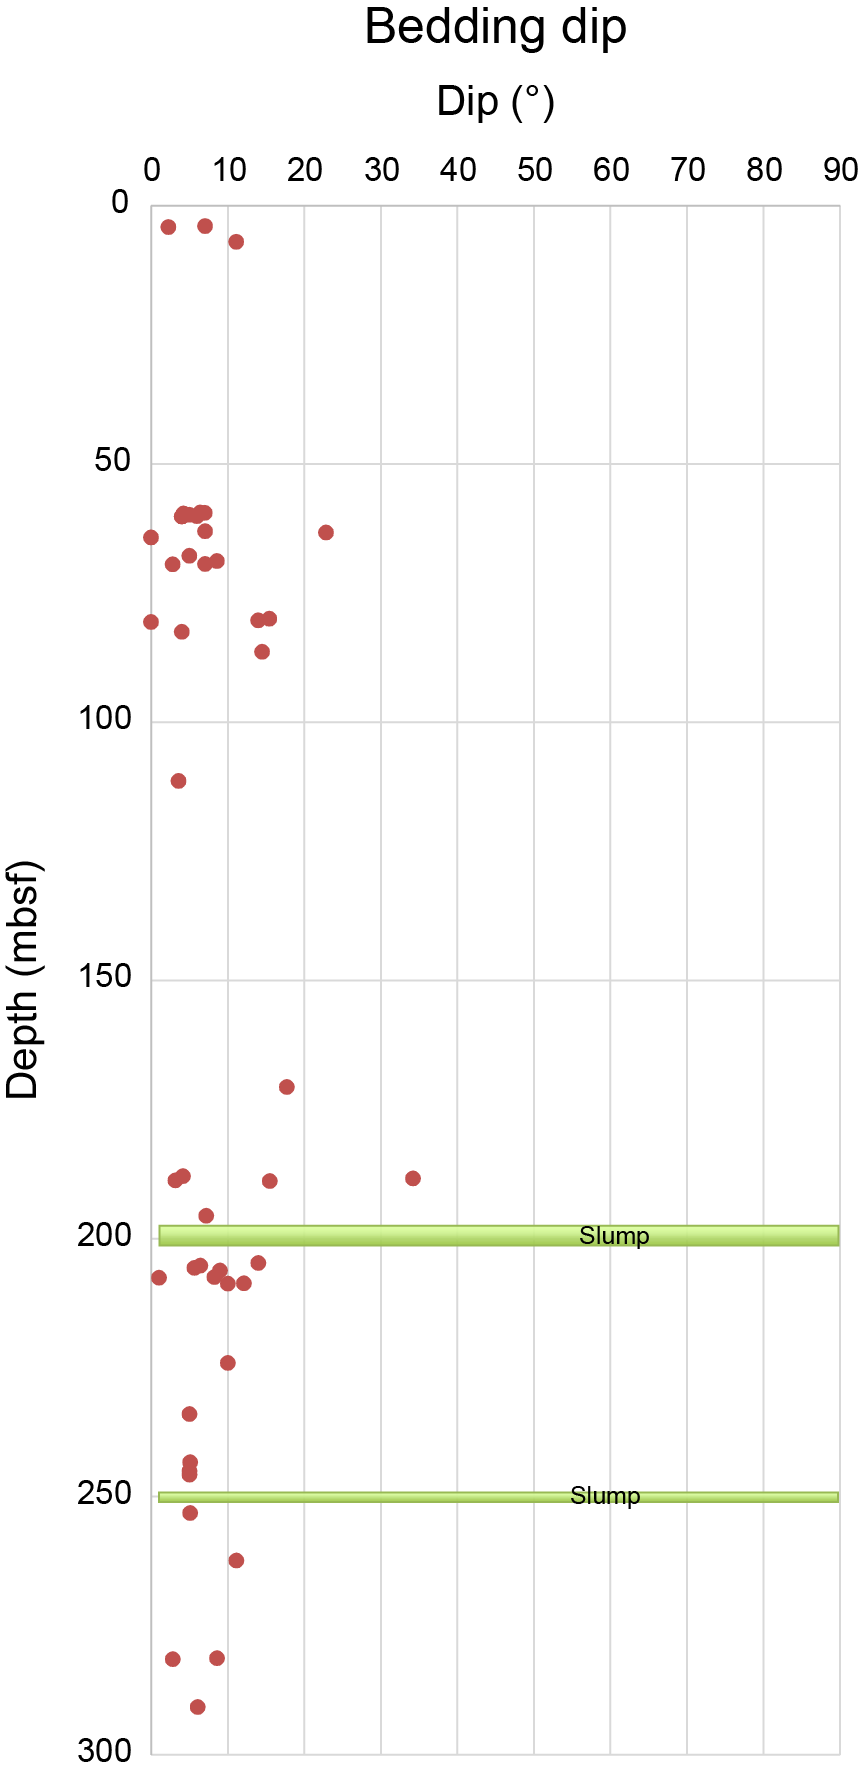
Figure F14. Dip variations of lamination.
7. Sediment and interstitial water geochemistry
At Site U1615, a total of 1 mudline and 17 core whole-round samples were collected and processed for geochemical analyses. They ranged in depth from 0.0 to 253.6 mbsf. Interstitial water (IW) samples were extracted by pressurizing cores in the Carver hydraulic press (see Sediment and interstitial water geochemistry in the Expedition 402 methods chapter [Malinverno et al., 2025]). A series of shipboard measurements were made on the IW and solid-phase sediments to determine depth profiles of their chemical properties and elemental compositions. Headspace gas sampling was also performed at this site to measure the composition and abundance of C1–C6 hydrocarbon gases.
7.1. Inorganic geochemistry
7.1.1. Alkalinity, pH, and salinity
IW alkalinity varies from 1.0 to 5.6 mM (Table T3). Above Section 402-U1615A-8H-1 at 65.3 mbsf, alkalinity shows higher values, reaching a maximum of 5.6 mM at 41.6 mbsf (Section 5H-4). Below this interval, alkalinity decreases, fluctuating between 1.0 and 1.8 mM. The IW pH value exhibits little variation, remaining in a narrow range of 7.4–8.0 throughout the entire cored interval (Figure F15).
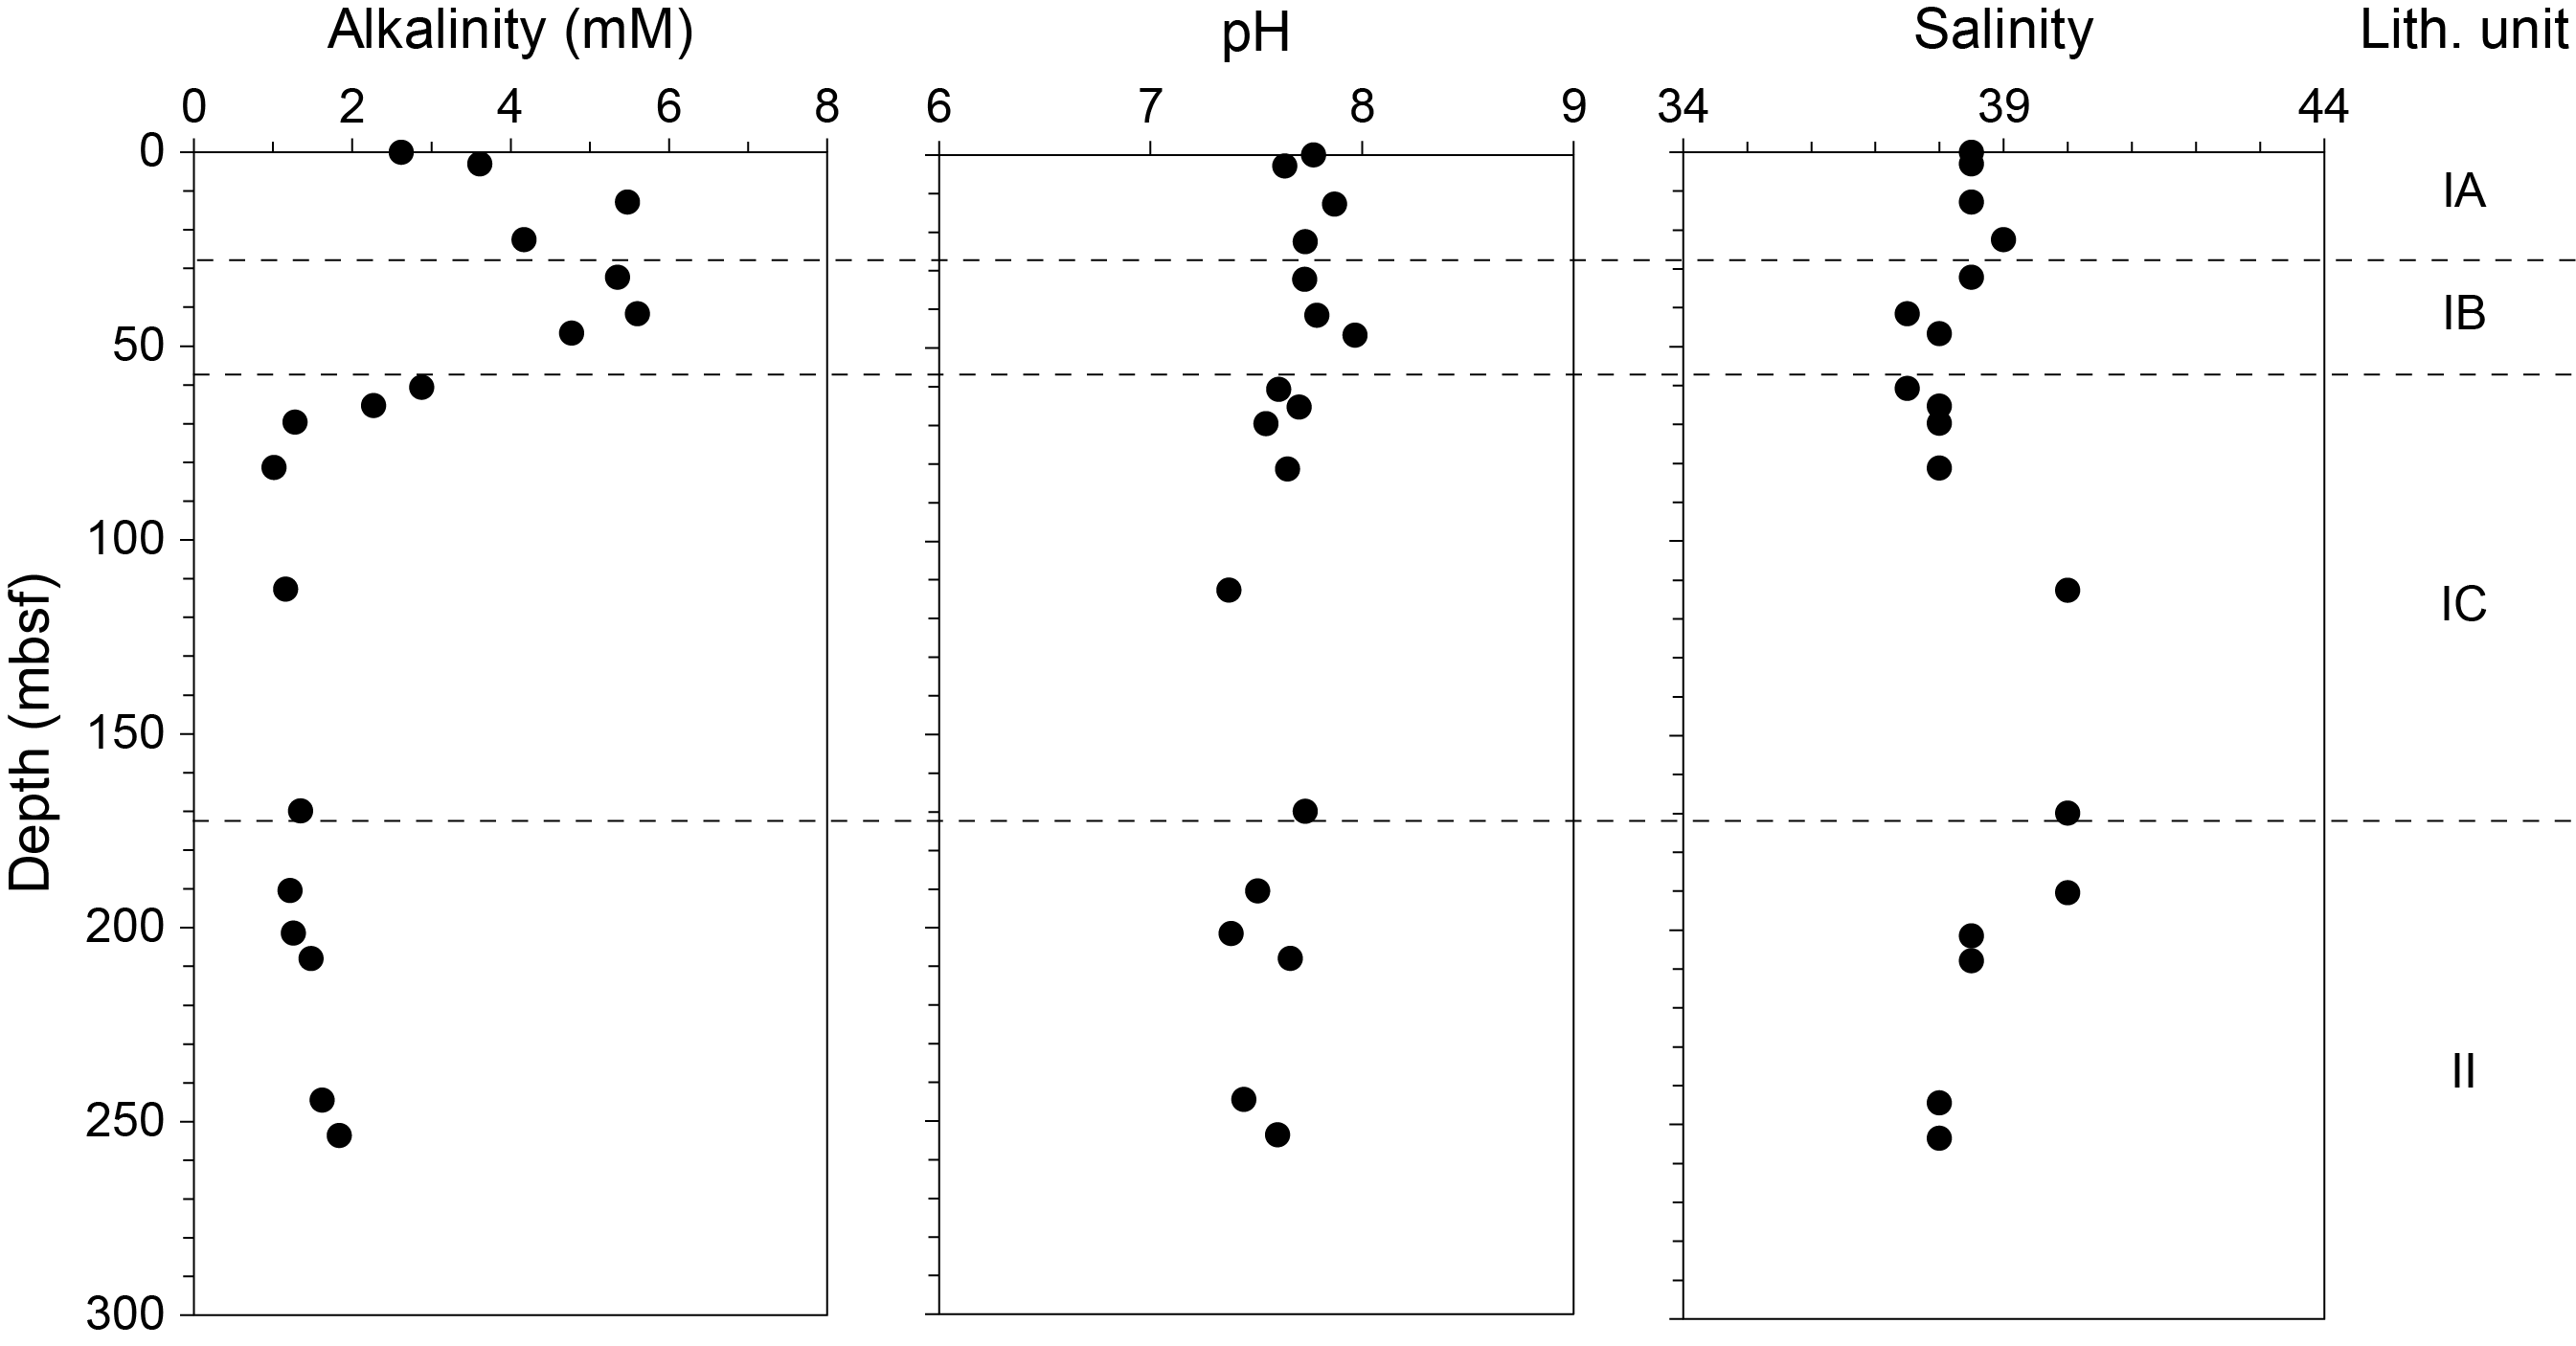
Figure F15. Alkalinity, pH, and salinity in IW.
IW salinity is 38.5 near the seafloor, similar to the reported values for bottom seawater in the Mediterranean Sea (Roether et al., 1996; Tsimplis and Baker, 2000; Tanhua et al., 2013). It varies within a limited range of 37.5–40.0, with the highest values occurring in the interval 112.6–190.4 mbsf (Sections 402-U1615A-15X-2 through 23X-3). Below this interval, salinity decreases continuously to 38.0 at the base of the cored interval (Figure F15).
7.1.2. Major elements
The concentrations of the predominant cation and anion species, sodium (Na+) and chloride (Cl−), vary from 528.0 to 567.3 mM and from 608.5 to 646.7 mM, respectively (Table T3). They are slightly higher than the reported values (500 mM for Na+ and 600 mM for Cl−) of the Mediterranean seawater (Michard et al., 1974). As for the concentration-depth profile, Na+ closely parallels Cl− with higher values at 46.7–207.9 mbsf, and both correlate with salinity variations (Figure F16). They peak at 169.9 mbsf in Section 402-U1615A-21X-2, coinciding with the highest value of 40 for salinity. The Na/Cl ratio varies from 0.85 to 0.89. Except above 22 mbsf and at two deeper depths (112.6 and 253.6 mbsf), this ratio is slightly higher than the seawater ratio (value of 0.86). The highest value of 0.89 is observed at 190.4–244.4 mbsf, corresponding to Lithostratigraphic Unit II, which is mainly composed of volcaniclastic materials. The increasing concentration of these two elements in this depth interval could be explained by diagenetic alteration of these materials.
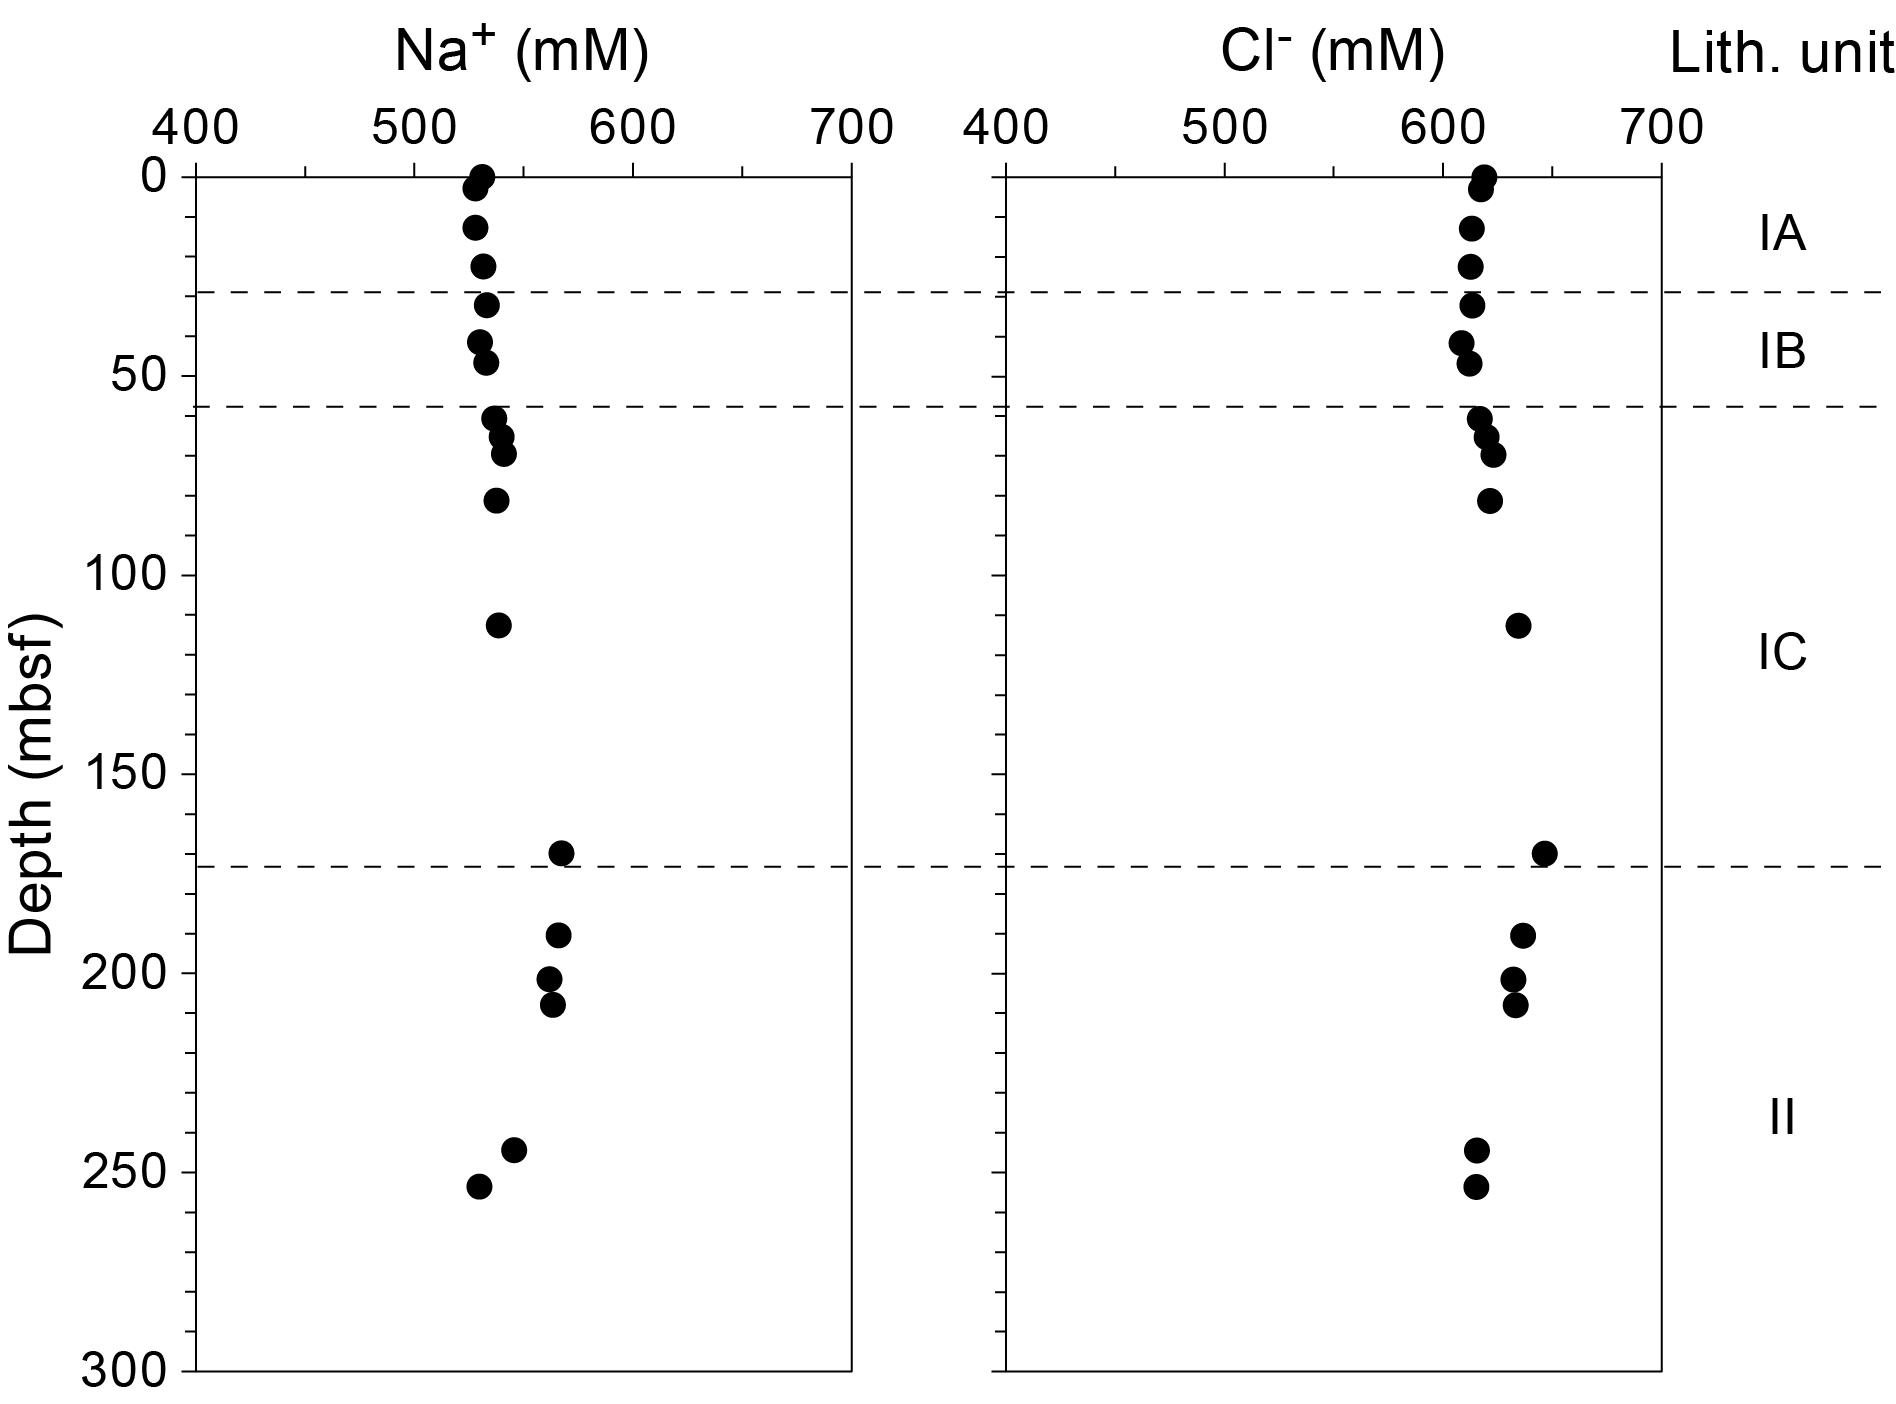
Figure F16. Sodium and chloride in IW.
The Mg2+ concentration decreases from a maximum of 60.4 mM near the seafloor to a low of 15.4 mM at 190.4 mbsf (Section 402-U1615A-23X-3). Mg2+ concentration then increases gradually downhole to 28.9 mM at the bottom of the hole. In contrast, Ca2+ concentration fluctuates at shallow depths before exhibiting an increasing trend and reaching a maximum of 40.5 mM at 169.9 mbsf (Section 21X-2). Below this depth, Ca2+ concentration decreases to 30.3 mM just above the base of the cored interval (Figure F17). Magnesium (Mg2+) and calcium (Ca2+), two of the other major cations, display inversely correlated concentration-depth profiles (R2 = 0.92). The release of Ca2+ in parallel with the uptake of Mg2+ could result from diagenetic processes, especially affecting carbonate minerals (substitution processes in calcite minerals and dolomitization) and volcaniclastic materials. The concentration of K+ shows an increase from 11.6 to 17.6 mM above 69.6 mbsf. Higher concentrations of K+ than bottom seawater levels in the Mediterranean Sea (11.00 mM; Michard et al., 1974) are observed to 169.9 mbsf and could result from the alteration of K-rich material such as K-feldspars generally present in volcaniclastic materials. K+ concentrations decrease with minor fluctuations below 169.9 mbsf (Figure F17).
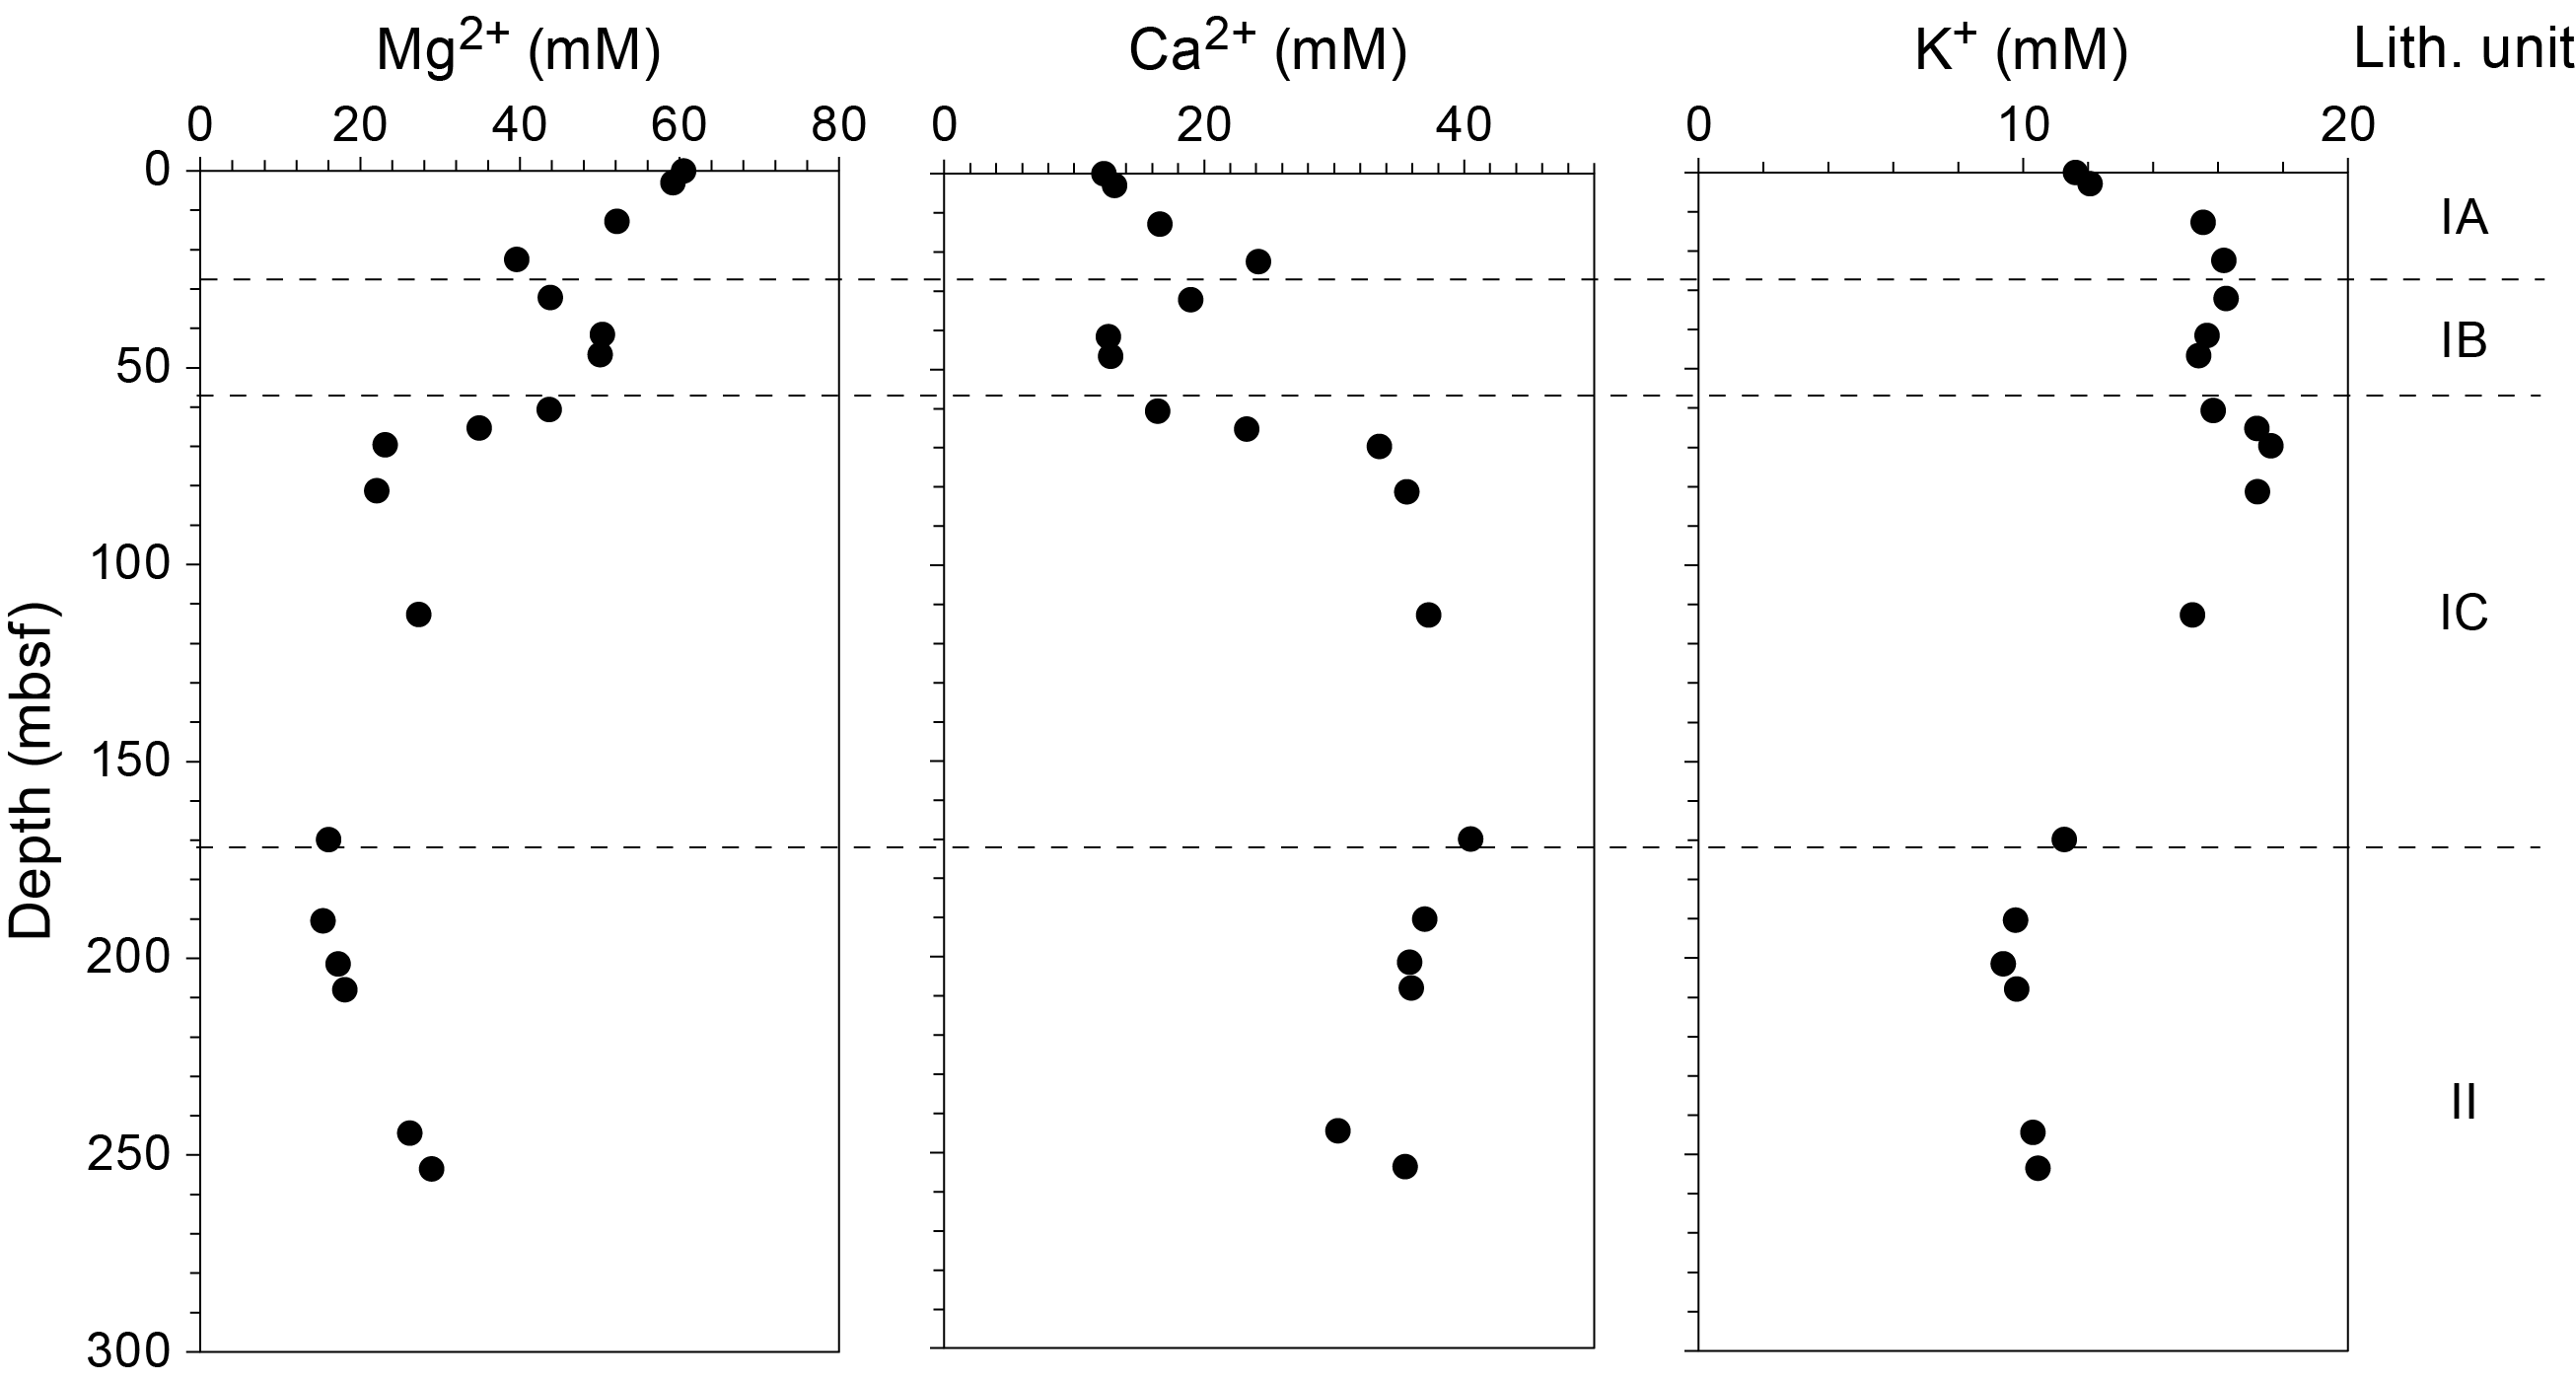
Figure F17. Magnesium, calcium, and potassium in IW.
The bromide (Br−) concentration shows slight fluctuations in the range of 0.9–1.0 mM across the entire cored interval with no discernible trend with depth (Table T4).
7.1.3. Minor elements
Concentrations of Boron (B) and strontium (Sr) exhibit very similar trends throughout the sedimentary succession (Figure F18; Table T4). They show an overall increasing trend between the seafloor and 207.9 mbsf and then decrease to the base of the cored sediments. They reach a maxima of 2255.4 µM at 190.4 mbsf for B and 317.8 mM for Sr at 207.9 mbsf. Lithium (Li) concentrations increase to a maximum of 103.4 µM at 69.6 mbsf and then show a weak decreasing profile below this depth, reaching 60.1 µM at the base of the cored interval. Concentrations of barium (Ba) are very low with maximum values of 2.2 µM at 12.8 mbsf and of 2.0 at 65.3 mbsf. The variation of these elements might be closely related to precipitation and/or dissolution processes occurring throughout the sedimentary column. Dissolved silica (Si) varies in a wide range of 167.4–372.7 µM with no obvious pattern with depth and is probably influenced by silicate diagenesis.
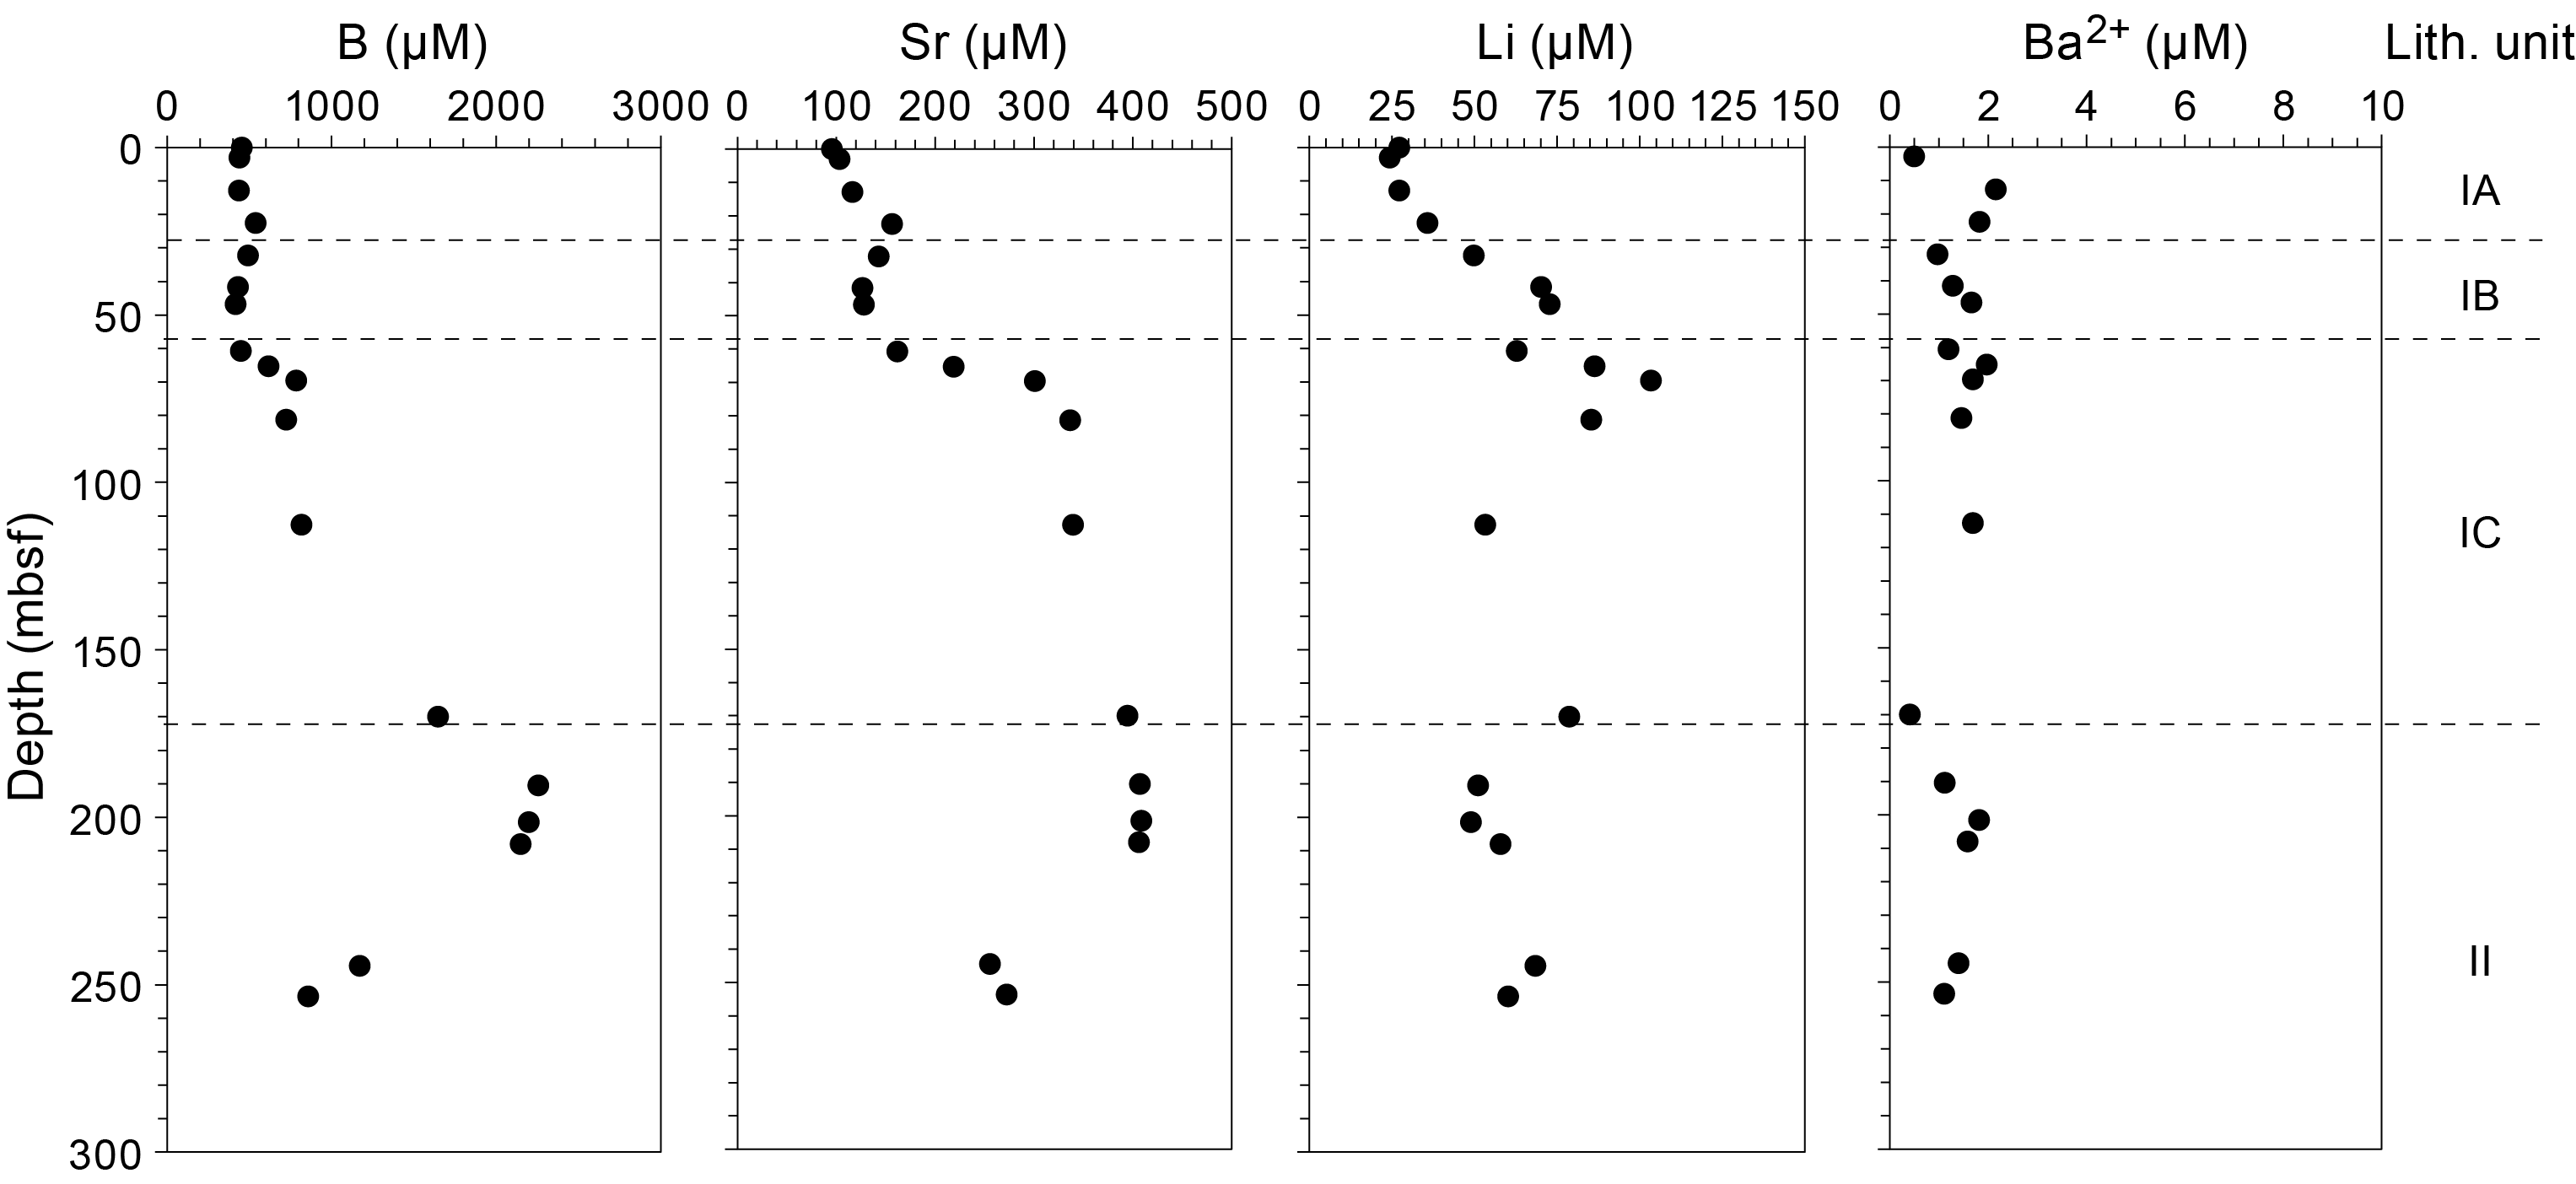
Figure F18. Boron, strontium, lithium, and barium in IW.
The concentration of iron (Fe = Fe2+ + Fe3+), ranging 0.8–13.8 µM, is low and characterized by maximum values at 3.0 mbsf (13.8 µM), 60.7 mbsf (4.4 µM), and 69.6 mbsf (6.7 µM) (Table T4). The concentration of manganese (Mn = Mn2+ + Mn4+) exhibits a sharp increase at 3.0 mbsf, revealing the reduction of manganese oxides during organic matter mineralization in the upper part of the sediment column. This concentration shows a sharp decreasing trend to 46.7 mbsf, from a maximum of 75.1 µM to a minimum of 7.1 µM, followed by a gradually increasing trend below this interval toward the basement (Table T4). The vertical variations of Fe and Mn could be due to biologically mediated reactions such as organic matter mineralization using (oxy)hydroxides (Jørgensen, 2000), oxidation, and solubilization of metal sulfides (Jørgensen et al., 2004).
7.1.4. Sulfate, sulfide, and nutrients
The sulfate (SO42−) concentration is highest (31.9 mM) near the seafloor and is similar to the reported values for the bottom seawater in the Mediterranean Sea (Michard et al., 1974; Haese et al., 2003; Werne et al., 2004). It decreases to reach a minimum value of 25.7 mM at 41.6 mbsf before increasing again at 46.7–112.6 (26.9–27.5 mM) and 244.4–253.6 mbsf (26.6–28.7 mM). Above 69.7 mbsf, the decrease of sulfate concentration, coinciding with a slightly increasing trend of alkalinity, probably indicates the occurrence of bacterial sulfate reduction (Figure F16; Table T4).
The nutrient species ammonium (NH4+) and phosphate (PO43−) show concentrations different to those observed at other Expedition 402 sites except Site U1614 (Table T4). The NH4+ content increases sharply in the upper part of the cored interval, reaching a maximum of 737.3 µM at 32.2 mbsf. It then decreases gradually to a minimum of 64.5 µM at the basement interface, following a pattern with depth similar to that of alkalinity (Figure F19). In contrast, PO43− concentrations are less than 4.7 µM with no discernible trend with depth. The highest alkalinity value and the NH4+ maximum at 32.2 mbsf as well as a maximum value of 4.7 µM for PO43− at 12.8 mbsf argue for biogenic oxidation of organic matter (Figure F19; Table T3).
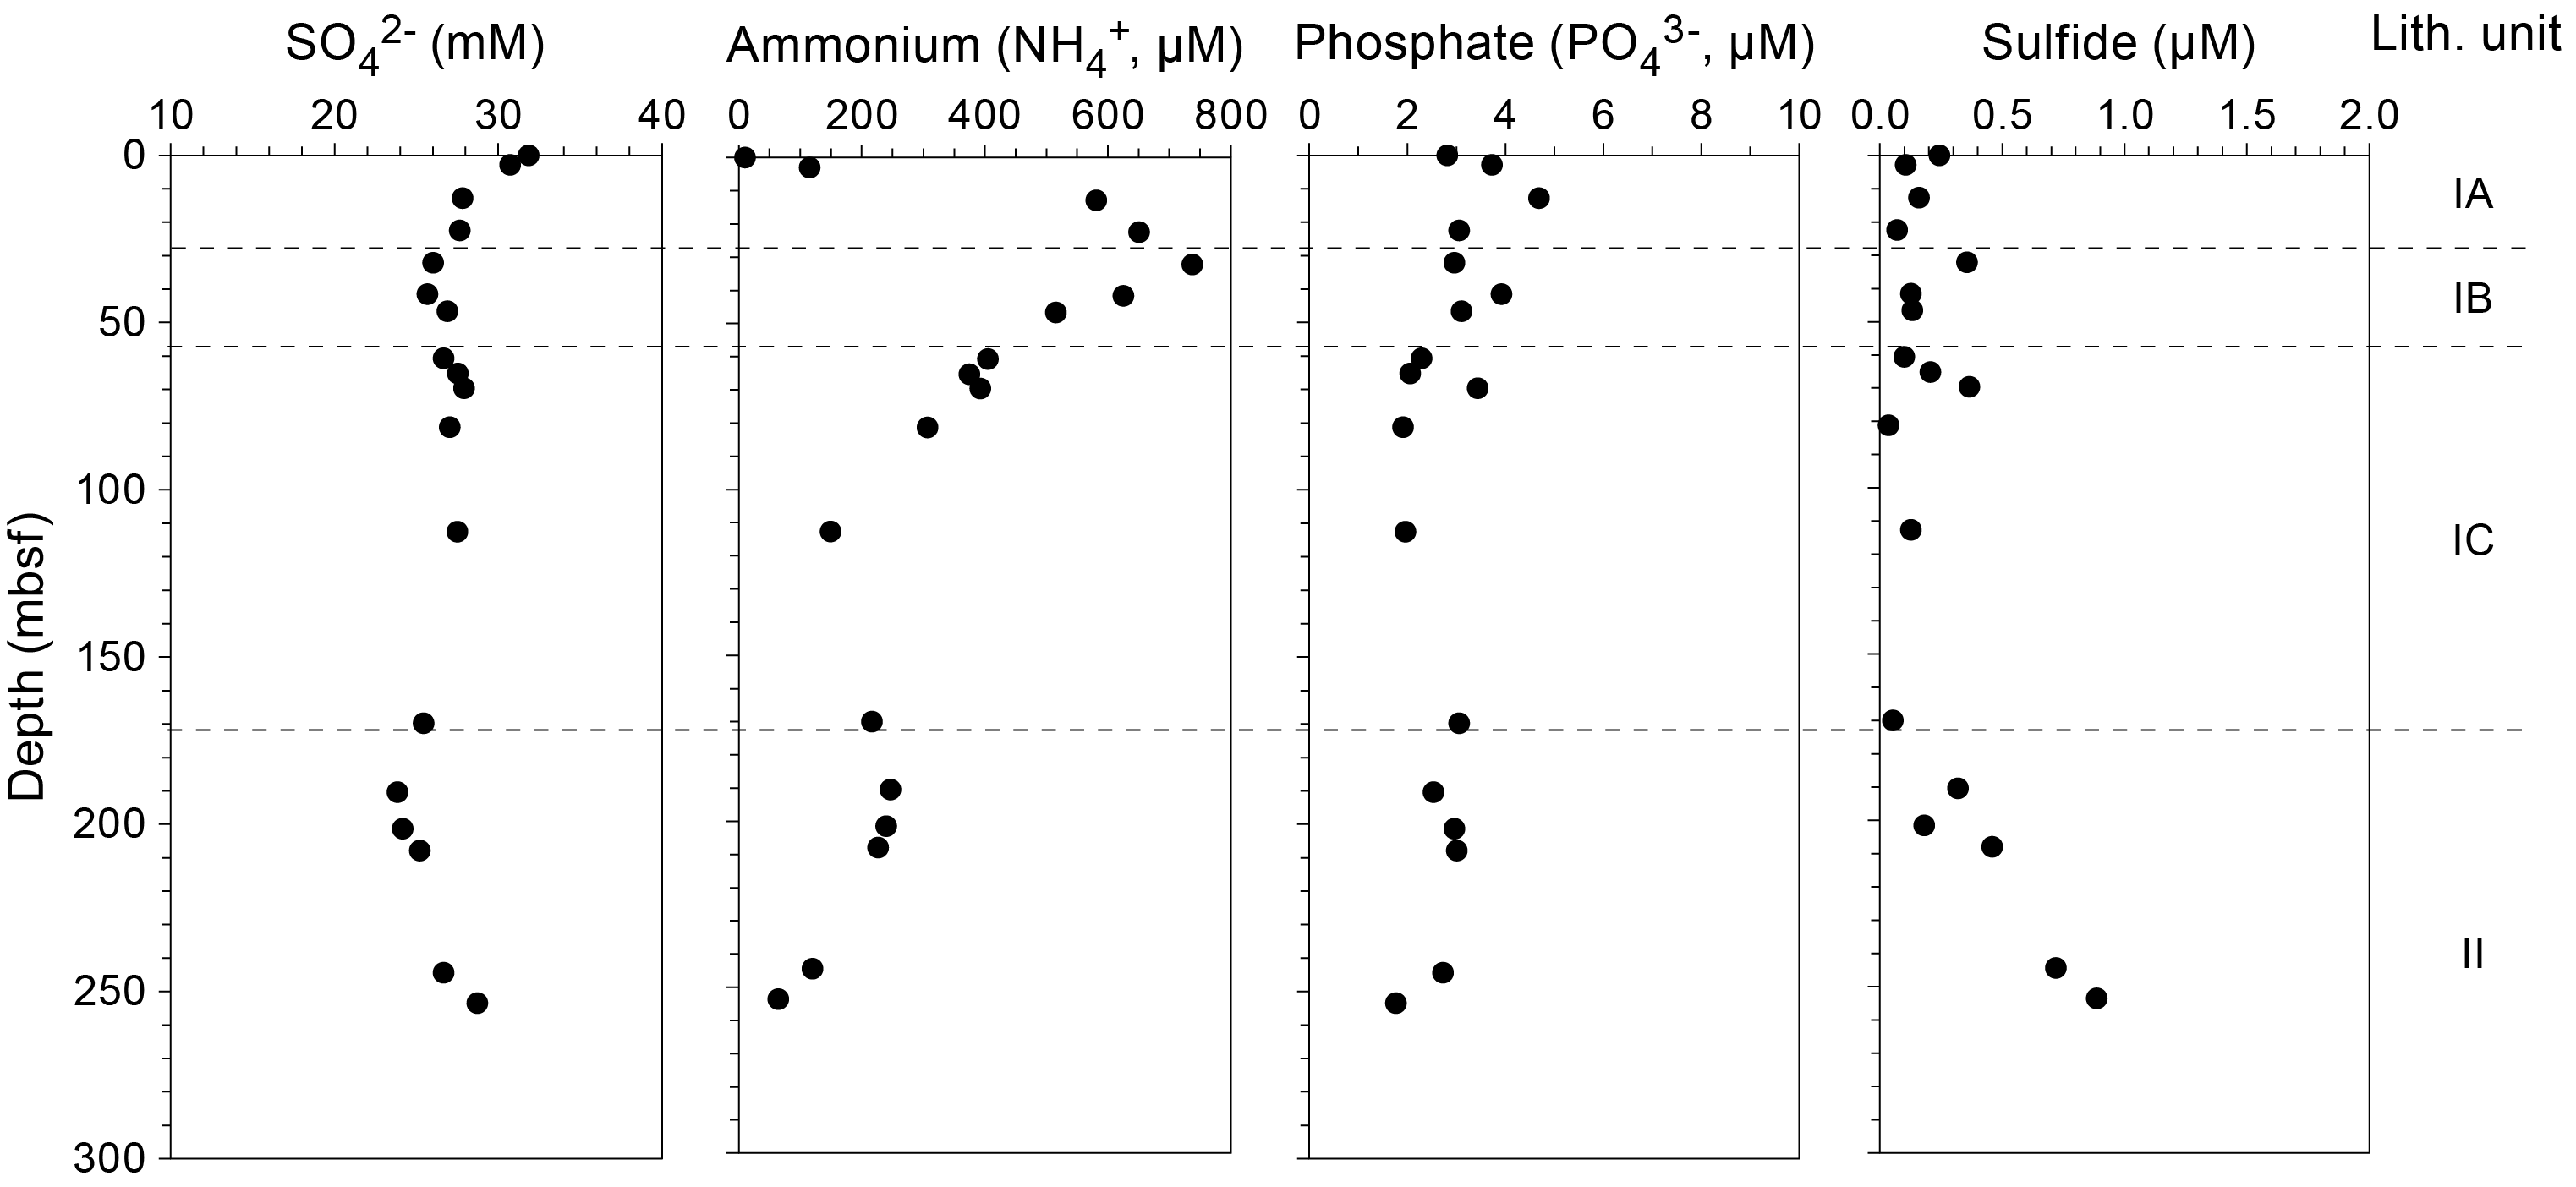
Figure F19. Sulfate, ammonium, phosphate, and sulfide in IW.
Sulfide concentration (ΣH2S = S2 + HS− + H2S; Table T4) is low and ranges 0.1–0.9 µM (Figure F19) with a peak of 0.4 µM at 32.2 mbsf.
7.2. Organic geochemistry
Solid-phase sediment samples were analyzed to determine (1) the weight percent of calcium carbonates (CaCO3); (2) the percent total carbonate contents (including both calcium carbonates and other carbonate phases); (3) the percent total organic matter determined using loss on ignition (LOI); and (4) total organic carbon (TOC), total nitrogen (TN), and total sulfur (TS). Hole U1615A samples analyzed included the 17 squeeze cakes and an additional 9 samples selected by the core description team from the sediment lithologies of interest. Headspace samples were generally collected from each core (402-U1615A-1H through 34X-CC) except for nine cores from which no samples were taken (11F, 12F, 14X, 16X–19X, 26X, and 27X) because of low or no recovery.
7.2.1. Carbonates
Table T5 and Figure F20 show the results obtained for CaCO3 content and percentage of total carbonate content. CaCO3 contents of the bulk sediments from Hole U1615A vary from 1.4 to 47.2 wt% and are lithology dependent (see Lithostratigraphy). The average CaCO3 content is 16.7 ± 10.8 wt% for Unit I (24.6 ± 9.1 wt% for Subunit IA, 6.4 ± 5.6 wt% for Subunit IB, and 15.4 ± 9.9 wt% for Subunit IC) and 17.2 ± 17 wt% for Unit II. The highest CaCO3 contents are measured at 190.4 mbsf in a nannofossil chalk with foraminifera (Unit II; 47.2 wt%) and at 244.4 mbsf (Unit II; 37.9 wt%) in a nannofossil ooze. Compared to the CaCO3 content, the percentage of total carbonate content show higher values, ranging from 5.7% (Sample 402-U1615A-8H-1, 98–103 cm; 65.3 mbsf) to 100% (Sample 29X-1, 143–148 cm; 244.4 mbsf) due to the presence of carbonates other than calcium carbonates. The XRD patterns show that the d(104) values of calcite vary from 3.037 to 2.993 Å, indicating contributions from two different calcite groups. A low-Mg calcite group, mostly derived from calcite in pelagic or detrital sediments, predominates between 3.037 and 3.029 Å, and a calcite group enriched in Mg, probably authigenic, predominates from 3.019 to 2.993 Å. Two groups of dolomite are also identified: one group, characterized by d(104) values between 2.891 and 2.887 Å, is considered to be near-stoichiometric dolomite; the second group, with d(104) values between 2.924 and 2.901 Å, corresponds to dolomites in which some larger cations such as Fe2+ or Ca2+ substitute for some fraction of the Mg2+. Based on both XRD data and percentage of total carbonate content, low-Mg calcite ranging 3.9%–91.7% represents 55%–100% of the sedimentary total carbonate content. Thus, it is the dominant carbonate phase present in all sediments collected from Hole U1615A, most likely originating from biogenic precipitation (Figure F20; Table T5). This dominant carbonate phase is associated with variable amounts of high-Mg calcite (0.0%–6.0%), Fe- and/or Ca-rich dolomite (0.0%–3.5%), and stoichiometric dolomite (0.0%–14.8%). The highest percentage of stoichiometric dolomite is observed in sediments from Section 1H-2 at 2.95 mbsf in Subunit IA.
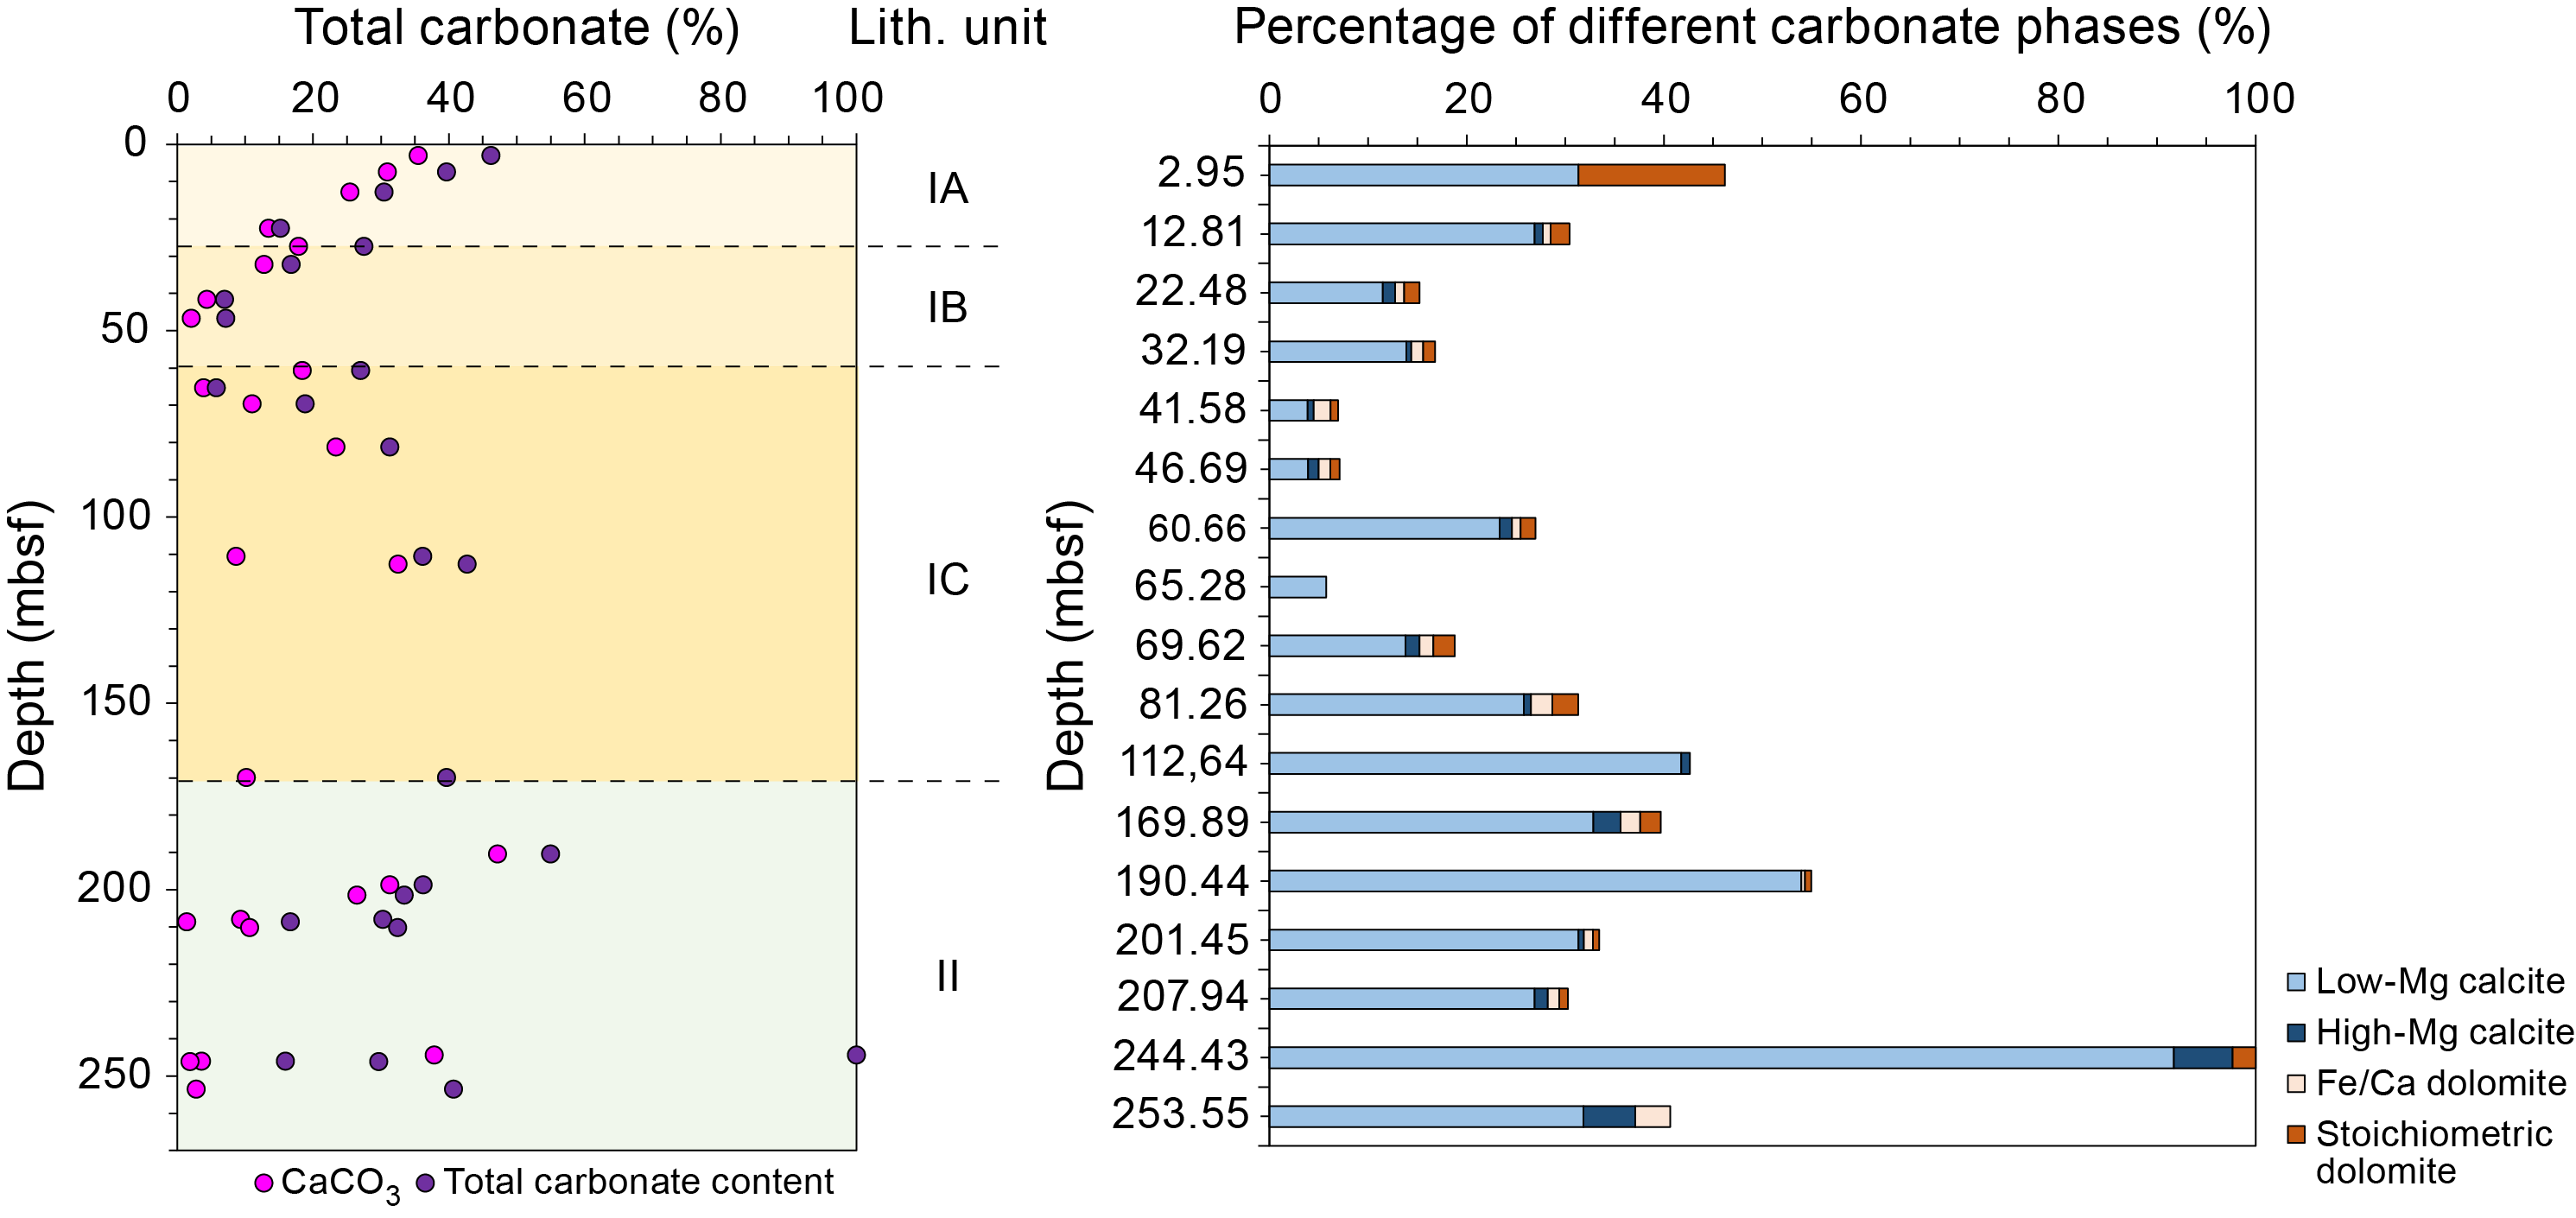
Figure F20. Carbonate.
7.2.2. Total organic matter, organic carbon, nitrogen, and sulfur in the solid-phase samples
Measurements of total organic matter, TOC, TN, and TS in the solid-phase samples are shown in Table T6 and Figure F21. The percentage of total organic matter varies from 2.3% (Section 402-U1615A-2H-4) to 14.4% (Section 1H-2). The mean value is 7.2 ± 3.1% in Unit I (7.8 ± 5.1% for Subunit IA, 5.4 ± 0.8% for Subunit IB, and 7.5 ± 2.0% for Subunit IC) and 7.6 ± 1.5% for Unit II. The highest value is measured at 3.0 mbsf (14.4%) in a mud/nannofossil ooze with mud layer in Subunit IA, and the lowest values are observed at 12.8–22.5 mbsf (2.3%–3.1%) in a volcaniclastic-rich silty sand and a sandy silt with volcaniclastic material layer in Subunit IA. TOC content varies between 0.01 and 0.45 wt% from 2.95 to 190.4 mbsf. At 198.7 mbsf, TOC content reaches 1.15 wt% and then decreases to 0.02 wt% at 253.6 mbsf. TN content exhibits little variation throughout the sediments from this hole (mean value = 0.07 ± 0.04 wt%). TOC and TN contents are roughly correlated (Figure F22A), revealing that the TN contains both organic nitrogen and inorganic nitrogen bound to surface mineral particles (particularly on the clay mineral species; Faganeli et al., 1991), as confirmed by the slightly positive intercept value (0.0430) of the linear correlation between TOC and TN contents in sediments (Goñi et al., 1998). Atomic TOC/TN ratios vary between 0.3 (Sample 30X-1, 105–110 cm) and 38.9 (Sample 3H-4, 133–138 cm). Atomic TOC/TN ratios with a value of ~9 are indicative of higher inputs of marine-derived organic matter (Meyers, 1994). The presence of a nonnegligible amount of inorganic nitrogen could lead to overestimation of the marine organic matter source and to atomic TOC/TN ratios less than 5. On the other hand, atomic TOC/TN ratios of ~12 or higher (Sample 2H-4, 145–150 cm; atomic TOC/TN ratio = 20.0; Sample 3H-4, 133–138 cm; atomic TOC/TN ratio = 38.9) indicate a higher input of terrestrial organic matter (Meyers, 1994) and/or preferential remineralization of N relative to C during organic matter diagenesis (Goldman et al., 1987; Hopkinson et al., 1997).
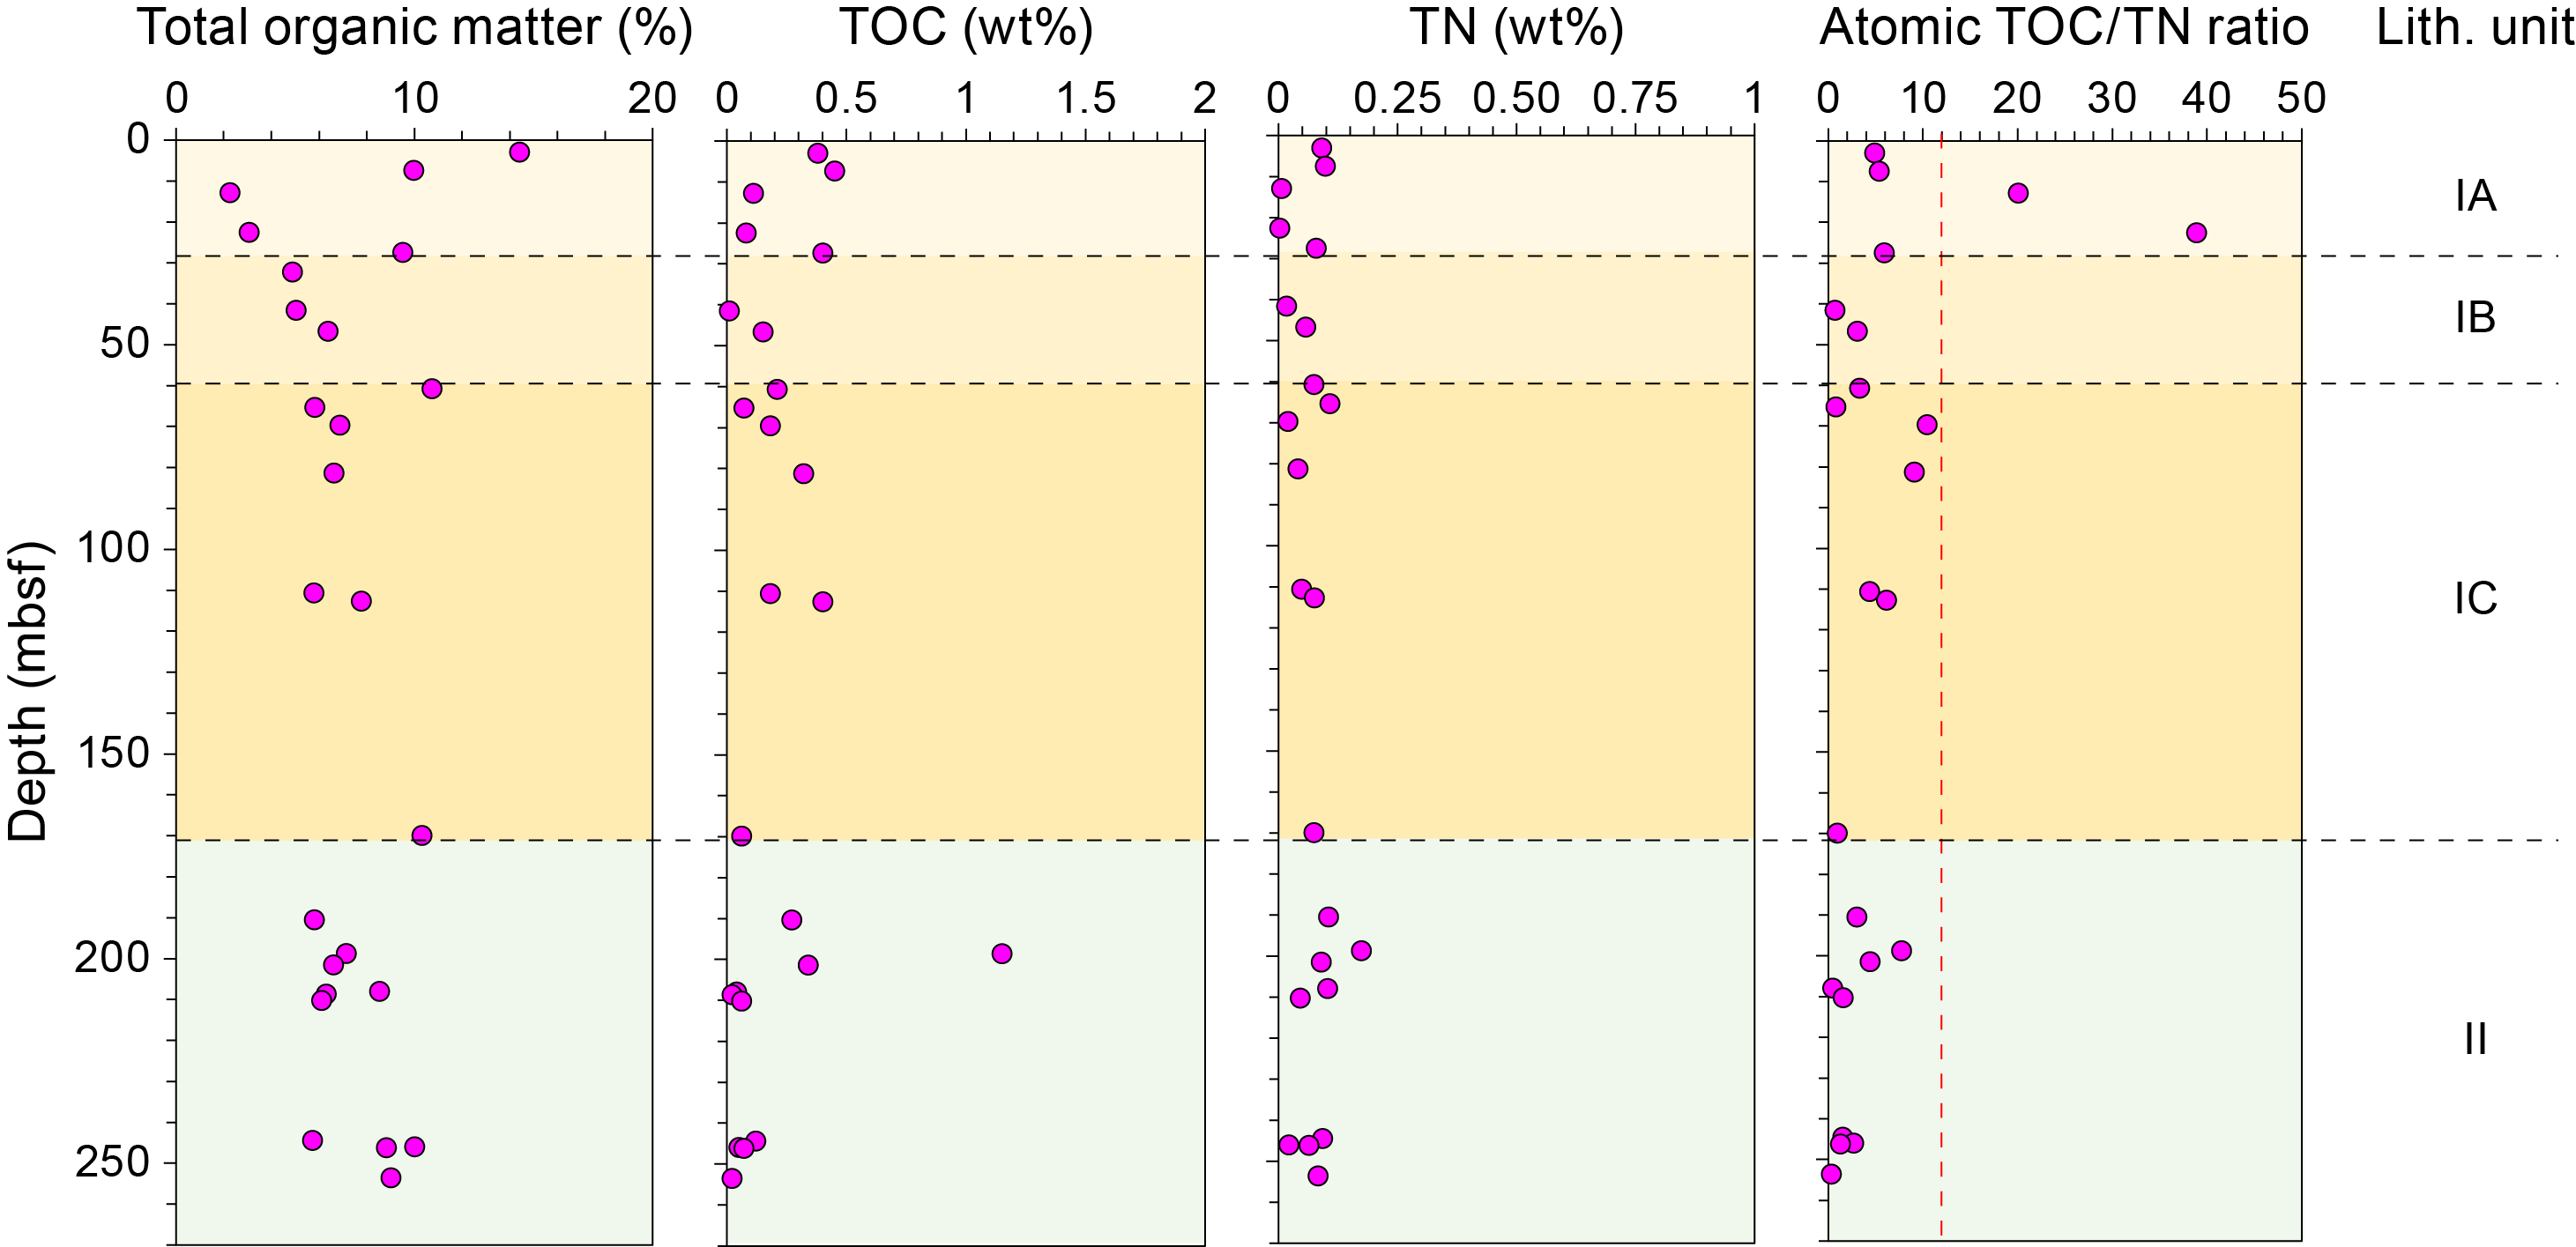
Figure F21. Total organic matter, TOC, atomic TOC/TN ratio, and TS.
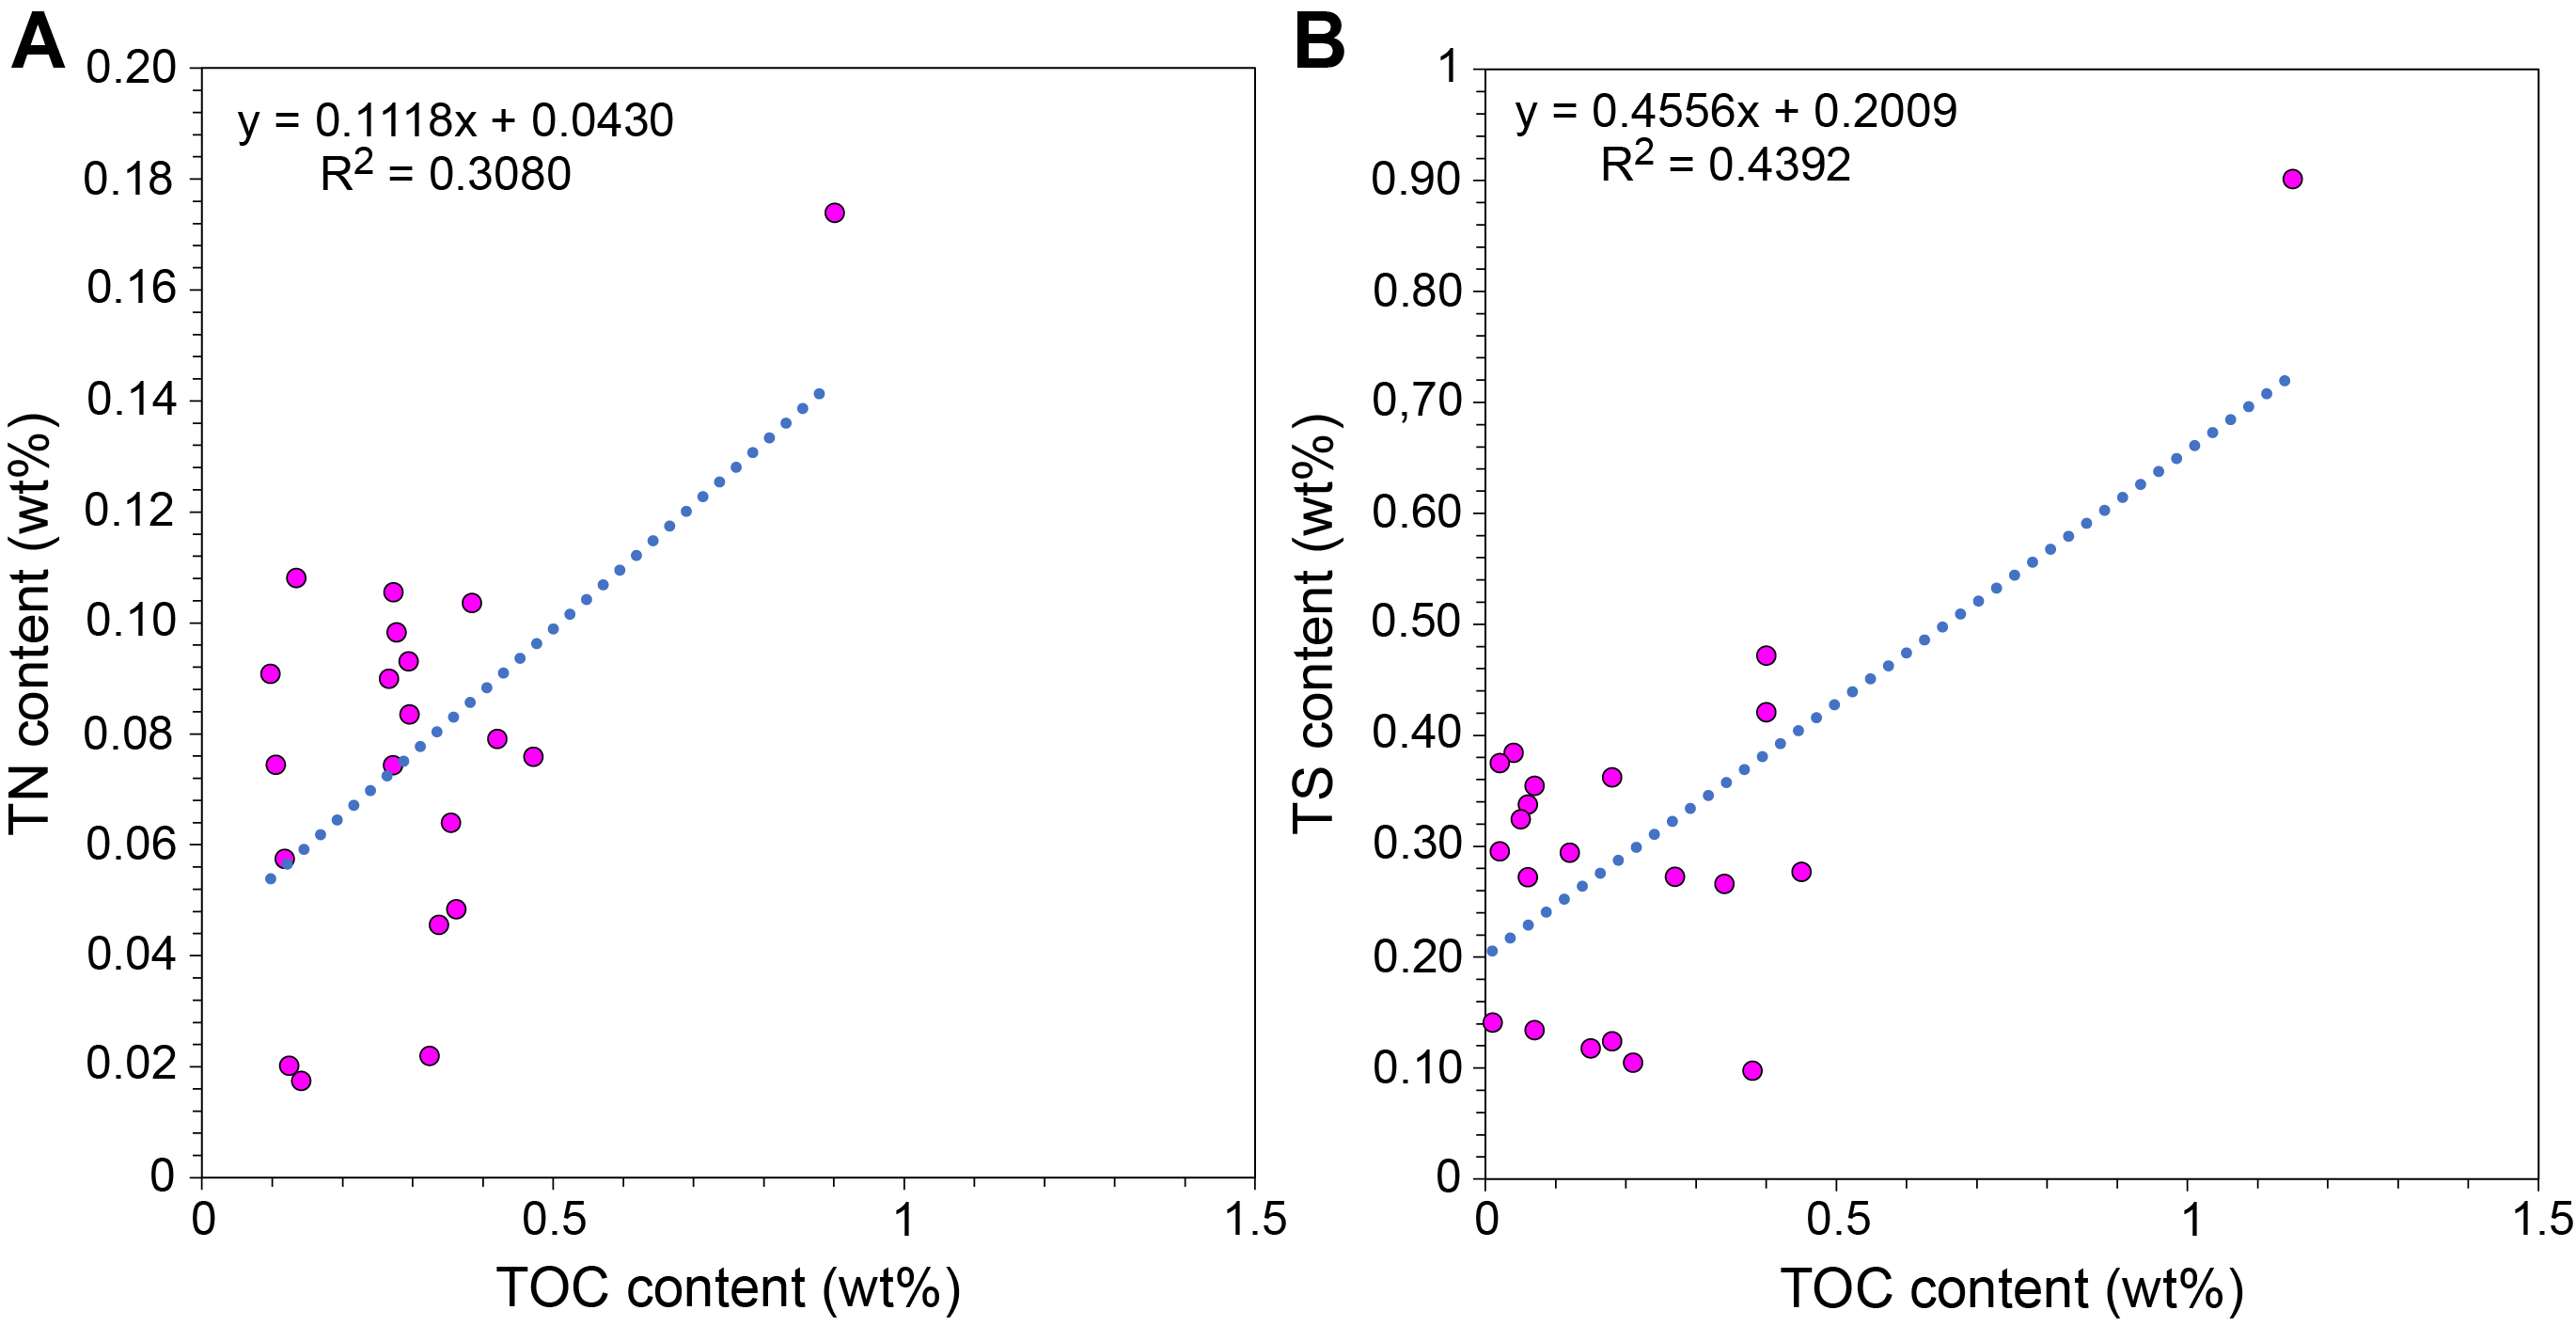
Figure F22. TOC vs. TN and TOC vs. TS.
The TS content varies from undetectable to 0.90 wt% with a mean value of 0.30 ± 0.18 wt%. Higher values of TS are found in TOC-rich sediments, as indicated by a positive correlation between these two parameters (n = 20; Figure F22B). The highest value of TS content is found in sediments with greater TOC and TN values at 198.7 mbsf (TS = 0.90 wt%, TOC = 1.15 wt%, and TN = 0.17 wt%; Unit II; nannofossil-rich chalk with mud).
7.2.3. Major, minor, and trace element content of sediments
Sediments collected from Site U1615 were analyzed using portable X-ray fluorescence spectrometry (pXRF) and inductively coupled plasma–atomic emission spectrometry (ICP-AES). We used pXRF to measure the compositions of 17 IW squeeze cakes along with their adjacent intervals in the same section halves. Four section halves (402-U1615A-5H-4, 6H-1, 21X-2, and 30X-1) could not be properly analyzed using pXRF because the core surface was uneven due to coarse-grained sediments, resulting in low analytical totals. As a result, only 13 analyses on section halves are reported. The results of pXRF analyses, in the form of corrected and raw data, are summarized in Tables T7 and T8. Variations with depth are plotted in Figure F23.
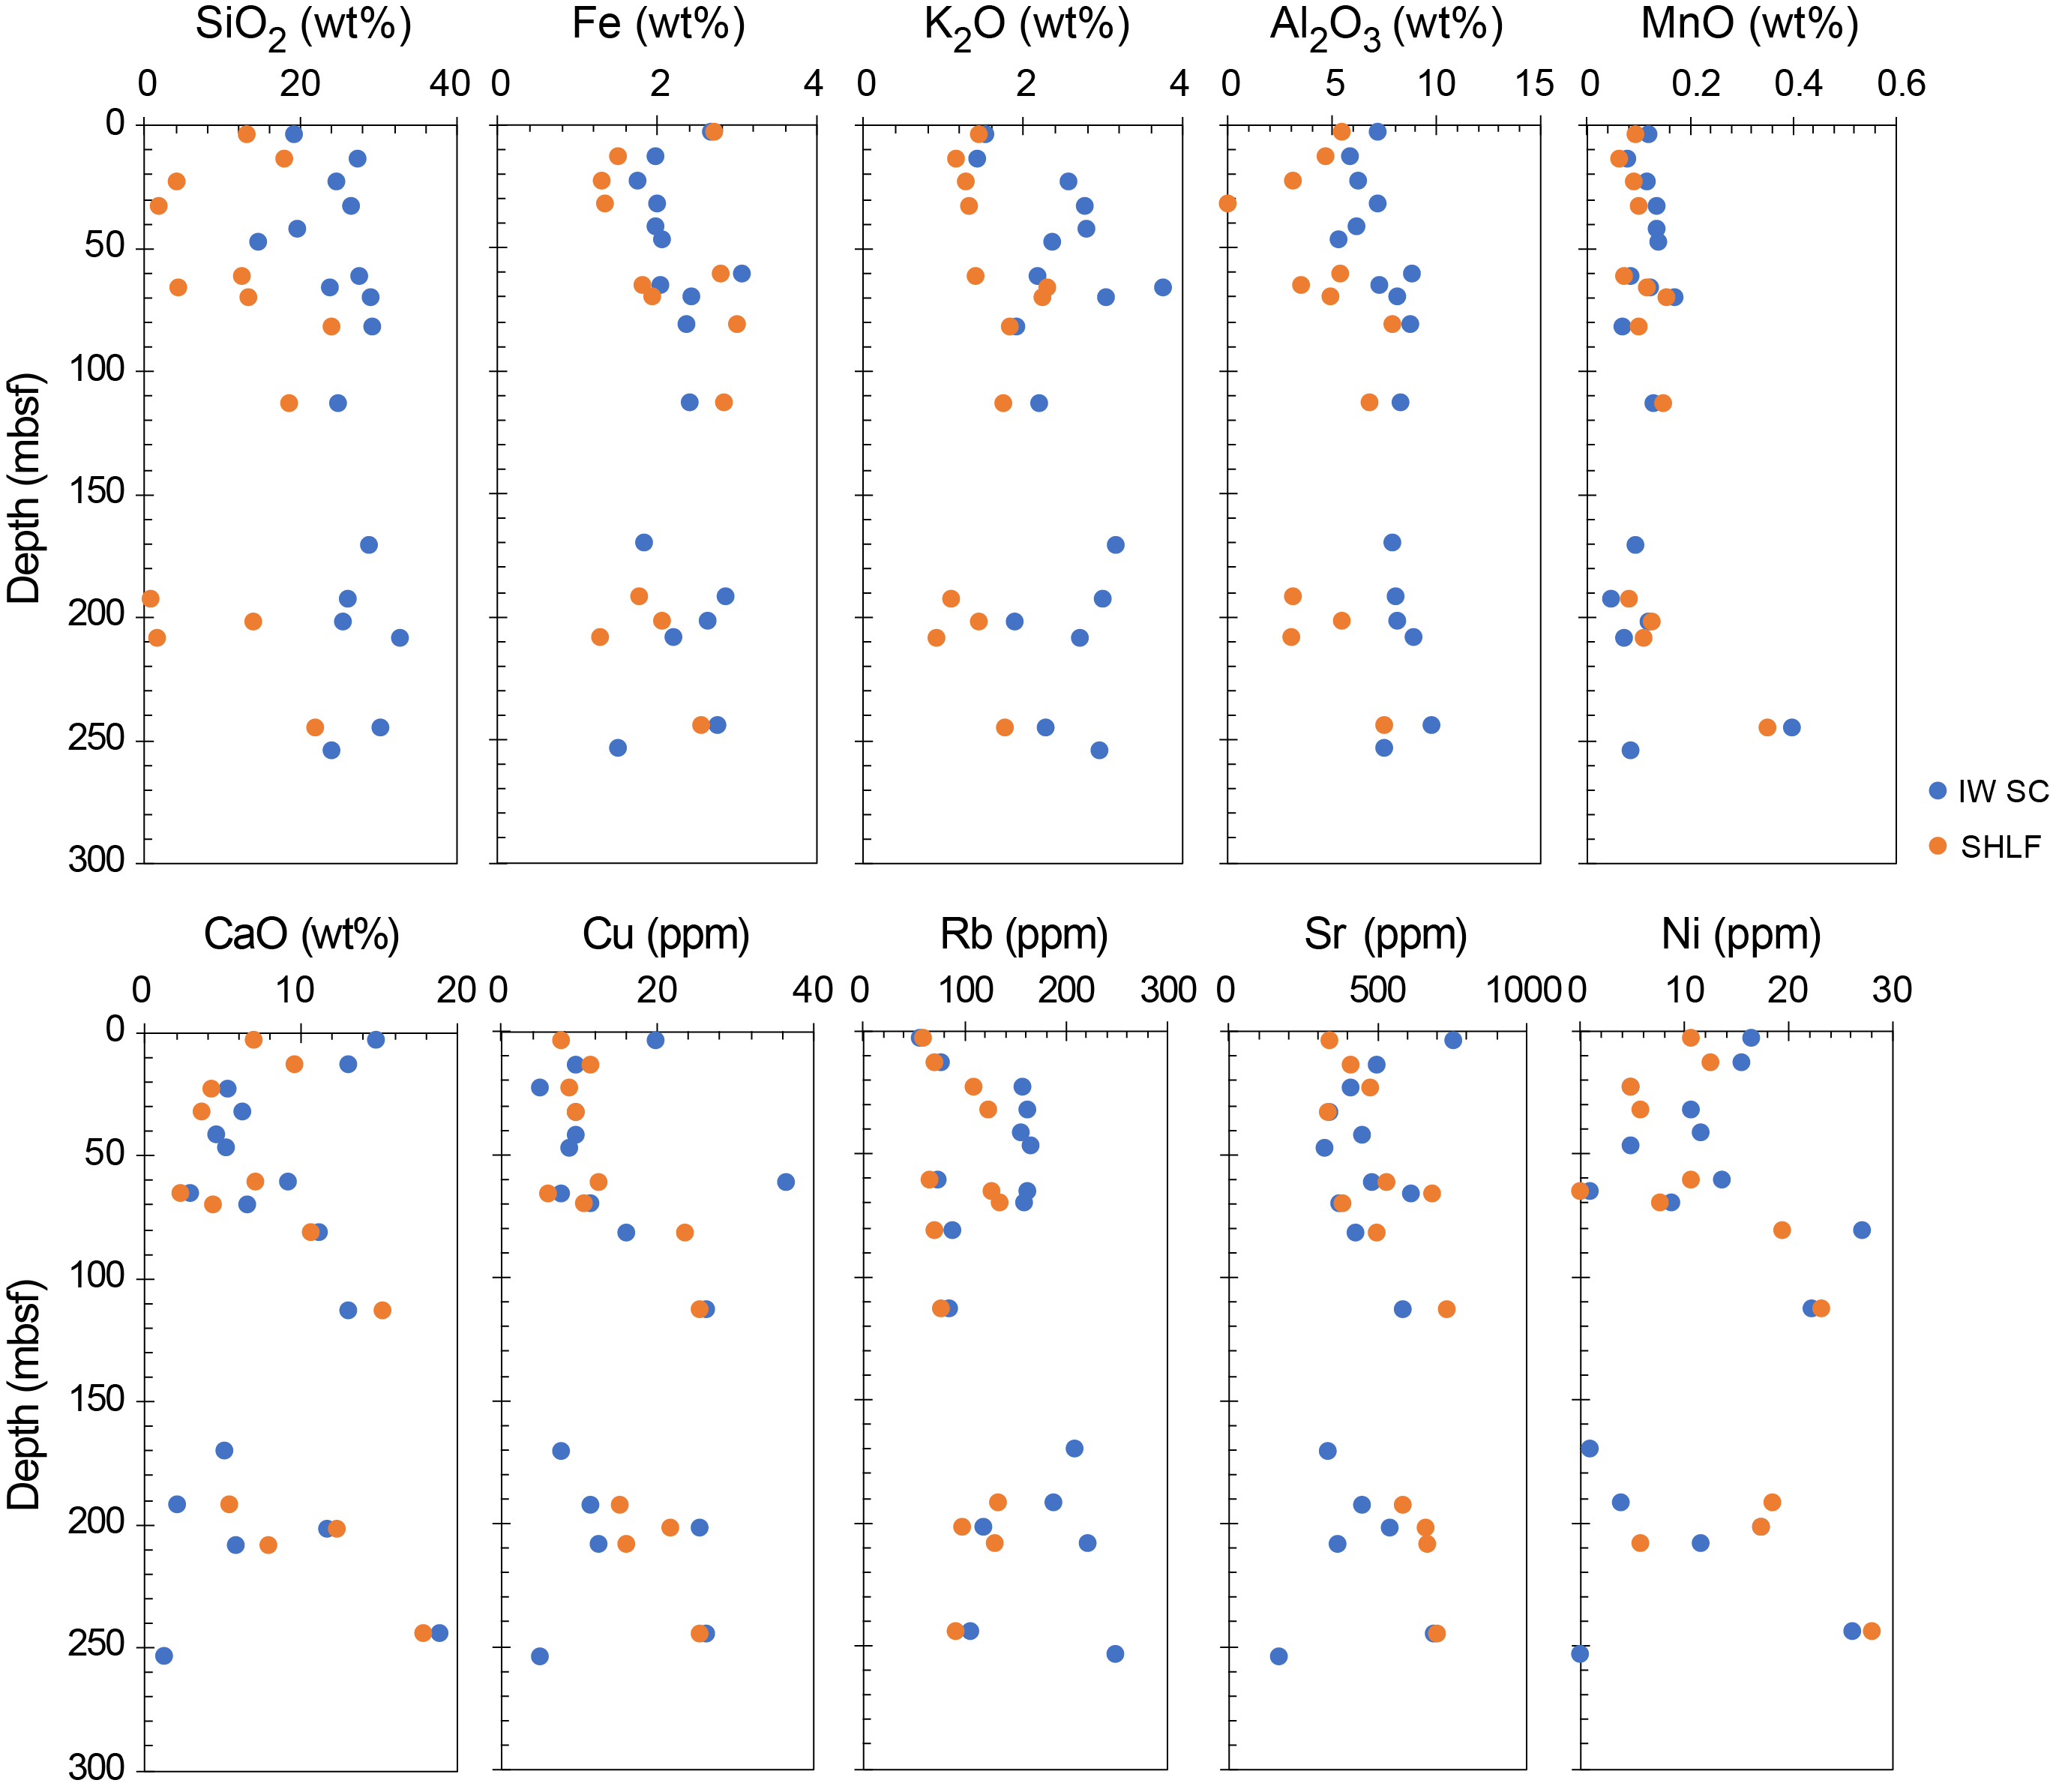
Figure F23. pXRF elemental concentration.
The pXRF data for Site U1615 have a high degree of scatter (Figure F23) due to frequent changes between nannofossil and/or foraminifera-rich materials and volcaniclastic-rich materials even at the scale of a few centimeters. Such small-scale interlayering probably resulted in the high degree of data scatter and pXRF data deviations between IW squeeze cake and nearby section-half core intervals, which is most apparent between about 190 and 210 mbsf (Figure F23). In short, analysis of squeeze cakes compared to section halves likely integrated different layers and volumes of sediment. However, general trends such as increases in K2O and Rb contents and decreases in CaO, Sr, and Ni contents downhole can be seen in the squeeze cakes extracted from the top sediment layer to ~50 mbsf (Figure F23).
Two intervals from Hole U1615A were selected for analysis using ICP-AES. The results of these analyses are presented with LOI values in Table T9. The volcaniclastic-rich silt sample (31X-CC, 42–44 cm) shows lower CaO content and higher total Fe2O3 and alkali contents than the siltstone sample (29X-1, 73–75 cm) because of the higher contribution of volcaniclastic materials in the former (Table T9).
7.3. Headspace gas sample analysis
Sampling and analysis of gas were performed to monitor C1–C6 hydrocarbons in accordance with the standard safety protocol during drilling (Pimmel and Claypool, 2001). A total of 25 headspace samples were analyzed for Hole U1615A to determine their hydrocarbon concentration in parts per million by volume (Figure F24; Table T10). In Hole U1615A, methane (CH4) is the only hydrocarbon gas detected in the cores analyzed between 6.0 and 290.5 mbsf. The amount of methane is considered to be negligible, ranging from undetectable to 5.2 ppmv. Methane concentrations are low and relatively stable between 6.0 and 157.9 mbsf with a mean value of 0.9 ± 0.3 ppmv. In the interval 170.0–244.5 mbsf, the CH4 concentrations are greater, with a mean value of 3.0 ± 1.4 ppmv and the maximum value of 5.2 ppmv occurring in a silt layer with volcaniclastic material at 201.5 mbsf. Below 252.5 mbsf, methane concentrations are low, ranging from undetectable to 1.9 ppmv (mean value = 0.7 ± 0.7 ppmv). Because of the absence of C2–C6 hydrocarbon gases in this hole, the C1/C2 and C1/C+ values were not calculated.
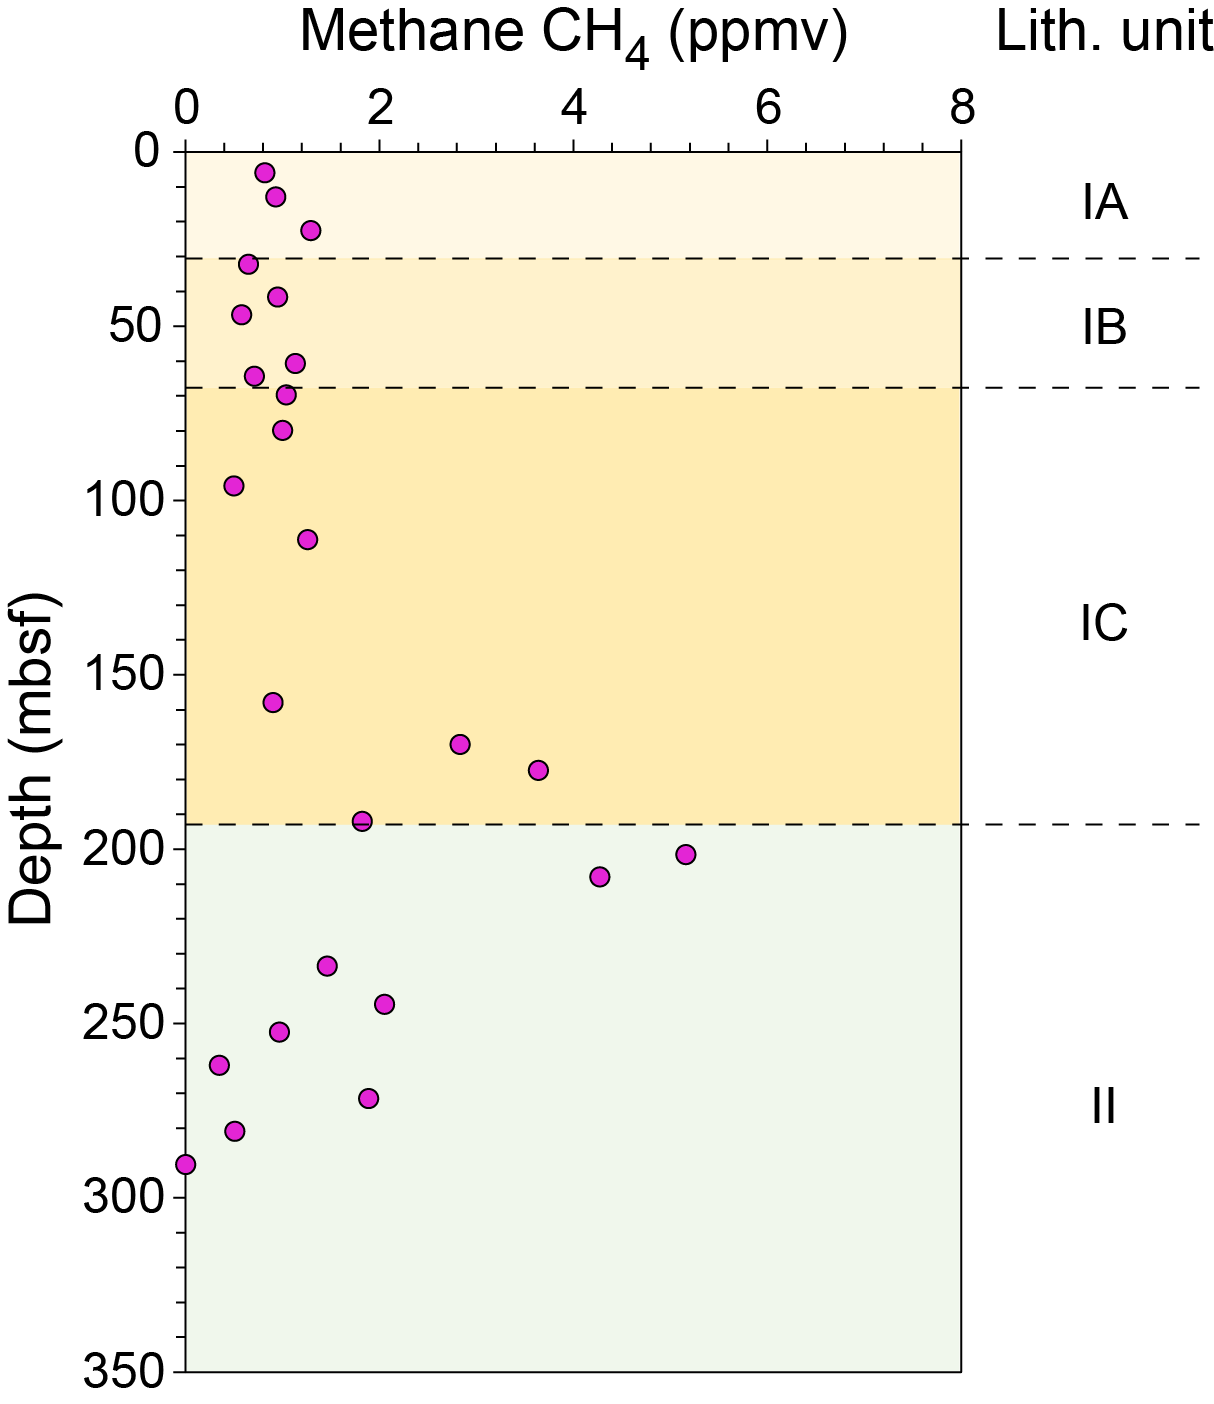
Figure F24. Methane concentrations.
8. Physical properties
Physical properties measured on the sedimentary sequence recovered in Hole U1615A included gamma ray attenuation (GRA) bulk density, magnetic susceptibility (MS), and P-wave velocity (VP) measured on whole-round sections with the Whole-Round Multisensor Logger (WRMSL), as well as natural gamma radiation (NGR). In addition, we obtained X-ray images of all split-core sections and collected discrete VP measurements with the Gantry system along with moisture and density (MAD) and thermal conductivity measurements (Table T11).
The total penetration depth in Hole U1615A was 300 mbsf with an overall recovery of 38%. WRMSL VP increases with depth from ~1450 to ~1900 m/s (average = 1624 m/s), which is consistent with the expected compaction trend in deepwater sediments (Figure F25). The 25 discrete VP measurements made on the Gantry system agree with the WRMSL data and range 1481–1846 m/s (average = 1596 m/s). We made only one discrete velocity measurement in two different directions in Section 2H-2, showing directional velocity variations from 1513 m/s in the X-direction to 1479 m/s in the Z-direction. We were not able to obtain velocity measurements in the Y-direction because the core was disturbed. For the rest of the cores, we decided to not measure velocity in the Y- and Z-directions because the bayonets did not provide reliable results and damaged the core; therefore, we measured only unidirectional velocity in the X-direction using the caliper tool.
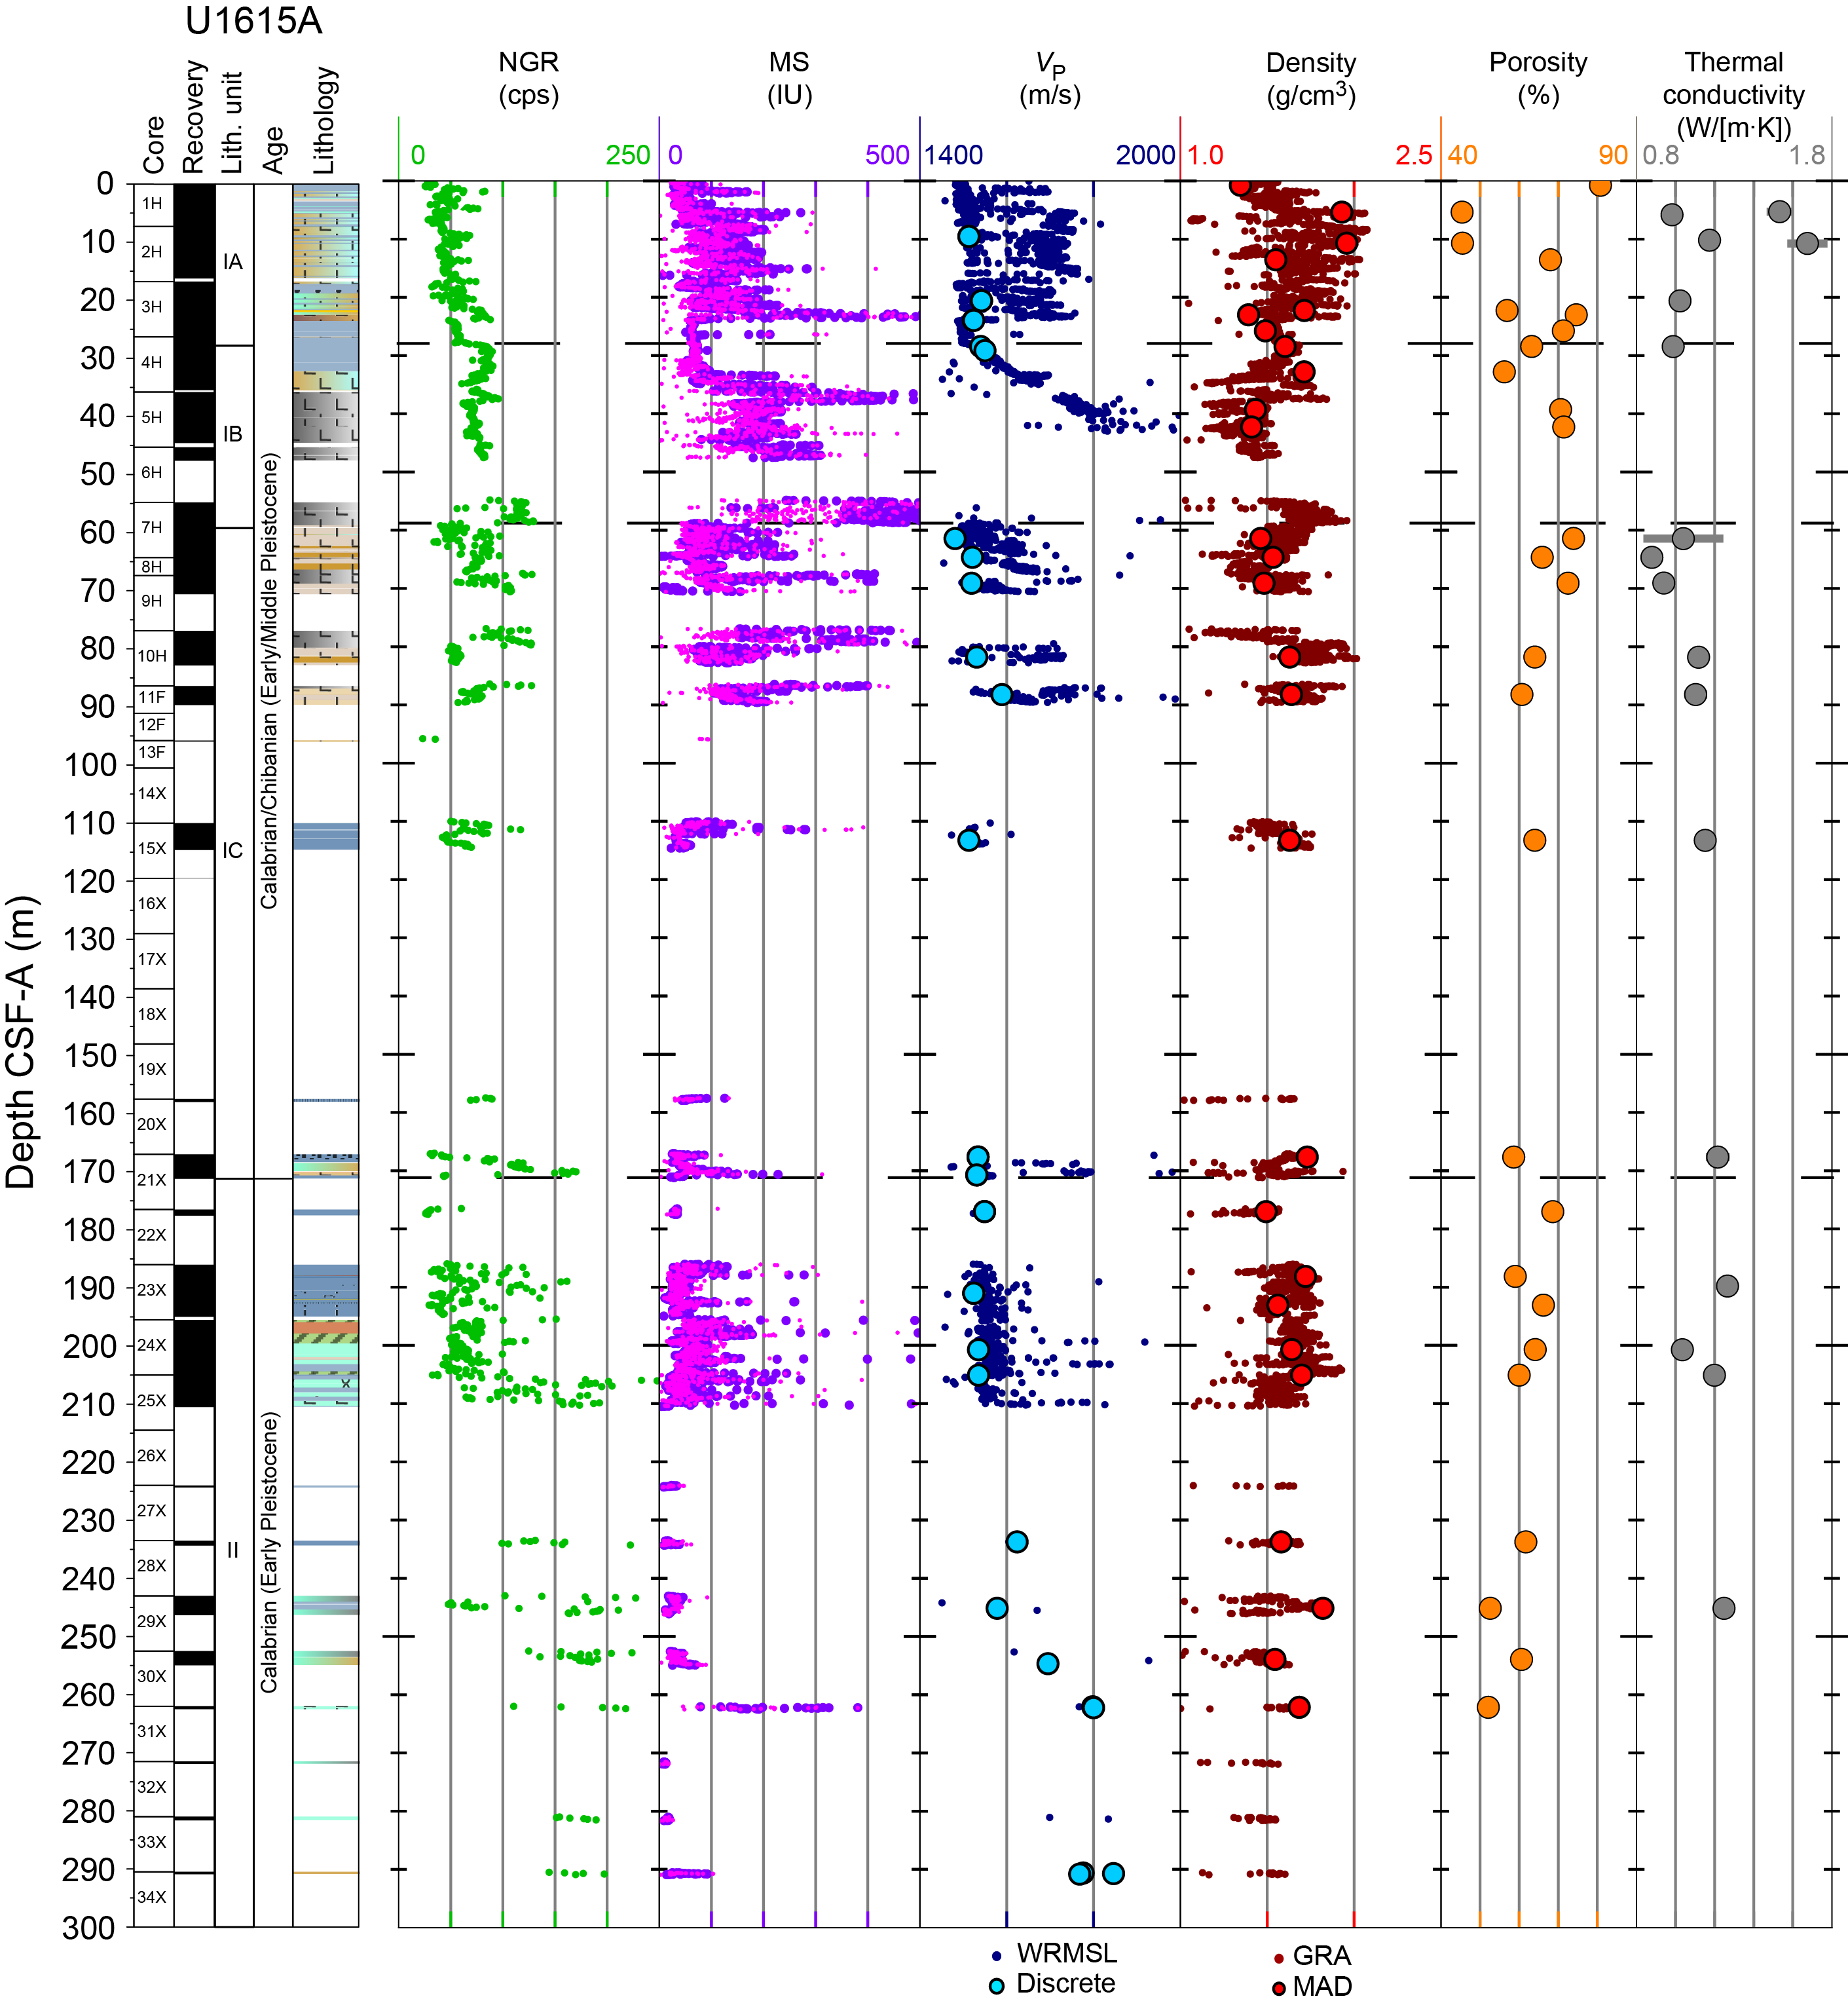
Figure F25. Physical properties.
A total of 27 MAD samples show that the bulk density increases with depth from 1.345 to 1.957 g/cm3 (average = 1.606 g/cm3) and porosity decreases from ~81% at the top of the hole to 45% at the bottom (average = 63%) as in a normal compaction trend, but with local variability due to lithology changes within Lithostratigraphic Unit I.
MS is highly variable in the uppermost 211 m with individual peaks up to 2050 (WRMSL) and 2391 IU (Section Half Multisensor Logger [SHMSL]). In the bottom 89 m, MS has more constant values with an average of 37 IU on both instruments. NGR values, on the other hand, are more constant in the uppermost 211 m with an average value of 72 counts/s and a range of 23–248 counts/s. In the bottom 89 m, the NGR has more variable values, ranging 48–331 counts/s with an average value of 164 counts/s.
Thermal conductivity shows widely scattered values in the upper 50 m (Cores 402-U1615A-1H through 2H), and below this interval there is a general increasing trend downhole ranging 0.85–1.25 W/(m·K). The two highest values of 1.533 and 1.675 W/(m·K) are observed in the shallow section (Sections 1H-4 and 2H-3, respectively) in volcanic-rich sandy intervals. Except for these two measurements, thermal conductivity remains relatively constant with an average of 1.09 W/(m·K). The physical properties of the sampled sedimentary section are summarized in Figure F25 and listed in Table T12.
8.1. Lithostratigraphic Unit I
8.1.1. Lithostratigraphic Subunit IA
Lithostratigraphic Subunit IA includes the interval from the seafloor to the base of Section 402-U1615A-4H-1 (0–27.81 mbsf). Sediment porosity in this interval varies from 81% to 45% based on seven MAD samples, and bulk density ranges 1.35–1.96 g/cm3 (Table T12). The average VP is 1526 m/s based on three Gantry measurements. NGR shows a generally increasing trend with depth from 25 to 88 counts/s (Figure F25), and MS is highly variable and ranges 25–80 IU with a few peaks up to 580 IU. Thermal conductivity varies from 0.97 to 1.65 W/(m·K). The high variability of physical properties is related to the presence of volcaniclastic layers that alternate with nannofossil ooze layers.
8.1.2. Lithostratigraphic Subunit IB
Lithostratigraphic Subunit IB extends from Section 402-U1615A-4H-2 through Section 7H-3 (27.81–59.22 mbsf). Bulk density in this interval varies from 1.41 to 1.71 g/cm3 based on four MAD samples, and porosity ranges 71%–56% (Table T12). This interval is composed of volcaniclastic-rich gravel and volcaniclastic-rich sand with an average VP of 1545 m/s (based on two Gantry measurements). Thermal conductivity was difficult to measure on these rocks, and only one measurement gave a value of 0.988 W/(m·K). MS varies greatly with a peak of 1150 IU, and NGR is also variable between 40 and 129 counts/s (Figure F25). These variations relate to the heterogeneity of the volcanic rocks encountered in Subunit IB.
8.1.3. Lithostratigraphic Subunit IC
Lithostratigraphic Subunit IC extends from the top of Section 402-U1615A-7H-4 to the base of Section 21X-CC (59.22–171.2 mbsf). This subunit is composed of nannofossil chalk, volcaniclastic-rich sand, and volcaniclastic-rich mud. Seven MAD samples from this interval showed an average density of 1.59 g/cm3 and average porosity of 66% (Figure F25; Table T12). Based on two measurements, thermal conductivity decreases downhole from 0.88 to 1.22 W/(m·K). MS is generally low with a local peak over 2050 IU in Section 10H-2. NGR varies between 23 and 170 IU, and VP remains low with average values of 1611 (WRMSL) and 1527 m/s (Gantry) (Figure F25).
8.2. Lithostratigraphic Unit II
Lithostratigraphic Unit II extends from Section 402-U1615A-22X-1 through Section 34X-CC (171.2–300 mbsf). The recovery was high only in the upper part of the unit; therefore, the physical properties measurements are highly discontinuous with depth (Figure F25). Nine MAD samples collected from Unit II gave an average density of 1.64 g/cm3 and a porosity of 61% (Table T12). The VP shows an average of 1669 m/s based on 12 Gantry measurements, which is largely representative of the nannofossil-rich chalk intervals abundant in Unit II. Thermal conductivity increases from 1.03 to 1.27 W/(m·K) from the top to the bottom of Unit II based on four measurements. MS shows several peaks with values up to 680 IU, and NGR shows a large variability from 26 to 331 counts/s (Figure F25; Table T12).
9. Downhole measurements
The APCT-3 tool was deployed three times in the upper part of Hole U1615A to measure in situ sediment temperatures. Three measurements were successful at 35.8, 64.30, and 86.4 mbsf (Cores 4H, 7H, and 10H, respectively), with equilibrium temperatures of 17.86°, 21.51°, and 24.96°C after applying the shipboard correction factor (see Downhole measurements in the Expedition 402 methods chapter [Malinverno et al., 2025]). These temperatures are consistent with the equilibrium seafloor temperature of 13.61°C recorded before the second run, yielding a thermal gradient of 13.02°C/100 m (Figure F26; Table T13).
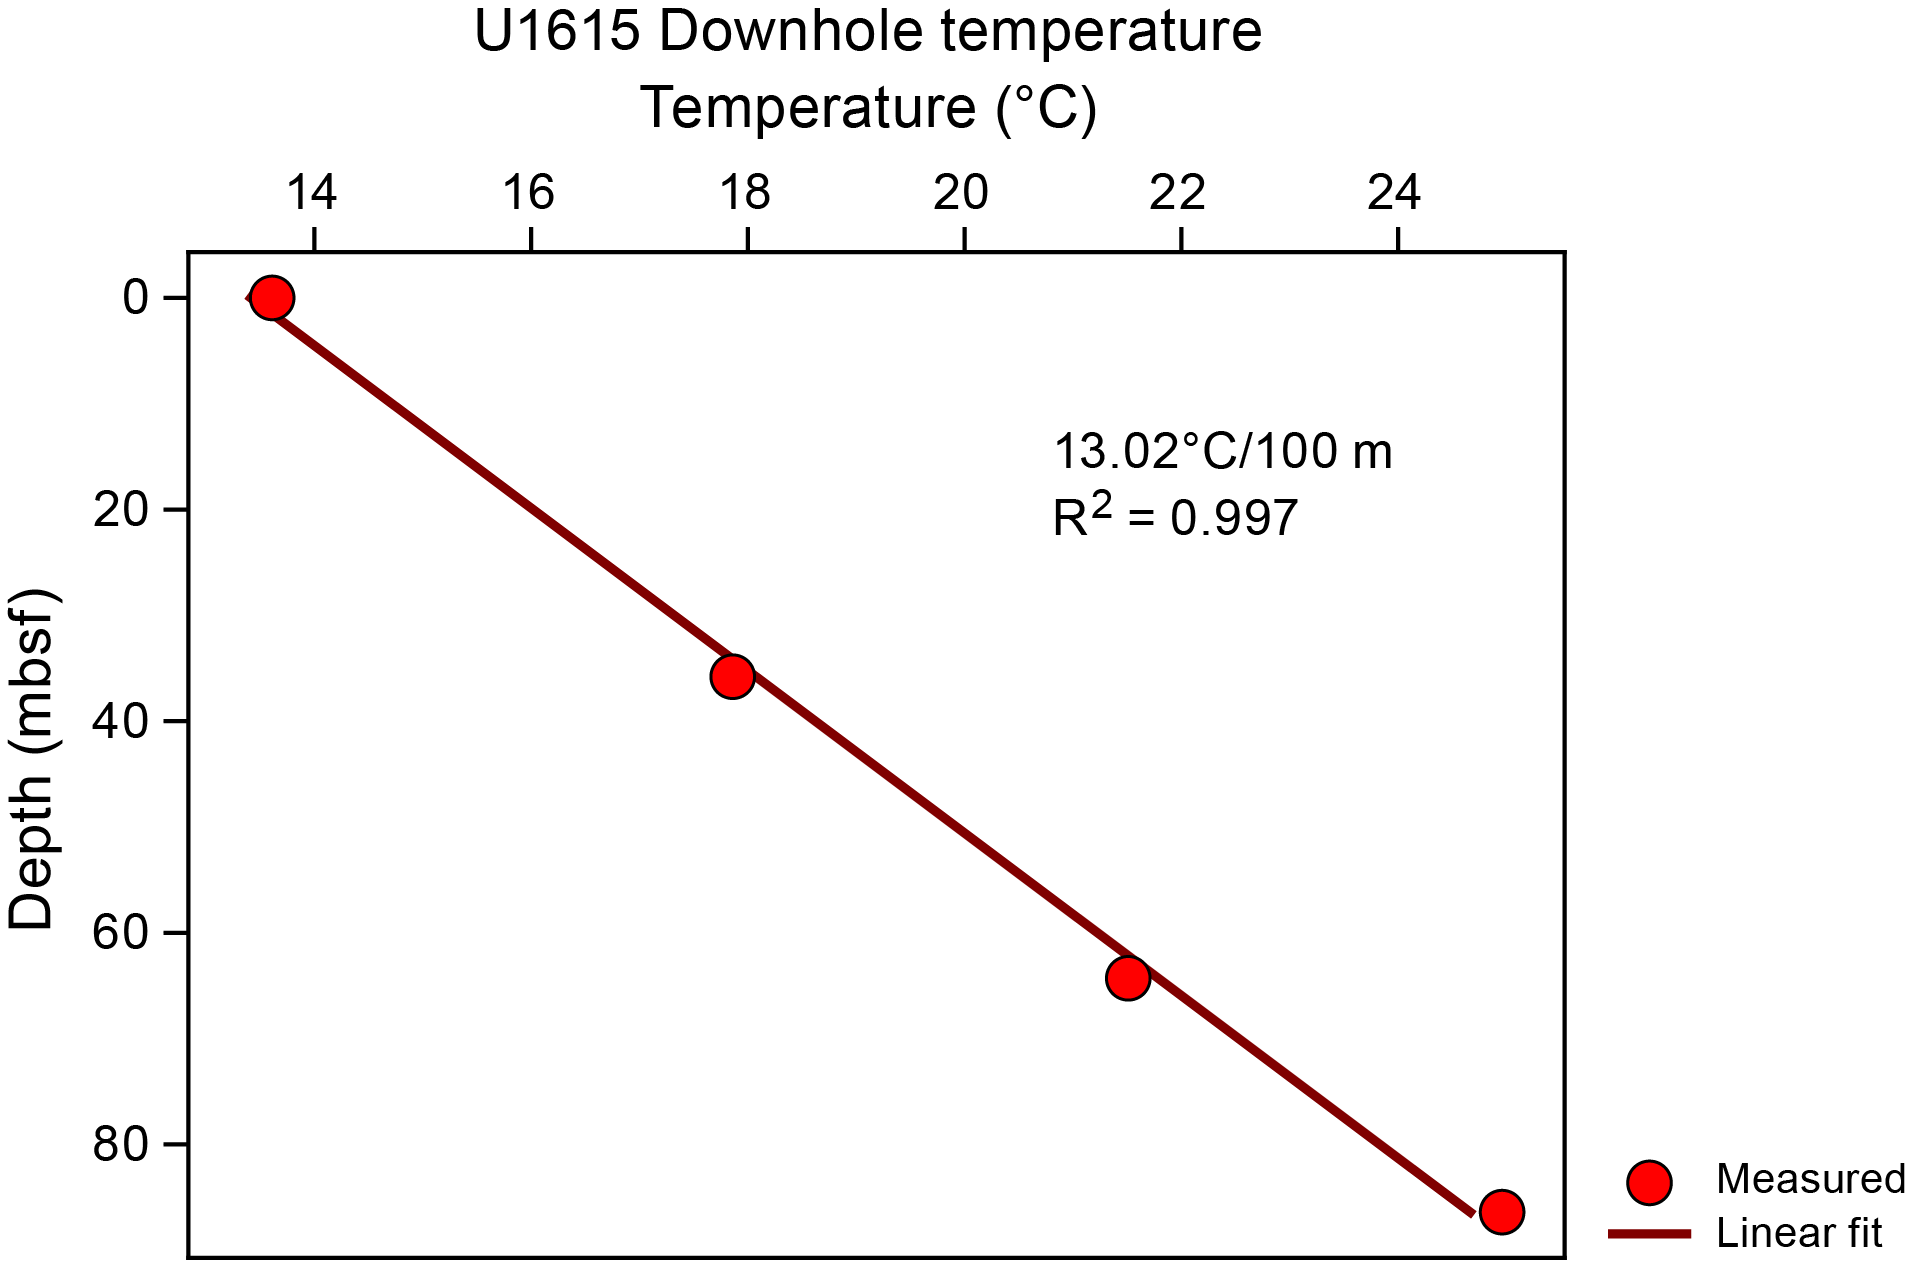
Figure F26. Downhole temperatures.
9.1. Heat flow
With a thermal gradient of 13.02°C/100 m, a heat flow of 148 mW/m2 is obtained for Site U1615 using the average thermal conductivity measured on cores at Site U1615 for the interval over which APCT-3 temperature measurements were made (1.135 W/[m·K]) (see Physical properties). Although slightly lower than average for the region, this result is still high compared to continental averages and compares favorably with the values previously obtained from seafloor measurements (Della Vedova et al., 2001) at ODP Leg 107 Sites 650 (132 mW/m2), 651 (131 mW/m2), and 655 (63 mW/m2) (Kastens, Mascle, Auroux et al., 1987) and at Sites U1612 (184 mW/m2) and U1614 (217 mW/m2).
10. Microbiology
10.1. Sediment
Site U1615 was drilled to 300 mbsf. We carried out microbiological analyses to search for life in the sediments at various depths, including measurements of dissolved oxygen in sediment IW, contamination tests using PFD, and the collection of samples for shore-based molecular biology and culture studies.
10.1.1. Oxygen profiles
Oxygen is the first molecule to be reduced during microbial degradation of organic matter, and its concentration in Hole U1615A (Subunits 1A–1C) was measured immediately after core recovery, beginning with Core 1H. Core 1H was measured at several points in the upper 20 cm of Section 1H-1, and the lowest value of 0.73 µmol/L was found at 0.2 mbsf; readings became undetectable below this depth (Figure F27; Table T14). However, an increase in oxygen concentrations began at 17.5 mbsf. Despite the attempts to continue with the measurements in deeper cores, the sandy composition or the presence of water could lead to erroneous measurements. The values from Cores 402-U1615A-3H and 4H might have been affected by the introduction of oxygen into the cores, resulting in false readings.
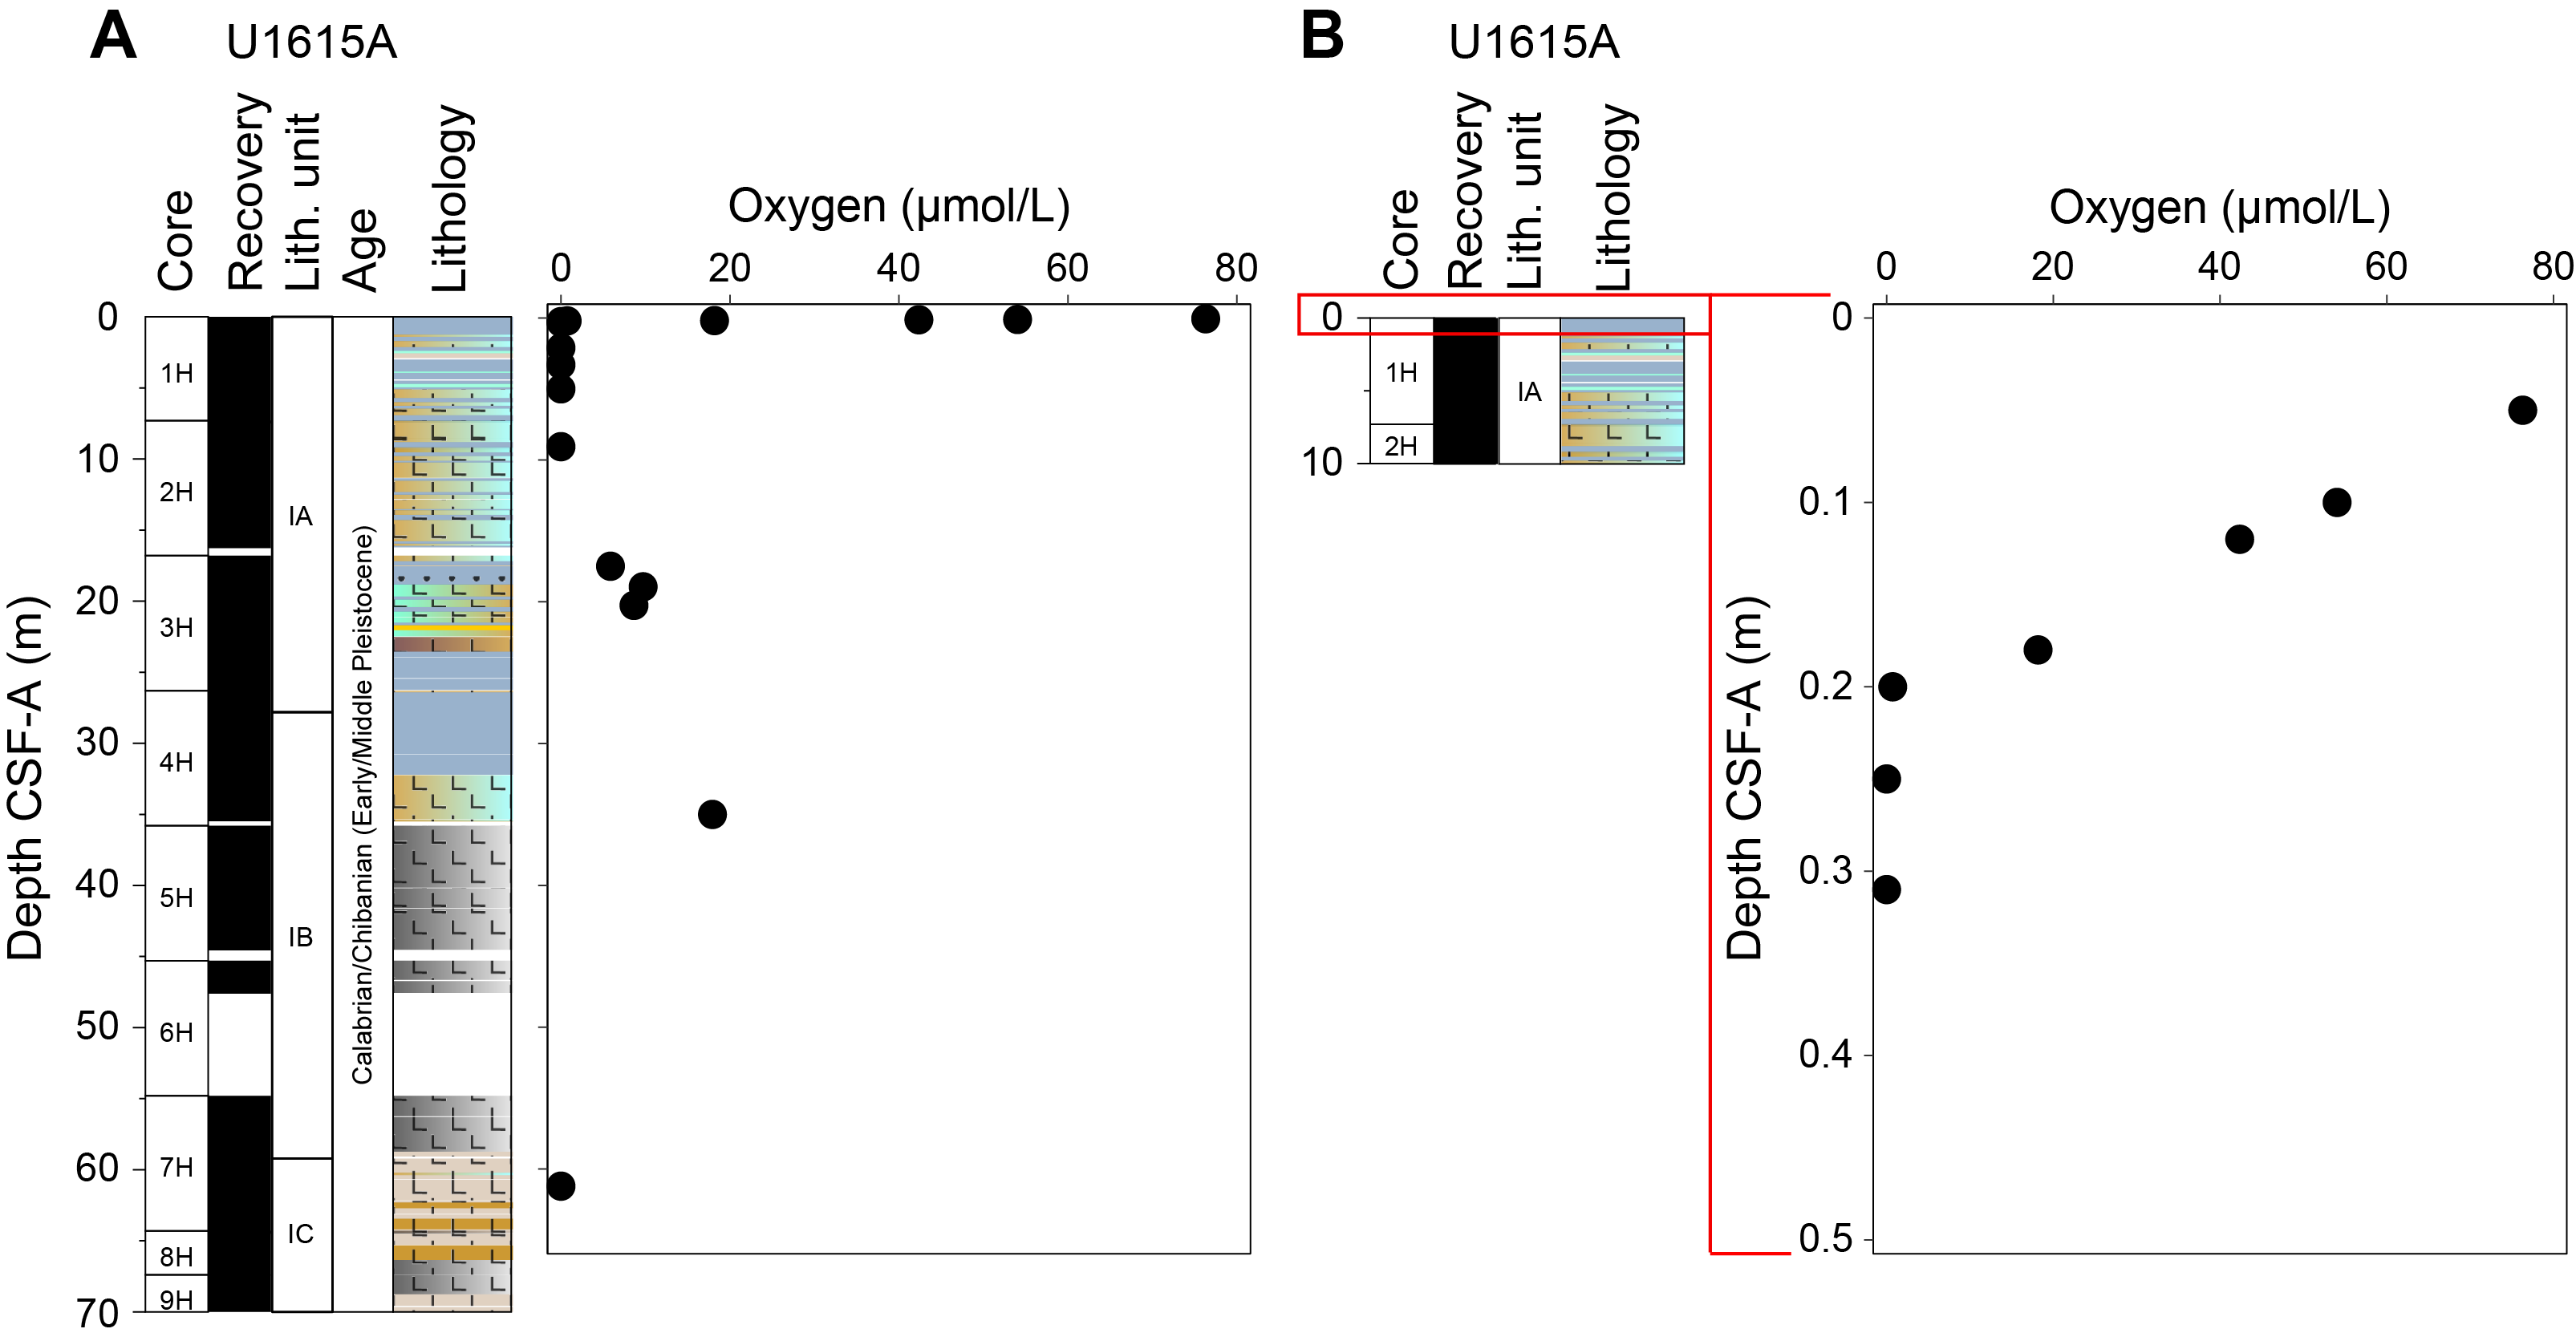
Figure F27. Oxygen concentration profile.
10.1.2. Microbiological contamination testing
PFD, an inert chemical substance, was used as a tracer to determine the extent of drill fluid contamination in microbiological samples. It was injected into the drilling fluid at a concentration of 0.4 mL/L during circulation in Hole U1615A. Drilling fluid was collected in glass vials as external samples (from drilling fluid in the core liner) and internal samples (taken inside the core along with microbiological samples) were taken. Detection of PFD in the cores indicates drilling fluid intrusion into the sediments.
A total of 14 samples of drilling fluid, both exterior and interior, were collected on the catwalk. PFD was detected in external samples, indicating the expected presence of the tracer. PFD was detected in a total of six interiors of core samples, indicating they were affected by drilling fluid intrusion (Sections 402-U1615A-1H-4, 21X-2, 24X-6, 25X-4, 29X-3, and 30X-2); interior samples had a median of 0.5 PFD/g, and exterior samples had a median of 0.01 PFD/g (Figure F28; Table T15). The sample from Section 21X-2 was severely affected by drilling fluid intrusion.
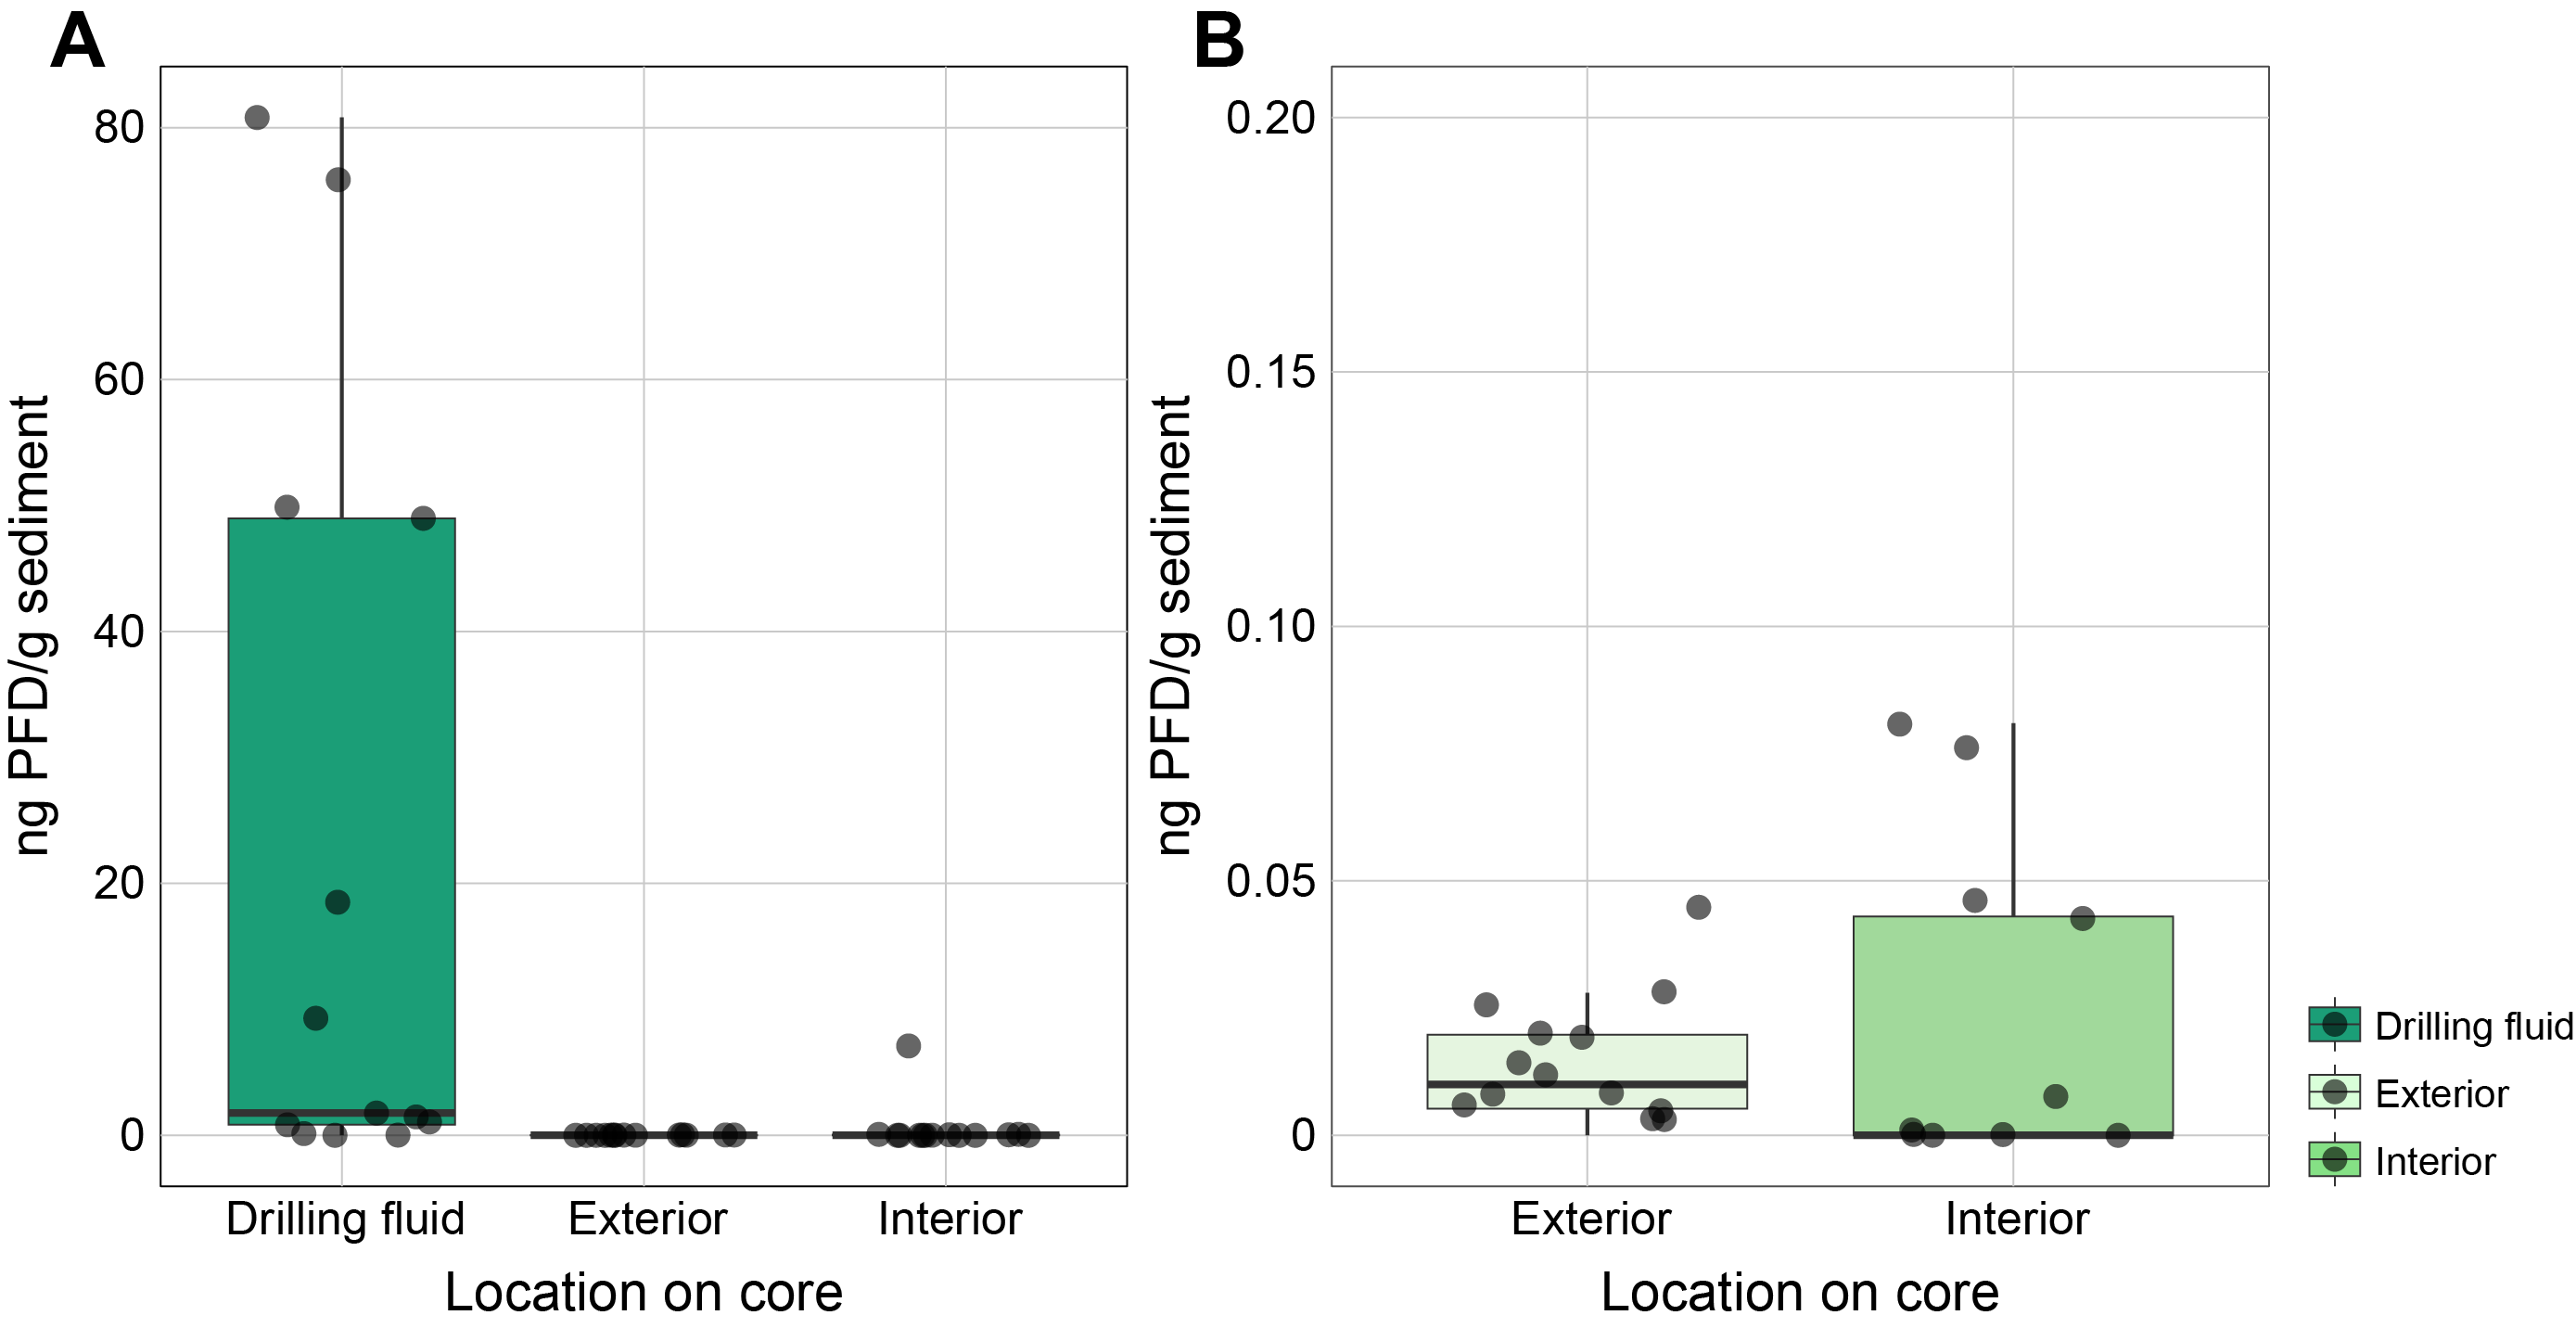
Figure F28. PFD tracer concentrations.
10.1.3. Microbiological sampling
10.1.3.1. Microbial community
Sediment samples were collected in Hole U1615A for analysis of the resident microbial communities. For this analysis, 5 cm long whole rounds were collected every 20 m for metagenomic analysis and a 10 mL plug was extracted from the center of each core for 16S rRNA gene amplification and sequencing. These samples were bagged and frozen at −86°C immediately after collection for onshore analysis.
10.1.3.2. Microbial experiments
An additional whole-round sample was collected on the catwalk to perform microbial experiments on samples from possible geochemical transition zones where there may be important changes in sediment and IW composition affecting the distribution and availability of nutrients and elements essential for life. One whole-round sample (Section 1H-3) was selected for processing in the anaerobic chamber under 0% oxygen conditions and kept at 11°C. Then, several experiments were performed, including viral production, prophage induction, enrichment experiments, and an additional viral production from the enrichment cultures. To detect viral activity, the sample was incubated in a 100 mL serum vial under dark conditions while maintaining an anaerobic headspace. Incubations were subsampled at t = 0, t = 4, t = 8, t = 12, and t = 24 h. For each subsample, 1 mL of sample was collected in triplicate, fixed with 54 µL of 37% formaldehyde, and stored at −86°C. Incubations were performed in the anaerobic chamber, and the subsampling was performed in the biosafety cabinet (clean air) without opening the incubation bottles. Enrichment cultures were prepared using two anaerobic culture media (MMJHS and MJYPGS) (see Microbiology in the Expedition 402 methods chapter [Malinverno et al., 2025]) and stored in the dark at room temperature. The sediment was diluted in synthetic anaerobic seawater to facilitate transfer of the sediment to the vials.
10.1.3.3. Viral counts
Plug samples (1 cm3) were taken from each core (9.5 m) and then fixed with 4 mL of a solution of formaldehyde with phosphate-buffered saline (100 mM) and stored at 4°C for onshore analysis.
References
Beccaluva, L., Bonatti, E., Dupuy, C., Ferrara, G., Innocenti, F., Lucchini, F., Macera, P., Petrini, R., Rossi, P.L., Serri, G., Seyler, M., and Siena, F., 1990. Geochemistry and mineralogy of volcanic rocks from ODP Sites 650, 651, 655, and 654 in the Tyrrhenian Sea. In Kastens, K.A., Mascle, J., et al., Proceedings of the Ocean Drilling Program, Scientific Results. 107: College Station, TX (Ocean Drilling Program), 49–47. https://doi.org/10.2973/odp.proc.sr.107.140.1990
Boillot, G., and Winterer, E.L., 1988. Drilling on the Galicia margin: retrospect and prospect. In Boillot, G., Winterer, E. L., et al., Proceedings of the Ocean Drilling Program, Scientific Results. 103: College Station, TX (Ocean Drilling Program), 809–828. https://doi.org/10.2973/odp.proc.sr.103.180.1988
Bonatti, E., Seyler, M., Channell, J.E.T., Giraudeau, J., and Mascle, G., 1990. Peridotites drilled from the Tyrrhenian Sea, ODP Leg 107. In Kastens, K.A., Mascle, J., et al., Proceedings of the Ocean Drilling Program, Scientific Results. 107: College Station, TX (Ocean Drilling Program), 37–47. https://doi.org/10.2973/odp.proc.sr.107.141.1990
Colantoni, P., Fabbri, A., Gallignani, P., Sartori, R., and Rehault, J.P., 1981. Carta Litologica e Stratigrafica dei Mari Italiani, scala 1/1.500.000. Italy: Litografia Artistica Cartografica.
Della Vedova, B., Bellani, S., Pellis, G., and Squarci, P., 2001. Deep temperatures and surface heat flow distribution. In Vai, G.B. and Martini, I.P., Anatomy of an Orogen: the Apennines and Adjacent Mediterranean Basins. (Springer), 65–76. https://doi.org/10.1007/978-94-015-9829-3_7
Di Stefano, A., Baldassini, N., Raffi, I., Fornaciari, E., Incarbona, A., Negri, A., Negri, A., Bonomo, S., Villa, G., Di Stefano, E., and Rio, D., 2023. Neogene-Quaternary Mediterranean calcareous nannofossil biozonation and biochronology: a review. Stratigraphy, 20(4):259–302. https://www.micropress.org/microaccess/check/2342
Faganeli, J., Planinc, R., Pezdič, Smodiš, B., Stegnar, P., and Ogorelec, B., 1991. Marine geology of the Gulf of Trieste (northern Adriatic): geochemical aspects. Marine Geology, 99(1):93–108. https://doi.org/10.1016/0025-3227(91)90085-I
Goldman, J.C., Caron, D.A., and Dennett, M.R., 1987. Regulation of gross growth efficiency and ammonium regeneration in bacteria by substrate C: N ratio. Limnology and Oceanography, 32(6):1239–1252. https://doi.org/10.4319/lo.1987.32.6.1239
Goñi, M.A., Ruttenberg, K.C., and Eglinton, T.I., 1998. A reassessment of the sources and importance of land-derived organic matter in surface sediments from the Gulf of Mexico. Geochimica et Cosmochimica Acta, 62(18):3055-3075. https://doi.org/10.1016/S0016-7037(98)00217-8
Haese, R.R., Meile, C., Van Cappellen, P., and De Lange, G.J., 2003. Carbon geochemistry of cold seeps: methane fluxes and transformation in sediments from Kazan mud volcano, eastern Mediterranean Sea. Earth and Planetary Science Letters, 212(3):361–375. https://doi.org/10.1016/S0012-821X(03)00226-7
Heezen, B.C., Gray, C., Segre, A.G., and Zarudski, E.F.K., 1971. Evidence of foundered continental crust beneath the central Tyrrhenian Sea. Nature, 229(5283):327–329. https://doi.org/10.1038/229327a0
Hopkinson, C.S., Fry, B., and Nolin, A.L., 1997. Stoichiometry of dissolved organic matter dynamics on the continental shelf of the northeastern U.S.A. Continental Shelf Research, 17(5):473–489. https://doi.org/10.1016/S0278-4343(96)00046-5
Jørgensen, B.B., 2000. Pathways of organic matter degradation. In Schulz, H.D., and Zabel, M. (Eds.), Marine Geochemistry (2nd edition). Berlin (Springer-Verlag).
Jørgensen, B.B., Nelson, D.C., Amend, J.P., Edwards, K.J., and Lyons, T.W., 2004. Sulfide oxidation in marine sediments: geochemistry meets microbiology. In Amend, J.P., Edwards, K.J., and Lyons, T.W. (Eds.), Sulfur Biogeochemistry - Past and Present. 379: Special Paper - Geological Society of America. https://doi.org/10.1130/0-8137-2379-5.63
Kastens, K.A., and Mascle, J., 1990. The geological evolution of the Tyrrhenian Sea; an introduction to the scientific results of ODP Leg 107. In Kastens, K.A., Mascle, J., et al., Proceedings of the Ocean Drilling Program, Scientific Results. 107: College Station, TX (Ocean Drilling Program), 3–26. https://doi.org/10.2973/odp.proc.sr.107.187.1990
Kastens, K.A., Mascle, J., Auroux, C., et al., 1987. Proceedings of the Ocean Drilling Program, Initial Reports: College Station, TX (Ocean Drilling Program). https://doi.org/10.2973/odp.proc.ir.107.1987
Kirschvink, J.L., 1980. The least-squares line and plane and the analysis of palaeomagnetic data. Geophysical Journal International, 62(3):699–718. https://doi.org/10.1111/j.1365-246X.1980.tb02601.x
Lirer, F., Foresi, L.M., Iaccarino, S.M., Salvatorini, G., Turco, E., Cosentino, C., Sierro, F.J., and Caruso, A., 2019. Mediterranean Neogene planktonic foraminifer biozonation and biochronology. Earth-Science Reviews, 196:102869. https://doi.org/10.1016/j.earscirev.2019.05.013
Lister, G.S., and Davis, G.A., 1989. The origin of metamorphic core complexes and detachment faults formed during Tertiary continental extension in the northern Colorado River region, U.S.A. Journal of Structural Geology, 11(1):65–94. https://doi.org/10.1016/0191-8141(89)90036-9
Malinverno, A., Zitellini, N., Estes, E.R., Abe, N., Akizawa, N., Bickert, M., Cunningham, E.H., Di Stefano, A., Filina, I.Y., Fu, Q., Gontharet, S., Kearns, L.E., Koorapati, R.K., Lei, C., Loreto, M.F., Magri, L., Menapace, W., Morishita, T., Pandey, A., Pavlovics, V.L., Pezard, P.A., Poulaki, E.M., Rodriguez-Pilco, M.A., Sanfilippo, A., Shuck, B.D., Vannucchi, P., and Zhao, X., 2025. Expedition 402 methods. In Zitellini, N., Malinverno, A., Estes, E.R., and the Expedition 402 Scientists, Tyrrhenian Continent–Ocean Transition. Proceedings of the International Ocean Discovery Program, 402: College Station, TX (International Ocean Discovery Program). https://doi.org/10.14379/iodp.proc.402.102.2025
Meyers, P.A., 1994. Preservation of elemental and isotopic source identification of sedimentary organic matter. Chemical Geology, 114(3–4):289–302. https://doi.org/10.1016/0009-2541(94)90059-0
Michard, G., Church, T.M., and Bernat, M., 1974. The pore water chemistry of recent sediments in the western Mediterranean basin. Journal of Geophysical Research (1896-1977), 79(6):817–824. https://doi.org/10.1029/JC079i006p00817
Peccerillo, A., 2017. Cenozoic Volcanism in the Tyrrhenian Sea Region: (Springer). https://doi.org/10.1007/978-3-319-42491-0
Pimmel, A., and Claypool, G., 2001. Introduction to shipboard organic geochemistry on the JOIDES Resolution. Ocean Drilling Program Technical Note, 30. https://doi.org/10.2973/odp.tn.30.2001
Prada, M., Sallares, V., Ranero, C.R., Vendrell, M.G., Grevemeyer, I., Zitellini, N., and de Franco, R., 2014. Seismic structure of the Central Tyrrhenian basin: Geophysical constraints on the nature of the main crustal domains. Journal of Geophysical Research: Solid Earth, 119(1):52–70. https://doi.org/10.1002/2013JB010527
Prada, M., Sallares, V., Ranero, C.R., Vendrell, M.G., Grevemeyer, I., Zitellini, N., and de Franco, R., 2015. The complex 3-D transition from continental crust to backarc magmatism and exhumed mantle in the Central Tyrrhenian basin. Geophysical Journal International, 203(1):63–78. https://doi.org/10.1093/gji/ggv271
Roether, W., Manca, B.B., Klein, B., Bregant, D., Georgopoulos, D., Beitzel, V., Kovačević, V., and Luchetta, A., 1996. Recent changes in eastern Mediterranean deep waters. Science, 271(5247):333–335. https://doi.org/10.1126/science.271.5247.333
Rosenbaum, J., Reynolds, R., Smoot, J., and Meyer, R., 2000. Anisotropy of magnetic susceptibility as a tool for recognizing core deformation: reevaluation of the paleomagnetic record of Pleistocene sediments from drill hole OL-92, Owens Lake, California. Earth and Planetary Science Letters, 178(3–4):415–424. https://doi.org/10.1016/S0012-821X(00)00077-7
Shipboard Scientific Party, 1978. Site 373: Tyrrhenian Basin. In Hsü, K., Montadert, L., et al., Initial Reports of the Deep Sea Drilling Project. 42(1): Washington, DC (US Government Printing Office), 151–174. https://doi.org/10.2973/dsdp.proc.42-1.104.1978
Tanhua, T., Hainbucher, D., Schroeder, K., Cardin, V., Álvarez, M., and Civitarese, G., 2013. The Mediterranean Sea system: a review and an introduction to the special issue. Ocean Science, 9(5):789–803. https://doi.org/10.5194/os-9-789-2013
Tauxe, L., 2010. Essentials of Paleomagnetism: Oakland, CA (University of California Press).
Tsimplis, M.N., and Baker, T.F., 2000. Sea level drop in the Mediterranean Sea: an indicator of deep water salinity and temperature changes? Geophysical Research Letters, 27(12):1731–1734. https://doi.org/10.1029/1999GL007004
Tucholke, B.E., Lin, J., and Kleinrock, M.C., 1998. Megamullions and mullion structure defining oceanic metamorphic core complexes on the Mid-Atlantic Ridge. Journal of Geophysical Research: Solid Earth, 103(B5):9857-9866. https://doi.org/10.1029/98JB00167
Werne, J.P., Haese, R.R., Zitter, T., Aloisi, G., Bouloubassi, I., Heijs, S., Fiala-Médioni, A., Pancost, R.D., Sinninghe Damsté, J.S., de Lange, G., Forney, L.J., Gottschal, J.C., Foucher, J.-P., Mascle, J., and Woodside, J., 2004. Life at cold seeps: a synthesis of biogeochemical and ecological data from Kazan mud volcano, eastern Mediterranean Sea. Chemical Geology, 205(3):367–390. https://doi.org/10.1016/j.chemgeo.2003.12.031