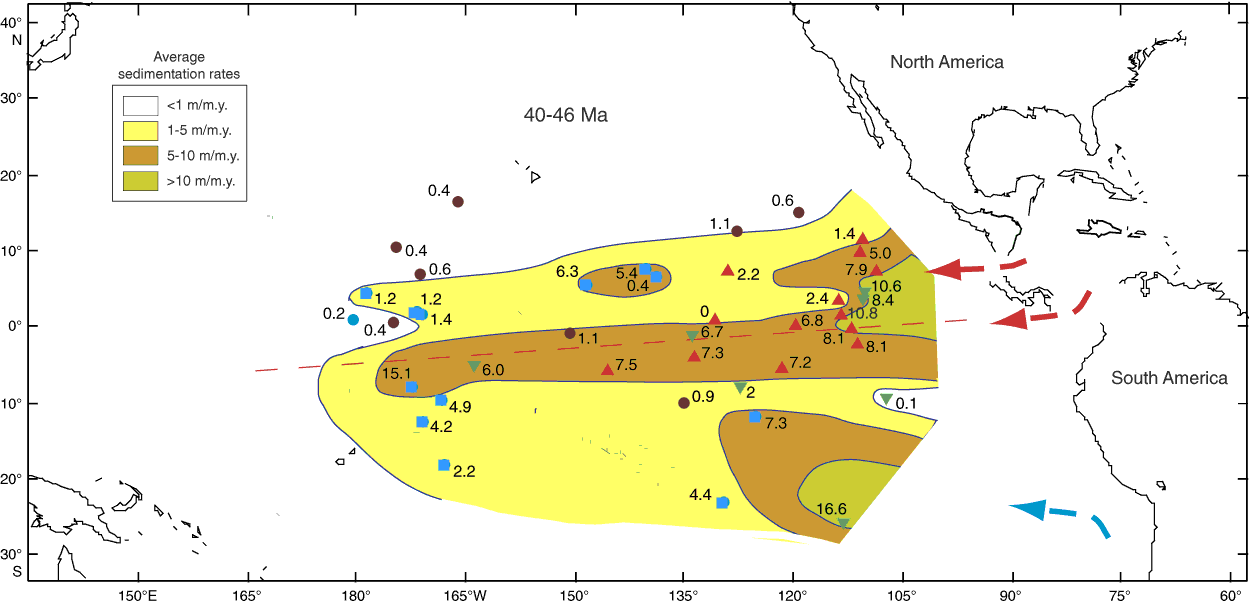
Figure F7. Average sediment accumulation for the interval 40–46 Ma (after Moore et al., 2004). Site positions are backtracked to their estimated position at 43 Ma. Site location solid circles are colored according to sediment type for the time interval: blue = carbonate, green = siliceous carbonate, red = siliceous, brown = clay. Contours are at 1, 5, and 10 m/m.y. Red dashed line indicates the approximate geographic paleoequator based on the sediment archive—with a notable difference compared to the fixed-hotspot rotation. Two regions of relatively high accumulation occur on both sides of the paleoequator in addition to the primary upwelling center.

Previous | Close | Next | Top of page