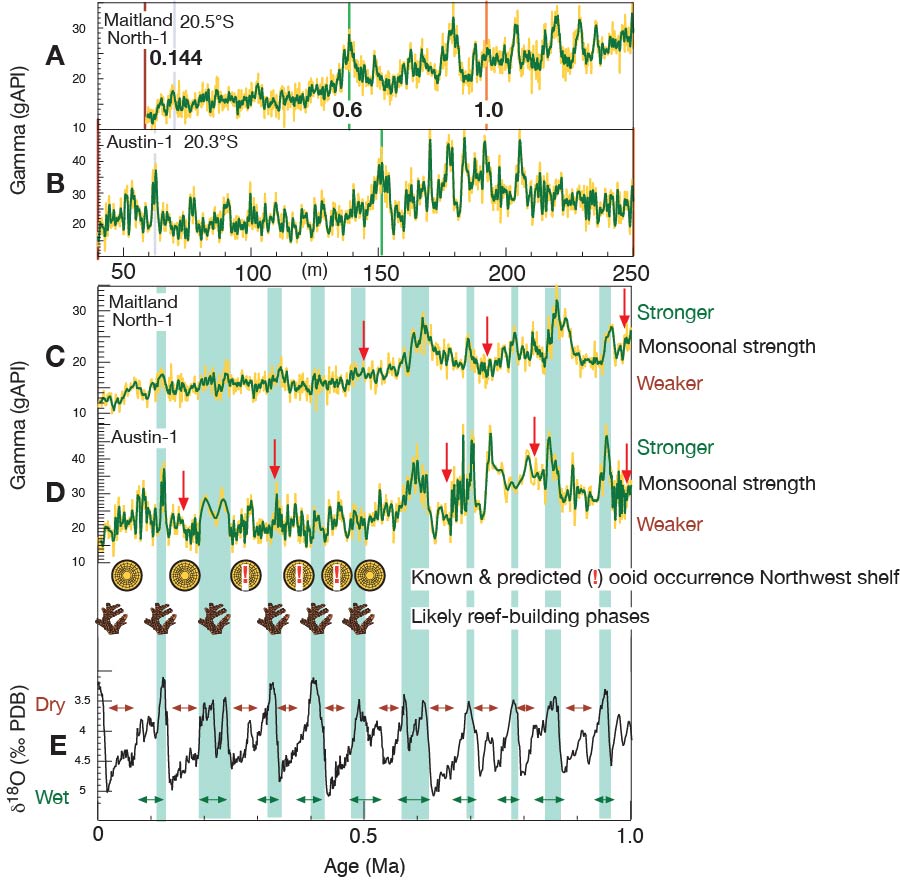
Figure F6. A, B. Gamma profiles (in depth) from Maitland North-1 and Austin-1 wells (Gallagher et al., 2009; in press). C, D. Gamma profiles of these two wells plotted with age. Intervals of increased clay input (gamma peaks) reflect relatively stronger monsoonal intensity. We also show the ages of known and predicted ooid occurrences and interpreted reef-building phases. E. Data from Maitland North-1 and Austin-1 wells are expanded to show possible correlations (0–1.0 Ma) to interglacial isotopic maxima in the LR2004 stack (Lisiecki and Raymo, 2005).
Previous | Close | Next | Top of page