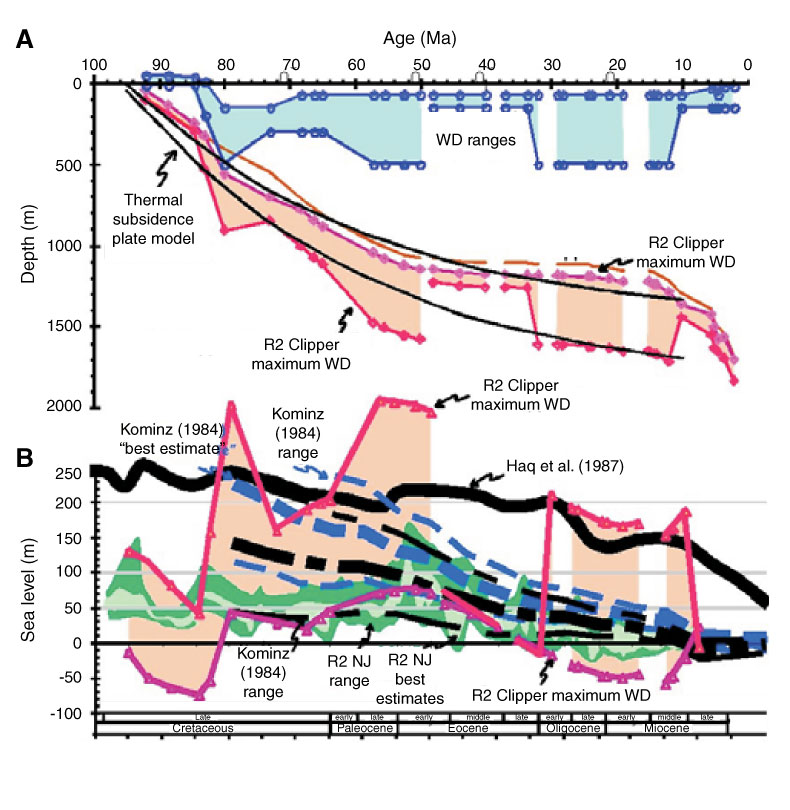
Figure F6. Revised subsidence analysis for the Clipper exploration well with eustatic estimates. A. Water depth (WD) (blue), tectonic subsidence (red), and theoretical thermal curves (minimum and maximum) for the Clipper exploration well (Figs. F2, F3). As Figure F5 also shows, most tectonic subsidence occurred during the early Late Cretaceous, with mild uplift during the latest Cretaceous. This analysis also shows the low rates of tectonic subsidence between 30 and ~8 Ma and the increase in total subsidence beginning at ~8 Ma, which may be associated with increasing convergence at the Alpine Fault. B. R2, an estimate of eustasy, has large uncertainties due to the poorly constrained paleowater depths of much of the sediment preserved in the Clipper well (M. Kominz, unpubl. data). NJ = New Jersey.
Previous | Close | Next | Top of page