Li, C.-F., Lin, J., Kulhanek, D.K., and the Expedition 349 Scientists, 2015
Proceedings of the International Ocean Discovery Program Volume 349
publications.iodp.org

doi:10.14379/iodp.proc.349.104.2015
Site U14321
C.-F. Li, J. Lin, D.K. Kulhanek, T. Williams, R. Bao, A. Briais, E.A. Brown, Y. Chen, P.D. Clift, F.S. Colwell, K.A. Dadd, W.-W. Ding, I. Hernández-Almeida, X.-L. Huang, S. Hyun, T. Jiang, A.A.P. Koppers, Q. Li, C. Liu, Q. Liu, Z. Liu, R.H. Nagai, A. Peleo-Alampay, X. Su, Z. Sun, M.L.G. Tejada, H.S. Trinh, Y.-C. Yeh, C. Zhang, F. Zhang, G.-L. Zhang, and X. Zhao2
Keywords: International Ocean Discovery Program, IODP, JOIDES Resolution, Expedition 349, Site U1432, South China Sea, continent/ocean boundary, deep-marine turbidite, nannofossils, deep biosphere, continental breakup, seafloor spreading, magnetic anomalies, sedimentation rate, pyrite nodule
MS 349-104: Published 30 March 2015
Background and objectives
International Ocean Discovery Program (IODP) Site U1432 is located ~60 km south of Ocean Drilling Program (ODP) Site 1148 (Shipboard Scientific Party, 2000; Li et al., 2006; Wang and Li, 2009), just south of the northern continent/ocean boundary (Figure F1). This part of the basin has the deepest basement in the northern part of the South China Sea and is likely the oldest among the subbasins based on magnetic anomalies (Taylor and Hayes, 1980, 1983; Pautot et al., 1986; Briais et al., 1993). This site was chosen to recover the oldest oceanic crust and the oldest sedimentary rocks in the East Subbasin to test the hypothesis that the onset of seafloor spreading in the South China Sea occurred here first at ~32 Ma. Magnetic Anomaly 11, the oldest anomaly interpreted by Taylor and Hayes (1980) and Briais et al. (1993), passes near this site (Figure F2) and hence would allow key calibrations between ages estimated from magnetic anomalies and in situ ages from biostratigraphy, radiometric dating, and magnetostratigraphy.
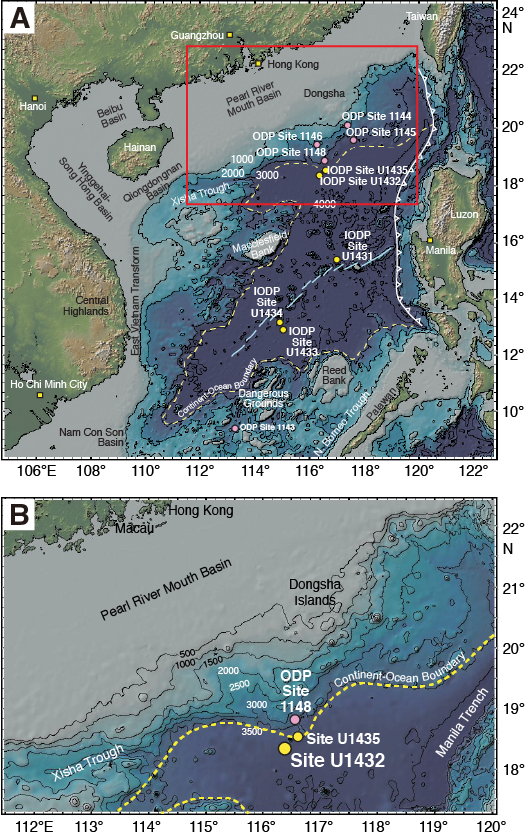
Figure F1. SCS regional bathymetry.
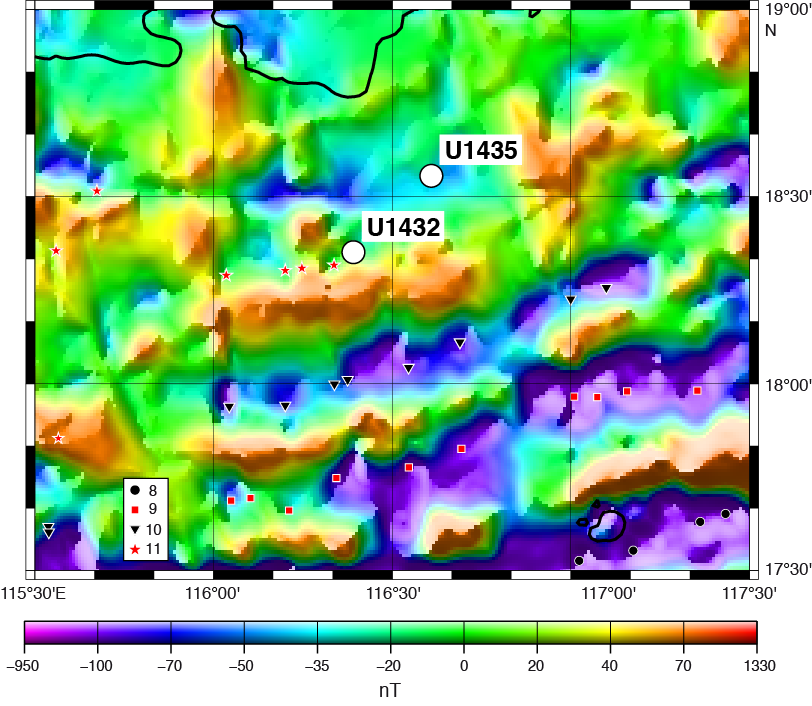
Figure F2. Magnetic anomalies.
The true nature of the continent–ocean transition and oceanic basement at this site is speculative (Figure F3); there could be volcanic extrusions associated with early continental breakup and the onset of seafloor spreading, exhumed lower crustal material from preferential lower crust extension, exhumed mantle material, or Mesozoic rocks. Coring at this site will help pinpoint the exact location and tectonic nature of the continent–ocean transition and address key problems in the early tectonic transition from rifting to drifting and associated paleoenvironmental changes, including the following:

Figure F3. Regional contoured bathymetry.
- The age of basement (presumably the oldest oceanic crust) near the continent/ocean boundary;
- Petrological and geochemical characteristics of basement rocks and their bearings on continental breakup, incipient seafloor spreading, and mantle evolution;
- Physical properties of basement rocks and their implications for interpreting sharp magnetic contrasts between different subbasins; and
- Sedimentary, paleoceanographic, and ecosystem responses to the opening of the South China Sea.
Because of operational challenges (see Operations), the objectives of sampling basement and basal sediments at Site U1432 were not achieved.
Operations
The primary objectives at this site required deep penetration, so the plan was to install a reentry cone and casing system. Site U1432 (proposed Site SCS-6A) consisted of three holes (Table T1). The first hole (U1432A) was a planned jet-in test to determine the correct casing depth for the 20 inch casing string. The second hole (U1432B) was to consist of a reentry system with three strings of casing to ~900 meters below seafloor (mbsf), followed by coring to ~1930 mbsf. Because of poor weather conditions, an additional hole (U1432C) was piston cored while waiting on suitable weather to continue the reentry installation.
Table T1. Coring summary, Site U1432. Download table in .csv format.
Hole U1432A was successfully jetted-in to 62.0 mbsf. A reentry system was then successfully installed to 787.1 mbsf in Hole U1432B. The final cement job on the last casing string compromised the reentry system when the drill string became stuck in the cement. The drill string had to be severed, forcing us to abandon Hole U1432B. Hole U1432C was successfully cored to 110.0 mbsf with the advanced piston corer (APC). Four downhole temperature measurements were taken in Hole U1432C with the advanced piston corer temperature tool (APCT-3). A total of 12 APC cores were collected at this site, recovering 88.74 m of core over 110.0 m of penetration (81% recovery). The total time spent on Site U1432 was 492 h (17.9 days).
Transit to Site U1432
The vessel arrived at Site U1432 at 2337 h (UTC + 8 h) on 16 February 2014 after a 181 nmi transit at an average speed of 10.3 kt. An acoustic positioning beacon was deployed at 2352 h. The position reference was a combination of GPS signals and a single acoustic beacon.
Hole U1432A
The bottom-hole assembly (BHA) for the jet-in test was assembled with an 18½ inch tricone bit and run to just above the seafloor. The vessel was offset 20 m south of the original coordinates for Site U1432 when the acoustic beacon landed within 6 m of the coordinates. The subsea camera and frame (VIT) was deployed to observe the bit tag the seafloor (3840.0 meters below rig floor [mbrf]). After picking up the top drive and spacing out the bit, Hole U1432A was spudded at 1525 h on 17 February 2014. The BHA with the 18½ inch tricone bit was jetted into the formation 62.0 m over a 3 h period. The drill string was then pulled clear of the seafloor and the top drive set back. The remainder of the drill string was tripped out of the hole and the bit cleared the rotary table at 0205 h on 18 February, ending Hole U1432A. The total time spent in Hole U1432A was 26.5 h (1.1 days).
Hole U1432B
Based on the results from the jet-in test, a 5-joint, 57.12 m long 20 inch casing string was selected. The 20 inch casing shoe joint was cut off to length and a Texas-pattern casing shoe welded on the end of the shoe joint. The remainder of the reentry cone and base were put together, moved into the moonpool, and positioned underneath the rotary table. The casing was run through the rotary table and the reentry cone in the moonpool. Each casing connection was tack welded to prevent the casing from backing out. The third joint of casing had to be replaced because of a damaged thread on the pin. The casing hanger and casing pup joint were picked up and attached to the top of the casing string. The Dril-Quip CADA (casing) running tool was made up into the casing hanger on the rig floor. The casing was then lowered through the rig floor, into the moonpool, and through the reentry cone. The casing hanger was landed into the landing ring inside the reentry cone and snapped into place inside the cone. The landing joint was lowered to release the weight of the casing. The casing running tool was rotated 3.75 turns to the right and the casing released. A BHA (casing stinger) with an 18½ inch bit, bit sub, and 6 drill collars was lowered into the reentry cone and casing. The casing running tool was inserted into this BHA and latched into the casing hanger in the reentry cone and secured by rotating the upper BHA 3.75 turns to the left. The moonpool doors were opened and the reentry system with the 20 inch casing was lowered through the moonpool to 3819 mbrf. The top drive was picked up and spaced out to jet-in the 20 inch casing. Hole U1432B was spudded at 0635 h on 19 February 2014. Jetting continued as the casing was slowly lowered. Seven hours later, the reentry system landed on the seafloor. The subsea camera was lowered to assist in releasing the casing. After attempting to release the casing for 2.5 h, the casing tool finally released after the vessel was offset from the original position in order to get the casing running tool to rotate. The rotation required to release the tool was observed clearly on the new subsea camera system. The camera was then pulled back to the surface and secured. The drill sting was tripped back to the surface, and the BHA was set back in the derrick. During the trip out of the hole, the rig was secured to slip and cut 115 ft of drilling line as per the slip and cut program.
An underreamer with an 11¾ inch closed diameter was made up to the 18½ inch tricone bit and bit sub. The underreamer was set to open up the 18½ inch hole to 22 inches in diameter. The underreamer and bit were lowered into the moonpool, the top drive was picked up, and the underreamer function was tested. The top drive was then set back, and the remainder of the BHA was assembled and run in the hole to 3828.7 mbrf. During the trip, the VIT was deployed. The bit was spaced out for reentry, and the vessel was positioned using the subsea camera system. Hole U1432B was reentered at 2005 h on 20 February. After reentering the hole, the top drive was picked up and the drill string washed down to the casing shoe at 57.1 mbsf. After carefully washing down below the casing shoe so that the underreamer was below the base of the 20 inch casing, the pump rate and speed were optimized for drilling a 22 inch hole below the 20 inch casing. Drilling continued to 4000.0 mbrf (160.0 mbsf). Drilling was suspended at 0610 h on 21 February when weather conditions worsened and the high heave of the vessel began to severely affect the weight on the bit and underreamer. The bit was tripped back inside the 20 inch casing, and the top drive was set back. The drill string was then tripped back to the surface, clearing the seafloor at 0835 h on 21 February, and finally clearing the rig floor at 1620 h. The underreamer and bit were inspected and laid out and the BHA racked back into the derrick. While waiting on the weather to subside, the vessel offset 40 m south to be well away from the reentry cone for Hole U1432B. An APC hole (U1432C) was cored and, after coring to 110.0 mbsf, the weather appeared to have subsided sufficiently for another attempt at drilling out the 22 inch hole for the 16 inch casing.
After tripping out of Hole U1432C, the BHA was set back in the derrick and the upper guide horn was removed and laid out on the drill collar racks. We then returned to Hole U1432B to continue drilling the 22 inch hole for the 16 inch casing. As before, an underreamer with an 11¾ inch closed diameter was made up to the 18½ inch tricone bit and bit sub. The underreamer was set to open up the 18½ inch hole to a 22 inch diameter. The underreamer and bit were lowered into the moonpool, the top drive picked up, and the underreamer function tested. The top drive was set back, and the remainder of the BHA was assembled and run in the hole to 3828.7 mbrf. During the trip, the VIT was deployed. The bit was spaced out for reentry, and Hole U1432B was reentered at 1944 h on 23 February. The VIT was pulled back to the surface while the top drive was picked up. The bit and underreamer were run in the hole to 160.0 mbsf, and drilling continued from 4000 to 4090.0 mbrf (160.0–250.0 mbsf). The depth of Hole U1432B reached 250 mbsf at 0640 h on 24 February. The hole was conditioned and displaced with 379 bbl of 10.5 lb/gal mud. The drill string was tripped back to the surface and cleared the rig floor at 2120 h. During the trip out of the hole, the vessel was secured to slip and cut 115 ft of drilling line as per the slip and cut program.
The drill floor was rigged up to run 16 inch casing. We assembled 240.85 m of 16 inch casing, including a Dril-Quip casing hanger. The casing was landed on the moonpool doors with the casing running tool, which was then released and pulled back through the rig floor. The 240.77 m casing stinger was made up to the bottom of the casing hanger running tool and lowered through the 16 inch casing in the moonpool. The casing hanger running tool with the casing stinger below was latched into the 16 inch casing hanger, with two control length drill collars and a tapered drill collar above the casing running tool. The entire casing string plus running tools was lowered to 3827.4 mbrf while filling the drill pipe with water every 20 stands. The subsea camera system was installed and lowered to reenter Hole U1432B. After 15 min of maneuvering the vessel, we reentered Hole U1432B at 0500 h on 26 February. The camera system was pulled back to the surface while the top drive was picked up. The casing was lowered into the 22 inch hole and washed down to ~200 mbsf. The VIT was again lowered to assist in releasing the casing running tool from the casing. As the camera system neared the seafloor, the video feed from the subsea camera was lost. The camera system was pulled back to the surface for repair (water had intruded the pan and tilt unit, causing a power overload in the system). The casing was washed in to 240.9 mbsf and landed in the reentry cone. The casing running tool was rotated clockwise 3.75 turns and released from the casing hanger. The BHA, including the internal casing stinger, was pulled back ~11 m, and the top drive was set back. The cementing assembly was rigged up, the lines were pressure tested, and ~20 bbl of cement mixed to 15 lb/gal was pumped downhole. The cement was displaced with seawater and positioned to balance at the casing shoe to an estimated height of 17 m above the casing shoe (both inside and outside the casing). The cementing equipment was rigged down and the drill string pulled back to 161.9 mbsf. The circulating head was connected and the drill string flushed with twice the drill string capacity with seawater. The remainder of the drill string was pulled from the hole, clearing the seafloor at 2140 h on 26 February and finally clearing the rig floor at 0400 h on 27 February. The BHA components were secured, and the running tool was detorqued.
A new 14¾ inch bit and four stands of drill collars were made up and run in the hole with drill pipe while filling with water at 20-stand intervals. When the bit was at 3823.3 mbrf, the subsea camera system was lowered to view reentry. Hole U1432B was reentered at 1655 h on 27 February and the VIT pulled back to surface. After securing the camera system, the drill string was run in the hole until the top of the cement was tagged at 4069.0 mbrf (229 mbsf). The cement was drilled out from 4069.0 to 4083.0 mbrf (229.0–243.0 mbsf). After washing down to total depth (250.0 mbsf), new 14¾ inch hole was drilled from 4090.0 to 4640.0 mbrf (250.0–800.0 mbsf). After reaching 800.0 mbsf, the hole was swept clean with high-viscosity mud. After setting back the top drive, the drill string was pulled back to the surface. The bit cleared the rotary table at 1120 h on 1 March. The 10¾ inch casing stinger components were made up, and the underreamer arms were set to 12¾ inches. The top drive was then picked up, and the mud motor and underreamer were tested. After the test was successfully completed, they were racked back in the derrick. After assembling all the casing stinger components, slip and cut of the drilling line was completed.
The rig floor was then prepared for running 10¾ inch casing, and 787.06 m of casing with a 10¾ inch casing hanger was made up. The casing was lowered into the moonpool and secured with a casing elevator on the prepared landing platform. The buoyant weight of the casing string was 70,000 lb. The running tool was released from the casing and pulled back to the rig floor and then made up to the bottom of a drill collar stand and racked back in the derrick. The casing stinger with the bit, underreamer, and mud motor were then run inside the casing. Also included in the stinger were three stands of drill collars and 24 stands of drill pipe. The bit and underreamer were positioned just below the bottom of the casing after the running tool was landed and made up to the casing. The casing was run to the seafloor with drill pipe and the subsea camera system deployed to assist with the reentry at the seafloor. Hole U1432B was reentered at 0242 h on 3 March. The camera system was pulled back to the surface and set back into the storage position on the moonpool doors. The casing was run in the hole with drill pipe to 223.5 mbsf. The top drive was picked up and the casing lowered to 244.0 mbsf. The casing was washed to the bottom while pumping 530 gal/min. At 530 gal/min, the mud motor was turning the bit at 80–85 rotations/min with the underreamer arms extended to clear a 12¾ inch hole in front of the casing. The casing was steadily lowered until it was landed and released at 1745 h on 3 March. The top drive was set back and the drill string tripped from the hole, clearing the seafloor at 2045 h and then clearing the rotary table at 0915 h on 4 March. The casing stinger components were flushed with freshwater and either laid out or, in the case of the drill collars, racked back in the derrick.
After successfully running the 10¾ inch casing, a cementing stinger was assembled. The stinger consisted of a reentry/cleanout bit, a bit sub, a stand of drill collars, 24 stands of 5 inch drill pipe, F-cup tester, another 2 drill collars, a tapered drill collar, and 2 stands of 5½ inch transition drill pipe. The entire assembly was made up and run in the hole with drill pipe to just above the seafloor while stopping every 20 stands to fill the drill pipe with water. The VIT was deployed to just above the seafloor, and Hole U1432B was reentered at 0344 h on 5 March. The camera system was pulled back to the surface and secured. The bit was run in the hole to 767 mbsf, 20 m above the 10¾ inch casing shoe. The F-cup tester was spaced out so that it was at 42 mbsf, inside the 16 inch casing. The circulating head was made up to the top of the drill string, and the mud pumps were brought up to 60 strokes/min to verify circulation up the annulus between the hole and the casing. After establishing circulation, the cement pump was used to pump 10 bbl of freshwater ahead of the cement slurry. Fourteen barrels of 15.5 lb/gal cement were then mixed and pumped downhole, followed by another 10 bbl of freshwater. This was displaced down the drill string with 263 bbl of saltwater using the mud pumps. After displacing the cement, the circulating head was removed, and the driller attempted to pull out of the hole. He immediately noticed a steadily increasing overpull as he tried to pull out of the hole. After pulling up enough to remove 2 singles of drill pipe, we were unable to raise the drill string any further. It now appears that the formation collapsed around the 10¾ inch casing string, preventing circulation up the open hole annulus and outside the casing. Instead, the circulation path was up through the 10¾ casing, bypassing the cup tester. The elevated temperatures at 700 mbsf (~65°–70°C) accelerated the hardening of the cement. The drill string was worked for the next 9 h using combinations of overpull, torque, and pump pressure in an effort to free the drill string. At that point, we rigged up to sever the drill string. The drill string severing charge was lowered to just above the cup tester, which has a 1.5 inch internal diameter. The charge was detonated at 0430 h on 6 March; however, there was no loss of overpull on the pipe. The wireline was pulled out of the hole, and the severing tool cleared the rig floor at 0808 h. The drill pipe was worked with a maximum of 100,000 lb of overpull for ~1 h. The elevators were then lowered back to the elevator stool while the vessel was offset 200 m. The top drive was picked up and the drill pipe was picked up slowly while moving the vessel back to the original location. The pipe was worked free with a maximum of 400 A of torque and 40,000 lb of overpull. The end of pipe cleared the casing hanger at 1105 h. The top drive was set back and the drill string pulled from the hole. The end of pipe cleared the rotary table at 1830 h. The acoustic positioning beacon was recovered while tripping drill pipe. The upper guide horn was reinstalled, the rig floor was secured for transit, and the thrusters were raised. The vessel switched to transit mode at 2036 h on 6 March, ending Site U1432. The total time spent on Hole U1432B was 363.25 h (15.1 days).
Hole U1432C
After pulling out of Hole U1432B to wait on weather, the upper guide horn was picked up from the drill collar rack, lifted to the rig floor, and reinstalled below the rotary table. An APC/extended core barrel (XCB) BHA was made up while the vessel was offset 40 m south of Hole U1432B. The drill string was then tripped toward the seafloor. After completing the pipe trip to just above the seafloor, the top drive was picked up and spaced out, and Hole U1432C was spudded at 0555 h on 22 February 2014. The first coring attempt with the bit at 3835 mbrf did not recover any core. The bit was then lowered to 3838.5 mbrf, and the next coring attempt recovered a mudline core of 7.95 m of sediment. This core length was used to calculate the seafloor depth at 3840.1 mbrf (3829.1 mbsl). Nonmagnetic core barrels were used with the APC for Cores 329-U1432C-1H through 12H to a final depth of 110.0 mbsf. Perfluorocarbon tracer (PFT) fluid was displaced into the drill string prior to spudding the hole and was pumped continuously during Hole U1432C. Temperature measurements were taken with the APCT-3 on Cores 5H, 7H, 9H, and 11H, with good results. The hole was terminated when weather conditions improved sufficiently to return to Hole U1432B. The bit was tripped to the surface and cleared the rig floor at 0735 h, ending Hole U1432C. A total of 12 APC cores were taken over a 110.0 m interval in Hole U1432C, recovering 88.74 m of core (80.7% recovery). The total time spent in Hole U1432C was 39.25 h (1.6 days).
Lithostratigraphy
Lithostratigraphic units
One lithostratigraphic unit was defined at Site U1432 based on visual core description, smear slide, and thin section inspection, together with scanning of an array of physical properties, especially magnetic susceptibility and color spectra, as described in Lithostratigraphy in the Methods chapter (Li et al., 2015a).
Unit description
Unit I (0–109.93 mbsf)
Unit I (Figure F4) spans the uppermost 109.93 m (a minimum thickness limited by drilling depth in this hole) and is dominated by a sequence comprising dark greenish gray clay and clay with silt. The clay has faint color banding with color variation typically across 10–20 cm intervals. Some lighter colored intervals have higher nannofossil content, but otherwise there is little difference seen in microscopic examination of the clay. Patches and layers of more intense green color in the clay intervals are interpreted to contain glauconite. Most clay intervals have heavy bioturbation, resulting in a homogeneous appearance. No individual burrows are visible. Rare pyrite nodules occur in the clay intervals. There are three pyrite nodules in the interval from 54.5 to 56.0 mbsf (Section 349-U1432C-7H-2A). One nodule, ~2 cm in width, is rounded and slightly botryoidal in shape (Figure F5); another is elongate, ~4 cm long, and appears to be replacing a burrow.
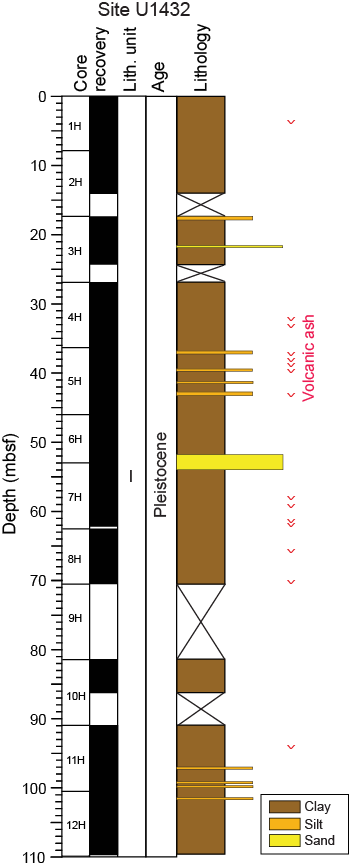
Figure F4. Lithostratigraphy summary.
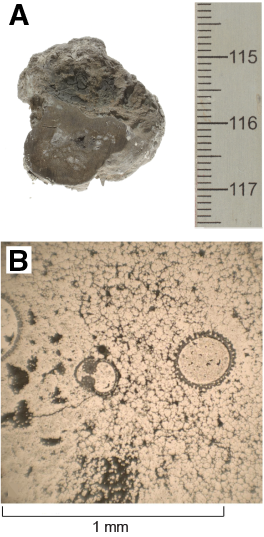
Figure F5. Pyrite nodule in clay layer.
The clay is interbedded with rare silty layers that vary from dark greenish gray silty clay to clayey silt with sand. These layers are usually only a few millimeters thick but are rarely as thick as 10 cm, fine upward, and have sharp erosive bases (Figure F6). The number of silty layers varies between cores but is up to three or four per section. We interpret the silty layers as distal turbidites. Some silty intervals have multiple layers, up to six within an interval of <10 cm, indicating that at times multiple turbidites followed one another in quick succession.

Figure F6. Sharp-based silt layers.
Microscopic inspection of the silty layers shows that they contain subrounded to subangular grains of quartz, feldspar, and minor amounts of mica, volcanic glass, and foraminifer shells. The silty layers have low magnetic susceptibility compared to the clay-rich layers (Figures F7, F8), possibly due to greater abundance of nonmagnetic minerals such as quartz and feldspar.
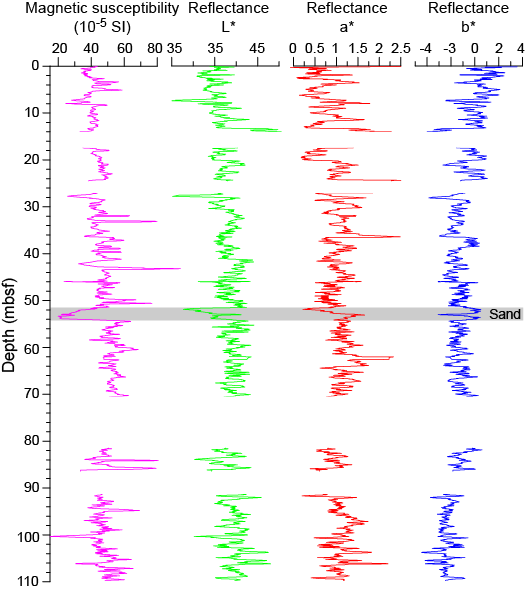
Figure F7. Magnetic susceptibility and spectroscopy.

Figure F8. Lithology and magnetic susceptibility correlation.
The base of Core 349-U1432C-6H and top of Core 7H contain a sand interval that is approximately 2.42 m thick. The sand is soupy, probably as a result of drilling disturbance, and no sedimentary structures are preserved. The sand is dominantly siliciclastic with subangular to subrounded grains of quartz and rock fragments and with lesser feldspar and minor mica, amphibole, and mafic ash shards (Figure F9). There are abundant foraminifer grains. The sand has very low magnetic susceptibility (Figure F7).

Figure F9. Sand in Unit I.
Thin volcanic ash layers (0.5–2.0 cm thick) occur in many cores in this unit but overall comprise <1% by volume. They vary in color from light colored (Figure F10) and slightly pinkish to dark brown and black, indicating varying chemical composition of the ash particles. Most ash layers have a sharp base and fine upward; however, others are bioturbated and occur as isolated pods within the clay or silt.
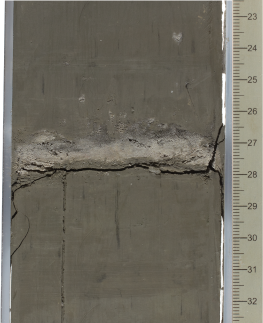
Figure F10. Ash layer.
Discussion
Unit I at Site U1432 can be correlated with Unit I at Site U1431; however, here the unit is much richer in clay and the silty turbidites are thinner and separated by greater thicknesses of strongly bioturbated clay. This unit also lacks the rare foraminifer sands of Site U1431 and has fewer ash layers, most likely because it is further away from the active volcanic arc and has no nearby seamount-derived sediment source.
The thin silt beds that fine upward and have erosive bases are interpreted as the distal deposits of turbidity currents. The silt has a similar grain composition to the silty intervals at Site U1431 (see Figure F7 in the Site U1431 chapter [Li et al., 2015b]), and probably has a similar source, with the siliciclastic grains coming from a continental region, likely South China or Taiwan (Figure F1).
Dark green and/or greenish sediment layers occur intermittently in the sediment at Sites U1431 and U1432 and form a distinctive characteristic of the sediment. These layers occur both within turbidite beds and separately (Figure F11).
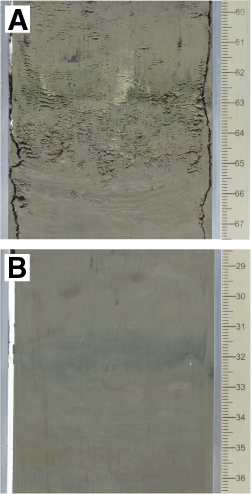
Figure F11. Green layers.
Similar green sediment was encountered at Deep Sea Drilling Project (DSDP) Leg 90 Sites 588, 590, 591, 592, and 593 (Gardner et al., 1986), ODP Leg 130 Sites 803–807 (Lind et al., 1993), ODP Leg 162 Site 985 (Ikehara et al., 1999), and ODP Leg 184 Sites 1143 and 1148 (Tamburini et al., 2003), and discussions on their origins were included in their site reports. These investigations were based on a combination of smear slide and thin section observation, X-ray diffraction (XRD), grain size analysis, and sediment chemistry. During initial shipboard investigations on sediment from New Caledonia to the New Zealand region (Leg 90), the origin and formation mechanism of the green sediment were largely explained by external factors, such as the supply of volcanic ash, but it was revealed that there was no significant mineralogical variation between the green sediment and the host sediment (Lind et al., 1993).
More detailed investigation of similar greenish sediment layers was conducted during Leg 162 in the Gardar Drift of the North Atlantic (ODP Site 983; Ikehara et al., 1999) and during postcruise research in the northern South China Sea (Leg 184; Tamburini et al., 2003). The organic geochemistry of the greenish clay sediment sampled at Site 983 was analyzed and indicated that the sediment contained a large amount of organic matter and sulfur, reaching a maximum of 5.6 wt% total organic carbon (TOC) and 26 wt% sulfur. The sediment also contained large amounts of molecular n-alkanes, indicating a terrigenous source (Ikehara et al., 1999), as well as significant amounts of hopanoid hydrocarbons such as diploptene, suggesting that prokaryotes, such as methane-oxidizing bacteria or cyanobacteria, may have contributed to the formation of that organic-rich sediment.
Research following Leg 184 in the South China Sea included detailed grain size analysis, XRD, and inorganic and organic geochemistry. Tamburini et al. (2003) concluded that the green color in the sediment formed as a result of the initial process of glauconite formation. The sedimentary environment and active sedimentation processes may have favored a reducing environment at the sediment/water interface. This may have led to increased microbial activity and degradation of organic matter. Tamburini et al. (2003) found that the green layers had lower TOC than the surrounding sediment. The reducing conditions may have led to dissolution of carbonate and a subsequent increase in Ca, Ba, and Sr, as found in the green layers at Sites 1147 and 1148 of Leg 184. Examination of the relationship between TOC and the green layers at Sites U1431 and U1432 will be included in later research.
The sediment color can be expressed by three color components (L*, a*, and b*). Based on previous work, the L* (lightness) value appears to be mainly controlled by calcium carbonate content, such that the lightness of the sediment color increases with an increase in the calcium carbonate content, and more blackish colors indicate an increase in the organic matter content (e.g., Nagao and Nakashima, 1992; Hyun et al., 1999; Ortiz et al., 1999); the a* (psychometric red–green) value is controlled by iron for pelagic sediment and also by manganese carbonate; and the b* value (psychometric yellow–blue) is thought to be a function of iron content in the form of hydroxides. Recently, Khim et al. (2009) and Helmke et al. (2002) have shown that these color changes, particularly L*, in sediment provide valuable information on the depositional environment and can assist with chronostratigraphy and paleoceanographic interpretations. For example, L* can be related to sediment that is deposited under anoxic conditions. Darker sediment generally has a laminated structure suggesting lack of bioturbation and oxygen.
The dark greenish sediment layers at Sites U1431 and U1432 are distinguished by visual core inspection and are not differentiated from the other sediment layers by color reflectance data. There may be a slight decrease in the a* value for green layers, but this has not been determined on a systematic basis. Further study is needed to determine whether there is a correlation between the green color and sediment organic and inorganic geochemistry.
Biostratigraphy
We analyzed all core catcher samples for calcareous nannofossils, planktonic foraminifers, and radiolarians in Hole U1432C. Specimens of calcareous nannofossils, foraminifers, and radiolarians are present in all samples. Based on three planktonic foraminifer events and three calcareous nannofossil events, sediment recovered at Site U1432 spans the Middle to Late Pleistocene, with the base of the sequence older than 0.61 Ma and younger than 0.91 Ma (Figure F12; Tables T2, T3). Radiolarian age control is based on the general assemblage because of the lack of biostratigraphic index species. A correlation of biohorizons with paleomagnetic data from the same hole suggests a sedimentation rate of ~12 cm/ky for the 108.83 m sequence of Hole U1432C.
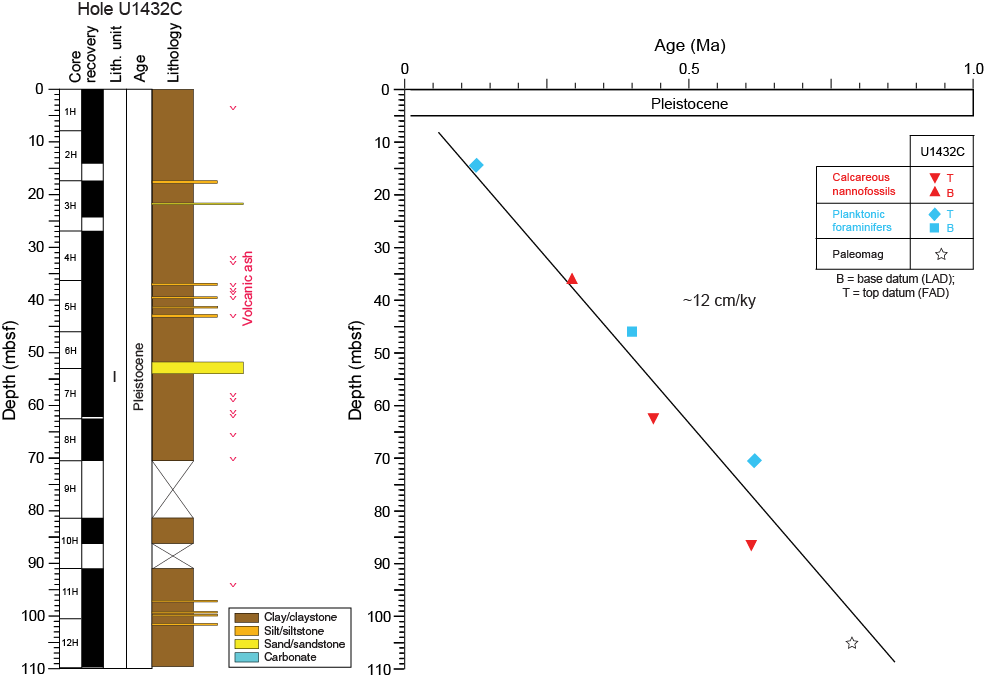
Figure F12. Age-depth model.
Table T2. Depths and ages of calcareous nannofossil events, Hole U1432C. Download table in .csv format.
Table T3. Depths and ages of planktonic foraminifer events, Hole U1432C. Download table in .csv format.
Preservation of calcareous nannofossils is moderate to good, although some intervals appear to contain heavy reworking (Table T4). Preservation of planktonic foraminifer assemblages is poor to good, with frequent observance of test fragmentation; reworking is also evident in some samples (Table T5). Radiolarian preservation is poor to moderate (Table T6). Siliceous sponge spicules and diatoms are present but rare in abundance.
Table T4. Distribution of calcareous nannofossils, Hole U1432C. Download table in .csv format.
Table T5. Distribution of planktonic foraminifer species, Hole U1432C. Download table in .csv format.
Table T6. Distribution of radiolarian species, Hole U1432C. Download table in .csv format.
Calcareous nannofossils
Calcareous nannofossil biostratigraphy in Hole U1432C was established through analysis of core catcher and additional split-core samples. Nannofossil preservation is moderate to good, with some samples (e.g., Samples 349-U1432C-1H-CC and 4H-CC) containing reworked Miocene species (Table T4). Three Pleistocene nannofossil datums are identified in the recovered sedimentary sequence. The presence of Emiliania huxleyi in Samples 1H-CC through 4H-CC (7.90–36.41 mbsf) indicates a Middle to Late Pleistocene age (≤0.29 Ma) based on the first appearance datum (FAD) of E. huxleyi (Zone NN21). Zone NN20 is assigned to Sections 5H-CC and 6H-CC. The top of Zone NN19 is recognized in Sample 7H-CC (62.11 mbsf) based on the last appearance datum (LAD) of Pseudoemiliania lacunosa (0.44 Ma). The LAD of Gephyrocapsa sp. 3 (0.61 Ma) occurs in Sample 10H-CC (86.15 mbsf), indicating that this sample is within Zone NN19. Based on these latter two datums (0.44 and 0.61 Ma; Gradstein et al., 2012), a Middle Pleistocene age can be assigned to Samples 5H-CC through 10H-CC. Rare specimens of Reticulofenestra asanoi occur in Samples 6H-CC and 7H-CC (52.96–62.11 mbsf); however, these specimens are considered reworked, as they co-occur with the LAD of P. lacunosa at the same depth. R. asanoi also occurs rarely in Sample 11H-CC (100.57 mbsf) but is absent in the bottommost sample (Sample 12H-CC; 109.83 mbsf), indicating an interval above its last common appearance datum at 0.91 Ma. Thus, an age of >0.61 and <0.91 Ma is estimated for the base of the sediment sequence recovered in Hole U1432C.
Planktonic foraminifers
We analyzed planktonic foraminifers in core catcher samples from Hole U1432C. The abundance of planktonic foraminifers varies from rare to abundant with poor to good preservation (Table T5). Fragmented planktonic foraminifer tests are common, reaching 70% or more in Sample 349-U1432C-7H-CC (62.11 mbsf).
The planktonic foraminifer assemblage is dominated by late Quaternary tropical to subtropical Indo-Pacific species, including Globorotalia spp., Globigerinoides spp., Pulleniatina obliquiloculata, Sphaeroidinella dehiscens, Neogloboquadrina dutertrei, and Orbulina universa. Together with three bioevents (Table T3), this planktonic foraminifer assemblage indicates that the sedimentary sequence recovered in Hole U1432C is from Pleistocene Zone Pt1. The LAD and FAD of Globigerinoides ruber (pink) occur in Samples 349-U1432C-2H-CC (14.5 mbsf) and 5H-CC (46.0 mbsf), respectively, indicating Subzone Pt1b. The LAD of Globorotalia tosaensis (0.61 Ma) in Sample 8H-CC (70.59 mbsf) is used to mark the Pleistocene Subzone Pt1b/Pt1a boundary.
The absence of Globigerinoides obliquus indicates an age younger than 1.3 Ma for the base of this sequence (see Table T3 in the Methods chapter [Li et al., 2015a]). The mixing of younger (Pleistocene) species such as G. tosaensis and older (Pliocene) species such as Dentoglobigerina altispira and Globorotalia multicamerata is interpreted as resulting from redeposition by turbidites (see Lithostratigraphy), especially in Sample 349-U1432C-6H-CC (53.01 mbsf) (Table T5), which contains abundant sand and some shallow-water benthic foraminifers.
Radiolarians
The radiolarian assemblage from Hole U1432C (Samples 349-U1432C-1H-CC through 12H-7, 63–73 cm) represents a Pleistocene sequence. Detailed biostratigraphic zonation could not be assigned to this assemblage because of the lack of biostratigraphically important species; however, the presence of Collosphaera tuberosa in Sample 1H-CC (7.95 mbsf) suggests an age no older than Zone NR2 (<0.42 Ma) (Wang and Abelmann, 1999). Radiolarians in Hole U1432C vary from abundant to few in Samples 1H-CC and 2H-CC (Table T6) to rare or barren downhole (14.15–109.93 mbsf). Preservation ranges from moderate to poor. Sponge spicules and diatoms are scarce.
Geochemistry
Interstitial water chemistry
We collected 16 whole-round sediment samples (5 cm long) from 2.95 to 105 mbsf in Hole U1432C for interstitial water measurements. Interstitial water samples were taken at a frequency of 2 samples per core for the uppermost 35 mbsf and at a frequency of 1 sample per core below 40 mbsf. Interstitial water chemistry data are given in Tables T7 and T8 and shown in Figures F13, F14, F15, and F16.
Table T7. Interstitial water major element concentrations, salinity, pH, alkalinity, sulfate, ammonium, phosphate, chloride, bromide, calcium, magnesium, sodium, and potassium, Hole U1432C. Download table in .csv format.
Table T8. Interstitial water minor element concentrations, barium, iron, lithium, manganese, silicon, and strontium, Hole U1432C. Download table in .csv format.
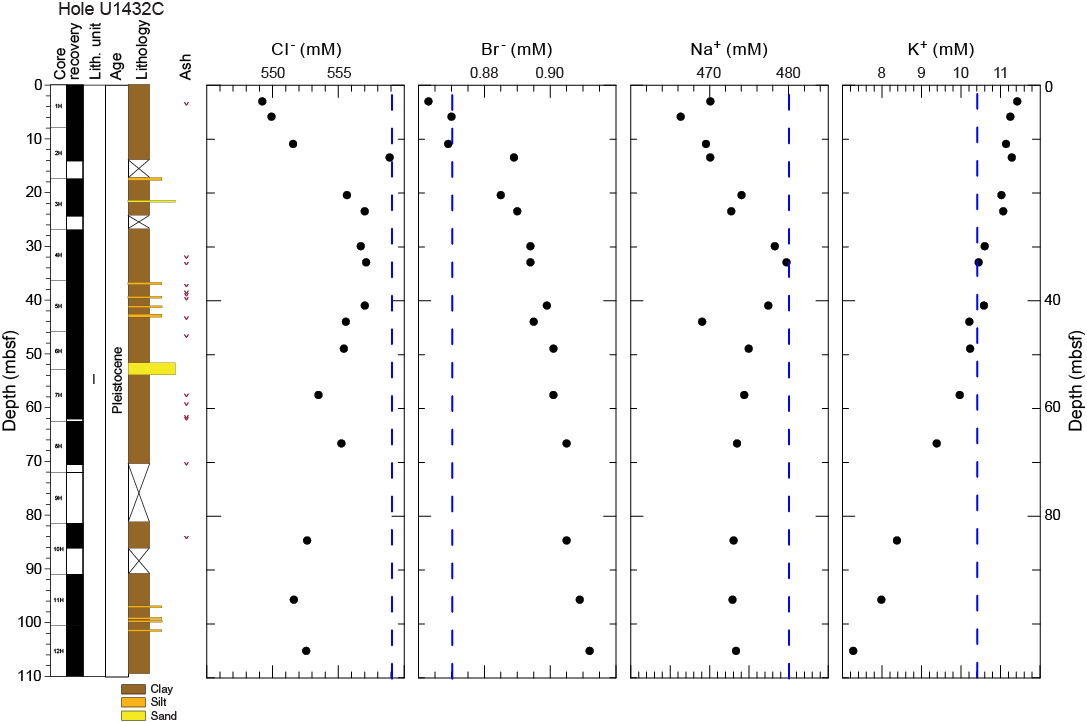
Figure F13. Chloride, bromide, sodium, and potassium.
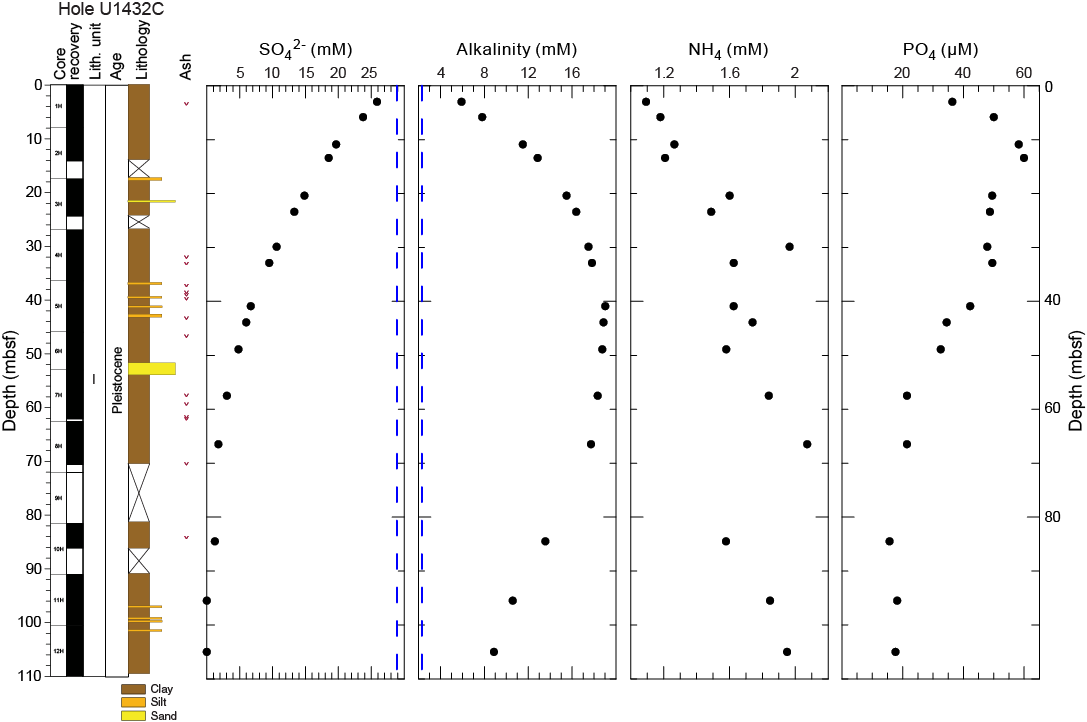
Figure F14. Sulfate, alkalinity, ammonium, and phosphate.
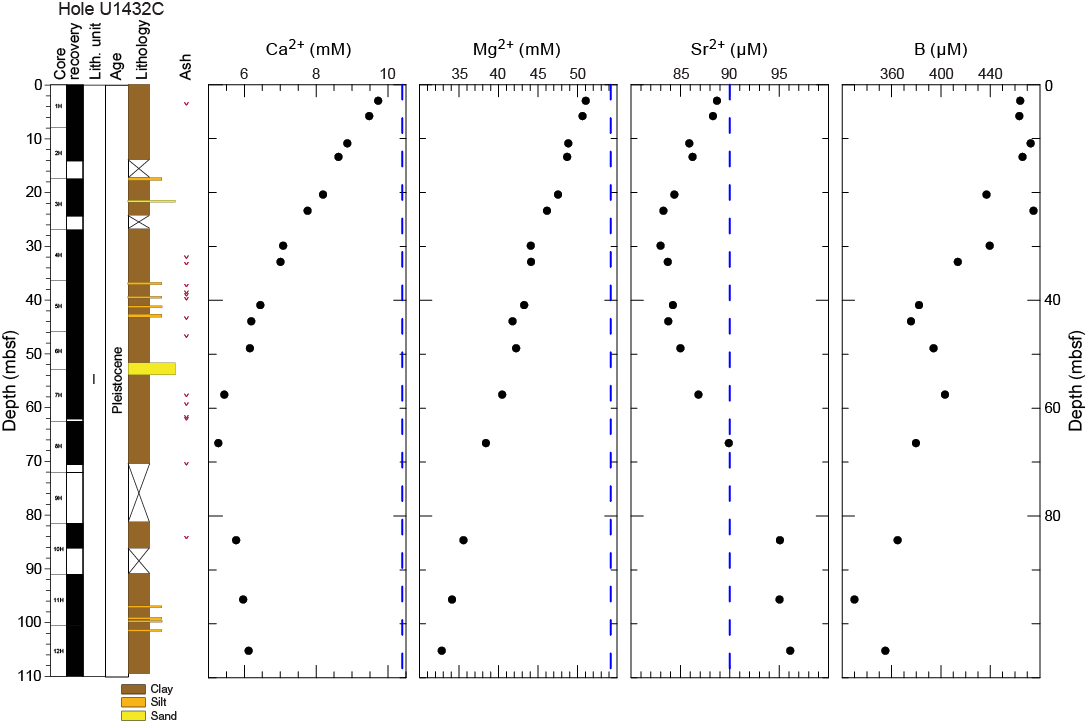
Figure F15. Calcium, magnesium, strontium, and boron.
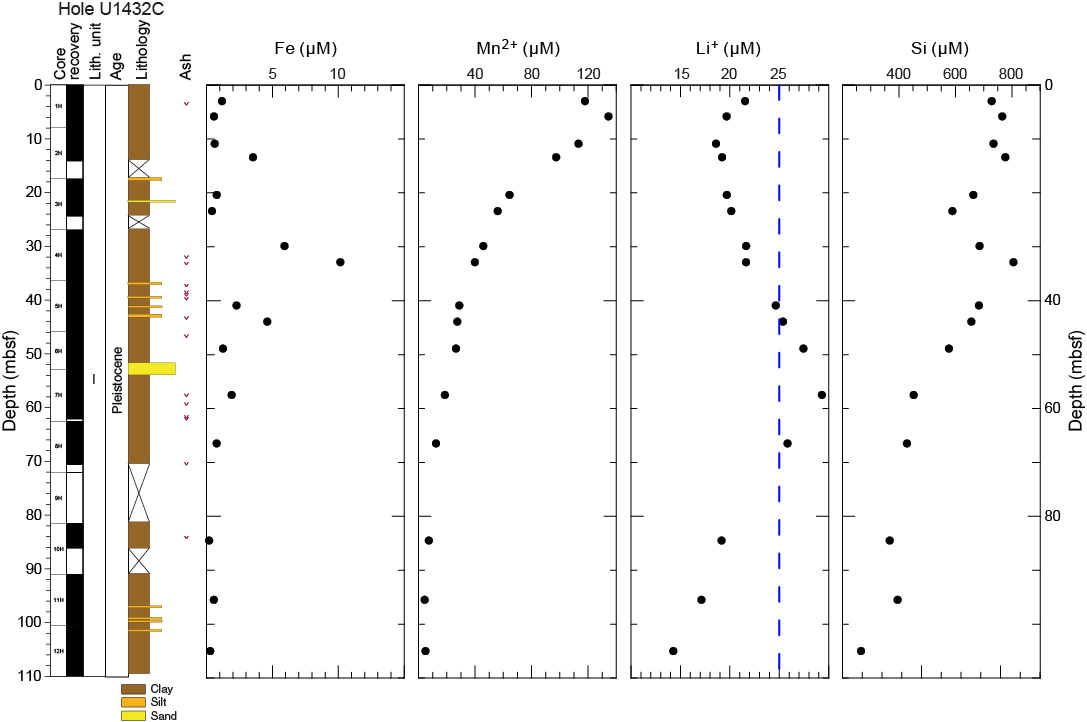
Figure F16. Iron, manganese, lithium, and silica.
Chloride, bromide, and alkalis (sodium and potassium)
Downhole profiles of chloride, bromide, sodium, and potassium in Hole U1432C are shown in Figure F13. Chloride concentrations fluctuate slightly with depth, ranging between 549 and 559 mM throughout the hole. Only one sample at ~13.4 mbsf has a modern seawater-like value (559 mM), whereas other chloride concentrations are slightly lower than the modern seawater value. Sodium concentrations vary from 466 to 479 mM in the uppermost 44 mbsf, with several samples close to modern seawater (480 mM) between 30 and 41 mbsf. Below 48 mbsf, sodium concentrations remain constant at ~473 mM. Bromide concentrations increase with depth, ranging from 0.86 mM close to the seafloor to 0.91 mM at the bottom of the hole. Most concentrations are higher than that of modern seawater (0.87 mM). The high bromide concentrations may be caused by organic matter diagenesis in the sediment as indicated by sulfate reduction and high methane concentrations (Figures F14, F17).

Figure F17. Headspace methane.
The K+ concentrations decrease with depth throughout the hole, from 11.4 mM at the top to 7.3 mM (~70% that of seawater) at the bottom. Concentrations higher than modern seawater (10.4 mM) occur in the uppermost 40 mbsf. This phenomenon was also observed at Site U1431 and was attributed to ion exchange with clay minerals (see Geochemistry in the Site U1431 chapter [Li et al., 2015b]). The significant K+ decrease below 40 mbsf is likely caused by K-rich and Si-rich mineral formation in the sediment, as silica concentrations also decrease with depth below 40 mbsf (Figure F16).
Sulfate, alkalinity, ammonium, and phosphate
Alkalinity, sulfate, ammonium, and phosphate profiles are shown in Figure F14. Alkalinity increases from ~6 mM close to the seafloor to a maximum of ~19 mM at ~41 mbsf, which is ~50 m above the depth at which sulfate is completely consumed. Below 41 mbsf, alkalinity decreases with depth to ~9 mM at the bottom of the hole. The decrease in alkalinity is mainly caused by carbonate precipitation around the sulfate–methane transition zone (SMTZ), as suggested by the calcium depth profile (Figure F15).
Sulfate decreases with depth and is completely depleted at ~90 mbsf, where methane reaches a maximum ~4800 ppmv (Figure F17). Methane concentration increases from 4 to 50 ppmv at 66.5 mbsf, reaching concentrations between 2400 and 4800 ppmv below that depth. This is in good agreement with the decrease in sulfate concentrations to ~1.8 mM at 66.5 mbsf, reaching 0 mM below. Based on sulfate and methane concentrations, the SMTZ occurs between ~70 and 100 mbsf. Shore-based carbon isotope analysis of dissolved inorganic carbon will provide better understanding of the SMTZ.
Ammonium concentration shows a general increasing trend from ~1 mM near the seafloor to a maximum value of ~2 mM at 66.5 mbsf, corresponding to the depth where methane increases sharply and sulfate is depleted. This suggests ammonium production is mostly caused by organoclastic decomposition coupled to sulfate reduction. Phosphate behaves differently from ammonium; it increases from 36 μM at the top to a maximum of ~60 μM at 13.4 mbsf, followed by a decrease with depth to ~18 μM at the bottom of the hole.
Calcium, magnesium, and strontium
Downhole distributions of Ca2+, Mg2+, and Sr2+ are shown in Figure F15. Calcium concentration decreases from 10.2 mM near the seafloor to a minimum of 5.4 mM at 66.5 mbsf, where sulfate is almost completely consumed. Alkalinity reaches a maximum of ~19 mM at ~40 mbsf, which could trigger diagenetic carbonate precipitation, causing the uptake of Ca2+ and some of the other alkaline earth elements, particularly Mg2+ and Sr2+. Calcium concentrations increase below this depth to 6.1 mM at the bottom of the hole. Magnesium concentrations are lower than the modern seawater value (54 mM) throughout Hole U1432C, decreasing from 51 mM near the seafloor to 33 mM at the bottom of the hole. Magnesium behaves differently from calcium, possibly because of other diagenetic reactions occurring in the sediment, such as clay ion exchange and low-temperature ash alteration. Sr2+ concentrations decrease from 89 μM near the seafloor to 83 μM at ~30 mbsf, followed by an increase with depth to 96 μM at the bottom of the hole.
Boron, barium, lithium, silica, iron, and manganese
Downhole distributions of boron, iron, manganese, lithium, and silica are given in Figures F15 and F16. Barium concentrations (Table T8) increase from a seawater-like value of ~0.02 μM close to the seafloor to a maximum of 55.1 μM at 84.5 mbsf, followed by a slight decrease with depth to ~42.4 μM at the bottom of the hole. The highest Ba2+ concentrations (42.4–55.1 μM) occur at 84–105 mbsf, corresponding to the SMTZ. The Ba2+ concentration is likely controlled by the stability of the mineral barite (BaSO4). The Ba2+ concentration increase may result from in situ barite dissolution due to sulfate reduction or the migration of Ba2+ in the low-sulfate fluid. Shore-based solid-phase barium analyses will be critical for determining the origin of the elevated barium and the history of fluid flow.
Boron concentrations vary from 330 to ~475 μM, with the highest values of ~470 μM at 25 mbsf, followed by a decrease to ~360 μM at ~45 mbsf. Below 50 mbsf, boron shows a general decreasing trend to a minimum of 330 μM at ~100 mbsf).
Lithium concentrations decrease from 21.5 μM close to the seafloor, which is slightly lower than the modern seawater value (25 μM), to 18.6 μM at ~11 mbsf, followed by a gradual increase with depth to a maximum of 29.3 μM at ~60 mbsf, before decreasing with depth to a minimum of 14.3 μM at the bottom of the hole. The decrease in lithium concentration is likely caused by secondary mineral precipitation, probably related to clay ion exchange reactions in that interval.
Silica concentrations are elevated compared to modern seawater (0–180 μM), ranging from 266 to 806 μM. This is mostly controlled by lithology and silicate mineral diagenesis. In the upper 40 mbsf, silica concentrations are high, ranging from 550 to 806 μM, and vary with depth with an average around 650 μM. Below 40 mbsf, silica concentrations gradually decrease with depth, from ~650 to 350 μM at the bottom of the hole.
Dissolved iron concentrations vary with depth, ranging from 0.2 to 10.2 μM, with two peaks of 3.5 μM at 13.3 mbsf and 10.2 μM at 33 mbsf. The second iron peak corresponds to a volcanic ash layer, which may indicate that the higher iron concentrations are caused by volcanic ash alteration. Dissolved manganese concentrations increase from 117.8 μM at the top to a maximum of 134.5 μM at 5.8 mbsf, followed by a gradual decrease with depth to a minimum of ~4 μM at the bottom of the hole. The manganese peak is above the iron peaks, reflecting a normal order for the redox sequence in marine sediments.
Headspace gas geochemistry
We analyzed 11 headspace gas samples as part of the shipboard safety and pollution prevention program (Figure F17; Table T9). Methane is the predominant hydrocarbon present in Hole U1432C, ranging from 2 to 4748 ppmv. Methane (C1) concentrations abruptly increase by 2 orders of magnitude at 84 mbsf. Ethane (C2) and ethene (C2=) are observed only in one sample at 5.84 mbsf (Sample 349-U1432C-1H-5, 0–5 cm), with values of 1.61 and 1.02 ppmv, respectively.
Table T9. Headspace sample hydrocarbon concentrations, methane, ethene, and ethane, Hole U1432C. Download table in .csv format.
Bulk carbon and nitrogen analysis
The distributions of TOC, calcium carbonate (CaCO3), total nitrogen, and the total organic carbon to total nitrogen ratio (C/N) at Site U1432 are illustrated in Figure F18 and listed in Table T10. TOC content decreases slightly with depth from ~1 to 0.5 wt% in the uppermost 11 mbsf, and then increases to ~1 wt% at 32 mbsf. Below 40 mbsf, TOC contents vary little between 0.4 and 0.6 wt% to the bottom of the hole. CaCO3 content increases with depth from 5.5 wt% at the top to 10.6 wt% at 32 mbsf. Below 40 mbsf, CaCO3 content is variable with depth ranging from 1.7 to 5.8 wt%. The C/N ratio ranges from 4.3 to 8.6.
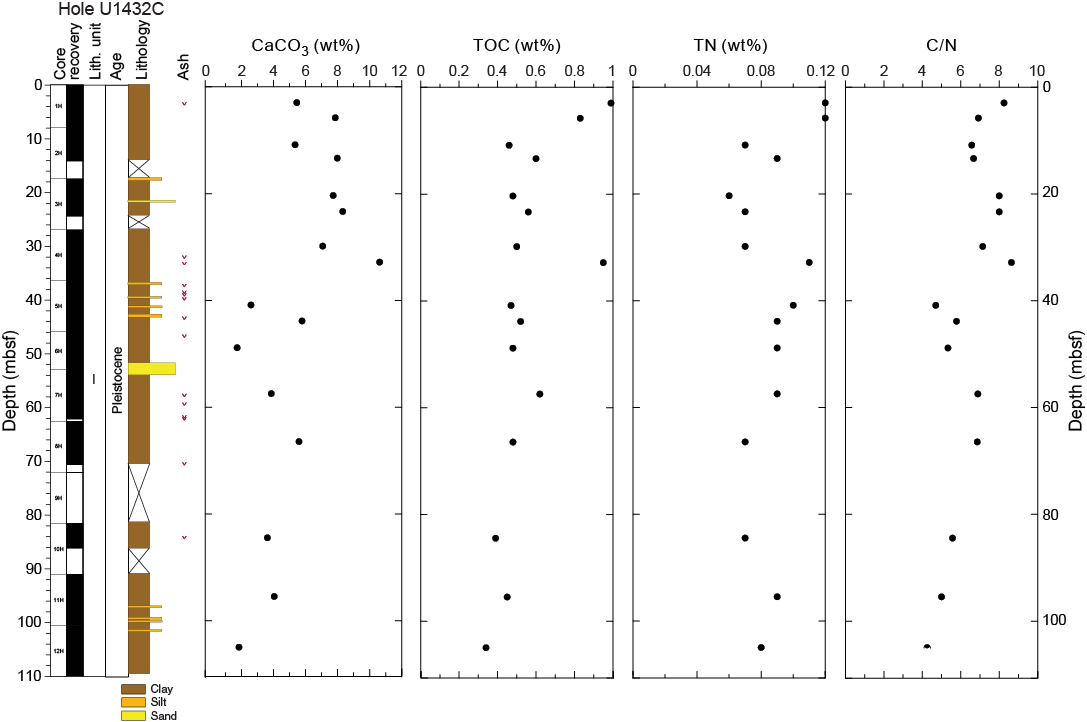
Figure F18. Calcium carbonate, TOC, TN, and C/N ratios.
Table T10. Carbon and nitrogen content, TOC, CaCO3, TN, and C/N ratios, Hole U1432C. Download table in .csv format.
Microbiology
Our goal for microbiological research conducted at Site U1432 was to collect and preserve samples for shore-based characterization of the microbial communities. We collected samples on a routine basis throughout the cored interval and on a case by case basis, according to features in the cores that suggested the presence of important geological interfaces. We used a limited number of samples to start microbial cultivations on board the ship. In addition, we collected samples for measuring contamination testing tracers including perfluorocarbons and fluid community tracers. Microspheres were not used at Site U1432.
Specific depths sampled for microbiology at Site U1432 are shown in Figure F19. Five routine, 5–10 cm whole-round samples were collected from 4.3 to 95.4 mbsf in Hole U1432C to be used for microbiological analysis. These whole-round samples for microbiology were collected adjacent to samples for interstitial water measurements in order to understand proximal interstitial water chemistry.
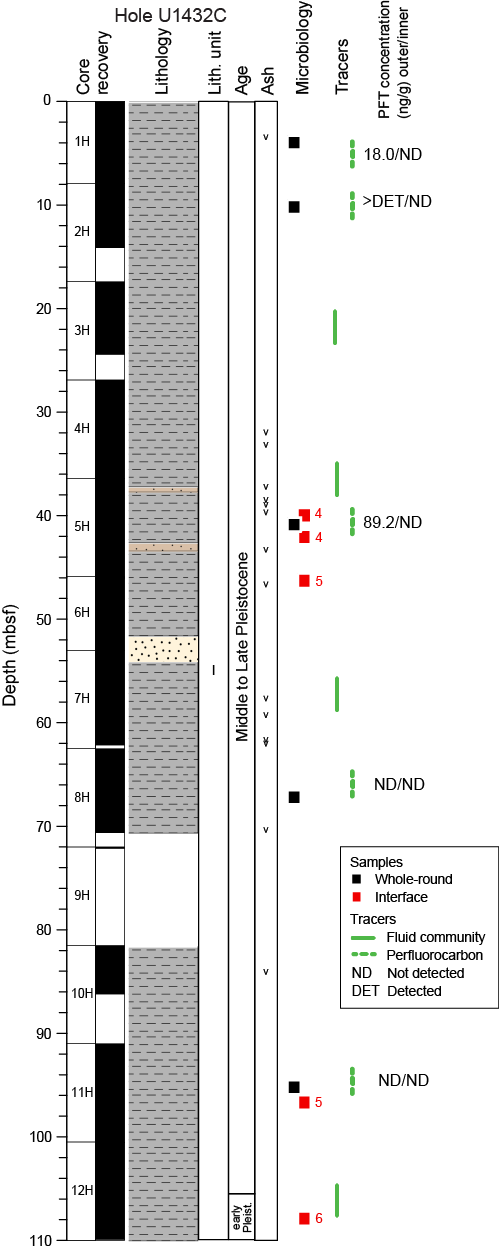
Figure F19. Microbiology and contamination testing samples.
We collected and preserved 24 samples for investigating the microbiology of interfaces using lipid and nucleic acid analyses. We obtained these samples between 38.9 and 108.5 mbsf in Hole U1432C. Two sets of interface samples were obtained from volcanic ash/clay interfaces and three sets were obtained from turbidite sand (silt)/clay interfaces. We selected all interface samples based on recognition of key intervals and through consultation with shipboard sedimentologists.
Microbiological analyses
Most of the samples collected at Site U1432 were preserved for shore-based analysis. Samples for DNA and RNA extractions and sequencing were frozen at −80°C and samples for lipid extraction and analysis were frozen at either −80° or −20°C. Subsamples of the routinely collected whole-round samples were prepared for fluorescent in situ hybridization analysis (five subsamples preserved at −20°C). Portions of the whole-round samples were selected for cultivation-based studies to enrich anaerobic heterotrophs, sulfate reducers, and nitrate reducing microorganisms.
Contamination testing
We used two different methods of contamination testing during coring of Hole U1432C. The PFT perfluoromethylcyclohexane was introduced into the drilling fluid throughout coring of Hole U1432C to trace potential drilling fluid contamination of the cores. PFT samples were acquired from the outside and inside of five cores from Hole U1432C (Figure F19). PFT concentrations measured on samples from the outside of the core are higher than those measured on the inside of the core in 3 of the core sections measured (Sections 349-U1432C-1H-3, 2H-2, and 5H-4), which indicates no apparent drilling fluid contamination of the interiors of these cores. On the other hand, PFTs could not be detected in either the outer or inner samples from either of the 2 deeper sections of Hole U1432C that were used for PFT analysis (Sections 349-U1432C-8H-5 and 11H-3). The PFT pump was operating during these coring events, but it is possible that the lack of detectable PFTs in the outer samples of these 2 cores may be the result of insufficient mixing of the PFTs during circulation of the drilling fluid. For these deeper samples, we cannot conclude whether drilling fluid contamination occurred based on the PFT measurements.
Four fluid community tracer (FCT) samples were collected from the drilling fluids to track the microbial communities typical of the seawater and other mud constituents. The fluids collected for FCT samples correspond to cores obtained from depths ranging between 22 and 106 mbsf. Microbial community DNA and lipids from FCT samples will be compared to the same measurements made on the core samples to determine if the drilling fluids contain microbes that can be regularly tracked as recognizable contaminant taxa. Shortly after coring Hole U1432C, we also collected samples of sepiolite mixed with seawater from the mud pits. These samples will be treated like other FCT samples in order to determine whether there are key microbial taxa that are introduced to the hole when sepiolite is used to remove cuttings from the hole (e.g., during coring in Holes U1431E and U1433B).
Paleomagnetism
At Site U1432, Cores 349-U1432C-1H through 12H were cored with the APC using nonmagnetic core barrels. Shipboard paleomagnetic studies for Hole U1432C consisted of continuous measurements of archive-half core sections and progressive demagnetization measurements of discrete samples. The pass-through magnetometer measurements on all archive-half cores were conducted using the 2G superconducting rock magnetometer (SRM), with demagnetization steps of 0, 5, 10, 15, and 20 mT. Selected discrete samples were alternating field (AF) demagnetized to 120 mT with an ASC Scientific D-2000 AF demagnetizer using 0, 5, 10, 15, 20, 30, 40, 60, 80, 100, and 120 mT steps. Remanences were measured using the SRM. We analyzed the results in Zijderveld diagrams (Zijderveld, 1967) and calculated the characteristic remanent magnetization (ChRM) direction using principal component analysis (Kirschvink, 1980).
Natural remanent magnetization of sedimentary cores
Downhole variation in natural remanent magnetization (NRM) properties is illustrated in Figure F20. NRM intensity of the archive halves from Hole U1432C is <0.06 A/m. NRM intensities peak at certain depth intervals, such as at ~32 mbsf (Section 349-U1432C-4H-5), ~46 mbsf (Section 5H-5), and ~84 mbsf (Section 10H-2), which correspond to thin ash layers (see Lithostratigraphy). At the base of Core 349-U1432C-6H and top of Core 7H, at ~52–54 mbsf, a 2.42 m thick loose sand layer has the lowest NRM intensity of the hole (Figure F20). Variations in NRM intensities are consistent with variations in magnetic susceptibility (see Physical properties).
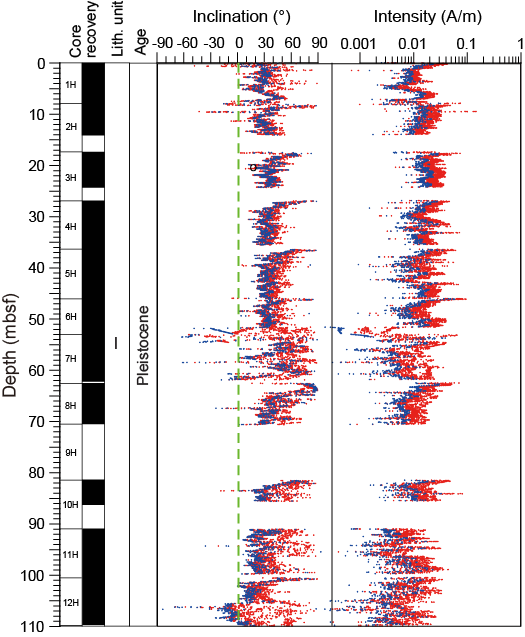
Figure F20. Paleomagnetism.
Pervasive remagnetization imparted by the coring process is commonly encountered in cores from Hole U1432C, as shown by the significant decreases of NRM intensity after 20 mT AF demagnetization. NRM inclinations are biased toward vertical (mostly toward +90°) in a majority of cores. Typically at the base of each core, NRM inclinations are >80°, which suggests that a more complete remagnetization during coring occurs near the drill bit. Such strong magnetization contaminations cannot be removed even after 20 mT AF demagnetization. Nevertheless, average inclination after 20 mT AF demagnetization is consistent with the expected dipole inclination for the site (33.56° for normal polarity or −33.56° for reversed polarity).
Paleomagnetic demagnetization results
Representative vector plots (Zijderveld, 1967) showing magnetism behavior of detailed AF demagnetization are given in Figure F21. For most samples, the nearly vertical overprints were removed by AF demagnetization of 5–10 mT. Assuming that the viscous remanent magnetization (VRM) of core samples was acquired during the entire Brunhes normal polarity chron, the horizontal orientation of the secondary magnetization points to geographic north on average. Thus, VRM direction could be used for reorientation of the drilled site. At Site U1432, VRM is not observed, mostly because VRM could share coercivity spectra similar to that of the induced remanent magnetization. For samples demagnetized using the ASC Scientific D-2000 AF demagnetizer up to 120 mT, ChRM can be clearly defined between 20 and 120 mT using principal component analysis (Kirschvink, 1980). Therefore, we use remanent magnetization after 20 mT AF demagnetization to represent ChRM for the pass-through magnetometer measurements on all archive-half cores of this site. Inclinations after 20 mT AF demagnetization are illustrated in Figure F22. Clearly, the negative inclinations at ~52–54 mbsf correspond to the soupy sand layer. Moreover, the steep ChRM inclinations at the base of each core (e.g., green arrows in Figure F22) indicate that the overprints of the drilling-induced magnetization are not removed. Thus, these anomalous inclinations cannot be regarded as reliable paleomagnetic records. Interestingly, there are 2 short inclination shifts from positive to negative between ~62 and 67 mbsf that are not associated with core ends or loose sands. Shore-based studies on discrete samples at these intervals are needed to confirm these short polarity changes.
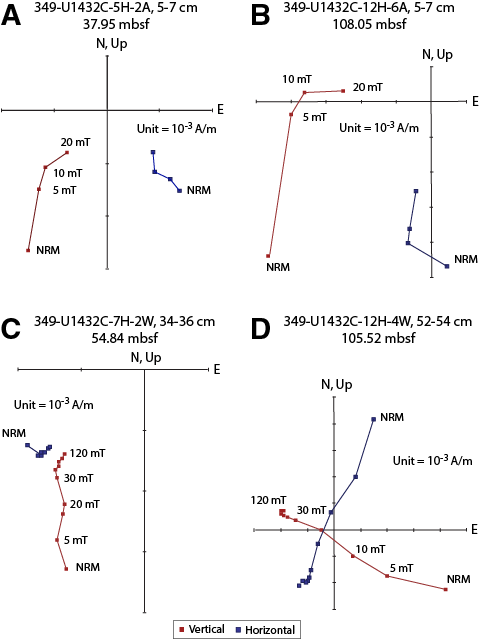
Figure F21. Demagnetization.
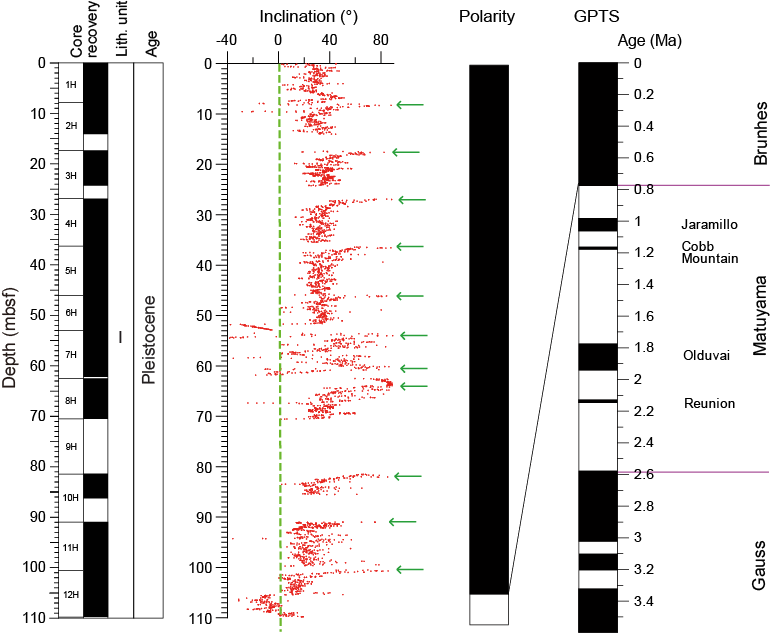
Figure F22. Magnetostratigraphy.
Magnetostratigraphy
Unlike cores from Site U1431, which were oriented with the FlexIT orientation tool (hence with magnetic declination correction available), only inclinations from cores in Hole U1432C can be used to construct magnetostratigraphy; weather prevented the use of the FlexIT orientation tool in Hole U1432C. Because the age of the bottom of Core 349-U1432C-12H is <0.91 Ma based on planktonic foraminifer and calcareous nannofossil biostratigraphy (see Biostratigraphy), we assign the first magnetic reversal at ~105 mbsf as the Brunhes/Matuyama Chron boundary (0.781 Ma) (Figure F22). Demagnetization of the corresponding core section also shows antipodal relative declinations. After AF demagnetization at 20 mT, the reversal indicated by the difference in polarity of inclination at ~105.4 mbsf is confirmed by a near 180° change in declination. This positive “antipodal test” is perhaps the most compelling evidence for isolating primary ChRM.
To further test our polarity pattern assignments, we compare the magnetic susceptibility curves of Holes U1431D and U1432C (Figure F23). The sharp magnetic susceptibility peaks (usually >50 SI) mark ash layers. The excellent correlation of magnetic susceptibility curves between these two holes demonstrates that (1) ash layers are coevally distributed across a relatively large area and (2) the assignment of the Brunhes/Matuyama Chron boundary in Hole U1432C is tenable. Therefore, it is possible that a composite age model can be constructed by integrating age controls from these two holes. The properties of ash layers from these two holes can be compared in detail and their absolute ages assigned accordingly. For example, the ash layers at ~32 mbsf (Section 349-U1432C-4H-5), ~46 mbsf (Section 5H-5), and ~84 mbsf (Section 10H-2) are paleomagnetically dated to ~0.23, 0.54, and 0.62 Ma, respectively, which could be compared to ash layers in Hole U1431D.
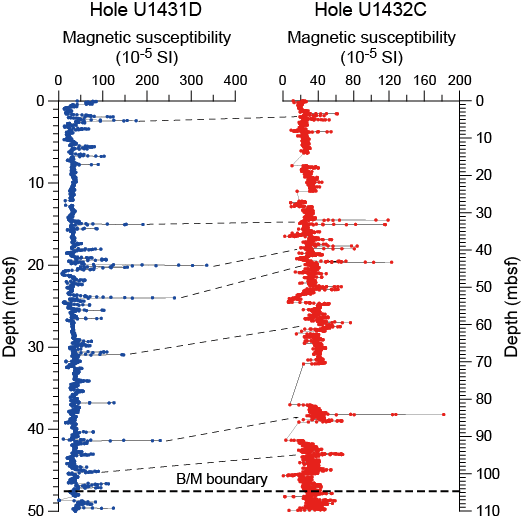
Figure F23. Comparison of magnetic susceptibility curves.
Preliminary magnetic polarity stratigraphy (Figure F22) in Hole U1432C is used to estimate the sedimentation rate at this site at ~13.5 cm/ky, which is approximately two times higher than that of Site U1431 for the same age interval. These rates are generally in agreement with those inferred from shipboard biostratigraphic studies (see Biostratigraphy).
Physical properties
At Site U1432, we measured physical properties on whole-round cores (P-wave velocity, bulk density from gamma ray attenuation, magnetic susceptibility, and natural gamma radiation [NGR]), on split cores (thermal conductivity and x-caliper and z-bayonet P-wave velocities), and on discrete samples (porosity, moisture, and density). Only one discrete sample could be collected from the soupy sand layer between 52 and 54 mbsf, so its properties are better observed on the whole-round measurements.
Physical property measurements
Measurement points clearly out of range were removed from the whole-round core data, which were then smoothed using a 5-point average moving window. The compiled measurements of physical properties of Hole U1432C are shown in Figure F24. The measurements are mutually consistent and correspond to lithology.
Magnetic susceptibility values increase in Hole U1432C from ~30 × 10−5 to 50 × 10−5 SI in the uppermost 70 mbsf and then remain near 50 × 10−5 SI below 70 mbsf. Values approximately 20 × 10−5 to 40 × 10−5 SI lower than the background are observed in short intervals near 18, 47, 52–54, and 100 mbsf (yellow arrows in Figure F24). Narrow peaks up to 100 × 10−5 SI are observed near 4 mbsf, between 30 and 45 mbsf, and near 95 mbsf (red arrows in Figure F24). NGR values display a general increase from ~30 to ~70 counts/s in the uppermost 70 mbsf of Hole U1432C and then remain relatively constant near 70 counts/s. NGR values that are ~20–30 counts/s below the general trend typically coincide with either highs or lows in magnetic susceptibility values. P-wave velocity near the seafloor in Hole U1432C is close to the velocity in seawater (~1500 m/s), increases to ~1550 m/s in the uppermost 70 mbsf, and then remains approximately constant. The layer at 52–54 mbsf shows higher velocities ranging from 1600 to 1750 m/s (yellow box in Figure F24).

Figure F24. Physical properties.
Bulk density increases with depth from ~1.2 to ~1.8 g/cm3 in the uppermost 70 mbsf and then remains constant near 1.8 g/cm3 to the bottom of the hole. Dry bulk density values are very low near the seafloor (~0.5 g/cm3), reflecting higher porosity. Dry bulk density increases with depth to ~1.2 g/cm3 near 110 mbsf. Grain density is almost constant at 2.9 g/cm3. Porosity is very high near the seafloor (~85%), decreases with depth to ~60% in the uppermost 70 mbsf, and then remains nearly constant below 70 mbsf.
Thermal conductivity increases gradually from 0.8 to 1.4 W/(m·K) in Hole U1432C. The increase in shear strength with depth from 10 to 110 kPa also spans the entire Hole U1432C.
Data interpretation and lithology correlation
In general, physical properties correlate with lithology, composition, and lithification. In Hole U1432C, the observed ranges of magnetic susceptibility (30 × 10−5 to 70 × 10−5 SI) and NGR (30–70 counts/s) are typical for clay, which dominates the lithology. Variations from these background values coincide with the compaction effect near the surface, as well as the observation of ash layers and silt/sand.
Bulk and dry densities, P-wave velocity, NGR, and thermal conductivity increase gradually with depth, whereas porosity measured on discrete samples decreases from 85% to 60% over the uppermost 70 mbsf (Figure F24). Variations of thermal conductivity and shear strength also mainly result from compaction.
Higher magnetic susceptibility and lower NGR values correspond to ash layers (red arrows in Figure F24). Volcanic material typically has lower NGR values and higher magnetic susceptibility, resulting from the presence of ferromagnetic minerals. Similar physical properties of ash layers were also observed at Site U1431; however, because of the thicker and more abundant turbidites in the top of Hole U1431D, it is difficult to compare the stratigraphy between the holes based on observed physical properties.
Low magnetic susceptibility and low NGR values coincide with sand and silt (yellow arrows in Figure F24), which usually contain fewer magnetic minerals. Compared to clay, the sand layer from 52 to 54 mbsf shows a higher P-wave velocity measured on whole-round core sections (yellow box in Figure F24).
Downhole measurements
Downhole temperature and heat flow
Four APCT-3 downhole temperature measurements in Hole U1432C range from 6.6°C at 45.9 mbsf to 10.9°C at 100.5 mbsf (Table T11; Figure F25), giving a geothermal gradient of 85°C/km (Figure F26). These measurements, together with the seafloor temperature of 2.4°C, indicate that the temperature increases linearly with depth.
Table T11. Advanced piston corer temperature tool (APCT-3) temperature measurements, Hole U1432C. Download table in .csv format.
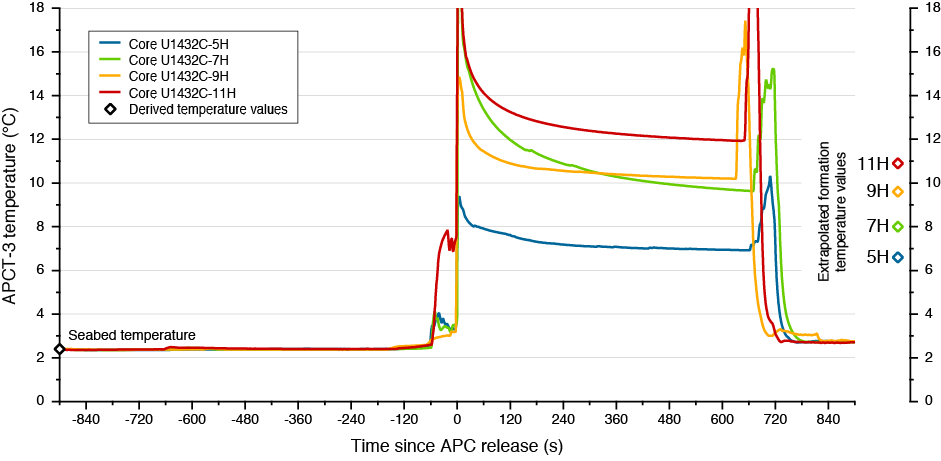
Figure F25. APCT-3 temperature-time series.
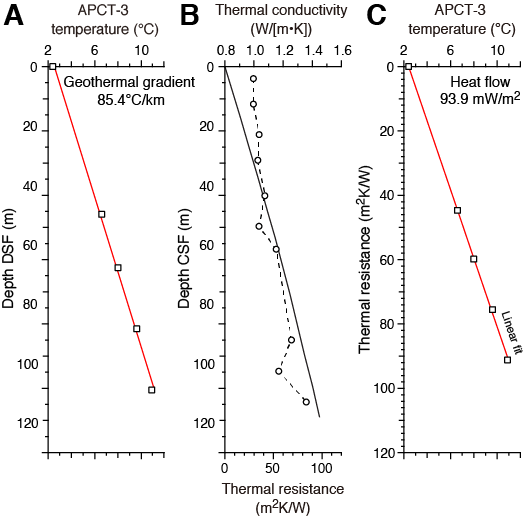
Figure F26. Heat flow calculations.
Thermal conductivity under in situ conditions was estimated from laboratory-determined thermal conductivity in Hole U1432C using the method of Hyndman et al. (1974) (see Downhole measurements in the Methods chapter [Li et al., 2015a]). Calculated in situ values average 0.8% higher than measured laboratory values. Thermal resistance was then calculated by integrating the inverse of the in situ thermal conductivity over depth (Figure F26). A heat flow of 94 mW/m2 was obtained from the linear fit between temperature and thermal resistance (Pribnow et al., 2000). This is a high heat flow, but it is similar to heat flow measurements at other sites within a few tens of kilometers of Site U1432, including at Site 1148 (Li et al., 2010).
References
Briais, A., Patriat, P., and Tapponnier, P., 1993. Updated interpretation of magnetic anomalies and seafloor spreading stages in the South China Sea: implications for the Tertiary tectonics of Southeast Asia. Journal of Geophysical Research: Solid Earth, 98(B4):6299–6328. http://dx.doi.org/10.1029/92JB02280
Gardner, J.V., Nelson, C.S., and Baker, P.A., 1986. Distribution and character of pale green laminae in sediment from Lord Howe Rise: a probable late Neogene and Quaternary tephrostratigraphic record. In Kennett, J.P., von der Borch, C.C., et al., Initial Reports of the Deep Sea Drilling Project, 90: Washington, DC (U.S. Government Printing Office), 1145–1159. http://dx.doi.org/10.2973/dsdp.proc.90.125.1986
Gradstein, F.M., Ogg, J.G., Schmitz, M.D., and Ogg, G.M. (Eds.), 2012. The Geological Time Scale 2012: Oxford, UK (Elsevier).
Helmke, J.P., Schulz, M., and Bauch, H.A., 2002. Sediment-color record from the northeast Atlantic reveals patterns of millennial-scale climate variability during the past 500,000 years. Quaternary Research, 57(1):49–57. http://dx.doi.org/10.1006/qres.2001.2289
Hyndman, R.D., Erickson, A.J., and Von Herzen, R.P., 1974. Geothermal measurements on DSDP Leg 26. In Davies, T.A., Luyendyk, B.P., et al., Initial Reports of the Deep Sea Drilling Project, 26: Washington, DC (U.S. Government Printing Office), 451–463. http://dx.doi.org/10.2973/dsdp.proc.26.113.1974
Hyun, S., Ortiz, J.D., Raymo, M.E., and Taira, A., 1999. Low-frequency oscillations in Site 983 sediments: relationships between carbonate and productivity proxies. In Raymo, M.E., Jansen, E., Blum, P., and Herbert, T.D. (Eds.), Proceedings of the Ocean Drilling Program, Scientific Results, 162: College Station, TX (Ocean Drilling Program), 197–207. http://dx.doi.org/10.2973/odp.proc.sr.162.019.1999
Ikehara, M., Kawamura, K., Ohkouchi, N., and Taira, A., 1999. Organic geochemistry of greenish clay and organic-rich sediments since the early Miocene from Hole 985A, Norway Basin. In Raymo, M.E., Jansen, E., Blum, P., and Herbert, T.D. (Eds.), Proceedings of the Ocean Drilling Program, Scientific Results, 162: College Station, TX (Ocean Drilling Program), 209–216. http://dx.doi.org/10.2973/odp.proc.sr.162.020.1999
Ishihara, T., and Kisimoto, K., 1996. Magnetic anomaly map of East Asia, 1:4,000,000 (CD-ROM version). Geological Survey of Japan, Coordinating Committee for Coastal and Offshore Geoscience Programs in East and Southeast Asia (CCOP).
Khim, B.-K., Tada, R., Park, Y.H., Bahk, J.J., Kido, Y., Itaki, T., and Ikehara, K., 2009. Correlation of TL layers for the synchronous paleoceanographic events in the East Sea (Sea of Japan) during the late Quaternary. Geosciences Journal, 13(2):113–120. http://dx.doi.org/10.1007/s12303-009-0010-8
Kirschvink, J.L., 1980. The least-squares line and plane and the analysis of palaeomagnetic data. Geophysical Journal of the Royal Astronomical Society, 62(3):699–718. http://dx.doi.org/10.1111/j.1365-246X.1980.tb02601.x
Li, C.-F., Lin, J., Kulhanek, D.K., Williams, T., Bao, R., Briais, A., Brown, E.A., Chen, Y., Clift, P.D., Colwell, F.S., Dadd, K.A., Ding, W., Almeida, I.H., Huang, X.-L., Hyun, S., Jiang, T., Koppers, A.A.P., Li, Q., Liu, C., Liu, Q., Liu, Z., Nagai, R.H., Peleo-Alampay, A., Su, X., Sun, Z., Tejada, M.L.G., Trinh, H.S., Yeh, Y.-C., Zhang, C., Zhang, F., Zhang, G.-L., and Zhao, X., 2015a. Methods. In Li, C.-F., Lin, J., Kulhanek, D.K., and the Expedition 349 Scientists, Proceedings of the Integrated Ocean Drilling Program, 349: South China Sea Tectonics: College Station, TX (International Ocean Discovery Program). http://dx.doi.org/10.14379/iodp.proc.349.102.2015
Li, C.-F., Lin, J., Kulhanek, D.K., Williams, T., Bao, R., Briais, A., Brown, E.A., Chen, Y., Clift, P.D., Colwell, F.S., Dadd, K.A., Ding, W., Almeida, I.H., Huang, X.-L., Hyun, S., Jiang, T., Koppers, A.A.P., Li, Q., Liu, C., Liu, Q., Liu, Z., Nagai, R.H., Peleo-Alampay, A., Su, X., Sun, Z., Tejada, M.L.G., Trinh, H.S., Yeh, Y.-C., Zhang, C., Zhang, F., Zhang, G.-L., and Zhao, X., 2015b. Site U1431. In Li, C.-F., Lin, J., Kulhanek, D.K., and the Expedition 349 Scientists, Proceedings of the Integrated Ocean Drilling Program, 349: South China Sea Tectonics: College Station, TX (International Ocean Discovery Program). http://dx.doi.org/10.14379/iodp.proc.349.103.2015
Li, C.-F., Shi, X., Zhou, Z., Li, J., Geng, J., and Chen, B., 2010. Depths to the magnetic layer bottom in the South China Sea area and their tectonic implications. Geophysical Journal International, 182(3):1229–1247. http://dx.doi.org/10.1111/j.1365-246X.2010.04702.x
Li, Q., Wang, P., Zhao, Q., Shao, L., Zhong, G., Tian, J., Cheng, X., Jian, Z., and Su, X., 2006. A 33 Ma lithostratigraphic record of tectonic and paleoceanographic evolution of the South China Sea. Marine Geology, 230(3–4):217–235. http://dx.doi.org/10.1016/j.margeo.2006.05.006
Lind, I.L., Janecek, T.R., Krissek, L.A., Prentice, M.L., and Stax, R., 1993. Color bands in Ontong Java Plateau carbonate oozes and chalks. In Berger, W.H., Kroenke, L.W., Mayer, L.A., et al., Proceedings of the Ocean Drilling Program, Scientific Results, 130: College Station, TX (Ocean Drilling Program), 453–470. http://dx.doi.org/10.2973/odp.proc.sr.130.007.1993
Nagao, S., and Nakashima, S., 1992. The factors controlling vertical color variations of North Atlantic Madeira abyssal plain sediments. Marine Geology, 109(1–2):83–94. http://dx.doi.org/10.1016/0025-3227(92)90222-4
Ortiz, J.D., O’Connell, S., and Mix, A., 1999. Data report: spectral reflectance observations from recovered sediments. In Raymo, M.E., Jansen, E., Blum, P., and Herbert, T.D. (Eds.), Proceedings of the Ocean Drilling Program, Scientific Results, 162: College Station, TX (Ocean Drilling Program), 259–264. http://dx.doi.org/10.2973/odp.proc.sr.162.029.1999
Pautot, G., Rangin, C., Briais, A., Tapponnier, P., Beuzart, P., Lericolais, G., Mathieu, X., Wu, J., Han, S., Li, H., Lu, Y., and Zhao, J., 1986. Spreading direction in the central South China Sea. Nature, 321(6066):150–154. http://dx.doi.org/10.1038/321150a0
Pribnow, D., Kinoshita, M., and Stein, C., 2000. Thermal Data Collection and Heat Flow Recalculations for Ocean Drilling Program Legs 101–180: Hanover, Germany (Institute for Joint Geoscientific Research, Institut für Geowissenschaftliche Gemeinschaftsaufgaben [GGA]). http://www-odp.tamu.edu/publications/heatflow/ODPReprt.pdf
Shipboard Scientific Party, 2000. Site 1148. In Wang, P., Prell, W.L., Blum, P., et al., Proceedings of the Ocean Drilling Program, Initial Reports, 184: College Station, TX (Ocean Drilling Program), 1–122. http://dx.doi.org/10.2973/odp.proc.ir.184.109.2000
Tamburini, F., Adatte, T., and Föllmi, K.B., 2003. Origin and nature of green clay layers, ODP Leg 184, South China Sea. In Prell, W.L., Wang, P., Blum, P., Rea, D.K., and Clemens, S.C. (Eds.), Proceedings of the Ocean Drilling Program, Scientific Results, 184: College Station, TX (Ocean Drilling Program), 1–23. http://dx.doi.org/10.2973/odp.proc.sr.184.206.2003
Taylor, B., and Hayes, D.E., 1980. The tectonic evolution of the South China Basin. In Hayes, D.E. (Ed.), The Tectonic and Geologic Evolution of Southeast Asian Seas and Islands. Geophysical Monograph, 23:89–104. http://dx.doi.org/10.1029/GM023p0089
Taylor, B., and Hayes, D.E., 1983. Origin and history of the South China Sea Basin. In Hayes, D.E. (Ed.), The Tectonic and Geologic Evolution of Southeast Asian Seas and Islands (Pt. 2). Geophysical Monograph, 27:23–56. http://dx.doi.org/10.1029/GM027p0023
Wang, P., and Li, Q. (Eds.), 2009. Developments in Paleoenvironmental Research (Vol. 13): The South China Sea: Paleoceanography and Sedimentology: Dordrecht (Springer). 13. http://dx.doi.org/10.1007/978-1-4020-9745-4
Wang, R., and Abelmann, A., 1999. Pleistocene radiolarian biostratigraphy in the South China Sea. Science in China (Series D), 42(5):537–543.
Zijderveld, J.D.A., 1967. AC demagnetization of rocks: analysis of results. In Collinson, D.W., Creer, K.M., and Runcorn, S.K. (Eds.), Methods in Palaeomagnetism: Amsterdam (Elsevier), 254–286.
1Li, C.-F., Lin, J., Kulhanek, D.K., Williams, T., Bao, R., Briais, A., Brown, E.A., Chen, Y., Clift, P.D., Colwell, F.S., Dadd, K.A., Ding, W.-W., Hernández-Almeida, I., Huang, X.-L., Hyun, S., Jiang, T., Koppers, A.A.P., Li, Q., Liu, C., Liu, Q., Liu, Z., Nagai, R.H., Peleo-Alampay, A., Su, X., Sun, Z., Tejada, M.L.G., Trinh, H.S., Yeh, Y.-C., Zhang, C., Zhang, F., Zhang, G.-L., and Zhao, X., 2015. Site U1432. In Li, C.-F., Lin, J., Kulhanek, D.K., and the Expedition 349 Scientists, Proceedings of the International Ocean Discovery Program, 349: South China Sea Tectonics: College Station, TX (International Ocean Discovery Program). http://dx.doi.org/10.14379/iodp.proc.349.104.2015
2Expedition 349 Scientists’ addresses.
Figure F1. A. Bathymetric map of South China Sea region. Solid yellow circles = Expedition 349 sites. Solid pink circles = ODP Leg 184 sites. Yellow dashed line = inferred continent/ocean boundary, blue lines = fossil South China Sea spreading center, white-flagged line = Manila Trench. B. Detailed bathymetry around Site U1432 (red box in A) showing nearby continental shelf, the Manila Trench, and inferred continent/ocean boundary.
Figure F2. Shaded map of magnetic anomalies near Site U1432 (data from Ishihara and Kisimoto, 1996). Black lines mark 3000 m isobaths outlining the continental shelf and seamounts. Symbols are magnetic picks from Briais et al. (1993).
Figure F3. A. Regional contoured bathymetric map showing seismic reflection profiles (yellow and red lines) and the location of Sites U1432 and U1435 and ODP Site 1148. Contour interval = 100 m. B. Seismic profile Line 08ec1573 with location of Site U1432. SP = shotpoint. Green line = interpreted top of basement, blue line = interpreted Oligocene/Miocene boundary.
Figure F4. Lithostratigraphy summary.
Figure F5. Pyrite nodule in a clay layer (349-U1432C-7H-2A). A. Close-up showing nodule shape. B. Reflected-light thin section showing microcrystals of pyrite and shapes of foraminifers (113–117 cm; TS64).
Figure F6. Very thin, upward-fining, sharp-based silt layers, Hole U1432C (12H-1A, 100–113 cm).
Figure F7. Magnetic susceptibility and reflectance spectroscopy profiles (after 10-point running average), Site U1432. The shaded area correlates with a prominent sand layer.
Figure F8. Correlation of lithology with magnetic susceptibility and reflectance spectroscopy (349-U1432C-11H-6A).
Figure F9. Sand in Unit I of Hole U1432C consisting mainly of quartz, feldspar, volcanic glass, and foraminifer fragments (6H-5A, 90 cm).
Figure F10. Light-colored ash layer, Hole U1432C (7H-5A, 23–32 cm).
Figure F11. Two types of green layers, Hole U1432C. A. Graded silt layer with very thin bedded green layer (11H-3A, 60–67 cm). B. Green layer in mud layer with strong bioturbation (12H-4A, 29–36 cm).
Figure F12. Age-depth model.
Figure F13. Interstitial water chloride, bromide, sodium, and potassium. Blue dashed lines = modern seawater values.
Figure F14. Interstitial water sulfate, alkalinity, ammonium, and phosphate. Blue dashed lines = modern seawater values.
Figure F15. Interstitial water calcium, magnesium, strontium, and boron. Blue dashed lines = modern seawater value.
Figure F16. Interstitial water iron, manganese, lithium, and silica. Blue dashed line = modern seawater value.
Figure F17. Headspace methane, Hole U1432C.
Figure F18. Calcium carbonate, TOC, TN, and C/N ratios.
Figure F19. Microbiology whole-round and interface samples and contamination testing samples.
Figure F20. Paleomagnetic measurements of NRM inclination and intensity on archive core sections after 0 mT (red) and 20 mT (blue) AF demagnetization for Hole U1432C.
Figure F21. Representative vector endpoint diagrams (Zijderveld, 1967) for sediment samples through stepwise AF demagnetization. A, C. Normal polarity. B, D. Reversed polarity. Most samples display a normal vertical component of drilling-induced magnetization that is removed after 10 mT AF demagnetization.
Figure F22. Magnetostratigraphic results, Hole U1432C. Paleomagnetic inclination after 20 mT AF demagnetization. Green arrows indicate steep characteristic remanent magnetization inclinations at the end of each core caused by overprints of drilling-induced magnetization. For polarity and GPTS (Gradstein et al., 2012), black = normal polarity and white = reversed polarity.
Figure F23. Comparison of magnetic susceptibility curves. Thin dashed lines show interpreted correlation between ash layers in the 2 holes. Note the different depth scales in these 2 plots, indicating that the sedimentation rate for Site U1432 is ~2 times higher than that of Site U1431 for the same age interval.
Figure F24. Physical property measurements, Hole U1432C. Red arrows = ash layers, yellow arrows = thin sand/silt layers. Shaded yellow bar corresponds to a sand layer between 52 and 54 mbsf with higher P-wave velocity, lower magnetic susceptibility, and lower NGR than the clay. Porosity was measured on discrete samples, and thermal conductivity was measured on whole-round sections.
Figure F25. APCT-3 temperature-time series with extrapolated formation temperature estimates, Site U1432.
Figure F26. Heat flow calculations, Site U1432. A. APCT-3 sediment temperatures. B. Thermal conductivity data from Hole U1432C (circles and dashed line) with calculated thermal resistance (solid line). C. Bullard plot of heat flow calculated from a linear fit of the temperature data.
Table T1. Coring summary, Site U1432. Download table in .csv format.
Table T2. Depths and ages of calcareous nannofossil events, Hole U1432C. Download table in .csv format.
Table T3. Depths and ages of planktonic foraminifer events, Hole U1432C. Download table in .csv format.
Table T4. Distribution of calcareous nannofossils, Hole U1432C. Download table in .csv format.
Table T5. Distribution of planktonic foraminifer species, Hole U1432C. Download table in .csv format.
Table T6. Distribution of radiolarian species, Hole U1432C. Download table in .csv format.
Table T7. Interstitial water major element concentrations, salinity, pH, alkalinity, sulfate, ammonium, phosphate, chloride, bromide, calcium, magnesium, sodium, and potassium, Hole U1432C. Download table in .csv format.
Table T8. Interstitial water minor element concentrations, barium, iron, lithium, manganese, silicon, and strontium, Hole U1432C. Download table in .csv format.
Table T9. Headspace sample hydrocarbon concentrations, methane, ethene, and ethane, Hole U1432C. Download table in .csv format.
Table T10. Carbon and nitrogen content, TOC, CaCO3, TN, and C/N ratios, Hole U1432C. Download table in .csv format.
Table T11. Advanced piston corer temperature tool (APCT-3) temperature measurements, Hole U1432C. Download table in .csv format.