Tamura, Y., Busby, C.J., Blum, P., and the Expedition 350 Scientists, 2015
Proceedings of the International Ocean Discovery Program Volume 350
publications.iodp.org

doi:10.14379/iodp.proc.350.104.2015
Site U14371
Y. Tamura, C.J. Busby, P. Blum, G. Guèrin, G.D.M. Andrews, A.K. Barker, J.L.R. Berger, E.M. Bongiolo, M. Bordiga, S.M. DeBari, J.B. Gill, C. Hamelin, J. Jia, E.H. John, A.-S. Jonas, M. Jutzeler, M.A.C. Kars, Z.A. Kita, K. Konrad, S.H. Mahony, M. Martini, T. Miyazaki, R.J. Musgrave, D.B. Nascimento, A.R.L. Nichols, J.M. Ribeiro, T. Sato, J.C. Schindlbeck, A.K. Schmitt, S.M. Straub, M.J. Vautravers, and Y. Yang2
Keywords: International Ocean Discovery Program, IODP, JOIDES Resolution, Expedition 350, Site U1437, Izu-Bonin-Mariana, IBM, prehnite, rear arc, seamount, Manji, tuffaceous mud, volcaniclastic, hyaloclastite, zircon, Neogene, ash, pumice, tuff, lapilli, Quaternary, breccia, peperite, rhyolite, intrusive, subduction, glass, continental crust, fore arc, density current, turbidite, fall deposit, tephra, greigite, volcano-bounded basin, hemipelagic mud, caldera, andesite, pXRF, ICP-AES, bioturbation, hydrothermal alteration, smectite, hornblende, sulfide reduction, fiamme, diagenesis, Aogashima, Kuroshio, explosive volcanism, submarine volcanism
MS 350-104: Published 30 May 2015
Background and objectives
International Discovery Program (IODP) Site U1437 (proposed Site IBM-3C) is in the Izu-Bonin-Mariana (IBM) arc, which formed in response to subduction of the Pacific plate over the past 52 My. The IBM arc is divided into two major segments, the Mariana arc and the Izu-Bonin arc (Figure F1). The Izu-Bonin arc is further divided into the Izu and Bonin segments (in the north and south, respectively), separated by a fault zone referred to as the Sofugan Tectonic Line (Figure F2, F3); because these segments have somewhat different histories, we refer to them separately as the Izu arc and the Bonin arc. Site U1437 is located in the Izu rear arc, behind the main chain of active volcanoes (referred to as the arc front, Figure F4), about 90 km west of the arc-front Myojinsho Volcano (Figure F5) and 330 km west of the axis of the Izu-Bonin Trench (Figures F1B, F2, F3) at 2117 meters below sea level (mbsl). Site U1437 is about 160 km west-southwest of IODP Site U1436, which was drilled as a 150 m geotechnical hole in preparation for Site IBM-4. Site U1437 is the main objective for IODP Expedition 350.
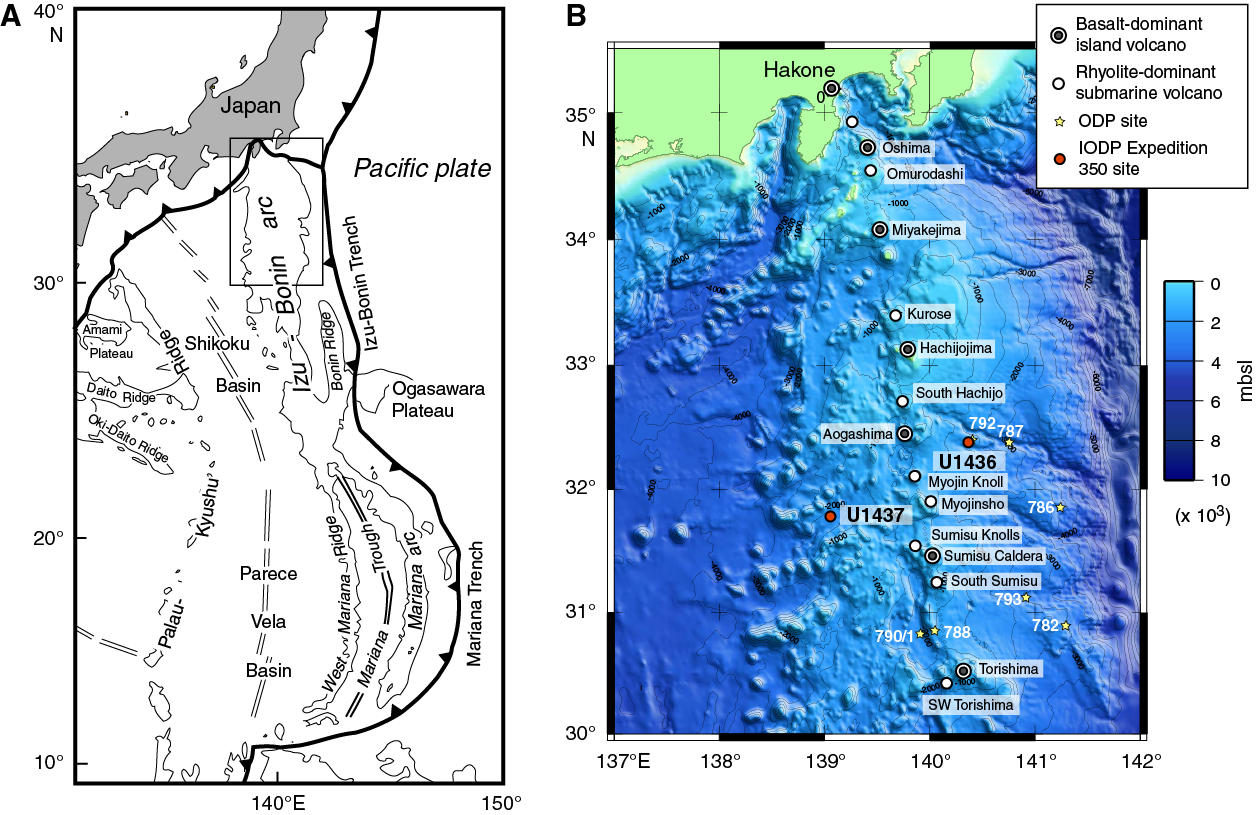
Figure F1. Tectonic setting of IBM arc.
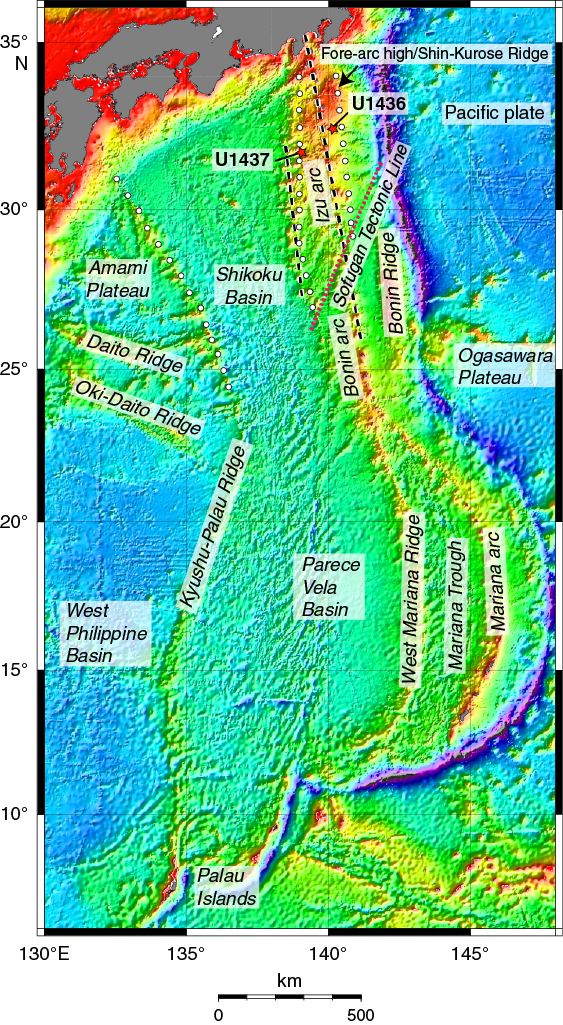
Figure F2. Bathymetric features.
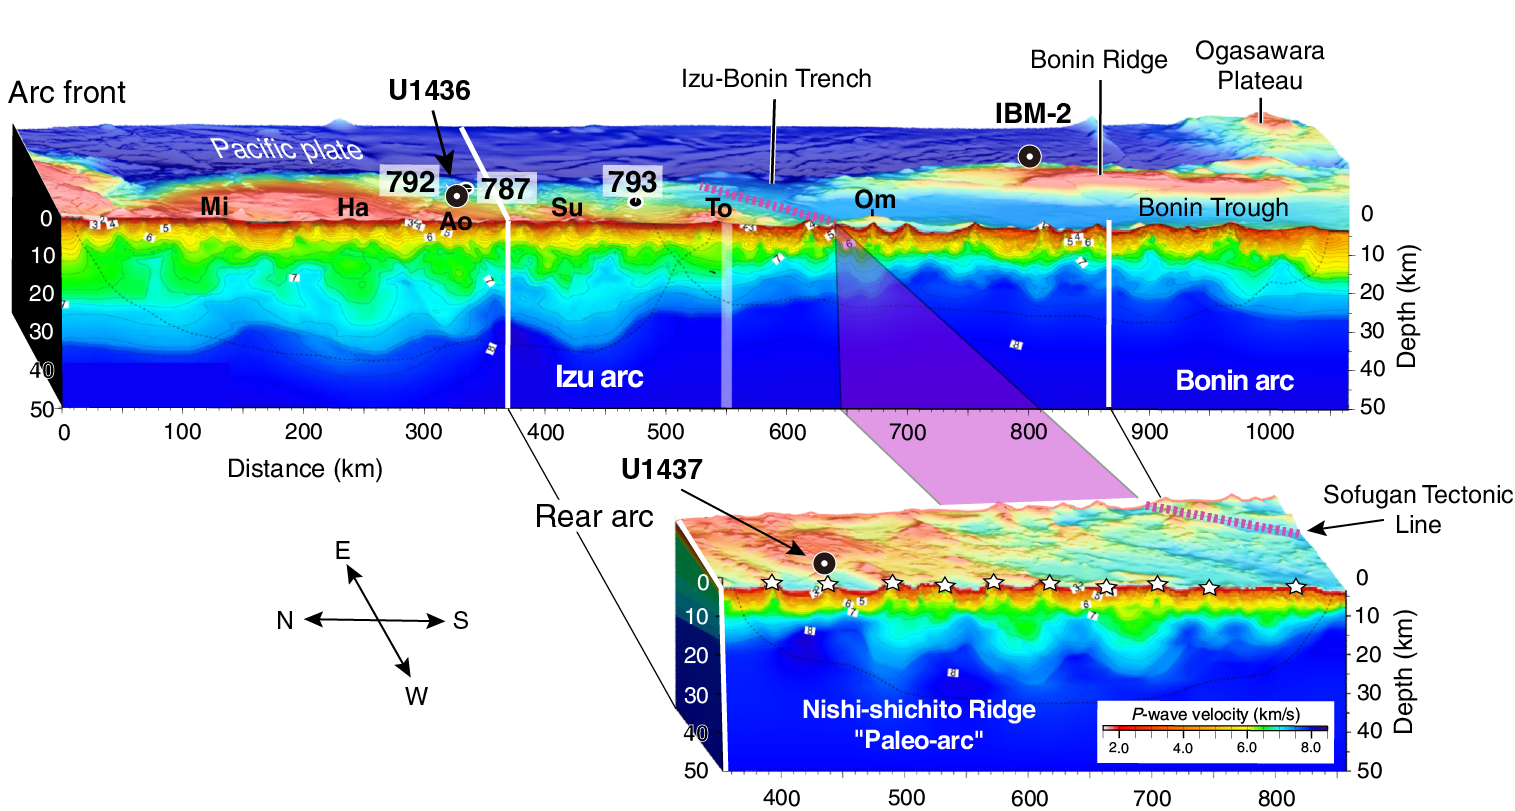
Figure F3. Wide-angle seismic profiles showing thick middle crust.
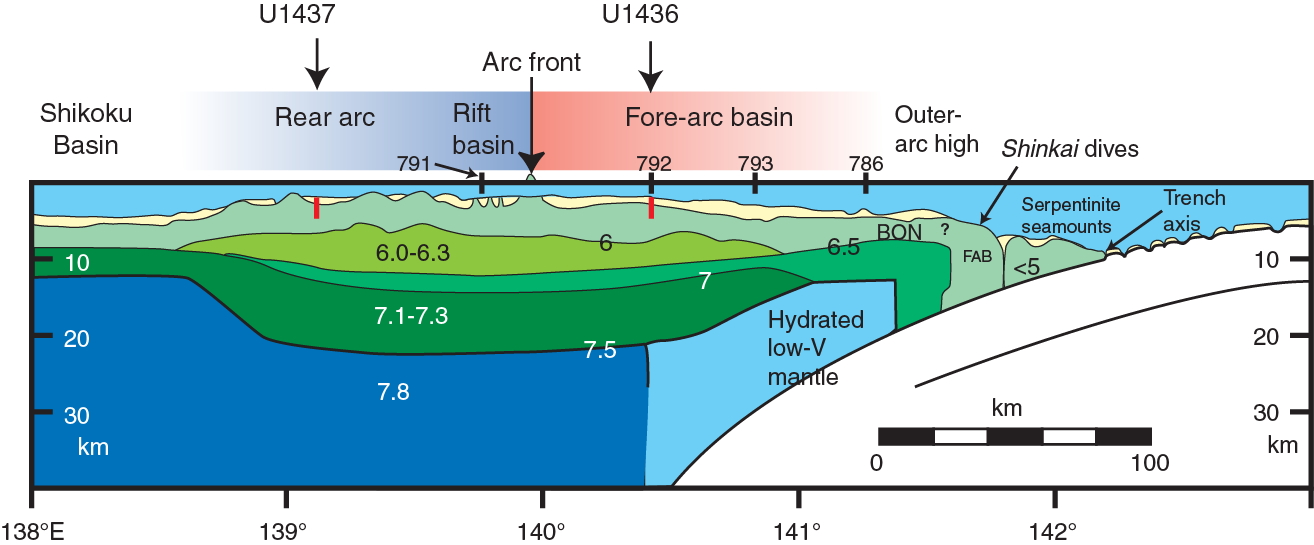
Figure F4. Wide-angle seismic profile across Izu arc.
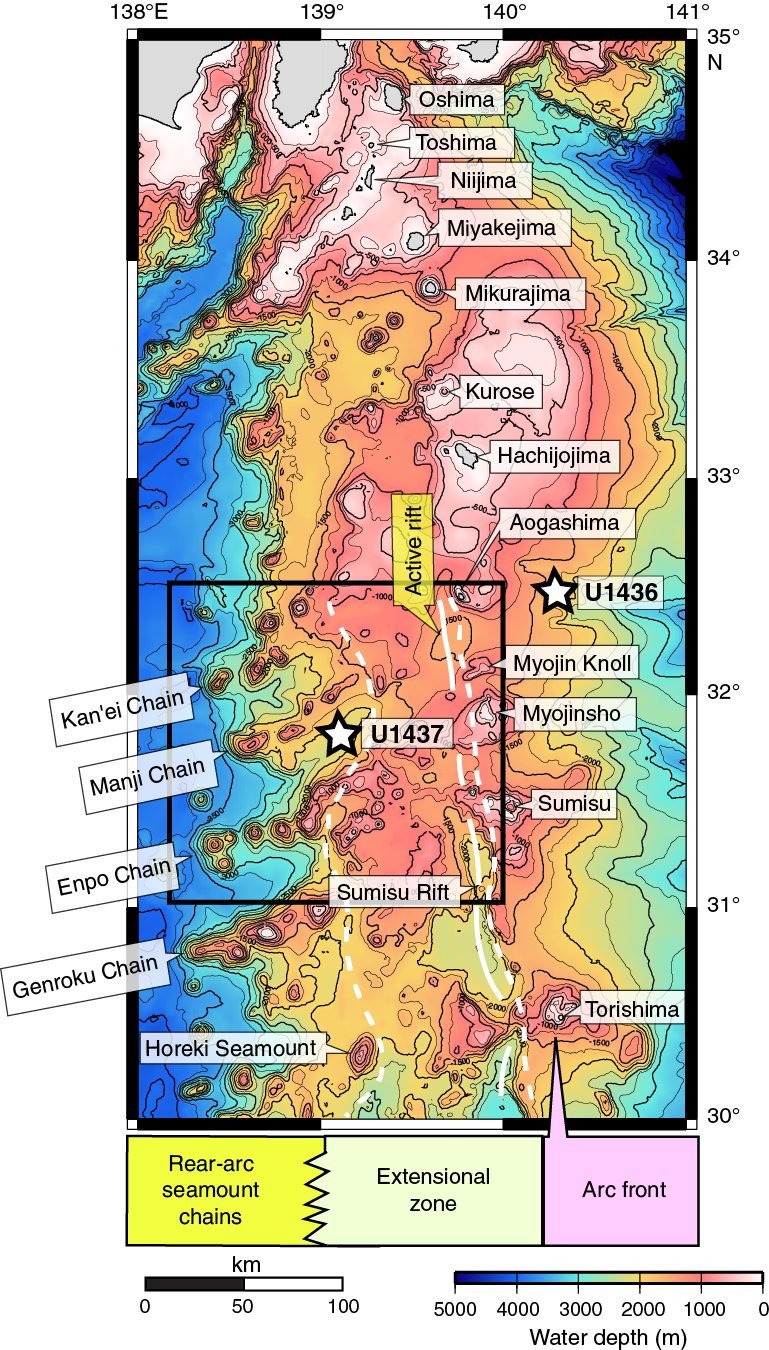
Figure F5. Volcano-tectonic domains.
Site U1437 is the first site drilled in the rear part of the Izu arc; all other sites have been in or near the Izu arc front or in the Izu fore arc (Figures F1B, F4), leading to an incomplete view of Izu arc magmatism as a whole. Site U1437 was selected as the ideal spot for drilling in the rear arc for two main reasons. First, the site is located in a basin between two rear-arc seamount chains (Manji and Enpo seamount chains, Figure F5) in a spot that appears to be bathymetrically shielded from arc-front volcaniclastic density current inputs (Figure F6). This site was thus chosen to maximize the chances of the stratigraphic record being dominated by rear-arc volcaniclastic input. Second, the Neogene Izu rear-arc seamount chains are inferred to young eastward and onlap eastward onto Paleogene (Eocene to Oligocene?) arc rocks, referred to as basement rocks (Figure F7). At Site U1437, the Paleogene crystalline basement rocks are inferred to lie about 2200 meters below seafloor (mbsf) (as described below); this depth is probably attainable by the R/V JOIDES Resolution, although it was the deepest target ever proposed for the ship.
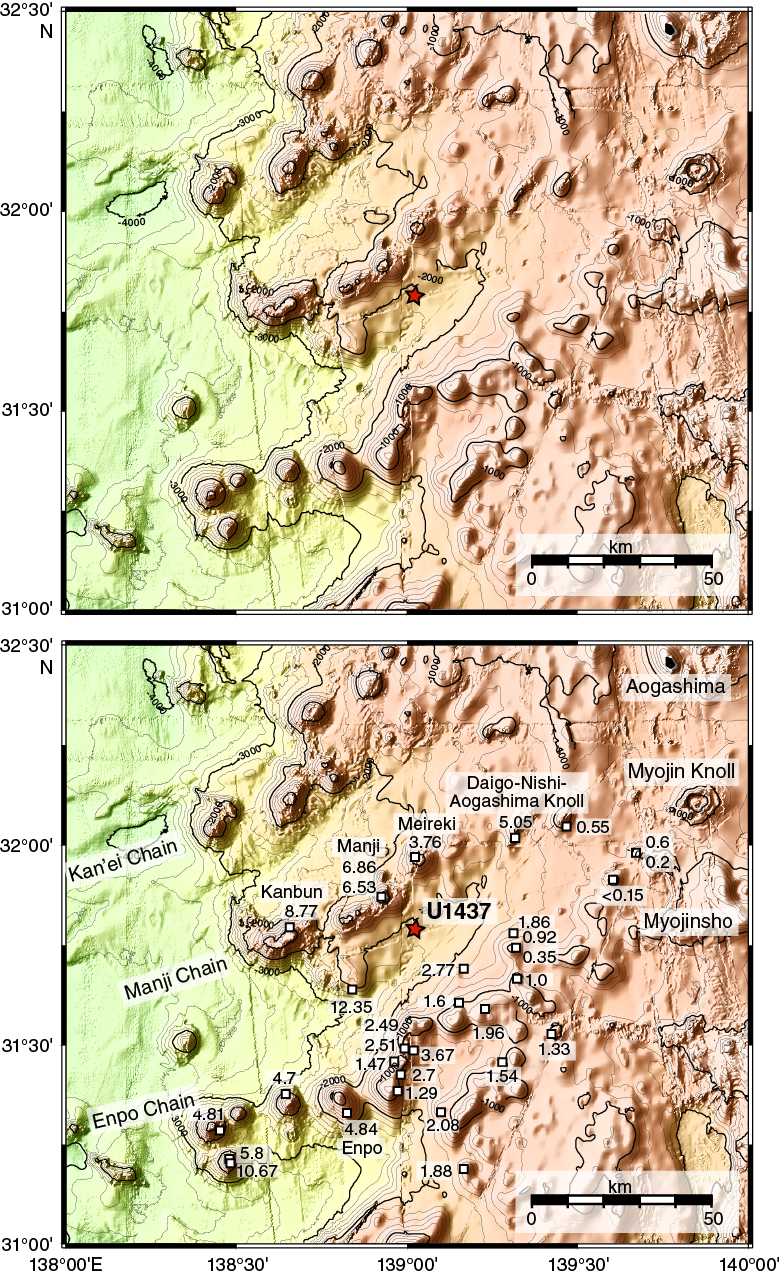
Figure F6. Bathymetric maps of rear-arc region.
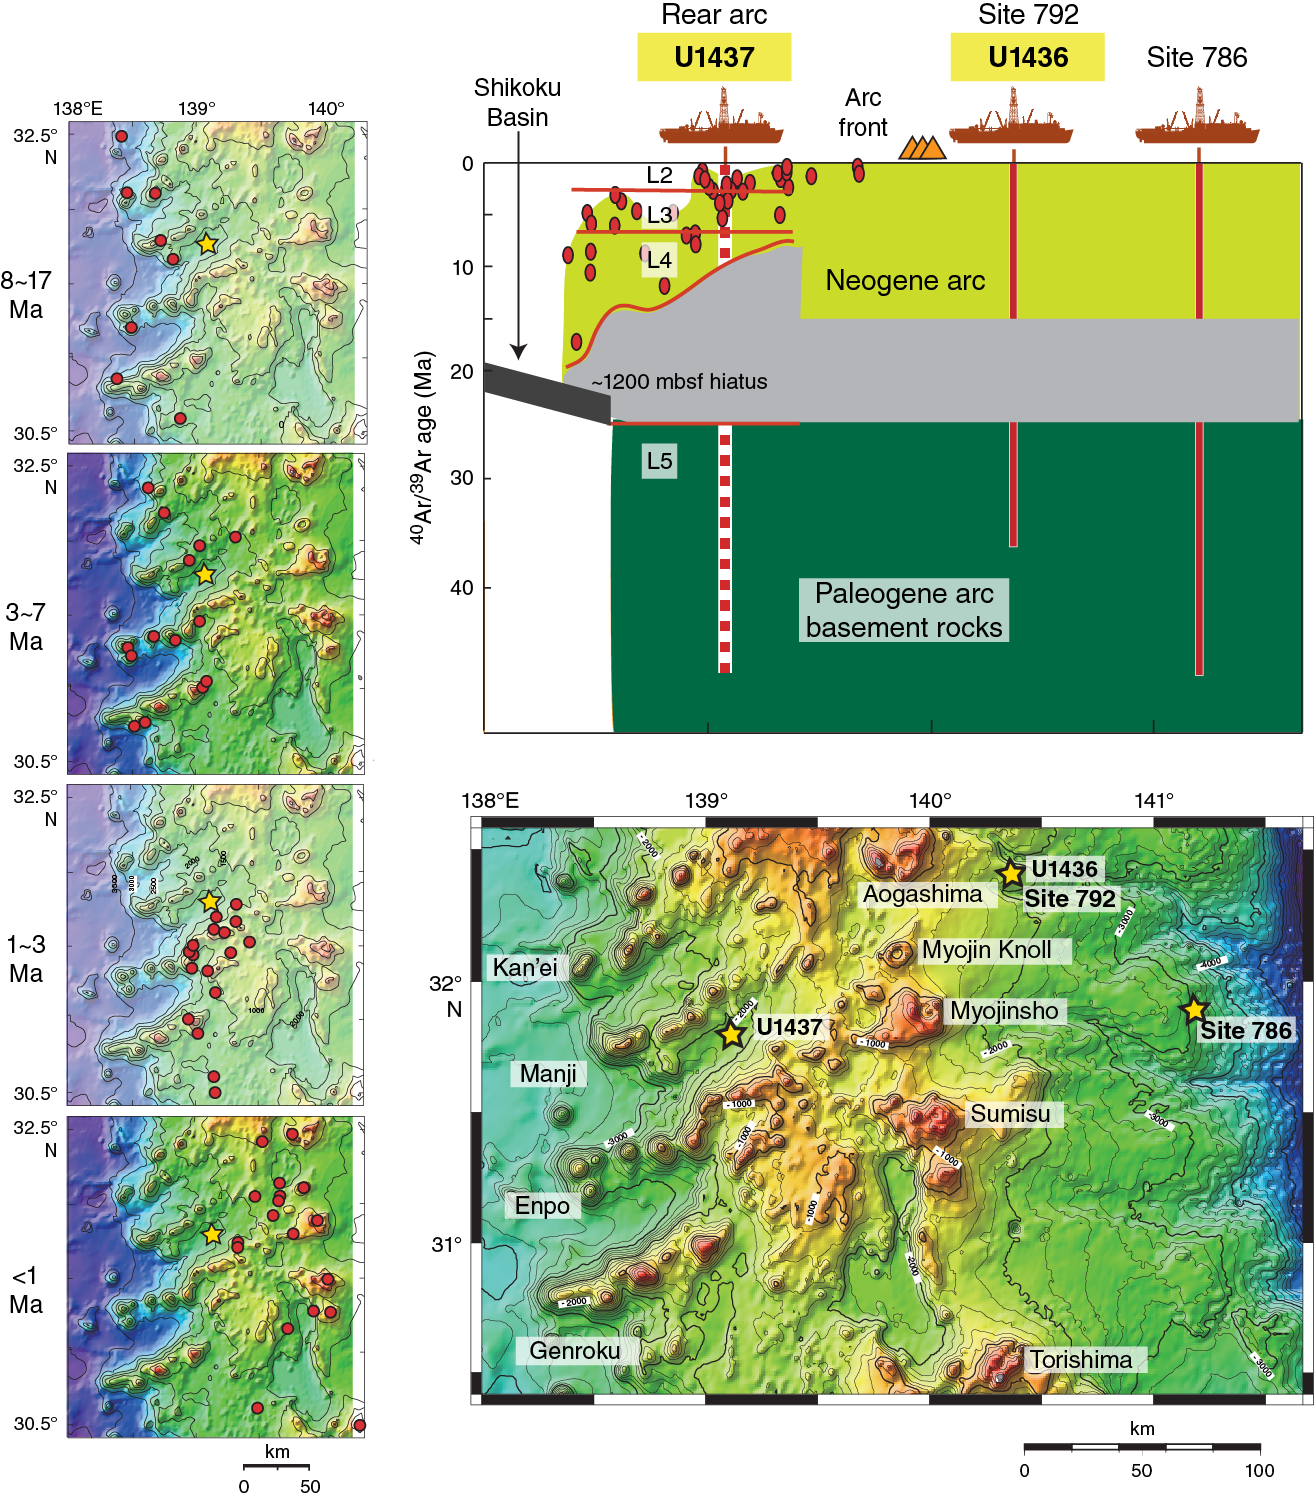
Figure F7. Temporal and spatial variation in 40Ar/39Ar ages.
Background
Evolution of the Izu-Bonin-Mariana arc system
IBM subduction began as part of a hemisphere-scale foundering of old, dense lithosphere in the western Pacific at ~50 Ma (Bloomer et al., 1995; Cosca et al., 1998; Stern et al., 2003), perhaps aided by reorganization of plate boundaries throughout the western Pacific (Okino et al., 2004; Hall et al., 2003; Whittaker et al., 2007). During the subduction initiation stage (Figure F8), ~52–47 Ma igneous activity produced boninite, low-K tholeiite, and subordinate low-K rhyodacite across the region that now lies in the fore arc, suggesting a dramatic episode of asthenospheric upwelling and melting over a zone that was thousands of kilometers long and as wide as 200 km. This igneous activity was followed by establishment of the first mature arc in Eocene to Oligocene time; these rocks also lie in the modern IBM fore arc (Taylor, 1992; Ishizuka et al., 2006b, 2011).
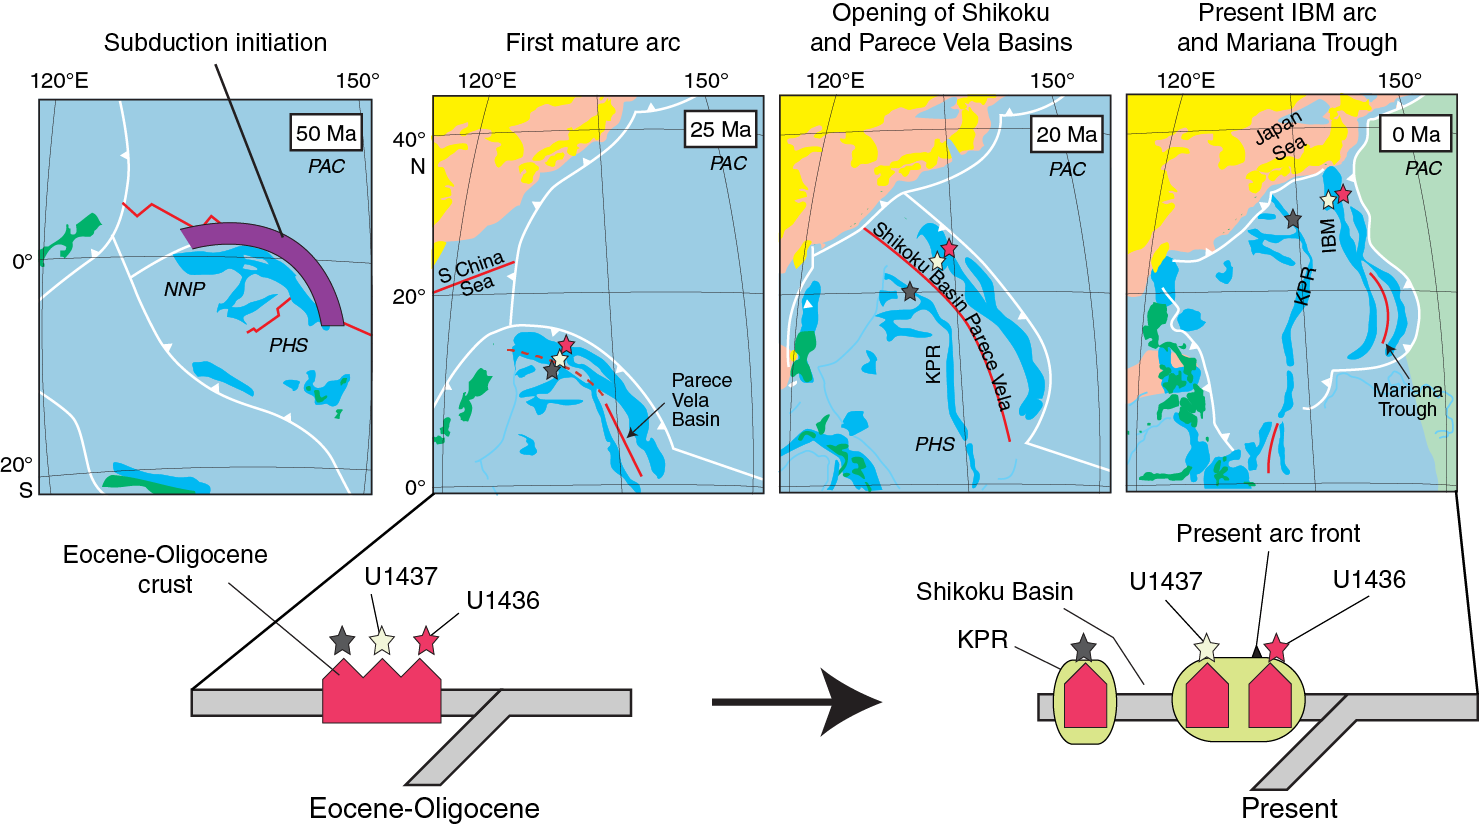
Figure F8. Tectonic evolution of Philippine Sea region.
By ~25 Ma, the mature arc was rifted to form the Shikoku-Parece Vela Basin spreading system and the Kyushu-Palau remnant arc (Figure F8); the chemistry of the Eocene to Oligocene rocks in the Kyushu-Palau Ridge indicates that it was the rear arc that was rifted off (Ishizuka et al., 2011). IBM arc-front magmatism was minimal when the Shikoku Basin opened by seafloor spreading, from ~25 to 15 Ma. When arc-front magmatism resumed at ~15 Ma, the arc front formed slightly west of its Eocene to (?)Oligocene position, where it is thought to have remained stationary to the present time (Taylor, 1992; Ishizuka et al., 2011). Slightly before Shikoku Basin spreading ended at ~15 Ma, basaltic to rhyolitic magmatism began in the Izu rear arc (at ~17 Ma), across the boundary between Shikoku Basin back-arc crust to the west and arc crust to the east (Figure F7). Then, rear-arc magmatism migrated east-northeast toward the arc front, producing a series of large seamounts until ~3 Ma. Site U1437 lies in a basin between two of these ~17–3 Ma rear-arc seamount chains (Manji and Enpo seamount chains, Figure F6), as discussed in detail below.
In the southern IBM arc, a new episode of arc rifting began at ~7 Ma, with seafloor spreading to form the Mariana Trough back-arc basin beginning at ~3–4 Ma (Yamazaki and Stern, 1997) (Figure F8), proceeding northward toward the Izu-Bonin arc with time. Meanwhile, a broad (~100 km wide) north-northwest–trending extensional zone developed behind the Izu arc front (Figure F5), from ~3 Ma to present, forming grabens with fill up to several kilometers thick and generally small bimodal volcanic cones or ridges referred to as back-arc knolls (Figure F6). The western approximately half of this broad north-northwest–trending extensional zone overlaps with the eastern half of the east-northeast–west-southwest trending rear-arc seamount chains (Figure F5). By ~1.5 Ma, volcanism and extension largely became more focused into a narrower (<20 km wide) zone, termed the active rift, along the eastern margin of the extensional zone immediately behind the arc front, which is also bimodal (such as the Sumisu Rift). However, some younger than 1.5 Ma magmatism continued in the broader extensional zone, as shown by ages of rocks dredged along the Enpo seamount chain (Figure F6); furthermore, there is evidence for younger than 1.5 Ma faulting in the broader extensional zone, discussed under seismic interpretations below.
Izu rear-arc magmatism
We refer to all Neogene volcanic rocks behind the Izu arc front as rear-arc volcanic rocks. Rear-arc volcanic rocks include (1) the ~17–3 Ma east-northeast–trending basaltic to rhyolitic rear-arc seamount chains, (2) the younger than 3 Ma bimodal back-arc knolls of the broad extensional zone, and (3) the younger than 1.5 Ma bimodal volcanic rocks of the active rift immediately behind the arc front (Figures F5, F6). Thus, Izu rear-arc volcanism falls into two magmatic suites: the <3 Ma bimodal rift-type magmas and the ~17–3 Ma basalt to rhyolite rear-arc seamount type magmas. Both types lie within the rear part of the arc (i.e., behind the arc front) and both types lie on arc crust, although the westernmost end of the rear-arc seamount chains lie on Shikoku Basin oceanic crust. The bimodal rift-type magmas differ from both the arc-front volcanoes and the rear-arc seamount chains in trace element and isotope ratios; this has been variably attributed to (1) a transition from flux to decompression mantle melting as arc rifting commences, (2) a change in the character of the slab-derived flux, and (3) a change in thermal structure of the mantle (Hochstaedter et al., 1990a, 1990b, 2001; Ishizuka et al., 2003a, 2006b; Tollstrup et al., 2010).
The Izu rear-arc seamount chains are as long as ~50 km and strike N60°E (Figures F1B, F5, F6). The sides and tops of the Izu rear-arc volcanic chains have been dredged and sampled by submersibles and range from basalt to rhyolite in composition (Ishizuka et al., 1998, 2003b; Hochstaedter et al., 2000, 2001; Tollstrup et al., 2010; Machida et al., 2008). Three main hypotheses have been proposed for the origin of the seamount chains:
- They are related to compression caused by collision between the southwest Japan and Izu arcs, associated with the Japan Sea opening (Karig and Moore, 1975; Bandy and Hilde, 1983).
- They formed along Shikoku Basin transform faults (Yamazaki and Yuasa, 1998).
- They overlie diapirs in the mantle wedge (Figure F9), such as the “hot fingers” proposed for northeast Japan (Tamura et al., 2002).
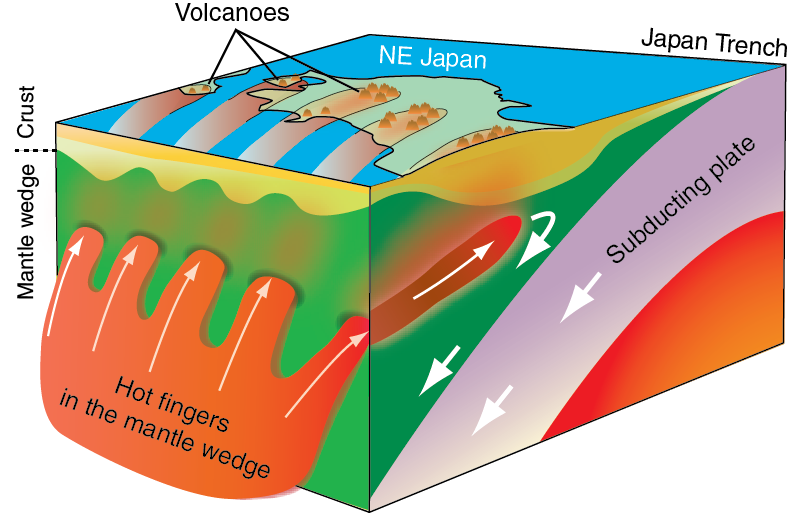
Figure F9. Hot fingers hypothesis.
In some cases (e.g., Manji and Genroku chains), the seamount chains seem to be aligned with large volcanoes on the arc front (e.g., Aogashima and Sumisu, respectively; Figures F6, F7); however, the alignment is imperfect, and it is not clear which hypothesis a perfect alignment would support.
Geochemical arc asymmetry
In this section, we discuss the concept of geochemical asymmetry in arcs in general and in the Izu arc in particular (Figures F10, F11). The geology of the Izu rear arc was described above. The geology of the Izu arc front is described in the Site U1436 chapter (Tamura et al., 2015b); in brief, the Izu arc front is an ~700 km long volcanic chain whose Quaternary geology can be characterized by (1) basalt-dominant volcanoes spaced at 80–100 km intervals, many of which form islands, and (2) submarine rhyolite-dominant calderas between basalt-dominant volcanoes (Kodaira et al., 2007a; Tamura et al., 2009) (see Figure F10 in the Site U1436 chapter [Tamura et al., 2015b]). In this section, we review the main geochemical differences observed between arc-front magmas and rear-arc seamount chain magmas in the Izu arc. The young (<3 Ma) bimodal rift-type magmas are not discussed here.
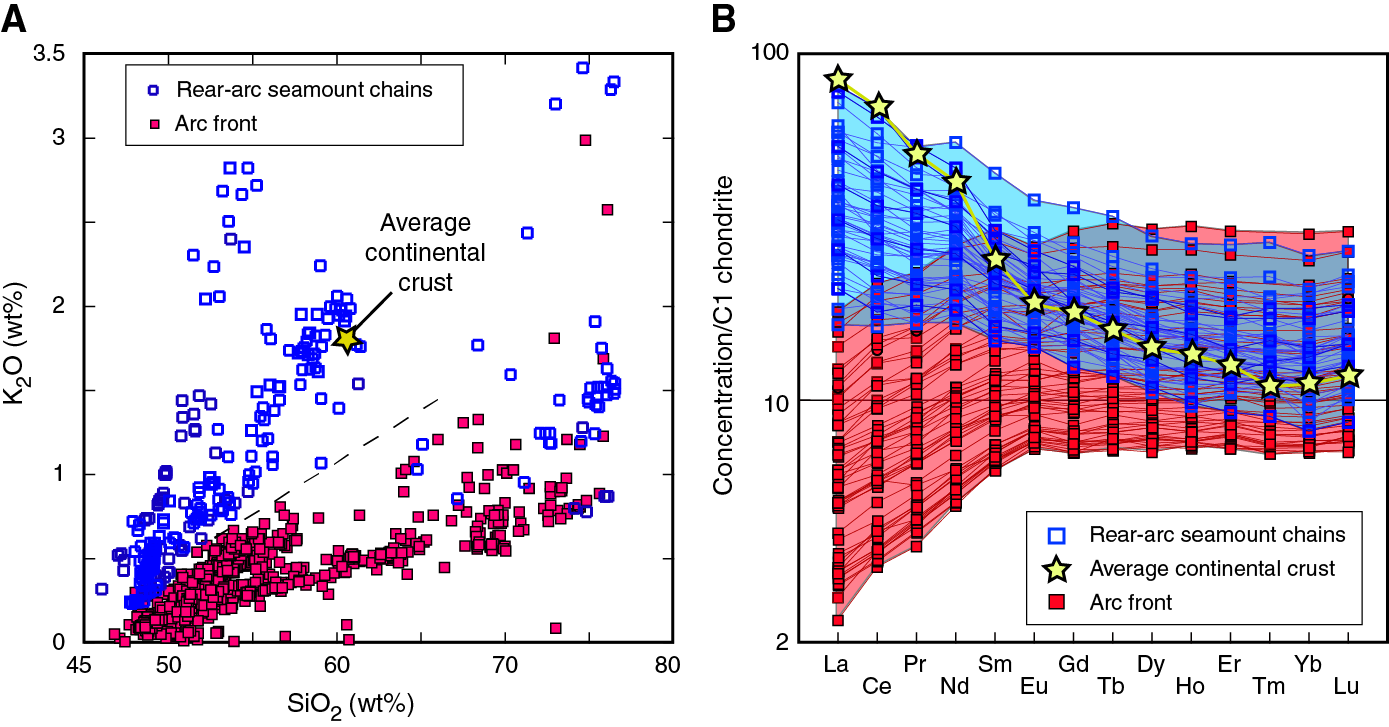
Figure F10. K2O vs. SiO2.
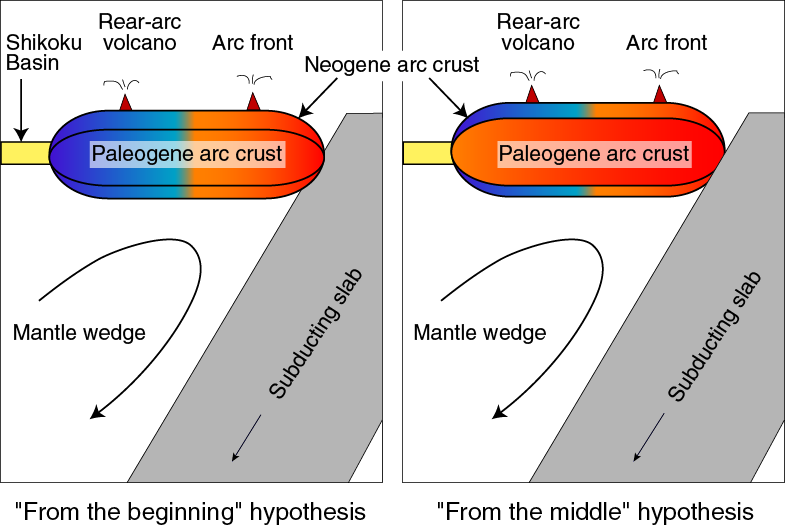
Figure F11. Two hypotheses for evolution of Izu arc crust.
A striking characteristic of volcanic arcs is the asymmetry in geochemical characteristics with distance from the trench, which was known prior to, coincided with, and informed by the advent of plate tectonics (Kuno, 1959; Dickinson and Hatherton, 1967). Izu arc-front rocks are low-K, but the rear-arc type lavas are medium- and high-K (Figure F10A). Similarly, arc-front volcanic rocks are strongly depleted in incompatible light rare-earth elements (REEs) relative to middle REEs and heavy REEs, whereas those from rear-arc seamount chains are enriched (Figure F10B). This asymmetry was first described by Gill (1981). Gamma radiation logs obtained during IODP rear-arc drilling should record higher K, U, and Th and lower Th/U than those that have been obtained from the Izu-Bonin fore-arc sites, where volcaniclastics come from the arc front. On both K2O versus SiO2 and REE plots, the rear-arc seamount chain magmas are much more similar to continental crust than the arc-front magmas. Thus, the Izu rear arc appears to be a better candidate for the generation of continental crust.
Although Site U1437 is in a location that should be topographically shielded from arc front–derived density currents, arc front–derived ash fall may be present. However, it should be possible to distinguish between arc-front and rear-arc seamount chain sources because the rear-arc seamount chains are enriched in alkalis, high-field-strength elements (e.g., Nb and Zr), and other incompatible elements but have less enriched Sr and Pb isotopes compared to the arc front, and because rear-arc 144Nd/143Nd and 176Hf/177Hf isotope ratios are lower (more enriched) (Hochstaedter et al., 2001; Ishizuka et al., 2003a; Tamura et al., 2007; Tollstrup et al., 2010) (Figure F10). However, the <3 Ma bimodal volcanic rocks of the broad extensional zone and narrow active rift are not easily distinguished from rear-arc seamount chain or arc-front rocks (Hochstaedter et al., 2001), and the site may not be shielded from dilute density flows from those sources. Therefore, we can distinguish rear-arc and arc-front magmas for all rocks older than 3 Ma, but not for rocks younger than 3 Ma. Drilling Proposal 697-Full3 said that Zr/Y = ~2.5 could distinguish arc-front from rear-arc seamount chains, although we did not then recognize R2 rhyolite from arc-front submarine calderas, which have much higher Zr/Y, ranging from 3 to 6 (Tamura et al., 2009).
We do not know if arc geochemical asymmetry was present early in the history of the arc (in the Paleogene) or if it is strictly a Neogene feature. These two options are presented as “from the beginning” versus “from the middle” hypotheses in Figure F11. Paleogene rocks have been drilled in the fore arc, so their chemistry is known, but no drilling has been done in the rear arc, so its Paleogene chemistry is unknown. In the following section, we summarize the geophysical evidence for Paleogene “basement” rocks (lava or crystalline rocks) at Site U1437, which would allow us to determine which hypothesis is correct.
Geophysical evidence for Paleogene basement rocks at Site U1437
Magnetic and seismic surveys, summarized in this section, both indicate that Site U1437 lies along an approximately north–south buried ridge that consists of magmatic crystalline rocks.
Three conspicuous north–south rows of long-wavelength magnetic anomalies were identified by Yamazaki and Yuasa (1998) in the Izu arc system and attributed to loci of middle to lower crustal magmatic bodies (Figure F2). The western approximately north–south anomaly corresponds to the Kyushu-Palau Ridge, where Eocene and Oligocene lava have been dredged. These have been geochemically characterized as rear-arc magmas (Ishizuka et al., 2011). The eastern approximately north–south anomaly corresponds to the Shin-Kurose Ridge (Yamazaki and Yuasa, 1998), also referred to as the Izu fore-arc high (Taylor, 1992). The Shin-Kurose Ridge/fore-arc high forms a bathymetric high in the northern Izu arc and is buried beneath Oligocene to Quaternary volcaniclastic and sedimentary rocks in the southern Izu arc, at Ocean Drilling Program (ODP) Site 792, where it has yielded Eocene 40Ar/39Ar ages. We infer that this ridge is a late Eocene arc-front constructional high and that the basin in front of it formed as a volcano-bounded (rather than fault-controlled) basin (see Figure F4 in the Site U1436 chapter [Tamura et al., 2015b]). The central approximately north–south magnetic anomaly lies buried in the Izu rear arc (Figure F2) and is referred to as the Nishi-shichito Ridge (Yamazaki and Yuasa, 1998). Kodaira et al. (2008) ran a wide-angle seismic profile along the length of the rear-arc Nishi-shichito Ridge and compared it to a wide-angle seismic profile made along the length of the arc front by Kodaira et al. (2007a) (Figure F3). They divided the arc front into segments based on variations in the thickness of middle crust and did the same for the rear-arc Nishi-shichito Ridge. They reported that the thickness of the middle crust for each segment of the rear arc is smaller than the arc front but that the bulk compositions of crust are almost identical. Furthermore, they used the match on middle crustal thicknesses to infer that the Nishi-shichito Ridge is a “paleo-arc” that got obliquely rifted off the arc front. In this reconstruction, the extension direction is parallel to the northeast–southwest Sofugan Tectonic Line. The Sofugan Tectonic Line is the boundary between the Izu and Bonin arc segments, as mentioned above. South of it lies the prominent Bonin Ridge and the deep, fault-bounded Ogasawara Trough, produced by Eocene to early Oligocene arc magmatism and back-arc extension, respectively. These tectonic features do not appear to be present north of the Sofugan Tectonic Line, so we speculate that the Sofugan Tectonic Line originated as an accommodation fault between a region of high extension to the south and little or no extension to the north. The timing of the proposed oblique rifting of the Nishi-shichito Ridge paleoarc of the arc front is not given by Kodaira et al. (2008), but we assume that it occurred sometime in the Oligocene or Miocene, perhaps as a failed arc rift strand related to the opening of the Shikoku Basin. If the oblique rifting model is correct, the crystalline basement beneath Site U1437 may represent rear-arc crust that formed in a position much closer to the arc front than it is now; alternatively, it may represent arc-front crust that has become stranded in the rear arc by rifting.
Seismic surveys also suggest that Site U1437 lies on buried Paleogene arc crust. The preliminary results of seismic surveys for Site U1437 are summarized here briefly from Tamura et al. (2013); full results of the seismic surveys will be presented in a full paper at a later time after drilling results are integrated (M. Yamashita, pers. comm., 2014). Numerous lines were shot in two different campaigns; parts of three seismic sections that cross at Site U1437 are plotted on Figure F12 and described here (Figures F13, F14, F15, F16). Line IBr5 is the longest seismic line, running east–west from the Manji rear-arc seamount chain across the Enpo seamount chain to the arc front; it was shot both as wide-angle ocean-bottom seismometer (OBS) and by multichannel seismic (MCS) (Figure F13). The wide-angle OBS survey shows the velocity structure of the upper ~10 km. Generally, the velocity transition to >5 km/s is thought to represent the transition to igneous rocks, perhaps representing upper crustal crystalline rocks, and the velocity transition to 6 km/s is generally thought to represent the transition to middle crust (e.g., see boundaries picked in Figures F3 and F4, both in the Site U1436 chapter [Tamura et al., 2015b]). Tamura et al. (2013) estimated the 5 km/s iso-velocity contour to lie at ~2100 mbsf at Site U1437 and suggested that these rocks could be Oligocene–Eocene “igneous basement,” consisting of lava and/or intrusions. The MCS lines are also used to infer that the strata drilled in Site U1437 represent the fill of a volcano-bounded basin.

Figure F12. Locations of three MCS profiles.
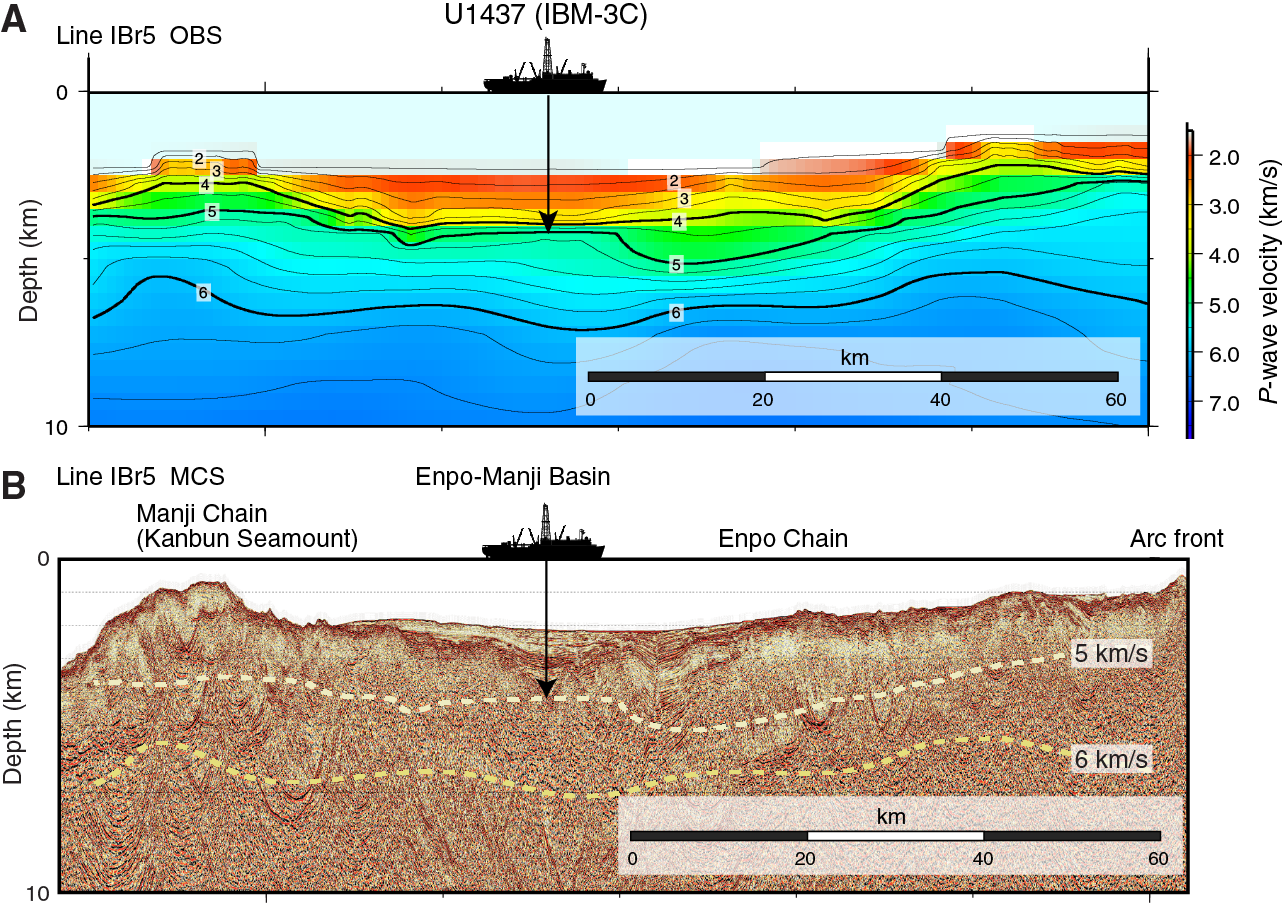
Figure F13. Seismic Line IBr5.
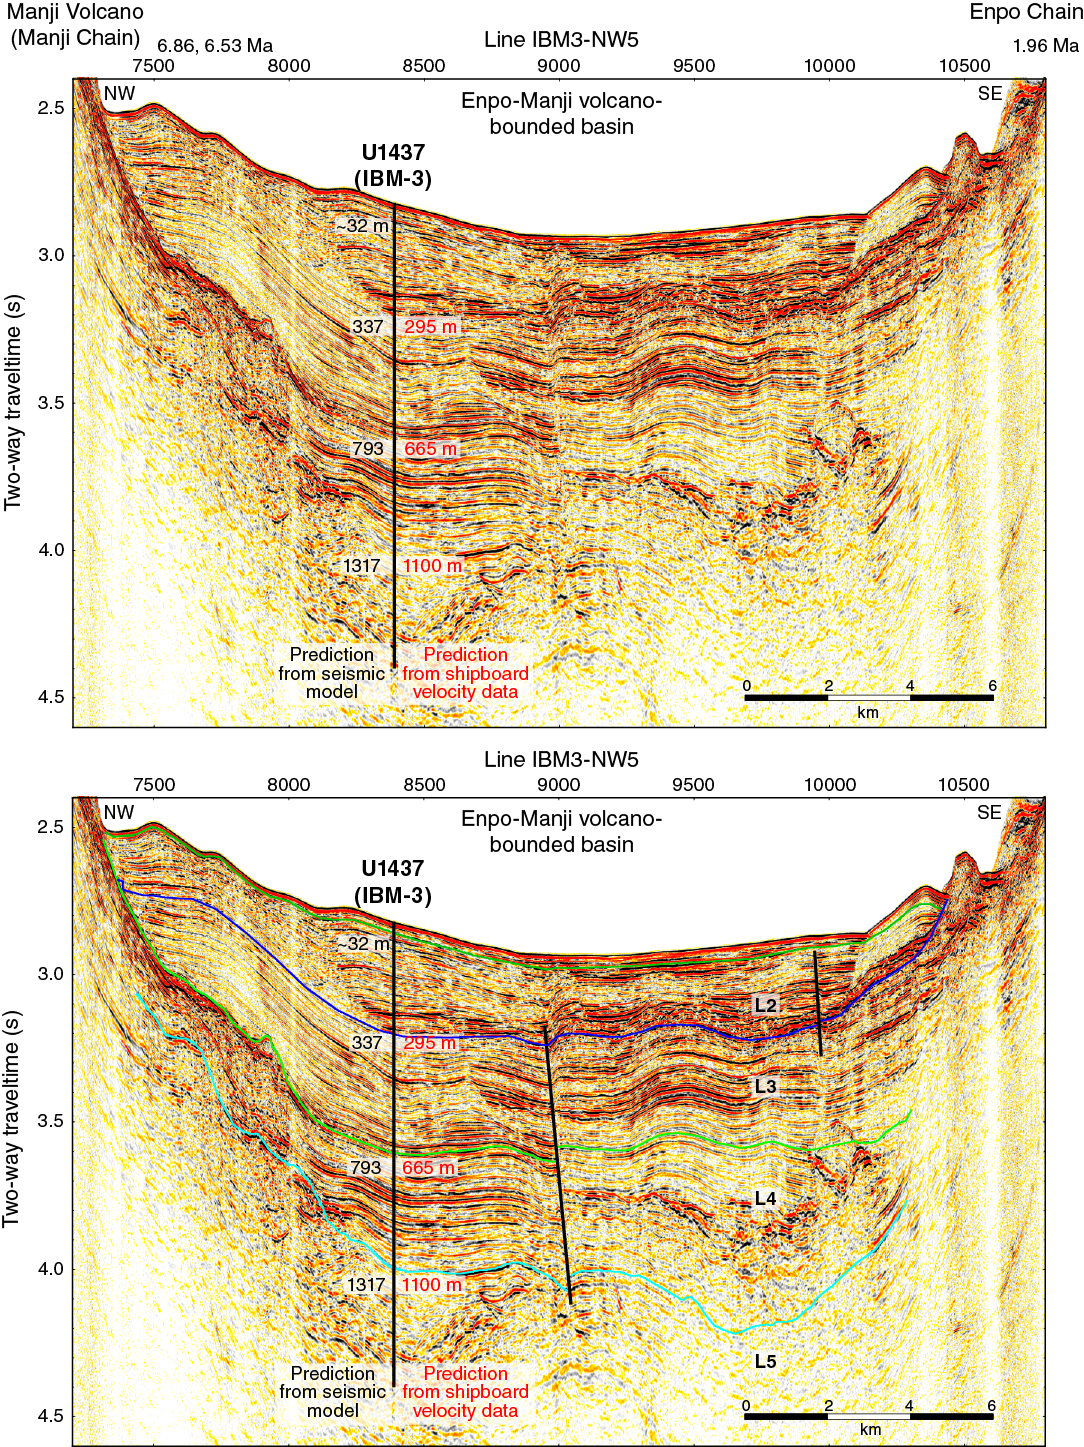
Figure F14. Seismic line IBM3-NW5.
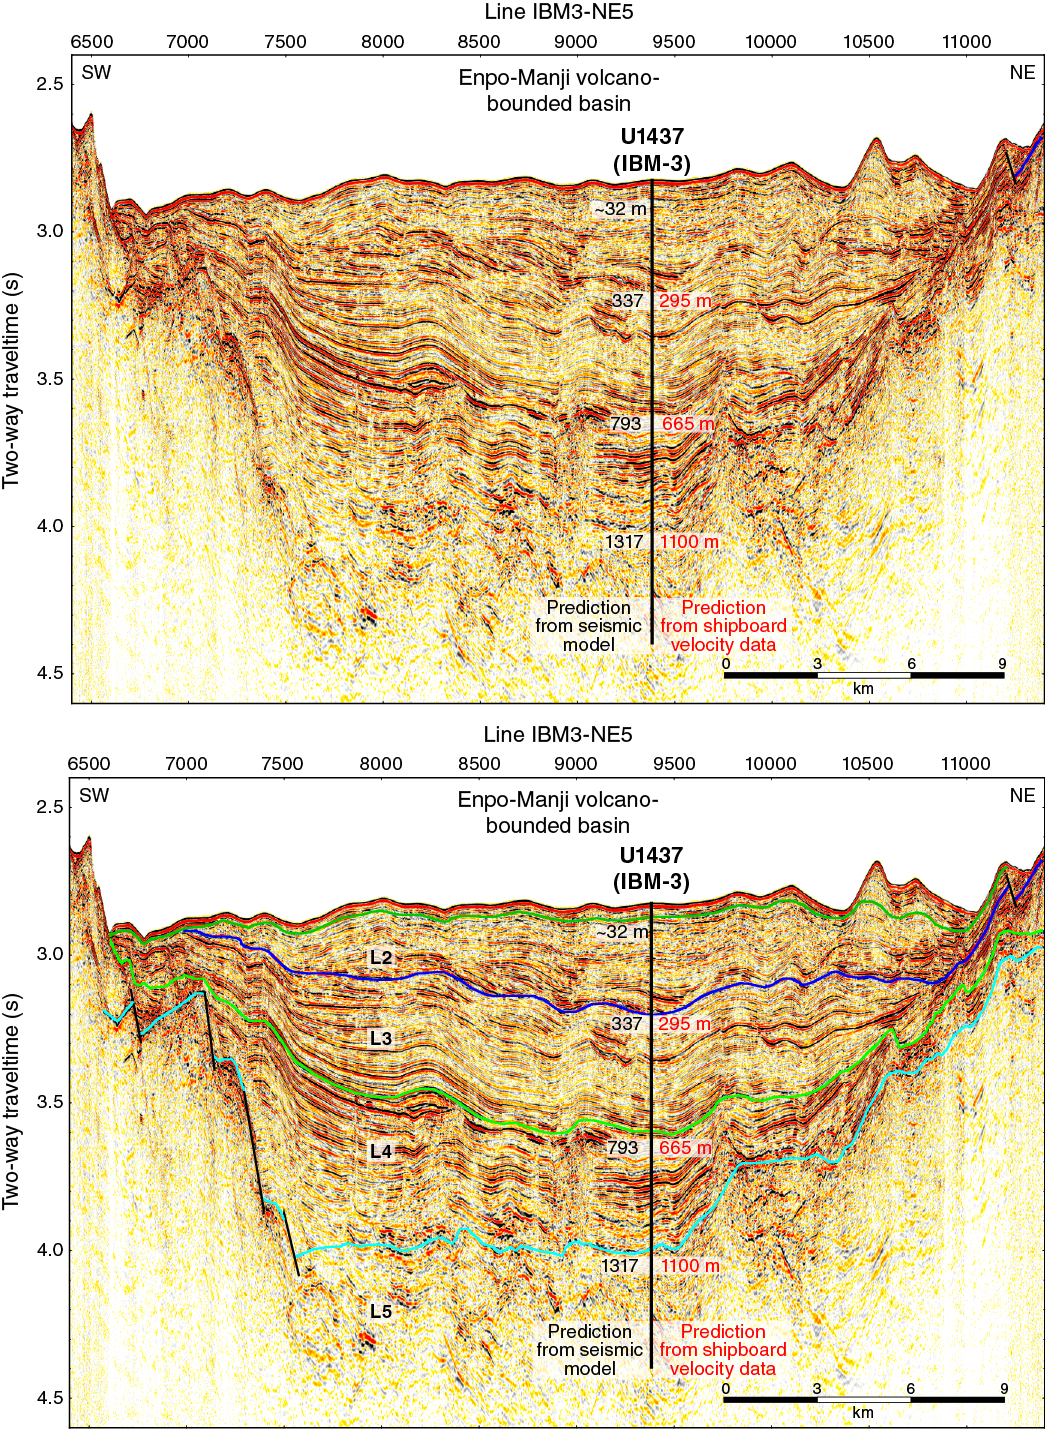
Figure F15. Seismic Line IBM3-NE5.

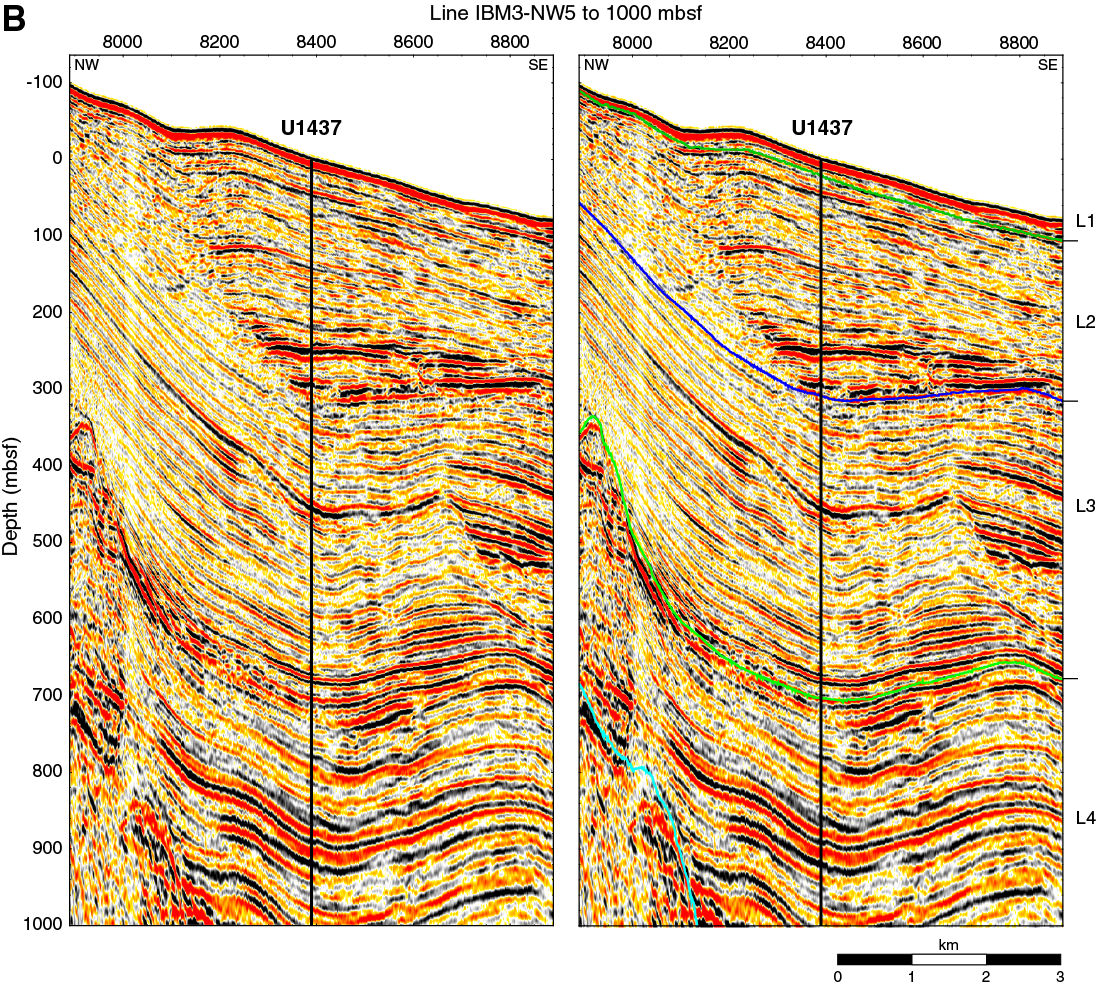
Figure F16. Seismic lines displayed as a function of depth.
The Neogene Enpo-Manji Basin: a volcano-bounded basin between seamount chains
In this section we show that the Neogene strata drilled at Site U1437 represent the fill of a volcano-bounded intra-arc basin, using the definition of Smith and Landis (1995), illustrated on Figure F17. We mainly do this by using the two shorter MCS lines (IBM3-NW5 and IBM3-NE5) that intersect the longer Line IBr5 described above (shown in Figures F14, F15, F16) at Site U1437. These seismic sections show strata that lie above the 2100 mbsf basement defined by magnetic and seismic surveys described above (Figure F13).
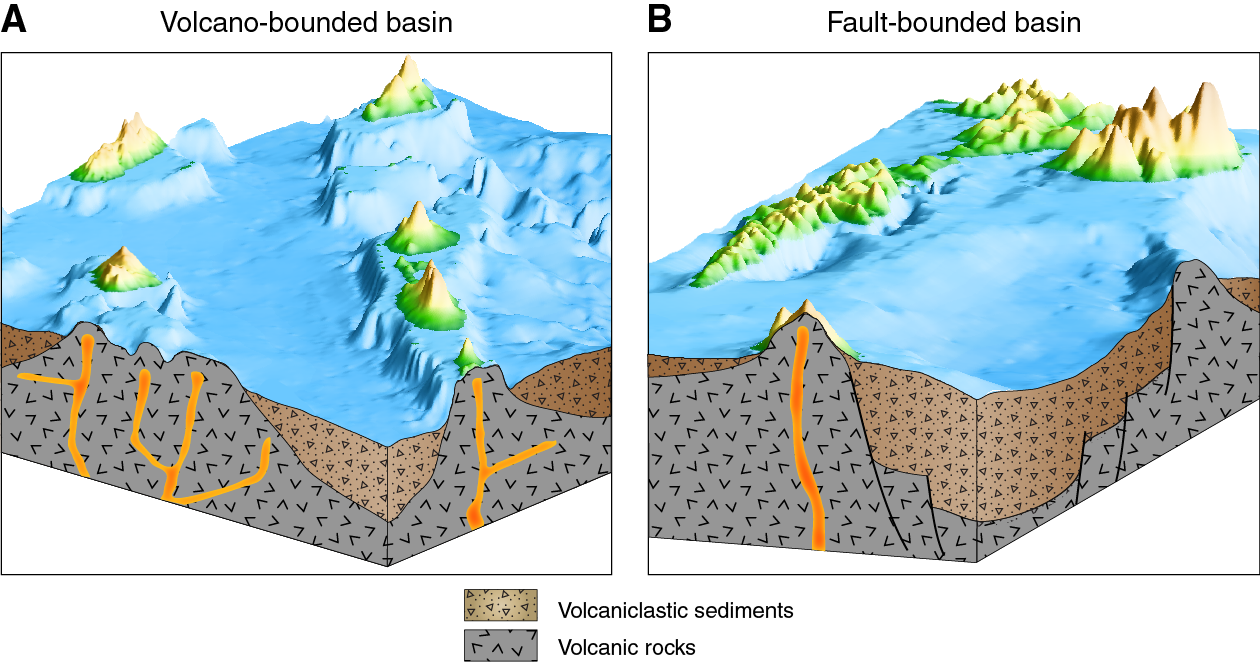
Figure F17. Two main basin types recognized within arcs.
Five seismic layers were previously inferred to lie above the 2100 mbsf basement (Tamura et al., 2013), using relations with dated volcanoes and with other lines in the seismic survey, as well as seismic characteristics (Figures F14, F15). Layers L1 and L2 were inferred to be <3 Ma, Layer L3 was inferred to be 3–6.5 Ma, the Layer L4/L5 boundary was interpreted to be the Neogene–Paleogene hiatus (Figure F7), Layer L5 was interpreted to be Oligocene strata, and rocks below Layer L5 were interpreted to be Paleogene crystalline rocks. However, as shown in the age model below (Figure F162), the strata at Site U1437 are younger than predicted by seismic interpretation. Layer L3 and approximately the upper half of Layer L4 are <5.3 Ma (Pliocene and younger), and approximately the lower half of Layer L4 is late Miocene (<11 Ma). Nonetheless, the seismic surveys (and drilling results presented below) demonstrated that the northeast-southwest–trending basin that is obvious in map view between the Manji and Enpo rear-arc seamount chains (Figure F6) (1) formed between two active arc volcanic chains (in the rear arc but as part of the arc) and (2) that accommodation was provided by development of a low between the two volcanic constructs. The basin is thus an intra-arc volcano-bounded basin using the criteria of Smith and Landis (1995) (Figure F17). For simplicity we refer to this basin as the Enpo-Manji Basin and suggest that other basins in the rear arc be named for the volcanic chains that bound them.
All of the ages on volcanoes that bound the Enpo-Manji Basin overlap with the age of the basin fill. Line IBM3-NW5 lies perpendicular to the rear-arc seamount chains and crosses the volcano-bounded basin between the Manji and Enpo seamount chains (Figure F14). Its northwest end is at the Manji Volcano (with 40Ar/39Ar ages of 6.86 and 6.53 Ma), and the unnamed volcano on the southeast end has an 40Ar/39Ar age of 1.96 Ma. Line IBM3-NE5 runs parallel to the rear-arc seamount chain, close to the Manji seamount chain, and intersects an unnamed volcano on the southwest having an age of 12.35 Ma. Furthermore, material coming from rear-arc seamounts was identified with geochemistry in sampled volcaniclastic strata.
The Enpo-Manji Basin is only 20 km wide at Site U1437, and because the site lies near the Manji seamount chain, it is within 10 km of the late Miocene (6.86 and 6.53 Ma) Manji Volcano and within 20 km of the Pliocene (3.76 Ma) Meireke Volcano (Figure F6). This site was therefore predicted to be dominated by coarse-grained volcaniclastic deposits, divided into two basic types (Tamura et al., 2013): (1) those fed directly by eruptions, including thick pumice-rich pyroclastic units fed from explosive eruptions, breccia formed by lava dome collapse, hydroclastic breccia produced by quench fragmentation of subaqueous lava and domes, and peperites, common in marine basins where magma invades wet sediment; and (2) resedimented volcanic debris, including the products of sector collapse, volcaniclastic apron collapse, and volcanic debris flow activity. Instead, the Pliocene and late Miocene strata are dominated by tuffaceous mudstone with lesser tuff and minor lapilli-tuff with clast sizes generally <1 cm, mostly in thin beds (millimeters to centimeters thick). This required a shift in some of the scientific objectives.
Scientific objectives
The main scientific objectives set out in the prospectus by Tamura et al. (2013) were the following:
- Test the model for asymmetry in Neogene arc magma compositions. This model was constructed using rear-arc seamount samples, all obtained by dredge from the tops (and presumably youngest parts) of volcanoes. This sample base is much smaller than the sample base for arc-front volcanism, which is constructed from arc-front island volcanoes, dredges, and the drilled fore-arc stratigraphic record. Drilling at Site U1437 provides the first time-integrated sample base from the rear-arc seamount volcanic chains.
- Determine the eruptive, transport, and depositional processes recorded in the rear-arc basin that lies between the Enpo and Manji seamount chains.
- Determine whether the Neogene–Paleogene arc volcanic hiatus recorded in fore-arc drill sites is also present in the rear arc and if Paleogene arc basement rocks are present as predicted by the seismic surveys.
- When Paleogene arc basement rocks are encountered, determine whether they are geochemically similar to the Neogene rear-arc seamount chains (from the beginning) or different (from the middle).
It is not clear if the third and fourth objectives can be met, because Paleogene ages were not obtained, although the lowest ~400 m is not yet dated and could be Paleogene. In addition, the generally fine grain size of the deposits at Site U1437 relative to those expected required some shifts in the scientific objectives. Alteration was also encountered deeper than ~750 mbsf, which also required some changes in objectives. In response to these factors, the following new objectives were added:
- Determine the origin of the tuffaceous mud/mudstone that dominates the stratigraphy. What is it made of, and where did the mud and ash come from?
- Determine the periodicity of explosive volcanic events recorded in the mafic and evolved ash/tuff and lapilli-ash/lapilli-tuff that are intercalated with the tuffaceous mud/mudstone. What controls this event periodicity?
- Determine the chemistry of rear-arc magmatism using “sedimentary” deposits (which dominate the upper ~1400 m) rather than igneous rocks. The lack of coherent igneous rocks (e.g., lava or intrusions), as well as a general lack of clasts >2 cm in size, required us to focus shipboard geochemical work on samples consisting of hundreds or thousands of grains. Individual glass shards, crystals, and small individual scoria, pumice, or lithic clasts will be studied in future shore-based laboratory work, but that is not possible using shipboard analytical techniques. This required us to test the reliability of analyzing composite (multiclast or multigrain) samples, mainly with the goal of distinguishing between arc-front and rear-arc eruptive sources, but also to determine the range of compositions present. These inferences became more difficult, but not impossible, in altered rocks.
- Determine transport and depositional processes for relatively fine grained, thin bedded tuff and lapilli-tuff, which are more readily disturbed by marine currents and bioturbation than thick-bedded, coarse-grained deposits.
- Regardless of whether the lowest 400 m yields Paleogene or Miocene ages, the geochemistry appears to change in this part of the section, which is vent proximal. It is important to understand the timing and nature of this change and its bearing on the hot fingers hypothesis as well as the from the middle versus from the beginning hypothesis.
Operations
Hole U1437A
The 77 nm transit from Site U1436 to Site U1437 (31°47.39′N, 139°01.58′E; 2116 m water depth) was completed in 7.5 h. All times reported here are ship local time, which was UTC + 9 h. A beacon was dropped at 2304 h on 10 April 2014, marking the beginning of operations in Hole U1437A. See Table T1 for coring summary.
Table T1. Coring summary. Download table in .csv format. View PDF table.
An advanced piston corer (APC)/extended core barrel (XCB) bottom-hole assembly (BHA) was made up and deployed to 2110 meters below rig floor (mbrf). The subsea camera system was lowered to depth, and a seafloor survey was conducted to confirm that no subsea cables were present at the site. The seafloor was tagged at 2127 mbrf with visual confirmation through the camera. After the camera was recovered, Hole U1437A was initiated at 0915 h on 11 April for a jet-in test to ~25 mbsf, which was completed successfully.
Hole U1437B
The ship was repositioned 10 m north of Hole U1437A and coring in Hole U1437B (31°47.39′N, 139°01.58′E; 2116 m water depth) commenced at 1035 h on 11 April 2014. Cores 350-U1437B-1H through 10H (0–89.2 mbsf), drilled with the full-length APC system, recovered 89.2 m of core (100% recovery). Pulling the core barrels from the formation became increasingly harder at the bottom of that interval, and we therefore switched to the half-length APC system. Cores 11F through 24F (89.2–145.7 mbsf) recovered 56.5 m of core (100% recovery). When the rate of penetration decreased to a critical point, we changed to the XCB system. Coring in Hole U1437B was completed with Cores 25X through 55X (145.7–439.1 mbsf), recovering 96.9 m of core for the 293.4 m interval drilled (33% recovery). The last core from Hole U1437B arrived on deck at 0000 h on 14 April. We cored 439.1 m and recovered 242.6 m in Hole U1437B (55% recovery). The drill string was recovered and the bit cleared the rig floor at 0645 h on 14 April, ending the hole.
Hole U1437C
A rotary core barrel (RCB) BHA was made up with three stands of drill collars, and a core barrel with a center bit was installed. Our plan was to drill without coring to 425 mbsf, several meters shallower than the total depth cored in Hole U1437B, and then start RCB coring. The ship moved 20 m south of Hole U1437B, and the bit was lowered to the seafloor. Drilling in Hole U1437C (31°47.38′N, 139°01.58′E; 2116 water depth) began at 1530 h on 14 April 2014. At 232 mbsf, the center bit was pulled for inspection and then deployed again. Circulation and rotation was lost at 309.7 mbsf. The stuck pipe was worked for several hours without success. The ship was offset 140 m to allow the rig crew to pull the center bit and run the rotary shifting tool to drop the bit. A single joint of drill pipe was laid out at this time as well. With the bit dropped, the ship moved back to the Hole U1437C coordinates and the pipe was worked for another 2 h. The drill pipe was finally worked free at 0910 h on 15 April. The bit was raised to 183.7 mbsf using the top drive. After the top drive was set back, the drill string was retrieved, clearing the seafloor at 1055 h and the rig floor at 1305 h on 15 April, and ending operations in Hole U1437C.
Hole U1437D
A new mechanical bit release (MBR) and RCB bit were made up, and the drill string was run into the hole while the vessel was repositioned 10 m west of Hole U1437A.
Drilling without coring in Hole U1437D (31°47.39′N, 139°01.57′E; 2116 water depth) began at 2250 h on 15 April 2014 and extended from the seafloor to 427.2 mbsf. The center bit was retrieved and a RCB core barrel was deployed. The first core (350-U1437D-2R) arrived on deck at 2045 h on 16 April. RCB coring continued until 21 April with Cores 2R through 59R (427.2–980.4 m) recovering 434.56 m (79% recovery). At this time, the bit had been rotating for 51.5 h and required changing, so we decided to stop coring and collect wireline log data.
A free-fall funnel (FFF) was deployed, and the drill string was pulled out of the hole to drop the bit in preparation for logging. When we attempted to reenter Hole U1437D without the bit, the top connection of the MBR, which has razor sharp edges, was unable to slide into the FFF and reentry was aborted. The drill string was retrieved, with the end of the pipe clearing the rotary table at 0430 h on 22 April. The MBR top connection was removed, and a logging bit was made up to the BHA. The drill string was then lowered and Hole U1437D was reentered at 1207 h on 22 April. The logging bit was set at 92.4 mbsf.
Three logging strings were deployed in Hole U1437D. The first tool string deployed consisted of the triple combo with the magnetic susceptibility sonde (MSS). The triple combo/MSS tool string reached ~960 mbsf, indicating ~20 m of fill had accumulated at the bottom of the hole. The data recorded from this first run show that the hole was in excellent condition, with a diameter barely exceeding bit size for most of the hole. The second tool string deployed (Formation MicroScanner [FMS]-sonic) was able to record high-quality velocity data and electrical images to a maximum depth of 950 mbsf. The final logging run was a vertical seismic profile (VSP) that obtained data at 14 depths spaced every 50 m from a maximum depth of 875 mbsf. All logging operations were completed within 24 h, and the equipment was rigged down by 1330 h on 23 April.
The subsea camera system was lowered to observe the drill string exiting the FFF; however, a fishing line was observed tangled on the drill pipe ~300 m below the ship, so the camera system was brought back up. The drill string was then pulled out of the hole, the drill string recovered, and the logging bit cleared the rig floor at the 2235 h on 23 April.
A new RCB bit was made up to the BHA and Hole U1437D was reentered at 0630 h on 24 April. The drill string was lowered without circulation or rotation to 950 mbsf. The hole was then washed to the bottom of the hole (980.4 mbsf) and coring resumed. Hole U1437D was deepened to 1104.6 mbsf by the morning of 26 April. Cores 350-U1437D-60R through 73R (980.4–1104.6 mbsf) recovered 69.29 m (56%). At that time, hole-cleaning time was exceeding coring time because of crushed rock in the borehole that was difficult to remove, requiring a large number of mud sweeps. Also, packing of mud around the bottom of the core barrel indicated a malfunction. The drill string was recovered and the bit cleared the rig floor at 2040 h on 26 April, ending Hole U1437D. The total cored interval in Hole U1437D was 677.4 m, with 503.8 m recovered (74%).
At this point, we decided to drill and case a new hole to the total depth of Hole U1437D and then core and log it as deep as time permitted. This decision was prompted by (1) the increasing risk with penetration depth of not being able to clean a hole, particularly a deep noncased hole, and (2) the fact that the ship was carrying ~1100 m of 11¾ inch casing, just enough to cover the interval cored to date, which made this the optimal time to install the casing.
Hole U1437E
The ship moved ~20 m east of Hole U1437A to begin installation of casing in Hole U1437E (31°47.39′N, 139°01.59′E; 2116 m water depth). The reentry cone, equipped with 20.7 m of 20 inch casing, was run to the seafloor. The subsea camera system was deployed to observe the jetting in of the casing and landing of the reentry cone on the seafloor. Deployment was complete at 1905 h on 27 April 2014 when the bit cleared the reentry cone. The drill string was retrieved back on the rig floor at 0030 h on 28 April.
A drilling assembly consisting of an 18½ inch tricone bit and an underreamer was made up to drill the hole for the 264 m long, 16 inch casing. The underreamer was set to enlarge the hole to 22 inches and tested to confirm that the arms opened at a mud pump rate of 25 strokes/min. The drill string was deployed to the seafloor, followed by deployment of the subsea camera to guide the reentry into Hole U1437E at 1105 h. After successful reentry, the camera system was retrieved, and Hole U1437E was drilled to the target depth of 271.7 mbsf by 0400 h on 29 April. The hole was swept with 60 bbl of high-viscosity mud to remove drill cuttings. The drill string was then raised to 12.7 mbsf and lowered back down to total depth (271.7 mbsf) while circulating seawater to ensure the borehole was clear. No obstruction or fill at the bottom of the hole was detected. Another 60 bbl high-viscosity mud sweep was circulated. The drill string was pulled out of the hole with the bit clearing the seafloor at 0910 h and arriving at the rig floor at 1300 h on 29 April.
The 264 m long 16 inch casing was assembled in an 8 h effort. The casing running tool was installed, and the casing string was lowered to the seafloor by 0145 h on 30 April. The camera system was deployed to guide reentry into Hole U1437E, which was completed at 0350 h. The casing was lowered into the hole, and the top of the casing was latched into the casing hanger in the reentry cone at 0600 h. The latch was verified with 10,000 lb of pull from the rig.
To ensure the casing would act as the circulation conduit during future coring in Hole U1437E, the bottom of the casing had to be cemented firmly to the formation. With the casing running tool forming a seal at the top of the 16 inch casing, 20 bbl of 14.5 lb/gal cement was mixed and pumped from the rig floor through the drill string and through the 60 m stinger extending from the casing running tool down into the hole. The cement emplacement was followed with 295.8 bbl of seawater, a volume calculated to displace the cement to the bottom of the casing such that half the cement volume would extend upward between the formation and the base of the casing and the other half would remain inside the bottom of the casing to be drilled out later. The cement was in place at 0720 h on 30 April. The casing running tool was released, and the drill string and standpipe manifold were flushed clean with seawater. The camera was retrieved, the top drive was disengaged, and the drill string was tripped to the surface, with the running tool clearing the rig floor at 1220 h on 30 April.
The next operation was to drill out the cement and then a 14¾ inch hole to 1104 mbsf (the total depth of Hole U1437D) for the 10¾ inch casing. After breaking down the running tool and the underreamer assembly, a BHA with a 14¾ inch tricone drill bit was installed and the drill string was tripped back to the seafloor. The camera was deployed to guide reentry into Hole U1437E, which was completed at 2245 h on 30 April, and was then retrieved back to the rig floor. At 0030 h on 1 May, the top drive was picked up and the bit was lowered to the bottom of Hole U1437E. At 0330 h, the bit tagged the top of the cement plug at 264.7 mbsf, 1 m below the 16 inch casing shoe. Cement should have been contacted ~10 m above the shoe. This indicated that the cement had been displaced several meters too far down the 16 inch casing and that the casing likely had not been cemented to the formation as planned, thereby requiring a second cementing round trip.
The drill string was pulled back to 230.7 mbsf, the top drive was disengaged, and the drill string was tripped to the surface, clearing the seafloor at 0440 h and arriving at the rig floor at 1030 h on 1 May. The casing running tool and logging bit were made up once more, the drill string was lowered to the seafloor, and the subsea camera was deployed to guide reentry into Hole U1437E, which was completed at 1740 h on 1 May. After tripping into the hole to 55.7 mbsf using the top drive, weight was applied through the drill string to ensure the casing running tool sealed the top of the casing in preparation for cement delivery. When circulation was attempted by pumping seawater into the hole and around the bottom of the 16 inch casing, a pressure increase was observed, indicating that the bottom of the casing was actually sealed off, either by the first cementing job or by the formation sealing off around the casing since. The second cementing job was therefore aborted at 1830 h. The drill string was raised to 18.1 mbsf, the top drive disengaged, the camera system retrieved, and the drill string tripped to the surface, clearing the drill floor at 2350 h on 1 May.
The 14¾ inch tricone bit was installed again, lowered to the seafloor, and Hole U1437E was reentered for the seventh time at 0605 h on 2 May. The bit was lowered to 230.7 mbsf, the camera used to guide reentry was retrieved, and the top drive was engaged to wash the hole down to 266.7 mbsf, where the cement plug was encountered. The cement plug, which extended to 271.7 mbsf, was drilled out and the hole was flushed with high-viscosity mud. Hole U1437E was drilled (without coring) to the target depth of 1104 mbsf (the total depth of RCB coring in Hole U1437D) at 1745 h on 5 May. The hole was cleaned with a 41 bbl mud sweep before the bit was raised to 988 mbsf and the top drive was disengaged. The bit was then further raised to 18.0 mbsf and lowered again to 260.1 mbsf, just above the bottom of the 16 inch casing string. The drill string remained in that position while the rig crew was slipping and cutting the drilling line.
A wiper trip was conducted to ensure the hole was clear. The bit was lowered into the hole without the top drive from 259.7 to 1016.7 mbsf. The top drive was then picked up to wash and ream to 1104 mbsf; fill was encountered at 1022.7 mbsf. High torque occurred at 1063.7 mbsf, and after raising the bit to 1035.7 mbsf, the hole was finally washed and reamed to total depth (1104 mbsf) at 0545 h on 6 May. The hole was swept with 40 bbl of high-viscosity mud, and the bit was raised to 1035.7 mbsf, where another 60 bbl high-viscosity mud sweep was circulated to ensure the hole was clean. The bit was then raised to 1016.7 mbsf, where the top drive was disengaged. The drill string was tripped out of the hole, clearing the seafloor at 1115 h and the rig floor at 1500 h on 5 May.
The 1085.6 m long 10¾ inch casing string was assembled with a total of 85 joints, with the couplings of the bottom 7 joints welded in four places and the rest of the couplings tack-welded in two places. The casing hanger was installed, the running tool was engaged, and the complete assembly was hung from the moonpool doors while the casing stinger was assembled. A mud motor and underreamer were made up and tested. When the underreamer arms failed to open, a backup unit was installed, which performed as expected with the arms opening at a circulation rate of 35 strokes/min. The stinger BHA and the running tool were made up and run and latched into the casing by 1945 h on 7 May. The casing was tripped to the seafloor, the camera was deployed, and Hole U1437E was reentered with the 10¾ inch casing at 2115 h. When the bit had passed below the 16 inch casing shoe (264.1 mbsf; 2200 h), the camera system was raised above the running tool at the top of the casing string, to be lowered together with the casing string. Tripping of the casing continued to 1000.7 mbsf, where the top drive was engaged. After further lowering the casing string to 1034.7 mbsf (0145 h on 8 May), fill was encountered in the hole. The pumps were engaged and the casing was washed down to 1086.7 mbsf. At that point, the 10¾ inch casing hanger latched into the 16 inch casing hanger at the reentry cone. The latch was verified with 20,000 lb of pull from the rig floor. The casing was released and the stinger assembly was raised to 1057.7 mbsf. The top drive was disengaged and the trip to the surface continued, with a stop at 796.7 mbsf to retrieve the camera, and the bit cleared the seafloor at 0610 h and arrived at the rig floor at 1100 h on 8 May.
The underreamer and mud motor were removed, and a cementing BHA was made up consisting of a bullnose, two stands of drill collars, the casing running tool, and one stand of drill collars above. The cementing assembly was lowered to the seafloor, and after the camera was deployed, reentered Hole U1437E at 1700 h on 8 May. The running tool was landed in the reentry cone with the bit at 55.8 mbsf. Attempts to establish circulation failed, indicating that the bottom of the casing was sealed, and the cement job was aborted. The cementing string was raised and cleared the seafloor at 1830 h, and after recovering the camera, was tripped to the surface clearing the rig floor at 2235 h on 8 May. This ended the deepest casing deployment in the history of the JOIDES Resolution.
After several hours of routine rig maintenance, we were ready to resume RCB coring. An RCB coring bit was assembled and lowered to the seafloor, which was followed by the deployment of the camera to guide reentry of the bit into Hole U1437E at 0930 h on 9 May. The bit was lowered to 1048 mbsf, where the top drive was engaged, and the bit reached the bottom of the hole (1104 mbsf) at 1345 h. The hole was swept with 20 bbl of mud, and coring in Hole U1437E began at 1500 h on 9 May. The first core arrived on deck at 1815 h.
The rotation rate (and thus the coring rate) was kept low while the 95 m long BHA was still within the 10¾ inch casing that extended to 1086 mbsf. Drill collars in the BHA have a larger diameter than the regular drill pipe above and may compromise the casing and/or deviate the hole from vertical if not advanced into the formation below the (uncemented) casing shoe with care.
Cores 350-U1437E-4R though 24R (1104.0–1290.8 mbsf) obtained 140.43 m of core (75% recovery). Although recovery was generally good to excellent (two cores with >100% recovery), we also had two barrels with (near) zero recovery, presumably as a result of losing a perfectly cut core because it could not be broken off the formation (evidence found in one core), or, upon retrieval, could not be kept in the barrel by the core catchers.
On 13 May, the expected bit life cycle (~50 h of rotation with weight on bit) expired and a new bit needed to be installed. The bit was pulled from the bottom of the hole to 1077 mbsf with the top drive engaged. High torque, temporary loss of circulation, and the up to 40,000 lb overpull required to raise the drill string indicated that the hole was packing off at 1281–1242 mbsf. After circulation was reestablished and torque and pull returned to normal levels, the top drive was removed with the bit at 1077 mbsf, and the drill string was retrieved with the bit clearing the seafloor at 1025 h and the rig floor at 1400 h on 13 May.
After a few hours of rig maintenance, including installation of the upper guide horn, a new RCB bit was installed and lowered to the seafloor. The camera was lowered to the seafloor to guide reentry into Hole U1437E with the new RCB bit at 0010 h on 14 May. When the bit could not easily pass 1176 mbsf, it was raised to 1164 mbsf and the top drive was engaged. The hole was washed to 1206 mbsf, where another obstruction and high torque were encountered. After raising the bit back to 1174 mbsf, where normal torque was reestablished, the bit was washed down to 1290 mbsf and no fill was detected in the bottom of the hole. The hole was swept with 40 bbl of high-viscosity mud, and RCB coring resumed at 0915 h on 14 May.
Cores 350-U1437E-25R through 31R penetrated from 1290.8 to 1359.0 mbsf and obtained 44.66 m of core (65% recovery). After Core 31R was recovered, a wiper trip was conducted from 1291 to 1359 mbsf (0930–1630 h on 15 May) to clear the hole of drill cuttings. The procedure included two sweeps with 30 and 40 bbl of high-viscosity mud, respectively.
RCB coring in Hole U1437E continued until the expected safe bit life (50 h of rotation with weight on bit) had expired again after Core 350-U1437E-54R (1573.0–1582.7 mbsf) arrived on deck at 0005 h on 19 May. Cores 32R through 54R (1359.0–1582.7 mbsf) recovered 94.81 m or core (42% recovery). The hole was swept with high-viscosity mud before the bit was raised with the top drive from 1583 to 1485 mbsf. The top drive was disengaged for the remainder of the trip, and the bit cleared the seafloor at 0515 h on 19 May. The drilling line was slipped and cut on the rig floor as part of general rig maintenance before the drill string was retrieved; the bit arrived back at the rig floor at 1100 h on 19 May.
A new bit was installed and lowered to the seafloor. The camera was deployed, and Hole U1437E was reentered at 1710 h on 19 May. The camera was retrieved, and the bit was lowered to 1489 mbsf, where resistance was encountered. The bit was pulled back to 1475 mbsf to engage the top drive and washed to the bottom (1582.7 mbsf) by 0215 h on 20 May. RCB coring resumed and continued until 0800 h on 24 May, except for 6 h on 22 May when rough seas forced us to suspend coring.
Cores 350-U1437E-55R through 79R penetrated from 1582.7 to 1806.5 mbsf and recovered 107.55 m of core (48% recovery). At 0800 h on 24 May, the expected safe bit life (50 h) had expired again. The hole was swept with 30 bbl of high-viscosity mud before the bit was raised to 1708.7 mbsf with the top drive. The top drive was disengaged for the remainder of the trip, with the bit clearing the seafloor at 1320 h and the rig floor at 1645 h on 24 May.
After installing the new bit, the drill string was lowered to the seafloor (1800–2200 h). At that time the camera transmission test, carried out routinely before the camera is lowered to the seafloor to guide reentry into the hole, failed to transmit a signal, indicating that the last of three fiber optic cables had broken. Measurements confirmed that the fiber was damaged at ~4000 m from the camera end of the cable—an interval that was never unspooled during Expedition 350. The other two fiber optic strands had been broken before this expedition, and a replacement cable was scheduled for installation during the next port call in Yokohama, Japan. We lowered the camera to the seafloor to see if decompression from the spool might bring back the connectivity, without success. This prematurely ended this expedition’s operations in Hole U1437E. Hole U1437E is currently in excellent condition for logging and/or further coring operations, preferably attempted soon, before the hole deteriorates.
Cores 350-U1437E-4R through 79R (1104.0–1806.5 mbsf) recovered 387.45 m of core (55% recovery). The drill string was recovered with the bit clearing the drill floor at 0730 h. The rig was secured for transit, ending Hole U1437E and Site U1437 at 0800 h on 24 May. Total time in Hole U1437E was 683.25 h or 28.5 days.
At 0930 h, the ship was under way for contingency operations at Site U1436.
Lithostratigraphy
Site U1437 consists of three consecutive cored holes that recovered a coherent stratigraphy from 0 to 1806.50 mbsf (Figure F18). Hole U1437B consists of Cores 1H to 55X (0–439.10 mbsf; Figures F19, F20), Hole U1437D contains Cores 2R to 73R (427.20–1104.60 mbsf; Figures F21, F22), and Hole U1437E encompasses Cores 4R to 79R (1104.00–1806.50 mbsf; Figures F23, F24). The recovered lithologies are dominantly sedimentary, consisting of tuffaceous mud/mudstone with intercalated volcaniclastic layers. Sediment gradually becomes consolidated with depth and was considered lithified from the top of Hole U1437D (427.20 mbsf), leading to a change in the descriptive nomenclature. The unconsolidated sediment is dominantly tuffaceous mud with lesser intervals of mafic ash and evolved ash, whereas the main consolidated sedimentary rocks comprise varying proportions of tuffaceous mudstone, tuff, lapilli-tuff, lapillistone, tuff-breccia, and volcanic breccia. The lithologies are divided into seven lithostratigraphic units (I–VII) based on the proportion and characteristics of volcaniclastic intervals relative to tuffaceous mud/mudstone (Figure F18; Table T2). The uppermost 1300 m of the site includes three units that are dominated by tuffaceous mud/mudstone with intercalated volcaniclastic intervals (Units I, III, and V) and two units in which volcaniclastic intervals dominate over tuffaceous mudstone (Units II and IV). Volcaniclastic layers become more dominant and the clasts become coarser in the lowermost 500 m (Units VI and VII). Unit VI is intruded by a 1.2 m thick rhyolite-dacite sheet denoted as igneous Unit 1.
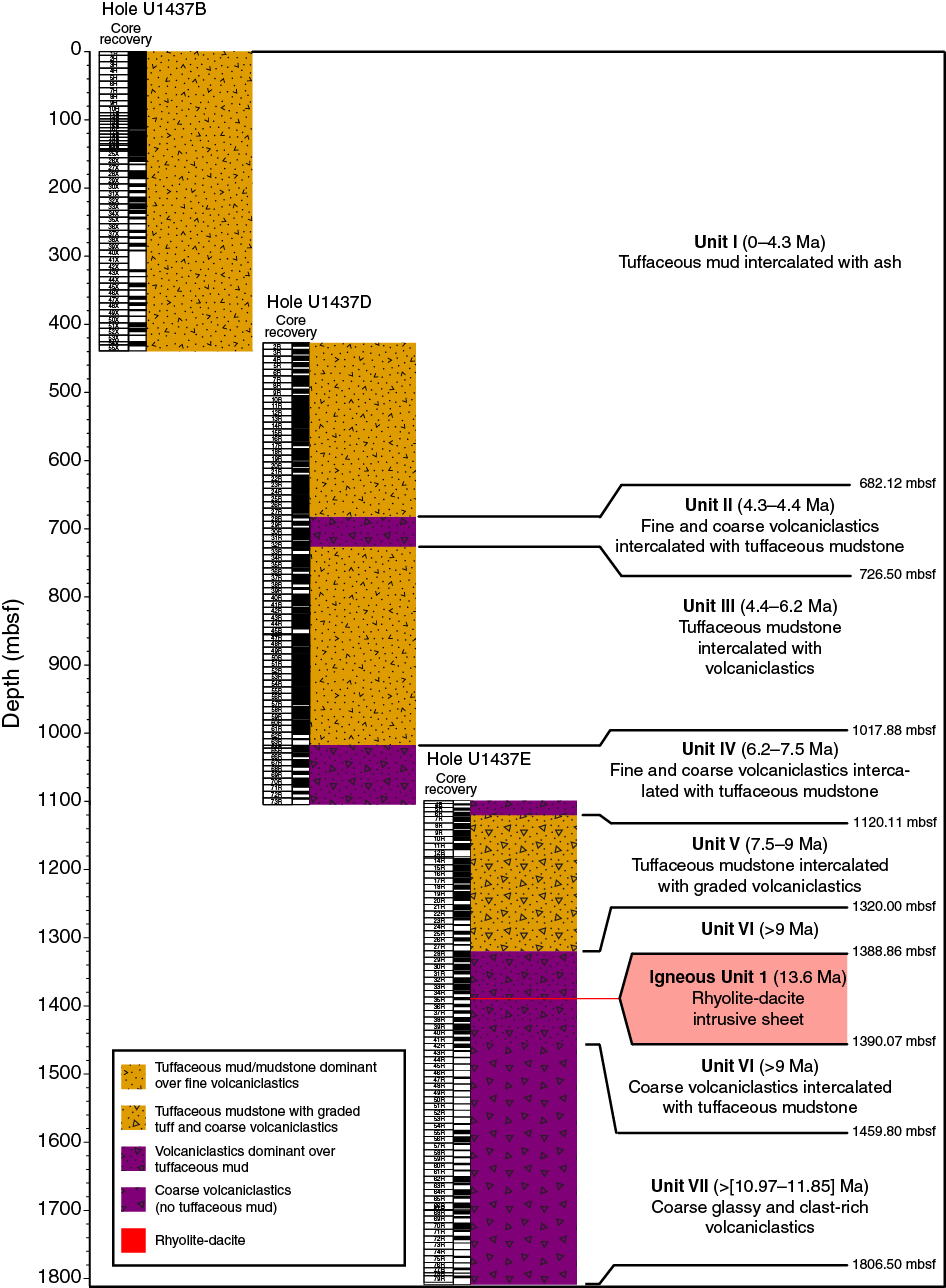
Figure F18. Summary lithostratigraphic log.

Figure F19. Summary lithostratigraphic log, Hole U1437B.
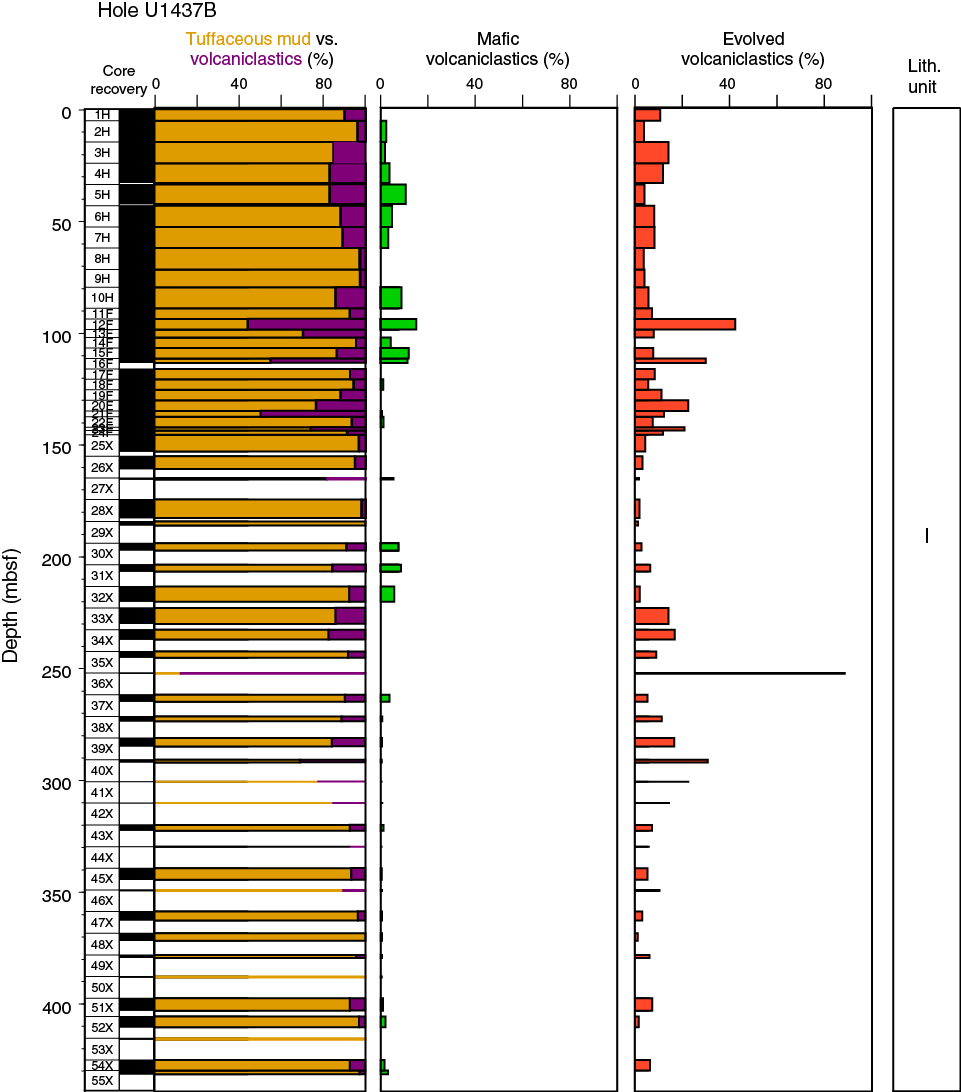
Figure F20. Tuffaceous mud and volcaniclastics, Hole U1437B.
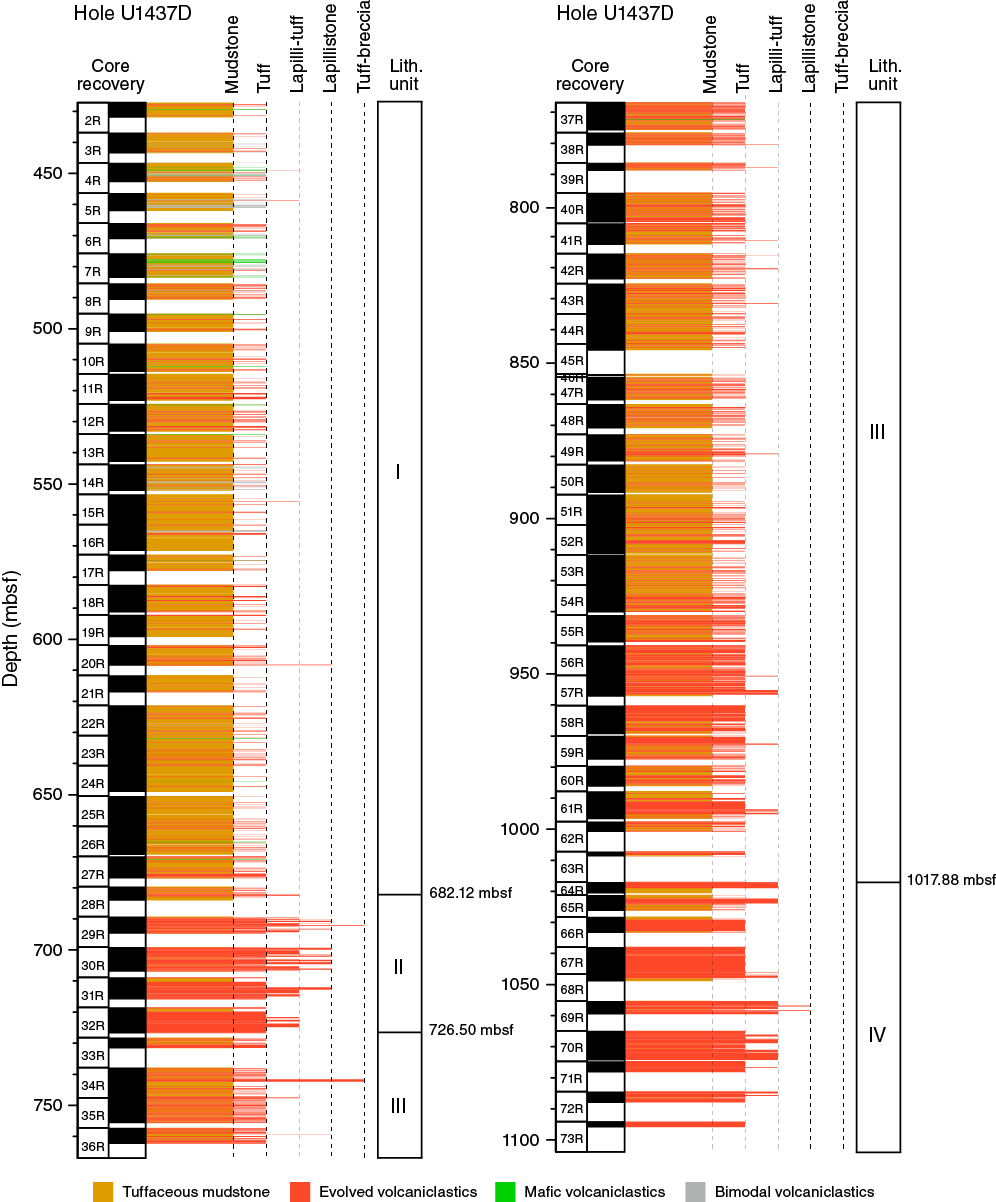
Figure F21. Summary lithostratigraphic log, Hole U1437D.
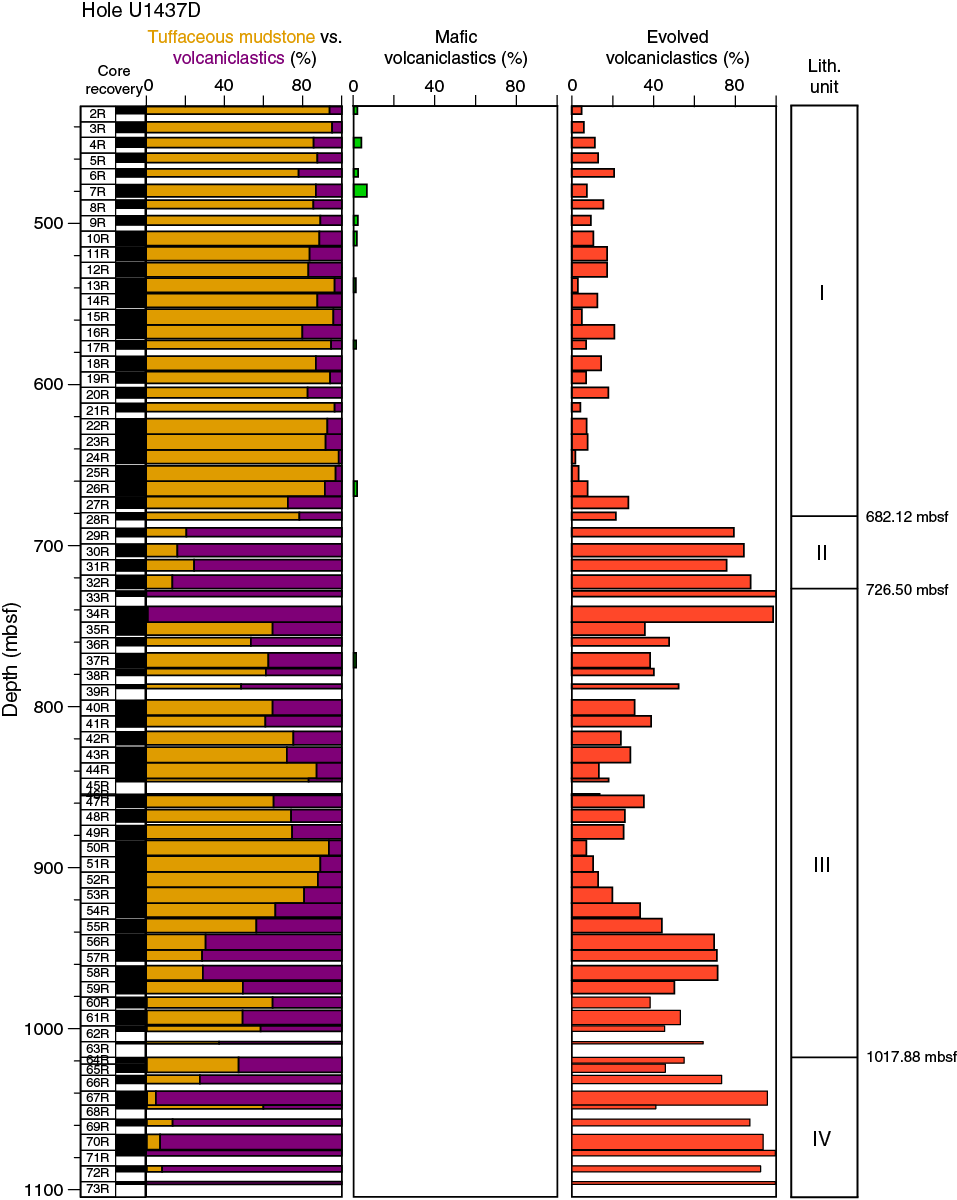
Figure F22. Tuffaceous mud and volcaniclastics, Hole U1437D.
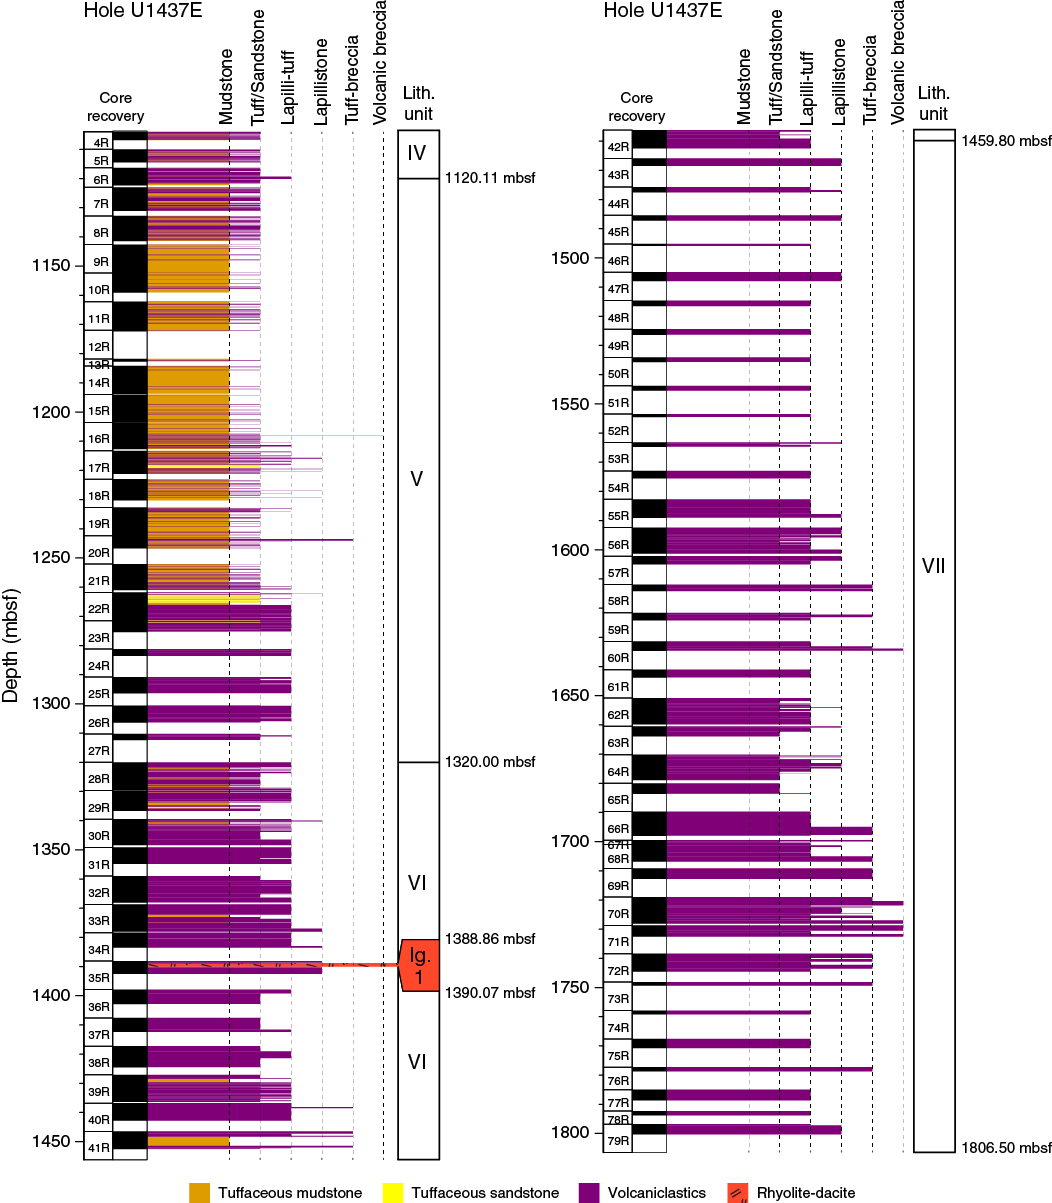
Figure F23. Summary lithostratigraphic log, Hole U1437E.

Figure F24. Tuffaceous mudstone and volcaniclastics, Hole U1437E.
Table T2. Unit descriptions. Download table in .csv format.
Figure F18 summarizes the complete lithostratigraphy of Site U1437, combining the three holes. Figures F19, F21, and F23 show the lithostratigraphy of each hole separately in more detail. Table T2 provides the upper and lower boundaries of each unit, unit thicknesses, and the relative proportions of the lithologies within each unit. Figures F20, F22, and F24 graphically present the relative proportions of tuffaceous mud/mudstone and volcaniclastics in Holes U1437B, U1437D, and U1437E, respectively. Figures F20 and F22 divide the volcaniclastics further into the proportions that are mafic or evolved compositions. Figure F24 shows the number of volcanic clasts (>2 cm) per meter of recovered core in the coarser volcaniclastics in Hole U1437E. Colors denote the composition of the volcanic clasts.
The following sections report the lithologies, structural features, and alteration of each unit described in Site U1437.
Unit I
- Interval: 350-U1437B-1H-1, 0 cm, to 350-U1437D-28R-2, 112 cm
- Depth: 0–682.12 mbsf
- Lithology: tuffaceous mud/mudstone intercalated with intervals of ash, tuff, lapilli-ash, and lapilli-tuff
- Age: 0 to ~4.3 Ma
Lithostratigraphic Unit I of Site U1437 includes the entirety of Hole U1437B (0–439.10 mbsf) and the upper part of Hole U1437D (from 427.20 to 682.12 mbsf). Of the 682.12 m cored, 433.23 m was recovered, including 11.90 m of overlapping material between Holes U1437B and U1437D (Figure F18). XCB core recovery was 33% from 145.70 to 439.10 mbsf (Cores 350-U1437-25X through 55X, the bottom of Hole U1437B). RCB core recovery was 64% in Unit I in Hole U1437D (Cores 350-U1437D-2R to 28R). The sedimentation rate is ~118 m/My in the uppermost 230 m (0~2 Ma) and ~200 m/My in the lower part or Unit I (2~4.3 Ma) (Figure F162).
The upper 432 m of Unit I (Hole U1437B) consists of tuffaceous mud that contains dispersed ash and carbonate intercalated with discrete intervals of mafic ash, scoria lapilli-ash, evolved ash, pumice lapilli-ash, and bimodal ash and lapilli-ash, all of which are mostly carbonate-free. Deeper than 432 mbsf (in Hole U1437D), these lithofacies become more lithified, so their names change from variations on tuffaceous mud and ash to variations on tuffaceous mudstone and tuff. No difference other than lithification is denoted by the name change. This transition from unconsolidated sediment to sedimentary rock is shown in three representative line scans that show mud or mudstone intercalated with ash or tuff (Figures F25, F26, F27).

Figure F25. Tuffaceous mud intercalated with mafic ash intervals, Unit I.
Figure F26. Evolved ash intervals intercalated with tuffaceous mud, Unit I.
Figure F27. Evolved tuff intervals, Unit I.
Unit I contains 1713 (682.12 m) described intervals. Of these intervals, 1056 (381.9 m, 88% of the unit) are tuffaceous mud or mudstone, 8 are clay or claystone (2.34 m, 1% of the unit), and 649 are volcaniclastic (48.96 m in total, 11% of the unit). Of the volcaniclastic intervals, 638 are ash or tuff, of which 73% are evolved, 18% are mafic, and 9% are bimodal. Ash is most abundant in the uppermost and lowermost 150 m of Unit I (Figure F28). Lapilli-ash, lapilli-tuff, and lapillistone intervals are rare (11 intervals scattered randomly in depth) and contain lapilli that are both dark (scoria) and light (pumice) colored. The mean thickness of ash/tuff intervals is 8 cm, whereas the mean thickness of lapilli-ash and lapilli-tuff intervals is 6 cm. Intervals of all types of ash appear to be least common between 310 and 400 mbsf (Cores 350-U1437B-41X to 51X), especially between 368 and 398 mbsf, where only 4 ash intervals were recovered in 19 m of mud. However, this may just reflect the lower recovery in this depth range.

Figure F28. Percentage of lithofacies per core, Unit I.
Core disturbance
Six principal types of core disturbance disrupt the lithostratigraphy within Unit I (see the Expedition 350 methods chapter [Tamura et al., 2015a] and Jutzeler et al., 2014, for description of core disturbances). The most common disturbance types in the shallower hole (U1437B) are intervals that are biscuited (e.g., interval 350-U1437B-38X-2, 42–64 cm; Figure F26), fractured (e.g., interval 47X-3, 15–70 cm), soupy (e.g., interval 28X-2, 63–69 cm), or show sediment flowage (e.g., interval 14F-4, 0–57 cm). Disturbance intensities vary from slight to severe. Fall-in is described at the top of five sections (34X-1, 37X-1, 39X-1, 40X-1, and 43X-1) and basal flow-in at the base of three sections (45X-3, 8X-CC, and 55X-CC). In the deeper part of Unit I (in Hole U1437D), the dominant types of core disturbance are biscuited (e.g., interval 350-U1437D-2R-3, 0–150 cm) and slightly, moderately and severely fractured (e.g., interval 15R-4, 52–59 cm). Only one fall-in is described at the top of Section 7R-1.
Lithofacies
Because the primary difference within lithofacies is the degree of consolidation (e.g., tuffaceous mud versus tuffaceous mudstone), the following descriptions apply to both lithified rock and nonlithified sediment unless otherwise stated. Most intervals of ash/tuff contain subordinate tuffaceous mud/mudstone and vice versa.
The macroscopic and microscopic descriptions of ash lithofacies below apply to most of the thickness of the described intervals. Consequently, they may underestimate the grain size and componentry of the basal several millimeters that are the coarsest and most crystal rich part of the interval.
Tuffaceous mud and tuffaceous mudstone
The most common lithofacies in Unit I is tuffaceous mud containing clay, >25% ash-sized shards, crystals, and carbonate. This lithofacies constitutes 88% of the described unit and occurs in intervals that range in thickness from a few centimeters to several meters, with an average thickness of 36 cm (Figure F19). The median thickness (26 cm) is the same as at Site U1436 in the Izu fore arc. Seventy intervals are thicker than 1 m, and there are two instances where ~7 m of mud occurs without interruption: at 72–79 and 102–109 mbsf (intervals 350-U1437B-9H-1, 2 cm, to 9H-5, 73 cm, and 14F-1, 40 cm, to 15F-2, 101 cm).
Both tuffaceous mud and tuffaceous mudstone are light gray to dark gray-brown, commonly with a greenish hue. The tuffaceous mud contains abundant fine, colorless, often vesicular glass shards and rare crystals (Figure F29). Isolated pumice lapilli dropstones are present but uncommon (Figure F30). Foraminifers are visible in many mud intervals, and fecal pellets are abundant in a few intervals; the average CaCO3 content is ~25 wt% (see Geochemistry).
Figure F29. Tuffaceous mudstone, Hole U1437D Unit I.
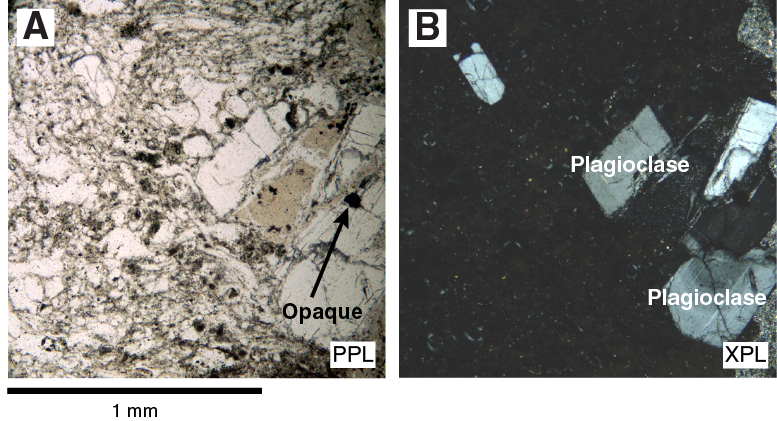
Figure F30. Pumice lapilli dropstone, Hole U1437B Unit I.
Bioturbation is widespread in both mud and ash lithofacies (e.g., Figures F31, F32). Green horizons, possibly due to the presence of glauconite, occur irregularly throughout, especially at the boundaries between tuffaceous mud and underlying evolved ash intervals and in association with bioturbation (Figure F33). Although tuffaceous mud is usually homogeneous and massive to faintly stratified where bioturbation is minor, variations in physical properties, especially natural gamma radiation (NGR), may reflect ash to clay proportions (see Physical properties). Lacking shipboard X-ray diffraction (XRD) results, nothing more can be said about the tuffaceous mud mineralogy.
Figure F31. Tuff and tuffaceous mudstone, Unit I.
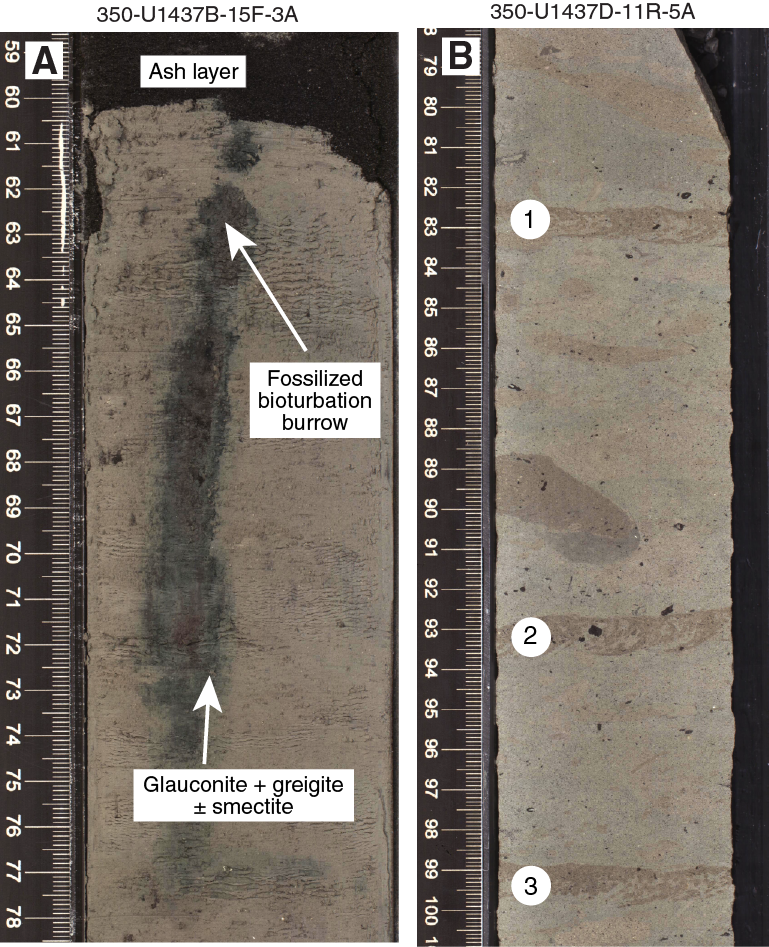
Figure F32. Bioturbated tuffaceous mud, Unit I.
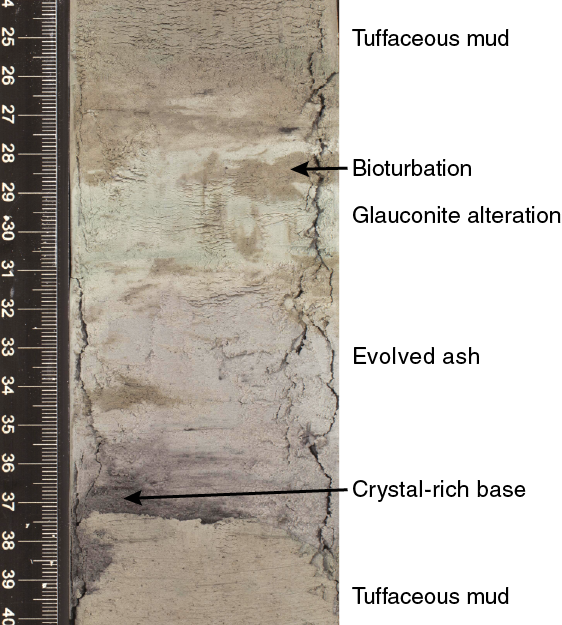
Figure F33. Evolved ash grading upward into tuffaceous mud, Unit I.
Bioturbation and core disturbances, particularly biscuiting (Figure F26), are often pervasive and destructive (Figure F2 in the Expedition 350 methods chapter [Tamura et al., 2015a]). In more competent sawn cores, worm burrows up to 7 cm long and 1 cm wide are present in all orientations. They disrupt the internal structure such that originally core-spanning laminae are broken into pods and sharp internal boundaries are diffused. Similarly, core disturbances can homogenize the mud and obliterate sedimentary structures; many subhorizontal, curviplanar boundaries are shear planes caused by biscuiting.
Evolved ash and evolved tuff
Most volcaniclastic intervals in Unit I consist of evolved glass and crystals. There is 35.13 m of evolved ash/tuff in the described core in at least 480 discrete intervals that range in thickness from 1 to 70 cm (average thickness = 7 ± 4 [1σ] cm) (Figure F33). The thickest evolved ash intervals (>20 cm each) are at restricted depths: 100–140 mbsf, including three that are ~40 cm thick (intervals 350-U1437B-13F-2, 57–95 cm, 16F-2, 16–57 cm, and 20F-1, 0–38 cm), and 530–600 mbsf, including three that are 40–50 cm thick (intervals 350-U1437D-12R-6, 63–112 cm, 16R-3, 0–53 cm, and 18R-3, 72–112 cm). All ash layers recovered between 322 and 398 mbsf (Sections 350-U1437B-43X-2 to 50X-CC) are evolved (Figure F28).
Macroscopically, evolved ash is typically white to dark gray, fine grained (silt to sand size), and variably admixed with mud at the top. Evolved ash is typically normally graded or nongraded and is characterized by a sharp, commonly crystal-rich base and a more diffuse and often bioturbated upper boundary that grades into tuffaceous mud (Figure F33). Figures F34 and F35 show a detailed view of an evolved tuff layer in Section 350-U1437B-38X-2 (273.22 mbsf) from macroscale to microscale, highlighting the intermixed nature of mud and tuff in some intervals, including a crystal-rich basal layer. Microscopically, the evolved material is characterized by colorless angular glass shards (Figure F36). Crystals are uncommon, usually limited to plagioclase but can be accompanied by pyroxene, hornblende, or opaque minerals. Possible hornblende occurs macroscopically in 45 (7%) of the evolved intervals (Figure F37), occurring sporadically throughout Unit I but apparently becoming more common in the lowermost part, from Section 350-U1437D-26R-1 (660.10 mbsf). Chemical analysis is available for four of the possible hornblende-bearing ash intervals (350-U1437B-10H-2, 30–32 cm [81.50 mbsf], and 35X-2, 6–7 cm [244.16 mbsf], and 350-U1437D-27R-1, 37–55 cm [670.35 mbsf], and 28R-2, 98–112 cm [682.12 mbsf]). All four intervals have higher K2O contents than most other evolved ash intervals (they are medium-K; see Geochemistry for definition). Quartz occurs macroscopically in only two intervals (350-U1437D-25R-2, 54–59 cm [652.49 mbsf], and 26R-1, 133–134 cm [661.43 mbsf]) and microscopically in Thin Sections 350-U1437B-38X-2, 32–35 cm (TS06), 35–38 cm (TS07), 38–41 cm (TS08), and 41–45 cm (TS09), from 273.22 to 273.35 mbsf.
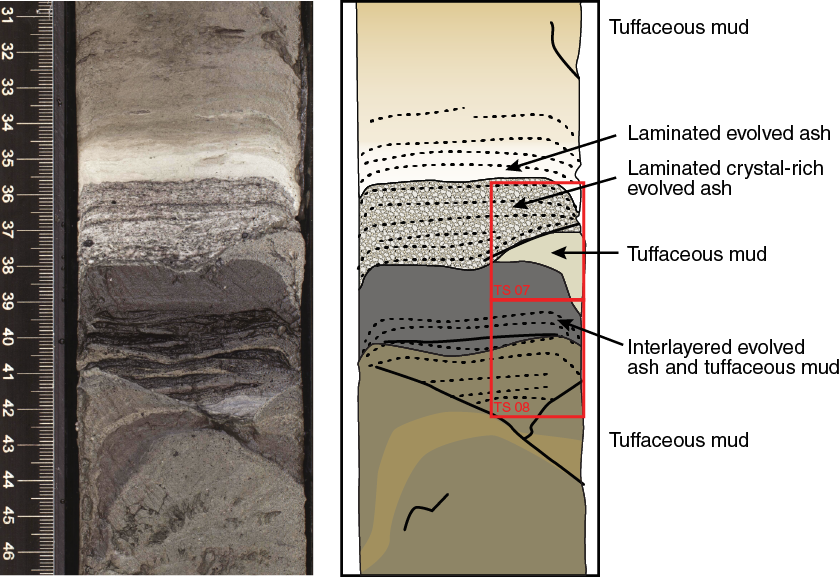
Figure F34. Laminated evolved ash, Unit I.
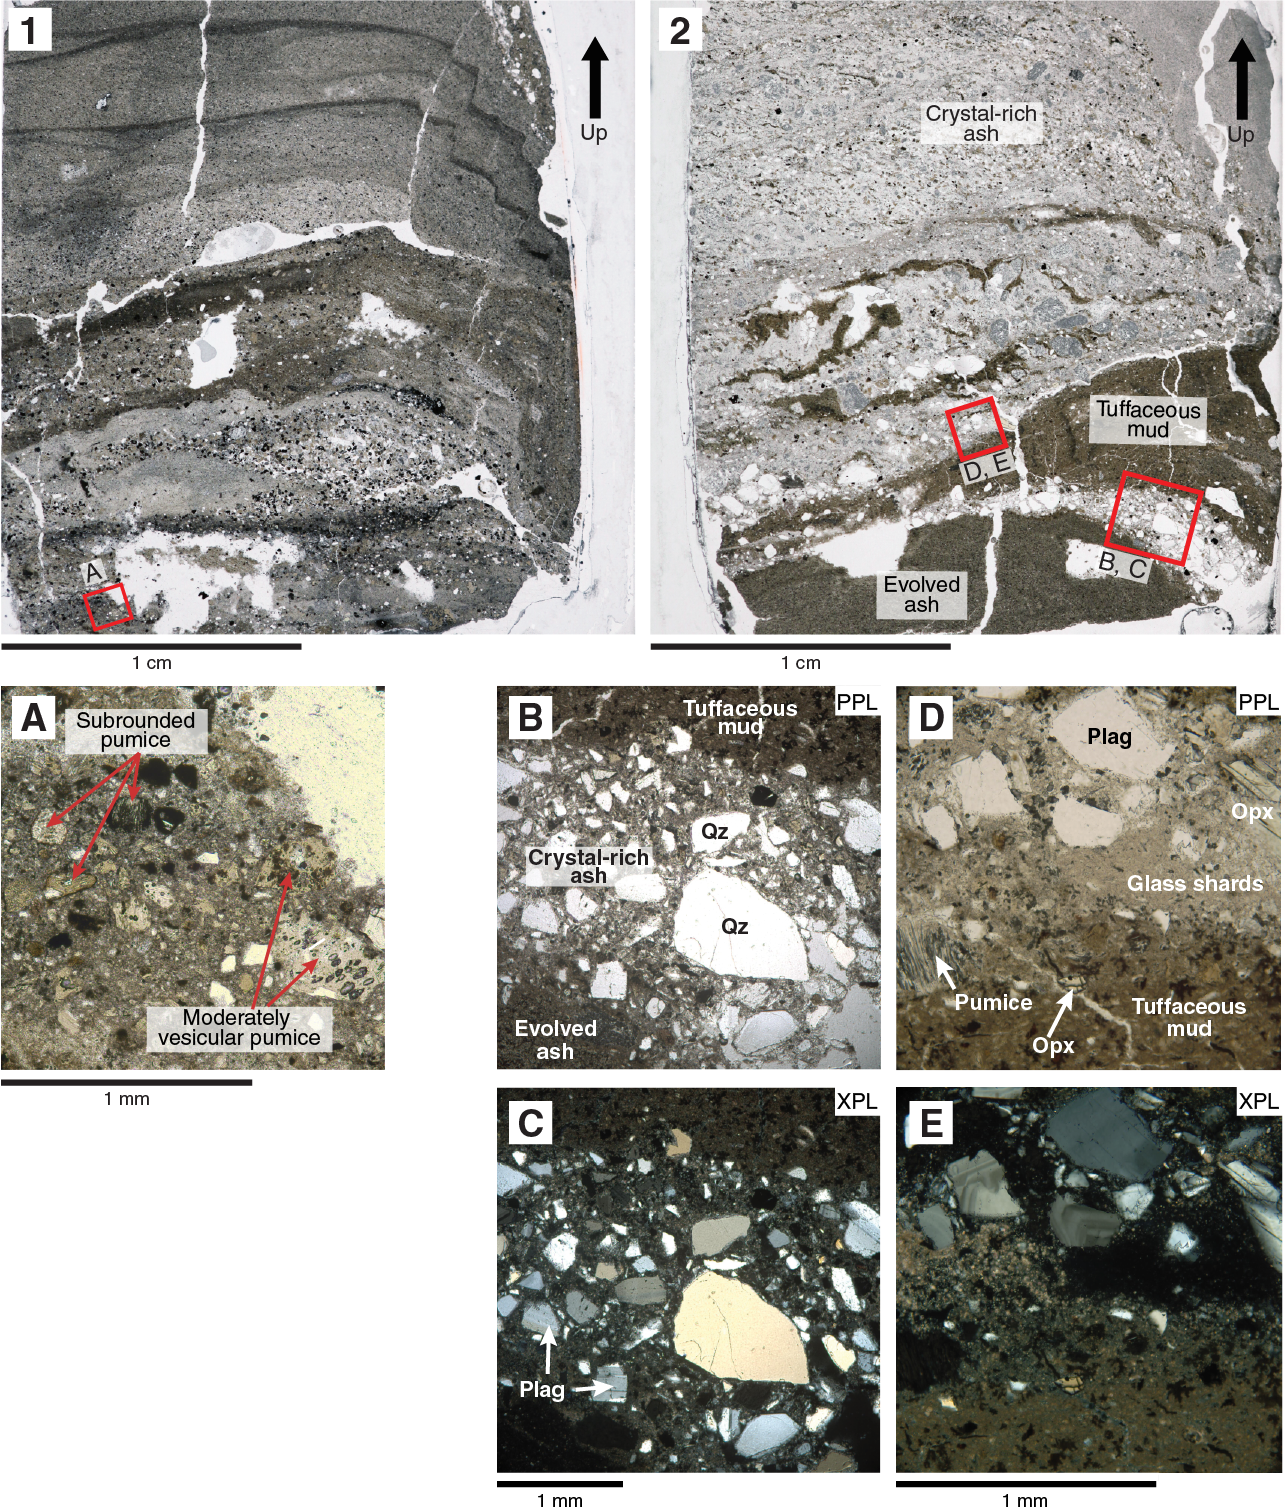
Figure F35. Laminated evolved ash layers, Hole U1437B Unit I.
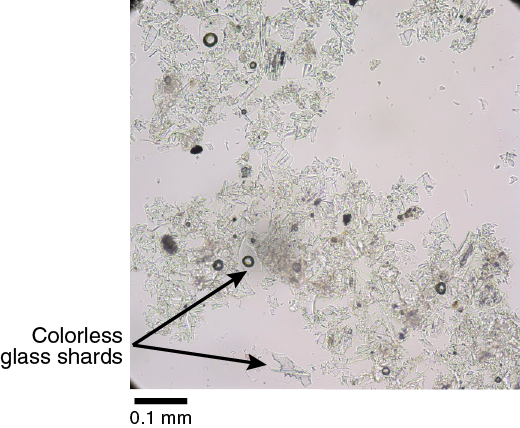
Figure F36. Evolved ash, Unit I.
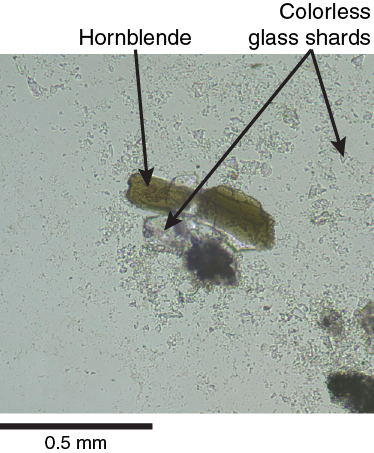
Figure F37. Hornblende and colorless glass in evolved ash, Unit I.
The macroscopic variation in color of evolved ash from light to dark gray defines fine-scale lamination (e.g., Figure F34). The color differences are a consequence of differences in componentry that are visible microscopically and can change over a few centimeters (Figure F35). Darker layers are richer in crystals and pumice grains, whereas lighter layers are richer in glass shards. In the example shown, the following sequence occurs within 3 cm. The lowest and darkest layer contains mostly altered pumice grains and crystals, overlain by a horizon rich in quartz and plagioclase crystals, and then by tuffaceous mud. That horizon, in turn, grades upward into more typical finer grained, light-colored ash containing colorless glass shards. There was too little quartz to identify macroscopically.
Mafic ash and mafic tuff
Mafic volcaniclastic intervals in Unit I are four times less common than intervals of evolved materials (Figure F28). The mafic intervals are macroscopically black, contain brownish glass, and stand out with high contrast to the mud above and below (Figures F25, F38). A total of 8.49 m of mafic ash intervals average 8 cm in thickness and are up to 30 cm thick. Their median thickness (6 cm) is almost twice that of evolved ash intervals. They are most common and thickest in Cores 350-U1437B-1H to 7H (0–62.58 mbsf), 10H to 16F (79.70–113.44 mbsf), and 30X to 32X (194.10–220.26 mbsf). Basal contacts are typically sharp and rich in plagioclase and pyroxene crystals and are often normally graded from coarse sand to fine sand with diffuse, bioturbated upper boundaries. Mafic ash with grain sizes >2 cm (scoria lapilli) are rare, and no mafic ash interval contains lapilli >3 cm.
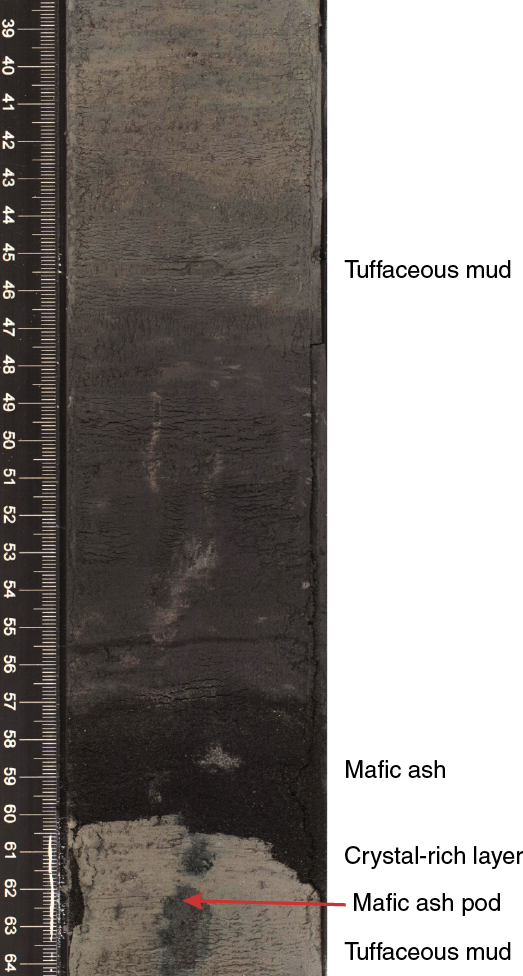
Figure F38. Mafic ash, Unit I.
Mafic ash also occurs as pods within tuffaceous mud (Figures F25, F39). These ash pods consist of subrounded concentrations of black fine-grained ash and possibly greigite and range from several millimeters to several centimeters in diameter. The pods can compose as much as 1%–5% of the tuffaceous mud intervals, but this is uncommon. They were probably formed by bioturbation.
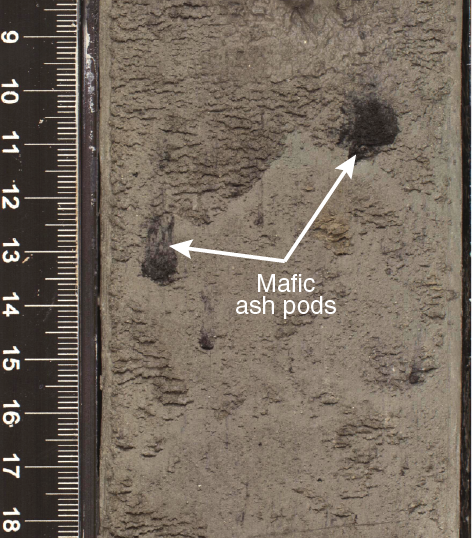
Figure F39. Mafic ash pods, Unit I.
Microscopically, mafic ash consists mostly of unaltered, green to brown, curved to angular vesicular glass shards and lesser amounts of plagioclase, pyroxene, and rare hornblende crystals. In detail, however, most ash intervals that were macroscopically described as mafic turn out to contain some colorless evolved glass shards in smear slides (e.g., Figure F40). Crystals of plagioclase and pyroxene are more common than in evolved ash, occurring in about half of the mafic ash intervals.

Figure F40. Mafic ash, Unit I.
Bimodal ash layers
Bimodal ash intervals have >25% of both colorless and colored glass based on microscopic inspection of small samples in water on an interval-by-interval basis. Colorless glass predominates in most cases (Figure F41). A total of 47 intervals are described as bimodal ash; collectively they constitute 4.75 m of core. Two occurrences make up a quarter of the thickness of bimodal ash: intervals 350-U1437B-21F-1, 86 cm, to 21F-2, 10 cm, and 350-U1437D-7R-5, 0–127 cm (Figure F19, F20). These intervals are medium to coarse sand size, nongraded, and contain abundant feldspar. Thinner intervals of bimodal silt-sized ash occur infrequently between Cores 350-U1437B-21F and 27X.

Figure F41. Bimodal ash, Unit I.
Lapilli-ash, lapilli-tuff, and lapillistone
The coarsest intervals in Unit I contain lapilli of mafic scoria or evolved pumice (Figure F42). Eleven intervals occur sporadically throughout the unit: three monomictic mafic lapilli-ash (intervals 350-U1437B-27X-CC, 37–41 cm, 43X-1, 95–98 cm, and 54X-3, 83–86 cm), five monomictic evolved lapilli-ash (intervals 35X-2, 0–9 cm, and 47X-2, 106–111 cm, and 350-U1437D-4R-2, 81–83 cm, 5R-2, 100–105 cm, and 15R-2, 103–113 cm), one intercalated lapilli-tuff with mudstone (interval 21R-1, 0–33 cm), and two monomictic evolved lapillistone (intervals 20R-5, 56–59 cm, and 20R-5, 63–65 cm). The total thickness of lapilli-ash, lapilli-tuff, and lapillistone in Unit I is only 59 cm (1.2% of Unit I volcaniclastics), with the layers having a median thickness of 4 cm. Where recovered, bottom contacts are either sharp or bioturbated. Four of the 11 intervals are normally graded. Most lapilli are subrounded pumice or scoria with subordinate lithic clasts.
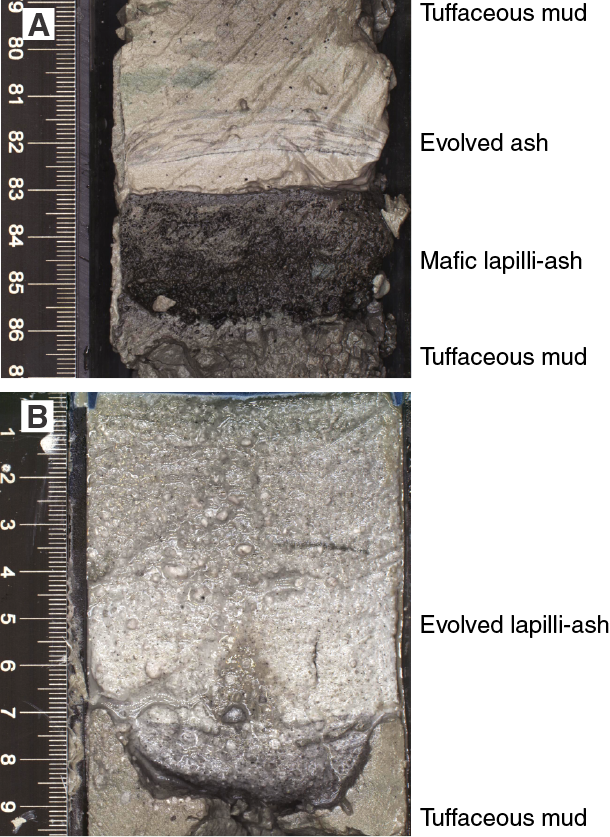
Figure F42. Lapilli-ash, Hole U1437B.
Alteration
Macroscopic alteration in Unit I is present as thin layers of green clay minerals, likely interlayered glauconite-smectite, that often occur parallel to the bedding in tuffaceous mud/mudstone or in tuffaceous mud/mudstone above the contact with evolved ash layers (Figure F33). Locally, these green clay minerals occur together with pyrite clots and greigite associated with bioturbation in the tuffaceous mudstone (Figure F32). Fine-grained pyrite also occurs disseminated within tuffaceous mudstone. These features are described as alteration, but they may result from authigenesis or diagenesis (see Interpretation).
Reduced recovery intervals within Unit I
Core recovery in Hole U1437B was poor (~30%) in the XCB-cored interval from 145 to 425 mbsf (Figure F18), where sediment became increasingly lithified. The relative proportion of lithofacies does not change in the 84 m of core recovered across this interval; it remains 94% tuffaceous mud beds of the usual thickness and only 24 cm of lapilli-sized material. Physical properties of the recovered core also do not change except for a gradual increase in P-wave velocity (see Physical properties). However, Hole U1437C terminated within this depth range (at 310 mbsf) because the drill bit stuck. In addition, logging results of Hole U1437D across this interval show unusually low NGR from ~260 to 290 mbsf and unusually high resistivity and magnetic susceptibility (MS) from ~290 to 320 mbsf (see Downhole measurements). Reinterpretation of previously collected MCS data for Site U1437 using shipboard P-wave velocity shows that strong reflectors within Unit I become frequent at ~230–320 mbsf and that the seismic Layer L2/L3 boundary described in Tamura et al. (2013) occurs at 295 mbsf (Figures F12, F14). Site U1437 provides few lithologic clues as to what may make up this critical interval, as only 1.1 m of core was recovered between 290 and 320 mbsf.
Unit II
- Interval: 350-U1437D-28R-3, 0 cm, to 32R-CC, 7 cm
- Depth: 682.12–726.50 mbsf
- Lithology: lithified; dominated by intervals of evolved tuff intercalated with pumice lapilli-tuff and pumice lapillistone; includes minor tuffaceous mudstone
- Age: ~4.3–4.4 Ma.
Unit II is characterized by abundant intervals of lapilli-tuff and lapillistone intercalated with tuffaceous mudstone. The top of Unit II is defined by the first lapilli-tuff in a 44.38 m thick sequence dominated by intervals of lapilli-sized volcaniclastics (Figure F18). The base of Unit II is defined by the first tuffaceous mudstone below that contiguous sequence, which ends with evolved tuff.
Unit II is 44.38 m thick, and a total of 29.26 m of core was described. Core recovery is 46% and 56% in Cores 350-U1437D-28R and 29R, respectively, but increases to an average of 80% in Cores 30R to 32R. The rocks described from the unit are lithified and dominated (72%) by thin to very thick intervals of intercalated evolved tuff (9.82 m thickness), pumice lapilli-tuff (6.88 m), pumice lapillistone (3.90 m), and one interval of tuff-breccia (0.18 m). Minor evolved dark gray tuff (1.88 m) is present. Tuffaceous mudstone (6.60 m) is only 23% of Unit II, much less than in Units I and III (Figures F19, F43). Evolved tuff intervals are on average 16 cm thick (maximum = 95 cm), whereas tuffaceous mudstone intervals are on average 19 cm thick (maximum = 85 cm).
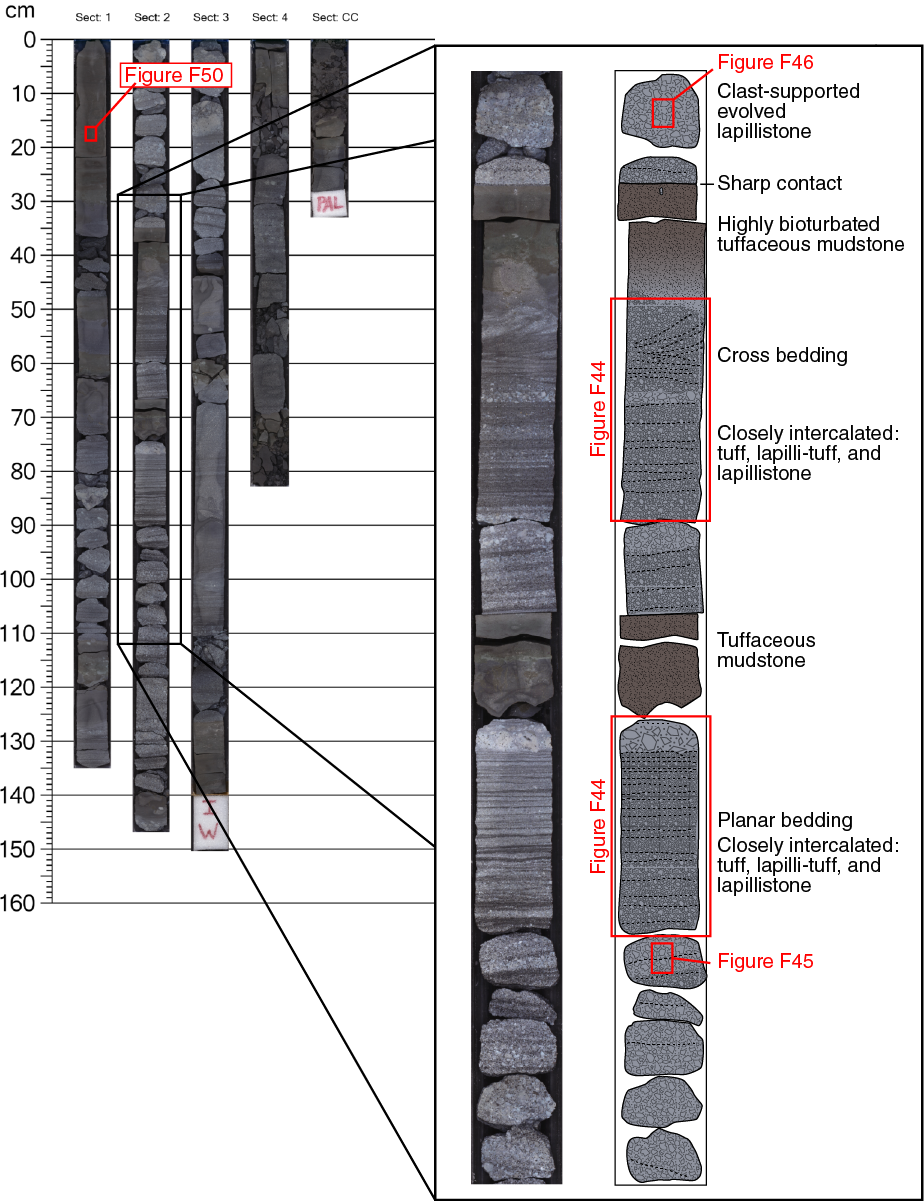
Figure F43. Core 350-U1437D-29R.
Unit II is distinguished from Units I and III by (1) the abundance of pebble-sized pumice lapilli-rich facies, (2) the low volume of tuffaceous mudstone, and (3) the complete absence of mafic tuff. The top of Unit II is defined as the first appearance of a 12 cm thick monomictic lapilli-tuff (interval 350-U1437D-28R-3, 0–12 cm), which is a characteristic lithofacies of Unit II. This boundary also coincides with distinct variations in physical properties. MS increases in both mean and range of values within Core 28R, and both remain high through Core 45R. In addition, the scatter and range in values of seismic velocity (P-wave) and porosity from moisture and density (MAD) measurements increase abruptly in Cores 28R through 33R.
Core disturbance
The lithology of Unit II is interrupted by four principal types of core disturbance. Within this stratigraphic unit, intervals are slightly to severely biscuited (e.g., interval 350-U1437D-29R-1, 74–120 cm), severely fractured (e.g., interval 30R-5, 53–83 cm), moderately fractured (e.g., interval 32R-6, 21–48 cm), or slightly fractured (e.g., interval 31R-2, 0–115 cm).
Lithofacies
The three lithofacies in Unit II are (1) intercalated evolved tuff, pumice lapilli-tuff, pumice lapillistone, and tuff-breccia; (2) dark gray evolved tuff; and (3) tuffaceous mudstone. The first lithofacies varies in grain size, grading, stratification, componentry, and thickness.
Intercalated evolved tuff, pumice lapilli-tuff, pumice lapillistone, and tuff-breccia
Intercalated intervals of evolved tuff, lapilli-tuff, lapillistone, and tuff-breccia are monomictic and matrix or clast supported (Figure F44). Evolved tuff intervals are light colored and consist of small pumice grains with plagioclase, clinopyroxene, orthopyroxene, and amphibole crystals in variable proportions (Figures F45, F46); colorless and light brown glass shards also are present in a few intervals. Pumice lapilli-tuff is composed of pumice lapilli and pumice grains, crystal fragments, and glass shards. Lapillistone is mainly composed of pumice lapilli that are typically subrounded and moderately vesicular. The pumice lapilli layers are composed of sparsely plagioclase-phyric pumice in a matrix of plagioclase, pyroxene, and amphibole.
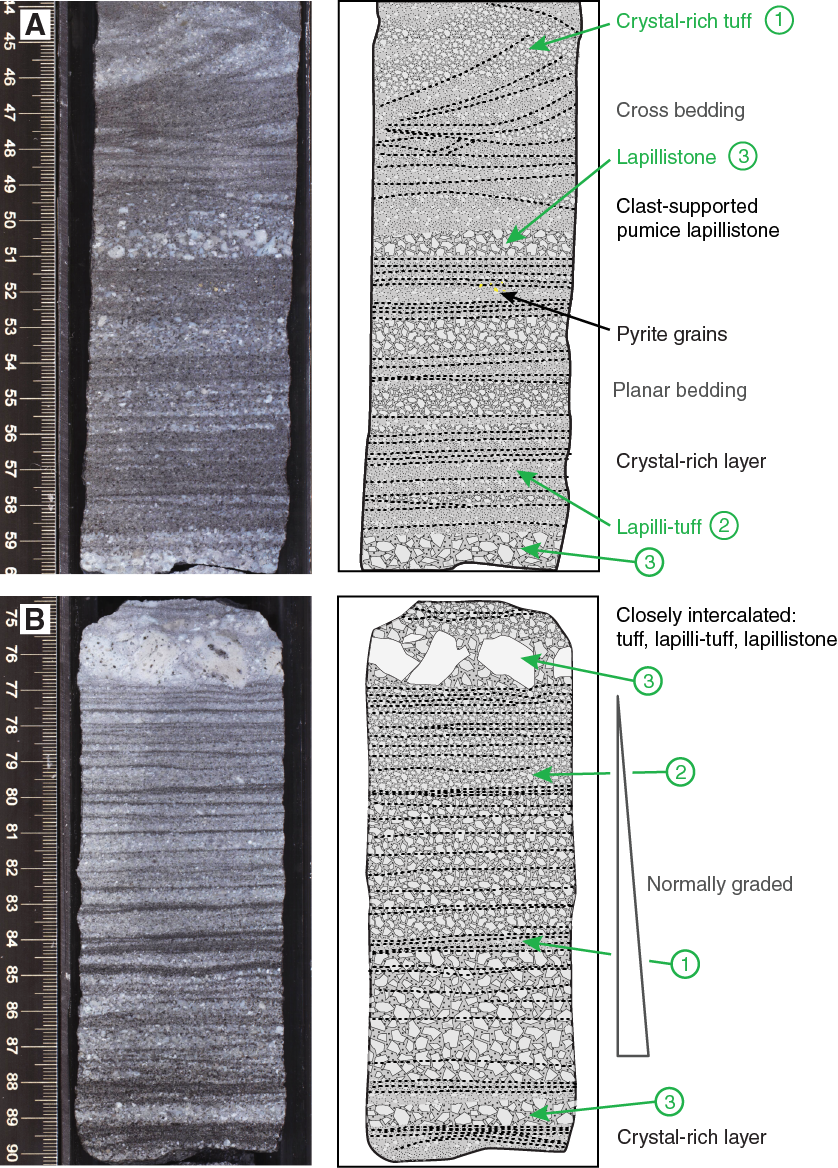
Figure F44. Section 350-U1437D-29R-2, Unit II.
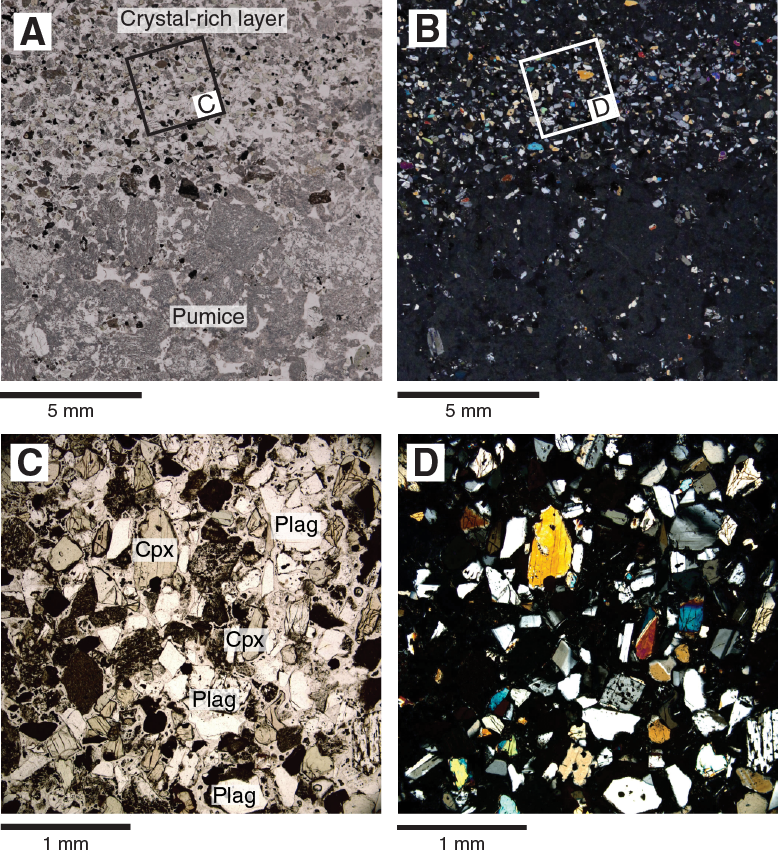
Figure F45. Crystal-rich tuff and pumice-rich lapilli-tuff layers, Unit II.
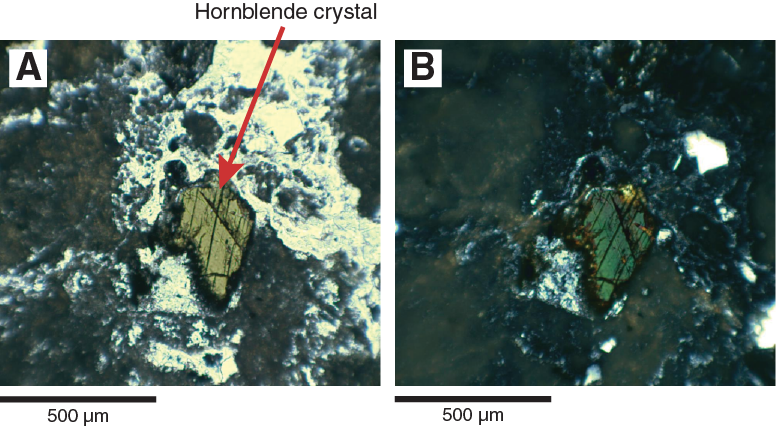
Figure F46. Hornblende in an altered pumice clast, Unit II.
Monomictic clast-supported intervals are composed of thinly to thickly bedded and stratified pumice lapilli-tuff, pumice lapillistone, and tuff-breccia (e.g., interval 350-U1437D-29R-1, 83 cm, to 29R-2, 141 cm; Figures F43, F44). Lapilli-tuff and lapillistone are commonly intercalated with no obvious grading. Some pumice lapillistone grades progressively upward into stratified pumice lapilli-tuff, indicating normal coarse-tail grading in pumice grain size. Cross bedding and planar bedding commonly occur in the upper part of the intervals. The basal contacts are sharp where in contact with tuffaceous mudstone but sharp to gradational where in contact with other intervals of pumice lapilli-tuff or lapillistone.
Monomictic matrix-supported intervals of evolved lapilli-tuff are thin to medium bedded (e.g., intervals 350-U1437D-30R-4, 23–51 cm, and 31R-5, 21–38 cm; Figures F44, F47). Many are reversely graded and characterized by the occurrence of coarse (≤4 cm), angular to subrounded, moderately to highly vesicular pumice clasts toward the top of the intervals. The matrix is composed of crystal fragments (feldspar, clinopyroxene, orthopyroxene, and amphibole), small pumice grains, and abundant glass shards (Figure F48). Light brown glass is dominant, but colorless glass is common. The crystal content in pumice lapilli-tuff and pumice lapillistone classifies them as andesitic in composition.
Figure F47. Core 350-U1437D-31R, Unit II.
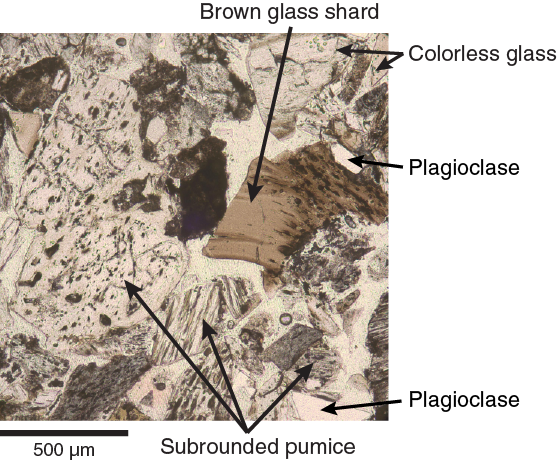
Figure F48. Pumice grains, Unit II.
Dark gray evolved tuff
Dark gray evolved tuff is distinguished from the evolved tuff of the preceding lithofacies by its distinctly darker color. Intervals of normally graded evolved dark gray tuff are thin to medium bedded (Figure F49). They are more lithified and altered but similar to the darker colored evolved tuff intervals in Unit I, with a crystal-rich base (silt to medium sand sized) that grades upward into an evolved glass-rich, crystal-poor top. The bases of these intervals are planar to irregular and consistently sharp, whereas their top boundaries are gradational and commonly bioturbated where in contact with tuffaceous mudstone.
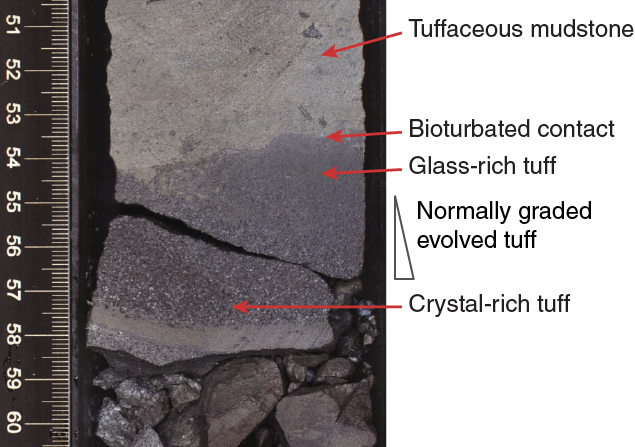
Figure F49. Normally graded evolved tuff, Unit II.
Tuffaceous mudstone
Intervals of tuffaceous mudstone are subordinate and intercalated with evolved volcanic deposits (Figures F43, F47, F50). This facies is the pervasively lithified and altered equivalent of the tuffaceous mudstone described in Unit I. The tuffaceous mudstone is heavily bioturbated and contains bioclasts. The volume of volcaniclastic components (glass shards and crystals) varies from bed to bed but is typically >25%.
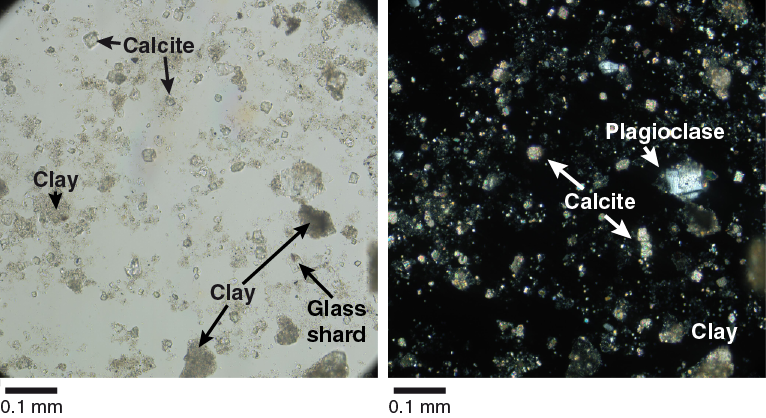
Figure F50. Tuffaceous mudstone, Unit II.
Alteration
Most of the macroscopic alteration of the tuffaceous mudstone in Unit II is either associated with bioturbation or consists of thin green layers parallel to the sedimentary bedding. Both are similar to the styles of macroscopic alteration in Unit I. The green layers are composed of green clay minerals, likely glauconite and smectite, plus pyrite. Microscopic observations of tuff, lapilli-tuff, and lapillistone show that the pumice is commonly devitrified or replaced by palagonite, zeolite, oxyhydroxides, or clay minerals. Rare glauconite grains are present in these lapilli layers. Altered volcanic clasts have epidote, biotite, clay, and opaque minerals in the groundmass.
Unit III
- Interval: 350-U1437D-32R-CC, 7 cm, to 64R-1, 8 cm
- Depth: 726.50–1017.88 mbsf
- Lithology: lithified; dominated by intervals of tuffaceous mudstone intercalated with evolved tuff; includes minor lapilli-tuff and matrix-supported tuffaceous consolidated breccia with lapilli and deformed tuffaceous mudstone intraclasts
- Age: ~4.4–6.2 Ma
Unit III is 291.38 m thick, of which 77% was recovered and 222.39 m was described (Figure F21) and divided into four facies. The most abundant facies is tuffaceous mudstone (141.06 m in total, 63% of the described unit) in 623 intervals with an average interval thickness of 0.23 m (maximum = 1.35 m). A total of 724 intervals of evolved tuff (76.33 m in total, 34% of the described unit), some being closely intercalated with tuffaceous mudstone, have an average thickness of 0.11 cm (maximum succession = 1.49 m) (Figure F22). Twenty intervals of evolved lapilli-tuff and one interval of evolved lapillistone (3.1 m in total, 1.4% of the described unit), some being closely intercalated with tuffaceous mudstone, have an average thickness of 0.15 cm (maximum = 0.43 m). They include very thin to thick pumice-rich lapilli-tuff as well as thin to medium beds of lapilli-tuff (e.g., interval 350-U1437D-43R-2, 0–47 cm). A 1.91 m thick interval of matrix-supported tuffaceous, consolidated breccia with lapilli and deformed tuffaceous mudstone intraclasts occurs in the upper part of Unit III (interval 34R-3, 78 cm, to 34R-4, 118 cm).
Unit III is distinguished from Unit II by the overall abundance of tuffaceous mudstone and overall lack of thick intercalated pumice lapilli-tuff and lapillistone intervals. Consequently, the Unit II/III boundary is defined by the last occurrence downhole of intercalated pumice lapilli-tuff and lapillistone. The upper part of Unit III is dominated by tuffaceous mudstone and subordinate evolved tuff that have similar characteristics as in Unit I, without the presence of mafic tuff. The abundance of white to light gray evolved tuff increases downhole.
Relative to Units I and II, the physical properties in Unit III (see Physical properties) show an overall decrease in NGR and P-wave values and greater scatter in MAD. In the lower part of Unit III, MAD and MS decrease and are matched by an increase in average values and scatter of P-wave speeds; both show continuous trends downhole. These variations are consistent with increasing lithification, compaction, or alteration with depth in Unit III. MS increases continuously to Core 350-U1437D-47R (855.3 mbsf), where it substantially drops, possibly due to a change in alteration style. Overall MS values increase again from Core 54R (922.2 mbsf) downhole.
Core disturbance
Unit III is disrupted by six types of core disturbance. The most common types are slightly fractured (e.g., interval 350-U1437D-52R-6, 0–150 cm), moderately fractured (e.g., 47R-2, 0–148 cm), and severely fractured (e.g., interval 38R-CC, 0–13 cm). A minority of intervals are biscuited.
Lithofacies
Tuffaceous mudstone
This facies is the lithified and altered equivalent of tuffaceous mudstone described in Unit I (Figures F18, F51). Bioclasts are common (Figure F52), bioturbation is ubiquitous, and the volcanic grain content varies from bed to bed but is typically >25%. Dark laminae reflecting higher clay mineral content are widespread in the lower part of the unit and were mostly visible after cores had dried and been in contact with air for more than 24 h.
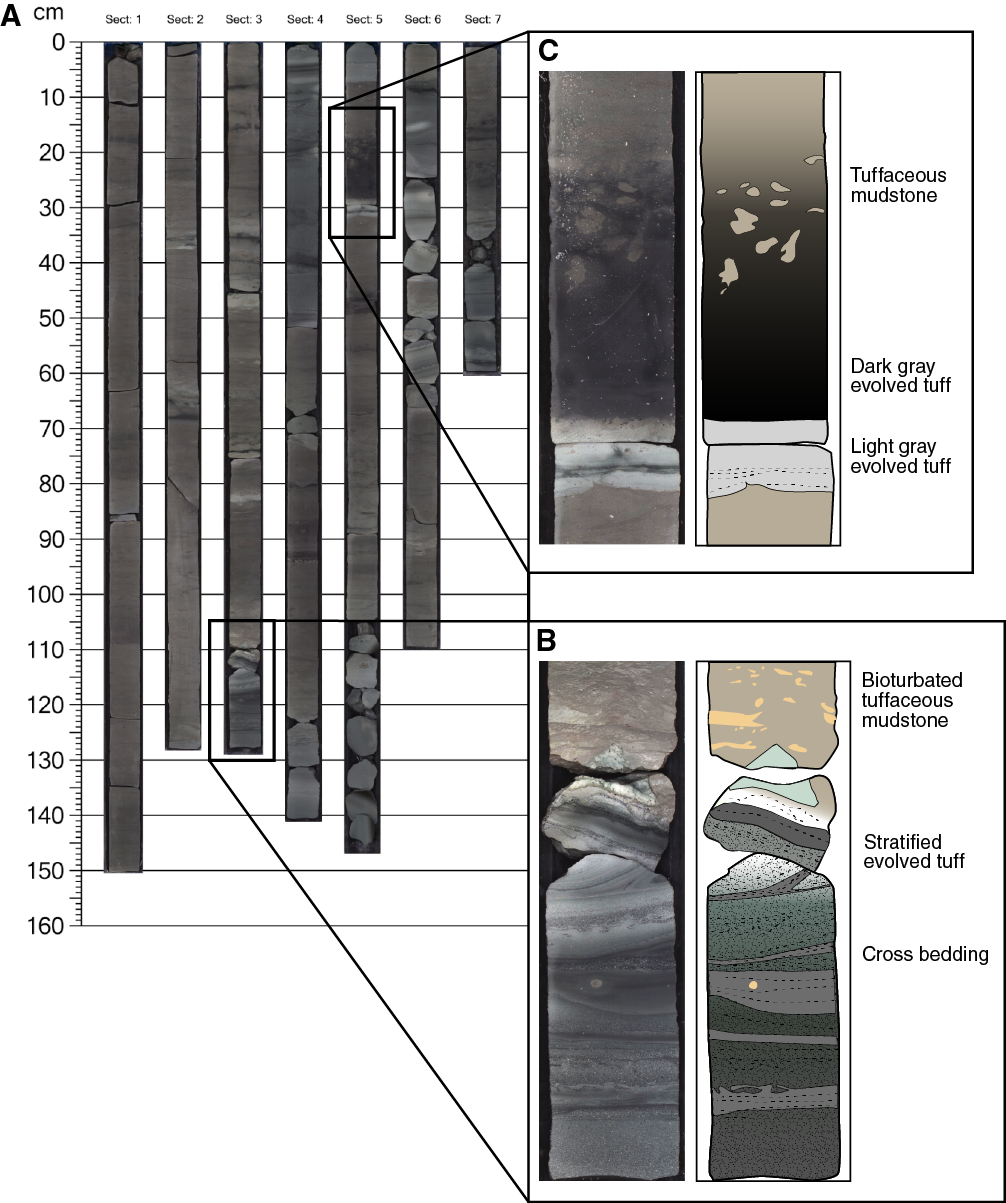
Figure F51. Core 350-U1437D-54R.
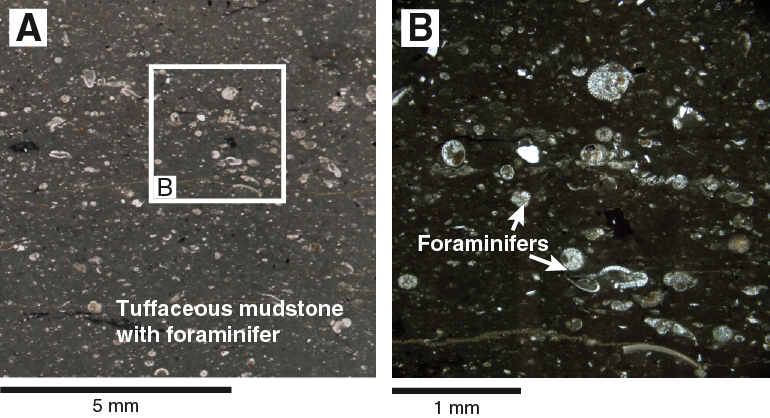
Figure F52. Tuffaceous mudstone with foraminifers, Unit III.
Evolved tuff
Evolved tuff intervals are dark gray to white and occasionally have a well-sorted, crystal-rich, sharp basal contact (Figures F51, F53, F54). Their contact with overlying tuffaceous mudstone is gradational and commonly bioturbated. The evolved tuff intervals are chiefly composed of pumice grains or fiamme, glass fragments, crystals (feldspar, clinopyroxene, orthopyroxene, opaque minerals, and occasional hornblende), and minor lithic grains (Figure F55). The matrix is green, reflecting alteration to clay minerals, and some intervals are partly bioturbated (Figures F53, F54). Variations in clast componentry modify the interval’s color, coarseness, and sorting. Two main subfacies are described below.
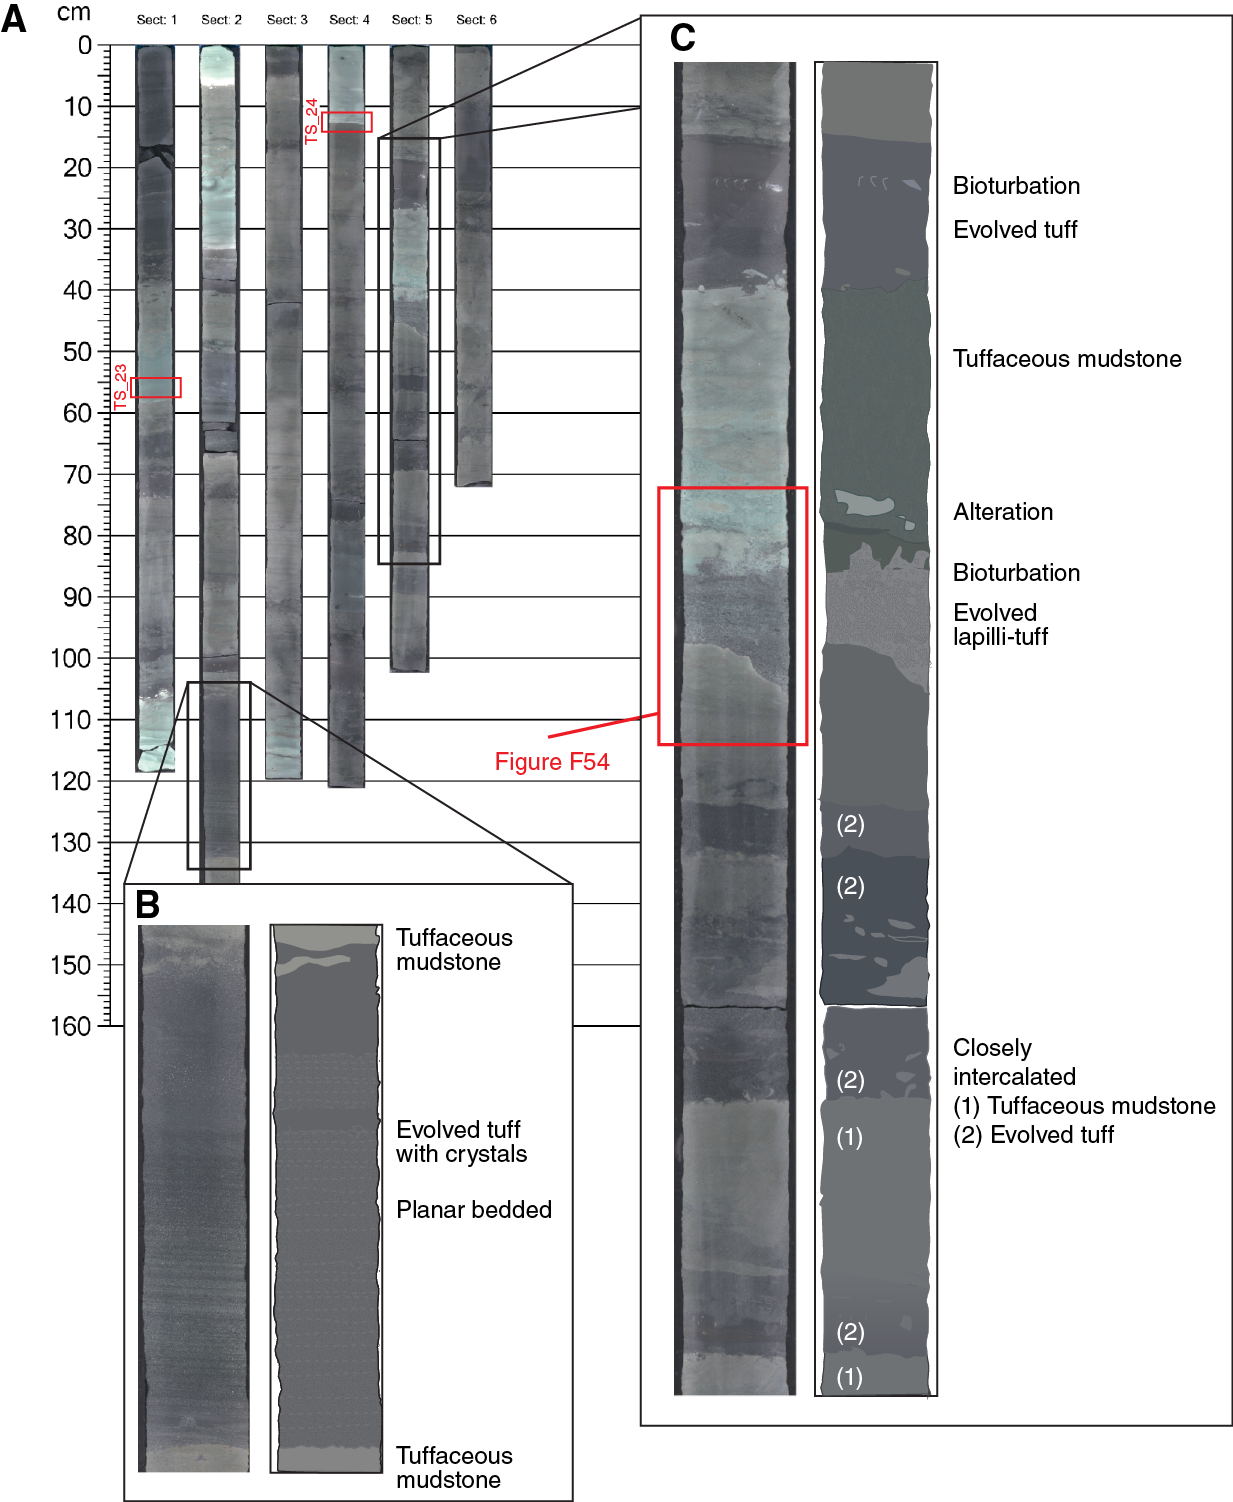
Figure F53. Core 350-U1437D-41R.
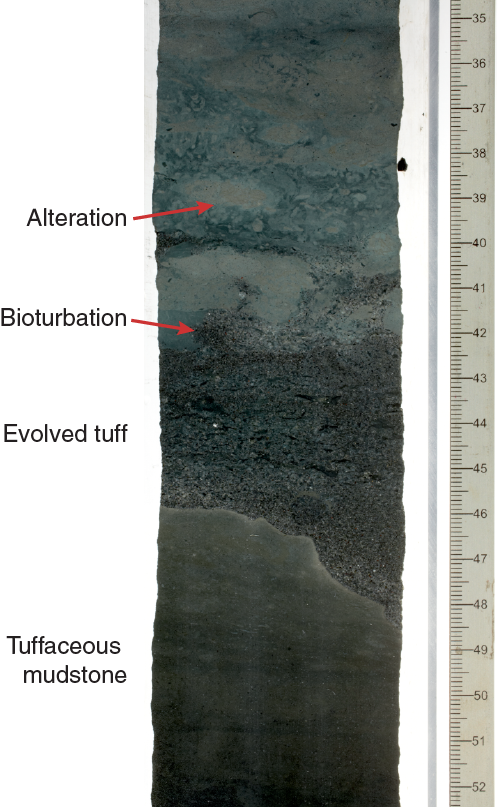
Figure F54. Unit III interval 350-U1437D-41R-5, 35–52 cm.

Figure F55. White to medium-gray tuff, Hole U1437D Unit III.
Dark gray evolved tuff
Dark gray evolved tuff is similar to some of the evolved tuff facies described in Units I and II. Dark gray evolved tuff occurs as nongraded, normally graded, or reversely graded intervals and typically contains moderately vesicular (30%) pumice grains, fiamme, evolved glass shards, and evolved volcanic lithic grains in varying proportions (Figure F56A–F56B). The majority of the glass shards are fresh to variably altered colorless glass, but fresh to variably altered brown glass dominates in some samples. Plagioclase, pyroxene, hornblende, opaques, and rare quartz occur as crystal fragments (e.g., Thin Section 350-U1437D-59R-5, 139–141 cm; TS46), suggesting dominantly andesite through to rhyolite-dacite compositions. Thin Section 57R-1, 61–65 cm (TS57), samples a very fine grained altered tuff with feldspar and abundant opaque crystals (including pyrite and magnetite) that are likely the cause of its notably high magnetic susceptibility (Figure F56C) (see Physical properties).
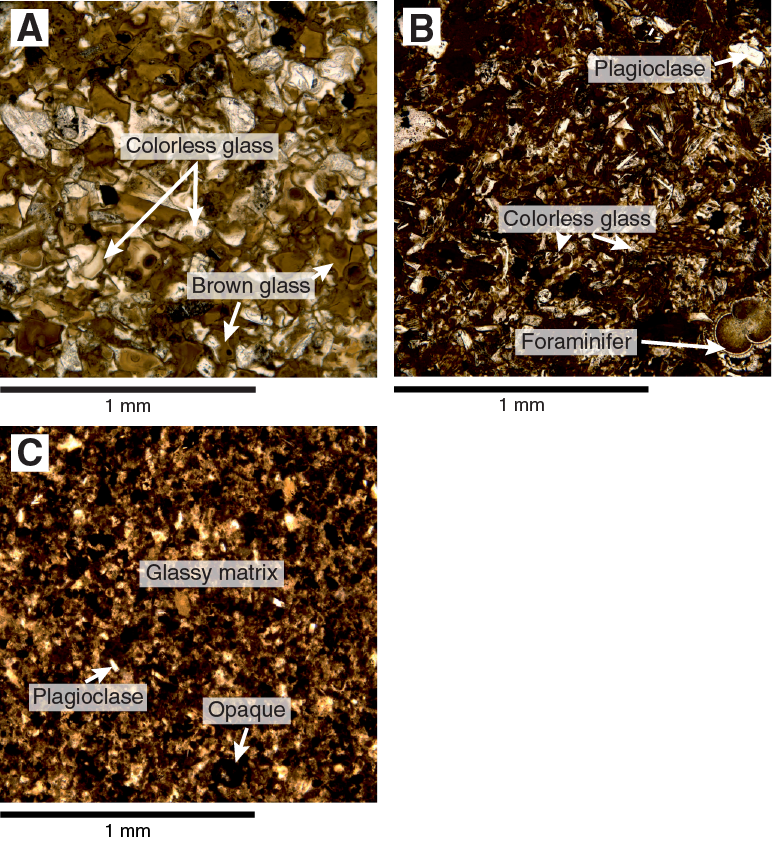
Figure F56. Dark gray evolved tuff, Hole U1437D Unit III.
Intercalated white to gray-green evolved tuff
Medium to very thick successions of microcrystalline and cryptocrystalline (chert-like) intercalated white and gray-green evolved tuff (Figure F51) first appear in interval 350-U1437D-41R-1, 49–58 cm (806.29–806.38 mbsf). This subfacies progressively increases in abundance and interval thickness downhole to become the dominant facies from Section 54R-1 to the bottom of Section 63R-2 at 1009.49 mbsf. This increase in abundance is clearly visible in the overall thickness increase in intervals of evolved tuff (Figure F22). Gray-green evolved tuff differs in componentry and grain size from white evolved tuff, and these two tuffs are either closely intercalated (Figure F57) or fully gradational, creating graded textures. The shades of gray to green tuff reflect varying proportions of altered pumice, fiamme, crystals, colorless and brown glass shards, and evolved volcanic lithic grains (Figure F55). White tuff is composed entirely of devitrified glass shards and crystal fragments. Much of the vitric material is altered to clay minerals. This subfacies can be distinguished from the tuffaceous mudstone facies by its relatively good sorting, fine grain size, and weak to absent bioturbation. Soft-sediment deformation is common and creates highly deformed convoluted beds (Figure F57), reflecting the fine-grained, framework-supported nature of these deposits.
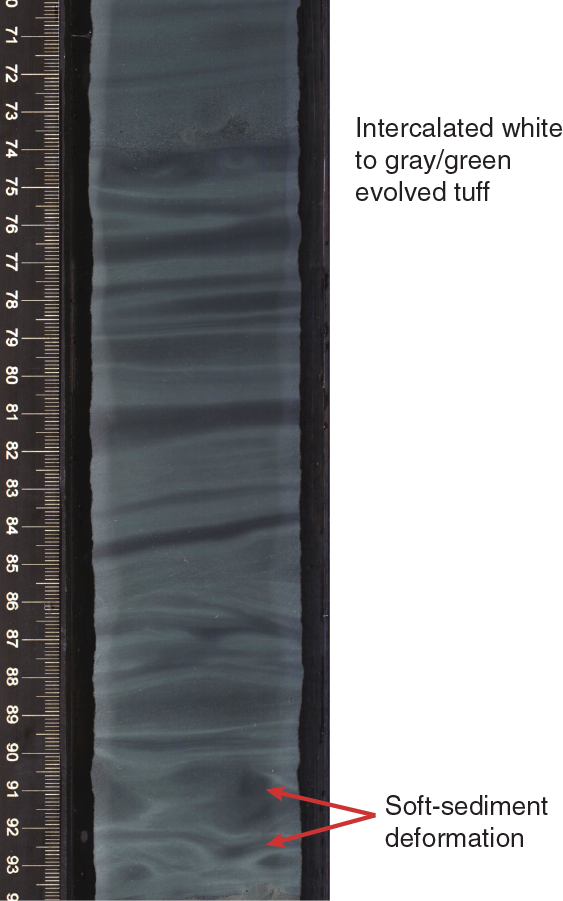
Figure F57. White to gray-green evolved tuff, Unit III.
Evolved lapilli-tuff
Twenty very thin to thick intervals of pumice-rich lapilli-tuff (e.g., interval 350-U1437D-34R-7, 97 cm, to 34R-CC, 18 cm) occur in Unit III and share some facies characteristics with the intercalated tuff, lapilli-tuff, and lapillistone of Unit II (Figure F58). However, the Unit III lapilli-tuff differs by being finer grained, containing fiamme, and lacking clast-supported pumice lapillistone. Most intervals are stratified and intercalated with crystal-rich tuff, although a few are normally graded without intercalation of tuff. Most are matrix-supported and polymictic; a single interval appears to be matrix-supported and monomictic. The lapilli-tuff intervals contain grains of pumice, variably devitrified and altered glass shards, crystal fragments (plagioclase, clinopyroxene, orthopyroxene, rare hornblende, and opaques) (Figure F59), and variably altered plagioclase-phyric andesite lithic grains. The crystal content and lithic clast mineralogy define an andesitic composition.
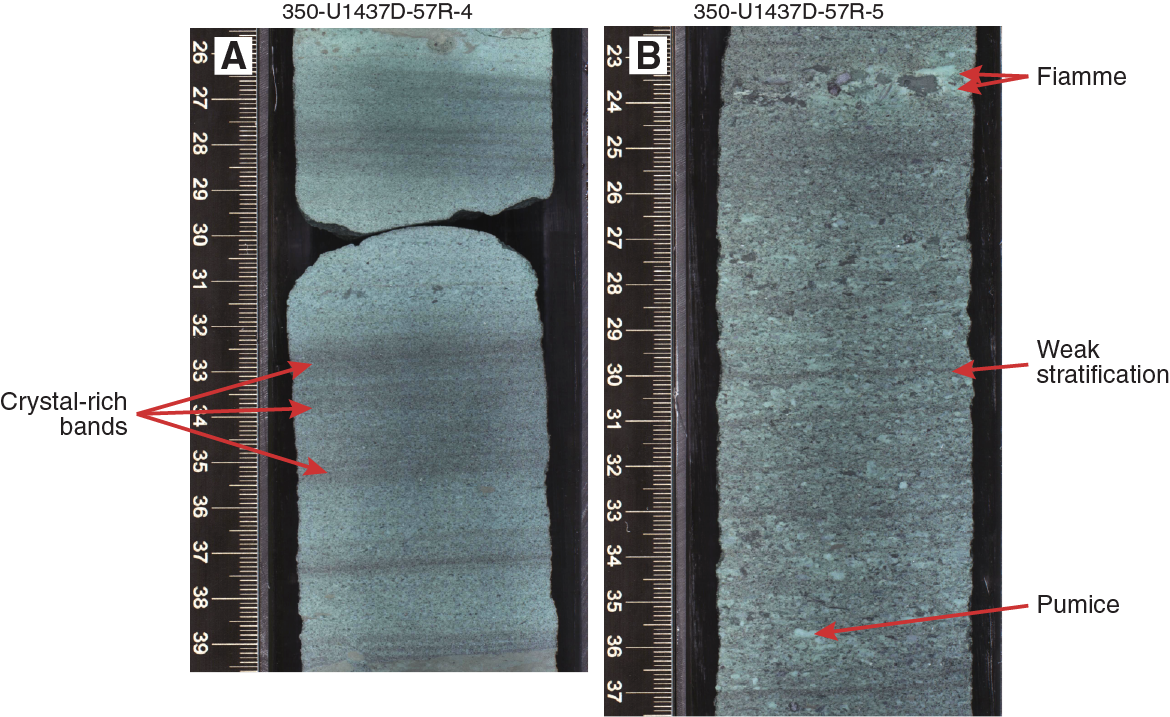
Figure F58. Crystal-rich stratified interval, Unit III.
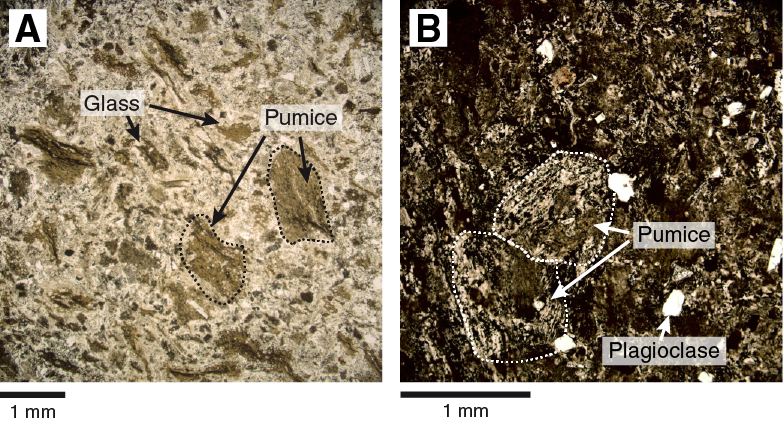
Figure F59. Lapilli-tuff, Hole U1437D Unit III.
Matrix-supported tuffaceous consolidated breccia with lapilli and deformed tuffaceous mudstone intraclasts
Interval 350-U1437D-34R-3, 78 cm, to 34R-4, 118 cm, is a strongly polymictic very poorly sorted matrix-supported tuffaceous consolidated breccia with lapilli and deformed tuffaceous mudstone intraclasts. It includes large (25 cm) partly fractured and deformed tuffaceous mudstone clasts supported by a matrix of mixed tuffaceous mudstone and volcanic clasts (Figures F60, F61, F62). Matrix abundance grades uphole from <10% to 90% and contains coarse scoria clasts (≤5 cm), moderately vesicular (50%) devitrified pumice clasts, clinopyroxene, and plagioclase.
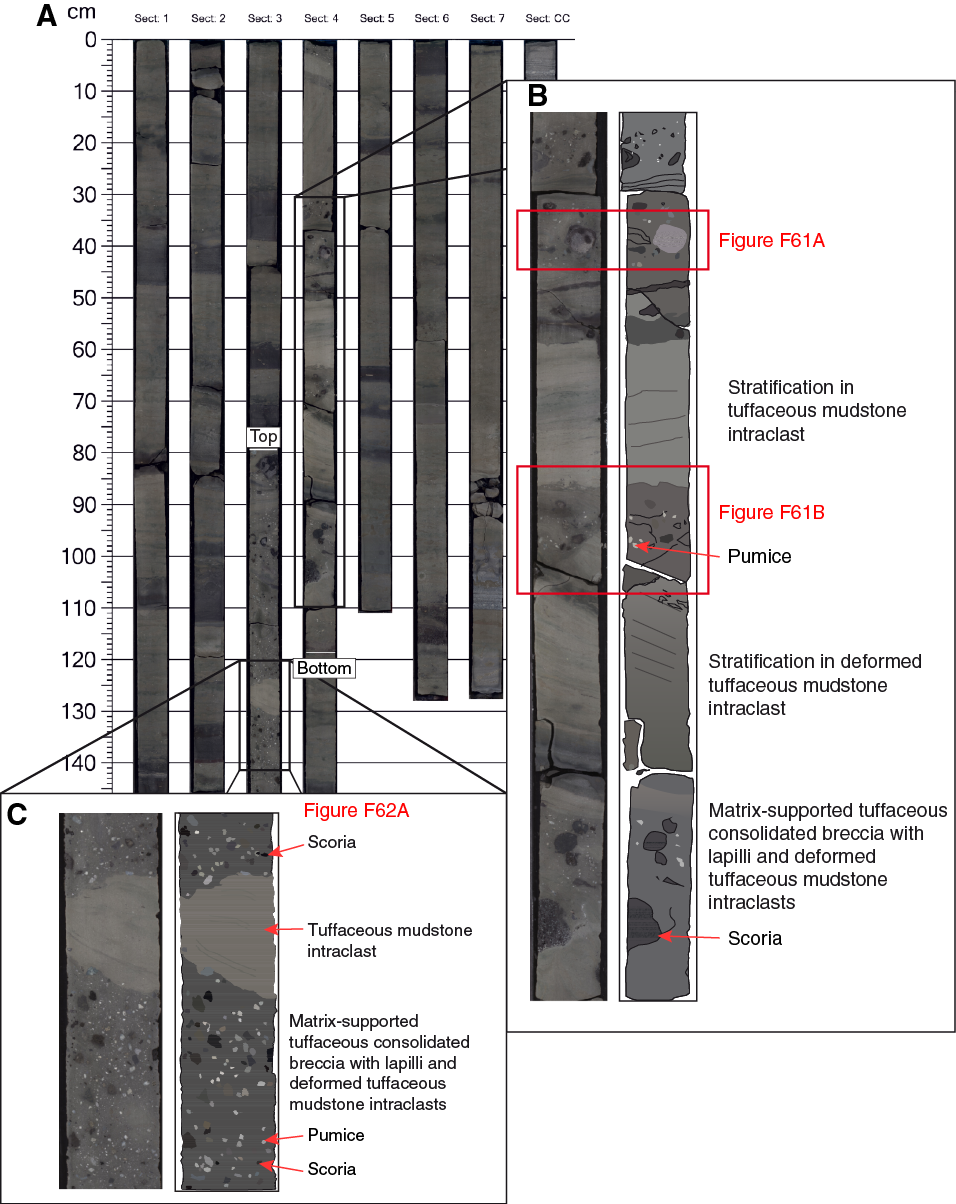
Figure F60. Core 350-U1437D-34R.
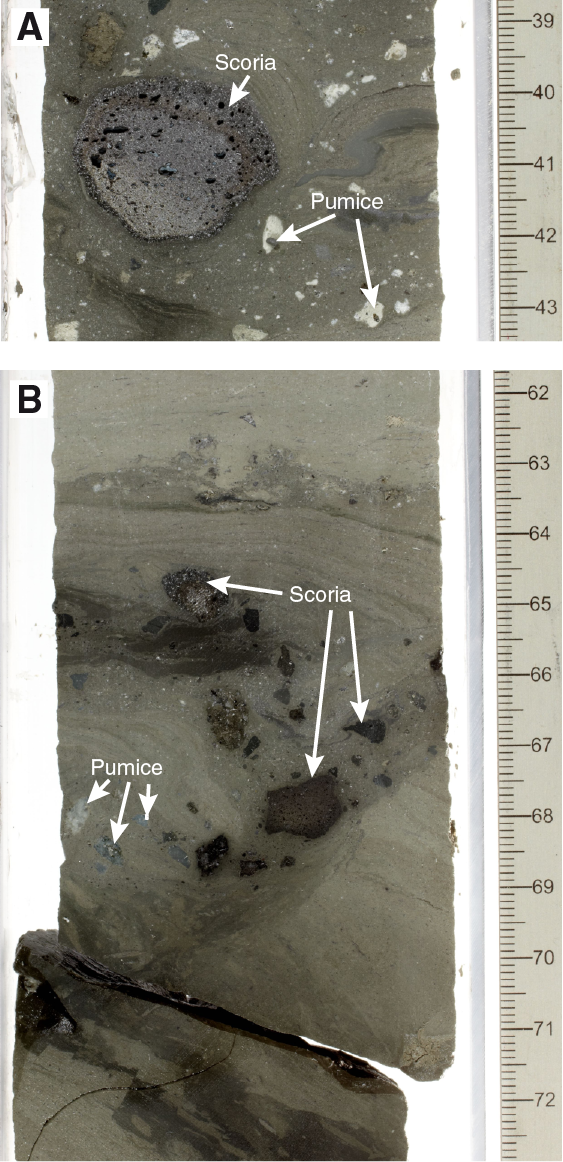
Figure F61. Matrix-supported tuffaceous consolidated breccia, Hole U1437D.

Figure F62. Matrix-supported tuffaceous consolidated breccia, Hole U1437D Unit III.
Alteration
The alteration at the top of Unit III (Cores 350-U1437D-33R to 39R) is similar to those characterizing Units I and II (i.e., thin [several millimeters thick] beds of dark green clay minerals likely including glauconite at the top of tuff layers). From Core 42R to the bottom of Unit III, intercalated white to medium gray evolved tuff develops a green alteration color that varies from greenish gray to light green (Figures F51, F53, F54). Pyrite continues to be disseminated in tuffaceous mudstone, associated with bioturbation, and in tuff layers.
Microscopically, glass shards and vitric grains and clasts are highly altered to gray-brown cryptocrystalline clay minerals, oxyhydroxides, and locally to zeolites (Figure F63). Brown glass shards are generally better preserved than colorless glass. Crystals are not altered with the exception of a few amphibole grains partially replaced by chlorite. The altered matrix is gray-greenish and cloudy. The green color suggests contribution of chlorite or mixed-layer chlorite-smectite. The cryptocrystalline texture of clay minerals and the absence of XRD data preclude determination of the alteration clay minerals. Some tuff layers have round prehnite aggregates in their matrix (Figure F64).
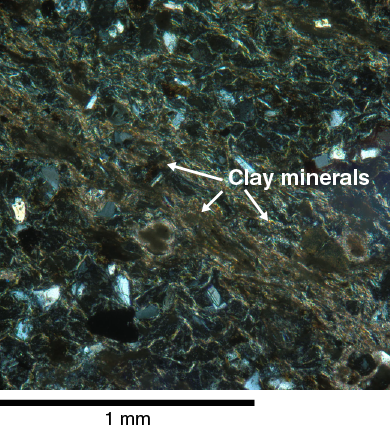
Figure F63. Clay replacing vitric matrix in an evolved tuff, Unit III.
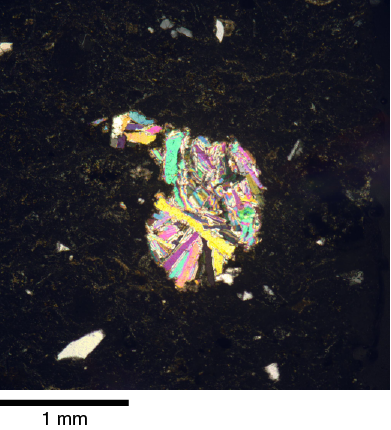
Figure F64. Cavity filled with prehnite aggregate in an evolved tuff, Unit III.
Unit IV
- Interval: 350-U1437D-64R-1, 8 cm, to 350-U1437E-6R-3, 122 cm
- Depth: 1017.88–1120.11 mbsf
- Lithology: lithified; evolved tuff and polymictic lapilli-tuff with subordinate tuffaceous mudstone
- Age: ~6.2–7.5 Ma
Unit IV is 102.23 m thick, of which 59.20 m (58%) was recovered and described, and includes 132 intervals of tuff (31.14 m), 34 intervals of polymictic lapilli-tuff (14.53 m), 2 intervals of polymictic lapillistone (0.46 m), and 80 intervals of tuffaceous mudstone (13.07 m). Polymictic tuff and lapilli-tuff dominate over tuffaceous mudstone in Unit IV, in contrast to Units III (dominated by tuffaceous mudstone) and V (dominated by monomictic lapilli-tuff). Unit IV is characterized by normally graded dark green coarse sand–sized tuff, polymictic lapilli-tuff, and minor polymictic lapillistone (78% of the described thickness of rock). Of these, fine-grained green tuff intervals and the polymictic lapilli-tuff intervals are the most distinctive. Tuffaceous mudstone intervals form a minor part of the unit (the remaining 22% of the described rocks), becoming more common toward the base.
The top of Unit IV (Sample 350-U1437D-64R-1, 8 cm; 1017.88 mbsf) is defined by the top of the uppermost interval of a succession of polymictic lapilli-tuff intervals (64R-1, 8 cm, to 64R-2, 51 cm; 1017.88–1019.77 mbsf), including 1.75 m of uninterrupted lapilli-tuff (64R-1, 22 cm, to 64R-2, 51 cm; 1018.02–1019.77 mbsf). This is the first succession of closely interstratified lapilli-tuff below Unit II and the thickest contiguous lapilli-tuff sequence to this depth at Site U1437. The base of Unit IV is defined by the last interval of polymictic lapilli-tuff thicker than 0.50 m (the next lapilli-tuff is 146.66 m lower in Unit V at Sample 350-U1437E-22R-4, 58 cm; 1266.77 mbsf). In contrast, Unit V is characterized by monomictic matrix-supported lapilli-tuff with mudstone.
Core disturbance
Four types of core disturbance are present in Unit IV: slightly fractured (e.g., interval 350-U1437E-5R-3, 0–139 cm), moderately fractured (e.g., interval 70R-2, 83–106 cm), and severely fractured (e.g., interval 72R-2, 12–64 cm). The intensity of any disturbance in Cores 350-U1437D-64R to 70R is slight to severe, but Cores 71R to 73R, at the base of the hole, are destroyed and reduced to brecciated and randomly oriented gravels. Disturbance is slight within Unit IV at the top of Hole U1437E, except for intervals 350-U1437E-5R-1, 0–21 cm, and 6R-3, 40–59 cm, which are brecciated and randomly oriented.
Lithofacies
Unit IV consists of four lithofacies, in order of abundance: (1) normally graded tuff, polymictic lapilli-tuff, and lapillistone; (2) fine-grained light green tuff; (3) dark gray crystal-rich tuff; and (4) tuffaceous mudstone. Intervals of the normally graded tuff, lapilli-tuff, and lapillistone lithofacies average 0.34 m thick (maximum = 1.33 m). Tuff intervals in the fine-grained green tuff and dark gray tuff lithofacies are on average 0.42 m (maximum = 1.50 m) and 0.17 m thick (maximum = 0.82 m), respectively. Tuffaceous mudstone intervals average 0.16 m thick (maximum = 0.83 m). The different lithofacies are intercalated intimately throughout Unit IV so that no single lithofacies is exclusive for more than 5.54 m (fine-grained green tuff in interval 350-U1437D-67R-3, 12 cm, to 67R-6, 120 cm; 1041.47–1047.01 mbsf).
The normally graded tuff, polymictic lapilli-tuff, and lapillistone lithofacies (30% of Unit IV) is concentrated in the middle of Unit IV, where it comprises 69% of the described intervals (interval 350-U1437D-69R-1, 6 cm, to 350-U1437E-4R-1, 59 cm; 1056.16–1104.59 mbsf). In the same range of intervals, dark gray crystal-rich tuff comprises 25%, tuffaceous mudstone is uncommon (6%), and fine-grained green tuff is absent. In contrast, the tuff, polymictic lapilli-tuff, and lapillistone lithofacies is subordinate in the upper (5%) and lower (7%) parts of Unit IV. The boundaries of Unit IV are established at isolated polymictic lapilli-tuff intervals intercalated with tuffaceous mudstone and dark gray tuff. The fine-grained green tuff lithofacies (24% of Unit IV) is restricted to the upper and lower parts of the unit. It is the dominant lithofacies in the upper part (47%; interval 350-U1437D-64R-1, 8 cm, to 69R-1, 6 cm; 1017.88–1056.16 mbsf); here it forms the single thickest contiguous set of intervals (perhaps one >5 m thick bed). However, it is subordinate (20%) to both the dark gray tuff (35%) and tuffaceous mudstone (38%) lithofacies in the lower part (interval 350-U1437E-4R-1, 59 cm, to 6R-3, 122 cm; 1104.59–1120.11 mbsf). In contrast, the dark gray crystal-rich tuff lithofacies (23% of Unit IV) is present throughout the entirety of the unit without any significant clustering; it is uniformly intercalated with tuffaceous mudstone in the upper and lower thirds and with lapilli-tuff in the middle. The tuffaceous mudstone lithofacies (22% of Unit IV) is most common in the upper (20%) and lower (38%) parts and almost absent in the middle of Unit IV, reflecting the gradational nature of the boundaries with tuffaceous mudstone–dominated Units III and V.
Normally graded tuff, polymictic lapilli-tuff, and lapillistone lithofacies
This lithofacies is characterized by polymictic rocks that are much coarser than the other lithofacies (tuff and mudstone) in Unit IV (Figure F65, F66). Their presence, and in particular their coarse polymictic nature, defines Unit IV relative to Unit III above and Unit V below. The lithofacies consists of intervals of medium- or coarse-grained tuff with minor lapilli that are normally graded to clast-supported polymictic evolved lapilli-tuff and lapillistone.
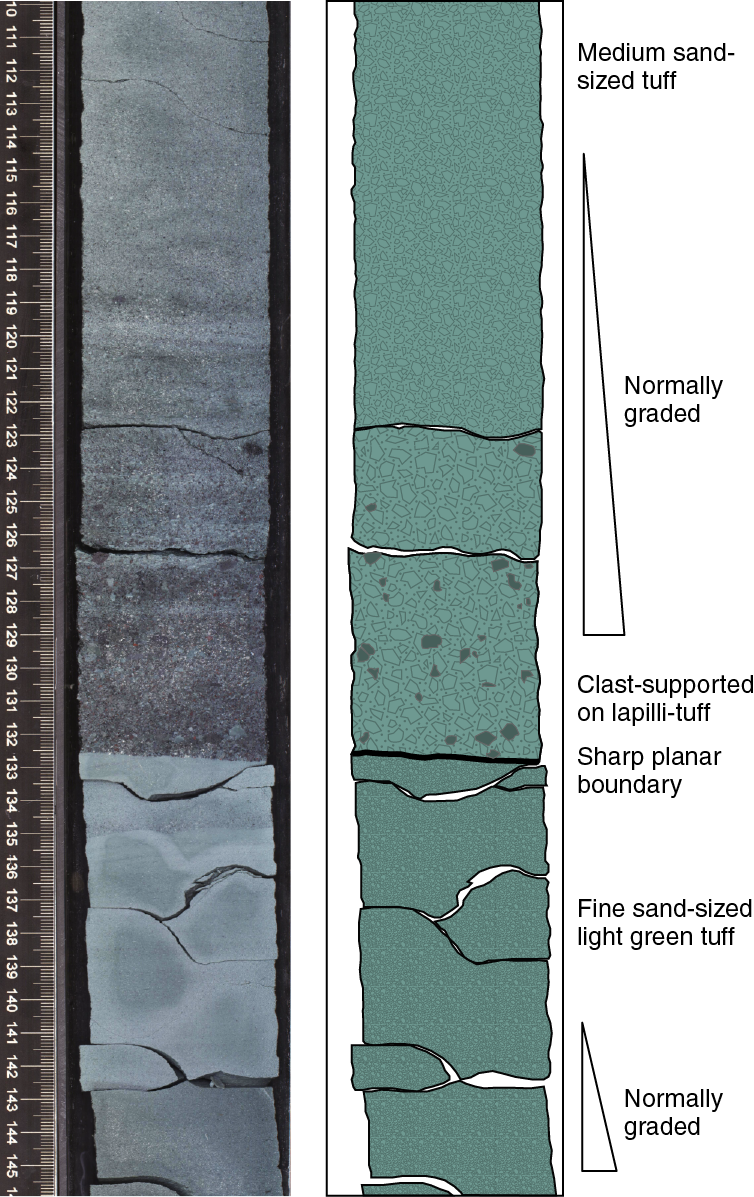
Figure F65. Distinction between tuff and clast-supported polymictic lapilli-tuff.
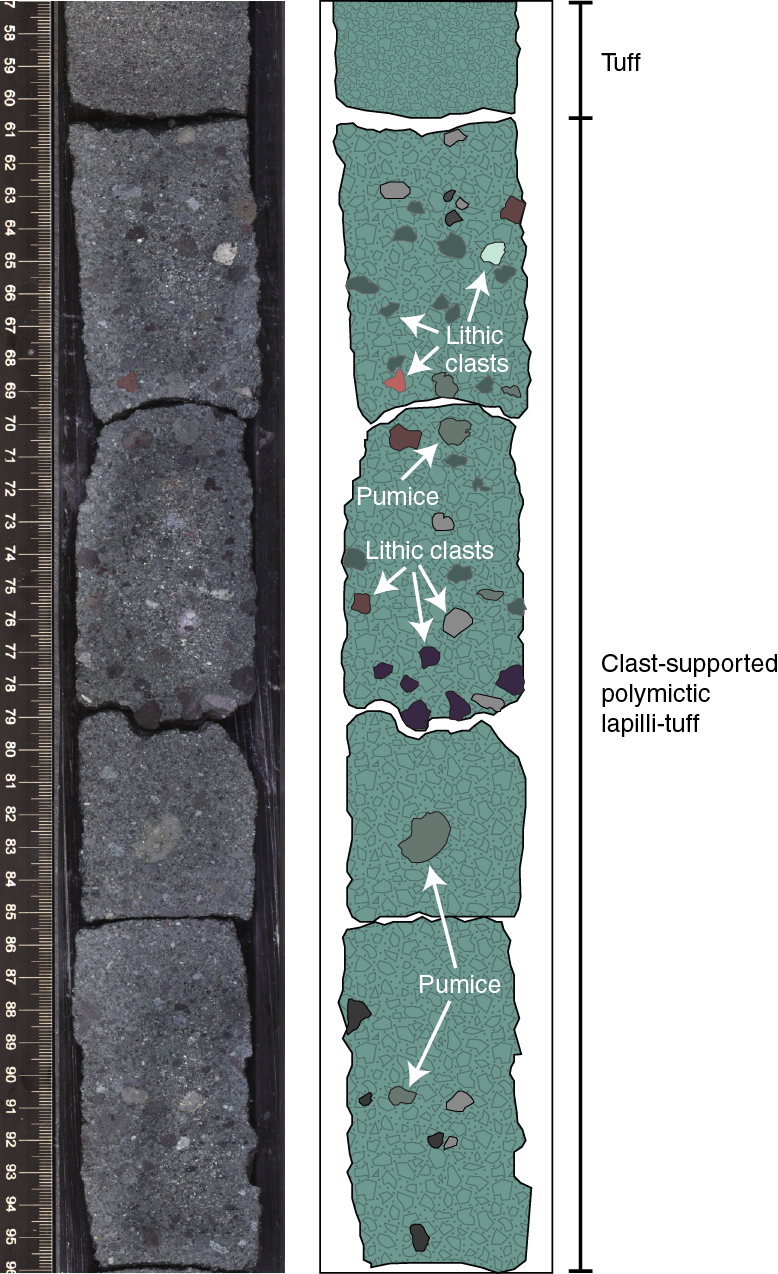
Figure F66. Tuff and clast-supported polymictic lapilli-tuff lithofacies.
Lapilli are subrounded and up to 1.5 cm in size, with an average diameter of 3–5 mm (i.e., granule- and small pebble–sized clasts; Figure F66). Lithic clasts (variably plagioclase-phyric andesite) dominate over vitric clasts (inferred to be mostly pumice) and crystal fragments. Rare macrofossil shell fragments occur in a few intervals. Light- and dark-colored lithic lapilli are present in similar proportions, both of which contain plagioclase phenocrysts (Figure F67). Among the vitric clasts, pumice is more abundant than fiamme, which in turn is more common than scoria. Vesicularity in pumice and fiamme is <50 vol%, and their glass is colorless. Microscopically, lithic lapilli are sparsely to highly pyroxene-plagioclase-phyric andesites with either microcrystalline or porphyritic textures (Figure F68). Coarse (>0.5 mm) plagioclase phenocrysts (20 vol%), locally forming glomeroporphyrocrysts, are fresh and commonly show oscillatory and sector zoning. Clinopyroxene is present in almost all clasts, but its size and abundance are smaller than plagioclase. Occasional hornblende crystals are brown and less abundant than clinopyroxenes (<3 vol%). The groundmass of the andesite lithic lapilli is composed of plagioclase microlites and a glassy matrix often altered into a fine-grained light-colored to brown aggregate of clay minerals, some of them showing perlitic texture. Opaques, mainly magnetite with subordinate sulfides, are present in all samples as accessory phases.
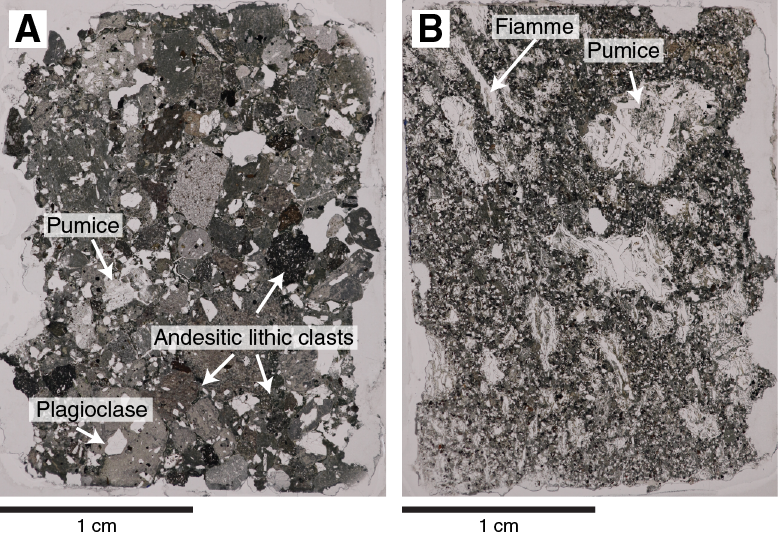
Figure F67. Lapillistone and lapilli-tuff, Hole U1437D.

Figure F68. Plagioclase-phyric andesite clast, Unit IV.
Fine-grained light green tuff
The light green tuff lithofacies is composed of normally graded silt- to medium sand–sized volcanic grains (Figure F65), is white to light to medium green color, and exhibits outstanding planar and convolute stratification (Figure F69, F70C). A total of 14.36 m of this lithofacies is described in 34 intervals (24% of Unit IV). The light-colored intervals are well sorted, weakly altered, silt-sized, evolved glass shards. The darker green layers are silt- to medium sand–sized evolved tuff (Figure F71) composed of grains of pumice, fiamme, crystal, and glass shards. Crystal-rich layers of euhedral to subhedral plagioclase and clinopyroxene are common at the bases of the darker intervals; brown hornblende is rare. This lithofacies is similar to the intercalated white to gray-green evolved tuff in Unit III (Figure F51) and Unit V.
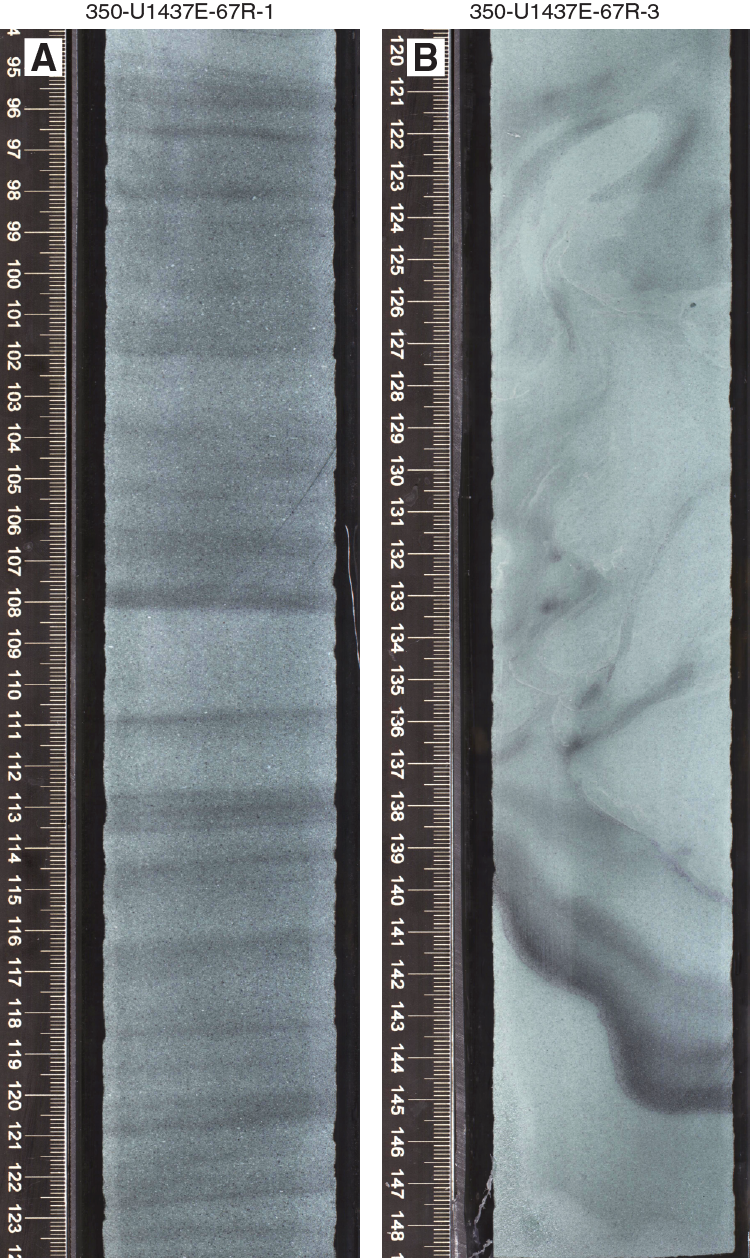
Figure F69. Fine-grained light green tuff.
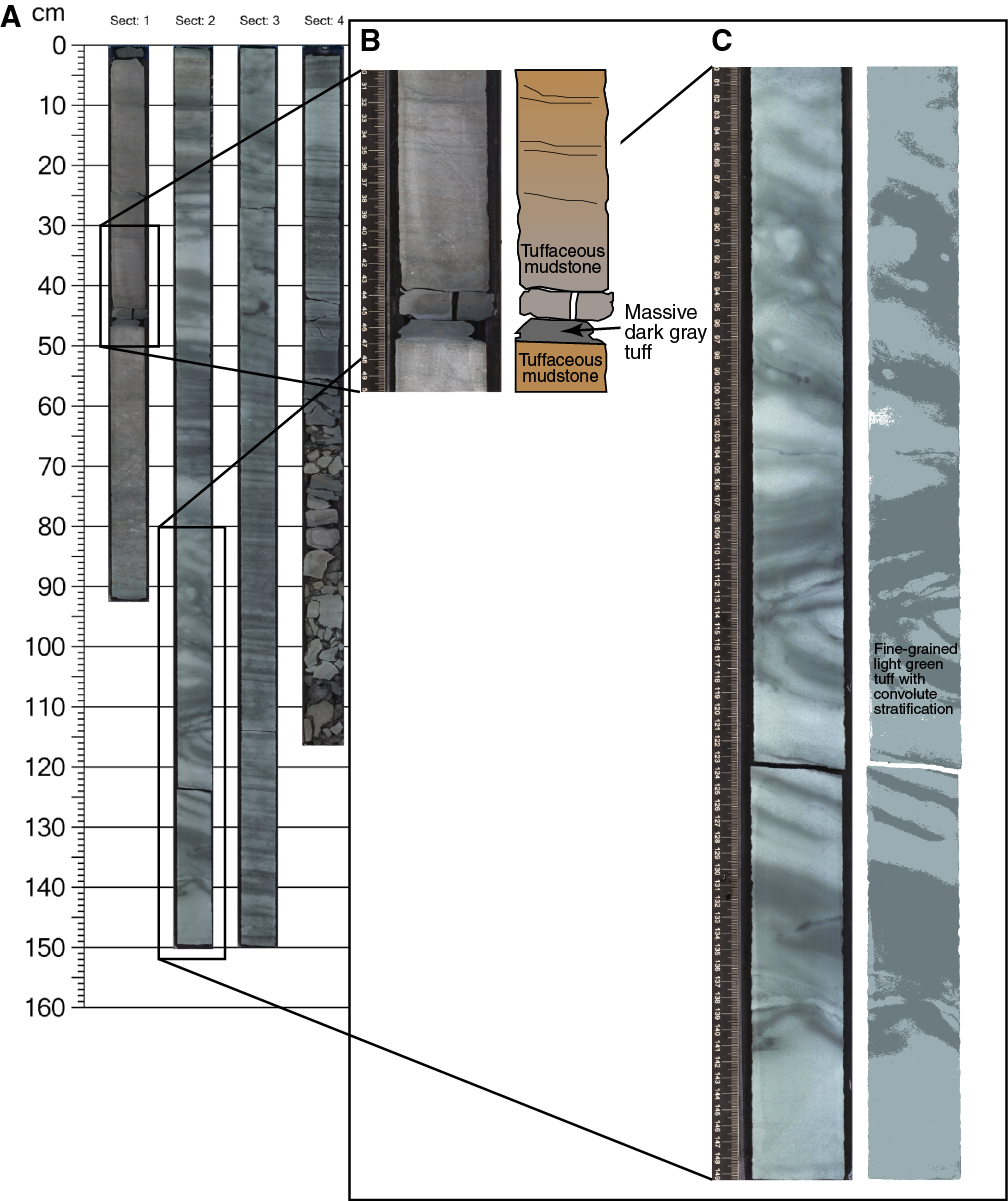
Figure F70. Core 350-U1437D-66R.

Figure F71. Fine-grained light green tuff lithofacies, Unit IV.
Dark gray crystal-rich tuff
Dark gray crystal-rich tuff (Figure F70) is composed of medium- to coarse sand–sized plagioclase and clinopyroxene crystals and silt- to fine sand–sized glass shards. Intervals are massive or weakly stratified and occasionally normally graded (Figure F72). This lithofacies appears as mostly thin (<10 cm) intervals throughout Unit IV; its total recovered thickness in Unit IV is 13.78 m (23% of the unit). Microscopically, this lithofacies is crystal rich, dominated by euhedral plagioclase crystals with occasional clinopyroxene and hornblende in a brownish vitric matrix (Figure F73). Silt-sized tuff layers are rich in glass shards and poor in crystals.
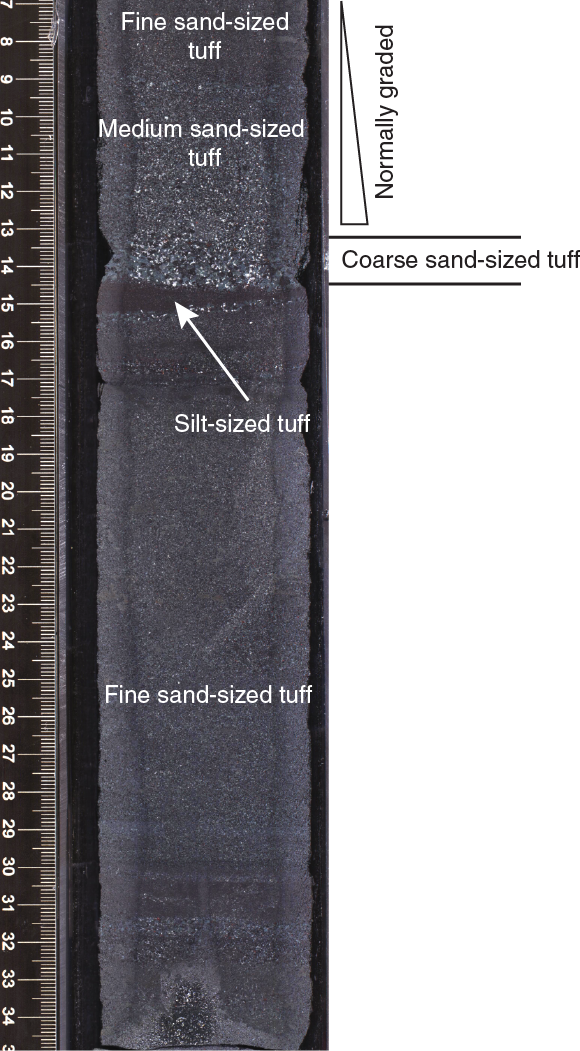
Figure F72. Typical dark gray crystal-rich tuff, Unit IV.
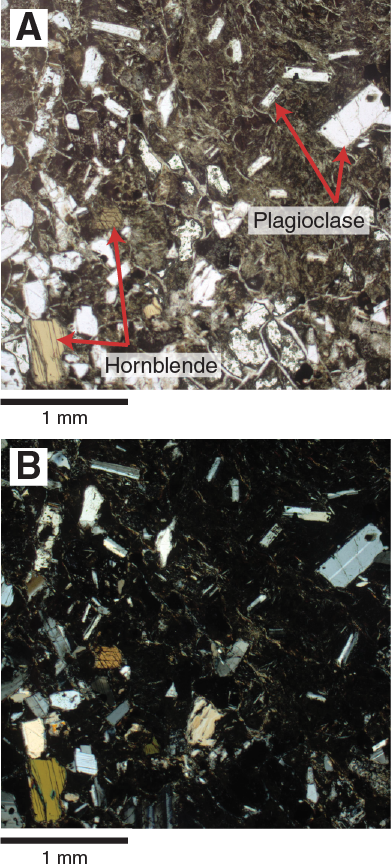
Figure F73. Dark gray crystal-rich tuff.
Tuffaceous mudstone
Tuffaceous mudstone is identical to that in Units I–III and is highly bioturbated. In thin section, this lithofacies includes plagioclase crystal fragments, altered vitric shards, and occasional hornblende and foraminifers. In two intervals (350-U1437D-65R-1, 72–114 cm [1022.72–1023.14 mbsf], and 70R-5, 47–51 cm [1071.83–1071.87 mbsf]), tuffaceous mudstone contains pumice lapilli.
Alteration
Alteration in Unit IV is pervasive and affects all vitric material (shards, pumice, and fiamme), but the crystals are still fresh. The fine-grained light green tuff lithofacies has a cloudy vitric matrix replaced by cryptocrystalline clay minerals (Figure F71). As with Unit III, in the absence of shipboard XRD we can only suggest that the green color is due to the presence of chlorite. The dark gray crystal-rich tuff lithofacies and the polymictic lapilli-tuff lithofacies are distinguished by a brownish alteration color that is visible in the matrix and in the rims of clasts (Figure F74). These characteristics are similar to the smectite-bearing alteration assemblages described in Unit III. A few zeolite veins cut the lithologic intervals.
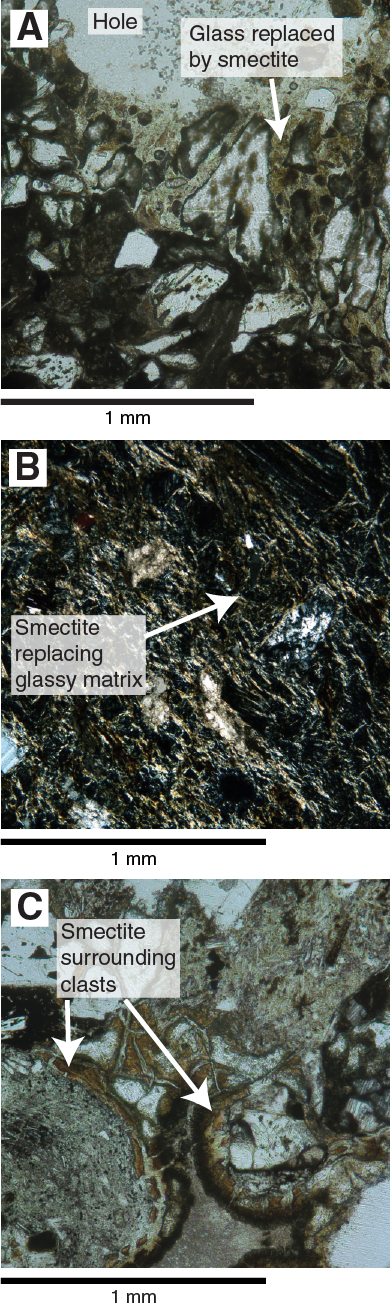
Figure F74. Characteristic microscopic features of alteration, Hole U1437D Unit IV.
Unit V
- Interval: 350-U1437E-6R-3, 122 cm, to 28R-1, 0 cm
- Depth: 1120.11–1320.00 mbsf
- Lithology: monomictic reversely graded lapilli-tuff with mudstone, tuffaceous mudstone, minor evolved tuff, and rare lapilli-tuff and lapillistone
- Age: ~7.5–9 Ma
Unit V is characterized by distinctive intervals of monomictic reversely graded lapilli-tuff with mudstone and the absence of significant thick polymictic lapilli-tuff. In contrast, the base of Unit IV (Sample 350-U1437E-6R-3, 122 cm) and the top of Unit VI (Sample 28R-1, 0 cm) are the bottom and top of thick (>70 cm) polymictic lapilli-tuff intervals, respectively. The tuffaceous mudstone and evolved tuff intervals of Units I, III, and IV are also found in Unit V. Unit V is 192.25 m thick, has an average of 72% core recovery, and a total of 141.76 m of core is described. Tuffaceous mudstone constitutes 98 m of Unit V with an average interval thickness of 27 cm, making up 69% of the unit. The intervals of evolved tuff are on average 6 cm thick and compose 15% of Unit V, and lapilli-tuff (of all types) accounts for 16% of Unit V. The upper part of Unit V is dominated by tuffaceous mudstone (Cores 9R to 21R). Lower in Unit V, volcaniclastics become more abundant than the tuffaceous mudstone (Cores 22R to 27R; 1261.80–1312.36 mbsf). The lithofacies occurring in Unit V are divided into (1) monomictic reversely graded lapilli-tuff with mudstone, (2) tuffaceous mudstone, (3) evolved tuff, and (4) lapilli-tuff and lapillistone.
Core disturbance
Unit V is disrupted by two types of core disturbance (see the Expedition 350 methods chapter [Tamura et al., 2015a]). Unit V contains slightly to severely fractured and brecciated and randomly oriented core disturbances (e.g., interval 350-U1437E-14R-5, 28–63 cm) (Figure F2 in the Expedition 350 methods chapter [Tamura et al., 2015a]).
Structure
Several anastomosing normal faults are present in Core 350-U1437E-8R with offsets ranging from 0.3 to 2 cm. Normal faults become more abundant downhole in, for instance, Cores 21R and 22R, with offsets ranging from 1 to 10 cm (Figure F75). Deformation is cataclastic in Core 22R, and a polymictic fault breccia occurs in Section 22R-1. Faults mainly occur in tuffaceous mudstone and tuff and are commonly absent in coarser grained intervals of lapilli-tuff.
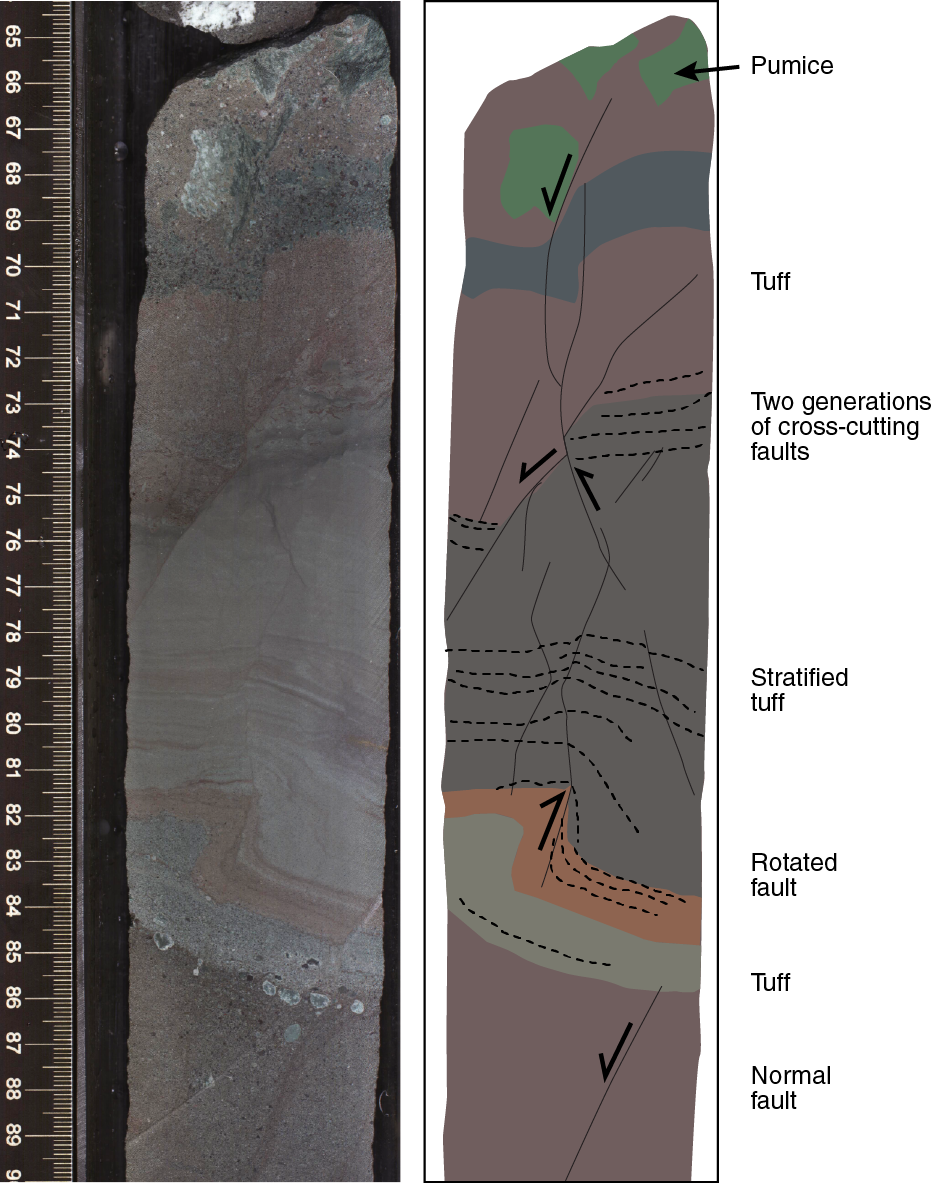
Figure F75. Soft-sediment faulting in tuff, Unit V.
Lithofacies
Monomictic reversely graded lapilli-tuff with mudstone
Monomictic reversely coarse-tail graded lapilli-tuff with mudstone occurs frequently in Cores 350-U1437E-7R-3 through 27R-1 (1125.64–1311.40 mbsf). This lithofacies is a complex association of distinct parts, each a different lithology. From the bottom upward, each interval is composed of
- A sharp curviplanar base is typically eroded into the underlying tuffaceous mudstone or tuff to form a scour (Figure F76).
- The eroded scour is filled with a massive or faintly stratified tuff. The tuff is typically light green or gray and occasionally has concentrated lamellae of crystals. Microscopically, the tuff is composed of evolved, angular, glassy, blocky, and bubble-wall shards; rounded and subrounded pumice grains (fine sand–sized); and anhedral plagioclase fragments (Figure F77).
- The tuff grades upward into reversely coarse-tail graded fiamme-rich lapilli-tuff (Figure F76). Fiamme are typically 1–3 cm wide and <0.5 cm tall, angular (i.e., very ragged margins), and subhorizontal (Figure F78C–F78E). Fiamme become progressively larger and more abundant uphole.
- In the uppermost 30%–60% of an interval, the matrix becomes browner and more admixed with mud as well as more calcareous; the abundance of foraminifers increases significantly (Figure F78D). Microscopically, the matrix contains abundant calcite, indeterminate amounts of mud, many foraminifers and foraminifer fragments mixed with glass shards, and rounded pumice grains. Crystal fragments, typically plagioclase, are abundant (Figure F78B).

Figure F76. Core 350-U1437E-22R, Unit V.
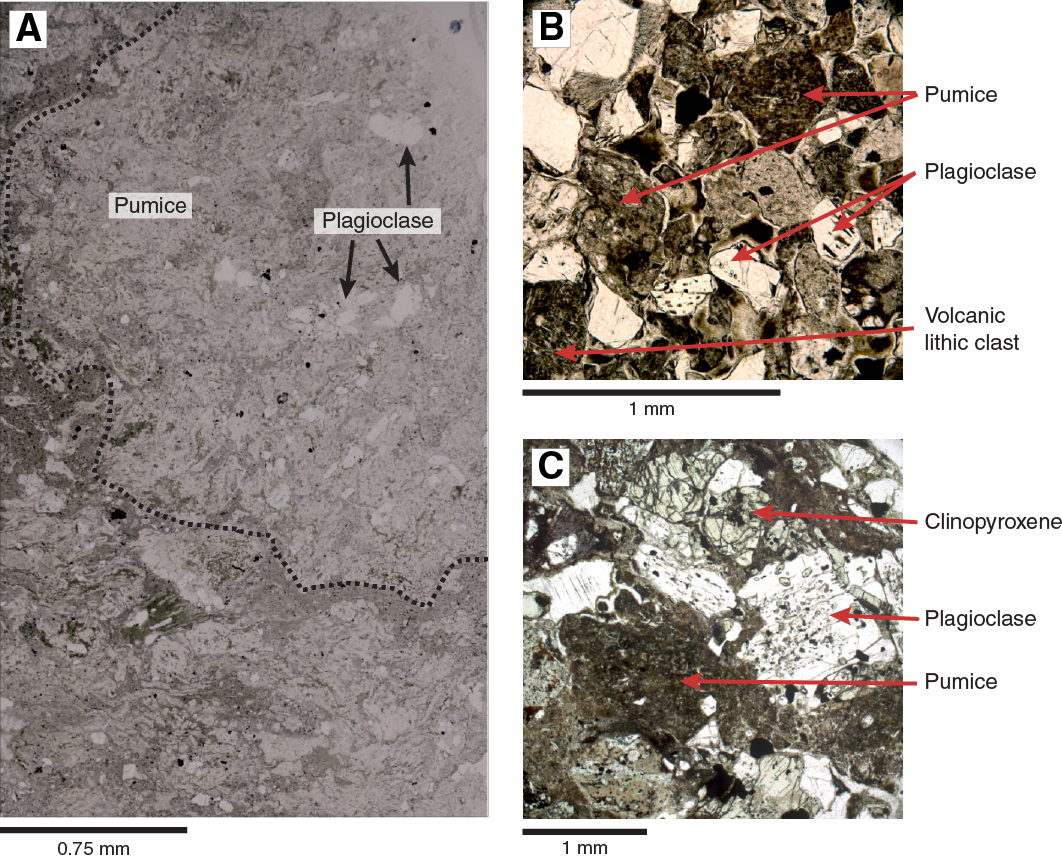
Figure F77. Lapilli-tuff and lapillistone, Hole U1437E Unit V.
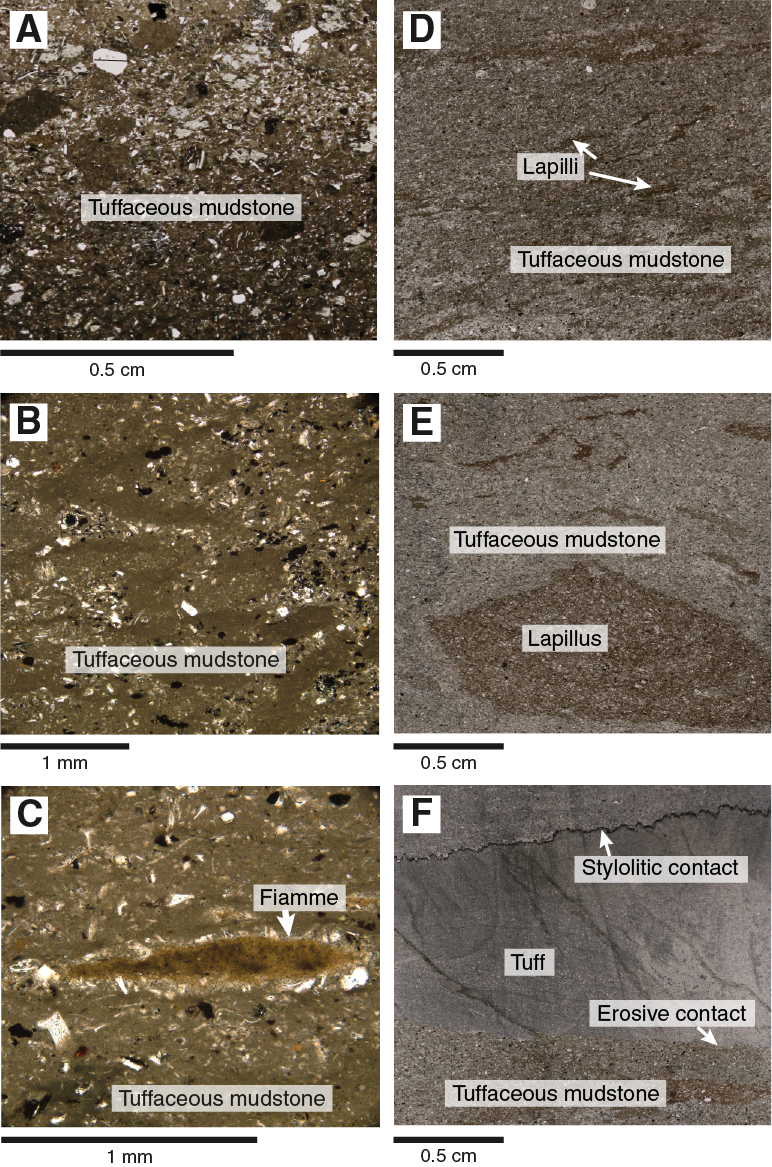
Figure F78. Tuffaceous mudstone, Hole U1437E Unit V.
Tuffaceous mudstone in the uppermost part of the lapilli-tuff is either truncated and eroded by the base of the overlying interval or conformably overlain by tuff (i.e., no evidence of erosion). In at least one case (Sample 350-U1437E-22R-4, 75–78 cm; TS101; 1267.40–1267.43 mbsf), the contact between monomictic reversely graded lapilli-tuff and overlying tuff is stylolitic and the tuff has receded 0.75 mm into the tuffaceous matrix of the lapilli-tuff below (Figure F78F, F76).
Tuffaceous mudstone
Tuffaceous mudstone is moderately to highly bioturbated, contains >25% volcanic material, and is comparable to the corresponding lithofacies in Units I and III (Figures F51, F53). Microfossils and crystals are commonly mixed into the tuffaceous mudstone, and lapilli, typically fiamme, occur locally (Figure F78A). Some intervals of tuffaceous mudstone are gradational with the tuff below, where substantial mixing of ash and lapilli has occurred upward into the tuffaceous mudstone (Figure F78B–F78E); many of these (e.g., Cores 350-U1437E-8R and 9R) may be the strongly bioturbated equivalents of the monomictic reversely graded fiamme lapilli-tuff lithofacies. Grain size and bed thickness increase with depth in Unit V, and tuffaceous sandstone occurs. In a few cases, larger pebble-sized pumice clasts are mixed with tuffaceous mudstone, producing a matrix-supported tuffaceous breccia.
Evolved tuff
The evolved tuff intervals form three subfacies distinguished by color: (1) intercalated white to gray-green tuff; (2) dark gray tuff, similar to the corresponding evolved tuff lithofacies described in Units III and IV (Figure F51); and (3) brown tuff. Evolved tuff is composed of altered pumice grains often compacted to fiamme, altered glass shards, evolved volcanic lithic clasts, and crystals of plagioclase, clinopyroxene, iron oxides ± hornblende, and occasional biotite (Figure F79). The crystal assemblage suggests that the evolved tuff is andesitic in composition.

Figure F79. Evolved tuff, Hole U1437E Unit V.
Intercalated white to gray-green evolved tuff
Intervals of white to light gray-green evolved tuff are stratified and commonly intercalated with darker gray-green tuff layers (Figure F51B). The light and dark layers reflect differences in componentry and grain size, with the lighter layers concentrating altered pumice, fiamme, and glass shards, whereas the darker layers are crystal rich (Figure F79A–F79B). The grain sizes range from silt to medium sand size, with the crystal-rich layers concentrating the coarse fraction. The basal contacts with tuffaceous mudstone are typically sharp or bioturbated. Normal grading (e.g., interval 350-U1437E-7R-2, 25–60 cm), planar stratification (e.g., interval 7R-1, 0–15 cm), and cross bedding (e.g., interval 6R-4, 0–98 cm) occur in the intercalated white to gray-green evolved tuff.
Dark gray evolved tuff
The silt- and fine sand–sized dark gray tuff forms intervals typically with lapilli- or crystal-rich bases. The contact of the dark gray tuff intervals with underlying tuffaceous mudstone is typically sharp, whereas the upper contact with tuffaceous mudstone is commonly gradational (Figure F51C). Dark gray evolved tuff can be stratified (e.g., interval 350-U1437E-4R-2, 0–24 cm), normally graded (e.g., intervals 5R-3, 3–48 cm, 18R-6, 39–40 cm, and 19R-1, 50–57 cm), or cross bedded (e.g., interval 21R-6, 48–56 cm). Dark gray evolved tuff generally occurs as small proportions of the described intervals throughout Unit V. The dark gray evolved tuff intervals in Unit V are considered to be similar to those occurring in the overlying lithostratigraphic units.
Brown tuff
The brown tuff intervals are silt to medium sand sized and moderately to well sorted (Figure F80). The basal contacts are sharp to gradational and can be bioturbated. Brown tuff is dominated by glass shards with a few fiamme (e.g., interval 350-U1437E-27R-2, 0–9 cm) (Figure F79D). Some intervals are stratified (21R-6, 84–89 cm, and 19R-1, 83–85 cm) or planar bedded (27R-2, 0–9 cm, and 26R-5, 39–48 cm).
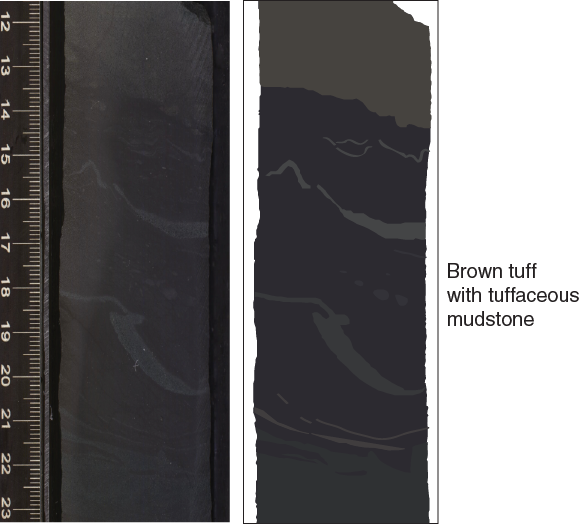
Figure F80. Brown tuff with tuffaceous mudstone, Unit V.
Lapilli-tuff and lapillistone
Lapilli-tuff and lapillistone, distinct from the monomictic reversely graded lapilli-tuff with mudstone, are minor components of Unit V, making up only 3% of the unit. The lapilli-tuff and lapillistone occurrences fall into 2 distinct subfacies.
Polymictic dark gray-green lapilli-tuff to lapillistone
Discrete intervals of coarse sand– to pebble-sized dark gray to green lapilli-tuff to lapillistone are matrix supported to clast supported, monomictic to polymictic, and evolved. Lapilli-tuff and lapillistone are interlayered with thinner, more dispersed, finer grained intervals similar to the polymictic, clast-supported, evolved lapilli-tuff to lapillistone grading to coarse sand–sized tuff with lapilli of Unit IV (1017.88–1120.11 mbsf; Figure F65). There are 30 intervals of this type of lapilli-tuff in Unit V, most of which are thin, averaging 5 cm, with occasional thicker intervals to a maximum thickness of 43 cm. The clast types are diverse, ranging from subrounded pumice (Figure F77) to evolved and mafic volcanic and plutonic lithic clasts. All of the clasts are variably altered, providing a wide range of colors from black to red, orange, and green. The assemblage of crystals in the matrix is plagioclase and clinopyroxene, suggesting andesitic compositions. The basal contacts with tuffaceous mudstone are generally sharp, whereas the upper contact with tuffaceous mudstone is gradational and often bioturbated. Normally graded intervals are present (e.g., interval 350-U1437E-17R-1, 13–21 cm). Higher magnetic susceptibility seems to coincide with the occurrence of these lapilli-tuff intervals.
Monomictic white to light gray evolved lapilli-tuff
Isolated intervals, up to 30 cm thick, of white to light gray matrix-supported, monomictic, evolved lapilli-tuff with cobble-sized fiamme in a vitric matrix are present in intervals 350-U1437E-20R-1, 116–138 cm, and 20R-2, 0–30 cm (n = 2; Figure F77A). They are similar to the intercalated evolved tuff, pumice lapilli-tuff, pumice lapillistone, and tuff-breccia lithofacies occurring in Unit II (Figure F43). Fiamme are evolved and host crystals of plagioclase and amphibole ± biotite and ± quartz classify them as andesite to rhyolite-dacite. The matrix is dominantly small grains of fiamme and crystals of plagioclase, amphibole, and quartz, also suggesting a rhyolite-dacite composition.
Minor intervals of white to light gray medium sand– to pebble-sized matrix- to clast-supported monomictic evolved lapilli-tuff also occur in Unit V in Cores 350-U1437E-25R and 26R (n = 8; Figure F81). The intervals are on average 28 cm thick and one interval is 60 cm thick. The intervals display planar stratification of fiamme and pumice lapilli in a matrix of altered glass shards that are interlayered with crystal-rich layers. The crystal assemblage is plagioclase, clinopyroxene, and ± amphibole, indicating andesitic compositions.

Figure F81. Monomictic white to light gray evolved lapilli-tuff, Unit V.
Alteration
The cores continue to be green and pervasively altered. The tuff and lapilli-tuff intervals are highly altered, such that former glass is unrecognizable and lapilli are highlighted by variations in clay minerals. The matrix and vitric clasts are altered to mixed-layer chlorite-smectite and chalcedony with minor prehnite. Prehnite appeared in Unit IV and more commonly occurs in Unit V, although still in minor abundance. The primary minerals are mostly fresh with minor localized alteration. Patches of sulfide are relatively common and not restricted to any specific lithologic host (e.g., interval 350-U1437E-9R3, 103–106 cm).
Unit VI
- Interval: 350-U1437E-28R-1, 0 cm, to 42R-3, 60 cm
- Depth: 1320.00–1459.80 mbsf
- Lithology: dominated by intervals of matrix- and clast-supported polymictic and monomictic evolved pumice lapilli-tuff, lapillistone, and minor tuff-breccia; dark tuff; minor tuffaceous mudstone and sandstone
- Age: older than ~9 Ma and extends to at least 10.97–11.85 Ma
Unit VI is characterized by more tuff and lapilli-sized volcaniclastic intervals (89% of the described intervals) and less tuffaceous mudstone (11%) than Unit V (31% volcaniclastics, 69% tuffaceous mudstone). The top of the unit is marked by the first appearance of multiple intervals of matrix-supported polymictic lapilli-tuff (interval 350-U1437E-28R-1, 0 cm, through 28R-2, 37 cm) and continues downward through intervals dominated by tuff and lapilli-tuff. Unit VI is intruded by igneous Unit 1 (interval 35R-1, 76 cm, to 35R-2, 55 cm; 1388.86–1390.07 mbsf), which is a rhyolite-dacite sheet (see Igneous Unit 1). The bottom of the unit is marked by the first dense glass-rich interval of Unit VII.
Unit VI is 139.80 m thick, of which 100.27 m was described in 306 intervals (Figure F21). Average core recovery over the unit is 71%, from a maximum of 99% in Core 350-U1437E-28R to a minimum of 45% in Core 35R. The unit includes 116 intervals of lapilli-tuff (total of 50.49 m), 134 intervals of dark gray and green tuff (32.35 m), 44 intervals of tuffaceous mudstone (10.95 m), 7 intervals of clast-supported polymictic lapillistone (4.6 m), and 5 intervals of matrix-supported polymictic and monomictic tuff-breccia (1.88 m). Descriptive intervals are thickest for clast-supported polymictic lapilli-tuff (0.71 m average thickness) and lapillistone (0.66 m average thickness). The three thickest intervals are of lapilli-tuff (2.67 and 2.81 m thick) and lapillistone (1.95 m thick). Dark tuff has an average interval thickness of 0.24 m with a maximum thickness of 1.43 m. The average interval thickness for tuffaceous mudstone is 0.25 m, with the thickest interval being 0.81 m.
Physical properties do not show distinct changes at the top of Unit VI but are gradational into the unit from the base of Unit V (see Physical properties). NGR declines from ~10–12 counts/s at the base of Unit V to a sustained ~5–6 counts/s in Unit VI. MS increases into Unit VI and becomes less variable as compared with Unit V. The base of Unit VI (350-U1437E-42R-3, 60 cm) coincides with a sustained one order of magnitude reduction in MS and a sustained but minor reduction in P-wave velocity. Porosity increases slightly into Unit VII but becomes much less variable. Conversely, NGR ceases to be stable and becomes highly variable in the upper part of Unit VII.
Core disturbance
The lithology of Unit VI is interrupted by fractured to brecciated and randomly oriented core disturbances (see the Expedition 350 methods chapter [Tamura et al., 2015a]).
Structure
Normal faults with offsets ranging between 1 and 15 cm cut across most of the lithofacies of Unit VI (Figure F82). High-angle (>70°) reverse faults with 0.5–13 cm offset are also present (Figure F83). The overwhelming majority of faults are anastomosing and splayed.
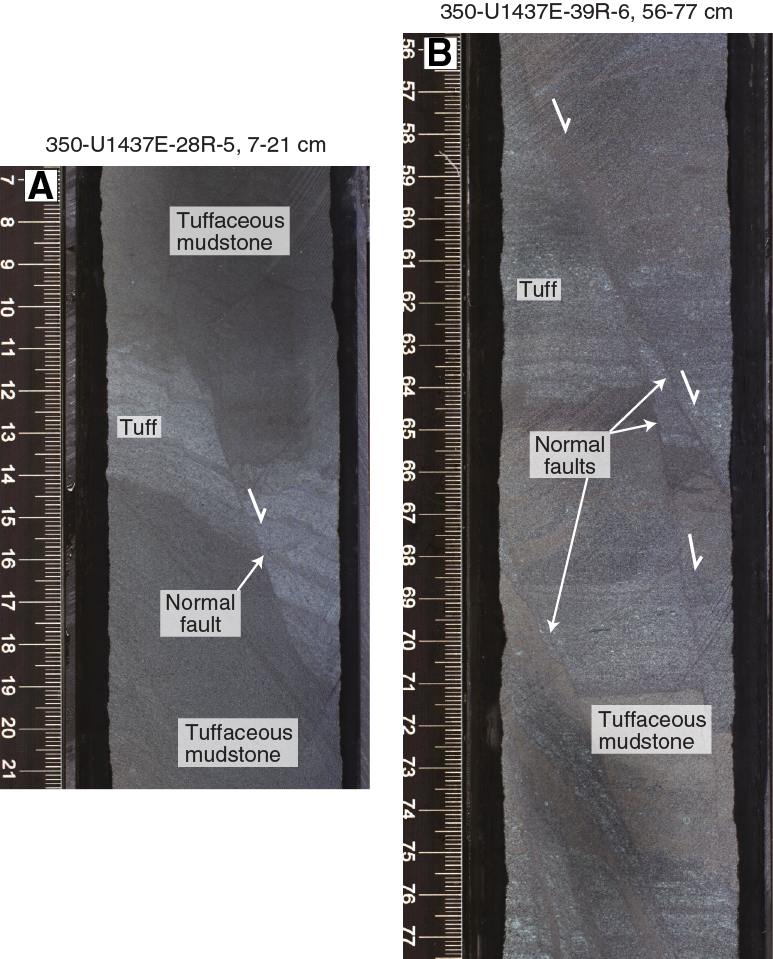
Figure F82. Normal faults, Hole U1437E Unit VI.
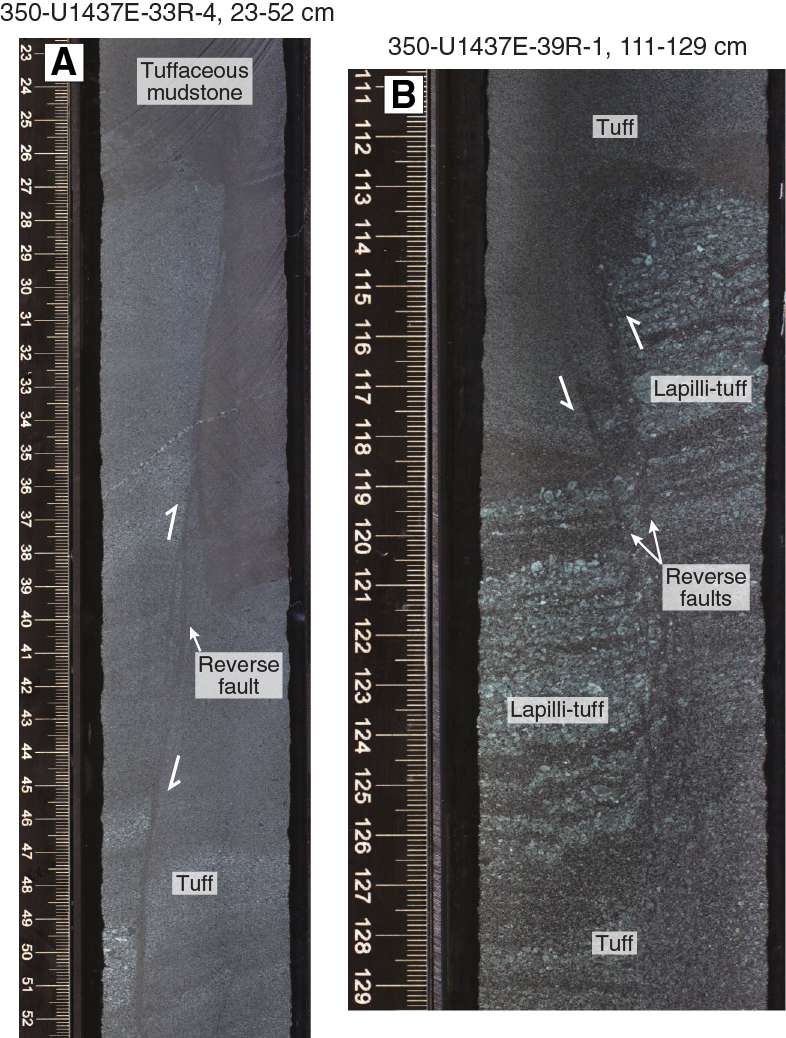
Figure F83. High-angle reverse faults, Hole U1437E Unit VI.
Lithofacies
The three lithofacies in Unit VI in order of dominance are (1) lapilli-tuff, lapillistone, and tuff-breccia (monomictic and polymictic varieties and matrix- and clast-supported varieties), (2) dark tuff, and (3) tuffaceous mudstone (Figure F84). The latter two lithofacies are often interlayered. Of the total Unit VI core described (100.27 m), 56.59 m is combined lapilli-tuff, lapillistone, and tuff-breccia (57% of Unit VI), 32.35 m is dark tuff (32% of Unit VI), and 10.95 m is tuffaceous mudstone (11% of Unit VI).
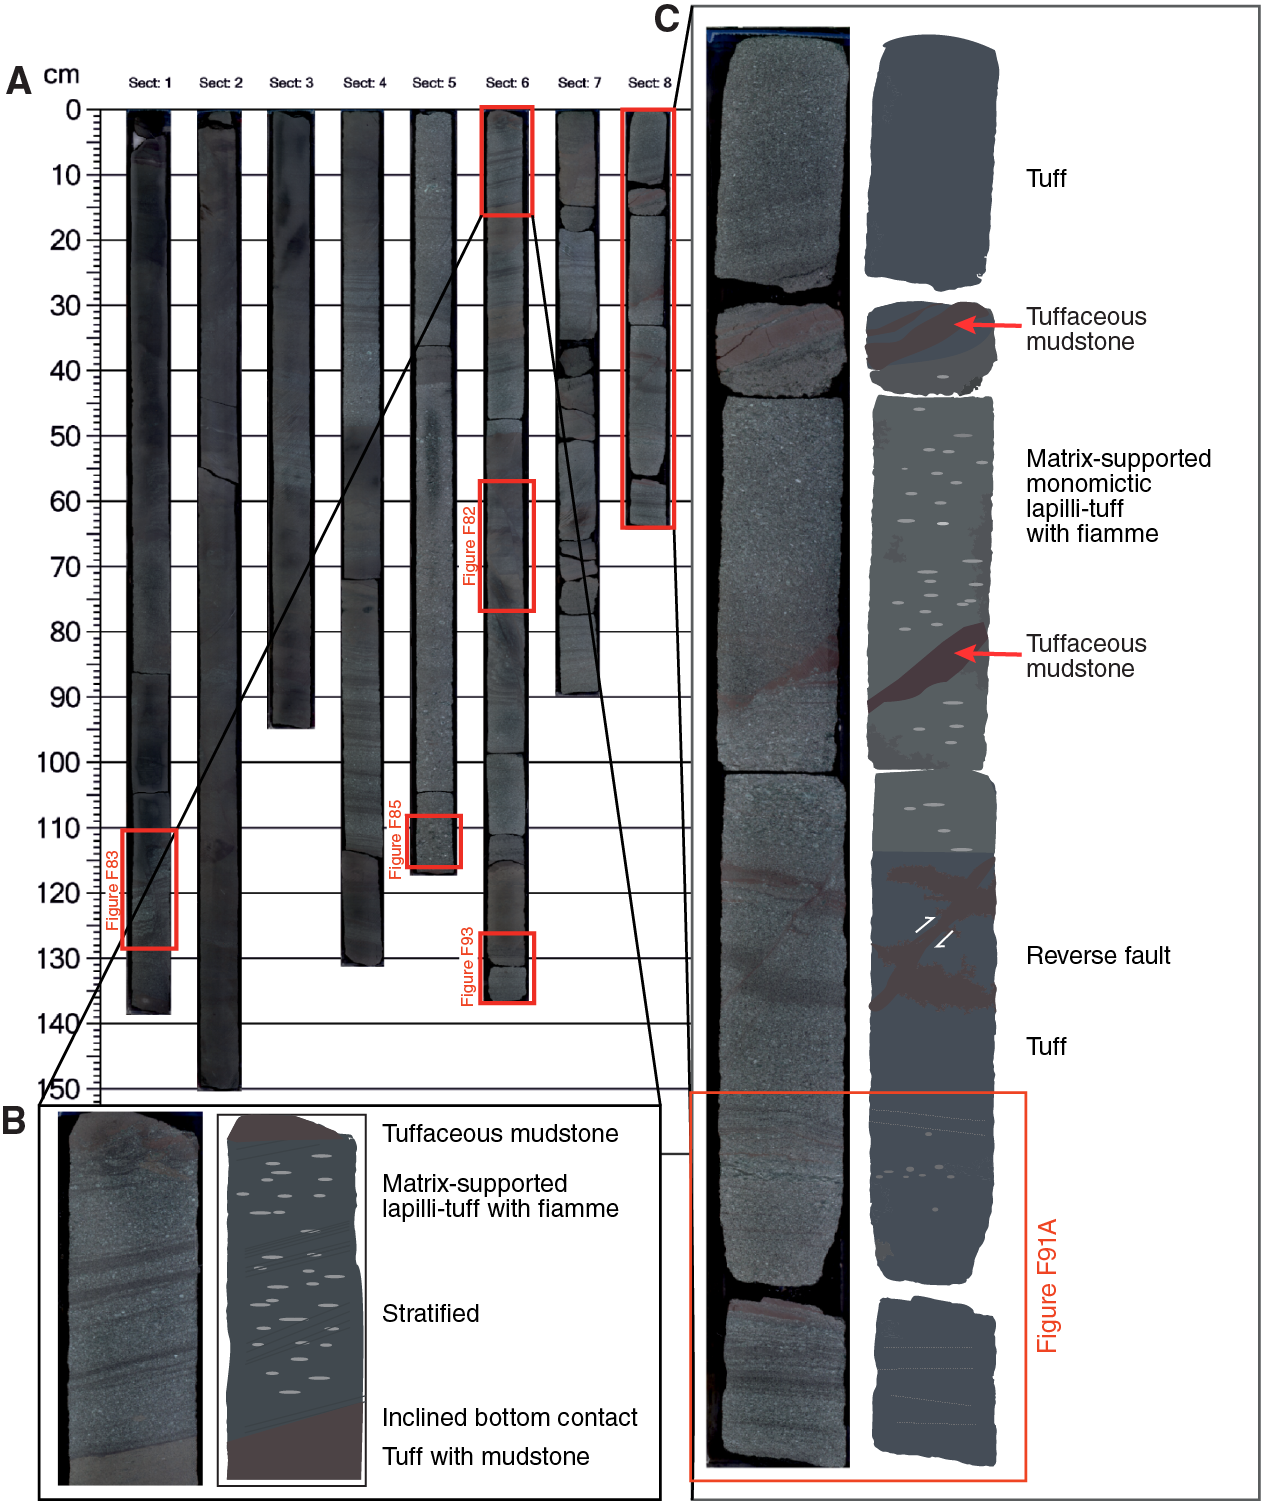
Figure F84. Core 350-U1437E-39R, Unit VI.
Lapilli-tuff, lapillistone, and tuff-breccia
The most common lithofacies in Unit VI is thick-bedded matrix-supported polymictic or monomictic lapilli-tuff (56% of the lithofacies) (Figure F85). Polymictic lapilli-tuff is approximately four times more abundant than monomictic lapilli-tuff. Other varieties include clast-supported polymictic lapilli-tuff (32%) (Figure F86A), clast-supported polymictic lapillistone (8%) (Figure F86B), and matrix-supported polymictic or monomictic tuff-breccia (3%) (Figure F87). All of these varieties contain dominantly evolved clasts (see below); monomict varieties typically contain only pumice. Bioturbation is minimal.
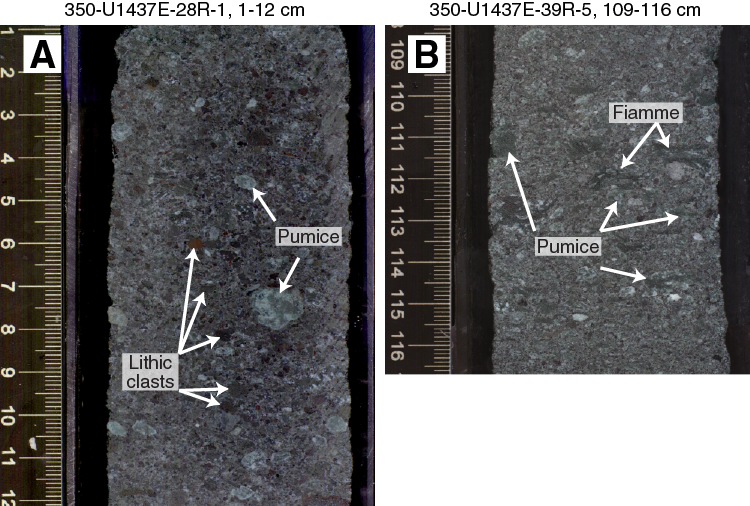
Figure F85. Unit VI.
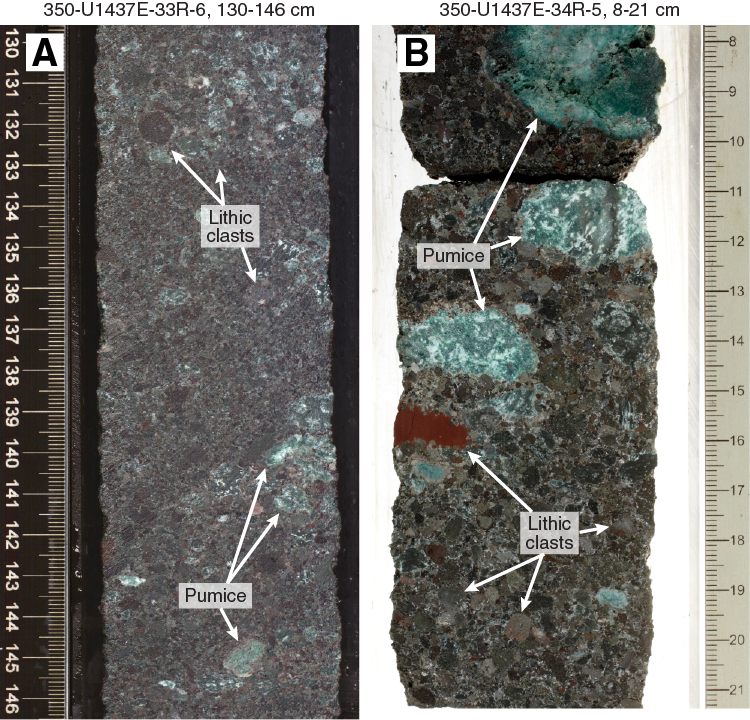
Figure F86. Clast-supported polymictic lapilli-tuff, Unit VI.
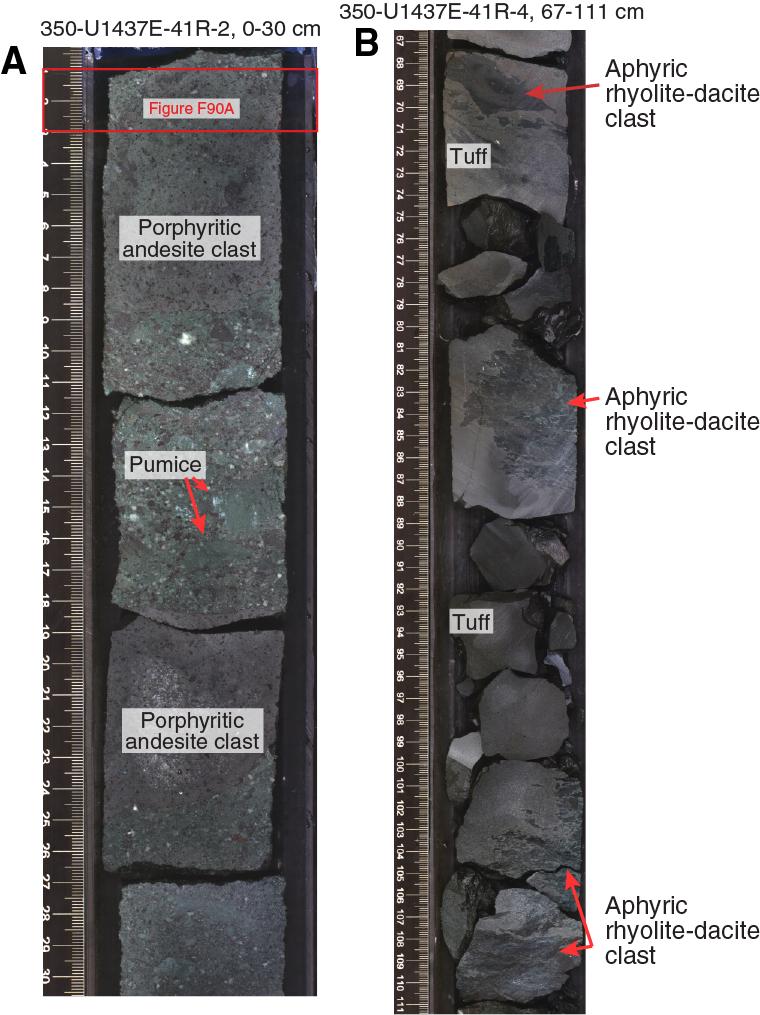
Figure F87. Hole U1437E Unit VI.
The difference between matrix-supported lapilli-tuff, clast-supported lapilli-tuff, and lapillistone is the decreasing amount of sand-sized material between lapilli. The transitions between these three subfacies are gradational, and monomictic varieties are limited to matrix-supported lapilli-tuff and tuff-breccia (Figure F85B). Tuff-breccia is always matrix supported and is distinct from matrix-supported lapilli-tuff only on the basis of having coarse cobble–sized clasts. Clasts are porphyritic andesite (Figure F87A), aphyric rhyolite-dacite (Figure F87B), mudstone (Figure F88A), or altered pumice (Figures F86, F88B).
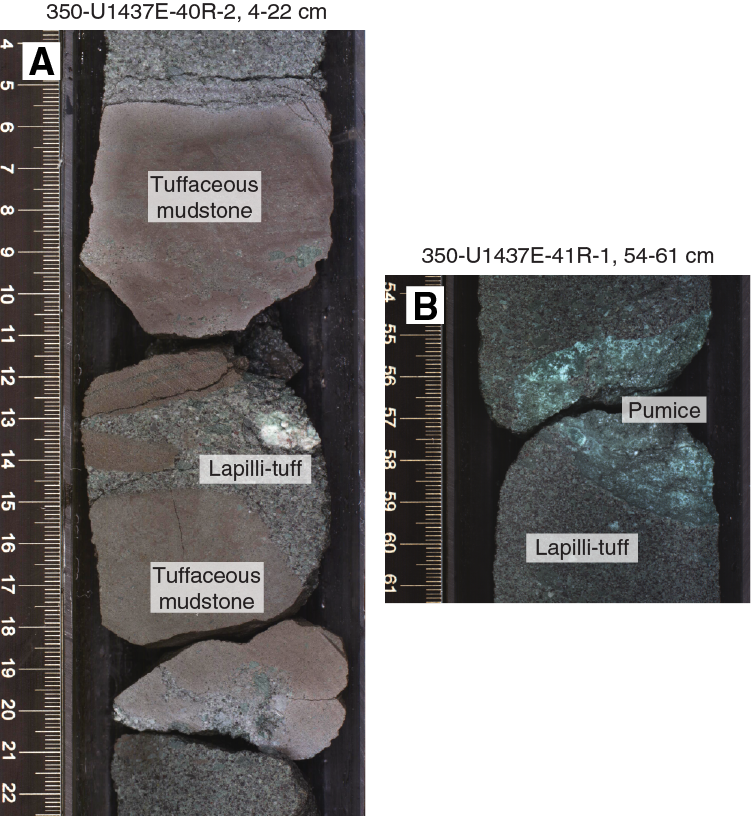
Figure F88. Matrix-supported polymictic evolved tuff-breccia, Unit VI.
Average bed thickness in the coarse-grained intervals is 0.41 m, with three beds spanning more than one 1.5 m thick core section. Coarse-grained beds are commonly overlain by mudstone in the upper part of Unit VI and by tuff or another coarse-grained bed in the lower part of the unit. Grading is variable and equally distributed between nongraded, normally graded, and reversely graded. Reverse grading (including coarse-tail) is most common in clast-supported lapilli-tuff.
Clast types within matrix- and clast-supported lapilli-tuff, lapillistone, and tuff-breccia include both lithic and vitric varieties (Figure F89). Igneous clasts include lithic volcanic (dominantly andesite with rare basalt and rhyolite-dacite) and vitric (phyric and aphyric) pumice and fiamme. Rhyolite-dacite clasts are more common near the rhyolite-dacite intrusive sheet (see Igneous Unit 1) in a peperitic interval.
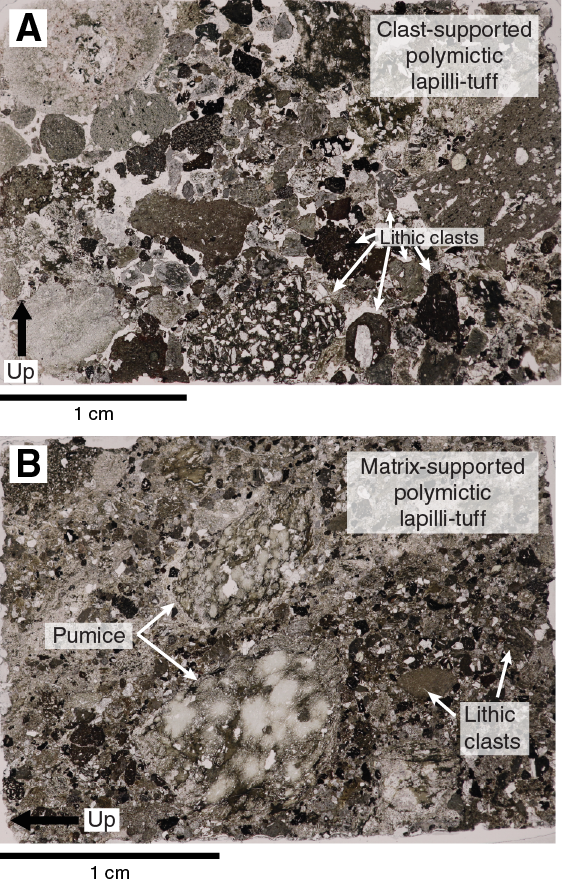
Figure F89. Hole U1437E Unit VI polymictic lapilli-tuff.
Porphyritic andesite clasts (Figure F87A) are typically gray to green with microcrystalline to cryptocrystalline groundmass. Phenocrysts are fine to medium grained, and they usually consist of plagioclase, clinopyroxene, and opaque minerals (± rare hornblende) (Figure F90). They range from nonvesicular to highly vesicular (up to ~50% vesicles). Vesicles are subrounded and locally filled with zeolites, clay minerals, or chalcedony.
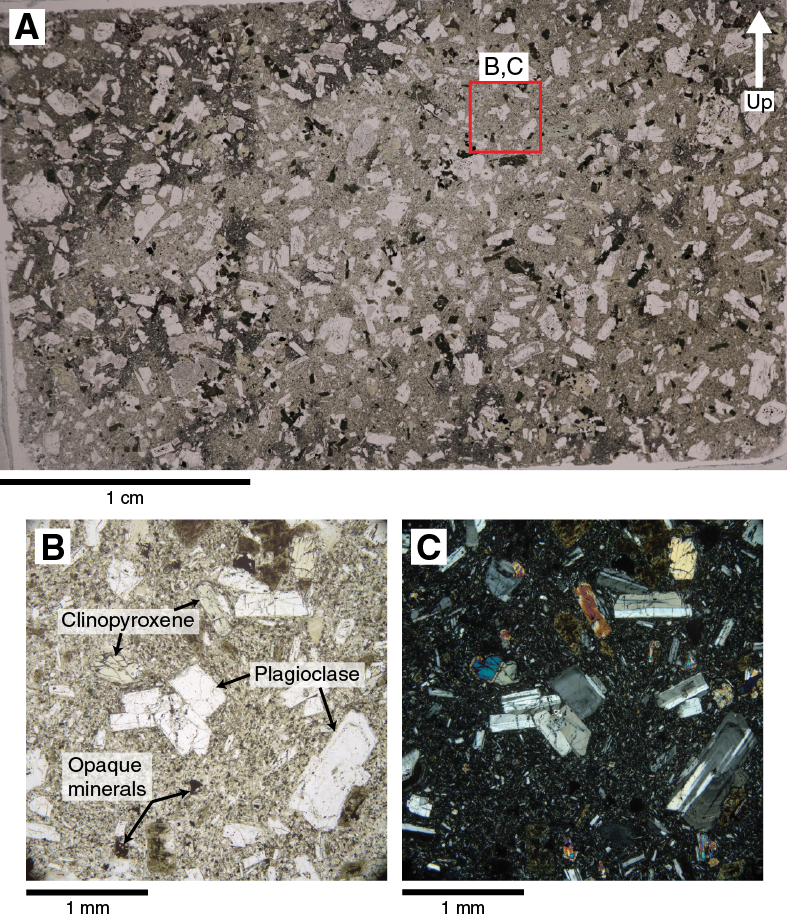
Figure F90. Sample 350-U1437E-41R-2, 1–3; TS131.
Pumice clasts are light green (e.g., interval 350-U1437E-41R-1, 55–59 cm; 1447.05–1447.09 mbsf) to dark green (Figure F87B) cryptocrystalline, commonly flattened into fiamme. Some pumice clasts are still sparsely to moderately vesicular with rounded vesicle shapes, some of them filled with chlorite.
Porphyritic rhyolite-dacite clasts are typically tan to light purple with porphyritic texture and subhedral feldspar (~5%), amphibole (~9%), and quartz (~1%). The matrix is microcrystalline.
Two aphyric basalt clasts are present (intervals 350-U1437E-35R-1A, 24–25 cm, and 38R-3A, 66–67 cm). The clasts are moderately to highly vesicular (10%–60%, 1–4 mm); the vesicles are subrounded and elongate to moderately spherical.
Red to brown mudstone clasts (>6.4 cm) in intervals of tuff-breccia are prevalent in Sections 350-U1437E-40R-1 to 40R-2 (Figure F88A).
Dark tuff
A major lithofacies in Unit VI is dark tuff. The 134 dark tuff intervals described in Unit VI are dominantly silt to fine sand sized, but medium to coarse sand sizes also occur. The total thickness of dark tuff intervals within Unit VI is 32.35 m. The average interval thickness is 0.24 m, whereas the maximum thickness of a single dark tuff interval is 1.43 m. Colors vary between gray, green, dark gray, dark green, and brown. After drying, some color variety is lost and intervals appear gray. Dark tuff intervals can contain subordinate fiamme (Figure F91) and mudstone. Most dark tuff intervals are nongraded (Figure F92) or normally graded (Figure F93), and only a few intervals are reversely coarse-tail (interval 350-U1437E-41R-CC, 0–12 cm) or normally coarse-tail graded (intervals 36R-2, 32–131 cm, and 30R-4, 8–26 cm). Stratification (planar bedding) of the dark tuff intervals is present macroscopically as well as microscopically (Figure F84). Bioturbation is slight to moderate, and bottom contacts of dark tuff intervals are often inclined or subhorizontal.

Figure F91. Tuff layer with subordinate fiamme, Hole U1437E Unit VI.
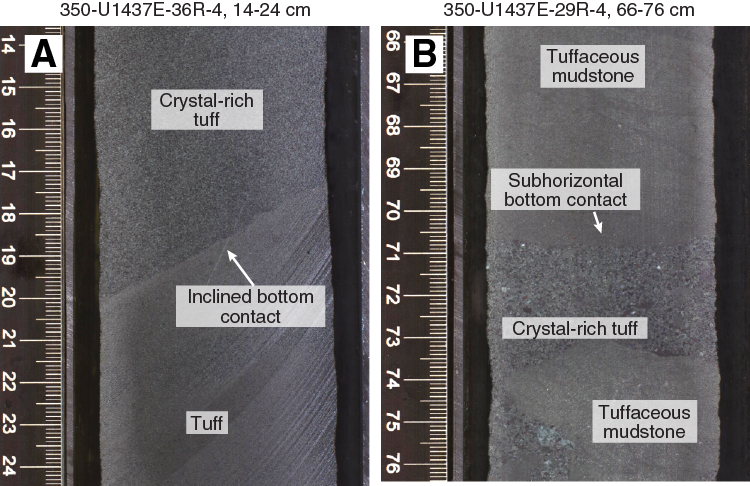
Figure F92. Hole U1437E Unit VI nongraded crystal-rich tuff and tuff layers.
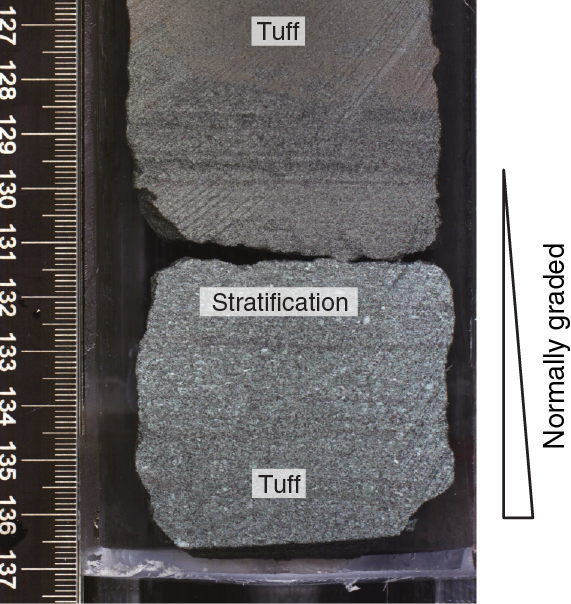
Figure F93. Tuff layer, Unit VI.
Crystal-rich layers in dark tuff have a matrix of glass shards (± pumice grains) and lithic and broken crystal fragments (Figures F94A–F94C, F95). Crystals are predominantly plagioclase, clinopyroxene, and opaque minerals with rare amphibole.

Figure F94. Tuff, lapilli-tuff, and tuffaceous mudstone, Hole U1437E Unit VI.
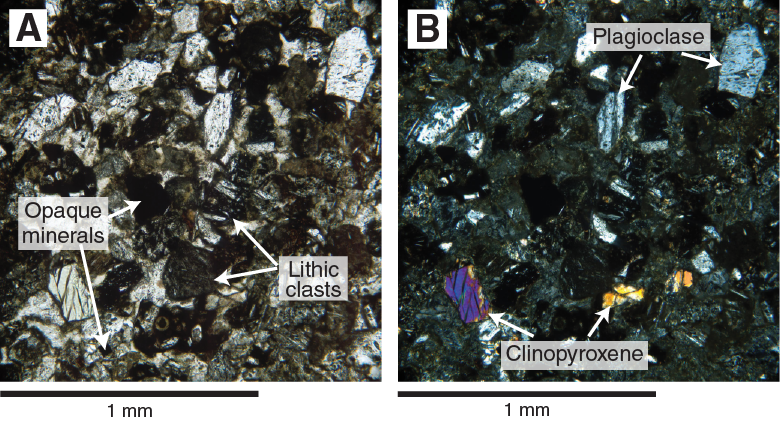
Figure F95. Crystal-rich tuff.
Tuffaceous mudstone
Tuffaceous mudstone is only a minor lithofacies within Unit VI (10.95 m total thickness). The average bed thickness is 0.25 m. The intervals are silt to fine sand sized and dark gray to brown. Tuffaceous mudstone incorporates subordinate facies, including tuffaceous mudstone with lapilli, lapilli-tuff, and tuff. Tuffaceous mudstone is often closely intercalated with tuff or lapilli-tuff intervals. Bottom contacts are subhorizontal or inclined (Figures F82, F92). Microscopically, tuffaceous mudstone is similar to that described in Units I, III, and V (Figure F94D). Microfossils, lithic and crystal fragments of plagioclase, clinopyroxene, quartz, and opaque minerals (Figure F96) are commonly mixed into tuffaceous mudstone. Bioturbation intensity is moderate to high but is less pervasive in comparison to the overlying units.
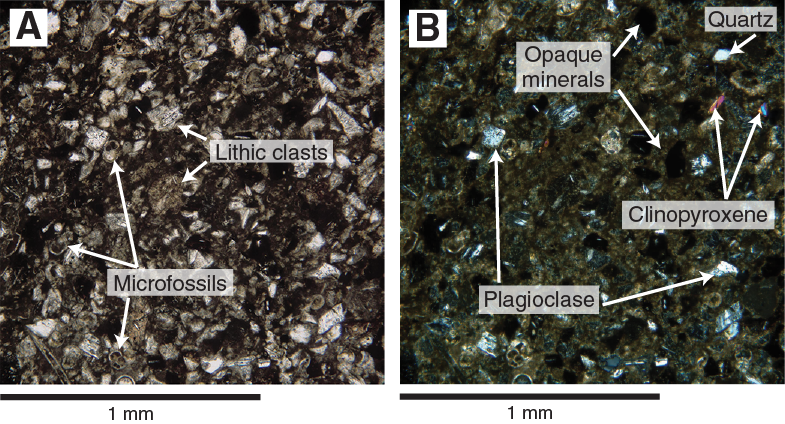
Figure F96. Tuffaceous mudstone with microfossils, Unit VI.
Alteration
Alteration of Unit VI has led to patches of sulfides, probably pyrite, as well as a pervasive greenish color that is interpreted to reflect alteration of glass to clay minerals, most probably chlorite. Vitric clasts are typically altered to clay-chlorite or chalcedony. Under the microscope, the matrix of some rocks has been replaced by chalcedony, chlorite, zeolite (Figure F97), and clay minerals. Prehnite has replaced some of the phenocryst minerals. Zeolite and clay minerals also fill vesicles.
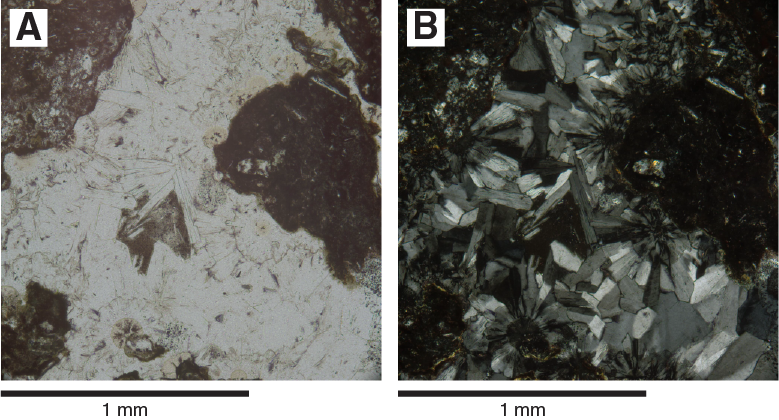
Figure F97. Zeolite alteration, Unit VI.
Unit VII
- Interval: 350-U1437E-42R-3, 60 cm, to 79R-3, 83 cm
- Depth: 1459.80–1806.50 mbsf
- Lithology: lithified; black, evolved lapilli-tuff and lapillistone; tuff and evolved tuff; and polymictic evolved lapilli-tuff, lapillistone, tuff-breccia, and consolidated volcanic breccia
- Age: older than 10.97–11.85 Ma
Unit VII is distinguished from Unit VI by the dominance of medium to extremely thick coarse-grained intervals, such as lapilli-tuff, lapillistone, tuff-breccia, and volcanic consolidated breccia (195 intervals, corresponding to 89% of the described intervals). The unit has core recovery of 39%. The dominant lithofacies is black, evolved lapilli-tuff and lapillistone. The other voluminous lithofacies is nongraded, nonstratified, very poorly sorted, polymictic lapilli-tuff, lapillistone, tuff-breccia, and volcanic breccia that commonly contain a large variety of angular andesite pebble and cobble sized, some with quenched and peperitic margins, and alteration halos in the surrounding sediment. Graded and stratified lapilli-tuff and lapillistone are subordinate, tuff is common (70 intervals, 11% of the described intervals), and tuffaceous mudstone is extremely rare (one interval). The alteration intensity varies downhole from weak (e.g., some glass is preserved) to strong, with complete alteration of the clasts’ groundmass and filling of the vesicles and cracks by secondary minerals. Glass-rich intervals show much lower MS than any other interval in Unit VII.
Core disturbance
The lithology of Unit VII is interrupted by slightly fractured (e.g., interval 350-U1437E-55R-1, 0–81 cm) to severely fractured (e.g., interval 44R-1, 0–103 cm) and brecciated and randomly oriented core disturbances.
Structure
Bedding is variably inclined throughout the entire Unit VII, from horizontal-subhorizontal to inclined by as much as 80° (interval 350-U1437E-67R-1, 1–74 cm). One interval (63R-1, 26–52 cm) shows fiamme sheared by deformation within a normal fault of <1 cm displacement.
Lithofacies
Black evolved lapilli-tuff and lapillistone
This lithofacies is composed of black, nongraded, nonstratified, well-sorted, matrix- or clast-supported, polymictic to monomictic, evolved lapilli-tuff and lapillistone (Figures F98, F99). This lithofacies is present over two continuous sequences with low core recovery (24.5%): intervals 350-U1437E-42R-3, 60 cm, to 55R-2, 91 cm (>120 m thick), and 61R-1, 0 cm, to 61R-3, 116 cm (2.63 m thick). More than 95% of this lithofacies is composed of similar angular, glassy, nonvesicular to sparsely vesicular, porphyritic clasts and grains (Figure F100, F101, F102, F103) that are moderately to highly pyroxene-plagioclase-phyric. Phenocrysts are subhedral, and plagioclase and pyroxene glomerocrysts are abundant. The mineralogy suggests an andesitic composition. Bubble-wall shards are absent, and free crystal fragments are minor. Only a few red, oxidized, sparsely phyric and aphyric volcanic lithic clasts (Figure F102B) are randomly spread within the intervals in the lower part of the lithofacies, as well as scarce clasts with quenched margins (Figure F103). Glass is isotropic and slightly to moderately altered near the top of the unit but increasingly altered downhole. The Unit VII uppermost interval is normally graded. One interval (350-U1437E-53R-1, 42–82 cm) is finer grained (tuff) but of similar componentry.
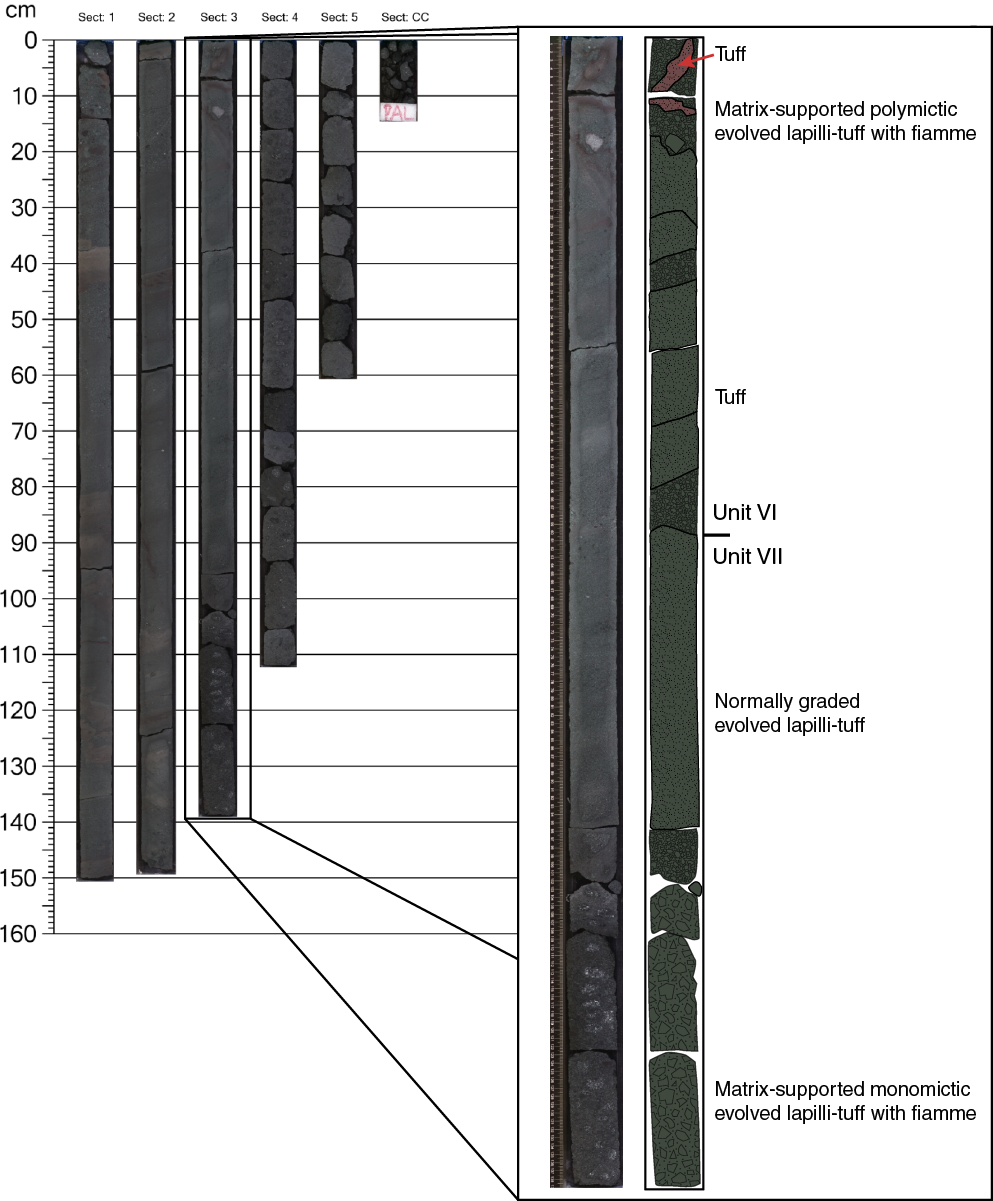
Figure F98. Core 350-U1437E-42R.
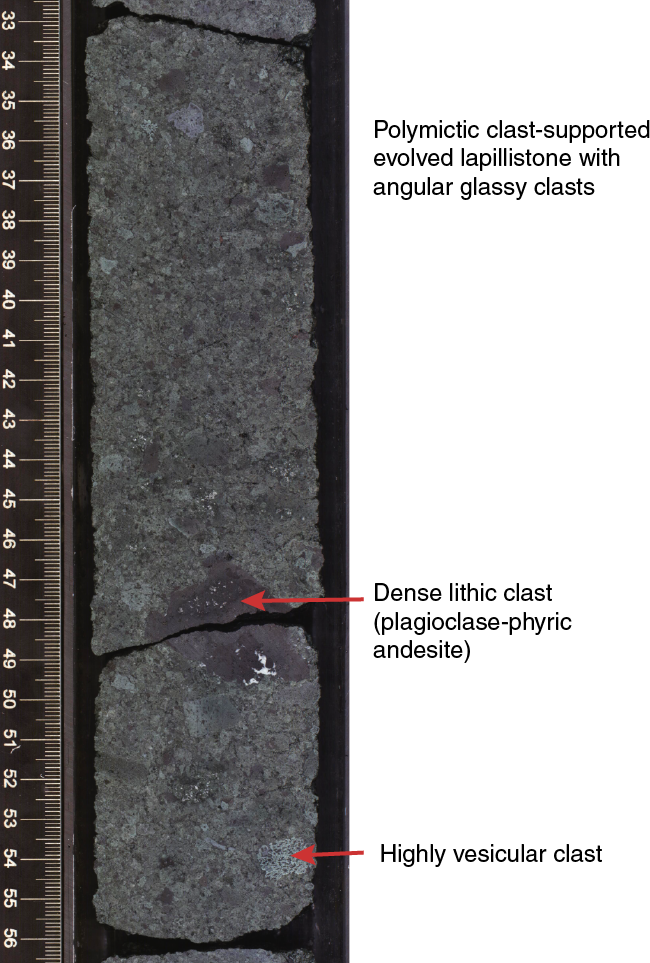
Figure F99. Clast-supported monomictic evolved lapillistone, Unit VII.
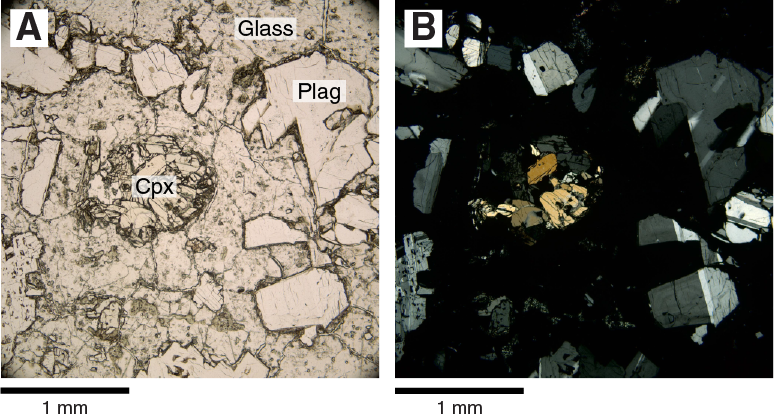
Figure F100. Plagioclase-pyroxene-phyric andesite clast.
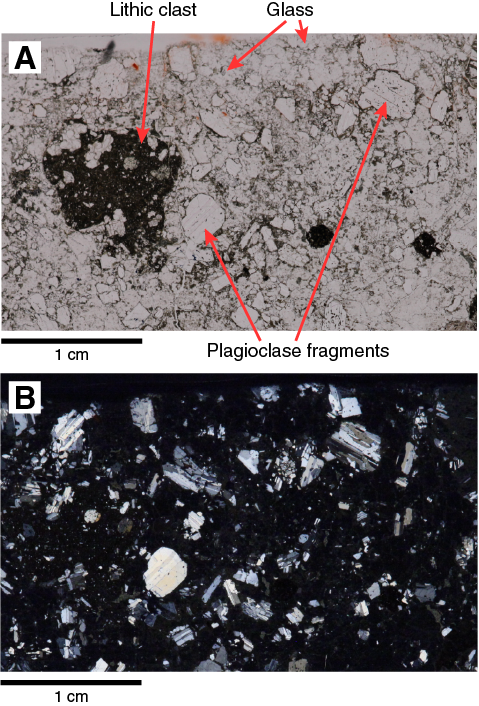
Figure F101. Vitric andesite clasts.
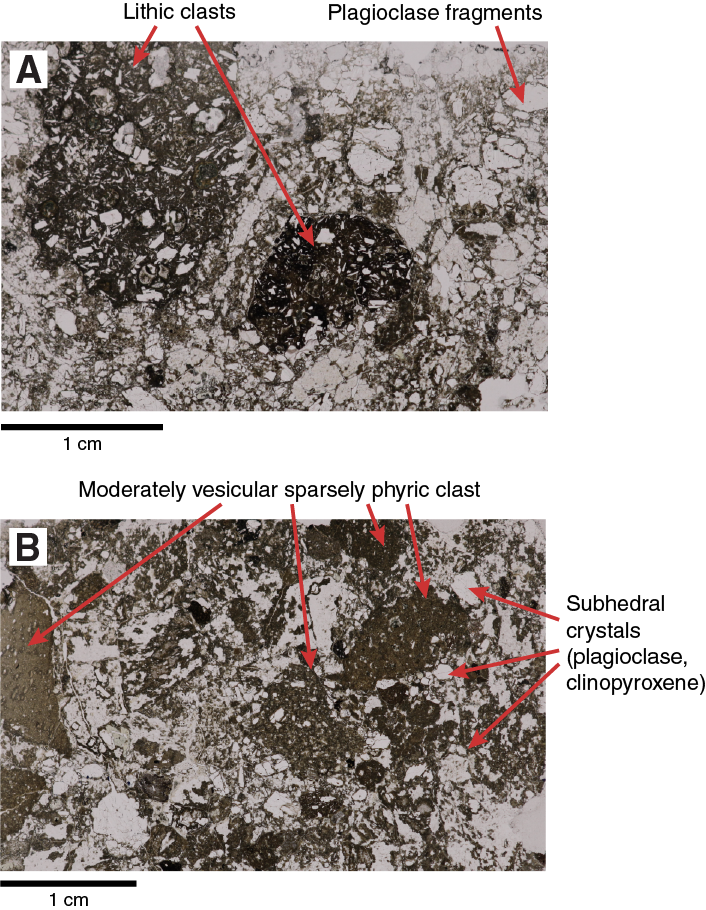
Figure F102. Vitric andesite clasts with preserved glassy groundmass, Hole U1437E.
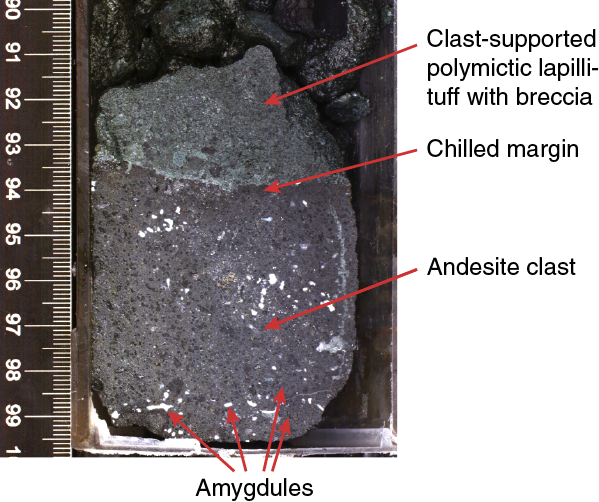
Figure F103. Chilled margin.
Tuff and evolved tuff
Brown, dark gray, red-brown, and green very thin to very thick intervals of tuff and evolved tuff are present (11% of described intervals) in Unit VII. Intervals are stratified or massive (e.g., 350-U1437E-60R-2, 0–34 cm), subhorizontal to inclined (Figure F104), and nongraded to normally graded; reverse grading is rare. These intervals commonly contain minor lapilli clasts. Bioturbation is rare (Figure F105).
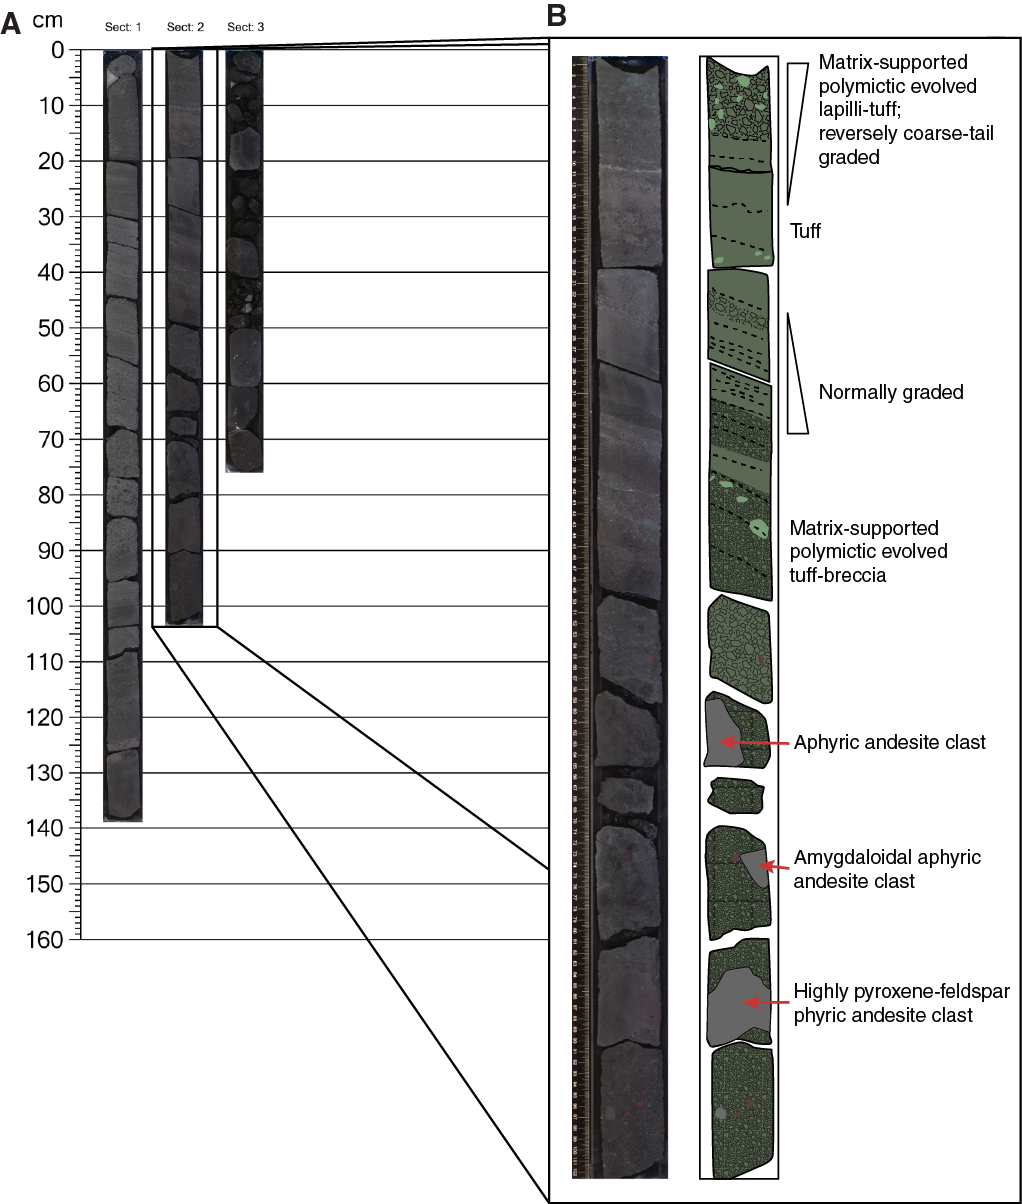
Figure F104. Core 350-U1437E-60R.
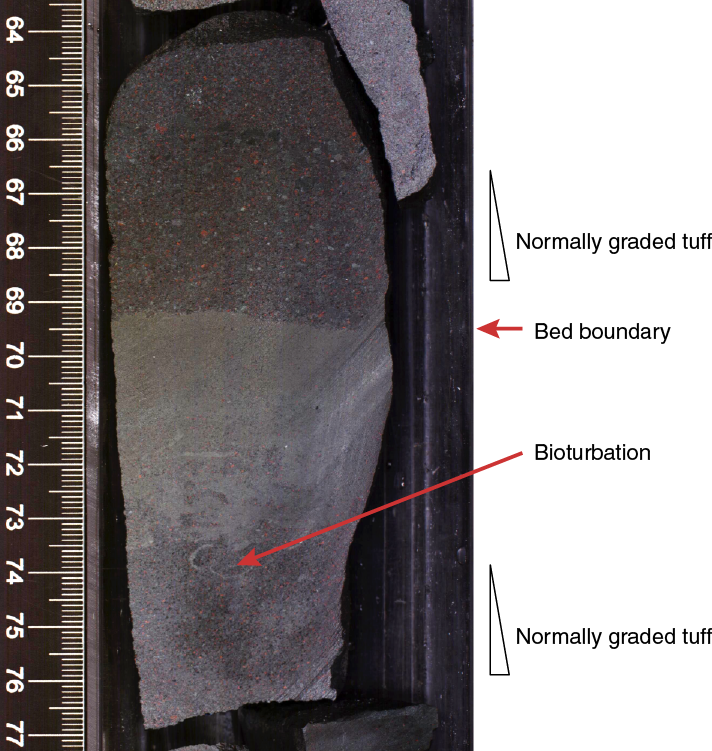
Figure F105. Weak bioturbation in normally graded tuff.
Polymictic evolved lapilli-tuff, lapillistone, tuff-breccia, and consolidated volcanic breccia
This lithofacies is made of coarse-grained (coarse sand to cobble sized), matrix-poor polymictic intervals that comprise (1) graded and stratified intervals and (2) nongraded, nonstratified, and very poorly sorted intervals.
Graded and stratified lapilli-tuff and lapillistone
This lithofacies commonly occurs in Sections 350-U1437E-55R-2 through 58R-2, 60R-1 through 60R-2, and 62R-1 through 66R-4, 89 cm, and is interbedded with tuff and evolved tuff. The lithofacies is similar to the polymictic intervals dominant in Units IV and VI (e.g., interval 350-U1437D-64R-1, 8 cm, to 64R-2, 51 cm; 1672.22–1678.20 mbsf). The intervals are thin to very thick, variably graded (normal, reversely, or density graded) or ungraded, stratified or unstratified, and are made of subrounded pumice and lithic clasts in a dominantly vitric matrix.
Nongraded, nonstratified, very poorly sorted lapilli-tuff, lapillistone, tuff-breccia, and volcanic breccia
This lithofacies resembles the graded and stratified lapilli-tuff and lapillistone but contains larger pebbles and cobbles of angular evolved volcanic clasts that obliterate or hide the overall grading. Various types of evolved volcanic clasts, dominantly andesite, produce a strongly polymictic, coarse-grained lithofacies, some with quenched margins (e.g., intervals 350-U1437E-59R-1, 20–35 cm, and 59R-1, 75–116 cm) (Figure F106) or altered halos in surrounding sediments and peperitic margins (interval 72R-4, 100–123 cm). Evolved pebbles and cobbles occur as randomly distributed clasts or in clusters of very angular clasts with the same phenocryst mineralogy. Well-preserved jigsaw-fit textures (Figure F107) occur in individual clasts (e.g., intervals 56R-3, 0–13 cm, and 70R-2, 35–61 cm) and groups of very angular clasts with identical mineralogy. Jigsaw-fit textures, anastomosing fracture surfaces, and weak alteration veins are present together in several intervals (e.g., 70R-2, 105–144 cm) (Figure F108). In other places, clasts are angular with large-scale concave (reentrant) angles and have ~1 cm thick quenched margins and possible poorly inflated breadcrust textures (e.g., interval 59R-1, 75–116 cm) (Figure F106).
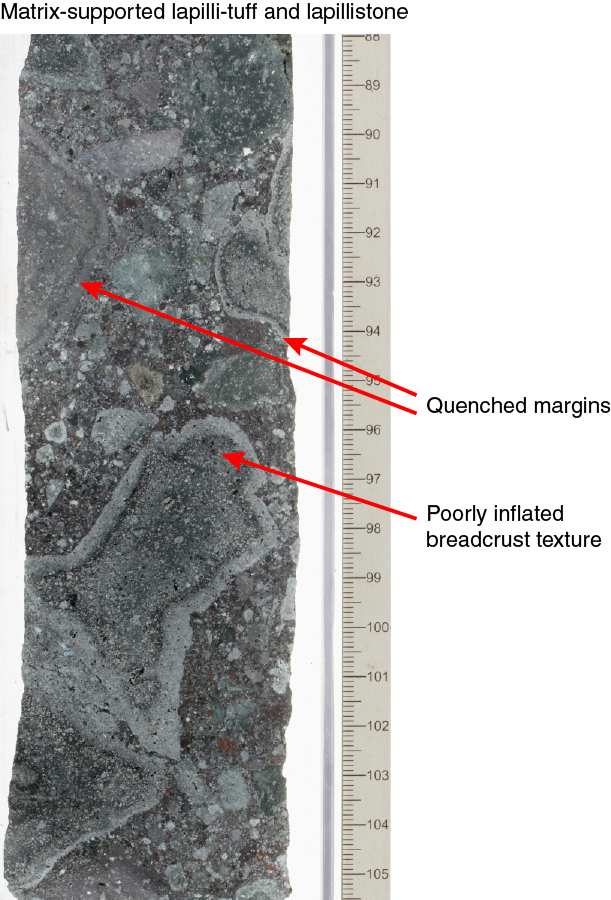
Figure F106. Matrix-supported lapilli-tuff, Unit VII.
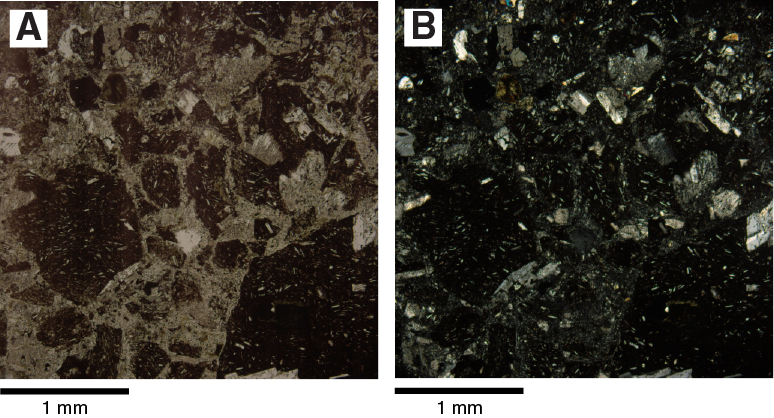
Figure F107. Jigsaw-fit and randomly distributed andesite clasts.
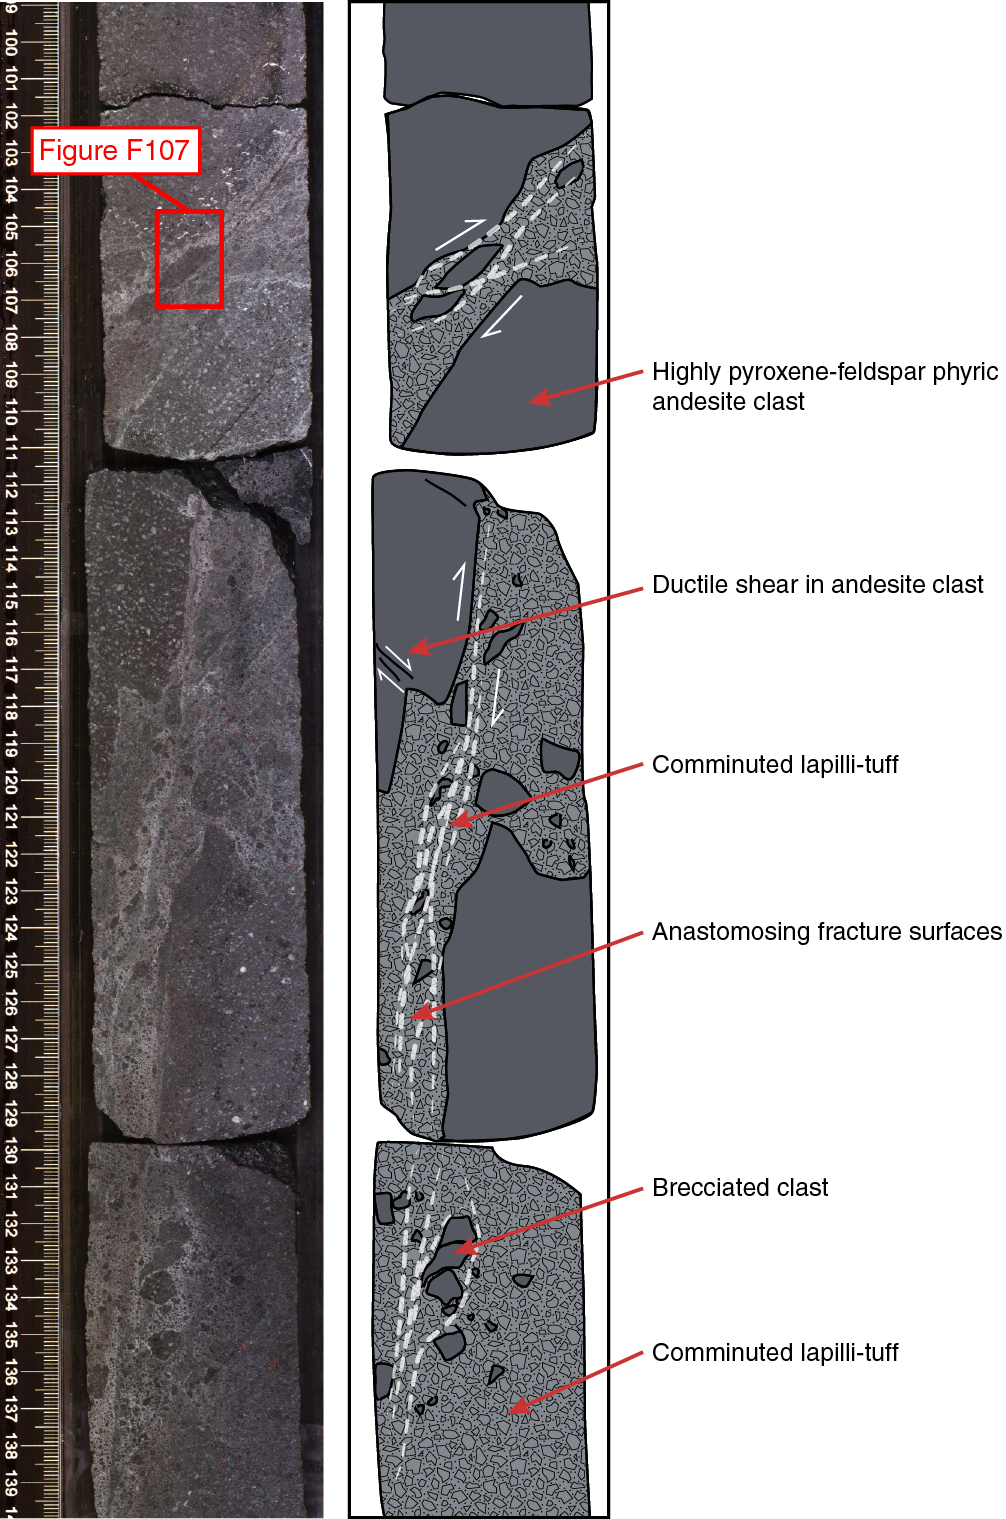
Figure F108. Clast-supported evolved consolidated volcanic breccia, Unit VII.
Andesite clasts are porphyritic to glomeroporphyritic (Figure F109) and nonvesicular to poorly vesicular. The clasts are sparsely to highly phyric and include 0.2–5 mm phenocrysts, equant to tabular, subhedral to euhedral feldspar crystals (2%–40%), and minor amounts of 0.2–2 mm, equant to prismatic and subhedral pyroxene (1%–10%), oxides (<0.1 mm), and pyrite aggregates. The groundmass of the clasts is microcrystalline to medium grained. The clasts vary from sparsely to moderately vesicular; vesicles (0.1–10 mm) vary from angular to rounded and from elongated to moderately spherical in shape. About 50%–100% of vesicles are filled by clay minerals, chalcedony, zeolite, or pyrite.
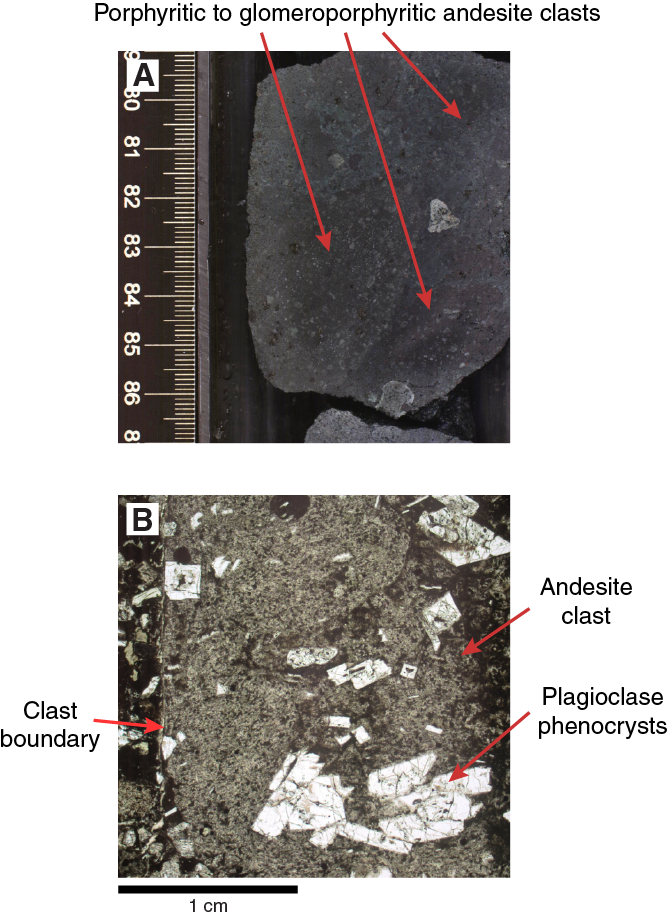
Figure F109. Andesite clast.
Alteration
Clasts are either slightly (small to large patches) or completely altered. Locally, some feldspar phenocrysts are moderately altered. Change in color of clast groundmass (green, dark green, light gray, or red) and matrix is mostly related to pervasive alteration to clay minerals, pyrite, and chlorite. Scarce fractures, veins, and vesicles are filled by zeolite, chalcedony, quartz, and albite.
Igneous Unit 1
- Interval: 350-U1437E-35R-1, 76 cm, to 35R-2, 55 cm (Figure F18)
- Depth: 1388.86–1390.07 mbsf
- Lithology: moderately quartz-amphibole-feldspar-phyric rhyolite-dacite intrusive sheet
- Age: 13.6 +1.6/−1.7 Ma (see Geochemistry); intrusive into lithostratigraphic Unit VI
Core disturbance and core recovery
The entirety of igneous Unit 1 is affected by moderately fractured core disturbance. Core recovery for Core 350-U1437E-35R is 45%, which is significantly lower than previous cores (e.g., 94% for Core 32R or 96% for Core 33R), recovering mostly volcaniclastic material. The greater competency of the rhyolite-dacite compared to surrounding volcaniclastics may have led to difficulties in recovering igneous Unit 1, leading to the lower core recovery. This might result in an underestimation of the true thickness of this intrusive body. The minimum thickness is the 1.21 m that was described. Assuming that all the material not recovered from the drilling of Core 35R (5.38 m) was part of Unit 1, the maximum thickness is 6.50 m. This latter scenario is unlikely, and the true thickness is somewhere between 1.21 and 6.50 m.
Lithologic and petrographic description
The only clearly igneous unit present at Site U1437 consists of a single magmatic body, with 1.21 m recovery, emplaced within lithostratigraphic Unit VI (Figure F110). The bottom contact of igneous Unit 1 is peperitic, mingling lapilli-tuff with apophyses of Unit 1 (Figure F111). The upper contact is composed of a chilled (cryptocrystalline) margin within Unit 1 and a baked and oxidized margin in the overlying lapilli-tuff (Figure F112). The groundmass varies from cryptocrystalline near the upper and lower contacts to fine grained in the center of the unit. Flow banding occurs across the entire unit in various orientations.
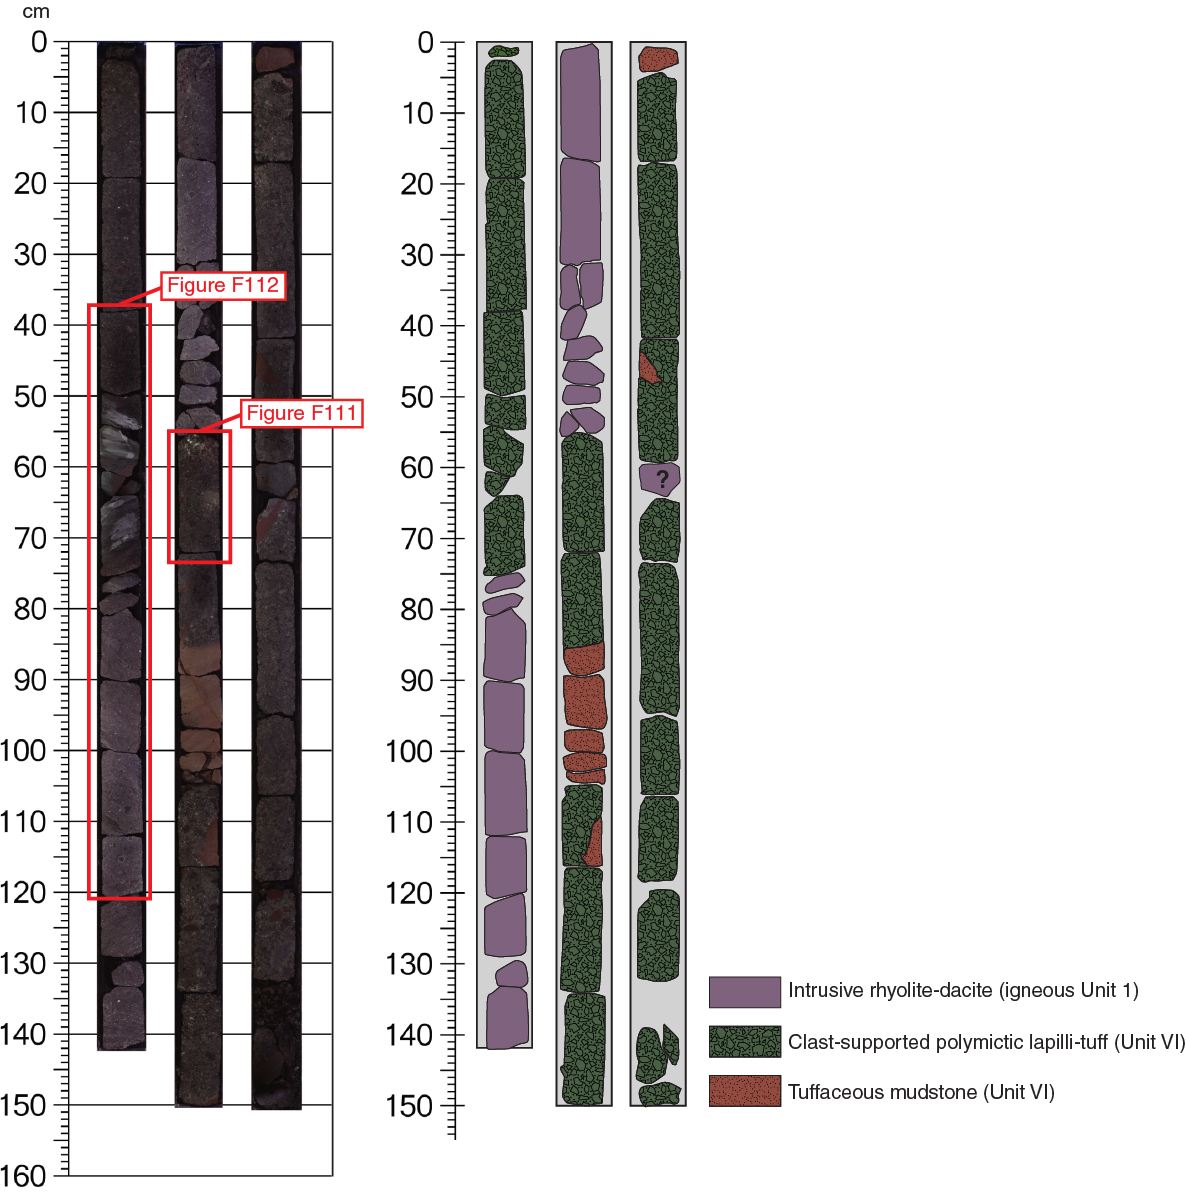
Figure F110. Core 350-U1437E-35R.
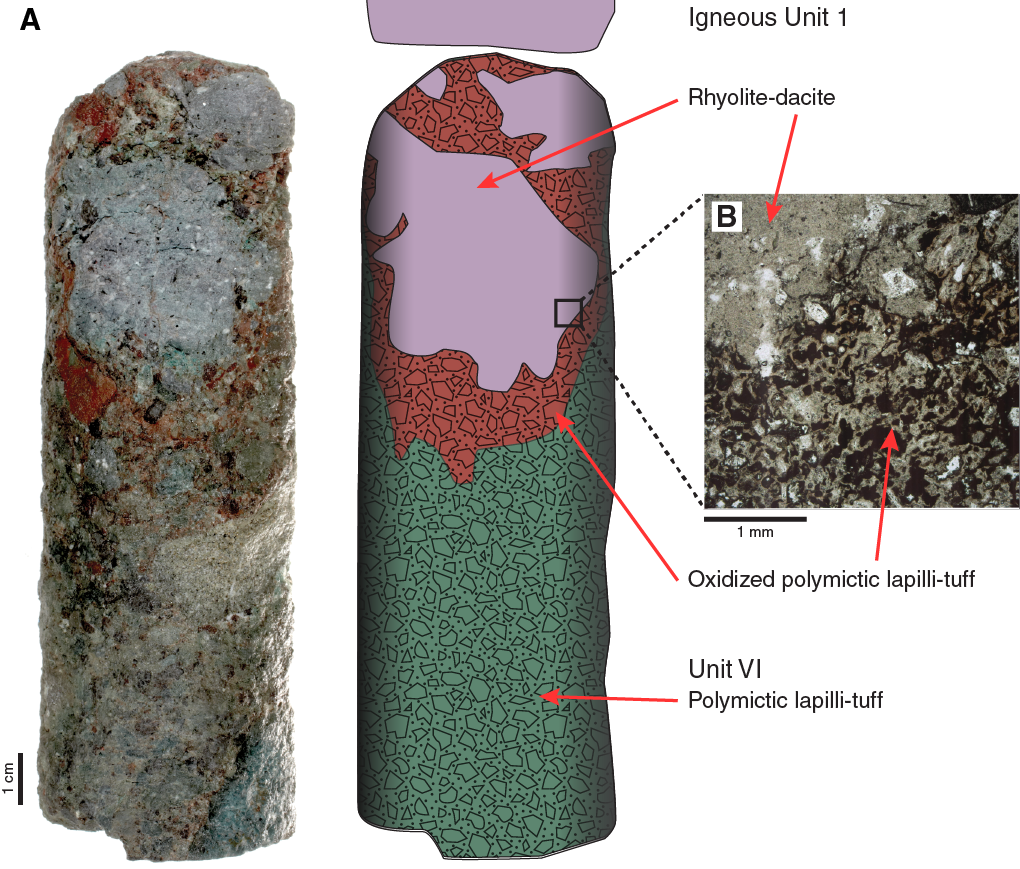
Figure F111. Bottom contact of igneous Unit 1 within Unit VII, Hole U1437E.
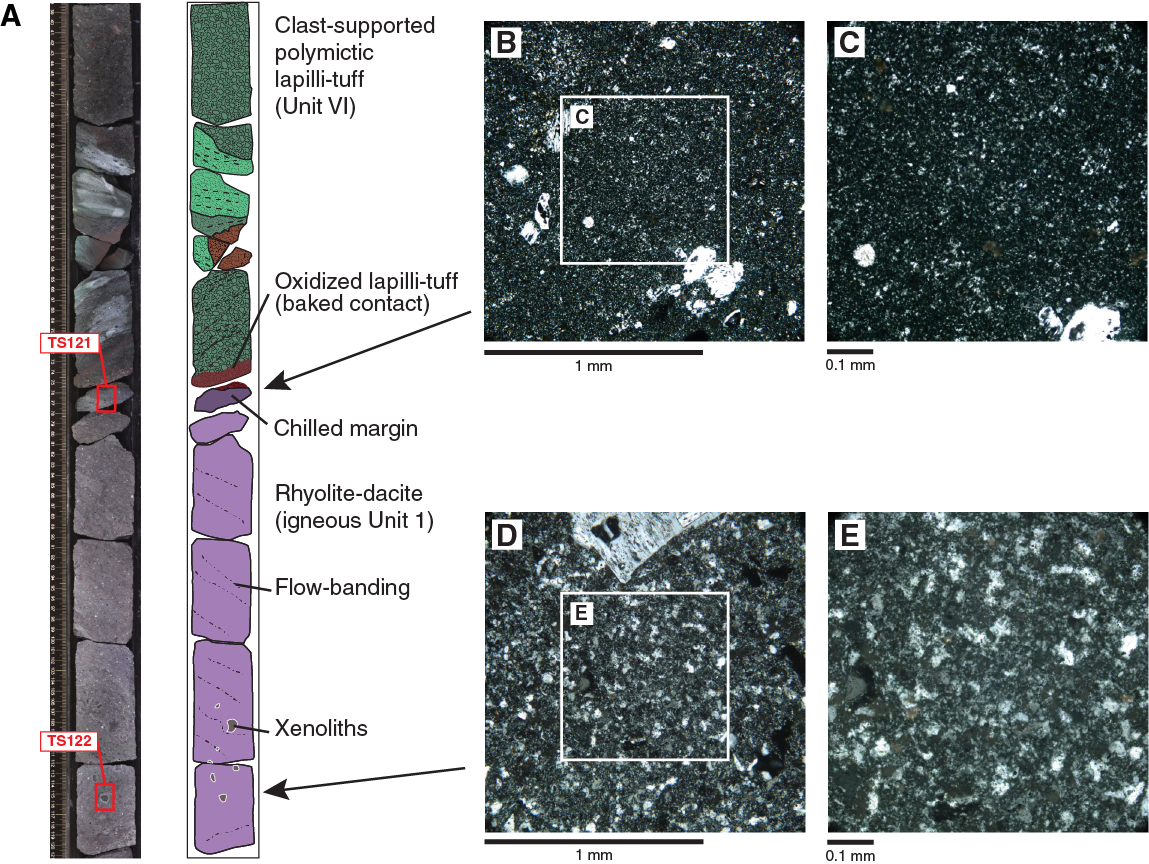
Figure F112. Upper part of igneous Unit 1.
Igneous Unit 1 has a porphyritic texture with sieve-textured subhedral plagioclase (≤4 mm, ~7%), euhedral hornblende (0.5 mm, ~3%), anhedral to subhedral quartz (≤8 mm, ~1%) with fresh glassy melt inclusions, some opaque minerals (Figure F113), and rare zircon (20 µm in diameter). The anorthite content of plagioclase is <An20 (oligoclase, albite) based on the maximum extinction of albite twins in plagioclase (Michel-Levy’s method). This value is significantly lower than the values measured in plagioclase from the surrounding volcaniclastics (~An40, andesine).

Figure F113. Moderately quartz-amphibole-feldspar-phyric rhyolite-dacite.
Based on its distinctive purplish light gray color and the presence of large quartz crystals, igneous Unit 1 has been classified as a moderately quartz-amphibole-feldspar-phyric rhyolite-dacite.
Another interval of moderately quartz-amphibole-feldspar-phyric rhyolite-dacite appears within the clast-supported polymictic lapilli-tuff (Unit VI) in interval 350-U1437E-35R-3, 59–64 cm. Although this interval could be interpreted as another appearance of igneous Unit 1, it has no recovered contacts with the surrounding sediment and was therefore described as a clast (Figure F110).
Rhyolite-dacite contains numerous xenoliths, dominantly plagioclase-porphyritic andesite, particularly in interval 350-U1437E-35R-1, 106–117 cm (Figure F112). They are surrounded by reaction zones up to 1 cm wide (Figure F114). In thin section, the xenoliths are microcrystalline porphyritic andesite exhibiting various amounts of plagioclase (20%–40%) and clinopyroxene (0%–5%); amphibole and quartz are absent. The andesite xenoliths are similar to the andesitic lapilli in the adjacent lapilli-tuff host.

Figure F114. Two less-evolved andesite xenoliths.
Lithostratigraphic relationships
Cryptocrystalline zones at the top and bottom of igneous Unit 1 (Figure F112) are interpreted as chilled margins. In addition, baked contacts (adjacent to its base and top) within the surrounding lapilli-tuff, characterized by a reddish oxidized zone near the rhyolite-dacite contact, contrasts with more common greenish alteration color further away from the rhyolite-dacite. The peperitic bottom contact of igneous Unit 1 with Unit VI strongly suggests that the adjacent lapilli-tuff was unconsolidated when the magmatic body was emplaced. Consequently, igneous Unit 1 is interpreted as an intrusive sheet emplaced into the clast-supported, polymictic lapilli-tuff of Unit VI. Additional support for this interpretation is provided by the fact that highly evolved lavas are expected to be tens of meters thick, whereas igneous Unit 1 is only 1.21 m thick, as well as the paleomagnetic study of discrete samples from igneous Unit 1. These samples all exhibit reversed remnant inclination consistent with the latitude of Site U1437 (see Paleomagnetism), suggesting that igneous Unit 1 cooled below the Curie temperature in situ.
Alteration
Macroscopic alteration of the moderately quartz-amphibole-feldspar-phyric rhyolite-dacite is less intense than alteration occurring in the surrounding volcaniclastic sediment. Microscopically, phenocrysts are fresh and groundmass recrystallization is limited. In the same core, microscopic observations of volcanic clasts from the clast-supported polymictic lapilli-tuff revealed epidote, biotite, clay, and opaque minerals in the groundmass.
The peperitic contact occurring at the bottom of this unit suggests that the magmatic body intruded into unconsolidated volcaniclastic deposit. In this scenario, deposition of the volcaniclastic sediment and intrusion of the rhyolite-dacite are penecontemporaneous. It is unlikely that the thin igneous Unit 1 (1.21 m thick) was itself the source of sufficient heat or fluids to drive the pervasive alteration within surrounding Unit VI (~140 m thick). Two explanations for the difference in alteration between the rhyolite-dacite and the surrounding volcaniclastic sediments are therefore possible: (1) the relative coherence, lower porosity, and lower permeability of the massive rhyolite-dacite intrusive sheet prevented the pervasive fluid alteration processes present in the more permeable clast-supported polymictic lapilli-tuff or, alternatively, (2) the clasts of the surrounding lapilli-tuff were altered prior to being intruded by igneous Unit 1.
Interpretation
Geological history
Site U1437 (Holes U1437B, U1437D, and U1437E) records the sedimentary history of the volcano-bounded Enpo-Manji Basin, adjacent to the Manji Seamount, and possibly the older stratigraphy before the Manji and Enpo seamount chains developed. Our preliminary interpretation suggests that background sedimentation of hemipelagic clay and carbonate at this site was punctuated by frequent proximal and distal volcanic events that deposited ash across the site. Ash has been mixed into the mud intervals by bioturbation and resedimentation, as well as background eruptions from the rear arc (see Origin and significance of the tuffaceous mud/mudstone). In Holes U1437D and U1437E, the tuffaceous mud and ash have been lithified to tuffaceous mudstone and tuff. The geological history of Site U1437 is summarized as follows.
The oldest rocks recovered at Site U1437 (older than ~9 Ma, see Age model) are thick monomictic andesitic lapilli-tuff and breccia (Unit VII) interpreted to be hyaloclastite deposits. Many andesite clasts show macroscopic textural evidence of quench fragmentation (e.g., quenched, concave margins, and emplacement at high temperature). The clasts and matrix were probably deposited very close to their volcanic sources, which were probably submarine andesite lavas or shallow intrusions.
Input from proximal andesitic volcanism waned by ~9 Ma, and deposition became dominated by polymictic lapilli-sized volcaniclastics and minor background hemipelagic sediment (Unit VI). The volcanic units were probably transported by and deposited from density currents carrying detritus from seamounts surrounding the Enpo-Manji Basin.
Unit VI was intruded by a quartz-phyric rhyolite-dacite sheet dated at 13.6 +1.6/−1.7 Ma (see Geochemistry).
Continued deposition became dominated by monomictic volcaniclastic units (reversely graded tuff and matrix-supported lapilli-tuff) and tuffaceous mudstone during 7.5–9 Ma (Unit V). The volcaniclastic deposits containing rare plutonic clasts probably formed from medially or distally derived eruption-fed density currents transporting cognate or accidental lithic clasts.
Deposition of tuffaceous mudstone continued and was briefly overwhelmed by waxing periods of density current emplacement (Unit IV). Rare shell fragments in Unit IV suggest a nearby island, perhaps the emergent Manji Seamount, at this time (6.2–7.5 Ma, see Background and objectives). These density currents deposited thick, coarse-grained tuff and polymictic lapilli-tuff that probably formed by transport of detrital volcaniclastic sediment down the slopes of basin-bounding seamounts.
Sedimentation from 6.2 to ~5.3 Ma was dominated by approximately equal input from pelagic and volcanic sources, resulting in deposition of intercalated tuffaceous mudstone and thin coarse-grained tuff and minor lapilli-tuff (lower half of Unit III). Discrete intervals of coarse volcaniclastics suggest that they may have been derived from a source within the basin over a short period of time and were intermittently able to overwhelm the background sedimentation.
Volcanic input waned and background hemipelagic sedimentation became overwhelmingly dominant in the upper half of Unit III (~5.3–4.4 Ma). Although the frequency and intensity of volcanism was lower (reflected in thinner tuff layers), ash was still regularly deposited in the area and mixed with hemipelagic mud.
Near the top of Unit III, a submarine debris flow or partly disaggregated slump deposited matrix-supported tuffaceous consolidated breccia with lapilli and deformed tuffaceous mudstone intraclasts. The size of the clasts and the tuffaceous matrix suggest that the debris flow originated from a proximal submarine volcano. This was a single instantaneous depositional event. Background hemipelagic sedimentation, punctuated by the deposition of ash layers, continued unabated.
Hemipelagic sedimentation was abruptly overwhelmed by a period of evolved explosive volcanism (~4.3 Ma) resulting in the deposition of pumice-rich tuff, lapilli-tuff, and lapillistone intervals (Unit II).
Volcanism waned rapidly, leading to a return of the dominance of hemipelagic sedimentation. As before, background sedimentation was frequently punctuated by ash-depositing proximal, medial, and distal volcaniclastic intervals (Unit I).
Sedimentological and lithologic processes
Lithification
One of the first-order observations at Site U1437 is that the transition from unconsolidated sediment to fully consolidated sedimentary rock (Figure F25) occurs progressively throughout the uppermost several hundred meters in Hole U1437B, and lithification is complete by Core 350-U1437D-1R (445 mbsf). At this point, core description switched to the use of rock rather than sediment names. This transition is accompanied by distinct changes in core disturbance (from biscuiting to fracturing or brecciation) and corresponds to changes in coring technology used (i.e., APC to XCB and RCB). This change occurs simultaneously in all lithofacies: tuffaceous mud becomes tuffaceous mudstone and ash becomes tuff. No changes in mineralogy or microfossil preservation occur across this transition.
Compaction
Cores described from Site U1437 show clear evidence of having experienced vertical compaction, for example, flattened pumice lapilli and deformed worm burrows. Compaction of sediment during burial is responsible for (1) reduced porosity and expulsion of pore fluids; (2) densification of sediment, which increases the effectiveness of diagenesis, cementation, and alteration, ultimately leading to lithification; and (3) vertical contraction of the sediment pile. Densification and porosity reduction need to be taken into account in estimation of the sedimentation rate. A simple vertical (1-D) compaction model was derived for Holes U1437B and U1437D (0–1096.69 mbsf), based on measurements of strain markers (Figure F115) in the tuffaceous mudstone lithofacies of Units I–III and lapilli in a lapilli-tuff interval in Unit IV (Core 350-U1437D-70R-6; 1072.87–1074.31 mbsf)
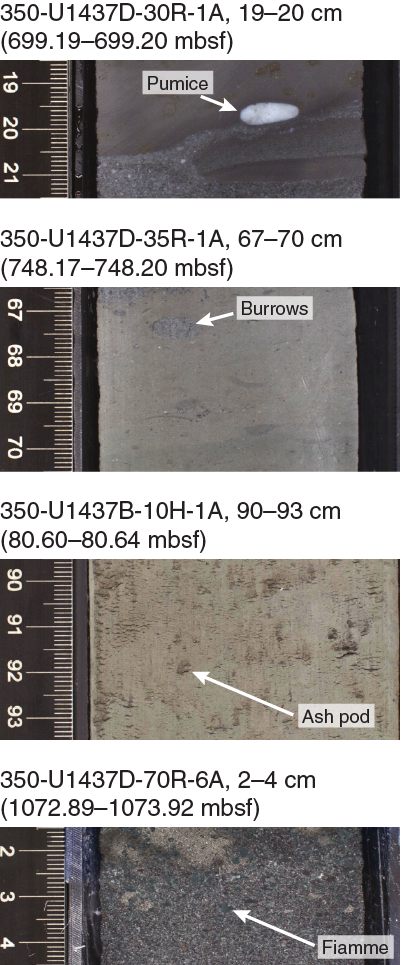
Figure F115. Objects used for strain analysis.
Strain markers were identified and measured from core scan images of the split or sawn core halves to 1074.31 mbsf. The first section of every fifth core (e.g., Sections 350-U1437B-5H-1, 10H-1, 15F-1, etc.) was analyzed with a goal of 10 markers (i.e., n = 10); when this was not possible, the second section was analyzed, and so on. The 200 objects used as strain markers are worm burrows (n = 152), ash pods (n = 36), and pumice lapilli and fiamme (n = 12; Figure F115). All analyzed intervals have a minimum of 8 objects with the exception of Cores 350-U1437B-5H, 10H, 15F, and 20F (n = 5, each); 25X (n = 7), and 55X (n = 1). Although these objects are assumed to have originated as spheres, or in two dimensions, circles, for the purpose of this analysis none of these strain markers are ideal for estimating strain. The objects available can be used with caution, especially if corrected with other data, for example, porosity.
The lack of obvious asymmetry in objects and the consistent subhorizontal fabric (i.e., the core is perpendicular to bedding) indicate the noncoaxial (“simple”) shear strain was negligible and that a 1-D coaxial (“pure”) shear strain model is applicable. This allows for the axial ratios (vertical length [V] divided by horizontal length [H]) of ellipses to be measured. The data are presented as percent extension (e):
where shortening (vertical compaction) is negative, the extension is positive, and a circle (typically assumed to be nondeformed) would be 0%.
Plotting strain data against porosity (Figure F116A) reveals that porosity does not change with strain at high porosity at 0–410 mbsf (Core 350-U1437B-52X). Deeper than ~410 mbsf, a positive linear correlation exists between porosity and strain. Because strain is measured in discrete objects in the sediment or sedimentary rock, it records shear strain rather than volume strain (i.e., reduction in porosity without deformation of the solid). Shear strain inevitably changes porosity as the rock and pore spaces deform; therefore, the absence of a decrease in porosity shallower than ~410 mbsf despite a range of apparent strains (−80% to +40%) is not easily explainable. The discrepancy between apparent (uncorrected) strain and porosity shallower than ~410 mbsf is interpreted to be the result of the variability in the predeformation shapes of objects, compounded by core extension where APC cores have been stretched vertically. Apparent compaction (≤−36%) not accompanied by a reduction in porosity is attributed to originally elliptical (1:1.8) objects, rather than circular. As none of the objects can be expected to have started spherical or circular, this is reasonable, especially considering that worm burrows, whatever their true cross-sectional shape, intersect the core at all orientations. Taking ~36% as an arbitrary cutoff value that discriminates between valid and invalid strain estimates, we can correct for the irregular shapes. Thus,
uncorrected e − 36% = corrected e,
where the corrected 0% strain value corresponds with the onset of covariance in strain and porosity at ~410 mbsf (Figure F116B).
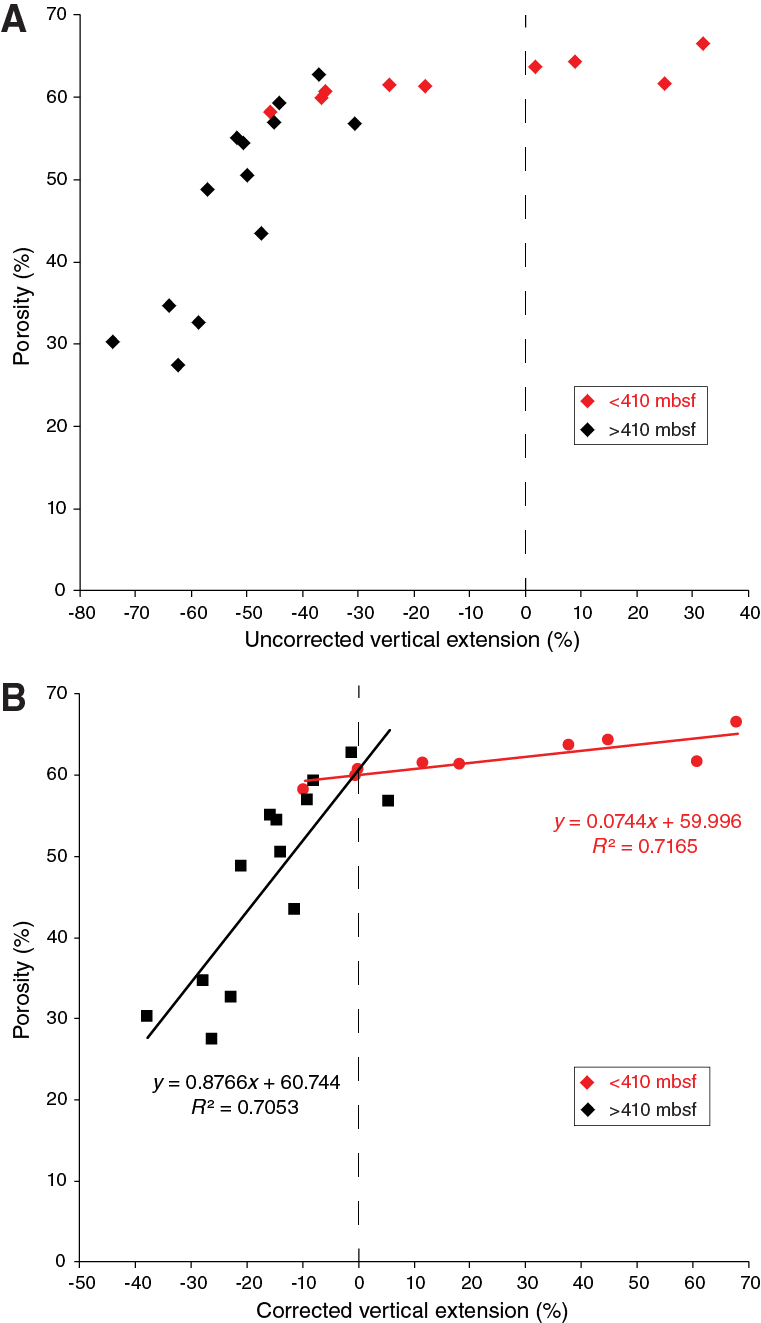
Figure F116. Compaction vs. porosity plots.
Between 0 and ~410 mbsf (Cores 350-U1437B-1H to 51X), the strain-depth relationship is not linear and most cores have experienced extension (≤+68%), with the effect decreasing with increasing depth. Corrected vertical strain increases linearly with depth deeper than ~410 mbsf (Cores 350-U1437B-52X to 350-U1437D-73R) from ~0% (~410 mbsf) to approximately −34% (1096.96 mbsf), corresponding to a rate of 1% every 25.2 m (Figure F117). Deeper than ~410 mbsf, compaction and porosity share a positive linear relationship at a rate of 0.87% porosity per 1% strain (Figure F116B). The persistence of simple linear relationships between depth, porosity, and strain between ~410 and 1074 mbsf suggests that Units I–IV share a common compaction history not interrupted by major discontinuities (e.g., unconformities) and that no intervals were overcompacted.
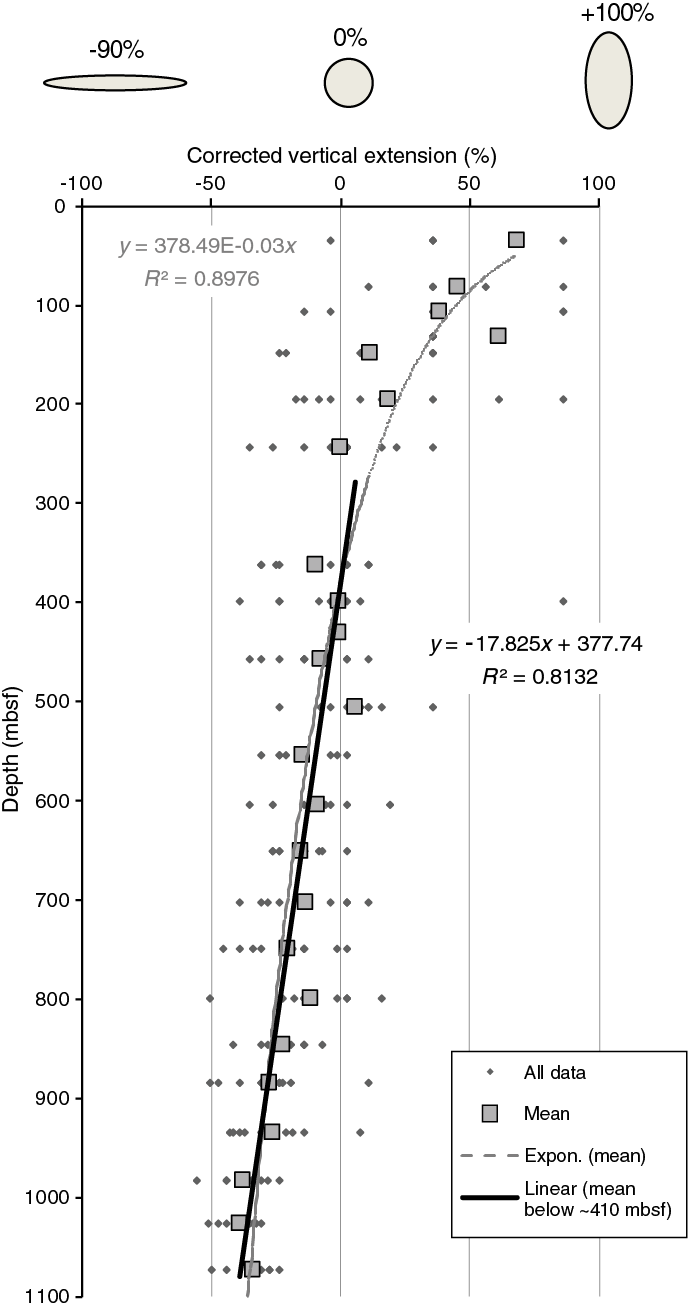
Figure F117. Compaction vs. depth.
Alteration
Alteration of tuffaceous mudstone in Units I and II comprises thin layers of green clay minerals, possibly glauconite, and pyrite clots. Glauconite is a mixed-layer mineral composed of smectite and glauconite mica (nonexpandable) (Odin and Matter, 1981). It mostly forms as pseudomorphs of organic or inorganic solid debris because of chemical exchange with pore water or seawater at the sediment/seawater interface. Although glauconite contains both Fe3+ and Fe2+ ions, the lack of a clear relationship between the abundance of the two valences in glauconite can be associated with biogenic pyrite owing to the reducing properties of organic matter in the environment (Velde, 2003). Although most glauconite occurrences are associated with intertropical domains at shallow water depths (125–250 mbsl) and low sedimentation rates (Meunier, 2003), glauconite pellets found on the abyssal plain of the Japan Sea are considered autochthonous (Föllmi and von Breymann, 1992). Additionally, dissolved sulfide (HS− or H2S) is available in sediment and sedimentary rock near the seafloor through seawater sulfate reduction by anaerobic bacteria. During diagenesis, the dissolved sulfide bonds with other metals to precipitate sulfide minerals (Robb, 2005), including pyrite or greigite (see Paleomagnetism). At Site U1437, sulfides are present as pyrite clots in association with green clay minerals in the inner zones of worm burrows (e.g., intervals 350-U1437B-15F-3, 61–75 cm, and 19F-3, 77–83 cm) and in foraminifer shells. Tuffaceous mudstone in Unit III exhibits more pervasive green alteration developed within some intervals, presumably indicating the presence of green clay minerals such as Fe-rich chlorite.
Altered tuff, lapilli-tuff, and lapillistone layers in Units II–VI exhibit replacement of pumice and glass shards by palagonite, zeolite, oxyhydroxides, and brownish clay minerals. These minerals are optically identified as smectite, although the clay mineralogy could not be verified on board without XRD analysis. From Core 350-U1437D-42R in the lower part of Unit III to Unit VII, tuff layers exhibit more pervasive greenish alteration, presumably indicating higher abundance of Fe-rich chlorite or chlorite-smectite mixed-layer minerals. The intensity of glass alteration in the volcaniclastic intervals increases downhole from Unit II to Unit VII (with the exception of the upper part of Unit VII). Fresh glass commonly occurs in Unit II and the top of Unit III, whereas it is totally transformed to palagonite, zeolite, oxyhydroxides, and brown clay minerals, optically identified as smectite, and, locally, chlorite from the bottom of Unit III downhole. The upper part of Unit VII surprisingly shows fresh colorless glass with only slight localized alteration. Primary minerals are fresh to Unit VI, with a few amphibole grains in Unit III showing partial replacement by chlorite. By Unit VII feldspar phenocrysts are moderately altered into clay and epidote, and orthopyroxene is transformed into brownish aggregates of clay minerals. Clinopyroxene remains fresh throughout all cores. The downhole transition from smectite-dominated alteration to chlorite-bearing assemblages reflects progressive increase in burial metamorphism (Velde, 2003).
Volcanic clasts are present in the volcaniclastics of Units II, V, VI, and VII. Vitric clasts are typically altered to mixed-layer chlorite-smectite and chalcedony with minor prehnite filling vesicles (e.g., Figure F64). Lithic clasts are slightly to highly altered and have alteration assemblages including epidote, biotite, clay, and opaque minerals. Volcanic clasts in Units IV–VII also show moderate alteration of feldspar phenocrysts, and their vesicles are filled with zeolite, clay, and acicular epidote. The presence of biotite, prehnite, and epidote in some lithic clasts supports higher temperature alteration (>300°C; Ishizuka et al., 2002). The higher alteration temperature of clasts suggests alteration proximal to a volcanic heat source followed by transportation to the site of deposition and low-temperature burial metamorphism. The nearby Manji Seamount is a likely source candidate of near-vent, high-temperature altered clasts (Ishizuka et al., 2002).
Origin and significance of the tuffaceous mud/mudstone
The first-order lithostratigraphic characteristic of Site U1437 is its abundant tuffaceous mud that contains >25% fine devitrified glass shards and crystals. Of its uppermost 1312 m, 73% (Units I–V) is tuffaceous mud or mudstone. Those lithologies are twice as abundant as tuff or coarser volcaniclastic rocks in Units III and V and seven times more abundant than ash and lapilli in Unit I. Tuffaceous mudstone is subordinate in Unit VI (11%) and largely absent from Units II and VII. This lithofacies was referred to as “clay with vitric silt” and its lithified equivalent during ODP Legs 125 and 126 (Fryer, Pearce, Stokking, et al., 1990; Taylor, Fujioka, et al., 1990) in the fore arc and as “clay with dispersed ash” and its lithified equivalent during ODP Leg 185 (Plank, Ludden, Escutia, et al., 2000) in sediment on the Pacific plate ~75 km east of the Bonin Trench, to which comparisons will be made below. Figure F1 shows the location of the sites drilled during these expeditions.
The abundance of such fine-grained sediment was surprising considering (1) the abundance of rear-arc volcanoes within ~25 km of Site U1437 that are known to have erupted during the last 4 My (Ishizuka et al., 2003b), (2) the greater abundance of ash to lapilli-tuff and lapillistone of the same age at Site 792 in the fore arc that is about the same distance from the arc front, and (3) the presence of two large (~100 km3) rhyolitic arc-front volcanoes with calderas directly upslope to the northeast (Myojinsho and Myojin Knoll).
We attribute the abundance of tuffaceous mud/mudstone and the relative paucity of ash and coarser volcaniclastic sediment to several factors. First, the slope of the rear arc is slightly more gentle than the fore arc, and Site U1437 is 15 km farther away from the arc-front volcanoes than Sites 792 and U1436 (Figure F1). The average slope from the arc front to Site U1437 is 2.8%, whereas it is 3.6% to fore-arc Site 792, and the two sites are ~75 km versus 60 km away from the arc front, respectively. Second, a >200 m deep depression, the Myojin Rift, currently separates the arc front from the volcano-bounded basin (Smith and Landis, 1995) between the Enpo-Manji seamount chains in which Site U1437 is located. Results from Leg 126 showed that the active rifts immediately west of the arc front, such as the Myojin Rift, developed between 1.5 and 2.4 Ma (Taylor, 1992). No such basin impedes sediment transport to the fore arc. The ~50% decrease in sedimentation rate at Site U1437 at about 2 Ma (see Age model) may be related in part to the development of the Myojin Rift starting at that time. These features (slope, distance, and intervening intra-arc basin) may have inhibited delivery of coarse sediment from the arc front to Site U1437, especially in the last 2 My, with less restriction of the supply of fine-grained ash. Third, subaerially dispersed ash and lapilli fall deposits from arc-front volcanoes are less likely in the rear arc because winds and currents are generally westerly. Fourth, Site U1437 was intentionally located slightly north of the axis of the Enpo-Manji Basin (Figure F6). This upslope location was chosen to avoid coarse- or medium-grained arc-front–derived sediment transported by density currents from arc-front sources (see Background and objectives). Fine-grained deposits from such currents are preserved only if they were thick enough, or buried fast enough, to survive erosion by bottom water currents and dispersion by bioturbation. Fifth, the proximal rear-arc volcanoes active in the last 4 My (the “back-arc knolls”) are relatively small (<1000 m above their base), deep (>1000 mbsl), and mostly basaltic in composition (Hochstaedter et al., 2000; Ishizuka et al., 2003b), even though half of those sampled have some rhyolite pumice (Tamura et al., 2009). Consequently, they may not have delivered coarse volcaniclastic sediment beyond their break-in-slopes that are situated >20 km from Site U1437, but they may have yielded fine evolved glass by a variety of eruptive processes. Finally, the Izu arc may have a kind of orographic effect on proximally erupted ash-sized particles from the west (i.e., from the Izu western seamount rear-arc volcanoes) such that the Kuroshio Current or other currents might sweep ash and mud particles into west-opening basins such as the Enpo-Manji Basin. This effect may also apply to fine particles from distal sources (e.g., fluvial input and loess from mainland Asia and volcanic ash from the Ryuku arc). Even though Kuroshio Current velocities >30 cm/s are confined to depths <1000 m east of the arc and north of Site U1437 (Qui, 2001), bottom currents might sweep fine particles into the Enpo-Manji Basin, creating sediment drifts or slugs. In contrast, the stronger, shallower currents may redistribute ash from submarine rear-arc eruptions and may sweep ash from eruptions at the arc front away toward the fore arc and trench. Evidence for this kind of winnowing effect at the front is found in the Sumisu caldera and its surroundings (Tani et al., 2008).
Some combination of these factors may explain the abundance of Neogene tuffaceous mud/mudstone in Units I–V at Site U1437. Submarine lava and proximal coarse volcaniclastic detritus may often be highly localized, no more than a few kilometers from their source. In particular, coarse vesicular volcanic clasts may not be produced by submarine volcanoes if their volatile content is too low and the hydrostatic pressure (i.e., water depth) too great (Head and Wilson, 2003). Consequently, input of coarse volcaniclasts from submerged rear-arc volcanoes to the adjacent basins may be very limited. Thus, the primary sediment size at Site U1437 is dominated by clay and ash, corresponding to the background hemipelagic sedimentation. The ash may be lofted into the water column by small submarine rear-arc eruptions, resedimented by mass-wasting events, and reworked by ocean currents.
The abundant tuffaceous mud/mudstone in the upper parts of Site U1437 are, therefore, interpreted to record background sedimentation of hemipelagic clay and carbonate mixed with substantial volumes (>25%) of dispersed volcanic material contributed directly from explosive eruptions or indirectly from resedimentation. Indeed, there is a continuum between tuffaceous mudstone and tuff in all lithologic units where they both occur. Tuff intervals typically grade upward into foraminifer-bearing tuffaceous mudstone, and the tuffaceous mudstone in Unit V even contains pumice pebbles. The bioturbation that is common in the tuffaceous mudstone and in the upper dilute portion of ash or tuff intervals adds to ash dispersion.
The sedimentation rate at which Unit I was deposited is much greater than on the Izu outer arc high (ODP Site 786) or at ODP Site 1149 on the Pacific plate ~75 km east of the trench (Figure F1). Both sites are <450 km east of Site U1437 at about the same latitude. Since 5 Ma, the sedimentation rate in the Izu rear arc has been higher than in the fore arc (ODP Sites 792 and 793) despite the latter being downslope, downwind, and downcurrent from the arc-front volcanoes, increasing the potential for deposition from pyroclastic ash falls over water and subaqueous density currents. Since 4 Ma, the average sedimentation rate in the rear arc was even higher than at the arc front between Sumisu Caldera and Torishima. Similar tuffaceous mud/mudstone of the same age occur at all of these sites. In detail, the sedimentation rate at Site U1437 was highest when sediment was the muddiest: in the lower half of Unit I and the top 40% of Unit III (see Age model). In summary, tuffaceous mud was deposited more rapidly during the Neogene in the rear arc than in its surroundings.
The importance of a rear-arc volcanic component is illustrated by comparing the radioactivity of the tuffaceous mud at rear-arc Site U1437 to that of sediments of similar age at Site U1436 in the fore arc. NGR values at Site U1437 are about twice that of similar age tuffaceous mud at Site U1436 (see Physical properties) that should otherwise have similar inputs, especially from arc-front volcanoes. In addition, intervals described as tuffaceous mud or mudstone at Site U1437 have higher NGR values than do the intercalated intervals of ash, especially mafic ash, in the same core section. That is, discrete ash layers, some of which may come from the arc front (see Geochemistry), have lower K and Th than the mud, so the simple addition of ash from the arc front cannot explain the elevated NGR in rear-arc tuffaceous mud/mudstone.
Gamma ray attenuation (GRA) logs (see Downhole measurements) add detail to the NGR comparison. K and especially Th concentrations from logging are lower at Site U1437 than in the Cenozoic hemipelagic clay and dispersed ash of the westernmost Pacific plate at this latitude (Units I and II of Site 1149; Plank, Ludden, Escutia, et al., 2000) that represent the background hemipelagic detrital component of the region including Site U1437 (Figure F118). The silicate component of Neogene sediment at Site 1149 has been interpreted as being >88% Chinese loess or Ryuku arc felsic ash plus <12% ash from the Izu arc front (Scudder et al., 2009). The same sources should be present at Site U1437 so that its lower GRA, and especially Th content, must reflect a more dominant influx from the Izu arc. As with NGR values for cores, gamma ray downhole logging reveals that tuffaceous mud has higher K and Th contents and Th/K2O ratios than discrete ash layers and that mud-poor Unit II has lower K and Th contents than the muddier Units I and III (Figure F119).
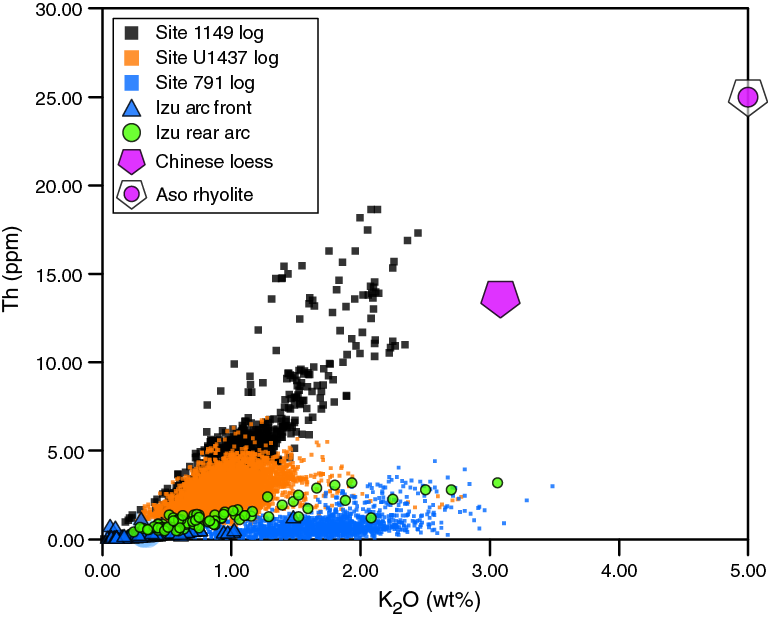
Figure F118. Th and K2O.
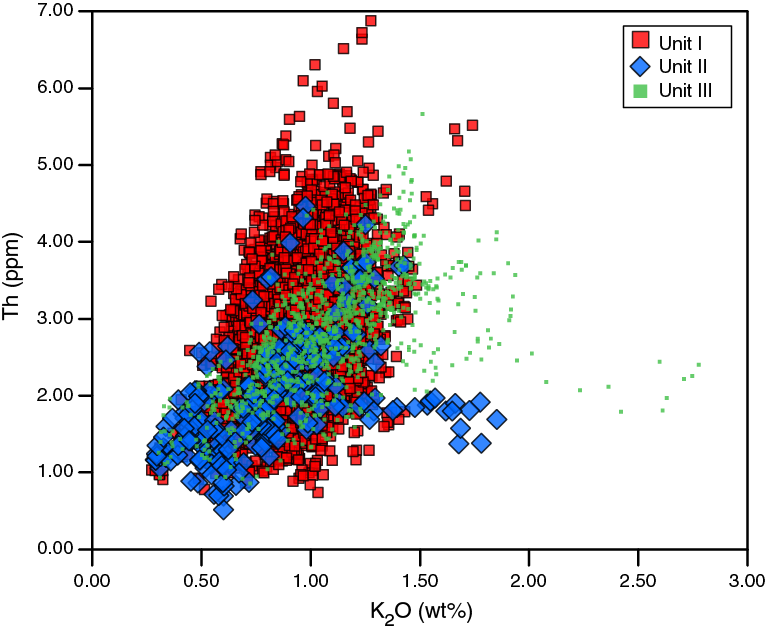
Figure F119. K2O and Th logs, Units I–III.
Shipboard measurements of trace element concentrations of tuffaceous mud are consistent with it containing substantial ash from somewhere in the Izu arc. Zr and Y are unaffected by alteration and merely diluted by foraminfers. The Zr/Y ratio in tuffaceous mud is 2–3, decreasing downhole (see Geochemistry). That is within the range of Izu arc front and rear arc and much lower than in loess (~9; Chen et al., 2001). Moreover, the average concentrations of Zr and Y in tuffaceous mud/mudstone are 90% of their average values in ash/tuff, which in turn are slightly lower than in lapilli and lapillistone (see Geochemistry), reflecting dilution of ash by mud. That is, tuffaceous mud, ash, and lapilli seem to share a common source and tuffaceous mud has a high mass fraction of it.
The sources of volcanic ash cannot yet be determined with confidence, but several features suggest that much of it comes from rear-arc volcanoes. First, tuffaceous mud is too Th-poor, and the site is too distant, for most of the ash to come from Kyushu (cf. Shibata et al., 2013). Second, rear-arc volcanoes are smaller and deeper than those of the arc front, so products of their submarine eruptions are more likely to remain in the local water column. Because water and air currents generally move west to east across the arc, products of explosive submarine rear-arc volcanism may be concentrated in rear-arc basins, whereas the equivalent products of volcanic-front volcanism may be swept toward the fore arc and trench. Third, as also noted before, the ratios and even the concentrations of the most alteration-resistant trace elements measured shipboard (Zr and Y) are very similar between the tuffaceous mud and volcaniclastic intervals, indicating that their volcanic component has a common source. Fourth, the sedimentation rate in the rear arc is out of phase with rates east of the arc front, where increased rates since ~2 Ma have been attributed to increased volcanic output of the arc, especially of felsic ejecta, after rifting commenced (Taylor, 1992; Scudder et al., 2009). In contrast, rates in the rear arc decreased at about the same time, perhaps because new rift basins reduced sediment flow to the west. Whatever the cause, the decrease argues against the arc front being the primary source of ash in rear-arc tuffaceous mud. Finally, the presence of possible hornblende and very rare biotite in rear-arc tuffaceous mud is more consistent with a rear-arc than frontal-arc source. These minerals are present in rear-arc volcanic or plutonic rocks (e.g., Ishizuka et al., 2002; Machida and Ishii, 2003) but are unknown at the Izu arc front, even in rhyolite (e.g., Nishimura et al., 1992).
In summary, the abundant tuffaceous mud/mudstone intervals in Units I–V of Site U1437 and the resulting high sedimentation rate are interpreted as reflecting a large input of ash from the Izu arc front, rear arc, or both, together with clay from Asia and biogenic carbonate. The sedimentary record of the volcanism was just finer grained than anticipated. Characterization and quantitative estimates of the relative proportion of components in the tuffaceous mud await postcruise mineralogical, elemental, and isotopic analyses, but at least three components seem to be present. Foraminifers are visible and can explain the high CaCO3 and Sr contents. A distal source such as Chinese loess or Kyushu felsic ash is required to explain the high concentrations of Th and perhaps other highly incompatible trace elements that exceed those of Izu arc volcanic rocks. The third and probably most abundant component is Izu arc volcanic ash, and we predict that a substantial fraction of it comes from rear-arc sources for the reasons given above. The higher sedimentation rate than in the fore arc probably reflects the combination of accommodation space in volcano-bounded basins (e.g., the Enpo-Manji Basin), additional volcanism in the rear arc, and the role of westerly ocean currents that retain fine sediments in those basins and sweep fine sediments into them.
Interpretation of the volcanic units at Site U1437
Site U1437 contains many hundreds of intervals (n = 2677) of volcaniclastic material of mafic to evolved composition. The upper 1320 m of Site U1437 (Units I–V) is chiefly composed of thin to thick intervals of tuffaceous mud or mudstone (53%) interbedded with intervals of ash or tuff (31%) (see Table T2). Thin to very thick monomictic or polymictic lapilli-tuff and lapillistone intervals are dominant in Units II and IV and subordinate in Unit V. Unit VI (1320.00–1459.80 mbsf) is dominated by successions of thick to very thick polymictic lapilli-tuff and lapillistone interbedded with tuffaceous mudstone and tuff. Unit VII (1495.80–1806.50 mbsf) is dominated by in situ and resedimented hyaloclastite intercalated with bedded intervals of polymictic lapilli-tuff, lapillistone, and tuff. One intrusion of rhyolite-dacite (igneous Unit 1) occurs in Unit VI (1388.86–1390.07 mbsf).
The diverse lithofacies described above are grouped into several general lithofacies for the purpose of interpretation.
Evolved ash/tuff and mafic ash/tuff
- Unit I: evolved ash and evolved tuff
- Unit I: mafic ash and mafic tuff
- Unit I: bimodal ash layers
- Unit II: dark gray evolved tuff
- Unit III: dark gray evolved tuff
- Unit V: dark gray evolved tuff
- Unit V: brown tuff
- Unit VI: dark tuff
- Unit VII: tuff and evolved tuff
The sharp basal contacts, normal grading, and well-sorted nature of the silt- to sand-sized grains in the evolved ash/tuff and the mafic ash/tuff intervals (e.g., Figure F25) suggest that they were deposited from eruption-fed or resedimented seafloor-hugging density currents or suspension settling of subaerially distributed ash through the water column. Distinguishing between these two modes of transport and deposition is commonly extremely difficult, in particular because high concentrations of particles settling from vertical density currents can transform into lateral density currents when they reach the seafloor (Carey, 1997; Manville and Wilson, 2004). Most tuff intervals at Site U1437 are bioturbated at their top, destroying any further evidence of emplacement processes.
Intercalated white to gray-green evolved tuff
- Unit III: intercalated white to gray-green evolved tuff
- Unit IV: fine-grained light green tuff
- Unit V: intercalated white to gray-green evolved tuff
Intercalated white to gray-green evolved tuff intervals (e.g., Figures F57, F69, F70) are dominant at the base of Unit III and minor in Unit V, and a similar lithofacies, named fine-grained light green tuff is common at the base of Unit IV. White beds are made entirely of glass shards, whereas gray-green beds are a mixture of glass shards, pumice grains, and crystal fragments; color intercalations (white to gray-green) reflect componentry segregation, probably during transport and at deposition.
The large quantity of very fine glass shards in this facies (particularly in the white layers) is typical for products of shallow-water (<100 m water depth to subaerial) phreatomagmatic eruptions with extremely efficient glass fragmentation (e.g., Zimanowski and Büttner, 2003). Alternatively, it could represent extreme hydraulic sorting related to long-distance transport of products from subaerial (i.e., dry) pyroclastic eruptions. Repetition of this characteristic lithofacies over successive centimeter to several meter thick intervals and the overall absence of background sedimentation within it strongly suggest waxing and waning input over a short period of time (possibly days to weeks) for each interval. Therefore, the intercalated white to gray-green evolved tuff intervals were probably deposited by the unsteady supply of fine-grained volcaniclastic material from pulsating eruption-fed density currents and modified by turbulence in the most dilute parts of the density current (Branney and Kokelaar, 2002) and resedimentation by bottom currents (e.g., cross bedding). Intercalated white to gray-green evolved tuff lithofacies decrease in abundance and interval thickness uphole in Unit IV, which suggests that this type of sediment contribution waned with time, probably from either the subsidence or erosion of source volcanoes to >100 mbsl.
Monomictic pumice/fiamme lapilli-tuff and lapillistone
- Unit I: lapilli-ash, lapilli-tuff, and lapillistone
- Unit II: intercalated evolved tuff, pumice lapilli-tuff, pumice lapillistone, and tuff-breccia
- Unit V: monomictic white to light gray evolved lapilli-tuff
- Unit VI: lapilli-tuff, lapillistone, and tuff-breccia
Monomictic pumice and fiamme lapilli-tuff and lapillistone intervals (e.g., Figures F44, F76, F84) are dominant in Unit II, subordinate in Unit VI, and minor in Units I and V. They are interpreted to be deposited from seafloor-hugging density currents that transported ash, pumice lapilli, pumice grains, and crystal fragments. Basal structures indicate erosion by density currents, and the variably graded deposits preclude transport only through vertical settling (i.e., pyroclastic fall deposits). Stratification and the presence of crystal-rich bands within the intervals suggest unsteady supply of material from density currents. Their source remains unknown, but the thickest and graded intervals (e.g., in Unit II) are inferred to be eruption fed based on the abundance of crystal fragments, evolved glass shards, and normal coarse-tail grading of pumice grains and lapilli.
Polymictic evolved lapilli-tuff and lapillistone
- Unit IV: normally graded tuff, polymictic lapilli-tuff, and lapilli-stone lithofacies
- Unit VI: lapilli-tuff, lapillistone, and tuff-breccia
- Unit VII: graded and stratified lapilli-tuff and lapillistone
Bedded polymictic evolved lapilli-tuff and lapillistone intervals (e.g., Figures F66, F86) are common in Units IV, VI, and VII. They consist of relatively well sorted, stratified or unstratified, variably graded intervals that are commonly very thick and are clast or matrix supported. These characteristics suggest deposition from voluminous high-concentration density currents that are commonly derived from mass wasting of evolved rocks from islands or seamounts or from multicycle resedimentation of such products. Alternatively, these facies can be products from pyroclastic eruptions that remobilized large volumes of lithic clasts. The presence of macrofossil shell fragments in Unit IV suggests shallow water, possibly a nearby island (e.g., an emergent phase of the Manji Seamount), and are consistent with the possible products of shallow-water phreatomagmatism in Units III, IV, and V represented by intercalated with to gray-green evolved tuff intervals. Interbedded tuffaceous mudstone is minor, indicating rapid accumulation.
Matrix-supported tuffaceous consolidated breccia with lapilli and deformed tuffaceous mudstone intraclasts
- Unit III: matrix-supported tuffaceous consolidated breccia with lapilli and deformed tuffaceous mudstone intraclasts
The matrix-supported tuffaceous consolidated breccia with lapilli and deformed tuffaceous mudstone intraclasts in Unit III consists of granule- to pebble-sized volcanic clasts and pebble- to boulder-sized deformed tuffaceous mudstone intraclasts supported in a poorly sorted soft-sediment deformed tuffaceous mudstone matrix (e.g., Figure F60). Paleomagnetic data show inconsistent reversal values in the intraclasts, implying that they rotated during transport (see Paleomagnetism). FMS images suggest that the interval consists of several domains, consistent with core descriptions (see Downhole measurements). This facies strongly suggests deposition from a slump that partly disaggregated or from a submarine debris flow that eroded the seafloor and entrained tuffaceous mudstone blocks as intraclasts.
Black evolved lapilli-tuff and lapillistone
Black evolved lapilli-tuff and lapillistone intervals present in Unit VII (e.g., Figure F99) are interpreted as proximal deposits of minimally mobilized and resedimented hyaloclastite. The ubiquitous presence of glassy, nonvesicular, evolved volcanic clasts but the minor amount of crystal fragments and absence of glass shards in the matrix between clasts indicate autobrecciation in a submarine setting. The few nonglassy clasts in the deposit probably result from minor incorporation of accidental clasts during transport, thus suggesting deposition in a relatively proximal setting from the source vent or magma-body front. The uppermost interval is normally graded, indicating some sorting and organization within the density current, but the remainder is nongraded and massive, suggesting minimal resedimentation.
Nongraded, nonstratified, very poorly sorted lapilli-tuff, lapillistone, tuff-breccia, and volcanic breccia
- Unit VII: nongraded, nonstratified, very poorly sorted lapilli-tuff, lapillistone, tuff-breccia, and volcanic breccia
Thick to extremely thick intervals of nongraded, nonstratified, very poorly sorted lapilli-tuff, lapillistone, tuff-breccia, and volcanic breccia (e.g., Figures F106, F108) occur in Unit VII and are interpreted as in situ hyaloclastite emplaced in coarse-grained, unconsolidated host sediment or as partly resedimented hyaloclastite. Clasts with perlitic textures, concave fractures, poorly inflated breadcrust textures, or ~1 cm thick quenched margins may be products of quench-fragmentation of submarine lava, but these features do not unambiguously indicate whether they are in situ. Domains of jigsaw-fit clasts may represent either larger peperitic clasts or apophyses emplaced at magmatic temperature and quenched and fragmented in a water-saturated sediment host. Some domains locally interrupt graded intervals of polymictic lapilli-tuff and lapillistone, suggesting mixing of andesite hyaloclastite with soft sediments and with other hyaloclastites. The overall extreme thickness of the lithofacies and absence of background sedimentation (e.g., tuffaceous mudstone) within Unit VII imply rapid accumulation.
Summary
Site U1437 was expected to sample volcanogenic material from various sources. It is located within the immediate depositional range of more than a dozen rear-arc seamount volcanoes and back-arc knolls and at least four major arc-front rhyolitic calderas, all of which are possible sources of volcaniclastic layers, in addition to far-field volcanism (see Background and objectives). There may have been time periods when the location of Site U1437 was bypassed by the coarse fraction of density currents or when density currents were not depositing at all. In any case, discrete volcaniclastic intervals are only those that were thick enough, or buried quickly enough, to survive erosion by bottom ocean currents and dispersion by bioturbation. Many tuffaceous mud/mudstone intervals contain the products of volcanic eruptions or volcaniclastic resedimentation, such as dispersed glass shards, igneous crystals, and bioturbated tuff laminae.
The Manji Seamount, from the top of which a few dredged samples were dated at 6.35–6.95 Ma (see Background and objectives), is the closest seamount; it is only 6 km northwest of Site U1437. Continuous reflectors between Manji Seamount and Site U1437 (see Background and objectives) imply that Units III–VII (and possibly Unit II) form part of the volcaniclastic apron around Manji or parts of its undated basement. In situ and resedimented hyaloclastites (Unit VII) indicate shallow intrusions and submarine extrusions at Site U1437 and therefore are at least 6 km away from the nearest large known volcanic edifice (i.e., top of the Manji Seamount). This suggests that Unit VII may represent part of the basement upon which Manji was constructed. Alternatively, it may indicate that volcanism was more widely dispersed throughout the rear arc and less restricted to the rear arc volcanic chains, at that time.
Volcanic periodicity
Volcaniclastic intervals within marine sediments have long attracted attention for their potential to provide a high-resolution temporal record of volcanic activity (“volcanic periodicity”) to study links between volcanism, the plate tectonic cycle, and Earth’s climate (e.g., Kennett and Thunell, 1975, 1977; Cambray and Cadet, 1994; Prueher and Rea, 1998; Kutterolf et al., 2013). Such questions can be addressed using the volcaniclastic record that has been drilled in the Quaternary to late Miocene (0–6.9 Ma; 6–1096 mbsf) volcaniclastic sediments at Site U1437. Combined, Holes U1437B and U1437D cored a 1097 m succession of tuffaceous mud and mudstone that is intercalated with abundant mostly centimeter to decimeter thick volcaniclastic intervals (average recovery = 80% ± 23%). The excellent biostratigraphic and magnetostratigraphic record (see Paleomagnetism, Biostratigraphy, and Age model) demonstrates that the volcaniclastic intervals represent a time series of volcanic events that produced volcaniclastic deposits rapidly accumulated and preserved within tuffaceous mud. This sequence provides an outstanding opportunity to search for evidence of volcanic periodicity, and if found, to speculate on the causes.
Methods
Shipboard data allow for preliminary investigation of volcanic periodicity on the basis of the lithologic descriptions and downhole logging data (see Downhole measurements) sensitive to the presence of volcaniclastic intervals. In this analysis, each volcaniclastic interval >1 cm thick is considered the product of a single volcanic event, regardless of grain size, depositional mode, composition, alteration, and thickness. The host sediment (tuffaceous mud/mudstone) was treated similarly; however, it is important to note that the number of tuffaceous mud/mudstone intervals is overestimated because intervals across core section boundaries are recorded as two distinct intervals. For each interval of tuffaceous mud/mudstone and volcaniclastics (e.g., tuff), the thickness, recovery rate (as given for the respective core), and depositional age were obtained. The depositional age of each interval is calculated using the depth-appropriate sedimentation rate (see Age model). The age model is considered reliable until 6.033 Ma (Chron boundary C3An.1n; 977 mbsf).
The next step is to calculate summary data, including the cumulative thickness of volcaniclastics versus host sediment and the abundance of volcaniclastic intervals per 100 ky. The time step of 100 ky, initially chosen arbitrarily, is a suitable balance between temporal resolution and minimal loss of data. Preliminary evaluations of the data show that correction for core recovery is necessary, as the average recovery rates vary from 100% ± 10% at 0–146 mbsf (<1.23 Ma, APC coring), to 51% ± 24% between 146 and 430 mbsf (1.23–2.9 Ma, XCB coring), and 80% ± 20% deeper than 430 mbsf (>2.9 Ma, RCB coring). A correction is applied to the number of volcaniclastic intervals per unit time (“abundance of volcaniclastics”). The abundances of volcaniclastic intervals were corrected linearly. For example, if three volcaniclastic intervals were recorded in a core with 50% recovery, the corrected number of volcaniclastic intervals is 6, assuming 100% recovery.
Finally, the abundance of volcaniclastics data were compared to downhole logging data sensitive to the presence of volcaniclastic intervals: GRA, resistivity, and MS (see Downhole measurements). The logging data covering the period from 1.25 to 5.7 Ma (148–937 mbsf) were averaged over 100 ky steps. All downhole logging data were collected only in Hole U1437D, which is displaced laterally by ~10 m from Hole U1437B in an area affected by normal faults. Thus, slight discrepancies in depth below seafloor shallower than 430 mbsf (~2.9 Ma) may occur, where lithologic data from Hole U1437B were matched with the logging data from Hole U1437D.
Results
Figure F120 compares the cumulative thickness of volcaniclastics and host sediment (as measured) to the recovery rate in order to assess the effect of core loss. Figure F121 shows clearly that low core recovery principally affects tuffaceous mud but has little visible effect on the far less abundant volcaniclastic intervals. Figure F122 further shows that the low recovery interval coincides with a maximum in sedimentation rate at ~1.9–2.5 Ma (230–360 mbsf) that is not accounted for by the host sediment or by the volcaniclastics, presumably due to their loss by coring. Note that the thickness of the host sediment is also comparatively low during another maximum in sedimentation rate at ~4.3–4.7 Ma (667–726 mbsf, Unit II). However, the loss in host sediment appears to be compensated by the coeval high flux of volcaniclastic sediment. These observations suggest that some of the missing thickness within XCB-drilled intervals might be due to preferential loss of volcaniclastic intervals.
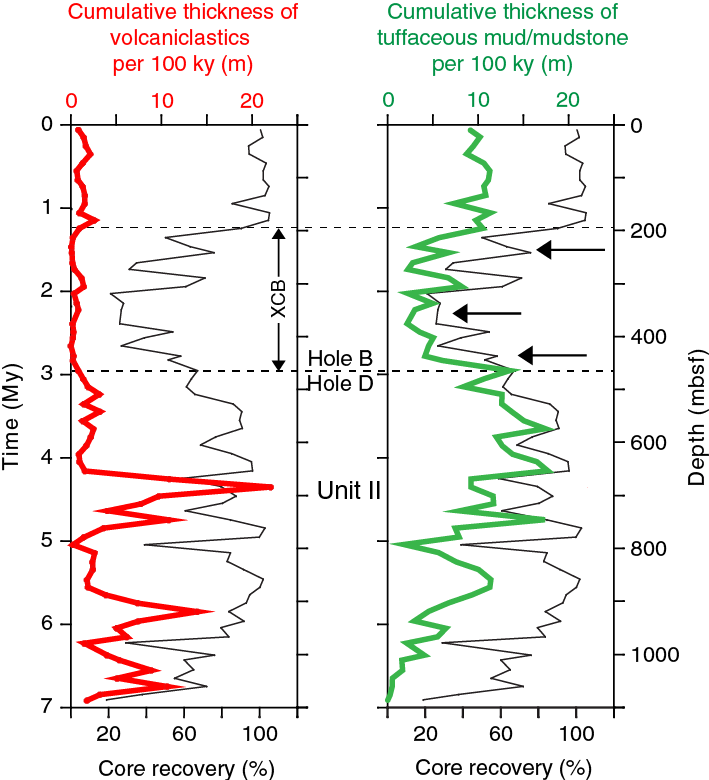
Figure F120. Cumulative thickness of volcaniclastic intervals vs. recovery rate.
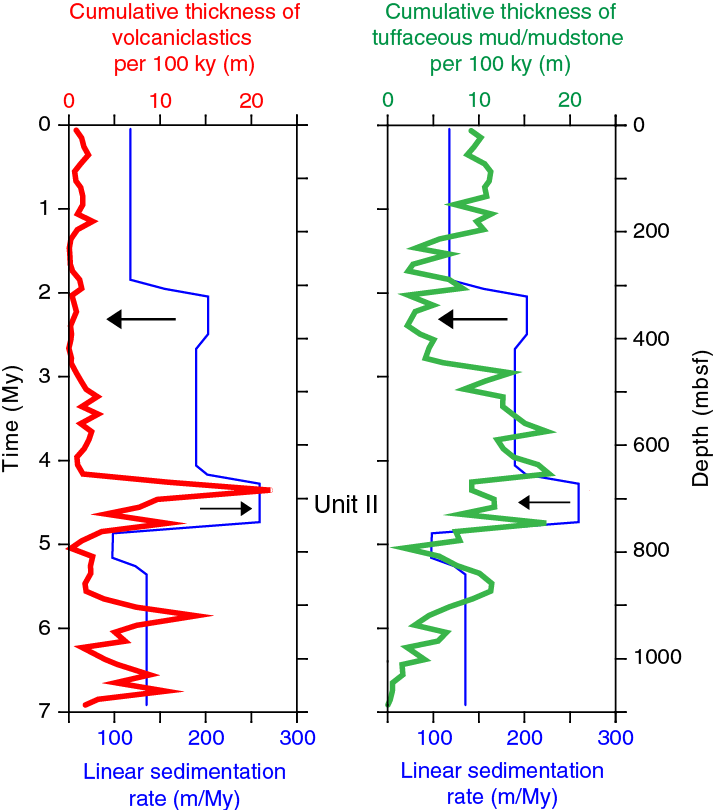
Figure F121. Thickness of volcaniclastic intervals vs. sedimentation rates.
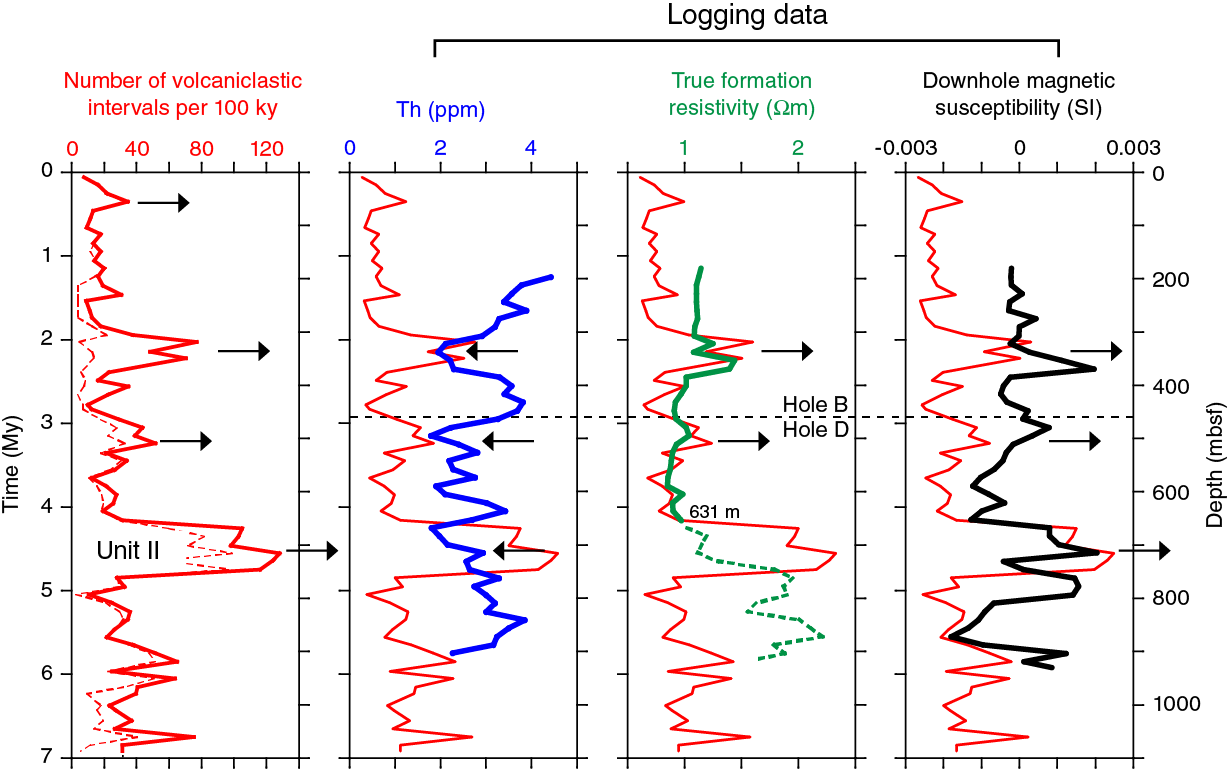
Figure F122. Volcaniclastic intervals vs. downhole logging data.
Figure F123 displays the number of volcaniclastic intervals corrected and uncorrected for core recovery. The corrected curve emphasizes the maximum abundance of volcaniclastics at 4.3–4.7 Ma (~Unit II) and displays two additional maxima at ~2.0–2.2 and ~3.1–3.2 Ma, respectively, and a minor peak at 0.35 Ma. Significantly, the ~2.0–2.2 Ma maximum abundance of volcaniclastics coincides with the maximum in sedimentation rate at ~1.9–2.5 Ma (230–360 mbsf), which suggests that the high sedimentation rate during this interval may be linked to a high influx of volcaniclastics.

Figure F123. Volcaniclastic intervals vs. core recovery and sedimentation rate.
Figure F122 compares the corrected maximum abundance of volcaniclastics to the downhole logging data. The Th abundance (in ppm) was selected from the GRA because it is most sensitive to the presence of volcaniclastic intervals. Thorium decreases at each of the three major volcaniclastic-rich peaks, which is consistent with volcaniclastic intervals being depleted in Th relative to the host sediment.
Resistivity increases at the two younger maxima in abundance of volcaniclastics at ~2.0–2.2 and ~3.1–3.2 Ma, but there is no correlation with the maximum abundance of volcaniclastics at 4.3–4.7 Ma. The resistivity increase at the younger maximum abundance of volcaniclastics agrees with the proposed increase in the abundance of volcaniclastic intervals that are more resistive. However, the significant increase in resistivity at ~4.1 Ma (631 mbsf) is unrelated to the abundance of volcaniclastics and is mostly likely caused by a depth-dependent change in physical properties of the rock, which also shows in the concurrent significant decrease in porosity and increase in density (see Physical properties). We suggest that deeper than 631 mbsf (~4.1 Ma), resistivity ceases to be a satisfactory discriminator between volcaniclastic intervals tuffaceous mudstone intervals, and instead, responds to physical property variations that are unrelated to the primary lithologies.
MS increases concurrently with all three major maxima in abundance of volcaniclastics at ~2.0–2.2, ~3.1–3.2, and ~4.3–4.7 Ma. This agrees with the volcaniclastic intervals being typically (but not always) enriched in magnetic minerals (see Physical properties). The slight offset in depth (mbsf) between the maxima in the abundance of volcaniclastics and MS (and also resistivity) at ~2.0–2.2 Ma is likely caused by a discrepancy in the stratigraphic depths between Holes U1437D (used for logging) and U1437B (used for core description) shallower than 430 mbsf (<2.9 Ma).
Discussion
Overall, the corrected data for the abundance of volcaniclastics (per 100 ky) provide good evidence for at least three major periods of volcanic activity at ~2.0–2.2, ~3.1–3.2, and ~4.3–4.7 Ma. These periods are separated by intervals of roughly 1 My of reduced volcanic activity; an order of magnitude greater than the resolution of the model. It might be that additional periodicities are present during these comparatively quieter intervals, but these cannot be further resolved with the shipboard data.
Notably, there is no correlation to the well-documented Quaternary increase in global volcanism that has been linked with the Earth’s glaciations (Kennett and Thunell, 1977; Cambray and Cadet, 1994; Prueher and Rea, 1998). To the contrary, Site U1437 seems to record a decrease in volcanic activity at the Pliocene–Quaternary transition at ~1.8 Ma, concurrent with a decrease in the sedimentation rate from 205 to 118 m/My (see Age model). The Pliocene–Quaternary transition likely is connected to the waning volcanic input from rear-arc seamount chain volcanism, which ceases by 3 Ma with the onset of along-strike arc extension and rifting, and possibly with an increase in explosive volcanism in the arc front (e.g., Taylor, 1992; Stern et al., 2003). Despite the decrease to 118 m/My, the sedimentation rate is still very high, probably due to the continuing input of volcanic ash from the active arc front. Overall, such high sedimentation rates due to volcanic input from local and regional sources very likely suppress any signals of climate-related changes of global volcanism that are documented in the marine sediments deposited at much lower rates (usually <50–80 m/My; Prueher and Rea, 1998, 2001).
Despite the strong local and regional volcanic signal, it is not clear whether Site U1437 records any overarching volcanic periodicity of the broader Izu Bonin arc, as no comparable temporal record exists from other locations in the Izu Bonin arc. It is possible that Site U1437 volcanic episodes are simply the accidental consequence of accumulation of volcaniclastics from the various proximal volcanic vents, either from the rear arc itself or from the active rift zone. Postcruise compositional analyses of these volcaniclastic intervals that will ascertain rear arc versus rift or arc front origins of the volcaniclastic intervals may shed further light on potential volcanic periodicity in the Izu-Bonin arc.
Geochemistry
Samples for hydrocarbon gas analysis from headspace (n = 184) were collected and analyzed for every core at Site U1437 in compliance with the shipboard hydrocarbon safety program. Interstitial water (IW) samples (n = 59) were squeezed from whole-round core sections between 5 and 10 cm long that targeted muddy intervals in cores over a total depth range of 8.3–693 mbsf. Deeper than 693 mbsf, the sediment became too indurated to efficiently squeeze pore waters, and IW sampling was terminated.
Solid samples (n = 229) were systematically collected for bulk carbon and nitrogen (CN) and carbonate analyses (including computed total inorganic carbon [TIC]/total organic carbon [TOC]). In shallow cores with high recovery (mostly from the APC/XCB cores in Hole U1437B), a representative tuffaceous mud sample was extracted in every core section. With declining core recovery deeper than 291 mbsf, sampling switched to only one tuffaceous mud/mudstone interval per core.
Volcaniclastic sediments and igneous rocks were sampled opportunistically when sufficiently pure material for inductively coupled plasma–atomic emission spectroscopy (ICP-AES) or portable X-ray fluorescence (pXRF) analyses could be obtained (ICP-AES n = 59; pXRF n = 279). In some cases, components of volcanic origin were too fine grained to be separated from nonvolcanic materials; such samples were included for ICP-AES analysis for comparison, but because the shipboard ICP-AES calibration was based on igneous reference rocks with lower CaO abundances compared to samples containing hemipelagic mud with carbonaceous matter, these data are considered semiquantitative.
Hydrocarbon gases
Methane was the only hydrocarbon gas above detection limits in sediment headspace samples in Holes U1437B and U1437D. Methane abundances gradually increase with depth, with significant abundances at ~750–1459 mbsf (Figure F124), and reach maximum values of 638 parts per million by volume (ppmv) at 920 mbsf, which is still well below critical safety thresholds. The zone of methanogenesis is unusually deep because of a release of sulfate below the sulfate reduction zone (27–83 mbsf; see Pore fluid analysis), which may buffer methanogenesis by anaerobic methanogens. Deeper than 1459 mbsf, methane concentrations decrease again and are <10 ppmv in the lowermost sections of the cored sequence.
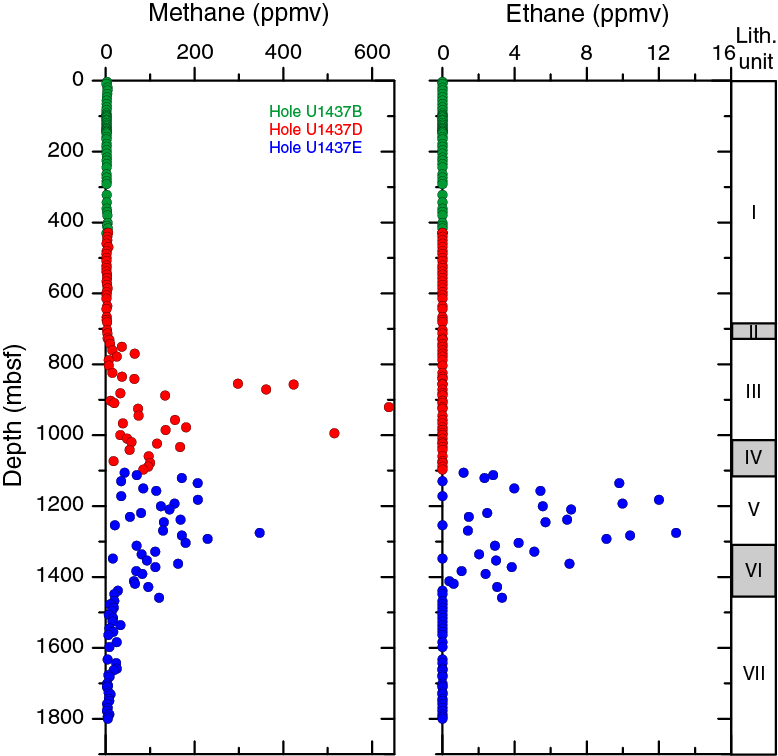
Figure F124. Headspace methane and ethane
Coincidently with the first cores recovered in Hole U1437E, ethane was also detected with maximum abundances of 13 ppmv at 1275 mbsf (Figure F124). In the horizons where both methane (C1) and ethane (C2) were detected (namely in Cores 350-U1437E-4R-2 through 42R-3; 1105–1450 mbsf), C1/C2 values are <100, possibly indicating the organic matter is mature and the hydrocarbon gases are thermogenic. However, C1/C2 never reached the critical threshold for drilling operations according to the shipboard safety program.
Pore fluid analysis
Salinity, chloride, and bromide
The IW salinity and chloride profiles (Figure F125) are characterized by moderate increases above seawater values with depth. The chloride profile is nearly constant in Hole U1437B between 18 and 401 mbsf. After resuming RCB coring in Hole U1437D, chloride abundances increase sharply over a short interval and then continue to increase more gradually with depth. Between 500 and 700 mbsf, chloride increases more rapidly to maximum concentrations of 580 and 586 mM for titration and ion chromatography (IC) analyses, respectively, in the deepest IW Sample 350-U1437D-29R-3, 140–150 cm (694 mbsf). This increase gives the overall chloride profile a hockey stick appearance with a knick point between 400 and 500 mbsf. Bromide gradually decreases with depth but, in contrast to Hole U1436A, is poorly correlated with chloride. Because of data scatter, bromide variations with depth are difficult to interpret. Higher chloride with depth indicates hydration of volcanic ash and the formation of hydrous alteration products such as clay and zeolite. These reactions consume H2O and increase pore water salinity and chloride concentrations. Variations in Ca, Mg, and B abundances with depth (discussed below) are consistent with this interpretation.

Figure F125. Salinity, chloride, and bromide.
Alkalinity, pH, ammonium, sulfate, and phosphate
Depth profiles for the species in this category (Figure F126) are highly complementary and characterized by prominent deviations from seawater compositions over the uppermost 50–100 m of the profile, followed by a more gradual reversal to near-seawater compositions at depth. Pore water pH is variable but shows a robust increase by ~0.5–1 pH units deeper than 600 mbsf. The sharp decrease in sulfate between the surface (~24 mM) and ~50 m depth (~5 mM) is mirrored by an approximately equimolar increase in alkalinity, which is consistent with microbial sulfate reduction and the release of HCO3− into solution, according to the simplified net reaction:
2 CH2O (organic matter) + SO42− = 2 HCO3− + H2S.
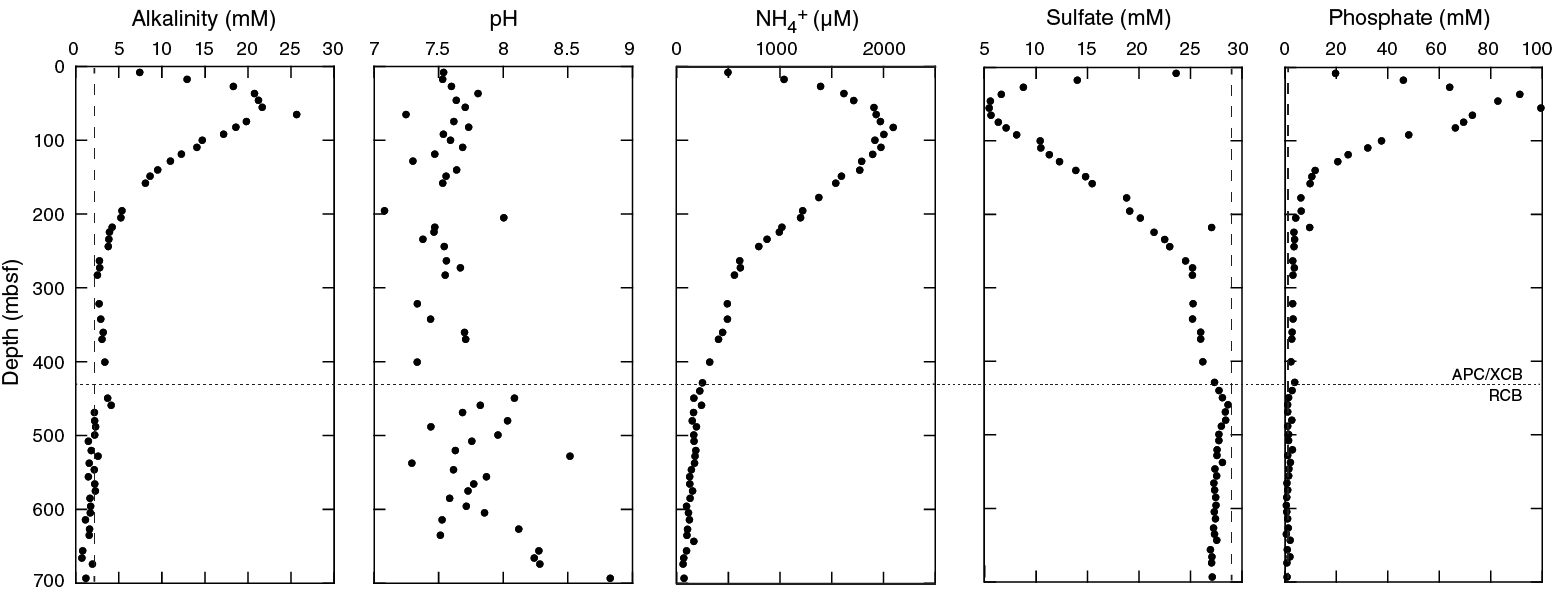
Figure F126. Alkalinity, pH, NH4+, sulfate, and phosphate.
Microbially mediated degradation of organic matter is likely responsible for the production of ammonium (NH4+) and phosphate recorded in the uppermost parts of the profile (Shipboard Scientific Party, 1997) where they peak at 2094 µM at 82.5 mbsf and nearly 100 mM or ~100 times seawater abundance at 55.5 mbsf, respectively.
Below this narrow zone of intense microbial anaerobic respiration, alkalinity and phosphate gradually decrease between ~50 and 300 mbsf, with a slow and near-constant rate of decrease deeper than ~300 mbsf. NH4+ lags alkalinity and phosphate in the rate of decrease, which indicates that pore water NH4+ is potentially buffered by ion exchange reactions with ammonia absorbed by clay and altered volcanic ash. Over the same depth intervals, sulfate steadily increases from ~5 to 28.6 mM in Core 350-U1437D-5R (460 mbsf) and from then on shows a gradual and minor decrease with depth. The maximum value of sulfate at 460 mbsf occurs 30 m deeper than the onset of RCB coring and is therefore likely not an artifact of drilling fluid contamination. The overall shape of the sulfate profile, strong depletion in a shallow region of microbially mediated sulfate reduction, and a gradual return to seawater compositions is peculiar but has been previously documented in several holes (ODP Leg 170 Site 1039 and Integrated Ocean Drilling Program Expedition 334 and 344 Site U1381). In these cases it was attributed to infiltration and upward diffusion of sulfate-rich fluids from below the sulfate reduction zone (Shipboard Scientific Party, 1997; Expedition 334 Scientists, 2012; Expedition 344 Scientists, 2013). We hypothesize that this region of fluid influx coincides with a zone of poor core recovery, grain-size increase, and strong seismic attenuation at ~300 mbsf in Hole U1437B (see Downhole measurements). This zone is also characterized by a broad peak in pore water Li, which would be consistent with vertical diffusion from a zone of horizontal fluid infiltration (see below).
Major (Na, Ca, and Mg) and minor (B, Ba, Fe, Li, Mn, Si, and Sr) cations
Variations in IW major elements (Figure F127) are best evaluated by separating the trends observed over a shallow depth range (0–100 mbsf) attributed to biologic processes from those at greater depth (>100 mbsf), which are more strongly controlled by processes such as uphole and downhole fluid migration and diagenesis. At shallow depth, Na slightly increases from seawater values (480 mM) to 494 mM at 100 mbsf, whereas Ca displays a strong drop from ~8 to 2 mM over the same depth interval. Mg also significantly decreases (from 53 to 45 mM) but less so than Ca. These trends are consistent with calcite precipitation triggered by an alkalinity surge from microbial sulfate reduction. Na and Mg then remain relatively constant, whereas Ca gradually increases at an average rate of 0.05 mM/m to ~450–500 mbsf. At this depth the trends for Na, Ca, and Mg show prominent breaks: Na and Ca increase more strongly with depth with a Ca concentration versus depth gradient of 0.14 mM/m, and Mg strongly decreases at −0.11 mM/m to a minimum of 9.6 mM at 693 mbsf. The changes in major cation gradients coincide approximately with the depth where RCB coring was initiated (starting with Core 350-U1437D-2R; 429 mbsf) but are offset to greater depth by several core lengths and, therefore, likely reflect actual changes in IW composition rather than drilling artifacts. Lithification increases at about the same depth, resulting in dominantly tuffaceous mudstone rather than tuffaceous mud. Moreover, the abundance of mafic and evolved tuff increases deeper than ~450 mbsf (see Lithostratigraphy); therefore, the increase in Ca with concomitant depletion in Mg is reasonably attributed to alteration of volcanic glass and the formation of smectite (e.g., Riedel, Collett, Malone, and the Expedition 311 Scientists, 2006).
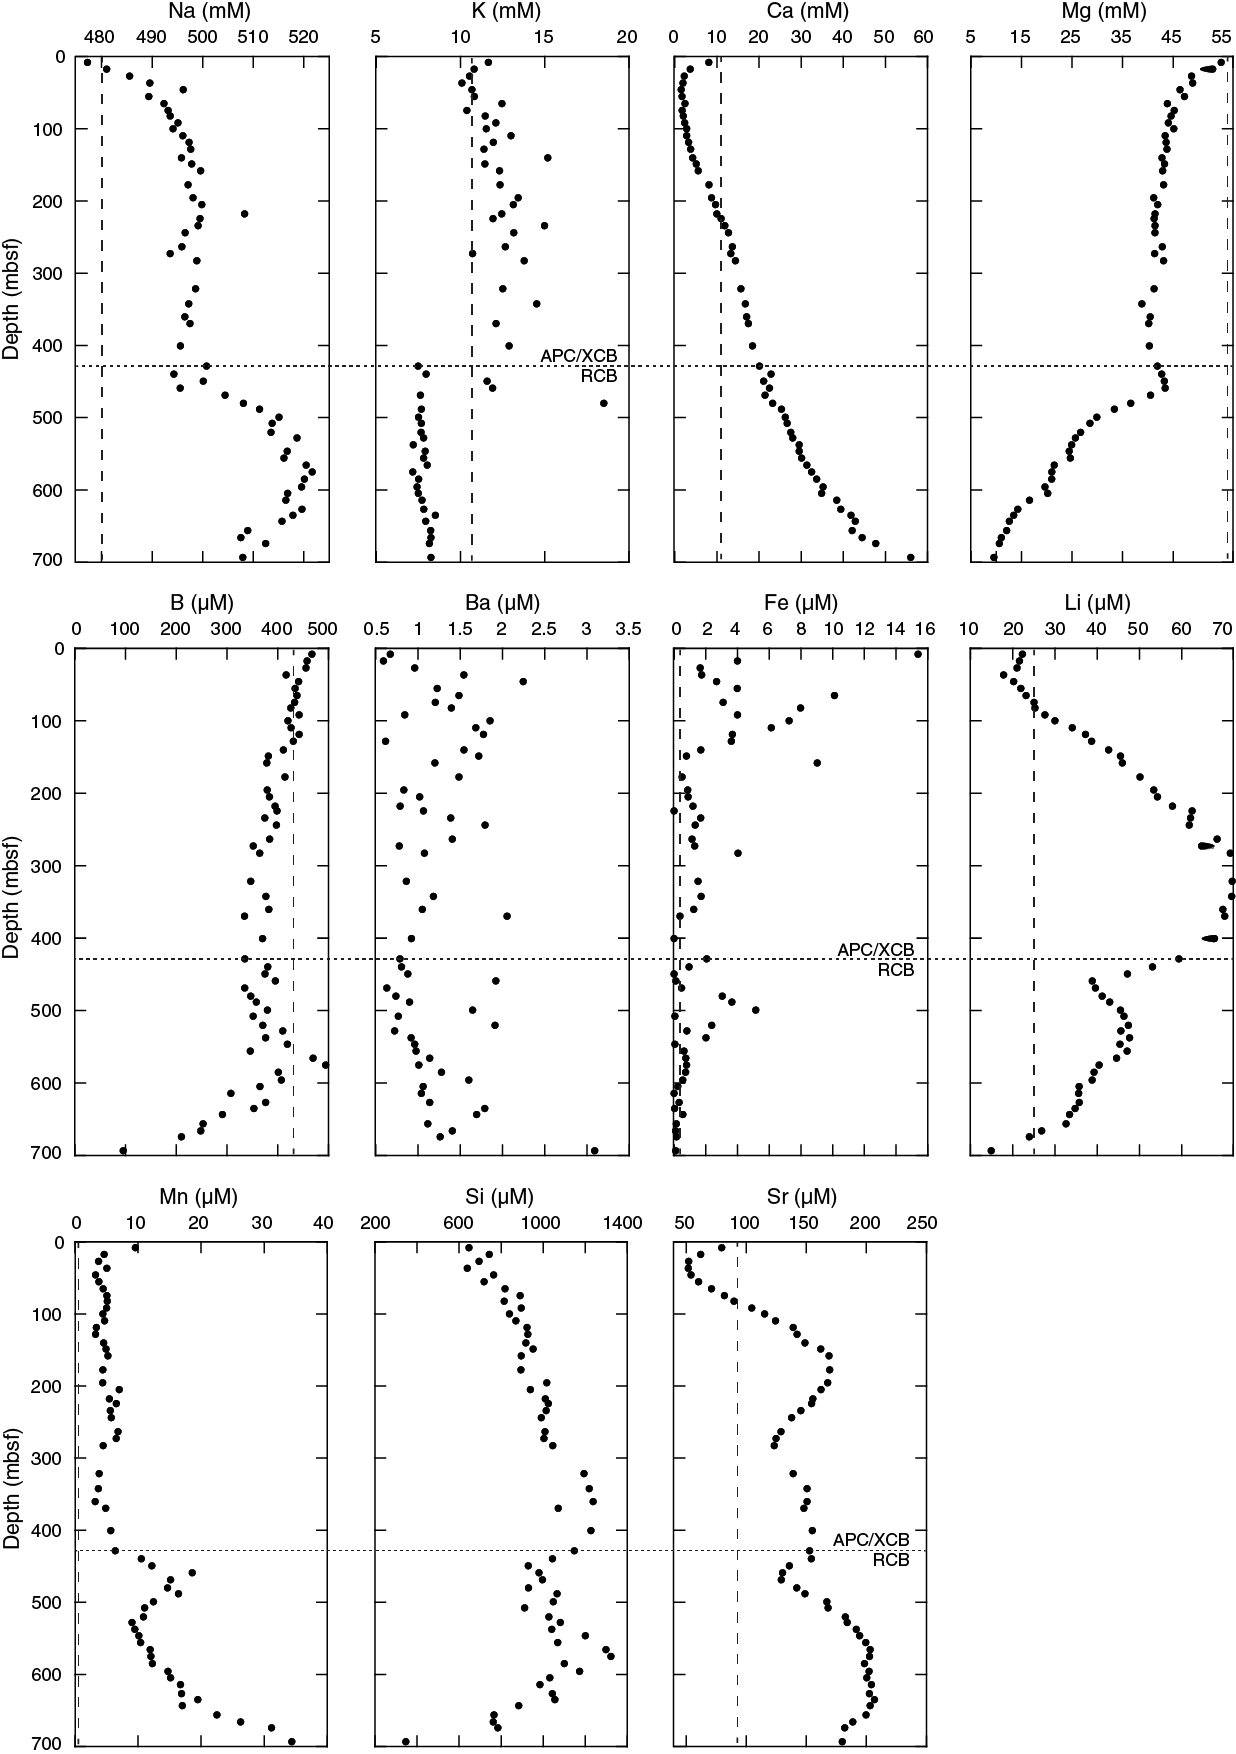
Figure F127. Pore water geochemical depth profiles.
Depth discontinuities of IW minor components often correlate with the changes described above. B depth variations mirror the pH hockey stick profile by very gradually decreasing from near-seawater compositions to ~600 mbsf, followed by a sharp drop to the terminal depth of IW sampling at 693 mbsf. The correlation of this decrease with strong depletions of deep pore waters in Mg and concomitant increases in pH and Ca suggests absorption of B in clay formed from alteration of volcanic glass. Ba and Fe concentrations show little systematic variability with depth and often scatter widely over small depth intervals. Fe concentrations are generally more elevated near the surface and, in particular, in several IW samples from the shallow interval of sulfate depletion. Li displays a hump-shaped profile with a maximum between 283 and 343 mbsf. Its steady decline deeper than 343 mbsf is interrupted by a minor excursion, which coincides with the inception of RCB drilling in Hole U1437D, and is interpreted as an artifact from splicing two adjacent holes. The overall shape of the Li profile is consistent with the ingression of a high-Li fluid at ~300 mbsf, which corresponds to a zone of poor core recovery that also matches a major seismic reflector at this depth (bottom of seismic Layer L2; see Downhole measurements). This situation is similar to observations for Expedition 344 Hole U1380, where a horizon of elevated Li concentrations correlated with a shear zone interpreted to act as a conduit for fluids with elevated source temperatures (Expedition 344 Scientists, 2013). The uphole decrease in Li in the Site U1437 profile suggests progressive dilution with shallow pore water, whereas the downhole decrease indicates uptake of Li by clay minerals formed during alteration of volcanic glass. The Mn depth profile mimics the hockey stick profile for Cl, except for an excursion to high Mn concentrations in the near-surface IW sample from Core 350-U1437D-2H (8.4 mbsf). Dissolved Si parallels the hump-shaped Li depth profile and also shares the same discontinuity at the transition from Hole U1437B to U1437D. At shallow depth, the progressive dissolution of diatoms could be responsible for Si increases, whereas transformation of biogenic opal-A to opal-CT could act as a sink for Si (Littke et al., 1991). The peak in IW Si between ~400 and 600 mbsf qualitatively agrees with the decline in diatom preservation with depth (diatoms are last observed in Core 350-U1437D-6R and are absent from 483 mbsf; see Biostratigraphy), and the decrease of Si below the putative opal-A to opal-CT transition zone correlates with accelerated B uptake (Brumsack and Zuleger, 1992). Furthermore, downhole logging data indicate an extrapolated temperature of ~50°C at the transition (see Downhole measurements); coupled with an age of ~3.5 Ma (see Age model), these conditions appear optimal for forming opal-CT (Hein et al., 1979). Alternatively, the Si maximum at intermediate depth could also be attributed to fluid influx, analogous to Li. Sr defines a complex downhole profile, displaying a minimum of 52 µM at 37 mbsf, consistent with the sulfate reduction zone (see above) and CaCO3 precipitation, which shows a broad maximum at this depth (see below). Although Sr concentrations are depleted at shallow depth, the Sr/Ca ratio peaks at ~45 μM/mM at ~100 mbsf. This is consistent with diagenetic carbonate recrystallization, which releases Sr into the pore waters (Baker et al., 1982). Deeper than 100 mbsf, Sr shows a gradual but wavy increase to 203 μM at 644 mbsf. Over the same depth range Sr/Ca rapidly decreases to near-seawater values (8.5 μM/mM) at ~370 mbsf and continuously decreases to a minimum of 3.2 μM/mM in the deepest IW sample from Core 350-U1437D-29R (693 mbsf). Coincidentally, the depth interval with near-seawater Sr/Ca at ~370 mbsf corresponds to the Li maximum and might indicate the influx of modified seawater along fast pathways.
Pore water summary
Depth variations in pore fluid chemistry suggest at least three major processes control the changes in major and trace element abundances in a fluid that started out as sediment-trapped seawater. Ranked according to increasing impact with depth, these processes include (1) biologic activity (i.e., sulfate reduction and decomposition of organic material), (2) lateral fluid transport (fracture or formation controlled), and (3) diagenesis (i.e., carbonate recrystallization alteration of volcanic glass and opal-A to opal-CT transition), although this ranking does not rule out complex interplay between all these processes over the entire interval sampled.
Tuffaceous mud/mudstone bulk geochemistry
A total of 229 sediment samples were collected at Site U1437 and analyzed for CaCO3, total carbon (TC), TOC, and total nitrogen (TN) contents (Figure F128) using coulometry and elemental analyses, respectively. The atomic ratios of TOC and TN (TOC/TNat) were calculated to determine the source of the sedimentary organic matter.
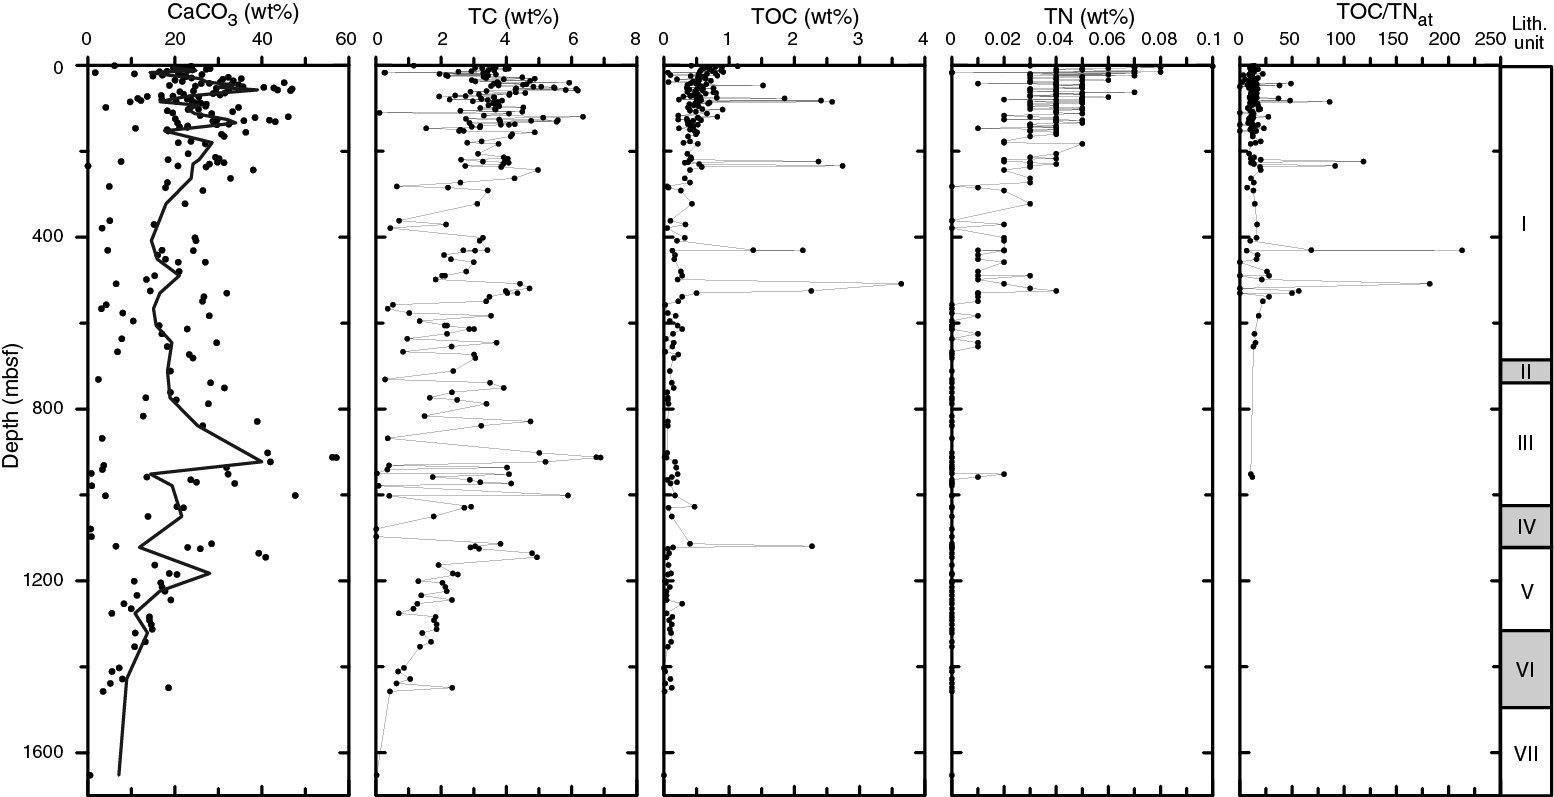
Figure F128. CaCO3, TC, TOC, and TN.
TC contents are highly variable over the whole cored sequence and range between 0.26 wt% at 17 mbsf (Section 350-U1437B-3H-2) and 6.89 wt% at 913 mbsf (Section 350-U1437D-53R-1) with an average of 3.2 wt%. CaCO3 shows a highly variable profile with an average of 21.9 wt%. Minimum (0.46 wt%) and maximum (57.1 wt%) CaCO3 contents occur at the same depths as minimum and maximum TC values, respectively. Plotting the 5-point average values of CaCO3 contents reveals two intervals with comparatively high CaCO3 in the uppermost ~170 m of the cored sequence (Figure F128). Another interval with elevated CaCO3 contents is observed at ~900 mbsf. Thereafter, CaCO3 contents gradually decrease with depth.
The observed strong and short-termed variations in sedimentary CaCO3 weight percentages may not be a result of highly variable inputs of CaCO3 reaching the seafloor but a result of varying inputs of detrital material such as clay and ash, which may act as diluents.
TIC contents were calculated by dividing CaCO3 weight percentages by 8.33 (stoichiometric factor for carbon in CaCO3) and have an average value of 2.6 wt% over the whole cored sequence. Values for TIC ranged between 0.06 and 6.86 wt% and generally parallel the TC depth profile, indicating that most carbon is inorganic. The exceptions are six intervals that deviate from this general trend, which is expressed by the difference between TC and TIC. TOC contents range from below detection to a maximum of 3.64 wt% at 508 mbsf (average = 0.45 wt%) throughout the cored sequence and are comparatively higher in the upper ~230 mbsf, where the TOC average is 0.59 wt%, although there are several peaks with elevated TOC contents thereafter (Figure F128). Despite these peaks, TOC contents remain at a low level, averaging 0.29 wt% deeper than ~230 mbsf.
TN contents are generally low throughout Site U1437. Values range up to a maximum of 0.1 wt% with an average of 0.024 wt% and highest TN contents in the uppermost ~230 m of the cored sequence. TN contents decrease continuously with depth, probably as a result of nitrogen loss during diagenesis, and are essentially below detection limits deeper than ~900 mbsf.
TOC/TNat ratios vary from 2.33 to 213 with an average of 18.6, suggesting mixed input of both marine-derived and terrestrial-derived organic matter. Typical values for marine sources of organic matter range between 4 and 10, whereas terrestrial-derived organic matter has TOC/TNat ratios >20. However, the TOC and TN values at Site U1437 show only a very weak correlation (R2 = 0.18), possibly suggesting an important contribution of inorganic nitrogen sources. Ammonium adsorbed to clay particles can make up a significant TN fraction in organic-poor marine sediments (Müller, 1977). The admixtures of this inorganic nitrogen species and organic nitrogen may lead to overestimation of marine-derived organic matter, which is typically enriched in nitrogen (Meyers, 1994).
Major and trace elements
Major and trace element compositions of tuffaceous mud indicate mixing between at least three major components (Figure F129). Based on variations in CaO and K2O contents, these components are characterized as (1) high CaO and low K2O, (2) low CaO and low K2O, and (3) low CaO and high K2O. Sr and Rb display similar compositional patterns and can be interpreted as the trace element equivalents of CaO and K2O, respectively, with CaO and Sr being dominantly contributed by marine carbonate (with stoichiometric CaO = 56 wt% for pure CaCO3, and average Sr = 1100 ppm; Morse and Mackenzie, 1990), whereas K2O or Rb are essentially nil in marine carbonates but comparatively enriched in volcanic ash or terrigenous clay (e.g., Plank, 2014). Component 1 represents marine carbonates, and a significant amount of carbonate in tuffaceous mud is supported by large loss on ignition (LOI) values (average = 16 wt%), although this value may overestimate CaCO3 because of the presence of H2O and minor volatile components such as N or S. Direct determination of CaCO3 in a different set of samples (see above) yielded an average of 21.9 wt% and a maximum of 57.1 wt%. The identification of low CaO components (Components 2 and 3) is tentative because of the limitations of shipboard data in frequency and number of elements analyzed, but binary variation diagrams for K2O versus CaO and Rb versus Sr are consistent with the low-K2O and low-Rb Component 2 being Izu arc front (including R2-type rhyolites) and/or rear arc, which cannot be further discriminated by the variables plotted in Figure F129. Izu arc-front volcanism (excluding active rift basins and back-arc knolls, which are younger than 3 Ma and whose deposits are likely restricted to arc-parallel basins; see Volcaniclastic compositions and provenance) includes basalt-dominant island volcanoes with compositionally related rhyolites and compositionally distinct rhyolites from submarine calderas (e.g., Tamura et al., 2009). Rhyolites from submarine calderas (R2 in Tamura et al., 2009) are higher in K2O and Rb compared to rhyolites from basalt-dominant island volcanoes (R1), but R2 rhyolites still fall short of the high K2O and Rb abundances at low CaO and K2O in some of the tuffaceous mud samples. The same holds for the average composition of rear-arc volcaniclastics determined from Site U1437 data. We therefore invoke another component with K2O and Rb higher than the Izu arc-front or rear-arc compositions. A suitable match for Component 3 is distal Ryukyu arc ash (Scudder et al., 2009), whereas terrigenous sediment such as Chinese loess (Chen et al. 2001) is insufficiently enriched in K2O and Rb to match the end-member (Component 3) in mixing triangles. This does not rule out the presence of terrigenous clay, but its presence would be geochemically cryptic for the components discussed here because it would plot close to a binary join between arc-front and rear-arc ash (Component 2) and distal Ryukyu ash (Component 3) in Figure F129. Dilution of ash and clay components by siliceous ooze is also possible but hard to quantify with the existing geochemical data.
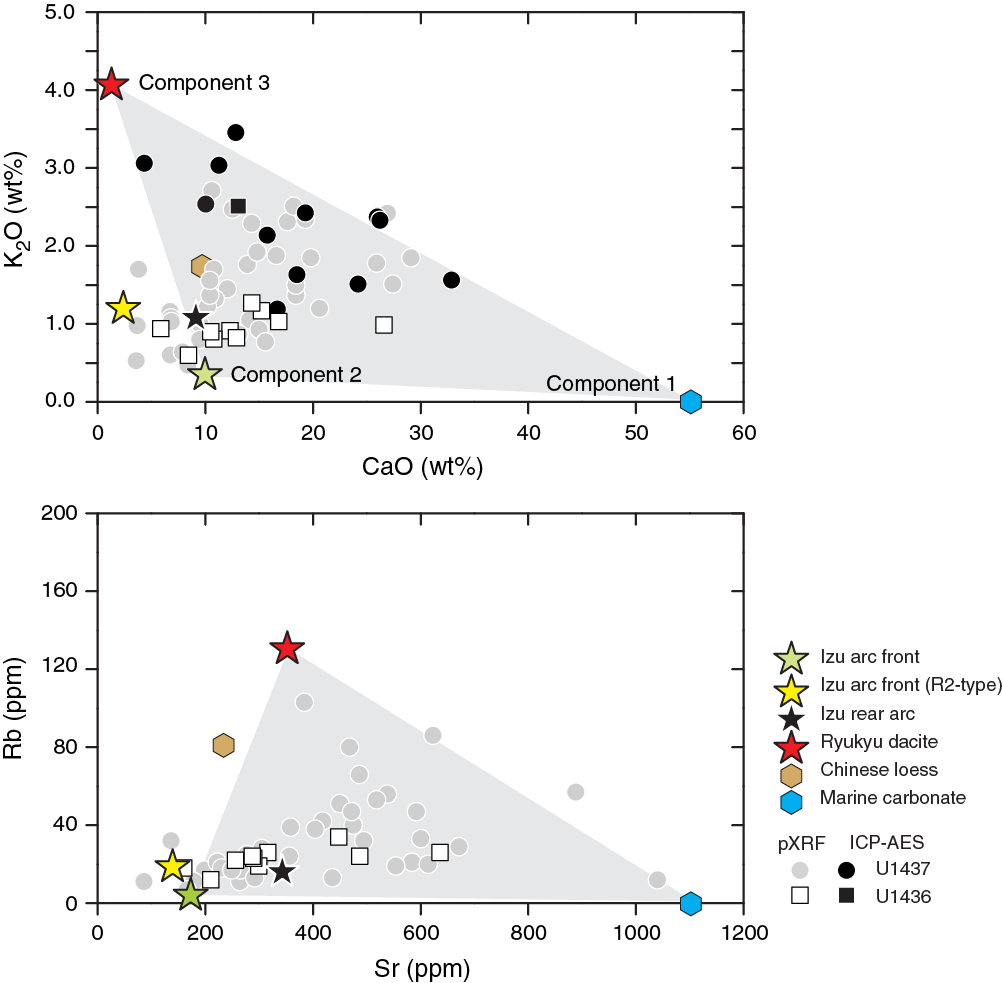
Figure F129. Tuffaceous mud/mudstone compositions.
Downhole variations in tuffaceous mud geochemistry are monitored by minor and trace elements (Rb, Zr, Y, and TiO2; Figure F130). These elements are only contributed in significant amounts by ash or terrigenous sediment, and Zr/Y is invariant with dilution from carbonate siliceous ooze and alteration. Zr/Y from ICP-AES (n = 10) and pXRF (n = 38) closely agree and show systematic decreases with depth that correlate with decreasing Rb and Zr. TiO2, by contrast, increases, especially below the transition from lithostratigraphic Unit III to IV at 1018 mbsf. This increase indicates a larger contribution from ash and clay relative to carbonate, which mirrors the increase in TiO2. The overall average for Site U1437 tuffaceous mud is Zr/Y = 3.1, slightly higher than in tuffaceous mud from fore-arc Site U1436 (Zr/Y = 2.7) but not as elevated as the average subducting sediment composition for the Izu-Bonin trench at 31°20′N (Site 1149 from Leg 185; Zr/Y = 3.3; Plank and Langmuir, 1998). Significant variations in Zr/Y with depth are detected by both pXRF and ICP-AES analyses of tuffaceous mud: maximum Zr/Y in tuffaceous mud from Unit I is 4.4, whereas values as low as 1.6 are detected in Units III–VI (no tuffaceous mudstone was recovered from Unit VII). Importantly, the decrease in Zr/Y is correlated with downhole decreases in Rb. It thus appears unlikely that the downhole trends in Zr/Y reflect variations in ash provenance from local sources (i.e., arc front versus rear arc), which are both extremely depleted in Rb, but rather a declining influence of terrigenous clay or distal ash, especially from sources with high Zr/Y and Rb such as the Ryukyu arc. This agrees with findings from Site 1149 (Scudder et al., 2009) and suggests a remarkable far-field influence from volcanic activity in the Ryukyu arc younger than 3.5 Ma on the chemistry of the fine-grained sediment in the northwest Pacific Ocean.
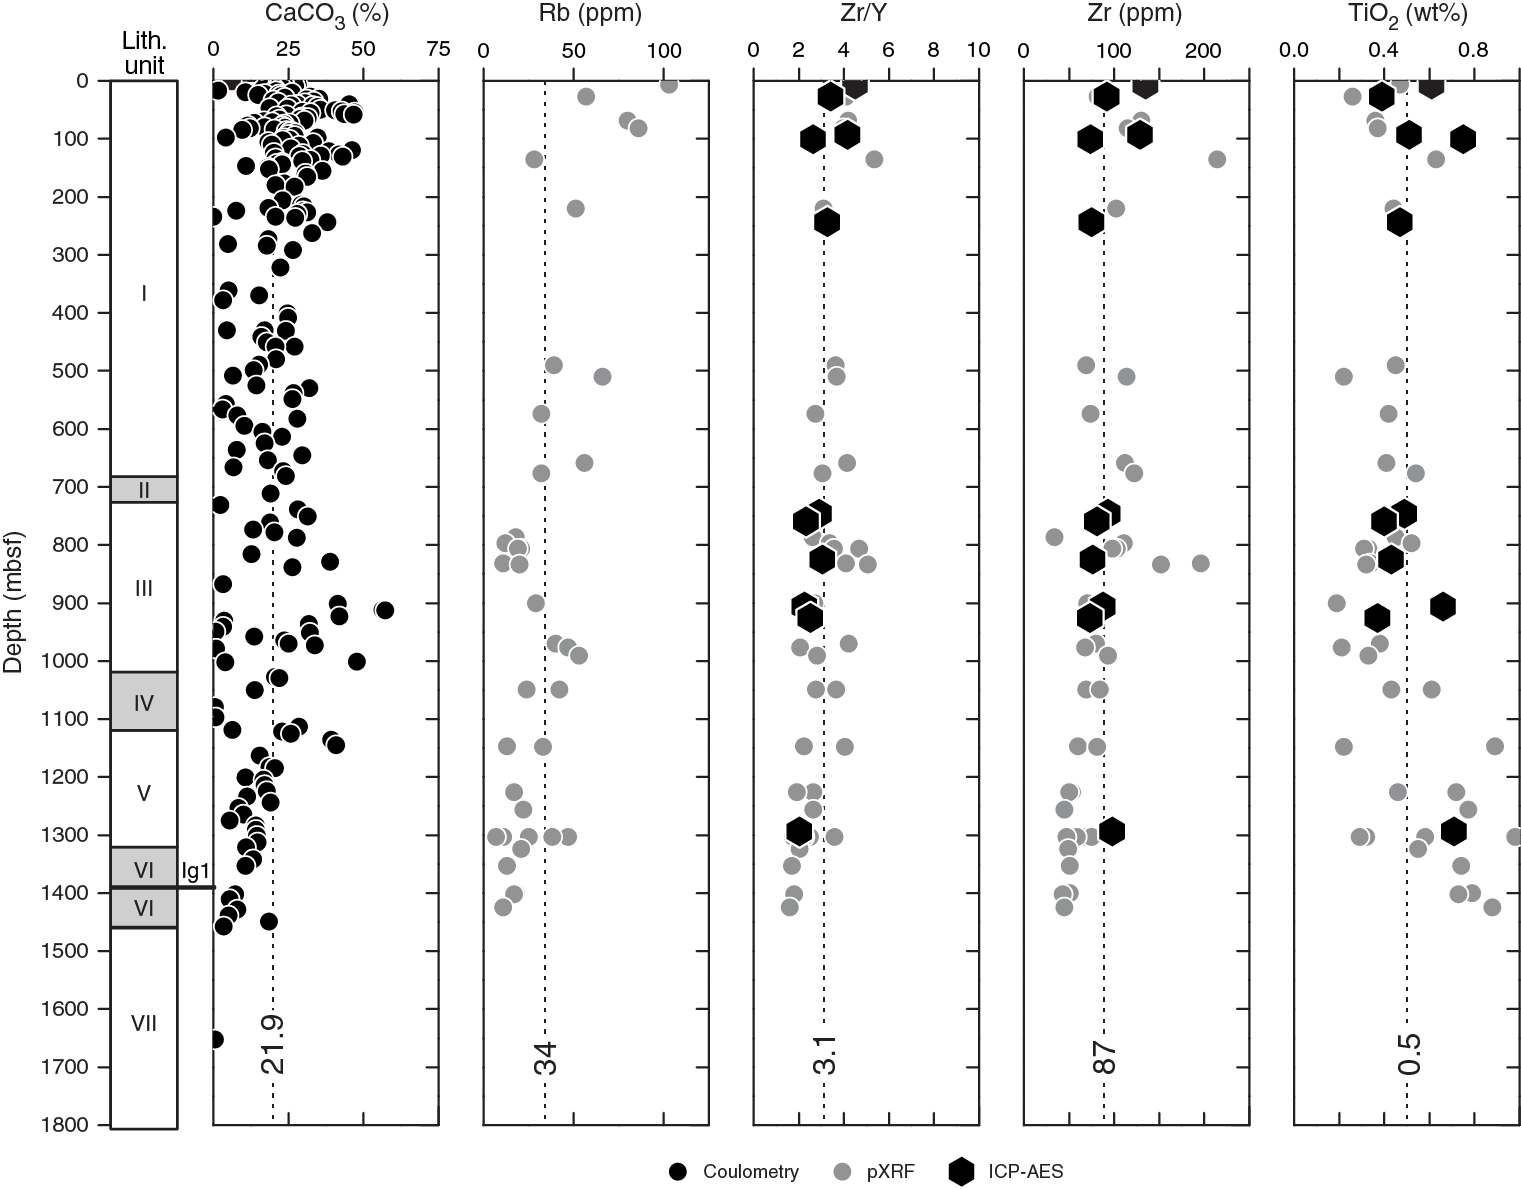
Figure F130. Depth variations of CaCO3, Rb, Zr/Y, Zr, and TiO2.
Volcaniclastic and igneous geochemistry
Sampling, data acquisition, and data treatment
Whole-rock geochemistry data presented here primarily cover the magmatic addition to the shallow (<1.8 km) crust of the Izu rear arc. Analyses were carried out by pXRF and ICP-AES, and samples included ash and tuff (pXRF n = 88; ICP-AES n = 26), lapilli-tuff and lapillistone (pXRF n = 7; ICP-AES n = 14), igneous clasts (pXRF n = 39; ICP-AES n = 9), and a rhyolite sheet (pXRF n = 1; ICP-AES n = 1). Reconnaissance pXRF and ICP-AES analyses generally agree within <20% (relative) for elements that can be analyzed by both techniques (see Geochemistry in the Expedition 350 methods chapter [Tamura et al., 2015a] for additional information on analytical techniques, instrumentation, and data quality). ICP-AES data reported here include only samples with analytical totals of 100% ± 5% (after ignition). Unfortunately, this meant that a significant number of altered volcaniclastic sediment and rock analyses had to be discarded because of low totals that likely resulted from problems with ignition at 700°C, which may have only incompletely devolatilized the samples. This comparatively low ignition temperature was required because samples fused and stuck to the crucible at higher temperatures. Deeper than 1233 mbsf (Sections 350-U1437E-19R-1 to 70R-2), samples were ignited at 1050°C because of the relative freshness of the sampled igneous clasts.
Identifying sources for volcaniclastics at Site U1437 requires the detrimental effects of pervasive alteration to be accounted for, which causes element mobility (see also Pore fluid analysis). These effects are most severe for alkali elements and Ba (Gill et al., 1994). Elements that are insoluble in seawater (Ti, Al, and Fe; e.g., Stroncik and Schmincke, 2002) are therefore more reliable indicators for magmatic compositions. This also holds for high-field-strength element ratios such as Zr/Y that remain largely unaffected by alteration (Gill et al., 1994). Another concern is contamination from pelagic sediment, especially in fine-grained ash or tuff samples, which can impact major and trace elements such as CaO and Sr that are enriched in calcareous materials. High-field-strength element ratios are reliable indicators here because they are invariant with regard to carbonate abundances (estimated from CaO). For shipboard analyses (ICP-AES and pXRF), this is limited to Zr/Y, which is the only high-field-strength ratio that could be determined reliably.
For classification, we use the total alkali versus silica scheme (extrapolated to account for the low K2O of Izu rear-arc rocks); minor discrepancies in nomenclature between this section and that used in other sections (e.g., Lithostratigraphy) can arise from the temporal delay between visual classification during core description and chemical classification. Although pXRF data lack SiO2, CaO can be used to estimate SiO2 in fresh volcanic samples for broad classification purposes within ±5 wt% accuracy because of the tight trends between CaO and SiO2 in Izu rear-arc and arc-front lava compositions (Figure F131). All major elements are plotted normalized to 100 wt% volatile-free.

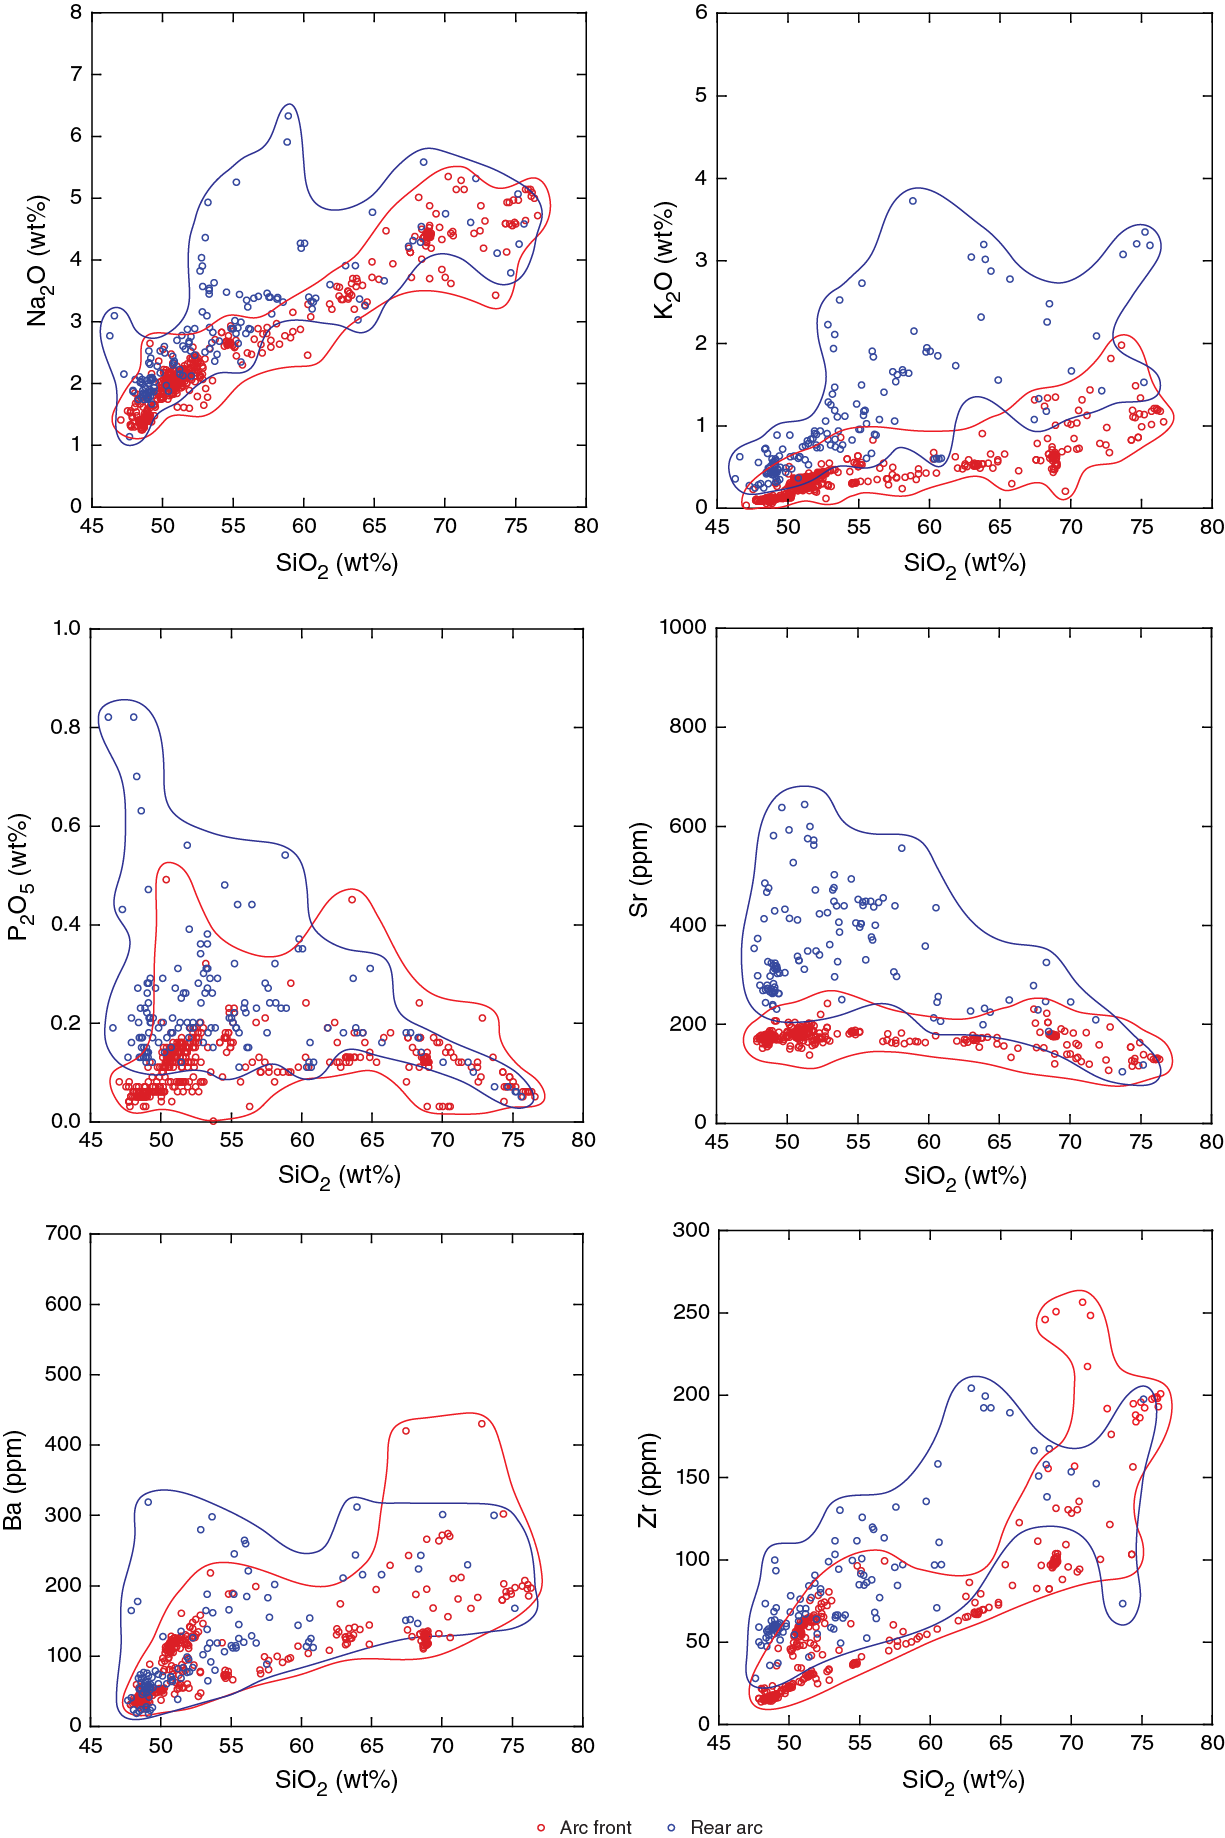
Figure F131. Silica diagrams, major and trace element compositions.
Volcaniclastic compositions and provenance
Rear-arc seamounts and arc-front volcanoes are geochemically distinct in several major and trace elemental as well as isotopic parameters (see Background and objectives). Here, we compare shipboard analyses with a compilation of literature data (Figure F131), which we grouped into two major categories:
- Izu arc front includes basalt-dominant island volcanoes and rhyolite-dominant submarine calderas (Tamura et al., 2009), as well as volcaniclastic (“turbidite”) samples collected in the fore-arc region (Jordan et al., 2012; Gill et al., 1994; Bryant et al., 2003; Straub, 2003; Straub et al., 2010). The basalt-dominant island volcanoes also produced minor amounts of rhyolite (R1 in Tamura et al., 2009), which have lower Zr/Y (1.1–3.2) than rhyolite erupted from submarine calderas (R2; Zr/Y = 2.7–5.5; Tamura et al., 2009). Note that Tamura et al. (2009) use the term rhyolite in a general sense and R2 lithologies include compositions ranging from dacite to rhyolite.
- Rear-arc volcanic rocks include all the western seamount volcanoes from 3 to 17 Ma (Hochstaedter et al., 2001; Ishizuka et al., 2002, 2003a, 2003b, 2006a; Machida and Ishii, 2003; Machida et al., 2008; Tollstrup et al., 2010), which are generally higher in Zr/Y (1.4–6.7) compared to arc-front rocks at comparable SiO2, but there is some overlap between R2 arc-front and rear-arc seamount compositions (Figure F131).
Volcanism younger than ~3 Ma immediately to the west of the arc front also comprises bimodal eruptions in active rift basins, ridges, and seamounts collectively termed back-arc knolls (Tollstrup et al., 2010). For simplicity, we did not plot these compositions but note that they are often transitional between Category 1 and 2 rocks. This limits unambiguous source assignments for samples younger than 3 Ma from Site U1437 using shipboard geochemical data.
Unit I
Unit I samples from 0 to 440 mbsf (<3 Ma) include 6 ICP-AES and 13 pXRF analyses of mostly fine-grained ash and rare lapilli. The samples range from basaltic andesite to rhyolite, have relatively low K2O abundances (0.35–1.48 wt%), and generally overlap with compositions from the arc-front and back-arc knolls (Figure F132). Unit I samples from 440 to 682 mbsf (3–4.3 Ma) include 2 ICP-AES and 19 pXRF analyses of tuff that range in composition from andesite to rhyolite. These tuff samples have slightly higher K2O contents (0.50–2.43 wt%) compared to the <3 Ma rocks and have low Zr/Y (2.2–2.3) similar to arc-front magmatic compositions (Figure F133). With the possible exception of high-SiO2 Samples 350-U1437B-1H-3, 13–14 cm (3.1 mbsf; SiO2 = 71.6 wt%), 7H-3, 12–13 cm (55.7 mbsf; SiO2 = 70.2 wt%), and 12R-6, 98–100 cm (531.7 mbsf; SiO2 = 75.1 wt%), most ash samples are mixtures between mafic and evolved end-members, which is evident from the presence of different glass types in smear slides (Figure F40) and thus may not be representative of magma compositions. Most Unit I samples are transitional in K2O versus SiO2 plots between arc-front and rear-arc volcanic rocks. Reconnaissance pXRF analyses for shallow Unit I (<3 Ma) yielded Zr/Y from 2.1 to 8.4 with a median value of 3.2 (n = 13). The high Zr/Y Sample 350-U1437B-35X-2, 6–7 cm (244 mbsf), is a lapilli-tuff and thus likely proximal, although its Zr/Y exceeds that of known rear-arc eruptions. Low Zr/Y samples (e.g., 5H-5, 32–33 cm; 40 mbsf) are fine-grained mafic ash, consistent with a distal origin from the arc front. Unit I (>3 Ma) samples show a similar range in pXRF Zr/Y (1.7–6.0) and a median Zr/Y of 2.9 that is indistinguishable from those of shallower volcaniclastic samples from Unit I, consistent with ICP-AES analyses. The low Zr/Y (2.3) of the high-silica tuff Sample 12R-6, 98–100 cm (531.7 mbsf), suggests a possible origin as a R1 rhyolite associated with a basalt-dominant island volcano in the arc front (Tamura et al. 2009).
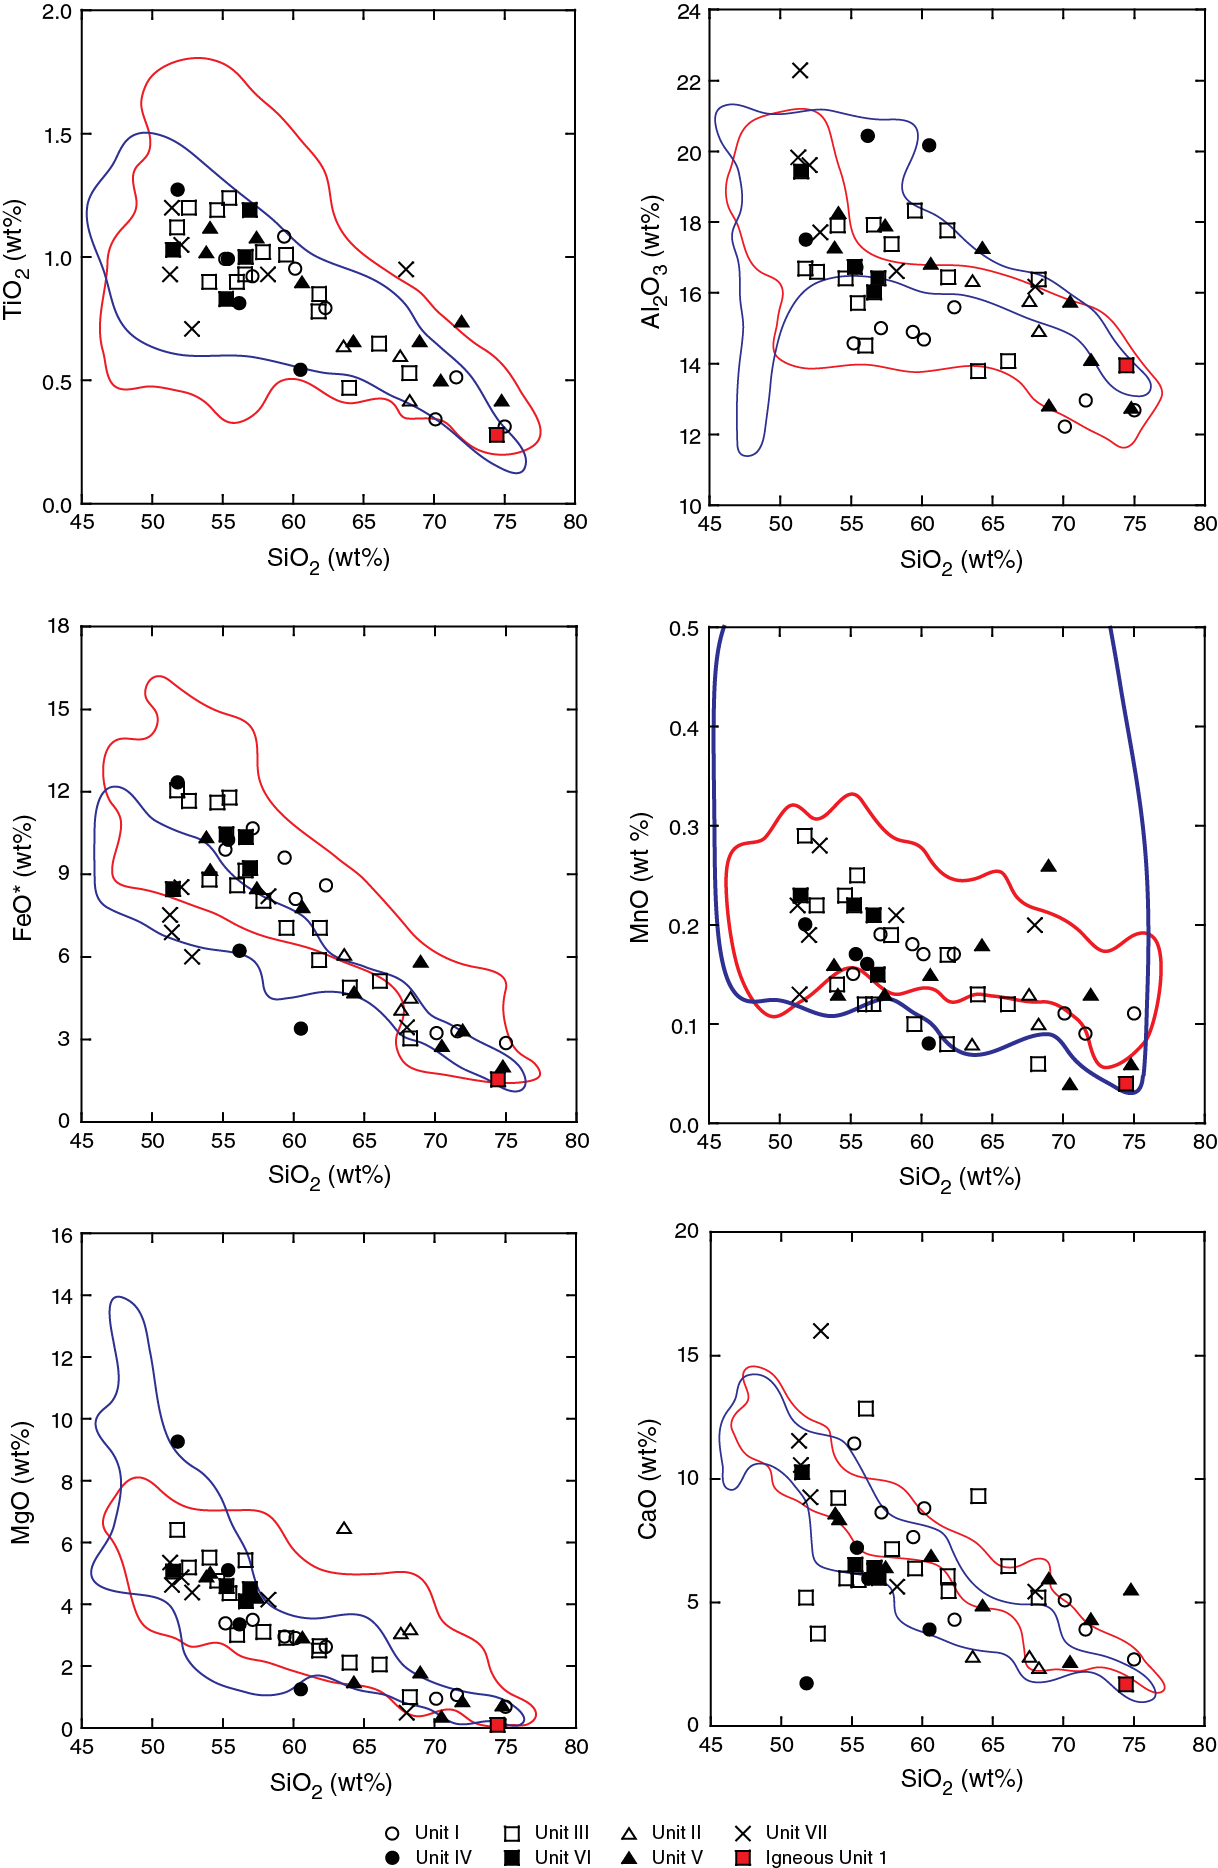
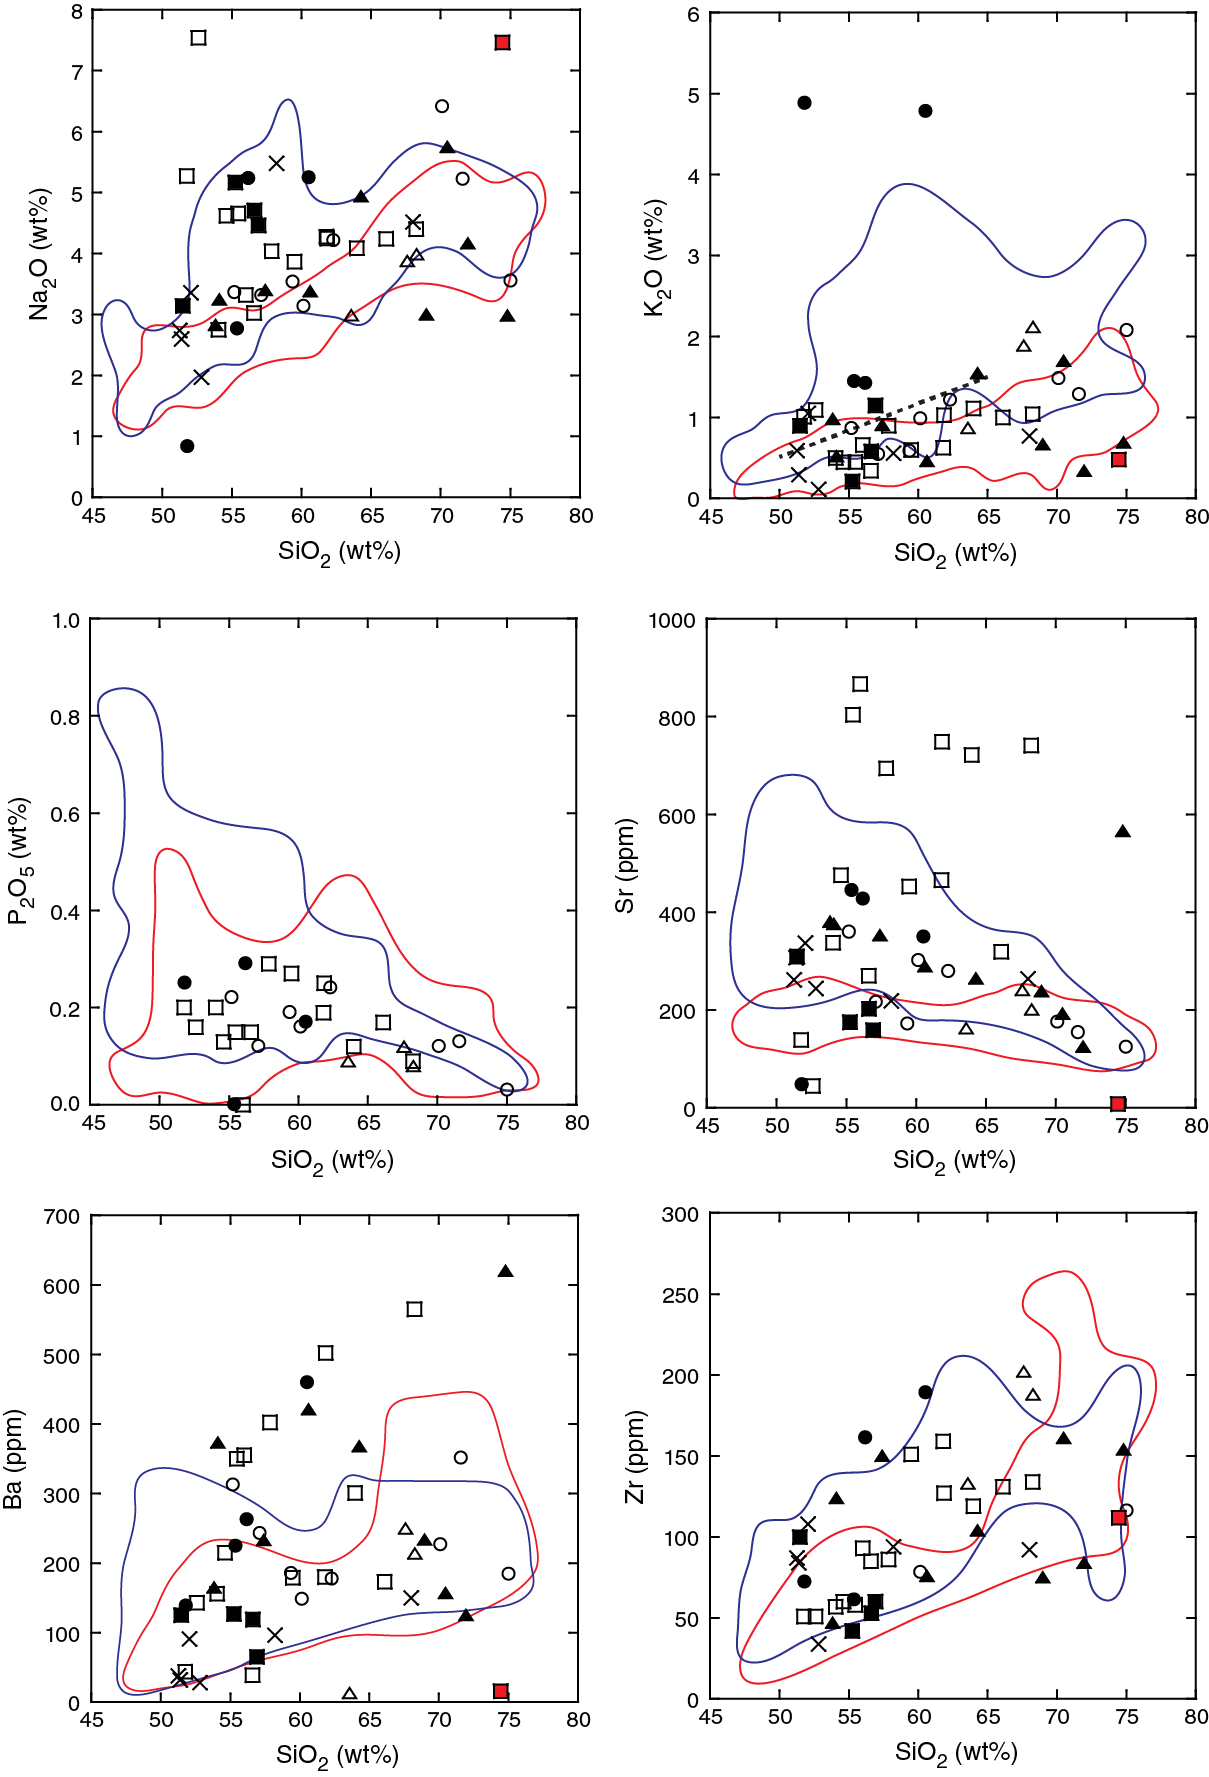
Figure F132. Major and trace element compositions vs. SiO2.
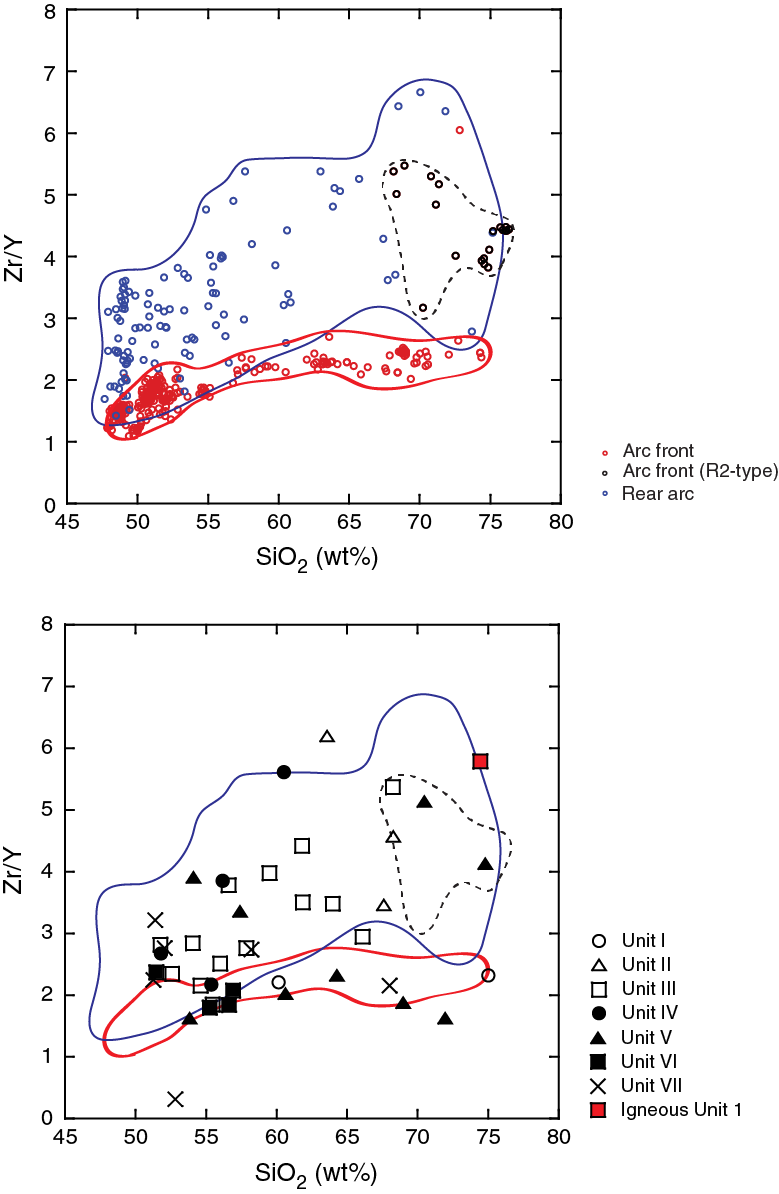
Figure F133. Zr/Y vs. SiO2.
Unit II
Unit II (682.12–726.50 mbsf; 4.3–4.4 Ma) is marked by a shift in grain size and style of deposition, containing the first lapilli-tuff and lapillistone deposits (see Lithostratigraphy for more details). Unit II samples include 3 ICP-AES and 4 pXRF analyses of tuff and lapilli-tuff ranging from andesite to dacite with K2O contents of 0.39–2.22 wt% (Figure F132). Sample 350-U1437D-29R-2, 4–5 cm (691 mbsf), represents an individual lithified pumice clast, which is dacitic in composition (SiO2 = 63.6 wt%), with high LOI (6.9 wt%), suggesting some alteration. Possible alteration is supported by elevated MgO concentrations (6.48 wt%) relative to SiO2, but Zr/Y = 6.2 is elevated to a level that is only found in rear-arc rocks (Figure F133). Nearby bulk lapilli-tuff Sample 30R-2, 122–125 cm (701.2 mbsf), comprises intricate layers with variable proportions of glass and crystal (feldspar, amphibole, clinopyroxene, biotite, and minor quartz), whereas Sample 30R-6, 58–61 cm (706.2 mbsf), consists primarily of fresh and devitrified glass with plagioclase and amphibole of uniform grain size. Although both samples are texturally distinct, they are very similar in bulk composition, with minor chemical variability largely resulting from sedimentary sorting. Both samples are classified as dacites (68.3 and 67.6 wt% SiO2) with moderate K2O concentrations of 2.12 and 1.89 wt%, respectively. Abundances of Zr and Y are generally higher than in Unit I samples, and Zr/Y between 3.5 and 4.6 is elevated relative to arc-front rocks of equivalent SiO2, although they overlap with the range of R2 rhyolites from arc-front submarine calderas. The elevated Zr/Y in Unit II volcaniclastics is supported by pXRF analyses with Zr/Y ranging between 3.2 and 5.2 (n = 5).
Unit III
Unit III (726.50–1017.88 mbsf; age model 4.4–6.2 Ma) consists primarily of altered green tuffaceous mudstone with occasional interbedded tuff. This layer marks the onset of green clay alteration, which remains pervasive throughout the remainder of the core. Fourteen volcaniclastic samples analyzed by ICP-AES have intermediate compositions ranging from basaltic andesite to dacite and are mostly similar to the arc-front field in K2O versus SiO2 plots (Figure F132). There are four exceptions: Samples 350-U1437D-40R-7, 44–46 cm (805.2 mbsf), 41R-1, 0–2 cm (805.8 mbsf), 42R-5, 40–43 cm (820.5 mbsf), and 43R-2, 31–33 cm (826.9 mbsf) that have elevated K2O contents. Concentrations of Sr (up to 804 ppm) vary greatly and are elevated compared to Unit I and II volcaniclastics as well as lava from the arc front and are typically higher than rear-arc lava (Figure F133). Two basaltic andesites (Samples 40R-7, 44–46 cm [805.2 mbsf], and 41R-1, 0–2 cm [805.8 mbsf]) contain exceptionally low Sr concentrations (45 and 139 ppm), for which the closest equivalent is Manji Seamount volcanic rocks with potassic alteration (Sr = 107 ppm; Ishizuka et al., 2002).
All but three volcaniclastic samples display elevated Zr/Y compared to rocks from basalt-dominant volcanic islands in the Izu arc front that have Zr/Y ratios generally <3. This includes several volcaniclastic samples that range from coarse-grained tuff to minor lapilli-tuff. Low Zr/Y volcaniclastics in Unit III comprise andesitic tuff Samples 350-U1437D-40R-7, 44–46 cm (805.2 mbsf; Zr/Y = 2.3), 55R-6, 95–97 cm (940 mbsf; Zr/Y = 2.2), and 56R-5, 0–4 cm (947.55 mbsf; Zr/Y = 1.9), in which glass shards are often altered (Figure F133). Despite the presence of some low Zr/Y volcaniclastics likely derived from basalt-dominant volcanoes in the arc front, high Zr/Y volcaniclastics are predominant in Unit III, as indicated by the overall median of Zr/Y = 3.1 (pXRF n = 43; ICP-AES n = 14), which is elevated above the average for arc-front basalts, intermediates, and R1 rhyolites.
Unit IV
The upper boundary of Unit IV (1017.88–1120.11 mbsf; 6.2–7.5 Ma) is defined by the onset of lapilli-tuff deposits, which remain the dominant lithology throughout the unit, and it terminates with mud-rich rocks becoming more prevalent. Samples analyzed by ICP-AES comprise a single andesite clast (Sample 350-U1437D-68R-2, 43–46 cm; 1049.2 mbsf) and three bulk lapilli-tuff samples (69R-1, 37–39 cm [1056.5 mbsf], 72R-1, 44–46 cm [1085.7 mbsf], and 350-U1437E-6R-3, 106–109 cm [1120.0 mbsf]). All samples show evidence for alteration. As seen in thin section, ~20% of the groundmass for Sample 350-U1437D-68R-2, 43–46 cm (1049.2 mbsf) is altered to clay. Samples 69R-1, 37–39 cm (1056.5 mbsf), and 72R-1, 44–46 cm (1085.7 mbsf), are also characterized by high abundances of submicroscopic alteration phases (~40% and ~50%, respectively), have low CaO relative to SiO2 (3.88 and 1.71 wt%, respectively), and anomalously high K2O (4.78 and 4.88 wt%, respectively). Sample 350-U1437E-6R-3, 106–109 cm (1120.0 mbsf), has high FeO* (Figure F132), consistent with pervasive chlorite alteration visible in thin section. With the caveat that most Unit IV samples are highly altered, their elevated Zr/Y (median Zr/Y from pXRF = 4.1; n = 41 and average Zr/Y from ICP-AES = 3.6; n = 4) is consistent with the hypothesis that they are derived from proximal sources in the rear arc, most likely the Manji Seamount (Figure F133), based on their comparatively large grain size.
Unit V
Unit V (1120.11–1320.00 mbsf; age model 7.5–9 Ma) is characterized by the absence of thick lapilli-tuff deposits. Nine volcaniclastic samples analyzed by ICP-AES with large compositional variations from basaltic andesite to rhyolite generally are chemically more depleted than Unit IV volcaniclastics. Samples 350-U1437E-7R-7, 71–74 cm (1130.9 mbsf), 16R-6, 114–117 cm (1211.6 mbsf), 19R-1, 104–105 cm (1233.7 mbsf), and 27R-1, 99–102 cm (1311.3 mbsf), have slightly higher K2O (0.91–1.70 wt%) than arc-front rocks (Figure F132). The other five ICP-AES samples in Unit V have low K2O (0.34–0.69 wt%). This includes a rhyolite tuff with fiamme (Sample 20R-2, 25–26 cm; 1244.0 mbsf) that displays unusually low K2O (0.69 wt%) and high Ba (620 ppm) and Sr (566 ppm) concentrations indicative of alteration. Four volcaniclastic samples display elevated Zr/Y (>3) that are higher than compositions for basalt-dominant island volcanoes in the arc front, including Samples 16R-6, 114–117 cm (1211.6 mbsf), 17R-2, 114–117 cm (1216.0 mbsf), 19R-1, 104–105 cm (1233.7 mbsf), and 20R-2, 25–26 cm (1244.0 mbsf). The lack of systematic variations between K2O and Zr/Y (both potential discriminants between rear-arc and arc-front sources) is interpreted to result from intense alteration. Sample 7R-7, 71–74 cm (1130.9 mbsf), for example, is an andesitic tuff that has rear-arc-like K2O (0.98 wt%) but low Zr/Y (1.6), indicative of an arc-front magma composition. On the contrary, Sample 17R-2, 114–117 cm (1216.0 mbsf), a lapillistone with andesite clasts, has low K2O (0.53 wt%) but high Zr/Y (3.9).
Unit VI and igneous Unit 1
Unit VI (1320.00–1459.80 mbsf; >9 Ma) is marked by a shift in grain size with the abundant appearance of lapilli-tuff throughout the unit. Six volcaniclastic samples analyzed by ICP-AES include four lapilli-tuff, one clast, and one rhyolite from igneous Unit 1. Three lapilli-tuff samples and the clast are basaltic andesite in composition. The single clast (Sample 350-U1437E-41R-2, 1–3 cm; 1448.0 mbsf) has slightly higher K2O (0.90 wt%) relative to SiO2 than expected if it evolved along the arc-front trend (Figure F132), yet its Zr/Y of 2.4 is well within the range of basalt-dominant island volcanoes from the arc front (Figure F133). The three lapilli-tuff samples (28R-4, 42–44 cm [1324.5 mbsf], 31R-4, 63–65 cm [1353.8 mbsf], and 34R-4, 31–32 cm [1382.1 mbsf]) also have low Zr/Y (1.8–2.1), consistent with low K2O (0.21–0.58 wt%) except for 34R-4, 31–32 cm (1382.1 mbsf), which is moderately enriched in K2O (1.15 wt%). Nineteen pXRF analyses on Unit VI samples yielded a median Zr/Y of 2.5, consistent with low Zr/Y in ICP-AES analyses (2.2; n = 8) and confirm the generally depleted nature of Unit VI volcaniclastics. One unusual composition is that of Sample 34R-5, 50–53 cm (1383.5 mbsf), with high SiO2 = 85.6 wt% indicating silicification, which is consistent with the presence of chalcedony observed petrographically.
Igneous Unit 1 is a peperitic sheet that intruded into Unit VI sediment (Sample 350-U1437E-35R-2, 42–44 cm; 1390.0 mbsf). Its age is preliminarily constrained by a postcruise U-Pb zircon concordia intercept age of 13.6 +1.6/−1.7 Ma (2σ error; mean square of weighted deviates = 2.12; n = 9; J.C. Schmitt, pers. comm., 2014). Compositionally, this sheet is a highly evolved rhyolite with extremely low Sr (8 ppm) and Ba (16 ppm), unusually low K2O (0.48 wt%), but high Zr/Y (5.8) (Figures F132, F133). Its origin remains elusive with limited shipboard analyses, but high-silica rhyolites with extremely low abundances of feldspar-compatible trace elements such as Sr and Ba are interpreted to be products of protracted fractional crystallization, rather than direct products of crustal melting (Mahood and Halliday, 1988).
Unit VII
Unit VII (1459.80–1806.50 mbsf; >[10.97–11.85] Ma) is characterized by dominant coarse-grained lapilli-tuff, lapillistone, tuff-breccia, and volcanic consolidated breccia. The presence of volcanic breccia with sizable and comparatively fresh clasts allows for more reliable major and trace elemental analyses. Six volcanic breccia samples were analyzed by ICP-AES, comprising five andesites and one dacite. All but one sample are highly depleted in K2O (0.11–0.77 wt%), similar to arc-front rocks (Figure F132). Sample 350-U1437E-70R-2, 95–97 cm (1721.4 mbsf), displays slightly higher K2O (1.05 wt%) compared to other Unit VII samples. This sample is an angular clast showing jigsaw fractures within its host tuff and was interpreted to be intrusive into the host rock. This sample also has significantly higher Ba and lower Cr and Cu compared to the other three andesite samples at equivalent SiO2 (Samples 43R-2, 99–101 cm [1468.2 mbsf], 44R-2, 36–38 cm [1477.1 mbsf], and 51R-1, 31–34 cm [1544.1 mbsf]), suggesting different volcanic sources. All Unit VII ICP-AES samples have comparatively low Zr/Y (average = 2.6; n = 3), overlapping with the range of pXRF analyses of clasts from this unit (average = 3.0; n = 45). These values generally fall between the peak in Zr/Y for basalt-dominant island volcanoes in the arc front and Zr/Y in rear-arc lava (Figure F133).
Possible effects of alteration and grain size on chemical compositions of volcaniclastics
The presence of low-temperature alteration (indicated by the presence of biotite) and high-temperature alteration (indicated by the presence of epidote) has been observed from dredged and submersible samples of the Manji Seamount (Ishizuka et al., 2002). Both types of alteration can greatly affect major and trace element compositions evident in steep depletions in CaO relative to increasing SiO2 or unusual enrichments in K2O (Figure F132). We thus focus on Zr and Y instead of K2O as a discriminant between arc-front and rear-arc sources because Zr and Y are relatively fluid-immobile and remain robust during alteration (Gill et al., 1994). This is supported by published Manji Seamount data, which show near-constant Zr/Y even when highly altered (Ishizuka et al., 2002).
Experiments were also undertaken to test if glass versus crystal sorting during deposition affects Zr/Y. For three tuff sections sampled over several centimeters to tens of centimeters, the variability in Zr/Y between bottom (crystal rich) and top (glass rich) was inconclusive. A tuff section in interval 350-U1437D-57R-5, 4–56 cm (956.7–957.2 mbsf), shows a systematic decrease in Zr/Y from bottom to top (from 3.2 to 2.8, excluding the top layer, which is likely contaminated with pelagic mud), whereas a tuff in nearby interval 59R-2, 52–93 cm (972.6–973.0 mbsf), has Zr/Y that varies irregularly between 2.2 and 3.1 from bottom to top. These variations only marginally exceed pXRF analytical uncertainties (estimated at ~15% relative error) and do not change the overall conclusion regarding the provenance of volcaniclastic intervals. They confirm, however, that chemical compositions vary in deposits that are graded by grain size and density, which cautions against the use of bulk samples for provenance analysis using trace element geochemistry. Our preference is therefore discussing analyses of individual clasts, wherever possible.
Volcaniclastics provenance
Downhole geochemical variations in Units I–V generally reflect the relative proportions of distal arc-front and proximal rear-arc volcanic depositions (Figure F134). As a general trend, coarse-grained volcaniclastics from Units II and IV show stronger rear-arc affinity compared to fine-grained tuff from Units I, III, and V. Complications for provenance arise from mixing evident by mafic and evolved glass shards in fine-grained volcaniclastic samples and pervasive green alteration in Units III and V.
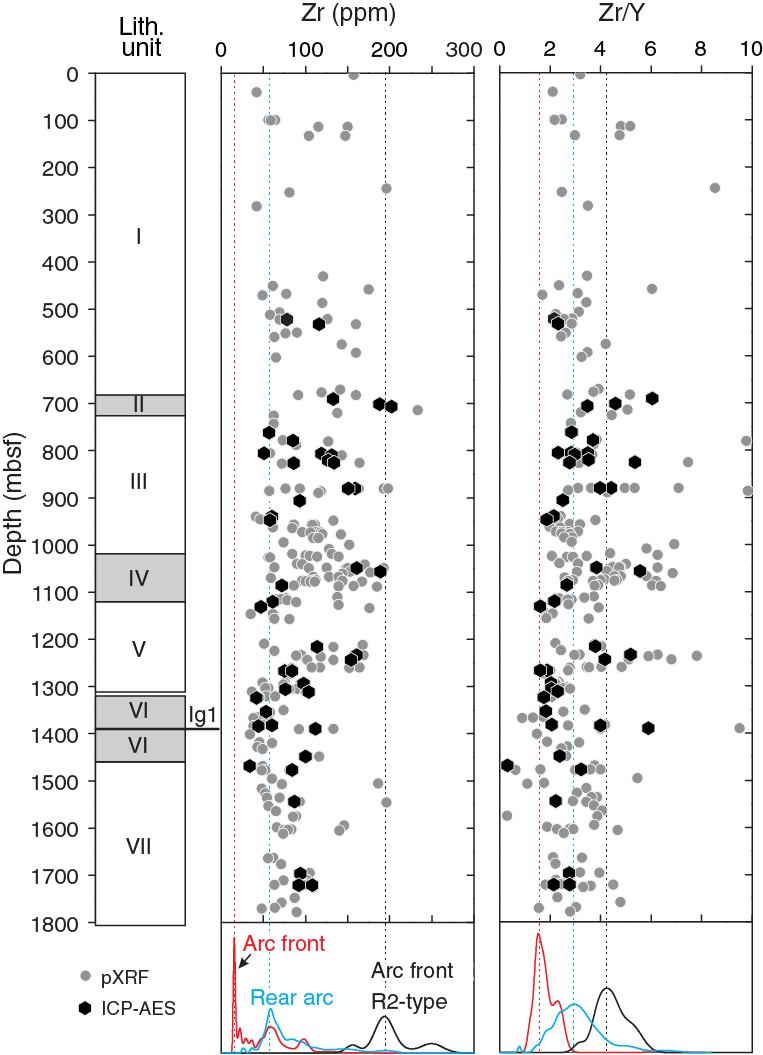
Figure F134. Downhole profiles of Zr and Zr/Y.
The predominance of ash layers from Unit I containing low K2O relative to SiO2 indicates likely arc-front or back-arc knolls (the latter for ash younger than 3 Ma) provenance. Some <3 Ma volcaniclastics in Unit I with high Zr/Y could thus be mixtures of mafic and evolved (high Zr/Y R2 rhyolites; Tamura et al., 2009) ash derived from arc-front volcanoes, but this cannot be confirmed without onshore in situ analyses of glass. The coarse-grained deposits from Units II and IV indicate proximal provenance. Active Manji Seamount chain volcanoes around the time of deposition of Unit II (4.3–4.4 Ma) were the Meireki Seamount (3.76 Ma; Ishizuka et al., 1998), ~20 km to the north, and the Daigo-Nishi-Aogashima Knoll (5.05 Ma, Ishizuka et al., 2003b), ~40 km to the northeast of Site U1437. Both are rhyolite volcanoes with similar SiO2 contents (72–76 wt%), whereas Meireki Seamount volcanic rocks have higher K2O (~3 wt%) but lower Zr/Y (~2.8) compared to Daigo-Nishi-Aogashima Knoll (K2O ~1.5 wt%, Zr/Y ~4.4) (Hochstaeder et al., 2001). Although the limited data (five analyses in total) available for both seamounts preclude reliable geochemical matching with Unit II volcaniclastics, they are potential sources for coarse-grained lapilli from Unit II considering their geographic locations, ages, and chemical compositions. Similarly, single clast compositions of Unit IV can be tentatively matched to available data for Manji Seamount volcanic rocks (~6.5–6.9 Ma; Ishizuka et al., 2002). Two high-K2O volcaniclastic samples resemble the high-K Manji rocks with potassic alteration, whereas most volcaniclastics from Unit IV follow the trend for altered Manji rocks, leading to depletions in CaO with increasing SiO2 (Figure F135) (Ishizuka et al., 2002).

Figure F135. Model crust, volcanic rocks, and fore-arc turbidites.
Unit V comprises primarily tuffaceous mud, and given the pervasive alteration throughout this interval it is difficult to provide an accurate provenance for the volcaniclastic samples. Based on ICP-AES Zr/Y data and the only moderately elevated median Zr/Y from pXRF data (2.7; n = 39) (Figure F133), we tentatively interpret Unit V to be geochemically transitional, with volcaniclastic intervals and clast compositions that include both rear-arc and arc-front sources. The presence of large volcanic breccia (with clast sizes up to 40 cm) in Units VI and VII supports proximal volcanic deposition. The Zr/Y values of blocks within breccia vary widely between 0.4 and 4.0, but because of their large size, it is unreasonable to assume transport over large distances for different sources. A similar compositional heterogeneity exists in the late Miocene Shirahama Group on the Izu Peninsula of southern Japan, which are of rear-arc origin (Tamura, 1994; Tani et al., 2011). The Shirahama Group is divided into a tholeiitic (low Zr/Y) series and a calc-alkaline (high Zr/Y) series, which are interbedded and are believed to have been erupted around 4.98 Ma (Tani et al., 2011). The Shirahama Group does not, however, display the same degree of depletion as seen in the K2O contents of Units VI and VII blocks.
Bulk chemical composition of Site U1437: preliminary inferences on continental crust genesis
A primary driving force behind Expedition 350 was to determine the role the rear arc plays in continental crust genesis (see Background and objectives). The Izu rear arc is an ideal location to understand continental crust growth because of the lower degrees of mantle melt and diminished slab component with respect to creating a significant volume of elementally more enriched rocks (Tollstrup et al., 2010). Thus far, geochemical exploration of the rear arc has focused primarily on basalts because of the interest in understanding mantle chemistry and dynamics (Hochstaedter et al., 2001; Ishizuka et al., 2003a, 2003b; Tollstrup et al., 2010). Significant geochemical sampling biases exist toward the mafic end-members even though >50 dredges recovered rhyolite pumice (Tamura et al., 2009). This problem is just as apparent at the arc front, wherein submarine rhyolitic calderas are significantly undersampled relative to the basalt-dominant island volcanoes (e.g., Tamura et al., 2009).
Site U1437 provides an excellent archive of both mafic and evolved volcaniclastic end-members that are potentially derived from the rear-arc. Furthermore, chemical analyses of both the sedimentary and volcaniclastic components at this site have been conducted at a high sampling frequency downcore using pXRF. Site U1437 is located in one of the rear-arc volcano-bounded basins along the Izu arc, which collectively compose a sizable volume of the rear-arc terrain. In the absence of other constraints, we model Site U1437 as representative of Izu rear-arc volcano-bounded basin fill deposits. If these deposits are preserved during continental accretion, they might represent an underappreciated component of arcs accreted to continental margins (see Background and objectives).
The origin of continental crust remains a first-order problem for Earth science, in particular because its share of many incompatible elements exceeds 20% despite representing only ~1% of Earth’s volume. Continental crust is heterogeneous and is commonly divided into three types (e.g., Rudnick and Gao, 2004): upper continental crust (UCC), middle continental crust (MCC), and lower continental crust (LCC), which differ in lithology, chemical composition, and seismic velocity. UCC composition is derived by averaging compositions of loess, till, shale, and other surface sediments, which converge to a bulk composition equivalent to dacite or granodiorite (average SiO2 = 66.6 wt%). UCC has the highest incompatible element (e.g., Rb and K2O) abundances of Earth’s crust. MCC is andesitic in composition (average SiO2 = 63.5 wt%) and is sometimes modeled as a mixture of mafic and felsic amphibolite-facies rocks with some percentage of metapelites (Rudnick and Gao, 2004). LCC is significantly more mafic (53 wt% SiO2) than the shallower layers, with a chemical composition averaged from granulite-facies rocks and gabbroic xenoliths (Rudnick and Gao, 2004). Relative proportions of UCC, MCC, and LCC are estimated from seismic velocities. All values reported in Figure F135 are normalized to bulk continental crust (Rudnick and Gao, 2004).
Methods
The average composition of rear-arc volcano-bounded basin fill deposits was modeled by integrating geochemical and lithostratigraphic data for Site U1437. Volume-weighted chemical compositions were calculated based on the percentage of individual major lithostratigraphic categories over the recovered and described core length and average chemical compositions of individual categories (Table T3):
 ,
,
where Xε represents the weighted mass fraction of element (a) in lithology (i), and x is the volume fraction of i. The volume fraction (x) of each lithologic type was calculated by taking the total length of lithology described divided by the total length of described core (Table T3). This method assumes that all unrecovered portions of the core are equivalent to the recovered layers. Different types of deposits were categorized into tuffaceous mud/mudstone, ash/tuff, and lapilli/lapillistone (which includes volcanic breccia). Individual analyses of clasts/blocks are assigned to the lapillistone category. We restrict the suite of elements used for this model to the capabilities of the pXRF because of the significantly greater number of analyses (n = 305) compared to ICP-AES (n = 44). Table T3 shows the average concentrations in each lithologic type and the weighted mean of Site U1437. Averages for rear-arc and arc-front lava are calculated from the sources listed above. The average composition of Leg 126 “turbidites” (volcaniclastics by this expedition’s definition) deposited in the fore arc from Gill et al. (1994) does not include chemical compositions of tuffaceous mud/mudstone. Potential sampling biases in our data and those from literature sources are acknowledged (see below).
Table T3. Average reference values for major and trace elements. Download table in .csv format.
Results and discussion
Site U1437 provides a better match to average continental crust in most major and trace elements than fore-arc turbidites or arc-front lava (Figure F135). A strong similarity between Site U1437 and rear-arc lava exists for trace elements (Figure F136), underscoring that the bulk of deposition in this location is locally derived. Major elements are a poor match, with Site U1437 appearing more similar to average continental crust. A notable exception is CaO, which is elevated for our site relative to rear-arc lava and the continental crust. This is likely a result of the high carbonate component of tuffaceous mud/mudstone (average = 21.9 wt%) that composes ~56% of the recovered core at Site U1437.

Figure F136. Model crust trace elemental abundances.
The Site U1437 model composition for the rear arc falls below UCC values for highly incompatible elements (e.g., K and Rb; Figure F136). This underscores that modern oceanic arcs are too depleted in many incompatible trace elements that are characteristically enriched in Archean crust (e.g., Gill et al., 1994). Model LCC compositions agree with the Site U1437 model rear-arc volcano-bounded basin composition, but this is not to say that LCC is a product of accretion of shallow rear-arc crust. Instead, we emphasize that rear-arc volcano-bounded basins are a voluminous geochemical reservoir to be included in models for continental crust genesis, in particular for its metapelite component.
Quantifying the role that rear-arc magmatism and associated volcano-bounded basins play in continental accretion transcends the possibilities of shipboard data analyses. Key parameters to be improved include resolving sampling biases toward mafic rocks that are presumed for the Izu rear-arc and arc-front region. Volumetric estimates of dredged rocks from seamounts keyed to their composition are required, as are constraints on the abundances and compositions of fine-grained sediment in the fore arc. Complete sets of major and trace element analyses and isotopic data for Site U1437 are essential for refined geochemical modeling. Lastly, ultradeep drilling into the middle crust of an intraoceanic arc is within technical reach and can provide new insights into arc compositions and its role for continental crust genesis.
Physical properties
Physical properties measurements were performed on cores recovered from Holes U1437B, U1437D, and U1437E to obtain basic information on density, porosity, shear strength, color, thermal conductivity, magnetic susceptibility, and P-wave velocity. After the cores reached thermal equilibrium with ambient temperature (~20°C), GRA bulk density, magnetic susceptibility logger (MSL), and P-wave logger (PWL) measurements were taken on the Whole-Round Multisensor Logger (WRMSL) at a measurement spacing of 5 cm. The whole-round sections were then measured with the Natural Gamma Radiation Logger, with a counting period of 10 min and a measurement spacing of 10 cm. Thermal conductivity was measured in soft sediment using a needle full-space probe and on lithified samples using a puck probe. Thermal conductivity measurements were made at irregular intervals, depending on the availability of material homogeneous and continuous enough for measurement, resulting in a sampling frequency of ~1 per core. Discrete measurements of P-wave velocity, bulk density, porosity, and shear strength were taken from the working halves. Shear strength was measured only on soft tuffaceous mud and fine-grained ash layers using the Giesa automated vane shear on the Section Half Measurement Gantry (SHMG). Bulk density and porosity were obtained with MAD Method C on 330 samples of soft to indurated tuffaceous mud/mudstone and fine ash, as well as on 264 cube samples of tuffaceous mudstone and tuff. In soft sediment and ash, P-wave velocity was measured with the P-wave caliper (PWC) and the P-wave bayonet (PWB) pulser-receiver systems on the SHMG. Indurated sediment and hard rock were measured only with the PWC system. Additionally, P-wave velocities were measured in the x-, y-, and z-directions on 268 cube samples cut from tuffaceous mudstone or tuff intervals.
High-resolution images were taken of the archive halves on the Section Half Imaging Logger (SHIL). Color reflectance measurements as well as magnetic susceptibility measurements were performed on the archive halves using the point magnetic susceptibility (MSP) sensor on the Section Half Multisensor Logger (SHMSL).
Physical property units
Thirteen physical properties (PP) units were differentiated based on (1) distinct offsets in otherwise continuous profiles that define boundaries between intervals and (2) interval characteristics such as magnitude, rate of change, and relative scatter of measurements (Figures F137, F138). Five PP unit boundaries coincide with lithostratigraphic unit boundaries. Basic statistics obtained for the 13 PP units are given in Table T4.

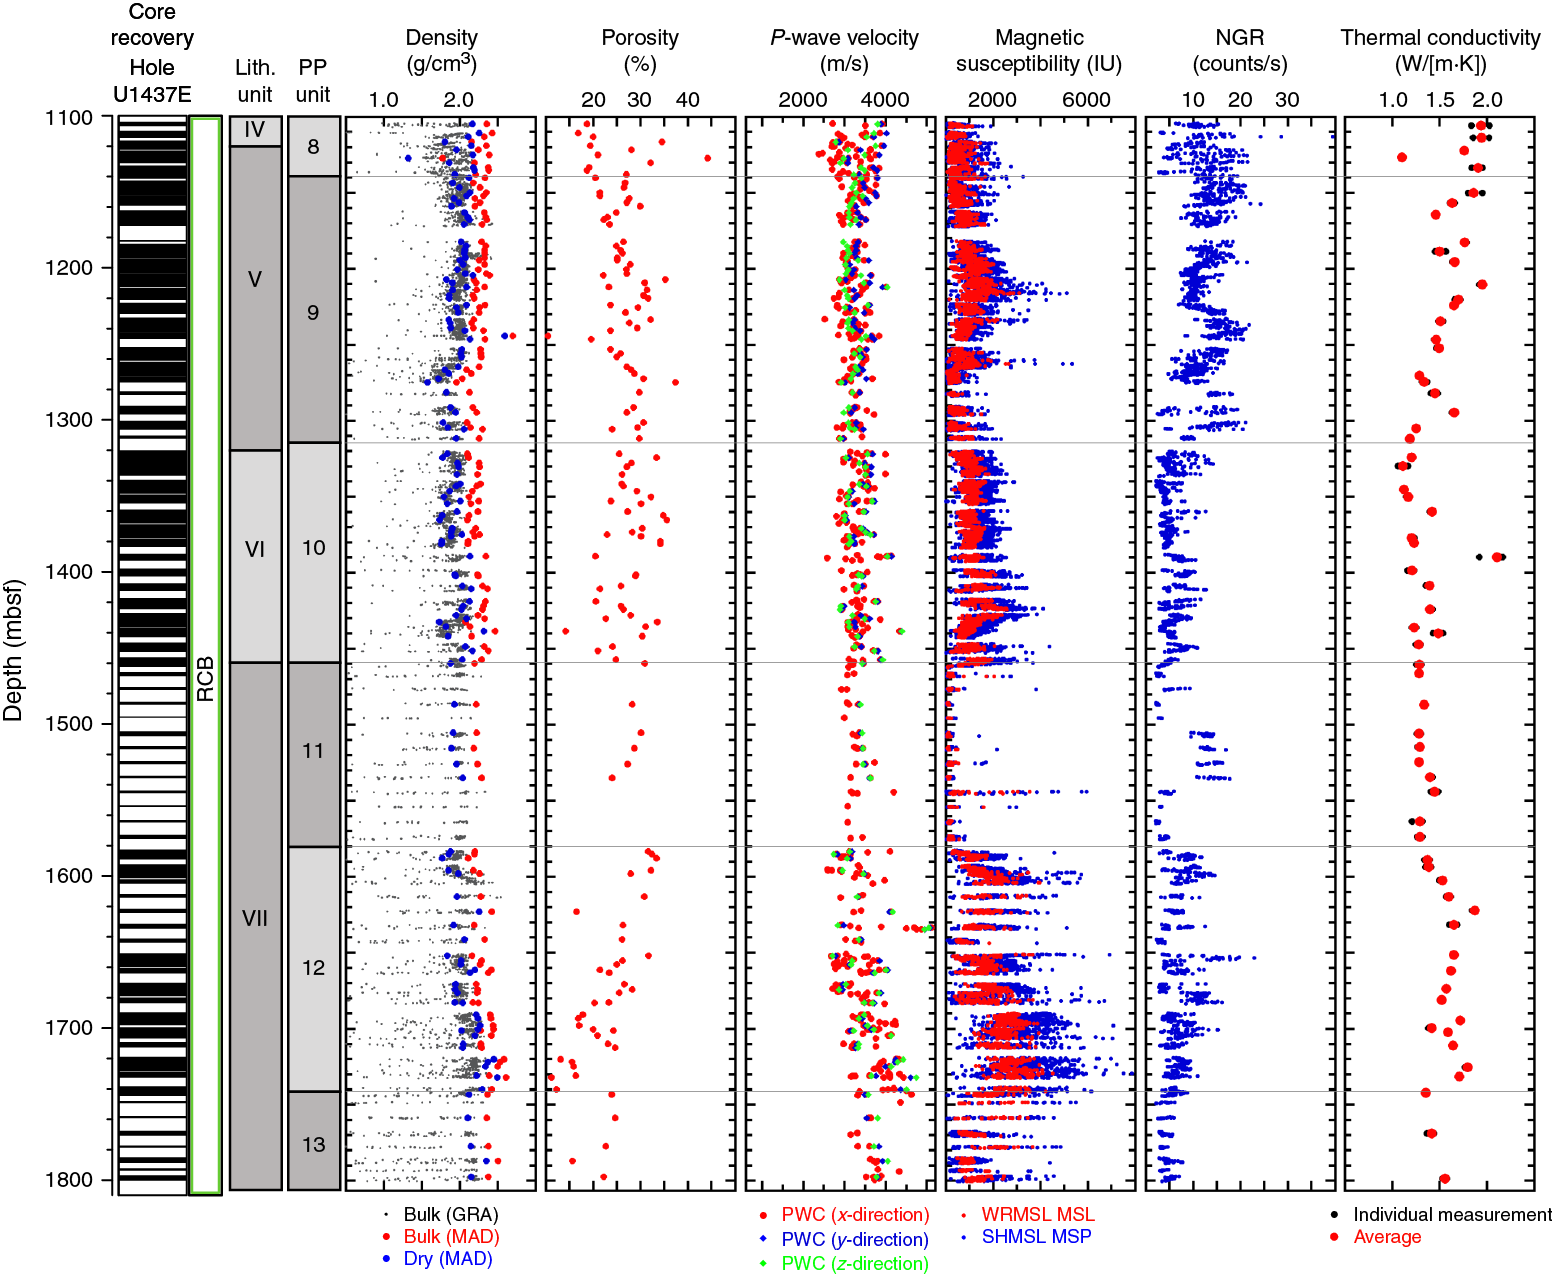
Figure F137. Physical properties.
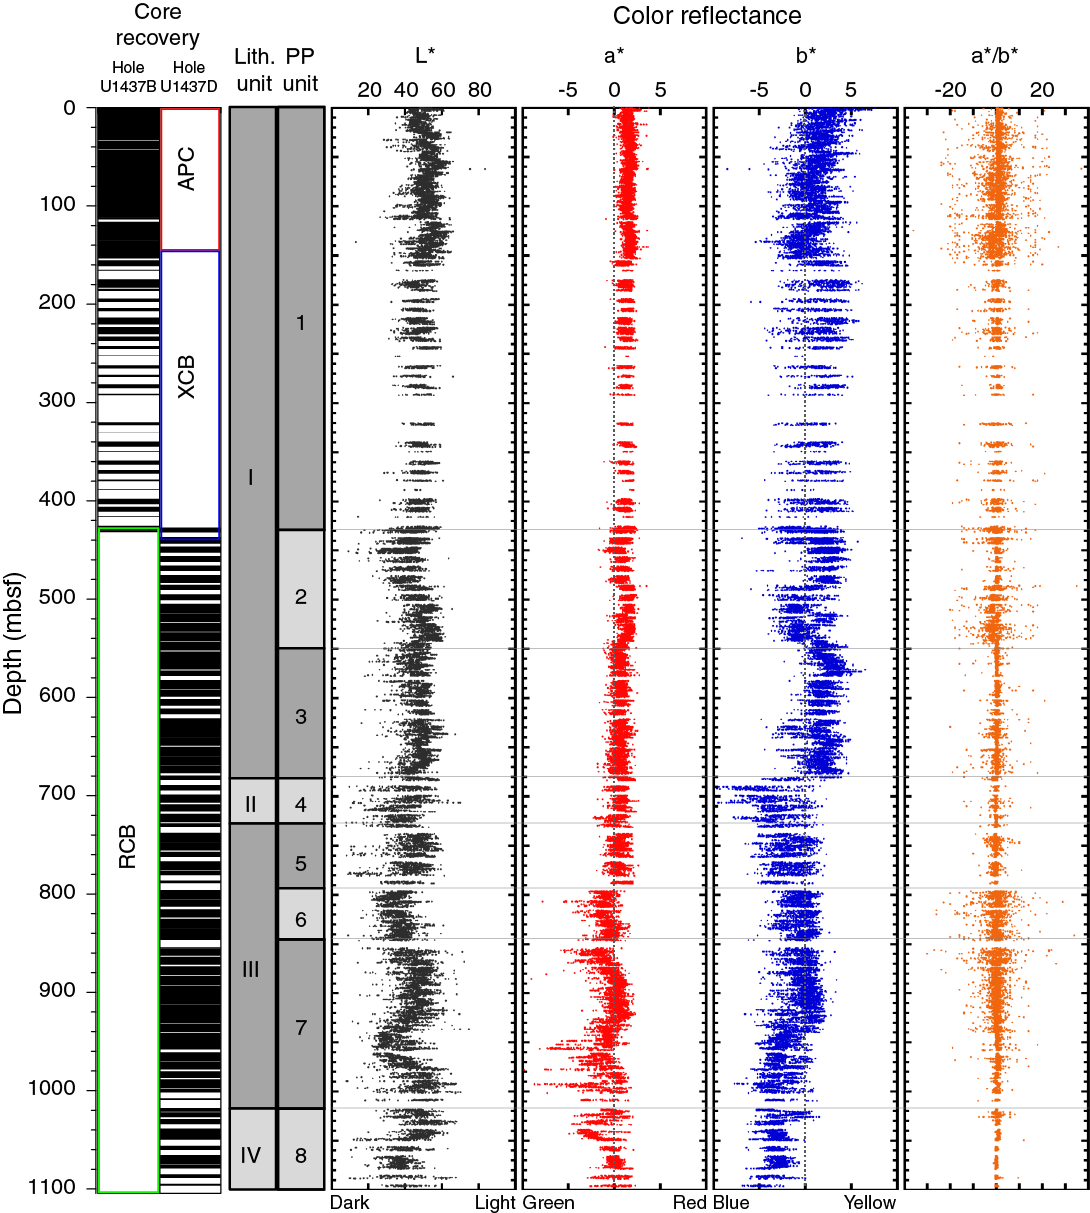
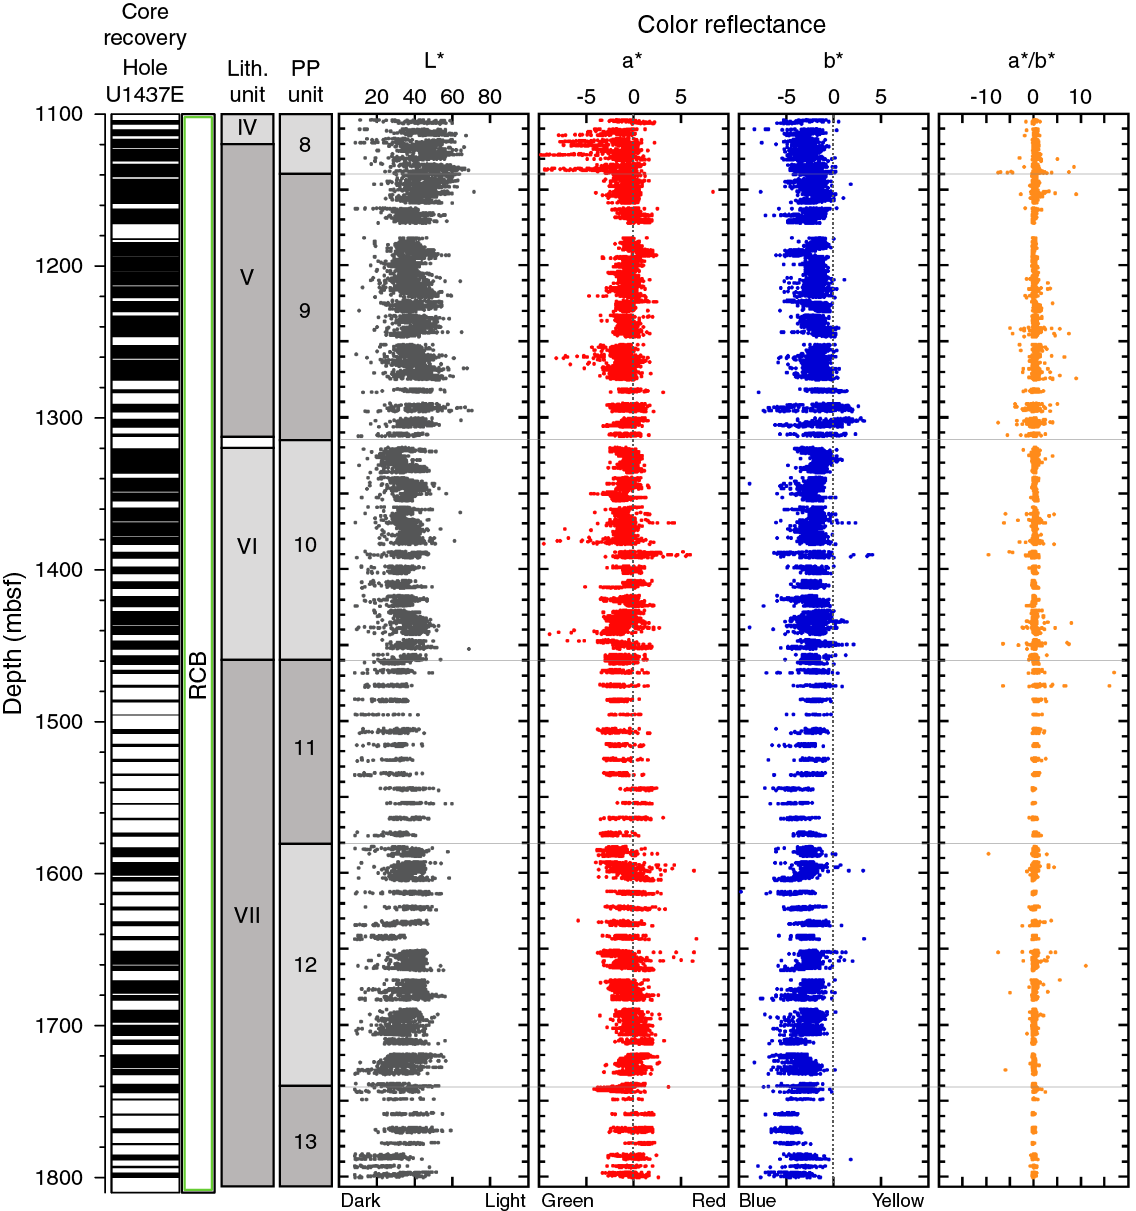
Figure F138. Physical properties from archive halves.
Table T4. Summary statistics for physical properties measurements. Download table in .csv format.
PP Unit 1
PP Unit 1 (0–430 mbsf) is characterized by a downhole increase in bulk density (1.5–1.6 g/cm3) and P-wave velocity (1501–1848 m/s) and a corresponding downhole decrease in porosity (70–65 vol%) (Figure F137). MS measurements yielded the lowest mean values (109 IU for MSL and 103 IU for MSP) compared with the other PP units.
PP Unit 2
The top of PP Unit 2 (430–550 mbsf) is marked by an initial increase in porosity (61–67 vol%), followed by a downhole continuation of the decrease observed through PP Unit 1, as well as a decrease in reflectance L* and a* values (Figures F137, F138). P-wave velocity increases at the boundary between PP Units 1 and 2, and MS is higher in PP Unit 2 compared to the bottom of PP Unit 1.
PP Unit 3
The top of PP Unit 3 (550–682 mbsf) is characterized by a sharp increase in porosity (52–65 vol%) and corresponding decrease in bulk density (1.8–1.6 g/cm3) (Figure F137). This initial offset is followed by more gradual downhole trends, similar to those seen in PP Unit 2. The reflectance ratio of a*/b* shows a decrease in the scatter of the data, indicating that color is less variable through PP Unit 3 than in PP Units 1 and 2 (Figure F138).
PP Unit 4
The upper boundary of PP Unit 4 (682–728 mbsf) corresponds to the lithostratigraphic Unit I/II boundary and is marked by an increase in the scatter of density and porosity, an increase in P-wave velocity and MS values (MS average of 476 IU versus 138 IU for PP Unit 3), and a decrease in NGR (from ~20 to ~7 counts/s) and reflectance b* (from ~1.7 to ~−3.5) values (Figures F137, F138).
PP Unit 5
The top of PP Unit 5 (728–794 mbsf) corresponds to the upper boundary of lithostratigraphic Unit III and is defined by an increase in NGR values and a decrease in the scatter of P-wave velocity, which is followed downhole by the continuation of the P-wave increasing trend observed in PP Unit 3 (Figure F137).
PP Unit 6
PP Unit 6 (794–846 mbsf) is defined by increased scatter in P-wave velocity and reflectance a*/b* values (Figures F137, F138).
PP Unit 7
The upper boundary of PP Unit 7 (846–1018 mbsf) is marked by an initial ~0.5 g/cm3 decrease in bulk density and a corresponding 18 vol% increase in porosity, followed downhole by trends similar to those in PP Unit 6 (marked by significant scatter, Figure F137). The top of this unit is also characterized by an abrupt decrease in MS values, with the average value decreasing from 491 IU (in PP Unit 6) to 167 IU (in PP Unit 7). In PP Unit 7, P-wave velocity shows the largest scatter of all units. Thermal conductivity is characterized by alternating intervals of high (~2 W/[m·K]) and low (~1 W/[m·K]) values.
PP Unit 8
The top of PP Unit 8 (1018–1140 mbsf) corresponds to the top of lithostratigraphic Unit IV. PP Unit 8 is characterized by an increase in the MS mean value (916 IU), largely due to a peak in MS values between 1050 and 1090 mbsf. Scatter in the color reflectance a*/b* ratios decreases. An initial decrease in P-wave velocity is followed by an abrupt increase in values (Figures F137, F138). Density, porosity, and NGR all show highly scattered data.
PP Unit 9
The upper boundary of PP Unit 9 (1140–1315 mbsf) is 20 m below the upper boundary of lithostratigraphic Unit V and is defined by decreased scatter in density, porosity, P-wave velocity, and NGR measurements, as well as a decrease in thermal conductivity values through the unit from top (~1.9 W/[m·K]) to bottom (~1.2 W/[m·K]) (Figure F137).
PP Unit 10
The upper boundary of PP Unit 10 (1315–1460 mbsf) coincides with the top of lithostratigraphic Unit VI. PP Unit 10 is characterized by an abrupt decrease in NGR values relative to PP Unit 9 (mean count rate of 5.6 and 12.7, respectively) and a slight downhole increase in thermal conductivity (~1.2 to ~1.5 W/[m·K]) (Figure F137).
PP Unit 11
The top of PP Unit 11 (1460–1582 mbsf) corresponds to the top of lithostratigraphic Unit VII. PP Unit 11 is characterized by an abrupt decrease in MS values and decreased scatter in density, porosity, and P-wave velocity values (Figure F137). Decreased scatter may be an artifact of the low core recovery rate in this unit. NGR values from the upper part of PP Unit 11 are higher than in PP Unit 10 and then decrease again in the lower part of PP Unit 11.
PP Unit 12
The upper boundary of PP Unit 12 (1582–1742 mbsf) is defined by an abrupt increase in MS relative to PP Unit 11 (mean = 1924.1 and 241.8 IU, respectively) (Figure F137). Density and P-wave velocity increase downhole, whereas porosity decreases.
PP Unit 13
The top of PP Unit 13 (1742–1800.3 mbsf) is marked by an abrupt decrease in P-wave velocity and thermal conductivity, which then increase downhole until the maximum drilling depth reached (Figure F137).
Physical properties profiles
Density and porosity
MAD and GRA bulk density values agree well between 0 and 145 mbsf (Figure F137). Deeper than 145 mbsf, where coring was performed with the XCB system, GRA bulk density values are lower than MAD values, possibly as a result of drilling disturbances leading to incompletely filled core liners. In addition, GRA bulk density values display greater scatter caused by measurement of voids, cracks, and core slurry, all of which produce values that are not representative of core material. PP Units 1–8 are characterized by a general downhole increase in bulk and dry densities (Figure F137; Table T4), locally interrupted by three abrupt drops marking the boundaries between PP Units 2 and 3 (550 mbsf), PP Units 5 and 6 (794 mbsf), and PP Units 6 and 7 (846 mbsf). Such drops in density are associated with local rises in porosity, which generally decreases from PP Unit 1 to 8. In PP Units 9–12, MAD bulk density and porosity average 2.3 g/cm3 and 26.3 vol%, respectively. An increase in the scatter of the density and porosity measurements was observed in PP Units 4–5 (682–794 mbsf) and 7–8 (846–1130 mbsf).
P-wave velocity
P-wave measurements with the PWL, PWC, and PWB agree well (Figure F137). PWB measurements ended at 107 mbsf because deeper sediments were too stiff to insert the transducer blades. Moreover, PWL measurements ended at 430 mbsf because from this depth the RCB system produced smaller core diameters, resulting in a gap between the core liner and the recovered sediments and rocks. P-wave velocities measured with the PWL display greater scatter than those measured using the PWC and PWB because of voids, cracks, and core slurry producing values that are not representative of core material. P-wave velocity increases downhole from ~1500 to ~4500 m/s (Table T4). Major scatter in the measured values was observed in PP Unit 4 (682–728 mbsf) and from the top of PP Unit 6 downward (deeper than ~794 mbsf).
Shear strength
Shear strength measurements were confined to relatively soft sediment (0–127 mbsf). Shear strength increases from 15 to 93 kPa in the uppermost ~80 mbsf (Figure F137; Table T4). Deeper than ~80 mbsf, values become very scattered (9~116 kPa).
Magnetic susceptibility
MS data obtained with the MSL and the MSP vary downhole between ~1 and ~7847 IU (Figure F137; Table T4). In PP Units 1–3, mean values are the lowest at Site U1437 (103–176 IU), and the profiles do not show any discernible trend with depth. The increase in MS at the PP Unit 3/4 boundary is abrupt. Throughout PP Units 4–6, MS mean values are twice as high as those in PP Units 1–3. MS sharply decreases in PP Unit 7 (mean = 225 IU) then increases again throughout PP Units 8–10 (means of 814, 975, and 1452 IU, respectively). MS values are extremely low in PP Unit 11 (mean = 304 IU) and are the highest at Site U1437 in PP Unit 12 (mean = 2492 IU).
Natural gamma radiation
NGR values vary downhole from 1.6 to 45.9 counts/s (Figure F137; Table T4). PP Unit 1 displays the highest NGR values (mean = 23.1 counts/s) and large scatter. An apparent downhole decrease in the NGR scatter throughout PP Unit 1 may be an artifact of incomplete recovery. A decrease in the magnitude and scatter of NGR values was observed in PP Units 2 and 3 (means of 13.3 and 15.6 counts/s, respectively). PP Unit 4 is characterized by a further abrupt decrease in NGR readings (mean = 10.4 counts/s), which is followed by a subsequent increase in PP Units 5 and 6. A consistent downhole increase in the scatter of NGR values was observed in PP Units 7 and 8. The scatter is reduced in PP Unit 9, which displays a higher NGR mean count rate relative to PP Unit 8 (12.7 and 11.4 counts/s, respectively). An abrupt decrease in the count rate was recorded below PP Unit 9 and continues to the end of the hole.
Thermal conductivity
Downhole through PP Unit 1 thermal conductivity is fairly constant (average = 0.9 W/[m·K]), with a decrease in values at the bottom of the unit (Figure F137). No measurements were taken in PP Units 2 and 3 because the recovered sediments were too stiff to insert the needle probe and too loose to measure with the puck probe. In PP Units 4–6, thermal conductivity values steadily increase downhole from ~1 to ~1.5 W/(m·K). Increased scatter in thermal conductivity readings (from ~1.1 to ~2.0 W/[m·K]) was observed in PP Units 7 and 8 and is followed by a subsequent decrease through PP Unit 9 (from ~2.0 to ~1.1 W/[m·K]). Downhole through PP Units 10 and 11, thermal conductivity is fairly constant (average = 1.1 W/[m·K]) then increases in the upper part of PP Unit 12. An abrupt decrease of thermal conductivity values was observed at the top of PP Unit 13.
Reflectance spectrophotometry
Reflectance L* values range between 0.4 and ~187 throughout Site U1437, indicating the wide range of shades observed (Figure F138; Table T4). Downhole through PP Units 1–3 reflectance L* values are fairly consistent (mean = ~48), with a drop in values through the upper half of PP Unit 2 (~35; 430–590 mbsf). Through PP Units 4–8 reflectance L* shows more fluctuation than in the overlying three units. PP Units 4 and 5 have larger scatter of data, with a gradual decrease in values through PP Unit 4 then a sharp increase at the top of PP Unit 5. Scatter reduces and values are fairly consistent (mean = ~36) through PP Unit 6 and through the top half of PP Unit 7. In PP Unit 7 between approximately 940 and 970 mbsf, reflectance L* values drop to ~25 before increasing downhole, peaking (~60) at the PP Unit 7/8 boundary. L* values decrease through PP Unit 8. Downhole through PP Units 9 and 10 the reflectance L* values are fairly consistent then decrease from the top of PP Unit 11 to 1540 mbsf, where they increase again. From 1540 mbsf to the bottom of the hole, reflectance L* values gradually decrease.
Reflectance a* values gradually decrease through PP Units 1–5. PP Units 6–8 have a series of negative peaks of reflectance a* values, indicating a greater green component. This matches the intervals of green alteration identified in Lithostratigraphy, the negative a* peaks marking the alteration fronts. From PP Unit 9 to the bottom of the hole, reflectance a* values are consistent with some negative peaks (at ~1130, ~1140, ~1260, ~1380, and ~1490 mbsf) and positive peaks (~1370, 1390, ~1600, and 1650 mbsf).
Reflectance b* values are fairly constant downhole through PP Units 1–3, with the exception of a drop in b* values at the bottom of PP Unit 2 followed by a rise at the top of PP Unit 3. Reflectance b* values then gradually decrease downhole through PP Unit 3. At the top of PP Unit 4 reflectance b* values abruptly decrease, indicating a greater blue component. Reflectance b* then gradually increases in value through Units 4–6 and part way through PP Unit 7 (~930 mbsf). Deeper than ~930 mbsf, reflectance b* values gradually drop again (approximately −3) then continue at approximately this value to the bottom of PP Unit 8. Reflectance b* values are consistent through PP Units 9–13, with negative peaks at ~1295, ~1390, ~1550, and ~1800 mbsf.
The reflectance a*/b* ratio demonstrates how color rich the core material is, with wider scatter in the a*/b* ratio indicating more color variations. Greater scatter in the a*/b* ratio occurs at 0 to ~150, ~480 to ~540, ~600 to ~680, and ~800 to ~980 mbsf.
Integration of physical properties with lithofacies and chemistry
Lithofacies analysis of the recovered sediment and rock permitted the differentiation of tuffaceous mud/mudstone from volcaniclastics (see Lithostratigraphy). Differences in NGR and MS values were observed for these different lithofacies and are described as follows.
Tuffaceous mud and mudstone
Tuffaceous mud/mudstone display NGR values between ~10 and ~36 counts/s, which are generally higher than those obtained from volcaniclastic layers (Figure F139). MS measurements on tuffaceous mud/mudstone yielded values from ~33 to ~1252 IU (mean = ~235 IU), which is low compared to those obtained from volcaniclastic layers (~660 IU).
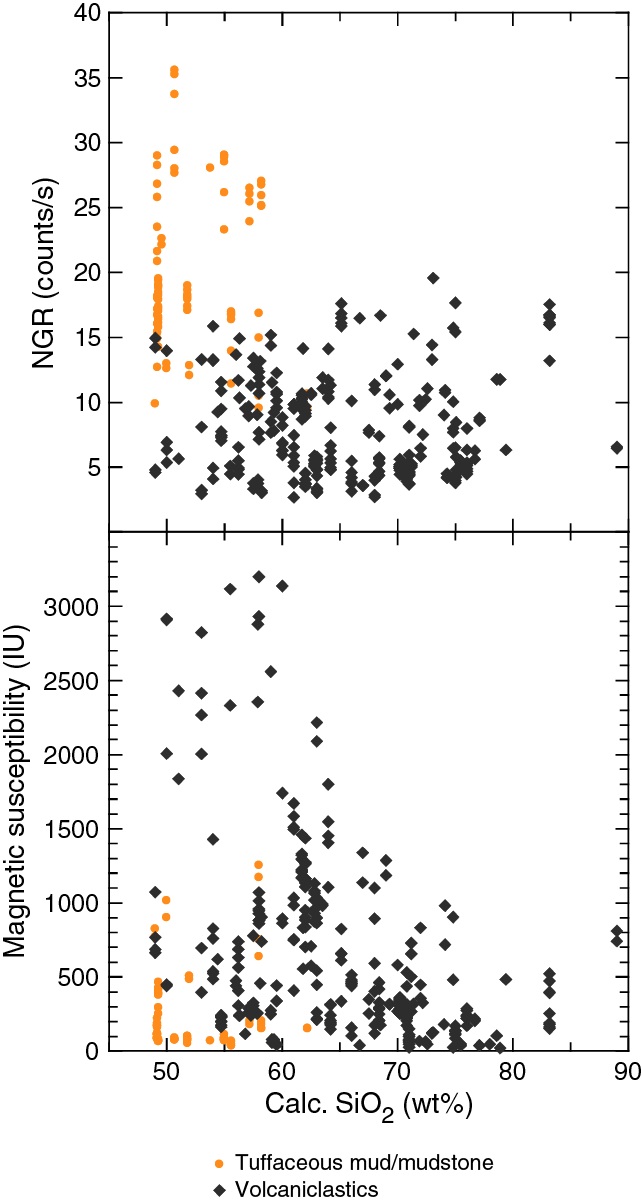
Figure F139. SiO2 vs. NGR and SiO2 vs. magnetic susceptibility.
Volcaniclastic layers
Measurements on volcaniclastic layers display NGR values in the range of ~3–20 counts/s (Figure F139). Besides this range partly overlapping with readings from tuffaceous mud/mudstone, volcaniclastic layers yielded a NGR mean of ~8 counts/s, which is lower than the value obtained for tuffaceous mud/mudstone (~20 counts/s). The lower amount of radiogenic K, Th, and U in volcaniclastics relative to tuffaceous mud/mudstone is appreciable also in the NGR profile, where the former generally define negative peaks relative to the background sediment and sedimentary rock (Figure F140).
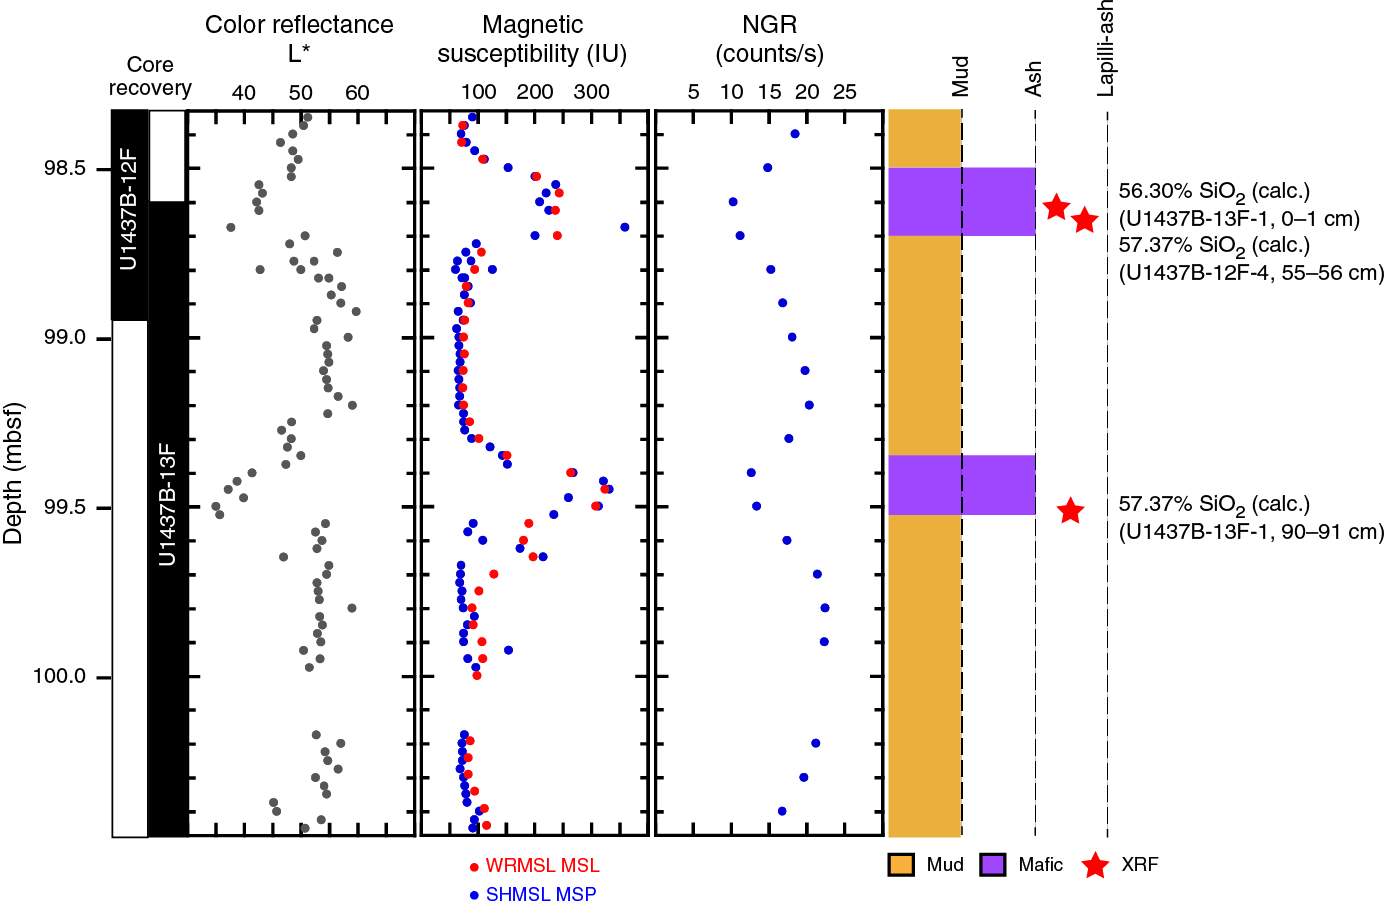
Figure F140. L*, magnetic susceptibility, and NGR, Hole U1437B.
The scatter of MS values from volcaniclastic layers vary with the SiO2 content calculated from CaO values measured by pXRF (see Geochemistry). Volcaniclastics with SiO2 > 65% display MS values from ~23 to ~1340 IU, which roughly coincide with the range obtained for tuffaceous mud/mudstone (Figure F139). MS readings in volcaniclastic layers with SiO2 < 65% are more scattered and vary between ~42 and ~3200 IU. As a result, mafic volcaniclastic layers generally produce positive peaks relative to tuffaceous mud/mudstone in the MS profile (Figure F140).
Physical properties comparison of mafic and evolved volcaniclastics at Sites U1436 and U1437
Assigning a lithology to all physical properties data points allowed investigation of the relationship between physical properties and lithofacies, here, evolved and mafic volcaniclastic intervals. The lithologic descriptions include many types of mafic and evolved volcaniclastic intervals. However, because of the difficulty expressed by the core describers in assigning a “mafic” or “evolved” identifier for some intervals, for this investigation only the ash layers described as “mafic ash” or “evolved ash” were used. Physical properties that are based on discrete measurements (MAD, PWC, PWB, shear strength, and thermal conductivity) were not used in this correlation study, as there were too few data points from mafic or evolved ash layers because of sample bias toward tuffaceous mud.
Data for mafic and evolved volcaniclastic intervals are largely overlapping, except for reflectance (Table T5; Figures F141, F142). Some differences can still be highlighted, in particular for MS and GRA bulk density. MS values for mafic intervals always plot > 86 IU and reach high values, up to 1150 IU, whereas density ranges from 1.6 to 2.0 g/cm3. Evolved volcaniclastics have MS values below 518 IU, with a large number of values below 100 IU, and have low densities (1.35–1.75 g/cm3). Data here are observed over the same range as recovered in Hole U1436A (0–110 mbsf) to allow comparison of results between sites and to avoid effects of compaction, for example on density. Evolved ash intervals are characterized by high L* (>51.4), and mafic ash intervals are recognized by low reflectance L* (<35.2).
Table T5. Intervals of physical properties values, Hole U1437A. Download table in .csv format.
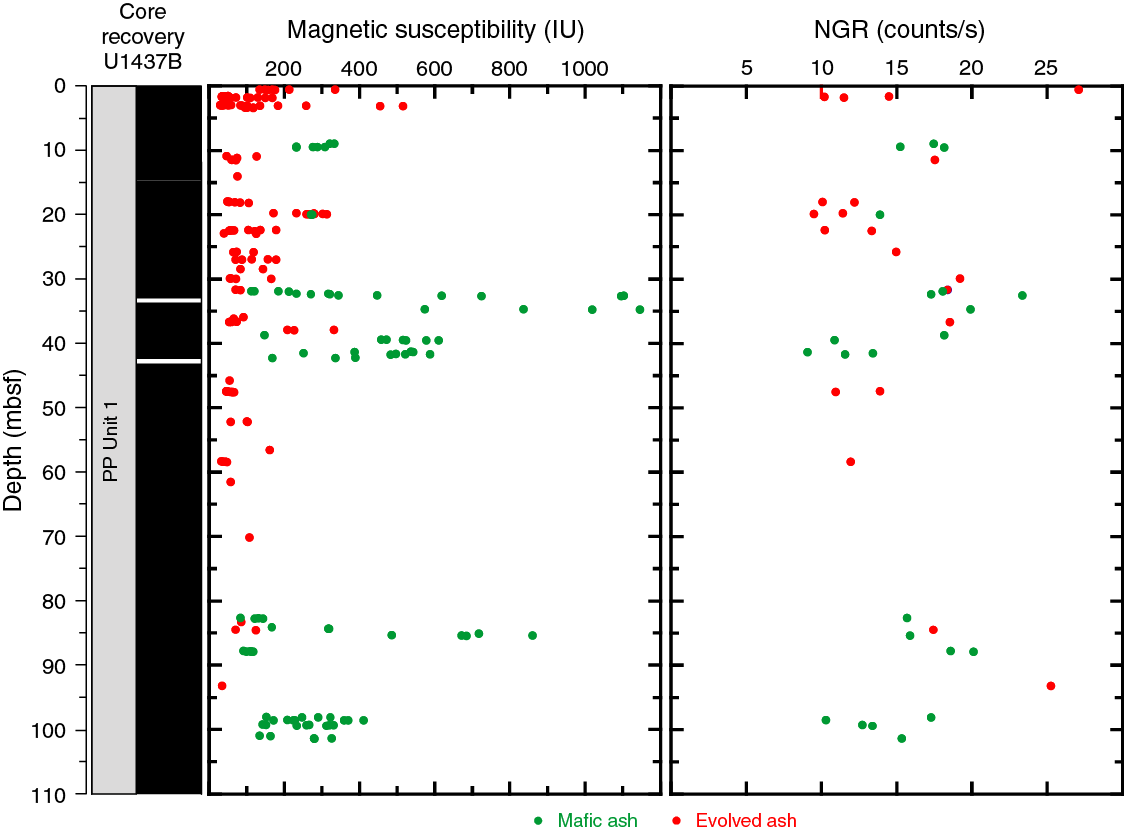
Figure F141. Magnetic susceptibility and NGR, Hole U1437B.

Figure F142. GRA bulk density and L*, Hole U1437B.
When these results are compared with the study in Hole U1436A (Figures F35, F36, both in the Site U1436 chapter [Tamura et al., 2015b]), it is evident that the evolved ash intervals at both sites have low MS values, high reflectance L*, and a low bulk density. The mafic ash intervals at both sites have low reflectance L* values, high bulk density, and high magnetic susceptibility. The difference between the two sites is that at Site U1437 NGR values are not a discriminator for mafic or evolved ash (Figure F141).
Characteristic expressions of alteration
The upper boundaries of PP Units 2, 3, 6, 7, 9, 12, and 13 do not correspond to lithostratigraphic boundaries. The changes in the physical properties at these boundaries may reflect postdepositional processes like diagenetic and hydrothermal dissolution and recrystallization, which may affect primary color, porosity, density, and consequently, P-wave velocity of the recovered sediment and rock. Evidence for fluid interaction from the top of PP Unit 4 (~682 mbsf) is provided by the dissolution and silicification of foraminifers and nannofossils (see Biostratigraphy), which hindered the identification of species for age-depth constraints. Slight to pervasive recrystallization of calcite, quartz, and fine-grained opaque minerals infilling primary porosity was observed in thin sections from below PP Unit 3 (~680 mbsf) (Figure F143A–F143C). Moreover, from the top of PP Unit 6 (~794 mbsf), evidence for pervasive alteration was described from the cores and coincides with the observed negative reflectance a* values, indicating increased greenness compared with PP Units 1–5. Recrystallization of fine-grained clay minerals and calcite deeper than this depth is also evident in thin section (see Lithostratigraphy; Figure F143D).
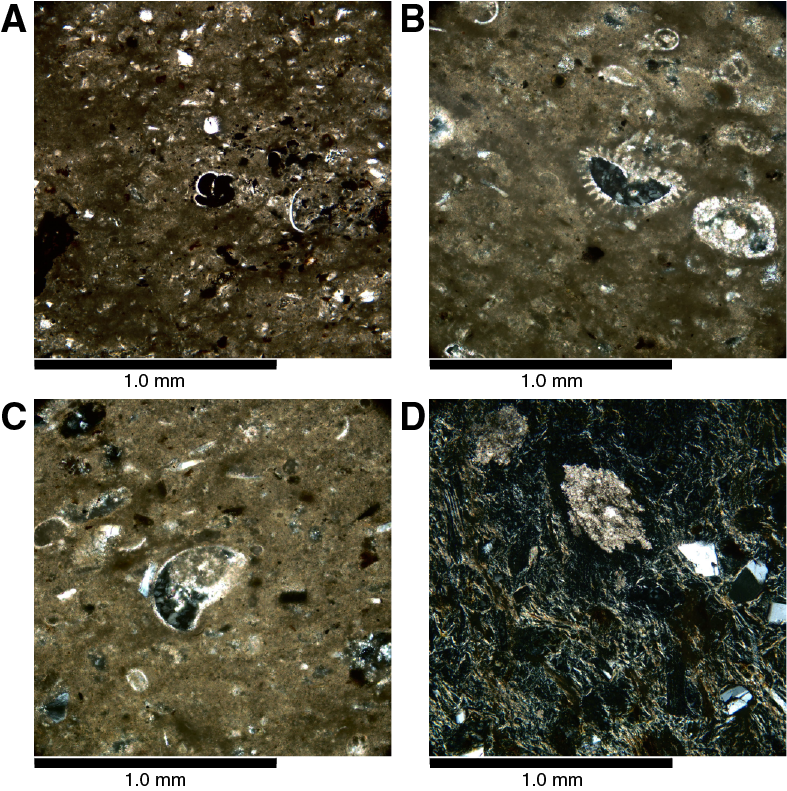
Figure F143. Foraminifers from Hole U1437D.
Paleomagnetism
Paleomagnetic studies at Site U1437 comprised both determination of remanence polarity, in order to derive a magnetostratigraphy, and rock-magnetic analysis. Rock magnetism both aided in selecting appropriate techniques to reveal the polarity record and provided a downhole profile of the changes in the magnetic mineralogy in response to lithology, diagenesis, fluid flow, and alteration.
Remanence
Paleomagnetic analysis at Site U1437 comprised remanence measurements on archive halves at 2.5 cm intervals before and after alternating field (AF) demagnetization at 10 mT steps up to 30 mT. With the exception of some highly disturbed sections, all sections in all three cored holes at this site were analyzed. Over most of the cored interval in both Holes U1437B and U1437D this was sufficient to reveal the magnetostratigraphy, based on the sign of inclination. Polarity became more difficult to recognize from the archive halves in Hole U1437E.
Holes U1437B and U1437D
Within Holes U1437B and U1437D removal of the drilling overprint appeared to be more effective in RCB cores than in XCB or APC cores, possibly because RCB cores are free of the annulus of disturbed tuffaceous mud that surrounds many XCB and some APC cores. We continued demagnetization to 40 mT in some cores to improve removal of the drilling overprint or to confirm the interpretation of polarity. In some intervals within the deeper parts of Hole U1437D (e.g., from Cores 350-U1437D-67R to 70R) we found that the 40 mT step in fact removed the depositional remanence to a proportionally greater extent than the drilling overprint, so we discontinued use of this higher demagnetization step.
Severe core disturbance in many of the APC and XCB cores from Hole U1437B resulted in complete destruction of the depositional remanence in many intervals. In order to clarify interpretation, we examined intervals described by the core describers as exhibiting flow-in (basal and mid-core), fall-in, sediment flowage, or soupy disturbance. In addition, we found that some intervals described as biscuited were dominated by the semifluidized material that surrounds the biscuits, with the integral centers of the biscuits only occupying a small proportion of the core. All such intervals displayed either chaotic or intensely overprinted remanence, and we removed the remanence records from these intervals before further processing. The resulting inclination record is shown in Figure F144. Core orientation by reference to the FlexIT tool was available for the full-length APC cores from Hole U1437B (Cores 350-U1437B-1H through 9H), and declination for these cores is shown in Figure F145; after AF demagnetization all of the oriented intervals display declination near 0°/360°, consistent with assignment to the Brunhes normal chron.

Figure F144. SRM inclination before and after AF demagnetization.
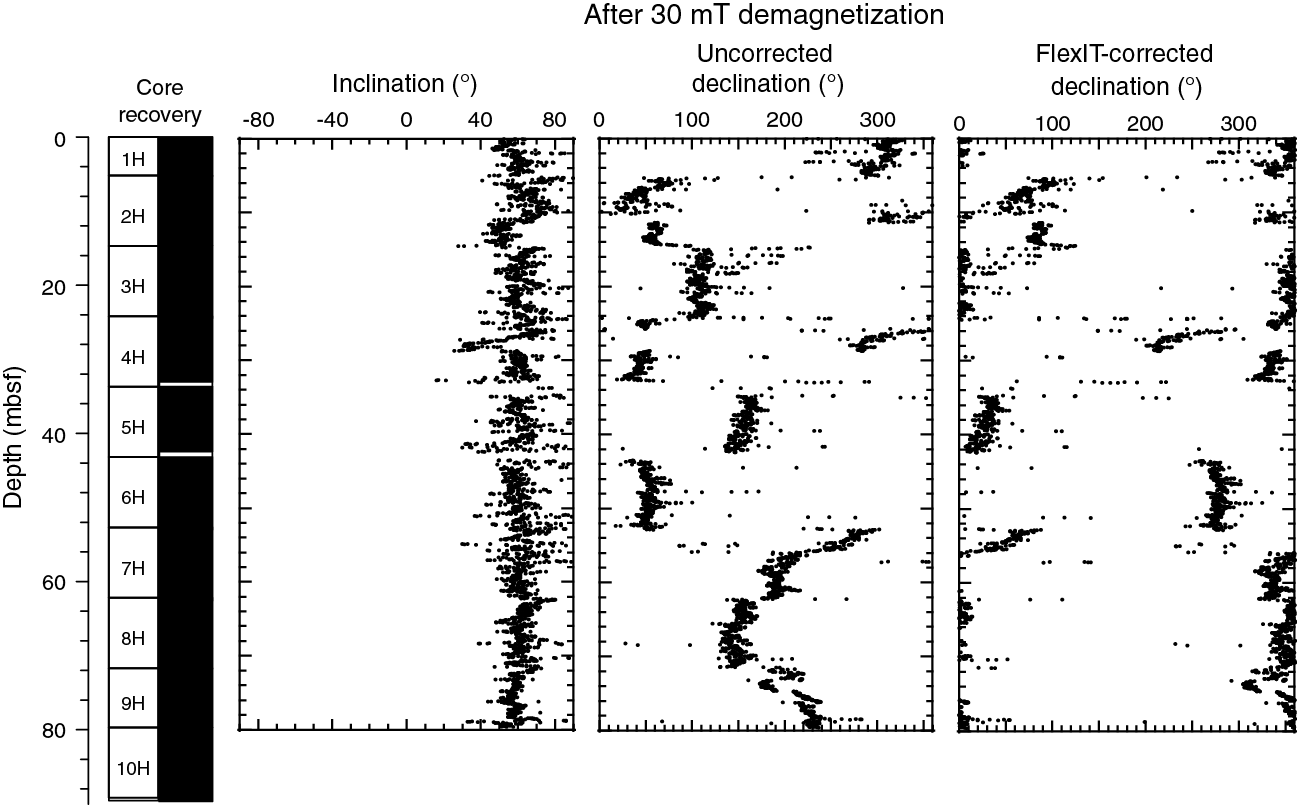
Figure F145. SRM declination before and after FlexIT orientation correction.
Hole U1437E
Recognition of magnetostratigraphy became more difficult in Hole U1437E. This was largely due to changes in lithology that saw the loss of finer grained material, particularly the change to the volcaniclastics that dominate lithostratigraphic Units VI and VII. Increasingly intense alteration in the lower parts of lithostratigraphic Unit II and through lithostratigraphic Units IV, V, and VI also appeared to degrade the magnetostratigraphic record, probably through the removal of fine-grained magnetite (see Discrete sample remanence analysis: Hole U1437E). Increasing formation temperature as the holes deepened probably also served to strengthen the drilling overprint through partial thermal remanence acquisition in the high-field environment of the drill pipe as the cores cooled while ascending to the surface. We also noted more intense overprinting that was also more resistant to demagnetization in the first few cores from Hole U1437E, where coring was intentionally slowed while part of the BHA remained within the casing. This is likely to reflect increasingly strong and resistive overprints acquired when cores are held for a protracted time in the drill pipe (Lund et al., 2003).
NRM intensity
Remanence measured before demagnetization (often referred to simply as natural remanent magnetization [NRM]) ranges in intensity from 1.54 to 9684 mA/m (mean = 362 mA/m) for Site U1437 (Figure F146), although it should be noted that these values reflect the contribution of both true NRM and drilling overprint. In general, the volcaniclastic rocks in lithostratigraphic Units VI and VII and intervals of mafic ash and tuff in lithostratigraphic Units I, III, IV, and V correlate with elevated NRM intensity and magnetic susceptibility, as, for example, in the interval spanned by Cores 350-U1437D-69R to 71R, where the lithology is almost exclusively tuff. Notwithstanding this, some intervals of evolved tuff and tuffaceous mud are also marked by very high NRM values (e.g., in intervals 350-U1437B-52X-3, 50–143 cm [409.50–410.43 mbsf], and 350-U1437D-43R-4, 53–75 cm [829.63–829.85 mbsf]). NRM and susceptibility are, however, not always correlated. These two magnetic variables depend strongly on both type and quantity of the magnetic mineralogy present, and NRM intensity, as measured on material recovered in cores, largely reflects the extent of acquisition of the drilling overprint.
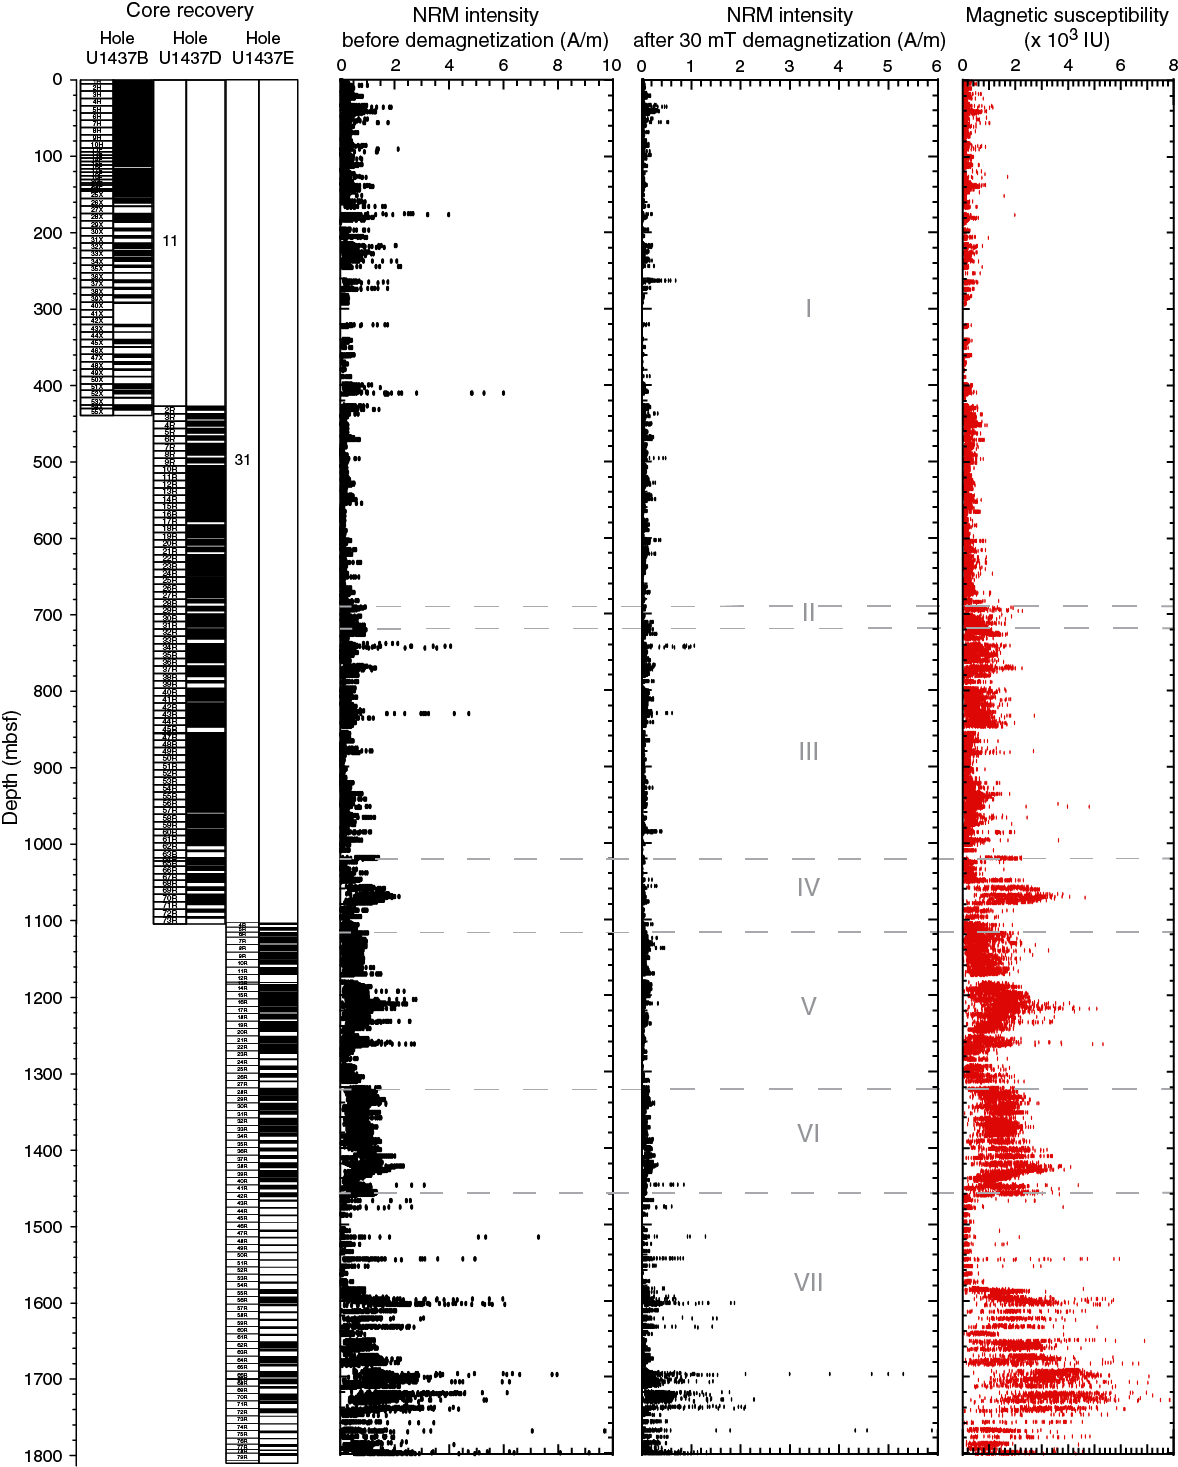
Figure F146. SRM NRM intensity vs. SHMSL MSP.
Magnetic polarity from archive-half measurement
Magnetic polarity was interpreted from demagnetized inclination data, supported by the FlexIT-corrected declination values in the full-length APC cores, although this was limited to the Brunhes normal chron. The high proportion of core recovery and the mostly moderate to low level of core disturbance in APC- and RCB-cored intervals at Site U1437 made for a continuous record of changes in magnetic polarity down as far as lithostratigraphic Unit V; only the XCB-cored interval from Cores 350-U1437B-25X to 55X presented significant interruptions to the record of polarity, until the remanence signal eventually became overwhelmed by overprinting.
Discrete sample remanence analysis
Holes U1437B and U1437D
One discrete paleomagnetic cube was sampled per working-half section in Hole U1437B. In Cores 350-U1437B-39X, 40X, and 46X, within the interval of limited XCB recovery, samples were also collected from the core catcher. Sampling focused on undisturbed tuffaceous mud intervals. Paleomagnetic sampling continued in similar fashion in Hole U1437D to Core 350-U1437D-29R, where the decision was made to share cube samples with the MAD analysis conducted by the Physical Properties team. Sampling was reduced to one sample per two sections, where available, and a wider variety of materials was sampled, although tuffaceous mud was still preferred. After initial measurement of NRM and prior to any demagnetization, the samples were subjected to the saturation-and-drying procedure required in the MAD analysis. As drying at 105°C was conducted in space subject to magnetic fields, these samples were thermally demagnetized at 110°C in field-free space on return to the paleomagnetic laboratory, in order to remove the overprint acquired during cooling (the “MAD overprint”); remanence after this demagnetization was also measured. Subsequent demagnetization of the cubes was either by AF, starting at 5 mT, or by continued thermal demagnetization, starting at 150°C.
Remanence on both plastic-enclosed samples and lithified cubes was measured on the Agico JR-6A spinner magnetometer. We found by practice, and later confirmed by rock-magnetic analysis, that for most discrete samples from Holes U1437B and U1437D AF demagnetization to 15 mT was sufficient to reveal the sign of the inclination of the characteristic remanent magnetization (ChRM).
Demagnetization plots showed that most of the discrete samples in these two holes had approached a stable endpoint, or were demagnetizing linearly toward the origin, after 15 mT demagnetization (Figure F147). Inclination from samples from Holes U1437B and U1437D demagnetized to 15 mT tightly clusters around the expected geocentric axial dipole (GAD) inclination of ±51° (Figure F148A). We demagnetized a subset of samples from these two holes to 80 mT, by which point remanence was usually very weak and chaotic, as a test of the efficiency of the 15 mT demagnetization and to prepare samples for further rock-magnetic analysis. As at Site U1436, we found overprinting to be less severe and magnetically softer in the discrete samples than in the archive halves (see Paleomagnetism in the Site U1436 chapter [Tamura et al., 2015b]).
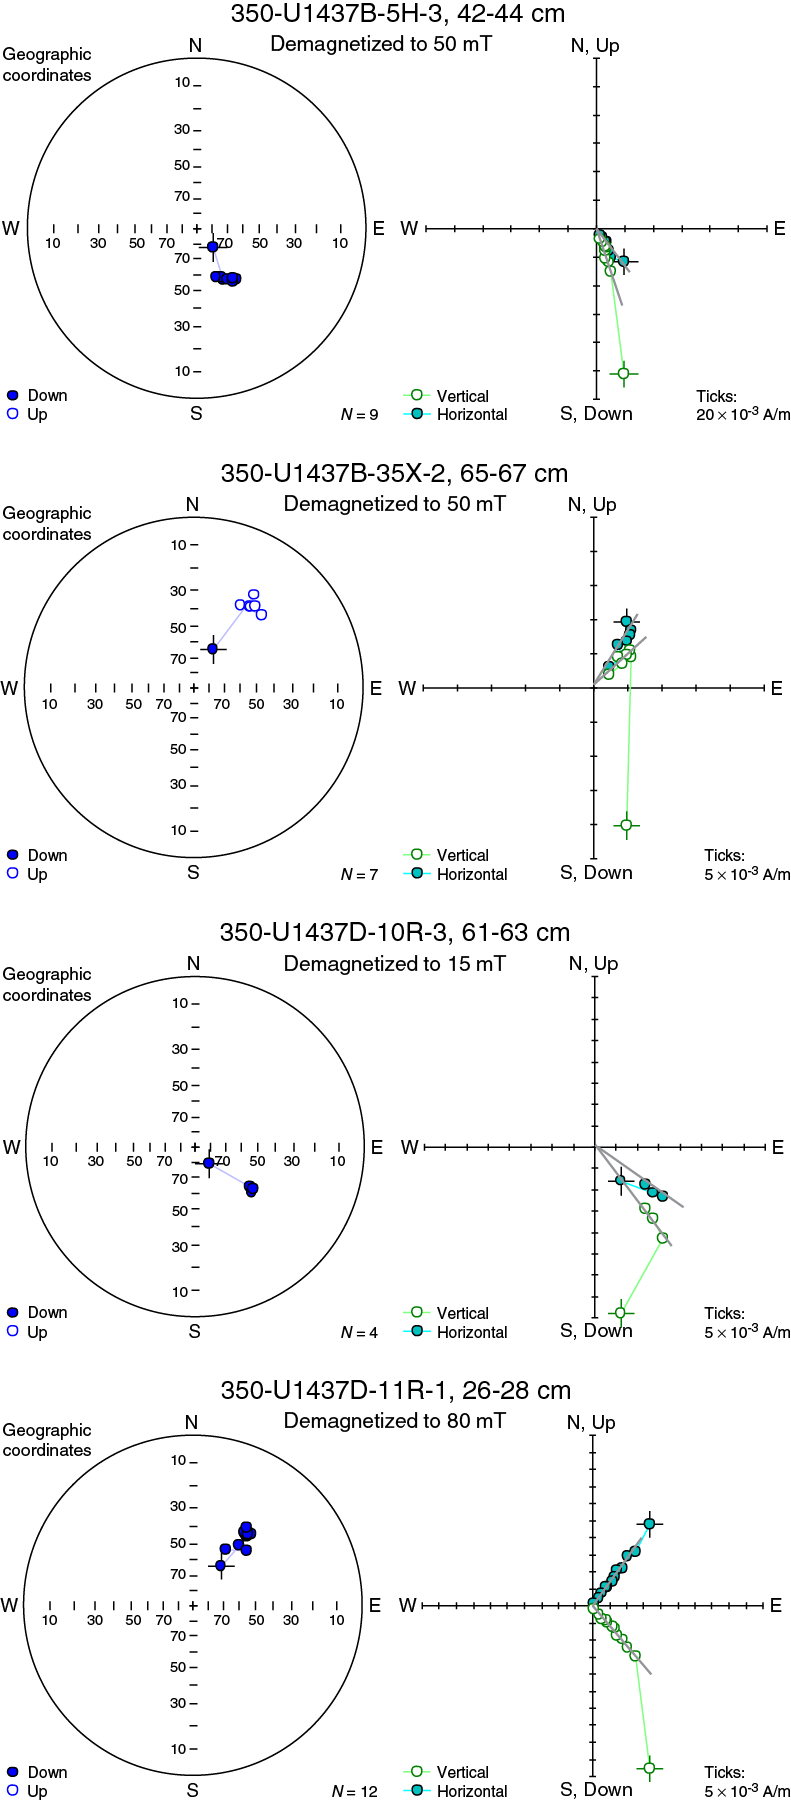
Figure F147. Stereographic plots, AF demagnetized discrete samples.
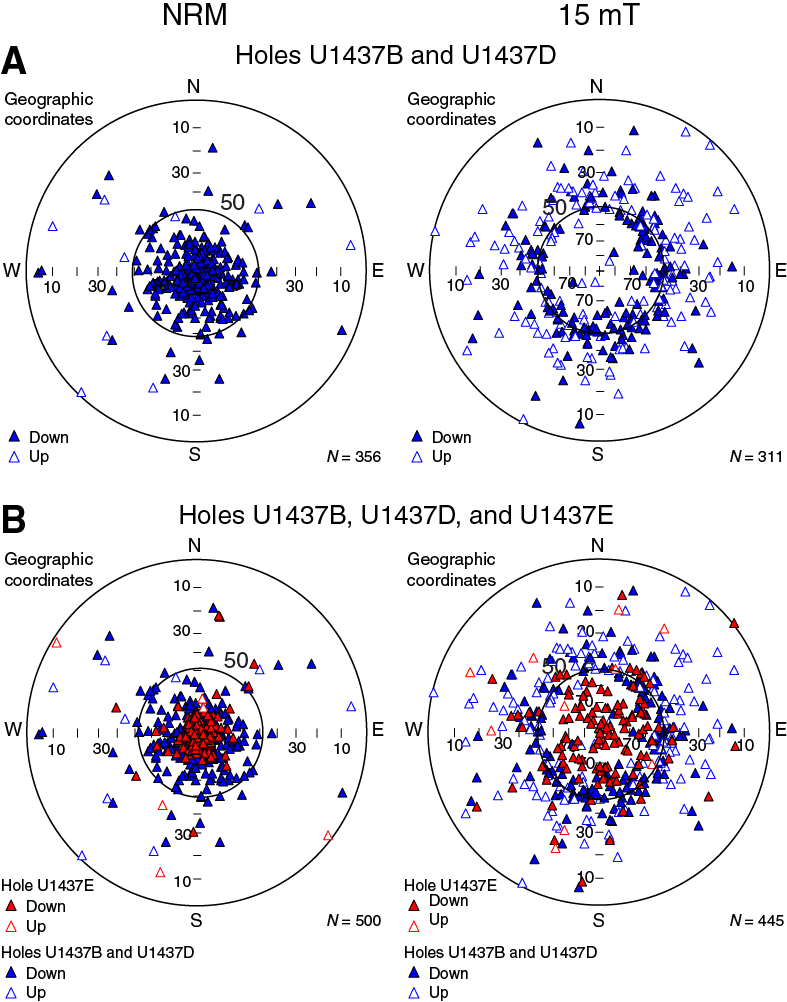
Figure F148. Stereographic plots, unoriented discrete sample directions.
Thermal demagnetization of discrete samples also served to remove the drilling overprint and additionally allowed discrimination of components carried by a thermally stable phase (presumably magnetite) and a phase that lost magnetization rapidly between ~250° and 400°C (Figure F149), which in the absence of confirming X-ray diffraction data, we take to be the magnetic sulfide greigite (see discussion in Rock-magnetic analysis). By 450°C, thermal demagnetization had isolated the ChRM polarity in all but a few samples.
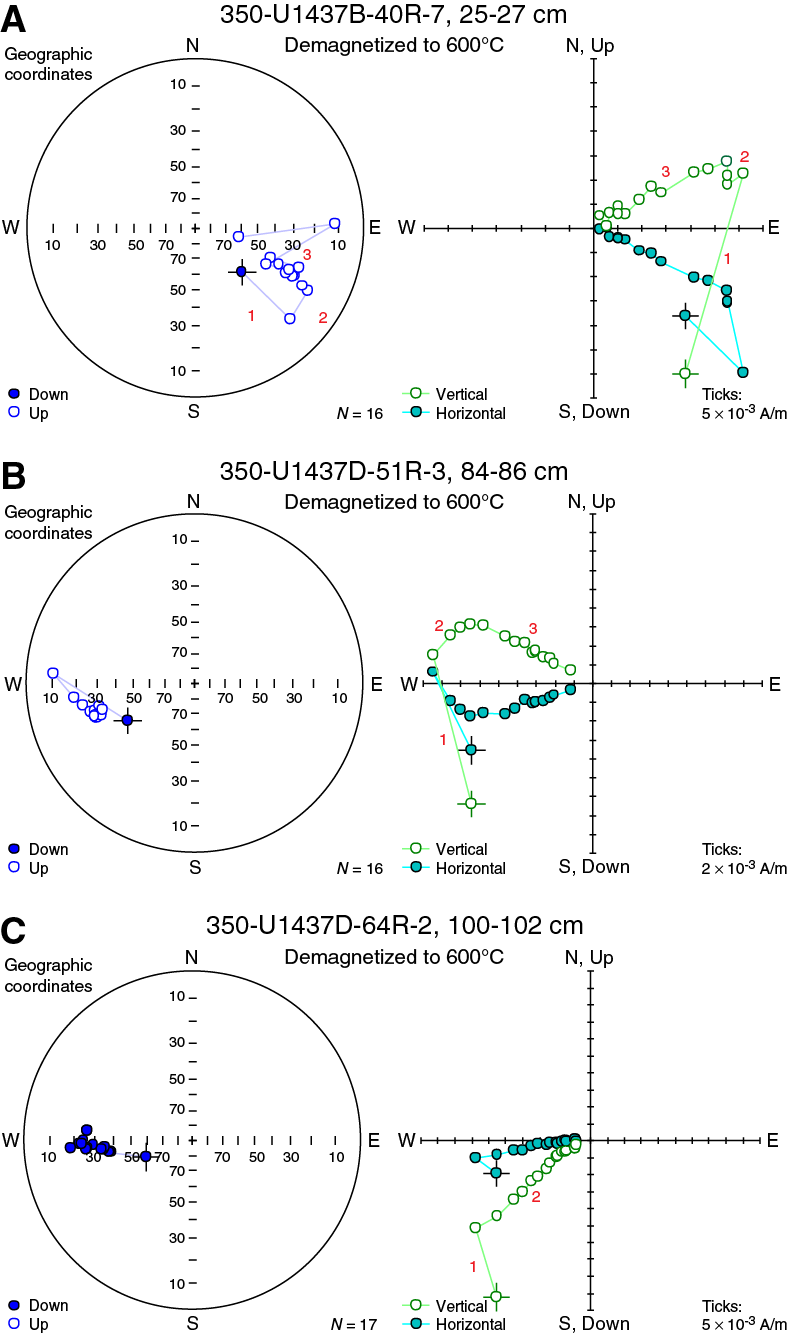
Figure F149. Stereographic plots, thermally demagnetized discrete samples.
Hole U1437E
In a large proportion of samples from Hole U1437E, the MAD overprint replaced the drilling overprint and persisted to very high demagnetization levels. This can be observed on stereonet demagnetization plots (Figure F150), which show the demagnetization path before MAD treatment and the demagnetization path after treatment following two distinct tracks, each representing very extensive overlap of the stability spectra of the corresponding overprint with the ChRM. It was clear that even though the MAD overprint was acquired at low temperature (~105°C), it had a demagnetization stability that extended to anomalously high temperatures, exceeding 450°C. Such behavior is characteristic of multidomain magnetite grains (Dunlop et al., 1997). AF demagnetization after the 110°C thermal demagnetization step intended to remove the MAD overprint was clearly inefficient, compared to the equivalent treatment in Hole U1437D, as the demagnetized remanence from the Hole U1437E samples clustered poorly around the dipole inclination (Figure F148B). Similar problems occurred with removing the drilling overprint in samples specifically selected for paleomagnetic analysis and not subject to the MAD overprint. These difficulties in demagnetizing overprints prompted our adoption of the liquid nitrogen treatment regime (see Paleomagnetism in the Expedition 350 methods chapter [Tamura et al., 2015a]) for discrete samples from Hole U1437E. In many samples, this approach significantly improved identification of ChRM, either by directly removing the drilling and MAD overprints during the low-temperature cycling or by reducing the overlap of stability spectra to the point where AF or thermal demagnetization could adequately isolate ChRM (Figure F151). Despite these measures, however, we had no consistent success in determining the polarity of discrete samples in Units VI or VII.
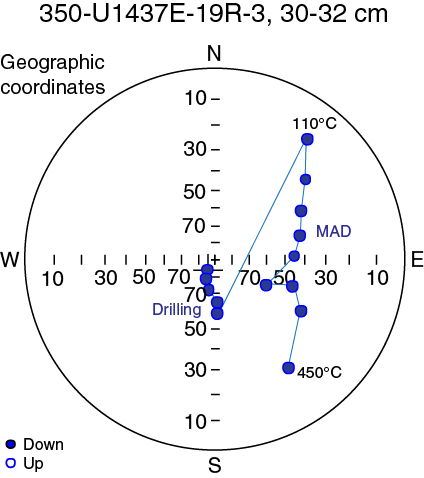
Figure F150. Stereographic plot, separate thermal demagnetization paths.

Figure F151. Liquid nitrogen treatment.
At the request of the core describers, a series of samples of igneous materials were collected in order to determine if they were emplaced while still hot or after cooling (Figure F152). The first of these (Sample 350-U1437E-35R-1, 126–128 cm) sampled what was later interpreted to be igneous Unit 1; a consistent, single component demagnetization plot (after removal of the drilling overprint) and the normal polarity and appropriate inclination of the ChRM provided part of the evidence that this was in fact an intrusion, rather than simply a large clast.
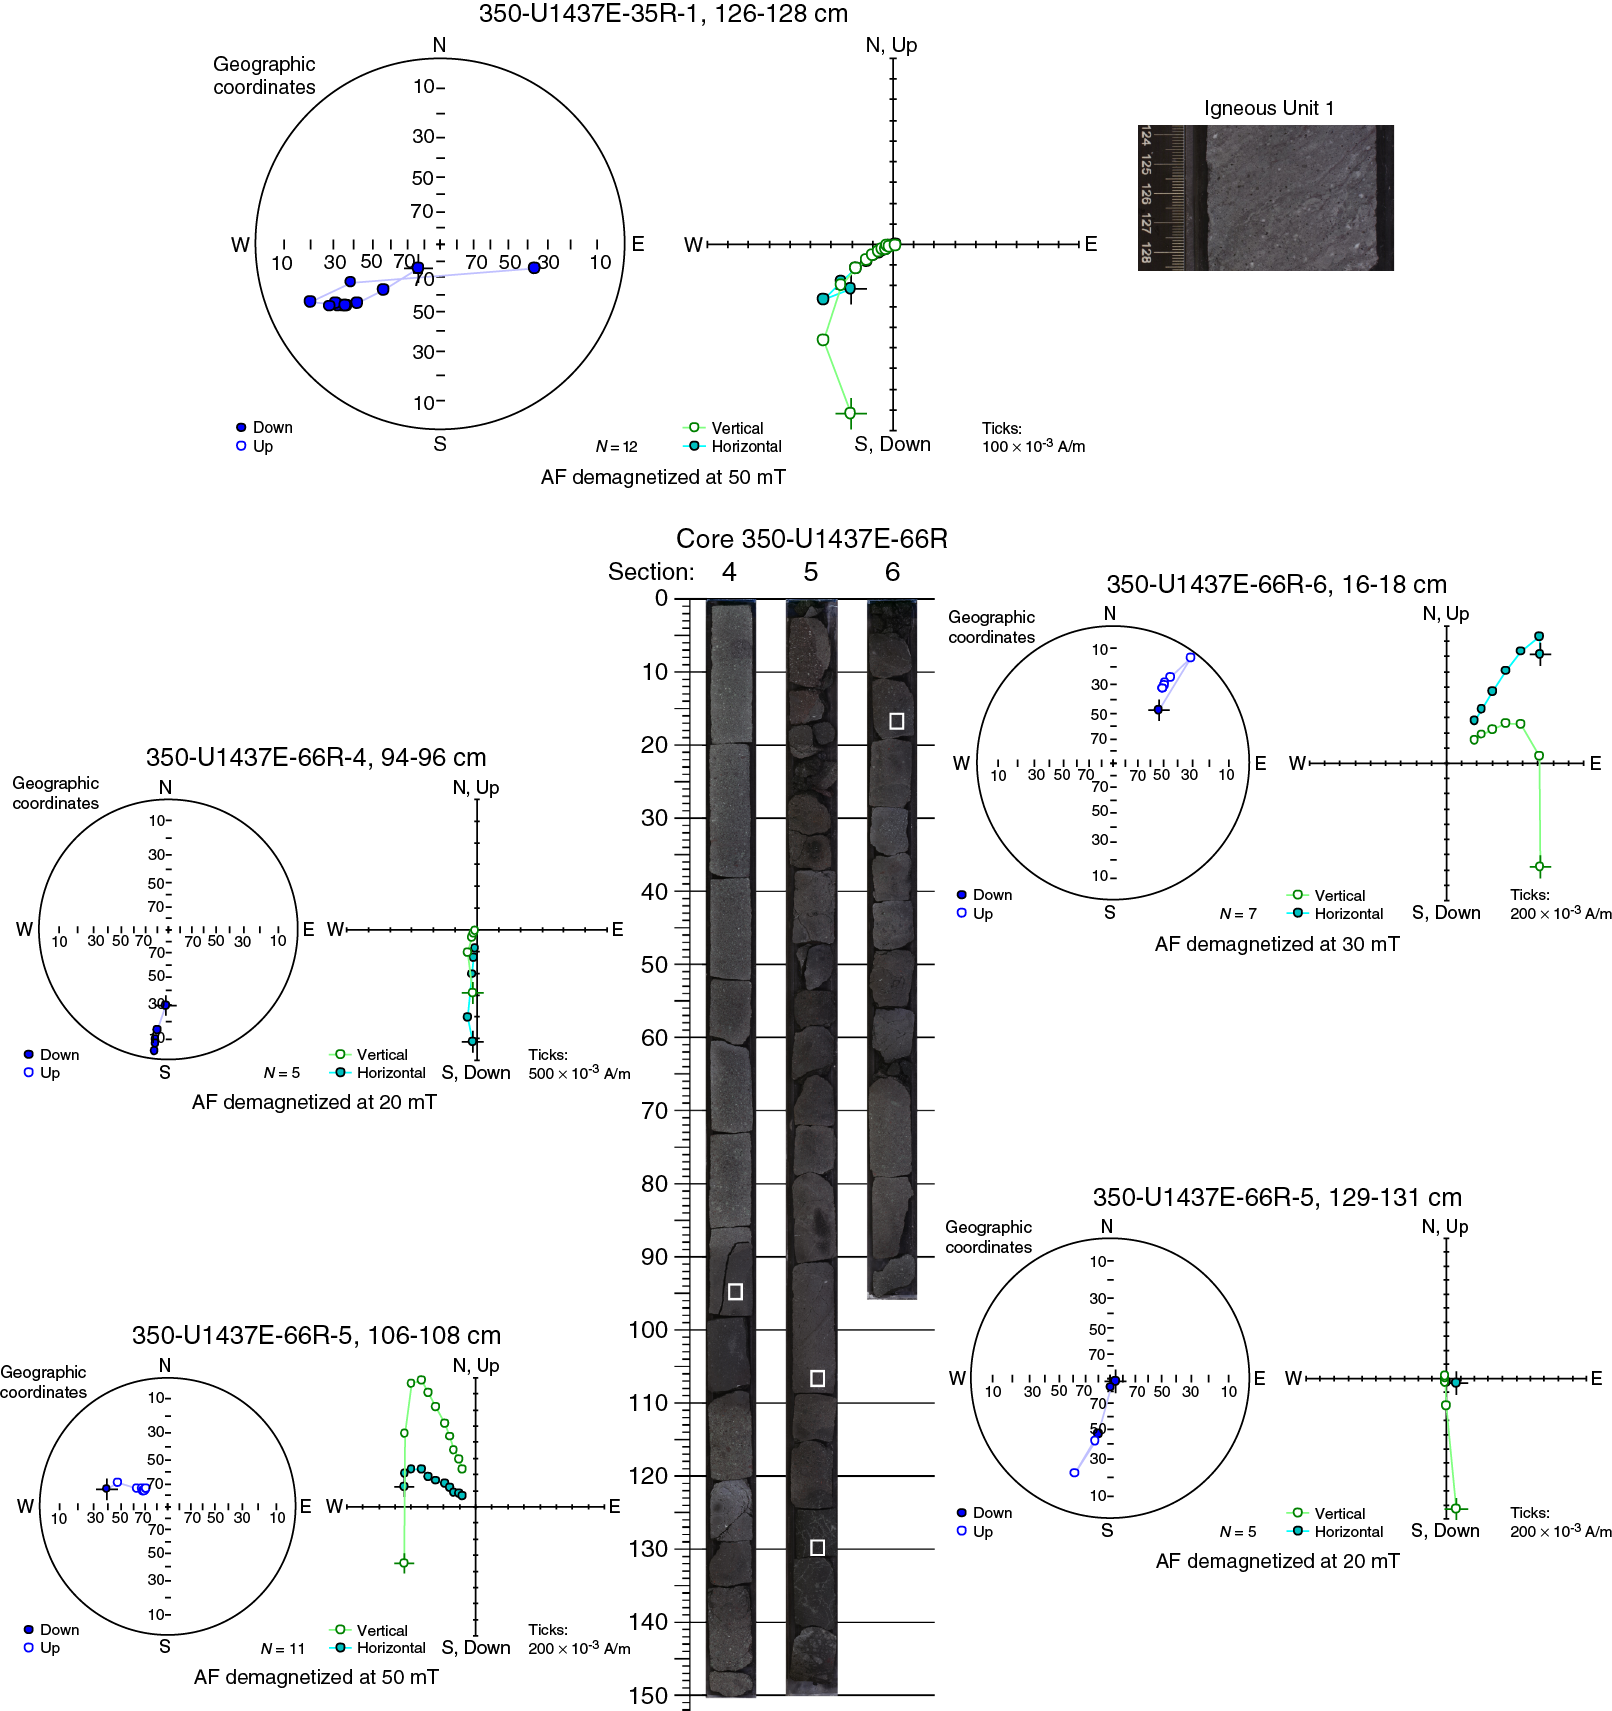
Figure F152. Demagnetization plots, igneous Unit 1.
Other samples, from what were clearly clasts, were selected from Unit VII in Cores 350-U1437E-66R (5 samples), 70R (3 samples), and 72R (3 samples). These were demagnetized either by AF (up to 50 mT) or thermally (up to 450°C). Results showed that the dominant magnetic mineralogy is multidomain, making recovery of the primary magnetization difficult because of the consequent strong and stable overprint. However, Samples 66R-5, 106–108 cm, and 66R-6, 16–18 cm, display a single component of negative inclination, which is consistent with hot emplacement if the polarity at this time was reversed. Samples from Core 72R were collected in the tuff-breccia, the baked area around the clast, and within the clast. The goal to identify distinct magnetic behaviors between these three samples was not achieved because of highly overprinted, multidomain-type behavior.
Magnetostratigraphy
Broadly speaking, the magnetostratigraphy at Site U1437 can be broken down into three intervals based on the difficulty in removing the drilling overprint and the quality of preservation of the depositional remanence. In Holes U1437B and U1437D, removal of the drilling overprint by 30 mT demagnetization of the archive halves was sufficiently effective that the magnetostratigraphy could largely be recognized on the basis of the archive-half record alone. However, as at Site U1436, we found the discrete samples, which are less overprinted than the archive halves, very useful for interpreting more overprinted intervals and clarifying the position of polarity reversals (Table T6); this was particularly true in the XCB-cored interval of Hole U1437B. In most cases, 15 mT demagnetization of the discrete samples in Holes U1437B and U1437D was sufficient to define the sign of the inclination and, hence, polarity.
Table T6. Polarity of discrete samples. Download table in .csv format.
Overprinting became much more difficult to remove in Hole U1437E, and much more reliance was placed on discrete samples. These also required liquid nitrogen cooling and the use of higher demagnetization levels (40 mT for AF demagnetization or a minimum of 450°C for thermal demagnetization) to identify polarity. Even these measures proved ineffective in the third interval, corresponding to lithostratigraphic Units VI and VII, where no coherent polarity record could be identified in the tuff and breccia, and the only signal was present in the intrusive igneous Unit 1 and (arguably) some hot-emplaced clasts.
The resulting magnetostratigraphy is shown in Figure F153. Depths and corresponding ages of the magnetostratigraphic datums are listed in Table T7. Continuous magnetostratigraphy was recognizable to the top of Subchron C3An.2n (6.436 Ma; 1056.65 mbsf). None of the major chron and subchron boundaries recognized in the 2012 geomagnetic polarity timescale (GPTS2012) appear to have been missed throughout this interval, although some minor cryptochrons (among them the Cobb Mountain and Réunion, each spanning 20 ky) were absent, presumably lost through discontinuous recovery. All datums through Holes U1437B and U1437D could be fixed to narrow depth ranges of less than a few tens of centimeters, with the exception of the top of Subchron C3An.1n (the base of the Gilbert Chron, 6.033 Ma), where overprinting, and possibly an extended interval of transitional behavior, made constraining the datum only possible within a 7.1 m interval (969.56–976.66 mbsf).
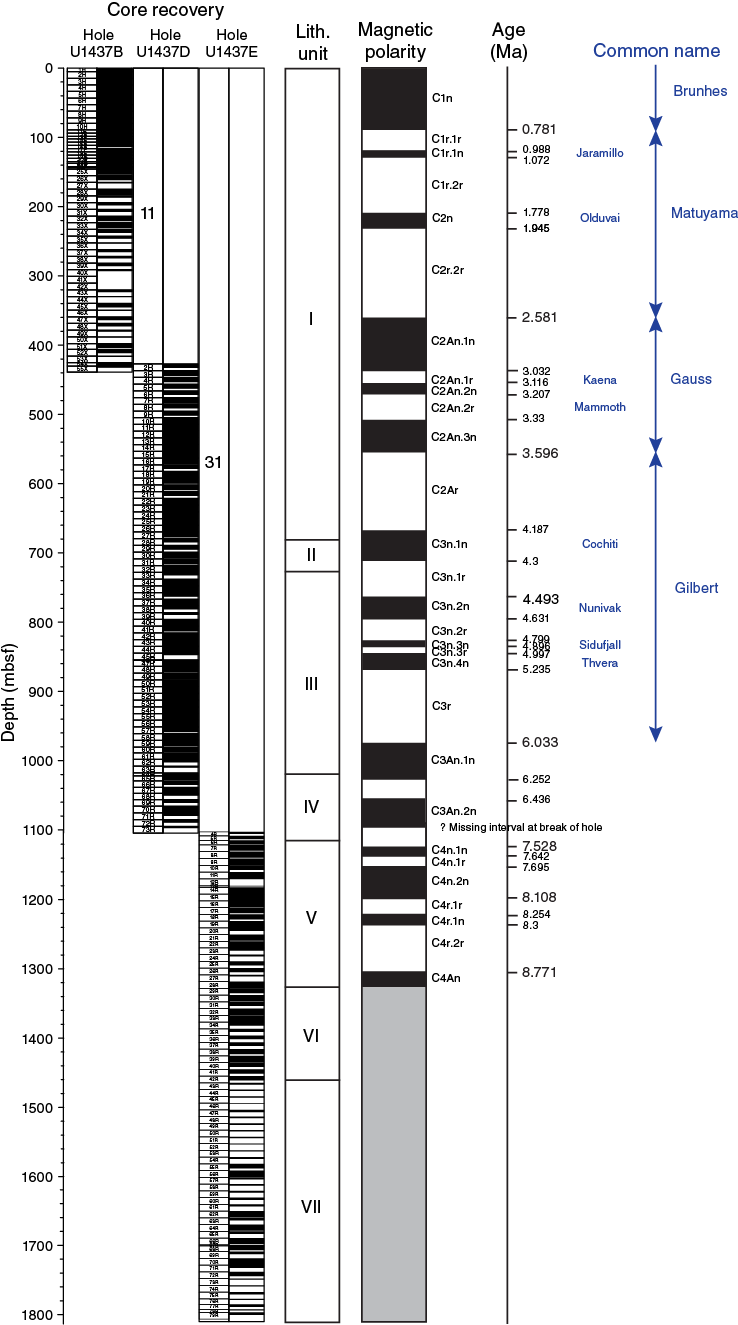
Figure F153. Magnetostratigraphy, Site U1437.
Table T7. Magnetostratigraphic datums. Download table in .csv format.
The base of Subchron C3An.2n was not recognized: Hole U1437D ended in normal polarity, but the first core in Hole U1437E was reversed. Coring in Hole U1437D finished with Core 350-U1437D-73R at 1104.6 mbsf, which had 19% recovery, and the hole was terminated due to difficult coring conditions. Coring in Hole U1437E commenced at 1104.0 mbsf, with 48% recovery, and recovery increased in each of the six following cores to 68% or better. The base of Subchron C3An.2n may have been present in the unrecovered part of Core 73R, but if so, this would require a marked reduction in sedimentation rate within the lower part of Unit IV, inconsistent with two paleomagnetic datums immediately above. A hiatus is inconsistent with the continuation of Unit IV into the upper part of Hole U1437E and also is at odds with the nearly uniform sedimentation rates observed in Units IV and V (LSR = 157 and 146 m/My, respectively; see Age model). The two holes lie at almost exactly the same latitude (their north–south displacement is only 0.0006′ = 1.1 m), and the local bedding strike is roughly east–west, indicating that significant loss of section because of dip between the two holes can be ruled out. The remaining plausible mechanism for the sharp magnetostratigraphic break between the two holes is a normal fault at or near the base of Hole U1437D and passing between the base of this hole and the top of Hole U1437E, leading to a loss of section. Such a fault could have been responsible for the difficult drilling conditions that led to the decision to terminate Hole U1437D. Alternatively, there may have been significant erosion within lithostratigraphic Unit IV, although this was not directly observed.
Despite this apparent loss of section, the magnetostratigraphy in the upper part of Hole U1437E appears to be well defined and continuous. All chrons and subchrons from Chron C4n.1n to the top of Chron C4An can be recognized, apparently including the normal Cryptochron C4r.2r-1n. The last datum is at 8.771 Ma near the base of lithostratigraphic Unit V. Extrapolating this rate to the core catcher of Core 350-U1437E-36R (1402 mbsf) substantially underestimates the age range of the nannofossil assemblage at this depth, 10.97–11.85 Ma (see Biostratigraphy). The most likely explanation is a hiatus at the lithostratigraphic Unit V/VI boundary. Magnetostratigraphy in lithostratigraphic Units VI and VII was impossible to recognize, with the exception of normal polarity seen in the discrete sample (35R-1, 126–128 cm) from igneous Unit 1. Normal polarity in this sample is consistent with the nannofossil age range in the succeeding core, which overlaps the older part of normal Chron C5n.2n (9.984–11.056 Ma).
One consideration that applied during our assessment of the polarity stratigraphy was a repeated observation of short discontinuous intervals of apparently opposite polarity, persisting for only a few meters, that are repeatedly present at a depth of about 1 or 2 core lengths—roughly 10–20 m—below a polarity transition (Figure F154). These short intervals do not match any known cryptochrons and cannot be reconciled with longer polarity intervals on the chron or subchron scale, so we termed them the “ghost polarity.” We surmise that this reflects short intervals of enhanced postdepositional magnetization through the growth of authigenic greigite and/or magnetite within the early stages of sulfate reduction. Such a process would result in repeated cases of a delayed lock-in of remanence, but this only becomes noticeable in the magnetic polarity record in the sediments deposited a short time interval before the polarity transition, where the depositional and postdepositional remanence would be opposite in sign. Similar polarity artifacts were recognized by Sagnotti et al. (2005), who likewise interpreted their source to be postdepositional remanence carried by patchily distributed greigite. With this in mind, we reviewed polarity reversals carefully, picking the first point the reversal was encountered moving downward through the archive-half inclination record, and confirming the selection by reference to the discrete samples. These were intentionally selected well away from signs of vigorous bioturbation or concentrations of glaucony or glauconite (see Lithostratigraphy), where concentration of organic materials is likely to spur the microbially driven reduction that is the origin of the magnetite-greigite magnetic diagenesis sequence (Rowan et al., 2009).

Figure F154. Ghost polarity.
Rock-magnetic analysis
Rock-magnetic analysis at Site U1437 spanned the gamut of techniques available in the shipboard laboratory: partial anhysteretic remanent magnetization (pARM), isothermal remanent magnetization (IRM), backfield demagnetization, thermal demagnetization, and anisotropy of magnetic susceptibility (AMS). We aimed to understand, and therefore make adequate allowance for, the mechanisms of overprinting seen to affect the magnetostratigraphic record. We also used rock-magnetic analysis as a proxy for downhole changes in the iron oxide and sulfide mineralogy that are a result of diagenetic and fluid-transport processes, as well as lithologic changes. Significant differences in the rock-magnetic behavior of the sequence in Hole U1437E suggest that the sequence in this hole should be considered separately.
Partial anhysteretic remanence
Holes U1437B and U1437D
Coercivity spectra defined by pARM show a peak in the 10–20 mT window that persists throughout the cored interval of Holes U1437B and U1437D (Figure F155). Of the 13 samples studied from these two holes, only one, Sample 350-U1437D-51R-1, 50–52 cm (893.60 mbsf), showed higher peak coercivity, in the 20–30 mT window. Peak coercivity of 10–20 mT, typical of magnetite in the multidomain to pseudosingle-domain size range (Thompson and Oldfield, 1986), justifies the use of a 15 mT peak AF demagnetization for the routine discrimination of polarity in discrete specimens from this site.

Figure F155. pARM spectra, Site U1437.
Superimposed on this coercivity population, most of the samples exhibited evidence for a second, higher coercivity component, expressed as a convexity in the coercivity spectrum representing a subsidiary peak in the 20–30 or 30–40 mT window. The exceptions, which expressed only a single coercivity population, were the shallowest sample (350-U1437B-1H-1, 94–96 cm, at 0.94 mbsf), and three of the five samples representing the interval deeper than about 680 mbsf, comprising lithostratigraphic Units III and IV (e.g., Sample 350-U1437D-70R-1, 65–67 cm, at 1066.35 mbsf).
Although the evidence for the higher coercivity component is consistent, the magnitude of the pARM contributed by this component and its coercivity are both substantially less than in strongly reduced hemipelagic sediments from the Blake Ridge sites cored during ODP Leg 164 (Paull, Matsumoto, Wallace, et al., 1996), which were subjected to similar pARM analysis.
Hole U1437E
Samples from Hole U1437E display a wider range of stability spectra, ranging from very soft, with a peak at 10–20 mT and a strong skew to low values (e.g., Sample 350-U1437E-70R-5, 90–92 cm), to harder, with a broader maximum centered on about 20 mT (e.g., Sample 14R-3, 78–80 cm). Some specimens have a subsidiary peak at 30–40 mT (e.g., Sample 55R-3, 56–58 cm). Examples of each class of behavior are present in each of Units V, VI, and VII, suggesting that some control other than lithologic type is influencing the magnetic mineralogy.
Isothermal remanence
IRM imparted at 1000 mT—effectively saturation isothermal remanent magnetization (SIRM) in samples dominated by magnetite and/or magnetic sulfides—was imparted on a set of 49 samples from Holes U1437B, U1437D, and U1437E, including all samples used in the pARM analysis.
Holes U1437B and U1437D
Two populations are visible in S−0.3T (Figure F156) from the seafloor to about 205 mbsf. One has higher values of S−0.3T clustering around 0.98, the second has lower values, around 0.95. This index decreases when the proportion of a higher coercivity magnetic phase increases relative to that of magnetite, and decreases in S−0.3T have been inferred to represent increases in the relative concentration of the magnetic sulfide greigite (e.g., Shipboard Scientific Party, 1996c). Hence, this part of the sequence appears to have both greigite-poor and (comparatively) greigite-rich mud intervals, although the selection bias in these samples may underemphasize the greigite-rich population because samples were selected away from signs of intense biological activity (worm burrows and other bioturbation markers). From about 400 mbsf to about 680 mbsf (i.e., the base of lithostratigraphic Unit I), S−0.3T increases steadily from about 0.95 to about 0.995 then remains roughly constant through lithostratigraphic Units II–IV, to the bottom of Hole U1437D. Such an increase in S−0.3T values suggests a decrease in the proportion of greigite relative to magnetically soft pseudosingle-domain magnetite. The highest values of S−0.3T , exceeding 0.9975 and implying that magnetite is essentially the only ferromagnetic phase present, occur in samples from near the base of lithostratigraphic Unit III and within Unit IV.
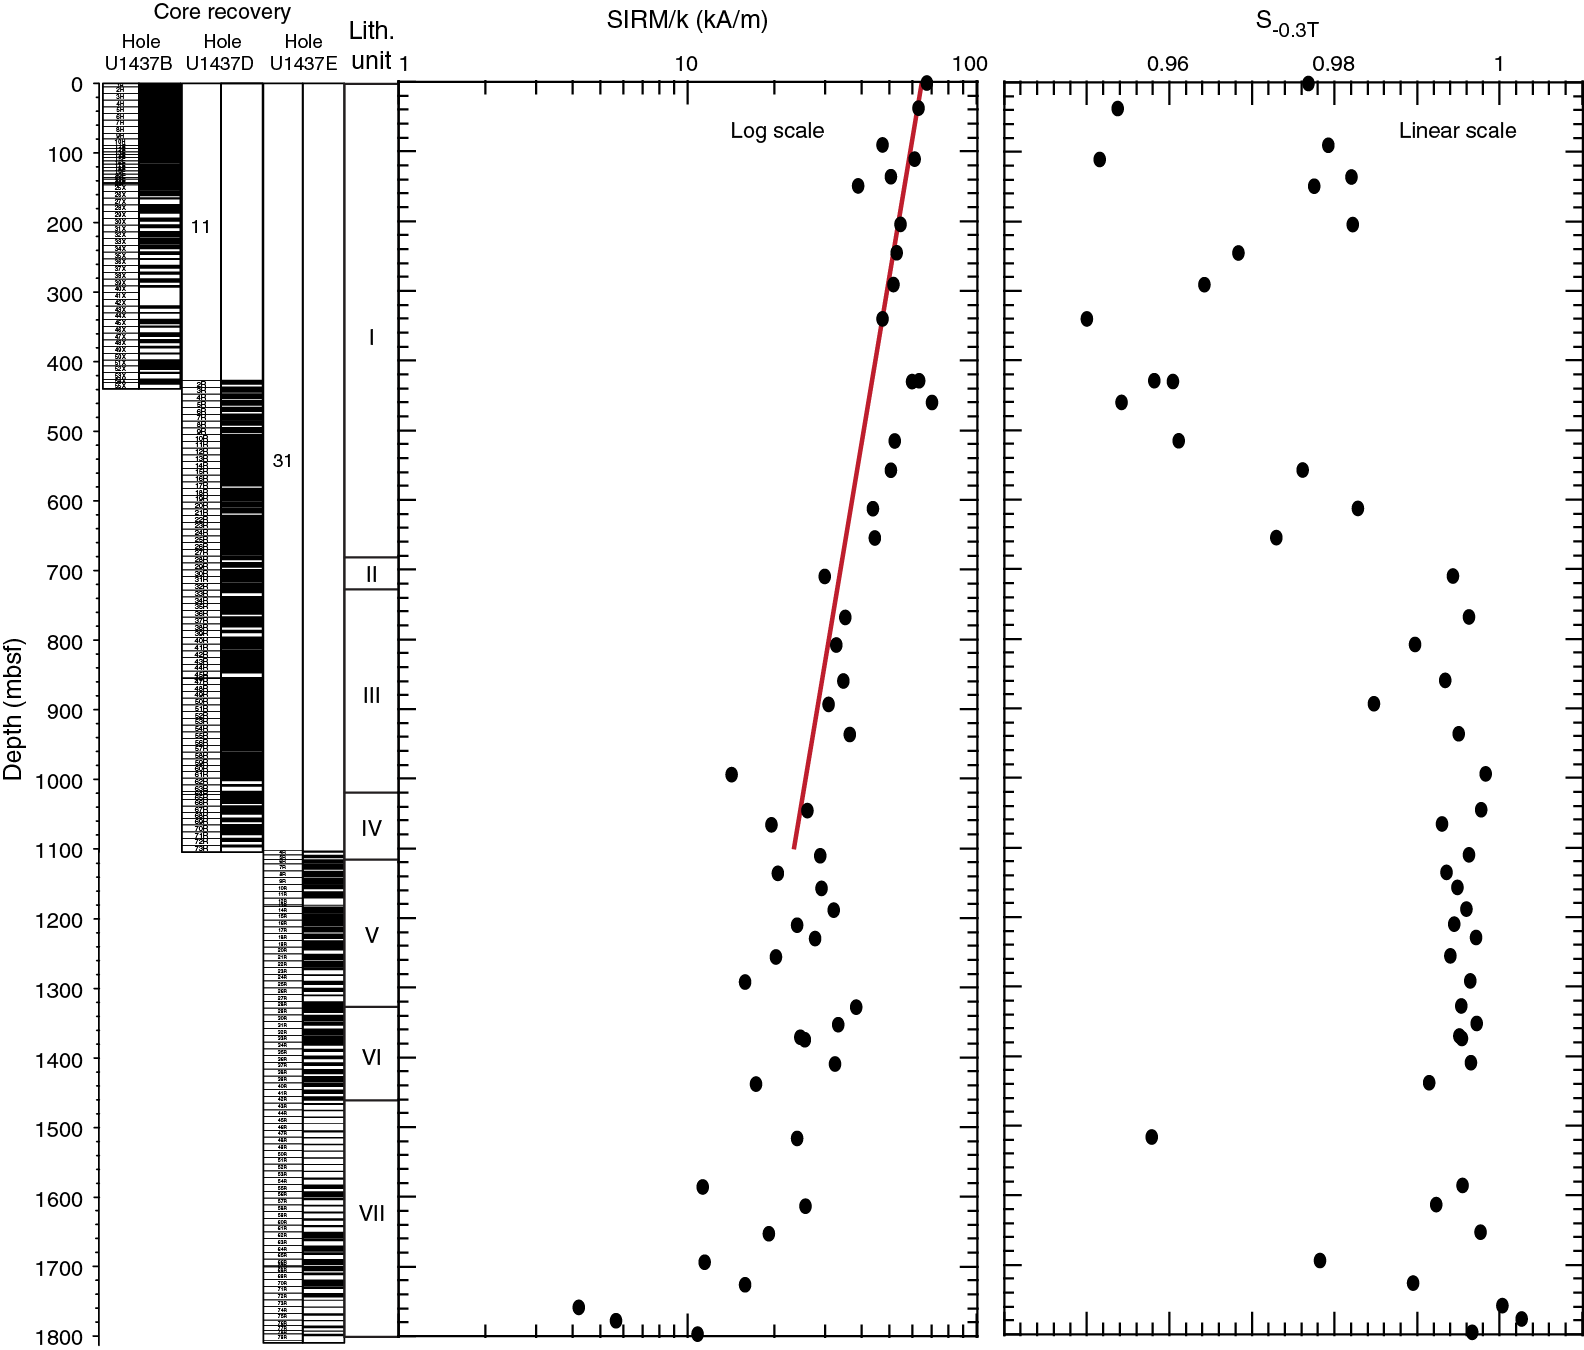
Figure F156. SIRM/k and S–0.3T ratios, Site U1437.
SIRM/k exhibits a background log-linear decrease with subbottom depth through the sequence in Holes U1437B and U1437D, in an analogous fashion to behavior reported from the much more lithologically uniform hemipelagic drift sequence at Blake Ridge (Leg 164: see Shipboard Scientific Party, 1996a, 1996b), where this trend was attributed to a background rate of reduction of ferromagnetic greigite (Fe3S4) to paramagnetic pyrite (FeS2) continuing with depth. Positive excursions of SIRM/k at Blake Ridge were attributed to enhanced greigite authigenesis, whereas a negative excursion corresponded to an interval of free H2S gas, which would be expected to complete reduction of greigite to pyrite. At Site U1437, an anomalously high interval of SIRM/k begins at about 400 mbsf, where there is a step increase, and continues to the lithostratigraphic Unit I/II boundary. A single high SIRM/k value occurs in Unit III. Anomalously low SIRM/k occurs in three samples within the upper 200 mbsf of Unit I and in scattered samples in Units III and IV.
Hole U1437E
S−0.3T stays tightly grouped from the top of Hole U1437E to the base of lithostratigraphic Unit VI, maintaining the high values reached at the bottom of Hole U1437D, indicating near-complete conversion of magnetic sulfides to pyrite. Unit VII, by contrast, displays the most extreme scatter of S−0.3T seen in the whole of Site U1437, to both high and low values. Without XRD data, the source of this dispersion to both magnetically softer (high S−0.3T) and harder (low S−0.3T) states is unclear.
Despite the broadly similar lithologic characteristics of Units III and V, the background log-linear decrease in SIRM/k downhole that persists throughout Units I–IV is less clearly defined in Units V, VI, and VII, where SIRM/k values are scattered over a wide range.
Thermal demagnetization behavior
Hole U1437D
Thermal demagnetization of 68 samples from Hole U1437D and 53 samples from Hole U1437E (excluding the sample from igneous Unit 1) shows that at least 50% of the remanence is lost by 350°C (Figure F157). In samples from Cores 350-U1437D-34R to 59R (Figure F157A–F157B), a change in slope in the NRM versus demagnetization temperature plot occurs in the temperature range 300°–400°C, suggesting the occurrence of an iron sulfide, likely greigite (Roberts et al., 2011). These samples correspond to the depth range where an overprint is identified in the AF demagnetization of the archive halves. Greigite is likely responsible for this overprint and is the carrier of the second component on the Zijderveld plots (Figure F149A–F149B). At 600°C, almost all the remanence is removed, indicating the occurrence of magnetite (Tc = 580°C). Magnetite is the carrier of the ChRM.

Figure F157. Thermal demagnetization intensity vs. heating temperature.
Hole U1437E
The inflection in NRM versus thermal demagnetization plot is absent, or markedly less pronounced, in samples from Hole U1437E. In general, samples from this hole are very thermally soft, typically decreasing to <10% of the initial NRM by 150°–300°C (Figure F157D–F157E), although there are some more stable exceptions (Figure F157F).
Anisotropy of magnetic susceptibility
AMS was determined for samples from Holes U1437B and U1437D. AMS reveals a dominantly oblate texture when plotted on a Flynn diagram (Figure F158; left); foliation, though mild (maximum F = 1.08), dominates the magnetic texture. Magnetic foliation overall increases downhole, in accord with observations of increased compaction with depth (see Lithostratigraphy), although the degree of magnetic foliation is less than the 34% maximum compaction determined from observations of strain markers (Figure F158; right). Unlike the strain marker evidence, no significant elongation in the magnetic fabric is seen in the upper 400 m, possibly because of the preferential selection of cubes in undisturbed material. Instead, a weak increase in magnetic foliation develops from the surface to about 400 mbsf, where it resets in a sharp step to lower values before the steady downhole increase in magnetic foliation resumes. Scattered low values of magnetic foliation occur deeper than about 1000 mbsf in Hole U1437D, corresponding roughly to lithostratigraphic Unit IV, which evidently has a distinctive compaction or depositional history to the higher units at this site.
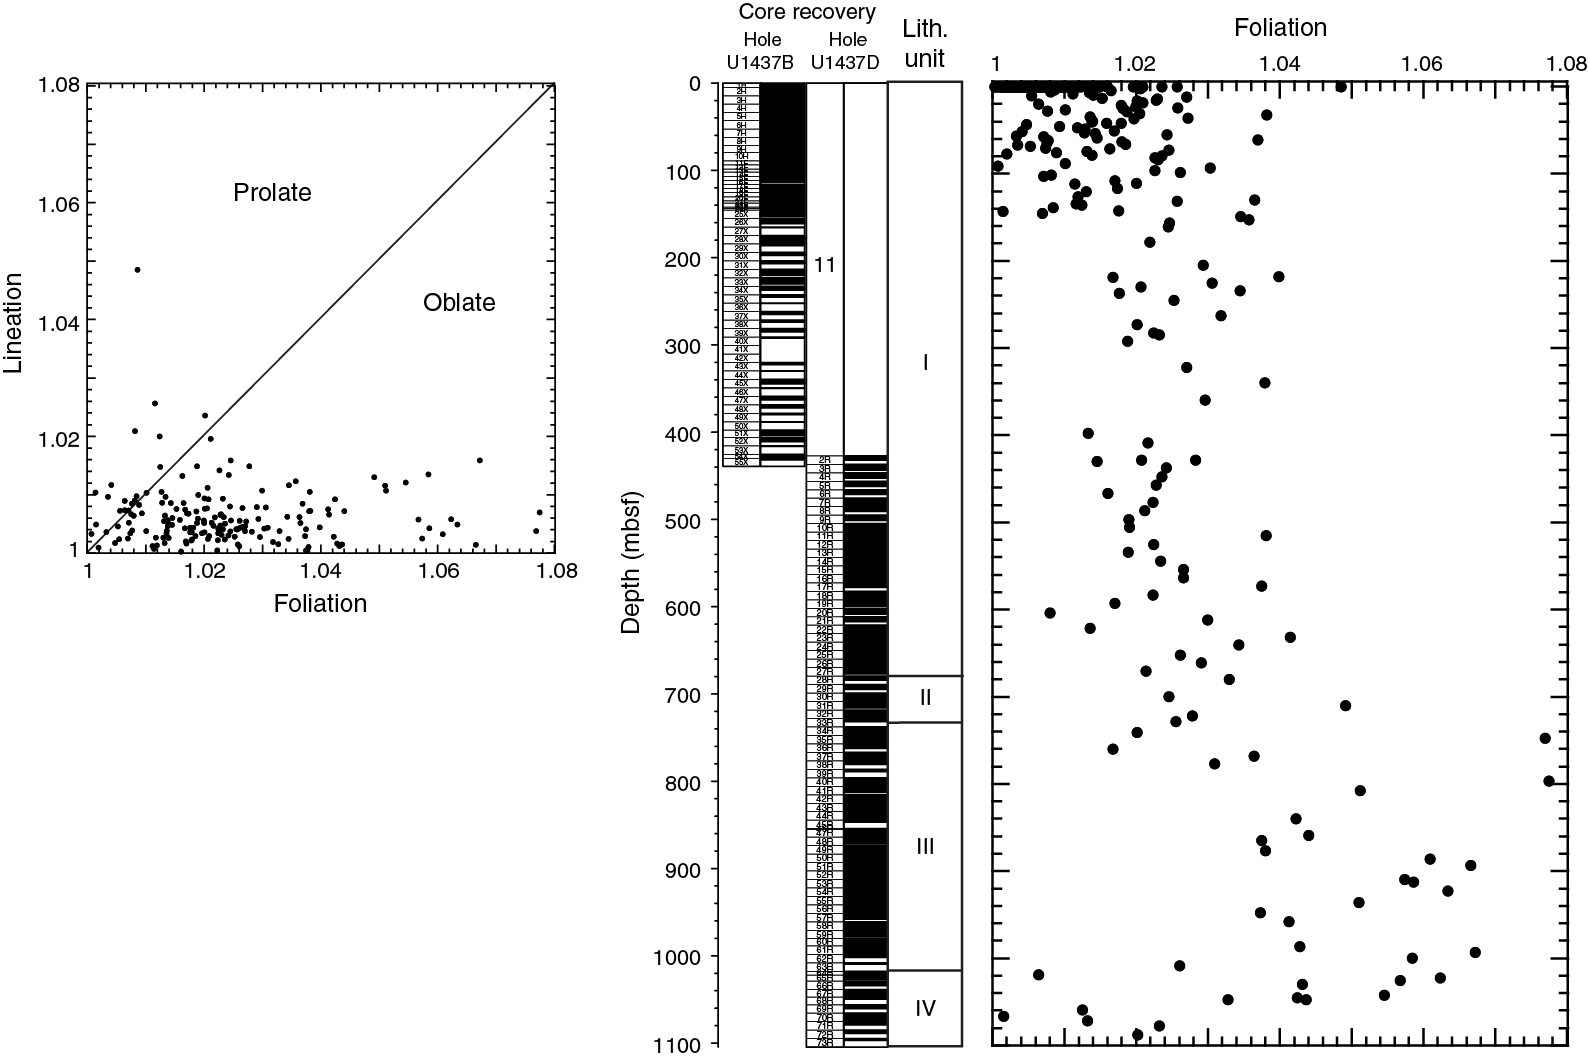
Figure F158. AMS and foliation with depth, Holes U1437B and U1437D.
Interpretation of rock magnetism
Mineralogy
Thermal demagnetization, pARM, and IRM analysis together suggest the presence of two magnetic phases in the tuffaceous mud of Holes U1437B and U1437D. Although magnetite is certainly one phase, the presence of greigite can be inferred from the thermal instability and higher coercivity of the second phase. In the absence of a shipboard X-ray diffractometer during Expedition 350, support for the presence of greigite was restricted to the recognition of features in the core known to be associated with greigite development in other silty mud sequences as described below.
Layers of green clay, likely to be glauconite with smectite and associated with pyrite, occur throughout lithostratigraphic Units I, II, and III (see Lithostratigraphy). Glauconite is particularly prominent where associated with bioturbation features in which bacterial activity stimulated by nutrients produce a strongly reducing environment. Glauconite, and its immature form glaucony, have been shown to be associated with development of magnetic iron sulfides (Shipboard Scientific Party, 1994), including greigite (Housen and Musgrave, 1996).
Large burrows show a core of pyrite surrounded by a rim of a very fine grained, black material (Figure F159); similar material described from ODP Sites 1244–1252 on the Cascadia margin (ODP Leg 204) has been shown to comprise mixtures of iron sulfides, including both greigite and pyrrhotite, by a combination of rock-magnetic, scanning electron microscope energy dispersive spectrometry (SEM-EDS), and XRD analyses (Shipboard Scientific Party, 2003; Musgrave et al., 2006; Larrasoaña et al., 2007). Pyrrhotite can probably be excluded at Site U1437, as the coercivity spectra do not extend to the high values typical of pyrrhotite.
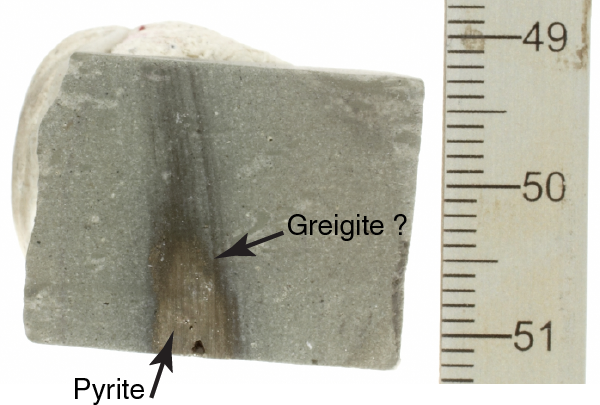
Figure F159. Burrow exposed by a saw cut.
Voids in foraminiferal tests near the top of PP Unit 4 (682 mbsf) are filled with a fine opaque mineral, likely also to be iron sulfides including greigite (see Figure F143). Again, similar observations were made at Sites 1244–1252 (Leg 204).
Based on the thermal demagnetization behavior, magnetic sulfides would appear to be much less prominent in Hole U1437E, and this is consistent, at least, with the uniformly high values of S−0.3T in lithostratigraphic Units V and VI. However, the origin of some very low values of S−0.3T in Unit VII and of the general scatter to anomalously high SIRM/k in both Units VI and VII, raises the question of what is the responsible magnetic mineralogy.
Overprinting
Given the evidence for the presence of authigenic greigite and the inference of reduction processes generating iron sulfides, it might be expected that a poor quality, ambiguous magnetostratigraphy would result. In fact, overprinting is mostly mild within Holes U1437B and U1437D, consistent with rock-magnetic evidence that greigite represents a smaller fraction of the magnetic mineralogy than at strongly reduced sites such as those encountered at the Cascadia margin or Blake Ridge. S−0.3T at ODP Site 997 (Leg 164) on the Cascadia margin rarely exceeds 0.96 (Shipboard Scientific Party, 1996b), whereas only a small proportion of the samples from Site U1437, all restricted to the upper 500 mbsf, were below this value. The geochemical signal of reduction is also weaker; the sulfate reduction zone at Site U1437 extends to about 50 mbsf, and sulfate rebounds below this to near seawater values (see Geochemistry; Figure F126), whereas at Site 997, sulfate is completely reduced at about 23 mbsf, and does not recover at deeper depths.
Although overprinting in Holes U1437B and U1437D is mild, the ghost polarity intervals can be understood in the context of postdepositional remanence being carried by authigenetic iron sulfides generated during the sulfate reduction sequence in the shallow subsurface.
Overprinting was notably more severe in Hole U1437E, even in the interval within Unit V in which magnetostratigraphy could still be recognized. Magnetic sulfides appear not to be the cause in this case, but rather a shift in magnetic grain size from pseudosingle domain to dominantly multidomain. This may reflect dissolution of fine-grained, single-domain magnetite by hydrothermal alteration.
Downhole trends
The downhole trends in rock-magnetic properties suggest that, after initial biologically mediated reduction in the sulfate reduction zone to produce greigite, the proportion of greigite gradually decreased, presumably though slow completion of the iron sulfide reduction chain to convert this ferrimagnetic sulfide to paramagnetic pyrite. Superimposed on this trend is a break at about 400 mbsf, where SIRM/k, S−0.3T , and magnetic foliation all show step changes: for the IRM indexes, this represents a step increase in the proportion of magnetic sulfides, followed by gradual returns to trend over the next 300 m downhole. Lithification noticeably increases at about 400 mbsf, and just below this depth the decision was made to cease XCB drilling and commence the RCB recovery of Hole U1437D. The return to trend in SIRM/k and S−0.3T occurs in the lower part of lithostratigraphic Unit I and appears to be complete by the Unit I/II boundary at about 680 mbsf, corresponding also to the top of PP Unit 4.
Interstitial water sulfate concentrations match several of the downhole rock-magnetic features. After initial sulfate reduction, sulfate recovers and reaches a plateau concentration from about 275 mbsf to about 400 mbsf; over this interval S−0.3T values drop to below 0.97, suggesting renewed and enhanced production of greigite. Deeper than about 400 mbsf, sulfate increases again downhole to near-seawater concentrations at about 460 mbsf, corresponding to the highest value of SIRM/k in all samples measured at Site U1437. Transport of sulfate in pore fluid appears to have been responsible for a history of renewed magnetic authigenesis at this depth. The step reduction in AMS foliation at about 400 mbsf can also be explained by renewed growth of magnetic sulfides, which would have a compaction history reset at zero at this subbottom depth.
Given the contrast in rock-magnetic properties between the otherwise continuous sequences in Holes U1437D and U1437E, we speculate that the interval represented in Hole U1437E, in the footwall of the fault inferred to separate the two holes, may have been exposed to a higher degree of hydrothermal alteration. Support for this inference may be provided by the observation of the sudden appearance of ethane at the top of Hole U1437E (see Geochemistry) and the step increase in thermal conductivity from <1.5 W/(m·K) at the bottom of Hole U1437D to 1.8–1.9 W/(m·K) at the top of Hole U1437E (see Physical properties).
Biostratigraphy
Coring at Site U1437 recovered an 1806 m thick succession of tuffaceous mud, tuffaceous mudstone, and volcaniclastic rocks in Holes U1437B, U1437D, and U1437E. The biochronology was established using planktonic foraminifers and calcareous nannofossils, which are present in varying numbers and with variable degrees of preservation to 1403 mbsf. Deeper than 1403 mbsf, no microfossils are found. The succession in Hole U1437B (0–439 mbsf) corresponds to the upper part of lithostratigraphic Unit I (see Lithostratigraphy) and spans from the middle Pliocene to early Pleistocene. The succession in Hole U1437D (427–1105 mbsf) records late Miocene to middle Pliocene deposition and corresponds to the lower part of lithostratigraphic Unit I, all of Units II and III, and the upper part of Unit IV. Because of poor preservation and low fossil abundance, bioevents were difficult to establish in Hole U1437E (1107–1807 mbsf) within the lower part of Unit IV and Units V and VI. Nonetheless, calcareous nannofossil assemblages indicate a Miocene age (10.97–11.85 Ma) in Sample 350-U1437E-36R-CC (1403 mbsf), within Unit VI.
Overall, the biostratigraphic constraints from the two microfossil groups agree well in the upper ~570 mbsf and indicate that this part of the succession spans the last 3.7 My. The datums from this interval show remarkable consistency with the magnetostratigraphy. However, between ~570 and 1806 mbsf, establishing a biochronology proved challenging because of preservation issues and/or the scarcity of datum marker species. No datums were recognized deeper than 863 mbsf. Between 570 and 863 mbsf (middle Pliocene to late Miocene), datums were tentatively assigned and, despite their scarcity, agreed reasonably well with magnetostratigraphic datums (see Age model and Paleomagnetism). The planktonic foraminifer and calcareous nannofossil biozonation and bioevent summaries for Site U1437 are presented in Tables T8 and T9, respectively. An age-depth plot showing biostratigraphic and magnetostratigraphic datums is shown in Figure F162. Summaries of planktonic foraminifer, benthic foraminifer, and calcareous nannofossil abundance and preservation data are shown in Tables T10, T11, and T12, respectively. We do not present the record of the benthic foraminifer occurrence for Hole U1437E because it is discontinuous and very poor. Range charts are also available in BIOSTRAT in Supplementary material.
Table T8. Planktonic foraminifer datums, ages, and depths. Download table in .csv format.
Table T9. Calcareous nannofossil datums, ages, and depths. Download table in .csv format.
Table T10. Planktonic foraminifer species. Download table in .csv format.
Table T11. Benthic foraminifer species. Download table in .csv format.
Table T12. Calcareous nannofossil species. Download table in .csv format.
Foraminifers
A total of 146 core catcher samples from Holes U1437B (n = 52), U1437D (n = 68), and U1437E (n = 26) were examined for their planktonic and benthic foraminifer content. In the upper ~543 m of the succession (Samples 350-U1437B-1H-CC through 350-U1437D-13R-CC; recent to early Pliocene), planktonic foraminifers are generally abundant, diverse, and show moderate to good preservation. In this upper part of the succession, recognizing datums was only limited by the lack of certain age-diagnostic species (e.g., Globigerinoides fistulosus), most likely as the area fell outside of their preferred climatic range. Recognizing foraminifer datums deeper than ~543 mbsf (from Sample 350-U1437D-14R-CC downhole) became increasingly challenging because of a combination of low foraminifer abundance, lack of age-diagnostic species in most of the assemblages, poor preservation, and/or induration of sediments. Induration posed difficulties in extracting the foraminifers; we examined thin sections in selected indurated samples. Interval 350-U1437D-29R-CC through 36R-CC (694–762 mbsf) shows particularly poor foraminifer preservation with evidence of recrystallization of calcite tests, silica replacement of tests, and/or silica infilling; some specimens are only present as internal molds. In interval 350-U1437D-40R-CC through 63R-CC (805–1009 mbsf, within lithostratigraphic Unit III), many samples are barren of foraminifers or, where foraminifers are present, they show strong evidence of both plastic deformation and recrystallization, presumably due to compaction. This made identification to species level very difficult either in thin section or under light microscope. Figure F160 shows some examples of foraminifer preservation in the lower part of the succession. Less deformed foraminifers were recovered from Samples 350-U1437D-64R-CC through 72R-CC (1021–1088 mbsf), but most are present as internal molds. Evidence of reworking is found deeper than 543 mbsf; unequivocal specimens of Praeorbulina sicana (top [T] 14.53 Ma) were found in several samples, as shallow as Sample 350-U1437B-43X-CC (322 mbsf), which either indicates that this species has a greater age range than previously thought, or that these specimens are reworked.
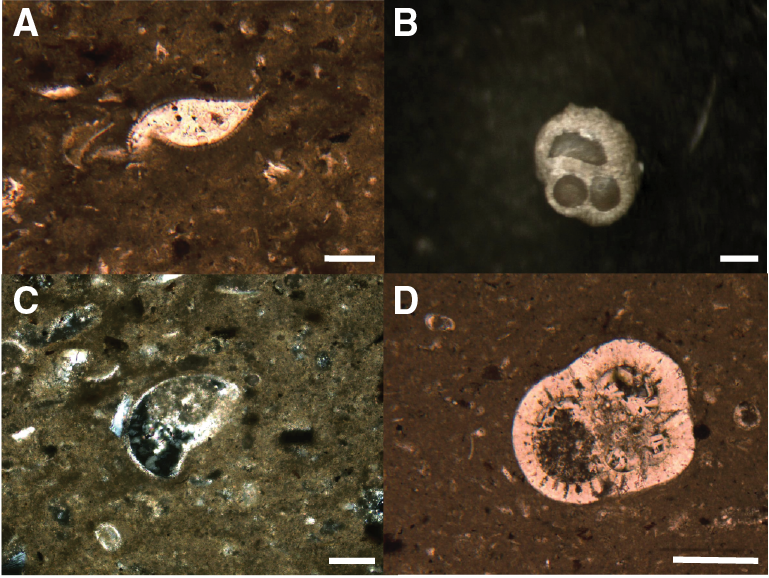
Figure F160. Preservation of foraminifer tests, Hole U1437D.
In Hole U1437E (1105–1806 mbsf), most samples are barren of planktonic foraminifers, particularly below Sample 350-U1437E-19R-CC (1243 mbsf). Samples that contain no carbonate and/or nannofossils were not examined, from Sample 30R-CC to the bottom of Hole U1437E (1348–1806 mbsf), with the exception of Sample 36R-CC (1403 mbsf). A number of samples were shown to contain foraminifers in thin section, but it was not possible to recognize any datum marker species in thin section or disaggregate the samples sufficiently to identify many foraminifer species (and therefore any datum markers) in these samples. The isolated Sample 36R-CC (1403 mbsf) was shown to contain numerous foraminifers in thin section, but when disaggregated it yielded only 2 specimens of Globigerina angustiumbilicata. Preparation and study of planktonic foraminifers in Hole U1437E was abandoned deeper than Sample 36R-CC (1402 mbsf) because of the increasing proportion of volcaniclastic sediments at the expense of mudstone and the absence of calcium carbonate (including calcareous nannofossils).
In terms of datums, the Pliocene/Pleistocene boundary (2.588 Ma) is placed somewhere between 372 and 416 mbsf based on the recognition of T Globoturborotalita decoraperta (T 2.75 ± 0.03 Ma) in Sample 350-U1437B-53X-CC (416 mbsf) and T Globorotalia pseudomiocenica (T 2.39 Ma) in Sample 350-U1437B-48X-CC (372 mbsf). Other recognized datums are presented in Table T8 along with their corresponding depth ranges. Many typical age-diagnostic fauna (e.g., G. fistulosus and Globoturborotalita nepenthes) are very rare or absent in this succession. The datums in the lower part of the succession (deeper than ~570 mbsf) are tentatively assigned to include T and bottom (B) Globorotalia margaritae (3.85 ± 0.03 Ma and 6.08 ± 0.03 Ma, respectively), B Globorotalia crassaformis sensu lato (4.31 ± 0.04 Ma), and T Sphaeroidinellopsis kochi (4.53 ± 0.17 Ma). These datums are included in the final age-depth figure (Figure F162) and, despite their associated uncertainties and scatter, still show reasonable consistency with the magnetostratigraphy and nannofossil datums. An additional bioevent, the extinction of the benthic foraminifer genus Stilostomella in the Middle Pleistocene (Sample 350-U1437B-11F-CC; 94 mbsf), is not used to establish the biochronology but corroborates it.
Preliminary patterns of species richness at Site U1437
The three most represented species in this late Miocene to Pleistocene succession are present in >45% of all samples and include, in decreasing number of recognized occurrences, (1) the opportunistic to high-productivity species Globigerinita glutinata, (2) the high-productivity and/or temperate climate species Globigerina bulloides, and (3) the temperate to subpolar species Neogloboquadrina incompta. A second group of 9 species (Orbulina universa, Globigerina falconensis, Globorotalia menardii, G. crassaformis, Globigerinoides ruber, Globorotalia inflata, Neogloboquadrina humerosa, Globorotalia scitula, and Globigerinoides obliquus) are present in more than 30% of the samples. The cumulative occurrence of these 13 most represented species is 53% of the total occurrences of all 83 planktonic foraminifer species observed at Site U1437 (see Table T10). Comparison of the cumulative occurrences of the different species in this group shows the dominance of the Globorotalidae (4 species), closely followed by the Globigerinoidae (3 species). The make-up of the faunal assemblages (i.e., dominance of G. glutinata and G. bulloides and co-occurrence of several species of the genus of Globorotalia and Globigerinoides) could be related to some seasonal changes linked to changes in surface water stratification and temperature near the Kuroshio Current.
The average number of planktonic foraminifer species per sample (n = 146), or average species richness (SR), is 9, and the range of SR values is 0–29. An average SR value of 9 is rather low for a subtropical site in view that subtropical areas in general record high diversity (Bé and Tolderlund, 1971). We observed (Figure F161) that only 18 samples have a SR value >20. Such a large number of samples with low SR values cannot primarily reflect paleoceanographic changes, such as could occur during dramatic cooling events (Vautravers et al., 2004). Given the clear changes we observed in preservation of foraminifer tests (i.e., deformation and low abundance) we infer that most of the observed SR variability reflects changes in the preservation state at Site U1437, especially deeper than 543 mbsf, where higher sedimentation rates are recorded (i.e., in the volcaniclastic sediments). Higher values of SR, which mainly occur in the Pliocene–Pleistocene succession (Figure F161), coincide with samples in which carbonate preservation is good to moderate (Table T10), whereas samples with low SR values (deeper than 543 mbsf) are noticeably fragmented, infilled, or replaced, and preservation is poor. In addition, major dilution of foraminifer concentrations is caused by volcanic material in a number of samples and can partly explain the SR distribution observed.
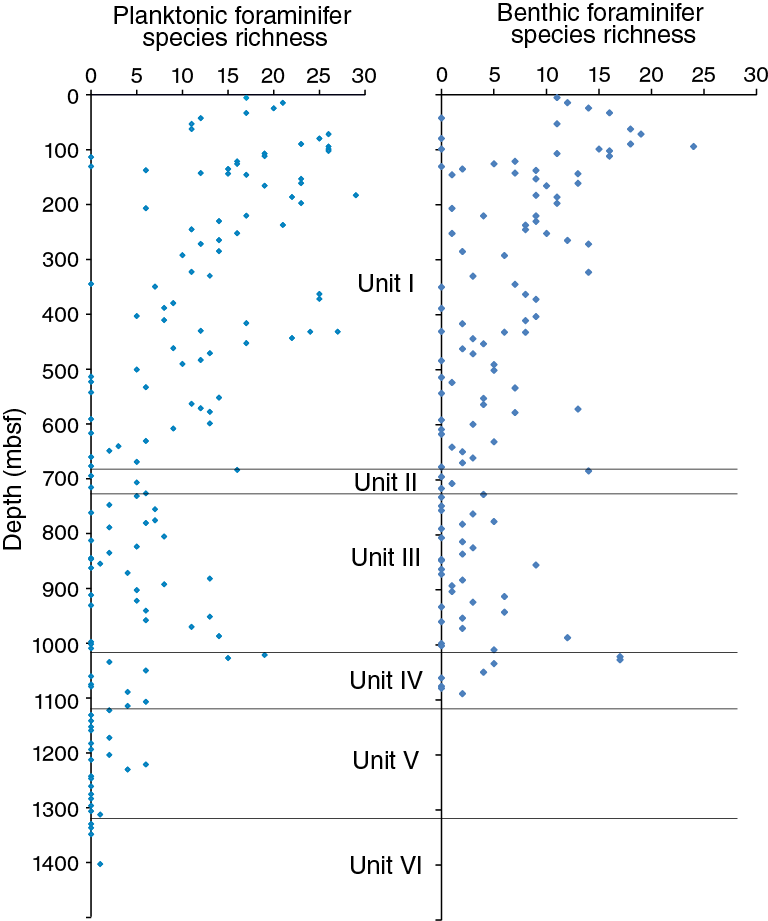
Figure F161. Planktonic and benthic foraminifer species richness.
Over the whole studied interval, the benthic assemblages are dominated by Oridorsalis umbonatus, Pullenia bulloides, and Melonis barleanum: each species was present in 40 of the 122 samples. Other well-represented species, particularly in Hole U1437B, are Cibicides wuellerstorfi, Bulimina aculeata, Uvigerina hispidocostata, and Hoeglundina elegans. The increase in SR of benthic foraminifers upsection (Table T11; Figure F161) supports the idea that preservation is likely the dominant factor controlling foraminifer assemblages and abundances at Site U1437.
The causes behind the observed SR patterns for either benthic or planktonic foraminifers still need further investigation. They will need to be placed within the context of the changing rear arc paleogeography and paleodepth and changes in surface (Kuroshio Current) and intermediate circulation since the end of the middle Miocene.
Calcareous nannofossils
We examined the calcareous nannofossils in all available core catchers as well as in several extra samples from Holes U1437B, U1437D, and U1437E. The calcareous nannofossils are generally abundant and well preserved throughout Holes U1437B and U1437D to Sample 350-U1437D-26R-CC (669 mbsf). In contrast, interval 350-U1437D-27R-CC through 73R-CC (677–1096 mbsf) displays moderate to poor preservation and several samples are barren in nannofossils. Strong signs of overgrowth are seen in this interval, especially in the genus Discoaster. Most likely, the star-shaped species belonging to this genus can be easily broken during fossilization, and most features used to differentiate between species could have been easily dissolved or overgrown. Downhole from Sample 350-U1437E-27R-CC (1312.4 mbsf) the amount of tuffaceous mudstone in the recovered sediment abruptly decreases and coarse volcaniclastics dominate; thus, from 1312 to 1806 mbsf, many samples are almost barren in nannofossils.
Signs of possible reworking are present throughout the sequence, even if only a few reworked specimens are present. Seventeen standard bioevents are recognizable in the early Pleistocene–late Miocene part of the succession (Table T9). Table T12 shows the semiquantitative assessment of preservation and relative nannofossil species abundance and a semiquantitative estimate of diatom and siliceous plankton fragment abundance.
Based on calcareous nannofossil bioevents, the succession in Hole U1437B spans the early Pleistocene (interval 350-U1437B-1H-CC to 50X-CC; 1–388 mbsf) to late Pliocene (interval 50X-CC to 55X-CC; 388–431 mbsf). The succession in Hole U1437B is continuous, and 14 standard bioevents are recognized. Between the top of the succession and 14.6 mbsf, Biozone CN15 is recognized based on B Emiliania huxleyi in Sample 2H-CC. T Pseudoemiliania lacunosa (Sample 6H-5, 75–76 cm; 50 mbsf) defines the bottom of Zone CN14b. Between 111 and 121 mbsf, the bottom of Zone CN14a is placed on the basis of the top common/common last occurrence (Tc) Reticulofenestra asanoi (Sample 15F-3, 80–81 cm; 110 mbsf) and bottom common/common first occurrence (Bc) R. asanoi (Sample 16F-CC; 113 mbsf). Also, B Gephyrocapsa omega at 113 mbsf identifies the bottom of Zone CN14a, despite the reentry of the medium Gephyrocapsa spp. not being clearly defined. The bottom of Zones CN13a, CN12d, CN12c, and CN12b are defined by T Discoaster brouweri (248 mbsf), T Discoaster pentaradiatus (337 mbsf), T Discoaster surculus (367 mbsf), and T Discoaster tamalis (384 mbsf), respectively. The assemblage in the entire Hole U1437B is characterized mainly by the genus Gephyrocapsa (such as, Gephyrocapsa aperta, Gephyrocapsa caribbeanica, and Gephyrocapsa oceanica) and secondarily by P. lacunosa, Calcidiscus leptoporus, and Calcidiscus macintyrei. From Sample 40X-CC (291 mbsf) downhole, the species Dictyococcites haqii also becomes more abundant. The good preservation detected in the entire Hole U1437B confirms the preservation of the original assemblage in the fossil record.
In Hole U1437D, the succession spans the Pliocene to late Miocene. Preservation is good to moderate in interval 350-U1437D-2R-CC through 26R-CC (431–669 mbsf); below this interval preservation strongly decreases and several samples are barren. Intense dissolution could have affected the SR.
T Reticulofenestra pseudoumbilicus in Sample 350-U1437D-19R-3, 32 cm (595 mbsf), defines the bottom of Zone CN12a. The last reliable datum indicator is T Triquetrorhabdulus rugosus (Sample 48R-CC; 871 mbsf), which could be detected even where dissolution/overgrowth was evident. Because the preservation of nannofossils quickly deteriorates deeper than Sample 27R-CC (677 mbsf), it was not possible to recognize other bioevents in the middle Pliocene to late Miocene part of the succession. In particular, it was not possible to define the bioevents of the genus Amaurolithus because of its extreme rarity.
Preservation in Hole U1437E is very poor, and from Sample 350-U1437E-27R-CC (1312 mbsf) downhole, the majority of the samples are barren in nannofossils. The main standard marker species are generally not present or are not identifiable. However, it is possible to provide a broad age range for the samples using a few preserved specimens. On the basis of the simultaneous presence/absence of long-ranging species, it is possible to establish that Sample 25R-CC (1296 mbsf) contains a late Miocene association because of the absence of Cyclicargolithus floridanus (T 11.85 Ma) and the presence of C. macintyrei (B 13.36 Ma) and R. pseudoumbilicus >7 µm (B 12.83 Ma). From 1296 mbsf downhole, all the recovered samples are poorly preserved or barren. Moreover, only a few tuffaceous mudstone intervals are present and, with the exception of Sample 36R-CC (1403 mbsf), these have a low percentage of carbonate. In Sample 36R-CC (1403 mbsf), the presence of the species Coccolithus miopelagicus (T 10.97 Ma) and the absence of C. floridanus (T 11.85 Ma) confirm that the sequence falls within Biozone CN5b. Biozones CN10a–CN6 are not identifiable because preservation issues affect the presence of markers (e.g., the different species of Discoaster, Catinaster, and Minylitha convallis).
Diatoms and siliceous plankton fragments are common to frequent in Hole U1437B, becoming less abundant from 363 mbsf downhole. From 483 mbsf downhole, diatoms and siliceous plankton are absent from all analyzed samples. The observed decrease in siliceous plankton abundance could be compared with shipboard Si in interstitial water data (see Geochemistry). Because Si increases downhole from ~360 mbsf, it could be indicative of a higher dissolution of the siliceous material from the sediment into the pore water.
Age model
A Pleistocene to upper Miocene succession was recovered within the cored interval of 1806.50 m at Site U1437. Sixteen biostratigraphic and 29 magnetostratigraphic datums obtained in the upper 1303 mbsf were selected to construct the age-depth model for Site U1437 and to estimate linear sedimentation rates (LSRs), total mass accumulation rates (MARs), carbonate accumulation rates (CARs), and noncarbonate accumulation rates (nCARs) (Table T13; Figure F162). The age model was not extended deeper than 1303 mbsf because no biostratigraphic or magnetostratigraphic datums were detectable from 1303 to 1806.50 mbsf.
Table T13. Age control points, LSR, total MAR, CAR, and nCAR. Download table in .csv format.
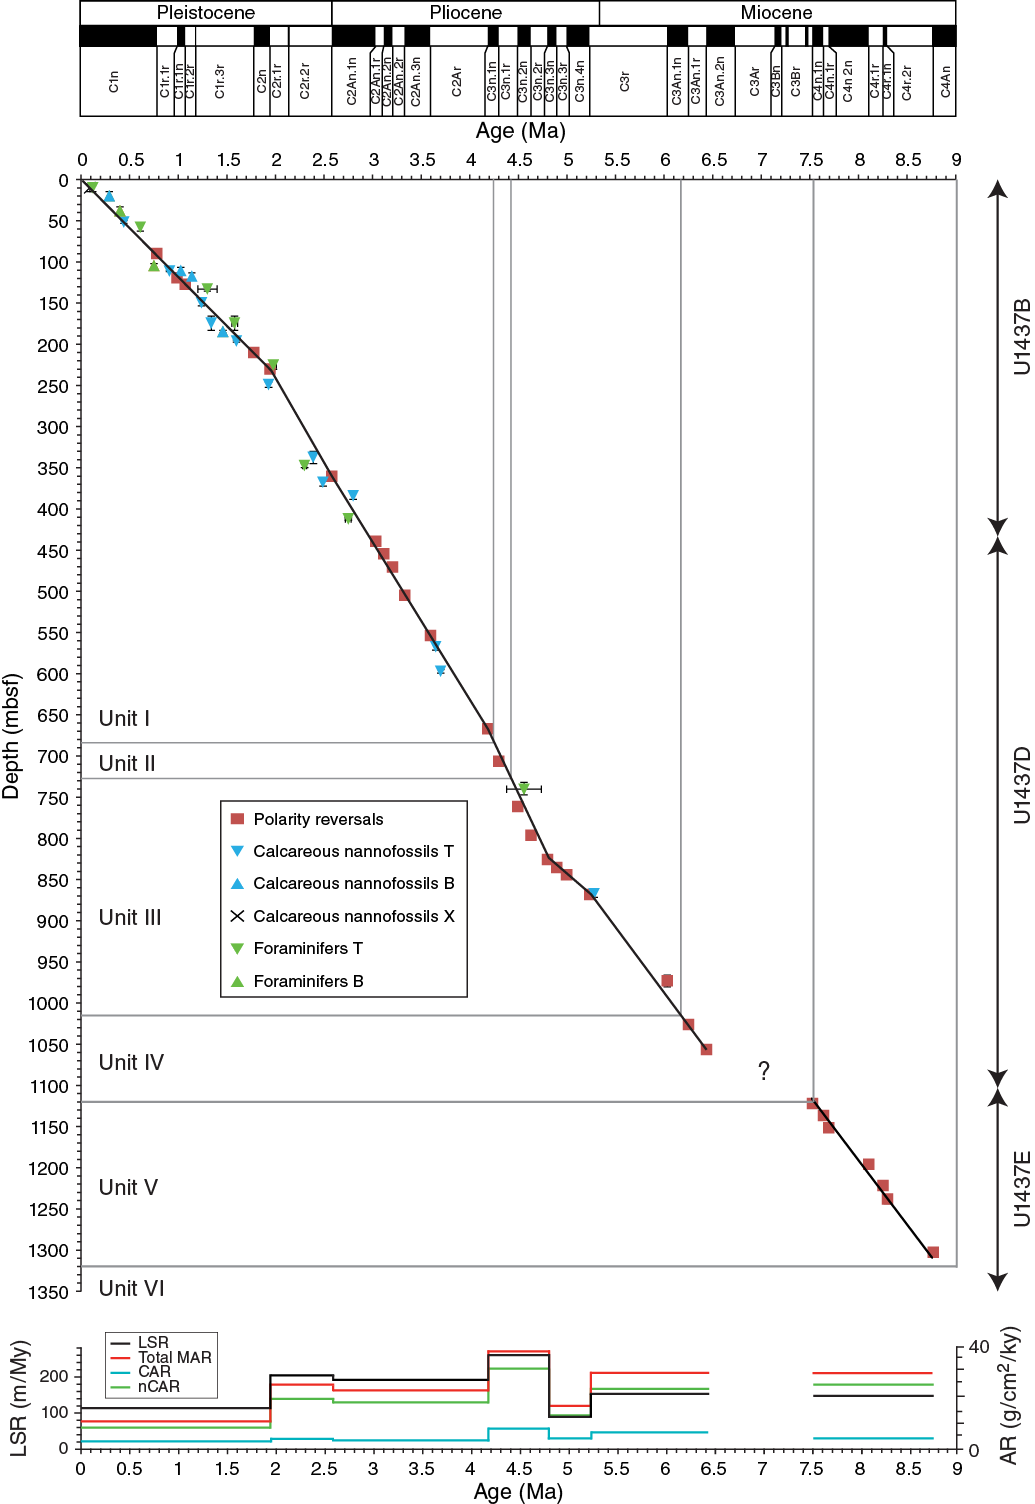
Figure F162. Constructed age-depth model and accumulation rates.
Biostratigraphic and magnetic reversal datums (Figure F162) agree well to 867 mbsf, and the age model for this part of this succession was constructed using all datum types. No biostratigraphic datums were recognized deeper than 867 mbsf, so the age model for 867–1303 mbsf was constructed only using magnetic reversal datums. Deeper than 1303 mbsf, the only constraint from microfossil datums is given by a calcareous nannofossil assemblage, which confirms a range of age between 10.97 and 11.85 Ma at 1403 mbsf.
Seven segments with different LSRs were recognized, considering mostly the magnetostratigraphic datums, which are more precise than the biostratigraphic control points. On the basis of these LSR segments, 19 of a total of 35 bioevents were then considered outliers according to the criteria described in Age model in the Expedition 350 methods chapter (Tamura et al., 2015a).
In the Pleistocene and upper Pliocene part of the succession (0–570 mbsf), biostratigraphic and paleomagnetic datums agree well, as shown by the position of the outliers relative to the interpolation line. Deeper than ~570 mbsf, poorer preservation and lower abundances of planktonic foraminifers and calcareous nannofossils makes identification of the bioevents more difficult. Only one planktonic foraminifer datum and two calcareous nannofossil datums were recognized deeper than 570 mbsf. Nevertheless, these three datums fit well with the paleomagnetic datums, thus supporting the reliability of the age model to at least 867 mbsf.
LSRs were calculated for each of the seven LSR segments, assuming constant sedimentation rates (Figure F162; Table T13). LSRs range from a minimum of 98 m/My to a maximum of 259 m/My. The highest LSRs (259 m/My) are found from the top of lithostratigraphic Unit II through the upper part of Unit III, to ~825 mbsf. From 825 to 868 mbsf, LSR decreases, reaching a minimum LSR of 98 m/My. The lower part of lithostratigraphic Unit III through the upper part of Unit IV records an increase in LSR to 157 m/My. The LSR in the lower part of Unit IV is indeterminate for reasons discussed below. Lithostratigraphic Unit V records an LSR of 146 m/My.
An offset in LSR between intervals 868–1057 and 1122–1303 mbsf corresponds to the change from Hole U1437D to U1437E. However, this offset appears to also correspond to a missing interval in the magnetostratigraphy. Normal polarity within Chron C3An.2n extends without interruption to the bottom of Hole U1437D, but cores in Hole U1437E commence with reversed polarity, apparently within reversed Chron C3An.1r. The coincidence of a change in polarity corresponding precisely to the break between holes (within the limits of recovery of the last core in Hole U1437D) is unlikely, and would in any event require a substantial reduction in sedimentation rate internally within lithostratigraphic Unit IV. Equally, Ockham’s razor would argue against a hiatus that corresponded precisely to the break in holes, unless the coring problems that prompted the end of Hole U1437D were related to a hardground: in any event, no evidence for such a hardground was recovered in coring. Instead, the probable explanation is a normal fault between the two holes, resulting in a partial loss of section within lithostratigraphic Unit IV. See Paleomagnetism for a more detailed discussion.
Projection of the LSR for Unit V into Unit VI does not intercept the age of an isolated late Miocene nannofossil association (described in Biostratigraphy) within lithostratigraphic Unit VI in interval 350-U1437E-36R-CC. Recovery over the interval from Cores 26R to 36R averages 72%; therefore, an unrecovered or unrecognized fault is unlikely, so there must either be a significant reduction in sedimentation rate in Unit VI or a hiatus at the Unit V/VI boundary. Given that the reduced sedimentation rate would have to be 38 m/My, markedly lower than for any other part of the datable sequence, a hiatus at the Unit V/VI boundary is the more likely explanation.
The total MAR is calculated using dry bulk density and ranges between 12 and 35 g/cm2/ky, with the highest values in two intervals, 2–2.5 and 4.2–4.7 Ma. This latter age range corresponds mainly to lithostratigraphic Unit II, which is the coarsest material in the section. High MARs are also recorded in the lower part of Unit III (860 mbsf) to the upper part of Unit IV, with an average value of 28.8 g/cm2/ky, and in Unit V, with an average value of 28.5 g/cm2/ky.
CARs are low over the entire succession, ranging from a minimum average of 3 g/cm2/ky to an average maximum of 8.3 g/cm2/ky in the intervals 4.2–4.7 and 5.2–6.4 Ma. nCAR ranges from 8.8 to 30 g/cm2/ky with maximum values in the same intervals.
Downhole measurements
Hole U1437B
The only downhole measurements made in Hole U1437B were two deployments of the advanced piston corer temperature tool (APCT-3) on Cores 350-U1437B-4H and 7H. A third deployment with Core 10H failed, indicating that the formation was getting too hard to get further temperature data. The measured temperatures are 5.32°C at 33.7 mbsf and 7.45°C at 62.2 mbsf. Combined with a seafloor temperature of 2.3°C, an average of the measurements at the mudline during all the deployments, the data fit a linear geothermal gradient of 83°C/km (Figure F163). A simple estimate of the conductive heat flow can be derived from the product of this gradient by the average thermal conductivity over this interval (1.062 W/[m·K]; see Physical properties). The resulting value of 88.2 mW/m2 is within the wide range of previous measurement in the area (global heat flow database of the international heat flow commission, www.heatflow.und.edu/index2.html).
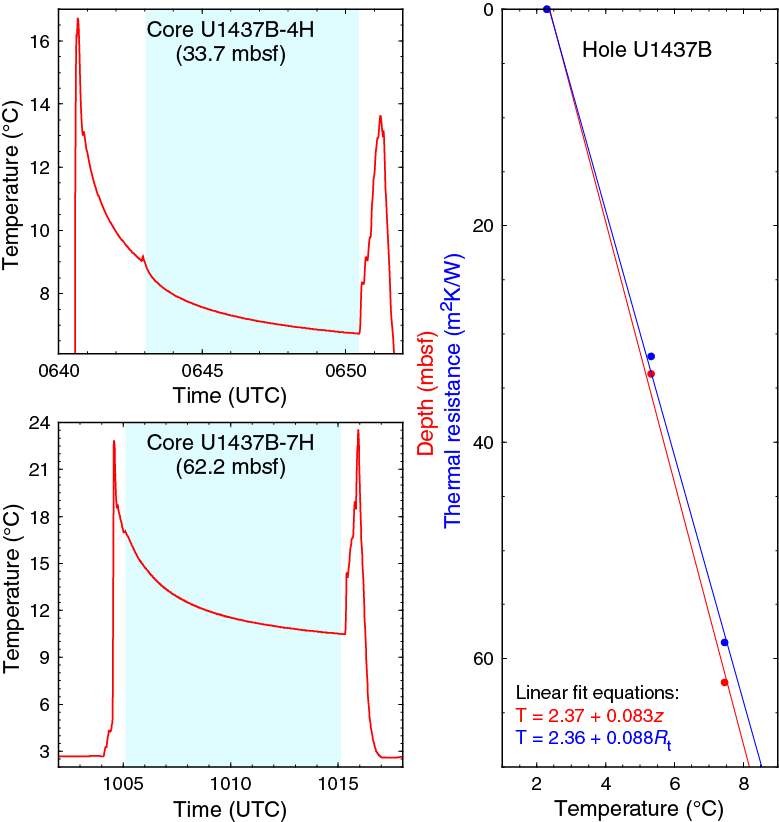
Figure F163. Frictional heating during penetration.
Considering the variations in thermal conductivity with depth, a more accurate measure of the heat flow in a conductive regime can be given by a “Bullard plot.” The thermal resistance of an interval is calculated by integrating the inverse of thermal conductivity over depth. If the thermal regime is purely conductive, the heat flow will be the slope of the temperature versus thermal resistance profile (Bullard, 1939). The thermal resistance calculated over the intervals overlying the APCT-3 measurements is shown in Table T14, and the resulting linear fit of the temperature gives an almost identical heat flow value of 88.3 mW/m2 (Figure F163).
Table T14. Downhole temperature. Download table in .csv format.
Hole U1437D
The decision to log Hole U1437D was made after reaching 980 mbsf (3108 mbrf), when the bit that had been used until this point was reaching its life expectancy and was showing signs of wear. The plan was to reenter the hole after logging and try to reach the bottom of seismic Layer L4 (see Background and objectives). Because most of the seismic reflectors and seismic layer boundaries were estimated to be in the interval already cored, it was also decided to record a VSP at this intermediate depth, to establish the depth of these reflectors and track our progress down the seismic surveys.
Operations
Because drilling conditions had been very good, only minimal hole conditioning was necessary. It consisted of pumping 50 bbl of sepiolite-based mud in the very bottom of the hole. To allow reentry and further coring, a FFF was deployed before exiting the hole and dropping the bit on the seafloor. However, some parts of the MBR mechanism kept hanging on the FFF at every reentry attempt and it was decided to change to a logging bit. The pipe was tripped to the surface, and a logging BHA was built. After tripping back to the seafloor, the hole was reentered and the bit was in position for logging at 2219 mbrf (~92 mbsf) at 1430 h on 22 April 2014.
Once the rig floor was configured for logging, rig up of the triple combo started at 1500 h. The tool was then checked and run into the hole at 1635 h. A downlog was started at 2100 mbrf and ended when the tools reached 3091 mbrf (964 mbsf), indicating that ~17 m of fill had accumulated at the bottom of the hole. The amount of fill kept increasing during the following passes and runs. It was likely loose borehole wall material and cuttings settling from the drilling process, and it never created conditions that would cause concern for the safety of the tools.
A first pass was recorded over the deepest ~100 m for quality control. The main pass started at 3089 mbrf (~962 mbsf) and was concluded when the gamma ray log identified the seafloor through the pipe at 2126.5 mbrf. The triple combo was brought back to the surface and was completely rigged down at 0040 h on 23 April.
Rig up of the FMS-sonic string followed, and the string was lowered at 0120 h. A downlog (sonic and gamma ray data) was initiated at 2120 mbrf and concluded at 3075 mbrf (948 mbsf), indicating that ~14 m of more fill had settled since the previous run. A first pass was recorded over the deepest 300 m in order to try to get additional FMS coverage in an interval where many volcaniclastic layers had been recovered. The tool was then sent back to the bottom of the hole and the main pass started at 3072 mbrf (945 mbsf). The pass concluded at 2260 mbrf (133 mbsf) when the FMS arms were closed before entering the pipe. The FMS-sonic string was pulled back on the rig floor and rigged down at 0845 h.
Because the first two runs established that the borehole conditions were favorable to acquire a VSP, the Versatile Seismic Imager (VSI) string was built up immediately after completion of the FMS-sonic run and run into the hole at 0900 h.
At the same time, a 1 h survey of protected species (marine mammals and sea turtles) was started. While the survey was ongoing and the tool going down, the air gun array was put in position, maintained by portside Crane 3 at 34 m from the well head, and hung 7 m below the sea surface. No protected species were observed during the survey, and a soft ramp-up of the gun was performed to a maximum pressure of 1950 psi. The tool reached a maximum depth of 3025 mbrf (898 mbsf), and data were successfully acquired at 14 stations spaced by 50 m from 3000 to 2350 mbrf (873 to 223 mbsf). After the last station, the tool was brought back to the surface and rigged down at 1520 h. The rig floor was cleared of logging equipment at 1540 h for a total logging operations time of 24 h and 40 min. A detailed timing of all logging operations can be found in Table T15.
Table T15. Logging operations, Hole U1437D. Download table in .csv format.
Data quality and processing
The depth for all logs was matched using the gamma ray log from the Hostile Environment Natural Gamma Ray Sonde (HNGS) recorded during the main pass of the triple combo as the reference curve. The gamma ray logs from other passes were matched to this log through identification of common features through the logged section. A depth shift to the seafloor was then applied to all logs, with the seafloor identified from the gamma ray logs.
Caliper data from both the triple combo and FMS tool strings indicate that Hole U1437D was in very good condition. Hole diameter remained between 10 and 12 inches deeper than 250 mbsf. The Hostile Environment Litho-Density Sonde (HLDS) caliper suggests that hole diameter steadily increased uphole to ~14 inches at 150 mbsf and became wide immediately below the pipe. However, the less intrusive FMS arms were never more than 13 inches apart (Figure F164). This narrow range in diameter and the overall smooth profile of the borehole mean that most measurements are reliable. The differences between the two orthogonal calipers of the FMS shallower than 650 mbsf suggest that the hole was somehow elliptical in places. The shape and trajectory of the well derived from the General Purpose Inclinometry Tool (GPIT) confirm that the well was almost vertical, with a slight deviation to the southeast amounting to a ~7 m offset at 950 mbsf, or an average angular deviation of 0.4°.
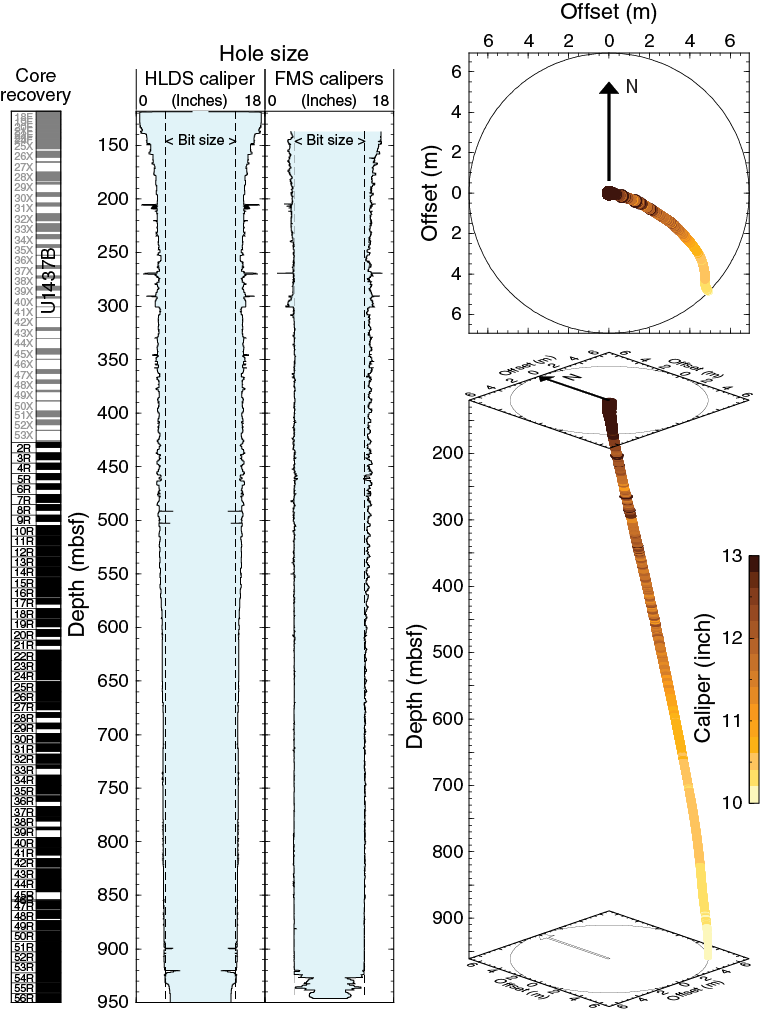
Figure F164. Geometry of Hole U1437D.
The main logs recorded by the triple combo are shown in Figures F165 and F166. The quality of the logs can be assessed by comparison with measurements made on cores from the same hole. Figure F165 shows a comparison between the natural gamma ray, magnetic susceptibility, and density logs with the same measurements made on cores. The different sets of measurements display good agreement where core recovery was sufficient to allow such comparisons. The agreement in magnetic susceptibility is mostly a qualitative match in the variability of the data sets, as the MSS readings and the core measurements are not calibrated. Porosity derived from the density log, assuming a grain density of 2.68 g/cm3, also agrees with porosity measured on core (see Physical properties), showing porosity decreasing steadily with depth from 60% to 30%. Neutron porosity is also in general agreement but displays significantly higher values shallower than 200 mbsf, reflecting the enlargement of the borehole shallower than 200 mbsf and the failure of the Accelerator Porosity Sonde (APS) to make good contact.

Figure F165. Triple combo tool string logs, Hole U1437D.
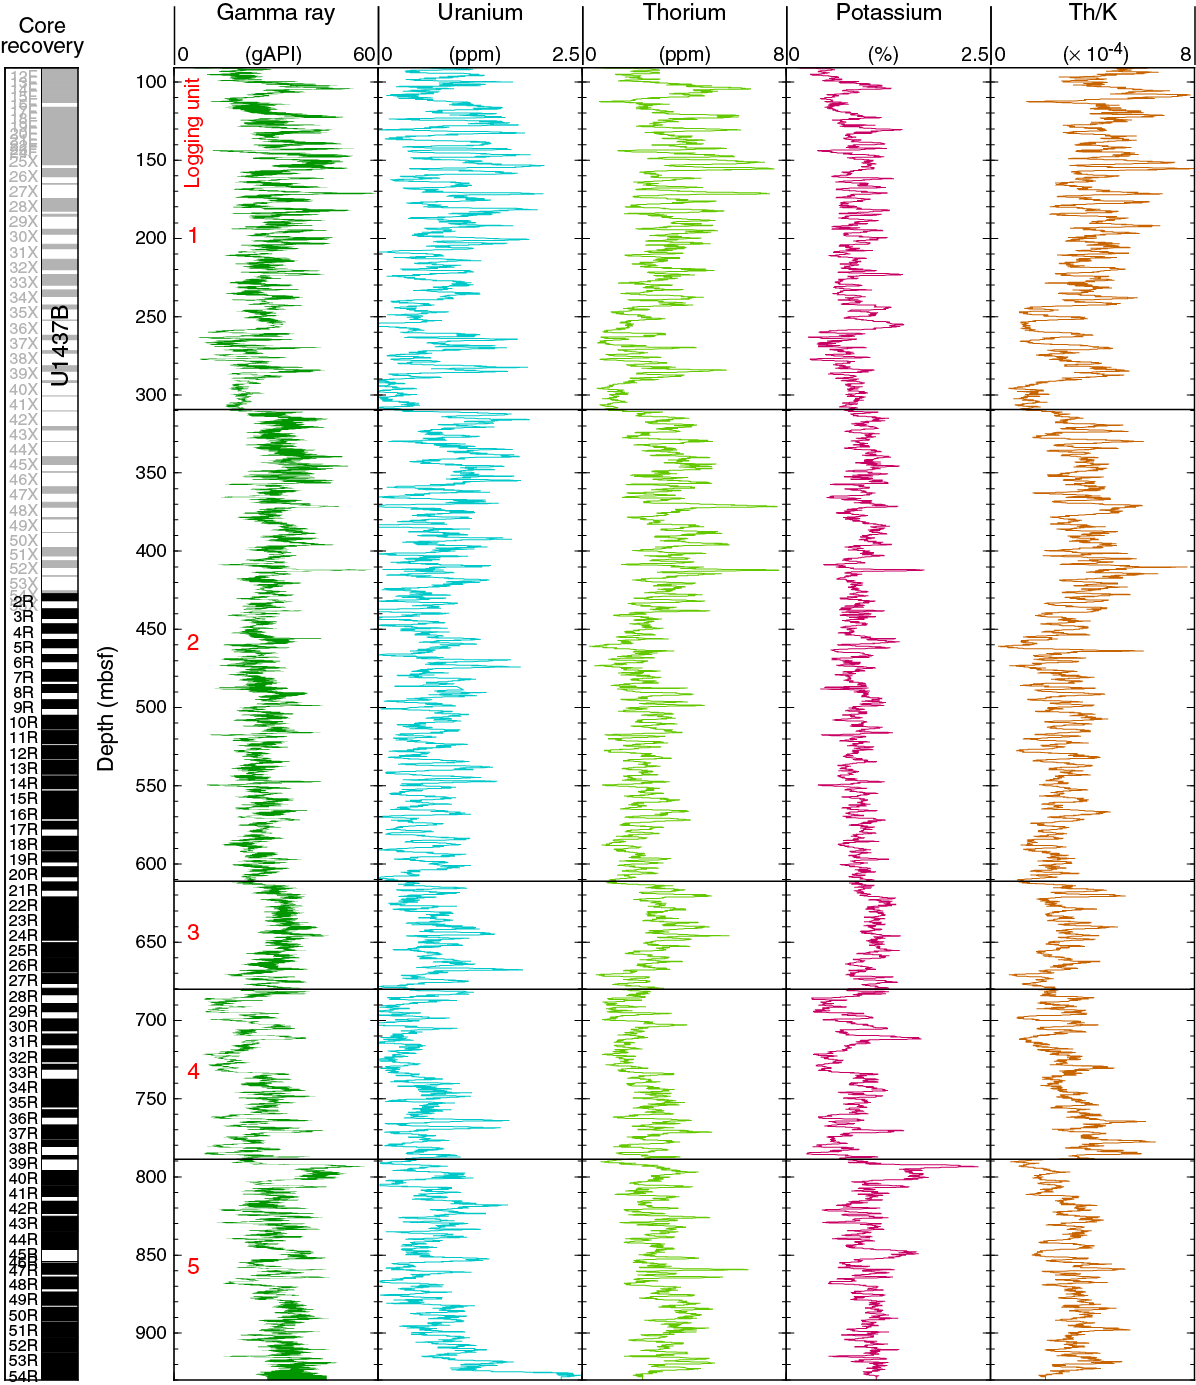
Figure F166. Total and spectral gamma ray data.
The good data quality is also manifest in the data recorded by the FMS-sonic tool string in Figure F167. The gamma ray log recorded on this string closely matches the data recorded with the triple combo, ensuring consistency in depth across all logs. The clear arrivals in the monopole waveforms and high coherence in the compressional and shear velocity tracks indicate that reliable velocity values were recorded over most of the hole. Comparison of the compressional velocity log (VP) with the core measurements again shows good agreement, although the core measurements display a much higher level of variability in the deeper section. Some of the high shear velocity (VS) values shallower than 130 mbsf are a consequence of the noise in the dipole waveform at the shallower depths and are not valid.
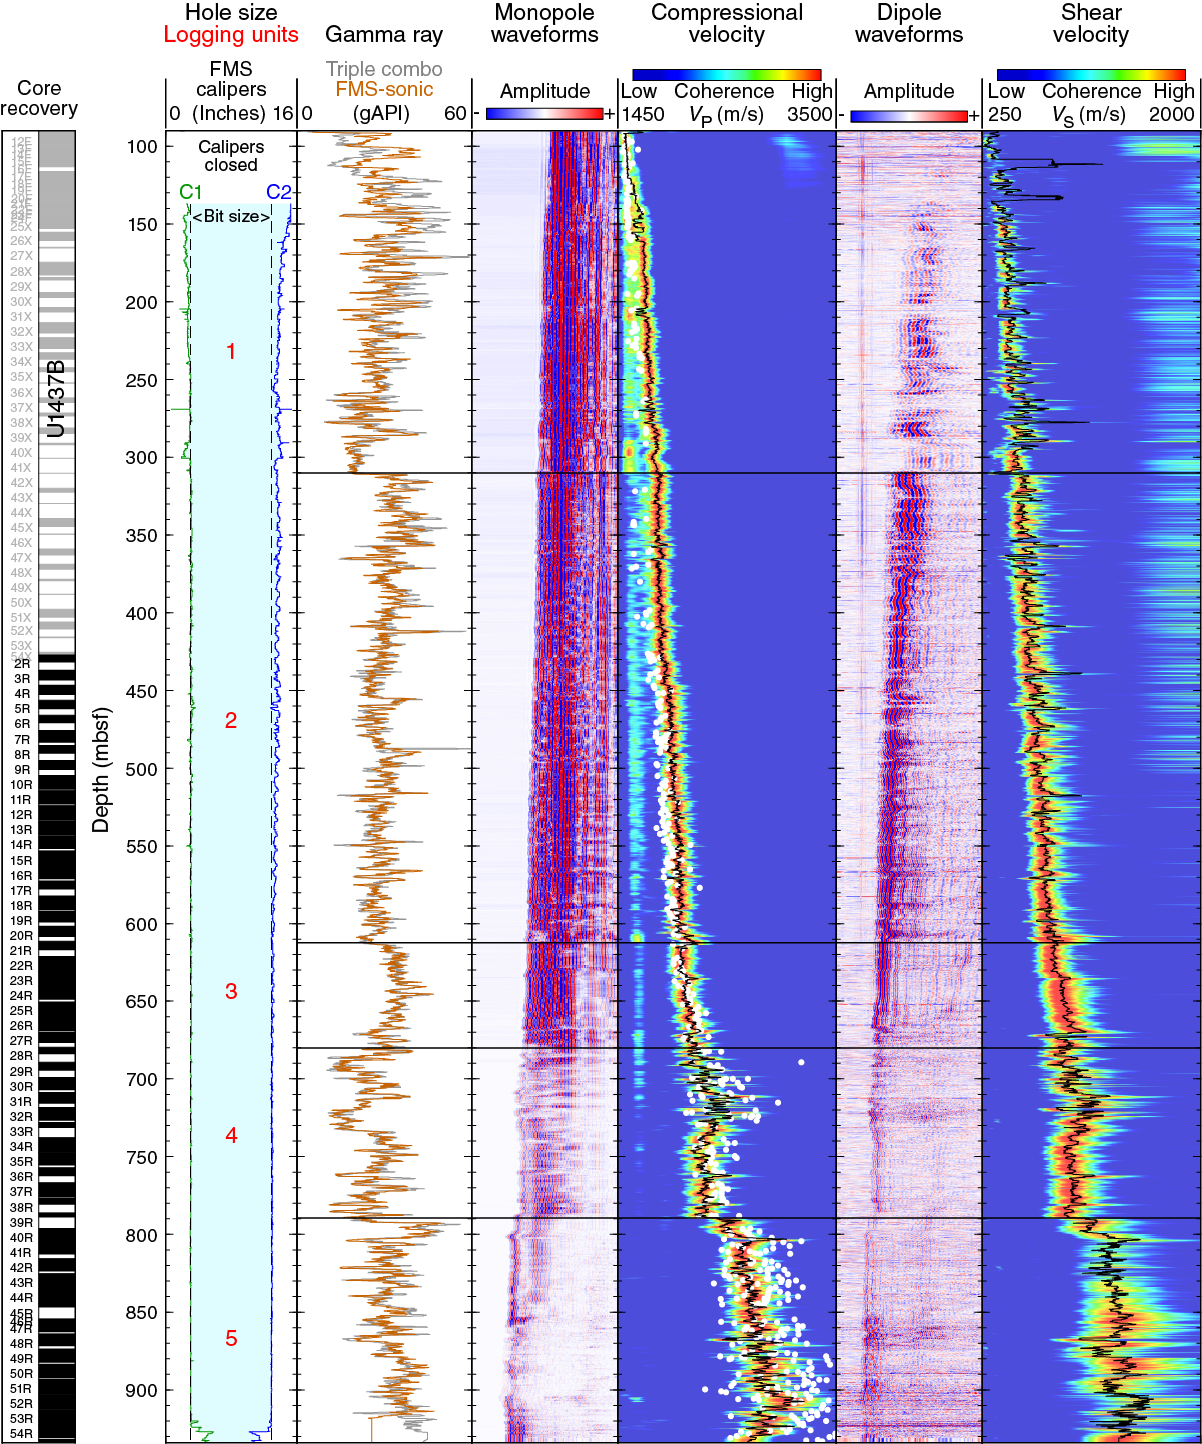
Figure F167. Sonic logs, Hole U1437D.
The VSI tool string recorded 14 check shot stations spaced by 50 m (Table T16). Each station was completed by firing up to 12 traces and stacking between 3 and 5 good ones, except for the stations at 2850, 2900, and 2950 mbrf, where only one good trace was recorded with a high enough signal-to-noise ratio to identify the first arrival and estimate seismic traveltime. The sharpness of the first breaks in the resulting stacks (Figure F168) is a measure of the high data quality and reliability of the estimated traveltimes.
Table T16. VSP results, Hole U1437D. Download table in .csv format.
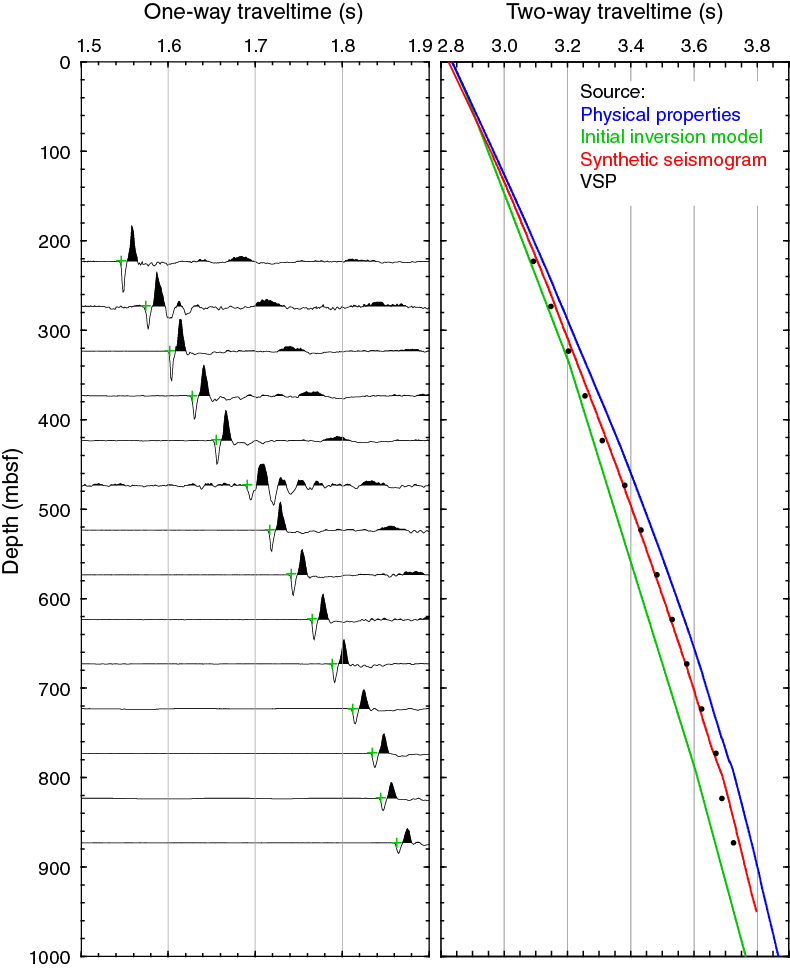
Figure F168. VSP, Hole U1437D.
Logging units
Logging units are defined by changes in the character of the most indicative logs, primarily gamma ray, resistivity, VP , and VS. They can all be related to the relative predominance of the volcanic over sedimentary components and the grain size of volcaniclastics, which were the primary criteria for defining lithostratigraphic units at Site U1437 (see Lithostratigraphy). Other factors such as compaction and alteration influence physical properties as well, and the resulting logging units may therefore be distinct from the lithostratigraphic units.
Logging Unit 1 (92–310 mbsf) is characterized by a decreasing trend with depth in gamma ray and resistivity (Figure F165). The bottom of this unit is defined at ~310 mbsf by the bottom of a very distinct 20 m thick interval (290–310 mbsf) with low gamma ray counts and high resistivity and magnetic susceptibility. This interval also displays lower values in density and slightly reduced acoustic velocity and is discussed in more detail in Bottom of seismic Layer L2. This interval was not recovered in cores.
Logging Unit 2 (310–614 mbsf) is also characterized by a slightly decreasing downhole trend in gamma ray and resistivity, and its top is marked by the sharp gamma ray increase immediately below logging Unit 1. The only significant variability in the logs in this unit is an interval between 430 and 490 mbsf with fine (~1 m scale) peaks in resistivity; some of the sharpest ones are associated with lower density values (Figure F165). This interval is also where the lowest value in the Th/K ratio occurs at ~460 mbsf (Figure F166), marking an inflection in the thorium content from slightly higher values shallower than this depth to lower values deeper that could be linked to an increase in volcaniclastic deposits. The bottom of the unit is an 8 m thick interval (606–614 mbsf) with high resistivity and low gamma ray and density, similar in character to the bottom of logging Unit 1, and mostly composed of tuffaceous mudstone with unrecovered intervals (see Lithostratigraphy).
The defining trait of logging Unit 3 (614–680 mbsf) is an increase in resistivity with depth, contrasting with the decreasing trends in the shallower units. The density and velocity data also display a slightly enhanced increase with depth, combining with the resistivity trend to indicate a steady lithification. Most data display little variability, suggesting a broadly uniform composition.
Contrasting with the overlying unit, logging Unit 4 (680–790 mbsf) is mostly defined by high levels of variability, particularly in resistivity, magnetic susceptibility, and velocity. Magnetic susceptibility values are also significantly higher than in the shallower units. The high variability in all data and the high susceptibility can be related to the change to predominantly coarse volcaniclastic material that defines lithostratigraphic Unit II, the top of which coincides with the top of this logging unit.
The top of logging Unit 5 (790–950 mbsf) is defined by a sharp increase in gamma ray, resistivity, and velocity. The gamma ray increase is produced by an increase in potassium, which is also responsible for a significant decrease in Th/K. Resistivity is extremely variable over the unit, which is manifest in the multiple centimeter-scale resistive layers that alternate in the FMS electrical images recorded in this unit.
Well/Seismic integration
High-quality seismic lines were recorded to select the sites and constrain the target depths necessary to achieve the objectives of the IBM project. After drilling, these lines allow us to extend the interpretation of the observations from each well to the regional settings. One of the priorities of the logging program was to establish the relationship between seismic traveltimes and the depth of the coring and logging data collected in Site U1437.
VSP calibration
The most direct way to build this relationship was to use the VSP recorded with the VSI. The first break in the waveforms displayed in Figure F168 (left) illustrates the time taken by a seismic pulse to travel from the sea surface to each of the 14 depths where the VSI was anchored during the survey. Figure F168 (right) shows the resulting relationship between depth and two-way traveltime that was then used to tie the well results to the lines crossing Site U1437. This relationship can be compared to similar relationships that were drawn from the integration of slowness data (inverse of velocity) measured on core samples prior to logging and from the results of the seismic inversion that were used to estimate target depths for the expedition. The comparison shows that traveltimes measured by the VSP fall between the earlier estimates, suggesting in particular that the depth to the target horizons should be shallower than originally estimated.
Synthetic seismogram
A complementary way to establish the time-depth relationship is to use the density and VP logs to generate a synthetic seismogram reproducing the seismic trace closest to the site. By recognizing individual reflectors, it is then possible to identify in the well the changes responsible for the reflectors and to determine the depth of these features. The synthetic seismogram shown in Figure F169 was generated by convolution of a synthetic 40 Hz Ricker wavelet (that matched best the frequency content of the survey trace) with the reflection coefficients series calculated from the density and VP logs. The time-depth relationship derived from matching the seismogram with the seismic line is compared with the other relationships in Figure F168 (right) and agrees very well with the check shot results. Figure F169 shows that the reflectors defining the bottom of seismic Layers L2 and L3 are at 310 and 710 mbsf, respectively, and that the 20 m interval of high resistivity and magnetic susceptibility at the bottom of logging Unit 1 is the bottom of seismic Layer L2. Other prominent reflectors can be recognized:
- The strong negative polarity reflector at 3.36 s coincides with the interval with fine resistive layers and the Th/K minimum in the middle of logging Unit 2 at ~460 mbsf.
- The broad positive reflector at 3.68 s, created by the changes in velocity at 790 mbsf, defines the bottom of logging Unit 4.
- The top of logging Unit 4 and lithologic Unit II at ~680 mbsf is also a small but distinct reflector at 3.58 s.
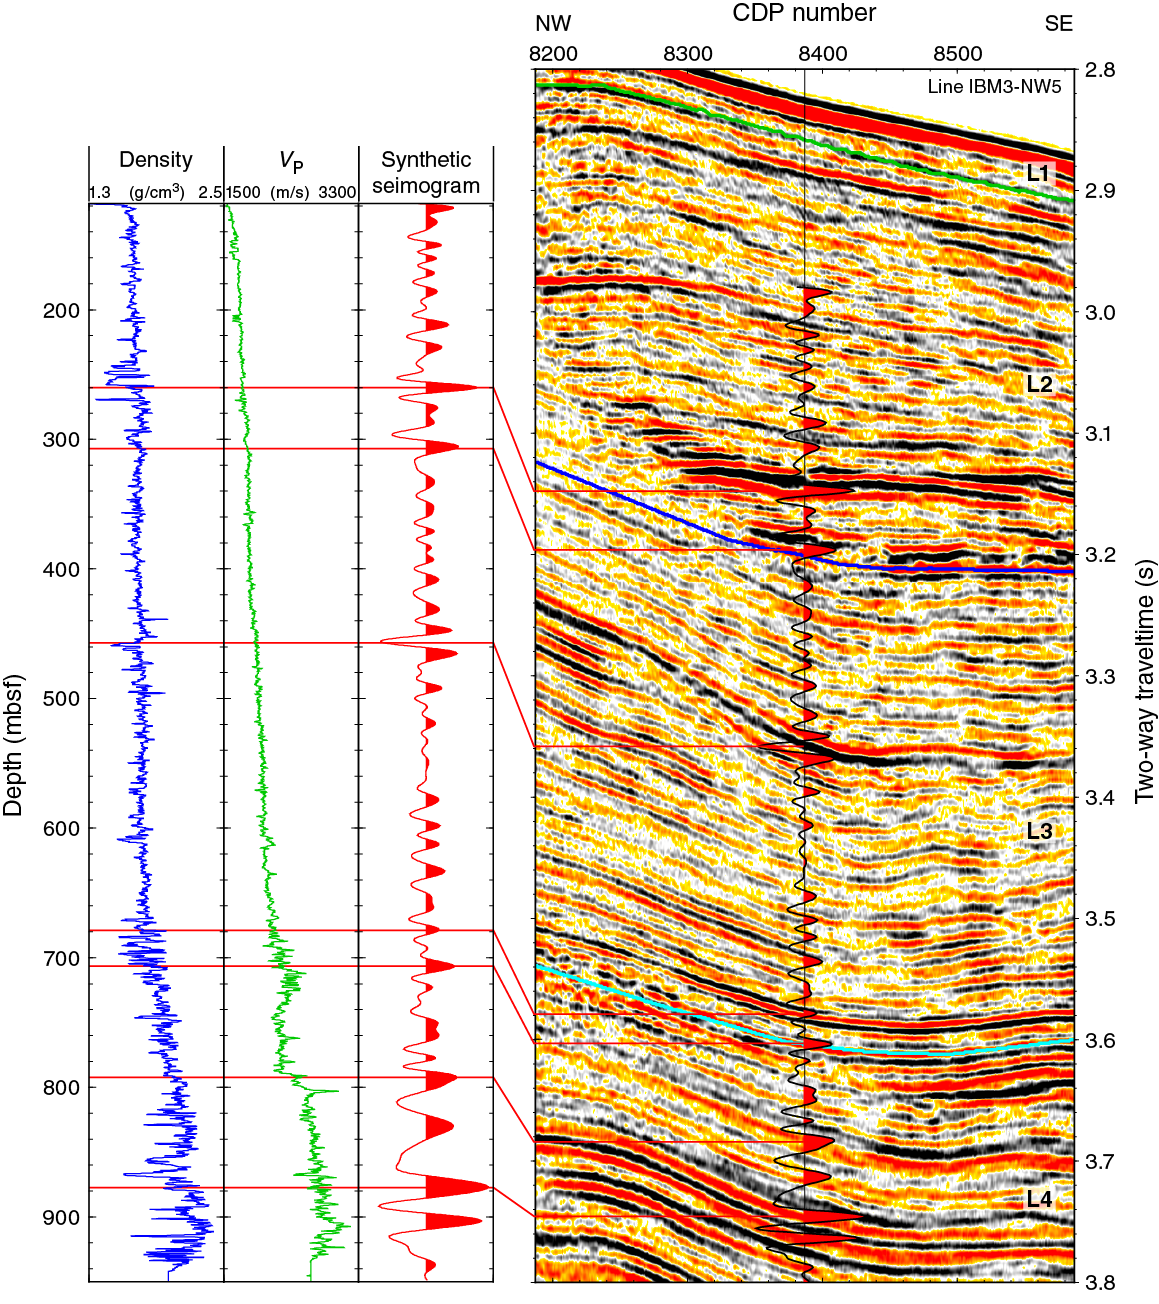
Figure F169. Synthetic seismogram, Hole U1437D.
Depth migration of the seismic data
Although recognizing individual reflectors provides the link between the seismic data and well observations, it does not allow us to directly map the well data, recorded as a function of depth, onto the seismic stratigraphy, which is displayed as a function of time. Assuming that the velocity profile measured in Hole U1437D is representative of its vicinity, the time-depth relationship derived from the VSP and the synthetic seismogram can be used to convert the seismic data from time to depth and allow direct mapping of all the data. After resampling the time-depth relationship to the same sampling rate as the seismic data, each seismic sample of every trace was assigned a depth, starting from the seafloor reflector for that trace. The resulting traces were resampled at 1 m intervals to generate the seismic section in Figure F170, where Line IBM3-NW5 is displayed as a function of depth.
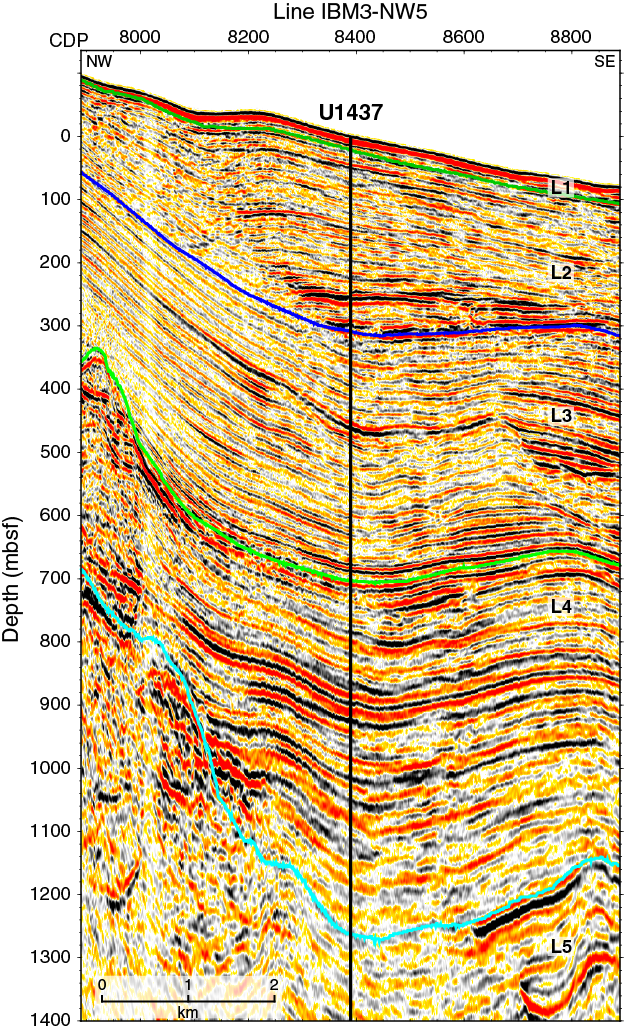
Figure F170. Seismic Line IBM3-NW5 crossing Site U1437.
Bottom of seismic Layer L2
The comparison of the borehole and seismic data shows that the interval between 290 and 310 mbsf, which was not recovered, is linked to a significant reflector that was chosen as the bottom of seismic Layer L2. Figure F171 is a summary of the various data that make this interval stand out. The reduced density and compressional velocity are the origin of the seismic reflector. In addition to the previously noted lower readings in gamma ray, density, and sonic velocity and to the higher magnetic susceptibility and resistivity values, this interval also has a distinct signature in the Stoneley data recorded at the same time as VP and VS. Stoneley waveforms are generated at low frequency (<1 kHz) to be mostly sensitive to formation permeability. The reduced amplitude and lower Stoneley velocity suggest that this interval is significantly more permeable than the surrounding rocks (Winkler et al., 1989). This seems to contradict the higher resistivity values, which suggest a formation less permissive to electrical current and hence less permeable. However, the high permeability is consistent with evidence of fluid flow at this depth as suggested by the inflections in the profiles of several pore water components across this interval, most noticeably sulfate, chloride, and strontium (see Geochemistry). The higher resistivity might be an indication that the fluid circulating in this interval has a lower salinity, or that this permeable formation had been invaded by the resistive drilling mud that was pumped at regular intervals during coring. It might also be related to a different lithology, as shown by the lower gamma ray readings. The high magnetic susceptibility suggests abundant volcaniclastic material. The statically normalized electrical image of the full interval underlines the extremely sharp contact with the underlying unit. The dynamically normalized images, enhancing the local contrasts, show a mottled texture, mostly uniform over the interval, without indication of any grading, as well as the occurrence of some fractures (at 304.4 mbsf). These observations indicate a sharp and drastic change in lithology. The similarity with the bottom of logging Unit 2 (610 mbsf) and the mottled texture in dynamic FMS images suggests a composition dominated by tuffaceous mudstone with dispersed coarse volcaniclastic components, probably representing a debris flow.
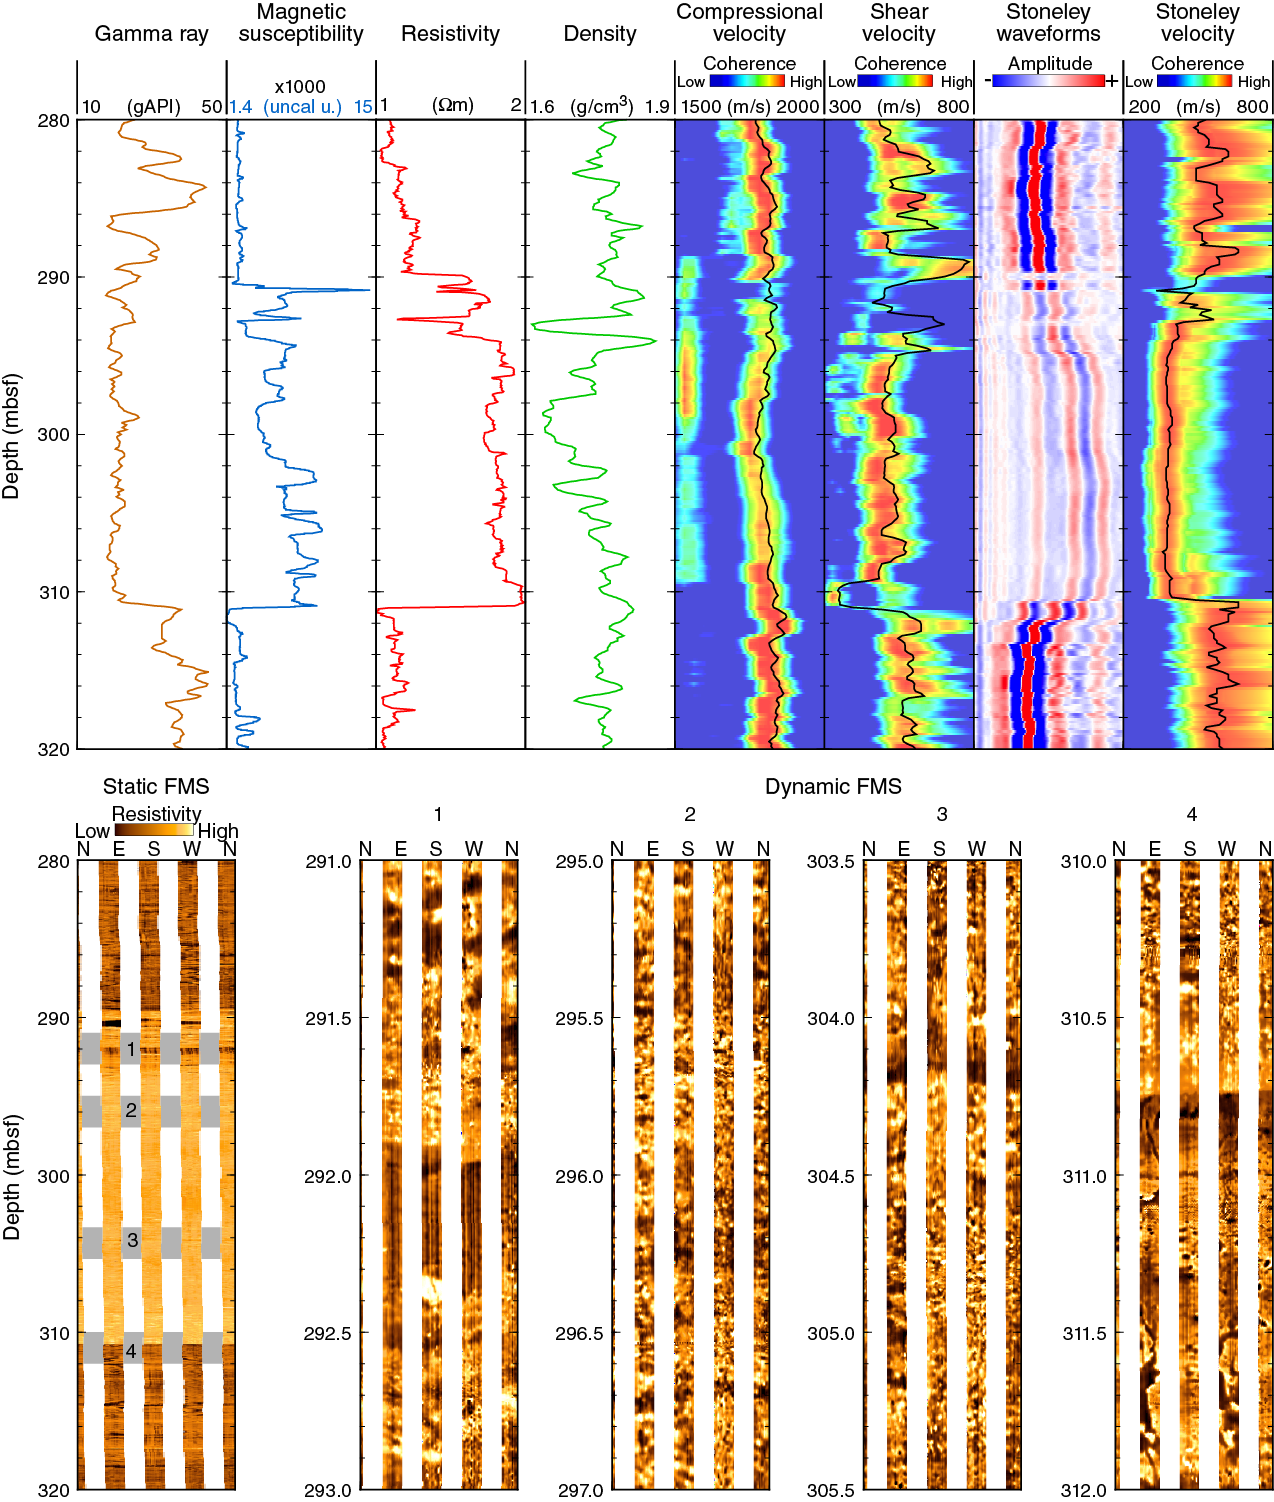
Figure F171. Logging data, 280–320 mbsf.
Core/Log correlations
Whereas the bottom of seismic Layer L2 illustrates how interpretation can be challenging without any recovery, Figure F172 shows how the good match between the gamma ray and magnetic susceptibility logs and core data allows correlations and interpretation in intervals with low or partial recovery. Visual correlations are shown for the interval between 687 and 727 mbsf, where core recovery was incomplete (Cores 350-U1437D-28R to 32R) and dominated by a succession of tuff, lapilli-tuff, and lapillistone layers that define lithostratigraphic Unit II. The offset between the core and log data is a result of incomplete recovery and complex dynamics of coring and logging, which make it difficult to assign consistent depths (see Downhole measurements in the Expedition 350 methods chapter [Tamura et al., 2015a]). The FMS images of the full interval provide a complete illustration of the thickness and distribution of the layers in this interval, including in the intervals without core recovery.

Figure F172. Natural gamma ray and magnetic susceptibility logs.
When layers have a distinct character or texture or are part of a recognizable sequence, they can be matched visually and compared side by side with the FMS images. Figure F173 shows examples of three intervals with diverse composition where the core photo and the FMS images were matched: clast- and matrix-supported lapilli-tuff with discrete pumice (Section 350-U1437D-30R-2), evolved tuff and tuffaceous mudstone overlying consolidated breccia in a debris flow (Sections 34R-3 and 34R-4), or a succession of evolved tuff and tuffaceous mudstone layers (Sections 52R-3 and 52R-4).

Figure F173. FMS images vs. core photographs.
Because of incomplete recovery, depth mismatch between cores and logs, and the high number of layers with similar signatures, it is not always possible to confidently match individual features between core photos and FMS images. A more global analysis can be made by the automated pick of the dip and orientation of the features observed in the FMS images (Figure F174). Identification is not based on features of a particular nature (conductive or resistive layers or beds) but on a continuous cross correlation between the four arms of the FMS that is most sensitive to systematic patterns. The histograms (“fanplots”) on the right side of the figure, summarizing the orientation data over 100 m intervals, show that layers in the shallower interval have no preferred orientation, whereas layers deeper than 600 mbsf, where the highest density of volcaniclastic intervals have been observed, are predominantly dipping to the southeast.
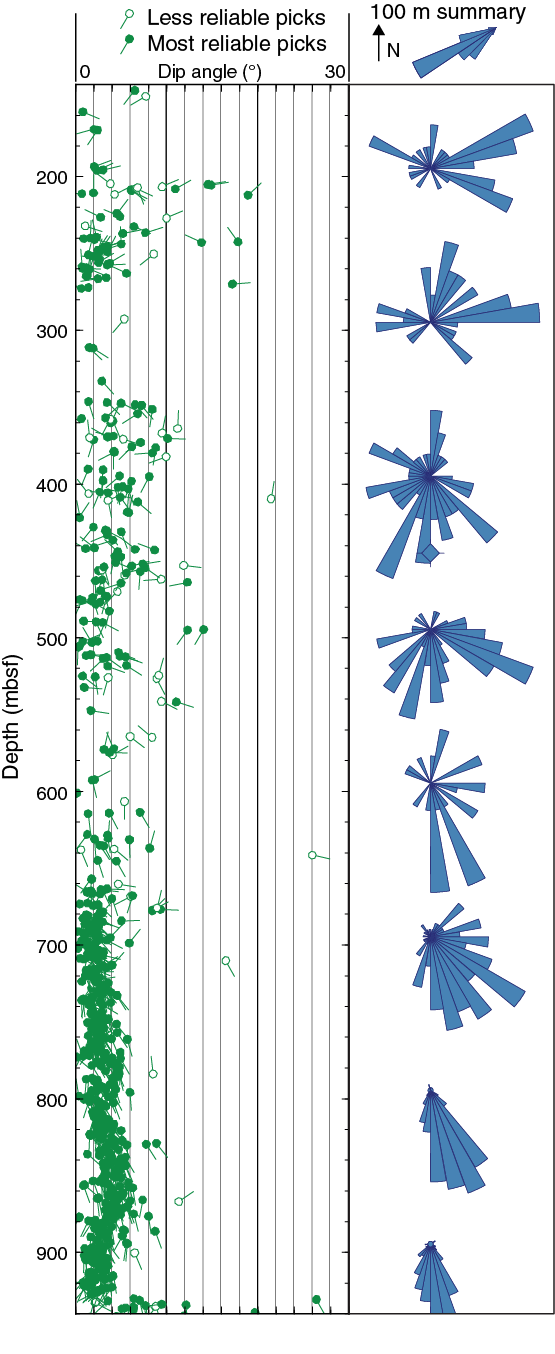
Figure F174. Structural analysis of FMS data.
References
Baker, P.A., Gieskes, J.M., and Elderfield, H., 1982. Diagenesis of carbonates in deep-sea sediments: evidence from Sr/Ca ratios and interstitial dissolved Sr 2+ data. Journal of Sedimentary Research, 52(1):71–82. http://dx.doi.org/10.1306/212F7EE1-2B24-11D7-8648000102C1865D
Bandy, W.L., and Hilde, T.W.C., 1983. Structural features of the Bonin arc: implications for its tectonic history. Tectonophysics, 99(2–4):331–353. http://dx.doi.org/10.1016/0040-1951(83)90111-7
Bé, A.W.H., and Tolderlund, D.S., 1971. Distribution and ecology of living planktonic foraminifera in surface waters of the Atlantic and Indian Oceans. In Funnel, B.M., and Riedel, W.R. (Eds.), The Micropaleontology of Oceans: Cambridge, UK (Cambridge University Press), 105–149.
Bloomer, S.H., Taylor, B., MacLeod, C.J., Stern, R.J., Fryer, P., Hawkins, J.W., and Johnson, L., 1995. Early arc volcanism and the ophiolite problem: a perspective from drilling in the western Pacific. In Taylor, B., and Natland, J. (Eds.), Active Margins and Marginal Basins of the Western Pacific. Geophysical Monograph, 88:1–30. http://dx.doi.org/10.1029/GM088p0001
Branney, M.J., and Kokelaar, B.P., 2002. Pyroclastic Density Currents and the Sedimentation of Ignimbrites. Memoirs—Geological Society of London, 27.
Brumsack, H.-J., and Zuleger, E., 1992. Boron and boron isotopes in pore waters from ODP Leg 127, Sea of Japan. Earth and Planetary Science Letters, 113(3):427–433. http://dx.doi.org/10.1016/0012-821X(92)90143-J
Bryant, C.J., Arculus, R.J., and Eggins, S.M., 2003. The geochemical evolution of the Izu-Bonin arc system: a perspective from tephras recovered by deep-sea drilling. Geochemistry, Geophysics, Geosystems, 4(11):1094. http://dx.doi.org/10.1029/2002GC000427
Bullard, E.C., 1939. Heat flow in South Africa. Proceedings of the Royal Society of London, Series A, 173(955):474–502. http://dx.doi.org/10.1098/rspa.1939.0159
Cambray, H., and Cadet, J.P., 1994. Testing global synchronism in peri-Pacific arc volcanism. Journal of Volcanology and Geothermal Research, 63(3–4):145–164. http://dx.doi.org/10.1016/0377-0273(94)90071-X
Carey, S., 1997. Influence of convective sedimentation on the formation of widespread tephra fall layers in the deep sea. Geology, 25(9):839–842. http://dx.doi.org/10.1130/0091-7613(1997)025<0839:IOCSOT>2.3.CO;2
Chen, J., An, Z., Liu, L., Ji, J., Yang, J., and Chen, Y., 2001. Variations in chemical compositions of the eolian dust in Chinese Loess Plateau over the past 2.5 Ma and chemical weathering in the Asian inland. Science in China Series D: Earth Sciences, 44(5):403–413. http://dx.doi.org/10.1007/BF02909779
Cosca, M.A., Arculus, R.J., Pearce, J.A., and Mitchell, J.G., 1998. 40Ar/ 39Ar and K-Ar geochronological age constraints for the inception and early evolution of the Izu-Bonin-Mariana arc system. Island Arc, 7(3):579–595. http://dx.doi.org/10.1111/j.1440-1738.1998.00211.x
Dickinson, W.R., and Hatherton, T., 1967. Andesitic volcanism and seismicity around the Pacific. Science, 157(3790):801–803. http://dx.doi.org/10.1126/science.157.3790.801
Dunlop, D.J., Özdemir, Ö., and Schmidt, P.W., 1997. Paleomagnetism and paleothermometry of the Sydney Basin 2. Origin of anomalously high unblocking temperatures. Journal of Geophysical Research: Solid Earth, 102(B12):27285–27295. http://dx.doi.org/10.1029/97JB02478
Expedition 334 Scientists, 2012. Site U1381. In Vannucchi, P., Ujiie, K., Stroncik, N., Malinverno, A., and the Expedition 334 Scientists, Proceedings of the Integrated Ocean Drilling Program, 334: Tokyo (Integrated Ocean Drilling Program Management International, Inc.). http://dx.doi.org/10.2204/iodp.proc.334.106.2012
Expedition 344 Scientists, 2013. Costa Rica Seismogenesis Project, Program A Stage 2 (CRISP-A2): sampling and quantifying lithologic inputs and fluid inputs and outputs of the seismogenic zone. IODP Preliminary Report, 344. http://dx.doi.org/10.2204/iodp.pr.344.2013
Föllmi, K.B., and von Breymann, M., 1992. Phosphates and glauconites of Sites 798 and 799. In Pisciotto, K.A., Ingle, J.C., Jr., von Breymann, M.T., Barron, J., et al., Proceedings of the Ocean Drilling Program, Scientific Results, 127/128 (Pt. 1): College Station, TX (Ocean Drilling Program), 63–74. http://dx.doi.org/10.2973/odp.proc.sr.127128-1.116.1992
Fryer, P., Pearce, J.A., Stokking, L.B., et al., 1990. Proceedings of the Ocean Drilling Program, Initial Reports, 125: College Station, TX (Ocean Drilling Program). http://dx.doi.org/10.2973/odp.proc.ir.125.1990
Gill, J.B., 1981. Minerals and Rocks (Vol. 16): Orogenic Andesites and Plate Tectonics: Berlin (Springer-Verlag). http://dx.doi.org/10.1007/978-3-642-68012-0
Gill, J.B., Hiscott, R.N., and Vidal, P., 1994. Turbidite geochemistry and evolution of the Izu-Bonin arc and continents. Lithos, 33(1–3):135–168. http://dx.doi.org/10.1016/0024-4937(94)90058-2
Gradstein, F.M., Ogg, J.G., Schmitz, M.D., and Ogg, G.M. (Eds.), 2012. The Geological Time Scale 2012: Amsterdam (Elsevier).
Hall, C.E., Gurnis, M., Sdrolias, M., Lavier, L.L., and Dietmar Müller, R., 2003. Catastrophic initiation of subduction following forced convergence across fracture zones. Earth and Planetary Science Letters, 212(1–2):15–30. http://dx.doi.org/10.1016/S0012-821X(03)00242-5
Hall, R., 2002. Cenozoic geological and plate tectonic evolution of SE Asia and the SW Pacific: computer-based reconstructions, model and animations. Journal of Asian Earth Sciences, 20(4):353–431. http://dx.doi.org/10.1016/S1367-9120(01)00069-4
Head, J.W., III, and Wilson, L., 2002. Deep submarine pyroclastic eruptions: theory and predicted landforms and deposits. Journal of Volcanology and Geothermal Research, 121(3–4):155–193. http://dx.doi.org/10.1016/S0377-0273(02)00425-0
Hein, J.R., O’Neil, J.R., and Jones, M.G., 1979. Origin of authigenic carbonates in sediment from the deep Bering Sea. Sedimentology, 26(5):681–705. http://dx.doi.org/10.1111/j.1365-3091.1979.tb00937.x
Hochstaedter, A., Gill, J., Peters, R., Broughton, P., Holden, P., and Taylor, B., 2001. Across-arc geochemical trends in the Izu-Bonin arc: contributions from the subducting slab. Geochemistry, Geophysics, Geosystems, 2(7):1019. http://dx.doi.org/10.1029/2000GC000105
Hochstaedter, A.G., Gill, J.B., Kusakabe, M., Newman, S., Pringle, M., Taylor, B., and Fryer, P., 1990a. Volcanism in the Sumisu Rift, I. Major element, volatile, and stable isotope geochemistry. Earth and Planetary Science Letters, 100(1–3):179–194. http://dx.doi.org/10.1016/0012-821X(90)90184-Y
Hochstaedter, A.G., Gill, J.B., and Morris, J.D., 1990b. Volcanism in the Sumisu Rift, II. Subduction and non-subduction related components. Earth and Planetary Science Letters, 100(1–3):195–209. http://dx.doi.org/10.1016/0012-821X(90)90185-Z
Hochstaedter, A.G., Gill, J.B., Taylor, B., Ishizuka, O., Yuasa, M., and Morita, S., 2000. Across-arc geochemical trends in the Izu-Bonin arc: constraints on source composition and mantle melting. Journal of Geophysical Research: Solid Earth, 105(B1):495–512. http://dx.doi.org/10.1029/1999JB900125
Housen, B.A., and Musgrave, R.J., 1996. Rock-magnetic signature of gas hydrates in accretionary prism sediments. Earth and Planetary Science Letters, 139:(3–4):509–519. http://dx.doi.org/10.1016/0012-821X(95)00245-8
Ishizuka, O., Kimura, J.-I., Li, Y.B., Stern, R.J., Reagan, M.K., Taylor, R.N., Ohara, Y., Bloomer, S.H., Ishii, T., Hargrove, U.S., III, and Haraguchi, S., 2006a. Early stages in the evolution of Izu-Bonin arc volcanism: new age, chemical, and isotopic constraints. Earth and Planetary Science Letters, 250(1–2):385–401. http://dx.doi.org/10.1016/j.epsl.2006.08.007
Ishizuka, O., Taylor, R.N., Milton, J.A., and Nesbitt, R.W., 2003a. Fluid-mantle interaction in an intraoceanic arc: constraints from high-precision Pb isotopes. Earth and Planetary Science Letters, 211(3–4):221–236. http://dx.doi.org/10.1016/S0012-821X(03)00201-2
Ishizuka, O., Taylor, R.N., Milton, J.A., Nesbitt, R.W., Yuasa, M., and Sakamoto, I., 2006b. Variation in the mantle sources of the northern Izu arc with time and space—constraints from high-precision Pb isotopes. Journal of Volcanology and Geothermal Research, 156(3–4):266–290. http://dx.doi.org/10.1016/j.jvolgeores.2006.03.005
Ishizuka, O., Taylor, R.N., Yuasa, M., and Ohara, Y., 2011. Making and breaking an island arc: a new perspective from the Oligocene Kyushu-Palau arc, Philippine Sea. Geochemistry, Geophysics, Geosystems, 12(5):Q05005. http://dx.doi.org/10.1029/2010GC003440
Ishizuka, O., Uto, K., and Yuasa, M., 2003b. Volcanic history of the back-arc region of the Izu-Bonin (Ogasawara) arc. In Larter, R.D., and Leat, P.T. (Eds.), Tectonic and Magmatic Processes. Geological Society Special Publication, 219(1):187–205. http://dx.doi.org/10.1144/GSL.SP.2003.219.01.09
Ishizuka, O., Uto, K., Yuasa, M., and Hochstaedter, A.G., 1998. K-Ar ages from seamount chains in the back-arc region of the Izu-Ogasawara arc. Island Arc, 7(3):408–421. http://dx.doi.org/10.1111/j.1440-1738.1998.00199.x
Ishizuka, O., Yuasa, M., and Uto, K., 2002. Evidence of porphyry copper-type hydrothermal activity from a submerged remnant back-arc volcano of the Izu-Bonin arc: implications for the volcanotectonic history of back-arc seamounts. Earth and Planetary Science Letters, 198(3–4):381–399. http://dx.doi.org/10.1016/S0012-821X(02)00515-0
Jordan, E.K., Lieu, W., Stern, R.J., Carr, M.J., Feigenson, M.D., and Gill, J.B., 2012. Data from: CentAm & IBM Geochem Database version 1.02. Integrated Earth Data Applications. http://dx.doi.org/10.1594/IEDA/100053
Jutzeler, M., White, J.D.L., Talling, P.J., McCanta, M., Morgan, S., Le Friant, A., and Ishizuka, O., 2014. Coring disturbances in IODP piston cores with implications for offshore record of volcanic events and the Missoula megafloods. Geochemistry, Geophysics, Geosystems, 15(9):3572–3590. http://dx.doi.org/10.1002/2014GC005447
Karig, D.E., and Moore, G.F., 1975. Tectonic complexities in the Bonin arc system. Tectonophysics, 27(2):97–118. http://dx.doi.org/10.1016/0040-1951(75)90101-8
Kennett, J.P., and Thunell, R.C., 1975. Global increase in Quaternary explosive volcanism. Science, 187(4176):497–502. http://dx.doi.org/10.1126/science.187.4176.497
Kennett, J.P., and Thunell, R.C., 1977. On explosive Cenozoic volcanism and climatic implications. Science, 196:1231–1234. http://dx.doi.org/10.1126/science.196.4295.1231-a
Kodaira, S., Sato, T., Takahashi, N., Ito, A., Tamura, Y., Tatsumi, Y., and Kaneda, Y., 2007a. Seismological evidence for variable growth of crust along the Izu intraoceanic arc. Journal of Geophysical Research: Solid Earth, 112(B5):B05104. http://dx.doi.org/10.1029/2006JB004593
Kodaira, S., Sato, T., Takahashi, N., Miura, S., Tamura, Y., Tatsumi, Y., and Kaneda, Y., 2007b. New seismological constraints on growth of continental crust in the Izu-Bonin intra-oceanic arc. Geology, 35(11):1031–1034. http://dx.doi.org/10.1130/G23901A.1
Kodaira, S., Sato, T., Takahashi, N., Yamashita, M., No, T., and Kaneda, Y., 2008. Seismic imaging of a possible paleoarc in the Izu-Bonin intraoceanic arc and its implications for arc evolution processes. Geochemistry, Geophysics, Geosystems, 9(10):Q10X01. http://dx.doi.org/10.1029/2008GC002073
Kuno, H., 1959. Origin of Cenozoic petrographic provinces of Japan and surrounding areas. Bulletin of Volcanology, 20(1):37–76. http://dx.doi.org/10.1007/BF02596571
Kutterolf, S., Jegen, M., Mitrovica, J.X., Kwasnitschka, T., Freundt, A., and Huybers, P.J., 2013. A detection of Milankovitch frequencies in global volcanic activity. Geology, 41(2):227–230. http://dx.doi.org/10.1130/G33419.1
Larrasoaña, J.C., Roberts, A.P., Musgrave, R.J., Gràcia, E., Piñero, E., Vega, M., and Martínez-Ruiz, F., 2007. Diagenetic formation of greigite and pyrrhotite in gas hydrate marine sedimentary systems. Earth and Planetary Science Letters, 261(3–4):350–366. http://dx.doi.org/10.1016/j.epsl.2007.06.032
Littke, R., Fourtanier, E., Thurow, J., and Taylor, E., 1991. Silica diagenesis and its effects on lithification of Broken Ridge deposits, central Indian Ocean. In Weissel, J., Peirce, J., Taylor, E., Alt, J., et al., Proceedings of the Ocean Drilling Program, Scientific Results, 121: College Station, TX (Ocean Drilling Program), 261–272. http://dx.doi.org/10.2973/odp.proc.sr.121.179.1991
Lund, S.P., Stoner, J.S., Mix., A.C., Tiedemann, R., Blum, P., and the Leg 202 Shipboard Scientific Party, 2003. Appendix: observations on the effect of a nonmagnetic core barrel on shipboard paleomagnetic data: results from ODP Leg 202. In Mix, A.C., Tiedemann, R., Blum, P., et al., Proceedings of the Ocean Drilling Program, Initial Reports, 202: College Station, TX (Ocean Drilling Program), 1–10. http://dx.doi.org/10.2973/odp.proc.ir.202.114.2003
Machida, S., and Ishii, T., 2003. Backarc volcanism along the en echelon seamounts: the Enpo Seamount chain in the northern Izu-Ogasawara arc. Geochemistry, Geophysics, Geosystems, 4(8):9006. http://dx.doi.org/10.1029/2003GC000554
Machida, S., Ishii, T., Kimura, J.-I., Awaji, S., and Kato, Y., 2008. Petrology and geochemistry of cross-chains in the Izu-Bonin back arc: three mantle components with contributions of hydrous liquids from a deeply subducted slab. Geochemistry, Geophysics, Geosystems, 9(5):Q05002. http://dx.doi.org/10.1029/2007GC001641
Mahood, G.A., and Halliday, A.N., 1988. Generation of high-silica rhyolite: a Nd, Sr, and O isotopic study of Sierra La Primavera, Mexican Neovolcanic Belt. Contributions to Mineralogy and Petrology, 100(2):183–191. http://dx.doi.org/10.1007/BF00373584
Manville, V., and Wilson, C.J.N., 2004. Vertical density currents: a review of their potential role in the deposition and interpretation of deep-sea ash layers. Journal of the Geological Society, 161(6):947–958. http://dx.doi.org/10.1144/0016-764903-067
Meunier, A., 2003. Argiles: Paris (Contemporary Publishing International [Gordon and Breach]).
Meyers, P.A., 1994. Preservation of elemental and isotopic source identification of sedimentary organic matter. Chemical Geology, 114(3–4):289–302. http://dx.doi.org/10.1016/0009-2541(94)90059-0
Morse, J.W., and Mackenzie, F.T., 1990. Geochemistry of Sedimentary Carbonates: Amsterdam (Elsevier). http://dx.doi.org/10.1016/S0070-4571(08)70329-7
Müller, P.J., 1977. C/N ratios in Pacific deep-sea sediments: effect of inorganic ammonium and organic nitrogen compounds sorbed by clays. Geochimica et Cosmochimica Acta, 41(6):765–776. http://dx.doi.org/10.1016/0016-7037(77)90047-3
Musgrave, R.J., Bangs, N.L., Larrasoaña, J.C., Gràcia, E., Hollamby, J.A., and Vega, M.E., 2006. Rise of the base of the gas hydrate zone since the last glacial recorded by rock magnetism. Geology, 34:117–120. http://dx.doi.org/10.1130/G22008.1
Nishimura, A., Rodolfo, K.S., Koizumi, A., Gill, J., and Fujioka, K., 1992. Episodic deposition of Pliocene–Pleistocene pumice from the Izu-Bonin arc, Leg 126. In Taylor, B., Fujioka, K., et al., Proceedings of the Ocean Drilling Program, Scientific Results, 126: College Station, TX (Ocean Drilling Program), 3–21. http://dx.doi.org/10.2973/odp.proc.sr.126.115.1992
Odin, G.S., and Matter, A., 1981. De glauconiarum origine. Sedimentology, 28:611–641. http://dx.doi.org/10.1111/j.1365-3091.1981.tb01925.x
Okino, K., Matsuda, K., Christie, D.M., Nogi, Y., and Koizumi, K., 2004. Development of oceanic detachment and asymmetric spreading at the Australian-Antarctic Discordance. Geochemistry, Geophysics, Geosystems, 5(12):Q12012. http://dx.doi.org/10.1029/2004GC000793
Paull, C.K., Matsumoto, R., Wallace, P.J., et al., 1996. Proceedings of the Ocean Drilling Program, Initial Reports, 164: College Station, TX (Ocean Drilling Program). http://dx.doi.org/10.2973/odp.proc.ir.164.1996
Plank, T., 2014. The chemical composition of subducting sediments. In Rudnick, R.L. (Ed.), Treatise on Geochemistry (2nd ed.) (Vol. 4): The Crust. Holland, H.D., and Turekian, K.K. (Series Eds.): Oxford, UK (Elsevier), 607–629. http://dx.doi.org/10.1016/B978-0-08-095975-7.00319-3
Plank, T., and Langmuir, C.H., 1998. The chemical composition of subducting sediment and its consequences for the crust and mantle. Chemical Geology, 145(3–4):325–394. http://dx.doi.org/10.1016/S0009-2541(97)00150-2
Plank, T., Ludden, J.N., Escutia, C., et al., 2000. Proceedings of the Ocean Drilling Program, Initial Reports, 185: College Station, TX (Ocean Drilling Program). http://dx.doi.org/10.2973/odp.proc.ir.185.2000
Prueher, L.M., and Rea, D.K., 1998. Rapid onset of glacial conditions in the subarctic North Pacific region at 2.67 Ma: clues to causality. Geology, 26(11):1027–1030. http://dx.doi.org/10.1130/0091-7613(1998)026<1027:ROOGCI>2.3.CO;2
Prueher, L.M., and Rea, D.K., 2001. Tephrochronology of the Kamchatka-Kurile and Aleutian arcs: evidence for volcanic episodicity. Journal of Volcanology and Geothermal Research, 106(1–2):67–84. http://dx.doi.org/10.1016/S0377-0273(00)00266-3
Qui, B., 2001. Kuroshio and Oyashio currents. In Thorpe, S.A., and Turekian, K.K. (Eds.), Encyclopedia of Ocean Sciences: Oxford, UK (Academic Press), 1413–1425. http://dx.doi.org/10.1006/rwos.2001.0350
Riedel, M., Collett, T.S., Malone, M.J., and the Expedition 311 Scientists, 2006. Proceedings of the Integrated Ocean Drilling Program, 311: Washington, DC (Integrated Ocean Drilling Program Management International, Inc.). http://dx.doi.org/10.2204/iodp.proc.311.2006
Robb, L., 2005. Introduction to Ore-Forming Processes: Oxford, UK (Blackwell Science Publishing).
Roberts, A.P., Chang, L., Rowan, C.J., Horng, C.-S., and Florindo, F., 2011. Magnetic properties of sedimentary greigite (Fe3S4): an update. Reviews of Geophysics, 49(1):RG1002. http://dx.doi.org/10.1029/2010RG000336
Rowan, C.J., Roberts, A.P., and Broadbent, T., 2009. Reductive diagenesis, magnetite dissolution, greigite growth and paleomagnetic smoothing in marine sediments: a new view. Earth and Planetary Science Letters, 277(1–2):223–235. http://dx.doi.org/10.1016/j.epsl.2008.10.016
Rudnick, R.L., and Gao, S., 2004. Composition of the continental crust. In Rudnick, R.L. (Ed.), Treatise on Geochemistry (Vol 3): The Crust. Holland, H.D., and Turekian, K.K. (Series Eds.): Oxford, UK (Elsevier), 1–64. http://dx.doi.org/10.1016/B0-08-043751-6/03016-4
Sagnotti, L., Roberts, A.P., Weaver, R., Verosub, K.L., Florindo, F., Pike, C.R., Clayton, T., and Wilson, G.S., 2005. Apparent magnetic polarity reversals due to remagnetization resulting from late diagenetic growth of greigite from siderite. Geophysical Journal International, 160(1):89–100. http://dx.doi.org/10.1111/j.1365-246X.2005.02485.x
Scudder, R.P., Murray, R.W., and Plank, T., 2009. Dispersed ash in deeply buried sediment from the northwest Pacific Ocean: an example from the Izu-Bonin arc (ODP Site 1149). Earth and Planetary Science Letters, 284(3–4):639–648. http://dx.doi.org/10.1016/j.epsl.2009.05.037
Shibata, T., Yoshikawa, M., Itoh, J., Ujike, O., Miyoshi, M., and Takemura, K., 2013. Along-arc geochemical variations in Quaternary magmas of northern Kyushu Island, Japan. In Gómez-Tuena, A., Straub, S., and Zellmer, G. (Eds.), Orogenic Andesites and Crustal Growth. Geological Society Special Publication, 385(1):15–29. http://dx.doi.org/10.1144/SP385.13
Shipboard Scientific Party, 1994. Sites 889 and 890. In Westbrook, G.K., Carson, B., Musgrave, R.J., et al., Proceedings of the Ocean Drilling Program, Initial Reports, 146 (Pt. 1): College Station, TX (Ocean Drilling Program), 127–239. http://dx.doi.org/10.2973/odp.proc.ir.146-1.008.1994
Shipboard Scientific Party, 1996a. Site 994. In Paull, C.K., Matsumoto, R., Wallace, P.J., et al., Proceedings of the Ocean Drilling Program, Initial Reports, 164: College Station, TX (Ocean Drilling Program), 99–174. http://dx.doi.org/10.2973/odp.proc.ir.164.107.1996
Shipboard Scientific Party, 1996b. Site 997. In Paull, C.K., Matsumoto, R., Wallace, P.J., et al., Proceedings of the Ocean Drilling Program, Initial Reports, 164: College Station, TX (Ocean Drilling Program), 277–334. http://dx.doi.org/10.2973/odp.proc.ir.164.110.1996
Shipboard Scientific Party, 1996c. Sites 991/992/993. In Paull, C.K., Matsumoto, R., Wallace, P.J., et al., Proceedings of the Ocean Drilling Program, Initial Reports, 164: College Station, TX (Ocean Drilling Program), 65–97. http://dx.doi.org/10.2973/odp.proc.ir.164.106.1996
Shipboard Scientific Party, 1997. Site 1039. In Kimura, G., Silver, E., Blum, P., et al., Proceedings of the Ocean Drilling Program, Initial Reports, 170: College Station, TX (Ocean Drilling Program), 45–93. http://dx.doi.org/10.2973/odp.proc.ir.170.103.1997
Shipboard Scientific Party, 2003. Site 1244. In Tréhu, A.M., Bohrmann, G., Rack, F.R., Torres, M.E., et al., Proceedings of the Ocean Drilling Program, Initial Reports, 204: College Station, TX (Ocean Drilling Program), 1–132. http://dx.doi.org/10.2973/odp.proc.ir.204.103.2003
Smith, G.A., and Landis, C., 1995. Intra-arc basins. In Busby, C.J., and Ingersoll, R.V. (Eds.), Tectonics of Sedimentary Basins: Oxford (Blackwell Science Publishing), 263–298.
Stern, R.J., Fouch, M.J., and Klemperer, S., 2003. An overview of the Izu-Bonin-Mariana subduction factory. In Eiler, J. (Ed.), Inside the Subduction Factory. Geophysical Monograph, 138:175–222. http://dx.doi.org/10.1029/138GM10
Straub, S.M., 2003. The evolution of the Izu Bonin-Mariana volcanic arcs (NW Pacific) in terms of major elements. Geochemistry, Geophysics, Geosystems, 4(2):1018. http://dx.doi.org/10.1029/2002GC000357
Straub, S.M., Goldstein, S.L., Class, C., Schmidt, A., and Gomez-Tuena, A., 2010. Slab and mantle controls on the Sr-Nd-Pb-Hf isotope evolution of the post 42 Ma Izu-Bonin volcanic arc. Journal of Petrology, 51(5):993–1026. http://dx.doi.org/10.1093/petrology/egq009
Stroncik, N.A., and Schmincke, H.-U., 2002. Palagonite; a review. International Journal of Earth Sciences, 91(4):680–697. http://dx.doi.org/10.1007/s00531-001-0238-7
Summerhayes, C.P., and Thorpe, S.A., 1996. Oceanography: An Illustrated Guide: Hoboken, NJ (John Wiley & Sons), 165–181.
Suyehiro, K., Takahashi, N., Ariie, Y., Yokoi, Y., Hino, R., Shinohara, M., Kanazawa, T., Hirata, N., Tokuyama, H., and Taira, A., 1996. Continental crust, crustal underplating, and low-Q upper mantle beneath an oceanic island arc. Science, 272(5260):390–392. http://dx.doi.org/10.1126/science.272.5260.390
Tamura, Y., 1994. Genesis of island arc magmas by mantle-derived bimodal magmatism: evidence from the Shirahama Group, Japan. Journal of Petrology, 35(3):619–645. http://dx.doi.org/10.1093/petrology/35.3.619
Tamura, Y., Busby, C., and Blum, P., 2013. Izu-Bonin-Mariana Rear Arc: the missing half of the subduction factory. International Ocean Discovery Program Scientific Prospectus, 350. http://dx.doi.org/10.2204/iodp.sp.350.2013
Tamura, Y., Busby, C.J., Blum, P., Guèrin, G., Andrews, G.D.M., Barker, A.K., Berger, J.L.R., Bongiolo, E.M., Bordiga, M., DeBari, S.M., Gill, J.B., Hamelin, C., Jia, J., John, E.H., Jonas, A.-S., Jutzeler, M., Kars, M.A.C., Kita, Z.A., Konrad, K., Mahony, S.H., Martini, M., Miyazaki, T., Musgrave, R.J., Nascimento, D.B., Nichols, A.R.L., Ribeiro, J.M., Sato, T., Schindlbeck, J.C., Schmitt, A.K., Straub, S.M., Vautravers, M.J., and Yang, Y., 2015a. Expedition 350 methods. In Tamura, Y., Busby, C.J., Blum, P., and the Expedition 350 Scientists, Proceedings of the International Ocean Discovery Program, Expedition 350: Izu-Bonin-Mariana Rear Arc: College Station, TX (International Ocean Discovery Program). http://dx.doi.org/10.14379/iodp.proc.350.102.2015
Tamura, Y., Busby, C.J., Blum, P., Guèrin, G., Andrews, G.D.M., Barker, A.K., Berger, J.L.R., Bongiolo, E.M., Bordiga, M., DeBari, S.M., Gill, J.B., Hamelin, C., Jia, J., John, E.H., Jonas, A.-S., Jutzeler, M., Kars, M.A.C., Kita, Z.A., Konrad, K., Mahony, S.H., Martini, M., Miyazaki, T., Musgrave, R.J., Nascimento, D.B., Nichols, A.R.L., Ribeiro, J.M., Sato, T., Schindlbeck, J.C., Schmitt, A.K., Straub, S.M., Vautravers, M.J., and Yang, Y., 2015b. Site U1436. In Tamura, Y., Busby, C.J., Blum, P., and the Expedition 350 Scientists, Proceedings of the International Ocean Discovery Program, Expedition 350: Izu-Bonin-Mariana Rear Arc: College Station, TX (International Ocean Discovery Program). http://dx.doi.org/10.14379/iodp.proc.350.103.2015
Tamura, Y., Gill, J.B., Tollstrup, D., Kawabata, H., Shukuno, H., Chang, Q., Miyazaki, T., Takahashi, T., Hirahara, Y., Kodaira, S., Ishizuka, O., Suzuki, T., Kido, Y., Fiske, R.S., and Tatsumi, Y., 2009. Silicic magmas in the Izu-Bonin oceanic arc and implications for crustal evolution. Journal of Petrology, 50(4):685–723. http://dx.doi.org/10.1093/petrology/egp017
Tamura, Y., Tani, K., Chang, Q., Shukuno, H., Kawabata, H., Ishizuka, O., and Fiske, R.S., 2007. Wet and dry basalt magma evolution at Torishima Volcano, Izu-Bonin arc, Japan: the possible role of phengite in the downgoing slab. Journal of Petrology, 48(10):1999–2031. http://dx.doi.org/10.1093/petrology/egm048
Tamura, Y., Tani, K., Ishizuka, O., Chang, Q., Shukuno, H., and Fiske, R.S., 2005. Are arc basalts dry, wet, or both? Evidence from the Sumisu Caldera Volcano, Izu-Bonin arc, Japan. Journal of Petrology, 46(9):1769–1803. http://dx.doi.org/10.1093/petrology/egi033
Tamura, Y., and Tatsumi, Y., 2002. Remelting of an andesitic crust as a possible origin for rhyolitic magma in oceanic arcs: an example from the Izu-Bonin arc. Journal of Petrology, 43(6):1029–1047. http://dx.doi.org/10.1093/petrology/43.6.1029
Tamura, Y., Tatsumi, Y., Zhao, D., Kido, Y., and Shukuno, H., 2002. Hot fingers in the mantle wedge: new insights into magma genesis in subduction zones. Earth and Planetary Science Letters, 197(1–2):105–116. http://dx.doi.org/10.1016/S0012-821X(02)00465-X
Tani, K., Fiske, R.S., Dunkley, D.J., Ishizuka, O., Oikawa, T., Isobe, I., and Tatsumi, Y., 2011. The Izu Peninsula, Japan: zircon geochronology reveals a record of intra-oceanic rear-arc magmatism in an accreted block of Izu-Bonin upper crust. Earth and Planetary Science Letters, 303(3–4):225–239. http://dx.doi.org/10.1016/j.epsl.2010.12.052
Tani, K., Fiske, R.S., Tamura, Y., Kido, Y., Naka, J., Shukuno, H., and Takeuchi, R., 2008. Sumisu Volcano, Izu-Bonin arc, Japan: site of a silicic caldera-forming eruption from a small open-ocean island. Bulletin of Volcanology, 70(5):547–562. http://dx.doi.org/10.1007/s00445-007-0153-2
Taylor, B., 1992. Rifting and the volcanic-tectonic evolution of the Izu-Bonin-Mariana arc. In Taylor, B., Fujioka, K., et al., Proceedings of the Ocean Drilling Program, Scientific Results, 126: College Station, TX (Ocean Drilling Program), 627–651. http://dx.doi.org/10.2973/odp.proc.sr.126.163.1992
Taylor, B., Fujioka, K., et al., 1990. Proceedings of the Ocean Drilling Program, Initial Reports, 126: College Station, TX (Ocean Drilling Program). http://dx.doi.org/10.2973/odp.proc.ir.126.1990
Taylor, R.N., and Nesbitt, R.W., 1998. Isotopic characteristics of subduction fluids in an intra-oceanic setting, Izu-Bonin arc, Japan. Earth and Planetary Science Letters, 164(1–2):79–98. http://dx.doi.org/10.1016/S0012-821X(98)00182-4
Thompson, R., and Oldfield, F., 1986. Environmental Magnetism: London (Allen and Unwin).
Tollstrup, D., Gill, J., Kent, A., Prinkey, D., Williams, R., Tamura, Y., and Ishizuka, O., 2010. Across-arc geochemical trends in the Izu-Bonin arc: contributions from the subducting slab, revisited. Geochemistry, Geophysics, Geosystems, 11(1):Q01X10. http://dx.doi.org/10.1029/2009GC002847
Vautravers, M.J., Shackleton, N.J., Lopez-Martinez, C., and Grimalt, J.O., 2004. Gulf Stream variability during marine isotope Stage 3. Paleoceanography, 19(2):PA2011. http://dx.doi.org/10.1029/2003PA000966
Velde, B., 2003. Green clay minerals. In Mackenzie, F.T., Treatise on Geochemistry (Vol. 7): Sediments, Diagenesis, and Sedimentary Rocks. Holland, H.D., and Turekian, K.K. (Series Eds.): Oxford, UK (Elsevier), 309–324. http://dx.doi.org/10.1016/B0-08-043751-6/07090-0
Whittaker, J.M., Müller, R.D., Leitchenkov, G., Stagg, H., Sdrolias, M., Gaina, C., and Goncharov, A., 2007. Major Australian-Antarctic plate reorganization at Hawaiian-Emperor Bend time. Science, 318(5847):83–86. http://dx.doi.org/10.1126/science.1143769
Winkler, K.W., Liu, H.-L., and Johnson, D.L., 1989. Permeability and borehole Stoneley waves: comparison between experiment and theory. Geophysics, 54(1):66–75. http://dx.doi.org/10.1190/1.1442578
Yamazaki, T., and Stern, R.J., 1997. Topography and magnetic vector anomalies in the Mariana Trough. JAMSTEC Deep Sea Research, 13:31–45.
Yamazaki, T., and Yuasa, M., 1998. Possible Miocene rifting of the Izu–Ogasawara (Bonin) arc deduced from magnetic anomalies. Island Arc, 7(3):374–382. http://dx.doi.org/10.1111/j.1440-1738.1998.00196.x
Zimanowski, B., and Büttner, R., 2003. Phreatomagmatic explosions in subaqueous volcanism. In White, J.D.L, Smellie, J.L., and Clague, D.A. (Eds.), Explosive Subaqueous Volcanism. Geophysical Monograph, 140:51–60. http://dx.doi.org/10.1029/140GM03
1Tamura, Y., Busby, C.J., Blum, P., Guèrin, G., Andrews, G.D.M., Barker, A.K., Berger, J.L.R., Bongiolo, E.M., Bordiga, M., DeBari, S.M., Gill, J.B., Hamelin, C., Jia, J., John, E.H., Jonas, A.-S., Jutzeler, M., Kars, M.A.C., Kita, Z.A., Konrad, K., Mahony, S.H., Martini, M., Miyazaki, T., Musgrave, R.J., Nascimento, D.B., Nichols, A.R.L., Ribeiro, J.M., Sato, T., Schindlbeck, J.C., Schmitt, A.K., Straub, S.M., Vautravers, M.J., and Yang, Y., 2015. Site U1437. In Tamura, Y., Busby, C.J., Blum, P., and the Expedition 350 Scientists, Proceedings of the International Ocean Discovery Program, Expedition 350: Izu-Bonin-Mariana Rear Arc: College Station, TX (International Ocean Discovery Program). http://dx.doi.org/10.14379/iodp.proc.350.104.2015
2Expedition 350 Scientists’ addresses.
Figure F1. A. Tectonic setting of the Izu-Bonin-Mariana (IBM) arc (modified from Taylor, 1992; Tamura and Tatsumi, 2002). The IBM arc trench system forms the convergent margin between the Pacific and Philippine Sea plates. Double lines indicate spreading centers active in the Mariana Trough and inactive (relic) in the Shikoku and Parece Vela Basins. The Izu arc, Bonin arc, West Mariana Ridge, and Mariana arc are outlined by the 3 km bathymetric contour, and other basins and ridges are outlined by the 4 km contour. Box shows area of B. B. Map of the 16 Quaternary volcanoes on the Izu arc front (modified from Tamura et al., 2009), showing positions of Expedition 350 sites (Site U1436 in the fore arc and Site U1437 in the rear arc); ODP sites are also shown. Dotted line along arc front indicates locations of 103 ocean-bottom seismometers deployed at ~5 km intervals (Kodaira et al., 2007a, 2007b); for profile see Figure F3 in the Site U1437 chapter (Tamura et al., 2015b).
Figure F2.Location of Site U1436 (IBM-4GT) and ODP Sites 792, 786, and 787. Site U1436 lies 60 km east of Aogashima, an arc-front mafic volcano that forms a small inhabited island; east of that is the East (Higashi) Aogashima submarine caldera, which also appears on the west end of the line of section shown in Figure F4.
Figure F3. Izu arc seismic stratigraphy. P-wave velocity after Suyehiro et al. (1996). Expedition 350 drilled two sites: Site U1436 in the fore arc and Site U1437 in the rear arc. Site U1436 is a geotechnical hole for Site IBM-4 (see Figure F2) and lies 1.5 km from Site 792. Other ODP sites are projected onto the line of section (black bars). Site U1436 is located 25 km north of the seismic line shown here. BON = boninite, FAB = fore-arc basalt.
Figure F4. A. Time-migrated MCS section IBM4-EW5 along the east–west profile through proposed Site IBM-4 (M. Yamashita, pers. comm., 2014). In order to better image the intracrustal structure and to precisely define the upper/middle crust boundary beneath Site IBM-4, seismic experiments were conducted in 2008 using the Japan Agency for Marine-Earth Science and Technology R/V Kairei (KR08-09) to deploy a wide-angle ocean-bottom seismometer array with 1 km intervals. Seismic velocity (VP) of 5 and 6 km/s are inferred to represent upper crust volcanic rocks and middle crust intermediate pluton, respectively. B. Lithostratigraphic Units I–VI described from Site 792 by Taylor, Fujioka, et al. (1990) and inferred intracrustal structure deeper than 886 mbsf.
Figure F5. Bathymetric features of the eastern Philippine Sea, including the IBM arc system, from Tamura et al. (2010), showing positions of Expedition 350 sites (Site U1436 in fore arc and Site U1437 in rear arc). Black dashed lines = wide-angle seismic profiles: the two approximately north–south seismic profiles (along the present-day arc front and rear arc ~150 km west of the arc front) are presented in the Site U1437 chapter (Tamura et al., 2015b). The lines of circles = three conspicuous north–south rows of long-wavelength magnetic anomalies, attributed to loci of Eocene–Oligocene magmatic centers by Yamazaki and Yuasa (1998). Site U1436 lies on the eastern row of anomalies, which coincides with a fore-arc high (also referred to as the Shin-Kurose Ridge, see text).
Figure F6. Major element compositions of representative subarc mantle (45.6 wt% SiO2 and 38.6 wt% MgO; Takazawa et al., 2000), primary (basalt) arc magma in the Mariana arc, which is in equilibrium with the subarc mantle (48.2 wt% SiO2 and 16.4 wt% MgO; Tamura et al., 2014), and average continental crust, which is andesitic in composition (60.6 wt% SiO2 and 4.7 wt% MgO; Rudnick and Gao, 2004).
Figure F7. Primitive mantle–normalized trace element patterns of average continental crust (Rudnick and Gao, 2004) and two basalt samples from the Pagan Volcano and Mariana arc, interpreted as primary magma compositions (Tamura et al., 2014).
Figure F8. Volume-weighted histograms of rock types from (A) the Quaternary Izu arc (30.5°–35.0°N) (Tamura and Tatsumi, 2002) and (B) the Kermadec arc (30.0°~36.5°S) (Wright et al., 2006), suggesting bimodal volcanism in the oceanic arcs. Basalt and basaltic andesite (<57 wt% SiO2) are clearly the predominant eruptive products but dacite and/or rhyolite also form a major mode.
Figure F9. Sr, Nd, and Pb isotopes along the Izu arc front from Oshima to southwest Torishima volcanoes, divided into basalt- and rhyolite-dominated volcanoes (modified from Tamura et al., 2007, 2009, and data sources cited therein, including Taylor and Nesbitt, 1998; Ishizuka et al., 2003; Tamura et al., 2005, 2007). Volcano locations shown on Figure F1B. For comparison, lava from active rifts (behind arc front) and from rear-arc volcanoes are shown.
Figure F10. From Tamura et al., 2009. A. Along-arc crustal structure (dotted line; thickness of middle crust with VP = 6.0–6.8 km/s at depths between 5 and 20 km) and average SiO2 of volcanic rocks (black squares) sampled and dredged from the 16 Izu arc Quaternary volcanoes (Figure F1B). The basalt-dominant island volcanoes produce small volumes of rhyolites referred to as R1 by Tamura et al. (2009). Rhyolite-dominant submarine volcanoes erupt mostly rhyolite that is compositionally distinct from R1, referred to as R2 by Tamura et al. (2009). B. Schematic crustal structure of the Izu arc front from Hachijo to Sumisu volcanoes showing alternating basalt-dominant island volcanoes and rhyolite-dominant submarine volcanoes, which have thick and thin middle crust and erupt R1 and R2 rhyolite, respectively.
Figure F11. Composite core scan (350-U1436A-3H). Inset is a blow-up of 3H-2, 2–86 cm, and a graphic log highlights important features.
Figure F12. Summary lithostratigraphic log, Hole U1436A.
Figure F13. Downhole evolution in the relative proportions of the three main lithofacies in Hole U1436A. Relative abundances are the normalized total thickness of each lithofacies per core. Values are not plotted where recovery is too low or where core disturbance is too severe.
Figure F14. Hole U1436A lithofacies. Top: tuffaceous mud (17X-3A, 11–24 cm [105.21–105.34 mbsf]). Bottom: isolated pumice in tuffaceous mud (4H-1A, 103–108 cm [17.85–17.87 mbsf]).
Figure F15. Hole U1436A lithofacies. Top: mafic ash intercalated with tuffaceous mud (16X-2A, 79–83 cm [95.09–95.13 mbsf]). Bottom: normally graded mafic ash transitioning to tuffaceous mud (3H-2A, 39–50 cm [13.09–13.20 mbsf]).
Figure F16. Hole U1436A lithofacies. Top: scoria clast (1H-1, 126–127 cm; TS01 [1.26–1.27 mbsf]). Bottom: normally graded mafic lapilli-ash with scoria clasts (6H-2A, 34–44 cm [37.14–37.24 mbsf]).
Figure F17. Correlation between all Site U1436 holes from 46.15 mbsf and deeper. Tie lines link evolved ash layers, which form good markers because they are undisturbed due to their thinness, with tuffaceous mud above and below.
Figure F18. Hole U1436A lithofacies. Top: range of mafic ash shard morphologies in black glassy mafic ash (8H-2, 97–99 cm; TS03 [52.55–52.57 mbsf]). Bottom: allochthonous black glassy mafic ash intercalated with tuffaceous mud (8H-3A). The mafic ash layer is the result of mid-core flow-in core disturbance.
Figure F19. Nongraded, nonstratified layer of black glassy mafic ash, Hole U1436D (7F-2A, 0–90 cm [52.82–53.72 mbsf]) bounded by tuffaceous mud at top and bottom. The layer is weakly disturbed by core extension.
Figure F20. Normally graded evolved ash intercalated with tuffaceous mud lithofacies, Hole U1436A (4H-2A, 10–29 cm [18.40–18.59 mbsf]).
Figure F21. Hole U1436A lithofacies. Evolved lapilli-ash with pumice intercalated with tuffaceous mud (1H-2A, 21–29 cm [1.73–1.76 mbsf]). Evolved lapilli-ash with pumice and scoria lapilli (3H-3A, 6–35 cm [14.09–14.35 mbsf]).
Figure F22. Correlation between lithostratigraphy in the upper 3 m of Holes U1436A–U1436C, showing perfect correlation of units. Stratigraphy is much more complicated in the rest of the holes, as shown in Figure F17.
Figure F24. Pore water salinity, chloride (titration), chloride (IC), and bromide, Hole U1436A (circles). Squares = Hole 792A data, dashed lines = abundances for standard seawater (IAPSO) (Summerhayes and Thorpe, 1996).
Figure F23. Headspace methane concentrations, Hole U1436A, reported in ppmv of 1 cm3 of air. Methane is plotted at 0 when below detection.
Figure F25. Pore water alkalinity, pH, ammonium, sulfate, and phosphate, Hole U1436A (circles). Squares = Hole 792A data, dashed lines = IAPSO seawater compositions (Summerhayes and Thorpe, 1996).
Figure F26. Pore water geochemical depth profiles, Hole U1436A (circles). IC results for Na, Ca, and Mg and ICP-AES results for B, Ba, Fe, Li, Mn, Si, and Sr. Squares = Hole 792A data, dashed lines = IAPSO seawater compositions (seawater Si 99 µM is below scale; Summerhayes and Thorpe, 1996).
Figure F27. Major element compositions for ash and lapilli samples measured by ICP-AES, Hole U1436A. The bulk samples of black glassy mafic ash are 8H-1, 92–93 cm (51.3 mbsf), 8H-2, 97–99 cm (52.6 mbsf), and 8H-3, 55–56 cm (53.5 mbsf), and a single elevated K2O pumice composite (7H-2, 20–75 cm [45 mbsf]) is plotted. Oxides are plotted against SiO2 (Harker diagrams). Data sources referenced in Tamura et al. (2013). Dashed line separates low-K from medium-K field (after Gill, 1981). (Continued on next page.)
Figure F28. Trace element abundances for ash and lapilli samples measured by ICP-AES and volatile (LOI) abundances for volcaniclastics measured by gravimetry, Hole U1436A. Tuffaceous mud (4H-6, 60–62 cm [24.9 mbsf]) is plotted for comparison. Top: Sr vs. SiO2 (normalized to 100 wt%). Bottom: LOI vs. SiO2 (not normalized). See Figure F27 for additional data sources.
Figure F30. GRA bulk density and P-wave velocity profiles, Holes U1436A–U1436D.
Figure F31. Bulk density, porosity, and P-wave velocity with simplified lithology column, Hole U1436A. GRA bulk density values <1.2 g/cm3 are not displayed because those values are related to cracks, voids, or slurry and are not realistic for sediment cores.
Figure F33. Magnetic susceptibility and NGR profiles, Holes U1436A–U1436D.
Figure F32. Shear strength measurements with simplified lithology column, Hole U1436A.
Figure F34. Magnetic susceptibility and NGR data with simplified lithology column, Hole U1436A.
Figure F35. Thermal conductivity data with simplified lithology column, Hole U1436A.
Figure F36. Color reflectance profiles, Holes U1436A–U1436D. L* (luminosity), a* (redness), and b* (yellowness).
Figure F37. Color reflectance with simplified lithology column, Hole U1436A. L* (luminosity), a* (redness), and b* (yellowness).
Figure F38. Magnetic susceptibility and NGR for evolved and mafic volcaniclastic layers, Hole U1436A.
Figure F39. GRA bulk density and reflectance L* for evolved and mafic volcaniclastic layers, Hole U1436A.
Figure F40. Magnetic susceptibility, GRA bulk density, NGR, CaO and K2O from XRF, P-wave velocity, and reflectance L* for the black glassy mafic ash layer at ~50–52 mbsf, Hole U1436A.
Figure F41. SRM inclination on archive halves before and after 40 mT AF demagnetization. Normal (blue) and reversed (red) GAD inclinations (±51°) for the site latitude. Movement away from steep positive (>+80°) after demagnetization indicates removal of the drilling overprint. Although some negative inclinations deeper than 56.80 mbsf (the Brunhes/Matuyama boundary) appear to be reversed, much of the scatter in inclination is related to severe core disturbance (shaded areas). Last column indicates magnetic polarity determined after 20 mT demagnetization on discrete samples: solid = normal, open = reversed, gray = indeterminate polarity.
Figure F42. Lithology compared with SRM NRM before demagnetization and SHMSL point magnetic susceptibility.
Figure F43. Inclination before and after demagnetization (Core 350-U1436A-9H). Normal (blue) and reversed (red) GAD inclinations. The upper two sections (to 56.55 mbsf) were heavily disturbed, and their inclination record is unreliable. Section 9H-3 (enlarged at left) comprises undisturbed tuffaceous mud, and a magnetic polarity reversal (indicated by gray band) corresponding to the Brunhes/Matuyama (C1n/C1r.1r) boundary at 56.80 mbsf is preserved.
Figure F44. Stereographic plots of unoriented discrete sample directions before and after 20 mT AF demagnetization. Inner ring = GAD inclination (~50°). Undermagnetized NRM is characterized by steep positive (down) inclinations. After demagnetization both normal (down) and reversed (up) polarities cluster around the GAD inclination.
Figure F45. Stereographic projections, vector demagnetization (Zijderveld) plots, and intensity vs. demagnetization plots for typical normal and reversed discrete samples.
Figure F46. Magnetostratigraphy, Site U1436. Black = normal, white = reversed, gray = undetermined polarity.
Figure F47. Core recovery, shipboard biostratigraphic and magnetostratigraphic (Gradstein et al., 2012) datums and our constructed age-depth model, and LSRs and MARs calculated from age model. T = top, B = bottom, X = crossover.