Reagan, M.K., Pearce, J.A., Petronotis, K., and the Expedition 352 Scientists, 2015
Proceedings of the International Ocean Discovery Program Volume 352
publications.iodp.org

doi:10.14379/iodp.proc.352.106.2015
Site U14421
M.K. Reagan, J.A. Pearce, K. Petronotis, R. Almeev, A.A. Avery, C. Carvallo, T. Chapman, G.L. Christeson, E.C. Ferré, M. Godard, D.E. Heaton, M. Kirchenbaur, W. Kurz, S. Kutterolf, H.Y. Li, Y. Li, K. Michibayashi, S. Morgan, W.R. Nelson, J. Prytulak, M. Python, A.H.F. Robertson, J.G. Ryan, W.W. Sager, T. Sakuyama, J.W. Shervais, K. Shimizu, and S.A. Whattam2
Keywords: International Ocean Discovery Program, IODP, JOIDES Resolution, Expedition 352, Site U1442, Izu-Bonin-Mariana fore arc, subduction initiation, mantle melting, ophiolites, high-magnesium andesite, volcanic rocks, drill core
MS 352-106: Published 29 September 2015
Background and objectives
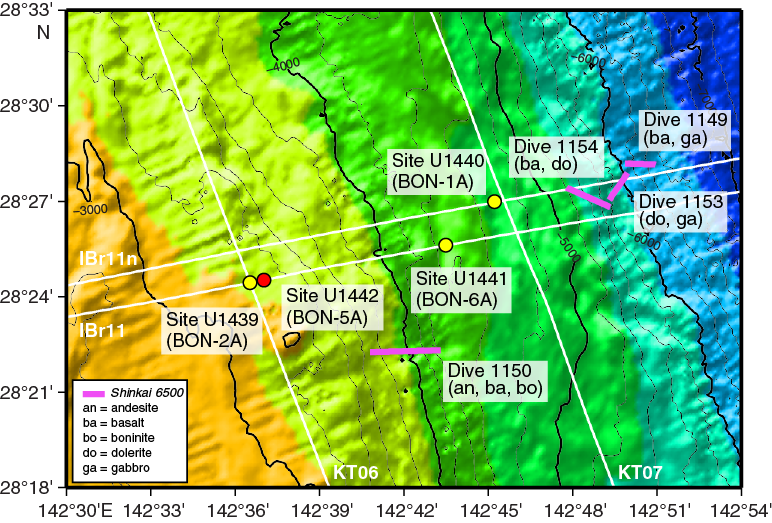
The Izu-Bonin-Mariana (IBM) fore arc is believed to have formed during the period of seafloor spreading that accompanied the rapid rollback and sinking of the newly subducting Pacific plate immediately following subduction initiation at 51–52 Ma (Ishizuka et al., 2011). The deepest and oldest volcanic rocks appear to be fore-arc basalt (FAB), a distinctive type of volcanic rock akin to mid-ocean-ridge basalt (MORB) that has been recovered during dredging and submersible sampling of the IBM fore arc (Reagan et al., 2010), as well as by drilling at Sites U1440 and U1441. More strongly subduction-affected magnesian lavas called boninites also erupted in the IBM nascent arc. These lavas are named after the type section on the island of Chichijima in the Bonin Islands (Umino, 1986) and were also drilled at Site U1439.
Before drilling started at Site U1442, end-member hypotheses for explaining the nature of the IBM volcanic stratigraphy were (1) that FAB is overlain by the initial products of arc volcanism, namely lavas with compositions that are transitional between FAB and boninite, boninite lavas themselves, and then by more typical island arc lavas, and (2) that this stratigraphy was offset at progressive distances westward from the trench, such that each lava type was underlain solely by its own plutonic equivalents. Hypothesis 1 has the implication that melting sources evolved through time beneath specific forearc locations, whereas Hypothesis 2 implies that the strongly subduction-affected, and younger, boninites erupted to the west of FAB crust, which itself was produced shortly after subduction initiation and nearer to the nascent subduction zone.
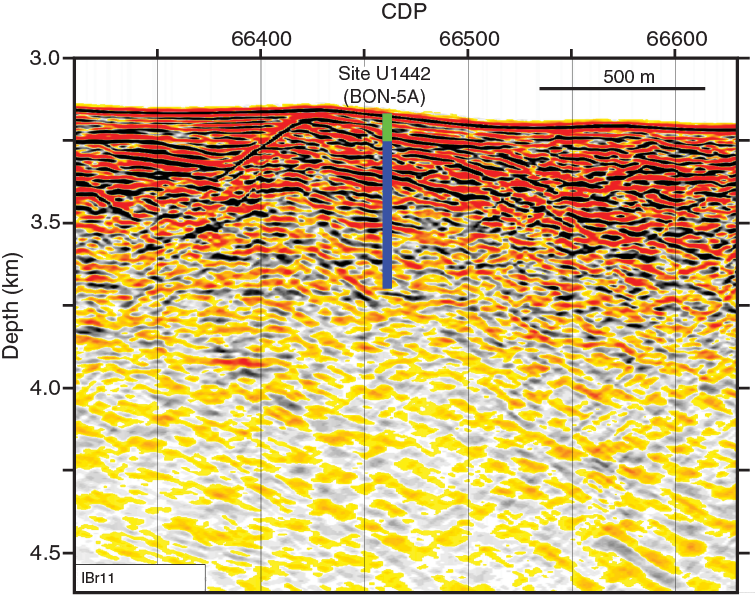
Site U1442 was chosen for the final drilling location because it was significantly more likely to provide lavas with compositions between those of FAB and boninite than the other remaining approved site (proposed Site BON-3A) (Figure F1). The specific drilling location was selected to be as far to the east of Site U1439 (~1.35 km) as we could drill while remaining within the approved limits of Site U1442. This eastward offset allowed us to target a location to the east of a west-dipping normal fault identified along multichannel seismic Line IBr11 (Figure F2). This location had the potential of placing us deeper into the volcanic stratigraphy than Site U1439. Having a site this close to Site U1439 also provided the opportunity to determine how thicknesses, compositions, and ages of the igneous units change from east to west. As with Site U1441, Site U1442 aimed to determine whether the compositions of IBM fore-arc lavas are entirely gradational between FAB and boninite or whether a compositional gap exists between these two end-members. This was our final site for enhancing our understanding of the fore-arc crustal architecture, as well as the dynamics of subduction and concomitant mantle flow that led to development of the IBM arc.
The specific objectives for Site U1442 fit into the four overall expedition objectives as follows.
- Obtain a high-fidelity record of magmatic evolution during subduction initiation by coring volcanic rocks down to underlying intrusive rocks, including radiometric and biostratigraphic ages.
Coring of the volcanic succession at Site U1442 was targeted to provide lavas with compositions and ages between FAB and boninite, as well as to better understand the areal distribution of boninites.
- Use the results of Objective 1 to test the hypothesis that forearc basalt lies beneath boninites and to understand chemical gradients within these units and across their transitions.
We originally expected FAB to be present at the base of the Bonin fore-arc volcanic succession, and a sequence of boninitic and arc-like lavas to be present at the top, but results at Sites U1439, U1440, and U1441 suggest that these lavas might be offset more horizontally than vertically. Site U1442 targeted lavas that are trenchward of those encountered at Site U1439 and therefore potentially have compositions and stratigraphic positions between boninite and FAB. The transitions in magma compositions with space and time allow us to better constrain how mantle and subduction components and petrogenetic processes changed with time as subduction progressed.
- Use drilling results to understand how mantle melting processes evolve during and after subduction initiation.
Determining how lava compositions and their locations of eruption change with time after subduction initiation in the IBM system addresses this objective. FAB compositions indicate that adiabatic decompression is the most important process at the beginning of subduction initiation, and boninite compositions indicate that fluid flux melting of more depleted mantle was important shortly thereafter. Information obtained from the Site U1442 cores will be used to construct more realistic models for the transition from decompression-dominated to fluid flux-dominated melting processes.
- Test the hypothesis that the fore-arc lithosphere created during subduction initiation is the birthplace of suprasubduction zone ophiolites.
Drilling at Site U1442 was targeted to provide more information about the volcanic chemostratigraphy of the Bonin fore arc, enhancing our ability to compare the IBM fore arc with suprasubduction zone ophiolites, such as Pindos in Greece, Mirdita in Albania, Semail in Oman, and Troodos in Cyprus.
Operations
Transit to Site U1442
The R/V JOIDES Resolution completed the 5.5 nmi transit from Site U1441 in dynamic positioning mode while the drill string was being raised from the seafloor. The vessel arrived at Site U1442 (proposed Site BON-5A) at 1630 h on 14 September 2014 (all times are ship local time, which is UTC + 9 h), and a seafloor positioning beacon was deployed. The vessel was then offset 500 m to the east, which avoided a fault that could have interfered with drilling (Figure F2).
Hole U1442A
A rotary core barrel (RCB) bottom-hole assembly (BHA; see Introduction in the Expedition 352 methods chapter [Reagan et al., 2015a]) was assembled with a C-4 bit. Hole U1442A was spudded at 2320 h on 14 September 2014 (28°24.5784′N, 142°37.3368′E; 3162 m water depth). The RCB coring system with nonmagnetic core barrels was deployed 57 times (Cores 352-U1442A-1R through 57R), with 529.8 m cored and 100.7 m recovered (19%) (Table T1). The basement contact was identified at ~82 mbsf. A free-fall funnel was deployed on 19 September so that the RCB bit could be changed upon reaching 46.1 h of coring time. Hole U1442A was terminated when the time available for coring expired. The hole was then logged with the triple combo-Magnetic Susceptibility Sonde (MSS) tool string to 379 mbsf on the first pass and 305 mbsf on the second pass, and the Formation MicroScanner (FMS)-sonic tool string was deployed to 287 mbsf on both passes. The total time spent in Hole U1442A was 235.75 h. The beacon was recovered at 0940 h on 24 September, and the thrusters were raised at 1030 h, ending Site U1442. The vessel started the ~4.5 day transit to Keelung, Taiwan. The first line ashore at Passenger Terminal Berth E4 was at 1536 h on 28 September 2014, ending Expedition 352.
Table T1. Coring summary, Site U1442. Download table in .csv format. View PDF table.
Sedimentology
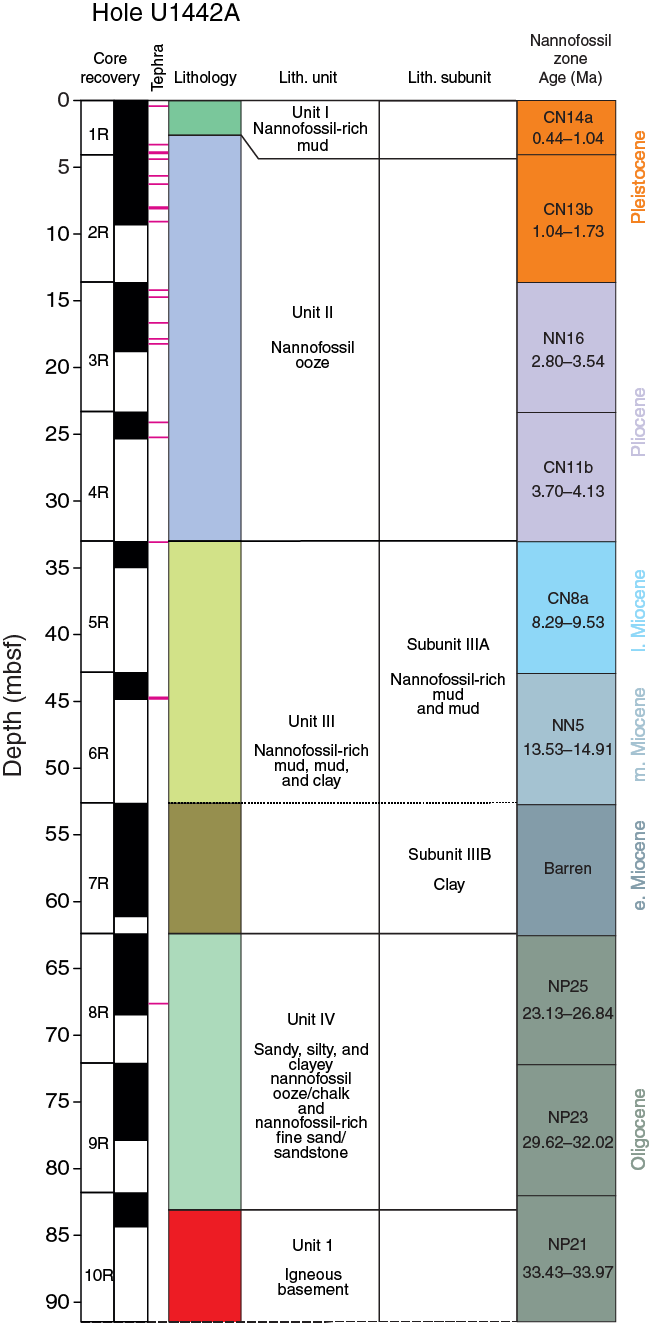
Pelagic and volcaniclastic sediments were recovered from the seafloor to 83.12 mbsf, beneath which igneous rock was drilled (see Petrology). The sediment represents part of the late Oligocene to recent deep-sea sedimentary cover of the Izu-Bonin fore arc that is stratigraphically condensed due to its position on a basement high (see Biostratigraphy). Core recovery by rotary drilling within the sequence as a whole was 53%.
The recovered sedimentary succession is divided into four lithologically distinct units (Figure F3). The third unit is divided into two subunits (Table T2). The main criteria for recognition of lithologic units and subunits are a combination of primary lithology, grain size, color, and diagenesis. Within the overall succession, 21 ash or tuff layers were observed. However, the original number of tuff layers must have been considerably greater in view of the limited recovery and the obvious disturbance by a combination of drilling, bioturbation, and probably bottom currents, the latter possibly being important owing to the position of the site on a basement high.
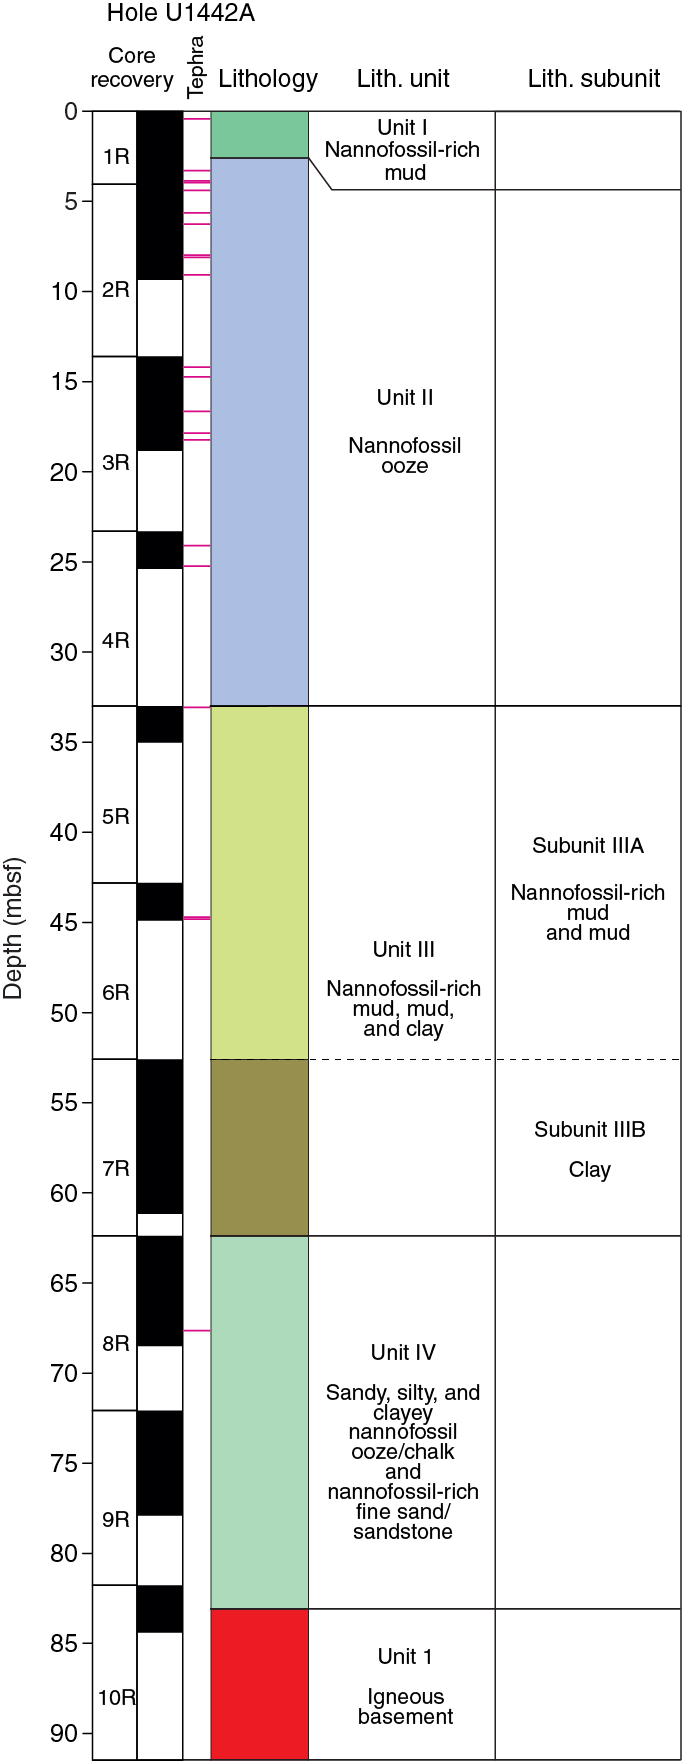
Table T2. Lithologic unit and subunit summary, Hole U1442A. Download table in .csv format.
Unit I is mostly silty to sandy nannofossil mud and nannofossil ooze with additional dark gray “blotches” rich in volcanic glass that probably represent the remains of thin ash-rich layers.
Unit II is dominantly silty nannofossil ooze with slight off-white to pale brown color banding, reflecting the presence of more or less muddy and silty/sandy layers. The silty and sandy material is volcaniclastic in origin and is accompanied by several thin, discrete ash layers dispersed over tens of centimeters–thick intervals within the background sediment.
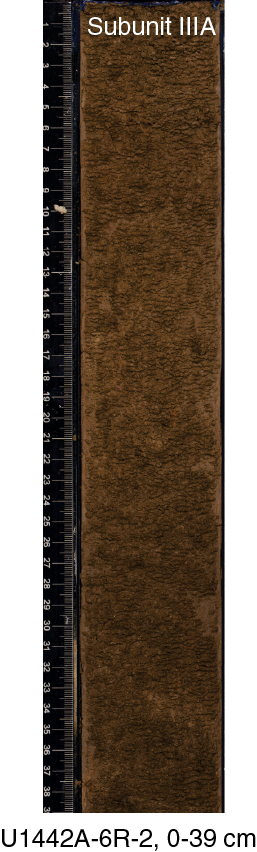
Unit III is divided into two subunits. Subunit IIIA is recognized by the presence of brownish mud and nannofossil-rich mud. Subunit IIIB is relatively pure clay with some manganese-stained horizons and nannofossil ooze intervals.
Unit IV is distinguished by nannofossil-rich sediment that becomes more lithified downhole, transitioning to nannofossil chalk. This sediment contains variable amounts of clay (of undefined origin), volcaniclastic silt/siltstone, and volcaniclastic fine sand/sandstone. The most clastic-rich sediment can be classified as nannofossil-bearing fine sand/sandstone. The sedimentary succession terminates downhole in a several-millimeter-thick manganese layer, followed by a profound change to brownish red noncalcareous volcanogenic sandy and silty clay interspersed with clasts of mafic extrusive igneous rocks.
Unit descriptions
Cores recovered from Hole U1442A are divided into four lithologic units (Figure F3). Overall, the sedimentary succession is 83 m thick, with igneous rock beneath (see Petrology).
The succession in Hole U1442A includes abundant volcanic ash. However, much of the ash is dispersed throughout the sediment, such that it is recognizable only as somewhat more silty and sandy intervals compared to the background pelagic and hemipelagic sediment. Smear slides show that many of the sandy and silty layers contain >50% tuffaceous material. Of these layers, 6 are mafic and 15 felsic in composition (Figures F3, F4). Mixing of pelagic and tuffaceous material is likely to reflect a combination of bottom current reworking, bioturbation, and localized drilling disturbance. The site was drilled on a basement high, which may explain the importance of current reworking compared to the other holes drilled during Expedition 352.
The relative abundances of transparent versus brown glass, and also the textures and vesicles of the pyroclasts, vary between the different ash layers. However, it is likely that, as in Hole U1441A, many of the ash layers originally present were not recovered by rotary drilling.
Unit I
- Interval: 352-U1442A-1R-1, 0 cm, through 1R-2, 109 cm
- Thickness: 2.95 m
- Depth: 0–2.95 mbsf
- Age: Late Pleistocene
- Lithology: nannofossil-rich mud with foraminifers
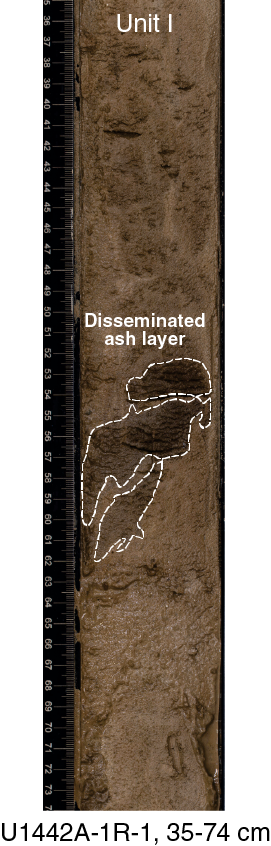
Unit I is lithologically distinctive, although it is very strongly disturbed by drilling and is mostly soupy flow-in material. The sediment is mostly silty to sandy nannofossil mud and nannofossil ooze. Beginning in the middle part of Section 352-U1442A-1R-1, dark gray blotches are interpreted as the remains of thin ash-rich layers (Figure F4). These layers are similar in color to the sediment above and below but are distinguished by being more silty and sandy.
In smear slides, the background sediment of Unit l is nannofossil ooze with abundant planktonic foraminifers, together with common radiolarians, rare diatoms, siliceous sponge spicules, and trace amounts of organic matter. Volcanic glass is present in rare amounts, both as transparent and colored varieties, together with trace amounts of volcanic lithic fragments. Mineral grains are restricted to trace amounts of quartz, plagioclase, and ferromagnesian minerals. The more sandy and silty layers are similar in composition, except that they contain abundant amounts of both transparent and pale brown glass, together with trace to rare amounts of volcanic lithic fragments and trace amounts of palagonite. The lithic fragments are mostly basaltic, with feldspar microphenocrysts set in a glassy mesostasis without feldspar (probably boninite).
The disseminated ash layer (interval 352-U1442A-1R-1, 52–62 cm; Figure F4), which was probably several centimeters thick prior to drilling disturbance, contains abundant brown pumiceous pyroclasts with predominantly round and elliptical vesicles, together with minor dense, blocky, and cuspate glass shards. There are also some transparent pumiceous pyroclasts with elongate and tubular vesicles. Mineral grains are rare, with plagioclase being the most abundant, followed by quartz and then pyroxene.
Unit II
- Interval: 352-U1442A-1R-2, 109 cm, through 4R-CC, 18 cm
- Thickness: 30.41 m
- Depth: 2.59–30.41 mbsf
- Age: Late Pleistocene to early Pliocene
- Lithology: nannofossil ooze
In Unit II, sediment is less disturbed beginning in the lower part of Section 352-U1442A-1R-3A. Below this, the unit is dominantly silty nannofossil ooze with slight off-white to pale brown color banding reflecting the presence of more and less muddy, silty, and sandy volcaniclastic layers (Figure F5). Chemical analysis shows that samples from Unit II range in calcium carbonate content from 51.0 to 74.9 wt% (see Sediment and rock geochemistry). The minerals present, as determined by X-ray diffraction (XRD) in four samples, are calcite with locally abundant quartz and illite as the main phases, together with quartz, illite, chlorite, and phillipsite as minor phases. However, the relative abundances of the different minerals vary in different samples (Table T3).
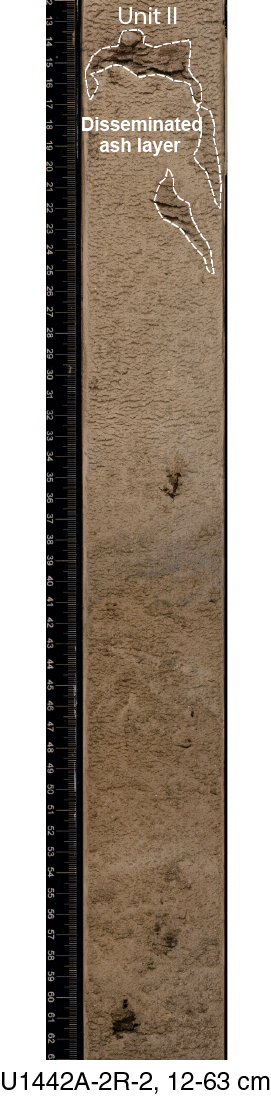
Table T3. XRD analyses of background muddy sediment, Hole U1442A. Download table in .csv format.
Section 1R-2A shows a tendency toward cyclicity on a 10 cm to several-meter scale, in which pale nannofossil ooze becomes slightly darker and more muddy downhole in each cycle. The whole of Unit ll is at least moderately bioturbated.
Seventeen thin (<5 cm), discrete ash layers are dispersed throughout the background sediment as a result of bioturbation, bottom currents, or drilling disturbance and are recognizable only as centimeter-scale blotches within nannofossil ooze.
In smear slides, the background calcareous ooze is dominated by nannofossils with rare amounts of foraminifers and radiolarians, together with trace amounts of diatoms and siliceous sponge spicule fragments. In the majority of the smear slides, foraminifer tests are broken, possibly as a result of bottom-current reworking. Mineral grains are mostly trace amounts of quartz, plagioclase, and ferromagnesian minerals. Volcanic glass of both transparent and colored type is dispersed through the sediment in variable amounts, together with volcanic and sedimentary lithic grains.
The silty and sandy layers are dominantly nannofossil ooze with the addition of abundant to common amounts of transparent glass, common to trace amounts of brownish glass, and common to rare amounts of lithic fragments, mostly basalt and rare palagonite. Brown glass commonly co-occurs with volcanic lithic grains containing fresh glass, as seen in the smear slides (e.g., Sample 2R-2, 72–73 cm). Considerable differences exist in the relative amounts of transparent and brown glass in different intervals. Volcanic lithic grains are invariably present, including numerous glassy grains (e.g., Samples 1R-1A, 34–35 cm; and 1R-1A, 35–36 cm). In some smear slides, large, blocky transparent shards are difficult to recognize because they are concealed beneath nannofossils (e.g., Sample 2R-4, 59–60 cm). Reworked sedimentary lithic grains in the form of reworked consolidated nannofossil ooze are also present in rare to common amounts. Authigenic carbonate growth that is seen in many smear slides is indicative of carbonate diagenesis. Mineral grains, namely plagioclase, are common, together with trace amounts of quartz and pyroxene. In addition to calcareous nannofossils, biota comprise rare foraminifers and radiolarians as well as trace occurrences of diatoms and siliceous sponge spicules, together with indeterminate organic matter.
Identified ash layers (>50% glass shards) were probably several centimeters thick prior to drilling disturbance, bioturbation, or current reworking. Six out of eight felsic ash layers (Samples 1R-4, 12–13 cm; 1R-4, 76–77 cm; 2R-2, 16–17 cm; 3R-1, 112–113 cm; 3R-1, 1–2 cm; and 3R-4, 8–9 cm) are composed of dominantly transparent dense, blocky, and cuspate glass shards with only minor contributions of pumiceous pyroclasts containing elongate and tubular vesicles. The remaining two felsic ash layers (Samples 2R-1, 35–36 cm; and 2R-4, 59–60 cm) have abundant amounts of transparent pumiceous pyroclasts with predominantly elongate and tubular vesicles but only minor dense, blocky, and cuspate glass shards.
Six additional mafic ash layers were identified in Unit II. Two of these ash layers contain predominantly brown glass shards (Samples 2R-3, 104–105 cm; and 3R-1, 58–59 cm); these have abundant dense, blocky, and cuspate glass shards. In contrast, pumiceous clasts with round and elliptical vesicles reach only common abundance levels (5%–25%). There are also some transparent pumiceous pyroclasts with elongate and tubular vesicles. Two additional ash layers in the uppermost part of Unit II (Samples 1R-4, 102–103 cm; and 2R-1, 34–35 cm) have very similar glass and pyroclast textures but differ in the presence of very light brownish glass shards. In contrast, two other ash layers contain mostly brown glass shards (Samples 2R-2, 72–73 cm; and 4R-1, 82–83 cm), together with abundant pumiceous pyroclasts. These shards contain common round and elliptical vesicles, whereas dense glass shards are only rarely present. The relatively low mineral content in all of the ash layers is dominated by feldspar, with rare pyroxene, quartz, and amphibole.
Unit III
- Interval: 352-U1442A-5R-1, 0 cm, through 7R-CC, 24 cm
- Thickness: 29.40 m
- Depth: 33.00–62.40 mbsf
- Age: Miocene
- Lithology: nannofossil-rich mud, mud, and clay
Unit III is characterized by nannofossil-rich mud, mud, and clay. More specifically, Subunit IIIA is characterized by nannofossil-rich mud, together with variable amounts of volcaniclastic silt (Figure F6). The noncalcareous mud and clay beneath are defined as Subunit IIIB. This subunit has variable amounts of volcaniclastic silt and sand, as observed in Unit II (Figure F7).

Two strongly dispersed ash layers were identified within Subunit IIIA; these are dominated by brown glass and volcanic lithic clasts, together with common transparent glass (e.g., Sample 352-U1442A-5R-1, 8–9 cm). Plagioclase is common with trace amounts of quartz and pyroxene. Nannofossils are common, whereas radiolarians are rare and siliceous sponge spicules occur in trace amounts. Several tuffaceous layers are unusually rich in plagioclase and also in glassy and basaltic grains (Sample 6R-2, 89–90 cm). Transparent glass locally predominates (e.g., Sample 6R-CC, 2–3 cm).
Subunit IIIA: late to middle Miocene (33.00–52.60 mbsf)
In the lowest part of Unit ll, the color darkens subtly through shades of brown and the sediment becomes slightly more silt rich. By the beginning of Subunit IIIA (Section 5R-1), the sediment has become nannofossil mud, which characterizes Unit III as a whole. Core 7R continues the overall trend of the sediment to become darker downhole, with increasing clay and silt. Testing with dilute HCl revealed that carbonate generally decreases downhole throughout this core. Several relatively coarse grained black lenses of ash (up to 3 cm thick) are concentrated near the top of Core 5R. Their presence can be explained by strong reworking of an original several centimeter–thick ash layer. In addition, a dark gray, graded ash layer is present near the base of Section 6R-1, of which only a “pod” remains, probably due to bioturbation that affects the core as a whole. Otherwise, Subunit IIIA is structureless.
In smear slides, the background nannofossil-rich mud contains variable amounts of sand, silt, and clay relative to nannofossils (e.g., Sample 5R-1, 20–21 cm). Transparent glass and volcanic lithic grains are common (5%–35%), whereas brown glass is rare (1%–5%), together with trace amounts of palagonite, quartz, plagioclase, and pyroxene. In addition to common to dominant amounts of nannofossils, well-preserved radiolarians are common, as are diatoms and siliceous sponge spicules. Several samples of mud are characterized by unusually large sand-sized plagioclase crystals, which can be explained by current reworking of sediment from several different primary ash layers. Planktonic foraminifers have been dissolved to varying extents, and there is corresponding evidence of neomorphic carbonate precipitation (Sample 5R-2, 23–24 cm).
The dark ash pods in interval 5R-1, 0–12 cm, mainly consist of brownish blocky to cuspate glass shards. These are dense or have round or elliptical vesicles. There are rare occurrences of pumiceous clasts with elongate to tubular vesicles and common to abundant volcanic lithics (probably tachylitic glass). The dark gray ash layers (interval 6R-CC, 0–5 cm) predominantly contain dense transparent glass shards with abundant to dominant blocky and cuspate glass shards. The mineral assemblages in both of the ash layers are dominated by plagioclase with rare to very rare pyroxene and trace amounts of quartz.
Subunit IIIB: early Miocene? (52.66–62.40 mbsf)
Subunit IIIB mainly consists of alternating layers of consolidated clay, varying from dark brownish to pinkish to pinkish red (e.g., Sample 7R-1, 51–52 cm). The clay is similar in composition to the nannofossil mud in Subunit IIIA, except that nannofossils are effectively absent. Reflecting this difference, the calcium carbonate content was measured as only 0.6 wt% in the single sample that was analyzed (Sample 7R-5, 58–59 cm) (see Sediment and rock geochemistry). XRD analysis of one sample revealed quartz, plagioclase, and illite as major phases and montmorillonite and chlorite as minor phases (Table T3).
In addition to clay, rare to trace amounts of tuffaceous material and sparse siliceous microfossils are present. In contrast to uphole in the core, there is little or no bioturbation. The grayish color banding becomes more conspicuous toward the base of the core (Sections 7R-3, 7R-5, and 7R-6). The contacts between the different color bands do not correspond to changes in grain size or sediment composition and are interpreted as being of mainly diagenetic origin, probably related to the mobilization of manganese.
Unit IV
- Interval: 352-U1442A-8R-1, 0 cm, through 10R-2, 25 cm
- Thickness: 20.72 m
- Depth: 62.40–83.12 mbsf
- Age: Oligocene
- Lithology: sandy, silty, and clayey nannofossil ooze and nannofossil fine sand
Unit IV is characterized by a return to nannofossil-rich sediment, which becomes more lithified downhole and is transitional to nannofossil chalk (Figure F8). This sediment contains variable amounts of clay (of undefined origin), volcaniclastic silt, and volcaniclastic fine sand. The most clastic-rich sediment can be classified as nannofossil-bearing fine sand or nannofossil-bearing fine sandstone. Within several meters above the igneous basement, the nannofossil chalk becomes relatively silty and sandy (e.g., Sample 8R-1, 123–124 cm). Calcium content was measured as 9.3 and 9.2 wt% in the two samples analyzed (Samples 8R-2, 67–68 cm; and 10R-2, 2–3 cm) (see Sediment and rock geochemistry). XRD analyses of these samples revealed calcite as the major component of both samples. Quartz and chlorite are minor components of one of the samples, whereas quartz, chlorite, and kaolinite are minor components of the other sample (Table T3).
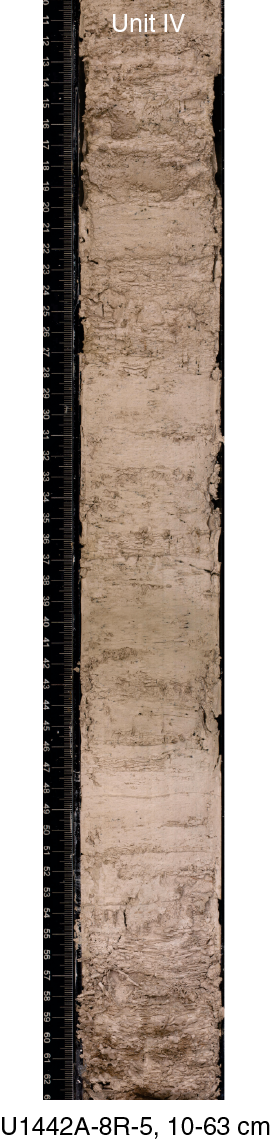
The uppermost levels of Unit IV in Core 8R are made up of structureless olive-colored nannofossil ooze. The color mainly reflects the presence of disseminated silt and clay. The texture is firm compared to the overlying sediment but not lithified. The sediment becomes progressively more consolidated downhole until it is classified as nannofossil chalk. The increase in lithification corresponds to a decrease in the content of clay and silt and a corresponding increase in nannofossil carbonate.
Sections 9R-1 and 9R-2 include several slightly darker layers that are slightly more silty and sandy than the lower part of Core 9R. A reddish brown, relatively coarse-grained lens of ash is dispersed within a 5 cm thick horizon in interval 8R-4, 70–75 cm. This horizon contains small, transparent, dense, and blocky glass shards that are partly devitrified.
Within Core 10R, the bedding, as defined by horizontal borrows, is inclined up to 45°. Changes in the angle of dip of the primary layering in Cores 9R and 10R, taken together, possibly reflect prelithification gravity sliding or slumping (see Structural geology).
In Core 9R, the primary sedimentary bedding is again indicated by the presence of horizontal burrows (e.g. Zoophycos) that probably represent feeding traces. The primary bedding in this interval is locally oriented up to 35°, which is believed to be the result of tectonic tilting (see Structural geology). Minor small (<0.5 cm) dark gray to black elongate diagenetic segregations appear in the lower part of the tilted interval (Section 9R-2). Some of the manganese segregations follow hairline fractures that are oriented subparallel to the tilted bedding (Figure F9A). This suggests that the manganese migrated into the fractures after lithification and tilting of the nannofossil ooze. From Section 10R-1 to the igneous basement (Section 10R-2, 25 cm), mottled nannofossil chalk passes transitionally downhole into pale olive nannofossil chalk. The color probably relates to diagenetic manganese mobilization (Figure F9B) because the primary composition of the nannofossil ooze remains unchanged.

The top of the igneous basement (below Section 10R-2, 25 cm) includes five relatively large (<5 cm) clasts and also numerous smaller clasts (<1 cm) of altered extrusive igneous rocks that are subrounded and coated with manganese oxide (<3 mm thick). The clasts are supported within a matrix of pinkish noncalcareous sandy and silty clay, which contrasts strongly with the overlying nannofossil chalk (Figure F9C).
In smear slides, the nannofossil ooze and chalk are dominated by calcareous nannofossils in various states of recrystallization and neomorphism. Siliceous biota are virtually absent, probably because of diagenetic dissolution. Compared to the overlying succession as a whole, volcanic glass is sparse, restricted to rare to trace amounts of transparent and brown glass and volcanic lithic fragments. Trace amounts of quartz and pyroxene and rare amounts of plagioclase are present, as seen higher in the succession. In addition, scattered grains of biotite, hornblende, and orthopyroxene are present throughout Unit IV (e.g., Sample 8R-1, 99–100 cm). Altered glassy fragments are locally abundant, especially within several meters of the basement (e.g., Sample 8R-1, 113–114 cm). In places, some of the glass appears to be devitrified (e.g., Sample 8R-4, 72–73 cm).
Biostratigraphy
The microfossil content of core catcher samples from Hole U1442A was examined and described in order to provide preliminary biostratigraphic constraints. Biostratigraphy was based solely on calcareous nannofossils.
Calcareous nannofossils are present in 8 of the 9 core catcher samples examined, as well as Sample 352-U1442A-10R-2W, 22–23 cm, which was taken from carbonate-rich sediment as close to the basement interface as possible. Preservation is moderate to good in each sample. Based on seismic interpretation, the sedimentary section appears to be condensed (similar to the previous sites), causing apparent gaps in what is likely a fairly continuous section.
Samples 1R-CC and 2R-CC contain nannofossils of approximately Late Pleistocene age. Sample 1R-CC may be placed in Upper Pleistocene Subzone CN14a (0.44–1.04 Ma) based on the occurrence of Pseudoemiliania lacunosa along with Gephyrocapsa oceanica. Sample 2R-CC may be placed in Upper Pleistocene Subzone CN13b (1.04–1.73 Ma) based on the occurrence of P. lacunosa and the absences of G. oceanica and Discoaster brouweri (Table T4).
Table T4. Calcareous nannofossils, Hole U1442A. Download table in .csv format.
Samples 3R-CC and 4R-CC contain nannofossils approximately Pliocene in age. Sample 3R-CC may be placed in upper Pliocene Zone NN16 (2.80–3.54 Ma) based on the first (downhole) occurrence of Discoaster tamalis and the absence of Reticulofenestra pseudoumbilica (>7 µm). Sample 4R-CC may be placed in lower Pliocene Subzone CN11b (3.70–4.13 Ma) based on the occurrence of D. tamalis with R. pseudoumbilica (>7 µm) and a discoaster assemblage consisting of D. brouweri, Discoaster surculus, and common Discoaster asymmetricus.
Sample 5R-CC contains nannofossils of approximately early late Miocene age and may be placed in upper Miocene Subzone CN8a (8.29–9.53 Ma) based on the occurrence of Discoaster bellus, Discoaster prepentaradiatus, and Discoaster pentaradiatus and the absence of Discoaster hamatus.
Sample 6R-CC contains nannofossils of approximately middle Miocene age and may be placed in middle Miocene Zone NN5 (13.53–14.91 Ma) based on the first (downhole) occurrence of Sphenolithus heteromorphus and the absence of Helicosphaera ampliaperta. Closer examination of this interval of the condensed section may reveal that this marker is actually reworked, and the proper marker would be Discoaster kugleri, indicating upper middle Miocene Zone NN7 (10.89–11.90). However, we have deemed this form an intergraded, closely related morphotype of Discoaster deflandrei and have zoned this sample based on S. heteromorphus. There is no clear evidence of reworking in any other samples, and therefore S. heteromorphus should be used until more detailed examination can confirm a different age.
Sample 7R-CC is barren of calcareous nannofossils. Samples 8R-CC and 9R-CC contain nannofossils of approximately late Oligocene age. Sample 8R-CC may be placed in upper Oligocene Zone NP25 (23.13–26.84 Ma) based on the occurrence of Sphenolithus ciperoensis and the absence of Sphenolithus distentus and Sphenolithus predistentus. Sample 9R-CC may be placed in upper lower Oligocene Zone NP23 (29.62–32.02 Ma) based on the occurrence of S. distentus, S. predistentus, and the first (downhole) occurrence of Coccolithus eopelagicus.
Sample 10R-2W, 22–23 cm, is early Oligocene in age. Determining an exact age is difficult, as key marker taxa do not appear within the assemblage. The sample may best be placed in lower Oligocene Zone NP21 (32.92–34.44 Ma) based on the occurrence of Isthmolithus recurvus, Coccolithus formosus, and the absence of Discoaster saipanensis and Discoaster barbadiensis. The base or last (downhole) occurrence of I. recurvus restricts this sample from being older than the boundary of upper Eocene Zones NP20/NP19 and NP18 (36.97 Ma).
Figure F10 is an age-depth plot with all approximate ages from productive intervals in Hole U1442A.
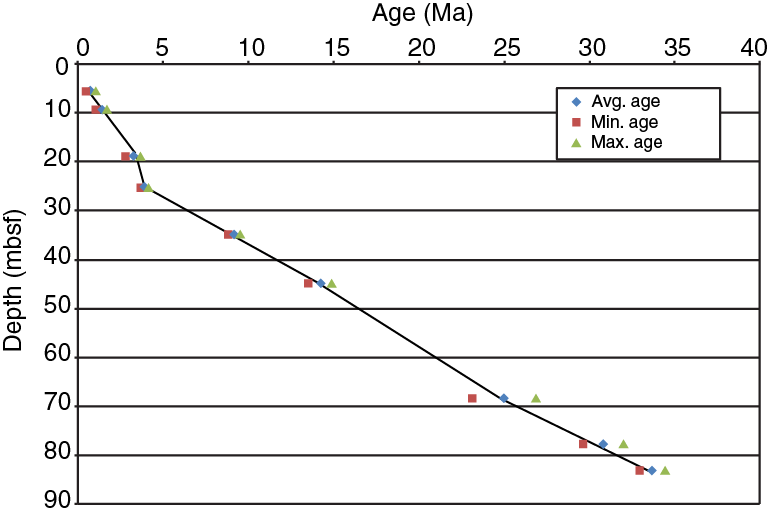
Figure F11 shows a comparison of sedimentary units with calcareous nannofossil biozonations providing approximate ages for each unit.
Fluid geochemistry
Ten samples were collected from Hole U1442A for headspace hydrocarbon gas analysis as part of the standard shipboard safety monitoring procedure: 1 sample per core was collected from Cores 352-U1442A-1R through 10R. One sample was also taken from Piece 1 in Section 352-U1442A-29R-2 to test the presence of methane in this zeolite-rich sample (see Petrology and Alteration). Headspace gas was collected and analyzed following the protocol described in Fluid geochemistry in the Expedition 352 methods chapter (Reagan et al., 2015a). The concentrations of methane, ethane, and propane in the 11 headspace gas samples are reported in Table T5.
Table T5. Headspace gas concentrations (methane, ethane, and propane), Hole U1442A. Download table in .csv format.
In the sediment, methane concentrations range from 1.04 to 1.78 ppmv in Hole U1442A, a greater range than at Site U1441 (1.08–1.29 ppmv methane) but also low and indicative of negligible concentrations of organic matter. As in all holes previously drilled and surveyed during Expedition 352, no ethane or propane was detected in Hole U1442A.
Petrology
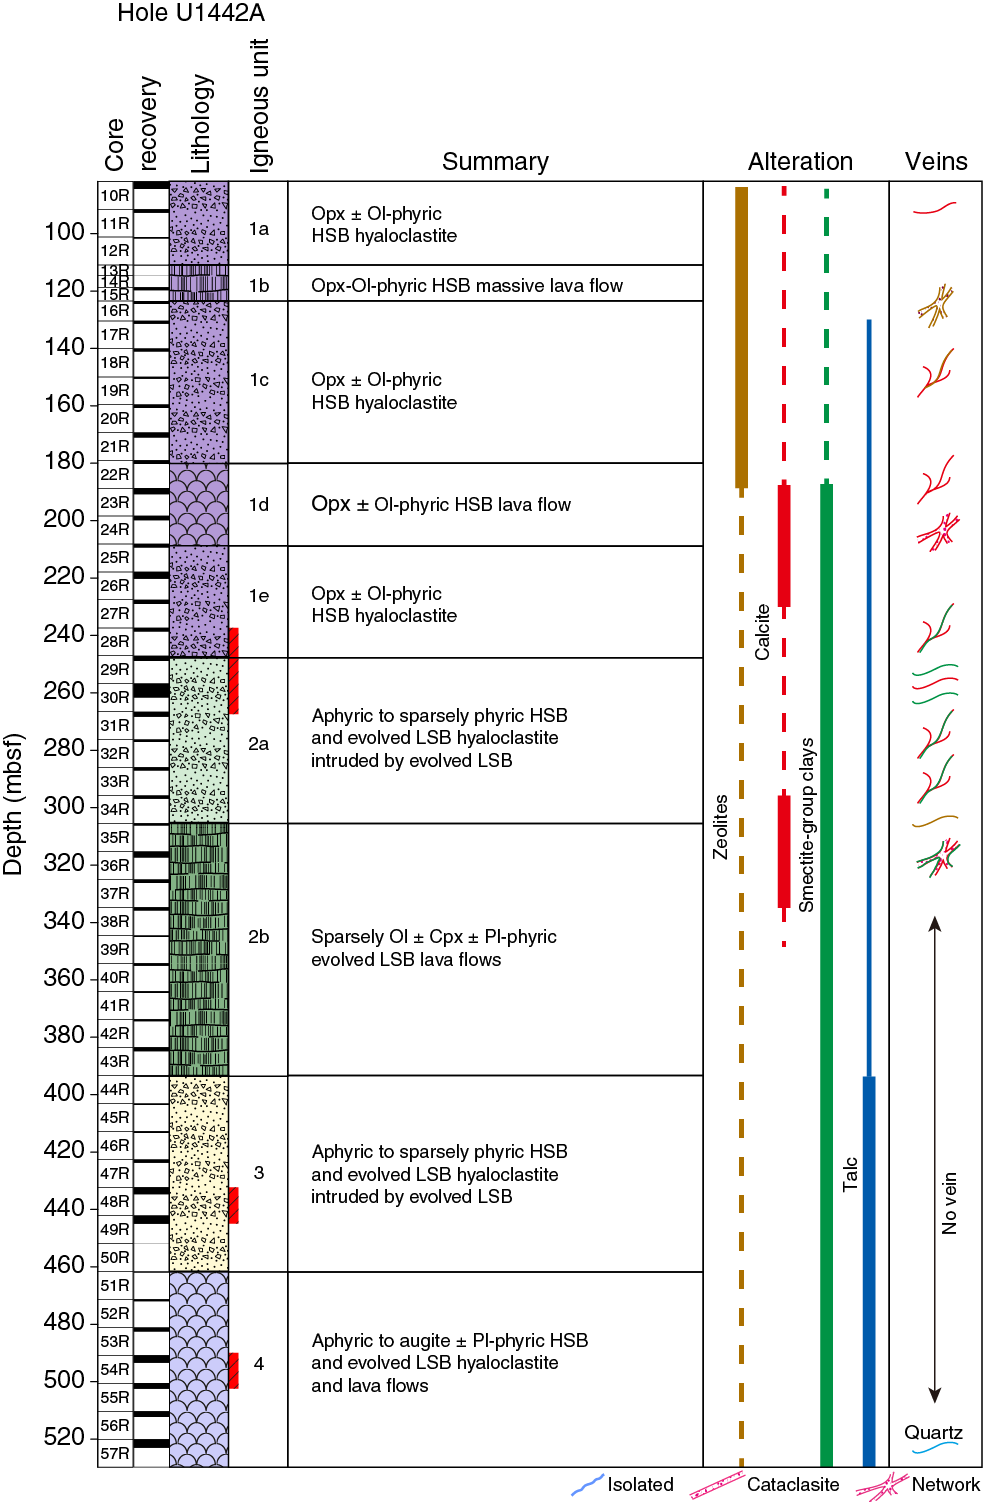
Igneous rocks were recovered in Hole U1442A, which penetrated more than 440 m of igneous basement (Section 352-U1442A-10R-2, 22 cm, through Core 57R; 55.7 m recovered). The top of the igneous basement is defined by a manganese-rich sediment layer. The uppermost part of the section comprises breccias that may represent seafloor colluvium. These are underlain by boninitic lavas and hyaloclastites. Hole U1442A contains multiple zones of faulting. For example, Sections 29R-2 (248 mbsf) and 49R-3 (445 mbsf) both contain fault zones with cataclasite, below which the lithology and chemistry of volcanic rocks change drastically. Four igneous units are defined for this hole (Figure F12).
Petrologic and geochemical classification
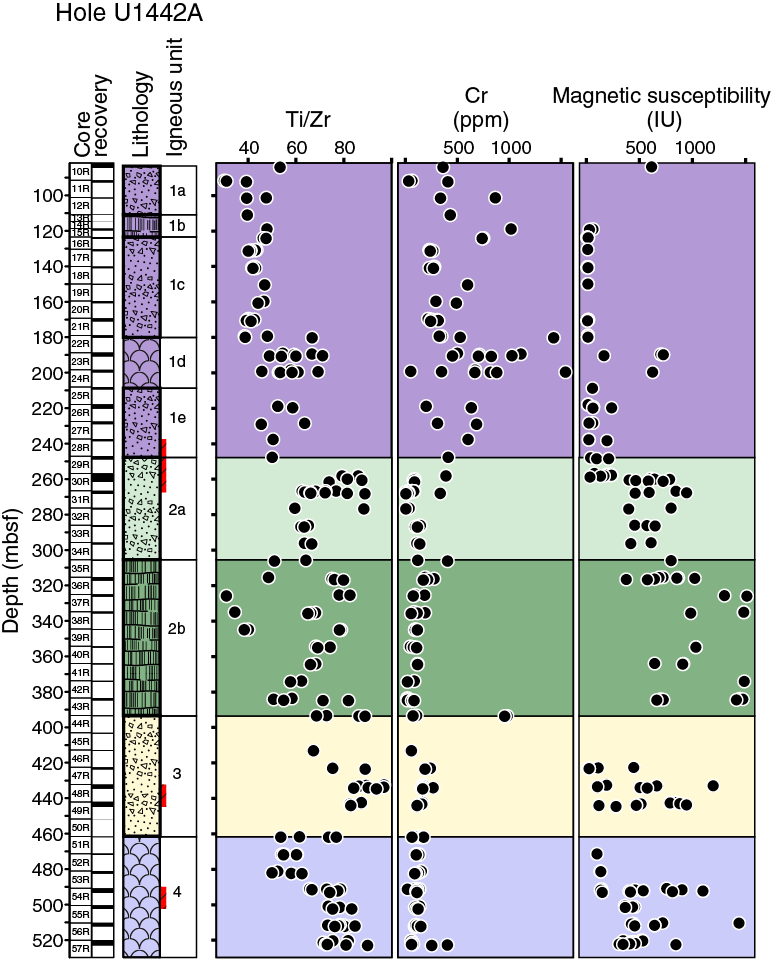
Phenocrysts are common throughout Hole U1442A; however, the variations in phase assemblages and abundances are not always diagnostic (e.g., Figure F13). As a result, chemical distinctions based on portable X-ray fluorescence (pXRF) spectrometry were also used to assess changes in rock composition and to track the different magma series. Rapid (~5 min per sample, each an average of three analyses), nondestructive pXRF measurements directly on the surface of the section halves of core were particularly advantageous. These provided high-density sampling for precisely defining chemical unit boundaries. Though not a substitute for complete whole-rock analyses by inductively coupled plasma–atomic emission spectroscopy (ICP-AES), pXRF measurements have the advantage of rapid turn-around time, the ability to refine boundaries within minutes, and relatively high precisions for the elements of interest.

Three elements (Ti, Cr, and Zr) were selected to define the chemical characteristics of each unit and the chemical differences between them (Figure F14). All of these elements have relatively high precision and accuracy by pXRF (for cross-calibration with ICP-AES and a complete discussion of calibrations and data correction; see Sediment and rock geochemistry in the Expedition 352 methods chapter [Reagan et al., 2015a]). Lithologic units in Hole U1442A are all made up of boninite. Below we summarize the criteria used to classify these into the distinct varieties encountered at Site U1442.
High-silica boninites
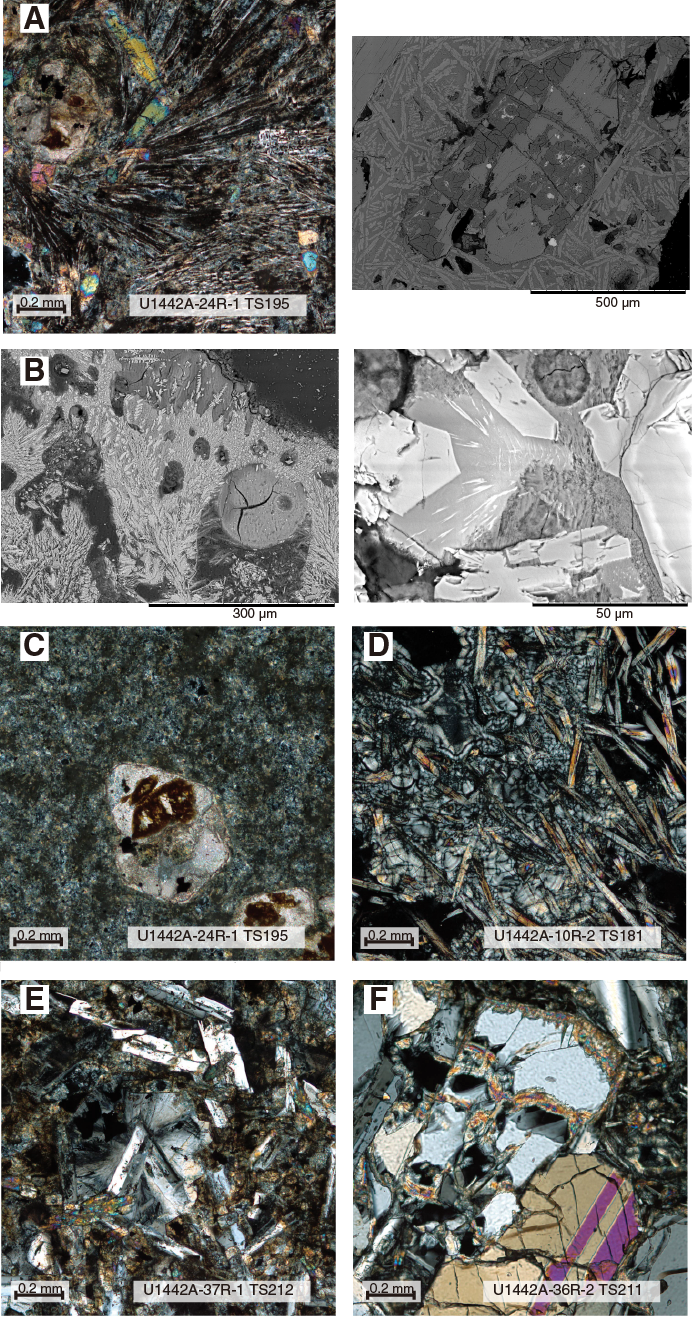
High-silica boninites (HSBs) are characterized petrologically by phenocrysts of orthopyroxene and/or olivine, recognized by their shape and cleavage when viewed with a binocular microscope and by abundant radiating needles of acicular orthopyroxene in the groundmass. In thin section, high-silica boninites are characterized by phenocrysts of olivine and low-calcium pyroxene (typically enstatite or clinoenstatite), which may occur as single crystals or in glomerocrysts. Olivine is the dominant phenocryst phase, typically forming blocky euhedral crystals. The groundmass consists of pale tan glass with abundant pyroxene microlites, which include either or both low-calcium pyroxene (orthopyroxene) and high-calcium pyroxene (augite). When present, the high-calcium pyroxene typically forms an overgrowth on low-calcium pyroxene. High-Si boninites are recognized in the pXRF data by their high Cr concentrations (>300 ppm), very low TiO2 (<0.5 wt%), and Ti/Zr ratios < 70 (e.g., Crawford, 1987). For further details on classification nomenclature, see Petrology in the Expedition 352 methods chapter (Reagan et al., 2015a).
Low-silica boninites
All low-silica boninites have groundmass augite (with or without orthopyroxene cores), and some have augite phenocrysts (Figure F13). These lavas are also characterized by TiO2 ≤ 0.35 wt%, high Cr (500–1000 ppm), and Ti/Zr ratios of ~65–75 (see Petrology in the Expedition 352 methods chapter [Reagan et al., 2015a] for explanation of classification based on pXRF data). The low silica contents and slightly higher Ti/Zr ratios of low-silica boninites distinguish them from high-silica boninites.
Evolved low-silica boninites
Evolved low-silica boninites are generally high-magnesium andesites (HMA; see Sediment and rock geochemistry), characterized petrographically by modal plagioclase and high-calcium pyroxene (augite). Augite phenocrysts are common, but plagioclase phenocrysts are rare (Figure F13). Plagioclase and augite are the dominant groundmass phases and may be intergrown intimately in quench textures. They are recognized in pXRF data by their low Cr concentrations (typically <200 ppm) and Ti/Zr ratios >80. Evolved low-silica boninites are also distinguished from primitive boninites (both high- and low-silica varieties) by magnetic susceptibility, where the high magnetic susceptibility (≥400 IU; see Physical properties) of evolved low-silica boninites, due to groundmass Fe-Ti oxides, is distinct from the low magnetic susceptibility of primitive boninites (typically <300 IU; Figure F14). Evolved low-silica boninite at Site U1442 has trace element characteristics (e.g., Ti-Cr-Zr; also see Sediment and rock geochemistry) consistent with differentiation from primitive boninites and must represent evolved magmas of the boninite series.
Igneous rock lithostratigraphy
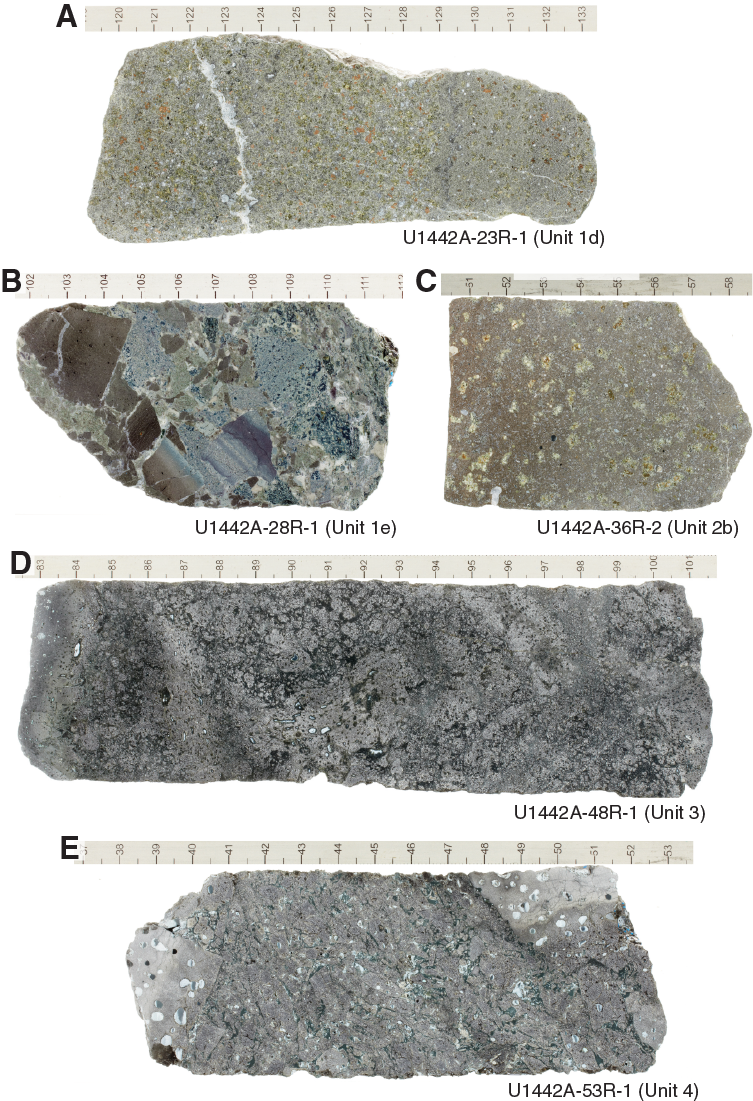
Four lithostratigraphic units were identified in Hole U1442A (Figure F12). Unit boundaries represent an abrupt change in chemical characteristics, phenocrysts, and groundmass assemblages, and some are marked by faults. Subunits typically represent changes in the eruptive nature of a unit (e.g., from hyaloclastite to pillow lava or massive lava). Chemical groupings based on Ti, Cr, and Zr were combined with petrographic information on phase assemblages (e.g., phenocryst assemblages and the presence or absence of groundmass plagioclase), physical volcanology (pillows versus hyaloclastite versus massive lavas), and physical property data (magnetic susceptibility) in order to define the lithologic units. A summary of modal and phenocryst mineral assemblages is depicted in Figure F13, and the chemostratigraphy is summarized in Figure F14. Typical or notable macroscopic features of the core are depicted in Figure F15, and microscopic thin section observations of note are shown in Figure F16. Alteration features are shown in Figures F17 and F18.

Unit 1
Subunit 1a
- Interval (top): 352-U1442A-10R-2, 25 cm
- Depth: 83.12–110.90 mbsf
- Thickness: 27.78 m (2.42 m recovered)
- Rock type: orthopyroxene ± olivine-phyric high-silica boninite
- Deposit: hyaloclastite
The basement sediment contact is at 25 cm in Section 352-U1442A-10R-2. The section is curated as a sediment because it is a muddy matrix containing a few igneous clasts. Subunit 1a consists of gravel-sized volcanic clasts in a sandy-granular green matrix of altered glassy fragments. The volcanic clasts are moderately phyric boninites with 5%–8% orthopyroxene and trace amounts of olivine phenocrysts. The groundmass in the clasts consists of microcrystalline orthopyroxene and augite needles with interstitial glass that remained partly unaltered. The clasts are usually highly vesicular (25%). Subunit 1a is characterized by low TiO2 (<0.3 wt%), 300–500 ppm Cr, and low Ti/Zr ratios (30–50).
Subunit 1b
- Interval (top): 352-U1442A-13R-1, 0 cm
- Depth: 110.90–124.34 mbsf
- Thickness: 13.44 m (1.78 m recovered)
- Rock type: orthopyroxene-olivine-phyric high-silica boninite
- Deposit: massive lava flow
Subunit 1b consists of moderately phyric high-silica boninite lava with ~7%–10% olivine and ~10% orthopyroxene phenocrysts (Figure F16A). Groundmass phases are acicular orthopyroxene and clinopyroxene in a glassy mesostasis. These lavas are moderately vesicular (~11%) and rounded and moderately spherical with a maximum diameter of 4 mm and a mode of 1 mm. Subunit 1b is characterized by low TiO2 (≤0.2 wt%), 400–800 ppm Cr, and low Ti/Zr ratios (40–50).
Subunit 1c
- Interval (top): 352-U1442A-16R-1, 84 cm
- Depth: 124.34–179.90 mbsf
- Thickness: 55.56 m (5.54 m recovered)
- Rock type: orthopyroxene ± olivine-phyric high-silica boninite
- Deposit: hyaloclastite
Subunit 1c is a hyaloclastite breccia containing high-silica boninite clasts and pumice within a green glassy matrix. The boninite clasts contain sparse orthopyroxene and olivine phenocrysts. The groundmass phases are acicular orthopyroxene in a glassy matrix. The clasts are moderately vesicular (~8%–18%) with a maximum diameter of 16 mm and a mode of 2 mm. The glassy green matrix is, in general, highly altered but still contains portions of unaltered glass. Subunit 1c is characterized by low TiO2 (<0.3 wt%), 300–500 ppm Cr, and low Ti/Zr ratios (40–50).
Subunit 1d
- Interval (top): 352-U1442A-22R-1, 90 cm
- Depth: 179.90–208.10 mbsf
- Thickness: 28.20 m (3.58 m recovered)
- Rock type: orthopyroxene-olivine-phyric high-silica boninite
- Deposit: lava flow
Subunit 1d is characterized by highly phyric high-silica boninite lavas containing ~5%–20% orthopyroxene and ~9% olivine phenocrysts (Figures F15A, F16B). The groundmass is dominated by orthopyroxene and clinopyroxene crystals in a glassy matrix. The lava is sparsely to moderately vesicular. The vesicles are generally subrounded and have a maximum diameter of 9 mm and a mode of 1.5 mm. Subunit 1d is characterized by slightly higher TiO2 (up to 0.35 wt%), 200–1300 ppm Cr, and slightly higher Ti/Zr ratios (50–70). The wide range in elemental concentrations (e.g., Cr) suggests that some samples may contain high proportions of cumulate crystals. Unlike other subunits of Unit 1, the Subunit 1d lavas have slightly elevated magnetic susceptibility (Figure F14).
Subunit 1e
- Interval (top): 352-U1442A-25R-1, 0 cm
- Depth: 208.10–248.605 mbsf
- Thickness: 40.505 m (6.975 m recovered)
- Rock type: orthopyroxene ± olivine-phyric high-silica boninite
- Deposit: hyaloclastite
Subunit 1e is a hyaloclastite breccia containing high-silica boninite clasts and pumice within a green glassy matrix (Figure F15B). The boninite clasts contain sparse orthopyroxene and clinopyroxene phenocrysts. The groundmass phases are orthopyroxene and clinopyroxene in a glassy matrix. The clasts are sparsely to moderately vesicular (~2%–15%) with a maximum diameter of 6 mm and a mode of 1 mm. The glassy green matrix is highly altered to clay but still contains portions of unaltered glass. This subunit is chemically similar to Subunit 1d. The lower contact of this unit is a fault gouge.
Unit 2
Subunit 2a
- Interval (top): 352-U1442A-29R-2, 38.5 cm
- Depth: 248.605–305.89 mbsf
- Thickness: 57.285 m (9.435 m recovered)
- Rock type: aphyric to sparsely phyric high-silica boninite and high-Mg andesite
- Deposit: hyaloclastite intermingled with evolved lava
Subunit 2a consists of rounded to subangular clasts of moderate to highly vesicular high-silica boninite glass and lava with chilled rims, commonly intermingled with evolved low-silica boninite (high-magnesium andesite) lava. The high-silica boninite clasts contain sparse orthopyroxene and olivine phenocrysts, whereas the evolved low-silica boninite contains augite ± plagioclase phenocrysts (Figure F16C) in a groundmass of microcrystalline clinopyroxene, plagioclase, and in some cases orthopyroxene. Deeper than Section 30R-3, 0 cm (258.99 mbsf), the unit contains a massive evolved lava flow with high magnetic susceptibilities. The wide range in compositions (e.g., TiO2 of ~0.25–0.45 wt% and Ti/Zr ratios of 60–85) and magnetic susceptibilities are consistent with a mixed magma origin for this subunit.
Subunit 2b
- Interval (top): 352-U1442A-35R-1, 39 cm
- Depth: 305.89–393.52 mbsf
- Thickness: 87.63 m (7.58 m recovered)
- Rock type: sparsely olivine ± clinopyroxene ± plagioclase phyric high-magnesium andesite
- Deposit: lava flow
Subunit 2b is composed of evolved low-silica boninite (high-Mg andesite) containing sparse phenocrysts of olivine, plagioclase, and clinopyroxene. Although clinopyroxene is often the sole phenocryst phase, olivine and plagioclase phenocrysts are rarely present without clinopyroxene. The clinopyroxene abundance increases dramatically (up to 15 modal%) in the middle of the unit (Cores 352-U1442A-35R through 37R); in this rare instance, olivine and plagioclase are also present as phenocrysts in sparse to moderate amounts (Figures F15C, F16D). The microcrystalline groundmass has an intersertal to intergranular texture composed largely of clinopyroxene and plagioclase; groundmass plagioclase is present throughout. The lava is sparsely to moderately vesicular (~1%–10%), with a maximum diameter of 8 mm and a mode of 1 mm. This subunit has uniformly low Cr concentrations (≤250 ppm), moderate TiO2, relatively high Ti/Zr ratios (50–90), and high magnetic susceptibilities. Dikes might be present in several core sections within this unit, characterized by uniformly fine grained to aphanitic textures and a complete lack of vesicles or glass pillow rims, (e.g., Sections 37R-1 [Pieces 10–14], 38R-1 [Pieces 6–18], 41R-1 [all pieces], and 43R-1 [Pieces 5–9]).
Unit 3
- Interval (top): 352-U1442A-44R-1, 22 cm
- Depth: 393.52–461.60 mbsf
- Thickness: 68.08 m (7.32 m recovered)
- Rock type: aphyric to sparsely phyric high-magnesium andesite
- Deposit: hyaloclastite intermingled with lava
Boninite hyaloclastite and aphyric to sparsely phyric evolved low-silica boninites (high-magnesium andesite) are found throughout this section. The hyaloclastites contain highly vesicular and/or glassy high-silica boninite fragments in an altered glass matrix (now clays, zeolites, and calcite) (Figures F15D, F16E). Rare phenocrysts of olivine and orthopyroxene are in Section 352-U1442A-49R-2. Interspersed with the hyaloclastite are flows of evolved, lighter colored boninite, which typically appear to have invaded the hyaloclastites before lithification. The evolved low-silica boninites are chilled against the glassy breccias with irregular lobate contacts. In some places, magma mingling created diffused cuspate contacts between dark- and light-colored magmas (high-silica boninite and evolved low-silica boninite). The overall appearance is similar to Unit 8 in Hole U1439C. The evolved lavas in Unit 3 are characterized by higher TiO2 (~0.35 wt%), low Cr (<200 ppm), and Ti/Zr ratios of 70–90.
Unit 4
- Interval (top): 352-U1442A-51R-1, 0 cm
- Depth: 461.60–522.97 mbsf
- Thickness: 61.37 m thick (11.21 m recovered)
- Rock type: aphyric to augite ± plagioclase-phyric high-magnesium andesite
- Deposit: hyaloclastite and lava flows
Unit 4 consists of evolved high-silica boninite and aphyric or sparsely phyric evolved low-silica boninite (both high-magnesium andesites). Cores 51R through 53R include lighter colored evolved low-silica boninite flows that intermingled with hyaloclastites (Figure F15E), as in Unit 3. The hyaloclastite contains fresh glass with sparse orthopyroxene needles (Figure F16F). Below Core 53R, massive dark gray aphyric lavas are highly brecciated by a series of shear zones that impose a poorly defined rock cleavage on much of the section (see Structural geology). Plagioclase phenocrysts reappear in the deepest portion of this unit (Core 57R).
Alteration
In Unit 1 hyaloclastites, alteration degree is extremely variable and dominated by smectite group clay minerals (montmorillionite, saponite) and zeolites (largely phillipsite shallower in the hole and natrolite deeper in the hole). Fresh volcanic clasts exist in a sometimes completely altered matrix (Figure F15B). Phenocrysts in the clasts (olivine and orthopyroxene) are transformed to variable degrees into green to brown smectite clays with more or less calcite (Figure F17C). Glass in the clasts is mostly fresh. In isolated high-alteration patches, glass is completely altered into clay minerals and/or zeolites (Figure F17C, F17D).
In Unit 1 lava flows, phenocrysts are altered to variable degrees into smectites and calcite (Figures F15A, F17A). Glass is mostly fresh but sometimes strongly devitrified with elongated crystals of clinopyroxene growing around phenocrysts in a star shape (Figure F17A, F17B). In altered zones, glass is transformed into zeolite with minor clay. Devitrified zones may be themselves altered with transformation of glass into zeolites and clay and phenocrysts into calcite and smectites. However, clinopyroxene tends to resist this kind of alteration and mostly remains fresh in an altered groundmass containing abundant zeolite (Figure F17B).
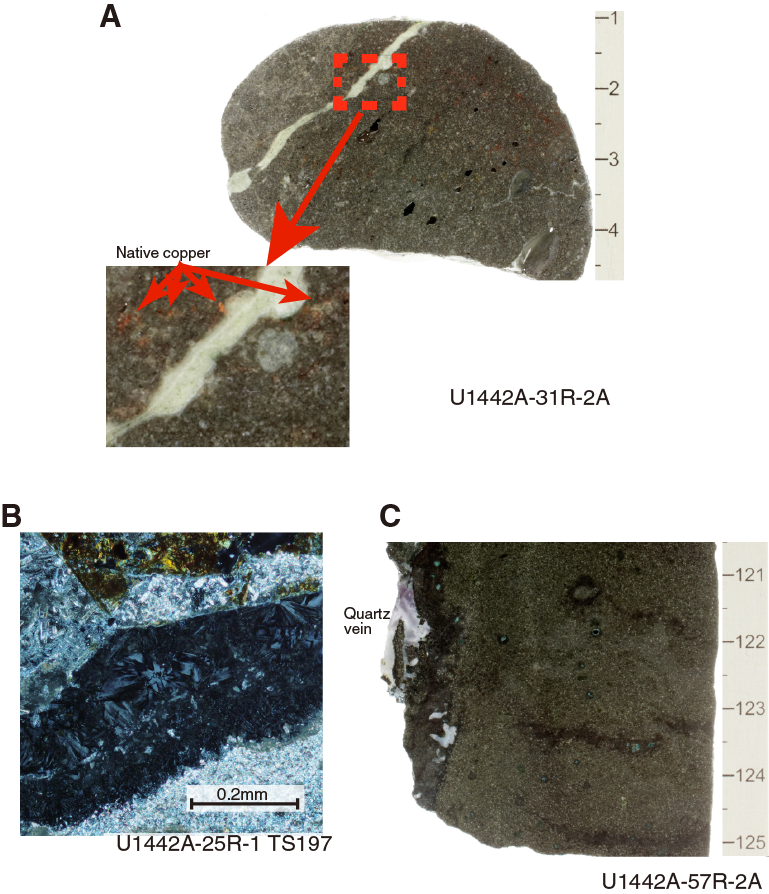
In contrast to Unit 1, in Unit 2 and deeper, zeolites are still present and green clay becomes the dominant alteration mineral. The top of Unit 2 (Core 29R) is marked by a short sandstone deposit followed by fault gouge with palygorskite and sepiolite. In the sandstone, volcanic clasts and crystals, probably derived from the boninites, are completely altered to clays cemented by a later calcite precipitate (see Sedimentology). Below the fault, from Core 30R to 39R in the middle of Subunit 2b, green clay in association with calcite forms the dominant alteration assemblage. Calcite appears especially abundant in highly phyric boninites as a replacement phase for olivine and orthopyroxene (Figures F15A, F15C, F17A, F17C). The alteration degree in this interval is variable. Alteration patches, vesicles, and veins (see below) may contain native copper flakes (Figure F18A).
The first appearance of talc as an alteration phase of orthopyroxene and olivine (Figure F17F) is observed in Core 16R. From Core 40R to the bottom of the hole, the relative amount of talc increases and includes partial replacement of primary phases. However, the general degree of alteration stays low to moderate in these lowest intervals. High alteration degree is observed only in the fault zones corresponding to cataclasites and mylonites in Cores 48R, 49R, 54R, and 55R. Native copper and sulfides were found in some of these zones.
Veins
Veins are much scarcer than in other holes and are of a different type. Calcite veins are abundant only in two zones (from Core 23R to 26R and 33R to 37R) where calcite dominates alteration-affected phenocrysts and groundmass in the boninites (Figure F12). Calcite in these zones tends to replace other previous minerals, like zeolite or clays (Figure F18B), with cataclastic texture or as replacive patches. From the top of the hole to Core 22R, veins are mainly filled by clay minerals with minor calcite. A small, discontinuous clay vein network was observed in Cores 13R through 15R, but in other cores, only single isolated veins exist.
Below the top of Unit 2 (Core 29R), veins are most commonly filled by green clays. As in the fault zone at the boundary between Units 1 and 2, native copper flakes appear in zeolite veins (Figure F18A), in some zeolite-filled vesicles, and in the groundmass in the same core (31R). Isolated or branched veins appear sporadically downhole to Core 38R, and there is one small clay and calcite vein network in Core 37R. Between Core 38R and the bottom of the hole, clay is completely absent, except in the very last core (57R). The mineral assemblages filling the veins are in accordance with the background alteration type: generally clays and calcite. Interestingly, veins completely disappear at about Core 36R, probably because of pervasive fluid percolation rather than flow along fractures. A quartz vein was observed in Section 352-U1442A-57R-2 (Figure F18C).
Discussion
Coring in Hole U1442A recovered igneous lithologies like those in Hole U1439C, which lies only 1.3 km away. Nevertheless, there are notable differences between the two holes. Coring in Hole U1442A recovered high-silica boninites, low-silica boninites, and evolved low-silica boninites; however, no basaltic boninites were recovered, and no basal dikes were encountered. Given the close proximity of the two sites, it is reasonable to try to correlate their stratigraphies. However, this task is not straightforward. One particular obstacle is the numerous faults encountered in Hole U1442A (Figure F2; also see Structural geology). Some faults contained evidence for oblique strike-slip motion, which raises the possibility that the two sites were originally much further apart than their current 1.3 km separation.
The upper unit of Hole U1442A downhole to ~250 mbsf consists mostly of hyaloclastites and lava flows of high-silica boninitic affinity. This section roughly correlates with Units 1–4 in Hole U1439C, but Unit 1 in Hole U1442A has much less intact pillow lava and much more hyaloclastite compared with Hole U1439C. The most distinctive chemical feature of the upper section of Hole U1442A is the variable Cr content, which reaches values in excess of 1000 ppm (Figure F14). Below a major fault zone at 240–270 mbsf, which separates Subunit 1e from 2a, Cr contents drop drastically and, with few exceptions, remain below 500 ppm. Units 2–4 are reminiscent of Unit 8 in Hole U1439C in that they contain what appear to be magmas of both high- and low-silica boninites intermingled with more evolved low-silica boninite. Compositionally, Units 2–4 are more similar to Unit 9 in Hole U1439C, but are thicker by almost an order of magnitude.
Finally, a striking feature of Hole U1442A is its excellent preservation in comparison with its sister Site at U1439. Fresh glass is pervasive throughout the entire depth range of Hole U1442A, making it an invaluable resource for postcruise research requiring primary material.
Sediment and rock geochemistry
Seven sediment samples were collected from Hole U1442A (one per core from Cores 352-U1442A-1R through 4R, 7R, 8R, and 10R). These sediment samples were analyzed for carbonate contents following the protocol described in Sediment and rock geochemistry in the Expedition 352 methods chapter (Reagan et al., 2015a). The percentage of inorganic carbon and carbonate contents of the sediments are reported in Table T6.
Table T6. Inorganic carbon and carbonate contents of sediment samples, Hole U1442A. Download table in .csv format.
Twenty-one igneous rock samples collected in Sections 352-U1442A-11R-1 through 43R-1 were selected by the Shipboard Science Party as representative of the different lithologic units recovered from Hole U1442A (see Petrology). All samples were taken next to thin sections (see Petrology for thin section petrographic descriptions). They were analyzed for major and trace element concentrations by ICP-AES and for H2O and CO2 contents for any samples with loss on ignition (LOI) > 2%. Aliquots of the oxidized powders used for ICP-AES analyses were subsequently used for pXRF analyses, which were carried out with a Niton handheld portable spectrometer. The analytical procedures, precision, and accuracy of the methods are described in detail in Sediment and rock geochemistry in the Expedition 352 methods chapter (Reagan et al., 2015a). The chemical compositions of the igneous rocks are reported in Tables T7 and T8.
Table T7. ICP-AES major, trace, and volatile element concentrations of igneous rocks, Hole U1442A. Download table in .csv format.
Table T8. pXRF major and trace element concentrations of igneous rocks, Hole U1442A. Download table in .csv format.
The pXRF instrument was used also as a tool for chemostratigraphic analysis of the igneous rocks cored in Hole U1442A. The rock surfaces of 167 pieces from the archive half were analyzed for Ti, Ca, K, Rb, Sr, Zn, Cu, Cr, V, and Zr. The results are reported in PXRF in Supplementary material and discussed in Petrology.
Sediments
Sediments from Hole U1442A have inorganic carbon contents ranging from 0.07 to 9.34 wt%, which mainly reflect their variable carbonate contents. Carbonate contents range from 0.6 to 77.8 wt% (Table T6), with one sample (352-U1442A-7R-5, 49–50 cm) containing ~0.6 wt% carbonate. In all the other samples, carbonate constitutes 50–77 wt% of the sample.
Igneous rocks
The igneous rocks recovered in Hole U1442A comprise a range of volcanic rocks with petrographic and chemical affinities to the boninite series samples from Site U1439. Four units were identified in Hole U1442A by micro- and macroscopic observations, in combination with chemostratigraphic measurements of core pieces using pXRF and the ICP-AES bulk rock analyses (see Petrology for the detailed description of units and chemostratigraphy and Petrology in the Expedition 352 methods chapter [Reagan et al., 2015a] for presentation of the use of the ICP-AES bulk rock analyses).
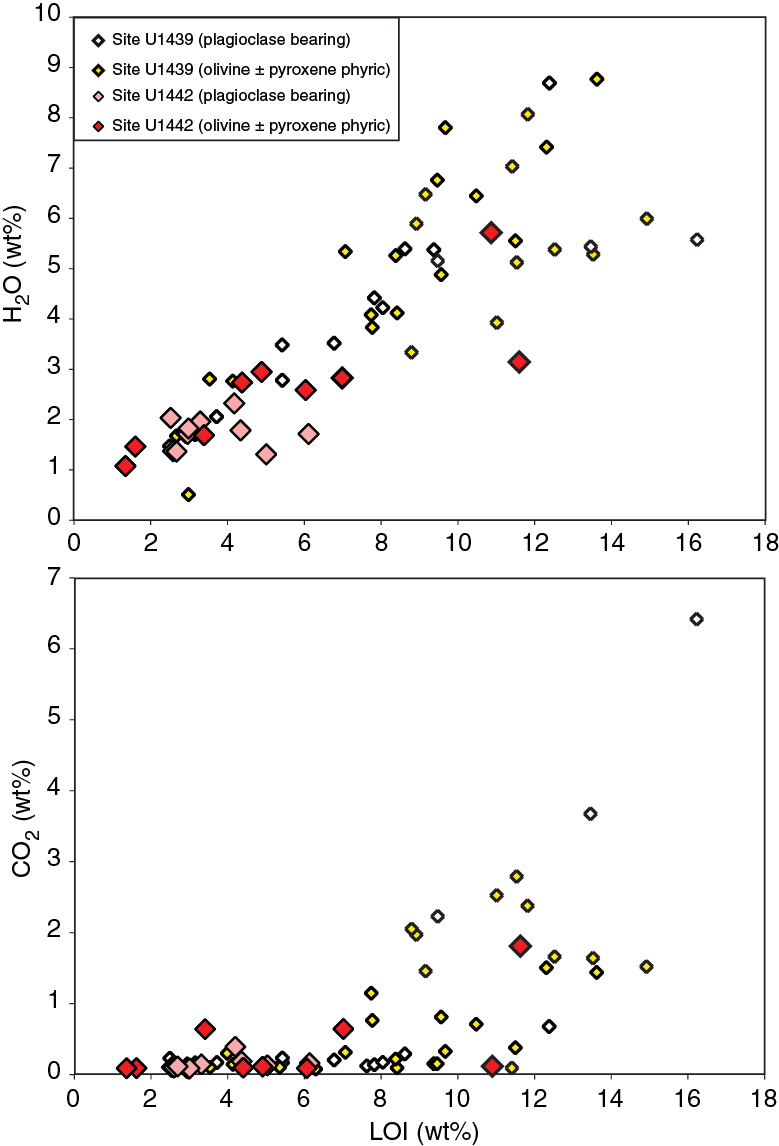
The 21 igneous rocks recovered from Hole U1442A include two samples that are substantially altered (LOI > 10 wt%; samples 23R-3, 30–35 cm, and 30R-2, 21–27 cm) (Figure F19), but the others have LOI values that are consistently <5 wt%, CO2 concentrations <0.6 wt%, and H2O contents <3 wt%. Most of these samples were also visibly fresh in hand specimen and thin section.
The igneous rocks analyzed from Hole U1442A are primarily boninites and boninitic differentiates (see Petrology for details on classification). They plot across the basalt, basaltic andesite, andesite, and dacite fields of the total alkali-silica classification diagram (Le Bas et al., 1986) (Figure F20), though this reflects their boninitic character as well as fractional crystallization. On a plot of SiO2 versus MgO (Figure F20), Hole U1442A samples form a broad array that encompasses much of the field for the Site U1439 suite and is distinct from the igneous samples from Sites U1440 and U1441. The samples recovered from the top of Hole U1442A (92–260 mbsf) are olivine-pyroxene-phyric, and most are compositionally boninites sensu stricto. The remaining samples extend to higher SiO2 and lower MgO contents and are also petrographically distinct (plagioclase bearing; see Petrology) and exclusively occur in the lower two-thirds of Hole U1442A (260 mbsf and deeper). All Hole U1442A samples range from 52.5 to 63.4 wt% SiO2, 1.44 to 4.74 wt% in total alkali contents (Na2O + K2O), and 2.6 to 17.0 wt% MgO.
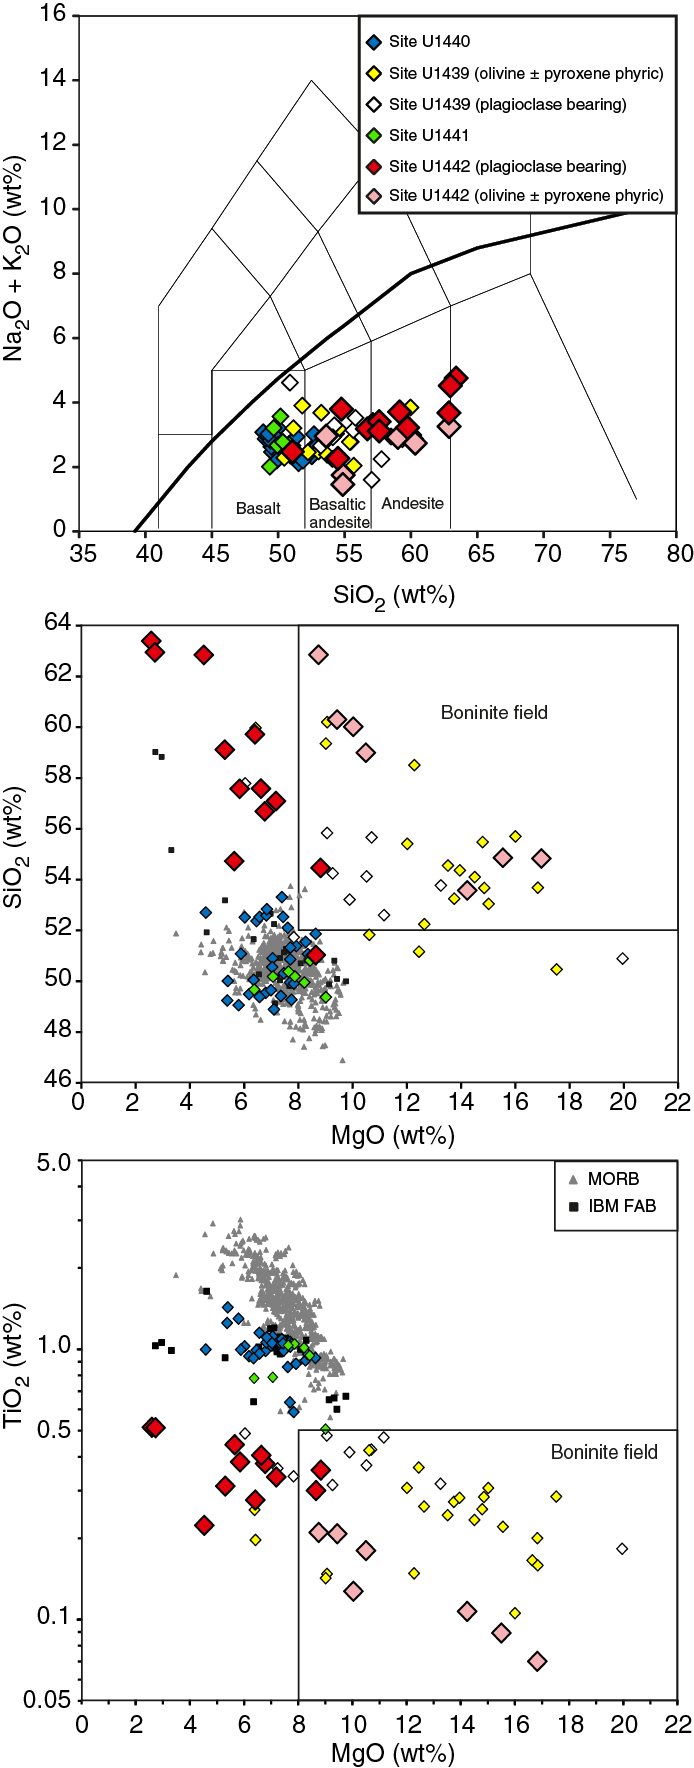
In Figure F20, the plot of TiO2 versus MgO, Site U1442 samples form a clear array that broadly follows the trend defined by the boninite-series igneous rocks recovered from Site U1439. In general, Hole U1442A samples tend toward lower TiO2 than the Site U1439 suite, though there is considerable overlap between them.
Concentrations of major elements (CaO, Al2O3, K2O, and Fe2O3) versus MgO are shown in Figure F21. Aside from Fe2O3, the plagioclase-bearing Hole U1442A samples have compositions that overlap with the field defined for MORB and the samples from Sites U1440 and U1441. The high SiO2 concentrations in the Hole U1442A lavas (Figure F20), however distinguish them from FAB or MORB.
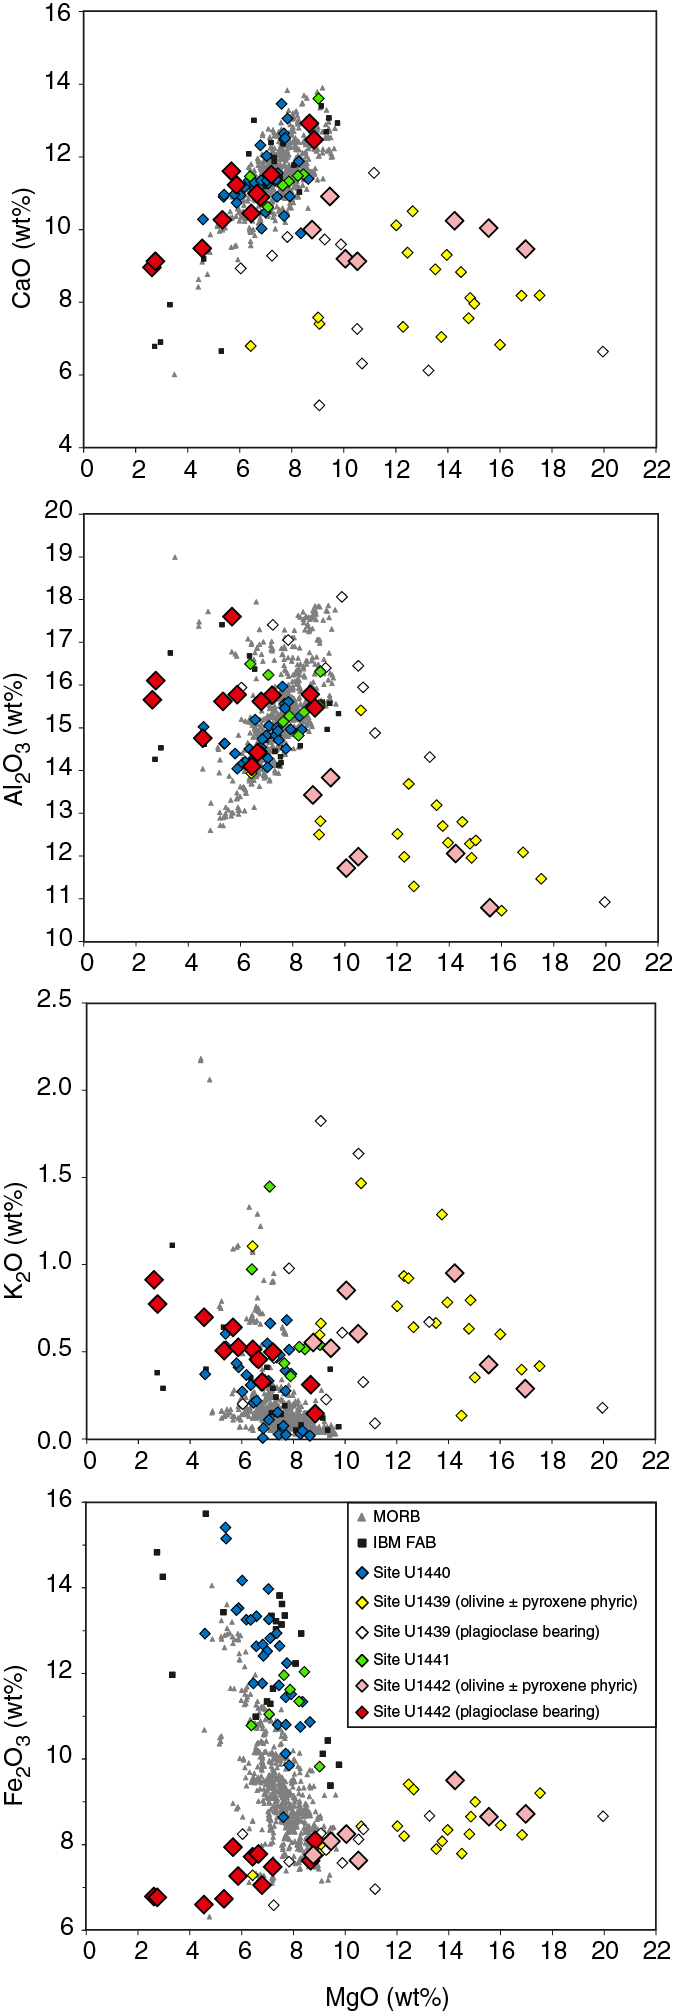
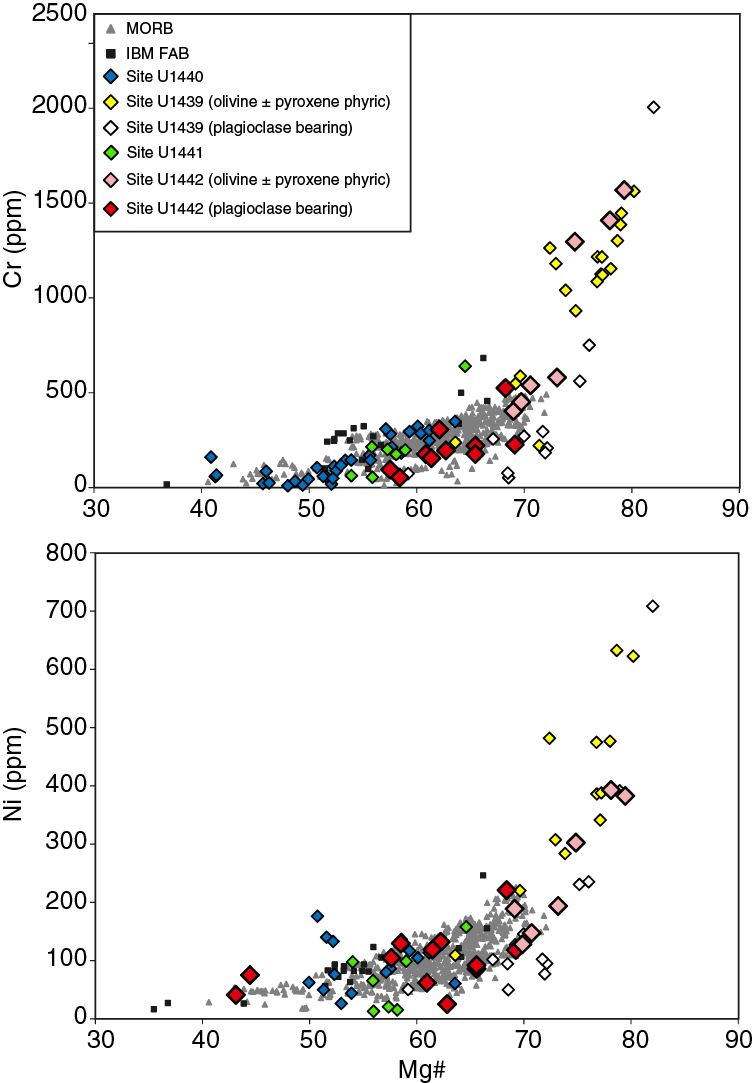
On plots of Mg# versus Cr and Ni concentrations (Figure F22), Site U1442 samples follow the trend defined by Site U1439 boninites. However, three samples (15R-1, 70–75 cm; 22R-1, 122–125 cm; and 23R-1, 99–103 cm) have high Cr (>1200 ppm) and Ni (>300 ppm) at high Mg# (>75), which reflects their highly olivine-pyroxene-phyric petrography.
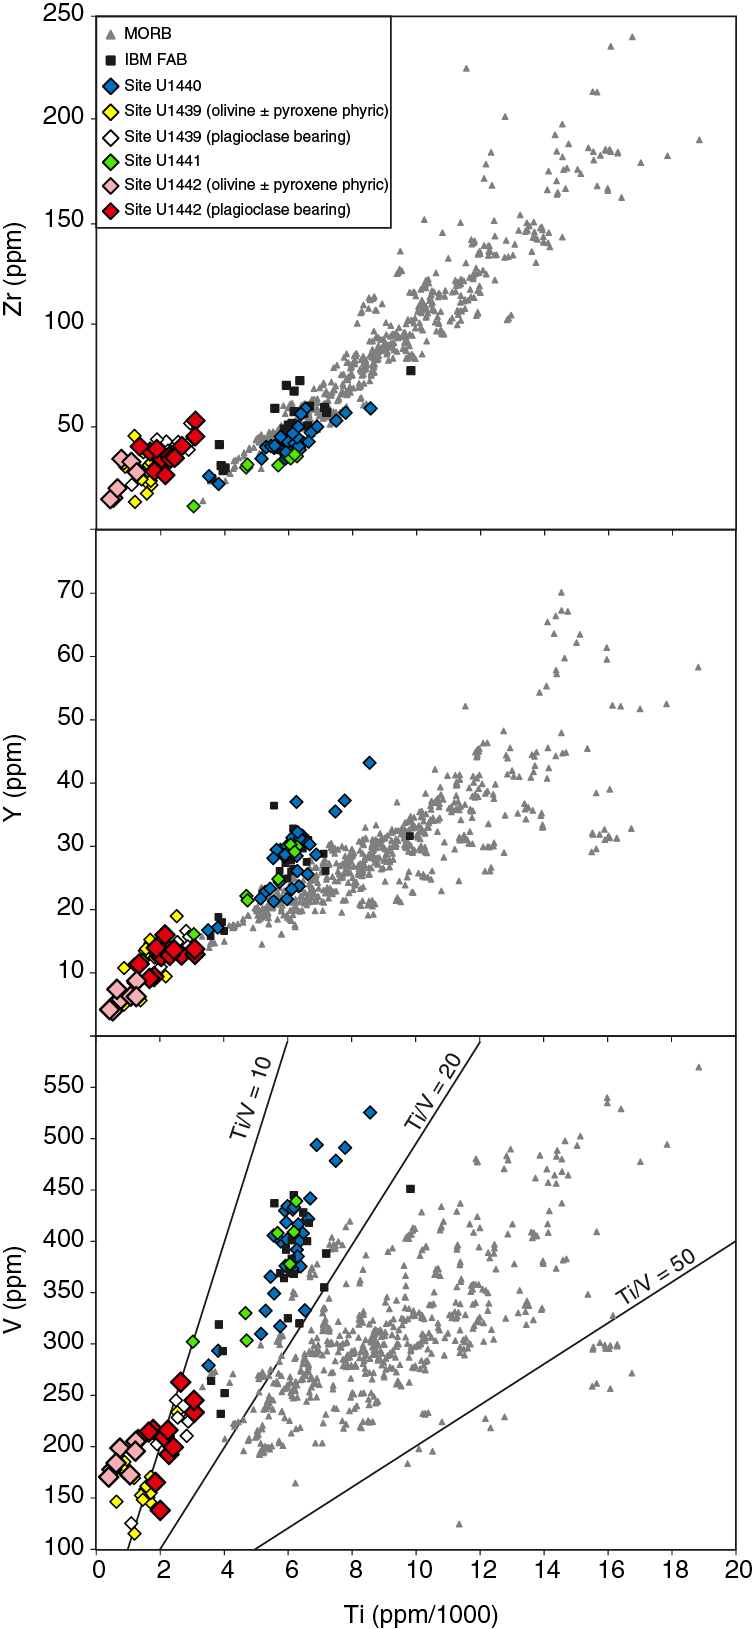
The concentrations of incompatible trace elements Zr, Y, V, and Ti for Site U1442 igneous rocks are consistent with those of the Site U1439 samples and of boninites in general (Figure F23). The olivine-pyroxene-phyric and plagioclase-bearing samples from Hole U1442A can be distinguished from each other based on their Ti, Y, and Zr concentrations, which are higher in the plagioclase-bearing samples. The olivine-pyroxene-phyric and plagioclase-bearing groups form relatively tight clusters with regard to their Zr and Y concentrations (15–53 and 10–16 ppm, respectively) that overlap with the samples from Site U1439. Note, however, that samples at the low end of this range are close to detection limit. It is also noteworthy that the boninitic samples from Sites U1439 and U1442 have Ti, Zr, and Y that are distinct from those of the fore-arc basalts from Sites U1440 and U1441. For mobile elements (e.g., K), Site U1442 samples overlap the fields for both Site U1439 and Izu-Bonin boninites. Site U1439 samples extend to higher alkali abundance levels than both the Site U1442 samples and most boninites from the IBM region, most likely indicating the greater effects of alteration that are evident in Hole U1439C.
Structural geology
Sedimentary structures
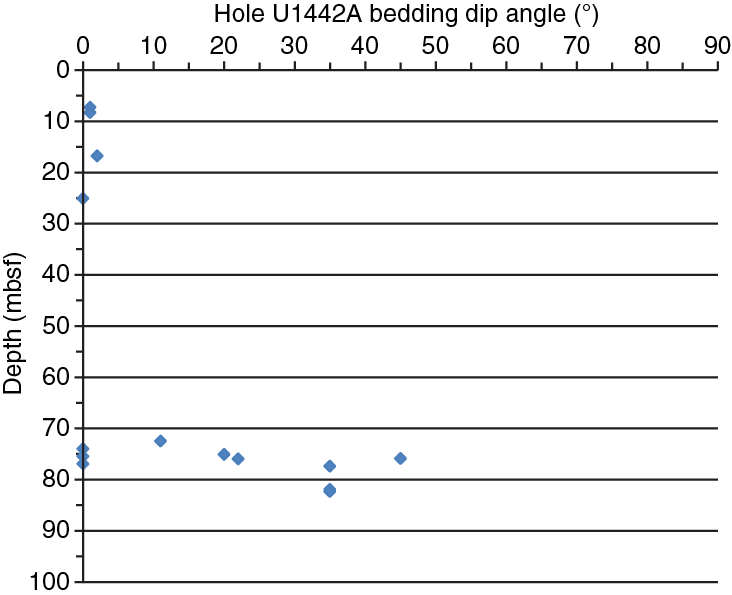
Variations in lithologic composition, color, and/or grain size of the sedimentary material commonly mark the bedding planes. Dark pyroclastic beds, a few centimeters in thickness, and thin sandy beds, a few millimeters in thickness, are conformable with the local bedding. Above 75 mbsf, bedding planes are subhorizontal, with dips generally less than 10° (Figure F24). Subvertical dewatering pipes, usually <5 mm in diameter, are common between ~75.0 and 75.5 mbsf. Between 75 and 155 mbsf, the bedding planes dip at angles between 22° and 45°, with an average of ~35°. The dip angle changes in interval 352-U1442A-9R-2, 77–78 cm, and defines an angular discordance between ~74 and 75 mbsf. Based on biostratigraphic ages (Samples 352-U1442A-8R-CC, 23.13–26.84 Ma; 9R-CC, 29.62–32.08 Ma; and 10R-CC, 32.92–34.44 Ma), the timing of this discordance lies between ~27 and 32 Ma.
Igneous structures
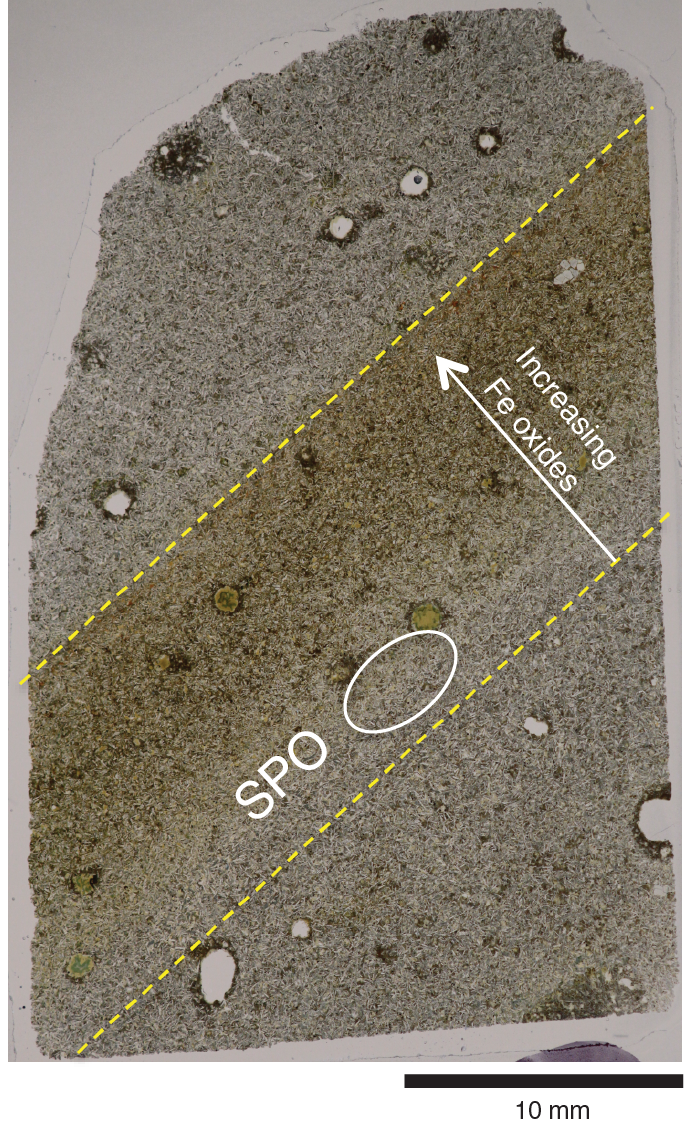
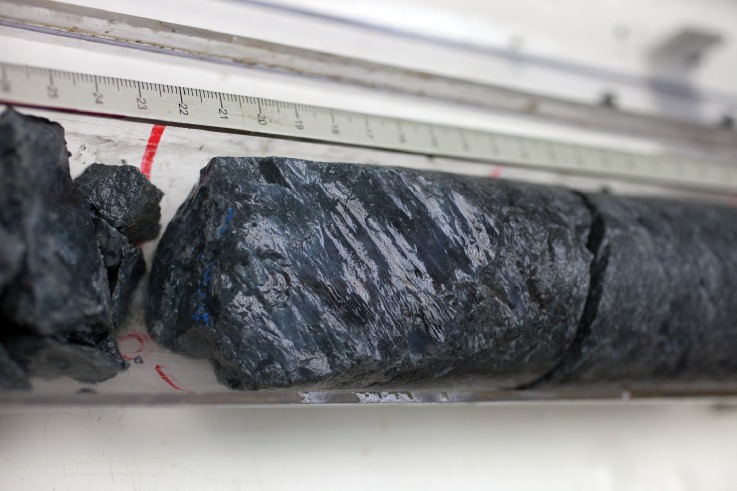
Magmatic structures observed in basement cores from Hole U1442A include contacts between distinct rock types, laminations, flow-banding structures, alignments of elongate vesicles, and magmatic breccias. In general, contacts between rock types are relatively sharp, locally lobate, and do not show progressive grain-size variation across the contacts. Laminations consist of millimeter-wide bands of different grain size and/or composition. Flow-banding structures consist of millimeter- to centimeter-wide bands of different grain size and/or composition that exhibit a shape-preferred orientation (SPO), which is generally parallel to the bands (Figure F25; Sample 352-U1442A-41R-1W, 0–2 cm; TS216). Vesicles can be locally aligned and elongate with aspect ratios up to 1:5 (Figure F26). Magmatic breccias, a few centimeters in width, occur in several intervals (e.g., intervals 52R-1W, 18–30 and 36–44 cm) (Figure F27). In places, the alignment of lozenge-shaped clasts in a breccia defines weak foliation. In several thin sections, magmatic minerals exhibit weak to moderate SPOs that are not visible at the macroscopic scale.
Tectonic structures
Basement
The following reports on the 192 structures caused by brittle deformation measured in Cores 352-U1442A-10R through 57R. These structures include shear fractures, cataclastic shear bands, cataclastic shear zones, veins, slickensides, and breccias. Cataclastic shear bands occur at 190.5, 248.21–248.59, 276.48, and 276.69 mbsf (Figure F28). Based on the abundance of fault rocks (cataclasites, fault breccias, and fault gouges), slickensides (Figures F29, F30), and networks of (shear) fractures (Figures F31, F32), fault zones are defined within the following intervals, with a few meters of uncertainty because of the low core recovery (Table T9):
- Fault Zone 1 (238.20–267.45 mbsf),
- Fault Zone 2 (432.80–444.80 mbsf), and
- Fault Zone 3 (490.90–502.20 mbsf).
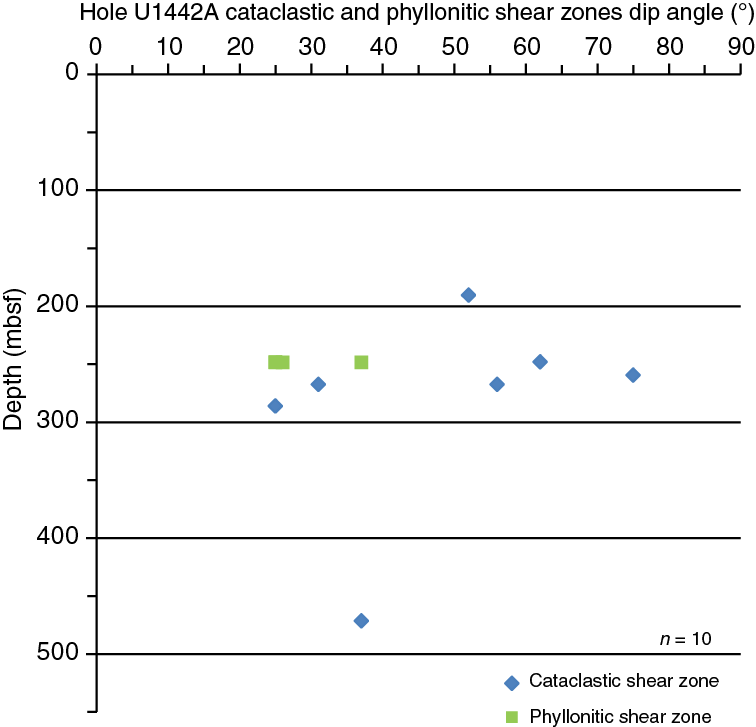


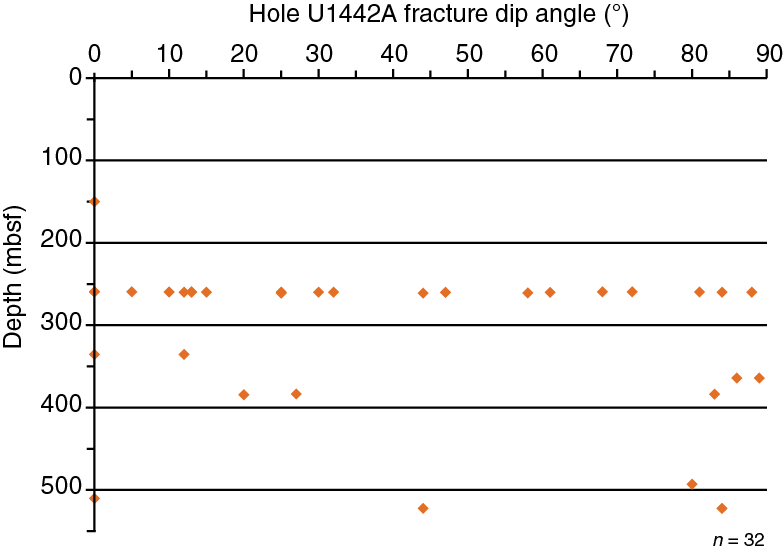

Table T9. Fault data, Hole U1442A. Download table in .csv format.
The top boundary of fault Zone 1 is defined by the first appearance of medium- to coarse-grained cataclasite within interval 28R-1, 80–115 cm (238.20 mbsf). Fault-related structures within Section 29R-1 dip steeply and consist of shear fractures and cataclastic shear zones, which are only a few centimeters thick, as well as thin shear bands with chlorite alteration seams. A phyllonitic fault core is defined by the abundance of foliated, cohesive fault gouge within interval 29R-2, 0–38 cm (248.215–248.595 mbsf). Foliation dips between 25° and 37° (Figure F28). The propylitic fault gouge consists mainly of palygorskite and sepiolite (XRD analyses of Samples 29R-2, 28–29, and 35–36 cm). Distinct shear bands at 248.40 and 248.50 mbsf indicate reverse and normal sense of shear, respectively. Sections 30R-1 and 30R-2 are characterized by boninitic hyaloclastite breccia, which is almost unaffected by tectonic fracturing. Single, steeply dipping calcite veins were observed at ~258.50 mbsf.
Sections 30R-3 and 30R-4 retrieved fractured intervals defined as fault damage zones. These are characterized by an abundance of shear fracture networks (Figure F33), which form conjugate sets of steeply dipping to subvertical, and inclined, fractures (Figures F31, F32). Fractured intervals appear at 259.30–259.35, 259.68–260.50, and 261.05–261.43 mbsf.

Two cataclastic shear zones, formed by fault breccias with fragments up to 5 cm in length embedded within a fine-grained matrix, are localized at ~267.00 and 267.45 mbsf and define the lower boundary of the fault zone.
The top of fault Zone 2 can be defined by the increase in abundance of slickensides from 432.80 mbsf downhole (Figure F29). Slickensides generally dip steeply to subvertically and show a reverse-oblique sense of shear between 432.8 and 432.9 mbsf. Between 442.6 and 442.7 mbsf, however, normal partly oblique displacement directions are observed. The slickenside-dominated interval between 432.80 and 443.65 mbsf marks a fault damage zone. The fault core comprises ~15 cm thick, greenish gray, slightly cohesive, fine-grained cataclasite and fault gouge with single millimeter-sized host rock fragments (interval 49R-3W, 45–58 cm). Because the interval below was not recovered (Core 50R), however, the lower boundary of Fault Zone 2 cannot be defined accurately. Sections 51R-1 and 52R-1 retrieved almost unfaulted boninite.
Distinct cohesive cataclastic shear zones as thick as 3 cm were observed between 461.60 and 461.70 mbsf. These shear zones consist of fault breccia with fragments as large as 1 cm in diameter.
Fault Zone 3 comprises centimeter-spaced slickensides and slightly cohesive cataclasites. The latter consist of a fine-grained matrix (<1 mm in grain size) and fragments of variable diameter up to a few centimeters. The slickenside dip angles are steep (>45°) to subvertical. Sense of shear criteria along slickenlines indicate mainly strike-slip motion with a reverse sense (Figure F34).
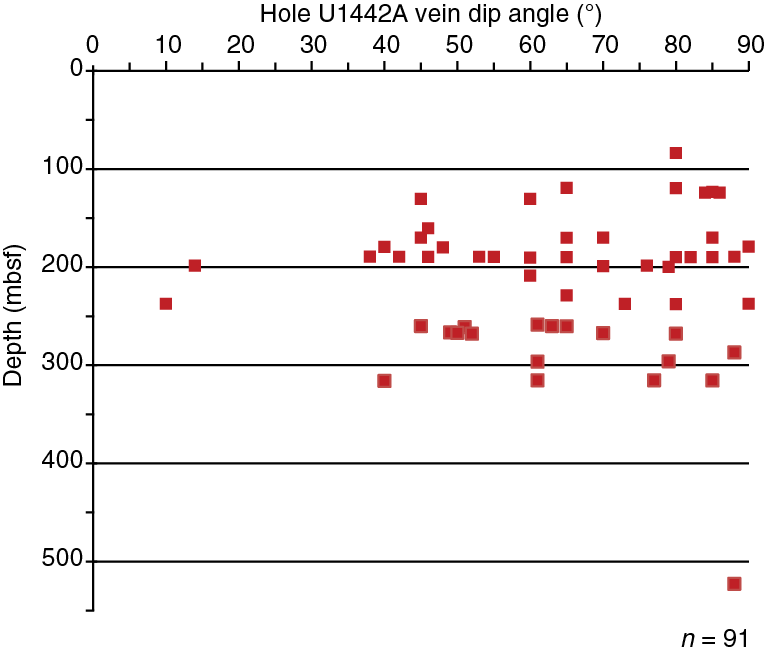
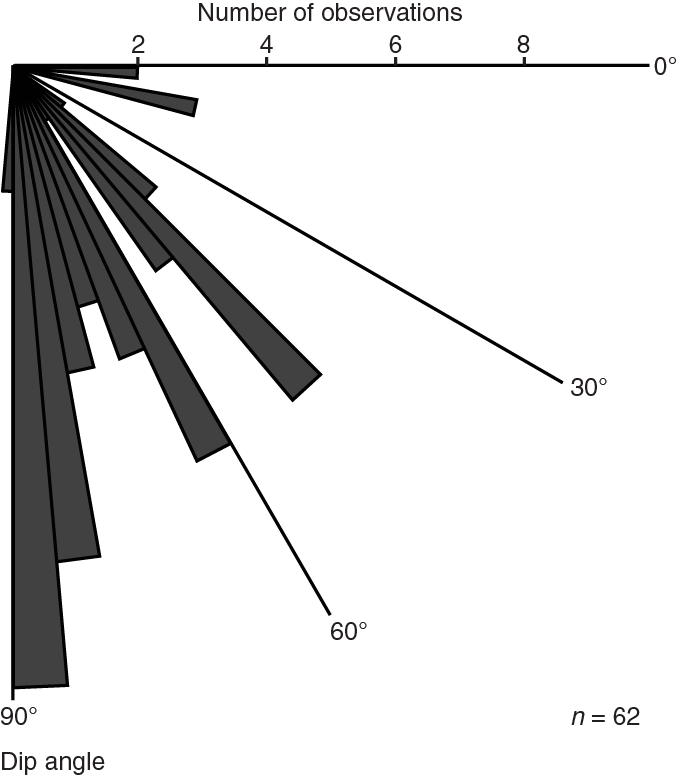
Veins are abundant between 83.80 and 316.00 mbsf and form both single and conjugate sets. Veins are usually mineralized with zeolite and only minor calcite. Vein dip angles vary from ~35° to subvertical (Figure F35), with a relatively higher frequency of 45°–50°, 60°–65°, and 80°–90° angles (Figure F36).
Microstructures
Veins are usually filled with zeolite and/or with calcite (or Mg calcite). Calcite veins are abundant and may be zoned, typically with coarse-grained calcite along the vein margins and fine-grained calcite within the central vein domains. Coarse grains of calcite are slightly deformed by twinning. Single coarse grains usually show slight undulose extinction. The shape of the calcite grain boundaries is highly variable and irregular. Only a few calcite grains are affected by subgrain development.
Physical properties
Physical properties of the cores recovered at Site U1442 were characterized by means of a set of measurements on core sections and discrete samples (see details in Physical properties in the Expedition 352 methods chapter [Reagan et al., 2015a]). Gamma ray attenuation (GRA) density, magnetic susceptibility (Magnetic Susceptibility Logger [MSL]), and P-wave velocity (P-wave Logger [PWL]) were obtained on the sediment cores using the Whole-Round Multisensor Logger (WRMSL), whereas only GRA density and magnetic susceptibility were obtained on the hard rock cores. Natural gamma radiation (NGR) was measured on the Natural Gamma Radiation Logger (NGRL) for whole-round core sections. Point magnetic susceptibility (MSP) and reflectance spectroscopy and colorimetry (RSC) data were acquired using the Section Half Multisensor Logger (SHMSL). Thermal conductivity (TCON) was obtained on whole-round sediment sections and discrete hard rock samples. Moisture and density (MAD) measurements were obtained from sediment and hard rock discrete samples and P-wave velocities, and magnetic susceptibility measurements were obtained from discrete hard rock samples. All raw data were uploaded to the Laboratory Information Management System database and subsequently filtered to remove the spurious points that correspond to empty intervals in the liner or broken pieces.
Sediment samples
P-wave velocities
Within the interval from the seafloor to 65 mbsf, P-wave velocities are between 1500 and 1520 m/s (from lithologic Unit I to the top of Unit IV; Figure F37), with the exception of peaks to 1560 m/s at 4 mbsf (Unit II) and to 1570 m/s at 45 mbsf (Subunit IIIA). These peaks correspond to tephra units. P-wave velocities start to vary significantly in Unit IV: the minimum value is ~1500 m/s and the maximum value reaches 1620 m/s (66–67 mbsf).
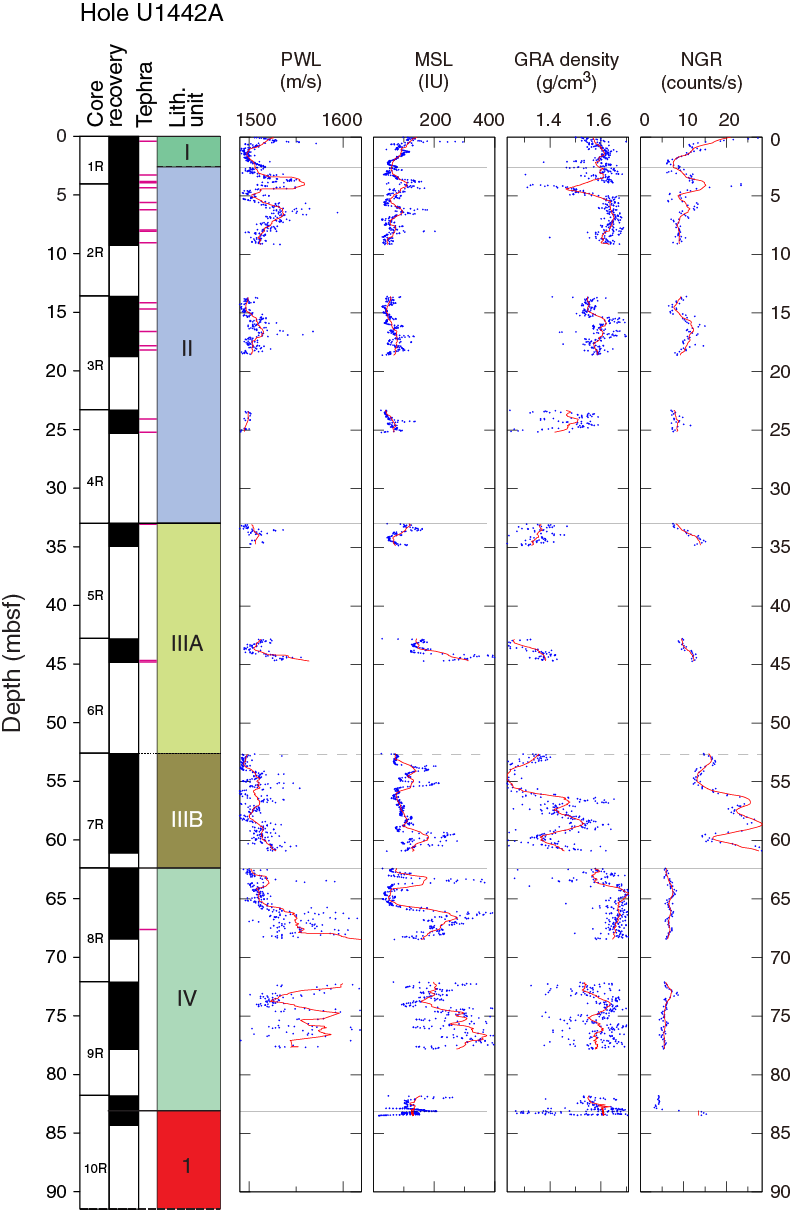
Magnetic susceptibility (MSL and MSP)
Magnetic susceptibility values (Figure F37) are 50–200 IU at 0–65 mbsf (Unit I to the middle of Subunit IIIA) except for positive peaks of ~300 IU at 45 mbsf (Subunit IIIA), ~200 IU at 60 mbsf (Subunit IIIB), and ~200 IU at 64 mbsf (top of Unit IV). The positive peak at 45 mbsf corresponds to a peak in observed P-wave velocities. Magnetic susceptibility values increase to 200–400 IU at 67–77 mbsf (Unit IV) and are highest (~400 IU) at 77 mbsf. In general, MSP values have similar trends to MSL values (Figure F38).

GRA density
Bulk GRA density values (Figure F37) decrease gradually with depth from ~1.6 to ~1.2 g/cm3 from 0 to 55 mbsf (from Unit I to the top of Subunit IIIB), increase from ~1.2 to ~1.7 g/cm3 between 55 and 62 mbsf (Unit IIIB), and are relatively constant at 1.6–1.7 g/cm3 from 62 to 83 mbsf.
Natural gamma radiation
NGR values (Figure F37) are 5–15 counts/s at 0–55 mbsf (from Unit I to upper Subunit IIIB) with a peak of 20 counts/s at the seafloor, they remain steady at ~30 counts/s from 55 to 61 mbsf (Subunit IIIB, a clay layer), and decrease to <10 counts/s at 63–77 mbsf (Unit IV).
Reflectance spectroscopy and colorimetry
There are two modes in the values of the reflectance parameter L* (Figure F38). Reflectance parameter L* values are 50–60 from 0 to 33 mbsf (Units I and II) and 63 to 75 mbsf (middle of Unit IV), and 30–50 from 33 to 63 mbsf (Units II and III). Reflectance parameter a* values are 5–8 in Units I–III (0–58 mbsf) and Unit IV (70–78 mbsf), and increase to 9 in the middle of Unit IV (67–72 mbsf). Reflectance parameter b* values gradually decrease with depth from 14 to 6 at 0–45 mbsf (from Unit I and Subunit IIIA), from 12 to 6 at 53–61 mbsf (Subunit IIIB), and from 14 to 6 at 63–77 mbsf (Unit IV).
Moisture and density
Average dry, bulk, and grain densities (Figure F38) are 0.9, 1.6, and 2.8 g/cm3, respectively, in Units I–IV (0–77 mbsf). Bulk and dry densities show a similar pattern with depth with positive spikes to 1.9 and 1.4 g/cm3 at 24 mbsf (Unit II), whereas grain density is relatively constant with depth. Calculated porosity is 65%–70% at 0–17 mbsf (Unit I), increases to 77%–87% at 33–57 mbsf (Subunits IIIA and IIIB) and decreases to 58%–70% at 60–77 mbsf (from the middle of Subunit IIIB to Unit IV).
Basement samples
Magnetic susceptibility (MSL, MSP, and discrete cubes)
Magnetic susceptibility was measured on whole-round basement cores, with maximum MSL values recorded at the center of each intact core piece (red circles in Figure F39). With the exception of the top of the basement at 83 mbsf, MSL values are mostly lower than 100 IU at 83–180 mbsf (igneous Subunits 1a–1c). MSL values increase abruptly to 700 IU at ~190 mbsf in Subunit 1d and decrease gradually to 300 IU at ~240 mbsf in the bottom of Unit 1. MSL values are high in Unit 2 and increase to >1500 IU from the fault at 248 mbsf to 385 mbsf at the bottom of Unit 2. MSL values are variable at 300–1200 IU in Unit 3. MSP values have a similar trend to the MSL values, with highest MSP values observed at ~335 mbsf in Unit 2 (Figure F40). Discrete cube magnetic susceptibility values are <40 IU at 83–245 mbsf in Unit 1 except for peaks up to 300–360 IU at 189–200 mbsf in Subunit 1d (Figure F40). Discrete cube magnetic susceptibility values increase to 200–760 IU in Unit 2, decrease to <10 IU at 433 mbsf in Unit 3, and are variable between 10 and 500 IU at 480–522 mbsf in Unit 4.
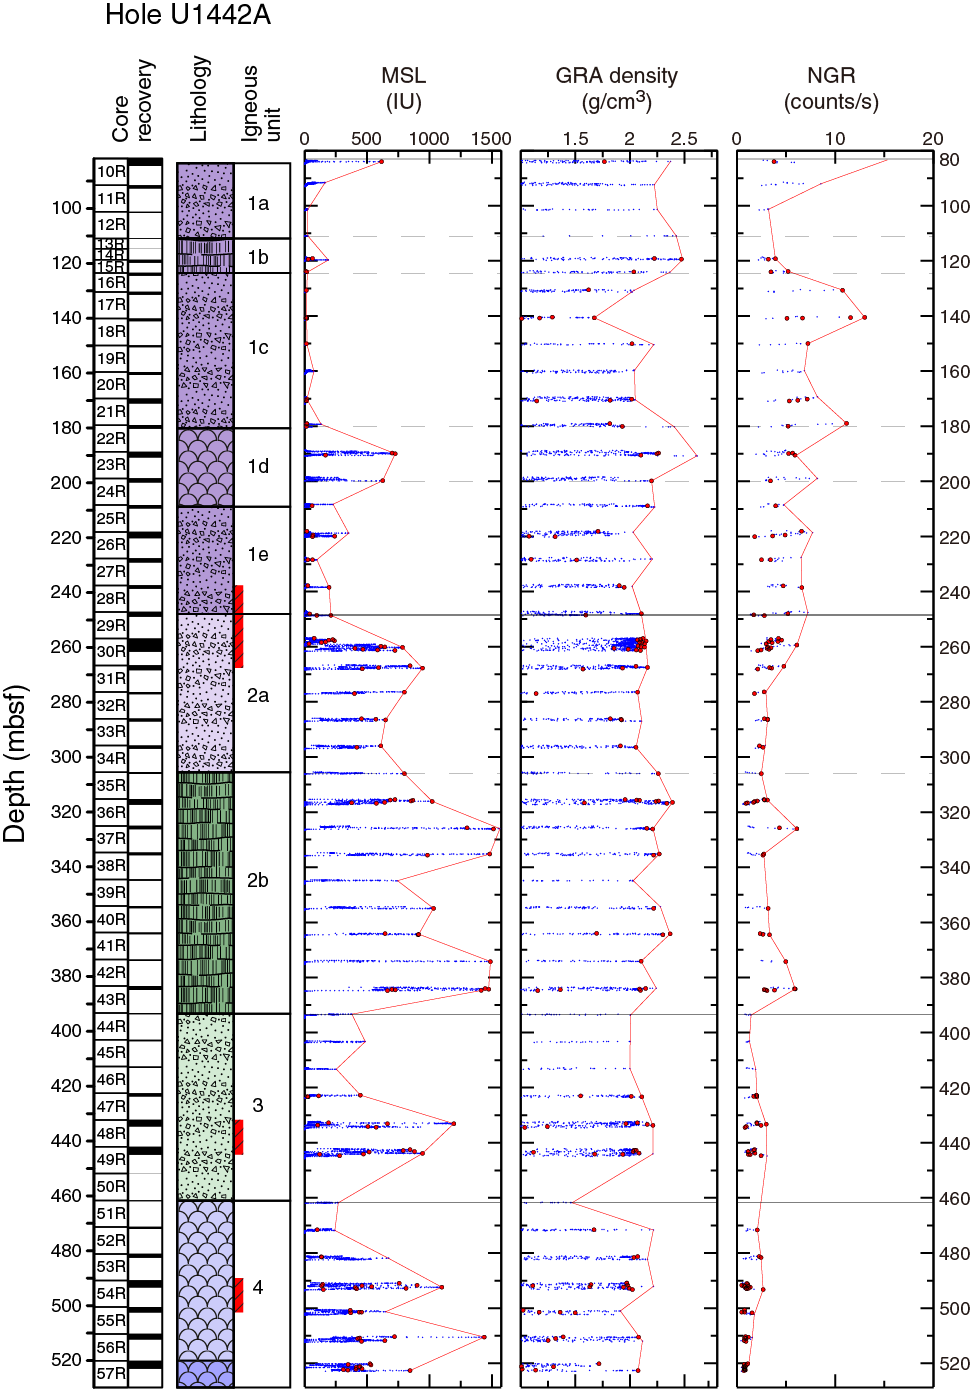
GRA density
As with magnetic susceptibility values, GRA density values reach a maximum at the center of each intact core piece (red circles in Figure F39). The maximum GRA density varies from 2.0 to 2.4g/cm3 in Unit 1, with the lowest value of ~1.6 g/cm3 at 140 mbsf and the highest value of ~2.6 g/cm3 at 190 mbsf. GRA densities are 2.1–2.4 g/cm3 in Units 2–4.
Natural gamma radiation
NGR values have the highest values of >10 counts/s at 83–140 mbsf in Subunits 1a–1c and gradually decrease with depth to 8 counts/s at 150–245 mbsf (lower Unit 1). They decrease further to 3–6 counts/s at 244–390 mbsf in Unit 2 and are <4 counts/s at 390–500 mbsf in Units 3–4.
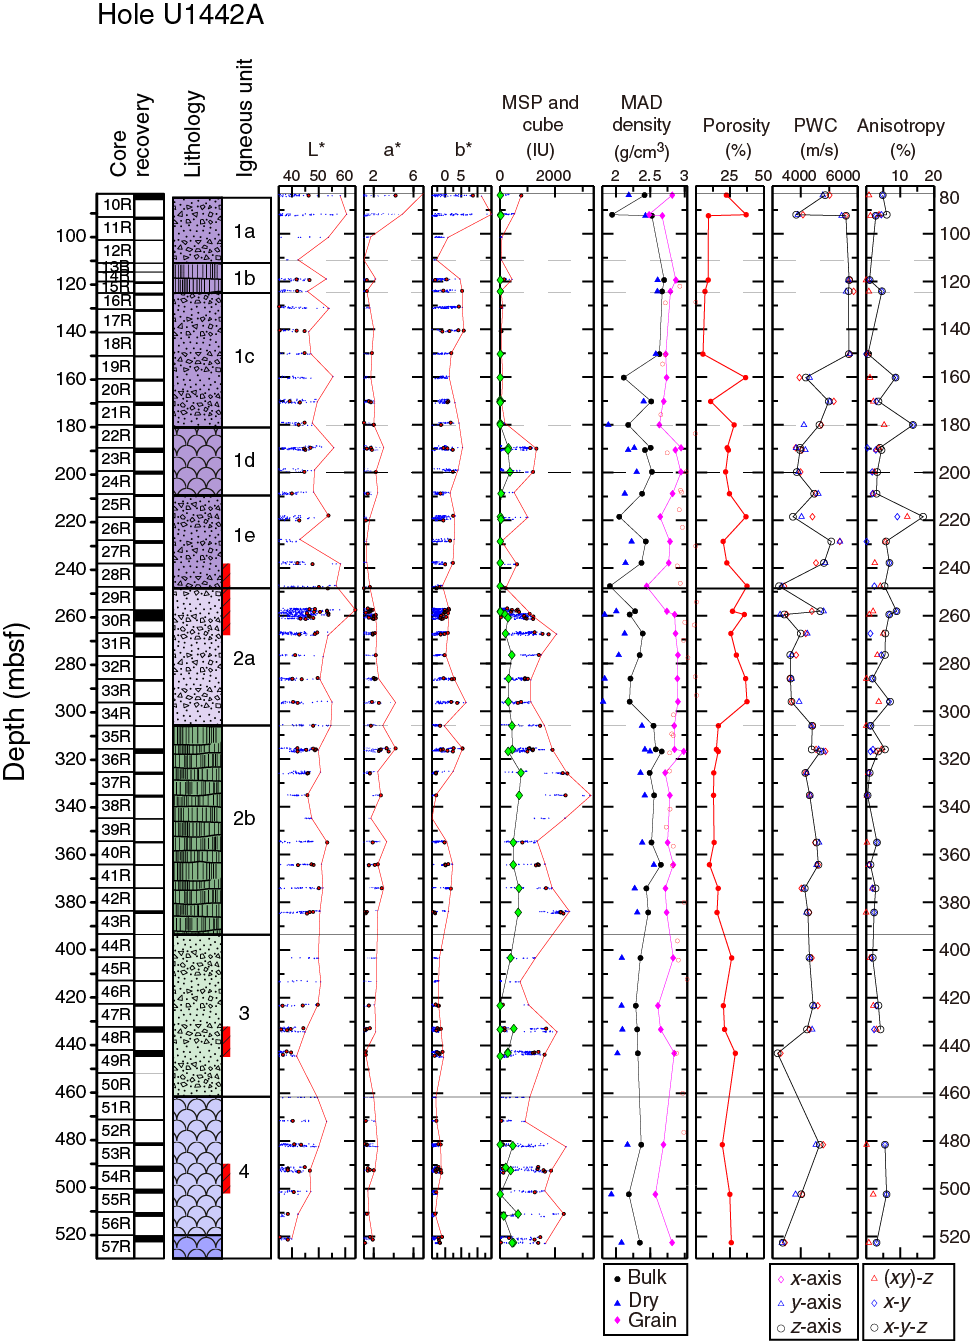
Reflectance spectroscopy and colorimetry
The maximum values of reflectance parameter L* are variable at 42–60 and show no systematic trend with depth. Reflectance parameters a* and b* show similar trends with depth, with maximum values at 83–90 mbsf in Subunit 1a.
Moisture and density
The calculated dry, bulk, and grain densities average 2.2, 2.3, and 2.8 g/cm3, respectively (Figure F40). Dry density and bulk density have the highest values of 2.6–2.7 g/cm3 at 90–150 mbsf in Subunits 1a–1c. Dry and bulk density values decrease to 2.0 and 2.7 g/cm3 at 150–310 mbsf in the lower half of Unit 1 and the upper half of Unit 2, centered at the fault zone located at the boundary between Units 1 and 2 (see Structural geology in the Site U1439 chapter [Reagan et al., 2015b]). Dry density and bulk density values are ~2.4 and ~2.5 g/cm3, respectively, at 310–390 mbsf in Subunit 2b and decrease to 2.1 and 2.3 g/cm3 at 390–520 mbsf in Units 3 and 4. Grain density values are at 2.6–2.8 g/cm3 in Units 1–4. Porosity values show a negative correlation to bulk density values. Porosity values are the lowest at 90–150 mbsf with values <10% in Subunits 1a–1c and are variable between 10% and 40% at 150–310 mbsf in the lower half of Unit 1 and the upper half of Unit 2, centered at the fault zone at the boundary between Units 1 and 2. Porosity values are ~12% at 305–365 mbsf in Subunit 2b and increase to ~25% at 365–522 mbsf in Units 3 and 4.
P-wave velocities (PWC)
P-wave velocities measured on discrete samples show a negative correlation with porosity (Figure F40). P-wave velocities have a maximum value of ~5800 m/s at 90–150 mbsf in Subunits 1a–1c, where porosities are <10%. P-wave velocities are variable between 3000 and 5000 m/s and decrease to <4000 m/s at 150–310 mbsf in the lower half of Unit 1 and Subunit 2a. P-wave velocities are 4500 m/s at 310–520 mbsf in Subunit 2b and Units 3–4, with the exceptions of the fault zones at 443 and 500 mbsf where decreased values of 3500–4000 m/s are observed. P-wave velocity is 3200 m/s at 522 mbsf.
Thermal conductivity
The thermal conductivity of the sedimentary cores was measured (usually once per core in the middle part of the third section) using a needle sensor. Most of the measurements (which consisted of three replicate analyses in the same spot) were unreliable, and only a few measurements were successful, although all the raw data are available in the database. Thermal conductivity ranges from 0.81 to 1.10 W/(m·K), with an average value of ~0.99 W/(m·K) (Figure F41). Thermal conductivity on basement rocks often required 5 replicate analyses but delivered reliable results. Average thermal conductivity values of 1.28, 1.81, and 1.12 W/(m·K) were measured for discrete samples at 83–296, 306–383, and 423–481 mbsf, respectively.

Paleomagnetism
Sediment
Paleomagnetic measurements were made with the pass-through cryogenic magnetometer on sediment Cores 352-U1442A-2R through 9R as well as on Core 10R, which contains a mixture of sediment and igneous rock. Core 1R was not measured because it was highly disturbed by rotary drilling. Measurements were made at 5 cm intervals, and five sets of measurements were made with different alternating field (AF) demagnetization levels (0, 15, 20, 25, and 30 mT). No discrete samples were measured because the sediment magnetization is likely to be weak and easily affected by the anhysteretic remanent magnetization (ARM) observed on most of the samples treated with the shipboard D-Tech AF demagnetizer.
Magnetic polarity was interpreted from the inclination of the 30 mT AF step (Figure F42), which appears to have the drill string overprint removed. Inclinations are reasonably consistent within cores, mainly showing zones with high positive and negative inclinations. Nevertheless, the recorded inclinations are rather high, mostly having absolute values >60°. This is unexpected because the geocentric axial dipole inclination for the site (i.e., the current average field direction) is 47.6°. The cause of inclination steepening is unclear.
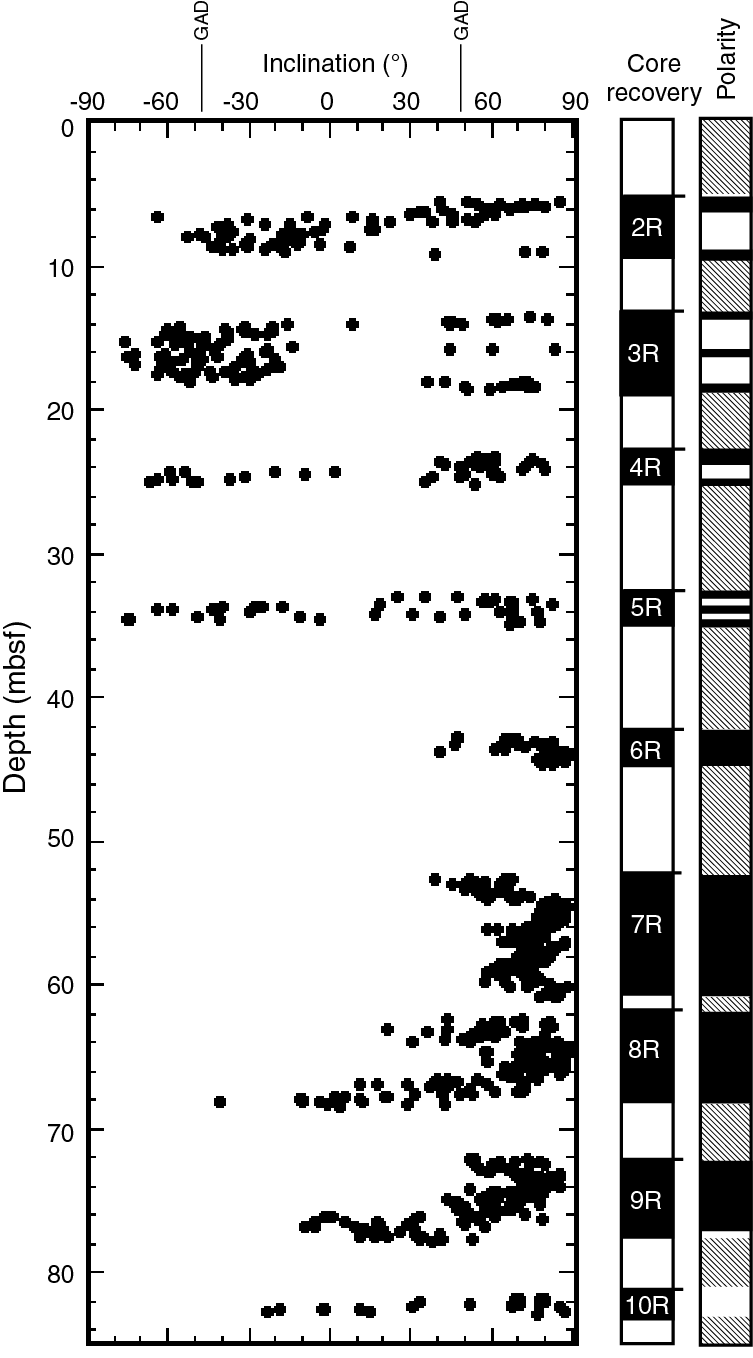
These cores display alternate intervals with positive and negative inclinations, implying a magnetic stratigraphy. However, it is difficult to interpret the pattern because it is neither continuous nor distinctive. More than half of the polarity record appears to be missing because of nonrecovery of cored material (Figure F42). In addition, biostratigraphic datums (see Biostratigraphy) indicate that these cores span a time range of ~30 million years. The geomagnetic polarity timescale (GPTS; Gradstein et al., 2012) shows dozens of normal and reversed polarity intervals over this time range, but in the cores only a few are observed. These observations indicate that the polarity record in Hole U1442A cores is fragmentary and probably riddled with sedimentary gaps. Unfortunately, the pattern of the measured polarity record is not distinctive, so it cannot be reliably correlated to the GPTS.
Igneous rock
Archive-half measurements
Recovery in Hole U1442A was usually low, and few core pieces were long enough to measure with the pass-through cryogenic magnetometer. In previous holes, we measured archive-half core pieces that were >10 cm (Site U1439) and >15 cm in length (Site U1440). The reason for restricting measurements to longer pieces is that the magnetometer has a sensing region with a half-width of 8 cm, so short pieces will have distortions of the sample magnetic field at their edges that can cause erroneous measurements of field direction. Despite limiting measurements to longer pieces, the consistency of archive-half pieces was poor at previous sites. Given this inconsistency and the few large pieces recovered in Hole U1442A, archive-half pieces were not measured, with one exception. Sections 352-U1442A-30R-1 through 30R-3 were continuous and long enough to be demagnetized and measured in the cryogenic magnetometer using the normal section routine. AF demagnetization was used to remove overprint magnetizations, using 5, 10, 15, 20, 30, 40, and 50 mT steps. The plan was to correlate the measured data with the core photographs and take the most consistent inclination measurements from the middle of the larger pieces. Unfortunately, the results were inconsistent (Figure F43). Inclination values change abruptly within the sections, and these changes do not correlate with piece edges or boundaries. Furthermore, even after AF demagnetization, the inclinations remain inconsistent. Our conclusion is that we have no basis to choose the correct magnetic inclination because of the many different values obtained from these sections. Without further experimentation, it is difficult to determine the cause of this behavior, but it implies that these and other similar measurements are unreliable.
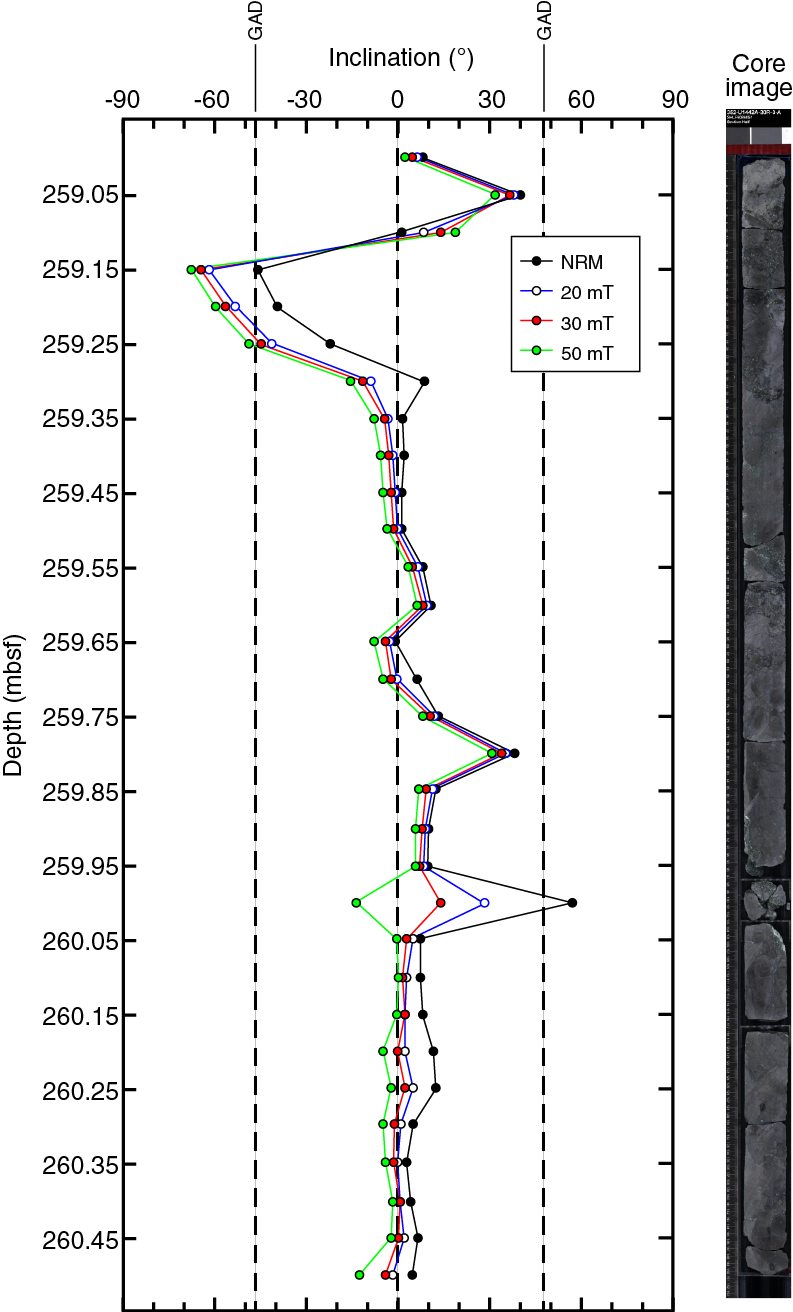
Discrete samples
Discrete samples were taken as 8 cm3 cubes at a rate of ~1 discrete sample per section, except in sections in which there were no core pieces long enough to be considered oriented. Because of the ongoing issue with ARM acquisition in weaker samples in the D-Tech demagnetizer, thermal demagnetization was preferred, although a few samples with a strong NRM were treated with AF demagnetization. In total, eight samples were treated with AF demagnetization and 39 with thermal demagnetization.
Six AF-demagnetized samples produced results consistent enough to be analyzed with principal component analysis (PCA; Kirschvink, 1980). Demagnetization spectra are characterized by an initial plateau and high median destructive fields (MDFs) between 14.5 and 30.8 mT, with higher values in the uppermost part of the hole (Figure F44). These observations imply that the magnetization carriers are fine grains. With the successful AF demagnetizations, a single direction is easily identified on the orthogonal vector (Zijderveld) diagram (Figure F44).
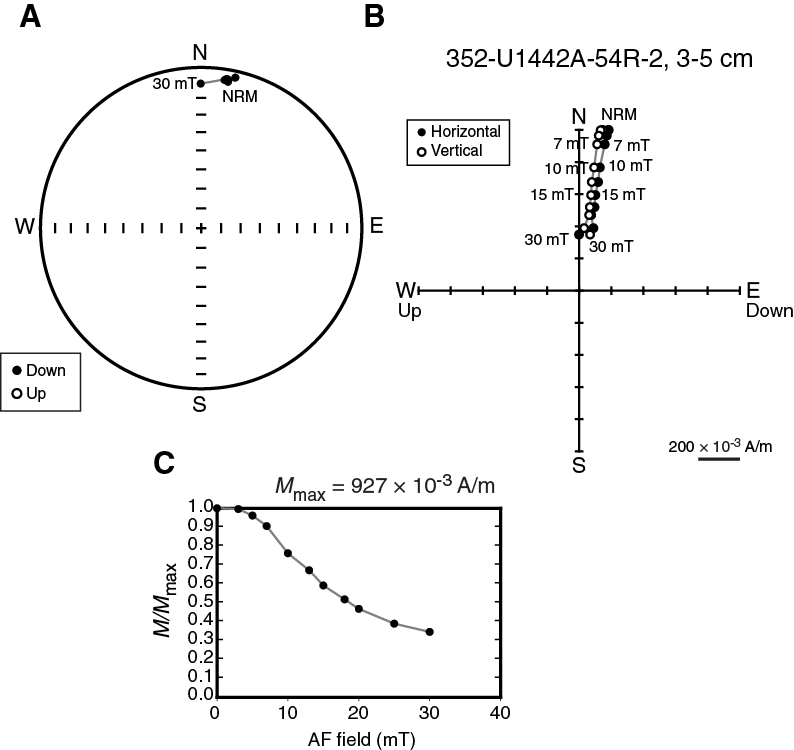
Thermal demagnetizations were carried out between 150° and 550° or 600°C, depending on the magnetic behavior, typically with 50°C steps up to 450°C and 25°C steps at higher temperatures. No pretreatment, low-temperature demagnetization in liquid nitrogen was used, as the samples were largely fine grained, and no multidomain behavior was noted in the AF demagnetizations. All samples were completely demagnetized by 600°C (implying no hematite content). As with samples from Sites U1439, U1440, and U1441, some of the Hole U1442A igneous samples display either an initial plateau in the demagnetization curve or a slight decrease, followed by an increase in magnetization around 250° to 300°C (Figure F45) that appears to result from partial self-reversal (Doubrovine and Tarduno, 2004, 2005). At temperatures above 350°C, the magnetization declines between about 400° and 600°C, typically with a sharp drop between 550° and 600°C. These steps can be used to identify a stable magnetic direction in most samples using PCA. Self-reversal was not observed as often as in the previous holes. In other samples, two main behaviors are observed. In some cases, the NRM decreases gradually between 300° and 550°–600°C (Figure F46). Curie temperatures are between 450° and 500°C, which implies that the magnetization carriers are titanomagnetite or titanomaghemite with a Ti substitution, x, between 0.1 and 0.4 (O’Reilly, 1976). In the other cases, the NRM is stable with heating up to 400° or 500°C and drops precipitously within 50°C (Figure F47). As was observed in Holes U1439C and U1441A, some demagnetization spectra are typical of fine-grained pure magnetite, with a sharp drop of the NRM between 550° and 600°C.
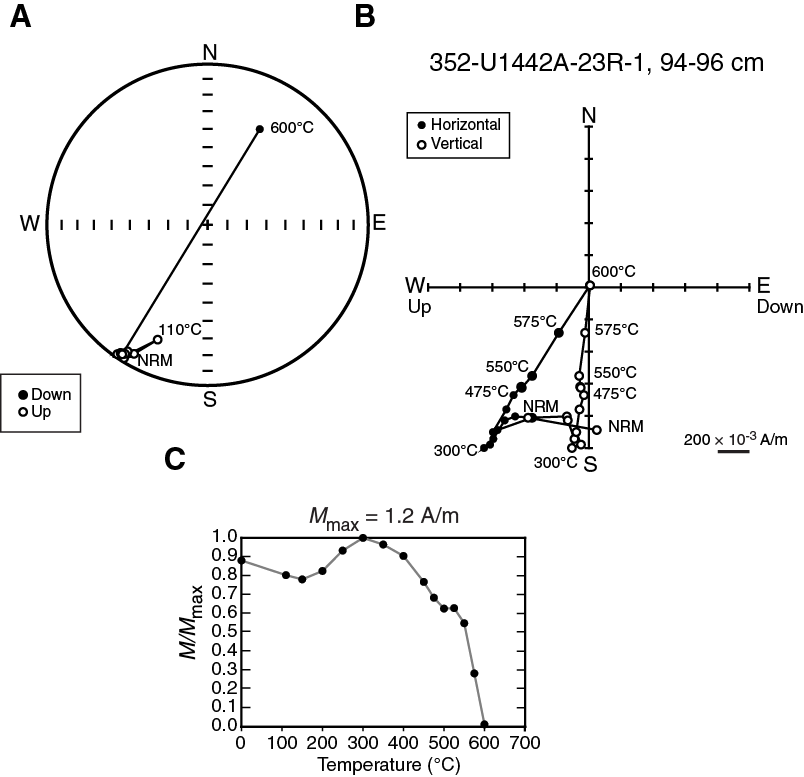
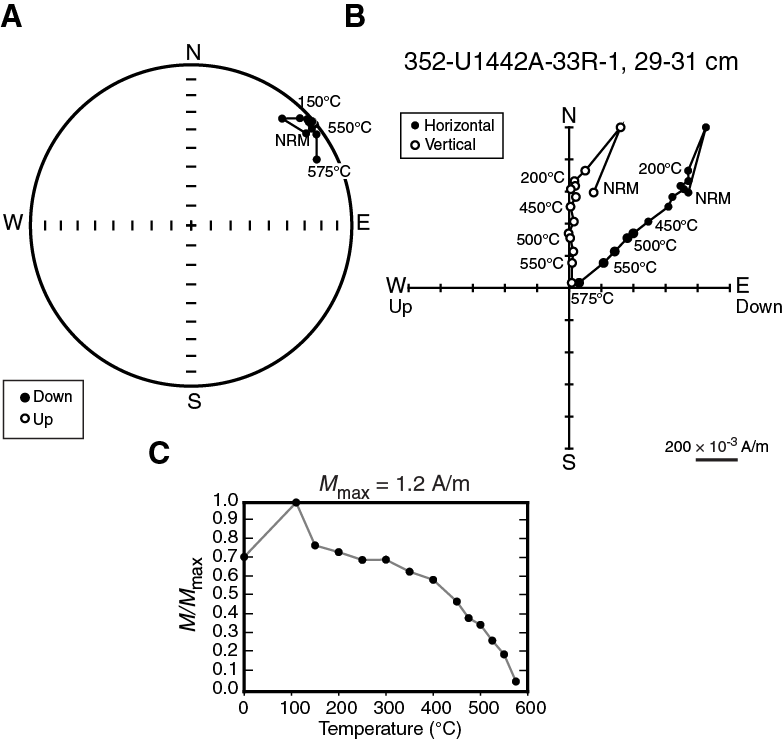
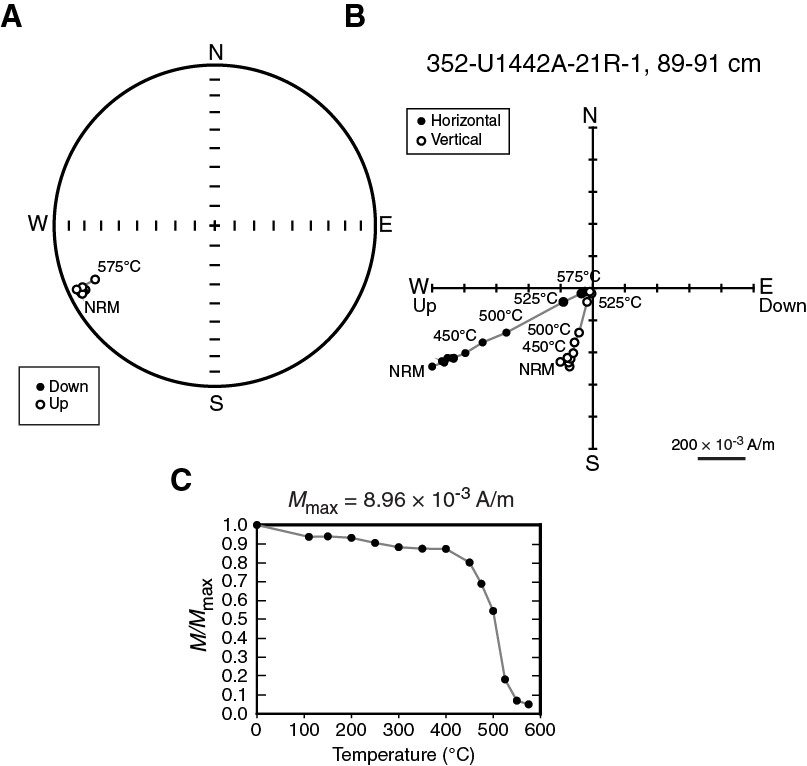
In most samples, the bulk magnetic susceptibility varies little during the thermal treatment. Some samples exhibit a change in susceptibility by a factor of ~2 between room temperature and the last heating step, which could indicate that titanomaghemite grains are transformed into magnetite with the higher heating steps (Özdemir and O’Reilly, 1982). Nevertheless, the magnetization increase is usually modest, implying that the content of titanomaghemite is low. Most demagnetization plots are of high quality, showing a single paleomagnetic direction in most cases, even when a self-reversed component is present (Figures F45, F46, F47). Of the 47 discrete samples measured, 10 (21%) had unstable behavior that did not allow the identification of a paleomagnetic direction.
Rock magnetic measurements
In order to characterize the magnetization carriers, we measured the acquisition of partial ARM (pARM) on the samples that were used for AF demagnetization. The samples were measured at 10 mT steps with the ARM applied over 10 mT intervals up to 100 mT (Figure F48). It was impossible to start from a completely demagnetized state (near zero magnetization strength) because of the high coercivity of the samples and because they acquired a spurious ARM in the AF demagnetizer. This is why the measurements near the origin of Figure F48 are not zero. The pARM acquisition curves show a broad peak with a maximum for fields between 10 and 30 mT. This confirms that the carriers of magnetization are fine grains. Comparing with measurements made on synthetic magnetite (Jackson et al., 1988), our peak values correspond to grain sizes around 2–3 μm.
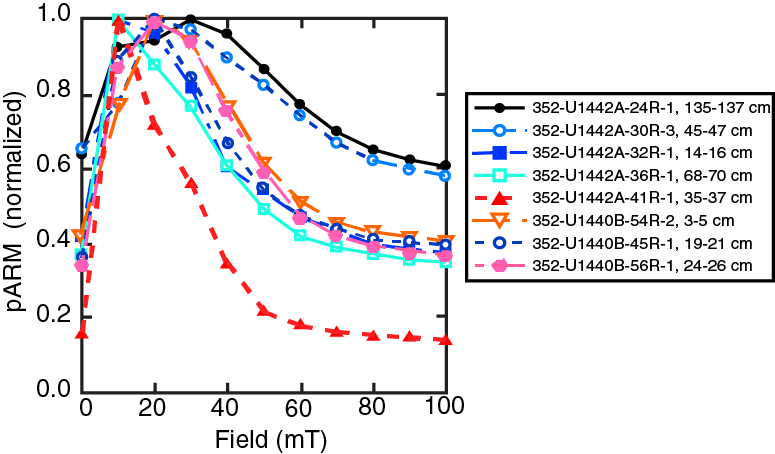
Inclinations
Paleomagnetic directions were calculated using PCA analysis on a subset of demagnetization values, usually at high demagnetization steps, that appear to show a linear decay toward the origin of an orthogonal vector (Zijderveld) plot (Figures F44, F45, F46, F47). This consistent set of demagnetization steps is assumed to be the characteristic remanent magnetization that was recorded at the time of initial sample cooling (e.g., Butler, 1992; Tauxe, 2010).
Inclinations from Hole U1442A are mostly low in absolute value (<30°) but with a few individual measurements or clusters that have higher values (Figure F49). Most samples give inclinations that are low negative values with a small number of low positive values mixed in. Histograms of inclinations show peaks near zero (Figure F50). Excluding samples with inclination absolute values >30°, there is no significant difference between the mean for thermal (–4.3°) and AF (–1.0°) demagnetized samples.


The observed pattern of inclinations is similar to that observed in the basement section of Hole U1439C, except that for Hole U1439C the low values were mostly positive. The low inclinations are consistent with other studies that show that the Izu-Bonin arc formed at low latitude near the Equator (e.g., Hall et al., 1995). The mixture of negative and positive inclinations probably results from paleosecular variation, which typically causes the magnetic inclination at a site to vary by 15° to 20°. Thus, these changes in the inclination sign are probably not magnetic reversals recorded in the volcanic layers. A total of 13 such changes in inclination sign are observed downhole, a number that if interpreted as successive reversals would imply an unrealistically large age range in the section. However, the difference in inclination between Holes U1439C (average positive) and U1442A (average negative) does potentially imply a time gap and perhaps a magnetic reversal. One possibility is that one section is older than the other by perhaps a few million years, in which case the site may have drifted across the Equator (from low negative inclinations to low positive inclinations) in the time in between. Without other constraints, it is uncertain which site is the older because polarity must be assumed. If the sections both have normal polarity, then Hole U1442A formed south of the Equator and Hole U1439C to the north. If reversed polarity, the opposite is true. Another possibility is that one hole has normal polarity and the other has reversed polarity.
Interestingly, there is a subtle shift at ~400–440 mbsf in the Hole U1442A section. Above that level, inclinations are mostly low negative values, but below that they are positive. This difference may indicate a shift in magnetic polarity from igneous Units 3 and 4 to Units 1 and 2 (Figure F49). Alternatively, Units 3 and 4 may have formed rapidly and so recorded only a small variation in magnetic inclination when the field had a positive inclination.
In the Hole U1439C basement section, it was observed that many of the magnetic inclinations with high absolute values are located near faults. In Hole U1442A, this correlation is not observed (Figure F49). The observed outlier values occur in several spots. One is near the top of the hole in Subunit 1a, which is a breccia (see Petrology) and could be expected to give scattered results. Four samples in Subunits 1d and 1e give values near the present-day magnetic field, which could result from recent remagnetization. One high negative value in Subunit 2b may be simply an errant sample.
Downhole logging
Hole U1442A was logged with two downhole logging tool strings over a period of ~15 h (Figure F51). The borehole conditions were challenging, with the hole filling in significantly during the first tool string run but stabilizing thereafter. Weather conditions and sea state were favorable for logging operations. Gamma ray, bulk density, electrical resistivity, magnetic susceptibility, and sonic velocity data sets were successfully collected, in addition to microresistivity images.
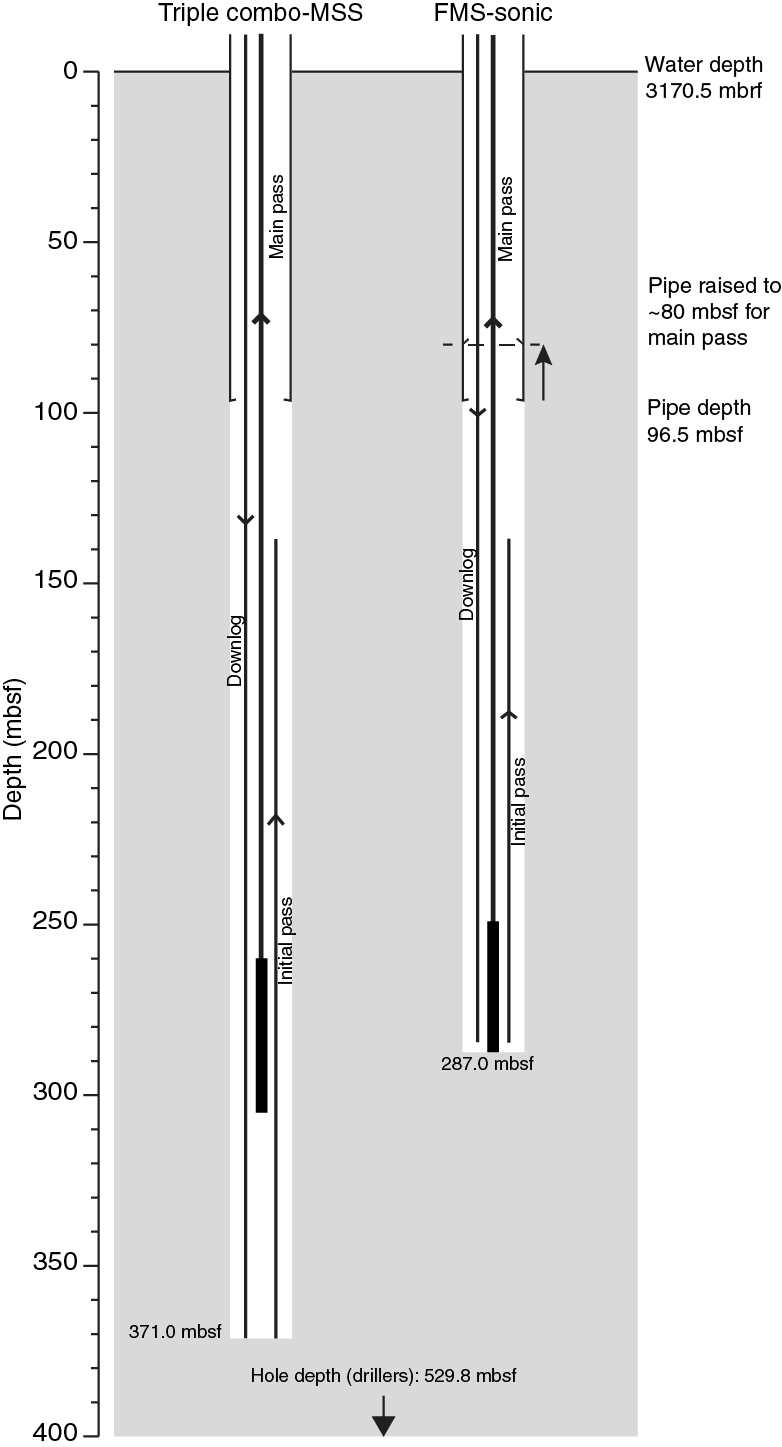
Operations
Downhole logging operations in Hole U1442A commenced at 1045 h local time on 23 September 2014. Generally, good hole conditions were reported by the drillers, though three problematic depths were noted at ~82 (sediment/basement contact), 279, and 473 mbsf. Neither of the lower problematic depths coincide with any specific lithologic changes or faults reported by the Science Party.
The first logging tool string deployed, the triple combo-MSS, reached a maximum depth of ~371 mbsf, where it encountered a blockage in the hole. This is ~158 m short of the total depth of the hole. Between the first and second passes of this tool string, the hole filled in significantly, with the tool only reaching a depth of ~305 mbsf on the second pass. Hole conditions continued to deteriorate between the triple combo-MSS and FMS-sonic tool string deployments, with an additional 19 m of fill accumulating, so that the maximum hole depth reached by the FMS-sonic was ~287 mbsf. The sea state was reasonable for logging operations (0.8 m peak-to-peak at the start) but, with a forecast for increasing heave, the wireline heave compensator was utilized to minimize the effect on tool motion in the hole.
The triple combo-MSS (see Downhole logging in the Expedition 352 methods chapter [Reagan et al., 2015a]) was the first tool string deployed in Hole U1442A. The tool string included the Hostile-Environment Natural Gamma Ray Sonde (HNGS), Hostile-Environment Litho-Density Sonde (HLDS), High-Resolution Laterolog Array (HRLA), and the deep-reading cartridge of the MSS-B (see Downhole logging in the Expedition 352 methods chapter [Reagan et al., 2015a] for tool string diagrams, descriptions, and acronym definitions). An initial logging pass was undertaken at a speed of 460 m/h from ~371 to ~137 mbsf, followed by a second pass from 305 mbsf through the pipe to the seafloor at the same speed. Note that the HLDS caliper failed to open on the second pass, so no caliper or density data are available for this tool string pass. The tool string arrived back at the rig floor by 1815 h.
The FMS-sonic was the second tool string deployed in Hole U1442A. This tool string included the HNGS, Dipole Sonic Imager (DSI), and FMS tools, which produced spectral gamma ray, acoustic velocity, and electrical image data, respectively. This tool string reached a depth of ~286 mbsf, from where an initial uplog was undertaken at a speed of 400 m/h to a depth of ~137 mbsf. A second and final pass at a speed of 460 m/h acquired data from ~287 mbsf through the drill pipe to the seafloor before the tool string was retrieved at the rig floor. Logging operations concluded at 0105 h local time on 24 September.
Data processing and quality assessment
Consistency across the downhole logging data sets is achieved by depth shifting to a reference datum and depth matching to a reference logging pass. Seafloor was identified on the gamma ray logs by a very subtle inflection. The reference logging pass was taken as the second uplog (main pass) of the triple combo-MSS, with the seafloor picked at 3170.5 mbrf. Depth matching of the gamma ray logs from the different passes was undertaken based on identification of common features, also using the triple combo-MSS main pass as the reference. The depth adjustments made through this process were then propagated to all other log curves from the triple combo-MSS initial pass and both FMS-sonic passes.
Caliper data from both of the tool strings (HLDS and FMS tools from triple combo-MSS and FMS-sonic tool strings, respectively) indicate that Hole U1442A does not have a smooth profile but has some large washed out zones (Figures F52, F53, F54). The two orthogonal caliper measurements of the FMS tool indicate that the hole was not symmetrical in cross section. However, the range in hole diameter is such that effective tool centralization (HRLA and DSI) and eccentralization (HLDS) was possible and, as such, data quality should be reasonable. At some depths, where there are short discrete washed out zones, effective tool pad contact (HLDS and FMS) may have been difficult, affecting data quality in these intervals.
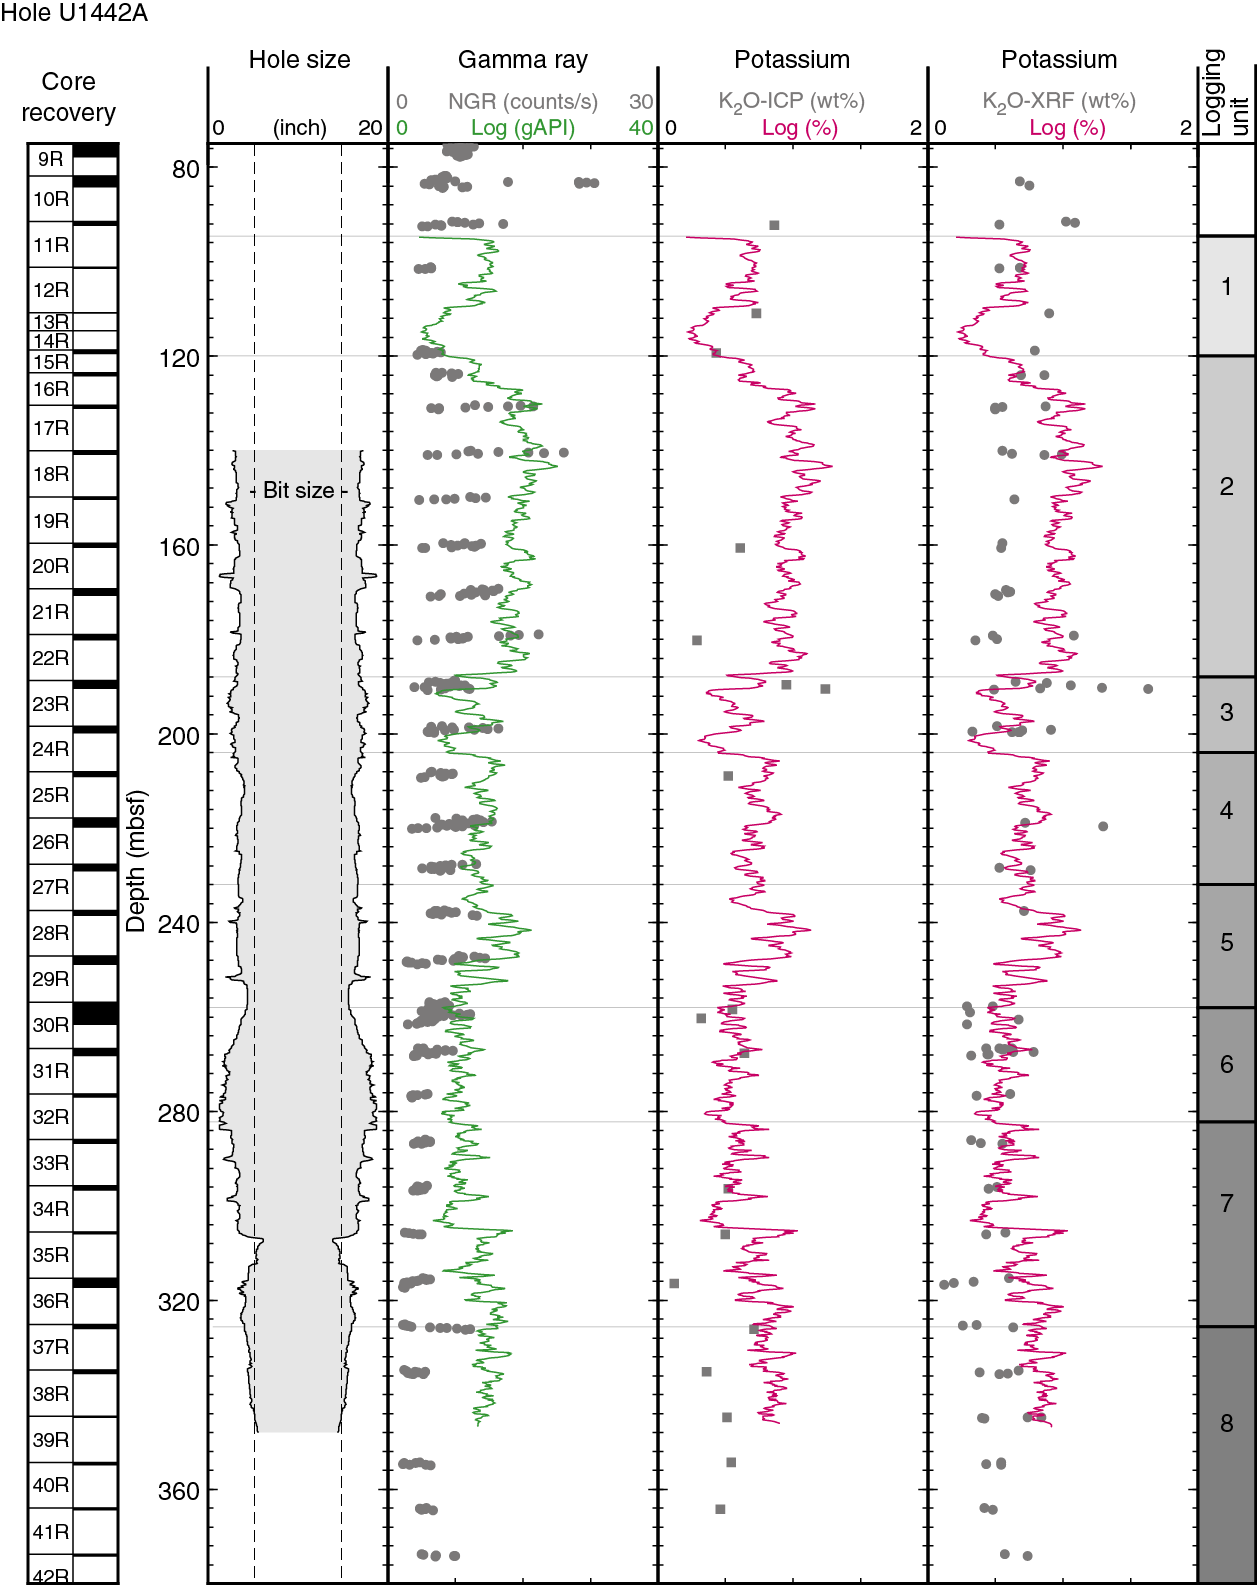
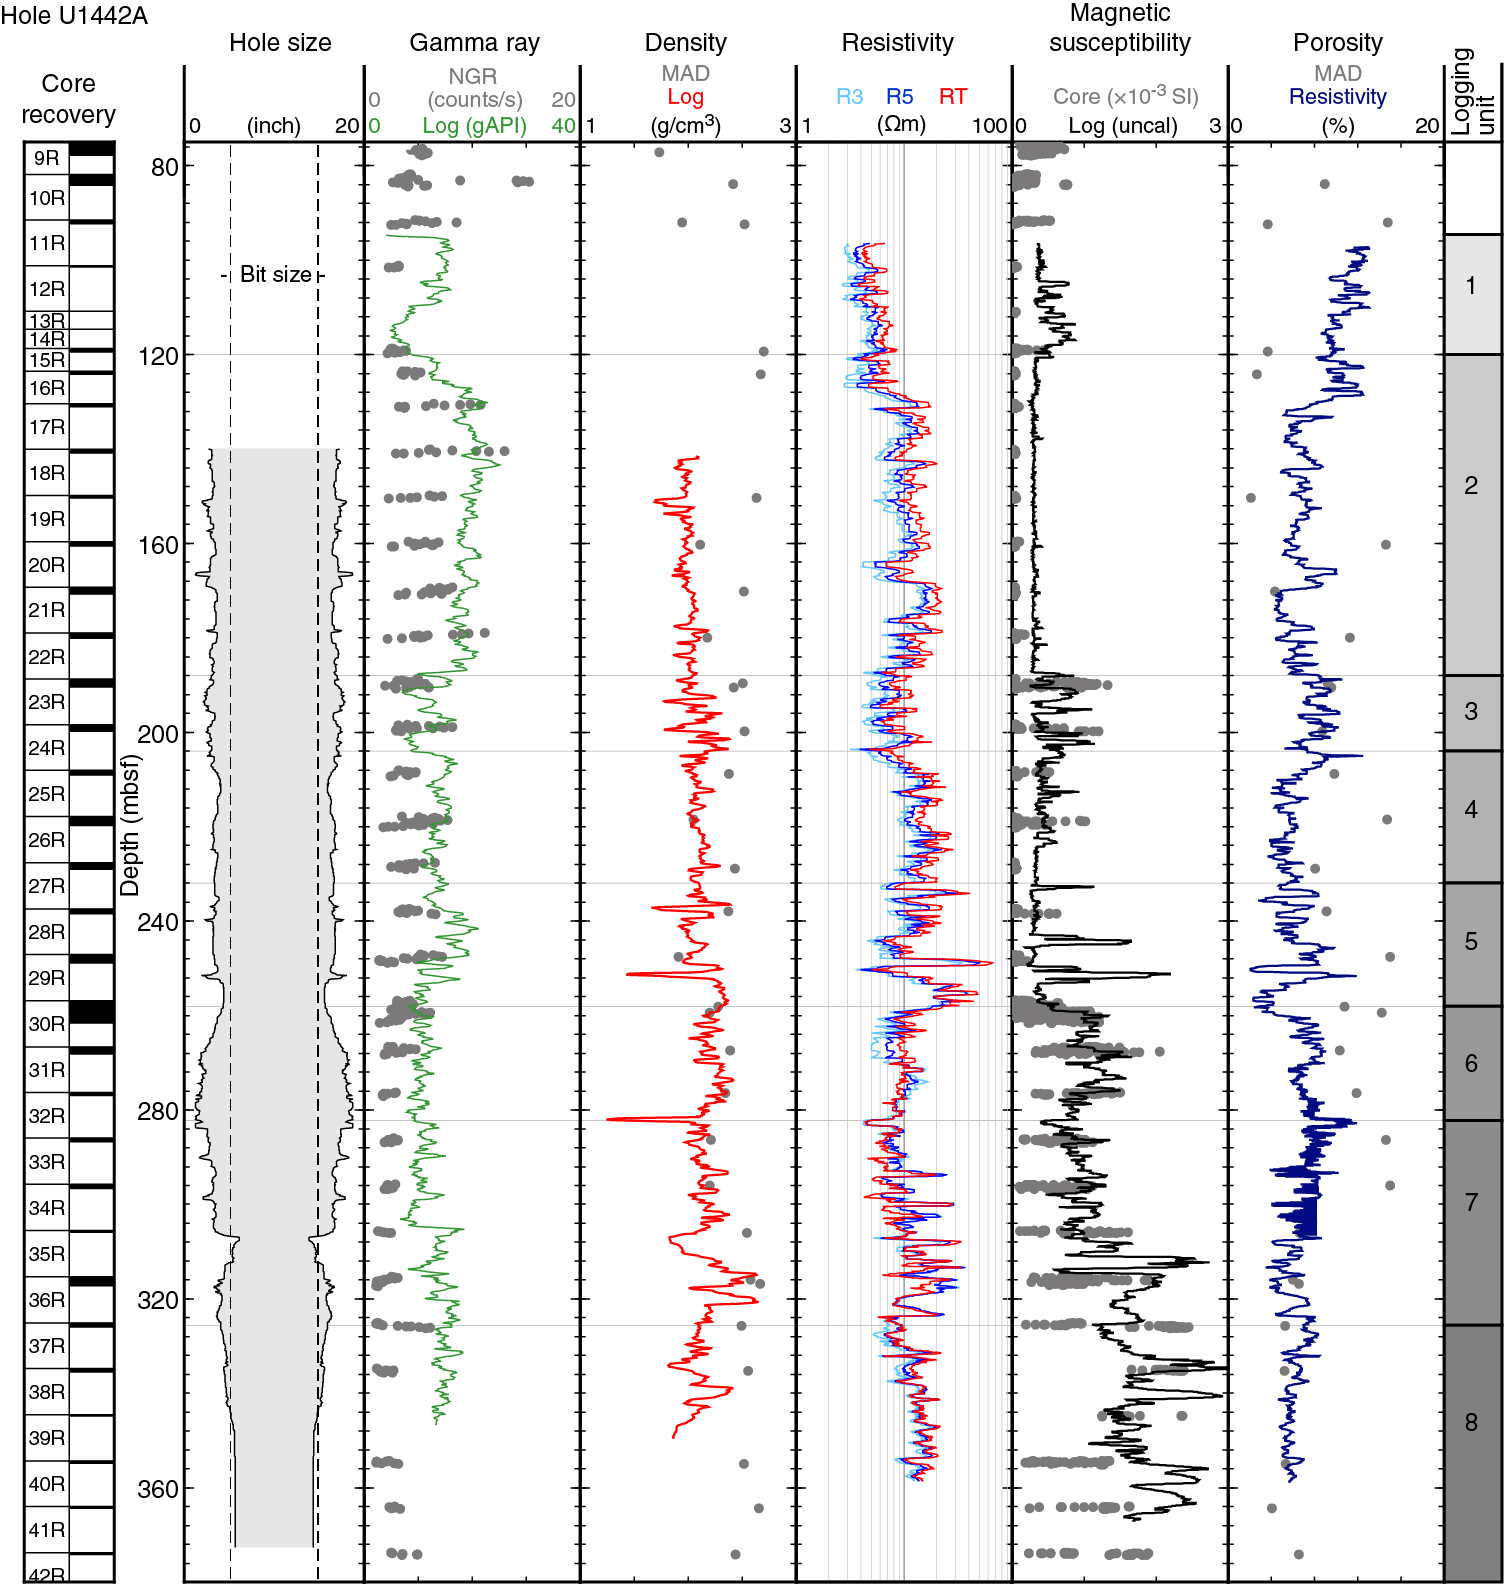
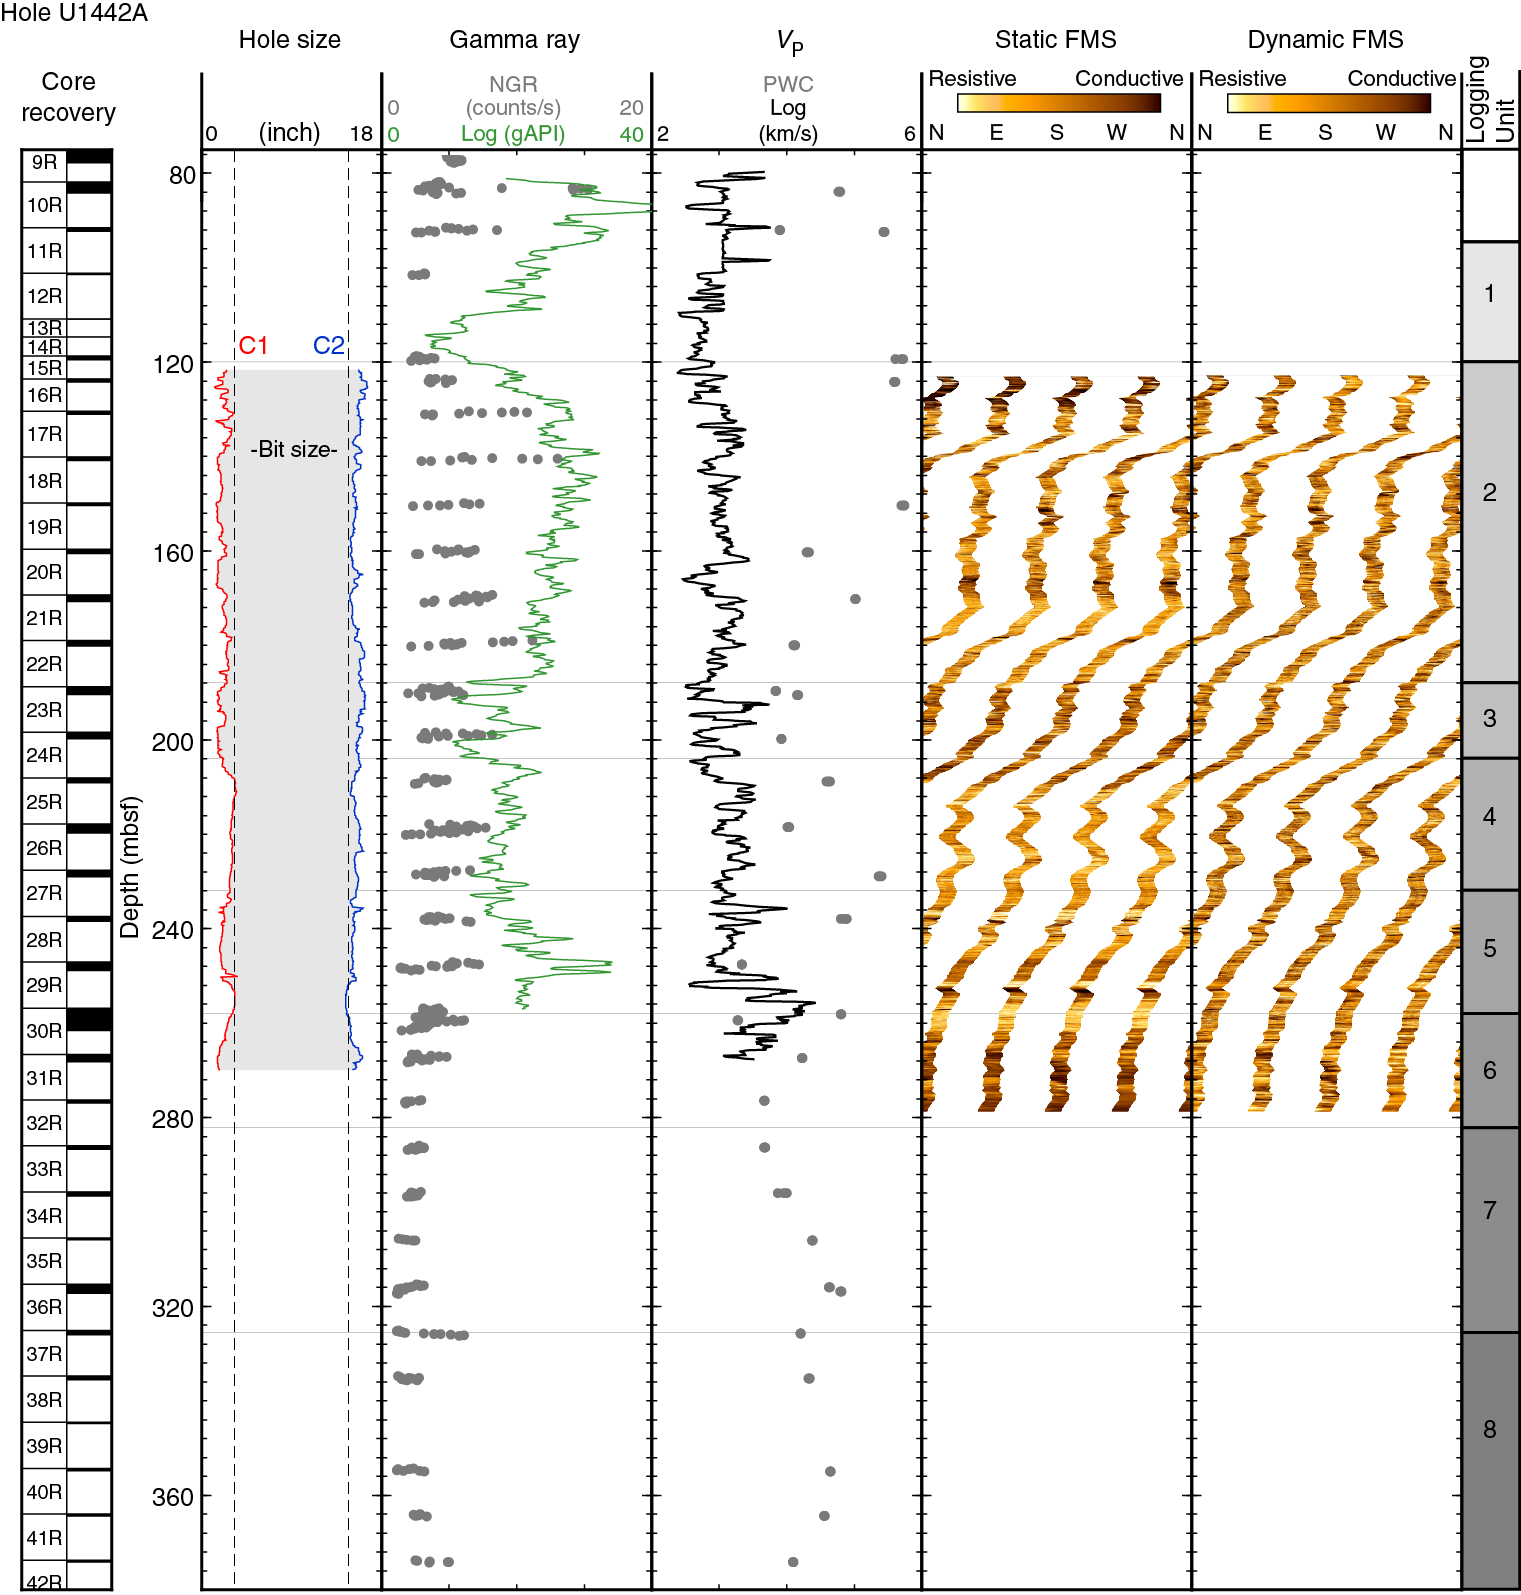
Figure F55 summarizes repeatability of subsequent passes of the triple combo-MSS tool string, with excellent agreement between the trends in gamma ray, resistivity, and magnetic susceptibility profiles. An offset between the gamma ray curves from subsequent passes can be attributed to the position of the tool in the borehole, with the tool eccentralized (due to successful deployment of the HLDS caliper) on the first pass, but with no active tool positioning on the second pass. An offset in the values of the resistivity curves may be attributed to deteriorating hole conditions or equilibration of the tool to ambient temperature. As at the other sites logged during Expedition 352, thorium and uranium data from the HNGS are below the limits of detection and so are not presented here.
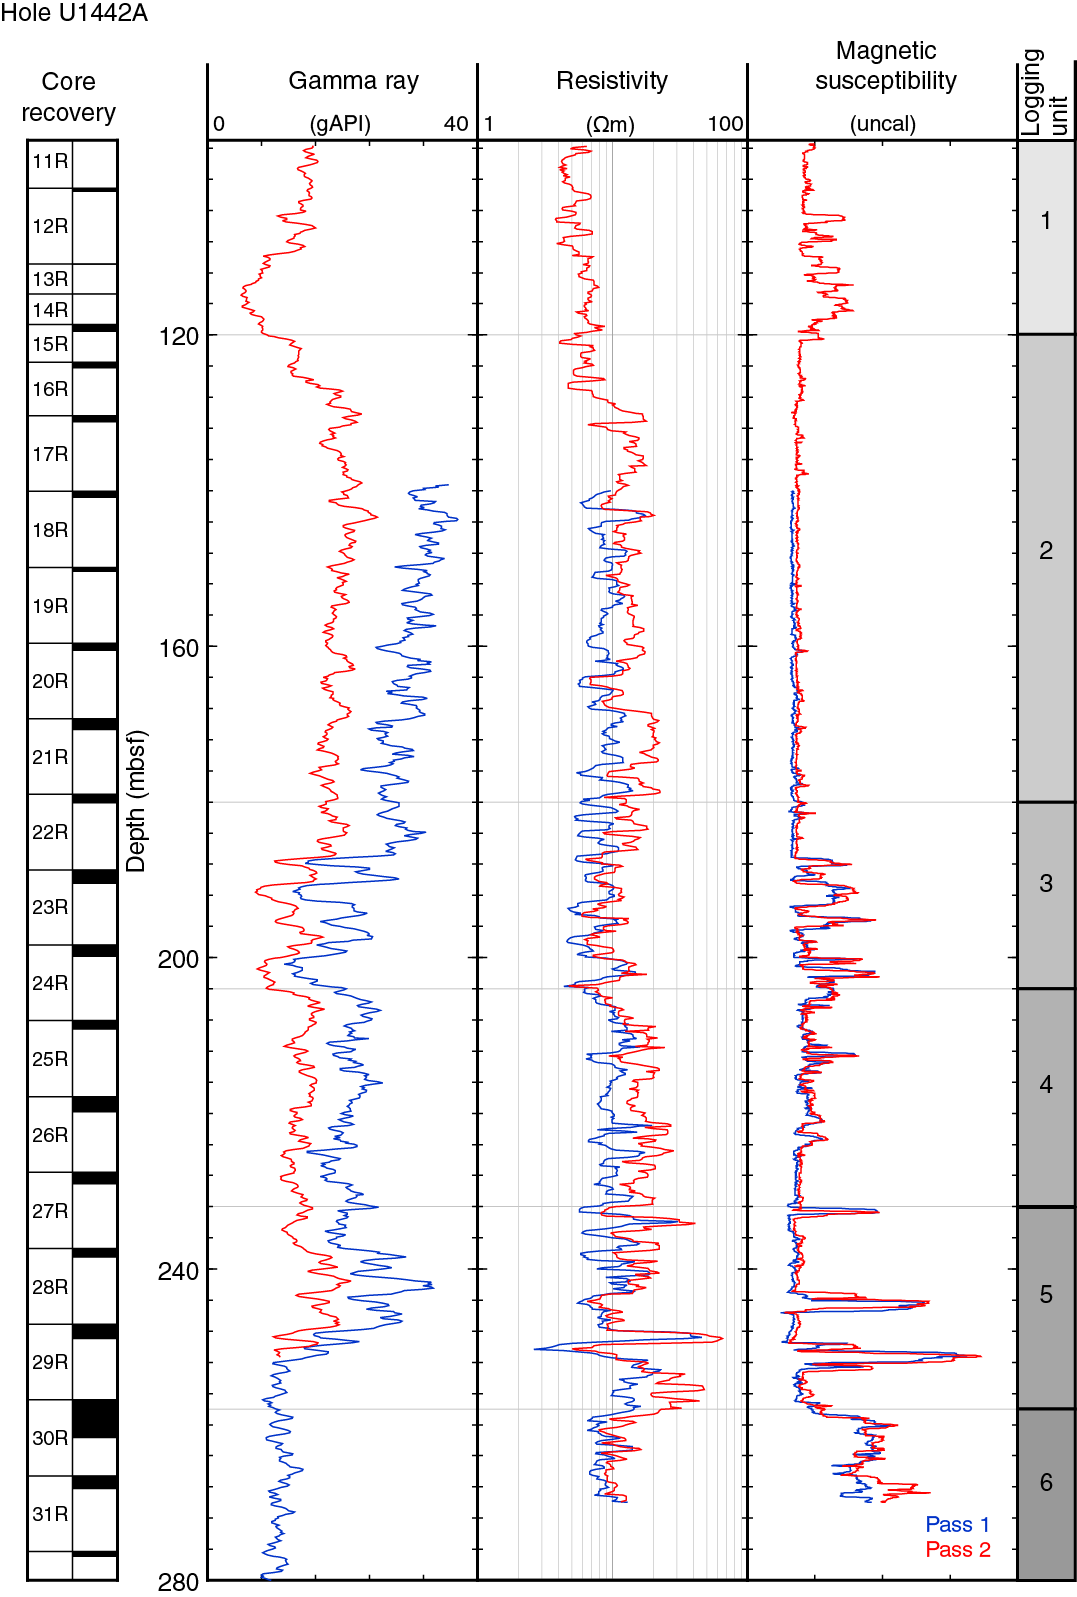
Repeatability of common measurements acquired by the 2 tool strings is summarized in Figure F56. The absolute values of the gamma ray logs are offset as a consequence of the orientation of the HNGS in the two tool strings.
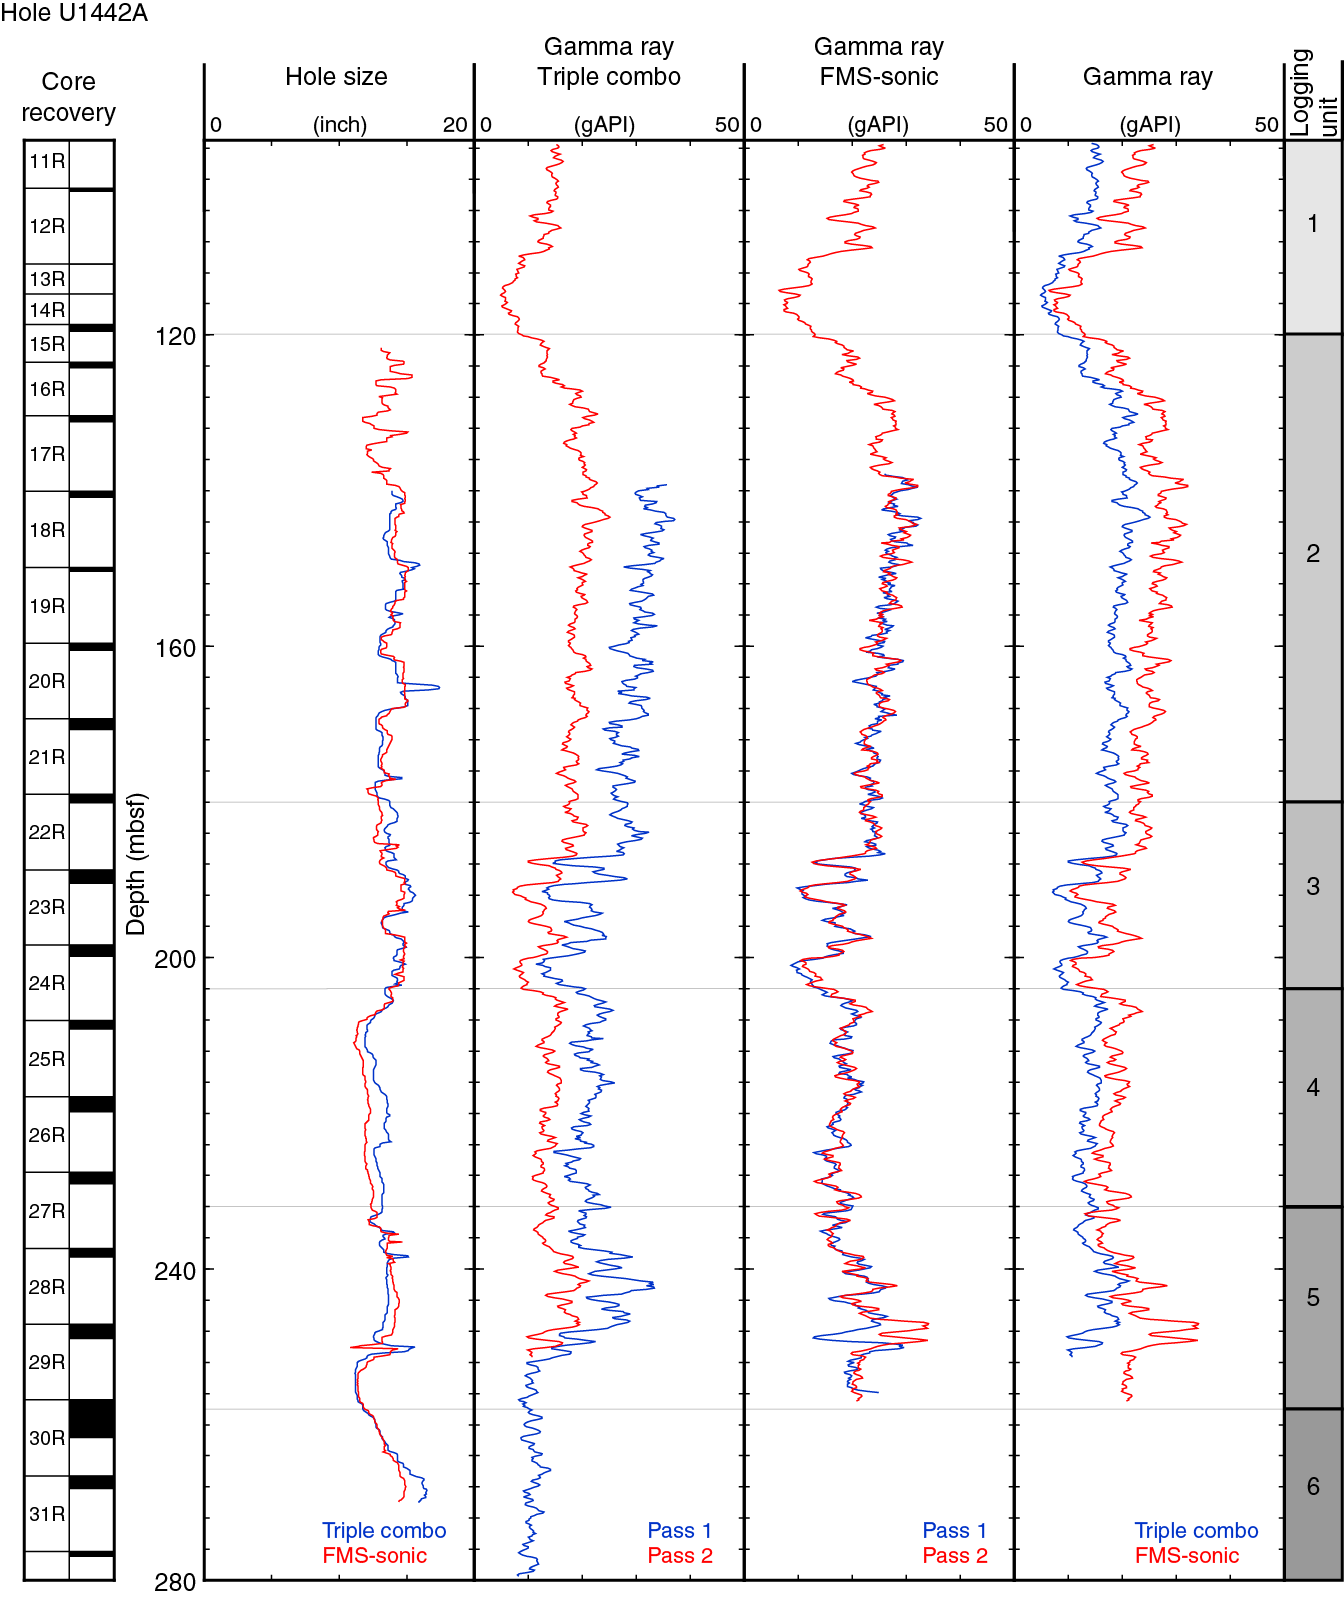
The electrical resistivity data are of generally good quality, with reasonable agreement between the different depths of investigation (medium [R3] and deep [R5] in Figure F53). Separation of the curves occurs where the hole is washed out, for example at ~166 mbsf. However, separation may also take place in porous intervals where borehole fluid has invaded the formation. Archie’s law has been used to calculate a porosity measurement from the deep resistivity measurement (R5), which is presented alongside the corresponding core data.
The magnetic susceptibility data do not appear to be affected by borehole rugosity, as there are no systematic changes with borehole diameter. The MSS-B is a deep-reading measurement, and the resulting data are uncalibrated. A very small offset between the 2 passes of the triple combo-MSS is noted (Figure F55), and this is attributed to changes in tool temperature through time.
The DSI operating modes were selected to optimize the velocity data acquired in Hole U1442A, based on the lithologies recovered by drilling. The upper dipole was operated in low-frequency mode and the 3 other modes (P&S monopole, Stoneley, and lower dipole) were all operated in standard mode. The resulting slowness data were converted to acoustic velocities (VP [monopole] and VS [lower dipole]) (Figure F54). Provisional assessment of the velocity data indicates that data quality is good.
Good tool pad contact with the borehole wall is essential for the acquisition of high-quality microresistivity images. This is achieved by the FMS tool where borehole diameter is <15 inches. Contact was therefore possible through the majority of Hole U1442A, with the exception of some small, discrete washed out zones. In addition to hole diameter, tool motion is a major factor in image data quality. Fortunately, sea conditions were favorable (heave <1 m peak-to-peak) during logging operations at this site and data quality is therefore good.
Logging stratigraphy
Distinguishing features and trends in the downhole logging data sets are used to identify 8 logging units in Hole U1442A. The logging data and logging unit boundaries are summarized in Figures F52, F53, F54, F55, and F56. A description of the petrophysical properties of each unit follows.
Logging Unit 1
Unit 1 (~95–120 mbsf) is characterized by decreasing gamma ray and velocity values and increasing resistivity and magnetic susceptibility values with depth. Gamma radiation ranges from 4.9 to 16.3 gAPI (mean = 11.2 gAPI) with small-scale variations and 2 peaks between ~96 and 100 mbsf (Figure F52). The resistivity log exhibits low-amplitude, high-frequency variations and has a mean value of 5.73 Ωm, making Unit 1 the least resistive logging unit in this hole. The magnetic susceptibility log is relatively featureless in the top of this unit and then increases with depth with a significant peak at ~105 mbsf. P-wave velocity (VP) decreases with depth, ranging from 2409 to 3761 m/s (mean = 2924 m/s) with discrete peaks at ~91 and 98 mbsf. No density data are available for this unit.
Logging Unit 2
Unit 2 (~120–188 mbsf) is differentiated from the overlying unit by elevated gamma ray and resistivity values. Gamma ray initially increases and is then relatively constant with depth, with a mean of 18.6 gAPI. Magnetic susceptibility is very low and constant and on the linear scale is featureless (Figure F53). Bulk density ranges from 1.69 to 2.18 g/cm3 and variability is low, with generally low-amplitude changes with depth. Resistivity shows variation with a frequency of ~10 m, with finer scale variation superimposed. The mean value of resistivity is 12.7 Ωm, varying from 4.05 to 22.4 Ωm. Overall, P-wave velocity shows no net change with depth (mean = 2998 m/s), though there is a significant interval of lower velocity (~162–170 mbsf).
Logging Unit 3
Unit 3 (~188–204 mbsf) exhibits significant variability across the logging data sets, which is likely in part due to borehole rugosity through this interval. Overall, the gamma ray profile decreases with depth (mean = 14.1 gAPI), whereas the density (mean = 2.08 g/cm3), resistivity (mean = 9.65 Ωm), and magnetic susceptibility log curves all show a net increase with depth. Three discrete highs in P-wave velocity occur at ~192, 196, and 203 mbsf (Figure F54), and the mean VP through this interval is 2953 m/s.
Logging Unit 4
Unit 4 (~204–232 mbsf) marks a return to lower variability in the gamma ray (mean = 14.1 gAPI) and density logs. Density continues to increase downhole, ranging in value from 1.78 to 2.38 g/cm3. Resistivity has very high frequency, moderate-amplitude variations between 4.72 and 18.0 Ωm (mean = 9.65 Ωm), with a marked low at ~213 mbsf. Magnetic susceptibility is variable in the upper portion of this logging unit and is much lower and less variable from ~254 mbsf. P-wave velocity has a mean of 2952 m/s, increasing slightly with depth.
Logging Unit 5
Unit 5 (~232–258 mbsf) has overall low magnetic susceptibility punctuated by 3 peaks at ~233, 244, and 251 mbsf, which do not correspond with peaks in any of the other data sets. Density continues to increase with depth with a mean of 2.11 g/cm3. The two lows in density correspond to two discrete washed out zones at ~248 and 256 mbsf, so the data at these depths should be discarded. Unit 5 has the highest mean resistivity in Hole U1442A (18.9 Ωm), exhibiting high variability and two significant peaks at ~234 and 246 mbsf. The gamma ray log curve shows some of the greatest variability in the hole in this unit, ranging in value from 8.79 to 21.2 gAPI (mean = 14.4 gAPI). P-wave velocity continues to increase with depth through this unit (mean = 3326 m/s).
Logging Unit 6
Unit 6 (~258–282 mbsf) is characterized by decreasing trends in the magnetic susceptibility and density profiles. Magnetic susceptibility is elevated compared to the overlying unit, showing variation on the scale of ~6 m, with higher frequency, lower amplitude variation superimposed on it. The gamma ray log is relatively constant with depth, ranging in value between 7.9 and 14.2 gAPI (mean = 10.5 gAPI). Counter to the overall trend in the hole, both resistivity (mean = 9.88 Ωm) and density (mean = 2.21 g/cm3) decrease with depth through this unit. These logs also both exhibit a change in character at ~270 mbsf (Figure F53). There is only partial coverage (<50%) of this unit with the P-wave velocity data. The data that exist decrease with depth and have a mean of 3629 m/s.
Logging Unit 7
Changes in the trends of gamma ray values, density, and resistivity distinguish Unit 7 (~282–326 mbsf) from the overlying Unit 6. Magnetic susceptibility increases significantly with depth with a major peak at ~312 mbsf. Variations below ~314 mbsf are of lower amplitude and frequency than higher in the unit. Resistivity shows a lot of variation through this unit, ranging in value between 4.25 and 34.2 Ωm and increasing with depth. Density increases with depth, exhibiting greater variation compared to Unit 6 (range 1.29–2.65 g/cm3). Similarly, gamma ray values shows a net increase with depth (mean = 12.3 gAPI). Note that some of the variability in this unit may be attributable to borehole rugosity.
Logging Unit 8
Unit 8 (below ~326 mbsf) does not have full data coverage but has relatively constant gamma radiation with depth, with values ranging from 12.4 to 18.2 gAPI. Resistivity has lower variability than the overlying unit but continues the downward-increasing trend (mean = 13.8 Ωm). However, density in this unit opposes the overall trend, decreasing with depth (mean = 2.05 g/cm3). As the bottom tool in the triple combo tool string, magnetic susceptibility gives the best coverage in Unit 8. There are 4 significant peaks in this data set at ~334, 340, 357, and 363 mbsf.
FMS images
Figure F54 provides an overview of the FMS images from Hole U1442A, indicating the variability in resistivity in the hole. Examples of some of the textures and features captured by the FMS tool are given in Figure F57. Part A is an example of a coherent interval in Unit 2 (174–176 mbsf) containing high-angle, linear, conductive features (open fractures or veins). This image also illustrates some of the internal variability in resistivity that is exhibited commonly throughout this hole. Such variability may be caused by textural or compositional variability or may be due to a combination of the two. Part B indicates a significant conductive fracture (indicated by the dark sinusoid), dividing a massive unit in Unit 4. Subvertical conductive fractures are also seen in this image. Parts C (Unit 5) and D (Unit 6) demonstrate some of the textural variation that is encountered in Hole U1442A.
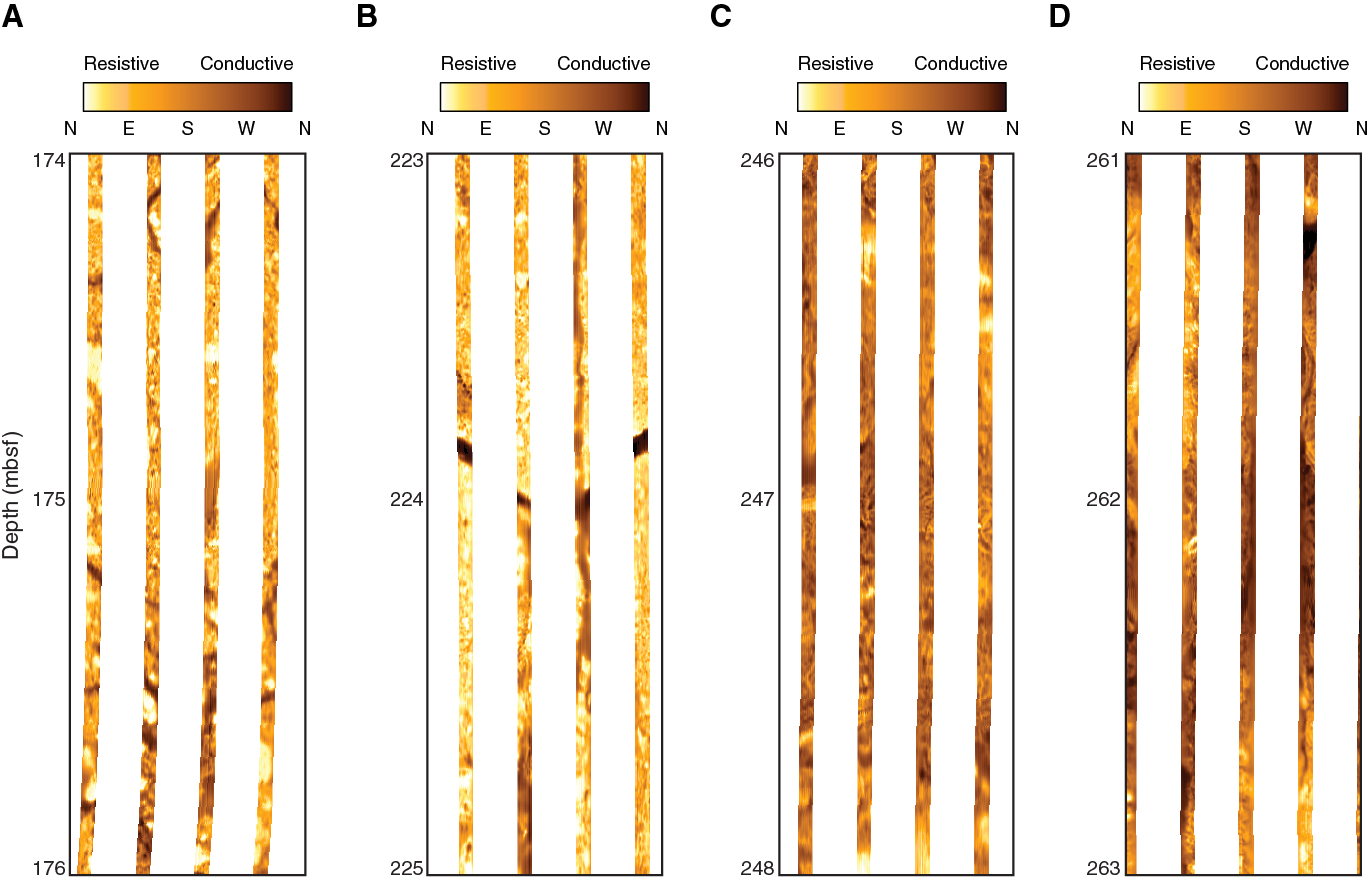
Overall, the FMS images from Hole U1442A indicate that the formations encountered at this site are more coherent than those at Sites U1440 and U1439. A number of measurable features are present through the ~154 m imaged interval, which will be useful to better understand the structures observed in the cores. As with the other data sets, the borehole images will prove valuable in filling in some of the gaps in core recovery (19%) from this hole.
Core-log correlation
Logging unit boundaries are defined purely on the various downhole logging tool responses and as such represent petrophysical boundaries. These petrophysical boundaries do not correspond perfectly with the defined stratigraphic units (see Petrology) (Figure F52). However, comparison with the corresponding physical properties and geochemical data sets provides some interesting correlations. These core data are represented in Figures F52, F53, F54, and F58. The measurement units used are sometimes different (e.g., counts per second compared to gAPI units), and often the proxies used are different too (e.g., pycnometer bulk density compared to gamma bulk density; see Physical properties and Downhole logging in the Expedition 352 methods chapter [Reagan et al., 2015a]). Downhole trends of the gamma ray and magnetic susceptibility log curves broadly agree, with decreasing gamma radiation and increasing magnetic susceptibility with depth. These data sets will be used to depth match the core to the logging data, which will improve the depth control for the 19% of core material recovered from Hole U1442A.
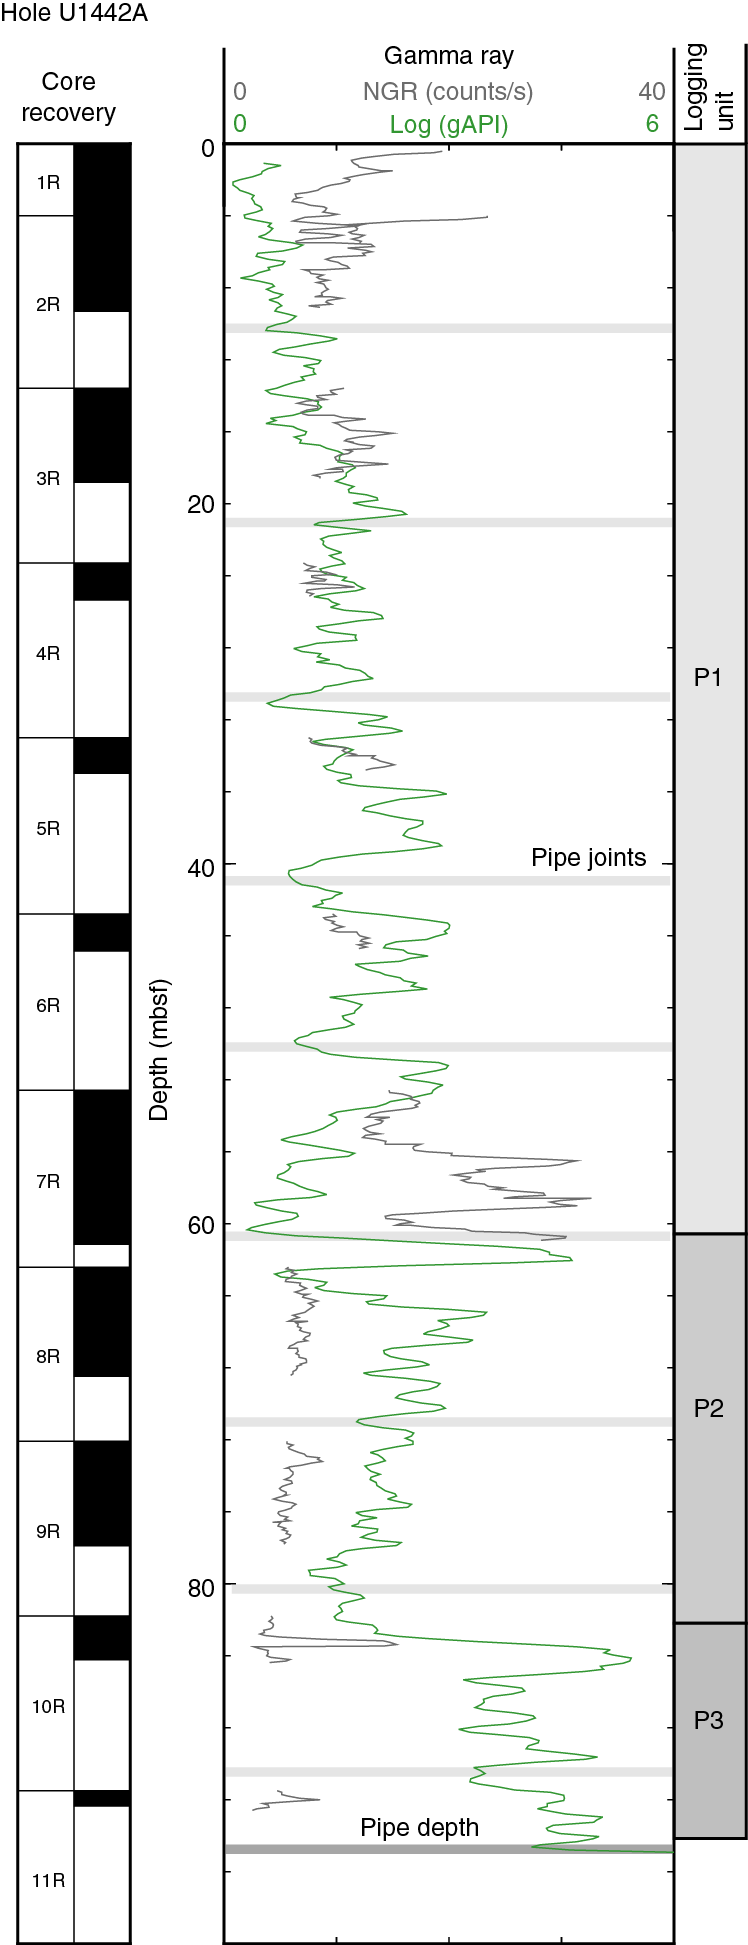
Density measurements agree in the lower portion of the hole, but core measurements are generally elevated in comparison to the log data set in the upper portion. P-wave velocity (caliper) is consistently higher in the core data set (Figure F54), likely a consequence of bias in the selection of samples for core analysis (see Physical properties).
Porosity data derived from resistivity using Archie’s law are presented (Figure F53) with the other triple combo tool string data sets. These data do not correlate well with the corresponding core data (from moisture and density) although, overall, the absolute values are comparable. The differences can be attributed to sampling bias and the different scales of the measurements being compared.
Potassium data from the HNGS are compared to potassium data from two types of core analysis: ICP-AES and pXRF (see Sediment and rock geochemistry). These core data show a downhole-decreasing trend, which is similar to the logging data (Figure F52), though the detailed variations with depth do not correlate well.
Through-pipe gamma radiation
Attenuation of the gamma ray signal through the drill pipe means that the absolute values measured are lower than the actual value for a formation. However, the trends of the gamma ray log curves can prove useful in making correlations between cores and logs. Leftward kicks in the signal are noted on a frequency of ~10 m (Figure F58), marking the position of the joints in the drill pipe where the steel is thicker.
There is an overall increase in gamma ray through pipe with depth. This interval is divided into three logging units based on the character and trend of the gamma ray profile. Values in Unit P1, from seafloor to ~61 mbsf, increase to ~44 mbsf and then decrease. The amplitude of variations gradually increases with depth through this unit, whereas frequency decreases. Unit P2 (~61–82 mbsf) is differentiated from the overlying unit by a significant peak in gamma radiation. The trend through this unit decreases steadily with increasing depth. Another significant peak in the through-pipe gamma ray log marks the top of Unit P3 (below ~82 mbsf), which exhibits an increasing downhole trend. The sediment/basement contact may be interpreted as being at the boundary between Units 2 and 3. This interpretation is based on the boundary being roughly coincident with the sediment/basement contact depth, as reported by the drillers.
Comparison of the trends with the corresponding core natural gamma ray measurements indicates some similarities, though the discontinuous nature of the core data set makes it difficult to draw too many conclusions. The stratigraphic unit boundaries (see Sedimentology) agree well, with the base of Unit P1 corresponding to the bottom of lithologic Unit III and the base of logging Unit P2 corresponding to the base of lithologic Unit IV (base of sediment interval).
References
Butler, R.F., 1992. Paleomagnetism: Magnetic Domains to Geologic Terranes: Boston (Blackwell Science Publishing).
Doubrovine, P.V., and Tarduno, J.A., 2004. Self-reversed magnetization carried by titanomaghemite in oceanic basalts. Earth and Planetary Science Letters, 222(3–4):959–969. http://dx.doi.org/10.1016/j.epsl.2004.04.009
Doubrovine, P.V., and Tarduno, J.A., 2005. On the compositional field of self-reversing titanomaghemite: constraints from Deep Sea Drilling Project Site 307. Journal of Geophysical Research: Solid Earth, 110(B11):B11104. http://dx.doi.org/10.1029/2005JB003865
Gradstein, F.M., Ogg, J.G., Schmitz, M.D., and Ogg, G.M. (Eds.), 2012. The Geological Time Scale 2012: Amsterdam (Elsevier).
Hall, R., Fuller, M., Ali, J.R., and Anderson, C.D., 1995. The Philippine Sea plate: magnetism and reconstructions. In Taylor, B., and Natland, J. (Eds.), Active Margins and Marginal Basins of the Western Pacific. Geophysical Monograph, 88:371–404. http://dx.doi.org/10.1029/GM088p0371
Ishizuka, O., Tani, K., Reagan, M.K., Kanayama, K., Umino, S., Harigane, Y., Sakamoto, I., Miyajima, Y., Yuasa, M., and Dunkley, D.J., 2011. The timescales of subduction initiation and subsequent evolution of an oceanic island arc. Earth and Planetary Science Letters, 306(3–4):229–240. http://dx.doi.org/10.1016/j.epsl.2011.04.006
Jackson, M., Gruber, W., Marvin, J., and Banerjee, S.K., 1988. Partial anhysteretic remanence and its anisotropy: applications and grainsize-dependence. Geophysical Research Letters, 15(5):440–443. http://dx.doi.org/10.1029/GL015i005p00440
Jenner, F.E., and O’Neill, H.St.C., 2012. Analysis of 60 elements in 616 ocean floor basaltic glasses. Geochemistry, Geophysics, Geosystems, 13(2):Q02005. http://dx.doi.org/10.1029/2011GC004009
Kirschvink, J.L., 1980. The least-squares line and plane and the analysis of palaeomagnetic data. Geophysical Journal of the Royal Astronomical Society, 62(3):699–718. http://dx.doi.org/10.1111/j.1365-246X.1980.tb02601.x
Le Bas, M.J., Le Maitre, R.W., Streckeisen, A., Zanettin, B., and the IUGS Subcommission on the Systematics of Igneous Rocks, 1986. A chemical classification of volcanic rocks based on the total alkali-silica diagram. Journal of Petrology, 27(3):745–750. http://petrology.oxfordjournals.org/content/27/3/745.abstract
O’Reilly, W., 1976. Magnetic minerals in the crust of the Earth. Reports on Progress in Physics, 39(9):857–908. http://dx.doi.org/10.1088/0034-4885/39/9/002
Özdemir, Ö., and O’Reilly, W., 1982. Magnetic hysteresis properties of synthetic monodomain titanomaghemites. Earth and Planetary Science Letters, 57(2):437–447. http://dx.doi.org/10.1016/0012-821X(82)90162-5
Reagan, M.K., Ishizuka, O., Stern, R.J., Kelley, K.A., Ohara, Y., Blichert-Toft, J., Bloomer, S.H., Cash, J., Fryer, P., Hanan, B.B., Hickey-Vargas, R., Ishii, T., Kimura, J.-I., Peate, D.W., Rowe, M.C., and Woods, M., 2010. Fore-arc basalts and subduction initiation in the Izu-Bonin-Mariana system. Geochemistry, Geophysics, Geosystems, 11(3):Q03X12. http://dx.doi.org/10.1029/2009GC002871
Reagan, M.K., Pearce, J.A., Petronotis, K., Almeev, R., Avery, A.A., Carvallo, C., Chapman, T., Christeson, G.L., Ferré, E.C., Godard, M., Heaton, D.E., Kirchenbaur, M., Kurz, W., Kutterolf, S., Li, H.Y., Li, Y., Michibayashi, K., Morgan, S., Nelson, W.R., Prytulak, J., Python, M., Robertson, A.H.F., Ryan, J.G., Sager, W.W., Sakuyama, T., Shervais, J.W., Shimizu, K., and Whattam, S.A., 2015a. Expedition 352 methods. In Reagan, M.K., Pearce, J.A., Petronotis, K., and the Expedition 352 Scientists, Proceedings of the International Ocean Discovery Program, 352: Izu-Bonin-Mariana Fore Arc: College Station, TX (International Ocean Discovery Program). http://dx.doi.org/10.14379/iodp.proc.352.102.2015
Reagan, M.K., Pearce, J.A., Petronotis, K., Almeev, R., Avery, A.A., Carvallo, C., Chapman, T., Christeson, G.L., Ferré, E.C., Godard, M., Heaton, D.E., Kirchenbaur, M., Kurz, W., Kutterolf, S., Li, H.Y., Li, Y., Michibayashi, K., Morgan, S., Nelson, W.R., Prytulak, J., Python, M., Robertson, A.H.F., Ryan, J.G., Sager, W.W., Sakuyama, T., Shervais, J.W., Shimizu, K., and Whattam, S.A., 2015b. Site U1439. In Reagan, M.K., Pearce, J.A., Petronotis, K., and the Expedition 352 Scientists, Proceedings of the International Ocean Discovery Program, 352: Izu-Bonin-Mariana Fore Arc: College Station, TX (International Ocean Discovery Program). http://dx.doi.org/10.14379/iodp.proc.352.103.2015
Shervais, J.W., 1982. Ti–V plots and the petrogenesis of modern and ophiolitic lavas. Earth and Planetary Science Letters, 59(1):101–118. http://dx.doi.org/10.1016/0012-821X(82)90120-0
Tauxe, L., 2010. Essentials of Paleomagnetism: Berkeley, California (University of California Press).
Umino, S., 1986. Magma mixing in boninite sequence of Chichijima, Bonin Islands. Journal of Volcanology and Geothermal Research, 29(1–4):125–157. http://dx.doi.org/10.1016/0377-0273(86)90042-9
1Reagan, M.K., Pearce, J.A., Petronotis, K., Almeev, R., Avery, A.A., Carvallo, C., Chapman, T., Christeson, G.L., Ferré, E.C., Godard, M., Heaton, D.E., Kirchenbaur, M., Kurz, W., Kutterolf, S., Li, H.Y., Li, Y., Michibayashi, K., Morgan, S., Nelson, W.R., Prytulak, J., Python, M., Robertson, A.H.F., Ryan, J.G., Sager, W.W., Sakuyama, T., Shervais, J.W., Shimizu, K., and Whattam, S.A., 2015. Site U1442. In Reagan, M.K., Pearce, J.A., Petronotis, K., and the Expedition 352 Scientists, Izu-Bonin-Mariana Fore Arc. Proceedings of the International Ocean Discovery Program, Expedition 352: College Station, TX (International Ocean Discovery Program). http://dx.doi.org/10.14379/iodp.proc.352.106.2015