France-Lanord, C., Spiess, V., Klaus, A., Schwenk, T., and the Expedition 354 Scientists
Proceedings of the International Ocean Discovery Program Volume 354
publications.iodp.org
doi:10.14379/iodp.proc.354.105.2016

Site U14511
C. France-Lanord, V. Spiess, A. Klaus, R.R. Adhikari, S.K. Adhikari, J.-J. Bahk, A.T. Baxter, J.W. Cruz, S.K. Das, P. Dekens, W. Duleba, L.R. Fox, A. Galy, V. Galy, J. Ge, J.D. Gleason, B.R. Gyawali, P. Huyghe, G. Jia, H. Lantzsch, M.C. Manoj, Y. Martos Martin, L. Meynadier, Y.M.R. Najman, A. Nakajima, C. Ponton, B.T. Reilly, K.G. Rogers, J.F. Savian, T. Schwenk, P.A. Selkin, M.E. Weber, T. Williams, and K. Yoshida2
Keywords: International Ocean Discovery Program, IODP, Expedition 354, JOIDES Resolution, Site U1451, Bengal Fan
MS 354-105: Published 7 September 2016
Site summary
Site U1451 (proposed Site MBF-3A) is the easternmost site of our Bengal Fan transect at 8°N and was the only one aimed at coring the oldest part of the fan. The site is located above the western flank of the Ninetyeast Ridge at 8°0.42′N, 88°44.50′E in 3607.3 m water depth. Seismic data show that the overall fan section is condensed at Site U1451 compared to the axial part of the fan because of ongoing deformation along the Ninetyeast Ridge since the Miocene (Schwenk and Spiess, 2009). The drilling objective was to recover the complete fan section down to a seismic unconformity, which is believed to indicate the onset of fan deposition at this location. Site U1451 also contributes to the Miocene–Pliocene transect of three ~900 m deep holes documenting Himalayan erosion and paleoenvironment. Finally, the upper section of the site is part of the seven-site transect drilled to investigate late Pliocene to recent depocenter migration and overall fan sedimentation.
Two holes were drilled at Site U1451, Hole U1451A to 582.1 m drilling depth below seafloor (DSF) and Hole U1451B to 1181 m DSF. Hole U1451A was advanced with the advanced piston corer (APC), half-length APC (HLAPC), and extended core barrel (XCB) systems. From 200 to 582.1 m DSF, 4.8 m intervals were drilled without coring between HLAPC cores to achieve overall coring depths. In Hole U1451B, a reentry cone with 400 m casing was drilled into the seafloor. Below 400 m DSF, Hole U1451B was cored with the XCB system from 542.0 to 640.8 m DSF and then with the rotary core barrel (RCB) system to 1181 m DSF. Wireline logging failed because of unstable hole conditions. Core recovery was 86% in Hole U1451A and 29% in Hole U1451B.
Principal results
Coring at Site U1451 returned a complete sedimentary record of Bengal Fan construction back to the Paleogene. It constrains the timing of the fan turbiditic onlap at this location around the Oligocene/Miocene boundary (~23–24 Ma) and provides the longest continuous record of Himalayan erosion throughout the Neogene. The upper section, part of the seven-site transect at 8°N, documents a change since the Miocene to a higher proportion of hemipelagic clay–rich deposition, consistent with a position less exposed to fan turbiditic deposition because of Ninetyeast Ridge uplift.
The recovered turbiditic record extends back to the late Oligocene or early Miocene, which is marked by a transition from late Paleogene pelagic limestones to early Neogene claystones and siltstones, intercalated into pelagic intervals. Although this old turbiditic record carries all characteristics of Himalayan erosion across the full grain-size spectrum, including sands, the growth rate of the fan deposits remained overall relatively low, on the order of a few centimeters per thousand years. A distinct change is observed in the middle Miocene, when fan growth intensified by almost an order of magnitude (>10 cm/ky). In the Pliocene, coarser material is absent, and the time interval between the early Pliocene and early Pleistocene is characterized by accumulation of calcareous clay–rich hemipelagic units. During the Pleistocene, higher fine-grained detrital input is observed but only over the last ~0.4 My. Fan deposits dominate the lithology again. As at other Expedition 354 sites except for Site U1454, hemipelagic sediments dominate the surficial deposition.
The Site U1451 record, combined with that of Site U1450, reflects steady conditions of Himalayan erosion and Himalayan geological and structural evolution as documented by the recovered sediment’s relatively uniform chemical composition and clay mineral assemblages. This record will be further constrained and refined postexpedition to reveal information about sources, erosion rates, and evolution of weathering.
At first glance, the Neogene record appears remarkably stable through time. One notable exception is the detrital carbonate contents of the turbidites, which are markedly higher during the Miocene than during the Pliocene–Pleistocene. This exception reflects either a long-term change in the geological sources or a difference in the weathering regime. The petrology of the sand reveals that high-grade metamorphic rock fragments and minerals that are characteristic of modern river sediments have been present since the middle Miocene and were less abundant during the early Miocene and late Oligocene. Such trends are consistent with increasing exhumation of high metamorphic grade rocks through time, but confirmation by postexpedition studies is required. Turbiditic sediments deposited at Site U1451 since the late Oligocene or early Miocene reflect detrital archives similar in many aspects to those of recent fan deposits or modern river sediments. Nonetheless, fan clastic deposition is not only restricted to turbidites; deposition of detrital clays is prevalent in hemipelagic intervals during the Neogene and likely represents deposition associated with distant turbidity currents. Similar processes may also have been involved in the formation of the early Miocene and Oligocene claystones recovered, which have accumulation rates similar to Pleistocene hemipelagic units.
From seismic data, the early history of fan deposition at Site U1451 is associated with a change in depositional style above a seismic unconformity. This unconformity was likely cored at the bottom of the hole, recovering Eocene and Paleocene limestones and containing a 16–18 My hiatus. The structurally disturbed unit immediately overlying the unconformity is an Oligocene/Eocene limestone and claystone unit injected by sand and silt (injectites). On top, parallel strata are onlapping, which clearly indicates turbiditic sedimentation. Tilting of these Miocene strata with respect to the modern stratification indicates tectonic deformation associated with the Ninetyeast Ridge at Site U1451. However, this tectonic deformation has only a minor effect on fan deposition.
The well-represented hemipelagic deposition at Site U1451 during the last 6 My provides an excellent opportunity to develop a stratigraphic framework for the entire transect based on high-resolution biostratigraphy, oxygen isotopes, and cyclostratigraphy. This chronology can be tied into the seismic stratigraphy and will constrain ages throughout the Pliocene–Pleistocene part of the transect, as hemipelagic units prove to be reliable and easily traceable horizons.
The Miocene section reveals pronounced parallel stratification in seismic data, which seems to be related to the different consolidation behavior of sands, silts, clays, and hemipelagic units. Carbonate-bearing and clay-rich units show a much more pronounced lithification, whereas sand remains unconsolidated. This might explain why sand is not well represented in rotary cores. The stratification of the Miocene section, which is similar across the 8°N drill site transect, may in turn indicate a different mode of deposition with less channelized transport and more widespread distribution of turbiditic deposits. Whether this change in deposition is linked to an overall change in sediment transport or grain size has to await further detailed analysis that carefully considers the potential sampling bias.
Operations
Hole U1451A extends from the seafloor to 582.1 m DSF and was advanced using the APC, HLAPC, and XCB systems. Below 200 m DSF, 4.8 m intervals were drilled without coring alternating with most HLAPC cores to achieve required penetration depths within the operation time available. Formation temperature measurements were made with the advanced piston corer temperature tool (APCT-3) to 406.4 m DSF, the deepest piston core formation temperature measurement ever obtained. Hole U1451A cored 394.9 m and recovered 337.80 m of core (86%).
In Hole U1451B, a reentry cone with 400 m of casing was drilled into the seafloor. This assembly was intended to stabilize the hole for deep coring and logging operations. XCB coring in the upper 600 m was stopped because of failures of XCB cutting shoes. Hole U1451B was reentered a second time, and RCB coring penetrated to 1181 m DSF. RCB coring penetrated 627.6 m and recovered 180.86 m (29%). Wireline logging failed because of unstable hole conditions, probably due to collapse of the sand formation around 500 m DSF.
Lithostratigraphy
Recovered sediments from Site U1451 were divided into 23 lithostratigraphic units based on lithologic and microfossil characteristics obtained through macroscopic and smear slide analyses, as well as physical property measurements. The overall lithology of the expedition’s deepest hole is comparable to that described at other sites, with the exception of the early Miocene–Eocene section, which is lithified and was not penetrated at the other sites. The dominant lithology at Site U1451 is mica- and quartz-rich sand, silt, and clay turbidites, carrying high-grade metamorphic minerals in some intervals. Units of turbidites are separated by bioturbated nannofossil-rich calcareous clays and occasionally calcareous ooze. Five volcanic ash layers with fresh glass shards were identified in nonturbiditic intervals above 154 m core depth below seafloor (CSF-A), including the youngest Toba tuff ash layer, which is present at 2.6 m CSF-A in Hole U1451A.
Hemipelagic calcareous clay intervals of variable carbonate content, observed between 50 and 190 m CSF-A, are common throughout the Pleistocene and Pliocene. These intervals are intercalated with intermittent sand and mud turbidites representing intervals of rapid deposition during the Late Pleistocene. During the Miocene, calcareous clay deposition is reduced and the record is dominated by turbiditic sediments. The latter contains numerous sand-rich layers to 520 m CSF-A (about 9 Ma). Downhole, the proportion of sand decreases. This observation is likely biased by the change in coring technique from the HLAPC system in Hole U1451A to the RCB system in Hole U1451B, as the RCB system was believed to be unable to recover loose sand. Turbidite units from 190 m CSF-A downhole mark an extended period of proximal channel or turbidite activity at this site initiated at 1086 m CSF-A (Core 354-U1451B-62R) around the Oligocene/Miocene boundary. Below this interval, calcareous and clastic sediments become increasingly lithified. Green to brown claystones are interbedded with light green and yellow calcareous claystones and limestones. Within the calcareous claystone sequences, breccias of calcareous claystone clasts in a siltstone and sandstone matrix are postdepositional injectites. The lowermost ~100 m of Hole U1451B contains foraminiferal limestones, mottled calcareous claystones, and claystones reflecting the prefan paleoceanographic environment and much reduced influence of fan sedimentation. The transition from turbidites to limestone around 1100 m CSF-A marks the last occurrence of any significant fan deposition at this site. The present lithostratigraphic section therefore captures the complete sedimentary record of fan deposition to the onlap of the fan onto late Oligocene limestones. This sedimentary record extends existing oceanic archives of the Himalayan erosion (Cochran, 1990) to the Oligocene/Miocene boundary.
Biostratigraphy
Calcareous nannofossils and foraminiferal biostratigraphic analyses at Site U1451 resulted in the identification of 39 biomarkers and the construction of 31 biozones, providing a comprehensive and detailed age model for the long-term development of the Middle Bengal Fan from the Paleogene to recent. Furthermore, the transition from pelagic-dominated sedimentation to probably Himalayan-derived turbiditic sediments is constrained near the Oligocene/Miocene boundary.
The uppermost 120 m of Hole U1451A (lithostratigraphic Units I–III) is a sequence of turbiditic sands and muds with minor intercalated hemipelagic layers. Six biomarkers were identified within this sequence, providing good age control for Pleistocene fan development at this site. A thick (66 m) pelagic sequence was recovered in Cores 23F–29F (lithostratigraphic Unit IV) and contains eight biomarkers. This sequence represents more than 3 My of pelagic sedimentation, with little turbiditic influence. Below lithostratigraphic Unit IV, 450 m of turbidite-dominated sedimentation, present from Core 30F to the base of the hole, was deposited in approximately 3.5 My, based on four biomarkers observed in this sequence. The accumulation rates of ~1 and >10 cm/ky in the pelagic sequence and the turbidite-dominated sequence, respectively, suggest that the majority of turbiditic activity at this position occurred in the Miocene and Pleistocene and is more restricted in the Pliocene. The first occurrence of Catinaster coalitus was observed at the base of Hole U1451A (midpoint = 575.60 m CSF-A) and the top of Hole U1451B (590.06 m CSF-A) and provides tight age control for the overlap succession of the two holes.
The Oligocene/Miocene boundary was recovered and lies between Samples 354-U1451B-54R-CC and 63R-CC. This boundary is identified by the last occurrence (LO) of Reticulofenestra bisectus and Zygrhablithus bijugatus (nannofossil Zone NP25). A major change from turbidite-dominated to pelagic-dominated sedimentation occurs between Cores 62R and 63R (nannofossil Zone NP24).
Because of intense recrystallization and preservation issues, the depositional age of the limestones is difficult to constrain. Samples 71R-CC and 72R-CC contain Morozovella aragonensis, which is a marker species for foraminifer Zone E9 (43.6–52.3 Ma). The radiolarian species Thyrsocyrtis rhizodon was observed in Sample 69R-CC, confirming an Eocene age for these sediments.
There appears to be a significant hiatus of 16–18 My between Samples 71R-CC and 72R-CC. Sample 72R-1, 0–1 cm, contains Discoaster multiradiatus and Fasciculithus spp., which are biomarkers for nannofossil Zone NP10. Sample 73R-CC represents a gap zone marked by the absence of D. multiradiatus and places the base of Site U1451 in the Paleocene (Thanetian). Confirming the presence and extent of this hiatus will be the subject of postexpedition research.
Paleomagnetism
Paleomagnetism of 269 archive section halves and 93 discrete samples from Site U1451 allowed us to identify 12 polarity reversals in Hole U1451A, mostly in calcareous clay deposits. We place the boundary between the Brunhes and Matuyama Chrons at 72.24 m CSF-A in Hole U1451A. A calcareous ooze deposit in Hole U1451A contains polarity zones corresponding to the Jaramillo and Cobb Mountain Subchrons (80.35–81.78 and 83.10–83.44 m CSF-A, respectively), allowing us to correlate the interval with similar lithostratigraphic units at Sites U1449 and U1450. Several reversals between 140 and 163 m CSF-A in Hole U1451A are interpreted as the Gauss and Gilbert Chrons and their subchrons. Reversals at 108.30 and 218.70 m CSF-A in Hole U1451A have not yet been linked to the geomagnetic polarity timescale. Multiple declination changes were observed in Hole U1451B, most related to rotation during the coring process. None has yet been identified unambiguously as a polarity reversal.
Physical properties
Physical property data were acquired at Site U1451 for all Hole U1451A and Hole U1451B cores, including density, magnetic susceptibility, P-wave velocity, natural gamma radiation (NGR), and thermal conductivity. Data from APC cores are mostly of good quality. However, the whole-round logger data from cores obtained through RCB drilling—the majority of Hole U1451B—underestimate density, magnetic susceptibility, and NGR because the cores typically do not completely fill the liner cross section.
Hole U1451A recovered core material from 0 to 579 m CSF-A, and Hole U1451B recovered core material from 542 to 1175 m CSF-A. Physical properties at Site U1451 primarily reflect lithologic variations but also show downcore compaction and lithification documented by decreasing porosities and increasing densities and P-wave velocities, specifically in the lowermost Cores 354-U1451B-65R through 73R. Based on the principal lithologic name from the core description, average physical properties were determined for 10 lithologies. The total core recovery assigned to lithology at Site U1451 was 518.66 m (51%). The most common principal lithology is calcareous ooze (~120 m), followed by clay (~96 m), sand (~84 m), and silt (~74 m). Claystone (~65 m), limestone (~41 m), and siltstone (~21 m) make up the lower part of Hole U1451B. Volcanic ash occurs only in limited intervals (totaling 0.57 m), and siliceous ooze is absent. Physical property measurements follow the following general trends: limestones have the highest average density and P-wave velocity; sands have the highest magnetic susceptibility; volcanic ashes, clays, and claystones have the highest NGR; and calcareous oozes generally have the lowest values in all measurements. Some of the sand-rich intervals were difficult to recover and were often fluidized and filled the core liners only partially, resulting in anomalously low whole-round measurements (gamma ray attenuation [GRA] density, magnetic susceptibility, and NGR values). The same is true for most of the lithified intervals drilled with the RCB system, where GRA values significantly underestimate moisture and density (MAD) values.
Geochemistry
Detailed pore water measurements distinguish five hydrologic units based on sulfate, phosphate, silica, magnesium, potassium, calcium, and alkalinity contents. The deepest unit bears distinct characteristics due to the strong influence of the limestones underlying the fan deposits. It is characterized by a strong rise in calcium content, although alkalinity remains low and constant, buffered by pressure-dissolution and recrystallization of the carbonate-rich lithology and an upward diffusion/advection of interstitial water.
Throughout Site U1451, the carbonate contents of bulk sediments vary widely from 0.2 to 96.6 wt% CaCO3, reflecting contrasted depositional environments, including significant contributions from detrital carbonates. Turbiditic sediments have low carbonate content in the upper section (Pleistocene), with values roughly doubling around 130–180 m CSF-A. This transition occurs around the Miocene/Pliocene boundary and is followed by gradually increasing carbonate content to 700 m CSF-A. These trends in carbonate content of the turbiditic sediments most likely reflect changes in detrital carbonate supply, which correlates with observations at Site U1450. Turbiditic sediments are absent below 1090 m CSF-A, and limestone—at times almost pure (CaCO3 > 97 wt%)—becomes the dominant lithology. Hemipelagic clays are present throughout the entire record and are characterized by highly variable carbonate content, often indistinguishable from that of turbiditic sediments. Major and trace element concentrations (e.g., CaO and Sr) measured via hand-held X-ray fluorescence (XRF) suggest that turbiditic and hemipelagic sediments consist of distinct binary mixings between carbonate and silicate end-members. The contrasted composition of the silicate fraction of hemipelagic clays is further supported by their frequent K-depletion and Fe-enrichment compared to turbiditic clays. In turbiditic sediments, the major element composition (e.g., Fe/Si and Al/Si) closely matches the chemical composition of sediments from the modern Ganga-Brahmaputra river system.
Overall, TOC content is low, with an average value of 0.3 wt%. Within turbidites, TOC broadly covaries with Al/Si ratios—a proxy for sediment grain size and mineral composition—reflecting preferential association of organic matter with clays previously documented in both the modern Ganga-Brahmaputra river system and in active channel-levee sediments in the Bay of Bengal deposited over the past 18 ky (e.g., Galy et al., 2007). Miocene and Pliocene clay-rich turbiditic sediments are often characterized by significant organic carbon depletion compared with sediments from the modern Ganga-Brahmaputra river system and the active channel-levee system at 17°N. However, the organic carbon budget is likely to be also affected by the frequent presence of woody debris concentrated in the lower part of turbiditic sequences.
Microbiological subsampling of sediments and pore water at Site U1451 included establishing a microbial cell counting method, with further processing of the samples to be performed following the expedition.
Background and objectives
Site U1451 is the easternmost site of the Expedition 354 transect across the Middle Bengal Fan at 8°N (see Figures F3, F4, and F8 in the Expedition 354 summary chapter [France-Lanord et al., 2016c]). Site U1451 is located at 8°0.42′N, 88°44.50′E in 3607.3 m water depth on the western flank of the Ninetyeast Ridge. The overall thickness of the fan reaches ~4 km (Curray et al., 2003) at Site U1450 in the center of our drill site transect. Sediment thickness decreases toward both the Ninetyeast Ridge east of the Bengal Fan transect and above 85°E Ridge to the west, likely the result of ongoing deformation on both ridges during the Neogene (Schwenk and Spiess, 2009). It inferred, however, that the fan has maintained a flat average topography and therefore channel and depocenter migration were not directly affected by tectonic activity.
This site targeted a maximum penetration of 1500 m to recover the oldest record of fan deposition possible along the 8°N transect. It also targeted the overall Neogene and Pliocene–Pleistocene objectives across the transect. The target depth, however, was largely uncertain because of the unknown velocity structure of the formation. The drilling strategy was based on the presence of a pronounced deep reflector attributed by Curray et al. (2003) to an unconformity likely dating back to the Eocene–Oligocene. Drilling at Ocean Drilling Program (ODP) Site 758 on the Ninetyeast Ridge near Site U1451 in a purely pelagic sequence confirmed a hiatus around the Paleocene–Eocene, whereas sedimentation rate in the late Eocene remained very low.
Because the unconformity is characterized by an onlap of overlying reflectors, it was interpreted as the onset of fan deposition of possible Paleogene age. Considering the tectonic-induced tilting to the east since then, reflector terminations originally mainly represented onlaps. The choice of Site U1451 with respect to the depth of the presumed Eocene–Oligocene unconformity represents a compromise between where the unconformity is the shallowest, to allow access by coring, and the deepest possible position in a basin with respect to Oligocene–Eocene paleobathymetry, to obtain the oldest fan sediments. From the seismic data, deeper successions with the same reflection character and onlapping reflectors do exist, but all other locations would be much more challenging to reach with the R/V JOIDES Resolution. We therefore expected this site to have the oldest turbiditic sediments of our transect sites but not the oldest overall fan deposits at 8°N. Because fan deposition is comparably fast and depressions such as preexisting fracture zones are filled first, we expected only a limited time gap between fan progradation to 8°N and the initial fan sediments reaching Site U1451. We will estimate this time lag from analysis of the seismic data through extrapolation of Paleogene fan sedimentation rates.
In addition to providing earlier fan sediments, the shallower parts of Site U1451 also contribute to an integrated fan inventory for the Pleistocene as part of the seven-site transect and to documenting the Neogene sedimentary record of Himalayan erosion. Because the late Neogene section is thinner at this site, the site was expected to recover a complete Neogene section, unlike the two other deep sites (U1450 and U1455), which were more focused on coring to the middle Miocene. Therefore, Site U1451 was intended to provide the most complete record of the evolution of the sources, erosion rate, and weathering conditions of Himalayan material and to document the paleoenvironment of the Himalayan basin before 20 Ma. This record will be compared to and integrated with those existing for the deep Bengal Fan (Stow et al., 1990) and on land in the Siwaliks foreland sections that record the evolution of various sub-Himalayan basins (e.g., Quade et al. 1995; DeCelles et al., 1998b; Huyghe et al., 2011; Najman et al., 2012). In addition, the deeper section of Site U1451 will extend the Himalayan erosional record further back in time to document the early stage of Himalayan buildup and erosion in the Paleogene. Drilling the unconformity imaged in the seismic data below 1000 meters below seafloor (mbsf) was planned to reveal the nature and deposition during fan onlap at this location. Comparable records of erosion are scarce in the foreland basin of the Indo-Burman Range and essentially absent for the Oligocene (Najman et al., 2008).
Figure F1 shows the bathymetry in the vicinity of Site U1451. A relatively straight transport channel passes ~10 km west of Site U1451. Knolls south and east of the site rise 50 and 200 m above the fan surface; these are the result of Miocene tectonic activity on the Ninetyeast Ridge.
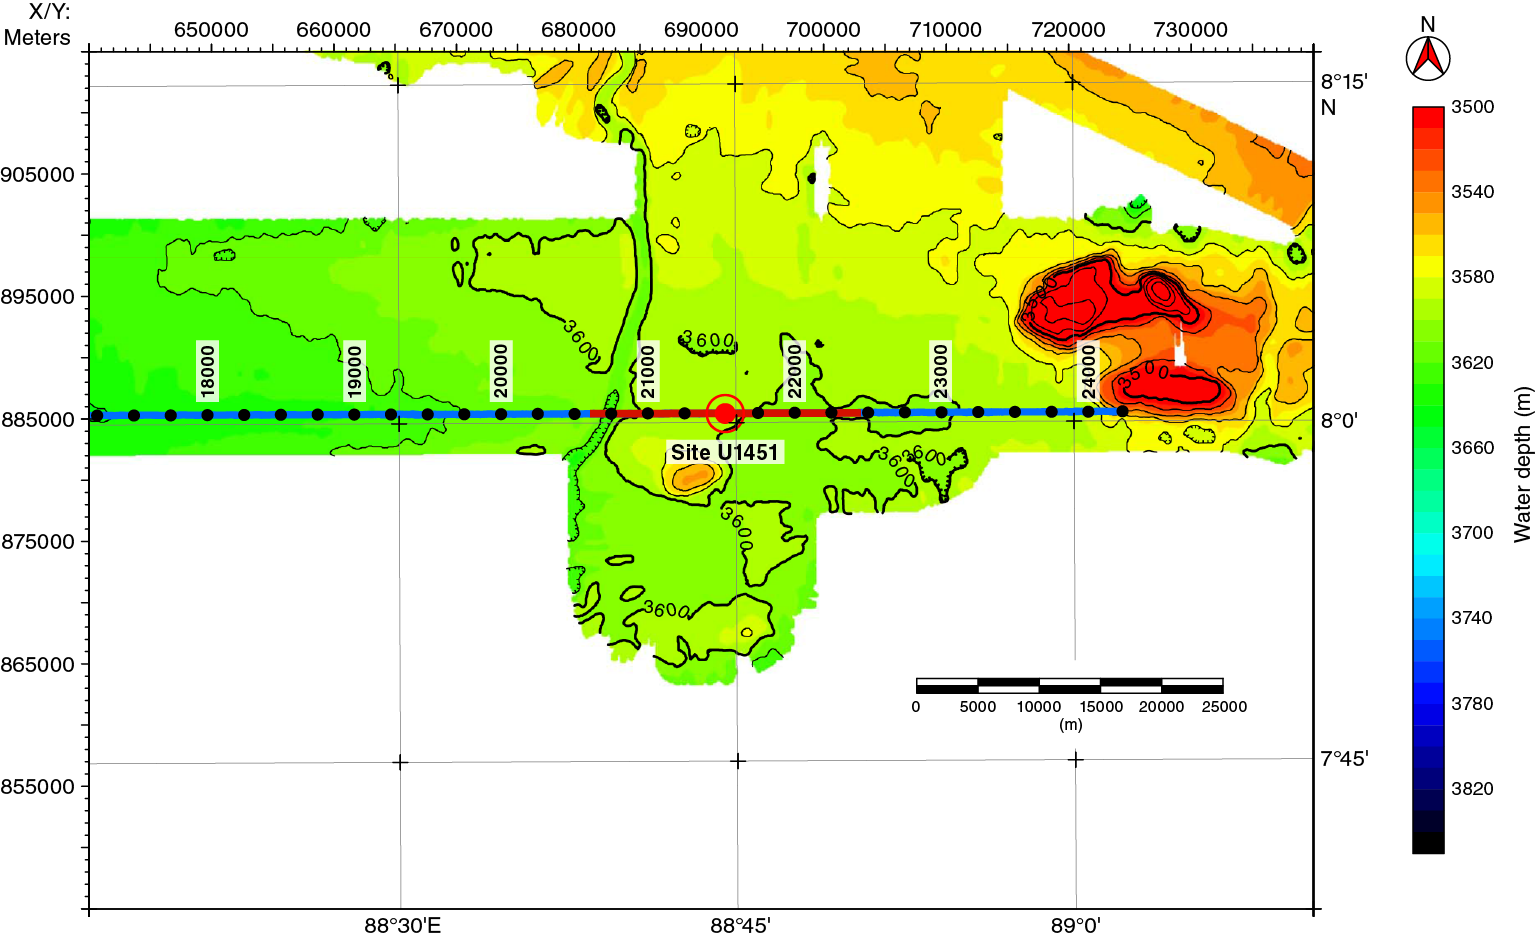
Figure F1. Bathymetric and track chart, Site U1451. Two knolls rise ~50 and ~200 m above the fan surface. A minor straight channel passes ~10 km west. Projection is UTM Zone 45N. Multibeam bathymetry was acquired during R/V Sonne Cruises SO125 and SO188.
The shallow portion of the seismic data at this site is shown in Figure F2. Site U1451 is one of the seven sites of the 8°N transect that aim to investigate Middle Bengal Fan architecture in space and time and to reconstruct Pleistocene sediment delivery rates in conjunction with depocenter migration. This site is special because it represents the most condensed shallow sequence of Pliocene and Pleistocene sediments, which makes it less suitable to record fan deposition but is better for providing a reliable chronology. We expect this site to document seismic reflector ages that provide age constraints that can be correlated across the whole transect. The figure also reveals pronounced faulting, which can be mostly attributed to Miocene plate deformation. Despite the evident uplift, levees from a recently active channel to the west (Figure F1) and from several buried channels in the eastern part of the cored section confirm that the site received turbiditic sediments and was not decoupled from fan deposition by tectonic uplift for longer time periods.
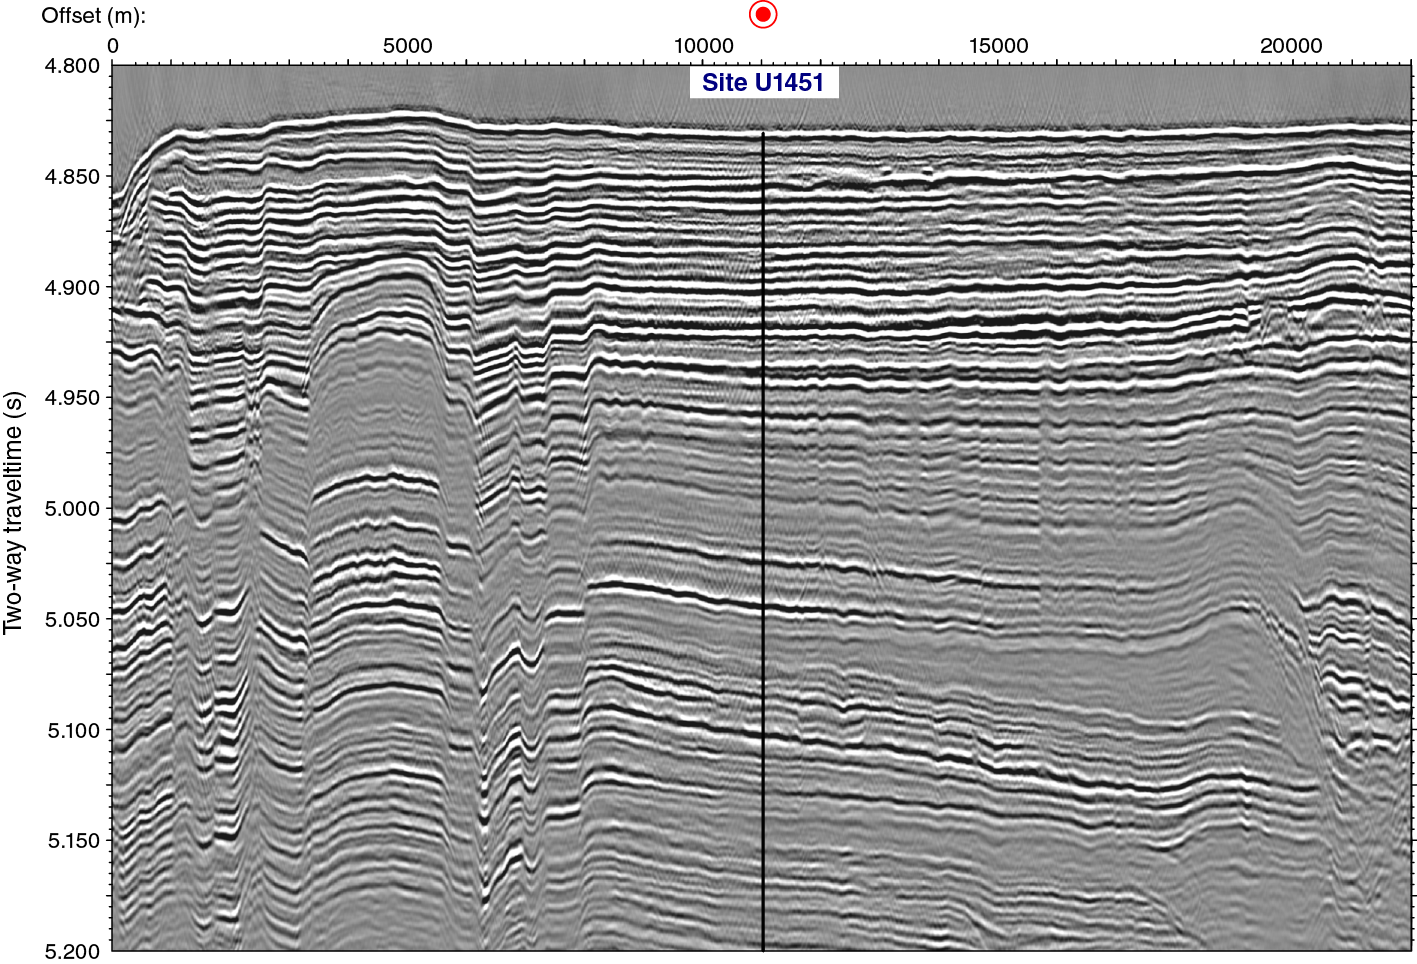
Figure F2. Seismic Line SO125-GeoB97-027 across Site U1451, showing upper portion of sedimentary section.
The overall sediment thickness on top of the oceanic crust is thought to be ~4 km (Curray et al., 2003). Although the upper Miocene and Pliocene–Pleistocene sections of the fan appear condensed at this position on the seismic record compared to the axial fan position of Site U1450 (Schwenk and Spiess, 2009), the overall reflectivity of the seismic section down to 6 s two-way traveltime (TWT) (Figure F3) indicates high impedance contrasts, likely associated with the presence of turbiditic sand-rich successions. The uniform stratification between the seafloor and 5.85 s TWT is similar to the deeper portion of Site U1450 and represents a style of fan deposition seemingly characterized by the absence of major channel-levee systems before ~7 Ma according to Schwenk and Spiess (2009).
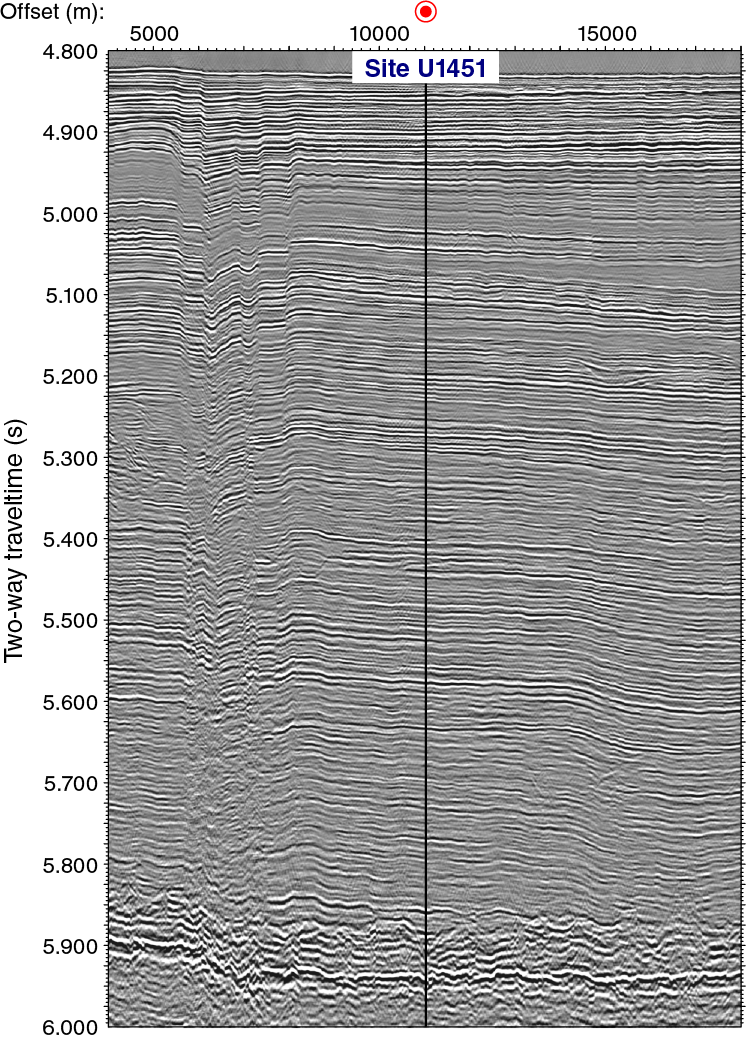
Figure F3. Seismic Line SO125-GeoB97-027 across Site U1451, showing complete sedimentary section cored. A 0.5 s AGC algorithm was applied to equalize amplitudes throughout the seismic section.
The basal section of the seismic line (5.85–5.95 s TWT) is marked by an onlap of the sedimentary reflectors onto a structurally disturbed but layered unit of ~100 ms TWT thickness, which may represent the transition from partly reworked pelagic to turbiditic fan deposition. Beneath, the strong reflector marks the target horizon, believed to be associated with a major regional change in depositional regime.
Operations
We drilled two holes at Site U1451. Hole U1451A extends from the seafloor to 582.1 m DSF and was advanced by the APC, HLAPC, and XCB systems, as well as short (4.8 m) intervals drilled without coring. A reentry cone with 401.76 m of 10¾ inch casing was installed in Hole U1451B before coring with both the XCB and RCB systems to a total depth of 1181.3 m DSF. Unfavorable hole conditions in Hole U1451B precluded collecting wireline log data. All cores, penetration depths, core recovery, and time recovered on deck are presented in Table T1.
Table T1. Site U1451 core summary. Download table in .csv format. View PDF table.
Hole U1451A
After the 64 nmi transit from Site U1450, we arrived at Site U1451 at 1018 h on 17 February 2015. We assembled the APC/XCB bottom-hole assembly (BHA), lowered it to the seafloor, and started coring in Hole U1451A at 1810 h. Cores 1H–9H extended to 55.6 m DSF and were advanced by recovery; they were also oriented. The last of these cores recovered only 3.3 m, so we switched to HLAPC cores. Cores 10F–21F extended from 55.6 to 112.0 m DSF (56.4 m) and recovered 58.78 m of core (104%).
Based on the nature of the core material recovered, we decided to switch back to APC coring. Cores 22H–30H extended from 112.0 to 197.5 m DSF (85.5 m) and recovered 73.99 m of core (74%). Each of these cores was not advanced by recovery but by the full 9.5 m barrel length. Core orientation was conducted on Cores 23H–30H. The core liner of the last two APC cores failed, so we switched back to the HLAPC system.
The hole was then deepened from 197.5 to 573.7 m DSF with an alternating series of HLAPC cores and 4.8 m advances without coring. The 41 HLAPC cores from this interval (31F–110F) cored 189.0 m and recovered 144.3 m (76%); thirty-nine 4.8 m long intervals were drilled without coring. The majority of HLAPC cores in this section were partial strokes. Recovery for the last four HLAPC cores was poor (only 0.55–1.30 m), and up to 40,000 lb was required to pull the core barrel out of the formation, despite only having penetrated a short distance. We decided further HLAPC coring would not work. Before stopping coring operations in Hole U1451A, we took one XCB core (111X; 573.7–582.1 m DSF; 4.75 m recovered; 57%). After this last core from Hole U1451A arrived on deck at 1750 h on 21 February, we started pulling the drill string out of the hole. The bit cleared the seafloor at 2130 h on 21 February. After taking a break from tripping pipe to slip and cut the drill line, we continued to retrieve the drill string, and the bit arrived back on the rig floor at 0600 h on 22 February.
Formation temperature measurements (APCT-3) were made while taking Cores 4H, 7H, 10H, 13H, 29H, 52F, and 74F (28.9, 46.3, 60.3, 74.4, 188.0, 301.9, and 406.4 m DSF, respectively). The latter of these broke the record for the deepest piston core formation temperature measurement ever obtained. The previous record was set at our last site.
We cored 394.9 m in Hole U1451A and recovered 337.80 m of core (86%). The breakdown by coring system is as follows:
- 18 APC cores penetrated 141.1 m and recovered 129.96 m of core (92%).
- 53 HLAPC cores penetrated 245.4 m and recovered 203.1 m of core (83%).
- 1 XCB core penetrated 8.4 m and recovered 4.75 m of core (57%).
- Thirty-nine 4.8 m long intervals were drilled without coring for a total length of 187.2 m.
Hole U1451B
After finishing Hole U1451A, we started preparing and assembling the Hole U1451B reentry system to facilitate our deep coring and logging objectives at this site. The preassembled reentry cone was moved over the moonpool, and 401.75 m of 10¾ inch casing was assembled and latched into the reentry cone. To drill this casing into the seafloor with a bit and underreamer, we made up a drilling assembly consisting of a 9⅞ inch tricone bit, an underreamer set to 12¾ inches, a mud motor, two stands of drill collars, and 328.57 m of drill pipe. The casing running tool was attached to the top of the drilling assembly and then latched into the reentry system. At 0315 h on 23 February 2015, we opened the moonpool and started lowering the reentry system to the seafloor. After deploying the camera system at 1000 h, we started to drill the reentry system into the seafloor at 1205 h.
At 0430 h on 24 February, we finished drilling in 401.76 m of 10¾ inch casing with the reentry cone. The reentry cone landed on the mound of cuttings from drilling the hole ~1 m above the seafloor. The bottom of the casing was at ~400.76 mbsf. The casing running tool was detached from the reentry system, and we started to retrieve the camera system and drilling assembly. By 1600 h on 24 February, all parts of the drilling assembly had arrived back on the rig floor and been taken apart, cleaned, and stored. We assembled an APC/XCB BHA with a 9⅞ inch polycrystalline diamond compact (PDC) bit and started lowering it to seafloor at 1830 h on 24 February. We planned to drill without coring to ~540 mbsf (Hole U1451A was cored to 582.1 m DSF) and then XCB core as far as possible. We decided on the APC/XCB system so that we had the option to deploy the APC/HLAPC system to recover any loose sands, a high-priority science objective not likely to be recovered by our other coring systems (XCB/RCB).
We reentered Hole U1451B at 0255 h on 25 February, retrieved the camera system, lowered the bit to 396 mbsf (~5 m above the bottom of the casing), dropped a center bit, and then washed to 404.7 mbsf. At 0645 h on 25 February, we started drilling ahead without coring from that depth to 542 m DSF; the previous hole was cored to 582.1 m DSF, and we wanted to attempt to recover core from this overlapping interval. We retrieved the center bit and started XCB coring. Eleven XCB cores and a single 6.7 m interval drilled without coring penetrated from 542.0 to 640.8 m DSF (98.8 m). Cores 2X–13X sampled 92.1 m and recovered 19.05 m of core (21%).
Several XCB cutting shoe failures occurred while coring. When Core 7X arrived back on the rig floor, the lower part of the XCB cutting shoe was missing; it had been left in the hole. The inner flow diverter was still in place, so we inferred that the bit became overheated and failed after coring as the bit was pulled off the bottom of the hole. We deployed an XCB barrel with a center bit, advanced 6.7 m to push the pieces of the broken XCB bit out of the path of our coring bit, and then resumed XCB coring (Cores 9X–12X). On the last of these cores (12X), the XCB cutting shoe was recovered with substantial cracks in it; it fell apart on deck when the core was hydraulically extracted from the throat of the cutting shoe. Once again, we inferred that the bit was overheating. For the next core, we decided to reduce the weight on the bit, lower the rotation rate, and increase the fluid being pumped. However, while cutting Core 13X the penetration was substantially reduced, so we retrieved it after only a 3 m advance. When Core 13X was recovered on the rig floor, the lowermost part of the XCB cutting shoe was missing, and we decided that XCB coring was no longer viable. At 1930 h on 26 February, we started pulling out of the hole so we could switch to an RCB coring assembly, reenter Hole U1451B, and continue coring to our target depth.
After the APC/XCB bit arrived back on the rig floor (0340 h on 27 February), we started assembling an RCB bit and BHA. After the bit was spaced out, we picked up three additional drill collars, finished assembling the BHA, and started lowering it to the seafloor at 0800 h on 27 February. We deployed the camera and reentered Hole U1451B at 1642 h. The bit was lowered through the 10¾ inch casing that extended to 400.76 mbsf and then into the open hole below. At 578 mbsf, the bit encountered an obstruction in the hole, so it was raised up to 569 mbsf to install the top drive. At this time, the drill string became stuck in the hole. The drill string was freed after 2 h of working the drill string by applying overpull, torque, and circulation. We raised the bit back up to 549 mbsf, installed two knobbies beneath the top drive, and started washing and reaming back to the bottom of the hole (640.8 mbsf). After reaching the bottom of the hole, we drilled ahead 5 m (640.8–645.8 m DSF) with a center bit to ensure any pieces of the failed XCB cutting shoe were cleared to the side of the hole. Two wireline runs were needed to retrieve the center bit, as the first run came up without the core barrel and center bit. We started RCB coring at 0645 h on 28 February.
Cores 15R–36R penetrated from 645.8 to 860.2 m DSF (214.4 m) and recovered 49.51 m of core (23%). The drill string became stuck after retrieving Core 35R, and 30 min was needed to work the pipe free. Because of poor hole conditions, we decided to conduct a wiper trip after Core 36R arrived on the rig floor. While raising the bit back up into the 10¾ inch casing that extended to 401 mbsf, the drill string encountered significant torque and up to 30,000–40,000 lb of drag. After slipping and cutting the drill line with the bit inside the casing, the bit was lowered to 637 mbsf, where it encountered a bridge. We washed and reamed from this depth back down to the bottom of the hole (860.2 m DSF) and resumed RCB coring at 0145 h on 3 March. After a few fast-penetration, low-recovery cores (Cores 38R–41R; presumably loose sands) with high drill string torque and some overpull, we conducted a short wiper trip by raising the bit from 908.9 to 869.6 mbsf and then washing back to bottom. RCB coring resumed at 1115 h on 3 March.
Cores 42R–73R penetrated from 908.9 to 1181.3 m DSF (272.4 m) and recovered 104.28 m of core (38%). Because of the nature of the rocks being recovered, we decided to stop further coring at 1440 h on 6 March and conduct wireline logging. We started to raise the bit back up to the base of the 10¾ inch casing (401 m), two joints of drill pipe at a time (doubles) with the top drive in place, because of the poor hole conditions. While raising the bit, the drill string experienced torque and overpull and then became stuck at 963 mbsf. We also observed up to 250 psi of overpressure in the drill pipe. After the drill string was freed, we had to rotate, apply overpull, and circulate to be able to raise the bit up to 529 mbsf. We then removed the top drive but still had 20,000–25,000 lb of overpull until the bit was up inside the casing. Based on hole conditions, we decided it was not reasonable to log the hole. At the end of 6 March, we started reassembling the drill pipe doubles back into stands so that we could resume recovery of the drill string. After the bit was back on board, the rig floor was secured, and the seafloor positioning beacon was recovered, we departed for Site U1450 at 0806 h on 7 March.
Lithostratigraphy
At Site U1451, two holes were drilled. Hole U1451A penetrated to a maximum depth of 582.1 m DSF (cored interval: 394.9 m with 86% recovery). Coring of Hole U1451B was initiated at 542.0 m DSF and completed at 1181.3 m DSF (cored interval: 627.6 m with 29% recovery). Hole U1451B lithostratigraphic units overlap with Hole U1451A units from 542 to 582.1 m CSF-A. The overall dominant lithology for Site U1451 (51% of total recovered material) is micaceous siliciclastic sediment in fining-upward sequences of fine sand, silt, and clay (i.e., turbidites), along with homogeneous sands and mixed silt-clay layers. Lithified clastic material (siltstone and claystone) makes up 16% of the total recovered material. Siliciclastic units alternate with at least nine units of mottled and bioturbated calcareous clay (24% of total recovered material) to 860.2 m CSF-A. From this point to the bottom of the hole, intervals of clastic material alternate with impure limestones and calcareous claystones (9% of total recovered material). Additionally, Site U1451 contains eight thin volcanic ash layers that constitute less than 1% of total recovered material.
Recovered sediments from Site U1451 are divided into 24 lithostratigraphic units based on lithologic characteristics from macroscopic description, microfossil contents from smear slide analyses, and physical property measurements (Figures F4, F5).
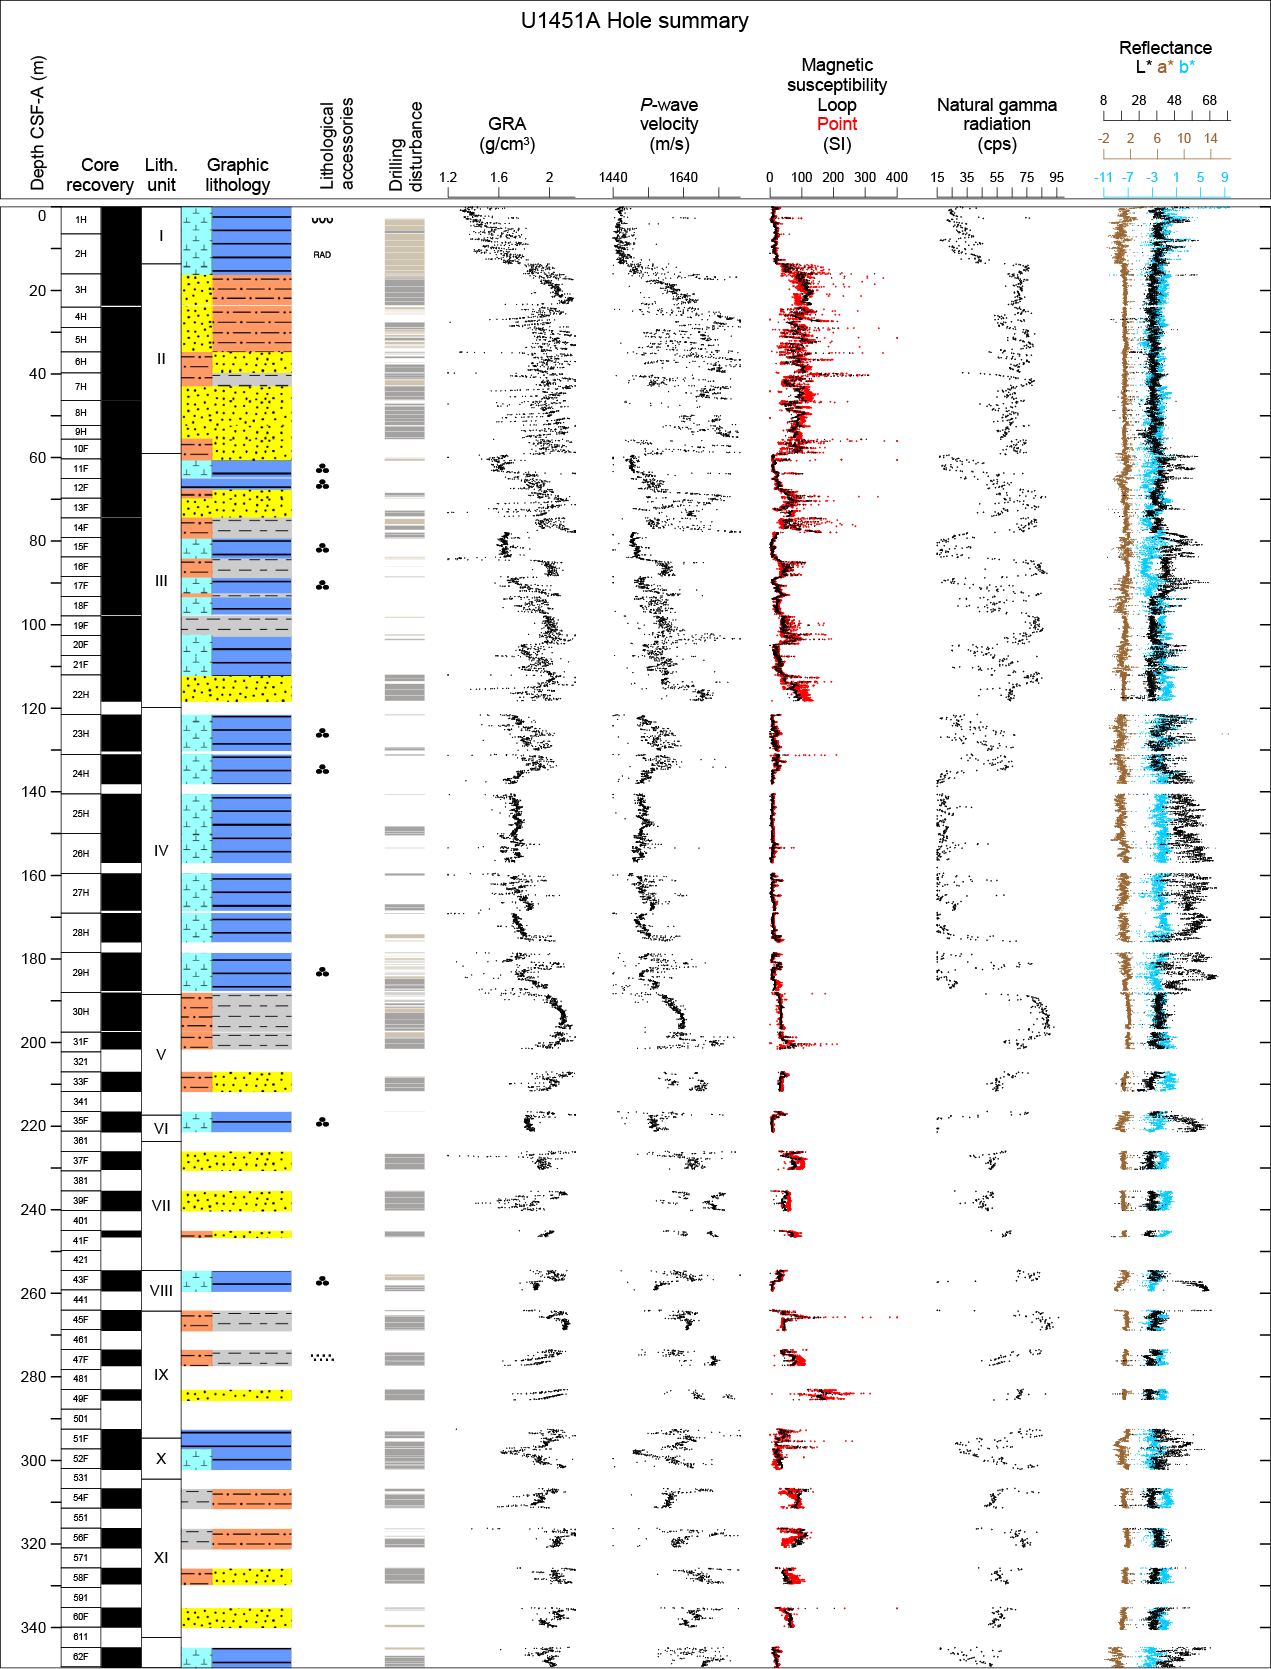
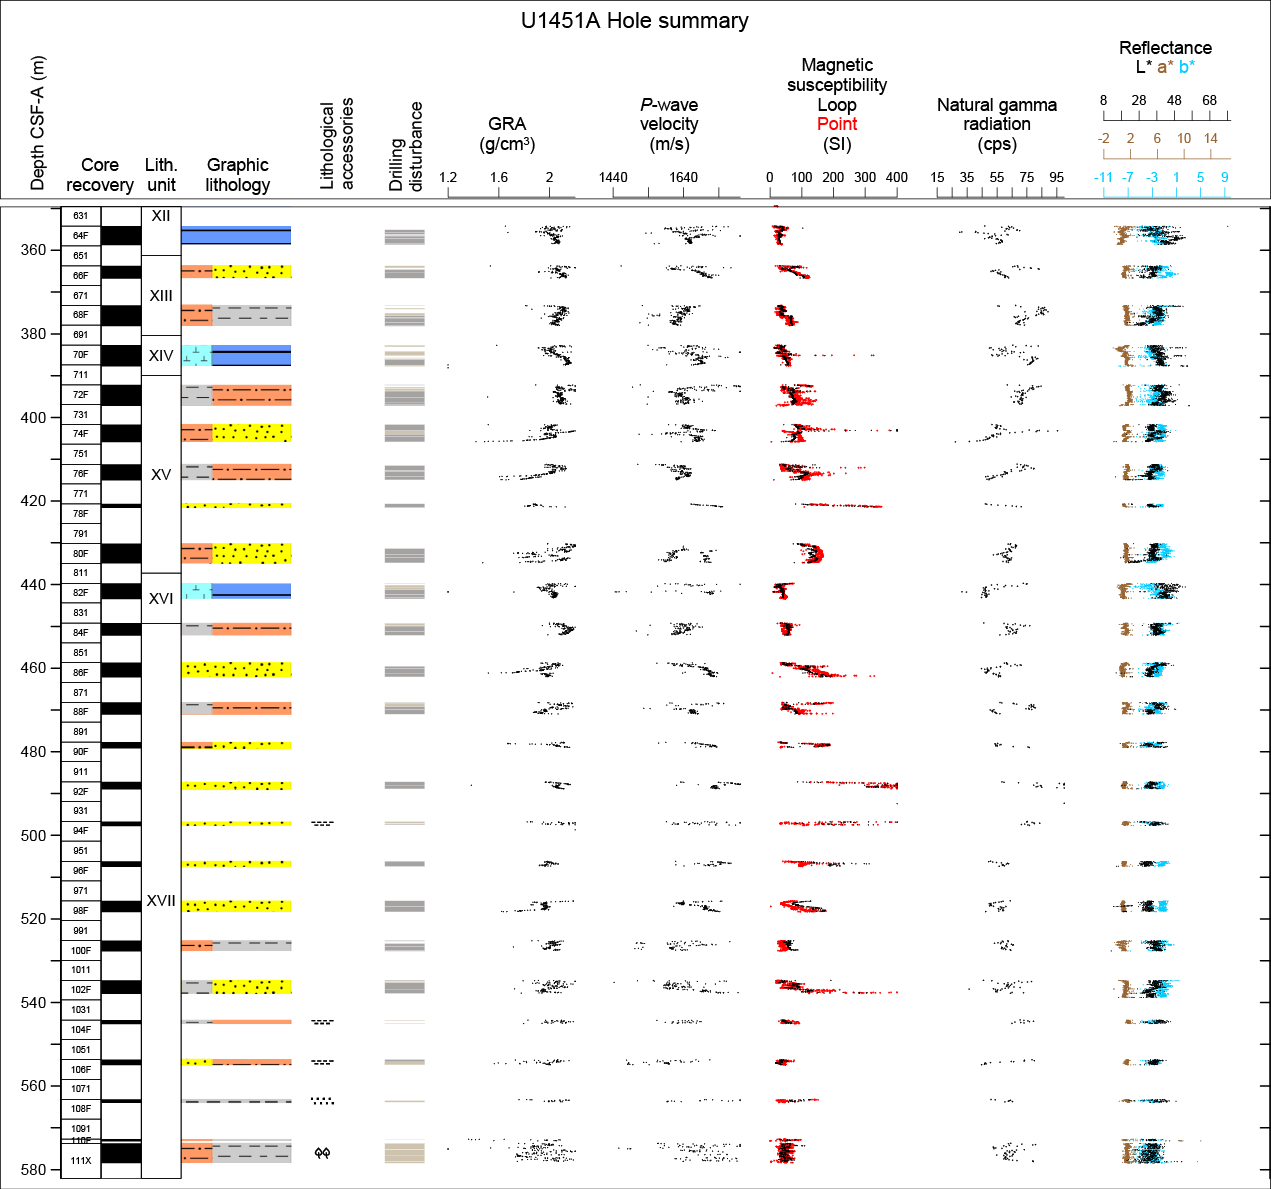
Figure F4. Lithostratigraphic summary, Hole U1451A.
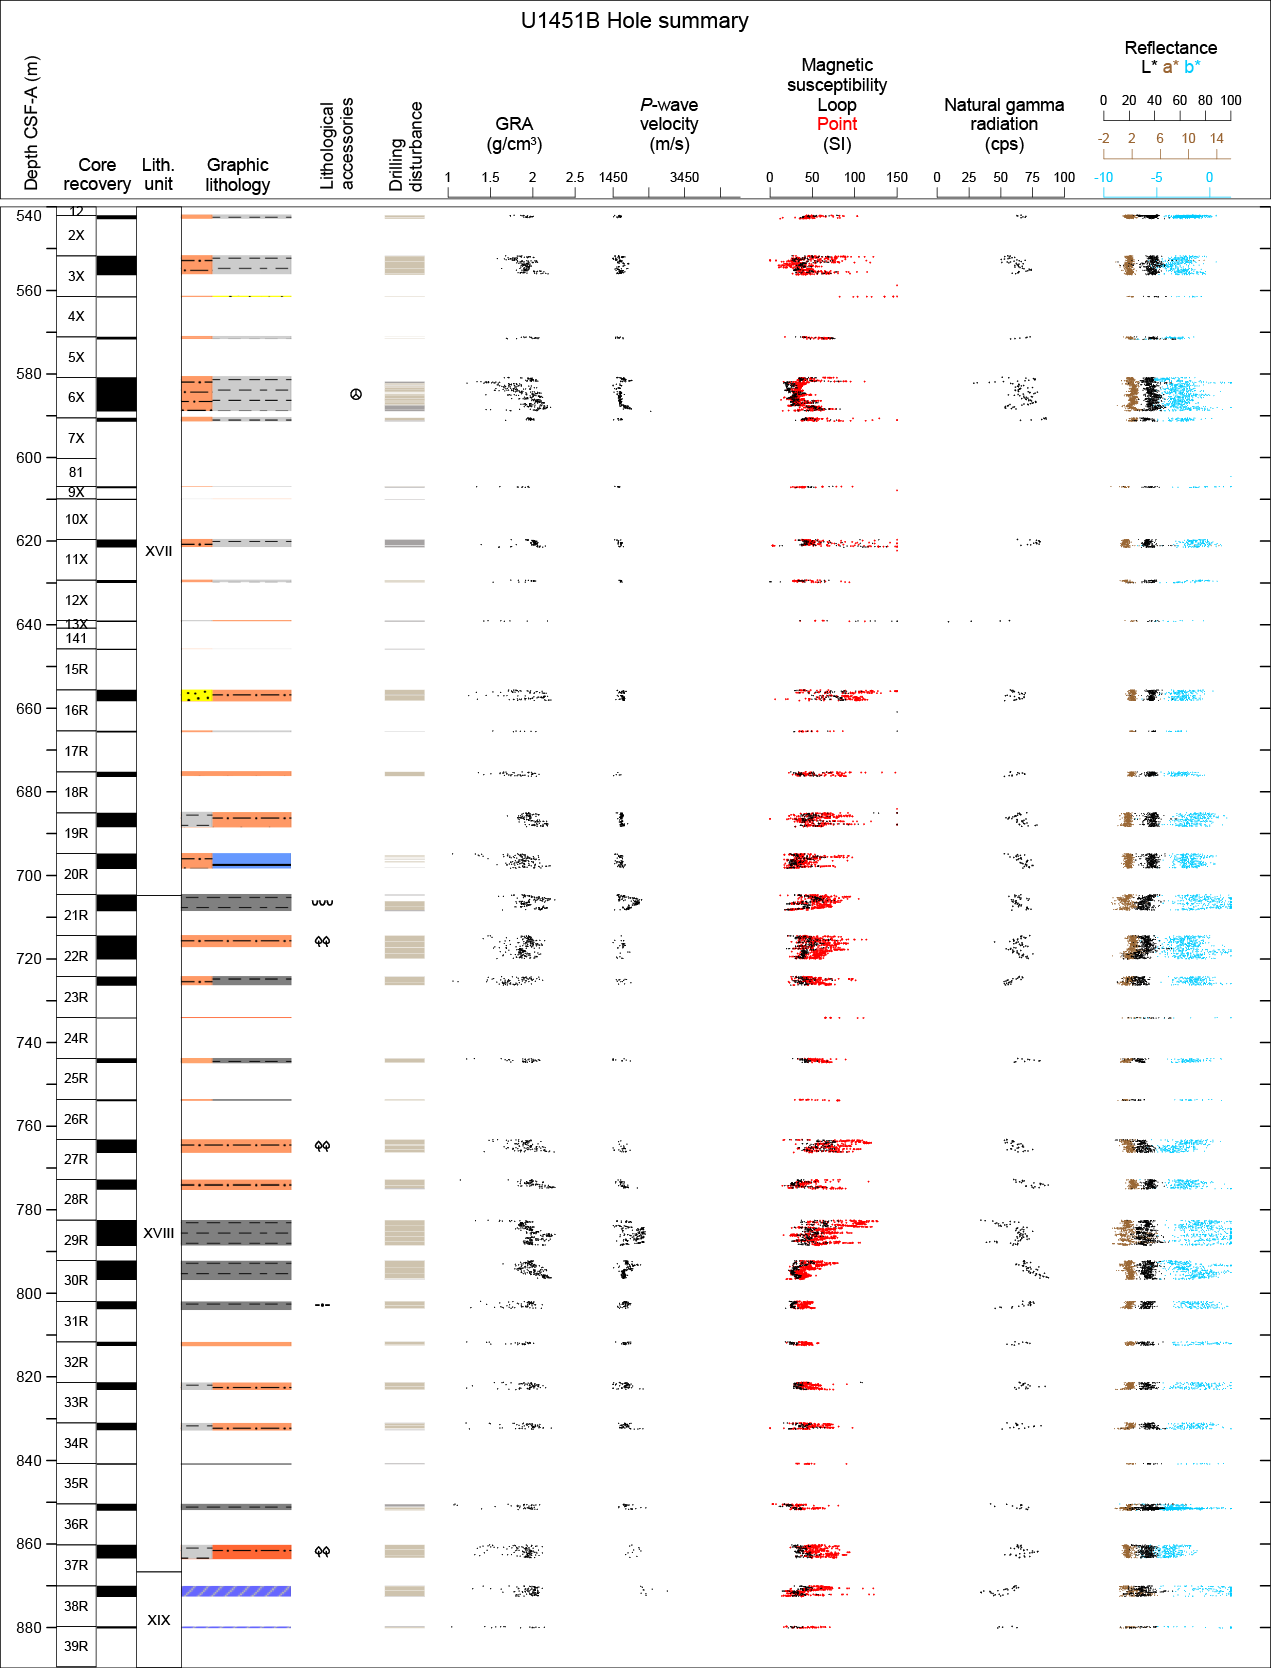

Figure F5. Lithostratigraphic summary, Hole U1451B.
Unit summaries
Units are grouped by lithology and summarized here. More detailed descriptions of individual units are presented below.
Units I, III, IV, VI, VIII, X, XII, XIV, and XVI are dominated by mottled and bioturbated calcareous clay interbedded with silt and clay (Table T2).
Table T2. Intervals, depths, major and minor lithologies, and ages of units, Site U1451. Download table in .csv format.
Units II, XVII, XVIII, XX, XXI, and XXIII are principally siliciclastic sediments with preserved fining-upward structures (i.e., turbidites) and/or parallel laminations. These units may also contain minor fractions of calcareous clay. Silt-rich intervals in Units XX and XXI contain plant fragments. Unit XXII contains siltstones with angular calcareous claystone clasts, interpreted to be postdepositional intrusions or injectites. Drilling disturbances are common (e.g., up-arching, “soupy” texture in sands, flow-in, fracturing, biscuiting, and fall-in).
Units V, VII, IX, XI, XIII, and XV are also principally siliciclastic but contain intervals of homogeneous sediment. These units may also contain minor fractions of calcareous clay. Some silt-rich intervals contain plant fragments.
Units XIX, XXI, XXII, and XXIV are calcareous clays and impure limestones, with minor components of silty clay, claystone, and siltstone occasionally containing plant fragments. Unit XXII contains silt and claystone turbidite sequences.
Units I, III, IV, and XXIV contain volcanic ash layers.
Units III, VII, XV, and XVII also contain intervals of soupy sand that were vertically settled in core liners on the catwalk (Table T3; see the Expedition 354 methods chapter for a detailed description of this procedure [France-Lanord et al., 2016a]). As a result, these units may include core sections with grain size grading structures that are not included in the descriptions.
Table T3. Core sections containing sand that were vertically settled on the core receiving platform, Site U1451. Download table in .csv format.
Lithostratigraphic summary
As at Sites U1449 and U1450, lithologic differences between units and variations in grain size and bed thickness reflect cycles of proximal turbidity current channel activity and abandonment. Sand intervals may represent interlevee “sheet flow” (e.g., Curray et al., 2003), whereas finer grained fractions are more likely preserved in leveed sections. Calcareous clay units represent times of local channel-levee inactivity and reduced siliciclastic deposition and reflect a relative increase in the settling of suspended sediment from the pelagic zone. Intervals of calcareous clay material contain repeated sequences of color-graded beds that may be due to increased entrainment of siliciclastic material, changes in water column productivity, or changes in the oxidation/reduction horizons of the pore waters. In Hole U1451B, intervals dominated by calcareous and/or clayey material become increasingly lithified with depth, and many are intercalated with very thin to thin silt or siltstone layers. In this hole, there are also intervals of brecciated limestone in a siltstone matrix, interpreted to be postdepositional intrusions or injectites. Plant fragments occur throughout the site, more commonly in silt and siltstone intervals, although a few sand-dominated units also contain macroscopic plant material. Unit I contains a 20 cm thick ash layer (2.56–2.77 m CSF-A) that presumably corresponds to the 75.0 ± 0.9 ka Toba volcanic eruption that produced widespread tephra deposits across the Bay of Bengal (e.g., Mark et al., 2014). Additional ash layers occur in Unit III (72.34–72.45, 90.72–90.81, and 107.53–107.62 m CSF-A), Unit IV (153.38–153.42 m CSF-A), and Unit XXIVa (1113.6–1113.84, 1153.03–1153.18, and 1153.67–1153.89 m CSF-A).
Coarse (i.e., sand) and fine-grained turbidite sequences alternate with calcareous clays in the upper 570 m of the site. Below this depth, a switch from APC and HLAPC coring to XCB and RCB coring likely reduced sand recovery. From 578.45 to 889.12 m CSF-A, recovered sediments are dominated by silt, siltstone, and claystone turbidites. Mixed calcareous and clastic deposition resumes from 889.12 to 1086.34 m CSF-A; deeper sediments to the base of the hole are lithified calcareous beds with claystone layers.
Overall, siliciclastic units (silt, clay, and sand) at Site U1451 are compositionally classified as mica rich (muscovite and biotite) and quartz rich. Sand occurs mostly in fine to medium grain size ranges, with rare occurrences of coarse grain-sized sand particles. Feldspar and heavy minerals (e.g., tourmaline, apatite, zircon, amphibole, garnet, sphene, rutile, chrome spinel, zoisite, glauconite, sillimanite, chloritoid, and opaque minerals) are common in silt- and sand-rich layers, and lithic fragments (e.g., quartzite, gneiss, cataclastic granite, and garnet-bearing schist) occasionally appear in sand. From other sites (see Figure F14 in the Site U1455 chapter [France-Lanord et al., 2016b]), it is known that siliciclastic sediments in the fan contain between ~3% and 10% of detrital carbonate as well. Units containing higher calcareous sediment contents are divided between calcareous claystones and impure limestones. Calcareous claystones are greenish gray, exhibit mottling, and represent a mixture of marine carbonates and siliciclastic fine-grained material. Impure limestones occur in Unit XXIV, vary in color from white to yellow to pink, consistently include radiolarians and planktonic foraminifers in a dominantly micritic matrix, and represent a different environmental setting from the fan deposits above.
The nomenclature for lithologic descriptions of sediments containing carbonate consists of a principal name and a modifier based on the composition estimated from visual description of the cores and from smear slide observations. The principal name of sediment that appears to contain >75% carbonate is calcareous ooze or limestone, depending on the degree of lithification. The principal name of sediment that appears to contain <10% carbonate is clay or claystone. If sediment contains a mixture of clay-sized siliciclastic particles and calcareous components (i.e., carbonate contents between 10% and 75%), the principal name is calcareous clay or calcareous claystone. This nomenclature was adopted to describe the continuum of sediments recovered from almost pure claystone to almost pure limestone. In most cases, lithologic names assigned using this protocol match well with measured carbonate content and accurately reflect the continuum of sediments recovered at this site (Figure F6). Lithified sequences show a wide variety of color and a larger range of carbonate contents (perhaps the result of diagenesis and lithification) than the younger unlithified sequences.
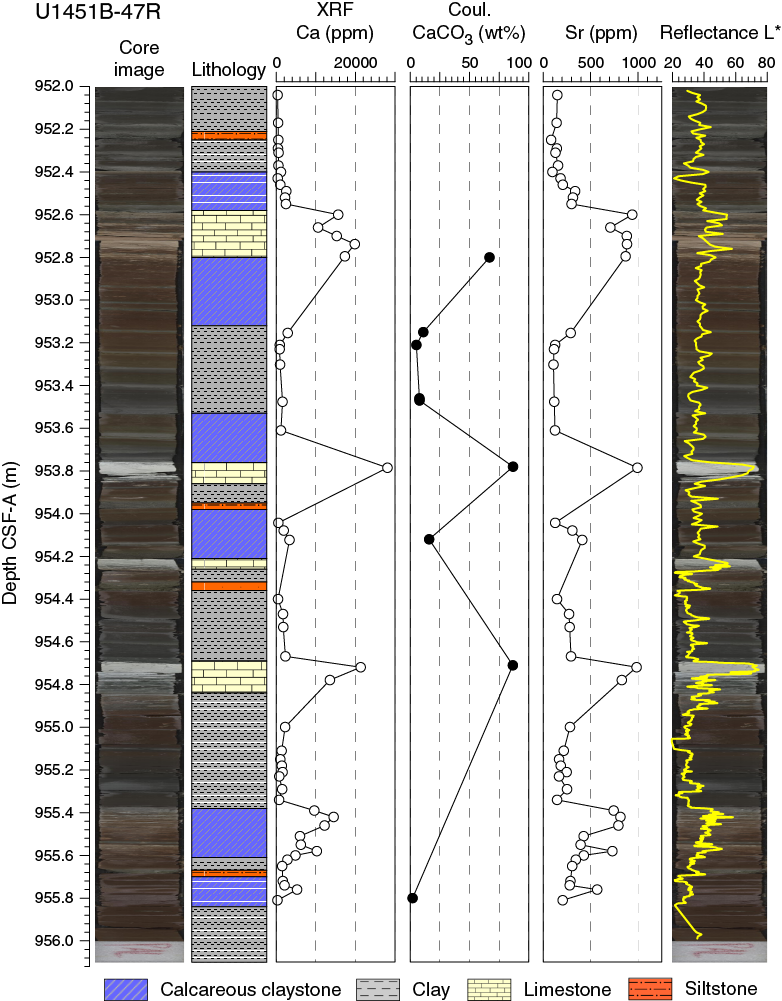
Figure F6. Lithology and carbon contents, Core 354-U1451B-47R.
Drilling disturbances at this site vary in intensity from slight to severe and include flow-in, fractures, up-arching, soupy sand homogenization, and drilling biscuits. Flow-in is the most common drilling disturbance in fine-grained intervals, whereas disturbed sands may display a homogenized (or soupy) texture. A more detailed description and graphic examples of drilling disturbance types can be seen in Figure F6 in the Expedition 354 methods chapter (France-Lanord et al., 2016a).
Unit I
- Interval: 354-U1451A-1H-1, 0 cm, to 2H-5, 111 cm
- Depth: 0–13.61 m CSF-A
- Age: Late or Middle Pleistocene to recent
- Lithology: calcareous clay, clay (major); volcanic ash (minor)
Description
Unit I is dominated by calcareous clay and bioturbated clay intercalated with a thin volcanic ash layer (Figure F7A) between 2.56 and 2.77 m CSF-A. Calcareous clay is characterized by abundant burrows, mottling, and gradational color changes between bright yellow and dark gray. It occasionally includes greenish gray indurated very thin layers within the dark gray interval. Bioturbated clay also shows pervasive mottling throughout the unit but can be distinguished from calcareous clay by frequent intercalation of very thin bioturbated silt layers and persistent dark gray color (Figure F8A). Calcareous clay units predominate from the seafloor to 5.07 m CSF-A and are intercalated within bioturbated clay at 7.66–9.43 and 9.30–10.03 m CSF-A, with bioturbated gradational boundaries. In Section 1H-2, 107–127 cm, a light brown volcanic ash layer probably corresponds to the Toba volcanic eruption, also recovered at Sites U1449 and U1450.

Figure F7. Representative examples of major lithologies recovered in Hole U1451A. A. Volcanic ash. B. Succession of mud turbidites. C. Homogeneous fine sand. D. Centimeter-sized deformed clasts with no discernible matrix; clasts consist of light gray nannofossil-rich calcareous clay and gray silty clay. E. Nannofossil-rich calcareous clay. F. Silt/fine sand–dominated turbidites.
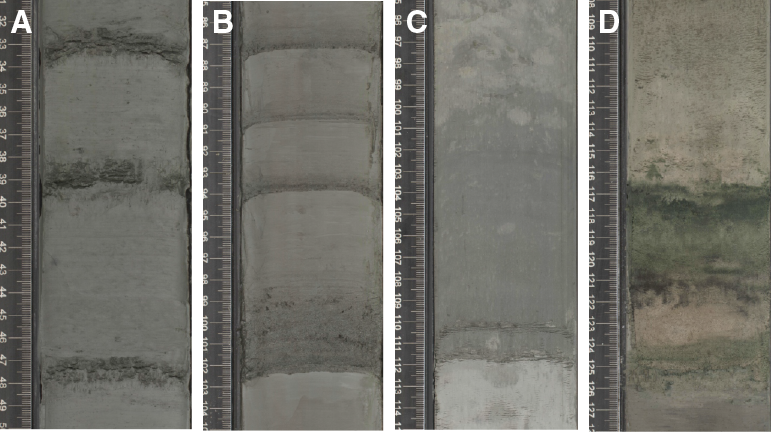
Figure F8. Hole U1451A features. A. Bioturbated clay with bioturbated very thin silt layers. B. Mud turbidite sequences consisting of repeated lower silt to upper clay units. C. Structureless to bioturbated clay intercalated with calcareous clay. D. Volcanic ash layer overlain by calcareous clay; dark green color indicates diagenetic alteration of volcanic glass.
Composition from smear slides
See Figure F9 for representative smear slide images.
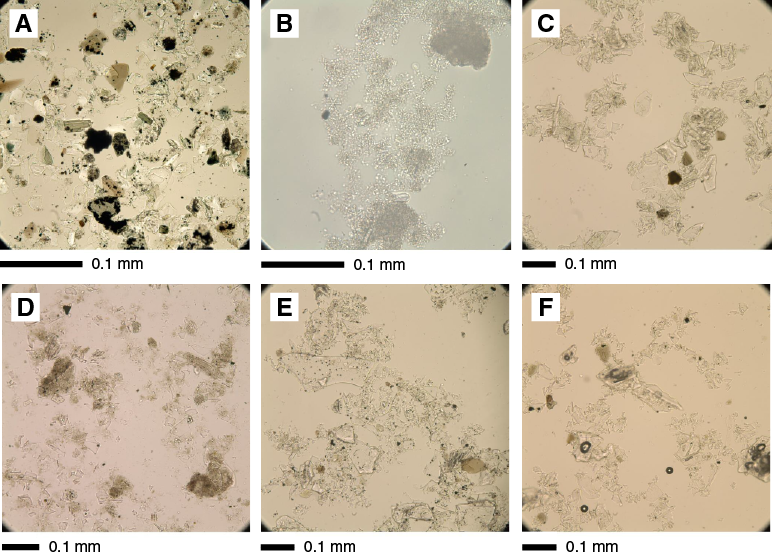
Figure F9. Representative smear slide images, Hole U1451A. A. Silt. B. Nannofossil-rich calcareous clay. C. Volcanic ash. D. Volcanic ash with nannofossils. E. Weakly altered volcanic ash. F. Weakly altered volcanic ash.
Nannofossil-rich calcareous clay
Smear slides from this unit consist of a significant proportion of calcareous nannofossils and clay minerals with fragments of radiolarians and foraminifers (2H-3, 108 cm; 10.58 m CSF-A).
Volcanic ash
Smear slides from the ash layers mainly consist of volcanic glass shards 0.01–0.30 mm in diameter and minor amounts of quartz, feldspar, biotite, hornblende, and opaque mineral grains. Volcanic glass appears in the form of clear plates, flakes, and strands, with a relatively low refractive index (1H-2, 125 cm; 2.75 m CSF-A). Slightly altered glass shards are also recorded. The typical range for the volcanic glass proportion is 90%–95% of total grains.
Unit II
- Interval: 354-U1451A-2H-5, 111 cm, to 10F-3, 86 cm
- Depth: 13.61–59.29 m CSF-A
- Age: Middle–Late Pleistocene
- Lithology: sand (major); clay, silt (minor)
Description
Unit II is characterized by overall dominance of medium-bedded to very thick bedded sand turbidites intercalated with a few successive thin- to medium-bedded mud turbidites (Figure F8B). Sand turbidite beds are mostly composed of fine sand with fining-upward texture (normal grading), especially in the uppermost parts of the beds. The beds also commonly show horizontal stratification with mica and occasionally include a few distorted mud clasts. Thick to very thick units commonly show a soupy appearance and/or flow-in structures attributed to the coring process. Intercalated mud turbidites mainly consist of structureless to bioturbated clay with basal thin or very thin silt layers. Basal silt layers fine upward (normally graded) and are laminated with sharp lower boundaries.
Composition from smear slides
See Figure F9 for representative smear slide images.
Clay and clay with silt
Clay and clay with silt mainly consist of clay minerals and silt-sized grains of quartz, feldspar, mica, altered mica, and heavy minerals. Clay-sized minerals include amorphous and aphanitic grains (3H-1, 54 cm; 16.54 m CSF-A). The clay sample at 15.42 m CSF-A (2H-7, 11 cm) includes a large number of nannofossils and fragments of foraminifers.
Silty sand
Silty sand consists of fine sand–, medium sand–, and silt-sized grains of quartz, feldspar, mica, lithic fragments, and carbonate minerals. Heavy minerals, including amphibole, tourmaline, zoisite, zircon, pyroxene, apatite, and opaque minerals, are frequently recorded. Metamorphic minerals such as sillimanite and chloritoid were occasionally observed. In coarser sand layers, fragments of gneiss, cataclastic granite, and garnet-bearing schist are found (10F-1, 3 cm; 55.63 m CSF-A and 5H-4, 100 cm; 34.40 m CSF-A). Very fine grained carbonate minerals and carbonate aggregate grains occur in this lithology.
The maximum grain size for sand grains is 1.10 mm in diameter (10F-1, 3 cm; 55.63 m CSF-A).
Unit III
- Interval: 354-U1451A-10F-3, 86 cm, to 22H-5, 127 cm
- Depth: 59.29–118.24 m CSF-A
- Age: early–Middle Pleistocene
- Lithology: calcareous clay, clay (major); sand, silt, clay, volcanic ash (minor)
Description
Unit III mainly consists of interbedded medium-bedded to very thick bedded calcareous clay and structureless to bioturbated clay sequences intercalated by intervals dominated by mud and sand turbidites. Calcareous clay beds are generally bright yellow to pale olive in color and are characterized by dense burrows and mottles. They particularly predominate between 59.29 and 63.02 and between 79.1 and 83.82 m CSF-A. Structureless to bioturbated clay beds interbedded with calcareous clay are characterized by consistent light gray color and moderate bioturbation that often increases in intensity uphole. These clay beds have gradational bioturbated upper boundaries and sharp planar lower boundaries with occasional basal silt laminae (e.g., Figure F8C). In some cases, they have gradational changes to mud turbidites downhole. Mud turbidites mainly consist of thin- to medium-bedded structureless to bioturbated clay with basal thin or very thin silt or sand layers. Basal silt or sandy layers fine upward (normally graded) and are laminated with sharp lower boundaries. Sand turbidites are usually medium bedded to very thick bedded and mostly composed of coarse silt to fine sand that fine upward (normal grading), especially in the uppermost parts of the beds. They also commonly show horizontal stratification with mica and occasionally include a few distorted mud clasts. Thick to very thick units commonly show soupy appearance and/or flow-in structures attributed to the coring process. The sand and mud turbidite sequences are particularly dominant in the intervals between 67.58 and 77.92, 98.10 and 104.63, and 112.02 and 118.24 m CSF-A. Unit III includes two distinct volcanic ash beds between 72.34 and 72.45 and between 107.53 and 107.62 m CSF-A. Both ash beds are characteristically overlain by medium-bedded bright yellow calcareous clay (Figure F8D). Another ash layer at 90.72–90.81 m CSF-A is heavily bioturbated.
Composition from smear slides
See Figure F9 for representative smear slide images.
Nannofossil-rich calcareous clay
Calcareous nannofossils and clay minerals make up a significant proportion of this lithology. Radiolarians and foraminifers make up the remaining proportion.
Volcanic ash
Three ash layers are intercalated in this interval:
- The first ash layer (13F-2, 123 cm; 72.42 m CSF-A) mainly consists of slightly corroded volcanic glass shards 0.01–0.25 mm in diameter and minor amounts of quartz, plagioclase, biotite, and opaque minerals along with very few hornblende and pyroxene grains. The volcanic glass shows mainly clear plates with subordinate flakes and strands and has a relatively low refractive index. Where greenish coloration is observed in the ash (13F-2, 118 cm; 72.37 m CSF-A), the glass shards are etched, corroded, and partly altered to indistinguishable clay minerals. The typical range for the volcanic glass proportion is 90%–95% of total grains.
- The second ash layer (17F-2, 78 cm; 90.78 m CSF-A) primarily contains altered volcanic glass shards 0.01–0.20 mm in diameter. Very minor quartz, feldspar, and biotite grains are observed. The volcanic glass grains are mainly needle, flake, and strand shaped; some glass shards are partly altered to aphanitic clay minerals. This ash is contaminated by aggregates of clay, calcareous nannofossils, and fragments of foraminifers and radiolarians. The typical range for the volcanic glass proportion is 40%–60% of total grains.
- The third ash layer (21F-1, 30 cm; 107.6 m CSF-A) mainly contains relatively coarse grained volcanic glass shards. These glass shards have platy shapes 0.01–0.45 mm in diameter. Minor amounts of quartz, feldspar, biotite, and opaque grains occur, along with very minor hornblende and zircon grains. The typical range for the volcanic glass proportion is 85%–95% of total grains. Clay aggregate grains frequently occur. The volcanic glass contains very fine grained and granular opaque minerals (pyrite?), especially in black ash layers at 107.59 m CSF-A (21F-1, 29 cm).
Clay
Smear slides show essentially clay-sized minerals in this lithology. Occasionally, rare nannofossils and plant fragments occur with the clay minerals.
Silty sand
Silty sand principally contains grains of quartz, feldspar, lithic fragments, mica, and heavy minerals. Heavy minerals include garnet, staurolite, zoisite, clinozoisite, amphibole, pyroxene, tourmaline, sphene, sillimanite, pyroxene, zircon, apatite, allanite, and opaque minerals. The amphibole grains, garnet, and opaque minerals predominate over other heavy minerals in this interval. The total heavy mineral proportion in some sections in the lower part of the unit is considerably lower than it is in the upper part of the unit. The maximum grain size ranges from 0.35 to 0.55 mm in diameter.
Unit IV
- Interval: 354-U1451A-23H-1, 0 cm, to 29H-CC, 59 cm
- Depth: 121.5–187.6 m CSF-A
- Age: late Miocene–early Pleistocene
- Lithology: calcareous clay (major); clay, silt, volcanic ash (minor)
Description
Unit IV is characterized by an overall predominance of thick-bedded to very thick bedded calcareous clay. Calcareous clay beds are generally bright yellow to pale olive-green and characterized by dense burrows and mottles. The beds are frequently interbedded with bioturbated clay units between 125.33 and 134.82 m CSF-A. These clay beds are characterized by consistent light gray color, moderate bioturbation that increases in intensity uphole (Figure F8B), gradational bioturbated upper boundaries, and sharp planar lower boundaries with occasional basal silt laminae. Thin mud turbidites are also occasionally intercalated. A bioturbated thin ash layer occurs between 153.38 and 153.42 m CSF-A.
Composition from smear slides
See Figure F9 for representative smear slide images.
Nannofossil-rich calcareous clay
Smear slide components from the white and gray calcareous layer are mainly composed of nannofossils and clay minerals (25H-2, 90 cm; 142.90 m CSF-A) and a low proportion of foraminifers.
Volcanic ash
The ash layer mainly consists of corroded and etched volcanic glass shards 0.01–0.20 mm in diameter and minor amounts of quartz, plagioclase, biotite, and opaque minerals and very few zircon, allanite, and apatite grains. Volcanic glass shows mainly platy and strand shapes. Glass shards have partly broken down to indistinguishable clay minerals (26H-4, 32 cm; 153.4 m CSF-A). The typical range for the volcanic glass proportion is 85%–95% of total grains.
Clay with sand and clay with silt
Clay with sand and clay with silt mainly contain clay-sized detrital grains with occasional nannofossils, radiolarians, and their fragments. The mineralogy of silt- and sand-sized grains are similar to that of silty sand, described below, although heavy mineral and opaque mineral content tends to be richer (26H-3, 61 cm; 152.6 m CSF-A).
Silty sand
Silty sand consists of grains of quartz, feldspar, mica, heavy minerals, and carbonate minerals. Heavy minerals include amphibole, pyroxene, clinozoisite, zoisite, tourmaline, zircon, garnet, and opaque minerals. In several horizons, the proportion of heavy minerals is very high (23H-5, 35 cm; 126.18 m CSF-A). Carbonate is found as aggregate grains with coarser grain size and single-grain carbonate minerals. The typical range of the carbonate mineral portion is 1%–2% of total grains. Organic material, such as plant debris, was frequently observed. Silt grains can be well sorted (23H-5, 35 cm; 126.18 m CSF-A). Smear slides from the black laminae section show principally pyrite grains (29H-1, 22 cm; 178.72 m CSF-A).
The maximum grain size is 0.21 mm in diameter (27H-2, 35 cm; 161.35 m CSF-A).
Unit V
- Interval: 354-U1451A-30H-2, 12 cm, to 35F-1, 87 cm
- Depth: 188.48–217.37 m CSF-A
- Age: late Miocene
- Lithology: silty clay (major); silty sand, silt, clayey silt (minor)
Description
The major lithology, silty clay, sometimes micaceous, is more prominent in the upper part of the unit, from Section 31F-1 uphole. Bed thickness ranges from very thin to medium, and very thin beds and laminations of silt are intercalated at some locations. Fining-upward texture (normal grading), mud clasts, mottling, and wavy laminations are recorded but uncommon. Medium-bedded micaceous silty sand is more prevalent in the lower part of the unit. One interval of micaceous silt with fining-upward texture (normal grading) is recorded at 31F-1, 105–127 cm, and one unit of medium-bedded clayey silt occurs at 33F-1, 43–140 cm. Coring disturbance is predominantly severe, with flow-in, fall-in, and up-arching all recorded. The soupy, homogenized nature of the sand might also be attributed to the coring process.
Composition from smear slides
See Figure F9 for representative smear slide images.
Silty sand
Silty sand consists primarily of sand-sized grains of quartz, feldspar, lithic fragments, mica, heavy minerals, and carbonate minerals. All grains are angular except altered mica. Heavy minerals amphibole, tourmaline, garnet, zircon, sphene, apatite, and opaque minerals are present. Large fragments of garnet, reaching 0.5 mm in diameter, were occasionally observed. Carbonate occurs as aggregate grains, and single crystal carbonate minerals also occur. The typical range of this carbonate fraction is 1%–2% of total grains.
Maximum grain size is 0.82 mm in diameter in this interval (31F-3, 14 cm; 200.31 m CSF-A).
Clay and silty clay
Clays and silty clays mainly contain clay-sized detrital grains with subordinate silt-sized grains. Occasionally, carbonate minerals, nannofossils, radiolarians, and their fragments are found. The mineralogy of silt- and sand-sized grains is similar to that of silty sand, described above, although heavy mineral and opaque mineral contents tend to be richer compared to sand.
Unit VI
- Interval: 354-U1451A-35F-1, 87 cm, to 35F-CC, 17 cm
- Depth: 217.37–221.36 m CSF-A
- Age: late Miocene
- Lithology: nannofossil-rich calcareous clay (major); silty fine sand (minor)
Description
The majority of the 3.99 m thick Unit VI consists of light gray to slightly brownish gray nannofossil-rich calcareous clay. The mottled structure of these sediments and prominent burrows throughout the unit indicate moderate to high bioturbation. A bed of dark gray silty sand (with mica) fining upward into gray silty clay occurs at 35F-1, 130–140 cm. The sharp base and gradational upper contact indicate deposition by turbidity currents. Coring-induced normal faults occur in Sections 35F-3, 90–100 cm, and 35F-4, 3–22 and 48–65 cm. The lower part of Section 35F-4, 30–69 cm, and Section 35F-CC are heavily affected by flow-in of sediment due to suction by APC coring.
Composition from smear slides
See Figure F9 for representative smear slide images.
Nannofossil-rich calcareous clay
Calcareous clay mainly consists of nannofossils and clay minerals. Radiolarians make up the majority of the minor component.
Unit VII
- Interval: 354-U1451A-37F-1, 0 cm, to 41F-CC, 15 cm
- Depth: 226.00–246.64 m CSF-A
- Age: late Miocene
- Lithology: sand (major); silty sand, silty clay (minor)
Description
The majority of this unit consists of sand with a soupy appearance due to high water content. One interval of silty sand with fining-upward texture (normally graded) and soupy texture is found at the base of the unit (41F-1, 16–49 cm). Two intervals of silty clay are found in Sections 37F-1, 0–9 cm, and 41F-1, 0–16 cm.
Composition from smear slides
See Figure F9 for representative smear slide images.
Nannofossil-rich calcareous clay with radiolarians
Calcareous clay mainly consists of nannofossils and clay minerals. Radiolarians and foraminifers make up the majority of the minor component.
Sand and silty sand
Sand and silty sand consist primarily of fine sand–sized grains of quartz, feldspar, lithic fragments, mica, heavy minerals, and carbonate minerals. All grains are angular except altered mica grains. Heavy minerals include garnet, staurolite, zircon, amphibole, apatite, tourmaline, sphene, and opaque minerals. Carbonate grains are found as aggregate grains of carbonate minerals, and euhedral carbonate minerals are also recorded. The typical range of the carbonate fraction is less than 1% of total grains. Occasionally, glauconitic grains and organic matter occur (37F-3, 130 cm; 230.22 m CSF-A).
The maximum grain size is 0.75 mm in diameter in this interval (37F-3, 130 cm; 230.22 m CSF-A).
Unit VIII
- Interval: 354-U1451A-43F-1, 0 cm, to 45F-1, 26 cm
- Depth: 254.50–264.26 m CSF-A
- Age: late Miocene
- Lithology: nannofossil-rich calcareous clay, clay (major); silt (minor)
Description
The upper part of Unit VIII (43F-1, 0 cm, to 43F-2, 105 cm) shows gray medium- to thick-bedded clay alternating with light gray thin-bedded nannofossil-rich calcareous clay. Calcareous clays are intensively mottled by bioturbation. The clay beds in Section 43F-1, 84–106 cm, are interbedded with 0.5–3 cm thin silt layers. The sharp lower contact, normal grading, and gradational upper contact of the single beds characterize this interval as a succession of mud turbidites. Coring disturbance within all aforementioned sections is generally low and restricted to slight up-arching. Below Section 43F-2, 105 cm, nannofossil-rich calcareous clay represents the dominant lithology but is heavily affected by coring disturbance (flow-in). The upper part of Section 45F-1 (0–26 cm) represents fall-in of drilled sediment (calcareous clay).
Composition from smear slides
See Figure F9 for representative smear slide images.
Nannofossil-rich calcareous clay
Nannofossils and clay minerals make up the major proportion of this unit, and silt grains make up the minor proportion.
Sandy silt
Sandy silt consists primarily of very fine grained to fine-grained sand with subordinate silt-sized grains, such as quartz, feldspar, lithic fragments, mica, heavy minerals, and carbonate minerals. Most grains are angular except altered mica. Heavy minerals amphibole, garnet, zoisite, clinozoisite, zircon, apatite, tourmaline, sphene, and opaque minerals are found. Carbonate aggregate and euhedral carbonate grains are also recorded in this lithology. The typical proportion of these carbonate grains is less than 1% of total grains.
The maximum grain size is 0.12 mm in diameter (43F-1, 100 cm; 255.5 m CSF-A).
Unit IX
- Interval: 354-U1451A-45F-1, 26 cm, to 51F-2, 63 cm
- Depth: 264.26–294.63 m CSF-A
- Age: late Miocene
- Lithology: fine sand (major); silty clay (minor)
Description
Unit IX comprises 30.37 m of dark gray fine sand and gray silty clay. This unit is divided into two subunits. The upper part, Subunit IXa (45F-1, 26 cm, to 47F-1, 144 cm), is 10.68 m thick and consists of thin- to medium-bedded gray to dark gray silty clay interbedded with laminated to very thinly bedded dark gray silt (succession of mud turbidites) (Figure F7B). Sections 45F-2 and 45F-3 are entirely disturbed with flow-in, and the lower portion of Section 47F-1 shows up-arching. The lower part, Subunit IXb (47F-2, 0 cm, to 51F-2, 63 cm), is 19.69 m thick and consists of dark gray fine sand (Figure F7C). The sand is homogeneous and soupy, which could indicate high drilling disturbance. The lower portion of this subunit consists of thick-bedded dark gray silty clay intercalated with very thin bedded dark gray silt and is affected by up-arching.
Composition from smear slides
See Figure F9 for representative smear slide images.
Clayey silt
Clayey silts mainly contain detrital grains with subordinate clay minerals, nannofossils, and radiolarians. Clay-sized carbonate minerals are commonly recorded. The mineralogy of silt-sized grains is similar to silty sand, described below, although feldspar grains tend to be of slightly higher proportion than sand.
Silty sand
Silty sand consists primarily of fine- to medium-grained sand grains, such as quartz, feldspar, lithic fragments, mica, heavy minerals, and carbonate minerals. Most grains are angular except altered mica. Heavy minerals amphibole, garnet, apatite, tourmaline, sphene, zircon, and opaque minerals are found. Sands containing a high proportion of amphibole occur at several horizons (47F-3, 90 cm; 277.12 m CSF-A and 49F-1, 105 cm; 284.05 m CSF-A). Carbonate consists of aggregate grains, and euhedral carbonate grains are also recorded in this lithology. The typical proportion of carbonate grains is less than 1% of total grains.
The maximum grain size is 0.91 mm in diameter (49F-1, 105 cm; 284.05 m CSF-A).
Unit X
- Interval: 354-U1451A-51F-2, 63 cm, to 52F-CC, 33 cm
- Depth: 294.63–302.14 m CSF-A
- Age: late Miocene
- Lithology: nannofossil-rich calcareous clay
Description
Unit X comprises 7.51 m of light greenish gray to white nannofossil-rich calcareous clay. This entire unit is affected by flow-in, which is most pronounced from Section 52F-1, 0 cm, to 52F-2, 55 cm.
Composition from smear slides
See Figure F9 for representative smear slide images.
Nannofossil-rich calcareous clay
Nannofossil-rich calcareous clay consists of calcareous nannofossils and clay minerals (52H-1, 18 cm; 297.38 m CSF-A), as well as very minor amounts of radiolarians.
Clay with silt
The upper section of this unit mainly contains clay-sized grains with minor amounts of silt grains and nannofossils. High amounts of opaque minerals were observed in the clay with silt section (51H-2, 28 cm; 294.28 m CSF-A).
Unit XI
- Interval: 354-U1451A-54F-1, 0 cm, to 60F-4, 60 cm
- Depth: 306.70–339.90 m CSF-A
- Age: late Miocene
- Lithology: clayey silt (major); silty sand, silty clay, nannofossil-rich calcareous clay (minor)
Description
Unit XI comprises 33.20 m of dark gray clayey silt, silty fine sand, and silty clay. This unit is divided into two subunits. The upper part, Subunit XIa (54F-1, 0 cm, to 58F-1, 9 cm), is 19.09 m thick and consists of thin- to thick-bedded dark gray clayey silt. The upper portion of this subunit consists of dark gray clay beds, dark gray fine sand beds, and a few clay beds alternating within clayey silt beds. The upper clayey silt beds are soupy, and the lower clayey silt beds are affected by flow-in. The lower part, Subunit XIb (58F-1, 9 cm, to 60F-4, 60 cm), is 14.11 m thick and consists of dark gray silty fine sand and dark gray silt. In Section 60F-1, 0–28 cm, nannofossil-rich white calcareous clay is present. Sands are homogeneous and soupy.
Composition from smear slides
See Figure F9 for representative smear slide images.
Clay with nannofossils
Clay with nannofossils contains 30%–50% calcareous nannofossils along with clay minerals. It also contains minor amounts of radiolarians and diatoms and their fragments.
Clay and clayey silt
Clay mainly contains detrital grains and rare nannofossils, radiolarians, and their fragments. Clayey silt consists mainly of silt-sized minerals (mineralogy similar to silty sand, described below) and clay minerals with nannofossils, radiolarians, diatoms, and their fragments. Carbonate minerals are commonly noted. Occasionally, organic matter (i.e., wood fragments) occurs (56F-2, 6 cm; 317.26 m CSF-A).
Silty sand
Silty sand consists primarily of sand-sized grains such as quartz, feldspar, lithic fragments, micas, heavy minerals, and carbonate minerals. Most grains are angular except altered mica. Heavy minerals such as garnet, zircon, amphibole, apatite, tourmaline, pyroxene, sphene, and opaque minerals are also found. Garnet and green amphibole tend to increase in this interval compared to the other heavy minerals. Occasional large fragments of garnet less than 1 mm in diameter are found (56F-2, 76 cm; 317.96 m CSF-A). Carbonate aggregate and euhedral carbonate grains are present in less than 3% of total grains.
The maximum grain size is 0.55 mm in diameter (54F-1, 58 cm; 307.28 m CSF-A).
Unit XII
- Interval: 354-U1451A-62F-1, 0 cm, to 64F-CC, 19 cm
- Depth: 344.70–358.63 m CSF-A
- Age: late Miocene
- Lithology: nannofossil-rich calcareous clay
Description
Unit XII comprises 13.93 m of light gray to white nannofossil-rich calcareous clay. This unit is divided into two subunits. The upper part, Subunit XIIa (62F-1, 0 cm, to 62F-CC, 18 cm), is 4.80 m thick and consists of dark gray to white nannofossil-rich calcareous clay. Mottling is observed in all sections of this subunit. The interval 62F-3, 87 cm, to 62F-CC, 18 cm, is highly disturbed with flow-in, mostly of gray silt. The lower part, Subunit XIIb (64F-1, 0 cm, to 64F-CC, 19 cm), is 4.43 m thick and consists of light gray to white calcareous clay with mottling. In Section 64F-1, 35–95 cm, centimeter-sized deformed clasts with no discernible matrix are observed (Figure F7D). The clasts consist of light gray nannofossil-rich calcareous clay or gray silty clay. This layer was most probably formed as a result of a clast-supported mass flow. The upper portion of Subunit XIIb is affected by up-arching, whereas the middle and lower portions are affected by flow-in of silt.
Composition from smear slides
See Figure F9 for representative smear slide images.
Nannofossil-rich calcareous clay with foraminifers
Nannofossil and clay minerals make up the major proportion of this lithology (62F-1, 55 cm; 345.25 m CSF-A), which also contains a minor amount of foraminifer shells.
Unit XIII
- Interval: 354-U1451A-66F-1, 0 cm, to 68F-CC, 18 cm
- Depth: 363.70–378.15 m CSF-A
- Age: late Miocene
- Lithology: silty clay (major); sand, silty sand, silt, clay (minor)
Description
The major lithology, silty clay, is most prevalent in the lower part of the unit (68F-2 through 68F-CC). On rare occasions, silty clay shows mottling, fining-upward texture, and silt laminations. Nannofossils are occasionally present. Sand and silty sand dominate the upper part of the unit (66F-1 through 66F-CC). Clays are frequently mottled and burrowed, can be nannofossil rich (68F-1, 9–63 cm), and at one location (66F-1, 60–65 cm) are interbedded with a 5 cm silt bed. Sands are characterized by soupy texture. Up-arching and flow-in are recorded in the finer grained lithologies.
Composition from smear slides
See Figure F9 for representative smear slide images.
Silty clay and clay with nannofossils
Silty clay and clay with nannofossils mainly contain clay-sized detrital grains and clay minerals with subordinate silt-sized grains and nannofossils. Occasionally, radiolarians and their fragments are present. The mineralogy of silt-sized grains is similar to that of silty sand, described below, although heavy mineral and opaque mineral contents tend to be richer than sand.
Silty sand and sand
Silty sand and sand primarily consist of fine to medium sand-sized grains such as quartz, feldspar, lithic fragments, micas, heavy minerals, and carbonate minerals. Grains are mostly angular, with a few exceptions in altered mica and large lithic fragments. The heavy minerals consist of amphibole, garnet, zircon, apatite, tourmaline, sphene, and opaque minerals.
The maximum grain size is 0.55 mm in diameter (66F-1, 95 cm; 364.65 m CSF-A).
Unit XIV
- Interval: 354-U1451A-70F-1, 0 cm, to 72F-1, 3 cm
- Depth: 382.70–392.23 m CSF-A
- Age: late Miocene
- Lithology: nannofossil-rich calcareous clay (major); clay, silt (minor)
Description
The upper part of 9.53 m thick Unit XIV consists of dark gray nannofossil-rich clay (70F-1, 10–46 cm). Planar and cross laminations, fining-upward from silt to clay, and a gradational upper contact are the most prominent structures of this thin-bedded succession of mud turbidites. Comparable lithologies (but medium bedded or heavily disturbed by flow-in) are present from 70F-1, 123 cm, to 70F-2, 57 cm, and from 70F-3, 13 cm, to 70F-CC, 17 cm. A prominent dark gray silt bed was observed in Section 70F-2, 57 cm. All other parts of Unit XIV are made up of light gray to gray nannofossil-rich calcareous clay showing mottling and burrows. The upper part of Section 72F-1 (0–3 cm) contains fall-in of drilled sediment (calcareous clay).
Composition from smear slides
See Figure F9 for representative smear slide images.
Calcareous clay
This unit is principally composed of calcareous nannofossils (65%–75%) and clay minerals (70F-1, 62 cm; 383.32 m CSF-A). Very minor amounts of radiolarians are also present.
Unit XV
- Interval: 354-U1451A-72F-1, 3 cm, to 80F-4, 118 cm
- Depth: 392.23–434.77 m CSF-A
- Age: late Miocene
- Lithology: clayey silt (major); silty clay, clay, silty sand, sand (minor)
Description
Clayey silt is frequently micaceous. Plant fragments and mottling are recorded at 72F-1, 16–43 cm. Very thin beds of clay are found interbedded with the clayey silt at 76F-1, 31–89 cm. Silty clay can also be micaceous and contain plant fragments and silty laminations, with fining-upward texture noted at 72F-1, 43–110 cm. Plant fragments are also noted in the clay intervals. Sands and silty sands are micaceous and soupy. Drilling disturbance in the finer lithologies ranges from severe flow-in to minor up-arching.
Composition from smear slides
See Figure F9 for representative smear slide images.
Clay and silty clay
Clay and silty clay mainly contain detrital grains, clay minerals, nannofossils, and radiolarians. Occasionally, plant fragments occur. Carbonate minerals are commonly present. The mineralogy of the silt-sized grain is similar to silty sand, described below, except lithic fragments are absent.
Silty sand
Silty sand contains angular sand-sized grains of quartz, feldspar, lithic fragments, micas, heavy minerals, and carbonate minerals. Heavy minerals consist of garnet, tourmaline, zoisite, sphene, rutile, apatite, zircon, clinozoisite, and opaque minerals. The proportion of deep green amphibole and zoisite compared to other heavy minerals is higher in this interval than in other units. Carbonate minerals occur as aggregate and also frequently as euhedral diagenetic carbonate minerals with a euhedral shape. The typical proportion of the carbonate mineral fraction is less than 1% of total grains (74F-4, 117 cm; 405.82 m CSF-A). Amphibole-mica–bearing schist and biotite-sillimanite–bearing gneiss fragments occasionally occur in this lithology.
The maximum grain size is 0.56 mm in diameter (74F-4, 117 cm; 405.82 m CSF-A).
Unit XVI
- Interval: 354-U1451A-82F-1, 0 cm, to 84F-1, 10 cm
- Depth: 439.70–449.30 m CSF-A
- Age: late Miocene
- Lithology: nannofossil-rich calcareous clay (major); silty clay (minor)
Description
Unit XVI is a 9.6 m thick package of mottled light gray to gray nannofossil-rich calcareous clay (e.g., Figure F7E). The only exception to this case is a succession of thin beds of gray silt fining upward into gray silty clay (mud turbidites) in the upper part of Section 82F-1 (8–29 cm). The upper 8 cm of this section is fall-in of drilled sediments (calcareous clay). Besides slight up-arching, sediments below 82F-1, 92 cm, are heavily disturbed by flow-in.
Composition from smear slides
See Figure F9 for representative smear slide images.
Clayey silt
Clayey silt mainly consists of detrital grains and occasionally contains apatite, mica, nannofossils, and plant fragments. The maximum grain size is 0.05 mm in diameter (82F-1, 69 cm; 440.39 m CSF-A).
Nannofossil-rich calcareous clay
The lower part of the unit is mainly composed of nannofossils and clay minerals (82F-1, 76 cm; 440.46 m CSF-A).
Unit XVIIa
- Interval: 354-U1451A-84F-1, 10 cm, to 111X-CC, 40 cm
- Depth: 449.30–578.45 m CSF-A
- Age: late Miocene
- Lithology: sand, silt (major); clay, calcareous clay (minor)
Description
Sands, sometimes silty or clayey, are distributed throughout this unit (e.g., Figure F7C, F7F). They are micaceous in the upper part of the unit (Cores 86F and 90F). Fining-upward texture (normal grading) is recorded at 90F-2, 0–80 cm, and 108F-1, 0–11 cm; plant material is recorded at 111X-2, 71–91 cm; and thin beds of clay are interbedded in Section 102F-2.
The fine-grained lithologies consist of various permutations of clay, silty clay, sandy clay, clayey silt, and silt. Thin interbeds of clay are recorded in the silts, and laminations and thin beds of silt are recorded in the clays in Core 111X. Plant material is common in the silt throughout this core, and the clayey silt is micaceous at 86F-1, 23–39 cm.
Nannofossil-rich calcareous clay is found at 90F-2, 80–101 cm, and 90F-CC; calcareous clay is found at 102F-1, 0–18 cm; and chalk (i.e., indurated calcareous clay) with thin interbeds of clay is found at 111X-2, 91–133 cm.
Drilling disturbance consists predominantly of the acquisition of soupy texture in the sands, along with flow-in. Finer grained facies are sometimes fractured, show up-arching, or display biscuits. Calcareous clay sometimes displays fall-in.
Composition from smear slides
See Figure F9 for representative smear slide images.
Clayey silt and sandy silt
Clayey silt and sandy silt mainly include detrital grains and occasionally carbonate minerals, nannofossils, radiolarians, and their fragments. The mineralogy of detrital grains is similar to that described for silty sand below.
Silty sand
Silty sand consists primarily of sand-sized grains such as quartz, feldspar, lithic fragments, mica, and heavy minerals. Most grains are angular except altered mica. Heavy minerals such as garnet, zircon, amphibole, apatite, tourmaline, sphene, and opaque minerals are present. Green amphibole grains predominate over other heavy minerals, except opaque minerals, in this interval. Occasionally, brown hornblende grains occur (106F-1, 118 cm; 554.88 m CSF-A). Organic material, such as plant debris, is occasionally found. Euhedral carbonate minerals, mainly calcite, are often present. Aggregate grains formed by finer grained irregularly shaped carbonate minerals are also present in this lithology. The typical proportion of these carbonate grains is 3%–8% of total grains. The sand sample from 554.88 m CSF-A contains a large portion of carbonate minerals, about 10% of total grains.
The maximum grain size is 0.51 mm in diameter (94F-1, 14 cm; 496.84 m CSF-A and 96F-1, 80 cm; 507 m CSF-A).
Unit XVIIb
- Interval: 354-U1451B-2X-1, 0 cm, to 21R-1, 18 cm
- Depth: 542.00–704.78 m CSF-A
- Age: late Miocene
- Lithology: silty clay (major); calcareous clay, clay, clayey silt, silt, sandy silt, silty sand, sand (minor)
Description
Silty clay is thin to medium bedded, with thin interbeds and laminations of clay and silt at some locations. Mottling, indicative of bioturbation, is common. The presence of mica, plant fragments, foraminifers, and nannofossils is also recorded.
Clayey silt, sometimes micaceous, sometimes includes thin interbeds of clay. The presence of both foraminifers and nannofossils is recorded in some places, as are plant fragments. Sedimentary structures include parallel laminations and normal grading (fining upward). Silt sometimes contains parallel laminations and thin interbeds of clay. Silty sand and fine sand are also recorded, with a fining-upward grain size and sometimes clay interbeds.
Calcareous clay is nannofossil rich and sometimes contains foraminifers.
Drilling disturbance throughout this unit is high and characterized by fractures. Some biscuiting, fall-in, and voids are also noted.
Composition from smear slides
See Figure F10 for representative smear slide images.

Figure F10. Representative smear slide images, Hole U1451B. A. Silty sand with mica. B. Silty sand with organic matter. C. Nannofossil-rich calcareous clay.
Calcareous clay
The upper part of this unit consists of detrital grains with significant amounts of nannofossils.
Silty clay
Silty clay includes mainly clay-sized detrital grains and clay minerals with nannofossils, radiolarians, and diatoms. Occasionally, euhedral carbonate minerals are found.
Silty sand
Silty sand consists primarily of sand-sized grains such as quartz, feldspar, lithic fragments, mica, and heavy minerals. Most grains are angular except altered mica. Heavy minerals such as garnet, zircon, amphibole, apatite, tourmaline, sphene, pyroxene, and opaque minerals are found. The heavy mineral content as a percentage of the total grains decreases downsection (13X-CC, 19 cm; 639.19 m CSF-A). Occasionally, euhedral carbonate minerals and aggregate grains of carbonate minerals are found. The sand at 803.18 m CSF-A (31R-2, 26 cm) is rich in carbonate minerals (<15%). The maximum grain size is 0.48 mm in diameter (4X-CC, 6 cm; 561.46 m CSF-A).
Unit XVIII
- Interval: 354-U1451B-21R-1, 18 cm, to 37R-3, 64 cm
- Depth: 704.78–863.31 m CSF-A
- Age: middle–late Miocene
- Lithology: claystone (major); calcareous claystone, silty clay, clayey silt, silt, sandy clay (minor)
Description
Claystone has interbedded thin to very thick beds of silt at some locations (Figure F11A). Ash and nannofossils are occasionally present. Mottling and parallel laminations are recorded. Fine-grained lithologies (silty clay, clayey silt, and silt) are commonly interbedded, with interbed thickness ranging from thin to very thick. Plant fragments are common in these lithologies, and nannofossils are rarely recorded. Observed sedimentary structures are parallel and cross-laminations, fining-upward texture (normal grading), and infrequent mud clasts. Sandy silt is similar to the fine-grained lithologies, but interbeds are absent. Calcareous claystones are recorded in Sections 22R-3, 20–32 cm, 34R-2, 55–88 cm (burrowed and clayey), and 36R-2, 19–28 cm. Drilling disturbance throughout this unit is overwhelmingly high and characterized by fractures. Some biscuiting, fall-in, and voids are also noted.
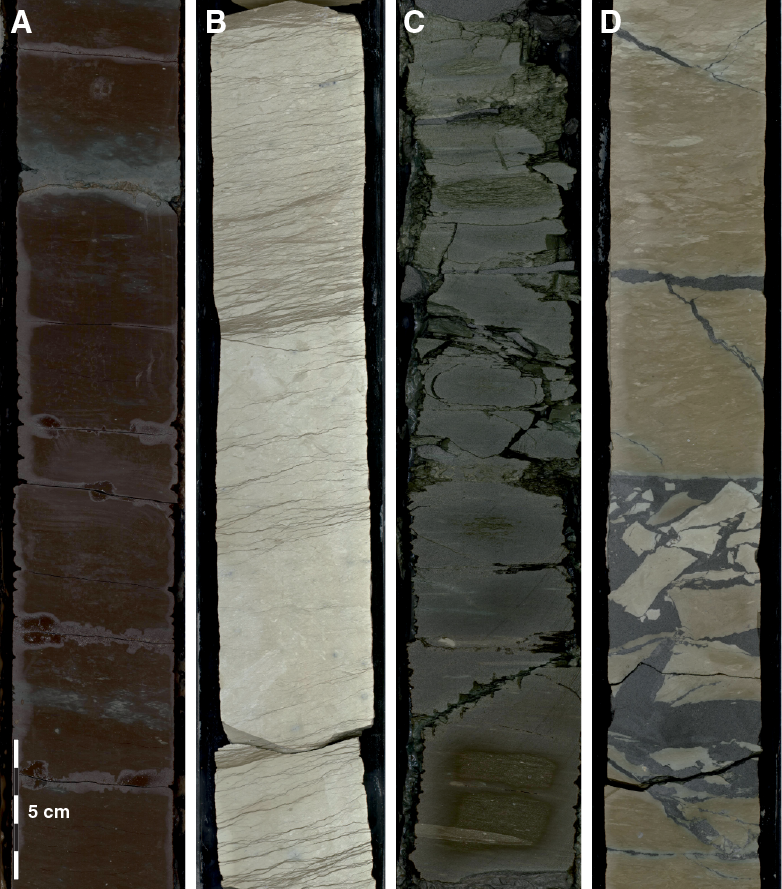
Figure F11. Representative examples of major lithologies recovered in Hole U1451B. A. Brown mottled claystone interbedded with very thin silt layers and occasional green color banding. B. White to light gray mottled limestone with abundant microfractures. C. Green claystone with volcanic ash particles. D. Fragmented clayey limestone with gray silt filling the fractures.
Composition from smear slides
See Figure F10 for representative smear slide images.
Silty sand
Silty sand layers intercalated in the upper part of the unit consist of fine sand–, medium sand–, and silt-sized grains of quartz, feldspar, micas, lithic fragments, and heavy minerals. The heavy mineral assemblage is much more limited than the more diverse assemblage in other units, with a high proportion of garnet, amphibole, and tourmaline and rare zoisite, epidote, pyroxene, zircon, and opaque minerals. Carbonate aggregate grains and euhedral carbonate minerals are found in this lithology, and the typical portion of these carbonate minerals is 1%–5% of total grains. The maximum grain size is 0.41 mm in diameter (28R-2, 49 cm; 774.7 m CSF-A).
Unit XIX
- Interval: 354-U1451B-38R-1, 0 cm, to 39R-1, 42 cm
- Depth: 870.20–889.12 m CSF-A
- Age: middle Miocene
- Lithology: calcareous claystone (major); silt, clay (minor)
Description
Calcareous claystone is medium to thick bedded and infrequently interbedded with thin beds of clay and silt. Burrows are present in the calcareous claystone and its interbeds. The reddish color in the lower part of the interval represents a departure from the normal gray-green colors and could be a diagenetic effect. Fractures at the top of the interval are infilled with carbonate-cemented black sandstone. Clay underlies the calcareous claystone, and siltstone with clay overlies it. Drilling disturbance is a high degree of fracturing with fall-in at the top of both cores.
Composition from smear slides
See Figure F10 for representative smear slide images.
Clay with nannofossils
Clay mainly contains clay-sized detrital grains and nannofossils. Occasionally, radiolarians and carbonate minerals are recorded.
Silty sand
Silty sand consists primarily of very fine grained and fine-grained sand, such as quartz, feldspar, lithic fragments, mica, and heavy minerals. Most grains are angular except altered mica and glauconitic grains. Heavy minerals garnet, zircon, amphibole, apatite, tourmaline, sphene, and opaque minerals are found. Minor plant fragments are recorded. This lithofacies also contains carbonate minerals as a minor proportion. The maximum grain size is 0.42 mm in diameter (37R-1, 41 cm; 860.61 m CSF-A).
Unit XX
- Interval: 354-U1451B-41R-1, 0 cm, to 43R-3, 36 cm
- Depth: 899.12–920.56 m CSF-A
- Age: middle Miocene
- Lithology: clayey silt (major); claystone, calcareous claystone (minor)
Description
The majority of the 21.46 m thick Unit XX consists of medium beds of unlithified gray clayey silt fining upward into gray claystone (silt-dominated turbidites). Silt beds contain mica and variable amounts of dispersed plant fragments. A layer enriched in such organic debris was observed at 42R-1, 45–46 cm. Clay beds show few internal structures, such as mottling and parallel laminations. Light brown to greenish gray mottled calcareous claystone is recorded from 41R-1, 126 cm, to 41R-CC, 8 cm. Drilling disturbances within Unit XX are restricted to some subhorizontal fractures and slight displacements/biscuiting of claystone beds.
Composition from smear slides
See Figure F10 for representative smear slide images.
Clayey silt
Clayey silt mainly includes detrital grains and occasionally contains nannofossils, radiolarians, and their fragments. Occasionally, euhedral grains and aggregate grains of carbonate minerals occur.
Silty sand
Silty sand layers intercalated in the upper part of this unit consist of fine sand–, medium sand–, and silt-sized grains of quartz, feldspar, mica, and lithic fragments. Heavy minerals, mainly opaque minerals and minor amphibole, tourmaline, and zoisite, are recorded. Occasionally, euhedral carbonate minerals are found. The maximum grain size is 0.46 mm in diameter (42R-1, 63 cm; 909.530 m CSF-A).
Unit XXI
- Interval: 354-U1451B-43R-3, 36 cm, to 47R-CC, 26 cm
- Depth: 920.56–956.10 m CSF-A
- Age: middle Miocene
- Lithology: clayey limestone (major); limestone, claystone, silt(stone) (minor)
Description
Unit XXI mostly consists of light brown to brown mottled clayey limestone. Greenish color bands dissect the brown intervals and are usually less than 10 cm thick. Intervals of higher carbonate content (i.e., limestones) are clearly distinguished by white to light gray color and mottled appearance. The interval from 44R-2, 0 cm, to 46R-1, 15 cm, is characterized by beds of laminated silt(stone) with dispersed plant fragments fining upward into gray parallel-laminated claystone. Sharp lower boundaries, fining-upward texture (normal grading), parallel lamination, and minor cross-lamination suggest that these deposits represent successions of mud turbidites. Some siltstone layers display reverse gradation in terms of plant fragment grain size and quantity, but this pattern is not clearly present in other beds.
Composition from smear slides
See Figure F10 for representative smear slide images.
Nannofossil-rich calcareous clay
This lithofacies contains 50%–70% calcareous nannofossils with a subordinate amount of clay minerals (25%–40%), as well as minor amounts of radiolarians (5%–10%).
Silt and clayey silt
Silt-sized grains of quartz, feldspar, lithic fragments, mica, heavy minerals, and plant fragments are found with minor clay-sized grains. Occasionally, carbonate minerals, nannofossils, radiolarians, and their fragments are also present.
Silty sand
Silty sand consists of fine sand– and silt-sized grains of quartz, feldspar, and mica. Organic material, such as plant debris, is frequently observed. As accessory minerals, opaque minerals, and minor heavy minerals such as tourmaline, zoisite, zircon, rutile, and garnet are found. In most horizons, the proportion of heavy minerals is very low, less than 1% of total grains. Occasionally, euhedral carbonate minerals, aggregate grains of carbonate minerals, and fragments of foraminifers are found. The silty sand at 954.20 m CSF-A (47R-2, 148 cm) is remarkably rich in carbonate minerals (<20%). The maximum grain size is 0.41 mm in diameter (47R-2, 14 cm; 744.750 m CSF-A).
Unit XXII
- Interval: 354-U1451B-48R-1, 0 cm, to 62R-2, 103 cm
- Depth: 957.5–1086.37 m CSF-A
- Age: early Miocene–middle Miocene
- Lithology: silt, claystone (major); nannofossil-rich claystone, calcareous claystone
Description
This unit mainly consists of repeated silt and claystone turbidite sequences intercalated with relatively short intervals of bioturbated claystone and/or nannofossil-rich calcareous claystone. Silt turbidite beds are thin to thick bedded with planar sharp boundaries and commonly include abundant plant fragments. They have a variety of internal structures (Figure F12): (1) disorganized structure with floating irregular plant fragments and mud clasts, (2) thick lamination with plant fragment–rich laminae, and (3) thin lamination with cross or lenticular bedding. Microscopic observation of a thin section made from a thinly laminated silt turbidite revealed alternation of quartz-rich and mica-and-organic-debris-rich laminae (Figure F13). Silt turbidites are usually overlain by claystone turbidites with gradational boundaries. Claystone turbidite beds are dark brown to dark gray and thin to medium bedded. They are usually structureless but sometimes show faint lamination with fine silt laminae. Intervals of bioturbated claystone and nannofossil-rich calcareous claystone are characterized by dense burrows and mottles with reddish brown to light gray color variations. They commonly include thin-bedded thinly laminated silt turbidite beds.
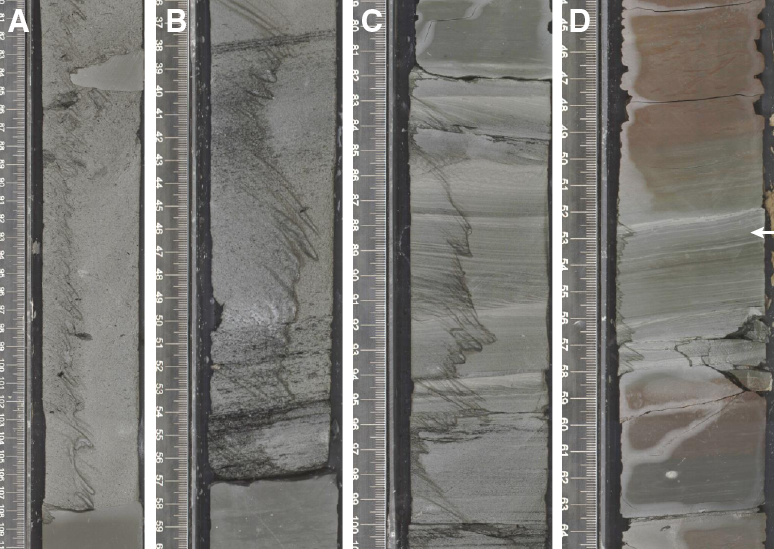
Figure F12. Hole U1415B features. A. Disorganized silt turbidite with a floating mud clast and scattered dark plant fragments. B. Silt turbidite with parallel plant fragment–rich dark laminae. C. Thinly laminated silt turbidite with cross-laminations. D. Thin-bedded thinly laminated silt turbidite interbedded with bioturbated claystone.
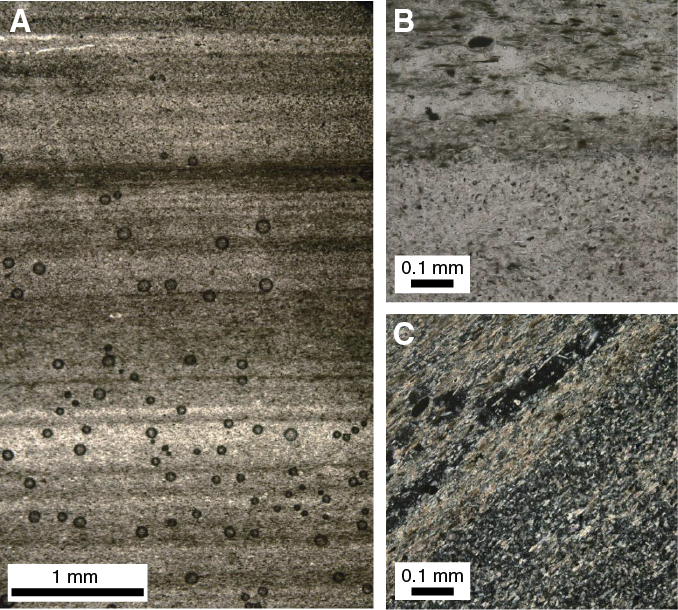
Figure F13. A. Thin section photograph of thinly laminated silt turbidite. B. Enlargement of upper dark lamina enriched with mica and organic flakes aligned parallel to the bedding and lower quartz-rich light lamina. C. View of B tilted 45° counterclockwise. Mica flakes show high-order birefringence colors.
Composition from smear slides
See Figure F10 for representative smear slide images.
Nannofossil-rich calcareous clay and claystone
Nannofossil-rich calcareous clay consists of nannofossils, clay-sized detrital grains, and clay minerals, foraminifers, radiolarians, and their fragments.
Clayey silt
Clayey silt mainly includes detrital grains and occasionally contains nannofossils, radiolarians, and their fragments. Occasionally, euhedral grains and aggregate grains of carbonate minerals occur. In some horizons, plant fragments are found.
Silty sand
Silty sand consists primarily of fine-sized sand grains such as quartz, feldspar, lithic fragments, mica, and heavy minerals. Heavy minerals include mainly opaque minerals with minor amounts of tourmaline, garnet, zircon, zoisite, and clinozoisite. In medium-grained sand, schist and phyllite rock fragments were observed. Carbonate aggregate grains and euhedral carbonate minerals are present, and the typical proportion of these carbonate minerals is 5%–15% of total grains. The maximum grain size is 0.38 mm in diameter (60R-3, 72 cm; 1067.77 m CSF-A).
Unit XXIII
- Interval: 354-U1451B-63R-1, 0 cm, to 63R-CC, 17 cm
- Depth: 1093.70–1101.06 m CSF-A
- Age: late Oligocene–early Miocene
- Lithology: claystone (major); calcareous claystone, siltstone (minor)
Description
This unit mainly consists of mottled greenish gray to brown claystone interbedded with light brown to brown calcareous claystone and dark gray siltstone. Claystone units show pervasive dense fractures due to expansion after core splitting. Interbedded dark gray siltstone units are variable in thickness from a few centimeters to over a meter and often show sharp inclined boundaries. They generally appear structureless and commonly include very angular irregular-shaped calcareous claystone and claystone clasts of variable size scattered in the silt matrix. These features are interpreted to be postdepositional intrusions or injectites.
Composition from thin sections
See Figure F14 for representative thin section images.
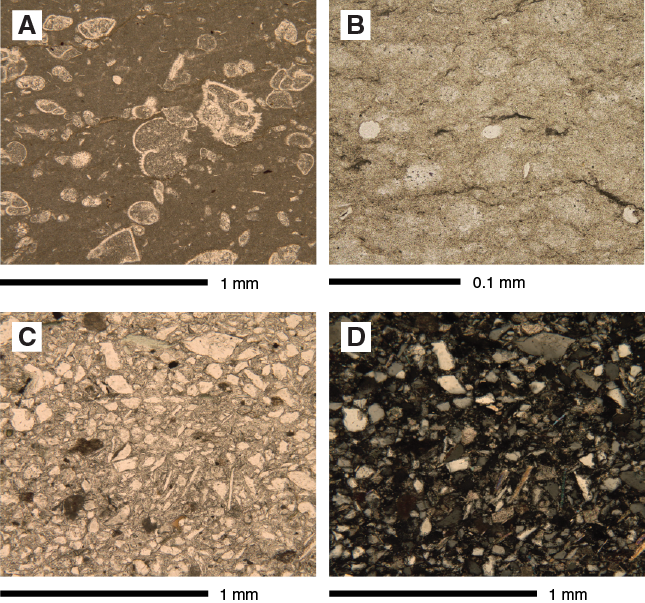
Figure F14. Representative thin section images, Hole U1451B. A. Limestone. B. Claystone. C. Injectite siltstone. D. Same as C.
Silty claystone
Silty claystone consists mainly detrital grains and clay minerals with rare nannofossils and fragments of radiolarians. Occasionally, euhedral grains and aggregate grains of carbonate minerals occur (63R-5, 112 cm; 1099.99 m CSF-A).
Unit XXIVa
- Interval: 354-U1451B-64R-CC, 0 cm, to 71R-1A, 11 cm
- Depth: 1103.40–1161.91 m CSF-A
- Age: early–late Oligocene
- Lithology: calcareous claystone, limestone (major); claystone, siltstone (minor)
Description
This unit is dominated by calcareous claystone and impure limestone (Figure F11B) occasionally fractured and brecciated and infilled with dark gray siltstone (Figure F11D). It also includes relatively short intervals of green, greenish gray, and brown claystone (Figure F11C) interbedded with siltstone from 1147.4 to 1154.3 m CSF-A. Calcareous claystones and limestones are bioturbated and mottled and occasionally contain wavy strata and vary in color. Impure limestones are light gray, pink, white, and yellow, whereas calcareous claystones are light brown, light green, and yellow. All intervals are segmented by drilling. From ~1126 m CSF-A to the bottom of the unit, burrows and sediment surrounding clasts are discolored, suggesting diagenetic alteration. The dark gray siltstone infilling the limestone fractures is interpreted to be postdepositional intrusions or injectites. Other sedimentary features include (1) three ash layers (1113.6–1113.84, 1153.03–1153.18, and 1153.67–1153.89 m CSF-A), (2) three intervals of brecciated limestone in silt matrixes (1113.1–1117.63, 1133.45–1133.57, and 1136.38–1136.43 m CSF-A), (3) slickensides (1120.41–1120.68 m CSF-A), and (4) internal deformation structures due to shearing of brecciated limestone (1113.1–1117.63 m CSF-A).
Composition from thin sections
See Figure F14 for representative thin section images.
Calcareous claystone
Nannofossils and clay minerals make up the significant proportion of this unit, which also contains radiolarians as a minor proportion. The lithology also contains foraminifers and sponge spicules. Some of the smear slides of this lithology contain white mica grains (1, 64 cm; 1118.44 m CSF-A). Smear slides from 1113.99 m CSF-A (65R-1, 89 cm) contain volcanic ash with nannofossils.
Claystone with silt
Smear slides show clay-sized minerals with a minor proportion of silt grains (10%–20%). Occasionally, rare nannofossils, radiolarian fragments, and quartz grains occur with the clay minerals. Green claystone contains a minor amount of volcanic ash (70R-1, 100 cm; 1153.1 m CSF-A).
Limestone
Calcareous nannofossils make up a significant proportion of this lithology. Radiolarians and foraminifers make up the remaining amount.
Siltstone
Siltstone consists principally of grains of quartz, feldspar, lithic fragments, mica, and very few heavy minerals, including tourmaline, zoisite, clinozoisite, and amphiboles. Opaque minerals are extremely rare in some of the sections (68R-1, 51 cm; 1133.11 m CSF-A). The slide contains authigenic calcite up to 40% and a minor proportion (10%–20%) of radiolarian fragments. The maximum grain size is 0.21 mm in diameter.
Sandstone (injectites)
Sandstone consists of poorly sorted and very fine to fine sand grains such as quartz, feldspar, carbonate minerals, and lithic fragments. The matrix consists of carbonate minerals that make up a maximum proportion of 50% in thin section. Sand grains are angular. Sandstone is characterized by a low content of organic matter (<2%, per geochemical analyses; see Geochemistry and microbiology) and a lack of large mica minerals. As accessory minerals, tourmaline, zircon, rutile, zoisite, and white mica occur. Lithic fragments consist of claystone and phyllite fragments.
Unit XXIVb
- Interval: 354-U1451B-71R-1, 11 cm, to 73R-CC, 28 cm
- Depth: 1161.91–1175.06 m CSF-A
- Age: late Paleocene(?)–early Oligocene
- Lithology: limestone (major); claystone, siltstone (minor)
Description
This unit mostly consists of white to pink impure limestone with dense burrowing structures and stylolites (1166.88–1168.96 m CSF-A). All intervals in the unit are segmented by drilling. Dark greenish claystone and dark gray siltstone are limited to the core tops less than a few tens of centimeters deep.
Composition from thin sections
See Figure F14 for representative thin section images.
Claystone
This lithofacies includes clay aggregate grains 0.5–5 mm in diameter with an indistinguishable clay mineral matrix (72R-1, 14–17 cm; TS 11; 1166.6 m CSF-A). Aggregate grains are spherical and elliptical. Euhedral zeolite minerals 0.2–1.1 mm in diameter occur in the aggregate grains.
Foraminiferal limestone
This milky white limestone contains large foraminifers 0.1–0.8 mm in diameter and their fragments (20%–30%) as skeletal grains and micritic calcite matrix (70%–80%). The inside pore spaces of foraminifers are filled by sparry calcite with a geopetal structure.
Maximum grain size
Maximum grain size was determined at approximately 9 m intervals at Site U1451. In each case, the coarsest and/or thickest lithology in the individual core (generally from the base of the coarsest turbidite) was chosen for smear slide analysis, and the largest five equant detrital grains (quartz and feldspar) were measured. Results are shown in Figures F15 and F16. In Hole U1451A, the maximum grain size ranges from 0.04 to 1.10 mm (coarse silt to coarse sand), and in Hole U1451B, the maximum grain size ranges from 0.02 to 0.48 mm (medium silt to medium sand). The apparent decrease in grain size in the deeper Hole U1451B could be a true environmental signal or an artifact of coring caused by poor sand recovery with RCB technology. In any case, background values throughout the sequence show that coarse sand–sized material (>0.5 mm) reached the fan setting via turbidity currents since at least the late Miocene. Before, only material finer than medium sand was recovered at this site, likely reaching back to the late Eocene.
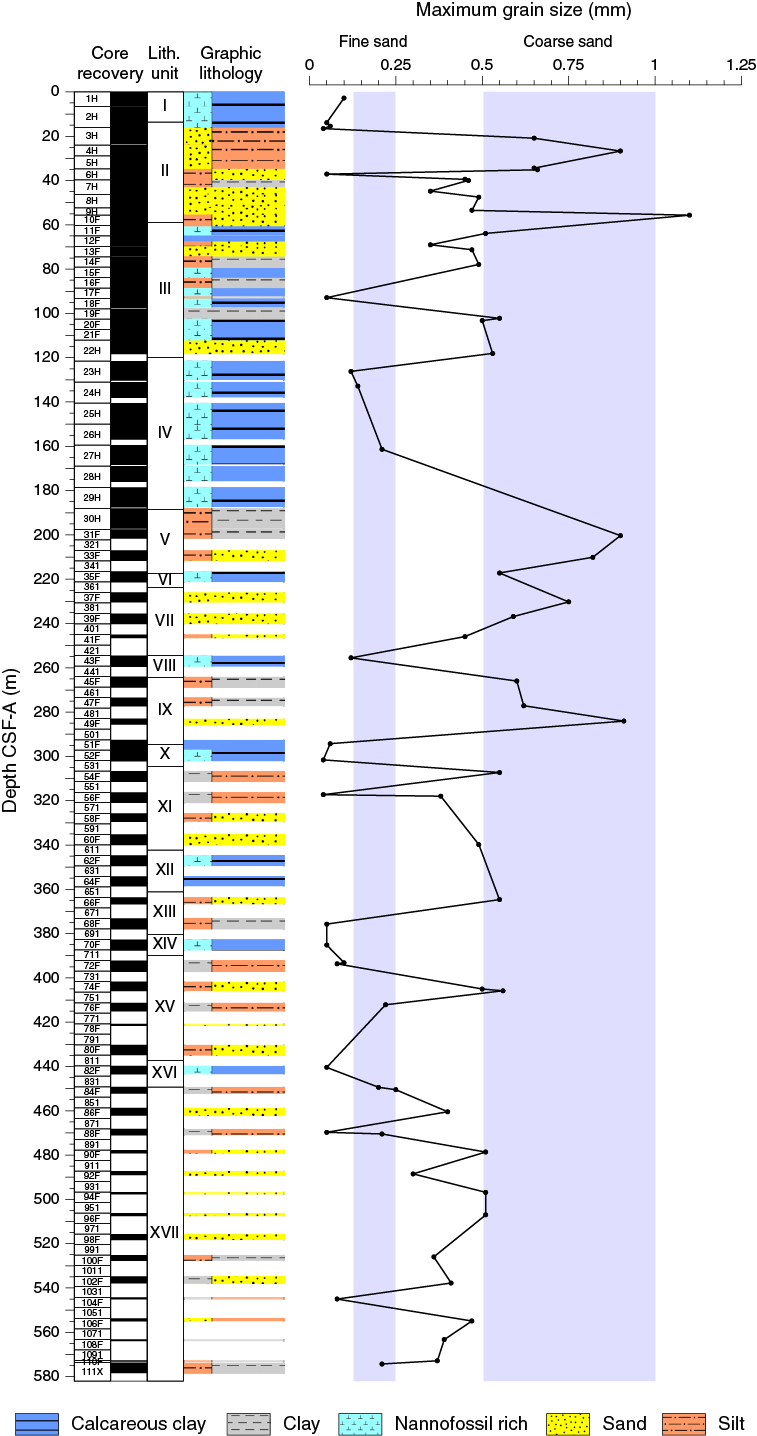
Figure F15. Maximum grain size, Hole U1451A.
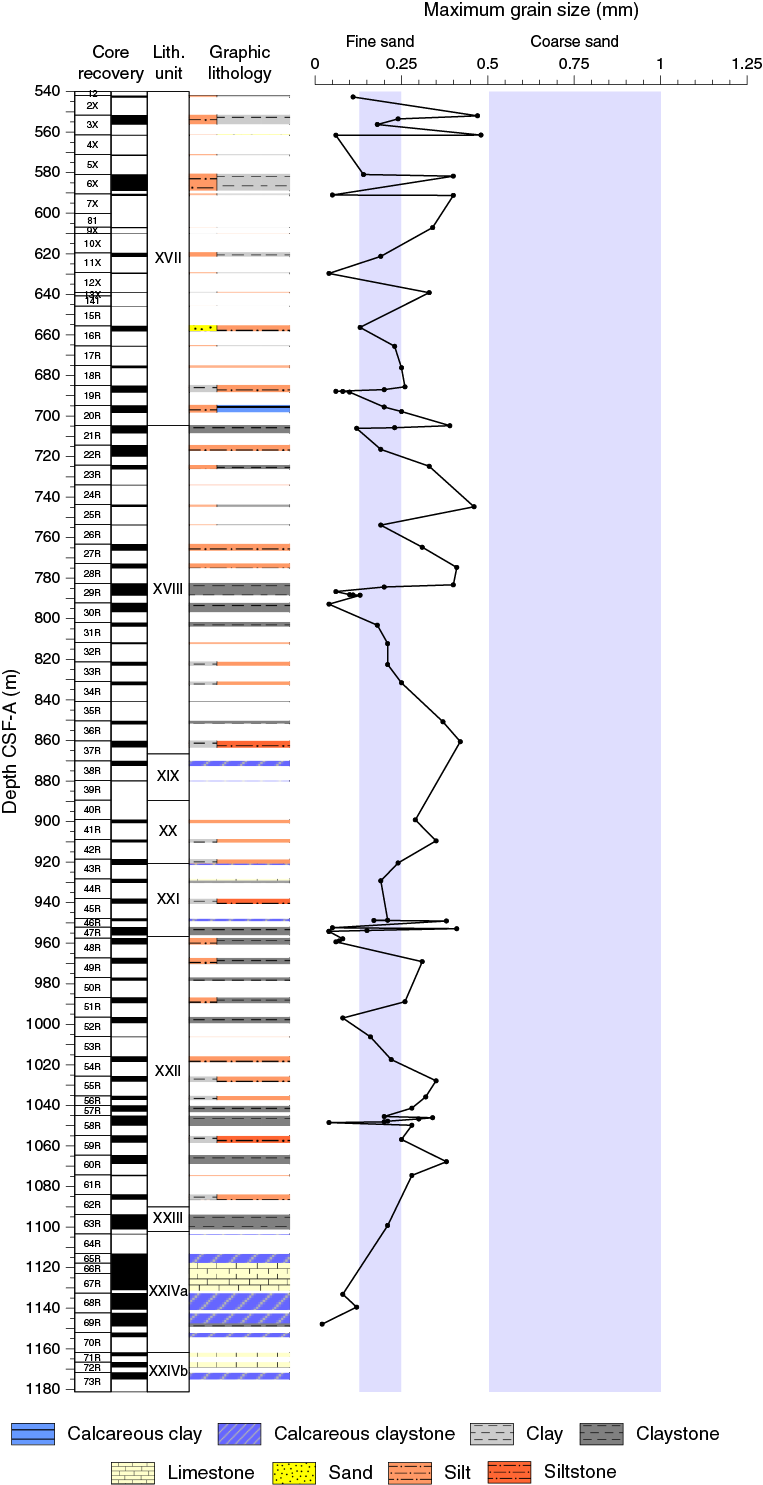
Figure F16. Maximum grain size, Hole U1451B.
XRD data
Samples were taken at an interval of approximately one every four cores. Clay minerals were extracted from representative lithologies (sand, silt, clay, and calcareous clay).
Hole U1451A
The observed clay mineral assemblages are mainly composed of illite, chlorite, smectite, and kaolinite. Illite is the dominant clay mineral in calcareous clay, clay, and sand samples (average = 65%). Only calcareous clay samples show a relatively higher proportion of smectite (around 15%), whereas sand generally does not contain any smectite. The clay assemblage observed in Hole U1451A in the different lithologies does not show any evolution with depth (Figure F17), suggesting relatively stable sources and/or turbiditic transport processes. This assemblage appears similar to the illite-chlorite–rich clay assemblage documented in the distal fan (Bouquillon et al., 1990). Unlike the upper Miocene–Pliocene section from ODP Leg 116, no smectite-rich sediments were observed in turbidites from Hole U1451A.
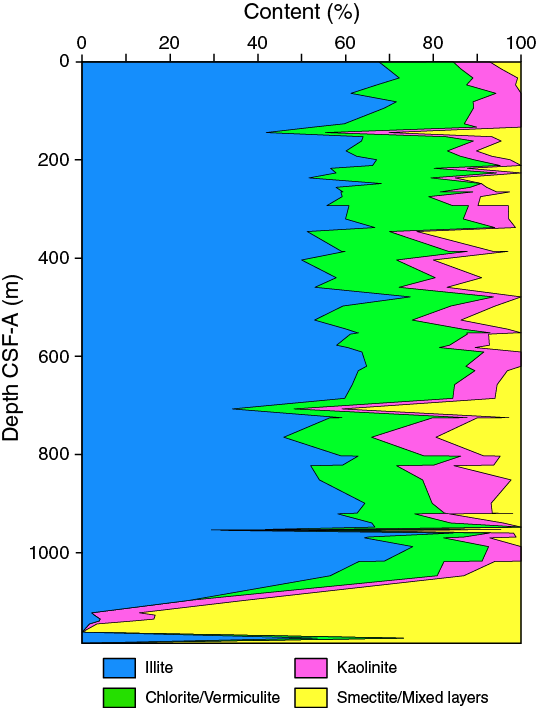
Figure F17. Semiquantitative clay mineral proportions, Site U1451.
Hole U1451B
The observed clay mineral assemblages are mainly composed of illite, chlorite, smectite, kaolinite, and vermiculite, with mixed-layer clays also contributing. The average proportion of smectite, kaolinite, and mixed-layer clays increases to >70% in the calcareous claystone and limestone of Unit XXIII (Figure F17), suggesting either a sourcing or an environmental change.
In conclusion, the assemblages observed at Site U1451 appear similar to the illite-chlorite–rich clay assemblage documented in the distal fan (Bouquillon et al., 1990) to about 1080 m DSF. Unlike in the upper Miocene–Pliocene section of Leg 116, no smectite-rich sediments were observed in the turbidites at Site U1451. At this site, lithologic changes to claystone and limestone in the late Oligocene are accompanied by a change to a smectite and kaolinite–rich clay assemblage.
Sand compositional trends
This section discusses sand compositional trends at Site U1451 and compares them to Bengal Fan Leg 116 sites and the upstream record in the onland foreland basin and Bengal Basin.
Compositional trends determined from smear slide data, Holes U1451A and U1451B
In late Miocene, Pliocene, and Pleistocene sands from Holes U1451A and U1451B, the heavy mineral proportion is frequently high and the assemblage is varied (common heavy minerals include amphibole, garnet, tourmaline, rutile, zircon, apatite, epidote-group minerals, sphene, and pyroxene). As old as the late Miocene, there are intervals where less stable minerals such as amphibole predominate (Unit XVIIa) and where there is evidence of input from high-grade metamorphic sources (Unit XV; presence of schist and gneiss lithic fragments).
In the mid-late Miocene and before, the proportion of heavy minerals decreases and the heavy mineral assemblage becomes relatively more enriched in ultrastable minerals (zircon and tourmaline). However, less stable minerals such as amphibole do persist to the base of the hole (Unit XXIVb; early Oligocene–late Paleocene), and the metamorphic grade of the contributing sources decreases. Compared to Unit XV, where sillimanite and gneiss lithic fragments are recorded, Unit XXII (middle Miocene–late Oligocene) only contains phyllite and schist lithic fragments and Unit XXIVb (late Oligocene to early Eocene/late Paleocene) only contains claystone and phyllite lithic fragments. Garnet persists to the late Oligocene–middle Miocene (Unit XXII), and large micas persist to the late Oligocene to early Eocene/late Paleocene (Subunit XXIVa).
These trends are undoubtedly influenced by provenance evolution, as the contributing Himalaya exhumed its increasingly higher metamorphic grade material through time. However, the effects of diagenesis should not be overlooked, particularly when interpreting the downhole decrease in heavy minerals and diversity of assemblage.
Shipboard observations cannot be directly compared to the onland record or to Bengal Fan Leg 116 shore-based studies because of differences in the techniques employed (smear slide compared to thin section and quantitative heavy mineral analysis by mineral separation and energy-dispersive X-ray spectrometry [EDS]). However, the following comparisons can be made, bearing the above in mind.
Comparison with modern-day Ganges and Brahmaputra River petrography
Petrography of the modern day delta sediments (i.e., detritus from the Brahmaputra and Ganges Rivers below their confluence) is very similar to that from the Pleistocene sediments of the Bengal Fan. Both contain a significant proportion of amphibole and epidote (zoisite and clinozoisite), representing ≈50% of the heavy minerals, as well as appreciable proportions of garnet (5%–15%) and minerals indicative of a higher metamorphic grade, as well as sphene and uncommon pyroxene (Garzanti et al., 2004, 2011).
Comparison with Bengal Fan Leg 116 sites
The petrography of Bengal Fan sediments recovered during Expedition 354 compares broadly with that from Leg 116 (Yokoyama et al., 1990; Amano and Taira, 1992): assemblage of the common heavy minerals is similar, proportion of the ultrastables (zircon, tourmaline, and rutile) increases downhole, amphibole increases, and pyroxene is recorded from the late Miocene and later. However, in contrast to Leg 116, olivine and pumpellyite are not recorded at Expedition 354 sites. In the case of pumpellyite, this is probably because this mineral is not easily recognizable in smear slides but is detectable with EDS. However, olivine should be recognizable in smear slide analysis, and the difference between sites may thus reflect a real variation, or perhaps the olivine (recognized by later EDS analyses of Leg 116 sands) is of too small a grain size to be detected by smear slide analysis at Expedition 354 sites.
Comparison with the onland Bengal Basin remnant ocean basin (Surma Basin)
The late Eocene–early Miocene rocks of the Surma Basin (Barail Formation) are similar to the older parts of the Hole U1451B Bengal Fan record in view of their low heavy mineral content, paucity of amphiboles, dominance of ultrastables (zircon, tourmaline, and rutile), and the low metamorphic grade of lithic fragments. However, Paleogene Surma Basin rocks differ from Hole U1451B sediments in their earlier arrival of staurolite compared to the fan (in the mid-upper Barail; i.e., by the early Miocene) and in their abundance of chloritoid (Najman et al., 2008). As in the Bengal Fan, the zircon-tourmaline-rutile (ZTR) index in the Surma Basin continues to decrease into the Neogene. However, the Miocene comparison produces a complex pattern; the Miocene Surma Basin rocks described by Uddin and Lundberg (1998) contain staurolite, kyanite, andalusite, and sillimanite, but these contents are not recorded in the Miocene Surma Basin rocks described by Najman et al. (2005), who describe high chloritoid and garnet. Both sets of observations from the Surma Basin Miocene rocks differ from coeval sediments in the Bengal Fan, which do not contain either high chloritoid or a high variety of metamorphic minerals during this time interval. Moving into the Pliocene–Pleistocene, the record from the Surma Basin and Bengal Fan become more similar. Amphibole and epidote–group minerals become increasingly prevalent in both the Surma Basin and the Bengal Fan, and high-grade metamorphic minerals are also present in both.
Comparison with the eastern Himalayan foreland basin
Similar to the Bengal Fan, Eocene deposits of the foreland basin contain a low heavy mineral proportion of restricted assemblage (e.g., the Bhainskati Formation; DeCelles et al., 1998a). An unconformity stretching from the late Eocene to approximately the late Oligocene in the foreland basin precludes comparison with the fan for the Oligocene. Above the foreland basin unconformity, the basal part of the foreland basin succession (early Miocene; basal Dagshai Formation) contains sparse mica and no garnet, and metamorphic lithic fragments of medium and high grade are sparse (Najman and Garzanti, 2000). The early Miocene foreland basin succession then rapidly passes up into micaceous garnet-rich sandstone, although metamorphic lithic fragments remain predominantly of low grade (Kasauli Formation, Dharamsala Formation, and Dumre Formation; DeCelles et al., 1998a; Najman and Garzanti, 2000; White et al., 2002). Staurolite, although recorded uncommonly from 20 Ma, becomes prevalent around the middle/late Miocene boundary (DeCelles et al., 1998b; Szulc et al., 2006). In these respects, the foreland basin succession thus broadly emulates the Bengal Fan trend: both successions lack large micas in the lowest part of their successions, the occurrence of garnet and schist lithic fragments is recorded from Miocene times, and staurolite is recorded from the late Miocene onward, with input from sources of increasing metamorphic grade upsection. Where the Bengal Fan and foreland basin successions differ is in the proportion of amphibole. The Bengal Fan petrography is frequently rich in amphibole, whereas ferromagnesian siliciclastics are rare in foreland basin sedimentary rocks. The paucity in ferromagnesian mineral in the foreland basin has been ascribed to the effects of diagenesis (Andò et al., 2012; Szulc et al., 2006).
In summary, both the Bengal Fan and the onland sedimentary archives record a complex interplay of a provenance signal overprinted to some extent by downhole diagenesis.
Biostratigraphy
Calcareous nannofossils and planktonic foraminifers provide biostratigraphic constraints at Site U1451. Overall, the abundance and preservation of these microfossils is highly variable. In total, 39 biomarkers were observed and 31 biozones were constructed at Site U1451 (Tables T4, T5, T6, T7, T8).
Table T4. Calcareous nannofossils, Hole U1451A. Download table in .csv format.
Table T5. Calcareous nannofossils, Hole U1451B. Download table in .csv format.
Table T6. Planktonic foraminifer group and species abundance, Hole U1451A. Download table in .csv format.
Table T7. Planktonic foraminifer group and species abundance, Hole U1451B. Download table in .csv format.
Table T8. Biostratigraphic age datums and midpoint calculations, Site U1451. Download table in .csv format.
Calcareous nannofossils
The distribution of calcareous nannofossils is shown in Tables T4 and T5. Nannofossil abundances range from barren in coarse-grained turbidites to very abundant in nannofossil oozes, with moderate to good preservation. Nannofossils are very abundant in lithostratigraphic Unit XXIII, with predominantly poor preservation due to recrystallization and overgrowth.
Based on nannofossil biostratigraphy, the sediments from Hole U1451A extend back to the late Miocene. Ten nannofossil biohorizons were identified, with two first occurrences (FOs) and seven LOs delineating the zones, as well as one gap zone that was identified by the absence of biomarker species. The Pleistocene is well represented at this site within 150 m of levee, interlevee, and hemipelagic sediments. Samples 1H-CC to 4H-CC contain Emiliania huxleyi, the biomarker for Zone NN21. Samples 4H-CC to 10H-CC represent Zone NN20, and Samples 11F-CC to 20F-CC contain Pseudoemiliania lacunosa within Zone NN19 (0.44–1.93 Ma). Sample 21F-CC contains the FO of Discoaster brouweri and is within Zone NN18 (1.93–2.39 Ma). A thick (66 m) pelagic sequence was recovered in Cores 23F–29F (lithostratigraphic Unit IV) and contains nannofossil Zones NN17–NN11, which represent >3 My of pelagic sedimentation at this site. Nannofossil Zones NN11–NN9 were identified in Cores 30F–111X (Table T8 gives the midpoints of these zones), suggesting that this 450 m interval spans 3.5 My.
In Hole U1451B, 20 nannofossil biomarkers, including 3 FOs and 17 LOs, were identified. These biomarkers were used to divide the hole into 14 biozones and 2 gap zones. The Zone NN9 boundary provides a chronostratigraphic tie point between the holes. This tie point was observed at the base of Hole U1451A (midpoint = 575.60 m CSF-A) and the top of Hole U1451B (midpoint = 590.06 m CSF-A).
Nannofossil biostratigraphy indicates that deposition is continuous downcore and represents a late Oligocene to late Miocene (Zones NN9–NN1) sedimentary sequence dominated by turbidites. The Oligocene/Miocene boundary is located between Samples 354-U1451B-54R-CC and 63R-CC and is identified by the LOs of Reticulofenestra bisectus and Zygrhablithus bijugatus (Zone NP25). A major change in lithology in Core 63R (lithostratigraphic Unit XXIII) coincides with the Zone NP25/NP24 boundary (26.93 Ma). Increased diagenesis and overgrowth were observed in Unit XXIII, but nannofossil Biozone NP23 was identified in Sample 69R-CC. Samples 70R-CC to 71R-CC contain the biomarkers for Zones NP20–NP19, Discoaster barbadiensis and Discoaster saipanensis. There appears to be a significant gap of 16–18 My between Samples 71R-CC and 72R-CC. Sample 72R-1, 0–1 cm, contains Discoaster multiradiatus and Fasciculithus spp., which are biomarkers for Zone NP10 and range from 55.6 to 57.2 Ma. Sample 73R-CC represents a gap zone marked by the absence of D. multiradiatus, placing the base of Site U1451 in the Paleocene (Thanetian).
Planktonic foraminifers
The planktonic foraminifer biostratigraphy for Site U1451 is constrained primarily by analysis of core catcher samples. Supplementary samples were taken from core sections when time permitted or when no foraminifers were found in the core catcher. The group and species abundances of planktonic foraminifers for Hole U1451A are shown in Table T6, and those for Hole U1451B are shown in Table T7. In Hole U1451A, foraminifers were regularly found in core catcher samples in the upper 300 m, but samples became increasingly rare and barren with respect to foraminifers with depth. Where this transition occurs, mixed-layer planktonic foraminifers become increasingly sparse, and deeper-dwelling species dominate the assemblage. It is possible that this transition is due to preservation changes in the sediments rather than, or in addition to, recording a change in environmental conditions of the overlying water column. Benthic foraminifers are rare throughout Site U1451.
As with previous sites, foraminiferal abundance was very low (<1%) to barren in sand and silt layers and considerably higher in hemipelagic and calcareous clay layers. Hole U1451B, which penetrated from 543 to 1169 m CSF-A, has a considerably lower abundance of foraminifers, and many intervals are barren. This could be due to the lower percentage of calcareous clay layers recovered in the core catchers in Hole U1451B (1% compared to 35% in Hole U1451A). In addition, as the sediments became increasingly hard and lithified with depth, they were harder to disaggregate. We attempted to disaggregate samples by adding 30% hydrogen peroxide (see Biostratigraphy in the Expedition 354 methods chapter [France-Lanord et al., 2016a]), which worked well for many clay samples. When samples became lithified, we attempted to use kerosene, which yielded little success because of the low porosity of the lithified material. Making thin sections of samples with high foraminiferal abundance was a successful way of identifying species in lithified sediments.
The upper 200 m of Hole U1451A provided five foraminifer biomarkers, indicating the sediments are older than 5.92 Ma at 193 m CSF-A and providing relatively good foraminiferal age constraints to this depth. Deeper sediments become increasingly barren in foraminifers, and Hole U1451A yielded no more biomarkers. Hole U1451B has very low foraminiferal abundances. Two marker species were found, including Paragloborotalia mayeri in Sample 19R-CC, indicating those sediments are older than 10.46 Ma. In addition, thin sections of Samples 71R-CC and 72R-CC both contain Morozovella aragonensis, which is a marker species for Zone E9 and has a range of 43.6–52.3 Ma. The radiolarian species Thyrsocyrtis rhizodon (identified by sending scanning electron microscope images to a shore-based radiolarian specialist) is found in Sample 69R-CC, confirming that the bottom of Site U1451 contains Eocene sediments.
Paleomagnetism
Paleomagnetic measurements were conducted on 40 of the 110 APC and HLAPC cores and 1 XCB core collected from Hole U1451A. We avoided measuring core sections with sandy sediment or coring disturbance. In addition, paleomagnetic measurements were conducted on 5 of the 11 XCB cores and 46 of the 59 RCB cores collected from Hole U1451B. In lithified sediments recovered using the RCB system, we paired paleomagnetic measurements with structural measurements to account for rotation of pieces within core sections. As at other Expedition 354 sites, we observed that hemipelagic and calcareous clay sediments are the most useful for magnetostratigraphic interpretation. Interpretation was complicated by a drilling overprint that affected the natural remanent magnetization (NRM) of cores collected using all coring methods. The drilling overprint was generally removed in APC cores with 15 mT AF demagnetization but appeared to be more persistent in many XCB and RCB cores.
At the low latitude of Site U1451, where the geocentric axial dipole (GAD) approximation to the magnetic field predicts a low inclination (15.7° for the present latitude), orientation is important for polarity interpretation. For Hole U1451A, only Cores 1H–9H and 28H–30H were azimuthally oriented using the FlexIT tool. This allowed us to make polarity determinations with confidence on oriented Cores 1H, 2H, 4H, 5H–7H, and 28H, all of which had minimal visible coring deformation and intervals that were suitable for paleomagnetic study. Where possible, we interpret polarity in unoriented cores using inclination data. In many cores, however, the quality of inclination data and/or the paleolatitude of Site U1451 make it difficult to assign polarity with any confidence. Therefore, in most of the unoriented APC and HLAPC cores, we relied on declination data to identify polarity transitions within cores. Declinations measured on unoriented cores may also allow reorientation of the cores for future magnetic anisotropy studies.
For Hole U1451A, remanent magnetization measurements were made on archive section halves (N = 133) and on discrete samples from the working section halves (N = 83). The NRM of archive halves was measured on the shipboard superconducting rock magnetometer (SRM) before and after 10, 15, and 20 mT alternating field (AF) demagnetization. In some cases, measurements were made only before and after the 20 mT AF demagnetization step. Remanent magnetization measurements made after the 20 mT AF treatment are used here for polarity determination. Sections where the sediment was watery or heavily disturbed by the coring process were not measured (see Paleomagnetism in the Expedition 354 methods chapter [France-Lanord et al., 2016a]). Although most sections were measured at 2.5 cm intervals, some sections identified as pelagic or hemipelagic were measured at 1 cm intervals. For nearly all sections, we averaged three replicate SRM measurements per point. Intervals described as highly disturbed, soupy, or flow-in, or as having a sandy principal lithology (see Lithostratigraphy in the Expedition 354 methods chapter [France-Lanord et al., 2016a]), as well as tops of cores and edges of sections likely to be affected by edge effects, were not interpreted (see Paleomagnetism in the Expedition 354 methods chapter [France-Lanord et al., 2016a]).
Discrete sample locations were chosen in fine-grained or calcareous clay intervals where drilling deformation was not visible or was minimal. These measurements were carried out on the JR-6 spinner magnetometer before and after 10, 15, 20, 25, 30, 35, 40, 50, 60, and in some cases 80 and/or 100 mT AF demagnetization with a measurement protocol designed to minimize gyroremanent magnetization (GRM) and anhysteretic remanent magnetization (ARM) used above 40 mT (see Paleomagnetism in the Expedition 354 methods chapter [France-Lanord et al., 2016a]; Table T9). A subset of the AF steps between 10 and 60 mT were included in the direction determination for all samples. Specific steps were chosen based on the demagnetization behavior of each sample. Coercivities of the remanence carriers are consistent with magnetite and/or titanomagnetite as the principal NRM carrier. The specific magnetic mineralogy will be investigated further during postexpedition studies.
Table T9. ChRM of discrete samples, Site U1451. Download table in .csv format.
For Hole U1451B, remanent magnetization measurements were made on archive section halves (Nsections = 136) and limited discrete samples (Nsamples = 10). Coring deformation, limited recovery, and strong drilling overprints made measurements on XCB cores uninterpretable. Lithified sediments recovered using RCB coring were often broken and rotated within the core, resulting in variable declinations. To assess these rotations, we compare the best-fit bedding orientation for each core (based on magnetic declinations and apparent dips measured on bedding-parallel features on archive-half surfaces; Figure F8 in the Expedition 354 methods chapter [France-Lanord et al., 2016a]) with bedding orientation estimates from other cores. We interpret 180° changes in dip direction to reflect changes in magnetic polarity rather than structural changes. Preliminary estimates of bedding orientation based on Cores 354-U1451B-21R through 62R suggest a consistent east-west–trending strike and a mean dip of approximately 7° to the north or south. Postexpedition work will help determine whether these observations can be used to determining the magnetic polarity of these RCB cores.
Results
A selection of 93 discrete samples was taken from working section halves from Holes U1451A and U1415B (Table T9). The samples were collected from mainly hemipelagic intervals with finer grained sediments and calcareous clay. Characteristic remanent magnetizations (ChRMs) of discrete samples were calculated using the principal component analysis (PCA) technique (Kirschvink, 1980). The ChRM directions include both positive (56 samples; ~60.2%) and negative (37 samples; ~39.8%) inclinations. In many cases, these directions allow us to identify unoriented cores as normal or reversed, but several samples have low or noisy inclination values (Figure F18). Because the angular distance of inclinations between polarities is small near the magnetic equator and any sample will have some dispersion about their mean inclination, the sign of shallow inclinations is not indicative of polarity (e.g., McFadden and Reid, 1982).
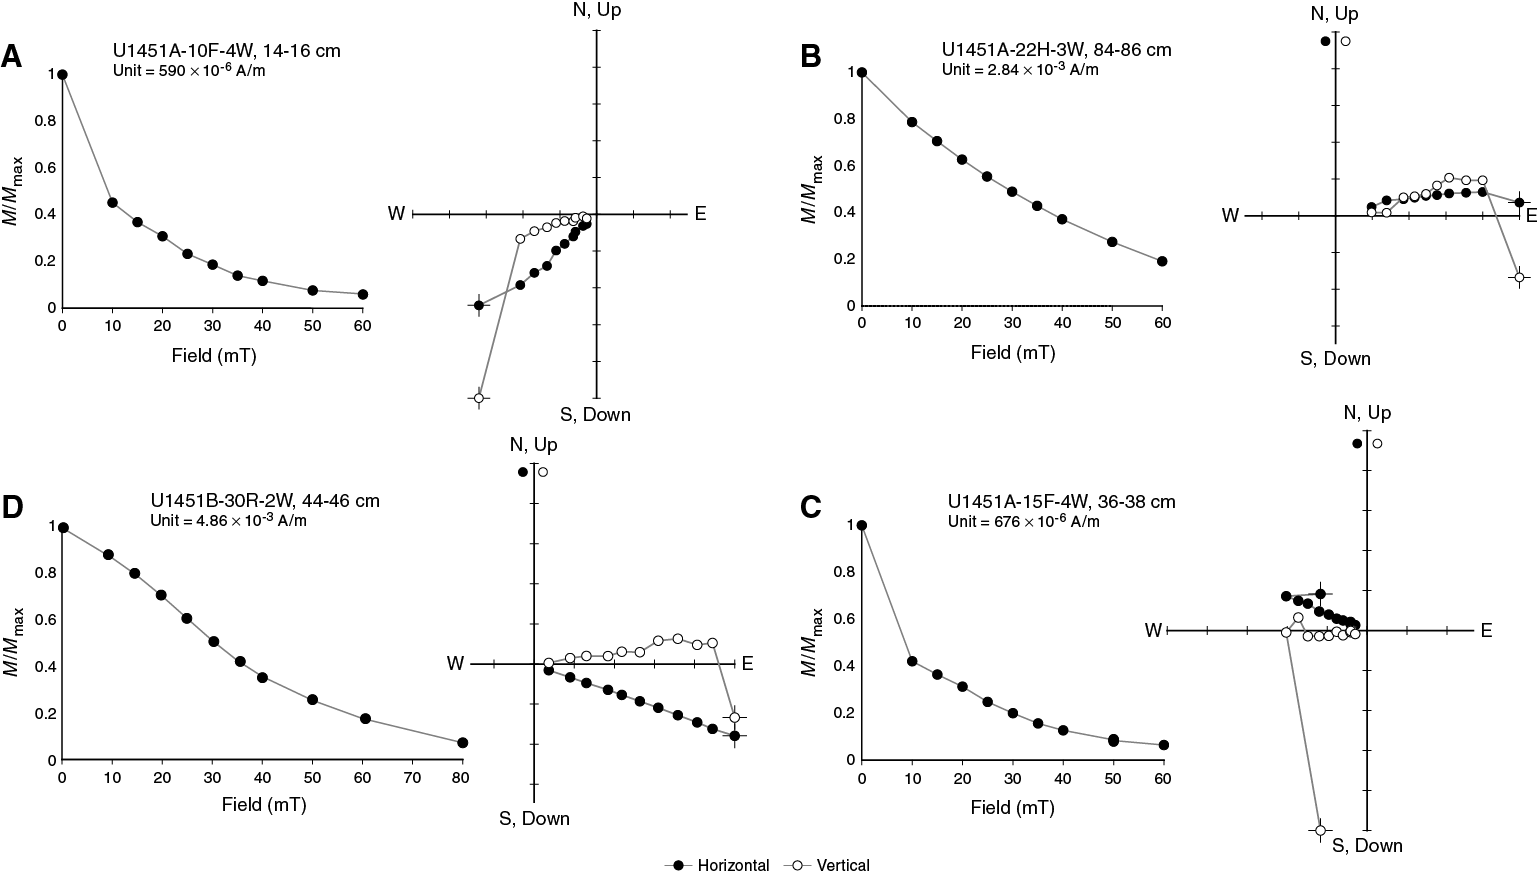
Figure F18. NRM decay and AF demagnetization vector diagrams of discrete samples, Site U1451.
Using the lithology, deformation, and edge effect criteria for data from Hole U1451A (see Paleomagnetism in the Expedition 354 methods chapter [France-Lanord et al., 2016a]; Table T9), median section-half NRM intensity before AF demagnetization for intervals described as calcareous clay (lithologic terms here refer to principal lithology descriptions; see Lithostratigraphy) is 1.1 × 10⁻² A/m. Following 20 mT AF demagnetization, the median intensity is 1.8 × 10⁻³ A/m, indicating 83% of the median intensity lost after demagnetization. For lithologies not described as calcareous clay but still meeting our criteria, primarily silts and clays, median NRM intensity before AF demagnetization is higher (3.8 × 10⁻² A/m; 1.1 × 10⁻² A/m following AF demagnetization). Normalized to initial NRM intensities, 72% of median intensity is lost after demagnetization in these lithologies. In intervals where sand is noted as the principal lithology, median NRM intensities drop by a similar amount after 20 mT AF demagnetization (1.0 × 10⁻¹ A/m before AF demagnetization; 2.0 × 10⁻² A/m after 20 mT AF demagnetization; 81% of median intensity lost).
We determined that coring deformation and the strong drill string overprint during XCB coring makes all XCB cores recovered at this site unsuitable for magnetostratigraphy. Rotation of lithified intervals within RCB cores complicates low-latitude paleomagnetic study, but our preliminary results from pairing remanence measurements with structural measurements, discussed above, suggest further work may make polarity determinations possible for the majority of RCB cores.
Magnetostratigraphy
We focused our shipboard magnetostratigraphic interpretation on the APC and HLAPC cores recovered from Hole U1451A. For Cores 1H–28H, based on section half and discrete data and using FlexIT orientations, we identify 9 cores with only normal directions, 6 cores with only reversed directions, and 5 cores with mixed polarity that contain 11 polarity reversals (Figure F19; Tables T10, T11). Because of the discontinuous nature of recovered sediments, we cannot assign all 11 reversals to specific chron or subchron boundaries at this time, but we are confident that all can be placed with further work. Additionally, Core 35F contains a well-defined reversal but cannot be placed at this time because of limited biostratigraphic constraint.

Figure F19. NRM of archive section halves and discrete samples before and after 20 mT AF demagnetization, Cores 354-U1451A-1H through 28H.
Table T10. Magnetostratigraphy, Hole U1451A. Download table in .csv format.
Table T11. Orientation data, Hole U1451A. Download table in .csv format.
We interpret Core 15F, described as calcareous clay, as containing four reversals, which we place as the boundaries of the Jaramillo (C1r.1n) and Cobb Mountain (C1r.2n) Subchrons (Figure F20). These subchrons were also identified at Sites U1449 and U1450. Consistent physical properties and sediment thickness in this polarity interval give us confidence in our interpretation. Within this context, we place Cores 1H–12F, interpreted as having normal polarity, in the Bruhnes Chron (C1n), and we place Core 14F, with discrete samples having negative inclinations, in the Matuyama Chron (C1n.1r). We identify the reversal in Core 13F as the Bruhnes/Matuyama (C1n-C1r.1r) boundary. Ash is associated with the chron boundary here, as at ODP Site 758 (Dehn et al., 1991).
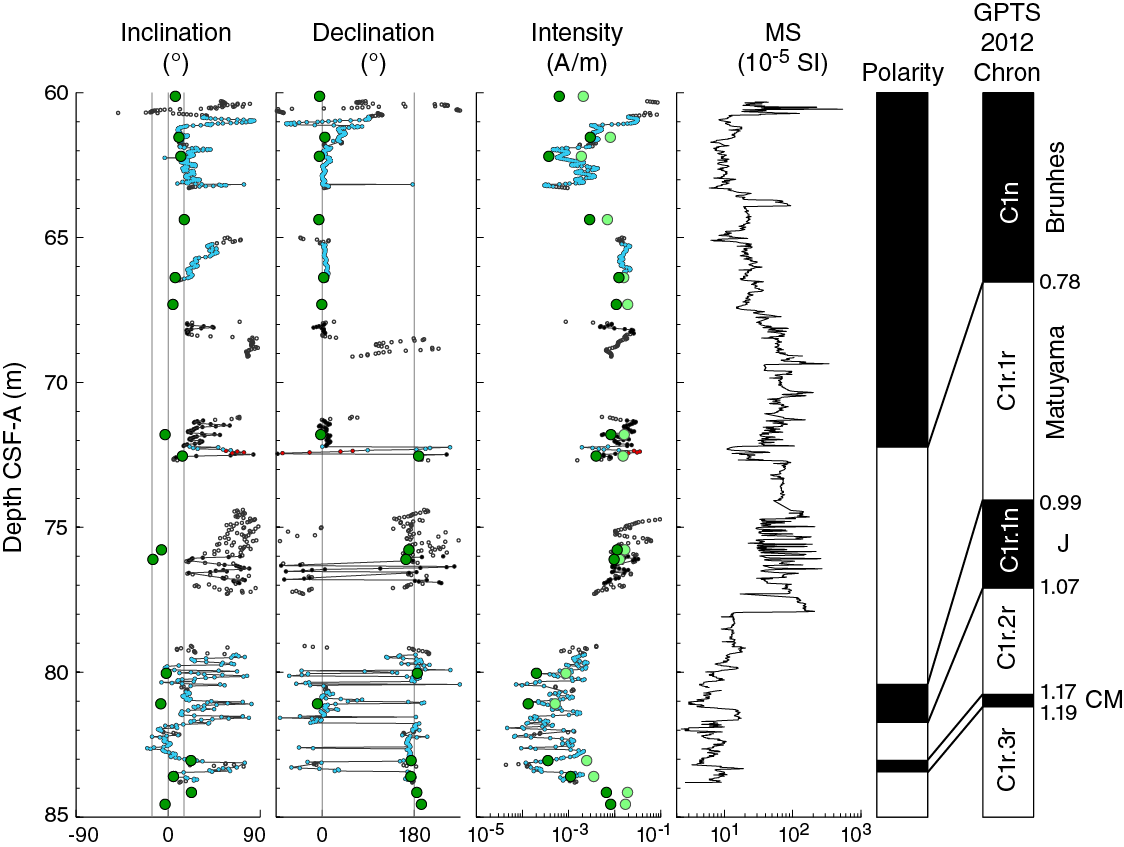
Figure F20. NRM of archive section halves and discrete samples after 20 mT AF demagnetization, Cores 354-U1451A-11F through 15F. These cores were deposited during the early Bruhnes and late Matuyama, with the short normal intervals representing the Jaramillo and Cobb Mountain Subchrons.
We interpret Core 21F as containing a normal to reversed polarity transition within the described calcareous clay lithology. Although we cannot make a definitive interpretation at this time, biostratigraphic constraints suggest this must be either the Upper Olduvai (C1r.3r-C2n) or Matuyama/Gauss (C2n.2r-C2An.1n) boundary.
We interpret Cores 25H–28H, mostly described as calcareous clay, as containing seven reversals (Figure F21). We interpret Core 25H as containing a reversed to normal transition, which we place as the Gauss/Gilbert boundary (C2An.3r-C2Ar) because of biostratigraphic constraints and the thickness of reversed polarity carbonate ooze preceding the boundary, assuming these carbonate ooze sediments are deposited at rates of 2 cm/ky or less. Core 26H contains two well-defined reversal boundaries, which we interpret as bounding a ~2.5 m normal interval. Core 27H contains two well-defined reversal boundaries and a ~1 m interval characterized by frequent variations in declination. We interpret the latter interval as rock-magnetic noise. Core 28H is oriented with the FlexIT tool and entirely reversed.
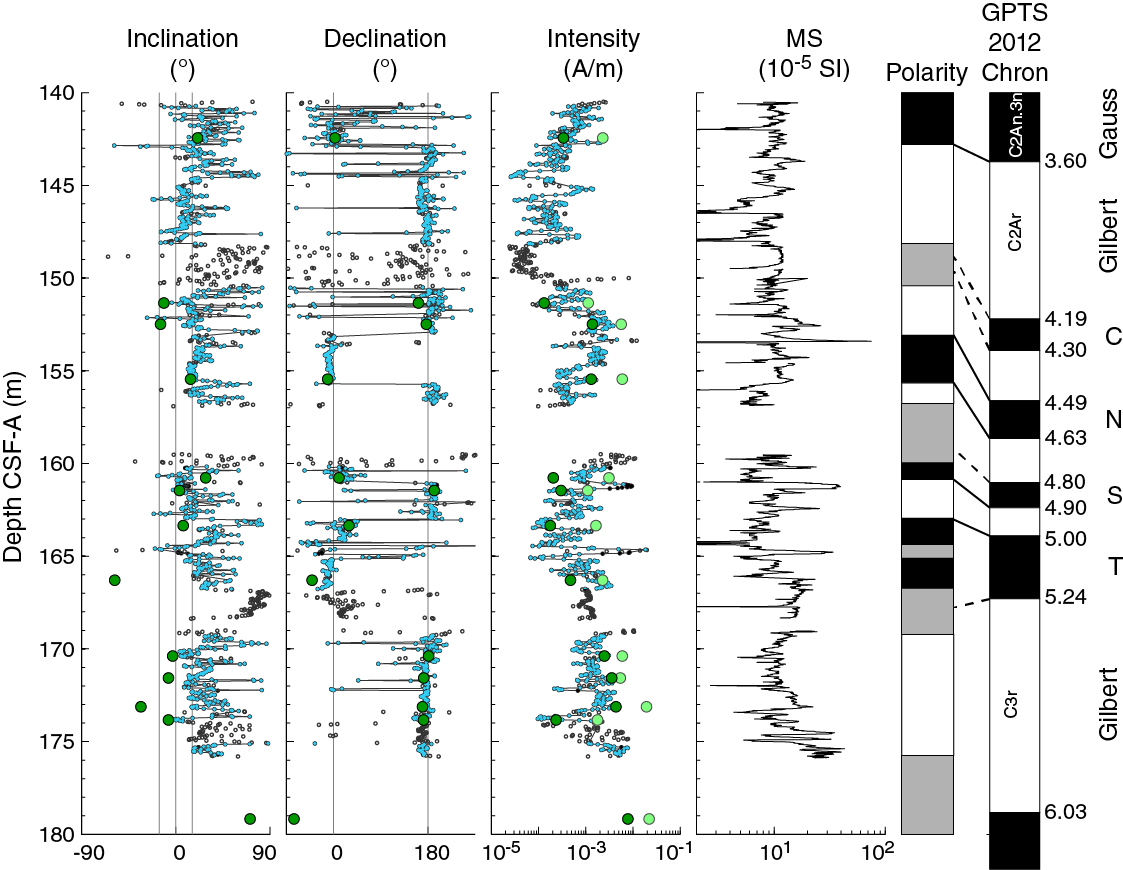
Figure F21. NRM of archive section halves and discrete samples after 20 mT AF demagnetization, Cores 354-U1451A-25H through 28H. These cores were deposited during the early Gauss and Gilbert Chrons, with three of the four Gilbert normal polarity subchrons in Cores 26H and 27H.
Based on biostratigraphy and the thickness of this reversed interval, we place Cores 25H–28H in the Gilbert (C3r-C2Ar) and early Gauss (C2An.3r) Chrons, with Core 28H deposited during the early Gilbert Chron (C3r). Our preferred interpretation of the magnetic polarity zonation is based on the assumption of near-constant sedimentation rates on the CSF-A depth scale for the Gilbert Chron. Making this assumption, the reversed polarity calcareous clay interval in Core 28H represents a relatively long time interval, likely C3r. Considering the two intervals of similar polarity at the base of Core 27H as a single subchron, we interpret Core 27H as containing the upper boundary of the Thvera (C3n.4n) and the lower boundary of the Sidufjall (C3n.3n) subchrons. The polarity reversals in Core 26H correspond to the boundaries of the Nunivak Subchron (C3n.2n). In this interpretation, the Cochiti Subchron (C3n.1n) is missing, likely in the gap between Cores 25H and 26H. Other interpretations are possible; for example, we cannot rule out the possibility that the constant-polarity interval in Core 26H is the Cochiti Subchron rather than the Nunivak Subchron, or that the two polarity intervals in Core 27H separated by high-frequency variations are in fact two separate subchrons.
Although cores deeper than Core 28H have not yet been interpreted, several of them contain calcareous clay intervals that may provide interpretable records similar to the calcareous clay intervals described above. In Sections 43F-1 and 43F-2, calcareous clay has declinations that indicate the same (undetermined) polarity. A discrete sample (43F-2, 102–104 cm) has a negative inclination, suggesting that this core has reversed polarity. The rest of this core is affected by severe drilling disturbance. At least six other cores have calcareous clay intervals that are likely to yield reliable polarity information that will be interpreted once tighter biostratigraphic constraints are available.
Geochemistry and microbiology
Hydrocarbon gas sampling and analysis
Headspace gas samples were taken at a frequency of one sample per core in Holes U1451A and U1451B as part of the routine safety monitoring program (Table T12). Methane concentrations were consistently very low (<9 ppmv) throughout Holes U1451A and U1451B. Marginally elevated methane concentrations were observed in both holes between 530 and 680 m CSF-A. Ethane, ethene, propane, and propene were below the quantification limit in all samples. Headspace gas concentrations at Site U1451 stand in sharp contrast to those measured at Sites U1449 and U1450, where elevated (>10,000 ppmv) methane concentrations were observed.
Table T12. Methane concentrations, Holes U1451A and U1451B. Download table in .csv format.
Interstitial water sampling and chemistry
A total of 60 samples from Holes U1451A and U1451B were analyzed for interstitial water chemistry (Table T13). Seven samples were obtained by Rhizon sampling from the top of Hole U1451A to 57 m CSF-A, and the remaining samples were obtained by squeezing whole rounds. The whole-round samples were generally 5 cm long but reached up to 13 cm near the bottom of Hole U1451B. The applied squeezing pressures never exceeded 28,000 psi, and the amounts of extracted interstitial water ranged between 4 and 40 mL. A 13 cm long whole-round core from Section 354-U1451A-63R-3 (1097 m CSF-A) was squeezed for more than 6 h without releasing a single drop of water, so we did not take any more samples of lithified lithology from that depth to the bottom of Hole U1451B.
Table T13. Interstitial water geochemical data, Site U1451. Download table in .csv format.
Based on the rate of change of cation and anion content with depth and changes in their covariations, five hydrologic units can be distinguished at Site U1451 (Figure F22). For the three upper units, the limits are sharp around 60, 152, and 386 m CSF-A. The transition from the fourth to the fifth unit is more difficult to define (860 and 920 m CSF-A), in part because of the scarcity of samples in this interval. In the upper portion of the sediment column (0–60 m CSF-A), biogenic processes release dissolved phosphate (maximum of 75.7 μM at 57.4 m CSF-A) and consume sulfate, with a sulfate minimum of 1.8 mM at the bottom of the upper unit. A corresponding increase in alkalinity and decrease in Ca and Mg result from carbonate formation from biogenic reactions that generate alkalinity. Salinity, although 1.2 higher than the bottom seawater of the Bay of Bengal at 8°N (Levitus94 at http://iridl.ldeo.columbia.edu), marginally rises from 35.9 to 36.4 in this unit. The unit between 60 and 152 m CSF-A is characterized by a rise in sulfate content (up to 8.1 mM at the bottom of this unit), a strong decline in phosphate and alkalinity contents, and a rise in calcium content, whereas dissolved silica reaches maximum concentration for this hole at 62 and 145 m CSF-A. It is also worth noting near-constant dissolved magnesium and potassium concentrations (6% and 14% decline in the entire depth interval, respectively) and salinity. The rise in bromide to 0.935 mM at the very bottom of the second unit and the high dissolved silica concentrations preclude, however, a passive lateral intrusion of seawater in this unit to explain the changes. The third unit is characterized by a significant decline in magnesium and potassium content, a drop in silica content to values lower than 200 μM, a concomitant rise in sodium content (by 5%), and the gradual disappearance of sulfate (concentrations below 1 mM correspond to less than 3.5% of contamination by drilling fluid, as at Site U1450, and are considered to be negligible). Alkalinity continues to drop at a subdued rate, and calcium content rises by 80% in this unit. This unit is characterized by exchange reactions and diffusion controlled by boundary conditions of the pore water chemistry of the two adjacent units. The unit between 386 and 860 m CSF-A is also characterized by diffusion-driven processes inducing only significant and monotonous changes in the calcium and sodium concentrations. Sulfate content tends to increase downhole to reach concentrations around 7 mM at the bottom of this unit. The small variations in the sulfate, magnesium, potassium, and sodium contents with depth (Figure F22) could be related to incomplete decontamination of drilling fluid/mud, and this is likely the case at 555 m CSF-A. Nevertheless, most of those spikes in the depth profile of this unit are likely related to the admixture of evolved fluid (or freshwater) rather than seawater because the drop in salinity is associated with a rise in calcium content above the value of bottom seawater. The bottom unit is characterized by a strong rise in calcium content, whereas alkalinity remains low and constant, buffered by pressure-dissolution and recrystallization of the carbonate-rich lithology below 1095 m CSF-A and an upward diffusion/advection of interstitial water.
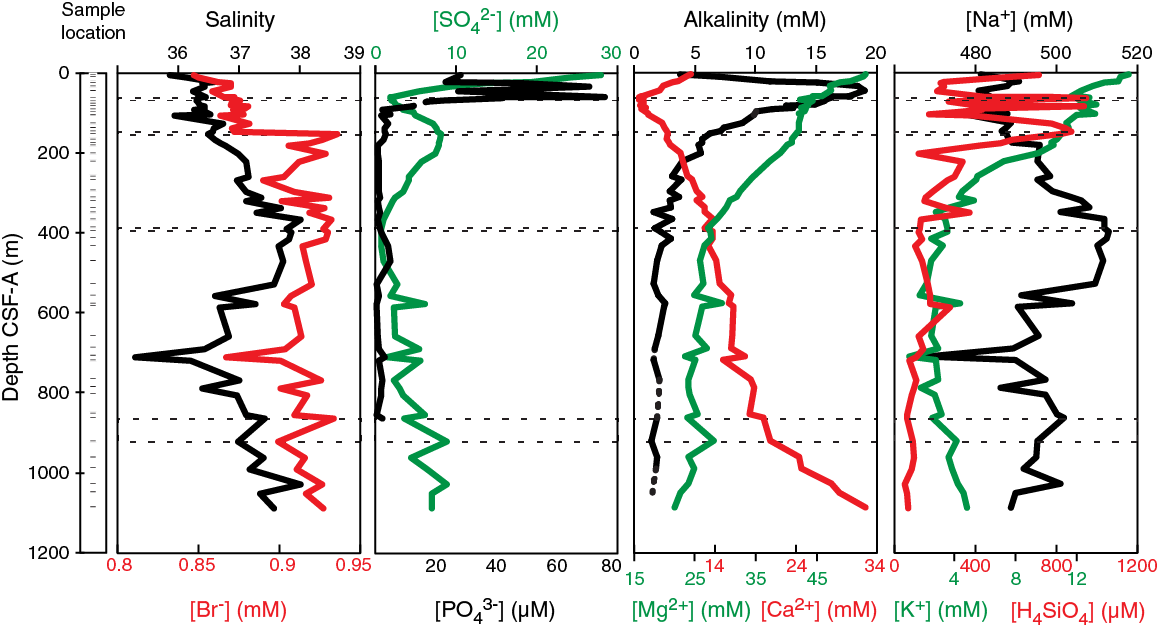
Figure F22. Variations of salinity, bromide, sulfate, phosphate, alkalinity, magnesium, calcium, sodium, potassium, and silicon concentrations in interstitial waters, Site U1451.
Bulk-sediment geochemistry
Inorganic carbon
Total inorganic carbon (TIC) concentrations were determined on 153 sediment samples from Holes U1451A and U1451B (Table T14; Figure F23). TIC values expressed as weight percent calcium carbonate (CaCO3), assuming inorganic carbon is exclusively present as CaCO3, range between 0.2 and 97.6 wt% (average = 14.6 wt%). Pelagic and hemipelagic deposits (defined as calcareous clay and calcareous claystone in Lithostratigraphy) are on average richer in carbonate (average = 42.6 wt%; median = 34.8 wt%). However, the CaCO3 content of these lithologies covers the entire range of values measured at Site U1451 (0.2–97.6 wt%). Indeed, these lithologies are not systematically enriched in carbonate minerals and often have CaCO3 content indistinguishable from that of turbiditic sediments. For instance, clay-rich brown lithologies (which we refer to as brown clays and claystone in this section) are generally characterized by low CaCO3 content (median = 6.0 wt%). Turbiditic sediments are also characterized by low carbonate content (1.8–13.4 wt%; average = 6.5 wt%; median = 6.5 wt%). Within turbidites, no systematic covariation between grain size and carbonate content was observed, as indicated by the lack of statistical covariation (not shown) between carbonate content and Al/Si, a proxy for grain size and mineral composition in these sediments. Comparable features have been observed in modern Ganga-Brahmaputra River sediments (Lupker et al., 2012). An abrupt increase in the carbonate content of turbiditic sediments occurs around 130–180 m CSF-A. This increase is marked by the simultaneous disappearance of carbonate content <2.5 wt% and the appearance of carbonate content >5.6 wt%. Below this transition, the carbonate content of turbiditic sediments broadly increases to 700 m CSF-A. This increase is manifested in a doubling of average carbonate content from ~6 to ~12 wt%. Below 700 m CSF-A, the carbonate content of turbiditic sediments shows an abrupt decrease to an average value of 6 wt%. In addition, the range (1.8–13.4 wt%) in carbonate content of turbiditic sediments below 700 m CSF-A is noticeably wider than that of turbiditic sediments above 700 m CSF-A.
Table T14. Inorganic carbon, CaCO3, TC, and organic carbon contents, Holes U1451A and U1451B. Download table in .csv format.
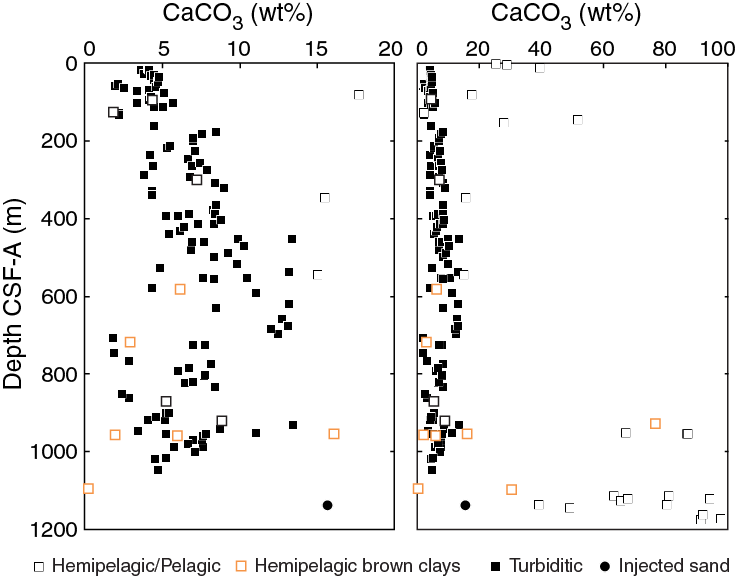
Figure F23. TIC content expressed as CaCO3, Holes U1451A and U1451B. Pelagic and hemipelagic deposits correspond to calcareous clay and calcareous claystone in the lithostratigraphy. Note that these lithologies do not have carbonate content systematically >15 wt%.
Overall, the carbonate content of turbiditic sediments from Site U1451 reaches higher values than (1) modern Ganga-Brahmaputra River sediments (Galy et al., 1999; Lupker et al., 2012) and (2) active channel-levee sediments deposited over the past 18 ky in the Bay of Bengal at 16°N (Lupker et al., 2013). In the latter, Lupker et al. (2013) found that sediments deposited during the last deglaciation have higher carbonate content (6–10 wt%) than Holocene sediments (2–5 wt%), with isotopic compositions indicative of a mainly detrital origin in both cases. Lupker et al. (2013) interpret the decline in carbonate content over the past 18 ky as variations in weathering intensity. Indeed, the decline in carbonate content was found to be accompanied by a relative decline in K content and an increase in H2O+ content, both tracking enhanced weathering over the studied time period. At the much broader time range of the Site U1451 sediments, we observe no correlation between carbonate content and K/Al ratio, a proxy for silicate weathering (and mineralogical composition), except for sediments with carbonate content <4% that are characterized by low a K/Al ratio. Unless the provenance of the silicate component changes in tandem with carbonate content, this lack of correlation suggests that variations in chemical weathering intensity are not the dominant control of carbonate content in turbiditic sediments deposited at Site U1451. We suggest instead that variations in the carbonate content of the detrital component and/or variable contributions of pelagic carbonates are likely to exert a primary control on carbonate content in turbiditic sediments from Site U1451. To test this hypothesis and shed light on the composition of the carbonate and silicate components present in the different lithologies sampled at Site U1451, we conducted XRF measurements (see Geochemistry and microbiology in the Expedition 354 methods chapter [France-Lanord et al., 2016a]).
X-ray fluorescence results
A total of 49 core sections from 716 to 1168 m CSF-A totaling more than 42 m of core were investigated by XRF analysis. The 603 analyses correspond to spot analysis of representative beds of variable size in thickness, ranging from less than 2 cm to more than 50 cm in the case of sands or limestones. Ca content was used to estimate the carbonate content (see Geochemistry and microbiology in the Expedition 354 methods chapter [France-Lanord et al., 2016a]) (Table T15; Figure F24). This semiquantitative approach is valid because the Ca content on the silicate component is generally less than 1 wt% CaO in the turbiditic fraction. The carbonate content determined by XRF analysis has a similar range as the TIC data (between 2 and 114 wt%, with high values suggesting an overestimation of the carbonate content in the pure limestone below 1090 m CSF-A) but a different average (13.0 wt% vs. 24.0 wt% by TIC on the similar depth range), highlighting the impact of the limestone values found deeper than 1090 m CSF-A in the TIC data set, as these are underrepresented in the XRF data set. The significant difference between the mean (13.0 wt%) and median (5.8 wt%) values of the 603 beds investigated by XRF, together with the low occurrence (<13% of the investigated beds) of calcareous beds (defined as carbonate content greater than 25 wt%), support a bimodal occurrence of carbonates potentially from different sources (detrital and biogenic). No major changes with depth were observed between 700 and 1090 m CSF-A, and siliciclastic lithologies (carbonate content <25 wt%) are also present below that interval (Figure F24). Other major and trace elements investigated by XRF show dependency on carbonate content; scandium and strontium are strongly positively correlated to carbonate content, casting some doubts about the correct determination of scandium because this element is generally associated with silicates and heavy minerals. The noncarbonate material is characterized by a positive relationship in the contents of potassium, titanium, chromium, rubidium, thorium, vanadium, and zinc. However, the zirconium, thorium, chromium, and titanium contents are not so well correlated, suggesting that other processes, such as different source materials, are likely to affect the content of these element in addition to dilution by carbonate and the variable occurrence of heavy minerals related to sedimentary processes. The variability in the chemistry of the silicate component is clearly visible in the spread by a factor of 5 in potassium content of the samples with less than 12 wt% carbonate (Figure F25), the scale of that range being too large to be an analytical artifact of the uncalibrated XRF data. In addition, the bimodal occurrence of carbonate content is clearly controlled by the occurrence of a detrital source and a biogenic source characterized by respectively a low (0.3 × 10⁻³) and a high (1.8 × 10⁻³) Sr/Ca molar ratio (Figure F26). Although the XRF data are not calibrated, those ratios are comparable to those of Himalayan metamorphic carbonate transported by the Ganges (0.5 × 10⁻³; Galy et al., 1999) and Neogene biogenic carbonate (1.5–3 × 10⁻³; e.g., Graham et al., 1982; Lear et al., 2003). The difference in the compositions of the noncarbonate end-member required to fit the data (Silicate A and B in Figure F26) supports the idea that at least two silicate end-members with Sr/Ca molar ratio differing by a factor of ~2 are involved. This was already suggested by the variability in the potassium content (Figure F25). Finally, uranium and sulfur were detected in 12.6% and 37.1% of the investigated beds, respectively (average content = 7.6 and 387 ppm, respectively) (Figure F24). High sulfur content is generally associated with beds rich in coarse woody debris. When uranium is detected, its content is associated with the occurrence of authigenic uranium (defined as an excess of uranium compared to the measured thorium content and the average U/Th crustal ratio) representing between 15% and 86% of total uranium (Figure F24). The absolute abundance of authigenic uranium has to be considered with caution because the XRF data are not fully calibrated, but given the high relative contribution of authigenic uranium (average = 53%), its presence, at least in some beds, is highly likely. Authigenic uranium suggests the presence of an oxygen minimum zone (OMZ) in the water column, and if present in sediments with a low sedimentation rate, it could also document the expansion of the OMZ to the sediment/water interface. The timing and potential lithologic control (occurrence of organic matter–rich turbiditic layers) of the OMZ would require a fully calibrated data set and a systematic study of the sedimentary column beyond the scope of this volume.
Table T15. Selected major and trace element contents by XRF in situ analysis in beds of selected core sections with corresponding carbonate content, Hole U1451B. Download table in .csv format.
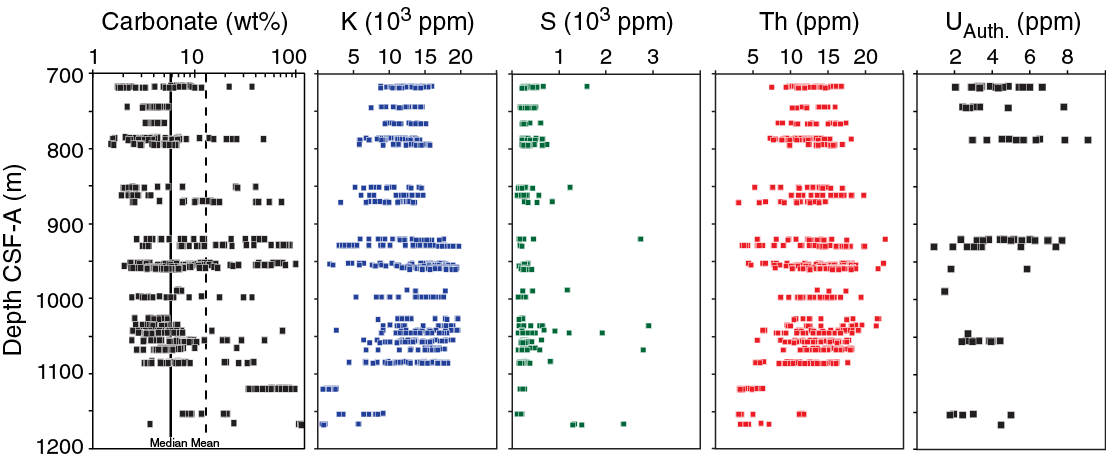
Figure F24. Variations of carbonate, potassium, sulfur, thorium, and authigenic uranium content from XRF measurements on split cores in selected individual beds, Hole U1451B.
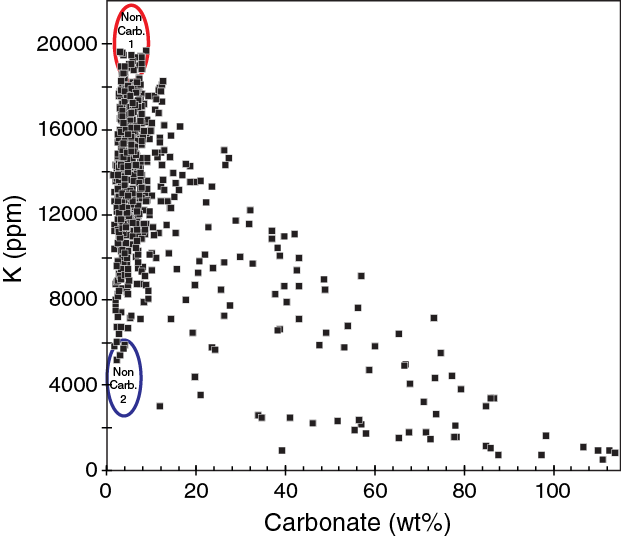
Figure F25. Variation in potassium content with carbonate content from XRF measurements on split cores in selected individual beds, Hole U1451B. The triangular shape of the distribution of the data in this diagram suggests a dilution effect related to the amount of carbonate (very poor in potassium) superimposed onto the occurrence of at least two types of noncarbonate material (likely silicate), with some beds characterized by a low-K bearing silicate and other beds containing K-rich silicate.
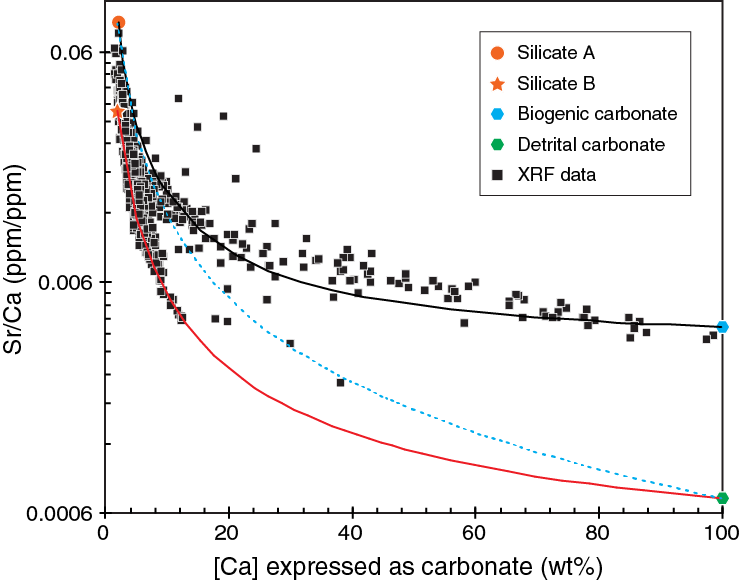
Figure F26. Variation in potassium/calcium ratio with carbonate content from in situ XRF measurement in selected individual beds, Hole U1451B.
Inductively coupled plasma–atomic emission spectroscopy results
Bulk-sediment major and trace element concentrations were determined on 36 samples from Hole U1451A and 46 samples from Hole U1451B by inductively coupled plasma–atomic emission spectroscopy (ICP-AES) (Table T16). Bulk-sediment elemental composition at Site U1451 was obtained to a maximum depth of 1180 m CSF-A and corresponds closely with lithologic type and SiO2 content. Six samples (929, 1115, 1123, 1127, 1162, and 1174 m CSF-A) have CaO contents in excess of 35 wt% associated with total major element weight percentages lower than 97.7% and as low as 90%. Those samples are characterized by carbonate contents between 63.3 and 92.0 wt%, and we noticed that some reaction occurred with the silica crucible during the loss on ignition (LOI) measurement because the lime reacted with the silica and chemical elements have been lost to the silica. As a result, those analyses are only semiquantitative, especially for SiO2 and alkali element contents. However, we note that Sr/Ca plotted against carbonate content demonstrates similar trends to the XRF data (Figure F27). Fe/Si (mol/mol) versus Al/Si (mol/mol) ratios at Site U1451 (Figure F28) show clear mineral sorting trends between clay- and quartz-rich lithologies; however, it is worth noting that some clay-rich lithologies are offset from the main trend, suggesting the occurrence of Fe-rich clays, especially for samples taken at 718, 956, and 1097 m CSF-A (samples from 929, 1115, and 1123 m CSF-A are also Fe rich, but the enrichment is more questionable because those samples might have been contaminated during the LOI determination). Such Fe-rich character is also found in two samples (324 and 393 m CSF-A) from Hole U1450A and is characteristic of smectite-kaolinite–rich samples from Leg 116 (France-Lanord and Derry, 1997). The low quality of the onboard XRD analysis of clay fractions precludes further comparison with the samples from Leg 116, and the Fe-rich character found at Sites U1451 and U1450 might or might not be related to the occurrence of Fe-rich smectite characteristic of terrigenous input.
Table T16. Major elements and selected trace element contents, Holes U1451A and U1451B. Download table in .csv format.

Figure F27. Sr/Ca (ICP-AES data) vs. carbonate content, Holes U1451A and U1451B. Trends are similar to those revealed by XRF analysis, indicating detrital vs. biogenic influence on the carbonate component.
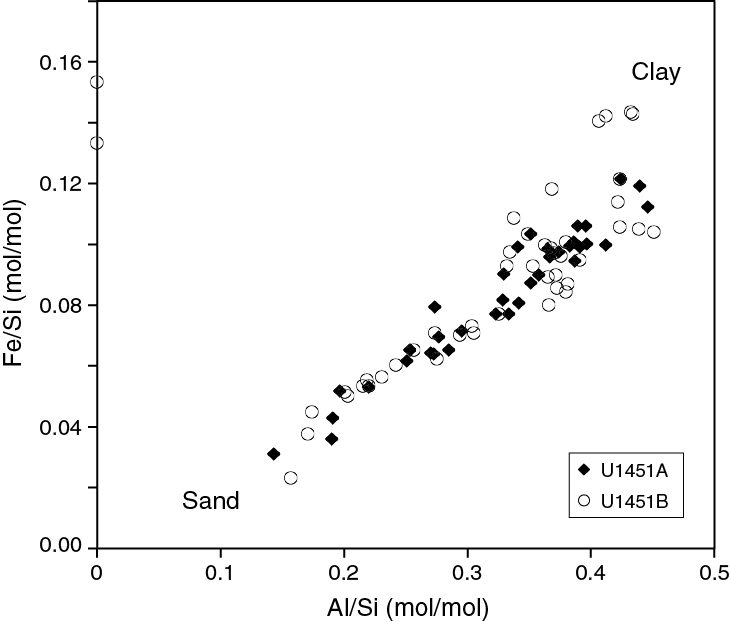
Figure F28. Fe/Si vs. Al/Si by ICP-AES, Holes U1451A and U1451B. The higher, off-trend Fe/Si values in Hole U1451B occur below 700 m CSF-A, possibly reflecting an increasing contribution from Fe-rich clays.
The lithified sand at 1139 m CSF-A, classified as sand injectite, is also geochemically anomalous to sand/silt-dominated lithologies analyzed from shallower depths at this site. Comparing the sand injectite (SiO2 = 68 wt%) to other sand/silt-dominated lithologies (SiO2 > 60 wt%) from Hole U1451B, the following geochemical differences are noted for the injectites: (1) low Al, Fe, Mg, K, Ti, Co, Sc, V, Zn, and K/Ca and (2) high Ca, Sr, and Ca/Sr (Figure F29) corresponding to the highest abundance of carbonate (15.6%) in sand, possibly related to cementation processes. We note that the surrounding lithology is carbonate rich and that the interstitial water, although not sampled in the carbonate-rich lithology, exhibits a downhole trend toward carbonate saturation below 1000 m CSF-A (Figure F23). We also note that the injectite sand has Al/K and Ti/K ratios similar to other low-Al/Si samples, consistent with a lack of preferential sorting between the clay and heavy mineral fractions.
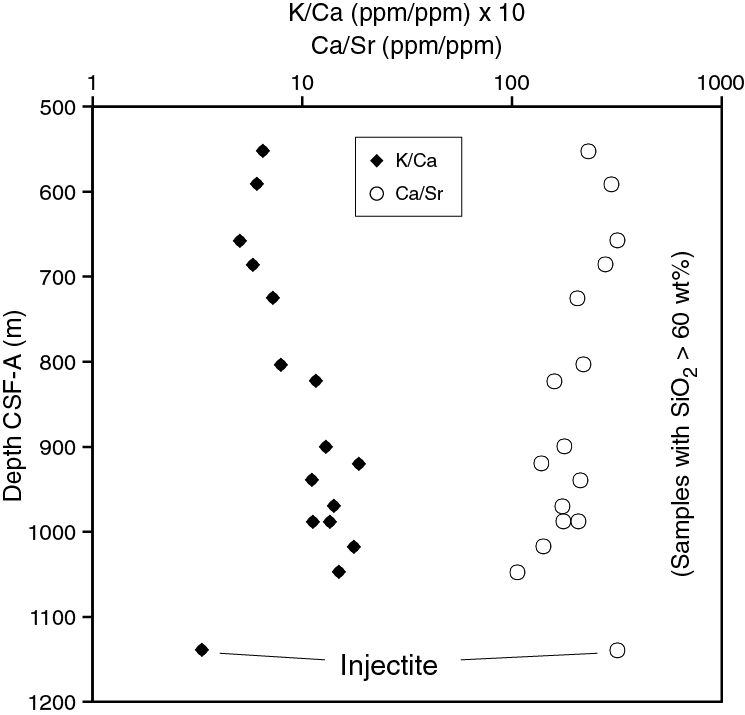
Figure F29. K/Ca and Ca/Sr (ICP-AES data), Hole U1451B. The sand injectite unit (68 wt% SiO2) near the base of the hole is characterized by low K/Ca and high Ca/Sr relative to other lithologies with similar SiO2 abundances.
Organic carbon
Total carbon (TC) concentrations were determined on 146 sediment samples from Holes U1451A and U1451B (Table T14). TC values range from 0.1 to 11.8 wt% (average = 1.9 wt%). Total organic carbon (TOC) content, calculated from the difference between TC and TIC, is low (average = 0.3 wt%) and ranges between 0.1 and 1.1 wt% (Figure F30). TOC of pelagic and hemipelagic lithologies (i.e., lithologies that do not resemble classic turbiditic sequences; described as calcareous clay, calcareous claystone, and limestone in Lithostratigraphy) decreases with depth from relatively high values (>0.8 wt%) in the uppermost 10 m of Hole U1451A to very low values (<0.2 wt%) below 300 m CSF-A. Brown clays and claystone have systematically low (<0.2 wt%) TOC. In turbiditic sediments, TOC is variable, with values ranging from <0.05 wt% (quantification level) to 0.8 wt%, and broadly covaries with the Al/Si ratio (Figure F31), reflecting the preferential association of organic matter with clays that has previously been documented in both the modern Ganga-Brahmaputra river system and in active channel-levee sediments in the Bay of Bengal deposited over the past 18 ky (Galy et al., 2007, 2008a, 2008b). We note, however, a significant scatter around the TOC–Al/Si relationship, especially for clay-rich sediments, which tend to have relatively low TOC. Turbiditic sediments enriched in woody debris are conversely relatively enriched in organic carbon (OC), at times having twice as much OC as turbiditic sediments with an identical Al/Si ratio but devoid of visible woody debris. Pelagic and hemipelagic lithologies have relatively invariant Al/Si, suggesting that their TOC is not primarily controlled by the composition of the noncarbonated component. Instead, we infer that the decline in TOC with depth displayed by these lithologies reflects diagenetic alteration of marine organic matter (e.g., Hedges and Keil, 1995; Burdige, 2007). TOC of brown clays and claystones is strongly correlated with Al/Si (although the data set is relatively small; N = 6) but shows systematic OC depletion compared to turbiditic sediments. Because brown clays and claystones have low carbonate content, this OC depletion cannot be primarily explained by a dilution with OC-poor carbonates. Instead, we suggest that the silicate component of these lithologies is characterized by low OC loading indicative of OC degradation either on land or during early diagenesis.
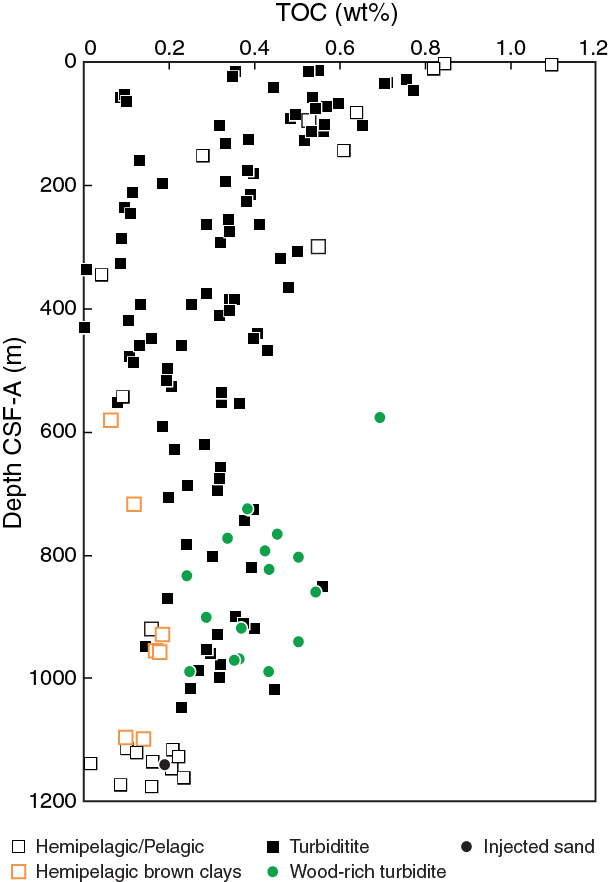
Figure F30. TOC content, Holes U1451A and U1451B. Pelagic and hemipelagic deposits correspond to calcareous clay and calcareous claystone in the lithostratigraphy.
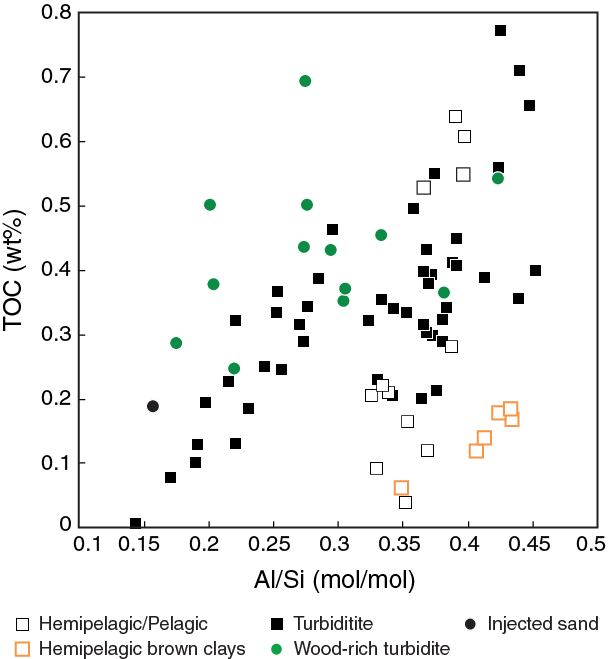
Figure F31. Relationship between TOC content and Al/Si ratio, Holes U1451A and U1451B. Pelagic and hemipelagic deposits correspond to calcareous clay and calcareous claystone in the lithostratigraphy.
Interestingly, none of the 146 samples we measured has TOC comparable with that of smectite-rich turbiditic sediments of the distal fan (Leg 116; Cochran et al., 1989; France-Lanord and Derry, 1994, 1997). This is puzzling, given that some of the sediments recovered at Site U1451 (in particular many of the characterized brown clays and claystones) bear inorganic characteristics (e.g., K depletion and Fe enrichment), suggesting the presence of smectite, a phyllosilicate characterized by very high specific surface area, which is thought to enhance OC preservation (Kennedy and Wagner, 2011). Overall, a finer characterization of both the organic (e.g., molecular characterization) and inorganic (e.g., provenance) components will be needed to reconstruct OC loading and degradation/preservation in Site U1451 sediments.
Microbiology
A total of 34 whole-round core sections (25 from Hole U1451A and 9 from Hole U1451B) were collected shipboard. Whole-round core sections were subsampled for various microbiological investigations. A microbial cell counting method was initiated shipboard in advance of further postexpedition processing.
Physical properties
Physical property data were acquired for all Hole U1451A and Hole U1451B cores, including density, magnetic susceptibility, P-wave velocity, NGR, and thermal conductivity (see Physical properties in the Expedition 354 methods chapter [France-Lanord et al., 2016a]). The data from APC cores are mostly of good quality. However, whole-round logging data from cores obtained through RCB drilling—the majority of Hole U1451B—underestimate density, magnetic susceptibility, and NGR because they typically do not fully fill the liner cross section and therefore underestimate in situ values.
Physical properties at Site U1451 primarily reflect lithologic variations but also show downcore compaction and lithification documented by decreasing porosities and increasing densities and P-wave velocities, specifically in lowermost Cores 354-U1451B-65R through 73R. Using the principal lithologic name from core description, we assigned 10 lithologies (see Lithostratigraphy) and calculated their minimum, maximum, and average physical properties (Table T17). Hole U1451A recovered core material from 0 to 579 m CSF-A, and Hole U1451B recovered core material from 542 to 1175 m CSF-A. The total core recovery assigned to lithology at Site U1451 was 518.66 m (51%). Accordingly, the most common principal lithology is calcareous clay (~128 m), followed by clay (~91 m), sand (~85 m), and silt (~73 m). Claystone (~58 m), siltstone (~19 m), and limestone (~11 m) make up the lower part of Hole U1451B. Volcanic ash occurs only in limited intervals (totaling 0.57 m), and siliceous ooze is absent. Physical property measurements are each described in detail below, but in general, limestones have the highest average density and P-wave velocity; sands have the highest magnetic susceptibility; volcanic ashes, clays, and claystones have the highest NGR; and calcareous clays generally have the lowest values in all measurements (except for carbonate content). Some sand-rich intervals were difficult to recover and were often homogenized, which sometimes resulted in incompletely filled core liners; this caused anomalously low whole-round measurements (GRA density, magnetic susceptibility, and NGR values) with respect to MAD measurements. The same is true for most of the lithified intervals drilled by RCB, where GRA wet bulk densities are significantly lower than MAD wet bulk densities.
Table T17. Total sediment thickness, percentage of recovered material, and average physical properties with respect to lithology, Site U1452. Download table in .csv format.
Physical property measurements and measurement intervals
High-resolution physical property measurements were made on cores from Site U1451 to provide basic information on sediment composition and variability. Whole-Round Multisensor Logger (WRMSL) measurements were made at 2.5 cm increments for density by GRA, magnetic susceptibility, and compressional wave velocity on the P-wave logger (PWL). NGR measurements were made at 10 cm increments, and thermal conductivity was measured once per core. Because WRMSL P-wave velocities were less reliable in the deeper, RCB-drilled cores, we increased the number of P-wave caliper (PWC) measurements to about five to ten per section on different lithologies, where possible, but PWL data were not measured on the WRMSL for the lowermost intervals of Hole U1451B (Cores 65R–73R). On split cores, point magnetic susceptibility and color reflectance were measured at 1 cm increments using the Section Half Multisensor Logger (SHMSL). Additionally, we took discrete samples for MAD measurements (one to three samples per core, ideally representing coarse-, medium-, and fine-grained intervals or pelagic intervals with varying carbonate or biogenic opal content) to determine water content, wet bulk density, dry bulk density, porosity, and grain density. For the lowermost, lithified sections of Hole U1451B, MAD samples were cut with a saw. Ten different lithologies were derived from core description (see Lithostratigraphy). Average physical properties measured for Site U1451 are given in Table T17.
Whole-Round Multisensor Logger measurements
Results from Hole U1451A WRMSL measurements are compiled in Figure F32; those for Hole U1451B are in Figure F33. For the purposes of the figures, data from the top and bottom 2 cm of each section were removed because they often represent part sediment and part air and the volume contributing to the measurement is unknown. Data that are unrealistic for the cored formations, such as densities <1.05 g/cm3 and velocities <1425 m/s or >6000 m/s, were also filtered out. All original data remain in the LIMS database.

Figure F32. Physical property measurements, Hole U1451A.
Measurements with the WRMSL became increasingly difficult because the liners were no longer completely filled with sediment because of RCB drilling. As a consequence, the PWL was turned off after Core 354-U1451B-64R, and we increased the number of PWC measurements from five to ten per section to ensure a representative collection of P-wave velocity data. Also, we explored ways to compensate for the missing core material adjacent to the liner to correct GRA values in the lower part of Hole U1451B (see Physical properties in the Expedition 354 methods chapter [France-Lanord et al., 2016a]).
Gamma ray attenuation bulk density
Wet bulk densities (GRA) measured with the WRMSL range from 1.3 to 2.4 g/cm3 with average values of 1.65 and 1.98 g/cm3, depending on lithology (Table T17). These values are substantially lower than those determined with MAD procedures (see Moisture and density, below). The mismatch reflects, on one hand, the partially filled liners in homogenized sandy sections. On the other hand, all wet bulk densities of lithified cores obtained through RCB drilling (claystone, limestone, and siltstone) have values that are substantially too low. In both cases, the liner cross section was not entirely filled, and therefore in situ values are likely underestimated (Figure F33). MAD bulk density measurements appear more realistic than the GRA data and provide values either at the upper limit of GRA measurements or above. Wet bulk density values increase downcore because of compaction and loss of water, depending on lithology, with limestones and calcareous clays experiencing the most significant density increase with depth in the lower sections of Hole U1451B (Figures F33, F34).
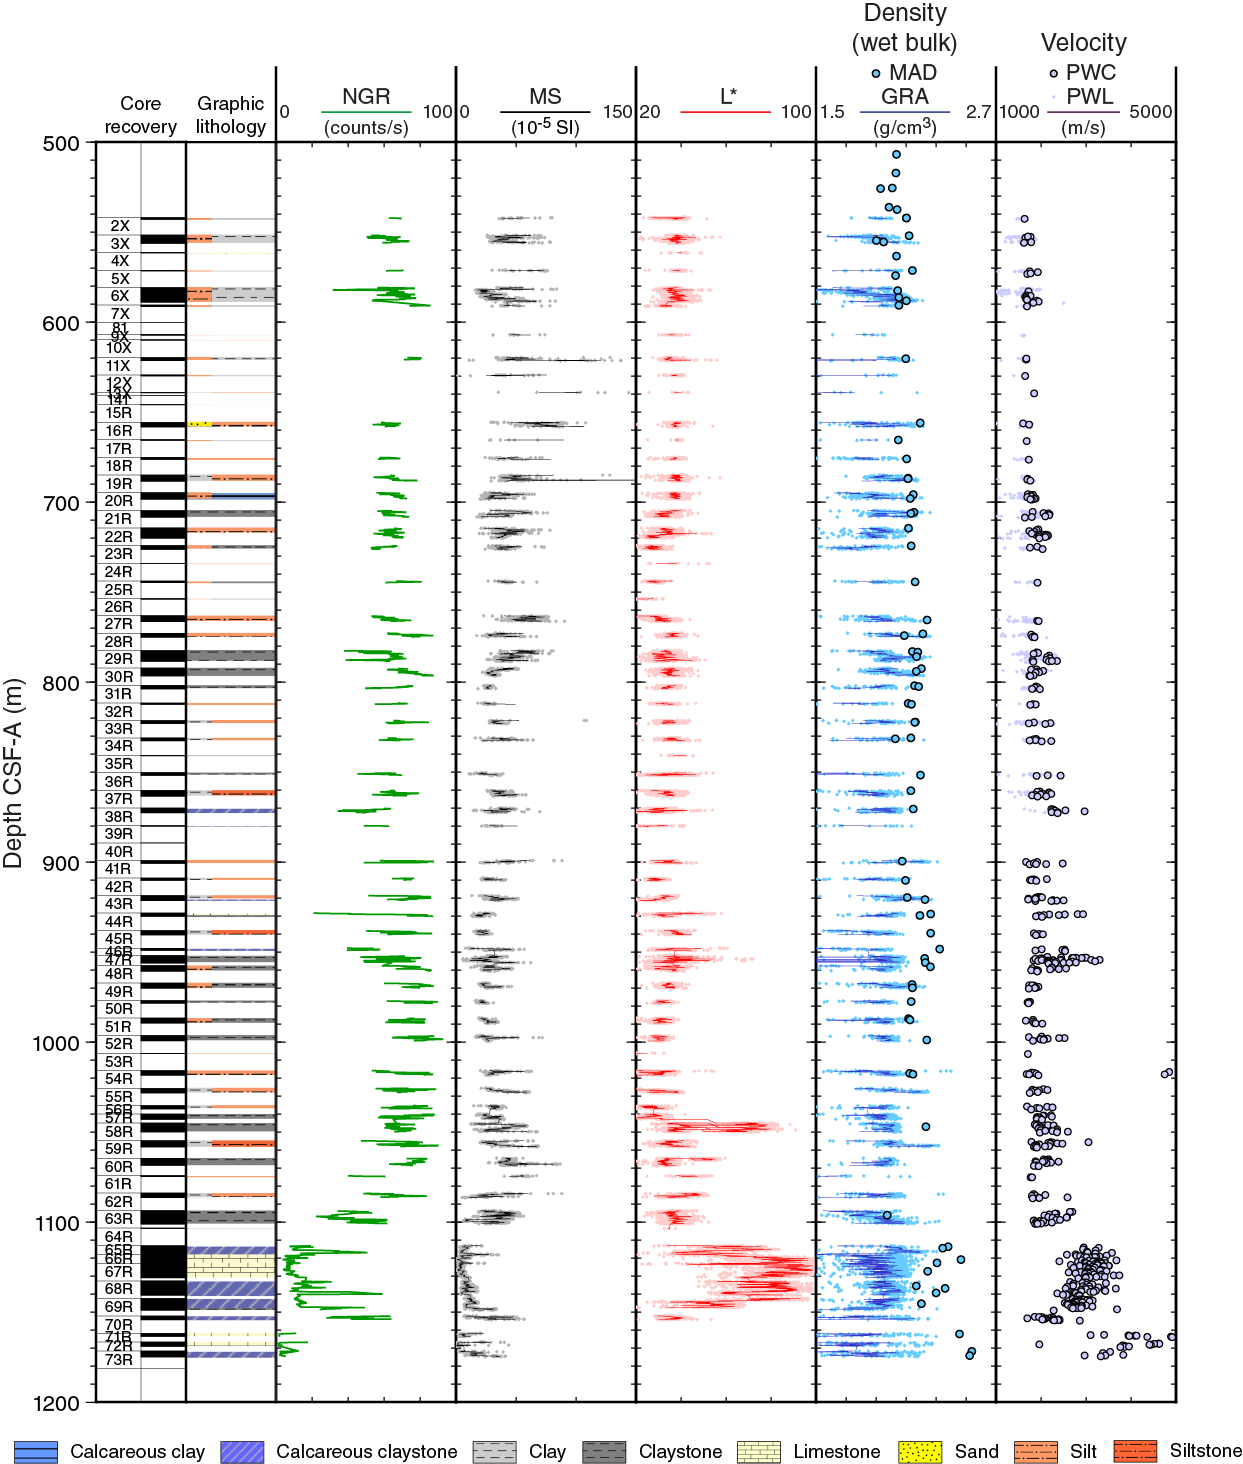
Figure F33. Physical property measurements, Hole U1451B.
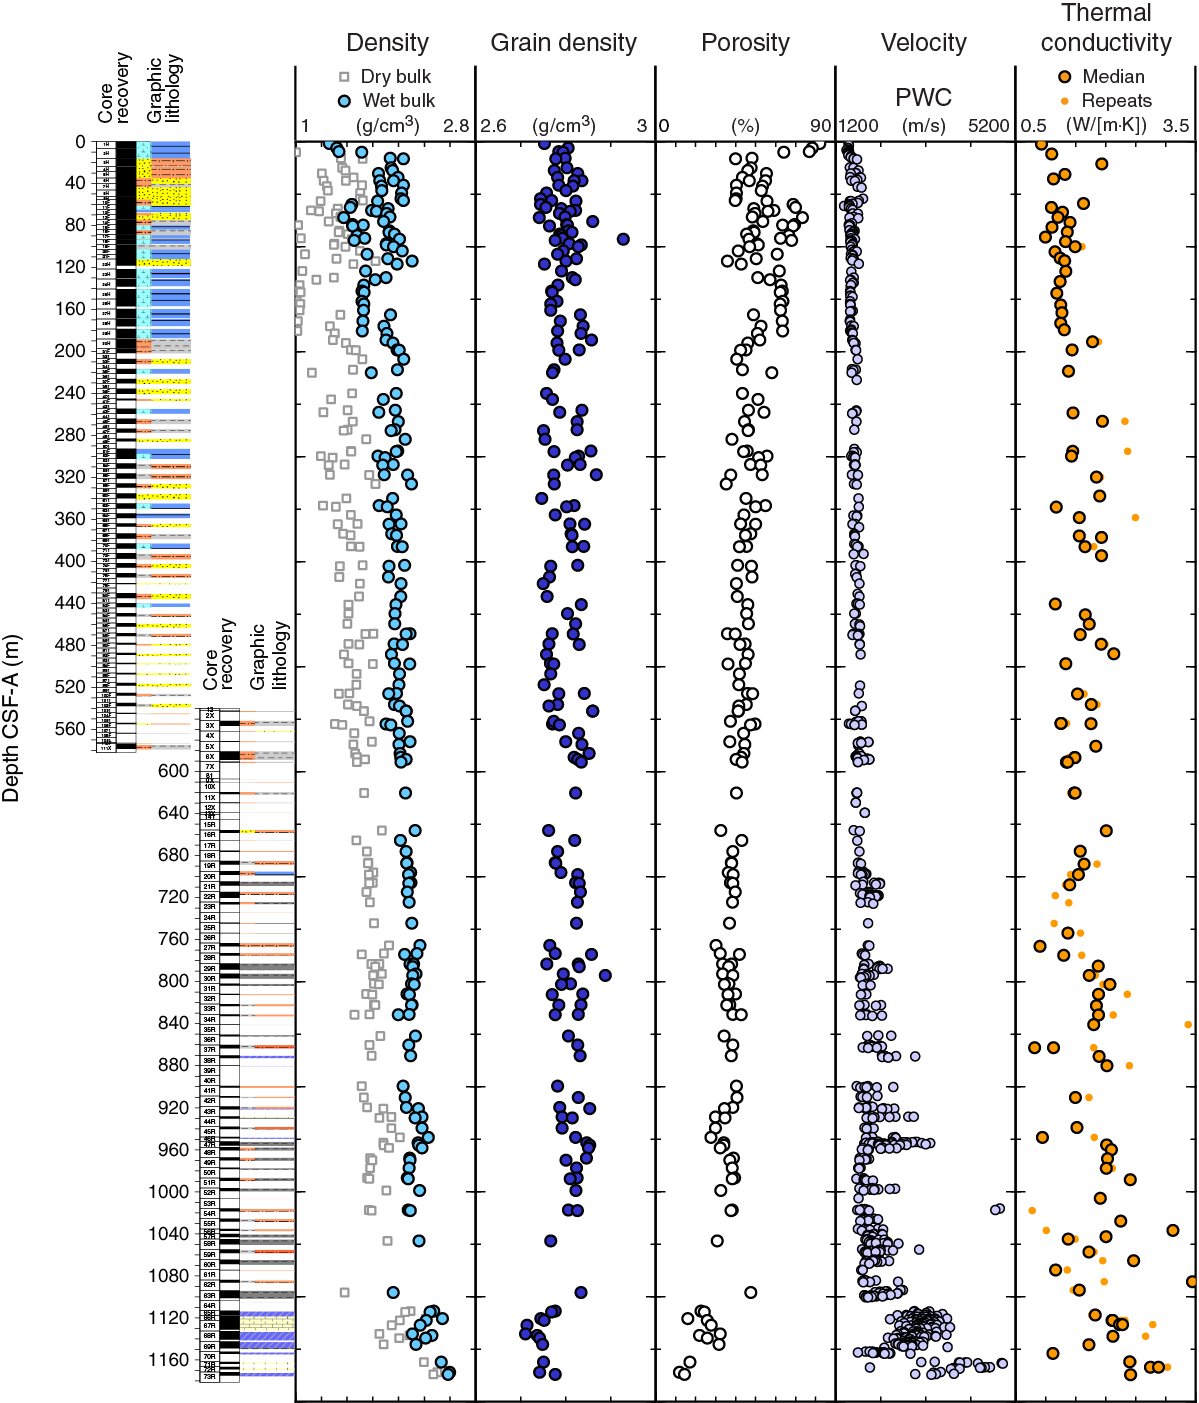
Figure F34. Moisture and density results, Site U1451.
Magnetic susceptibility
Magnetic susceptibility is sensitive to the concentration and type of magnetic minerals. Average values are lowest in limestones and calcareous claystone (9 × 10⁻⁵ to 17 × 10–5 SI) and highest in silty and sandy lithologies (65 × 10–5 to 75 × 10–5 SI; Table T17). These contrasts show that the majority of lithologies can clearly be distinguished based on magnetic susceptibility measurements.
P-wave velocity
Average P-wave velocities from the PWL range from 1595 to 1693 m/s (Table T17). PWL velocities are systematically lower than PWC velocities. The discrepancy is larger in sandy lithologies because of homogenized sands in the deeper, RCB-drilled intervals. The PWL delivered good quality data for the upper ~200 m (Cores 354-U1451A-1H through 30H), specifically in sections rich in calcareous clay. Because of the poor data quality in PWL measurements from Hole U1451B RCB cores, those measurements were terminated with Core 38R at 880 m CSF-A (see Discrete compressional wave velocity, below, for PWC results).
Natural gamma radiation
Average NGR values vary from 11 to 71 counts/s for the different principal lithologies (Table T17). The lowest values are found in limestones, followed by calcareous clay, siltstones, sand, and silt. The highest values are documented in claystones, clays, and volcanic ashes. NGR values vary significantly with sediment type and pronounced downcore repetition (Figures F32, F33).
Thermal conductivity
Average thermal conductivities at Site U1451 vary between 1.00 W/(m·K) for volcanic ashes and 2.80 W/(m·K) for calcareous claystone (Table T17). Measurements were conducted with a needle for the upper, nonlithified sections (mostly for Hole U1451A). In the stiffer sediment and lithified material of Hole U1451B, however, we used the Mini HLQ (a line heater/detector embedded in the surface of a “hockey puck” that is held against the flat core surface). Lithified sections and intervals rich in sand or silt have higher values. Comparison of measurements made with the hockey puck showed better data quality for water-bathed samples relative to dry samples. Also, there is a trend toward larger scatter and a slight increase downcore (Figure F34).
Point magnetic susceptibility
Point magnetic susceptibility measurements made with the SHMSL agree well with WRMSL magnetic susceptibility results with respect to downcore variability (Figures F32, F33). They vary from 23 × 10–5 to 78 × 10–5 SI, depending on lithology. Values are higher for point magnetic susceptibility, with slight differences in nonlithified material and significant differences in lithified sections (Table T17). This is again due to the smaller integration volume of the SHMSL point sensor (1 cm; 1σ), which will deliver good data even if the liner is not filled entirely, relative to the WRMSL loop sensor (8 cm; 1σ) (see Physical properties in the Expedition 354 methods chapter [France-Lanord et al., 2016a]). Accordingly, point magnetic susceptibility measurements are higher on average and also detect a number of spikes on the centimeter scale (primarily in sandy sediment) that are not reproduced by loop magnetic measurements.
Discrete compressional wave velocity
Average P-wave velocities for each principal lithology measured with the PWC vary from 1690 to 2958 m/s (Table T17). There are significant differences to WRMSL measurements (see P-wave velocity, above) due to either lithologic variations (sandy lithologies due to homogenized sands) or partially filled core liners from RCB drilling.
Below 880 m CSF-A (Core 354-U1451B-38R), all P-wave velocities rely on PWC measurements because PWL determinations became increasingly unreliable. At those depths, nonlithified sections have average values well below 2000 m/s (e.g., sand, silt, clay, and calcareous clay), whereas the lithified sections document average P-wave velocities above 2000 m/s (claystones and siltstones). Specifically, limestones show very high average values (3292 m/s) (e.g., Hamilton, 1971), with limestones in Cores 72R and 73R in excess of 5000 m/s (Figure F33). These very high values reflect the very low porosity and cementation of the deepest limestones in this hole.
Moisture and density
Water content, porosity, and wet and dry bulk densities are interdependent. Wet bulk densities determined with MAD procedures show less extreme variations than WRMSL measurements (Figures F32, F33). Average MAD wet bulk densities from Site U1451 are rather high, ranging from 1.92 g/cm3 for clay to 2.41 g/cm3 for limestone. For APC- and HLAPC-cored Hole U1451A, MAD and GRA densities are in good agreement with each other and trace lithologic changes quite well. However, for XCB- and RCB-drilled Hole U1451B, GRA underestimates in situ wet bulk densities substantially, whereas MAD documents realistic wet bulk densities. We investigated this issue by conducting various measurements of GRA densities on split cores and attempting to correct for the missing volume (see Physical properties in the Expedition 354 methods chapter [France-Lanord et al., 2016a]). A simple correction to the whole-core GRA measurements could be to either apply a linear scaling based on a typical RCB core diameter (e.g., 5.5 cm) or apply a linear scaling to bring the average GRA density into line with the average MAD density over the same broad depth interval. Postexpedition work will investigate these possibilities.
The lowest MAD wet bulk densities are found in calcareous clay (1.92 g/cm3), whereas lithified intervals show high values, specifically for limestones (2.41 g/cm3) (Table T17).
Average grain densities calculated from MAD pycnometer measurements vary from 2.76 g/cm3 for limestone to 2.82 g/cm3 (Table T17). Porosities range from 10% observed for limestones in the lowermost cores of Hole U1451B to 85% in the uppermost hemipelagic to pelagic section of Hole U1451A. There is a clear downcore decrease indicative of compaction (Figure F34).
Color reflectance
Average sediment lightness (L*) varies from ~35 to ~74, depending on lithology (Table T17). Elevated L* values are found within calcareous clay (e.g., Cores 354-U1451A-24H through 29H) (Figure F32) and for calcareous claystone. Extremely high values are documented for limestone in Cores 354-U1451B-65R through 69R (Figure F33). These values reach the numbers of the white calibration and are indicative of very high carbonate contents (up to 98%; see Geochemistry and microbiology).
Color component a*, the red–green component, varies from –4 to 6 with average values around 1.4 for most lithologies, except calcareous claystone and limestone, where they reach ~3 (Figure F35). Claystones are occasionally red in color, so the corresponding a* values extend over a much wider range than values from previous Sites U1449 and U1450. Color component b* shows the highest values (yellower colors) in the upper 5 m of Hole U1451A. Below that point, higher values are usually associated with calcareous claystone.
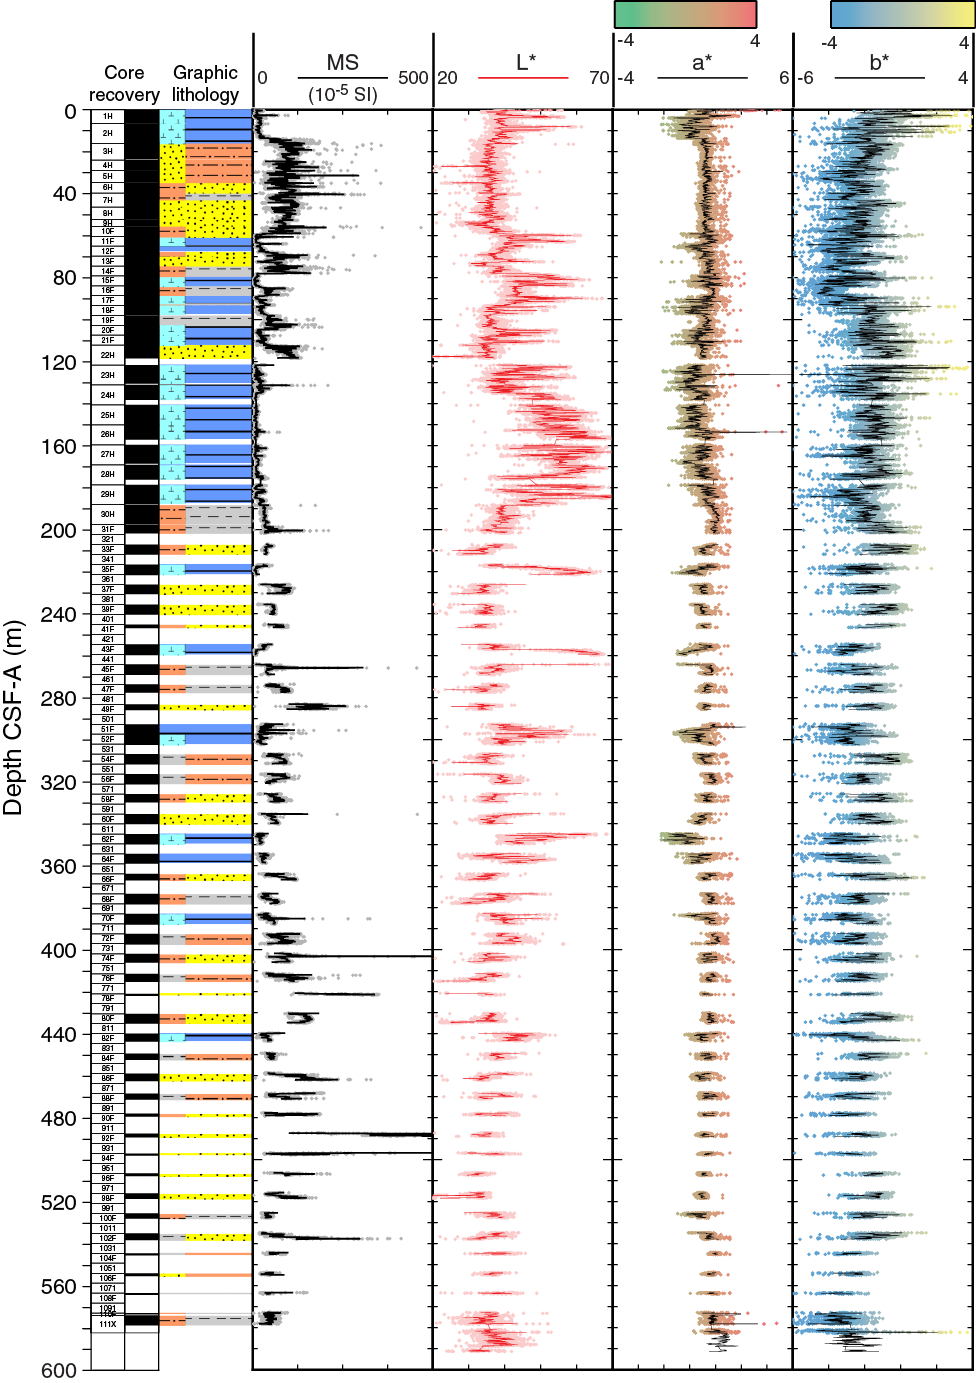
Figure F35. Color reflectance data, Hole U1451A.
Core disturbances and data quality
Core disturbances are displayed in Figures F4 and F5. They affect the quality and reliability of physical properties in various ways. Sandy intervals at Site U1451 that are homogenized no longer possess the original sediment texture or fabric, especially those that were allowed to settle vertically on the catwalk to remove some of the excess water (these core sections are characterized by a GRA density gradient). When laid horizontally, there can be a gap between the liner and the upper part of the section as the sand settles. Accordingly, GRA density, measured by a vertical beam of gamma rays, underestimates the true values because of the missing sediment volume. PWL data are not affected by this gap because they are measured horizontally across the core, but they are still affected by the loss of overpressure and sediment fabric. This is important because 85 m (17%) of the sections retrieved at Site U1451 consist of sandy sediment. Core disturbances in muddy turbidites also affect the overall quality of GRA and PWL data but only slightly underestimate average values. Color reflectance data are typically not affected unless cracks occur in the sections.
For XCB and RCB drilling (Hole U1451B), the missing contact to the outer liner wall (approximately 17% of volume is missing on average, according to our multiple measurements with a ruler) has the same negative effect: GRA densities, WRMSL magnetic susceptibilities, and NGR are underestimated. For PWL data, the air gap between the liner and the sediment means that P-waves cannot pass from the transmitter to receiver, so often no data was acquired, which is why we turned off the sensor below 880 mbsf in Hole U1451B.
Data variability and downhole trends
Site U1451 penetrated much deeper (1181 m DSF) than Sites U1449 and U1450. Accordingly, we observed a greater variety of lithofacies: 10 versus 6 in the previous sites, made up of the lithified counterparts of clay (claystone), silt (siltstone), and calcareous clay (limestone) (Table T17). The presence of sand decreases downhole in Hole U1451A, and sand is almost absent in Hole U1451B, except for a minor occurrence in the upper part. As at the previous sites, the physical properties obtained at Site U1451 correlate well with lithology and composition. For instance, cross-plots of velocity and wet bulk density, as well as magnetic susceptibility and NGR (Figure F36), show distinctly different populations with respect to lithology. This finding is very promising and important for postexpedition investigation. Intervals rich in biogenic carbonate have low wet bulk densities and low P-wave velocities. Clay has low magnetic susceptibilities and high NGR, whereas calcareous clay has low magnetic susceptibilities and also low NGR. Sandy and silty sections reveal large scattering in all cross-plots.
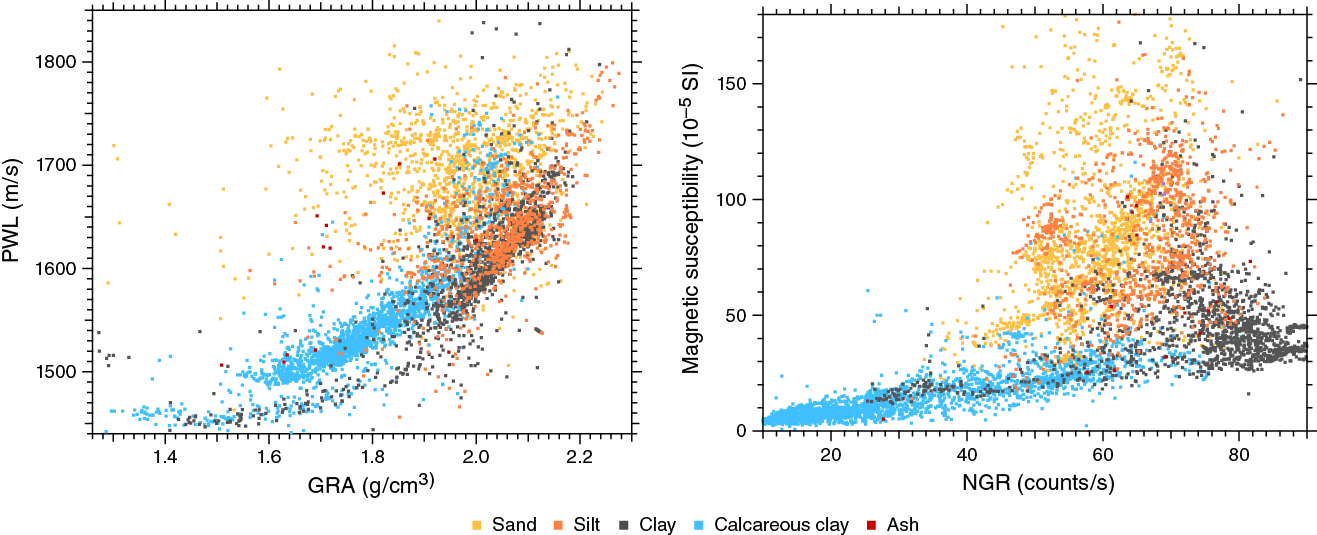
Figure F36. PWL data vs. GRA wet bulk density and WRMSL magnetic susceptibility vs. NGR, Site U1451.
Also, there is a downcore trend toward more intensified lithification, which again is shown by the physical properties (Figure F34). Specifically, in the lowermost limestone sections we measured extreme and very high values for sediment color with L* values indicating almost pure carbonate and P-wave velocities in excess of 5000 m/s, values which are usually only found in diagenetically altered or basement rock.
Downhole measurements
Downhole temperature and heat flow
Seven APCT-3 downhole temperature measurements in Hole U1451A range from 4.5°C at 46.3 m DSF to 17.95°C at 406.5 m DSF (Table T18; Figures F37, F38A), giving an approximately linear temperature increase with depth and a geothermal gradient of 40°C/km. The measurement at 28.9 m DSF is not considered reliable because of the disturbances in the temperature equilibration curve. The measurement at 406.5 m DSF was the deepest piston core temperature measurement made in scientific drilling. The seafloor temperature was determined to be 1.55°C based on APCT-3 data taken while the tool was held at the mudline for 5 min during each run.
Table T18. Formation temperatures derived from APCT-3 measurements, Hole U1451A. Download table in .csv format.
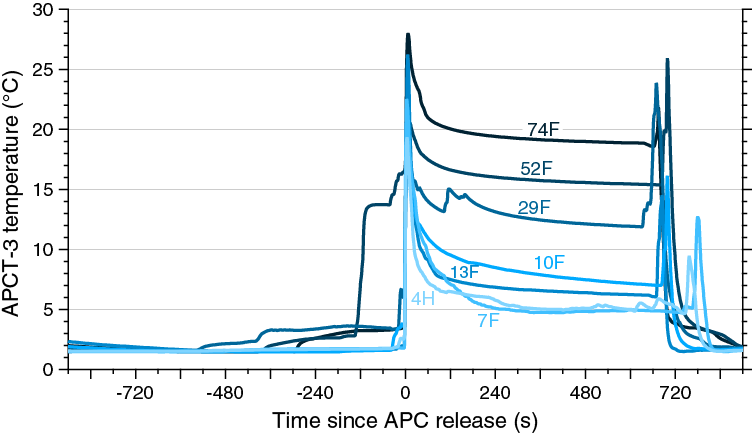
Figure F37. APCT-3 temperature-time series, Hole U1451A.
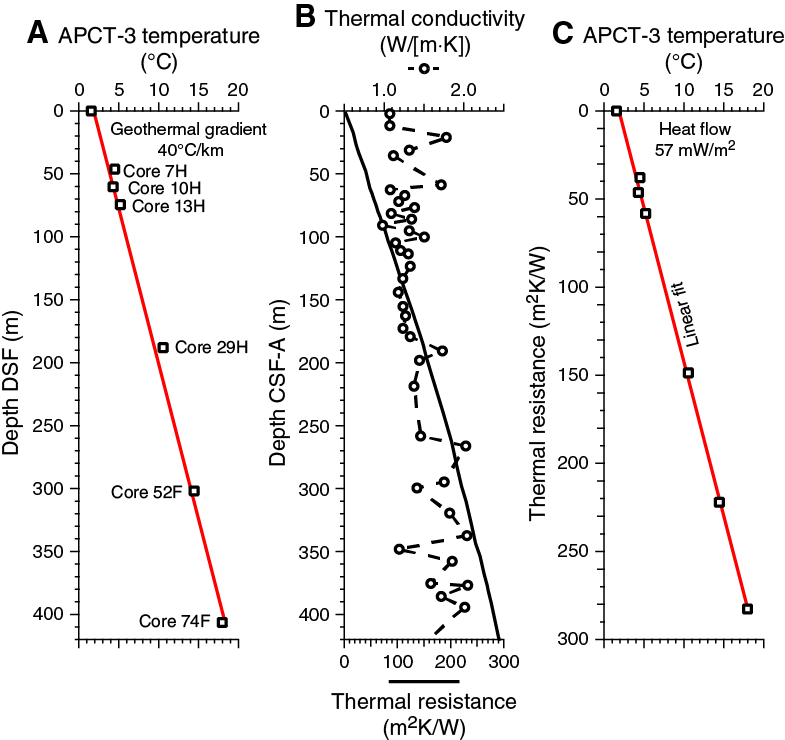
Figure F38. Heat flow calculations, Hole U1451A. A. Sediment temperatures. B. Thermal conductivity data from Hole U1451A with calculated thermal resistance. C. Bullard plot of heat flow calculated from a linear fit of the temperature data.
Thermal conductivity under in situ conditions was estimated from laboratory-determined thermal conductivity from Hole U1451A using the method of Hyndman et al. (1974) (see Physical properties in the Expedition 354 methods chapter [France-Lanord et al., 2016a]). The calculated in situ values are within 2% of the measured laboratory values. Thermal resistance was then calculated by integrating the inverse of the in situ thermal conductivity over depth (Figure F38B). A heat flow of 57 mW/m2 was obtained from the linear fit between temperature and thermal resistance (Figure F38C) (Pribnow et al., 2000). The geothermal gradient and heat flow values at Site U1451 are within the normal range for ocean basins of same age of 90–100 Ma (Müller et al., 2008) and consistent with other values measured in the Bay of Bengal (Hasterok et al., 2011).
Stratigraphic synthesis
The main objectives of Site U1451 were (1) to investigate the shallow sedimentary section as part of the seven-site transect to decipher the succession and Pleistocene evolution of fan deposition, (2) to study the Neogene history of sediment delivery back to Miocene times, and (3) to extend the record of fan sedimentation as far back in time as is possible at this location.
Based on seismic data, Site U1451 is comparable to Site U1455 (see Background and objectives in the Site U1455 chapter [France-Lanord et al., 2016b]), as it represents a condensed sedimentary section compared to the central part of the transect (Site U1450) (Schwenk and Spiess, 2009). Site U1451 was located for its proximity to the northern extension of the Ninetyeast Ridge, where a distinct reflector, expected to represent an unconformity spanning late Paleogene to early Neogene times (Curray et al., 2003), is present at the shallowest depth below seafloor along the drilling transect. It is visible at 5.95 s TWT (Figure F1) on the seismic line. Above this unconformity, a 100 ms TWT–thick unit with complex, irregular, discontinuous, and inclined reflectors likely indicates reworking or mass wasting. Overlying layers that onlap the unconformity or the irregular unit are interpreted as representing the earliest fan deposits at this location.
The overlying fan sedimentation (from 5.85 s TWT to the seafloor) reveals a very uniform seismic facies predominantly showing parallel layering of varying reflectivity. To the west, these otherwise mostly parallel strata are penetrated by faults that result in some deformation. Typical levee geometries associated with main fan structural elements cannot be identified in the vicinity. Therefore, for a better understanding of seismically inferred sheeted deposition, Site U1451 provides a unique section among all Expedition 354 sites. This section will be used to interpret the strata where sheeted deposition seems to dominate and for comparison to the Miocene section of the entire transect, which has similar characteristics but could not be cored (e.g., at Site U1450).
Seismic, physical properties, and lithology
The shallow seismic section at Site U1451 (Figure F39) reveals a pronounced parallel layering of varying reflectivity with depth. However, lithologies change distinctly throughout the section. For example, sand-rich intervals occur between 4.85 and 4.90 s TWT and carbonate oozes were recovered between 4.97 and 5.06 s TWT. Only a few levee units, recognizable by their low reflectivity, wedge-shaped geometry, and muddy to silty lithology, are present (e.g., at 5.07 and 5.16 s TWT).
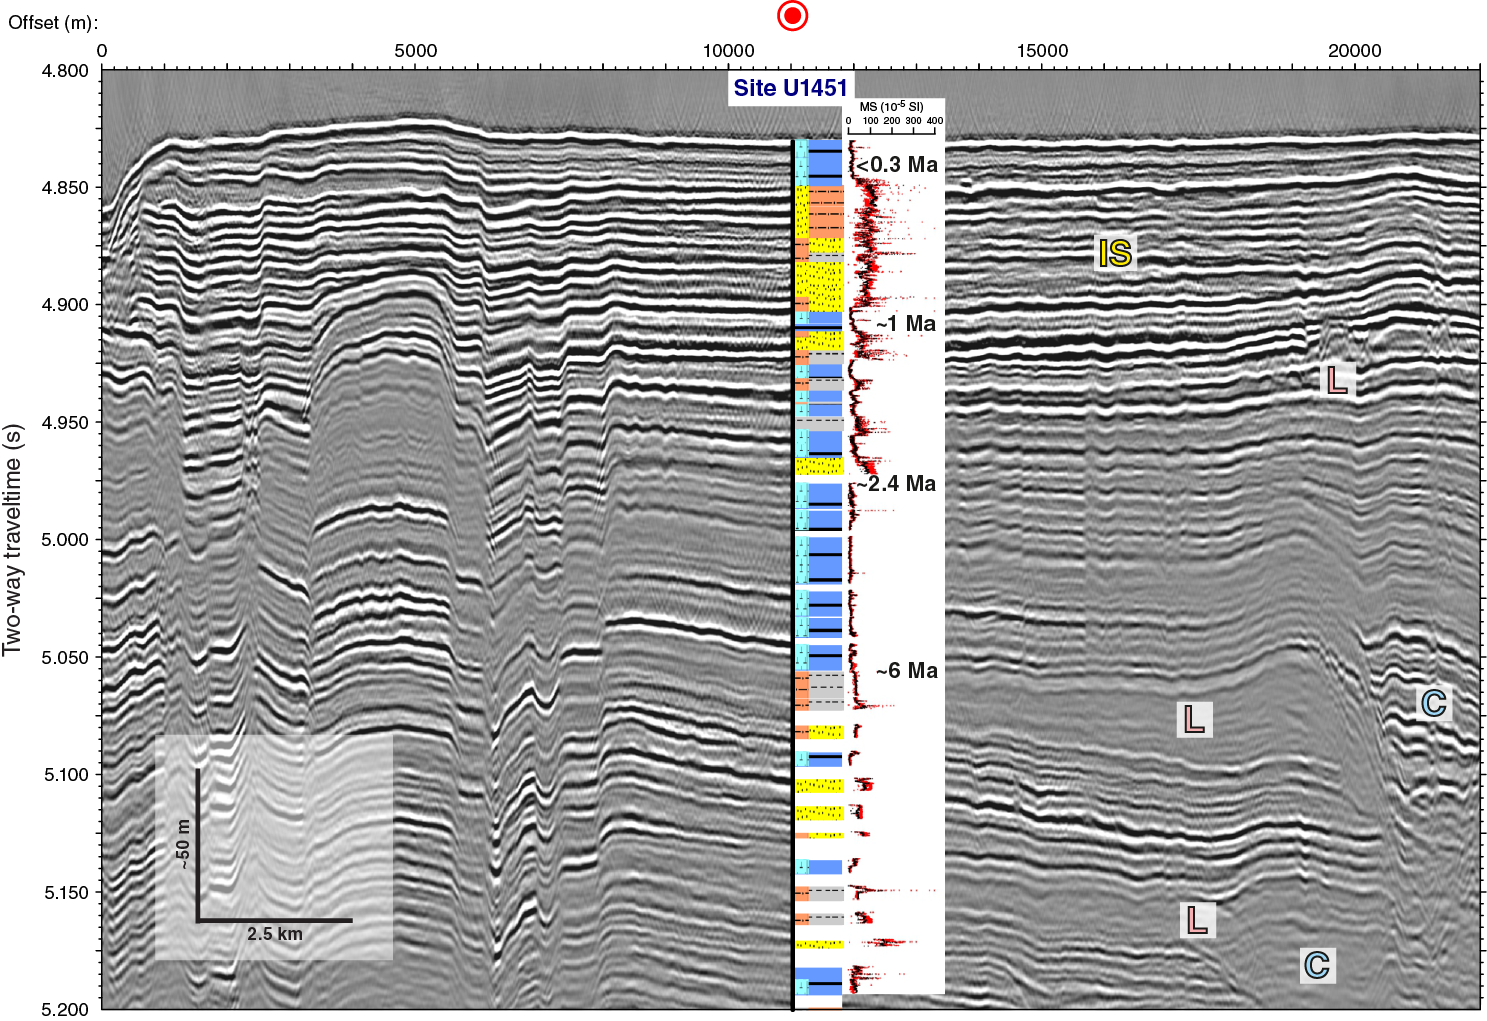
Figure F39. Seismic Line SO125-GeoB97-027, upper 350 ms TWT of the cored interval, Site U1451 (black line).
It is difficult at this site to distinguish depositional phases and estimate average grain size from the seismic data. All units, independent of lithology, resemble a sheet-like geometry. Reflectivity, which is related to relative seismic impedance variations, the product of wet bulk density and P-wave velocity, appears high within the upper 150 ms TWT, but these values are not restricted to sandy intervals. In calcareous clay intervals between 4.90 and 4.95 s TWT, reflectivity is equally high.
Magnetic susceptibility data acquired on cores (see Physical properties) can be used to further differentiate the origin of the sediments and shed light on depositional processes. High values are associated with particularly coarse-grained intervals, but elevated values also exist within the mud and silt turbidites and in parts of the calcareous clay units. When detrital input is minor, very low magnetic susceptibility values are observed, as at 4.97–5.05 s TWT.
However, when calcareous clay units are intercalated with mud turbidites or contain an overall higher concentration of detrital clay, as at 4.90–4.96 s TWT, much higher magnetic susceptibility values are observed. Accordingly, the average grain size strongly correlated to wet bulk density increases, along with seismic impedance variations, reflection coefficients, and amplitudes.
Although it appears that Site U1451 was only marginally influenced by channel-levee deposition within the upper 150 ms TWT, a prevailing supply of clay and mud turbidites is documented in magnetic susceptibility data and impacts the seismic appearance. This supply is related to an ambiguous association of amplitudes and lithology that requires more detailed comparisons of sediment and physical properties to derive constraints for a seismic stratigraphy.
Average density and velocity physical property values from core measurements do not differentiate between unconsolidated sand, silt, and clay. This is the case for all density and velocity measurements, including density determined from GRA and MAD, as well as PWL and PWC measurements (Table T17). Only calcareous clay has distinctly lower densities and velocities. More consolidated or lithified units represent distinctly higher PWC velocities and MAD wet bulk densities on split cores but not for whole-round core logging data sets.
Figure F40 compares the seismic section of the cored interval with general trends in discrete bulk density and velocity data. Bulk densities show a higher scatter in the upper portion of Site U1451, driven by grain size variations in unconsolidated material of turbiditic origin. This in turn originates in high seismic reflectivity in this upper part. In contrast, a smooth trend is seen in the lower portion, where sediment becomes more lithified. P-wave velocity data, on the other hand, show minor velocity variations in the upper portion of Site U1451, but scatter increases with the appearance of claystones and limestones in selected intervals beneath. These changes in restricted intervals in the lower portion cause large excursions in seismic impedance and thus strong reflections as well.
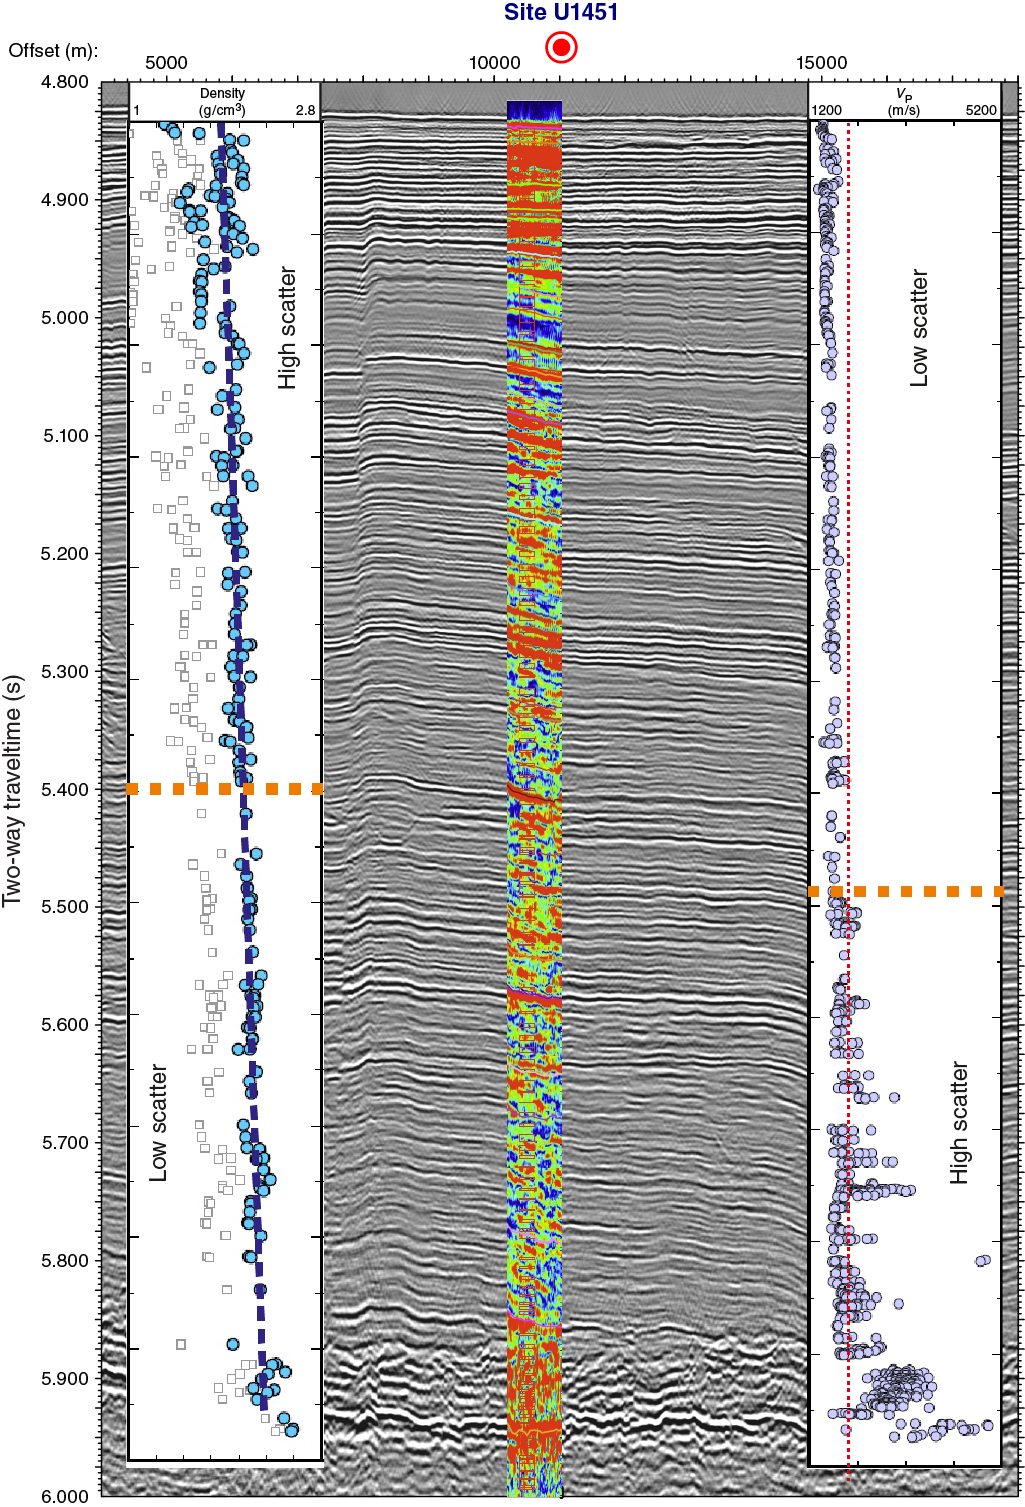
Figure F40. Seismic Line SO125-GeoB97-027, upper 1.1 s TWT of seismic section, Site U1451. Because an automatic gain control algorithm was applied to enhance deeper amplitudes, they cannot be directly compared. A color-coded envelope plot shows overall relative amplitude variations with depth.
As seismic impedance is the product of density and velocity, we do observe a transition from density/grain size–driven high seismic reflectivity in unconsolidated sections toward cementation-driven velocity variations between 5.4 and 5.5 s TWT or 600 and 700 m DSF, respectively. It must be noted that this transition reflects the contribution of sand to the overall physical properties: sand content drives high impedance in the upper section, whereas high impedance in the deeper section originates from the presence of limestones and claystones, both fine-grained sediments. As the in situ P-wave velocities of sand could not be determined because of the lack of logging data, a detailed seismostratigraphic interpretation, particularly above the unconformity, must await more detailed postexpedition research.
Age-depth relationship
Calcareous nannofossils and planktonic foraminifers provide biostratigraphic constraints at Site U1451. In total, 39 biomarkers were observed and 31 biozones were constructed at Site U1451, providing a robust age model from prefan sedimentation in the Paleogene to the present day (Figures F41, F42). In addition, 10 geomagnetic reversals were identified at Site U1451 over the uppermost 165 m CSF-A. The Brunhes/Matuyama boundary is recorded in Core 354-U1451A-13F (72.24 m CSF-A), and four reversals are recorded in Core 15F (80.35–83.44 m CSF-A). These reversals are the Upper and Lower Jaramillo (0.998–1.072 Ma) and Upper and Lower Cobb Mountain (1.173–1.185 Ma) Subchrons. Core 25H contains a reversed to normal transition, which was identified as the Gauss/Gilbert Chron boundary (C2An.3r-C2Ar) because of biostratigraphic constraints and the thickness of reversed polarity calcareous clay preceding the boundary. Based on biostratigraphy, the sediment of Cores 23H and 24H was deposited during the Gauss period and should have recorded the reversed Kaena or Mammoth Subchrons. However, the depth series of magnetization of these two cores was very noisy, and no reversals were found. Cores 26H and 27H record four reversals. The sediment from these two cores (153–163 m CSF-A) was most likely deposited in the reversed Gilbert Chron over the period of the normal Nunivak, Sidjufall, and Thvera Subchrons (4.493–5.235 Ma). Six ash layers were described in the calcareous clays deposited over the last 6 My. The youngest Toba ash is found in Core 1H. One of the other five ash layers is associated with the Brunhes/Matuyama reversal, as at Site 758. (Dehn et al., 1991).
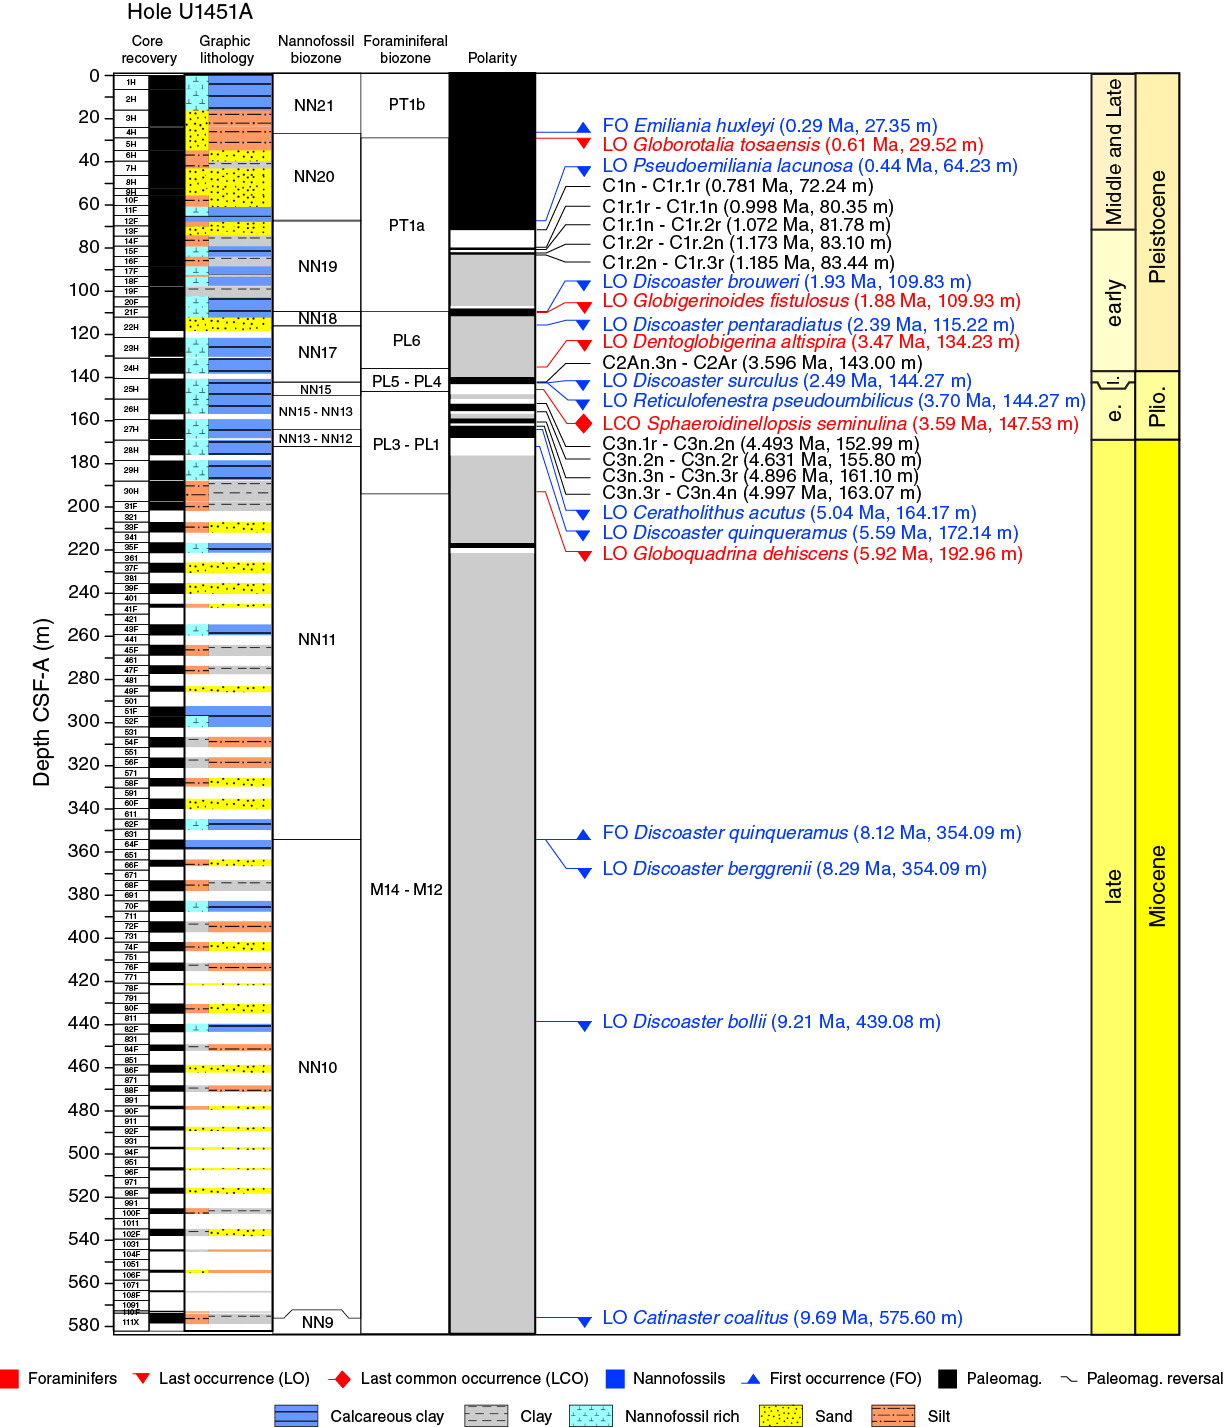
Figure F41. Compilation of biostratigraphic and chronostratigraphic markers, Hole U1451A.
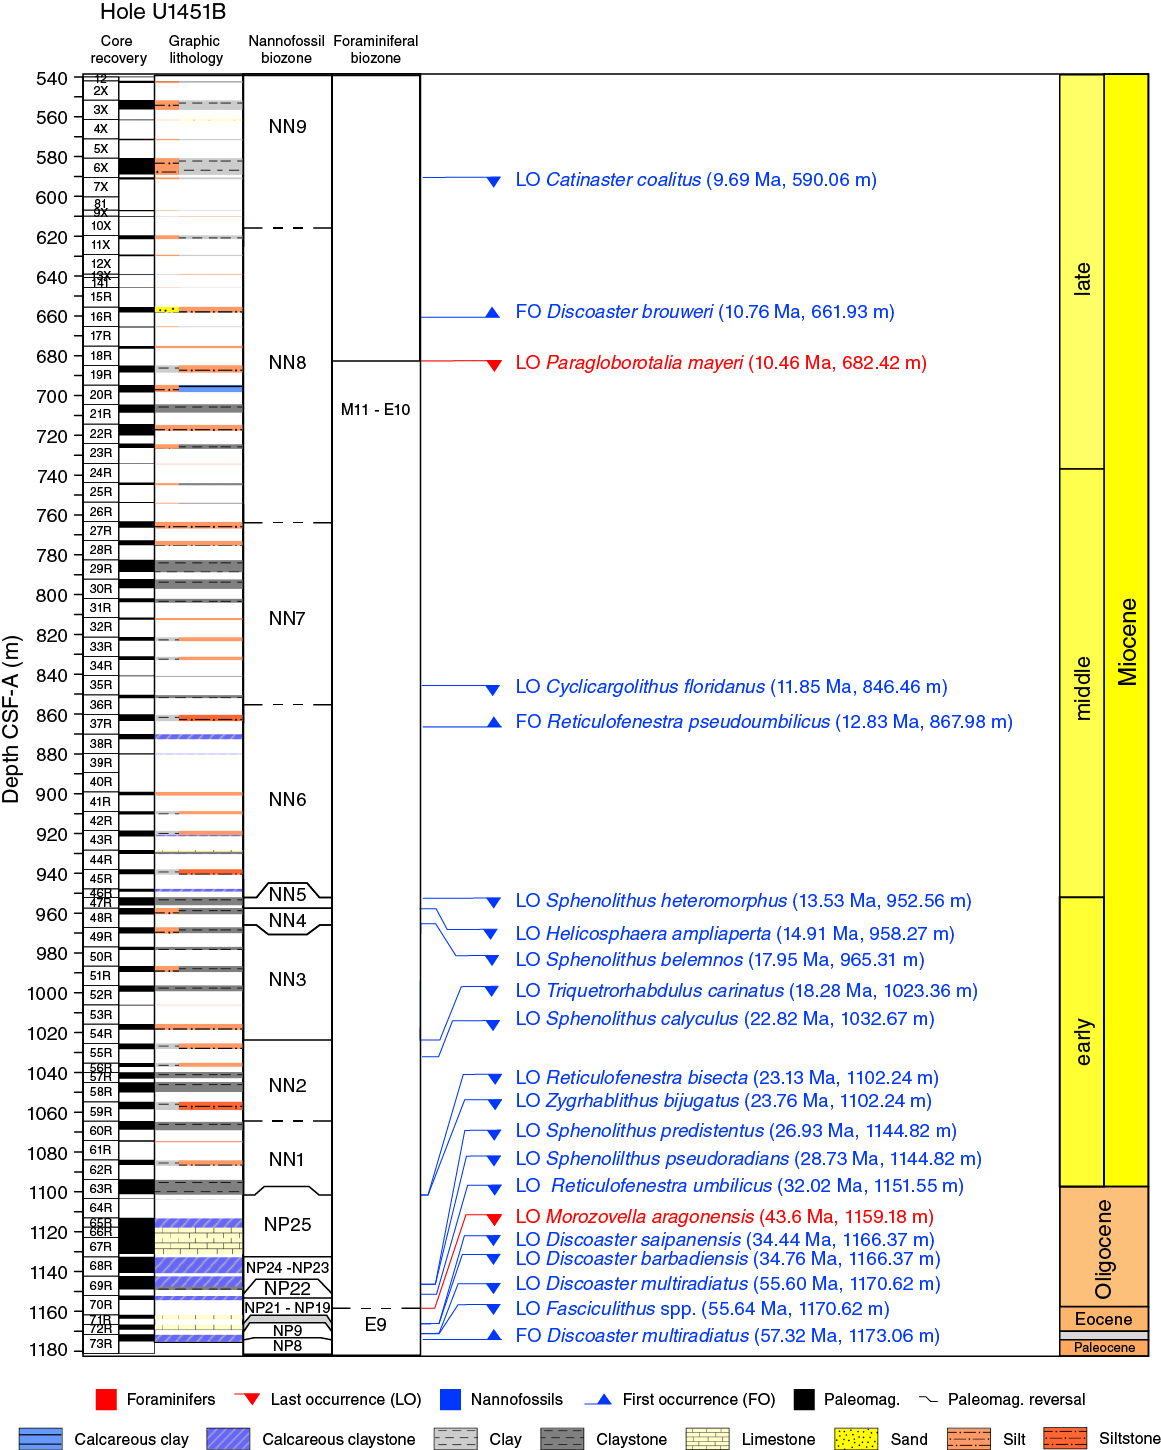
Figure F42. Compilation of biostratigraphic and chronostratigraphic markers, Hole U1451B.
The upper part of this site contains levee and interlevee sediments with thick calcareous clay intervals (lithostratigraphic Units I–III). Six biomarkers were identified in the Pleistocene, providing some constraints on the buildup of the levees during this time period. A thick (66 m) pelagic sequence was recovered in Cores 23F through 29F (lithostratigraphic Unit IV) with biomarkers spanning over 3 My. This unit indicates migration of turbiditic sedimentation away from this site during the Pliocene. The onset of the switch is constrained by the LOs of Discoaster quinqueramus (5.59 Ma; midpoint at 172.14 m CSF-A) and Globoquadrina dehiscens (5.92 Ma; midpoint at 192.96 m CSF-A). Biostratigraphic constraints from the 450 m of fan sediments underlying this pelagic unit (lithostratigraphic Units XVII–V) suggest that the fan sediments were deposited over 3.5 My.
The late Miocene–late Oligocene sequence at this site appears to represent continuous fan deposition dominated by turbidites. The Oligocene/Miocene boundary is located between Samples 354-U1451B-55R-CC and 64R-CC (Zone NP25; 1032.67–1102.24 m CSF-A). A major change from pelagic- to turbidite-dominated sedimentation is observed between Cores 63R and 64R. The onset of turbidite-dominated sedimentation occurs between the LOs of Zygrhablithus bijugatus and Sphenolithus predistenus (23.76–26.93 Ma) in Core 68R. The lowermost section recovered is a pelagic-dominated sequence (lithostratigraphic Units XXIVa and XXIVb) that spans the late Oligocene to Paleocene. However, considerable refinement of the shipboard age model for this unit is required in postexpedition research.
Achievements
Site U1451 plays a key role in deciphering the early history of the Bengal Fan. However, it was not expected to recover the earliest onset of overall Bengal Fan deposition, as the paleobathymetry constraints of the site limit this goal.
The seismic unconformity that was a primary target for this site was likely cored at the base of the hole. However, a precise time-to-depth conversion is still lacking. The physical property data of the lower three cores (354-U1451B-71R through 73R) show a clear change to a strongly lithified domain with high velocities and wet bulk densities, which would explain the very strong reflection. Furthermore, given the high-frequency seismic source used for the site survey data, signal attenuation increases at such boundaries, which is consistent with the overall seismic characteristics. The material overlying the lithified sediments remained unconsolidated and/or weakly consolidated, with the exception of a few thin layers which have extreme velocity values above 2500 m/s. As we observed very fast penetration during coring even below 1000 m DSF, we assume that sand or coarse silt was present throughout the formation but not recovered by rotary coring.
Physical property data indicate that high impedance values are restricted to the fine-grained intervals, which in the upper sections are decimeters to meters thick only. Compared to the seismic wavelength of >5 m, those layers only generate weak “thin layer” reflections. This would explain why no extremely strong reflections are observed throughout the section, except for the deep unconformity, beneath which pelagic chalk and limestone dominate.
Based on the preliminary shipboard biostratigraphic framework, the bottom 50 m at the site represents a time period of >30 My of predominantly pelagic sedimentation. The earliest claystones and turbidites observed are early Miocene/late Oligocene in age (Core 354-U1451B-62R). According to Figures F43 and F44, average fan growth at Site U1451 was up to ~190 m in ~13.5 My between the early and middle Miocene. Although interpreted as fan deposition, these rates are moderate to low (~1.5 cm/ky) compared to Pleistocene fan growth rates observed at other sites but similar to rates observed in the Pleistocene in (some) hemipelagic units. A major change occurred around 13.5 Ma (middle Miocene), when fan growth apparently intensified at this site, leading to 750 m of turbiditic successions accumulated over a time span of ~6.4 My (~12 cm/ky) from the middle to late Miocene.
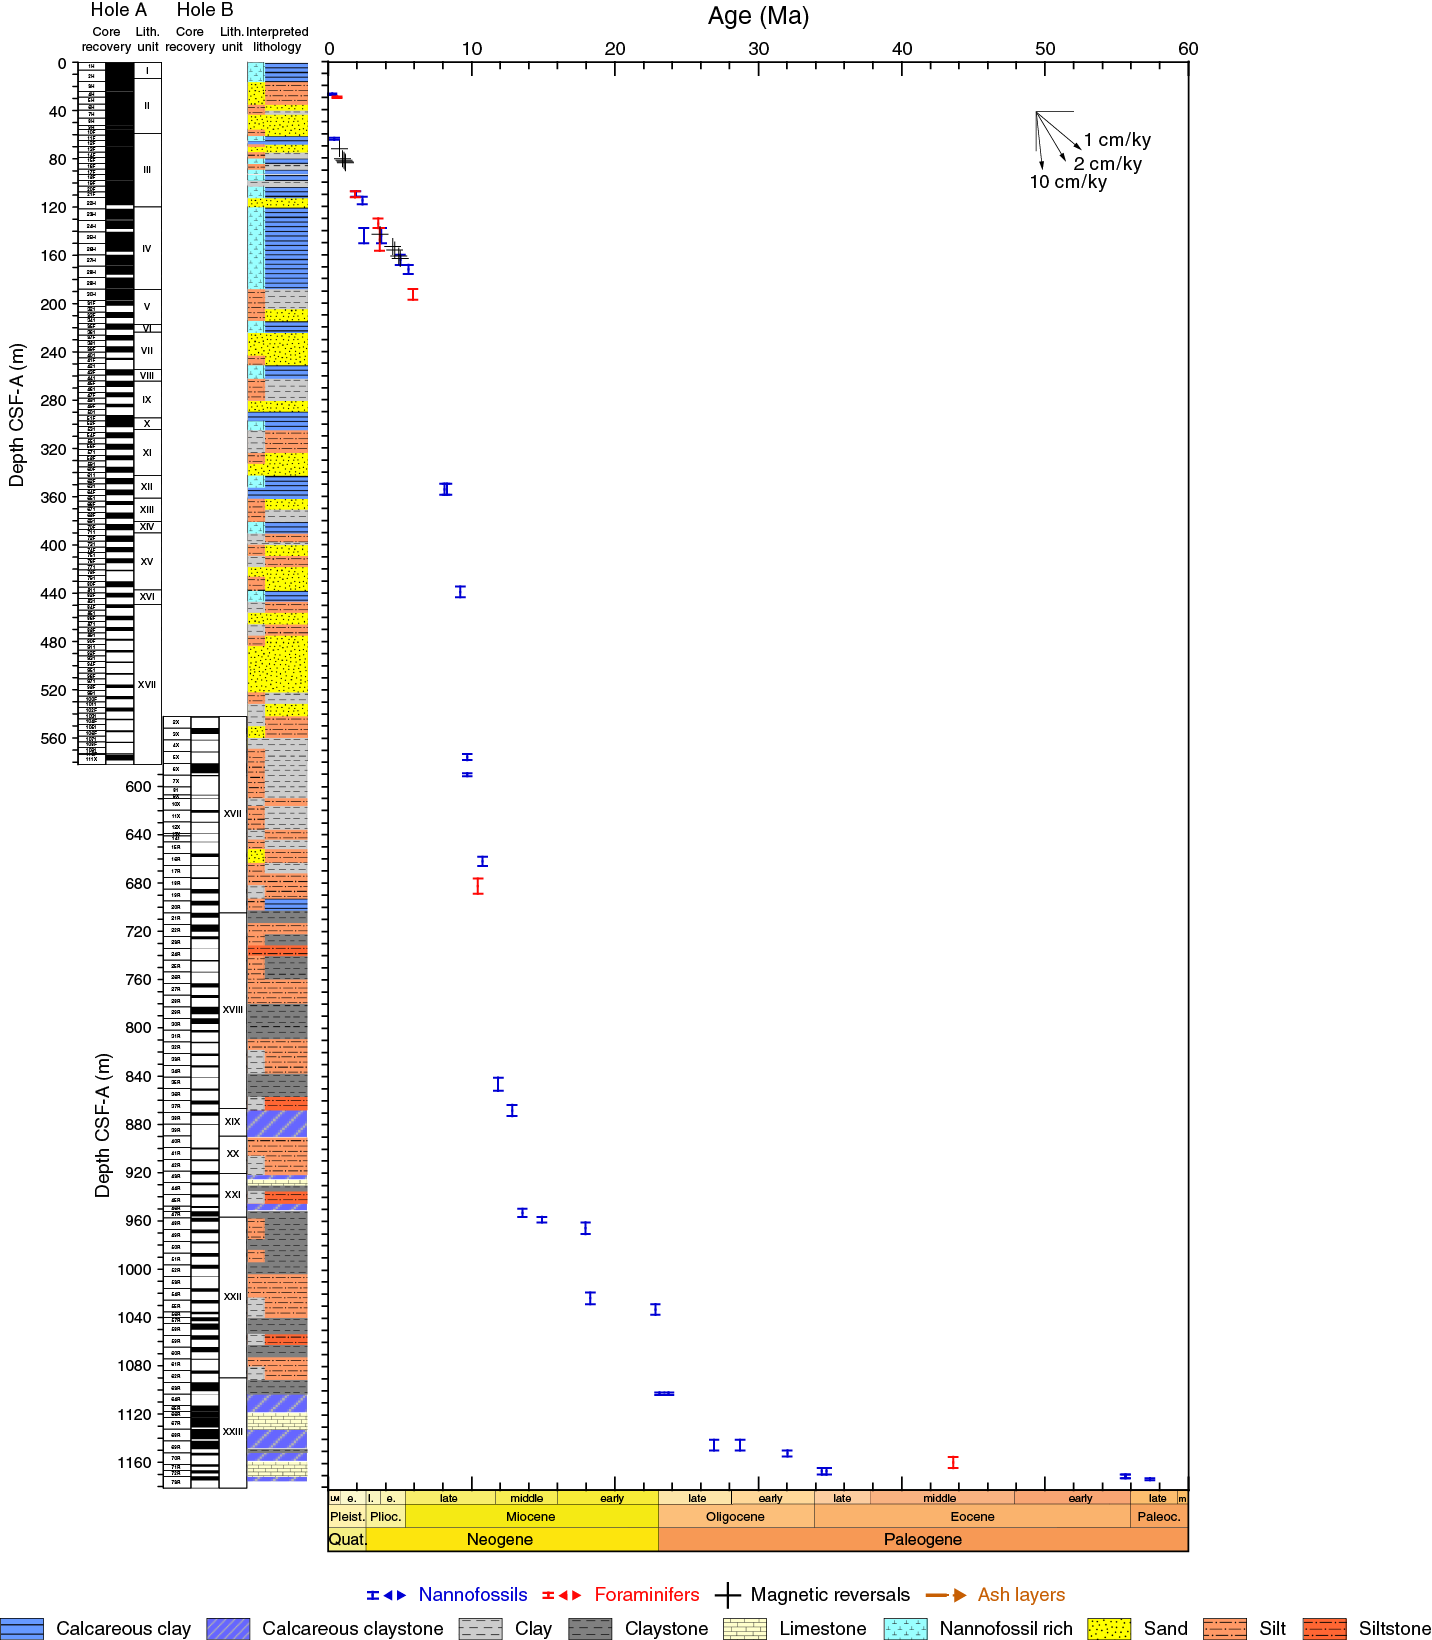
Figure F43. Age-depth plot, Site U1451.
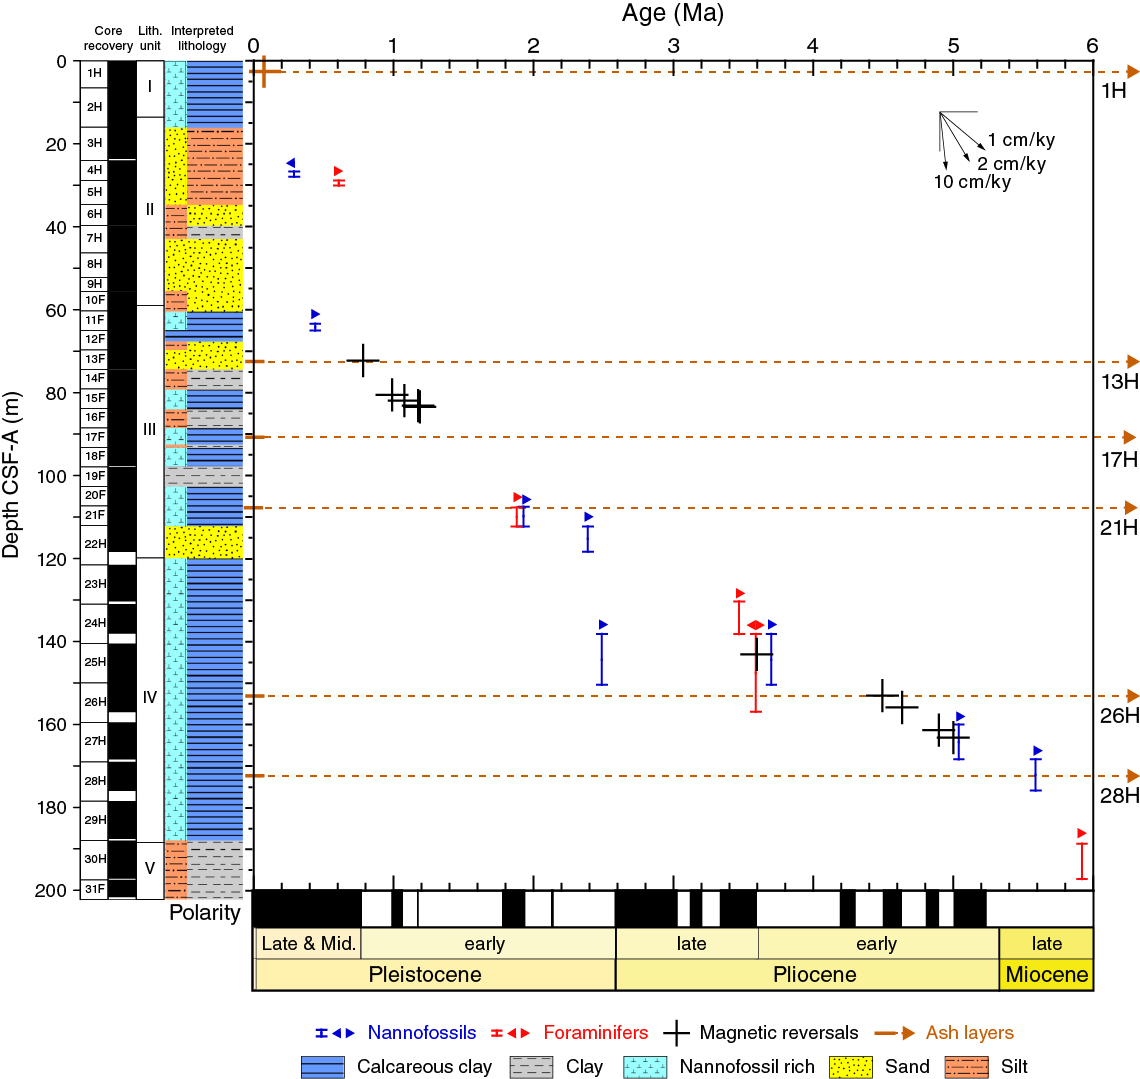
Figure F44. Age-depth plot, 0–6 Ma, Site U1451.
After ~6.8 Ma, intense fan deposition ceased in the Pliocene at this site and sediments are, with exceptions, characterized by increased carbonate content. In the Pleistocene, after 2.4 Ma, a higher fine-grained detrital input is observed with very few intermittent coarser intercalations, but since only 0.4 My ago, fan deposits dominate lithology again (~20 cm/ky). As at the other sites, hemipelagic deposition dominates the last 0.2 My.
References
Amano, K., and Taira, A., 1992. Two-phase uplift of Higher Himalaya since 17 Ma. Geology, 20(5):91–394. http://dx.doi.org/10.1130/0091-7613(1992)020<0391:TPUOHH>2.3.CO;2
Andò, S., Garzanti, E., Padoan, M., and Limonta, M., 2012. Corrosion of heavy minerals during weathering and diagenesis: a catalog for optical analysis. Sedimentary Geology, 280:165–178. http://dx.doi.org/10.1016/j.sedgeo.2012.03.023
Bouquillon, A., France-Lanord, C., Michard, A., and Tiercelin, J.-J., 1990. Sedimentology and isotopic chemistry of the Bengal Fan sediments: the denudation of the Himalaya. In Cochran, J.R., Stow, D.A.V., et al., Proceedings of the Ocean Drilling Program, Scientific Results, 116: College Station, TX (Ocean Drilling Program), 43–58. http://dx.doi.org/10.2973/odp.proc.sr.116.117.1990
Burdige, D.J., 2007. Preservation of organic matter in marine sediments: controls, mechanisms, and an imbalance in sediment organic carbon budgets? Chemical Reviews, 107(2):467−485. http://dx.doi.org/10.1021/cr050347q
Cochran, J.R., 1990. Himalayan uplift, sea level, and the record of Bengal Fan sedimentation at the ODP Leg 116 sites. In Cochran, J.R., Stow, D.A.V., et al., Proceedings of the Ocean Drilling Program, Scientific Results, 116: College Station, TX (Ocean Drilling Program), 397–414. http://dx.doi.org/10.2973/odp.proc.sr.116.144.1990
Cochran, J.R., Stow, D.A.V., et al., 1989. Proceedings of the Ocean Drilling Program, Initial Reports, 116: College Station, TX (Ocean Drilling Program). http://dx.doi.org/10.2973/odp.proc.ir.116.1989
Curray, J.R., Emmel, F.J., and Moore, D.G., 2003. The Bengal Fan: morphology, geometry, stratigraphy, history and processes. Marine and Petroleum Geology, 19(10):1191–1223. http://dx.doi.org/10.1016/S0264-8172(03)00035-7
DeCelles, P.G., Gehrels, G.E., Quade, J., and Ojha, T.P., 1998. Eocene–early Miocene foreland basin development and the history of Himalayan thrusting, western and central Nepal. Tectonics, 17(5):741–765. http://dx.doi.org/10.1029/98TC02598
DeCelles, P.G., Gehrels, G.E., Quade, J., Ojha, T.P., Kapp, P.A., and Upreti, B.N., 1998. Neogene foreland basin deposits, erosional unroofing, and the kinematic history of the Himalayan fold-thrust belt, western Nepal. Geological Society of America Bulletin, 110(1):2–21. http://dx.doi.org/10.1130/0016-7606(1998)110<0002:NFBDEU>2.3.CO;2
Dehn, J., Farrell, J.W., and Schmincke, H.-U., 1991. Neogene tephrochronology from Site 758 on northern Ninetyeast Ridge: Indonesian arc volcanism of the past 5 Ma. In Weissel, J., Peirce, J., Taylor, E., Alt, J., et al., Proceedings of the Ocean Drilling Program, Scientific Results, 121: College Station, TX (Ocean Drilling Program), 273–295. http://dx.doi.org/10.2973/odp.proc.sr.121.123.1991
France-Lanord, C., and Derry, L.A., 1994. δ13C of organic carbon in the Bengal Fan: source evolution and transport of C3 and C4 plant carbon to marine sediments. Geochimica et Cosmochimica Acta, 58(21):4809–4814. http://dx.doi.org/10.1016/0016-7037(94)90210-0
France-Lanord, C., and Derry, L.A., 1997. Organic carbon burial forcing of the carbon cycle from Himalayan erosion. Nature, 390(6655):65–67. http://dx.doi.org/10.1038/36324
France-Lanord, C., Spiess, V., Klaus, A., Adhikari, R.R., Adhikari, S.K., Bahk, J.-J., Baxter, A.T., Cruz, J.W., Das, S.K., Dekens, P., Duleba, W., Fox, L.R., Galy, A., Galy, V., Ge, J., Gleason, J.D., Gyawali, B.R., Huyghe, P., Jia, G., Lantzsch, H., Manoj, M.C., Martos Martin, Y., Meynadier, L., Najman, Y.M.R., Nakajima, A., Ponton, C., Reilly, B.T., Rogers, K.G., Savian, J.F., Schwenk, T., Selkin, P.A., Weber, M.E., Williams, T., and Yoshida, K., 2016a. Expedition 354 methods. In France-Lanord, C., Spiess, V., Klaus, A., Schwenk, T., and the Expedition 354 Scientists, Bengal Fan. Proceedings of the International Ocean Discovery Program, 354: College Station, TX (International Ocean Discovery Program). http://dx.doi.org/10.14379/iodp.proc.354.102.2016
France-Lanord, C., Spiess, V., Klaus, A., Adhikari, R.R., Adhikari, S.K., Bahk, J.-J., Baxter, A.T., Cruz, J.W., Das, S.K., Dekens, P., Duleba, W., Fox, L.R., Galy, A., Galy, V., Ge, J., Gleason, J.D., Gyawali, B.R., Huyghe, P., Jia, G., Lantzsch, H., Manoj, M.C., Martos Martin, Y., Meynadier, L., Najman, Y.M.R., Nakajima, A., Ponton, C., Reilly, B.T., Rogers, K.G., Savian, J.F., Schwenk, T., Selkin, P.A., Weber, M.E., Williams, T., and Yoshida, K., 2016b. Site U1455. In France-Lanord, C., Spiess, V., Klaus, A., Schwenk, T., and the Expedition 354 Scientists, Bengal Fan. Proceedings of the International Ocean Discovery Program, 354: College Station, TX (International Ocean Discovery Program). http://dx.doi.org/10.14379/iodp.proc.354.109.2016
France-Lanord, C., Spiess, V., Klaus, A., Schwenk, T., Adhikari, R.R., Adhikari, S.K., Bahk, J.-J., Baxter, A.T., Cruz, J.W., Das, S.K., Dekens, P., Duleba, W., Fox, L.R., Galy, A., Galy, V., Ge, J., Gleason, J.D., Gyawali, B.R., Huyghe, P., Jia, G., Lantzsch, H., Manoj, M.C., Martos Martin, Y., Meynadier, L., Najman, Y.M.R., Nakajima, A., Ponton, C., Reilly, B.T., Rogers, K.G., Savian, J.F., Selkin, P.A., Weber, M.E., Williams, T., and Yoshida, K., 2016c. Expedition 354 summary. In France-Lanord, C., Spiess, V., Klaus, A., Schwenk, T., and the Expedition 354 Scientists, Bengal Fan. Proceedings of the International Ocean Discovery Program, 354: College Station, TX (International Ocean Discovery Program). http://dx.doi.org/10.14379/iodp.proc.354.101.2016
Galy, V., France-Lanord, C., Beyssac, O., Faure, P., Kudrass, H., and Palhol, F., 2007. Efficient organic carbon burial in the Bengal Fan sustained by the Himalayan erosional system. Nature, 450(7168):407–410. http://dx.doi.org/10.1038/nature06273
Galy, A., France-Lanord, C., and Derry, L.A., 1999. The strontium isotopic budget of Himalayan rivers in Nepal and Bangladesh. Geochimica et Cosmochimica Acta, 63(13–14):1905–1925. http://dx.doi.org/10.1016/S0016-7037(99)00081-2
Galy, V., France-Lanord, C., and Lartiges, B., 2008a. Loading and fate of particulate organic carbon from the Himalaya to the Ganga–Brahmaputra delta. Geochimica et Cosmochimica Acta, 72(7):1767–1787. http://dx.doi.org/10.1016/j.gca.2008.01.027
Galy, V., François, L., France-Lanord, C., Faure, P., Kudrass, H., Palhol, F., and Singh, S.K., 2008b. C4 plants decline in the Himalayan basin since the Last Glacial Maximum. Quaternary Science Reviews, 27(13–14):1396–1409. http://dx.doi.org/10.1016/j.quascirev.2008.04.005
Garzanti, E., Vezzoli, G., Andò, S., France-Lanord, C., Singh, S.K., and Foster, G., 2004. Sand petrology and focused erosion in collision orogens: the Brahmaputra case. Earth and Planetary Science Letters, 220(1–2):157–174. http://dx.doi.org/10.1016/S0012-821X(04)00035-4
Garzanti, E., Andó, S., France-Lanord, C., Censi, P., Vignola, P., Galy, V., and Lupker, M., 2011. Mineralogical and chemical variability of fluvial sediments, 2. Suspended-load silt (Ganga–Brahmaputra, Bangladesh). Earth and Planetary Science Letters, 302(1–2):107–120. http://dx.doi.org/10.1016/j.epsl.2010.11.043
Gradstein, F.M., Ogg, J.G., Schmitz, M.D., and Ogg, G.M. (Eds.), 2012. The Geological Time Scale 2012: Amsterdam (Elsevier).
Graham, D.W., Bender, M.L., Williams, D.F., and Keigwin, L.D., Jr., 1982. Strontium-calcium ratios in Cenozoic planktonic foraminifera. Geochimica et Cosmochimica Acta, 46(7):1281–1292. http://dx.doi.org/10.1016/0016-7037(82)90012-6
Hamilton, E.L., 1971. Elastic properties of marine sediments. Journal of Geophysical Research, 76(2):579–604. http://dx.doi.org/10.1029/JB076i002p00579
Hasterok, D., Chapman, D.S., and Davis, E.E., 2011. Oceanic heat flow: implications for global heat loss. Earth and Planetary Science Letters, 311(3–4):386–395. http://dx.doi.org/10.1016/j.epsl.2011.09.044
Hedges, J.I., and Keil, R.G., 1995. Sedimentary organic matter preservation: an assessment and speculative synthesis. Marine Chemistry, 49(2–3):81–115. http://dx.doi.org/10.1016/0304-4203(95)00008-F
Huyghe, P., Guilbaud, R., Bernet, M., Galy, A., and Gajurel, A.P., 2011. Significance of the clay mineral distribution in fluvial sediments of the Neogene to Recent Himalayan Foreland Basin (west-central Nepal). Basin Research, 23(3):332–345. http://dx.doi.org/10.1111/j.1365-2117.2010.00485.x
Hyndman, R.D., Erickson, A.J., and Von Herzen, R.P., 1974. Geothermal measurements on DSDP Leg 26. In Davies, T.A., Luyendyk, B.P., et al., Initial Reports of the Deep Sea Drilling Project, 26: Washington, DC (U.S. Government Printing Office), 451–463. http://dx.doi.org/10.2973/dsdp.proc.26.113.1974
Kennedy, M.J., and Wagner, T., 2011. Clay mineral continental amplifier for marine carbon sequestration in a greenhouse ocean. Proceedings of the National Academy of Sciences of the United States of America, 108(24):9776–9781. http://dx.doi.org/10.1073/pnas.1018670108
Kirschvink, J.L., 1980. The least-squares line and plane and the analysis of palaeomagnetic data. Geophysical Journal of the Royal Astronomical Society, 62(3):699–718. http://dx.doi.org/10.1111/j.1365-246X.1980.tb02601.x
Lear, C.H., Elderfield, H., and Wilson, P.A., 2003. A Cenozoic seawater Sr/Ca record from benthic foraminiferal calcite and its application in determining global weathering fluxes. Earth and Planetary Science Letters, 208(1–2):69–84. http://dx.doi.org/10.1016/S0012-821X(02)01156-1
Lupker, M., France-Lanord, C., Galy, V., Lavé, J., Gaillardet, J., Gajurel, A.P., Guilmette, C., Rahman, M., Singh, S.K., and Sinha, R., 2012. Predominant floodplain over mountain weathering of Himalayan sediments (Ganga basin). Geochimica et Cosmochimica Acta, 84:410–432. http://dx.doi.org/10.1016/j.gca.2012.02.001
Lupker, M., France-Lanord, C., Galy, V., Lavé, J., and Kudrass, H., 2013. Increasing chemical weathering in the Himalayan system since the Last Glacial Maximum. Earth and Planetary Science Letters, 365:243–252. http://dx.doi.org/10.1016/j.epsl.2013.01.038
Mark, D.F., Petraglia, M., Smith, V.C., Morgan, L.E., Barfod, D.N., Ellis, B.S., Pearce, N.J., Pal, J.N., and Korisettar, R., 2014. A high-precision 40Ar/39Ar age for the Young Toba Tuff and dating of ultra-distal tephra: forcing of Quaternary climate and implications for hominin occupation of India. Quaternary Geochronology, 21:90–103. http://dx.doi.org/10.1016/j.quageo.2012.12.004
Martini, E., 1971. Standard Tertiary and Quaternary calcareous nannoplankton zonation. In Farinacci, A. (Ed.), Proceedings of the Second Planktonic Conference, Roma 1970: Rome (Edizioni Tecnoscienza), 2:739–785.
McFadden, P.L., and Reid, A.B., 1982. Analysis of paleomagnetic inclination data. Geophysical Journal of the Royal Astronomical Society, 69(2):307–319. http://dx.doi.org/10.1111/j.1365-246X.1982.tb04950.x
Müller, R.D., Sdrolias, M., Gaina, C., and Roest, W.R., 2008. Age, spreading rates, and spreading asymmetry of the world’s ocean crust. Geochemistry, Geophysics, Geosystems, 9(4):Q04006. http://dx.doi.org/10.1029/2007GC001743
Najman, Y., Allen, R., Willett, E.A.F., Carter, A., Barfod, D., Garzanti, E., Wijbrans, J., Bickle, M.J., Vezzoli, G., Ando, S., Oliver, G., and Uddin, M.J., 2012. The record of Himalayan erosion preserved in the sedimentary rocks of the Hatia Trough of the Bengal Basin and the Chittagong Hill Tracts, Bangladesh. Basin Research, 24(5):499–519. http://dx.doi.org/10.1111/j.1365-2117.2011.00540.x
Najman, Y., Bickle, M., BouDagher-Fadel, M., Carter, A., Garzanti, E., Paul, M., Wijbrans, J., Willett, E., Oliver, G., Parrish, R., Akhter, S.H., Allen, R., Ando, S., Chisty, E., Reisberg, L., and Vezzoli, G., 2008. The Paleogene record of Himalayan erosion: Bengal Basin, Bangladesh. Earth and Planetary Science Letters, 273(1–2):1–14. http://dx.doi.org/10.1016/j.epsl.2008.04.028
Najman, Y., Carter, A., Oliver, G., and Garzanti, E., 2005. Provenance of Eocene foreland basin sediments, Nepal: constraints to the timing and diachroneity of early Himalayan orogenesis. Geology, 33(4):309–312. http://dx.doi.org/10.1130/G21161.1
Najman, Y., and Garzanti, E., 2000. Reconstructing early Himalayan tectonic evolution and paleogeography from Tertiary foreland basin sedimentary rocks, northern India. Geological Society of America Bulletin, 112(3):435–449. http://dx.doi.org/10.1130/0016-7606(2000)112<435:REHTEA>2.0.CO;2
Okada, H., and Bukry, D., 1980. Supplementary modification and introduction of code numbers to the low-latitude coccolith biostratigraphic zonation (Bukry, 1973; 1975). Marine Micropaleontology, 5:321–325. http://dx.doi.org/10.1016/0377-8398(80)90016-X
Pribnow, D., Kinoshita, M., and Stein, C., 2000. Thermal Data Collection and Heat Flow Recalculations for Ocean Drilling Program Legs 101–180: Hanover, Germany (Institute for Joint Geoscientific Research, Institut für Geowissenschaftliche Gemeinschaftsaufgaben [GGA]). http://www-odp.tamu.edu/publications/heatflow/ODPReprt.pdf
Quade, J., Cater, J.M.L., Ojha, T.P., Adam, J., and Harrison, T.M., 1995. Late Miocene environmental change in Nepal and the northern Indian subcontinent: stable isotopic evidence from paleosols. Geological Society of America Bulletin, 107(12):1381–1397. http://dx.doi.org/10.1130/0016-7606(1995)107<1381:LMECIN>2.3.CO;2
Schwenk, T., and Spieß, V., 2009. Architecture and stratigraphy of the Bengal Fan as response to tectonic and climate revealed from high-resolution seismic data. In Kneller, B.C., Martinsen, O.J., and McCaffrey, B. (Eds.), External Controls on Deep-Water Depositional Systems. Special Publication - SEPM (Society of Sedimentary Geologists), 92:107–131.
Stow, D.A.V., Amano, K., Balson, P.S., Brass, G.W., Corrigan, J., Raman, C.V., Tiercelin, J.-J., Townsend, M., and Wijayananda, N.P., 1990. Sediment facies and processes on the distal Bengal Fan, Leg 116. In Cochran, J.R., Stow, D.A.V., et al., Proceedings of the Ocean Drilling Program, Scientific Results, 116: College Station, TX (Ocean Drilling Program), 377–396. http://dx.doi.org/10.2973/odp.proc.sr.116.110.1990
Szulc, A.G., Najman, Y., Sinclair, H.D., Pringle, M., Bickle, M., Chapman, H., Garzanti, E., Andò, S., Huyghe, P., Mugnier, J.-L., Ojha, T., and DeCelles, P., 2006. Tectonic evolution of the Himalaya constrained by detrital 40Ar-39Ar, Sm-Nd and petrographic data from the Siwalik foreland basin succession, SW Nepal. Basin Research, 18(4):375–391. http://dx.doi.org/10.1111/j.1365-2117.2006.00307.x
Uddin, A., and Lundberg, N., 1998. Unroofing history of the eastern Himalaya and the Indo-Burman ranges; heavy-mineral study of Cenozoic sediments from the Bengal Basin, Bangladesh. Journal of Sedimentary Research, 68(3):465–472. http://dx.doi.org/10.2110/jsr.68.465
Wade, B.S., Pearson, P.N., Berggren, W.A., and Pälike, H., 2011. Review and revision of Cenozoic tropical planktonic foraminiferal biostratigraphy and calibration to the geomagnetic polarity and astronomical time scale. Earth-Science Reviews, 104(1–3):111–142. http://dx.doi.org/10.1016/j.earscirev.2010.09.003
White, N.M., Pringle, M., Garzanti, E., Bickle, M., Najman, Y., Chapman, H., and Friend, P., 2002. Constraints on the exhumation and erosion of the High Himalayan Slab, NW India, from foreland basin deposits. Earth and Planetary Science Letters, 195(1–2):29–44. http://dx.doi.org/10.1016/S0012-821X(01)00565-9
Yokoyama, K., Amano, K., Taira, A., and Saito, Y., 1990. Mineralogy of silts from the Bengal Fan. In Cochran, J.R., Stow, D.A.V., et al., Proceedings of the Ocean Drilling Program, Scientific Results, 116: College Station, TX (Ocean Drilling Program), 59–73. http://dx.doi.org/10.2973/odp.proc.sr.116.116.1990
1France-Lanord, C., Spiess, V., Klaus, A., Adhikari, R.R., Adhikari, S.K., Bahk, J.-J., Baxter, A.T., Cruz, J.W., Das, S.K., Dekens, P., Duleba, W., Fox, L.R., Galy, A., Galy, V., Ge, J., Gleason, J.D., Gyawali, B.R., Huyghe, P., Jia, G., Lantzsch, H., Manoj, M.C., Martos Martin, Y., Meynadier, L., Najman, Y.M.R., Nakajima, A., Ponton, C., Reilly, B.T., Rogers, K.G., Savian, J.F., Schwenk, T., Selkin, P.A., Weber, M.E., Williams, T., and Yoshida, K., 2016. Site U1451. In France-Lanord, C., Spiess, V., Klaus, A., Schwenk, T., and the Expedition 354 Scientists, Bengal Fan. Proceedings of the International Ocean Discovery Program, 354: College Station, TX (International Ocean Discovery Program). http://dx.doi.org/10.14379/iodp.proc.354.105.2016