France-Lanord, C., Spiess, V., Klaus, A., Schwenk, T., and the Expedition 354 Scientists
Proceedings of the International Ocean Discovery Program Volume 354
publications.iodp.org
doi:10.14379/iodp.proc.354.109.2016

Site U14551
C. France-Lanord, V. Spiess, A. Klaus, R.R. Adhikari, S.K. Adhikari, J.-J. Bahk, A.T. Baxter, J.W. Cruz, S.K. Das, P. Dekens, W. Duleba, L.R. Fox, A. Galy, V. Galy, J. Ge, J.D. Gleason, B.R. Gyawali, P. Huyghe, G. Jia, H. Lantzsch, M.C. Manoj, Y. Martos Martin, L. Meynadier, Y.M.R. Najman, A. Nakajima, C. Ponton, B.T. Reilly, K.G. Rogers, J.F. Savian, T. Schwenk, P.A. Selkin, M.E. Weber, T. Williams, and K. Yoshida2
Keywords: International Ocean Discovery Program, IODP, Expedition 354, JOIDES Resolution, Site U1455, Bengal Fan
MS 354-109: Published 7 September 2016
Site summary
Site U1455 (proposed Site MBF-1A) is the last site drilled during Expedition 354 in the Bengal Fan. It is a reoccupation of Deep Sea Drilling Project (DSDP) Site 218 (see Figure F11 in the Expedition 354 summary chapter [France-Lanord et al., 2016e]) (von der Borch, Sclater, et al., 1974), which was the first attempt to drill the Bengal Fan and was only spot cored with the rotary core barrel (RCB) system to 773 meters below seafloor (mbsf). The site is above the eastern flank of the 85°E Ridge at 8°0.42′N, 86°16.97′E at 3743 m water depth. Site U1455 is one of three deep-penetration sites along the Expedition 354 transect dedicated to reveal Neogene fan evolution and Himalayan erosion. This site will also document Pleistocene fan architecture when integrated into the complete seven-site transect. Coring to 900 mbsf was planned to determine Miocene to Pliocene accumulation rates and changes related to Himalayan erosion and environment. The deeper part of the site will extend the existing Site 218 record back into the middle Miocene. Because of time constraints at the end of the expedition, we focused coring on three objectives: the Pleistocene (0–122 mbsf), the late Miocene terrestrial vegetation transition from C3 to C4 plants (360–431 mbsf), and the middle Miocene (773–949 mbsf) to extend the existing core record of Site 218.
Because Site U1455 is above the 85°E Ridge, which has undergone deformation since the Miocene (Schwenk and Spiess, 2009), accumulation rates at this site are lower than at Site U1450 in the axial part of the fan transect and similar to those at Site U1451. The overall thickness of the fan is less than 4 km in this location according to Curray et al. (2003). These lower accumulation rates offer the possibility to capture a longer stratigraphic range within an achievable depth of penetration. Site U1455 was intended to help establish a representative accumulation history from the middle Miocene to recent, which is essential to complete the 8°N transect of the Bengal Fan.
Principal results
Site U1455, located above 85°E Ridge, is a key location for the transect approach, particularly for investigating Miocene fan deposition. A comparison between the easternmost Site U1451 and this site should elucidate whether depocenter migration occurred in a similar manner as in the Pliocene and Pleistocene. Because of the absence of major channel-levee systems, addressing these objectives can only be achieved by integrating core and seismic data. This integration will require good chronostratigraphic control to allow comparison of the same time periods, which has to await postexpedition work.
Site U1455 cored critical intervals that will address different objectives. In the upper section of Core 354-U1455C-1H, the Toba ash layer is found at 5.6 m drilling depth below seafloor (DSF) instead of being consistently around 2 m deep as at other eastern Expedition 354 sites. The vicinity of the most recently active channel (Site U1454, ~50 km west) is the likely explanation for this increased recent sedimentation, and discrete detrital deposition was observed above the Toba ash layer at this site. This site will further highlight deposition of clay and silt in the context of a distant active channel.
Second, the deeper late Miocene interval cored between 360 and 431 m DSF returned a relatively continuous record across the terrestrial vegetation change from the C3 to C4 photosynthetic types of plant, known to occur around 380 mbsf at Site 218. A number of short hemipelagic intervals are present in this section that should provide good chronological constraint for this transition. They may also document ecological variability on shorter timescales.
Coarser grained deposition has been found deeper than 770 mbsf, even though recovery of sand was limited by RCB drilling. Intervals with penetration rates as high as 0.5–1 min/m without recovery in this deep section of the hole revealed the presence of thick unconsolidated layers of sand. Coarser grained material suitable to study Himalayan erosion was found, although it was not recovered at Site U1451 for the same period. In this particular depth interval, further detailed sedimentary analyses may shed light on the causes for the depositional facies being different from Pliocene and Pleistocene times and may help to determine whether the absence of levees originated from a change in sediment supply or transport pathways or from other factors.
Operations
We cored three holes at Site U1455. Holes U1455A and U1455B each consist of a single mudline core; the cores penetrated to 0.9 and 6.9 m DSF, respectively. Hole U1455C consists of coring in three intervals: 0–122.3 m DSF (advanced piston corer [APC] and half-length APC [HLAPC] systems), 359.8–431.4 m DSF (HLAPC system), and 773.0–949.0 m DSF (RCB system).
The uppermost interval of Hole U1455C consists of APC and HLAPC coring and four 4.8 m advances without coring (19.2 m). Cores 1H–24F penetrated 103.1 m in this interval and recovered 89.82 m of sediment (87%). We drilled 237.5 m without coring from 122.3 to 359.8 m DSF and then resumed continuous HLAPC coring. Cores 26F–41F penetrated from 359.8 to 431.4 m DSF (71.6 m) and recovered 48.82 m of sediment (68%). After dropping a free-fall funnel (FFF) and retrieving the drill string to switch to the RCB system, we reentered Hole U1455C and drilled ahead without coring from 431.4 to 773.0 m DSF. We RCB cored from that depth to 949.0 m DSF. Cores 43R–60R penetrated 176.0 m and recovered 59.36 m of sediment (34%). Coring ended on 28 March 2015 at 1435 h when the operational time for the expedition expired.
Lithostratigraphy
As at other Expedition 354 sites, lithologic differences between units and variations in grain size and bed thickness reflect cycles of proximal turbidity current channel activity and abandonment. Sand intervals may represent interlevee “sheet flows” (e.g., Curray et al., 2003), whereas finer grained fractions are more likely preserved in leveed sections. Calcareous clay units reflect cessation of proximal channel activity, but the intervals also resemble episodes of minor increase in siliclastic deposition.
Coring in Hole U1455C was divided into three segments. The uppermost segment (from the seabed to 120.51 m core depth below seafloor [CSF-A]) is principally composed of micaceous quartz-rich siliciclastic sediments, many containing typical characteristics of turbidites (sharp base, normal grading, and laminations). In this segment, the lower sand units are overlain by 13.5 m of calcareous clay covered by a 45.86 m thick section of sand and mud turbidites. There are two glassy volcanic ash layers at 5.68–5.75 and 82.80–82.89 m CSF-A. The second recovered segment of Hole U1455C (359.80–431.39 m CSF-A) is also predominantly micaceous and quartz-rich sand, silt, and clay, although fewer turbiditic characteristics are present. Calcareous clay units alternate with siliciclastic sediments. The lowermost segment (773.0 m CSF-A to the base of the hole at 942.35 m CSF-A) contains claystone and siltstone intervals with preserved turbiditic characteristics, as well as a ~4 m thick unit of calcareous claystone. Organic fragments are prevalent in this segment.
Overall, siliciclastic units (silt, clay, and sand) at Site U1455 are compositionally classified as micaceous (muscovite and biotite) and quartz rich. Sand occurs mostly in fine to medium grain size ranges, with rare coarse-grained particles. Feldspars and heavy minerals (e.g., amphibole, garnet, clinozoisite, zoisite, tourmaline, zircon, rutile, sphene, epidote, sillimanite, chloritoid, pyroxene, staurolite, and opaque minerals) are common in silt and sand layers and occasionally contain euhedral carbonate minerals and carbonate aggregate grains. Lithic fragments (e.g., biotite-gneiss, amphibole-mica schist, sillimanite-biotite-gneiss, and phyllite fragments) appear in sand. From previous sites (see Principal results in the Site U1450 chapter [France-Lanord et al., 2016b]), we know that siliciclastic sediments in the fan contain between ~3% and 10% of detrital carbonate as well. Calcareous clays contain calcareous nannofossils, clay minerals, foraminifers, diatoms, and radiolarians.
Biostratigraphy
Calcareous nannofossil and planktonic foraminiferal biostratigraphic analyses were conducted at Site U1455 on 113 samples and resulted in the identification of 14 biomarker events. These events were used to construct 3 foraminiferal and 10 nannofossil biozones, providing good age control extending back to the middle Miocene. The age model reconstruction is limited to the drilled intervals from 0 to 120 m CSF-A and from 360 to 430 m CSF-A and by the very low abundance and barren intervals from 773 m CSF-A to the bottom of Hole U1455C. Foraminiferal species diversity decreased with depth, which could be due to preservation changes in the sediments or could reflect a change in environmental conditions of the overlying water column.
Paleomagnetism
We identified the Brunhes/Matuyama boundary and the Jaramillo Subchron in a calcareous clay interval at Site U1455 that was correlated with similar intervals in other holes within the Expedition 354 transect based on both magnetostratigraphy and seismic stratigraphy. The Brunhes/Matuyama boundary occurs at 82.83 m CSF-A in Core 354-U1455C-6F. As at all other sites where the Brunhes/Matuyama boundary is identified, the transition is associated with an ash layer. Core 17F contains the Jaramillo Subchron (86.40–87.92 m CSF-A). Unlike all other sites, the Cobb Mountain Subchron was not recorded at Site U1455 and is likely located between Cores 17F and 18F.
Physical properties
Physical property data were acquired on all Hole U1455C cores, including density, magnetic susceptibility, P-wave velocity, natural gamma radiation (NGR), and thermal conductivity. Physical property data at Site U1455 are mostly of good quality. Using the principal lithologic name from the core description, we assigned eight lithologies and calculated their average physical properties. Accordingly, the most common principal lithology is sand (~56 m), followed by clay (~40 m), claystone (~38 m), silt (~22 m), clay (~21 m), calcareous claystone (~10 m), siltstone (~6 m), and volcanic ash occurring in minor proportions. Average wet bulk densities vary from 1.84 to 2.06 g/cm3 for terrigenous sediment (sand, silt, and clay). Lithified sediments (claystone, calcareous claystone, and siltstone) have higher average wet bulk densities (2.12–2.20 g/cm3). Average P-wave velocities are also higher for lithified intervals (1795–1931 m/s), whereas they are lowest in clay and calcareous clay (~1540 m/s). Average magnetic susceptibilities are highest in sand (112 × 10–5 SI), followed by silt (166 × 10–5 SI) and clay (55 × 10–5 SI). The lowest values occur in calcareous clay and volcanic ash (~20 × 10–5 SI). NGR is elevated throughout the terrigenous and lithified sediment (64–71 counts/s) and low in calcareous clay (37 counts/s). Thermal conductivity is highest in claystone (2.23 W/[m·K]) and lowest in calcareous clay and calcareous claystone (~1.2 W/[m·K]).
Geochemistry
Interstitial water chemistry was only conducted in the upper section of Site U1455 and suggests active biotic processes releasing dissolved phosphate and ammonium and influencing pore water alkalinity and sulfate concentrations. Phosphate and ammonium contents covary, and the rise in alkalinity in the upper section of the core is associated with a drop in calcium and magnesium contents.
Bulk-sediment major and trace element concentrations correspond closely to sediment lithology and are consistent with observations made at other Expedition 354 sites and within the Ganga-Brahmaputra river system. The increase in carbonate content in turbiditic sediments deeper than 360 m CSF-A is consistent with a similar increase at Sites U1450 and U1451 and Site 218 and indicates a regional change in the delivery of detrital carbonate to the fan. Total organic carbon (TOC) contents in Pleistocene turbiditic sediments covary with Al/Si, a proxy for grain size and mineral composition, reflecting preferential association of organic matter with clay. This behavior is consistent with similar observations in the Ganga-Brahmaputra river system, in modern (18 ka) fan deposits, and at all sites along the 8°N transect across the Bengal Fan. The organic carbon content of pelagic and hemipelagic sediments broadly decreases with depth, consistent with organic carbon concentrations observed at Site 218.
Background and objectives
Site U1455 is a reoccupation of DSDP Site 218 (Shipboard Scientific Party, 1974), which was the first attempt to drill the Bengal Fan and was only spot cored to 773 mbsf. The site is located above the eastern flank of the 85°E Ridge at 8°0.42′N, 86°16.97′E at 3743 m water depth (see Figures F3, F4, and F8 in the Expedition 354 summary chapter [France-Lanord et al., 2016e]). Together with the 8°N seismic surveys in 1997 and 2006, Site 218 was the basis for the Expedition 354 transect strategy. Site U1455 is one of the three deep-penetration transect sites aimed to document Neogene fan evolution and Himalayan erosion. The site will also document the Pleistocene fan architecture when integrated into the complete seven-site transect of the expedition. Coring to 900 mbsf was planned to determine Miocene to Pliocene accumulation rates and changes related to Himalayan erosion and environment. The deeper part of the site will extend the existing Site 218 record into the middle Miocene.
Because of ongoing deformation of the 85°E Ridge since the Miocene (Schwenk and Spiess, 2009), accumulation rates at this site are lower than at Site U1450 in the axial part of the fan transect and similar to those at Site U1451. These lower accumulation rates offer the possibility to capture a longer stratigraphic range within an achievable depth of penetration. Site U1455 will establish a representative accumulation history from the middle Miocene to recent, which is essential to complete the 8°N transect of the Bengal fan.
Site U1455 provides a long-term record of turbiditic deposition since the upper Miocene. Sediments from Site 218 were analyzed to determine source regions and to identify known paleovegetation changes (Galy et al., 2010). These data show relatively constant Sr, Nd, and Os isotopic signatures for turbiditic sediments throughout the late Miocene to recent section. These compositions are in line with those from the distal fan (Ocean Drilling Program [ODP] Leg 116) and most data documented on the modern river system or recent upper fan levee (Lupker et al., 2013). This agreement suggests a rather steady mixing of Himalayan sources over the last 10 My. In contrast, the evolution of terrestrial organic carbon shows a clear change around 380 mbsf that reflects the expansion of C4 photosynthetic flora (savanna vs. forest) in the Himalayan subbasin during the late Miocene (Quade et al., 1995). Sediments cored at Site U1455 should provide a much more accurate characterization of environmental and erosional conditions throughout this time period. These data will further be integrated into accumulation rates across the 8°N transect to assess the relationship between Himalayan tectonic, monsoon activity, and erosional processes.
The seafloor near Site U1455 is smooth, and there are no surface or buried channels visible in the vicinity (Figure F1). The site is located at equal east–west distance (~50 km) from Sites U1453 and U1454. Although the channel adjacent to Site U1453 has been inactive during the last ~300 ky (see Stratigraphic synthesis in the Site U1453 chapter [France-Lanord et al., 2016d]), the supposedly active channel during the Holocene is only 600 m from Site U1454. Only ~30 km northwest of Site U1455, this channel may have supplied overspill sediment to the drilling location. This is in agreement with the observation that a reflector in echo-sounder data, typically associated with the Toba ash within an extended calcareous clay interval at ~2 mbsf at other Expedition 354 sites to the east, is imaged at ~7 mbsf at Site U1455. Therefore, the calcareous pelagic flux is likely more diluted by detrital input than at Sites U1449–U1453, which is typical for a distal levee setting.
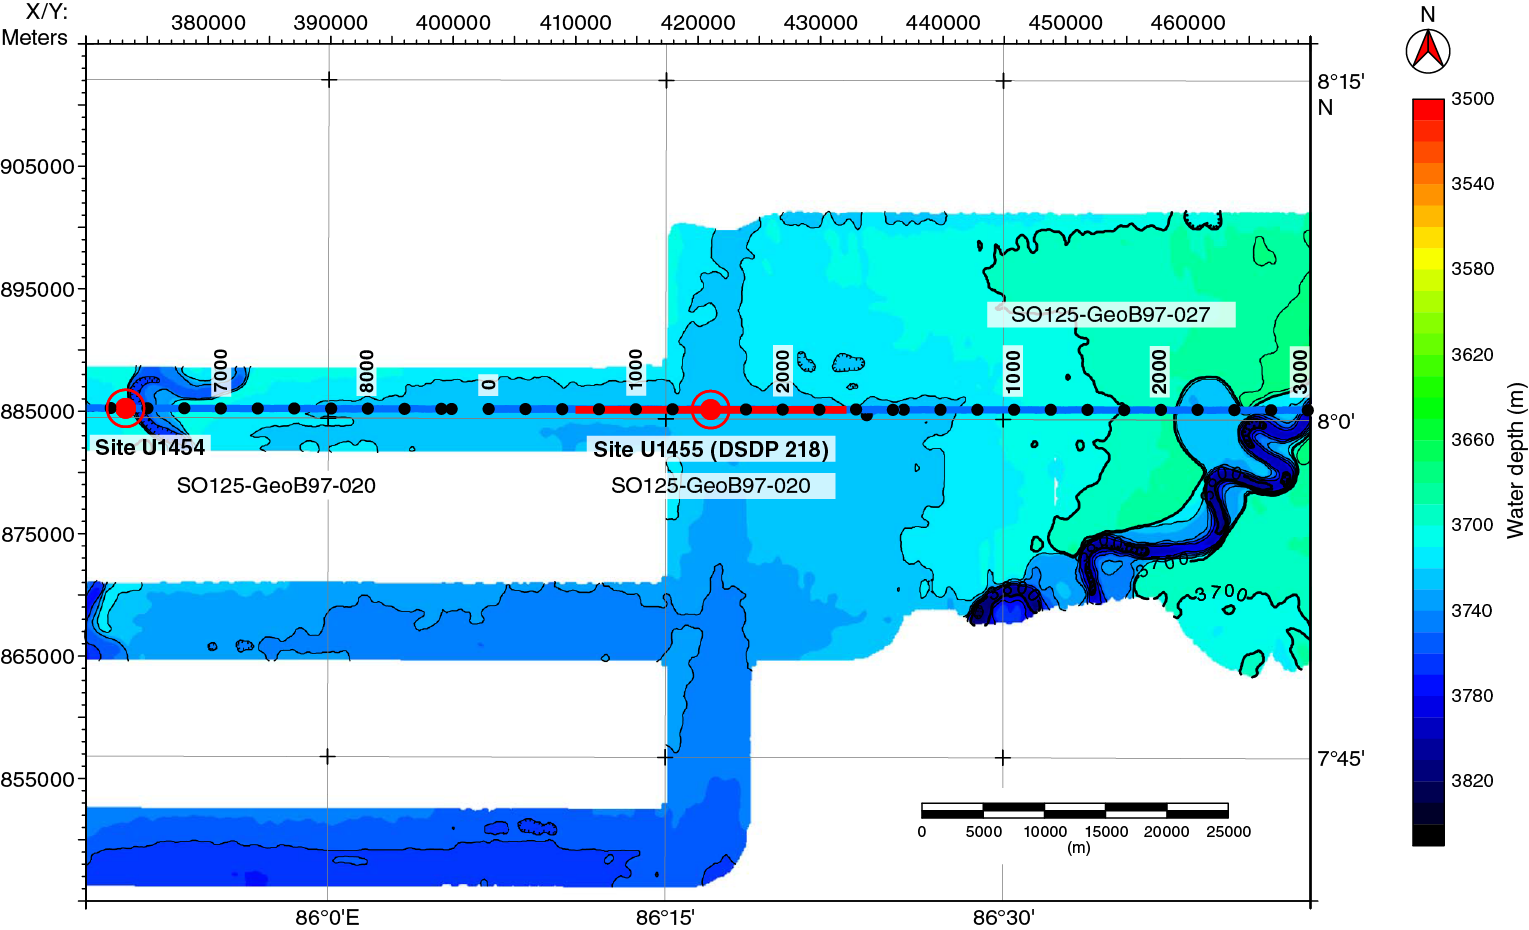
Figure F1. Bathymetry and track chart, Site U1455. Projection is UTM Zone 45N. Multibeam bathymetry was acquired during R/V Sonne Cruises SO125 and SO188.
Within the shallow seismic portion at this site (Figure F2), the upper 100 ms two-way traveltime (TWT) of the formation exhibits a comparably highly reflective unit with relatively thin levee units intercalated, indicating channels both east and west of the site. The 60 ms TWT thick levee beneath can be directly attributed to the buried channel seen in the seismic data ~5 km east. Another intercalation of several thin units with strong bounding reflectors reaches to 5.17 s TWT. Together with the surface unit, they may represent relatively sand rich formations, whereas the packages deeper than 5.17 s TWT reveal a significantly lower average reflection amplitude. This lower average might be interpreted as predominantly mud–turbidite succession. Faulting, observed in the vicinity, is related to crustal deformation centered around 85°E Ridge.
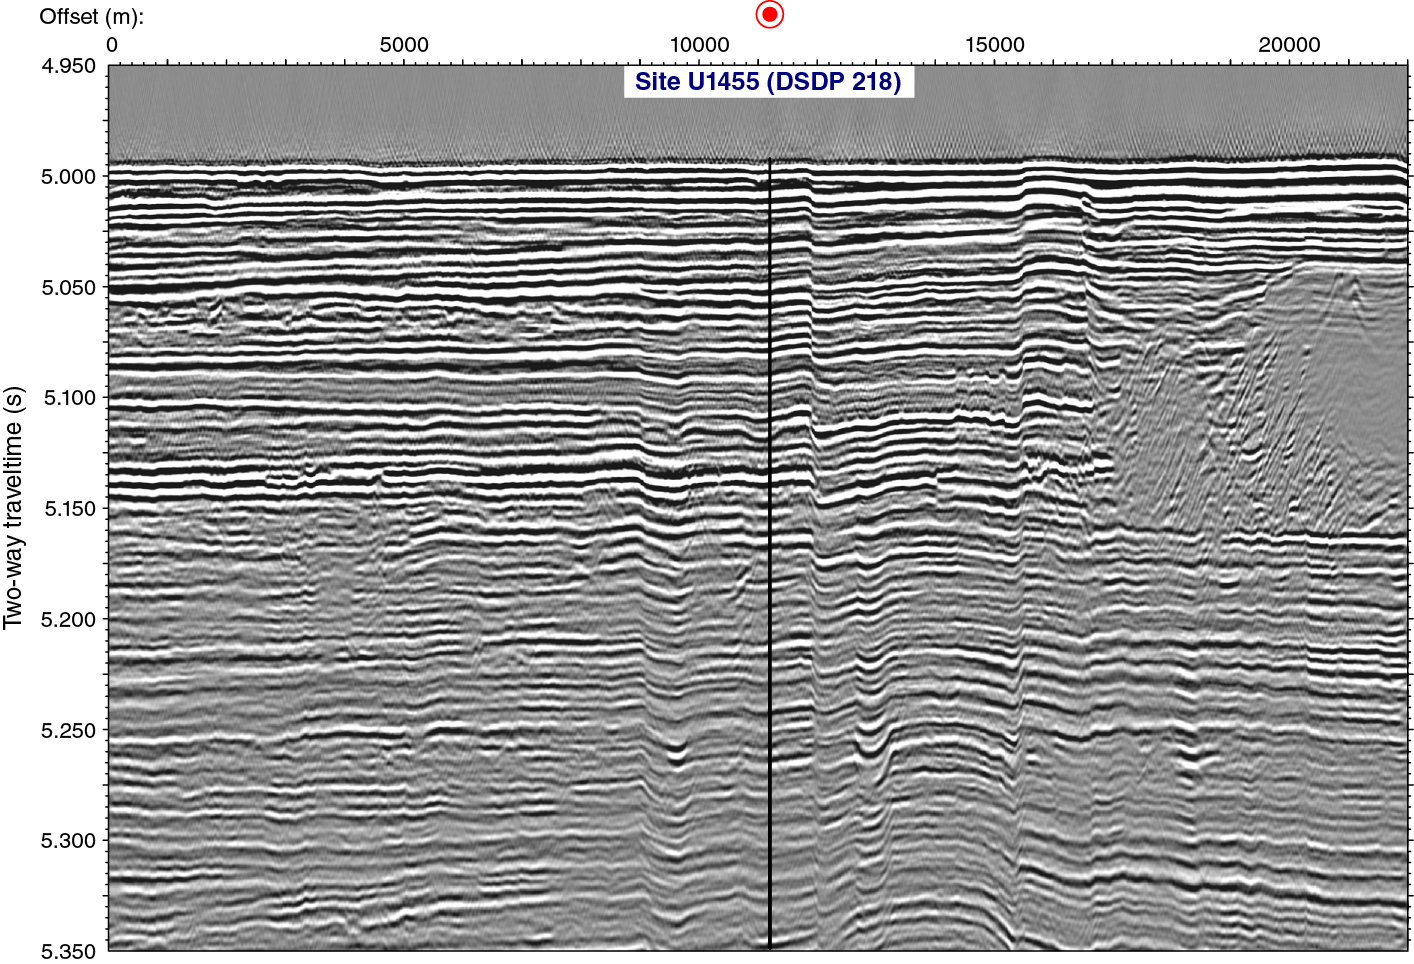
Figure F2. Seismic Line SO125-GeoB97-020, Site U1455, showing upper portion of the sedimentary section.
Site U1455 is similar to Site U1451, as it has a condensed shallow sequence of Pliocene and Pleistocene sediments (Figure F3). Although the overall sediment thickness on top of the oceanic crust is proposed to be around ~4 km on average in this area (Curray et al., 2003), above 85°E Ridge, a distinct basement high ~30 km west of Site U1455, sediment cover is <800 ms TWT thick. Deeper reflectors onlap onto the flanks of 85°E Ridge but are not uplifted, and sedimentary strata at Site U1455 thus appear only minimally affected by faulting. The anticipated coring to 900 mbsf (Site 218 penetrated to 773 mbsf during DSDP Leg 22) shows parallel layering and minor variations in thickness over distances of 20 to 50 km, a typical width of channel-levee systems. According to Schwenk and Spiess (2009), channel-levee systems are absent before ~7 Ma and since then dominate the fan architecture. In the vicinity of Site U1455, no other levee system could be identified deeper than ~400 mbsf, and coring in the associated late to early Miocene sequence may reveal the origin of this absence, one of the primary expedition objectives.
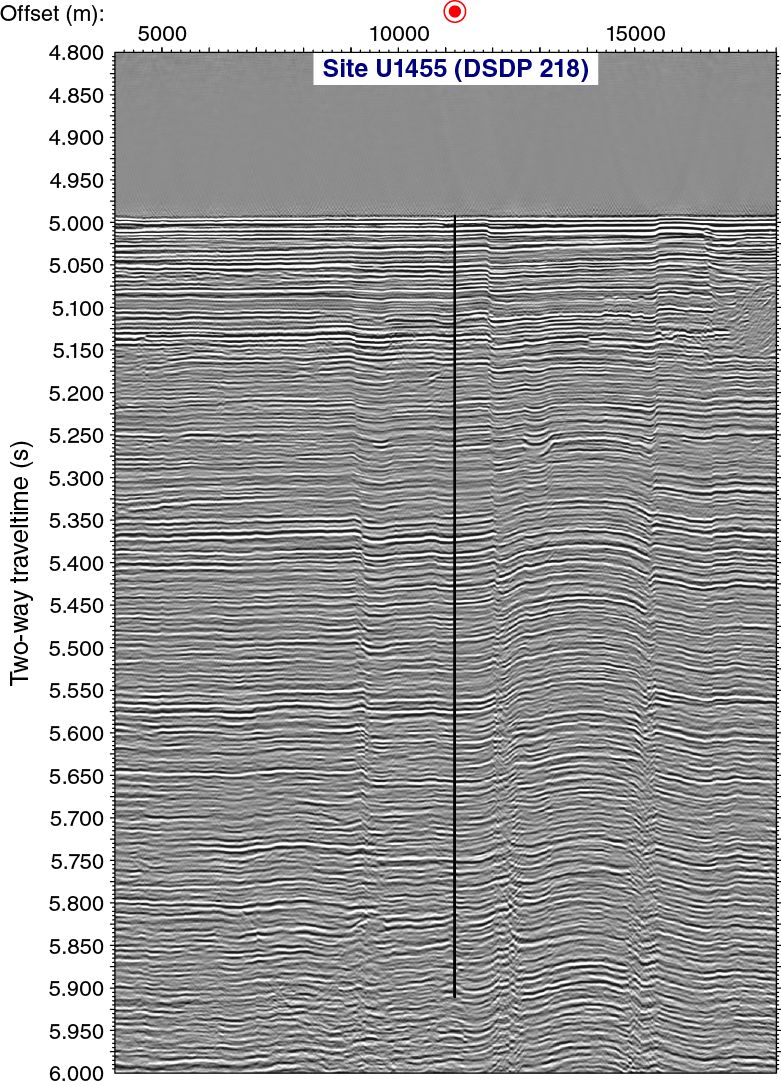
Figure F3. Seismic Line SO125-GeoB97-020_2 across Site U1455, showing complete sedimentary section cored.
Operations
We cored three holes at Site U1455 (DSDP Site 218). Holes U1455A and U1455B each consist of a single mudline core; the cores penetrated to 0.9 and 6.9 m DSF, respectively. Hole U1455C consists of coring in three intervals: 0–122.3 m DSF (APC and HLAPC systems), 359.8–431.4 m DSF (HLAPC system), and 773.0–949.0 m DSF (RCB system). The uppermost interval consists of APC and HLAPC coring and four 4.8 m advances without coring (19.2 m). Cores 1H–24F cored 103.1 m in this interval and recovered 89.82 m of sediment (87%). We drilled 237.5 m without coring from 122.3 to 359.8 m DSF and then resumed continuous HLAPC coring. Cores 26F–41F penetrated from 359.8 to 431.4 m DSF (71.6 m) and recovered 48.82 m of sediment (68%). After retrieving the drill string to switch to the RCB system, we reentered Hole U1455C and drilled ahead without coring from 431.4 to 773.0 m DSF. We RCB cored from that depth to 949.0 m DSF. Cores 43R–60R penetrated 176.0 m and recovered 59.36 m of sediment (34%). All cores, penetration depths, core recovery, and time recovered on deck are presented in Table T1. Coring ended when the operational time for the expedition expired.
Table T1. Site U1455 core summary. Download table in .csv format. View PDF table.
Site U1455
Hole U1455A
After the 26 nmi transit, we arrived at Site U1455 at 1640 h on 21 March 2015. We assembled an APC bottom-hole assembly (BHA) with a 9⅞ inch polycrystalline diamond compact (PDC) bit and a lockable float valve (LFV; in case logging became an option) and lowered it to the seafloor. Coring in Hole U1455A started at 0105 h on 22 March. This hole was intended to be a single mudline core for microbiologic and geochemical studies. Because Core 1H recovered only 0.9 m, we decided to offset the ship and start another hole.
Hole U1455B
After the ship was offset 20 m east, coring started in Hole U1455B at 0225 h on 22 March 2015. Core 1H recovered 6.88 m and was considered sufficient for microbiologic and geochemical studies.
Hole U1455C
We offset the ship 20 m south and started coring in Hole U1455C at 0350 h on 22 March 2015. Cores 1H–3H penetrated to 23.2 m DSF and recovered 22.42 m of sediment (97%). Because Core 3H was only a partial stroke and the core liner cracked, we switched to the HLAPC system. The hole was deepened to 122.2 m DSF with 17 HLAPC cores and four 4.8 m advances without coring. Cores 1H–24F cored 103.1 m in this interval and recovered 89.82 m of sediment (87%). We then drilled from 122.3 to 359.8 m DSF (237.5 m) without coring; this lasted from 0230 to 1345 h on 23 March. Continuous HLAPC coring resumed, and Cores 26F–41F penetrated from 359.8 to 431.4 m DSF (71.6 m) and recovered 48.82 m of sediment (68%).
Because the formation was getting quite firm and we had obtained suitable cores from this section, we decided to stop piston coring. We decided that we would reenter this hole with the RCB system to core our deep objectives below ~770 m DSF. We circulated 30 barrels of mud to clear cuttings out of the hole and started raising the bit back up the hole at 1530 h on 24 March. After pulling a couple stands of pipe, we removed the top drive and continued pulling out of the hole. When the bit reached 77.4 m, we assembled a FFF around the drill string and dropped it through the moonpool at 1850 h on 24 March. We waited 1 h to allow the FFF to land, pulled the bit out of the hole at 1955 h, and retrieved the drill string. The APC bit arrived back on the rig floor at 0145 h on 25 March. After a couple of hours servicing the rig (drill line slip and cut; lubricating crown sheave and main blocks; 0230–0445 h), we assembled an RCB BHA with a mechanical bit release (MBR; to allow for any potential logging) and lowered it to the seafloor. The camera system was deployed, and we reentered the Hole U1455C FFF after only ~15 min of maneuvering at 1540 h on 25 March. The camera system was retrieved, and we lowered the bit to 219.4 mbsf before it encountered any resistance. The top drive was installed, and we washed and reamed back down to the bottom of the cored part of the hole (431.4 m). We deployed a center bit and started to drill ahead without coring at 2215 h on 25 March.
At 0945 h on 26 March, we finished penetrating to 773 m DSF (Site 218 was cored to 773 mbsf). The center bit was retrieved and then redeployed in the middle of this drilled interval to ensure it could be removed and to tighten all connections in the core barrel. When the bit reached 773 m DSF, we retrieved the center bit, circulated mud to clean cuttings out of the hole, and started RCB coring at 2030 h on 26 March. Cores 43R–60R penetrated 176.0 m (773.0–949.0 m DSF) and recovered 59.36 m of sediment (34%). Coring ended when the operational time for the expedition expired; the last core of Expedition 354 arrived on deck at 1435 h on 28 March. We pulled the drill string out of the formation with the top drive in place until hole conditions were good enough to remove the top drive. The bit cleared the seafloor at 2120 h on 28 March, and it arrived back on the rig floor at 0640 h on 29 March. The BHA was taken apart, the rig floor was secured, the thrusters were raised, and we started our transit to Colombo, Sri Lanka, at 0645 h on 29 March.
Transit to Colombo, Sri Lanka
After the 513 nmi transit, we arrived at Colombo at 0600 on 31 March 2015.
Lithostratigraphy
At Site U1455, three holes (U1455A–U1455C) were cored. Hole U1455A penetrated to 0.9 m DSF with 100% recovery. Hole U1455B penetrated to 6.9 m DSF with 100% recovery. Hole U1455C penetrated to 949.00 m DSF (cored interval: 350.7 m with 56% recovery). Holes U1455A and U1455B overlap with Hole U1455C to 0.90 and 6.88 m CSF-A, respectively. Hole U1455C contains two drilled intervals with no coring: 120.51–359.80 and 431.39–773.00 m CSF-A. Similar to all other Expedition 354 sites, the overall dominant lithology for Site U1455 is fine sand, silt, and clay, some with fining-upward sequences (i.e., turbidites). Calcareous clay comprises most of the remaining recovered material, with a very minor fraction of volcanic ash. Recovered sediments from Site U1455 are divided into 15 lithostratigraphic units based on lithologic characteristics from macroscopic description, microfossil contents from smear slide analyses, and physical property measurements (Figures F4, F5; Table T2).
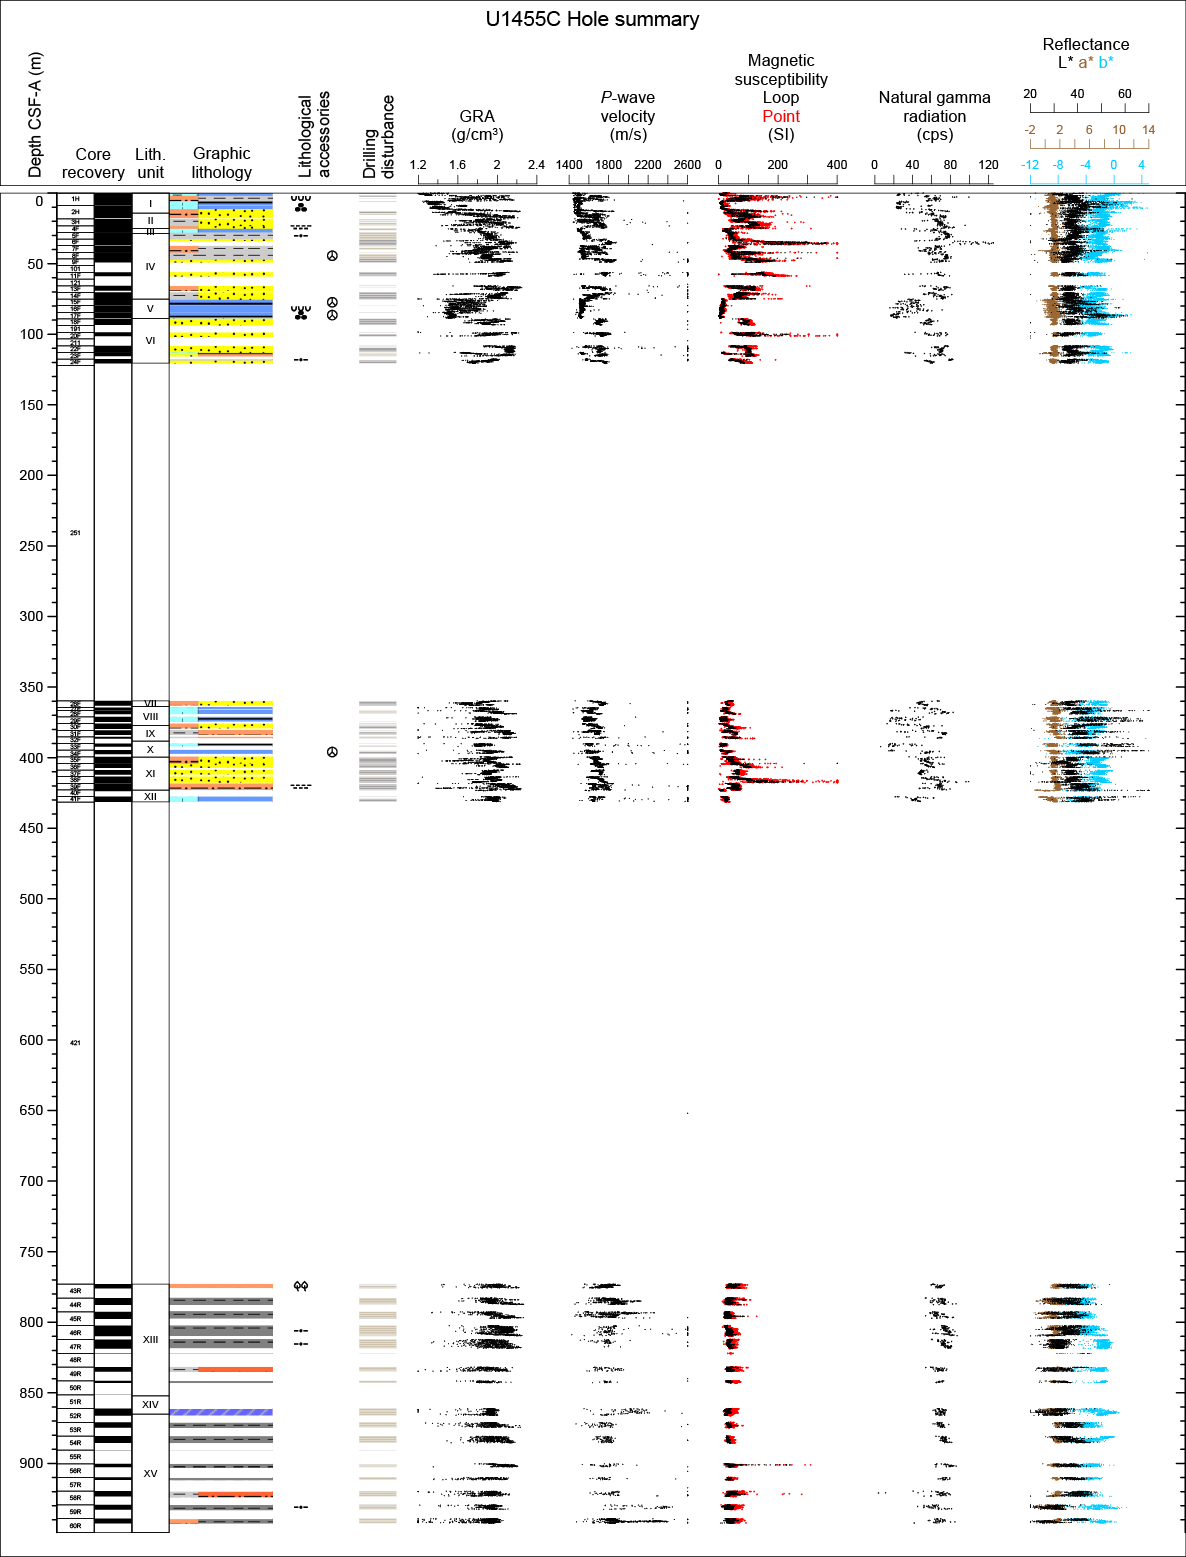
Figure F4. Lithostratigraphic summary, Hole U1455C.
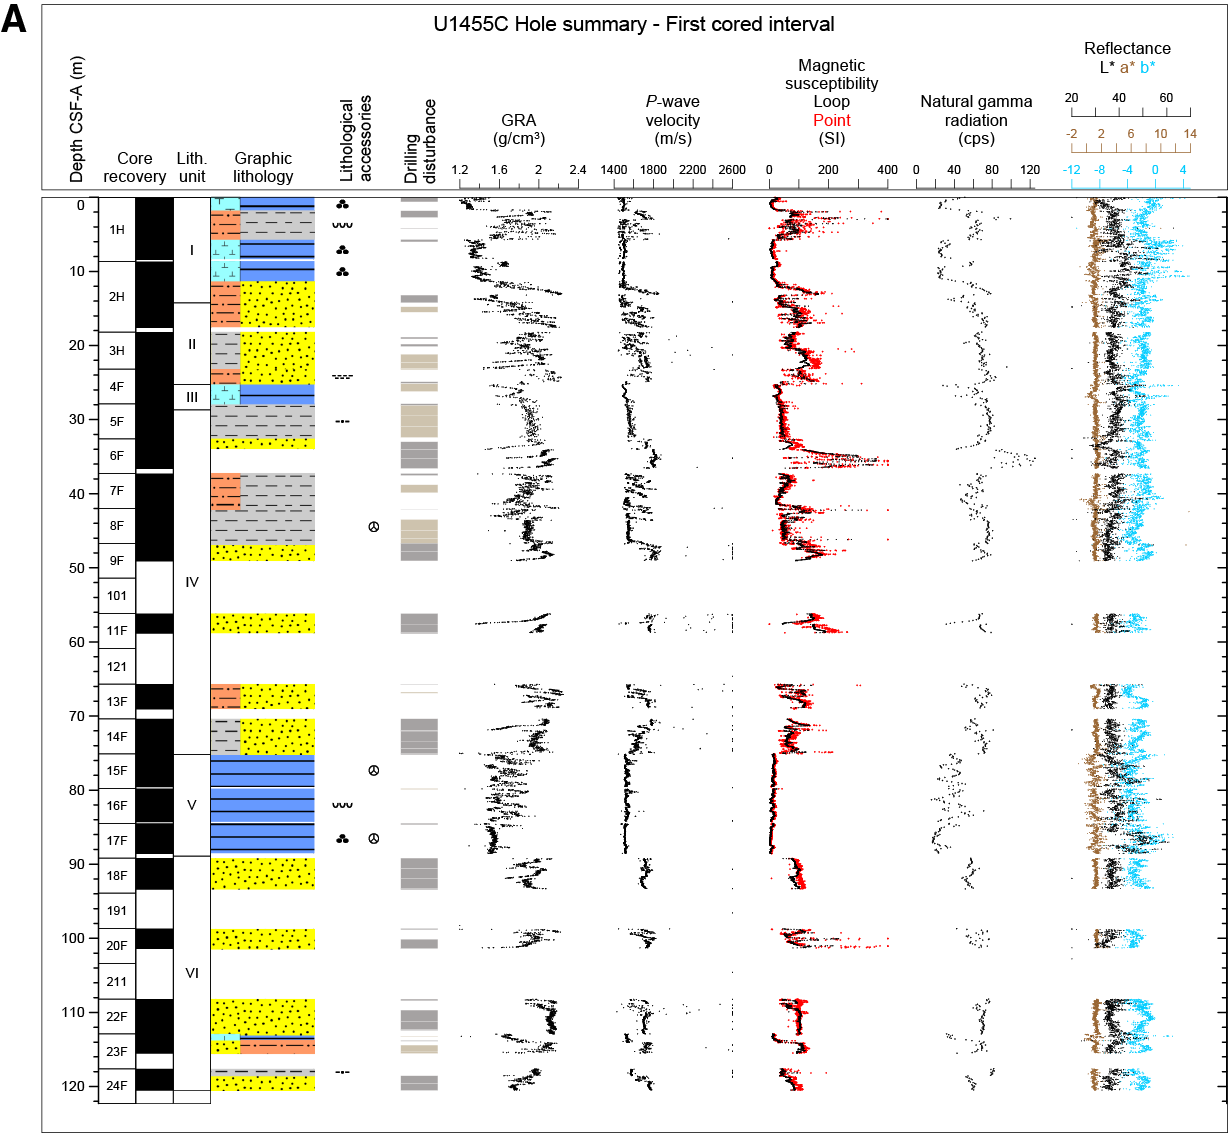
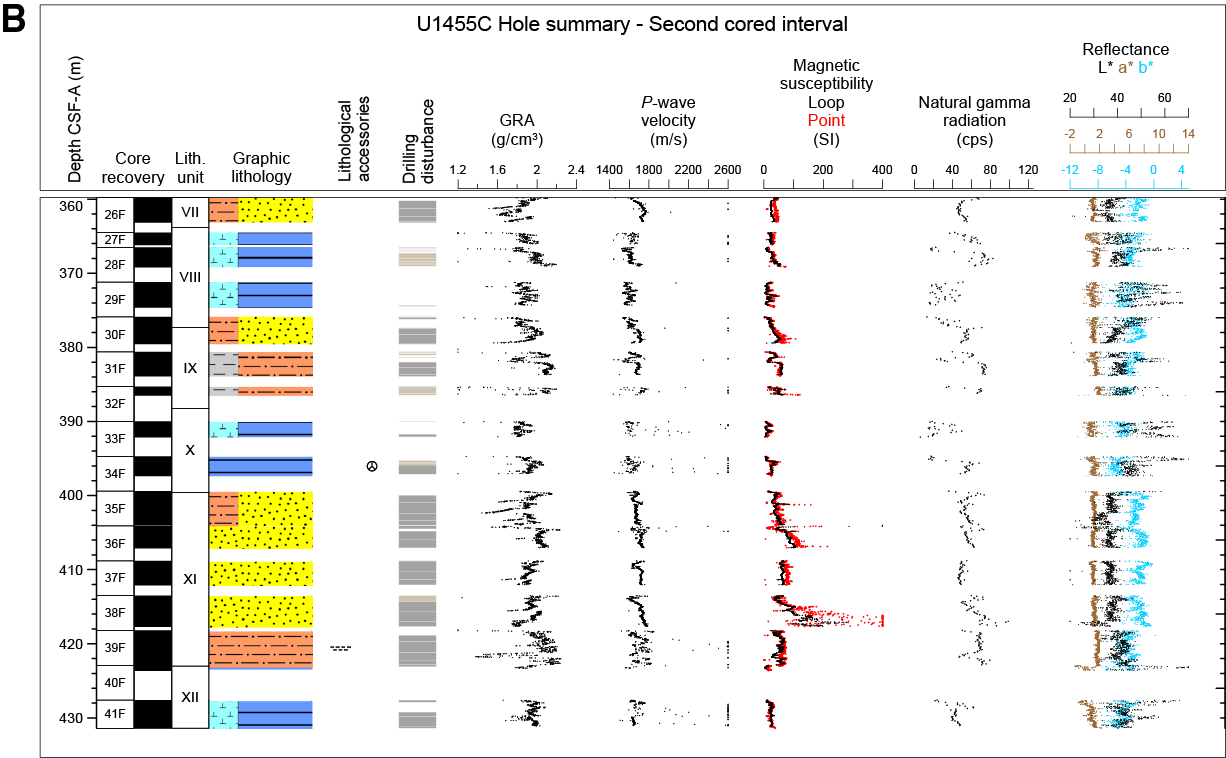
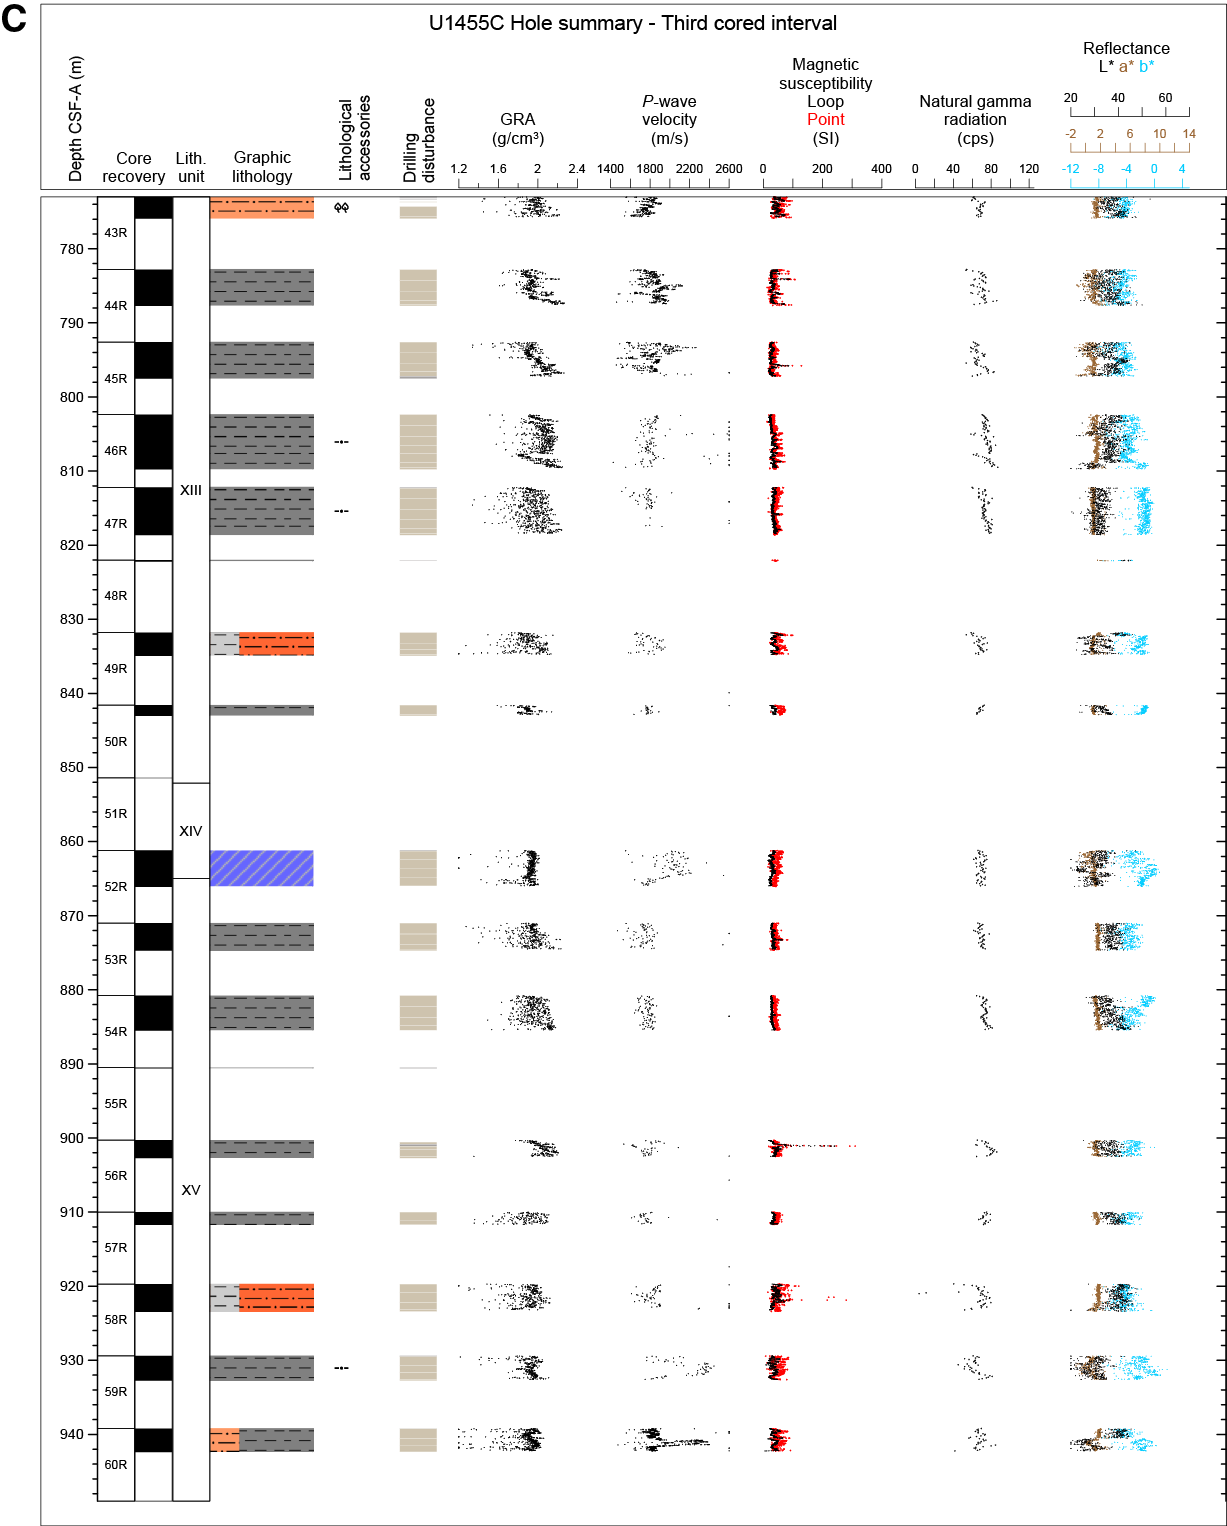
Figure F5. Lithostratigraphic summary for cored intervals, Hole U1455C.
Table T2. Intervals, depths, major and minor lithologies, and ages of units, Site U1455. Download table in .csv format.
Unit summaries
Summaries of individual units are presented here, with more detailed descriptions in the following section.
Units I, III, V, VIII, X, and XII are dominated by bioturbated and mottled calcareous clay, some with interbedded silt and clay with fining-upward structures (i.e., turbidites). Units I and V contain glassy volcanic ash layers. Units VIII and XII contain intervals of calcareous ooze.
Units II, IV, and VI are composed mainly of mica- and quartz-rich sand and/or mud turbidites with some preserved fining-upward structures and/or parallel laminations and minor fractions of calcareous clay.
Units VII, IX, and XI are mostly structureless and sand/silt dominant with minor fractions of clay and calcareous clay.
Units XIII and XV contain siltstone fining-upward to claystone with interbedded silt and siltstone and occasional calcareous claystone beds. Siltstones have abundant plant fragments.
Unit XIV is bioturbated and mottled calcareous claystone.
Units IV, VI, IX, and XI also contain intervals of “soupy” sand that were vertically settled in core liners on the catwalk (see Lithostratigraphy in the Expedition 354 methods chapter (France-Lanord et al., 2016a) for a detailed description of this procedure) (Table T3).
Table T3. Core sections containing sand that were vertically settled on the core receiving platform, Site U1455. Download table in .csv format.
Lithostratigraphic summary
Similar to other Expedition 354 sites, lithologic differences between units and variations in grain size and bed thickness reflect cycles of proximal turbidity current channel activity and abandonment (Table T2). Sand intervals may represent interlevee sheet flows (e.g., Curray et al., 2003), whereas finer grained fractions are more likely preserved in leveed sections. Calcareous units reflect cessation of proximal channel activity and/or increased deposition of marine carbonate.
Recovery in Hole U1455C is divided into three cored intervals. The uppermost segment (from the seafloor to 120.51 m CSF-A) is principally micaceous quartz-rich siliciclastic sediments, many containing turbiditic structures and/or parallel laminations. In this segment, sand units are overlain by 13.5 m of calcareous clay, which is covered by a 45.86 m thick section of sand and mud turbidites. There are two glassy volcanic ash layers at 5.68–5.75 and 82.80–82.89 m CSF-A. The second cored interval (431.39–359.80 m CSF-A) is also dominantly micaceous and quartz-rich sand, silt, and clay, although fewer turbiditic structures are preserved. Calcareous units alternate with siliciclastic sediments. The lowermost cored interval (773.0 m CSF-A to the base of the hole at 942.35 m CSF-A) contains claystone and siltstone intervals with few preserved turbiditic structures and a ~4 m thick unit of calcareous claystone.
Overall, siliciclastic units (silt, clay, and sand) at Site U1455 are compositionally classified as micaceous (muscovite and biotite) and quartz rich. Sand occurs mostly in fine to medium grain size ranges, with the rare occurrence of coarse-grained particles. Feldspar and heavy minerals (amphibole, garnet, clinozoisite, zoisite, tourmaline, zircon, rutile, sphene, epidote, sillimanite, chloritoid, pyroxene, staurolite, and opaque minerals) are common in silt and sand layers and occasionally contain euhedral carbonate minerals and carbonate aggregate grains. Lithic fragments (e.g., biotite-gneiss, amphibole-mica schist, sillimanite-biotite-gneiss, and phyllite fragments) appear in sand. From previous sites (see Lithostratigraphy in the Site U1450 chapter [France-Lanord et al., 2016b]), it is known that siliciclastic sediments in the fan contain between ~3% and 10% of detrital carbonate as well. Calcareous clays contain calcareous nannofossils, foraminifers, clay minerals, and in lesser amounts diatoms and radiolarians.
The nomenclature for lithologic descriptions of sediments containing carbonate consists of a principal name and a modifier based on the composition estimated from visual description of the cores and from smear slide observations. The principal name of sediment that appears to contain >75% carbonate is calcareous ooze or limestone, depending on the degree of lithification. The principal name of sediment that appears to contain <10% carbonate is clay or claystone. If sediment contains a mixture of clay-sized siliciclastic particles and calcareous components (i.e., carbonate contents between 10% and 75%), the principal name is calcareous clay or calcareous claystone. This nomenclature was adopted to describe the continuum of sediments recovered from almost pure claystone to almost pure limestone (see Figure F4 in the Expedition 354 methods chapter [France-Lanord et al., 2016a]). Lithified sequences show a wide variety of color and a larger range in carbonate contents (perhaps the result of diagenesis and lithification) than the younger unlithified sequences.
Drilling disturbances at this site vary in intensity from slight to severe and include flow-in, fractures, up-arching, soupy sand homogenization, and drilling biscuits. Flow-in is the most common drilling disturbance in fine-grained intervals, whereas sands may display a structureless (or soupy) texture. Core sections containing water-rich, loose, soupy sands were vertically settled on the catwalk and then normally curated, and as a result any grading or structures in these cores may be artificial and are not described here (Table T3). A more detailed description and graphic examples of drilling disturbance types can be seen in Figure F6 in the Expedition 354 methods chapter (France-Lanord et al., 2016a).
Unit I
- Intervals: 354-U1455A-1H-1, 0 cm, to 1H-CC, 17 cm; 354-U1455B-1H-1, 0 cm, to 1H-CC, 17 cm; 354-U1455C-1H-1, 0 cm, to 2H-4, 107 cm
- Depths: Hole U1455A = 0–0.90 m CSF-A; Hole U1455B = 0–6.88 m CSF-A; Hole U1455C = 0–14.23 m CSF-A
- Age: Middle–Late Pleistocene to recent
- Lithology: calcareous clay (major); sand, silt, clay, volcanic ash (minor)
Description
Unit I mainly consists of light gray to gray nannofossil-rich calcareous clay with abundant burrows and mottling (Figure F6A). The interval from 354-U1455B-1H-2, 33 cm, to 1H-4, 147 cm, is characterized by sharp-based dark gray soupy fine sands and dark gray silt fining upward into gray clay and represents a succession of turbidites. A light brown volcanic ash layer occurs from 354-U1455C-1H-4, 147 cm, to 1H-5, 4 cm. All three holes at Site U1455 show comparable lithologies, and significant differences are restricted to the top of the uppermost section. Although all three holes display a light brown layer at the top of the first section (indicating oxidation close to the seafloor), the thickness of this layer varies largely, from 40 cm in Hole U1455A to 20 cm in Hole U1455C. In Hole U1455B, this layer shows an intermediate thickness of 35 cm but is overlain by a 7 cm thick layer of gray silty fine sand, which appears to be an upward displacement of loose sand due to suction during coring.
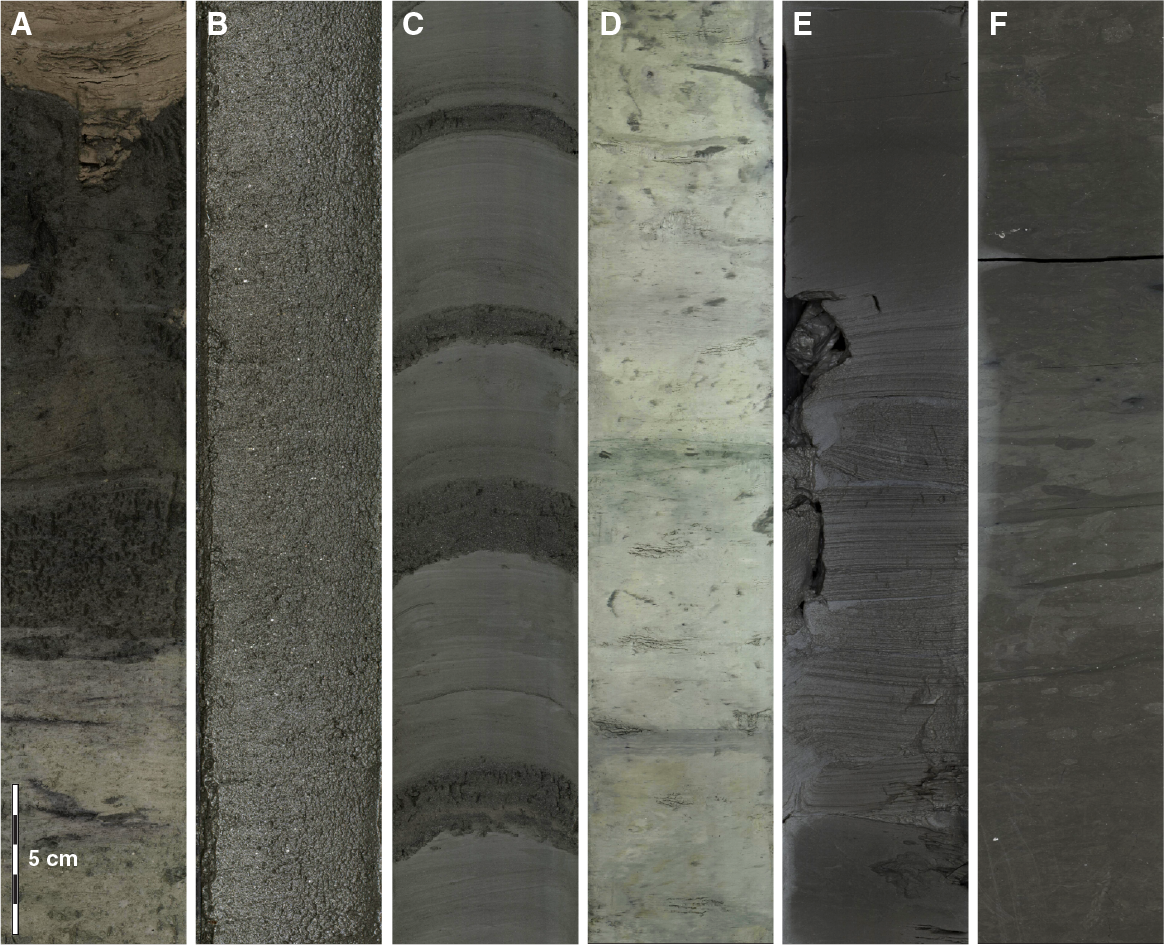
Figure F6. Hole U1455C features. A. Volcanic ash and calcareous clay. B. Homogeneous fine sand. C. Succession of mud turbidites. D. Bioturbated, mottled nannofossil-rich calcareous clay. E. Claystone interbedded with parallel-laminated silt. F. Bioturbated, mottled claystone.
Composition from smear slides
See Figure F7 for representative smear slide images.
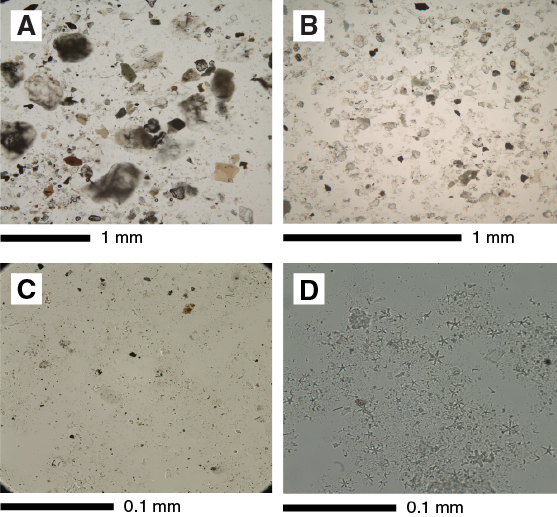
Figure F7. Representative examples of major lithologies in smear slides, Hole U1455C. A. Silty sand. B. Sandy siltstone. C. Clay. D. Calcareous clay.
Calcareous clay
Calcareous clays mainly contain calcareous nannofossils (70%–80%) and clay minerals in minor proportion (15%–10%). This lithology also contains diatoms and radiolarians and occasionally a minor amount of foraminifers (up to 10%) (354-U1455C-1H-5, 119 cm; 6.9 m CSF-A).
Volcanic ash
Smear slides from the ash layers consist of volcanic glass shards 0.01–0.28 mm in diameter. Very minor amounts of biotite, quartz, and feldspar are also observed. The volcanic glass appears in the form of clear plates, flakes, and strands with a relatively low refractive index (1H-4, 140 cm; 5.61 m CSF-A). The typical range for the volcanic glass proportion is 90%–97% of the total grains.
Silty sand
Silty sand layers consist primarily of grains of quartz, feldspar, lithic fragments, mica, and heavy minerals. Heavy minerals such as garnet, zircon, amphibole, apatite, tourmaline, sphene, sillimanite, apatite, zoisite, clinozoisite, chloritoid, and opaque minerals are present. Lithic fragments consist of biotite-gneiss, sillimanite gneiss, amphibole-mica schist, sillimanite-biotite-gneiss, and phyllite fragments. The maximum grain size is 0.55 mm in diameter (1H-3, 20 cm; 2.91 m CSF-A).
Unit II
- Interval: 354-U1455C-2H-4, 107 cm, to 4F-2, 59 cm
- Depth: 14.23–25.29 m CSF-A
- Age: Middle–Late Pleistocene
- Lithology: sand, silt (major); clay (minor)
Description
Unit II is dominated by thick- to very thick–bedded dark gray sand and silt beds intercalated with thin- to medium-bedded dark gray clay beds. The sand and silt beds often show normal grading in the uppermost parts and are usually soupy because of drilling disturbance (Figure F6B).
Composition from smear slides
See Figure F7 for representative smear slide images.
Silty sand
This unit consists primarily of sand-sized with subordinate silt-sized grains of feldspar, lithic fragments, mica, and heavy minerals. Heavy minerals such as amphibole, zoisite, garnet, clinozoisite, tourmaline, epidote, zircon, pyroxene, chloritoid, sillimanite, rutile, sphene, and opaque minerals are found (3H-4, 60 cm; 22.9 m CSF-A). Occasionally, staurolite is also found. The maximum grain size is 0.54 mm in diameter (2H-6, 130 cm; 17.41 m CSF-A).
Unit III
- Interval: 354-U1455C-4F-2, 59 cm, to 4F-CC, 22 cm
- Depth: 25.29–27.98 m CSF-A
- Age: Middle–Late Pleistocene
- Lithology: calcareous clay
Description
Unit III consists of gray calcareous clay characterized by burrows and mottles toward the base of the unit that transition into light gray and white calcareous clays toward the top.
Unit IV
- Interval: 354-U1455C-5F-1, 0 cm, to 14F-CC, 15 cm
- Depth: 29.40–75.26 m CSF-A
- Age: Middle–Late Pleistocene
- Lithology: sand, sit, clay (major); calcareous clay (minor)
Description
Unit IV is characterized by alternations of clay- and sand-dominant intervals intercalated with calcareous clay beds at 40.59–41.40 and 65.87–66.34 m CSF-A. The clay-dominant intervals mainly consist of thin- to medium-bedded repeated mud turbidite sequences with basal silt units fining upward to clay units (Figure F6C). The sand-dominant intervals mainly comprise thick- to very thick–bedded sands that show normal grading in the upper parts and occasionally include mud clasts.
Composition from smear slides
See Figure F7 for representative smear slide images.
Calcareous clay
Calcareous nannofossils make up the major proportion (70%–90%) of this lithology, along with aggregates of clay minerals that comprise the minor proportion. The smear slide of Sample 8F-1, 6 cm (42.06 m CSF-A), shows a minor amount of foraminifers (up to 10%) along with clay minerals and plant fragments.
Silty sand
Silty sand consists primarily of sand-sized grains of quartz, feldspar, lithic fragments, mica, and heavy minerals. Heavy minerals comprise amphibole, garnet, sphene, clinozoisite, pyroxene, tourmaline, zoisite, epidote, zircon, rutile, sillimanite, staurolite, and opaque minerals. The grain size of this silty sand is coarser than that found in overlying units (9F-1, 5 cm, 47.2 m CSF-A; 6F-2, 100 cm, 35.05 m CSF-A). The maximum grain size is 0.95 mm in diameter (9F-1, 5 cm; 47.2 m CSF-A).
Unit V
- Interval: 354-U1455C-15F-1, 0 cm, to 17F-3, 108 cm
- Depth: 75.10–88.58 m CSF-A
- Age: Middle–Late Pleistocene
- Lithology: calcareous clay (major); silt, volcanic ash (minor)
Description
Unit V is dominated by calcareous clay beds of various colors: white, olive-gray, and dark gray. The beds are generally characterized by dense burrows and mottles and are occasionally intercalated with bioturbated thin silt beds. One ash bed occurs between 82.83 and 82.89 m CSF-A.
Composition from smear slides
See Figure F7 for representative smear slide images.
Nannofossil-rich calcareous clay with foraminifers
Calcareous nannofossils make up a significant proportion of up to 90% of the total grains in the smear slides. A minor proportion of up to 5% foraminiferal fragments is observed. A minor amount (2%–5%) of radiolarians, diatoms, sponge spicules, and clay minerals are also found (15F-3, 39 cm; 78.49 m CSF-A).
Volcanic ash
Smear slides from the ash layers mainly consist of volcanic glass shards 0.10–0.30 mm in diameter and very minor amounts of quartz, feldspar, and biotite. Rarely, garnet grains are found. Volcanic glass appears as clear plates, flakes, and strands with a relatively low refractive index (16F-3, 6 cm; 82.86 m CSF-A). The typical range for the volcanic glass proportion is up to 97% of total grains.
Unit VI
- Interval: 354-U1455C-18F-1, 0 cm, to 24F-3, 85 cm
- Depth: 89.20–120.51 m CSF-A
- Age: early to Middle–Late Pleistocene
- Lithology: sand (major); silty sand, sandy silt, clay, calcareous clay (minor)
Description
Sand is frequently micaceous. Silty sand displays fining-upward texture at some intervals where thin and very thin interbeds of clay and/or silt were recorded. Sandy silt contains mud clasts at 23F-1, 119–150 cm. The clay interval (Section 24F-1) contains thin silt interbeds, and foraminifers were recorded at 24F-1, 0–98 cm. The calcareous clay is nannofossil-rich and burrowed. Drilling disturbance is restricted to flow-in, which affects the sandy silt in Cores 23F-2 and 23F-CC; some fracturing and voiding in the same cores, affecting calcareous clay and clay respectively; and sands and silty sands that are soupy, a texture which may be due to drilling.
Composition from smear slides
See Figure F7 for representative smear slide images.
Clay with silt
The clay with silt lithology is composed primarily of silt-sized grains and a minor proportion of clay minerals (20F-1, 53 cm; 99.23 m CSF-A).
Sand
Sand consists primarily of sand-sized grains of quartz, feldspar, lithic fragments, mica, and heavy minerals. Heavy minerals such as amphibole, garnet, pyroxene, zoisite, tourmaline, sphene, zircon, clinozoisite, epidote, rutile, staurolite, sillimanite, kyanite, and opaque minerals were observed. The maximum grain size is 0.88 mm in diameter (18F-3, 90 cm; 92.83 m CSF-A). The drilled interval is from 120.51 to 359.80 m CSF-A.
Unit VII
- Interval: 354-U1455C-26F-1, 0 cm, to 26F-CC, 5 cm
- Depth: 359.80–363.11 m CSF-A
- Age: Late Miocene
- Lithology: silty sand (major); clay, silty clay (minor)
Description
The majority of this interval is composed of soupy silty sand. The minor lithologies are clay and silty clay. The clay bed grades upward from the silty sand below but has a sharp planar contact with the overlying silty sand.
Unit VIII
- Interval: 354-U1455C-27F-1, 0 cm, to 30F-1, 139 cm
- Depth: 364.50–377.29 m CSF-A
- Age: late Miocene
- Lithology: calcareous clay (major); calcareous ooze, silty sand, clayey silt, clay (minor)
Description
Calcareous clay is commonly nannofossil rich, mottled, and burrowed. At two locations, it is interbedded with either very thin (28F-1, 66–150 cm) or thin (27F-2, 0–56 cm) interbeds of silt. In Sections 29F-2 and 29F-3, calcareous clay is interbedded with two intervals of nannofossil-rich calcareous ooze. Silty sand is micaceous, clayey silt contains silt clasts and is parallel laminated at some locations, and clay is mottled. Drilling disturbance is not severe, restricted to some up-arching and fracturing, with a void and fall-in recorded in Section 28F-1.
Composition from smear slides
See Figure F7 for representative smear slide images.
Calcareous clay
Calcareous nannofossils make up the major proportion (70%–90%) of this lithology, along with aggregates of clay minerals that comprise the minor proportion.
Silty sand
This lithology consists primarily of sand-sized with subordinate silt-sized grains, such as quartz, feldspar, lithic fragments, mica, and heavy minerals. Most grains are angular to subangular, except altered mica. The heavy mineral component, which includes amphibole, garnet, zoisite, clinozoisite, epidote, rutile, tourmaline, zircon, sillimanite, staurolite, and opaque minerals, is in a lower proportion compared to overlying units. The maximum grain size is 0.54 mm in diameter (28F-2, 100 cm; 369.00 m CSF-A).
Unit IX
- Interval: 354-U1455C-30F-1, 139 cm, to 32F-CC, 22 cm
- Depth: 377.29–386.46 m CSF-A
- Age: late Miocene
- Lithology: clayey silt (major); silty sand, silt, silty clay, calcareous clay (minor)
Description
Both clayey silt and silty sand are frequently micaceous. Clayey silt shows parallel laminations. Calcareous clay can contain calcareous nannofossils and is mottled and burrowed. Drilling disturbance in the silts and clays is limited to up-arching. Silty sand is soupy, possibly the result of drilling.
Composition from smear slides
See Figure F7 for representative smear slide images.
Nannofossil-rich calcareous clay
Calcareous nannofossils make up a significant proportion of total grains, up to 90%. A minor proportion, up to 5%, of foraminiferal fragments are observed. Minor amounts of radiolarians, diatoms, sponge spicules, and clay minerals are also found.
Sandy silt
Sandy silt consists primarily of detrital grains of quartz, feldspar, lithic fragments, micas, heavy minerals, and carbonate minerals.
Silty sand
Silty sand in this unit consists primarily of detrital grains of quartz, feldspar, lithic fragments, mica, and heavy minerals. The heavy mineral proportion is comparatively lower than that of the overlying units, and amphibole, garnet, zircon, zoisite, clinozoisite, sphene, epidote, pyroxene, sillimanite, staurolite, and opaque minerals are all found. The maximum grain size is 0.32 mm in diameter (30F-3, 38 cm; 378.66 m CSF-A).
Unit X
- Interval: 354-U1455C-33F-1, 0 cm, to 35F-1, 21 cm
- Depth: 390.00–399.61 m CSF-A
- Age: late Miocene
- Lithology: calcareous clay
Description
Unit X is composed of 9.61 m of light gray to white nannofossil-rich calcareous clay and greenish gray calcareous clay with calcareous nannofossils (Figure F6D). In all clay beds, mottled texture is observed. Most of the contacts between beds are bioturbated or gradational. In interval 34F-2, 8–23 cm, a light brown silt bed with parallel lamination was recovered. In interval 33F-2, 66 cm, to 33F-CC, 35 cm, flow-in drilling disturbance was observed.
Composition from smear slides
See Figure F7 for representative smear slide images.
Silty sand
Silty sand consists primarily of sand-sized grains of quartz, feldspar, lithic fragments, mica, and heavy minerals. Most grains are angular to subangular except altered mica. Heavy minerals include amphibole, garnet, zircon, zoisite, clinozoisite, sphene, epidote, pyroxene, sillimanite, staurolite, and opaque minerals. Occasionally, euhedral carbonate minerals and carbonate aggregate grains are found. The maximum grain size is 0.54 mm in diameter (35F-1, 130 cm; 400.7 m CSF-A).
Unit XI
- Interval: 354-U1455C-35F-1, 21 cm, to 39F-CC, 19 cm
- Depth: 399.61–423.13 m CSF-A
- Age: late Miocene
- Lithology: sand (major); silt, calcareous clay (minor)
Description
Unit XI is composed of 23.42 m of dark gray silty fine sand with mica, dark gray fine sand, gray silt, and light gray to gray calcareous clay with mottled texture. In interval 36F-1, 0–68 cm, dark gray thinly bedded silt is interbedded with thinly bedded dark gray clay. In interval 39F-1, 23–72 cm, gray silt beds have parallel laminations. Sands are homogeneous and soupy, which could indicate high drilling disturbance. Sections 39F-1 through 39F-CC are disturbed with flow-in.
Composition from smear slides
See Figure F7 for representative smear slide images.
Silty sand
Silty sand layers intercalated in this unit consist of fine- and medium-grained sand and silt-sized grains of quartz, feldspar, mica, and lithic fragments. Most grains are angular to subangular except mica. Heavy minerals are mainly composed of amphibole, garnet, tourmaline, zoisite, clinozoisite, epidote, sphene, zircon, sillimanite, rutile, and kyanite. Smear slide 37F-2, 31 cm (410.50 m CSF-A), contains tremolite and actinolite. Occasionally, wood fragments and euhedral carbonate minerals are found. The maximum grain size is 0.58 mm in diameter (39F-1, 20 cm; 418.40 m CSF-A).
Unit XII
- Interval: 354-U1455C-40F-1, 0 cm, to 41F-CC, 28 cm
- Depth: 422.90–431.39 m CSF-A
- Age: late Miocene
- Lithology: nannofossil-rich calcareous clay (major); calcareous ooze (minor)
Description
Unit XII is composed of 8.21 m of greenish gray nannofossil-rich calcareous clay and white calcareous nannofossil-ooze. Bioturbation is common in the clay and ooze beds. In the interval from 41F-1, 0 cm, to 41F-CC, 28 cm, flow-in is observed.
Composition from smear slides
See Figure F7 for representative smear slide images.
Nannofossil-rich calcareous clay
Calcareous nannofossils make up the major proportion (70%–90%) of this lithology, and aggregates of clay minerals and silt grains comprise the minor proportion.
Silt with nannofossils
This lithology mainly contains silt-sized detrital grains with subordinate clay-sized detrital grains, clay minerals, and calcareous nannofossils. The drilled interval is from 431.39 to 773.00 m CSF-A.
Unit XIII
- Interval: 354-U1455C-43R-1, 0 cm, to 50R-CC, 14 cm
- Depth: 773.00–843.03 m CSF-A
- Age: late Miocene
- Lithology: claystone and silt(stone) (major); calcareous claystone (minor)
Description
Unit XIII mostly consists of successions of dark gray silt(stone) fining upward into dark gray claystone (Figure F6E). Silt and siltstone beds frequently exhibit parallel lamination and contain abundant plant fragments and some mud clasts. Claystone beds sometimes exhibit parallel lamination and other times have no internal structures. Between 43R-2, 33 cm, and 44R-1, 55 cm, claystones contain calcareous nannofossils. Gray to dark gray mottled calcareous claystones are observed at 44R-2, 99–150 cm, 46R-2, 95–146 cm, 46R-3, 0–48 cm, and 46R-5, 0–121 cm. Unit XIII predominantly shows slight drilling disturbance, either fracturing or biscuiting. The uppermost part (<13 cm) of most of the cores shows fall-in.
Composition from smear slides
See Figure F7 for representative smear slide images.
Nannofossil-rich calcareous clay
Calcareous nannofossils make up the major proportion (70%–90%) of this lithology, and aggregates of clay minerals and silt grains comprise the minor proportion.
Silty sand
Silty sand consists primarily of sand-sized with subordinate silt-sized grains, such as quartz, feldspar, lithic fragments, mica, and heavy minerals. Most grains are angular to subangular except altered mica. Heavy minerals contain garnet, amphiboles, zoisite, tourmaline, epidote, zircon, pyroxene, and opaque minerals. Occasionally, euhedral carbonate minerals and carbonate aggregate grains are found. The maximum grain size is 0.38 mm in diameter (44R-3, 48 cm; 786.21 m CSF-A).
Unit XIV
- Interval: 354-U1455C-52R-1, 0 cm, to 52R-4, 23 cm
- Depth: 861.20–865.01 m CSF-A
- Age: late Miocene
- Lithology: calcareous claystone
Description
Unit XIV is composed of 3.81 m of greenish gray bioturbated mottled calcareous claystone (Figure F6F).
Unit XV
- Interval: 354-U1455C-52R-4, 23 cm, to 60R-3, 90 cm
- Depth: 865.01–942.35 m CSF-A
- Age: middle–late Miocene
- Lithology: claystone (major); siltstone, calcareous claystone (minor)
Description
Claystone exhibits parallel laminations and has thin interbeds of siltstone. Calcareous claystone is found in interval 58R-3, 66 cm, to 58R-CC, 25 cm. Siltstone beds show parallel laminations and fining-upward texture, contain micas and/or plant fragments, and in some intervals are interbedded with thin beds of claystone. Drilling disturbance is primarily reflected as fracturing (slight to high), with fall-in at the top of some sections.
Composition from smear slides
See Figure F7 for representative smear slide images.
Clay with nannofossils
Calcareous nannofossils account for 30%–50% of the composition. The remaining fraction is composed mostly of clay minerals and minor amounts of radiolarians, diatoms, and their fragments.
Silty sand
Silty sands consist primarily of detrital grains of quartz, feldspar, lithic fragments, mica, and heavy minerals. Most grains are angular to subangular except altered mica. Heavy minerals such as tourmaline, garnet, amphibole, clinozoisite, zoisite, zircon, rutile, apatite, sillimanite, and opaque minerals are found. Occasionally, euhedral carbonate minerals, aggregate grains of carbonate minerals, and foraminiferal fragments are found. The silty sand from 929.92 m CSF-A (59R-1, 52 cm) is remarkably rich in carbonate minerals (<15%). The maximum grain size is 0.41 mm in diameter (59R-1, 52 cm; 929.92 m CSF-A).
Maximum grain size
Maximum grain size was determined at approximately 9 m intervals in Hole U1455C. In each case, the coarsest and/or thickest lithology in the individual core (generally from the base of the coarsest turbidite) was chosen for smear slide analysis, and the largest five equant detrital grains (quartz and feldspar) were measured. Results are shown in Figure F8. In Hole U1455C, the maximum grain size ranges from 0.07 to 0.95 mm (very fine sand to coarse sand). There are three drilled intervals in this hole, and the average maximum grain size decreases with depth. The first drilled interval (0.00–120.51 m CSF-A) averages 0.55 mm (coarse sand), the second drilled interval (359.80–431.39 m CSF-A) averages 0.40 mm (medium sand), and the third interval (773.00–942.35 m CSF-A) averages 0.20 mm (fine sand). The apparent decrease in grain size in the deeper part of Hole U1455C could be a true environmental signal or an artifact of coring caused by the poor sand recovery of RCB technology. We suspect the second possibility is likely, given that in some instances while drilling the deeper sections we observed fast penetration rates followed by poor sediment recovery, indicative of unconsolidated sands.
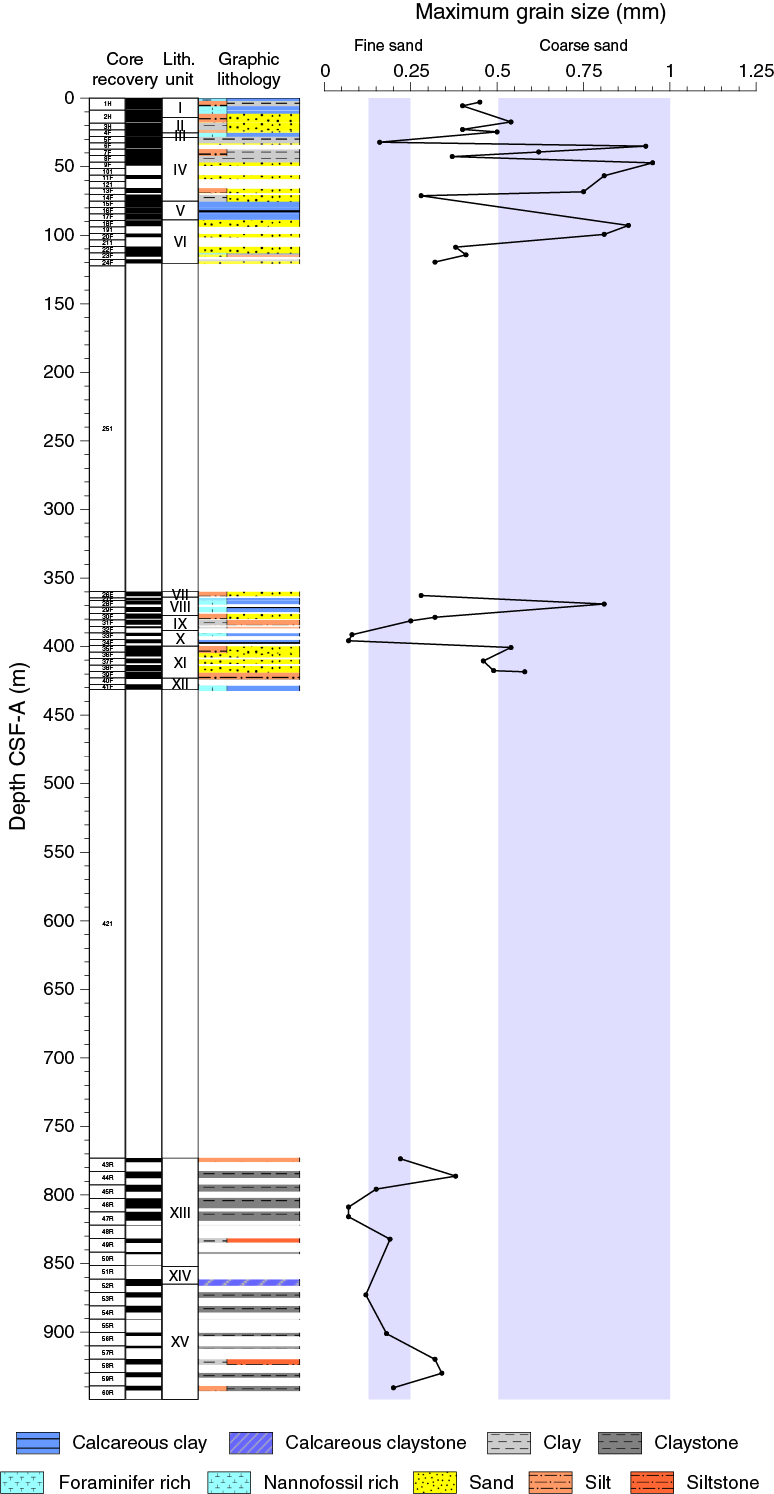
Figure F8. Maximum grain size, Hole U1455C.
Biostratigraphy
Calcareous nannofossils and planktonic foraminifers provide biostratigraphic constraints at Site U1455. Overall, the abundance and preservation of these microfossils is highly variable (Tables T4, T5). In total, 14 biomarkers were observed and 12 biozones were constructed at Site U1455 (Table T6).
Table T4. Calcareous nannofossils, Site U1455. Download table in .csv format.
Table T5. Planktonic foraminifer group and species abundance, Site U1455. Download table in .csv format.
Table T6. Biostratigraphic age datums and midpoint calculations, Site U1455. Download table in .csv format.
Calcareous nannofossils
The distribution of calcareous nannofossils is shown in Table T4. Nannofossil abundances range from barren to very abundant, with poor to excellent preservation.
Based on nannofossil biostratigraphy, the sediments from Site U1455 extend to the middle–late Miocene. Ten nannofossil biohorizons were identified, with four first occurrences (FO) and six last occurrences (LO) dividing the sequence into eight zones, including one gap zone which was identified by the absence of biomarker species (Table T4). Samples 354-U1455C-1H-CC to 7F-CC contain Emiliania huxleyi, the biomarker for Zone NN21. Samples 8F-CC to 14F-CC represent Zone NN20, which can be separated from Zone NN19 (0.44–1.93 Ma) by the presence of Pseudoemiliania lacunosa in Sample 15F-3, 145–150 cm. After Core 24F was retrieved, 240 m of sediment was drilled before coring resumed. Sample 26F-CC contains the FOs of Discoaster brouweri, Discoaster surculus, and Discoaster quinqueramus, which define the biozone as NN11. Nannofossil Zone NN11 was assigned to Cores 26F–41F. The presence of Catinaster coalitus along with D. surculus constrains Cores 43R–53R to nannofossil Zone NN9. The FO of D. brouweri in Sample 55R-CC defines the base of Zone NN8. Core 57R to the bottom of the hole is assigned to Zone NN7 based on the presence of Cyclicargolithus floridanus.
Planktonic foraminifers
The planktonic foraminifer biostratigraphy for Hole U1455 is constrained primarily by analysis of core catcher samples. The group and species abundances of planktonic foraminifers for Site U1455 are shown in Table T5. At Site U1455, foraminifers were regularly found in core catcher samples in the upper 80 m of core. This was followed by a barren interval between 93 and 374 m CSF-A (no cores were recovered from 120 to 360 m CSF-A). Core catcher foraminiferal abundances vary from barren to abundant from 370 m CSF-A to the bottom of the hole at 942.40 m CSF-A. Species diversity decreases with depth, which could be due to preservation changes in the sediments or could reflect a change in environmental conditions of the overlying water column. As with previous sites, benthic foraminifers are rare throughout Site U1455, and planktonic foraminiferal abundance is very low (<1%) to barren in sand and silt layers and considerably higher (common to abundant) in calcareous clay layers.
The sedimentary succession at this site ranges from Subzone PT1b (Middle–Late Pleistocene) to Zone M14 (late Miocene) and agrees with the nannofossil biostratigraphy. A number of barren intervals were identified in Hole U1455C (no cores were recovered from 120 to 360 m CSF-A), most likely because of recovery of turbidite sands in these core catchers. Assemblages exhibited low diversity and were dominated by abundant Neogloboquadrina dutertrei and Pulleniatina obliquiloculata with common Dentoglobigerina venezuelana and rare Globigerina bulloides and Orbulina universa.
The Pleistocene biomarker Globorotalia tosaensis (0.61 Ma) was not found in the core catcher samples at Site U1455, which prevented the identification of Zone PT1a. The FO of Globorotalia truncatulinoides was observed in Sample 354-U1445C-16F-CC (84.28 m CSF-A); the bottom of this species has been calibrated by Gradstein et al. (2012) to 1.93 Ma within planktonic foraminifer Zone PL6. Zone PL3 is indicated by the LO of Sphaeroidinellopsis seminulina between Samples 29F-CC (374.59 m CSF-A) and 28F-CC (369.15 m CSF-A). This bioevent immediately follows a barren interval; therefore, further postexpedition work is required to constrain the timing of this event. The LO of Globoquadrina dehiscens is between Samples 30F-CC (376.49 m CSF-A) and 29F-CC (374.59 m CSF-A). The top of this species has been calibrated by Gradstein et al. (2012) to 5.92 Ma.
Paleomagnetism
We completed a preliminary paleomagnetic study on 42 of the 54 cores collected from Hole U1455C, with our work focused on identifying polarity reversals, particularly in pelagic and hemipelagic units. Cores that contained mostly sand or were watery or highly deformed were not measured. Hole U1455C cores were collected in three intervals. From 0 to ~120 m CSF-A (Cores 1H–24F), cores were collected using the APC and HLAPC systems; these cores are the focus of our shipboard analysis. Cores from a middle interval (Cores 26F–41F; ~360–430 m CSF-A) and a deep interval (Cores 43R–60R; 773–949 m CSF-A) had lower recovery rates and/or were more deformed by coring. Holes U1455A and U1455B were mudline cores and were also measured for survey purposes.
Cores 354-U1455C-1H through 3H were azimuthally oriented using the Icefield MI-5 tool. All other cores were unoriented. In relatively continuous cores of fine-grained material, we were able to use declination data to identify polarity transitions within cores. Use of the RCB system in the deep interval in Hole U1455C caused core pieces to rotate independently of one another, making polarity determination from declination data impossible in most cases. Although structural features such as dipping beds can allow pieces to be oriented relative to one another in some cases (see Paleomagnetism in the Expedition 354 methods chapter [France-Lanord et al., 2016a]), such features are difficult to interpret in Hole U1455C cores. However, declinations measured on unoriented cores will allow reorientation of the cores or core pieces for future magnetic anisotropy studies.
Remanent magnetization measurements were made on archive section halves (Nsections = 70) and discrete samples from the working section halves (Nsamples = 15) from Hole U1455C (Figures F9, F10; Tables T7, T8). The natural remanent magnetization (NRM) of most archive halves was measured on the shipboard superconducting rock magnetometer (SRM) before and after 15 and 20 mT alternating field (AF) demagnetization. For Cores 1H and 2H, we measured the remanence after 0, 10, and 15 mT AF treatments to preserve the cores in case future work could be done in a shielded environment. The remanence vector measured after the highest AF treatment is used here for polarity interpretation. Sections were measured at 2.5 cm intervals. Coarse-grained and deformed intervals, as well as ends of sections likely to be affected by edge effects, were not interpreted (see Paleomagnetism in the Expedition 354 methods chapter [France-Lanord et al., 2016a]).

Figure F9. NRM decay (left) and AF demagnetization vector (right) diagrams of discrete samples, Site U1455.
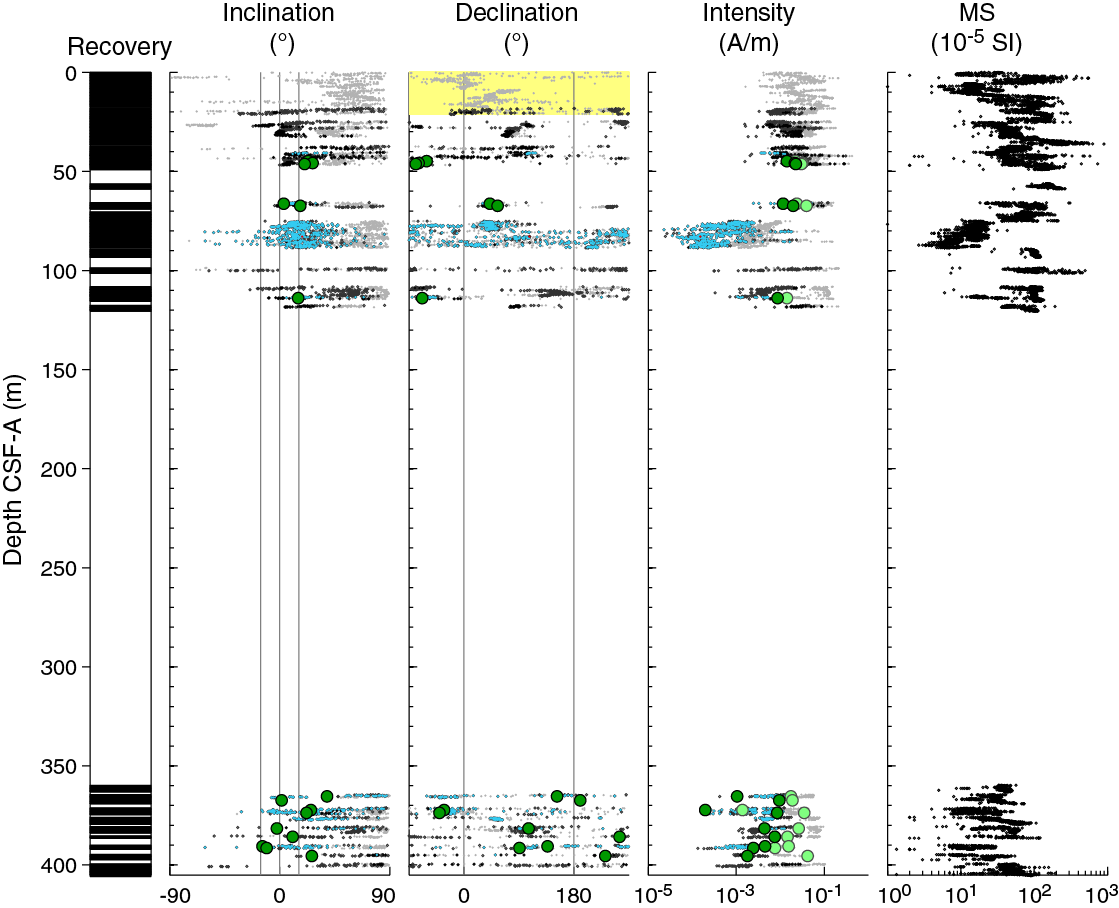
Figure F10. NRM of archive section halves and discrete samples before and after 15 (Cores 1H–3H) or 20 mT AF demagnetization, Hole U1455C.
Table T7. ChRM of discrete samples, Hole U1455C. Download table in .csv format.
Table T8. Orientation data, Site U1455. Download table in .csv format.
Discrete sample locations were chosen in fine-grained intervals where drilling deformation was minimal or not visible. These samples were measured on the JR-6 spinner magnetometer before and after 10, 15, 20, 25, 30, 35, 40, 50, and 60 mT AF demagnetization with a measurement protocol designed to identify and mitigate the effects of anhysteretic remanent magnetization (ARM) (see Paleomagnetism in the Expedition 354 methods chapter [France-Lanord et al., 2016a]; Table T7). AF steps ranging between 10 and 50 mT were included in the principal component analysis (PCA) direction determination for all samples. Specific steps were chosen based on the demagnetization behavior of each sample. Discrete samples with characteristic remanent magnetization (ChRM) vectors that deviate from the origin by more than 10° or with maximum angular deviation angles of over 15° were not used to guide our magnetostratigraphic interpretation.
Results
Paleomagnetic results from both section-half and discrete measurements are presented in Figures F9 and F10 and Tables T7 and T9. As at previous sites, both positive and negative NRM inclinations are present in Hole U1455C, although steep positive NRM inclinations are much more abundant because of the pervasive drilling overprint. The overprint is removed in most cases by AF demagnetization in peak fields of 10 mT. After 20 mT AF treatment, remanence vectors from section halves that pass our quality criteria (see Paleomagnetism in the Expedition 354 methods chapter [France-Lanord et al., 2016a]) have a Fisher (1953) mean inclination of 14.7°, close to the angle expected from a geocentric axial dipole (GAD) at the present site location. Nonetheless, the inclination of remanence vectors from Site U1455 sediments is generally too variable and too close to zero to use for magnetostratigraphic interpretation.
Table T9. Magnetostratigraphy, Hole U1455C. Download table in .csv format.
Calcareous clay layers from Site U1455 typically have NRM intensities almost an order of magnitude lower than those of other lithologies (calcareous clay = median intensity 7.3 × 10⁻³ A/m; sand = median intensity 7.6 × 10⁻²; other lithologies = 4.6 × 10⁻² A/m). In some calcareous clay intervals, magnetization is at or near the detection limit of the SRM, leading to short-wavelength spurious directional changes.
Coercivities of the remanence carriers are consistent with magnetite and/or titanomagnetite as the principal NRM carrier. In some cases, discrete samples acquire a remanence (an ARM or gyroremanent magnetization [GRM]) in high AF treatments (Figure F9).
Magnetostratigraphy
Based on section-half and discrete sample data, we interpret the paleomagnetic data from Hole U1455C to indicate intervals of both normal and reversed polarity and intervals in which the polarity is uncertain (Figure F11; Table T8). Remanence vectors from Core 1H, measured after 15 mT AF demagnetization, have a Fisher (1953) mean direction consistent with the GAD approximation of the magnetic field (357.4° declination; 18.4° inclination). Cores 2H and 3H have substantially different mean remanence directions, both in inclination and declination (2H = 44.2° declination, 26.0° inclination; 3H = 178.2° declination, 59.5° inclination). Both mean directions are considerably steeper than either the present-day field or the GAD approximation, suggesting that the directions in these two cores may be affected by drilling overprint even after demagnetization. Nonetheless, we identify the interval above Core 16F as normally magnetized.
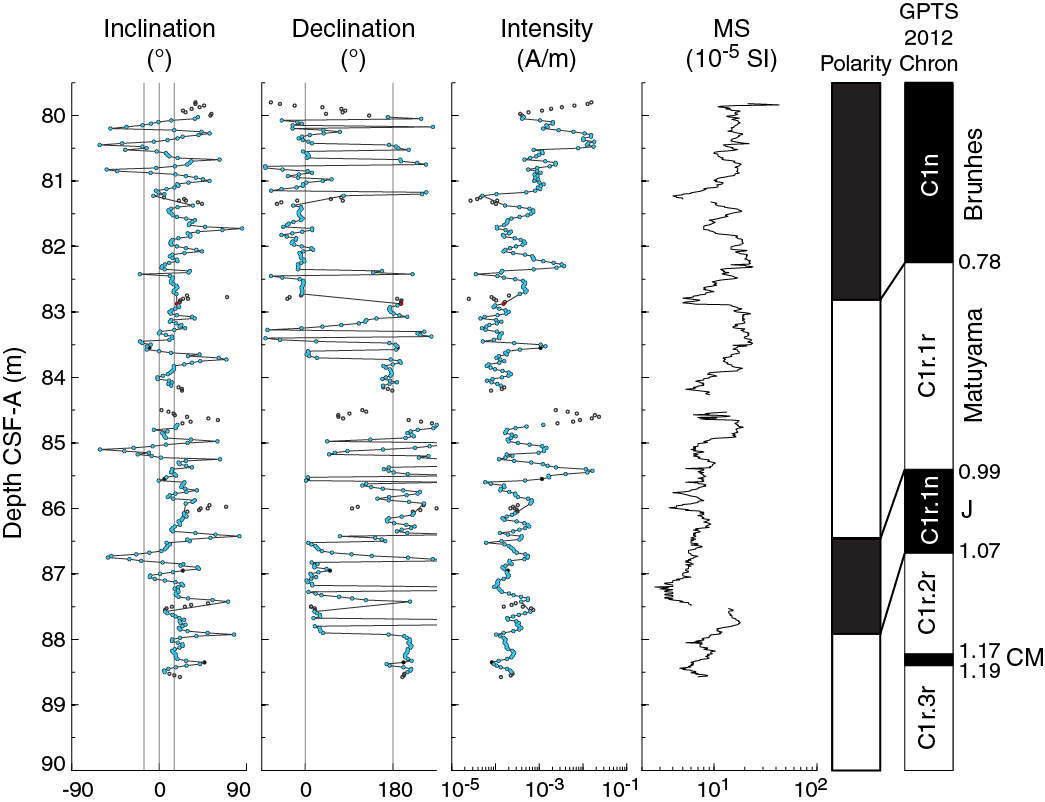
Figure F11. Polarity interpretation, Cores 354-U1455C-16F and 17F.
The uppermost two sections of Core 16F, although plagued by short-wavelength directional variations, are dominantly of one polarity. Near the break between Sections 16F-2 and 16F-3, a ~180° change in declination occurs just above a thin ash layer. Based on similar occurrences at other sites in the Expedition 354 transect, we interpret this as the Brunhes/Matuyama boundary (C1n-C1r.1r; 0.781 Ma). The short-wavelength noise continues into Core 17F. We interpret two of the ~180° polarity changes not associated with large intensity changes (Sections 17F-2 and 17F-3) as the boundaries of the Jaramillo Subchron (C1r.1n; 0.998–1.072 Ma). Unlike at previous sites, sediments recording the Cobb Mountain Subchron were not recovered at Site U1455. We note that, as at previous sites, the interval containing the Brunhes/Matuyama boundary and the Jaramillo Subchron comprises dominantly mottled, bioturbated calcareous clay, which we interpret as hemipelagic. The thickness of the Jaramillo Subchron here (~1.5 m) implies a deposition rate (~2 cm/ky) within this hemipelagic layer similar to that calculated for previous sites. We propose labeling this hemipelagic interval M1HL (the “magic 1 Ma hemipelagic layer”) and plan to investigate its extent and significance further in postexpedition research.
In the interval between Cores 26F and 41F (~360–430 m CSF-A), few continuous intervals of fine-grained material long enough for robust magnetostratigraphic interpretation were recovered. In a calcareous clay interval in Section 27F-1, a large change in inclination is accompanied by a complex change in declination. Because there is no evidence of disturbance in the core visual descriptions or in our observation of the core itself, we believe this indicates a polarity reversal. Calcareous nannoplankton marker species indicate that this core is in Biozone NN11 (see Biostratigraphy) (Gradstein et al., 2012). Several possible reversals in C3A and C3B occur within this biozone; because of the discontinuous magnetic record, we are unable to identify which reversal this is. Deeper in the middepth interval (Core 33F), we observed a nearly 180° change in declination in the section-half data, again in a calcareous clay interval. There is no corresponding change in the inclination data from section halves, and discrete samples on both sides of this possible transition have negative inclinations (e.g., Figure F9). This transition requires further postexpedition investigation.
Geochemistry and microbiology
Hydrocarbon gas sampling and analysis
Headspace gas samples were taken at a frequency of one sample per core in Holes U1455B and U1455C as part of the routine safety monitoring program (Table T10). The methane concentration measured at a single depth interval (3.5 m CSF-A) in Hole U1455B was 1 ppmv. In Hole U1455C, low methane concentrations (1–3 ppmv) from the top of the hole to 430 m CSF-A were observed, with the exception of 73–78 m CSF-A, where methane concentrations were higher (33–120 ppmv). Methane concentrations increase at depths below 430 m CSF-A and range between 15 and 2758 ppmv from 430 m CSF-A to the bottom of Hole U1455C. The highest methane abundances were measured at 922 m CSF-A. At 794 m CSF-A, quantifiable concentrations (1 ppmv) of ethene were also observed. Quantifiable concentrations (1 ppmv) of ethane were observed at 873 and 902 m CSF-A.
Table T10. Methane concentrations, Site U1455. Download table in .csv format.
Interstitial water sampling and chemistry
A total of 10 samples from Holes U1455A and U1455B were analyzed for interstitial water chemistry (Table T11), focusing on microbiological processes occurring in the uppermost 30 m of the sediment pile. As at previous sites, the chemistry of the interstitial water in the upper portion of the sediment column is dominated by biogenic processes that release dissolved phosphate, ammonium, and CO2 (leading to a rise in alkalinity) and consume sulfate. Coring disturbance prevented sampling the uppermost 3.4 m CSF-A of Site U1455, but linear extrapolation to the water/sediment interface suggests sulfate content indistinguishable from seawater composition and salinity within 0.5‰ of the values found in the top unit at Sites U1449–U1453. Sulfate reduction reaches 75% at 30 m CSF-A (Figure F12). The rate of increase in alkalinity is greater in the uppermost 7 m and is in excess of 600% with respect to bottom seawater at 30 m CSF-A. This rise in alkalinity is associated with a drop in calcium and magnesium contents (33% and 17%, respectively). Unlike at Site U1454, phosphate and ammonium contents are correlated at this site.
Table T11. Interstitial water geochemical data, Site U1455. Download table in .csv format.
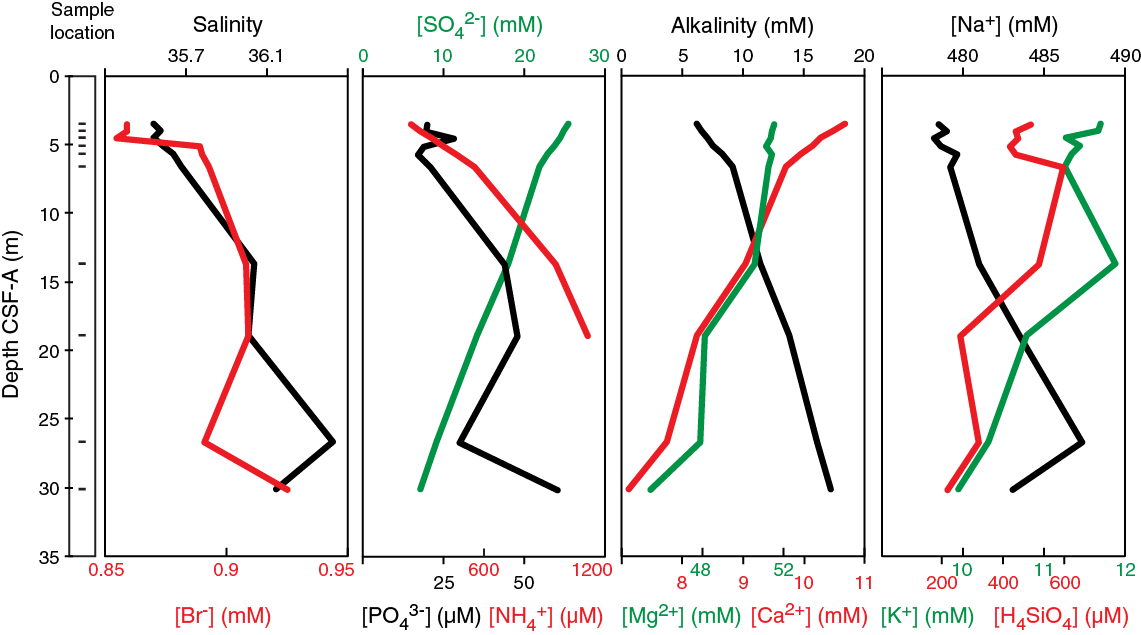
Figure F12. Variations of salinity, bromide, sulfate, phosphate, ammonium, alkalinity, magnesium, calcium, sodium, potassium, and silicon concentrations in interstitial waters, Site U1455.
Bulk-sediment geochemistry
Inorganic carbon
Total inorganic carbon (TIC) concentrations were determined on 30 sediment samples from Hole U1455B and the uppermost 420 m CSF-A of Hole U1455C (Table T12). TIC values range from 0.2 to 9.0 wt% (average = 1.5 wt%). TIC expressed as weight percent calcium carbonate (CaCO3), assuming all inorganic carbon is present only as CaCO3, ranges between 1.4 and 74.8 wt% (average = 12.2 wt%; Figure F13). Turbiditic sediments are characterized by carbonate content ranging from 1.4 to 10.0 wt% (average = 5.3 wt%) and have higher carbonate content deeper than 360 m CSF-A than in the uppermost 110 m CSF-A. The spot coring technique employed at Site U1455 does not allow us to pinpoint the character (i.e., sharp or gradual) or loci of this change. However, combining our data with the shipboard carbonate content measurements of DSDP Site 218 sediments (Table T13; Figure F13) shows that they are in excellent agreement with data from overlapping sections of Site U1455 (i.e., 0–120 and 360–420 m CSF-A). The Site U1455/Site 218 composite record suggests that the change in carbonate content of turbiditic sediments occurs somewhere between 300 and 360 m CSF-A.
Table T12. TIC, CaCO3, TC, and TOC contents, Site U1455. Download table in .csv format.
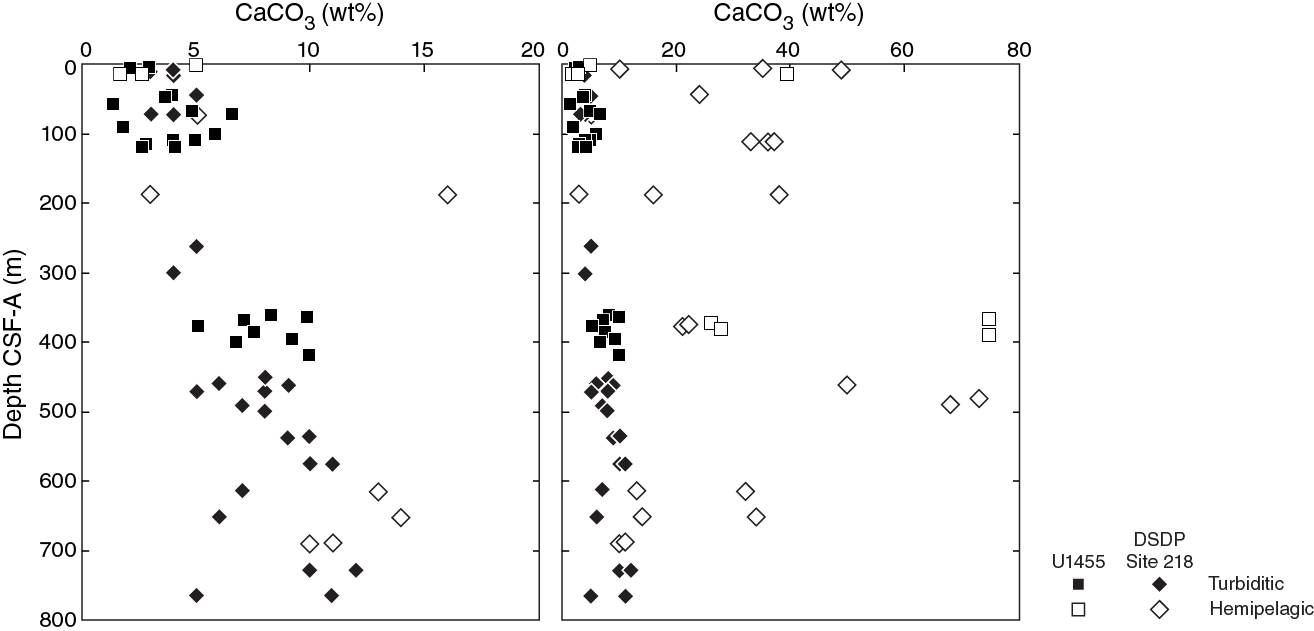
Figure F13. TIC content expressed as CaCO3, Sites U1455 and 218.
Table T13. TOC and CaCO3 content, DSDP Leg 22, Site 218. Download table in .csv format.
A similar increase in carbonate content was observed between 130 and 180 m CSF-A at Site U1451 and around 620 m CSF-A at Site U1450. At all three sites, this increase in carbonate content seems to occur near the Pliocene/Miocene boundary according to published (Site 218: von der Borch, Sclater, et al., 1974; Galy et al., 2010) and preliminary (Sites U1450 and U1451) age-depth models. The similarity in timing and character of the carbonate content change (i.e., sharp) over three sites across the Bengal Fan suggests it reflects a regional phenomenon, such as a major change in the delivery of detrital carbonate from the Himalayan range.
Pelagic and hemipelagic intervals sampled at Site U1455 (defined as calcareous clay and ooze in Lithostratigraphy) are characterized by extremely variable carbonate content (1.7–74.8 wt%). All together, the carbonate contents of 67 pelagic and hemipelagic sediments for the seven sites along the 8°N transect across the Bengal Fan vary between 0.2 and 87.1 wt% (median = 20.8 wt%; Figure F14). By comparison, turbiditic sediments generally have lower carbonate content (0.6–15.6 wt%; median = 4.6; N = 272). However, carbonate contents of pelagic and hemipelagic deposits are not normally distributed, and in 29 out of 67 samples (43%) they are statistically indistinguishable from turbiditic sediments.
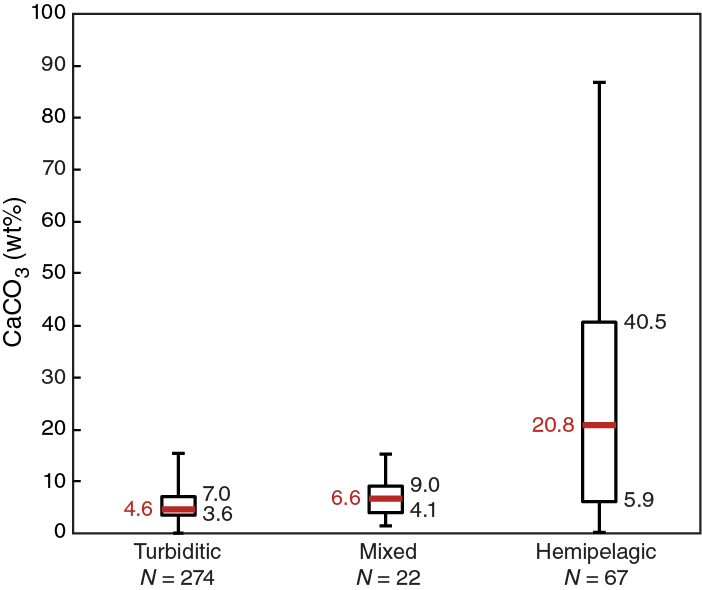
Figure F14. Whisker plot of calcium carbonate content of hemipelagic, mixed, and turbiditic sediments from all Expedition 354 sites.
Organic carbon
Total carbon (TC) values range from 0.2 to 9.6% (average = 1.9%). TOC of sediments, calculated by the difference between TC and TIC, is systematically low (average = 0.4%), ranging between <0.1 and 0.9 wt% (Table T12; Figure F15). Shipboard TOC measurements of Site 218 sediments (Table T13; Figure F15) are in excellent agreement with data from overlapping sections of Site U1455 (i.e., 0–120 and 360–420 m CSF-A). The Site U1455/Site 218 composite record shows that TOC of pelagic and hemipelagic sediments broadly decreases with depth. A similar decline was observed at Sites U1450 and U1451. Overall, this decline could reflect either postdepositional degradation of organic matter or variable rate of transfer of marine primary production from the photic zone to the bottom of the ocean.

Figure F15. TOC content, Sites U1455 and 218.
In turbiditic sediments, TOC is variable, ranging from <0.1 to 0.7 wt% and broadly covarying with grain size and mineral composition. All together, the TOC values of Pleistocene turbiditic sediments recovered from the seven sites along the 8°N transect across the Bengal Fan covary with Al/Si (Figure F16), a proxy for grain size and mineral composition, reflecting the preferential association of organic matter with clays that has previously been documented in both the modern Ganga-Brahmaputra river system and in active channel-levee sediments in the Bay of Bengal deposited over the past 18 ky (e.g., Galy et al., 2007). Preliminary estimates of organic carbon loading in Pleistocene turbiditic sediments compare well with observations made in the modern Ganga-Brahmaputra river system, suggesting efficient terrestrial organic carbon burial in the Bengal Fan throughout the Pleistocene.
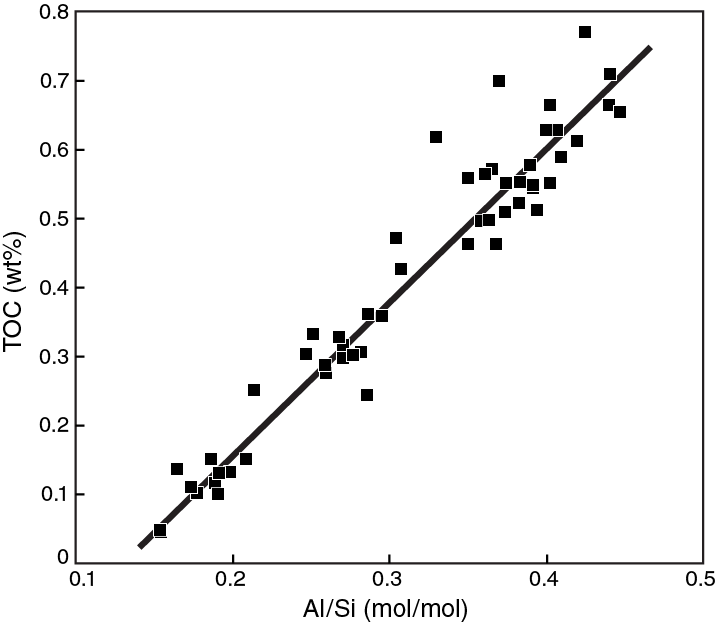
Figure F16. Relationship between TOC content and Al/Si ratio of Pleistocene turbiditic sediments from all from all Expedition 354 sites.
ICP-AES results
Major and trace element concentrations were determined on six sediment samples from Holes U1455B and U1455C by inductively coupled plasma–atomic emission spectroscopy (ICP-AES) (Table T14) to 14 m CSF-A. As at all previous sites, bulk-sediment major and trace element trends correspond closely with lithologic type. Combined Fe/Si or K/Si versus Al/Si datasets for Sites U1455 and U1454 (Figure F16) are well correlated, as observed for Sites U1449–U1453, and match well the trends for modern sediments in the Ganga-Brahmaputra river system (e.g., Lupker et al., 2012). As noted previously at other sites (e.g., see Geochemistry and microbiology in the Site U1453 chapter [France-Lanord et al., 2016d]), pelagic and hemipelagic samples offset from the main trends indicate the possible occurrence of (1) Fe-rich clays and (2) low K/Si subpopulation characteristic of smectite-kaolinite-rich samples similar to those from the 7–1 Ma period in sediments recovered during ODP Leg 116 (France-Lanord and Derry, 1997). As previously noted, these signatures may suggest a different terrigenous input (i.e., more highly weathered sources) for some intervals (Figure F17). Trace element variations are also well correlated with lithology at Site U1455, showing the expected trends previously noted at other sites for the lithologic types represented, (e.g., for Sr vs. Ca, etc. [not shown]).
Table T14. Major elements and selected trace element contents, Site U1455. Download table in .csv format.

Figure F17. Fe/Si and K/Si plotted vs. Al/Si, Sites U1454 and U1455.
Microbiology
For microbiological investigations, eight whole-round core sections were collected from a 6.9 m long mudline core on the catwalk. Samples were taken and stored for detailed postexpedition microbiological studies. For prokaryotic cell count, a method was initiated onboard by fixing 2 cm3 sediment in 10 mL 2.5% NaCl and 2% formaldehyde solution.
Physical properties
Physical property data were acquired for Site U1455, including density, magnetic susceptibility, P-wave velocity, NGR, and thermal conductivity (see Physical properties in the Expedition 354 methods chapter [France-Lanord et al., 2016a]). Three holes were cored at this site: two shallow-penetration surficial holes (U1455A and U1455B), and one deeper hole (U1455C). In Hole U1455C, three intervals were drilled: 0–122.3 m CSF-A (Cores 1H–24F), 359.8–431.4 m CSF-A (Cores 26F–41F), and 773.0–949.0 m CSF-A (Cores 43R–60R). The upper two intervals were cored with APC and HLAPC technology with rather good core recovery, whereas the lower, RCB-drilled interval had relatively poor core recovery (34%; Figure F18).

Figure F18. Physical property measurements, Site U1455.
Using the principal lithologic name from the core description, we assigned eight lithologies (see Lithostratigraphy) and calculated their average physical properties (Table T15). Accordingly, the most common principal lithology is sand (~56 m), followed by clay (~40 m), claystone (~38 m), silt (~22 m), clay (~21 m), calcareous claystone (~10 m), siltstone (~6 m), and volcanic ash occurring in minor proportions. Physical property measurements are described in detail below, but average values are as follows. Average wet bulk densities vary from 1.84 to 2.06 g/cm3 for terrigenous sediment (sand, silt, and clay). Lithified sediments (claystone, calcareous claystone, and siltstone) have higher average wet bulk densities (2.12–2.20 g/cm3). Average P-wave velocities are also higher for lithified intervals (1795–1931 m/s), whereas they are lowest in clay and calcareous clay (~1540 m/s). Average magnetic susceptibilities are highest in sand (112 × 10–5 SI), followed by silt (166 × 10–5 SI) and clay (55 × 10–5 SI). The lowest values occur in calcareous clay and volcanic ash (~20 × 10–5 SI). NGR is elevated throughout the terrigenous and lithified sediment (64–71 counts/s) and low in calcareous clay (37 counts/s). Thermal conductivity is highest in claystone (2.23 W/[m·K]) and lowest in calcareous clay and calcareous claystone (~1.2 W/[m·K]).
Table T15. Total sediment thickness, percentage of recovered material, and average physical properties with respect to lithology, Site U1455. Download table in .csv format.
Physical property measurements and measurement intervals
High-resolution physical property measurements were made on Site U1455 cores to provide basic information on sediment composition and variability. Whole-Round Multisensor Logger (WRMSL) measurements were made at 1 cm increments for density by gamma ray attenuation (GRA) and magnetic susceptibility and at 5 cm increments for P-wave logger (PWL) data. NGR measurements were made at 10 cm increments, and thermal conductivity measurements were made at one measurement per core.
On split cores, point magnetic susceptibility and color reflectance (RSC) were measured at 1 cm increments using the Section Half Multisensor Logger (SHMSL). Additionally, we took discrete samples for moisture and density (MAD) measurements (one or two samples per core, typically representing coarse-, medium-, and fine-grained intervals or pelagic intervals with varying carbonate or biogenic opal content) to determine water content, wet bulk density, dry bulk density, porosity, and grain density. P-wave velocities were made on the half-core gantry caliper instrument (P-wave caliper; PWC) at one to three measurements per section, where possible. Also, the assignation into different lithologies was taken from the core description (see Lithostratigraphy). Average physical properties measured for Hole U1455C are given in Table T15.
Whole-Round Multisensor Logger measurements
Results from WRMSL measurements on the three intervals cored in Hole U1455C are compiled in Figure F18. For illustration purposes, data from the top and bottom 2 cm of each section were removed because they contain a cap and often represent part sediment and part air and because the volume contributing to the measurement is unknown. Data that are unrealistic for the cored formations, such as densities <1.05 g/cm3 and velocities <1425 m/s, were also excluded. All original data remain in the LIMS database.
Gamma ray attenuation bulk density
Average wet bulk densities (GRA) measured with the WRMSL range from 1.66 to 2.0 g/cm3, depending on lithology (Table T15). These values are in good agreement with MAD-determined values for the upper two intervals, which show larger variability depending on frequent lithologic changes between sandy to silty and clayey sections. However, for the lowermost interval drilled with the RCB system (773.0–949.0 m CSF-A; Cores 43R–60R), the few MAD samples analyzed on board indicate that GRA densities are too low because the liner cross section of RCB cored material is not entirely filled, and therefore in situ values are underestimated (Figure F18; see Physical properties in the Site U1451 chapter [France-Lanord et al., 2016c]).
Magnetic susceptibility
Magnetic susceptibility is sensitive to the concentration and type of magnetic minerals. Average values are lowest in calcareous clay and volcanic ash (16 × 10–5 SI to 19 × 10–5 SI) and highest in silty and sandy lithologies (61 × 10–5 SI to 94 × 10–5 SI; Table T15). The first interval cored in Hole U1455C (0–122.3 m CSF-A; Cores 1H–24F) shows the highest variability in magnetic susceptibility, which results from the high degree of lithologic variability. The lowermost interval, however (773.0–949.0 m CSF-A; Cores 43R–60R), has low and rather uniform values, with the exception of Core 56R (Figure F18), where, claystone, siltstone, and calcareous claystone prevail.
P-wave velocity
Average P-wave velocities from the PWL are highest in lithified sediments (1795–1931 m/s) (Table T15) of the lowermost interval (773.0–949.0 m CSF-A; Cores 43R–60R). Higher values of calcareous claystone with respect to claystone could indicate diagenetic mobilization. The lowest average values were observed for clay and calcareous clay (1534–1552 m/s). As at previous sites, the PWL software and settings were being adjusted. Applying higher pressure to the transducer heads led to minor differences between PWL- and PWC-determined P-wave velocities because of a better coupling.
Natural gamma radiation
Average NGR values are lowest in calcareous clay (37 counts/s). Average values for all other lithologies are rather uniform (63–71 counts/s; Table T15). The uppermost two intervals (0–122.3 and 359.8–431.4 m CSF-A) show distinct downcore variations depending on lithology, whereas the lowermost, more lithified interval (773.0–949.0 m CSF-A) shows rather uniform and elevated values (Figure F18).
Thermal conductivity
Average thermal conductivities are highest in claystone (2.23 W/[m·K]) and lowest in clay, calcareous clay, and calcareous claystone (1.2–1.3 W/[m·K]). The lowermost interval of Site U1455 (773.0–949.0 m CSF-A; Cores 43R–60R) shows the largest scatter and the highest values (Figure F19).
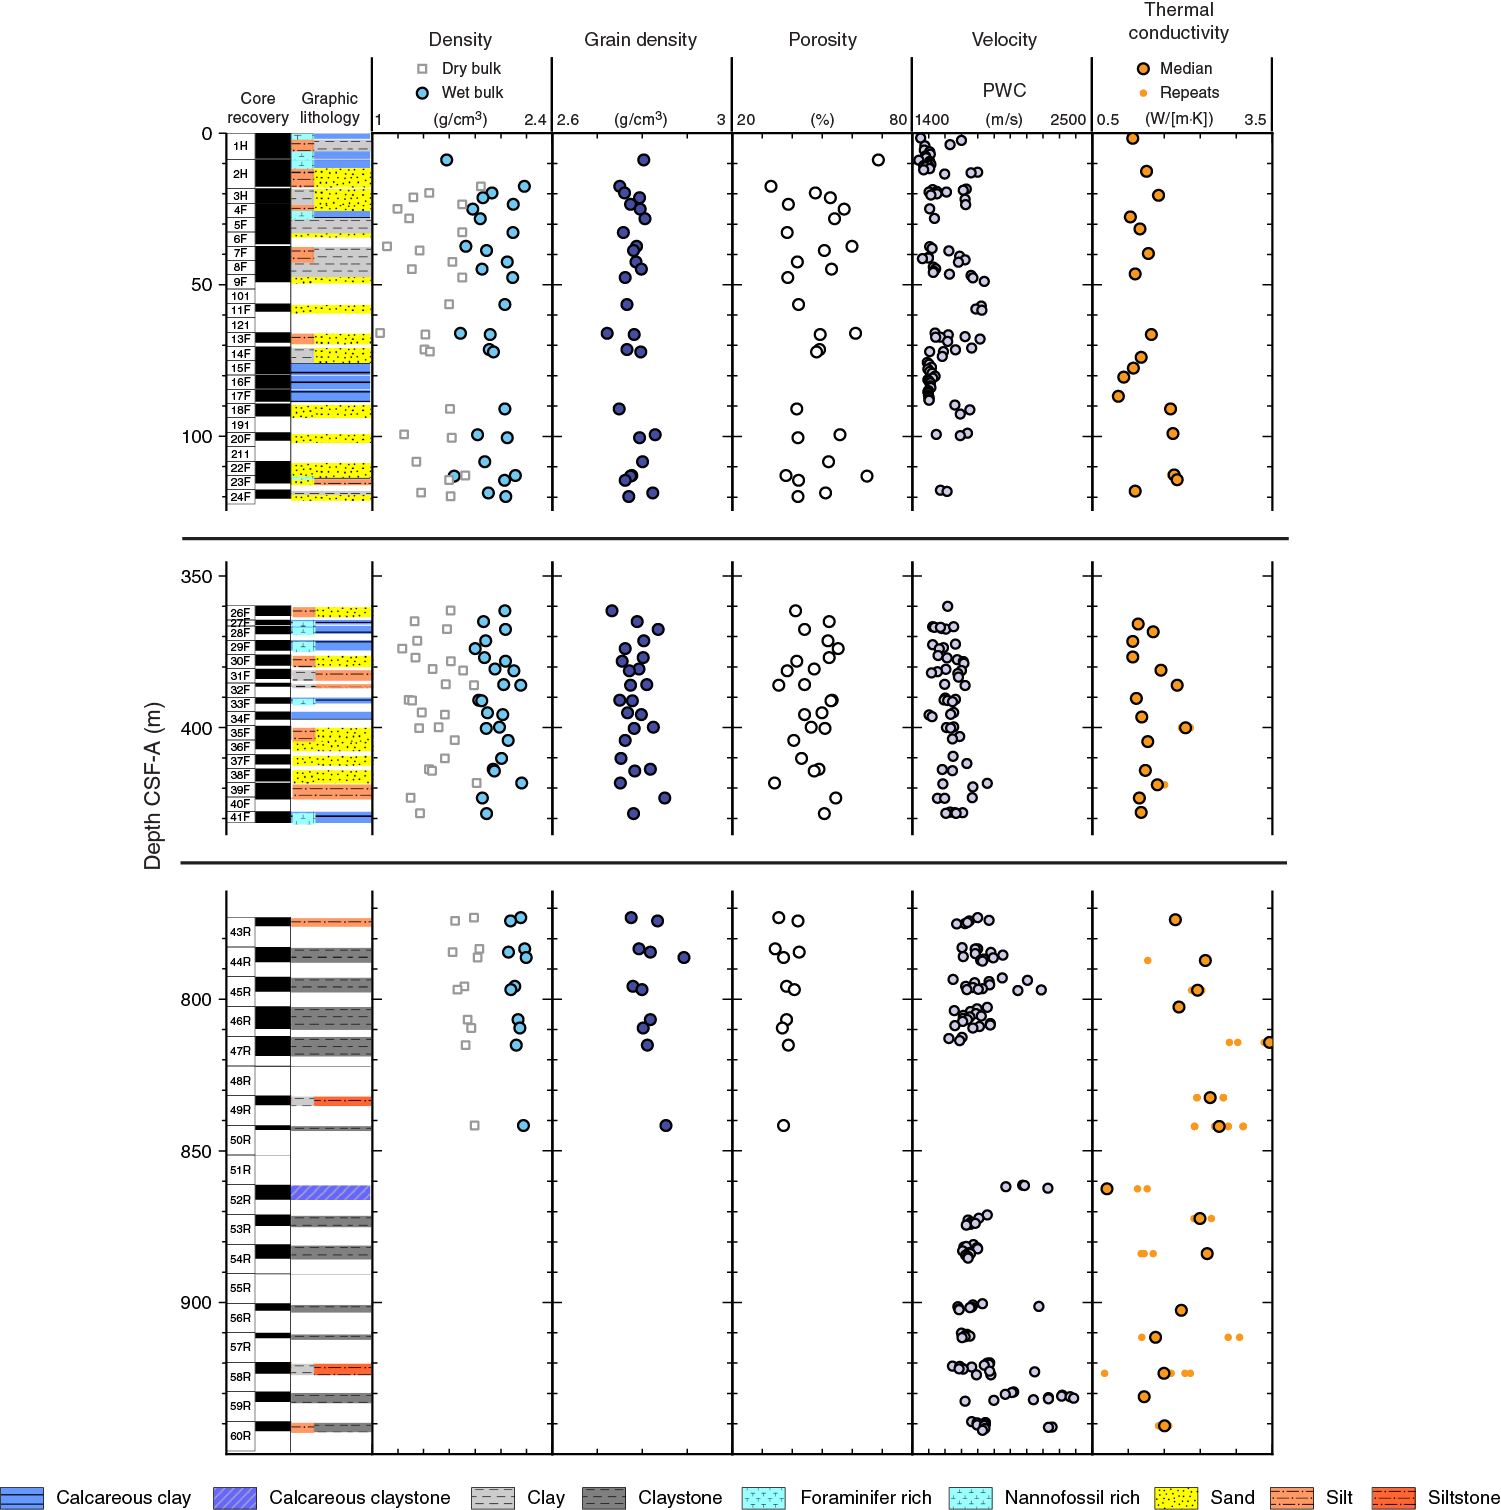
Figure F19. Moisture and density results, Hole U1455B.
Point magnetic susceptibility
Point magnetic susceptibility measurements made with the SHMSL are slightly higher than WRMSL susceptibility results (Table T15). However, they follow the same downcore trend as WRMSL-determined magnetic susceptibility (Figure F18).
Discrete compressional wave velocity
Average P-wave velocities for each principal lithology measured with the PWC vary from 1534 to 1931 m/s (Table T15). They are slightly higher than PWL-determined values (see P-wave velocity, above) but generally follow their trend rather closely (Figure F18).
Moisture and density
Water content, porosity, and wet and dry bulk densities are interdependent. Wet bulk densities determined with MAD procedures have less extreme variations than WRMSL measurements (Figures F18, F19). As this was the last site of Expedition 354, MAD measurements could only be completed through Core 49R (842 m CSF-A).
Average Site U1455 MAD wet bulk densities are highest for lithified material (2.12–2.20 g/cm3) and lowest for clay and calcareous clay (~1.85 g/cm3) (Table T15). Porosities range from 30% to 80% depending on lithology (Figure F19). Average grain densities are rather uniform and range from 2.77 to 2.83 g/cm3.
Color reflectance
Sediment color component L* varies from 20 to 70, with highest average values for calcareous clay (43) and lowest values for siltstone and claystone (32–34) (Table T15). Variability is highest in the middle interval drilled from 359.8 to 431.4 m CSF-A (Cores 26F–41F), with distinct cyclicity.
Core disturbances and data quality
Core disturbances are displayed in Figures F4 and F5. They affect the quality and reliability of physical properties in various ways.
Data variability and downhole trends
In Hole U1445C, 350.7 m were cored with an overall recovery of 194.35 m that have been assigned to a principal lithology. The upper and middle cored intervals (0–122.3 and 359.8–431.4 m CSF-A) show lithologic changes from sandy to clayey sediment repeatedly interrupted by calcareous clay (Figure F18). Accordingly, all physical properties show high-frequency variability in these intervals as well, especially in the middle interval. The lowermost, relatively poorly recovered, RCB-cored interval (773.0–949.0 m CSF-A) recovered mostly lithified sediment. Here, NGR, magnetic susceptibility, and L* show little variability, whereas wet bulk densities and P-wave velocities vary substantially.
Downhole measurements
Downhole temperature and heat flow
The two advanced piston corer temperature tool (APCT-3) downhole temperature measurements in Hole U1455C are 7°C at 117.6 m DSF and 14.4°C at 371.2 m DSF (Figure F20; Table T16), and over the interval from the seabed to the lowest measurement the geothermal gradient is 34°C/km. The seafloor temperature was 1.55°C, based on APCT-3 data taken while the unit was held at the mudline for 5 min while lowering it into the hole.

Figure F20. APCT-3 temperature-time series, Hole U1455C.
Table T16. Formation temperatures derived from APCT-3 measurements, Hole U1455C. Download table in .csv format.
Thermal conductivity under in situ conditions was estimated from laboratory-determined thermal conductivity from Hole U1455C using the method of Hyndman et al. (1974) (see Physical properties in the Expedition 354 methods chapter [France-Lanord et al., 2016a]). The calculated in situ values are within 2% of the measured laboratory values. Because of the long gap in measurements over the drilled interval from 120 to 360 m CSF-A, we did not use the piecewise linear calculation of thermal resistance that was used for previous Expedition 354 sites. Instead, we calculated the thermal resistance based on the average thermal conductivity value between 0 and 375 m CSF, 1.39 W/(m·K). A heat flow of 48 mW/m2 was obtained from the linear fit between temperature and thermal resistance (Pribnow et al., 2000). The geothermal gradient and heat flow values at Site U1455 and at all Expedition 354 sites are within the normal range for ocean basins of same age of 90–100 Ma (Müller et al., 2008) and consistent with other measurements in the Bay of Bengal (Figure F21) (Hasterok et al., 2011).
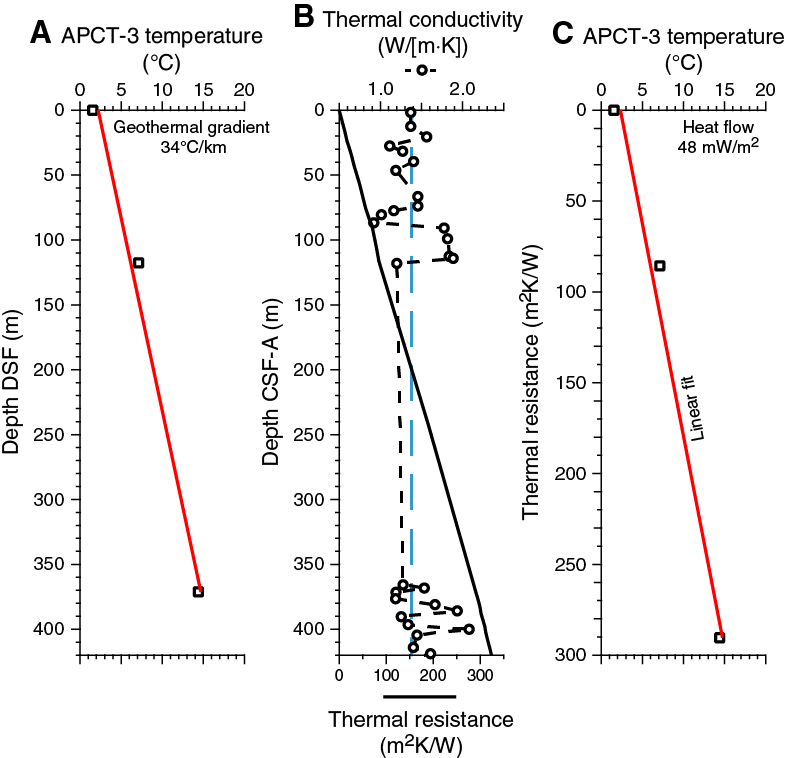
Figure F21. Heat flow calculations, Hole U1453C. A. Sediment temperatures. B. Thermal conductivity data from Hole U1453C with calculated thermal resistance and average thermal conductivity. C. Bullard plot of heat flow calculated from a linear fit of the temperature data.
Heat flow values for Expedition 354 sites have a quite narrow range, from 46 to 58 mW/m2 (Figure F22), compatible with Cretaceous-age crust and the absence of major nearby heat sources or major hydrothermal circulation.

Figure F22. Heat flow data compilation in the Bay of Bengal and surrounding areas (Hasterok et al., 2011), including values obtained for all Expedition 354 sites. Inset shows APCT-3 temperature profiles and heat flow values for the expedition.
Stratigraphic synthesis
Site U1455 is a reoccupation of DSDP Site 218, which served as an important starting point for Expedition 354 research. Although core material was available for research, rotary and spot coring led to large gaps in recovery. This sequence was recored to refine and completely recover critical intervals and to penetrate deeper than the original 773 mbsf of Site 218 to reach further back into the middle Miocene. In addition, the site contributes to the Pleistocene seven-site transect for the inventory of fan deposition and architecture, and as such, the upper section was cored continuously.
Sedimentation at Site U1455 is influenced by the presence and tectonic activity of the 85°E Ridge. Deeper strata (>6.3 s TWT) onlap onto the ridge, and the entire sedimentary section shows clear indications of faulting as the result of plate deformation (Figure F3).
The seismic data show that Site U1455 is comparable to Site U1451 (see Background and objectives in the Site U1451 chapter [France-Lanord et al., 2016c]) because it represents a condensed sedimentary section with respect to the central part of the transect (e.g., Site U1450) (Schwenk and Spiess, 2009). The Pliocene/Pleistocene section at these two sites is relatively condensed, but deeper in the section the seismic facies is very similar, with pronounced parallel layering and relative uniform thickness of seismic units over distances of several tens of kilometers.
Seismic, physical properties, and lithology
The shallow seismic section at Site U1455 (Figure F23) reveals pronounced parallel layering of reflectivity varying with depth. A few seismic units exhibit levee geometry and seismic characteristics, but are all <10 m thick. A large buried channel to the east has clearly contributed to the sediment accumulation at the site. At Site U1455, however, there are no distinct levees compared to those cored at Sites U1449, U1452, and U1454. Instead, the reflector geometries are more similar to those at Site U1453.
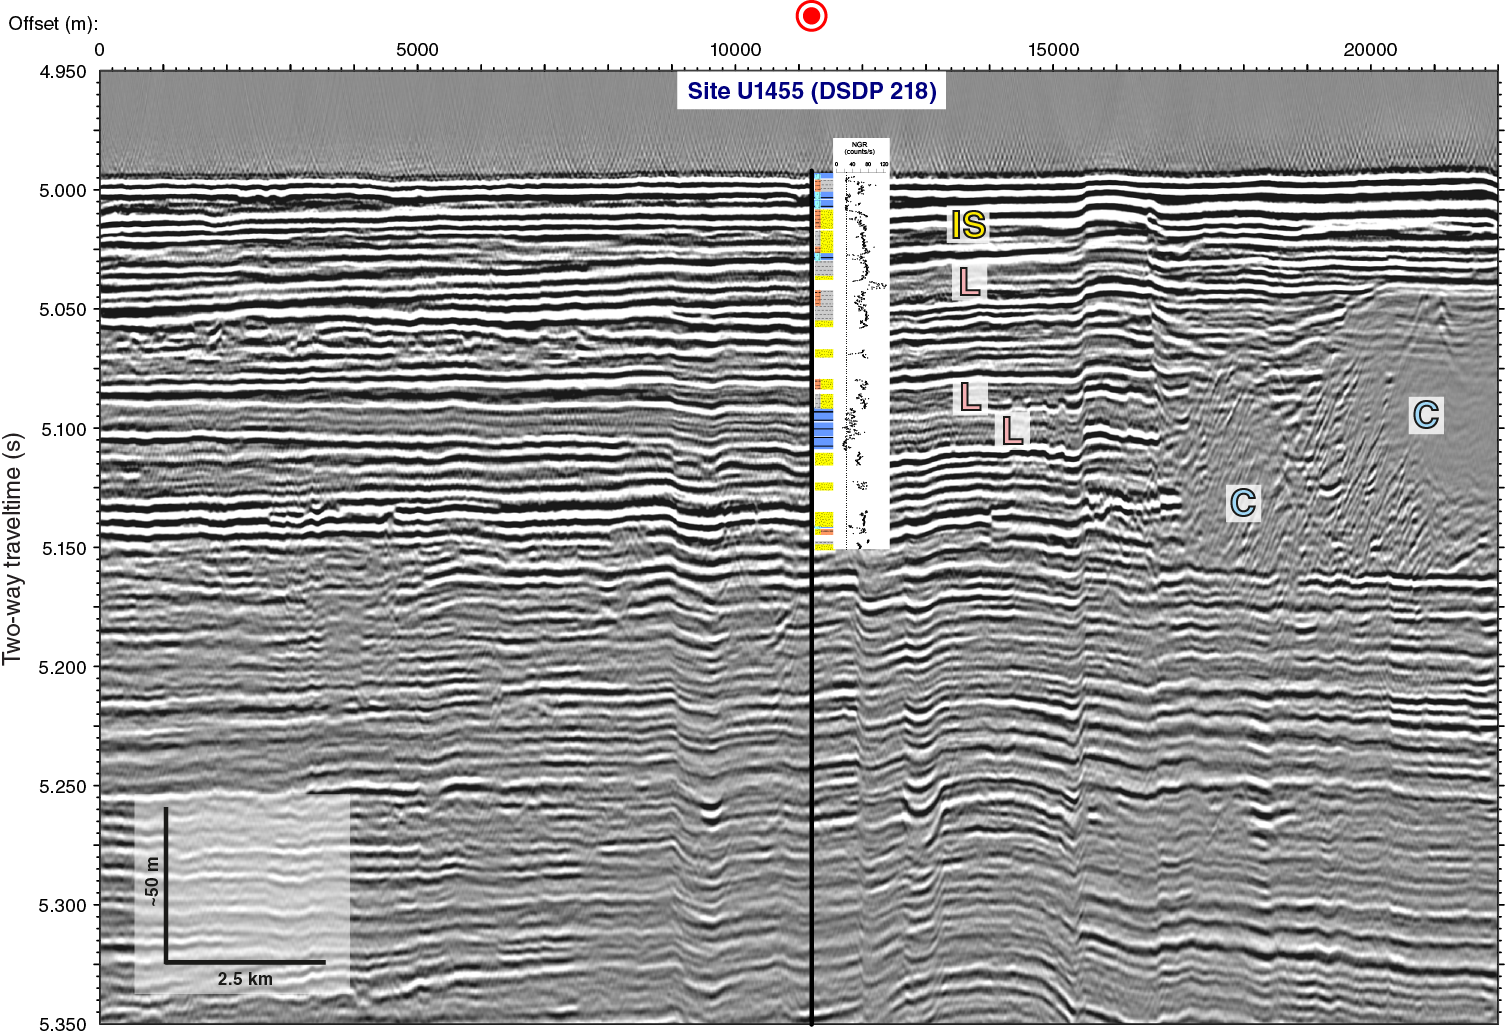
Figure F23. Seismic Line SO125-GeoB97-027, upper 350 ms TWT of cored interval, Site U1455.
In general, the lithology of the upper section matches well with the seismic facies. Thin levees observed at 5.04 or 5.09 s TWT in the seismic data are associated with mud or silt turbidites in the cores. The upper levee is overlain by a thin calcareous clay unit, followed by a sand-rich interval with strong reflection amplitudes. These sands are interpreted as interlevee sedimentation. Lithology above the well-cored mid-Pleistocene hemipelagic unit (5.09 s TWT) resembles a coarsening-upward transition, likely representing a progradational phase, and channel incision is associated with finer material above, typical for levees. This is in agreement with the seismic signature of this unit. Both levee units seem to originate from the same channel.
The formation drilled at Site U1455 reveals a pronounced similarity with Site U1451, dominated by sheeted depositional units. From seismic data, it is evident that several of these sheeted units originate from nearby channels and the material has spread laterally without building any significant levee topography. This seismic character extends down to the base of the section cored at this site (Figure F2).
Major channel structures are not observed in the seismic data, nor are levee units with thicknesses >10 m. For the late Miocene interval drilled between 360 and 430 m DSF, the seismic facies is overall very uniform (Figure F24). Several hemipelagic intervals were cored, but the pattern of seismic reflections does not allow immediate correlation to the coring results. Furthermore, in situ formation velocities are not known, and an improved time-to-depth conversion requires postexpedition work. A comparison to the NGR data from the cores, reflecting the clay content and heavy mineral concentration, reveals three different levels in values. Low NGR is mostly associated with calcareous clay principal lithologies, whereas very high values are associated with silty to muddy turbidite intervals, and sandy sediments have medium values. These NGR data confirm high variability of formation properties on the meter scale, which cannot be resolved by seismic data alone.
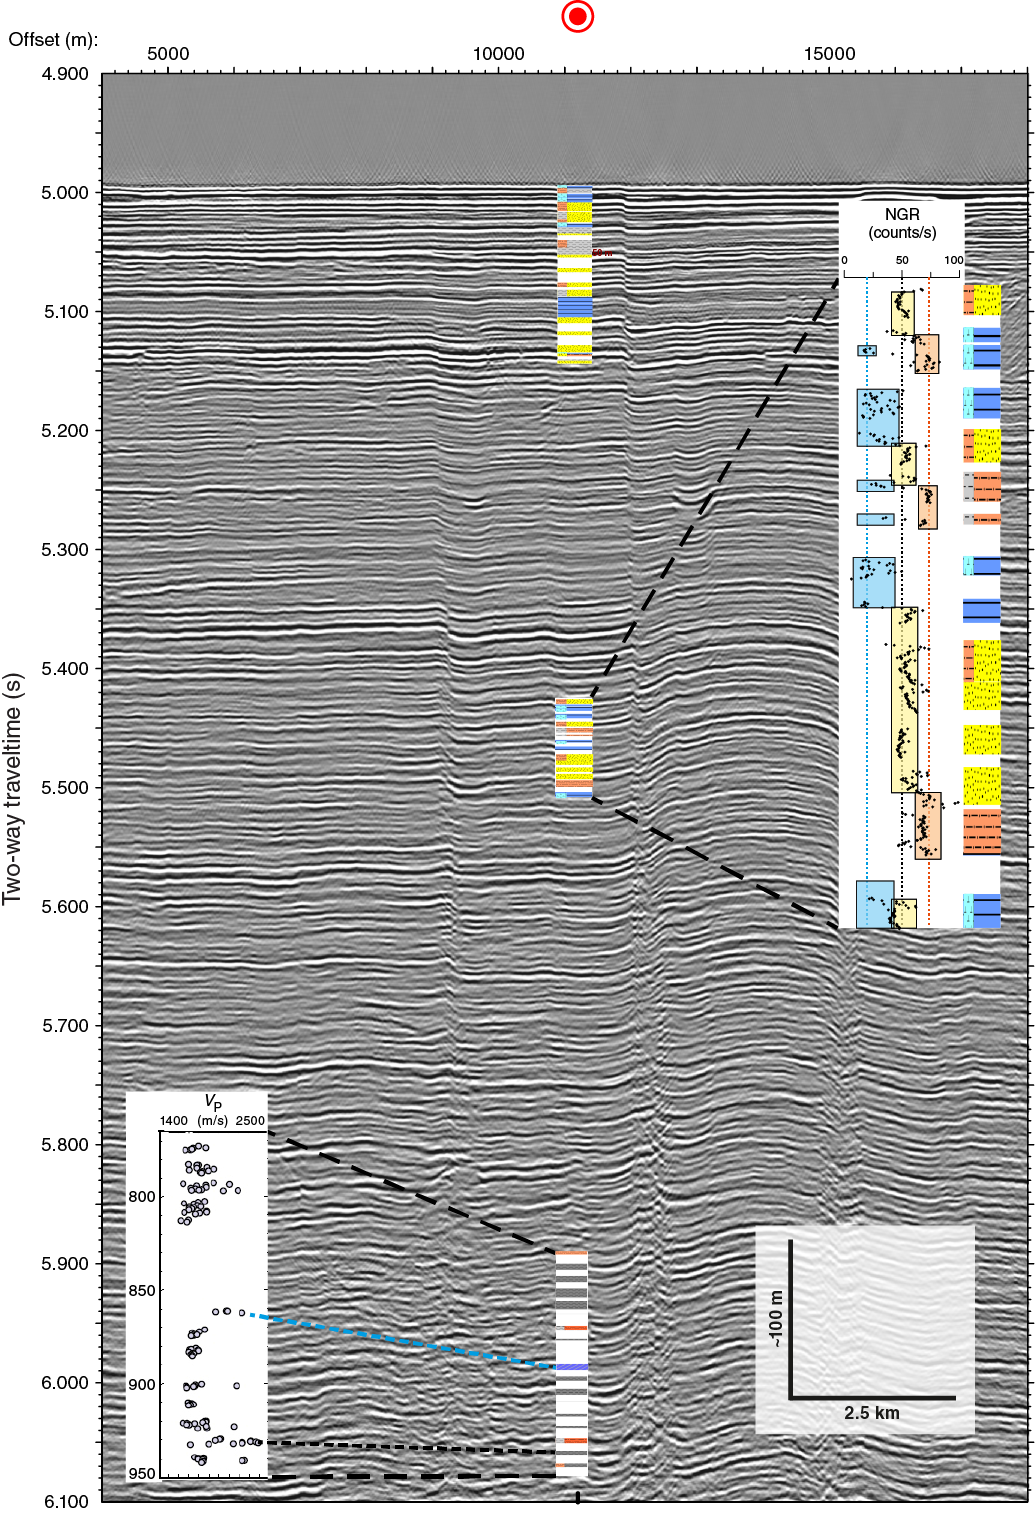
Figure F24. Seismic Line SO125-GeoB97-027, upper 1.1 s TWT of seismic section, Site U1455.
The interval cored deeper than 773 mbsf, the base of coring at Site 218, reveals a different seismic facies. In addition to faulting, reflectors are more irregular and discontinuous. These characteristics have often been indicative for sand-rich deposition. Coring of these sequences did not recover much sand at Site U1455; however, penetration rates during some RCB coring were extremely fast (5–10 min per 9.7 m advance) with extremely poor recovery. These are indicative almost certainly of unconsolidated sand layers contrasting the more advanced lithification of other lithologies. Cores with a lower penetration rate (30–45 min per 9.7 m advance) were systematically associated with higher recovery, mainly of clay-rich material and mud/silt turbidites. We infer that the interval between 770 and 950 m DSF represents sand-enriched fan deposition. Velocity measurements on cores show, similar to Site U1451, narrow intervals with distinctly elevated values, which suggest the initial stages of lithification. This applies to one calcareous clay unit and one muddy turbidite unit, whereas other units of similar composition above and below did not show such signs of lithification. This pattern of variable lithification is likely responsible for the quite variable reflection amplitude of single reflectors.
Age-depth relationship
Calcareous nannofossils and planktonic foraminifers provide biostratigraphic constraints for Site U1455. Fourteen biomarkers were identified at this site, extending back to the middle Miocene (Figure F25).
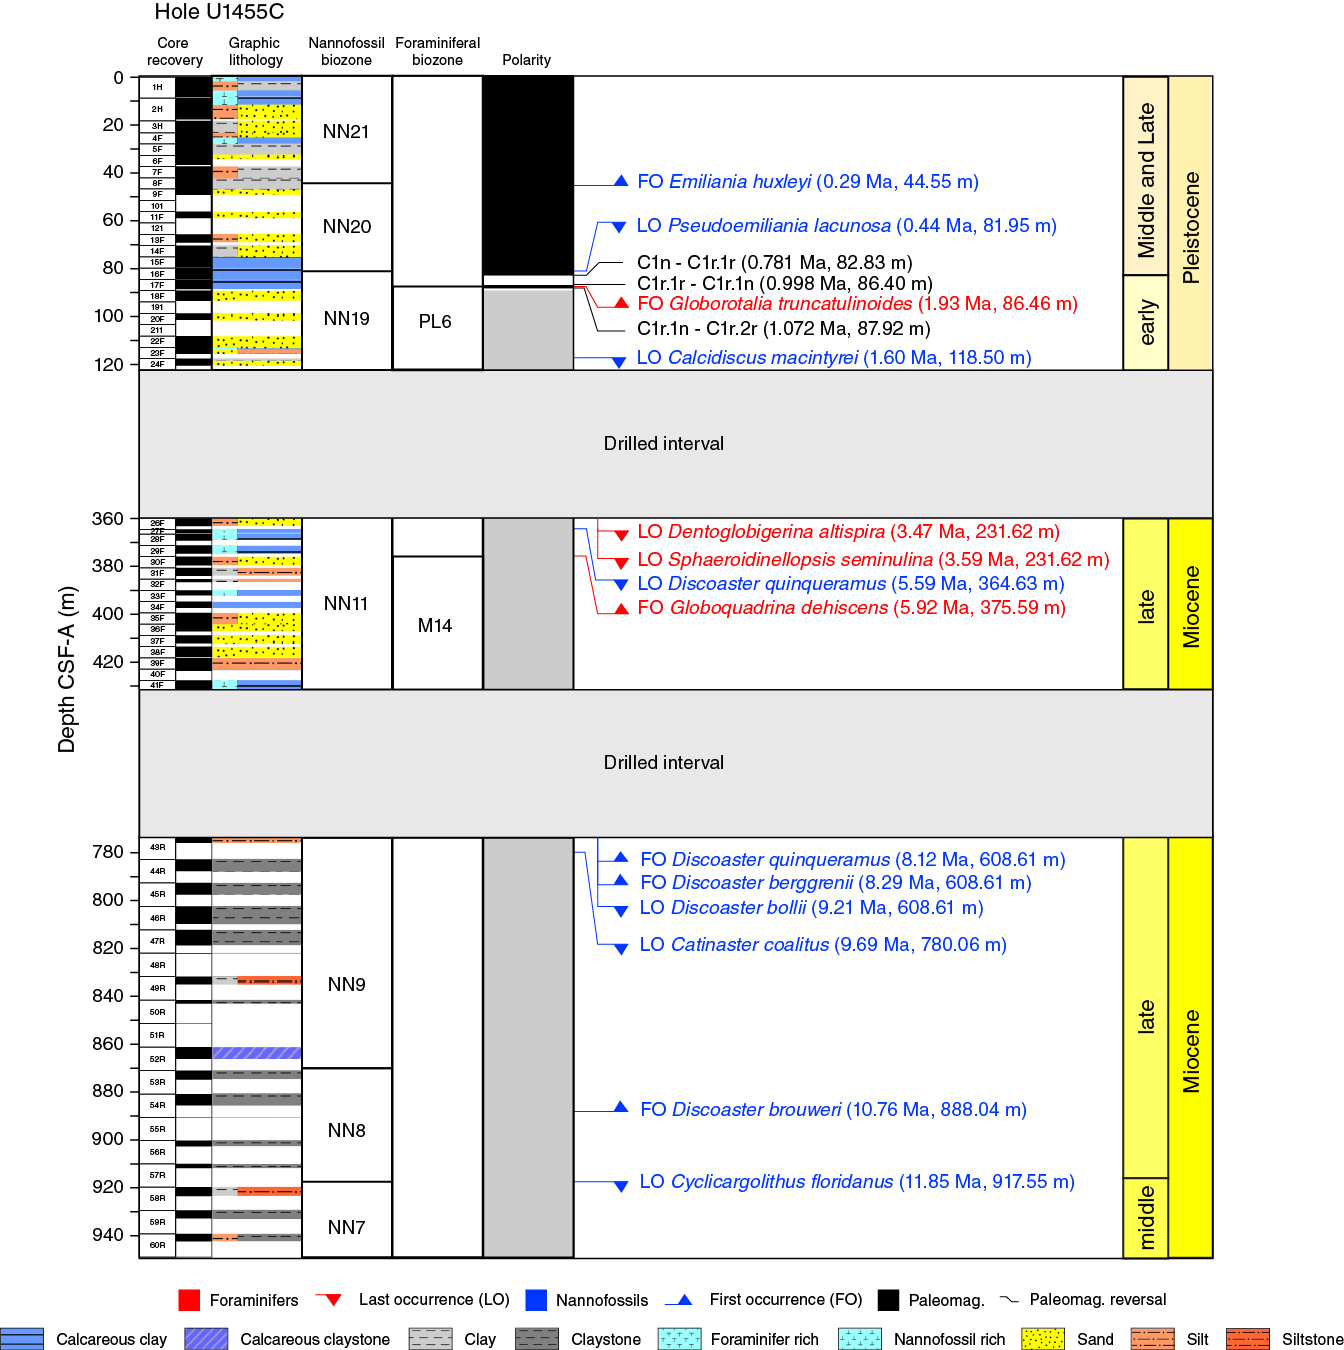
Figure F25. Compilation of biostratigraphic and chronostratigraphic markers, Site U1455.
Three magnetic reversals were identified in the upper 122 m of Site U1455, all in the calcareous clays of Unit V. The Brunhes/Matuyama reversal (C1n-C1r.1r; 0.781 Ma) occurs just above a thin ash layer close to a section break in Core 354-U1455C-16F. The occurrence of this ash layer, identified in most of the other Expedition 354 transect sites, gives good confidence for the identification of this boundary, even though the magnetic signal in Core 16F is noisy. This noise is also present in Core 17F where the upper and lower Jaramillo Subchron was identified (C1r.1n; 0.998–1.072 Ma). Unlike previous sites, sediments recording the Cobb Mountain Subchron were not recovered at Site U1455. The sedimentation rate calculated over the Jaramillo Subchron is ~1.8 cm/ky.
Figures F26 and F27 illustrate the age assignments from biostratigraphy and paleomagnetism for Site U1455 as a function of depth. Although preliminary, these data confirm distinct changes between slow accumulation in hemipelagic units and rapid fan deposition. The sedimentation rate over the last 12 My at Site U1455 averages 8 cm/ky.

Figure F26. Age-depth plot, Hole U1455C. Interpreted lithology proposes the most probable lithologies in intervals of nonrecovery.
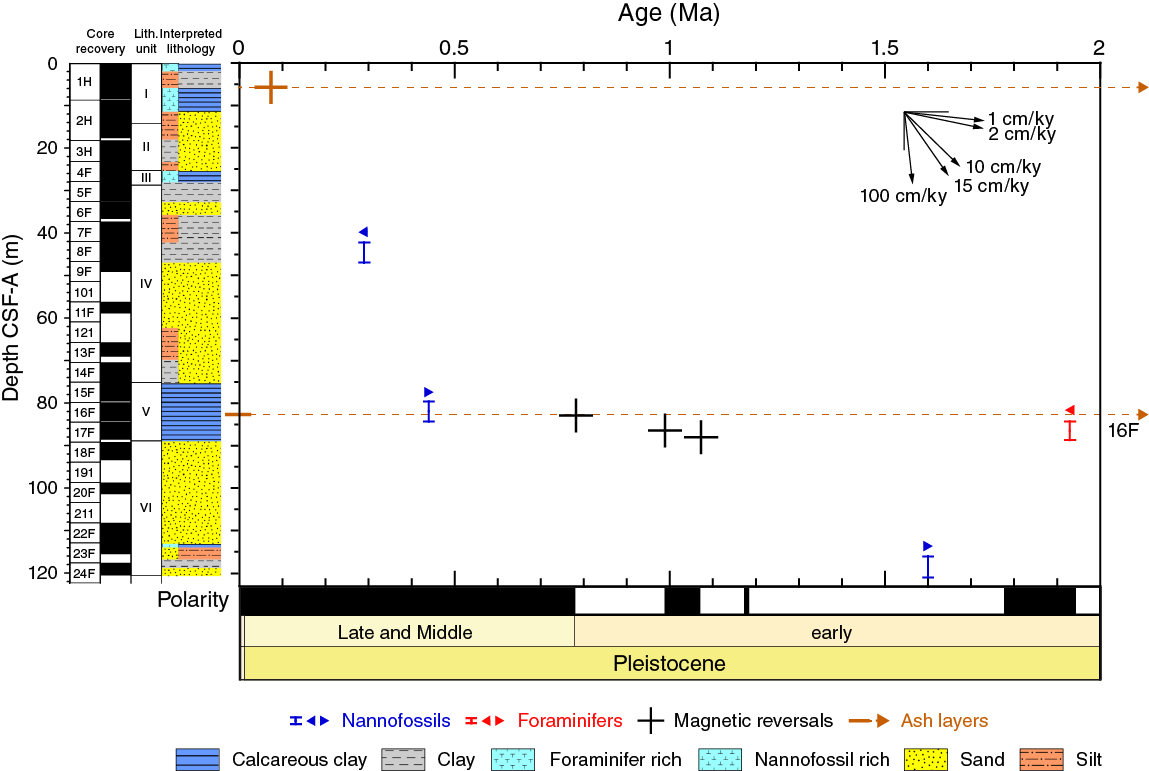
Figure F27. Age-depth plot, 0–2 Ma, Hole U1455C. Interpreted lithology proposes the most probable lithologies in intervals of nonrecovery.
Achievements
Site U1455, located above the 85°E Ridge, is a key location for the transect approach, particularly for investigating Miocene fan deposition. A comparison between the easternmost Site U1451 and this site should elucidate whether depocenter migration occurred in a similar manner as in the Pliocene and Pleistocene. Because of the absence of major channel-levee systems, addressing these objectives can only be achieved by integrating core and seismic data. This will require good chronostratigraphic control to compare the same time periods. This comparison has to await postexpedition work, including reanalysis of Site 218 cores.
Coarse-grained deposition occurs in the lower 200 m of the site. In this particular depth interval, further detailed sedimentologic analyses may shed light on the causes for the different depositional facies, whether the absence of levees originates from a change in sediment supply, in the lifetime of transport pathways, or other factors.
With respect to deciphering depositional processes, Site U1455 is also particularly interesting for the time period of the last 300 ky, which were cored in the surficial 10 m. The youngest Toba ash (75 ka) was found at 5.6 m CSF-A. Hemipelagic sediments extend to >14 m CSF-A, which is interpreted as dilution by detrital clay likely originating from the active channel ~30 km to the northwest and cored at Site U1454. Through a comparison between the transect sites, delivery of turbidite material can be studied as a function of distance from the channels, which provides constraints on the kind of material supplied to distal levees and associated accumulation rates.
Based on the preliminary shipboard biostratigraphic framework and the postexpedition work planned, we will further refine and develop the age model at this site. In addition, we have extended the middle Miocene record at this site from that recovered at Site 218.
References
Curray, J.R., Emmel, F.J., and Moore, D.G., 2003. The Bengal Fan: morphology, geometry, stratigraphy, history and processes. Marine and Petroleum Geology, 19(10):1191–1223. http://dx.doi.org/10.1016/S0264-8172(03)00035-7
Fisher, R.A., 1953. Dispersion on a sphere. Proceedings of the Royal Society of London, Series A, 217:295–305.
France-Lanord, C., and Derry, L.A., 1997. Organic carbon burial forcing of the carbon cycle from Himalayan erosion. Nature, 390(6655):65–67. http://dx.doi.org/10.1038/36324
France-Lanord, C., Spiess, V., Klaus, A., Adhikari, R.R., Adhikari, S.K., Bahk, J.-J., Baxter, A.T., Cruz, J.W., Das, S.K., Dekens, P., Duleba, W., Fox, L.R., Galy, A., Galy, V., Ge, J., Gleason, J.D., Gyawali, B.R., Huyghe, P., Jia, G., Lantzsch, H., Manoj, M.C., Martos Martin, Y., Meynadier, L., Najman, Y.M.R., Nakajima, A., Ponton, C., Reilly, B.T., Rogers, K.G., Savian, J.F., Schwenk, T., Selkin, P.A., Weber, M.E., Williams, T., and Yoshida, K., 2016a. Expedition 354 methods. In France-Lanord, C., Spiess, V., Klaus, A., Schwenk, T., and the Expedition 354 Scientists, Bengal Fan. Proceedings of the International Ocean Discovery Program, 354: College Station, TX (International Ocean Discovery Program). http://dx.doi.org/10.14379/iodp.proc.354.102.2016
France-Lanord, C., Spiess, V., Klaus, A., Adhikari, R.R., Adhikari, S.K., Bahk, J.-J., Baxter, A.T., Cruz, J.W., Das, S.K., Dekens, P., Duleba, W., Fox, L.R., Galy, A., Galy, V., Ge, J., Gleason, J.D., Gyawali, B.R., Huyghe, P., Jia, G., Lantzsch, H., Manoj, M.C., Martos Martin, Y., Meynadier, L., Najman, Y.M.R., Nakajima, A., Ponton, C., Reilly, B.T., Rogers, K.G., Savian, J.F., Schwenk, T., Selkin, P.A., Weber, M.E., Williams, T., and Yoshida, K., 2016b. Site U1450. In France-Lanord, C., Spiess, V., Klaus, A., Schwenk, T., and the Expedition 354 Scientists, Bengal Fan. Proceedings of the International Ocean Discovery Program, 354: College Station, TX (International Ocean Discovery Program). http://dx.doi.org/10.14379/iodp.proc.354.104.2016
France-Lanord, C., Spiess, V., Klaus, A., Adhikari, R.R., Adhikari, S.K., Bahk, J.-J., Baxter, A.T., Cruz, J.W., Das, S.K., Dekens, P., Duleba, W., Fox, L.R., Galy, A., Galy, V., Ge, J., Gleason, J.D., Gyawali, B.R., Huyghe, P., Jia, G., Lantzsch, H., Manoj, M.C., Martos Martin, Y., Meynadier, L., Najman, Y.M.R., Nakajima, A., Ponton, C., Reilly, B.T., Rogers, K.G., Savian, J.F., Schwenk, T., Selkin, P.A., Weber, M.E., Williams, T., and Yoshida, K., 2016c. Site U1451. In France-Lanord, C., Spiess, V., Klaus, A., Schwenk, T., and the Expedition 354 Scientists, Bengal Fan. Proceedings of the International Ocean Discovery Program, 354: College Station, TX (International Ocean Discovery Program). http://dx.doi.org/10.14379/iodp.proc.354.105.2016
France-Lanord, C., Spiess, V., Klaus, A., Adhikari, R.R., Adhikari, S.K., Bahk, J.-J., Baxter, A.T., Cruz, J.W., Das, S.K., Dekens, P., Duleba, W., Fox, L.R., Galy, A., Galy, V., Ge, J., Gleason, J.D., Gyawali, B.R., Huyghe, P., Jia, G., Lantzsch, H., Manoj, M.C., Martos Martin, Y., Meynadier, L., Najman, Y.M.R., Nakajima, A., Ponton, C., Reilly, B.T., Rogers, K.G., Savian, J.F., Schwenk, T., Selkin, P.A., Weber, M.E., Williams, T., and Yoshida, K., 2016d. Site U1453. In France-Lanord, C., Spiess, V., Klaus, A., Schwenk, T., and the Expedition 354 Scientists, Bengal Fan. Proceedings of the International Ocean Discovery Program, 354: College Station, TX (International Ocean Discovery Program). http://dx.doi.org/10.14379/iodp.proc.354.107.2016
France-Lanord, C., Spiess, V., Klaus, A., Schwenk, T., Adhikari, R.R., Adhikari, S.K., Bahk, J.-J., Baxter, A.T., Cruz, J.W., Das, S.K., Dekens, P., Duleba, W., Fox, L.R., Galy, A., Galy, V., Ge, J., Gleason, J.D., Gyawali, B.R., Huyghe, P., Jia, G., Lantzsch, H., Manoj, M.C., Martos Martin, Y., Meynadier, L., Najman, Y.M.R., Nakajima, A., Ponton, C., Reilly, B.T., Rogers, K.G., Savian, J.F., Selkin, P.A., Weber, M.E., Williams, T., and Yoshida, K., 2016e. Expedition 354 summary. In France-Lanord, C., Spiess, V., Klaus, A., Schwenk, T., and the Expedition 354 Scientists, Bengal Fan. Proceedings of the International Ocean Discovery Program, 354: College Station, TX (International Ocean Discovery Program). http://dx.doi.org/10.14379/iodp.proc.354.101.2016
Galy, V., France-Lanord, C., Peucker-Ehrenbrink, B., and Huyghe, P., 2010. Sr-Nd-Os evidence for a stable erosion regime in the Himalaya during the past 12 Myr. Earth and Planetary Science Letters, 290(3–4):474–480. http://dx.doi.org/10.1016/j.epsl.2010.01.004
Galy, V., France-Lanord, C., Beyssac, O., Faure, P., Kudrass, H., and Palhol, F., 2007. Efficient organic carbon burial in the Bengal Fan sustained by the Himalayan erosional system. Nature, 450(7168):407–410. http://dx.doi.org/10.1038/nature06273
Gradstein, F.M., Ogg, J.G., Schmitz, M.D., and Ogg, G.M. (Eds.), 2012. The Geological Time Scale 2012: Amsterdam (Elsevier).
Hasterok, D., Chapman, D.S., and Davis, E.E., 2011. Oceanic heat flow: implications for global heat loss. Earth and Planetary Science Letters, 311(3–4):386–395. http://dx.doi.org/10.1016/j.epsl.2011.09.044
Hyndman, R.D., Erickson, A.J., and Von Herzen, R.P., 1974. Geothermal measurements on DSDP Leg 26. In Davies, T.A., Luyendyk, B.P., et al., Initial Reports of the Deep Sea Drilling Project, 26: Washington, DC (U.S. Government Printing Office), 451–463. http://dx.doi.org/10.2973/dsdp.proc.26.113.1974
Lupker, M., France-Lanord, C., Galy, V., Lavé, J., Gaillardet, J., Gajurel, A.P., Guilmette, C., Rahman, M., Singh, S.K., and Sinha, R., 2012. Predominant floodplain over mountain weathering of Himalayan sediments (Ganga basin). Geochimica et Cosmochimica Acta, 84:410–432. http://dx.doi.org/10.1016/j.gca.2012.02.001
Lupker, M., France-Lanord, C., Galy, V., Lavé, J., and Kudrass, H., 2013. Increasing chemical weathering in the Himalayan system since the Last Glacial Maximum. Earth and Planetary Science Letters, 365:243–252. http://dx.doi.org/10.1016/j.epsl.2013.01.038
Martini, E., 1971. Standard Tertiary and Quaternary calcareous nannoplankton zonation. In Farinacci, A. (Ed.), Proceedings of the Second Planktonic Conference, Roma 1970: Rome (Edizioni Tecnoscienza), 2:739–785.
Müller, R.D., Sdrolias, M., Gaina, C., and Roest, W.R., 2008. Age, spreading rates, and spreading asymmetry of the world’s ocean crust. Geochemistry, Geophysics, Geosystems, 9(4):Q04006. http://dx.doi.org/10.1029/2007GC001743
Okada, H., and Bukry, D., 1980. Supplementary modification and introduction of code numbers to the low-latitude coccolith biostratigraphic zonation (Bukry, 1973; 1975). Marine Micropaleontology, 5:321–325. http://dx.doi.org/10.1016/0377-8398(80)90016-X
Pribnow, D., Kinoshita, M., and Stein, C., 2000. Thermal Data Collection and Heat Flow Recalculations for Ocean Drilling Program Legs 101–180: Hanover, Germany (Institute for Joint Geoscientific Research, Institut für Geowissenschaftliche Gemeinschaftsaufgaben [GGA]). http://www-odp.tamu.edu/publications/heatflow/ODPReprt.pdf
Quade, J., Cater, J.M.L., Ojha, T.P., Adam, J., and Harrison, T.M., 1995. Late Miocene environmental change in Nepal and the northern Indian subcontinent: stable isotopic evidence from paleosols. Geological Society of America Bulletin, 107(12):1381–1397. http://dx.doi.org/10.1130/0016-7606(1995)107<1381:LMECIN>2.3.CO;2
Schwenk, T., and Spieß, V., 2009. Architecture and stratigraphy of the Bengal Fan as response to tectonic and climate revealed from high-resolution seismic data. In Kneller, B.C., Martinsen, O.J., and McCaffrey, B. (Eds.), External Controls on Deep-Water Depositional Systems. Special Publication - SEPM (Society of Sedimentary Geologists), 92:107–131.
Shipboard Scientific Party, 1974. Site 218. In von der Borch, C.C., Sclater, J.G., et al., Initial Reports of the Deep Sea Drilling Project, 22: Washington, DC (U.S. Government Printing Office), 325–338. http://dx.doi.org/10.2973/dsdp.proc.22.109.1974
von der Borch, C.C., Sclater, J.G., et al., 1974. Initial Reports of the Deep Sea Drilling Project, 22: Washington (U.S. Government Printing Office). http://dx.doi.org/10.2973/dsdp.proc.22.1974
Wade, B.S., Pearson, P.N., Berggren, W.A., and Pälike, H., 2011. Review and revision of Cenozoic tropical planktonic foraminiferal biostratigraphy and calibration to the geomagnetic polarity and astronomical time scale. Earth-Science Reviews, 104(1–3):111–142. http://dx.doi.org/10.1016/j.earscirev.2010.09.003
1 France-Lanord, C., Spiess, V., Klaus, A., Adhikari, R.R., Adhikari, S.K., Bahk, J.-J., Baxter, A.T., Cruz, J.W., Das, S.K., Dekens, P., Duleba, W., Fox, L.R., Galy, A., Galy, V., Ge, J., Gleason, J.D., Gyawali, B.R., Huyghe, P., Jia, G., Lantzsch, H., Manoj, M.C., Martos Martin, Y., Meynadier, L., Najman, Y.M.R., Nakajima, A., Ponton, C., Reilly, B.T., Rogers, K.G., Savian, J.F., Schwenk, T., Selkin, P.A., Weber, M.E., Williams, T., and Yoshida, K., 2016. Site U1455. In France-Lanord, C., Spiess, V., Klaus, A., Schwenk, T., and the Expedition 354 Scientists, Bengal Fan. Proceedings of the International Ocean Discovery Program, 354: College Station, TX (International Ocean Discovery Program). http://dx.doi.org/10.14379/iodp.proc.354.109.2016