France-Lanord, C., Spiess, V., Klaus, A., Schwenk, T., and the Expedition 354 Scientists
Proceedings of the International Ocean Discovery Program Volume 354
publications.iodp.org
doi:10.14379/iodp.proc.354.104.2016

Site U14501
C. France-Lanord, V. Spiess, A. Klaus, R.R. Adhikari, S.K. Adhikari, J.-J. Bahk, A.T. Baxter, J.W. Cruz, S.K. Das, P. Dekens, W. Duleba, L.R. Fox, A. Galy, V. Galy, J. Ge, J.D. Gleason, B.R. Gyawali, P. Huyghe, G. Jia, H. Lantzsch, M.C. Manoj, Y. Martos Martin, L. Meynadier, Y.M.R. Najman, A. Nakajima, C. Ponton, B.T. Reilly, K.G. Rogers, J.F. Savian, T. Schwenk, P.A. Selkin, M.E. Weber, T. Williams, and K. Yoshida2
Keywords: International Ocean Discovery Program, IODP, Expedition 354, JOIDES Resolution, Site U1450, Bengal Fan
MS 354-104: Published 7 September 2016
Site summary
Site U1450 (proposed Site MBF-2A) occupies a central position at 8°0.42′N and 87°40.25′E in the east–west transect across the Bengal Fan at 8°N. It is located at equal distance from Site U1451 on the flank of the Ninetyeast Ridge and Site U1455 on the flank of the 85°E Ridge. The overall thickness of the fan reaches ~4 km at this location (Curray et al., 2003). Neogene sediment thickness decreases toward the two ridges, which is likely the result of ongoing deformation on both ridges during the Neogene (Schwenk and Spiess, 2009). At this central position of the transect, the upper Miocene and Pliocene–Pleistocene sections of the fan appear to be most expanded and are inferred to contain a higher resolution record, as well as accumulating, on average, coarser grained material. The shallow section at this site is one of the seven ~200 m deep sections along the 8°N transect that constrain the Middle Bengal Fan architecture in space, time, and sediment delivery rate during the Pleistocene. The deeper section at this site will document the delivery mechanisms of the fan and the climatically and tectonically influenced sediment supply from the Himalaya during the Neogene. Changes in the source regions in response to tectonic and climatic evolution of the Himalaya are expected to be reflected in the sediment’s mineralogical and geochemical compositions, the geochronological data, and in accumulation rates across the transect.
Principal results
Half-length advanced piston corer (HLAPC) coring combined with 4.8 m advances by drilling without coring was essential to achieve sufficient recovery in difficult lithologies with reasonable drilling times to reach 812 meters below seafloor (mbsf). This approach proved to be particularly efficient in recovering loose sand that otherwise would have been washed out during rotary core barrel (RCB) or extended core barrel (XCB) coring. Because of remarkably low lithification of the sediment formation, this HLAPC approach permitted piston coring to 550 mbsf, and seven HLAPC cores were taken in even deeper intervals to a maximum depth of 688 mbsf.
As at other transect sites, the sedimentary succession is dominated by turbidites of siliciclastic composition with detrital carbonate contents between 5% and 10%. These turbidites have high accumulation rates (~5–10 cm/ky) from the upper Miocene to lower Pliocene. From the Pliocene to Pleistocene, turbidite accumulation peaks around 20–25 cm/ky. These turbidites have close mineralogical and geochemical affinities with sand and silt sampled in the Ganges, Brahmaputra, and lower Meghna Rivers. They carry all the mineral characteristics and major element composition characteristics of river sediments derived from high-grade metamorphic rocks of the Himalayan range. Sand comprises ~40% of the section cored at Site U1450; this composition is similar to the grain size spectrum expected from river-derived detrital material, so bias due to turbiditic transport may be minor. Downhole logging was not possible at this site because of poor hole conditions, so it remains difficult to estimate the exact proportion of sand, silt, and clay. Overall, the mineralogical and chemical composition of the turbidites appears almost uniform, but detrital carbonate content tends to be gradually higher in sediment older than the Pliocene, reaching concentrations twice as high as in modern rivers and Pleistocene turbidites. This evolution suggests a change in eroded lithologies (i.e., a higher proportion of Tethyan formations exposed to erosion during the Miocene) and/or a change in weathering conditions.
Another distinctive, more carbonate-rich lithology is represented by about 10 relatively thin hemipelagic intervals composed of calcareous clays. These intervals correspond to periods of slow accumulation at the site when pelagic deposition is significant enough to be identified but is still diluted in variable proportions by a clay component. This clay is assumed to be related to the plumes generated by surrounding turbidity currents that originate from canyons and the slope offshore Bangladesh. However, this affinity remains to be determined by geochemical and clay mineralogical approaches. These low-accumulation intervals will provide geochronological control through a combination of paleomagnetic and biostratigraphic ground-truth data and orbital tuning, which will be essential for constraining detailed accumulation rates. Testing their continuity across the transect will be a key element for the integrated study of fan construction dynamics and long-term detrital sedimentary input utilizing seismic correlation across the transect.
Site U1450 represents a reference section for shore-based studies of the erosion of the Himalaya during the Neogene. The detrital sediments cored here present little evidence of a change over the last 8 My, suggesting rather steady conditions of erosion in the Himalayan basin. Such a change would require a major mountain range undergoing fast erosion and a monsoonal climate that allows rapid transport to inhibit weathering of the sediment in the floodplain. Unlike in the distal fan cored during Leg 116 (Cochran, Stow, et al., 1989), Site U1450 sediments show no clear change in accumulation rate, grain size, and clay mineralogy. This stability suggests that the smectite-rich fine turbidites recorded in the distal fan from 7 to 1 Ma (Bouquillon et al., 1990) may relate more to a change in the channel and turbidity current routing to the distal fan than to a change in Himalayan erosion. Site U1450 also covers the interval of expansion of C4 photosynthetic flora (i.e., savanna at the expense of forest) recorded in both the continental basin and distal and middle fan (Galy et al., 2010). Sediments recovered at Site U1450 will allow detailed studies of this ecological transition and its possible connection with climate changes or erosion conditions.
Operations
Site U1450 consists of two holes. Hole U1450A was cored to 687.4 m drilling depth below seafloor (DSF) using primarily the HLAPC system alternating with short (4.8 m) advances without coring. The advanced piston corer (APC) and XCB systems were used in the shallow and deepest portions of the hole, respectively. Because of very low recovery at depth with the XCB system, we pulled out and planned for deeper penetration coring and logging in a second hole later in the expedition. Overall, 282.7 m of core was recovered for the 444.7 m cored in Hole U1450A. Hole U1450B was drilled without coring to 608.0 m DSF and then RCB cored continuously to 811.9 m DSF. Coring in Holes U1450A and U1450B overlaps from 608.0 to 677.8 m DSF. This deeper section cored 203.9 m and recovered 46.7 m of sediment (23%). Downhole logging was attempted with the triple combo tool string. On the way down, the bottom of the tool string encountered an obstruction at 133.7 m DSF and was stuck, likely in a collapsing sand layer. After the tool string was released, a short section of logging data was acquired, and deep logging of the site was abandoned.
Lithostratigraphy
Recovered sediments from Site U1450 are divided into 24 lithostratigraphic units based on lithologic and paleontological characteristics obtained through macroscopic and smear slide analyses and on physical property measurements.
The overall dominant lithology for Site U1450 (84% of total recovered material) is siliciclastic and comprises fining-upward sequences of fine sand, silt, and clay (i.e., turbidites), as well as homogenized sands and mixed silt-clay layers. These turbidites carry major and trace mineral characteristics of Himalayan rivers and of high-grade metamorphic rocks of the Himalaya. Clay assemblages are dominated by illite, which is indicative of the same rivers. Siliciclastic units alternate with at least 10 units of calcareous clay (16% of total recovered material). The thickest continuous calcareous clay intervals are in lithostratigraphic Unit III and consist of 5.14 m in Core 354-U1450A-34F and 4.8 m in Core 36F. Sediments give way downhole in Hole U1450B to increasingly more lithified material (e.g., limestone and claystone) from 627.50 m core depth below seafloor (CSF-A) to the base of recovered material. Additionally, Site U1450 contains three volcanic ash layers.
Lithologic differences between units and variations in grain size and bed thickness reflect cycles of turbidity current activity and channel abandonment. Sand intervals may represent interlevee sheet flows, whereas finer grained fractions are more likely preserved in levee deposits. Bioturbated calcareous clays represent times of local channel inactivity with reduced and finer siliciclastic deposition that reflects a relative increase in the contribution of biogenic origin from the pelagic zone. Many intervals of calcareous clay show repeated sequences of color-graded beds, which can be attributed to increased entrainment of siliciclastic material, changes in water column productivity, or changes in the oxidation/reduction horizons of pore water. In Hole U1450B, intervals dominated by calcareous and/or clayey material become increasingly lithified with depth, and many are intercalated with very thin to thin silt or siltstone layers. Plant fragments occur throughout the cored section, more commonly in silt and siltstone intervals, although a few sand-dominated units also contain macroscopic organic material. At the top of Hole U1450A, an 18 cm thick ash layer presumably corresponds to the ~75 ka Toba volcanic eruption that produced widespread tephra deposits across the Bay of Bengal (e.g., Gasparotto et al., 2000).
Biostratigraphy
Calcareous nannofossil and planktonic foraminiferal biostratigraphic analyses conducted on Site U1450 samples identified 18 biomarker events. These events were used to construct 4 foraminiferal and 11 nannofossil biozones, providing excellent age control extending back to the late Miocene. The recovery of a late Miocene succession achieves one of the key objectives of this expedition and includes sediments that may contain the C4 photosynthetic flora expansion (Galy et al., 2010).
The succession of biostratigraphic zones at this site appears continuous, as no significant nannofossil biostratigraphic hiatuses were observed, indicating that the fan has been accumulating sediments, albeit at highly variable accumulation rates, since the late Miocene.
Paleomagnetism
A preliminary paleomagnetic study was conducted on 36 of the 86 cores collected from Hole U1450A, comprising 108 archive section-half and 52 discrete sample measurements. Sandy and/or deformed intervals were not measured. Polarity zones corresponding to the Jaramillo and Cobb Mountain Subchrons were identified in a calcareous clay unit in Core 36F (173.30–174.60 and 175.70–175.90 m CSF-A, respectively). An additional pair of reversals was observed in Core 52F (248.38 and 248.51 m CSF-A), but the polarity chron to which they belong has not yet been identified. The thickness of the Jaramillo and Cobb Mountain polarity zones in Hole U1450A suggests an accumulation rate for the calcareous clay interval similar to that in Hole U1449A (~1.5 cm/ky).
Physical properties
Physical property data acquired on Site U1450 cores includes density, magnetic susceptibility, P-wave velocity, natural gamma radiation (NGR), and thermal conductivity. The data are mostly of good quality, but the results from disturbed and partially filled sections are less reliable, as described below.
Physical properties at Site U1450 primarily reflect lithologic variations, with downcore compaction having a relatively minor effect. Using the principal lithologic name from the core description, which assigned six types of lithologies, we calculated the total thickness and average physical property value for each lithology. From the 319 m total core recovery assigned to lithology (39.6%), sand accounts for 131 m (41%), silt for 46 m (14%), clay for 72 m (22%), calcareous clay for 45 m (14%), claystone for 13 m (4%), calcareous claystone for 6 m (2%), and limestone for 7 m, with additional thin ash layers. In general, sands and silts have the highest density and P-wave velocity, sands have the highest magnetic susceptibility, clays have the highest NGR, and calcareous clay has the lowest values in all measurements. Some sand-rich intervals were difficult to recover and were often fluidized, which sometimes resulted in incompletely filled core liners; these cores had the effect of giving unexpectedly low gamma ray density, magnetic susceptibility, and NGR values. Cores that had inflow of core material (“suck in”) also likely have lower than expected values in these physical properties Because of volume reduction.
Geochemistry
Detailed pore water measurements distinguish four hydrologic units based on sulfate, phosphate, silica, magnesium, potassium, calcium, and alkalinity contents. Carbonate contents of bulk sediments vary widely from 1.2 to 63.2 wt% CaCO3, reflecting contrasting depositional environments and significant contributions from detrital carbonates. The carbonate contents of turbiditic sediments, however, exhibit a significant change at ~620 m CSF-A, where they roughly double from an average of 3.8 wt% above to 7.3 wt% below. This transition occurs around the Miocene/Pliocene boundary and most likely reflects a change in detrital carbonate supply. A similar change was also observed at Site U1451 and can be deduced from Deep Sea Drilling Project (DSDP) Site 218 total inorganic carbon (TIC) data (von der Borch, Sclater, et al., 1974). Overall, total organic carbon (TOC) contents are low, with an average value of 0.4 wt%. Within turbidites, TOC broadly covaries with Al/Si ratios—a proxy for sediment grain size and mineral composition—reflecting preferential association of organic matter with clays previously documented in both the modern Ganga-Brahmaputra river system and in active channel-levee sediments in the Bay of Bengal deposited over the past 18 ky (e.g., Galy et al., 2007). The TOC budget is likely also affected by the frequent presence of woody debris concentrated in the lower part of many turbiditic sequences. In turbiditic sediments, major element composition (e.g., Fe/Si and Al/Si) closely matches the chemical composition observed in sediments from the modern Ganga-Brahmaputra river system for both the trend and the range of variation (e.g., Galy and France-Lanord, 2001). At the low end of Al/Si ratios, the lack of significant difference suggests that extreme sorting documented in coarse bed sediments from these rivers is also generated by turbidity current at Site U1450. Conversely, the clay-rich end-member recovered at Site U1450 is only slightly more aluminous (and likely finer) than monsoonal surface-suspended sediments from the lower Meghna River.
Microbiological subsampling of sediments and pore water at Site U1450 included establishing a microbial cell counting method, with further processing of the samples to be performed following the expedition.
Downhole measurements
Five downhole measurements were taken in Hole U1450A with the advanced piston corer temperature tool (APCT-3), ranging from 4.6°C at 86.3 m DSF to 13.5°C at 318.1 m DSF. These measurements return a geothermal gradient of 38°C/km, which appears to be in the expected range.
Stratigraphic summary
Lithologic and physical property results confirm the expectation that Site U1450 would contain a high proportion of sand in the recovered cores; it may be even higher in the formation. As at Site U1449, the match between these data sets and seismic facies and reflectors will allow us to assign broad lithologic categories to the seismic units and thus extrapolate throughout the seismic data set and between Expedition 354 drill sites. These data also allow identification of major depositional processes, which can be integrated to reconstruct the stacking pattern and evolution of fan deposition.
Because Site U1450 reaches back to 8 Ma at 812 m DSF, a precise seismic stratigraphy will be established postexpedition, based on major hemipelagic units and associated distinct seismic reflectors. These units and reflectors will be used to estimate accumulation for various subfan units in time slices on the order of several hundred thousand to millions of years, one of the main expedition objectives. Site U1450 is located in a key position between the two other deep penetration sites (U1451 and U1455).
Recovering material of sufficient quality was a challenge during Expedition 354 and particularly at Site U1450 because of the high proportion of sand. It was unexpected that the consolidation state of sand apparently does not change much with depth. Although loose sand was recovered with the APC and HLAPC systems to refusal depth (560 and 630 m DSF in Holes U1450A and U1450B, respectively), the XCB and RCB systems provided little or no recovery of sand. The sand proportion is likely underrepresented in cores from the deeper section of the site. Based on discrete sample measurements of density and porosity, a downhole trend of porosity loss is observed, but from lithologic observations we infer that consolidation state is different for different grain sizes. Clay shows a gradual transition to claystone with depth, with increasing P-wave velocities and densities downhole. However, sand was not recovered in any more consolidated state within the entire 800 m cored section.
Based on biostratigraphic and paleomagnetic data, the upper Miocene to lower Pliocene portion of the site is characterized by a relatively uniform accumulation, averaging about 5–10 cm/ky. From the early Pliocene to the Pleistocene, fan accumulation has intensified (~20–25 cm/ky), accompanied by a transition from more silt-dominated to sand-dominated lithologies. As at Sites U1449 and U1451, turbidite deposition ceased at this site at ~300 ka, as observed at 11°N in the axial fan (Weber et al., 2003).
Background and objectives
Site U1450 occupies a central position at 8°0.42′N, 87°40.25′E in the east–west transect across the Bengal Fan at 8°N (see Figures F3, F4, and F8 in the Expedition 354 summary chapter [France-Lanord et al., 2016d]). It is located at equal distance from Site U1451 on the flanks of the Ninetyeast Ridge and Site U1455 above the 85°E Ridge. The overall thickness of the fan reaches ~4 km at this location (Curray et al., 2003). Neogene sediment thickness decreases toward the two ridges, likely the result of ongoing deformation on both ridges during the Neogene (Schwenk and Spiess, 2009). Site U1450 is located in the center of the transect where the upper Miocene and Pliocene–Pleistocene sections of the fan appear to be most expanded and were inferred to contain a higher resolution record and accumulate, on average, coarser grained material. It was also inferred, however, that the fan has maintained a flat average topography and therefore channel and depocenter migration were not directly affected by any tectonic activity.
The shallow section at this site is one of the seven ~200 m thick sections of the 8°N transect at which we investigated Middle Bengal Fan architecture in space and time to reconstruct Pleistocene sediment delivery rates in conjunction with depocenter migration. This site also allows insight into the delivery mechanisms of the fan and the climatically and tectonically influenced sediment supply from the Himalaya during the Neogene. Because the site provides a long-term record of turbiditic deposition since the late Miocene, these sediments can be analyzed for detrital particles predominantly supplied by the Ganga-Brahmaputra river system, as shown by earlier fan studies (e.g., France-Lanord et al., 1993). Changes in the source regions in response to tectonic processes and climatic conditions in the Himalayan basin were expected to be reflected in the sediment composition and mineralogy as a result of Himalayan erosion. In this context, it is of particular interest to resolve in detail the emergence of the C4 photosynthetic flora in the Gangetic plain that is clearly documented in Bengal fan sediments (e.g., France-Lanord and Derry, 1994; Freeman and Colarusso, 2001).
The deeper portion of Site U1450 will be compared with the two other deep-penetration transect sites: Site U1451 above the Ninetyeast Ridge and Site U1455 above the 85°E Ridge.
The seafloor in the vicinity of Site U1450 is relatively flat and smooth (Figure F1). However, there is an abandoned meandering channel ~10 km east of the site.
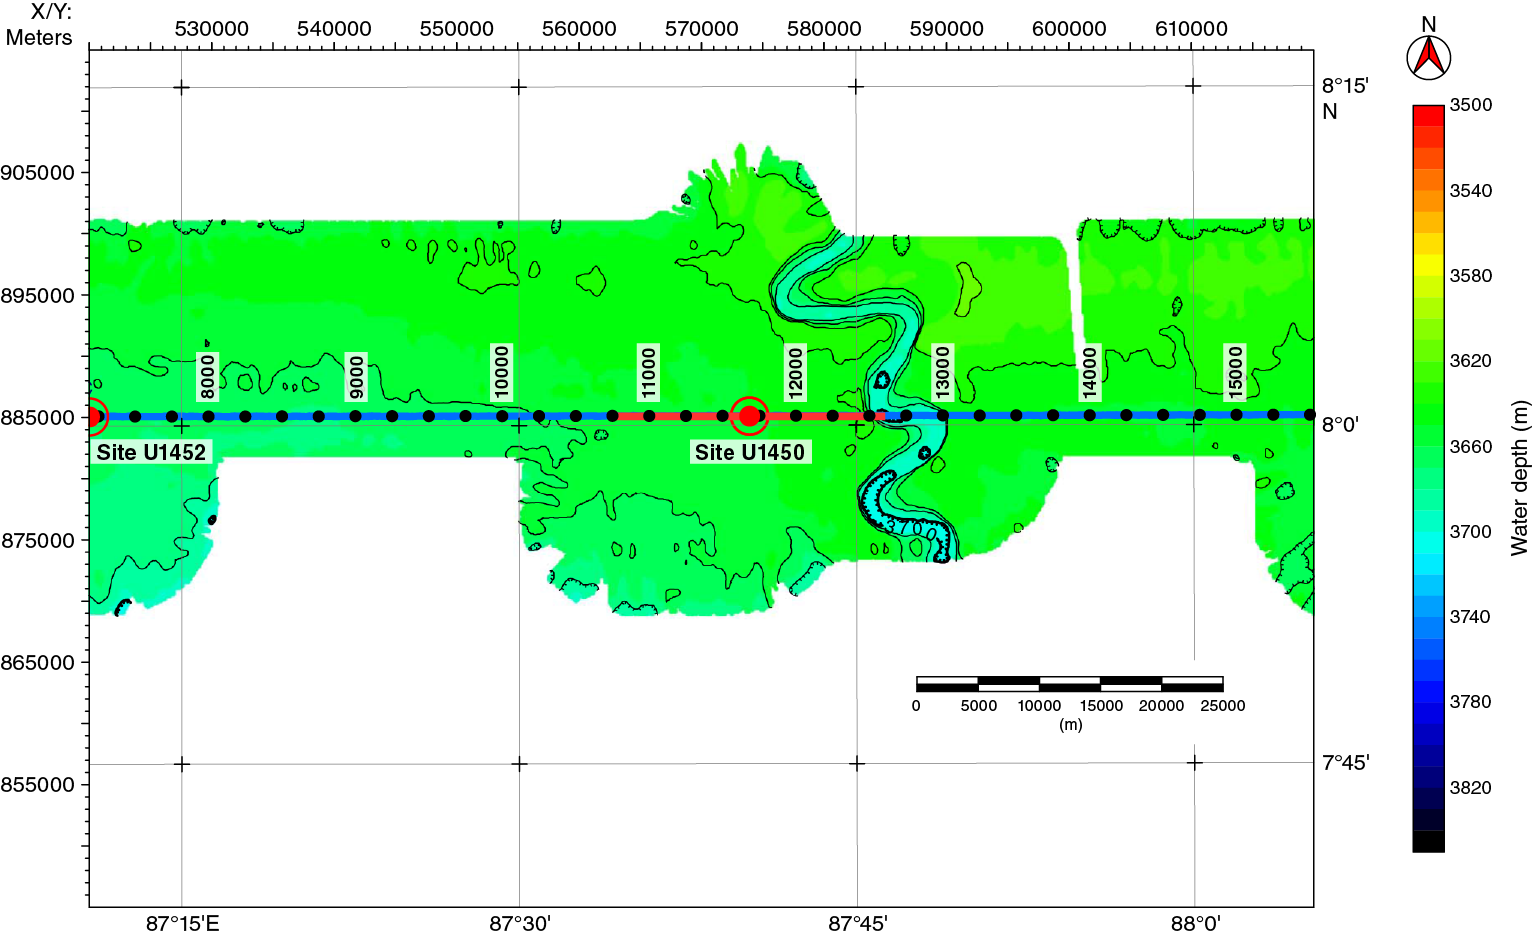
Figure F1. Bathymetric and track chart, Site U1450. Projection is UTM Zone 45N. Multibeam bathymetry was acquired during R/V Sonne Cruises SO125 and SO188.
Figure F2 shows the shallow portion of the seismic data in the vicinity of Site U1450. A thin sedimentary unit of uniform thickness covers the area. Beneath this unit, in the upper 200 ms two-way traveltime (TWT), several smaller channel-levee structures can be identified within <10 km of the site, interrupted by reflectors of pronounced continuity. Deeper than 200 ms TWT, reflections are nearly parallel and sediment packages mostly uniform in thickness. This interval is comparable to depositional style and units observed at the other transect sites.
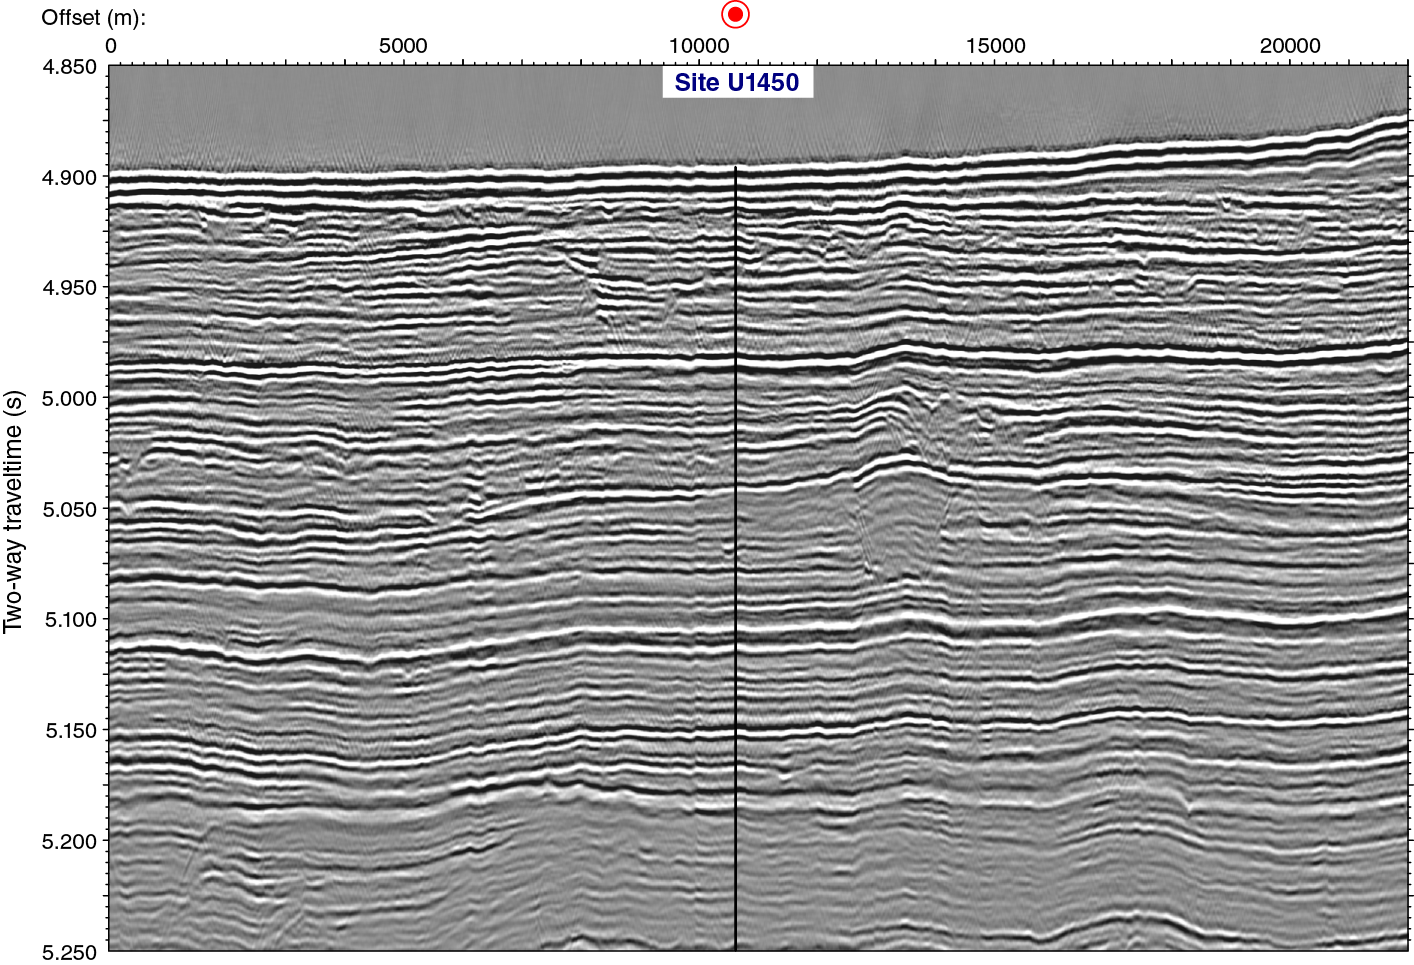
Figure F2. Seismic Line SO125-GeoB97-027 across Site U1450, showing upper portion of sedimentary section.
Deeper than 5.15 s TWT (Figure F3), smaller scale channels are recognized, and associated levee systems cause both converging reflections within these units and onlapping reflections of overlying interlevee sediments or younger levees. Overall, reflectivity and reflector geometries remain similar throughout the entire section below 5.15 s TWT. Deeper than 5.7 s TWT, channel-levee structures are absent. Drilling at this and the two other deep-penetration sites should elucidate the causes for the absence of channel construction before the late Miocene. In particular, it should determine whether there is a relationship between the nature and quantity of delivered material or changes in the erosional regime or the transport system from the delivering rivers through the fan.
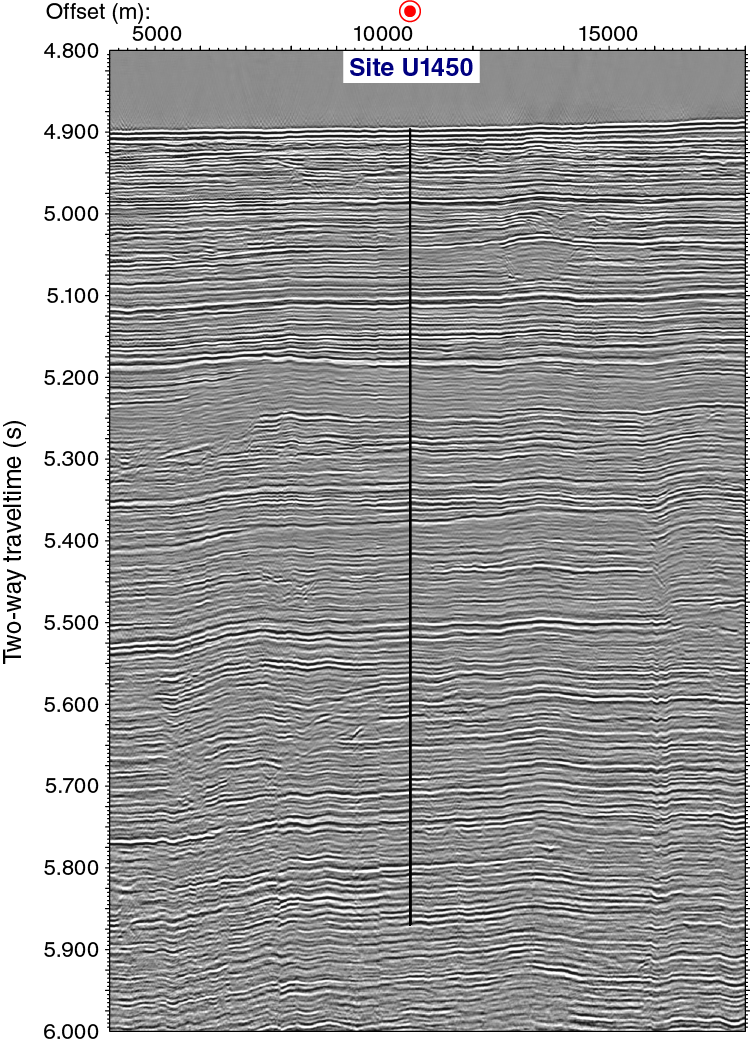
Figure F3. Seismic Line SO125-GeoB97-027 across Site U1450, showing complete sedimentary section cored. A 0.5 s AGC algorithm was applied to equalize amplitudes throughout the seismic section.
Operations
Site U1450 consists of two holes. Hole U1450A was cored to 687.4 m DSF using primarily the HLAPC system alternating with short (4.8 m) advances without coring. The APC and XCB systems were only used in the shallow and deepest portions of the hole, respectively. Hole U1450B was drilled without coring to 608.0 m DSF and RCB cored continuously from there to 811.9 DSF, and then downhole logging was attempted.
Hole U1450A
After the short 26 nmi transit from Site U1449, we arrived at Site U1450 at 1830 h on 10 February 2015 and lowered the bit to the seafloor. We spudded Hole U1450A at 0255 h on 11 February, and the mudline core established the seafloor at 3655.3 meters below sea level (mbsl). This hole was drilled to a total depth of 687.4 DSF using a combination of coring (APC, HLAPC, and XCB systems) and short (mostly 4.8 m) advances without coring. Nonmagnetic core barrels were used for all APC and HLAPC cores, and the nonmagnetic drill collar was in the bottom-hole assembly (BHA). All cores, penetration depths, core recovery, and time recovered on deck are presented in Table T1.
Table T1. Site U1450 core summary. Download table in .csv format. View PDF table.
We used the APC system for the first three cores (1H–3H, 0–20.2 m DSF; 20.2 m cored; 18.63 m recovered). Because the latter two cores were partial strokes, we switched to the HLAPC system. Cores 4F–8F extended from 20.2 to 43.7 m DSF with a range of recoveries (0%–72%); despite this change we did not advance by recovery but rather the full 4.7 m barrel length each core.
From 43.7 to 132.9 m DSF (below Core 8F through Core 27F), we took a series of HLAPC cores interspersed with six 4.8 m long advances without coring. These HLAPC cores were taken consecutively when fine-grained intervals (e.g., without sand/silt) were encountered. Two cores with the APC system (Cores 22H and 24H) were taken in this section, but they recovered only 3.35 m of sediment. These were the only two cores where core orientation was attempted.
Based on our experiences in the upper portion of this hole and at Site U1449, we decided to deepen the hole by an alternating series of 4.7 m long HLAPC cores followed by 4.8 m advances without coring. The full APC coring system could not sufficiently penetrate/recover this formation, and the XCB system, although it could penetrate it, could not recover core from this type of formation. In addition, the science objectives required deep penetration sampling at multiple sites, which could not be accomplished in time if the HLAPC was used continuously. This alternating pattern penetrated 428.4 m of formation from 132.9 to 561.3 m DSF (Cores 28F–119F). The only exception to this pattern occurred in a few intervals where HLAPC cores were taken consecutively (Cores 80F–84F, 114F, 115F, and 117F–119F). The HLAPC cores taken from this interval (Cores 28F–119F) penetrated 226.8 m of formation and recovered 176.7 m of core (77%). Forty-two 4.8 m advances without coring penetrated 201.6 m of formation.
Because we had some difficulty getting Core 119F to penetrate the formation, we cored the rest of the hole with the XCB system, except for five HLAPC cores and three 4.8 m advances without coring. Cores 120X–123X cored 37.7 m (561.3–599.0 mbsf) and recovered 8.89 m (24%). Because the penetration rate substantially increased while cutting the last part of Core 123X, we inferred that the formation had likely changed back to sand. We switched back to HLAPC coring, as it was the most likely system to be able to recover sand. We then cored an alternating series of HLAPC cores (124F, 126F, and 128F) and 4.8 m advances without coring that penetrated 11.2 m of formation and recovered 8.89 m (85%).
The lowermost section of the hole consisted of mostly of XCB cores, with two HLAPC cores. Cores 129X and 132X–136X (619.8–628.2 and 637.7–686.3 mbsf) penetrated 57.0 m and recovered 6.47 m of core (11%). Two HLAPC cores (130F and 137F; 628.2–632.9 and 686.3–687.4 mbsf) penetrated 5.8 m and recovered 4.05 m (70%). The deepest core in this hole (HLAPC Core 137F) set the record for the deepest penetration piston core in scientific ocean drilling.
We decided to terminate operations in Hole U1450A after this last HLAPC core. We felt that recovering core to the 900 mbsf target objective and obtaining good wireline logs would be better achieved by drilling a new RCB hole at this site later in the expedition. We pulled the drill string out of Hole U1450A, and the bit cleared the seafloor at 2035 h on 16 February and was back on the rig floor at 0235 h the next day. After the drill floor was secured and the thrusters raised, we started the transit to Site U1451 at 0418 h on 17 February. We decided we would return to core the deeper portion of Site U1450 later in the expedition.
Five APCT-3 formation temperature measurements were conducted in Hole U1450A at 86.3, 118.7, 156.6, 175.6, and 318.1 m DSF (while taking Cores 17F, 24H, 32F, 36F, and 66F, respectively). The last of these measurements is the deepest (318.1 m DSF) APC formation temperature measurement ever obtained.
In Hole U1450A, we cored a total of 444.7 m and recovered 282.73 m of core (64%). This included 71 HLAPC cores (318.3 m cored; 245.39 m recovered; 77%), 5 APC cores (31.7 m cored; 21.98 m recovered; 69%), and 10 XCB cores (94.7 m cored; 15.36 m recovered; 16%).
Hole U1450B
After a 64 nm transit from Site U1451, we arrived back at Site U1450 at 1342 h on 7 March 2015. Hole U1450A was cored to 687.4 m DSF, so we decided to drill without coring to 608 m DSF and then RCB core below that depth and attempt to log the hole. This RCB coring has a 79.4 m overlap with the deepest cores from Hole U1450A. We assembled an RCB with a mechanical bit release (MBR), lowered it to the seafloor, and started drilling in Hole U1450B at 2305 h on 7 March. We continued drilling without coring in Hole U1450B from 0 to 465.0 m DSF. At this point (1945 h on 8 March), the low penetration rate led us to retrieve the center bit for inspection. No problems were observed. The center bit was redeployed, and drilling resumed at 2100 h on 8 March. At 0414 h on 9 March, the bit reached 608.0 m. After retrieving the center bit, RCB coring started at 0515 h on 9 March. Nonmagnetic core barrels were used for all RCB cores. Cores 2R–11R penetrated from 608.0 to 705.1 m DSF (97.1 m) and recovered 15.77 m of core. Because of poor recovery for Cores 3R–6R (3.72 m; 8%), a slow penetration rate, and sediment jammed in the core catchers, we ran a bit deplugger after Core 6R to clear the bit. After the bit deplugger was recovered, Cores 12R–22R penetrated from 705.1 to 811.9 m DSF (106.8 m) and recovered 15.77 m of core (29%). RCB coring in Hole U1450B sampled 203.9 m of formation (608.0–811.9 m DSF) and recovered 46.66 m of sediment (23%).
After the last core arrived on deck (1715 h on 10 March), we decided our primary coring objectives had been mostly achieved, so we prepared the hole for downhole logging. We circulated 35 barrels of mud to clear cuttings out of the hole (before retrieving the last core), deployed the rotary shifting tool (RST) to release the bit in the bottom of the hole, filled the hole with weighted mud, and raised the bottom of the drill string to 82.7 mbsf. At 2300 h, we started assembling the first logging tool string (triple combo). We finished assembling and testing the triple combo at 0115 h on 11 March. We lowered it through the drill string and out of the open end of the drill string at 82.7 mbsf. The bottom of the tool string encountered an obstruction in the hole at 133.7 mbsf. The tool string was raised and lowered a few times in an attempt to pass through this obstruction, but the tool became stuck in the hole. After applying the maximum amount of force to the logging wireline, the tool string was freed from the formation. The tool string was recovered on the rig floor at 0615 h on 11 March. We decided logging was not possible because of the hole conditions. After the rig floor was cleared of the logging setup, the driller started to pull the string out of the seafloor. However, the pipe had become stuck, and the drillers had to apply 40,000 lb of overpull to extract the BHA out of the seafloor. After the drill string was retrieved, the rig floor secured, the thrusters raised, and the seafloor positioning beacon recovered, we departed for Site U1452 at 1430 h on 11 March.
Lithostratigraphy
At Site U1450, two holes (U1450A and U1450B) were drilled to respective total depths of 687.36 m DSF (cored interval: 444.7 m with 64% recovery) and 811.9 m DSF (cored interval: 203.9 m with 23% recovery). Hole U1450B lithostratigraphic units overlap with those from Hole U1450A from 608.00 to 677.80 core depth below seafloor (CSF-A). The overall dominant lithology for Site U1450 (84% of total recovered material) is siliciclastic and comprises fining-upward sequences of fine sand, silt, and clay (i.e., turbidites), as well as homogenized sands and mixed silt-clay layers. Siliciclastic units alternate with at least 10 units of calcareous sediment (16% of total recovered material). The thickest continuous calcareous intervals are in Unit III and consist of 5.14 m in Core 354-U1450A-34F and 4.8 m in Core 36F with 3.36 m of drilling without coring in between them. Sediments give way downhole in Hole U1450B to increasingly more lithified material (e.g., limestones and claystones) from 627.50 m CSF-A to the base of recovered material. Additionally, Site U1450 contains three volcanic ash layers.
Recovered sediments from Site U1450 are divided into 24 lithostratigraphic units based on lithologic and paleontological characteristics obtained through macroscopic and smear slide analyses and physical property measurements (Figures F4, F5; Table T2).

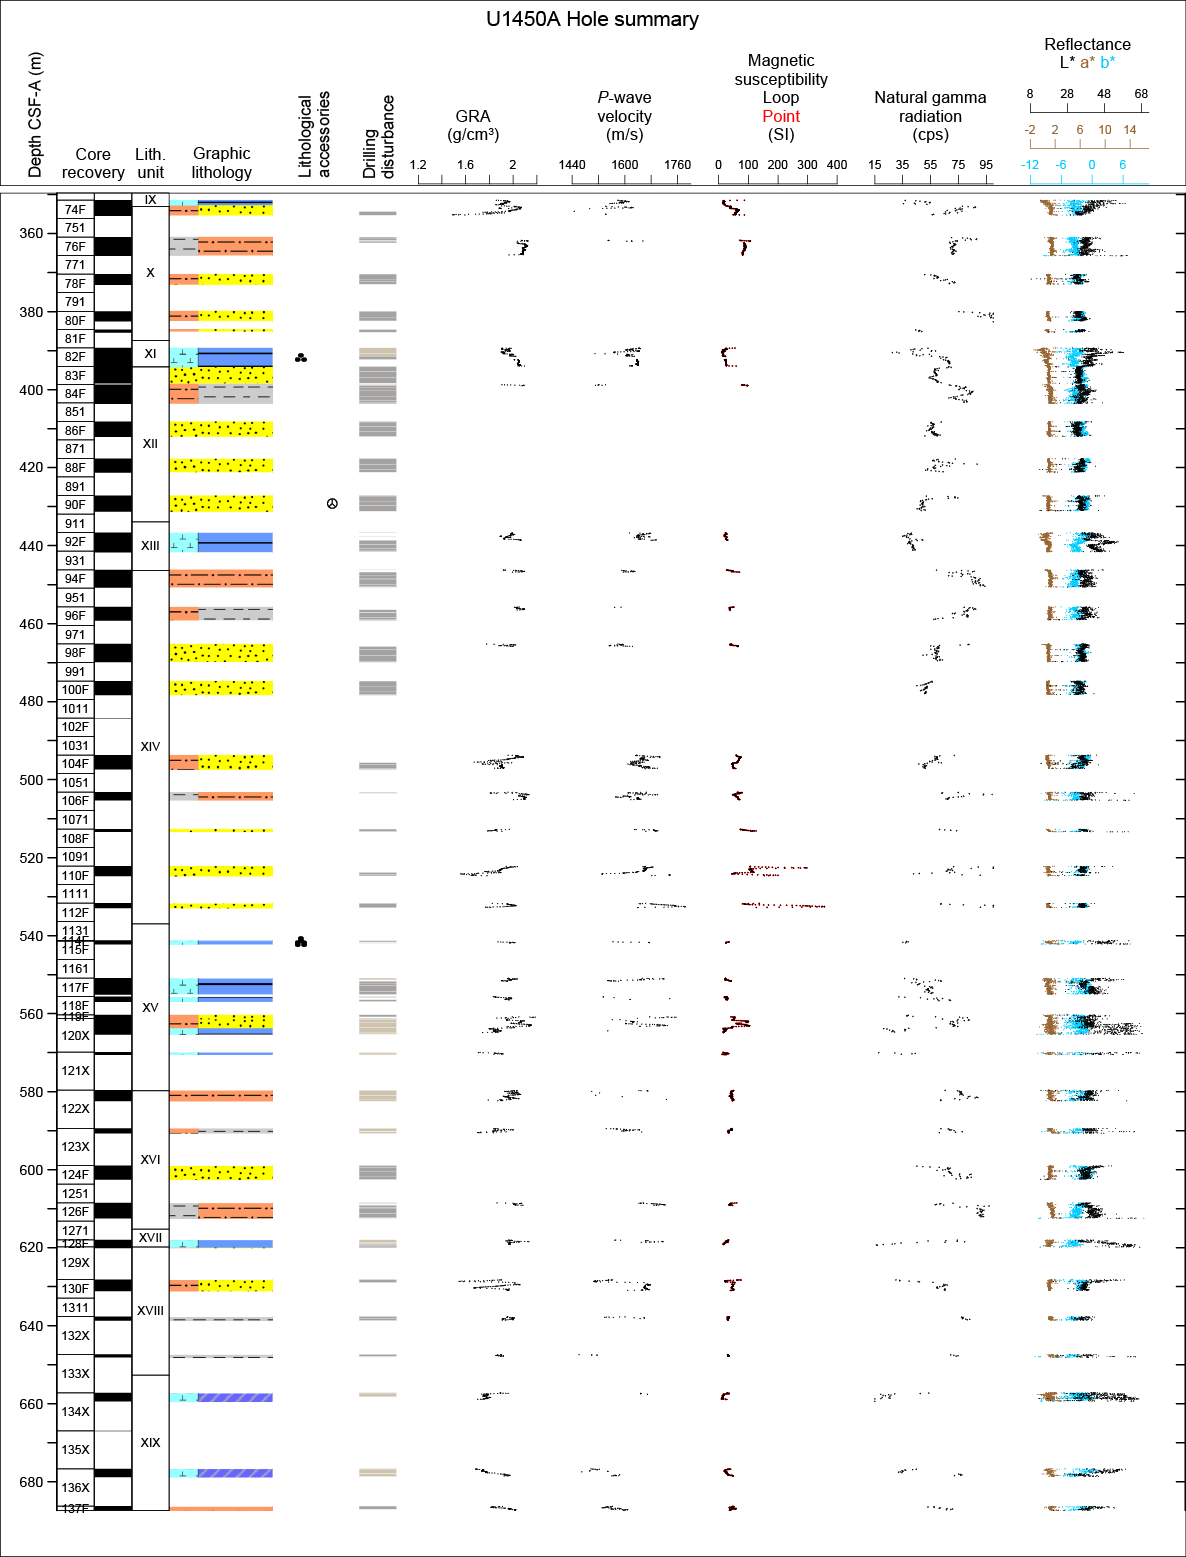
Figure F4. Lithostratigraphic summary, Hole U1450A.
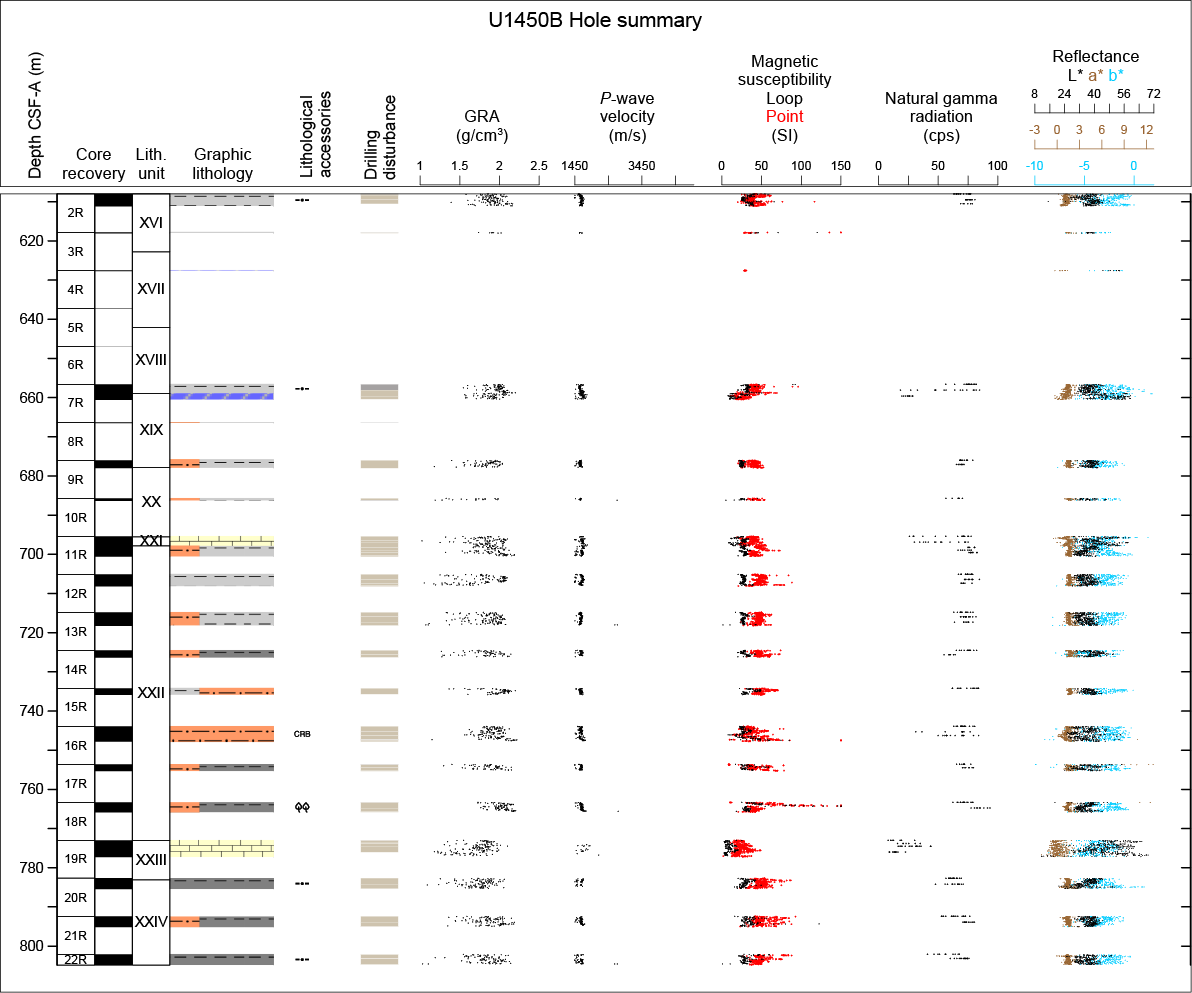
Figure F5. Lithostratigraphic summary, Hole U1450B.
Table T2. Intervals, depths, major and minor lithologies, and ages of units, Site U1450. Download table in .csv format.
Unit summaries
Because of the lithologic similarities between units, they have been grouped by lithology and summarized. More detailed descriptions of individual units are presented in the subsequent sections.
Units I, III, V, VII, IX, XI, XIII, XV, XVII, and XIX are dominated by calcareous clays. Lower units (XI, XV, and XIX) contain pyritized burrows and/or intercalated clay and silt beds with plant fragments. Units II, IV, VI, VIII, and XVI are principally siliciclastic sediments that fine upward (i.e., turbidites).
Units X, XII, XIV, XVIII, XX, and XXII are also dominated by siliciclastic sediment but are texturally homogeneous
Units XXI, XXIII, and XXIV are impure limestones and calcareous claystones with minor components of silty clay, claystone, and siltstone occasionally containing plant fragments.
Units I and VII contain ash layers.
Lithostratigraphic summary
Similar to Site U1449, lithologic differences between units and variations in grain size and bed thickness reflect cycles of proximal turbidity current channel activity and abandonment. Sand intervals may represent interlevee sheet flows (e.g., Curray et al., 2003), whereas finer grained fractions are more likely preserved in leveed sections. Bioturbated calcareous clays represent times of local channel-levee inactivity and reduced siliciclastic deposition and reflect an increase in settling of pelagic material. Many intervals of calcareous material show repeated sequences of color-graded beds, which can occur because of increased entrainment of siliciclastic material, changes in water column productivity, or changes in the oxidation/reduction horizons of the pore waters. In Hole U1450B, intervals dominated by calcareous and/or clayey material become increasingly lithified with depth, and many are intercalated with very thin to thin silt or siltstone layers. Plant fragments occur throughout the site, more commonly in silt and siltstone intervals, although a few sand-dominated units also contain macroscopic organic material. At the top of Hole U1450A is an 18 cm thick ash layer that presumably corresponds to the ~75 ka Toba volcanic eruption that produced widespread tephra deposits across the Bay of Bengal (e.g., Ninkovich et al., 1978; Gasparotto et al., 2000).
Overall, siliciclastic units (silt, clay, and sand) at Site U1450 are compositionally classified as mica rich (muscovite and biotite) and quartz rich. Sands occur mostly in fine to medium grain size ranges with rare occurrence of coarse-sized particles. Feldspar and heavy minerals (e.g., tourmaline, apatite, zircon, amphibole, garnet, sphene, rutile, chrome spinel, zoisite, glauconite, and opaque minerals) are common in silt- and sand-rich layers, and metamorphic minerals (sillimanite and chloritoid) and lithic fragments (e.g., quartzite, gneiss, and schist) occasionally appear in sands.
Units containing calcareous sediment (limestone and calcareous claystone) are mottled and bioturbated, consistently include radiolarians and foraminifers, and often exhibit color variations from white to greenish gray. The nomenclature for lithologic descriptions of fine sediments containing carbonate consists of a principal name and a modifier based on the composition estimated from visual description of the cores and from smear slide observations. The principal name of sediment that appears to contain >75% carbonate is calcareous ooze (see Figure F4 in the Expedition 354 methods chapter [France-Lanord et al., 2016a]). The principal name of sediment that appears to contain <10% carbonate is clay. If sediment contains a mixture of clay-sized siliciclastic particles and calcareous components (i.e., carbonate contents between 10% and 75%), the principal name is calcareous clay. This nomenclature was adopted to describe the continuum of sediments recovered from almost pure clay to almost pure calcareous ooze. In most cases, lithologic names assigned using this protocol match well with measured carbonate content and accurately reflect the continuum of sediments recovered at this site. Examples can be seen in Figure F6 in the Site U1451 chapter (France-Lanord et al., 2016b) and Figure F5 in the Site U1452 chapter (France-Lanord et al., 2016c).
Drilling disturbances at this site vary in intensity from slight to high and include flow-in, fractures, up-arching, “soupy” textures, and drilling biscuits. Flow-in is the most common drilling disturbance in fine-grained intervals, whereas disturbed sands may display a homogeneous (or soupy) texture. See Figure F6 in the Expedition 354 methods chapter (France-Lanord et al., 2016a) for a more detailed description and graphic examples of drilling disturbance types.
Unit I
- Interval: 354-U1450A-1H-1, 0 cm, to 1H-4, 54 cm; Hole U1450B not recovered
- Depth: 0–5.04 m CSF-A
- Age: Late Pleistocene–recent
- Lithology: calcareous clay (major); volcanic ash (minor)
Description
Unit I consists of a 5.0 m thick nannofossil-rich calcareous clay with foraminifers. The uppermost 20 cm is yellow and has a soft spongy texture. The color gradually changes downsection to light gray with mottling and abundant burrows. Intervals 1H-1, 19–66 and 108–141 cm, are particularly rich in planktonic foraminifers. Section 1H-2, 9–27 cm, contains a light brown volcanic ash layer composed of fine sand–sized glass shards fining upward (Figure F6). The base of this layer appears to have been disturbed by coring, and a blob of ash is found 32 cm farther downcore (1H-2, 59–65 cm). This ash blob does not appear to be a laterally continuous feature; therefore, we interpret it to be a result of displacement by coring. Below the base of the ash layer is a 67 cm thick interval of white calcareous clay with large vertical burrows (>5 cm) infilled with dark material, probably pyrite framboids. Below this interval, the white calcareous clay becomes gray with a mottled texture. Intervals 20–50 cm thick of gray calcareous clay are divided by 1–2 cm thick bands of dark green calcareous clay. At the base of the unit (Section 1H-4, 48 cm), calcareous clay transitions into bioturbated gray clay with foraminifers.
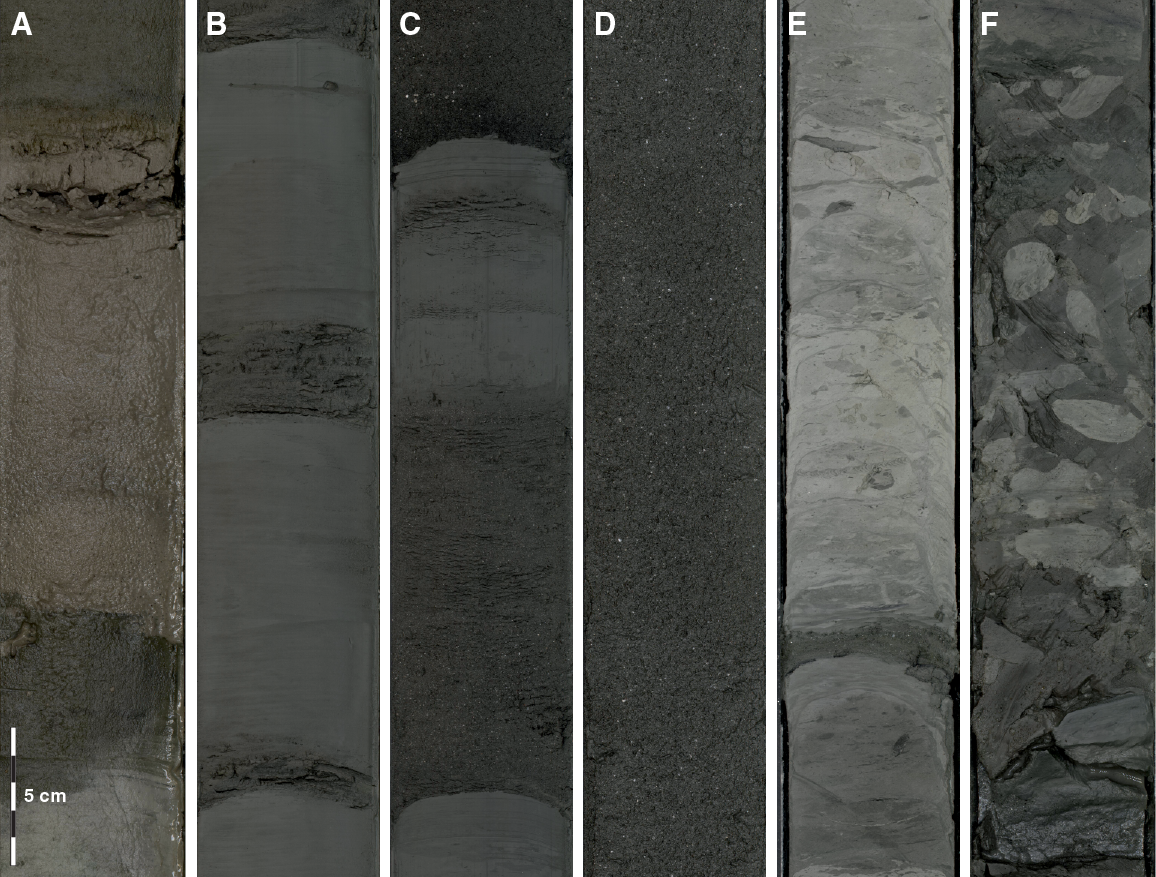
Figure F6. Representative examples of major lithologies recovered in Hole U1450A. A. Volcanic ash. B. Succession of mud turbidites. C. Silt/fine-sand dominated turbidites. D. Homogeneous fine sand. E. Nannofossil-rich calcareous clay. F. Centimeter-sized clasts of light gray nannofossil-rich calcareous clay in a matrix of clay.
Composition from smear slides
See Figure F7 for representative smear slide images.

Figure F7. Representative smear slide images, Hole U1450A. A. Volcanic ash with abundant glass shards. B. Silty sand including quartz, feldspar, and various kinds of mica and heavy minerals. C. Clay minerals. D. Nannofossil-rich calcareous clay.
Nannofossil-rich calcareous clay
Calcareous nannofossils make up a significant proportion of the total grains in the smear slides, up to 85%–95%, with fragments of radiolarians, foraminifers, and diatoms (1H-1, 54 cm; 0.539 m CSF-A). Minor amounts of clay minerals are also found.
Volcanic ash
Smear slides from the ash layers mainly consist of volcanic glass shards 0.01–0.35 mm in diameter and minor amounts of quartz, feldspar, biotite, and hornblende. Volcanic glass appears in the form of clear plates, flakes, and strands with a relatively low refractive index (1H-2, 64 cm; 2.14 m CSF-A). Occasionally, fragments of radiolarians and foraminifers contaminate the ash. The typical range for the volcanic glass proportion is 90%–95% of total grains.
Unit II
- Interval: 354-U1450A-1H-4, 54 cm, to 32F-CC, 31 cm; Hole U1450B not recovered
- Depth: 5.04–156.76 m CSF-A
- Age: Middle–Late Pleistocene
- Lithology: clay, silt, sand (major); nannofossil-rich calcareous clay with foraminifers (minor)
Description
Unit II is generally characterized by alternating sequences of silt- and clay-rich (Figure F6B) and sand-rich intervals (i.e., turbidites) intercalated with calcareous clay between 70.79 and 72.41 m CSF-A. The silt- and clay-rich intervals are located at 5.04–11.6, 96.76–99.04, 128.82–134.4, and 151.9–153.35 m CSF-A. They usually consist of repeated thin- to medium-bedded laminated silt fining upward into clay (Figure F8A). The clays are either structureless or bioturbated (Figure F8B). The silts often exhibit an overall upward decreasing trend of thickness and frequency. The sand-dominated intervals mainly consist of medium to very thick beds overlain by thin- to medium-bedded clay layers with gradational boundaries. Thick to very thick sand beds often show a soupy texture and are mostly composed of fine to medium normally graded sand, especially in the uppermost parts of the beds (Figure F8C). They also commonly show horizontal stratification with mica-rich or plant debris–rich layers (Figure F9) and occasionally include a few mud clasts.
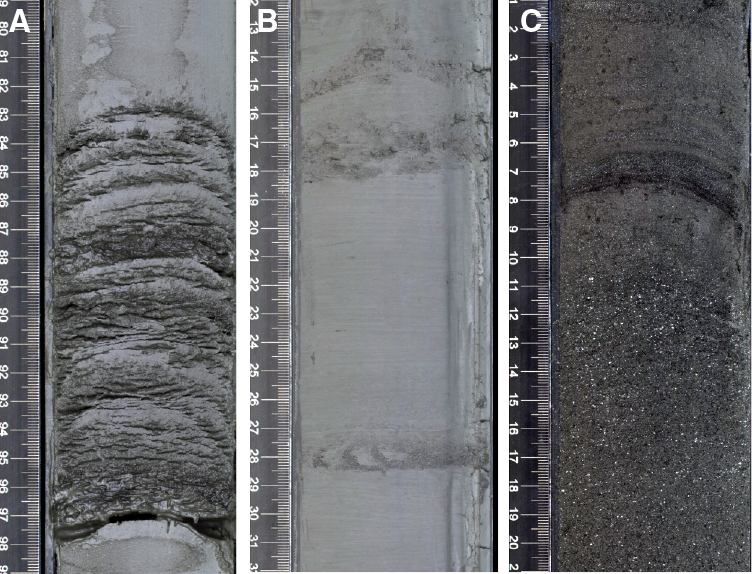
Figure F8. Hole U1450A features. A. Laminated silt overlain by structureless clay. B. Bioturbation in thin mud turbidites. C. Two successive sand turbidites. Note fining-upward texture (normal grading) in the uppermost part of the lower unit and horizontal stratification in the basal part of the upper unit.
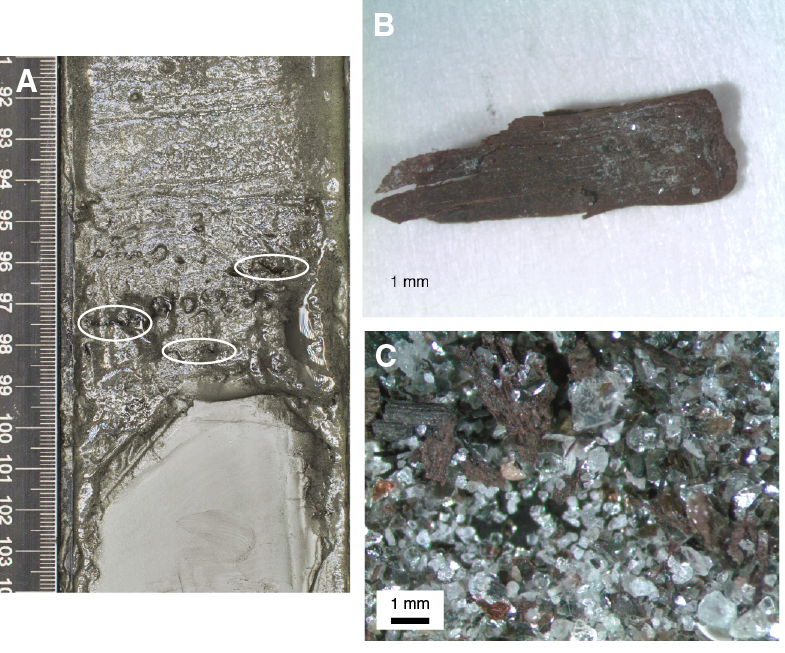
Figure F9. Plant fragments, Hole U1450A. A. Plant fragments in basal part of sand turbidites. B. Microscope photograph of plant fragment. C. Microscope photograph of sand grains from the basal part of the sand turbidites, showing abundant plant fragments.
Composition from smear slides
See Figure F7 for representative smear slide images.
Calcareous clay
White and greenish white calcareous clay is mainly composed of calcareous nannofossils with radiolarians. The average proportion of the nannofossil component is 65%–80% of total grains. In some horizons, clay minerals and fragments of foraminifers occur (14F-3, 73 cm; 71.10 m CSF-A).
Clayey silt and silty clay
Silt-sized grains include quartz, feldspar, mica, altered mica, and heavy minerals. Clay-sized minerals include amorphous and aphanitic grains (2H-1, 52 cm; 9.02 m CSF-A). Carbonate minerals are occasionally present.
Silty sand
Silty sand layers intercalated in the upper part of the unit consist of quartz, feldspar, mica, and lithic fragments. Heavy minerals, including amphibole, tourmaline, zoisite, zircon, apatite, and opaque minerals, are frequently recorded. Metamorphic minerals such as sillimanite and chloritoid were occasionally observed. In several horizons, a few glauconitic grains, mostly 0.1–0.2 mm in diameter, are found. The sand at 20.20 m CSF-A includes a large amount of plant debris and wood fragments with foraminifers. Occasionally, aggregate grains of carbonate minerals occur. The maximum grain size for sand grains is 0.67 mm in diameter (8F-1, 80 cm; 39.80 m CSF-A).
Unit III
- Interval: 354-U1450A-34F-1, 0 cm, to 36F-CC, 37 cm; Hole U1450B not recovered
- Depth: 161.40–176.00 m CSF-A
- Age: Middle Pleistocene
- Lithology: calcareous clay (major); biosiliceous-rich clay, silt (minor)
Description
Unit III consists of 14.6 m of varicolored nannofossil-rich calcareous clay with foraminifers and occasional 3–15 cm thick dark gray silt interbeds. The calcareous clay is mostly white-yellow with green and light gray intervals. Small horizontal burrows and mottling are pervasive. Vertical burrows occur less often and are generally larger (>3 cm) and infilled with pyrite. From 34F-4, 0 cm, to 34F-CC, 36 cm, a biosilica-rich interval with radiolarians is present. The uppermost 5.1 m of the unit was recovered in Core 34F, followed by 4.4 m of drilling without coring. When coring resumed in Core 36F, another 5.2 m of this calcareous clay unit was recovered.
Composition from smear slides
See Figure F7 for representative smear slide images.
Nannofossil-rich calcareous clay
Calcareous nannofossils make up a significant proportion (up to 85%) of the clay-sized fraction, and clay minerals occur in minor proportion (up to 10%). Radiolarians also contribute a minor amount, generally up to 5%.
Silt
Silt-sized grains of quartz, feldspar, lithic fragments, mica, and heavy minerals are found (34F-1, 108 cm; 162.388 m CSF-A). Occasionally, carbonate minerals, nannofossils, radiolarians, and their fragments are also present.
Unit IV
- Interval: 354-U1450A-38F-1, 0 cm, to 44F-CC, 32 cm; Hole U1450B not recovered
- Depth: 180.40–213.75 m CSF-A
- Age: Middle Pleistocene
- Lithology: clay, silt, fine sand
Description
Unit IV is characterized by overall dominance of medium- to thick-bedded sand beds intercalated with a few successive thin- to medium-bedded clay- and silt-rich intervals (i.e., turbidites; Figure F6C). Sand-dominated intervals are mostly composed of normally graded fine to medium sand. The grading is especially visible in the uppermost parts of the beds. Some sand beds display no internal structures, perhaps because of homogenization by coring (Figure F6D). However, they also commonly show horizontal stratification with mica. The intercalated clay- and silt-rich beds mainly consist of structureless clay with basal thin or very thin silt or sand layers. Basal silt or sandy layers are laminated and normally graded with sharp lower boundaries.
Composition from smear slides
See Figure F7 for representative smear slide images.
Clayey silt
Clayey silt mainly contains detrital grains. Occasionally, nannofossils, radiolarians, and their fragments are also found. The mineralogy of clayey silt is similar to that of silty sand, as described below, although the heavy mineral content tends to be richer compared to sand. Occasionally, carbonate minerals are also recorded.
Silty sand
Silty sand consists of quartz, feldspar, and mica. Organic material, such as plant debris, was frequently observed. As accessory minerals, heavy minerals including amphibole, tourmaline, zircon, garnet, chromian spinel, chloritoid, and opaque minerals are found. In several horizons, the proportion of heavy minerals is very low, less than 1% of total grains (40F-2, 85 cm; 192.28 m CSF-A). Occasionally, euhedral carbonate minerals and aggregate grains of carbonate minerals are found. The maximum grain size is 0.41 mm in diameter (38F-1, 40 cm; 180.8 m CSF-A).
Unit V
- Interval: 354-U1450A-46F-1, 0–140 cm; Hole U1450B not recovered
- Depth: 218.40–219.80 m CSF-A
- Age: Middle Pleistocene
- Lithology: nannofossil-rich calcareous clay
Description
Unit V consists of 1.4 m of green to light gray nannofossil-rich calcareous clay. The uppermost 0.78 m is deformed and consists of broken pieces of calcareous clay in a liquefied matrix, probably fall-in from the interval above that was drilled without coring.
Composition from smear slides
See Figure F7 for representative smear slide images.
Nannofossil-rich calcareous clay with radiolarians
Calcareous clay is mainly composed of nannofossils and a greenish gray layer rich in radiolarians. A relatively high proportion of foraminifers was also observed. The average proportion of the nannofossil component is 50%–75% of total grains.
Unit VI
- Interval: 354-U1450A-46F-1, 140 cm, to 50F-CC, 32 cm; Hole U1450B not recovered
- Depth: 219.80–240.13 m CSF-A
- Age: Middle Pleistocene
- Lithology: fine sand (major); silty clay (minor)
Description
Unit VI is characterized by overall dominance of medium-bedded to very thick bedded fine to medium sands. The uppermost part of the sand beds often shows normal grading. The sands are overlain by very thin to thin structureless clay layers with gradational boundaries and commonly show horizontal stratification with mica. Taking all characteristics into account, Unit VI mostly represents sand-dominated turbidites.
Composition from smear slides
See Figure F7 for representative smear slide images.
Silty sand
Silty sand consists primarily of quartz, feldspar, lithic fragments, mica, and heavy minerals. All grains are angular except altered mica grains. Heavy minerals such as garnet, zircon, amphibole, apatite, tourmaline, sphene, and opaque minerals are present. Large grains of mica and quartz, reaching 0.5 mm in diameter, are ubiquitous. This lithofacies also contains fragments of foraminifers and aggregates of carbonate minerals as a minor proportion. The maximum grain size is 0.54 mm in diameter in this interval (46F-2, 77 cm; 220.62 m CSF-A).
Unit VII
- Interval: 354-U1450A-52F-1, 0 cm, to 52F-2, 82 cm; Hole U1450B not recovered
- Depth: 246.90–249.17 m CSF-A
- Age: Middle Pleistocene
- Lithology: nannofossil-rich calcareous clay with foraminifers (major); volcanic ash (minor)
Description
Unit VII consists of 2.3 m of mottled white to light gray nannofossil-rich calcareous clay with foraminifers. Horizontal and vertical burrows are pervasive. Interval 52F-1, 9–21 cm, is a light brown volcanic ash layer composed of fine sand-sized glass shards. The base of this ash layer shows a band of black coloration and has an irregular sharp boundary with the calcareous clay beneath.
Composition from smear slides
See Figure F7 for representative smear slide images.
Nannofossil-rich calcareous clay with radiolarians
Calcareous clay mainly consists of nannofossils, ranging from 85% to 90% of total grains. Few radiolarians and foraminifers were also observed.
Volcanic ash
The ash layers mainly consist of volcanic glass shards 0.01–0.55 mm in diameter. Minor amounts of quartz, feldspar, biotite, hornblende, and rare clinopyroxene grains were also observed (52F-1, 19 cm; 247.09 m CSF-A). The volcanic glass is partially dissolved and replaced by clay minerals. The typical range for the volcanic glass proportion is 60%–85% of total grains. The glass is mainly platy or strand shaped. Relatively common calcareous nannofossils along with a few radiolarian fragments and foraminifers were also observed.
Unit VIII
- Interval: 354-U1450A-52F-3, 0 cm, to 72F-CC, 23 cm; Hole U1450B not recovered
- Depth: 249.17–345.61 m CSF-A
- Age: early–Middle Pleistocene
- Lithology: silty clay, clayey silt (major); silty fine sand (minor)
Description
Unit VIII is composed of 96.44 m of dark gray silty clay, clayey silt, and silty fine sand. This unit is divided into two subunits. The upper part, Subunit VIIIa (52F-3, 0 cm, to 64F-2, 30 cm), is 55.70 m thick and consists of dark gray clayey silt fining upward into dark gray silty clay (mud turbidites; Figure F6C–F6D). A longer interval of homogeneous clayey silt was observed between 54F-4, 0 cm, and 56F-4, 59 cm. Subunit VIIIb (64F-2, 30 cm, to 72F-CC, 23 cm) is 40.74 m thick and consists of dark gray silty fine sand deposited in medium to thick beds (sand-dominated turbidites) interbedded with minor gray clay and silty clay intervals (mud-dominated turbidites).
Composition from smear slides
See Figure F7 for representative smear slide images.
Clayey silt and clay with silt
Clayey silt mainly contains detrital grains, nannofossils, and radiolarians. The mineralogy of clayey silt is similar to silty sand, as described below, although feldspar grains tend to be a higher proportion compared to silty sand. Carbonate minerals are occasionally recorded.
Silty sand
Silty sand consists primarily of quartz, feldspar, lithic fragments, mica, and heavy minerals. Occasionally, glauconitic grains less than 0.1 mm in diameter occur (66F-1, 135 cm; 314.75 m CSF-A). Most grains are angular except altered mica and glauconitic grains. Heavy minerals such as garnet, zircon, amphibole, apatite, tourmaline, sphene, and opaque minerals are found. Sand containing a high proportion of garnet and zoisite occurs at several horizons (54F-2, 32 cm, 258.03 m CSF-A, and 58F-1, 21 cm, 275.61 m CSF-A). Metamorphic minerals, such as sillimanite and chloritoid, occur rarely (54F-2, 32 cm; 258.03 m CSF-A). Rounded and large lithic fragments of quartzite, gneiss, and schist (mica-amphibole schist) are ubiquitous (68F-1, 6 cm; 322.96 m CSF-A). The sand at 266.88 m CSF-A (56F-1, 98 cm) is remarkably rich in pyrite grains and amorphous organic matter. This lithofacies also contains fragments of foraminifers and aggregates of carbonate minerals as a minor proportion.
Sand in this interval tends to be relatively coarse grained with maximum grain sizes of 0.59 mm (66F-1, 135 cm; 314.75 m CSF-A) and 0.71 mm (72F-2, 32 cm; 343.31 m CSF-A) in diameter.
Unit IX
- Interval: 354-U1450A-74F-1, 0 cm, to 74F-2, 12 cm; Hole U1450B not recovered
- Depth: 351.40–352.98 m CSF-A
- Age: early Pleistocene
- Lithology: nannofossil-rich calcareous clay with foraminifers (major); clay (minor)
Description
Unit IX consists of 1.6 m of nannofossil-rich calcareous clay with foraminifers. Color variations from white to yellow to light gray occur in ~10 cm thick bands. Mottled texture and burrows are prevalent. In Section 74F-1, 134–146 cm, a dark gray clay-rich interval with abundant nannofossils is underlain by 12 cm of nannofossil-rich calcareous clay with foraminifers.
Composition from smear slides
See Figure F7 for representative smear slide images.
Nannofossil-rich calcareous clay
Calcareous nannofossils make up the major component. This calcareous clay also contains aggregates of clay minerals as a minor proportion.
Clay
Clay minerals make up the significant proportion of total grains in this layer, with a minor amount of nannofossils and aggregates of carbonate grains.
Unit X
- Interval: 354-U1450A-74F-2, 12 cm, to 81F-1, 80 cm; Hole U1450B not recovered
- Depth: 352.98–385.40 m CSF-A
- Age: early Pleistocene
- Lithology: clayey silt (major); silty fine sand, silty clay (minor)
Description
Unit X is 32.42 m thick and consists predominantly of very thick beds of dark gray homogeneous clayey silt and silty fine sand. Thin-bedded intervals of dark gray clayey silt fining upward into silty clay occur in Sections 74F-2 and 76F-1. A sharp base and fining-upward texture (normal grading) define these as turbidites. The absence of such beds in lower sections of the cores and the lack of sedimentary structures point toward material homogenization probably due to coring. A thin layer at the top of interval 76F-1, 0–10 cm, contains nannofossil-rich calcareous clay. Fall-in of these sediments at the core top is indicated by several centimeter-sized clasts within a muddy matrix. Therefore, the drilled interval above Section 74F-2 might contain significant amounts of hemipelagic sediments.
Composition from smear slides
See Figure F7 for representative smear slide images.
Clayey silt and clay with silt
Clayey silt mainly includes silt- and clay-sized detrital grains and occasionally contains calcareous nannofossils, radiolarians, and their fragments. Clay with silt consists mainly of calcareous nannofossils, radiolarians, diatoms, and their fragments. Occasionally, minor amounts of carbonate minerals also occur.
Silty sand
Silty sand consists primarily of quartz, feldspar, lithic fragments, mica, and heavy minerals. Occasional shell fragments less than 2 mm in diameter are found (78F-3, 30 cm; 372.54 m CSF-A). Most grains are angular except altered mica. Heavy minerals such as garnet, zircon, amphibole, apatite, tourmaline, sphene, and opaque minerals are also found. Although deep green tourmaline and green amphibole tend to increase in this interval, the proportion of heavy minerals fluctuates irregularly. Occasionally, euhedral grains and aggregate grains of carbonate minerals are found as a minor component. The maximum grain size is 0.8 mm in diameter (80F-1, 53 cm; 380.43 m CSF-A).
Unit XI
- Interval: 354-U1450A-82F-1, 0 cm, to 82F-CC, 22 cm; Hole U1450B not recovered
- Depth: 389.30–394.24 m CSF-A
- Age: early Pleistocene
- Lithology: nannofossil-rich calcareous clay with foraminifers
Description
Unit XI consists of 4.9 m of massive light gray and white nannofossil-rich calcareous clay with foraminifers. Mottled texture and burrows are prevalent. In several instances, burrows ~0.5 cm in diameter are infilled with dark material, probably pyrite framboids.
Composition from smear slides
See Figure F7 for representative smear slide images.
Nannofossil-rich calcareous clay
The smear slide of this layer contains 50%–70% calcareous nannofossils along with a subordinate proportion of clay minerals (25%–40%). It also contains a minor amount of radiolarians (5%–10%).
Unit XII
- Interval: 354-U1450A-83F-1, 0 cm, to 90F-3, 136 cm; Hole U1450B not recovered
- Depth: 394.00–431.13 m CSF-A
- Age: early Pleistocene
- Lithology: fine sand (major); silty clay (minor)
Description
Unit XII is composed of 37.13 m of dark gray fine sand and dark gray silty clay. This unit is divided into three subunits. The upper part, Subunit XIIa (83F-1, 0 cm, to 83F-3, 147 cm), is 4.36 m thick and consists of dark gray fine sand. These sands are soupy and lack internal structures, possibly because of drilling disturbance. The middle part, Subunit XIIb (84F-1, 0 cm, to 86F-1, 14 cm), is 9.64 m thick and consists of dark gray silty clay. The beds are highly disturbed by flow-in of material from the core bottom. The lower part, Subunit XIIc (86F-1, 14 cm, to 90F-3, 136 cm), is 22.72 m thick and consists of dark gray fine sand. The sands are homogeneous and soupy because of high water contents. Nannofossil-rich greenish-gray calcareous clay was observed at 90F-1, 0–10 cm.
Composition from smear slides
See Figure F7 for representative smear slide images.
Clayey silt and clay with silt
Clayey silt mainly includes detrital grains and occasionally nannofossils, radiolarians, and their fragments. Clay with silt consists mainly of clay-sized minerals and clay minerals with few nannofossils and fragments of radiolarians. Occasionally, euhedral grains and aggregate grains of carbonate minerals occur.
Silty sand
Silty sand consists primarily of quartz, feldspar, lithic fragments, mica, and heavy minerals. Nannofossils are occasionally found in this lithology (83F-1, 43 cm; 394.43 m CSF-A). The grains are mostly angular, with a few exceptions in altered mica and large lithic fragments. The heavy minerals consist of amphibole, garnet, zircon, apatite, tourmaline, sphene, and opaque minerals. In this interval, the heavy mineral assemblage is characterized by low tourmaline contents and abundant garnet and zoisite grains. This lithofacies also contains euhedral grains of carbonate minerals as a minor proportion. The maximum grain size is 0.68 mm in diameter (88F-1, 104 cm; 418.74 m CSF-A).
Unit XIII
- Interval: 354-U1450A-92F-1, 0 cm, to 94F-1, 16 cm; Hole U1450B not recovered
- Depth: 436.70–443.36 m CSF-A
- Age: early Pleistocene
- Lithology: nannofossil-rich calcareous clay
Description
Unit XIII consists of 9.7 m of massive light gray nannofossil-rich calcareous clay with some light green intervals (<5 cm thick). Mottled texture and burrows are prevalent. The uppermost 5.0 m of the unit was recovered in Core 92F, followed by 4.5 m of drilling without coring. The last 15 cm of this calcareous clay unit was recovered in Section 94F-1. The base of the unit has a sharp planar-inclined boundary geometry.
Unit XIV
- Interval: 354-U1450A-94F-1, 16 cm, to 112F-1, 113 cm; Hole U1450B not recovered
- Depth: 446.36–532.83 m CSF-A
- Age: early Pleistocene
- Lithology: fine sand, silty sand, silt (major); silty clay (minor)
Description
Unit XIV is composed of 86.47 m of silty fine sand, silt, and silty clay. This unit is divided into three subunits. The upper part, Subunit XIVa (94F-1, 16 cm, to 98F-1, 37 cm), is 19.21 m thick and consists of gray silt and dark gray silty clay. Large parts of this subunit are affected by flow-in drilling disturbance. The middle part, Subunit XIVb (98F-1, 37 cm, to 100F-CC, 16 cm), is 12.78 m thick and consists of dark gray fine sand. The sands are homogeneous, probably because of the drilling process. The lower part, Subunit XIVc (104F-1, 0 cm, to 112F-1, 113 cm), is 39.13 m thick and consists of alternate beds of dark gray silty clay and dark gray silty fine sand with mica. The silty sand beds are soupy, and the silty clay beds show up-arching. The lower portion of this subunit consists of three thin beds of nannofossil-rich dark gray calcareous clay (Sections 110F-1 through 112F-1) interbedded with dark gray fine sand with mica.
Composition from smear slides
See Figure F7 for representative smear slide images.
Clayey silt
Clayey silt mainly contains detrital grains with nannofossils and radiolarians. The mineralogy of clayey silt is similar to silty sand, described below, but lithic fragments are absent in this lithology. Occasionally, carbonate minerals are recorded.
Silty sand
Silty sand contains angular grains of quartz, feldspar, lithic fragments, mica, and heavy minerals. Heavy minerals consist of garnet, tourmaline, zoisite, sphene, rutile, apatite, zircon, clinozoisite, and opaque minerals. Fibrolithic sillimanite grains occasionally occur in this lithology. In coarse-grained sand, schistose rock fragments, such as mica schist and mica-amphibole schist, were observed. Occasionally, this lithofacies contains aggregate grains of carbonate minerals as a minor proportion. The maximum grain size is 0.65 mm in diameter (112F-1, 30 cm; 532.00 m CSF-A).
Unit XV
- Interval: 354-U1450A-114F-CC, 0 cm, to 121F-CC, 66 cm; Hole U1450B not recovered
- Depth: 541.20–570.57 m CSF-A
- Age: early–Middle Pleistocene
- Lithology: nannofossil-rich calcareous clay (major); fine sand, silty clay (minor)
Description
Unit XV consists of 29.4 m of nannofossil-rich calcareous clay with intervals of silty clay and fine sand. The uppermost 1.0 m of the unit consists of indurated gray nannofossil-rich calcareous clay with mottling (Figure F6E), followed by 8.7 m of drilling without coring. When coring resumed with Core 117F, an additional 0.8 m of a very similar indurated calcareous clay was recovered. In Section 117F-1, a layer of centimeter-sized clasts of light gray calcareous clay in a matrix of clay was observed from 51 to 80 cm (Figure F6F). This interval was potentially deposited by a mass flow (cf. Normark et al., 1997). Immediately below this interval, 0.7 m of soupy silty sand is followed by 2.0 m of broken pieces of calcareous clay in a liquefied matrix of silty sand. Core 118F contains 1.4 m of indurated and slightly fractured gray nannofossil-rich calcareous clay with mottling and abundant burrows, followed by another 0.5 m of broken pieces of calcareous clay at the top of Core 119F. Below the top of Core 119F is a sequence of 2.5 m of fine sand with a sharp lower boundary fining upward into silty clays. The base of Unit XV consists of 1.5 m of indurated white and gray nannofossil-rich calcareous clay with vertical and horizontal burrows.
Composition from smear slides
See Figure F7 for representative smear slide images.
Calcareous clay
The upper and middle parts of this unit are mainly composed of calcareous nannofossils with calcareous grains and clay minerals. Very minor amounts of plant fragments and carbonate aggregate grains were also observed.
Silty sand
Silty sand mainly contains angular grains of quartz, feldspar, lithic fragments, mica, and heavy minerals. Heavy minerals consist of garnet, tourmaline, zoisite, sphene, rutile, apatite, zircon, clinozoisite, and opaque minerals, with zoisite, clinozoisite, and amphibole grains predominant in the interval. Metamorphic rock fragments (schistose fragments bearing muscovite, actinolite, and garnet) were recognized. Occasionally, euhedral carbonate minerals and aggregate grains of carbonate minerals are found. The maximum grain size is 0.51 mm in diameter (120X-2, 93 cm; 563.25 m CSF-A).
Unit XVI
- Intervals: 354-U1450A-122X-1, 17 cm, to 126F-CC, 20 cm; 354-U1450B-2R-1, 0 cm, to 3R-1, 23 cm
- Depths: Hole U1450A = 579.77–612.51 m CSF-A; Hole U1450B = 608.00–618.03 m CSF-A
- Age: middle Pliocene
- Lithology: clay, silt (major); sand, clay, calcareous clay (minor)
Description
In Hole U1450A, the majority of this unit is composed of fine-grained turbidite lithologies (clay, silty clay, clayey silt, and silt) that are dark gray in color and occasionally display fining-upward texture (normal grading). However, in interval 124F-1, 39 cm, to 124F-3, 81 cm, dark gray fine sand predominates; in interval 122X-1, 0–10 cm, calcareous clay is recorded; and in interval 124F-1, 0–39 cm, light gray nannofossil-rich clay was observed. In Hole U1450B, Unit XVI is composed of silt with plant fragments and clay with thin silt interbeds.
Composition from smear slides
See Figures F7 and F10 for representative smear slide images.

Figure F10. Representative smear slide images, Hole U1450B. A. Silty sand. B. Nannofossil-rich calcareous clay. C. Clay with nannofossils. D. Silt.
Silty clay
Silty clay includes mainly detrital grains and clay minerals with nannofossils, radiolarians, and diatoms. Occasionally, euhedral carbonate minerals are found.
Silty sand
Silty sand consists primarily of quartz, feldspar, lithic fragments, mica, and heavy minerals. Most grains are angular except altered mica. Heavy minerals such as garnet, zircon, amphibole, apatite, tourmaline, sphene, and opaque minerals are found. The garnet and green amphibole grains predominate over other heavy minerals in this interval, except for opaque minerals, but the heavy mineral content as a percentage of the total grains decreases downsection (354-U1450A-122X-CC, 30 cm; 582.24 m CSF-A). Occasionally, euhedral carbonate minerals and aggregate grains of carbonate minerals are found. The maximum grain size is 0.95 mm in diameter (124F-2, 85 cm; 601.23 m CSF-A).
Unit XVII
- Intervals: 354-U1450A-128F-1, 0 cm, to 128F-CC, 38 cm; 354-U1450B-4R-CC, 0–12 cm
- Depths: Hole U1450A = 618.00–619.90 m CSF-A; Hole U1450B = 627.50–627.62 m CSF-A
- Age: early Pliocene
- Lithology: calcareous clay (major); clay (minor)
Description
In Hole U1450A from 128F-1, 66 cm, to 128F-CC, 38 cm, Unit XVII mostly consists of light gray nannofossil-rich calcareous clay. The top of the section, at 128F-1, 0–66 cm, consists of dark gray clay with varying proportions of calcareous nannofossils. The entire unit is bioturbated, expressed as mottling, and in two intervals, 128F-1, 21–36 and 66–90 cm, burrows are recorded. In Hole U1450B, only 12 cm of Unit XVII was recovered, consisting of a light gray nannofossil-rich calcareous clay with burrows.
Composition from smear slides
See Figure F7 for representative smear slide images.
Nannofossil-rich calcareous clay
The smear slide of this lithofacies shows 85%–90% calcareous nannofossil content with subordinate foraminifers and clay minerals. Occasionally, this lithofacies shows a significant amount of framboidal pyrite grains (354-U1450A-128F-CC, 7 cm; 619.59 m CSF-A).
Silty clay
Silty clay mainly contains detrital grains and clay minerals with a significant proportion of calcareous nannofossils. Minor amounts of opaque minerals, zoisite, tourmaline, garnet, and zircon, along with quartz, feldspar, and rock fragments, were also observed. Occasionally, plant fragments and nannofossils occur.
Unit XVIII
- Intervals: 354-U1450A-129X-CC, 0 cm, to 133X-CC, 25 cm; 354-U1450B-7R-1, 0 cm, to 7R-2, 80 cm
- Depths: Hole U1450A = 619.90–648.14 m CSF-A; Hole U1450B = 656.50–658.90 m CSF-A
- Age: late Miocene–early Pliocene
- Lithology: fine sand (major); clay, clayey silt, silty clay, calcareous clay (minor)
Description
In Hole U1450A, the upper part of the unit, from 129X-CC, 0 cm, to 130F-3A, 51 cm, is dominated by dark gray fine-grained micaceous silty sand, with minor lithology silty clay recorded at 130F-1A, 0–70 cm. Clasts of nannofossil-rich calcareous clays are found in the silty sand at 129X-CC, 10–15 cm. The lower part of the unit, from 132X-1A, 0 cm, to the base of the unit, comprises finer lithologies: dark gray clay, clayey silt, and silty clay, with mottling indicative of bioturbation at 132X-1A, 32–38 cm. In Hole U1450B, this unit consists mainly of gray clay with thin silt interbeds and silt with plant fragments.
Composition from smear slides
See Figures F7 and F10 for representative smear slide images.
Silty sand
Silty sand layers intercalated in the upper part of the unit consist of quartz, feldspar, mica, lithic fragments, and heavy minerals. The heavy mineral assemblage shows relatively little variation compared to the other units, including garnet, amphibole, tourmaline, zoisite, epidote, zircon, and opaque minerals. Carbonate aggregate grains and euhedral carbonate minerals are found in this lithology, and the typical portion of these carbonate minerals is 5%–10% of total grains. The maximum grain size is 0.41 mm in diameter (354-U1450A-129X-CC, 6 cm; 619.86 m CSF-A).
Unit XIX
- Intervals: 354-U1450A-134X-1, 0 cm, to 137F-1, 106 cm; 354-U1450B-7R-2, 80 cm, to 9R-1, 0 cm
- Depths: Hole U1450A = 657.20–687.36 m CSF-A; Hole U1450B = 658.90–677.80 m CSF-A
- Age: late Miocene
- Lithology: calcareous claystone (major); silty clay, silt, sand (minor)
Description
In Hole U1450A, the dominant lithology comprises white nannofossil-rich limestone, which is clayey and sandy in interval 137F-1, 0–78 cm. Siliciclastic components consist predominantly of clayey silt and silty clay recorded throughout the unit, silt (with plant fragments) in interval 137F-1, 78–92 cm, and sand in interval 137F-1, 99–106 cm. Within this unit, thin beds of clay are interlaminated with the limestone, and thin beds of laminated silt, interbedded with the silty clay, occur in intervals 134X-1, 27 cm, to 134X-2, 64 cm, and 137F-1, 92–99 cm. Normal grading is noted in the siliciclastic component of Core 137F, and bioturbation, expressed as mottling and burrows, is common in Cores 134X and 136X. In Hole U1450B, Unit XIX consists of light gray impure limestone with burrows and interbeds of silt and nannofossil-rich clay.
Composition from smear slides
See Figure F10 for representative smear slide images.
Nannofossil-rich calcareous clay
This lithofacies is composed of 85%–90% calcareous nannofossils with clay minerals (15%–10%) and minor silt-sized grains.
Clay with nannofossils
This lithofacies contains mainly detrital grains and clay minerals with significant proportions of calcareous nannofossils and minor amounts of silt grains.
Silty sand
The silty sand layer consists primarily of quartz, feldspar, lithic fragments, mica, and heavy minerals (opaque minerals, garnet, tourmaline, amphibole, zircon, zoisite, and clinozoisite). Carbonate aggregate grains and euhedral carbonate minerals are present, and the typical proportion of these carbonate minerals is 4%–7% of total grains.
Unit XX
- Interval: Hole U1450A not recovered; 354-U1450B-9R-1, 0 cm, to 11R-1, 11 cm
- Depth: 677.80–695.51 m CSF-A
- Age: late Miocene
- Lithology: silty clay
Description
This unit mostly consists of gray silty clay with silt laminae (Figure F11A). A succession of thin silt beds fines upward into silty clay. Drilling disturbance consists of biscuiting and fracturing.
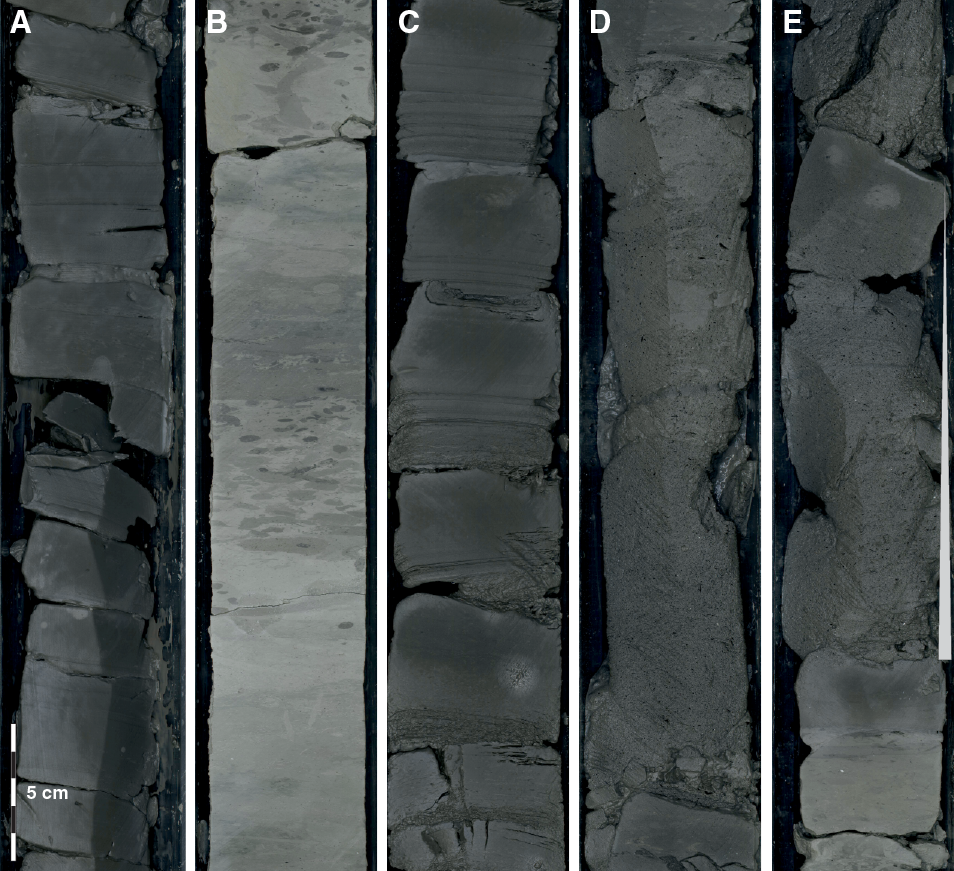
Figure F11. Representative examples of major lithologies recovered in Hole U1450B. A. Gray silty clay with silt laminae. B. Bioturbated calcareous claystone with nannofossils. C. Parallel laminated silty clay and parallel laminated interbeds of silt. D. Siltstone with organic fragments and mud clasts. E. Normally graded siltstone with organic fragments.
Composition from smear slides
See Figure F10 for representative smear slide images.
Silt
Silt layers in the upper part of the unit consist of quartz, feldspar, mica, lithic fragments, and heavy minerals, including amphibole, tourmaline, zoisite, clinozoisite, zircon, and opaque minerals. Occasionally, euhedral carbonate minerals are found.
The maximum grain size for sand grains is 0.18 mm in diameter (10R-1, 44 cm; 686.14 m CSF-A).
Unit XXI
- Interval: Hole U1450A not recovered; 354-U1450B-11R-1, 11 cm, to 11R-2, 94 cm
- Depth: 695.51–697.83 m CSF-A
- Age: late Miocene
- Lithology: limestone, calcareous claystone (major); silty clay (minor)
Description
The top of the unit (11R-1, 11–69 cm) consists of limestone with calcareous nannofossils, frequently bioturbated expressed as mottling and the presence of burrows (Figure F11B), followed by silty clay with mottling (11R-1, 69 cm, to 11R-2, 9 cm). The lower part of the unit is light gray nannofossil-rich limestone, also burrowed and mottled. Drilling disturbance occurs as biscuiting in the clays only.
Composition from smear slides
See Figure F10 for representative smear slide images.
Limestone
White and greenish limestone is mainly composed of calcareous nannofossils with radiolarians and foraminifers. The average range of the nannofossil component is 55%–70%, with the remaining proportion consisting of clay minerals.
Clayey silt and silty clay
Clayey silt and silty clay contains mainly detrital grains (quartz, feldspar, mica, altered mica, and heavy minerals) and clay minerals. In some horizons, this lithofacies contains abundant calcareous nannofossils (11R-1, 81 cm; 696.21 m CSF-A).
Unit XXII
- Interval: Hole U1450A not recovered; 354-U1450B-11R-2, 94 cm, to 19R-1, 5 cm
- Depth: 697.83–773.05 m CSF-A
- Age: late Miocene
- Lithology: clay and silty clay (major); clayey silt, silt, limestone (minor)
Description
Clay is gray and frequently mottled and sometimes contains interbeds of thin to very thin bedded silt, displaying parallel laminations in places and rare medium-bedded interbeds of burrowed sand. Silty clay is frequently parallel laminated and rarely interbedded with parallel-laminated silt (Figure F11C). Clayey silt and silt frequently contain organic matter and sometimes display laminations and thin beds of clay. The one thin-bedded, burrowed limestone interval in Section 16R-2 contains thin interbeds of clay. Drilling disturbance is mainly expressed as biscuiting in the upper part of the unit (to Core 14R), and below that point, fracturing is pervasive to the bottom of the unit. One void (Section 16R-3) and one soupy interval (Section 17R-CC) were also observed.
Composition from smear slides
See Figure F10 for representative smear slide images.
Silty clay and nannofossil-rich clay
Silty clay mainly includes detrital grains and occasional calcareous nannofossils and radiolarian fragments. Nannofossil-rich clay consists mainly of clay minerals with a large amount of calcareous nannofossils and minor radiolarians, diatoms, and their fragments.
Silty sand
Silty sand consists primarily of quartz, feldspar, lithic fragments, mica, and heavy minerals. Grains are angular in some horizons, except for altered mica. As accessory minerals, amphibole, garnet, zircon, tourmaline, sphene, and opaque minerals are recorded. The lower section of this unit contains fewer heavy minerals than the upper section. Most of the sandy silt sections contain plant and wood fragments along with altered micas. Occasionally, euhedral carbonate minerals and aggregate grains of carbonate minerals are found.
The maximum grain size is 0.39 mm in diameter (18R-1, 67 cm; 763.97 m CSF-A).
Unit XXIII
- Interval: Hole U1450A not recovered; 354-U1450B-19R-1, 5 cm, to 20R-1, 39 cm
- Depth: 773.05–783.09 m CSF-A
- Age: late Miocene
- Lithology: limestone (major); calcareous claystone, siltstone, claystone (minor)
Description
Limestone is commonly burrowed and in its upper part contains thin interbeds of burrowed claystone. Clayey limestone is also commonly burrowed and displays thin interbeds of limestone and claystone. Mottling was observed in both interbedded lithologies. Siltstone contains organic material, and claystone contains thin interbeds of siltstone, commonly mottled. Drilling disturbance is expressed as fracturing.
Unit XXIV
- Interval: Hole U1450A not recovered; 354-U1450B-20R-1, 39 cm, to 22R-CC
- Depth: 783.09–804.86 m CSF-A
- Age: late Miocene
- Lithology: claystone (major); siltstone, sandstone, calcareous claystone (minor)
Description
Claystone displays frequent mottling and rare parallel laminations and contains uncommon thin interbeds of mottled siltstone. Siltstones invariably contain organic fragments, apart from Section 22R-1. Mud clasts (Section 21R-1; Figure F11D) and fining upward (Section 22R-1; Figure F11E) were also observed in the siltstones. Siltstones are interbedded with very thin beds of clay (Section 21R-1) and very thin beds of parallel laminated silt (Section 22R-2). The fine sand layer (Section 22R-1, 1–14 cm) is homogeneous, and the calcareous claystone layer (Section 22R-1, 33–55 cm) is burrowed. Drilling disturbance is characterized by fracturing and biscuiting, and the sand layer is soupy.
Composition from smear slides
See Figure F10 for representative smear slide images.
Sandy siltstone
Sandy siltstone consists mainly of quartz, feldspar, lithic fragments, mica, and heavy minerals. Heavy minerals such as amphibole, tourmaline, garnet, zircon, zoisite, sillimanite, and opaque minerals are found. Heavy minerals are comparatively lower in proportion to sand higher in the unit. Samples at 784.50 and 794.24 m CSF-A include large amounts of plant debris and wood fragments and a minor amount of calcareous nannofossils. Occasionally, euhedral carbonate minerals and aggregate grains of carbonate minerals are found.
The maximum grain size is 0.33 mm in diameter (22R-1, 31 cm; 802.41 m CSF-A).
Maximum grain size
Maximum grain size was determined at approximately 8 m intervals at Site U1450 (Figures F12, F13). In each core, the coarsest and/or thickest lithology (generally from the base of the coarsest turbidite) was chosen for smear slide analysis, and the largest five equant detrital grains (quartz and feldspar) were measured. The maximum grain size ranges from 0.03 to 0.95 mm (coarse silt to coarse sand) and corresponds to the sand layer at the base of Unit XVI at 354-U1450A-124F-2, 85 cm. However, background values throughout the sequence show that coarse silt-sized material reached the fan setting at Site U1450 via turbidity currents since at least the late Miocene.
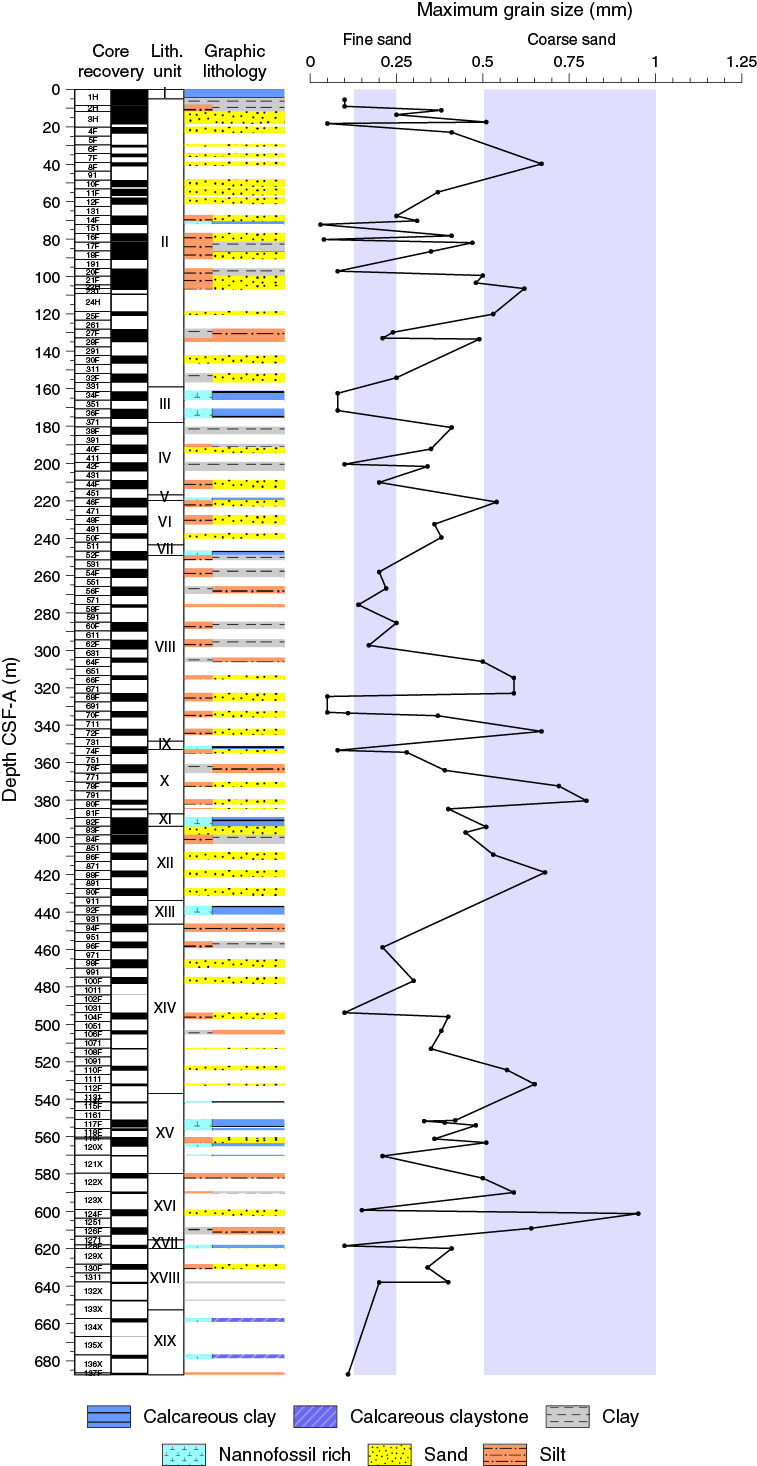
Figure F12. Maximum grain size, Hole U1450A.
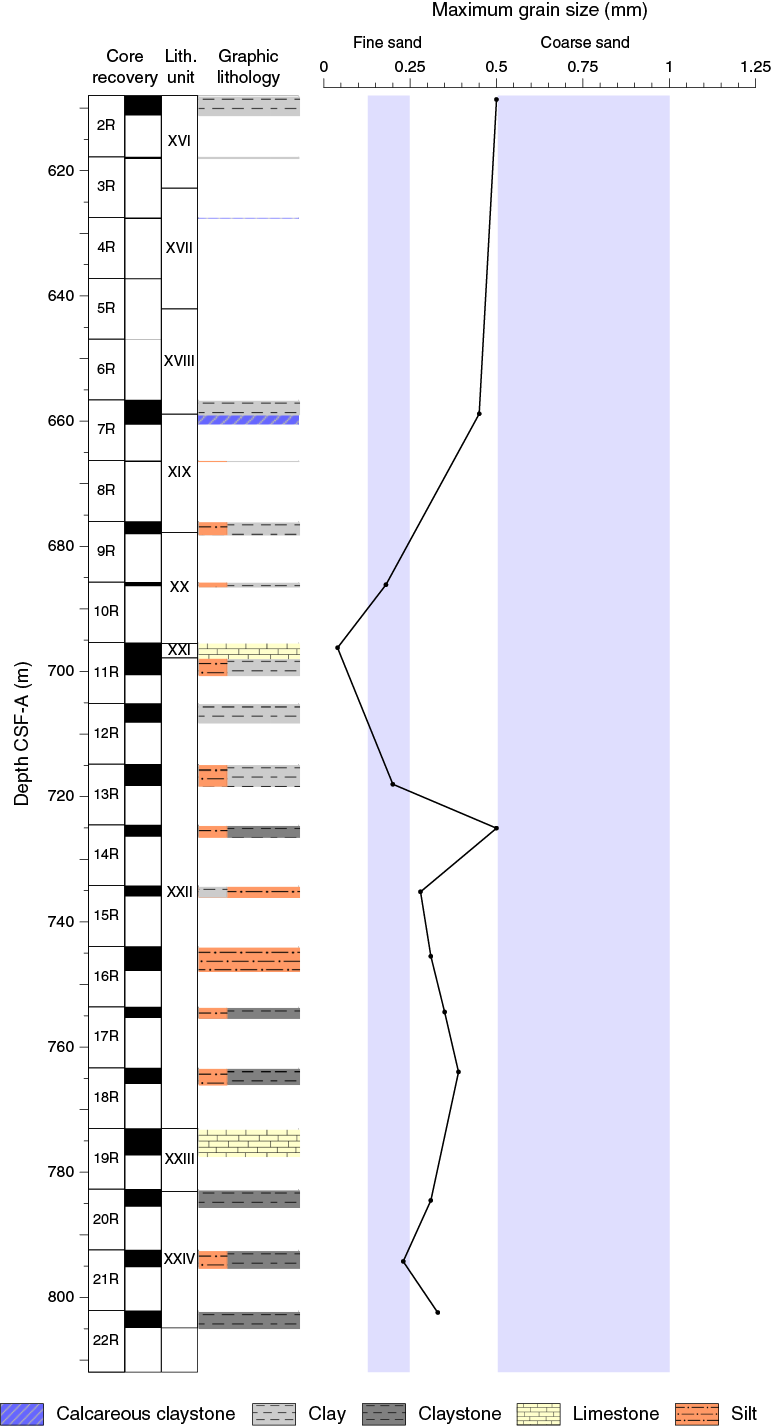
Figure F13. Maximum grain size, Hole U1450B.
XRD
Samples were taken for XRD analysis at an interval of approximately one every four cores. Clay minerals were extracted from representative lithologies (sand, silt, clay, and calcareous clay).
In Hole U1450A, the observed clay mineral assemblages are mainly composed of illite, chlorite, smectite, and kaolinite (Figure F14). Minor sepiolite was detected in some samples, probably because of injections of drilling mud during coring. Illite is the dominant clay mineral in calcareous clay, clay, and sand samples (average = 65%). Only calcareous clay samples show a relatively higher proportion of smectite (around 15% smectite content), whereas sand generally does not contain any smectite. The clay assemblage observed in Hole U1450A in the different lithologies shows no evolution with depth (Figure F15), suggesting relatively stable sources and/or transport processes. This assemblage appears similar to the illite-chlorite–rich clay assemblage documented in the distal fan (Bouquillon et al., 1990). Unlike the upper Miocene–Pliocene section of ODP Leg 116, no smectite-rich sediments were observed in the turbidite in Hole U1450A.
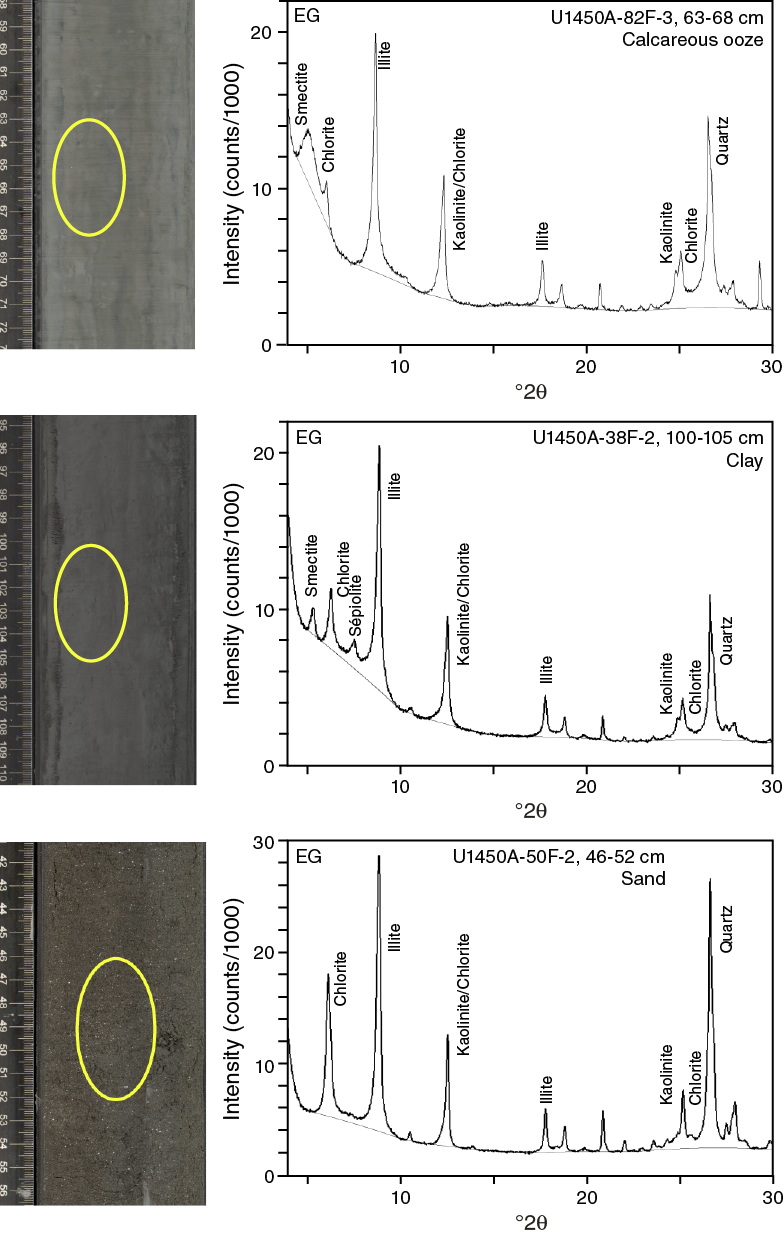
Figure F14. Ethylene glycol–treated X-ray diffractograms of oriented clay aggregates.
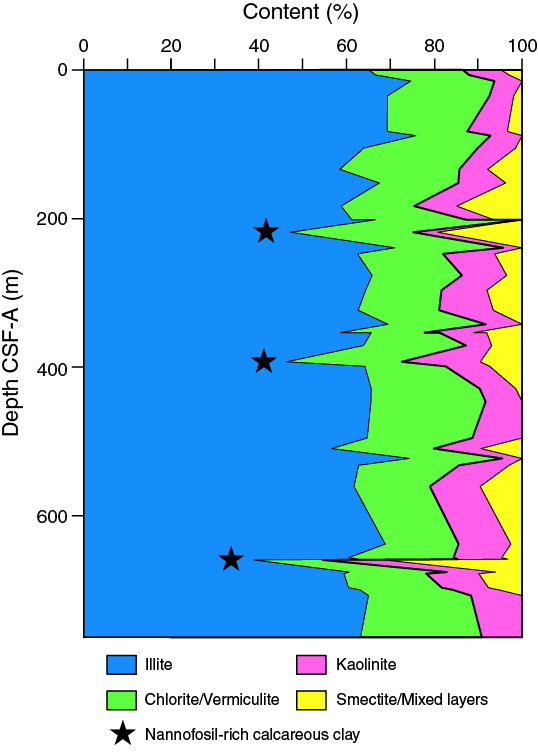
Figure F15. Semiquantitative clay mineral proportions, Site U1450.
No data are currently available for Hole U1450B.
Biostratigraphy
Calcareous nannofossils and planktonic foraminifers provide biostratigraphic constraints at Site U1450. Overall, the abundance and preservation of these microfossils is highly variable. Eighteen biomarkers were identified at this site, and they were used to construct 4 foraminifer and 11 nannofossil biozones extending back to the late Miocene. These biozones are listed in Table T3 and are integrated into the figures in Stratigraphic synthesis.
Table T3. Biostratigraphic age datums and midpoint calculations, Site U1450. Download table in .csv format.
Calcareous nannofossils
The distribution of calcareous nannofossils is shown in Tables T4 and T5. In total, 101 samples from Hole U1450A and 25 samples from Hole U1450B were observed and their relative abundances recorded. Nannofossil abundances range from barren in the coarser grained samples to very abundant in the oozes and hemipelagic muds.
Table T4. Calcareous nannofossils, Hole U1450A. Download table in .csv format.
Table T5. Calcareous nannofossils, Hole U1450B. Download table in .csv format.
Based on nannofossil biostratigraphy, Site U1450 extends to the late Miocene. In Hole U1450A, ten nannofossil biozones were identified, with one first occurrence (FO) and seven last occurrences (LO) delineating the zones. The remaining two biozones were gap zones, identified by the absence of biomarker species. In Hole U1450B, three nannofossil biozones were identified, with two subzones in nannofossil Zone NN11. The overlap sections of Holes U1450A and U1450B require further work to correlate the sections, but the Zone NN12/NN11 boundary was observed at 653.43 m CSF-A in Hole U1450A and at 663.35 m CSF-A in Hole U1450B.
Pleistocene biomarkers include the FO of Emiliania huxleyi in Sample 354-U1450A-5H-CC, the LO of Pseudoemiliania lacunosa in Sample 11H-CC, and the LO of Discoaster brouweri in Sample 56F-CC. Pliocene and lower Miocene biozones are dominated by the genus Discoaster. The biomarkers for Zones NN17 (Discoaster pentaradiatus) and NN16 (Discoaster surculus) are found in Samples 82F-1, 108–109 cm, and 92F-CC, respectively.
The bottom of the hole is assigned to the late Miocene (Zone NN11) based on the presence of Discoaster quinqueramus and the absence of Discoaster berggrenii. The FO of Amaurolithus primus and the first common occurrence (FCO) of D. surculus, both tentatively identified in Hole U1450B, suggest that the sediments recovered extend back older than 7.8 Ma.
Planktonic foraminifers
At Site U1450, planktonic foraminifer assemblages are characteristic of tropical–subtropical environments. The planktonic foraminifer biostratigraphy for Site U1450 is generated primarily by analysis of core catcher samples. Supplementary samples were taken from core sections when time permitted or when no foraminifers were found in the core catcher. Twenty-five samples were examined from Hole U1450B to constrain species ranges during intervals of nonrecovery in Hole U1450A and to extend the record to greater depth. The sedimentary succession at this site ranges from Subzone PT1b (Pleistocene) to Zone M14 (late Miocene) and agrees with the nannofossil biostratigraphy. A number of primary and secondary markers were absent in Site U1450 samples or had insufficient abundances to provide robust stratigraphic control; these included Globorotalia (Truncorotalia) truncatulinoides, Globorotalia cibaoensis, Globorotalia multicamerata, and Pulleniatina primalis.
The group and species abundances of planktonic foraminifers are shown in Tables T6 and T7. Sandy samples are predominantly barren (or contain <0.1% foraminifers), whereas mud-rich and hemipelagic samples have foraminifers in abundances ranging from rare (<5%) to abundant (>25%). Foraminiferal preservation ranges from poor to good in samples where foraminifers occur. Foraminiferal preservation decreases from the Pleistocene into the Pliocene, and in samples where preservation was poor, assemblages are dominated by dissolution-resistant species (e.g., Globorotalia spp., Pulleniatina spp., and Sphaeroidinellopsis spp.), indicating an altered assemblage. Fragmentation of planktonic foraminifers, which can be caused by chemical dissolution or mechanical processes, ranges from light to very severe and was particularly intense in carbonate oozes.
Table T6. Planktonic foraminifer group and species abundance, Hole U1450A. Download table in .csv format.
Table T7. Planktonic foraminifer group and species abundance, Hole U1450B. Download table in .csv format.
Surface water species (Globigerinoides ruber, Globigerinoides sacculifer, and Neogloboquadrina dutertrei) are more abundant than deepwater species (Globorotalia menardii, Globorotalia tumida, and Sphaeroidinella dehiscens) in Holocene and Pleistocene assemblages. In contrast, deepwater species (G. tumida and Sphaeroidinellopsis seminulina) are more abundant in the Pliocene assemblages compared to surface water species. Benthic foraminifers are rare throughout the site (Tables T6, T7).
Foraminifers are reworked in some samples, so biomarker dates were determined using the last common occurrence (LCO) rather than the LO. This allowed us to construct workable biozonations. The LCO of Globorotalia tosaensis in Sample 354-U1450A-34R-CC marks the transition from Zone PT1b above to Zone PT1a below (0.61 Ma). Unfortunately, biomarkers for Zones PL6 (Globigerinoides fistulosus) and PL5 (Globorotalia pseudomiocenica and Globorotalia miocenica) were not found. The LCO of Dentoglobigerina altispira in Sample 98F-CC marks the transition to Zone PL4 (3.47 Ma), which is followed by the transition to Zone PL3 in Sample 114F-CC with the LCO of S. seminulina (3.59 Ma). Zones PL2 and PL1 could not be defined at Site U1450 because of the absence of key marker species Globorotalia margaritae and Globorotalia nepenthes. However, examination of samples from Hole U1450B indicates that the LO of Globorotalia dehiscens is between Samples 354-U1450B-7R-CC and 8R-CC (666.4 m CSF-A), marking the top of Zone M14.
The group and species abundances of planktonic foraminifers are shown in Tables T6 and T7.
Paleomagnetism
We completed a preliminary paleomagnetic study on 36 of the 86 cores collected from Hole U1450A, focusing on identifying polarity reversals, particularly in pelagic and hemipelagic units, and evaluating the prospect of obtaining useful paleomagnetic data from levee and interlevee deposits. In addition, we obtained paleomagnetic data from all 21 cores collected from Hole U1450B. Interpreting the data from the unoriented Hole U1450B cores will require additional postexpedition work, so this section will focus on the cores from Hole U1450A.
At the low latitude of Site U1450, where the geocentric axial dipole (GAD) approximation to the magnetic field predicts a low inclination (15.7°), orientation is important for polarity interpretation. Cores 1H–3H were azimuthally oriented using the FlexIT tool. The newer Icefield MI-5 tool was not run because of potential hard impacts on the APC core barrel when encountering hard or sandy formations shallow in the hole. All other cores are unoriented. Because of the small number of cores with orientation data, the declinations we report here are not azimuthally oriented. Declination data were used in some cases to identify whether polarity transitions occur within cores. However, declinations measured on unoriented cores may allow reorientation of the cores for future magnetic anisotropy studies.
Cores from Hole U1450B were collected with the RCB system, which rotates core pieces independently of each other; nonmagnetic core barrels were used for all cores. Although structural features such as dipping beds allow pieces to be oriented relative to one another in some cases (see Paleomagnetism in the Expedition 354 methods chapter [France-Lanord et al., 2016a]), such features are difficult to interpret in cores from Hole U1450B. Declination, therefore, is of limited use in identifying magnetic polarity in Hole U1450B.
Remanent magnetization measurements were made on archive section halves (Nsections = 108) and on discrete samples from the working section halves (Nsamples = 52) from Hole U1450A (Figures F16, F17; Tables T8, T9). An additional 42 section halves and 11 discrete samples were measured from Hole U1450B. Paleomagnetic results from Hole U1450B samples are not discussed further because of the orientation issues described above. The natural remanent magnetization (NRM) of archive section halves was measured on the shipboard superconducting rock magnetometer (SRM) before and after 20 mT alternating field (AF) demagnetization. In some cases, magnetizations after additional 10 and 15 mT AF treatments were measured. Remanent magnetization vectors measured after 20 mT demagnetization are used for the polarity interpretation. Sections where sediment was watery or heavily disturbed by the coring process were not measured (see Paleomagnetism in the Expedition 354 methods chapter [France-Lanord et al., 2016a]). Although most sections were measured at 2.5 cm intervals, some sections, particularly sections identified as calcareous clay (see Lithostratigraphy), were measured at 1 cm intervals. Sandy, soupy, and deformed intervals, as well as tops of cores and edges of sections likely to be affected by edge effects, were not interpreted (see Paleomagnetism in the Expedition 354 methods chapter [France-Lanord et al., 2016a]). We calculated Fisher (1953) statistics for measurements from each section (after 20 mT AF demagnetization) to guide our interpretation of archive section half data.
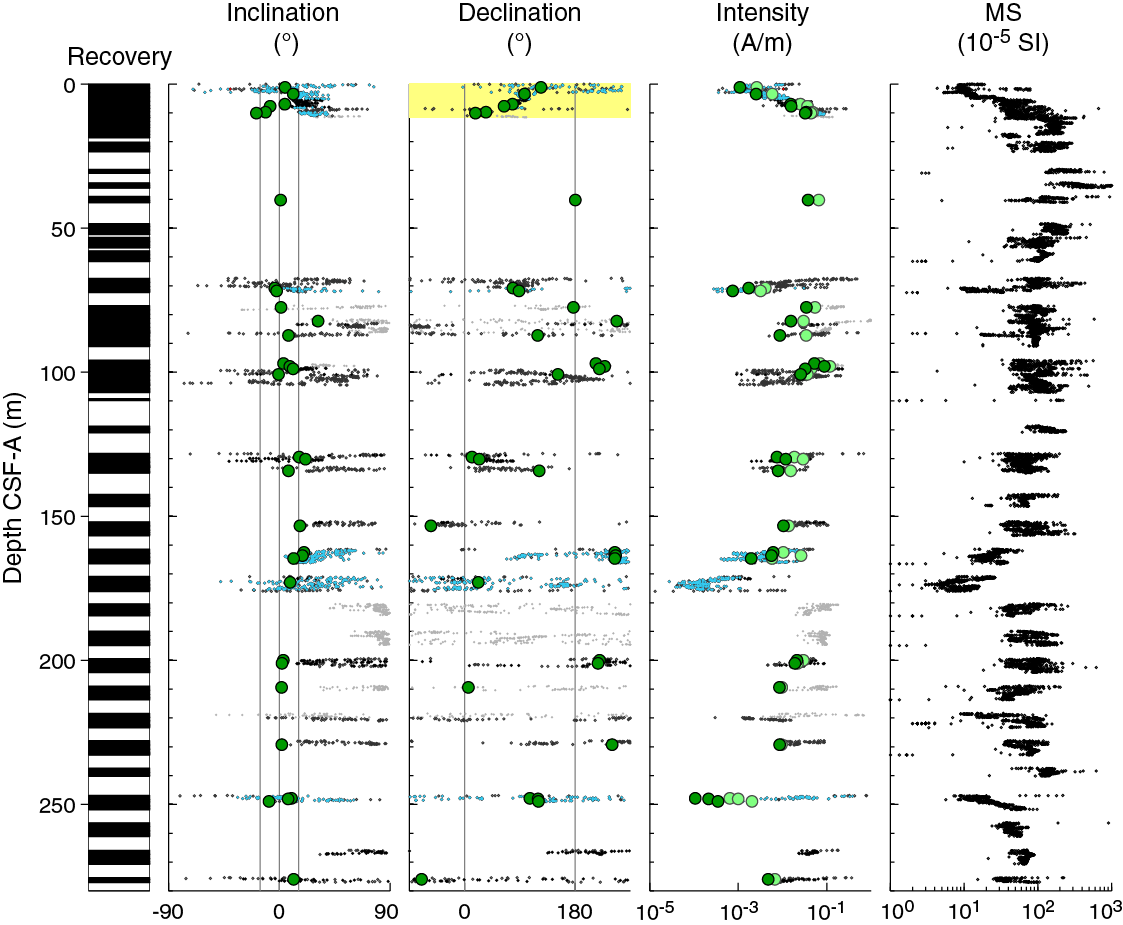
Figure F16. NRM of archive section halves and discrete samples before and after 20 mT AF demagnetization, Hole U1450A.

Figure F17. AF demagnetization diagrams of three discrete samples, Cores 354-U1450A-1H through 62F. Samples selected in similar lithologies present similar behavior downhole. A, B. Typical demagnetizations. C. Sample affected by GRM or ARM during AF demagnetization, mainly after a 40 mT peak field.
Table T8. ChRM of discrete samples, Holes U1450A and U1450B. Download table in .csv format.
Table T9. Orientation data, Hole U1450A. Download table in .csv format.
Discrete sample locations were chosen in fine-grained intervals where drilling deformation was not visible or minimal. These samples were measured on the JR-6 spinner magnetometer before and after 10, 15, 20, 25, 30, 35, 40, and in some cases 50, 60, 80, and/or 100 mT AF demagnetization, with a measurement protocol designed to minimize gyroremanent magnetization (GRM) and anhysteretic remanent magnetization (ARM) used above 40 mT (Table T8; see Paleomagnetism in the Expedition 354 methods chapter [France-Lanord et al., 2016a]). AF steps ranging between 10 and 40 mT were included in the principal component analysis (PCA) direction determination for all samples. Specific steps were chosen based on the demagnetization behavior of each sample. Discrete samples with characteristic remanent magnetization (ChRM) vectors that deviate from the origin by more than 10° or with maximum angular deviation angles of more than 15° were not used to guide our magnetostratigraphic interpretation.
Results
Paleomagnetic results from both section-half and discrete measurements are presented in Figures F16 and F17 and Tables T8 and T9. Similar to Site U1449, both positive and negative inclinations are present in Hole U1450A, and NRM intensities range from 5 × 10⁻⁴ to 1.3 A/m. Drilling overprint is in most cases removed by AF demagnetization in peak fields of 10 mT. Coercivities of the remanence carriers are consistent with magnetite and/or titanomagnetite as the principal NRM carrier. The specific magnetic mineral assemblages are discussed in detail below (see Stability of remanence).
The paleomagnetic records of the calcareous clay units are less variable than the paleomagnetic records from levee and interlevee deposits, both because of the more or less continuous nature of pelagic deposition and the rock magnetic characteristics of the two types of units. Calcareous layers, the thickest of which occur in Cores 1H, 2H, 34F–36F, and 92F, are associated with NRM intensities at least an order of magnitude lower than the rest of the section. Discrete samples from Core 36F were taken in carbonate-rich horizons. Their NRM intensities were too low to be measured on board.
The majority of NRM inclinations are GAD-like after 20 mT demagnetization (mode = 14.4°), although a substantial number of inclinations remain steep even after demagnetization. Gradual NRM declination trends in several APC cores were caused by twisting of the core, possibly due to rotation of the core barrel as it enters the sediment.
Magnetostratigraphy
Based on section-half and discrete sample data, we interpret the paleomagnetic data from Hole U1450A to indicate intervals of both normal and reversed polarity, as well as intervals in which the polarity is uncertain (Table T10). We identify five normally magnetized cores (1H, 20F, 32F, 34F, and 42F) and one core with mixed polarity (36F) based principally on inclination data. Section-half data from one additional core (2H) indicate normal polarity, but discrete samples have GAD-like negative (reversed) inclinations. Cores 52F and 62F may contain reversely magnetized sections (with negative inclinations), even though the discrete samples from these cores are normally magnetized. In particular, Section 52F-2 contains two successive 180° changes in declination. Based on section-half inclination data and a discrete sample (52H-2, 56–58 cm), we propose that this is a brief normal episode. It is difficult to put this polarity zone in context, as Section 52F-1 is largely influenced by very high magnetization due to an ash layer at the top of the core. Paleomagnetic data from the other cores are not interpretable.
Table T10. Magnetostratigraphy, Hole U1450A. Download table in .csv format.
Many of the identifiable polarity zones coincide with calcareous clay units. In particular, the mixed polarity interval in Core 36F bears closer inspection (Figure F18). Four polarity transitions within Core 36F are associated with large changes in declination. Paleomagnetic directions following 20 mT demagnetization from Section 36F-2 have nonrotated declinations that vary around 360° and variable inclinations. Near the base of Section 36F-2, sediments have a more stable positive mean inclination and a mean declination close to 160°. We interpret this as a polarity reversal near the section break between reversed polarity in the upper part of Section 36F-2 and normal polarity in the lower part of Section 36F-2 and the upper part of Section 36F-3. Near the base of Section 36F-3 and in Section 36F-4, the declination swings to values around 330°, which we interpret as a transition back to reversed polarity. We interpret the longer normal polarity zone in Core 36F to be the normal polarity Jaramillo Subchron (C1r.1n). We note that a polarity transition interpreted as the Jaramillo Subchron was found in a similar calcareous ooze unit in Hole U1449A along with the Brunhes/Matuyama boundary and the short polarity interval interpreted as the Cobb Mountain Subchron. The thickness of the Jaramillo Subchron at both sites is similar and suggests sedimentation rates within the subchron of around 1.4 cm/ky at Site U1450 and 1.6 cm/ky at Site U1449. Extrapolation of these sedimentation rates and correlation of physical property data suggest the Cobb Mountain Subchron, as identified at Site U1449, would be located in the core catcher of Core 36F. Although we treat magnetic remanence measurements of core catchers with skepticism, we measured the core catcher because no major coring deformation was observed by either the paleomagnetists or sedimentologists. We observed two large swings in declination that we interpret as the boundaries of the Cobb Mountain Subchron. Like the Jaramillo Subchron, the thickness of this subchron is comparable to the thickness found at Site U1449 and suggests similar sedimentation rates for the carbonate ooze unit between sites.
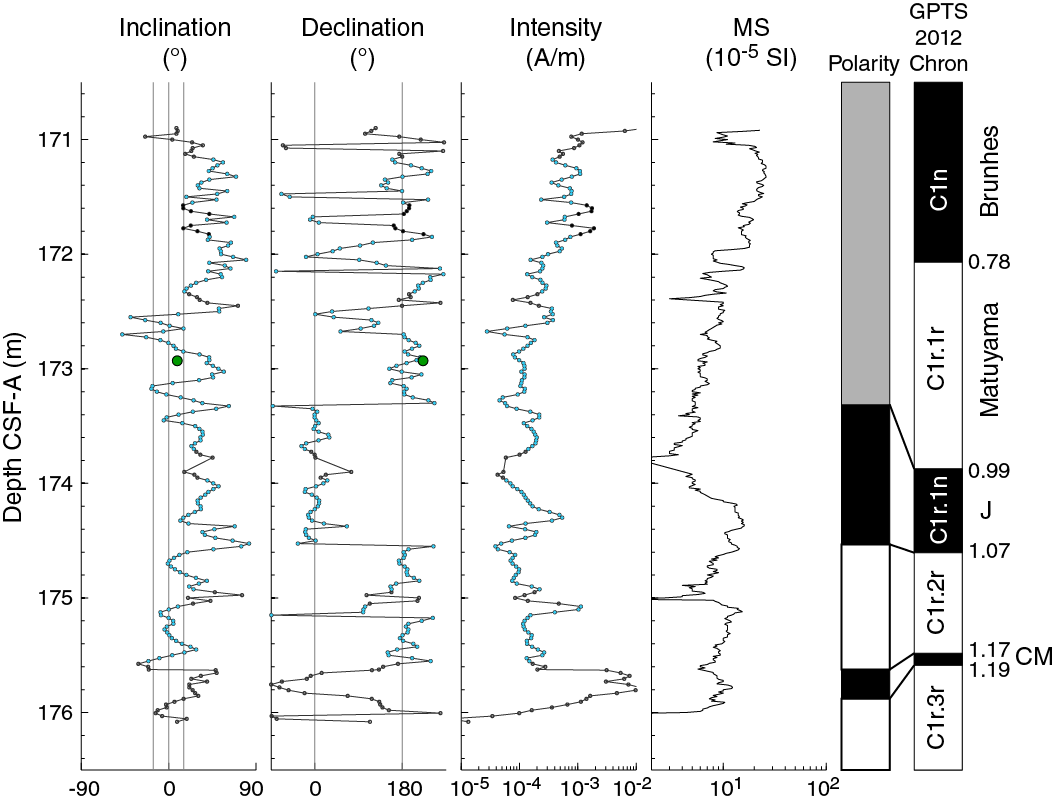
Figure F18. Polarity interpretation, Core 354-U1451A-36F.
Stability of remanence
We note that positive inclinations are much more prevalent in our data set than negative inclinations. Previous work notes the prevalence of normal magnetization in Bengal Fan International Ocean Discovery Program (IODP) cores (e.g., Clemens et al., 2016) in addition to the vertical drilling overprint generally removed at low demagnetization steps. Our observations suggest that this is also the case for cores recovered at Site U1450, as inclinations in reversed polarity intervals tend to be around 0° in Core 36F.
The demagnetization behavior of discrete samples from Site U1450 suggests two possible explanations for this behavior. AF demagnetization in peak fields less than 20 mT was sufficient to remove a large component of magnetization, likely associated with the drill string overprint (Figure F17). In addition, a substantial number of discrete samples acquired an ARM or a GRM during AF demagnetization. Although we do not offer an explanation for the inclination bias in our data at this time, explanations may include a component of the drilling overprint that is not completely removed by AF demagnetization at 20 mT, acquisition of GRM or ARM during AF demagnetization, chemical remanent magnetization (CRM) associated with an authigenic magnetic mineral, tectonic, or syndepositional deformation, or a persistent feature of the geomagnetic field. Here we briefly discuss the first two of these possibilities, but we plan to assess these and others in greater depth in postexpedition work.
If a relatively high coercivity NRM component is responsible for the normal polarity bias, remanent magnetization vectors of discrete samples that contain this component should not decay toward the origin. We use the statistic α to refer to the angle between the unanchored principal component direction and a principal component direction anchored to the origin. Samples with high values of α do not have remanence directions that decay toward the origin. If high values of α are the result of a component of magnetization that is not removed by the AF treatments we use, the amount of remanence remaining at a high AF field value should be proportional to α. Median destructive field (MDF), a common indicator of the stability of remanence, is only very weakly correlated with α (R2 = 0.0226). However, MDF may be more indicative of a sample’s drilling overprint than of its coercivity spectrum, as many samples have a drilling overprint that constitutes more than 50% of their NRM. As an alternative statistic, we define
In the equation above, NRM20 and NRM40 refer to the NRM remaining after AF demagnetization in a peak field of 20 and 40 mT, respectively. As with MDF, R40 is not well correlated with α (R2 = 0.1791, including discrete samples from Holes U1450A and U1450B). This preliminary analysis, then, suggests that the high values of α are not related to the presence of a second component of NRM. This does not necessarily exclude the possibility of a component that could be removed using higher peak AFs, but it does suggest that a simple model of overprinting does not account for the demagnetization behavior of discrete samples from Site U1450.
We suggest, as an alternative explanation, that the normal polarity bias (and the high values of α) may be related to the acquisition of remanence during AF demagnetization. We note that some samples acquire a much greater GRM or ARM than others, and that, anecdotally, this appears to be less common in lighter colored calcareous units than in levee and interlevee deposits. This may be related to differences in magnetic carriers between the two lithologies, which we plan to explore in greater depth at future sites and in postexpedition research.
Geochemistry and microbiology
Hydrocarbon gas sampling and analysis
Headspace gas samples were taken at a frequency of one sample per core in Holes U1450A and U1450B as part of the routine safety monitoring program (Table T11). Methane concentrations were consistently low (<5 ppmv) between 4.5 and 39 m CSF-A in Hole U1450A, increased to 19,482 ppmv at 72 m CSF-A, remained high (between 2,566 and 34,511 ppmv) to 371.7 m CSF-A, and then decreased again to values <3,000 ppmv to the base of Holes U1450A (686 m CSF-A) and U1450B (802 m CSF-A). Quantifiable levels of ethane (0.2 and 0.9 ppmv) were found in 12 samples. Methane/ethane ratios were in the 1,000 to 100,000 range, decreasing logarithmically with depth (i.e., temperature). Ethene, propane, and propene were below the quantification limit in all samples.
Table T11. Methane concentrations, Holes U1450A and U1450B. Download table in .csv format.
Interstitial water sampling and chemistry
A total of 52 samples from Hole U1450A were analyzed for interstitial water chemistry (Table T12; Figure F19). They consist of 48 different core intervals from Hole U1450A. Six samples were obtained using Rhizon sampling when sediments were soft enough (to a maximum depth of 630 m CSF-A). The rest were obtained by squeezing whole-round samples that were generally 5 cm long. The applied squeezing pressures never exceeded 28,000 psi, and the amounts of extracted interstitial water ranged between 4 and 40 mL.
Table T12. Interstitial water geochemical data, Site U1450. Download table in .csv format.
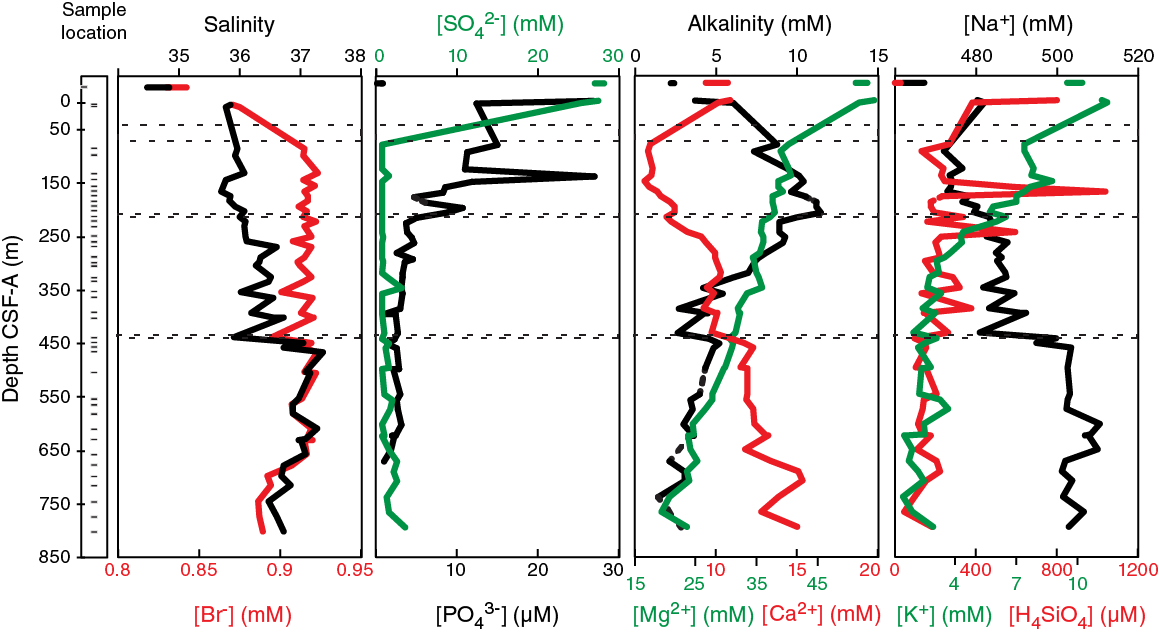
Figure F19. Variations of salinity, bromide, sulfate, phosphate, alkalinity, magnesium, calcium, sodium, potassium, and silicon concentrations in interstitial waters, Site U1450.
In addition, several tests were performed to assess potential contamination by the surface seawater used for the drilling fluid. The latter was sampled on the rig floor at the injection pipe (while coring at around 300 m CSF-A). We also sampled the water (either clear or muddy) above the core in the core liner in Cores 50F and 133X; the water was sampled and filtered following the normal procedures for pore water analyses. Also, the last 15 mL of one Rhizon sample (630 m CSF-A) and one whole-round squeeze (402 m CSF-A) were kept separate to test the potential evolution by contamination due to draining drilling fluid in the formation when Rhizon sampling or by ultrafiltration during squeezing. The results of these tests are reported in Figure F19 at an arbitrary depth of 30 m above the seafloor to keep them fully separated from the data on interstitial water. The results are listed in Table T12 and show that drilling fluid at point of injection bears all the characteristics of surface seawater: low in salinity and alkalinity, high in sulfate and magnesium content, and phosphate and dissolved silica close or below detection limit. The salinity is higher than literature data for the site—34.8 instead of 33.7 (Chatterjee et al., 2012)—and is likely to be related to local effects of the stationary position of the R/V JOIDES Resolution and sampling location rather than analytical inaccuracy. The two free-flowing water samples recovered from the top of the core liner have nearly identical chemical fingerprints as the drilling fluid at the point of injection (only dissolved silica content has been found significantly different in the muddy free-flowing water). Unlike in Hole U1449A, the tests of the homogeneity of Rhizon sampling or squeezing showed negligible difference between the aliquots of interstitial water sampled at 402 and 630 m CSF-A (Table T12).
Based on the rate of change of cation and anion content with depth and changes in their covariations, four hydrologic units are distinguished at Site U1450 (Figure F19). For the uppermost unit, the bottom limit is rather vague because no suitable sediment for interstitial water sampling (only soupy sand) was recovered between 10 and 83 m CSF-A. In this upper portion of the sediment column (0 to 40–70 m CSF-A), biogenic processes release dissolved phosphate and consume sulfate, with sulfate content reaching 0.7 mM at the bottom of this unit. This sulfate concentration is the lowest measured at this site, and many are below or close to 1 mM. Considering the measurement of the drilling fluid at the injection site, a sulfate content of 0.7 mM corresponds to less than 2.5% of contamination by drilling fluid. This small amount of contamination is likely due to incomplete removal of contaminated sediment when trimming the whole-round sample core before squeezing, and sulfate content <1.4 mM (a threshold of 5% contamination) is thus considered insignificant throughout this volume. Together with sulfate reduction, a corresponding increase in alkalinity and decrease in Ca and Mg results from carbonate formation from biogenic reactions that generate alkalinity. Salinity is 1 unit higher than the bottom seawater of the Bay of Bengal at 8°N (Levitus94 at http://iridl.ldeo.columbia.edu) and barely changes in this unit. The limits between the lower units are diffuse around 215 and 410 m CSF-A (Figure F19).
Hydrologic Unit II, between 40–70 and 215 m CSF-A, is characterized by negligible sulfate content, a strong decline in magnesium and potassium concentrations, an overall decline (although quite variable) in phosphate, and a strong rise in alkalinity content (from 3.7 to 11.7 mM). Calcium content is lower than that of seawater and compared to the upper unit but rises slightly from the top to bottom of the unit, where dissolved silica reaches maximum concentration (>1000 μM) for this hole at 174 m CSF-A. It is worth noting the near-constant salinity. Below 215 m CSF-A, hydrologic Unit III is characterized by a continuing decline in magnesium content, a drop in silica content to values lower than 200 μM with a few spikes, and a drop in alkalinity from peak values of 11.7 to 4.3 mM. This unit is characterized by exchange reactions and diffusion controlled by boundary conditions of the pore water chemistry of the two adjacent units. Unit IV, below 410 m CSF-A, is also characterized by diffusion-driven processes inducing only significant and sudden changes in the calcium and sodium concentrations and salinity. Sulfate content increases slightly toward the bottom of the hole, reaching around 3.6 mM. For all other elements, the second-order variations in content with depth could be related to incomplete decontamination of drilling fluid (Figure F19).
Bulk-sediment geochemistry
Inorganic carbon
Total inorganic carbon (TIC) and total carbon (TC) concentrations were determined on 96 sediment samples from Holes U1450A and U1450B (Table T13; Figures F20, F21). TIC values range from 0.1 to 7.6 wt% (average = 1.1 wt%). TIC expressed as weight percent calcium carbonate (CaCO3) (i.e., assuming all inorganic carbon is present only as CaCO3) ranges between 1.2 and 63.2 wt% (average = 9.3 wt%). Turbiditic sediments are characterized by consistently low carbonate content (1.2 to 15.1 wt%; average = 4.9 wt%). A few turbiditic sediments (N = 4) with elevated carbonate content actually correspond to bioturbated clay intervals at the top of turbiditic sequences (i.e., top of Unit E of the Bouma sequence). Apart from these isolated cases, the carbonate content of turbiditic sediments increases sharply at ~620 m CSF-A from values varying between 1.2 and 8.1 wt% (average = 3.8 wt%) above 620 m CSF-A to values covering a much narrower range (6.0–9.1 wt%; average = 7.3 wt%) below 620 m CSF-A. This correlates well with the rise in carbonate content observed between 125 and 175 m CSF-A at Site U1451 and between 300 and 450 mbsf at DSDP Site 218 (von der Borch, Sclater, et al., 1974). At all three sites, this increase in carbonate content occurs near the Miocene–Pliocene transition according to published data (Site 218: von der Borch, Sclater, et al., 1974; Galy et al., 2010) or preliminary age-depth models (Sites U1450, U1451, and U1455). Pelagic and hemipelagic intervals (described as calcareous clay and limestone in Lithostratigraphy) are characterized by variable carbonate contents (2.3–63.2 wt%). These lithologies have higher average carbonate contents (average = 34.9 wt%) than turbiditic sediments, but their carbonate contents are often statistically indistinguishable from those of turbiditic sediments.
Table T13. TIC, CaCO3, TC, and TOC contents, Holes U1450A and U1450B. Download table in .csv format.
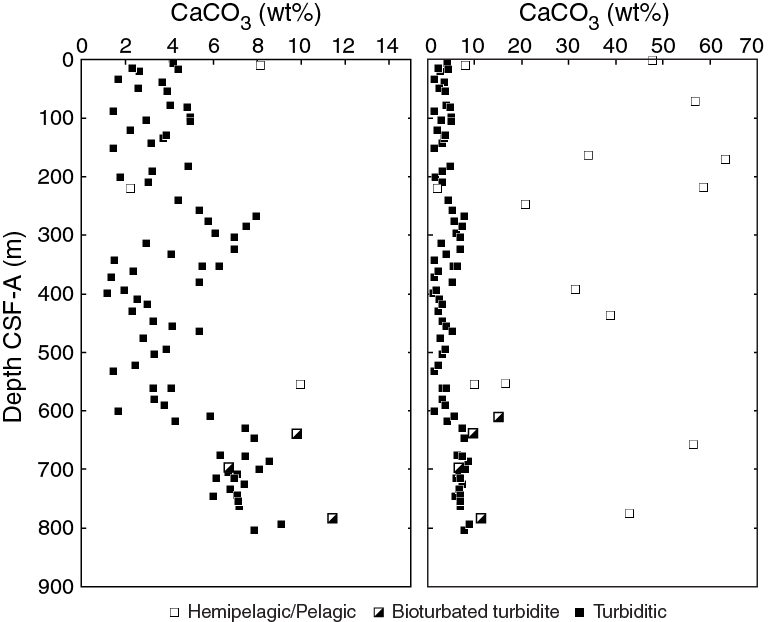
Figure F20. TIC content expressed as CaCO3, Holes U1450A and U1450B. Pelagic and hemipelagic deposits correspond to calcareous clay and calcareous claystone in the lithostratigraphy. Note that these lithologies do not have carbonate content systematically >15%.

Figure F21. TOC contents, Holes U1450A and U1450B.
TC values range from 0.2 to 8.3 wt% (average = 1.5 wt%). Total organic carbon (TOC) content of sediments, calculated by the difference between TC and TIC, is systematically low (average = 0.4 wt%), ranging between <0.1 and 1.2 wt% (Figure F21). In contrast, woody debris picked from a turbidite sequence (specifically from Unit B of the Bouma sequence) has high TOC (51.1 wt%; N =1). The lack of significant C enrichment compared to living biomass (i.e., TOC ≈ 48–53 wt%) suggests that this woody material has undergone minimal thermal alteration and diagenesis (i.e., processes resulting in the preferential loss of H and O). Two samples representing mixtures of coarse (silt) turbiditic material and hemipelagic clay have low TOC values (0.1–0.2 wt%). The remainder of pelagic and hemipelagic sediments (N = 12) have TOC values ranging from 0.3 to 0.8 wt% and decrease systematically with depth (Figure F21). A similar but much steeper decline was observed at Site U1451. Overall, this could either reflect postdepositional degradation of organic matter or variable rate of transfer of marine primary production from the photic zone to the bottom of the ocean.
In turbiditic sediments, TOC is variable, with values ranging from <0.05 wt% (quantification level) to 1.2 wt% and broadly covarying with the Al/Si ratio (Figure F22), a proxy for sediment grain size and mineral composition, reflecting the preferential association of organic matter with clays that has previously been documented in both the modern Ganga-Brahmaputra river system and in active channel-levee sediments in the Bay of Bengal deposited over the past 18 ky (Galy et al., 2007, 2008a, 2008b). In line with our observations at Site U1451, we note significant scatter around the TOC–Al/Si relationship, especially for clay-rich sediments, which tend to have relatively low TOC. Turbiditic sediments showing clear signs of bioturbation systematically have low TOC for a given Al/Si ratio (i.e., plot below the main linear trend in the TOC vs. Al/Si diagram). This reveals either (1) terrestrial organic carbon degradation under depositional conditions characterized by lower accumulation rates (as revealed by the presence of bioturbation) or (2) admixture of an organic carbon–poor hemipelagic component via bioturbation. These two scenarios can only be tested through postexpedition molecular and isotopic characterization.

Figure F22. Relationship between TOC content and Al/Si ratio of sediments, Holes U1450A and U1450B.
ICP-AES results
Bulk-sediment major and trace element concentrations were determined on 29 samples from Hole U1450A and 10 samples from Hole U1450B by inductively coupled plasma–atomic emission spectroscopy (ICP-AES) (Table T14) to a maximum depth of 794 CSF-A in Hole U1450B. Bulk-sediment samples were processed without any seawater or pore water component removal prior to analysis; thus, Na concentrations may be affected by contribution from these fluids. As in Hole U1449A, bulk-sediment major element compositions largely reflect lithology. Fe/Si (mol/mol) versus Al/Si (mol/mol) trends closely track those documented in Hole U1449A, reflecting mineral sorting that dominates the characteristics of clastic lithologies in the Bengal Fan (Figure F23) (Galy and France-Lanord, 2001; Garzanti et al., 2011; Lupker et al., 2013). The range of variation for Site U1450 turbiditic sediments (Al/Si = 0.16–0.47) is only slightly different from that of the river material in Bangladesh (Al/Si = 0.11–0.45). Lower Al/Si ratios in river sediment correspond to coarser bed sediments. On the other hand, the clay-rich end-member in Hole U1450 appears to have a composition similar to the most highly sorted surface water suspensions in rivers (Lupker et al., 2012). Four samples of clay and calcareous clay show clear enrichment in iron compared to the main trend defined by other samples. This suggests the occurrence of Fe-rich clays (i.e., smectite; at 324 and 393 m CSF-A in Hole U1450A) and/or iron oxides. It also suggests differences in the sources and/or weathering state of the terrigenous input. Samples with relatively low K/Si, which fall off the main K/Si versus Al/Si trend (not shown) for this data set, are all calcareous clays (>18 wt% CaO). Trace element abundances at Site U1450 show highly correlated trends, indicating sorting effects in the heavy mineral fraction of clastic lithologies. For example, Zr and Sc are strongly correlated, indicating that Sc abundances are mainly controlled by zircon content (Figure F24). No systematic trends with depth were observed in the bulk-sediment geochemistry, which reflects primarily mineral sorting effects associated with turbidite deposition.
Table T14. Major elements and selected trace element contents, Holes U1450A and U1450B. Download table in .csv format.
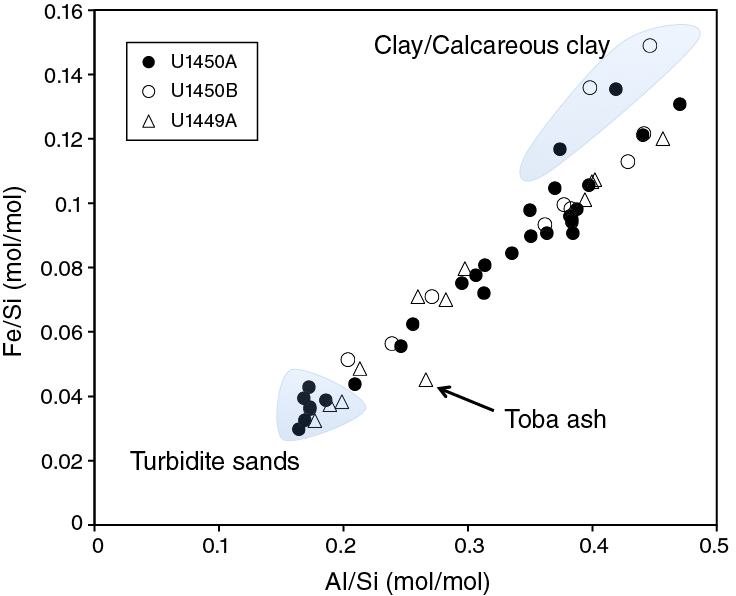
Figure F23. Al/Si vs. Fe/Si, Site U1450 and Hole U1449A.
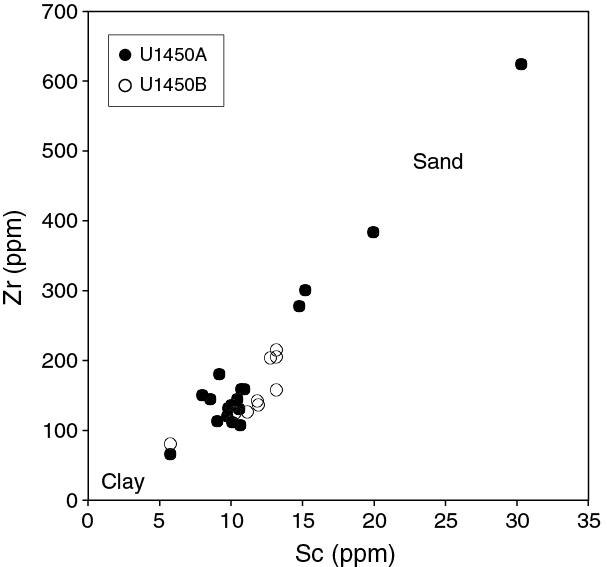
Figure F24. Zr vs. Sc, showing geochemical effects of sorting within the heavy mineral fraction, Site U1450.
Microbiology
A total of 23 whole-round core samples (21 from Hole U1450A and 2 from Hole U1450B) were collected shipboard. These whole-round samples were subsampled for various postexpedition microbiological investigations. A microbial cell counting method was initiated shipboard, with further processing of the samples to be performed following the expedition.
Physical properties
Physical property data were acquired from Site U1450 cores, including density, magnetic susceptibility, P-wave velocity, natural gamma radiation (NGR), and thermal conductivity (see Physical properties in the Expedition 354 methods chapter [France-Lanord et al., 2016a]). The data are mostly of good quality, but the results from disturbed or partially filled sections are less reliable, as described below.
The physical properties at Site U1450 principally reflect lithologic variations, with downcore compaction having a relatively minor effect. Using the principal lithologic name from the core description to assign six lithologies (see Lithostratigraphy), we calculated their average physical properties (Table T15). With a total penetration depth of 819 m CSF-A and 319 m total core recovery (39.6%), sand accounts for 131 m (41%), silt for 46 m (14%), clay for 72 m (22%), calcareous clay for 45 m (14%), claystone for 13 m (4%), calcareous claystone for 6 m (2%), and limestone for 7 m, with additional thin ash layers. Measurements are described in detail below, but in general, sands and silts have the highest density and P-wave velocity, sands have the highest magnetic susceptibility, clays have the highest NGR, and calcareous oozes have the lowest values in all measurements. Some of the sand-rich intervals were difficult to recover and were often fluidized, which sometimes resulted in incompletely filled core liners; this resulted in anomalously low GRA density, magnetic susceptibility, and NGR values. Cores that had inflow of core material (suck in) also likely have lower than expected values in these physical properties.
Table T15. Total sediment thickness, percentage of recovered material, and average physical properties with respect to lithology, Site U1450. Download table in .csv format.
Physical property measurements and measurement intervals
High-resolution physical property measurements were made on Hole U1450A cores to provide basic information on sediment composition and variability. Whole-Round Multisensor Logger (WRMSL) measurements were made at 2.5 cm increments for density by gamma ray attenuation (GRA), magnetic susceptibility, and compressional wave velocity by P-wave logger (PWL). NGR measurements were made at 10 cm increments, thermal conductivity at one measurement per core, and caliper P-wave velocity at about one or two measurements per section on different lithologies, where possible. On split cores, point magnetic susceptibility and color reflectance were measured at 1 cm increments using the Section Half Multisensor Logger (SHMSL). Additionally, we took discrete samples for moisture and density (MAD) measurements (one to three samples per core, ideally representing coarse-, medium-, and fine-grained intervals) to determine water content, wet bulk density, dry bulk density, porosity, and grain density.
Whole-Round Multisensor Logger measurements
Results from Hole U1450A WRMSL measurements are compiled in Figure F25. For the purposes of the figure, data from the top and bottom 2 cm of each section were removed because they often represent part sediment and part air and the volume contributing to the measurement is unknown. Data that are unrealistic for the cored formations, such as densities <1.05 g/cm3 and velocities <1425 m/s or >5000 m/s, were also filtered out. All original data remain in the LIMS database.

Figure F25. Physical property measurements, Hole U1450A.
Gamma ray attenuation bulk density
Wet bulk densities range from 1.62 to 1.97 g/cm3, depending on lithology (Table T15). The lowest values are found in volcanic ash and limestone. Clay and claystones show intermediate values. The highest densities were documented for the coarsest (sandy) sediment. However, approximately 65 m of the core showed either flow-in or suck-in of material, as described in Lithostratigraphy, and 45 m of this disturbed material was classified as homogenized sand (which may have been cored in place or may have flowed in during the core extraction process). Hence, these cores do not deliver good data because they typically do not completely fill the liner cross section and therefore likely lead to underestimated in situ values (Figure F25). MAD bulk density measurements improve compared to the overall GRA data quality, as indicated by their higher average sand density (1.99 vs. 1.76 g/cm3; Table T15). Interestingly, the expected downcore increase in wet bulk density due to compaction and loss of water depends on lithology, with calcareous and clayey lithologies experiencing the most density increase with depth.
Magnetic susceptibility
Magnetic susceptibility is sensitive to the concentration and type of magnetic minerals. Values range from 0 to 400 × 10–5 SI, with highest average values of 79 × 10–5 SI in sand (Figure F25). The data were helpful in identifying turbiditic and pelagic successions. The lowest average values (≤34 × 10–5 SI) are observed for calcareous clay, claystone, and limestone, which typically carry only minor amounts of magnetic particles. Intermediate average values (55 × 10–5 to 68 × 10–5 SI) are typical for fine-grained detrital (muddy) turbidites seen in the core (see Lithostratigraphy). The highest average values (79 × 10–5 SI) are documented for the sandy intervals (Figure F25; Table T15). The strong contrasts in magnetic susceptibility mean that the majority of lithologies can clearly be identified based on these measurements.
P-wave velocity
P-wave velocities from the PWL range from 1426 to 1819 m/s, with average values of 1593 m/s (Table T15). The lowest average values were observed for calcareous clay in the upper half of the hole. Intermediate values were measured for fine-grained silty turbidites. High velocities occur in sandy sediment, although homogenized sand prevented measurements quite often (Figure F25). Very high average values occur in claystone and calcareous claystone. These laboratory measurements likely underestimate the in situ values (see Discrete compressional wave velocity, below). However, P-wave velocities were obtained continuously from most fine-grained successions (muddy turbidites to pelagic clays).
Natural gamma radiation
NGR values vary from 13 to 135 counts/s, with average values of 65 counts/s (Table T15). NGR values vary significantly with sediment type, with the highest NGR counts for clays and claystones (average = 72–76 counts/s), followed by muddy turbidites (average = ~70 counts/s), intermediate counts for sandy sediment (average = ~59 counts/s), and significantly lower counts for pelagic and hemipelagic strata (~25–50 counts/s) (Figure F25).
Thermal conductivity
Thermal conductivity varies between 0.33 and 3.1 W/(m·K) in Hole U1450A, with average values of 1.43 W/(m·K) (Figure F26). However, values lower than 1 W/(m·K) are not considered reliable. There is a minor downcore trend toward increasing values, but variability primarily depends on the sediment facies, with clay and clay stone having the highest average thermal conductivities (~3 W/[m·K]). The lowest values were detected in calcareous clay and claystone (Table T15).
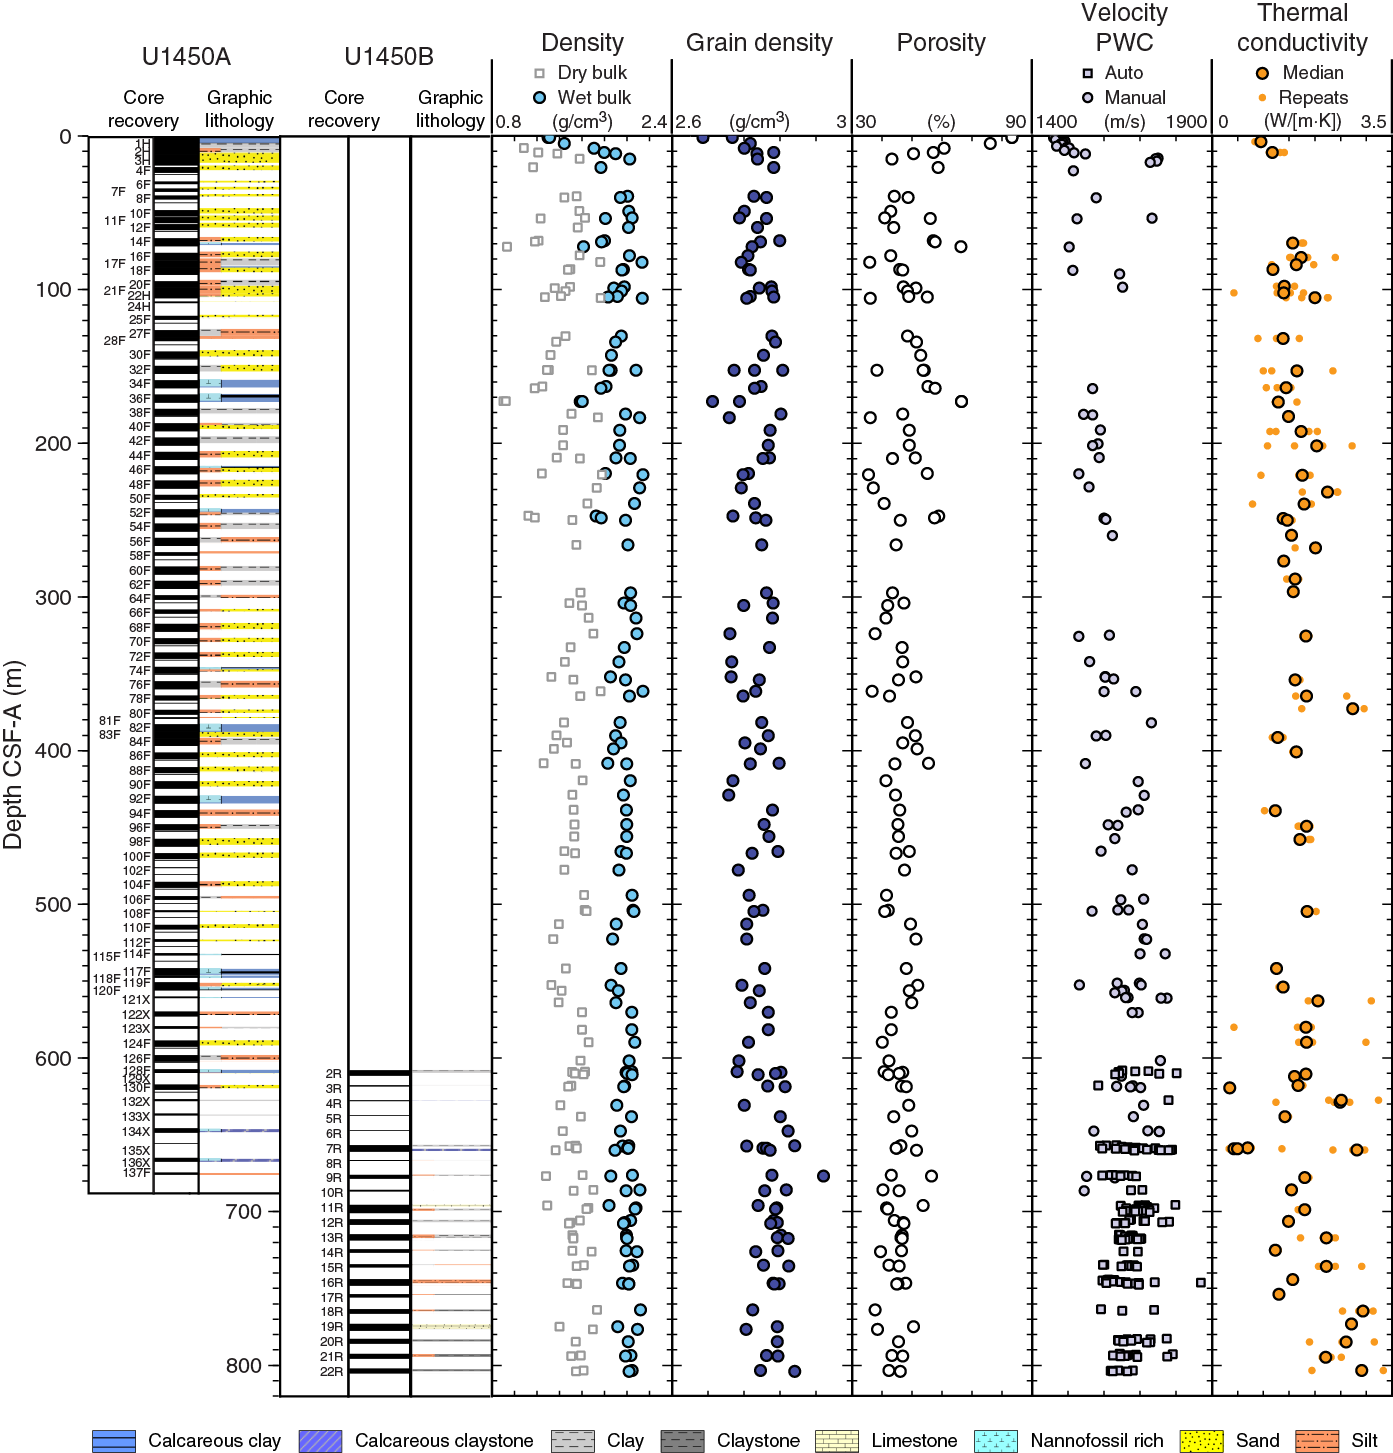
Figure F26. Moisture and density results, Hole U1450A.
Point magnetic susceptibility
Point magnetic susceptibility measurements agree well with WRMSL susceptibility results (Figure F25), with slightly higher average values of 85 × 10–5 SI (Table T15). Point magnetic susceptibility measurements have higher variability because of the denser measurement spacing (1 cm compared to 2.5 cm for WRMSL) and the smaller integration volume of the sensor (1 cm; 1σ) compared to the loop (8 cm; 1σ) on the WRMSL. Accordingly, point magnetic susceptibility measurements detected a number of spikes on the centimeter scale that are not reproduced by loop magnetic susceptibility measurements. Average values are lowest in siliceous ooze and limestone and highest in sandy deposits.
Discrete compressional wave velocity
P-wave velocities measured with the P-wave caliper (PWC) vary from 1588 to 1665 m/s, depending on lithology (Table T15). They are in good overall agreement with WRMSL measurements, except for sands and lithified material, where PWC values are higher (Figure F25; Table T15). Higher average values are indicative of better determination of the P-wave velocity in homogenized sands. These values still underestimate the in situ conditions of sandy layers, but given the low compressibility of sands, they should not be too far apart.
Moisture and density
Water content, porosity, and wet and dry bulk densities are interdependent. Wet bulk densities determined with MAD procedures have less extreme variations but more or less identical average values compared to WRMSL measurements (Figure F25). Grain densities calculated from MAD pycnometer measurements vary from 2.67 to 2.84 g/cm3. The overall average value of 2.79 g/cm3 is higher than the grain density of quartz (2.64 g/cm3), which is the major sediment-forming mineral in general (e.g., Whitmarsh, 1971) and specifically for fine-grained and sandy turbidites from the Bengal Fan (Weber et al., 2003) (Figure F26). The cause of this difference is not yet known, but it could be due to the presence of heavy minerals, which are observed in relatively high proportion in smear slides at this site. Alternatively, differences might be introduced during volume detection by the pycnometer. We are investigating these possibilities by comparing original samples to powdered samples to determine if the void has been entirely filled by helium. For sandy samples, grain densities are indeed too high by ~0.06–0.08 g/cm3, which accounts for approximately half of the observed discrepancy. However, for fine-grained, muddy samples one would expect an even more pronounced impact if voids were not entirely penetrated. These samples, however, did not show a significant reduction of grain densities, implying that the results are inconclusive at this stage.
Wet bulk densities determined on discrete samples vary from 1.3 to 2.14 g/cm3 depending on lithology, with an average value of 1.93 g/cm3. Porosities range from 30% to 90%, with an average value of ~50%. A few values over 90% occur in the uppermost 5 m of Hole U1450A (Figure F26), similar to high levels of water-saturated surficial sediments previously seen near the top of Site U1449.
Color reflectance
Sediment lightness (L*) varies from ~20 to ~65, with an average value around 38 (Figure F27). Elevated L* values were found within hemipelagic intervals (Table T15) containing higher amounts of biogenic carbonate (see Geochemistry and microbiology). These cores also contain some of the lowest L* values in dark green horizons, with a large contrast in lightness between clay and calcareous lithologies. Values <20 were excluded because they largely reflect depths where the sensor did not receive a full reflectance signal (too dark) because of cracks in the sediment or end cap positions. Values higher than 65 were excluded because they mainly reflect end caps with a partial capture of the white Styrofoam put into the liner at positions where material has been taken out.
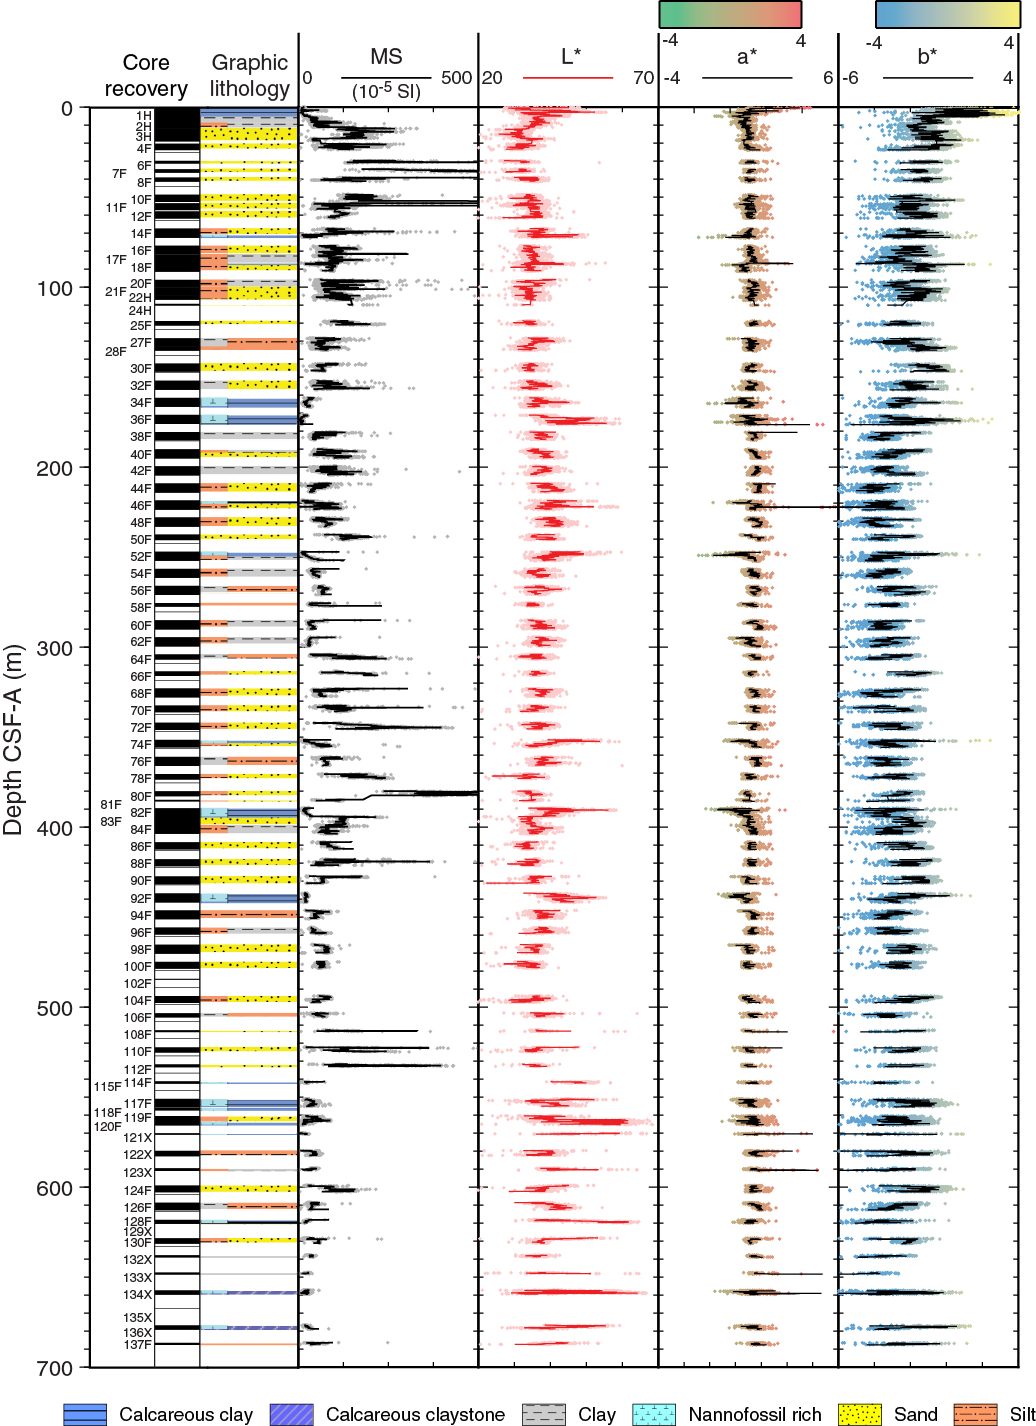
Figure F27. Color reflectance data, Hole U1450A.
Color component a*, redness, varies from 0.1 to 4.8, with an average value of 1.14 (Figure F27). The lowest values are associated with dark green intervals from pelagic sections. Muddy turbidites and sandy layers have intermediate values of ~1 and only little variability. Color component b* shows its highest values (yellower colors) in the uppermost 4 m of Hole U1450A. Below that interval, higher values are usually associated with pelagic sections. Intermediate to lower values usually occur in sandy sections.
Core disturbances and data quality
Core disturbances are shown in Figure F4. They affect the quality and reliability of physical properties in various ways. Sandy intervals in Hole U1450A that are homogenized no longer possess the original sediment texture or fabric, especially those that were allowed to settle vertically on the catwalk to remove some of the excess water (these core sections are characterized by a GRA density gradient). When laid horizontally, there can be a gap between the liner and the top of the sediment as the sand settles. Accordingly, GRA densities measured by a vertical beam of gamma rays underestimate true values. PWL data are not less affected by this gap because it is measured horizontally across the core but are still affected by the loss of water due to overpressure and expansion of the liner. This is important because ~45% of the sections retrieved from Hole U1450A consist of sandy sediment. Core disturbances in muddy turbidites also affect the overall quality of GRA and PWL data but only slightly underestimate average values. Color reflectance data are not affected unless cracks occur in the sections.
Data interpretation
As at Site U1449, physical property measurements obtained at Site U1450 correlate well with lithology and composition. Coarse-grained (sandy) sediments dominate the lithology at Site U1450. These sections are usually associated with maxima in P-wave velocity, wet and dry bulk density, and magnetic susceptibility. The fine-grained, muddy turbidites that dominate Site U1449 represent only a minor fraction (5%–15%) at Site U1450 according to lithostratigraphy (see Lithostratigraphy).
This correlation of lithology and physical properties provides proof for the principal concept that acoustic, physical, and optical properties of unconsolidated sediments such as P-wave velocity, wet and dry bulk density, porosity, water content, and sediment color are closely related to sediment composition. Moreover, it indicates that the grain size distribution of Bengal Fan sediment can be derived quantitatively from wet bulk densities and P-wave velocities (e.g., Weber et al., 2003) during postexpedition work. This concept should enable detailed calculation of sediment budgets of clay, sand, and silt in combination with chrono- and seismostratigraphy.
Hemipelagic to pelagic sequences are intercalated throughout Site U1450. These sequences exhibit two end-members: relatively dark sediment rich in biogenic silica with low densities and velocities and brighter sediment with higher densities and velocities and high biogenic carbonate contents (up to 60%; see Geochemistry and microbiology). The same lithologic variability and correlation trend among physical and optical properties has been observed for pelagic sediment from the eastern equatorial Pacific (e.g., Mayer, 1991; Weber, 1998) and therefore indicate that it should be possible in postexpedition work to provide quantitative predictions for biogenic opal and carbonate contents from measurements of sediment lightness (L*) and possibly from wet bulk density and P-wave velocity.
Based on physical properties, we were able to identify the Toba Ash 1 (75.0 ± 0.9 ka according to Mark et al., 2014) in the uppermost cores of Holes U1449A and U1450A (Figure F28). Physical properties are plotted at the same scale for both cores and show an exact reproduction of the Toba Ash 1 by all sensors, lending confidence to our ability to identify volcanic ash layers at all Expedition 354 sites.
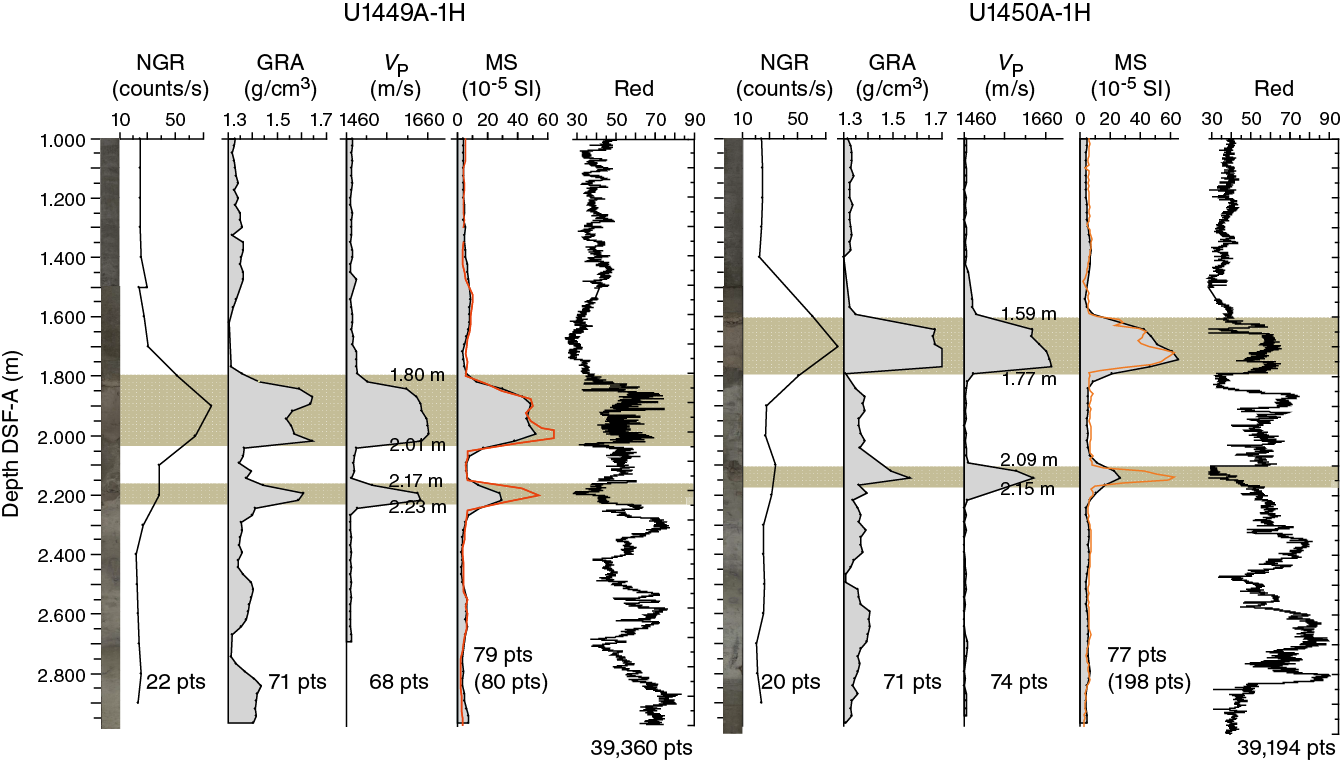
Figure F28. Physical property comparison of Toba Ash 1 in Sections 354-U1449A-1H and 354-U1450A-1H.
Downhole measurements
Logging operations
The last core from Hole U1450B arrived on deck at 1715 h on 10 March 2015. Hole preparation for the logging program included a sepiolite mud sweep, release of the RCB drill bit, and displacement with 250 barrels of heavy mud (11.0 lb/gal; attapulgite weighted with barite). The pipe was raised to a logging depth of 82.7 m DSF (about 81 m wireline log depth below seafloor [WSF]). The heavy mud aimed to prevent washout of the sand layers, which were observed in cores to easily become fluidized. Rig-up for downhole logging started at 2300 h on 10 March, and the modified triple combo tool string was assembled. The wireline heave compensator was used to reduce the effect of moderate vertical ship motion on the wireline depth.
The modified triple combo tool string consisted of magnetic susceptibility, NGR, and resistivity tools and was run in Hole U1450B at 0115 h on 11 March. The density tool was also run in the tool string for the caliper (borehole diameter) measurement, but it was run without the source because of concerns about hole stability; therefore, no density measurements were obtained. The bottom of the tool string encountered an obstruction in the hole at about 130 m WSF, only about 50 m into the open hole below the pipe. The tool string was raised and lowered a few times in an attempt to pass through this obstruction, but then the formation started to close in and overpull was required to pull the tool out. We decided to stop logging in this hole because of the adverse hole conditions.
NGR, magnetic susceptibility, and resistivity data were acquired for the short section of open hole. NGR measurements for the uppermost 80 m of the hole, taken from within the BHA, could be corrected for attenuation with a multiplication factor of 4.5. The multiplication factor was chosen to minimize the jump between downhole NGR measurements in open hole and in the pipe and to match the trends of NGR measured on core. The tool string returned to the ship, and the logging equipment was rigged down by 0715 h on 11 March.
Log data quality
The main control on log data quality is the diameter of the borehole, but there was no caliper measurement in Hole U1450B to gauge hole diameter. The diameter of invasion from the resistivity tool suggests that the hole was in reasonable condition in the very short (17 m) interval where these data were taken.
The NGR downlog and uplog match each other well, both in the open hole and in the BHA interval from 0 to 81 m WSF (Figure F29). The logs also have features in common with the laboratory NGR data from Hole U1450A, for example the transition from calcareous ooze (low NGR) to sand (higher NGR) at about 70–72 m WSF. In the uppermost 20 m of the hole, the large difference between downhole log and laboratory NGR is probably caused by a very wide borehole in this unconsolidated part of the hole, leading to particularly low NGR log values. Susceptibility peaks (associated with sand- and silt-rich lithologies) can be correlated between the uplog, the downlog, and the core data. The offset between the uplog and downlog is due to drift related to temperature, which is a known issue for the downhole magnetic susceptibility sonde (MSS). The interval of electrical resistivity data is very short, and there is only a partial match between uplog and downlog.
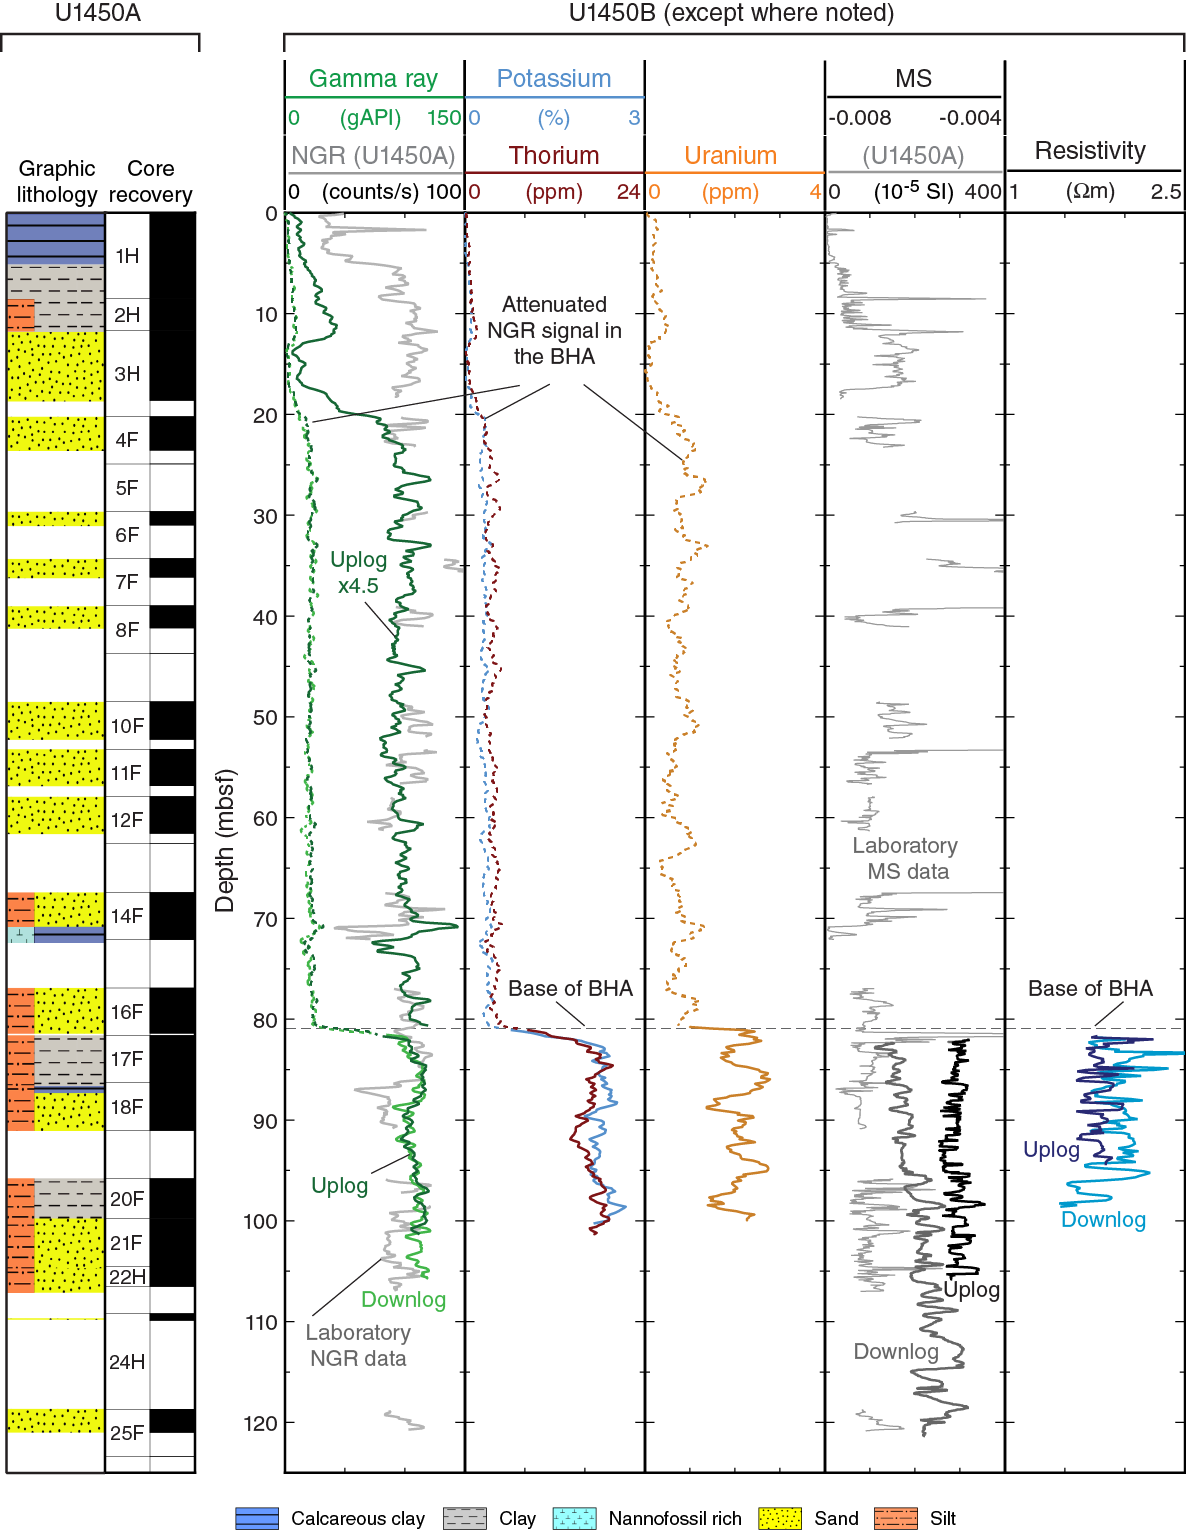
Figure F29. Downhole logs from Hole U1450B compared to equivalent laboratory physical property measurements and lithostratigraphy from Hole U1450A.
A variable small depth offset (maximum = ~2 m) between core and log data is due to a mix of uncertainty in logging depth, core depth, and real lateral differences between strata in Holes U1450A and U1450B (Figure F29).
Comparison of log with core data
From 20 to 110 m WSF, the NGR logs vary from 80 to 145 gAPI, with an average of about 100 gAPI. The excursions to higher values occur in sands and likely reflect increased levels of potassium-bearing minerals and heavy minerals, including those containing thorium and uranium. The lack of excursions to low NGR values suggests that there are few occurrences of calcareous clay in the 20 to 110 m WSF interval.
Downhole temperature and heat flow
Five APCT-3 downhole temperature measurements in Hole U1450A range from 4.6°C at 86.3 m DSF to 13.5°C at 318.1 m DSF (Table T16; Figures F30, F31A), and over the interval from the seabed to the lowest measurement the geothermal gradient is 38°C/km. The measurement at 318.1 m DSF was the deepest piston core temperature measurement made in scientific drilling (a deeper measurement was made later during this expedition). The seafloor temperature was 1.55°C, based on APCT-3 data taken while the unit was held at the mudline for 5 min on each run of the tool. The temperature equilibration curves of the shallower measurements are less smooth than for the deeper measurements because of the difficulty of keeping the APCT-3 from moving in the relatively unconsolidated shallow strata, which can provide additional frictional heating and allow cooler fluids to flow to the APCT-3. Equilibration calculations are performed on the smoothest part of the temperature equilibration curve.
Table T16. Formation temperatures derived from APCT-3 measurements, Hole U1450A. Download table in .csv format.
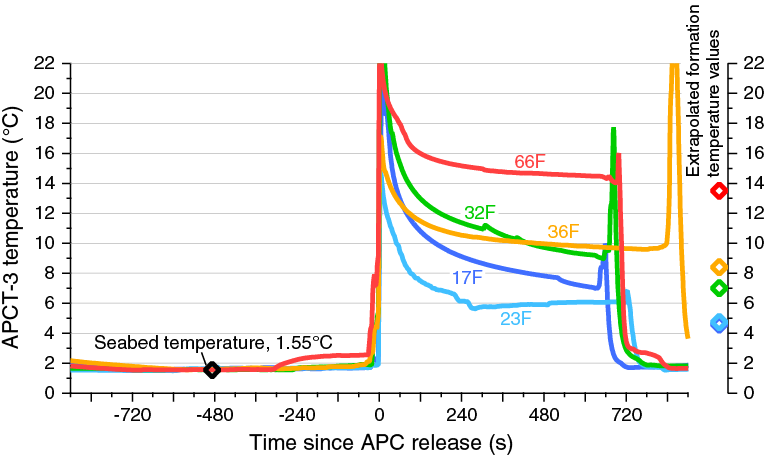
Figure F30. APCT-3 temperature-time series with extrapolated formation temperature estimates, Hole U1450A.

Figure F31. Heat flow calculations, Hole U1450A. A. Sediment temperatures. B. Thermal conductivity data from Hole U1450A with calculated thermal resistance. C. Bullard plot of heat flow calculated from a linear fit of the temperature data.
Thermal conductivity under in situ conditions was estimated from laboratory-determined thermal conductivity from Hole U1450A using the method of Hyndman et al. (1974) (see Physical properties in the Expedition 354 methods chapter [France-Lanord et al., 2016a]). Calculated in situ values are within 2% of measured laboratory values. Thermal resistance was then calculated by integrating the inverse of the in situ thermal conductivity over depth (Figure F31B). A heat flow of 58 mW/m2 was obtained from the linear fit between temperature and thermal resistance (Figure F31C) (Pribnow et al., 2000). The small trend to shallower geothermal gradient with depth is caused by the increasing thermal conductivity with depth. There are very few heat flow determinations for the Bay of Bengal (Hasterok et al., 2011), but the geothermal gradient and heat flow values at Site U1450 are within the normal range for ocean crust of the age at this location, 90–100 Ma (Müller et al., 2008; Hasterok et al., 2011).
Stratigraphic synthesis
The main objectives for Site U1450 were (1) to investigate the shallow sedimentary section as part of the seven-site transect to decipher the succession and Pleistocene evolution of fan deposition and (2) to study the Neogene history of sediment delivery back to Miocene times. Because this site is positioned in the middle between the 85°E and Ninetyeast Ridges, all sedimentary units back to the Miocene are significantly thicker than those to the west or east (Schwenk and Spiess, 2009). As a result, drilling at Site U1450 was expected to provide a higher resolution record and a higher proportion of sandy material. Based on seismic correlation to DSDP Site 218, an age of 8–10 Ma was predicted for the bottom of the planned 900 m penetration.
Within the shallow seismic section (Figure F32), characteristic variations of reflector geometry and reflection amplitudes allow a number of fan structural elements to be identified. These include channels (C), levees (L), channel fills (F), interlevee sedimentary units (IS), and hemipelagic units (orange arrows). Drilling was intended to provide a better understanding of the lithologies associated to the seismic facies, their physical properties, and ultimately the processes of sediment delivery and deposition.
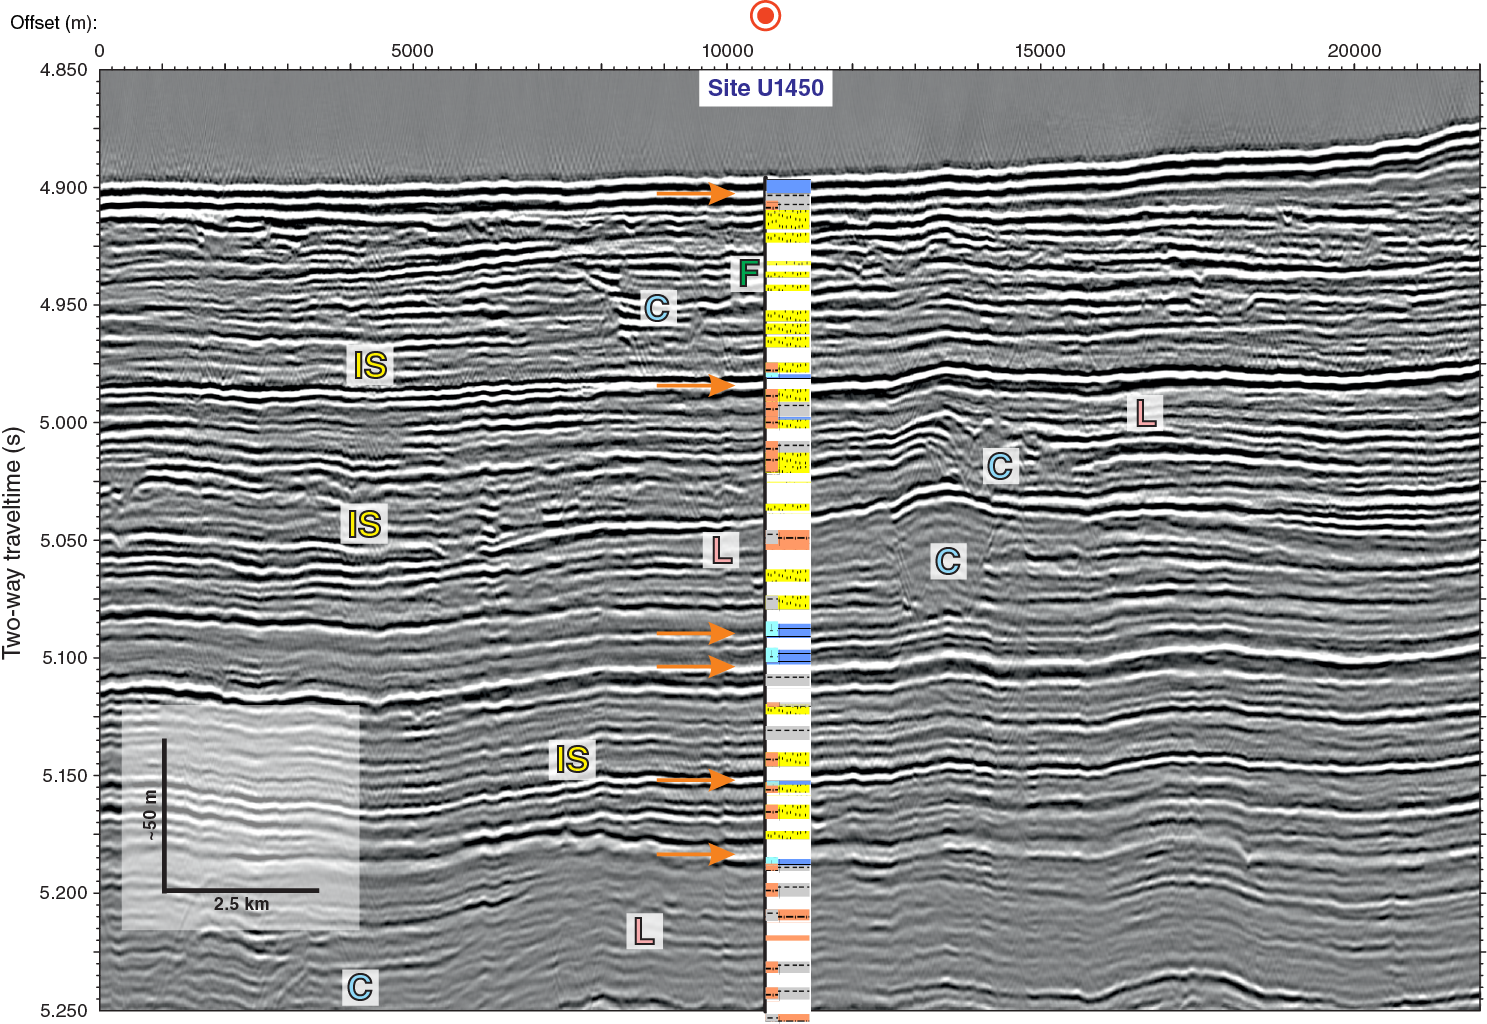
Figure F32. Seismic Line SO125-GeoB97-027, upper 350 ms TWT of cored interval, Site U1450.
Seismic, physical properties, and lithology
A comparison of the shallow seismic data with lithologies recovered from Site U1450 clearly reveals a distinct relationship (Figure F32). Hemipelagic units, for example, are mostly associated with sharp reflectors of pronounced continuity and relatively high amplitude (indicated by orange arrows), which can be traced over long distances across the 8°N transect. Where thicker, these units are characterized by low reflectivity. Interlevee sedimentary units reveal an increased reflectivity within thicker units, with undulating reflector geometries, truncations, and terminations. These units generally match well with sandy intervals, but accurate correlation is limited because of many intervals drilled without coring or intervals with low core recovery. Those intervals with more silt and mud (e.g., around 5.2 s TWT) reveal an increased reflector coherency and lower overall reflection amplitudes. Several erosive channels are present in the vicinity of Site U1450. Levees associated with these channels are distinguished by their medium reflectivity. These levees are mostly associated with mud- or silt-rich intervals. A channel fill of particularly high amplitude is found in the upper part of the section. In this interval, core recovery was particularly low, which may indicate relatively coarse sand.
Coarser materials were recovered fluidized, which indicates a mostly unconsolidated state (see Physical properties). Seismic impedance parameters, P-wave velocity and wet bulk density, were therefore difficult to determine from cores in conditions resembling those in situ. Although almost 46% of the recovered material was classified as sand (see Lithostratigraphy), it will be difficult to determine the true proportion of sand in the formation because of a recovery bias, which is known to be severe for XCB and RCB coring. The match between seismic data and the required P-wave velocities to correlate to lithologic boundaries may help to further estimate the relative proportion of sand and silt beds. Downhole logging, a primary expedition objective, was unfortunately not possible, except for a short 30 m section (see Downhole measurements), because of unstable hole conditions.
Average density and velocity physical property values from whole-round core measurements do not distinguish well between sand, silt, and clay. This is the case for all density and velocity measurements, including density determined from GRA and MAD and P-wave velocity from PWL and PWC measurements (Table T15). Only calcareous clay has distinctly lower densities and velocities, which explains the association of certain seismic reflectors with thicker hemipelagic units. However, magnetic susceptibility and NGR data allow detection of predominantly sand- and clay-rich intervals. It is therefore unclear at this time how the physical property data may be best utilized to characterize the cored formation and analyze turbiditic successions, and the data need to be carefully evaluated.
Age-depth relationship
Calcareous nannofossils and planktonic foraminifers provide biostratigraphic constraints for Site U1450. A total of 18 biomarkers were identified at this site and were used to construct 4 foraminiferal and 11 nannofossil biozones extending back to the late Miocene. A continuous sequence of sediments is found in Hole U1450A, with no major hiatuses present. Holes U1450A and U1450B overlap by ~80 m. Two nannofossil zonal boundaries were identified within this interval, allowing correlation between the two holes (Figure F33).
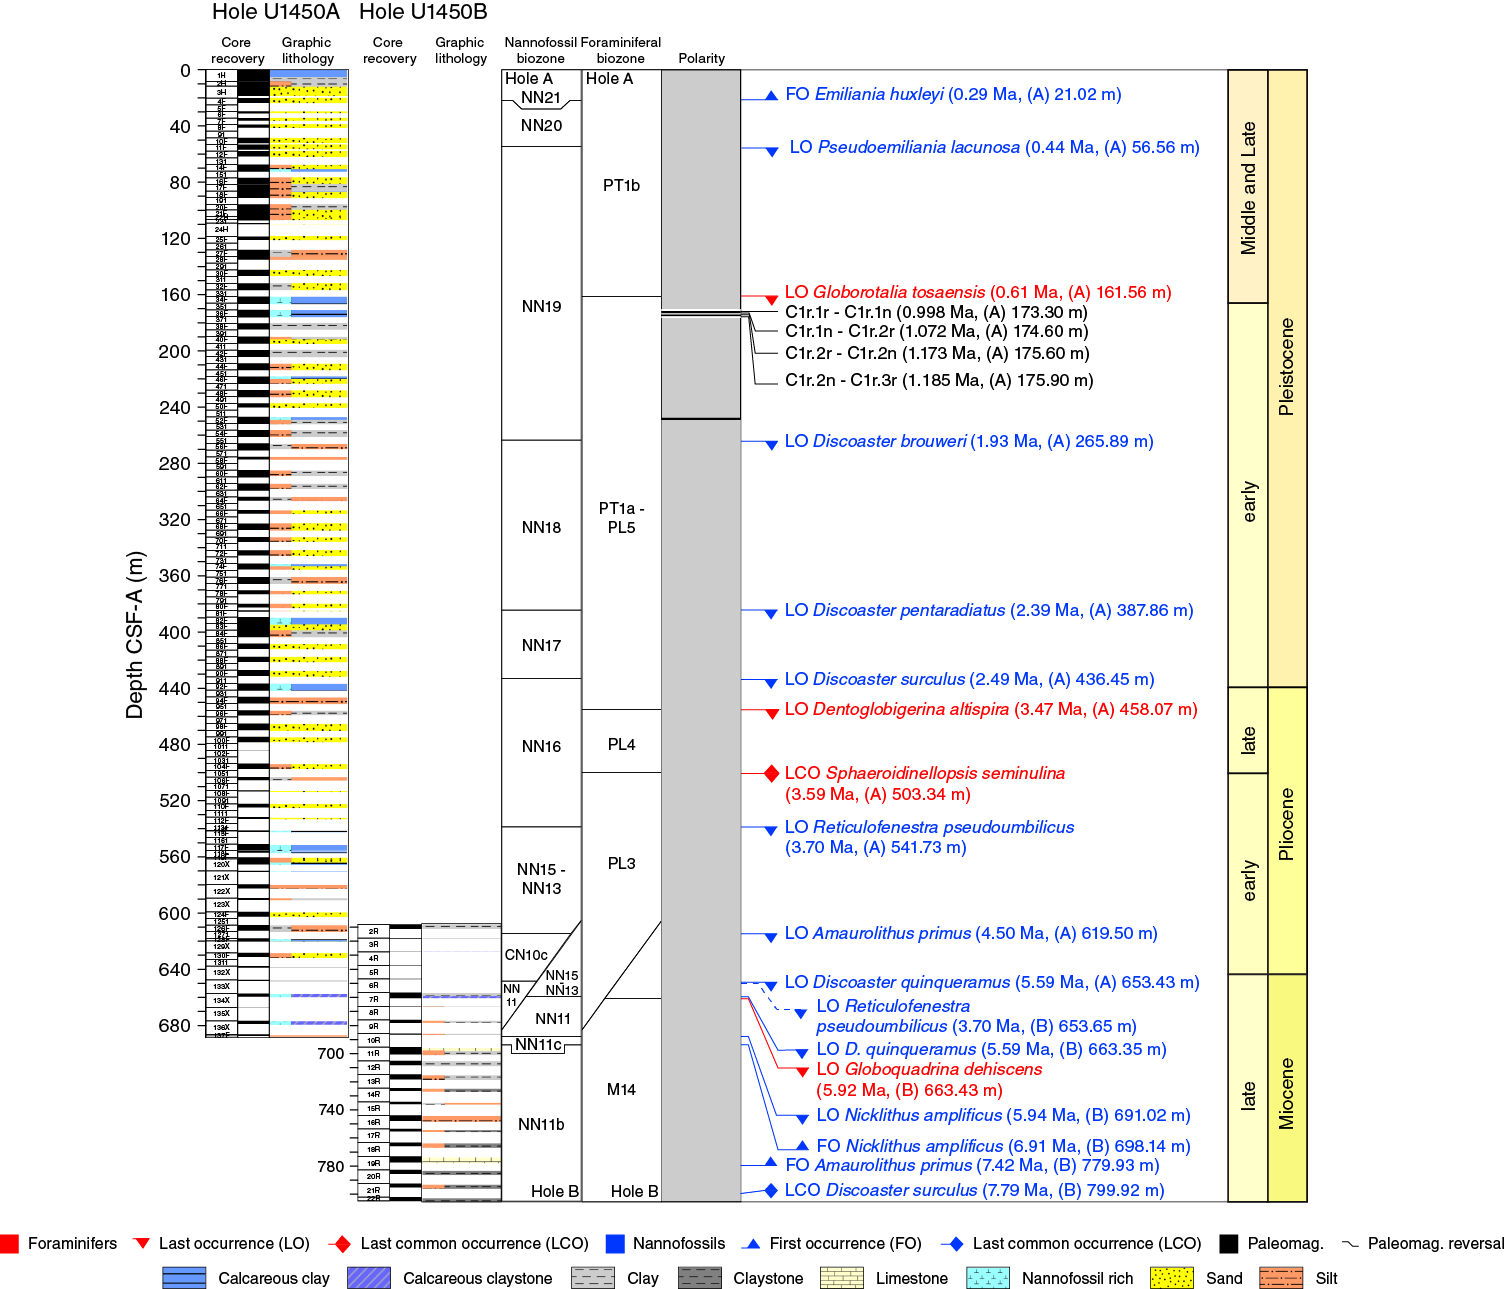
Figure F33. Compilation of biostratigraphic and chronostratigraphic markers, Site U1450.
The LO of Reticulofenestra pseudoumbilicus in Hole U1450A is found in Sample 115F-CC (542.19 m CSF-A), about 120 m higher than the LO of R. pseudoumbilicus in Hole U1450B (Sample 7R-CC; 660.40 m CSF-A). The reason for this discrepancy may be related to conditions at the top of Hole U1450B. The uppermost 608 m of Hole U1452B was drilled without coring, Cores 2R–6R have a recovery of only 8%, and we cannot exclude contamination at this stage. Although nannofossils were observed in Samples 2R-CC to 6R-CC, they may not represent in situ sediments and may be derived from fill material or cuttings. Core 7R (recovery = 42%), which is inferred to be the first uncontaminated core recovered from Hole U1450B, shows a clear absence of R. pseudoumbilicus, so the true LO must be above this level.
The second biomarker identified in the overlapped interval, Discoaster quinqueramus, is more robust. In Hole U1450A, the LO midpoint of D. quinqueramus is 653.43 m CSF-A. This is similar to its calculated midpoint from Hole U1450B (663.35 m CSF-A). This zonal boundary (NN12/NN11) provides a strong tie point to correlate Holes U1450A and U1450B.
The identification of magnetic reversals was restricted to the calcareous clays and clay horizons from the upper 250 m. The hemipelagic layer of lithologic Unit III (Core 354-U1450A-36F) recorded the Jaramillo (0.988–1.072 Ma) and Cobb Mountain (1.173–1.185 Ma) Subchrons and the short period of the Matuyama Chron in between. Over this 197 ky interval, the sedimentation rate is approximately 13 cm/ky (2.6 m of sediment). The Brunhes/Matuyama boundary was not recovered at this site. This is probably linked to the fact that the interval above Core 36F was drilled and not cored.
Figure F34 illustrates age assignments from biostratigraphy and paleomagnetism from Holes U1450A and U1450B. Although preliminary, these data confirm distinct changes between slow accumulation in hemipelagic units and rapid fan deposition. Figure F35 gives similar information for the last 2 My.
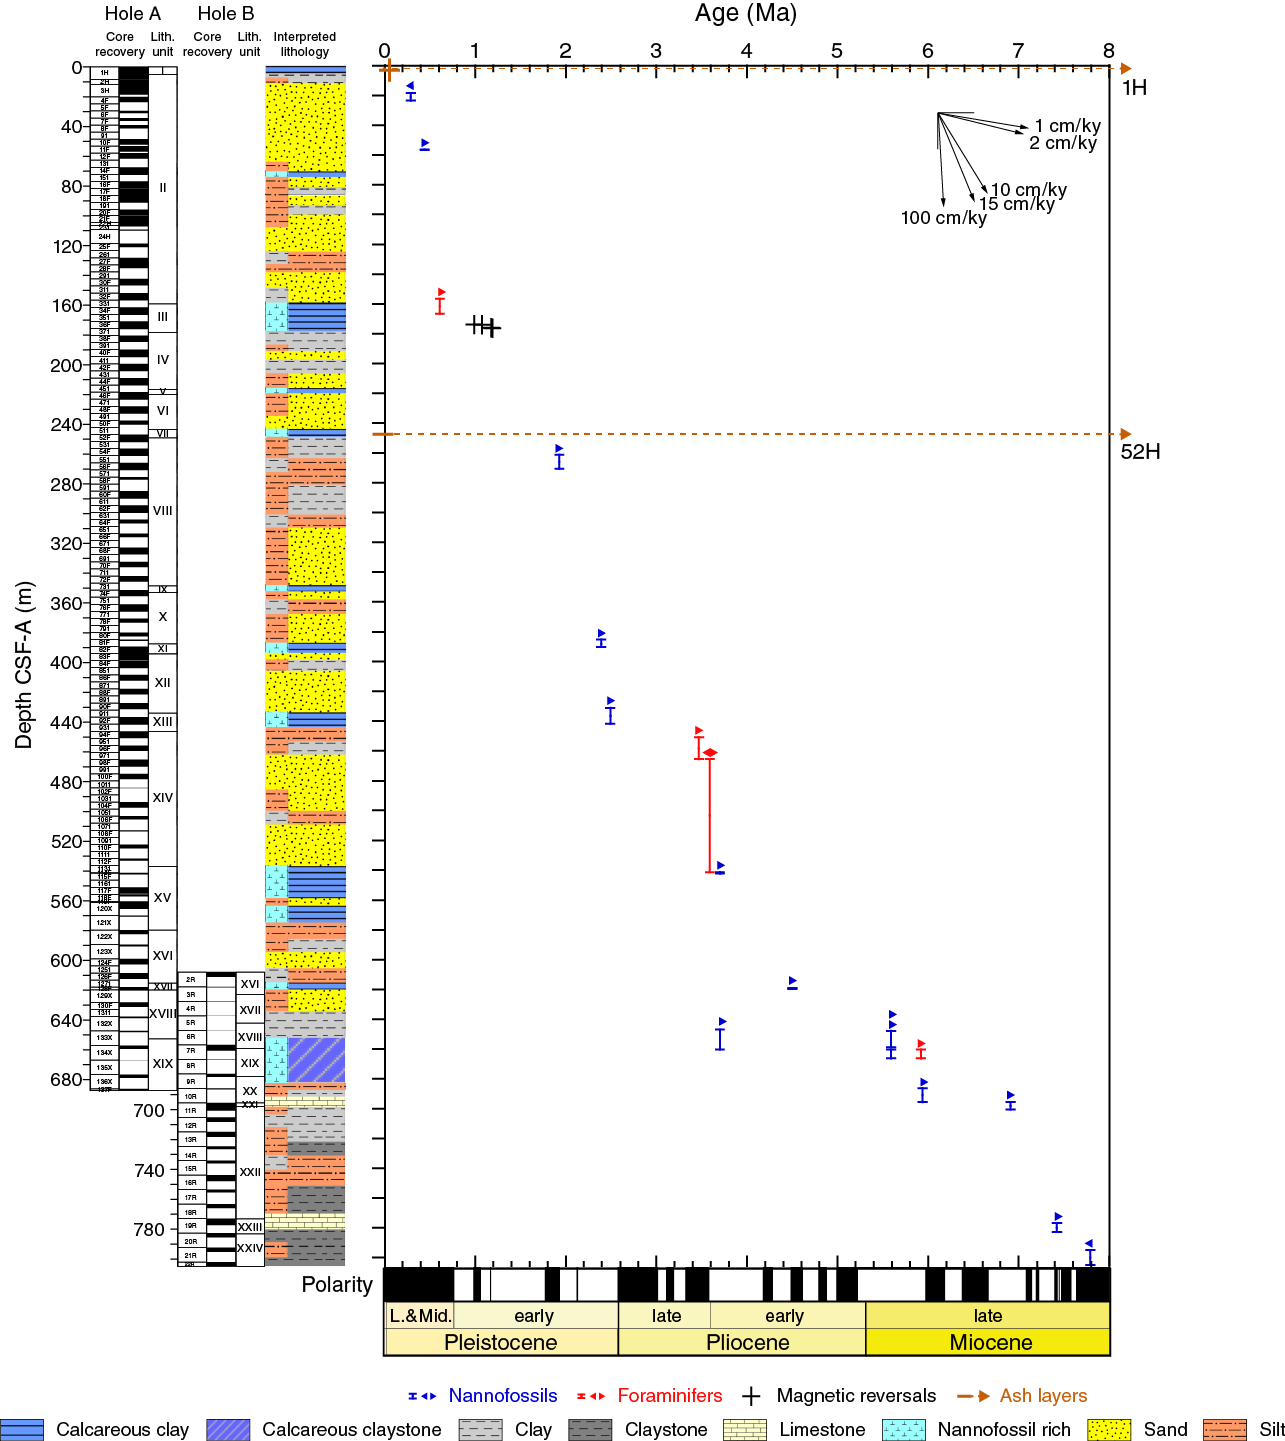
Figure F34. Age-depth plot, Site U1450. Interpreted lithology proposes the most probable lithologies in intervals of nonrecovery.
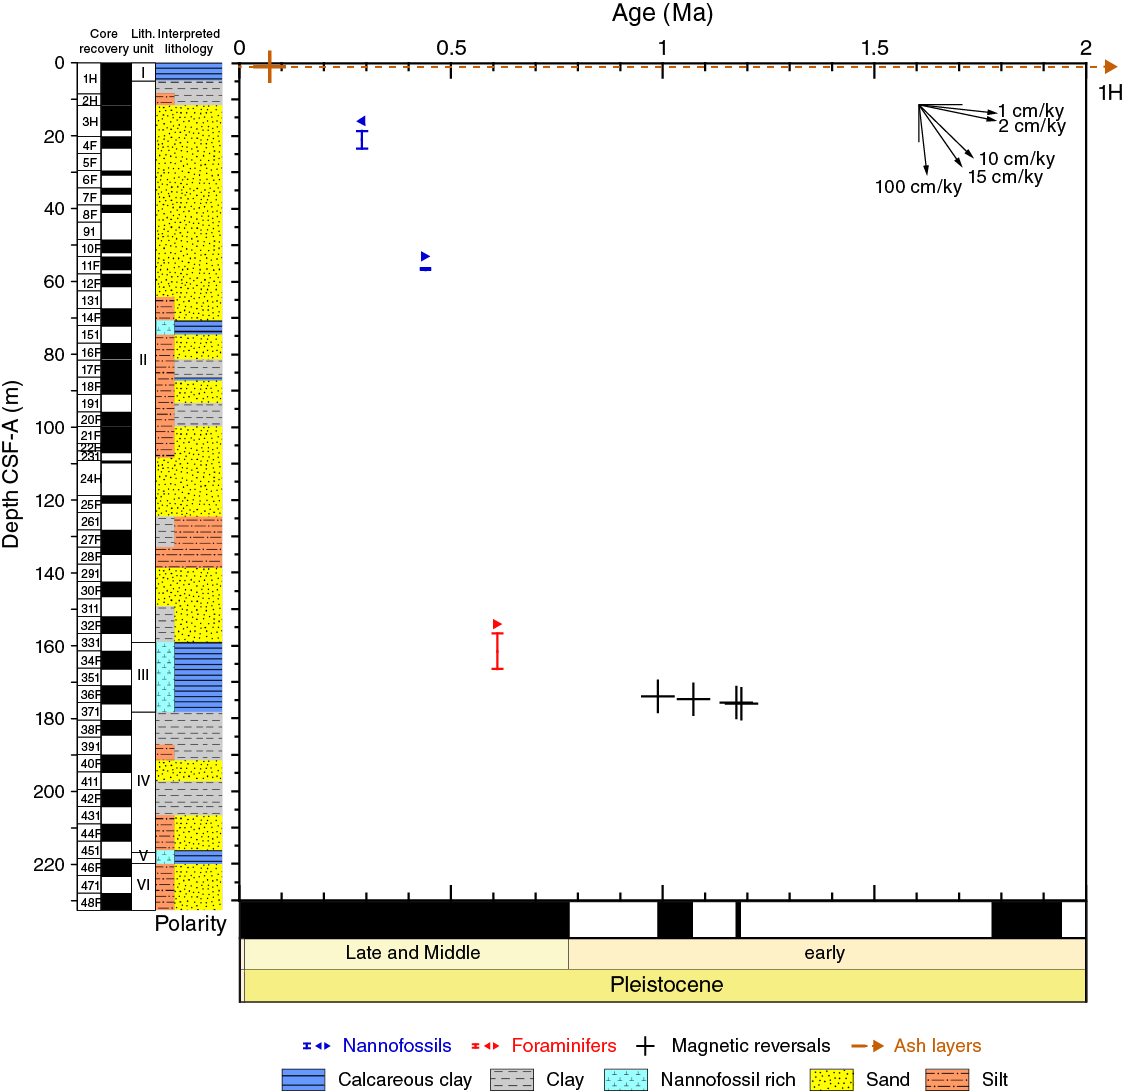
Figure F35. Age-depth plot for 0–2 Ma, Site U1450. Interpreted lithology proposes the most probable lithologies in intervals of nonrecovery.
Achievements
Lithologic and physical properties results confirm the expectation that Site U1450 would contain a high proportion of sand in the recovered cores. The true proportion of sand may be even higher in the formation. As at Site U1449, the match between these data sets and seismic facies and horizons will allow assignment of broad lithologic categories to the seismic units and thus extrapolation throughout the seismic data set and between Expedition 354 sites. These data also allow identification of major depositional processes, which can be integrated to reconstruct the stacking pattern and evolution of fan deposition.
Because Site U1450 reaches back to 8 Ma at 812 m DSF, a precise seismic stratigraphy can be established postexpedition. Major hemipelagic units provide age constraints (Figure F36), and thus approximate ages for distinct reflectors can be determined. These ages will be used to estimate accumulation for various units within the fan in time slices on the order of several hundred thousand to millions of years, one of the main expedition objectives. Site U1450 is located in a key position between the two other deep penetration sites (U1451 and U1455).

Figure F36. Seismic Line SO125-GeoB97-027, upper 1.1 s TWT of seismic section, Site U1450. Lithologic column is adjusted to the seismic data by matching most of the hemipelagic units with distinct reflectors.
Recovering material with sufficient quality was a challenge during Expedition 354, particularly at Site U1450, because of the high proportion of sand. It was unexpected that the consolidation state of sands apparently does not change much with depth. Although loose sand was recovered by the APC system to refusal depth (560 and 630 m DSF in Holes U1450A and U1450B, respectively; see Operations), the XCB and RCB systems provided little or no recovery of sand. The sand proportion is therefore likely underrepresented in cores from the deeper section of the site. Investigating the most representative samples for density measurement, the MAD discrete samples, an overall downhole trend of porosity loss was observed. Also, the scatter around the average is quite high, which can be attributed to extreme contrasts between the coarse-grained base of turbidites and their clay-rich tops. This in turn may be the origin of high reflectivity. From lithologic observations (see Lithostratigraphy) we infer that consolidation state is different for different grain sizes. Clay shows a gradual transition to claystone with depth, with increasing P-wave velocities and densities downhole. However, sand could not be recovered in any more consolidated state within the entire 800 m cored section. Accordingly, the large contrast in seismic impedance between sand- and clay-rich intervals decreases with lithification and depth, as do reflection coefficients and reflectivity. This agrees with the seismic data but is difficult to see in Figure F36 because an automatic gain control (AGC) has been applied to make deeper reflections visible.
Regarding the growth of the fan deposits, the upper Miocene to lower Pliocene portion is characterized by relatively uniform accumulation, averaging 5–10 cm/ky (Figure F34). This average is constrained by a number of stratigraphic tie points, but deposition on shorter timescales may still vary significantly. In the early Pliocene, accumulation intensified, with a few exceptions in the hemipelagic units, from which most biomarker horizons were extracted. Accompanied by a transition from more silt- to sand-dominated lithologies, more rapid delivery of coarser material was still followed by comparatively long periods of quiescence.
Average sedimentation rates during the late Pliocene and early Pleistocene are in the range of 20 cm/ky but can vary by more than one order of magnitude between calcareous clay units with little or no detrital input on the one end (1–2 cm/ky) and the rapid build-up of levees or sand/silt sheets on the other end. Late Pleistocene sedimentation is, on average, fastest (~25 cm/ky), comprising a 25% thicker unit of fan deposits after 0.8 Ma compared to Site U1449.
References
Bouquillon, A., France-Lanord, C., Michard, A., and Tiercelin, J.-J., 1990. Sedimentology and isotopic chemistry of the Bengal Fan sediments: the denudation of the Himalaya. In Cochran, J.R., Stow, D.A.V., et al., Proceedings of the Ocean Drilling Program, Scientific Results, 116: College Station, TX (Ocean Drilling Program), 43–58. http://dx.doi.org/10.2973/odp.proc.sr.116.117.1990
Chatterjee, A., Shankar, D., Shenoi, S.S.C., Reddy, G.V., Michael, G.S., Ravichandran, M., Gopalkrishna, V.V., Rama Rao, E.P., Udaya Bhaskar, T.V.S., and Sanjeevan, V.N., 2012. A new atlas of temperature and salinity for the North Indian Ocean. Journal of Earth System Science, 121(3):559–593. http://dx.doi.org/10.1007/s12040-012-0191-9
Clemens, S.C., Kuhnt, W., LeVay, L.J., Anand, P., Ando, T., Bartol, M., Bolton, C.T., Ding, X., Gariboldi, K., Giosan, L., Hathorne, E.C., Huang, Y., Jaiswal, P., Kim, S., Kirkpatrick, J.B., Littler, K., Marino, G., Martinez, P., Naik, D., Peketi, A., Phillips, S.C., Robinson, M.M., Romero, O.E., Sagar, N., Taladay, K.B., Taylor, S.N., Thirumalai, K., Uramoto, G., Usui, Y., Wang, J., Yamamoto, M., and Zhou, L., 2016. Site U1444. In Clemens, S.C., Kuhnt, W., LeVay, L.J., and the Expedition 353 Scientists, Indian Monsoon Rainfall. Proceedings of the International Ocean Discovery Program, 353: College Station, TX (International Ocean Discovery Program). http://dx.doi.org/10.14379/iodp.proc.353.104.2016
Cochran, J.R., Stow, D.A.V., et al., 1989. Proceedings of the Ocean Drilling Program, Initial Reports, 116: College Station, TX (Ocean Drilling Program). http://dx.doi.org/10.2973/odp.proc.ir.116.1989
Curray, J.R., Emmel, F.J., and Moore, D.G., 2003. The Bengal Fan: morphology, geometry, stratigraphy, history and processes. Marine and Petroleum Geology, 19(10):1191–1223. http://dx.doi.org/10.1016/S0264-8172(03)00035-7
Fisher, R.A., 1953. Dispersion on a sphere. Proceedings of the Royal Society of London, Series A, 217:295–305.
France-Lanord, C., and Derry, L.A., 1994. δ13C of organic carbon in the Bengal Fan: source evolution and transport of C3 and C4 plant carbon to marine sediments. Geochimica et Cosmochimica Acta, 58(21):4809–4814. http://dx.doi.org/10.1016/0016-7037(94)90210-0
France-Lanord, C., Derry, L., and Michard, A., 1993. Evolution of the Himalaya since Miocene time: isotopic and sedimentological evidence from the Bengal Fan. In Treloar, P.J., and Searle, M. (Eds.), Himalayan Tectonics. Geological Society Special Publication, 74(1):603–621. http://dx.doi.org/10.1144/GSL.SP.1993.074.01.40
France-Lanord, C., Spiess, V., Klaus, A., Adhikari, R.R., Adhikari, S.K., Bahk, J.-J., Baxter, A.T., Cruz, J.W., Das, S.K., Dekens, P., Duleba, W., Fox, L.R., Galy, A., Galy, V., Ge, J., Gleason, J.D., Gyawali, B.R., Huyghe, P., Jia, G., Lantzsch, H., Manoj, M.C., Martos Martin, Y., Meynadier, L., Najman, Y.M.R., Nakajima, A., Ponton, C., Reilly, B.T., Rogers, K.G., Savian, J.F., Schwenk, T., Selkin, P.A., Weber, M.E., Williams, T., and Yoshida, K., 2016a. Expedition 354 methods. In France-Lanord, C., Spiess, V., Klaus, A., Schwenk, T., and the Expedition 354 Scientists, Bengal Fan. Proceedings of the International Ocean Discovery Program, 354: College Station, TX (International Ocean Discovery Program). http://dx.doi.org/10.14379/iodp.proc.354.102.2016
France-Lanord, C., Spiess, V., Klaus, A., Adhikari, R.R., Adhikari, S.K., Bahk, J.-J., Baxter, A.T., Cruz, J.W., Das, S.K., Dekens, P., Duleba, W., Fox, L.R., Galy, A., Galy, V., Ge, J., Gleason, J.D., Gyawali, B.R., Huyghe, P., Jia, G., Lantzsch, H., Manoj, M.C., Martos Martin, Y., Meynadier, L., Najman, Y.M.R., Nakajima, A., Ponton, C., Reilly, B.T., Rogers, K.G., Savian, J.F., Schwenk, T., Selkin, P.A., Weber, M.E., Williams, T., and Yoshida, K., 2016b. Site U1451. In France-Lanord, C., Spiess, V., Klaus, A., Schwenk, T., and the Expedition 354 Scientists, Bengal Fan. Proceedings of the International Ocean Discovery Program, 354: College Station, TX (International Ocean Discovery Program). http://dx.doi.org/10.14379/iodp.proc.354.105.2016
France-Lanord, C., Spiess, V., Klaus, A., Adhikari, R.R., Adhikari, S.K., Bahk, J.-J., Baxter, A.T., Cruz, J.W., Das, S.K., Dekens, P., Duleba, W., Fox, L.R., Galy, A., Galy, V., Ge, J., Gleason, J.D., Gyawali, B.R., Huyghe, P., Jia, G., Lantzsch, H., Manoj, M.C., Martos Martin, Y., Meynadier, L., Najman, Y.M.R., Nakajima, A., Ponton, C., Reilly, B.T., Rogers, K.G., Savian, J.F., Schwenk, T., Selkin, P.A., Weber, M.E., Williams, T., and Yoshida, K., 2016c. Site U1452. In France-Lanord, C., Spiess, V., Klaus, A., Schwenk, T., and the Expedition 354 Scientists, Bengal Fan. Proceedings of the International Ocean Discovery Program, 354: College Station, TX (International Ocean Discovery Program). http://dx.doi.org/10.14379/iodp.proc.354.106.2016
France-Lanord, C., Spiess, V., Klaus, A., Schwenk, T., Adhikari, R.R., Adhikari, S.K., Bahk, J.-J., Baxter, A.T., Cruz, J.W., Das, S.K., Dekens, P., Duleba, W., Fox, L.R., Galy, A., Galy, V., Ge, J., Gleason, J.D., Gyawali, B.R., Huyghe, P., Jia, G., Lantzsch, H., Manoj, M.C., Martos Martin, Y., Meynadier, L., Najman, Y.M.R., Nakajima, A., Ponton, C., Reilly, B.T., Rogers, K.G., Savian, J.F., Selkin, P.A., Weber, M.E., Williams, T., and Yoshida, K., 2016d. Expedition 354 summary. In France-Lanord, C., Spiess, V., Klaus, A., Schwenk, T., and the Expedition 354 Scientists, Bengal Fan. Proceedings of the International Ocean Discovery Program, 354: College Station, TX (International Ocean Discovery Program). http://dx.doi.org/10.14379/iodp.proc.354.101.2016
Freeman, K.H., and Colarusso, L.A., 2001. Molecular and isotopic records of C4 grassland expansion in the late Miocene. Geochimica et Cosmochimica Acta, 65(9):1439–1454. http://dx.doi.org/10.1016/S0016-7037(00)00573-1
Galy, A., and France-Lanord, C., 2001. Higher erosion rates in the Himalaya: geochemical constraints on riverine fluxes. Geology, 29(1):23–26. http://dx.doi.org/10.1130/0091-7613(2001)029<0023:HERITH>2.0.CO;2
Galy, V., France-Lanord, C., Beyssac, O., Faure, P., Kudrass, H., and Palhol, F., 2007. Efficient organic carbon burial in the Bengal Fan sustained by the Himalayan erosional system. Nature, 450(7168):407–410. http://dx.doi.org/10.1038/nature06273
Galy, V., France-Lanord, C., and Lartiges, B., 2008. Loading and fate of particulate organic carbon from the Himalaya to the Ganga–Brahmaputra delta. Geochimica et Cosmochimica Acta, 72(7):1767–1787.http://dx.doi.org/10.1016/j.gca.2008.01.027
Galy, V., France-Lanord, C., Peucker-Ehrenbrink, B., and Huyghe, P., 2010. Sr-Nd-Os evidence for a stable erosion regime in the Himalaya during the past 12 Myr. Earth and Planetary Science Letters, 290(3–4):474–480. http://dx.doi.org/10.1016/j.epsl.2010.01.004
Galy, V., François, L., France-Lanord, C., Faure, P., Kudrass, H., Palhol, F., and Singh, S.K., 2008. C4 plants decline in the Himalayan basin since the Last Glacial Maximum. Quaternary Science Reviews, 27(13–14):1396–1409. http://dx.doi.org/10.1016/j.quascirev.2008.04.005
Garzanti, E., Andó, S., France-Lanord, C., Censi, P., Vignola, P., Galy, V., and Lupker, M., 2011. Mineralogical and chemical variability of fluvial sediments, 2. Suspended-load silt (Ganga–Brahmaputra, Bangladesh). Earth and Planetary Science Letters, 302(1–2):107–120. http://dx.doi.org/10.1016/j.epsl.2010.11.043
Gasparotto, G., Spadafora, E., Summa, V., and Tateo, F., 2000. Contribution of grain size and compositional data from the Bengal Fan sediment to the understanding of Toba volcanic event. Marine Geology, 162(2–4):561–572. http://dx.doi.org/10.1016/S0025-3227(99)00090-0
Gradstein, F.M., Ogg, J.G., Schmitz, M.D., and Ogg, G.M. (Eds.), 2012. The Geological Time Scale 2012: Amsterdam (Elsevier).
Hasterok, D., Chapman, D.S., and Davis, E.E., 2011. Oceanic heat flow: implications for global heat loss. Earth and Planetary Science Letters, 311(3–4):386–395. http://dx.doi.org/10.1016/j.epsl.2011.09.044
Hyndman, R.D., Erickson, A.J., and Von Herzen, R.P., 1974. Geothermal measurements on DSDP Leg 26. In Davies, T.A., Luyendyk, B.P., et al., Initial Reports of the Deep Sea Drilling Project, 26: Washington, DC (U.S. Government Printing Office), 451–463. http://dx.doi.org/10.2973/dsdp.proc.26.113.1974
Kirschvink, J.L., 1980. The least-squares line and plane and the analysis of palaeomagnetic data. Geophysical Journal of the Royal Astronomical Society, 62(3):699–718. http://dx.doi.org/10.1111/j.1365-246X.1980.tb02601.x
Lupker, M., France-Lanord, C., Galy, V., Lavé, J., Gaillardet, J., Gajurel, A.P., Guilmette, C., Rahman, M., Singh, S.K., and Sinha, R., 2012. Predominant floodplain over mountain weathering of Himalayan sediments (Ganga basin). Geochimica et Cosmochimica Acta, 84:410–432. http://dx.doi.org/10.1016/j.gca.2012.02.001
Lupker, M., France-Lanord, C., Galy, V., Lavé, J., and Kudrass, H., 2013. Increasing chemical weathering in the Himalayan system since the Last Glacial Maximum. Earth and Planetary Science Letters, 365:243–252. http://dx.doi.org/10.1016/j.epsl.2013.01.038
Mark, D.F., Petraglia, M., Smith, V.C., Morgan, L.E., Barfod, D.N., Ellis, B.S., Pearce, N.J., Pal, J.N., and Korisettar, R., 2014. A high-precision 40Ar/39Ar age for the Young Toba Tuff and dating of ultra-distal tephra: forcing of Quaternary climate and implications for hominin occupation of India. Quaternary Geochronology, 21:90–103. http://dx.doi.org/10.1016/j.quageo.2012.12.004
Martini, E., 1971. Standard Tertiary and Quaternary calcareous nannoplankton zonation. In Farinacci, A. (Ed.), Proceedings of the Second Planktonic Conference, Roma 1970: Rome (Edizioni Tecnoscienza), 2:739–785.
Mayer, L.A., 1991. Extraction of high-resolution carbonate data for palaeoclimate reconstruction. Nature, 352(6331):148–150. http://dx.doi.org/10.1038/352148a0
Müller, R.D., Sdrolias, M., Gaina, C., and Roest, W.R., 2008. Age, spreading rates, and spreading asymmetry of the world’s ocean crust. Geochemistry, Geophysics, Geosystems, 9(4):Q04006. http://dx.doi.org/10.1029/2007GC001743
Ninkovich, D., Sparks, R.S.J., and Ledbetter, M.T., 1978. The exceptional magnitude and intensity of the Toba eruption, Sumatra: an example of the use of deep-sea tephra layers as a geological tool. Bulletin of Volcanology, 41(3):286–298. http://dx.doi.org/10.1007/BF02597228
Normark, W.R., Damuth, J.E., and the Leg 155 Sedimentology Group, 1997. Sedimentary facies and associated depositional elements of the Amazon Fan. In Flood, R.D., Piper, D.J.W., Klaus, A., and Peterson, L.C. (Eds.), Proceedings of the Ocean Drilling Program, Scientific Results, 155: College Station, TX (Ocean Drilling Program), 611–651. http://dx.doi.org/10.2973/odp.proc.sr.155.247.1997
Okada, H., and Bukry, D., 1980. Supplementary modification and introduction of code numbers to the low-latitude coccolith biostratigraphic zonation (Bukry, 1973; 1975). Marine Micropaleontology, 5:321–325. http://dx.doi.org/10.1016/0377-8398(80)90016-X
Pribnow, D., Kinoshita, M., and Stein, C., 2000. Thermal Data Collection and Heat Flow Recalculations for Ocean Drilling Program Legs 101–180: Hanover, Germany (Institute for Joint Geoscientific Research, Institut für Geowissenschaftliche Gemeinschaftsaufgaben [GGA]) http://www-odp.tamu.edu/publications/heatflow/ODPReprt.pdf
Schwenk, T., and Spieß, V., 2009. Architecture and stratigraphy of the Bengal Fan as response to tectonic and climate revealed from high-resolution seismic data. In Kneller, B.C., Martinsen, O.J., and McCaffrey, B. (Eds.), External Controls on Deep-Water Depositional Systems. Special Publication - SEPM (Society of Sedimentary Geologists), 92:107–131.
von der Borch, C.C., Sclater, J.G., et al., 1974. Initial Reports of the Deep Sea Drilling Project, 22: Washington (U.S. Government Printing Office). http://dx.doi.org/10.2973/dsdp.proc.22.1974
Wade, B.S., Pearson, P.N., Berggren, W.A., and Pälike, H., 2011. Review and revision of Cenozoic tropical planktonic foraminiferal biostratigraphy and calibration to the geomagnetic polarity and astronomical time scale. Earth-Science Reviews, 104(1–3):111–142. http://dx.doi.org/10.1016/j.earscirev.2010.09.003
Weber, M.E., 1998. Estimation of biogenic carbonate and opal by continuous non-destructive measurements in deep-sea sediments: application to the eastern equatorial Pacific. Deep-Sea Research, Part I, 45(11):1955–1975. http://dx.doi.org/10.1016/S0967-0637(98)00028-4
Weber, M.E., Wiedicke-Hombach, M., Kudrass, H.R., and Erlenkeuser, H., 2003. Bengal Fan sediment transport activity and response to climate forcing inferred from sediment physical properties. Sedimentary Geology, 155(3–4):361–381. http://dx.doi.org/10.1016/S0037-0738(02)00187-2
Whitmarsh, R.B., 1971. Precise sediment density determination by gamma-ray attenuation alone. Journal of Sedimentary Petrology, 41(3):882–883. http://jsedres.geoscienceworld.org/content/41/3/882.abstract
1France-Lanord, C., Spiess, V., Klaus, A., Adhikari, R.R., Adhikari, S.K., Bahk, J.-J., Baxter, A.T., Cruz, J.W., Das, S.K., Dekens, P., Duleba, W., Fox, L.R., Galy, A., Galy, V., Ge, J., Gleason, J.D., Gyawali, B.R., Huyghe, P., Jia, G., Lantzsch, H., Manoj, M.C., Martos Martin, Y., Meynadier, L., Najman, Y.M.R., Nakajima, A., Ponton, C., Reilly, B.T., Rogers, K.G., Savian, J.F., Schwenk, T., Selkin, P.A., Weber, M.E., Williams, T., and Yoshida, K., 2016. Site U1450. In France-Lanord, C., Spiess, V., Klaus, A., Schwenk, T., and the Expedition 354 Scientists, Bengal Fan. Proceedings of the International Ocean Discovery Program, 354: College Station, TX (International Ocean Discovery Program). http://dx.doi.org/10.14379/iodp.proc.354.104.2016