France-Lanord, C., Spiess, V., Klaus, A., Schwenk, T., and the Expedition 354 Scientists
Proceedings of the International Ocean Discovery Program Volume 354
publications.iodp.org
doi:10.14379/iodp.proc.354.106.2016

Site U14521
C. France-Lanord, V. Spiess, A. Klaus, R.R. Adhikari, S.K. Adhikari, J.-J. Bahk, A.T. Baxter, J.W. Cruz, S.K. Das, P. Dekens, W. Duleba, L.R. Fox, A. Galy, V. Galy, J. Ge, J.D. Gleason, B.R. Gyawali, P. Huyghe, G. Jia, H. Lantzsch, M.C. Manoj, Y. Martos Martin, L. Meynadier, Y.M.R. Najman, A. Nakajima, C. Ponton, B.T. Reilly, K.G. Rogers, J.F. Savian, T. Schwenk, P.A. Selkin, M.E. Weber, T. Williams, and K. Yoshida2
Keywords: International Ocean Discovery Program, IODP, Expedition 354, JOIDES Resolution, Site U1452, Bengal Fan
MS 354-106: Published 7 September 2016
Site summary
Site U1452 (proposed Site MBF-5A) is in the center of our seven-site transect. It is located in a relatively flat environment with a smooth morphology. Topographic expressions of channels are absent in the vicinity of the site. The seismic profile at this site reveals a prominent, >20 km wide, and up to 40 m thick levee; the top is only at ~5 m below the seafloor.
At this site, we focused on coring the upper levee to provide a detailed record of this type of depositional system. Two holes were cored through this levee to allow high-resolution sedimentological, geophysical, geochemical, and micropaleontological investigations. A single mudline core from Hole U1452A was devoted to detailed study of the hemipelagic deposition during the last glacial cycle and to the Toba ash. Hole U1452B was cored to 217.7 m drilling depth below seafloor (DSF) for the study of the Upper Pleistocene section. Finally, Hole U1452C was cored to 41.3 m DSF to provide a more complete record of the levee and to allow more extensive sampling.
Principal results
Coring at Site U1452 contributed to the Pleistocene transect of seven sites, which was one of the primary Expedition 354 objectives. The levee sequence recovered will allow detailed integrated sedimentological and geochemical investigations. On such rapidly accumulated sediments, δ18O measurements on planktonic foraminifers are expected to provide the high-resolution biostratigraphy and paleoclimate conditions (i.e., glacial to interglacial) necessary to constrain potential evolution of erosion and transport processes. This record is also essential for the understanding of channel and levee formation. Site U1452 cored a fine-grained levee, such as the one cored deeper in Site U1449, but also penetrated the coarser basal unit. Physical properties seem to indicate progradation and the transition from sand deposition, through erosion, to levee construction.
The successful interpretation of seismic facies types with respect to grain size allowed coring strategies to target specific horizons. Hemipelagic layers, after being identified in several previous sites, were used to establish a preliminary Pleistocene seismic stratigraphy. Also, coring that targeted these layers was successful and provided an improved chronology even when half-length advanced piston corer (HLAPC) coring alternated with short 4.8 m advances without coring.
A hemipelagic unit deposited from ~0.8 to ~1.2 Ma between 166 and 190 m DSF marks a period when turbiditic deposition was diverted to other parts of the fan and only clays were supplied to this area; this history was also observed at other sites to the east (Sites U1449–U1451). Fan sedimentation intensified between 800 and 300 ka, as represented by sheeted sands and the levee. These sheeted sands and the levee grew by 100 m in 500 ky, equivalent to an average sedimentation rate of 20 cm/ky. The end of this intense period of fan sedimentation at 300 ka is constrained by the basal age of the surficial hemipelagic unit.
Operations
In Hole U1452A, a single advanced piston corer (APC) mudline core (1H) recovered 8 m of sediments, including the mudline.
In Hole U1452B, we completed oriented APC coring to 41.4 m DSF and continued coring with the HLAPC system. From 71.1 to 142.4 m DSF, we alternated 4.7 m long HLAPC cores with 4.8 m intervals drilled without coring. In this interval, seven HLAPC cores (14F–26F) penetrated 32.9 m and recovered 21.41 m of core (65%). The eight 4.8 m advances without coring penetrated 38.4 m, with nearly continuous HLAPC coring to 217.7 m DSF. Nine 4.8 m advances without coring were intercalated with cores in units predicted to be sandy. Overall recovery was 79% for Hole U1452B.
Hole U1452C was continuously cored from the seafloor to 41.3 m DSF to obtain a more complete record of the uppermost levee sequence to the sand layer at the base of the levee. All APC cores were oriented, and core recovery in this hole was 81%.
Lithostratigraphy
Drilling at Site U1452 targeted a Pleistocene-aged levee identified in the pre-expedition seismic data. The lithology and structures of recovered sediments indicate the initiation and cessation of an entire levee sequence (8–40 m DSF) was captured, as well as underlying prelevee sand sheets (40–167 m DSF) and calcareous clays (>167 m DSF). The prelevee sand sheets mark the initiation of turbiditic deposition at this location prior to the building of the levee. These turbiditic sand sheets are dominated by mica- and quartz-rich sand characteristic of sediments found in Himalayan rivers. The sand was likely deposited as interlevee sheet flows originating from a nearby channel. The hemipelagic calcareous clay unit extends to 190 m DSF and overlies older interlevee sand-rich turbidites.
Sediments at this site document the channel system shifting across the fan. Initially, proximal channel sand deposition was reduced and succeeded by increased deposition of hemipelagic nannofossil-rich calcareous clays. Overlying this calcareous interval, a very thick (~160 m) section of levee deposits (i.e., sand and mud turbidites) reflects activation of a nearby channel and the associated levee building that forms the top of the section. The levee is overlain by a relatively thin unit of bioturbated calcareous clay, representing the end of proximal channel activity and in turn a decrease in detrital input. This surficial calcareous clay unit at the top of the levee contains a glassy volcanic ash layer likely from the Toba eruption that occurred at ~75 ka.
Biostratigraphy
Biostratigraphic control at Site U1452 is limited, but four tie points were observed that help constrain levee development during the Pleistocene. Although the foraminiferal biomarker Globorotalia tosaensis (0.61 Ma) was found in Holes U1452B and U1452C (at 8.97 and 23.29 m core depth below seafloor [CSF-A], respectively), its first occurrence (FO) is at a shallower depth than the nannofossil biomarkers Emiliania huxleyi (0.29 Ma) and Pseudoemiliania lacunosa (0.44 Ma), indicating that this foraminifer was either reworked or has a longer range in the Indian Ocean. Cores 345-U1452B-33F through 37F are dominated by hemipelagic calcareous clay, are abundant in nannofossils, and contain abundant to barren foraminifers. Interestingly, fragmentation of planktonic foraminifers was higher in the hemipelagic sediments than in the turbiditic sediments. The nannofossil biomarkers agree well with the magnetic polarity reversals found at Site U1452.
Paleomagnetism
As observed in the upper parts of Sites U1449–U1451, Site U1452 sediments record the Brunhes/Matuyama boundary (184.10 m CSF-A) and both boundaries of the Jaramillo and Cobb Mountain Subchrons (186.00–187.20 and 188.33–188.61 m CSF-A, respectively). Relative to the seafloor, these are the deepest instances of these polarity transitions identified on our transect to date. Also similar to Sites U1449–U1451, the Jaramillo and Cobb Mountain Subchrons occur at Site U1452 within an interval of hemipelagic sedimentation. The Brunhes/Matuyama boundary is associated with an ash layer, believed to be from Toba. Microtektites, likely from the Australasian Microtektite Event dated at 790 ka, were found deeper than the Brunhes/Matuyama boundary, further supporting the identification of this polarity transition.
Physical properties
Physical property data were acquired on all cores from Holes U1452A and U1452B, including density, magnetic susceptibility, P-wave velocity, natural gamma radiation (NGR), and thermal conductivity. Physical property data are mostly of good quality and reflect lithologic variations. Using the principal lithologic name from the core description to assign five lithologies (sand = ~46 m, silt = ~27 m, clay = ~33 m, calcareous clay = ~26 m, and volcanic ash), we calculated their minimum, maximum, and average physical properties. Average wet bulk densities are rather uniform for terrigenous sediment (sand, silt, and clay), ranging from 1.89 to 2.03 g/cm3, calcareous clay has lower average densities (1.72 g/cm3), and volcanic ash has substantially lower wet bulk densities (1.54 g/cm3). Average P-wave velocities are highest in sand (1697 m/s) and lowest in clay and in calcareous clay (~1525 m/s). Average magnetic susceptibilities are also highest in sand (107 × 10–5 SI), followed by silt (80 × 10−5 SI) and clay (58 × 10–5 SI). The lowest values occur in calcareous clay (22 × 10–5 SI). Average NGR is high throughout the terrigenous components sand, silt, and clay (around 65 counts/s) and lower in calcareous clay (45 counts/s). Average thermal conductivity is highest in silt (1.63 W/[m·K]) and lowest in calcareous clay (1.18 W/[m·K]).
Geochemistry
Detailed pore water measurements distinguish two hydrologic units based on sulfate, phosphate, silica, magnesium, potassium, calcium, and alkalinity content. Carbonate contents of turbiditic sediments vary from 0.6 to 7.4 wt% CaCO3. Similar carbonate contents were measured in Pliocene and Pleistocene turbiditic sediments recovered at Sites U1449–U1451. A 4.6 m thick hemipelagic interval at 184 m CSF-A was analyzed at high resolution with X-ray fluorescence (XRF) scanning. It reveals that carbonate content varies between 18 and 60 wt% with an average of ~40 wt%. Sr/Ca ratio and carbonate content variations suggest a single binary mixing between marine biogenic carbonate and a silicate end-member.
Background and objectives
Site U1452 (see Figures F3, F4, and F8 in the Expedition 354 summary chapter [France-Lanord et al., 2016d]) is located in the center of the seven-site transect drilled during Expedition 354 to study Pleistocene fan architecture and evolution of the Middle Bengal Fan at 8°N. In combination, these sites will provide a complete inventory of Pleistocene fan architecture and evolution in the 300 km long central segment of the Bengal Fan. Seismic data along the transect reveal characteristic structures and patterns of fan deposition related to channel-levee systems (Schwenk and Spiess, 2009).
The objectives of this site were to provide characteristics of lithologies building the structural and depositional elements of the fan and to estimate accumulation rates related to different depositional processes. Combined with other transect sites, this site should document depocenter migration and quantify overall sediment delivery to 8°N since the Pliocene.
Site U1452 is located in a relatively flat environment with a smooth morphology. Topographic expressions of channels are absent in the vicinity (Figure F1), but an abandoned channel crosses the seismic profile ~50 km west near Site U1453. This channel strikes northeast–southwest and reaches as close as 20 km to Site U1452; thus, spillover material from this channel may have reached the site and formed distal levee deposits.
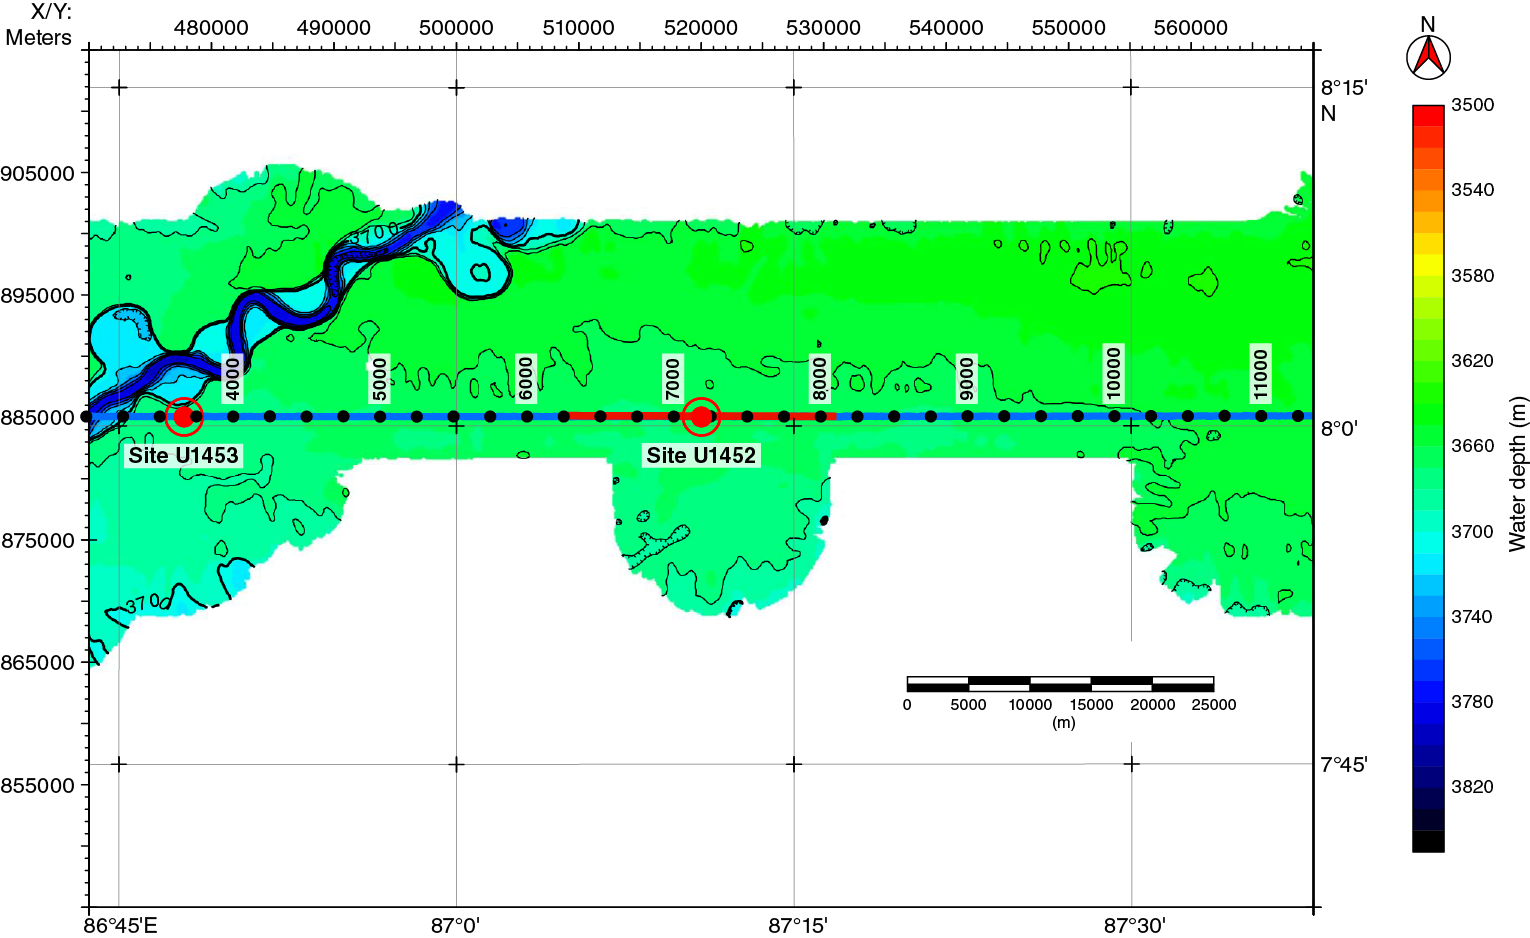
Figure F1. Bathymetric and track chart, Site U1452. Projection is UTM Zone 45N. Multibeam bathymetry was acquired during R/V Sonne Cruises SO125 and SO188.
The most striking feature of the seismic profile across Site U1452 (Figure F2) is a prominent levee >20 km wide at a shallow subbottom depth. At the site, positioned just west of the buried channel axis, the levee is 40 ms two-way traveltime (TWT) thick. A succession of mostly subparallel sedimentary units below the levee were observed, some of which represent levee facies and geometry. Other units of higher amplitude may represent coarser formations, in particular those with irregular reflector morphology. At the base of the hole, several stacked levee units were expected.
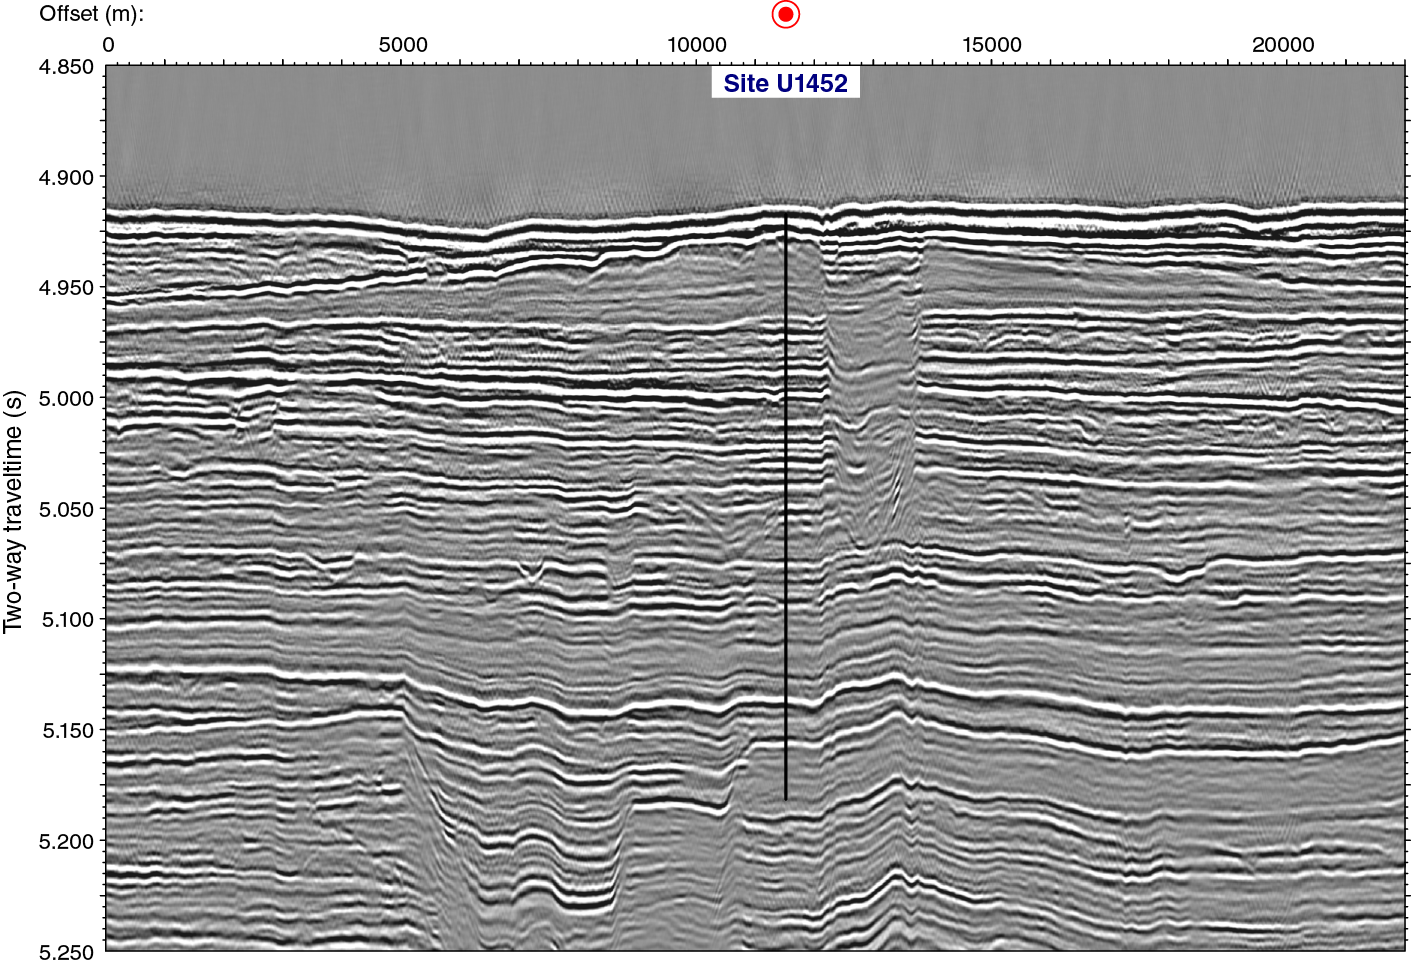
Figure F2. Seismic Line SO125-GeoB97-027 across Site U1452. Total depth is 217.7 m DSF, assuming an average velocity of 1640 m/s.
At this site, we focused on coring the upper levee to provide a detailed record of this type of depositional system. Two holes were cored through this levee to allow high-resolution sedimentological, geochemical, and micropaleontological investigations. In addition, sediments collected at Site U1452 will be used to document Pleistocene erosion rates and processes, as well as links between erosion and climate.
Operations
Three holes were cored at Site U1452. Hole U1452A recovered a single mudline core for high-resolution studies around the Toba ash layer. Hole U1452B penetrated a total of 217.7 m; 174.5 m of this interval was cored, and 140.33 m of core was recovered (64%). Hole U1452C was continuously cored from the seafloor to 41.3 m DSF to obtain a more complete sampling of the uppermost levee sequence. All cores, penetration depths, core recovery, and time recovered on deck are presented in Table T1.
Table T1. Site U1452 coring summary. Download table in .csv format. View PDF table.
Hole U1452A
After a 29 nmi transit, we arrived at Site U1452 at 1700 h on 11 March 2015, prepared an APC/extended core barrel (XCB) bottom-hole assembly (BHA), and lowered it to the seafloor. After lowering the drill string to the seafloor, we attempted to take the mudline APC core in Hole U1452A at 0315 h on 12 March, but the system would not fire (shear pins did not fail). After recovering the APC core barrel and diagnosing/fixing the problem, we redeployed the APC core barrel and started coring Hole U1452A at 0540 h on 12 March. Core 1H penetrated 8 m. This core is dedicated to high-resolution studies around the Toba ash layer, so it was only run through the whole-round logging systems and then stored for postexpedition splitting and sampling. Nonmagnetic hardware (drill collar and core barrels) was used for all APC and HLAPC cores at Site U1452.
Hole U1452B
We then offset the ship 20 m east and started coring Hole U1452B at 0700 h on 12 March 2015. Cores 1H–5H penetrated to 41.4 m DSF and recovered 33.51 m of sediment (80%). All of these cores were oriented. Core 5H was a partial stroke and was inferred to have only penetrated ~4.7 m based on the amount of competent material recovered in the top of the core. We then switched to the HLAPC system. Cores 6F–12F penetrated from 41.4 to 71.1 m DSF (29.7 m) and recovered 23.32 m of core (79%). Based on evidence on the outside of the core barrel (rusty steel scrubbed clean by the formation), Core 6F only penetrated 1.5 m into the formation, so it was advanced this amount; all other cores were advanced 4.7 m. From 71.1 to 142.4 m DSF, we started alternating 4.7 m long HLAPC cores with 4.8 m intervals drilled without coring. In this interval, seven HLAPC cores (14F–26F) penetrated 32.9 m and recovered 21.41 m of core (65%). The eight 4.8 m advances without coring penetrated 38.4 m. Nearly continuous HLAPC coring (Cores 28F–43F, except for a single 4.8 m advance without coring) penetrated from 142.4 to 217.7 m DSF and recovered 62.49 m of core (89%). Although we had originally planned to core to 300 mbsf, we decided our primary coring objectives at this site had been achieved. We pulled out of Hole U1452B, and the bit cleared the seafloor at 0030 h on 14 March. Hole U1452B penetrated a total of 217.7 m; 174.5 m of this interval was cored, and 140.33 m of core was recovered (64%). The majority of cores were partial strokes.
Hole U1452C
After the ship was offset 20 m south of Hole U1452B, Hole U1452C was continuously cored from the seafloor to 41.3 m DSF to obtain a more complete sampling of the uppermost levee sequence. APC coring in Hole U1452C started at 0245 h on 14 March 2015. After a successful mudline core (1H), we used the XCB system to core from 7.0 to 11.0 m DSF; in Hole U1452B, this interval had poor recovery and appeared to be a hard layer. Unfortunately, this core came back empty. APC coring resumed, and Cores 3H–6H extended from 11.0 to 41.3 m DSF (30.3 m) and recovered 30.3 m of core (87%). All APC cores were oriented. When the last core recovered sand, our objective for this hole was reached (we had passed below the targeted levee section), so we pulled out of the hole and recovered the drill string. After the bit was back on board, we secured the rig floor, raised the thrusters, and departed for Site U1453 at 1900 h on 14 March.
Lithostratigraphy
At Site U1452, three holes (U1452A, U1452B, and U1452C) were drilled. Hole U1452A penetrated to a maximum subbottom depth of 8.0 m DSF (cored interval: 8.0 m with 100% recovery). Hole U1452B penetrated to 217.7 m DSF (cored interval: 174.5 m with 79% recovery). Hole U1452C penetrated to 41.3 m DSF (cored interval: 41.3 m with 81% recovery). Hole U1452B lithostratigraphic units overlap with those in Hole U1452C from 0 to 41.3 m CSF-A. The overall dominant lithology for Site U1452 (95% of total recovered material) is fine sand with silt and clay, some with fining-upward sequences (i.e., turbidites). Two units of mottled and bioturbated calcareous clay comprise the overall minor lithology (5% of total recovered material). Additionally, Site U1452 contains two volcanic ash layers. Recovered sediments from Site U1451 are divided into five lithostratigraphic units based on lithologic and paleontological characteristics obtained through macroscopic and smear slide analyses and physical property measurements (Figures F3, F4).
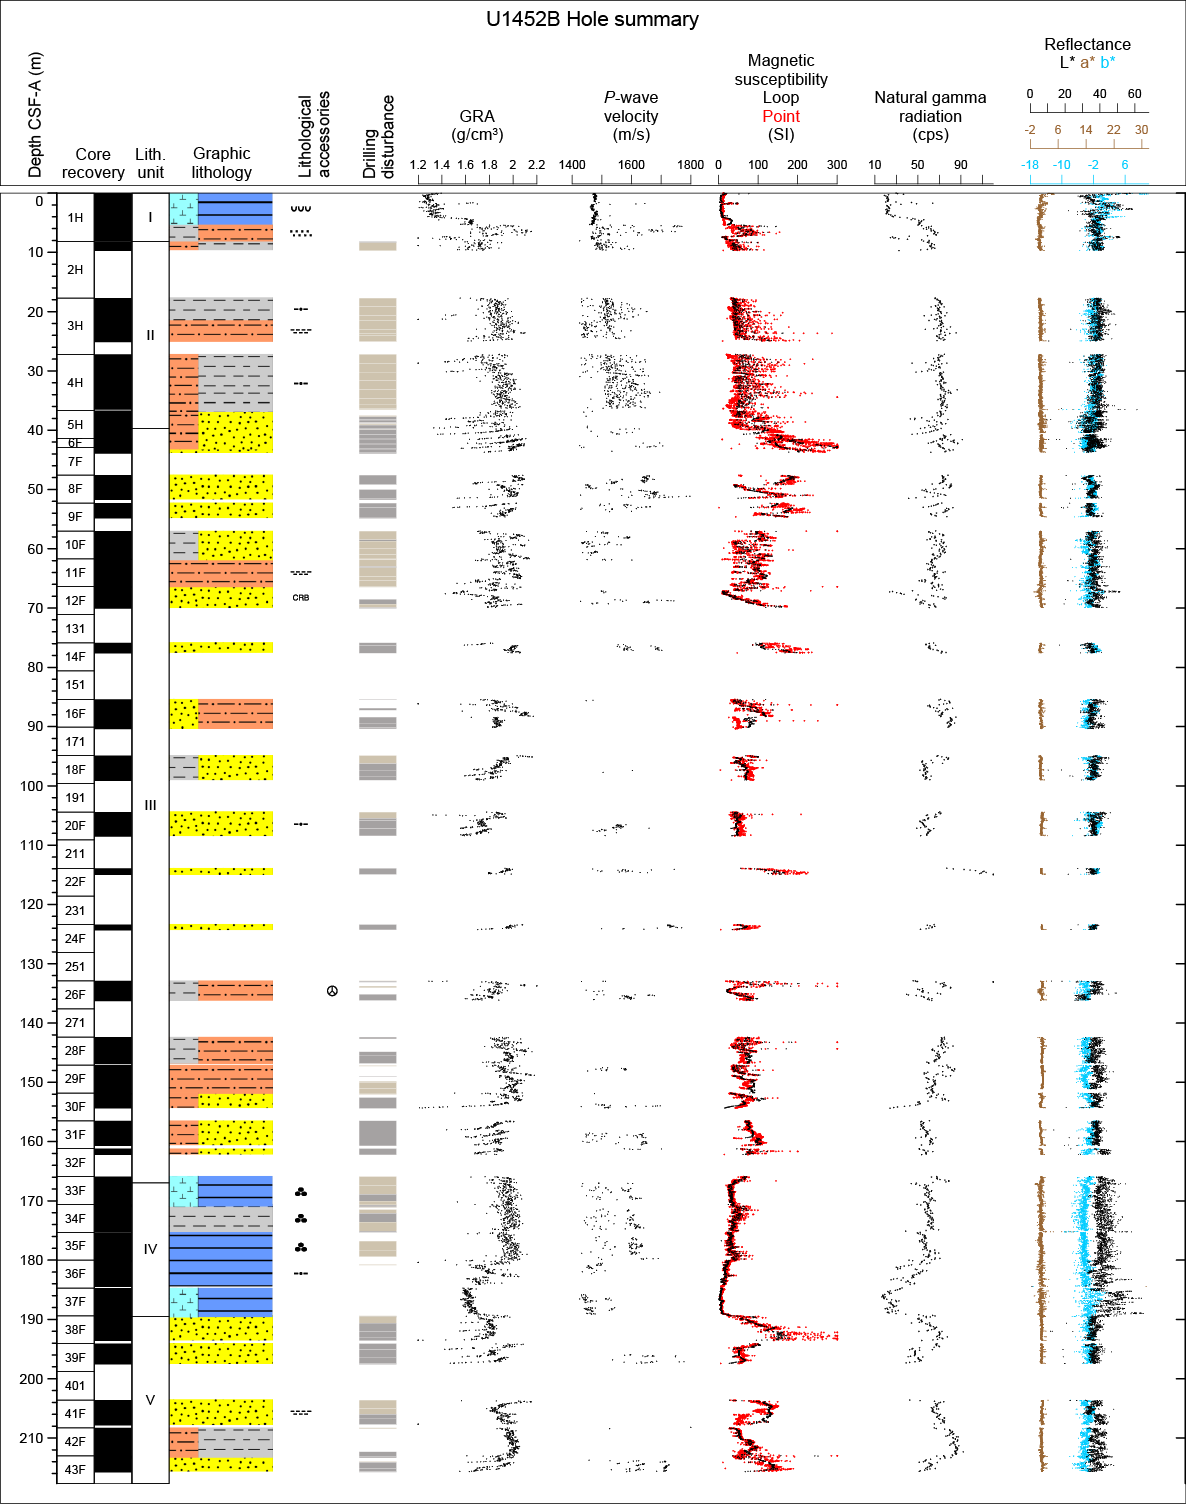
Figure F3. Lithostratigraphic summary, Hole U1452B.
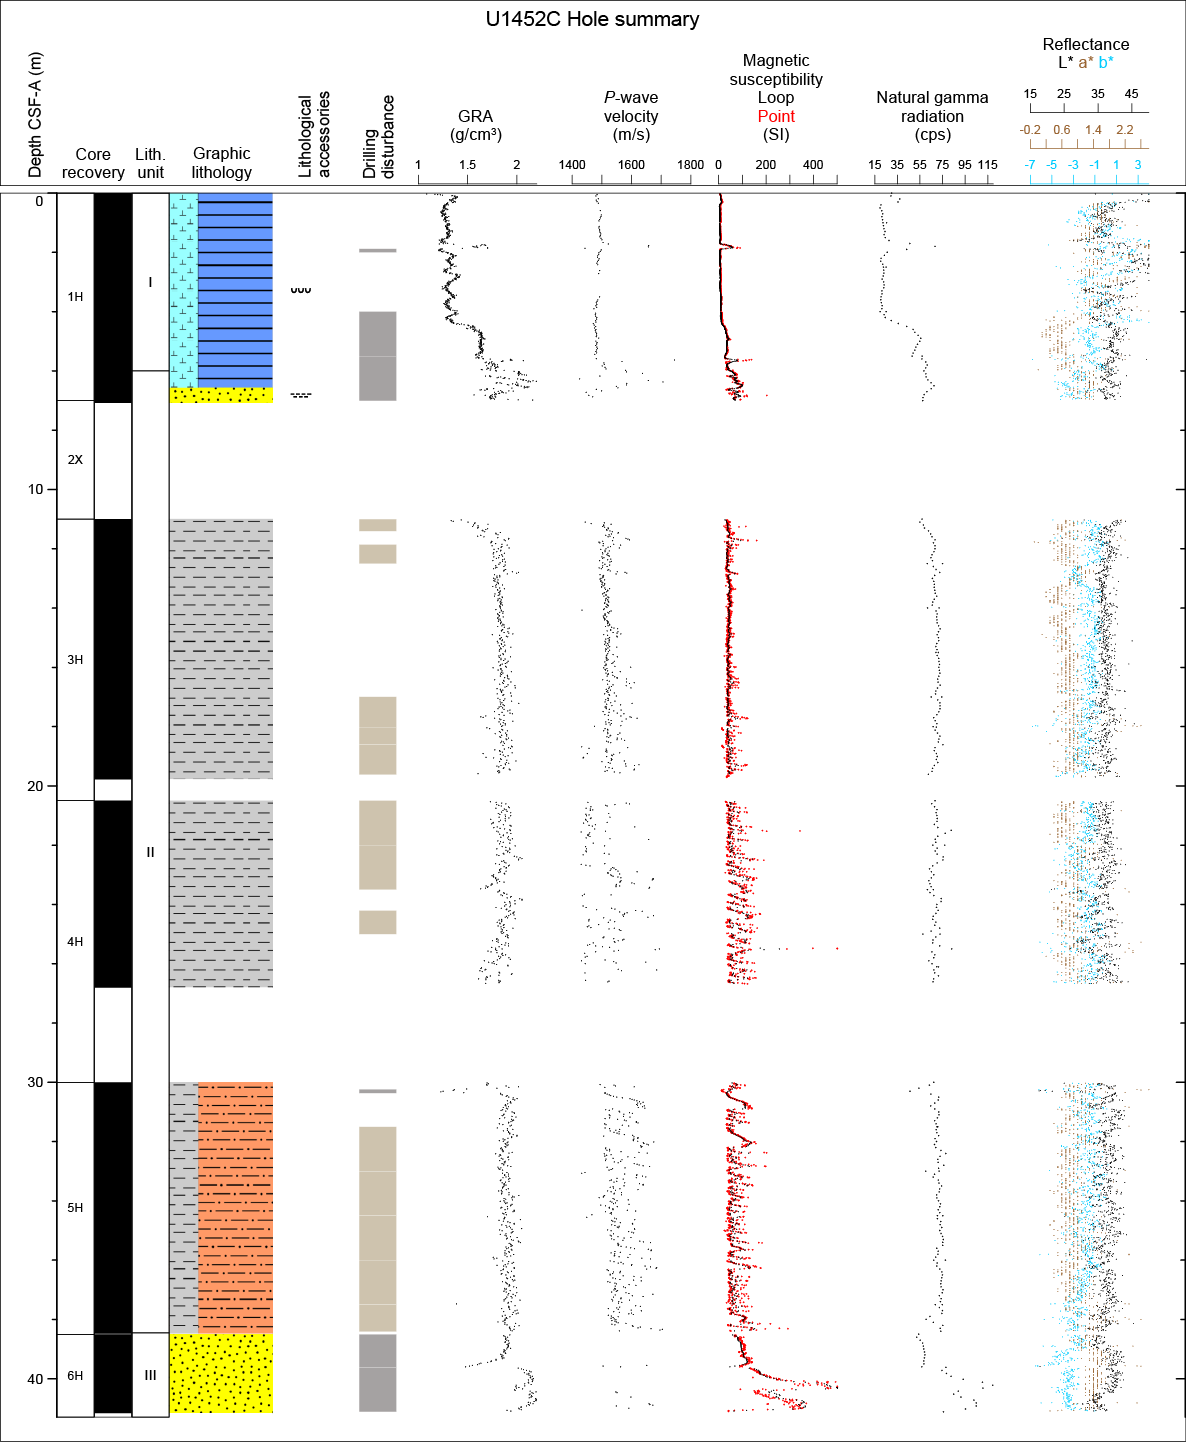
Figure F4. Lithostratigraphic summary, Hole U1452C.
Unit summaries
Summaries of individual units are presented here and in Table T2, with more detailed descriptions in the following sections.
Table T2. Intervals, depths, major and minor lithologies, and ages of units, Site U1452. Download table in .csv format.
Unit I is dominated by bioturbated and mottled nannofossil-rich calcareous clay and contains a single medium–thick bed containing silt turbidite sequences. This unit also contains a volcanic ash layer composed of fine-grained glass particles that presumably corresponds to the Toba volcanic eruption at 75.0 ka ± 0.9 ky that produced widespread tephra deposits across the Bay of Bengal (e.g., Mark et al., 2014).
Unit II is composed of successions of mud turbidites interbedded with clay and silt layers of varying thicknesses that frequently display laminations, cross-bedding, and sharp basal layers. The stratigraphic depth of this unit corresponds to a levee identified in seismic Profile GeoB97-020/027 collected on the Bengal Fan during the R/V Sonne SO125 cruise (Schwenk and Spiess, 2009).
Unit III is dominated by fine- and coarse-grained sand; some of the sand is interbedded with thin clay beds and bioturbated nannofossil-rich clay.
Unit IV lithologies range from silt and clay to calcareous clay with nannofossils and foraminifers. Also present is a 6 cm thick white volcanic ash layer. Underneath, a calcareous clay layer containing microtektites was identified.
Unit V is divided into three parts. The upper, most dominant part consists of dark gray fine sand and clayey sand. These sands overlie a 1.8 m interval of calcareous clays with mottling. The lower part consists of silty clays and homogeneous fine sands.
Lithostratigraphic summary
Lithologic differences between siliciclastic units and variations in grain size and bed thickness reflect cycles of proximal turbidity current channel activity, including activation, flow-stripping, avulsion, and abandonment. Sand units at the base of Hole U1452B may reflect interlevee sheet flow deposition (e.g., Curray et al., 2003) followed by cessation of proximal channel activity as represented by increased deposition of nannofossil-rich calcareous clay. The overlying thick interval of sand and silty sands, some with fining-upward textures, overlain by a 31.5 m interval of fine-grained turbidites corresponds to a levee feature identified in seismic Profile GeoB97-020/027 collected on the Bengal Fan during the R/V Sonne SO125 cruise (Schwenk and Spiess, 2009). These turbidite deposits are covered with a relatively thin (8.0 m) unit of dominantly calcareous clay representing a time of regional channel inactivity and reduced siliciclastic input. The uppermost calcareous clay–dominant unit contains a 23 cm thick bed of volcanic ash, presumably from the Toba volcanic eruption at 75.0 ka ± 0.9 ky that produced widespread tephra deposits across the Bay of Bengal (e.g., Mark et al., 2014).
Overall, siliciclastic units (silt, clay, and sand) at Site U1452 are compositionally classified as mica rich (muscovite and biotite) and quartz rich. Sands occur mostly in fine to medium grain sizes, with the rare occurrence of coarse-sized particles. Feldspar and heavy minerals (e.g., tourmaline, apatite, zircon, amphibole, garnet, sphene, rutile, chrome spinel, zoisite, glauconite, and opaque minerals) are common in silt- and sand-rich layers, and metamorphic minerals (sillimanite and chloritoid) and lithic fragments (e.g., quartzite, gneiss, cataclastic granite, and garnet-bearing schist) occasionally appear in sand.
The nomenclature for lithologic descriptions of sediments containing carbonate consists of a principal name and a modifier based on the composition estimated from visual description of the cores and from smear slide observations. The principal name of sediment that appears to contain >75% carbonate is calcareous ooze. The principal name of sediment that appears to contain <10% carbonate is clay. If sediment contains a mixture of clay-sized siliciclastic particles and calcareous components (i.e., carbonate contents between 10% and 75%), the principal name is calcareous clay (see Figure F4 in the Expedition 354 methods chapter [France-Lanord et al., 2016a]). This nomenclature was adopted to describe the continuum of sediments recovered from almost pure clay to almost pure calcareous ooze. In most cases, lithologic names assigned using this protocol match well with measured carbonate content and accurately reflect the continuum of sediments recovered at this site (Figure F5).
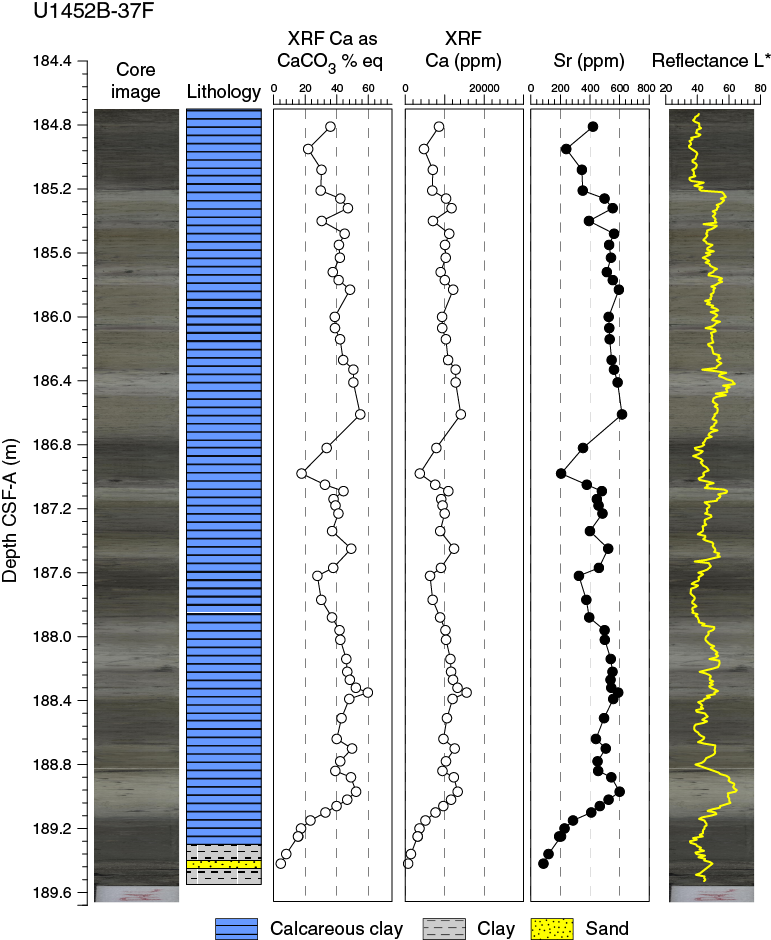
Figure F5. Core image, lithology, CaCO3 content from handheld XRF scanning, calcium and strontium values, and reflectance, Core 354-U1452B-37R.
Drilling disturbances at this site vary in intensity from slight to severe and include flow-in, fractures, up-arching, “soupy” texture, and drilling biscuits. Flow-in is the most common drilling disturbance in fine-grained intervals, whereas sand may have a homogeneous (or soupy) texture. Core sections containing soupy sands were vertically settled on the catwalk and then normally curated. As a result, they may have grading structures not described here (Table T3). For a more detailed description and graphic examples of drilling disturbance types, see Figure F6 in the Expedition 354 methods chapter (France-Lanord et al., 2016a).
Table T3. Core sections containing sand that were vertically settled on the core receiving platform, Site U1452. Download table in .csv format.
Unit I
- Intervals: Hole U1452A = no visual core description, core was cut into sections but not split during the expedition; 354-U1452B-1H-1, 0 cm, to 1H-6, 60 cm; 354-U1452C-1H-1, 0 cm, to 1H-5, 50 cm
- Depths: Hole U1452B = 0–8.10 m CSF-A; Hole U1452C = 0–6.00 m CSF-A
- Age: Late Pleistocene–recent
- Lithology: nannofossil-rich calcareous clay (major); clay, silt, volcanic ash (minor)
Description
Unit I is dominated by dark gray and greenish white nannofossil-rich calcareous clay with abundant burrows and mottling (Figure F6A). Light brown coloration of the uppermost 24 cm indicates oxidation close to the seafloor. A light brown volcanic ash layer occurs at 354-U1452B-1H-2, 14–37 cm (Figure F6B). The lower 10 cm of this layer is possibly displaced by coring. Another feature that might indicate coring disturbance is a blob-shaped ash bed at 1H-2, 79–84 cm. Between 1H-4, 88 cm, and 1H-5, 130 cm, a series of silt beds fining upward into clay was observed (succession of silt-dominated turbidites). Hole U1452C shows a comparable succession of lithologies; however, a significant difference is the blob-shaped ash bed at a deeper position (1H-4, 88–96 cm).
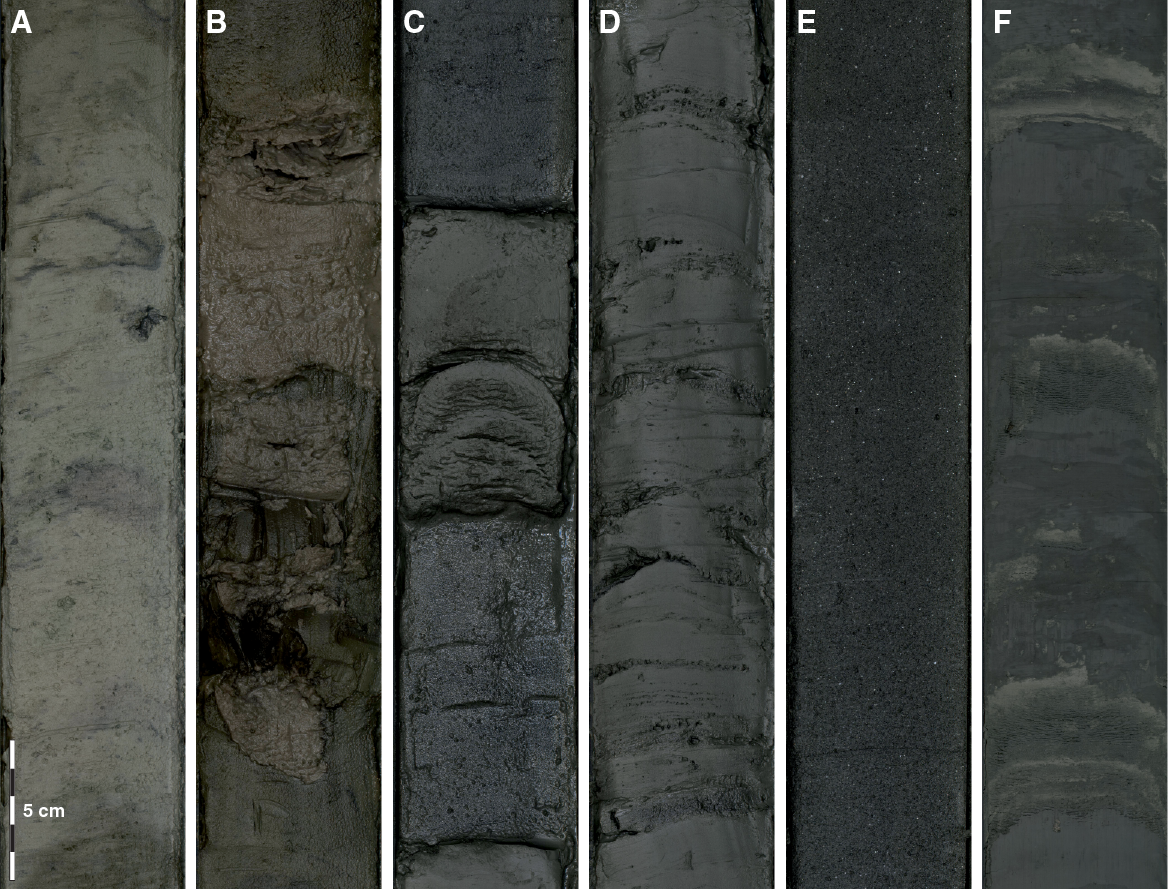
Figure F6. Representative examples of major lithologies recovered in Hole U1451B. A. Nannofossil-rich calcareous clay. B. Volcanic ash. C. Silt-dominated turbidites. D. Succession of clay-dominated turbidites. E. Homogeneous fine sand. F. Greenish gray nannofossil-rich clay with thin interbeds of light gray silt.
Composition from smear slides
See Figure F8 for representative smear slide images.
Nannofossil-rich calcareous clay with foraminifers
Calcareous nannofossils make up a significant proportion of total grains (up to 95%–99%). Minor proportions (up to 5%) of foraminifer fragments were observed. Minor amounts (2%–5%) of radiolarians, diatoms, and clay minerals (354-U1452B-1H-1, 126 cm; 2.76 m CSF) were also found.
Volcanic ash
Smear slides from the ash layers mainly consist of volcanic glass shards 0.01–0.60 mm in diameter and very minor amounts of quartz, feldspar, biotite, and hornblende. Volcanic glass appears as clear plates, flakes, and strands with a relatively low refractive index (1H-2, 22 cm; 1.72 m CSF). The typical range for the volcanic glass proportion is up to 90% of total grains.
Sand with silt
Sand with silt consists primarily of quartz, feldspar, lithic fragments, mica, and heavy minerals (1H-4, 120 cm; 5.7 m CSF). Most grains are angular to subangular except mica minerals. The heavy minerals consist of amphibole, tourmaline, zoisite, pyroxene, clinozoisite, garnet, epidote, zircon, sphene, allanite, apatite, rutile, chloritoid, sillimanite, staurolite, and opaque minerals. Some samples contain organic matter such as plant debris. The maximum grain size is 0.65 mm in diameter (1H-4, 120 cm; 5.7 m CSF-A)
Unit II
- Intervals: Hole U1452A not recovered; 354-U1452B-2H-1, 0 cm, to 5H-2, 150 cm; 354-U1452C-1H-5, 50 cm, to 5H-6, 91 cm
- Depths: Hole U1452B = 8.20–39.70 m CSF-A; Hole U1452C = 6.00–38.41 m CSF-A
- Age: Middle–Late Pleistocene
- Lithology: silt, clay
Description
Unit II mostly consists of a repeated sequence of dark gray silt fining upward into gray clay (i.e., mud turbidites). Both clay and silt beds frequently display parallel laminations. Cross-bedding and sharp basal contacts are restricted to silt beds. The thickness of silt and clay beds varies considerably from medium (10–30 cm) to very thin (1–3 cm) (Figure F6). Sedimentary logging of every silt and clay bed thicker than 1 cm revealed that the silt beds are mainly very thin to thin-bedded, and medium-bedded silt beds show at least two cycles of thickening- to thinning-upward trends in the composite section of Holes U1452B and U1452C (Figure F7). Such thickening- to thinning-upward trends of silt beds are also well represented by variations of P-wave velocity and magnetic susceptibility.
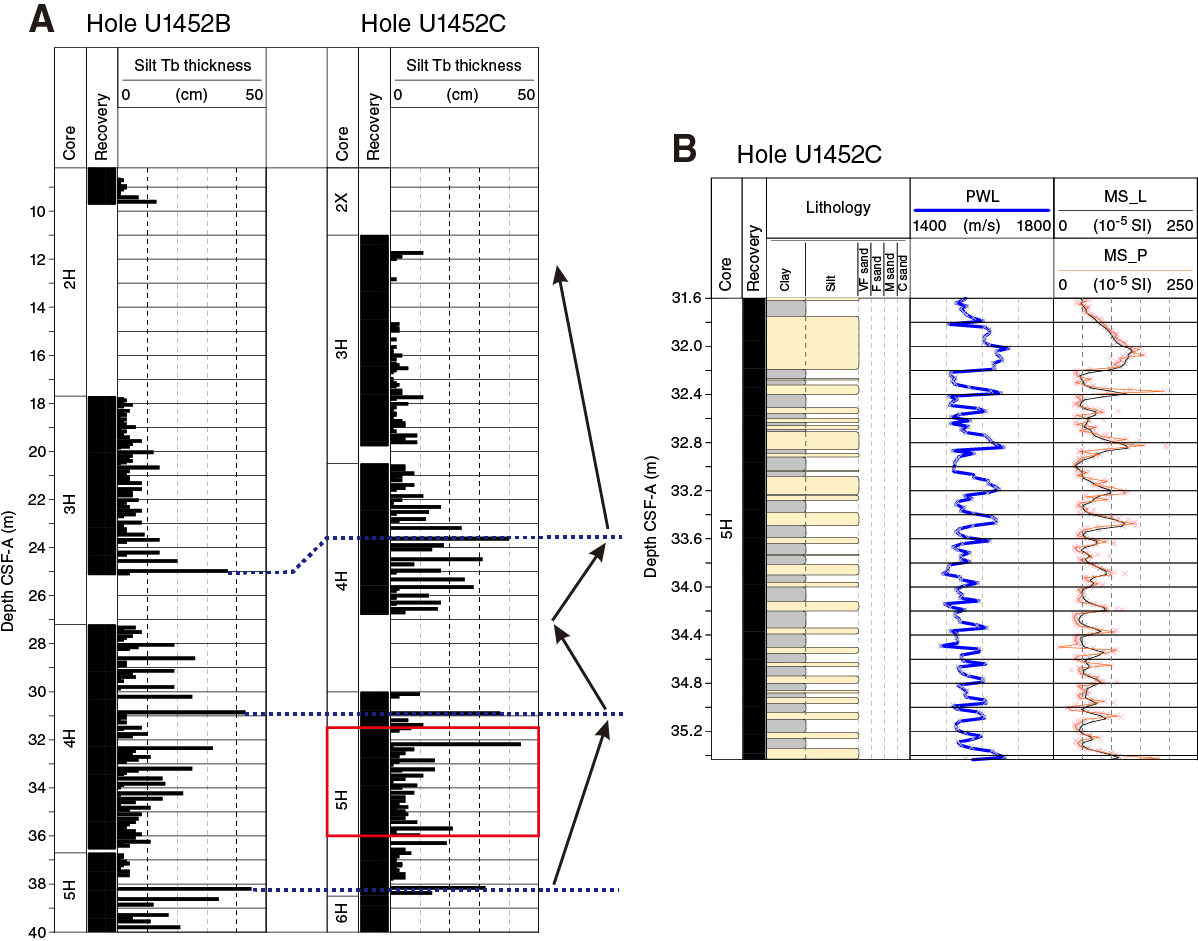
Figure F7. A. Silt turbidite bed thickness in Unit II, Holes U1452B and U1452C. Arrows indicate thickening to thinning upward trend. B. Variations of lithology, P-wave velocity, and magnetic susceptibility, Hole U1452C.
Composition from smear slides
See Figure F8 for representative smear slide images.
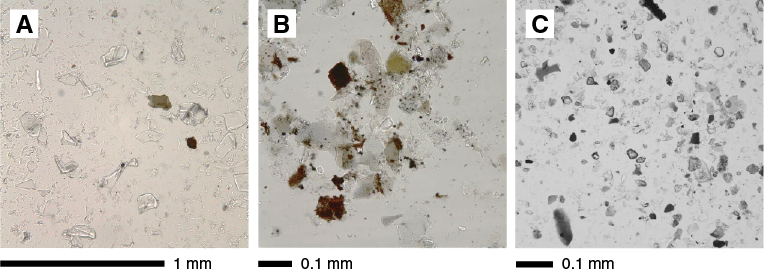
Figure F8. Representative examples of lithologies in smear slides, Hole U1452B. A. Volcanic ash. B. Mica-rich silty sand. C. Well-sorted silt.
Sandy silt
Sandy silt consists primarily of quartz, feldspar, lithic fragments, mica, heavy minerals, and carbonate minerals.
Silty sand
This lithology consists primarily of quartz, feldspar, lithic fragments, mica, and heavy minerals. Most grains are angular to subangular except altered mica. Heavy minerals amphibole, tourmaline, zoisite, pyroxene, clinozoisite, garnet, rutile, epidote, zircon, chloritoid, sillimanite, staurolite, and opaque minerals are found. Amphibole-bearing schist fragments and fibrolithic sillimanite fragments also occur.
The maximum grain size is 0.42 mm in diameter (354-U1452B-4H-1, 138 cm; 28.58 m CSF-A).
Unit III
- Intervals: Hole U1452A not recovered; 354-U1452B-5H-3, 0 cm, to 33F-1, 105 cm; 354-U1452C-6H-1, 0 cm, to 6H-2, 150 cm
- Depths: Hole U1452B = 39.70–166.95 m CSF-A; Hole U1452C = 38.50–41.12 m CSF-A
- Age: early to Middle–Late Pleistocene
- Lithology: sand (major); clay, silt, nannofossil-rich calcareous clay (minor)
Description
Sand and silty sand predominate, particularly in the upper part of the unit (Figure F6E). Sand departs from its usual fine-grained texture at 354-U1452B-12F-4, 0–61 cm, where it is coarse grained, and in Section 12F-1, where it is interbedded with thin beds of clay. In the lower part of the unit, from Core 30F downhole, silty sand is micaceous. Fining-upward texture (normal grading) infrequently occurs. The fine-grained clastic lithologies and their variants (clay, nannofossil-rich clay, silty clay, clayey silt, and silt) are more prevalent in the lower part of the unit. These lithologies are frequently interbedded with each other on a thin-bedded, very thin bedded, and laminated scale. Mottling is common in the clays, which are parallel laminated in Sections 18F-1 and 26F-3. Silts and sandy silts sometimes have fining-upward texture (normal grading) and are micaceous in some intervals. Nannofossil-rich clay (26F-2) contains foraminifers. Nannofossil-rich calcareous clay (12F-1 and 12F-2) is often burrowed. Finer grained lithologies suffer from up-arching and, more rarely, flow-in. Sands are homogeneous and soupy. Disturbance is therefore difficult to identify, but such textures may be interpreted as the result of drilling. In Hole U1452C, only the upper 2.62 m of Unit III was recovered, and the sediments consist of homogeneous dark gray sands with two thin interbeds of dark gray clay.
Composition from smear slides
See Figure F8 for representative smear slide images.
Nannofossil-rich clay
Nannofossil-rich clay mainly contains detrital grains and high amounts of calcareous nannofossils (up to 40%; 354-U1452B-12F-1, 77 cm; 67.17 m CSF-A). Occasionally, foraminifers and plant fragments are recorded (26F-2, 20 cm; 134.4 m CSF-A).
Clay
Clay mainly contains detrital grains and clay minerals with small amounts of calcareous nannofossils. Occasionally, euhedral carbonate minerals are found.
Silt
Silt consists primarily of quartz, feldspar, lithic fragments, mica, heavy minerals, and carbonate minerals.
Silty sand
Silty sand layers intercalated in the upper part of this unit consist of quartz, feldspar, mica, and lithic fragments. Heavy minerals mainly comprise amphibole, clinozoisite, zoisite, pyroxene, tourmaline, rutile, zircon, apatite, allanite, sillimanite, and opaque minerals. Occasionally, euhedral carbonate minerals are found.
Sample 33F-1, 104 cm (166.94 m CSF-A), contains mainly medium to fine sand grains such as subrounded quartz and feldspar and has a very low concentration of heavy minerals. This sample also contains a high concentration (20%) of fine carbonate grains smaller than 0.02 mm in diameter.
Micaceous sands, which include a large amount of micas up to 15% of total grains (20F-1, 81 cm; 105.21 m CSF-A), are occasionally found.
The maximum grain size is 0.92 mm in diameter (33F-1, 104 cm; 166.94 m CSF-A).
Unit IV
- Interval: Hole U1452A not recovered; 354-U1452B-33F-1, 105 cm, to 38F-1, 10 cm; Hole U1452C not recovered
- Depth: 166.95–189.50 m CSF-A
- Age: early Pleistocene
- Lithology: clay (major); nannofossil-rich calcareous clay, silt, volcanic ash (minor)
Description
Unit IV comprises 23.65 m of gray to dark gray clay, light to dark gray nannofossil-rich calcareous clay, and dark gray silt. The upper portion (33F-1, 105 cm, to 36F-1, 85 cm) consists of thin-bedded, greenish gray to gray, mottled, nannofossil-rich calcareous clay with foraminifers and thin-bedded dark gray clay with foraminifers interbedded with very thinly bedded gray silt. The lower portion (36-1, 85 cm, to 38F-1, 10 cm) consists of light gray bioturbated nannofossil-rich calcareous clay and light gray parallel-laminated silt. A white volcanic ash layer is observed at 36F-CC, 29–35 cm. Underneath this ash layer, a 5 cm thick foraminifer-rich calcareous clay layer containing microtektites was identified (36F-CC, 35.5-40.5 cm; 184.52–179.52 m CSF-A). Hundreds of microtektite grains were observed on the 125–250 and >250 µm size fractions. These fractions are dominated by planktonic foraminifers with a minor amount of glass shards. Most microtektites are from 50 to 250 µm in diameter and are entirely glassy with dark gray and dark brown color. Some grains are transparent and colorless. Twenty-three grains of these microtektites were hand-picked and imaged by scanning electron microscopy (Hitachi TM 3000). They display a variety of forms, such as spherical, flat, ellipsoid, dumbbell, and tear-droplet. Some grains contain bubble cavities. Surface structures vary from smooth and glassy to pitted and corroded. Flow lines and fractures are visible on the surface. Broken fragments show conchoidal fracture (Figure F9).
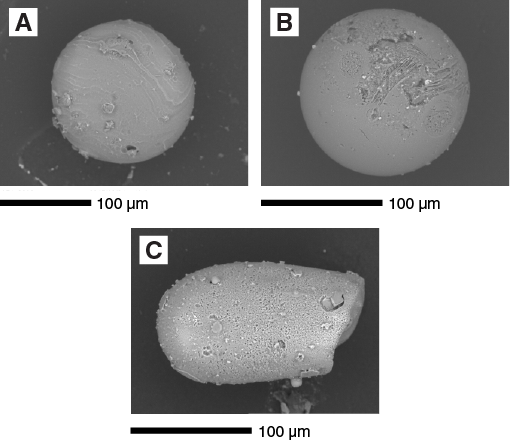
Figure F9. Scanning electron microscope images of microtektite grains from Section 354-U1452B-36F-CC, 35.5–40.5 cm.
Composition from smear slides
See Figure F8 for representative smear slide images.
Nannofossil-rich calcareous clay
Calcareous nannofossils make up the major proportion (70%–90%) of this lithology, and aggregates of clay minerals and silt grains comprise the minor proportion. The smear slide of 36F-1, 123 cm (181.23 m CSF-A), shows a minor amount of foraminifers (up to 10%) along with clay minerals.
Nannofossil-rich clay
Nannofossil-rich clay mainly contains detrital grains, clay minerals, and calcareous nannofossils. Occasionally, radiolarians and foraminifers are recorded. Some intervals contain a high percentage of clay minerals, up to 80% (35F-2, 10 cm; 176.50 m CSF-A).
Volcanic ash
The ash layer mainly consists of slightly corroded volcanic glass shards 0.01–0.3 mm in diameter, minor amounts of quartz, plagioclase, biotite, and opaque minerals, and very few hornblende and pyroxene grains. Volcanic glass shows mainly clear plates with subordinate flakes and strands with a relatively low refractive index. The typical range for the volcanic glass proportion is 90%–96% (36F-CC, 34 cm; 184.46 m CSF-A) of the total grains.
Sandy silt
Sandy silt consists primarily of quartz, feldspar, lithic fragments, mica, heavy minerals, and carbonate minerals. Heavy minerals such as amphibole, tourmaline, zoisite, and opaque minerals are found.
Silty sand
Silty sand consists primarily of quartz, feldspar, lithic fragments, mica, and heavy minerals. Most grains are angular except mica. The heavy mineral proportion is less than that of the overlying units and contains amphibole, tourmaline, pyroxene, zoisite, clinozoisite, zircon, and opaque minerals. Occasionally, amphibole-bearing schist fragments and fibrolithic sillimanite fragments occur.
The maximum grain size is 0.43 mm in diameter (34F-3, 145 cm; 175.05 m CSF).
Unit V
- Interval: Hole U1452A not recovered; 354-U1452B-38F-1, 10 cm, to 43F-CC, 5 cm; Hole U1452C not recovered
- Depth: 189.50–215.74 m CSF-A
- Age: early Pleistocene
- Lithology: fine sand (major); clayey sand, silty clay, silt, calcareous clay (minor)
Description
Unit V comprises 26.24 m of dark gray fine sand, dark gray clayey sand, gray silty clay, and gray calcareous clay. This unit is divided into three subunits. The upper part, Subunit Va (38F-1, 10 cm, to 41F-CC, 22 cm), is 18.40 m thick and consists of dark gray fine sand and dark gray clayey sand. The middle part, Subunit Vb (42F-1, 0 cm, to 43F-1, 55 cm), is 5.25 m thick and consists of gray nannofossil-rich clay with mottling (Figure F6F), gray parallel-laminated silty clay, and gray silt. The lower part, Subunit Vc (43F-1, 55 cm, to 43F-CC, 5 cm), is 2.19 m thick and consists of dark gray fine sand. The fine sands are soupy and lack internal structures, and the clayey sands show flow-in that might be related to drilling disturbance (see the Expedition 354 methods chapter [France-Lanord et al., 2016a]).
Composition from smear slides
See Figure F8 for representative smear slide images.
Sandy silt
Sandy silt consists primarily of quartz, feldspar, lithic fragments, mica, heavy minerals, and carbonate minerals. Heavy minerals amphibole, tourmaline, zircon, and opaque minerals are found.
Silty clay
Silty clay mainly contains detrital grains. Occasionally this lithology contains very fine sand–sized grains up to 0.11 mm in diameter (43F-1, 95 cm; 213.95 m CSF-A).
Sandy silt
Sandy silt consists primarily of detrital grains, such as quartz, feldspar, lithic fragments, micas, and heavy minerals. Most grains are angular except mica. The heavy mineral assemblage is relatively simple and consists of amphibole, zircon, zoisite, and opaque minerals. Occasionally, euhedral carbonate minerals and carbonate aggregate grains are found.
The maximum grain size is 0.13 mm in diameter (42F-4, 70 cm; 213.06 m CSF-A).
Maximum grain size
Maximum grain size was determined at approximately 7 m intervals at Site U1452 (Figure F10). In each core, the coarsest and/or thickest lithology (generally from the base of the coarsest turbidite) was chosen for smear slide analysis, and the largest five equant detrital grains (quartz and feldspar) were measured. Maximum grain size ranges from 0.11 to 0.92 mm (very fine to coarse sand) and corresponds to a clayey silt layer at the base of Unit III at 33F-1, 104 cm. However, background values throughout the sequence show that fine sand–sized material reached the fan setting at Site U1452 via turbidity currents since at least the early Pleistocene.
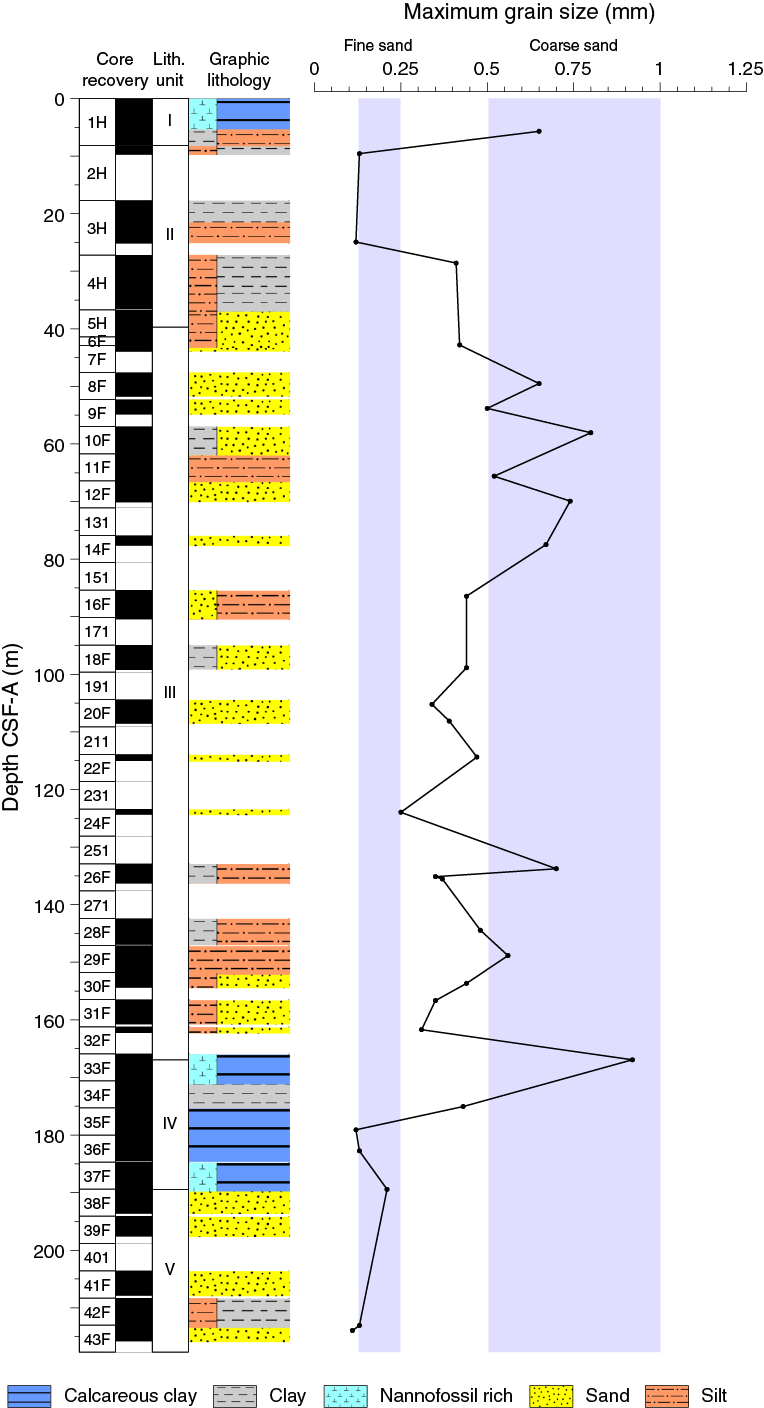
Figure F10. Maximum grain size, Hole U1452B.
Biostratigraphy
Calcareous nannofossils and planktonic foraminifers provide biostratigraphic constraints at Site U1452 (Tables T4, T5). Four biomarkers were identified at this site; they are listed in Table T6 and integrated into the figures in Stratigraphic synthesis.
Table T4. Calcareous nannofossils, Site U1452. Download table in .csv format.
Table T5. Planktonic foraminifer group and species abundance, Site U1452. Download table in .csv format.
Table T6. Biostratigraphic age datums and midpoint calculations, Site U1452. Download table in .csv format.
Calcareous nannofossils
The distribution of calcareous nannofossils at Site U1452 is shown in Table T4. Calcareous nannofossil assemblages were observed in 41 samples from Holes U1452A–U1452C. The sediments at Site U1452 extend in age to the early Pleistocene. Hole U1452B is differentiated into three calcareous nannofossil zones based on the FO of Emiliania huxleyi in Sample 2H-CC and the last occurrence (LO) of Pseudoemiliania lacunosa in Sample 8F-CC. The presence of Helicosphaera sellii in Sample 36H-CC suggests that the base of Hole U1452B is early Pleistocene. Hole U1452C is divided into two calcareous nannofossil zones (NN21 and NN20) using the FO of E. huxleyi in Sample 4H-CC.
Planktonic foraminifers
At Site U1452, planktonic foraminiferal assemblages are characteristic of tropical–subtropical environments. The planktonic foraminifer biostratigraphy for Site U1452 is generated primarily by analysis of core catcher samples from Hole U1452B. Supplementary samples were taken from core sections when time permitted or when no foraminifers were found in the core catcher. Five samples were examined from Hole U1452C to constrain species ranges in intervals that were not recovered in Hole U1452B. The sedimentary succession at this site ranges from Subzone PT1b (Middle–Late Pleistocene) to Zone PT1a (early Pleistocene) and agrees with the nannofossil biostratigraphy. A barren interval is present in Hole U1452B between Samples 5F-CC (43.27 m CSF-A) and 11F-2F, 71–76 cm (63.91 m CSF-A), and is associated with the recovery of turbidite sands in the core catcher.
The group and species abundances of planktonic foraminifers are shown in Table T5. Foraminiferal preservation ranges from poor to good in samples where foraminifers occur. Fragmentation of planktonic foraminifers ranges from light to severe and is particularly apparent in carbonate oozes. Assemblages are dominated by Neogloboquadrina dutertrei, Globigerinoides ruber, Globorotalia tumida, and Pulleniatina obliquiloculata, with rare Globigerina bulloides and Orbulina universa. No major faunal turnovers occur during this narrow interval, and benthic foraminifers remain rare throughout. The LO of Globorotalia tosaensis is in Samples 354-U1452B-2H-CC and 354-U1452C-4H-CC. Although this species usually marks the Zone PT1b/PT1a boundary, it occurs at this site before the LO of a younger nannofossil biomarker (Table T6). This occurrence could indicate that G. tosaensis is reworked at this site. Or, because this pattern is observed at other Expedition 354 sites, it is possible that the extinction of this species occurs at a younger age in the Indian Ocean.
Paleomagnetism
Paleomagnetic analyses at Site U1452 focused mainly on identifying magnetic polarity reversals and linking them to the geomagnetic polarity timescale (Gradstein et al., 2012), as well as on identifying intervals suitable for shore-based paleomagnetic work. Hole U1452A recovered a single mudline core intended mainly for detailed paleomagnetic and rock magnetic study of the effects of the Toba ash and for studies aimed at improving age control for the time interval since the Toba ash deposition at ~75 ka. Core 1H was therefore neither split on board nor measured, but it will be the focus of postexpedition study. All cores were collected with nonmagnetic APC or HLAPC barrels. Cores 354-U1452A-1H, 354-U1452B-1H through 5H, and 354-U1452C-1H, 3H, and 4H–6H were oriented using the Icefield MI-5 tool.
Archive section halves from 22 cores from Hole U1452B and 3 cores from Hole U1452C were measured using the shipboard superconducting rock magnetometer (SRM). The remanent magnetization of all section halves was measured after 0, 15, and 20 mT alternating field (AF) demagnetization at 2.5 cm intervals. Archive section halves with a substantial amount of hemipelagic or calcareous clay sediments were subjected to an additional 10 mT AF step and measurement. Cores 354-U1452B-1H and 354-U1452C-1H through 5H were not demagnetized to preserve them for possible shore-based paleomagnetic work. Remanent magnetization measurements made after the highest peak field AF treatment are used here for polarity determination. Sections where the sediment was sandy, watery, or heavily disturbed by the coring process were not measured. As at other sites, tops of cores and edges of sections likely to be affected by edge effects were not interpreted (see Paleomagnetism in the Expedition 354 methods chapter [France-Lanord et al., 2016a]).
Five discrete samples were collected to supplement archive section half data. Sample locations were chosen in fine-grained intervals where drilling deformation was minimal or not visible. No samples were taken from calcareous clay intervals to preserve the possibility of further U-channel sampling. Discrete samples were measured on the JR-6A spinner magnetometer after 0, 10, 15, 20, 25, 30, 35, 40, 50, 60, and 80 mT AF treatments.
Results
Paleomagnetic results from both section-half and discrete measurements are presented in Figures F11 and F12 and Tables T7 and T8. Similar to Sites U1449–U1451, both positive and negative inclinations are present in Hole U1452A. A vertical overprint, likely imparted by the drilling process, is in most cases demagnetized by AF demagnetization in peak fields of 10 mT. Many NRM inclinations from discrete samples and section halves are close to zero after 20 mT demagnetization (mode of section-half measurements = 2.5°), although the median inclination is still close to that expected from a geocentric axial dipole (GAD; median observed = 17°, expected = 15.7°) given the site’s present-day location. Several discrete samples acquired either a gyroremanent magnetization (GRM) or an anhysteretic remanent magnetization (ARM) in peak AF treatments above 60 mT.

Figure F11. NRM decay (left) and AF demagnetization vector (right) diagrams of discrete samples, Site U1452.
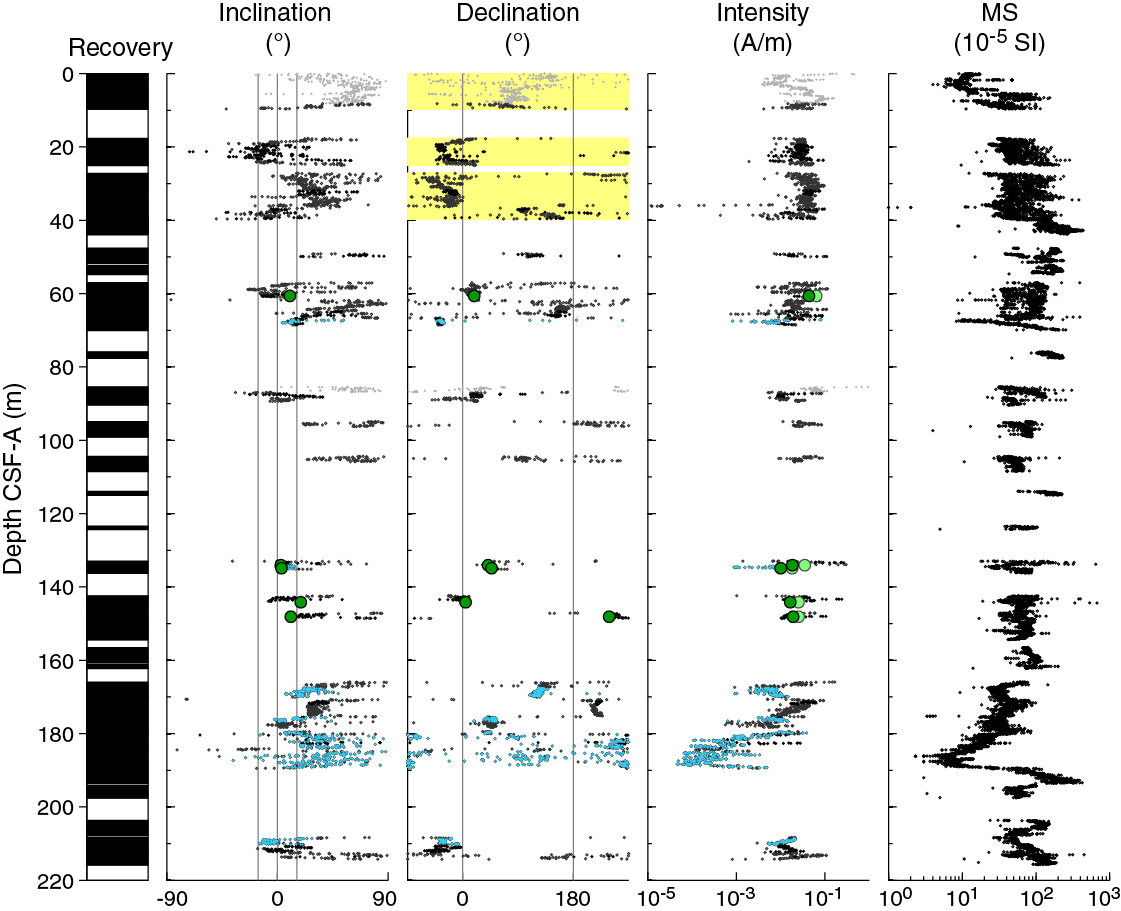
Figure F12. NRM of archive section halves and discrete samples before and after 20 mT AF demagnetization, Hole U1452B.
Table T7. ChRM of discrete samples, Site U1452. Download table in .csv format.
Table T8. Orientation data, Site U1452. Download table in .csv format.
Calcareous clay, which occurs in relatively high abundances in Cores 354-U1452B-1H, 12F, 30F, and 33F–37F, is associated with low NRM intensities in section halves (lithologic terms here refer to lithology descriptions; see Lithostratigraphy), following the pattern observed at other sites. Median NRM intensities in calcareous clay are 1.8 × 10⁻² A/m, compared to 7.2 × 10⁻² A/m for lithologies other than calcareous ooze, calcareous clay, or sand (principally clay and silt). NRM intensities of the limited number of sand intervals that we measured are slightly higher (median 7.9 × 10⁻² A/m). Calcareous clay from Hole U1452B loses a larger fraction of its NRM after 20 mT AF demagnetization (95%) than does sand (74%) or other lithologies (68%). We interpret these differences to reflect a variable concentration of a low-coercivity magnetic phase that acquires a strong drilling overprint. The low-coercivity component is present at higher concentrations in calcareous clay than in sand or other lithologies. Based on AF demagnetization of discrete samples, coercivities are consistent with magnetite and/or titanomagnetite as the principal NRM carrier. The specific magnetic mineralogy will be assessed during postexpedition work.
Magnetostratigraphy
Sediments from oriented Cores 354-U1452B-3H and 4H that pass our quality criteria (see Paleomagnetism in the Expedition 354 methods chapter [France-Lanord et al., 2016a]) have remanent magnetization directions with positive inclinations and declinations close to present-day magnetic north (Fisher [1953] mean declination of Core 3H = 320° after 20 mT demagnetization; Core 4H = 342°). Oriented Core 5H has a mean declination of 125° (after 20 mT demagnetization), which we believe is due to an error in the Icefield orientation measurement for this individual core. Corresponding Core 354-U1452C-5H was also oriented but was not demagnetized and has a mean NRM declination of 345°.
Core 354-U1452B-37F contains mixed polarity and can be correlated with the calcareous clay interval observed at roughly the same depth in Core 354-U1450A-36F and at somewhat shallower depths in Cores 354-U1449A-18F and 354-U1451A-13F. Three polarity reversals are identified in Core 354-U1452B-37F on the basis of changes in declination (Figure F13; Table T9). We identify the bottom two as the upper and lower boundaries of the Cobb Mountain Subchron (C1r.2n; 1.173–1.185 Ma; Gradstein et al., 2012). There is considerable high-frequency variability in the declination in the top two sections of Core 37F, but a reversed to normal transition can be identified using the Cobb Mountain Subchron as a reference for normal polarity. We identify this transition as the lower boundary of the Jaramillo Subchron (C1r.1n; 1.072 Ma). Although we regard the magnetic record of core catchers with caution, a large change in declination is observed between Sections 36F-CC and 36F-3. This change in declination may represent a change in magnetic polarity. As observed at Sites U1449 and U1451, the polarity change is associated with an ash layer (Section 36F-CC). We interpret this ash as Ash D of Dehn et al. (1991) and the polarity reversal as the Brunhes/Matuyama boundary (C1n-C1r; 0.781 Ma). Several microtektites, likely associated with the Brunhes-Matuyama boundary–age Australasian Microtektite Event (Smit et al., 1991) are found in Section 16F-CC (see Lithostratigraphy), further confirming our age interpretation of this polarity event.
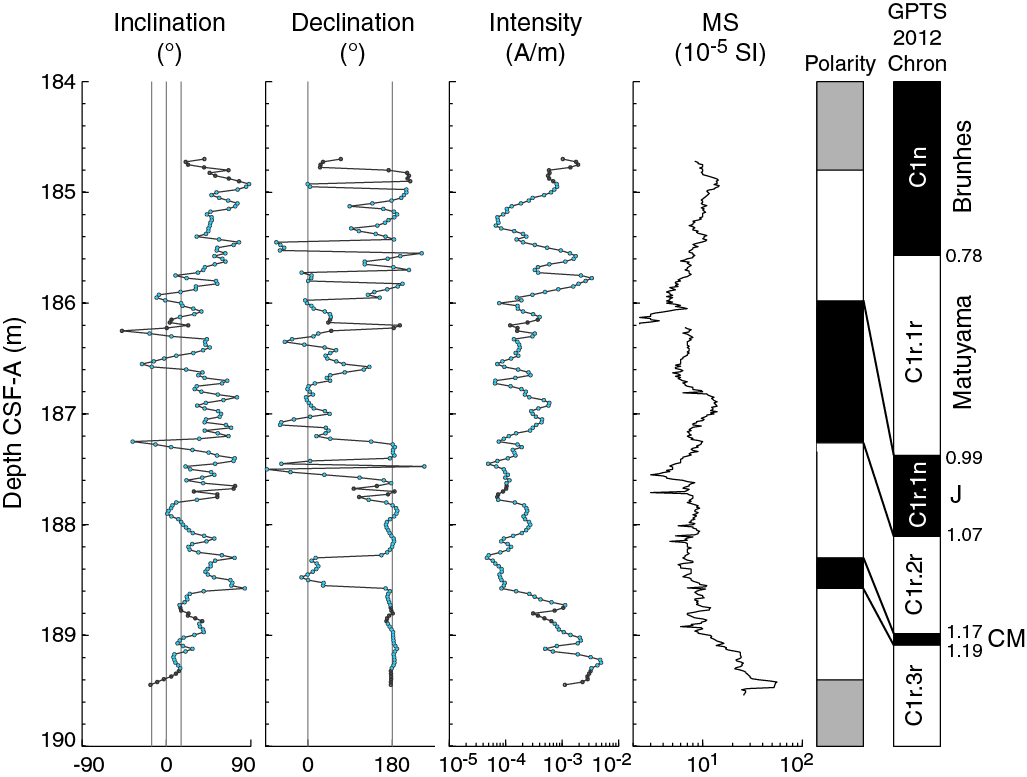
Figure F13. Polarity interpretation, Core 354-U1452B-37F.
Table T9. Magnetostratigraphy, Hole U1452A. Download table in .csv format.
Geochemistry and microbiology
Hydrocarbon gas sampling and analysis
Headspace gas samples were taken at a frequency of one sample per core in Holes U1452A and U1452B as part of the routine safety monitoring program (Table T10). Methane concentrations were low (2 ppmv) in Hole U1452A (one sample at 4 m CSF-A). In Hole 1452B, methane concentrations were low (1 ppmv) between 4 and 32 m CSF-A; concentrations increased below 32 m CSF-A and ranged from 75 to 33,761 ppmv (mean 6,695 ppmv; N = 30) between 32 m CSF-A and the bottom of Hole U1452B. The highest methane concentration (33,761 ppmv) was observed at 191 m CSF-A in Hole U1452B. Quantifiable levels (1 ppmv) of ethane were found at 191, 211, and 213 m CSF-A in Hole U1452B. The methane/ethane ratio varied within the 22,000 to 47,000 range in these samples. Ethene, propane, and propene were below the quantification limit in all samples.
Table T10. Methane concentrations, Holes U1452A and U1452B. Download table in .csv format.
Interstitial water sampling and chemistry
Nine samples from Hole U1452B were analyzed for interstitial water chemistry (Table T11). Two samples were obtained by Rhizon sampling when sediments were soft enough, one sample corresponds to free-flowing water flowing out the core liner when the liner was cut from a liquidized level of sand sandwiched between two more cohesive lithologies, and the remaining samples were obtained by squeezing whole-round cores generally 5 cm long. Based on the rate of change of cation and anion content with depth and changes in their covariation, two hydrologic units can be distinguished at Site U1452 (Figure F14). The limit between the two units is rather undefined because no interstitial water samples were taken between 5 and 50 m CSF-A to maximize preservation of the sedimentary record. In the upper portion of the sediment column (0 to 20–55 m CSF-A), biogenic processes release dissolved phosphate and consume sulfate, with sulfate content reaching 0.5 mM at the top of the next unit (60 m CSF-A). Such a low sulfate concentration is the lowest measured at this site. Together with sulfate reduction, a corresponding increase in alkalinity and decreases in Ca and Mg result from carbonate formation from biogenic reactions that generate alkalinity. Salinity is 1.3 higher than the bottom seawater of the Bay of Bengal at 8°N (Levitus94 at http://iridl.ldeo.columbia.edu) and barely changes in the upper unit. The lower unit is characterized by negligible sulfate content except at 97 m CSF-A, where an attempt was made to retrieve interstitial water from sandy layers. There, the sulfate content of 9.7 mM is likely the result of the admixture of formation water and drilling fluid because all the chemical parameters and particularly those very sensitive to mixing with drilling fluid (salinity, sulfate, and magnesium contents) are consistent with a mixture of about one-third drilling fluid and two-thirds interstitial water (Figure F14). When a correction for contamination is applied to that sample, the composition of the interstitial water from sandy layers is not different from the trend with depth defined by adjacent and cohesive lithologies (Figure F14). This agreement suggests vertical advection/diffusion and the lack of evidence of lateral hydrologic activity in the sand layers. Similar to Sites U1449–U1451, the lower unit is also characterized by a decline in magnesium and potassium concentrations, an overall but variable decline in phosphate, and high alkalinity content. Calcium content is lower than that of seawater and the upper unit, whereas dissolved silica is comparatively low at this site (<500 μM). It is also worth noting the near-constant salinity (Table T11).
Table T11. Interstitial water geochemical data, Site U1452. Download table in .csv format.
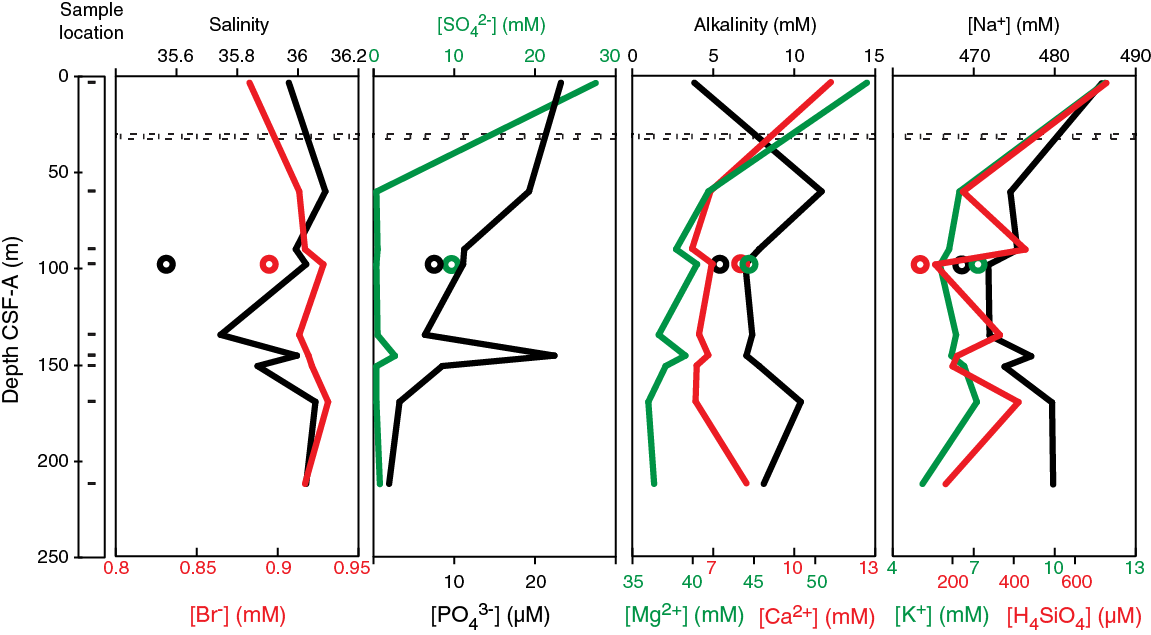
Figure F14. Variations of salinity, bromide, sulfate, phosphate, alkalinity, magnesium, calcium, sodium, potassium, and silicon concentrations in interstitial waters, Site U1452.
Bulk-sediment geochemistry
Inorganic carbon
Total inorganic carbon (TIC) concentrations were determined on 21 sediment samples from Holes U1452B and U1452C (Table T12; Figure F15). TIC values expressed as weight percent calcium carbonate (CaCO3), assuming inorganic carbon is exclusively present as CaCO3, range between 0.6 and 14.0 wt%. Turbiditic sediments are characterized by low carbonate content (0.6–7.4 wt%; average = 3.7 wt%). Within turbidites, no systematic covariation between grain size—as inferred from Al/Si ratio (Galy et al., 2008a)—and carbonate content was observed. Comparable features and carbonate content have been observed in modern Ganga-Brahmaputra river sediments (Lupker et al., 2012) and in sediments from the uppermost 150 m at Sites U1449–U1451 and DSDP Site 218 (von der Borch, Sclater, et al., 1974). Hemipelagic deposits (defined as calcareous clay in Lithostratigraphy) are marginally richer in carbonate (average = 6.8 wt%; N = 5) than turbiditic sediments. These lithologies often have CaCO3 content indistinguishable from that of turbiditic sediments.
Table T12. Total inorganic carbon (TIC), calcium carbonate (CaCO3), total carbon, and organic carbon contents, Holes U1452A and U1452B. Download table in .csv format.
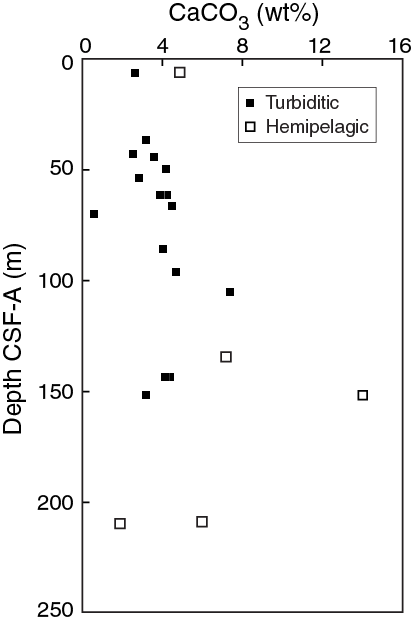
Figure F15. TIC content expressed as CaCO3, Site U1452.
Organic carbon
Total carbon (TC) concentrations were determined on 21 sediment samples from Holes U1452B and U1452C (Table T12). TC values range from 0.1 to 2.6 wt% (average = 1.0 wt%). Total organic carbon (TOC) content, calculated from the difference between TC and TIC, is low (average = 0.5 wt%) and ranges between <0.05 and 1.0 wt% (Figure F16). TOC of hemipelagic lithologies (described as calcareous clay in Lithostratigraphy) is slightly elevated compared to that of turbiditic sediments. In turbiditic sediments, TOC is variable, with values ranging from <0.05 wt% (quantification level) to 0.8 wt%, and covaries with the Al/Si ratio (N = 3; not shown), reflecting the preferential association of organic matter with clays that has previously been documented in both the modern Ganga-Brahmaputra river system and in active channel-levee sediments in the Bay of Bengal deposited over the past 18 ky (Galy et al., 2007, 2008a, 2008b).

Figure F16. TOC content, Site U1452.
ICP-AES results
Major and trace element concentrations were determined on 10 sediment samples from Holes U1452B (9) and U1452C (1) by inductively coupled plasma–atomic emission spectroscopy (ICP-AES) (Table T13). As at previous sites, bulk-sediment major and trace element trends correspond closely to lithologic type. The Fe/Si versus Al/Si and K/Si versus Al/Si trends for this small data set (Figure F17) closely track those observed at Sites U1449–U1451 and those for modern sediments in the Ganga-Brahmaputra river system (Galy and France-Lanord, 2001; Lupker et al., 2012). Samples that are offset from the main trends suggest the occurrence of (1) Fe-rich clays characteristic of smectite-kaolinite-rich samples and (2) a low K/Si clay-rich subpopulation representing a different terrigenous input (i.e., more highly weathered source).
Table T13. Major elements and selected trace element contents, Hole U1452. Download table in .csv format.
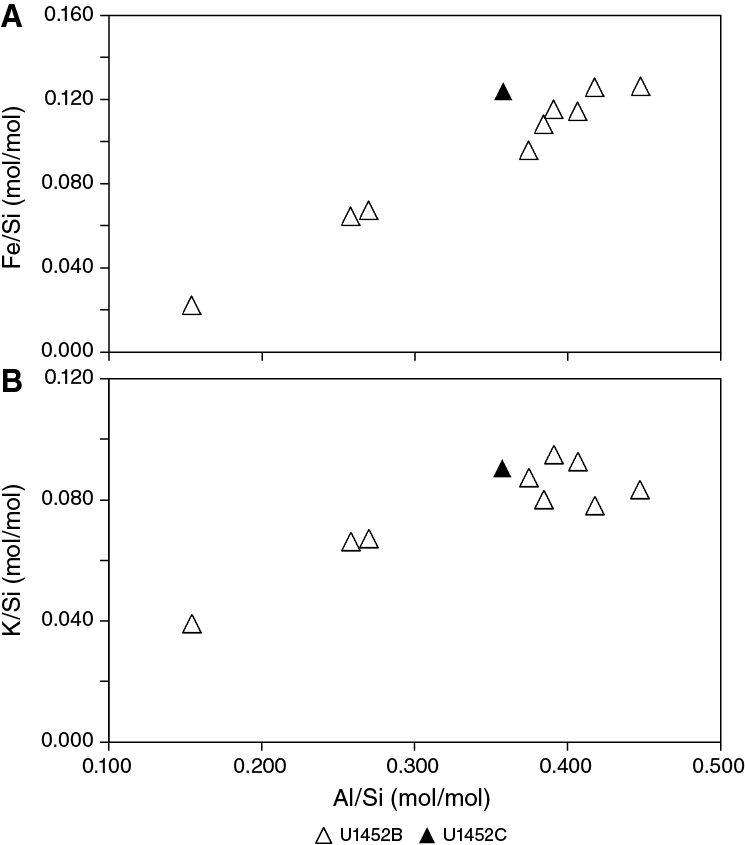
Figure F17. Fe/Si and K/Si vs. Al/Si, Site U1452.
XRF results
An entire half-length APC core (354-U1452B-37F; 184.8–189.4 m CSF-A) was scanned at high resolution using handheld XRF for a total of 57 spot analyses (Table T14; see the Expedition 354 methods and Site U1451 chapters [France-Lanord et al., 2016a, 2016b]). The semiquantitative (uncalibrated) Ca abundances measured by XRF range from 0.9 to 15.6 wt% (average = 9.4 wt%), corresponding to a wide range of calculated carbonate contents (5–60 wt%) consistent with the clay- and calcareous clay–dominated lithologies that are present (see Lithostratigraphy; see Geochemistry and microbiology in the Expedition 354 methods chapter [France-Lanord et al., 2016a]). Figure F18 shows the close correspondence between selected XRF parameters (calculated CaCO3, Ti, K, and Fe) and physical properties (gamma ray attenuation [GRA] bulk density, magnetic susceptibility, NGR, L*, and core image). In addition, this interval contains several paleomagnetic subchrons (see Paleomagnetism) within the reversed Matuyama Chron, allowing a Middle Pleistocene age to be assigned. These subchrons are indicated in Figure F18 and include the Jaramillo (0.988–1.072 Ma) and Cobb Mountain (1.173–1.185 Ma) Subchrons. Using these ages, an average linear depositional rate of approximately 1.325 cm/ky is calculated through this interval of the core. The peak in measured magnetic susceptibility around 186.9 m CSF-A, within the Jaramillo Subchron, corresponds to peaks in K, Ti, Fe, and NGR and low Ca abundance, indicating the dominance of terrigenous clay over carbonate within this interval. The base of this core also contains a silty interval distinctive in both XRF and physical properties resulting from enhanced detrital input (Figure F18). Between these two clear detrital inputs, the overall variability in the Ti/Ca ratio likely corresponds to changing relative contribution of detrital input in the hemipelagic sedimentation. These relative changes could also reflect changes in local biogenic productivity and accumulation rates of the pelagic component in this hemipelagic sequence. The fine tuning allowed by the paleomagnetic subchron ages suggest that the time elapsed between peak signatures for the detrital component is >115 and <155 ky. Therefore, primary control by an orbital forcing mechanism on local productivity seems unlikely. However, depositional cycles of 115–155 ky might correspond to cycles of active channel activity in the vicinity of Site U1452 during the period documented by Core 354-U1452B-37F. For comparison, another core section (34F-2) slightly younger in the sequence (also within the reversed Matuyama Chron) was scanned at high resolution (24 spot analyses; Table T14). The close correspondence between the Sr/Ca ratio and carbonate content for the sediment at 172.1–173.5 and 184.8–189.4 m CSF-A (Figure F19) suggests single binary mixing between marine biogenic carbonate and a silicate component (see Geochemistry and microbiology in the Site U1454 chapter [France-Lanord et al., 2016c]). This further supports incorporation in variable proportions (Section 34F-2 and Core 37F) of a pelagic carbonate component. The detailed location of the source of the silicate component is, however, difficult to assess because of its ubiquitous nature.
Table T14. Selected major and trace element contents by XRF in-situ analysis, Core 354-U1452B-37F and Section 354-U1452B-34F-2. Download table in .csv format.
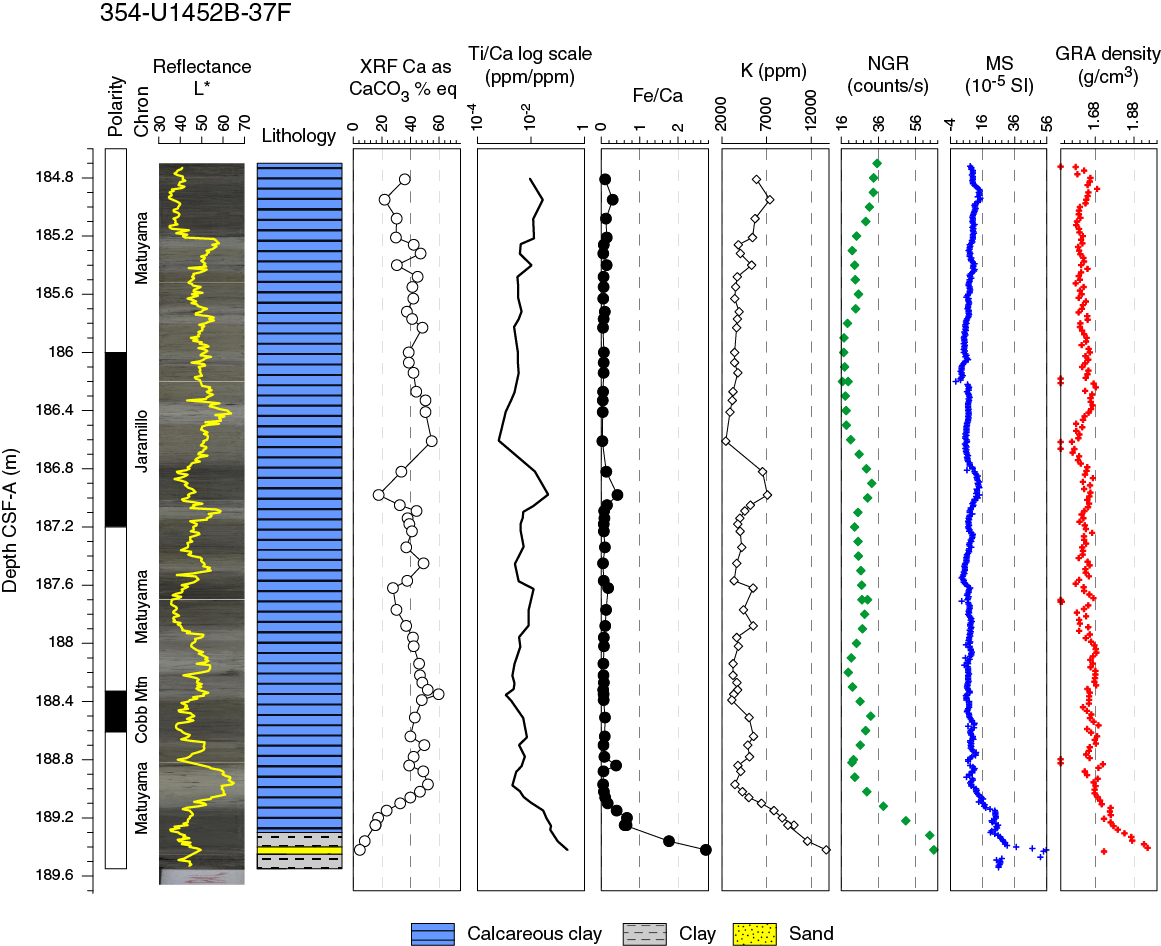
Figure F18. Variations in Ca content expressed as carbonate content, Ti/Ca ratio, Fe/Ca ratio, and K content, Core 354-U1452B-37F.
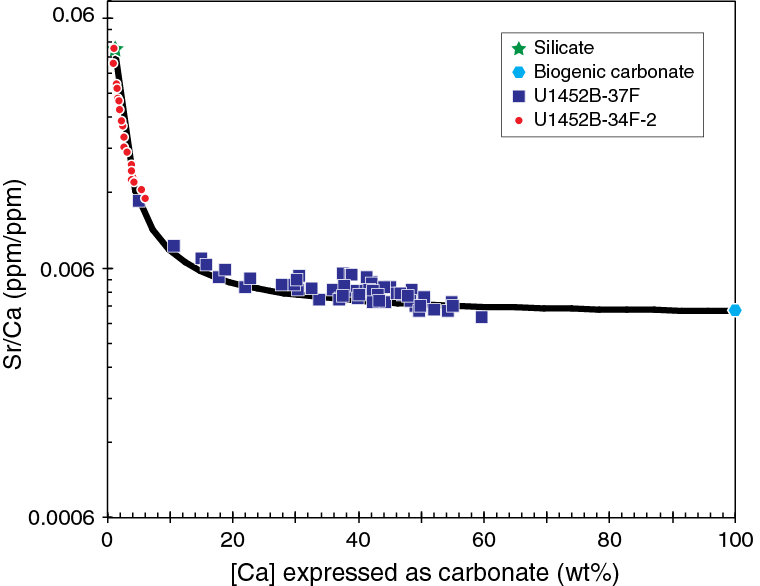
Figure F19. Variations in Sr/Ca ratio vs. Ca content expressed as carbonate content, Core 354-U1452B-37F and Section 34F-2. The curve corresponds to the binary mixing of silicate and marine biogenic carbonate. The composition of the end-members have been chosen to best describe the data.
Microbiology
A total of 11 microbiology samples (eight whole-round sections and three plugs) were collected on the catwalk. Whole-round core sections were sampled for various microbiological investigations. A microbial cell counting method was initiated shipboard, with further processing of the samples to be performed following the expedition.
Physical properties
Physical property data were acquired for all Hole U1452A and U1452B cores, including density, magnetic susceptibility, P-wave velocity, NGR, and thermal conductivity (see Physical properties in the Expedition 354 methods chapter [France-Lanord et al., 2016a]). The site was cored with the APC and HLAPC systems. Hole U1452B cored 174.5 m of the section from the seafloor to 217 m DSF with a recovery of 138.21 m (79%). Physical property data from Site U1452 are mostly of good quality (Figures F20, F21) and reflect lithologic variations as observed at previous sites. Using the principal lithologic name from the core description to assign five lithologies (sand, silt, clay, calcareous clay, and volcanic ash; see Lithostratigraphy), we calculated their minimum, maximum, and average physical properties (Table T15).
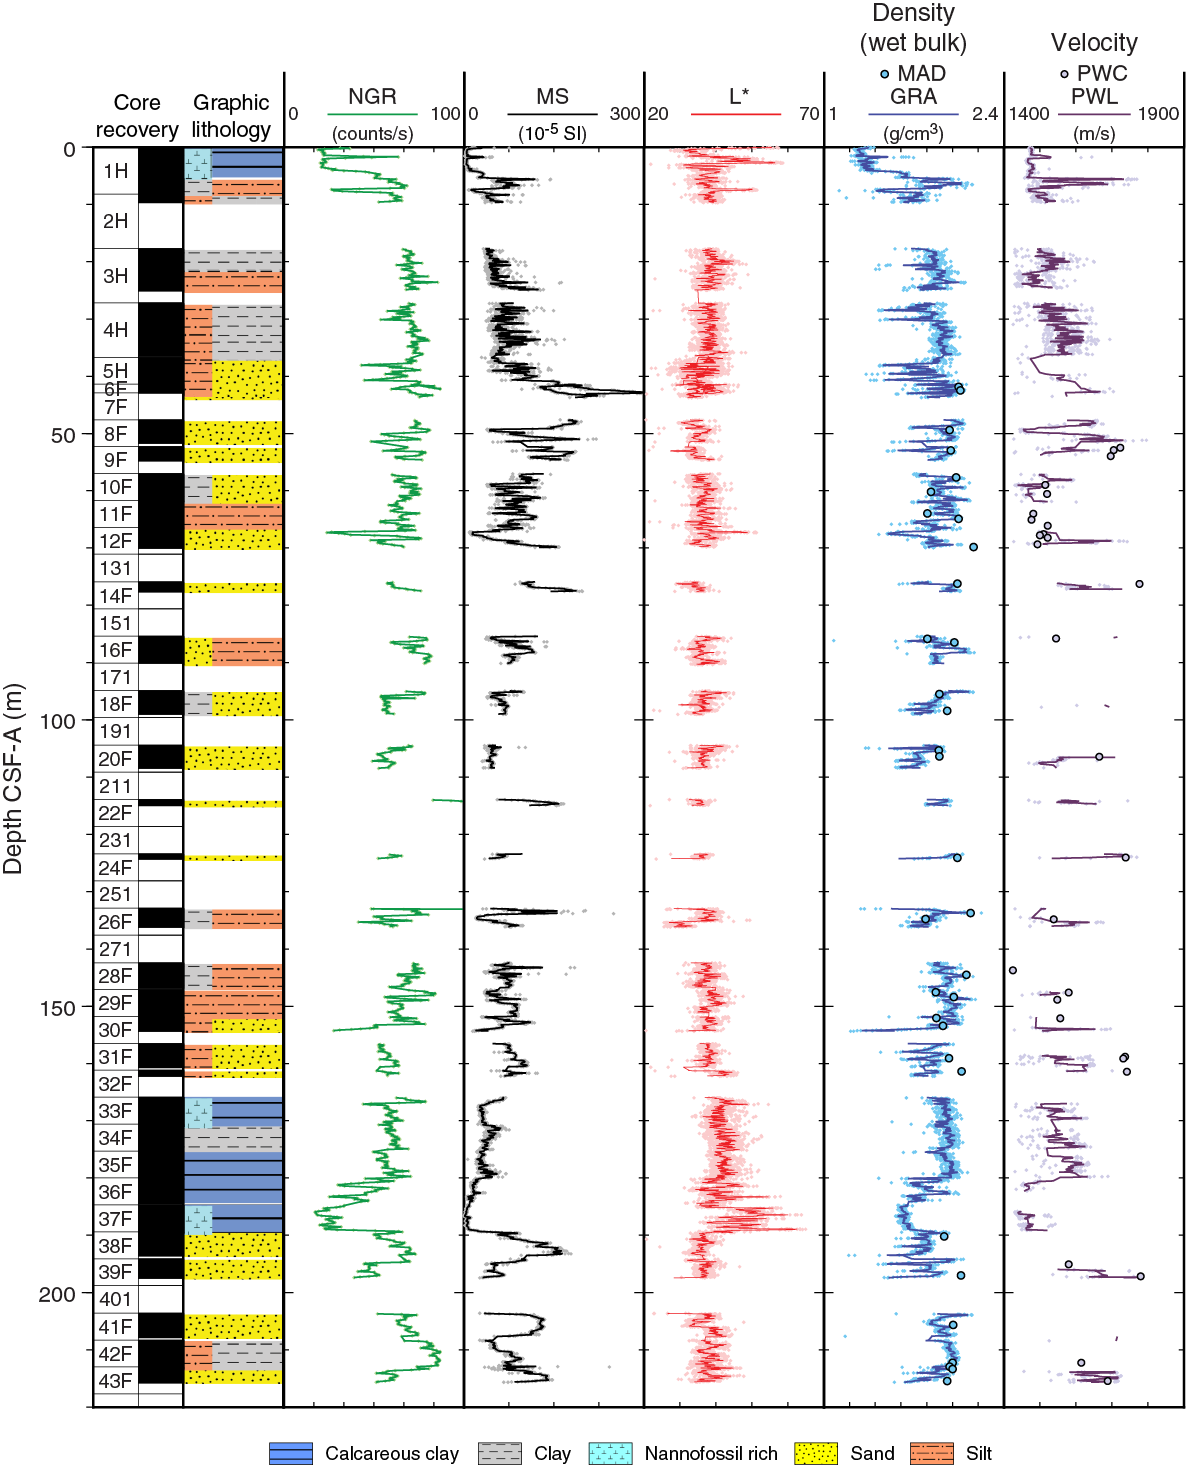
Figure F20. Physical property measurements, Hole U1452A.
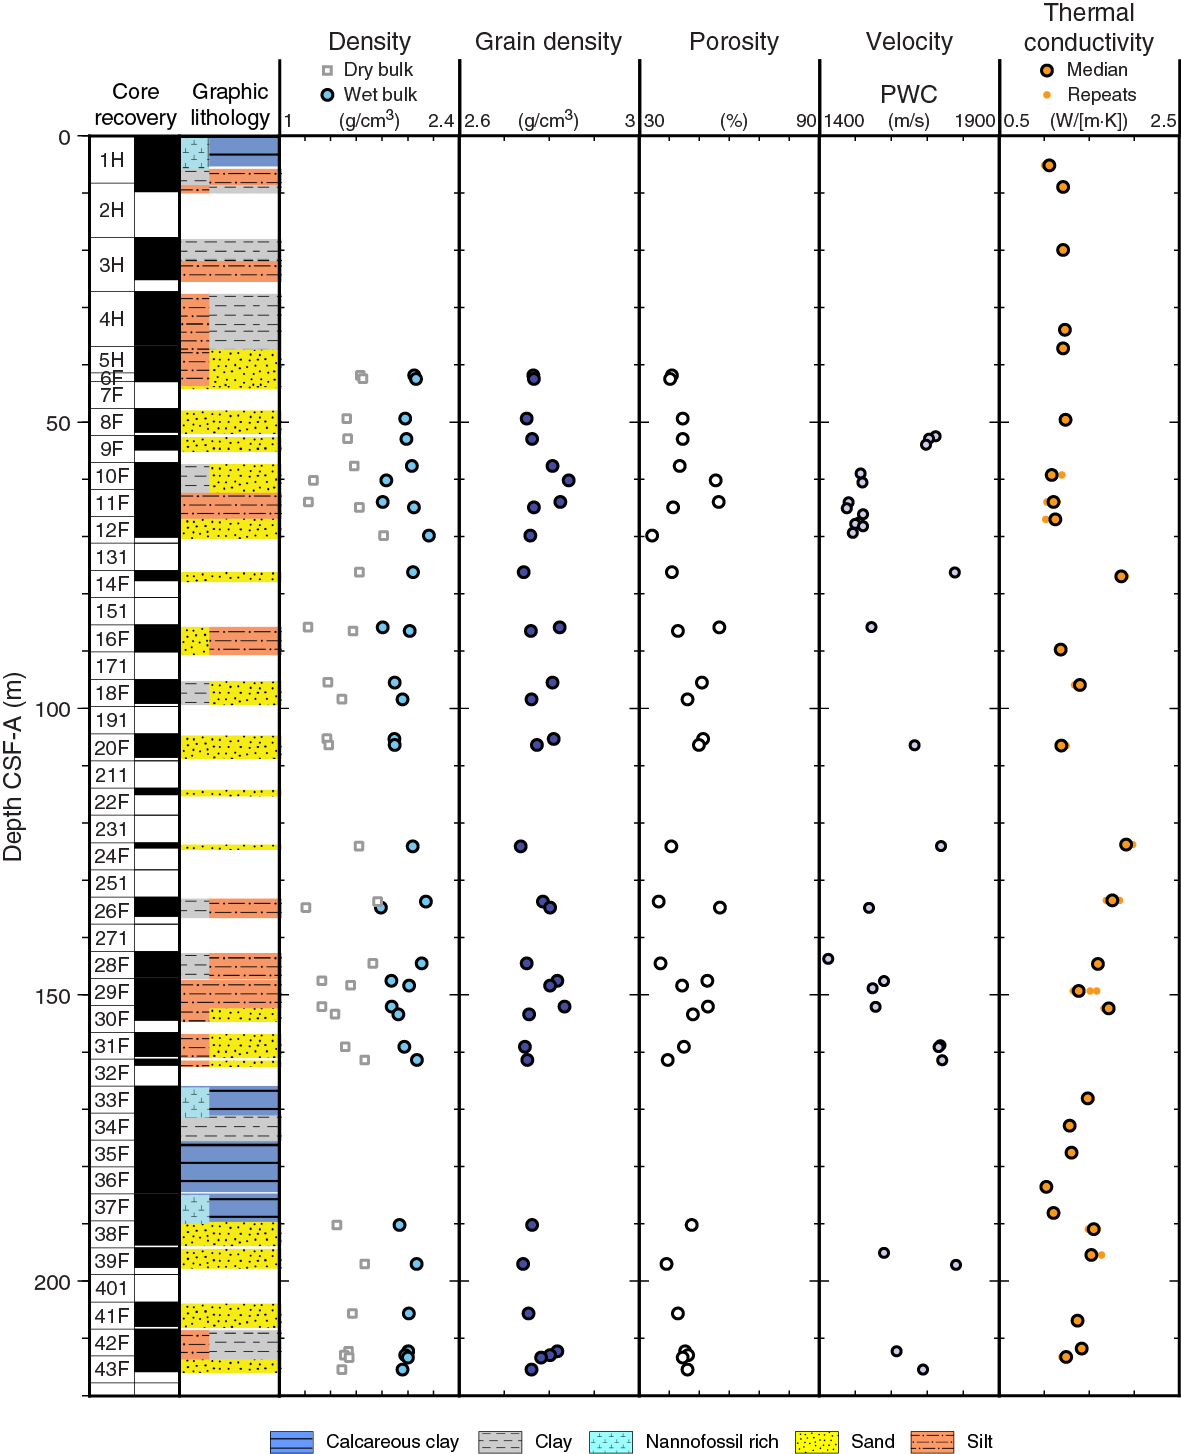
Figure F21. Moisture and density results, Site U1452.
Table T15. Total sediment thickness, percentage of recovered material, and average physical properties with respect to lithology, Site U1452. Download table in .csv format.
The most common principal lithology is sand (~46 m), followed by clay (~33 m), silt (~27 m), and calcareous clay (~26 m), with volcanic ash occurring in minor proportion. Measurements are described in detail below, but in general, average wet bulk densities are rather uniform for terrigenous sediment (sand, silt, and clay), ranging from 1.89 to 2.03 g/cm3. Calcareous clay has lower average densities (1.72 g/cm3), and volcanic ash has substantially lower wet bulk densities (1.54 g/cm3). Average P-wave velocities are highest in sand (1697 m/s on average) and lowest in clay and calcareous clay (~1525 m/s). Average magnetic susceptibilities are also highest in sand (107 × 10–5 SI), followed by silt (80 × 10–5 SI) and clay (58 × 10–5 SI). The lowest values occur in calcareous clay (22 × 10–5 SI). Average NGR is high throughout the terrigenous components sand, silt, and clay (around 65 counts/s) and lower in calcareous clay (45 counts/s). Average thermal conductivity is highest in silt (1.63 W/[m·K]) and lowest in calcareous clay (1.18 W/[m·K]).
Physical property measurements and measurement intervals
High-resolution physical property measurements were made on Site U1452 cores to provide basic information on sediment composition and variability. Whole-Round Multisensor Logger (WRMSL) measurements were made at 2.5 cm increments for density by GRA, magnetic susceptibility, and compressional wave velocity on the P-wave logger (PWL). However, for the first core of Holes U1452A, U1452B, and U1452C, we decreased the measurement interval to 1 cm to depict Toba Ash 1 (75.0 ka ± 0.9 ky according to Mark et al., 2014) and the Late Pleistocene in higher resolution. NGR measurements were made at 10 cm increments, and thermal conductivity measurements were made at one measurement per core.
On split cores, point magnetic susceptibility and color reflectance (RSC) were measured at 1 cm increments using the Section Half Multisensor Logger (SHMSL). For the uppermost core containing the Toba ash, we increased the resolution to 0.1–0.5 cm for both point magnetic susceptibility and RSC, depending on the hole. Additionally, we took discrete samples for moisture and density (MAD) measurements (one to three samples per core, typically representing coarse-, medium-, and fine-grained intervals or pelagic intervals with varying carbonate or biogenic opal content) to determine water content, wet bulk density, dry bulk density, porosity, and grain density. The assignation into five different lithologies was taken from the core description (see Lithostratigraphy). Average physical properties measured for the various Site U1452 lithologies are summarized in Table T15.
Whole-Round Multisensor Logger measurements
Results from Site U1452 WRMSL measurements are compiled in Figure F20. For illustration purposes, data from the top and bottom 2 cm of each section were removed because they contain a cap and often represent part sediment and part air and because the volume contributing to the measurement is unknown. Data that are unrealistic for the cored formations, such as densities <1.05 g/cm3 and velocities <1425 m/s or >6000 m/s, were also filtered out. All original data remain in the LIMS database.
Gamma ray attenuation bulk density
Average wet bulk densities (GRA) measured with the WRMSL range from 1.53 to 1.91 g/cm3, varying with lithology (Table T15). The average GRA wet bulk density values for clay are identical to those determined by MAD. However, for silt there is a difference of 0.12 g/cm3 to MAD, and for sand the difference is 0.16 g/cm3, reflecting the lack of sediment volume due to partially filled core liners for sandy lithologies. GRA values remain fairly stable downcore (i.e., there is no visible compaction effect on densities toward the base of Site U1452) (Figure F20).
Magnetic susceptibility
Magnetic susceptibility is sensitive to the concentration and type of magnetic minerals. Average values are lowest in calcareous clay (22 × 10–5 SI), intermediate in clays (48 × 10–5 SI), and highest in sandy lithologies (107 × 10–5 SI) (Table T15). These contrasts document that the majority of lithologies can clearly be distinguished based on magnetic susceptibility measurements. There are frequent downcore variations reflecting changing lithologies (e.g., a significant increase in sandy Cores 354-U1452B-7F and 38F–39F) but no downcore trend (Figure F20).
P-wave velocity
Average P-wave velocities from the PWL range from 1445 m/s for calcareous clay to 1686 m/s, with 1580 m/s for volcanic ash (Table T15). PWL velocities are systematically lower than P-wave caliper (PWC) velocities. The discrepancy is larger in sandy lithologies because of homogenized sands and lower in calcareous clay. The PWL sensor produced many erroneous readings (Figure F20) and had to be reconfigured quite often but without improvement.
Natural gamma radiation
Average NGR values vary from 31 to 68 counts/s for the different principal lithologies (Table T15). The lowest values are found in calcareous clay, followed by volcanic ashes, whereas the terrigenous lithologies sand, silt, and clay usually show high values. NGR values display significant variations downcore (Figure F20), with significant minima representing hemipelagic sediments near the top of the site (Core 354-U1452B-1H) and in Core 37F (see Downhole measurements).
Thermal conductivity
Average thermal conductivities at Site U1452 vary between 1.18 W/(m·K) for calcareous clay and 1.63 W/(m·K) for silty lithologies (Table T15). Measurements were conducted with the needle probe (see Physical properties in the Expedition 354 methods chapter [France-Lanord et al., 2016a]). No obvious downcore trend is documented by the data (Figure F21).
Point magnetic susceptibility
Point magnetic susceptibility measurements made with the SHMSL agree well with WRMSL susceptibility results (Figure F20). Average values are higher than WRMSL values for sandy lithologies (119 × 10–5 vs. 107 × 10–5 SI) because the susceptibility measurement assumes a full liner and sometimes this is not the case. This difference is due to the smaller integration volume of the SHMSL point sensor, which will deliver good data even if the liner is not filled entirely, compared to the WRMSL loop sensor. Accordingly, point magnetic measurements are higher for sand on average and also detect a number of peaks on the centimeter scale that are not resolved by loop magnetic measurements.
Discrete compressional wave velocity
Average PWC velocities for each principal lithology vary from 1505 to 1697 m/s (Table T15). PWC velocities are always higher than WRMSL velocities. For clay, the average difference is only 25 m/s, for calcareous clay it is higher (82 m/s), and for sand the differences are very high (209 m/s), again indicative of a lack of sediment volume in the core liner and insufficient preservation of in situ properties in sandy lithologies, which impacts the WRMSL P-wave velocity measurements.
Moisture and density
Water content, porosity, and wet and dry bulk densities are interdependent. Wet bulk densities determined with MAD procedures show less extreme variations than WRMSL measurements (Figures F20, F21). MAD samples were not taken in the upper 40 m of the hole to preserve material for postexpedition sampling. Average MAD wet bulk densities from Site U1452 are rather uniform, ranging from 1.89 g/cm3 for clay to 2.01 g/cm3 for sand (Table T15). Porosities range from 30% to 60%, depending on lithology. Average grain densities range from 2.76 g/cm3 for sand to 2.81 g/cm3 for clay.
Color reflectance
Sediment lightness (L*) varies from ~20 to ~65, with average values around 38. The highest L* values were found within calcareous clay from 187 to 190 CSF-A (e.g., Core 354-U1452B-37F) (Figure F20), where carbonate contents up to 70% are measured (see Geochemistry and microbiology).
Color component a*, the red–green component, has a rather uniform downcore distribution and varies only from –1 to 3, with average values around 1 (Figure F20). Only volcanic ash layers show values up to 3.5. Color component b* varies from –7 to 5, with average values around –2.8. Again, volcanic ash layers differ substantially, with much lower average values of –1.2. Elevated values (yellower colors) are documented in the uppermost 5 m of Site U1452.
Core disturbances and data quality
Core disturbances are displayed in Figures F3 and F4. They affect the quality and reliability of physical properties in various ways. For APC-cored Hole U1452B (total penetration depth = 217 m CSF-A), 46 m of sand was retrieved, which, as in previous Expedition 354 coring, partially included homogenized cores that do not possess a sediment texture or fabric. These sections were marked with the highest core disturbance value of 6 (see Lithostratigraphy).
Data variability and downhole trends
With only 217 m DSF total penetration depth, Site U1452 is one of the shallower sites of Expedition 354. Sediment recovered represents fine-grained, muddy turbidites interbedded with coarse-grained, sandy turbidites, indicative of levee and interlevee deposition. Pelagic influence is documented for the lowermost part (Cores 354-U1452B-33F through 37F), the time of generally reduced turbidite activity during the Middle Pleistocene. As at Site U1449, which has comparable lithology, there is no clear downcore trend in physical properties and the parameters correlate well with lithology and composition.
Downhole measurements
Downhole temperature and heat flow
One advanced piston corer temperature tool (APCT-3) downhole temperature measurement in Hole U1452B yielded a value of 8.69°C at 184.7 m DSF (Figure F22), giving a geothermal gradient of about 39°C/km. The seafloor temperature was 1.55°C, based on APCT-3 data taken while the unit was held at the mudline for 5 min as the tool was run down into the hole.
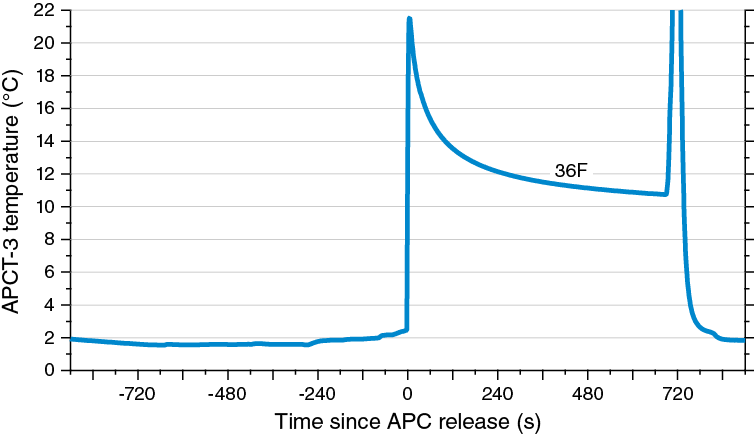
Figure F22. APCT-3 temperature-time series, Hole U1452B.
Thermal conductivity under in situ conditions was estimated from laboratory-determined thermal conductivity from Hole U1452B using the method of Hyndman et al. (1974) (see Physical properties in the Expedition 354 methods chapter [France-Lanord et al., 2016a]). The calculated in situ values are within 2% of the measured laboratory values. Thermal resistance was then calculated by integrating the inverse of the in situ thermal conductivity over depth. A heat flow of 51 mW/m2 was obtained from the linear fit between temperature and thermal resistance (Pribnow et al., 2000). The geothermal gradient and heat flow values at Site U1452 are within the normal range for ocean basins of same age of 90–100 Ma (Müller et al., 2008) and consistent with other values measured in the Bay of Bengal (Hasterok et al., 2011).
Stratigraphic synthesis
The main objective for Site U1452 drilling was to contribute to the reconstruction of the Pleistocene fan evolution as part of the seven-site drilling transect. In the vicinity of the site, the depositional style is dominated by a channel-levee system in the upper part (to 4.97 s TWT) and underlain by sheeted sedimentary units (Figure F1). Multiple holes through this levee section provide the opportunity to characterize in detail this main fan structural element and depositional units.
Seismic, physical properties, and lithology
The most striking feature in the vicinity of Site U1452 (Figure F1) is a prominent symmetrical channel-levee system at a shallow burial depth. The channel-levee system is >20 km wide, the inner flanks are ~100 m high, and the height of the outer levees (above the basal levee reflector at 4.97 s TWT) is ~30 m. Site U1452 is positioned only 700 m from the inner channel flank and therefore represents a levee position of particularly high accumulation rate. The seismic facies in the levee is of low reflectivity and is underlain by parallel to subparallel layered units that have much higher reflection amplitudes to ~5.1 s TWT, partially with irregular reflector geometries. The bottom of the cored section shows more well-defined parallel layering with weaker amplitudes.
Figure F23 compares the seismic data with the core lithology and magnetic susceptibility (see Lithostratigraphy and Physical properties). Sediment composition with respect to grain size is evenly distributed: 35% sand, 21% silt, 25% clay, and 20% calcareous clay. Mud-rich intervals are found in the levee and concurrently with calcareous clay between 5.15 and 5.25 s TWT. Otherwise, the formation is characterized by prevalent thick sand intervals. Of the physical properties measured, the sand can be best recognized from magnetic susceptibility, with high values likely positively correlated to grain size. In contrast, measured densities vary little from clay to sand. Only a few P-wave velocity measurements show values >1700 m/s, which would normally be expected for sand. These values may be attributed to the insufficient preservation of in situ conditions because of coring and retrieval of loose material.

Figure F23. Seismic Line SO125-GeoB97-027, Site U1452.
Using magnetic susceptibility as a proxy for grain size, the comparison between lithology, magnetic susceptibility, and seismic data allows a refined interpretation of the channel-levee complex evolution from 5.0 s TWT to the seafloor. After a short period of reduced fan sedimentation indicated by a calcareous clay layer in Core 354-U1452B-12F, a silt unit forms the base of a high-amplitude reflector package. Magnetic susceptibility values gradually increase for ~22 m within the sandy lithology, where they reach a distinct maximum. In the upper 6 m of this interval, reflection characteristics change toward a more irregular reflector geometry and small V-shaped incisions are visible. The sharp peak in magnetic susceptibility is followed by a distinct drop over 5 m, which marks a transition from a sand- to mud-dominated lithology, as indicated by the thick blue stippled line on top of the magnetic susceptibility data in Figure F23. This transition marks the base of the levee in the seismic data. Overall low magnetic susceptibility values characterize the levee sequence.
As an example of the approach to be taken during detailed postexpedition research, such a sequence may be tentatively interpreted with respect to dominant processes forming channel-levee complexes in the Bengal Fan. This is indicated in Figure F23, which lists evolutionary phases next to the channel-levee complex. Interlevee sedimentation, for example, after a channel avulsion in a neighboring channel (probably north of the transect), delivers coarse material into an unconfined area, which leads to immediate deposition of the sand, whereas silt may be transported further downslope. When the terminal lobe is prograding downslope, sand deposition succeeds the silty units. The terminal lobe is then characterized by erosive incisions of only a short lifetime before the large channel-levee system and lobes approach and finally develop a levee. Erosion is initiated when the coarsest sand arrives, which leads to successive confinement of the sand transport. Associated with this process is general fining-upward in surrounding deposits and the formation of levees, starting with a reduction in sand deposition with increasing channel incision depth. The full establishment of a turbidite channel then leads to an enhanced contribution of finer material to the levee buildup and its typical seismic character.
Similar to Sites U1449–U1451, hemipelagic layers are present in 9 out of 42 cores from Site U1452 and vary in thickness from several decimeters to several meters. These layers represent much longer time periods than the intercalated fan deposits. Where these hemipelagic layers display different physical properties (see Physical properties) and thus seismic impedance values, they can result in seismic reflectors. Blue arrows mark these layers in Figure F23. Most layers are associated with a distinct seismic reflection, and if sufficiently thick, they may be used as stratigraphic markers across the drilling transect.
The succession of hemipelagic layers indicates that fan deposition must have been highest within the upper 150 m with few and thin units, whereas in the lower portion of the hole, reduced sediment delivery with intercalated mud-to-silt turbidites prevails, leading to several thicker hemipelagic units. Such an interval was identified for a postexpedition stratigraphic pilot study to investigate type, temporal distribution, and flux of such sediment supply.
Age-depth relationship
Because of the limited number of Pleistocene biomarkers (Figure F24), the biostratigraphic age constraints at this site are restricted. However, the detection of the Bruhnes/Matuyama boundary and the Jaramillo and Cobb Mountain Subchrons, in addition to the three nannofossil biomarkers at Site U1452 (Table T6), provides age-depth constraints for this site (Figure F25).

Figure F24. Compilation of biostratigraphic and chronostratigraphic markers, Site U1452.
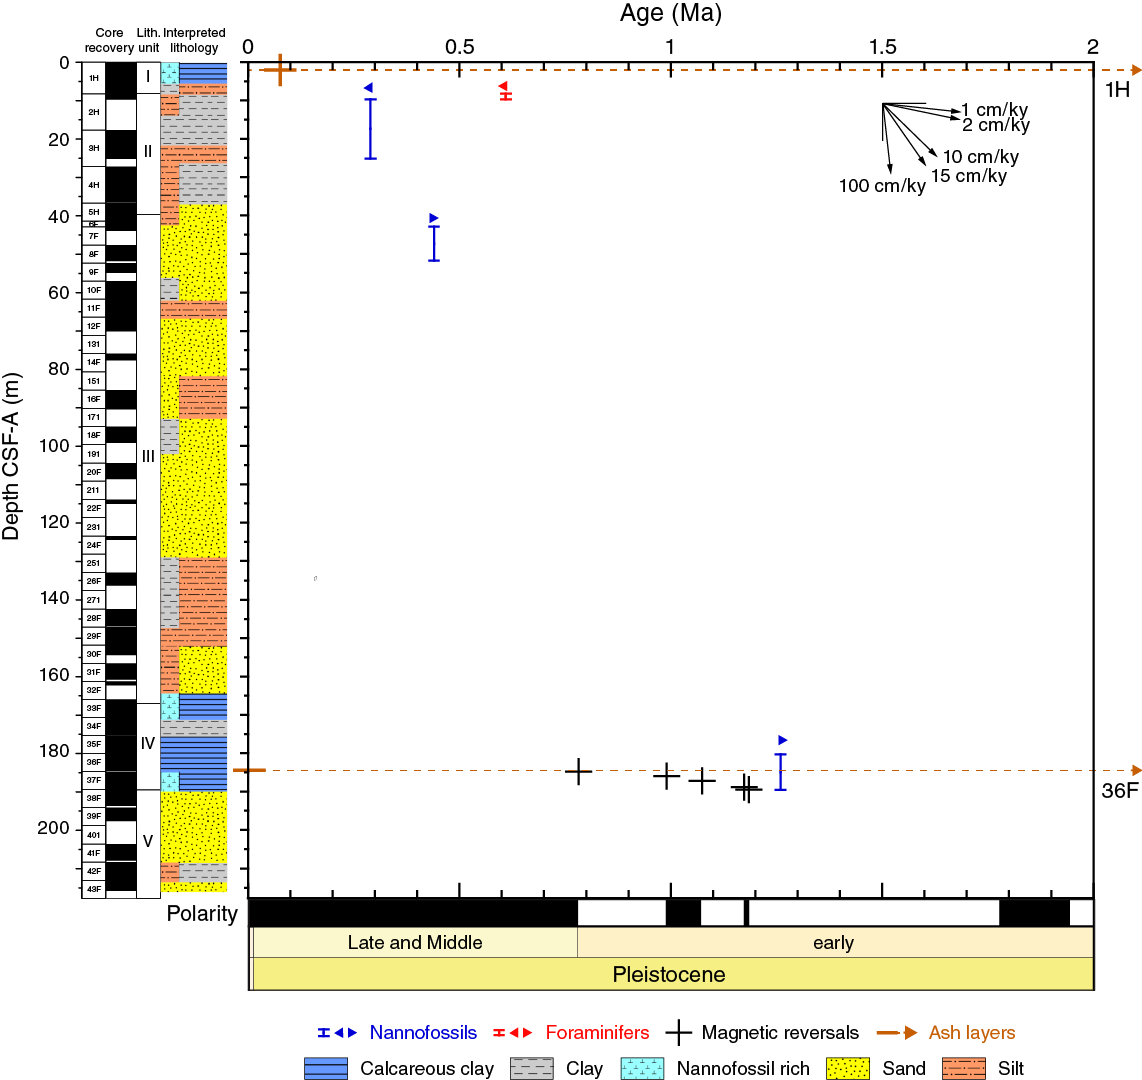
Figure F25. Age-depth plot, Site U1452. Interpreted lithology proposes the most probable lithologies in intervals of nonrecovery.
Although the foraminiferal biomarker Globorotalia tosaensis (0.61 Ma) was found in Holes U1452B and U1452C (at 8.97 and 23.29 m CSF-A, respectively), its LO was found at a shallower depth than the FO of nannofossil biomarkers Emiliania huxleyi (0.29 Ma) and Pseudoemiliania lacunosa (0.44 Ma), indicating that this foraminifer was either reworked or has a longer range in the Indian Ocean. The nannofossil biomarkers agree well with the magnetic polarity reversals found at Site U1452.
An additional note of concern is the position of some of the biomarkers (e.g., P. lacunosa) in the Pleistocene levee sequence. As remobilization of sediment may be associated with the turbiditic transport process during this time, reworking of fossils has to be taken into account, and these data should be used with caution.
Sediments from lithostratigraphic Unit IV (see Lithostratigraphy) recorded the Brunhes/Matuyama magnetic reversal (0.781 Ma) and both boundaries of the Jaramillo (0.988–1.072 Ma) and Cobb Mountain (1.173–1.185 Ma) Subchrons. As at Sites U1449–U1451, sediment deposited between 0.988 and 1.185 Ma is hemipelagic. The Brunhes/Matuyama magnetic reversal is related to an ash layer, most probably from the Toba Volcano, and is associated with a layer of microtektites. The latter is likely from the Australian Microtektite Event dated to 790 ka ± 5 ky by astronomical tuning on a sediment core from near the Maldives (Valet et al., 2014) and gives an independent tie point to the age-depth correlation.
The sedimentation rate in the hemipelagic layer from 0.988 to 1.185 Ma is ~1.3 cm/ky, and from the Brunhes/Matuyama boundary to the end of the Jaramillo Subchron it is only 0.9 cm/ky. However, because the reversals were recorded in two different cores, an interval of nonrecovered sediment between them may be responsible for the apparent change in sedimentation rate.
Achievements
Site U1452 contributes important new evidence to the understanding of channel and levee formation because it has not only cored the fine-grained levee, as deeper in Site U1449, but also the basal coarser unit. Physical properties seem to indicate a progradation and the transition from sand deposition, through erosion, to levee construction.
As the seismic facies interpretation successfully predicted the average grain size of units, we used this information to adjust our coring strategy. Hemipelagic layers, identified in several previous sites, were used to establish a preliminary Pleistocene seismic stratigraphy. Then we targeted these layers for coring and achieved full recovery of these intervals and thereby an improved chronology even when spot coring was carried out in other, coarser intervals.
The interval between 5.12 and 5.16 s TWT represents an expanded hemipelagic unit deposited from ~0.8 to ~1.2 Ma. Fan sedimentation intensified between 800 and 300 ka, as represented by sheeted sands and the levee. These sheeted sands and levees grew by 100 m in 500 ky, equivalent to an average sedimentation rate of 20 cm/ky. The end of this intense period of fan sedimentation at 300 ka is constrained by the basal age of the surficial hemipelagic unit.
References
Curray, J.R., Emmel, F.J., and Moore, D.G., 2003. The Bengal Fan: morphology, geometry, stratigraphy, history and processes. Marine and Petroleum Geology, 19(10):1191–1223. http://dx.doi.org/10.1016/S0264-8172(03)00035-7
Dehn, J., Farrell, J.W., and Schmincke, H.-U., 1991. Neogene tephrochronology from Site 758 on northern Ninetyeast Ridge: Indonesian arc volcanism of the past 5 Ma. In Weissel, J., Peirce, J., Taylor, E., Alt, J., et al., Proceedings of the Ocean Drilling Program, Scientific Results, 121: College Station, TX (Ocean Drilling Program), 273–295. http://dx.doi.org/10.2973/odp.proc.sr.121.123.1991
Fisher, R.A., 1953. Dispersion on a sphere. Proceedings of the Royal Society of London, Series A, 217:295–305.
France-Lanord, C., Spiess, V., Klaus, A., Adhikari, R.R., Adhikari, S.K., Bahk, J.-J., Baxter, A.T., Cruz, J.W., Das, S.K., Dekens, P., Duleba, W., Fox, L.R., Galy, A., Galy, V., Ge, J., Gleason, J.D., Gyawali, B.R., Huyghe, P., Jia, G., Lantzsch, H., Manoj, M.C., Martos Martin, Y., Meynadier, L., Najman, Y.M.R., Nakajima, A., Ponton, C., Reilly, B.T., Rogers, K.G., Savian, J.F., Schwenk, T., Selkin, P.A., Weber, M.E., Williams, T., and Yoshida, K., 2016a. Expedition 354 methods. In France-Lanord, C., Spiess, V., Klaus, A., Schwenk, T., and the Expedition 354 Scientists, Bengal Fan. Proceedings of the International Ocean Discovery Program, 354: College Station, TX (International Ocean Discovery Program). http://dx.doi.org/10.14379/iodp.proc.354.102.2016
France-Lanord, C., Spiess, V., Klaus, A., Adhikari, R.R., Adhikari, S.K., Bahk, J.-J., Baxter, A.T., Cruz, J.W., Das, S.K., Dekens, P., Duleba, W., Fox, L.R., Galy, A., Galy, V., Ge, J., Gleason, J.D., Gyawali, B.R., Huyghe, P., Jia, G., Lantzsch, H., Manoj, M.C., Martos Martin, Y., Meynadier, L., Najman, Y.M.R., Nakajima, A., Ponton, C., Reilly, B.T., Rogers, K.G., Savian, J.F., Schwenk, T., Selkin, P.A., Weber, M.E., Williams, T., and Yoshida, K., 2016b. Site U1451. In France-Lanord, C., Spiess, V., Klaus, A., Schwenk, T., and the Expedition 354 Scientists, Bengal Fan. Proceedings of the International Ocean Discovery Program, 354: College Station, TX (International Ocean Discovery Program). http://dx.doi.org/10.14379/iodp.proc.354.105.2016
France-Lanord, C., Spiess, V., Klaus, A., Adhikari, R.R., Adhikari, S.K., Bahk, J.-J., Baxter, A.T., Cruz, J.W., Das, S.K., Dekens, P., Duleba, W., Fox, L.R., Galy, A., Galy, V., Ge, J., Gleason, J.D., Gyawali, B.R., Huyghe, P., Jia, G., Lantzsch, H., Manoj, M.C., Martos Martin, Y., Meynadier, L., Najman, Y.M.R., Nakajima, A., Ponton, C., Reilly, B.T., Rogers, K.G., Savian, J.F., Schwenk, T., Selkin, P.A., Weber, M.E., Williams, T., and Yoshida, K., 2016c. Site U1454. In France-Lanord, C., Spiess, V., Klaus, A., Schwenk, T., and the Expedition 354 Scientists, Bengal Fan. Proceedings of the International Ocean Discovery Program, 354: College Station, TX (International Ocean Discovery Program). http://dx.doi.org/10.14379/iodp.proc.354.108.2016
France-Lanord, C., Spiess, V., Klaus, A., Schwenk, T., Adhikari, R.R., Adhikari, S.K., Bahk, J.-J., Baxter, A.T., Cruz, J.W., Das, S.K., Dekens, P., Duleba, W., Fox, L.R., Galy, A., Galy, V., Ge, J., Gleason, J.D., Gyawali, B.R., Huyghe, P., Jia, G., Lantzsch, H., Manoj, M.C., Martos Martin, Y., Meynadier, L., Najman, Y.M.R., Nakajima, A., Ponton, C., Reilly, B.T., Rogers, K.G., Savian, J.F., Selkin, P.A., Weber, M.E., Williams, T., and Yoshida, K., 2016d. Expedition 354 summary. In France-Lanord, C., Spiess, V., Klaus, A., Schwenk, T., and the Expedition 354 Scientists, Bengal Fan. Proceedings of the International Ocean Discovery Program, 354: College Station, TX (International Ocean Discovery Program). http://dx.doi.org/10.14379/iodp.proc.354.101.2016
Galy, A., and France-Lanord, C., 2001. Higher erosion rates in the Himalaya: geochemical constraints on riverine fluxes. Geology, 29(1):23–26. http://dx.doi.org/10.1130/0091-7613(2001)029<0023:HERITH>2.0.CO;2
Galy, V., France-Lanord, C., Beyssac, O., Faure, P., Kudrass, H., and Palhol, F., 2007. Efficient organic carbon burial in the Bengal Fan sustained by the Himalayan erosional system. Nature, 450(7168):407–410. http://dx.doi.org/10.1038/nature06273
Galy, V., France-Lanord, C., and Lartiges, B., 2008. Loading and fate of particulate organic carbon from the Himalaya to the Ganga–Brahmaputra delta. Geochimica et Cosmochimica Acta, 72(7):1767–1787. http://dx.doi.org/10.1016/j.gca.2008.01.027
Galy, V., François, L., France-Lanord, C., Faure, P., Kudrass, H., Palhol, F., and Singh, S.K., 2008. C4 plants decline in the Himalayan basin since the Last Glacial Maximum. Quaternary Science Reviews, 27(13–14):1396–1409. http://dx.doi.org/10.1016/j.quascirev.2008.04.005
Gradstein, F.M., Ogg, J.G., Schmitz, M.D., and Ogg, G.M. (Eds.), 2012. The Geological Time Scale 2012: Amsterdam (Elsevier).
Hasterok, D., Chapman, D.S., and Davis, E.E., 2011. Oceanic heat flow: implications for global heat loss. Earth and Planetary Science Letters, 311(3–4):386–395. http://dx.doi.org/10.1016/j.epsl.2011.09.044
Hyndman, R.D., Erickson, A.J., and Von Herzen, R.P., 1974. Geothermal measurements on DSDP Leg 26. In Davies, T.A., Luyendyk, B.P., et al., Initial Reports of the Deep Sea Drilling Project, 26: Washington, DC (U.S. Government Printing Office), 451–463. http://dx.doi.org/10.2973/dsdp.proc.26.113.1974
Lupker, M., France-Lanord, C., Galy, V., Lavé, J., Gaillardet, J., Gajurel, A.P., Guilmette, C., Rahman, M., Singh, S.K., and Sinha, R., 2012. Predominant floodplain over mountain weathering of Himalayan sediments (Ganga basin). Geochimica et Cosmochimica Acta, 84:410–432. http://dx.doi.org/10.1016/j.gca.2012.02.001
Mark, D.F., Petraglia, M., Smith, V.C., Morgan, L.E., Barfod, D.N., Ellis, B.S., Pearce, N.J., Pal, J.N., and Korisettar, R., 2014. A high-precision 40Ar/39Ar age for the Young Toba Tuff and dating of ultra-distal tephra: forcing of Quaternary climate and implications for hominin occupation of India. Quaternary Geochronology, 21:90–103. http://dx.doi.org/10.1016/j.quageo.2012.12.004
Martini, E., 1971. Standard Tertiary and Quaternary calcareous nannoplankton zonation. In Farinacci, A. (Ed.), Proceedings of the Second Planktonic Conference, Roma 1970: Rome (Edizioni Tecnoscienza), 2:739–785.
Müller, R.D., Sdrolias, M., Gaina, C., and Roest, W.R., 2008. Age, spreading rates, and spreading asymmetry of the world’s ocean crust. Geochemistry, Geophysics, Geosystems, 9(4):Q04006. http://dx.doi.org/10.1029/2007GC001743
Okada, H., and Bukry, D., 1980. Supplementary modification and introduction of code numbers to the low-latitude coccolith biostratigraphic zonation (Bukry, 1973; 1975). Marine Micropaleontology, 5:321–325. http://dx.doi.org/10.1016/0377-8398(80)90016-X
Pribnow, D., Kinoshita, M., and Stein, C., 2000. Thermal Data Collection and Heat Flow Recalculations for Ocean Drilling Program Legs 101–180: Hanover, Germany (Institute for Joint Geoscientific Research, Institut für Geowissenschaftliche Gemeinschaftsaufgaben [GGA]).
http://www-odp.tamu.edu/publications/heatflow/ODPReprt.pdf
Schwenk, T., and Spieß, V., 2009. Architecture and stratigraphy of the Bengal Fan as response to tectonic and climate revealed from high-resolution seismic data. In Kneller, B.C., Martinsen, O.J., and McCaffrey, B. (Eds.), External Controls on Deep-Water Depositional Systems. Special Publication - SEPM (Society of Sedimentary Geologists), 92:107–131.
Smit, J., van Eijden, A.J.M., and Troelstra, S.R., 1991. Analysis of the Australasian Microtektite Event, the Toba Lake event, and the Cretaceous/Paleogene boundary, eastern Indian Ocean. In Weissel, J., Peirce, J., Taylor, E., Alt, J., et al., Proceedings of the Ocean Drilling Program, Scientific Results, 121: College Station, TX (Ocean Drilling Program), 489–503. http://dx.doi.org/10.2973/odp.proc.sr.121.149.1991
Valet, J.-P., Bassinot, F., Bouilloux, A., Bourlès, D., Nomade, S., Guillou, V., Lopes, F., Thouveny, N., and Dewilde, F., 2014. Geomagnetic, cosmogenic and climatic changes across the last geomagnetic reversal from equatorial Indian Ocean sediments. Earth and Planetary Science Letters, 397:67–79. http://dx.doi.org/10.1016/j.epsl.2014.03.053
von der Borch, C.C., Sclater, J.G., et al., 1974. Initial Reports of the Deep Sea Drilling Project, 22: Washington (U.S. Government Printing Office). http://dx.doi.org/10.2973/dsdp.proc.22.1974
Wade, B.S., Pearson, P.N., Berggren, W.A., and Pälike, H., 2011. Review and revision of Cenozoic tropical planktonic foraminiferal biostratigraphy and calibration to the geomagnetic polarity and astronomical time scale. Earth-Science Reviews, 104(1–3):111–142. http://dx.doi.org/10.1016/j.earscirev.2010.09.003
1France-Lanord, C., Spiess, V., Klaus, A., Adhikari, R.R., Adhikari, S.K., Bahk, J.-J., Baxter, A.T., Cruz, J.W., Das, S.K., Dekens, P., Duleba, W., Fox, L.R., Galy, A., Galy, V., Ge, J., Gleason, J.D., Gyawali, B.R., Huyghe, P., Jia, G., Lantzsch, H., Manoj, M.C., Martos Martin, Y., Meynadier, L., Najman, Y.M.R., Nakajima, A., Ponton, C., Reilly, B.T., Rogers, K.G., Savian, J.F., Schwenk, T., Selkin, P.A., Weber, M.E., Williams, T., and Yoshida, K., 2016. Site U1452. In France-Lanord, C., Spiess, V., Klaus, A., Schwenk, T., and the Expedition 354 Scientists, Bengal Fan. Proceedings of the International Ocean Discovery Program, 354: College Station, TX (International Ocean Discovery Program). http://dx.doi.org/10.14379/iodp.proc.354.106.2016