France-Lanord, C., Spiess, V., Klaus, A., Schwenk, T., and the Expedition 354 Scientists
Proceedings of the International Ocean Discovery Program Volume 354
publications.iodp.org
doi:10.14379/iodp.proc.354.107.2016

Site U14531
C. France-Lanord, V. Spiess, A. Klaus, R.R. Adhikari, S.K. Adhikari, J.-J. Bahk, A.T. Baxter, J.W. Cruz, S.K. Das, P. Dekens, W. Duleba, L.R. Fox, A. Galy, V. Galy, J. Ge, J.D. Gleason, B.R. Gyawali, P. Huyghe, G. Jia, H. Lantzsch, M.C. Manoj, Y. Martos Martin, L. Meynadier, Y.M.R. Najman, A. Nakajima, C. Ponton, B.T. Reilly, K.G. Rogers, J.F. Savian, T. Schwenk, P.A. Selkin, M.E. Weber, T. Williams, and K. Yoshida2
Keywords: International Ocean Discovery Program, IODP, Expedition 354, JOIDES Resolution, Site U1453, Bengal Fan
MS 354-107: Published 7 September 2016
Site summary
Site U1453 (proposed Site MBF-4A) is in the center of our seven-site transect of shallow-penetration holes. It is located at 8°0.42′N, 86°47.90′E in a water depth of 3690.5 m. Combined with the other transect sites, Site U1453 will document depocenter migration and quantify overall sediment delivery to 8°N since the Pleistocene.
Site U1453 is located ~1 km south and ~5 km east of a prominent surficial channel. The channel exhibits pronounced meandering point bars and internal terraces. Sediment transported by this channel has therefore significantly influenced deposition at this site during the channel’s lifetime. A prominent buried point bar is located <1 km west of the site. The overall seismic reflectivity at the drill site is relatively high, indicating coarse material throughout most of the drilled section, except for the lower portion of the drill hole. Distinct and variable local spillover deposits were expected at the site in response to the channel and meander evolution. Toward the base of the hole, lower seismic reflectivity and distinct layering is inferred to reflect hemipelagic or distal levee deposition.
In addition to coring, downhole logging was introduced as an important objective of Site U1453 after attempts to log at Sites U1450 and U1451 were unsuccessful. Logging data are essential for determining the inventory of lithofacies and structures in the fan given the limitations in completely recovering unconsolidated coarse material and the importance of measuring in situ physical properties and imaging fine-scale sedimentary structures. Therefore, we decided to log Hole U1453A despite its shallow ~215 m penetration to increase chances that we could acquire this critical in situ log data. This was particularly important for characterizing the in situ properties of thick sandy intervals that half-length advanced piston corer (HLAPC) cores returned as loose and liquefied sand.
Principal results
Site U1453 contributes to the overall seven-site transect drilled during Expedition 354. When integrated with the seismic profile and refined chronostratigraphic data from the remaining part of the transect, this site will document fan construction processes and the depocenter migration time frame. Specifically, Site U1453 provides an almost completely recovered succession of silt- and/or sand-dominated sheeted units related to the formation and evolution of a large meandering channel system lacking a distinct levee unit. Intercalation of these sheets with thinner levee units either from the large channel or from nearby smaller channels may help us understand why the channel has been apparently maintained in this position for a relatively long time period. This type of configuration is part of the different processes that influence interlevee deposition. A few thin hemipelagic layers are also observed between sandy turbiditic units, which may indicate that sheeted sedimentation was restricted to short time periods only and was not always followed by an erosional and levee formation phase. The interval cored between 144 and 159 m core depth below seafloor (CSF-A) represents an expanded hemipelagic unit dated between 0.8 and 1.2 Ma. Fan sedimentation intensified between 800 and 300 ka, the basal age of the overlying hemipelagic unit at the surface. Accordingly, fan deposits grew by 100 m in 500 ky, equivalent to an average sedimentation rate of 20 cm/ky.
The successful acquisition of the expedition’s only downhole log data will allow detailed comparison of how well the fine-scale (centimeter to decimeter) structure in the formation has been preserved in cores. Particularly, the proportion of sand in the formation versus the amount recovered by coring will help calibrate sedimentary records from other sites.
Analyzing some graded variations within the sandy units using magnetic susceptibility data from both cores and downhole data shows that despite the HLAPC coring process and curatorial procedures (vertical settling of sands) the average physical properties still match with in situ data and can hence be used to characterize the formation. This match confirms that cored structureless sand truly reflects, on average, the sand unit at depth even though several meter thick sand cores were recovered with the HLAPC system, which apparently did not fully penetrate the formation.
Operations
In Hole U1453A, advanced piston corer (APC) and HLAPC coring penetrated the seafloor to 172.9 m CSF-A, except for one 5 m interval advanced without coring. Most of the coring was done with the HLAPC system. However, the APC system was used for the uppermost four cores and one deeper core around 145 m CSF-A when we attempted to recover a hemipelagic layer in a single core. From 172.9 to 215.7 m CSF-A, the hole was deepened with HLAPC cores alternating with five 4.8 m advances without coring. Hole U1453A penetrated 186.7 m, of which 164.8 m was cored with 88% recovery.
After coring was completed, we collected downhole logging data with two tool strings (triple combo and Formation MicroScanner [FMS]-sonic). Logging was very successful with good hole conditions and reached the full depth of the hole.
Lithostratigraphy
The overall lithology of Site U1453 is similar to that of other Expedition 354 sites in that it is dominated by mica- and quartz-rich sand, silt, and clay turbidites separated by bioturbated nannofossil-rich calcareous oozes and occasional glassy volcanic ash layers. Turbidite sequences at Site U1453 represent cycles of channel-levee activity and abandonment that constructed the fan. The base of the section contains thick sand units, which are most likely sheet deposits from nearby channels. Above these sands, a moderately thick (~15 m) section of calcareous clay indicates a time when channel activity and coarse detrital supply to this area of the fan was reduced. The middle of the section contains a 127 m thick interval of fine sand interbedded with mud turbidites and occasional calcareous clay beds, suggesting onset and waxing and waning of proximal channel activity and levee building. The stratigraphic section is topped with 10 m of calcareous clay, indicating reduced turbiditic input.
Biostratigraphy
Calcareous nannofossil and planktonic foraminiferal biostratigraphic analyses were conducted at Site U1453 on 37 samples and resulted in the identification of 4 biomarker events. The sedimentary succession at Site U1453 extends to the early Pleistocene. As with other sites, planktonic foraminiferal assemblages are characteristic of tropical–subtropical environments. Foraminiferal preservation ranges from poor to good in samples where they occur, and fragmentation of planktonic foraminifers ranges from light to severe. As at Site U1452, the last occurrence (LO) of the foraminiferal biomarker Globorotalia tosaensis (0.61 Ma) was found at a shallower depth than the nannofossil biomarkers Emiliania huxleyi (0.29 Ma) and Pseudoemiliania lacunosa (0.44 Ma), indicating that this foraminifer was either reworked or has a longer duration in the Indian Ocean. Foraminiferal biostratigraphy was limited at this site because of the large section of sands recovered from Cores 354-U1453A-10F through 28F, in which samples are either barren of foraminifers or have a very rare occurrence (<0.1%). The LO of the nannofossil Helicosphaera sellii (1.26 Ma) is found at approximately 116 m CSF-A. However, the Brunhes/Matuyama boundary (0.781) is found at 152 m CSF-A, indicating that either H. sellii was reworked or has a longer duration in the Indian Ocean. This discrepancy was observed at several Expedition 354 sites and will be further studied in postexpedition work.
Paleomagnetism
The Brunhes/Matuyama boundary and both boundaries of the Jaramillo and Cobb Mountain Subchrons were identified at Site U1453 in hemipelagic calcareous clay units between ~142 and 160 m CSF-A. A ~180° change in declination associated with a thin ash layer is interpreted as the Brunhes/Matuyama boundary (152.59 m CSF-A). Changes in declination also clearly delineate the Jaramillo and Cobb Mountain Subchrons (155.76–156.71 and 157.99–158.23 m CSF-A, respectively) in calcareous clay deposits at Site U1453.
Physical properties
Physical property data were acquired on all Hole U1453A cores, including density, magnetic susceptibility, P-wave velocity, natural gamma radiation (NGR), and thermal conductivity. Physical property data at Site U1453 are mostly of good quality and reflect lithologic variations. Using the principal lithologic name from the core description to assign five lithologies (sand = ~73 m, silt = ~11 m, clay = ~45 m, calcareous clay = ~23 m, and volcanic ash), we calculated their minimum, maximum, and average physical properties. Wet bulk densities are rather uniform for terrigenous sediment (sand, silt, and clay), ranging from 1.89 to 1.96 g/cm3. Calcareous clay has the lowest densities (1.62 g/cm3), followed by volcanic ash (1.68 g/cm3). P-wave velocities are highest in sand (1666 m/s on average) and lowest in silt and clay (~1530 m/s). Magnetic susceptibilities are also highest in sand (109 × 10–5 SI), followed by silt (90 × 10–5 SI) and clay (56 × 10–5 SI). The lowest values occur in calcareous clay (20 × 10–5 SI). NGR is high throughout the terrigenous components sand, silt, and clay (around 70 counts/s) and low in calcareous clay (43 counts/s). Thermal conductivity is highest in sand (1.82 W/[m·K]) and lowest in calcareous clay (1.17 W/[m·K]).
Downhole logging
The triple combo (magnetic susceptibility, NGR, and resistivity) and FMS-sonic velocity tool strings were run in Hole U1453A. The hole was filled with 12 lb/gal heavy viscous mud to inhibit borehole wall collapse. In contrast to our previous logging attempts, logging was successful with a single run of the triple combo tool string and two runs of the FMS-sonic tool string to the bottom of the hole at 220 m wireline log depth below seafloor (WSF). The hole diameter varied between 9 and 14 inches with only a few washout zones.
Downhole measurements of magnetic susceptibility and NGR match the equivalent core measurements well and permit preliminary interpretation of lithology based on the log data in the intervals where core was not recovered. The FMS resistivity images in particular provide a good record of the depth and thickness of the sand beds in the hole. Sand-rich cores were sometimes fluidized when recovered, but the log data could confirm that the sands in the 9.5 m core came from the same 9.5 interval in the hole and that compositional trends over several cores were similar in core and log data. Additionally, downhole P-wave velocities are higher than those measured in the laboratory, reflecting in situ conditions in the borehole.
Geochemistry
The close proximity of a channel incising deeper than 100 m CSF-A, associated with the variable dip angle of the formations, provided the opportunity to investigate a subseafloor hydrology that is potentially more affected by lateral flow than other drill sites. Based on sulfate and alkalinity data, a well-defined boundary between two hydrologic units is observed around 30 m CSF-A. However, this formation is very similar to what was observed at Sites U1449 and U1452, implying that the proximity of the channel does not affect the hydrology at this site.
Pleistocene turbidites are characterized by carbonate content of 0.8 to 5.9 wt%, and hemipelagic calcareous clays have an average carbonate content of 25.9 wt%. For turbidites, these characteristics are similar to what is observed in modern Ganga-Brahmaputra river sediments and the uppermost 150 m at Sites U1449–U1452 and Deep Sea Drilling Project (DSDP) Site 218. Total organic carbon (TOC) content in turbidites averages 0.7 wt% and covaries with bulk-sediment Al/Si ratios, reflecting the preferential association of organic matter with clays that is documented in both the modern Ganga-Brahmaputra river system and in active channel-levee sediments in the Bay of Bengal deposited over the past 18 ky. Bulk geochemical composition closely matches that observed at Sites U1449–U1452 and in modern sediments in the Ganga-Brahmaputra river system. Samples offset from the main trends are from hemipelagic units and suggest the occurrence of Fe-rich clays and/or a low K/Al subpopulation, possibly reflecting a different terrigenous input or an effect of particle sorting.
Background and objectives
Site U1453 (see Figures F3, F4, and F8 in the Expedition 354 summary chapter [France-Lanord et al., 2016d]) is located along the seven-site transect of ~200 m penetration drilled during Expedition 354 to study the evolution of the Middle Bengal Fan at 8°N. In combination, these sites will provide a complete inventory of Pleistocene fan architecture and evolution in the 300 km long central segment of the Bengal Fan. Seismic data along the transect reveal characteristic structures and patterns of fan deposition related to channel-levee systems (Schwenk and Spiess, 2009).
The objectives of this site were to provide characteristics of lithologies building the structural and depositional elements of the fan and to estimate accumulation rates related to different depositional processes. Combined with other transect sites, this site should document depocenter migration and quantify overall sediment delivery to 8°N since the Pliocene.
Multibeam bathymetry (Figure F1) shows Site U1453 adjacent to an abandoned channel trending northeast–southwest. The site is only ~5 km east and ~1 km south of this channel. The channel exhibits pronounced meandering, point bars, and internal terraces. Sediment transported by this channel has therefore significantly influenced deposition at this site during the channel’s lifetime.

Figure F1. Bathymetric and track chart, Site U1453. Projection is UTM Zone 45N. Multibeam bathymetry was acquired during R/V Sonne Cruises SO125 and SO188.
The portion of the 300 km long transect seismic profile across Site U1453 is shown in Figure F2. A prominent buried point bar is located <1 km west of the site between 4.957 and 5.052 s two-way traveltime (TWT), indicating that meandering of the channel was even more pronounced than what is visible at the surface. Overall reflectivity at the drill site is relatively high, except for the lower portion of the drill hole where we infer a higher contribution of silt onto the levee due to the proximity to the channel and its position near a channel bend. Distinct and variable local spillover deposits were expected at the site in response to channel evolution. Several thinner units between 4.97 and 5.1 s TWT reveal variable geometry, indicating shifting of the channel and associated changes in directions of sediment delivery. Deeper than 5.1 s TWT, lower reflectivity and distinct layering may reflect hemipelagic or distal levee deposition; this unit accumulated prior to the formation of the adjacent surficial channel and was incised by it.
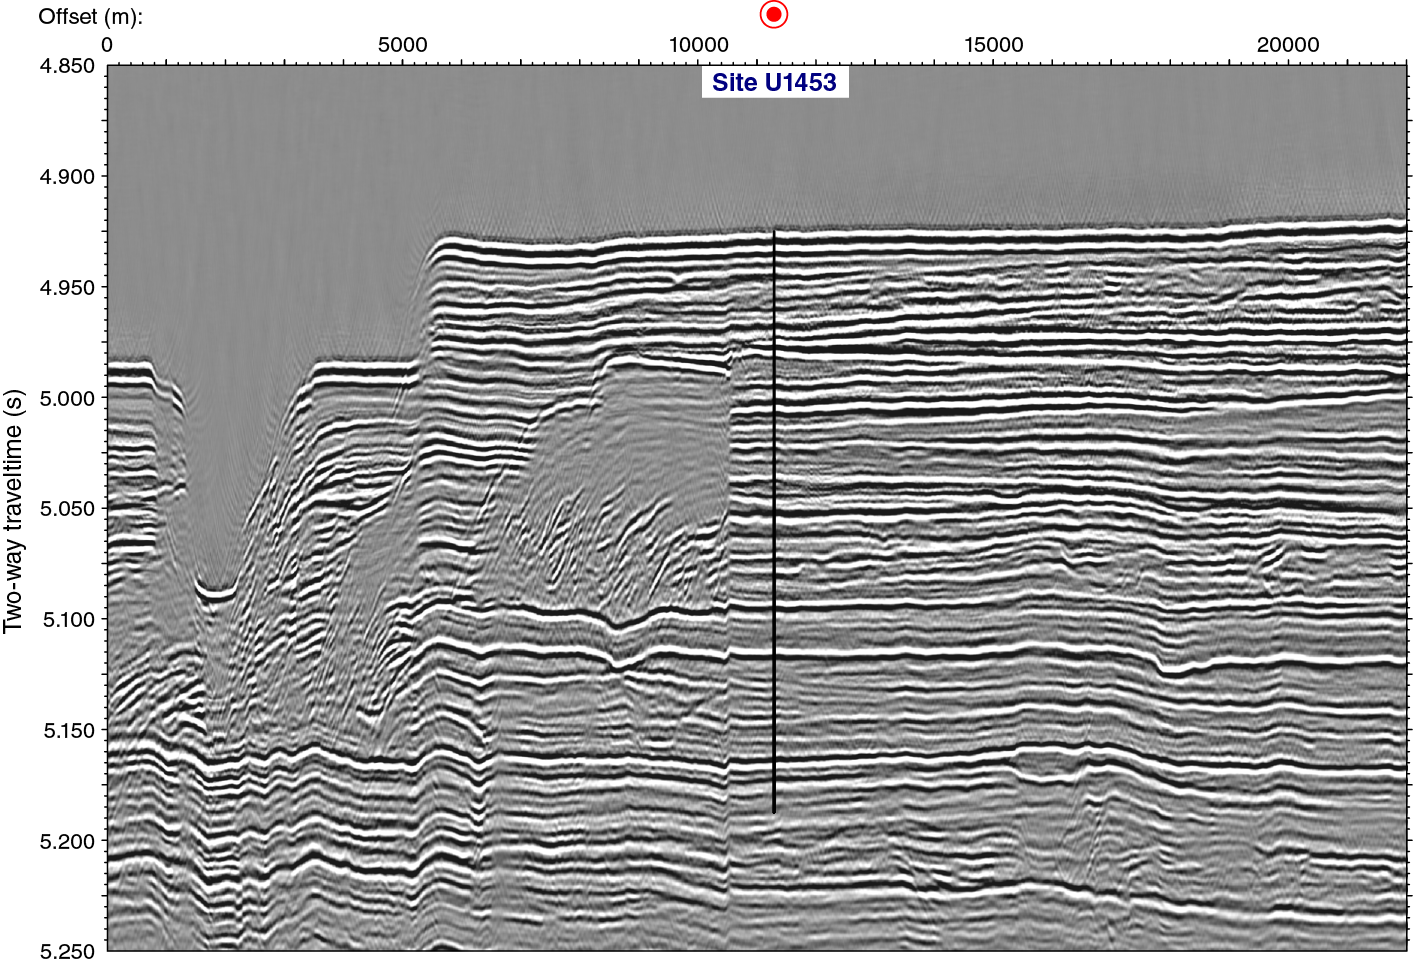
Figure F2. Seismic Line SO125-GeoB97-027 across Site U1453. Total depth is 215.7 m DSF, assuming an average velocity of 1640 m/s.
Operations
At Site U1453, we cored with the APC and HLAPC systems to 215.7 m drilling depth below seafloor (DSF). In this interval, 37 cores penetrated 186.7 m and recovered 164.78 m of sediment (88%). Six short (4.8 or 5.0 m) intervals were advanced without coring. All cores, penetration depths, core recovery, and time recovered on deck are presented in Table T1. After coring was completed, we collected downhole logging data with two tool strings (triple combo and FMS-sonic). Logging was very successful with good hole conditions and reached the full depth of the hole.
Table T1. Site U1453 core summary. Download table in .csv format. View PDF table.
Hole U1453A
After a short 23 nmi transit, we arrived at Site U1453 at 2145 h on 14 March 2015. We assembled an APC coring bottom-hole assembly (BHA) and lowered it to the seafloor. We used an 9.875 inch polycrystalline diamond compact (PDC) coring bit with a lockable float valve (LFV) so that we would have a smaller diameter hole for improved log data if hole conditions allowed. Nonmagnetic hardware was used for all cores (drill collar and core barrels). We finished lowering the drill string to the seafloor and started coring in Hole U1453A at 1020 h on 15 March. Except for one 5 m interval advanced without coring, APC and HLAPC coring penetrated from the seafloor to 172.9 m DSF (Cores 1H–34F) and recovered 148.84 m of core (89%). The HLAPC system was used for all cores except for the first four (1H–4H) and one deeper core (29H; 142.4–149.4 m DSF) that targeted a hemipelagic layer; these were cored with the APC system. The rest of the coring in Hole U1453A (172.9–215.7 m DSF) consisted of four HLAPC cores alternating with five 4.8 m advances without coring. Cores 36F–42F penetrated 18.8 m and recovered 15.94 m of sediment (85%). The majority of piston cores at this site were partial strokes. Orientation was attempted on all APC cores.
After the primary coring objectives were achieved, at 0715 h on 17 March we started preparing the hole for downhole logging. We circulated 25 barrels of mud to clean cuttings out of the hole. To ensure the LFV was functioning properly for logging, we also activated it with a go-devil and an extended core barrel (XCB) barrel. After filling the hole with 180 barrels of 12.0 lb/gal mud, we raised the bit up to logging depth (78.5 m DSF). The triple combo logging string was assembled, and we began lowering it down the drill string at 1200 h on 17 March. At ~2170 m drilling depth below rig floor (DRF) with the drill pipe well above the seafloor, the string began losing weight. We inferred it had encountered the weighted mud, so we circulated the mud down to the seafloor and resumed lowering the logging tool string. Log data were collected to the full depth of the hole and indicated good hole conditions. After the triple combo was recovered, we ran the FMS-sonic tool string, which also reached the bottom of the hole. The tool string was back on the rig floor just before midnight on 17 March, and the rig floor was cleared of all equipment by 0055 on 18 March. It took us ~45 min to free the pipe from the formation, and the bit cleared the seafloor at 0200 h. We retrieved the drill string, secured the rig floor, raised the thrusters, and departed for Site U1454 at 1130 h on 18 March.
Lithostratigraphy
At Site U1453, one hole (U1453A) was cored to a total depth of 210.9 m DSF (cored interval: 186.7 m with 88% recovery). The overall dominant lithology for Site U1453 (85% of total recovered material) is siliciclastic and composed of fining-upward sequences of fine sand, silt, and clay (i.e., turbidites), as well as structureless sands (likely due to the coring process) and mixed silt-clay layers. Calcareous clay constitutes the remaining 15%, and volcanic ash represents only 0.1% of the overall lithology.
Recovered sediments from Site U1453 are divided into four lithostratigraphic units based on lithologic characteristics from macroscopic description, smear slide analyses, and physical property measurements (Figure F3).
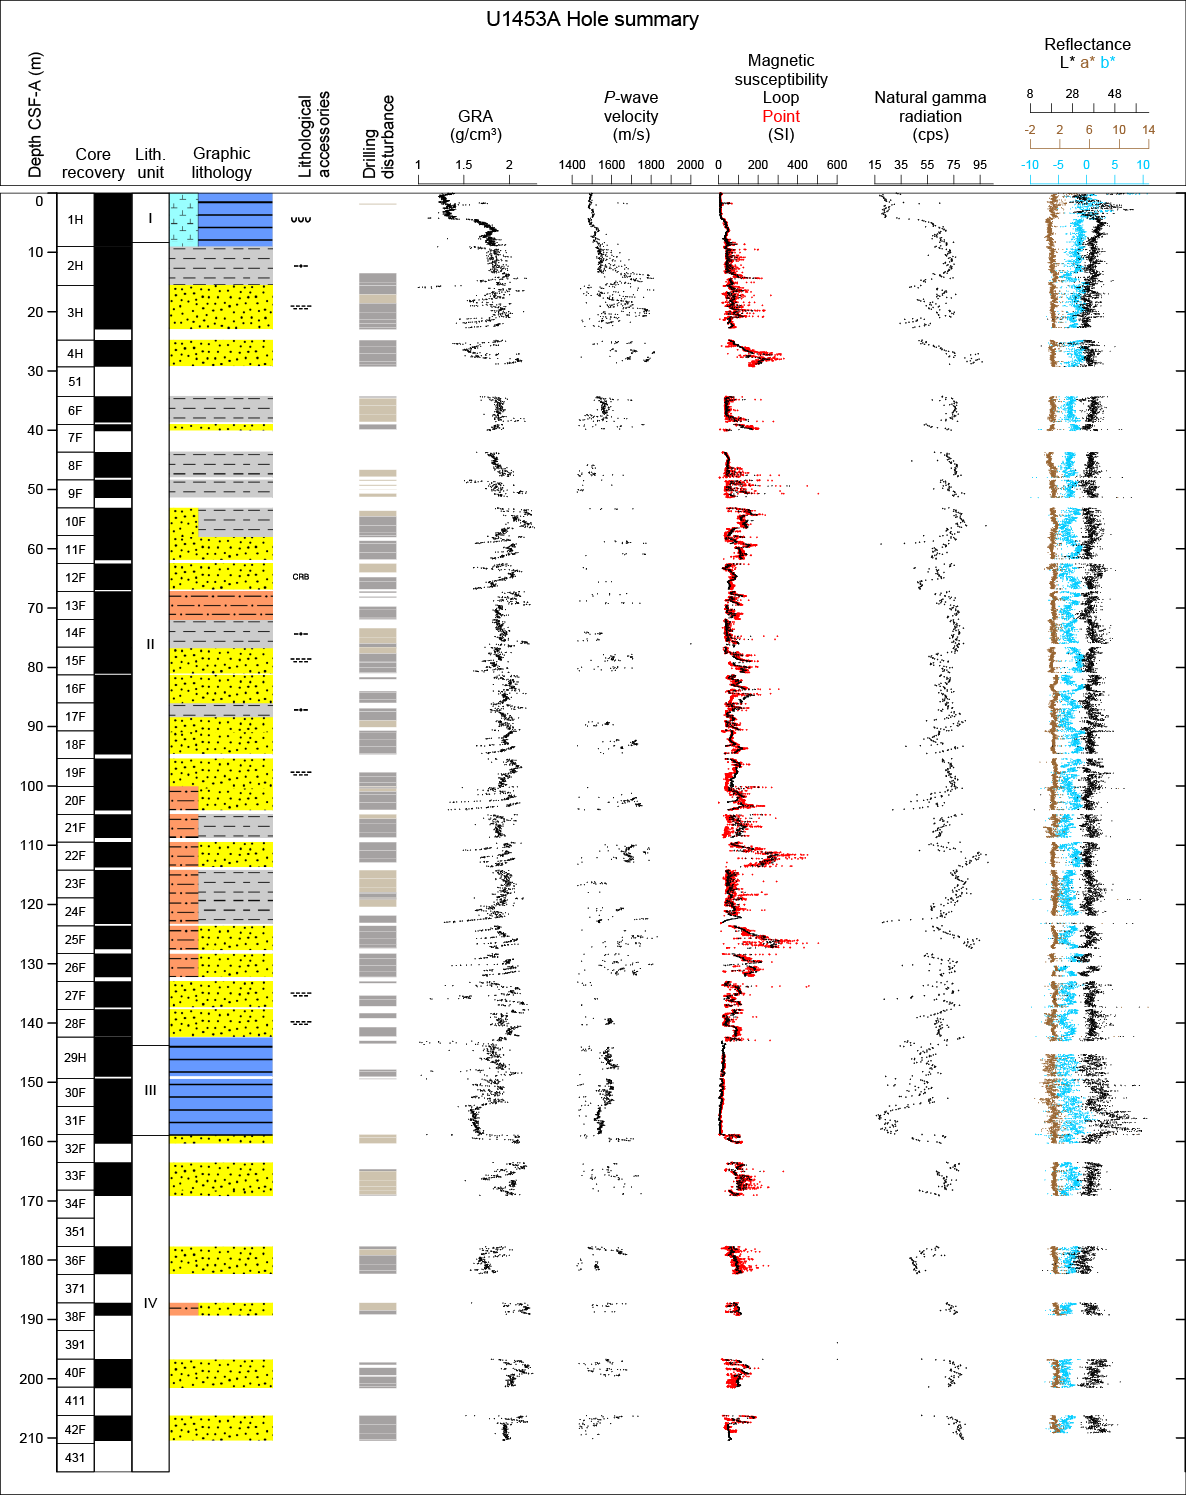
Figure F3. Lithostratigraphic summary, Hole U1453A.
Unit summaries
Summaries of individual units are presented here, with more detailed descriptions in the following sections.
Unit I is dominated by bioturbated and mottled nannofossil-rich calcareous clay and contains a single medium to thick bed containing silt turbidite sequences. This unit also contains a volcanic ash layer composed of fine sand-sized glass particles.
Unit II contains fine sands overlain by mud turbidites, with a few intervals of calcareous clay.
Unit III is predominantly bioturbated calcareous clay with a few silt interbeds. Thin volcanic ash was recorded from 152.64 to 152.71 m CSF-A.
Unit IV is dominated by “soupy” fine sands and successions of sand and mud turbidites and contains one interval of calcareous clay.
Lithostratigraphic summary
Lithologic differences between siliciclastic units and variations in grain size and bed thickness reflect cycles of proximal turbidity current channel activity, including activation, flow-stripping, avulsion, and abandonment (Table T2). Sand units may reflect interlevee sheet flow deposition (e.g., Curray et al., 2003), whereas fine-grained sequences represent levee deposits. The uppermost calcareous clay–dominant unit contains a 23 cm thick bed of volcanic ash from 1.66 to 1.79 m CSF-A, presumably from the Toba volcanic eruption at 75.0 ka ± 0.9 ky (e.g., Mark et al., 2014). A second thin (6 cm) volcanic ash layer was observed in Unit III (152.64–152.71 m CSF-A).
Table T2. Intervals, depths, major and minor lithologies, and ages of units, Site U1453. Download table in .csv format.
Overall, siliciclastic units (silt, clay, and sand) at Site U1453 are compositionally classified as mica rich (muscovite and biotite) and quartz rich. Sands occur mostly in fine to medium grain size ranges with rare occurrences of coarse-grained particles. Feldspars and heavy minerals (e.g., tourmaline, apatite, zircon, amphibole, garnet, sphene, rutile, chrome spinel, zoisite, glauconite, sillimanite, chloritoid, and opaque minerals) are common in silt- and sand-rich layers.
The nomenclature for lithologic descriptions of fine sediments containing carbonate consists of a principal name and a modifier based on the composition estimated from visual description of the cores and from smear slide observations. The principal name of sediment that appears to contain >75% carbonate is calcareous ooze (see Figure F4 in the Expedition 354 methods chapter [France-Lanord et al., 2016a]). The principal name of sediment that appears to contain <10% carbonate is clay. If sediment contains a mixture of clay-sized siliciclastic particles and calcareous components (i.e., carbonate contents between 10% and 75%), the principal name is calcareous clay. This nomenclature was adopted to describe the continuum of sediments recovered from almost pure clay to almost pure calcareous ooze. In most cases, lithologic names assigned using this protocol match well with measured carbonate content and accurately reflect the continuum of sediments recovered at this site. Examples can be seen in Figures F6 in the Site U1451 chapter (France-Lanord et al., 2016b) and F5 in the Site U1452 chapter (France-Lanord et al., 2016c).
Drilling disturbances at this site vary in intensity from slight to high and include flow-in, up-arching, soupy texture, and fall-in. Flow-in is the most common drilling disturbance in fine-grained intervals, whereas sands may display a structureless (or soupy) texture. Core sections containing water-rich, loose, soupy sands were vertically settled on the catwalk and then normally curated, and as a result any grading or structures in these cores may be artificial and not described here (Table T3). See Figure F6 in the Expedition 354 methods chapter (France-Lanord et al., 2016a) for a more detailed description and graphic examples of drilling disturbance types.
Table T3. Core sections containing sand that were vertically settled on the core receiving platform, Site U1453. Download table in .csv format.
Unit I
- Interval: 354-U1453-1H-1, 0 cm, to 1H-6, 110 cm
- Depth: 0–8.30 m CSF-A
- Age: Middle–Late Pleistocene to recent
- Lithology: nannofossil-rich calcareous clay (major); volcanic ash (minor)
Description
Unit I is dominated by 4.5 m of dark gray to greenish white nannofossil-rich calcareous clay with abundant burrows and mottling (Figure F4A). Light brown coloration of the uppermost 24 cm indicates oxidation close to the seafloor. A light brown volcanic ash layer occurs at 1H-2, 46–59 cm (Figure F4B). A blob of ash at 1H-2, 77–83 cm, might have originated from coring disturbance at the base of the ash layer. It does not seem to constitute a continuous depositional layer across the core. Interval 1H-2, 59–177 cm, is affected by drilling and shows up-arching.
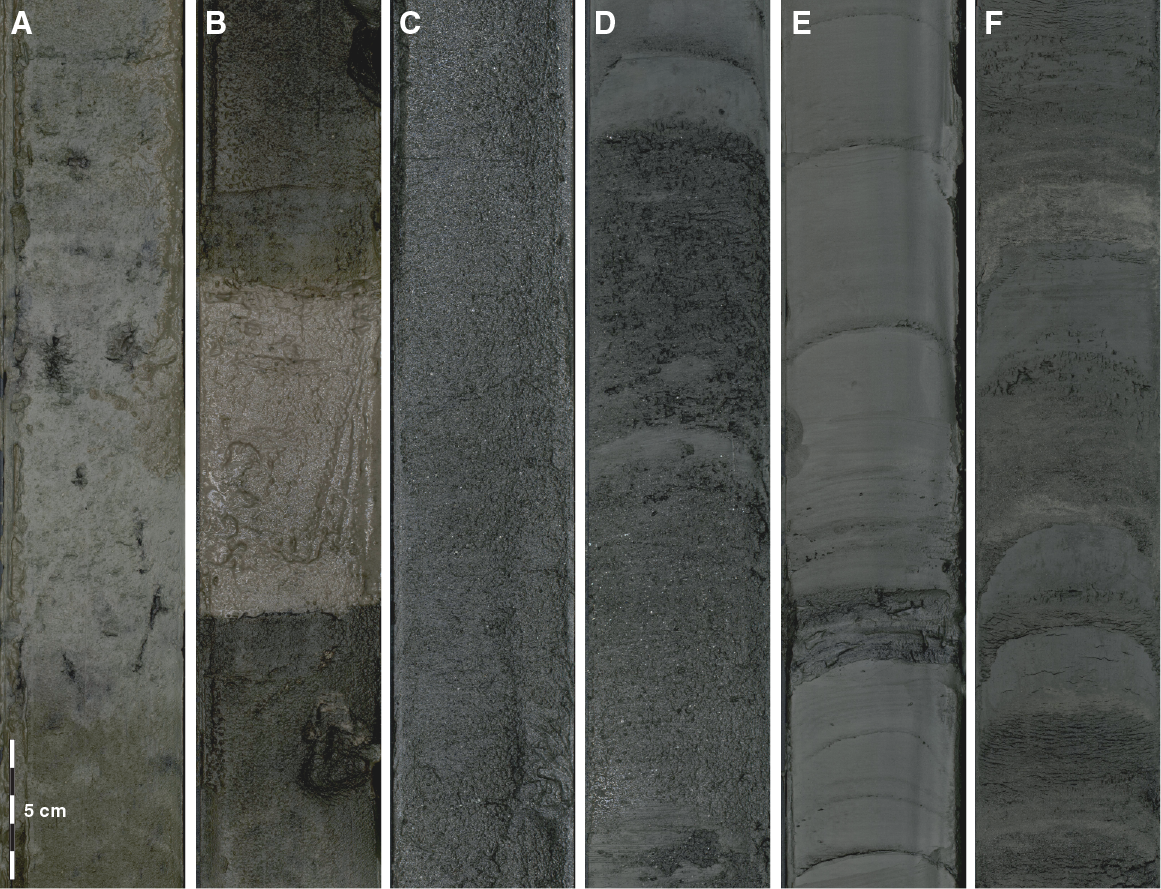
Figure F4. Representative examples of major lithologies recovered in Hole U1453A. A. Nannofossil-rich calcareous clay. B. Volcanic ash. C. Homogeneous fine sand. D. Silt-dominated turbidites. E. Succession of clay-dominated turbidites. F. Gray calcareous clay, gray silt, and light gray silt.
Composition from smear slides
See Figure F5 for representative smear slide images.
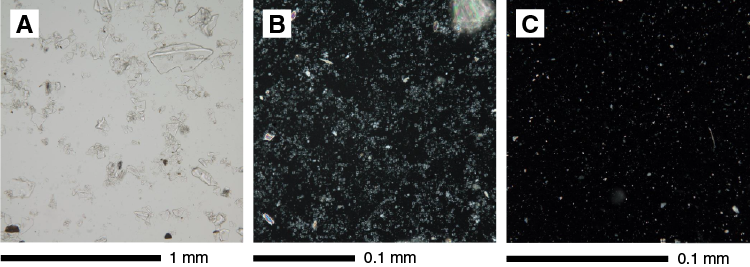
Figure F5. Representative examples of major lithologies in smear slides, Hole U1453A. A. Volcanic ash. B. Nannofossil-rich calcareous clay. C. Silty clay. Notice the absence of nannofossils compared to B.
Calcareous clay
Clay-sized detrital grains, clay minerals, and nannofossils make up the major proportion (70%–90%) of this lithology, and diatoms, radiolarians, and silt grains comprise the minor proportion. Occasionally, a minor amount of foraminifers (up to 10%) occur.
Volcanic ash
Smear slides from the ash layers mainly consist of volcanic glass shards 0.01–0.30 mm in diameter and very minor amounts of biotite, quartz, and feldspar. Volcanic glass appears in the form of clear plates, flakes, and strands, with a relatively low refractive index (1H-2, 58 cm; 1.78 m CSF-A). The volcanic glass proportion is typically 90%–97% of total grains.
Unit II
- Interval: 354-U1453A-1H-7, 0 cm, to 29H-2, 74 cm
- Depth: 8.30–143.77 m CSF-A
- Age: early to Middle–Late Pleistocene
- Lithology: fine sand, silt, clay (major); calcareous clay (minor)
Description
Unit II consists of several intervals that display dark gray soupy fine sand beds (Figure F4C) overlain by successions of dark gray silt fining upward into gray clay. The thickness of the silt and clay beds varies considerably, but the thickness of silt interbeds generally decreases upward from medium (10–30 cm) to very thin (1–3 cm) (Figure F4). Both clay and silt beds frequently display parallel laminations. Sharp basal contacts are restricted to silt beds, and mud clasts appear in fine sand beds. Taking all characteristics into account, Unit II consists of homogeneous (turbiditic?) fine sands overlain by mud turbidite successions with upward decreasing thickness of silt interbeds. Frequently occurring drilling disturbances are flow-in from the core bottom and up-arching. Intervals featuring higher carbonate contents (nannofossil-rich calcareous clay) occur at 12F-1, 65–95 cm, 17F-CC, 0–23 cm, and 20F-1, 0–2 cm, and from 21F-2, 22 cm, to 21F-3, 91 cm.
Composition from smear slides
See Figure F5 for representative smear slide images.
Calcareous clay
Calcareous clay mainly contains clay-sized detrital grains, clay minerals, and calcareous nannofossils. Occasionally, radiolarians, foraminifers, and carbonate minerals are recorded.
Clay and silty clay
Both lithologies contain predominantly clay minerals and minor amounts of silt-sized grains (27F-1, 33 cm; 133.33 m CSF-A and 8F-1, 60 cm; 44.30 m CSF-A) and occasional plant fragments.
Silty sand and sandy silt
Silty sand and sandy silt layers consist primarily of quartz, feldspar, lithic fragments, mica, and heavy minerals. Heavy minerals such as garnet, zircon, amphibole, apatite, tourmaline, sphene, sillimanite, apatite, zoisite, clinozoisite, and opaque minerals are present. Occasionally, organic material such as plant debris is found (25F-3, 81 cm; 126.59 m CSF-A). The maximum grain size is 0.55 mm in diameter (17F-4, 43 cm; 90.53 m CSF-A and 96F-1, 80 cm; 136.88 m CSF-A).
Unit III
- Interval: 354-U1453A-29H-3, 0 cm, to 31F-CC, 34 cm
- Depth: 143.77–159.06 m CSF-A
- Age: early Pleistocene
- Lithology: calcareous clay (major); volcanic ash, clay, silt (minor)
Description
Unit III mainly consists of calcareous clay with mottling and abundant burrows. Intervals 30F-2, 103–108 cm, and 30F-3, 94–100 cm, contain light gray silt interbeds (Figure F4F). These layers represent well-sorted silt beds rich in quartz and feldspar. A light brown to greenish volcanic ash was observed at 30F-3, 24–31 cm. The lower boundary is sharp, and the upper boundary is bioturbated. The greenish color of the basal part of the volcanic ash might indicate enrichment in smectite. Coring disturbance is generally low in Unit III, with the exception of interval 29H-6, 0 cm, to 29H-7, 84 cm, which was heavily disturbed by flow-in from the core bottom.
Composition from smear slides
See Figure F5 for representative smear slide images.
Volcanic ash
The ash layer mainly consists of volcanic glass shards 0.01–0.25 mm in diameter and very minor amounts of quartz, plagioclase, biotite, and opaque minerals. Volcanic glass has mainly platy and strand shapes. The volcanic glass proportion is typically 90%–98% of the total grains (30F-3, 2 cm; 152.69 m CSF-A).
Calcareous clay
Smear slides of this white and gray lithofacies contain mainly calcareous nannofossils and a subordinate amount of clay minerals (31F-1, 6 cm; 154.76 m CSF-A).
Silt
This lithology contains well-sorted grains of quartz, feldspar, lithic fragments, mica, and heavy minerals (29H-5, 29 cm; 147.06 m CSF-A).
Unit IV
- Interval: 354-U1453A-32F-1, 0 cm, to 42F-CC, 20 cm
- Depth: 158.80–210.47 m CSF-A
- Age: early Pleistocene
- Lithology: fine sand (major); silt, clay, calcareous clay (minor)
Description
Unit IV mostly consists of dark gray homogeneous soupy fine sands. Successions of either fine sand or dark gray silt fining upward into gray clay occur frequently throughout Unit IV. Sharp lower boundaries and normal grading indicate deposition from turbidity currents. These fine-grained beds are up-arching as a result of drilling disturbance. Calcareous clay was observed at 40F-1, 0–19 cm, and likely represents fall-in of sediments from the previously drilled sediment interval.
Composition from smear slides
See Figure F5 for representative smear slide images.
Sand
Sand layers in the upper part of this unit consist of quartz, feldspar, mica, and lithic fragments. Heavy minerals, mainly opaque minerals and minor amphibole, tourmaline, and zoisite, are recorded. Occasionally, euhedral carbonate minerals are found. Section 32F-2, 45 cm (159.82 m CSF-A), contains a higher percent of lithic grains (20%) and carbonate materials (5%) than the other sections. Maximum grain size measurement is 0.64 mm in diameter (32F-2, 45 cm; 159.82 m CSF-A).
Sandy silt
Sandy silt consists primarily of quartz, feldspar, lithic fragments, mica, and heavy minerals consisting predominantly of amphibole, garnet, clinozoisite, zoisite, epidote, pyroxene, tourmaline, zircon, rutile, sphene, chromian spinel, and opaque minerals. This lithofacies also contains amphibole mica schist fragments. The maximum grain size is 0.59 mm in diameter (40F-2, 89 cm; 206.6 m CSF-A).
Maximum grain size
Maximum grain size was determined at approximately 6 m intervals at Site U1453. In each case, the coarsest and/or thickest lithology in the individual core (generally from the base of the coarsest turbidite) was chosen for smear slide analysis, and the largest five equant detrital grains (quartz and feldspar) were measured. Results of the analysis are shown in Figure F6. The maximum grain size ranges from 0.18 to 0.64 mm (fine sand to coarse sand) and corresponds to the silty sand layer at the base of Unit III. However, background values throughout the sequence show that fine sand–sized material was able to reach the fan setting at Site U1453 via turbidity currents at least since the Late Pleistocene.

Figure F6. Maximum grain size, Hole U1453A.
XRD
Clay minerals were extracted from representative lithologies (sand, silt, clay, and calcareous clay).
The observed clay mineral assemblages from Site U1453 are mainly composed of illite, chlorite/vermiculite, smectite/mixed layers, and kaolinite (Figure F7). Illite and chlorite/vermiculite are the dominant clay minerals in all lithologies: calcareous clay, clay, and sand samples (average = 60%–65% and 20%, respectively). The clay assemblage observed at Site U1453 in the different lithologies does not show any evolution with depth (Figure F6), suggesting relatively stable sources and/or turbiditic transport processes. No change in clay mineralogy was observed in the calcareous clay deposits, except a higher smectite content of up to 22% in the sample featuring the highest carbonate content (52%; see Geochemistry and microbiology). In conclusion, this assemblage appears similar to the contemporaneous illite-chlorite–rich clay assemblage documented in the distal fan (Ocean Drilling Program [ODP] Leg 116) and modern rivers flowing from the Himalaya (Bouquillon et al., 1990).
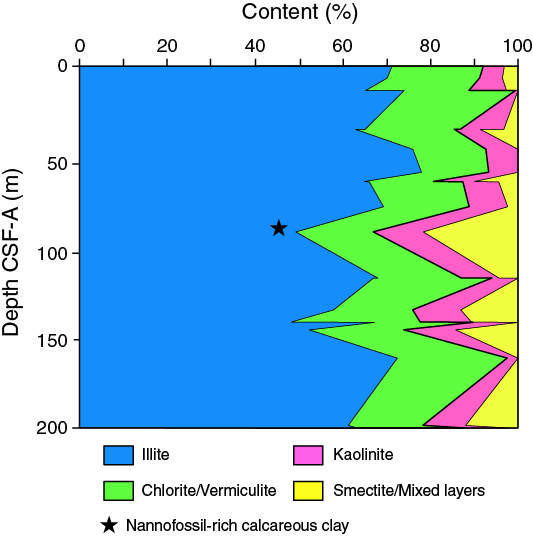
Figure F7. Semiquantitative clay mineral proportions, Site U1453.
Biostratigraphy
Calcareous nannofossils and planktonic foraminifers provide biostratigraphic constraints at Site U1453 (Tables T4, T5). Four biomarkers were identified at this site; they are listed in Table T6 and integrated into the figures in Stratigraphic synthesis.
Table T4. Calcareous nannofossils, Site U1453. Download table in .csv format.
Table T5. Planktonic foraminifer group and species abundance, Site U1453. Download table in .csv format.
Table T6. Biostratigraphic age datums and midpoint calculations, Site U1453. Download table in .csv format.
Calcareous nannofossils
The distribution and abundance of calcareous nannofossils are shown in Table T4. Calcareous nannofossil assemblages were observed in 37 samples from Site U1453. Preservation is moderate to good, and group abundance ranges from very few to very abundant.
The sediments at Site U1453 contain a recent to early Pleistocene sequence and are differentiated into three nannofossil zones. Zone NN21 is based on the first occurrence (FO) of Emiliania huxleyi in Sample 354-U1453A-3H-CC. Zone NN20 is a gap zone between the FO of E. huxleyi and the LO of Pseudoemiliania lacunosa. P. lacunosa was observed in Sample 9F-CC, marking the top of Zone NN19.
Planktonic foraminifers
The planktonic foraminifer biostratigraphy for Site U1453 is generated by analysis of core catcher samples. As with other sites, planktonic foraminiferal assemblages are characteristic of tropical–subtropical environments. The sedimentary succession at this site ranges from Subzone PT1b (Late Pleistocene) to Zone PT1a (early Pleistocene) and agrees with the nannofossil biostratigraphy. In total, 36 samples were analyzed, and of those 11 were barren and composed of sand. Foraminiferal preservation ranges from poor to good in samples where foraminifers occur, and fragmentation of planktonic foraminifers ranges from light to severe. The group and species abundances of planktonic foraminifers are shown in Tables T5.
Assemblages are dominated by Neogloboquadrina dutertrei, Globigerinoides ruber, Globorotalia tumida, and Pulleniatina obliquiloculata, with rare Globigerina bulloides and Orbulina universa. No major faunal turnovers occur during this short time interval, and benthic foraminifers remain rare throughout (Table T5). The LO of Globorotalia tosaensis was found in Sample 354-U1453A-2H-CC. Although this species marks the Zone PT1b/PT1a boundary, the fact that it is found above a younger nannofossil microfossil (Table T6) indicates either that G. tosaensis was reworked or that the extinction of this species occurs at a younger age in the Indian Ocean.
Paleomagnetism
Paleomagnetic analyses at Site U1453 focused mainly on identifying magnetic polarity reversals and linking them to the geomagnetic polarity timescale (Gradstein et al., 2012) and on identifying intervals suitable for shore-based paleomagnetic work. All cores were collected with nonmagnetic APC or HLAPC barrels. Cores 354-U1453A-1H-4H and 29H were oriented using the Icefield MI-5 tool.
Archive section halves from 17 Hole U1453A cores were measured using the shipboard superconducting rock magnetometer (SRM). Section-half remanent magnetization was measured after 0, 15, and 20 mT alternating field (AF) demagnetization at 5 cm intervals, except in cores identified as predominantly calcareous clay, where a 2.5 cm interval was used. Sections where the sediment was sandy, watery, or heavily disturbed by the coring process were not measured. Magnetic polarity interpretation below is based on remanence vectors measured after 20 mT AF treatment; sandy, soupy, and deformed intervals; section edges; and core tops are not interpreted (see Paleomagnetism in the Expedition 354 methods chapter [France-Lanord et al., 2016a]).
A total of 13 discrete samples were collected to supplement data from archive section halves. Sample locations were chosen in fine-grained intervals where drilling deformation was minimal or not visible. Three samples were taken in calcareous clay sediment from Core 29H. Samples were measured on the JR-6A spinner magnetometer after 0, 10, 15, 20, 25, 30, 35, 40, 50, 60, and 80 mT AF treatments.
Results
Paleomagnetic results from both section-half and discrete measurements are presented in Figures F8 and F9 and Tables T7 and T8. Similar to Sites U1449–U1452, both positive and negative inclinations are present in Hole U1453A. A vertical overprint, likely imparted by the drilling process, is in most cases demagnetized by AF demagnetization in peak fields of 10 mT (Figure F8). After 20 mT AF demagnetization, the median inclination is close to that expected from a geocentric axial dipole (GAD) given the site’s present-day location (median observed = 17.8°; expected = 15.7°). Several discrete samples acquired either a gyroremanent magnetization (GRM) or an anhysteretic remanent magnetization (ARM) in peak AF treatments above 60 mT.
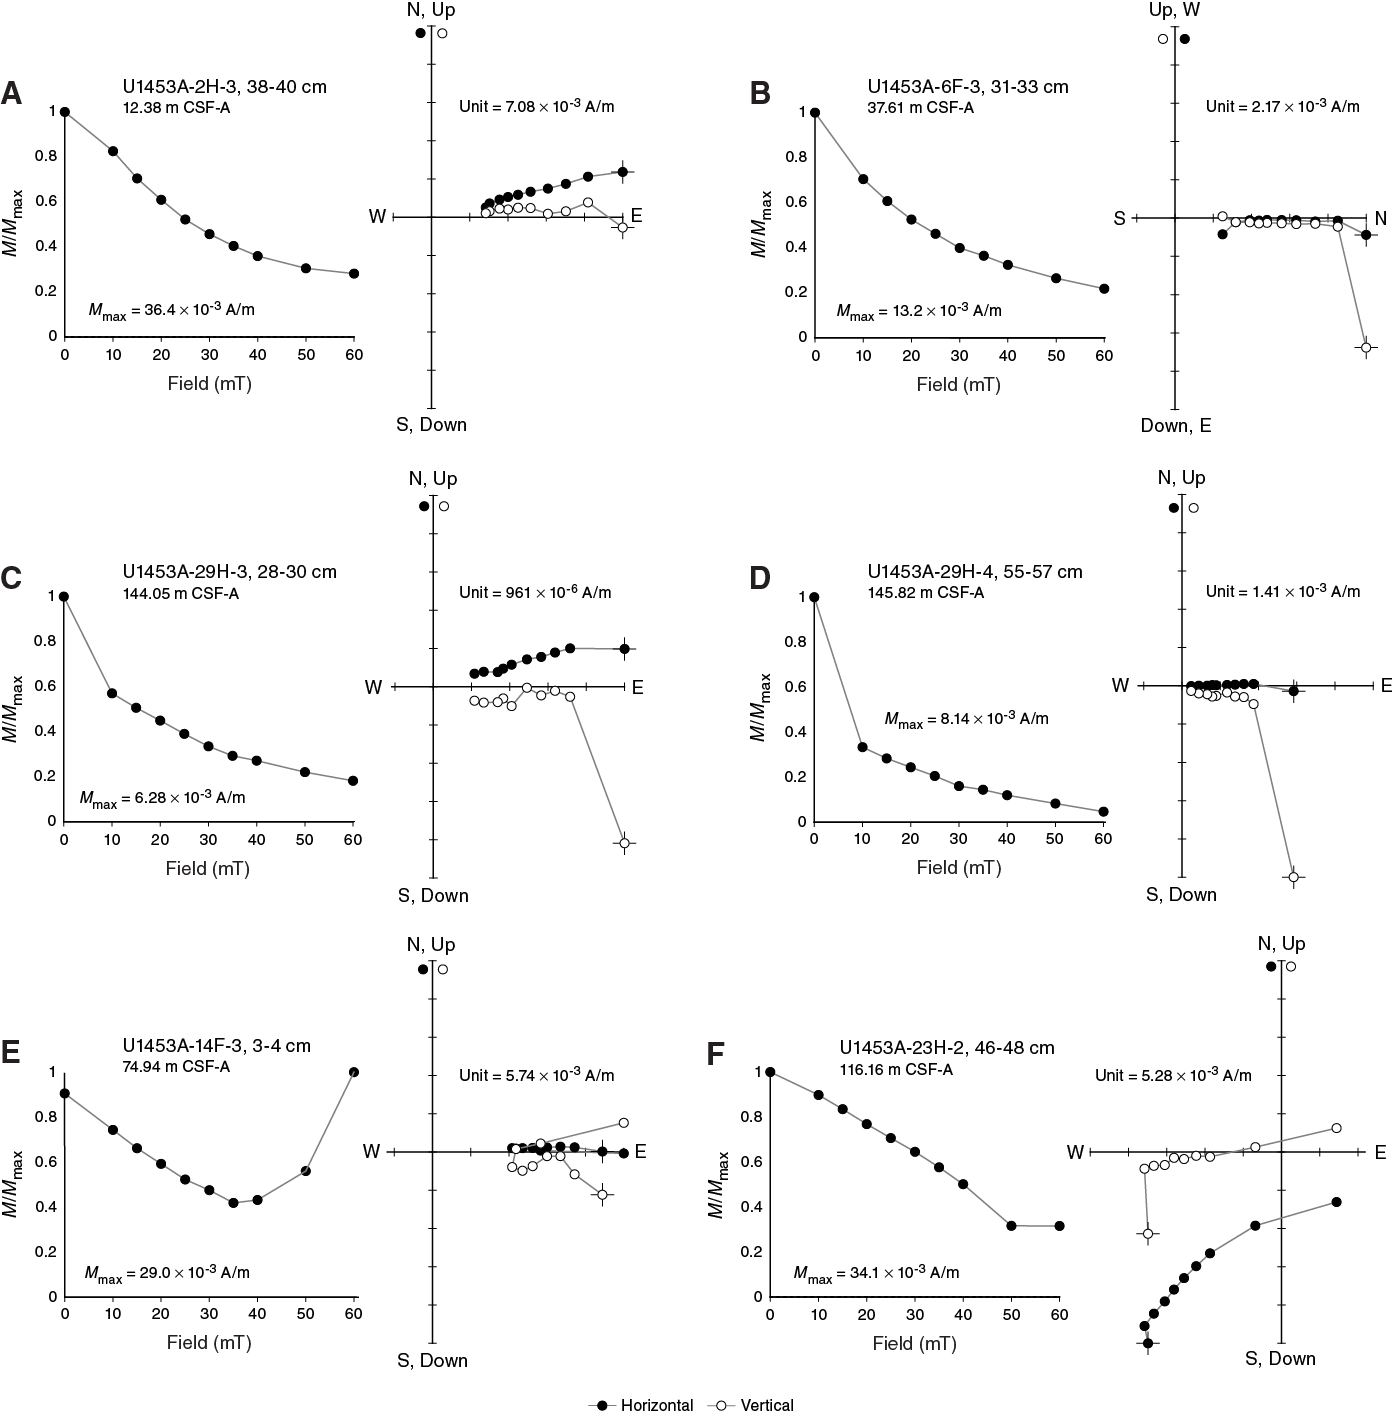
Figure F8. NRM decay (left) and AF demagnetization vector (right) diagrams of discrete samples, Site U1453.
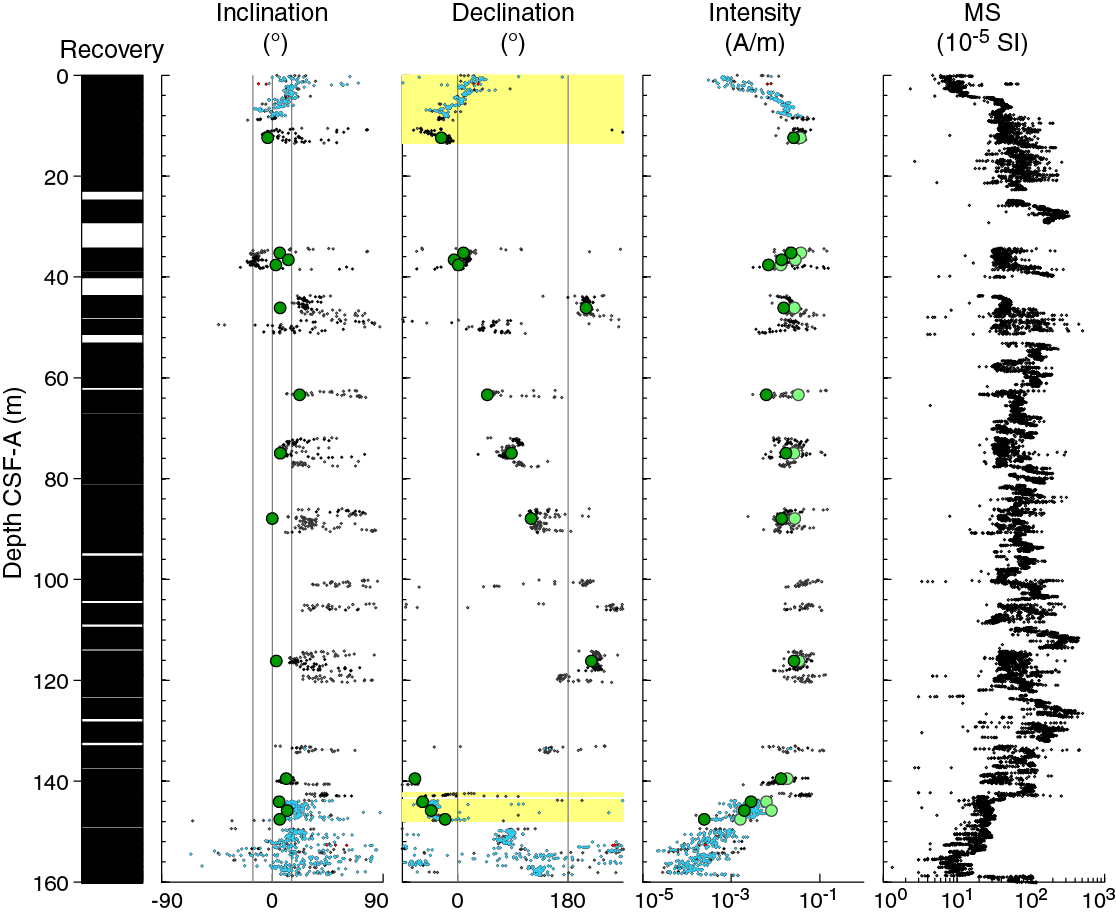
Figure F9. NRM of archive section halves and discrete samples before and after 20 mT AF demagnetization, Hole U1453A.
Table T7. ChRM of discrete samples, Site U1453. Download table in .csv format.
Table T8. Orientation data, Hole U1453A. Download table in .csv format.
Calcareous clay, which comprises a relatively large fraction of Cores 1H and 29F–31F, is associated with low natural remanent magnetization (NRM) intensities in section halves (lithologic terms here refer to lithology descriptions; see Lithostratigraphy), following the pattern observed in Hole U1451A. Median NRM intensities in calcareous clay are 5.6 × 10⁻³ A/m, compared to 5.5 × 10⁻² A/m for all other non-sand lithologies (principally clay and silt). NRM intensities of the limited number of sand intervals measured are substantially higher (8.6 × 10⁻² A/m). Calcareous clay from Hole U1453A loses a greater fraction of its NRM after 20 mT AF demagnetization (93%) than do sand (83%) or other lithologies (58%). We interpret these differences as variable concentration of a low-coercivity magnetic phase that acquires a strong drilling overprint. Regardless of lithology, sediments from Site U1453 lose a greater proportion of their NRM after 20 mT demagnetization than do those from Site U1452. Based on AF demagnetization of discrete samples, coercivities are consistent with magnetite and/or titanomagnetite as the principal NRM carrier. The specific magnetic mineralogy will be assessed during postexpedition work.
Magnetostratigraphy
Sediments from oriented Cores 1H–4H and 29H that pass our quality criteria (see Paleomagnetism in the Expedition 354 methods chapter [France-Lanord et al., 2016a]) have ChRM directions after 20 mT demagnetization with declinations close to present-day magnetic north (Fisher [1953] mean declination = 340°).
Core 31F contains mixed polarity and can be correlated with the calcareous clay interval observed at roughly the same depth in Cores 354-U1450A-36F and 354-U1452B-37F and at somewhat shallower depths in Cores 354-U1449A-18F and 354-U1451A-13F. Four polarity reversals can be identified in Core 354-U1453A-31F on the basis of changes in declination (Figure F10; Table T9). We identify the bottom two as the upper and lower boundaries of the Cobb Mountain Subchron (C1r.2n; 1.173–1.185 Ma; Gradstein et al., 2012). Although there is considerable high-frequency variability in the declination in the top section of Core 354-U1452B-31F, a reversed to normal transition and a normal to reversed transition can be identified using the Cobb Mountain Subchron as a reference for normal polarity. We identify these as the boundaries of the Jaramillo Subchron (C1r.1n; 0.988–1.072 Ma).
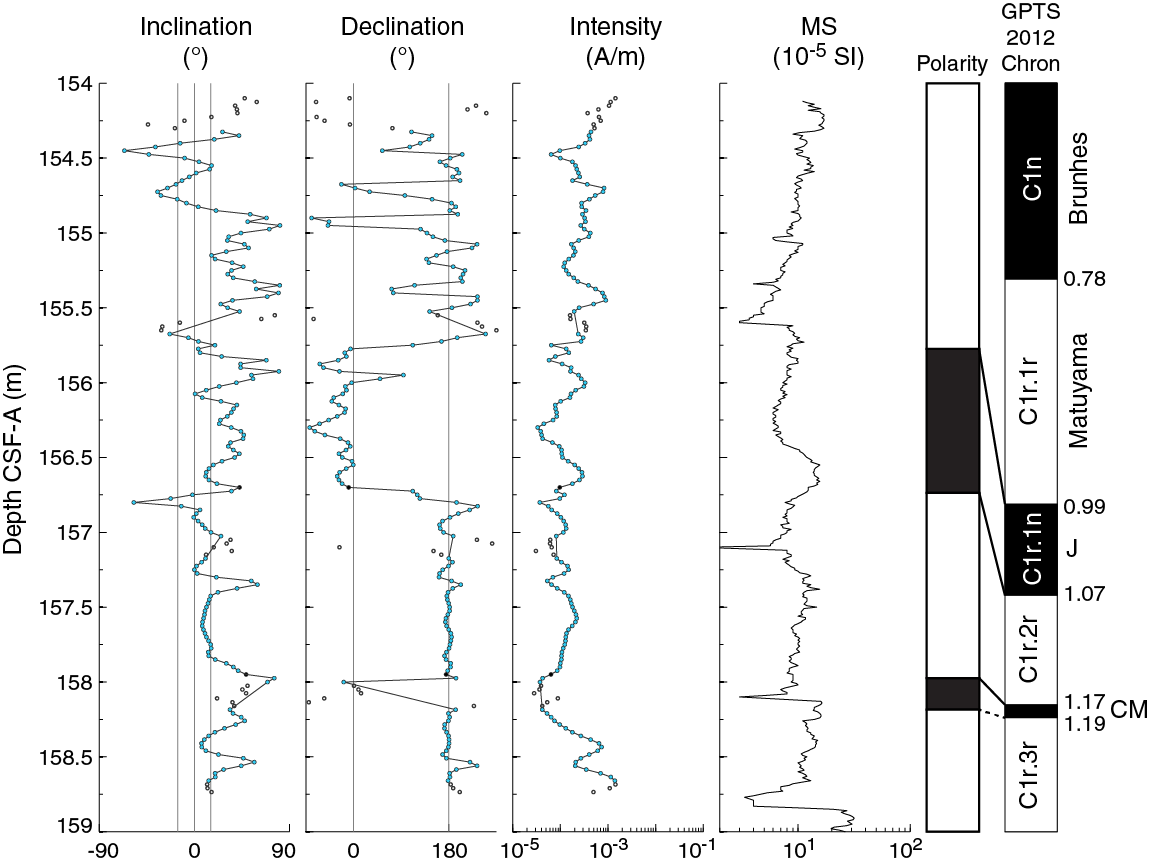
Figure F10. Polarity interpretation, Core 354-U1453A-31F.
Table T9. Magnetostratigraphy, Hole U1453A. Download table in .csv format.
As observed at Sites U1449, U1451, and U1452, a polarity change associated with an ash layer occurs in Section 354-U1453A-30F-4. We interpret this ash as Ash D of Dehn et al. (1991) and the polarity reversal as the Brunhes/Matuyama boundary (C1n-C1r; 0.781 Ma).
Geochemistry and microbiology
Hydrocarbon gas sampling and analysis
Headspace gas samples were taken at a frequency of one sample per core in Hole U1453A as part of the routine safety monitoring program (Table T10). Low methane concentrations (≤2 ppmv) were observed above 29 m CSF-A. From 37 m CSF-A to the bottom of the hole, methane concentrations ranging from 1,019 to 15,000 ppmv were observed. Relatively low concentrations of 174 and 243 ppmv were measured at 40 and 127 m CSF-A, respectively. Both of these samples were sandy intervals sampled from the core catcher. A quantifiable concentration of 0.4 ppmv propane was observed at 75 m CSF-A.
Table T10. Methane concentrations, Hole U1453A. Download table in .csv format.
Interstitial water sampling and chemistry
A total of 15 samples from Hole U1453A were analyzed for interstitial water chemistry (Table T11), and 6 samples were obtained by Rhizon samplers when sediments were soft enough. The close proximity of a channel incising deeper than 100 m CSF-A associated with a variable angle of the dip direction of the formation relative to the channel makes this site particularly suitable for investigating the possible hydrologic impact of lateral flow and seawater intrusion (for permeable formations dipping from the channel to Hole U1543A) or formation water extrusion (flow in the opposite direction). Based on the rate of change of cation and anion content with depth and changes in their covariations, two hydrologic units are distinguished at Site U1453 (Figure F11). The boundary between the two units is well defined between 18 and 36 m CSF-A by the peak of alkalinity and the decline of sulfate content below 1 mM. In the upper portion of the sediment column (0–30 m CSF-A), biogenic processes release dissolved phosphate and consume sulfate. Together with sulfate reduction, a corresponding increase in alkalinity and decrease in Ca and Mg results from carbonate formation from biogenic reactions that generate alkalinity. Salinity is within 0.5 of the values found in the uppermost unit at Sites U1449–U1452 and barely changes in this unit, except for a 2% drop at 13 m CSF-A seen in all other major dissolved species irrespective of their absolute concentration with respect to seawater (Figure F11). Such a spike is likely to be a 2% dilution by freshwater and an analytical artifact. The lower unit is characterized by negligible sulfate content. Similar to Sites U1449–U1451, this unit is characterized by a decline in magnesium and potassium concentrations, an overall decline in phosphate content, and high alkalinity content. Calcium content is lower than that in seawater and the upper unit, whereas pore water dissolved silica content is consistently low at this site (<500 μM). The location of the boundary between the two hydrologic units at Site U1453 (around 30 m CSF-A) and the depth profiles of sulfate content and alkalinity are very similar to what was observed at Sites U1449 and U1452, implying there is not much local hydrologic effect related to the close proximity of a channel.
Table T11. Interstitial water geochemical data, Hole U1453A. Download table in .csv format.

Figure F11. Variations of salinity, bromide, sulfate, phosphate, alkalinity, magnesium, calcium, sodium, potassium, and silicon concentrations in interstitial waters, Hole U1453A.
Bulk-sediment geochemistry
Inorganic carbon
Total inorganic carbon (TIC) concentrations were determined on 20 sediment samples from Hole U1453A (Table T12; Figure F12). TIC values expressed as weight percent calcium carbonate (CaCO3), assuming inorganic carbon is exclusively present as CaCO3, range between 0.8 and 51.6 wt%. Turbiditic sediments are characterized by low carbonate content (0.8–5.9 wt%; average = 3.8 wt%). Within turbidites, no systematic covariation between grain size—as inferred from Al/Si ratios (Lupker et al., 2012)—and carbonate content was observed. Comparable features and carbonate content have been observed in modern Ganga-Brahmaputra river sediments (Lupker et al., 2012) and sediments from the uppermost 150 m at Sites U1449–U1452 and DSDP Site 218 (von der Borch, Sclater, et al., 1974). Hemipelagic deposits (defined as calcareous clay in Lithostratigraphy) have highly variable CaCO3 content, ranging between 1.5 and 52 wt%, and are on average richer in carbonate (average = 25.9 wt%; N = 7) than turbiditic sediments. These data show that hemipelagic sediments can sometimes have CaCO3 content indistinguishable from that of turbiditic sediments.
Table T12. TIC, CaCO3, TC, and organic carbon contents, Hole U1453A. Download table in .csv format.
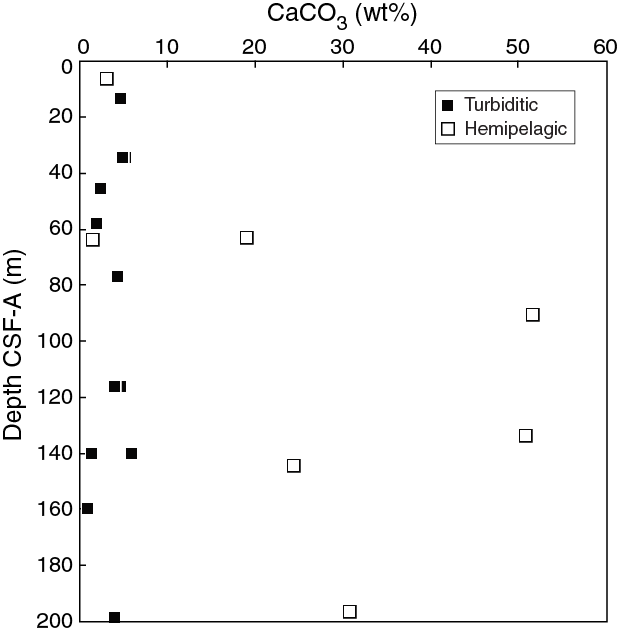
Figure F12. TIC content expressed as CaCO3, Hole U1453A.
Organic carbon
Total carbon (TC) concentrations were determined on 20 sediment samples from Hole U1453A (Table T12). TC values range from 0.1 to 7.1 wt% (average = 2.1 wt%). TOC content, calculated from the difference between TC and TIC, is low (average = 0.7 wt%) and ranges between 0.05 and 2.5 wt% (Figure F13). TOC of hemipelagic lithologies (described as calcareous clay in Lithostratigraphy) is on average elevated (up to 2.5 wt%) compared with turbiditic sediments (Figure F13). In most cases (4 out of 7), however, hemipelagic sediments have TOC values indistinguishable from those of turbiditic sediments. In the latter, TOC is variable, with values ranging from 0.05 to 0.8 wt%, and covaries with the Al/Si ratio (N = 10; not shown), reflecting the preferential association of organic matter with clay that has been previously documented in both the modern Ganga-Brahmaputra river system and in active channel-levee sediments in the Bay of Bengal deposited over the past 18 ky (e.g., Galy et al., 2007).
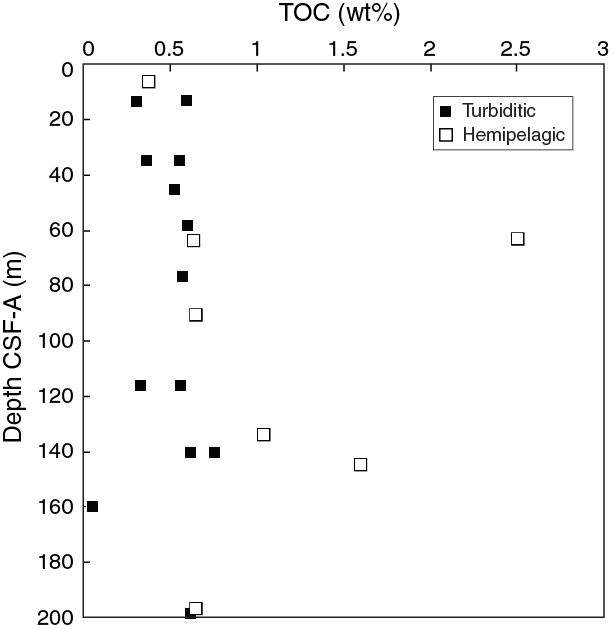
Figure F13. TOC content, Hole U1453A.
X-ray fluorescence results
Two core sections from hemipelagic calcareous clay Unit III (Lithostratigraphy) were scanned at high resolution using hand-held X-ray fluorescence (XRF) for a total of 38 spot analyses (Section 354-U1453A-30F-3, 152.5–153.5 m CSF-A; Section 31F-2, 155.6–156.9 m CSF-A) (Table T13; see Geochemistry and microbiology in the Expedition 354 methods chapter and Geochemistry and microbiology in the Site U1451 chapter [France-Lanord et al., 2016a, 2016b]). The semiquantitative (uncalibrated) Ca abundances in these two core sections measured by XRF range from 0.3 wt% (volcanic ash) to 14.8 wt% Ca (calcareous clay), corresponding to a wide range of calculated carbonate contents (CaCO3 = <2 to ~60 wt%) consistent with the silt, clay, calcareous clay, and ash lithologies present. Section 30F-3 (152.5–153.5 m CSF-A) was scanned at high resolution (17 spot analyses; Table T13) across a 5 cm ash layer associated with the 0.781 Ma Bruhnes-Matuyama polarity reversal (see Paleomagnetism) at 152.7 m CSF-A. The ash layer has distinctive chemistry, as evidenced in a plot of Sr/Ca ratio versus CaCO3 (Figure F14). The ash layer falls off the main trend defined by lithologies in the two measured core sections, which shows a relatively simple binary mixing trend (Figure F14). This mixing relationship is consistent with parallel observations at Sites U1451 and U1452 for mixing between a marine biogenic carbonate end-member and a terrigenous silicate component with a higher Sr/Ca ratio (see Geochemistry and microbiology in the Site U1451 chapter and Geochemistry and microbiology in the Site U1452 chapter [France-Lanord et al., 2016b, 2016c]). Section 31F-2 (155.6–156.9 m CSF-A) was also scanned at high resolution by spot XRF and contains a reversed to normal to reversed transition identified by paleomagnetic stratigraphy as the Jaramillo Subchron (0.988–1.072 Ma; see Paleomagnetism). A peak in Ti, Fe, and K contents occurs at 156.6 m CSF-A within the Jaramillo Subchron (Table T13).
Table T13. Scanned XRF data, Sections 354-U1453A-30F-3 (152.5–153.5 m CSF-A) and 31F-2 (155.6–156.9 m CSF-A). Download table in .csv format.
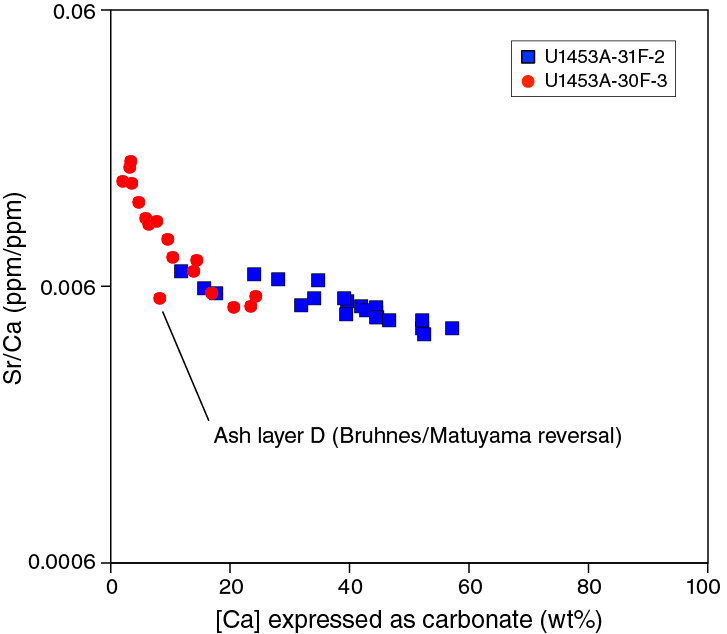
Figure F14. Ca content expressed as carbonate content (wt%) vs. Sr/Ca scanned XRF data plot, Sections 354-U1453A-30F-3 and 31F-2.
ICP-AES results
Major and trace element concentrations were determined on 16 sediment samples from Hole U1453A by inductively coupled plasma–atomic emission spectroscopy (ICP-AES) (Table T14). As at all previous sites, bulk-sediment major and trace element trends correspond closely with lithologic type. The Fe/Si versus Al/Si and K/Si versus Al/Si trends for this data set (Figure F15) closely track those observed at Sites U1449–U1452 and in modern sediments in the Ganga-Brahmaputra river system (e.g., Lupker et al., 2012). Several samples are offset from the main trends, suggesting the occurrence of (1) Fe-rich clays and (2) a low K/Si subpopulation characteristic of smectite-kaolinite-rich samples, similar to the trends observed in 7–1 Ma sediments recovered from ODP Leg 116 (France-Lanord and Derry, 1997). These offset samples suggest the influence of an additional terrigenous source input (e.g., more highly weathered sources) (Figure F15).
Table T14. Major elements and selected trace element contents, Hole U1453A. Download table in .csv format.
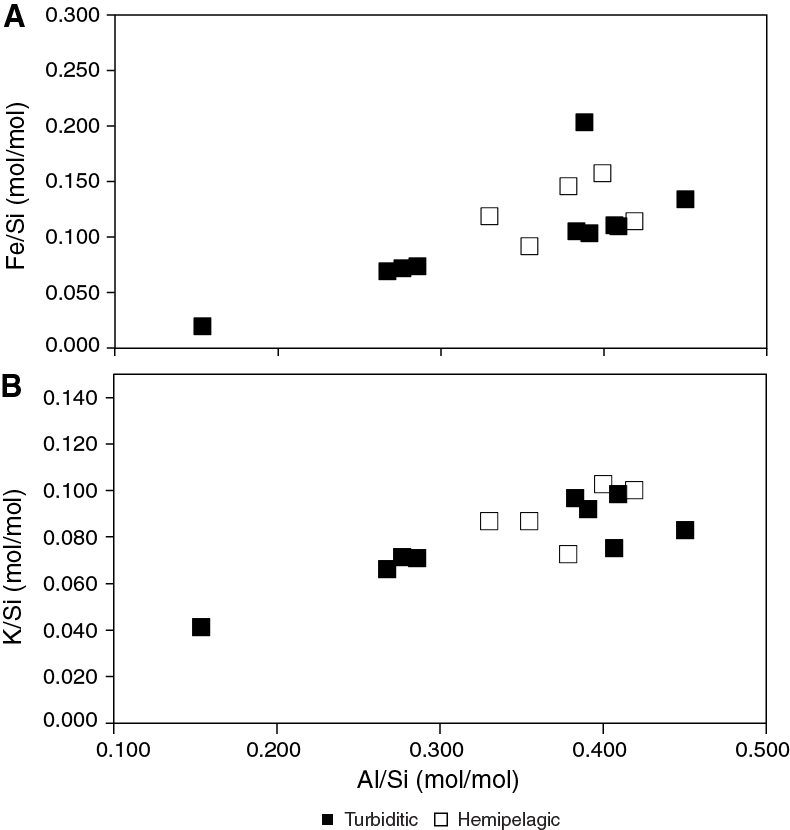
Figure F15. Fe/Si and K/Si vs. Al/Si, Hole U1453A.
Microbiology
A total of 17 whole-round core sections for various microbiological investigations (e.g., prokaryotic cell count, endospore count, hydrogenase enzyme activity measurement, DNA analysis, etc.) were collected shipboard. A microbial cell counting method was initiated shipboard, with further processing of the samples to be performed following the expedition.
Physical properties
Physical property data were acquired on all Hole U1453A cores, including density, magnetic susceptibility, P-wave velocity, NGR, and thermal conductivity (see Physical properties in the Expedition 354 methods chapter [France-Lanord et al., 2016a]). The site was cored with the APC and HLAPC systems to 215.7 m CSF-A and provided good recovery of 164.78 m (80%). Physical property data from Site U1453 are mostly of good quality (Figures F16, F17) and reflect lithologic variations as in previous sites. Using the principal lithologic name from the core description to assign five lithologies (sand, silt, clay, calcareous clay, and volcanic ash; see Lithostratigraphy), we calculated their minimum, maximum, and average physical properties (Table T15).
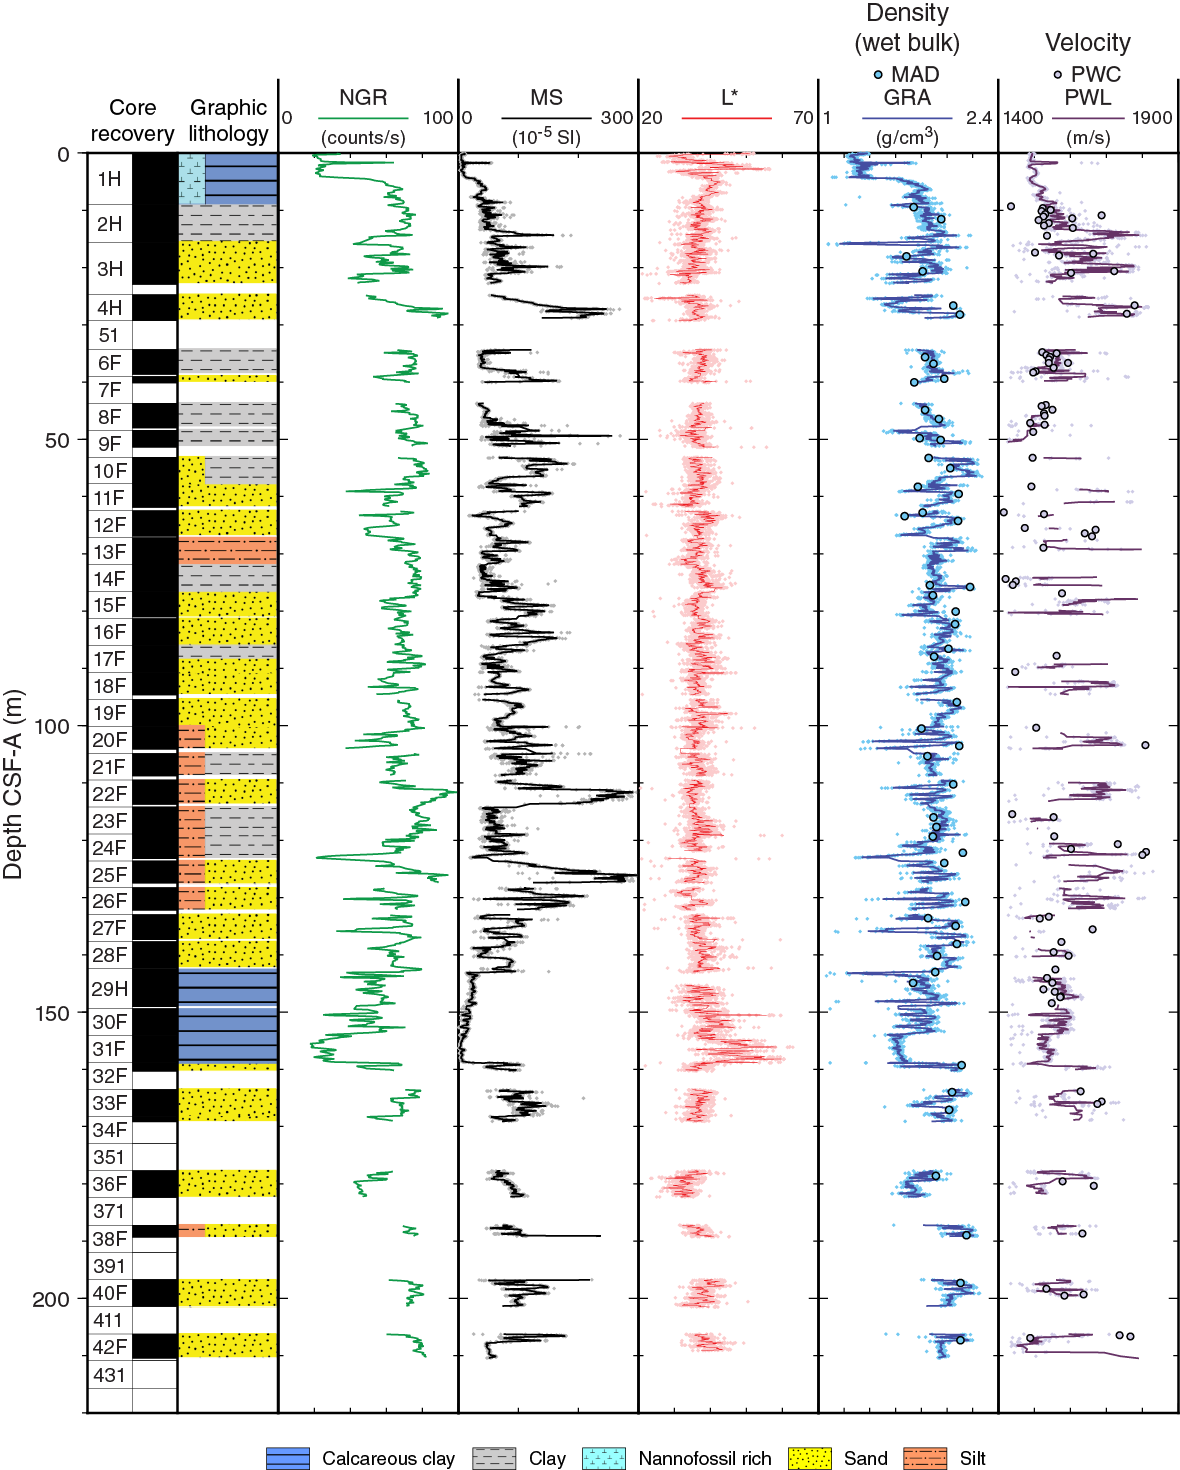
Figure F16. Physical property measurements, Hole U1453A.
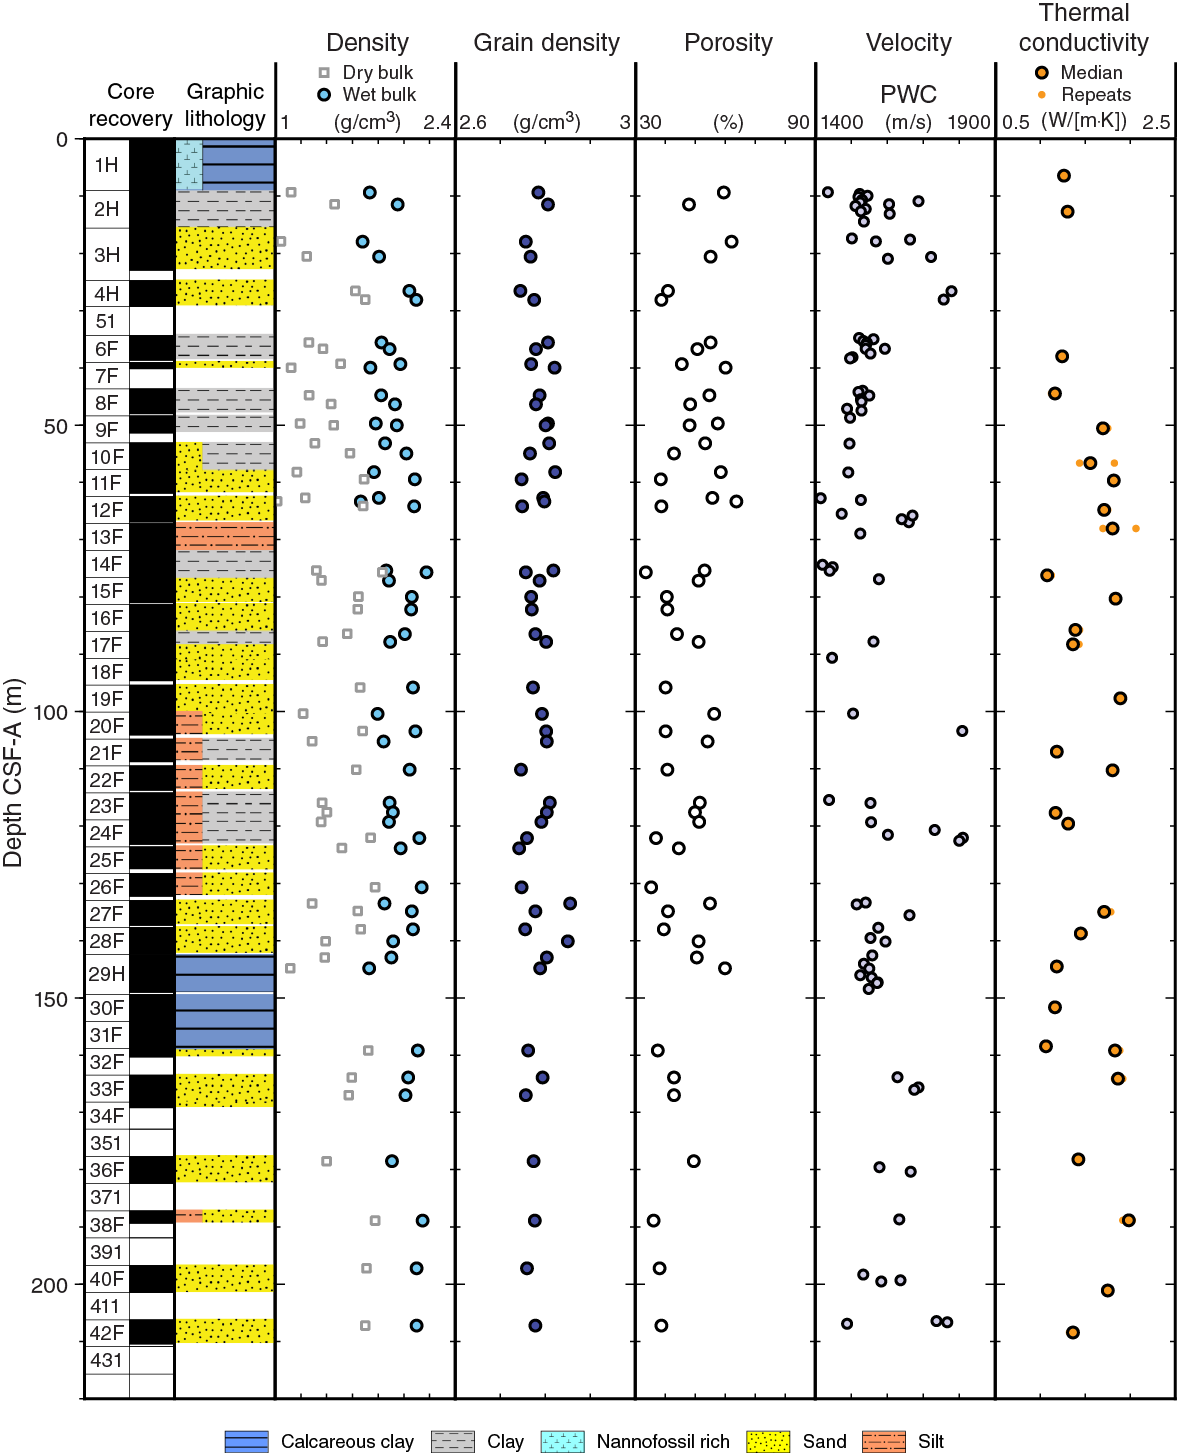
Figure F17. Moisture and density results, Site U1453.
Table T15. Total sediment thickness, percentage of recovered material, and average physical properties with respect to lithology, Site U1453. Download table in .csv format.
The most common principal lithology is sand (~73 m), followed by clay (~45 m), calcareous clay (~23 m), silt (~11 m), and volcanic ash occurring in traces. Measurements are described in detail below, but average values are as follows. Wet bulk densities are rather uniform for terrigenous sediment (sand, silt, and clay), ranging from 1.89 to 1.96 g/cm3. Calcareous clay has the lowest densities (1.62 g/cm3), followed by volcanic ash (1.68 g/cm3). P-wave velocities are highest in sand (1666 m/s) and lowest in silt and clay (~1530 m/s). Magnetic susceptibilities are also highest in sand (109 × 10–5 SI), followed by silt (90 × 10–5 SI) and clay (56 × 10–5 SI). The lowest values occur in calcareous clay (20 × 10–5 SI). NGR is high throughout the terrigenous components sand, silt, and clay (around 70 counts/s) and low in calcareous clay (43 counts/s). Thermal conductivity is highest in sand (1.82 W/[m·K]) and lowest in calcareous clay (1.17 W/[m·K]).
Physical property measurements and measurement intervals
High-resolution physical property measurements were made on Site U1453 cores to provide basic information on sediment composition and variability. Whole-Round Multisensor Logger (WRMSL) measurements were made at 1 cm increments for density by gamma ray attenuation (GRA) and magnetic susceptibility and at 5 cm increments for compressional wave velocity on the P-wave logger (PWL). NGR measurements were made at 10 cm increments, and thermal conductivity measurements were made at one measurement per core.
On split cores, point magnetic susceptibility and color reflectance (RSC) were measured at 1 cm increments using the Section Half Multisensor Logger (SHMSL). Additionally, we took discrete samples for moisture and density (MAD) measurements (one to three samples per core, ideally representing coarse-, medium-, and fine-grained intervals or pelagic intervals with varying carbonate or biogenic opal content) to determine water content, wet bulk density, dry bulk density, porosity, and grain density. Also, the assignation into five different lithologies was taken from the core description (see Lithostratigraphy). Average physical properties for Site U1453 are given in Table T15.
Whole-Round Multisensor Logger measurements
Results of Site U1453 WRMSL measurements are compiled in Figure F16. For illustration purposes, data from the top and bottom 2 cm of each section were removed because they contain a cap and often represent part sediment and part air and because the volume contributing to the measurement is unknown. Data that are unrealistic for the cored formations, such as densities <1.05 g/cm3 and velocities <1425 m/s or >6000 m/s, were also filtered out. All original data remain in the LIMS database.
Gamma ray attenuation bulk density
Average wet bulk densities (GRA) measured with the WRMSL range from 1.62 to 1.96 g/cm3, depending on lithology (Table T15). These values are slightly lower than MAD-determined wet bulk densities. GRA values remain fairly stable downcore and only show a minor compaction trend deeper than Core 354-U1453A-31F (Figure F16).
Magnetic susceptibility
Magnetic susceptibility is sensitive to the concentration and type of magnetic minerals. Average values are lowest in calcareous clay (22 × 10–5 SI), intermediate in clays (48 × 10–5 SI), and highest in sandy lithologies (107 × 10–5 SI) (Table T15). These contrasts document that the majority of lithologies can clearly be distinguished based on magnetic susceptibility measurements. There are frequent downcore variations reflecting changing lithologies but no downcore trend (Figure F16). Prominent peaks occur in sandier sections in Cores 4H, 22F, and 25F.
P-wave velocity
Average P-wave velocities from the PWL range from 1439 m/s for clay to 1636 m/s for volcanic ash (Table T15). PWL velocities are systematically lower than P-wave caliper (PWC) velocities. The discrepancy is larger in sandy lithologies because of homogenized sands and lower in calcareous clay. The PWL sensor produced many erroneous readings (Figure F16) and had to be reconfigured quite often without success, and the measurement increment was reduced to 5 cm, whereas the resolution of GRA and magnetic susceptibility was increased to 1 cm for the WRMSL.
Natural gamma radiation
Average NGR values vary from 42 to 73 counts/s for the different principal lithologies (Table T15). The lowest values are found in calcareous clay, followed by volcanic ash, whereas the terrigenous lithologies sand, silt, and clay commonly have high values. NGR values display significant variations downcore (Figure F16), with significant minima near the top of the site (Core 1H), at the base of Core 3H, and in Core 31F (see Downhole measurements).
Thermal conductivity
Average thermal conductivities vary between 1.17 W/(m·K) for calcareous clay and 1.82 W/(m·K) for sandy lithologies (Table T15). Measurements were conducted with the needle probe. There is no obvious downcore trend documented by the data (Figure F17).
Point magnetic susceptibility
Point magnetic susceptibility measurements made with the SHMSL agree well with WRMSL susceptibility results (Figure F16), although point magnetic measurements reveal peaks due to the measurement geometry that are not resolved by the WRMSL magnetic susceptibility loop. Average values are rather consistent between the methods, with the highest average values for sandy lithologies (~108 × 10–5 SI) and the lowest values in calcareous clay (~20 × 10–5 SI).
Discrete compressional wave velocity
Average P-wave velocities for each principal lithology measured with the PWC vary from 1528 to 1666 m/s, depending on lithology (Table T15). PWC velocities are always higher than WRMSL velocities, with substantial average differences in terrigenous lithologies (80–140 m/s). For calcareous clay, the average difference is 20 m/s; for silt it is 77 m/s, increasing to 96 m/s for clay, and reaching very high average differences of 137 m/s for sand, again indicative of only partial liner fill in sandy lithologies, which impact WRMSL P-wave velocity measurements.
Moisture and density
Water content, porosity, and wet and dry bulk densities are interdependent. Wet bulk densities determined with MAD procedures have less extreme variations than WRMSL measurements (Figures F16, F17). Average MAD wet bulk densities are rather uniform for sand and silt (~2.05 g/cm3), somewhat lower for clay (1.86 g/cm3), and lowest for calcareous clay (1.75 g/cm3) (Table T15). Porosities range from 30% to 60%, depending on lithology (Figure F17). Average grain densities range from 2.77 to 2.81 g/cm3 (Table T15).
Color reflectance
Average sediment lightness (L*) varies from ~37 for sand, silt, and clay to ~40 for calcareous clay and 44 for volcanic ash. The highest L* values were found in Cores 1H and 31F (Figure F16).
Color component a*, the red–green component, shows rather similar averages of ~1 for all lithologies, except for volcanic ash, where averages are ~2. Also, color component b* is rather uniform in terrigenous lithologies, with average values around –3, slightly higher values in calcareous clay (–2), and substantially higher average values in volcanic ash (0.5). Elevated values (yellower colors) are documented for Core 1H.
Core disturbances and data quality
Core disturbances are displayed in Figure F3. They affect the quality and reliability of physical properties in various ways. For this APC- and HLAPC-cored hole, 164.78 m of recovery was relatively good (~88%), although a significant portion of this was unconsolidated sand (73 m; 48%), for which some measurements are significantly affected.
Data variability and downhole trends
With only 215.7 m CSF-A total penetration depth, Site U1453 is one of the shorter sites cored during Expedition 354. Recovered sediment includes fine-grained, muddy turbidites interbedded with coarse-grained, sandy turbidites. The hemipelagic intervals encompass Toba Ash 1 at the top (Core 1H) and the period of turbidite inactivity during the mid-Pleistocene (Cores 29H–31F). As at Sites U1449 and U1452, which have a comparable lithology, there is no clear downcore trend in physical properties, except for density in the lowermost ~40 m. As at previous sites, the physical properties obtained at Site U1453 correlate well with lithology and composition. Comparison to downhole logging can be found in Downhole logging.
Downhole measurements
Logging operations
The last core from Hole U1453A arrived on deck at 1845 h on 17 March 2015. Hole preparation for the logging program included a sepiolite mud sweep, closing the lockable float valve, and displacement with 180 barrels of heavy mud (12.0 lb/gal, attapulgite weighted with barite). The pipe was raised to a logging depth of 78.5 m DSF (about 75 m WSF). The heavy mud inhibited washout of the sand layers, which were observed in core to become fluidized very easily. Rig-up for downhole logging started at 1100 h on 17 March, and the modified triple combo tool string was assembled. The wireline heave compensator was not used because of the small vertical ship motion.
The modified triple combo tool string consisted of magnetic susceptibility, NGR, and resistivity tools and was run in Hole U1453A at 1200 h on 17 March. The density tool was also run in the tool string for the caliper (borehole diameter) measurement, but it was run without the source because of concerns about hole stability; therefore, no density measurements were made in this hole. The tool string reached the bottom of the hole at 220 m WSF, and logs were acquired on the way down (the downlog) and up (the uplog, or main pass). The second tool string, the FMS-sonic, was rigged up and run into the hole at 1730 h. It too reached the bottom of the hole, and two passes were made, first a shorter “repeat” pass and then a “main” pass up to the seafloor. The hole was in good condition, varying from 9 inches in the lower 50 m to about 14 inches between 100 and 115 m WSF; some small washouts occurred, but nothing on the scale of what was expected for fluidized sands that were recovered in the cores. It appeared that the weighted mud did its job. The tool string returned to the ship, and the logging equipment was rigged down by 0055 h on 18 March.
Log data quality and corrections
The main control on log data quality is the diameter of the borehole, measured by the calipers on the FMS-sonic and Hostile Environment Litho-Density Sonde (HLDS) logging tools. The hole was in good condition, and consequently the logs are of good quality. Log data were transmitted to Lamont-Doherty Earth Observatory for depth matching and FMS processing and were returned to the ship a couple of days later.
In general, the downlog and uplog of each measurement match each other well (Figure F18), and differences are mainly due to small offsets in depth that result from nonconstant tool speed during logging. The downhole NGR and magnetic susceptibility logs also have features in common with the equivalent laboratory data from Hole U1453A—small offsets of log and core data due to assignment of core depths when core recovery is incomplete and other effects (see Physical properties in the Expedition 354 methods chapter [France-Lanord et al., 2016a]).
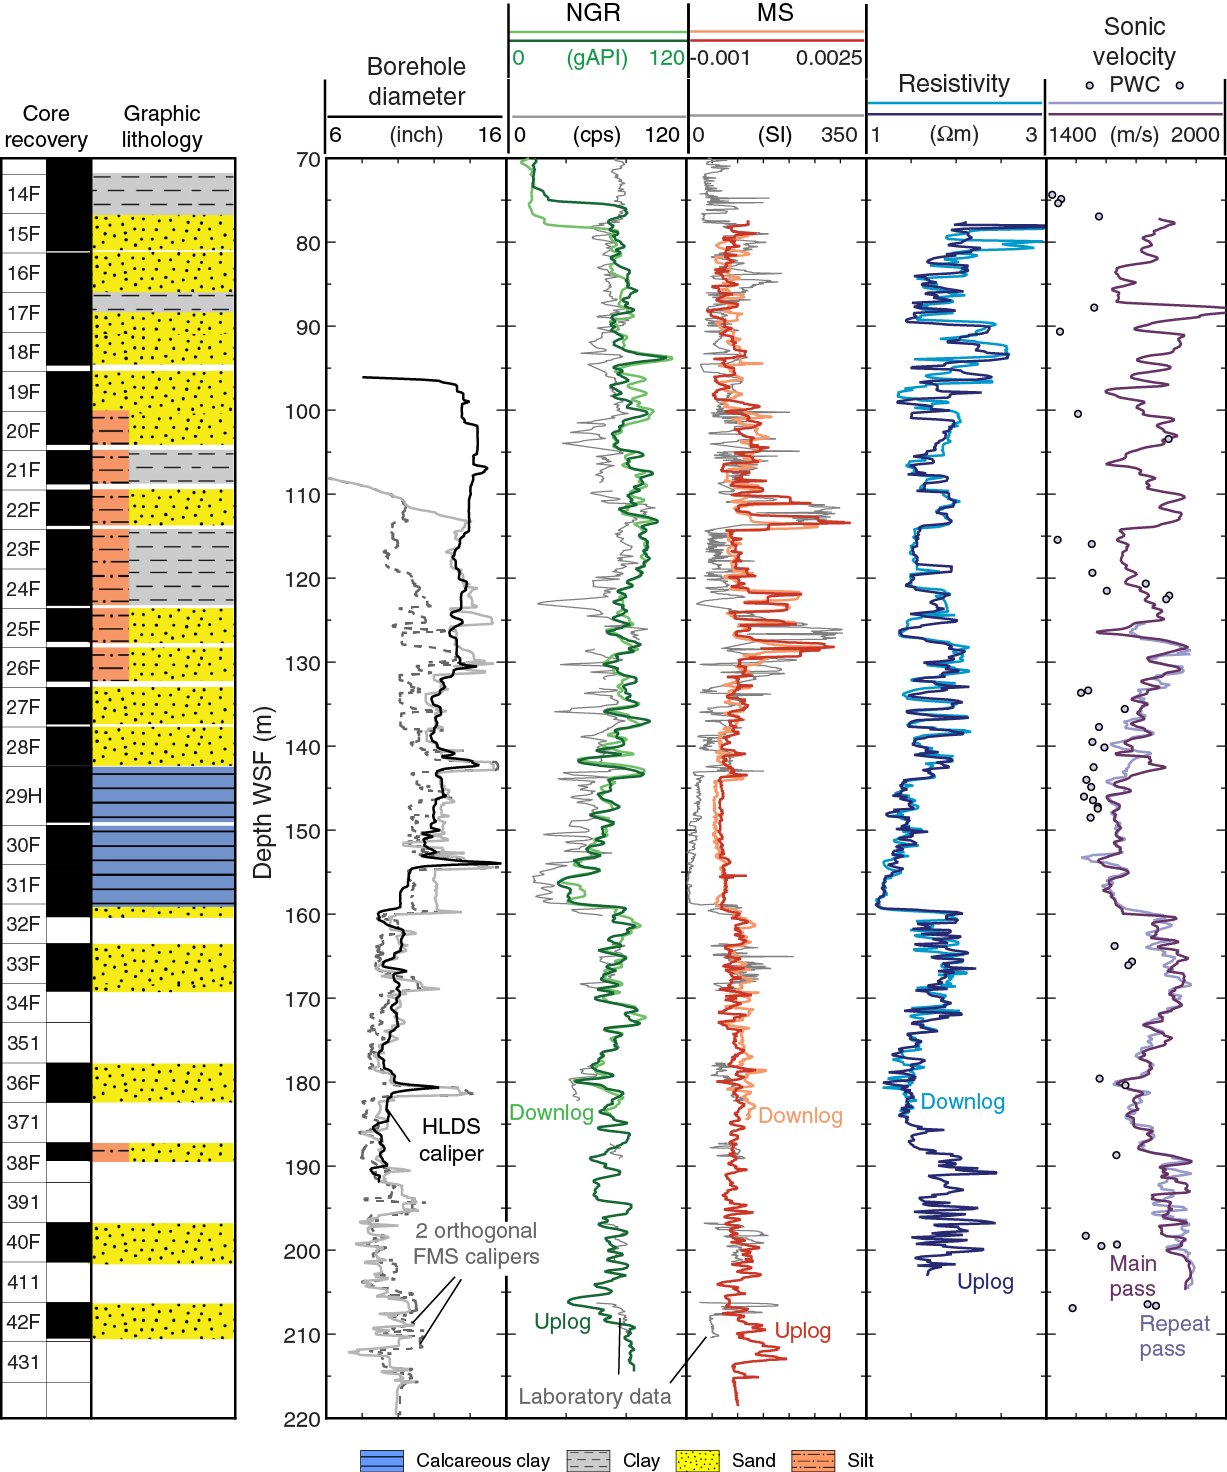
Figure F18. Downhole logs from Hole U1453A compared to equivalent laboratory physical property measurements and lithostratigraphy from Hole U1450A.
For the magnetic susceptibility logs, the drift related to temperature (a known issue for the downhole magnetic susceptibility sonde [MSS]) was removed using a quadratic polynomial fit to the data. This resulted in a good match to core magnetic susceptibility data, but it is possible that in the lower and upper 20 m of the log (80–100 and 195–215 m WSF) removal of the trend results in slightly underestimated in situ formation magnetic susceptibility values.
Measurements of NGR made through the BHA from 0 to 75 m WSF are attenuated but were corrected to the equivalent open-hole value by using a multiplication factor of 4 (Figure F19). The multiplication factor was chosen to minimize the jump between downhole NGR measurements in open hole and in the pipe and to match the trends of NGR measured on core. In the open-hole interval during logging, NGR data had initially been corrected for hole size and barite-weighted mud, assuming a circular borehole cross section and a centered tool. However, the borehole cross section was oval and the tool was likely to be not well centered. Removal of the hole size correction resulted in the good match in trend and details between log and core NGR data, but the NGR and magnetic susceptibility values will be underestimated if the size of the washout is large enough. The barite correction remained, and is partly responsible for the high absolute values in gAPI units.
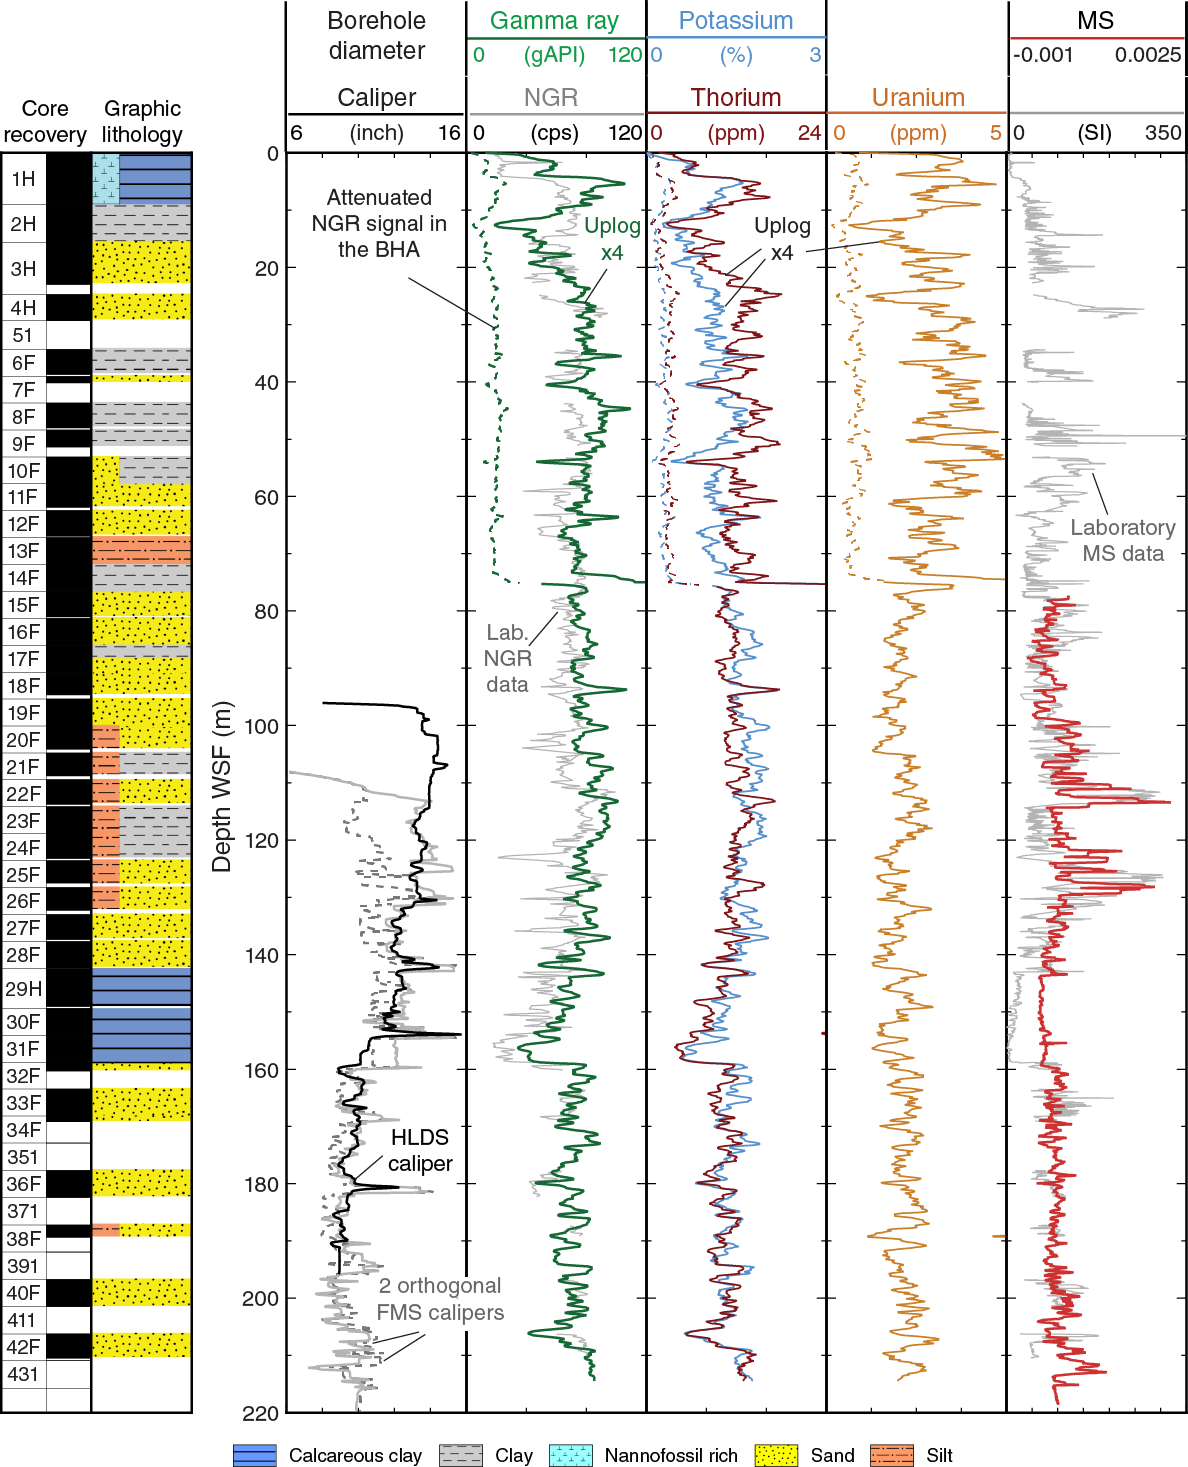
Figure F19. Downhole NGR logs, Hole U1453A. NGR logs within the BHA were multiplied by a factor of 4 to compensate for attenuation.
Comparison of log with core data, lithologic inferences
The physical properties measured downhole are interpreted in a similar way to those measured in the laboratory (see Physical properties). The hemipelagic calcareous clay interval between 143 and 159 m WSF is identifiable by low values in NGR, magnetic susceptibility, resistivity, and sonic velocity (Figure F18). Sands are distinguished by high resistivity, sonic velocity, and magnetic susceptibility values. Clays, by contrast, have low magnetic susceptibility, resistivity, and sonic velocity and consistently high NGR values.
In Hole U1453A, notable high magnetic susceptibility sands at 110–115 and 127–130 m WSF are seen in both core and log data (Figure F18). These sands also have high thorium concentrations (Figure F19), which together with the high magnetic susceptibility levels suggest that heavy minerals may be relatively concentrated in these sand units.
Sonic velocity values are consistently higher in downhole measurements compared to the values measured on cores because the downhole measurements are made under in situ conditions of pressure, the sand in the cores has been fluidized, and the sand in some core sections was settled with the section placed vertically (Figure F18).
Formation MicroScanner image logs
Two passes of the FMS-sonic tool produced good FMS resistivity images of the borehole wall. In intervals with both core recovery and FMS images, the characteristics of the different lithologies in FMS images were established (Figure F20). Low- to medium-resistivity intervals (relatively dark in the image) with thin resistive bands (relatively light in the image) result from clay-rich lithologies with decimeter- to meter-scale turbidites (e.g., 139–141 m WSF in Figure F20). High-resistivity massive intervals mark sand beds on the meter scale or thicker. In the hemipelagic unit, the lower part (154–160 m WSF) is conductive and the upper part (144–154 m WSF) also has alternations with more resistive beds on the decimeter scale. Based on these FMS observations and the other downhole logs, as well as the understanding of the physical property responses of the different lithologies (see Physical properties), we made a preliminary lithologic interpretation of the FMS images in the intervals of low core recovery (Figure F21). A more thorough lithologic interpretation will be possible postexpedition.
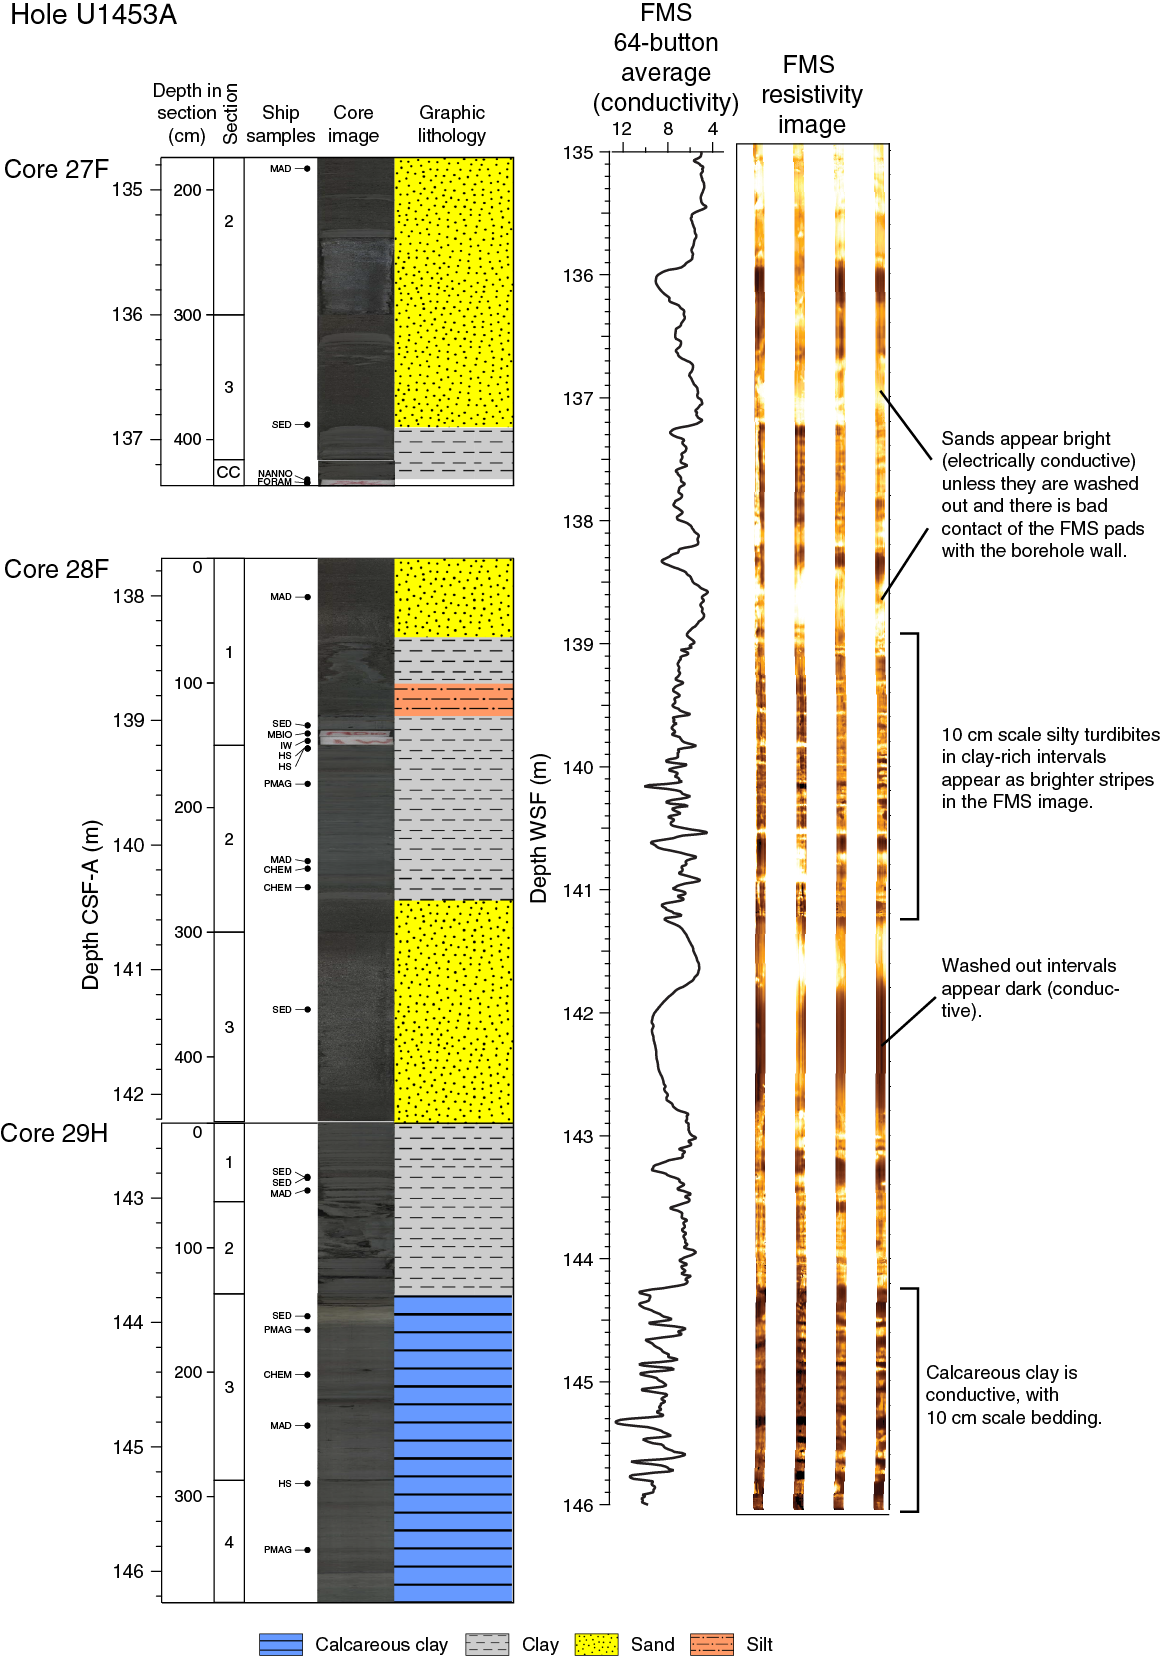
Figure F20. Comparison of FMS image data to core description for 135–146 m WSF, Hole U1453A.
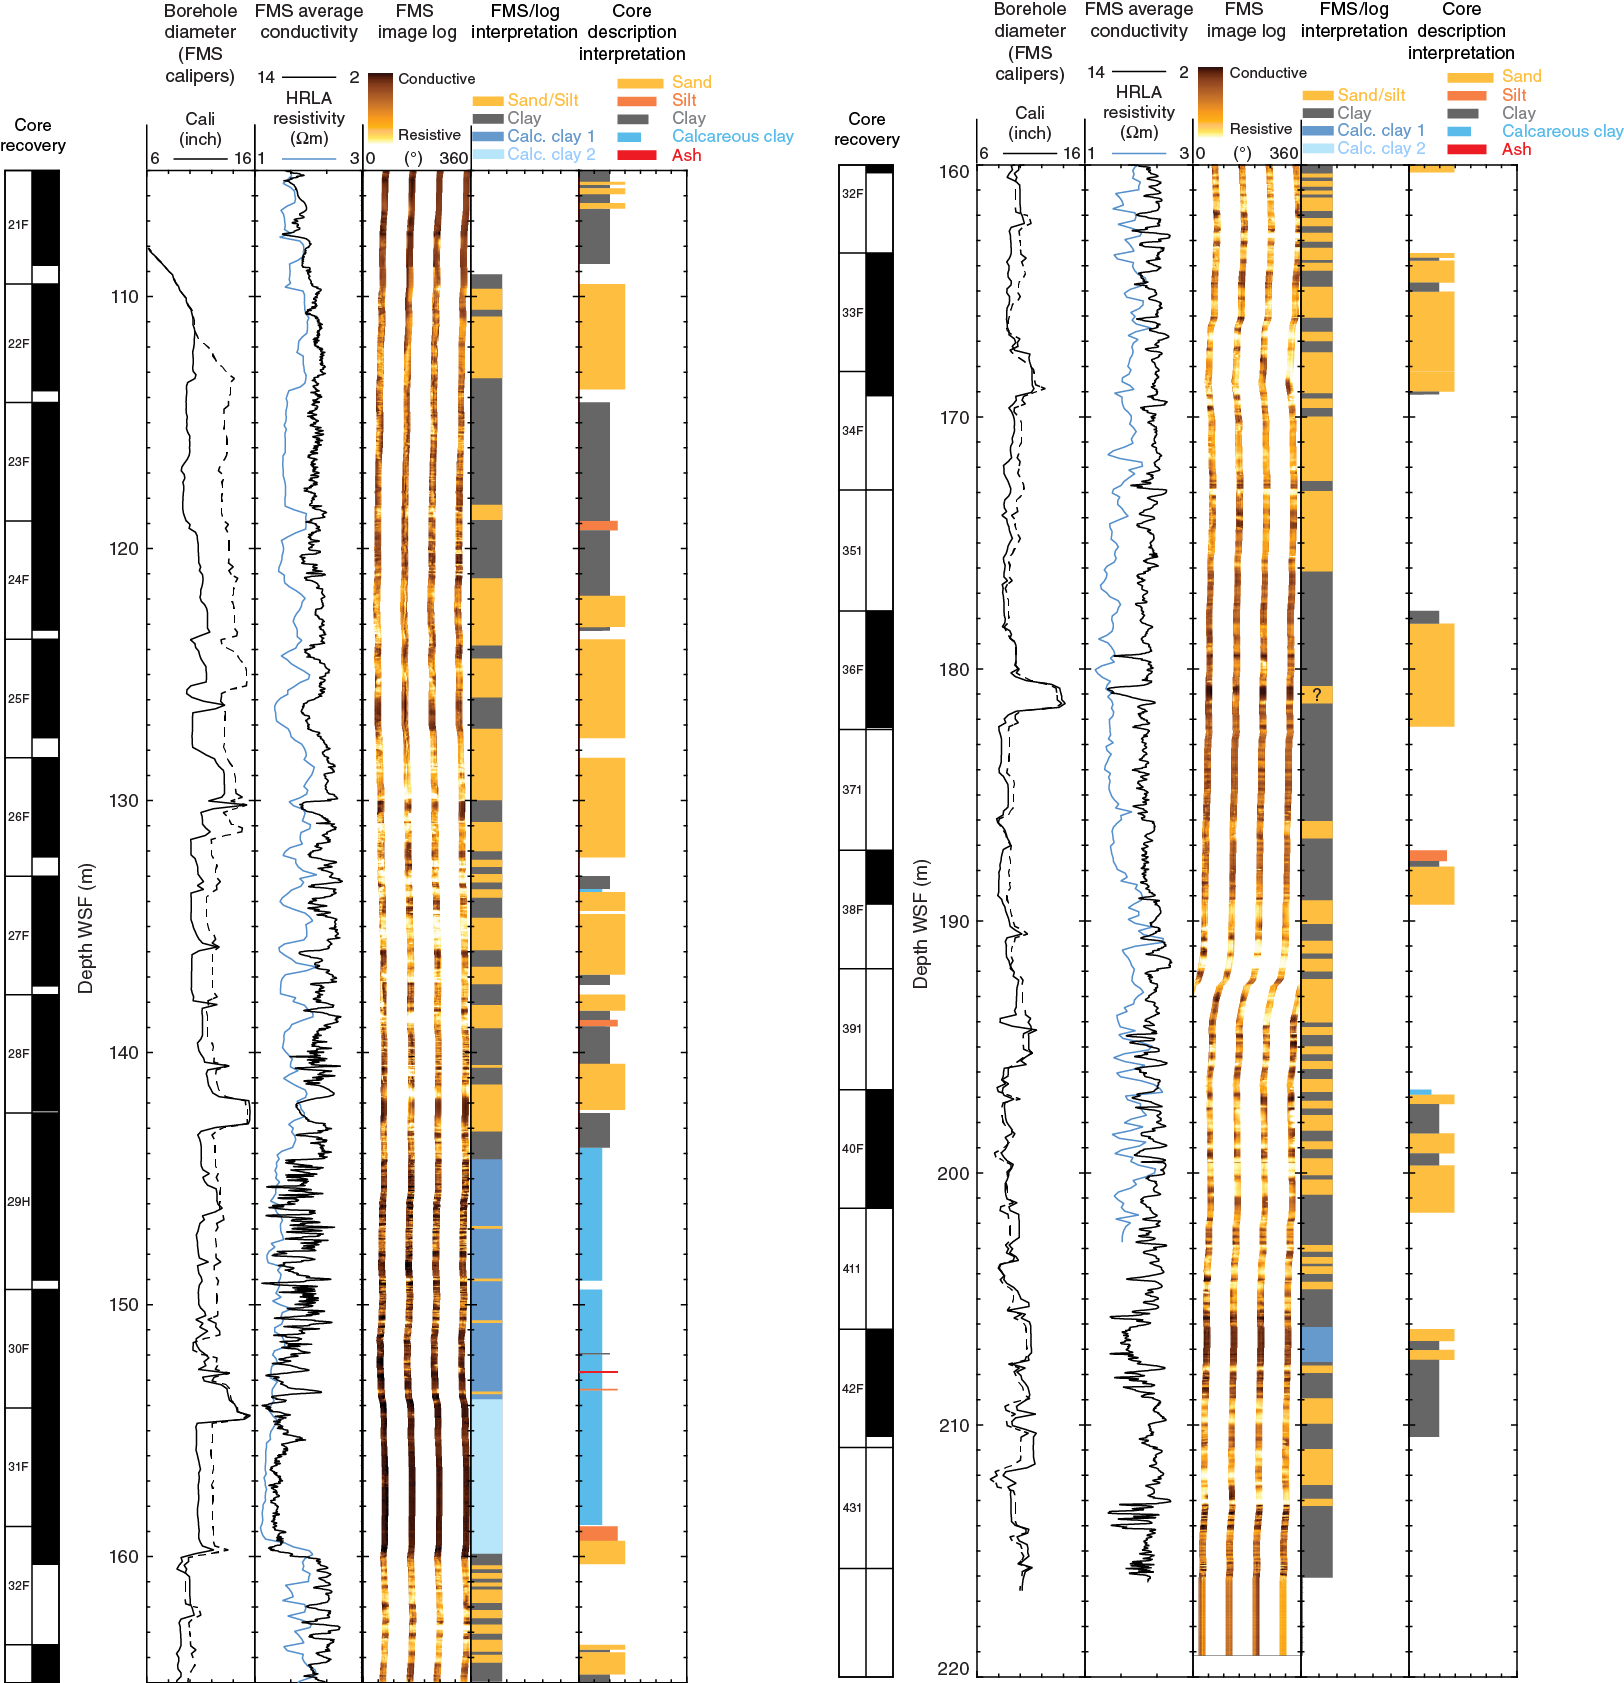
Figure F21. FMS images for 105–165 and 160–220 m WSF and their preliminary lithologic interpretation, Hole U1453A. Lithologic logs are taken from the principal lithology.
In broad scale, the downhole lithologic interpretation is similar to the lithologic core description: sand-rich intervals in the downhole interpretation are sand-rich intervals in the core description. However, there are some differences. For example, in the downhole interpretation there are intervals of meter-scale sand and clay alternations (probably turbidites) at 160–165 and 190–202 m WSF, but such alternations are not observed in the cores recovered from this interval.
The downhole data also provide insight into the origin of the sand in the cores that contained fluidized sand. The comparison in Figures F18 and F21 confirm that the sands are either in place or come from the same 9.5 m interval as the core, as required by the physics of taking piston cores (the only other way is sand falling down the hole between the coring, but in general fall-in sand at the top of cores was not observed). Homogenization of sand stratigraphy during both the coring process and settling of core sections on the catwalk can be seen in the two high–magnetic susceptibility sands, at 110–115 and 127–130 m WSF, where the susceptibility pattern in the core is smoother relative to the double peaks seen in the downhole logs; the original layers have been homogenized in the core. Some of the fluidized sand cores appear to be the result of “suck-in.” For example, Core 354-U1453A-36F contains mostly sand but comes from an interval that is clay rich according to the downhole logs. The sand could have been sucked in from a 1–2 m thick sand-rich bed at 181 m WSF, leaving a widened borehole diameter in this interval.
Downhole temperature and heat flow
One advanced piston corer temperature tool (APCT-3) downhole temperature measurement in Hole U1453A produced a value of 7.9°C at 177.7 m DSF (Figure F22), giving a geothermal gradient of about 33°C/km by drawing a straight line to the seafloor temperature of 2°C, based on APCT-3 data taken while the tool was held at the mudline for 5 min before being lowered into the hole.
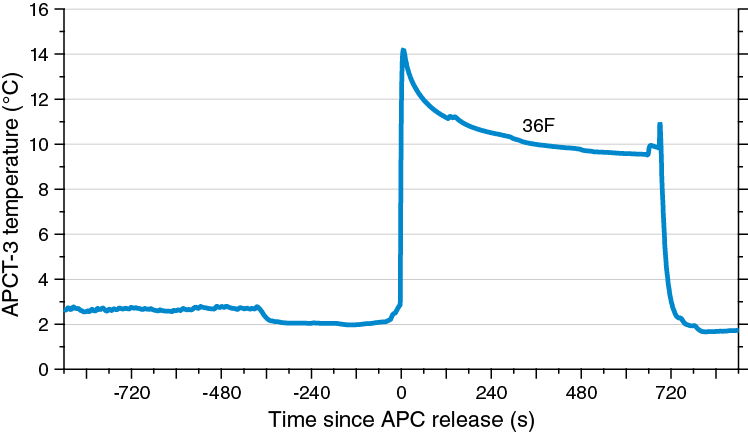
Figure F22. APCT-3 temperature-time series, Hole U1453A.
Thermal conductivity under in situ conditions was estimated from laboratory-determined thermal conductivity from Hole U1453A using the method of Hyndman et al. (1974) (see Physical properties in the Expedition 354 methods chapter [France-Lanord et al., 2016a]). The calculated in situ values are within 2% of the measured laboratory values. Thermal resistance was then calculated by integrating the inverse of the in situ thermal conductivity over depth. A heat flow of 46 mW/m2 was obtained from the linear fit between temperature and thermal resistance (Pribnow et al., 2000). The geothermal gradient and heat flow values at Site U1453 are within the normal range for ocean basins of same age of 90–100 Ma (Müller et al., 2008) and consistent with other measurements in the Bay of Bengal (Hasterok et al., 2011).
Stratigraphic synthesis
The main objective for Site U1453 drilling was to contribute to the reconstruction of Pleistocene fan evolution as part of the seven-site drilling transect. Site U1453 is located ~900 m south of an abandoned, strongly meandering channel (Figure F1) without a visible levee. This provides the opportunity to characterize proximal channel facies, which were not cored at other sites.
Seismic, physical properties, and lithology
Site U1453 is distinctly different from Sites U1449–U1452; seismic and bathymetric data show that there is no surficial levee despite its proximity to a large channel (Figure F1). The channel represents a mature state with numerous point bars and internal terraces and exhibits a high channel sinuosity. Accordingly, sedimentation on the sides of the channel will be affected both by changes in sediment delivery through turbidity currents and by changes in channel geometry, breaching of meander loops, and spillover units. At depth, several smaller levees are identified and are typically <10 m thick. The overall reflectivity is very high, indicative of a larger coarse-grained fraction. The cored section is next to a buried point bar (~500 m west) whose base reflector is shallower than the later incision of the present-day channel that is not yet filled (Figure F1). Several phases of channel activity seem to overlap. The height difference between the deepest base of the present-day channel (at ~5.15 s TWT) and the seafloor is ~150 m.
Figure F23 compares the seismic data with lithology and magnetic susceptibility from whole-core measurements (see Lithostratigraphy and Physical properties). This figure also shows the downhole magnetic susceptibility and P-wave velocity logs recorded at this site (see Downhole logging). Representation of lithologies (47% sand, 7% silt, 30% clay, and 15% calcareous clay) is distinctly different than at Site U1452. The small proportion of silt observed supports the seismic observation that surficial and buried levees (which commonly contain high proportions of silt) are mostly absent, and because of high recovery, a sampling bias is unlikely. Instead, sand proportions almost reach 50%. As at Site U1452, these sandy units may represent progradational phases, which seem to dominate. Seismic units with irregular reflector geometries as well as few V-shaped meter-deep incisions are more common, as are high-amplitude packages, which were found to correlate with sand-rich units at previous sites.
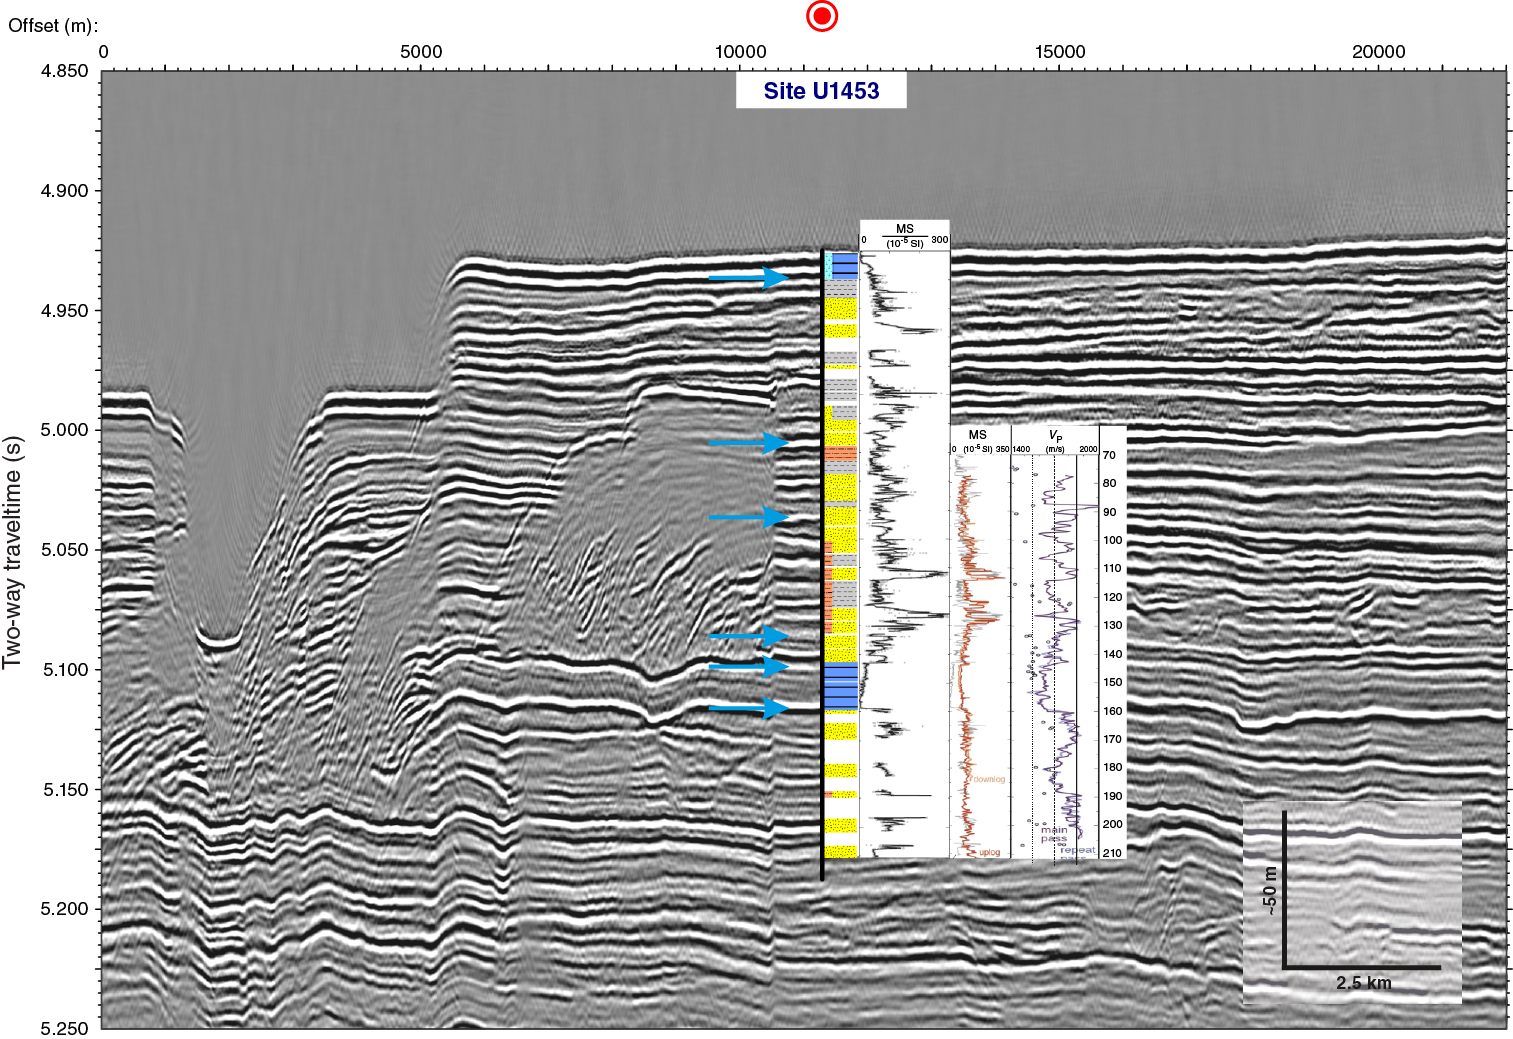
Figure F23. Seismic Line SO125-GeoB97-027, Site U1453.
As observed at Site U1452, high content of coarse sand seems to coincide well in some intervals with peaks in magnetic susceptibility (Figure F23). In contrast, measured densities do not seem to be indicative of lithology, and P-wave velocities in the sands are much lower than the expected values >1700 m/s. This discrepancy may be attributed to the insufficient preservation of in situ conditions during the retrieval of loose material.
The intermittent phases of sand deposition suggest that the area had been repeatedly covered by unchannelized sand sheet flows, likely associated with a reoccupation of the channel or levee breaches, and repeated erosional phases.
Downhole logging magnetic susceptibility data are in close agreement with core magnetic susceptibility data but are much smoother either because of a lower sensor resolution or the absence of coring disturbance. P-wave velocity downhole data reveal similar trends. Average in situ velocities are distinctly higher than those derived from core measurements, with in situ velocities ranging from ~1600 m/s in finer grained intervals to 1850 m/s in sand and velocities from core measurements ranging from 1530 m/s in finer grained intervals to 1666 m/s in sand. An adjustment of time-to-depth conversion must await further shore-based work and corrections. The uncertainty of this conversion therefore remains very high for sections deeper than 200 m at other sites because of the lack of in situ downhole data.
Of particular interest are two peaks in magnetic susceptibility observed in both downhole logging and core measurements at ~110 m CSF-A (Core 354-U1453A-22F) and 125 m CSF-A (Core 25F). Theses two cores contain sand-rich layers that arrived as liquefied sand in the core liner and were settled on the catwalk in order to retain the full grain size spectrum of the sediments. Core 26F is also a liquefied and settled sand core that does not show high magnetic susceptibility values similar to Cores 22F and 25F. The close match between magnetic susceptibility from downhole logging and core measurements for these contrasting sand layers is strong evidence that coring of these units provided representative samples of the formation, despite the loss of the original sedimentary structure during the coring process.
Similar to Sites U1449–U1452, hemipelagic layers were identified in the recovered cores, varying in thickness from several decimeters to several meters. These represent much longer time periods than the intercalated fan deposits. At Site U1453, they are observed at six different depth intervals, all of which can be tentatively attributed to a distinct horizon (Figure F23).
Age-depth relationship
Four biomarkers were identified at Site U1453 that help constrain the timing and rate of Pleistocene sedimentation at this site (Figures F24, F25). However, the reliability of the defined biozones is uncertain because of significant reworking of the sediments. An example is the LO of Globorotalia tosaensis observed at this site in Sample 354-U1453A-2H-CC (12.31 m CSF-A). Because G. tosaensis defines the first biozone in the foraminiferal biostratigraphic scheme used, it has been plotted at its first downhole occurrence; however, this does not correlate well with the nannofossil biostratigraphic biomarker. Refining the Pleistocene age model is a key area for postexpedition research.
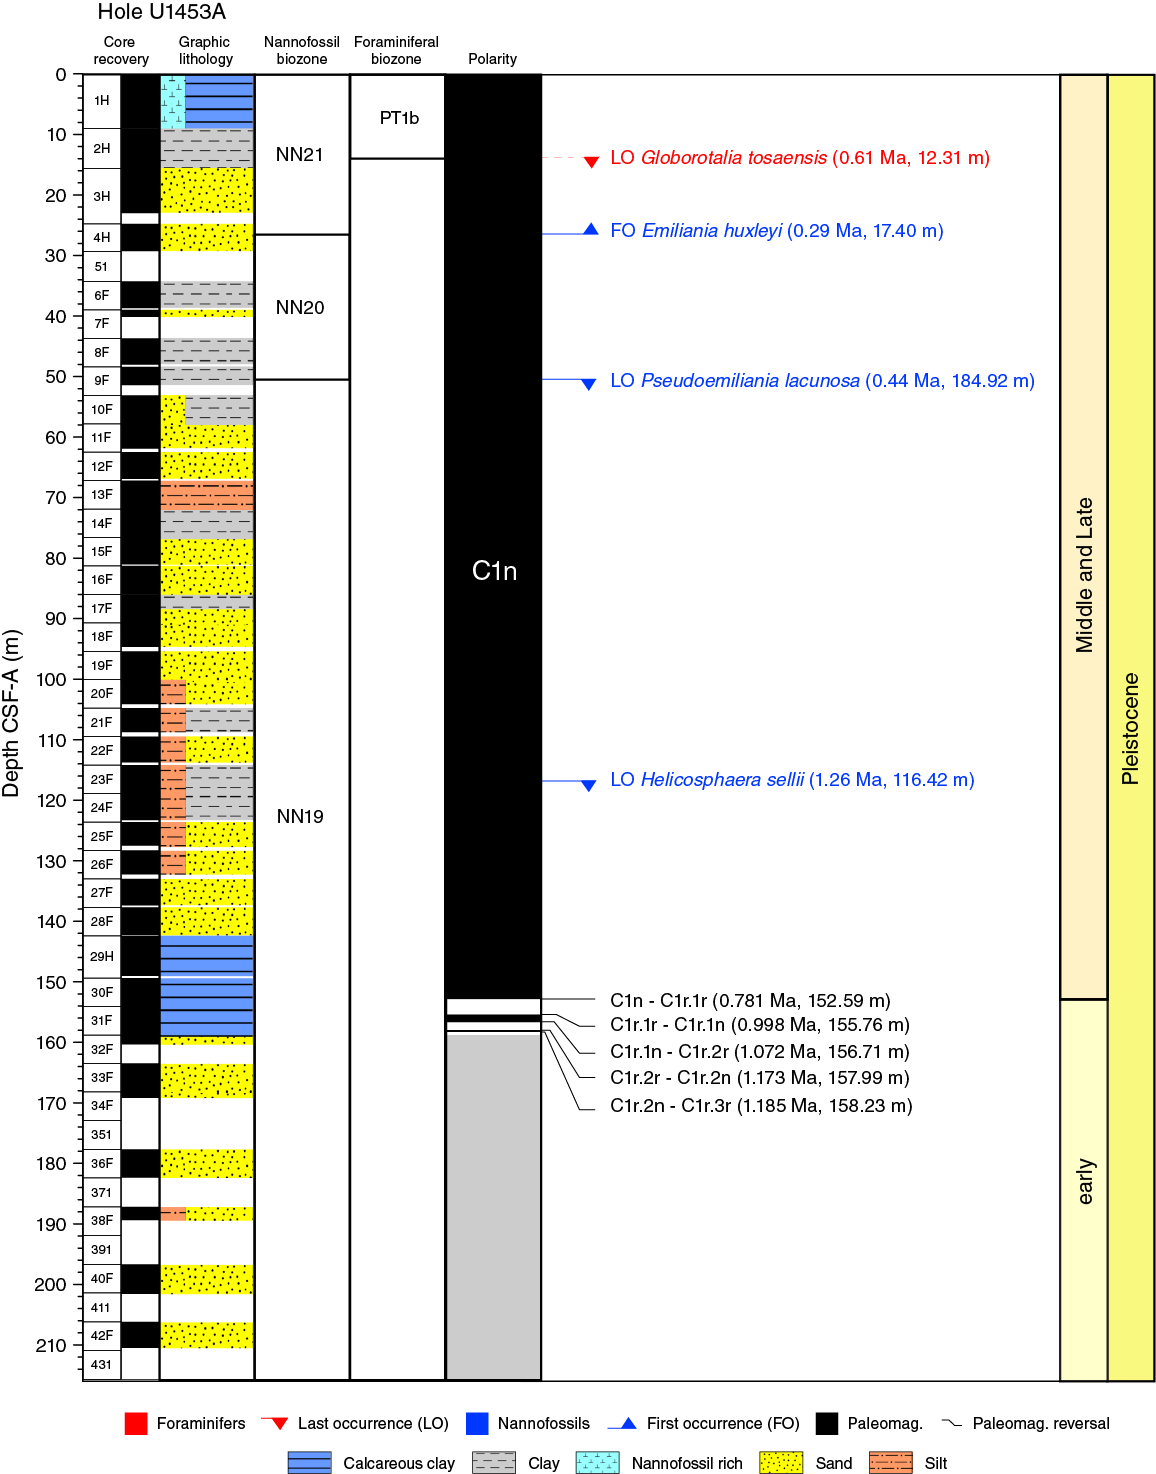
Figure F24. Compilation of biostratigraphic and chronostratigraphic markers, Site U1453.
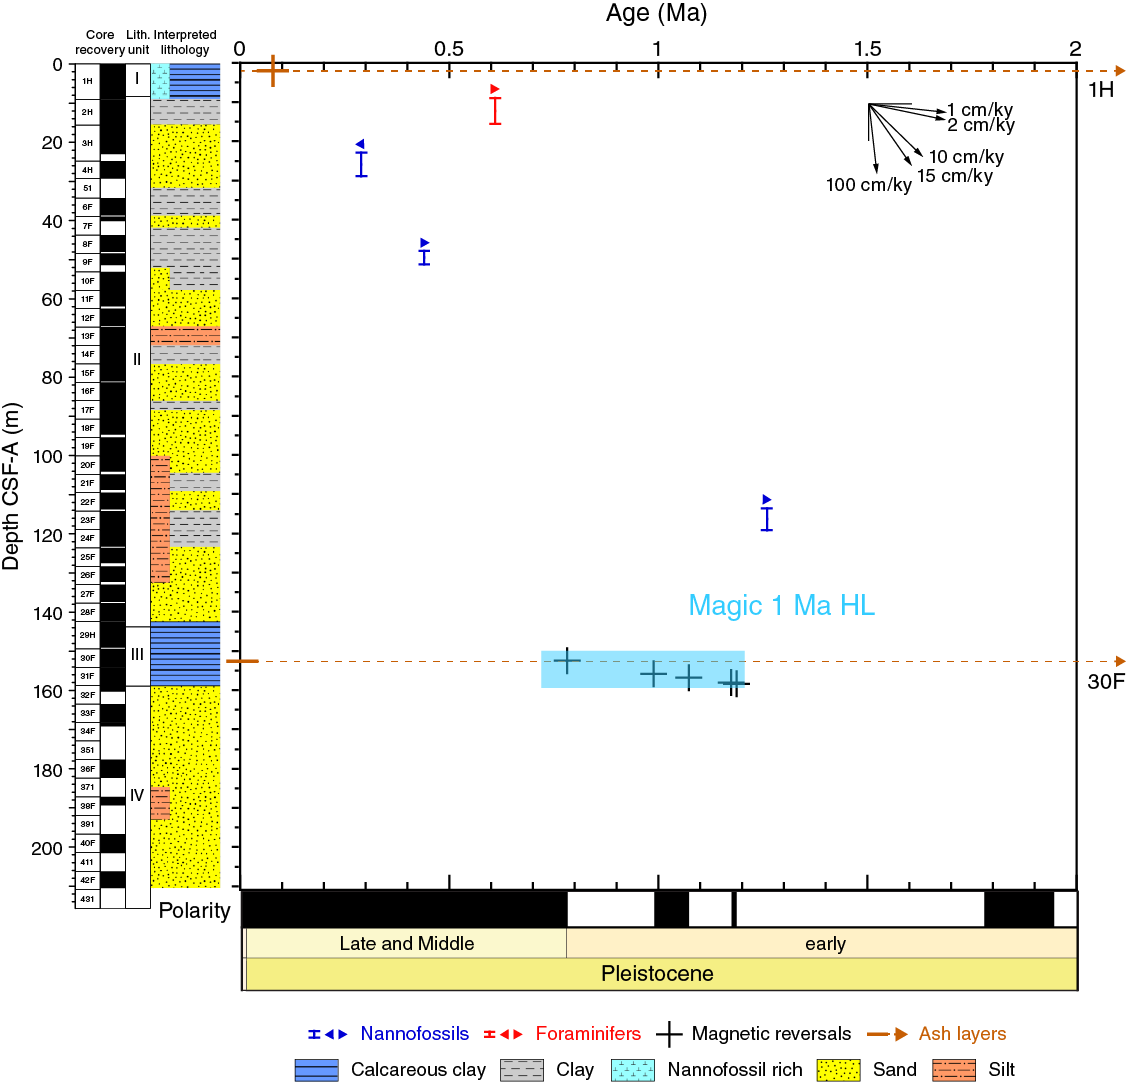
Figure F25. Age-depth plot, Site U1453. Interpreted lithology proposes the most probable lithologies in intervals of nonrecovery.
Figures F24 and F25 were constructed after determining the uncertainties of assigned biostratigraphic ages and ranges and depth uncertainties due to gaps in recovery and sample spacing. Barren samples were not used when calculating midpoints.
Sediments from lithostratigraphic Unit III (see Lithostratigraphy) recorded the Brunhes/Matuyama magnetic reversal (0.781 Ma) and both boundaries of the Jaramillo (0.988–1.072 Ma) and Cobb Mountain (1.173–1.185 Ma) Subchrons. As at Sites U1449–U1452, the sediment deposited from 0.988 to 1.185 Ma is hemipelagic. The Brunhes/Matuyama magnetic reversal is related to an ash layer, most probably from the Toba Volcano, and is associated with a layer of microtektites. The latter is likely from the Australian Microtektite Event dated to ~790 ka by astronomical tuning on a sediment core from near the Maldives (Valet et al., 2014) and gives an independent tie point to the age-depth correlation. Results are integrated in Figure F25.
Achievements
Site U1453 contributes important new evidence to the understanding of channel and levee formation because it provides an almost completely recovered succession of silt- and/or sand-dominated sheeted units that represent the earliest phase of the evolution of a large meandering channel system lacking a distinct surficial levee unit. Intercalation of these sheets with thinner levee units either from the large channel or from nearby smaller channels may help us to understand why the channel had been apparently maintained in this position for a relatively long time period.
Furthermore, based on the only downhole logging data of the expedition, it will be possible to compare in detail how well centimeter- to decimeter-scale structures have been preserved in cores. Particularly, the proportion of sand in the formation versus the amount recovered by coring will help calibrate the sedimentary records from other sites. A comparison between physical property data from downhole logging and cores may be utilized to correct core measurements to improve the lithologic characterization/identification on the basis of core logging data.
Analyzing some graded variations within the sandy units from both core magnetic susceptibility data and downhole magnetic susceptibility data shows that, despite the effects of the coring process and curational procedures of core settling, the average physical properties still match the in situ data and can be used to characterize the formation.
Hemipelagic layers were also found in intervals between sandy units, which may indicate that sheeted sedimentation was restricted to short time periods only and is not always followed by an erosional and levee formation phase. An expanded time period of low terrigenous input from ~1.2 to ~0.8 Ma is characterized by hemipelagic sediments between 160 and 142 m CSF-A (Figure F25). Above this hemipelagic interval, prevalent sand deposition marks an abrupt change in depositional style. This change differs from other sites, particularly Site U1452, where a gradual transition toward mud turbidites is observed. Thin calcareous clay units within Unit II sands mark shorter interruptions, perhaps indicative of phases of temporary channel abandonment and/or smaller channels in the vicinity. Fan deposition decreased around 300 ka, leading to calcareous clay deposition in the uppermost, 10 m thick Unit I. The sedimentation rate of fan growth is on average 15 cm/ky but quite variable.
References
Bouquillon, A., France-Lanord, C., Michard, A., and Tiercelin, J.-J., 1990. Sedimentology and isotopic chemistry of the Bengal Fan sediments: the denudation of the Himalaya. In Cochran, J.R., Stow, D.A.V., et al., Proceedings of the Ocean Drilling Program, Scientific Results, 116: College Station, TX (Ocean Drilling Program), 43–58. http://dx.doi.org/10.2973/odp.proc.sr.116.117.1990
Curray, J.R., Emmel, F.J., and Moore, D.G., 2003. The Bengal Fan: morphology, geometry, stratigraphy, history and processes. Marine and Petroleum Geology, 19(10):1191–1223. http://dx.doi.org/10.1016/S0264-8172(03)00035-7
Dehn, J., Farrell, J.W., and Schmincke, H.-U., 1991. Neogene tephrochronology from Site 758 on northern Ninetyeast Ridge: Indonesian arc volcanism of the past 5 Ma. In Weissel, J., Peirce, J., Taylor, E., Alt, J., et al., Proceedings of the Ocean Drilling Program, Scientific Results, 121: College Station, TX (Ocean Drilling Program), 273–295. http://dx.doi.org/10.2973/odp.proc.sr.121.123.1991
Fisher, R.A., 1953. Dispersion on a sphere. Proceedings of the Royal Society of London, Series A, 217:295–305.
France-Lanord, C., and Derry, L.A., 1997. Organic carbon burial forcing of the carbon cycle from Himalayan erosion. Nature, 390(6655):65–67. http://dx.doi.org/10.1038/36324
France-Lanord, C., Spiess, V., Klaus, A., Adhikari, R.R., Adhikari, S.K., Bahk, J.-J., Baxter, A.T., Cruz, J.W., Das, S.K., Dekens, P., Duleba, W., Fox, L.R., Galy, A., Galy, V., Ge, J., Gleason, J.D., Gyawali, B.R., Huyghe, P., Jia, G., Lantzsch, H., Manoj, M.C., Martos Martin, Y., Meynadier, L., Najman, Y.M.R., Nakajima, A., Ponton, C., Reilly, B.T., Rogers, K.G., Savian, J.F., Schwenk, T., Selkin, P.A., Weber, M.E., Williams, T., and Yoshida, K., 2016a. Expedition 354 methods. In France-Lanord, C., Spiess, V., Klaus, A., Schwenk, T., and the Expedition 354 Scientists, Bengal Fan. Proceedings of the International Ocean Discovery Program, 354: College Station, TX (International Ocean Discovery Program). http://dx.doi.org/10.14379/iodp.proc.354.102.2016
France-Lanord, C., Spiess, V., Klaus, A., Adhikari, R.R., Adhikari, S.K., Bahk, J.-J., Baxter, A.T., Cruz, J.W., Das, S.K., Dekens, P., Duleba, W., Fox, L.R., Galy, A., Galy, V., Ge, J., Gleason, J.D., Gyawali, B.R., Huyghe, P., Jia, G., Lantzsch, H., Manoj, M.C., Martos Martin, Y., Meynadier, L., Najman, Y.M.R., Nakajima, A., Ponton, C., Reilly, B.T., Rogers, K.G., Savian, J.F., Schwenk, T., Selkin, P.A., Weber, M.E., Williams, T., and Yoshida, K., 2016b. Site U1451. In France-Lanord, C., Spiess, V., Klaus, A., Schwenk, T., and the Expedition 354 Scientists, Bengal Fan. Proceedings of the International Ocean Discovery Program, 354: College Station, TX (International Ocean Discovery Program). http://dx.doi.org/10.14379/iodp.proc.354.105.2016
France-Lanord, C., Spiess, V., Klaus, A., Adhikari, R.R., Adhikari, S.K., Bahk, J.-J., Baxter, A.T., Cruz, J.W., Das, S.K., Dekens, P., Duleba, W., Fox, L.R., Galy, A., Galy, V., Ge, J., Gleason, J.D., Gyawali, B.R., Huyghe, P., Jia, G., Lantzsch, H., Manoj, M.C., Martos Martin, Y., Meynadier, L., Najman, Y.M.R., Nakajima, A., Ponton, C., Reilly, B.T., Rogers, K.G., Savian, J.F., Schwenk, T., Selkin, P.A., Weber, M.E., Williams, T., and Yoshida, K., 2016c. Site U1452. In France-Lanord, C., Spiess, V., Klaus, A., Schwenk, T., and the Expedition 354 Scientists, Bengal Fan. Proceedings of the International Ocean Discovery Program, 354: College Station, TX (International Ocean Discovery Program). http://dx.doi.org/10.14379/iodp.proc.354.106.2016
France-Lanord, C., Spiess, V., Klaus, A., Schwenk, T., Adhikari, R.R., Adhikari, S.K., Bahk, J.-J., Baxter, A.T., Cruz, J.W., Das, S.K., Dekens, P., Duleba, W., Fox, L.R., Galy, A., Galy, V., Ge, J., Gleason, J.D., Gyawali, B.R., Huyghe, P., Jia, G., Lantzsch, H., Manoj, M.C., Martos Martin, Y., Meynadier, L., Najman, Y.M.R., Nakajima, A., Ponton, C., Reilly, B.T., Rogers, K.G., Savian, J.F., Selkin, P.A., Weber, M.E., Williams, T., and Yoshida, K., 2016d. Expedition 354 summary. In France-Lanord, C., Spiess, V., Klaus, A., Schwenk, T., and the Expedition 354 Scientists, Bengal Fan. Proceedings of the International Ocean Discovery Program, 354: College Station, TX (International Ocean Discovery Program). http://dx.doi.org/10.14379/iodp.proc.354.101.2016
Galy, V., France-Lanord, C., Beyssac, O., Faure, P., Kudrass, H., and Palhol, F., 2007. Efficient organic carbon burial in the Bengal Fan sustained by the Himalayan erosional system. Nature, 450(7168):407–410. http://dx.doi.org/10.1038/nature06273
Gradstein, F.M., Ogg, J.G., Schmitz, M.D., and Ogg, G.M. (Eds.), 2012. The Geological Time Scale 2012: Amsterdam (Elsevier).
Hasterok, D., Chapman, D.S., and Davis, E.E., 2011. Oceanic heat flow: implications for global heat loss. Earth and Planetary Science Letters, 311(3–4):386–395. http://dx.doi.org/10.1016/j.epsl.2011.09.044
Hyndman, R.D., Erickson, A.J., and Von Herzen, R.P., 1974. Geothermal measurements on DSDP Leg 26. In Davies, T.A., Luyendyk, B.P., et al., Initial Reports of the Deep Sea Drilling Project, 26: Washington, DC (U.S. Government Printing Office), 451–463. http://dx.doi.org/10.2973/dsdp.proc.26.113.1974
Lupker, M., France-Lanord, C., Galy, V., Lavé, J., Gaillardet, J., Gajurel, A.P., Guilmette, C., Rahman, M., Singh, S.K., and Sinha, R., 2012. Predominant floodplain over mountain weathering of Himalayan sediments (Ganga basin). Geochimica et Cosmochimica Acta, 84:410–432. http://dx.doi.org/10.1016/j.gca.2012.02.001
Mark, D.F., Petraglia, M., Smith, V.C., Morgan, L.E., Barfod, D.N., Ellis, B.S., Pearce, N.J., Pal, J.N., and Korisettar, R., 2014. A high-precision 40Ar/39Ar age for the Young Toba Tuff and dating of ultra-distal tephra: forcing of Quaternary climate and implications for hominin occupation of India. Quaternary Geochronology, 21:90–103. http://dx.doi.org/10.1016/j.quageo.2012.12.004
Martini, E., 1971. Standard Tertiary and Quaternary calcareous nannoplankton zonation. In Farinacci, A. (Ed.), Proceedings of the Second Planktonic Conference, Roma 1970: Rome (Edizioni Tecnoscienza), 2:739–785.
Müller, R.D., Sdrolias, M., Gaina, C., and Roest, W.R., 2008. Age, spreading rates, and spreading asymmetry of the world’s ocean crust. Geochemistry, Geophysics, Geosystems, 9(4):Q04006. http://dx.doi.org/10.1029/2007GC001743
Okada, H., and Bukry, D., 1980. Supplementary modification and introduction of code numbers to the low-latitude coccolith biostratigraphic zonation (Bukry, 1973; 1975). Marine Micropaleontology, 5:321–325. http://dx.doi.org/10.1016/0377-8398(80)90016-X
Pribnow, D., Kinoshita, M., and Stein, C., 2000. Thermal Data Collection and Heat Flow Recalculations for Ocean Drilling Program Legs 101–180: Hanover, Germany (Institute for Joint Geoscientific Research, Institut für Geowissenschaftliche Gemeinschaftsaufgaben [GGA]). http://www-odp.tamu.edu/publications/heatflow/ODPReprt.pdf
Schwenk, T., and Spieß, V., 2009. Architecture and stratigraphy of the Bengal Fan as response to tectonic and climate revealed from high-resolution seismic data. In Kneller, B.C., Martinsen, O.J., and McCaffrey, B. (Eds.), External Controls on Deep-Water Depositional Systems. Special Publication - SEPM (Society of Sedimentary Geologists), 92:107–131.
Valet, J.-P., Bassinot, F., Bouilloux, A., Bourlès, D., Nomade, S., Guillou, V., Lopes, F., Thouveny, N., and Dewilde, F., 2014. Geomagnetic, cosmogenic and climatic changes across the last geomagnetic reversal from equatorial Indian Ocean sediments. Earth and Planetary Science Letters, 397:67–79. http://dx.doi.org/10.1016/j.epsl.2014.03.053
von der Borch, C.C., Sclater, J.G., et al., 1974. Initial Reports of the Deep Sea Drilling Project, 22: Washington (U.S. Government Printing Office). http://dx.doi.org/10.2973/dsdp.proc.22.1974
Wade, B.S., Pearson, P.N., Berggren, W.A., and Pälike, H., 2011. Review and revision of Cenozoic tropical planktonic foraminiferal biostratigraphy and calibration to the geomagnetic polarity and astronomical time scale. Earth-Science Reviews, 104(1–3):111–142. http://dx.doi.org/10.1016/j.earscirev.2010.09.003
1 France-Lanord, C., Spiess, V., Klaus, A., Adhikari, R.R., Adhikari, S.K., Bahk, J.-J., Baxter, A.T., Cruz, J.W., Das, S.K., Dekens, P., Duleba, W., Fox, L.R., Galy, A., Galy, V., Ge, J., Gleason, J.D., Gyawali, B.R., Huyghe, P., Jia, G., Lantzsch, H., Manoj, M.C., Martos Martin, Y., Meynadier, L., Najman, Y.M.R., Nakajima, A., Ponton, C., Reilly, B.T., Rogers, K.G., Savian, J.F., Schwenk, T., Selkin, P.A., Weber, M.E., Williams, T., and Yoshida, K., 2016. Site U1453. In France-Lanord, C., Spiess, V., Klaus, A., Schwenk, T., and the Expedition 354 Scientists, Bengal Fan. Proceedings of the International Ocean Discovery Program, 354: College Station, TX (International Ocean Discovery Program). http://dx.doi.org/10.14379/iodp.proc.354.107.2016