Data report: grain size analysis of Bengal Fan sediments
PDF Download figures Download tables Supplementary material Cited by
France-Lanord, C., Spiess, V., Klaus, A., Schwenk, T., and the Expedition 354 Scientists
Proceedings of the International Ocean Discovery Program Volume 354
publications.iodp.org
https://doi.org/10.14379/iodp.proc.354.202.2018

Data report: grain size analysis of Bengal Fan sediments at Sites U1450 and U1451, IODP Expedition 3541
Swostik Kumar Adhikari,2, 3 Tetsuya Sakai,3 and Kohki Yoshida4
Keywords: International Ocean Discovery Program, IODP, JOIDES Resolution, Expedition 354, Bengal Fan, Site U1450, Site U1451, grain size
MS 354-202: Received 22 March 2018 · Accepted 30 July 2018 · Published 17 October 2018
Abstract
Grain size distributions of 311 sediment samples from Sites U1450 and U1451 of International Ocean Discovery Program (IODP) Expedition 354 were determined using laser diffraction. Most of the samples were from turbidites, but some hemipelagic beds were also examined. The mean grain size values show that silt-sized particles are the dominant textural class, whereas the grain size values range from clay to coarse-grained sand. An overall upward change in mean grain size value reveals a slight coarsening-upward trend. However, other parameters such as standard deviation, skewness, and kurtosis show no systematic relationship with depth in the holes. The analyzed samples cover the age range from recent to early Miocene. Shepard textural classification plots show the sediments are mostly sandy silts, silty sands, and clayey silts with a few silts and sands also present. Frequency curve plots of samples from individual turbidite beds show inversely graded beds are most common at Site U1450, whereas thicker massive beds are dominant at Site U1451.
Introduction
International Ocean Discovery Program (IODP) Expedition 354 to 8°N in the Bay of Bengal drilled at seven sites along a 320 km long transect across the Bengal Fan. The submarine fan in the study area consists of channel and levee complexes (see the Expedition 354 summary chapter; France-Lanord et al., 2016a). The evolution of the channel and levee complexes may be related to sea level changes, which are functions of external forces such as climatic changes and tectonics, in addition to autogenic processes such as shifting of submarine channels (Stow et al., 1985, 1996; Bouma et al., 1989; Bouma, 2000, 2004; Stelting et al., 2000). Grain size characteristics are one of the most fundamental features of clastic sediments (Folk, 1974; Shiki and Yamazaki, 1984; Pettijohn et al., 1987; McManus, 1988, and others). Changes in grain size distribution are related to sedimentation processes, and such distributions can be expected to change even within a single channel-levee complex because of the growth of the levee through time (Gorsline, 1984; Manley et al., 1997; Bouma, 2000; Dennielou et al., 2006).
The sediments obtained during Expedition 354 consist mainly of turbidites. These turbidite sequences are generally separated by hemipelagic beds (mottled or bioturbated calcareous clays). The purpose of this study is to obtain grain size distributions of selected horizons of turbidites and their upward variation. Weight percentages of sand, silt, and clay yield statistical parameters of the resultant grain size distributions and hence provide comprehensive textural information for the sediments. This report presents the data set arising from grain size analysis of samples from two sites, U1450 and U1451. Most of the samples are turbidites, but data were also acquired for some hemipelagic beds. Two holes were drilled at each site, denoted Holes A and B. The deepest point of Hole U1450A was 687.4 meters below the seafloor (mbsf), and the depth of Hole U1450B ranged from 608 to 811.9 mbsf, which covers the age from recent to late Miocene. The lower limit of Hole U1451A was 582 mbsf, and the depth of Hole U1451B ranged from 542 to 1181 mbsf, which covers the age from recent to late Paleocene (see the Expedition 354 summary, Site U1450, and Site U1451 chapters, [France-Lanord et al., 2016a, 2016b, 2016c, respectively]).
Methods
Sample preparation and analysis
A total of 311 samples were collected from the two sites. Of these, 96 were taken from Hole U1450A, 24 from Hole U1450B, 100 from Hole U1451A, and 91 from Hole U1451B. Most of these sediment specimens were collected from the base (77 samples), middle (89 samples), and top (53 samples) horizons of the sandy and muddy (75 samples) parts of the well-preserved turbidites. Seventeen sediment specimens were also taken from hemipelagic beds. Samples from apparently massive beds containing loose sands that were placed vertically on the core receiving platform to allow the sand to settle to the bottom were not collected for this study.
Sediment samples of approximately 0.1 g dry weight were placed in glass vials and mixed with 10% hydrogen peroxide (H2O2). These solutions were held for more than 24 h to decompose the organic matter contained in the samples. To ensure complete disaggregation of the sediments, an ultrasonic probe was used for approximately 30 s before analysis of the sample in the laser-analyzer. The grain size analysis was performed by the laser diffraction method using a SALD 3000s (Shimadzu Corp.; range of measureable size: 0.3 µm–3 mm). A 0.2% sodium hexametaphosphate [(NaPO3)6] solution was used as a dispersant during the laser analysis. At least five measurements were taken for each sample aliquot to confirm reproducibility, and all results were then averaged to obtain the final value.
Statistical parameters
Grain size parameters of mean (Mz), sorting (standard deviation; σ), skewness (SK), and kurtosis (KG) as well as sand, silt, and clay weight percentages were calculated for all samples using the phi-scale, according to the methods of Folk and Ward (1957). The following mathematical calculations (Folk and Ward, 1957) were applied in this study:
σ = [(ϕ84 − ϕ16)/4] + [(ϕ95 − ϕ5)/6.6],
SK = [(ϕ16 + ϕ84 − 2ϕ50)/2(ϕ84 − ϕ16)] +
[(ϕ5 + ϕ95 − 2ϕ50)/2(ϕ95 − ϕ5)], and
KG = (ϕ95 − ϕ5)/[2.44 (ϕ75 − ϕ25)].
Graphical mean, standard deviation, skewness, and kurtosis were plotted against depth to examine the variation of these parameters downhole. Relative proportions of sand, silt, and clay were plotted on the ternary diagram of Shepard (1954) to evaluate the textural characteristics of the sediments. Frequency distribution curves were drawn from the percentages in each grain size to obtain the grain size distribution patterns. Frequency curves of the differing horizons in individual turbidite beds were compared to understand the variations in grain size distribution within them.
Results
Graphical grain size parameters
Holes U1450A and U1450B
The mean (Mz) grain size values in these holes range from 2.53 to 8.28 ϕ, with an overall average value of 5.36 ϕ (Figure F1A; Tables T1, T2; expanded versions of these tables are available in GRAINSIZE in Supplementary material). The mean values indicate that silt-sized particles are the dominant textural class. Most of the mud samples are fine- to medium-grained silts with only a few being coarse-grained silts. In the lower sandy part of the turbidites, the bed base samples range from medium-grained silts to very fine grained sands, whereas the sandy bed middle samples are slightly coarser, ranging from medium-grained silts to fine grained sands. The bed top samples are fine-grained silts to very fine grained sands. The overall upward change in mean grain size values in the sandy parts of the turbidites indicates a slight coarsening-upward trend, which includes some small-scale coarsening-upward trends (e.g., 180 to 50 m) (Figure F1A). Standard deviation (σ) values range from 0.95 to 2.27 ϕ, with an average of 1.58 ϕ. Most of the samples are poorly sorted, with only a few samples being moderately sorted or very poorly sorted (Figure F1B). Skewness (SK) values range from −0.06 to 0.49, with an average of 0.15. Most of the samples fall in the symmetrical and positively skewed category, but seven samples fall in the very positively skewed category (Figure F1C). Kurtosis (KG) values range from 0.76 to 2.05, with an average of 1.09. Most samples have mesokurtic and leptokurtic distributions, although five samples show very leptokurtic distributions (Figure F1D). The σ, SK, and KG values show no significant or systematic variation with depth.
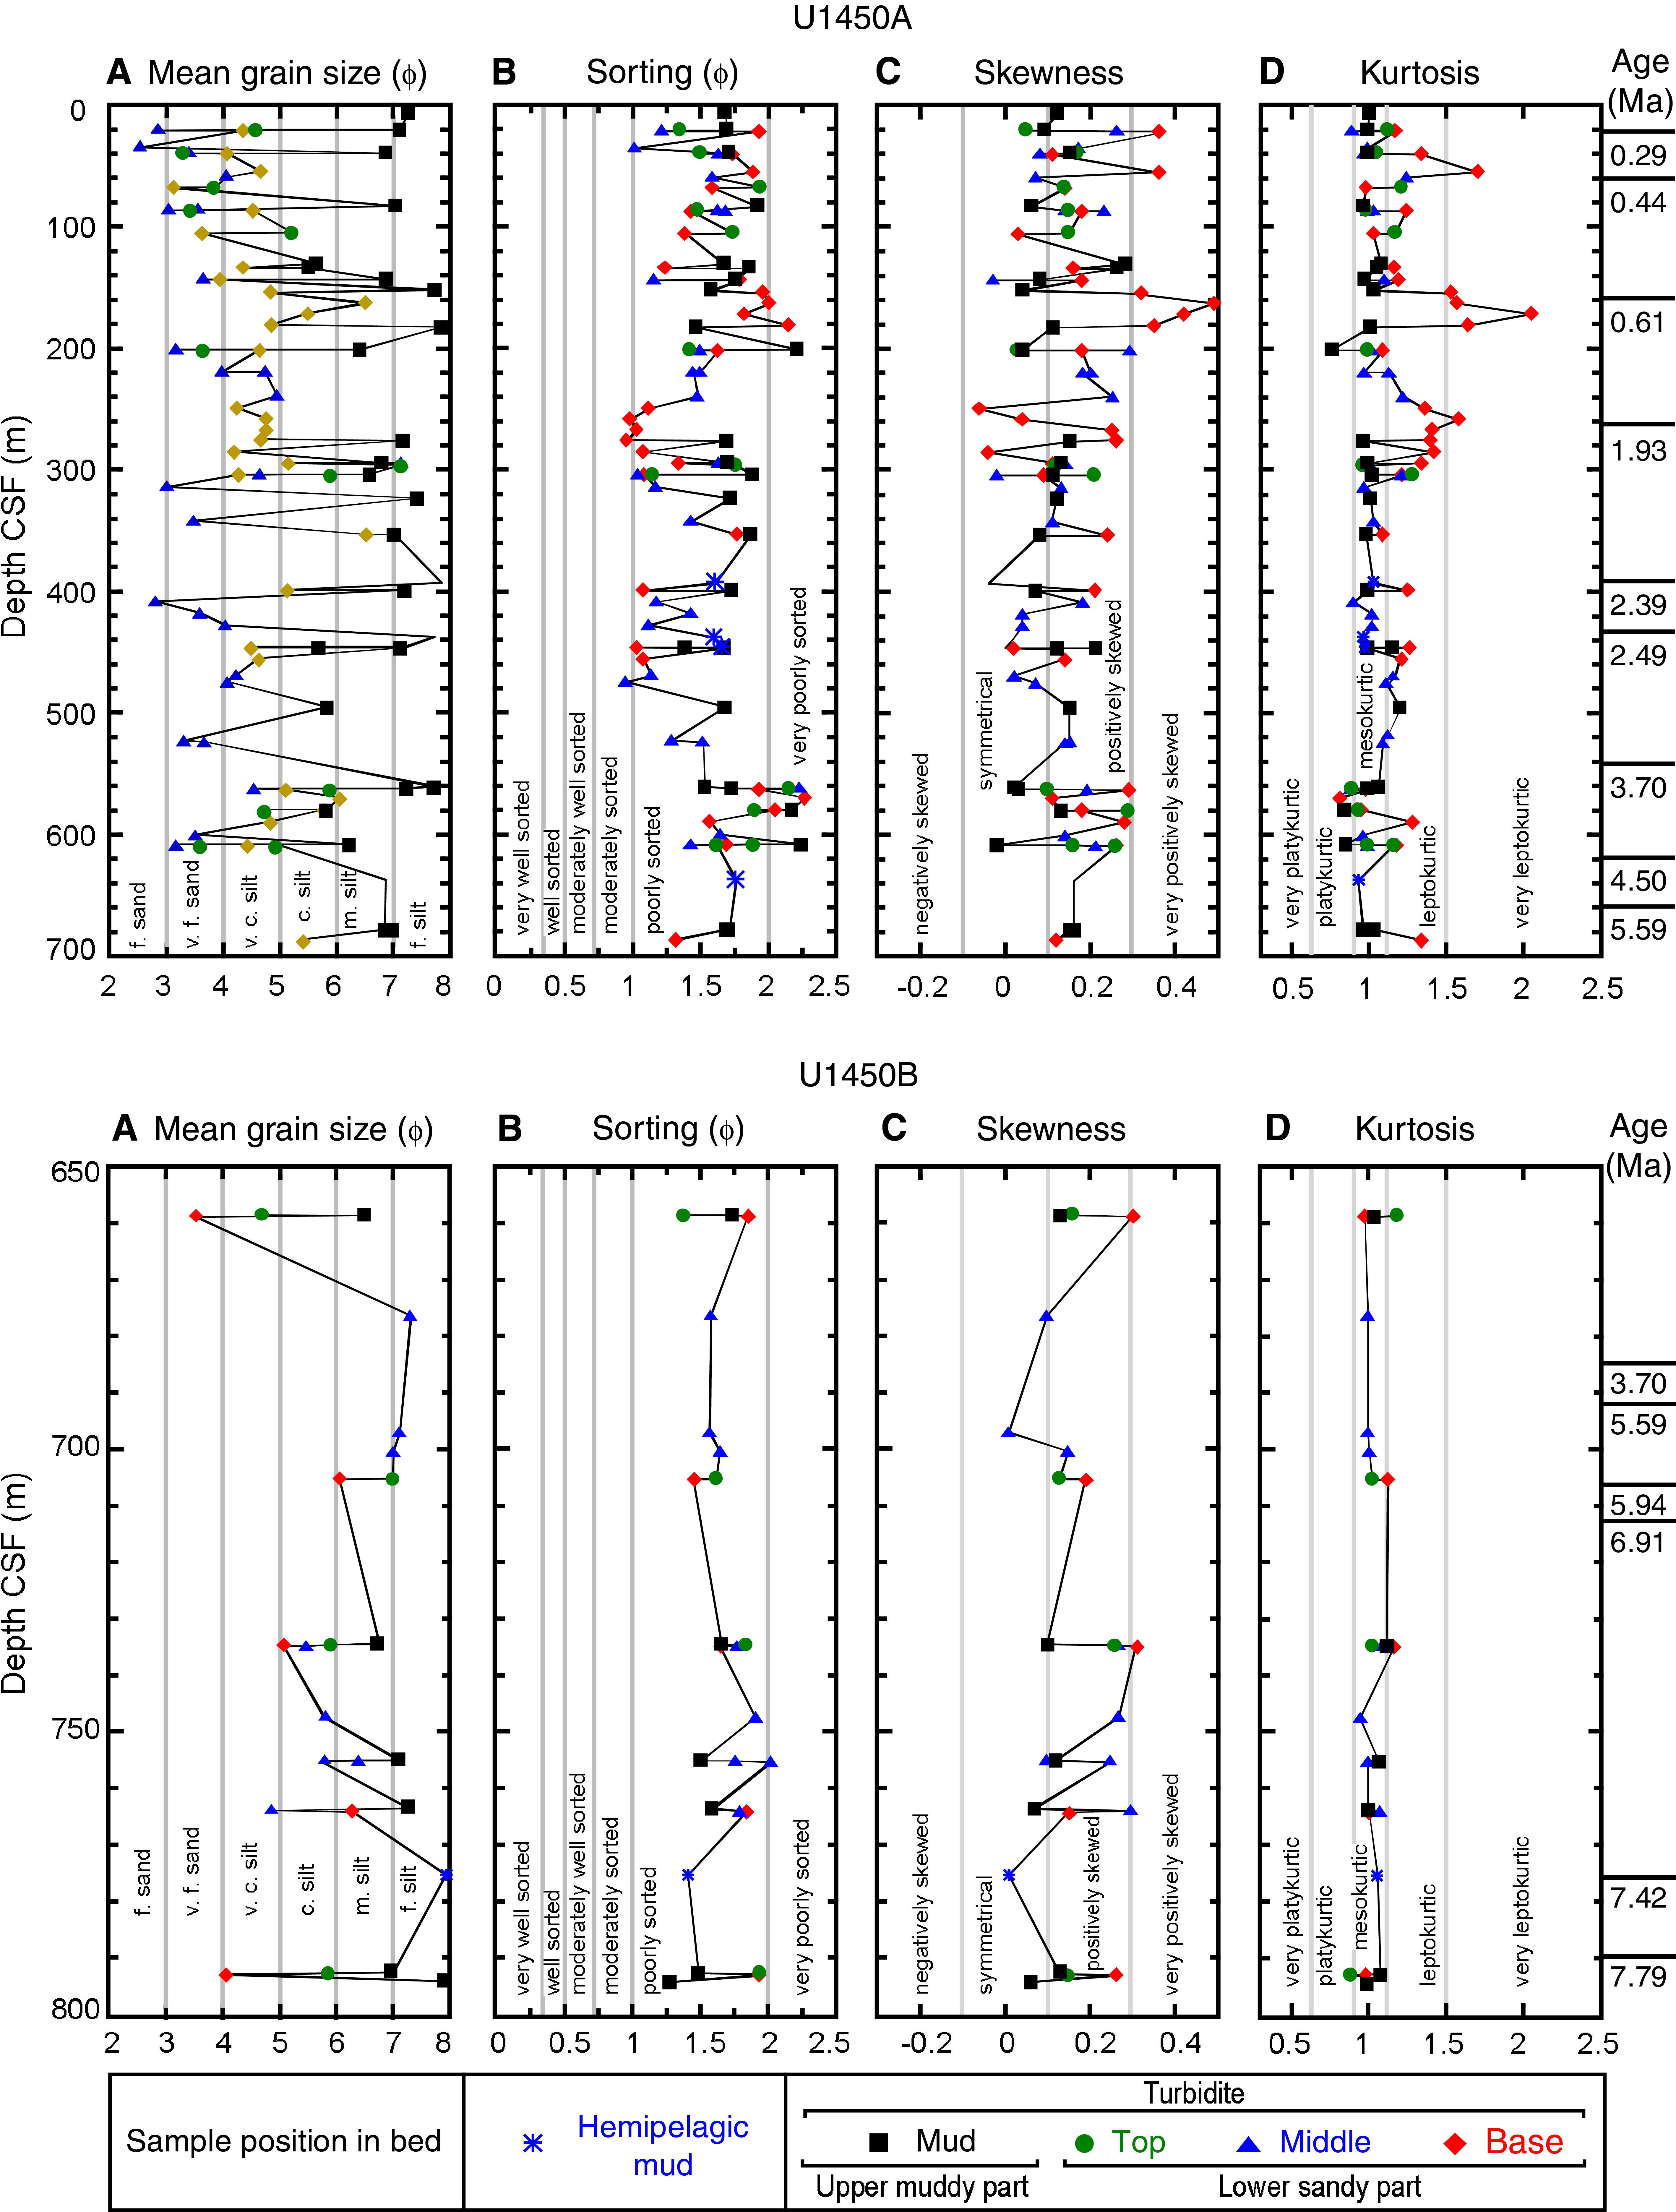
Figure F1. Depth variation in Site U1450 sediments.
Table T1. Grain size analysis data, Hole U1450A. Download table in CSV format.
Table T2. Grain size analysis data, Hole U1450B. Download table in CSV format.
Holes U1451A and U1451B
Mean grain size values in Site U1451 samples range from 1.69 to 8.02 ϕ with an overall average value of 5.63 ϕ (Figure F2A; Tables T3, T4; expanded versions of these tables are available in Supplementary material). The mean (Mz) values show that silt-size particles are again the major textural class with only a few samples being dominated by sand-size particles. Nearly all of the mud samples are fine- to medium-grained silts, with only three samples classified as coarse-grained silts. In the lower sandy parts, the bed base samples are medium-grained silts to very fine grained sands, whereas the bed middle samples are fine-grained silts to fine-grained sands. The top samples of the sandy beds are fine-grained silts to fine-grained sands, except for a single medium-grained sand near the top of Hole U1451A. The upward change in mean grain size values show small-scale fining (e.g., 250 to 125 m) (Figure F2A) as well as coarsening (e.g., 450 to 300 m) (Figure F2A) upward trends, whereas the mean grain size values of samples in the sandy parts of the turbidites show a slight coarsening-upward trend. Standard deviation (σ) values show almost all samples are poorly sorted except for two that are moderately sorted and one that is well sorted (Figure F2B). The σ values range from 0.38 to 2.29 ϕ, with an average value of 1.58 ϕ. Skewness values range from −0.12 to + 0.45 with an average of 0.17. Most of the samples are distributed in the symmetrical and positively skewed categories, although 13 samples are classified as very positively skewed (Figure F2C). Kurtosis values range from 0.78 to 1.40 with an average of 1.08. Most samples show mesokurtic and leptokurtic distributions, and five samples exhibit platykurtic distributions (Figure F2D). As at Site U1450, the σ, SK, and KG values show no significant variation with depth.
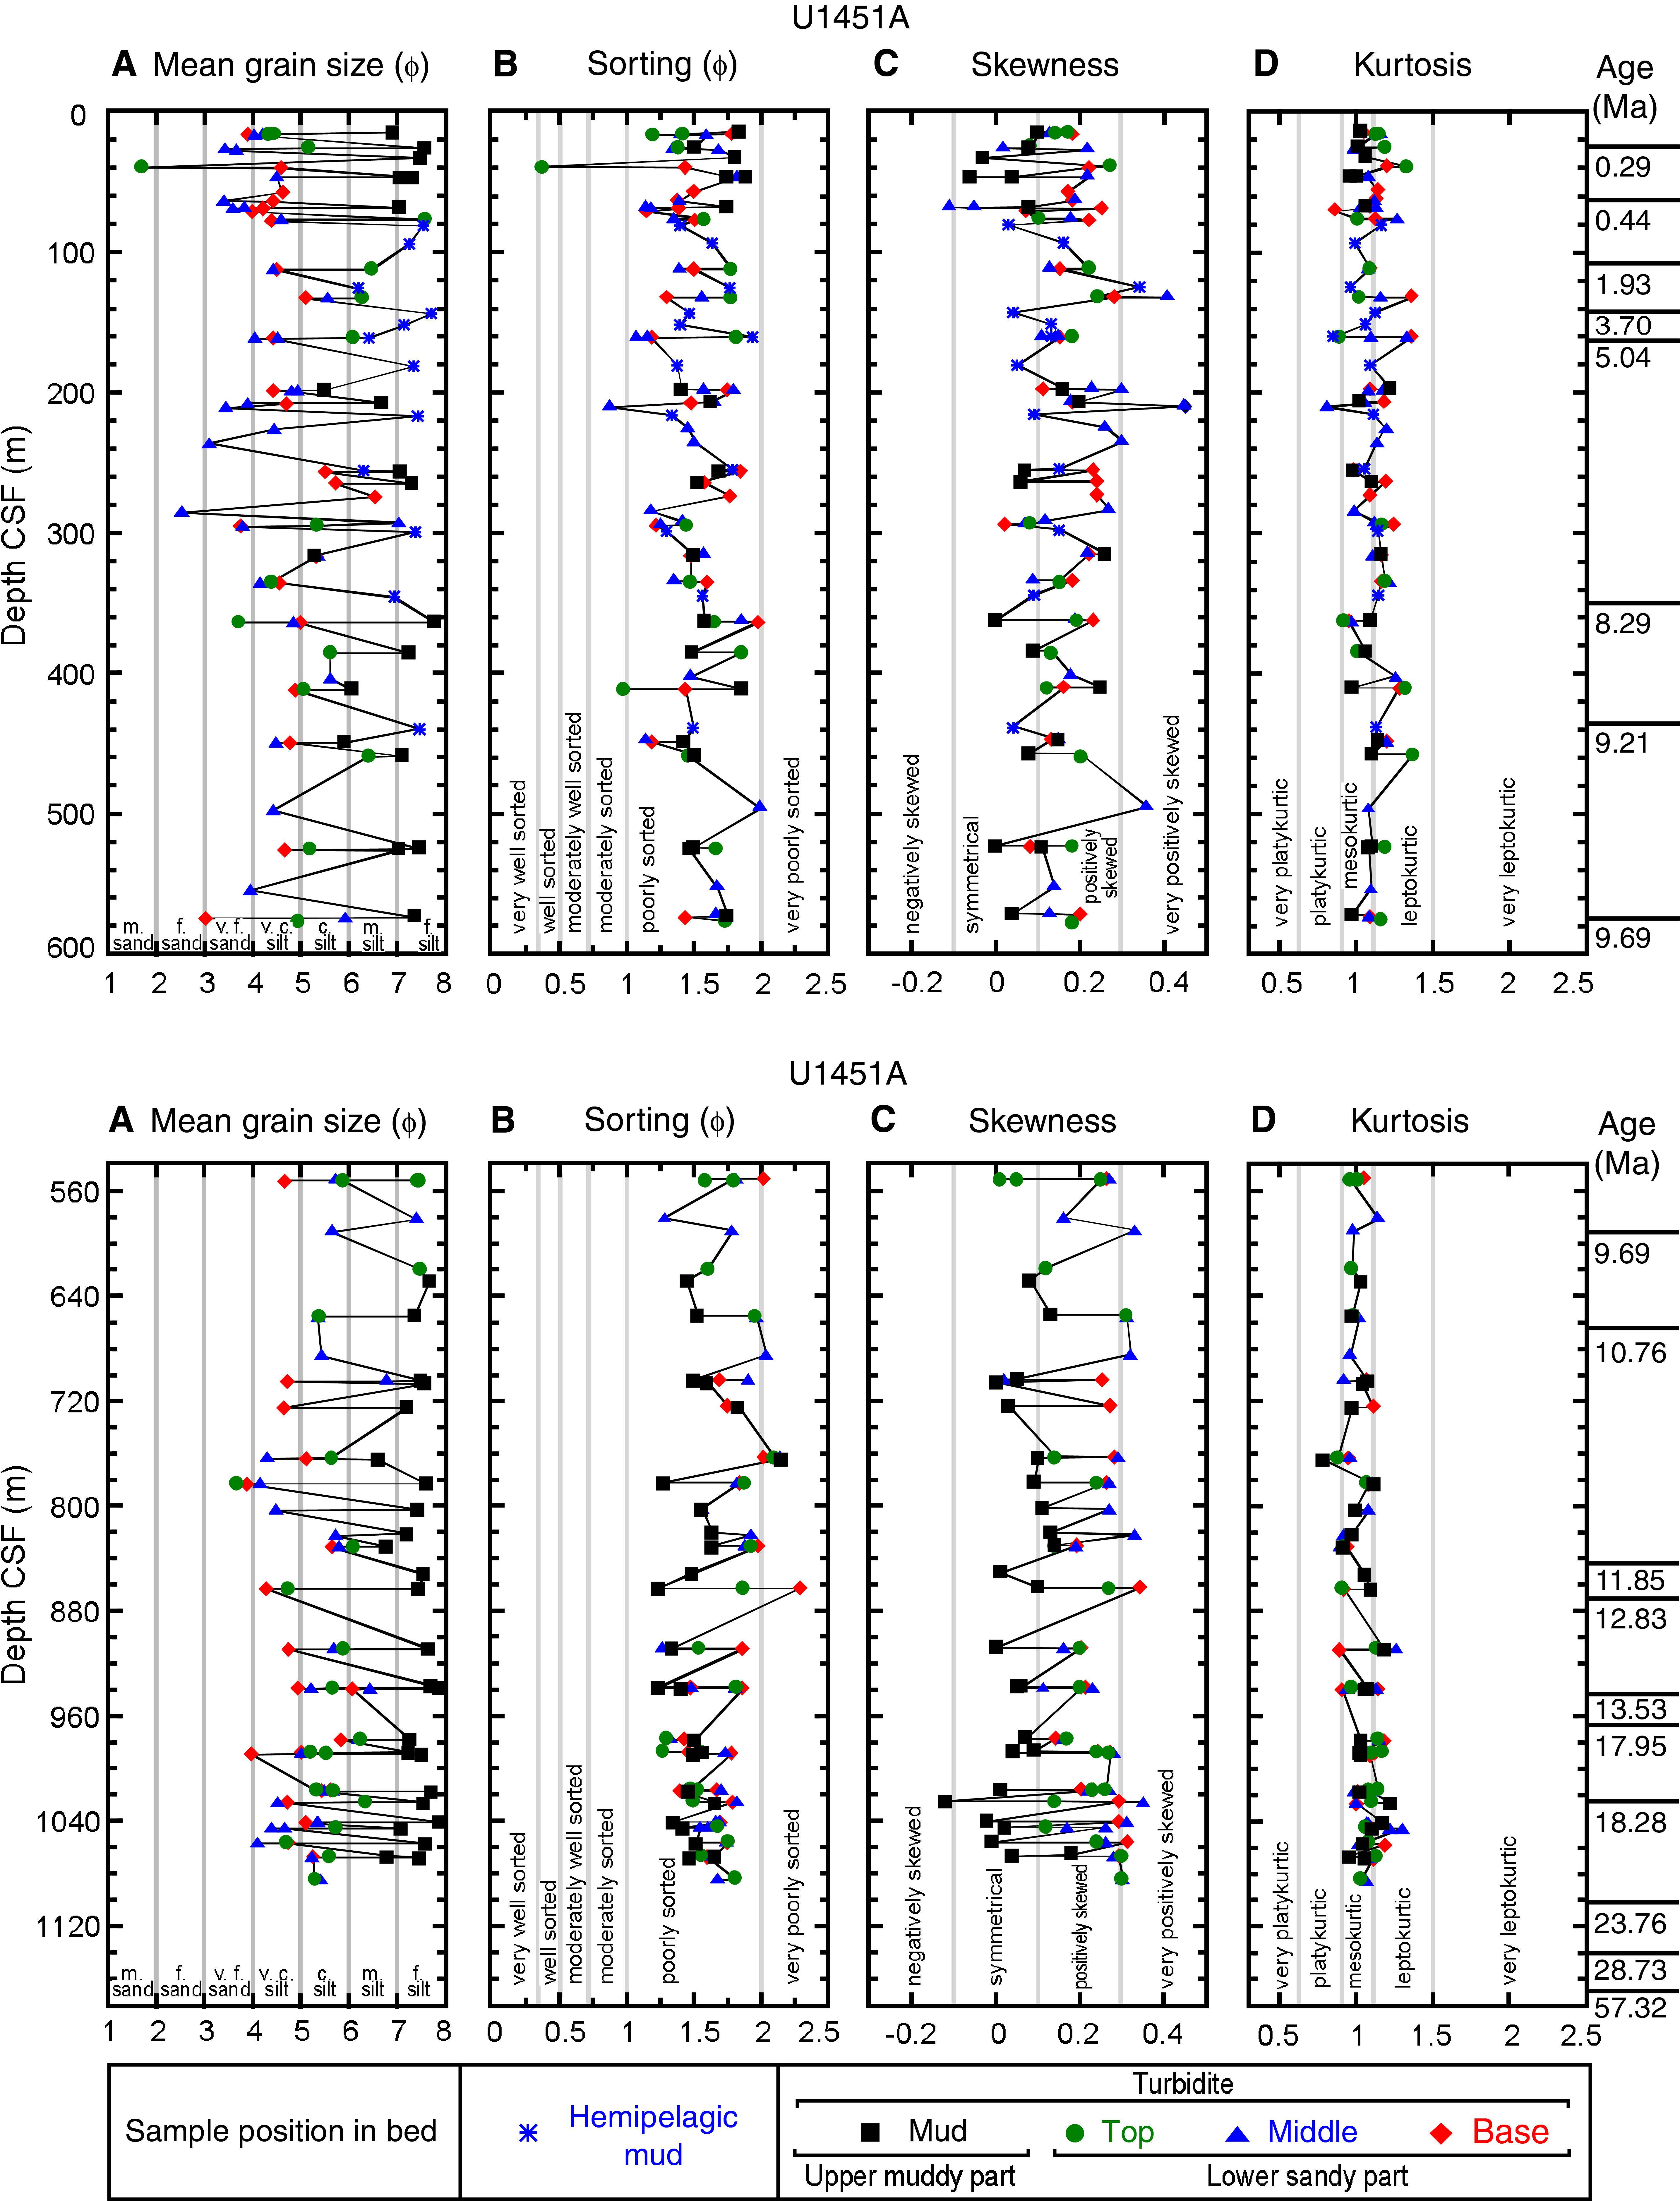
Figure F2. Depth variation in Site U1451 sediments.
Table T3. Grain size analysis data, Hole U1451A. Download table in CSV format.
Table T4. Grain size analysis data, Hole U1451B. Download table in CSV format.
Textural classification of the sediments
The ternary sand-silt-clay plot of Shepard (1954) provides a textural classification of the sediments based on grain size. Sediment samples from Sites U1450 and U1451 are plotted separately in Figure F3. Most of the samples from the base, middle, and top horizons of the sandy parts of the turbidites cluster near the edge between the sand and silt apexes, and the samples from upper muddy horizons cluster near the edge between silt and clay. The figures show that the sediments in both holes are mostly sandy silts, silty sands, and clayey silts with subordinate silts and sands.
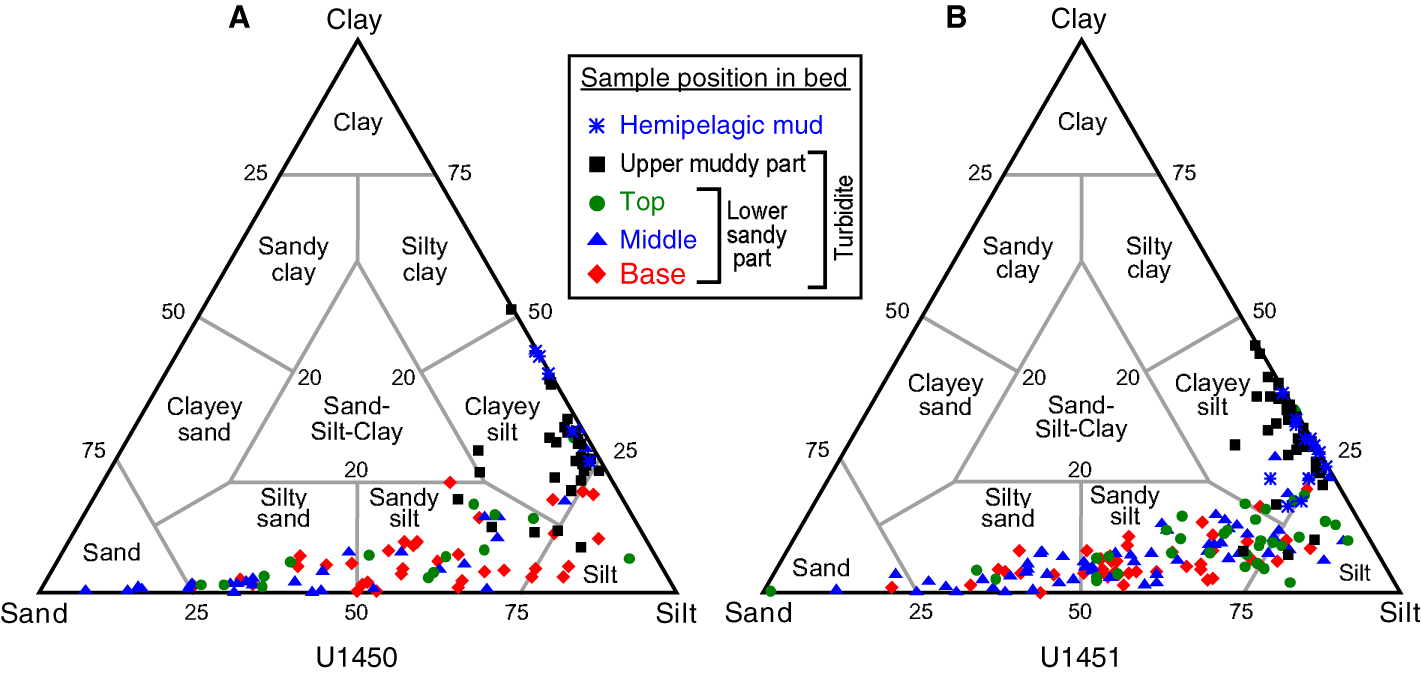
Figure F3. Ternary sand-silt-clay plots.
Frequency curves
Frequency curves of the differing horizons of individual turbidites were compared to examine the variation in grain size distribution within these beds. Nineteen turbidite beds from Site U1450 and 40 turbidite beds from Site U1451 were examined in this way. Frequency distribution curves show that three types of beds are present: normally graded, inversely graded, and homogeneous (massive) beds (Figure F4). The frequency curves show that inversely graded beds are dominant at Site U1450, whereas thicker massive beds dominate at Site U1451 among the analyzed beds. Most of the inversely graded beds show a coarsening-upward trend from their base to their middle horizons and then show normal grading toward the top horizons in the sandy parts. Overall from the analyzed turbidite beds, 38% are normally graded (examples in Figure F4A), 29% are inversely graded (Figure F4B), and 33% are massive beds (Figure F4C).
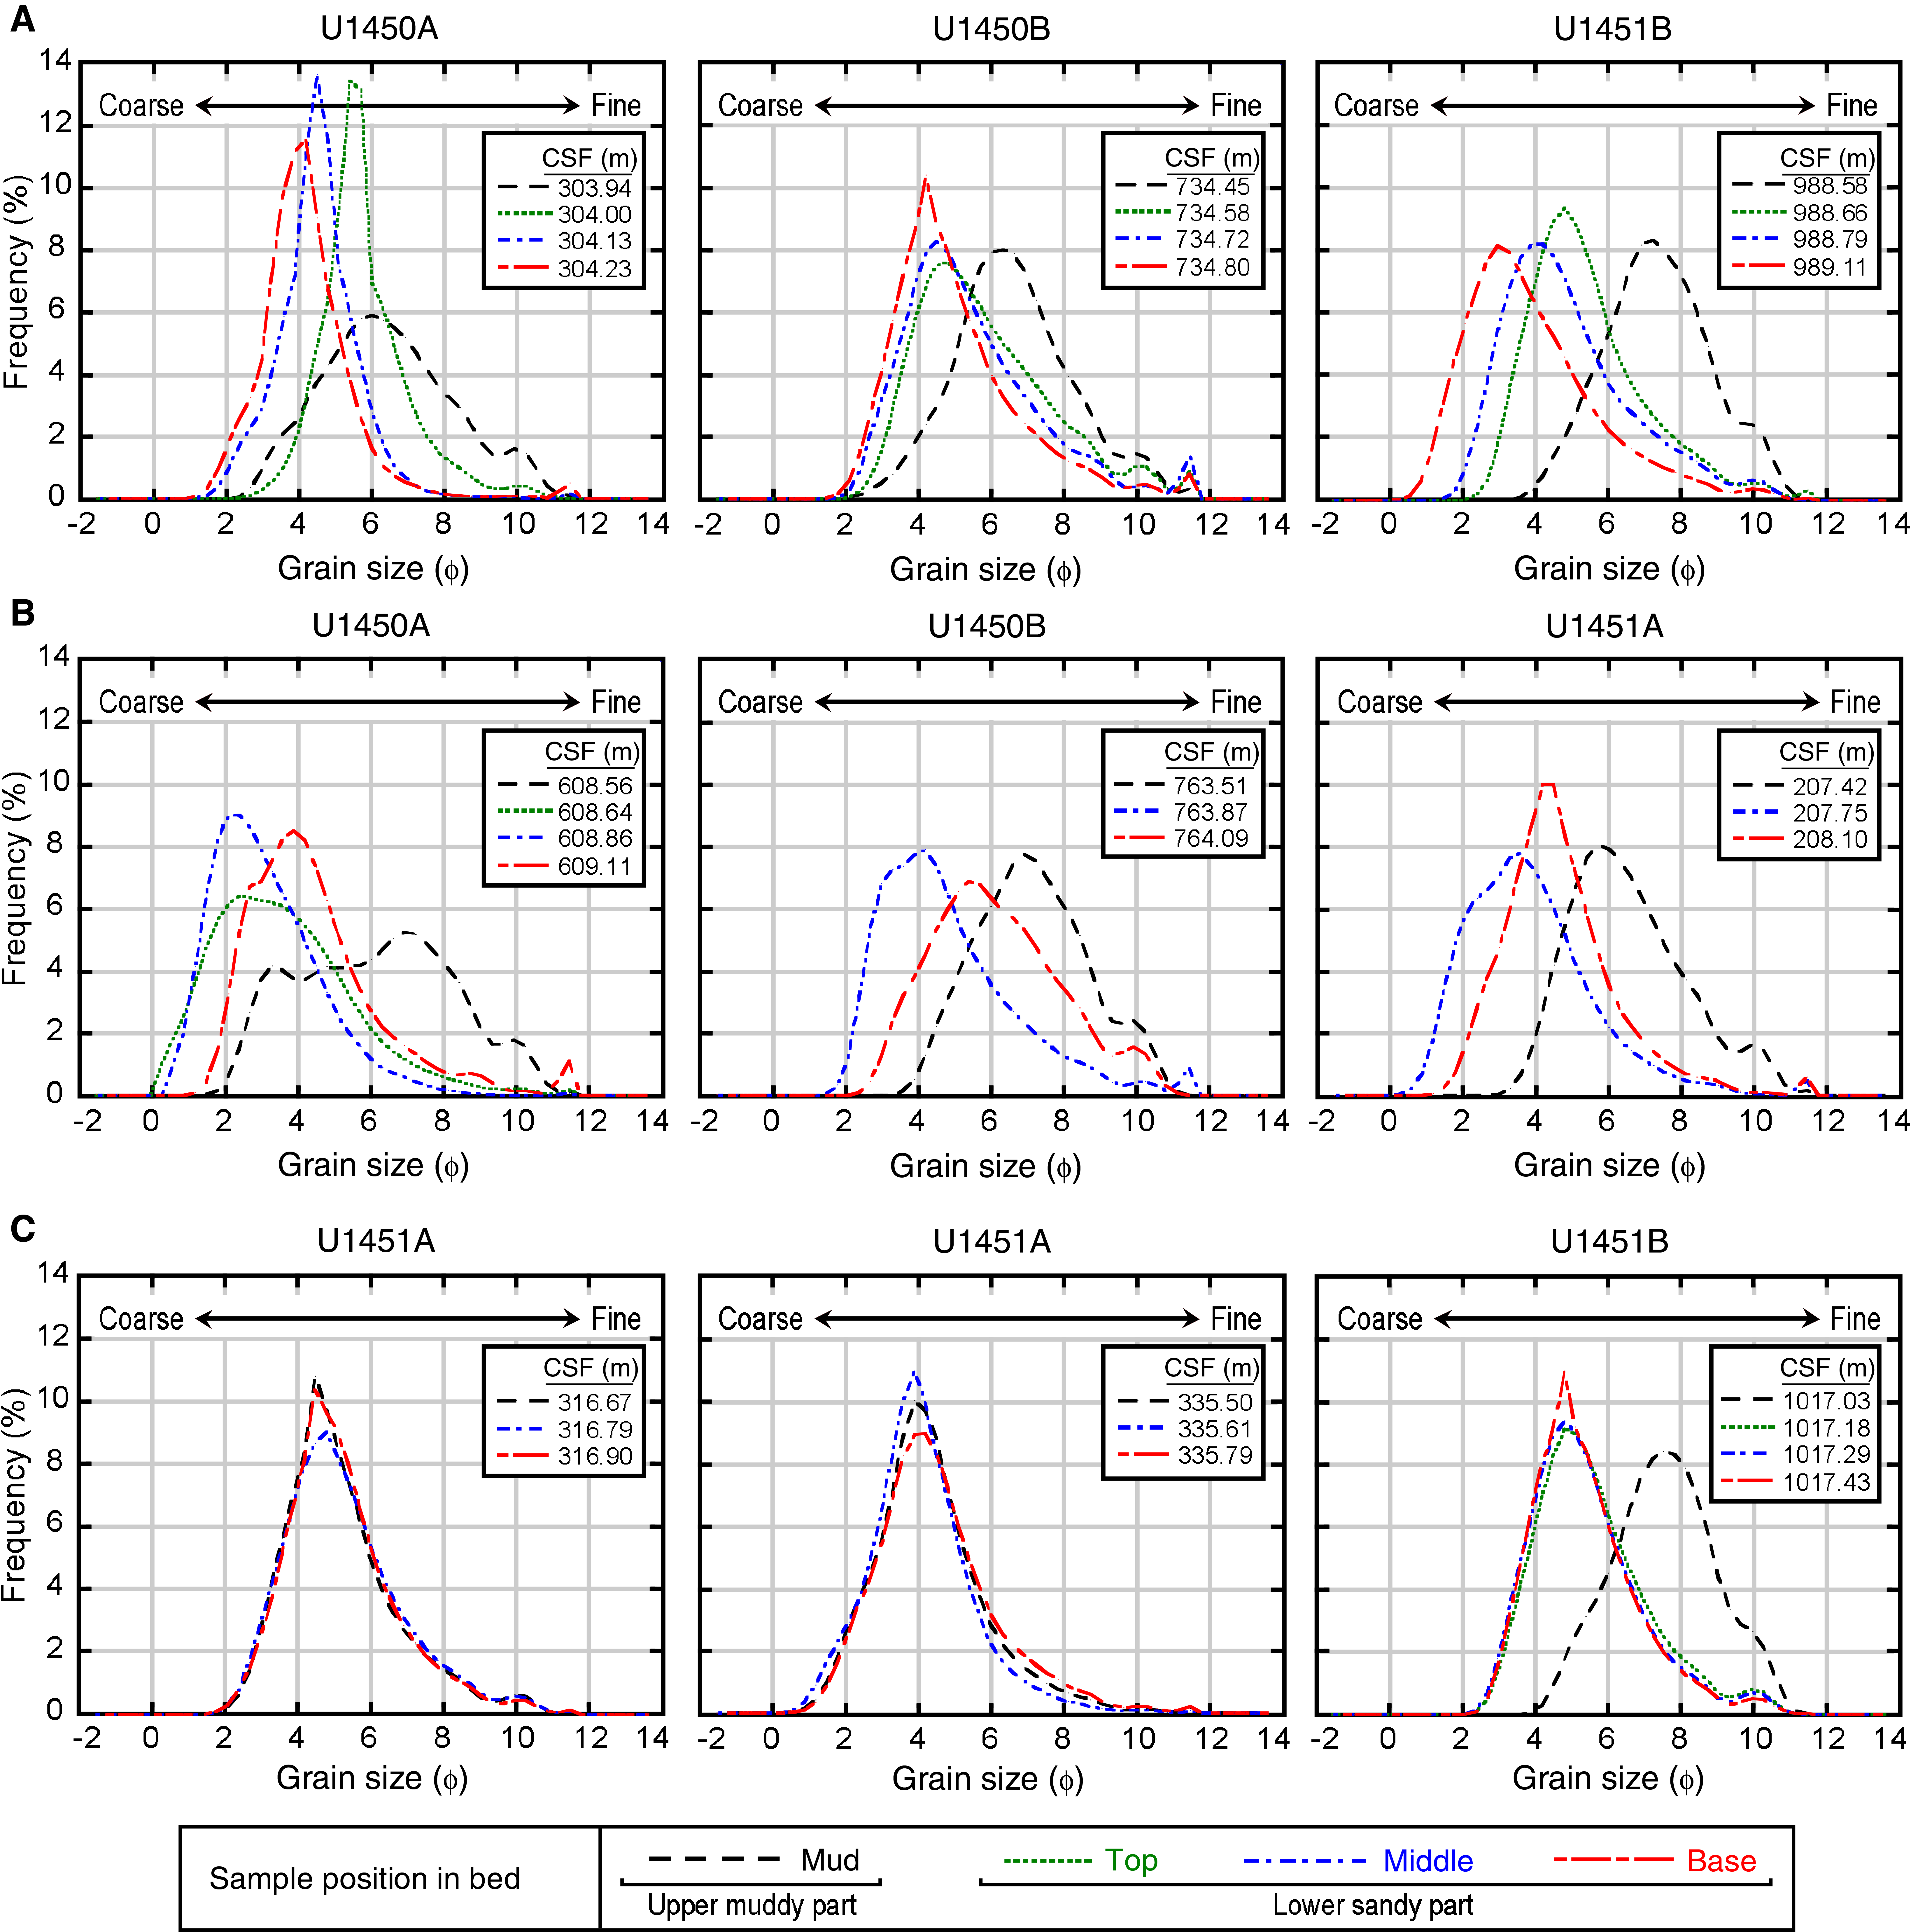
Figure F4. Frequency curve plots.
Acknowledgments
We thank the International Ocean Discovery Program (IODP) and Kochi Core Center (KCC) staff for their help and support during our sediment sampling. We thank Dr. M. Lupker for constructive review of the manuscript, Dr. B.P. Roser for critical reading and helpful comments on an early version of the manuscript, Dr. P. Huyghe for providing additional samples as well as her fruitful suggestions on research collaboration, and Drs. H. Lantzsch and M.E. Weber for their valuable suggestions during sample collection. Special thanks are due to Drs. C. France-Lanord, V. Spiess, A. Klaus, T. Schwenk, and the scientists of Expedition 354 for providing the opportunity to contribute this paper to the IODP publication and for collaboration during onshore and postcruise meetings. This research has been financially supported in part by the Japan Drilling Earth Science Consortium (J-DESC) and the Japan Agency for Marine-Earth Science and Technology (JAMSTEC).
References
Bouma, A.H., 2000. Fine-grained, mud-rich turbidite systems: model and comparison with coarse-grained, sand-rich systems. In Bouma, A.H., and Stone, C.G. (Eds.), Fine-Grained Turbidite Systems. AAPG Memoir, 72:9–20. https://pubs.geoscienceworld.org/books/chapter-pdf/3841040/9781629812625_ch02.pdf
Bouma, A.H., 2004. Key controls on the characteristics of turbidite systems. In Lomas, S.A., and Joseph, P. (Eds.), Confined Turbidite Systems. Geological Society Special Publication, 222:9–22. https://doi.org/10.1144/GSL.SP.2004.222.01.02
Bouma, A.H., Coleman, J.M., Stelting, C.E., and Kohl, B., 1989. Influence of relative sea level changes on the construction of the Mississippi Fan. Geo-Marine Letters, 9(3):161–170. https://doi.org/10.1007/BF02431043
Dennielou, B., Huchon, A., Beaudouin, C., and Berné, S., 2006. Vertical grain-size variability within a turbidite levee: autocyclicity or allocyclicity? A case study from the Rhône neofan, Gulf of Lions, Western Mediterranean. Marine Geology, 234(1–4):191–213. https://doi.org/10.1016/j.margeo.2006.09.019
Folk, R.L., 1974. Petrology of Sedimentary Rocks: Austin, TX (University of Texas).
Folk, R.L., and Ward, W.C., 1957. Brazos River bar [Texas]: a study in the significance of grain size parameters. Journal of Sedimentary Research, 27(1):3–26. https://doi.org/10.1306/74D70646-2B21-11D7-8648000102C1865D
France-Lanord, C., Spiess, V., Klaus, A., Schwenk, T., Adhikari, R.R., Adhikari, S.K., Bahk, J.-J., Baxter, A.T., Cruz, J.W., Das, S.K., Dekens, P., Duleba, W., Fox, L.R., Galy, A., Galy, V., Ge, J., Gleason, J.D., Gyawali, B.R., Huyghe, P., Jia, G., Lantzsch, H., Manoj, M.C., Martos Martin, Y., Meynadier, L., Najman, Y.M.R., Nakajima, A., Ponton, C., Reilly, B.T., Rogers, K.G., Savian, J.F., Selkin, P.A., Weber, M.E., Williams, T., and Yoshida, K., 2016a. Expedition 354 summary. In France-Lanord, C., Spiess, V., Klaus, A., Schwenk, T., and the Expedition 354 Scientists, Bengal Fan. Proceedings of the International Ocean Discovery Program, 354: College Station, TX (International Ocean Discovery Program). https://doi.org/10.14379/iodp.proc.354.101.2016
France-Lanord, C., Spiess, V., Klaus, A., Adhikari, R.R., Adhikari, S.K., Bahk, J.-J., Baxter, A.T., Cruz, J.W., Das, S.K., Dekens, P., Duleba, W., Fox, L.R., Galy, A., Galy, V., Ge, J., Gleason, J.D., Gyawali, B.R., Huyghe, P., Jia, G., Lantzsch, H., Manoj, M.C., Martos Martin, Y., Meynadier, L., Najman, Y.M.R., Nakajima, A., Ponton, C., Reilly, B.T., Rogers, K.G., Savian, J.F., Schwenk, T., Selkin, P.A., Weber, M.E., Williams, T., and Yoshida, K., 2016b. Site U1450. In France-Lanord, C., Spiess, V., Klaus, A., Schwenk, T., and the Expedition 354 Scientists, Bengal Fan. Proceedings of the International Ocean Discovery Program, 354: College Station, TX (International Ocean Discovery Program). https://doi.org/10.14379/iodp.proc.354.104.2016
France-Lanord, C., Spiess, V., Klaus, A., Adhikari, R.R., Adhikari, S.K., Bahk, J.-J., Baxter, A.T., Cruz, J.W., Das, S.K., Dekens, P., Duleba, W., Fox, L.R., Galy, A., Galy, V., Ge, J., Gleason, J.D., Gyawali, B.R., Huyghe, P., Jia, G., Lantzsch, H., Manoj, M.C., Martos Martin, Y., Meynadier, L., Najman, Y.M.R., Nakajima, A., Ponton, C., Reilly, B.T., Rogers, K.G., Savian, J.F., Schwenk, T., Selkin, P.A., Weber, M.E., Williams, T., and Yoshida, K., 2016c. Site U1451. In France-Lanord, C., Spiess, V., Klaus, A., Schwenk, T., and the Expedition 354 Scientists, Bengal Fan. Proceedings of the International Ocean Discovery Program, 354: College Station, TX (International Ocean Discovery Program). https://doi.org/10.14379/iodp.proc.354.105.2016
Gorsline, D.S., 1984. A review of fine-grained sediment origins, characteristics, transport, and deposition. In Stow, D.A.V., and Piper, D.J.W. (Eds.), Fine-Grained Sediments. Geological Society Special Publications, 15(1):17–34. https://doi.org/10.1144/GSL.SP.1984.015.01.02
Manley, P.L., Pirmez, C., Busch, W., and Cramp, A., 1997. Grain-size characterization of Amazon Fan deposits and comparison to seismic facies units. In Flood, R.D., Piper, D.J.W., Klaus, A., and Peterson, L.C. (Eds.), Proceedings of the Ocean Drilling Program, Scientific Results, 155: College Station, TX (Ocean Drilling Program), 35–52. https://doi.org/10.2973/odp.proc.sr.155.209.1997
McManus, J., 1988. Grain size determination and interpretation. In Tucker, M. (Ed.), Techniques in Sedimentology: Oxford, United Kingdom(Blackwell Science Publishing), 63–85.
Pettijohn, F.J., Potter, P.E., and Siever, R., 1987. Sand and Sandstone (2nd edition): New York (Springer-Verlag). https://doi.org/10.1007/978-1-4612-1066-5
Shepard, F.P., 1954. Nomenclature based on sand-silt-clay ratios. Journal of Sedimentary Research, 24(3):151–158. https://doi.org/10.1306/D4269774-2B26-11D7-8648000102C1865D
Shiki, T., and Yamazaki, T., 1984. A lamina-by-lamina analysis of grain-size distribution in fine-grained turbidites. Sedimentary Geology, 41(2–4):201–220. https://doi.org/10.1016/0037-0738(84)90062-9
Stelting, C.E., Bouma, A.H., and Stone, C.G., 2000. Fine-grained turbidite systems: overview. In Bouma, A.H., and Stone, C.G. (Eds.), Fine-Grained Turbidite Systems. AAPG Memoir, 72:1–8. https://pubs.geoscienceworld.org/books/chapter-pdf/3841038/9781629812625_ch01.pdf
Stow, D.A.V., Howell, D.G., and Nelson, C.H., 1985. Sedimentary, tectonic, and sea-level controls. In Bouma, A.H., Normark, W.R., and Barnes, N.E. (Eds.), Submarine Fans and Related Turbidite Systems: New York (Springer), 15–22. https://doi.org/10.1007/978-1-4612-5114-9_4
Stow, D.A.V., Reading, H.G., and Collinson, J.D., 1996. Deep seas. In Reading, H.G. (Ed.), Sedimentary Environments: Processes, Facies and Stratigraphy: Oxford, United Kingdom (Blackwell Science Publishing), 395–453.
1 Adhikari, S.K., Sakai, T., Yoshida, K., 2018. Data report: grain size analysis of Bengal Fan sediments at Sites U1450 and U1451, IODP Expedition 354. In France-Lanord, C., Spiess, V., Klaus, A., Schwenk, T., and the Expedition 354 Scientists, Bengal Fan. Proceedings of the International Ocean Discovery Program, 354: College Station, TX (International Ocean Discovery Program). https://doi.org/10.14379/iodp.proc.354.202.2018
2 Department of Geology, Tri-Chandra Campus,Tribhuvan University, Ghantaghar, Kathmandu, Nepal.
3 Department of Geoscience, Shimane University, Japan. Correspondence author: swostik_adhikari@hotmail.com
4 Department of Geology, Shinshu University, Japan.
This work is distributed under the Creative Commons Attribution 4.0 International (CC BY 4.0) license. 
Data report: grain size analysis of Bengal Fan sediments
PDF Download figures Download tables Supplementary material Cited by