Pandey, D.K., Clift, P.D., Kulhanek, D.K., and the Expedition 355 Scientists
Proceedings of the International Ocean Discovery Program Volume 355
publications.iodp.org
doi:10.14379/iodp.proc.355.104.2016

Site U1457 1
D.K. Pandey, P.D. Clift, D.K. Kulhanek, S. Andò, J.A.P. Bendle, S. Bratenkov, E.M. Griffith, G.P. Gurumurthy, A. Hahn, M. Iwai, B.-K. Khim, A. Kumar, A.G. Kumar, H.M. Liddy, H. Lu, M.W. Lyle, R. Mishra, T. Radhakrishna, C.M. Routledge, R. Saraswat, R. Saxena, G. Scardia, G.K. Sharma, A.D. Singh, S. Steinke, K. Suzuki, L. Tauxe, M. Tiwari, Z. Xu, and Z. Yu2
Keywords: International Ocean Discovery Program, IODP, JOIDES Resolution, Expedition 355, Site U1457, turbidite, mica, breccia, hypersthene, actinolite, recycling, faulting, hiatus, calcarenite, continental breakup, mass transport deposit, continental rifting, Paleocene, Neogene, Pleistocene, basalt, tholeiite, plagioclase, pyroxene, olivine, Deccan Traps Flood Basalt, Laxmi Basin, submarine fan, foraminifers, calcareous nannofossils, methanogenesis, dehydration of clay minerals
MS 355-104: Published 29 August 2016
Background and objectives
International Ocean Discovery Program (IODP) Site U1457 lies offshore of the western margin of India in the Arabian Sea, ~491 km from the Indian coast and ~750 km from the modern mouth of the Indus River, which is presumed to be the primary source of sediment to the area, at least during the Neogene (Figure F1). Site U1457 is situated on the western edge of Laxmi Basin, at the toe of the slope leading up to the structural and topographic high of Laxmi Ridge. Although there is no significant bathymetric expression directly east of Site U1457, a subseafloor intrusive structure is observed in the seismic data. Furthermore, the prominent Raman Seamount lies ~100 km east of Site U1457 (Figure F2). Neither of these structures exerts influence on the sedimentary cover at Site U1457.
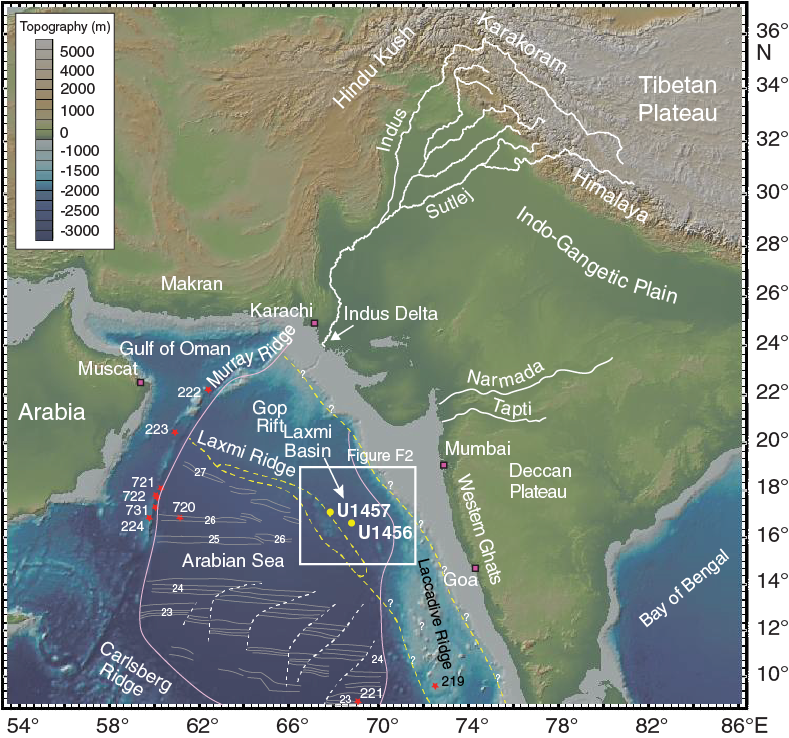
Figure F1. Bathymetric map of the Arabian Sea and the surrounding landmasses.
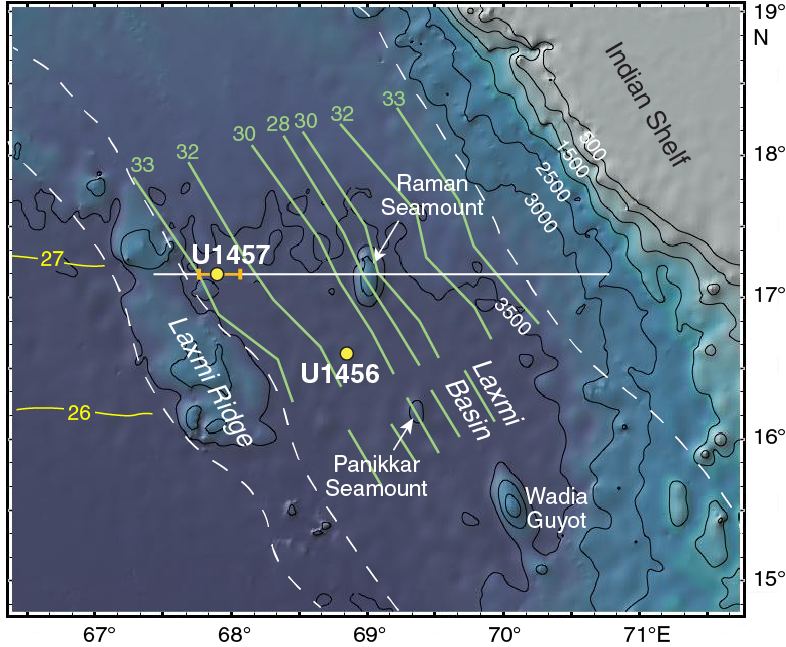
Figure F2. Bathymetric map of the region around Laxmi Basin with locations of Site U1457 in relation to other major bathymetric features.
Laxmi Basin is a 200–250 km wide depression that runs in a northwest–southeast direction parallel to the west coast of India. A series of isolated seamounts (e.g., Panikkar and Raman Seamounts together with Wadia Guyot) occur along the axial part of Laxmi Basin; these are collectively referred to as Panikkar Ridge (Krishna et al., 2006) (Figure F2). Gop Rift lies to the north of Laxmi Basin, with the former representing an along-strike equivalent that has accommodated a larger degree of extension and is believed to be oceanic in character (Minshull et al., 2008).
Site U1457 is positioned in order to core through the Cenozoic sedimentary cover and penetrate into acoustic basement. The primary objectives are to understand the long-term development of the regional tectonics, climate, and erosional history and to establish the nature of the crust in Laxmi Basin, particularly whether it is of continental or oceanic character.
Paleogeographic reconstructions of the northern Indian Ocean suggest that seafloor spreading between the India-Seychelles continental block and Madagascar initiated and focused in the Mascarene Basin and continued until Chron C27, ~62 Ma (Bernard and Munschy, 2000; Müller et al., 2000). The subsequent separation of the Seychelles Block from India did not occur until 62–64 Ma (Miles and Roest, 1993; Chaubey et al., 1998; Collier et al., 2008). The final phase of rifting along this margin is linked to the emplacement of the Deccan Traps Flood Basalts, supposedly at the initiation of Réunion mantle plume activity (Mahoney, 1988; White and McKenzie, 1989); however, the temporal and spatial relationships between Deccan Traps Flood Basalts and rifting between Seychelles and India are yet to be resolved.
The nature of crust in Laxmi Basin is enigmatic and inhibits full understanding of the continental breakup process. Laxmi Ridge, which is a structural and topographic high exhibiting a negative free-air gravity anomaly of 25 to 50 mGal, is usually interpreted as a continental fragment of India (Naini and Talwani, 1983; Talwani and Reif, 1998; Minshull et al., 2008). Identification of the oldest seafloor-spreading magnetic anomalies in the Arabian Sea is a matter of long-standing debate. The oldest seafloor spreading–related magnetic anomalies reported in this region are Anomalies 27n (62.2–62.5 Ma) and 28n (63.5–64.7 Ma), located southwest of Laxmi Ridge in the Arabian Basin and north of the Seychelles, respectively (Chaubey et al., 2002; Royer et al., 2002) and Anomaly 33 (~79.5 Ma; Bhattacharya et al., 1994) to the east of Laxmi Ridge (Figures F1, F2). If this interpretation is correct then Site U1457 could conceivably be located on the transition between continental and oceanic crust. In contrast, Todal and Edholm (1998) suggested that Laxmi Ridge has oceanic affinity and interpreted the magnetic anomalies within the Laxmi Basin as a continuation of anomalies (28–31) in the Arabian Basin. Under such a tectonic setting, Site U1457 would be positioned over purely oceanic crust of variable thickness and geochemistry.
Miles et al. (1998) and Krishna et al. (2006) argued that both Laxmi Basin and Gop Rift are underlain by stretched continental crust and attribute the observed magnetic anomalies to strongly magnetized magmatic intrusions unrelated to seafloor spreading. If this were the case, Site U1457 would also sit on stretched continental material, possibly even continental lithospheric mantle exposed as a core complex formed during extreme extension, perhaps analogous to Porcupine Rift in the North Atlantic (Reston et al., 2001) or the Iberia Abyssal Plain (Pickup et al., 1996). To test these hypotheses we need to directly sample the basement within Laxmi Basin, which will have significant implications in understanding the break-up history of India and the Seychelles.
The operations plan for Site U1457 included first piston coring to refusal in two holes, followed by rotary coring in a third hole through the ~970 m of sediment over the basement as estimated by precruise site survey data. The drilling plan then called for penetrating ~50 m into basement. The site was chosen using regional seismic profiles with the objective of penetrating through major regional seismic horizons thought to be Paleogene and younger in age (Figure F3). The upper Miocene and younger reflectors were identified based on regional correlation from industrial drilling sites on the Indian shelf to the east (http://www.dghindia.gov.in). Dating these reflectors through direct sampling of the sedimentary section in Laxmi Basin is necessary if meaningful and robust sediment budgets for this region are to be constructed. These sediment budgets are required if we are to attempt a mass balance estimation between erosion in the Himalaya source region and sedimentation in the Arabian Sea. In addition, we interpret the Paleogene reflector to approximate the base of the Indus submarine fan. Therefore, coring through this reflector will offer a much-needed constraint on estimating the Indus Fan sediment budget, as well as dating the base of the fan and thus place a minimum age on the time of India/Eurasia collision.
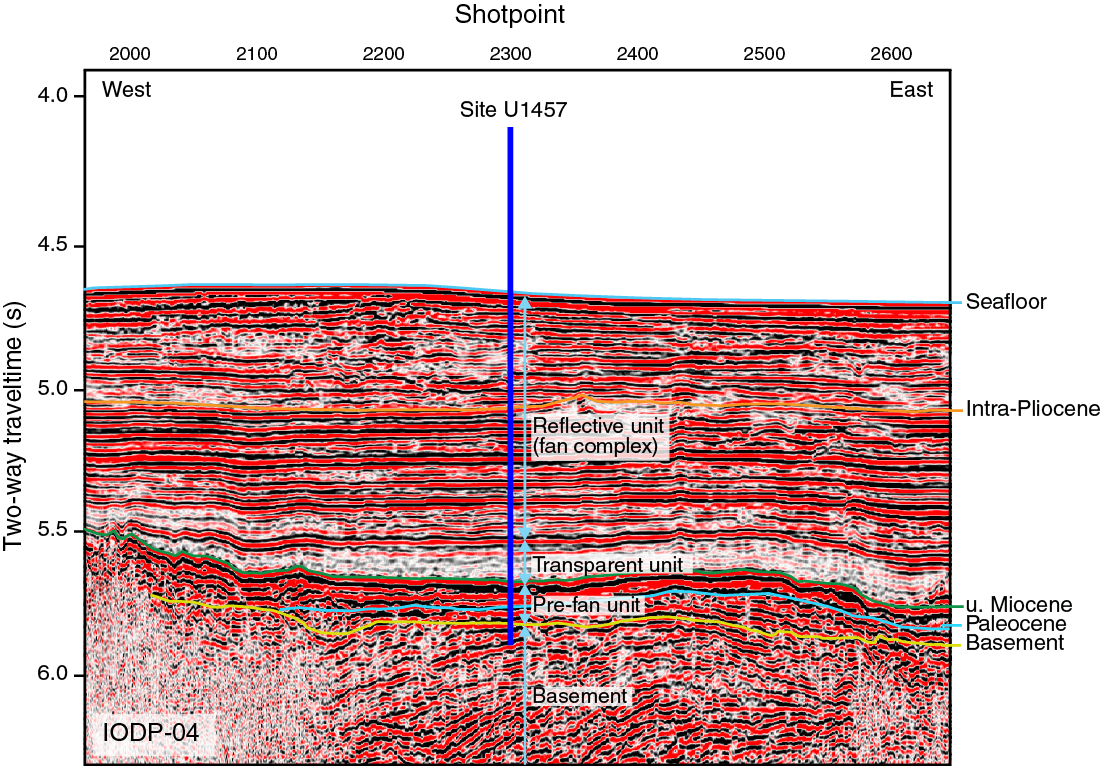
Figure F3. Seismic reflection profile Line IODP-04 with location of Site U1457 and main seismically defined divisions.
Much of the shallower part of the sediment section is dominated by a seismically reflective, largely flat-lying sequence interpreted as distal turbidite deposits forming a fan complex equivalent to the Indus Fan Megasequence of Droz and Bellaiche (1991) (Figure F3). The reflective unit consists of a series of parallel, high-amplitude, and continuous reflectors that terminate against Laxmi Ridge toward the west (Figure F4). The location of the site is relatively distal from the sediment source, which is also evident from the fact that we observe only a few smaller channel-levee complexes compared to the Upper Fan (Kolla and Coumes, 1987; Clift et al., 2002). Those that are identified are restricted to the top 0.5 s two-way traveltime (TWT). Nonetheless, channel features are observed within the upper parts of the stratigraphy. These are largely erosional channels showing cut-and-fill geometries and are typically <0.2 s TWT deep from their top to the base of the channel.
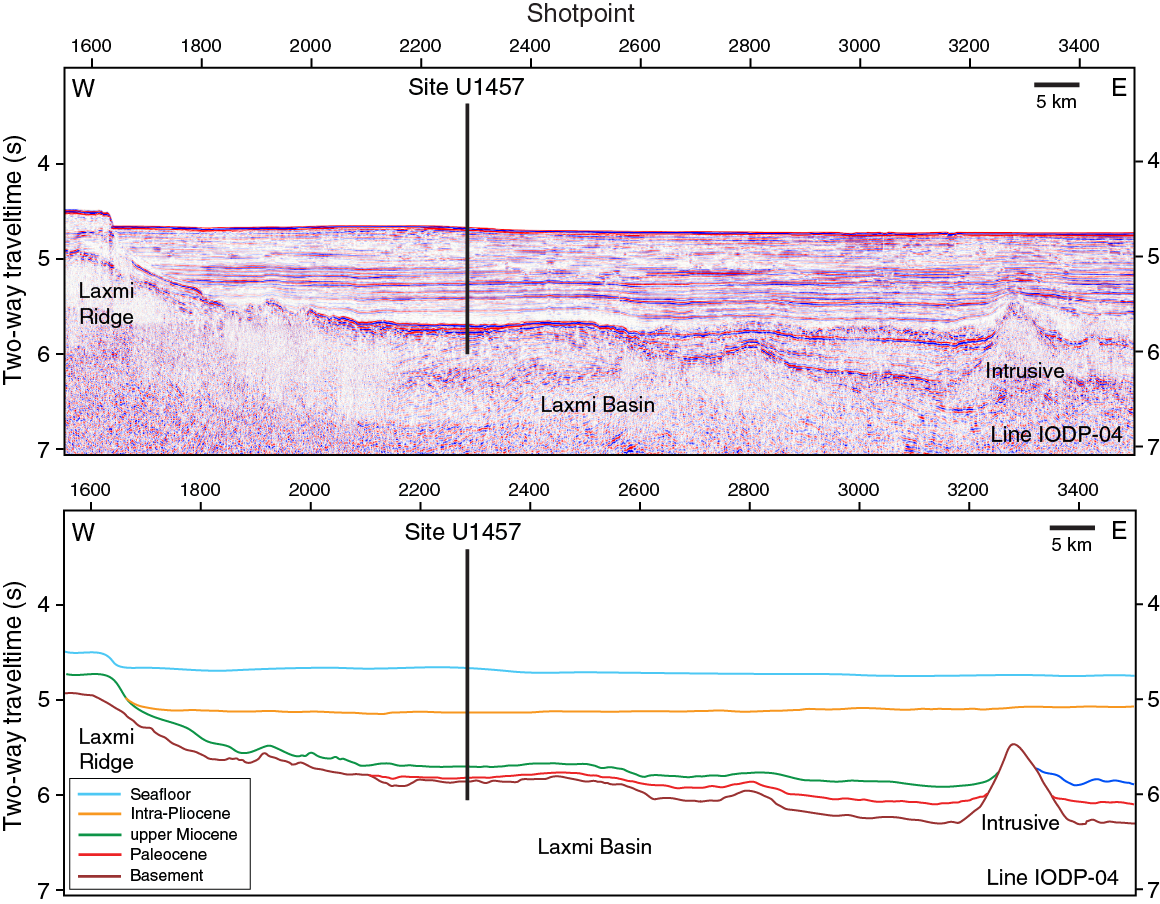
Figure F4. Uninterpreted seismic reflection profile Line IODP-04 and interpreted seismic sections with location of Site U1457.
The uppermost reflective unit is underlain by an acoustically transparent unit that thins across the basin from east to west and is ~0.15 s TWT thick at the location of Site U1457 (Figure F3). The transparent unit is ponded against Panikkar Ridge and thins westward toward Laxmi Ridge. The transparent unit shows a chaotic and more reflective character close to the intrusive structure ~20 km further east of Site U1457 but is fairly uniform and weakly reflective in the region of the site. A chaotic, reflective character was more evident and better developed where this transparent unit was drilled at Site U1456 (see Background and objectives in the Site U1456 chapter [Pandey et al., 2016c]), as well as what is seen in the seismic further east at the latitude of Site U1457. The origin of this transparent unit was not well understood prior to drilling, but its geometry and seismic character suggested that the unit may be a large mass transport deposit, likely derived from the western Indian continental margin. Our initial interpretation suggests that the top of the transparent unit lies close to the upper Miocene.
A very bright, low-frequency subhorizontal reflector, labeled “Paleocene” in Figure F3, underlies this transparent unit at ~5.7 s TWT. Below this high-amplitude reflector, the sediment is not as well bedded or clearly reflective. This unit thins out from east to west and is ~0.1 s TWT thick near Site U1457, compared to a maximum of 0.4 s TWT further east in the central Laxmi Basin along seismic Profile IODP-04 (Figure F4). Based on its seismic character, this sediment is interpreted as shale probably related to the earliest postrift sedimentation in the basin and my not be affiliated with the Indus Fan. Regional correlations from previous studies suggest that the base of the fan is early Eocene in age (Clift et al., 2002; Krishna et al., 2006). Therefore, this unit is believed to predate fan sedimentation and probably belongs to the onset of India/Eurasia collision and postbreakup. The source of sediment to the Paleocene unit is thus inferred to be dominantly from peninsular India to the east of Site U1457.
Scientific objectives
At Site U1457 we proposed to core ~50 m of basement to determine the nature of the crust in Laxmi Basin. The basement sampling will allow us to ascertain if the crust in Laxmi Basin is oceanic, continental, or transitional. In addition, analyses of sediment retrieved from the basin will also permit us to constrain depositional environments during the syn- and postrift periods that can be used to examine vertical motions and thus constrain the extensional tectonics in this region.
Another primary objective of this expedition is sampling and dating the base of the Indus Fan. Penetration through the ~970 m of Neogene and Paleogene sedimentary cover on top of the basement is targeted at Site U1457. Previous drilling at Owen Ridge at Deep Sea Drilling Project (DSDP) Site 224 indicated the occurrence of Himalayan sediment in ~45 Ma sandstone (Clift et al., 2001). Similar observations have been reported based on the transition from pelagic biogenic sediment in the Eocene to more muddy hemipelagic sediment in the upper Eocene and Oligocene at DSDP Sites 220 and 221 at the southern tip of the fan (Shipboard Scientific Party, 1974a, 1974b). Although the Paleogene section appears to be thin at this site, sediment cores from this section should still allow us to address at least some of the Paleogene objectives.
Coring at Site U1457 is further aimed to retrieve relatively high resolution records of erosion, weathering, and environmental history of the Western Himalaya through the Neogene. These records will complement observations from the foreland basin (Quade et al., 1995; Burbank et al., 1996; Sanyal et al., 2004; Singh et al., 2012) and the Bay of Bengal, which was cored during IODP Expedition 354 (France-Lanord et al., 2015). The source regions of the Indus Fan are quite different from those in the Ganges-Brahmaputra system and are located primarily in the Karakoram north of the Indus-Yarlung Suture Zone, which has no equivalent in the eastern Himalaya. Furthermore, the monsoon is anticipated to be weaker in the Indus catchment compared to the Eastern Himalaya, as it is today. Therefore, dating the seismic reflectors in the Neogene sections in the Arabian Sea will allow us to derive a relatively high resolution sediment budget that can be compared in detail with climatic and environmental reconstructions, something that has only been possible at low resolution up until this time. By doing this we can constrain how changing climate has affected erosion and in turn how this may have influenced orogenic structure.
One of the crucial issues, which we intend to address, is the nature of the climatic transition at ~8 Ma. This is traditionally thought to be a time of Indian summer monsoon intensification; however, it has recently been reinterpreted as a time at which drier conditions became established (Hoorn et al., 2000; Dettman et al., 2001; Singh et al., 2012). We will also examine whether this change in climate is accompanied by faster or slower erosion of the mountains themselves. Although sedimentation records preserved onshore in the Siwalik Group seem to show coarser and presumably faster erosion toward the end of the Miocene (Johnson et al., 1985; Ghosh and Kumar, 2000; Bernet et al., 2006; van der Beek et al., 2006), some reconstructions of marine sedimentation suggest that this was a time of slower erosion (Clift, 2006). Others argue for fast sediment supply to the Indian Ocean at that time (Rea, 1992; Métivier et al., 1999), so the erosional response to the monsoon change is debated. We will attempt to resolve this question through coring at this location.
Site U1457 also includes Pliocene–Pleistocene objectives. This time period is generally reconstructed as a time of stronger than average monsoon, albeit with rapid intensity transitions over relatively short timescales, probably driven by the same solar insolation that controls Northern Hemisphere ice sheet development (Clemens and Prell, 1991; Clemens et al., 2010). Early attempts to derive sediment budgets from the Indian Ocean indicate that this was a time of increased clastic sedimentation (Rea, 1992; Métivier et al., 1999), as recognized elsewhere globally, and presumed to be driven by rapid changes of climate over this time period (Zhang et al., 2001). More recently, cosmogenic isotope work suggests that the apparent increase in sedimentation rate is in fact an aberration derived from considering shorter and shorter time intervals in the younger part of the timescale, rather than being an actual response of the continents to changing climate (Willenbring and von Blanckenburg, 2010). Our detailed age model coupled with high-quality seismic profiling should allow us to contribute to this discussion.
We will also be able to study at relatively high resolution how erosion and chemical weathering patterns change in the source regions over glacial cycles. We can test the hypothesis that erosion was more centered in the northern Karakoram range during glacial times but switched to become faster overall and focused more on the southerly Lesser Himalaya during interglacial periods when the summer monsoon rains were strong (Bookhagen et al., 2005; Clift et al., 2008). This switch reflects the changing dominance of the Westerly Jet versus the summer monsoon in supplying moisture (Karim and Veizer, 2002). Moreover, chemical weathering indexes will allow us to understand changes in the chemical weathering flux during glacial times. Because chemical weathering itself helps to draw down atmospheric concentration of CO2, a well-known greenhouse gas, it is possible that the chemical weathering response to glacial cycles may either intensify or moderate the solar-driven cycles (Berner and Berner, 1997). As the largest orogenic belt on Earth, the weathering response of the Himalayas to climate forcing may also be a primary control to global climatic conditions (Raymo and Ruddiman, 1992).
Operations
Summary
The original operations plan called for three holes, the first to advanced piston corer (APC) refusal, followed by a second APC with extended core barrel (XCB) coring to ~500 m below seafloor (mbsf). The third hole was planned as a single bit rotary core barrel (RCB) hole to 50 m into basement, which was estimated at ~970 mbsf. We ultimately cored three holes at Site U1457, although the second hole was cored to a shallower depth than originally planned (Table T1).
Table T1. Site U1457 coring summary. Download table in .csv format. View PDF table.
We reached APC refusal at ~110 mbsf. In order to deepen the hole more quickly, we opted to core a 4.7 m interval with the half-length advanced piston corer (HLAPC), followed by a 4.8 m advance without coring. In the interest of time we terminated the hole after reaching 144.8 mbsf. We then cored Hole U1457B for stratigraphic correlation purposes in the upper ~110 mbsf. After reaching APC refusal, we continued with the HLAPC using the core/advance method to 204.7 mbsf where we terminated the hole to preserve enough time to reach our objective in the deep hole. Hole U1457C was drilled without coring to 191.6 mbsf and then cored using the RCB to 1108.6 mbsf, which included ~16 m of basement penetration. Hole U1457C was terminated when time allotted for the expedition expired.
A total of 136 cores were collected at this site. The APC coring system was deployed 24 times, recovering 202.73 m of core over 218.9 m of penetration (93% recovery). The HLAPC system was deployed 15 times, recovering 71.22 m of core over 70.9 m of penetration (101% recovery). The RCB coring system was deployed 97 times, recovering 436.96 m of core over 917.0 m of penetration (48% recovery).
Transit to Site U1457
After a 62 nmi transit from Site U1456 averaging 11.3 kt, the vessel arrived at the second expedition site, U1457 (proposed Site IND-06B). During the transit, the rig crew conducted rig maintenance tasks and began preparing equipment required for the ACP/XCB bottom-hole assembly (BHA). The vessel stabilized over the site and switched from cruise mode to dynamic positioning at 1330 h (all times are local; UTC + 5.5 h) on 16 May 2015, and the positioning beacon was deployed. The position reference was a combination of GPS signals and a single acoustic beacon.
Hole U1457A
We completed preparing the BHA, added the two stands of 5½ inch transition drill pipe, and then lowered the pipe to 3503.4 m below rigfloor (mbrf). The bit was positioned at 3521.0 mbrf or 6.4 m above the depth determined by the precision depth recorder. The bit was positioned slightly higher than normal because at the previous site 62 nmi away, the seafloor was determined to be 1.6–2.5 m shallower than the precision depth recorder depth. We prepared an APC core barrel and attempted to spud Hole U1457A. After the first attempt retrieved only water, the bit was lowered 3.0 m and a second water core was recovered. The bit was lowered again, and spudding at third attempt was successful, recovering 8.76 m of core and establishing a seafloor depth of 3534.3 mbrf (3523.11 m below sea level [mbsl]). Coring in Hole U1457A started at 0045 h on 17 May 2015.
Oriented APC coring using nonmagnetic core barrels continued in Hole U1457A through Core 355-U1456A-12H to 111.2 mbsf. Core 12H had an incomplete stroke and upon recovery was found to have a shattered core liner that required pumping out. We then continued coring using the HLAPC through Core 19F to a total depth of 144.8 mbsf for Hole U1457A. To advance the hole more quickly, we used the technique employed during IODP Expedition 354 during which a 4.7 m HLAPC-cored interval was followed by a 4.8 m drilled interval. At 1900 h on 17 May we terminated Hole U1457A in the interest of time. The drill string was tripped to the seafloor with the top drive in place, and the bit cleared the seafloor at 2015 h, ending Hole U1457A and beginning Hole U1457B.
Hole U1457A consisted of 12 APC cores recovering 103.93 m of core over 111.2 m of penetration (94% recovery) and 5 HLAPC cores recovering 18.83 m of core over 19.2 m of penetration (98% recovery). The total depth of the hole was 144.8 mbsf. Total time spent on Hole U1457A was 1.3 days.
Hole U1457B
The ship was offset 15 m west of Hole U1457A, and the bit was positioned at 3528.5 mbrf. Hole U1457B was started at 2140 h on 17 May 2015. The first core recovered 3.22 m, establishing a seafloor depth of 3534.8 mbrf. We continued APC coring with nonmagnetic core barrels and core orientation through Core 355-U1457B-13H to 110.7 mbsf. Cores 10H and 12H required pumping out and we also drilled ahead without coring over a 3 m interval (88.7–91.7 mbsf) to realign the core breaks for optimized stratigraphic correlation. We then continued coring with the HLAPC system from Core 14F through 33F to 204.7 mbsf, where the hole was terminated in the interest of time. The drill string was pulled back to 181.2 mbsf with the top drive in place, and then after racking the top drive, the pipe trip continued with the bit clearing the seafloor at 2250 h on 18 May. We had recovered the drill string to 2108.0 mbrf when a hydraulic hose on the starboard pipe racker ruptured. This caused a stand of drill pipe to drop into the pipe racker, damaging the center chain shock absorber and also causing the chain to jump off the sprocket. The damage was repaired in 1 h and the pipe trip resumed with the bit clearing the rig floor at 0810 h on 19 May. This ended Hole U1457B and marked the beginning of Hole U1457C.
Hole U1457B consisted of 12 APC cores recovering 98.80 m of core over 107.7 m of penetration (92% recovery) and 11 HLAPC cores recovering 52.39 m of core over 51.7 m of penetration (101% recovery). The total depth of the hole was 204.7 mbsf and total time spent on the hole was 1.5 days.
Hole U1457C
The ship was offset 15 m east of Hole U1457B, and we assembled a four-stand RCB BHA. The drill string was lowered to 199.0 mbrf, when another repair on the starboard pipe racker was required. It was fixed in 1 h and at 1100 h on 19 May 2015, the pipe trip resumed. The top drive was picked up when the drill string reached 3509.6 mbrf, the pipe was spaced out for spudding, and an RCB wash barrel was deployed. Hole U1457C was started at 1830 h on 19 May. The seafloor depth was established by tagging the seafloor at 3534.0 mbsf (3522.71 mbsl). We drilled without coring to 191.6 mbsf in 5.5 h. The interval was drilled at a rate of 95.8 m/h. The wash barrel was recovered, and at 0030 h on 20 May we began to RCB core using nonmagnetic core barrels. Core recovery in the first few cores was very poor (<0.5 m), most likely due to the formation being washed away by the RCB bit jets. As the material became more lithified the recovery improved.
RCB coring continued without any incident through Core 355-U1457C-95R to 1090.1 mbsf at 1610 h on 28 May. The drillers frequently pumped high-viscosity mud sweeps to maintain good hole conditions. Initially we pumped 30 bbl sweeps every third connection, later increasing to 35 bbl sweeps every other core and occasionally every core. Care and time were taken to fully pump the sweeps out of the hole at the seafloor before attempting to deploy the sinker bars and recover the core barrel. This technique worked, and excellent hole conditions prevailed despite the presence of unconsolidated sands over some intervals of the borehole.
While cutting Core 355-U1457C-96R, the rate of penetration (ROP) slowed dramatically at ~1098 mbsf (~1.4 from the end of the advance). Upon recovery, we discovered igneous rock in the core catcher and bottom portion of the core, indicating that we had reached our basement target. Given the short amount of time remaining for coring operations, we decided to cut two or three half-length RCB cores with the remaining time to improve recovery of the basement rock. Cores 97R and 98R were cut to 1108.6 mbsf at an average ROP of 1.9 m/h, with an average recovery of 91.7%. Coring operations ended with the retrieval of Core 98R.
The wireline was coated on the last core retrieval and a 50 bbl mud sweep was pumped at the total depth of 1108.6 mbsf to help mitigate problems that might occur while pulling the drill string out of the hole. The top drive was used to pull the pipe to 995.1 mbsf while laying out the 30 ft knobby drilling joints from the drill string to the forward pipe rack. Per protocol, the hole was displaced with 380 bbl of 10.5 lb/gal heavy mud and the top drive was set back. We then continued retrieving the drill string, with the bit clearing the seafloor at 1050 h on 29 May. We recovered the positioning beacon at 1723 h while retrieving the drill string. The drill collars were broken down and stored in the forward main deck pipe rack. The bit cleared the rotary table at 2115 h, and the RCB coring bit, mechanical bit release, and outer core barrels subs were broken down, and the rig floor was cleared of all handling equipment. The rig floor was secured for transit, all thrusters/hydrophones were raised, and at 2300 h on 29 May, we began the sea passage to Mumbai, India. This officially ended operations at Site U1457.
Hole U1456C consisted of 97 RCB cores recovering 436.96 m of core over 917.0 m of penetration (48% recovery). The total depth of the hole was 1108.6 mbsf. Total time spent on Hole U1456C was 10.6 days.
Transit to Mumbai, India
The 315 nmi transit to Mumbai was completed at an average speed of 8.7 kt. The pilot boarded the ship at 1026 h on 31 May 2015, and at 1112 h the ship dropped anchor in the Mumbai harbor anchorage, officially ending Expedition 355.
Lithostratigraphy
Five lithologic units are defined at Site U1457. The lithologic summaries of Holes U1457A–U1457C are shown in Figure F5, and the composite lithology of these three holes is summarized schematically in Figure F6. Lithologic units are defined on the basis of a combination of visual core description (VCD), microscopic examination of smear slides and thin sections, and magnetic susceptibility and color spectral observations (see Lithostratigraphy and Physical properties in the Expedition 355 methods chapter [Pandey et al., 2016a]). A composite lithostratigraphy for Site U1457 was derived from a combination of cores from Holes U1457A (0–144.81 mbsf), U1457B (0–205.20 mbsf), and U1457C (191.60–1108.91 mbsf), which were drilled to investigate the Cenozoic lithostratigraphy of Laxmi Basin and the underlying basement. The major lithologies found at Site U1457 are shown in Figure F7 as visual core images, whereas their microscopic composition is illustrated in Figure F8.
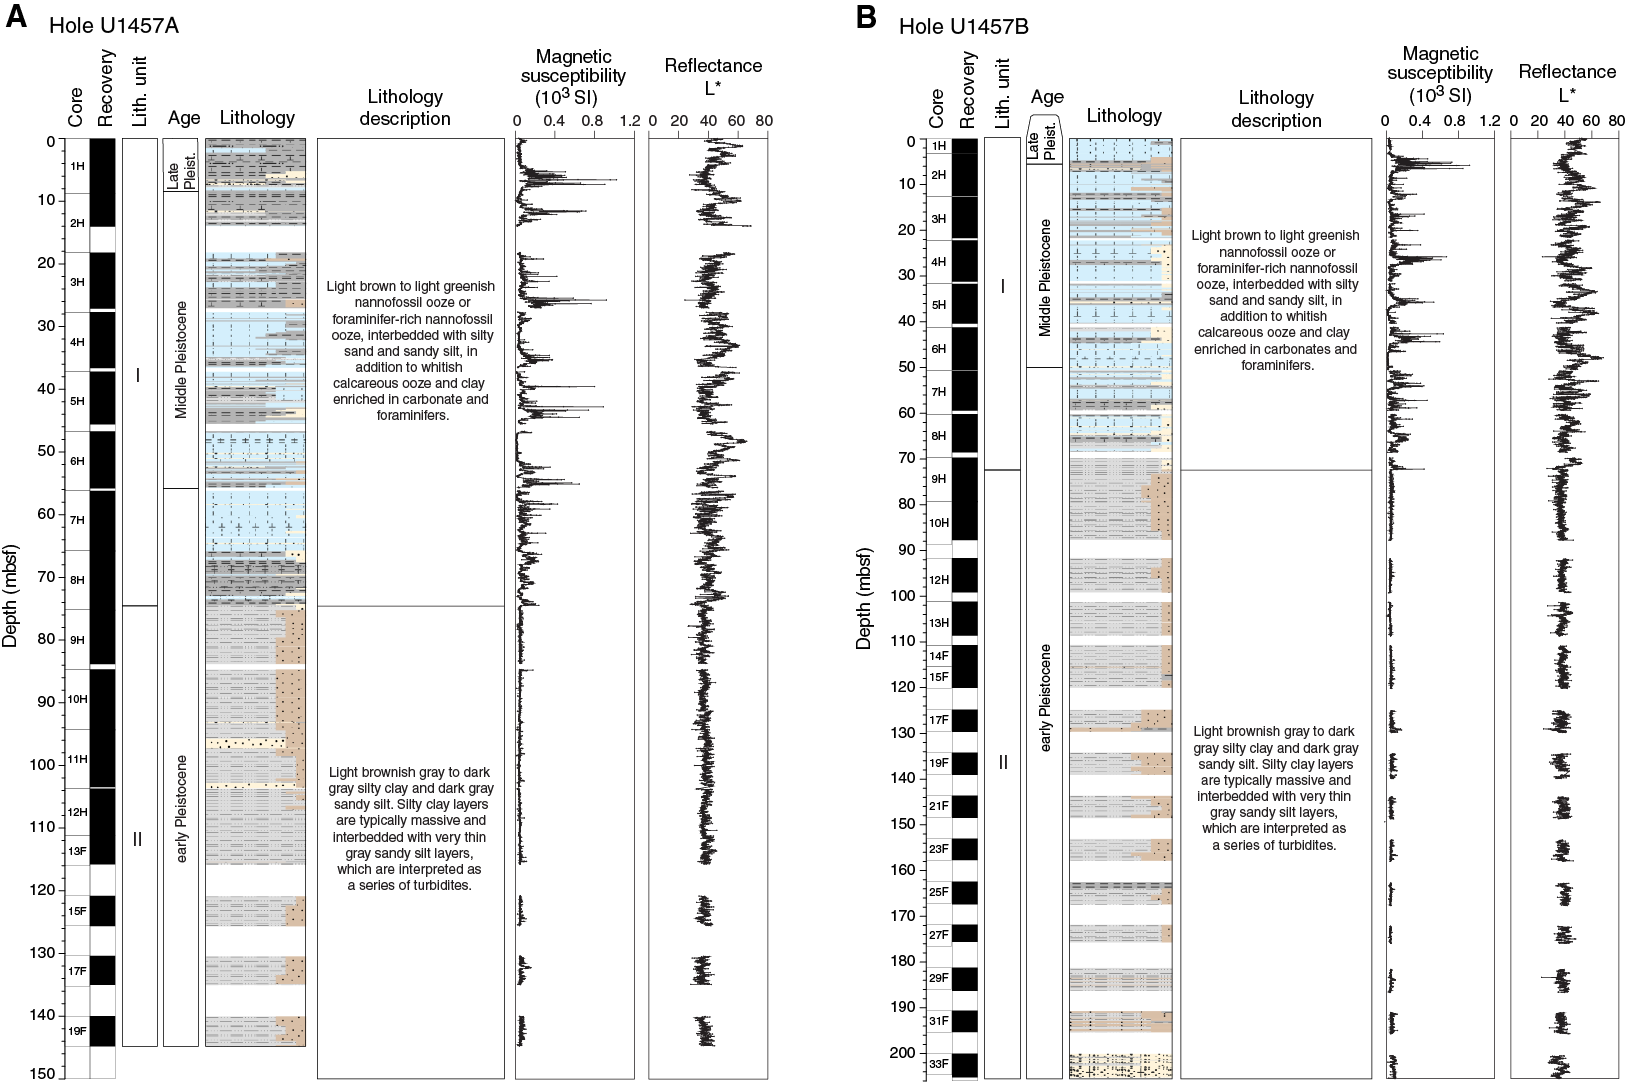
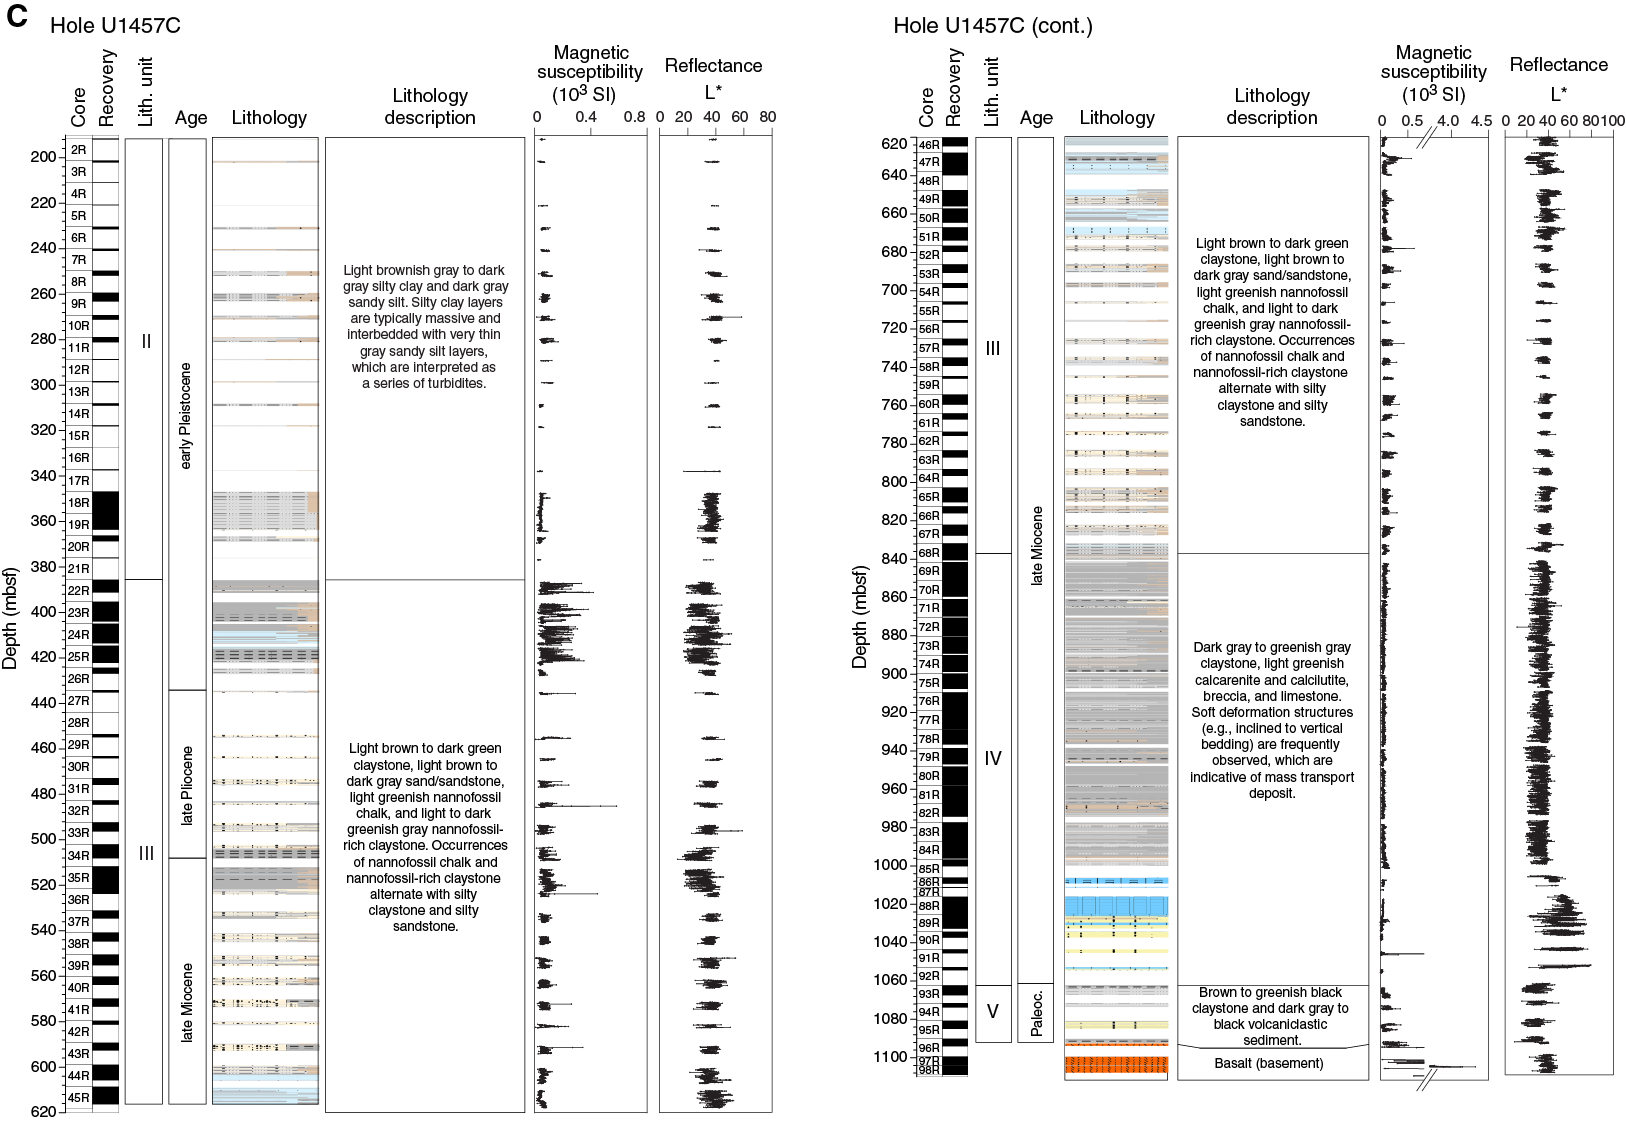
Figure F5. Lithostratigraphic summary.
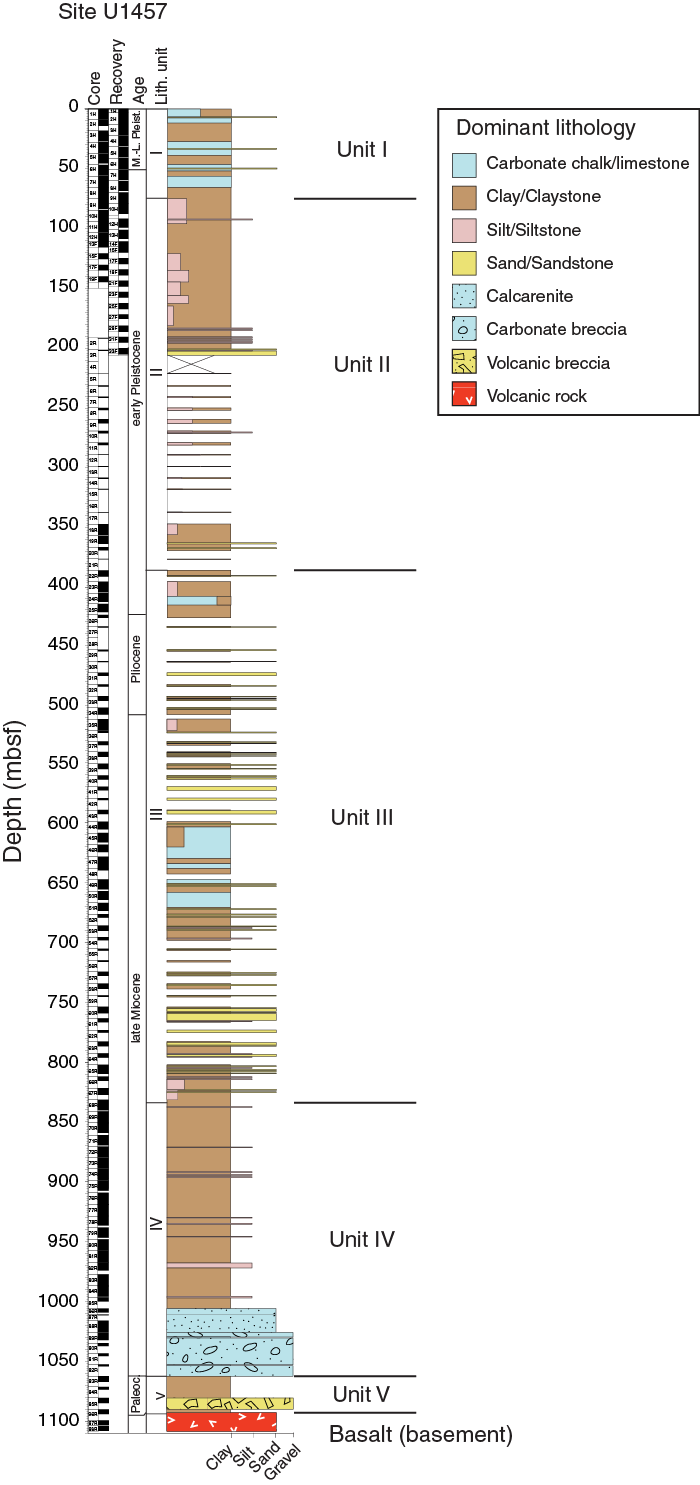
Figure F6. Synthesis lithostratigraphic log for Site U1457 showing combined recovery in Holes U1457A–U1457C.
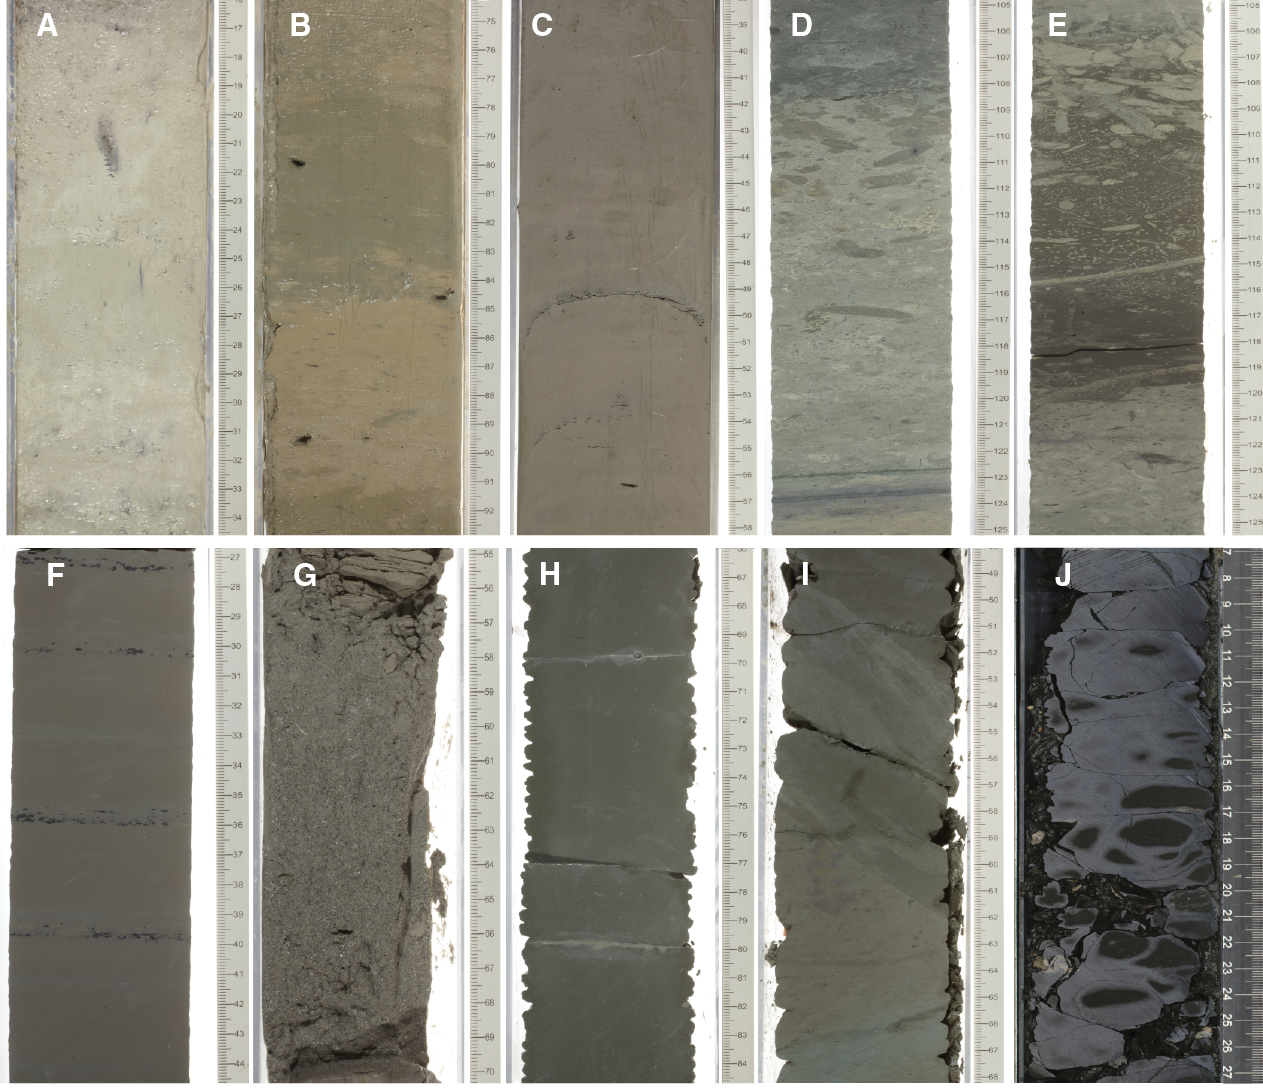
Figure F7. Dominant lithologies of Units I–IV.
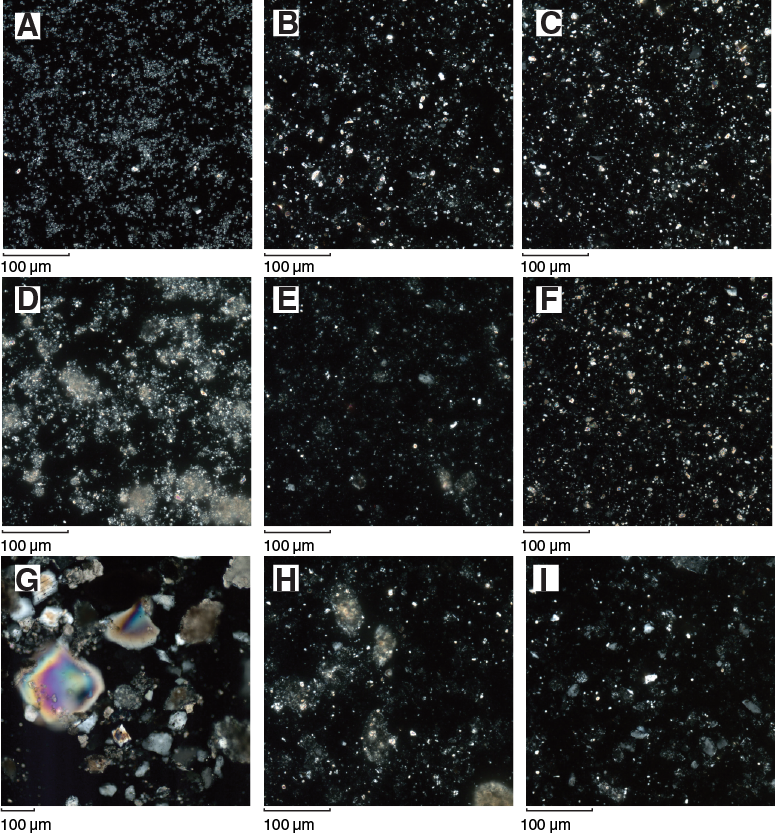
Figure F8. Microscopic observation of smear slides in Units I–IV.
Unit I consists of a ~74 m thick sequence of Pleistocene light brown to light greenish nannofossil ooze, together with associated foraminifer-rich nannofossil ooze and nannofossil-rich clay, which are all interbedded with silty clay and silty sand. Unit II is ~194 m thick and is dated to the early Pleistocene. It consists mainly of light brownish gray to dark gray silty clay and dark gray sandy silt. Silty clay layers are typically massive and interbedded with very thin, gray sandy silt layers, which are interpreted as a series of turbidites. Unit III is ~450 m thick and consists of upper Miocene to lower Pleistocene semi-indurated to indurated light brown to dark green silty claystone, light brown to dark gray silty sandstone, light greenish nannofossil chalk, and light to dark greenish gray nannofossil-rich claystone. Nannofossil chalk and nannofossil-rich claystone cycles of sedimentation are separated by normally graded intervals dominated by clay/claystone and sand/sandstone deposition. Unit IV is ~227 m thick and consists of a mixture of interbedded lithologies dominated by dark gray to greenish gray massive claystone at the top of the unit and light greenish massive calcarenite, calcilutite, breccia, and limestone toward the base of the unit. This unit is dated to the late Miocene, although significant reworking of older fossils in the lower part of the unit hampers age interpretation (see Biostratigraphy). Lower Paleocene Unit V is ~30 m thick and mostly consists of dark brown to dark greenish gray claystone and dark gray to black volcaniclastic sediment. These sedimentary rocks directly overlie the basaltic basement.
Unit descriptions
Unit I
- Intervals: 355-U1457A-1H-1, 0 cm, through 8H-7, 16 cm; 355-U1457B-1H-1, 0 cm, through 9H-2, 89 cm
- Depths: Hole U1457A = 0–74.37 mbsf, Hole U1457B = 0–72.09 mbsf
- Thickness: Hole U1457A = 74.37 m, Hole U1457B = 72.09 m
- Age: Pleistocene to recent
- Lithology: nannofossil ooze, foraminifer-rich nannofossil ooze, calcareous ooze, nannofossil-rich clay, clay, silt, and sand
Unit I is composed of light brown to light greenish nannofossil ooze (Figures F7A, F8A) with variable amounts of clay and foraminifers, such that the hemipelagic sediment is sometimes defined as foraminifer-rich nannofossil ooze or nannofossil-rich clay (Figures F7B, F8B). Silty clay and silty sand layers are interbedded within this hemipelagic background. Medium- to thick-bedded (<100 cm) nannofossil ooze layers compose >50% of the unit. This sediment is sparsely interbedded with thin to very thin (<20 cm) silty sand and sandy silt beds, showing sharp bases and normal grading. The coarser layers also contain redeposited foraminifers. Thin- to medium-bedded greenish nannofossil-rich clay is observed grading up into nannofossil ooze in repeated cycles. Medium-bedded (<30 cm) calcareous ooze and calcareous-rich clay are also interbedded with nannofossil ooze and nannofossil ooze with clay in the upper part of the unit. These interbeds are less common downhole. Silty clay is generally interbedded with thin- to medium-bedded (<15 cm) nannofossil-rich clay, sandy silt, or silty sand and composes <25% of the entire unit.
Black spots of authigenic pyrite, sometimes present as concretions, are frequently observed, particularly within nannofossil ooze beds (Figure F9A). Thin sandy silt or silty sand layers are found repeatedly overlying relatively thick nannofossil ooze or nannofossil-rich clay layers. These cycles show a distinct normal grading, which implies sedimentation from turbidity currents. In general, the top of the nannofossil ooze or nannofossil-rich clay beds are sharply eroded or scoured by the overlying sand or silt. These sharp contacts represent erosion during passage of turbidity currents. Based on microscopic observation, the mineralogical composition of the silt and sand is similar to that found in Unit I of Site U1456. The most common minerals are quartz, feldspar, and mica associated with trace or sparse amounts of heavy minerals. Heavy minerals that are present include common hornblende, pale green clinopyroxene, epidote, garnet, and augite, together with rare amounts of zircon, tourmaline, and titanite (Figure F10).
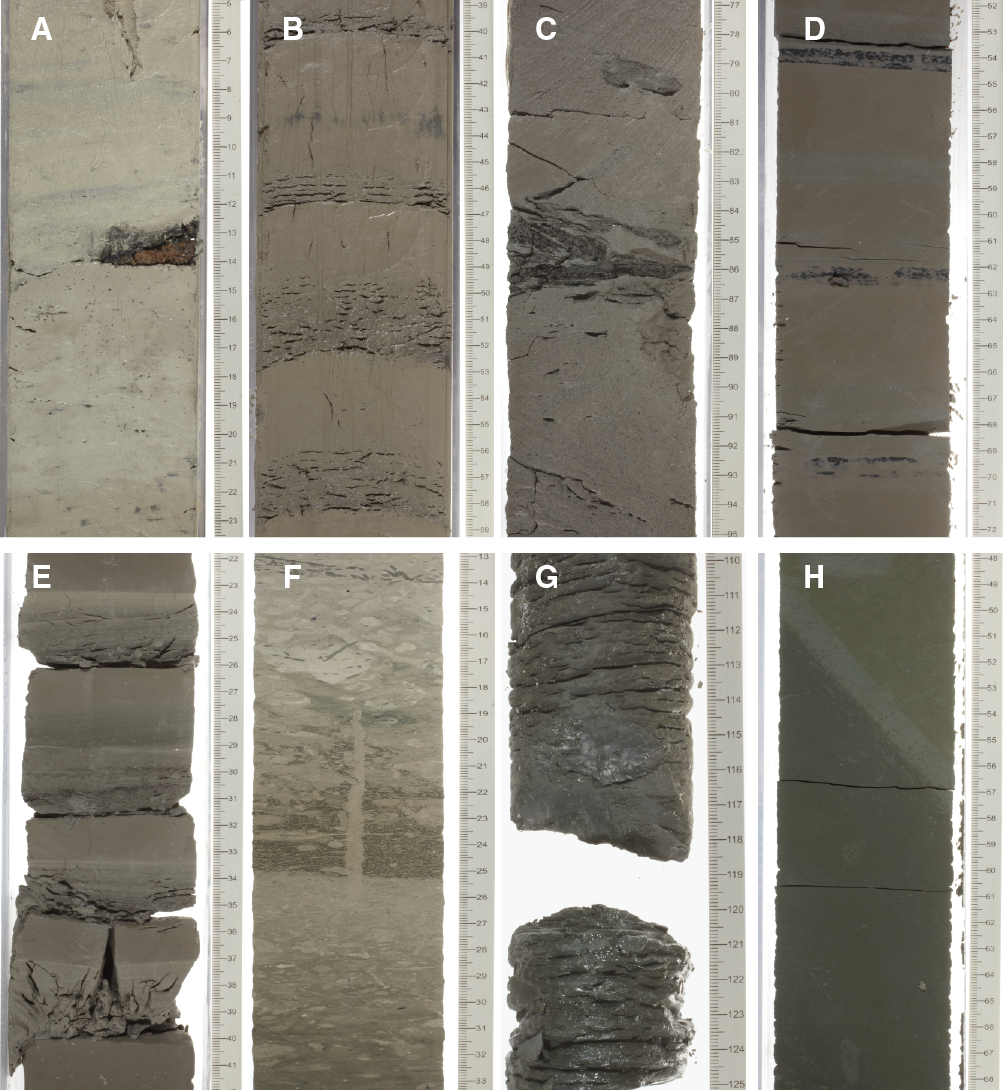
Figure F9. Main sedimentary features of Units I–IV.
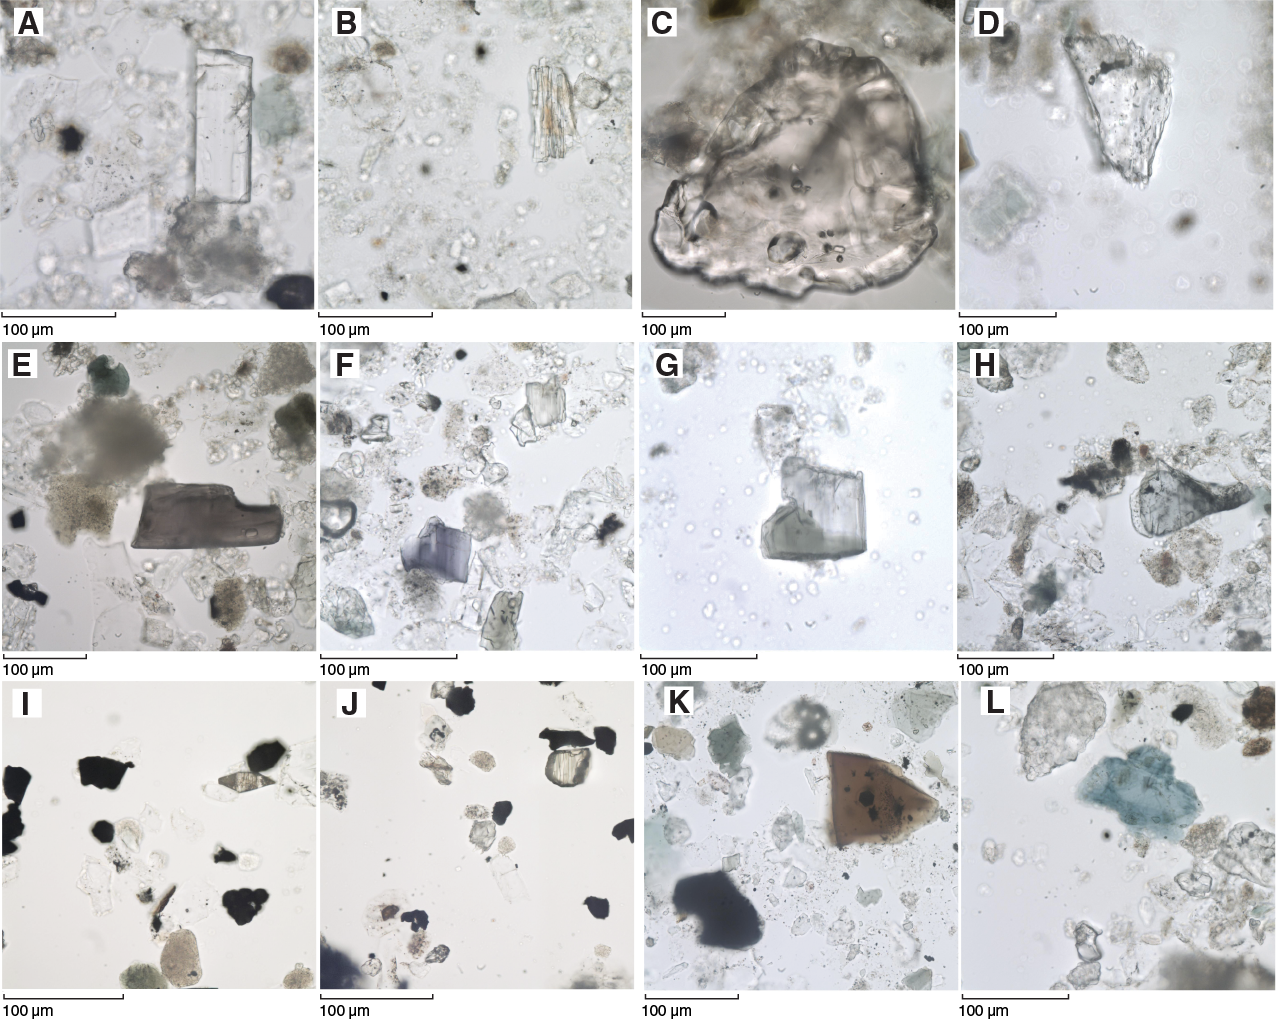
Figure F10. Heavy-mineral assemblages.
X-ray diffraction (XRD) analysis was conducted on selected sediment samples taken to be representative of each unit from Holes U1457A–U1457C. XRD data were analyzed only from the clay-sized fraction in these holes. The major minerals present in Unit I include chlorite, illite, quartz, and feldspar, whereas a small amount of smectite was detected in the glycol-treated sample from Section 355-U1456A-8H-2 in Unit I (Figure F11). A strong calcite peak confirms the presence of carbonate minerals within the nannofossil ooze and nannofossil-rich clay in Unit I.
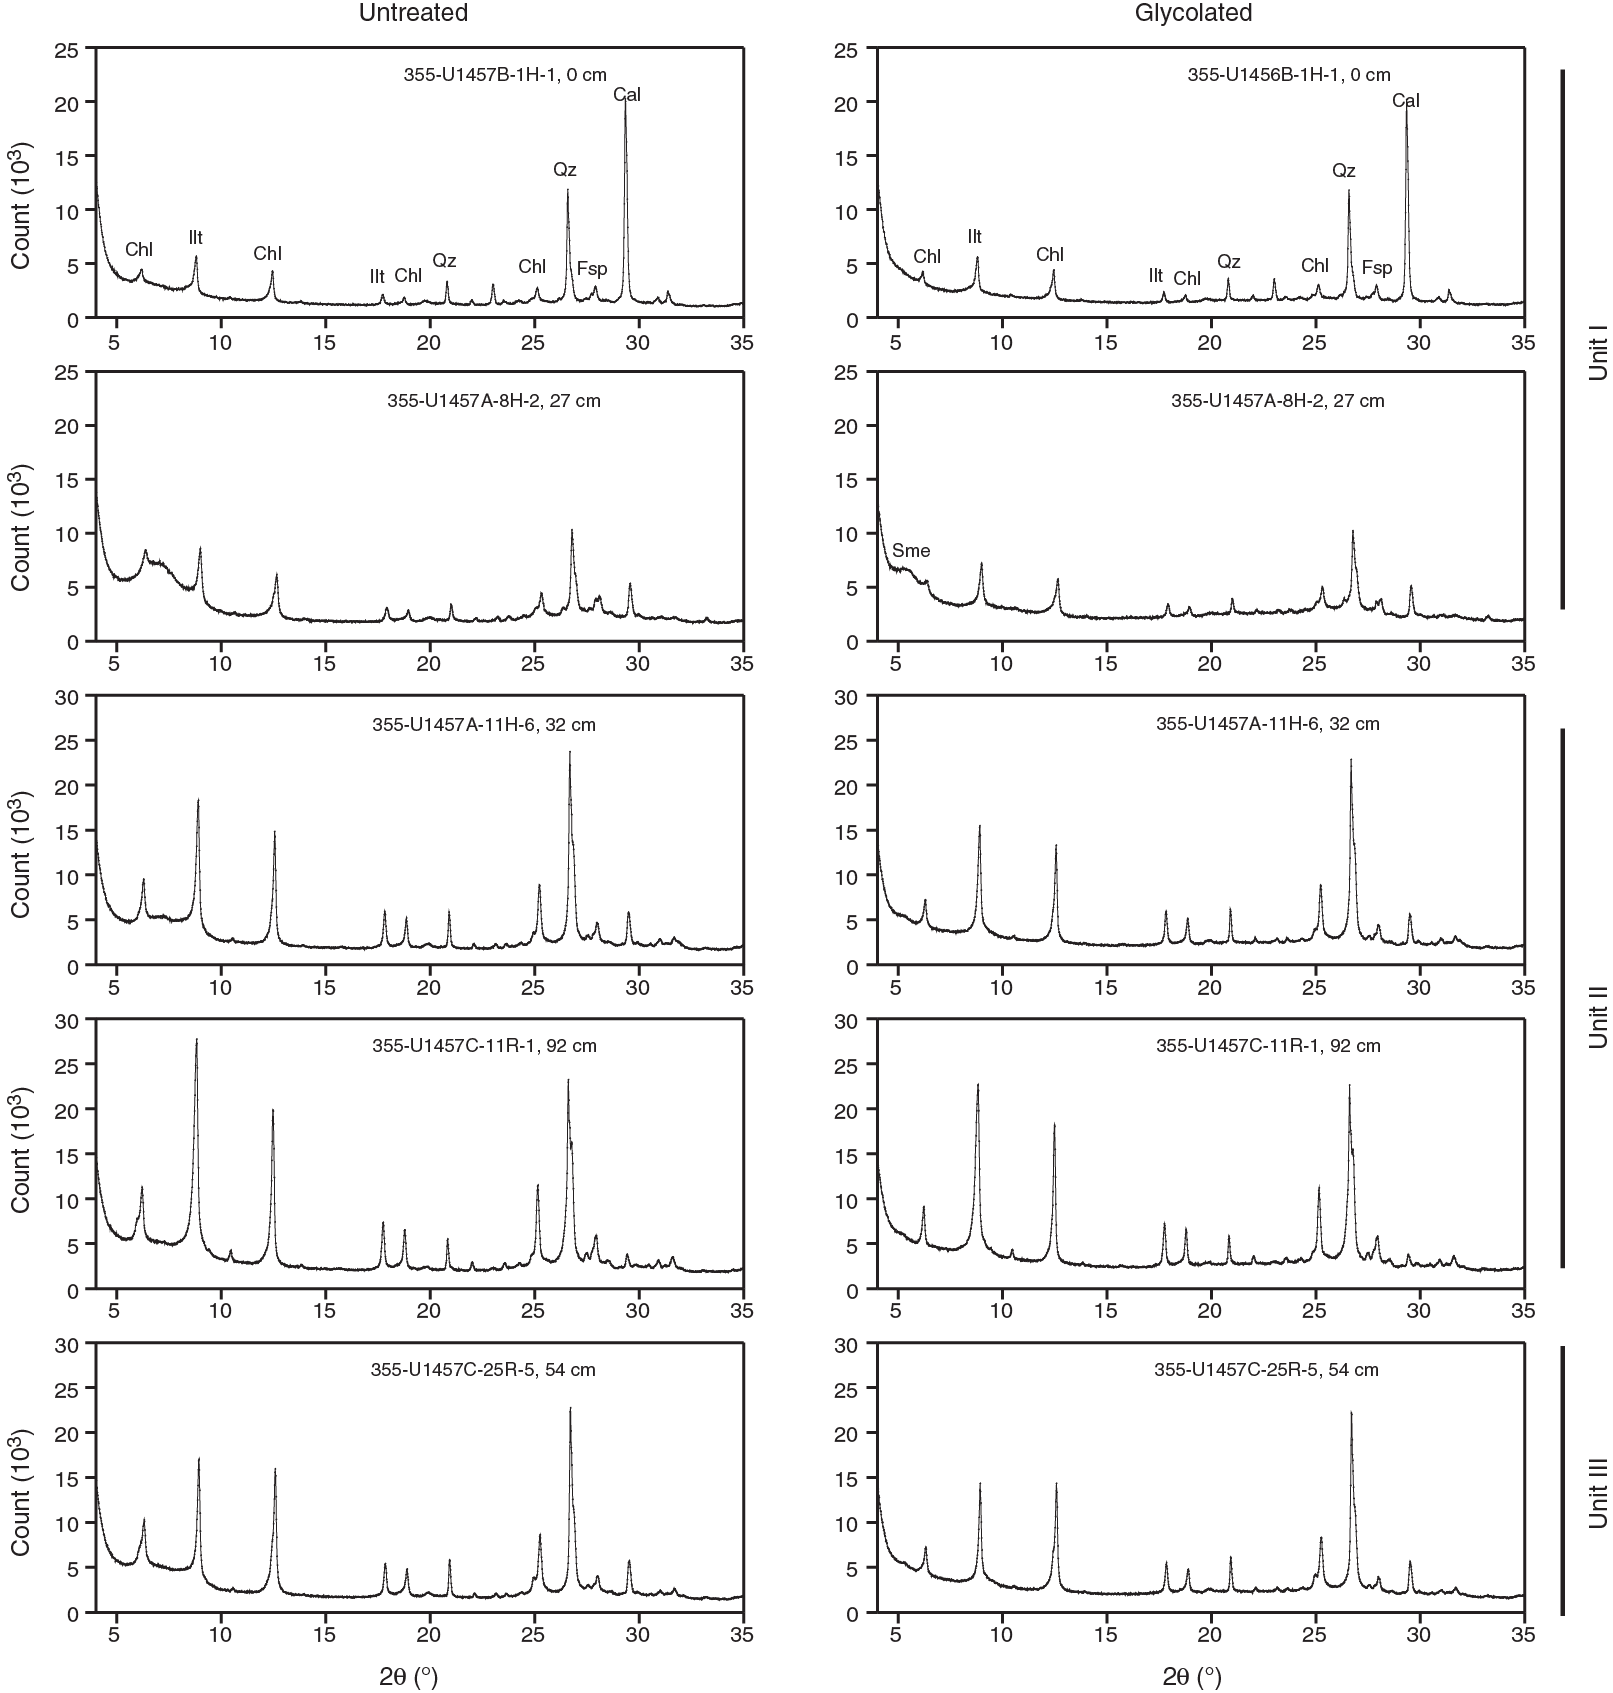
Figure F11. XRD patterns of clay fraction selected from Units I–III.
The lithologic boundary between Units I and II is at Sections 355-U1457A-8H-7, 16 cm (74.37 mbsf), and 355-U1457B-9H-2, 89 cm (72.09 mbsf). This lithologic unit boundary is presumed to be within the interval drilled without coring downhole to 191.6 mbsf in Hole U1456C. The unit boundary is distinguished by the abundance of nannofossil ooze in Unit I and the appearance of common sandy silt and silty sand in Unit II. This division is also seen clearly in magnetic susceptibility and color spectral data (Figure F5A, F5B; see also Physical properties), as well as carbonate content (see Geochemistry).
Unit II
- Intervals: 355-U1457A-8H-7, 16 cm, through 19F-CC, 25 cm (total depth); 355-U1457B-9H-2, 89 cm, through 33F-CC, 26 cm (total depth); 355-U1457C-2R-1, 0 cm, through 22R-1, 0 cm
- Depths: Hole U1457A = 74.37–144.81 mbsf (total depth), Hole U1457B = 72.09–205.20 mbsf (total depth), Hole U1457C = 191.6–385.6 mbsf
- Thickness: Hole U1457A = 70.44 m, Hole U1457B = 133.11 m, Hole U1457C = 194.0 m (minimum thickness)
- Age: early Pleistocene
- Lithology: silty clay/claystone, silty sand, and sandy silt
Unit II consists mainly of light brownish gray to dark gray silty clay and dark gray sandy silt, but most of this unit is composed of light brownish gray silty clay/claystone (Figures F7C, F8C). Silty clay layers are typically massive and interbedded with very thin, gray sandy silt layers, which are interpreted as a series of turbidites. Thick (<30 cm) silty clay layers are typically massive and lack structures and are interbedded with very thin (<5 cm) layers of normally graded gray sandy silt. The interbedding frequency and thickness of beds varies, but the association is always cyclic. Occasionally the thick (>30 cm) sandy silt layers are interbedded with thin (<10 cm) silty clay. Sandy silt locally composes >90% of the sequence. Most of the sandy silt and silty sand beds are medium- to fine-grained and enriched in medium- to coarse-grained mica grains. Thick-bedded silty clay is often overlain by thin-bedded sandy silt, with erosive, sharp contacts and a gradational fining-upward trend from coarse to fine sediment (Figure F9B). Such transitions are consistent with deposition from turbidity currents. Sediment becomes noticeably more lithified deeper than 346.8 mbsf (Section 355-U1457C-18R-1, 0 cm). Black diffuse pyrite patches are observed in the thick-bedded silty clay layers, whereas pyrite nodules are occasionally found in silty claystone. Up-arching caused by drilling disturbance is common.
In Unit II, the most abundant light minerals are quartz, feldspar, and mica together with lithic fragments and rare to common amounts of heavy minerals. The heavy mineral assemblage includes hornblende, epidote, garnet, kyanite, and sillimanite with minor zircon, tourmaline, rutile, apatite, titanite, actinolite, spinel, and pale clinopyroxenes (Figure F10).
XRD data from the clay fraction of sediment in Unit II show that the mineral compositions are similar to those found in Unit I and contain quartz, chlorite, illite, feldspar, and calcite (Figure F11). However, the peak intensities of these minerals, with the exception of calcite, are much stronger than those seen in Unit I. This observation implies that the concentration of these minerals is much higher in Unit II than in Unit I. In addition, smectite seems to be largely absent in Unit II based on analysis of the glycolated samples (Figure F11).
The lithologic boundary between Units II and III was recovered only in Hole U1457C. The boundary is defined at Section 355-U1457C-22R-1, 0 cm (385.6 mbsf). The appearance of common gray to light green nannofossil-rich claystone defines the top of Unit III and contrasts with the brown to dark gray silty clay/silty claystone and sandy silt/sandy siltstone found in Unit II. The Unit II/III boundary is also observed in magnetic susceptibility and color spectral data (Figure F5C; see also Physical properties), as well as in the carbonate content (see Geochemistry).
Unit III
- Interval: 355-U1457C-22R-1, 0 cm, through 68R-3, 57 cm
- Depth: 385.6–834.94 mbsf
- Thickness: 449.34 m
- Age: late Miocene to early Pleistocene
- Lithology: nannofossil chalk, nannofossil-rich claystone, silty claystone, silty sandstone, sandy siltstone, and clayey siltstone
The main lithologies of Unit III consist of two major groups, (1) hemipelagic sediment dominated by light greenish nannofossil chalk (Figures F7D, F8D) and light to dark greenish gray nannofossil-rich claystone (Figures F7E, F8E) and (2) redeposited turbidite sediment dominated by light brown to dark green claystone/silty claystone (Figures F7F, F8F) and light brown to dark gray silty sand/silty sandstone and sand/sandstone (Figures F7G, F8G). These two groups and their associated minor lithologies are observed to occur as repeated cycles of interbeds in Unit III. Nannofossil chalk is typically overlain by pale gray nannofossil-rich claystone, and these two lithologies are repeated in normally graded cycles, showing sharp, erosive boundaries at the base of the nannofossil-rich claystone intervals. Dark claystone is massive and structureless, whereas light brownish silty claystone is often interbedded with thin (<3 cm) intervals of clayey siltstone and silty sandstone. This sediment is interbedded in normally graded cycles of ~3–5 cm thickness. Claystone is occasionally foraminifer rich. Repeated occurrences of claystone, dark claystone, and brownish silty claystone are observed in Unit III. Differentiation into three types of claystone is also mirrored by physical properties such as magnetic susceptibility and lightness (L*) of sediment color (Figure F5C). Brownish silty claystone, siltstone, and sandstone occasionally contain wood fragments and show finer lamination (Figure F9C). The occurrence of wood implies that the sediment has been transported from a terrestrial environment. This unit is also marked by black staining of brownish claystone (Figure F9D). Dark staining is very thin (<1 cm), typically with horizontal distribution, but also sometimes scattered. These seem to be a result of chemical reaction by manganese within the sediment.
Light gray and light brown silty sandstone, sandy siltstone, and silty claystone layers are associated with fining-upward cycles with sharp erosive boundaries at the base of the silty sandstone. Such cycles are stacked in succession and show parallel lamination (Figure F9E). Silty sandstone layers are enriched in mica grains and are occasionally as thick as 5–20 cm, where they can comprise up to 80% of the sequence locally. Deformed claystone patches interpreted as rip-up clasts are commonly seen within sandstone. These indicate rapid sedimentation from a high-energy, erosive current consistent with deposition by turbidity currents and are similar to deposits observed in Units I and II but are coarser grained and deposited from a higher energy current.
Dark gray claystone and silty claystone are almost devoid of well-defined bioturbation, although we cannot exclude that they have been homogenized by extensive burrowing. Light greenish nannofossil chalk and light to dark greenish gray nannofossil-rich claystone are characterized by intensive bioturbation. Most burrows are <1 cm in diameter (Figure F9F). The ichnofacies are dominated by Planolites, Chondrites, and Zoophycos, as well as complex composite burrows typical of a deepwater clastic setting (Ekdale et al., 1984). Vertical burrows of Skolithos type are also observed occasionally (Figure F9F).
In Unit III, the most abundant light minerals are quartz, feldspar, and mica, together with lithic fragments. There are variable amounts of heavy minerals, which range from absent to common and include phases such as hornblende, epidote, garnet, minor glaucophane, actinolite, hypersthene, allanite, kyanite, and trace amounts of apatite, titanite, zircon, tourmaline, and rutile (Figure F10). According to XRD data, the mineral compositions in Unit III are similar to those found in Unit I and Unit II (Figure F11); however, the peak intensities of these minerals are more similar to those of Unit II rather than Unit I.
The unit boundary between Units III and IV is known only from Hole U1457C at Section 355-U1457C-68R-3, 57 cm (834.94 mbsf). The unit boundary is marked by greenish gray nannofossil chalk and nannofossil-rich claystone at the base of Unit III, overlying dark gray claystone of Unit IV. There is a clear color change between Units III and IV, which is also matched by changes in physical properties such as magnetic susceptibility (Figure F5C). The Unit III/IV division is also observed in the carbonate content (see Geochemistry).
Unit IV
- Interval: 355-U1457C-68R-3, 57 cm, through 93R-1, 0 cm
- Depth: 834.94–1062.20 mbsf
- Thickness: 227.26 m
- Age: late Miocene
- Lithology: claystone, silty claystone, siltstone, sandy siltstone, calcilutite, and calcarenite
Unit IV mainly consists of dark gray to light greenish claystone (Figures F7H, F8H) and silty claystone (Figures F7I, F8I), with lesser amounts of light greenish calcarenite and calcilutite, breccia, and light brownish to whitish limestone toward the base of the unit. The calcarenite, calcilutite, and breccia are similar to lithologies observed in Unit IV at Site U1456. Claystone dominates the upper part of Unit IV where it is seen in a variety of colors including dark and light greenish gray. These are interbedded with dark gray silty claystone and dark grayish green nannofossil-rich claystone. In the lower part of this unit, calcilutite, calcarenite, limestone, and breccia are most abundant. Similar changes are also discernible in the magnetic susceptibility and sediment color measurements (Figure F5C). Pyrite nodules are commonly found in the core within muddy intervals of this unit.
The dark gray claystone and dark gray silty claystone are mostly massive and occur with light brownish to light greenish interbeds of nannofossil-rich claystone. These lithologies are interbedded with gradational boundaries. Thin-bedded (2–5 cm) dark gray clayey siltstone or sandy siltstone often shows very thin parallel laminations and overlies claystone with sharp, erosional boundaries above which it fines upward. Sandy siltstone and silty sandstone are occasionally present as beds up to 30 cm thick and contain large foraminifer shells.
Thin- to medium-bedded, light greenish gray claystone is repeatedly interbedded with thin (<3 cm) bluish silty claystone beds. Bluish silty claystone grades up into claystone but sharply overlies claystone and siltstone. Bluish intervals are occasionally thick and contain rare nannofossils. They are slightly bioturbated and have color banding. Burrows in these lithologies are rare to common and commonly include forms such as Planolites and vertical Skolithos-type burrows.
Thin breccia layers that include small calcite grains (<1 cm across) are observed below 355-U1457C-71R-3, 100 cm (864.9 mbsf). Thick to very thick beds of fine- to medium-grained calcilutite and calcarenite occur below Section 86R-1 (1006.4 mbsf). The light green calcilutite and calcarenite are normally graded and are easily distinguished from dark gray claystone. The calcarenite is observed with patches and granule-sized intraclasts of calcite, but is generally well sorted and massive. Breccia beds are dominated by angular to subangular poorly sorted clasts of limestone (up to 8 cm across), as well as minor volumes of small claystone clasts and altered volcanic clasts, mostly suspended in a clay and carbonate matrix. The small breccia clasts are matrix-supported, mostly by clay or mixed clay and carbonate. The coarser-grained breccia is not strongly cemented. The size of breccia clasts increases with depth and they become less matrix-supported. With greater depth we also see more pressure solution and indentation of clasts into one another. Light brownish limestone is deposited along with the breccia and calcarenite. Medium-bedded limestone interbedded with calcarenite was observed with cracks >1 cm wide that are infilled with the breccia. This suggests that the limestone beds are also large clasts or rafts within the overall redeposited section. This is especially likely when the limestone is fine grained in texture, inconsistent with a mass wasting, deep sea setting.
Unit IV shows various structural features including microfaults, folds, slickensides, and steeply inclined to vertical bedding. Slickensides are observed, especially in claystone and siltstone (Figure F9G). The bedding is mostly inclined within this unit (10°–40°), occasionally being nearly vertical (Figure F9H). Dip directions may reverse to the opposite direction within a single section, although it is not clear if the different pieces are rotated relative to one another. Most of these sedimentary structures indicate that Unit IV is formed as a result of mass transport processes (Pickering and Hiscott, 2015). Dark gray chert with cryptocrystalline crystals is observed at the bottom of Unit IV.
In Unit IV, the most abundant light minerals are quartz, feldspars, micas, and clay minerals. There are also minor amounts of heavy minerals, such as hornblende, epidote, zircon, tourmaline, rutile, titanite, apatite, and garnet, which are present in trace to common quantities (Figure F10).
The lithologic unit boundary between Unit IV and Unit V is known only from Hole U1457C and is situated at 93R-1, 0 cm (1062.20 mbsf). The unit boundary is marked by the presence of chert overlain by carbonate breccia at the base of Unit IV and very dark greenish gray claystone at the top of Unit V. There is a clear color change between Units IV and V, which is also paralleled by changes in physical properties, including magnetic susceptibility (Figure F5C).
Unit V
- Interval: 355-U1457C-93R-1, 0 cm, through 96R-2, 81 cm
- Depth: 1062.2–1092.33 mbsf
- Thickness: 30.13 m
- Age: early Paleocene
- Lithology: claystone, silty claystone, and breccia
Unit V consists mainly of dark brown to greenish black claystone (Figure F7J), dark greenish gray silty claystone, and dark gray to black volcaniclastic breccia and sandstone. Dark brown, massive claystone contains black manganese-rich discontinuous layers, accompanied by nodules that are a few millimeters in diameter. Dark greenish gray massive siltstone is observed with small (1–3 cm) carbonate nodules/pods and in thin parallel carbonate bands that compose a small proportion of the total core. Bluish green claystone and dark greenish gray silty claystone are interbedded. Breccia and sandstone are observed to have sharp, erosive bases overlying the finer grained lithologies. Medium-bedded sandstone shows parallel lamination and is observed to have thin calcite-mineralized layers. The lower part of the unit (Cores 355-U1457C-94R and 95R) is dominated by massive dark gray to black volcaniclastic sedimentary rocks of wide-ranging grain size. Fining-upward cycles are seen with pebble-sized angular volcanic breccia fining up into parallel-laminated sandstone and then to massive black claystone. Breccia clasts are as large as 1 cm in diameter and suspended in a sandy matrix. Unit V directly overlies the basaltic basement. In Unit V, light minerals include feldspar, mica, and clay minerals, as well as traces of volcanic glass; however, heavy minerals are absent. XRD data from bulk sediment in Unit V show the presence of smectite with a distinct peak intensity (Figure F12). Smectite is a chemical weathering product that is commonly derived from the breakdown of volcanic rocks.
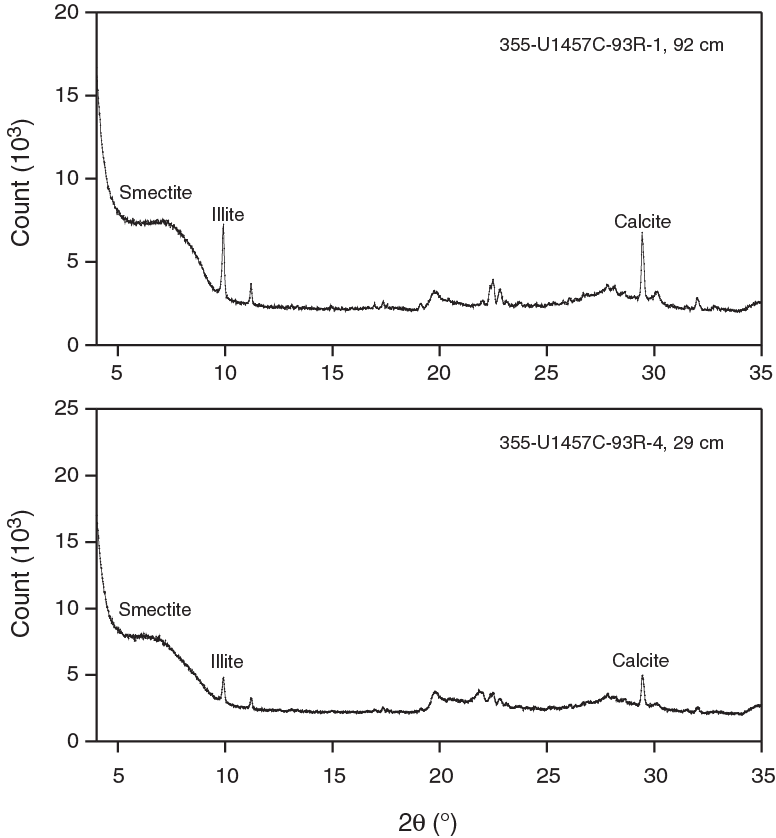
Figure F12. XRD patterns of bulk sediment from Unit V, Hole U1457C.
Basement
- Interval: 355-U1457C-96R-2, 81 cm, through 98R-4, 110 cm (total depth)
- Depth: 1092.33–1108.91 mbsf (total depth)
- Thickness: 16.58 m
- Lithology: basalt
The 8.72 m of basalt is described in detail in Igneous petrology.
Discussion
Site U1457 is located on the western flank of Laxmi Ridge and is more distal than Site U1456 in that it is away from the basin center, where the thickest sediment accumulates. Site U1457 is also further from the Indian passive margin. Site U1457 generally contains finer grained sediment than seen at Site U1456, likely a reflection of its location on the edge and away from the major sediment transport fairways. Nonetheless, the general setting of Site U1457 is the same in that it is in a distal submarine fan depositional environment, is influenced by mass wasting processes, and has a sediment provenance similar to that observed at Site U1456, allowing correlation of lithologic units between the two sites (Figure F13).
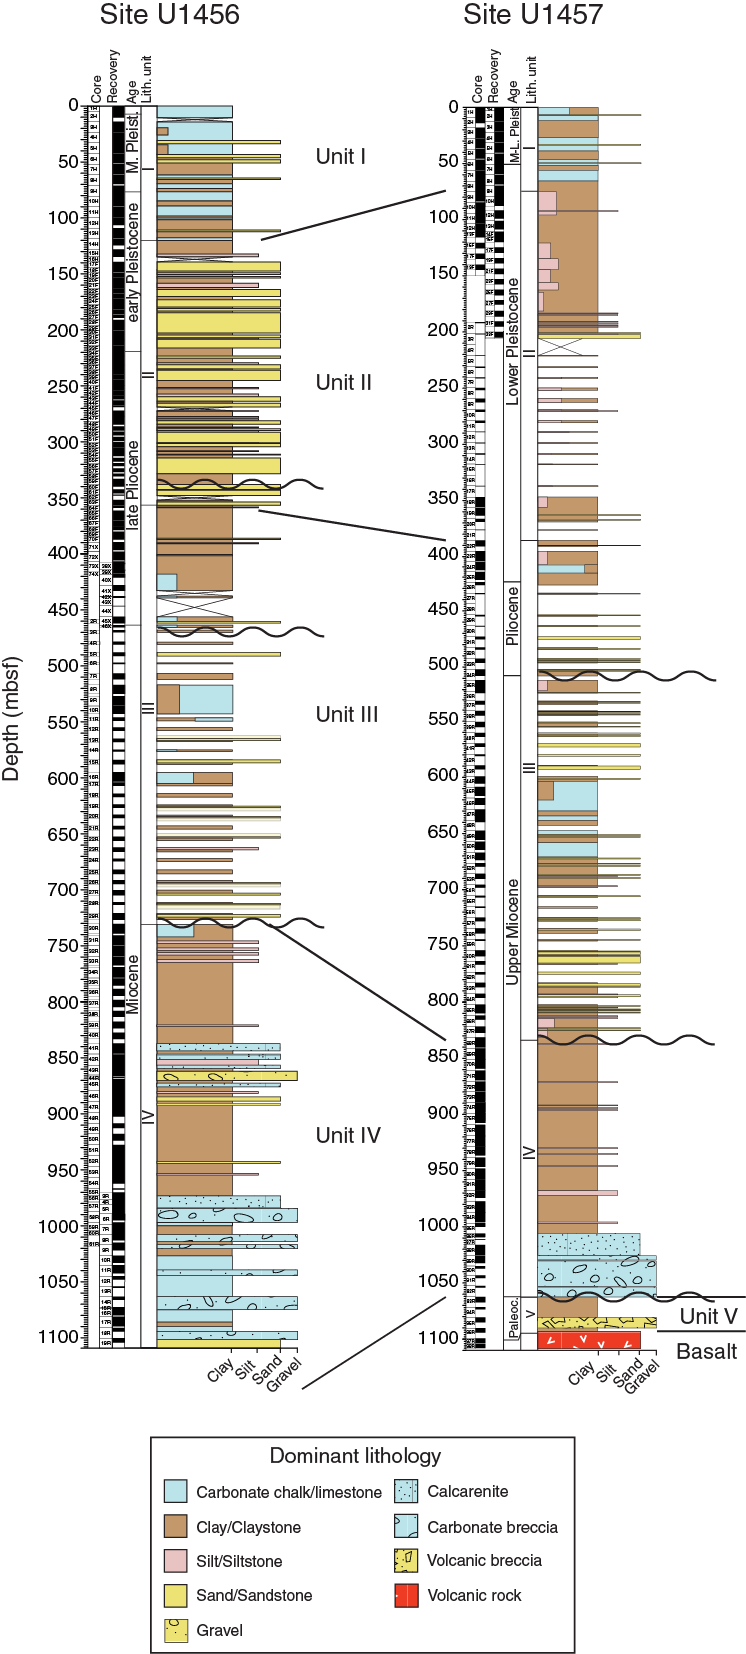
Figure F13. Correlation of lithologic units between Sites U1456 and U1457.
Depositional environments
Trace fossils preserved in deep-sea sediment represent the last burrows that are imposed on a sediment, mostly within the uppermost 5–7 cm of the seafloor (Ekdale et al., 1984). The assemblages seen in fine-grained sediment within cores from Units I–III are typical of intermediate- to very deepwater sedimentary environments in distal clastic settings and mostly correspond to the Nereites and Zoophycos ichnofacies. These ichnofacies indicate sedimentation in abyssal or equivalent deep-sea environments and are associated with pelagic deposits and distal turbidites (Seilacher, 1967). We conclude that water depths have not changed appreciably, within the uncertainty of our estimates, since at least ~10 Ma at Site U1457.
Burrows are mostly observed in hemipelagic nannofossil-rich clay and claystone, as well as nannofossil ooze and chalk, which are mostly present in Unit I and to a lesser extent Unit III. Nannofossil-rich claystone and nannofossil chalk are also observed interbedded in minor volumes in the lower part of Unit IV. The pelagic/hemipelagic sediment in Units I and III shows strong bioturbation dominated by fodinichnia (traces of infaunal deposit feeders) such as Planolites, Zoophycos, Chondrites, and various composite burrows. This indicates that sedimentation in this region took place in the presence of highly oxic conditions at the seawater/sediment interface and within the sediment mixed layer (see Geochemistry).
Clastic sedimentation dominates the drilled stratigraphy, yet more biogenic intervals are observed, especially in Unit I and to a lesser extent Unit III, much as they are at Site U1456. These more pelagic deposits formed during periods of increased surface-water productivity and/or decreased clastic influx, but all units show some evidence for long-term influx of clastic sediment. Because sea level highstands tend to cause sequestering of clastic sediment on the continental shelf, they are often associated with pelagic drapes in deep water (Vail et al., 1977), a pattern seen globally but also recognized during the present highstand in the Arabian Sea (Kolla et al., 1981; Prins et al., 2000). Although we recognize that sea level must be important in controlling sedimentation at the drill site, this alone cannot explain the large-scale variations in carbonate throughout the stratigraphy, most notably the carbonate-rich sequences in Unit I and at ~600–670 mbsf in Unit III. These larger scale changes may reflect the long-term development of the submarine fan and the location to which the bulk of the clastic sediment is being delivered at a given time.
The commonly muddy and carbonate-rich character of Unit I indicates that this site was in a distal location in relation to active depocenters throughout the Middle to Late Pleistocene climatic fluctuations since ~1.4 Ma. The muddy character suggests sedimentation in a lower fan, distal plain setting for Unit I (Mutti and Johns, 1978; Walker, 1978). There is no suggestion that the muddy character of this unit reflects slow erosion of the source regions onshore and reduced sediment delivery in the Indus catchment at this time, in fact quite the reverse. Regional sediment budgets here and across Asia point to fast sedimentation during the Pleistocene (Métivier et al., 1999; Clift, 2006), matching low-temperature thermochronology in the source regions (Jain et al., 2000; Bernet et al., 2006). Slow sedimentation at Site U1457 during deposition of Unit I, and briefly during deposition of Unit III, is the result of active lobe avulsion and autocyclic processes within the fan.
Terrigenous sediment such as sandy silt and silty claystone dominates Unit II and is interpreted as distal turbidites (Figures F7C, F9B). The seismic profiling suggests that coring in Unit II may have penetrated the edge of a major channel, but we recovered no stacked silty sand and sandy silt beds in the cores that are typical of many channel fills. The generally fine grained, thinner bedded, and silty nature of the Unit II turbidites is much more distal compared to those seen in Unit II at Site U1456. As a result, we conclude that Unit II at Site U1457 is not the product of turbidite sedimentation within an active lobe (Mutti, 1992; Normark et al., 1993), at least not in the proximal parts of such a feature. We interpret Unit II to be likely the product of sedimentation in a basin plain environment.
In contrast, Unit III is characterized mostly by coarser grained terrigenous sediment and sequences of associated hemipelagic sediment (Figure F5C). The graded cycles of claystone and silty sandstone with erosive bases found within Unit III are interpreted as distal turbidity current deposits. The unit is composite and is represented by several subdivisions. From the top of the unit (385 mbsf) down to ~470 mbsf is fine grained and partly biogenic, suggestive of sedimentation in a basin plain setting or on the edge of an active lobe. Below this level there are two sand-rich packages that closely parallel facies known from active lobe environments and are similar to Unit II at Site U1456. These are separated by a fine-grained, more calcareous unit at ~600–670 mbsf, which would indicate a period of deposition when lobe sedimentation had avulsed to another location within or even outside Laxmi Basin.
The mass transport deposit that dominates Unit IV is inferred to have been emplaced in deep water as a single ~190 m thick body. The upper part of this unit is dominated by siltstone and mudstone that often show strong plastic soft-sediment deformation, consistent with emplacement in a large-scale mass transport deposit. The basal part of the deposit comprises breccia and high-energy calcarenite, both derived from limestone originally deposited in shallow water on the continental shelf and redeposited into the current location in a catastrophic event. Unlike the mass transport deposit at Site U1456, we see only one cycle of this type of sedimentation, suggesting that this is a single event, whereas the sediment at Site U1456 left open the possibility that the deposit was the product of two or even more events. This difference and the thinner character of the deposit at Site U1457 probably reflects the basin margin location of the site. The bulk of the mass transport deposit could have been funneled by the bathymetry into the deepest part of the basin, away from Site U1457. Shallow-water carbonate interbeds within Unit IV were likely emplaced as coherent rafts or boulders and do not represent periods of tranquil in situ carbonate sedimentation. Although neighboring submarine ridges and seamounts (e.g., Laxmi Ridge and Panikkar Ridge) could supply some carbonate debris, the scale of the deposit recovered in Unit IV clearly points to the Indian continental margin as the primary source. Appropriate limestone sources are known from the western Bombay High spanning the Eocene to Miocene (Biswas, 1987) and similar rocks are believed to exist on the continental margin offshore Saurashstra where the mass transport deposit is believed to have been sourced (Calvès et al., 2015). This interpretation is also consistent with evidence for recently active mass wasting from the Indian margin offshore Ratnagiri and Goa (Rao and Wagle, 1997).
The brown and blackish mudstones that dominate Unit V do not show trace fossils but otherwise have the characteristics of deepwater distal sediment because there are no coarser grained interbeds and these pass gradationally down into the volcaniclastic deposits immediately overlying basement. Laxmi Basin appears to have been formed by extension in deep water and has remained at these depths or more likely deepened with age as a result of thermal subsidence. All shallow-water indicators in this sequence are redeposited from surrounding areas, mostly the Indian continental shelf.
Sediment at Site U1457 indicates five primary types of deposition:
- Pelagic sediment such as nannofossil ooze/chalk and nannofossil-rich clay/claystone, which are highly bioturbated and present in Unit I and at 600–670 mbsf in Unit III;
- Turbidites composed of sandy silt/siltstone, silty sand/sandstone, and clay/claystone with a clear Indus provenance, which dominate Units II and III;
- Mass transport deposit comprising clastic sediment and breccia eroded from the Indian continental shelf in Unit IV;
- Distal, base of slope, or outer fan basin plain mudstone as seen in Unit V;
- Volcaniclastic sedimentation in Unit V, likely in the form of hyaloclastites close to the volcanic centers that erupted during the opening of Laxmi Basin.
Provenance
The location of Site U1457 and the mineralogy of sediment cored require derivation of material mainly from the Indus River in Units I–III. The Indus Fan acquires most of its load from the high-relief topography of the western Tibetan Plateau, Karakoram, and Himalaya (Clift et al., 2004; Garzanti et al., 2005). Peninsular India is likely a much less important source in the upper three units because the wide continental shelf acts as a major sediment buffer (Rao and Wagle, 1997), and smear slide descriptions of the sediment at Site U1457 confirm that peninsular sources are only intermittently important, at least in Units I–III. Sediment flux from the major rivers draining the peninsula, such as the Narmada and Tapti Rivers, is less than the Indus River but may have been significant at times. Milliman and Syvitski (1992) recorded a sediment load for the prerecent Narmada River at around half that of the Indus, ~125 × 106 versus 250 × 106 tons/y, although flux from the Indus River may have been as high as 675 × 106 tons/y according to other estimates (Ali and De Boer, 2008). Mineralogy evidence from our cores strongly supports a dominant signature of the Indus River and suggests sequestration of Narmada/Tapti sediment on the shelf, or that the relative discharges of the Indus and Narmada Rivers were more asymmetric in the past. Derivation from the western Indian margin obviously dominates the mass transport deposit in Unit IV, named the Nataraja slide by Calvès et al. (2015). The provenance of claystone in Unit V is presently enigmatic because it is fine grained and no unique minerals have been identified that can separate an Indus River source from peninsular sources. The claystone could be derived from either an early Indus Fan or from peninsular India. A Paleocene depositional age means that they predate most estimates for the start of fan sedimentation (Qayyum et al., 1997; Clift et al., 2001) and the start of India/Eurasia collision (Najman et al., 2010), although some workers argue for collision at 60 Ma or even earlier (Beck et al., 1997; DeCelles et al., 2014; Wu et al., 2014, Hu et al., 2015). Thus, the possibility that Unit V is an Indus Fan deposit cannot be excluded until more detailed postcruise work is undertaken.
Biostratigraphy
Samples from core catchers and additional samples from split core sections from Holes U1457A–U1457C were ex99999amined to define calcareous nannofossil, planktonic foraminifer, radiolarian, and diatom biostratigraphies for Site U1457. The chronologic framework for Site U1457 is based on the identification of a series of calcareous nannofossil and planktonic foraminifer events (Table T2; Figure F14) and paleomagnetic events (Table T21; Figure F14).
Table T2. Biostratigraphic datums for Holes U1457A–U1457C. Download table in .csv format.
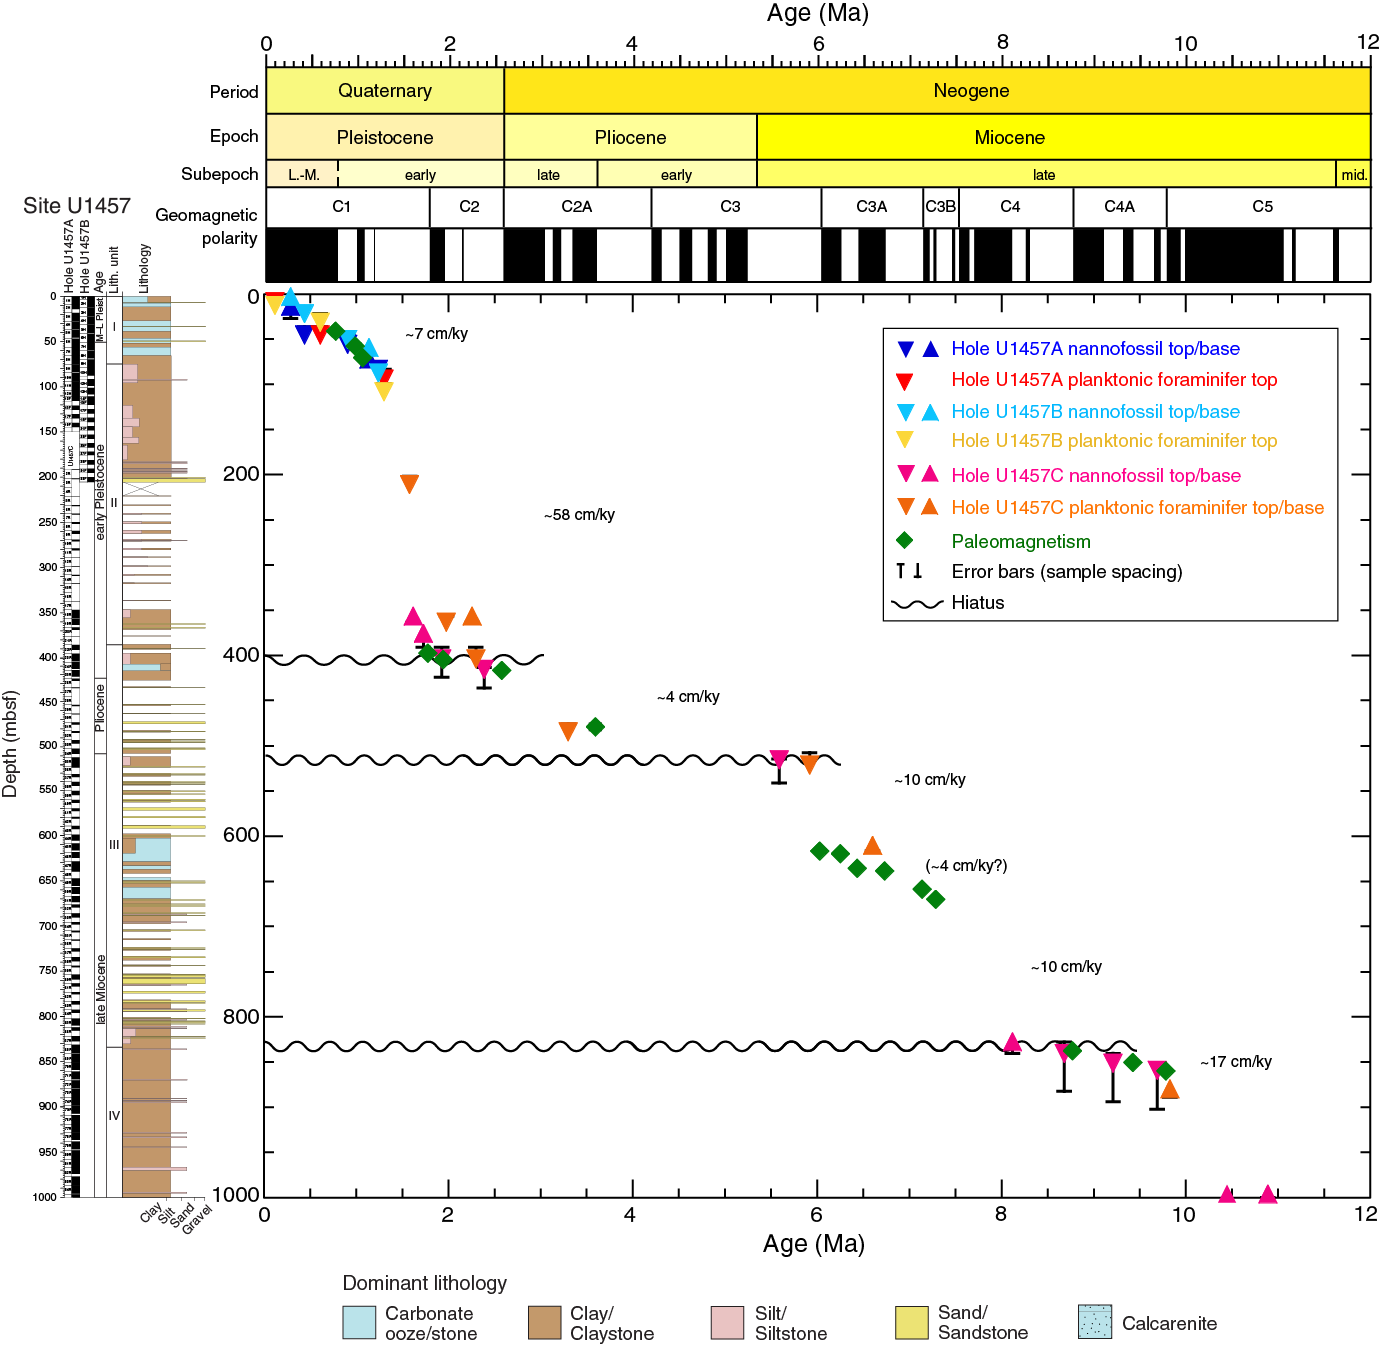
Figure F14. Age-depth plot for the section above 1000 mbsf.
Preservation of calcareous nannofossils and planktonic foraminifers varies from poor to good throughout Site U1457 (Tables T3, T4, T5, T6, T7). Calcareous nannofossils are very abundant and moderately to well preserved in lithologic Unit I (see Lithostratigraphy) but are usually present only in few to common numbers in Units II and III, except in a few intervals of nannofossil-rich lithologies in Unit III. Planktonic foraminifers are abundant and well preserved in most samples in Unit I but range between absent and common in Units II–V (see Lithostratigraphy). Diatoms and radiolarians were observed in the mudline sample collected in Hole U1457B where they were well preserved and abundant. Both siliceous microfossil groups are only present in very low abundance in the uppermost samples at Site U1457 and generally absent downhole (Table T8, T9, T10).
Table T3. Distribution of calcareous nannofossils, Hole U1457A. Download table in .csv format.
Table T4. Distribution of calcareous nannofossils, Hole U1457B. Download table in .csv format.
Table T5. Distribution of calcareous nannofossils, Hole U1457C. Download table in .csv format.
Table T6. Distribution of planktonic foraminifers, Holes U1457A and U1457B. Download table in .csv format.
Table T7. Distribution of planktonic foraminifers, Hole U1457C. Download table in .csv format.
Table T8. Distribution of diatoms, Hole U1457B. Download table in .csv format.
Table T9. Samples containing no diatoms. Download table in .csv format.
Table T10. Distribution of radiolarians, Holes U1457A-U1457C. Download table in .csv format.
The succession of calcareous nannofossil and planktonic foraminifer events indicates that Site U1457 spans the early Paleocene through recent, albeit with a very long hiatus (~50 million years) between lower Paleocene and upper Miocene sediment. The biostratigraphic framework established at Site U1457 enabled identification of three unconformities and an interval of mass transport in the recovered Neogene section. Calculated sedimentation rates at Site U1457 suggest that the sedimentation rate appears to have been relatively consistent in the late Miocene at ~17 cm/ky, although deposition was interrupted for ~0.50 million years around 8 Ma. Sedimentation rates were somewhat lower after sedimentation resumed following this hiatus, averaging ~10 cm/ky during the remainder of the late Miocene. There is some evidence for a short interval dominated by slower, hemipelagic sedimentation (~4 cm/ky) between ~7.4 and 6 Ma (Figure F14). There is an ~2 million year hiatus that spans the Miocene/Pliocene boundary and early Pliocene. The sedimentation rate in the late Pliocene to early Pleistocene was ~4 cm/ky. After another ~0.45 million year hiatus in the early Pleistocene, sedimentation rates for the remainder of the early Pleistocene were much higher (~58 cm/ky) during deposition of lithologic Unit II. The sedimentation rate slowed down from the late early Pleistocene to present, averaging ~7 cm/ky.
Calcareous nannofossils
Calcareous nannofossil biostratigraphy is based on analysis of core catchers and samples from split core sections from Holes U1457A–U1457C. Biostratigraphic datums used for the age-depth model are shown in Table T2 (ages from Gradstein et al., 2012), and nannofossil occurrence data are shown in Tables T3, T4, and T5. The section sampled from Holes U1457A and U1457B is Pleistocene to recent in age, whereas those from Hole U1457C span the early Paleocene to Pleistocene (Figure F14).
At Site U1457, the preservation of calcareous nannofossils varies from poor to good, and abundance varies from few to very abundant depending on lithology. Throughout lithologic Unit I (see Lithostratigraphy), nannofossils are very abundant and moderately to well preserved across both Holes U1457A and U1457B. Although the abundance of nannofossils ranges from few to common, they are moderately well preserved throughout Unit II. This unit represents a period of rapid deposition and high sedimentation rates estimated at ~58 cm/ky (Figure F14). Unit III shows common occurrences of nannofossils with only moderate preservation. There is common reworking of Cretaceous and Paleogene forms in Units I through III. Unit IV is characterized by a mass transport deposit that contains reworked Paleogene to early Neogene assemblages with no in situ taxa in the lower part of the unit, suggesting that deposition of the reworked material was so rapid that the normal background pelagic sedimentation was not included before the reworked sediments were further buried. Nannofossils of early Paleocene age are moderately preserved within the uppermost part of Unit V, but preservation decreases downhole until they are completely absent in the interval immediately above the basement.
Pleistocene
The presence of Emiliania huxleyi is recorded in Samples 355-U1457A-1H-CC through 2H-CC (8.69–14.02 mbsf) and 355-U1457B-1H-CC (3.17 mbsf), which indicates that this sediment is of Late Pleistocene age (<0.290 Ma) and within Zone NN21 of Martini (1971). Samples 355-U1457A-3H-CC and 4H-CC (27.07–36.59 mbsf) and 355-U1457B-2H-CC (12.49 mbsf) are assigned to Zone NN20 based on the absence of both E. huxleyi and Pseudoemiliania lacunosa. The top of Zone NN19 is recognized in Samples 355-U1457A-5H-CC (45.56 mbsf) and 355-U1457B-3H-CC (21.64 mbsf), where the last occurrence (LO) of P. lacunosa (0.44 Ma) is found.
Zone NN19 is further divided based on five nannofossil events recorded in Holes U1457A–U1457C:
- The last common occurrence (LCO) of Reticulofenestra asanoi (0.91 Ma) in Samples 355-U1457A-6H-CC (55.74 mbsf) and 355-U1457B-6H-CC (50.32 mbsf);
- The first common occurrence (FCO) of R. asanoi (1.14 Ma) in Samples 355-U1457A-8H-5, 38 cm (72.08 mbsf), and 355-U1457B-7H-CC (59.35 mbsf);
- The LO of large Gephyrocapsa spp. (>5.5 µm) in Samples 355-U1457A-9H-CC (83.78 mbsf) and 355-U1457B-10H-CC (87.7 mbsf), indicating an age older than 1.24 Ma;
- The first occurrence (FO) of large Gephyrocapsa spp. (>5.5 µm) in Sample 355-U1457C-18R-CC (356.6 mbsf), constraining the age to younger than 1.62 Ma; and
- The FO of medium Gephyrocapsa spp. (>4 µm) in Sample 355-U1457C-21R-1, 13 cm (376.03 mbsf), an event near the base of Zone NN19 at 1.73 Ma.
The top of Zone NN18 is marked by the LO of Discoaster brouweri (1.93 Ma), which is found in Sample 355-U1457C-23R-CC (403.83 mbsf). Sample 25R-1, 65 cm (415.35 mbsf), contains the LO of Discoaster pentaradiatus, which is dated to 2.39 Ma (top of Zone NN17). Between the LO of D. brouweri and the LO of D. pentaradiatus, we identify a period of nondeposition lasting ~0.45 million years. The nannofossil assemblages within the interval between the LO of D. pentaradiatus (Sample 25R-1, 65 cm) and Sample 355-U1457C-34R-CC (415.35–507.94 mbsf) show low diversity, with few discoasters present. This may be because the assemblages are diluted by the coarse-grained sediment found within Unit III. We are unable to identify the LO of Discoaster surculus (2.49 Ma) because of very sparse occurrences in this interval, which is likely a result of sediment dilution in this depositional setting.
Pliocene–Miocene
Samples 355-U1457C-32R-1, 53 cm, through 35R-3, 32 cm (483.13–515.02 mbsf), contain nannofossil assemblages indicative of the late Pliocene within Zone NN16 (markers observed include D. pentaradiatus, D. surculus, and Discoaster tamalis). The LO of Discoaster quinqueramus is dated to 5.59 Ma and is recorded in Sample 35R-6, 29 cm (515.49 mbsf). This event marks the top of Zone NN11. The absence of a number of key early Pliocene marker taxa (e.g., Ceratolithus acutus and Ceratolithus rugosus) above the LO of D. quinqueramus suggests the presence of an ~2 million year hiatus between Samples 35R-3, 32 cm, and 35R-6, 29 cm (515.02–515.49 mbsf). The hiatus encompasses much of the early Pliocene, as well as the Miocene/Pliocene boundary, representing a missing interval including Zones NN15–NN12.
The presence of Nicklithus amplificus in Sample 355-U1457C-46R-2, 45 cm (620.24 mbsf), indicates that this sample is older than 5.94 Ma. Between Samples 49R-CC and 67R-CC (665.85–827.70 mbsf), the section becomes sandier and nannofossil abundance also becomes more variable. Amauroliths and discoasters are sparse through this interval, making it difficult to better constrain the age.
The FO of D. quinqueramus is recorded in Sample 355-U1457C-67R-CC (827.7 mbsf) and constrains the age to younger than 8.12 Ma. This event also marks the top of Zone NN10. Within Zone NN10, the top of Minylitha convallis is observed in Section 355-U1457C-68R-CC (840.47 mbsf) and the top of Discoaster bollii is in Section 69R-CC (851.35 mbsf). These bioevents are dated to 8.68 and 9.21 Ma, respectively. These three bioevents occurring over a short stratigraphic interval, together with available paleomagnetic ties (see Paleomagnetism and rock magnetism), indicate the presence of a hiatus of at least 0.5 million years between Sections 355-U1457C-67R-CC and 68R-CC (Figure F14).
The interval from Sample 355-U1457C-70R-CC to 84R-CC (859.49–995.93 mbsf) contains Catinaster coalitus, which has a total age range of 9.69–10.89 Ma. The presence of Discoaster bellus (FO at 10.40 Ma) within this interval also helps to constrain the age to between 9.69 and 10.40 Ma in Section 355-U1457C-84R-CC (Table T2; Figure F14).
Section 355-U1457C-85R-CC is barren of calcareous nannofossils. There is a distinct change in the nannofossil assemblages in Section 355-U1457C-86R-CC and deeper. Much of the interval from Sections 86R-CC through 92R-CC (1009.21–1054.34 mbsf) contains a mixture of different lithologies (see Lithostratigraphy), as well as abundant reworked Paleogene to early Neogene microfossil assemblages. This interval is interpreted as a mass transport deposit and was likely emplaced during the late Miocene, at ~10.4 Ma.
Samples 355-U1457C-93R-1, 128 cm, through 94R-CC (1063.48–1073.69 mbsf) contain an early Paleocene assemblage that includes abundant Coccolithus pelagicus, common Cruciplacolithus primus and Cruciplacolithus tenuis, together with rare Prinsius spp. The presence of Ellipsolithus macellus and absence of Fasciculithus spp. indicate Zone NP4 and an age range between ~62.1 and 63.3 Ma. Therefore, it is likely that there is a hiatus of at least 50 million years between these lower Paleocene rocks and the overlying upper Miocene mass transport deposit.
Planktonic foraminifers
The abundance of planktonic foraminifers varies between rare and abundant throughout the core catcher samples and additional samples from split core sections examined from Holes U1457A–U1457C (Tables T6, T7). In Holes U1457A and U1457B, planktonic foraminifers are generally abundant in samples from Cores 355-U1457A-1H through 19H (8.69–144.76 mbsf) and 355-U1457B-1H through 17F (3.17–129.66 mbsf), which correspond to lithologic Units I and II (see Lithostratigraphy). Samples 355-U1457B-19H-CC through 33F-CC (139.02–205.15 mbsf) are mainly composed of clay/claystone and are devoid of planktonic foraminifers, except for Sample 31F-CC (195.25 mbsf), which contains few specimens (Table T6). Planktonic foraminifers from Holes U1457A and U1457B are moderately to well preserved, except for Samples 355-U1457A-19F-CC (144.76 mbsf) and 355-U1457B-14F-CC (115.36 mbsf), which show poor preservation (Table T6). Planktonic foraminifers are generally less abundant in Hole U1457C, varying from rare to common in abundance (Table T7). Planktonic foraminifers in samples from Hole U1457C generally show poor preservation compared to those from Holes U1457A and U1457B. Samples from Sections 355-U1457C-15R-1 and 17R-1 (318.02–337.50 mbsf), 28R-1 and 29R-1 (443.8–454.76 mbsf), 38R-CC through 41R-CC (544.66–573.26 mbsf), 59R-1 through 66R-CC (745.86–815.94 mbsf), and 75R-CC through 81R-CC (907.59–967.52 mbsf) are barren of planktonic foraminifers. Additionally, intermittent samples within the Hole U1457C section are also found to be devoid of planktonic foraminifers (Table T7).
The planktonic foraminifer assemblages identified at Site U1457 are typical for subtropical to tropical water masses. Globigerinoides ruber, Globigerina bulloides, Globigerina glutinata, Globigerinoides quadrilobatus, Pulleniatina obliquiloculata, and Neogloboquadrina dutertrei are the most abundant species. Globorotalia menardii, Orbulina universa, and Globigerinoides sacculifer are also frequently present in many of the samples examined (Tables T6, T7). Unlike at Site U1456, Globorotalia truncatulinoides and loborotalia tosaensis are present in many samples from Holes U1457A, U1457B, and U1457C, sometimes occurring in higher abundances (Tables T6, T7).
Important age-diagnostic taxa identified in the core catcher samples of Site U1457 are G. ruber (pink), G. tosaensis, G. truncatulinoides, Globigerinoides ( loboturborotalita) obliquus, Globigerinoides (Globoturborotalita) extremus, Globigerina (Globoturborotalita) woodi, Dentoglobigerina altispira, Neogloboquadrina acostaensis, Globoquadrina dehiscens, and Pulleniatina primalis. The LO of G. ruber (pink) (0.12 Ma; Indo-Pacific) is reported in Samples 355-U1457A-1H-CC (8.69 mbsf) and 355-U1457B-2H-CC (12.49 mbsf). The LO of G. tosaensis (0.61 Ma) is recorded in Samples 355-U1457A-5H-CC (45.56 mbsf) and 355-U1457B-4H-CC (31.14 mbsf). The LO of G. obliquus (1.3 Ma) is identified in Samples 355-U1457A-10H-CC (94.36 mbsf) and 355-U1457B-13H-CC (108.56 mbsf). The LOs of N. acostaensis (1.58 Ma), G. extremus (1.98 Ma), G. woodi (2.30 Ma), D. altispira (3.13 Ma in the Atlantic; 3.47 Ma in the Pacific), and G. dehiscens (5.92 Ma) are recorded in Samples 355-U1457C-4R-CC (211.00 mbsf), 19R-CC (363.55 mbsf), 23R-CC (403.88 mbsf), 32R-CC (484.43 mbsf), and 35R-CC (521.54 mbsf), respectively (Table T2). The FOs of G. truncatulinoides (1.93 Ma in the South Atlantic; 2.58 Ma in the Pacific), P. primalis (6.60 Ma) and N. acostaensis (9.83 Ma) are reported in Samples 18R-CC (356.60 mbsf); 45R-2, 24 cm (610.35 mbsf); and 72R-CC (879.87 mbsf), respectively.
Based on the recorded stratigraphic ranges (FO and LO) of the biozonal marker species G. tosaensis, D. altispira, and N. acostaensis, we identify biostratigraphic Subzones PT1b and PT1a in Holes U1457A and U1457B; along with Subzone PT1a and Zones PL5, PL4, M13, and M12 in Hole U1457C. Additionally, the record of planktonic foraminiferal datums indicates the presence of at least parts of Zones M14 and PL6, although the zonal boundaries are not defined because of the absence of zonal marker species. The boundary between Subzones PT1b and PT1a is defined by the LO of G. tosaensis, whereas the Zone PL5/PL4 boundary is defined by the LO of D. altispira and the Zone M13/M12 boundary by the FO of N. acostaensis. The presence of G. dehiscens (LO at 5.92 Ma) in Sample 355-U1457C-35R-CC (521.49 mbsf) and D. altispira (LO at 3.13 Ma in the Atlantic; 3.47 Ma in the Pacific) in overlying Sample 34R-CC (507.94 mbsf) suggests that a hiatus of at least 2 million years exists in Hole U1457C and that the Miocene/Pliocene boundary is missing. This interpretation is consistent with the nannofossil biostratigraphy (Figure F14).
An admixture of Paleogene planktonic species (e.g., acarininids, morozovellids, and Globigerinatheka species) is recorded in Cores 355-U1457C-86R through 90R (1009.21–1037.23 mbsf) in the calcarenite and carbonate breccia of lithologic Unit IV (see Lithostratigraphy). Planktonic foraminifers from these samples are poorly preserved because of intense recrystallization. Although Sample 355-U1457C-88R-CC (1025.91 mbsf) contains an admixture of a few morozovellids indicative of the middle Eocene, the planktonic foraminifer assemblage (including Fohsella robusta) suggests a middle Miocene age (between 11.79 and 13.13 Ma; Zone M9; Wade et al., 2011).
Planktonic foraminifers identified in Samples 355-U1457C-93R-CC (1067.32 mbsf) and 94R-CC (1073.69 mbsf) in Unit V immediately overlying the basement represent a Paleocene assemblage, including such forms as Parasubbotina pseudobulloides, Praemurica inconstans, Planorotalites compressa, and Globoconusa daubjergensis. It should be noted that specimens of these Paleocene species are small in size and are present in the 63–150 µm fraction only.
Benthic foraminifers
Benthic foraminifers are generally rare in the samples examined from Site U1457, except in samples from Sections 355-U1457C-22R-CC (391.10 mbsf) through 25R-CC (422.14 mbsf) where they are relatively more frequent. The constituent taxa of the benthic foraminiferal population belong to the rotaliid, miliolid, buliminid, bolivinid, uvigerinid, nodosarid, textularid, and cassidulinid groups. The assemblages are generally composed of deepwater species. Shallow-water benthic foraminifers of Paleogene age, including larger foraminifers, are found in Samples 355-U1457C-71R-3, 110 cm (866.1 mbsf), and 74R-CC (898.76 mbsf), and we assume that they are allochthonous, indicating transport and redeposition.
Diatoms
All core catcher samples from Hole U1457A and the uppermost five core catcher samples from Hole U1457B were examined for diatom biostratigraphy. In addition, a mudline water sample from Hole U1457B, samples from within Cores 355-U1457A-1H through 4H and 355-U1457B-1H, and selected samples from deeper in Hole U1457C were examined (Tables T8, T9).
Sample 355-U1457B-1H-1, 0 cm (mudline water sample), contains well-preserved diatoms comparable to those found at Site U1456 (Table T8). However, the diatom assemblage in the mudline sample at this site is slightly different from that of Site U1456. The diatom assemblage at this site is dominated by Paralia sulcata and Azpeitia nodulifera and also includes various neritic diatoms such as Cyclotella stiriata, Actinoptycus, Hyalodiscus, and Surrilera in fewer numbers. Tropical to subtropical diatoms such as Alveus marinus, Azpeitia africanus, and Thalassiosira spp. and coastal upwelling species Chaetoceros spp. and Bacteriostrum spp. are present but only in very low abundances at this site.
All sediment samples examined at Site U1457 are completely barren of diatoms except those from Core 355-U1457B-1H (0–3.17 mbsf; mudline core). Diatom abundance and diversity rapidly decreases downcore within Section 355-U1457B-1H-1, and only a few specimens of P. sulcata are found in Samples 355-U1457B-1H-2, 75–76 cm, and 1H-CC.
Fine structures of several diatom frustules are missing but have no fragmentation, suggesting dissolution affected the preservation of those diatoms. Potholes on sponge spicules also suggest strong silica dissolution (e.g., Sample 355-U1457B-1H-CC [3.27 mbsf]; Figure F15). The interstitial water silica profile at Site U1457 also supports active silica dissolution within the uppermost ~60 mbsf at this site (see Geochemistry).
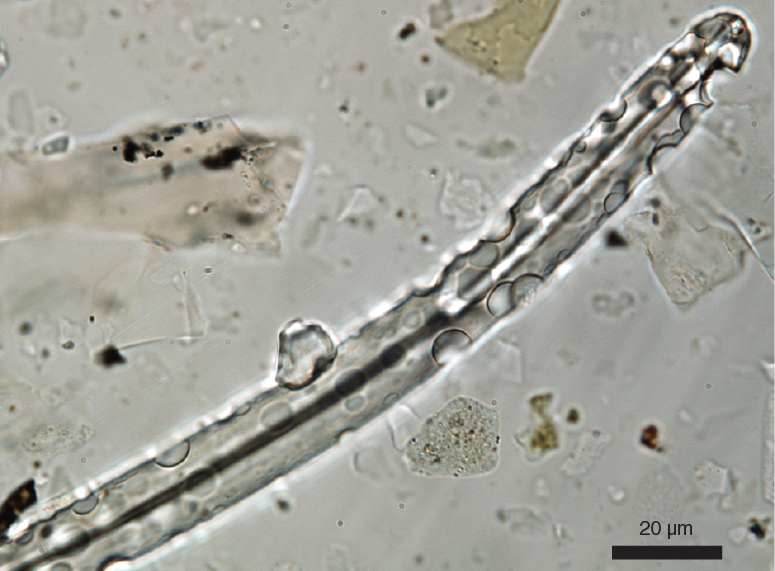
Figure F15. Sponge spicule dissolution.
Radiolarians
Twenty-four samples from Holes U1457A–U1457C were examined for radiolarian assemblages (Table T10). The preservation is poor, and radiolarians occur in only low abundance in Hole U1457A, whereas they are sporadically present in Holes U1457B and U1457C. Four taxa were identified, namely Cenosphaera cristata, Acrosphaera spinosa, Euchitonia furcata, and Spongatractus balbis. These taxa show rare occurrences in Samples 355-U1457A-1H-CC (8.74 mbsf), 355-U1457B-12H-CC (99.15 mbsf), and Core 355-U1457C-2R (1191.5 mbsf) and are completely absent in all other analyzed samples. The complete absence or rarity of radiolarians in the samples preclude zonal assignment based on the radiolarian assemblage. However, in Sections 355-U1457B-12H-CC (99.15 mbsf), 355-U1457C-2R-1 (191.5 mbsf), and 355-U1457A-1H-CC (8.74 mbsf), two reworked forms (E. furcata and S. balbis) of Miocene and Eocene age are found. It appears that the radiolarian assemblage was probably diluted by rapidly deposited detrital material within Unit I (see Lithostratigraphy). Additionally, intense silica dissolution would have also resulted in rare occurrence or absence of radiolarians in sediment.
The mudline sample of Hole U1457B is rich in radiolarians. This demonstrates that radiolarians currently live in this region. The species present include Spongaster tetras tetras, Spongaster pentas, Euchitonia elegans, E. furcata, Hymeniastrum spp., Didymocyrtis tetrathalamus tetrathalamus, Spongotrochus(?) venustum, and Spongotrochus glacialis.
Stratigraphic correlation
Sampling splice
A spliced sediment section for Site U1457 was constructed from the surface to a depth of 124 m core composite depth below seafloor (CCSF) using sediment cores recovered from Holes U1457A and U1457B. Two tie points in the composite are appended sections; the base of Core 355-U1457A-10H (98.67 m CCSF) marks the end of the composite section with good ties between cores. Below 124 m CCSF (base of Core 355-U1457B-15H), correlation between the two holes was lost because the half cores failed to bridge the drill-ahead intervals from the other hole.
The initial correlation was done using Correlator 2.0.1 software and is based on gamma ray attenuation (GRA) bulk density and magnetic susceptibility measured on the Special Task Multisensor Logger (STMSL) and the Whole-Round Multisensor Logger (WRMSL), along with natural gamma ray (NGR) activity from the Natural Gamma Radiation Logger (NGRL). The initial splice was revised using depth-registered core images along with the physical property data to refine correlations between the holes. The revised correlation was achieved with Igor 6.3.6 software using routines written by Dr. Roy Wilkens for IODP stratigraphic correlation. Based upon the correlations between holes, the CCSF depth scale grew by 5.3% relative to the core depth below seafloor (CSF-A) scale over the spliced interval cored by APC (Figure F16). In the HLAPC section, the offset did not continue to grow. The affine table (Table T11) summarizes the individual depth offsets needed to convert core depths from CSF-A depth to CCSF.
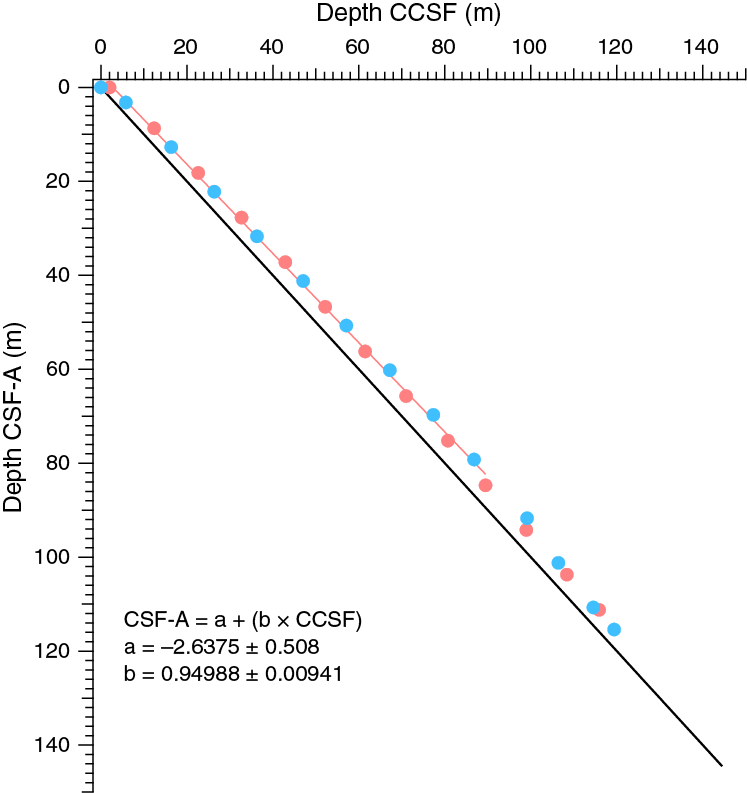
Figure F16. CCSF depth scale growth rate with respect to CSF-A depth.
Table T11. Affine table, Holes U1457A and U1457B. Download table in .csv format.
Correlation during drilling operations
Near real time assessment of the alignment of coring gaps was done during coring of Hole U1457B by quickly measuring GRA bulk density and magnetic susceptibility on the STMSL immediately after cores were curated on the catwalk. All cores from Hole U1457B were scanned at 2 cm spacing through Core 355-U1457B-10H; below this, cores were scanned at 5 cm spacing to enable faster coring decisions. After determining that Core 355-U1457A-1H had missed the mudline, we shot Core 355-U1457B-1H from a shallower depth to capture the mudline and to cover the core gap caused by low recovery in Core 355-U1457A-2H. While it was difficult to correlate Core 355-U1457B-1H to 355-U1457A-1H, subsequent core gaps were well placed with respect to those in Hole U1457A. To ensure that the core breaks did not drift too close together, we drilled ahead 3 m after Core 355-U1457B-10H. The drilled interval 355-U1457B-111 was large enough to cause a core gap at the base of Core 355-U1457A-10H but allowed matches between the HLAPC cores of Holes U1457A and U1457B over the brief interval where they were cored continuously in each hole. Once 4.7 m HLAPC coring was alternated with 4.8 m drilling ahead, it was impossible to continue a composite section.
Composite section and splice construction
Stratigraphic correlation and splice construction were based on WRMSL magnetic susceptibility and GRA bulk density data from Holes U1457A and U1457B collected after cores equilibrated to laboratory temperature. Initial correlations were then adjusted using depth-referenced core images collected on the Section Half Image Logger (SHIL) (see Lithostratigraphy in the Expedition 355 methods chapter [Pandey et al., 2016a]) in addition to the GRA density data and magnetic susceptibility data. Images from each core section were combined to form a scanned image of a full core, and the core images were depth shifted by the initial offsets determined by correlating the WRMSL data. Comparisons between depth-shifted core images from different holes were used to make finer scale matches and revise the offsets. Wherever the magnetic susceptibility, NGR, and GRA variations became weak below 80 m CCSF, these depth-shifted core images were critical to evaluate the correlation.
Figures F17, F18, and F19 illustrate the correlations between Holes U1457A and U1457B and also show the reconstructed splice interval. Each figure shows a 50 m long section of the composited and spliced data. Only the magnetic susceptibility data are plotted on the line-scan images to reduce the complexity of the profiles.
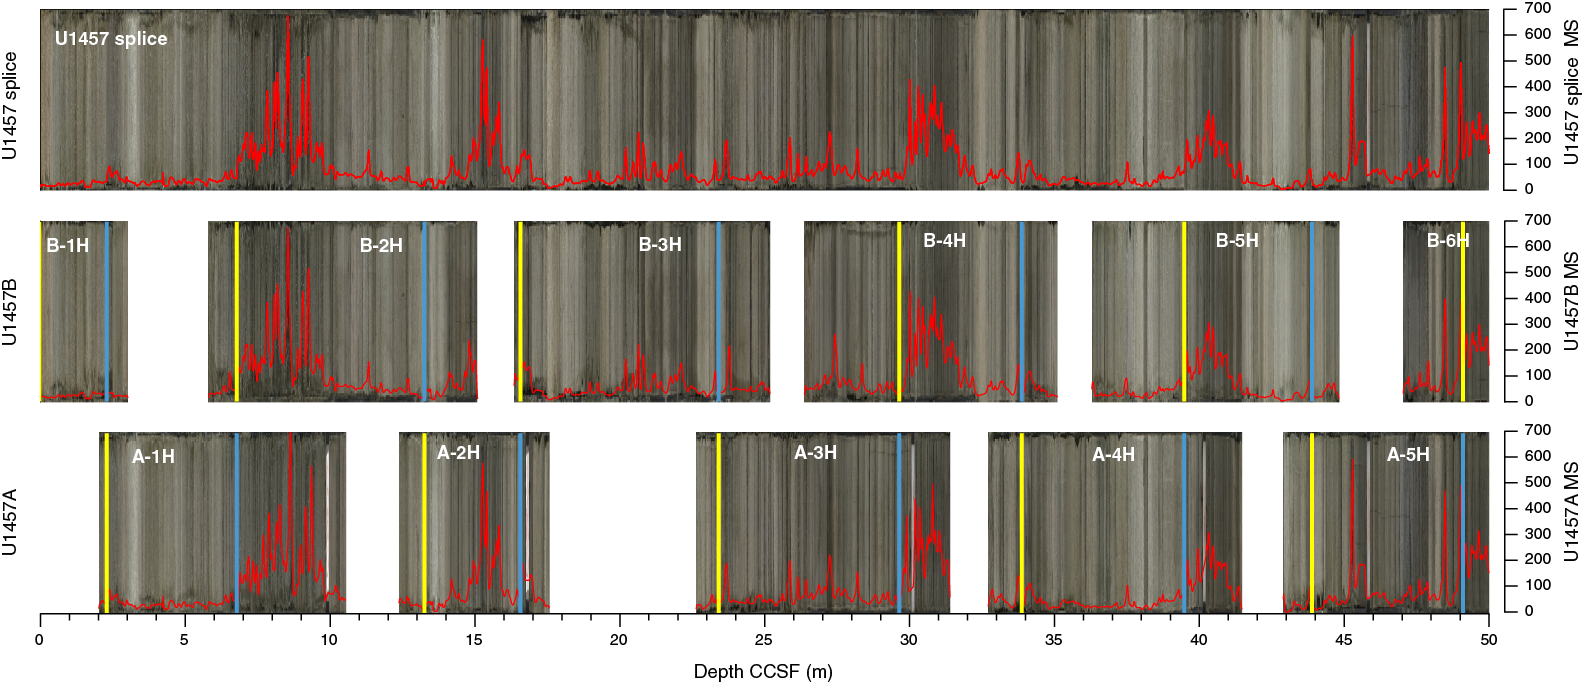
Figure F17. Core images and MS for 0–50 m CCSF for Holes U1457A and U1457B.
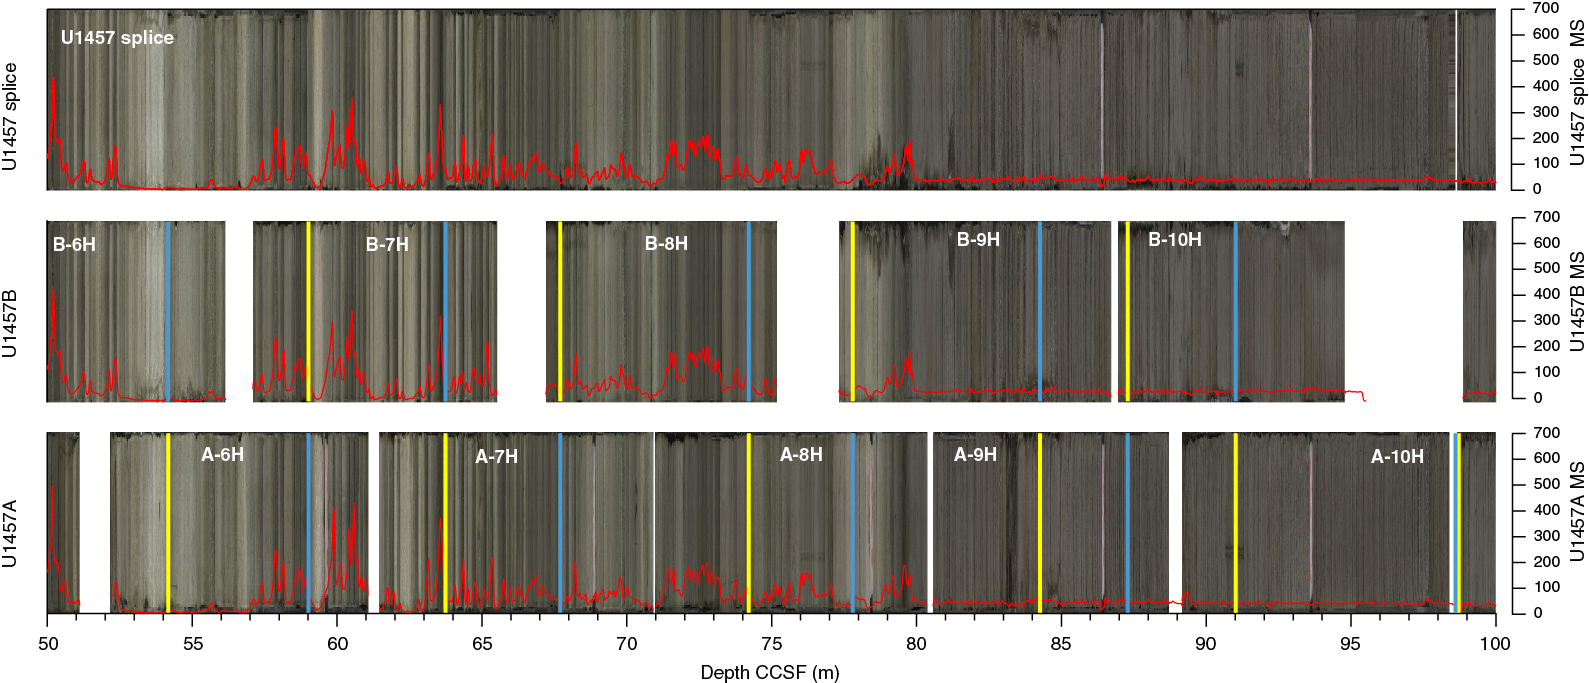
Figure F18. Core images and MS for 50–100 m CCSF for Holes U1457A and U1457B.
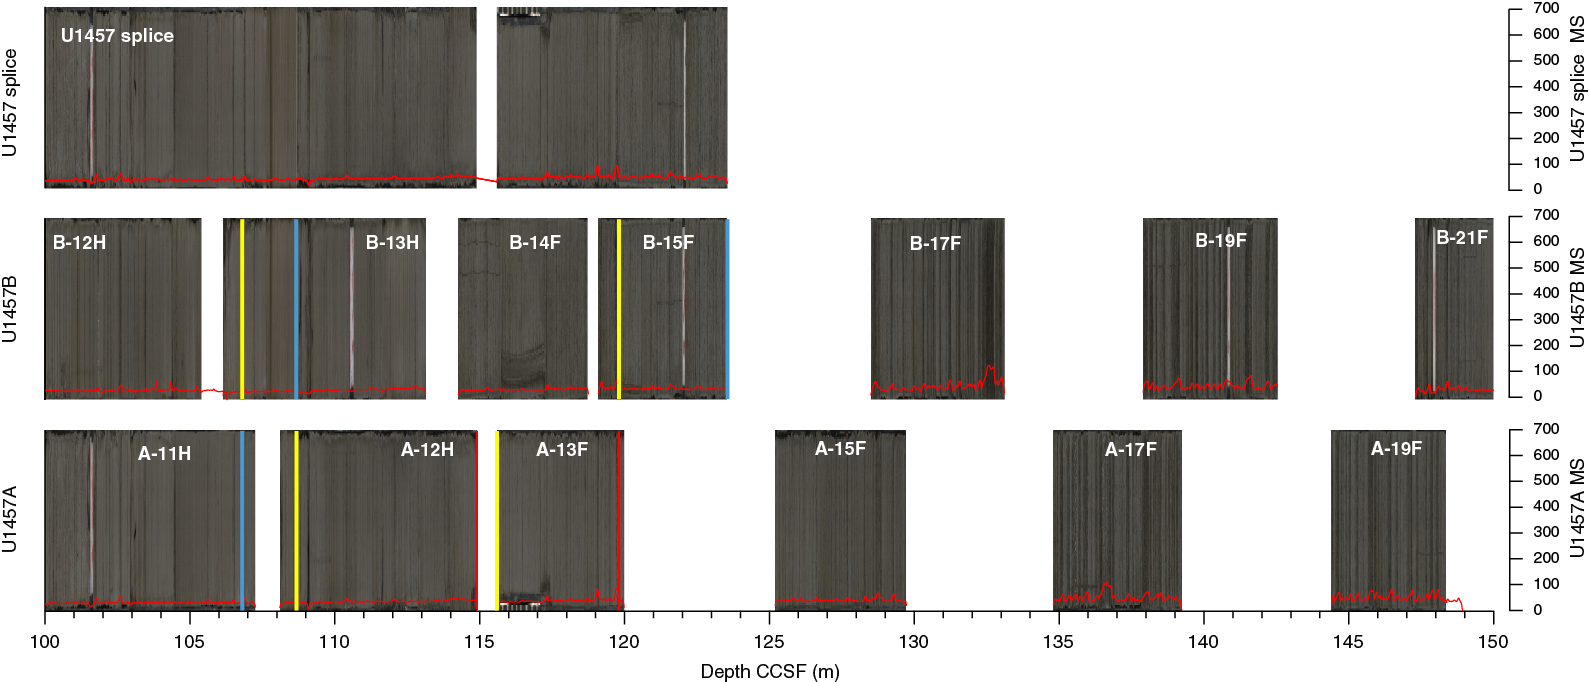
Figure F19. Core images and MS for 100–150 m CCSF for Holes U1457A and U1457B.
Core 355-U1457B-1H was shot from 5 m above the estimated depth of the seafloor to recover the mudline missed in Hole U1457A and so that a gap in Core 355-U1457A-2H would be covered with the cored interval of Core 355-U1457B-2H. Core 355-U1457B-1H clearly retrieved the thin brown layer typically found at the seafloor under oxygenated bottom waters with high organic matter deposition (Lyle, 1983), and there are good ties between Cores 355-U1457B-2H and 355-U1457A-2H. Unfortunately, the tie to Core 355-U1457B-1H is weak because there are few distinguishing characteristics in the overlapping section.
The rest of the ties down to Core 355-U1457B-9H (Table T12) are very good. Good overlaps between cores are maintained, and a very distinctive magnetic susceptibility profile along with distinctive core images allow confident and accurate matching of core depths between Holes U1457A and U1457B. Correlations became much more difficult when sediment transitions from the nannofossil ooze and clay of lithologic Unit I to the brown silty clay and silt of Unit II (see Lithostratigraphy). Weak signals and variability in the silt layers between holes nominally 15 m apart make the correlation a challenge (Figure F19).
Table T12. Splice interval. Download table in .csv format.
Figure F20 is an expanded image that shows the region of the composite around Cores 355-U1457A-9H and 355-U1457B-9H at the transition from Unit I to Unit II, which clearly illustrates the difference in magnetic susceptibility and color between the two units. Between 82 and 83 m CCSF in Core 355-U1457B-9H, there are four prominent intervals formed by deposition of multiple silt layers. In Core 355-U1457A-9H, there is much less deposition of black silt, and these intervals are more difficult to discern. In another example at ~84.5 m CCSF, one core has four layers, whereas the other core has three. Nevertheless, the pattern of deposition could be recognized between cores from the two holes until coring strategy changed from being continuous to alternating intervals of half cores with 4.8 m drill-ahead intervals (Figure F19).
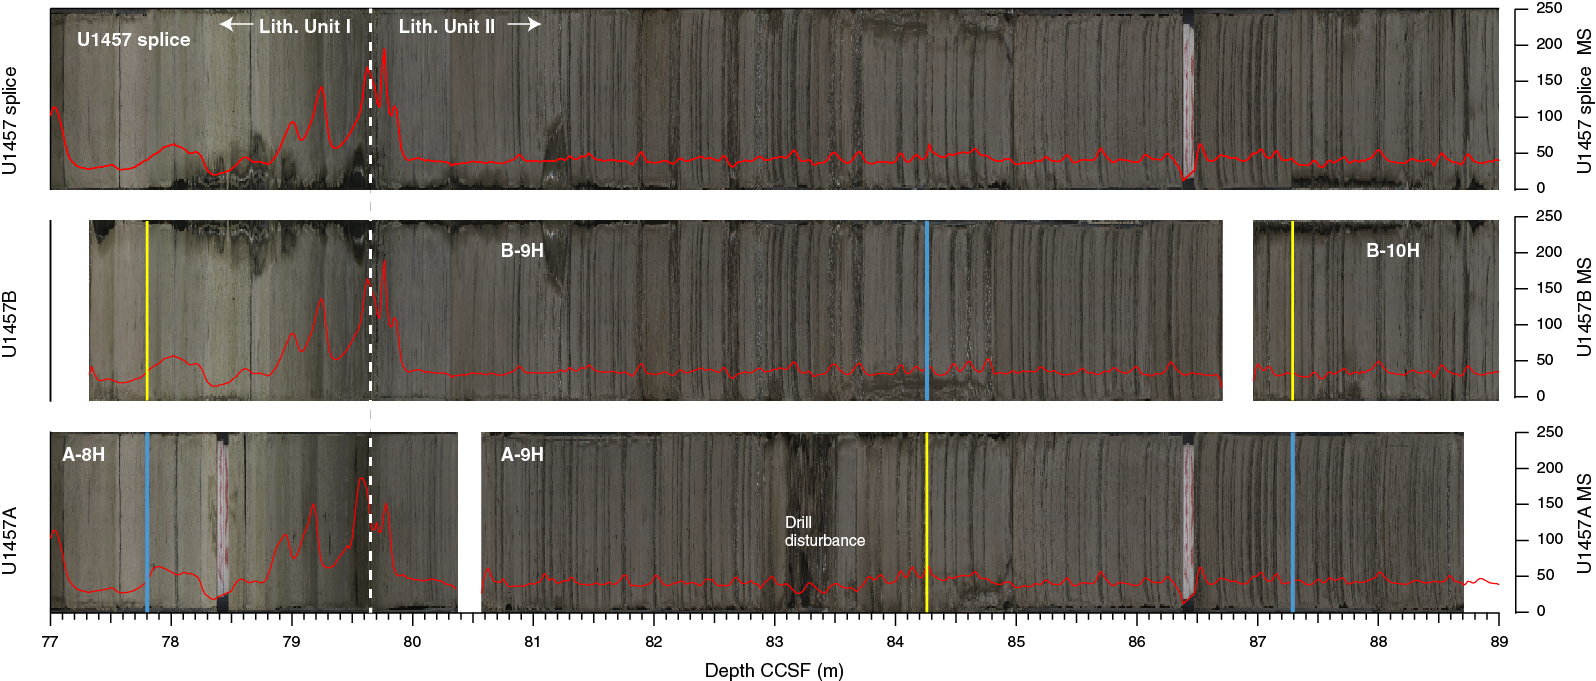
Figure F20. Core image and MS detail of the transition between lithologic Units I and II.
Compressing CCSF to CSF-A
Although the CCSF scale is useful to put cores and intervals in a detailed stratigraphic sequence, CCSF depth is typically greater than the drilled depth for the same cores because of core expansion. Compressing the scale is important in order to calculate sedimentation rates and to construct detailed synthetic seismic reflection profiles in the upper part of the drilled section. The composite section is 5.3% greater than the drilled section down to Cores 355-U1457A-9H and 355-U1457B-9H, where there were good splices and no appended cores.
There is an offset of CSF and CCSF depth scales in the first cores because of the missing mudline in Hole U1457A (Figure F16). Core 355-U1457A-1H is thus offset more than would occur from compression alone. The best algorithm to calculate CCSF (except for Core 355-U1457B-1H) is to use the linear regression:
Depth CSF-A (m) = –2.64 + 0.95 × depth CCSF (m).
Igneous petrology
We cored 16.58 m into the igneous basement from 1092.33 to 1108.91 mbsf in Hole U1457C, recovering 8.72 m of basalt (53% recovery). This short basement succession underlies five sedimentary lithologic units that range in age from early Paleocene to recent (see Lithostratigraphy and Biostratigraphy). We cored into igneous basement in the final hours of coring during Expedition 355. As a result of the time constraint, only macroscopic descriptions were carried out onboard. We also collected samples for shore-based petrographic and geochemical analyses that were carried out immediately after the expedition and incorporated into this volume before publication.
Lithostratigraphic unit and igneous interval descriptions
Basement
- Interval: 355-U1457C-96R-3A, 0 cm, through 98R-4A, 110 cm
- Depth: 1092.33–1108.91 mbsf
- Thickness: 16.58 m
- Lithology: basalt
The recovered basalt constitutes the basement lithologic Unit. This unit underlies Paleocene claystone and volcaniclastic breccias of lithologic Unit V (see Lithostratigraphy). The volcaniclastic sedimentary rocks are interpreted to represent deposits formed synchronous with the eruption of the basalt as a result of rapid chilling with seawater. The basalt is mostly massive and shows downcore variations in mineralogical composition, alteration intensity, and phenocryst grain size. The basalt ranges from aphyric to phyric in texture. The five igneous lithologic units are broadly similar in petrology and range from sparsely to highly clinopyroxene/olivine-plagioclase-phyric, with traces of olivine or clinopyroxene microphenocrysts. Most of the basalt is nonvesicular to sparsely vesicular, with moderately to highly vesicular intervals observed in thin sections from Sections 355-U1457C-97R-3 and 97R-4. Glass is also observed in a few sections. Microscopic observation indicates that the groundmass grain size is primarily microcrystalline, although it increases to fine grained downhole, and contains plagioclase laths and a large proportion of mesostasis. Based primarily on macroscopic observations, the recovered basalt sections were divided into five igneous lithologic units. Using downcore lithological variations and compositional changes through the igneous units, the sections were further divided into 20 subunits (see Site U1457 visual core descriptions in Core descriptions). Representative images from the various igneous basement lithologies are shown in Figure F21 to demonstrate the lithologic variation encountered in the basement section. Thin section photomicrographs are illustrated in Figures F22 and F23.
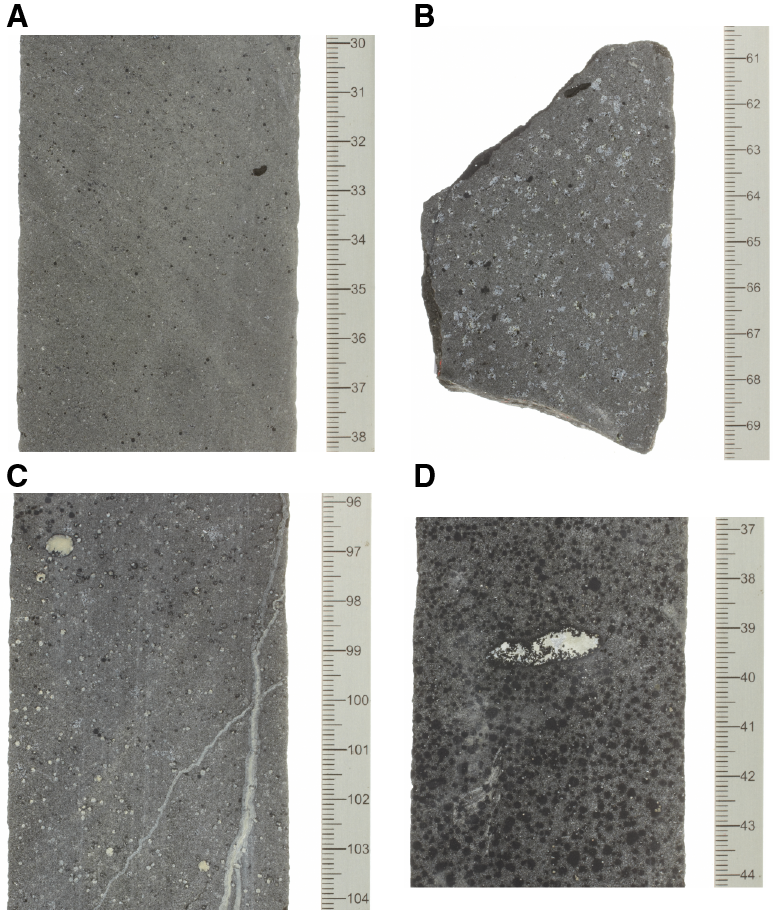
Figure F21. Plagioclase-phyric basalt, clinopyroxene-plagioclase phyric basalt, and carbonate/zeolite-filled lens.
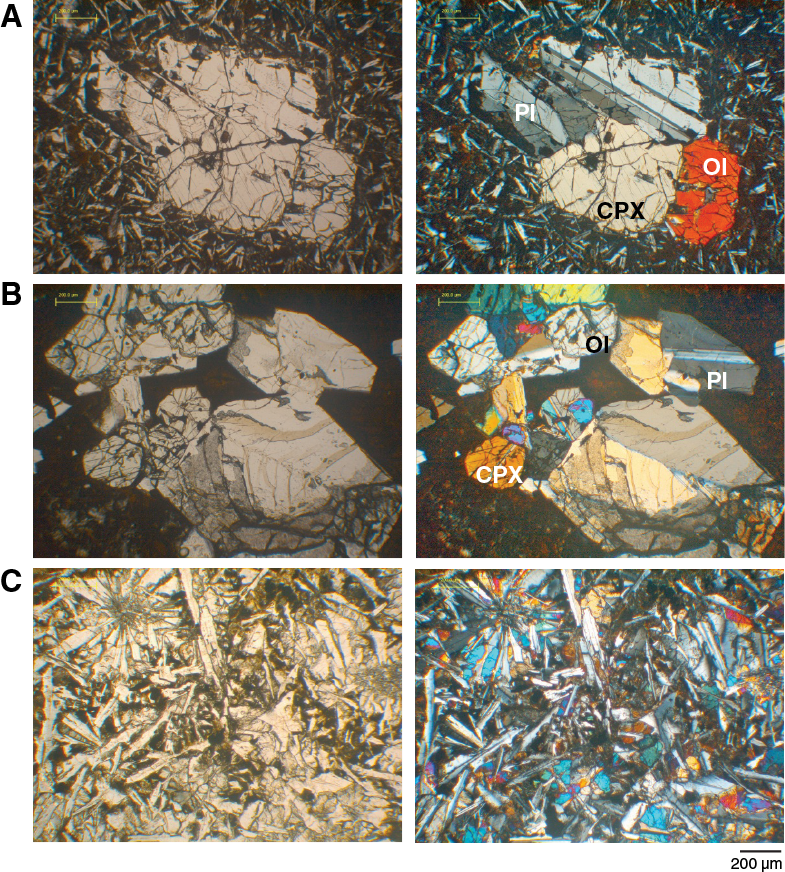
Figure F22. Basalt thin sections, Hole U1457C.
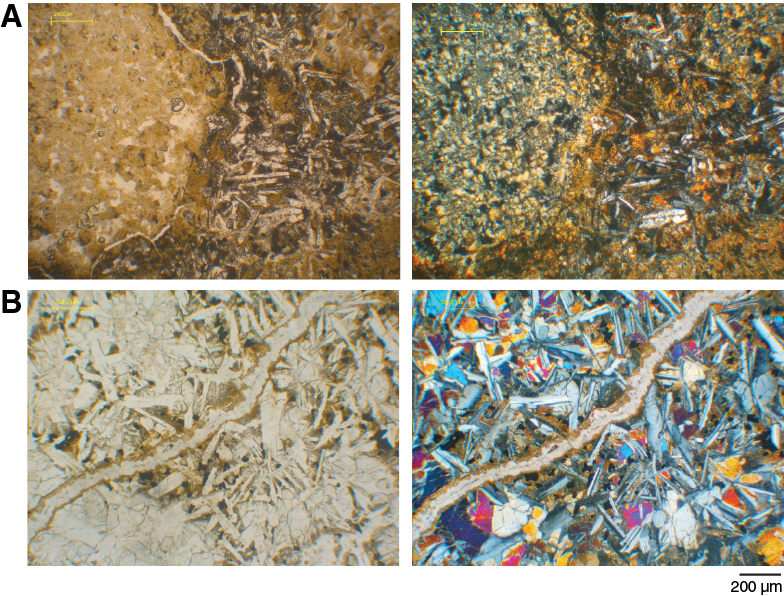
Figure F23. Vesicle and vein fillings in basement basalt, Hole U1457C.
Igneous lithologic Unit 1 (interval 355-U1457C-96R-3A, 0–37 cm) is a 37 cm thick aphyric to moderately phyric basalt unit underlying the black claystone and volcaniclastic deposits of lithostratigraphic Unit V (see Lithostratigraphy). Igneous Unit 1 is further divided into four subunits. The topmost Subunit 1a is a ~10 cm thick brown (altered) to grayish black basalt. The basalt is massive and nonvescicular with glassy groundmass and no significant phenocrysts. This subunit appears to be fall-in on top of the coherent basalt section. Subunit 1b is a ~9 cm thick, olivine-plagioclase phyric basalt with an aphanitic groundmass and no visible alteration. Microscopic observation shows trace numbers of olivine and clinopyroxene microphenocrysts (Figure F22B). The underlying Subunit 1c is an 11 cm thick aphyric basalt. Subunit 1d is 7 cm thick and comprises clinopyroxene-plagioclase phyric basalt with an aphanitic groundmass.
Igneous lithologic Unit 2 (interval 355-U1457C-96R-3A, 37 cm through 97R-1A, 134 cm) is 205 cm thick and is an aphyric to moderately clinopyroxene-plagioclase phyric basalt (Figure F21A). Unit 2 is primarily nonvesicular, although there are a few intervals that are sparsely vesicular (Figure F21C). The groundmass consists primarily of plagioclase laths and mesostasis (Figure F22A). The upper contact of Unit 2 consists of a glassy margin and is sparsely vesicular. Unit 2 is interpreted to be a massive lava flow. Subunit 2b (355-U1457C-97R-1A, 0–8 cm) appears to be a fall-in interval at the top of the core.
Igneous lithologic Unit 3 (355-U1457C-97R-2A, 0–41 cm) is 41 cm thick and comprises aphyric basalt with a grayish black color on fresh cut surfaces, with a glassy groundmass and no observable vesicularity. This unit is interpreted as a massive lava flow.
The underlying igneous lithologic Unit 4 (355-U1457C-97R-2A, 41–87 cm) is 46 cm thick and comprises clinopyroxene-plagioclase phyric basalt with a grayish black color on the less altered intervals (Figure F21B). This unit is nonvescicular and shows aphanitic groundmass. Although plagioclase phenocryst abundance is usually low (~1%–2%), it reaches 12% within Unit 4.
The remainder of the recovered igneous rock is defined as igneous lithologic Unit 5 (355-U1457C-97R-2A, 87 cm, through 98R-4A, 110 cm). Downcore lithological changes allow us to divide this 575 cm thick unit into five different subunits (see Site U1457 visual core descriptions in Core descriptions). The groundmass within this unit ranges from glassy to aphanitic with slight to no visible alteration. The aphyric basalt in this unit is intersertal, whereas the phyric basalt shows intersertal and rare subophitic textures. Some of the subunits in Unit 5 exhibit white and black veins ~1–3 mm wide (Figures F21C, F23B). Microscopic observation of the veins shows that they are filled with calcite, carbonate, or clay minerals. Most of the rocks in Unit 5 consist of nonvescicular grayish black plagioclase-clinopyroxene phyric basalt except in Subunit 5b (97R-2A, 111 cm, through 97R-4A, 29 cm), in which phenocrysts are moderately to highly vesicular with vesicles filled by carbonate, calcite, clay minerals, and zeolite (Figure F23A). Interval 97R-3A, 37–38 cm, contains an elongate lens measuring 7 mm × 18 mm filled by zeolite and/or carbonate (Figure F21D).
Alteration
The phenocrysts are generally fresh, whereas the groundmass shows varying degrees of alteration; however, alteration halos are not observed, and background alteration is not pervasive. Based on both macroscopic and microscopic observations, the overall alteration is characterized by minor vein filling or by partial to complete vesicle filling by secondary minerals, mostly carbonate, clay minerals, zeolite, and small amounts of Fe oxide, indicating nonoxidative alteration. The veins are up to 3 mm wide and are mostly gently inclined 20°–40° from the horizontal, although a variety of orientations are visible. A small number of veins are oriented subvertically and extend for ~30 cm along the core (e.g., interval 355-U1457C-97R-3, 0–116 cm). Overall, the basalt is only slightly altered, except for intervals that are vesicular, where alteration intensity is moderate.
Igneous rock geochemistry
Nine igneous rock samples from Cores 355-U1457C-96R-3 through 98R-4 were analyzed for concentrations of major oxides and trace elements by X-ray fluorescence (XRF) onshore at the National Centre for Earth Science Studies in Trivandrum, India (see Igneous petrology in the Expedition 355 methods chapter [Pandey et al., 2016a]). The analyzed samples are fresh or only slightly altered; however, the loss on ignition (LOI) in many samples is high (up to 7.3%). This high LOI may be attributed to the sparsely vesicular character of some of the samples. Thus, the analyses are recalculated to 100% and the volatile-free data are used for geochemical description, as the data are more robust. The geochemical data are shown in Table T13.
Table T13. Major and trace element composition of Site U1457 basalt. Download table in .csv format.
The SiO2 content of the measured samples ranges from 48.8 to 50.9 wt% and are hypersthene (17%–22%)-quartz (<6%) normative. On the total alkali-silica diagram (Figure F24) of Le Maitre et al. (2002), the (Na2O + K2O)–FeO(total)–MgO (AFM) ternary diagram (Figure F25A) of Irvine and Baragar (1971) and the alkali index versus Al2O3 diagram (Figure F25B), the igneous basement samples are classified as subalkaline tholeiitic basalt. The K2O content ranges from 0.05 to 0.13 wt%. In a SiO2 versus K2O plot, the basement samples are defined as low K and subalkalic using the classification system of Peccerillo and Taylor (1976). The samples all have high Mg/(Mg + Fe2+) values between 0.61 and 0.67 and low Zr (16–38 ppm) and therefore represent near-primary melt compositions. Accordingly, the basalt shows a high and narrow range of MgO content (9.6–11.0 wt%) and moderate to high CaO values (8.9–11.9 wt%). Al2O3 content shows a moderate range between 12.4 and 16.8 wt%. The rocks are typically enriched in Fe, with Fe2O3T values ranging from 9.9 to 14.4 wt%. The samples contain high Cr content (421–756 ppm), but are relatively impoverished in Ni (63–111 ppm). All samples have uniformly low P2O5 content (0.04–0.06 wt%), typical of subalkalic basalt. The TiO2 content of the basalt ranges from 0.52 to 0.89 wt%. As a result, these rocks are classified as low-Ti subalkalic tholeiitic basalt (TiO2 < 1.0 wt%). However, V content, despite showing a positive correlation with TiO2, is 277–418 ppm, which is high compared to the TiO2 content of Site U1457 basement.

Figure F24. Igneous rock classification total alkali-silica diagram with Site U1457 basement rocks in the basalt field.
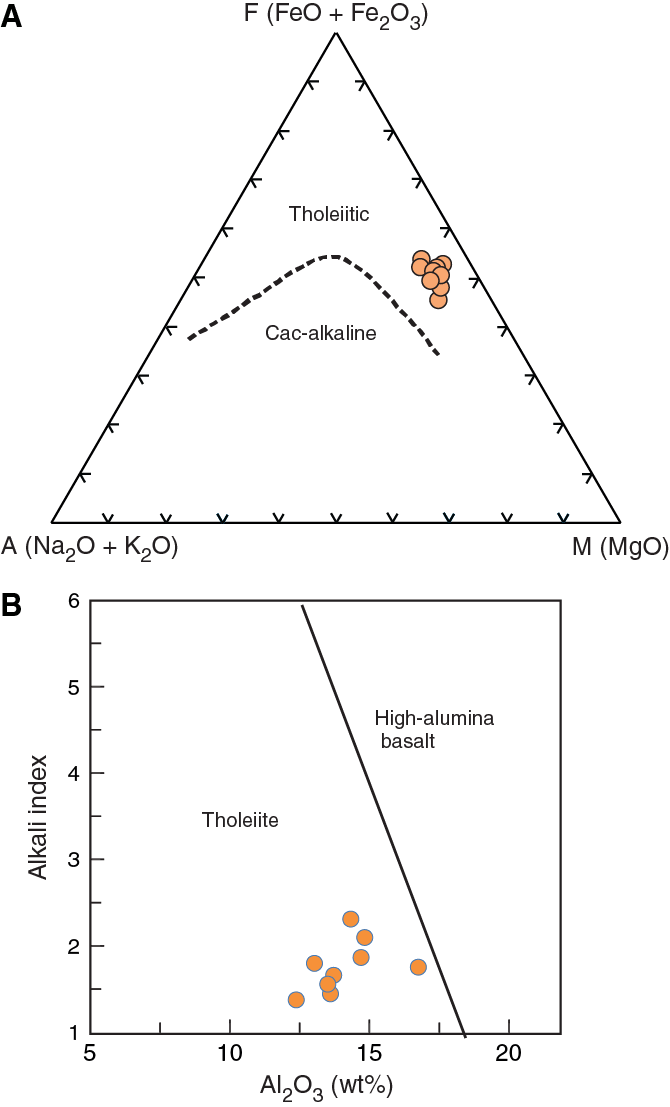
Figure F25. AFM diagram showing relative proportions of Na2O + K2O, FeO + Fe2O3, and MgO in basalt samples.
Geochemical analysis suggests that the basalt recovered from Site U1457 in Laxmi Basin is low-K, high-Mg tholeiitic basalt and does not represent a typical mid-ocean-ridge basalt (MORB) (Gale et al., 2013).
Discussion
The basalt recovered at Site U1457 is geochemically similar to primary melts of mantle source. The Mg/(Mg + Fe2+) variation (0.67–0.61) indicates a very limited degree of fractionation. Elemental concentrations plotted against Mg/(Mg + Fe2+) versus major elements and compatible trace elements (Cr and Ni concentrations) are used to assess the fractionation (Figure F26). Fe2O3 shows an inverse correlation with Mg/(Mg + Fe2+) (r = 0.96), as is typical for subalkalic basalt, whereas CaO shows a moderate decrease as Mg/(Mg + Fe2+) values decrease. There is no clearly discernible trend for Al2 O3. P2O5, TiO2, and K2O show slight increases with decreasing Mg/(Mg + Fe2+), but there is no clearly positive correlation. Ni shows a sharp positive correlation with Mg/(Mg + Fe2+) (r = 0.96), but no such relationship is observed for Cr content. These trends suggest olivine ± clinopyroxene as fractional crystallization phases on the liquid line of descent. Apatite or titanomagnetite is not involved in the fractional crystallization.
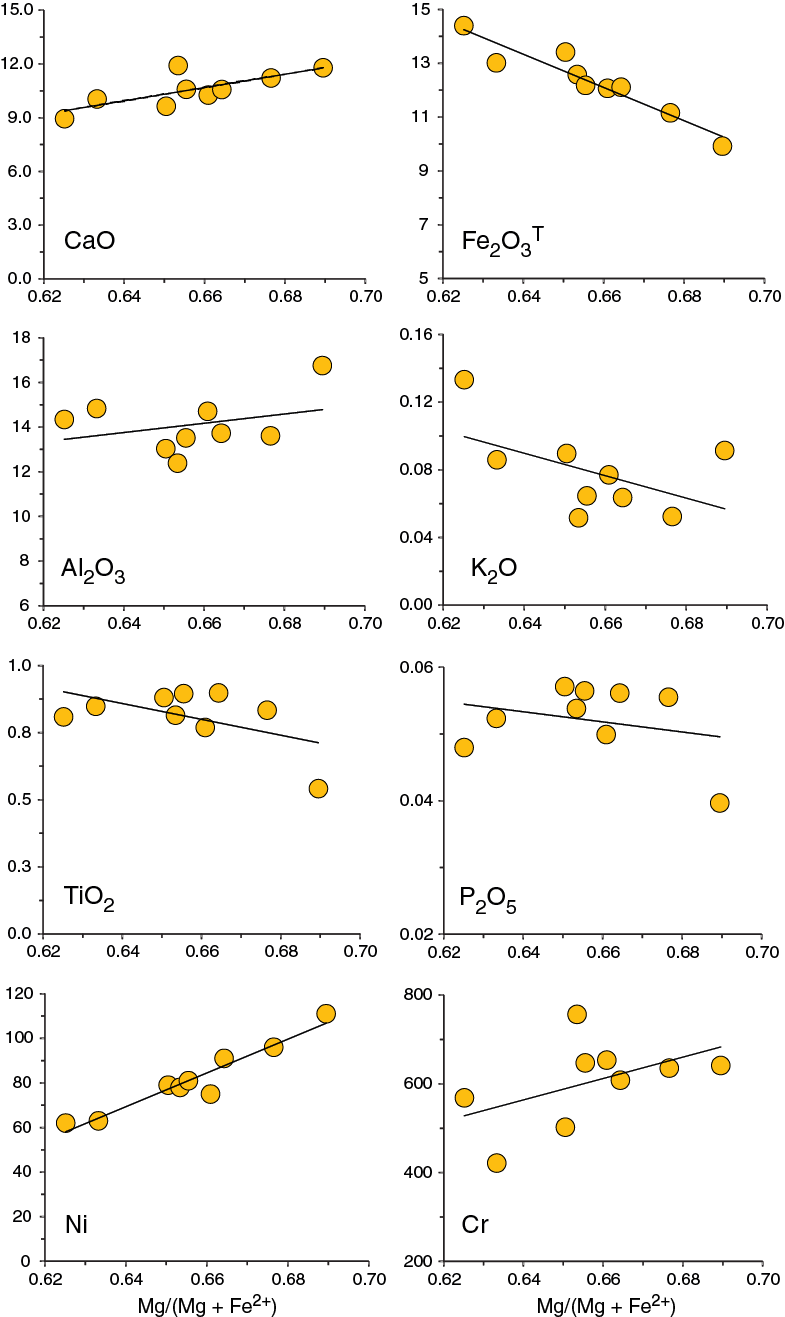
Figure F26. Variations of selected major oxides and compatible trace elements vs. Mg/(Mg + Fe2+) in basalt.
The Site U1457 basalt samples are characterized by low abundances of large-ion lithophile (LIL) elements (K2O < 0.13 wt%, Rb < 11 ppm, and Ba < 46 ppm) and closely compare with mantle-derived melts. The incompatible element ratios particularly between the LIL and high field-strength elements are useful to test if there was any significant role of crustal contamination in petrogenesis. Table T14 lists some important ratios from the Site U1457 basalt compared with values in crustal rocks, the depleted upper mantle, and mantle-derived volcanic rocks from an oceanic setting. Many of these ratios (K2O/P2O5, Sr/Y, Ba/Y, Ba/Sr, and K/Zr) in the Site U1457 basalt clearly overlap with values for mantle or direct mantle-derived volcanic rocks in an oceanic setting without any affinity toward crustal rocks. Thus, based on results from a limited number of samples, it is unlikely that crustal contamination influenced the Site U1457 basalt composition. TiO2/P2O5 ratios in the basement basalt are slightly higher than the values for mantle-derived rocks, whereas crustal rocks possess lower values. Similarly, the Zr/TiO2 values of the basement basalt are lower than those for mantle-derived rocks, whereas crustal rocks have quite high Zr/TiO2 ratios. These differences in composition suggest different mantle sources.
Table T14. Selected incompatible element ratios of Site U1457 basalt compared with other basalts. Download table in .csv format.
Figure F27A shows that the Site U1457 basalt plots on the edge of the arc lava field on the discrimination diagram of Pearce (1980) and not in the MORB field. Similarly, the basement basalts are characterized by low Ti/V values (11–14) that are much lower than the basalt in the volcanic rocks from oceanic settings and are distributed in the island-arc basalt field (Figure F27B). Laxmi Basin is not known to have been in a subduction setting during the Mesozoic and Cenozoic, so this signature may have resulted from the involvement of mantle sources (lithospheric mantle) developed by contributions from an old subduction slab. Signatures of mantle sources modified by the influence of subduction slabs are evident in rift-related igneous rocks of the Upper Cretaceous Deccan and related magmas on the west coast of India (Mahoney 1988; Radhakrishna and Joseph, 2012) in the vicinity of Laxmi Basin, as well as in volcanic rifted margins such as Greenland (Fitton et al., 2000).
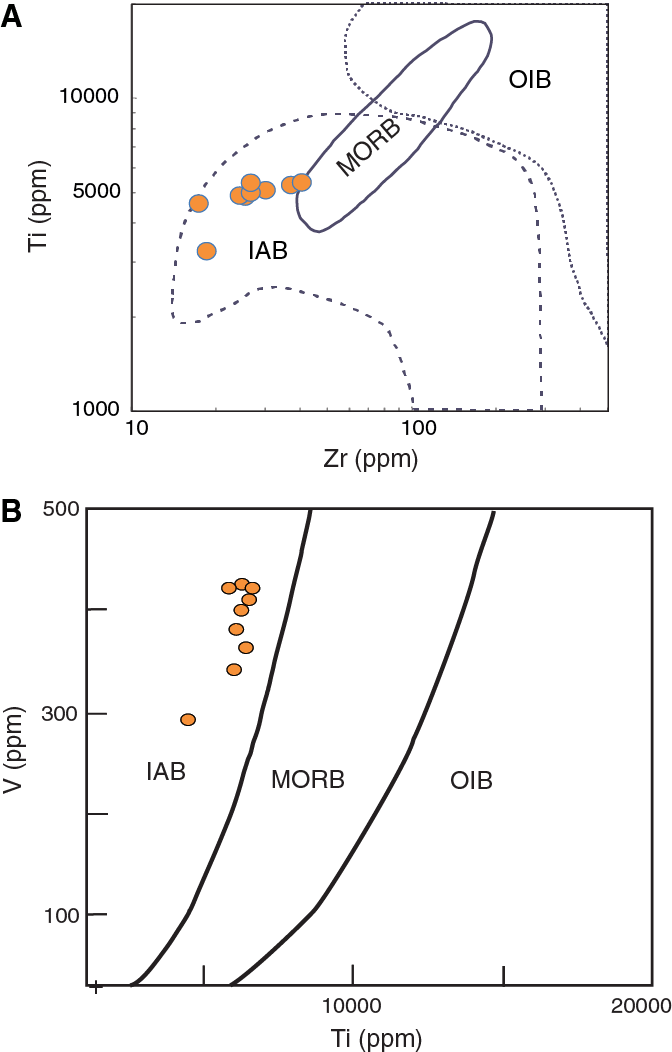
Figure F27. Zr vs. Ti and Ti vs. V discrimination diagram.
The presence of vesicles in submarine lava depends on the chemistry and petrogenesis, and these have been known to occur at great water depths in subduction settings where the supply of volatiles is abundant (Gill et al., 1990). However, it is significant to note that in typical oceanic rift or seafloor spreading type settings most lavas have few or no vesicles below ~2500 m water depth (Moore, 1970). The absence of vesicles in most of the Site U1457 basalts implies that the depth of eruption for the basaltic units in the Laxmi Basin may have been significantly deep, an interpretation supported by the deepwater clay that immediately overlies the basement, and is in sharp contrast with the highly vesicular lavas and paleosols that are usually associated with volcanism in rifted volcanic margin settings (Fitton et al., 2000), reflecting their emplacement in subaerial or shallow-marine settings or less gaseous content in the magma. Additionally, compared to trace element characteristics used to distinguish stratigraphic formations in the Deccan sequence (Widdowson et al., 2000), Laxmi Basin basalt (Ba = 22–46 ppm, Sr = 71–98 ppm, and Ba/Y = 1.4–2.7) is similar to the Panhala Formation (Ba = 42–94 ppm, Sr = 134–197 ppm, and Ba/Y = 0.7–2.7) exposed in the southern part of the Deccan (Widdowson et al., 2000) or Deccan-equivalent mafic dikes to the south of the Deccan on the west coast of India (Ba = 55 ± 36 ppm, Sr = 124 ± 36 ppm, and Ba/Y = 2.3 ± 0.9) (Radhakrishna and Joseph, 2012). However, it is important to iterate that because these geochemical observations are based on XRF analyses of only a few samples, detailed postcruise geochemical and isotopic analyses will help us more conclusively determine the origin and affinity of the Site U1457 basalt.
Geochemistry
Organic geochemistry
Shipboard organic geochemical analysis at Site U1457 included monitoring of hydrocarbon gases and bulk measurements of total carbon, total inorganic carbon (TIC), total sulfur, and total nitrogen (TN) of interstitial water squeeze cake and moisture and density (MAD) samples. We used these analyses to calculate the calcium carbonate (CaCO3) and total organic carbon (TOC) content (see Geochemistry in the Expedition 355 methods chapter [Pandey et al., 2016a]). In total, 111 samples were analyzed for hydrocarbon gas monitoring (Table T15; Figure F28). For bulk sediment measurements, 27 sediment samples were analyzed from Hole U1457A together with 14 samples from Hole U1457B and 89 samples from Hole U1457C (Table T16; Figure F29).
Table T15. Headspace gas composition in sediment. Download table in .csv format.
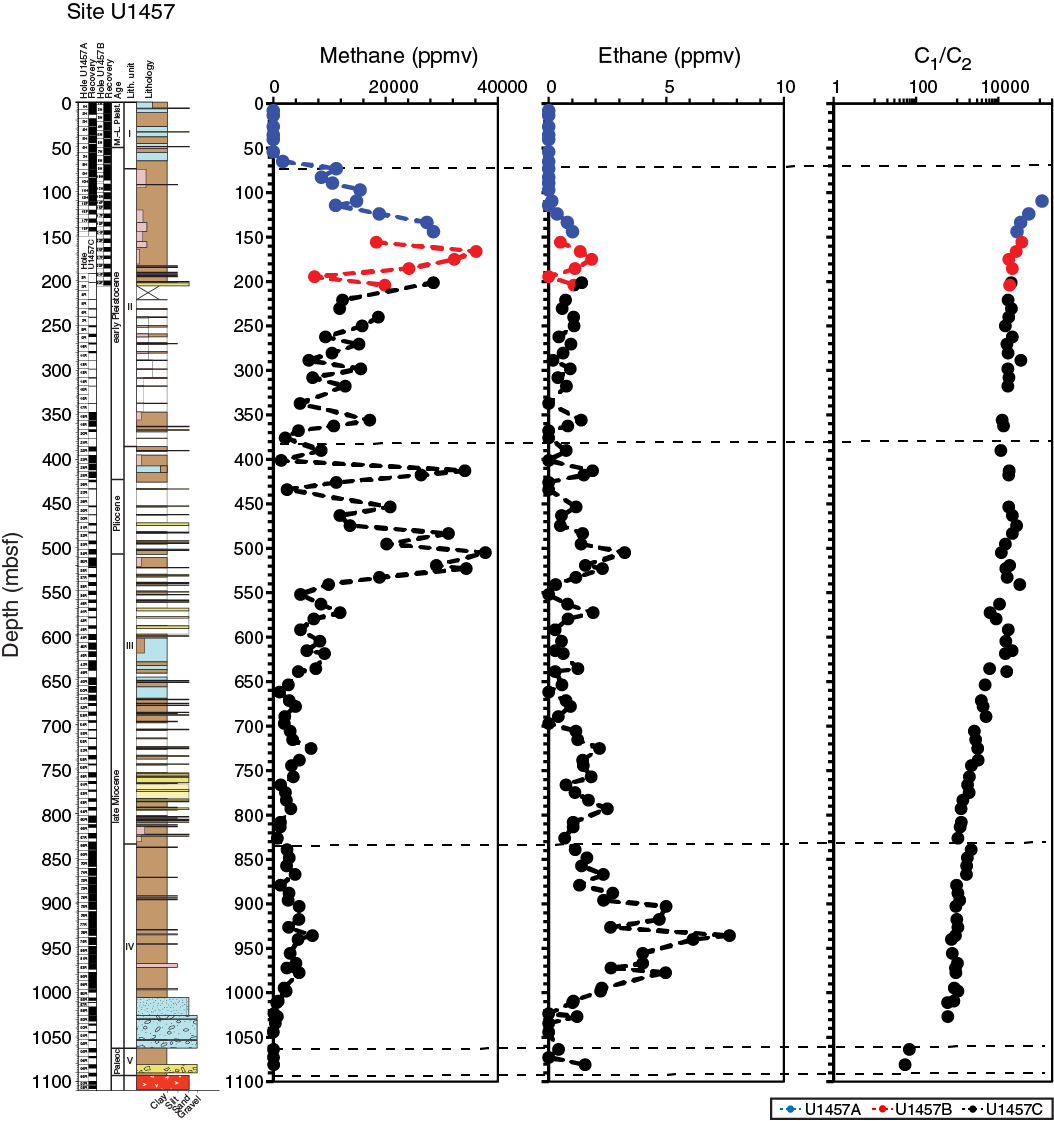
Figure F28. Methane, ethane, and C1/C2 ratios.
Table T16. Carbon, nitrogen, and sulfur analyses of sediment. Download table in .csv format.
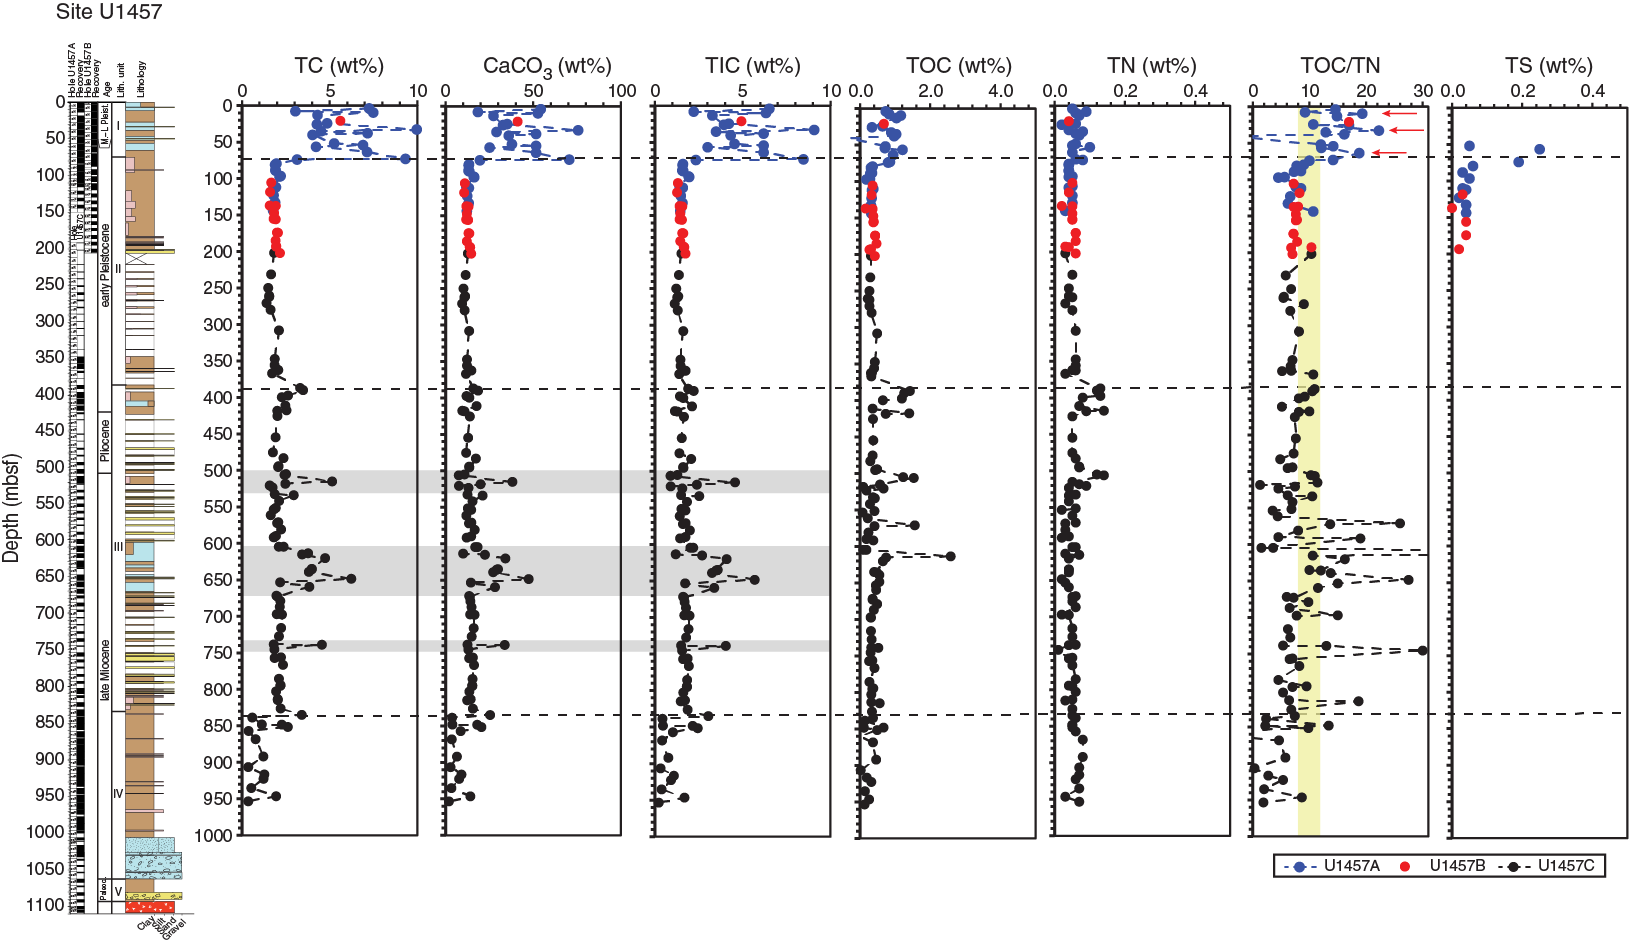
Figure F29. Total carbon, CaCO3, TIC, total sulfur, total nitrogen, TOC, and TOC/TN.
Volatile gases
Headspace gas analysis was performed typically once per core or once per ~9.5 m interval. Results are presented in Table T15 and Figure F28. Headspace methane content represents residual gas in cores (with some gas lost during core retrieval and sampling). Methane concentrations vary by four orders of magnitude through all holes. Methane levels are low (<5 ppmv) between 0 and 54 mbsf, then increase markedly from 65 mbsf to a peak of 36,139 ppmv at 166 mbsf. This increase in methane corresponds to a reduction in sulfate concentrations in the interstitial water profile, suggesting the typical transition from sulfate reduction to methanogenesis (Figure F30). Methane concentrations are variable but show a long-term decrease to ~1402 ppmv at 401 mbsf. Below this depth, methane levels increase by an order of magnitude to marked peaks of 34,100 and 37,780 ppmv at 412 mbsf and 505 mbsf, respectively. The relatively high methane levels encountered between ~400 and 500 mbsf show some coherence with higher TOC values (Figure F29), possibly indicating a lithologic control. Below 552 mbsf, methane levels do not exceed 12,000 ppmv but vary between ~11,900 and 700 ppmv and generally decrease with depth.
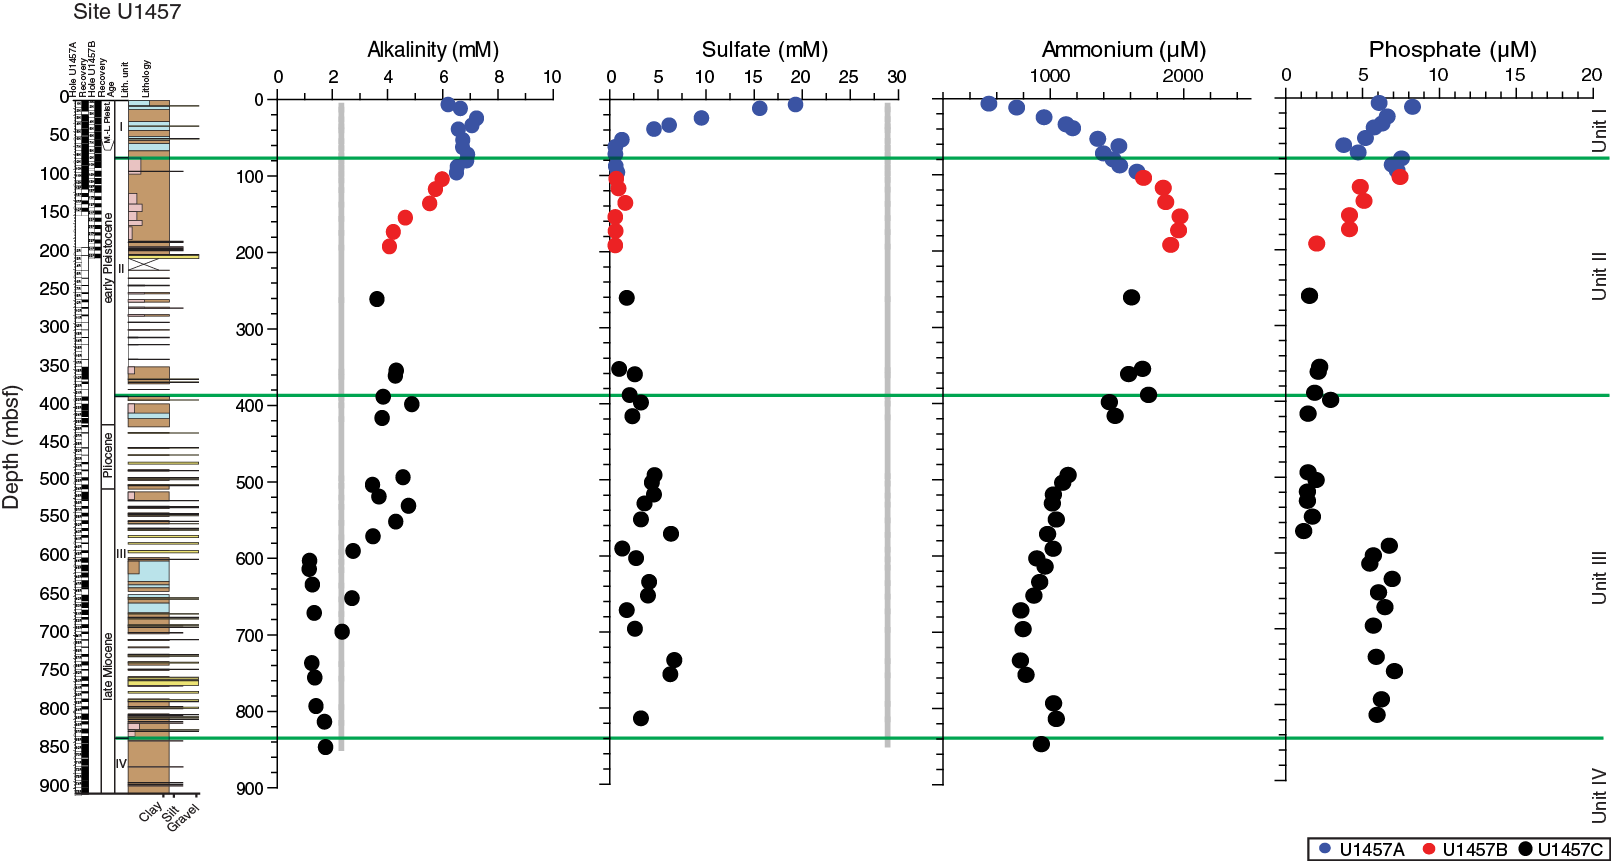
Figure F30. Interstitial water alkalinity, sulfate, ammonium, and phosphate variations.
Ethane levels are below detection limits for the uppermost 120 mbsf and are otherwise low (not exceeding 8 ppmv) for all intervals recovered at Site U1457. The C1/C2 ratio (Figure F28) decreases monotonically with depth at Site U1457 from 114,000 at 109 mbsf to 54 at 1080 mbsf, suggesting that the local geothermal gradient is the primary control on the ratio. C1/C2 ratios are at least an order of magnitude higher than levels associated with anomalous (i.e., hydrocarbon reservoir) thermogenic production and thus posed no threat to drilling operations.
Sedimentary geochemistry
In lithologic Unit I (0–74 mbsf), total carbon (1.9–9.9 wt%) and CaCO3 (14.7–75.5 wt%) contents are relatively high, variable, and tightly correlated, indicating that most of the total carbon is present as CaCO3 (Figure F29). TOC varies between 0.0 and 1.21 wt%. High TOC values occur within carbonate-rich lithologies. The total carbon values in Unit II (74–386 mbsf) are consistently low (<3.14 wt%). CaCO3 and TOC values fall within the ranges of 9.4–19.5 wt% and 0.16–0.85 wt%, respectively.
In Unit III (386–835 mbsf) total carbon, CaCO3, and TOC vary significantly. TOC is relatively high and variable from 387 to 615 mbsf, with values as low as 0.06 wt%, but also reaching notable peaks of 1.42, 1.53, 1.56, and 2.58 wt% at 387, 506, 571, and 613 mbsf, respectively (Figure F29). Below 615 mbsf, TOC values are consistently between ~0.2 and 0.7 wt% until 835 mbsf, which marks the Unit III/IV boundary. Below 506 mbsf, CaCO3 content is more variable, with three discrete intervals of higher values (up to 50 wt%) within Unit III (gray boxes in Figure F29). At the base of Unit III (750–835 mbsf), CaCO3 is consistently between ~13 and 16 wt%. In Unit IV (835–1062 mbsf), shipboard measurements were completed downhole to 953 mbsf. Between 838 and 953 mbsf, total carbon varies from 0.35 to 2.61 wt%, CaCO3 varies between 1.8 and 18 wt%, and TOC varies between 0.02 and 0.46 wt%. No measurements were made from the Paleocene claystone and volcaniclastic sediments of Unit V (1062–1092 mbsf), which overlie the igneous basement.
We report TOC/TN as a preliminary estimate for the source of organic material (Figure F29). Müller and Mathesius (1999) proposed that the TOC/TN ratio can be applied to resolve predominantly marine (TOC/TN < 8) from predominantly terrestrial (TOC/TN > 12) organic inputs (yellow box in Figure F29). However, this simple model of the factors influencing TOC/TN ratios is not always applicable. For instance, high TOC/TN ratios that are atypical of algal sources of organic carbon have been measured in organic carbon-rich Mediterranean sapropel layers, late Neogene sediment from the Benguela upwelling region offshore Angola, Eocene horizons from the Arctic Ocean, and Cenomanian–Turonian black shales (Meyers, 1990; Stein and Macdonald, 2004; Stein et al., 2006; Twichell et al., 2002).
In Unit I, three distinct intervals with high TOC/TN (>18) correspond to beds of nannofossil-rich clay (9.7 mbsf) and nannofossil ooze (32.9 and 63.6 mbsf) (red arrows in Figure F29). The dominantly hemipelagic nature of these lithologies precludes confident attribution of the high values to terrestrial input. Meyers (1997) suggests that in organic-rich marine sediment, high TOC/TN ratios are explained by the fact that (1) algae are able to synthesize lipid-rich organic carbon during times of abundant nutrient supply and/or (2) that during sinking, partial degradation of algal organic carbon may selectively diminish N-rich proteinaceous components and raise the TOC/TN ratio. In Unit II and the upper part of Unit III (74–553 mbsf) predominantly intermediate TOC/TN values (4.5–11.4) indicate mixed marine/terrestrial organic input, whereas low TOC/TN values (0.3–8.7) in Unit IV suggest predominantly marine organic matter input between 850 and 950 mbsf. Superimposed on the background of intermediate TOC/TN values in Unit III significantly high TOC/TN values (>20) occur at 591.7, 613.5, 648.5 and 745.3 mbsf. These samples were extracted from large IW squeeze-cake samples, which incorporated a mixture of silty sandstone to nannofossil chalk lithologies. Unit III is characterized by sedimentary structures indicative of rapid sedimentation from high-energy turbidity currents (see Lithostratigraphy). Unit III sediments occasionally contain wood fragments and show finer lamination (Figure F9C). The occurrence of wood implies that significant input from terrestrial environments must be incorporated and transported by such turbidity currents and we speculate that this terrestrial material is the source of the Unit III intervals characterized by high TOC/TN ratios, even when large wood fragments are not observed.
Inorganic geochemistry
Whole-round samples (5 cm long from 0 to 97.15 mbsf, 10 cm long from 105.71 to 635.5 mbsf, and 15 cm long thereafter) were collected for interstitial water extraction from sediment recovered at Site U1457 at regular intervals (one sample per core when recovery was >40%) throughout Hole U1457A, from 105–194 mbsf in Hole U1457B, and from 262–857 mbsf in Hole U1457C. The volume of the interstitial water recovered decreased with depth from 35 to 3 mL. Interstitial water sample collection was discontinued below 857 mbsf in Hole U1457C when adequate interstitial water volume could no longer be extracted. Specific aliquots were used for shipboard analyses, and the remaining fluid was sampled for shore-based analyses or archived.
Salinity, pH, chlorinity, sodium, and bromide
Downhole profiles of salinity, chlorinity, pH, sodium, and bromide concentrations at Site U1457 are shown in Figure F31, with the data given in Table T17. Salinity decreases from modern seawater values to 32 at 35 mbsf and then remains more or less uniform with depth in Holes U1457A–U1457C. This decrease in salinity may be caused by clay mineral dehydration with increasing depth (Jaeger et al., 2014). In the upper portion of the site, the pH of interstitial water is observed to be slightly lower than modern seawater pH. This lower pH could be driven by the release of organic acids in the initial stages of anaerobic organic matter degradation (Soetaert et al., 2007). Overall, pH exhibits an increasing trend with depth. Chloride is a conservative ion and its concentration is controlled by diffusion and compaction-driven advection in interstitial water (Jaeger et al., 2014). The chlorinity of interstitial water decreases from 564 mM near the top to 554 mM near 193 mbsf and then increases downhole to 570 mM near 750 mbsf in Hole U1457C. The concentration of sodium in interstitial water is close to seawater (480 mM) near the top and then decreases downhole to 467 mM at 193 mbsf, below which level it increases gradually to a maximum concentration of 498 mM. Bromide is incorporated in marine organic matter and can be released during microbial degradation. Bromide increases from ~0.89 mM near the top to 1 mM at 355 mbsf and then remains nearly uniform below that depth.
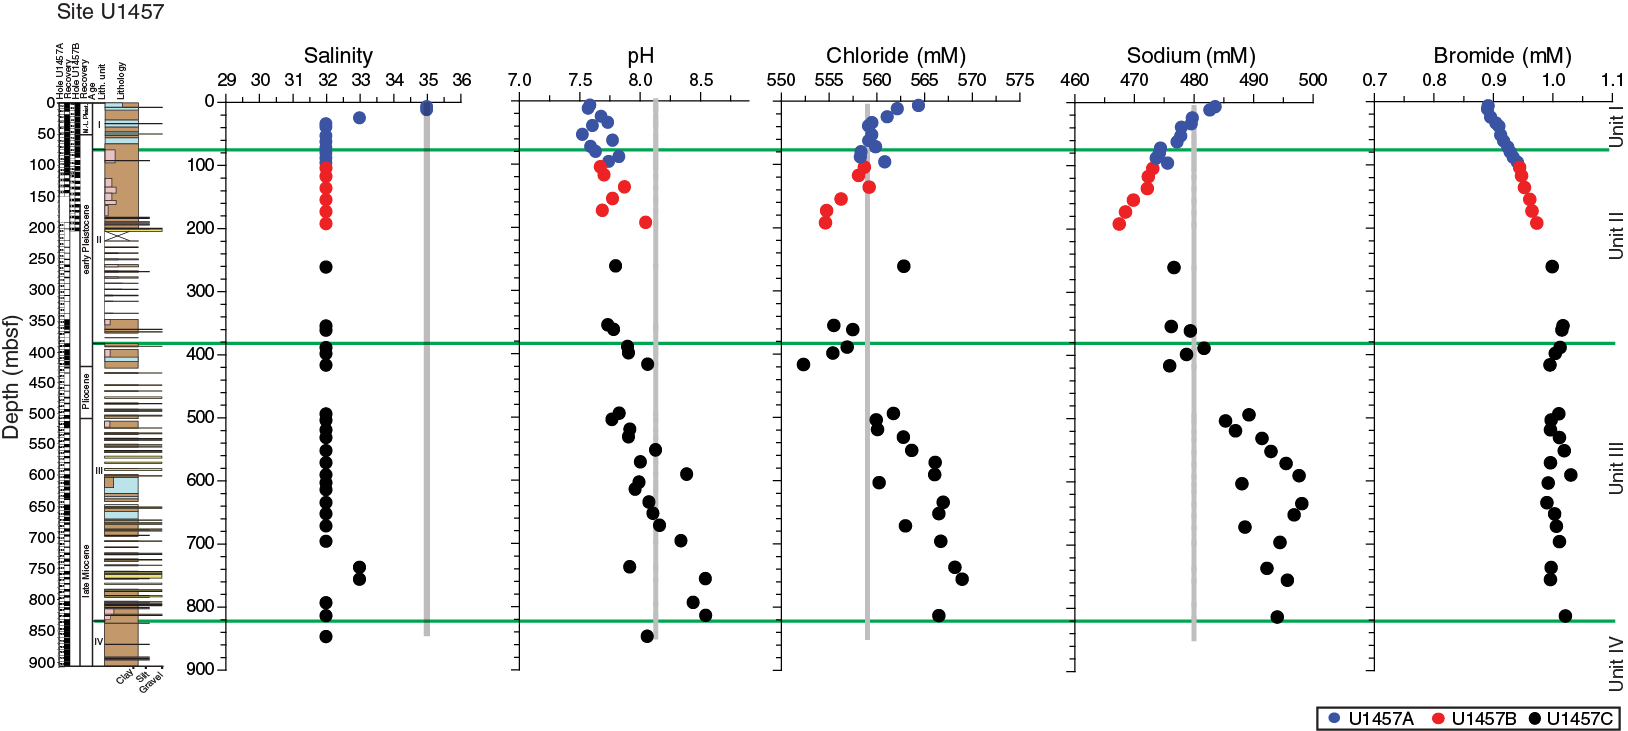
Figure F31. Interstitial water salinity, pH, chloride, sodium, and bromide variations.
Table T17. Cations and anions in interstitial water. Download table in .csv format.
Alkalinity, sulfate, phosphate, and ammonium
Downhole variations in alkalinity, sulfate, phosphate, and ammonium at Site U1457 are shown in Figure F30, with the data given in Table T17. From the seafloor to 70 mbsf, alkalinity increases from 6.2 to 6.9 mM and then decreases downhole to a concentration of 3.6 mM at 262 mbsf. Alkalinity then increases to 4.8 mM by 532 mbsf, decreases thereafter to a value of 1.2 mM at 600 mbsf, and then increases slightly to 1.8 mM by the end of interstitial water sampling in Hole U1457C at ~857 mbsf depth. Alkalinity increase is a byproduct of microbial degradation of organic matter, and its increase in the uppermost 50 mbsf reflects the action of anaerobic sulfate reduction, which in turn is reflected in the sulfate profile. The concentration of sulfate rapidly decreases with depth from 19.4 to 0.67 mM in the uppermost 60 mbsf, indicating anaerobic sulfate reduction. Sulfate then remains low throughout the remainder of the section. Ammonium increases from 548 µM near the surface to 1978 µM at 155 mbsf and decreases downhole until 738 mbsf where it has a value of 783 µM. Ammonium concentrations increase slightly to near 1050 µM below 738 mbsf until the end of interstitial water sampling at 857 mbsf. Phosphate decreases from 8.2 mM near the seafloor to 1.2 mM near 575 mbsf and then sharply increases to 6.8 mM at ~600 mbsf, below which it remains uniform to the end of sampling. Phosphate and ammonium are byproducts of microbial degradation, and their concentrations are also high in the sulfate reduction zone. Below the sulfate reduction zone, methanogenesis becomes an important process, which is reflected in the increase in methane concentrations deeper than 60 mbsf (Figure F28).
Calcium, strontium, lithium, magnesium, and potassium
Downhole variations at Site U1457 of calcium, magnesium, and potassium (data in Table T17), as well as minor elements strontium and lithium (data in Table T18) are shown in Figure F32. Calcium concentrations in interstitial water at Site U1457 range from 4 to 16 mM. Calcium concentration remains below the average value of seawater until 553 mbsf, below which it gradually increases to its maximum value at 700 mbsf in Hole U1457C. The calcium profile shows nearly 1:1 anticorrelation with the alkalinity trend; whenever the alkalinity is high, calcium is precipitated as carbonate, decreasing the concentration of calcium in the interstitial water. The concentrations of strontium and lithium range from 103 to 245 µM and 0.3 to 68 µM, respectively. The concentrations of magnesium and potassium range from 23 to 50 mM and 1.5 to 11 mM, respectively. Both show a decrease with depth. Strontium concentrations are high in the uppermost 60 mbsf, corresponding to Unit I, possibly caused by dissolution of biogenic carbonate, which is relatively enriched in strontium (Sayles and Manheim, 1975). Below Unit I, strontium exhibits a decreasing trend downhole to 500 mbsf as the biogenic carbonate source decreases with a change to more sand- and clay-dominated lithologies. A sharp increase in strontium concentrations is observed from 500 to 860 mbsf, possibly because of carbonate dissolution, which is also observed in the calcium profile. A major sink of lithium is through adsorption of lithium onto clay minerals such as kaolinite, vermiculite, and smectite, as well as onto other terrigenous sediment (Scholz et al., 2010; Millot et al., 2010, and references therein). The concentration of lithium is less than the average seawater value above 700 mbsf, indicating its adsorption on clay minerals and other terrigenous sediment. Lithium increases below 730 mbsf, possibly because of its release from clay minerals and terrigenous sediment during diagenesis. Magnesium and potassium concentrations decrease with depth and are lower than the average seawater value, possibly because of removal to newly formed clay minerals.
Table T18. Major and trace element concentrations in interstitial water. Download table in .csv format.
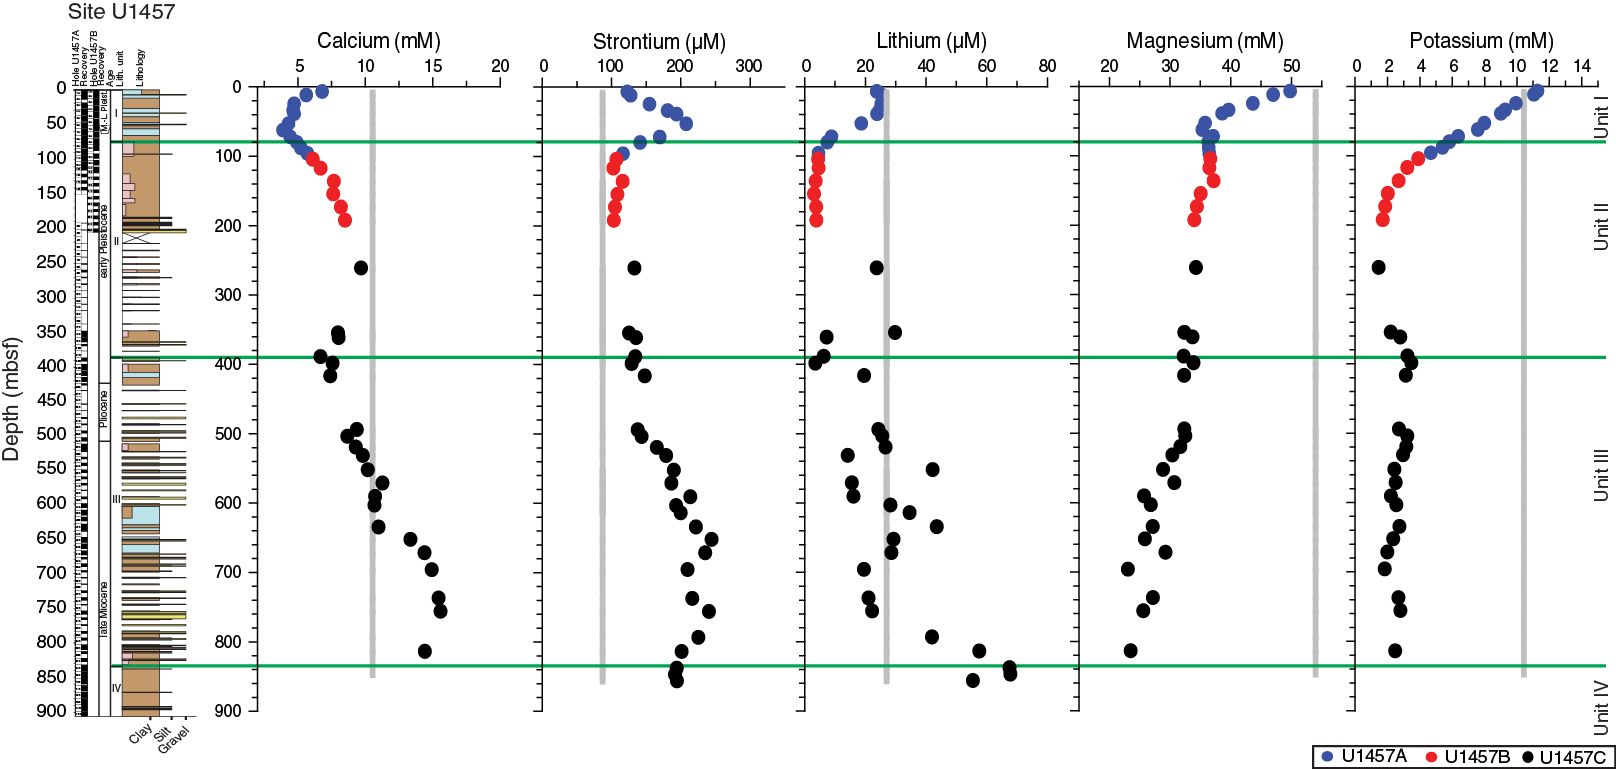
Figure F32. Interstitial water calcium, strontium, lithium, magnesium, and potassium variations.
Silicon, barium, manganese, boron, and iron
Downhole variations of minor elements including silicon, barium, manganese, boron, and iron at Site U1457 are shown in Figure F33 and the data are given in Table T18. Dissolved silicon concentrations range between 61 and 350 µM at Site U1457. Silicon concentrations are high in the uppermost 110 mbsf of Hole U1457A, which may be caused by release by dissolution of biogenic silica (diatoms, radiolarian, sponge spicules, etc.) (Figure F15). Silicon decreases below 120 mbsf and stays low throughout the remainder of the sampled section, suggesting that the biogenic source of the silica seen at shallower depths is absent or most likely expended. The barium concentration in the interstitial water ranges from 2 to 84 µM, with a few high values below 600 mbsf. Anaerobic degradation of organic matter (Schenau et al., 2001) and dissolution of feldspar can be potential sources of barium to interstitial water. Alternatively, barium can also be released by in situ barite dissolution in low-sulfate fluid (Li et al., 2015).
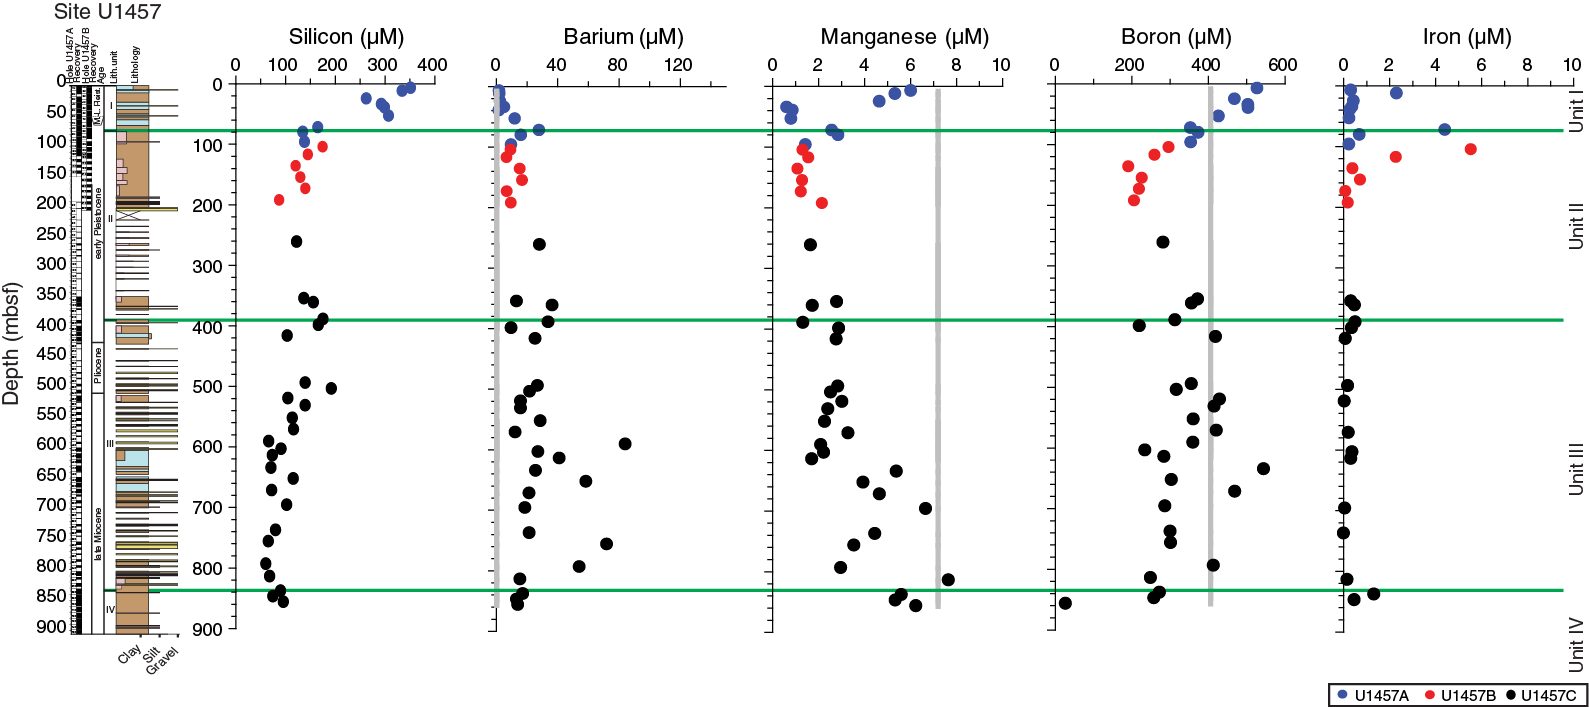
Figure F33. Interstitial water silicon, barium, manganese, boron, and iron variations.
Manganese concentrations in water from cores from Site U1457 range from 0.6 to 7.7 µM (Figure F33), whereas iron concentrations vary from below the detection limit to 5.6 µM. Manganese concentrations decline sharply in the uppermost 40 mbsf in Hole U1457A, which corresponds to the sulfate reduction zone. In this zone, hydrogen sulfide ions are formed, which can then precipitate manganese as sulfides. Iron shows consistently low concentrations, except in the uppermost 100 mbsf, indicating its removal, probably through metal sulfide formation under anaerobic conditions. The concentration of boron in interstitial water ranges from 193 to 605 µM. Boron concentrations decrease from 528 µM at 7.9 mbsf to 207 µM near 200 mbsf and then generally increase to maximum values by 653 mbsf. Below this depth there is a slight decline. A majority of the minor elements exhibit a change in their profiles at ~150–200 mbsf and then again at 550–600 mbsf, which corresponds with changes in lithology. For example, below 200 mbsf, the lithology changes from predominantly clay/claystone to silt/siltstone. Likewise, below 550 mbsf the predominant lithology changes from siltstone to sandstone and then to a carbonate-dominated lithology at 600 mbsf. Thus, we conclude that lithology exerts a control on the concentration of the minor elements in interstitial water at Site U1457.
Microbiology
The primary objectives of microbiological studies at Site U1457 were contamination assessment of samples, shipboard characterization of subsurface microbes and the preservation of samples for detailed shore-based investigation.
Microbial sampling
Eleven whole-round core samples were taken at a frequency of one per ~9.5 m of cored interval downhole to 97 mbsf in Hole U1457A. One sample was collected at 105 mbsf in Hole U1457B. Sampling was completed on the catwalk and the samples were immediately moved to the cold room in the microbiology laboratory for further subsampling. Subsampling procedures were completed within a short time of the core arriving on deck. Subsamples for total microbial count and molecular marker analyses were immediately collected using sterile syringes (one 50 mL and two 5 mL). Whole-round samples for microbial and interstitial water chemistry measurements were taken adjacent to one another for comparison purposes. The whole-round microbiology samples were preserved at –80°C for shore-based characterization of microbial communities using DNA/RNA, at –20°C for microbial-lipid analysis, and at 4°C for cultivation-based studies.
Contamination assessment
We used a fluorescent microsphere-based contamination testing method during APC coring at Site U1457 in which fluorescent microspheres were added to the core catcher sub for Cores 355-U1457A-1H through 11H, as well as for Core 355-U1457B-13H. Three samples were collected from each core for analysis of microspheres. These samples were taken from (1) the interior of the core, (2) the exterior of the core, and (3) an intermediate position in between the exterior and interior. Samples taken for microsphere-based contamination testing were analyzed during the expedition. In samples from Holes U1457A and U1457B, no microspheres were observed in the interior of any of the core samples (Table T19). The presence of multiple microspheres in most exterior samples is a strong indication of contamination. Samples from the intermediate position contained low concentrations of microspheres, demonstrating that contamination significantly decreases toward the interior of the core. In some exterior samples, no microspheres were detected, likely because the plastic bag containing the microspheres failed to rupture during the coring process. In these cores (355-U1457A-1H, 4H–6H, and 10H, as well as 355-U1457B-13H), microspheres cannot be used as a contamination tracer.
Table T19. Contamination test results, Holes U1457A and U1457B. Download table in .csv format.
Meiobenthos
Direct microscopic observations of the core samples revealed the presence of several different kinds of meiobenthos in sediments from Hole U1457A (Figure F34). Meiobenthos (organisms ranging between 1 mm and 45 μm in size) are thought to play a significant role in carbon mineralization, as well as in nitrification and denitrification cycles (Bonaglia et al., 2014). Although there are many studies dealing with macrofauna and their role on sediment biogeochemistry (e.g., Bonaglia et al., 2014), the literature available on meiobenthos below the seafloor is very limited. In general, meiobenthos live in aerobic environments; however, some are known to spend part of their life cycles under anaerobic conditions. Recently, Danovaro et al. (2010) were the first to demonstrate metazoa living under anoxic conditions through an obligate anaerobic metabolism, which is similar to that of eukaryotes. The observation reported here of meiobenthos existing as deep as 105 mbsf in Hole U1457A may be evidence that these organisms can inhabit subseafloor environments that were previously thought to be devoid of higher life forms. However, there is also the possibility that these organisms are preserved as organic-walled fossils in sediments. There is no trend in meiofauna presence downhole, and in some cores meiobenthos were completely absent (Table T20). Further advanced molecular studies are required to determine if meiobenthos are instead living in sediment to at least 100 mbsf at Site U1457 or are preserved as organic-walled fossils.
Figure F34. Meiofaunal organisms observed at 500× magnification, Hole U1457A.
Table T20. Presence of fungi and meiofauna, Holes U1457A and U1457B. Download table in .csv format.
Marine fungi
We report here the occurrence of deep-sea fungi in sediments from Hole U1457A. We identified fungal hyphae in several core samples using direct microscopic observations (Table T20). Preliminary assessment of 12 samples shows the presence of a few fungal morphotypes with single hyphae and branching hyphae (Figure F35). The observation reported here of fungi downhole to 105 mbsf in U1457B is further evidence that these organisms can inhabit the deep sea, including deep subsurface sedimentary environments (e.g., Ciobanu et al., 2014; Rédou et al., 2015). However, there is also the possibility that the fungal hyphae were preserved as organic-walled fossils in the sediment. We note the co-occurrence of fungi and meiobenthos in 7 out of the 12 samples surveyed, co-absence in four samples, and just 1 sample where fungal assemblages were detected without meiofauna. This co-occurrence/co-absence suggests a common controlling factor, possibly related to either (1) the control of detritivore abundances by the changing availability of food or nutrient substrates downcore or (2) changing preservational conditions. A further possibility may be that some form of symbioses exists between the fungi and meiobenthos.
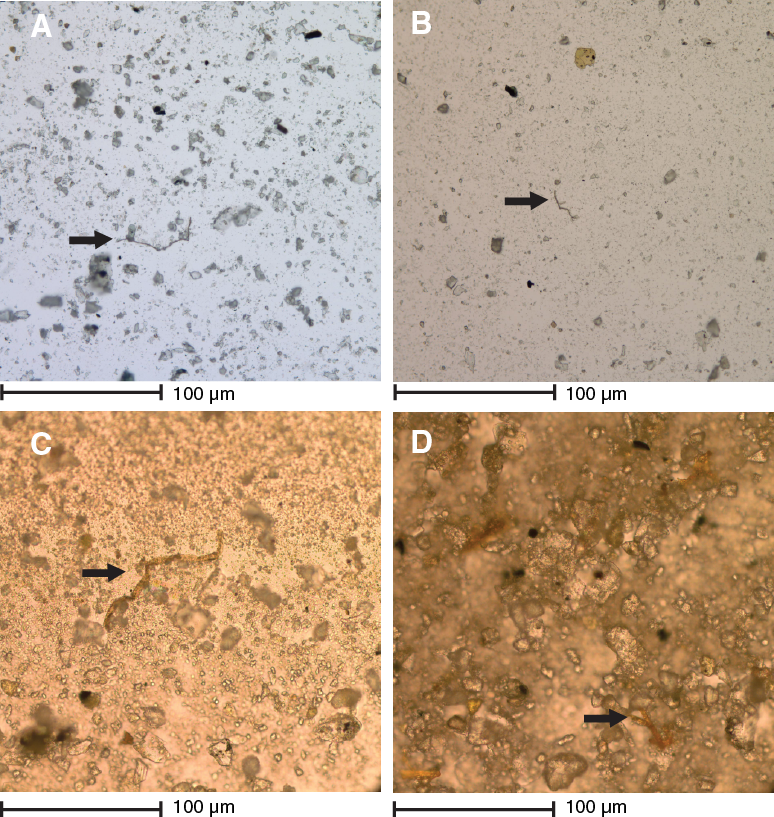
Figure F35. Fungal assemblages observed at 500× magnification, Hole U1457A.
Paleomagnetism and rock magnetism
Measurements
Paleomagnetic analyses were performed with step-wise demagnetization to 20 mT at 5 cm intervals on all archive halves from Holes U1457A (Cores 355-U1457A-1H through 19F) and U1457B (Cores 355-U1457B-1H through 17F). Continuous measurements were integrated with full demagnetization of discrete samples collected at a rate of one per section. Only discrete measurements were made for samples from Hole U1457C.
Interpretation
Archive-half data
In Figure F36 we show declination and inclination data for Hole U1457A from both continuous measurements derived from 20 mT step alternating field (AF) demagnetization and discrete measurements (least-square analysis; see Paleomagnetism and rock magnetism in the Expedition 355 methods chapter [Pandey et al., 2016a]), with both unoriented and oriented declination values displayed. The latter are derived from measurements made by the Icefield MI-5 tool. Data from within 10 cm of each core section end were removed from the continuous measurements because they are biased by the wide response function of the cryogenic magnetometer’s sensors. No severe core disturbance was observed; therefore, data were not filtered for this influence.
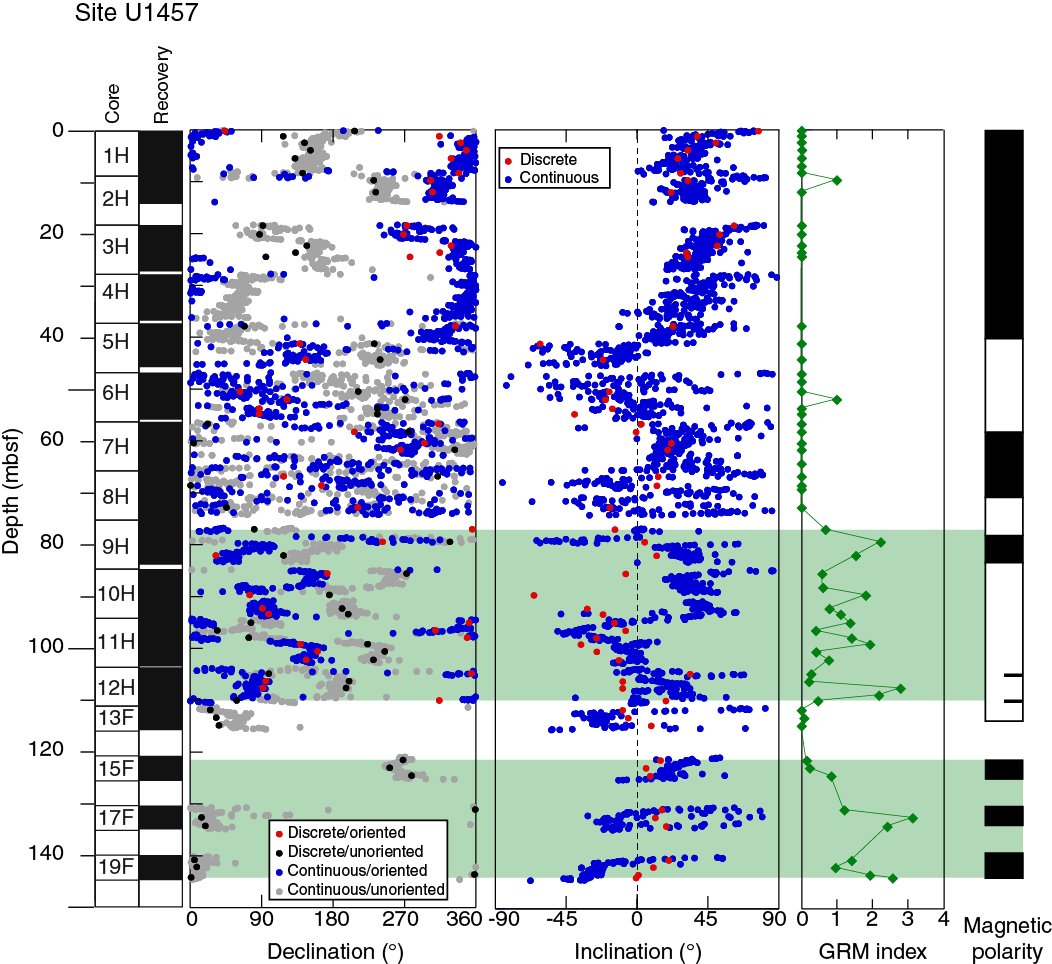
Figure F36. Results of pass-through magnetometer measurements, Hole U1457A.
Unoriented declinations are largely coherent within each core but randomly oriented from one core to another, suggesting that sediment was not completely remagnetized during coring and splitting operations. Oriented values show fair coherence from Core 355-U1457A-1H through 6H (~55 mbsf), ranging within the northwest (270°–360°) and southeast (90°–180°) quadrants (Figure F36). From Core 7H through Core 12H (the deepest core to which the Icefield device was applied), oriented declinations are scattered in both continuous and discrete measurements, suggesting that problems occurred with the orientation device. The Icefield orientations were quite similar from one core to another in this region, and the accelerometer indicated a malfunction of the instrument. Overall, results from continuous and discrete measurements show good agreement with very few discrepancies.
Inclinations from the archive measurements show a poorly defined pattern with alternating intervals of positive and negative values. Results from continuous and discrete measurements show a good coherence from Core 1H through 10H (~85 mbsf), at which point discrepancies begin to appear. From Core 10H and deeper, the polarity log after the 20 mT AF demagnetization step does not reflect the expected pattern for reversals, whereby intervals would be uniformly negative or positive. Furthermore, the polarity log appears to have many more positive inclinations than expected (Figure F36).
Results are similar for Hole U1457B (Figure F37). Oriented declinations downhole to Core 355-U1457B-12H (~90 mbsf) show values ranging within the northwest (270°–360°) or southeast (90°–180°) quadrants. In Core 13H, the deepest core oriented by the Icefield tool, declinations are scattered. Again, inclination values depict a poorly defined pattern with positive and negative values that do not reflect the expected pattern for geomagnetic reversals and normal polarity appears to be dominant. As a result, we ceased measurement of archive halves below Core 17F and focused our efforts on discrete samples. Archive halves from Hole U1457C were not measured. Poor behavior from the deeper APC cores not withstanding, we used the archive measurements in Cores 355-U1457A-5H and 355-U1457B-5H, an interval with well-defined magnetic stratigraphy, to pinpoint the position of the Brunhes/Matuyama boundary with high precision (Chrons C1r to C1n; Table T21).
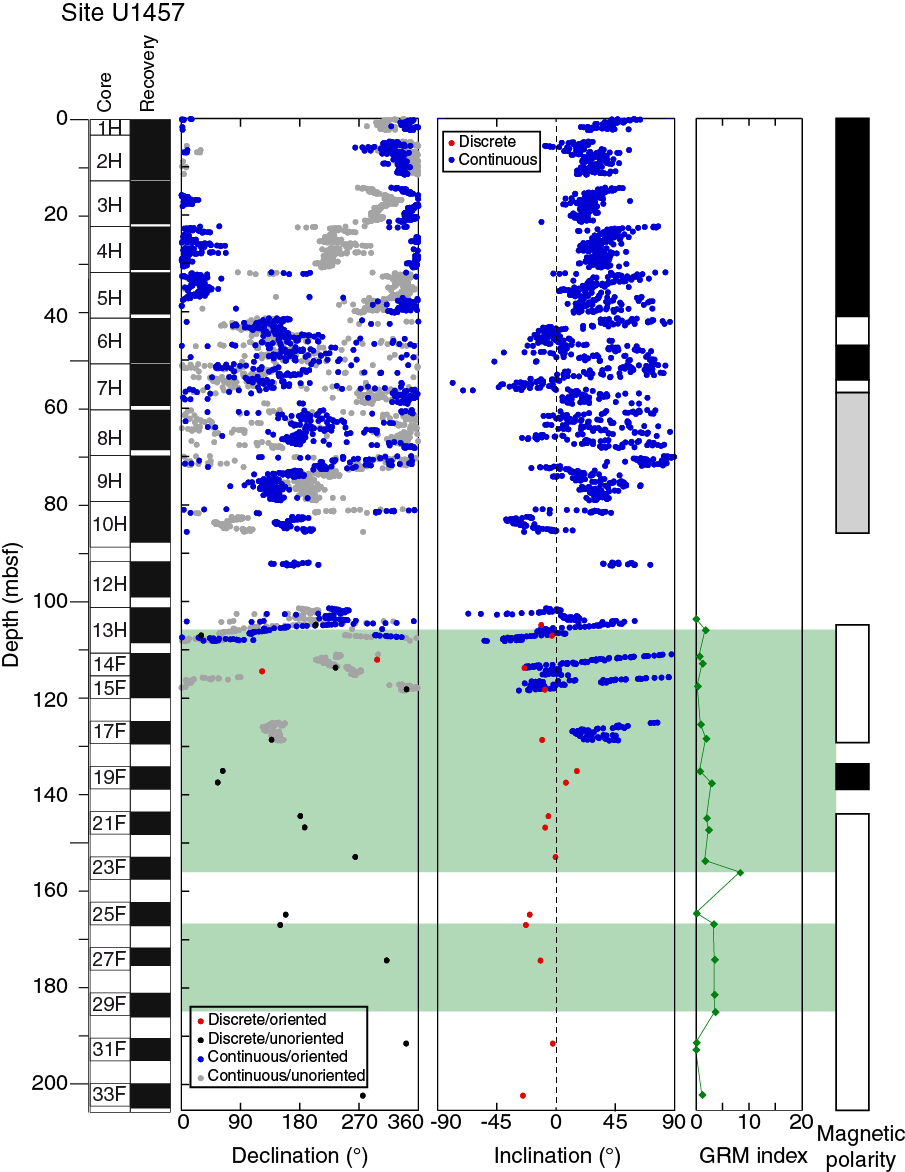
Figure F37. Results of pass-through magnetometer measurements, Hole U1457B.
Table T21. Magnetic polarity tie points. Download table in .csv format.
Discrete samples
Discrete measurements included all samples collected from Hole U1457A, samples from Core 355-U1457B-13H and deeper, and selected samples from Hole U1457C. Our choices for discrete measurements in Holes U1457B and U1457C were determined by time constraints, and we focused our efforts on refining the magnetostratigraphic pattern to the best degree possible. Shipboard measurements therefore avoided redundancy between the holes. Samples from Holes U1457A and U1457B were demagnetized up to 100 mT, but for samples from near the base of Hole U1457C it was possible only to bring the demagnetization treatment up to 50 or 60 mT.
Step-wise AF demagnetization treatment of discrete samples produced a variety of behaviors similar to those seen in Site U1456 samples, with an overall predominance of Types I and III (see Figure F39 in the Site U1456 chapter [Pandey et al., 2016c]). We followed the same procedure as for Site U1456 when interpreting the demagnetization data.
Samples of Type III were easily recognized in Holes U1457A and U1457B, where the AF treatment was carried out to the 100 mT step. The treated data after 40 mT show an increase in the intensity of magnetization that in some cases resulted in a final value equal to twice the initial value and the directions veer sharply toward the y-axis of the sample (orthogonal to the last axis treated by AF). As observed in the Site U1456 samples, this behavior has been interpreted as gyroremanent magnetization (GRM), likely associated with the authigenic (diagenetic or biogenic) iron sulfide, greigite (Fe3S4). We interpreted the data following the same rules as applied to Type I samples, although noting that this kind of behavior may be associated with a magnetization that does not reflect the original depositional one because greigite can grow significantly during diagenesis after initial shallow burial (e.g., Sagnotti et al., 2005). For Holes U1457A and U1457B, we calculated the GRM index proposed by Fu et al. (2008) (see Paleomagnetism and rock magnetism in the Expedition 355 methods chapter [Pandey et al., 2016a]), which allowed us to identify the potential occurrence of greigite downcore and to assess if there is a mineralogical control on the magnetic polarity (Figures F36, F37).
Besides evaluating the mineralogical control on the magnetic polarity, assessment of the reliability of the paleomagnetic data can be carried out by checking if the distribution of the measured magnetic vectors shows modes that can be ascribed to the theoretical behavior of the geomagnetic field, which is antipodal in declination and inclination.
Samples from Hole U1457A were all oriented by the Icefield device, and we plot them on an equal area stereographic projection. The results are shown in Figure F38. Unoriented declinations are randomly dispersed as might be expected, and the inclinations, both negative (upward; open symbols) and positive (downward; solid symbols), are limited to within 50° of horizontal, except for a few cases. After applying the core’s azimuth obtained from the Icefield device, the oriented declinations show a cluster in the northwest quadrant of positive inclinations and a fair tendency for negative inclinations to cluster in the southeast quadrant. The outliers from this distribution (i.e., negative inclinations at northwest and positive at southeast) are mostly from the lowermost oriented cores (355-U1457A-7H through 12H). Remarkably, oriented samples from Site U1457 show the same anticlockwise bias in the directions observed at Site U1456. Declination at these sites is nearly zero, so it is not clear if this bias is artificially produced by the orientation device or by some undetermined in situ sediment disturbance.

Figure F38. Equal area projections of specimen directions from APC cores.
Using the inclinations, which are the only available data for interpreting the magnetostratigraphy in Hole U1457C, we checked for the occurrence of a bimodal distribution in our data set. Figure F39A shows the results for Holes U1457A–U1457C. Holes U1457A and U1457C demonstrate a bimodal trend in inclination, whereas Hole U1457B is unimodal. This is primarily because measured samples from Hole U1457B are very few (15) and spread over a relatively small interval (100 m), so they fail a priori to correctly represent the bimodal behavior of the geomagnetic field. When the data are put together, a reasonable bimodal distribution can be observed, and we compared it to the theoretical distribution. We employed the TK03 model for paleosecular variation (Tauxe and Kent, 2004) and ran 1000 realizations of the model for a latitude of 16°N for both polarities (Figure F39B). The data from Site U1457 are in good agreement with the model distribution but appear to be biased toward shallower directions, particularly for those specimens with negative inclinations. This is probably caused by the fact that samples bearing reverse polarity come from deeper depths in the hole, so they may have experienced some disturbance due to coring operations and/or compaction due to lithostatic loading. A few positive inclinations steeper than ~50° may be an unresolved coring-induced remanence.
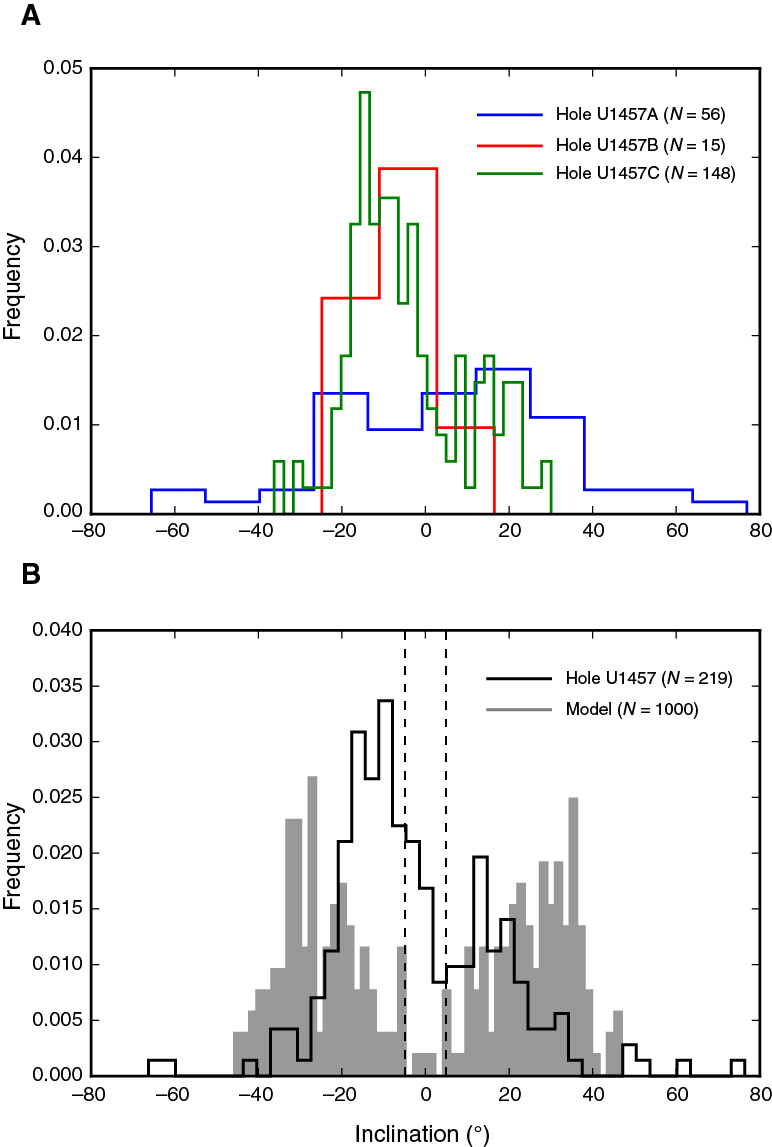
Figure F39. Histograms of measured inclinations.
Nonetheless, if nearly horizontal data, polarity zones based on single specimens, and inclinations steeper than 60° are given little weight, then a reasonable interpretation of the polarity can be made.
Magnetostratigraphy
The composite log of inclination data versus depth for Holes U1457A–U1457C is shown in Figure F40. Data are plotted on the CSF-A depth scale (reported as mbsf; see Introduction, background, and operations in the Expedition 355 methods chapter [Pandey et al., 2016a]), together with a simplified lithologic log (at left) and the reference geomagnetic polarity timescale (GPTS; Gradstein et al., 2012). Inclinations within 5° of horizontal are bounded by dashed lines and should be given little weight, as should polarity zones based on a single specimen (indicated by short bars in the polarity log). There are clear zones of dominant normal and reverse polarity (shown as black and white intervals, respectively). Where two holes overlap, the agreement is excellent.
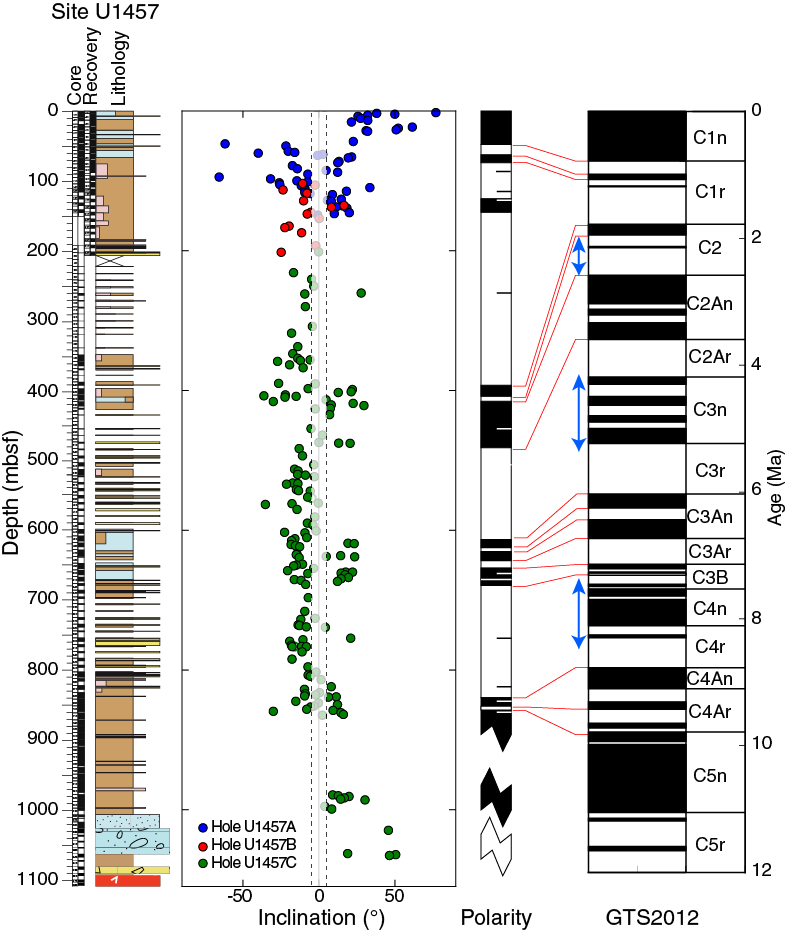
Figure F40. Magnetostratigraphy.
Correlation of the magnetostratigraphic pattern to the timescale is indicated by solid red lines in Figure F40. The derived tie points are listed in Table T21 and are plotted on the Site U1457 age-depth plot (Figure F14). Intervals with significant hiatuses or condensed sections are indicated by blue arrows alongside the GTS2012 column. On the whole we defined 16 tie points ranging from the Brunhes (Chron C1n, beginning at 0.781 Ma) to the top of Chron C5n (9.786 Ma). Combining the magnetostratigraphy with the available biostratigraphic constraints allows us to infer three substantial hiatuses or condensed sections in the magnetic polarity stratigraphy spanning the early Matuyama (Chron C2r), Chron C3n, and C4n, which are apparently missing.
The three positive inclinations just above the basement (~1070 mbsf) deserve some discussion. They have an average magnetic inclination value of 39°, which translates to a paleolatitude of ~22°. As a first-order approximation, this implies that
- The interval between the slump and the basement cannot have been deposited during the Oligocene–Eocene, when the expected inclination should have been very shallow because the paleolatitude of the site at that time was equatorial (Besse and Courtillot, 2002); and
- These data are in agreement with a Paleocene age suggested by the biostratigraphic constraints; the predicted inclination from global plate reconstructions for 60 Ma is ~30° (Besse and Courtillot, 2002).
Conclusions regarding the paleolatitudes of the site are quite tentative because they are based on a limited number of samples. Further study of the sedimentary interval directly overlying the basement may provide a robust estimate for paleolatitude. Paleolatitude estimates from the igneous section likely cannot be accomplished because too few cooling units were recovered and the age range of the sampled interval is likely to be extremely short.
Physical properties
Physical properties were measured on samples from each of the three holes drilled at Site U1457 to provide basic information for characterizing the drilled section using whole-round cores, split cores, and discrete samples. All core sections were measured with the GRA bulk densitometer, magnetic susceptibility loop, and P-wave Logger (PWL) on the WRMSL. In addition, GRA bulk density and magnetic susceptibility were measured on all core sections from Hole U1457B with the STMSL immediately after the cores were brought onboard for stratigraphic correlation. Core disturbances, in the form of gas expansion below ~100 mbsf, compromised the collection of core logger compressional wave (P-wave) velocity data during APC coring. After WRMSL scanning, sections were logged for NGR. Point-sensor magnetic susceptibility and color spectrophotometry (color reflectance) were measured using the Section Half Multisensor Logger (SHMSL). Shear strength measurements were made on samples from Hole U1457A and discrete P-wave measurements were made for all holes at the site on the Section Half Measurement Gantry. MAD were measured in Holes U1457A and U1457C through Core 355-U1457C-86R when time constraints prevented further analyses.
GRA bulk density
Bulk density varies from ~1.4 to 2.2 g/cm3 in Holes U1457A and U1457B (Figure F41A, F41B). The lowest bulk density is observed toward the top of Holes U1457A and U1457B. Notwithstanding large fluctuations, an overall increasing trend in density is observed from the top to the base of Unit I. The bulk density measured in sediment recovered from both Holes U1457A and U1457B is similar for Unit I, with only minor offsets. A distinct increase in bulk density is noted below ~74 mbsf, which coincides with the base of Unit I. Bulk density increases from ~1.7 g/cm3 at the base of Unit I up to 2.2 g/cm3 in Unit II. The change in density from Unit I to Unit II is attributed to the abundance of biogenic carbonate in Unit I as compared to Unit II, which has higher abundances of silt and sand. Fluctuations are also noted in Unit II, but are less dramatic than in Unit I. A slight decrease in bulk density is observed from ~185 mbsf until the base of Hole U1457B at ~205 mbsf. Below 200 mbsf in Hole U1457C, bulk density remains relatively constant until near the base of Unit II, between ~350 and 375 mbsf, where bulk density increases slightly (Figure F42A). This increase is attributed to the dominance of silty claystone and medium bedded silty sand within this interval, as compared to the silty clay and sandy silt above.

Figure F41. Physical property measurements.

Figure F42. Physical property measurements.
A decrease in bulk density is observed in the upper part of Unit III (Figure F42A) and is attributed to the dominance of dark gray, pale gray, and light gray nannofossil-rich claystone and nannofossil-rich chalk. Bulk density is somewhat higher from ~425 to ~600 mbsf, due to the abundance of silty claystone and silty sandstone. A further brief interval of low bulk density is observed to be centered at ~510 mbsf (red arrow in Figure F42A) and is attributed to the dominance of dark greenish gray, dark gray, and gray nannofossil-rich claystone in this interval. The decrease in bulk density between ~600 and 670 mbsf is attributed to the abundance of biogenic material again in this interval, which is dominated by nannofossil chalk. Bulk density is slightly higher from ~670 mbsf to the base of Unit III at ~835 mbsf, as a result of the presence of silty claystone over this interval.
A slight drop in bulk density is noted at the top of Unit IV and then values remain fairly uniform without any significant change downhole to ~1000 mbsf. The drop and subsequent uniform bulk density within this interval of Unit IV is attributed to the dominance of claystone. A distinct increase in bulk density deeper than ~1000 mbsf to the base of Unit IV at 1062 mbsf is attributed to the dominance of calcilutite, calcarenite, and breccia. Unit V has comparatively low bulk density because of the dominance of dark brown massive claystone and volcanic breccia. The basalt basement has the highest bulk density reported at Site U1457, reaching 2.9 g/cm3. Bulk density measured on discrete samples matches well with the GRA bulk density measured on the WRMSL. The lower densities associated with carbonate ooze show some correlation with carbonate content measured on discrete samples by coulometer (see Geochemistry in the Expedition 355 methods chapter [Pandey et al., 2016a]) (Figure F43). The relationship is not as well constrained as that in other pelagic sedimentation–dominated regions like the equatorial Pacific (e.g., Reghellin et al., 2013), because of the huge terrigenous input in the northwestern Arabian Sea. Carbonate-rich sediment is also generally light in color, which correlates nicely with the L* (lightness) measured by the SHMSL (Figure F44).
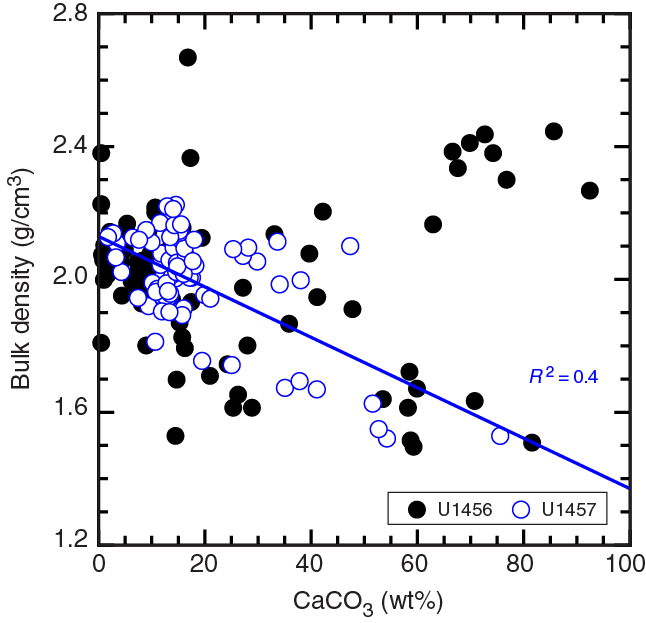
Figure F43. Relationship between MAD bulk density and CaCO3 content, Sites U1456 and U1457.
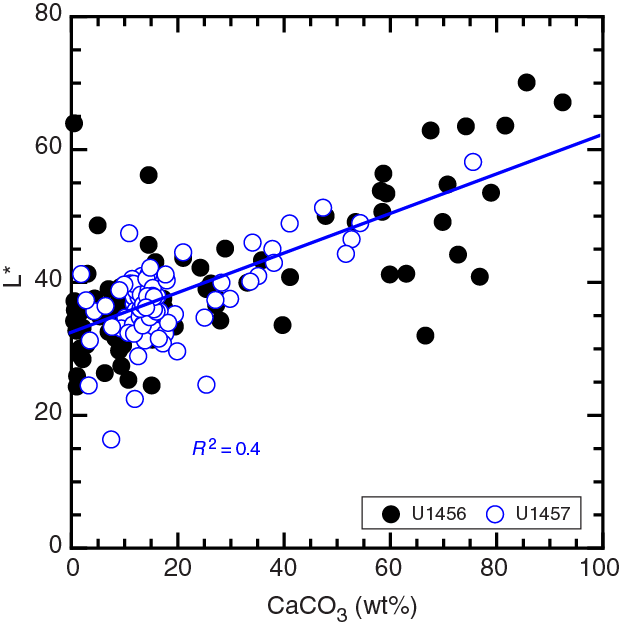
Figure F44. Relationship between L* and CaCO3 content, Sites U1456 and U1457.
Magnetic susceptibility
Large fluctuations in magnetic susceptibility (from 0 to ~600 × 10–5 SI) are observed throughout Unit I (Figure F41C, F41D). The lowest magnetic susceptibility in Unit I is between ~47 and ~52 mbsf. Several narrow distinct peaks occur within Unit I and are attributed to dark terrigenous layers that contrast with the biogenic carbonate–rich layers that have comparatively low susceptibility. Magnetic susceptibility measurements are similar in Holes U1457A and U1457B, with only a minor offset. The range of values is about an order of magnitude higher in Unit I as compared to that in Unit II. A drop in magnetic susceptibility toward the base of Unit II at ~300 mbsf is attributed to the dominance of silty claystone and medium-bedded silty sand in this interval (Figure F42B). Magnetic susceptibility increases in the upper part of Unit III, as a result of the dominance of nannofossil-rich claystone. Magnetic susceptibility in the rest of Unit III is relatively uniform except for an interval between ~605 and 670 mbsf that is marked by distinct variations associated with carbonates. A slight trend downcore toward lower values in magnetic susceptibility is observed in Unit IV until ~1000 mbsf. A further decrease in magnetic susceptibility toward the base of Unit IV (~1000–1060 mbsf) is the result of the presence of biogenic-rich calcilutite, calcarenite, and breccia. The abundance of dark brown massive claystone in Unit V results in a distinct increase in magnetic susceptibility. The magnetic susceptibility of the massive basalt recovered at the base of Hole U1457C has exponentially higher magnetic susceptibility than the sedimentary cover.
P-wave velocity
P-wave measurements by the PWL were only reliable in Unit I. A distinct increase in P-wave velocity is noted from the seafloor until the base of Unit I (Figure F41E, F41F). P-wave measurements (x-axis) using the P-wave caliper (PWC) tool were taken at Site U1457 at ~1.5 m resolution, or when recovery and lithology allowed. Because of poor data quality in sections with gas expansion, few PWC measurements were taken between ~100 and ~600 mbsf. Values start around 1500 m/s at the top of Unit I and increase slightly in the upper ~74 mbsf following the trend in PWL (Figure F41E, F41F). P-wave velocity varies between 1800 and 2100 m/s from ~600 to ~1000 mbsf as sediment becomes more compacted (Figure F42C). A modest sustained increase from 1900–2000 m/s to 2000–2100 m/s is observed at ~827 mbsf. This may be due to greater lithification of finer grained sediment below 827 mbsf close to the boundary between lithologic Units III and IV. Calcarenite and breccia below ~1000 mbsf have very high P-wave velocities (>3000 m/s) and should be evident as strong reflectors in the seismic profile (Figure F3). Intervals of claystone interbedded with the calcarenite and breccia continue to have much lower velocities of 2000–2400 m/s. The igneous rocks at the bottom of Hole U1457C have P-wave velocities between 4000 and 5500 m/s (Figure F42C).
Natural gamma radiation
NGR is low in Unit I compared to Unit II; however, large fluctuations in NGR are observed in Unit I (Figure F41G, F41H). The highest NGR in Unit I (marked by blue arrow) is at ~42 mbsf and is attributed to the presence of dark sandy silt. A distinct increase in NGR is noted below 74 mbsf, which corresponds to the boundary between Units I and II. The increase in NGR in Unit II is attributed to the abundance of clay, in contrast to the dominance of biogenic carbonate in Unit I. NGR is relatively uniform in the upper part of Unit II. A marked decrease in NGR in the upper part of Unit III is attributed to an abundance of nannofossil-rich claystone. The increase in NGR between ~425 and ~500 mbsf is caused by high levels of silty claystone and silty sandstone over that part of the section. The dominance of nannofossil-rich claystone results in another brief interval of lower NGR centered at ~510 mbsf (blue arrow in Figure F42D). The distinctly high NGR between ~525 and ~600 mbsf is attributed to the dominance of silty claystone and silty sandstone again. Subsequently, NGR decreases between ~610 and 670 mbsf as a result of the increasing abundance of biogenic material over this interval, in which the lithology is dominated by nannofossil chalk. Other intervals of low NGR correspond to low density and higher biogenic content (gray shaded areas in Figure F42). The slight increase in NGR from ~670 mbsf until the base of Unit III at 835 mbsf is attributed to the dominance of silty claystone over this interval. The dominance of claystone is also the reason for the almost uniform NGR values in Unit IV, although there is a dramatic drop in NGR toward the base of Unit IV, which is attributed to the common occurrence of biogenic-rich calcilutite, calcarenite, and breccia. A minor increase in NGR in Unit V is caused by an abundance of dark brown massive claystone. Massive basalt at the base of the drilled section has the lowest NGR (<1 counts/s) recorded at Site U1457.
Moisture and density
Bulk density, dry density, grain density, porosity, and void ratios in Holes U1457A–U1457C were calculated from mass and volume measurements on discrete samples taken from the working halves of split cores (see Physical properties in the Expedition 355 methods chapter [Pandey et al., 2016a]). MAD values compare well with WRMSL GRA bulk densities (Figure F41A, F41B) after correcting for density differences in GRA during RCB coring. MAD dry density, porosity, and void ratio measurements show a shift from low dry density values (0.7–1.2 g/cm3), high porosity (60%–70%), and high void ratios (~1.7) in the upper 74 m to higher dry density (1.4–2.0 g/cm3), lower porosity (25%–50%), and lower void ratios (~0.3–1.0) below 74 mbsf (Figure F45). We associate this with the abundance of carbonate-rich, fine-grained sediment in Unit I, which has lower dry densities and higher porosity and void ratios than the clastic sediment in the lower units. A gradual increase in dry density and corresponding gradual decrease in porosity and void ratio from the base of Unit I at 74 mbsf to the bottom of Hole U1457C is likely the result of a continuous increase in sediment compaction downhole. Variability in the dry density and porosity values between ~300 and 550 mbsf may be related to sampling of the varied lithologies in this unit (namely claystone, siltstone, and sandstone). Grain density mainly varies between 2.75 and 2.9 g/cm3, although some higher values (up to ~3.0 g/cm3) are associated with the carbonate-rich sediment of Unit I. Below 385 mbsf, several claystone layers have low grain densities (~2.65 g/cm3).
Shear strength
Shear strength measurements were performed on sediment from Hole U1457A using the automated vane shear (AVS) downhole to ~145 mbsf (Core 355-U1457A-19F). Below this depth sediment became too disturbed from gas expansion at the surface, so shear strength measurements were discontinued. The soft carbonate ooze and silty layers in the upper part of the sediment sequence are reflected in the low shear strength values (12–68 kPa) in Unit I (Figure F45). The coarse silt of Unit II also displays low shear strength (20–63 kPa), which may be partly artificially introduced by the gas expansion observed in this section.
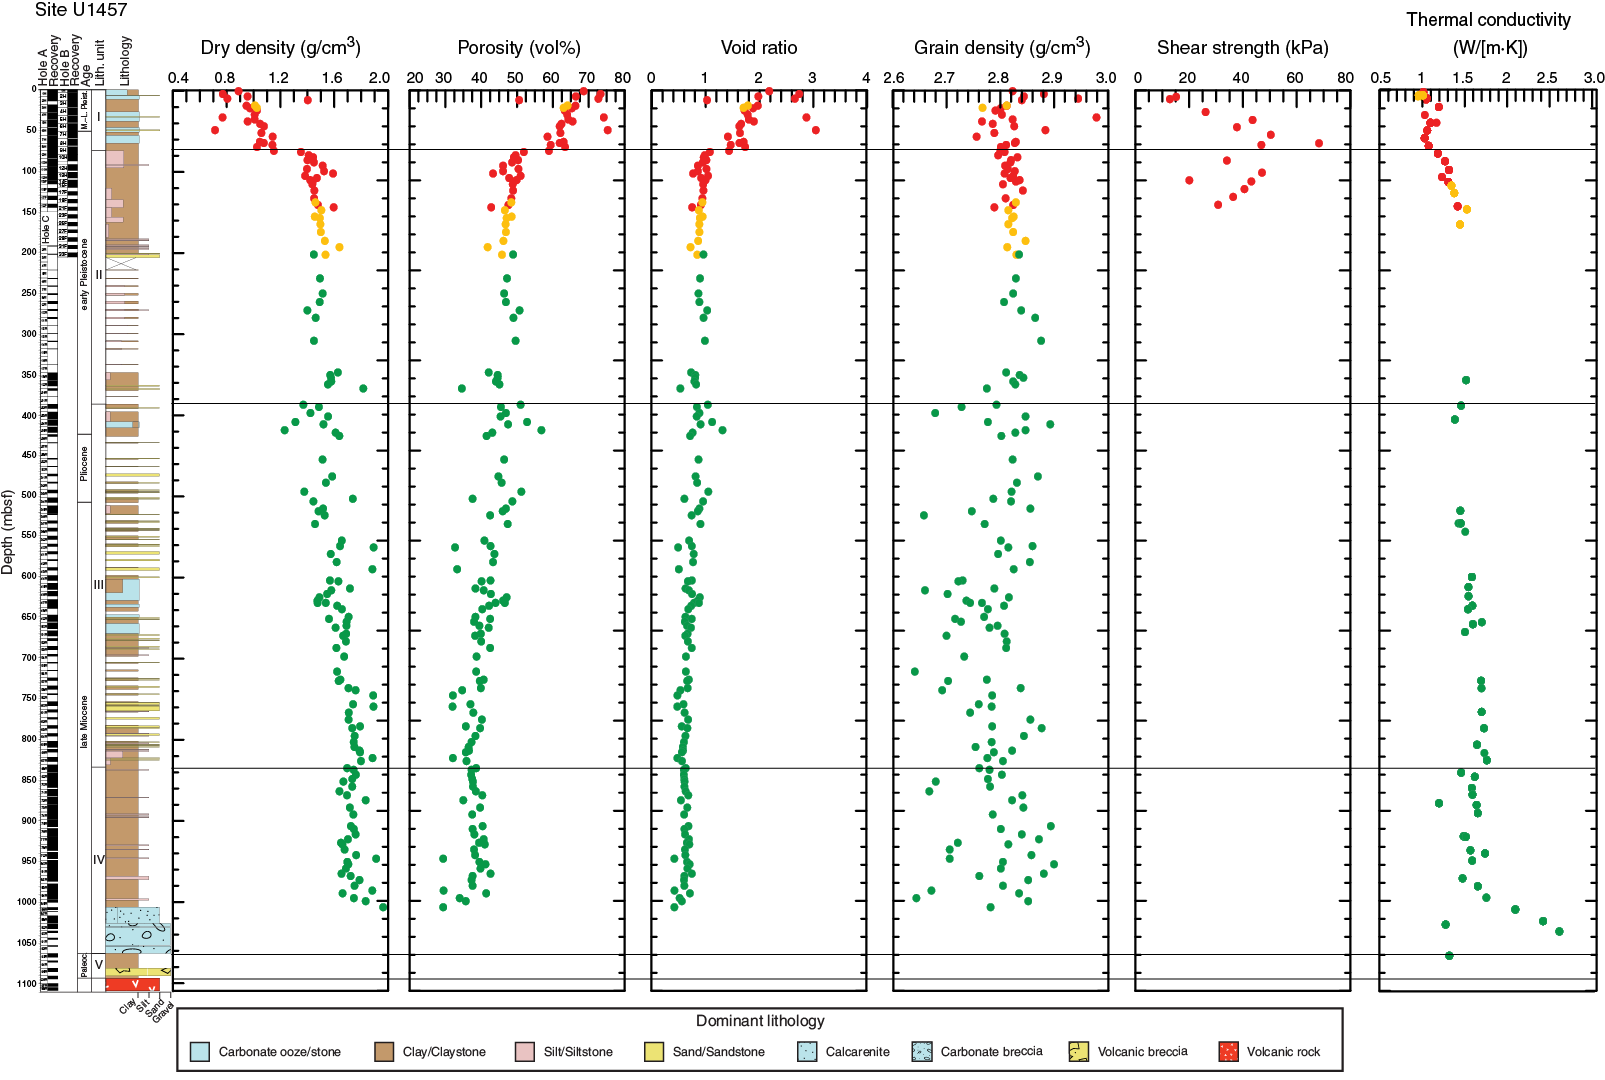
Figure F45. MAD discrete sample density, porosity, and void ratios; thermal.
Thermal conductivity
A ~10 m resolution thermal conductivity profile was obtained using a thermal conductivity needle probe until ~100 mbsf. Below this depth, a minipuck was used on the working half of the split core sections. An interval between ~165 and 350 mbsf was not measured for thermal conductivity because of disturbance caused by gas expansion, which fractured the sediment and thus yielded poor results. Low recovery over much of this interval was also a factor. Thermal conductivity measurements show a gradual increase from low values (1.0–1.2 W/[m·K]) in Unit I to higher values (1.2–1.7 W/[m·K]) in the deeper units above the calcarenite (Figure F45). This is probably related to the low conductivity of soft, carbonate-rich ooze compared to detrital sediment. The calcarenite below 1000 mbsf was found to be particularly conductive (up to 2.5 W/[m·K]).
Downhole measurements
Downhole temperature and heat flow
Three downhole temperature measurements were conducted using the advanced piston corer temperature tool (APCT-3) during coring operations in Hole U1457A. An exponential decrease in temperature is expected for the time interval highlighted in Figure F46 (between 210 and 540 s after penetration) to be consistent with thermal data analyzed by Pribnow et al. (2000) and was used to estimate ambient temperature. The data yielded values from 4.43°C at 37.2 m DSF (Core 355-U1457A-4H) to 7.47°C at 93.2 m DSF (Core 10H) (Figure F46), giving a geothermal gradient of 53°C/km for the upper ~93 m DSF shown in Figure F47A. Bottom water temperature was determined to be 1.76°C.
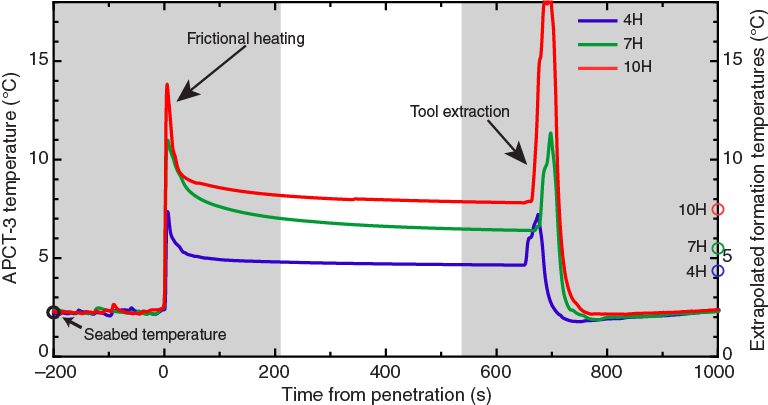
Figure F46. APCT-3 temperature-time series, Hole U1457A.
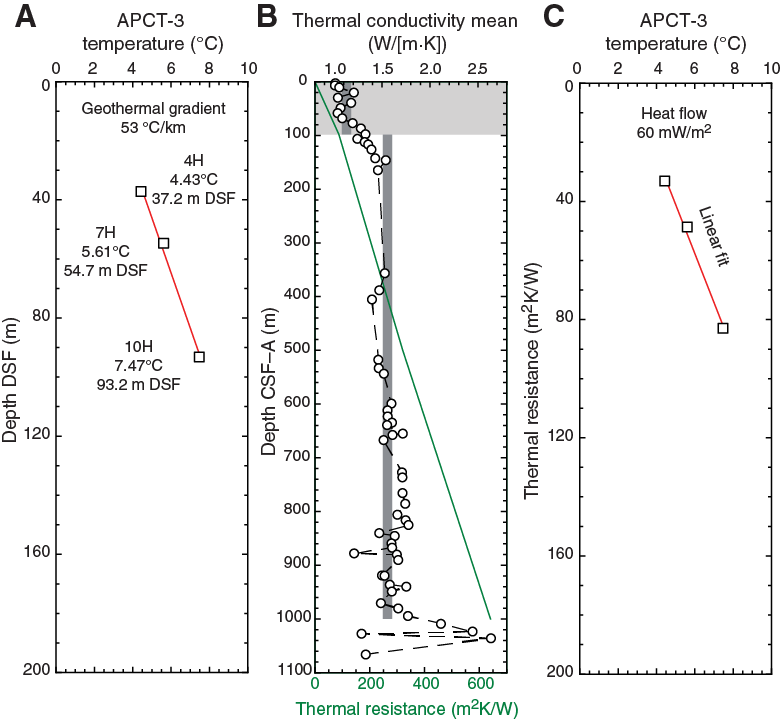
Figure F47. Plots of heat flow calculations, Holes U1457A–U1457C.F47. Plots of heat flow calculations, Holes U1457A–U1457C.
We estimated a thermal conductivity profile (~10 m resolution) using laboratory-determined thermal conductivity (see Physical properties in the Expedition 355 methods chapter [Pandey et al., 2016a]). Thermal resistance was calculated using the “average approach” outlined in Pribnow et al. (2000) using an average thermal conductivity of 1.12 W/(m·K) measured in the upper 98 mbsf (Figure F47B). The slope of the linear fit between temperature and thermal resistance indicates a heat flow of 60 mW/m2 (Figure F47C) (Pribnow et al., 2000). This estimate of heat flow is equivalent to ~74 Ma ocean crust according to the model of Stein and Stein (1992), slightly older than the anticipated age of Laxmi Basin at ~65 Ma (Bhattacharya et al., 1994). Using this estimate of heat flow and the higher average thermal conductivity measured at depths between 100 and 1000 mbsf (average 1.56 W/[m·K]), allows us to calculate a geothermal gradient of 38°C/km for depths between 100 and 1000 mbsf.
References
Ali, K.F., and de Boer, D.H., 2008. Factors controlling specific sediment yield in the upper Indus River basin, northern Pakistan. Hydrological Processes, 22(16):3102–3114. http://dx.doi.org/10.1002/hyp.6896
Beck, J.W., Récy, J., Taylor, F., Edwards, R.L., and Cabioch, G., 1997. Abrupt changes in early Holocene tropical sea surface temperature derived from coral records. Nature, 385(6618):705–707. http://dx.doi.org/10.1038/385705a0
Bernard, A., and Munschy, M., 2000. Were the Mascarene and Laxmi Basins (western Indian Ocean) formed at the same spreading centre? Comptes Rendus de l’Academie des Sciences, Serie IIa: Sciences de la Terre et des Planetes, 330(11):777–783. [French with English abstract] http://dx.doi.org/10.1016/S1251-8050(00)00221-4
Berner, R.A., and Berner, E.K., 1997. Silicate weathering and climate. In Ruddiman, W.F. (Ed.), Tectonic Uplift and Climate Change: New York (Springer), 353–365. http://dx.doi.org/10.1007/978-1-4615-5935-1_15
Bernet, M., van der Beek, P., Pik, R., Huyghe, P., Mugnier, J.-L., Labrin, E., and Szulc, A., 2006. Miocene to recent exhumation of the central Himalaya determined from combined detrital zircon fission-track and U/Pb analysis of Siwalik sediments, western Nepal. Basin Research, 18(4):393–412. http://dx.doi.org/10.1111/j.1365-2117.2006.00303.x
Besse, J., and Courtillot, V., 2002. Apparent and true polar wander and the geometry of the geomagnetic field over the last 200 Myr. Journal of Geophysical Research: Solid Earth, 107(B11):2300. http://dx.doi.org/10.1029/2000JB000050
Bhattacharya, G.C., Chaubey, A.K., Murty, G.P.S., Srinivas, K., Sarma, K.V.L.N.S., Subrahmanyam, V., and Krishna, K.S., 1994. Evidence for seafloor spreading in the Laxmi Basin, northeastern Arabian Sea. Earth and Planetary Science Letters, 125(1–4):211–220. http://dx.doi.org/10.1016/0012-821X(94)90216-X
Biswas, S.K., 1987. Regional tectonic framework, structure and evolution of the western marginal basins of India. Tectonophysics, 135(4):307–327. http://dx.doi.org/10.1016/0040-1951(87)90115-6
Bonaglia, S., Nascimento, F.J.A., Bartoli, M., Klawonn, I., and Brüchert, V., 2014. Meiofauna increases bacterial denitrification in marine sediments. Nature Communications, 5:5133. http://dx.doi.org/10.1038/ncomms6133
Bookhagen, B., Thiede, R.C., and Strecker, M.R., 2005. Late Quaternary intensified monsoon phases control landscape evolution in the northwest Himalaya. Geology, 33(2):149–152. http://dx.doi.org/10.1130/G20982.1
Burbank, D.W., Beck, R.A., and Mulder, T., 1996. The Himalayan foreland basin. In Yin, A., and Harrison, T.M. (Eds.), The Tectonic Evolution of Asia: Cambridge, United Kingdom (Cambridge University Press), 149–188.
Calvès, G., Huuse, M., Clift, P.D., and Brusset, S., 2015. Giant fossil mass wasting off the coast of West India: the Nataraja submarine slide. Earth and Planetary Science Letters, 432:265–272. http://dx.doi.org/10.1016/j.epsl.2015.10.022
Chaubey, A.K., Bhattacharya, G.C., Murty, G.P.S., Srinivas, K., Ramprasad, T., and Gopala Rao, D., 1998. Early Tertiary seafloor spreading magnetic anomalies and paleo-propagators in the northern Arabian Sea. Earth and Planetary Science Letters, 154(1–4):41–52. http://dx.doi.org/10.1016/S0012-821X(97)00178-7
Chaubey, A.K., Dyment, J., Bhattacharya, G.C., Royer, J.-Y., Srinivas, K., and Yatheesh, V., 2002. Paleogene magnetic isochrons and palaeo-propagators in the Arabian and Eastern Somali basins, NW Indian Ocean. In Clift, P.D., Kroon, D., Gaedicke, C., and Craig, J. (Eds.), The Tectonic and Climatic Evolution of the Arabian Sea Region. Geological Society Special Publication, 195(1):71–85. http://dx.doi.org/10.1144/GSL.SP.2002.195.01.05
Ciobanu, M.-C., Burgaud, G., Dufresne, A., Breuker, A., Rédou, V., Ben Maamar, S., Gaboyer, F., Vandenabeele-Trambouze, O., Lipp, J.S., Schippers, A., Vandenkoornhuyse, P., Barbier, G., Jebbar, M., Godfroy, A., and Alain, K., 2014. Microorganisms persist at record depths in the subseafloor of the Canterbury Basin. ISME Journal, 8:1370–1380. http://dx.doi.org/10.1038/ismej.2013.250
Clemens, S.C., and Prell, W.L., 1991. Late Quaternary forcing of Indian Ocean summer-monsoon winds: a comparison of Fourier model and general circulation model results. Journal of Geophysical Research: Atmospheres, 96(D12):22683–22700. http://dx.doi.org/10.1029/91JD02205
Clemens, S.C., Prell, W.L., and Sun, Y., 2010. Orbital-scale timing and mechanisms driving Late Pleistocene Indo-Asian summer monsoons: reinterpreting cave speleothem δ18O. Paleoceanography, 25(4):PA4207. http://dx.doi.org/10.1029/2010PA001926
Clift, P., Gaedicke, C., Edwards, R., Lee, J.I., Hildebrand, P., Amjad, S., White, R.S., and Schlüter, H.-U., 2002. The stratigraphic evolution of the Indus Fan and the history of sedimentation in the Arabian Sea. Marine Geophysical Research, 23(3):223–245. http://dx.doi.org/10.1023/A:1023627123093
Clift, P.D., 2006. Controls on the erosion of Cenozoic Asia and the flux of clastic sediment to the ocean. Earth and Planetary Science Letters, 241(3–4):571–580. http://dx.doi.org/10.1016/j.epsl.2005.11.028
Clift, P.D., Campbell, I.H., Pringle, M.S., Carter, A., Zhang, X., Hodges, K.V., Khan, A.A., and Allen, C.M., 2004. Thermochronology of the modern Indus River bedload; new insight into the controls on the marine stratigraphic record. Tectonics, 23(5):TC5013. http://dx.doi.org/10.1029/2003TC001559
Clift, P.D., Giosan, L., Blusztajn, J., Campbell, I.H., Allen, C., Pringle, M., Tabrez, A.R., Danish, M., Rabbani, M.M., Alizai, A., Carter, A., and Lückge, A., 2008a. Holocene erosion of the Lesser Himalaya triggered by intensified summer monsoon. Geology, 36(1):79–82. http://dx.doi.org/10.1130/G24315A.1
Clift, P.D., Shimizu, N., Layne, G.D., Blusztajn, J.S., Gaedicke, C., Schlüter, H.-U., Clark, M.K., and Amjad, S., 2001. Development of the Indus Fan and its significance for the erosional history of the western Himalaya and Karakoram. Geological Society of America Bulletin, 113(8):1039–1051. http://dx.doi.org/10.1130/0016-7606(2001)113<1039:DOTIFA>2.0.CO;2
Collier, J.S., Sansom, V., Ishizuka, O., Taylor, R.N., Minshull, T.A., and Whitmarsh, R.B., 2008. Age of Seychelles–India break-up. Earth and Planetary Science Letters, 272(1–2):264–277. http://dx.doi.org/10.1016/j.epsl.2008.04.045
Danovaro, R., Dell’Anno, A., Pusceddu, A., Gambi, C., Heiner, I., and Kristensen, R.M., 2010. The first metazoa living in permanently anoxic conditions. BMC Biology, 8(1):30. http://dx.doi.org/10.1186/1741-7007-8-30
DeCelles, P.G., Kapp, P., Gehrels, G.E., and Ding, L., 2014. Paleocene–Eocene foreland basin evolution in the Himalaya of southern Tibet and Nepal: implications for the age of initial India-Asia collision. Tectonics, 33(5):824–849. http://dx.doi.org/10.1002/2014TC003522
Dettman, D.L., Kohn, M.J., Quade, J., Ryerson, F.J., Ojha, T.P., and Hamidullah, S., 2001. Seasonal stable isotope evidence for a strong Asian monsoon throughout the past 10.7 m.y. Geology, 29(1):31–34. http://dx.doi.org/10.1130/0091-7613(2001)029<0031:SSIEFA>2.0.CO;2
Droz, L., and Bellaiche, G., 1991. Seismic facies and geologic evolution of the central portion of the Indus Fan. In Weimer, P., and Link, M.H. (Eds.), Frontiers in Sedimentary Geology (Volume 4): Seismic Facies and Sedimentary Processes of Submarine Fans and Turbidite Systems. Bouma, A.H. (Series Ed.): New York (Springer-Verlag), 383–402. http://dx.doi.org/10.1007/978-1-4684-8276-8_21
Ekdale, A.A., Bromley, R.G., and Pemberton, S.G. (Eds.), 1984. Ichnology: The Use of Trace Fossils in Sedimentology and Stratigraphy. SEPM Short Course, 15.
Fitton, J.G., Larsen, L.M., Saunders, A.D., Hardarson, B.S., and Kempton, P.D., 2000. Palaeogene continental to oceanic magmatism on the SE Greenland continental margin at 63°N: a review of the results of Ocean Drilling Program Legs 152 and 163. Journal of Petrology, 41(7):951–966. http://dx.doi.org/10.1093/petrology/41.7.951
France-Lanord, C., Spiess, V., Klaus, A., and the Expedition 354 Scientists, 2015. Expedition 354 Preliminary Report: Bengal Fan. International Ocean Discovery Program. http://dx.doi.org/10.14379/iodp.pr.354.2015
Fu, Y., von Dobeneck, T., Franke, C., Heslop, D., and Kasten, S., 2008. Rock magnetic identification and geochemical process models of greigite formation in Quaternary marine sediments from the Gulf of Mexico (IODP Hole U1319A). Earth and Planetary Science Letters, 275(3–4):233–245. http://dx.doi.org/10.1016/j.epsl.2008.07.034
Gale, A., Dalton, C.A., Langmuir, C.H., Su, Y., and Schilling, J.-G., 2013. The mean composition of ocean ridge basalts. Geochemistry, Geophysics, Geosystems, 14(3):489–518. http://dx.doi.org/10.1029/2012GC004334
Garzanti, E., Vezzoli, G., Andò, S., Paparella, P., and Clift, P.D., 2005. Petrology of Indus River sands: a key to interpret erosion history of the Western Himalayan syntaxis. Earth and Planetary Science Letters, 229(3–4):287–302. http://dx.doi.org/10.1016/j.epsl.2004.11.008
Ghosh, S.K., and Kumar, R., 2000. Petrography of Neogene Siwalik sandstone of the Himalayan foreland basin, Garhwal Himalaya: implications for source-area tectonics and climate. Journal of the Geological Society of India, 55(1):1–15. http://www.geosocindia.org/index.php/jgsi/article/view/69230
Gill, J., Torssander, P., Lapierre, H., Taylor, R., Kaiho, K., Koyama, M., Kusakabe, M., Aitchison, J., Cisowski, S., Dadey, K., Fujioka, K., Klaus, A., Lovell, M., Marsaglia, K., Pezard, P., Taylor, B., and Tazaki, K., 1990. Explosive deep water basalt in the Sumisu backarc rift. Science, 248(4960):1214–1217. http://dx.doi.org/10.1126/science.248.4960.1214
Gradstein, F.M., Ogg, J.G., Schmitz, M.D., and Ogg, G.M. (Eds.), 2012. The Geological Time Scale 2012: Amsterdam (Elsevier).
Hoorn, C., Ohja, T., and Quade, J., 2000. Palynological evidence for vegetation development and climatic change in the sub-Himalayan zone (Neogene, Central Nepal). Palaeogeography, Palaeoclimatology, Palaeoecology, 163(3–4):133–161. http://dx.doi.org/10.1016/S0031-0182(00)00149-8
Hu, X., Garzanti, E., Moore, T., and Raffi, I., 2015. Direct stratigraphic dating of India-Asia collision onset at the Selandian (middle Paleocene, 59 ± 1 Ma). Geology, 43(10):859–862. http://dx.doi.org/10.1130/G36872.1
Irvine, T.N., and Baragar, W.R.A., 1971. A guide to the chemical classification of the common volcanic rocks. Canadian Journal of Earth Sciences, 8(5):523–548. http://dx.doi.org/10.1139/e71-055
Jaeger, J.M., Gulick, S.P.S., LeVay, L.J., Asahi, H., Bahlburg, H., Belanger, C.L., Berbel, G.B.B., Childress, L.B., Cowan, E.A., Drab, L., Forwick, M., Fukumura, A., Ge, S., Gupta, S.M., Kioka, A., Konno, S., März, C.E., Matsuzaki, K.M., McClymont, E.L., Mix, A.C., Moy, C.M., Müller, J., Nakamura, A., Ojima, T., Ridgway, K.D., Rodrigues Ribeiro, F., Romero, O.E., Slagle, A.L., Stoner, J.S., St-Onge, G., Suto, I., Walczak, M.H., and Worthington, L.L., 2014. Expedition 341 summary. In Jaeger, J.M., Gulick, S.P.S., LeVay, L.J., and the Expedition 341 Scientists, Proceedings of the Integrated Ocean Drilling Program, 341: College Station, TX (Integrated Ocean Drilling Program). http://dx.doi.org/10.2204/iodp.proc.341.101.2014
Jain, A.K., Kumar, D., Singh, S., Kumar, A., and Lal, N., 2000. Timing, quantification, and tectonic modeling of Pliocene–Quaternary movements in the NW Himalaya: evidence from fission track dating. Earth and Planetary Science Letters, 179(3–4):437–451. http://dx.doi.org/10.1016/S0012-821X(00)00133-3
Johnson, N.M., Stix, J., Tauxe, L., Cerveny, P.F., and Tahirkheli, R.A.K., 1985. Paleomagnetic chronology, fluvial processes, and tectonic implications of the Siwalik deposits near Chinji village, Pakistan. The Journal of Geology, 93(1):27–40. http://dx.doi.org/10.1086/628917
Karim, A., and Veizer, J., 2002. Water balance of the Indus River Basin and moisture source in the Karakoram and western Himalayas: implications from hydrogen and oxygen isotopes in river water. Journal of Geophysical Research: Atmospheres, 107(D18):4362. http://dx.doi.org/10.1029/2000JD000253
Kolla, V., and Coumes, F., 1987. Morphology, internal structure, seismic stratigraphy, and sedimentation of Indus Fan. AAPG Bulletin, 71(6):650–677. http://archives.datapages.com/data/bulletns/1986-87/images/pg/00710006/0650/06500.pdf
Kolla, V., Ray, P.K., and Kostecki, J.A., 1981. Surficial sediments of the Arabian Sea. Marine Geology, 41(3–4):183–204. http://dx.doi.org/10.1016/0025-3227(81)90080-3
Krishna, K.S., Gopala Rao, D., and Sar, D., 2006. Nature of the crust in the Laxmi Basin (14°–20°N), western continental margin of India. Tectonics, 25(1):TC1006. http://dx.doi.org/10.1029/2004TC001747
Le Maitre, R.W. (Ed.), Streckeisen, A., Zanettin, B., Le Bas, M.J., Bonin, B., Bateman, P., Bellieni, G., Dudek, A., Efremova, S., Keller, J., Lameyre, J., Sabine, P.A., Schmid, R., Sørensen, H., and Woolley, A.R., 2002. Igneous Rocks: A Classification and Glossary of Terms (2nd edition)—Recommendations of the International Union of Geological Sciences Subcommission on the Systematics of Igneous Rocks: Cambridge, United Kingdom (Cambridge University Press). http://dx.doi.org/10.1017/CBO9780511535581
Li, C.-F., Lin, J., Kulhanek, D.K., Williams, T., Bao, R., Briais, A., Brown, E.A., Chen, Y., Clift, P.D., Colwell, F.S., Dadd, K.A., Ding, W., Hernández-Almeida, I., Huang, X.-L., Hyun, S., Jiang, T., Koppers, A.A.P., Li, Q., Liu, C., Liu, Q., Liu, Z., Nagai, R.H., Peleo-Alampay, A., Su, X., Sun, Z., Tejada, M.L.G., Trinh, H.S., Yeh, Y.-C., Zhang, C., Zhang, F., Zhang, G.-L., and Zhao, X., 2015. Site U1433. In Li, C.-F., Lin, J., Kulhanek, D.K., and the Expedition 349 Scientists, South China Sea Tectonics. Proceedings of the International Ocean Discovery Program, 349: College Station, TX (International Ocean Discovery Program). http://dx.doi.org/10.14379/iodp.proc.349.105.2015
Lyle, M., 1983. The brown-green color transition in marine sediments: a marker of the Fe(III)-Fe(II) redox boundary. Limnology and Oceanography, 28(5):1026–1033. http://dx.doi.org/10.4319/lo.1983.28.5.1026
Mahoney, J.J., 1988. Deccan Traps. In MacDougall, J.D. (Ed.), Continental Flood Basalts: Dordrecht, The Netherlands (Kluwer Academic), 151–194.
Martini, E., 1971. Standard Tertiary and Quaternary calcareous nannoplankton zonation. In Farinacci, A. (Ed.), Proceedings of the Second Planktonic Conference, Roma 1970: Rome (Edizioni Tecnoscienza), 2:739–785.
Métivier, F., Gaudemer, Y., Tapponnier, P., and Klein, M., 1999. Mass accumulation rates in Asia during the Cenozoic. Geophysical Journal International, 137(2):280–318. http://dx.doi.org/10.1046/j.1365-246X.1999.00802.x
Meyers, P.A., 1990. Impacts of late Quaternary fluctuations in water level on the accumulation of sedimentary organic matter in Walker Lake, Nevada. Palaeogeography, Palaeoclimatology, Palaeoecology, 78(3–4):229–240. http://dx.doi.org/10.1016/0031-0182(90)90216-T
Meyers, P.A., 1997. Organic geochemical proxies of paleoceanographic, paleolimnologic, and paleoclimatic processes. Organic Geochemistry, 27(5–6):213–250. http://dx.doi.org/10.1016/S0146-6380(97)00049-1
Middlemost, E.A.K., 1994. Naming materials in the magma/igneous rock system. Earth-Science Reviews, 37(3–4):215–224. http://dx.doi.org/10.1016/0012-8252(94)90029-9
Miles, P.R., Munschy, M., and Ségoufin, J., 1998. Structure and early evolution of the Arabian Sea and East Somali Basin. Geophysical Journal International, 134(3):876–888. http://dx.doi.org/10.1046/j.1365-246x.1998.00625.x
Miles, P.R., and Roest, W.R., 1993. Earliest sea-floor spreading magnetic anomalies in the north Arabian Sea and the ocean–continent transition. Geophysical Journal International, 115(3):1025–1031. http://dx.doi.org/10.1111/j.1365-246X.1993.tb01507.x
Milliman, J.D., and Syvitski, J.P.M., 1992. Geomorphic/tectonic control of sediment discharge to the ocean: the importance of small mountainous rivers. The Journal of Geology, 100(5):525–544. http://dx.doi.org/10.1086/629606
Millot, R., Vigier, N., and Gaillardet, J., 2010. Behaviour of lithium and its isotopes during weathering in the Mackenzie Basin, Canada. Geochimica et Cosmochimica Acta, 74(14):3897–3912. http://dx.doi.org/10.1016/j.gca.2010.04.025
Minshull, T.A., Lane, C.I., Collier, J.S., and Whitmarsh, R.B., 2008. The relationship between rifting and magmatism in the northeastern Arabian Sea. Nature Geoscience, 1(7):463–467. http://dx.doi.org/10.1038/ngeo228
Moore, J.G., 1970. Water content of basalt erupted on the ocean floor. Contributions to Mineralogy and Petrology, 28(4):272–279. http://dx.doi.org/10.1007/BF00388949
Müller, A., and Mathesius, U., 1999. The palaeoenvironments of coastal lagoons in the southern Baltic Sea, I. The application of sedimentary Corg/N ratios as source indicators of organic matter. Palaeogeography, Palaeoclimatology, Palaeoecology, 145(1–3):1–16. http://dx.doi.org/10.1016/S0031-0182(98)00094-7
Müller, R.D., Gaina, C., and Clarke, S., 2000. Seafloor spreading around Australia. In Veevers, J.J. (Ed.), Billion-Year Earth History of Australia and Neighbours in Gondwanaland: Sydney (GEMOC Press), 18–28.
Mutti, E., 1992. Turbidite Sandstones: Milan (Agip S.p.A., S. Donato Milanese).
Mutti, E., and Johns, D.R., 1978. The role of sedimentary by-passing in the genesis of fan fringe and basin plain turbidites in the Hecho Group system (south-central Pyrenees). Memorie della Societa Geologica Italiana, 18:15–22.
Naini, B.R., and Talwani, M., 1982. Structural framework and the evolutionary history of the continental margin of Western India. In Watkins, J.S., and Drake, C.L. (Eds.), Studies in Continental Margin Geology. AAPG Memoir, 167–191.
Najman, Y., Appel, E., Boudagher-Fadel, M., Bown, P., Carter, A., Garzanti, E., Godin, L., Han, J., Liebke, U., Oliver, G., Parrish, R., and Vezzoli, G., 2010. Timing of India-Asia collision: geological, biostratigraphic, and palaeomagnetic constraints. Journal of Geophysical Research: Solid Earth, 115(B12):B12416. http://dx.doi.org/10.1029/2010JB007673
Normark, W.R., Posamentier, H., and Mutti, E., 1993. Turbidite systems: state of the art and future directions. Reviews of Geophysics, 31(2):91–116. http://dx.doi.org/10.1029/93RG02832
Pandey, D.K., Clift, P.D., Kulhanek, D.K, Andò, S., Bendle, J.A.P., Bratenkov, S., Griffith, E.M., Gurumurthy, G.P., Hahn, A., Iwai, M., Khim, B.-K., Kumar, A., Kumar, A.G., Liddy, H.M., Lu, H., Lyle, M.W., Mishra, R., Radhakrishna, T., Routledge, C.M., Saraswat, R., Saxena, R., Scardia, G., Sharma, G.K., Singh, A.D., Steinke, S., Suzuki, K., Tauxe, L., Tiwari, M., Xu, Z., and Yu, Z., 2016a. Expedition 355 methods. In Pandey, D.K., Clift, P.D., Kulhanek, D.K., and the Expedition 355 Scientists, Arabian Sea Monsoon. Proceedings of the International Ocean Discovery Program, 355: College Station, TX (International Ocean Discovery Program). http://dx.doi.org/10.14379/iodp.proc.355.102.2016
Pandey, D.K., Clift, P.D., Kulhanek, D.K., Andò, S., Bendle, J.A.P., Bratenkov, S., Griffith, E.M., Gurumurthy, G.P., Hahn, A., Iwai, M., Khim, B.-K., Kumar, A., Kumar, A.G., Liddy, H.M., Lu, H., Lyle, M.W., Mishra, R., Radhakrishna, T., Routledge, C.M., Saraswat, R., Saxena, R., Scardia, G., Sharma, G.K., Singh, A.D., Steinke, S., Suzuki, K., Tauxe, L., Tiwari, M., Xu, Z., and Yu, Z., 2016b. Expedition 355 summary. In Pandey, D.K., Clift, P.D., Kulhanek, D.K., and the Expedition 355 Scientists, Arabian Sea Monsoon. Proceedings of the International Ocean Discovery Program, 355: College Station, TX (International Ocean Discovery Program). http://dx.doi.org/10.14379/iodp.proc.355.101.2016
Pandey, D.K., Clift, P.D., Kulhanek, D.K., Andò, S., Bendle, J.A.P., Bratenkov, S., Griffith, E.M., Gurumurthy, G.P., Hahn, A., Iwai, M., Khim, B.-K., Kumar, A., Kumar, A.G., Liddy, H.M., Lu, H., Lyle, M.W., Mishra, R., Radhakrishna, T., Routledge, C.M., Saraswat, R., Saxena, R., Scardia, G., Sharma, G.K., Singh, A.D., Steinke, S., Suzuki, K., Tauxe, L., Tiwari, M., Xu, Z., and Yu, Z., 2016c. Site U1456. In Pandey, D.K., Clift, P.D., Kulhanek, D.K., and the Expedition 355 Scientists, Arabian Sea Monsoon. Proceedings of the International Ocean Discovery Program, 355: College Station, TX (International Ocean Discovery Program). http://dx.doi.org/10.14379/iodp.proc.355.103.2016
Pearce, J.A., 1980. Geochemical evidence for the genesis and eruptive setting of lavas from Tethyan ophiolites. In Panayiotou, A. (Ed.), Proceedings of the International Ophiolite Symposium, Cyprus Geological Survey, 261–272.
Peccerillo, A., and Taylor, S.R., 1976. Geochemistry of Eocene calc-alkaline volcanic rocks from the Kastamonu area, northern Turkey. Contributions to Mineralogy and Petrology, 58(1):63–81. http://dx.doi.org/10.1007/BF00384745
Pickering, K.T., and Hiscott, R.N., 2015. Deep Marine Systems: Processes, Deposits, Environments, Tectonics and Sedimentation: Chichester, United Kingdom (Wiley-Blackwell).
Pickup, S.L.B., Whitmarsh, R.B., Fowler, C.M.R., and Reston, T.J., 1996. Insight into the nature of the ocean–continent transition off West Iberia from a deep multichannel seismic reflection profile. Geology, 24(12):1079–1082. http://dx.doi.org/10.1130/0091-7613(1996)024<1079:IITNOT>2.3.CO;2
Pribnow, D., Kinoshita, M., and Stein, C., 2000. Thermal Data Collection and Heat Flow Recalculations for Ocean Drilling Program Legs 101–180: Hanover, Germany (Institute for Joint Geoscientific Research, Institut für Geowissenschaftliche Gemeinschaftsaufgaben [GGA]). http://www-odp.tamu.edu/publications/heatflow/ODPReprt.pdf
Prins, M.A., Postma, G., Cleveringa, J., Cramp, A., and Kenyon, N.H., 2000. Controls on terrigenous sediment supply to the Arabian Sea during the late Quaternary: the Indus Fan. Marine Geology, 169(3–4):327–349. http://dx.doi.org/10.1016/S0025-3227(00)00086-4
Qayyum, M., Lawrence, R.D., and Niem, A.R., 1997. Discovery of the palaeo-Indus delta-fan complex. Journal of the Geological Society, 154(5):753–756. http://dx.doi.org/10.1144/gsjgs.154.5.0753
Quade, J., Cater, J.M.L., Ojha, T.P., Adam, J., and Harrison, T.M., 1995. Late Miocene environmental change in Nepal and the northern Indian subcontinent: stable isotopic evidence from paleosols. Geological Society of America Bulletin, 107(12):1381–1397. http://dx.doi.org/10.1130/0016-7606(1995)107<1381:LMECIN>2.3.CO;2
Radhakrishna, T., and Joseph, M., 2012. Geochemistry and paleomagnetism of Late Cretaceous mafic dikes in Kerala, southwest coast of India in relation to large igneous provinces and mantle plumes in the Indian Ocean region. Geological Society of America Bulletin, 124(1–2):240–255. http://dx.doi.org/10.1130/B30288.1
Rao, V.P., and Wagle, B.G., 1997. Geomorphology and surficial geology of the western continental shelf and slope of India: a review. Current Science, 73(4):330–340. http://www.currentscience.ac.in/Downloads/article_id_073_04_0330_0350_0.pdf
Raymo, M.E., and Ruddiman, W.F., 1992. Tectonic forcing of late Cenozoic climate. Nature, 359(6391):117–122. http://dx.doi.org/10.1038/359117a0
Rea, D.K., 1992. Delivery of Himalayan sediment to the northern Indian Ocean and its relation to global climate, sea level, uplift, and seawater strontium. In Duncan, R.A., Rea, D.K., Kidd, R.B., von Rad, U., and Weissel, J.K. (Eds.), Synthesis of Results from Scientific Drilling in the Indian Ocean. Geophysical Monograph, 70:387–402. http://dx.doi.org/10.1029/GM070p0387
Rédou, V., Ciobanu, M.C., Pachiadaki, M.G., Edgcomb, V., Alain, K., Barbier, G., and Burgaud, G., 2015. In-depth analyses of deep subsurface sediments using 454-pyrosequencing reveals a reservoir of buried fungal communities at record-breaking depths. FEMS Microbiology Ecology, 90(3):908–921. http://dx.doi.org/10.1111/1574-6941.12447
Reghellin, D., Dickens, G.R., and Backman, J., 2013. The relationship between wet bulk density and carbonate content in sediments from the Eastern Equatorial Pacific. Marine Geology, 344:41–52. http://dx.doi.org/10.1016/j.margeo.2013.07.007
Reston, T.J., Pennell, J., Stubenrauch, A., Walker, I., and Perez-Gussinye, M., 2001. Detachment faulting, mantle serpentinization, and serpentinite-mud volcanism beneath the Porcupine Basin, southwest of Ireland. Geology, 29(7):587–590. http://dx.doi.org/10.1130/0091-7613(2001)029<0587:DFMSAS>2.0.CO;2
Royer, J.-Y., Chaubey, A.K., Dyment, J., Bhattacharya, G.C., Srinivas, K., Yatheesh, V., and Ramprasad, T., 2002. Paleogene plate tectonic evolution of the Arabian and eastern Somali basins. In Clift, P.D., Kroon, D., Gaedicke, C., and Craig, J. (Eds.), The Tectonic and Climatic Evolution of the Arabian Sea Region. Geological Society Special Publication, 195(1):7–23. http://dx.doi.org/10.1144/GSL.SP.2002.195.01.02
Ryan, W.B.F., Carbotte, S.M., Coplan, J.O., O’Hara, S., Melkonian, A., Arko, R., Weissel, R.A., Ferrini, V., Goodwillie, A., Nitsche, F., Bonczkowski, J., and Zemsky, R., 2009. Global multi-resolution topography synthesis. Geochemistry, Geophysics, Geosystems, 10(3):Q03014. http://dx.doi.org/10.1029/2008GC002332
Sagnotti, L., Roberts, A.P., Weaver, R., Verosub, K.L., Florindo, F., Pike, C.R., Clayton, T., and Wilson, G.S., 2005. Apparent magnetic polarity reversals due to remagnetization resulting from late diagenetic growth of greigite from siderite. Geophysical Journal International, 160(1):89–100. http://dx.doi.org/10.1111/j.1365-246X.2005.02485.x
Sanyal, P., Bhattacharya, S.K., Kumar, R., Ghosh, S.K., and Sangode, S.J., 2004. Mio–Pliocene monsoonal record from Himalayan foreland basin (Indian Siwalik) and its relation to vegetational change. Palaeogeography, Palaeoclimatology, Palaeoecology, 205(1–2):23-41. http://dx.doi.org/10.1016/j.palaeo.2003.11.013
Sayles, F.L., and Manheim, F., 1975. Interstitial solutions and diagenesis in deeply buried marine sediments: results from the Deep Sea Drilling Project. Geochimica et Cosmochimica Acta, 39(2):103–127. http://dx.doi.org/10.1016/0016-7037(75)90165-9
Schenau, S.J., Prins, M.A., De Lange, G.J., and Monnin, C., 2001. Barium accumulation in the Arabian Sea: controls on barite preservation in marine sediments. Geochimica et Cosmochimica Acta, 65(10):1545–1556. http://dx.doi.org/10.1016/S0016-7037(01)00547-6
Scholz, F., Hensen, C., De Lange, G.J., Haeckel, M., Liebetrau, V., Meixner, A., Reitz, A., and Romer, R.L., 2010. Lithium isotope geochemistry of marine pore waters—insights from cold seep fluids. Geochimica et Cosmochimica Acta, 74(12):3459–3475. http://dx.doi.org/10.1016/j.gca.2010.03.026
Seilacher, A., 1967. Bathymetry of trace fossils. Marine Geology, 5(5–6):413–428. http://dx.doi.org/10.1016/0025-3227(67)90051-5
Shipboard Scientific Party, 1974a. Site 220. With contribution by R.E. Coleman and N. Hamilton. In Whitmarsh, R.B., Weser, O.E., Ross, D.A., et al., Initial Reports of the Deep Sea Drilling Project, 23: Washington, DC (U.S. Government Printing Office), 117–166. http://dx.doi.org/10.2973/dsdp.proc.23.104.1974
Shipboard Scientific Party, 1974b. Site 221. With contribution by R.E. Coleman and N. Hamilton. In Whitmarsh, R.B., Weser, O.E., Ross, D.A., et al., Initial Reports of the Deep Sea Drilling Project, 23: Washington, DC (U.S. Government Printing Office), 167–210. http://dx.doi.org/10.2973/dsdp.proc.23.105.1974
Singh, S., Parkash, B., Awasthi, A.K., and Singh, T., 2012. Palaeoprecipitation record using O-isotope studies of the Himalayan foreland basin sediments, NW India. Palaeogeography, Palaeoclimatology, Palaeoecology, 331–332:39–49. http://dx.doi.org/10.1016/j.palaeo.2012.02.031
Soetaert, K., Hofmann, A.F., Middelburg, J.J, Meysman, F.J.R., and Greenwood, J., 2007. The effect of biogeochemical processes on pH. Marine Chemistry, 106(1–2):380–401. (Reprint) http://dx.doi.org/10.1016/j.marchem.2007.06.008
Stein, C.A., and Stein, S., 1992. A model for the global variation in oceanic depth and heat flow with lithospheric age. Nature, 359(6391):123–129. http://dx.doi.org/10.1038/359123a0
Stein, R., Boucsein, B., and Meyer, H., 2006. Anoxia and high primary production in the Paleogene Central Arctic Ocean: first detailed records from Lomonosov Ridge. Geophysical Research Letters, 33(18):L18606. http://dx.doi.org/10.1029/2006GL026776
Stein, R., and Macdonald, R.W., 2004. Geochemical proxies used for organic carbon source identification in Arctic Ocean sediments. In Stein, R., and Macdonald, R.W. (Eds.), The Organic Carbon Cycle in the Arctic Ocean: Berlin (Springer), 24–32.
Talwani, M., and Reif, C., 1998. Laxmi Ridge—a continental sliver in the Arabian Sea. Marine Geophysical Research, 20(4):259–271. http://dx.doi.org/10.1023/A:1004674909280
Tauxe, L., and Kent, D.V., 2004. A simplified statistical model for the geomagnetic field and the detection of shallow bias in paleomagnetic inclinations: was the ancient magnetic field dipolar? In Channell, J.E.T., Kent, D.V., Lowrie, W., and Meert, J.G. (Eds.), Timescales of the Paleomagnetic Field. Geophysical Monograph, 145:101–115. http://dx.doi.org/10.1029/145GM08
Taylor, S.R., McLennan, S.M., Armstrong, R.L., and Tarney, J., 1981. The composition and evolution of the continental crust: rare earth element evidence from sedimentary rocks. Philosophical Transactions of the Royal Society A: Mathematical, Physical and Engineering Sciences, 301(1461):381–399. http://dx.doi.org/10.1098/rsta.1981.0119
Todal, A., and Edholm, O., 1998. Continental margin off western India and Deccan Large Igneous Province. Marine and Geophysical Research, 20(4):273–291. http://dx.doi.org/10.1023/A:1004640508371
Twichell, S.C., Meyers, P.A., and Diester-Haass, L., 2002. Significance of high C/N ratios in organic-carbon-rich Neogene sediments under the Benguela Current upwelling system. Organic Geochemistry, 33(7):715–722. http://dx.doi.org/10.1016/S0146-6380(02)00042-6
Vail, P.R., Mitchum, R.M., Jr., Todd, R.G., Widmier, J.M., Thompson, S.I., Sangree, J.B., Bubb, J.N., and Hatlelid, W.G., 1977. Seismic stratigraphy and global changes of sea level, Parts 1–11. In Payton, C.E. (Ed.), Seismic Stratigraphy: Applications to Hydrocarbon Exploration. AAPG Memoir, 26:51–212.
van der Beek, P., Robert, X., Mugnier, J.-L., Bernet, M., Huyghe, P., and Labrin, E., 2006. Late Miocene–recent exhumation of the central Himalaya and recycling in the foreland basin assessed by apatite fission-track thermochronology of Siwalik sediments, Nepal. Basin Research, 18(4):413–434. http://dx.doi.org/10.1111/j.1365-2117.2006.00305.x
Vermeesch, P., 2006. Tectonic discrimination diagrams revisited. Geochemistry, Geophysics, Geosystems, 7(6):Q06017. http://dx.doi.org/10.1029/2005GC001092
Wade, B.S., Pearson, P.N., Berggren, W.A., and Pälike, H., 2011. Review and revision of Cenozoic tropical planktonic foraminiferal biostratigraphy and calibration to the geomagnetic polarity and astronomical time scale. Earth-Science Reviews, 104(1–3):111–142. http://dx.doi.org/10.1016/j.earscirev.2010.09.003
Walker, R.G., 1978. Deep-water sandstone facies and ancient submarine fans: models for exploration of stratigraphic traps. AAPG Bulletin, 62:932–966.
White, R., and McKenzie, D., 1989. Magmatism at rift zones: the generation of volcanic continental margins and flood basalts. Journal of Geophysical Reasearch: Solid Earth, 94(B6):7685–7729. http://dx.doi.org/10.1029/JB094iB06p07685
Widdowson, M., Pringle, M.S., and Fernandez, O.A., 2000. A post K–T boundary (early Palaeocene) age for Deccan-type feeder dykes, Goa, India. Journal of Petrology, 41(7):1177–1191. http://dx.doi.org/10.1093/petrology/41.7.1177
Willenbring, J.K., and von Blanckenburg, F., 2010. Long-term stability of global erosion rates and weathering during late-Cenozoic cooling. Nature, 465(7295):211–214. http://dx.doi.org/10.1038/nature09044
Wu, F.-Y., Ji, W.-Q., Wang, J.-G., Liu, C.-Z., Chung, S.-L., and Clift, P.D., 2014. Zircon U–Pb and Hf isotopic constraints on the onset time of India-Asia collision. American Journal of Science, 314(2):548–579. http://dx.doi.org/10.2475/02.2014.04
Zhang, P., Molnar, P., and Downs, W.R., 2001. Increased sedimentation rates and grain sizes 2–4 Myr ago due to the influence of climate change on erosion rates. Nature, 410(6831):891–897. http://dx.doi.org/10.1038/35073504
1Pandey, D.K., Clift, P.D., Kulhanek, D.K., Andò, S., Bendle, J.A.P., Bratenkov, S., Griffith, E.M., Gurumurthy, G.P., Hahn, A., Iwai, M., Khim, B.-K., Kumar, A., Kumar, A.G., Liddy, H.M., Lu, H., Lyle, M.W., Mishra, R., Radhakrishna, T., Routledge, C.M., Saraswat, R., Saxena, R., Scardia, G., Sharma, G.K., Singh, A.D., Steinke, S., Suzuki, K., Tauxe, L., Tiwari, M., Xu, Z., and Yu, Z., 2016. Site U1457. In Pandey, D.K., Clift, P.D., Kulhanek, D.K., and the Expedition 355 Scientists, Arabian Sea Monsoon. Proceedings of the International Ocean Discovery Program, 355: College Station, TX (International Ocean Discovery Program). http://dx.doi.org/10.14379/iodp.proc.355.104.2016