Data report: X-ray fluorescence studies of Site U1457 sediments
PDF Download figures Download tables Cited by
Pandey, D.K., Clift, P.D., Kulhanek, D.K., and the Expedition 355 Scientists
Proceedings of the International Ocean Discovery Program Volume 355
publications.iodp.org

https://doi.org/10.14379/iodp.proc.355.203.2018
Data report: X-ray fluorescence studies of Site U1457 sediments, Laxmi Basin, Arabian Sea1
Mitchell Lyle,2 Denise K. Kulhanek,3 Melanie G. Bowen,4 and Annette Hahn5
Keywords: International Ocean Discovery Program, IODP, JOIDES Resolution, Expedition 355, Arabian Sea Monsoon, Laxmi Basin, Site U1457, bulk sediment chemistry, XRF scanning
MS 355-203: Received 10 May 2018 · Accepted 21 September 2018 · Published 11 December 2018
Abstract
Bulk sediment chemistry was measured at 2 cm resolution along cores from International Ocean Discovery Program (IODP) Site U1457 using the X-ray fluorescence (XRF) core scanner at the IODP Gulf Coast Repository. The Pleistocene splice section assembled from Holes U1457A and U1457B was scanned in its entirety, and nearly continuous sediment bulk chemistry profiles were constructed to a depth of 125 m core composite depth below seafloor (CCSF). Some sections of Hole U1457C were also scanned: (1) an upper Miocene hemipelagic section and (2) a 30 m lower Paleocene section directly overlying basalt. In the Pleistocene spliced sections, 2 cm spacing represents a sampling resolution of 150–300 y, whereas in the upper Miocene section this spacing represents about 500 y between samples. We report data and acquisition conditions for major and many minor elements.
We find large variability in CaCO3 content in the Pleistocene section, from around 14 to 89 wt%. We used discrete shipboard CaCO3 measurements to calibrate the XRF Ca data. CaCO3 has cyclic variability and correlates with light sediment colors. Variation in aluminosilicate elements is largely caused by changes in dilution by CaCO3. The lower part of the spliced section, presumably representing distal Indus Fan deposits, has a distinctive but more uniform composition than the upper part.
Introduction
Variability in chemical composition of deep-sea sediments provides important data needed to understand changes in primary productivity, the carbon cycle, and sources of aluminosilicates. However, chemical analyses are typically too slow and expensive for high-resolution study of chemical composition covering long intervals of time. They also consume the sediments, so only limited numbers of analyses can be performed. Nondestructive X-ray fluorescence (XRF) core scanning provides the potential to produce high-resolution chemical profiles that can be calibrated with a small number of discrete chemical analyses.
XRF is an X-ray optical technique that can measure most major and some minor elements. It is an economical way to extract bulk chemical data over longer sediment/rock profiles where thousands of analyses might be needed to resolve lithostratigraphic changes in the section. The method can be used to gather chemical data at a vertical resolution similar to that of physical property data collection by track systems on the JOIDES Resolution (e.g., Westerhold and Röhl, 2009; Lyle et al., 2012). These chemical measurements can augment physical property measurements to study cyclostratigraphy or rapid changes in sedimentation. If calibrated, the XRF data can be used to understand the long-term evolution of biogeochemical cycles and to identify the provenance of aluminosilicate sediments (Lyle and Baldauf, 2015).
Data acquisition methods
Data in this report were acquired at the IODP Gulf Coast Repository in College Station, Texas (http://iodp.tamu.edu/labs/xrf) using a third-generation Avaatech XRF core scanner with a Canberra X-PIPS SDD, Model SXD 15C-150-500 150 eV resolution X-ray detector. The XRF scanner is configured to analyze split sediment core halves for elements between Al and U in the periodic table. The X-ray tube and detector apparatus is mounted on a moving track so that multiple spots at different positions along a split core section can be analyzed during each scanning run, and multiple scans with different settings can be automatically programmed (Richter et al., 2006). The operator controls X-ray tube current, voltage, measurement time (live time), X-ray filters used, and area of X-ray illumination. The downcore position step is precise to 0.1 mm.
For the Site U1457 (Figure F1) XRF scans, sample spacing was set at 2 cm intervals downcore in each core section, and separate scans at two voltages were used. The X-ray illumination area was set at 1.0 cm in the downcore direction and 1.2 cm in the cross-core direction, and the scan was run down the center of the split core half (6.8 cm total diameter for cores collected using the advanced piston corer [APC]). The first scan was performed at 10 kV, 800 μA, 15 s live time, and no filter for the elements Al, Si, S, Cl, K, Ca, Ti, Mn, and Fe. A second scan was performed at 30 kV, 1000 μA, 20 s live time, and Pd-thick filter for Ni, Cu, Zn, Br, Rb, Sr, Y, Zr, Nb, Mo, Pb, and Bi. Of these elements, Br, Rb, Sr, and Zr had sufficiently large signals to justify further data reduction.
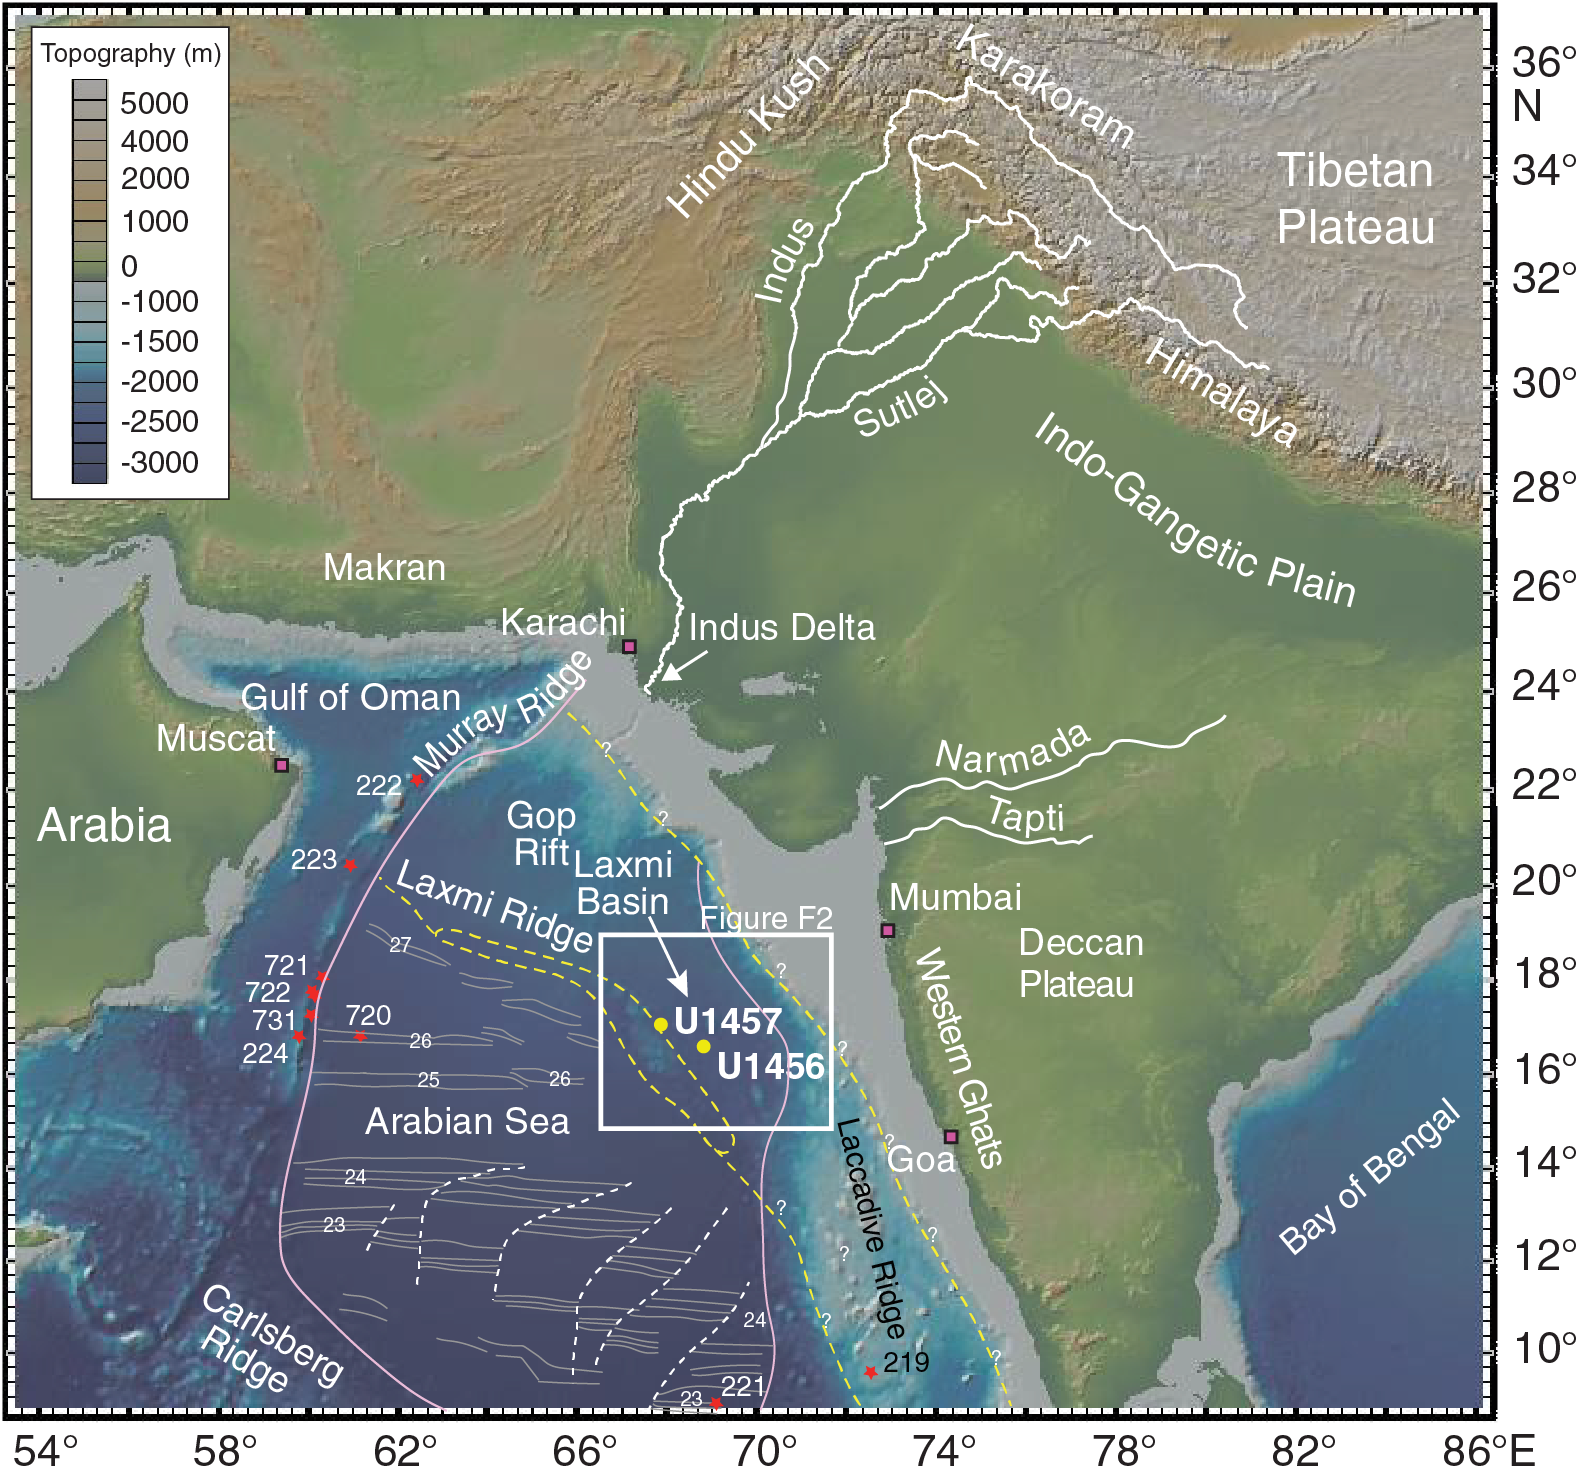
Figure F1. Bathymetric map.
Each core section was removed from refrigeration at least 2 h before scanning and was covered about 15 min before being placed on the scanner with 4 μm thick Ultralene plastic film (SPEX Centriprep, Inc.). The Ultralene film protects the detector face from becoming sediment covered and contaminated during the scan. It is important to wait until the core sections warm to room temperature before putting the film on core sections. Plastic film placed over cool core sections can cause water condensation onto the film, which severely reduces light-element XRF peak areas by absorbing the emitted low-energy X-rays (Lyle et al., 2012).
All core sections contained within the continuous spliced section of Site U1457 were analyzed. Where the sediment splice changed from one hole to the other, both sections at the tie point were scanned in their entirety. All of the sections within the revised Site U1457 splice listed in Lyle and Saraswat (2019) were scanned. All data gathered, including the overlaps, are included in Table T1 (Hole U1457A) and Table T2 (Hole U1457B). Table T3 contains the Hole U1457C data, and Table T4 contains the Site U1457 splice data, which represents the data along a continuous sediment section for the upper 125 m CCSF. All tables contain both the raw peak areas and the normalized median-scaled (NMS)-reduced data, described below.
Because there is more than one method of data reduction for XRF scan data (Weltje and Tjallingii, 2008; Lyle et al., 2012; Weltje et al., 2015), we report both raw peak area data and processed data in Tables T1, T2, and T3. The raw data thus will allow reprocessing in the future, if warranted.
Data reduction methods for later calibration—normalized median-scaled (NMS) data
Data reduction was achieved through a simple two-step method, as explained in Lyle et al. (2012): (1) The data were first median scaled by setting the median peak area of each element to a model percent derived from average graywacke (Wedepohl, 1995). The range in the peak area data was then converted into a raw percentage by dividing the peak area of each individual sample by the median peak area and then multiplying the result by the model median elemental abundance. (2) Because the resulting raw data rarely summed to 100% of the major elemental oxides, they were then normalized so that the major rock-forming elemental oxides summed to 100%. The normalization was achieved by dividing the raw sum of the major oxides into 100, and then multiplying each raw oxide by this factor. Minor elements were normalized by the same factor. The normalization step is used to eliminate variability caused by differences in porosity or cracks or by XRF source intensity variation (Lyle et al., 2012).
The NMS method of data reduction has a few similarities and several differences to that of Weltje and Tjallingii (2008) and the further elucidation of the method in Weltje et al. (2015). Weltje and Tjallingii (2008) normalize each elemental peak area first by dividing by the sum of the total raw peak areas. They then log transform these ratios to reduce the range between major and minor XRF-emitters, like our median-scaling step. Finally, they solve a matrix of XRF element/element ratios for composition. Weltje et al. (2015) investigated the use of various matrix solutions to get final composition information. The Weltje and Tjallingii (2008) approach has the advantage of being more global and developed from first principles, but it suffers from complexity and is not easily adapted. Furthermore, their method ignores geological information (i.e., the standard sum of oxides approach) because it works with elemental data alone rather than using well-known associations of elements in geological materials with their oxides, carbonates, and sulfates to simplify the analysis. The advantage of the NMS technique is that it can be quickly implemented, and the calibration step can be used to determine if a more detailed approach is needed.
The median model
The NMS method depends upon a median model sediment composition that is a reasonable match for the sediments being processed. In the case of the biogenic carbonates of the eastern equatorial Pacific, Lyle et al. (2012) used the median sediment composition based upon a set of representative samples that were analyzed for major and trace elements, CaCO3 content, and bio-SiO2 (opal) content.
We did not have available geochemical data to construct the median sediment model from existing data for Site U1457. Instead, we have used a model sediment composition where the aluminosilicates have the major element composition of average graywacke (Wedepohl, 1995) mixed with the median amount of CaCO3 and Corg measured on the ship in the upper 120 m CCSF of Site U1457 (27.3% and 0.68%, respectively; (see the Site U1457 chapter [Pandey et al., 2016]). Model trace element contents for Br were based on an assumed relationship with Corg and a Corg:Br ratio reported in Mayer et al. (2007). Ba was adjusted upward to 1000 ppm to reflect addition of bio-Ba to the graywacke (Dymond et al., 1992), and Sr was also adjusted upward to reflect an assumed Sr/Ca ratio of 11 × 10–3 in CaCO3, reflecting Sr/Ca in modern seawater (Coggon et al., 2010). Table T5 lists the model median composition that we used for this data set.
The actual model composition is not critical to the data reduction. The primary use of the model is to reduce the relative fluorescence sensitivity of major elements (e.g., between Ca and Si, roughly a factor of 25 greater peak area for a sediment with equal percentages of CaCO3 and SiO2) (Lyle et al., 2012). Of course, the correction factor needed to calibrate the data is much smaller if the median is reasonably close to the median sediment. If the model is a reasonable representation of the median sediment composition, the NMS percentages are more similar to the actual chemical composition than if the model does not adequately represent the median.
Results
The results of the U1457 XRF scanning are presented in Table T2 for Hole U1457A, Table T3 for Hole U1457B, Table T4 for Hole U1457C, and Table T5 for the Site U1457 splice section. Both raw peak areas and the NMS data are listed in Tables T2, T3, and T4. The profiles of the XRF data along the sediment splice are shown in Figure F2. The intervals scanned from Hole U1457C constitute an upper Miocene hemipelagic section and a Paleocene basal sediment section overlying basalt. Only the data from the Pleistocene splice section are discussed here.

Figure F2. XRF profiles.
The bulk chemical composition has high variability in the sediment section between 0 and 80 m CCSF, largely caused by changes in CaCO3 content (Figure F2). Sections of the Site U1457 splice with high CaCO3 are much lighter in color than the other sediment because of the white color reflectance spectrum of CaCO3 relative to other sediment components (King et al., 1997). The CaCO3 NMS was calibrated using the shipboard CaCO3 measurements (Figure F3). Based on this calibration, the sedimentary CaCO3 content varies between 11 and 85 wt% CaCO3, more than sufficient to cause carbonate dilution.
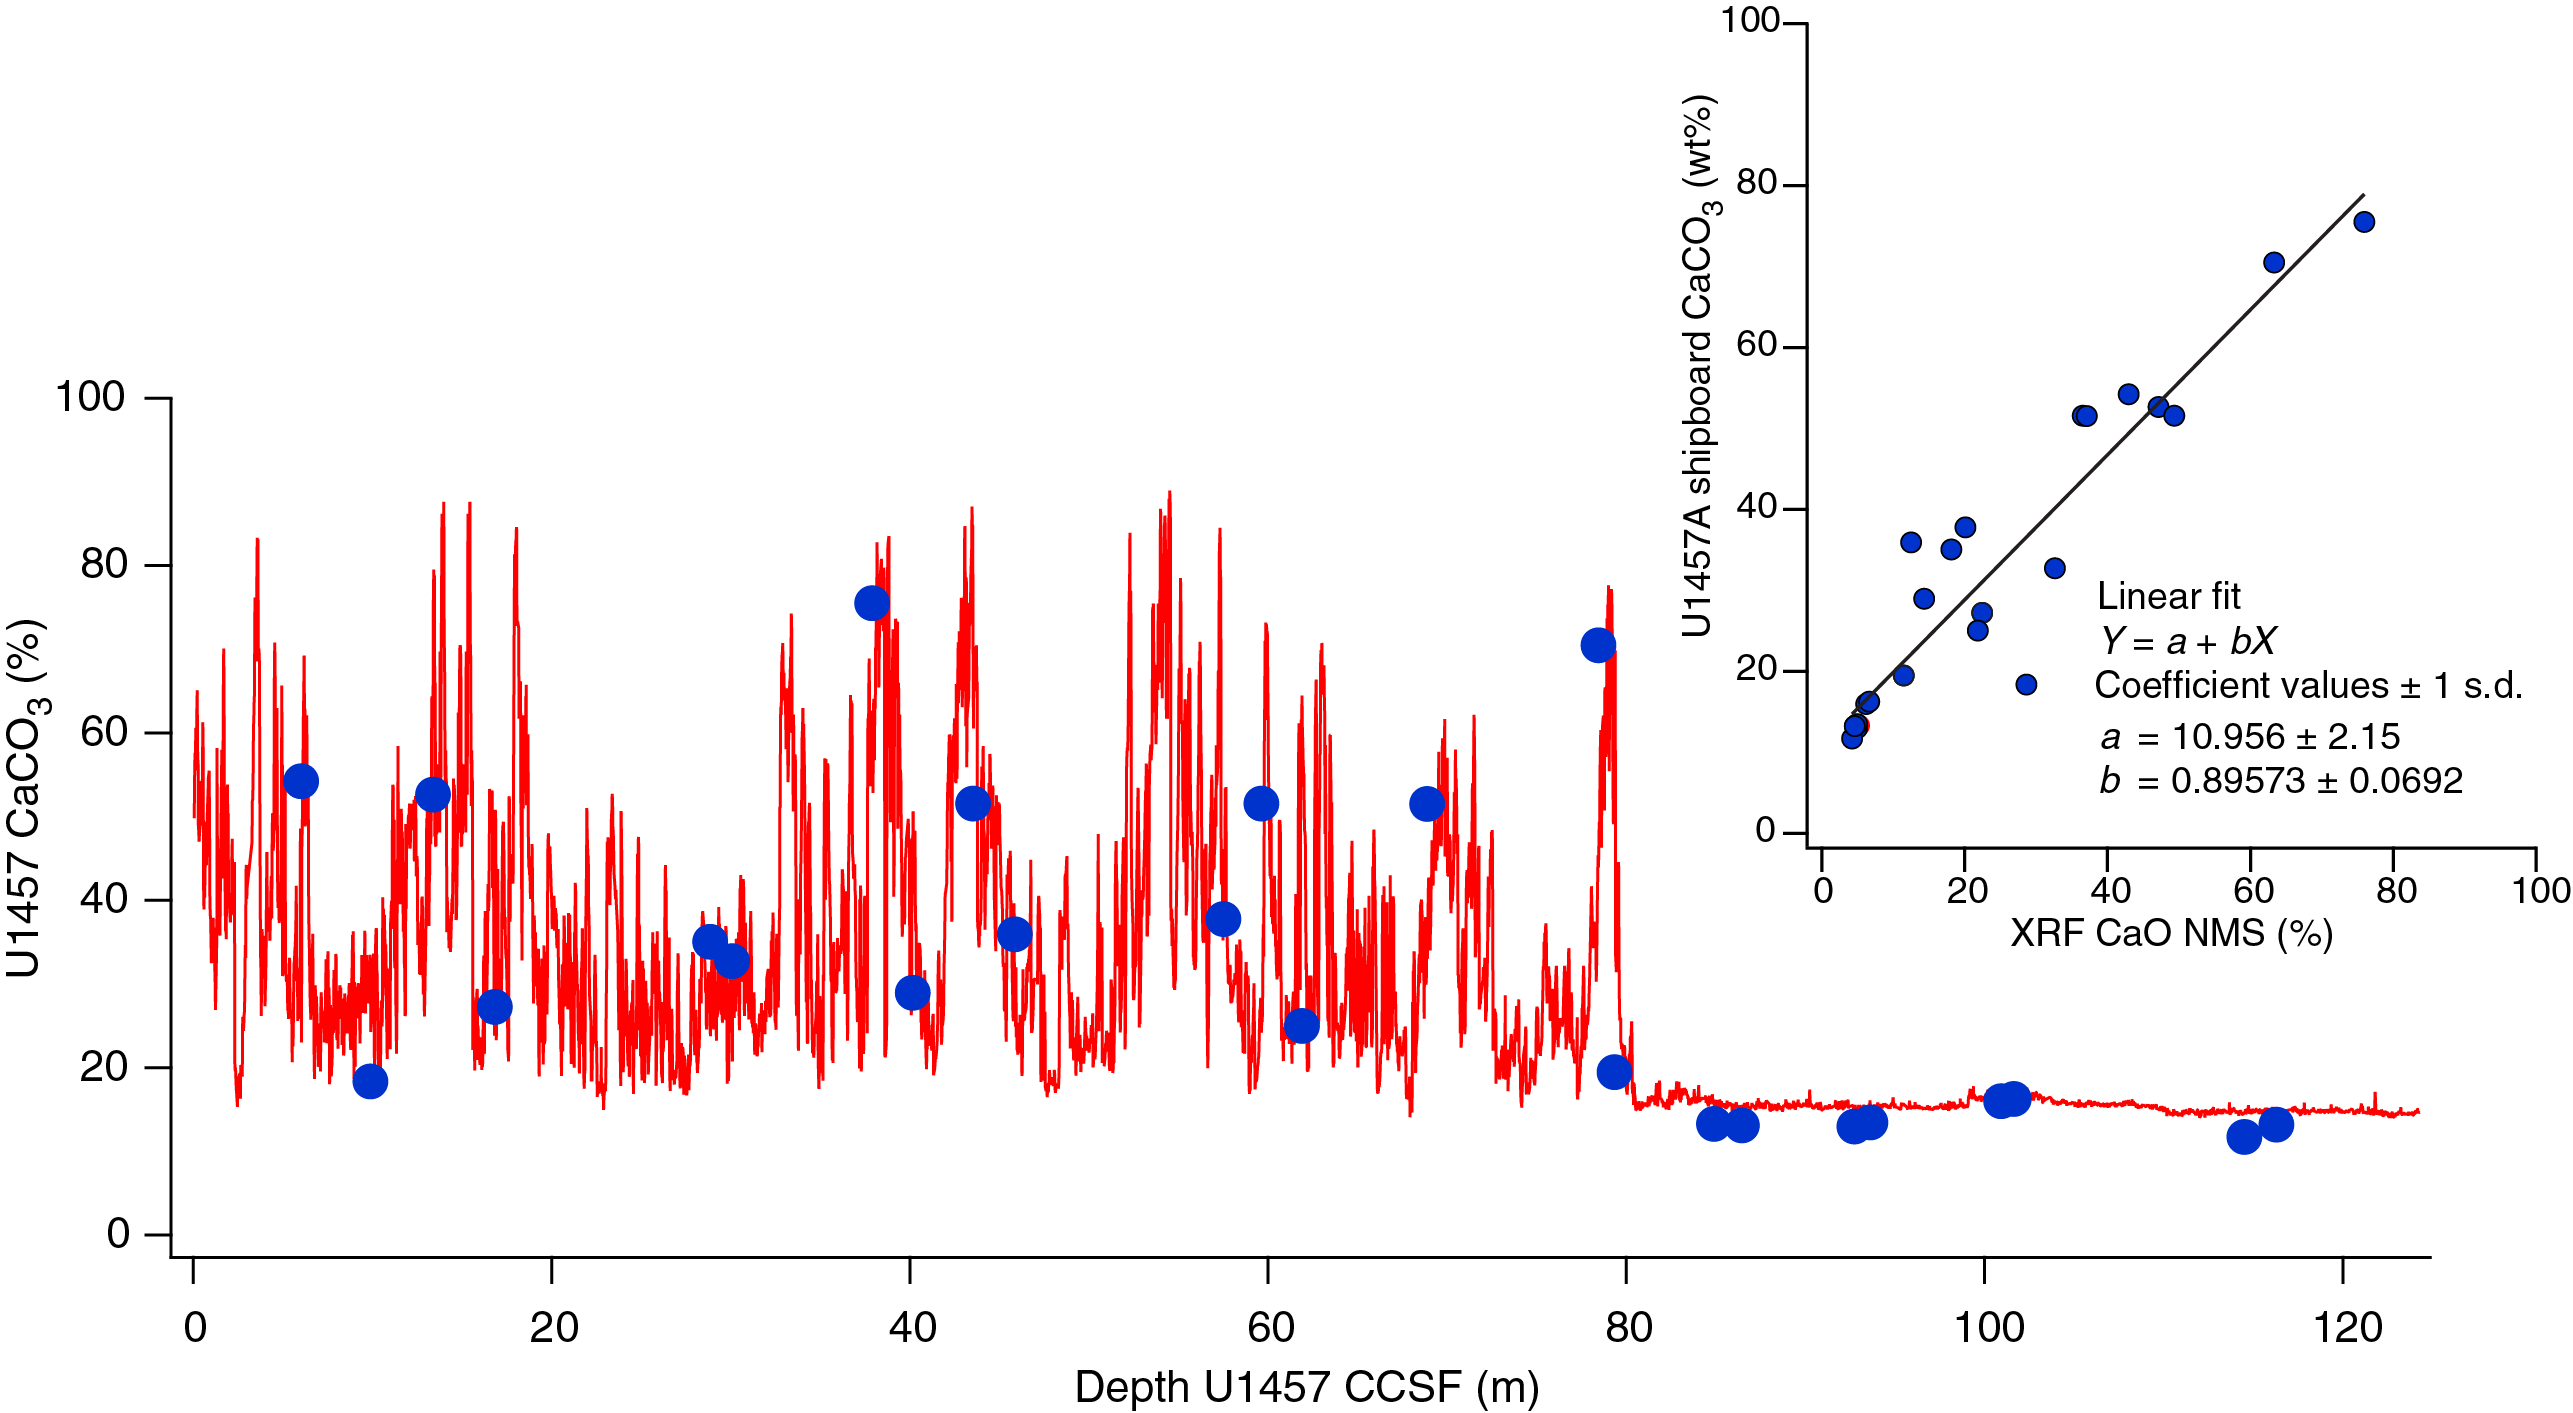
Figure F3. CaCO3 content.
Because only Sr and Mg typically replace Ca in marine carbonates, high deposition of CaCO3 reduces the percentage of clays in the bulk sediment and thus reduces the percentage of elements associated with aluminosilicates. The effect of variable CaCO3 on the bulk sediment composition is illustrated by the covariance of Sr and CaCO3 in Figure F2 and the dips in SiO2, TiO2, K2O, and so on, within the light-colored CaCO3-rich layers. Additional chemical variation occurs within the aluminosilicate fraction typically between the coarse and fine sediments in the section. This variability is best observed in the CaCO3-poor sections of the splice section.
The sediments below 86 m CCSF are much more uniform in composition than those shallower and contain higher SiO2, K2O, and Rb but lower and uniform CaCO3. There is also a transition interval between 80 and 86 CCSF where variability of TiO2, K2O, Rb, and Fe2O3 is high but CaCO3 is low and SiO2 shows only small changes. The change in sediment composition at 80 CCSF corresponds to the lithostratigraphic Unit 1/2 boundary (at 74 m CSF-A; 81 m CCSF), defined by the shipboard core description scientists in the Site U1457 chapter (Pandey et al., 2016).
Acknowledgments
This research used data and/or samples provided by the International Ocean Discovery Program (IODP). We thank IODP Expedition 355 party members and IODP for all the effort to properly collect and archive the Site U1457 sediment cores. We also acknowledge the IODP Gulf Coast Repository for use of the Avaatech XRF scanner. U.S. Science Support Program Post Expedition Awards to Lyle and Kulhanek were used to fund the scanning and analysis.
References
Coggon, R.M., Teagle, D.A.H., Smith-Duque, C.E., Alt, J.C., and Cooper, M.J., 2010. Reconstructing past seawater Mg/Ca and Sr/Ca from mid-ocean ridge flank calcium carbonate veins. Science, 327(5969):1114–1117. https://doi.org/10.1126/science.1182252
Dymond, J., Suess, E., and Lyle, M., 1992. Barium in deep-sea sediment: a geochemical proxy for paleoproductivity. Paleoceanography and Paleoclimatology, 7(2):163–181. https://doi.org/10.1029/92PA00181
King, T.A., Ellis, W.G., Jr., Murray, D.W., Shackleton, N.J., and Harris, S., 1997. Miocene evolution of carbonate sedimentation at the Ceara Rise: a multivariate data/proxy approach. In Shackleton, N.J., Curry, W.B., Richter, C., and Bralower, T.J. (Eds.), Proceedings of the Ocean Drilling Program, Scientific Results, 154: College Station, TX (Ocean Drilling Program), 349–365. https://doi.org/10.2973/odp.proc.sr.154.116.1997
Kolla, V., and Coumes, F., 1987. Morphology, internal structure, seismic stratigraphy, and sedimentation of Indus Fan. AAPG Bulletin, 71(6):650–677. http://archives.datapages.com/data/bulletns/1986-87/images/pg/00710006/0650/06500.pdf
Lyle, M., and Baldauf, J., 2015. Biogenic sediment regimes in the Neogene equatorial Pacific, IODP Site U1338: burial, production, and diatom community. Palaeogeography, Palaeoclimatology, Palaeoecology, 433:106–128. https://doi.org/10.1016/j.palaeo.2015.04.001
Lyle, M., Olivarez Lyle, A., Gorgas, T., Holbourn, A., Westerhold, T., Hathorne, E., Kimoto, K., and Yamamoto, S., 2012. Data report: raw and normalized elemental data along the Site U1338 splice from X-ray fluorescence scanning. In Pälike, H., Lyle, M., Nishi, H., Raffi, I., Gamage, K., Klaus, A., and the Expedition 320/321 Scientists, Proceedings of the Integrated Ocean Drilling Program, 320/321: Tokyo (Integrated Ocean Drilling Program Management International, Inc.). https://doi.org/10.2204/iodp.proc.320321.203.2012
Lyle, M. and Saraswat, R., 2019. Data report: revised Pleistocene sediment splice for Site U1457, IODP Expedition 355. In Pandey, D.K., Clift, P.D., Kulhanek, D.K., and the Expedition 355 Scientists, Arabian Sea Monsoon. Proceedings of the International Ocean Discovery Program, 355: College Station, TX (International Ocean Discovery Program). https://doi.org/10.14379/iodp.proc.355.202.2019
Mayer, L.M., Schick, L.L., Allison, M.A., Ruttenberg, K.C., and Bentley, S.J., 2007. Marine vs. terrigenous organic matter in Louisiana coastal sediments: the uses of bromine:organic carbon ratios. Marine Chemistry, 107(2):244–254. https://doi.org/10.1016/j.marchem.2007.07.007
Pandey, D.K., Clift, P.D., Kulhanek, D.K., Andò, S., Bendle, J.A.P., Bratenkov, S., Griffith, E.M., Gurumurthy, G.P., Hahn, A., Iwai, M., Khim, B.-K., Kumar, A., Kumar, A.G., Liddy, H.M., Lu, H., Lyle, M.W., Mishra, R., Radhakrishna, T., Routledge, C.M., Saraswat, R., Saxena, R., Scardia, G., Sharma, G.K., Singh, A.D., Steinke, S., Suzuki, K., Tauxe, L., Tiwari, M., Xu, Z., and Yu, Z., 2016. Site U1457. In Pandey, D.K., Clift, P.D., Kulhanek, D.K., and the Expedition 355 Scientists, Arabian Sea Monsoon. Proceedings of the International Ocean Discovery Program, 355: College Station, TX (International Ocean Discovery Program). https://doi.org/10.14379/iodp.proc.355.104.2016
Richter, T.O., van der Gaast, S., Koster, B., Vaars, A., Gieles, R., de Stigter, H.C., De Haas, H., and van Weering, T.C.E., 2006. The Avaatech XRF Core Scanner: technical description and applications to NE Atlantic sediments. In Rothwell, R.G. (Ed.), New Techniques in Sediment Core Analysis. Geological Society Special Publication, 267(1):39–50. https://doi.org/10.1144/GSL.SP.2006.267.01.03
Royer, J.-Y., Chaubey, A.K., Dyment, J., Bhattacharya, G.C., Srinivas, K., Yatheesh, V., and Ramprasad, T., 2002. Paleogene plate tectonic evolution of the Arabian and eastern Somali basins. In Clift, P.D., Kroon, D., Gaedicke, C., and Craig, J. (Eds.), The Tectonic and Climatic Evolution of the Arabian Sea Region. Geological Society Special Publication, 195(1):7–23. https://doi.org/10.1144/GSL.SP.2002.195.01.02
Wedepohl, K.H., 1995. The composition of the continental crust. Geochimica et Cosmochimica Acta, 59(7):1217–1232. https://doi.org/10.1016/0016-7037(95)00038-2
Weltje, G.J., Bloemsma, M.R., Tjallingii, R., Heslop, D., Röhl, U., and Croudace, I.W., 2015. Prediction of geochemical composition from XRF core scanner data: a new multivariate approach including automatic selection of calibration of samples and quantification of uncertainties. In Croudace, I.W., and Rothwell, R.G. (Eds.), Micro-XRF Studies of Sediment Cores. Developments in Paleoenvironmental Research, 17:507–534. https://doi.org/10.1007/978-94-017-9849-5_21
Weltje, G.J., and Tjallingii, R., 2008. Calibration of XRF core scanners for quantitative geochemical logging of sediment cores: theory and application. Earth and Planetary Science Letters, 274(3–4):423–438. https://doi.org/10.1016/j.epsl.2008.07.054
Westerhold, T., and Röhl, U., 2009. High resolution cyclostratigraphy of the early Eocene—new insights into the origin of the Cenozoic cooling trend. Climate of the Past, 5(3):309–327. https://doi.org/10.5194/cp-5-309-2009
1 Lyle, M., Kulhanek, D.K., Bowen, M.G., and Hahn, A., 2018. Data report: X-ray fluorescence studies of Site U1457 sediments, Laxmi Basin, Arabian Sea. In Pandey, D.K., Clift, P.D., Kulhanek, D.K., and the Expedition 355 Scientists, Arabian Sea Monsoon. Proceedings of the International Ocean Discovery Program, 355: College Station, TX (International Ocean Discovery Program). https://doi.org/10.14379/iodp.proc.355.203.2018
2 College of Earth, Ocean, and Atmospheric Sciences, Oregon State University, USA. mlyle@coas.oregonstate.edu
3 International Ocean Discovery Program, Texas A&M University, USA.
4 Department of Geology and Geophysics, Texas A&M University, USA.
5 Center for Marine Environmental Sciences, University of Bremen, Germany.
This work is distributed under the Creative Commons Attribution 4.0 International (CC BY 4.0) license. 
Data report: X-ray fluorescence studies of Site U1457 sediments
PDF Download figures Download tables Cited by