Gallagher, S.J., Fulthorpe, C.S., Bogus, K., and the Expedition 356 Scientists
Proceedings of the International Ocean Discovery Program Volume 356
publications.iodp.org
doi:10.14379/iodp.proc.356.107.2017

Site U14621
S.J. Gallagher, C.S. Fulthorpe, K. Bogus, G. Auer, S. Baranwal, I.S. Castañeda, B.A. Christensen, D. De Vleeschouwer, D.R. Franco, J. Groeneveld, M. Gurnis, C. Haller, Y. He, J. Henderiks, T. Himmler, T. Ishiwa, H. Iwatani, R.S. Jatiningrum, M.A. Kominz, C.A. Korpanty, E.Y. Lee, E. Levin, B.L. Mamo, H.V. McGregor, C.M. McHugh, B.F. Petrick, D.C. Potts, A. Rastegar Lari, W. Renema, L. Reuning, H. Takayanagi, and W. Zhang2
Keywords: International Ocean Discovery Program, IODP, Expedition 356, JOIDES Resolution, Site U1462, Northern Carnarvon Basin, Indonesian Throughflow, Miocene, Pliocene, Pleistocene, Australian monsoon, subsidence, aridity, anhydrite, reefs, ooids, tropical carbonates, Delambre Formation, Bare Formation
MS 356-107: Published 26 February 2017
Background and objectives
International Ocean Discovery Program (IODP) Site U1462 is 50 km north of the Montobello Islands in the Northern Carnarvon Basin, ~150 m from the Fisher-1 industry well (Figures F1, F2). Site U1462 is on the outer edge (87 m water depth) of a middle ramp (James et al., 2004). The seabed in the region is carbonate-rich (>90%) gravel and sand with minor mud (Jones, 1973; James et al., 2004). Coring at Site U1462 targeted a sequence of shelfal to shelf-edge carbonates that overlie a Miocene sand unit (the Bare Formation) (Figure F3).

Figure F1. Map of the northwest shelf showing major basins and location of modern and “fossil” reefs.

Figure F2. Bathymetric map showing the seafloor around Sites U1461 and U1462.
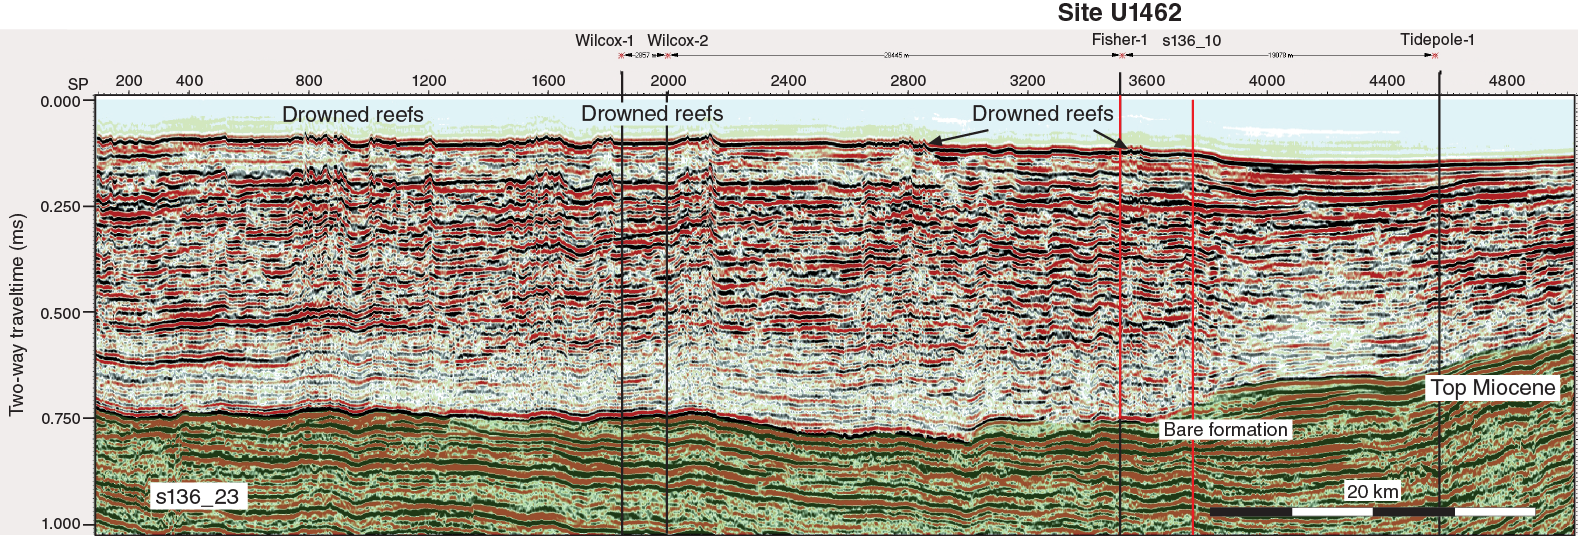
Figure F3. Multichannel seismic profile across Site U1462.
The primary aim of coring Site U1462 was to obtain a record of the secular variation in Indonesian Throughflow (ITF) connectivity over the last 5 My. Previous analyses of foraminifers in 28 sidewall cores from the adjacent Fisher-1 Well revealed carbonates that contain horizons of biogeographically significant Indo-Pacific foraminifers (sensu Gallagher et al., 2009), suggesting intermittent ITF connectivity. Further analyses are likely to reveal a more complete record of ITF connectivity than previously recognized. Another objective of Site U1462 was to date strata adjacent to several drowned reefs (Figure F3) (Gallagher et al., 2014) to determine the age and environmental conditions for their onset. Facies and fossil paleoenvironmental analyses of the succession recovered will shed light on when, how, and why these reefs first developed and why they drowned. An additional aim was to obtain an interglacial Pliocene–Pleistocene record of the Australian monsoon. Site U1462 was closer to the shoreline during this time than Site U1461 and could therefore yield significantly more terrigenous material. Shore-based analyses of the fossil pollen, clays, and other terrestrial sediments at this site will reveal a proximal Pliocene–Pleistocene history of the Australian monsoon. Finally, a variety of deepwater and shallow-water carbonate facies were anticipated. Postexpedition analyses of these strata will allow detailed estimates of Pliocene–Pleistocene paleobathymetry and subsidence.
Operations
Transit to Site U1462
After a 61 nmi transit (10.3 kt; 5.9 h) from Site U1461, the vessel arrived at Site U1462 at 0245 h (UTC + 8 h) on 30 August 2015. Shortly after arrival (0340 h), a seafloor positioning beacon was deployed.
Site U1462
Operations at Site U1462 consisted of four holes (Tables T1, T2); two of which were logged. The original plan called for three advanced piston corer (APC) holes to refusal, with the last two holes being extended to refusal with the extended core barrel (XCB) system. A fourth rotary core barrel (RCB) hole was planned to 835 meters below seafloor (mbsf) that would include downhole logging; however, the completion of Site U1462 differed from the initial plan with the first attempted core. Recovery of this mudline core was attempted with the half-length APC (HLAPC) system in Hole U1462A. Unfortunately, after shooting the core into the seafloor, we were unable to retrieve the core barrel because it was bent. After pulling the bottom-hole assembly (BHA) back to the surface, we cut the core barrel out. We redeployed the BHA, and Hole U1462A was cored with the XCB system to 855 m drilling depth below seafloor (DSF) (Cores 356-U1462A-1X through 100X). There was a brief attempt to use the HLAPC system, but after one 0.25 m recovered interval, the XCB system was used exclusively to total depth. Recovery was poor (<10%) during the first 300 m of coring but improved dramatically for the lower 555 m. After successfully coring to 855 m DSF, the hole was logged with the triple combination (combo) and Formation MicroScanner (FMS)-sonic tool strings. An attempt to use the Versatile Seismic Imager (VSI) was made but canceled because of multiple whale sightings during the protected species watch. The second hole (U1462B) was cored to 52.0 m DSF in an attempt to recover additional material in the lowest recovery section of Hole U1462A. Only 1.99 m of material (4%) was recovered in Hole U1462B. After operations were completed in Hole U1462B, the RCB system was prepared and Hole U1462C was started. The seafloor was tagged and the water depth was calculated to be 87.2 meters below sea level (mbsl). A total of 33 m was drilled with a center bit installed. The center bit was pulled, and coring with the RCB system began from 33.0 m DSF. Cores 356-U1462C-2R through 178R were recovered to 950.0 m DSF. In order to maximize recovery for Hole U1462C, we used half-length advances (4.8 m instead of 9.7 m) while cutting cores. There were only two sections of the hole in which full advances were used (Cores 65R and 66R and Cores 134R through 143R). After the completion of coring, the bit was dropped and the hole was conditioned for logging. The upper ~300 m was displaced with heavy mud. All three logging tool runs were successful. The triple combo tool string recovered data from ~896 to 89 m wireline log depth below seafloor (WSF). The VSI tool string was deployed from 770 (where a bridge was encountered) to 107 m WSF with 10 min stations every 25 m. The FMS-sonic also reached a total depth of ~770 m WSF and performed two successful passes along the entire open borehole. After logging was finished, preparations were made to proceed to the next site. The total time spent on Site U1462 was 323.0 h (13.5 days).
Table T1. Operations summary, Site U1462. Download table in .csv format.
Table T2. Site U1462 core summary. Download table in .csv format. View PDF table.
A total of 286 cores were recovered from Site U1462. The XCB system (Holes U1462A and U1462B) cored 907.1 m and recovered 322.28 m (35.5%), whereas the RCB system (Hole U1462C) cored 917.0 m and recovered 398.29 m (43.4%). The overall recovery for Site U1462 was 39.5%.
Hole U1462A
The vessel was offset 50 m on a line of 330°T from the site coordinates, and a seafloor positioning beacon was deployed at 0340 h. After offsetting the vessel from the acoustic beacon, drill floor activities commenced for Hole U1462A (19°49.2857′S, 115°42.5984′E). The APC/XCB system was assembled and deployed to just above the seafloor. Given the previous difficulty with the mudline core at Site U1459 (broken core barrel), we decided to tag the seafloor with the bit. The seafloor was tagged and thought to be soft, and the water depth was calculated as 87.1 mbsl. Thus, a nonmagnetic HLAPC core barrel was dressed with a core liner in preparation for starting Hole U1462A. Unfortunately, the first attempt resulted in a water core, so the depth of the bit was moved down 3 m. During the second attempt, the core barrel could not be recovered. After trying unsuccessfully to shear off from the core barrel, the coring line was cut at the surface and allowed to fall into the pipe. The top drive was set back and the BHA was pulled back to the surface to investigate the stuck core barrel. It was clear when the bit cleared the rotary table that the core barrel was severely bent, most likely caused by contact with a hard seafloor. Sections of the core barrel were cut and the core barrel was finally removed. The coring line was reheaded, the APC/XCB system was reassembled, and an XCB core barrel was prepared. Hole U1462A was started at 1530 h on 30 August 2015 and recovered Cores 356-U1462A-1X through 6X to 58.2 m DSF. Because recovery was terrible (0.3 m recovered from 58.2 m cored; 0.67%), the HLAPC system was then deployed in an effort to recover some material. However, Core 7F recovered only 0.25 m, so the XCB system was redeployed; coring continued with low recovery (<5%) through Core 32X to 300.9 m DSF. Beginning with Core 33X, recovery began to improve (45.7%) and continued with the recovery of Cores 34X through 66X to 621.03 m DSF. Deeper, we decided to start half-length advances (~4.7 m) in an attempt to further improve recovery; this continued with the recovery of Cores 67X through 75X to 671.7 m DSF. After Core 75X, we changed back to full XCB advances and continued through Core 88X to 796.7 m DSF. After hitting a zone of low recovery (Cores 87X and 88X; 0.56 m recovered from 19.4 m cored; 3%), we changed again to half-length advances that continued to a final depth of 855.0 m DSF with the recovery of Core 100X at 0745 h on 3 September. In total, 320.54 m were recovered from 855.0 m cored (37.5%).
We then circulated the hole with high-viscosity mud to clean out the cuttings, and a go-devil was pumped through the drill string to open the lockable float valve. The drill string was pulled back to 299.8 m DSF, and the upper section of the hole was displaced with heavy mud. The drill string was pulled back to 82.1 m DSF, and the rig floor was set up for downhole logging. We began assembling the triple combo logging tool string at 1400 h on 3 September. The tool string contained the following tools: magnetic susceptibility sonde (MSS), Hostile Environment Natural Gamma Ray Sonde (HNGS) (caliper only, no source), Hostile Environment Litho-Density Tool (HLDT), Enhanced Digital Telemetry Cartridge (EDTC), and logging equipment head-q tension (LEH-QT). The tools were deployed at 1520 h on 3 September. After the tool string exited the drill pipe, the active heave compensator was turned on. A downlog was performed from just above seafloor to ~800 m DSF. The hole was logged up with the triple combo tool string to 692 m DSF and then run back to the bottom; a second uplog was made from 799 m DSF to the end of the pipe (82.1 m DSF). The caliper reading indicated the hole size was from 14 to 17 inches (bottom to top). The tools were at the surface at 1900 h and then disassembled. The FMS-sonic tool string was assembled with the following tools: FMS, Dipole Sonic Imager (DSI), HNGS, EDTC, and LEH-QT. At 2050 h, the tool string was lowered to just above the seafloor. The logging tools were turned on and the hole was logged down to 797 m DSF. The hole was logged up to just below the end of the pipe (82.1 m DSF). A second pass was made over the total length of open hole. The tool string was pulled back into the drill pipe, and logging continued to the seafloor. The tool string was pulled back to the surface at 0200 h on 4 September. After rigging down the FMS-sonic tool string, the VSI tool string was prepared and tested. A caliper extension was added to the tool because of the large hole size. The tool string was deployed at 0445 h. We then waited for daylight so that the protected species watch could begin. Over the next 3.5 h, humpback whales were sighted continuously, and at 1120 h we canceled the vertical seismic profile (VSP) experiment. The tools were back at the surface at 1150 h. At 1245 h, all logging tools were disassembled and the logging wireline was secured. The total time spent on Hole U1462A was 130.5 h (5.4 days).
Hole U1462B
After clearing the seafloor and ending Hole U1462A, the vessel was offset 20 m at 060°T. Preparations for XCB coring were made, the seafloor was tagged with the bit (87.2 mbsl), and Hole U1462B (19°49.2801′S, 115°42.6091′E) was started at 1425 h on 4 September 2015. Coring with full advance (9.7 m) continued for the first two cores, but half-length advance intervals were then used to recover Cores 356-U1462B-3X through 9X to 52.3 m DSF. The hole reached this final depth at 1955 h on 4 September. The bit cleared the seafloor at 2040 h on 4 September. Hole U1462B ended at 2255 h. Of 52.4 m cored with the XCB system, 1.99 m was recovered (3.8%). The total time spent on Hole U1462B was 9.75 h (0.4 days).
Hole U1462C
The vessel was offset again, and preparations were made for RCB coring in Hole U1462C (19°49.2764′S, 115°42.6186′E). The BHA was deployed to just above the seafloor before the upper guide horn was removed and the moonpool doors opened for a planned 50 m box seafloor survey. Shortly after the subsea camera system’s deployment, it failed. The camera and frame were pulled back to the surface for repair. After temporarily abandoning the planned survey, the top drive was picked up and spaced out, the RCB center bit was dropped, and Hole U1462C was started at 0400 h on 5 September 2015. After drilling 33.0 m, the center bit was pulled. A nonmagnetic RCB core barrel was dressed and dropped, and coring with half-length advances began. We recovered Cores 356-U1462C-2R through 44R to 242.0 m DSF. After dropping the next core barrel, the drill string stopped rotating and high torque was noted. The pipe was worked upward in the hole while applying overpull, torque, and circulation. High-viscosity mud sweeps were also pumped to try to clear the hole of debris. After working the pipe for 8.25 h, the pipe reached 178.3 m DSF. The drill string torque returned to normal and the pipe was free to move up or down. The drill string was then lowered to the bottom of the hole (242.0 m DSF), where there were no signs of fill. Coring resumed with half-length (4.8 m) advances of the RCB system and recovered Cores 45R through 64R to 338.5 m DSF. We then switched to full (9.7 m) advances to recover Cores 65R and 66R to 357.9 m DSF, but a drop in recovery led us to return to half-length advances after this. We then recovered Cores 67R through 132R to 678.9 m DSF. A single 6 m core (133R) was then taken to adjust the correlation with Hole U1462A. Cores 134R through 143R (to 781.9 m DSF) were recovered with full advances. At 781.9 m DSF, we again changed back to half-length advances to try to optimize recovery. Apart from a single 3.5 m advance (Core 156R) to adjust the correlation with Hole U1462A, coring continued with half-length advances to the final depth of 950.0 m DSF (Core 178R) at 1030 h on 10 September. The final 100 m of coring experienced poor recovery (~10%). For Hole U1462C, 917.0 m was cored with 398.29 m of material recovered (43.4%).
After reaching the final depth, high-viscosity mud was pumped through to clean the annulus of cuttings. We then attempted to release the bit to allow wireline logging of this hole, but the driller noticed bottom contact on the weight indicator. Several attempts were made to shift the mechanical sleeve. The pipe was worked back up to 929.0 m DSF and the bit finally released. The driller then lost string rotation with high torque and high pressure. After working the pipe with rotation, overpull, and circulation, the pipe came free. The drill string was pulled to 725.1 m DSF, where heavy mud was used several times in an effort to stop the reverse flow before the mechanical bit release sleeve was shifted back. The drill string was then pulled to 307.1 m DSF, the circulating head was installed, and the hole was displaced with heavy mud. The drill string was then pulled up to logging depth (89.4 m DSF), and preparations for logging began at 2130 h on 10 September. The triple combo tool string was the first deployment. The tool string contained the following tools: MSS, HNGS, HLDT, EDTC, and LEH-QT. The tool string was deployed at 2330 h on 10 September. After the tool string exited the drill pipe, the active heave compensator was turned on. A downlog was performed from just above the seafloor to 896 m DSF. The hole was then logged up with the triple combo to ~90 m DSF. The tools were at the surface at 0300 h on 11 September and disassembled. The VSI tool string was the next scheduled deployment to take advantage of daylight. A caliper extension was added to the tool because of the large borehole size (17 inches in the upper section). The tool string was deployed at 0445 h to the seafloor, after which we were on standby until daylight. The protected species observations began at sunrise, and at 0645 h, the VSI tool string was lowered to the bottom of the hole. At 0740 h, the VSP experiment began. Starting from 773 m DSF, a series of ~25 m stations were tested at ~10 min per station. The last station tested was at 107 m DSF. After concluding the first successful VSP experiment during Expedition 356, the tools were pulled from the hole and were back at the surface at 1355 h. After rigging down the VSI tool string, the FMS-sonic tool string was assembled with the following tools: FMS, DSI, HNGS, EDTC, and LEH-QT. At 1550 h, the tool string was lowered without difficulty through the drill pipe to just above the seafloor. The logging tools were turned on and the hole was logged down to 770 m DSF. The hole was logged up to just below the end of pipe (89.4 m DSF). A second pass was made over the total length of the open hole. The tool string was pulled back to the surface at 2145 h on 11 September.
The drill string was pulled from the hole, and the seafloor was cleared at 2235 h. The upper guide horn was pulled, and the moonpool doors were opened to deploy the subsea camera system. A 50 m box survey of the seafloor was performed around Hole U1462C. After completing the survey, the subsea camera system was recovered, the remainder of the drill string was pulled back to the surface, and the vessel was secured for transit. The seafloor positioning beacon was recovered at 0214 h on 12 September, ending Site U1462. The total time spent on Hole U1462C was 193 h (8.05 days). The total time spent on Site U1462 was 330 h (13.5 days).
Lithostratigraphy
Lithostratigraphy of Site U1462 is divided into four units (Table T3; Figure F4). The lithostratigraphic units and their boundaries are defined by changes in lithology (identified by visual core description and smear slide observations), physical properties, color reflectance (L*, a*, and b*), petrographic section analyses, X-ray diffraction (XRD), and seismic data. The lithologic descriptions are based on sediments recovered from Holes U1462A (0–849.67 m core depth below seafloor [CSF-A]), U1462B (0–47.8 m CSF-A), and U1462C (33–946.09 m CSF-A). The holes were aligned based on drilling depth and correlation of lithologic boundaries (Figure F4).
Table T3. Lithostratigraphic unit summary, Site U1462. Download table in .csv format.
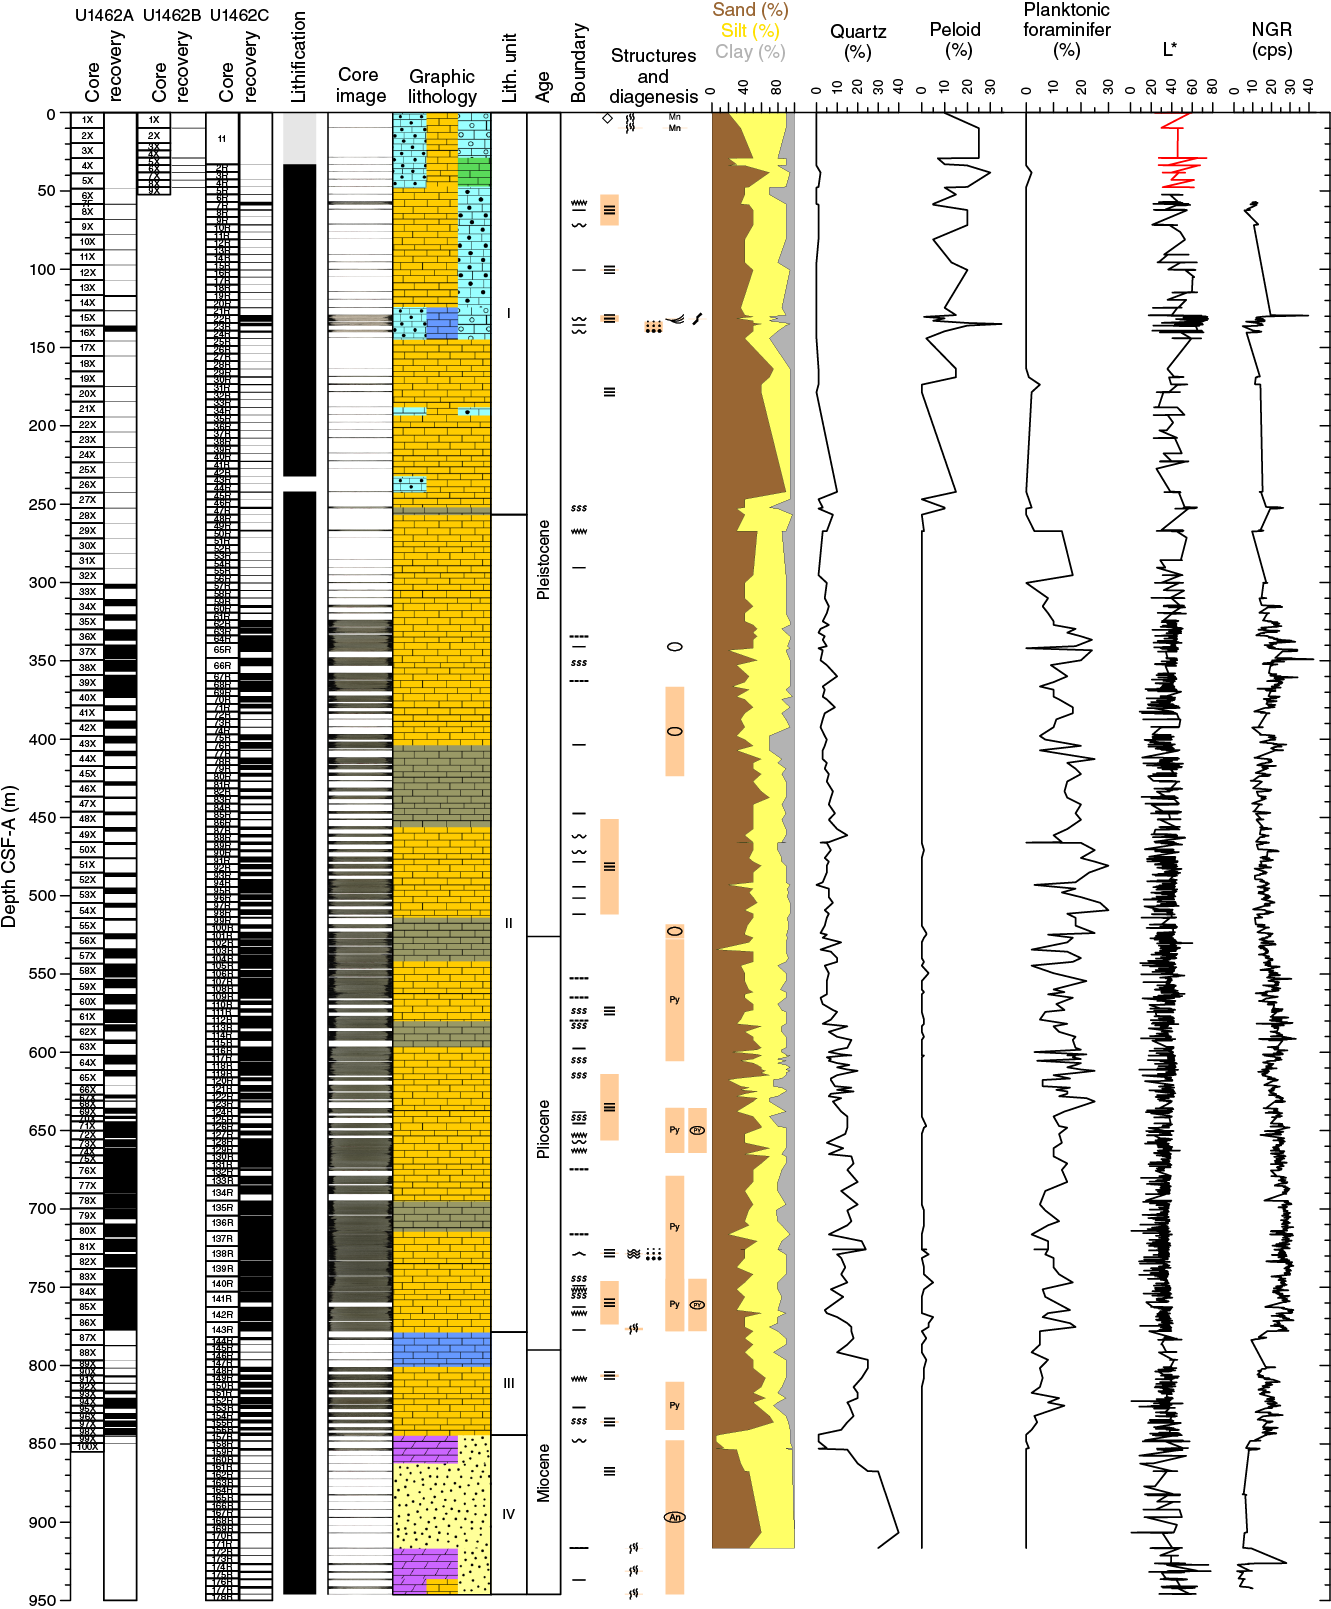
Figure F4. Lithostratigraphic and smear slide summary, Holes U1462A–U1462C.
Unit I
- Intervals: 356-U1462A-1X-CC, 0 cm, through 33X-CC, 0 cm; 356-U1462B-1X-CC, 0 cm, through 9X-CC, 20 cm; 356-U1462C-2R-CC, 0 cm, through 48R-CC, 0 cm
- Depths: Hole U1462A = 0–300.90 m CSF-A (300.90 m thick); Hole U1462B = 0–47.80 m CSF-A (47.80 m thick); Hole U1462C = 33.00–256.70 m CSF-A (256.70 m thick)
- Age: recent–early Pleistocene
- Lithology: lithified cream to light and dark greenish-gray nonskeletal grainstones and packstones with ooids and peloids alternating with lithified creamy-gray skeletal packstones and grainstones
- Core quality: severe drilling disturbance, fragmented and mainly nonrecovery
Recovery was very poor in the upper ~300 m of each hole and, with few exceptions, the lithologic description of the unit is based only on <30 cm thick core catcher (CC) sections that represent the only recovery from 4.7 m long cored intervals. Most of the recovered material consists of partially to fully lithified light grayish-green to dark greenish-gray nonskeletal grainstones to packstones with lesser amounts of skeletal packstone to grainstone. The grainstone consists mainly of medium sand–sized to coarse sand–sized grains with minor proportions of gravel-sized or very fine sand–sized grains. The grainstones contain macrofossils, peloids, and sometimes ooids (Figures F5, F6). Macrofossils are common and include bivalves, gastropods, barnacles, solitary corals, echinoderms, scaphopods, bryozoans, brachiopods, and serpulids. Small and larger benthic foraminifers are common, whereas planktonic foraminifers are scarce. Some sedimentary structures, such as planar laminations, slight to moderate bioturbation, and sharp to wavy gradational and bioturbated contacts, are present in the few cores with greater recovery, such as Cores 356-U1462A-16X and 356-U1462C-22X (Figures F7, F8). Sections 356-U1462B-1X-CC and 2X-CC contain solution cavities, manganese crusts, and intraclasts. Unit I is interpreted as a neritic facies.

Figure F5. A. Coarse bioclastic sediment. B. Skeletal and nonskeletal components. C. Glauconitized sediment. D. Sediment. E. Large quartz grains. F. Anhydrite crystals.

Figure F6. A. Skeletal packstone. B. Oolitic grainstone. C. Foraminiferal packstone. D. Packstone. E. Wackestone. F. Interlocked prismatic anhydrite.

Figure F7. Textures of nonskeletal ooid- and peloid-rich grainstones in Unit I.
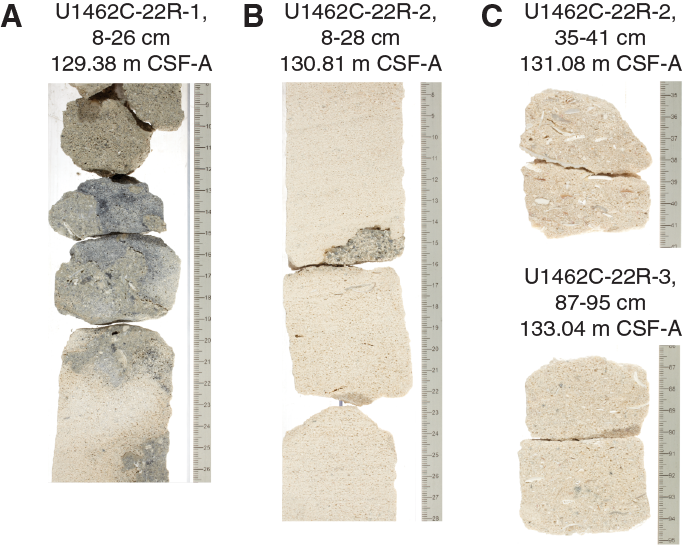
Figure F8. A. Nonskeletal ooid- and peloid-rich packstone. B. Massive ooid-rich nonskeletal packstone. C. Shell-rich beds with well-preserved macrofossils.
Both Holes U1462A and U1462C contain gaps in recovery (9.68 and 3.69 m, respectively) between the last occurrence of Unit I lithology and the start of Unit II. Following IODP protocol, it is assumed that the lithology of Unit I extends through these gaps of no recovery to the first occurrence of Unit II lithology. The base of Unit I is 44.2 m shallower in Hole U1462C than in Hole U1462A, an offset that may be due to differences in depositional environment between the two holes and/or to poor recovery of sedimentary material from the upper 300 m in both holes.
Due to poor recovery, Unit I sediments cannot be compared with magnetic susceptibility (MS) and natural gamma radiation (NGR) data. Moisture and density (MAD) data show relatively low porosity and high densities (see Physical properties).
Smear slides
Smear slide samples from Unit I are composed primarily of sand-sized skeletal and nonskeletal carbonate in a crystalline matrix consisting mainly of coarse micrite (~15–20 µm) and sparite (>25 µm; Figure F5A). Large (>350 µm) peloids and ooids are common throughout the unit, whereas only minor quantities of clay-sized particles occur (Figure F5B).
The microfossil assemblage consists mainly of benthic foraminifers and mollusk shell fragments. Echinoid spine fragments are a common (but minor) component, along with isolated occurrences of ascidian and fragmented sponge spicules. Planktonic foraminifers are rare in Unit I. Nannofossils also are rare, with lowest abundances in samples with a coarse matrix.
Throughout Unit I, all bioclasts are heavily overgrown by clear sparite (Figure F5A), reflecting strong cementation of the sediment. Glauconitized microfossils are absent, but detrital glauconite grains occur as sporadic accessories throughout the unit, and authigenic celestite is an enigmatic accessory. Siliciclastic components are rare and subrounded but are abundant in one interval in the lower part of the unit (Sample 356-U1462A-24X, 7 cm; ~213.5 m CSF-A).
Thin sections
Seventeen thin sections were prepared for Unit I (Table T4; Figure F6). Skeletal packstones with abundant phosphatized peloids are common in the upper part of the unit, whereas moderately to poorly sorted oolitic grainstones and skeletal packstones characterize the middle and lower parts of the unit.
Table T4. Thin section samples, Site U1462. Download table in .csv format.
Peloids are common in the upper skeletal packstones, which also contain abundant benthic foraminifers, mollusk fragments, red algae (Lithophyllum), and sand-sized bivalve and echinoderm fragments (Figure F6A). Superficial ooids (i.e., with only one or very few laminae) and planktonic foraminifers are rare, and a single coral fragment (Acropora) was observed. The peloids and skeletal fragments are cemented by isopachous fibrous cement. Glauconite grains are rare (<3%). Moderately sorted fine to medium sand–sized peloids and ooids are the most abundant nonskeletal particles in the middle of the unit, whereas the most abundant skeletal components are small benthic foraminifers, coralline algae, and bivalve and echinoderm fragments. Most ooids are single spheres, and compound ooids are rare. Where the primary texture is preserved, the ooids have concentric tangential laminae (Figure F6B). In many ooids, the primary texture of the laminated cortex is partially replaced by phosphate and micrite or has been dissolved and cemented by medium-grained crystalline sparite. Most peloids and skeletal components (e.g., benthic foraminifers, bivalve fragments, and coralline algae) in intervals containing ooids are phosphatized and manganese coated. Occasional intraclasts (bioclasts in a micritic matrix) are present. Throughout the middle and lower parts of the unit, pore spaces are usually filled with equant sparitic cement and rarely with celestite cement. Porosity is medium to high, mainly due to the dissolution of ooids.
XRD
Low-Mg calcite, averaging 60%, is the main carbonate mineral in the seven samples analyzed from Unit I (Table T5). Aragonite (21%) and dolomite (4%) are less abundant. High-Mg calcite is present only in samples shallower than 59 m CSF-A (which have a content of 20%). The average quartz content is 6%. The dolomite is Ca rich with a calculated MgCO3 content of ~42 mol%. In one sample, celestite is present in trace amounts (1%).
Table T5. Semiquantitative XRD analysis of dominant mineral phases, Site U1462. Download table in .csv format.
Unit II
- Intervals: 356-U1462A-33X-CC, 0 cm, through 87X-CC, 0 cm; 356-U1462C-48R-CC, 0 cm, through 143R-5, 57 cm
- Depths: Hole U1462A = 300.90–777.30 m CSF-A (476.40 m thick); Hole U1462C = 256.70–777.88 m CSF-A (521.18 m thick)
- Age: early Pleistocene–early Pliocene
- Lithology: mainly lithified olive-gray to dark greenish-gray packstone grading into interbedded wackestone; variable in color, grain size, fossil content and abundance, bioturbation, sedimentary contacts and structures, and the amount of pyrite
- Core quality: drilling disturbance, typically fragmentation, varies from none to complete destruction, with 0%–100% recovery
The transition from Unit I to Unit II is characterized by the disappearance of large (>250 µm) peloids, a distinct increase in planktonic foraminifers and siliciclastic components, and a transition from neritic to hemipelagic facies. Compositional changes, such as siliciclastic content and composition of the fossil assemblage, occur from the upper to the lower parts of Unit II. These compositional differences are apparent in smear slides and thin sections but are not discernible in visual core descriptions.
Unit II is composed largely of lithified packstones with some wackestone intervals (Figure F4). Grains vary from silt- and very fine sand sized to medium sand sized. The primary color of both packstones and wackestones is olive-gray, but darker shades (e.g., dark greenish gray) become more common with depth. Sedimentary features, including bioturbation, sedimentary structures, contacts, and diagenetic structures, are quite variable throughout Unit II, and these features are suggestive of multiple episodes of sediment transport of varying intensity and mixing. Gravitational flows, recognized by sharp basal contacts with normal grading above, are rarely preserved, and the coarser transported sand grains have been well mixed by common to complete bioturbation (Figure F9). This mixing of coarse and fine sand–sized grains is consistent with biostratigraphic observations of the presence of species with slightly shallower water origins in the deeper benthic foraminiferal assemblages (see Biostratigraphy and micropaleontology). Evidence for gravitational flows and other small-scale mass-transport deposits is common toward the base of Unit II. Unit II in Holes U1462A and U1462C appears gradational, from packstone with very fine sand–sized grains to packstone with coarse sand–sized grains toward the base of Unit II. The occurrence of quartz is also gradational, becoming more abundant toward the base of Unit II in both Holes U1462A and U1462B.
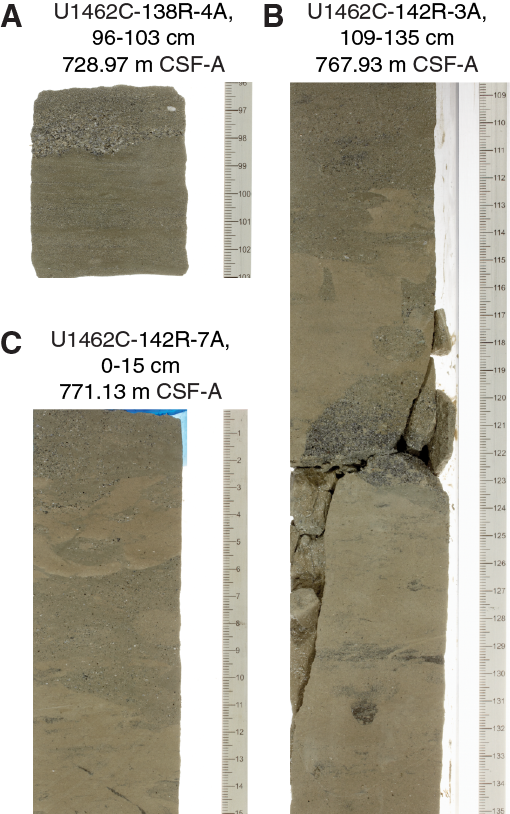
Figure F9. Gravitational flows in Units II and III, Hole U1462C.
Diverse and abundant macrofossils in the upper part of Unit II include bivalves, gastropods, scaphopods, bryozoans, and echinoderms, but bioclasts (mainly bivalve fragments) become much less common with depth. In contrast, small benthic foraminifers are common throughout Unit II. Bioturbation is variable, ranging from slight to complete, and generally increases in intensity with depth. Sedimentary features, such as laminations, grading, and contact surfaces (e.g., scoured, erosive, sharp, and bioturbated), and the abundances of pyrite nodules and disseminated pyrite grains all increase with depth in Unit II and are best preserved above the boundary of Unit III (Figure F9).
The sediment composition and characteristics suggest that Unit II was deposited in a hemipelagic setting. The unit is lithostratigraphically similar to Unit III at Site U1461 (i.e., mainly lithified greenish-gray to olive-gray wackestones with slight to common bioturbation, nodular and disseminated pyrite, sparse to common benthic foraminifers, and sedimentary features characteristic of mass flows). Calcium carbonate content decreases in Unit II (from 89.4 to 52.5 wt%) (Figure F10) and MS values increase. The upper part of Unit II corresponds to relatively low NGR and decreasing porosity, whereas in the lower part relatively high NGR and constant porosity were recorded (Figure F10).
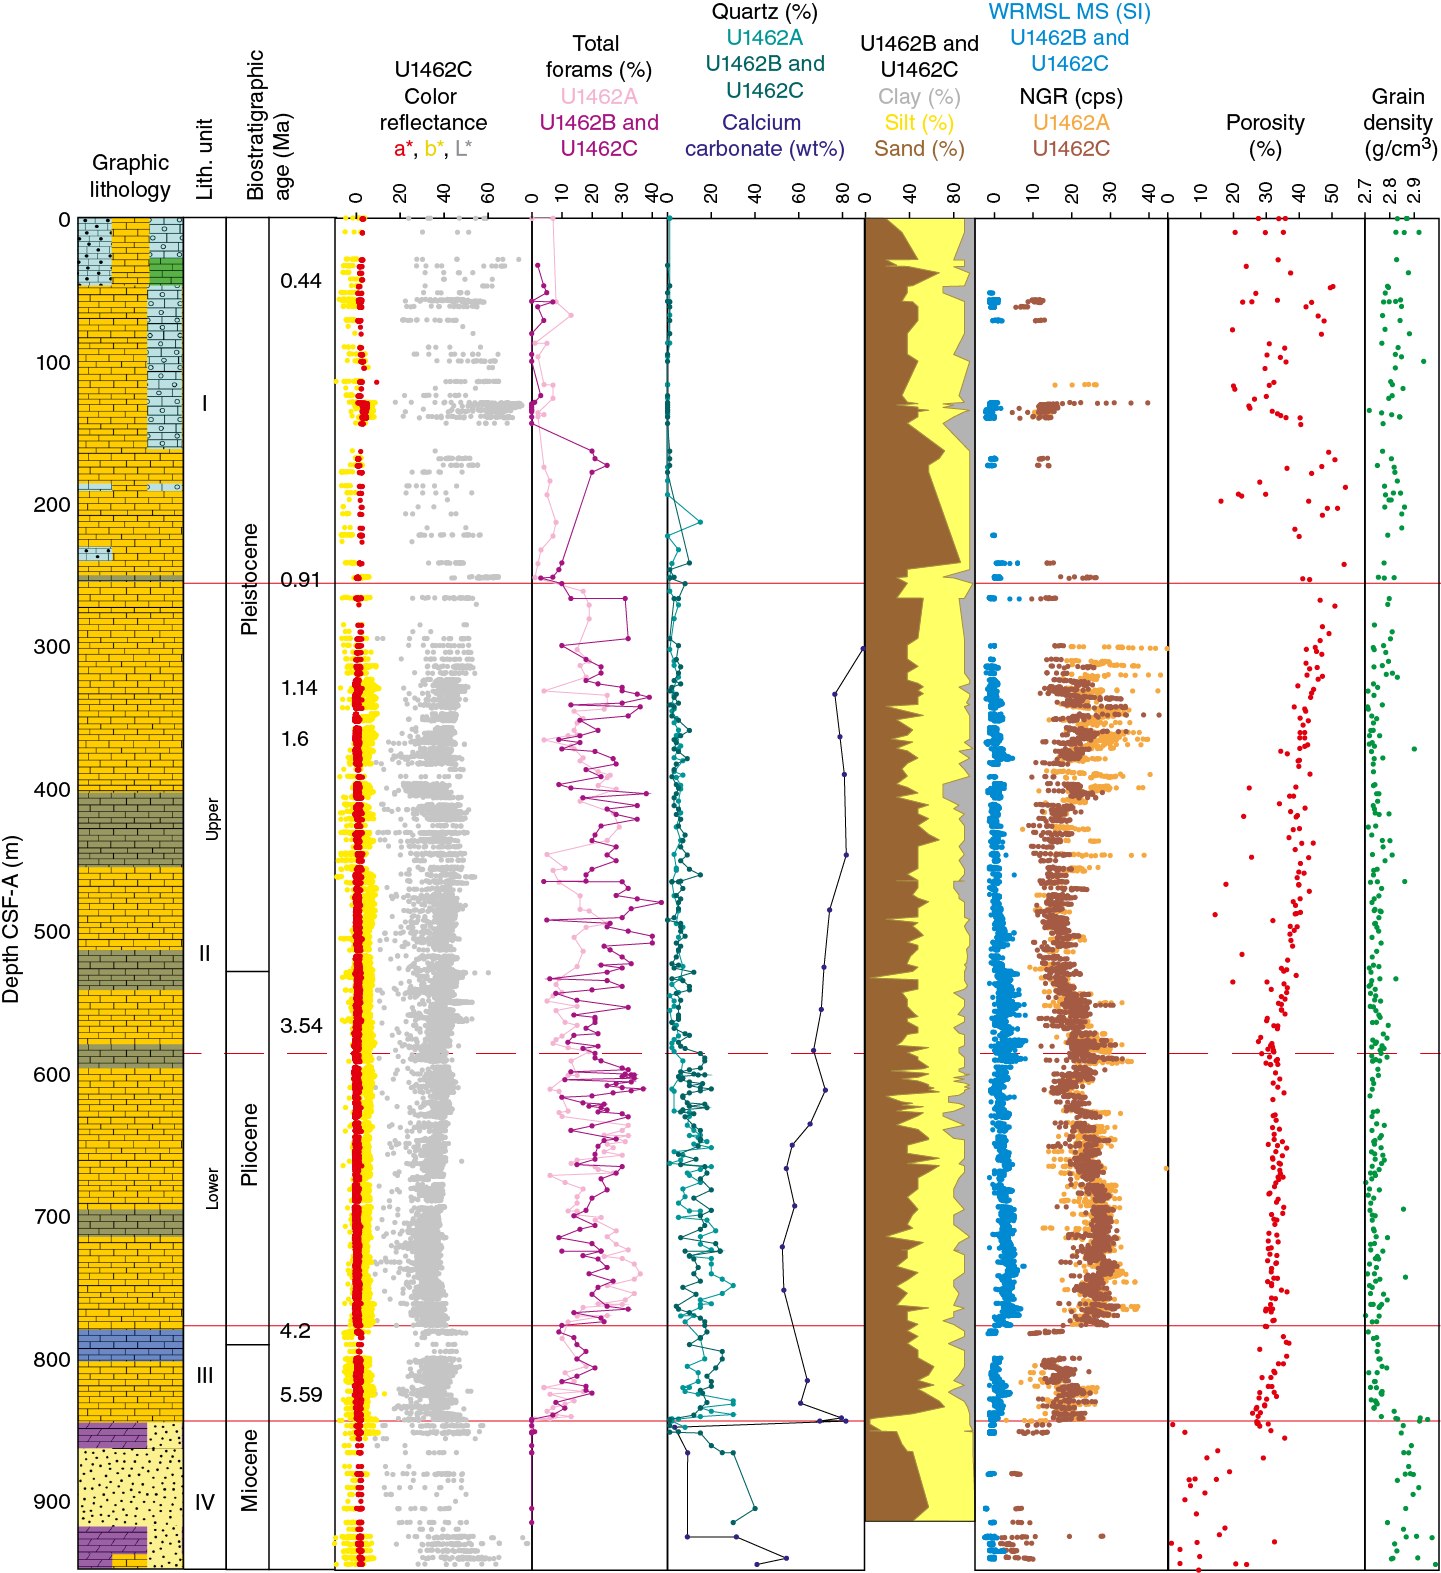
Figure F10. Summary of synthetized correlation of lithostratigraphy at Site U1462.
Smear slides
The upper part of Unit II (256.7–586.88 m CSF-A) is dominated by sand- and coarse silt–sized microfossils within a matrix of fine silt– to clay-sized micrite and low abundances of clay minerals. Larger sparite cement occurs throughout the interval (Figure F5C). Small (<100 µm), likely reworked, peloids are present in some samples. Quartz and other siliciclastic grains are minor components that increase slightly with depth. Zircon and apatite are common accessory heavy minerals. The fossil assemblage is dominated by planktonic foraminifers with less abundant benthic foraminifers and shell fragments and small numbers of echinoderm fragments. Nannofossils are usually very minor components of the fine silt– to clay-sized fractions but increase in abundance slightly with depth. Sparitic overgrowths are present on all microfossils. Authigenic glauconite and glauconitized bioclasts (Figure F5C) are abundant and increase with depth. Framboidal pyrite is a common accessory component, with occasional occurrences of authigenic anhydrite, gypsum, and celestite.
In the lower part of Unit II (586.88–777.88 m CSF-A), quartz and other siliciclastics, as well as fine silt– and clay-sized sediments and clay minerals, increase markedly (Figure F5D). The microfossil assemblage is dominated by small (50–100 µm) planktonic foraminifers with benthic foraminifers, unidentified shell fragments, and rare echinoderm spines as minor components. Nannofossils increase in abundance, mirroring the increased siliciclastic content. Calcite overgrowth of bioclasts is moderate to heavy, although some planktonic and benthic foraminifers are well preserved in several samples. Glauconitized bioclasts and authigenic glauconite are much less abundant than in the upper part of the unit but are present throughout. Detrital glauconite remains a common accessory component. Pyrite content is higher than in the upper part of the unit and often occurs as larger aggregates. Dolomite is a common accessory component, with two more heavily dolomitized intervals near the base of Unit II (Samples 356-U1462C-127R-2, 71 cm, and 139R-2, 71 cm). The dolomitic intervals are not present in Hole U1462A.
Thin sections
A total of 24 thin sections prepared from Unit II (Table T4; Figure F6) show wackestones to packstones with skeletal carbonate microfacies throughout the unit. Skeletal particles are mainly planktonic (Globigerinoides) and benthic (e.g., Amphistegina, Cibicidoides, Cibicides, Textularia, and Sphaeroidina bulloides) foraminifers. Echinoderm fragments (occasionally with syntaxial calcite overgrowth), bivalve fragments, and scaphopods are common in the matrix. Foraminiferal tests are strongly recrystallized. Glauconite grains are present but sparse throughout the unit and occasionally fill the chambers of foraminifers. Occasionally, the micritic matrix shows early stages of neomorphism. Bioturbation increases with depth, and burrows are mostly filled with fine-grained quartz and micritic matrix. Pyrite is also common in burrows. Silt-sized angular quartz is common (estimated at 5%–10%) throughout the unit, but increases rapidly (up to ~30%) in the lower part of the unit. Interparticle and intraparticle porosity are low, and pore spaces are usually filled with equant spar cement or, rarely, with celestite cement.
XRD
Low-Mg calcite, averaging 73%, is the main carbonate mineral in all samples from the upper part of Unit II (labeled II1; Table T5). Minor amounts of aragonite are present in two samples (356-U1462A-43X-1, 49 cm, and 43X-1, 72 cm [~398 m CSF-A]). Celestite is the dominant (25%) noncarbonate mineral in three samples (356-U1462C-60R-1, 51 cm, 60R-CC, 1 cm, and 356-U1462A-36X-2, 54 cm [~315 and 332.04 m CSF-A]), where it occurs as cement within burrows or as concretions, and is present in low amounts (<5%) in two other samples (356-U1462A-51X-1, 65 cm [476.15 m CSF-A], and 356-U1462C-103R-2, 70 cm [534.42 m CSF-A]). The average quartz content is 19%. Clay minerals of the illite and kaolinite groups are present throughout the unit. Dolomite is usually present with an average content of 5%. The dolomite is Ca rich with a calculated MgCO3 content of ~42 mol%.
The lower interval of Unit II (labeled II2) is characterized by an increase of the average quartz content to 43% and a decrease of the low-Mg calcite content to 54%. The average dolomite content declines slightly to 3%. Celestite occurs in low amounts (<5%) in two samples (356-U1462A-64X-3, 60 cm, and 85X-2, 51 cm [605.03 and 759.69 m CSF-A, respectively]). Anhydrite is present in one sample (4%; Sample 356-U1462A-84X-4, 63 cm [762.36 m CSF-A]). Clay minerals (illite and kaolinite groups) are present throughout the lower part of Unit II. The dolomite is Ca rich with a calculated MgCO3 content of ~43 mol%.
Unit III
- Intervals: 356-U1462A-87X-CC, 0 cm, through 98X-3, 25 cm; 356-U1462C-143R-5, 57 cm, through 157R-1A, 68 cm
- Depths: Hole U1462A = 777.30–843.03 m CSF-A (65.73 m thick); Hole U1462C = 777.88–843.48 m CSF-A (65.60 m thick)
- Age: early Pliocene–late Miocene
- Lithology: lithified packstone with quartz and sandstone
- Core quality: severe drilling disturbance, primarily due to no recovery
The top of Unit III is marked by a continuing increase in quartz from Unit II. Cores containing more than 50% quartz are described as siliciclastic sandstones (see Lithostratigraphy and sedimentology in the Expedition 356 methods chapter [Gallagher et al., 2017a]). In Hole U1462A, Unit III mainly consists of lithified gray to olive-gray packstone with fine to medium sand–sized quartz and various macrofossils, including bivalves, gastropods, bryozoans, echinoderms, and small benthic foraminifers. In Hole U1462C, the transition between Units II and III is characterized by a change in lithology from packstone to grainstone and a sharp contact consisting of a 20 cm thick pyrite-rich cemented interval below which the lithology changes to grainstone (Figure F11). X-ray fluorescence (XRF) elemental analyses show increased Fe content at the top of the contact and increased concentrations of Ti, Ca, K, and Al within the cemented interval below the contact (Table T6). The grainstone forms a 20 m thick interval. Below this interval, the lithology changes back to packstone with medium to coarser sand–sized grains and common pyrite. The packstone transitions to dark greenish-gray coarse-grained poorly sorted sandstone near the base of the unit, where only large benthic foraminifers (LBFs) are common. XRF analyses show that Si (weight percent) increases during the transition. Taxa and abundances of macrofossils in Hole U1462C are similar to those in Hole U1462A. Bioturbation is more severe in Hole U1462C than in Hole U1462A, whereas sedimentary features (e.g., parallel laminations, grading, and bioturbated contacts) are similar throughout Unit III in both holes. The main difference between Units II and III is that the sediment is generally coarser grained in Unit III than in Unit II, especially in the lower interval of Unit III. Gravitational flow deposits containing coarse sand–sized pyrite, benthic foraminifers, and carbonate grains lie above sharp basal contacts that, in general, are intensely bioturbated (Figure F9).
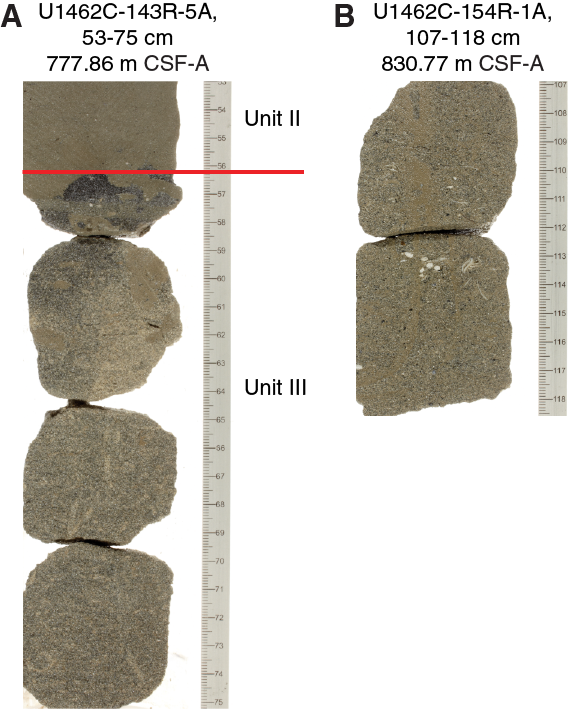
Figure F11. Unit II/III boundary, Hole U1462C.
Table T6. Semiquantitative XRF analysis of Units II and III, Hole U1462C. Download table in .csv format.
Unit III corresponds to relatively low MS, low NGR, and decreasing porosity. Calcium carbonate content increases in Unit III after a continuous decrease in Unit II, reaching almost 80 wt% near the Unit III/IV boundary (Figure F10).
Smear slides
Siliciclastic grains increase in abundance and size from Unit II to the top of Unit III (Figure F5E). Large (>500 µm) quartz grains occur throughout Unit III, together with increased amounts other siliciclastic components (e.g., feldspar, mica, and amphibole). The fossil assemblage differs markedly from that in Unit II, with abundant mollusk shell fragments and large unidentified bioclasts at the top of the unit and an associated decline in planktonic foraminifers. Conversely, the nannofossil and benthic foraminifer contents of Unit III are similar to the lower part of Unit II.
Glauconitization of planktonic and benthic foraminifers and the abundance of authigenic glauconite both decline slightly compared to Unit II, but detrital glauconite grains remain common. Framboidal pyrite and sparite are slightly more abundant in Unit III than in Unit II. Alteration of microfossils by calcite overgrowth is common, with particularly heavy alteration of benthic foraminifers and some shell fragments. Dolomite content at the top of Unit III is similar to that in Unit II but increases slightly with depth in Unit III. In the lowermost core from Unit III, dolomite increases markedly to become a dominant component (Sample 356-U1462A-98X-2, 72 cm).
Thin sections
Four thin sections from Unit III (Figure F6) consist exclusively of packstones with abundant silt-sized quartz grains. Bioclasts (i.e., planktonic and benthic foraminifers) are rare in these sections.
XRD
In the two samples from Unit III (Table T5), the dominant mineral is quartz (47%), followed by low-Mg calcite (44%) and dolomite (7%). The samples also contain clay minerals (illite and kaolinite groups). The dolomite is Ca-rich with a calculated MgCO3 content of ~45 mol%.
Unit IV
- Intervals: 356-U1462A-98X-3, 25 cm, through 100X-CC, 17 cm; 356-U1462C-157R-1, 68 cm, through 178R-CC, 39 cm
- Depths: Hole U1462A = 843.03–849.67 m CSF-A (6.57 m thick); Hole U1462C = 843.48–946.09 m CSF-A (102.61 m thick)
- Age: Miocene
- Lithology: dolostone and quartz-rich sandstone with anhydrite nodules
- Core quality: severe drilling disturbance, primarily due to fragmentation
Unit IV is composed primarily of dolostone and quartz-rich sandstone and is characterized by common anhydrite nodules and associated chickenwire structures (Figures F12, F13). The start of Unit IV is defined as the first appearance of macroscopic anhydrite nodules and an increase in dolomite (seen in thin sections). Unit IV varies in color from light brown and gray to white (anhydrite nodules and anhydrite rock) with generally coarse to medium sand–sized grains and brief intervals of fine sand–sized grains. Bioturbation is slight to moderate but sporadic throughout the unit. Burrows are often filled with dolomite. Macrofossil fragments occur in low numbers throughout the unit but are more common toward the top (Figure F12). Macrofossils include solitary corals, bivalves, echinoderms, small benthic foraminifers, and fossil molds (e.g., gastropods and bivalves). Parallel laminations are more frequent in the upper part of the unit, whereas dissolution cavities and intermittent moldic porosity appear in the lower part (Figure F13). Contact surfaces are uncommon but, if present, typically form sharp subhorizontal surfaces. Pyrite grains are intermittently common and sometimes rim intraclasts, quartz, and anhydrite grains.
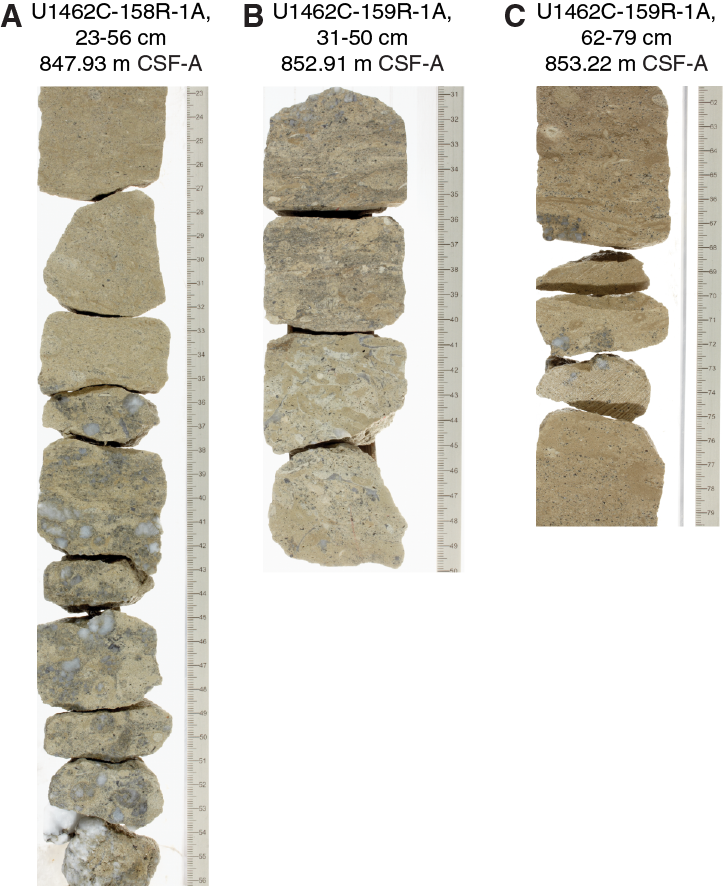
Figure F12. Unit IV lithology, Hole U1462C.

Figure F13. Unit IV lithofacies, Hole U1462C.
Unit IV shows a strongly decreased calcium carbonate content from 70–80 wt% at the top of the unit to 3.3 wt% in Core 356-U1462A-100X (Figure F10; also see Geochemistry and Figure F26) and also corresponds with low MS, low NGR, low porosity, and high grain densities (Figure F10).
Smear slides
Dolomite-rich packstones with sand-sized (>300 µm) quartz and anhydrite grains (Figure F5F) alternate with gray sandstones of well-sorted large-grained (>400 µm) quartz in an anhydrite matrix. Other siliciclastic components do not increase from Unit III. The dolomitic packstone matrix changes from fine crystalline euhedral rhombohedra in the uppermost sample to rounded and partially fractured grains in lower samples, indicating increasing cementation with depth. Microfossils and nannofossils are rare throughout the unit. Microfossils only occur in the uppermost samples of Unit IV, generally cannot be identified, and when present, are heavily altered by dolomitic overgrowth. Microfossils and nannofossils are both absent from the anhydrite-rich sandstone intervals. Framboidal pyrite is a common accessory throughout the unit.
Thin sections
Seventeen thin sections from Unit IV (Table T4) represent three main lithofacies (Figure F4). The upper lithofacies consists of dolomitic wackestone with a relatively low abundance of quartz (estimated 10%–15%) and high anhydrite replacement (pebble-sized nodules with few relict quartz grains) in a micritic matrix. In the middle lithofacies, quartz grains increase downhole and become the main components in a matrix that still consists of micrite. Anhydrite replacement, especially of the carbonate components, is high. Quartz grains increase in size and abundance toward the bottom part of the middle interval and the sandstones change to gravelly sandstones with 80%–90% quartz. The lower lithofacies consists of packstone with foraminifers and sand-sized quartz. Bioclastic components, including coralline red algae and foraminifers, are the dominant particles. Quartz content and anhydrite replacement textures vary downhole from 20% to 5% and 10% to 20%, respectively.
XRD
Because samples from Unit IV were predominantly taken from anhydrite-rich intervals in the core, eight of the nine samples from Unit IV (Table T5) consist of >50% anhydrite with variable amounts of dolomite, low-Mg calcite, and quartz. The ninth sample is dominated by quartz (43%), followed by anhydrite (35%) and dolomite (22%). The dolomite is Ca rich with a calculated MgCO3 content of ~46 mol%.
Biostratigraphy and micropaleontology
Core catcher samples from Site U1462 were processed at 20 m resolution. Nannofossil analyses were done at 10 m resolution in selected intervals to better constrain biostratigraphic datums between Holes U1462A, U1462B, and U1462C, and additional benthic foraminiferal samples were taken from selected intervals when specific assemblages were absent from CC samples.
The upper 390 m of Site U1462 contains Pleistocene sediments (<1.93 Ma; Biozones NN19–NN21 and Pt1a–Pt1b) that yielded very rare nannofossils and planktonic foraminifers. The top occurrence of Pseudoemiliania lacunosa at 42.67 m CSF-A (0.44 Ma) and the top occurrence of Reticulofenestra asanoi at 252.5 m CSF-A (0.91 Ma) are at similar depths as at Site U1461 (Figure F14), whereas older nannofossil (>1.6 Ma) and planktonic foraminiferal (>1.64 Ma) datums show depth offsets between these sites (Figures F14, F15B). The Pliocene/Pleistocene boundary is between 527.5 and 539.97 m CSF-A, based on the (rare) presence of Discoaster surculus (2.49 Ma, top of Biozone NN16) and the planktonic foraminifer Globorotalia limbata (2.39 Ma, top of Biozone PL5; Gradstein et al., 2012).
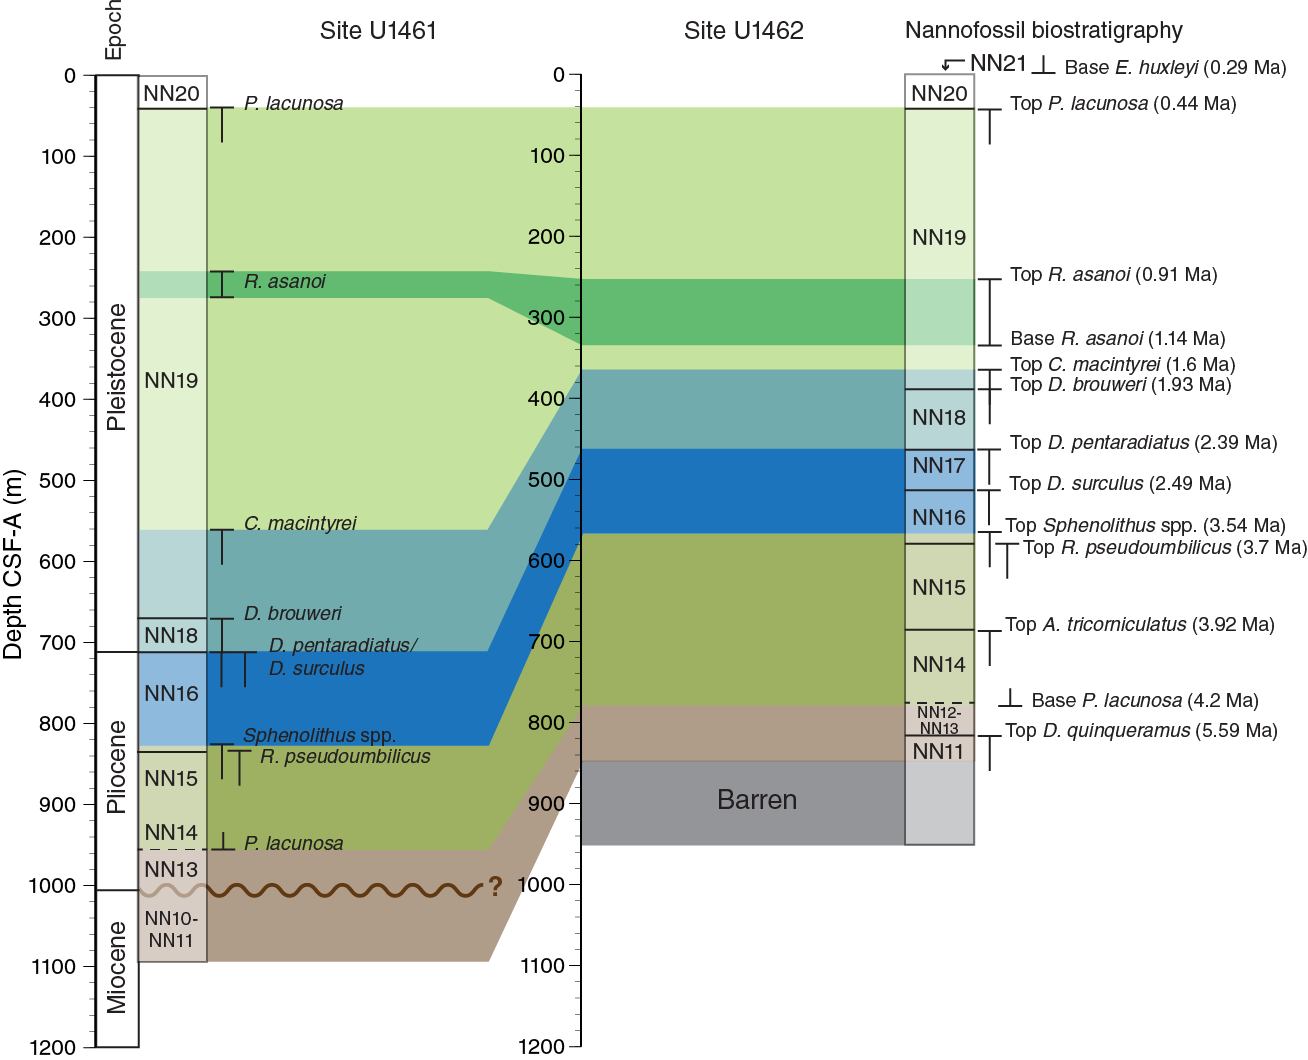
Figure F14. Correlation between Sites U1461 and U1462 based on calcareous nannofossil biostratigraphy.

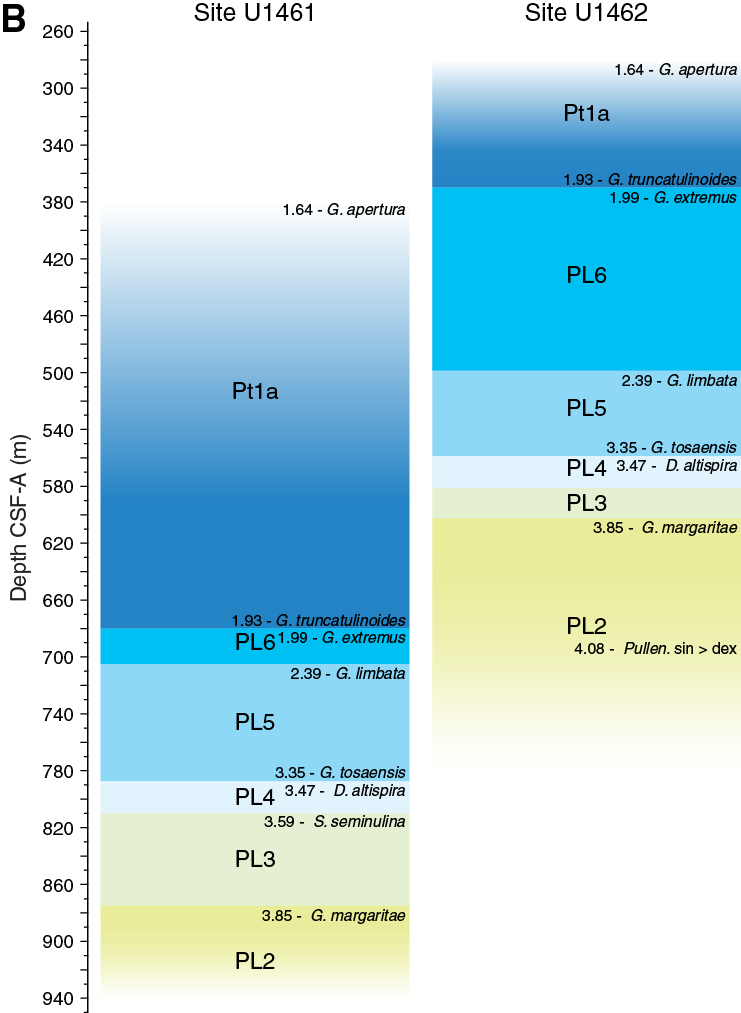
Figure F15. Planktonic foraminiferal marker species ranges for the earliest Pleistocene–Pliocene interval.
Microfossil and planktonic foraminiferal abundance and preservation improve in the early Pleistocene–Pliocene and the earliest Pliocene–late Miocene intervals between ~325 m CSF-A (Samples 356-U1462A-35X-CC and 356-U1462C-62R-CC) and 827 m CSF-A (Samples 356-U1462A-95X-CC and 356-U1462C-153R-CC). Despite the improvement in preservation and abundance of planktonic foraminifers at 368 m CSF-A, both are still relatively poor compared to Sites U1460 and U1461. The highest diversity is encountered in samples deeper than 420 m CSF-A (Sample 356-U1462A-87X-CC), which contain up to 90% planktonic foraminiferal taxa. As the general preservation is poorer than at previous sites, some of the biozone markers from the previous sites, such as G. limbata, Pulleniatina primalis, and Sphaeroidinellopsis seminulina, are rare and often deeper than their expected stratigraphic position. Nevertheless, the early Pleistocene–Pliocene sequence can be consistently identified using the more common biozone markers. Accordingly, the early Pleistocene/Pliocene section at Site U1462 (250–300 m thickness) can be correlated with Site U1461 (200 m thickness), but it occurs ~250 m shallower than at Site U1461 (Figure F15B). Deeper than ~820 m CSF-A, planktonic foraminiferal abundance markedly decreases and samples are mostly barren. The bottoms of Holes U1462A (849.67 m CSF-A) and U1462C (946.09 m CSF-A) are barren of microfossils, but Samples 356-U1462A-91X-CC through 95X-CC (807.55–827.46 m CSF-A) and 356-U1462C-149R-CC through 153R-CC (809.15–827.65 m CSF-A) yield a late Miocene age based on the presence of the nannofossils Discoaster quinqueramus (defining the Biozone NN11/NN12 boundary at 5.59 Ma) and Reticulofenestra rotaria (short range within Biozone NN11B; Young, 1998).
Samples from Holes U1462A–U1462C contain between 9% and 100% benthic foraminifers, with Cibicides spp. and Cibicidoides spp. as the most common taxa. Seven assemblages can be identified based on the abundance of Operculina spp. and Discorbinella spp. (Assemblage 1); Amphistegina spp. and Elphidium spp. (Assemblage 2); Melonis spp., Discorbinella spp., and Nonionoides spp. (Assemblage 3); Lenticulina spp., brizalinids, and bolivinids (Assemblages 4, 6, and 7); Pseudorotalia spp., Siphogenerina raphana, and Neoeponides margaritifer (Assemblage 5); and Uvigerina spp. (Assemblage 6). In the samples, 1–36 species are present, and the assemblages show deepening paleobathymetry downhole from an inner shelf setting (Assemblages 1–3), to a middle to outer shelf setting (Assemblages 3–5), and finally an outer shelf to upper bathyal/deeper setting (Assemblages 6–7) but interspersed with transported shallow taxa (Assemblage 7). Preservation varied from very good to poor throughout the site and was affected by fragmentation, abrasion, and encrustation.
Calcareous nannofossils
A total of 155 smear slides were examined for biostratigraphic marker species and common taxa. Calcareous nannofossils recovered in Holes U1462A and U1462C represent a complete stratigraphic succession from the late Miocene to Late Pleistocene (Biozones NN11–NN21; Table T7; Figures F14, F16). The bottom of Hole U1462B (47.8 m CSF-A) has a Pleistocene age, based on the presence of P. lacunosa (>0.44 Ma; Biozone NN19). Calcareous nannofossils are (very) rare to abundant with poor to good preservation in samples from the Pleistocene section and are rare to dominant with moderate to good preservation in the late Miocene–Pliocene sections (Table T8; Figure F16). Specimens of the genus Discoaster have poor to moderate preservation, commonly with overgrowth and broken rays, making identification to species level difficult. Barren intervals were found within the upper 30 m CSF-A in Hole U1462B, the bottom of Hole U1462A (844.8 m CSF-A; Sample 356-U1462A-99X-CC), and from 844.69 m CSF-A to the bottom of Hole U1462C.
Table T7. Calcareous nannofossil and planktonic foraminifer datums, Site U1462. Download table in .csv format.
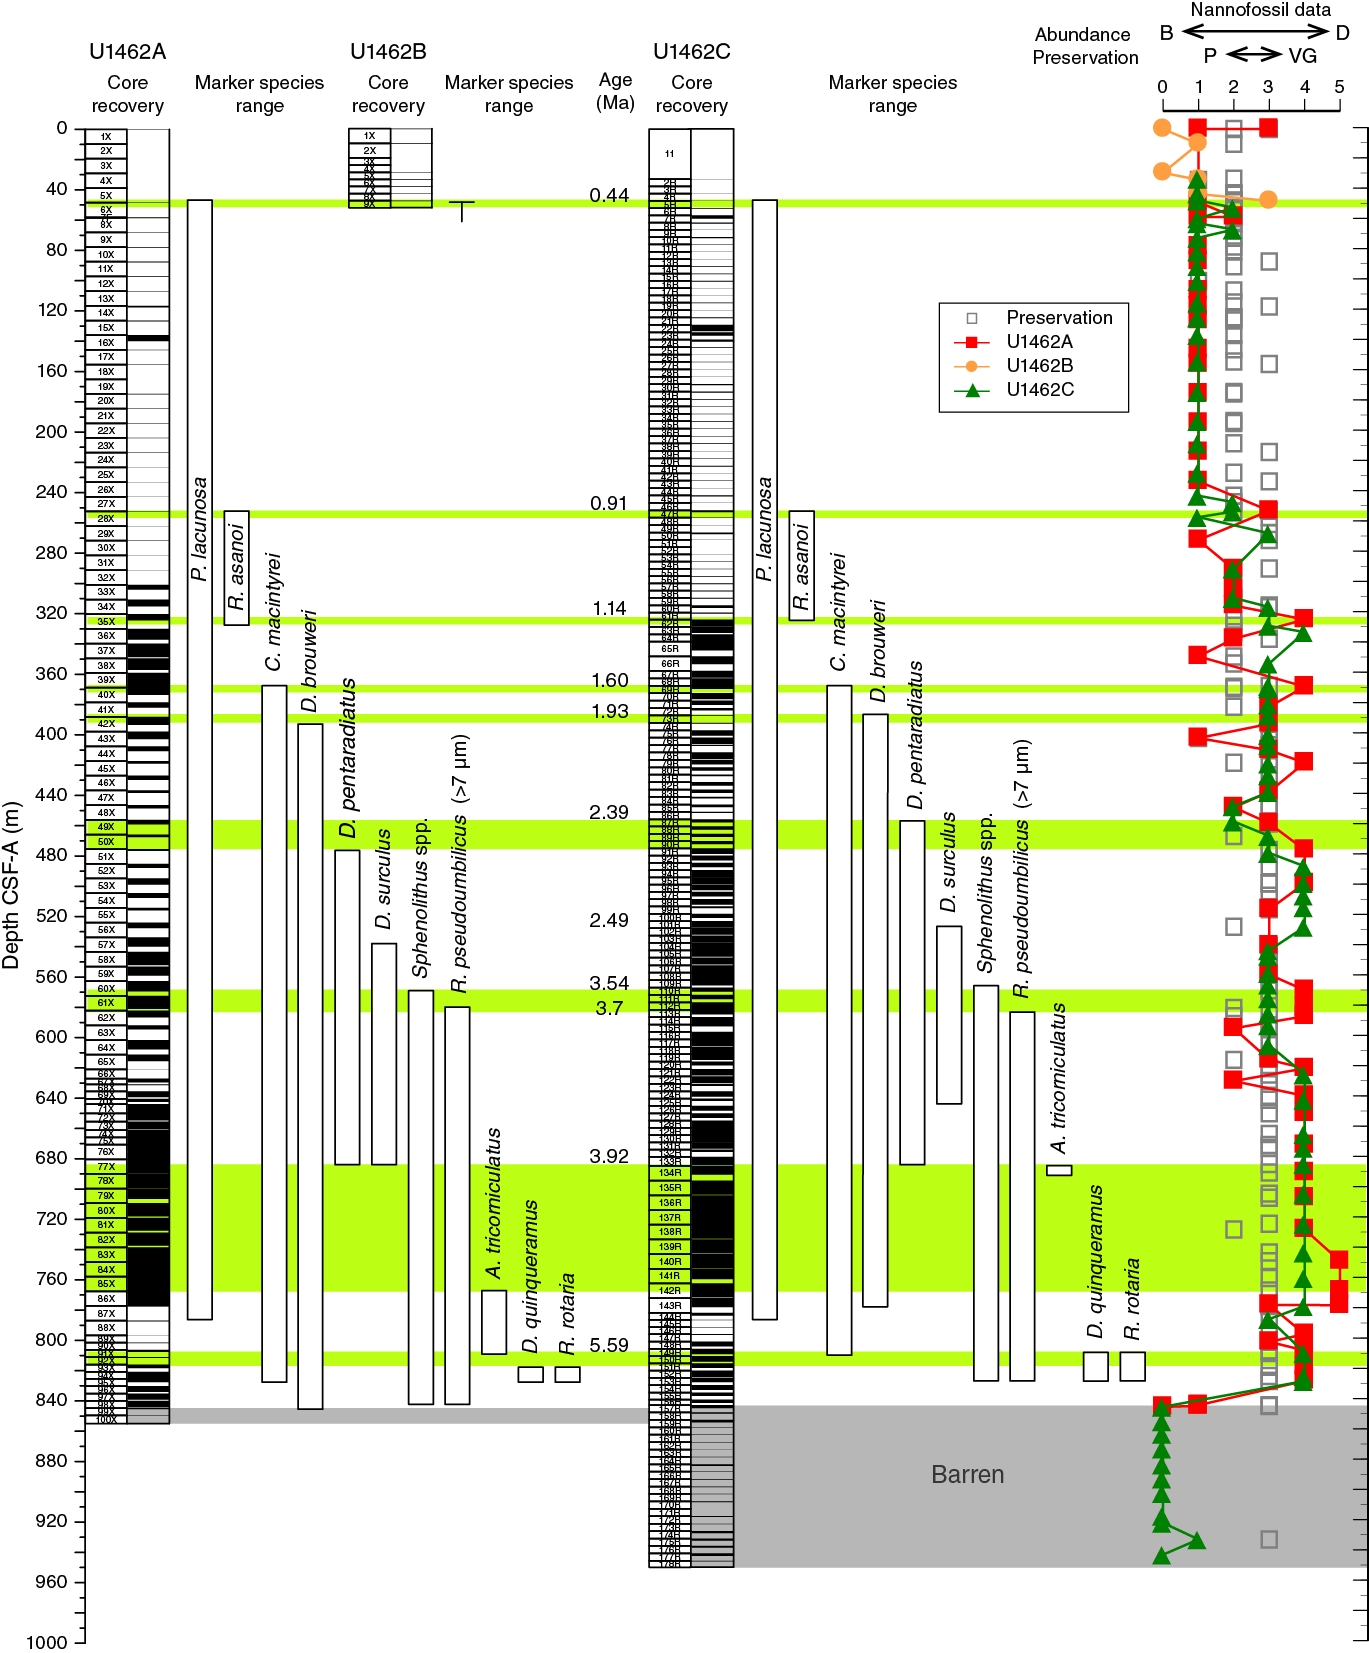
Figure F16. Depth ranges of late Miocene to Middle Pleistocene calcareous nannofossil age markers.
Table T8. Calcareous nannofossil abundance and range charts, Site U1462. Download table in .csv format.
Pleistocene
Calcareous nannofossil Biozone NN21 is recognized based on the occurrence of Emiliania huxleyi in Sample 356-U1462A-1X-CC (0.25 m CSF-A) and has a Late Pleistocene age (<0.29 Ma; Figures F14, F16). The top of P. lacunosa (Figure F17A), which defines the Biozone NN19/NN20 boundary (0.44 Ma), is in Samples 356-U1462A-11X-CC (87.73 m CSF-A), 356-U1462B-9X-CC (53.2 m CSF-A), and 356-U1462C-4R-CC (42.67 m CSF-A). The species R. asanoi (Figure F17B) is in Samples 356-U1462A-28X-CC through 35X-CC (252.5–324.4 m CSF-A) and 356-U1462C-47R-CC through 62R-CC (253.01–328.55 m CSF-A), constraining the age of this depth interval to 0.91–1.14 Ma (within Biozone NN19; Figure F16). The top occurrence of Calcidiscus macintyrei (1.6 Ma; Figure F17C) is in Samples 356-U1462A-39X-CC (368.81 m CSF-A) and 356-U1462C-68R-CC (368.29 m CSF-A), indicating the basal part of Biozone NN19. The top of Discoaster brouweri in Samples 356-U1462A-42X-CC (393.35 m CSF-A) and 356-U1462C-73R-CC (387.61 m CSF-A) represents the upper boundary of Biozone NN18 (1.93 Ma; Figure F17D). The Biozone NN18/NN17 boundary (2.39 Ma) is defined by the top occurrence of Discoaster pentaradiatus (Figure F17E) in Sample 356-U1462A-51X-CC (476.65 m CSF-A) in Hole U1462A and Sample 356-U1462C-87R-CC (457.92 m CSF-A) in Hole U1462C (Figures F14, F16).

Figure F17. Calcareous nannofossils, Site U1462.
The Pleistocene assemblages are characterized by different (size defined) morphotypes of Gephyrocapsa spp., P. lacunosa, and Reticulofenestra spp. Other common taxa include Calcidiscus leptoporus, Umbilicosphaera sibogae, Syracosphaera pulchra, Pontosphaera spp., and Helicosphaera spp. The presence of moderately preserved (broken) specimens of Coccolithus pelagicus among well-preserved small placoliths between 337 and 476 m CSF-A in Hole U1462A and between 369 and 467 m CSF-A in Hole U1462C may indicate reworking.
Pliocene
The top of Biozone NN16, which includes the Pliocene/Pleistocene boundary, is marked by the presence of D. surculus (2.49 Ma; Figure F17F) at 539.97 m CSF-A in Hole U1462A (Sample 57X-CC) and 527.5 m CSF-A in Hole U1462C (Sample 101R-CC) (Figures F14, F16). The top of Sphenolithus spp. (3.54 Ma; Figure F17G) within the basal part of Biozone NN16 is at 569.38 (Sample 356-U1462A-60X-CC) and 565.65 m CSF-A (Sample 356-U1462C-109R-CC). Reworked Oligocene and middle Miocene taxa (e.g., Reticulofenestra bisecta, Cyclicargolithus floridanus, Cyclicargolithus abisectus, and Catinaster coalitus; Figure F17H–F17K) were rare to common between 580 and 830 m CSF-A in both Holes U1462A and U1462C (Samples 356-U1462A-61X-CC through 95X-CC and 356-U1462C-113R-CC through 152R-CC) (Table T8).
The NN16/NN15 boundary (3.7 Ma) is defined by the top occurrence of Reticulofenestra pseudoumbilicus (Figure F17L) in Samples 356-U1462A-61X-CC (581.1 m CSF-A) and 356-U1462C-113R-CC (594.75 m CSF-A), marking the early/late Pliocene boundary (Figures F14, F16). The top occurrence of Amaurolithus tricorniculatus (3.92 Ma; Figure F17M) in Samples 356-U1462A-83X-CC (748.44 m CSF-A) and 356-U1462C-133R-CC (684.29 m CSF-A) indicates the top of Biozone NN14.
Pliocene nannofossil assemblages mainly consist of different (size defined) morphotypes of Reticulofenestra spp. and P. lacunosa. Small placoliths (2–3 and 3–5 µm) are common to very abundant in most samples (Table T8). Other typical contributors to the assemblage include rare Discoaster spp. (with highly variable preservation; Figure F17D–F17E, F17N–F17P); common to abundant Sphenolithus spp.; rare Amaurolithus spp.; and few Calcidiscus spp., Helicosphaera carteri (Figure F17Q), Pontosphaera spp., Umbilicosphaera spp., Scyphosphaera spp., and S. pulchra (Figure F17R). C. pelagicus (Figure F17S) is consistently present in Samples 356-U1462A-89X-CC through 95X-CC (796.73–827.56 m CSF-A) and 356-U1462C-143R-CC through 153R-CC (778.12–827.65 m CSF-A), characterizing the earliest Pliocene and late Miocene assemblages (see below).
Late Miocene
The Miocene/Pliocene boundary falls within Biozone NN12, which was difficult to constrain because of the lack of the marker species Ceratolithus acutus (top at 5.04 Ma, base at 5.35 Ma), Ceratolithus rugosus (base at 5.12 Ma), and Triquetrorhabdulus rugosus (top at 5.28 Ma) but is tentatively placed between 777.56 (base of P. lacunosa, and base common of D. brouweri, 4.12 Ma) and 809.15 m CSF-A (>5.59 Ma; top occurrence of 5-rayed discoasters cf. D. quinqueramus in Sample 356-U1462C-149R-CC). The presence of D. quinqueramus (top at 5.59 Ma; Figure F17T) and the co-occurrence of R. rotaria (short range within Biozone NN11B; Young, 1998; Figure F17U) indicate that the intervals between Samples 356-U1462A-91X-CC through 95X-CC (807.55–827.46 m CSF-A) and 356-U1462C-149R-CC through 153R-CC (809.15–827.65 m CSF-A) are of late Miocene age (Messinian; upper part of Biozone NN11; Figures F14, F16). The downhole extension of Biozone NN11 within Holes U1462A and U1462C is not further constrained, as calcareous nannofossils are absent deeper than 844 m CSF-A.
The Miocene assemblages were dominated by small-sized (2–5 µm) Reticulofenestra spp. with variable contributions of R. pseudoumbilicus (<7 and >7 µm), C. pelagicus, H. carteri, Oolithotus spp., Pontosphaera japonica, Rhabdosphaera spp., Scyphosphaera apsteinii, and Umbilicosphaera rotula (Figure F17V–F17W).
Planktonic foraminifers
At Site U1462, 50 samples were examined from Hole U1462A, 7 from Hole U1462B, and 55 from Hole U1462C. Planktonic foraminifers recovered at Site U1462 represent a stratigraphic succession from the early Pliocene to recent (Table T7; Hocking et al., 1987). Preservation ranged from (very) poor to moderate with frequent barren intervals in the Pleistocene, although other bioclasts (e.g., benthic foraminifers) were present. The poor preservation in Holes U1462A and U1462C to ~350 m CSF-A and Hole U1462B to 50 m CSF-A was accompanied by <4 species per sample (except for the well-preserved topmost Sample 356-U1462A-1X-CC, which contained 14 species) (Table T9; Figure F18). From ~350 to 845 m CSF-A (early Pleistocene and Pliocene), preservation was generally slightly better (poor to moderate) and accordingly, abundance of planktonic foraminifers increased (Figure F19; Table T10). Poor preservation and barren samples were encountered again deeper than ~845 m CSF-A (Samples 356-U1462A-95X-CC and 356-U1462C-157R-CC) (Figure F19; Table T10).
Table T9. Planktonic foraminifer presence, abundance, and preservation at Site U1462. Download table in .csv format.

Figure F18. Typical preservation states of planktonic foraminifers, Site U1462.
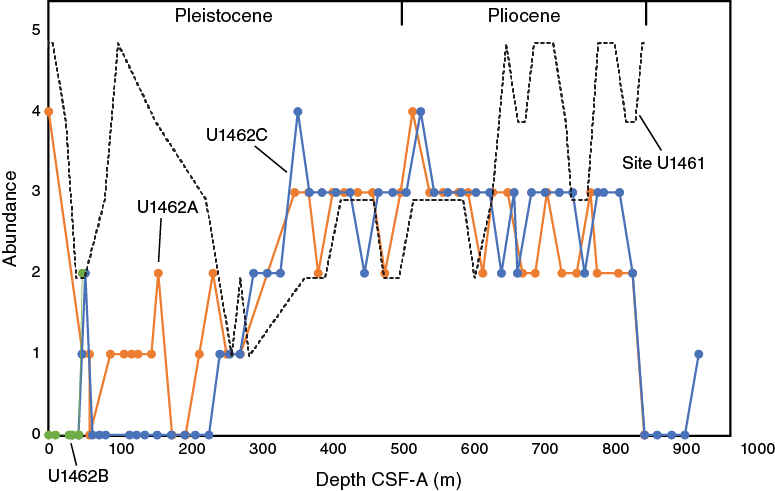
Figure F19. Planktonic foraminifer abundance, Holes U1462A–U1462C.
Table T10. Planktonic foraminifer abundance, Site U1462. Download table in .csv format.
The Pleistocene marker species Globorotalia tosaensis (top at 0.61 Ma) and Globorotalia truncatulinoides (base of Biozone Pt1a; 1.93 Ma) only co-occur in Sample 356-U1462A-39X-CC (368.71 m CSF-A) despite the expectation that they would co-occur more often in the early Pleistocene interval similar to Sites U1459–U1461. However, the rare G. truncatulinoides may be explained by the relatively shallow water paleodepths in the upper 300 m at this site as this species needs water depths of 500–1000 m to complete its life cycle (Hemleben et al., 1989). The benthic foraminiferal assemblages suggest increased paleowater depths only between 385 and 720 m CSF-A (between Samples 356-U1462A-39X-CC and 43X-CC; 368.71 and 402.76 m CSF-A). G. tosaensis (extinct taxon) is closely related to G. truncatulinoides and thus is likely to have had a similar habitat depth. Therefore, shallow paleowater depths in the upper 300 m at Site U1462 probably explain the rarity or absence of these taxa.
Despite the improvement in preservation and abundance in the early Pleistocene/Pliocene section (Figures F18, F19; Table T10) beginning at about 368 m CSF-A, both are still relatively poor compared to Sites U1460 and U1461. The overall diversity varied from 5 to 14 species per sample with the highest diversity in samples deeper than 420 m CSF-A (Sample 356-U1462A-87X-CC), which contained up to 90% planktonic foraminifers (Tables T9, T11). As the general preservation is not as good as at previous sites, some of the biozone markers found at previous sites, such as G. limbata, P. primalis, and S. seminulina, occur rarely and often deeper than expected from their stratigraphic position (Tables T7, T9; Figure F15). More common markers, such as Globigerinoides extremus (1.99 Ma; top of PL6), G. tosaensis (3.35 Ma, base of PL5), Dentoglobigerina altispira (3.47 Ma, top of PL4), and Globorotalia margaritae (3.85 Ma, top of PL2), show a more continuous presence, providing reliable stratigraphic markers. The top occurrence of P. primalis (Samples 356-U1462A-81X-CC and 356-U1462C-133R-CC) is the sinistral morphotype and therefore reflects the change of coiling direction of this species at 4.08 Ma (Chaisson and Pearson, 1997) rather than the absolute top at 3.66 Ma, which is based on the occurrence of dextral specimens. Comparison of the early Pleistocene and Pliocene sections (~4–2 Ma) of Site U1462 with the nearby slightly deeper Site U1461 reveals a similar sequence of strata, which is thicker at Site U1462 (250–300 m) than at Site U1461 (200 m) (Figure F15B). In addition, the first appearance of this interval at Site U1462 occurs much shallower (Sample 356-U1462C-69R-CC; 369 m CSF-A) than at Site U1461 (~680 m CSF-A; see the Site U1461 chapter [Gallagher et al., 2017b]).
Table T11. Occurrence of main genera and species of benthic and planktonic foraminifers and additional bioclasts and minerals, Site U1462. Download table in .csv format.
Deeper than ~820 m CSF-A, planktonic foraminiferal abundance rapidly decreases and samples are mostly barren. Some samples contain rare planktonic foraminifers, but these are mostly unidentifiable, heavily glauconitized (Core 356-U1462A-95X; 827.46 m CSF-A), and heavily cemented. Core 99X (844.8 m CSF-A) was completely dolomitized.
Benthic foraminifers
A total of 47 core catcher samples were investigated from Hole U1462A, 7 from Hole U1462B, and 63 from Hole U1462C. Additionally, 8 samples were taken from Holes U1462A and U1462C when specific assemblages of interest (e.g., Assemblage 7; see below) were not present in the core catchers. Overall, the number of species present per sample ranged from 1 (Section 356-U1462A-157R-1; 843.76 m CSF-A) to 36 (Sample 1X-CC; 0.25 m CSF-A). The benthic foraminiferal percentage ranged from 9% (Sample 49X-CC; 459.13 m CSF-A) to 100% (mainly in the upper 200 m of Holes U1462A–U1462C and the deepest sample of Hole U1462C [Sample 356-U1462C-177R-CC; 942.4 m CSF-A]) (Tables T11, T12). Eight samples from this site were barren of benthic foraminifers: the deepest two samples from Hole U1462A (Sample 356-U1462A-98X-CC [844.22 m CSF-A] and 99X [844.8 m CSF-A]) and six of the deepest samples in Hole U1462C between Samples 356-U1462C-157R-CC and 169R-CC (844.69–901.7 m CSF-A).
Table T12. Benthic foraminifer abundance, Site U1462. Download table in .csv format.
Preservation in Hole U1462A ranged from very good to poor with the majority of samples being poor (37 out of 45) (Table T11). In Hole U1462B, six out of seven samples showed poor preservation and one was well preserved. In Hole U1462C, preservation ranged from good to poor with a majority of samples being poor (49 out of 57). Preservation was affected by abrasion and fragmentation (breakage), as well as occasional cementation and infilling (coating in secondary crystals) with glauconite and pyrite. Secondary crystal coating was partially removed by ultrasonication.
All Site U1462 samples largely contained the same species, but the abundance of dominant species fluctuated between several intervals. Cibicides spp. and Cibicidoides spp. were almost always present throughout, but seven foraminiferal assemblages were found downhole. Except for Assemblage 7, all assemblages overlapped without sharp boundaries as conditions at the sediment/water interface changed gradually, and this is reflected with a mixing of assemblages representing their transitional phase (Table T12; Figure F20).
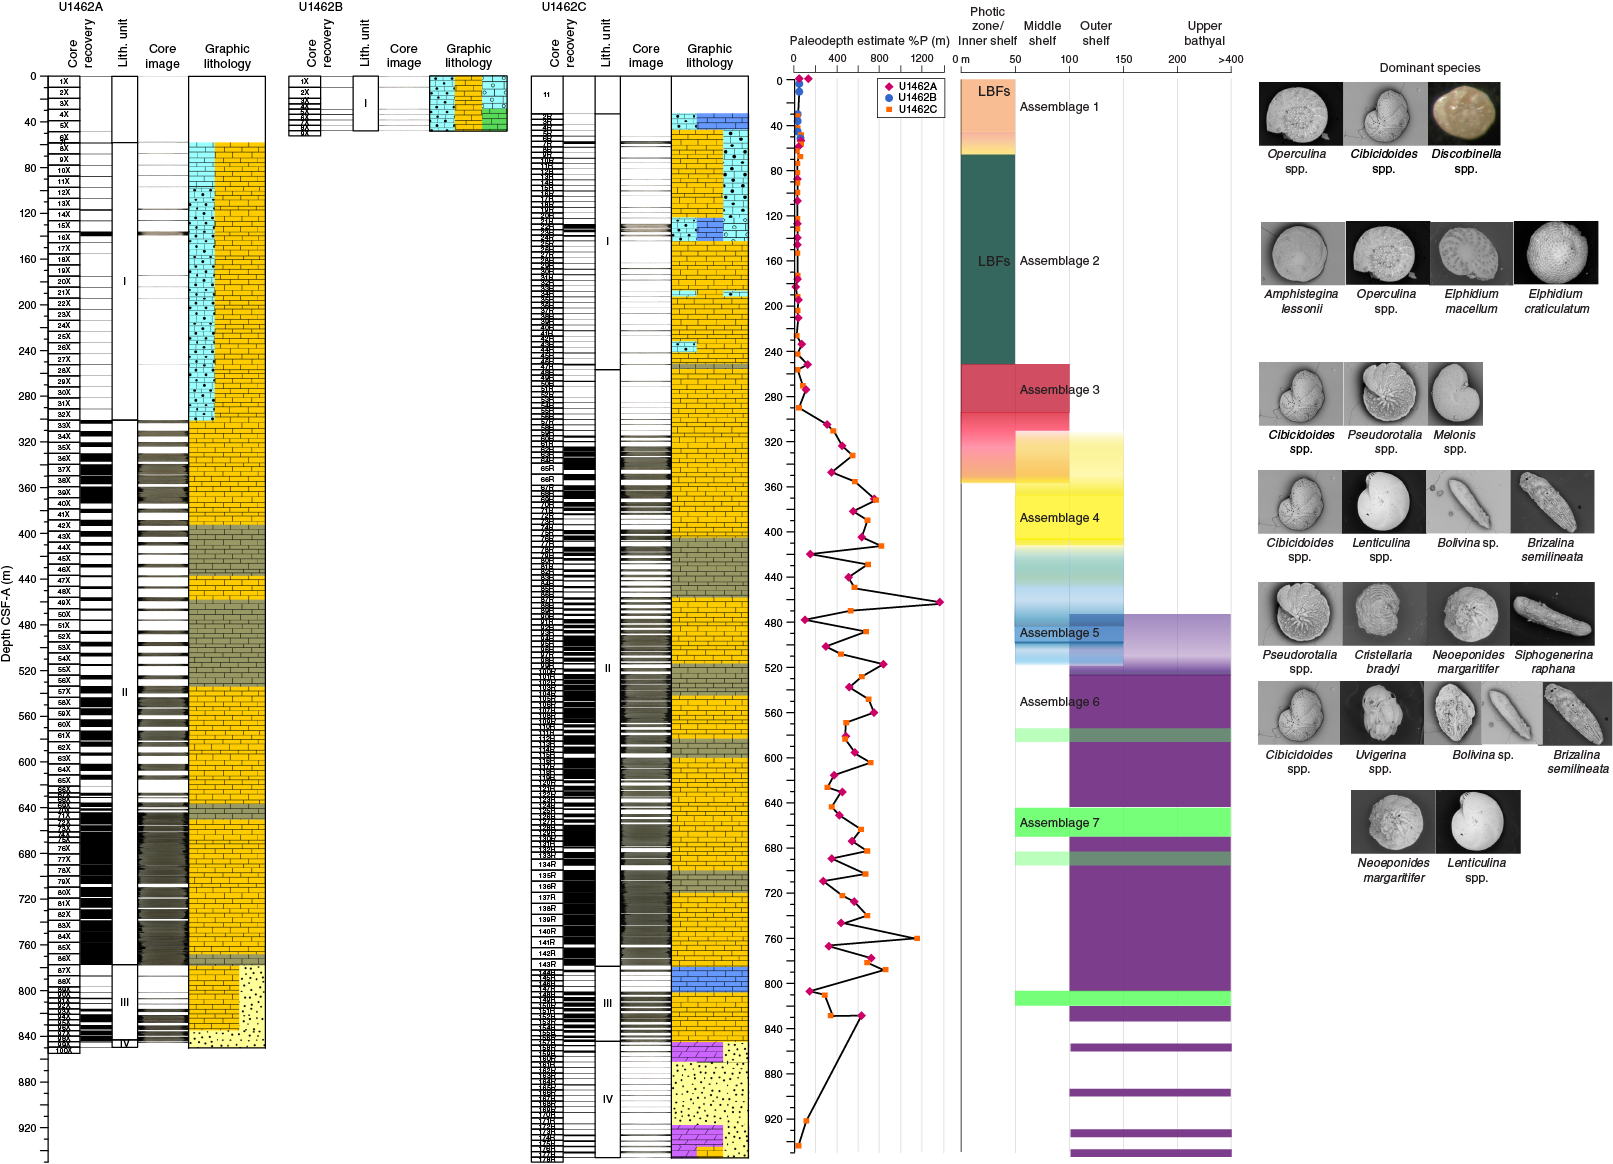
Figure F20. Dominant benthic foraminifers, Site U1462. This figure is available in an oversized format.
The first benthic foraminiferal assemblage is found in all three holes: from the uppermost core through Samples 356-U1462A-6F-CC (48.55 m CSF-A), 356-U1462B-8X-CC (43.17 m CSF-A), and 356-U1462C-5R-CC (47.45 m CSF-A). This assemblage contains a range of shallow-water (0–50 m) to moderately deep (50–100 m) tropical and temperate species typically found in the inner shelf/photic zone and middle shelf. With between 7 and 36 species and very good to poor preservation, the assemblage is dominated by epifaunal taxa, including Operculina spp., Cibicides spp., Cibicidoides spp., and Discorbinella spp. (Figure F20).
Assemblage 2 is present in all holes from Samples 356-U1462A-8X-CC through 24X-CC (58.45–213.7 m CSF-A), 356-U1462B-8X-CC through 9X-CC (43.17–47.8 m CSF-A), and 356-U1462C-8R-CC through 45R-CC (62.47–242.59 m CSF-A) (Figure F20). This assemblage has 2–17 species per sample with moderate to poor preservation and is also dominated by inner shelf/photic zone taxa. However, Assemblage 2 is dominated by LBFs and other large foraminiferal species, particularly Amphistegina spp. and Elphidium spp., including Amphistegina lessonii and Elphidium craticulatum.
Assemblage 3 is present in Samples 356-U1462A-26X-CC through 39X-CC (233.09–368.81 m CSF-A) and 356-U1462C-48R-CC through 66R-CC (256.72–353.42 m CSF-A). The assemblage has between 9 and 23 species per sample with moderate to poor preservation. Assemblage 3 is dominated by epifaunal middle shelf taxa, including Cibicidoides spp., Melonis spp., and Pseudorotalia spp. (Figure F20; Table T11).
Assemblage 4 is present in Samples 356-U1462A-41X-CC through 49X-CC (382.05–459.13 m CSF-A) and 356-U1462C-69R-CC through 85R-CC (369.81–447.77 m CSF-A) (Figure F20; Table T11). With 16–21 species per sample, Assemblage 4 has poor preservation and is dominated by species such as Cibicidoides spp. and Lenticulina spp. Common secondary elements of this assemblage are infaunal Bolivina spp. and Brizalina semilineata. These species typify middle to outer shelf bathymetry: slightly deeper than Assemblages 1–3.
Assemblage 5 is only clearly present in Samples 356-U1462A-51X-CC through 55X-CC (476.65–515.92 m CSF-A). Assemblage 5 is still present in low abundance in Hole U1462C from Samples 356-U1462C-77R-CC through 97R-CC (407.51–506.87 m CSF-A) but is mixed with Assemblages 4 and 6. Assemblage 5 has between 12 and 16 species per sample with moderate to poor preservation. The assemblage is identified by a dominance of large epifaunal foraminifers, including Pseudorotalia schroeteriana, Neoeponides spp., and Cristellaria bradyi, and infaunal Siphogenerina raphana. (Figure F20; Table T11). In Hole U1462C, the taxa associated with this assemblage are mixed in with species associated with both Assemblages 4 and 6. Here, the dominant species in Assemblage 5 are not as abundant as they were in Hole U1462A, which enabled their initial isolation as a distinct assemblage. Thus, the definitions of these three assemblages (4–6) were based primarily on Hole U1462A. Although the dominant species in Assemblage 5 indicate a bathymetric setting ranging from the middle to the outer shelf in Hole U1462A, the degree of mixing in Hole U1462C would suggest that downslope transport is possibly a bigger factor in this hole (see Lithostratigraphy).
Assemblage 6 is found from Samples 356-U1462A-57R-CC through 87X (539.97–777.35 m CSF-A) and 356-U1462C-101R-CC through 153R-CC (527.5.35–827.65 m CSF-A) (Figure F20; Table T11). Preservation is poor with between 7 and 22 species per sample. The most abundant species are Cibicidoides spp., uvigerinids, bolivinids, brizalinids, and Globocassidulina subglobosa, indicating an outer shelf to upper bathyal setting.
Assemblage 7 is found as distinct horizons in intervals dominated by Assemblage 6 in Holes U1462A and U1462C (e.g., Samples 356-U1462A-71X-CC [650.76 CSF-A] and 356-U1462C-128R-5W [659.76 m CSF-A]) (Table T11; Figure F20). Assemblage 7 is found in relatively coarse sediments that show sharp erosional boundaries (see Lithostratigraphy). With between 6 and 17 species per sample and moderate to poor preservation, this assemblage is marked by the dominance of the large foraminiferal species N. margaritifer and Lenticulina spp. Neoeponides margaritifer is commonly found in middle to outer shelf bathymetric settings (Gallagher et al., 2009) and Lenticulina spp. from the middle shelf to upper bathyal, although it is more common between outer shelf and upper bathyal. The coarse lenses that carry Assemblage 7 are likely to have been transported downslope from shelfal to upper bathyal environments (Figure F20; Table T11). Spot samples were taken from working halves to better understand the assemblage’s signature. Similar to Assemblage 5, the episodic appearance of Assemblage 7 was weaker in Hole U1462C compared to Hole U1462A. In Hole U1462C, the key taxa associated in this assemblage were found but frequently in lower abundances and mixed with taxa from Assemblage 6 (e.g., Cibicidoides spp.) (Figure F20).
The remaining cores from Holes U1462A and U1462C (i.e., samples from Sections 356-U1462A-98X-CC [844.22 m CSF-A] and 356-U1462C-157R-1 [843.76 m CSF-A] to the bottom of the holes) are from the Bare Formation (Hocking et al., 1987). They are all barren of foraminifers apart from Sections 356-U1462C-157R-1 (843.76 m CSF-A), 165R-1 (882.59 m CSF-A), 173R-CC (921.41 m CSF-A), and 177R-CC (942.4 m CSF-A). Spot samples were taken throughout this section to check whether foraminifers were present, particularly because core sections revealed coral fossils (see Lithostratigraphy; Table T11). All foraminifers from this interval in Holes U1462A and U1462C were, if present, rare and usually unidentifiable. However, Cibicidoides spp. was observed. Because the number of foraminifers found in this region is so low, neither an assemblage assignment nor a bathymetric setting can be determined based on the processed samples.
Overall paleodepth estimates based on the planktonic/benthic foraminiferal ratio (%P) range between 30 (100% benthic in Sample 356-U1462A-16X-CC; 139.86 m CSF-A) and >1000 m (3% benthic in Sample 47X-CC; 438.23 m CSF-A) (Table T11). Paleodepth estimates based on %P do not increase uniformly downhole from inner shelf to upper bathyal (Figure F20), as reflected in the benthic assemblages. However, this is likely influenced by poor preservation obscuring original planktonic/benthic ratios and the dominance of stress taxa such as bolivinids or uvigerinids (van Hinsbergen et al., 2005).
Investigated benthic foraminiferal percentage and diversity combined for all holes at Site U1462 are illustrated in Figure F21.
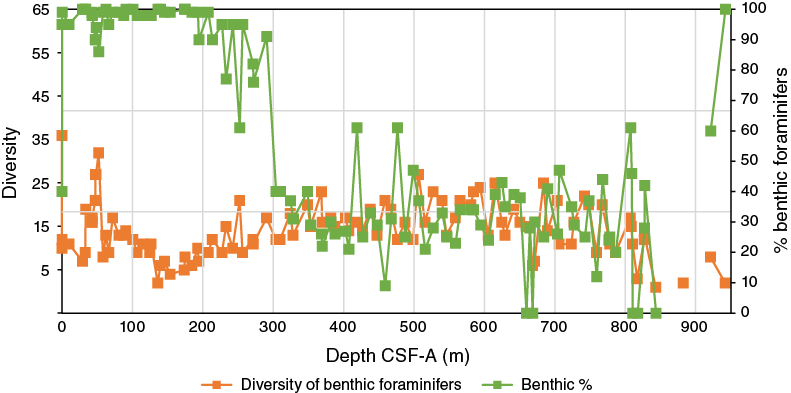
Figure F21. Benthic foraminifer diversity and percentages, Site U1462.
Geochemistry
The exceptionally high interstitial water (IW) salinity at Site U1462 is notable with a mean value of 123 and a maximum value of 153, the highest value of any Expedition 356 site. To our knowledge, this represents one of the highest IW salinity values reported from the Australian northwest shelf; similarly high values have been reported from the Great Australian Bight (Ocean Drilling Program Leg 182 [Feary, Hine, Malone, et al., 2000]). At Site U1462, elevated salinity and a number of elemental trends noted in IW samples may be related to the presence and dissolution of anhydrite, which was present deeper than 844 m CSF-A (see Lithostratigraphy). Relatively high calcium carbonate concentrations are noted in the upper part of the hole, shallower than 845 m CSF-A. At approximately 850 m CSF-A, a major decrease in calcium carbonate content occurs, denoting the transition into the quartz-rich siliciclastics of the Bare Formation (Wallace et al., 2003). Low total organic carbon (TOC) (mean = 0.7 wt%) and total nitrogen (TN) (mean = 0.017 wt%) characterize the upper 845 m. Site U1462 is also characterized by low headspace gas concentrations. Overall, several geochemical similarities are noted between Sites U1461 and U1462, which are discussed below.
Headspace gases
Headspace gas analysis for routine safety monitoring revealed the presence of methane, ethane, and propane (Figure F22; Table T13). All 107 samples analyzed contained methane, with concentrations ranging from 1.5 to 82.3 parts per million by volume (ppmv). Ethane was present in 41 samples, with concentrations ranging from 0.7 to 14 ppmv. Two samples (at 539 and 551 m CSF-A) also contained trace amounts of propane (<1.4 ppmv). Overall, Site U1462 is characterized by very low headspace gas concentrations. However, relatively increased hydrocarbon concentrations are noted in the interval from approximately 271 to 775 m CSF-A. Beginning at 271 m CSF-A, a trend of increasing gas concentrations occurs with depth, with a particularly rapid increase between 486 and 526 m CSF-A, where maximum values of all gases are observed. Subsequently, a rapid decrease in gas concentration is observed until approximately 568 m CSF-A, followed by a more gradual decrease toward ~750 m CSF-A. Deeper than 750 m CSF-A, trace amounts of hydrocarbons are present. The ratio of methane to ethane plus propane (C1/[C2 + C3]) has values <50 (ranging from 1 to 36), suggesting that the hydrocarbons at Site U1462 are likely of thermogenic origin (O’Brien and Heggie, 1989).
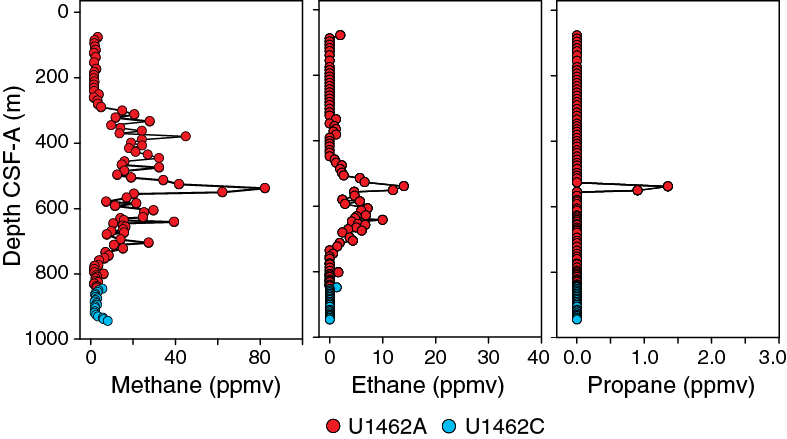
Figure F22. Hydrocarbons in headspace gases, Site U1462.
Table T13. Headspace gas contents, Site U1462. Download table in .csv format.
Interstitial water geochemistry
Geochemical measurements of IW samples were not taken between 0 and 300 m CSF-A because of poor core recovery in the upper ~300 m of Holes U1462A and U1462C. Likewise, it was not possible to take IW samples deeper than 833 m CSF-A because of low core recovery and insufficient IW quantities.
Salinity ranges from 101 to 153 and values generally increase with depth (Figure F23). The increasing salinity trend correlates well with increasing trends of sodium, chloride, bromide, calcium, lithium, and manganese. The extremely high salinity values at the bottom may be related to the presence of anhydrite at deeper intervals in Holes U1462A and U1462C (see Lithostratigraphy). pH ranges from 7.3 to 8 and displays a slight increase with depth (Figure F23).

Figure F23. Alkalinity, pH, salinity, sodium, and chloride, Site U1462.
Three general trends are present in major and minor elements and sulfate, phosphate, and ammonium (Figures F23, F24, F25): (1) sodium, chloride, bromide, lithium, manganese, and calcium all trend toward increasing concentrations from 300 m CSF-A to the bottom (833 m CSF-A); (2) magnesium, potassium, and sulfate all display downhole profiles with high concentrations at the surface that decrease until ~500 m CSF-A and subsequently increase toward the bottom; and (3) strontium, ammonium, barium, and boron display the opposite trends to magnesium, potassium, and sulfate with low concentrations at 300 m CSF-A, an overall trend of increasing concentrations until ~500 m CSF-A, followed by either decreasing (strontium) or relatively steady (ammonium, boron, and barium) values until the bottom (833 m CSF-A). Downhole trends of silicon and phosphate differ from the three common patterns described above. Silicon concentrations decrease from 300 to 833 m CSF-A, whereas phosphate concentrations are low (<2 µM) and display little overall variability with depth. Phosphate values were below detection limit in 7 of the 18 samples analyzed. Iron was not detected in any of the IW samples analyzed.
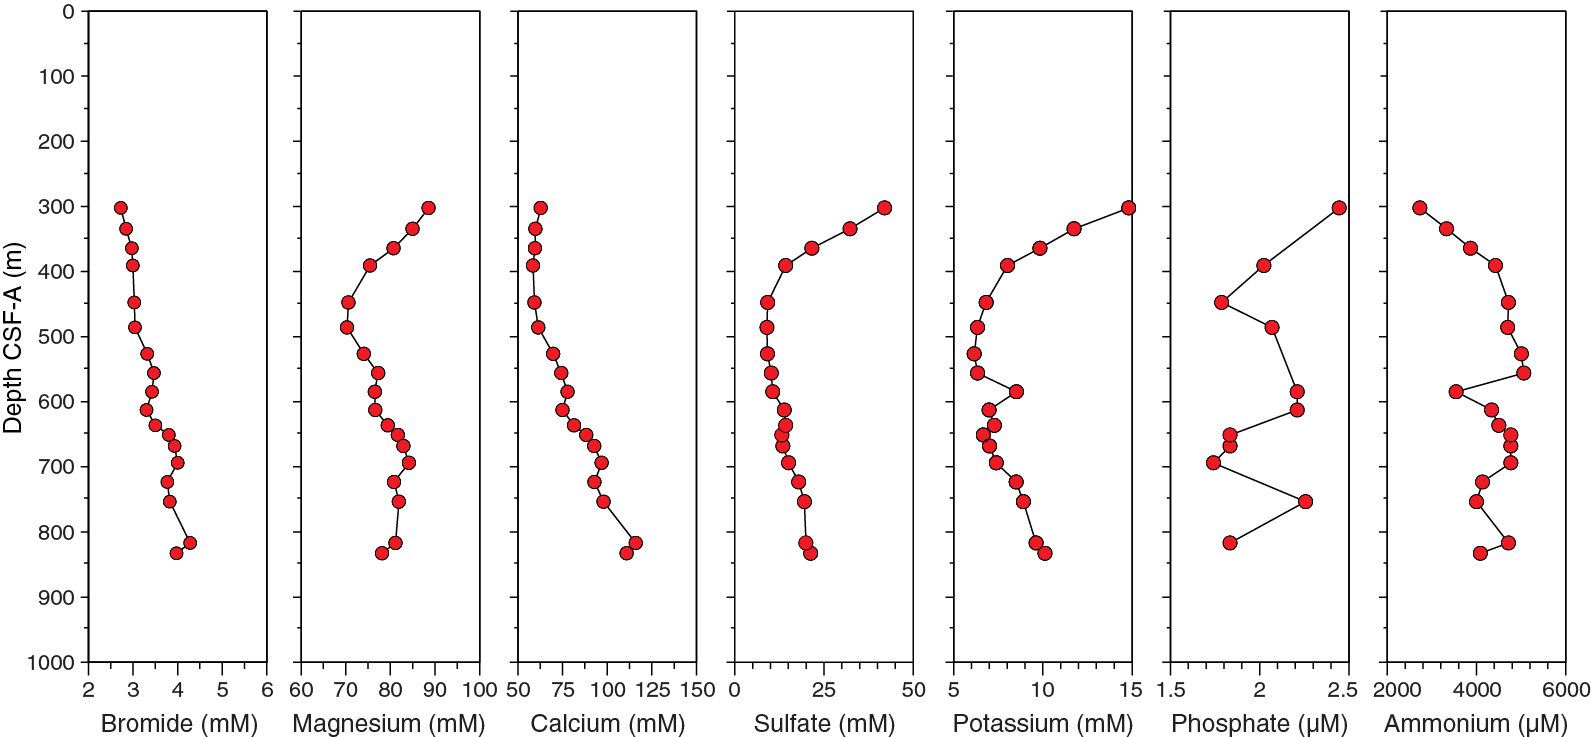
Figure F24. Major element interstitial water geochemistry, Site U1462.
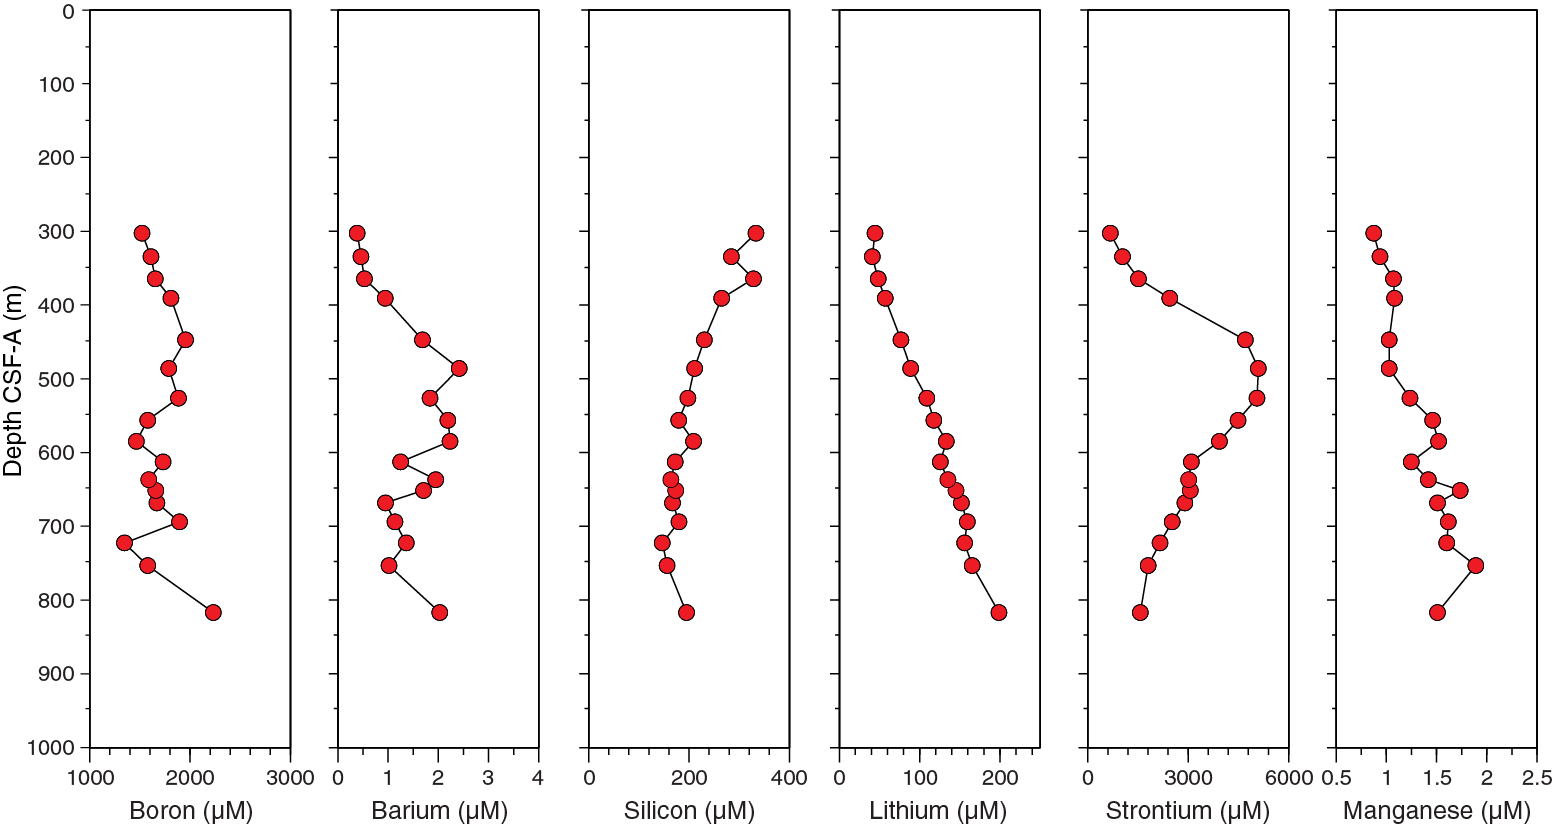
Figure F25. Minor element interstitial water geochemistry, Site U1462.
Sodium and chloride concentrations display a trend of increasing concentrations with depth, tracking the increase in salinity (Figure F23). As noted above, the unusually high salinity at Site U1462 may be related to the dissolution of anhydrite, which is observed deeper than 844 m CSF-A (see Lithostratigraphy). Furthermore, deeper than ~500 m CSF-A, slightly increasing sulfate concentrations with increasing depth (Figure F24) may also be related to the dissolution of anhydrite (CaSO4).
Other major features noted in the IW geochemistry are decreasing sulfate concentrations and simultaneously increasing ammonium concentrations between ~300 and 500 m CSF-A, suggesting a zone of sulfate reduction (Figure F24). A concomitant decrease in magnesium concentrations and a rapid increase in strontium concentrations may indicate the precipitation of dolomite and the contemporaneous dissolution of aragonite, which may contain strontium. In addition, the presence of strontium in IW may be related to the solubility of celestite (SrSO4), which is observed in the core and could precipitate where strontium and sulfate values are relatively high (see Lithostratigraphy). Finally, manganese and lithium concentrations increase with increasing depth (Figure F25).
Bulk sediment geochemistry
Calcium carbonate, TOC, and TN were measured from a portion of the IW squeeze cakes. Although it was not possible to make these measurements deeper than 833 m CSF-A, additional measurements for carbonate content only were made on residual material from XRD analyses in the interval from 843 to 946 m CSF-A.
Calcium carbonate content ranges from 3.3 to 89.4 wt% (Figure F26). An overall trend of gradually decreasing calcium carbonate is noted from ~300 to ~800 m CSF-A. The decreasing trend in calcium carbonate in this interval tracks the gradual overall decreasing silicon content downcore (also see Lithostratigraphy). Between 845 and 850 m CSF-A, a marked drop in calcium carbonate is noted with values reaching a low of 3.3 wt% at 850 m CSF-A. This boundary coincides with the transition from lithostratigraphic Units III to IV (see Lithostratigraphy).
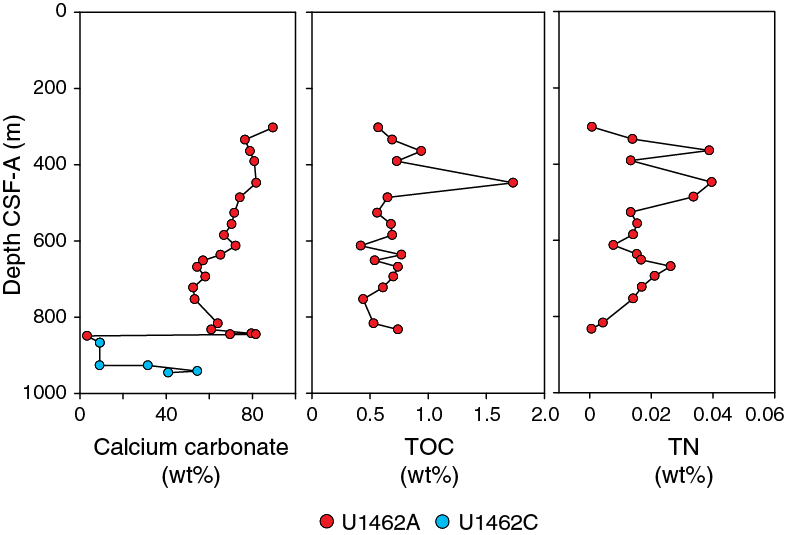
Figure F26. Bulk sediment geochemistry, Site U1462.
TOC content ranges from 0.4 to 1.7 wt% with a mean of 0.7 wt%. TOC content is relatively stable with depth, with one high value at 450 m CSF-A. TN content is low, ranging from 0.001 to 0.040 wt% with a mean of 0.017 wt%. The TOC and TN records are not correlated, suggesting different sources of carbon and nitrogen.
Discussion
Several geochemical similarities are noted between Sites U1461 and U1462. For example, deeper than ~300 m CSF-A at both sites, downhole profiles of salinity, sodium, and chloride are similar with comparable ranges of values. Downhole trends of bromide, calcium, and barium are also analogous between the sites. Strontium, although having higher overall values at Site U1462 (reaching a maximum of 5100 μM), also displays a similar profile to Site U1461 (excluding the uppermost sediments, which were not recovered at Site U1462). Headspace gases, although much lower in concentration at Site U1462, additionally suggest similarities between the two sites, with the interval of elevated hydrocarbon concentrations from ~300 to 800 m CSF-A at Site U1462 perhaps corresponding to the interval of elevated hydrocarbon concentrations from ~460 to 1085 m CSF-A at Site U1461.
Paleomagnetism
Paleomagnetism investigations at Site U1462 focused on natural remanent magnetization (NRM) and alternating field (AF) demagnetization measurements. Coring in Hole U1462A suffered from both poor recovery in the upper 300 m and core disturbance (biscuiting) during XCB coring at greater depths. Hole U1462B only penetrated to ~52 m CSF-A and suffered from poor recovery. Therefore, superconducting rock magnetometer (SRM) results are reported from cores recovered with the RCB system from deeper than 300 m CSF-A in Hole U1462C. Stepwise AF demagnetization was conducted on 24 discrete samples from Hole U1462A and the results were also used to augment magnetostratigraphic interpretations. Three discrete samples shallower than ~344.8 m CSF-A from Hole U1462A had negative inclination values that suggest normal polarity. Biostratigraphic datums at 0.91 (252.5 m CSF-A) and 1.14 Ma (324.4 m CSF-A) suggest that these samples may correlate with the early part of the Matuyama Chron (C1r), although the resolution of the samples does not allow definitive interpretation of chron boundaries. Magnetostratigraphic data for Hole U1462C shows that the majority of inclination values are negative, except for a prominent bias toward positive values from ~537.6 to 586.0 m CSF-A. Based on biostratigraphic datums of 3.54 Ma (565.6 m CSF-A) and 3.70 Ma (584.7 m CSF-A), this interval of reversed polarity could be related to the upper part of the Gilbert Chron (C2Ar).
Isothermal remanent magnetization (IRM) and backfield IRM acquisition curves were also carried out to investigate rock magnetism properties of four discrete samples from Hole U1462A. The samples that exhibit low MS demonstrate similar saturation IRM (SIRM) patterns that may indicate the presence of magnetite and/or titanomagnetite. Two samples showed higher SIRM values (~700 mT) and bimodal behavior, demonstrating higher coercivity. Remanent coercivity values of the four samples ranged between 46 and 58 mT.
Archive-half measurements
Archive-half core sections from Hole U1462C were measured on the SRM, with peak AF demagnetization steps at 20 mT, to construct the magnetostratigraphy for Site U1462 (Figure F27). Intensity values ranged from 10−5 to 10−3 A/m, and inclinations were predominantly negative. Stratigraphic intervals of possible normal polarity are suggested between 350 and 537 m CSF-A and between 596 and 850 m CSF-A. A reversed polarity interval may occur between 537.6 and 586.0 m CSF-A (Figure F27; Table T14).
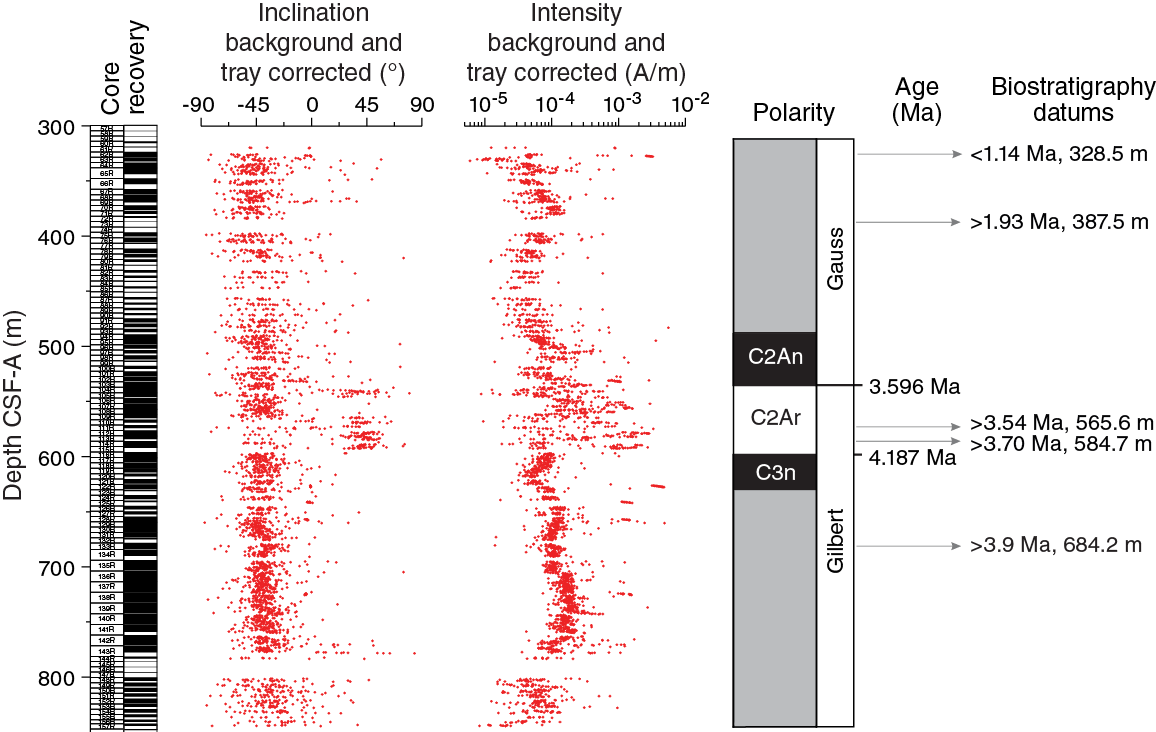
Figure F27. Magnetostratigraphic data, Hole U1462C.
Table T14. Core or sample intervals and correlative magnetozones, Hole U1462A discrete samples and Hole U1462C archive-half measurements. Download table in .csv format.
Discrete sample measurements
A total of 24 discrete samples from Hole U1462A underwent AF demagnetization, of which four (Samples 356-U1462A-43X-1, 49–51 cm, 54X-1, 38–40 cm, 85X-2, 51–53 cm, and 93X-1, 38–40 cm) were investigated further for magnetic mineralogy using IRM and backfield acquisition measurements, as well as bulk susceptibility. Samples 43X-1, 49–51 cm, and 54X-1, 38–40 cm, were chosen to represent samples with low MS and higher MS, respectively, in the upper part of the hole. Similarly, for the lower depths of Hole U1462A, Sample 93X-1, 38–40 cm, was chosen to represent sediments with low MS, and Sample 85X-2, 51–53 cm, represents sediments with high MS. IRM acquisition results, shown by the positive y-axis values in Figure F28, indicate that Samples 43X-1, 49–51 cm, and 93X-1, 38–40 cm, exhibit similar SIRM patterns wherein they reach saturation at ~100–200 mT. SIRM values of 100–200 mT could indicate the presence of magnetite and/or titanomagnetite. Samples 54X-1, 38–40 cm, and 85X-2, 51–53 cm, exhibit higher SIRM values and bimodal behavior. The softer component reaches SIRM at ~100 mT, and a more coercive phase reaches a higher SIRM at ~700 mT, possibly indicating the presence pyrrhotite in addition to magnetite and/or titanomagnetite. The backfield IRM acquisition curves indicate that remanent coercivity values of the four samples fall between 46 and 58 mT. Sample 85X-4, 63–65 cm, also underwent AF demagnetization after IRM acquisition up to 1.2 T and provides an estimated median destructive field value of 40 mT (Figure F29).

Figure F28. IRM acquisition curves for 4 discrete samples and their respective backfield IRM curves, Hole U1462A.
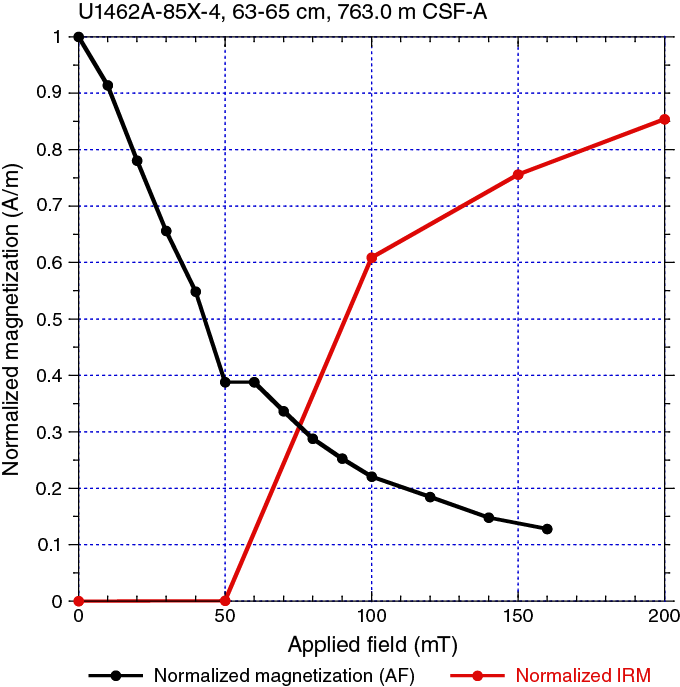
Figure F29. IRM curve and corresponding AF demagnetization trend.
AF cleaning procedures for discrete samples from Hole U1462A (Figure F30) followed demagnetization steps up to 100 mT in order to get an overview of the demagnetization behavior and possible trends in the sample results. Principal component analysis (PCA) makes it possible to distinguish two different patterns (Table T15): one from the top of the succession to ~504 m CSF-A and another from ~580 m CSF-A to the last measured sample (836.8 m CSF-A). Most of the samples from the uppermost ~500 m of sediments exhibited only one component, and ~80%–90% of NRM was eliminated after AF cleaning up to 20 mT. For some of these samples, a viscous remanence magnetization overprint was successfully removed by AF demagnetization up to 10 mT. Samples from sediments deeper than 580 m CSF-A demonstrate a second higher coercivity component that in general showed the same inclination (positive or negative) as the other component; it was removed after AF cleaning steps of 40 or 50 mT. This suggests that AF demagnetization up to 20 mT using the SRM for Hole U1462C may not be enough to fully reveal the characteristic remanent magnetization deeper than ~580 m CSF-A.
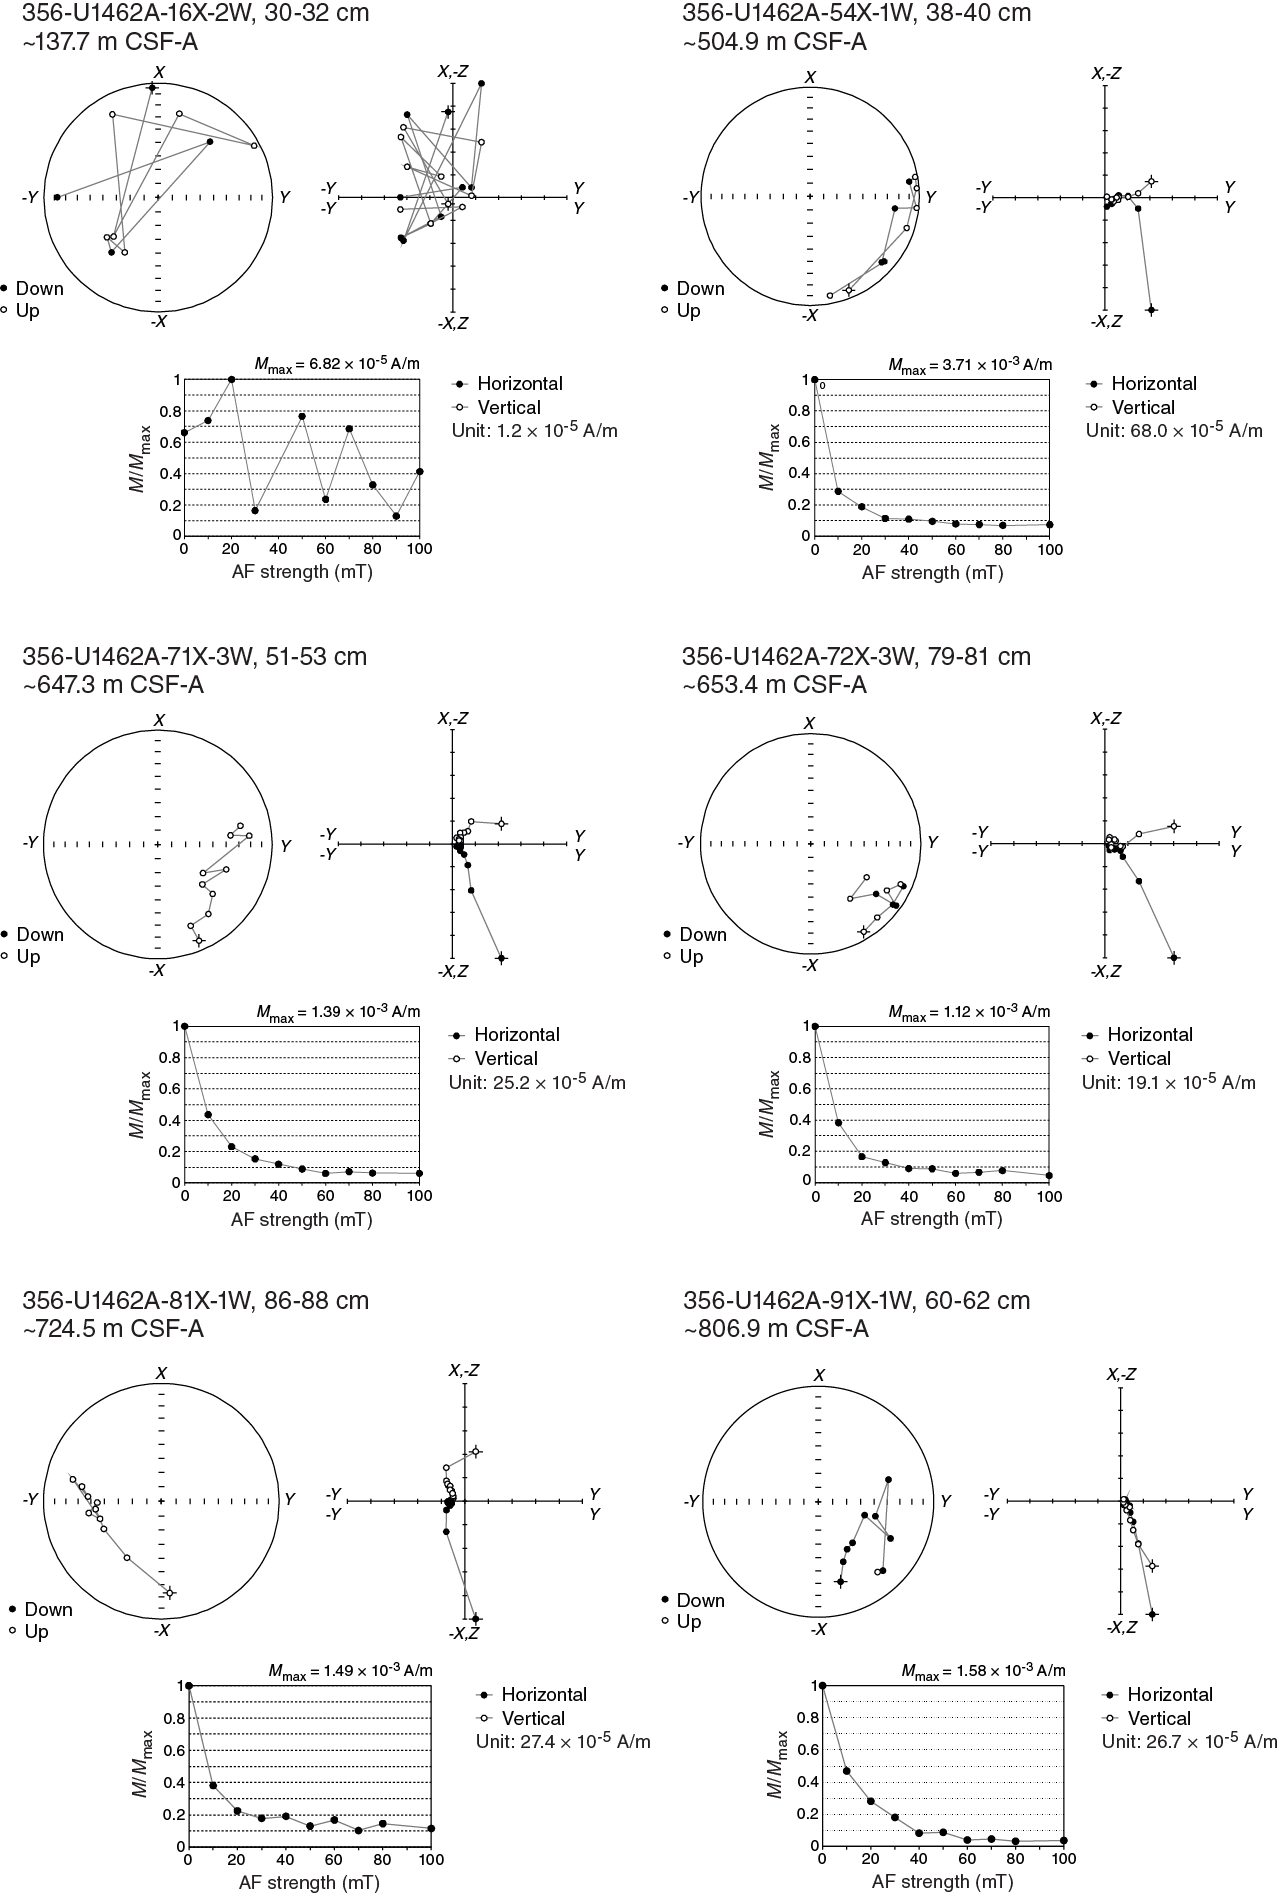
Figure F30. AF demagnetization results for 6 discrete samples, Hole U1462A.
Table T15. Results of PCA, together with NRM intensity and bulk susceptibility, for discrete samples, Hole U1462A. Download table in .csv format.
Two samples that show evidence for two vector components (Samples 356-U1462A-73X-2, 68–70 cm, and 75X-3, 91–93 cm) are from the lower part of lithostratigraphic Unit II (see Lithostratigraphy) and were not fully demagnetized even with high demagnetization steps at 120 and 140 mT; they exhibited the highest coercivity behavior of any samples at this site.
Bulk susceptibility measurements (Table T15) were conducted for all of the discrete samples taken from Hole U1462A using the shipboard KLY 4S Kappabridge (AGICO, Inc.). Results ranged from ~7 × 10⁻⁶ to 48 × 10−6 SI units, with the exception of Sample 356-U1462A-16X-2, 30–32 cm, which yielded negative susceptibility that is attributed to diamagnetic minerals.
Magnetostratigraphy
The Icefield MI-5 orientation tool was not used during coring at Site U1462, so we did not recover azimuthally oriented declinations that could help us to identify distinctive polarity magnetozones. Discrete sample inclination data from PCA analysis were correlated with the biostratigraphic datums (Figure F31; see Biostratigraphy and micropaleontology). The low resolution of the magnetostratigraphic data from Hole U1462A prevented correlation with Hole U1462C. Discrete samples from Hole U1462A at ~137.8 m CSF-A (Sample 356-U1462A-16X-2, 30–32 cm), ~322.8 m CSF-A (Sample 35X-2, 102–104 cm), and ~344.8 m CSF-A (Sample 37X-4, 56–58 cm) demonstrate negative inclination values that suggest normal polarity. Biostratigraphic datums at 0.91 (252.5 m CSF-A) and 1.14 Ma (324.4 m CSF-A) suggest that these samples may correlate with the early part of the Matuyama Chron (C1r).
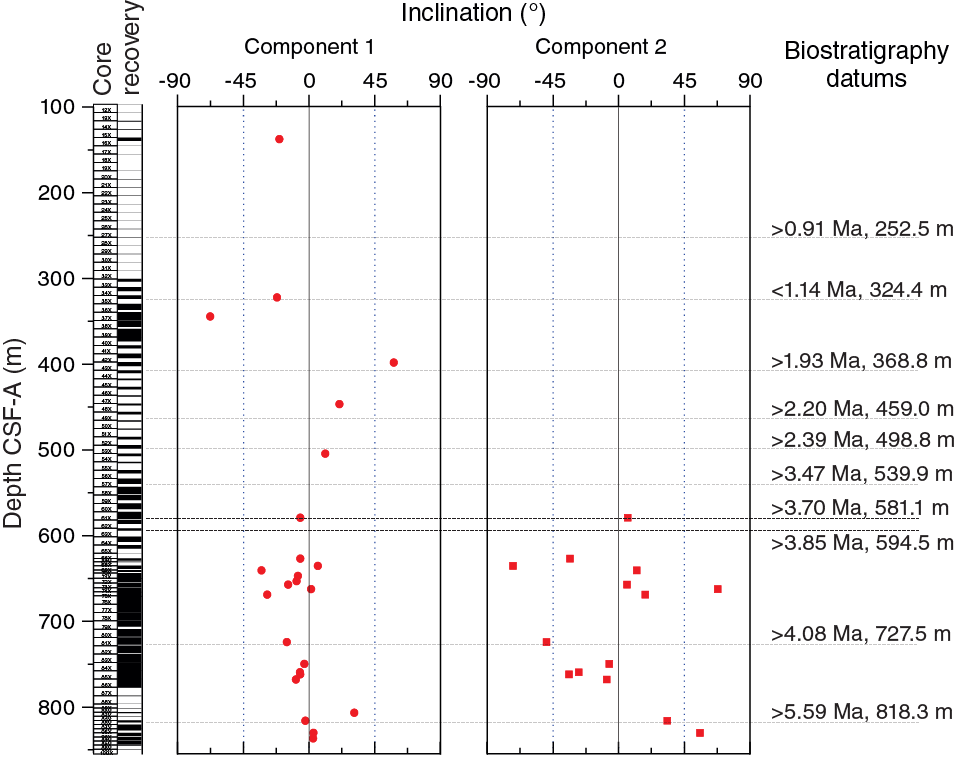
Figure F31. PCA magnetic inclination data for discrete samples from Hole U1462A.
Samples from ~580 m CSF-A to the bottom of Hole U1462A exhibit a pattern where Component 2 exhibits steeper inclination values than Component 1. The higher coercivity behavior and shallow inclination values of Component 1 suggest that it is not a drilling overprint, but instead may correspond to a secondary viscous remanent magnetization acquired gradually from long-term exposure to an opposing geomagnetic polarity. The two lowermost discrete samples (356-U1462A-96X-2, 31–33 cm [830.6 m CSF-A] and 97X-2, 24–26 cm [836.8 m CSF-A]) have positive inclination values, and their association with a biostratigraphic datum of 5.59 Ma (at 818.3 m CSF-A) could indicate that they represent the lower part (Chron C3r) of the Gilbert Chron.
Magnetostratigraphic data from Hole U1462C (Figure F27; Table T14) in the interval between Cores 356-U1462C-104R and 114R (~537.6 and 586.0 m CSF-A) clearly indicate a bias of inclination data toward positive values, corresponding to reversed polarity, with a corresponding shift toward higher intensity values. Correlation with biostratigraphic datums (see Biostratigraphy and micropaleontology) of 3.54 (565.6 m CSF-A) and 3.70 Ma (584.7 m CSF-A), suggest that this interval represents the upper part (Chron C2Ar) of the Gilbert Chron.
Physical properties
Physical properties measurements at Site U1462 were carried out using the Whole-Round Multisensor Logger (WRMSL), NGR sensor, and discrete sampling. Due to poor recovery, WRMSL and NGR data are scarce shallower than 300 m CSF-A. However, deeper than 300 m CSF-A, 60%–70% core recovery resulted in good coverage by these instruments. In this interval MS and NGR tend to be in phase, suggesting that they both reflect variations in clay input. Discrete P-wave measurements were taken in three different ways: on section halves within the liner, on individual rock pieces, and on cut cubes that were subsequently analyzed for MAD. From the seafloor to 300 m CSF-A and from 850 to 950 m CSF-A, intervals where measurements were made on sparsely recovered lithified fragments, P-wave velocities are scattered and range up to ~5500 m/s. P-wave velocities correlate linearly with porosity, but follow a power law relation with bulk density. Grain densities obtained from MAD measurements correlate with grain densities estimated by XRD. Thermal conductivity measured in Hole U1462A increases with depth from about 1.3 W/(m·K) at ~300 m CSF-A to 2.4 W/(m·K) at the bottom of the hole (~850 m CSF-A).
Magnetic susceptibility
MS was measured using two instruments: the WRMSL at 5.0 cm intervals and the Section Half Multisensor Logger (SHMSL) at 2.5 cm intervals. Sampling on the SHMSL was carried out by averaging two measurements per position in Holes U1462A and U1462B and three measurements per position in Hole U1462C. In Figure F32, the SHMSL values have been corrected for instrument drift (except for values from Hole U1462B), as outlined in Physical properties in the Expedition 356 methods chapter (Gallagher et al., 2017a). Between the time of measurements made on Hole U1462A and those carried out on Holes U1462B and U1462C, the uninterruptible power supply (UPS) for the SHMSL, installed in the vicinity of the SHMSL, was replaced, resulting in a shift of about 13 SI in SHMSL measurement values. This shift is related to the instrument and unrelated to any real signal, as indicated by repeated measurements on Sections 356-U1462A-81X-1 through 82X-2 (Figure F33).
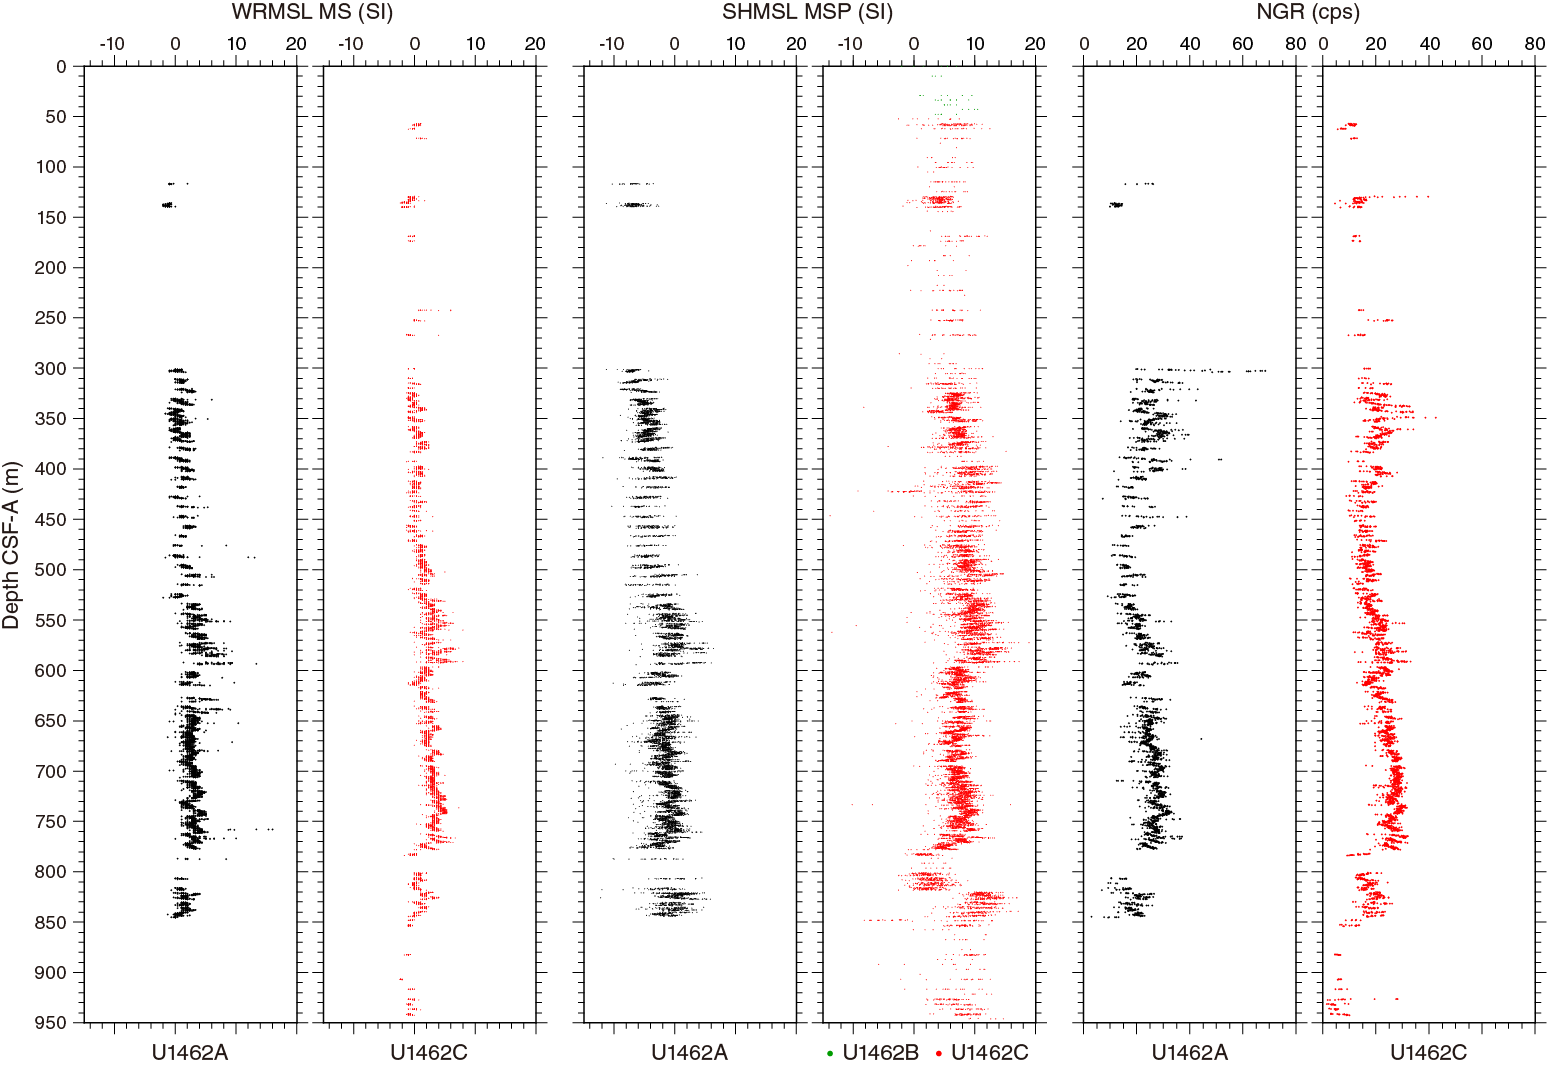
Figure F32. WRMSL MS, drift-corrected SHMSL MSP, and NGR results, Site U1462.
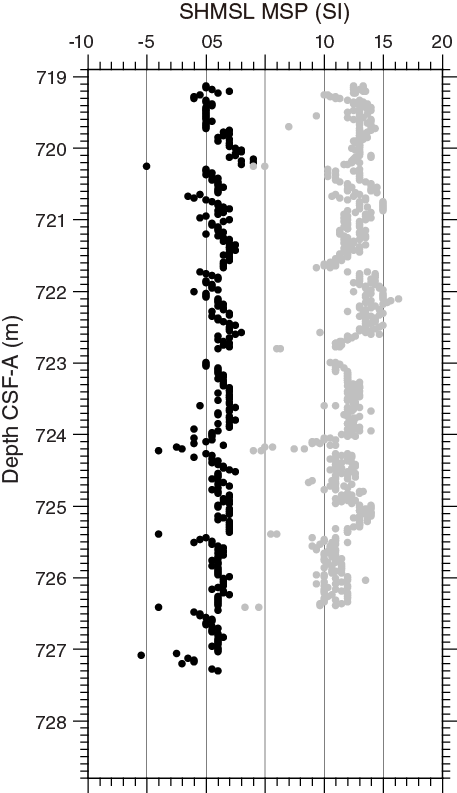
Figure F33. SHMSL MSP.
Because of poor recovery in the upper 300 m in both Holes U1462A and U1462C, MS data were limited within that interval. Recovery significantly improved in Cores 356-U1462A-33X through 86X and 356-U1462C-60R through 144R, with ~60% and 70% recovery, respectively. This allowed for regular MS measurements and assessment of the character of this interval. Despite the shift in SHMSL point magnetic susceptibility (MSP) values, 10 m scale variability in this interval is consistent between Holes U1462A and U1462C and between instruments (Figure F32). WRMSL MS values are relatively low (around 1 SI) between 300 and 530 m CSF-A and higher (around 3 SI) between 530 and 780 m CSF-A. Deeper than ~800 m CSF-A, WRMSL MS values tend to be relatively low (around 0 SI) to the bottom of Hole U1462C.
Natural gamma radiation
NGR was measured on whole-round cores from all holes at Site U1462 at 10 cm intervals. An NGR maximum (70 counts/s) was observed at 305 m CSF-A. Between 300 and 400 m CSF-A, NGR values are around 25 ± 5 counts/s (Figure F32), followed by a gradual decrease to ~490 m CSF-A. At greater depths, measured NGR values increased (up to 35 counts/s) to ~590 m CSF-A. Following a marked drop (~15 counts/s) at 620 m CSF-A, average NGR values remain fairly constant at about 28 ± 5 counts/s to 780 m CSF-A. From 800 to 850 m CSF-A, NGR values tend to be low (20 ± 5 counts/s) and deeper than 850 m CSF-A, they decrease to 5 ± 5 counts/s at the bottom of Hole U1462C (950 m CSF-A). In intervals where core recovery was relatively complete (330–370 and 530–770 m CSF-A in Holes U1462A and U1462C, respectively), well-defined 20–30 m thick cycles were observed. These cycles were also seen in MS data and are in phase with the NGR cycles.
P-wave sonic velocity
Two different tools were used to determine P-wave sonic velocities: the WRMSL (5 cm intervals) and discrete measurements with the P-wave caliper at one or two points in each core.
Few measurements were made with the WRMSL P-wave logger because core liners were generally not fully filled. However, between 300 and 450 m CSF-A in Hole U1462A, P-wave velocity measurements on the WRMSL were successful but tended to be lower than discrete measurements (Figure F33). The WRMSL software often failed to determine the first incoming waveform and, therefore, only the highest P-wave velocities measured on the WRMSL are comparable to discrete P-wave velocities.
From the surface to 300 m CSF-A, only sporadic cemented sediments were recovered and sampled. As a result, P-wave velocities are scattered and range between ~2000 and 5000 m/s (Figure F34). Deeper than 300 m CSF-A, the discrete samples reveal a relatively consistent trend in P-wave velocity that is fairly constant at about 2100 m/s from ~300 to 490 m CSF-A. Deeper, the average velocity increases to about 2400 m/s at 570 m CSF-A and then subsequently increases to about 2750 m/s at about 820 m CSF-A. From ~840 m CSF-A to the base of Hole U1462C (~950 m CSF-A), relatively high but variable velocities are observed, ranging between 3000 and 5500 m/s. The highest velocities were measured on discrete samples consisting dominantly or entirely of anhydrite. Other lithologies in this interval (lithostratigraphic Unit IV) include coarse-grained sandstones and dolostones (see Lithostratigraphy).
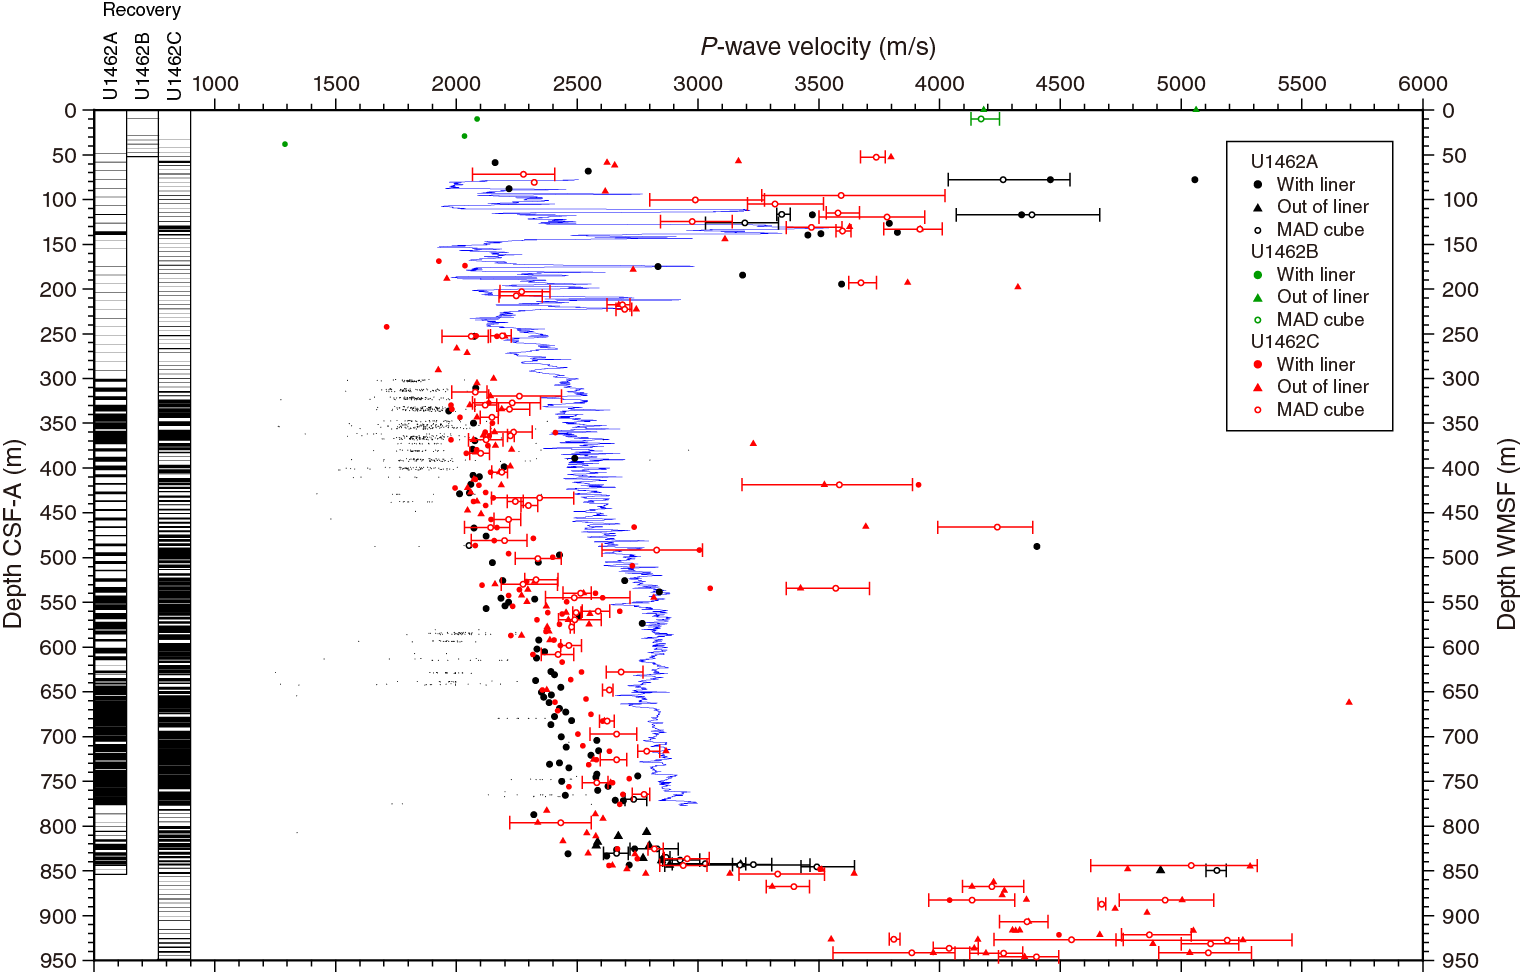
Figure F34. P-wave velocity.
At this site, discrete P-wave measurements were taken in three different ways: on section halves within the liner, on rock pieces, and on cut cubes that were subsequently analyzed for MAD. Because most material was at least semilithified at this site, we performed an experiment in which more than one of these measurements was made at the same location. This allowed us to determine whether there were systematic trends in the anisotropy of the sediments as well as to determine whether any systematic bias was generated as a result of normal measurements (e.g., on half rounds in the liner or discrete rock pieces out of the liner). The results of this experiment suggest several generalizations:
- Clasts, consisting of fully cemented lithified material, tend to show a higher degree of anisotropy than the semilithified packstone and wackestone that compose the majority of lithostratigraphic Unit II from 300 to 768 m CSF-A (see Lithostratigraphy). This is indicated by the wide range of velocities obtained on orthogonal (but usually unoriented) axes of MAD cubes (Figure F34). These highly lithified sediments are the dominant material retrieved by coring both in the top 300 m CSF-A and deeper than 840 m CSF-A. However, between 300 and 840 m CSF-A, the measurements were often taken on rare cemented samples within the packstones (generally taken in conjunction with thin sections). These samples were also found to be anisotropic with high velocities. In contrast, the packstones themselves tend to have lower P-wave velocities and to be less anisotropic.
- P-wave velocities measured in the liner tend to be lower than those measured on discrete half-core pieces outside of the liner (Figure F34). An important effect noticed when measuring pieces of rock outside of the liner is that the contact surfaces often consist of the most strongly lithified material, skewing results toward higher velocities. When measuring inside the liner, multiple points of contact between the rock and the liner result in a measurement that is better distributed among different components of the rock.
- Measurements made on MAD cubes provide flat surfaces, maximizing contact of the entire sample with the active surfaces of the P-wave caliper. The result is improved contact that better reflects the velocity of all constituent material within the sample, rather than only the hardest material present. MAD cubes also allow an assessment of the anisotropic nature of the material (discussed above).
We also observed consistencies and inconsistencies between the sonic velocities measured in Holes U1462A and U1462C (see Downhole measurements for a discussion of these data). From about 100 to 250 m wireline log matched depth below seafloor (WMSF), the wireline sonic velocities were consistent with the major positive swings in the core-based sonic velocities. For reading convenience, we used “mbsf” in this paragraph to designate depth scale WMSF/CSF-A. There is a tendency for the wireline log values to underestimate the values measured on the cores (e.g., the log values only reached about 3200 m/s, whereas the core-based sonic velocities often exceeded 4500 m/s). Between 250 and 500 mbsf, the log and discrete measurements on the cores progressively diverged so that at 500 mbsf, the log values exceeded the core values by ~400 m/s or a difference of ~15%. From 500 mbsf to the base of the wireline readings at 778 m WMSF, the gap narrowed so that the difference was <10%. We are confident in the veracity of the wireline sonic log values because they were quite consistent with seismic velocity values obtained from the detailed VSP experiment made on Hole U1462C (see Downhole measurements). We find these differences between measurements made on the cores and those measured in situ perplexing because they seem to exceed those generally found in these depth ranges for material that is semi- to fully lithified. Further study and comparison to other cored carbonate sections is warranted.
Within each sedimentary unit, taking all of the observations together, this data set reflects the heterogeneous nature of these rocks and the range of P-wave velocities present in the section. We conclude that P-wave sampling will always be limited in its reflection of the true variability of the material. The overall nature of the material can be accurately reflected by appropriate measurements, in the core liner for most sediment and outside of the liner for consolidated rocks. However, these measurements should be augmented with sonic wireline logs.
Gamma ray attenuation
Gamma ray attenuation (GRA) bulk density estimates were collected using the WRMSL at 5.0 cm intervals on all cores from all holes at this site (Figure F35). These results are reported with those from discrete bulk density measurements in Moisture and density below.
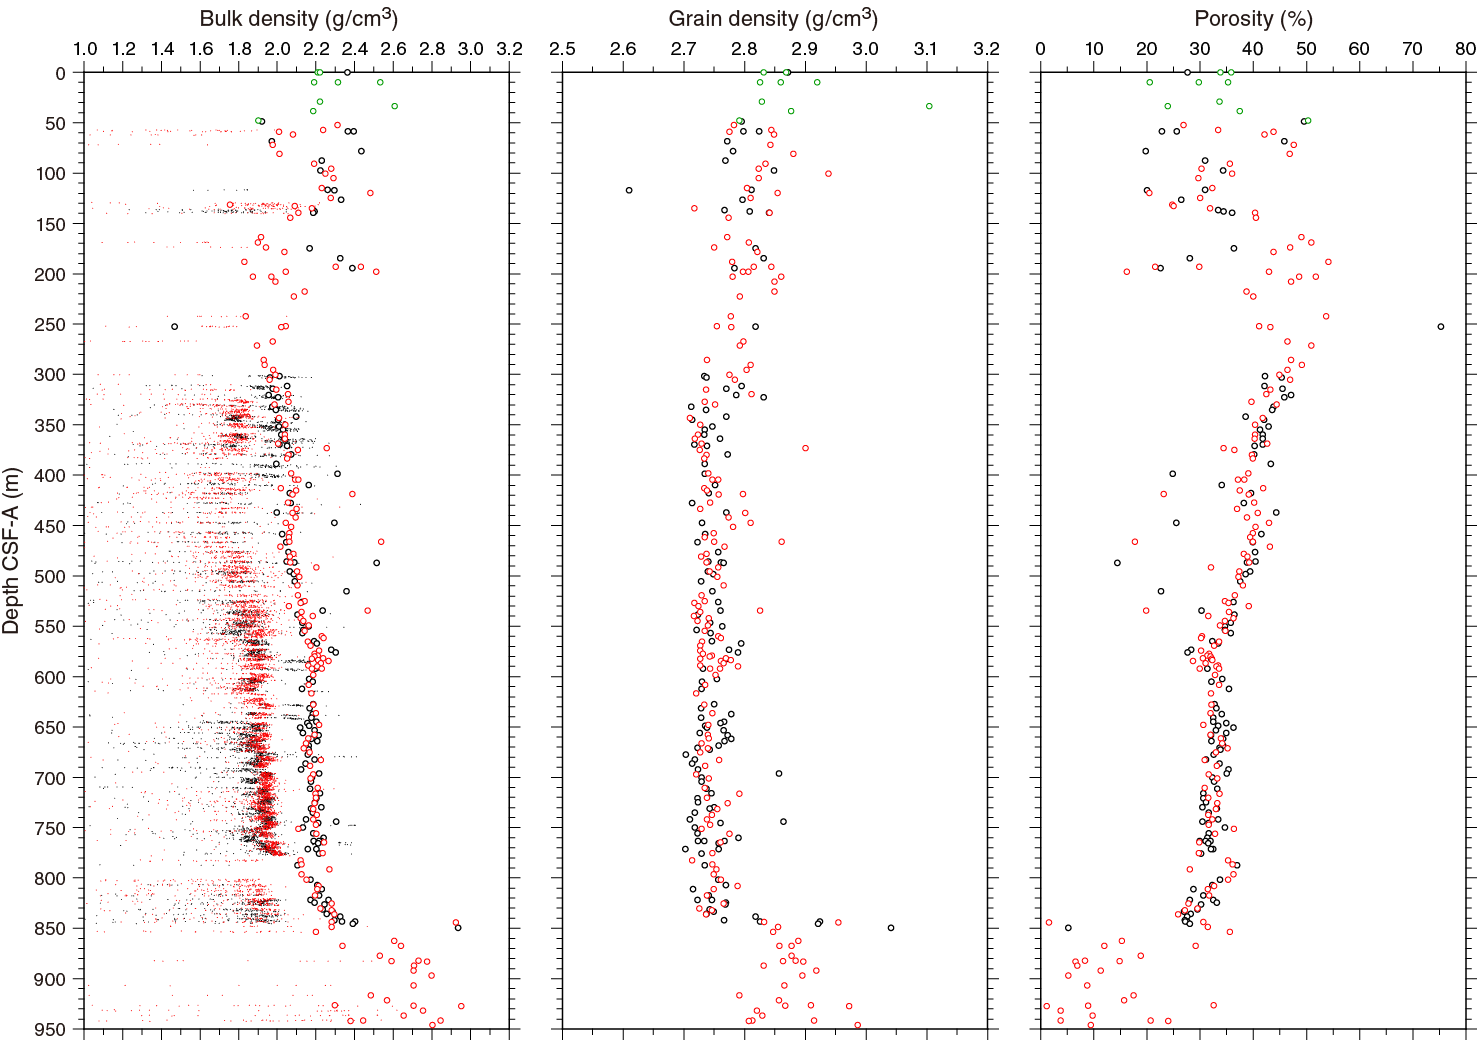
Figure F35. Bulk density, grain density, and porosity, Site U1462.
Moisture and density
One or two discrete samples were collected per core in all holes. Additionally, all sections of Cores 356-U1462C-112R through 115R were sampled. All MAD samples were taken in conjunction with smear slide samples, thin section samples, and XRD samples (see Lithostratigraphy). Plotted MAD results assume normal salinities. However, estimates of density and porosity were also calculated taking into account the high salinity values found in the pore waters at this site (see Geochemistry). The impact was to increase the absolute percent porosity value by as much as 2%, which is up to 5% of the measured values. Bulk and grain densities increased by <1% as a result of using corrected salinities.
As discussed above, the P-wave velocities shallower than 300 m CSF-A measured during wireline logging were variable, which was consistent with measurements on discrete samples. This observation suggests that the cored material represents a subsample of the lithologies present in this interval. The sampled material tends to have relatively high bulk and grain densities and low porosities. One sample at 250 m CSF-A in Hole U1462A has very low bulk density and very high porosity. Although this sample is composed of about 86% micrite (see Site U1462 smear slides in Core descriptions), which has significant porosity on a microscopic scale, we feel that this result is too inconsistent with other measurements in this interval to be accepted as close to the correct value.
Between 300 and 390 m CSF-A in Hole U1462A, bulk density data obtained through GRA correspond relatively well with bulk density as measured in discrete samples (Figure F35). However, in other intervals, the GRA values underestimated the actual bulk density because this measurement requires the sampled core to fill the liner (see Physical properties in the Site U1461 chapter [Gallagher et al., 2017b]). Between 280 and 400 m CSF-A in Holes U1462A and U1462C, discrete bulk density values increase from about 1.9 to 2.1 g/cm3. Between 400 and 570 m CSF-A, bulk density increases to about 2.2 g/cm3. From about 570 to 820 m CSF-A bulk density is relatively stable at 2.2 ± 0.05 g/cm3. A sharp increase is present between 820 and 845 m CSF-A in Holes U1462A and U1462C, with bulk densities of about 2.4 g/cm3 at the base before encountering anhydrite-rich clasts with very low porosity (1%–5%) and a bulk density of 2.91–2.95 g/cm3 (Figure F35).
Porosity reflects the same trends observed in the bulk density (Figure F35), with variable and relatively low values for the lithified pieces recovered in the upper 300 m. In lithostratigraphic Unit II (~300–768 m CSF-A, see Lithostratigraphy) porosities decrease from a high of 42%–46% at the top to 25%–29% at 840 m CSF-A. Grain densities are nearly constant throughout this unit at about 2.74 ± 0.03 g/cm3. Corresponding bulk densities increase, as described above, in response to these decreasing porosities and increasing grain densities. The more lithified aragonitic and dolomitic sands deeper than 840 m CSF-A are associated with lower porosities and variable grain densities as discussed above.
XRD measurements were often taken in conjunction with MAD samples. It is possible to estimate the relative abundance of most minerals from XRD data. However, with the tools available on board, this is not the case for clay minerals, for which presence or absence is determined (see Lithostratigraphy and sedimentology in the Expedition 356 methods chapter [Gallagher et al., 2017a]). The minerals present in these rocks include anhydrite, aragonite, low- and high-magnesium calcite, celestite, dolomite, and quartz (see Table T5). The grain densities of MAD samples were compared with those inferred from 21 XRD samples that were taken within 1 cm of each other (Table T16; Figure F36C). To estimate grain density from XRD we used the relative abundances of the minerals and the densities of minerals (2.98, 2.94, 2.71, 2.72, 3.97, 2.85, and 2.65 g/cm3, respectively) to calculate the grain densities of these samples without clay minerals. Where clay minerals were present, we calculated the grain density of these samples assuming various clay contents (5%, 10%, 25%, or 50%) and an average clay density of 2.70 g/cm3. The correlation between the grain densities generated through MAD and those estimated using XRD compositions, yield correlation coefficients (R2) of 0.81–0.82 (Table T16; Figure F36C). The similarity in grain density generated by these two very different methods suggests that these tools are accurate.
Table T16. MAD grain density compared with density inferred from XRD samples, Site U1462. Download table in .csv format.
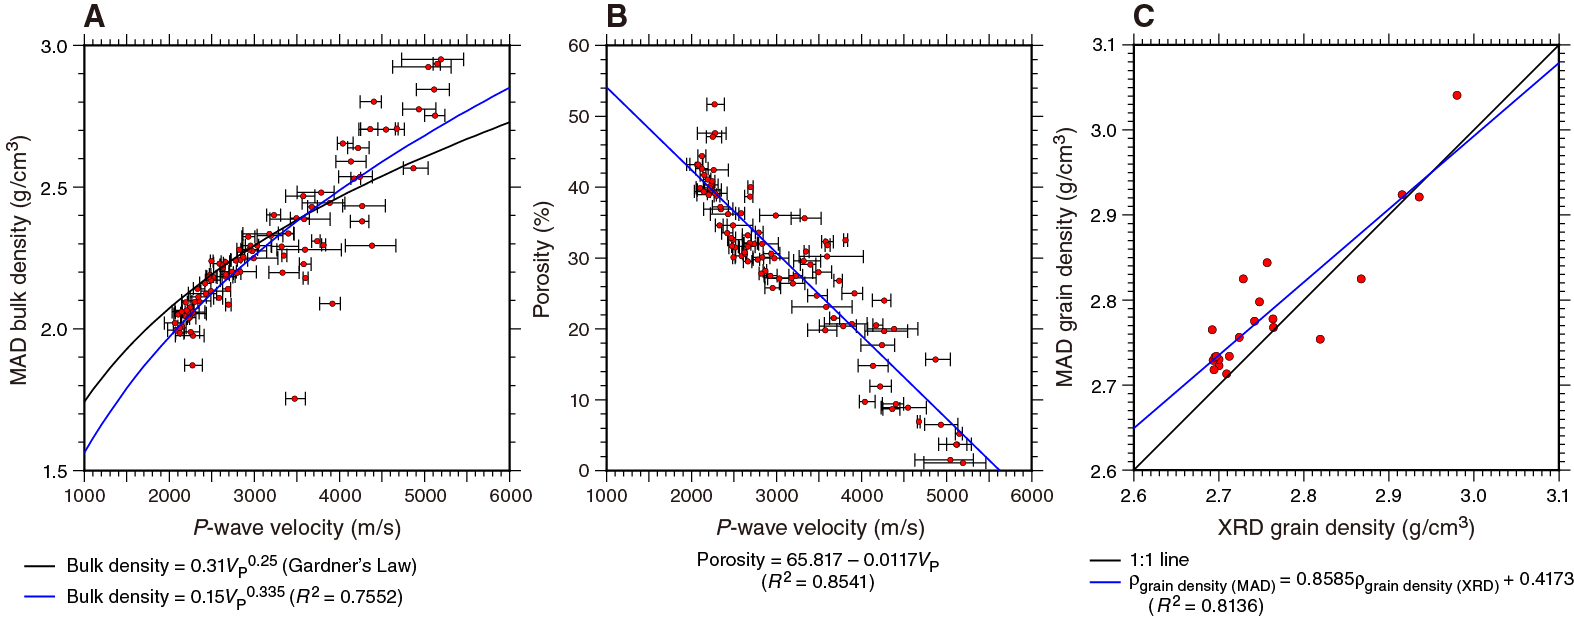
Figure F36. Correlations between discrete measurements, Site U1462.
Because P-waves were measured on MAD cubes, it was possible to analyze the correlation between P-wave velocity and bulk density and between P-wave velocity and porosity. We found these properties to be highly correlated (Figure F36A–F36B). It was high for porosity and lower for bulk density, which includes both porosity and grain density. The negative correlation with porosity results from the fact that the velocity of water is far less than the velocity of the sediment grains. A lithology-dependent relationship between seismic velocity and bulk density has long been established. A plot of Gardner’s relation (Gardner et al., 1974), which is a power law, is consistent with the character of the relationship seen in our data (Figure F36A). Fitting a power-law relation to our data yields high correlation (R2 = 0.755) and different constants, consistent with the expectation that constants are lithology dependent.
The nature of the 20–30 m thick cycles of NGR and MS (see Natural gamma radiation and Magnetic susceptibility) was assessed by high-resolution MAD sampling (one sample per section) in Cores 356-U1462C-112R through 115R, in conjunction with smear slides. A correspondence is observed between high NGR counts and low grain and bulk densities (Figure F37). MS and NGR are in phase, so the same correspondence is observed between grain and bulk densities and MS. Smear slide data suggest that low grain densities are a result of high clay input (see Lithostratigraphy). The average density of clays is about 2.7 g/cm3, which is lower than the average grain densities of these carbonate-rich sediments. This density relationship explains the correspondence between low grain density and high MS and NGR and confirms the detrital origin of the latter two physical properties.
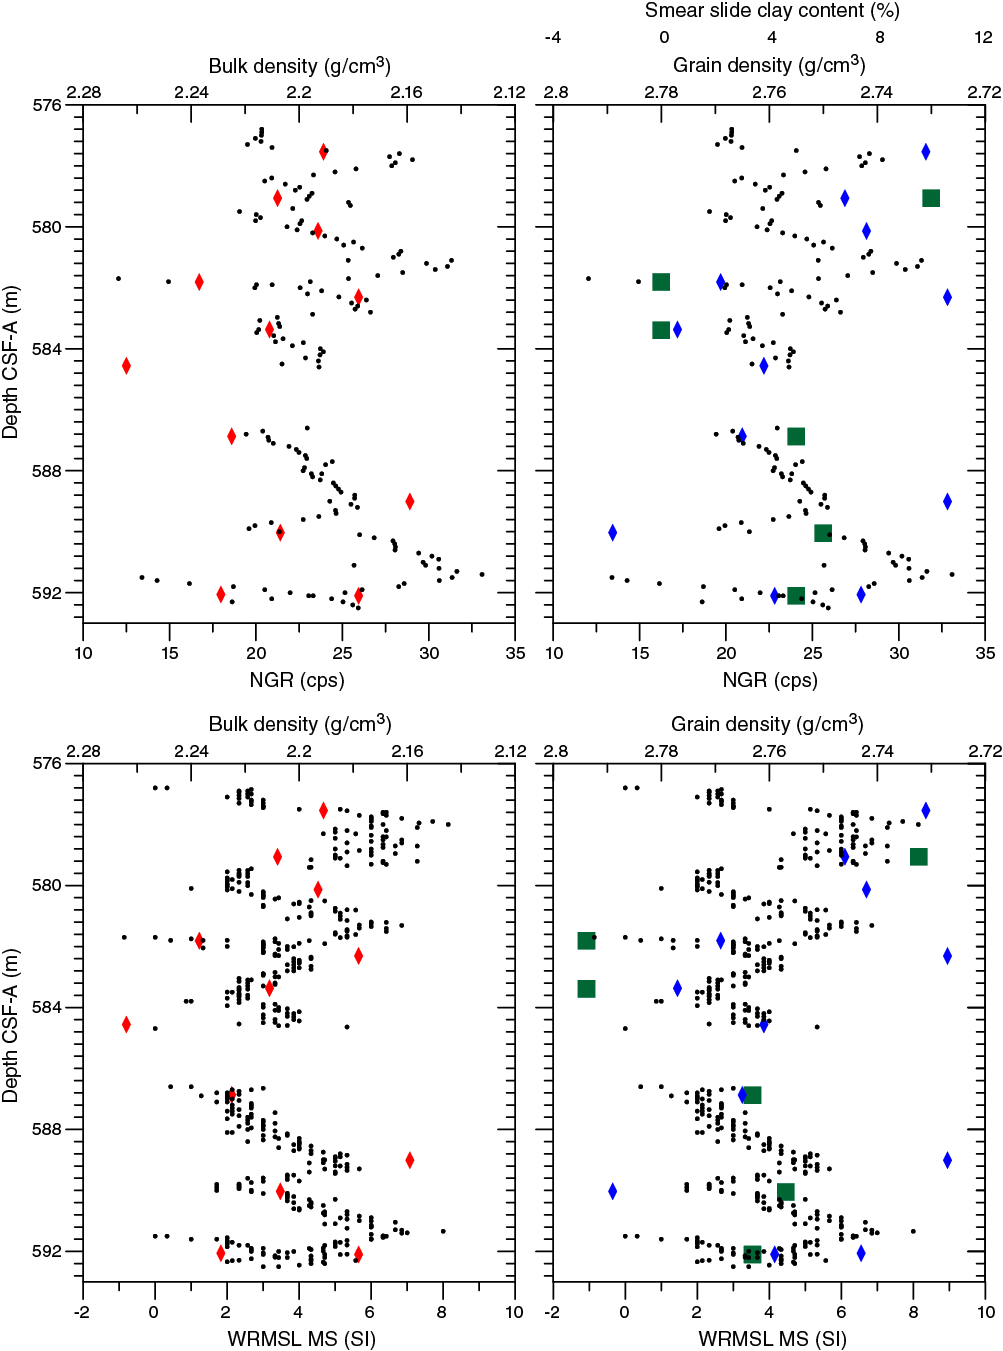
Figure F37. High-resolution MAD and smear slide sampling compared to NGR and WRMSL MS data.
Reflectance spectroscopy and colorimetry
Reflectance spectroscopy and colorimetry were measured on the archive-half core sections at 2.5 cm intervals (Figure F38). Relatively lighter colored sediments occur in the upper 300 m. Further downhole, sediments tend to be somewhat less reflective (L*). Deeper than 800 m CSF-A, L* values are relatively high to the bottom of Hole U1462C, probably in part because of the presence of anhydrite.
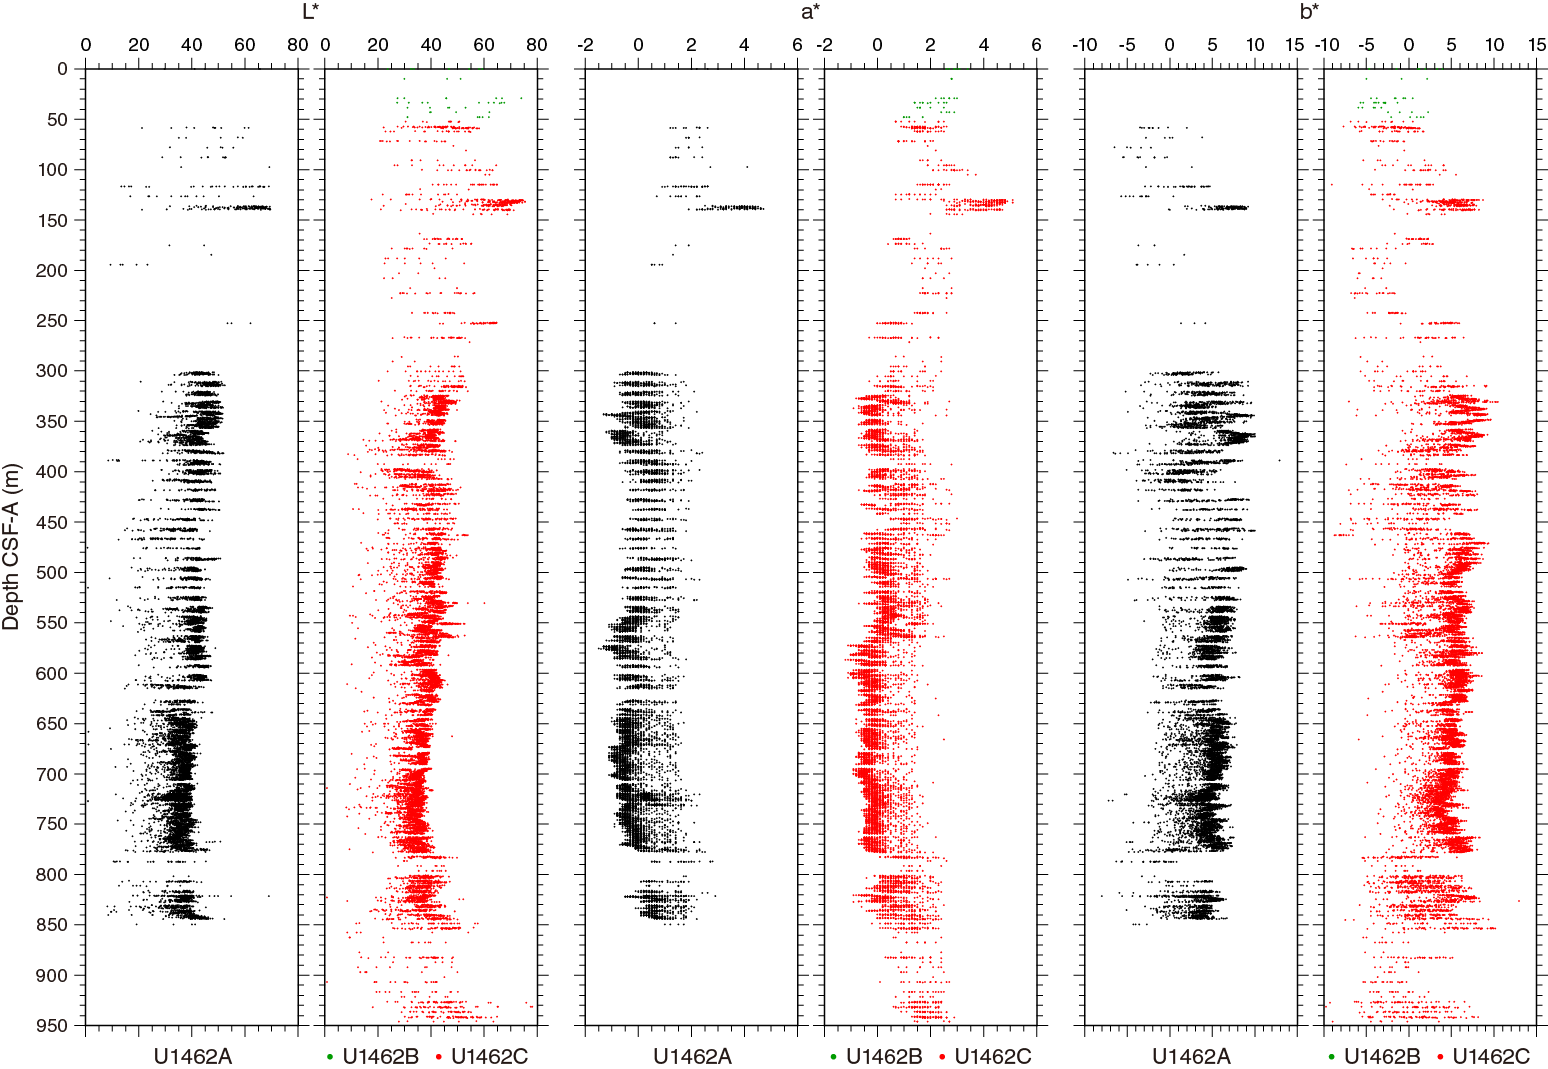
Figure F38. Reflectance spectroscopy and colorimetry, Site U1462.
Thermal conductivity
Thermal conductivity was measured using two different devices: the needle in unconsolidated sediment (Sections 356-U1462A-33X-2 and 36X-2) and the minipuck in harder, more consolidated sediment (all other measurements). In Hole U1462A, the values increased with depth from about 1.3 to 2.4 W/(m·K) at the bottom of the hole (Figure F39).
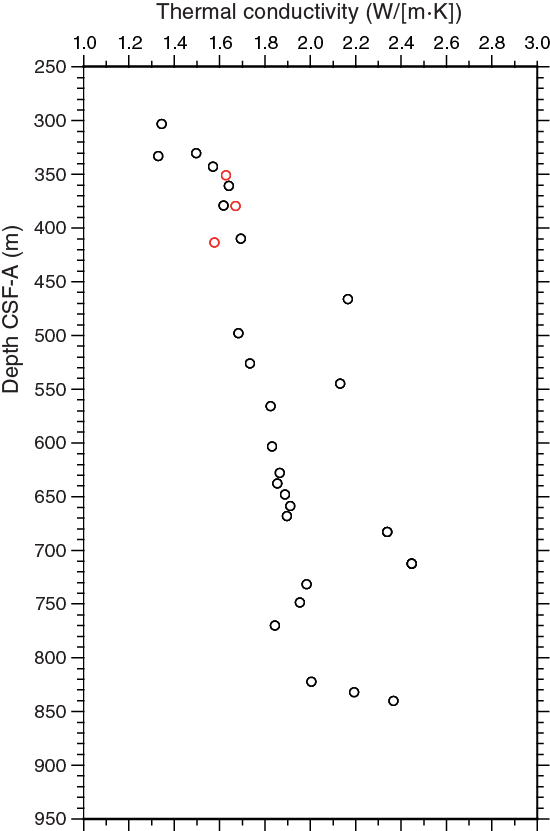
Figure F39. Thermal conductivity, Site U1462.
Downhole measurements
Downhole measurements were conducted in Holes U1462A and U1462C (see Operations for deployment details). In Hole U1462A, the triple combo tool string was run between 799 m WMSF and the seafloor. The triple combo measured borehole width, total spectral gamma ray (HSGR), resistivity, and MS but not density or porosity (the nuclear source was removed). The FMS-sonic tool string made two passes over the entire length of the open borehole (797–79 m WMSF). There were several changes to operations in Hole U1462C. First, the triple combo (895–0 m WMSF) was run with the nuclear sources so porosity and density data were collected. Next, the FMS-sonic tool string acquired two up passes from 768.5 m WMSF. Finally, a successful run with the VSI was carried out between 776.9 and 107.2 m WMSF using 27 stations that were ~25 m apart. Wireline HSGR data from both holes are in good agreement with core-based data and allowed for correlation of wireline and core data. MS measurements did not correlate with core-based data but rather showed an increase with depth that paralleled downhole temperature. Therefore, we judged the wireline MS measurements to be of insufficient quality for interpretation. Wireline bulk density and porosity measurements corresponded to results from discrete samples. Sonic velocities measured with the FMS-sonic tool string in both holes are in agreement with the VSP obtained from Hole U1462C. We compared downhole logging sonic velocities with core-based sonic velocities and found that wireline measurements yield higher values than core-based measurements. Borehole diameter exceeded 16.7 inches in most of the logged interval of both holes, which resulted in poor quality FMS resistivity. No in situ temperature measurements were made with the advanced piston corer temperature tool (APCT-3) at this site.
Depth matching
The depth scales of the preprocessed logs were first shifted to make them relative to the seafloor (−97 m in Hole U1462A and −97.5 m in Hole U1462C), which was determined by the step in gamma ray values observed by the triple combo. This differed by 1 and 0.5 m for Holes U1462A and U1462C, respectively, from the seafloor depth of 98 meters below rig floor (mbrf) determined by the drillers. The depth-shifted logs were then depth matched to the HSGR log from the main pass of the triple combo so that depth offsets among multiple logging runs were removed. There is a 1–4 m discrepancy between the curated depths of cores based on recovery (CSF-A) and wireline depths (WMSF). In the discussion below, we refer to all logs in WMSF and all cores in CSF-A, realizing that the match between the two is only approximate within several meters.
Natural gamma radiation
HSGR was measured during the down and up passes in both Holes U1462A and U1462C. For both holes, we present data obtained during the up passes (Figure F40). The HSGR logs show consistent results between both holes, but we observed slightly lower counts in Hole U1462C in the interval between 90 and 120 m WMSF. Nevertheless, relative HSGR variations in this interval were similar between both holes. Wireline HSGR data showed good agreement with the NGR data obtained on whole-round cores from this site. Between 120 and 400 m WMSF, HSGR shows a gradual increase from 20 to 40 American Petroleum Institute gamma radiation units (gAPI). Between 400 and 500 m WMSF, HSGR decreases to about 20 gAPI and then increases again to 45 gAPI at 760 m WMSF. Superimposed on these broad trends, the HSGR wireline logs show 20–30 m scale variations that were also observed in cores (see Physical properties). Between 760 and 780 m WMSF, there is a sharp drop in HSGR to 25 gAPI. From that depth to the bottom of the wireline log (857.25 m WMSF), HSGR values remain low and fluctuate between 25 and 35 gAPI. The five-window spectroscopy of the HSGR tool allowed the approximate concentrations of uranium (U), thorium (Th), and potassium (K) to be determined. These data showed that the peaks in HSGR at 129, 305, and 402 m WMSF were mainly driven by variations in U content (Figure F40) and indicate that U-driven peaks tend to correspond to average to relatively low K and Th concentrations. Between 310 and 760 m WMSF, the downhole HSGR elemental estimates suggest increases in Th and K concentrations, whereas U concentration decreases.
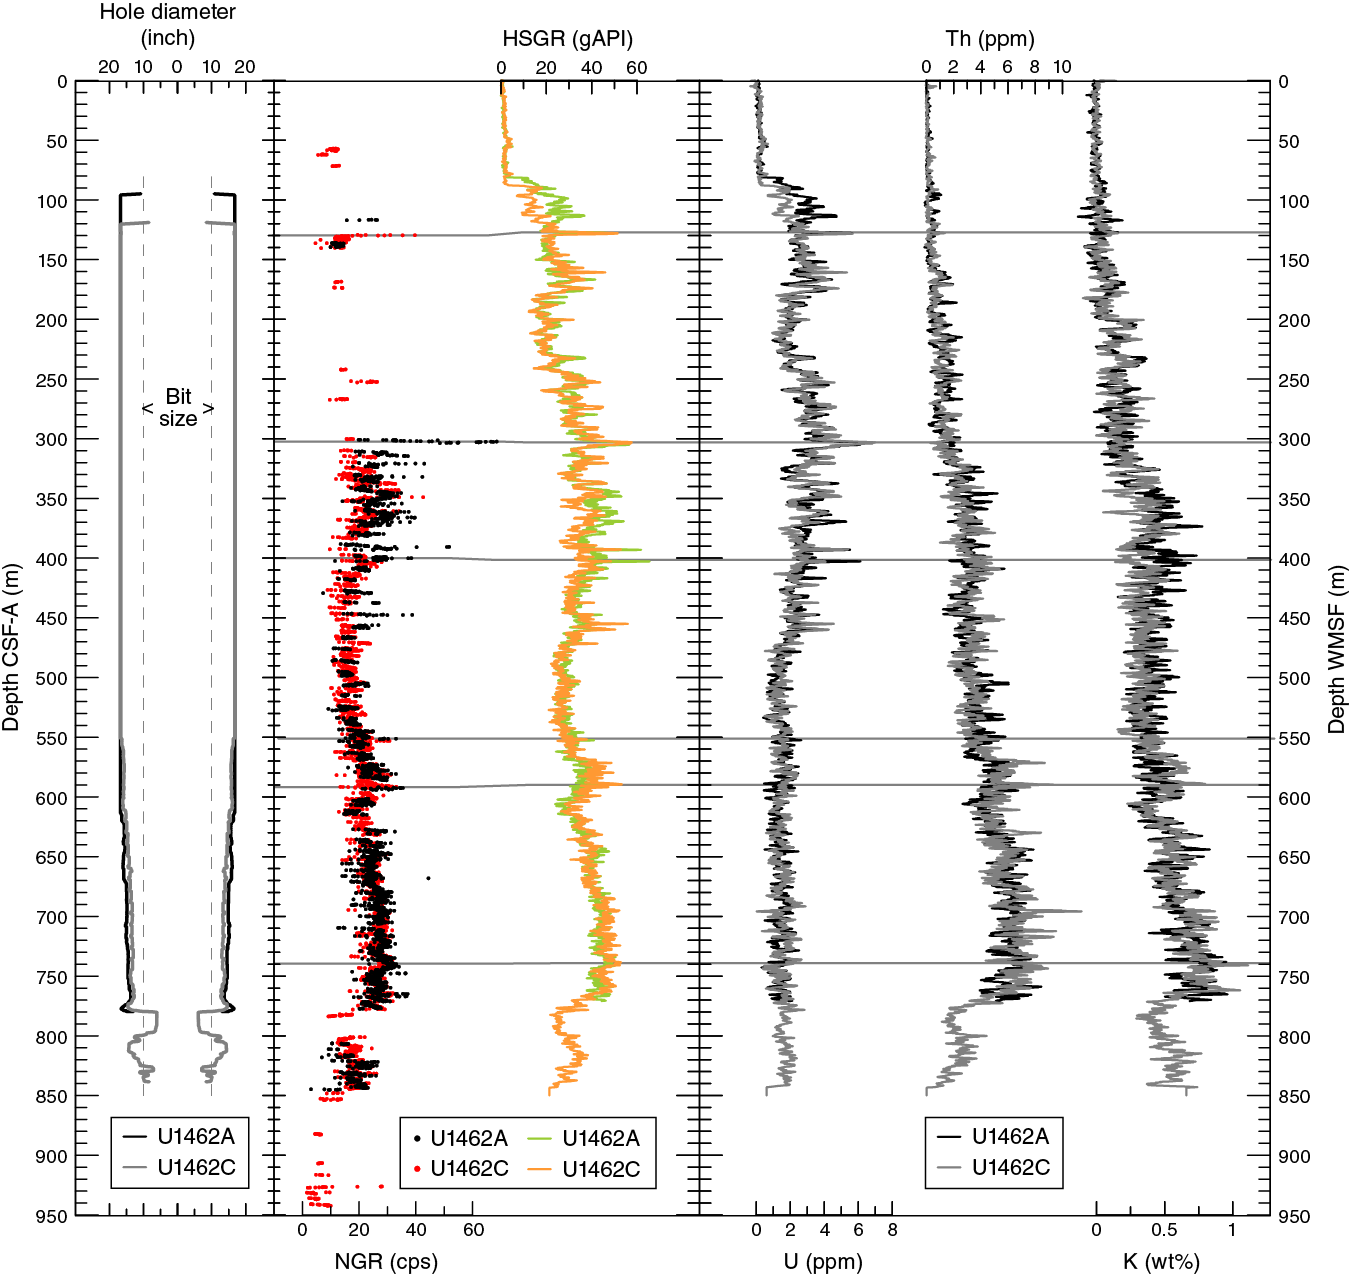
Figure F40. HSGR, NGR, and elemental U, Th, and K concentrations, Holes U1462A and U1462C.
As mentioned above, many features in the wireline HSGR records from Holes U1462A and U1462C were also observed in cores from the same holes. Six of the most consistent core-log correlations are indicated by horizontal gray lines on Figure F40 and consist of gamma ray peaks as well as distinctive variations over ~20 m intervals. The correlation of these distinct maxima in gamma ray values indicates that the offset between wireline and coring depth varied between 1 and 4 m.
Magnetic susceptibility
MS was measured during downhole wireline logging with the triple combo in Holes U1462A and U1462C. Wireline MS measurements did not correlate with core-based data but rather showed an increase with depth that paralleled downhole temperature (which was also measured by the MSS). This is similar to what was observed during downhole logging at Site U1461. This effect was not corrected for during processing. Therefore, the wireline MS data were judged to be of insufficient quality for interpretation.
Porosity and density
We measured porosity and density during the up pass with the triple combo (Figure F41) in Hole U1462C only because the nuclear source was not used in Hole U1462A (see Operations). In general, the wireline measurements of these sediment properties agreed with discrete measurements of core samples (see Physical properties). Where the wireline values differed from the measured core values, porosity was overestimated whereas bulk density was underestimated. Even when the width of the hole was greater than the caliper size on the triple combo (16.7 inches), we were able to obtain wireline measurements consistent with core measurements (Figure F41). In the upper part of the hole (100–300 m WMSF), bulk density was variable, with values ranging between 1.70 and 2.2 g/cm3. From 300 to 780 m WMSF, bulk density gradually increased from 2.0 to 2.25 g/cm3.
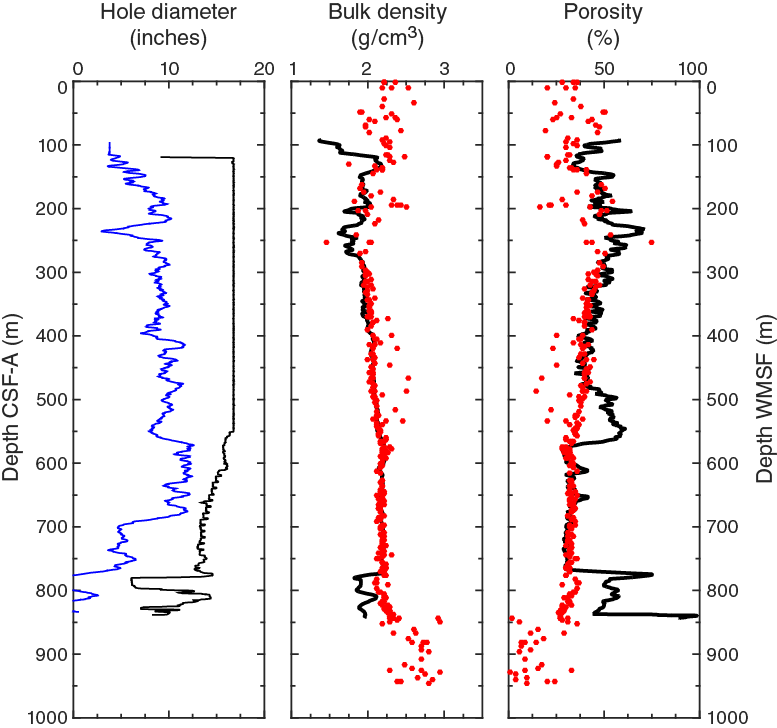
Figure F41. Hole U1462C diameter and standoff distance inferred from triple combo and bulk density and porosity.
From 100 to 250 m WMSF, porosity was high (~40%) but variable, ranging between 30% and 50% (Figure F41). An increase in porosity was observed from ~35% to 50% at 150 m WMSF, which is consistent with porosity data obtained from core-based MAD data. Another increase in the wireline porosity data was observed between 500 and 575 m WMSF; however, this increase diverges from the core values. This shift corresponds to a sudden decrease in standoff distance, which is the distance between the tool and wall inferred from the Accelerator Porosity Sonde (APS) tool signal. However, the porosity values >50% are implausibly large for these depths. Therefore, we described the wireline-inferred porosity as a simple decay from about 50% at 250 m WMSF to 30% at 770 m WMSF. This trend is consistent with the overall increase in wireline bulk density noted above. The wireline inferred porosity jumps again at 770 m WMSF to values >50% and then quickly stabilizes to about 50% from 770 to 850 m WMSF. We consider this final shift also to be implausible because it is inconsistent with the continued smooth decay in the core-measured MAD values. This variation in porosity also correlates with irregularities in the bottom of the hole, such as the size (caliper measurement) and standoff distance on the APS tool (Figure F41).
Formation MicroScanner
The FMS-sonic made two passes in each of Holes U1462A and U1462C. FMS images reveal differences in textures and lithology through the logged interval from about 102 to 794 m WMSF in Hole U1462A and 134 to 768 m WMSF in Hole U1462C. The FMS images are generally poor because the four pads on the tool rarely had good and complete coupling along the entire depth of the holes, an unsurprising result given that the borehole diameters were >16.7 inches. Nevertheless, there are intervals in which there was reasonably good contact and where we find alternations in resistivity (Figure F42) that may reflect changes in sediment electrical properties related to changes in lithology. Within Holes U1462A (~600 m WMSF) and U1462C (~575 m WMSF), we find coherent horizontal lineations between the four sensing pads where the character between the two holes was similar. The spacing between these alterations ranges from several tens of centimeters to several meters, with thin (several tens of centimeters) resistive layers embedded within broader more conductive areas (1–2 m). We find several prominent lineations, for example, at about 10 m spacing, which are traceable between Holes U1462A and U1462C. There is no evidence for any dip of the sediment layers in these logs, consistent with direct inspection of the cores (see Lithostratigraphy).
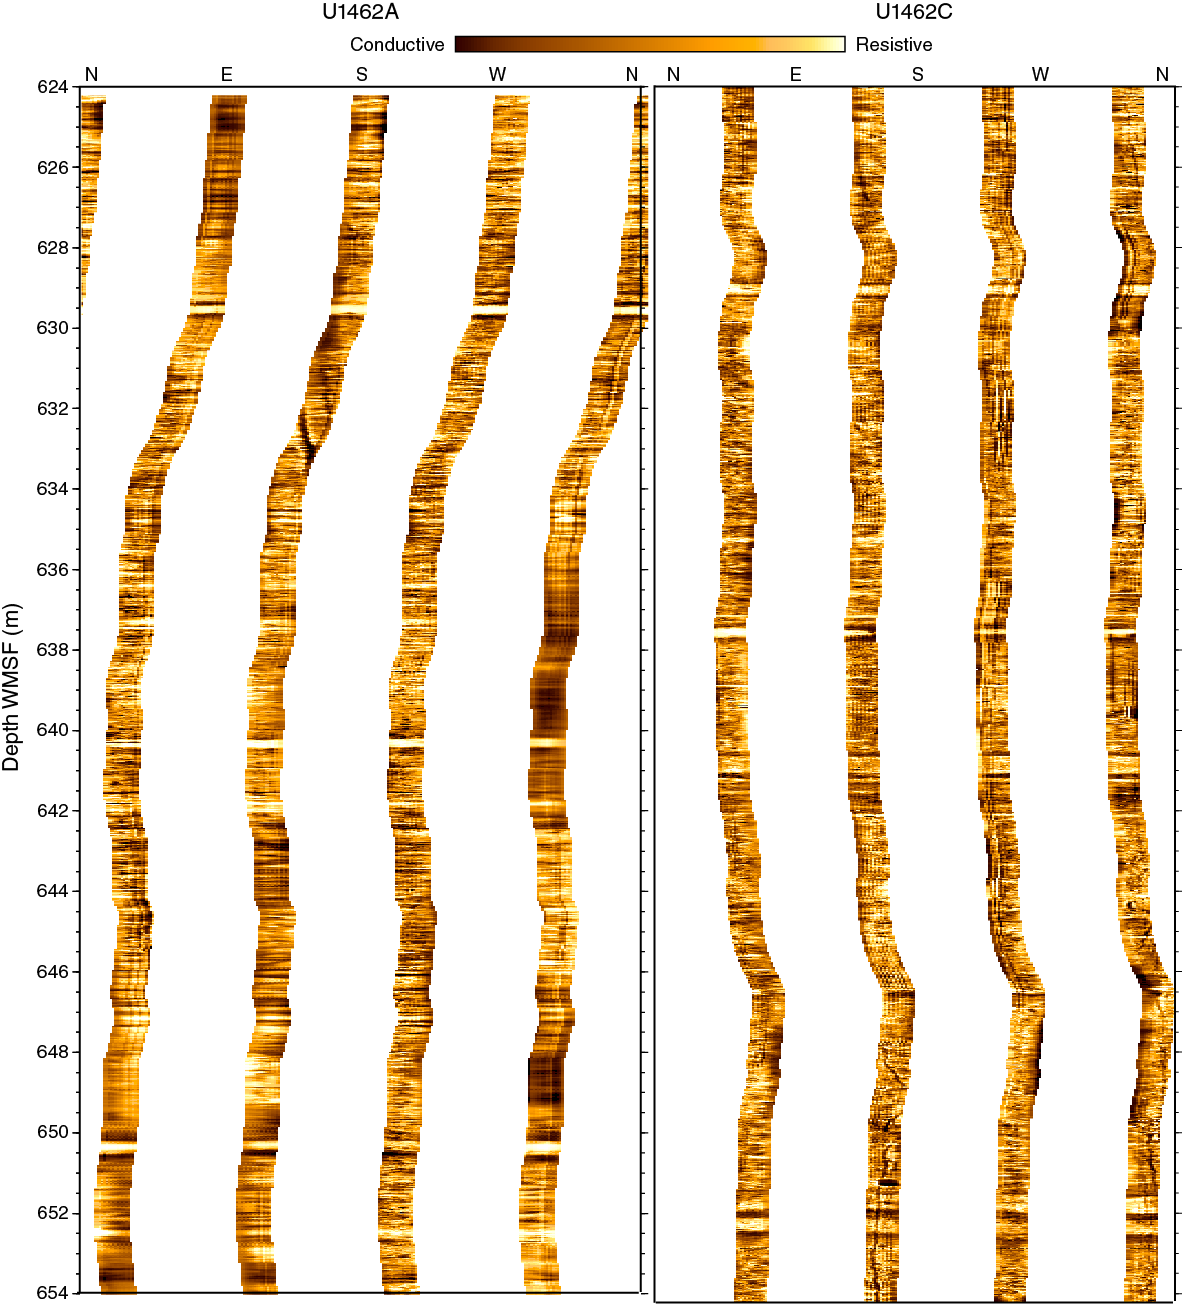
Figure F42. FMS images, Holes U1462A and U1462C.
Seismic properties
We measured the seismic properties of Site U1462 through both the FMS-sonic and through a VSP using the VSI. The wireline sonic P-wave velocity was determined in two passes in each of Holes U1462A and U1462C, whereas the VSP was performed only in Hole U1462C.
For the VSP, the lowest level of the sensor was deployed at 776.9 m WMSF. We then raised the tool uphole in ~25 m intervals, the actual spacing depending on contact with the borehole. If the coupling was good, a series of air gun shots was attempted to obtain five high-quality arrivals. In total, 27 stacked traveltime determinations were made from 776.9 to 107.2 m WMSF. However, between 302.5 and 227.3 m WMSF, we were unable to achieve good coupling of the VSI and the borehole wall because of the width of the borehole (>16.7 inches). The seismic arrivals were then stacked and a record section developed. Using the record section, the interval velocity between each successive receiver was determined as shown in Figure F43A. Presentation of the interval velocities in this way tends to accentuate noise because the velocity is determined solely between two stations. The interval velocity varied with depth with a minimum of 2161.8 m/s (177.5–202.3 m WMSF) and a maximum of 3224.8 m/s (672.6–692.6 m WMSF).
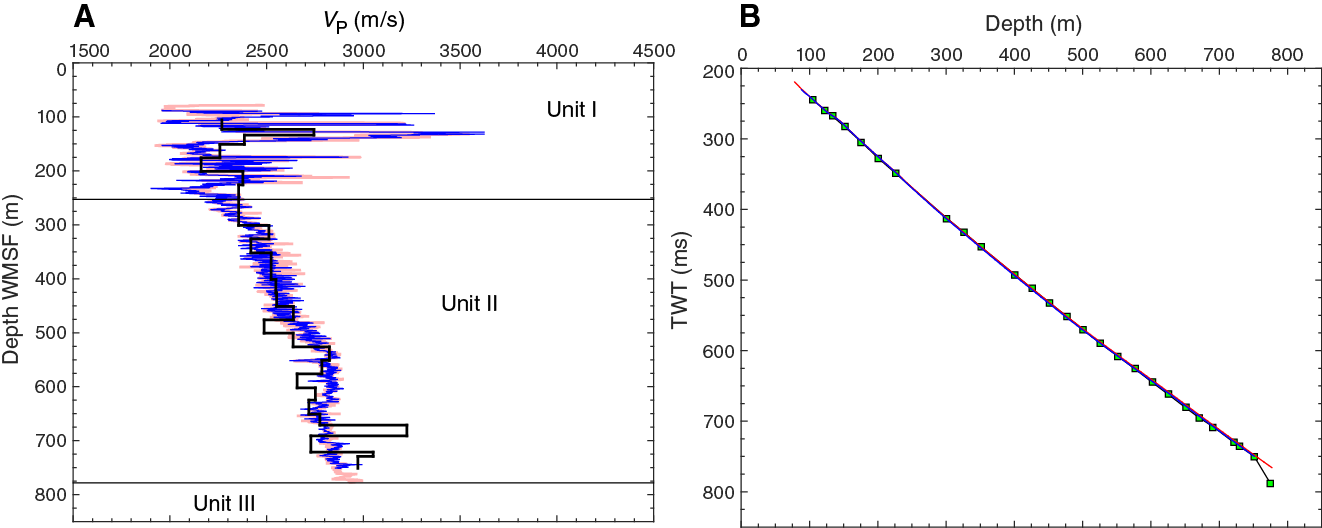
Figure F43. A. VSP interval velocities vs. wireline compressional sonic velocities. B. VSP downhole traveltimes vs. sonic log inferred two-way traveltimes.
The correspondence between the sonic velocity obtained with the FMS-sonic and the VSP experiment is quite good (Figure F43A), and the record section will allow all logs to be more precisely updated and integrated with the existing multichannel seismic profiles crossing at Site U1462. To allow for comparison of the wireline sonic traveltimes against the VSP, it was required to add a constant to each wireline sonic profile because they do not extend to the seafloor. Nevertheless, at the scale shown in Figure F43B, the two-way traveltimes for the VSP and the two wireline sonic profiles essentially overlie one another. At 752 m WMSF, the cumulative difference between the VSP and sonic log from Hole U1462C is about 2 ms, whereas for the sonic log from Hole U1462A it is <1 ms. Consequently, the VSP experiment validates the absolute values of the velocities obtained with the FMS-sonic. This confirms that the disagreement between core-based and wireline logging–based sonic velocities described in the Physical properties between 250 and 750 m WMSF is due to a change in the velocities as a result of coring and removal from in situ conditions and not from uncertain downhole measurements.
Essentially all of the sonic velocities between holes and passes at Site U1462 agree with one another. They show a steep rise from 2200 m/s at 100 m WMSF to about 3500 m/s at 150 m WMSF. This interval is underlain by a 50 m thick low-velocity layer (~2150 m/s). Deeper, a moderate-velocity layer with rapidly oscillating values (2200–2500 m/s) is present. All of these changes correspond to lithostratigraphic unit boundaries (see Lithostratigraphy). The base of Unit I is characterized by a prominent low-velocity layer ~50 m thick with velocities reaching as low as 2100 m/s. Velocity increases to about 2200 m/s at the top of Unit II and steadily increases to 2800 m/s at ~500 m WMSF. Velocity oscillates while gradually increasing to ~2900 m/s near the base of Unit II at ~775 m WMSF.
Stratigraphic correlation
The lithology in the upper ~300 m at Site U1462 was resistant to piston coring, so the XCB and RCB systems were used from the seafloor. As a result, recovery was very low in the upper ~300 m in both holes. However, wireline logging provides data from these intervals. Recovery varied with the coring system used. Recovery with the XCB system was high from ~545 to 585 m CSF-A (Cores 356-U1462A-58X through 62X), ~635 to 735 m CSF-A (69X through 86X), and ~820 to 845 m CSF-A (Cores 94X through 98X). Recovery with the RCB system was moderate to high from ~320 to 370 m CSF-A (Cores 356-U1462C-62R through 71R), ~460 to 775 m CSF-A (Cores 91R through 143R), and ~815 to 825 m CSF-A (Cores 151R through 153R). Because the recovered cores do not overlap for more than a few meters at a time, a detailed correlation cannot be constructed. However, the wireline gamma ray logs, which correlate well with NGR measured in the cores, provide an excellent framework for developing windows of high-resolution analyses in higher recovery intervals. For example, Cores 356-U1462A-36X through 40X overlap with Cores 356-U1462C-62R through 65R and 67R through 71R, Core 356-U1462A-53X overlaps with Cores 356-U1462C-54R through 57R, Cores 356-U1462A-57X through 61X overlap with Cores 356-U1462C-101R through 109R, Core 356-U1462A-64X overlaps with Cores 356-U1462C-117R through 120R, Cores 356-U1462A-71X through 86X overlap with Cores 356-U1462C-128R through 143R, and Cores 356-U1462A-94X through 98X overlap with Cores 356-U1462C-148R through 157R.
Guidance for coring (using CSF-A)
The lithology of the upper ~300 m CSF-A required the use of the XCB (Hole U1462A) and RCB (Hole U1462C) systems from the seafloor. Nevertheless, very little material was recovered in the upper ~300 m CSF-A. Cores were measured for MS and GRA on the Special Task Multisensor Logger (STMSL) at 10 cm intervals immediately after recovery. The results were used to monitor for coring gaps in real time. Operational guidance was provided by targeting intervals of low to no recovery and adjusting coring in Hole U1462C to avoid reproducing the same recovery gaps as in Hole U1462A. For example, Core 356-U1462C-156R was drilled only ~3.5 m to optimize the chances of recovering the contact at the top of the Miocene section that had been encountered in Cores 356-U1462A-99X through 100X.
Coring in Hole U1462A employed the XCB system, and recovery was very low (0%–39%) with the exception of 310–380 m CSF-A (Cores 356-U1462A-33X through 40X), 535–585 m CSF-A (Cores 58X through 62X), and 640–770 m CSF-A (Cores 69X through 86X) (see Figure F44 for core recovery). Hole U1462C was drilled using the RCB system; half-advancements (4.8 m) were utilized at the same depths as the low-recovery intervals of Hole U1462A to optimize core recovery and constrain the stratigraphic position of the recovered material. This strategy worked in the interval from 380 to 535 m CSF-A, where recovery in Hole U1462A was low, and allowed for improved recovery in this depth interval in Hole U1462C.
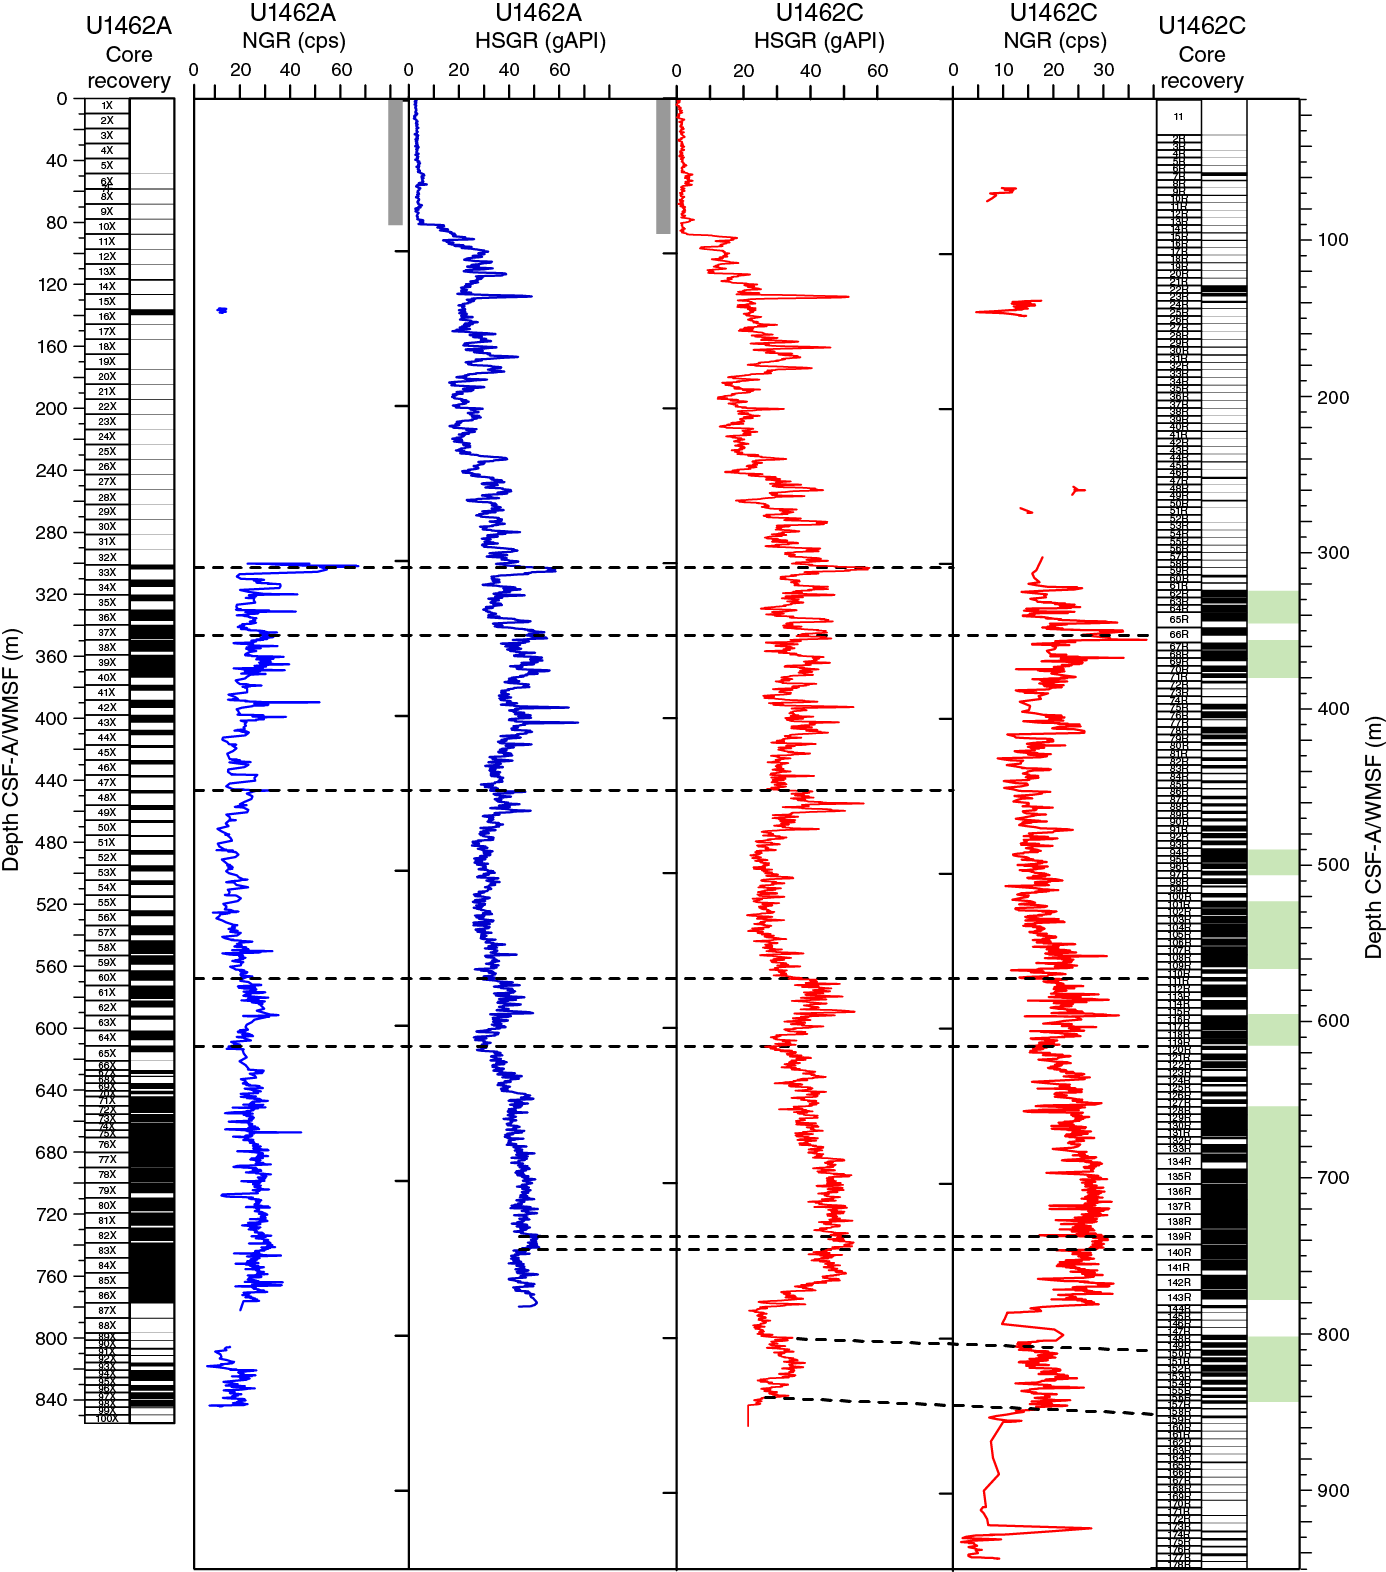
Figure F44. Core recovery plotted against NGR measured on cores and wireline HSGR, Holes U1462A and U1462C.
Correlation of the cores (to produce CCSF-A)
Coring in all three holes had consistently low levels of recovery in the upper ~300, so no correlation was possible in that interval. Recovery was higher deeper than ~300 m CSF-A in Holes U1462A and U1462C, although not high enough to create a continuous correlation and splice. The lithology and different coring systems (XCB and RCB) produced differences in recovery between holes that resulted in very little overlap. However, NGR measured on Hole U1462A and U1462C cores permits correlation to the respective HSGR wireline logs; tie points are shown in Figure F44.
Construction of a splice (to produce CCSF-D)
A splice was not generated because recovery was too limited to permit the development of a continuous correlation. High-resolution sampling may be accomplished in windows of higher recovery, such as Cores 356-U1462A-36X through 40X and 74X through 86X, using wireline logs to provide a stratigraphic framework. Lower resolution sampling should follow Figure F44, which illustrates the correlative depths between Holes U1462A and U1462C using tie points and where green blocks highlight intervals of relatively high recovery. Cores 356-U1462A-36X through 40X overlap with Cores 356-U1462C-62R through 65R and 67R through 71R, Core 356-U1462A-53X overlaps with Cores 356-U1462C-54R through 57R, Cores 356-U1462A-57X through 61X overlap with Cores 356-U1462C-101R through 109R, Core 356-U1462A-64X overlaps with Cores 356-U1462C-117R through 120R, Cores 356-U1462A-71X through 86X overlap with Cores 356-U1462C-128R through 143R, and Cores 356-U1462A-94X through 98X overlap with Cores 356-U1462C-148R through 157R.
Correlation of core to wireline
Both Holes U1462A and U1462C were logged, and the wireline gamma log (HSGR) was compared to NGR data measured on Hole U1462A and U1462C cores (Figure F44). Even though core recovery was not sufficient to generate a splice, it should be possible to generate relatively continuous records using the wireline data as a guide. However, not all peaks can be correlated with confidence between core and wireline (e.g., at ~740 m CSF-A).
Hole and site summaries (sedimentation rates)
A summary of the relationship between NGR and color reflectance b* (see Physical properties), biostratigraphic, lithostratigraphic (see Biostratigraphy and micropaleontology and Lithostratigraphy), and magnetostratigraphic (see Paleomagnetism) data, plus sedimentation rates calculated from biostratigraphic datums (see Biostratigraphy and micropaleontology), is presented graphically for Holes U1462A and U1462C (Figures F45, F46) and for Site U1462 (Figure F47). Sedimentation rates were calculated assuming a linear sedimentation rate between datums (in centimeters per thousand years and using the CSF-A depth scale).
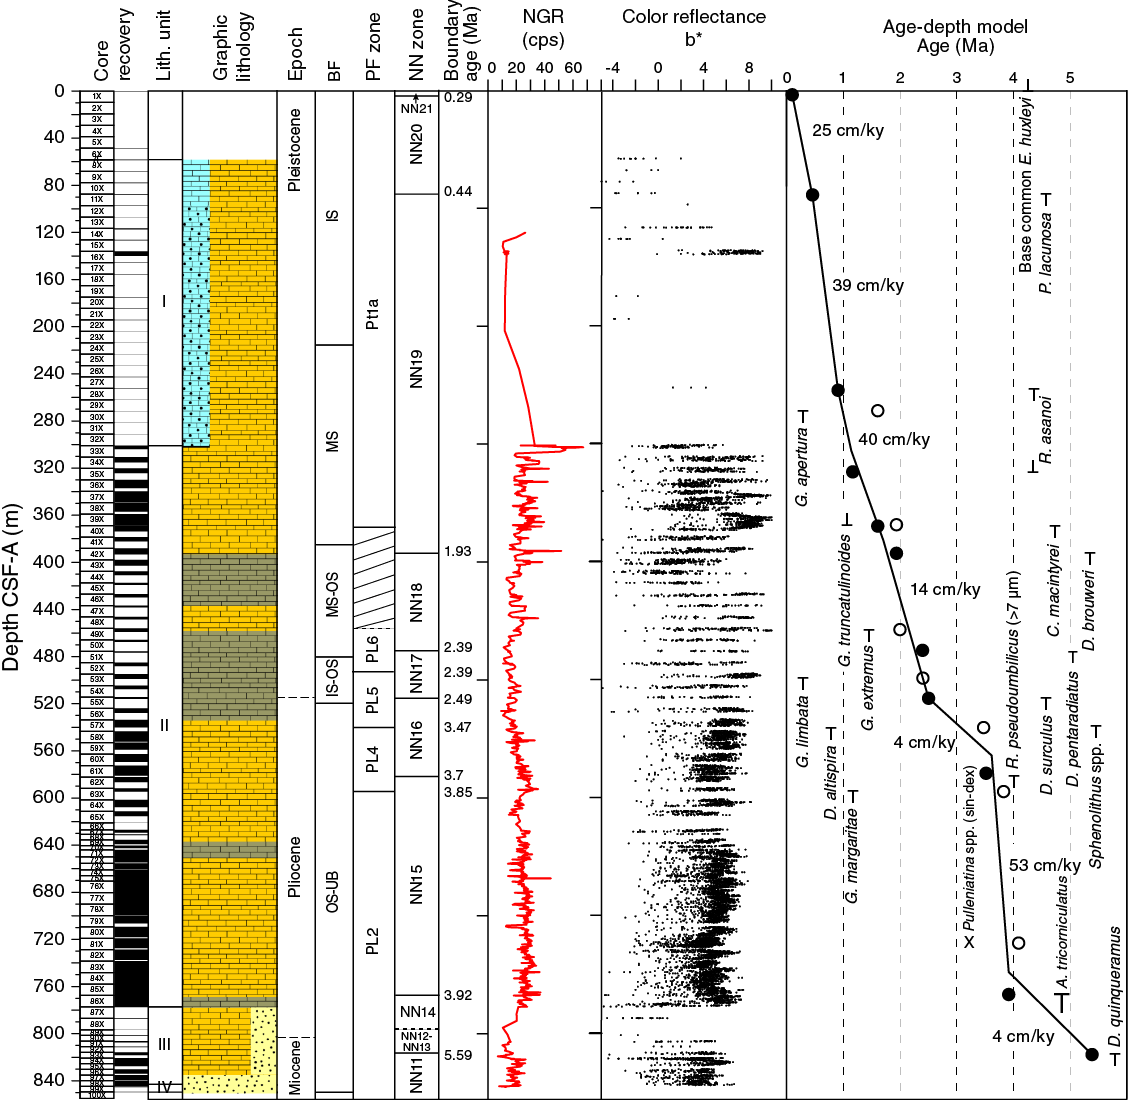
Figure F45. Hole U1462A lithology summary with NGR and color reflectance b*.
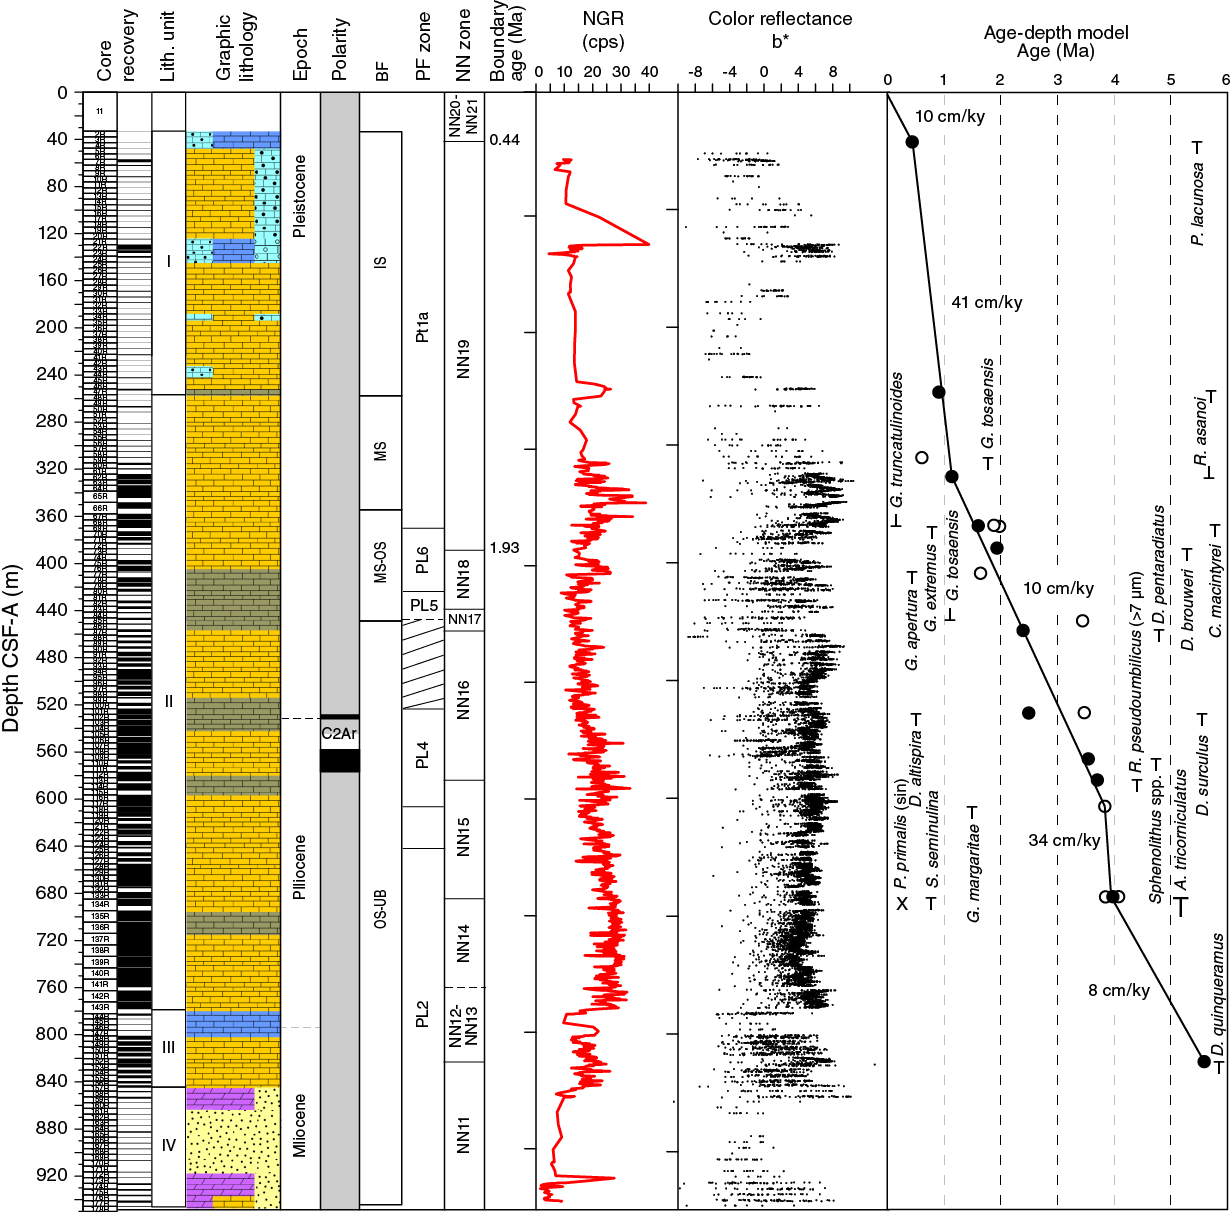
Figure F46. Hole U1462C lithology summary with NGR and color reflectance b*.
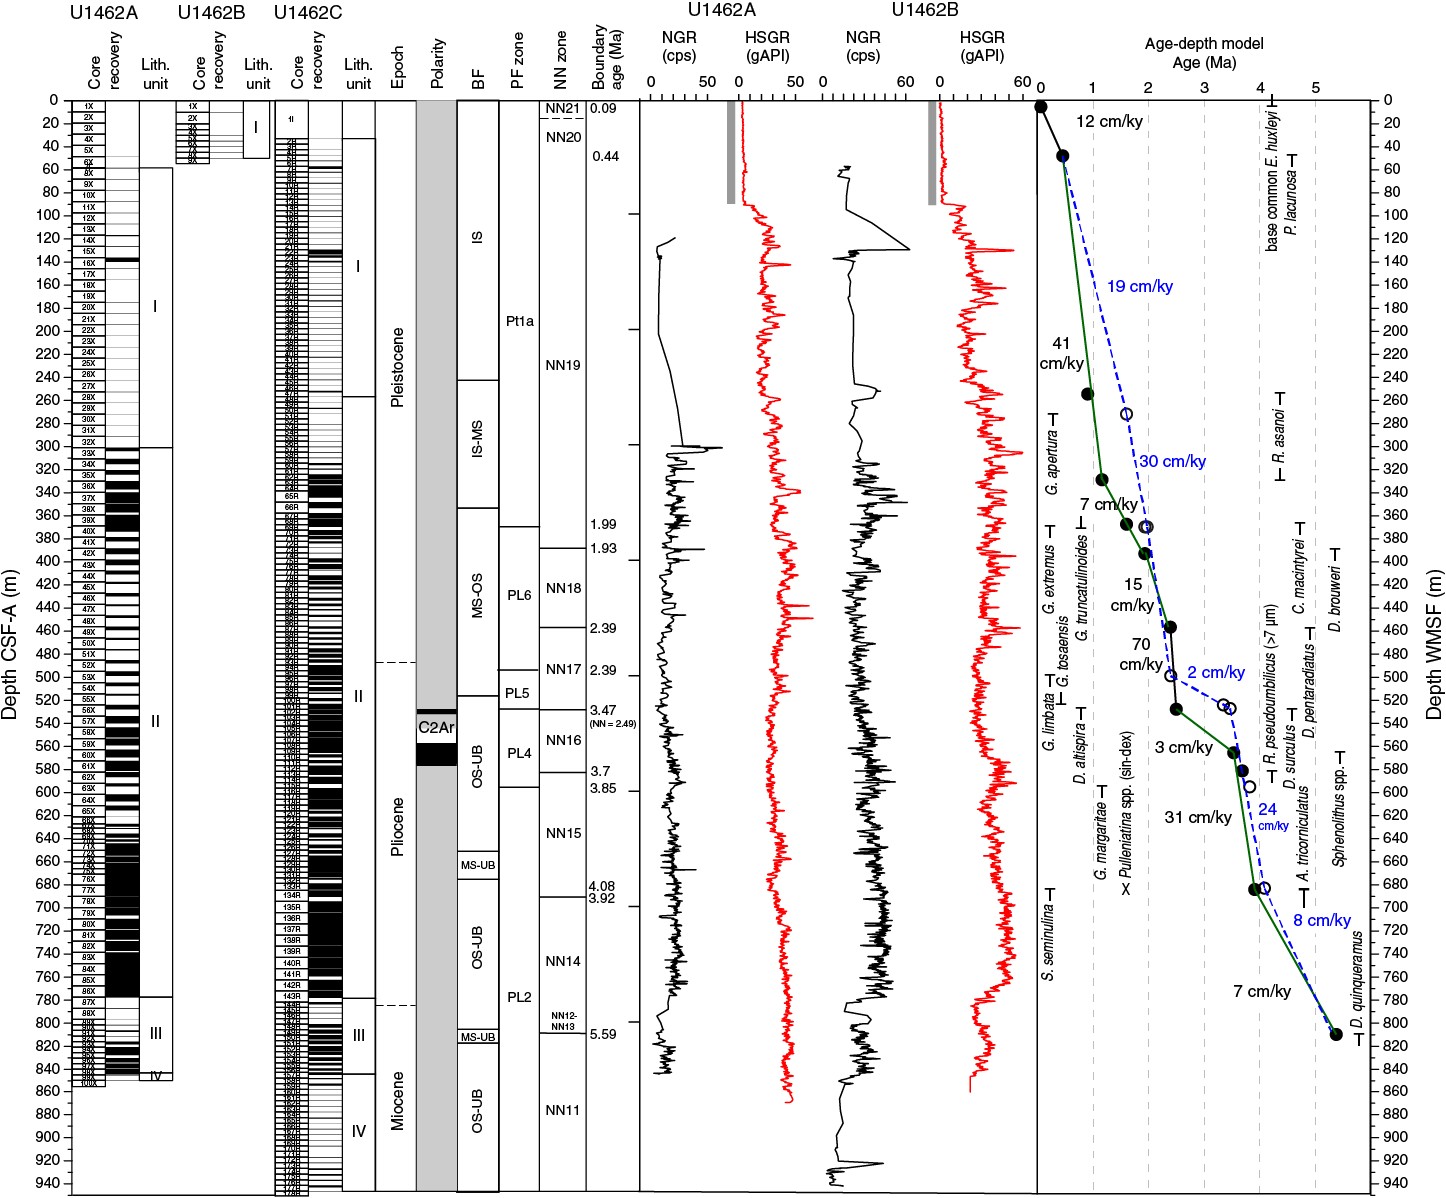
Figure F47. Site U1462 lithology summary with NGR and wireline HSGR.
Site U1462 penetrated late Miocene sediments (Figures F45, F46), reaching the Bare Formation (see Lithostratigraphy). Few datums are present in this Miocene interval as a result of low microfossil abundances (see Biostratigraphy and micropaleontology). Early Pliocene sedimentation rates are moderate (4 cm/ky) between Zones NN1 and NN14 in Hole U1462A (Figure F45); slightly higher rates (8 cm/ky) are calculated in Hole U1462C (Figure F46). Rates increase to 53 cm/ky in Zone NN15 (34 cm/ky in Hole U1462C), followed by a reduction through the end of the Pliocene (Zone NN16) to 4 cm/ky (Figures F45, F46). Rates are moderate (14 cm/ky) into Zone NN19 but increase to ~40 cm/ky higher in both holes. Rates are lower but still high (10–25 cm/ky) from Zone NN20 to the seafloor, but very low recovery rates render the stratigraphic position of the uppermost datums equivocal. Differences in sedimentation rates between the holes are attributed to differences in the positions of the datums, which vary with sampling interval and gaps from lower core recovery.
The summary figure for Site U1462 (Figure F47) illustrates the sedimentation rates from the Miocene to the Pleistocene. The site summary figure utilizes a composite set of biostratigraphic datums (see Biostratigraphy and micropaleontology). Sedimentation rates are calculated separately for calcareous nannofossils and planktonic foraminifers, resulting in slight differences. Nonetheless, the rates show similar patterns. Sedimentation rates are moderate in the Miocene but are elevated in the early Pliocene. An interval of reduced sedimentation rates around the Pliocene/Pleistocene boundary, depending on the datums utilized (Figure F47), is followed by rapid sedimentation in the early Pleistocene through at least Zone NN18 (1.93 Ma), based on calcareous nannofossil datums. A period of slower sedimentation (~7 cm/ky) is apparent from calcareous nannofossil datums but not from planktonic foraminiferal datums. Sedimentation rates are elevated until the Late Pleistocene, when rates fall. However, the stratigraphic position of the Late Pleistocene datums is broad because of the limited recovery in this interval.
References
Chaisson, W.P., and Pearson, P.N., 1997. Planktonic foraminifer biostratigraphy at Site 925: middle Miocene–Pleistocene. In Shackleton, N.J., Curry, W.B., Richter, C., and Bralower, T.J. (Eds.), Proceedings of the Ocean Drilling Program, Scientific Results, 154: College Station, TX (Ocean Drilling Program), 3–31. http://dx.doi.org/10.2973/odp.proc.sr.154.104.1997
Feary, D.A., Hine, A.C., Malone, M.J., et al., 2000. Proceedings of the Ocean Drilling Program, Initial Reports, 182: College Station, TX (Ocean Drilling Program). http://dx.doi.org/10.2973/odp.proc.ir.182.2000
Gallagher, S.J., Fulthorpe, C.S., Bogus, K., Auer, G., Baranwal, S., Castañeda, I.S., Christensen, B.A., De Vleeschouwer, D., Franco, D.R., Groeneveld, J., Gurnis, M., Haller, C., He, Y., Henderiks, J., Himmler, T., Ishiwa, T., Iwatani, H., Jatiningrum, R.S., Kominz, M.A., Korpanty, C.A., Lee, E.Y., Levin, E., Mamo, B.L., McGregor, H.V., McHugh, C.M., Petrick, B.F., Potts, D.C., Rastegar Lari, A., Renema, W., Reuning, L., Takayanagi, H., and Zhang, W., 2017a. Expedition 356 methods. In Gallagher, S.J., Fulthorpe, C.S., Bogus, K., and the Expedition 356 Scientists, Indonesian Throughflow. Proceedings of the International Ocean Discovery Program, 356: College Station, TX (International Ocean Discovery Program). http://dx.doi.org/10.14379/iodp.proc.356.102.2017
Gallagher, S.J., Fulthorpe, C.S., Bogus, K., Auer, G., Baranwal, S., Castañeda, I.S., Christensen, B.A., De Vleeschouwer, D., Franco, D.R., Groeneveld, J., Gurnis, M., Haller, C., He, Y., Henderiks, J., Himmler, T., Ishiwa, T., Iwatani, H., Jatiningrum, R.S., Kominz, M.A., Korpanty, C.A., Lee, E.Y., Levin, E., Mamo, B.L., McGregor, H.V., McHugh, C.M., Petrick, B.F., Potts, D.C., Rastegar Lari, A., Renema, W., Reuning, L., Takayanagi, H., and Zhang, W., 2017b. Site U1461. In Gallagher, S.J., Fulthorpe, C.S., Bogus, K., and the Expedition 356 Scientists, Indonesian Throughflow. Proceedings of the International Ocean Discovery Program, 356: College Station, TX (International Ocean Discovery Program). http://dx.doi.org/10.14379/iodp.proc.356.106.2017
Gallagher, S.J., Wallace, M.W., Hoiles, P.W., and Southwood, J.M., 2014. Seismic and stratigraphic evidence for reef expansion and onset of aridity on the Northwest shelf of Australia during the Pleistocene. Marine and Petroleum Geology, 57:470–481. http://dx.doi.org/10.1016/j.marpetgeo.2014.06.011
Gallagher, S.J., Wallace, M.W., Li, C.L., Kinna, B., Bye, J.T., Akimoto, K., and Torii, M., 2009. Neogene history of the West Pacific Warm Pool, Kuroshio and Leeuwin Currents. Paleoceanography, 24(1):PA1206. http://dx.doi.org/10.1029/2008PA001660
Gardner, G.H.F., Gardner, L.W., and Gregory, A.R., 1974. Formation velocity and density—the diagnostic basics for stratigraphic traps. Geophysics, 39(6):770–780. http://dx.doi.org/10.1190/1.1440465
Gradstein, F.M., Ogg, J.G., Schmitz, M.D., and Ogg, G.M. (Eds.), 2012. The Geological Time Scale 2012: Amsterdam (Elsevier).
Hemleben, C., Spindler, M., and Anderson, O.R., 1989. Modern Planktonic Foraminifera: Berlin (Springer-Verlag).
Hocking, R.M., Moors, M.T., and van der Graaff, W.J.E., 1987. The geology of the Carnarvon Basin, Western Australia. With contributions from A.D. Allen et al. Bulletin - Geological Survey of Western Australia, 133.
James, N.P., Bone, Y., Kyser, T.K., Dix, G.R., and Collins, L.B., 2004. The importance of changing oceanography in controlling late Quaternary carbonate sedimentation on a high-energy, tropical, oceanic ramp: north-western Australia. Sedimentology, 51(6):1179–1205. http://dx.doi.org/10.1111/j.1365-3091.2004.00666.x
Jones, H.A., 1973. Marine Geology of the Northwest Australian Continental Shelf. Bureau of Mineral Resources, Geology and Geophysics, Australia (Australian Government Publishing Service), 136. http://www.ga.gov.au/corporate_data/104/Bull_136.pdf
Lumsden, D.N., 1979. Discrepancy between thin section and X-ray estimates of dolomite in limestone. Journal of Sedimentary Petrology, 49(2):429–436. http://dx.doi.org/10.1306/212F7761-2B24-11D7-8648000102C1865D
Martini, E., 1971. Standard Tertiary and Quaternary calcareous nannoplankton zonation. In Farinacci, A. (Ed.), Proceedings of the Second Planktonic Conference, Roma 1970: Rome (Edizioni Tecnoscienza), 2:739–785.
O’Brien, G.W., and Heggie, D.T., 1989. Hydrocarbon gases in seafloor sediments, Otway and Gippsland shelfs: implications for petroleum exploration. The APEA Journal, 29:96–113.
van Hinsbergen, D.J.J., Kouwenhoven, T.J., and van der Zwaan, G.J., 2005. Paleobathymetry in the backstripping procedure: correction for oxygenation effects on depth estimates. Palaeogeography, Palaeoclimatology, Palaeoecology, 221(3–4):245–265. http://dx.doi.org/10.1016/j.palaeo.2005.02.013
Wallace, M.W., Condilis, E., Powell, A., Redfearn, J., Auld, K., Wiltshire, M., Holdgate, G., and Gallagher, S., 2003. Geological controls on sonic velocity in the Cenozoic carbonates of the Northern Carnarvon Basin, North West shelf, Western Australia. APPEA Journal, 43(1):385–400.
Young, J.R., 1998. Neogene. In Bown, P.R. (Ed.), Calcareous Nannofossil Biostratigraphy: Dordrecht, The Netherlands (Kluwer Academic Publishing), 225–265.
1 Gallagher, S.J., Fulthorpe, C.S., Bogus, K., Auer, G., Baranwal, S., Castañeda, I.S., Christensen, B.A., De Vleeschouwer, D., Franco, D.R., Groeneveld, J., Gurnis, M., Haller, C., He, Y., Henderiks, J., Himmler, T., Ishiwa, T., Iwatani, H., Jatiningrum, R.S., Kominz, M.A., Korpanty, C.A., Lee, E.Y., Levin, E., Mamo, B.L., McGregor, H.V., McHugh, C.M., Petrick, B.F., Potts, D.C., Rastegar Lari, A., Renema, W., Reuning, L., Takayanagi, H., and Zhang, W., 2017. Site U1462. In Gallagher, S.J., Fulthorpe, C.S., Bogus, K., and the Expedition 356 Scientists, Indonesian Throughflow. Proceedings of the International Ocean Discovery Program, 356: College Station, TX (International Ocean Discovery Program). http://dx.doi.org/10.14379/iodp.proc.356.107.2017
- F1. Map of the northwest shelf showing major basins and location of modern and “fossil” reefs.
- F2. Bathymetric map showing the seafloor around Sites U1461 and U1462.
- F3. Multichannel seismic profile across Site U1462.
- F4. Lithostratigraphic and smear slide summary, Holes U1462A–U1462C.
- F5. A. Coarse bioclastic sediment. B. Skeletal and nonskeletal components. C. Glauconitized sediment. D. Sediment. E. Large quartz grains. F. Anhydrite crystals.
- F6. A. Skeletal packstone. B. Oolitic grainstone. C. Foraminiferal packstone. D. Packstone. E. Wackestone. F. Interlocked prismatic anhydrite.
- F7. Textures of nonskeletal ooid- and peloid-rich grainstones in Unit I.
- F8. A. Nonskeletal ooid- and peloid-rich packstone. B. Massive ooid-rich nonskeletal packstone. C. Shell-rich beds with well-preserved macrofossils.
- F9. Gravitational flows in Units II and III, Hole U1462C.
- F10. Summary of synthetized correlation of lithostratigraphy at Site U1462.
- F11. Unit II/III boundary, Hole U1462C.
- F12. Unit IV lithology, Hole U1462C.
- F13. Unit IV lithofacies, Hole U1462C.
- F14. Correlation between Sites U1461 and U1462 based on calcareous nannofossil biostratigraphy.
- F15. Planktonic foraminiferal marker species ranges for the earliest Pleistocene–Pliocene interval.
- F16. Depth ranges of late Miocene to Middle Pleistocene calcareous nannofossil age markers.
- F17. Calcareous nannofossils, Site U1462.
- F18. Typical preservation states of planktonic foraminifers, Site U1462.
- F19. Planktonic foraminifer abundance, Holes U1462A–U1462C.
- F20. Dominant benthic foraminifers, Site U1462. This figure is available in an oversized format.
- F21. Benthic foraminifer diversity and percentages, Site U1462.
- F22. Hydrocarbons in headspace gases, Site U1462.
- F23. Alkalinity, pH, salinity, sodium, and chloride, Site U1462.
- F24. Major element interstitial water geochemistry, Site U1462.
- F25. Minor element interstitial water geochemistry, Site U1462.
- F26. Bulk sediment geochemistry, Site U1462.
- F27. Magnetostratigraphic data, Hole U1462C.
- F28. IRM acquisition curves for 4 discrete samples and their respective backfield IRM curves, Hole U1462A.
- F29. IRM curve and corresponding AF demagnetization trend.
- F30. AF demagnetization results for 6 discrete samples, Hole U1462A.
- F31. PCA magnetic inclination data for discrete samples from Hole U1462A.
- F32. WRMSL MS, drift-corrected SHMSL MSP, and NGR results, Site U1462.
- F33. SHMSL MSP.
- F34. P-wave velocity.
- F35. Bulk density, grain density, and porosity, Site U1462.
- F36. Correlations between discrete measurements, Site U1462.
- F37. High-resolution MAD and smear slide sampling compared to NGR and WRMSL MS data.
- F38. Reflectance spectroscopy and colorimetry, Site U1462.
- F39. Thermal conductivity, Site U1462.
- F40. HSGR, NGR, and elemental U, Th, and K concentrations, Holes U1462A and U1462C.
- F41. Hole U1462C diameter and standoff distance inferred from triple combo and bulk density and porosity.
- F42. FMS images, Holes U1462A and U1462C.
- F43. A. VSP interval velocities vs. wireline compressional sonic velocities. B. VSP downhole traveltimes vs. sonic log inferred two-way traveltimes.
- F44. Core recovery plotted against NGR measured on cores and wireline HSGR, Holes U1462A and U1462C.
- F45. Hole U1462A lithology summary with NGR and color reflectance b*.
- F46. Hole U1462C lithology summary with NGR and color reflectance b*.
- F47. Site U1462 lithology summary with NGR and wireline HSGR.
- T1. Operations summary, Site U1462.
- T2. Site U1462 core summary.
- T3. Lithostratigraphic unit summary, Site U1462.
- T4. Thin section samples, Site U1462.
- T5. Semiquantitative XRD analysis of dominant mineral phases, Site U1462.
- T6. Semiquantitative XRF analysis of Units II and III, Hole U1462C.
- T7. Calcareous nannofossil and planktonic foraminifer datums, Site U1462.
- T8. Calcareous nannofossil abundance and range charts, Site U1462.
- T9. Planktonic foraminifer presence, abundance, and preservation at Site U1462.
- T10. Planktonic foraminifer abundance, Site U1462.
- T11. Occurrence of main genera and species of benthic and planktonic foraminifers and additional bioclasts and minerals, Site U1462.
- T12. Benthic foraminifer abundance, Site U1462.
- T13. Headspace gas contents, Site U1462.
- T14. Core or sample intervals and correlative magnetozones, Hole U1462A discrete samples and Hole U1462C archive-half measurements.
- T15. Results of PCA, together with NRM intensity and bulk susceptibility, for discrete samples, Hole U1462A.
- T16. MAD grain density compared with density inferred from XRD samples, Site U1462.