Tobin, H., Hirose, T., Ikari, M., Kanagawa, K., Kimura, G., Kinoshita, M., Kitajima, H., Saffer, D., Yamaguchi, A. Eguchi, N., Maeda, L., Toczko, S., and the Expedition 358 Scientists
Proceedings of the International Ocean Discovery Program Volume 358
publications.iodp.org
Data report: clay mineral assemblages and diagenesis within the inner Nankai accretionary prism and the Kumano Basin, IODP Expedition 358, Sites C0002 and C0025, offshore Japan1
Michael B. Underwood2
1 Underwood, M.B., 2022. Data report: clay mineral assemblages and diagenesis within the inner Nankai accretionary prism and the Kumano Basin, IODP Expedition 358, Sites C0002 and C0025, offshore Japan. In Tobin, H., Hirose, T., Ikari, M., Kanagawa, K., Kimura, G., Kinoshita, M., Kitajima, H., Saffer, D., Yamaguchi, A. Eguchi, N., Maeda, L., Toczko, S., and the Expedition 358 Scientists, NanTroSEIZE Plate Boundary Deep Riser 4: Nankai Seismogenic/Slow Slip Megathrust. Proceedings of the International Ocean Discovery Program, 358: College Station, TX (International Ocean Discovery Program). https://doi.org/10.14379/iodp.proc.358.201.2022
2 Department of Earth & Environmental Science, New Mexico Institute of Mining & Technology, USA. UnderwoodM@missouri.edu
Abstract
Holes C0002Q–C0002T were drilled in the inner accretionary prism of the Nankai Trough during International Ocean Discovery Program (IODP) Expedition 358. Sample depths range 2827.5–3067.5 meters below seafloor (mbsf). This report provides the results of X-ray diffraction analyses of the clay-sized fraction (<2 µm spherical settling equivalent) from 33 specimens of bulk cuttings (1–4 mm size fraction). Four core samples from Hole C0002T were also analyzed. Mean weight percent values for common clay-sized minerals are smectite = 20.0 wt%, illite = 54.5 wt%, undifferentiated (chlorite + kaolinite) = 13.8 wt%, and quartz = 11.7 wt%. The average value of the illite crystallinity index is 0.64Δ°2θ. Values of expandability for smectite + illite/smectite (I/S) mixed-layer clay average 57%, and the average proportion of illite in I/S clay is 46%. Depth-dependent trends are not evident in either the clay mineral assemblages or diagenetic indicators. Significant discrepancies exist between these new results and data from the overlapping depth intervals in Hole C0002P.
A total of 18 core samples from IODP Hole C0025A in the central Kumano Basin were also analyzed, covering a depth range of 406.12–571.94 mbsf. In Lithologic Unit I (lower fore-arc basin facies), the mean values are smectite = 16.5 wt%, illite = 58.4 wt%, undifferentiated (chlorite + kaolinite) = 14.8 wt%, and quartz = 10.4 wt%. The statistics are similar for Lithologic Unit II (trench-slope facies): smectite = 23.7 wt%, illite = 54.1 wt%, undifferentiated (chlorite + kaolinite) = 11.9 wt%, and quartz = 10.3 wt%. The average value of the illite crystallinity index is 0.55Δ°2θ. The expandability of smectite + I/S averages 60%, and the average proportion of illite in I/S is 20%.
1. Introduction
When the Nankai Trough Seismogenic Zone Experiment (NanTroSEIZE) was first conceptualized, the fundamental scientific objectives were to characterize fault slip and strain accumulation, fault zone and wall rock composition, fault architecture, and state variables (Tobin and Kinoshita, 2006). The transect area is located seaward of the Kii Peninsula of Honshu, offshore Japan (Figure F1). Riser drilling during Integrated Ocean Drilling Program Expedition 348 advanced to intermediate depths of the inner accretionary prism (Tobin et al., 2015a). The operational plan for International Ocean Discovery Program (IODP) Expedition 358 (Tobin et al., 2018) was to deepen Hole C0002P (Figure F2) from ~2900 to ~5200 meters below seafloor (mbsf). Scientific achievements were anticipated through direct sampling of cuttings and sidetrack cores, logging while drilling, in situ stress measurements, and long-term monitoring in conjunction with allied laboratory studies and numerical modeling (Tobin et al., 2018). Unfortunately, the plan was overly ambitious and technically challenging (Tobin et al., 2020). Hampered by numerous operational setbacks, drilling extended no deeper than 3262.5 mbsf, and the long-held aspiration of reaching the seismogenic zone was abandoned (Kitajima et al., 2020). Cuttings and core specimens were recovered, however, and the resulting X-ray diffraction (XRD) data can be used to supplement information from overlapping and shallower intervals of the accretionary prism (Guo and Underwood, 2012; Underwood and Song, 2016a, 2016b; Underwood, 2017a, 2017b; Underwood and Guo, 2018).
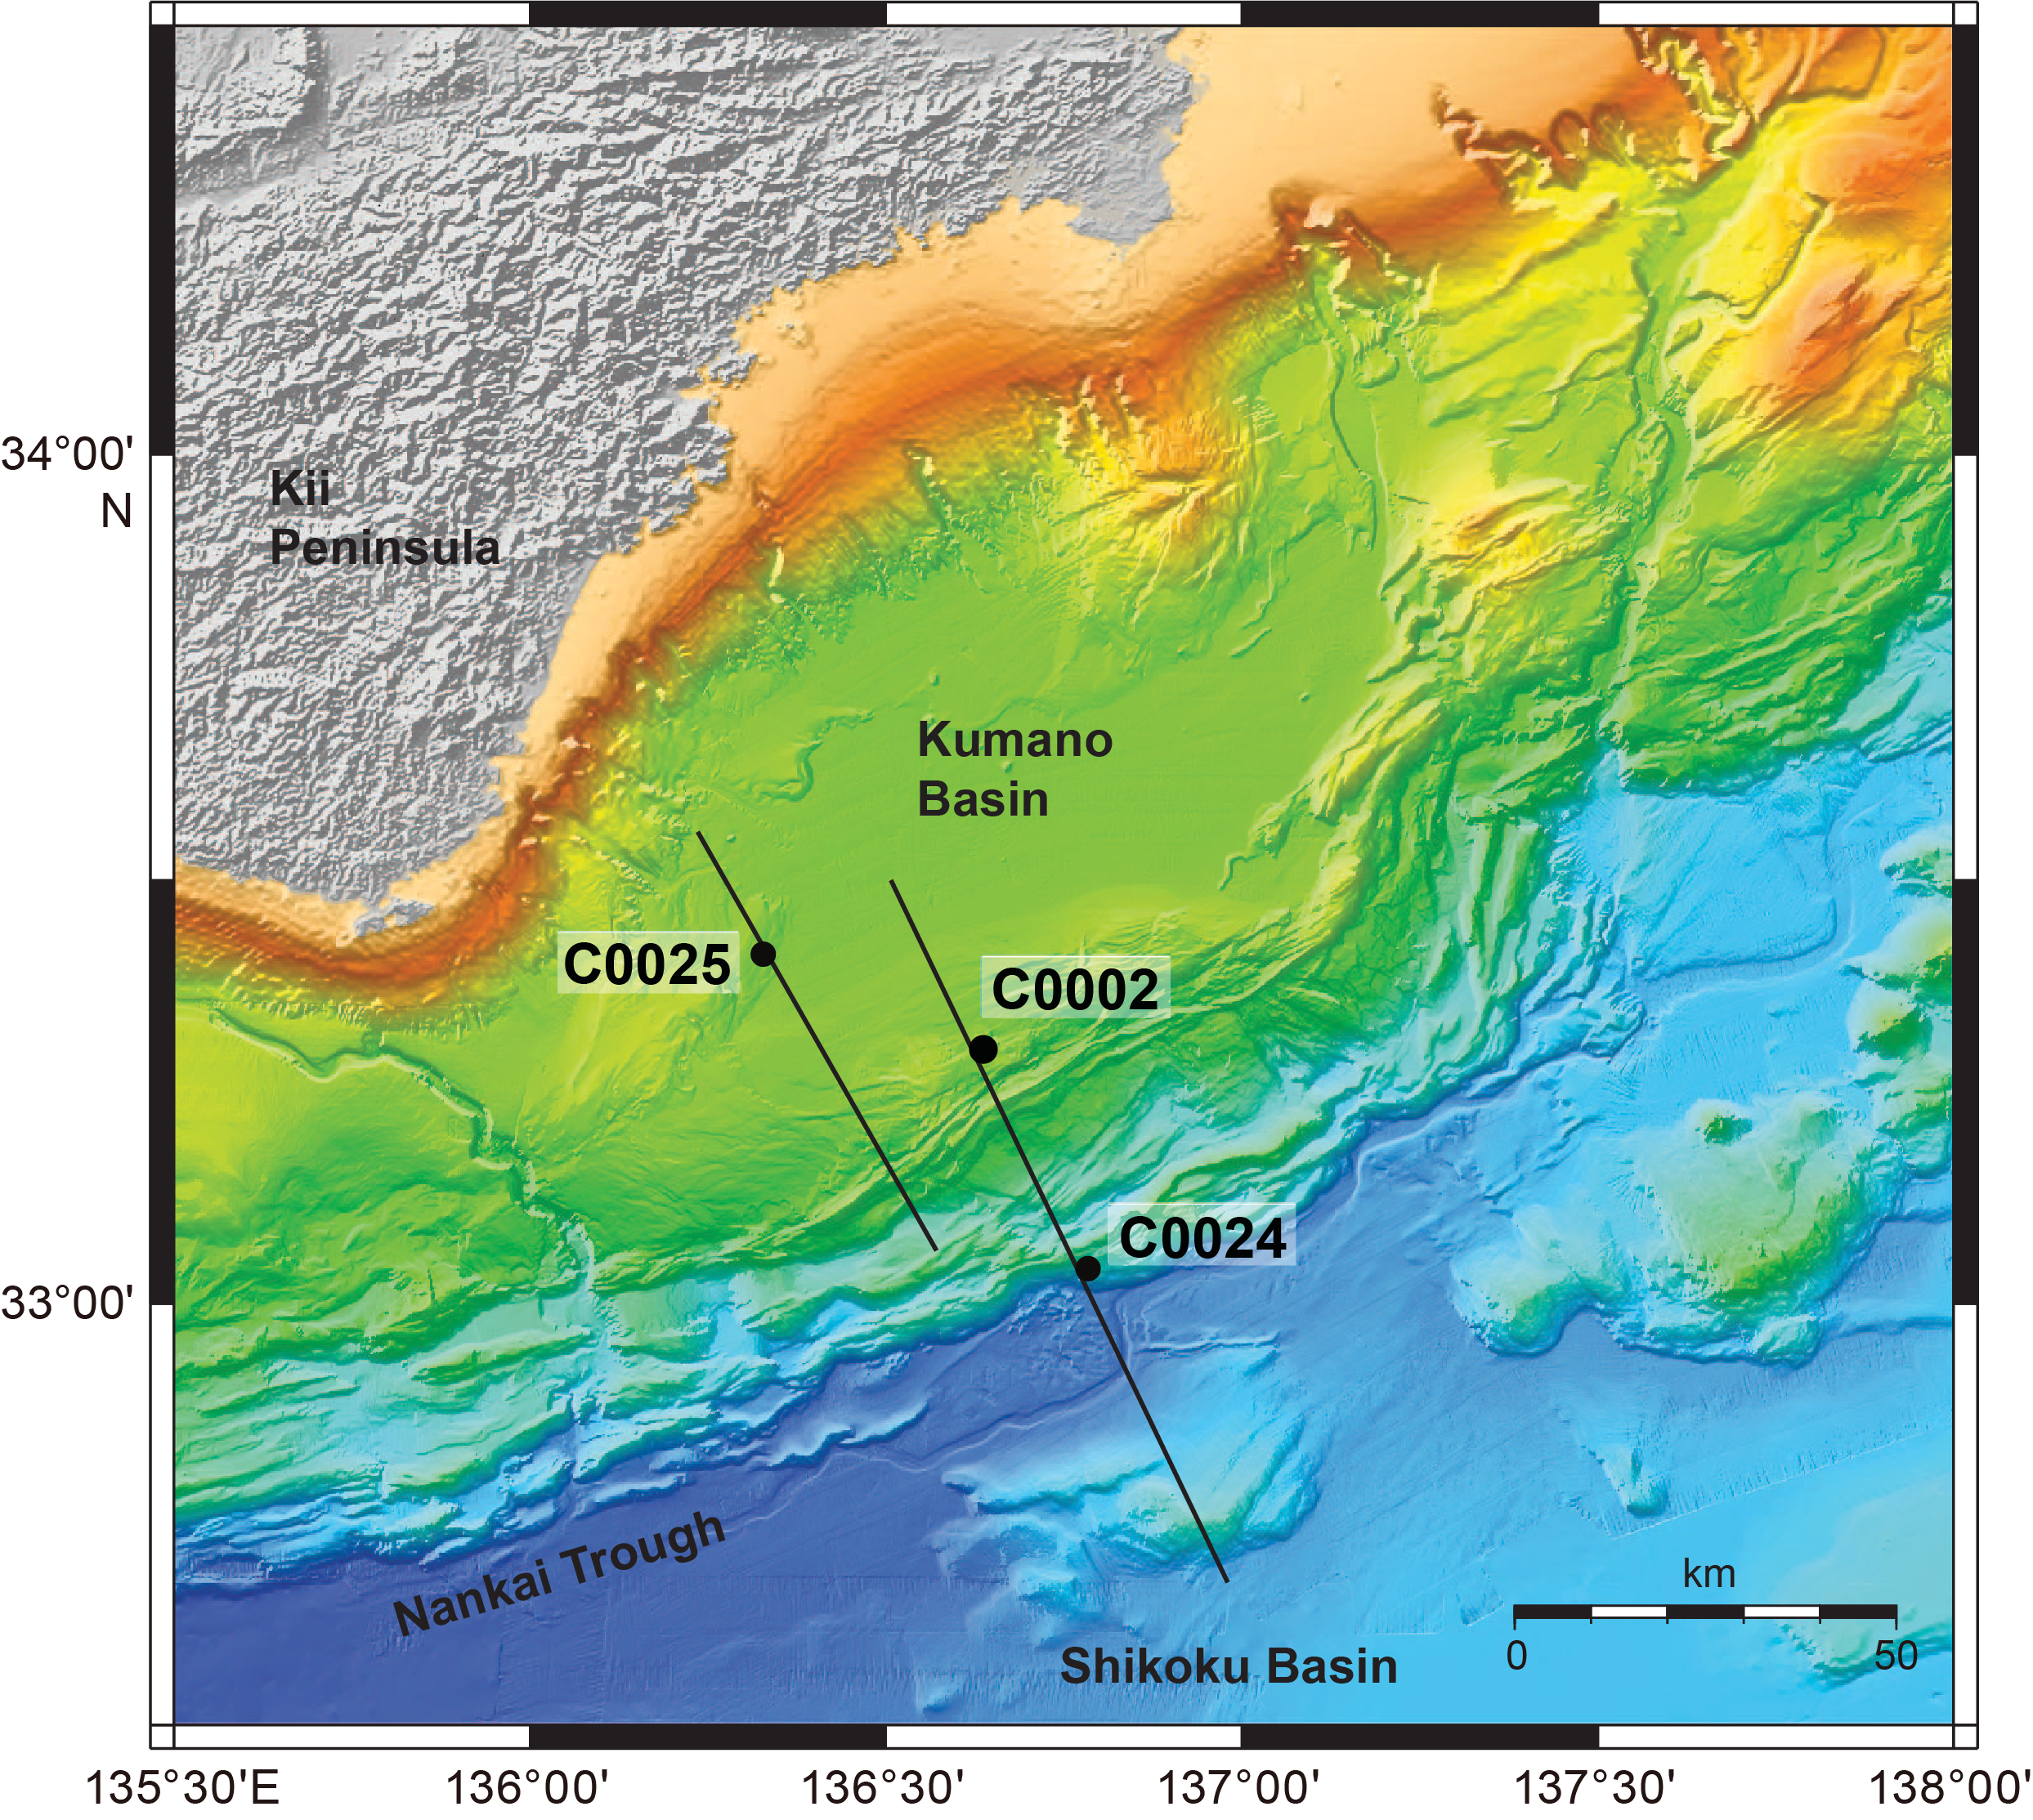
Figure F1. NanTroSEIZE transect area.
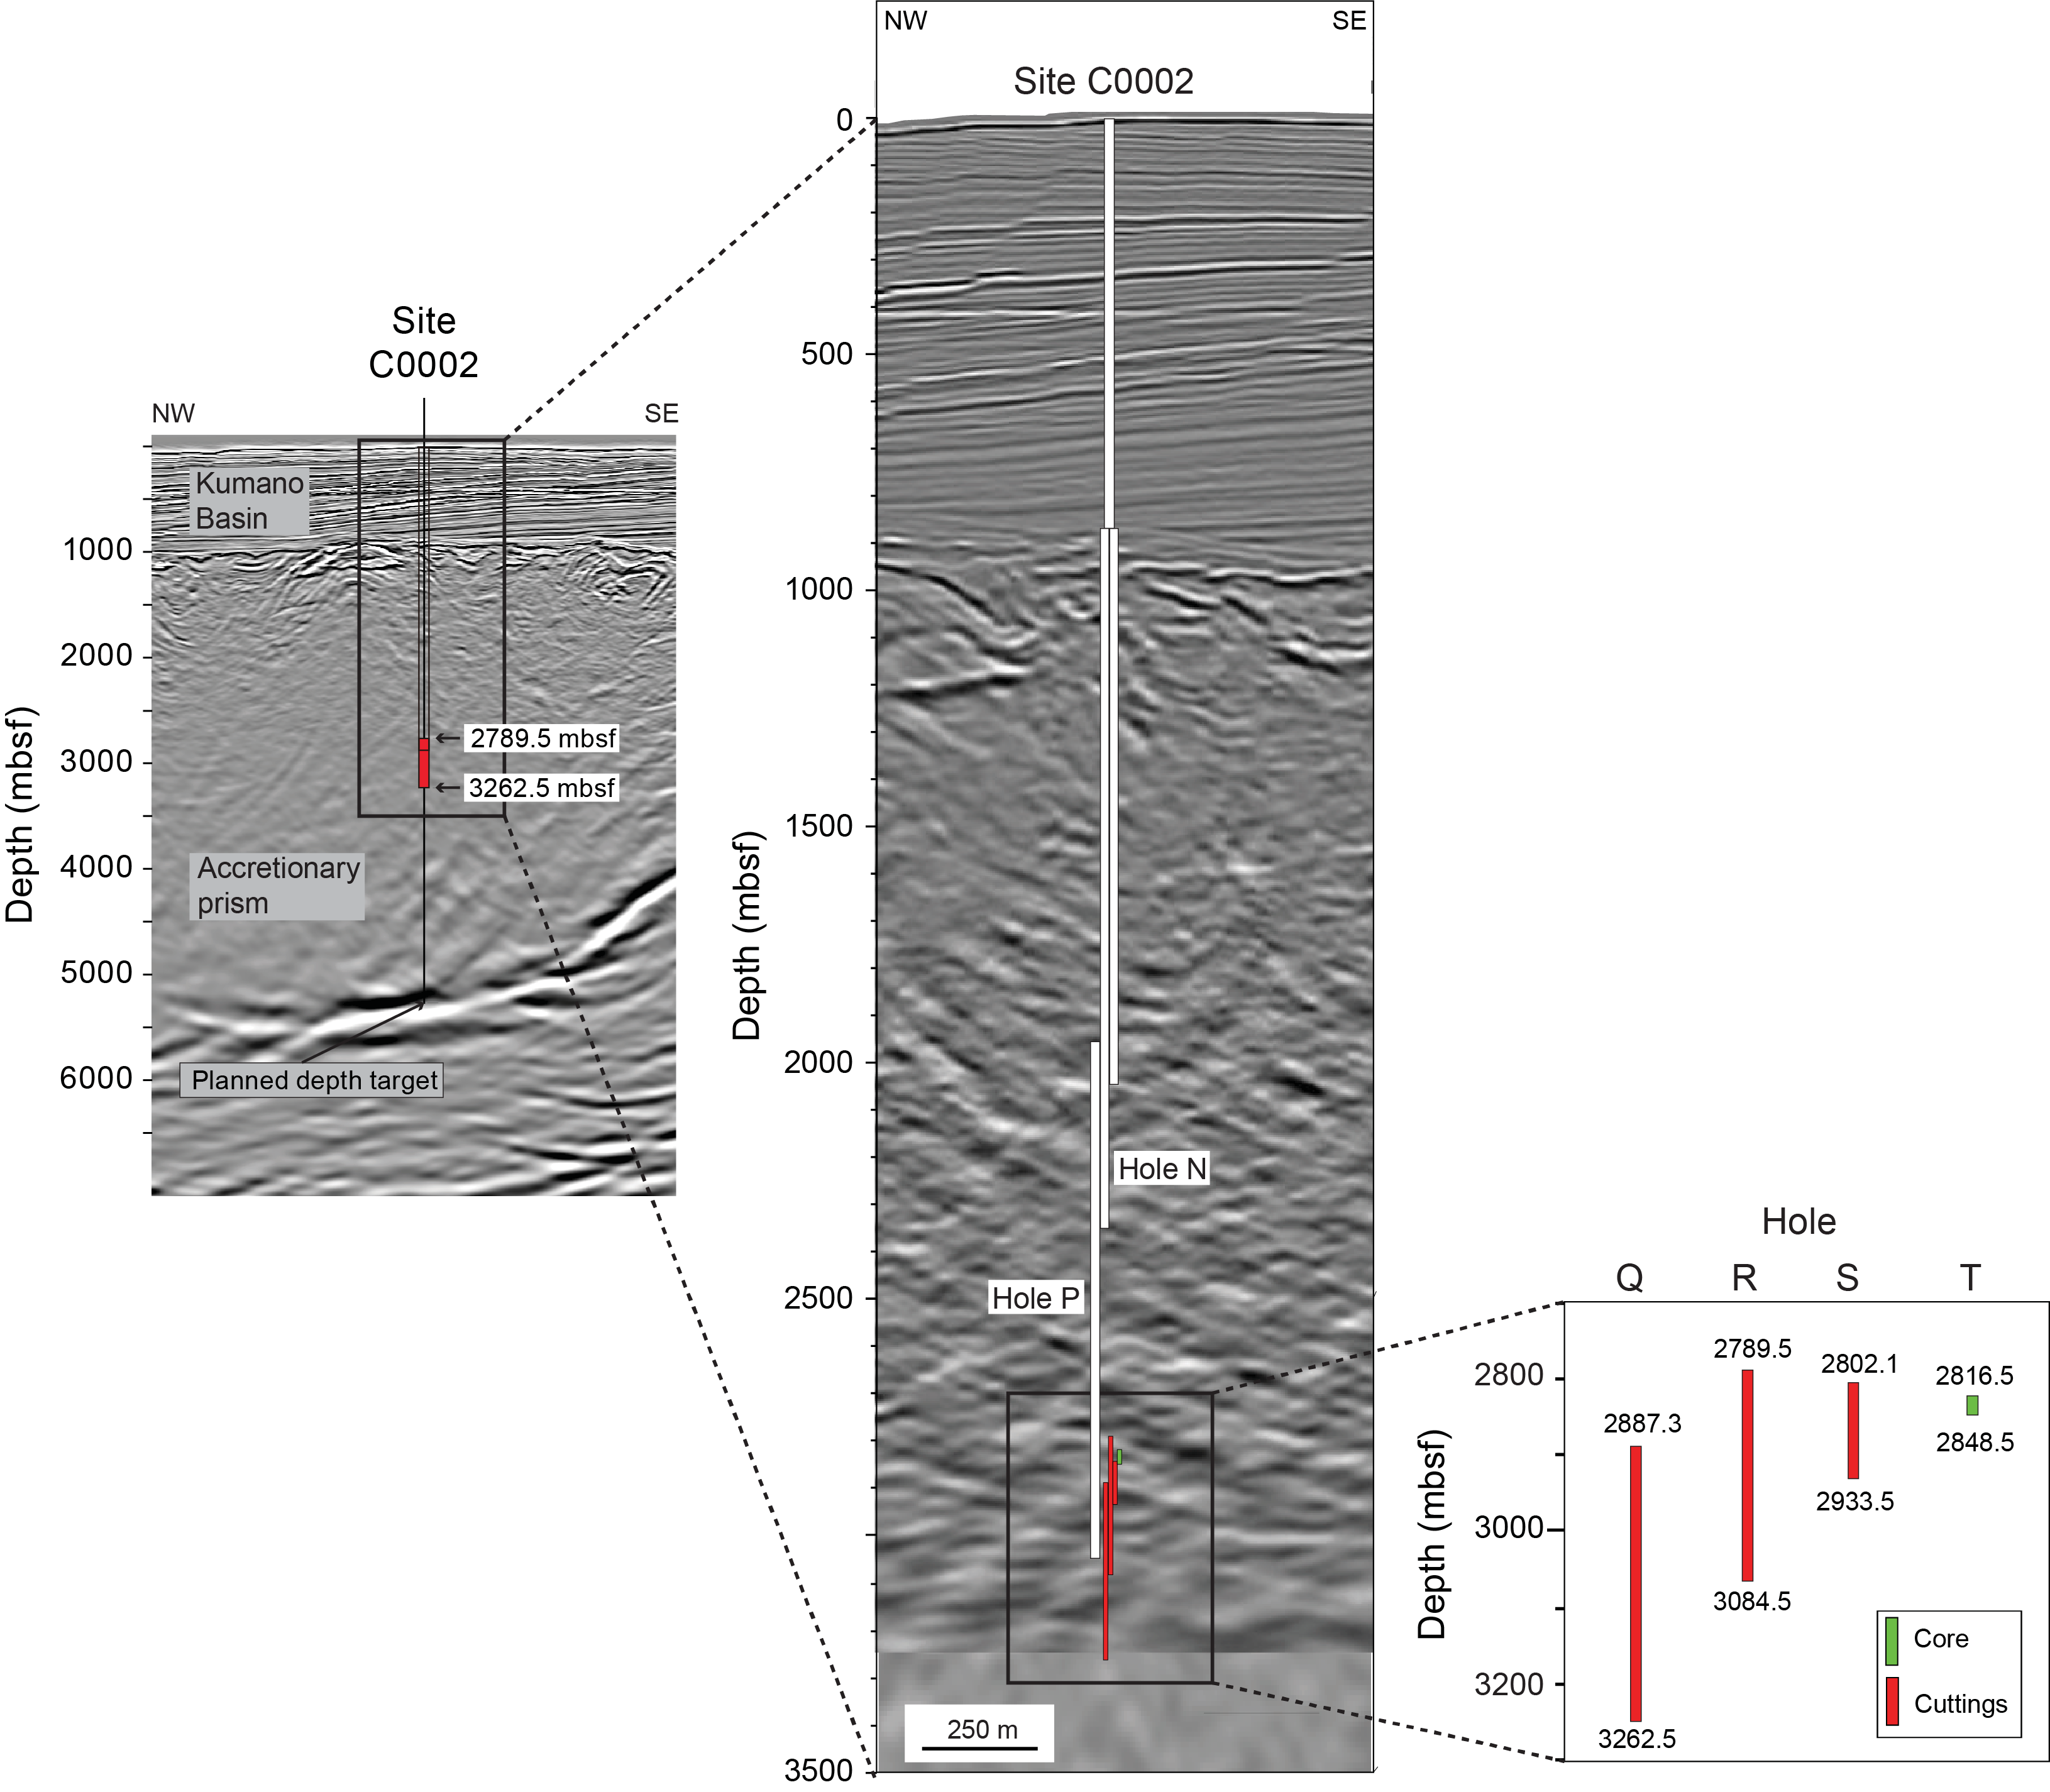
Figure F2. Seismic reflection profile, Site C0002.
After riser drilling was terminated at Site C0002, operations moved to two riserless contingency sites (Figure F1). The objectives at IODP Site C0024 (Tobin et al., 2020) were to sample and log hanging wall strata and to cross the frontal thrust at a position downdip (landward) from the successful drilling at Integrated Ocean Drilling Program Sites C0006 and C0007 (Screaton et al., 2009). Samples were not collected for XRD studies at Site C0024 because of redundancy with data from coeval strata at Sites C0006 and C0007 (Guo and Underwood, 2012; Underwood and Guo, 2018). The principal objectives at IODP Site C0025 (Figure F3) were to recover the lowermost fore-arc sediments in the central Kumano Basin (Figure F3) and to core across the transition into what was interpreted on seismic reflection profiles to be older strata of the inner accretionary prism (Tobin et al., 2020). This report includes XRD results for 18 of those samples.
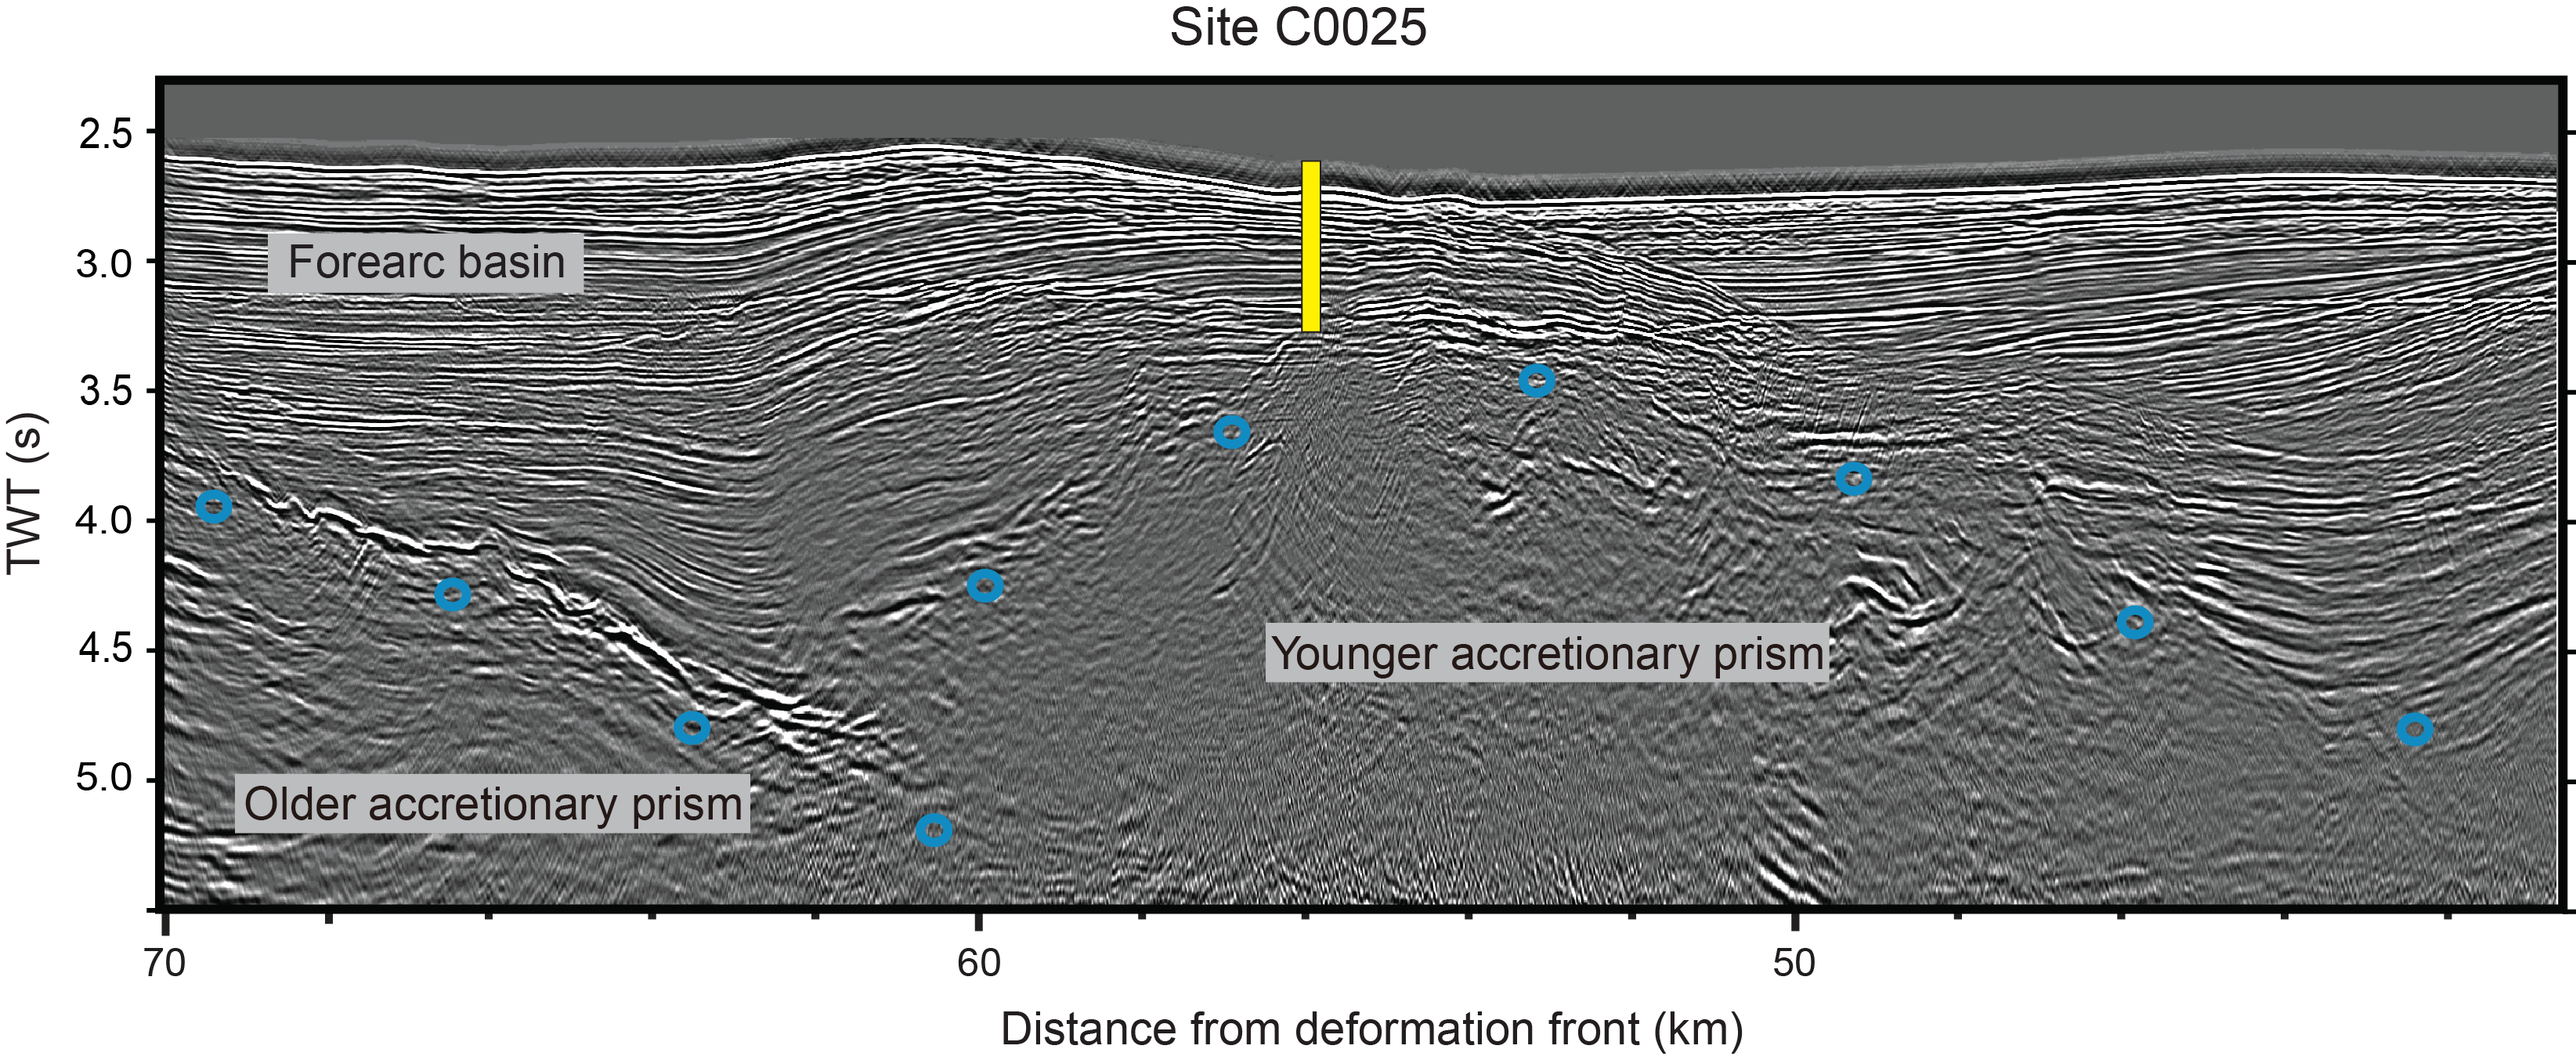
Figure F3. Seismic reflection profile, Site C0025.
2. Summary of lithostratigraphy
Shipboard descriptions of cuttings during Expedition 358 yielded proportional estimates of four common lithologies in the four overlapping boreholes (Kitajima et al., 2020). The dominant lithologies in Hole C0002Q are fine silty claystone and silty claystone, with subordinate proportions of siltstone and fine to very fine sandstone (Figure F4). In contrast, silty claystone composes about 60%–65% of the cuttings recovered from Hole C0002R, with subordinate proportions of siltstone and fine sandstone and minor to trace amounts of fine silty claystone (Figure F4). Silty claystone is also the dominant lithology in Hole C0002S, but those proportions decrease with depth at the expense of fine sandstone (Figure F4). Two cuttings samples from Hole C0002T are composed dominantly of silty claystone. Core recovery from Hole C0002T was very poor, and all three cores display ubiquitous drilling-induced deformation with high drilling mud contents (Kitajima et al., 2020). Silty claystone appears to be the dominant lithology, but that impression might be due to enhanced preservation potential in the damaged core.
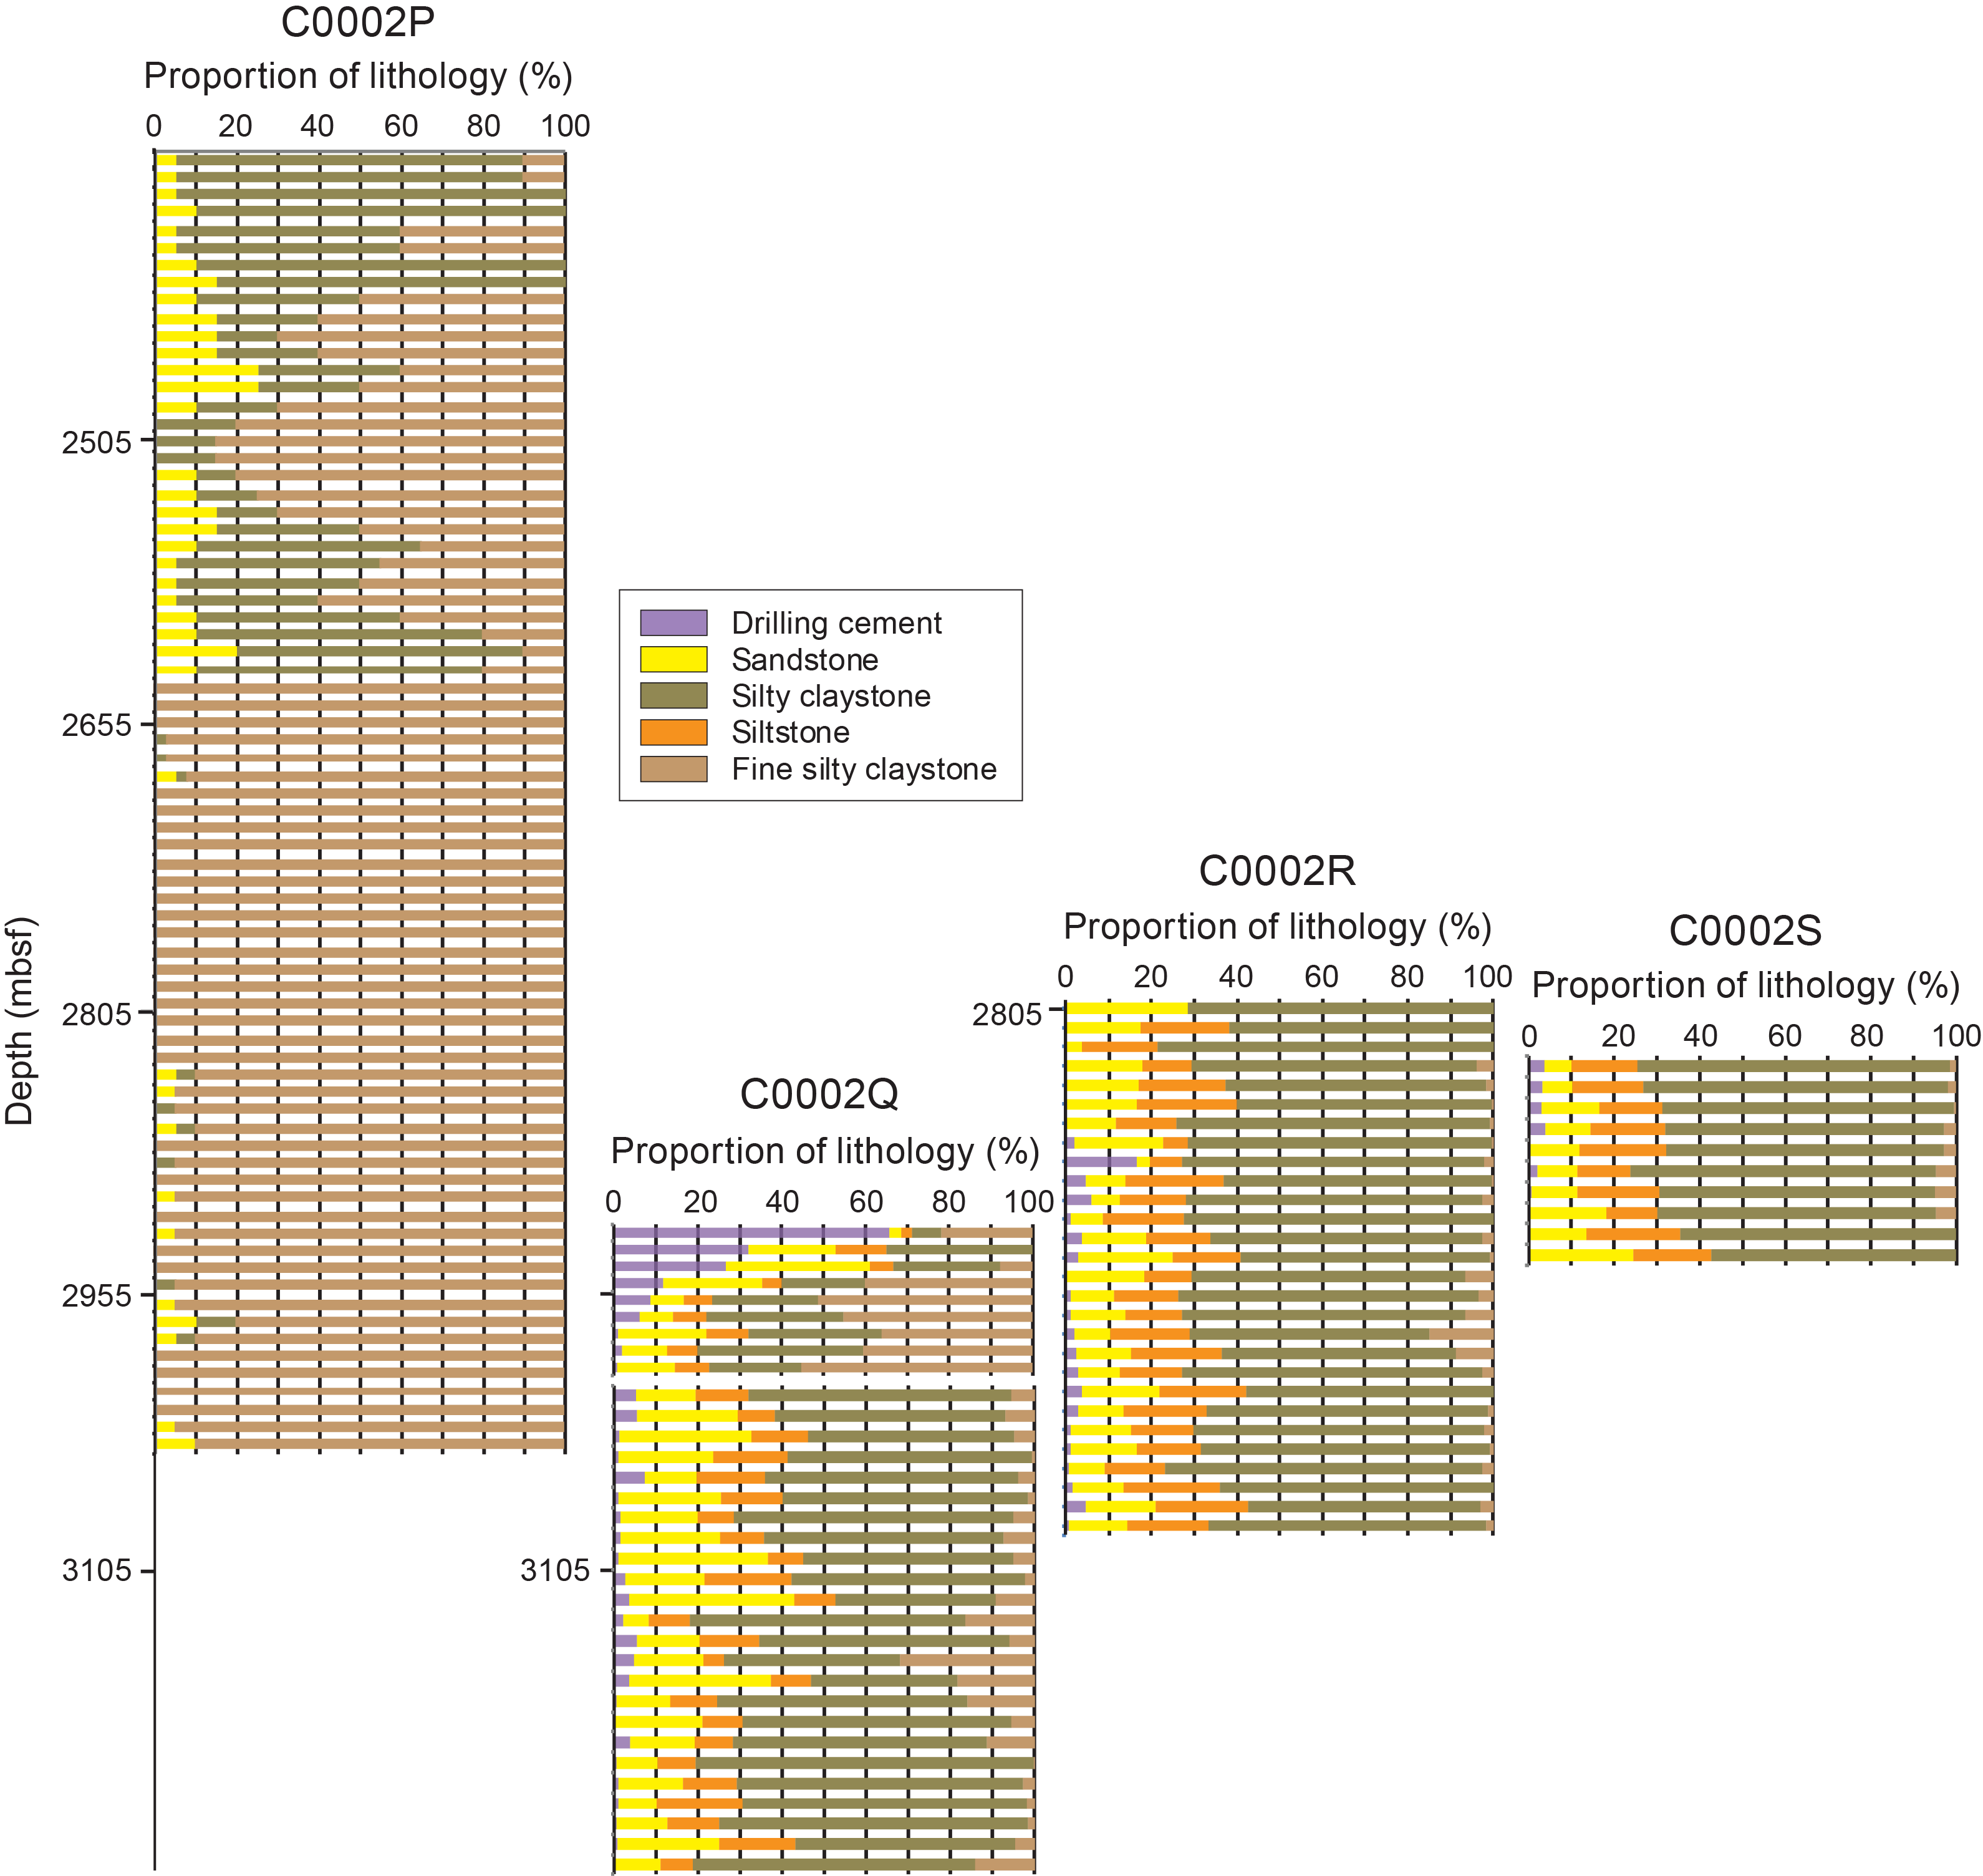
Figure F4. Proportional estimates for lithologies.
During Expedition 348, the upper boundary of Subunit VB in Hole C0002P was set at 2625.5 mbsf (Tobin et al., 2015b), and cuttings below that depth are composed almost entirely of fine silty claystone (Figure F4). Paradoxically, the same depth intervals in Holes C0002Q–C0002T contain significantly more fine sandstone and siltstone, with only minor proportions of fine silty claystone (Figure F4). Those proportional contrasts may or may not be representative of authentic spatial changes in lithofacies. On one side of the debate, in situ bedding dips are typically steep in the inner accretionary prism (Boston et al., 2016), so relatively small deviations of sand-to-shale ratios in the actual formation might be expected to produce conspicuous variations in the proportions of cuttings types. In support of that contention, bulk powder XRD results (Tobin et al., 2015b; Kitajima et al., 2020) are consistent with a net grain size effect in which larger proportions of total clay minerals in Hole C0002P (with mostly fine silty claystone cuttings in Subunit VB) are balanced by decreases in quartz (due to lesser amounts of siltstone and fine sandstone). On the other hand, cuttings proportions from adjacent holes may have been perturbed by differences in the mechanical and/or chemical responses to drilling mud compositions and/or changes in drilling parameters, cutting tools, and bottom-hole assemblies (BHAs) (Kitajima et al., 2020). Caution should be exercised, therefore, when making stratigraphic interpretations based on estimates of cuttings proportions from the deeper intervals of Site C0002 (Figure F4).
A total of 18 cores were recovered from Hole C0025A over a depth range of 400–574.77 mbsf (Figure F5). Shipboard scientists defined two lithologic units using conventional criteria from visual descriptions of the split cores and petrographic examination of smear slides (Kimura et al., 2020). The dominant lithology in Lithologic Unit I is silty claystone to clayey siltstone. Thin interbeds of medium to fine sandstone, silty sandstone, and siltstone are common in Unit I, with sedimentary structures that are indicative of deposition by turbidity currents. The age of Unit I is early Pleistocene (1.34–1.59 Ma), and the interpreted depositional environment is basal fore-arc basin (Kimura et al., 2020). At Site C0002 (Figure F1), the correlative mudstone/turbidite facies (designated Unit II at Site C0002) ranges in age from 1.24 to 1.62 Ma (Expedition 315 Scientists, 2009).
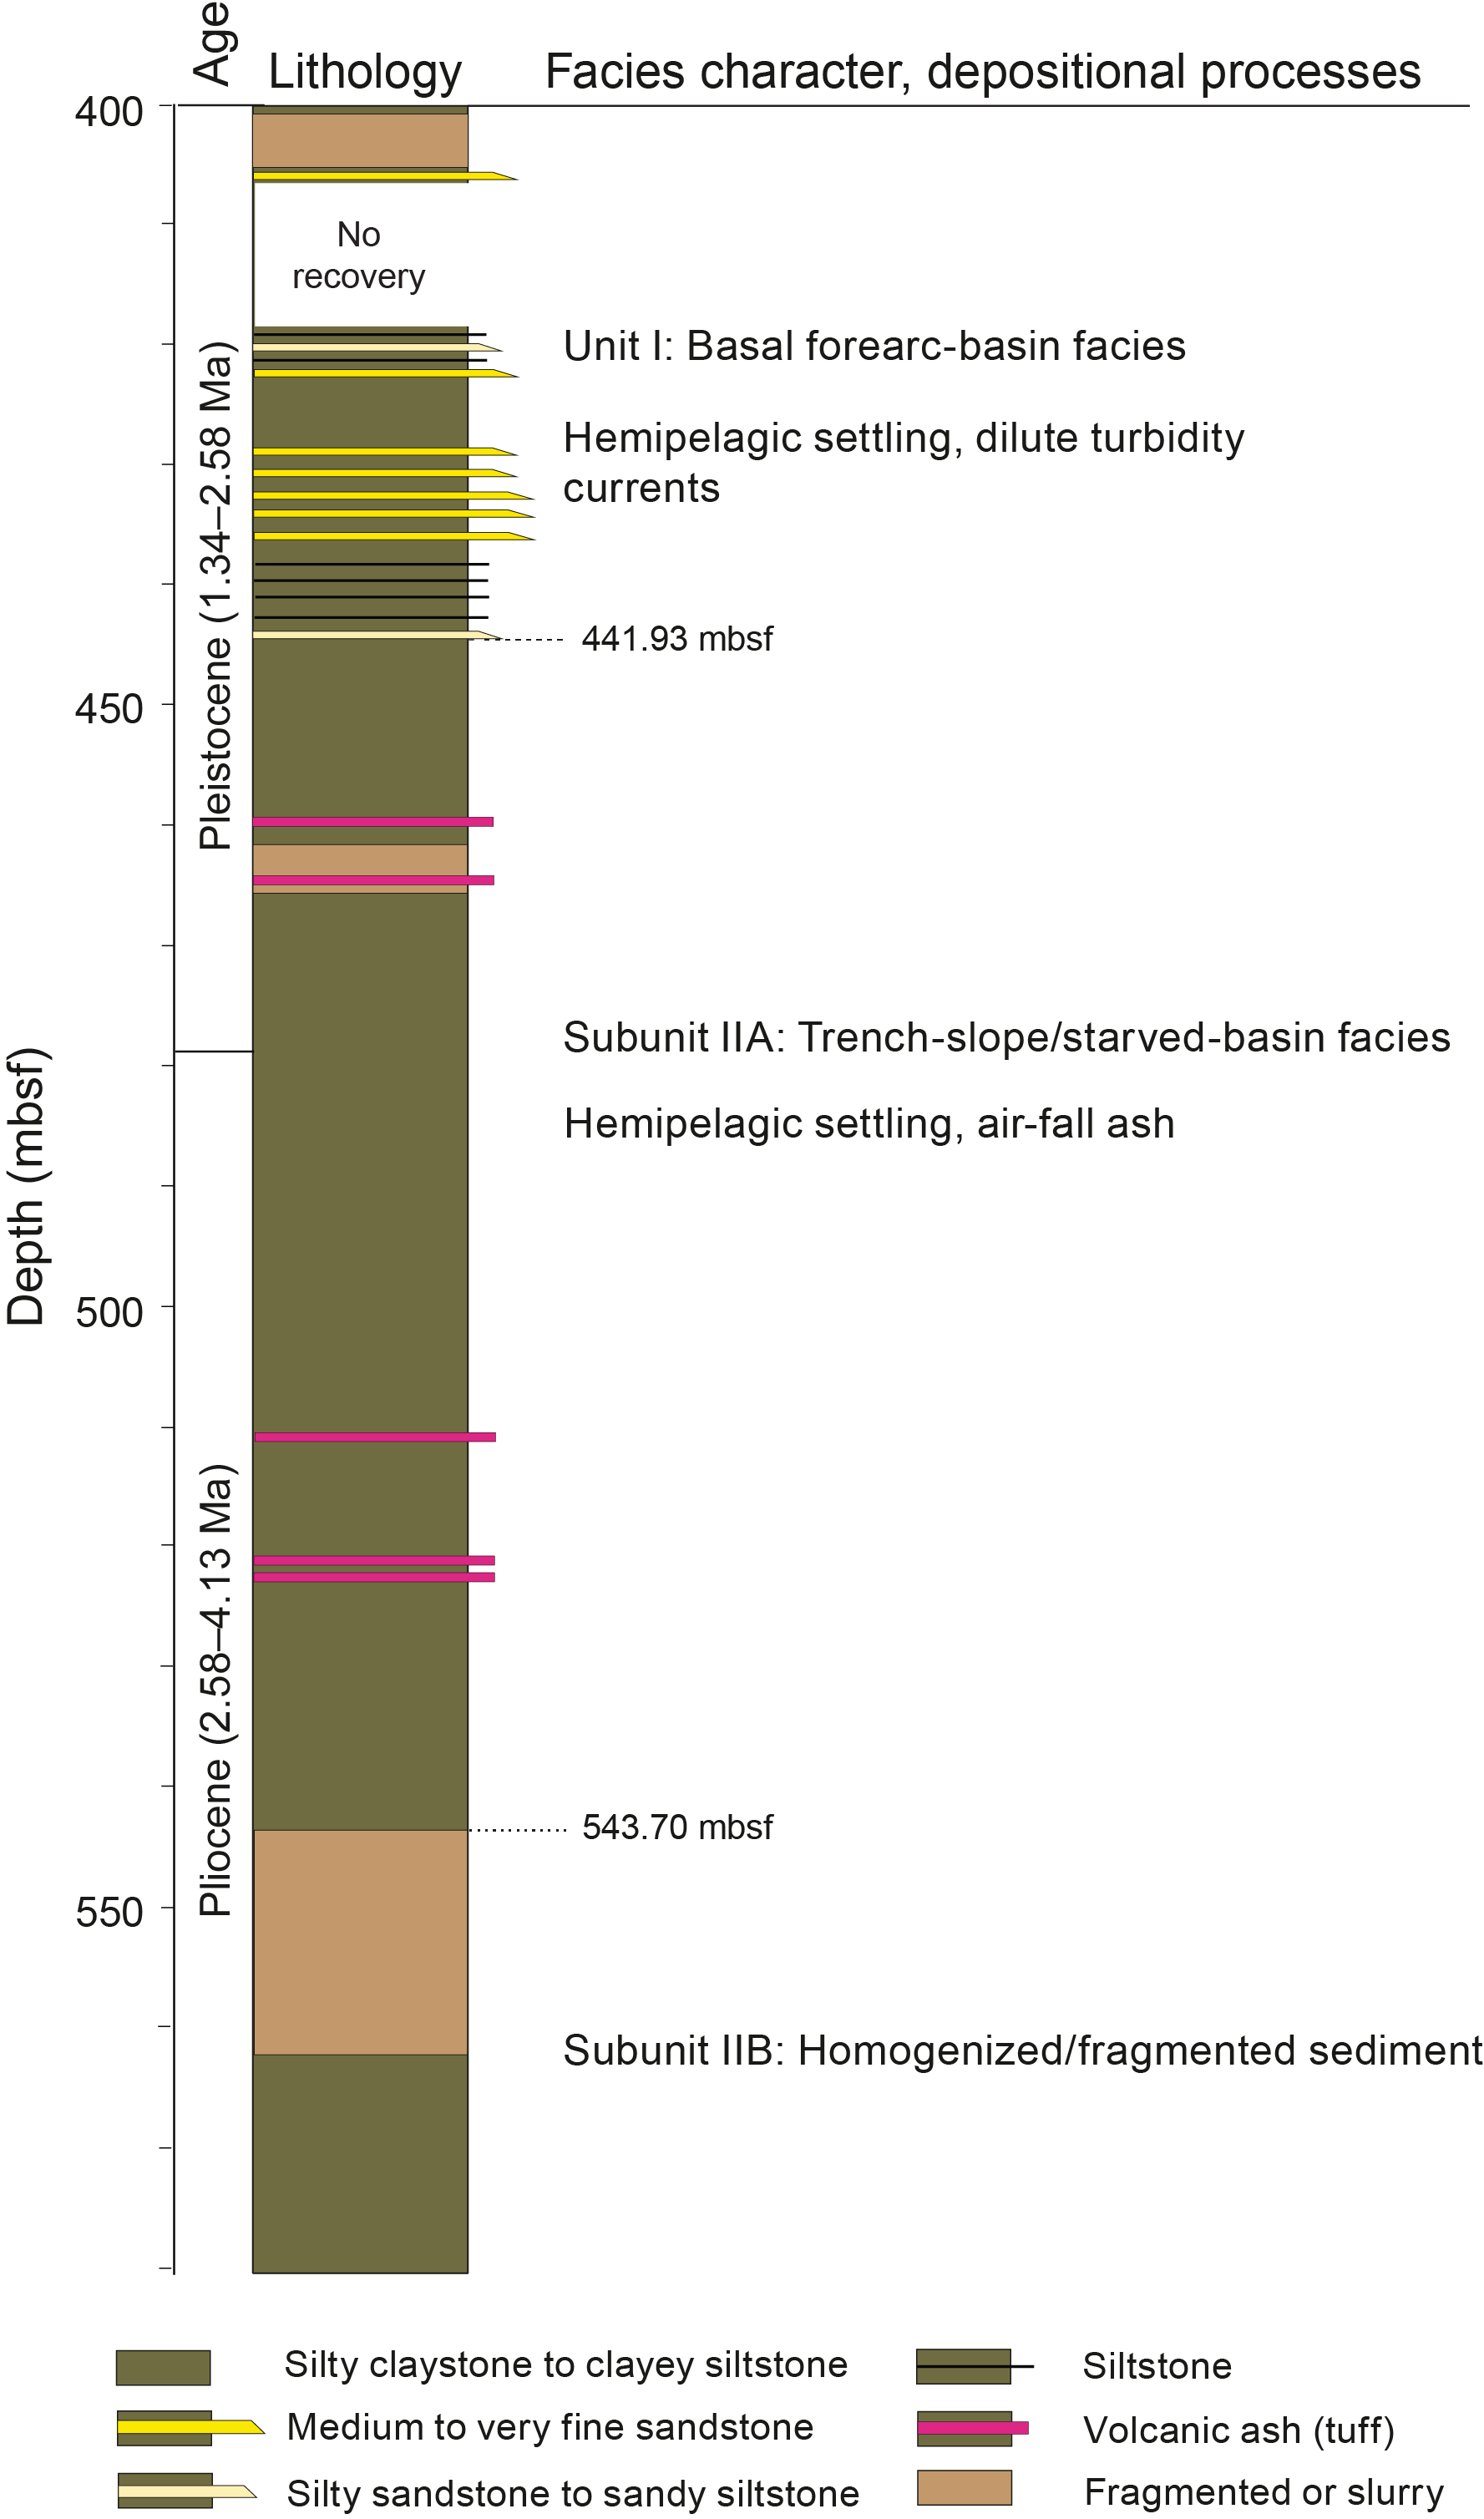
Figure F5. Stratigraphic column.
Silty claystone to clayey siltstone is also the dominant lithology of Lithologic Unit II at Site C0025 but without turbidite interbeds (Figure F5); instead, there are scattered occurrences of clay-rich bands, fine sand laminae, pumice clasts, and volcanic ash. In addition, calcium carbonate contents increase significantly in Unit II compared to Unit I, with an average value of 15 wt% calcite (Kimura et al., 2020). Some cores from Unit II contain an unusual blend of diverse particle sizes with pervasive fragmentation or reduction to slurry; primary stratification and internal sedimentary structures are absent. It is unclear whether those slurry intervals (Figure F5) are primary manifestations of sediment transport and deposition, products of structural deformation during emplacement of mud diapirs, or artifacts of drilling disturbance (Kimura et al., 2020). The apparent age of Unit II is early Pleistocene to early Pliocene (1.59–4.13 Ma), and the interpreted environment of deposition is trench slope (Kimura et al., 2020). At Site C0002 (Figure F1), the correlative facies of carbonate-rich, starved-basin mudstone (designated Unit III at Site C0002) also ranges in age from early Pleistocene to early Pliocene but has an older maximum age of ~5 Ma (Expedition 315 Scientists, 2009).
3. Methods
3.1. Sampling
A total of 33 specimens of washed bulk cuttings were extracted for XRD analyses from the 1–4 mm size fraction. The depth reported here for each specimen is the bottom of a 5 m drilling interval. Correlations to the in situ stratigraphic position of each sample are dubious, however, for several reasons. Multiple configurations of the BHA were tested during riser drilling, and the presence/absence and positioning of an underreamer resulted in significant differences in how and where the formation was cut. In addition, cavings from higher up in the open boreholes were introduced into the cuttings. The holes also deviated from vertical (Tobin et al., 2020). The range of borehole distance for the mixing zone is approximately 20–40 m (Kitajima et al., 2020).
In situ depth positioning of samples from split cores is less problematic. Four core samples were selected from Hole C0002T after visual inspection to identify intact pieces. At Site C0025, 18 samples were distributed at a spacing of one per core. The samples for clay XRD were collocated next to whole-round intervals that were analyzed shipboard for interstitial water geochemistry and bulk powder XRD (Kimura et al., 2020).
3.2. Sample preparation
Isolation of the clay-sized fraction (<2 µm) for XRD analyses requires several steps. With lithified cuttings and lithified core, the first step is to grind the air-dried split by hand with a mortar and pestle. A split of powdered sedimentary rock is then placed in a 600 mL beaker with 2% hydrogen peroxide to initiate disaggregation and remove organic matter. For weakly lithified core (e.g., Site C0025), the hand-powdering step is not required. Next, the disaggregated sediment is suspended in ~250 mL of Na hexametaphosphate solution (concentration of 2 g/1000 mL distilled H2O). Beakers with suspended sediment are inserted into an ultrasonic bath for several minutes to promote dispersion and retard flocculation of the clays. Next, suspensions are transferred to 180 mL bottles and washed of solutes via two passes in a Sorvall ST 16 centrifuge (5200 rpm for 30 min; ~2400 × g) with resuspension in distilled deionized water after each pass. After that step, the suspensions are transferred to 125 mL plastic bottles and dispersed by vigorous shaking plus insertion of an ultrasonic cell probe for ~2.5 min. Clay-sized splits (<2 µm equivalent spherical settling diameter) are separated from the silt and sand by centrifugation (1000 rpm for 2 min and 48 s; ~95 × g). Oriented clay aggregates are prepared following the filter-peel method (Moore and Reynolds, 1989b) using 0.45 µm filter membranes and glass discs. This approach is desirable because better preferred orientation enhances the intensity of basal reflections. To saturate the clay aggregates with ethylene glycol, clay-covered discs are placed in a closed vapor chamber at room temperature for ~48 h. This last step expands the interlayer of smectite to ~17Å, which reduces the amount of overlap between the peaks associated with smectite (001) and chlorite (001) reflections (Figure F6).
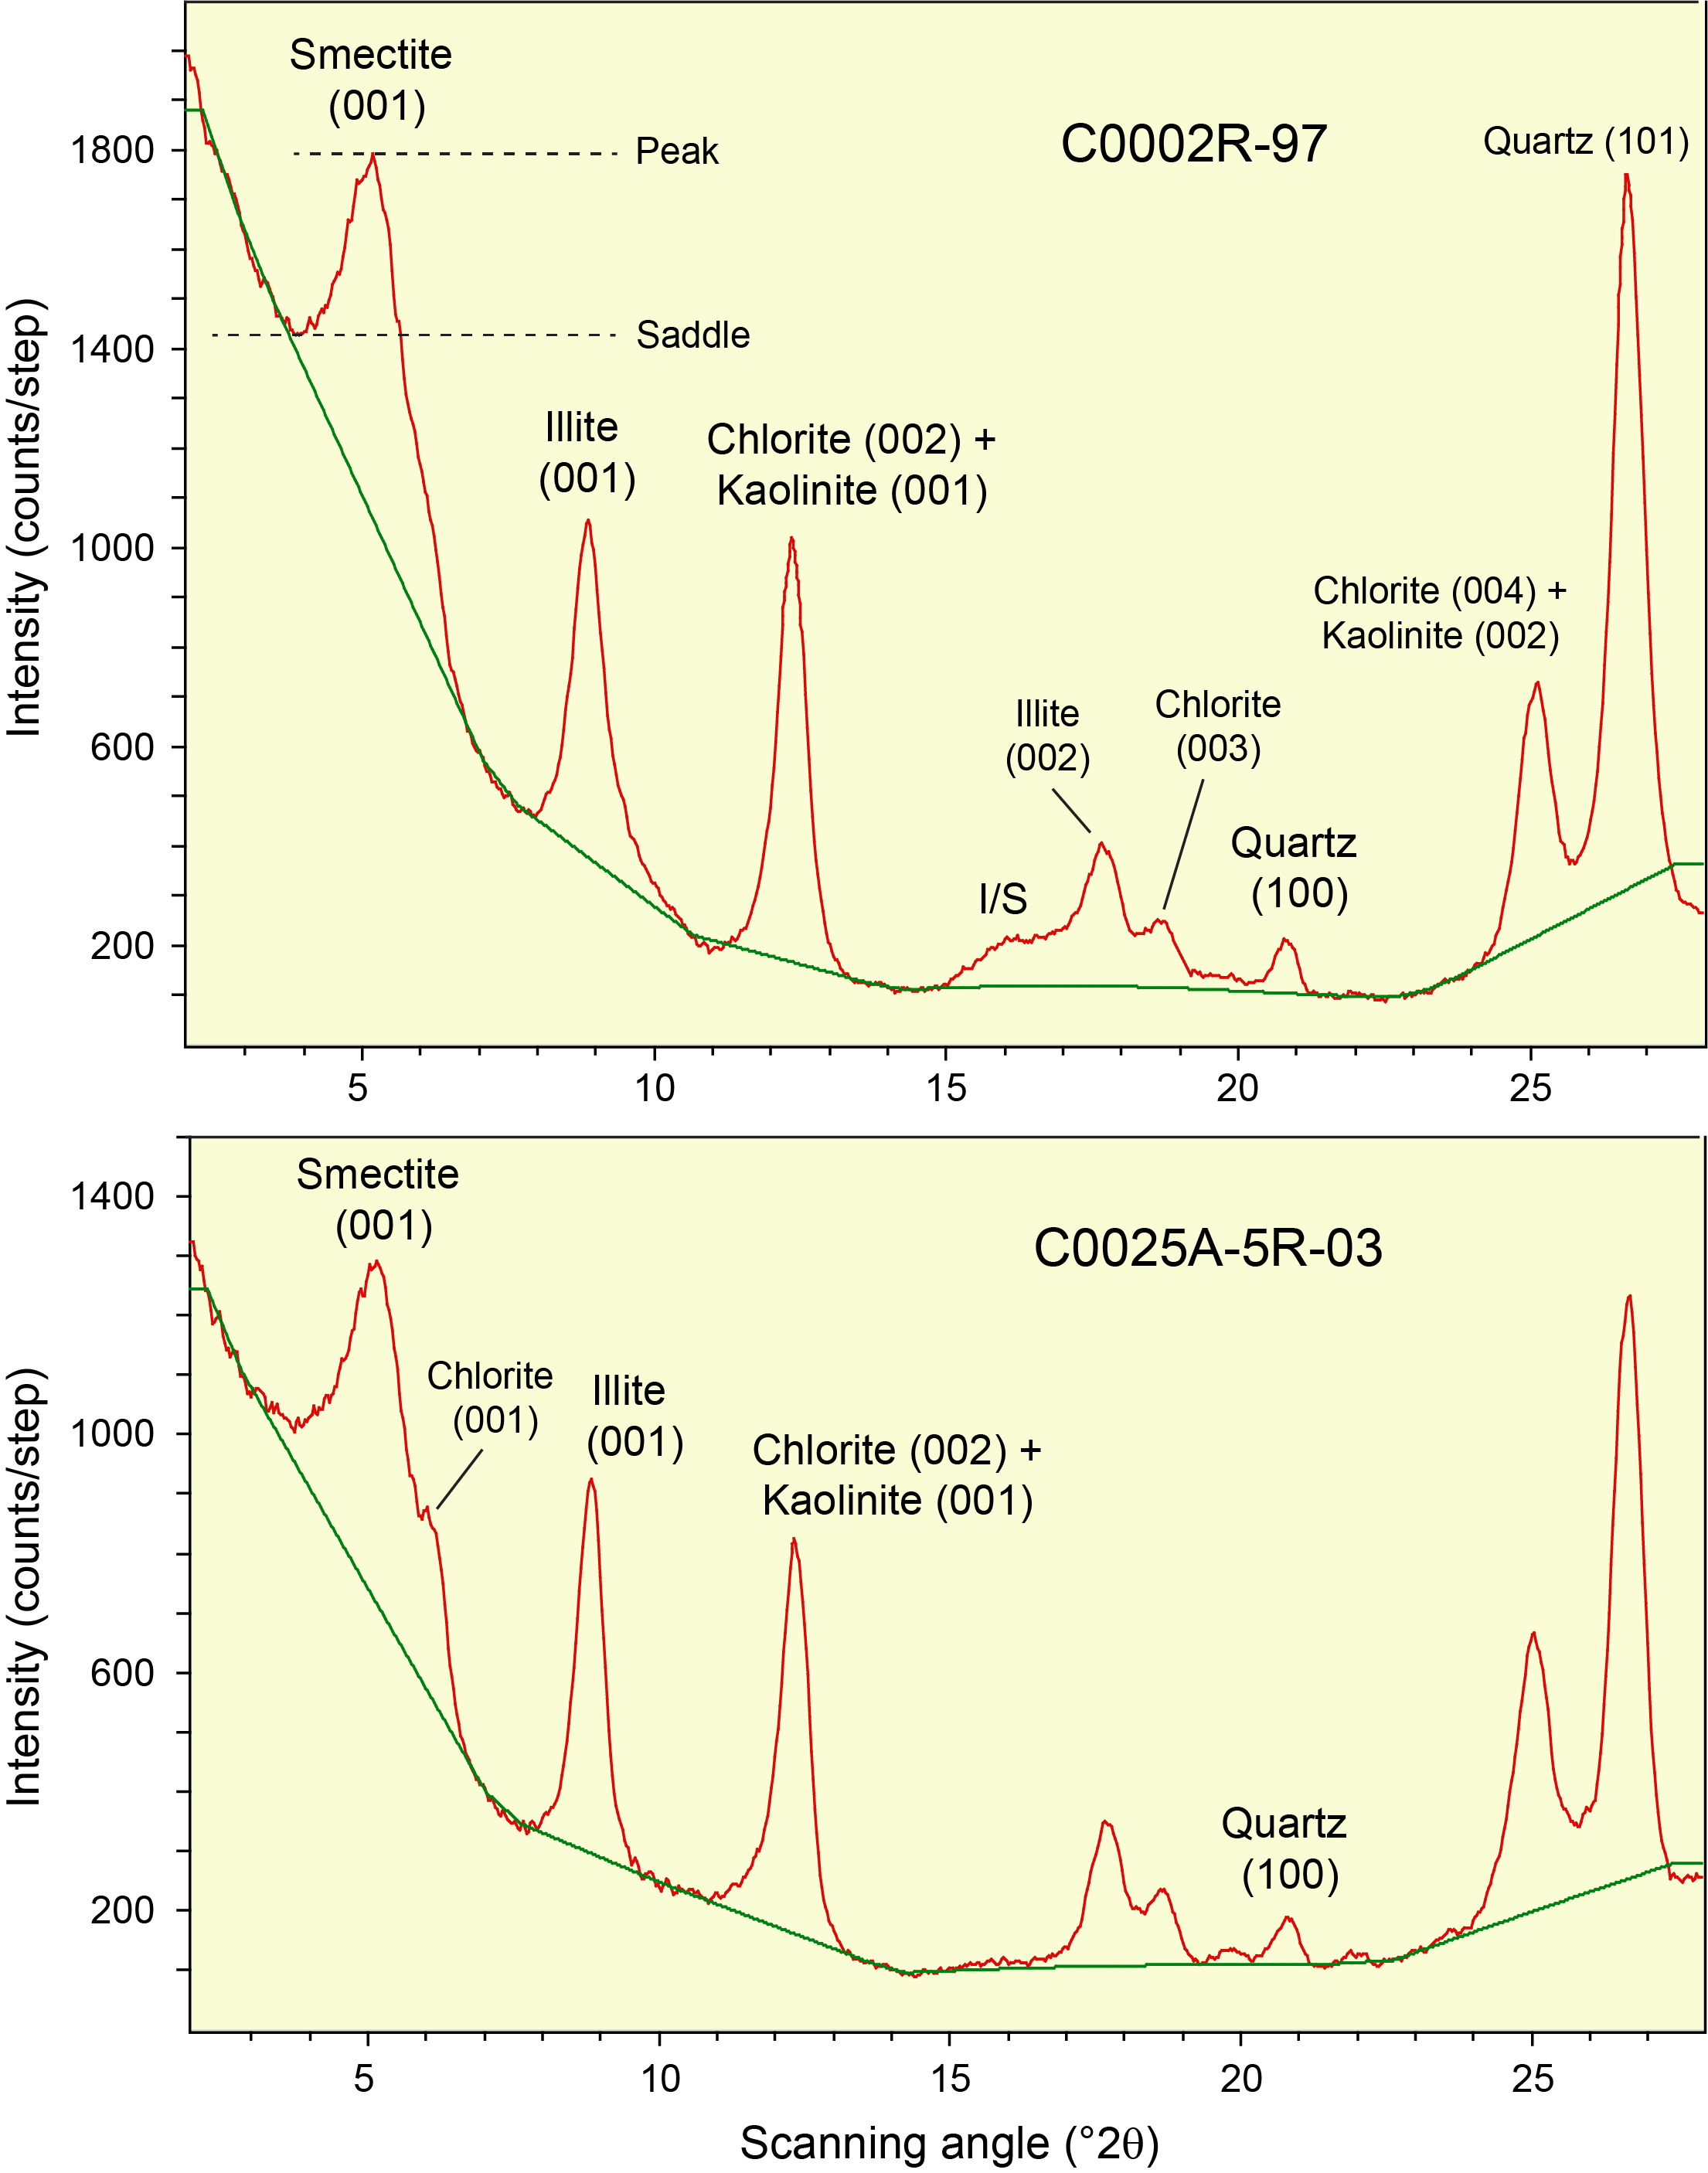
Figure F6. X-ray diffractograms.
3.3. X-ray diffractometer settings
The oriented clay-sized aggregates were analyzed at the New Mexico Bureau of Geology and Mineral Resources using a Panalytical X'Pert Pro diffractometer under the following parameters: generator settings = 45 kV and 40 mA, angular range = 2.0°–28.0°2θ, scan step time = 1.6 s, step size = 0.01°2θ, sample holder = stationary, slits fixed at 0.5 mm (divergence) and 0.1 mm (receiving), and specimen length = 10 mm. Raw data files were processed using MacDiff software (version 4.2.5) to establish a baseline of intensity, smooth counts, correct peak positions offset by slight misalignments of the detector and sample holder (using the quartz 100 peak at 20.95°2θ), record peak intensities (counts/step), and compute integrated peak areas (total counts). Representative diffractograms are shown in Figure F6, with identification of the diagnostic peaks for smectite, illite, mixed-layer illite/smectite (I/S), chlorite, kaolinite, and quartz.
3.4. Computations of mineral abundance
Computed relative abundance values for each of the common clay-sized minerals are based on values of integrated peak area from the smectite (001), illite (001), chlorite (002) + kaolinite (001), and quartz (100) reflections (Figure F6). As scrutinized in more detail by Underwood et al. (2020), three computational approaches are available:
- Biscaye (1965) peak-area weighting factors, which are equal to 1× smectite, 4× illite, and 2× undifferentiated (chlorite + kaolinite);
- A set of regression equations that relate peak area to weight percent, where smectite + illite + undifferentiated (chlorite + kaolinite) + quartz = 100%; and
- A matrix of singular value decomposition (SVD) normalization factors (Table T1), also where smectite + illite + undifferentiated (chlorite + kaolinite) + quartz = 100%.
In some instances, the sum of the four main relative abundance values is less than 100%; suppression of peak intensity is usually caused by filter-peel transfers that are too thin (i.e., less than "infinite" thickness). Another contributing factor, however, might be inclusion of additional minerals or amorphous solids within the clay-sized fraction (e.g., feldspar, volcanic glass shards, and biogenic calcite). To overcome those technical artifacts, the four relative abundance values were normalized to 100%.
XRD data from overlapping depth intervals in Hole C0002P were computed using SVD normalization factors (Underwood, 2017a), so the graphical plots and statistical comparisons in this report use data computed in the same manner. Underwood et al. (2020) showed that average absolute errors of accuracy using SVD are illite = 3.3 wt%, smectite = 6.2 wt%, and undifferentiated (chlorite + kaolinite) = 5.9 wt%. Compositional differences among individual specimens and lithologic units are not considered geologically significant unless those differences are greater than 6 wt%.
The burial depths for all cuttings samples analyzed in this study are >2827 mbsf (Figure F4). Although clay minerals respond differently to diagenetic conditions from place to place, the conventional XRD criteria for quantifying in situ smectite-to-illite reaction progress are reliable once temperatures exceed 60°–80°C (Freed and Peacor, 1989). Model-based projections of the shallow geothermal gradients yield temperature estimates of approximately 80°–110°C at the depths reported here (Harris et al., 2011; Spinelli and Harris, 2011; Sugihara et al., 2014; Hüpers et al., 2019). Accordingly, two criteria are evaluated here (Table T2) in accordance with previous data from Hole C0002P (Underwood, 2017a). The first method uses the saddle:peak intensity ratio (Figure F6) to compute the "expandability" of smectite plus I/S mixed-layer clay in the assemblage (Rettke, 1981). The second method involves computation of the percentage of illite layers in the I/S mixed-layer clay based on a visual pick of the angular position (°2θ) of the composite I(002)/S(003) peak (Figure F6). With progressive illitization, that peak shifts systematically to higher diffraction angles (Moore and Reynolds, 1989a). A reliable determination of %illite is not possible, however, unless the intensity of the I/S peak is high enough to resolve a clear apex above background noise and peak positions are corrected for misalignments.
Crystallinity of the illite assemblage is based on the width of the illite (001) peak at half maximum (units = Δ°2θ). That value is usually referred to as the illite crystallinity index or the Kübler Index (e.g., Kisch, 1991; Warr and Ferreiro Mählmann, 2015). Those peaks should sharpen and narrow as mixtures of detrital illite or detrital plus diagenetic illite become more crystalline. Conversely, if poorly crystalline illitic I/S is added to a detrital assemblage of metamorphic illite as smectite-to-illite diagenesis progresses, then the (001) peaks should broaden.
4. Results
4.1. Clay mineral assemblages
4.1.1. Site C0002
When viewed as a whole, portions of the inner accretionary prism that were sampled during Expedition 358 (Holes C0002Q–C0002T) display moderate amounts of scatter in clay-sized mineral assemblages (Figure F7), more than the scatter from overlapping intervals in Hole C0002P (Underwood, 2017a). The proportions of smectite range 14.3–26.2 wt% with a mean value (µ) of 20.0 wt% and a standard deviation (σ) of 2.2 (Table T3). Weight percent values for illite range 23.1–60.7 wt% (µ = 54.5; σ = 5.9), and the proportion of undifferentiated (chlorite + kaolinite) ranges 8.3–15.1 wt% (µ = 13.8; σ = 1.9). The content of clay-sized quartz ranges 8.3–35.9 wt% (µ = 11.7; σ = 4.2). In general, higher quartz content in the clay-sized fraction should be an expected effect if bulk cuttings mixtures contain larger proportions of fine siltstone. Larger excursions from the mean among the clay minerals are consistent with proportional differences in silty claystone versus fine silty claystone in the bulk cuttings (Figure F4).
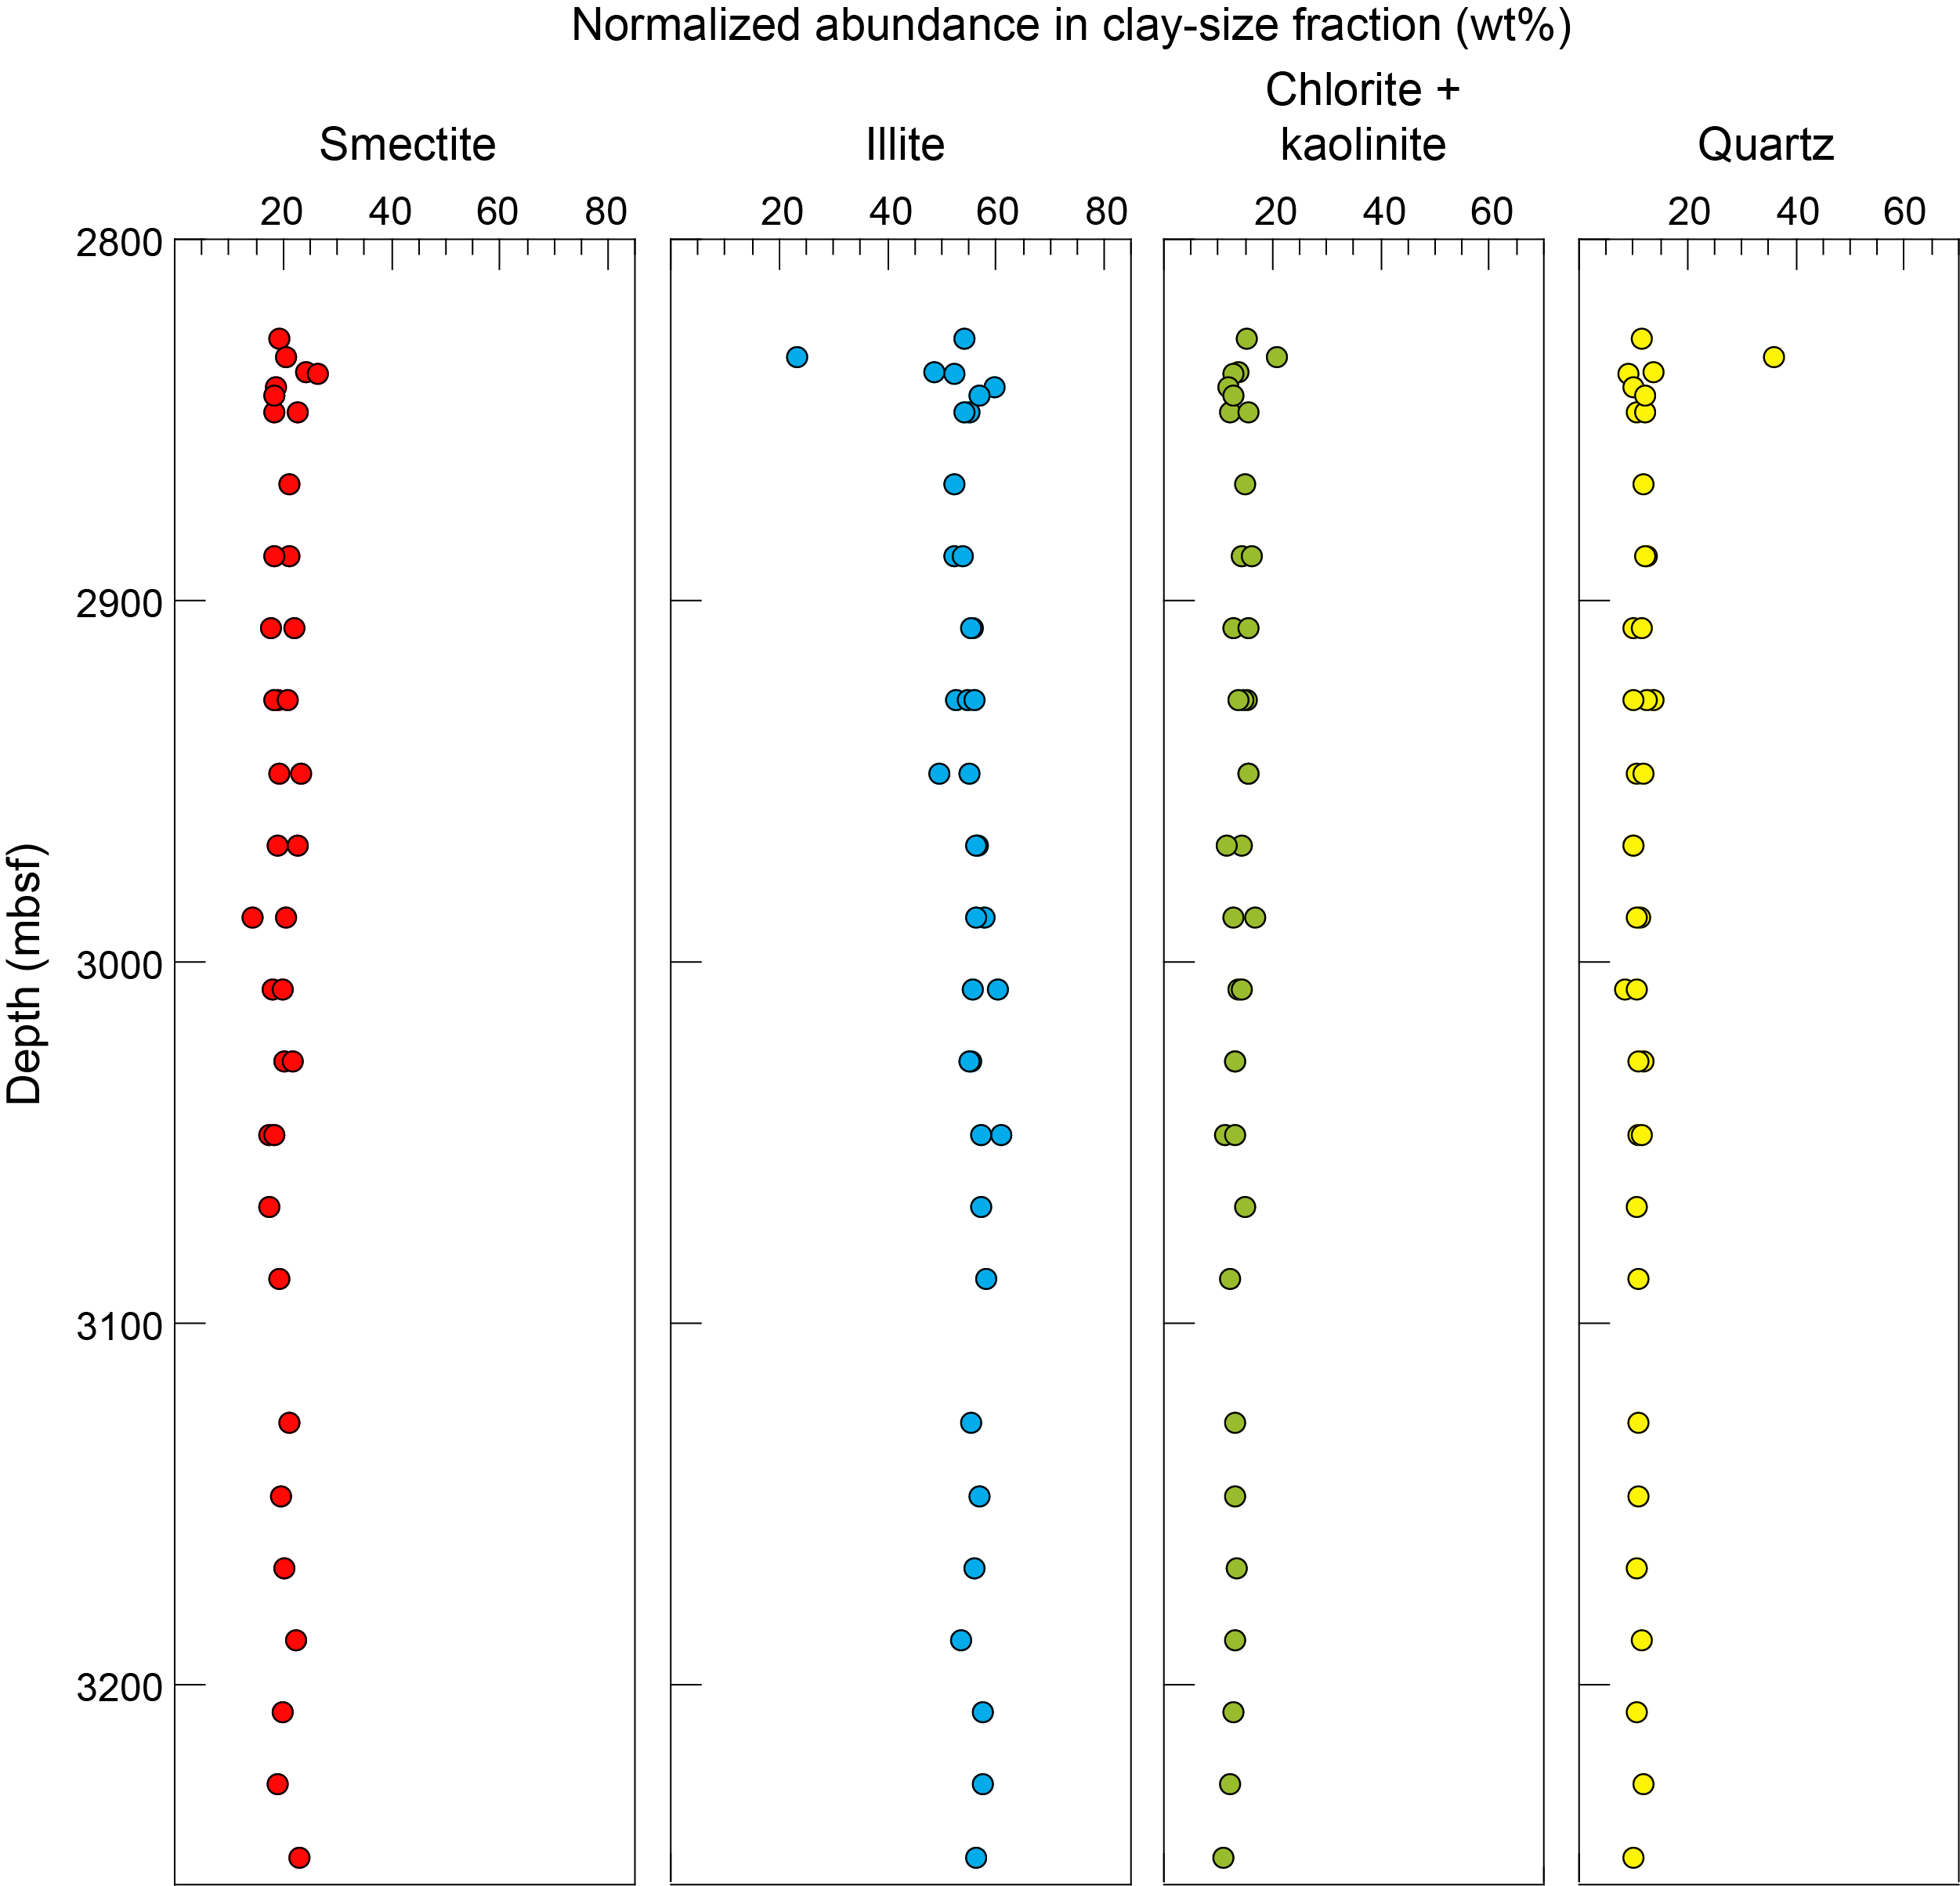
Figure F7. Normalized relative abundance.
Figure F8 shows estimates of total clay minerals from shipboard XRD measurements of bulk cuttings (Kitajima et al., 2020). The scatter among those values is greater than what was documented in cuttings from Hole C0002P (Tobin et al., 2015b). Data from Expedition 358 (Kitajima et al., 2020) also show an overall shift toward lower abundances of total clay minerals, with an average value of 47.2 wt% (Figure F8). In contrast, the mean value for total clay minerals in Hole C0002P (Subunit VB) is 59 wt% (Tobin et al., 2015b).
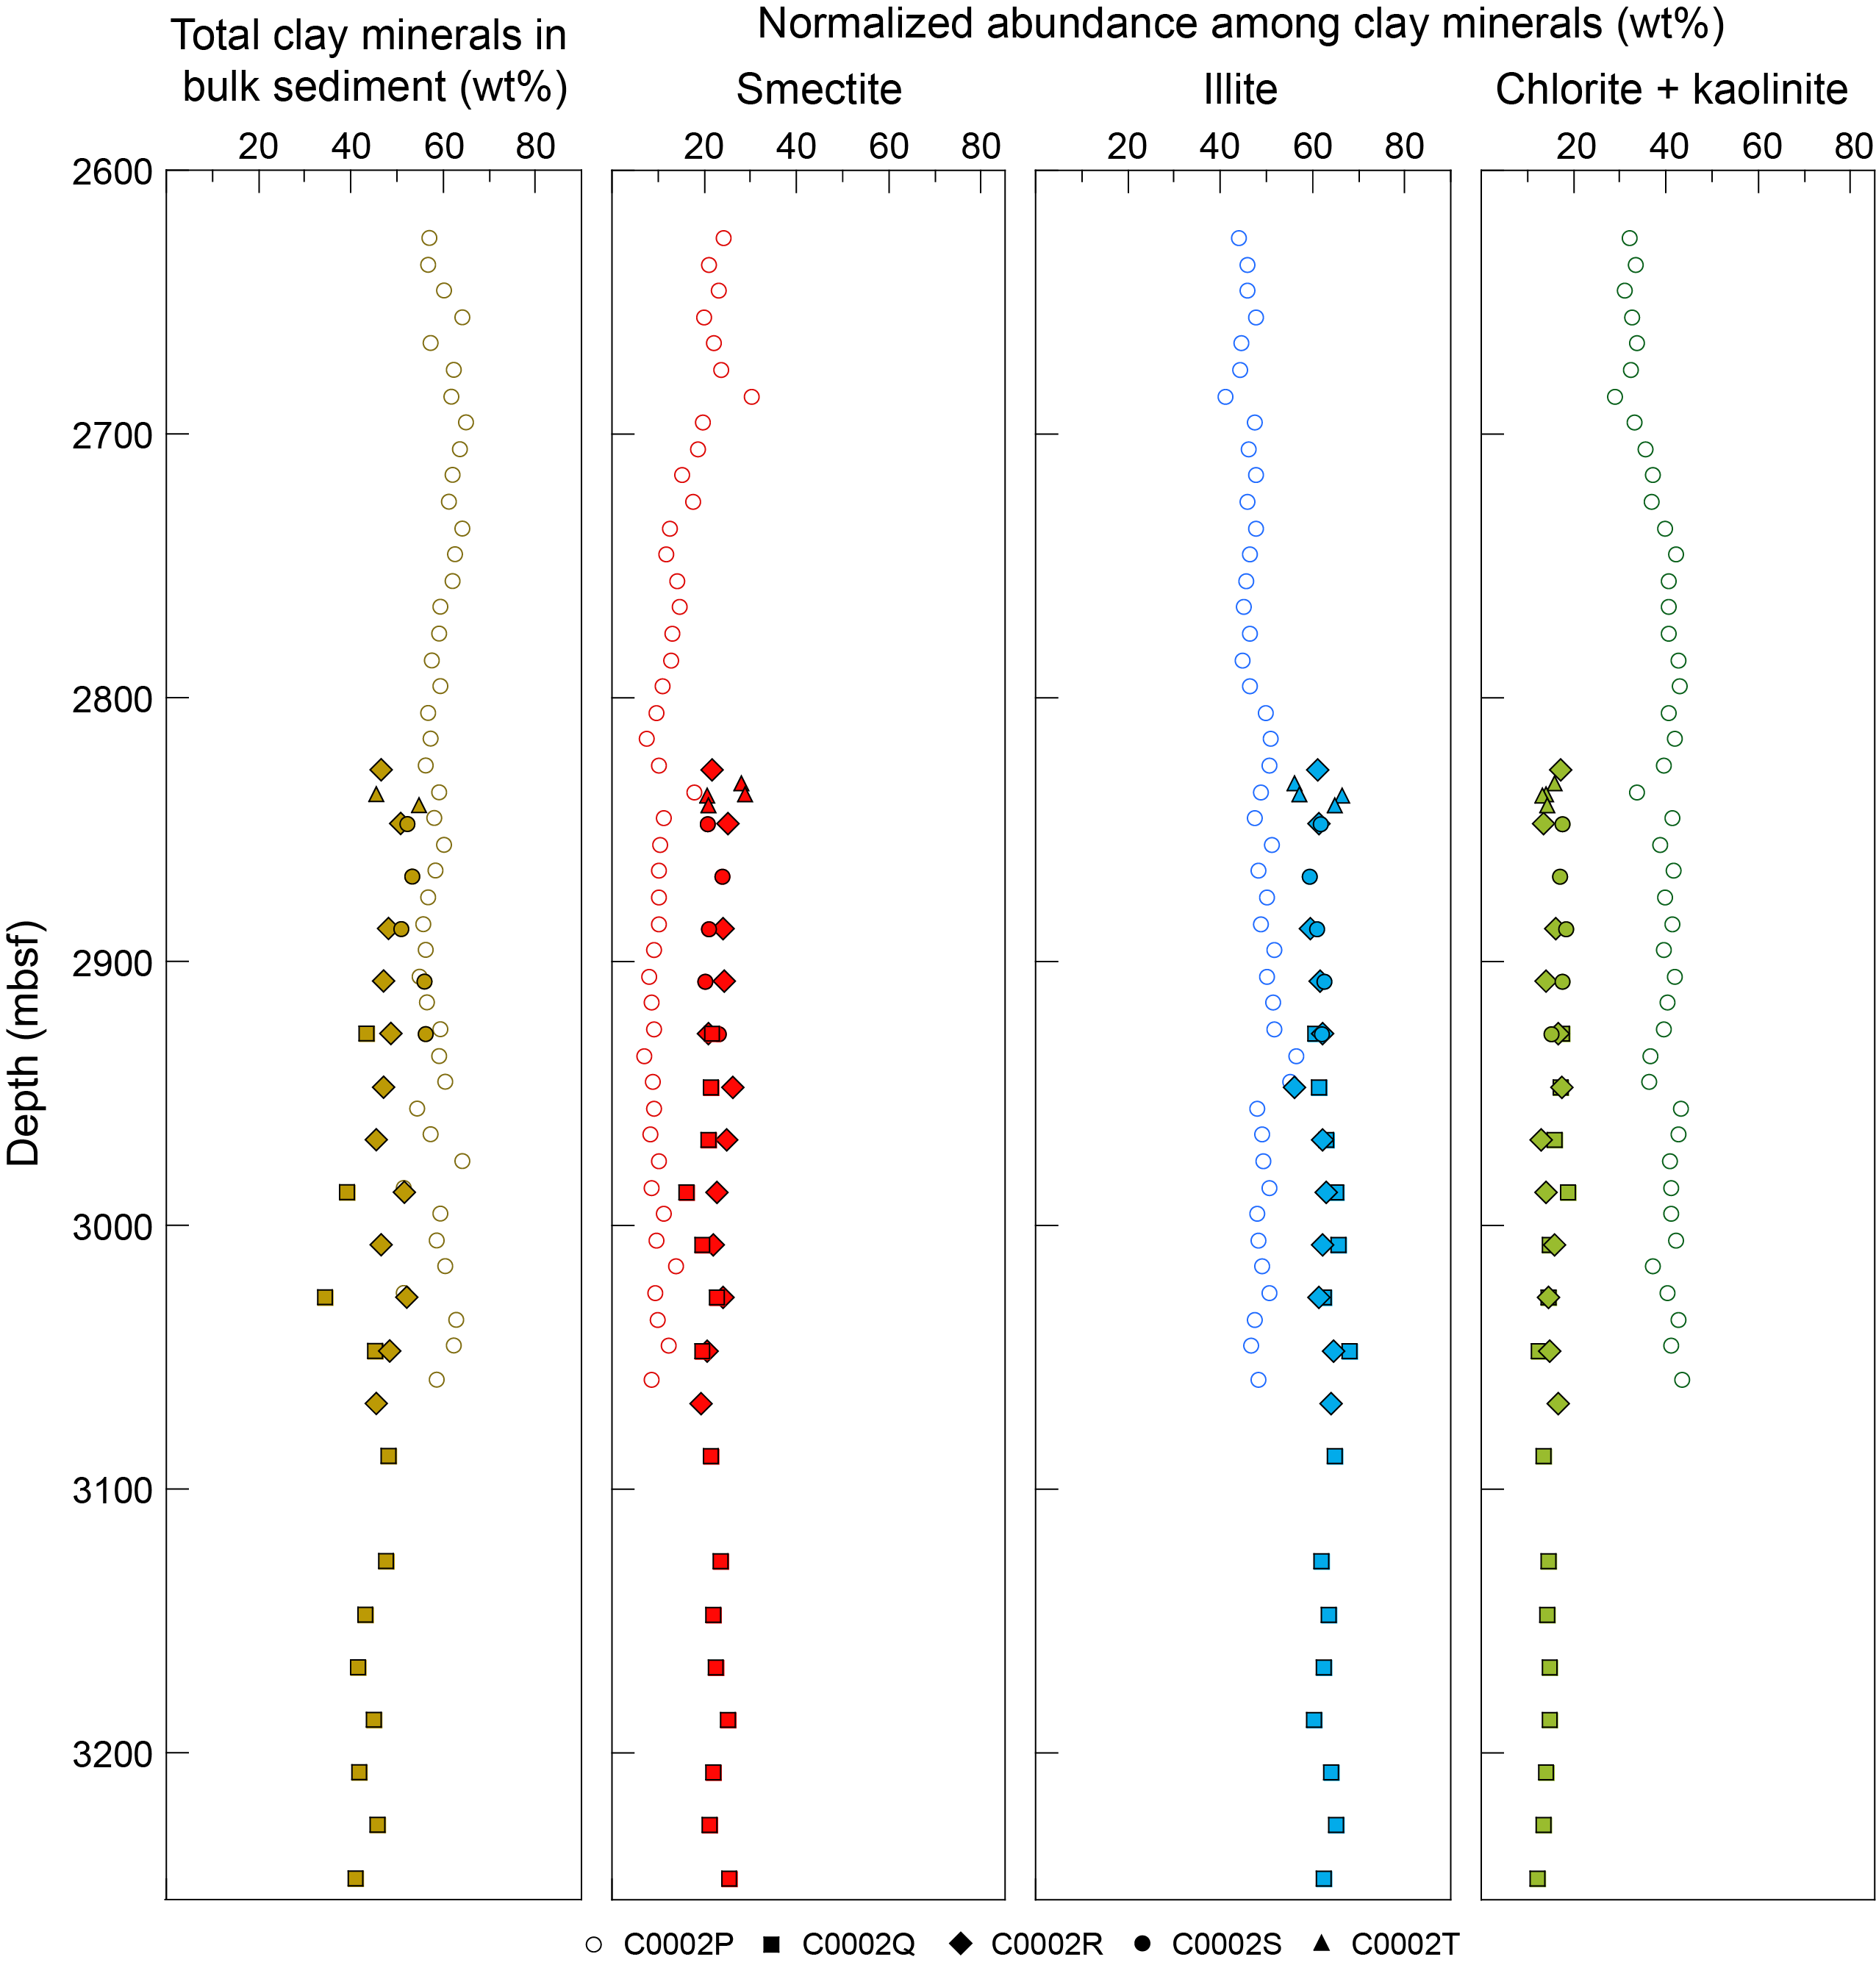
Figure F8. XRD data.
The normalized abundances among clay minerals reveal systematic shifts relative to data from Hole C0002P (Figure F8). The mean values are smectite = 25.4 wt%, illite = 49.3 wt%, and undifferentiated (chlorite + kaolinite) = 25.4 wt%, whereas comparable mean values for Hole C0002P (Subunit VB) are smectite = 13 wt%, illite = 48 wt%, and undifferentiated (chlorite + kaolinite) = 39 wt% (Underwood, 2017a). Those compositional differences far exceed the inherent inaccuracies of the XRD method (Underwood et al., 2020).
4.1.2. Site C0025
Data from Hole C0025A include only four analyses from Lithologic Unit I (lower fore-arc basin facies). The proportions of smectite in the clay-sized fraction range 14.9–19.9 wt% (µ = 16.5; σ = 2.3). Normalized weight percent values for illite range 52.9–61.1 wt% (µ = 58.4; σ = 3.8), and the proportion of undifferentiated (chlorite + kaolinite) ranges 13.0–16.8 wt% (µ = 14.8; σ = 2.0). The content of clay-sized quartz ranges 9.3–18.8 wt% (µ = 10.4; σ = 0.8). Data from the shallow coring intervals at Site C0002 should be compared with some caution because of the large differences in statistical populations (Guo and Underwood, 2012) and uncertainties regarding lithofacies and biostratigraphic correlations among what appear to be equivalent lithologic units (Kimura et al., 2020). For example, the maximum age of the starved-basin facies at Site C0002 is ~5 Ma, which is almost 1 My older than correlative strata at Site C0025. Those apparent differences in age could be responsible for shifting the proportions of different clay minerals. The trend for smectite is strongly temporal (Underwood and Guo, 2018). With those caveats in mind, the averages for Unit II at Site C0002 (lower fore-arc basin facies) are smectite = 25 wt%, illite = 35 wt%, undifferentiated (chlorite + kaolinite) = 27 wt%, and quartz = 13 wt% (Guo and Underwood, 2012).
In the 14 samples from Lithologic Unit II at Site C0025 (trench-slope facies), the values for smectite range 16.6–29.4 wt% (µ = 23.7 wt%; σ = 3.6). Weight percent values for illite range 49.5–63.7 wt% (µ = 54.1; σ = 3.8), and the statistics for undifferentiated (chlorite + kaolinite) are µ = 11.9 and σ = 1.6. The amount of clay-sized quartz is 8.7–15.4 wt% (µ = 10.3; σ = 1.9). There appear to be no significant excursions in clay mineral assemblages in the deformed (slurry) intervals (Figure F9). In shallow intervals at Site C0002, the averages for broadly correlative Unit III (starved basin facies) are smectite = 36 wt%, illite = 35 wt%, undifferentiated (chlorite + kaolinite) = 20 wt%, and quartz = 9 wt% (Guo and Underwood, 2012).
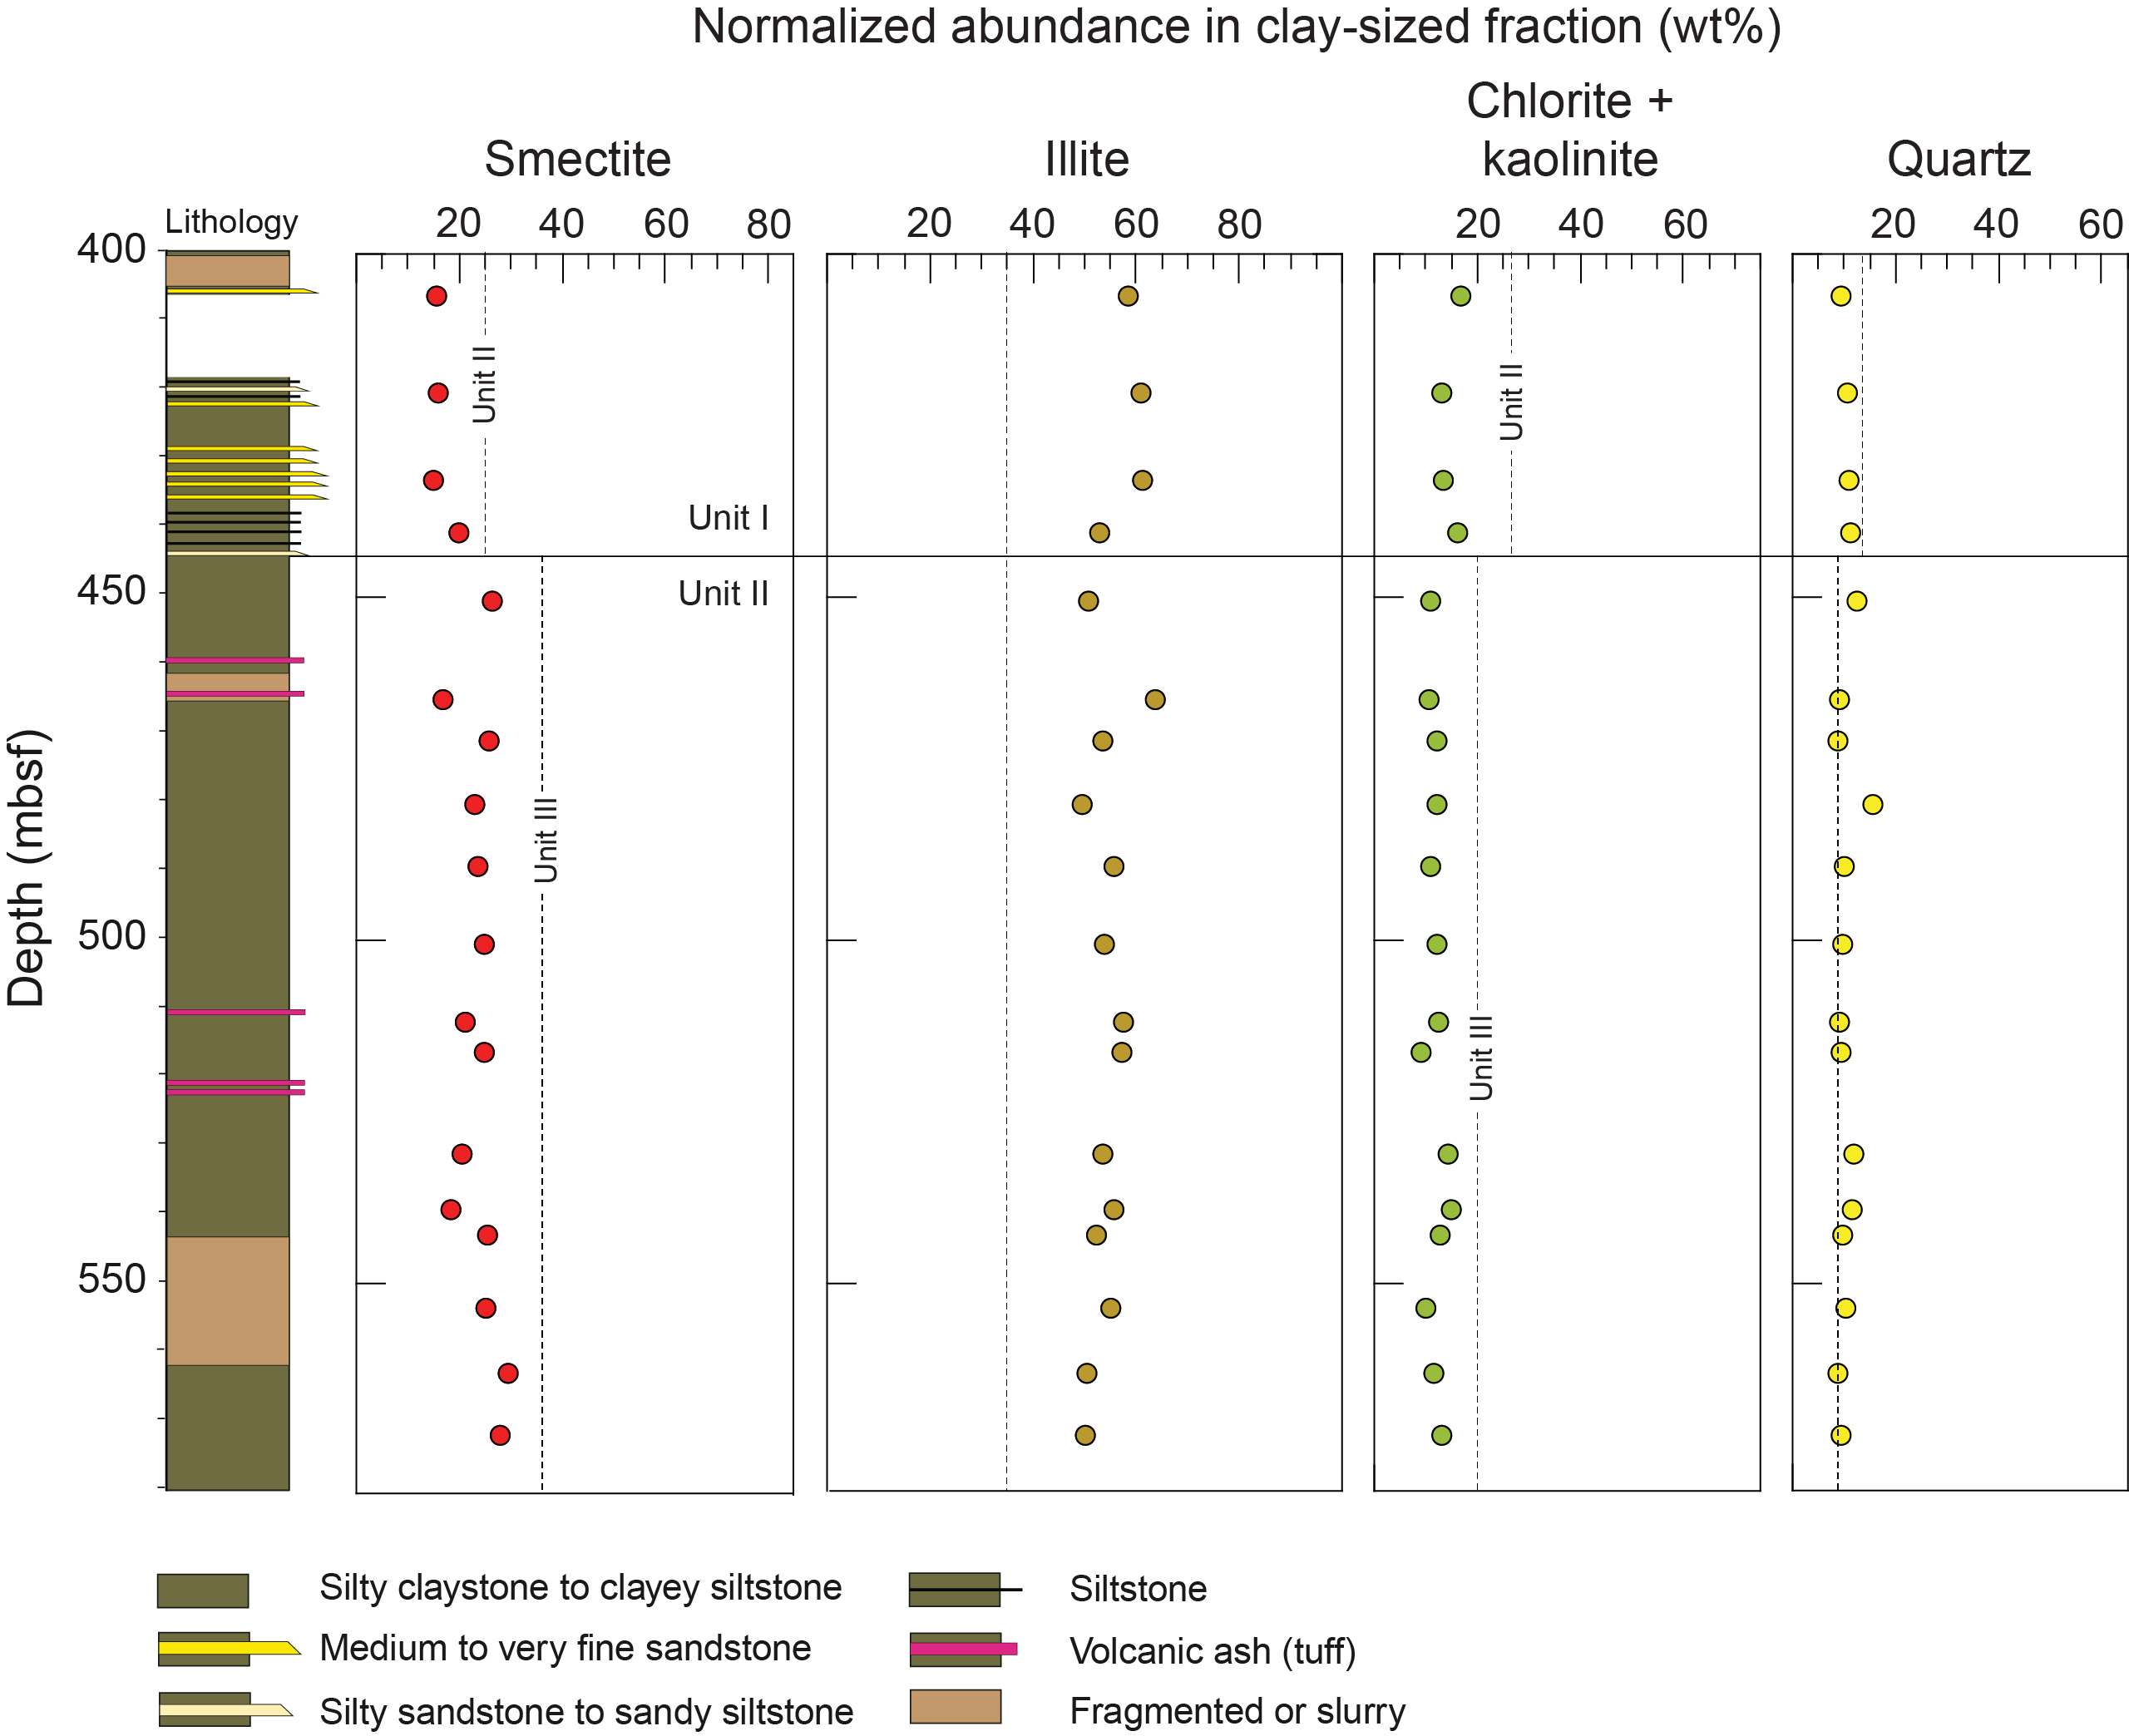
Figure F9. Normalized abundance.
4.2. Indicators of clay diagenesis
4.2.1. Site C0002
The apparent differences in clay-sized mineral assemblages from nearby and overlapping holes are significant (Figure F9), as are inconsistencies in the indicators of clay diagenesis (Figure F10). In Holes C0002Q–C0002T, values of illite crystallinity index fall in a range between 0.528Δ°2θ and 0.692Δ°2θ, with a mean of 0.64Δ°2θ and a narrow standard deviation of 0.03 (Table T2; Figure F10). According to the criteria of Warr and Ferreiro Mählmann (2015), that range of illite crystallinity values falls mostly within the realm of advanced diagenesis. Conversely, data from Hole C0002P (Subunit VB) fall consistently within the range for anchimetamorphic conditions, with an average value of 0.42Δ°2θ (Underwood, 2017a).
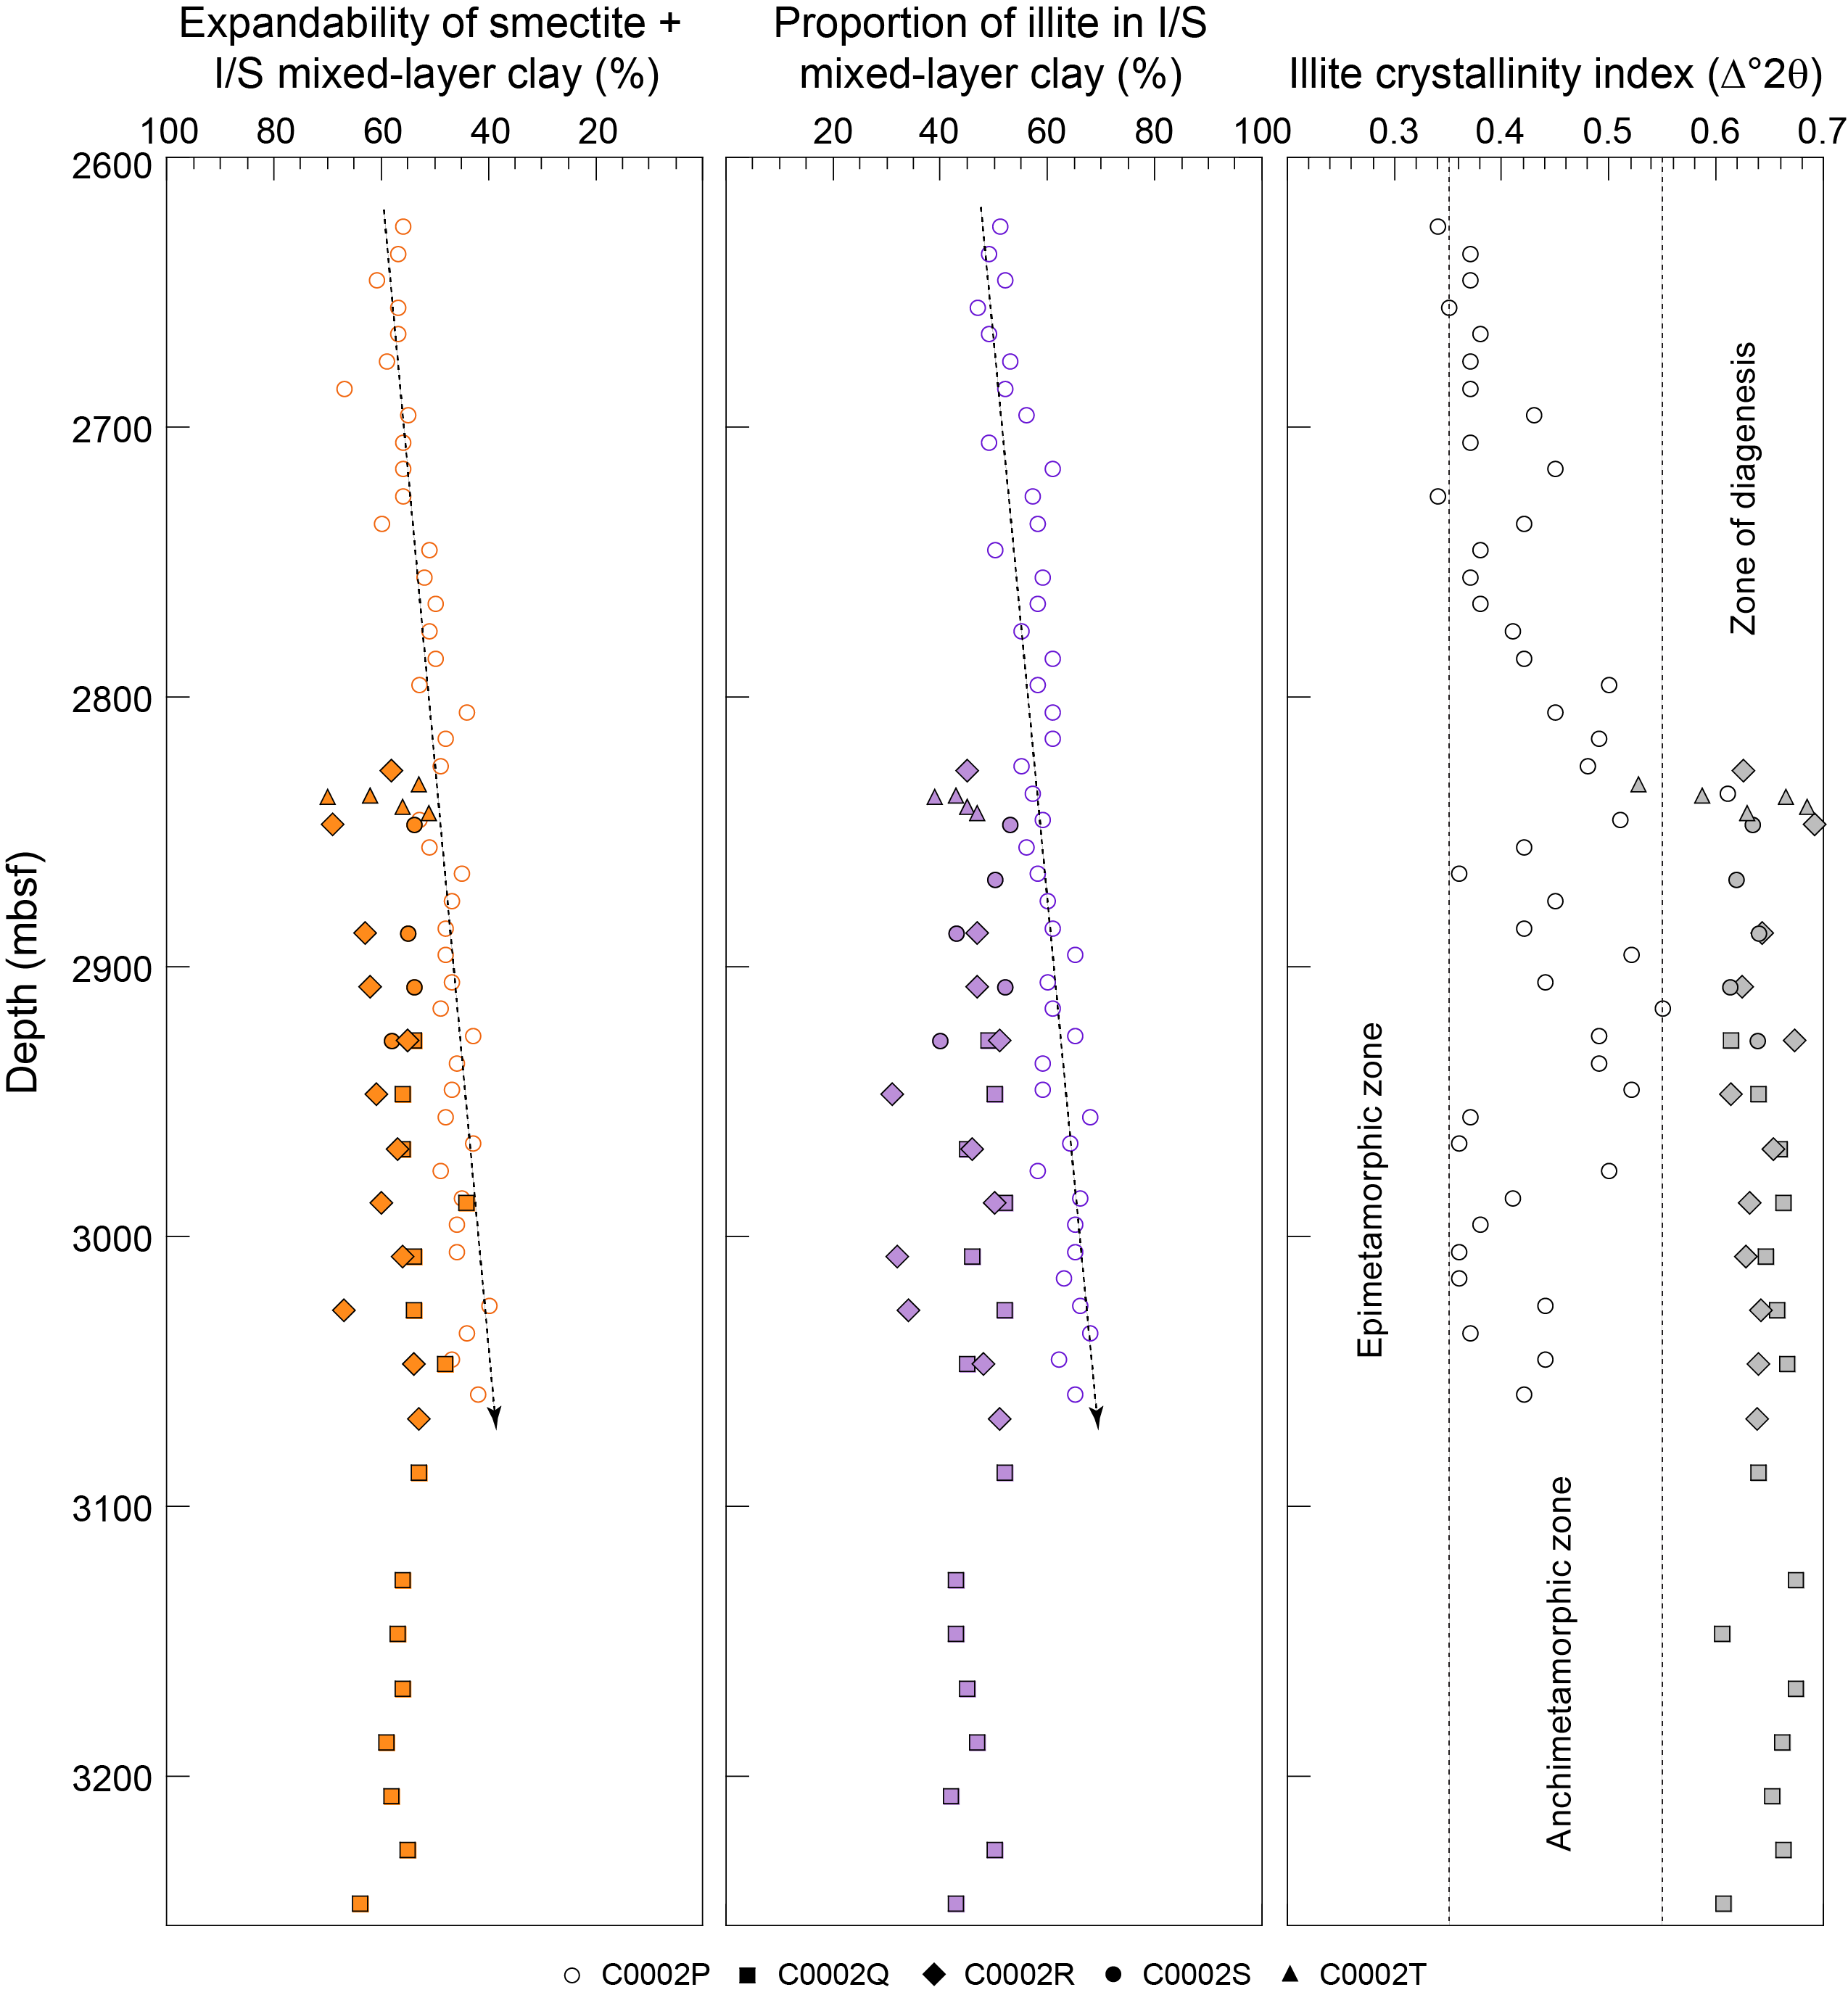
Figure F10. Diagenetic indicators.
Values of expandability for the assemblage of smectite and smectite-rich I/S in Holes C0002Q–C0002T range 44%–70% with a mean of 57% and a standard deviation of 5% (Table T2). Depth-dependent trends are noticeably absent (Figure F10). In contrast, the results from Subunit VB in Hole C0002P (Underwood, 2017a) show a consistent offset toward higher amounts of expandability (µ = 57%), and there is a well-defined gradient of reduced expandability with increasing depth (Figure F10). For generic reference, lower values (less expandability) are consistent with higher proportions of illitic I/S in the mix, whereas higher expandability values are indicative of dominance by discrete smectite and/or smectite-rich I/S derived from altered volcanic sources.
Percentages of illite within the I/S mixed-layer phase (Holes C0002Q–C0002T) range 31%–53% with a mean of 46% and a standard deviation of 6% (Table T2; Figure F10). In contrast, the average value for Hole C0002P (Subunit VB) is substantially more illitic (59%), and the data show progressive increases in %illite with depth (Underwood, 2017a). Those increases are consistent with model-based predictions of illitization (Hüpers et al., 2019). Gradual increases in %illite are absent in the results from Holes C0002Q–C0002T (Figure F10).
4.2.2. Site C0025
In the 18 cores from Site C0025, values of illite crystallinity index range 0.516Δ°2θ–0.614Δ°2θ with a mean of 0.55Δ°2θ (Table T2). That range straddles the boundary between advanced diagenesis and anchimetamorphism (Figure F11). Values of expandability for smectite + I/S range 55%–67% with a mean of 60% (Table T2). Percentages of illite in I/S range 8%–33% with an average of 20%. Five of the 18 specimens generated I/S peaks that were too small to resolve (Table T2). Depth-dependent trends are absent (Figure F11). Given the relatively shallow burial depths (400–572 mbsf), these results should be regarded as indicative of geologic conditions within detrital source areas rather than in situ diagenesis.
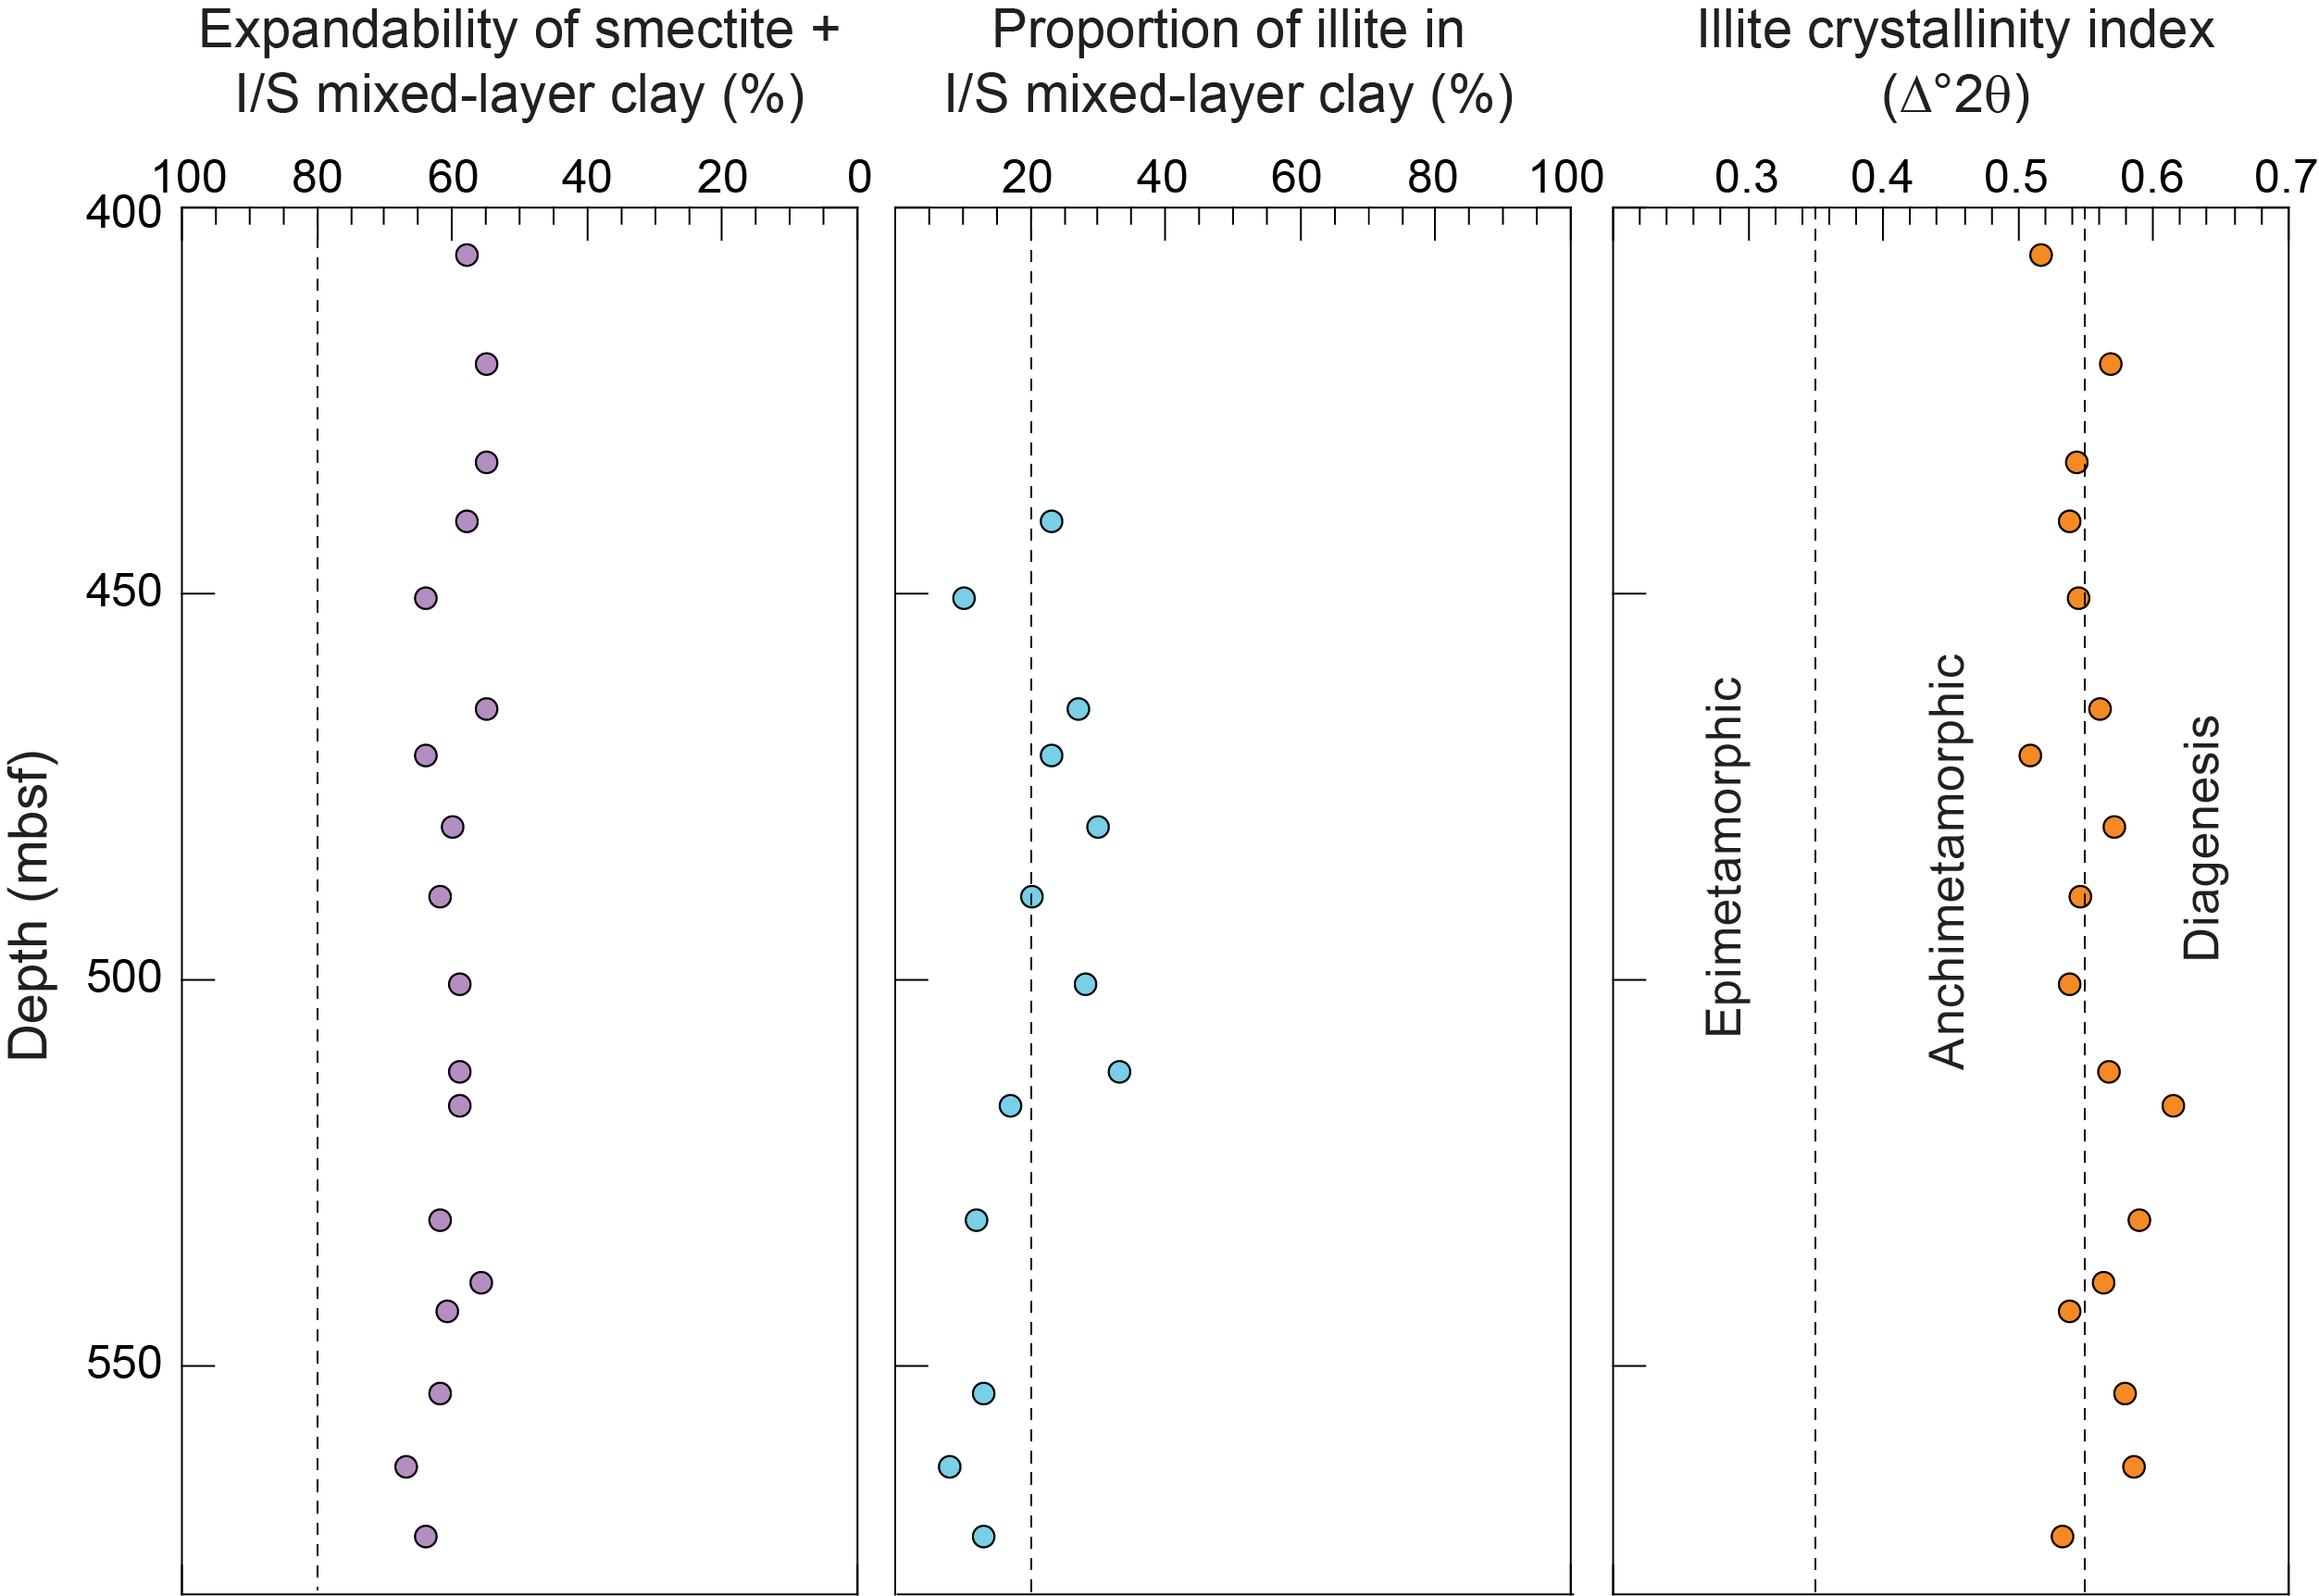
Figure F11. Indicators of clay diagenesis.
5. Conclusions
XRD analyses of the clay-sized fraction of cuttings and core specimens from Site C0002 (Holes C0002Q–C0002T) yield average normalized values of smectite = 20.0 wt%, illite = 54.5 wt%, undifferentiated (chlorite + kaolinite) = 13.8 wt%, and quartz = 11.7 wt%. The average value of expandability for assemblages of smectite + I/S mixed-layer clay is 57%. The average value of %illite in I/S mixed-layer clay is 46%. Most values of illite crystallinity index fall within the range for conditions for advanced diagenesis with an average of 0.64Δ°2θ. Neither the clay mineral assemblages nor indicators of clay diagenesis vary significantly or systematically as a function of depth, and all such values differ significantly from overlapping data from Subunit VB in Hole C0002P (Underwood, 2017a).
Reconnaissance-scale XRD results from Site C0025 (central Kumano Basin) show only minor compositional differences between Lithologic Unit I (lower fore-arc basin facies) and Unit II (trench-slope facies). Proportions of smectite in the clay-sized fraction average 27.1 wt%. Weight percent values for illite average 49.7 wt%, and the average proportion of undifferentiated (chlorite + kaolinite) is 11.8 wt%. The content of clay-sized quartz averages 11.4 wt%. The mean value of expandability for assemblages of smectite + I/S mixed-layer clay is 60%, whereas values of %illite in I/S mixed-layer clay average 20%. Values of illite crystallinity index range 0.516Δ°2θ–0.614Δ°2θ, straddling the boundary between advanced diagenesis and anchimetamorphism.
6. Acknowledgments
This study used samples provided by the International Ocean Discovery Program (IODP). I thank the members of the Mantle Quest Japan drilling crew, Marine Works Japan laboratory technicians, Co-Chief Scientists, and fellow shipboard scientists for their dedication and assistance with sample acquisition during Expedition 358. Funding was provided by the U.S. Science Support Program. Karissa Rosenberger and Mercedes Salazar assisted with sample preparation at New Mexico Tech, and Kelsey McNamara completed X-ray diffraction scans at the New Mexico Bureau of Geology and Mineral Resources.
References
Biscaye, P.E., 1965. Mineralogy and sedimentation of recent deep-sea clay in the Atlantic Ocean and adjacent seas and oceans. Geological Society of America Bulletin, 76(7):803–832. https://doi.org/
Boston, B., Moore, G.F., Jurado, M.J., and Sone, H., 2016. Deformation of the Nankai Trough inner accretionary prism: the role of inherited structures. Geochemistry, Geophysics, Geosystems, 17(2):485–500. https://doi.org/
Expedition 315 Scientists, 2009. Expedition 315 Site C0002. In Kinoshita, M., Tobin, H., Ashi, J., Kimura, G., Lallemant, S., Screaton, E.J., Curewitz, D., Masago, H., Moe, K.T., and the Expedition 314/315/316 Scientists, Proceedings of the Integrated Ocean Drilling Program, 314/315/316: Washington, DC (Integrated Ocean Drilling Program Management International, Inc.). https://doi.org/
Freed, R., and Peacor, D., 1989. Variability in temperature of the smectite/illite reaction in Gulf Coast sediments. Clay Minerals, 24:171–180. https://doi.org/
Guo, J., and Underwood, M.B., 2012. Data report: clay mineral assemblages from the Nankai Trough accretionary prism and the Kumano Basin, IODP Expeditions 315 and 316, NanTroSeize Stage 1. In Kinoshita, M., Tobin, H., Ashi, J., Kimura, G., Lallemant, S., Screaton, E.J., Curewitz, D., Masago, H., Moe, K.T., and the Expedition 314/315/316 Scientists, Proceedings of the Integrated Ocean Drilling Program, 314/315/316: Washington, DC (Integrated Ocean Drilling Program Management International, Inc.). https://doi.org/
Harris, R.N., Schmidt-Schierhorn, F., and Spinelli, G., 2011. Heat flow along the NanTroSEIZE transect: results from IODP Expeditions 315 and 316 offshore the Kii Peninsula, Japan. Geochemistry, Geophysics, Geosystems, 12(8):Q0AD16. https://doi.org/
Hüpers, A., Grathoff, G., Warr, L.N., Wemmer, K., Spinelli, G., and Underwood, M.B., 2019. Spatiotemporal characterization of smectite-to-illite diagenesis in the Nankai Trough accretionary prism revealed by samples from 3 km below seafloor. Geochemistry, Geophysics, Geosystems, 20(2):933–951. https://doi.org/
Kimura, G., Hirose, T., Ikari, M., Kanagawa, K., Kinoshita, M., Kitajima, H., Saffer, D., Tobin, H., Yamaguchi, A., Eguchi, N., Maeda, L., Toczko, S., Bedford, J., Chiyonobu, S., Colson, T.A., Conin, M., Cornard, P.H., Dielforder, A., Doan, M.-L., Dutilleul, J., Faulkner, D.R., Fukuchi, R., Guérin, G., Hamada, Y., Hamahashi, M., Hong, W.-L., Ijiri, A., Jaeger, D., Jeppson, T., Jin, Z., John, B.E., Kitamura, M., Kopf, A., Masuda, H., Matsuoka, A., Moore, G.F., Otsubo, M., Regalla, C., Sakaguchi, A., Sample, J., Schleicher, A., Sone, H., Stanislowski, K., Strasser, M., Toki, T., Tsuji, T., Ujiie, K., Underwood, M.B., Yabe, S., Yamamoto, Y., Zhang, J., Sanada, Y., Kido, Y., Le Ber, E., and Saito, S., 2020. Site C0025. With contributions by T. Kanamatsu. In Tobin, H., Hirose, T., Ikari, M., Kanagawa, K., Kimura, G., Kinoshita, M., Kitajima, H., Saffer, D., Yamaguchi, A. Eguchi, N., Maeda, L., Toczko, S., and the Expedition 358 Scientists, NanTroSEIZE Plate Boundary Deep Riser 4: Nankai Seismogenic/Slow Slip Megathrust. Proceedings of the International Ocean Discovery Program, 358: College Station, TX (International Ocean Discovery Program). https://doi.org/
Kisch, H.J., 1991. Illite crystallinity: recommendations on sample preparation, X-ray diffraction settings, and interlaboratory samples. Journal of Metamorphic Geology, 9(6):665–670. https://doi.org/
Kitajima, H., Hirose, T., Ikari, M., Kanagawa, K., Kimura, G., Kinoshita, M., Saffer, D., Tobin, H., Yamaguchi, A., Eguchi, N., Maeda, L., Toczko, S., Bedford, J., Chiyonobu, S., Colson, T.A., Conin, M., Cornard, P.H., Dielforder, A., Doan, M.-L., Dutilleul, J., Faulkner, D.R., Fukuchi, R., Guérin, G., Hamada, Y., Hamahashi, M., Hong, W.-L., Ijiri, A., Jaeger, D., Jeppson, T., Jin, Z., John, B.E., Kitamura, M., Kopf, A., Masuda, H., Matsuoka, A., Moore, G.F., Otsubo, M., Regalla, C., Sakaguchi, A., Sample, J., Schleicher, A., Sone, H., Stanislowski, K., Strasser, M., Toki, T., Tsuji, T., Ujiie, K., Underwood, M.B., Yabe, S., Yamamoto, Y., Zhang, J., Sanada, Y., Kido, Y., Le Ber, E., and Saito, S., 2020. Site C0002. With contributions by T. Kanamatsu. In Tobin, H., Hirose, T., Ikari, M., Kanagawa, K., Kimura, G., Kinoshita, M., Kitajima, H., Saffer, D., Yamaguchi, A. Eguchi, N., Maeda, L., Toczko, S., and the Expedition 358 Scientists, NanTroSEIZE Plate Boundary Deep Riser 4: Nankai Seismogenic/Slow Slip Megathrust. Proceedings of the International Ocean Discovery Program, 358: College Station, TX (International Ocean Discovery Program). https://doi.org/
Moore, D.M., and Reynolds, R.C., Jr., 1989a. Identification of mixed-layered clay minerals. In Moore, D.M., and Reynolds, R.C., Jr. (Eds.) X-ray Diffraction and the Identification and Analysis of Clay Minerals. New York (Oxford University Press), 241–271.
Moore, D.M., and Reynolds, R.C., Jr., 1989b. Sample preparation techniques for clay minerals. In Moore, D.M., and Reynolds, R.C., Jr. (Eds.) X-ray Diffraction and the Identification and Analysis of Clay Minerals. New York (Oxford University Press), 179–201.
Rettke, R.C., 1981. Probable burial diagenetic and provenance effects on Dakota Group clay mineralogy, Denver Basin. Journal of Sedimentary Research, 51(2):541–551. https://doi.org/
Screaton, E.J., Kimura, G., Curewitz, D., and the Expedition 316 Scientists, 2009. Expedition 316 summary. In Kinoshita, M., Tobin, H., Ashi, J., Kimura, G., Lallemant, S., Screaton, E.J., Curewitz, D., Masago, H., Moe, K.T., and the Expedition 314/315/316 Scientists, Proceedings of the Integrated Ocean Drilling Program, 314/315/316. Washington, DC (Integrated Ocean Drilling Program Management International, Inc.). https://doi.org/
Spinelli, G.A., and Harris, R.N., 2011. Thermal effects of hydrothermal circulation and seamount subduction; temperatures in the Nankai Trough Seismogenic Zone Experiment transect, Japan. Geochemistry, Geophysics, Geosystems, 12(12):Q0AD21. https://doi.org/
Sugihara, T., Kinoshita, M., Araki, E., Kimura, T., Kyo, M., Namba, Y., Kido, Y., Sanada, Y., and Thu, M.K., 2014. Re-evaluation of temperature at the updip limit of locked portion of Nankai megasplay inferred from IODP Site C0002 temperature observatory. Earth, Planets and Space, 66(1):107. https://doi.org/
Tobin, H., Hirose, T., Saffer, D., Toczko, S., Maeda, L., Kubo, Y., Boston, B., Broderick, A., Brown, K., Crespo-Blanc, A., Even, E., Fuchida, S., Fukuchi, R., Hammerschmidt, S., Henry, P., Josh, M., Jurado, M.J., Kitajima, H., Kitamura, M., Maia, A., Otsubo, M., Sample, J., Schleicher, A., Sone, H., Song, C., Valdez, R., Yamamoto, Y., Yang, K., Sanada, Y., Kido, Y., and Hamada, Y., 2015a. Expedition 348 summary. In Tobin, H., Hirose, T., Saffer, D., Toczko, S., Maeda, L., Kubo, Y., and the Expedition 348 Scientists, Proceedings of the Integrated Ocean Drilling Program, 348: College Station, TX (Integrated Ocean Drilling Program). https://doi.org/
Tobin, H., Hirose, T., Saffer, D., Toczko, S., Maeda, L., Kubo, Y., Boston, B., Broderick, A., Brown, K., Crespo-Blanc, A., Even, E., Fuchida, S., Fukuchi, R., Hammerschmidt, S., Henry, P., Josh, M., Jurado, M.J., Kitajima, H., Kitamura, M., Maia, A., Otsubo, M., Sample, J., Schleicher, A., Sone, H., Song, C., Valdez, R., Yamamoto, Y., Yang, K., Sanada, Y., Kido, Y., and Hamada, Y., 2015b. Site C0002. In Tobin, H., Hirose, T., Saffer, D., Toczko, S., Maeda, L., Kubo, Y., and the Expedition 348 Scientists, Proceedings of the Integrated Ocean Drilling Program, 348: College Station, TX (Integrated Ocean Drilling Program). https://doi.org/
Tobin, H., Hirose, T., Ikari, M., Kanagawa, K., Kimura, G., Kinoshita, M., Kitajima, H., Saffer, D., Yamaguchi, A., Eguchi, N., Maeda, L., Toczko, S., Bedford, J., Chiyonobu, S., Colson, T.A., Conin, M., Cornard, P.H., Dielforder, A., Doan, M.-L., Dutilleul, J., Faulkner, D.R., Fukuchi, R., Guérin, G., Hamada, Y., Hamahashi, M., Hong, W.-L., Ijiri, A., Jaeger, D., Jeppson, T., Jin, Z., John, B.E., Kitamura, M., Kopf, A., Masuda, H., Matsuoka, A., Moore, G.F., Otsubo, M., Regalla, C., Sakaguchi, A., Sample, J., Schleicher, A., Sone, H., Stanislowski, K., Strasser, M., Toki, T., Tsuji, T., Ujiie, K., Underwood, M.B., Yabe, S., Yamamoto, Y., Zhang, J., Sanada, Y., Kido, Y., Le Ber, E., and Saito, S., 2020. Expedition 358 summary. With contributions by T. Kanamatsu. In Tobin, H., Hirose, T., Ikari, M., Kanagawa, K., Kimura, G., Kinoshita, M., Kitajima, H., Saffer, D., Yamaguchi, A. Eguchi, N., Maeda, L., Toczko, S., and the Expedition 358 Scientists, NanTroSEIZE Plate Boundary Deep Riser 4: Nankai Seismogenic/Slow Slip Megathrust. Proceedings of the International Ocean Discovery Program, 358: College Station, TX (International Ocean Discovery Program). https://doi.org/
Tobin, H., Kimura, G., Kinoshita, M., Toczko, S., and Maeda, L., 2018. Expedition 358 Scientific Prospectus: NanTroSEIZE Plate Boundary Deep Riser 4: Nankai Seismogenic/Slow Slip Megathrust. International Ocean Discovery Program. https://doi.org/
Tobin, H., and Kinoshita, M., 2006. NanTroSEIZE: the IODP Nankai Trough Seismogenic Zone Experiment. Scientific Drilling, 2:23–27. https://doi.org/
Underwood, M.B., 2017a. Data report: clay mineral assemblages and illite/smectite diagenesis in cuttings from Hole C0002P, IODP Expedition 348, Nankai Trough accretionary prism. In Tobin, H., Hirose, T., Saffer, D., Toczko, S., Maeda, L., Kubo, Y., and the Expedition 348 Scientists, Proceedings of the Integrated Ocean Drilling Program, 348: College Station, TX (Integrated Ocean Drilling Program). https://doi.org/
Underwood, M.B., 2017b. Data report: clay mineral assemblages in cuttings from Hole C0002N, IODP Expedition 348, Nankai Trough accretionary prism. In Tobin, H., Hirose, T., Saffer, D., Toczko, S., Maeda, L., Kubo, Y., and the Expedition 348 Scientists, Proceedings of the Integrated Ocean Drilling Program, 348: College Station, TX (Integrated Ocean Drilling Program). https://doi.org/
Underwood, M.B., and Guo, J., 2018. Clay-mineral assemblages across the Nankai-Shikoku subduction system, offshore Japan: a synthesis of results from the NanTroSEIZE project. Geosphere, 14(5):2009–2043. https://doi.org/
Underwood, M.B., Lawler, N., and McNamara, K., 2020. Data report: standard mineral mixtures, normalization factors, and determination of error for quantitative X-ray diffraction analyses of bulk powders and clay-sized mineral assemblages. In Wallace, L.M., Saffer, D.M., Barnes, P.M., Pecher, I.A., Petronotis, K.E., LeVay, L.J., and the Expedition 372/375 Scientists, Hikurangi Subduction Margin Coring, Logging, and Observatories. Proceedings of the International Ocean Discovery Program, 372B/375: College Station, TX (International Ocean Discovery Program). https://doi.org/
Underwood, M.B., and Song, C., 2016a. Data report: clay mineral assemblages in cores from Hole C0002P, IODP Expedition 348, Nankai Trough accretionary prism. In Tobin, H., Hirose, T., Saffer, D., Toczko, S., Maeda, L., Kubo, Y., and the Expedition 348 Scientists, Proceedings of the Integrated Ocean Drilling Program, 348: College Station, TX (Integrated Ocean Drilling Program). https://doi.org/
Underwood, M.B., and Song, C., 2016b. Data report: clay mineral assemblages in cuttings from Hole C0002F, IODP Expedition 338, upper Nankai Trough accretionary prism. In Strasser, M., Dugan, B., Kanagawa, K., Moore, G.F., Toczko, S., Maeda, L., and the Expedition 338 Scientists, Proceedings of the Integrated Ocean Drilling Program, 338: Yokohama (Integrated Ocean Drilling Program). https://doi.org/
Warr, L.N., and Ferreiro Mählmann, R., 2015. Recommendations for Kübler Index standardization. Clay Minerals, 50(3):283–286. https://doi.org/