Betzler, C., Eberli, G.P., Alvarez Zarikian, C.A., and the Expedition 359 Scientists
Proceedings of the International Ocean Discovery Program Volume 359
publications.iodp.org
doi:10.14379/iodp.proc.359.103.2017

Site U14651
C. Betzler, G.P. Eberli, C.A. Alvarez Zarikian, M. Alonso-García, O.M. Bialik, C.L. Blättler, J.A. Guo, S. Haffen, S. Horozal, M. Inoue, L. Jovane, D. Kroon, L. Lanci, J.C. Laya, A. Ling Hui Mee, T. Lüdmann, M. Nakakuni, B.N. Nath, K. Niino, L.M. Petruny, S.D. Pratiwi, J.J.G. Reijmer, J. Reolid, A.L. Slagle, C.R. Sloss, X. Su, P.K. Swart, J.D. Wright, Z. Yao, and J.R. Young2
Keywords: International Ocean Discovery Program, IODP, JOIDES Resolution, Expedition 359, Site U1465, Maldives, Kardiva Channel, Goidhoo atoll, Indian Ocean paleoceanography, Oligocene, Miocene, Pliocene, Pleistocene, carbonate platform, carbonate platform drowning, celestine, dolomite, drift deposits, large benthic foraminifers, monsoon, sea level, sequence stratigraphy
MS 359-103: Published 4 May 2017
Background and objectives
The main goal of International Ocean Discovery Program (IODP) Expedition 359 was to retrieve cores from platform and drift sequences that carry the record of Neogene sea level changes and the onset of monsoon-related currents in the Inner Sea of the Maldives. In addition, the cause of platform drowning related to these environmental changes was a focus of the expedition. The drilling strategy to reach this goal was to drill two transects that penetrated the prograding portions of the drowned platforms and the overlying current deposits and the thick drift sequences adjacent to the drowned platform.
Site U1465 (proposed Site MAL-01A) is located at 4°55.9873′N, 73°0.6786′E, at a water depth of 515 m in the Kardiva Channel between the Goidhoo and South Maalhosmadulu atolls (Figure F1). It is the westernmost site of the northern transect that runs from west to east in the Kardiva Channel (Figure F2).
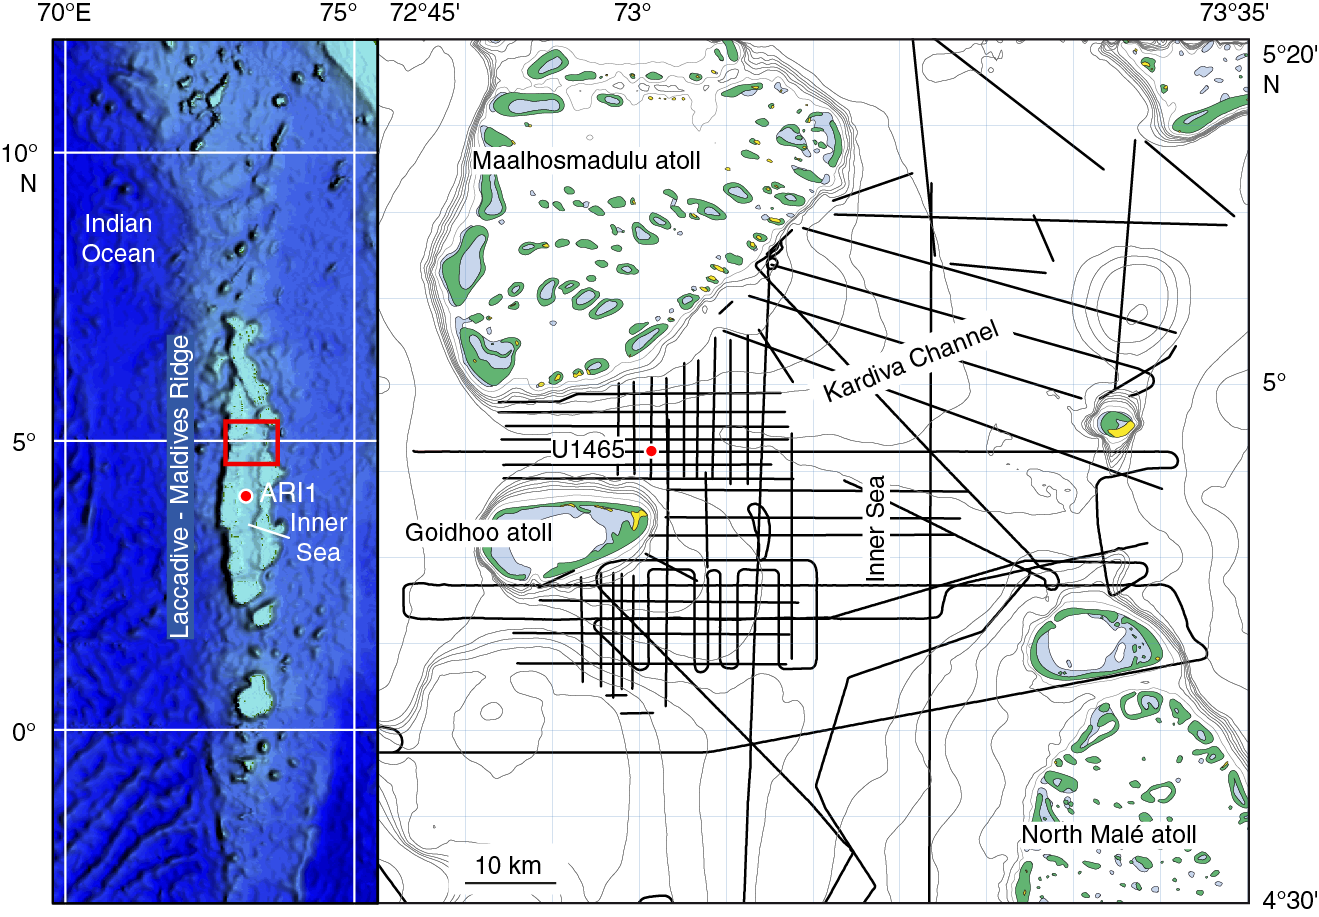
Figure F1. Seismic Line P65 with location of Site U1465.
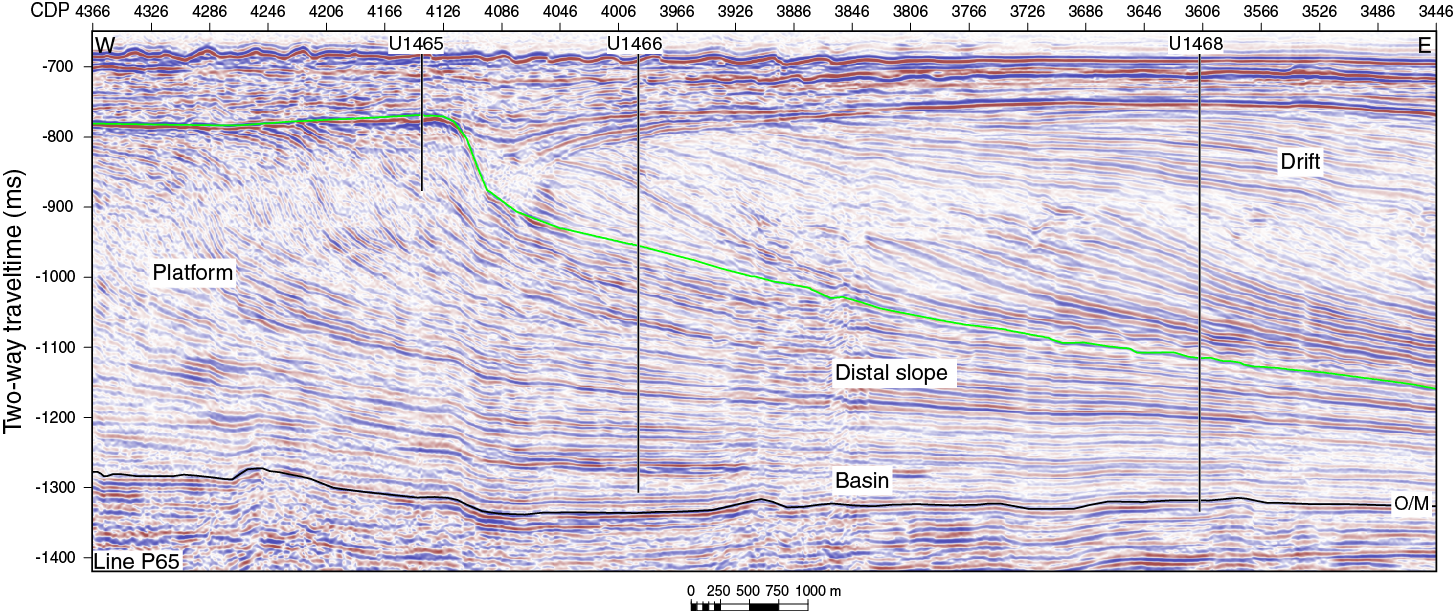
Figure F2. Seismic Line P65 with locations and final penetration depths, Sites U1465, U1466, and U1468.
Site U1465 is situated above the margin of a drowned platform overlain by 70 m of sediment. Within the platform, 11 sequences were identified and interpreted as related to sea level changes by recognizing lowstand and highstand units in the lowermost six sequences (Betzler et al., 2013). Site U1465 penetrates the topset of the youngest sequence (Platform Sequence [PS] PS11) and lies below the foresets of the underlying sequence (PS10) (Figure F30). The sequence boundaries are onlap unconformities at and below the platform edges and are high-amplitude reflections in the foresets and bottomsets. By dating the same seismic sequence boundaries at the other sites along the transect (Sites U1466 and U1468), a robust age model for sea level changes can be established.
Carbonate platforms are the only depositional system that can cease to exist and give way to a completely different system, such as a clastic shelf or deep-water deposit. Platform exposure terminates carbonate production, but subsequent flooding usually re-establishes it. Because carbonate production in general is faster than relative sea level rise (Schlager, 1981), the reason(s) for the drowning is still unresolved. Many processes have been proposed, such as global anoxic events, tectonic breakup, and excess nutrients (Arthur and Schlanger, 1979; Philip and Schlager, 1990; Eberli, 1991; Hallock and Schlager, 1986). The close relationship between platform drowning and intensification of ocean currents was proposed for the demise of the Miocene platforms on the Marion Plateau (John and Mutti, 2005; Eberli et al., 2010). Betzler et al. (2009, 2013) and Lüdmann et al. (2013) document partial platform drowning in the Maldives and propose that it is the combined product of current activity and nutrient supply.
Based on the geometric relationship of the seismic data along the northern transect, platform drowning in the western part of the archipelago coincides with the onset of drift deposition (Figure F2; seismic line). The drift sequences first onlap the last clinoform of the prograding platform and finally overstep it. This geometry indicates a large hiatus on top of the platform. Tracing the age information from commercial Well ARI1 (Belopolsky and Droxler, 2004) to the northern transect indicates that the platform drowned during the late middle Miocene, whereas the overlying deposits are likely Pliocene in age (Betzler et al., 2013; Lüdmann et al., 2013). To decipher the reason for the platform drowning, the sediment succession below the drowning surface, the drowning surface itself, and the overlying succession were sampled to determine age, geochemical signature, and faunal changes. A central question regarding platform drowning is the contribution of monsoon current–related nutrient influx to this process. The drilling location was selected to assess the respective role of ocean currents and nutrient supply, and a sampling strategy was developed for cores recovered from Holes U1465A and U1465B. Assessing the precise age of the onset of the currents and platform drowning is the first step toward establishing a causal link. If the proxies for increased nutrients (biota changes and geochemical proxies for upwelling) in the platform drowning succession and the drift package are age-equivalent, a case can be made that the combined causes caused the platform demise.
The specific objectives of Site U1465 were as follows: (1) provide detailed reconstruction of the predrowning, drowning, and postdrowning evolution of the carbonate bank by linking the seismic stratigraphic record to the sedimentary record; (2) constrain the timing of this evolution, thus allowing age assignments of unconformities, sedimentary interruptions, sedimentary turnovers, and onset of drift deposition; and (3) reconstruct and date the bank to drift turnover.
Operations
Port call and transit
Expedition 359 officially began with the first line ashore Fort Hill Wharf, Berth 2W, Darwin, Australia, at 1013 h on 30 September 2015. The initial week of Expedition 359 consisted entirely of port call activities in Darwin, including routine resupply of consumables, offloading the previous expedition’s freight, and refueling. Unfortunately, no onloading or offloading work could be conducted after dark in the wharf because of the city’s noise restrictions.
IODP JOIDES Resolution Science Operator (JRSO) staff and the Expedition 359 Co-Chief Scientists boarded the vessel at 1100 h on 30 September and immediately started crossover meetings with the previous expedition’s participants. Other activities on the first day included loading the ship operator’s airfreight, the Schlumberger logging sources, and local fresh food. In addition, a press conference with the Expedition 356 Co-Chief Scientists and a public relations tour were conducted. The second day of port call (1 October) included the ship crew change, the arrival of Expedition 359 scientists, and a tour for VIPs and media. We also offloaded Expedition 356 cores, loaded frozen food, and started loading drilling mud. On 2 October, loading continued with drilling mud, drill collars, arriving sea freight, and locally sourced laboratory supplies. Expedition 356 outgoing shipments were dispatched, including remaining cores, scientists’ personal samples, and JRSO/Schlumberger airfreight.
Completion of activities on 3 October was critical to an on-time departure for Expedition 359 because the port side aft crane could not be used during the refueling process planned for the following day. Therefore, all loading and storing of supplies that required the aft crane had to be completed before moving the ship to the bunkering pier. This process was further complicated because we were not able to operate the cranes after dark and were only able to operate one crane at a time in the afternoon.
On 4 October, the JOIDES Resolution was relocated to the East Arm Wharf refueling dock in Darwin, where bunkering activities commenced and final loading of reentry cones and a box of operations hardware (Motion Decoupled Hydraulic Delivery System [MDHDS]) was completed. Bunkering continued through the night and was completed at 1024 h on 5 October.
The port pilot came aboard, and with tugs on-site, the last line was cast away at 1206 h on 5 October. The pilot was discharged at 1306 h, and sea passage to the Maldives began. As part of the drilling clearance agreement with the Republic of Maldives, the vessel was required to report to anchorage in Malé and clear into the country. Two Maldivian coastal observers from the Ministry of Defense were also required to board the vessel and join the expedition. In addition, Overseas Drilling Limited (ODL) planned to have one of their drillers board the ship in Malé.
The ship was favored with good weather and calm seas during the 2 weeks of transit. The drilling department took advantage of the stable platform to conduct routine drilling equipment maintenance. Three time changes took place during the first week of transit, with the clocks being turned back a total of 2.5 h, placing the vessel on UTC + 8 h time or 13 h ahead of College Station, Texas (USA). As of 2400 h on Sunday, 11 October, the vessel had transited 1869 nmi at an average speed of 11.9 kt. With 1737 nmi remaining to our destination and a projected time of arrival at the Malé pilot station of 1200 h on 18 October, the ship was approximately 18 h ahead of schedule.
Already on the third week of the expedition, the ship continued to make good time in transit to Malé. At 1813 h on 15 October, the vessel crossed the Equator, entering into the Northern Hemisphere. Time was changed two more times, with the last change taking place at 0200 h on 16 October, placing the ship on Maldives time (UTC + 5 h or 10 h ahead of College Station) for the remainder of the operational period prior to the final transit of the expedition from Malé to Colombo (Sri Lanka).
The vessel arrived at the Malé pilot station at 0630 h on Sunday, 18 October, completing the 3594 nmi transit from Darwin at an average speed of 11.6 kt. The harbor pilot boarded the ship at 1030 h, and the ship proceeded to anchorage. By 1142 h, the ship was securely anchored. Maldivian Customs and Immigration personnel cleared the ship by 1300 h, and the Maldivian Coast Guard visited briefly. During the Malé stopover, the ship was cleared into Maldivian waters to conduct scientific coring operations over the next 6 week period. In addition, the Minister of Fisheries and Agriculture from the Republic of the Maldives, accompanied by an entourage of local news media personnel, took a brief tour of the ship’s laboratory facilities and held a press conference with the expedition Co-Chief Scientists. A limited amount of fresh food and hardware supplies were brought aboard, including some spare parts. Finally, two coastal observers came on board the ship to sail with us until the end of coring operations. The ship was scheduled to return to Malé on 28 November to clear out from the Republic of Maldives waters and disembark the two observers.
At 2048 h on 18 October, the harbor pilot arrived on board, and we proceeded out of the Malé harbor. After discharging the pilot at 2142 h, we began our sea passage to the first site (U1465). At 0418 h the next day, Monday, 19 October, the vessel completed the 65 nmi to Site U1465 at an average speed of 9.9 kt.
Site U1465
Hole U1465A
Thrusters/hydrophones were lowered, and by 0456 h on Monday, 19 October 2015, full control of the vessel was shifted to the dynamic positioning (DP) system operator. A positioning beacon was deployed at 0611 h. The bottom-hole assembly (BHA) and the outer core barrel assembly were made up, and advanced piston corer (APC)/extended core barrel (XCB) space-out was checked. A precision depth recorder (PDR) reading indicated the seafloor was at ~514.4 meters below rig floor (mbrf). The sinker bars were made up, and an APC core barrel was run in the hole with the bit positioned at 509.4 mbrf, or 5.0 m above the PDR depth. This core barrel was recovered empty, so the pipe was lowered an additional 9.0 m for a second attempt. This time, the barrel was again recovered empty; however, the core barrel may have hit the seafloor because the gap at the base of the core liner contained a small amount of coarse sand. At this point, the drill string compensator was opened, and the bit was lowered until it hit something hard at ~524.4 mbrf and again at ~528.0 mbrf. A third attempt at starting Hole U1465A was successful at 1405 h with the bit positioned at 523.4 mbrf. Core 1H recovered 7.3 m and established a seafloor depth of 525.8 mbrf. It was later determined that the original PDR measurement had a 10 m error.
Coring in Hole U1465A continued to a total depth of 76.6 meters below seafloor (mbsf) (see Figure F1 in the Expedition 359 summary chapter [Expedition 359 Scientists, 2017a]). Nine APC cores were obtained and recovered 77% of the 64.4 m penetrated. One half-length APC (HLAPC) core was taken and recovered 71% of the 4.7 m advance, and a single XCB core was cut at total depth, advancing 7.5 m and recovering a mere 0.42 m (6%). Coring was problematic from the start due primarily to the highly sandy formation and a few interspersed hard layers. The advanced piston corer temperature tool (APCT-3) shoe was deployed three times; however, analysis of the data indicated that all measurements were unreliable. The formation conditions were not good for core recovery or formation temperature measurement. Therefore, we halted coring when the depth objective, the ancient carbonate platform, was reached. As planned, we transited in DP mode to the next site (U1466). The strategy was to save time by using the same BHA on both holes to recover and date the thick prograding drift succession at Site U1466 and then return to Site U1465 to rotary core down to the target depth. The drill string was pulled clear of the seafloor and secured for a move in DP mode to Site U1466. At 0230 h on 20 October, the ship began moving east with the thrusters down. Total recovery for Hole U1465A was 53.37 m (70%). Of the 11 cores recovered, 9 were APC cores, 1 was a HLAPC core, and 1 was an XCB core (Table T1).
Table T1. Site U1465 core summary. Download table in .csv format. View PDF table.
Hole U1465B
After completing coring operations at Site U1466 at 1220 h on 26 October 2015, the ship was moved in DP mode ~1 nmi back to Site U1465 while a new rotary core barrel (RCB) bit/BHA was assembled. Once on station, the drill string was lowered to the sea bottom, and a seafloor depth was established as 512 meters below sea level (mbsl). The top drive was picked up, and after spacing out the drill string, Hole U1465B was spudded at 0655 h. The hole was drilled to 65.9 mbsf before deploying an RCB core barrel. Continuous rotary coring began at that point and continued through Core 23R to 221.3 mbsf. Recovery was poor through the high-porosity carbonate sedimentary unit. RCB half-cores were used a few times in an attempt to improve recovery with very limited success. Ultimately, the inability to effectively clean the hole, high drilling torque, and occasional stuck pipe led us to abandon the hole at 0215 h on 27 October. The drill string was pulled with the top drive to 63.5 mbsf before becoming stuck for 0.75 h. Once the drill string was freed, the bit was pulled clear of the seafloor at 0610 h, and the top drive was set back. The ship was offset 20 m east of Hole U1465B to start Hole U1465C. Total recovery for Hole U1465B was 9.41 m (6%). The 22 cores recovered were all RCB cores (Table T1).
Hole U1465C
A third hole at this site was not originally planned, but because of the exceptionally poor recovery in Hole U1465B, we decided to make another attempt to core the formation using the HLAPC and XCB coring systems. The target depth was reduced from the original 720 to 500 mbsf because given the sedimentological properties of the formation it was highly unlikely that hole conditions would allow penetrating even that deep. In this hole, the cores were not oriented and no temperature measurements were taken. An APC/XCB BHA was assembled with a mechanical bit release (MBR) system above the bit even though no logging was planned. The MBR was included to have the option of releasing the bit in case the pipe became stuck in the hole. After spacing out the wireline core barrels, the drill string was lowered to the bottom, where a seafloor tag established a mudline depth of 510 mbsl. Hole U1465C was spudded at 1330 h on 27 October 2015. The hole was drilled to 55 mbsf before coring began. Recovery was poor; however, the objective was to reach ~500 mbsf (or into the carbonate platform slope sediment below the drowned reef complex). APC/XCB coring was ultimately suspended at 233.2 mbsf because, just as in Hole U1465B, all circulation began going downhole into the formation and the drillers were no longer able to get the drill cuttings pumped out of the hole. After discussion, the general consensus was that most likely both holes were drilled into an area of very high porosity within the ancient reef formation, which made it impossible to further deepen either hole. Therefore, at 1430 h on 28 October, we stopped further cleaning attempts in Hole U1465B and ended operations at this site. Total recovery for Hole U1465C was 24.6 m (14%). Of the 25 cores recovered, 7 were HLAPC cores and 18 were XCB cores (Table T1).
Lithostratigraphy
Site U1465 was drilled through a series of hemipelagic drift deposits and the underlying platform and slope sediments of the Kardiva platform as indicated on seismic profiles (see Seismic stratigraphy). The 223.5 m thick succession recovered in three different holes is divided into three units based on variations in lithology and texture, grain size, lithification degree, and fossil assemblages (Figure F3):
- Unit I: unlithified bioclastic grainstone (Figure F4A–F4B).
- Unit II: lithified coral framestone and bioclastic floatstone (Figure F4C–F4D).
- Unit III: lithified bioclastic grainstone-packstone (Figure F4E–F4F).
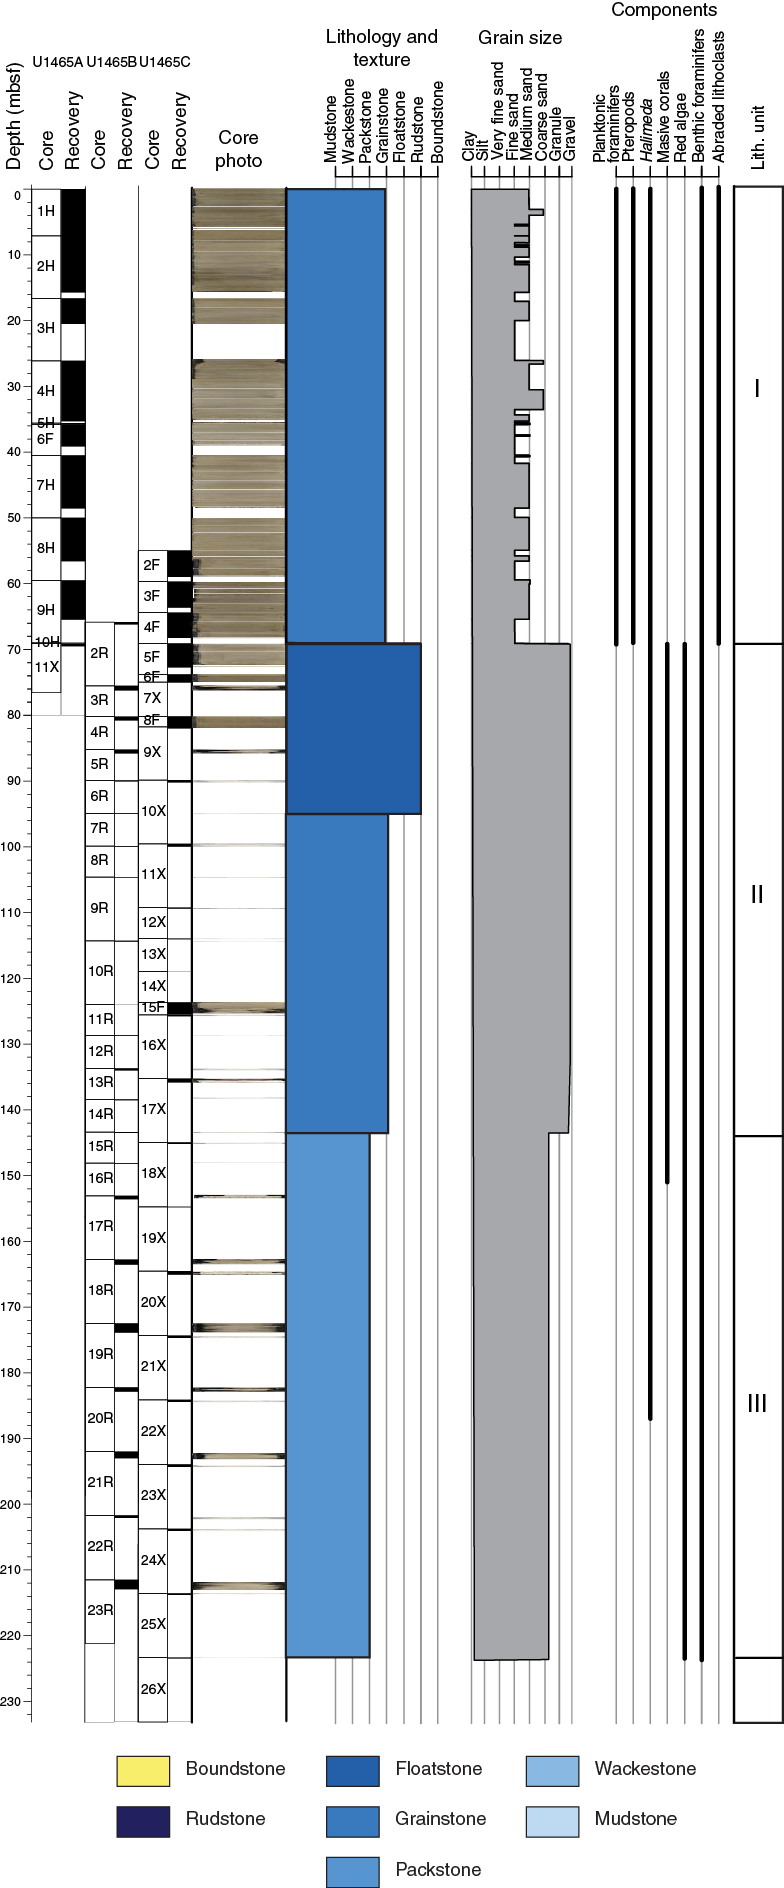
Figure F3. Lithostratigraphic summary, Site U1465.
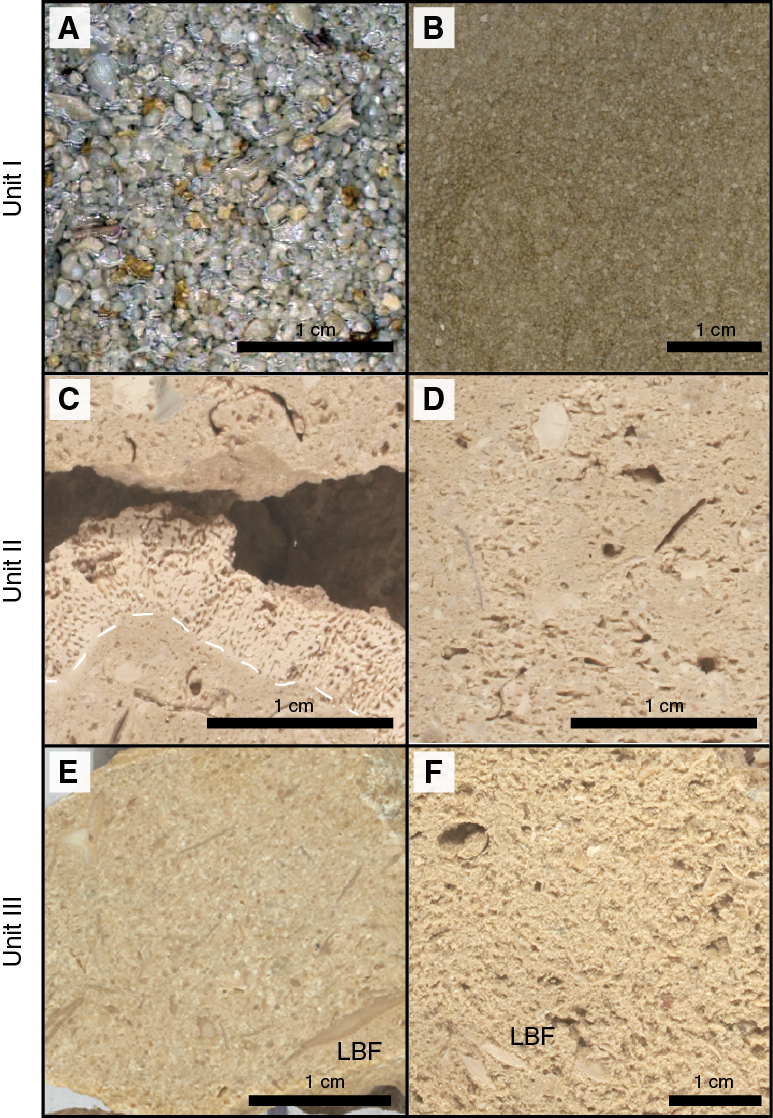
Figure F4. Lithostratigraphic unit facies. Unit I: coarse-grained bioclastic grainstone and fine-grained planktonic foraminiferal packstone. Unit II: coral framestone alternating with bioclastic floatstone. Unit III: alternating well-cemented and poorly cemented bioclastic grainstone to rudstone with abundant large benthic foraminifers.
Site U1465 sediments are poorly lithified in the uppermost part of the succession (seafloor to 69 mbsf) and lithified in the platform succession. Core recovery was high above 69 mbsf and poor below this depth. The decline in recovery corresponds to a drastic facies change from unlithified grainstone to cemented coral framestone and bioclastic floatstone. This change defines the Unit I/II boundary.
Lithostratigraphic units
Unit I
Unit I consists of alternating white/light gray to gray-brown and pale yellow unlithified grainstone to packstone (Figure F4A–F4B). Rudstone intervals are locally present. The sediment ranges in grain size from very fine grained in packstone intervals to coarse grained in grainstones. The main components are planktonic foraminifers (Figure F5) with a mixture of benthic foraminifers, pteropods, red algae, Halimeda plates, bivalves, echinoid fragments and spines, otoliths, and rare solitary corals. The finest fraction (micrometers) contains aragonite needles, sponge spicule fragments, and few calcareous nannofossils. Aggregate grains, yellow- to brown-stained grains, and black grains (most likely glauconite or organic material) occur throughout the unit and are concentrated in several centimeter-thick intervals in Core 7H. Some bioclasts and all lithoclasts show evidence of physical abrasion such as fragmentation and irregular shapes. In addition, skeletal grains are ocher or grayish in color.
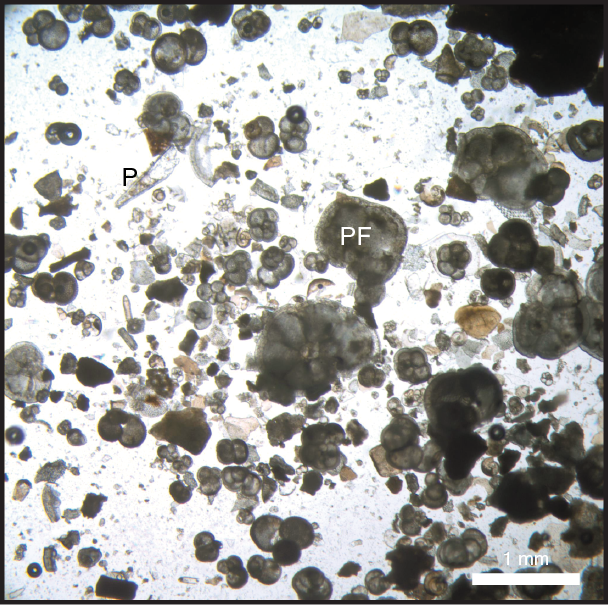
Figure F5. Main components of Unit I grainstone facies.
Unit II
- Intervals: 359-U1465A-10H-CC, 69–69.02 cm; 359-U1465B-2R, 0 cm, to 14R, 14 cm; 359-U1465C-8F to 18X, 0 cm
- Depths: Hole U1465B = 65–138.64 mbsf; Hole U1465C = 80.2–145 mbsf
Unit II contains alternating lithified light brownish gray, medium- to coarse-grained dolomitic boundstone and floatstone (Figure F4C–F4D). The main boundstone components are massive corals. Five different genera were differentiated, including Tarbelastrea (the only one identified). The corals are usually encrusted by red algae and rarely by bryozoans (Figure F6). Lithophaga boreholes are common. Above and below the massive coral is bioclastic floatstone with abundant red algal nodules and rhodoliths up to 4 cm long. Coral, bivalve, and gastropod fragments are also abundant in the floatstone facies, together with benthic foraminifers (Amphistegina sp., Lepidocyclina sp., Operculina sp., and Miogypsina sp. [?]), Halimeda fragments, and echinoid spines. Bryozoans are common. Most bioclasts are preserved as molds commonly partially infilled by dogtooth, fibrous, and drusy cements (Figure F7). Locally, dolomitic cement is present with crystals as large as 50 µm. Rare silica cements and poikilotopic cement also occur. Moldic porosity dominates this facies; however, intraparticle porosity is also present and varies from 20% to 50%.
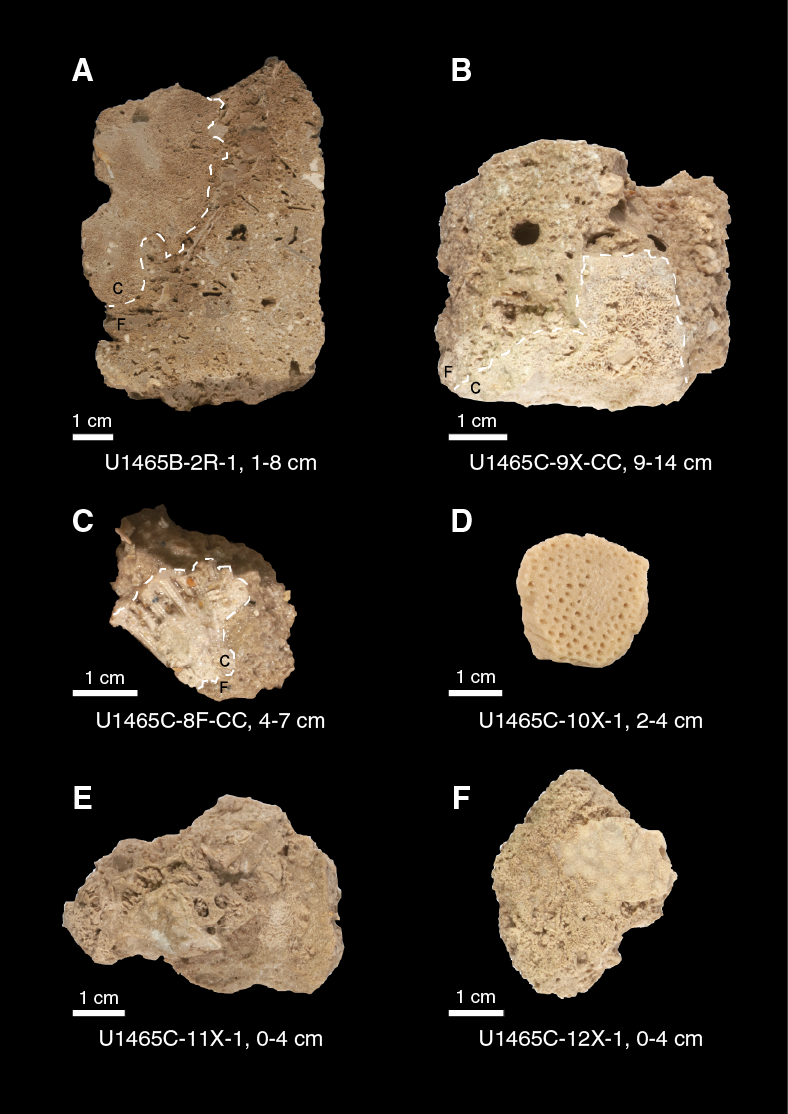
Figure F6. Coral species in Unit II framestone facies, Site U1465.
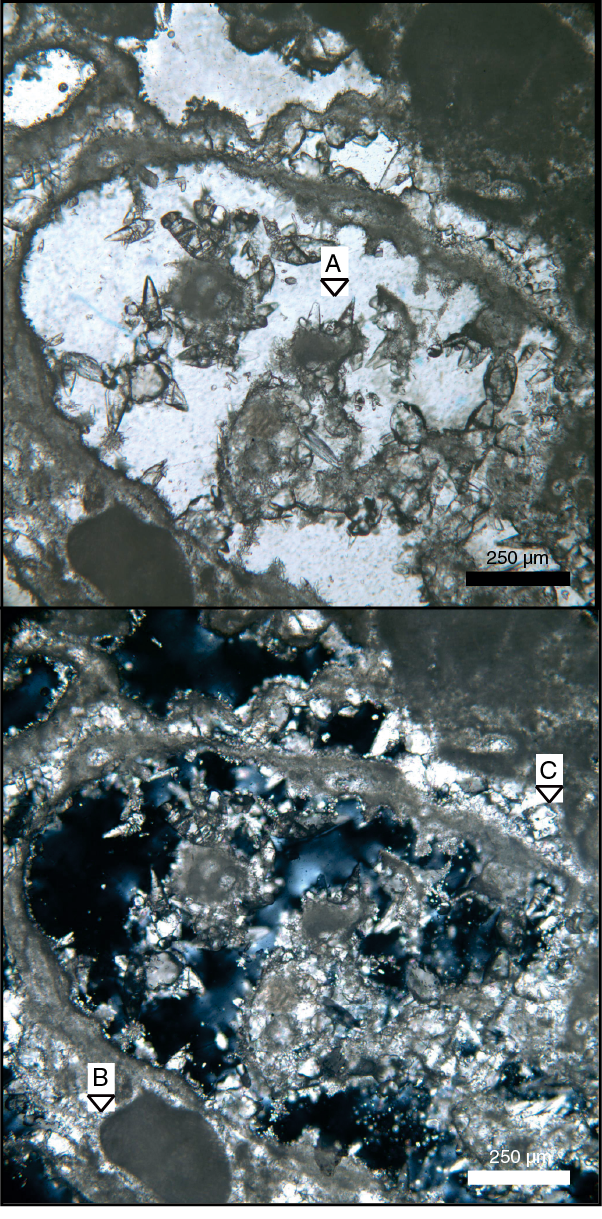
Figure F7. Diagenetic overprint in Unit II floatstone with partially infilled dissolved skeletal grain.
The top of Unit II (Core 359-U1465A-10R) is floatstone with coral fragments, red algae, large benthic foraminifers (Lepidocyclina sp., Borelis sp., and Miogypsina sp.), and bivalve and serpulid fragments. Lithophaga boring marks are present. Dolomites and micritic geopetal infills are recognized in this uppermost part (Figure F8). The geopetal infills are dark colored, probably related to the presence of phosphate.
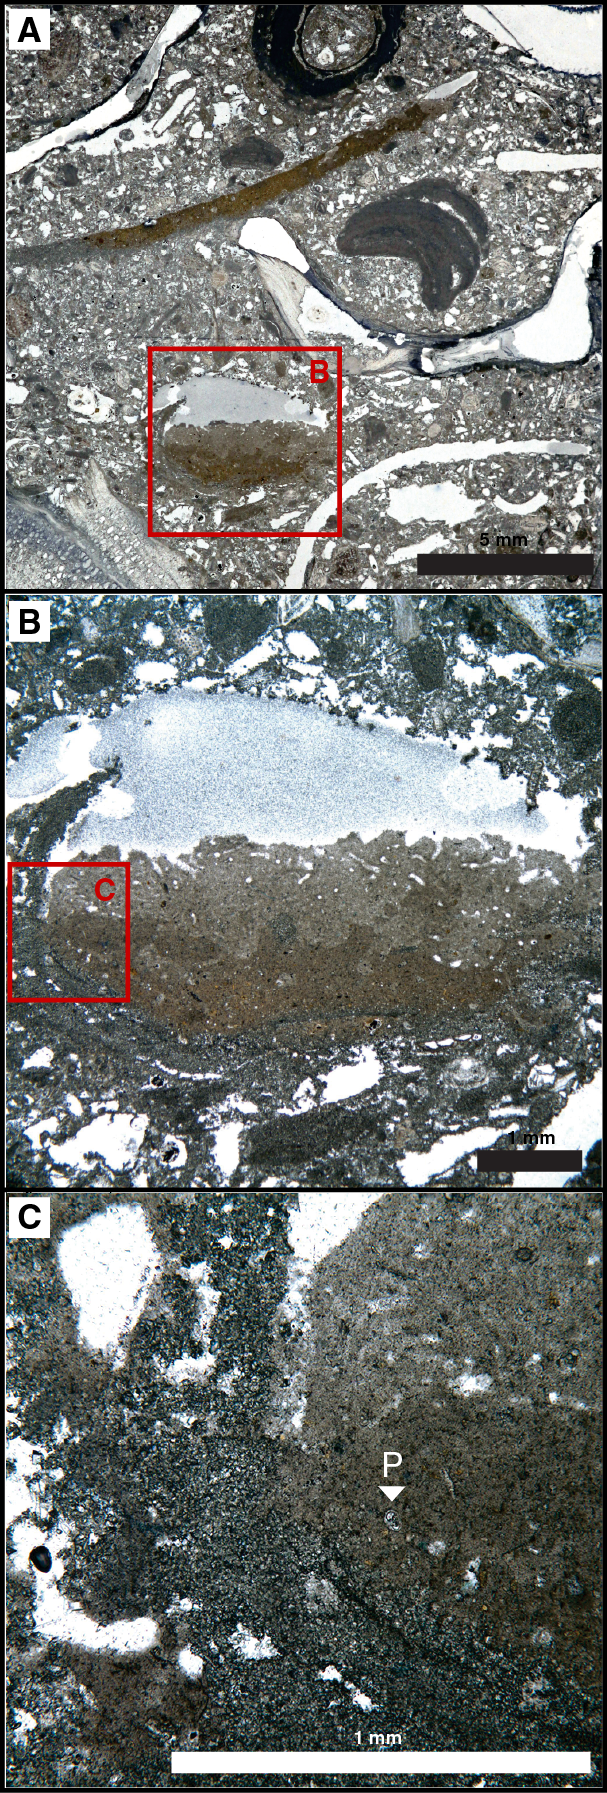
Figure F8. Unit II floatstone facies with abundant bioclastic molds, some with geopetal infill.
Unit III
- Intervals: 359-U1465B-15R, 0 cm, through 23R; 359-U1465C-18X, 0 cm, through 26X
- Depths: Hole U1465B = 143.63–213 mbsf; Hole U1465C = 145–223.49 mbsf
Unit III consists of alternating lithified, very pale brown, coarse-grained dolomitic grainstone to packstone with varying degrees of cementation (Figure F4E–F4F). Some layers are completely cemented and have exclusively moldic porosity, whereas others display significantly little cementation and significant interparticle porosity. Rudstone is present from 359-U1465B-15R, 0 cm, to the base of Core 17R with grains up to centimeter size in the rudstone intervals. The main components are large benthic foraminifers (Heterostegina sp., Lepidocyclina sp. [Nephrolepidina], Operculina sp., Amphistegina sp., Miogypsina sp., and Nummulites sp.), bivalves, Halimeda, red algae and minor coral fragments (massive and branching), bryozoans, echinoid spines, gastropods, and abundant bioclasts (Figure F9). In the strongly cemented intervals, most bioclasts occur as molds. In the less lithified parts, porosity is mostly interparticle (Figure F10). Some molds are partially infilled by dogtooth, fibrous, and granular calcitic cements and rarely siliceous and sucrosic dolomite cements. Some grains and some pores have black infills with pyrite.
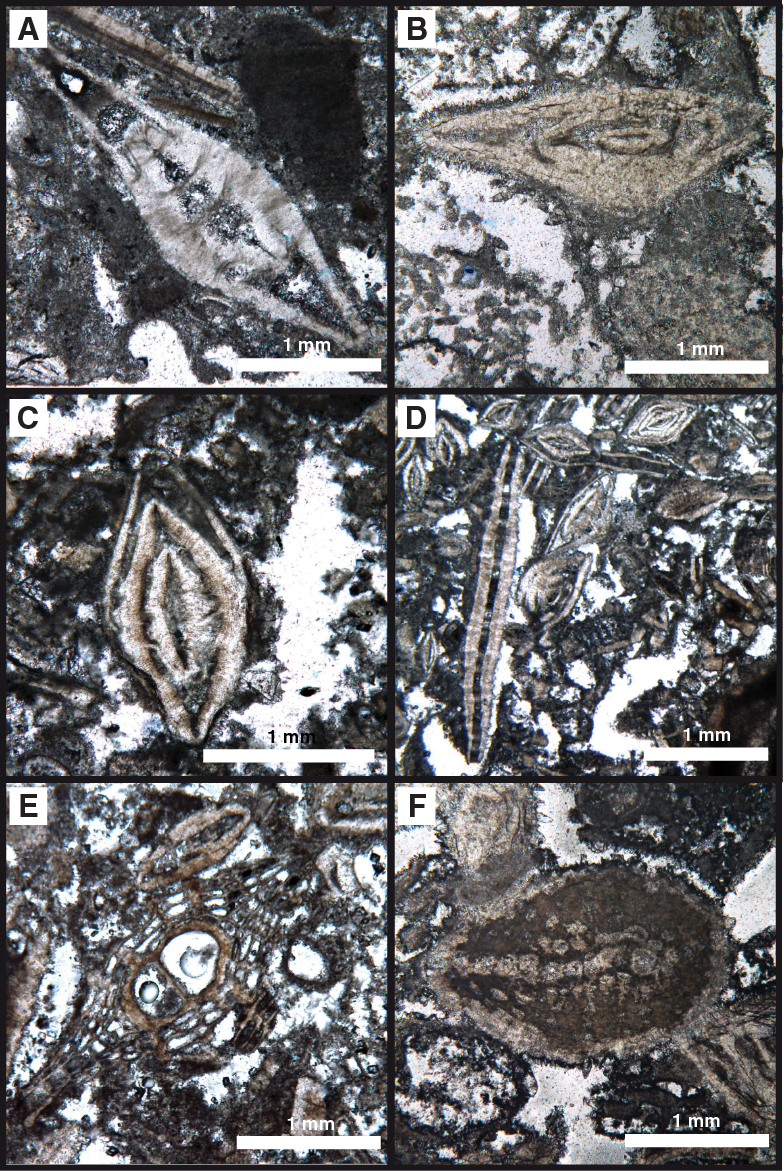
Figure F9. Benthic foraminifers from Units II and III, Hole U1465A.
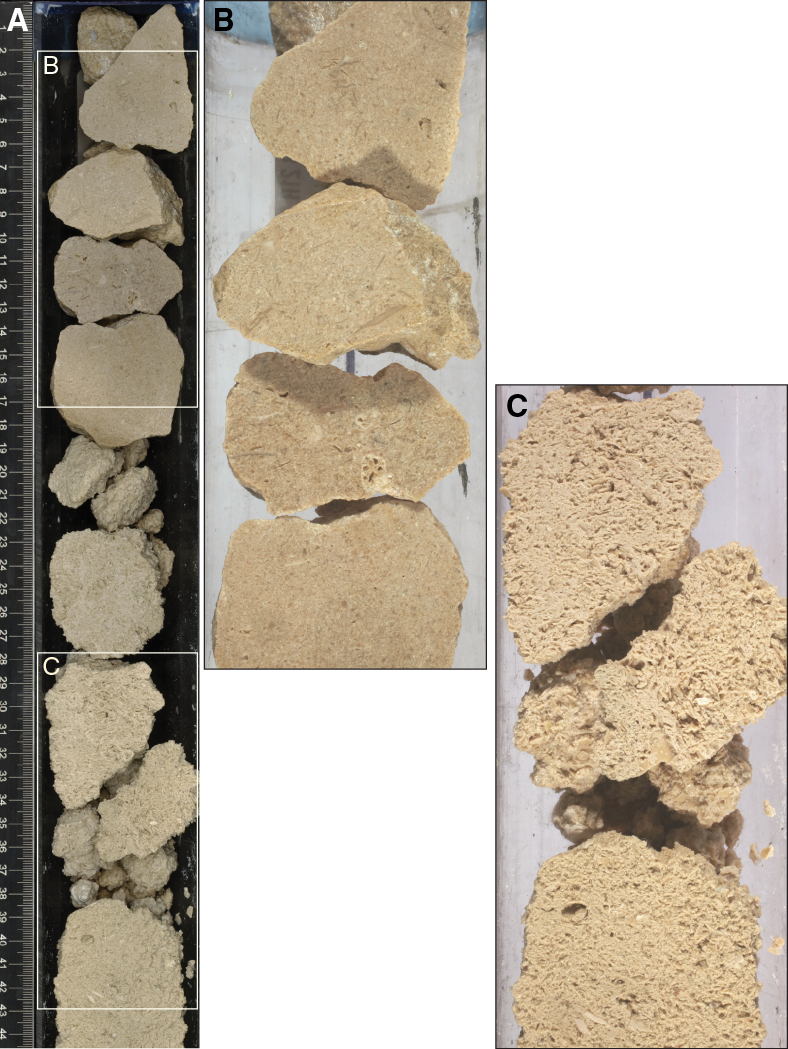
Figure F10. Degrees of cementation, well-cemented grainstone, and poorly cemented grainstone to rudstone.
Discussion
Site U1465 was drilled through a sequence of hemipelagic drift deposits into the underlying carbonate platform and slope deposits of the Kardiva platform. Unit I represents the unconsolidated drift deposits. The biota assemblage in this unit indicates a mixture of pelagic and neritic components. The occurrence of shallow-marine organisms, including some characteristic species of benthic foraminifers (e.g., 359-U1465A-5H-CC, 35.81 mbsf; see Biostratigraphy), suggests that material from shallow-water environments such as the present atolls and slopes was transported to the location of Site U1465. The normal basinal (background) deposition is represented by pteropods, otoliths, and planktonic foraminifers. The difference in bioclast preservation and the occurrence of yellow- to brown-stained grains indicate sediment reworking by bottom currents. Bottom currents also form the sand wave morphology registered at the top of the sequence in the seismic profile (see Seismic stratigraphy).
Units I and II are separated by a hardground/exposure surface located at the top of the Kardiva platform. Emersion of the platform explains the extensive dissolution of the aragonitic components and early lithification. The later reflooding of the platform flat promoted the dolomitization observed at the borders of the bioclastic molds (Figure F8) and the colonization by boring organisms such as Lithophaga. Reflooding eventually reached high water depths as recorded by the presence of small planktonic foraminifers and micrite within the geopetal infills of some molds. Reflooding resulted in the drowning of the platform, which never reestablished itself at this location.
The alternating coral framestone and floatstone in Unit II represent a classical facies association of a reef environment with bioclastic floatstone infilling the gaps among different coral framestones. Downcore, the reef facies gradually changes into the platform foreslope facies present in Unit III. This gradual change consists of a decrease in the number of coral fragments and an increase in red algae and large benthic foraminifers (Flügel, 2004). The different degree in cementation of the slope material may be related to the occurrence of successive depositional and diagenetic episodes, probably triggered by sea level changes and concomitant breaks between different stages of platform growth.
Biostratigraphy
The biostratigraphy of Site U1465 is based on Holes U1465A and U1465C. A ~70 m thick drift sediment succession was recovered in Hole U1465A (see Lithostratigraphy) that ranges in age from Late Pleistocene to early Pliocene. Core recovery in Hole U1465C starts at ~55 mbsf and reaches 223.5 mbsf within the ancient carbonate platform. For biostratigraphic purposes, we only studied sediments above the platform because the occurrence of planktonic foraminifers and nannofossils is very rare within the ancient carbonate platform sequence. Benthic foraminifers and ostracods were studied in selected samples above and within the platform to evaluate paleoenvironmental conditions. Planktonic foraminifers are well preserved in the upper part of Hole U1465A and moderately preserved downhole. Calcareous nannofossils are present through almost the entire succession with preservation ranging from good to poor. Benthic foraminifers are common throughout the succession, although many of them are reworked from shallow-water and reefal areas. Ostracods are rare overall, and radiolarians are virtually absent. The benthic assemblage composition indicates that sedimentation took place in an outer neritic to fore-reef environment.
Age model
Biostratigraphic data from planktonic foraminifers and calcareous nannofossils were combined to provide an age model for the site. Correlation between the two groups is good, and we regard the age model as robust. In Sample 359-U1465A-5H-CC (35.81 mbsf), we found a sand layer mainly composed of reworked reefal material (large benthic foraminifers, coral fragments, and Halimeda algae fragments). Below this layer, all core catcher samples contain variable amounts of fragments of reef organisms (corals and Halimeda) and reefal benthic foraminifers (Amphistegina, Sorites, and Peneroplis) that indicate input of reworked material. Reworking compromises biostratigraphic studies, and thus some events have a large error bar due to the possible input of reworked planktonic foraminifers. Additionally, nannofossil preservation is poor, and establishing chronostratigraphic events is difficult, particularly at ~25–60 mbsf. The integrated calcareous nannofossil and planktonic foraminifer biozonation generated is shown in Figure F11 along with the paleoenvironmental interpretations. The microfossil datums recognized at this site are summarized in Table T2, and the age-depth plot including biostratigraphic datums is given in Figure F12. The estimated sedimentation rate for the upper 65 m is ~1.78 cm/ky. Below 65 mbsf, we estimate a sedimentation rate of 0.42 cm/ky, although the first occurrence (FO) of Globorotalia tumida (5.57 Ma) and the last occurrence (LO) of Discoaster quinqueramus (5.59 Ma) were not found, which means the sedimentation rate may be higher.
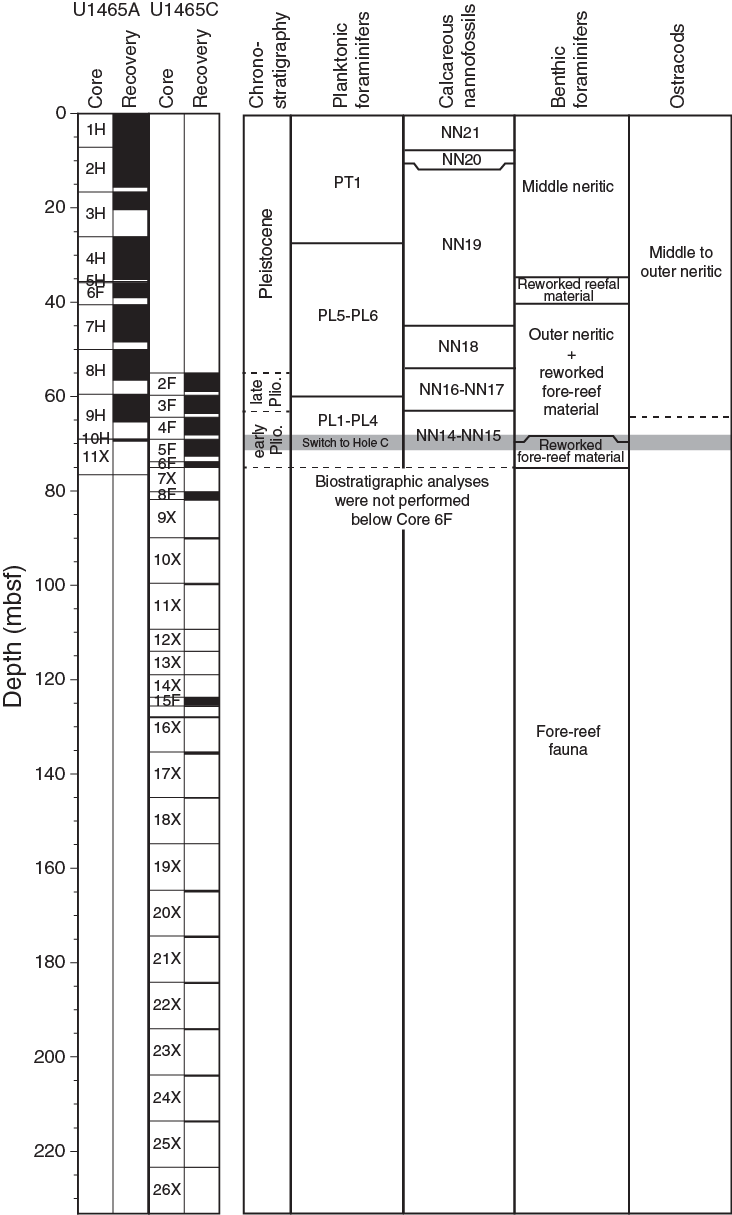
Figure F11. Biostratigraphic and paleoenvironmental summary, Site U1465.
Table T2. Biostratigraphic events, Site U1465. Download table in .csv format.
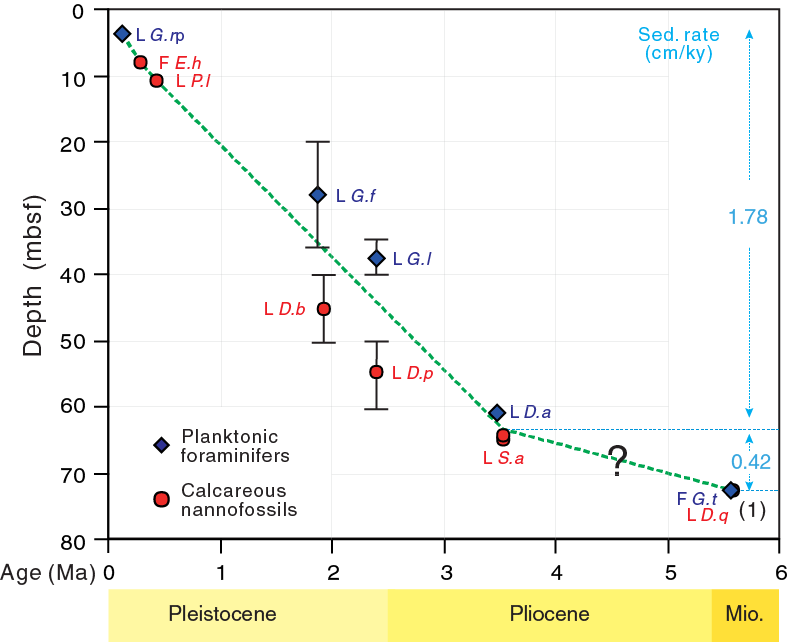
Figure F12. Age-depth profile, Site U1465.
Calcareous nannofossils
Nannofossils are well preserved in the uppermost two cores of Hole U1465A but are scarce and poorly preserved in Cores 3H–7H and moderately well preserved in the lower part of the drift (Cores 8H and 9H and Cores 359-U1465C-2F through 5F). The late Quaternary FO of Emiliania huxleyi and LO of Pseudoemiliania lacunosa were identified reasonably confidently. However, early Pleistocene events cannot be recognized due to poor preservation. In Pliocene sediments, nannofossil abundance is higher and preservation improves, allowing us to recognize a succession of events: the LOs of Discoaster brouweri (1.93 Ma), Discoaster pentaradiatus (2.39 Ma), and Sphenolithus abies (3.54 Ma). The same pattern, with particularly poor preservation in the early Pleistocene, was encountered at Site U1466. Details of the assemblages present are given in Table T3.
Table T3. Nannofossil range chart, Holes U1465A and U1465C. Download table in .csv format.
Planktonic foraminifers
Planktonic foraminifers were examined in all core catcher samples from Hole U1465A (nine samples) and the upper part of Hole U1465C (three samples) (Table T4). Additionally, the mudline sample recovered in Hole U1465A was investigated. Planktonic foraminifers are abundant throughout the entire sequence except for Samples 359-U1465A-5H-CC (35.81 mbsf) and 359-U1465C-6F-CC (75.05 mbsf).
Table T4. Planktonic foraminifer range chart, Holes U1465A and U1465C. Download table in .csv format.
Preservation of planktonic foraminiferal shells is very good to moderate. Three Pleistocene identifiable biohorizons are the LOs of Globigerinoides ruber pink (0.12 Ma), Globigerinoides fistulosus (1.88 Ma), and Globorotalia limbata (2.39 Ma), found in Samples 359-U1465A-1H-CC, 4H-CC, and 6F-CC, respectively. Few specimens of G. fistulosus in Sample 3H-CC are considered reworked. The Pliocene LO of Dentoglobigerina altispira (3.47 Ma) occurs in Sample 9H-CC. Samples 359-U1465C-5F-CC to 8F-CC contain abundant fore-reef material that indicates input of reworked material. Therefore, the LOs of G. fistulosus and G. limbata have been depicted with a large error bar in Figure F12. Assignment of planktonic foraminiferal biozones in the lower Pliocene is difficult because the markers Globorotalia margaritae and Globoturborotalita nepenthes were not found. Consequently, Zones PL1–PL4 are undifferentiated, but a hiatus is unlikely because all nannofossil biozones are present in this interval (Figure F11). Planktonic foraminiferal assemblages in Samples 4F-CC and 5F-CC are similar to the fauna in Sample 359-U1465A-9H-CC, implying that the late Miocene was not identified at this site above the platform sediments.
Benthic foraminifers
Benthic foraminifers were found throughout the succession at Site U1465 (Table T5). Preservation varies from poor to very good. Thirteen Pliocene–Pleistocene samples were investigated, and all samples contain reworked shallow-water taxa ranging from reefal to outer neritic environments with abundant reworked reefal materials. Hole U1465A samples have moderate to good preservation, and ostracods are also present, especially in Samples 1H-CC, 2H-CC, 4H-CC, 6H-CC, and 7H-CC.
Table T5. Benthic foraminifer range chart, Holes U1465A and U1465C. Download table in .csv format.
The Pliocene–Pleistocene benthic fauna in all samples generally indicate middle neritic to upper bathyal water depths (most likely <500 m) based on the presence of species such as Borelis melo, Cycloclypeus mediterraneus, Planulina ariminensis, Planulina subtenuissima, Cibicidoides dutemplei, Sphaeroidina bulloides, and Cibicidoides bradyi and small miliolids. The late Pliocene assemblages in Hole U1465C are dominated by large benthic foraminifers, especially C. mediterraneus (abundant but poorly preserved in Sample 6F-CC). Hole U1465C is characterized by abundant coral fragments, well-preserved echinoderm spine fragments, fish teeth, and planktonic foraminifers, but no ostracods were observed in the core catcher samples. All samples contain reworked shallow-water taxa ranging from reefal to middle neritic environments, such as Amphistegina lessonii, Sorites orbiculus, Peneroplis pertusus, and Amphistegina radiata. The larger specimens are highly abraded, indicating that they have been transported.
Thin sections studied from Samples 10H-CC to 15H-CC contain benthic foraminifers ranging from good to poor preservation and were identified to the genus level. Species include Amphistegina, Lepidocyclina, Operculina, and Miogypsina. Additional thin sections from Samples 16X-CC to 26X-CC also contain abundant benthic foraminifers from the fore-reef environment. Species were again identified to the genus level and include Heterostegina, Lepidocyclina, Operculina, Amphistegina, Miogypsina, and Nummulites.
Ostracods
Ostracods were studied in all Hole U1465A core catcher samples and from the mudline sample from Core 1H. All specimens present in the >150 µm fraction were picked and transferred to slides for identification and counting. Ostracod taxa were identified to the genus level. Ostracods are present in most samples, and the assemblages identified suggest reefal (bairdiids, Lankacythere, and Touroconcha) to upper bathyal (Bradleya, Argilloecia, and Krithe) environments (Jellinek, 1993; Mostafawi et al., 2005). Ostracod preservation varies from good (upper part of the section) to moderate (Samples 8H-CC and 9H-CC). Sample 4H-CC also contains phytal ostracods Xestoleberis and Argilloecia. Representative ostracods from Hole U1465A are shown in Figure F13.
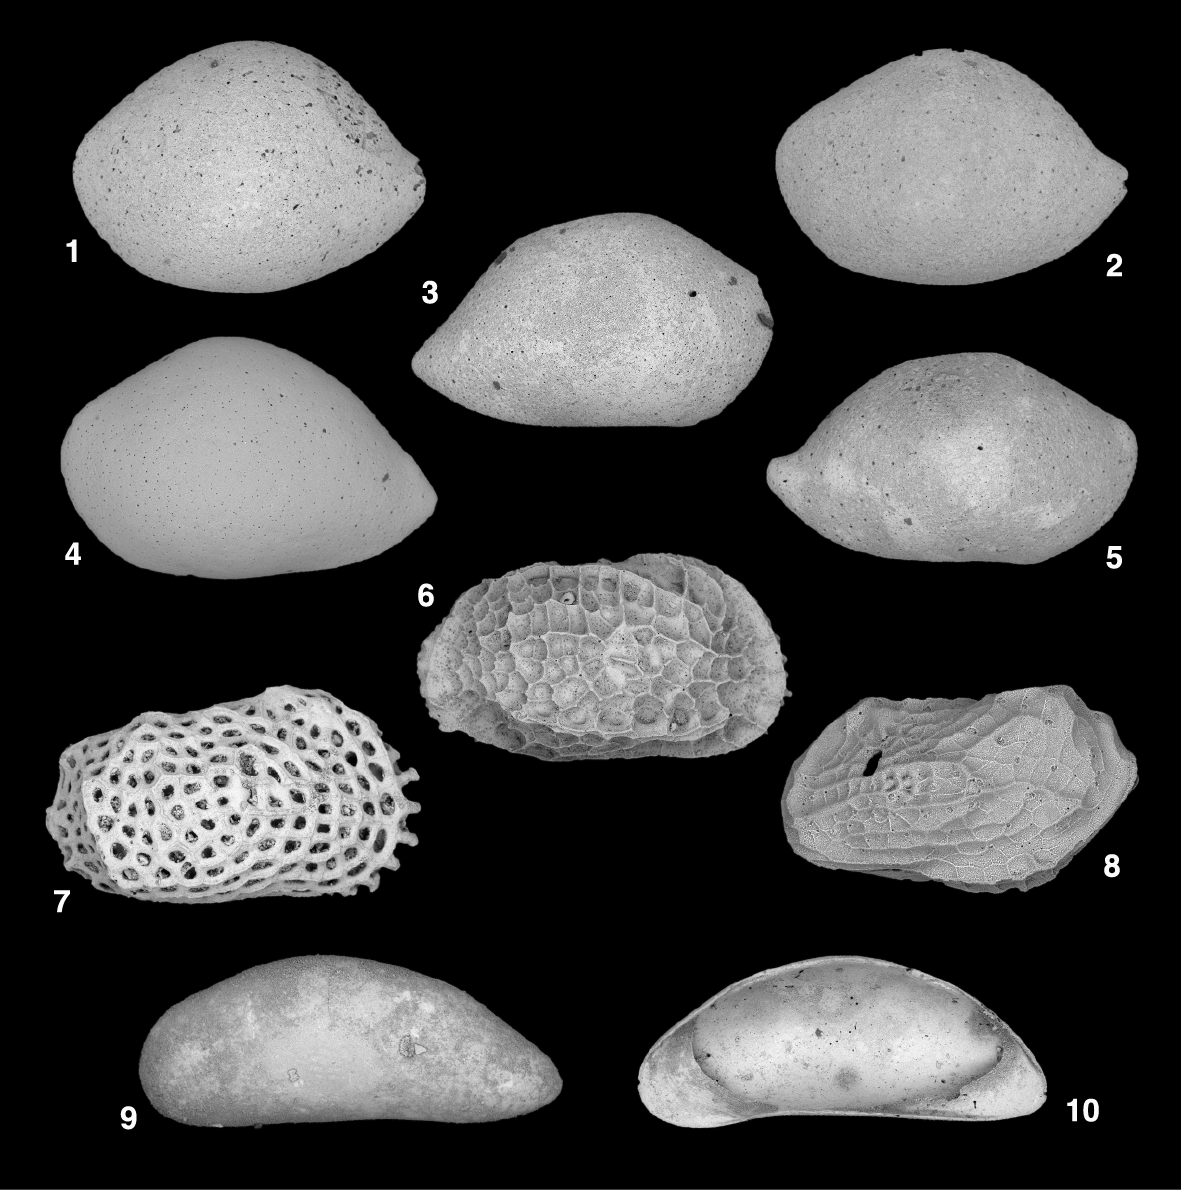
Figure F13. Representative Pliocene–Pleistocene ostracods, Site U1465.
Radiolarians
Nine core catcher samples from Hole U1465A and five core catcher samples and one split-core section sample from Hole U1465C were prepared for radiolarian analysis. Radiolarians are scarce, with only a few specimens found in Samples 359-U1465A-6H-CC, 7H-CC, and 8H-CC. No radiolarians were found in the Hole U1465C core catcher samples and split-core section samples.
Geochemistry
Interstitial water chemistry
Interstitial water (IW) sampling was limited by poor recovery at Site U1465. Only 11 samples were obtained by whole-round squeezing, in addition to a bottom water (mudline) sample. One IW sample was taken per core during full-length APC coring in Hole U1465A, and one was taken from every other core during HLAPC coring in Hole U1465C. Lithification and poor recovery prevented IW sampling below ~70 mbsf. Concentrations of all measured species are given in Table T6.
Table T6. Benthic foraminifer range chart, Holes U1465A and U1465C. Download table in .csv format.
Major ions and salinity
Major anion and cation concentrations generally remain constant and close to the mean seawater value throughout the sampled interval. Concentrations of Cl– measured using titration with AgNO3 vary between 555 and 564 mM (Figure F14). Results of Cl– by ion chromatography (IC) are considerably more variable, probably the result of dilution errors. Sulfate measured by IC also varies between 26.5 and 30.0 mM and is well correlated (R2 = 0.96) with the IC-derived Cl– data, suggesting that dilution errors affected all of the IC data in the same way.
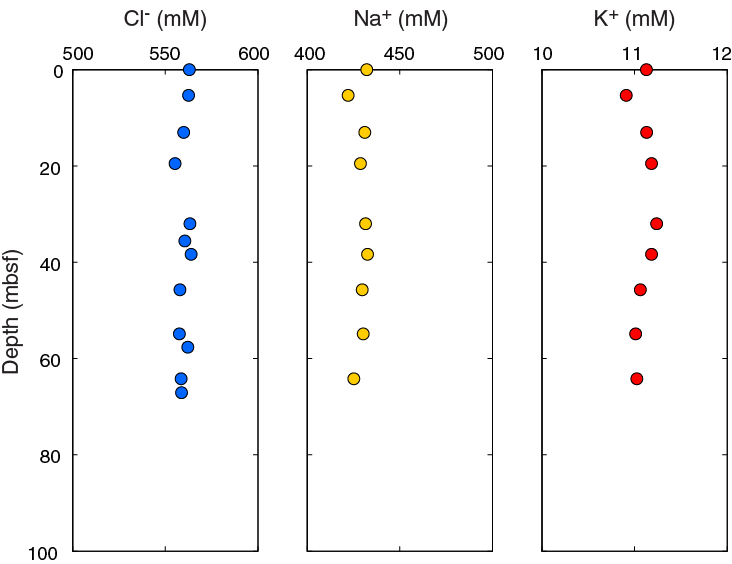
Figure F14. IW Cl–, Na+, and K+ concentrations, Holes U1465A and U1465C.
Concentrations of Na+ and K+ range between 422 and 433 mM and 10.9 and 11.2 mM, respectively. No trends are present with increasing depth. Similarly stable values are reflected in Ca2+ and Mg2+, which range between 9.7 and 11.0 mM and 51.3 and 53.2 mM, respectively (Figure F15). Salinity remains relatively constant at 34.5–35 throughout the measured interval.
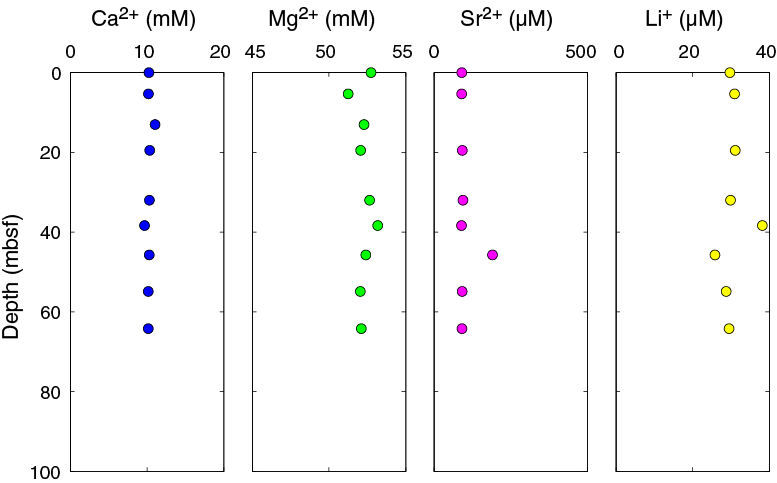
Figure F15. IW Ca2+, Mg2+, Sr2+, and Li+ concentrations, Holes U1465A and U1465C.
Minor ions, alkalinity, and pH
Concentrations of Br– measured by IC are between 0.79 and 0.88 mM and have an excellent correlation (R2 = 0.99) with IC measurements of Cl–. This suggests that Br– was subject to the same dilution effects as Cl– during IC analysis. Analysis of minor ions by inductively coupled plasma–atomic emission spectroscopy (ICP-AES) shows no significant trend with depth for Sr, Li, Mn, Fe, Ba, B, or Si. Sample 359-U1465A-2H-4, 145–150 cm, has outlying values for all minor elements and was possibly subject to contamination; therefore, data are included in Table T6 but omitted from the relevant panels in Figure F15.
Alkalinity measurements mostly range from 2.2 to 2.9 mM, close to the mean seawater value (Figure F16). One higher value of 4.1 mM was measured in Sample 2H-4, 145–150 cm, and one lower value of 1.8 was measured in Sample 6F-2, 108–113 cm. These values may be outliers resulting from user error during titration, or they could possibly reflect pockets of increased diagenetic activity. Values of pH are steady between 7.74 and 7.93.
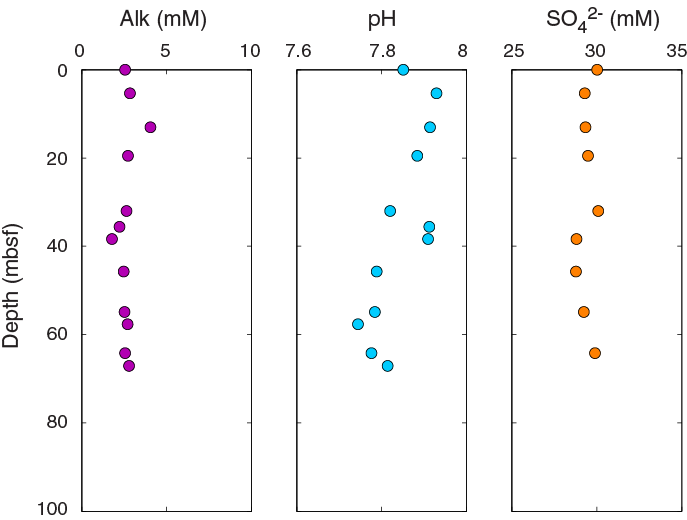
Figure F16. IW alkalinity, hydrogen (pH), and SO42– concentrations, Holes U1465A and U1465C.
Bulk sediment geochemistry
Calcium carbonate and organic matter
Calcium carbonate content was determined at a rate of one sample per section for a total of 48 samples. Calculated CaCO3 contents were corrected for the percentage of dolomite using semiquantitative analysis of X-ray diffraction (XRD) peaks on samples from the same core. This process yielded a range in carbonate content between 83 and 100 wt%, with the majority of the data falling between 85 and 95 wt% (Figure F17; Table T7).
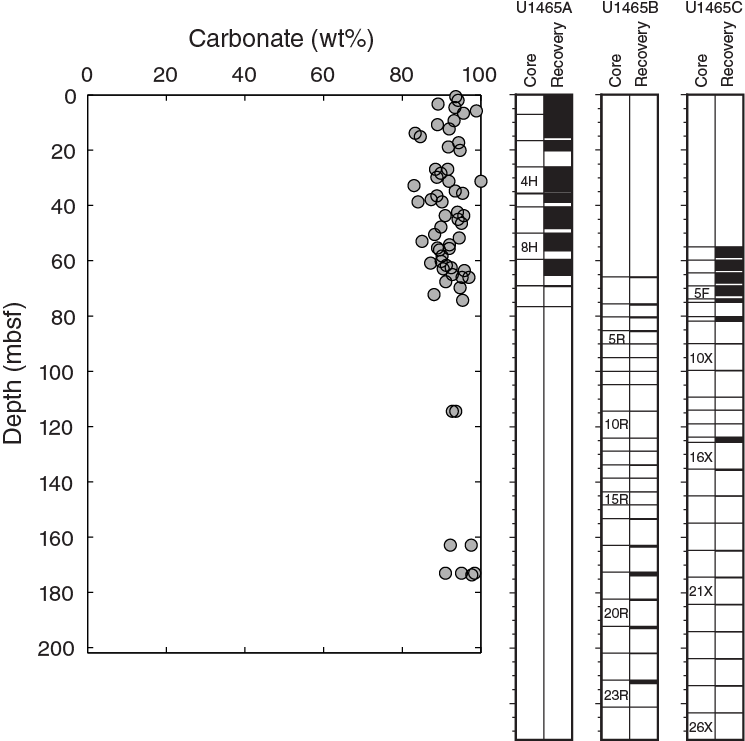
Figure F17. Carbonate content, Site U1465.
Table T7. Carbon and nitrogen, Site U1465. Download table in .csv format.
Total organic carbon concentration was measured on one sample per core in Hole U1465A only and is generally around 1 wt%. Total nitrogen (inorganic and organic nitrogen) is approximately 0.1 wt%.
X-ray diffraction
Mineralogy was determined at a rate of approximately one sample per core, with additional material analyzed for intervals of particular interest. The uppermost samples analyzed by XRD from Hole U1465C (through Core 9X) were contaminated by caved-in material and are excluded from further discussion.
Above 45 mbsf, the sediment consists of 30%–80% aragonite, 6%–18% high-Mg calcite (HMC), and the remainder low-Mg calcite (LMC) (Figure F18; Table T8). Below 45 mbsf, dolomite begins to appear up to 7%. Where the drowned platform top occurs at 69.1 mbsf in Hole U1465A, aragonite and HMC essentially disappear and strata are composed of LMC and dolomite. Concentrations of dolomite peak above 50% at 76.28 mbsf in Hole U1465B and at 143.5–145.0 mbsf in Holes U1465B and U1465C. Below 160 mbsf, aragonite is present in abundances of <10%, with dolomite constituting less than 5% and the remainder (>90%) consisting of LMC. Quartz is often present in the XRD spectra but is never a significant component (<1%).
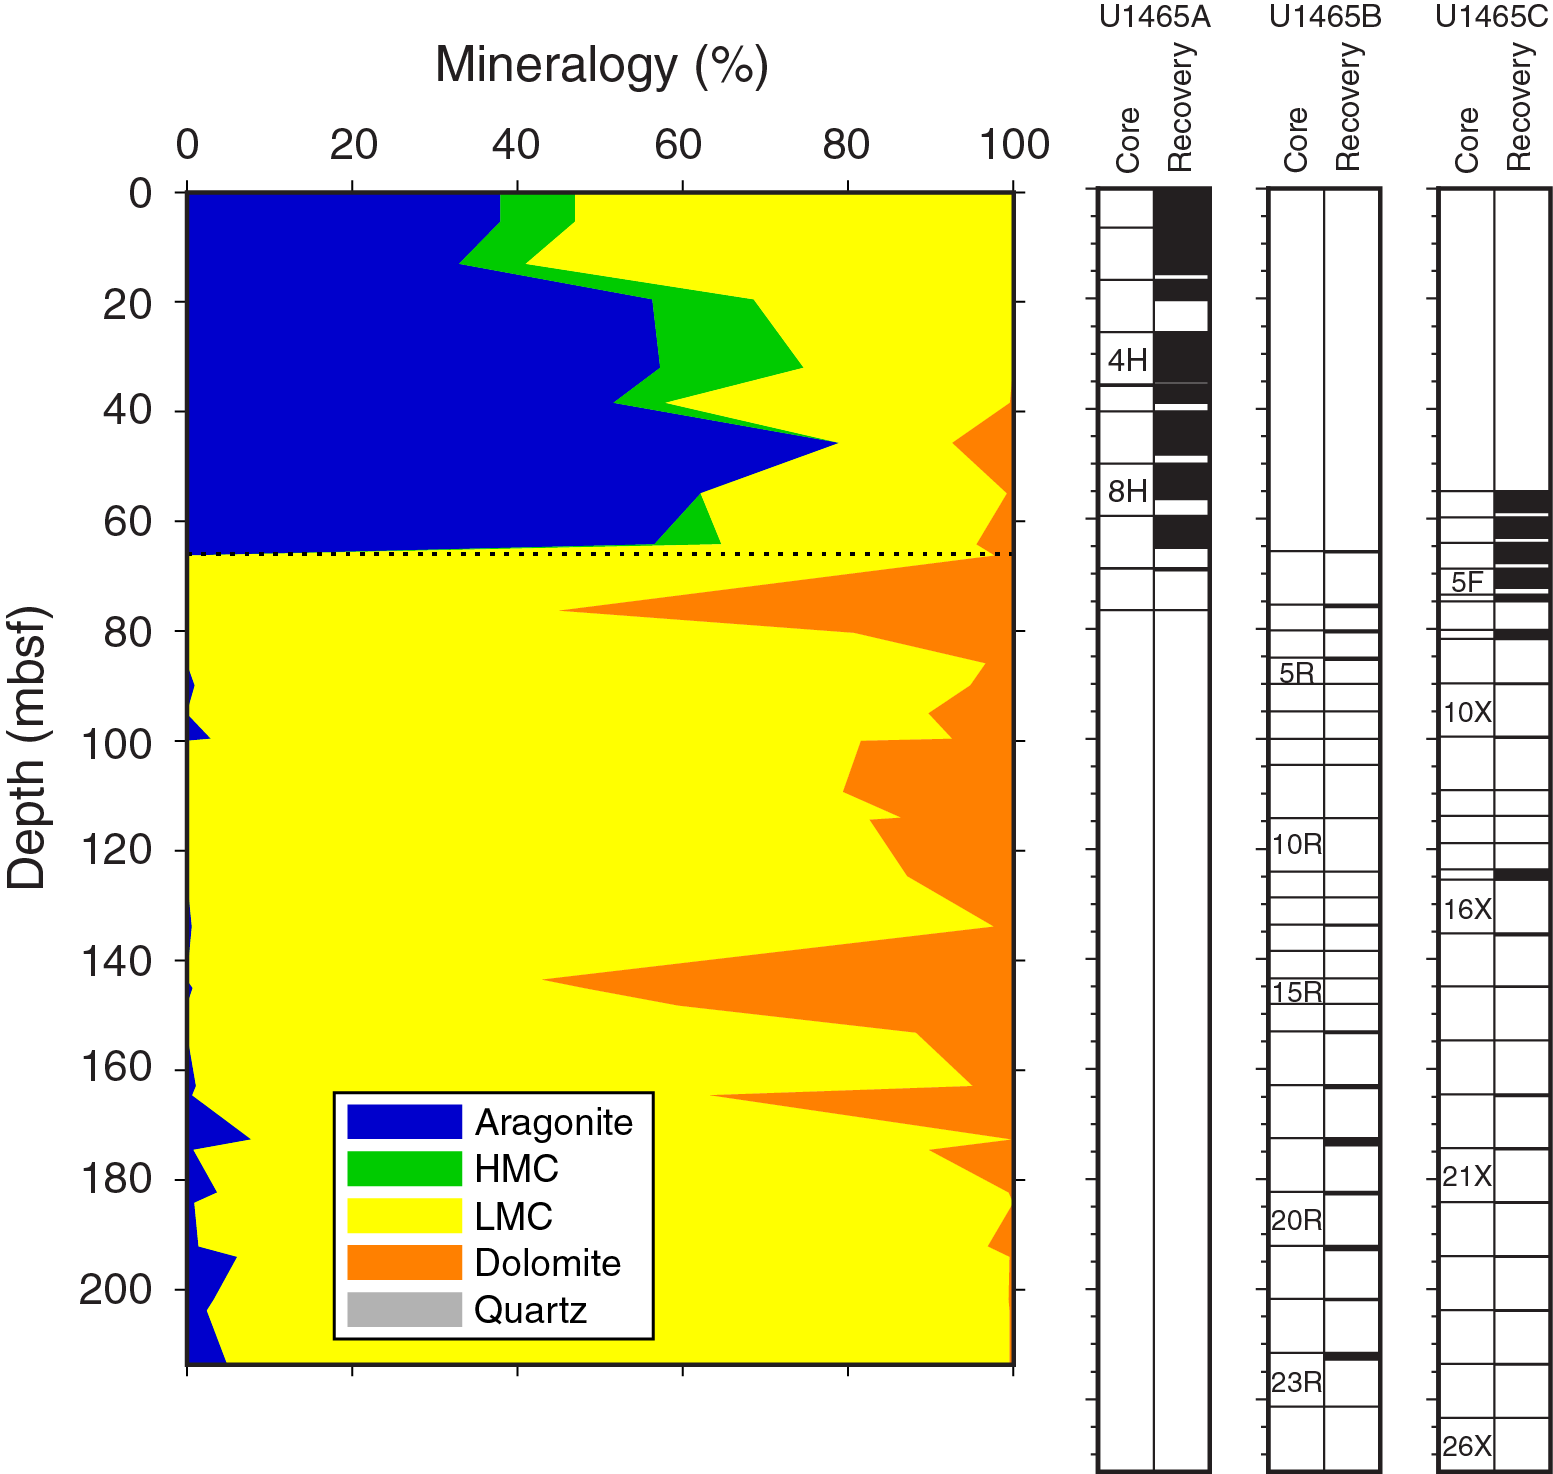
Figure F18. Aragonite, HMC, LMC, dolomite, and quartz by XRD, Site U1465.
Table T8. XRD results, Site U1465. Download table in .csv format.
Major, minor, and trace element composition
Minor and trace element compositions are presented in Table T9, with the most important elements relevant to carbonate diagenesis (Mg, Sr, Fe, and Mn) shown in Figure F19 as molar ratios relative to calcium.
Table T9. Solids geochemistry, Site U1465. Download table in .csv format.
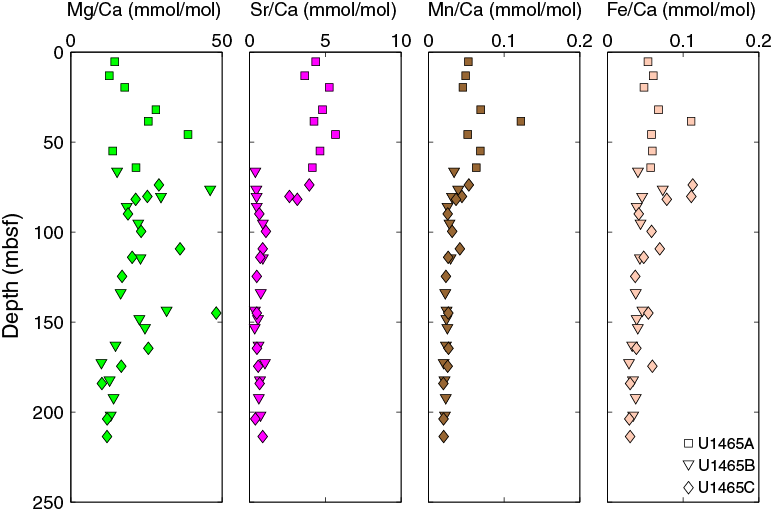
Figure F19. Mg/Ca, Sr/Ca, Mn/Ca, and Fe/Ca ratios in sediments, Site U1465.
Ratios of Mg/Ca have baseline values around 15–20 mmol/mol and maxima of ~50 mmol/mol. The highest Mg/Ca ratios are present at 76.28 mbsf (Hole U1465B) and 145.00 mbsf (Hole U1465C). Ratios of Sr/Ca are high (>2 mmol/mol) in Holes U1465A and U1465C above 81.80 mbsf but are <1 mmol/mol below this depth and in all Hole U1465B samples.
Ratios of Mn/Ca are higher in the upper part of the core, averaging ~70 µmol/mol, and then decrease to ~30 µmol/mol below ~65 mbsf. Ratios of Fe/Ca are generally 30–60 µmol/mol, with maximum values up to 110 µmol/mol at 38.34 mbsf in Hole U1465A and at 73.80 and 80.20 mbsf in Hole U1465C.
Volatile hydrocarbons
Headspace samples for the analysis of methane, ethene, ethane, propene, and propane were taken from every Site U1465 core, generally from the top of Section 5 in each core when an IW sample was taken. Methane is less than 3 ppmv to 160 mbsf, with higher concentrations up to 8.7 ppmv detected in the lower part of Hole U1465C (Figure F20; Table T10). No heavier hydrocarbons (C2+) were detected at Site U1465.
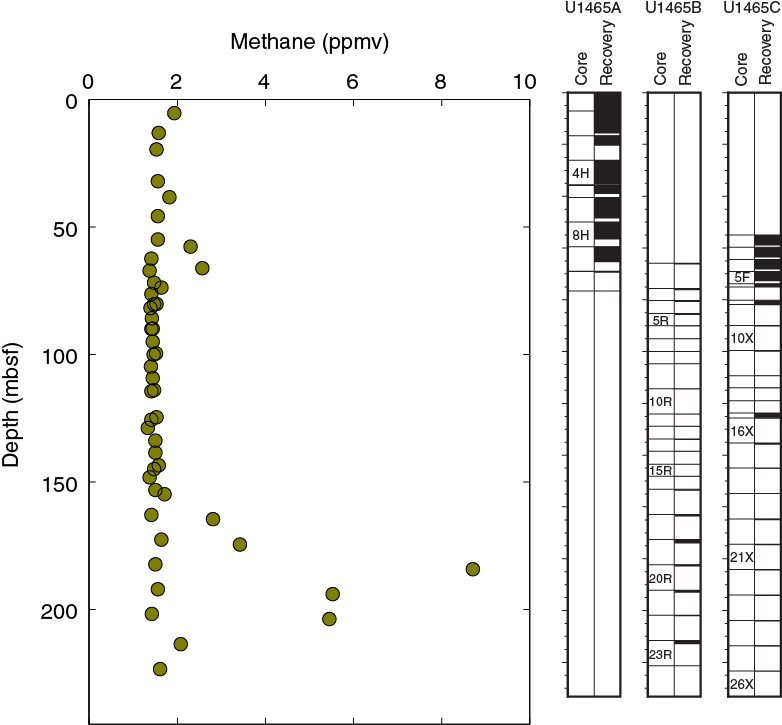
Figure F20. Headspace methane concentrations, Site U1465.
Table T10. Headspace hydrocarbons, Site U1465. Download table in .csv format.
Discussion
Interstitial water chemistry
In contrast to Site U1466, where changes in IW chemistry occur within the upper ~70 mbsf, no definitive trends occur in any properties measured at Site U1465. Major and minor ion concentrations are essentially identical to mean seawater values. This general lack of variation could result from three possible situations: no significant diagenesis, high rates of advection, or contamination by seawater. Given the measurable changes at Site U1466 with sediments of a similar grain size, contamination seems unlikely, and the constant IW chemistry at Site U1465 probably has another cause. The high-permeability sediments may allow rapid advection, or there may be negligible rates of modern diagenesis at this location.
Carbonate diagenesis
The mineralogical changes shown by the XRD data reflect carbonate diagenesis during the burial of sediments at Site U1465. Aragonite and HMC are metastable and readily undergo recrystallization to LMC. The interval where these metastable phases begin to decrease in abundance is coincident with the appearance of dolomite, which requires a lengthy period of time and/or substantial fluid flow to satisfy magnesium mass balance requirements.
The drowned platform top, which occurs at 69.1 mbsf in Hole U1465A, is essentially coincident with the disappearance of aragonite and HMC. The first XRD sample from Core 359-U1465B-2R (65.9–75.6 mbsf) is already devoid of aragonite. Contamination from caved-in sediments in Hole U1465C artificially introduces a high aragonite signal at greater depths (Table T8) but is not an accurate representation of mineralogical changes with respect to the drowned platform top. The major stratigraphic gap at this level provided time for extensive recrystallization to occur. The major peak in dolomite in Hole U1465C at 145 mbsf is also coincident with a sequence boundary (PS10/PS11). The reappearance of aragonite underneath this dolomitized interval indicates that less carbonate diagenesis has occurred at greater depths and/or earlier in time.
The patterns of carbonate diagenesis shown in the carbonate mineralogy are mirrored closely by the sedimentary composition. High aragonite intervals also have high (>2 mmol/mol) Sr/Ca ratios, and there is an overlap in depth where Hole U1465C sediments have high Sr/Ca ratios and Hole U1465B sediments have low Sr/Ca ratios. High Sr/Ca ratios below 75.0 mbsf in Hole U1465C are likely the result of contamination from infilled sediment. Peaks in dolomite detected by XRD are also consistent with maxima in sedimentary Mg/Ca ratios.
Paleomagnetism
Paleomagnetic investigation of 17 APC (including HLAPC) and 19 XCB cores collected from Holes U1465A and U1465C included measuring the magnetic susceptibility of whole-core and archive-half sections and the natural remnant magnetization (NRM) of archive-half sections. The 22 RCB cores collected in Hole U1465B were only measured for magnetic susceptibility (whole-core and archive-half sections). The Icefield MI-5 orientation tool was used to orient all APC cores from Hole U1465A and U1465C except for Cores 359-U1465C-6F and 7H. Cores 5H, 10H, and 11X include no recovery suitable for paleomagnetic measurements. Hole U1465B was drilled using the RCB system and yielded very poor recovery, which did not allow any interpretation of the sparse paleomagnetic data. All archive-half cores were measured and subjected to stepwise alternating field (AF) demagnetization up to 30 mT at every 5 or 10 cm interval. A few discrete samples were demagnetized up to 80 mT using the ASC D-2000 AF demagnetizer and measured with the AGICO JR-6A spinner magnetometer. In general, the water-trenched grainstone facies recovered at Site U1465 did not give a reliable record of the geomagnetic field.
Natural remanent magnetization of sedimentary cores
Natural remanent magnetization (NRM) intensity, inclination, and declination in Hole U1465A are compared with intensity and inclination results obtained after the partial AF demagnetization up to 30 mT. Holes U1465A and U1465C have similar magnetic properties with NRM intensities varying in a large range from 6.30 × 10⁻⁷ to 4.09 × 10⁻¹ A/m, as shown in pass-through magnetometer measurements (Figures F21, F22). The highest intensities are localized in the upper part of each core and correspond to analogous increases of magnetic susceptibility (see Physical properties). NRM intensities decrease to values typical for carbonate (between 1 × 10⁻⁵ and 1 × 10⁻⁴ A/m) in the lower half of the core. This high-intensity NRM signal, which is anomalous in carbonate rocks, is probably a drilling artifact resulting from pipe rust contamination, and the paleomagnetic directions in these intervals should be considered suspect.
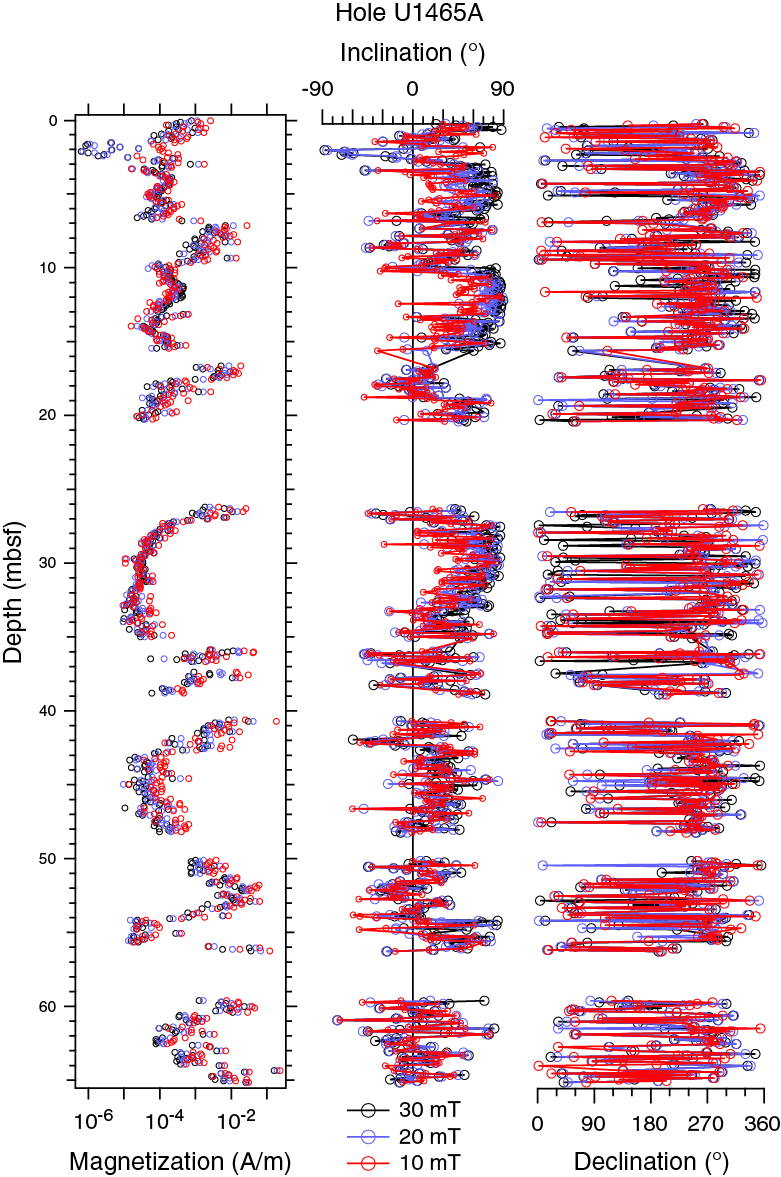
Figure F21. Magnetization with NRM inclination and declination, Hole U1465A.
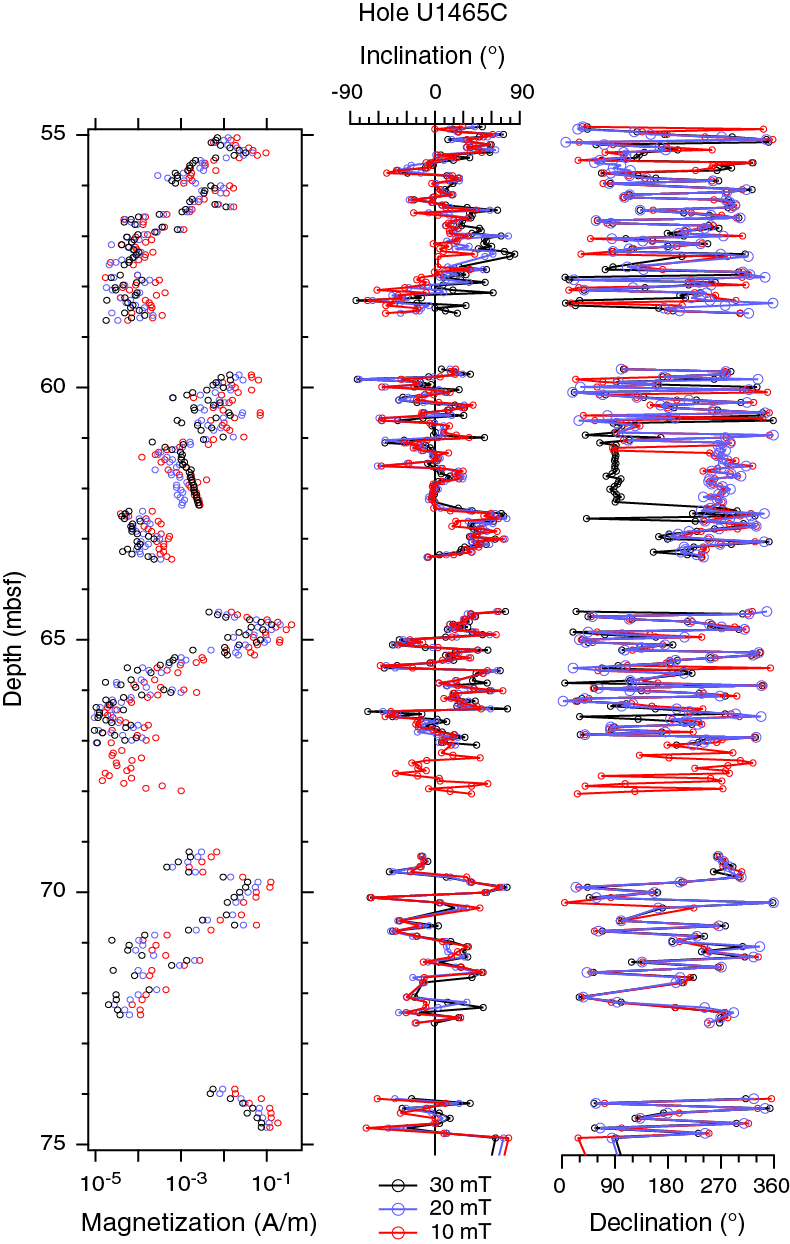
Figure F22. Magnetization with NRM inclination and declination, Hole U1465C.
Paleomagnetic results
The NRM of the uppermost four cores of Hole U1465A (1H–4H) shows a steep downward mean direction (284°/75°) (Figure F23) that was not removed after AF demagnetization at 30 mT. These directions cannot represent the geomagnetic record of the subequatorial field for this site and are unlikely to be a drilling overprint, which would usually have been removed at 10–20 mT. Nonetheless, they are probable coring artifacts, perhaps a result of coring disturbance in unconsolidated and soupy sediment. The NRM directions of Cores 6F–9H after 30 mT “blanket” demagnetization, although rather dispersed, have more reasonable inclinations. The mean direction (268°/19°) is compatible with the expected site paleolatitude (Figure F23). However, the mean inclinations and declinations in Cores 8H and 9H (267°/09° and 092°/06°, respectively) after the azimuth correction with the Icefield MI-5 tool data are significantly far from north, suggesting that they also do not represent a correct record of the geomagnetic field. The AF demagnetization of discrete samples did not give better results, mostly showing unstable NRM (Figure F24), and after a few samples it was not continued. We attempted to retrieve the characteristic remanent magnetization (ChRM) by applying principal component analysis (PCA; Kirschvink, 1980), which is more reliable than blanket demagnetization at 30 mT. We analyzed the AF demagnetization in Cores 7H–9H and restricted interpretation of the inclination because not all cores were oriented. Despite the apparent good quality of the Zijderveld plots (Figure F25), the best-fit inclinations still have very disperse values. Once the portion of sediment with anomalous intensity is disregarded, the inclination record appears more reasonable (Figure F26), but the remaining interpretable percentage of cores is too small to produce a meaningful polarity record.
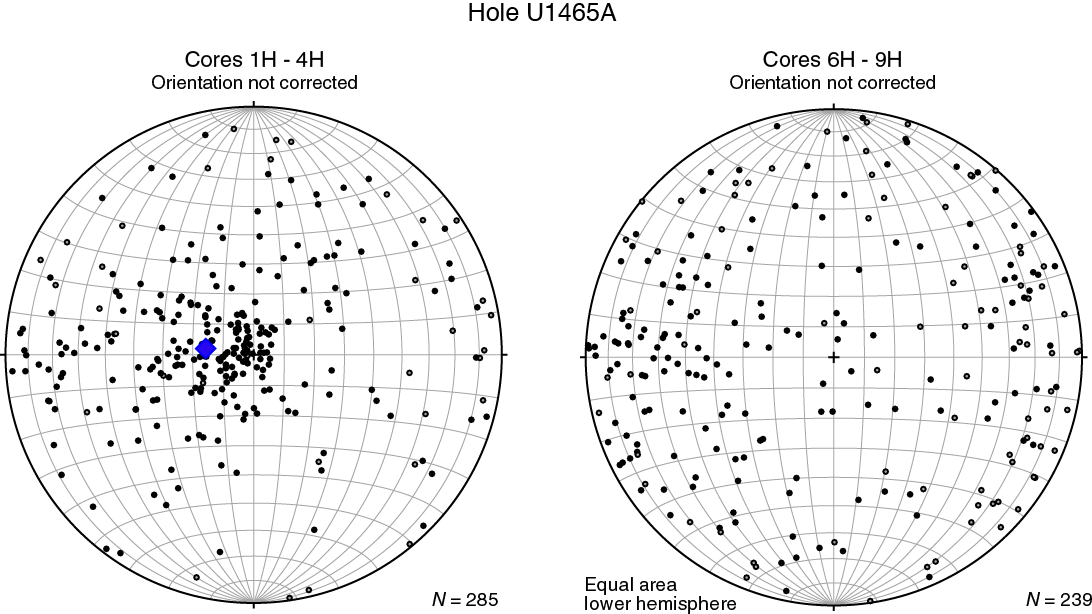
Figure F23. Paleomagnetic directions after 30 mT blanket demagnetization, Hole U1465A.
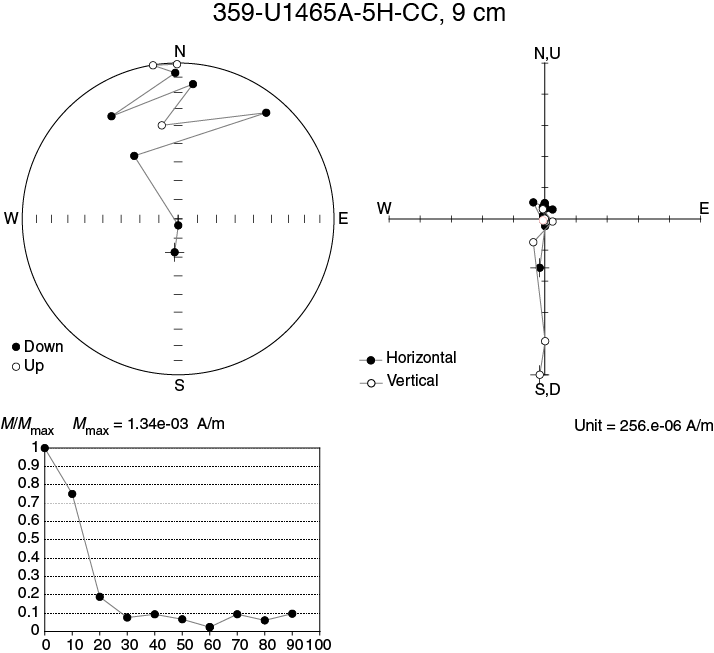
Figure F24. Paleomagnetic directions of a representative discrete sample during stepwise AF demagnetization.

Figure F25. Paleomagnetic directions of representative samples during stepwise AF demagnetization.
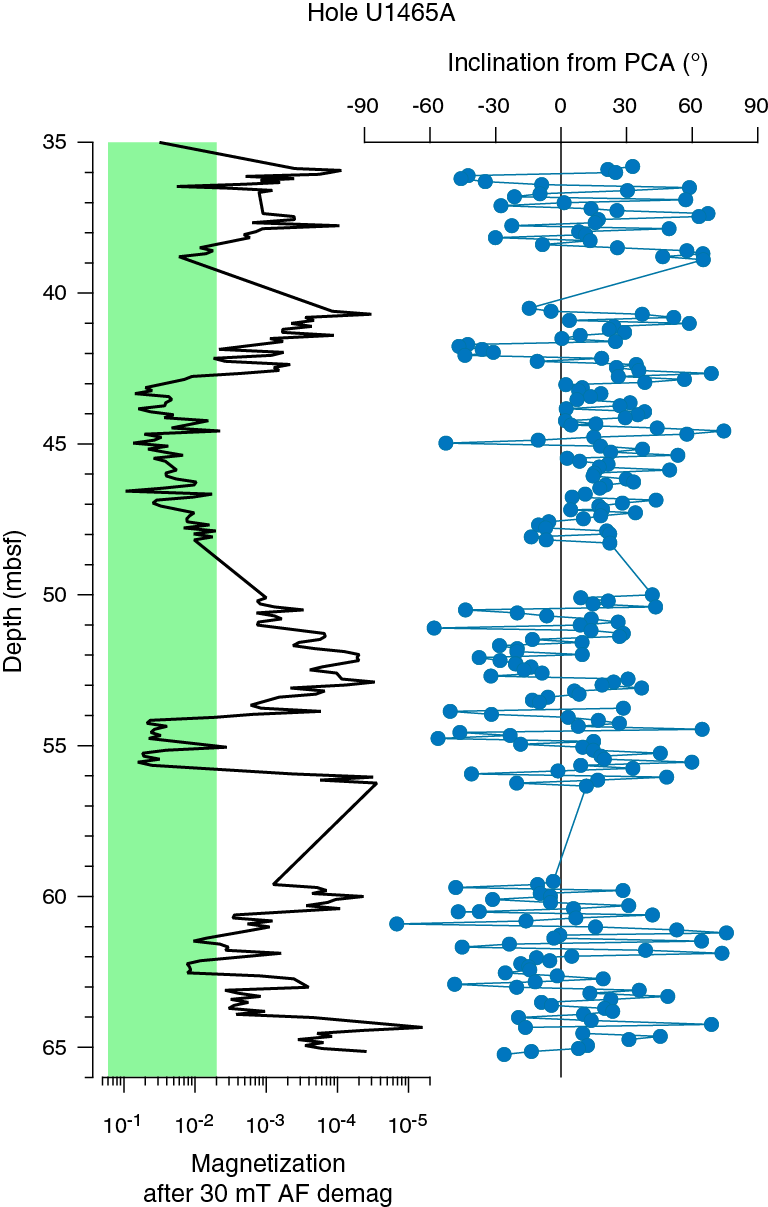
Figure F26. Paleomagnetic directions computed using PCA compared with NRM intensity after 30 mT AF demagnetization.
Physical properties
Physical properties measurements were performed on cores from Holes U1465A–U1465C to obtain basic information on density, porosity, natural gamma radiation (NGR), color reflectance, thermal conductivity, magnetic susceptibility, and P-wave velocity. Discrete measurements of P-wave velocity, bulk density, and porosity were obtained on working halves. P-wave velocity was measured along the x-axis with the P-wave caliper (PWC) on discrete cylinder samples and half-round split cores with or without liners. Bulk density and porosity measurements were performed on both soft sediments and hard rocks from Hole U1465A at a frequency of one per section and at least once per core for Holes U1465B and U1465C. Thermal conductivity was measured regularly on the third section of Hole U1465A whole-round cores but was measured only two times in Hole U1465B and five times in Hole U1465C.
Site U1465 is divided into three petrophysical (PP) units based on variations in physical properties, primarily NGR: Unit 1 (0–69 mbsf), Unit 2 (69–136 mbsf), and Unit 3 (136–233 mbsf).
Natural gamma radiation
Unit 1 extends from the seafloor to ~69 mbsf (359-U1465B-3R-1, 50 cm) with variable NGR values, ranging from 4 to 60 counts/s. Local peaks occur in several intervals, centered at 13.9, 29.2, 38.4, and 64 mbsf. The Unit 1/2 boundary is marked by decreasing NGR, although sharp peaks interrupt this trend (e.g., 71.8 mbsf). Low NGR values characterize Unit 2, ranging from 2 to 15 counts/s. The Unit 2/3 boundary is placed at 136 mbsf based on the start of a gradual increase in NGR values to ~36 counts/s. Two excursion peaks at 164.9 and 204 mbsf occur in this unit.
Density and porosity
Bulk density was measured on whole-round cores using the Whole-Round Multisensor Logger (WRMSL) and on discrete samples by moisture and density (MAD) measurements (Figure F27). MAD also allows grain density and porosity to be calculated. In the soft sediments from the seafloor to ~69 mbsf (359-U1465C-6F-1, 51 cm), there is no discernible trend with depth. Both measuring techniques record similar values, mostly between 1.5 and 1.7 g/cm3. The top of the carbonate platform was reached at ~69 mbsf, the depth of the lithostratigraphic Unit I/II boundary. The hard rock yielded low core recovery, limiting the study of physical properties. Within the XCB- and RCB-cored intervals, gamma ray attenuation (GRA) started to display erroneous low densities as a result of partially filled core liners; those values are eliminated from the figures. The few MAD bulk densities from discrete samples exhibit values averaging ~2.1 g/cm3 without any trend downhole. Grain density retains values similar to those in the soft-sediment strata above ~69 mbsf. Although there appears to be some structure in density in the interval below 69 mbsf (e.g., high values in both GRA and MAD at ~170 mbsf), low core recovery prevents any meaningful interpretation.
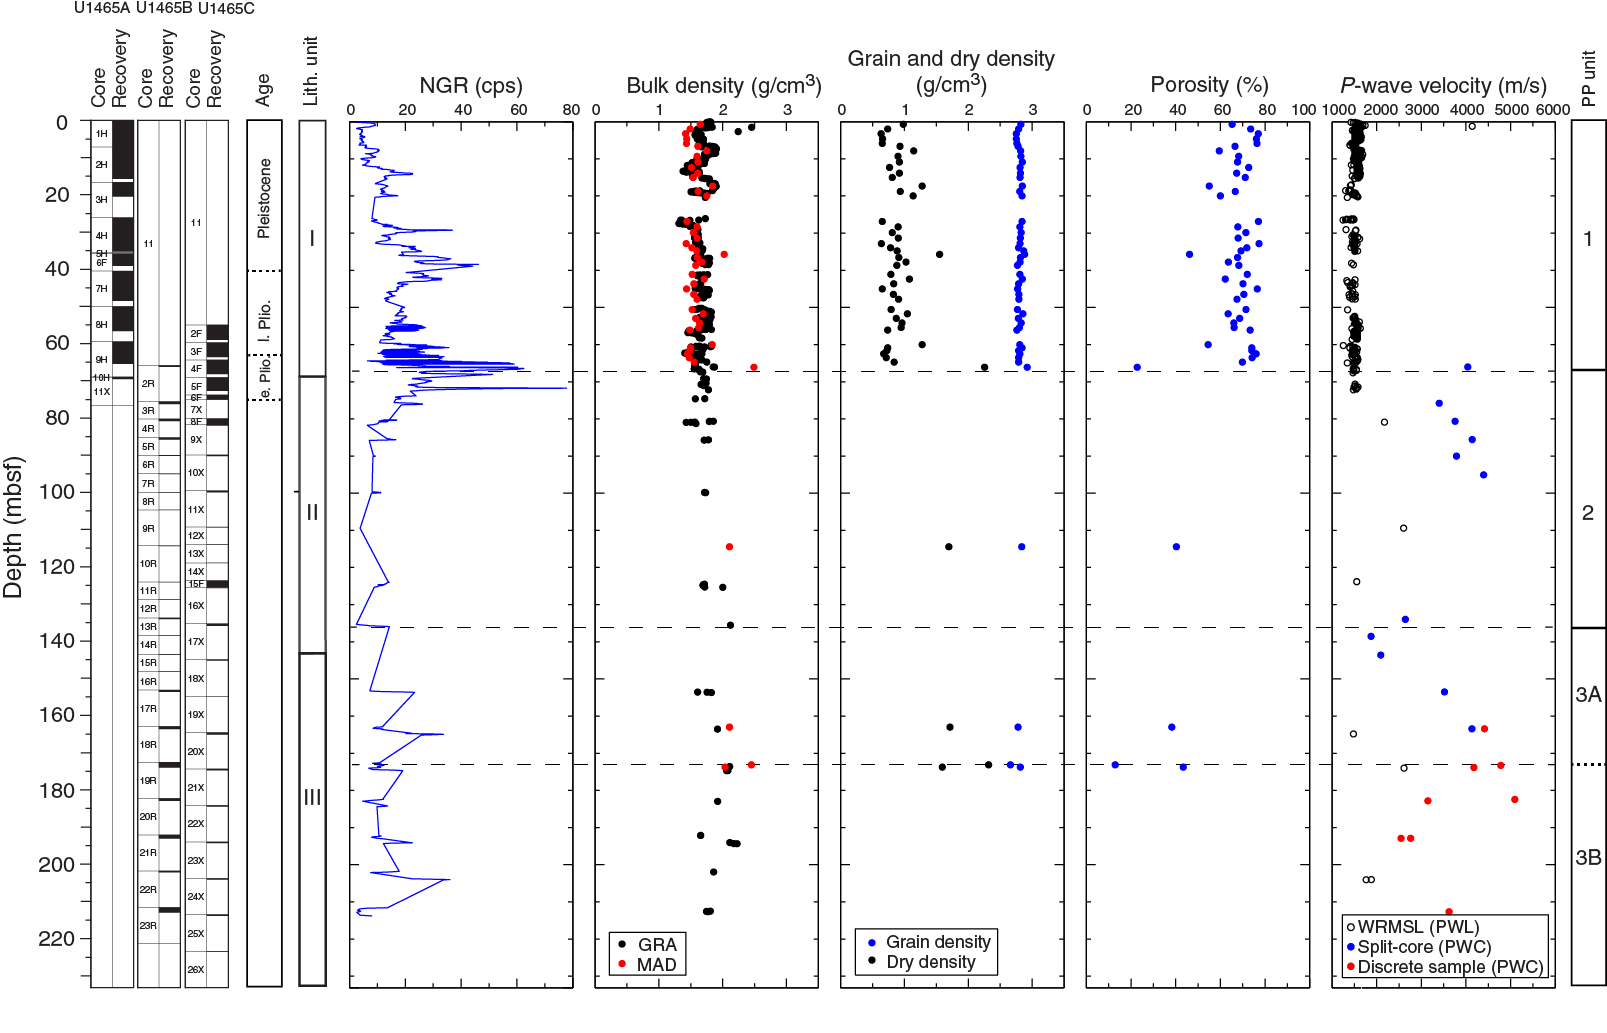
Figure F27. NGR, bulk density, grain and dry density, porosity, and P-wave velocity, Site U1465.
The porosity record shows two distinct modes separated at the petrophysical Unit 1/2 boundary (Figure F27). In the soft sediments above ~69 mbsf, porosity is high and relatively constant, ranging from ~55% to 77% with a few low values below 40%. In the platform carbonates below 69 mbsf, porosity is much lower (18%–40%).
P-wave velocity
P-wave velocity was measured on whole-round cores between 0 and 204 mbsf and on split cores from 66 to 212.6 mbsf (Cores 359-U1465B-2R through 25X) (Figure F27). Velocity measurements on whole-round cores were difficult to obtain because of poor coupling between cores and liners, high water content in the upper soft sediments, and core disturbance in the lower sections. As a result, most of the P-wave velocity measurements made on the WRMSL were considered to be unreliable at this site. In order to improve P-wave velocity data, measurements were also performed with the PWC on section halves with or without a liner and on discrete samples. P-wave velocity measurements on split cores and discrete samples are much higher than P-wave logger (PWL) measurements.
P-wave velocities obtained at shallow depths are slightly higher than the velocity of distilled water (about 1500 m/s), likely reflecting high porosity in near-surface sediments. At ~66 mbsf, the PWC sample displays a high velocity of 4000 m/s, but no change is observed in the PWL values. Below ~80 mbsf, both PWL and PWC values increase and exhibit greater variability than in shallower sediments. The maximum measured velocity in this interval is 5094 m/s. This high-velocity interval corresponds to the carbonate platform and upper slope deposits consisting of coarse-grained dolomitic boundstone and floatstone, respectively (see Lithostratigraphy). Two cycles of moderate to high velocity and back to moderate values correspond to lithostratigraphic Units II and III (Figure F27). Unit III is divided into Subunits IIIA and IIIB based on the occurrence of the highest values at ~170 mbsf. The few discrete samples that exhibit high velocities (greater than ~5000 m/s) may be related to recrystallized dolomitic intervals (see Lithostratigraphy and Geochemistry).
Color reflectance
Reflectance L* values range between 45 and 65 from the seafloor to 82 mbsf, corresponding to the interval with moderate to high core recovery (Figure F28). Between 0 and 82 mbsf, L* data exhibit moderate-amplitude, meter-scale variability with the appearance of longer wavelength cycles on the order of 10 to 20 m. Reflectance a* varies from 2 to 6 between 0 and 60 mbsf with no distinct trend with depth. From 0 to 82 mbsf, reflectance b* values range from approximately –5 to 15, but most are between 3 and 10. Below 82 mbsf, high variability in all three color reflectance parameters (L*, a*, and b*) characterizes an interval of low core recovery. In the deepest cores (>180 mbsf), a* appears to decrease, although this may be an artifact of low recovery.
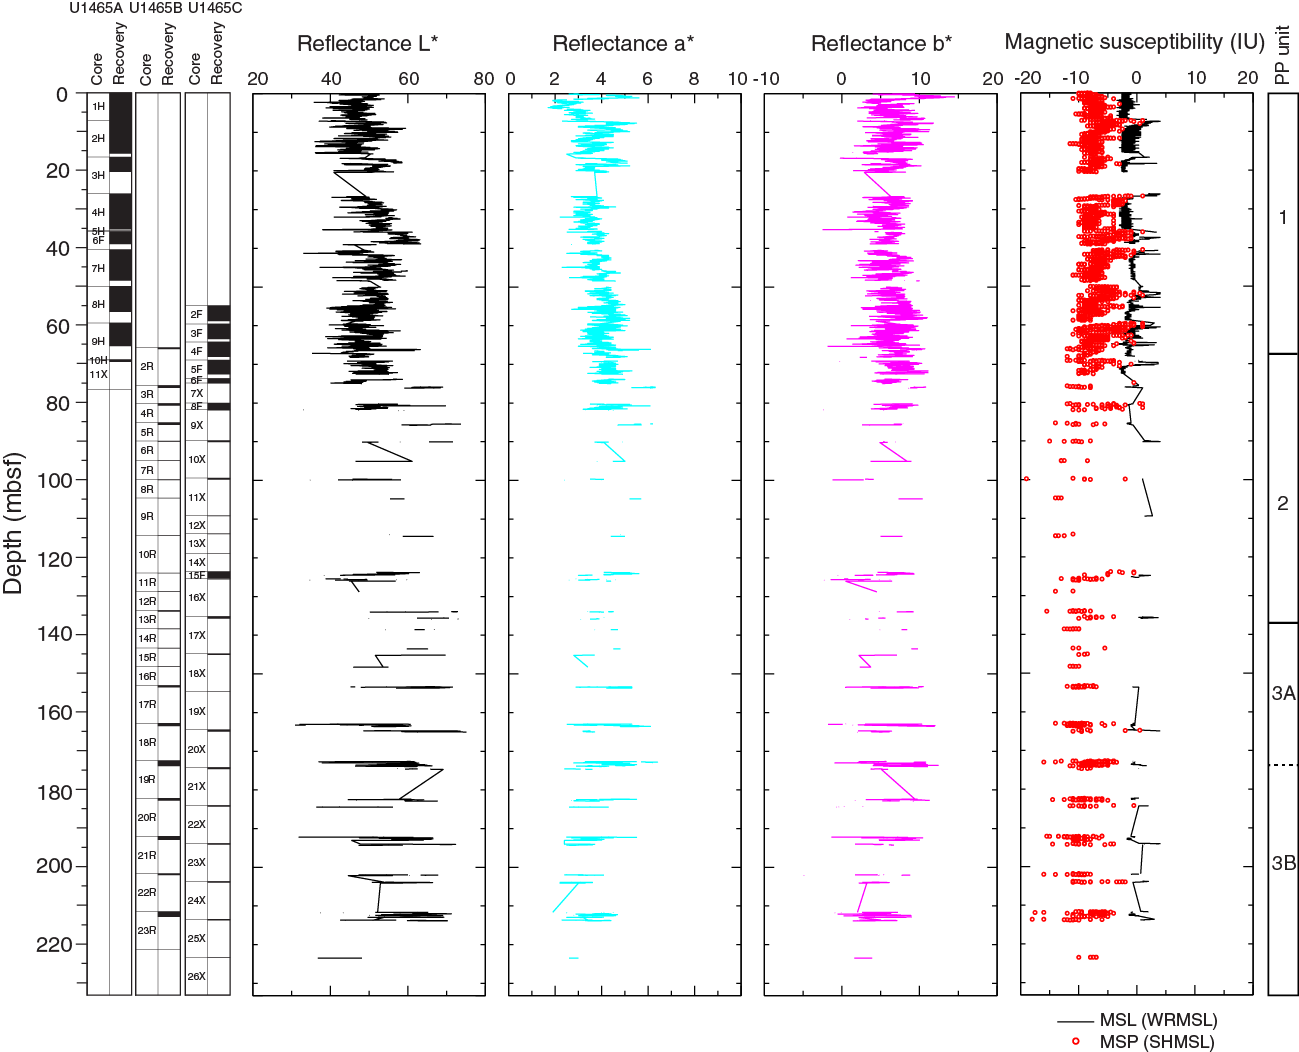
Figure F28. Color reflectance and magnetic susceptibility, Site U1465.
Magnetic susceptibility
Magnetic susceptibility profiles from the seafloor to 76.1 mbsf (359-U1465B-3R-1, 50 cm), measured on both whole-round and split cores, show similarly constant low values that range from about –3 to 3 IU and from about –10 to 3 IU, respectively. Below 76.1 mbsf, point magnetic susceptibility (MSP) values shift lower whereas magnetic susceptibility logger (MSL) values are similar to those in the strata above 76.1 mbsf.
Magnetic susceptibility measurements suggest that the top of each core was contaminated with rust from the drill pipe (see Paleomagnetism). These erroneously high magnetic susceptibility values were manually filtered from the data presented in Figure F28.
Thermal conductivity
Thermal conductivity was measured on whole-round sections with a full-space needle probe in soft sediment (Hole U1465A) and with the half-space probe for hard rock samples (some Hole U1465B and U1465C samples) (Table T11; Figure F29). Sparse data below 75 mbsf limits the analysis of thermal conductivity evolution with depth. In the shallow section between the seafloor and 69 mbsf, thermal conductivity values range from 0.8 to 1.0 W/(m∙K). The uppermost samples are close to the theoretical thermal conductivity of water: 0.6 W/(m∙K); therefore, these low values likely reflect the high water content of these coarse, uncemented sediments. From the seafloor to ~75 mbsf, soft-sediment thermal conductivity increases slightly, reaching ~1.1 W/(m∙K). Thermal conductivity measured on three platform samples displays great variations, ranging from ~0.3 to 2 W/(m∙K). The thermal conductivity of the deepest sample is 1.36 W/(m∙K), whereas another closely spaced (~20 cm) sample has a higher value of 1.96 W/(m∙K) (Figure F29).
Table T11. Thermal conductivity, Site U1465. Download table in .csv format.
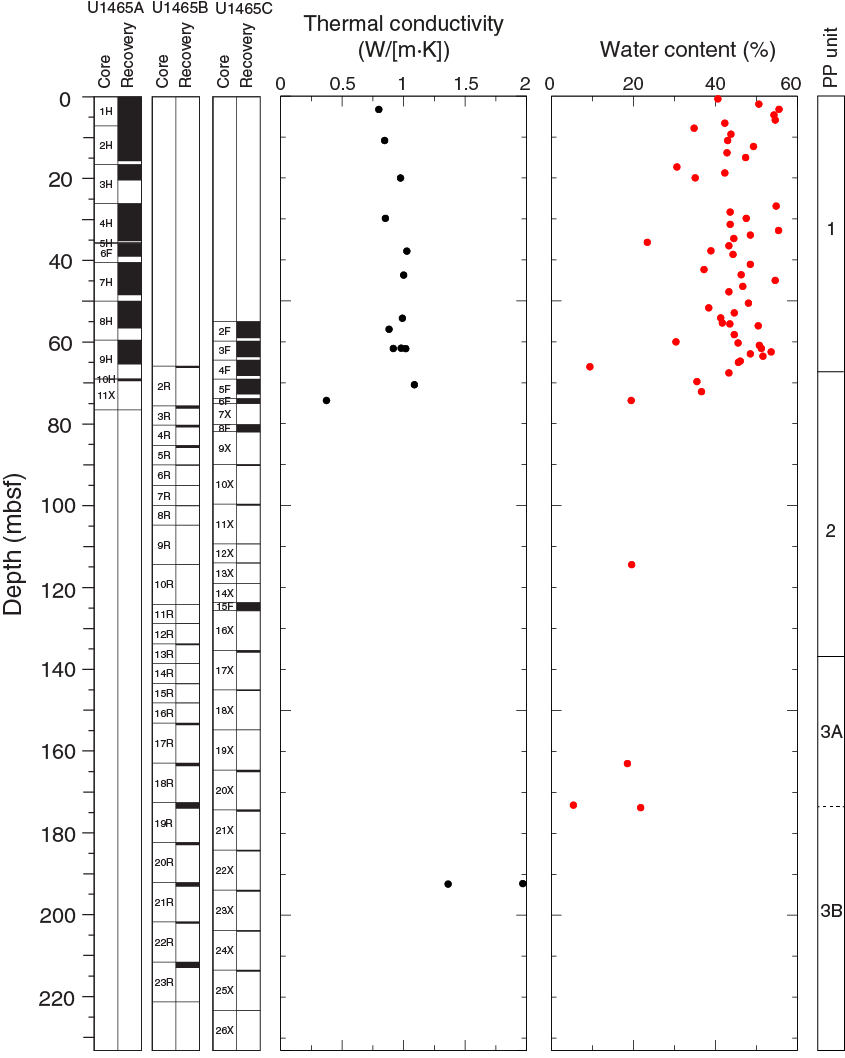
Figure F29. Thermal conductivity and water content, Site U1465.
Discussion
Three petrophysical units are identified at Site U1465 based on differences in physical properties data (Figure F27). Unit 1, from the seafloor to 69.1 mbsf, corresponds to the Pliocene–Pleistocene sheeted drift sediments. These sediments have physical properties similar to those of the drift sediments at Site U1466 (see Physical properties in the Site U1466 chapter [Expedition 359 Scientists, 2017b]). High porosities in this unit are consistent with a low degree of compaction in the drift sediments. Unit 2 is the carbonate platform succession, which is marked by higher P-wave velocities and bulk densities and lower NGR than the upper unconsolidated sediments. Unit 3 within the carbonate platform succession was identified by decreases in velocity and density at ~135 mbsf followed by gradual increases where the boundary of lithostratigraphic Unit III lies closely below 140 mbsf. Unit 3 is divided into two subunits at ~170 mbsf because of the gradual decrease of P-wave velocity and density in the lower interval. Thermal conductivity increases with decreasing water content and porosities (Figure F29). Different P-wave velocities at similar porosities may reflect a variation of pore types that form as a result of different diagenetic processes (Anslemetti and Eberli, 1997).
Downhole measurements
Downhole temperature
Downhole temperature was measured using the APCT-3. Three measurements were attempted between 26.1 and 35.8 mbsf in Hole U1465A (Table T12).
Table T12. APCT-3 measurements, Hole U1465A. Download table in .csv format.
All measurements were made in good sea state (<1 m swell). The APCT-3 was stopped at the mudline for at least 5 min prior to each penetration. The average mudline temperature was 13.6°C. Significant frictional heating occurred on all APCT-3 penetrations, and the temperature-time records exhibit characteristic probe penetration and subsequent decay. Tool movement while the probe was in the sediment was minimal during two deployments (at the bottom of Cores 3H and 5H), and the measurements from these deployments appear to be reliable. There was evidence of tool motion during the deployment at the bottom of Core 4H, and the time windows on either side of the temperature shift were not long enough for reliable temperature analysis, which requires at least 6 min (360 s) of temperature-time data. Therefore, the resulting equilibrium temperature is not reliable.
Mudline temperatures are >3°C higher than temperatures measured in sediment at Site U1465, and a linear temperature gradient from the seafloor cannot be assumed.
Seismic stratigraphy
Site U1465 is located in the western part of the Kardiva Channel (Figure F1) between the open Indian Ocean in the west and the Inner Sea in a position where drift deposits overlie the drowned Kardiva platform. Before drowning, this ancient platform had a width of 31 km. The site was chosen to determine the timing and cause of the platform drowning and the age of current-controlled deposits on the drowned platform. Hole U1465A (APC) cores recovered Drift Sequences (DS) DS7–DS10 and the platform top, and Hole U1465B (RCB) and U1465C (APC/XCB) cores retrieved parts of PS10 and PS11 (Figures F30, F31). The hiatus separating the platform top from the drifts encompasses DS1–DS6 and was biostratigraphically determined at Site U1466 as middle Miocene to middle Pliocene (i.e., ~12.8–3.5 Ma).
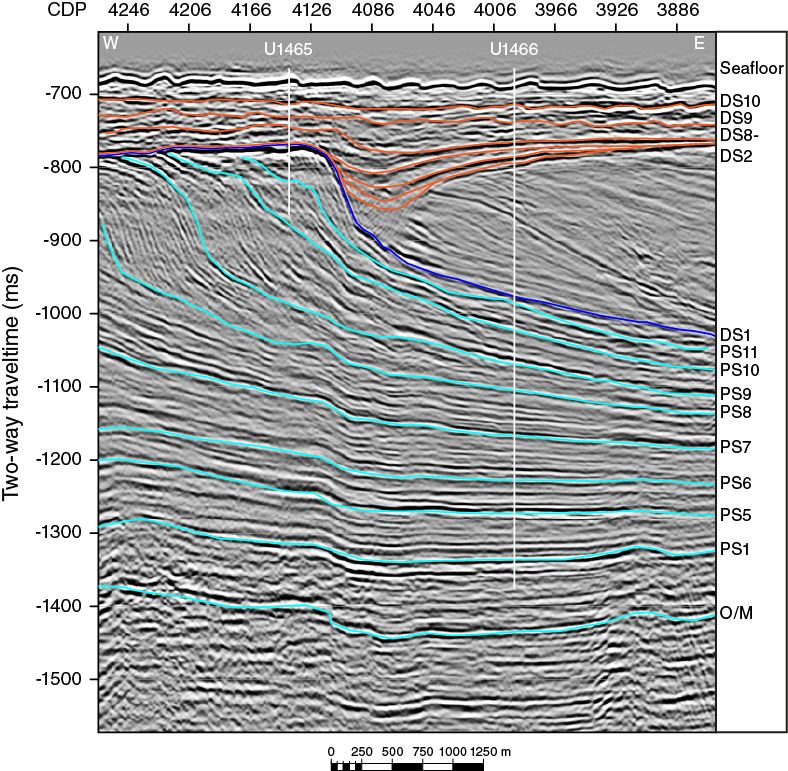
Figure F30. Seismic section of drowned Kardiva platform and onlap and burial by drift sequences, Site U1465.
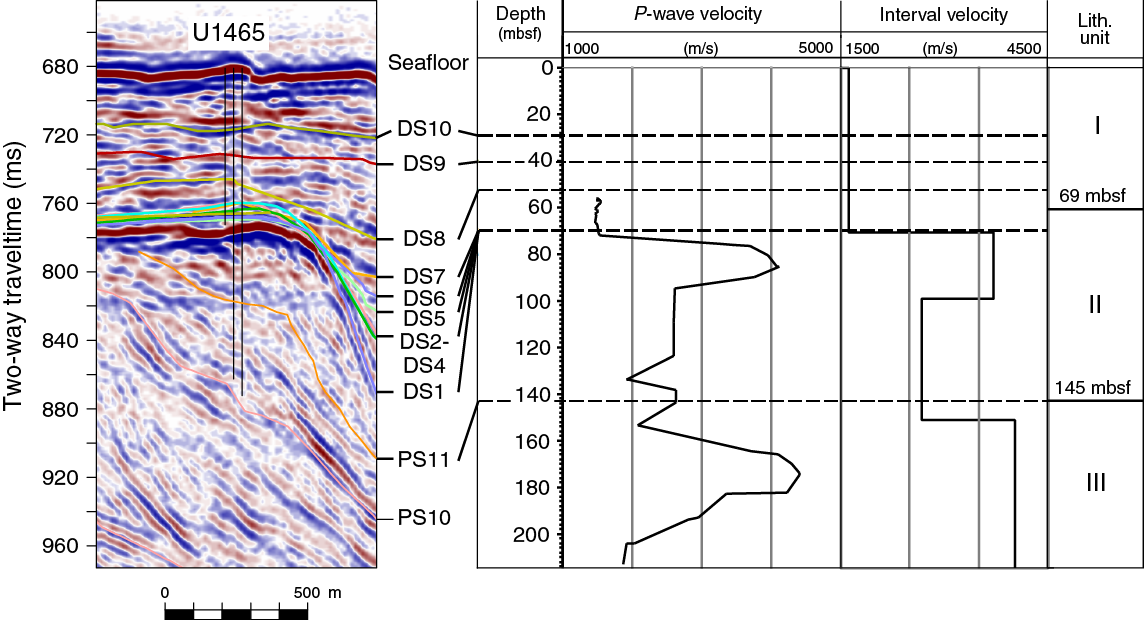
Figure F31. Correlation of seismic and core data, with seismic Line P65 and bases of platform and drift sequences.
Time-depth conversion
To convert seismic data from time into depth domain, a velocity model is needed that accounts for the particular difference in P-wave traveltime for the prevailing lithologic units. Velocities obtained from a vertical seismic profile (VSP) or a sonic log are, in that order, the best methods for producing time-depth models, but neither method could be applied at Site U1465 because the hole caved in during coring and downhole logging was impossible. As a consequence, we used P-wave velocities from the PWL of the upper 70 m in Hole U1465A (i.e., in the drift sequences overlying the platform). Core recovery from the platform carbonates in both Holes U1465B and U1465C was very low, and velocity was therefore derived from discrete samples measured by PWC (see Physical properties). In segments with very high velocities (>3000 m/s), the means of the measured P-wave values were used because finer material with lower velocity was probably washed out. Based on these two data sets, we then constructed the velocity model (Figure F31). The velocity profile used for site planning corresponds well with the drilled depth of the platform top, but the prograding reefal unit and its foreslope below show alternating high- and low-velocity intervals that could not have been predicted. Figure F32 shows the time-depth conversion for Site U1465, and Table T13 shows the computed depth values of the platform and drift sequences and their corresponding two-way traveltimes (TWTs).
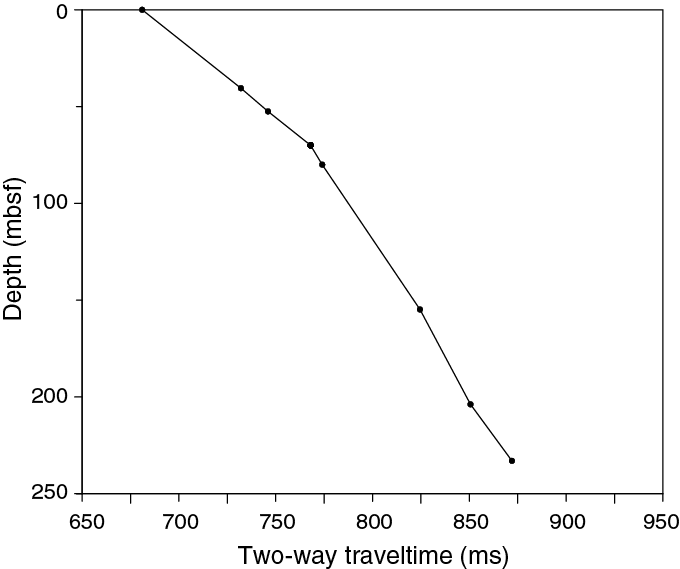
Figure F32. Time-depth conversion, Site U1465.
Table T13. DS and PS boundaries, Site U1465. Download table in .csv format.
Seismic facies and geometries
Drift Sequences DS7–DS10 cover the drowned Kardiva platform. Compared to the Inner Sea basin, where they exhibit well-stratified continuous reflections, their seismic facies consists of discontinuous, laterally offset high-amplitude reflections reminiscent of top-truncated wavy seismic reflections. The seafloor itself displays a wavy geometry that is the result of sediment waves with amplitudes of 10–15 m and wavelengths of 200–300 m (Betzler et al., 2013; Lüdmann et al., 2013). The single more continuous seismic reflection within the drift displays the same wavy pattern east of Site U1465 (Figure F30).
The seismic facies of the prograding Kardiva platform clinoforms has three main divisions. The topsets are high-amplitude horizontal or slightly inclined seismic reflections. The transition to and the upper portion of the foresets have dimmed, steeply inclined seismic reflections. This seismic facies is typical for carbonate platform margins and their uppermost foreslopes (Eberli and Ginsburg, 1989; Pomar, 1993; Yose et al., 2006). The middle and lower portions of the foresets have a sigmoidal geometry in which high-amplitude continuous reflections alternate with low-amplitude less continuous reflections (Figure F31). Onlap relationships along the upper foresets are used to identify the platform sequences. All platform sequences have a similar internal architecture with repeated alternations between packages of oblique-tangential and sigmoidal reflections (Betzler et al., 2013). The lower part of the sequences consists of wedge-shaped sediment packages deposited basinward of the offlap break of the underlying sequence boundary. The wedges are overlain by bundles of sigmoidal reflections. Aggradation of bank interiors occurred mostly during phases of sigmoid progradation. The upper 0.05 s TWT of the outermost part of PS10 has the chaotic weak-amplitude reflection pattern of a platform seismic facies (Betzler et al., 2013). PS10 shows erosional truncation indicating removal of portions of the platform margin deposits.
Core-seismic correlation
Hole U1465A cores retrieved the drift sequences overlying the Kardiva platform and touched the platform top at 69.1 mbsf. The uppermost platform facies recovered is floatstone with moldic porosity marking the top of lithostratigraphic Unit II (Core 10H). Molds are partially filled by brown micrite-bearing planktonic foraminifers. The brown color possibly represents elevated phosphate content, similar to drowning unconformities on the Queensland Plateau (Betzler, 1997).
The upper part of PS11 consists of a package of gently basinward reflections that can be laterally traced over a distance of around 600 m. This package encompasses the succession of Cores 6R–14R. The lower boundary of the packages coincides with Sequence Boundary PS11, which corresponds to the base of lithostratigraphic Unit II. The deepest hole at Site U1465 (Hole U1465C) was abandoned approximately 9 ms above the basal boundary of PS10 (see Operations).
References
Anselmetti, F.S., and Eberli, G.P., 1997. Sonic velocity in carbonate sediments and rocks. In Palaz, A., and Marfurt, F.J. (Eds.), Geophysical Developments Series (Volume 6): Carbonate Seismology. Thomsen, L.A. (Series Ed.): Tulsa, OK (Society of Exploration Geophysicists), 53–74. http://dx.doi.org/10.1190/1.9781560802099.ch4
Arthur, M.A., and Schlanger, S.O., 1979. Cretaceous “oceanic anoxic events” as causal factors in development of reef-reservoired giant oil fields. AAPG Bulletin, 63:870–885.
Belopolsky, A.V., and Droxler, A.W., 2004. Seismic expressions and interpretation of carbonate sequences: the Maldives platform, equatorial Indian Ocean. AAPG Studies in Geology, 49. http://archives.datapages.com/data/specpubs/study49/images/st49.pdf
Betzler, C., 1997. Ecological controls on geometries of carbonate platforms: Miocene/Pliocene shallow-water microfaunas and carbonate biofacies from the Queensland Plateau (NE Australia). Facies, 37(1):147–166. http://dx.doi.org/10.1007/BF02537376
Betzler, C., Eberli, G.P., Alvarez Zarikian, C.A., Alonso-García, M., Bialik, O.M., Blättler, C.L., Guo, J.A., Haffen, S., Horozal, S., Inoue, M., Jovane, L., Kroon, D., Lanci, L., Laya, J.C., Ling Hui Mee, A., Lüdmann, T., Nakakuni, M., Nath, B.N., Niino, K., Petruny, L.M., Pratiwi, S.D., Reijmer, J., Reolid, J., Slagle, A.L., Sloss, C.R., Su, X., Swart, P.K., Wright, J.D., Yao, Z., and Young, J.R., 2017a. Expedition 359 summary. In Betzler, C., Eberli, G.P., Alvarez Zarikian, C.A., and the Expedition 359 Scientists, Maldives Monsoon and Sea Level. Proceedings of the International Ocean Discovery Program, 359: College Station, TX (International Ocean Discovery Program). http://dx.doi.org/10.14379/iodp.proc.359.101.2017
Betzler, C., Eberli, G.P., Alvarez Zarikian, C.A., Alonso-García, M., Bialik, O.M., Blättler, C.L., Guo, J.A., Haffen, S., Horozal, S., Inoue, M., Jovane, L., Kroon, D., Lanci, L., Laya, J.C., Ling Hui Mee, A., Lüdmann, T., Nakakuni, M., Nath, B.N., Niino, K., Petruny, L.M., Pratiwi, S.D., Reijmer, J., Reolid, J., Slagle, A.L., Sloss, C.R., Su, X., Swart, P.K., Wright, J.D., Yao, Z., and Young, J.R., 2017b. Site U1466. In Betzler, C., Eberli, G.P., Alvarez Zarikian, C.A., and the Expedition 359 Scientists, Maldives Monsoon and Sea Level. Proceedings of the International Ocean Discovery Program, 359: College Station, TX (International Ocean Discovery Program). http://dx.doi.org/10.14379/iodp.proc.359.104.2017
Betzler, C., Fürstenau, J., Lüdmann, T., Hübscher, C., Lindhorst, S., Paul, A., Reijmer, J.J.G., and Droxler, A.W., 2013. Sea-level and ocean-current control on carbonate-platform growth, Maldives, Indian Ocean. Basin Research, 25(2):172–196. http://dx.doi.org/10.1111/j.1365-2117.2012.00554.x
Betzler, C., Hübscher, C., Lindhorst, S., Reijmer, J.J.G., Römer, M., Droxler, A.W., Fürstenau, J., and Lüdmann, T., 2009. Monsoon-induced partial carbonate platform drowning (Maldives, Indian Ocean). Geology, 37(10):867–870. http://dx.doi.org/10.1130/G25702A.1
Eberli, G.P., 1991. Growth and demise of isolated carbonate platforms: Bahamian controversies. In Müller, D., McKenzie, J., and Weissert, H. (Eds.), Controversies in Modern Geology: Evolution of Geological Theories in Sedimentology, Earth History and Tectonics: London (Academic Press), 231–248.
Eberli, G.P., Anselmetti, F.S., Isern, A.R., and Delius, H., 2010. Timing of changes in sea-level and currents along Miocene platforms on the Marion Plateau, Australia. In Morgan, W.A., George, A.D., Harris, P.M., Kupecz, J.A., and Sarg, J.F. (Eds.), Cenozoic Carbonate Systems of Australasia. Special Publication - SEPM (Society for Sedimentary Geology), 95:219–242. http://dx.doi.org/10.2110/sepmsp.095.219
Eberli, G.P., and Ginsburg, R.N., 1989. Cenozoic progradation of the northwestern Great Bahamas Bank: a record of lateral platform growth and sea-level fluctuations. In Crevello, P.D., Wilson, J.L., Sarg, J.F., and Read, J.F. (Eds.), Controls on Carbonate Platforms and Basin Development. Special Publication - SEPM (Society for Sedimentary Geology), 44:339–351. http://dx.doi.org/10.2110/pec.89.44.0339
Flügel, E., 2004. Microfacies of Carbonate Rocks: Analysis, Interpretation and Application: Berlin (Springer-Verlag). http://dx.doi.org/10.1007/978-3-662-08726-8
Gradstein, F.M., Ogg, J.G., Schmitz, M.D., and Ogg, G.M. (Eds.), 2012. The Geological Time Scale 2012: Amsterdam (Elsevier).
Hallock, P., and Schlager, W., 1986. Nutrient excess and the demise of coral reefs and carbonate platforms. Palaios, 1(4):389–398. http://dx.doi.org/10.2307/3514476
Hilgen, F.J., Lourens, L.J., and Van Dam, J.A., 2012. The Neogene period. With contributions by A.G. Beu, A.F. Boyes, R.A. Cooper, W. Krijgsman, J.G. Ogg, W.E. Piller, and D.S. Wilson. In Gradstein, F.M., Ogg, J.G., Schmitz, M.D., and Ogg, G.M. (Eds.), The Geologic Time Scale: Oxford, United Kingdom (Elsevier), 923–978. http://dx.doi.org/10.1016/B978-0-444-59425-9.00029-9
Jellinek, T., 1993. Zur Ökologie und Systematik rezenter Ostracoden aus dem Bereich des kenianischen Barriere-Riffs. Senckenbergiana Lethaea, 73(1):83–225.
John, C.M., and Mutti, M., 2005. Relative control of paleoceanography, climate, and eustasy over heterozoan carbonates: a perspective from slope sediments of the Marion Plateau (ODP Leg 194). Journal of Sedimentary Research, 75(2):216–230. http://dx.doi.org/10.2110/jsr.2005.017
Kirschvink, J.L., 1980. The least-squares line and plane and the analysis of palaeomagnetic data. Geophysical Journal of the Royal Astronomical Society, 62(3):699–718. http://dx.doi.org/10.1111/j.1365-246X.1980.tb02601.x
Lourens, L., Hilgen, F., Shackleton, N.J., Laskar, J., and Wilson, D., 2004. The Neogene period. In Gradstein, F.M., Ogg, J.G., and Smith, A. (Eds.), A Geologic Time Scale 2004: Cambridge, United Kingdom (Cambridge University Press), 409–440. http://dx.doi.org/10.1017/CBO9780511536045.022
Lüdmann, T., Kalvelage, C., Betzler, C., Fürstenau, J., and Hübscher, C., 2013. The Maldives, a giant isolated carbonate platform dominated by bottom currents. Marine and Petroleum Geology, 43:326–340. http://dx.doi.org/10.1016/j.marpetgeo.2013.01.004
Mostafawi, N., Colin, J.-P., and Babinot, J.-F., 2005. An account on the taxonomy of ostracodes from recent reefal flat deposits in Bali, Indonesia. Revue de Micropaléontologie, 48(2):123–140. http://dx.doi.org/10.1016/j.revmic.2004.12.001
Philip, J., and Schlager, W., 1990. Cretaceous carbonate platforms. In Ginsburg, R.N., and Beaudoin, B. (Eds.), Nato Science Series C (Volume 304): Cretaceous Resources, Events and Rhythms: Background and Plans for Research: Dordrecht, The Netherlands (Springer), 173.
Pomar, L., 1993. High-resolution sequence stratigraphy in prograding Miocene carbonates: application to seismic interpretation. In Loucks, R., and Sarg, I.F. (Eds.), Carbonate Sequence Stratigraphy: Recent Developments and Applications. AAGP Memoir, 57:389–407. http://archives.datapages.com/data/specpubs/seismic2/data/a168/a168/0001/0350/0389.htm
Raffi, I., Backman, J., Fornaciari, E., Pälike, H., Rio, D., Lourens, L., and Hilgen, F., 2006. A review of calcareous nannofossil astrobiochronology encompassing the past 25 million years. Quaternary Science Reviews, 25(23–24):3113–3137. http://dx.doi.org/10.1016/j.quascirev.2006.07.007
Schlager, W., 1981. The paradox of drowned reefs and carbonate platforms. Geological Society of America Bulletin, 92(4):197–211. http://dx.doi.org/10.1130/0016-7606(1981)92<197:TPODRA>2.0.CO;2
Thompson, P.R., Bé, A.W.H., Duplessy, J.-C., and Shackleton, N.J., 1979. Disappearance of pink-pigmented Globigerinoides ruber at 120,000 yr BP in the Indian and Pacific Oceans. Nature, 280(5723):554–558. http://dx.doi.org/10.1038/280554a0
Yose, L.A., Ruf, A.S., Strohmenger, C.J., Schuelke, J.S., Gombos, A., Al-Hosani, I., Al-Maskary, S., Bloch, G., Al-Mehairi, Y., and Johnson, I.G., 2006. Three-dimensional characterization of a heterogeneous carbonate reservoir, Lower Cretaceous, Abu Dhabi (United Arab Emirates). In Harris, P.M., and Weber, L.J. (Eds.), Giant Hydrocarbon Reservoirs of the World: from Rocks to Reservoir Characterization and Modeling. AAGP Memoir, 88:173–212. http://archives.datapages.com/data/specpubs/memoir88/chapter05/CHAPTER05.HTM
Zijderveld, J.D.A., 1967. AC demagnetization of rocks: analysis of results. In Collinson, D.W., Creer, K.M., and Runcorn, S.K. (Eds.), Methods in Palaeomagnetism: Amsterdam (Elsevier), 254–286.
1 Betzler, C., Eberli, G.P., Alvarez Zarikian, C.A., Alonso-García, M., Bialik, O.M., Blättler, C.L., Guo, J.A., Haffen, S., Horozal, S., Inoue, M., Jovane, L., Kroon, D., Lanci, L., Laya, J.C., Ling Hui Mee, A., Lüdmann, T., Nakakuni, M., Nath, B.N., Niino, K., Petruny, L.M., Pratiwi, S.D., Reijmer, J.J.G., Reolid, J., Slagle, A.L., Sloss, C.R., Su, X., Swart, P.K., Wright, J.D., Yao, Z., and Young, J.R., 2017. Site U1465. In Betzler, C., Eberli, G.P., Alvarez Zarikian, C.A., and the Expedition 359 Scientists, Maldives Monsoon and Sea Level. Proceedings of the International Ocean Discovery Program, 359: College Station, TX (International Ocean Discovery Program). http://dx.doi.org/10.14379/iodp.proc.359.103.2017
2 Expedition 359 Scientists’ addresses.
This work is distributed under the Creative Commons Attribution 4.0 International (CC BY 4.0) license. 
- F1. Seismic Line P65 with location of Site U1465.
- F2. Seismic Line P65 with locations and final penetration depths, Sites U1465, U1466, and U1468.
- F3. Lithostratigraphic summary, Site U1465.
- F4. Lithostratigraphic unit facies. Unit I: coarse-grained bioclastic grainstone and fine-grained planktonic foraminiferal packstone. Unit II: coral framestone alternating with bioclastic floatstone. Unit III: alternating well-cemented and poorly cemented bioclastic grainstone to rudstone with abundant large benthic foraminifers.
- F5. Main components of Unit I grainstone facies.
- F6. Coral species in Unit II framestone facies, Site U1465.
- F7. Diagenetic overprint in Unit II floatstone with partially infilled dissolved skeletal grain.
- F8. Unit II floatstone facies with abundant bioclastic molds, some with geopetal infill.
- F9. Benthic foraminifers from Units II and III, Hole U1465A.
- F10. Degrees of cementation, well-cemented grainstone, and poorly cemented grainstone to rudstone.
- F11. Biostratigraphic and paleoenvironmental summary, Site U1465.
- F12. Age-depth profile, Site U1465.
- F13. Representative Pliocene–Pleistocene ostracods, Site U1465.
- F14. IW Cl–, Na+, and K+ concentrations, Holes U1465A and U1465C.
- F15. IW Ca2+, Mg2+, Sr2+, and Li+ concentrations, Holes U1465A and U1465C.
- F16. IW alkalinity, hydrogen (pH), and SO42– concentrations, Holes U1465A and U1465C.
- F17. Carbonate content, Site U1465.
- F18. Aragonite, HMC, LMC, dolomite, and quartz by XRD, Site U1465.
- F19. Mg/Ca, Sr/Ca, Mn/Ca, and Fe/Ca ratios in sediments, Site U1465.
- F20. Headspace methane concentrations, Site U1465.
- F21. Magnetization with NRM inclination and declination, Hole U1465A.
- F22. Magnetization with NRM inclination and declination, Hole U1465C.
- F23. Paleomagnetic directions after 30 mT blanket demagnetization, Hole U1465A.
- F24. Paleomagnetic directions of a representative discrete sample during stepwise AF demagnetization.
- F25. Paleomagnetic directions of representative samples during stepwise AF demagnetization.
- F26. Paleomagnetic directions computed using PCA compared with NRM intensity after 30 mT AF demagnetization.
- F27. NGR, bulk density, grain and dry density, porosity, and P-wave velocity, Site U1465.
- F28. Color reflectance and magnetic susceptibility, Site U1465.
- F29. Thermal conductivity and water content, Site U1465.
- F30. Seismic section of drowned Kardiva platform and onlap and burial by drift sequences, Site U1465.
- F31. Correlation of seismic and core data, with seismic Line P65 and bases of platform and drift sequences.
- F32. Time-depth conversion, Site U1465.
- T1. Site U1465 core summary.
- T2. Biostratigraphic events, Site U1465.
- T3. Nannofossil range chart, Holes U1465A and U1465C.
- T4. Planktonic foraminifer range chart, Holes U1465A and U1465C.
- T5. Benthic foraminifer range chart, Holes U1465A and U1465C.
- T6. Interstitial water chemistry, Site U1465.
- T7. Carbon and nitrogen, Site U1465.
- T8. XRD results, Site U1465.
- T9. Solids geochemistry, Site U1465.
- T10. Headspace hydrocarbons, Site U1465.
- T11. Thermal conductivity, Site U1465.
- T12. APCT-3 measurements, Hole U1465A.
- T13. DS and PS boundaries, Site U1465.