Betzler, C., Eberli, G.P., Alvarez Zarikian, C.A., and the Expedition 359 Scientists
Proceedings of the International Ocean Discovery Program Volume 359
publications.iodp.org
doi:10.14379/iodp.proc.359.104.2017
Site U14661
C. Betzler, G.P. Eberli, C.A. Alvarez Zarikian, M. Alonso-García, O.M. Bialik, C.L. Blättler, J.A. Guo, S. Haffen, S. Horozal, M. Inoue, L. Jovane, D. Kroon, L. Lanci, J.C. Laya, A. Ling Hui Mee, T. Lüdmann, M. Nakakuni, B.N. Nath, K. Niino, L.M. Petruny, S.D. Pratiwi, J.J.G. Reijmer, J. Reolid, A.L. Slagle, C.R. Sloss, X. Su, P.K. Swart, J.D. Wright, Z. Yao, and J.R. Young2
Keywords: International Ocean Discovery Program, IODP, JOIDES Resolution, Expedition 359, Site U1466, Maldives, Kardiva Channel, Goidhoo atoll, Indian Ocean paleoceanography, Oligocene, Miocene, Pliocene, Pleistocene, carbonate platform, carbonate platform drowning, celestine, dolomite, drift deposits, large benthic foraminifers, monsoon, sea level, sequence stratigraphy
MS 359-104: Published 4 May 2017
Background and objectives
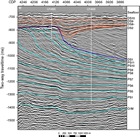
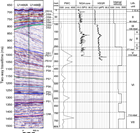
Site U1466 (proposed MAL-02) is positioned 1880 m east of Site U1465 at 4°55.9880′N, 73°1.6894′E, at about the same water depth (518 m), but it is situated above completely different strata (Figures F1, F2). The site is in front of the last prograding clinoform of the drowned carbonate platform targeted at Site U1465. In this basinal position, a thick prograding drift succession first overlays the bottomsets and foresets of the prograding platform and finally buries the platform (Figure F55). The main objective of Site U1466 was to retrieve and date the first drift sequence and the subsequent changes in current evolution that are likely related to the evolution of the Indian monsoon (Kroon et al., 1991). Thus, the site is located just east of the first onlap of the drift onto the slope of the buried platform. The drift sequence is partly eroded on top as a moat develops along the platform to the west (Lüdman et al., 2013). A condensed section covers the erosional unconformity overlain by a horizontally layered drift package that is wavy at the seafloor. Hole U1466A was intended to retrieve the first drift sequence, the condensed section, and the overlying drift package.
A second major objective at this site was to establish ages for sea level changes interpreted as being responsible for the pulses of platform progradation that produce platform sequences (Betzler et al., 2013b). This site penetrated the foresets and bottomsets of the prograding platform, so individual platform sequences can be dated. Dating platform sequences within shallow-water deposits or even the platform margin is inherently difficult because age-diagnostic planktonic foraminifers and calcareous nannofossils are generally absent. Dating carbonate sequences in the basinal portion of the sequence is a common approach to overcome the problem. Although sequence boundaries are determined by onlap unconformities along the platform margin, seismic reflections marking sequence boundaries can be traced into the basin. Because of the chronostratigraphic nature of the seismic reflections, ages can be determined in this basinal position by dating sediments above and below the horizon that generates the sequence boundary reflection (Eberli et al., 2002). Thus, ages of early and middle Miocene sea level changes in the Indian Ocean will be retrieved. Together with data sets from the Bahamas (Ocean Drilling Program [ODP] Leg 166) and offshore eastern Australia (ODP Legs 133 and 194), these ages will allow scientists to test the global synchroneity of Neogene sea level changes.
Site U1466 cores also address another major objective of Expedition 359. The periplatform sediments deposited at this site offer the opportunity to retrieve a complete δ13 C record through the lower and middle Miocene that together with other Expedition 359 sites will provide another data set of the carbon isotopic record needed to calibrate the periplatform platform margin record against the pelagic record. Open oceanic pelagic records offer the best data for reconstructing the global carbon cycle (Shackleton, 1985), but for Earth’s pre-Mesozoic history, only the record of platform-derived sediments is preserved (Veizer et al., 1999). Because periplatform and pelagic records can differ significantly, calibration is important for a meaningful interpretation of the δ13 C record in Earth’s ancient history (Swart and Eberli, 2005; Swart, 2008).
The specific objectives at Site U1466 were as follows: (1) constrain the timing of onset of drift deposition, the condensed section that indicates a current change, and platform sequence boundaries; (2) reconstruct and date bank to drift turnover; (3) provide detailed reconstruction of the predrowning, drowning, and postdrowning evolution of the carbonate bank by linking the seismic stratigraphic record to the sedimentary record; and (4) establish a carbon isotope record from the periplatform sediments.
Operations
Hole U1466A
After the ~1 nmi transit from Site U1465 to Site U1466, the ship was positioned over the new location by 0430 h on 20 October 2015 and rig floor activities began. At 0625 h, Hole U1466A was started, recovering 5 m of core and establishing a seafloor depth of 528.9 meters below rig floor (mbrf). Coring was problematic in this hole because of the abundance of sand in the surface layers of the formation. Nevertheless, coring with the advanced piston corer (APC) and half-length APC (HLAPC) systems proceeded to 100.5 meters below seafloor (mbsf) (Core 12F). Three formation temperature measurements (advanced piston corer temperature tool; APCT-3) were attempted between 43.0 and 88.5 mbsf in Hole U1466A. At this point, we decided to make a wiper trip because of high drilling torque. At 1730 h on 20 October, the drill string was pulled back to 63.1 mbsf and then washed back to bottom. With all drilling parameters back to normal, coring resumed at 1930 h and continued through Core 20F to 155.0 mbsf. Once again, high drilling torque necessitated a wiper trip. At 0100 h on 21 October, the drill string was recovered to 63.1 mbsf and then washed back to the bottom of the hole at 155.0 mbsf. As on the first wiper trip, the hole cleaned up, and all drilling parameters returned to normal. Coring resumed at 0400 h and continued through Core 50X to a total depth of 326.2 mbsf. All three coring systems (APC, HLAPC, and extended core barrel [XCB]) were used interchangeably and with great effectiveness during this cored interval. Coring was terminated at 0400 h on 22 October because the depth objective was achieved and we decided the formation could be cored at that point with the rotary core barrel (RCB) system. The drill string was recovered and pulled back to the rig floor at 1000 h on 22 October, officially ending Hole U1466A and initiating Hole U1466B.
Hole U1466B
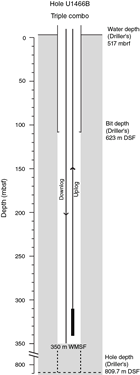
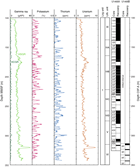
An RCB bottom-hole assembly (BHA) was lowered to the seafloor, and with the compensator open, the driller physically tagged the seafloor with the bit at 528.0 mbrf. Drilling without coring in Hole U1466B started at 1620 h on 22 October 2015 at the seafloor and continued to 158 mbsf. A wiper trip to 61 mbsf and back to bottom was conducted with no overpull or drag experienced and no fill noted on bottom. Drilling resumed, and 313.9 mbsf was reached by 0600 h on 23 October. A second wiper trip was conducted, and again there was no overpull or drag noted. At the bottom, 2 m of fill was circulated out with a high-viscosity mud sweep. At 1045 h, we started RCB coring at 314.0 mbsf. Coring continued with nonmagnetic core barrels. Poor recovery through the highly interbedded hard/soft formation led to a combination of full and half RCB cores. As the hole progressed and the scientific data set grew, the scientists decided that the scientific objectives had essentially been reached and terminated the hole so that downhole logging could start. At 1150 h on 25 October, the last RCB core (57R) was recovered at 809.7 mbsf. Hole conditions remained good. The bit was released, and the hole was displaced with heavy mud. The drill string was pulled up, and the end of the pipe was placed at 106.0 mbsf. At 1800 h, rig-up of the first wireline logging tool string was initiated. The triple combo tool string, without the source installed, was run in the hole. However, the tools would not pass 894.0 mbrf (366.0 mbsf). Log data were collected up from there, but constant tool drag indicated the hole was rapidly deteriorating. The triple combo was back on deck at 2100 h, and the decision was made to abandon any further logging attempts in Hole U1466B. The drill string was pulled out of the hole, clearing the seafloor at 2250 h. Hole U1466B was completed at 1220 h on 26 October, officially ending operations at Site U1466.
Total recovery for Site U1466 was 243.8 m (75%) in Hole U1466A and 88.54 m (18%) in Hole U1466B (Table T1; see Figure F34 in the Expedition 359 summary chapter [Betzler et al., 2017b]). Of the total 106 cores recovered, 20 were APC cores, 20 were HLAPC cores, 10 were XCB cores, and 56 were RCB cores.
Table T1. Site U1466 core summary. Download table in .csv format. View PDF table.
Lithostratigraphy
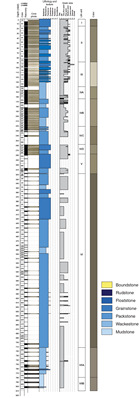
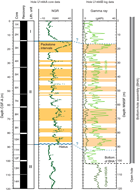
Seven lithostratigraphic units were identified at Site U1466 based on visual core descriptions, smear slide and thin section analyses, and scanning for an array of physical properties (Figure F3) (see Lithostratigraphy and sedimentology and Physical properties, both in the Expedition 359 methods chapter [Betzler et al., 2017a]). Lithostratigraphic units were defined by combining the units determined in Holes U1466A and U1466B. The cores recovered sand wave and moat fill sediments, contourite fan deposits overlying drift sediments, and a transition zone to a distal slope succession deposited on top of a chalky unit with intercalations of organic-rich layers.
Lithostratigraphic units
Unit I
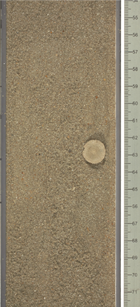
Unit I spans the uppermost 14.5 m of the sedimentary succession at Site U1466 and is characterized by gray-brown to pale yellow coarse-grained massive unlithified grainstone. Planktonic foraminifers dominate the skeletal grains, along with common benthic foraminifers, pteropods, otoliths, Halimeda plates, fragmented echinoid spines, bryozoan fragments, and bivalves. Solitary corals were also found (e.g., Section 359-U1446A-2H-3, 64 cm) (Figure F4). Yellow/red-stained bioclasts are common.
Unit II
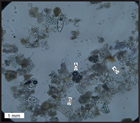
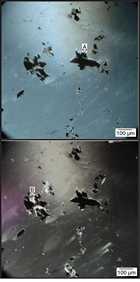
Unit II consists of unlithified packstone alternating with unlithified grainstone that is massive or normally graded. Sediments range in size from very fine grained in intervals with a grainstone texture to coarse grained in packstone intervals. A thin fine-grained unlithified wackestone lies between 117 and 121 cm in Section 359-U1466A-9H-4. Sediment colors gradually change from white/light gray (grainstone and packstone) to pale yellow (packstone) as a result of textural and grain size variations. Contacts are gradational with a few sharp boundaries present (interval 10H-5, 13 cm, through 10H-CC). The main components are planktonic foraminifers and minor benthic foraminifers, pteropods, red algae, Halimeda plates, bivalves, echinoid fragments and spines, and otoliths. Yellow to brown-stained aggregate grains and black grains (glauconite or organic material?) are present throughout the unit and are distinct in Sections 3H-1 and 3H-5 and Core 6H. The fine fraction (silt and clay size) contains spines/needles, sponge spicule fragments, rare calcareous nannofossils, and tunicates. The fine fraction of the wackestone interval shows abundant aragonite needles of 5–15 µm and calcite crystals smaller than 5 µm (Figure F5).
Unit III
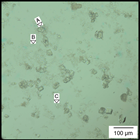
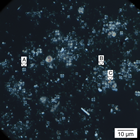
The transition from Unit II to Unit III is marked by an abrupt increase of benthic foraminifers, replacing planktonic foraminifers as the dominant skeletal grain. This contact coincides with a large hiatus (see Biostratigraphy). Unit III consists of very pale brown medium- to coarse-grained, unlithified to partially lithified wackestone, packstone, and grainstone. The top of the unit is a 50 cm thick layer with a grainstone texture at 359-U1466A-11H-1, 33–83 cm, that contains planktonic foraminifers, bioclasts, mollusks, and aggregates. Contacts between the different textures are gradational and represented by changes in color and/or grain size. The main components are planktonic foraminifers with common to present benthic foraminifers (e.g., Lepidocyclina sp.), encrusting red algae, Halimeda plates, and bryozoan fragments. Aggregate grains and black grains (pyrite?) are also observed (Figure F6). The number of planktonic foraminifers diminishes downcore from Section 12F-1, and the microfauna assemblage is dominated by benthic foraminifers. The fine fraction consists of abundant aragonite needles smaller than 5 μm, common micritic calcite (clotted brown specks), and dolomite rhombs (5 μm) (Figure F7). Bioturbation varies between moderate and extensive throughout this unit.
Core 12F contains typical unlithified (12F-1, 14 cm, to 12F-2, 44 cm) to partially lithified (12F-2, 44 cm, to 12F-4, 10 cm) to lithified (12F-4 through 12F-CC) sequences. Deeper in the unit, unlithified and lithified intervals alternate in a similar way at a similar scale.
Unit IV
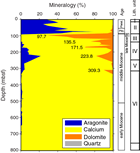
Unit IV consists of four subunits based on (1) textural changes (wackestone to packstone and/or grainstone), (2) lithification grade, and (3) the occurrence of dolomitic intervals. The unit itself consists of dolomitic wackestone to grainstone with benthic and planktonic foraminifers. The top of Subunit IVA at 138.61 mbsf is a slightly dolomitized wackestone to grainstone unit with red algae, which corresponds with a well-marked spike in the X-ray diffraction (XRD) results for this interval at 135.5 mbsf (see Geochemistry). The tops of Subunits IVB and IVC also coincide with discrete dolomite spikes: one spike at 171.5 mbsf, the top of Subunit IVB (sedimentology = 164.4 mbsf), and one at 223.8 mbsf, the top of Subunit IVC (sedimentology = 222.7 mbsf).
Subunit IVA
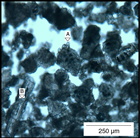
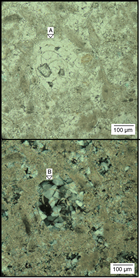
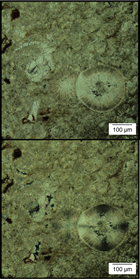
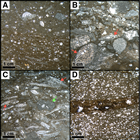
The top of Subunit IVA is marked by dolostone with red algae at 359-U1466A-18X-1, 0–5 cm. Below this interval, the subunit consists of alternating light gray and pale yellow, unlithified to partially lithified, very fine to medium-grained dolomitic wackestone. Benthic (miliolids) and planktonic foraminifers and bioclastic fragments are the dominant skeletal grains (Figure F8). The entire unit is slightly dolomitized, and most of the skeletal grains are partly recrystallized (Figure F9). Minor amounts of coccoliths were identified in the smear slides. The cements are microgranular calcite, minor silica, and possibly dolomite (Figure F10).
Subunit IVB
Subunit IVB consists of light gray to pale yellow, partly lithified to lithified, very fine to medium-grained dolomitic wackestone (dominant lithology) to packstone with mudstone intercalation at the top of the unit. Gradational contacts between the lithologies are changes in color, sorting, or degree of lithification. The main components are planktonic and benthic foraminifers, abundant bioclasts, and few ostracods. Most components are dissolved and partially infilled by calcite cements, such as acicular to fibrous calcite, dogtooth calcite cements (between 5 and 15 µm), and occasional dolomite (less than 5 µm long crystals). A single layer containing chert and dolomite clasts is located in interval 359-U1466A-23H-1, 20–62 cm (171.70–172.12 mbsf) (Figure F11).
Subunit IVC
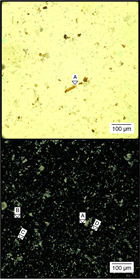
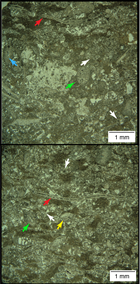
Subunit IVC is light gray to light brownish gray, very fine to medium-grained lithified dolomitic packstone (dominant lithology) to wackestone (dolomitic limestone). Occasionally, coarsening-upward and fining-upward units are present. Gradational contacts are represented by changes in sorting, degree of lithification, and/or grain size variations. The main bioclasts are planktonic and benthic foraminifers (Figure F12). Most components are cemented by microgranular calcite and rarely by acicular calcite. Bioturbation is common to abundant, with burrows commonly having a higher degree of lithification.
Subunit IVD
Subunit IVD is also light gray to light brownish gray, very fine to medium-grained lithified dolomitic packstone to grainstone. Bioclasts are mostly unidentifiable except for rare red algae and shell fragments.
Unit V
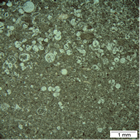
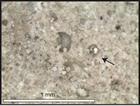
Unit V is marked by the abundant occurrence of large benthic foraminifers. The unit consists of light gray to light brownish gray, lithified, medium- to coarse-grained grainstone and packstone. The main components are abundant planktonic and benthic foraminifers (Miogypsinoides sp., Lepidocyclina sp. [?], Amphistegina sp., and Borelis sp.), and bivalves, red algae, and echinoid fragments are present (Figure F13). Bioturbation is very intense, destroying the original texture. A second generation of burrows is common. The base of Unit V is very fine to fine-grained lithified dolomitic wackestone in interval 359-U1466A-50X-1, 33 cm, to 50X-CC (Figures F14, F15). Bioclasts are abundant, and large benthic foraminifers and bivalve fragments are present. Microgranular calcite cements occur in some bioclasts.
Unit VI
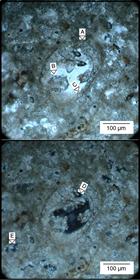
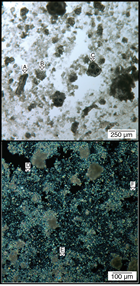
Unit VI is characterized by a significant increase in bioturbation intensity, with a large variety of ichnotaxa (Figure F16). The facies consists of alternating decimetric thick intervals of lithified fine- to medium-grained packstone and wackestone with discrete chert horizons. Contacts between alternating intervals are gradual and consist of changes in bioturbation intensity and sediment color (generally from grayish brown to light brownish gray). Planktonic and benthic foraminifers, echinoid fragments, and bioclasts are common. The finest fraction contains calcareous nannofossils (coccoliths and Discoaster) and dolomite crystals, pyrite, and aragonite needles (Figure F17). Analysis of the noncarbonate fraction shows that the dark intervals contain organic matter and lack clays. Some benthic and planktonic foraminifers have black infill in the chambers (presumably glauconite) and/or dogtooth calcite rims (Figure F18). Chert layers occur at 359-U1466B-37R-1, 38–41 cm, 38R-1, 0–10 cm, and 36R-1, 5–10 cm (large nodules); 36R-CC, 0–10 cm (small nodules); and 41R-1, 12–22 cm. Locally, glauconite (30R-1, 13–17 and 78–82 cm) and organic matter (30R-1, 71 cm) are present. Bioturbation is moderate to intense, resulting in a completely mottled appearance. Individual trace fossils with sharp outlines and regular geometry can be identified in the mottled, heavily bioturbated background mostly to the ichnogenus level (Gerard and Bromley, 2008). The trace fossil assemblage consists of seven ichnogenera including Chondrites, Palaeophycus, Planolites, Phycosiphon, Teichichnus, Thalassinoides, and Zoophycos (Figure F16). The ichnotaxa occurrence varies in the described interval.
Unit VII
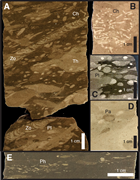
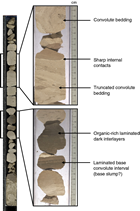
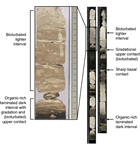
Unit VII consists of two subunits: Subunit VIIA, with gravity-induced resedimented deposits (Figure F19), and Subunit VIIB, with recurrent alternation of well-laminated black intervals with massive white chalk and gray-green intervals with moderate to abundant bioturbation (Figure F20).
Subunit VIIA
The top of Subunit VIIA is marked by intervals containing slumps, soft-sediment deformation features, and graded layers with sharp bases (Figure F19). The main facies of this subunit are lithified fine-grained wackestone to packstone with abundant planktonic foraminifers, benthic foraminifers, and calcareous nannofossils (e.g., coccoliths and Discoaster, especially abundant in the darkest intervals). Large benthic foraminifers (Operculina sp., Lepidocyclina [Eulepidina] sp., Heterostegina sp., and Nummulites sp.) occur in interval 359-U1466B-53R-1, 80 cm, to 53R-2, 129 cm (Figure F21).
The darker layers are organic rich (Figure F22), very fine grained, and poorly to well laminated and occasionally show an inclination up to 30° within slump intervals (49R-1, 0–104 cm). Bioturbation intensity decreases downhole, and Chondrites, Planolites, and Thalassinoides are the most common ichnospecies present and are often flattened. Benthic and planktonic foraminifers and bioclasts are abundant, and the latter show imbrication (dominantly horizontal along laminations). The darker layers generally have sharp basal contacts and gradational/bioturbated upper contacts that grade upward into the moderately to completely bioturbated lighter layers.
The lighter layers are thin to very thick, very fine grained, and (light) grayish brown to white. Bioturbation within these intervals is common to complete, and at times the sediments are too bioturbated to determine the ichnofossils. When observed, Thalassinoides is abundant, Chondrites and Planolites are common, and Zoophycos is present (intervals 51R-2, 81–112 and 45–102 cm, and 52R-4, 31–92 cm). A series of the lighter layers are convoluted, representing slump deposits (50R-1, 21–34 and 39–57 cm, 52R-1, 7–126 cm, and 52R-2, 0–13 cm). The white unit also includes very coarse grained to gravel rudstone (50R-1, 17–19 cm). The rudstone contains abundant large benthic and planktonic foraminifers, Halimeda, red algae, fragmented gastropods, and bivalves. Common coral fragments, up to 1 cm (at least two species present), were identified.
Subunit VIIB
At Section 359-U1466B-55R-2, 51 cm, Subunit VIIB starts with chalk that shows abundant calcareous nannofossils (coccoliths and Discoaster), and abundant >1 µm sized calcite crystals. Benthic foraminifers and aragonite needles are present. The up to 1 m thick chalk intervals alternate with thinner (up to 70 cm) black to light gray organic-rich mudstones that are very fine grained and well laminated (Figure F20). Bioturbation is well preserved in the chalk and displays rich diversity with Palaeophycus, Rhizocorallium, Thalassinoides, Planolites, Teichichnus, and Asterosoma. Bioturbation is absent in the black intervals, and hence they show well-developed laminations.
Discussion
Unit I represents the youngest sediments transported by the currents passing through the Kardiva Channel. They form sand waves and sheeted drift deposits. Sediments are coarse grained and contain a mix of shallow-water– and open-ocean–derived biota. The seismic profile and multibeam bathymetry also display the sand wave morphology at the seafloor (see Background and objectives).
Unit II contains unlithified packstone to grainstone, in some intervals it contains slightly more mud than the overlying sediment package, and it represents the moat fill (see Seismic stratigraphy). Planktonic foraminifers are the dominant skeletal grain throughout the entire unit, and there are fewer shallow-water–derived grains than in the overlying unit. Variations in sediment composition include alternating medium- and fine-grained sand and variations in texture in packstone and grainstone. These variations might originate from glacial–interglacial variations in sediment input with fine-grained packstone deposited during interglacial periods and coarser grained grainstone deposited during glacials that were reworked by currents (Paul et al., 2012; Betzler et al., 2013a).
The transition downcore to Unit III is sharp and marked by benthic foraminifers replacing planktonic foraminifers as the dominant skeletal grain. This boundary is a major erosional unconformity with a hiatus of approximately 6 My (see Biostratigraphy). Benthic foraminifers are well preserved, suggesting a short transport distance. The fauna and the abundance of the large benthic foraminifers indicate a fairly shallow depositional environment with an estimated maximum water depth of 150 m in highly oligotrophic zones (Renema and Troelstra, 2001). Hence, a fairly sharp upcore transition from a shallow-water benthic foraminifer–dominated environment (maximum 150 m water depth) to the open-ocean deep-water environment can be observed today. The overall depositional setting is most likely similar to the Nummulites shoals facies model proposed by Jorry et al. (2006), in which a large benthic foraminifer production site was combined with on- and offshore spreading of this biota by currents. The Kardiva Channel connecting the open ocean with the Inner Sea (see Seismic stratigraphy) was most likely the environment in which the large benthic foraminifers lived that subsequently were redistributed in the Inner Sea as part of a contourite fan deposit. Seismic profiles do show a downcutting erosion pattern marking the top of the unit (Lüdmann et al., 2013). The long hiatus associated with the erosion might explain the dolomitization of the underlying strata (Figure F7), with nearly 80% dolomite at 97.7 mbsf (see Geochemistry; Figure F37). Dolomitization below nondepositional surfaces is a well-documented process in other platform-slope settings (Swart and Melim, 2000).
Unit IV has a rather uniform texture and a slight fining-upward trend with wackestone at the top of the unit and grainstone at the base. The uniform texture and well-sorted character of the deposits confirm their drift sediment origin, as proposed by Betzler et al. (2013a), and agree with the grain size fraction <63 mm variations in ODP Leg 716 sediments described in Lüdmann et al. (2013; see fig. 9). The dolomitized tops of Subunits IVA, IVB, and IVC might be related to decreased sediment input and/or increased current activity.
Unit V is a fairly thin grainstone unit with large benthic foraminifers and wackestone, as well as planktonic foraminifers at the base. The mixed character of the sediments and the poor recovery hampers interpretation and attribution to the depositional environment of either Unit IV or Unit VI. A moderate peak in dolomite abundance at 309.3 mbsf (see Geochemistry; Figure F37) falls within this unit. The mixed character of the deposits and the diagenetic alteration, the latter of which possibly resulted from a combination of reduced sediment input and increased current activity, hints at a switchover of the sedimentation system from a platform-export–dominated system to a current-dominated depositional environment, but as mentioned above, core recovery limits straightforward interpretation.
Unit VI is fairly thick with cyclic alternations of intervals with varying ichnogenera in combination with color variations. The ichnogenera are typical for a deep basin environment. The cyclic alternation is largely similar to the Miocene sediments of the Great Bahama Bank (Eberli, Swart, Malone, et al., 1997; Betzler et al., 1999; Reuning et al., 2002) that showed dark gray–light gray wackestone–packstone cycles with dark layers deposited during rising sea levels and light layers that reflect sediment production and export during highstand of sea level. In analogy to these studies, the wackestone–packstone cycles of Unit VI represent a rather continuous sediment-shedding pattern related to sea level–controlled variations in sediment production and export of the carbonate platform.
The switch from packstone to grainstone at 420 mbsf possibly correlates with the platform changing from an aggradational phase to a progradational phase (Figure F3; see Seismic stratigraphy).
The upper part of Subunit VIIA contains intervals with mass-transported sediments, slump intervals, discrete gravity flows, and calciturbidites. Calciturbidites contain abundant shallow-water–derived large benthic foraminifers and other bioclastic debris. Deposits show gravity transport–related sorting. These sediment redeposition events might be related to increased platform production and subsequent destabilization of the carbonate platform slopes or result from a facies shift associated with progradation of the platform.
As described above, the lowermost Subunit VIIB displays alternating white and black intervals. Variations in the oxygenation levels of the depositional environment likely caused these cycles by enabling the full development of bioturbation during oxygenated time periods (white intervals) and resulting in their complete absence when oxygen levels were too low (black intervals). The transition from the white intervals to the black intervals is sharp, suggesting that a threshold was passed rapidly, whereas the transition from black to white is steady, suggesting a gradual return to normal oxygenated conditions.
Biostratigraphy
A ~318 m thick succession was recovered from Hole U1466A that ranges in age from Late Pleistocene to middle Miocene with one major hiatus inferred from biostratigraphy. Core recovery in Hole U1466B starts at ~314 mbsf, within the middle Miocene, and reaches 803.61 mbsf, close to the Oligocene/Miocene boundary. Calcareous nannofossils are present through almost the entire succession except for the middle–late Miocene but vary greatly in preservation. The best-preserved assemblages were recovered in Cores 359-U1466B-38R through 50R, which correspond to the early Miocene. Planktonic foraminifers are well preserved only in the uppermost 80 m of Hole U1466A and moderately to poorly preserved downhole, with two nearly barren intervals during the early and middle Miocene. Benthic foraminifer specimens are common throughout the succession, particularly in Samples 359-U1466A-11H-CC to 31H-CC. The overall assemblage composition indicates that sedimentation occurred in outer neritic to upper bathyal paleodepths. Ostracods are rare throughout the succession but are common in Samples 3H-CC to 5H-CC and 34F-CC. Radiolarians are virtually absent.
Age model
Data from planktonic foraminifers and calcareous nannofossils were combined to construct an age model for the site. Poor preservation of calcareous microfossils resulted in the age model being somewhat lower resolution than usual, but there is good correlation between the results from the two microfossil groups and we regard the age model as reliable.
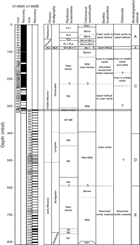
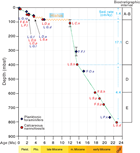
The integrated calcareous nannofossil and planktonic foraminifer biozonation and the paleoenvironmental interpretations are shown in Figure F23. The microfossil datums recognized at the site are summarized in Table T2. An age-depth plot including biostratigraphic datums is given in Figure F24. The estimated sedimentation rate for the Pliocene–Pleistocene succession is ~1.4 cm/ky. Most of the late Miocene is absent from the sedimentary record at this site. According to our data, a hiatus is inferred between the last occurrence (LO) of Coronocyclus nitescens (12.12 Ma) and the LO of Globoquadrina dehiscens (5.92 Ma), which correspond to ~114 mbsf (between Samples 359-U1466A-10H-CC and 16H-CC) and ~84 mbsf (between Samples 9H-CC and 10H-CC), respectively. The hiatus most likely corresponds to the lithostratigraphic Unit II/III boundary (see Lithostratigraphy). The error bar of the depth estimates of the two relevant biostratigraphic events allows positioning the hiatus at this depth level (Figure F24).
Table T2. Biostratigraphic events, Site U1466. Download table in .csv format.
The middle Miocene is divided into two intervals: the basal interval has a moderately high sedimentation rate (~4.4 cm/ky), whereas the upper interval has a much higher sedimentation rate (~17.1 cm/ky). The early Miocene is divided into two intervals based on microfossil preservation, although the average sedimentation rate does not change through those intervals and remains at the same values found in the basal middle Miocene (~4.4 cm/ky).
Calcareous nannofossils
Nannofossil assemblages were analyzed in all core catcher samples, including a basic inventory of the assemblage (see Biostratigraphy in the Expedition 359 methods chapter [Betzler et al., 2017a]). Inventory results are documented in Table T3. Additional samples were collected and examined from within core sections to check for variations in nannofossil assemblages and better constrain marker events.
Table T3. Nannofossil range chart, Holes U1466A and U1466B. Download table in .csv format.
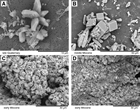
Preservation of nannofossils is highly variable, ranging from nearly pristine in the uppermost (late Quaternary) and lowermost (early Miocene) samples to very poor throughout most of the Pliocene to middle Miocene. A pervasive aspect of the preservation, however, is that overgrowth is far more evident than etching. Overgrowth occurs selectively on larger crystal faces; therefore, large nannofossils (e.g., discoasters and helicoliths) are virtually unrecognizable but smaller nannofossils (e.g., Umbilicosphaera and Syracosphaera) appear very well preserved. Examples of preservation are illustrated in Figure F25.
Interval A (Cores 359-U1466A-1H through 9H)
In the uppermost three cores, nannofossil preservation is good, and the first occurrence (FO) of Emiliania huxleyi (base of Zone NN21) and LO of Pseudoemiliania lacunosa (top of Zone NN19) can be reliably placed (Table T2). These events occur in successive samples, and because of coarse sampling (the samples are 3 m apart) we were not able to identify Zone NN20, but most likely it is not missing. Nannofossil preservation deteriorates markedly downhole, resulting in impoverished assemblages often dominated by Umbilicosphaera spp. As a result, Zone NN19 subzones cannot be distinguished. Discoasters are very heavily overgrown, but the FOs of the most abundant species, Discoaster brouweri and Discoaster pentaradiatus, were placed, although with larger uncertainty than usual (the Discoaster triradiatus acme was not observed). Subsequently, the LO of Sphenolithus abies is a well-marked, abrupt event and occurs during an interval of common small Gephyrocapsa, as is often the case (Young, 1998). Other early Pliocene markers were not observed, but most of these are rare and would not be expected in the low-diversity assemblages observed.
Interval B (Core 359-U1466A-10H)
Calcareous nannofossils in Core 359-U1466A-10H are more abundant and better preserved than those in Interval A, although still strongly overgrown. They include numerous Discoaster quinqueramus specimens. These assemblages are unambiguously of late Miocene, Zone NN11 age. No Amaurolithus specimens were observed; therefore, assignment to subzones is not possible. It is, however, notable that the other members of the D. quinqueramus lineage, Discoaster quinqueramus berggrenii and Discoaster quinqueramus bergenii, are absent. This suggests that the assemblages are of late Zone NN11 age. These Zone NN11 assemblages are present in all samples examined from Core 10H (Samples 10H-4, 21 cm; 10H-5, 11 cm; 10H-5, 132 cm; and 10H-CC) but are absent in Cores 9H (Samples 9H-2, 21 cm, and 9H-CC) and 11H (Samples 11H-1, 32 cm; 11H-2, 4 cm; and 11H-CC).
Interval C (Cores 359-U1466A-11H through 50X and 359-U1466B-2R through 9R)
Throughout this extended interval, nannofossils are sparsely present, with low-diversity assemblages and poor preservation. This event is also marked by the presence in the smear slides of abundant ascidian spicules and common rhombic dolomite. Assemblages are typically dominated by coccoliths, especially small reticulofenestrids and Umbilicosphaera jafari. Biostratigraphically, these assemblages are largely not age diagnostic, and the most useful result was the presence of several specimens of Coronocyclus nitescens in Sample 359-U1466A-16H-CC. C. nitescens is not used as a major marker, but its LO is a commonly noted secondary marker for the top of Zone NN6 (e.g., Young, 1998; Raffi et al., 2006).
Interval D (Cores 359-U1466B-10R through 34R)
Throughout this extended interval, nannofossils occur in low to moderate abundances but with somewhat higher diversity than in the preceding interval and are accompanied by fewer ascidian spicules, dolomite crystals, and aragonite needles. The marker fossil Sphenolithus heteromorphus occurs throughout this interval, from the middle of Core 359-U1466B-10R (10R-2, 15 cm) to the base of Core 34R. The FO is well marked, occurs in an interval with common coccoliths, and closely coincides with the first common occurrence of Cyclicargolithus floridanus, strongly indicating that it is a reliable stratigraphic horizon. The basal occurrence overlies a short interval of near-barren assemblages, so this may be a preservational event rather than the true LO. Helicosphaera ampliaperta was not observed, so it is not possible to separate Zones NN4 and NN5.
Interval E (Cores 359-U1466B-35R through 57R)
The upper part of Interval E is almost barren in coccoliths with very poor assemblages (Samples 359-U1466B-35R-CC to 39R-1, 69 cm). Below this interval, nannofossils are common to abundant with preservation generally improving downcore. The presence of common Helicosphaera euphratis, Helicosphaera recta, and Hughesius tasmaniae and occasional Triquetrorhabdulus carinatus support an age of Zones NN1–NN2. Specifically, H. euphratis is consistently present and more abundant than Helicosphaera carteri from Sample 40R-CC downward, H. recta is present from Sample 50R-CC downward, and clear T. carinatus was observed from Sample 52R-CC downward.
Sphenoliths are the prime markers in this interval (e.g., Fornaciari et al., 1990; Maiorano and Monechi, 1998; Raffi et al., 2006). Sphenolithus belemnos, the standard indicator for Zone NN3, was not observed, very likely because of the poor preservation in the upper part of Interval E. Below this interval, Sphenolithus pseudoheteromorphus occurs in Samples 39R-CC to 43R-CC. If we assume S. belemnos is missing because of poor preservation, this pattern corresponds closely to that recorded by Fornaciari et al. (1990) at ODP Site 714, in deep water just east of the Maldives. Below this pattern, a distinct occurrence of Sphenolithus calyculus occurs; this occurrence does not obviously correlate with other published records.
At the base of Hole U1466B (Cores 54R–57R), dark laminated and light bioturbated sediments alternate. These sediments have very abundant and well-preserved assemblages but with a high degree of variability between assemblages in the relative abundances of different species (Figure F25). This variability is likely due to the laminated sediments preserving ecological signals usually destroyed by bioturbation. A flood occurrence of Sphenolithus delphix in Sample 57R-2, 91 cm, clearly indicates that this sample is Zone NN1 in age, and this age assignment is supported by the occurrence of frequent H. recta and rare Clausicoccus fenestratus. The base of the sampled section is thus probably very near the Oligocene/Miocene boundary.
Planktonic foraminifers
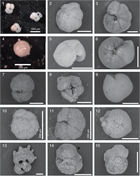
Planktonic foraminifers were examined in all core catcher samples from Holes U1466A (49 samples) and U1466B (50 samples) and were supplemented by occasional split-core samples (3 samples) (Tables T4, T5). Additionally, the mudline sample recovered at the core top of Hole U1466A was investigated. Planktonic foraminifer presence varies in sediments recovered in Holes U1466A and U1466B from highly abundant to few specimens (Figure F26). Notably, two near-barren intervals in the late and early Miocene interrupt the presence of planktonic foraminifers. When shells are present, planktonic foraminiferal preservation ranges from very good to poor.
Table T4. Planktonic foraminifer range chart, Hole U1466A. Download table in .csv format.
Table T5. Planktonic foraminifer range chart, Hole U1466B. Download table in .csv format.
Interval A (Cores 359-U1466A-1H through 9H)
Planktonic foraminifers are abundant in the Pliocene–Pleistocene section of Hole U1466A. Preservation of planktonic foraminiferal shells is variable in this section, ranging from very good to poor. Three Pleistocene biohorizons were identified, the LOs of Globigerinoides ruber pink (0.12 Ma), Globigerinoides fistulosus (1.88 Ma), and Globorotalia limbata (2.39 Ma), which were found in Samples 359-U1466A-1H-CC, 4H-CC, and 6H-CC, respectively. One or two specimens of G. fistulosus in Samples 2H-CC and 3H-CC are considered to have been reworked. The Pliocene LO of Dentoglobigerina altispira (3.47 Ma) occurs in Sample 7H-CC. Assignment of planktonic foraminiferal biozones in the early Pliocene is difficult because the markers Globorotalia margaritae and Globoturborotalita nepenthes were not found. Consequently, Zones PL1–PL4 are undifferentiated, but a hiatus is unlikely because all nannofossil biozones are present in this interval (Figure F23).
Interval B (Core 359-U1466A-10H)
Sample 359-U1466A-10H-CC yielded abundant, moderately preserved planktonic foraminifers. We assigned a late Miocene age to this sample based on the presence of Globoquadrina dehiscens (LO = 5.92 Ma) and the absence of Globorotalia tumida (FO = 5.57 Ma). This interval overlies a large near-barren interval separated by a hiatus.
Interval C (Cores 359-U1466A-11H through 50X and 359-U1466B-2R through 9R)
Placing the biozonal boundaries was difficult in Interval C because of poor preservation. A near-barren interval extends from Samples 359-U1466A-11H-CC to 33F-CC. Sample 34F-CC, the first sample below the near-barren interval, yielded rare Fohsella fohsi specimens, indicating that the top of this interval corresponds to Biozone M9. The boundary between Biozones M9 and M8, determined by the FO of F. fohsi (between Samples 49X-CC and 50X-CC), was tentatively placed at ~315 mbsf, but we acknowledge there may be a large error in this event due to poor preservation. Likewise, Biozones M7 and M8 were not differentiated because the shells of the Fohsella sp. lineage are poorly preserved.
Interval D (Cores 359-U1466B-10R through 34R)
Throughout Interval D, planktonic foraminifers occur at low to moderate abundances or are absent. Preservation of shells is very poor to moderate. Despite the overall low abundances and poor preservation, we placed the biozonal boundaries of Zones M4–M6 in this interval. The FO of Fohsella peripheroacuta, marking the Zone M6/M7 boundary, was tentatively placed in Sample 359-U1466B-12R-CC. Species of the Praeorbulina-Orbulina lineage define the M4–M6 zonal boundaries. The poor preservation of the specimens of this lineage makes identification of individual species difficult; as a result, the placement of zonal boundaries in this interval is tentative at this time. Nevertheless, we located the Zone M5/M6 boundary, marked by the FO of Orbulina suturalis, between Samples 13R-CC and 15R-CC. The Zone M4/M5 boundary was assigned based on the FO of Praeorbulina sicana in Sample 32R-CC.
Interval E (Cores 359-U1466B-35R through 57R)
A near-barren interval extends from Sample 359-U1466B-35R-CC to Sample 50R-CC. Few unidentifiable specimens or specimens from non–age diagnostic species are found in this interval. Few specimens of Globigerinatella sp. in Samples 51R-CC and 52R-CC support the presence of Biozone M3 below the near-barren interval. Samples downward throughout the remainder of the borehole contain slightly more diverse species and slightly improved preservation. The absence of Globigerinatella sp. in this interval confirms the presence of Biozones M1 and M2. The LO of “Paragloborotalia” kugleri was tentatively placed between Samples 54R-CC and 54R-3, 0–1 cm.
Benthic foraminifers
Benthic foraminifers are found throughout the Site U1466 succession (Table T6). Preservation varies from very good to poor. Four Pliocene–Pleistocene samples were investigated: 359-U1466A-1H-CC (good preservation), 3H-CC (good preservation), 8H-CC (good preservation), and 9H-CC (poor preservation). Pliocene–Pleistocene benthic fauna in all four samples generally indicate upper bathyal water depths of deposition (most likely <500 m) based on the presence of species such as Planulina ariminensis, Planulina subtenuissima, Cibicidoides dutemplei, Sphaeroidina bulloides, and Cibicidoides bradyi. All samples contain reworked shallow-water taxa ranging from reefal to middle neritic environments, such as Amphistegina lessonii, Sorites orbiculus, Peneroplis pertusus, and Amphistegina radiata. Late Miocene Sample 10H-CC yielded abundant, moderately preserved benthic foraminifers. The absence of reefal and neritic species indicates an upper bathyal paleodepth. Middle Miocene Samples 359-U1466B-12R-CC, 14R-CC, and 16R-CC yielded neritic assemblages of benthic foraminifers. The assemblages are highly diverse, comprising reefal to inner-middle neritic taxa (e.g., Cycloclypeus mediterraneus). The absence of outer neritic and upper bathyal taxa suggests that the maximum water depth was middle neritic, ranging between 30 and 100 m. Examples of reefal taxa are Calcarina sp., Parasorites sp., and Amphistegina sp. The large specimens are highly abraded, indicating that they have been transported. Five early middle Miocene samples were investigated for benthic foraminiferal content. All assemblages are poor to moderately preserved and dominated by Cibicides sp. A summary of the paleodepth inferred from the assemblages is indicated in Figure F23. Additionally, we found abundant echinoderm spine fragments, fish teeth, and coral fragments.
Table T6. Benthic foraminifer range chart, Hole U1466B. Download table in .csv format.
Ostracods
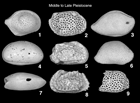
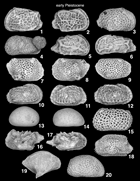
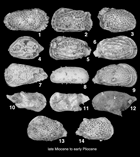
Forty core catcher samples spanning the sedimentary succession recovered in Holes U1466A and U1466B were examined for ostracods. Ostracods are generally rare to absent, although they are common in Samples 359-U1466A-3H-CC to 5H-CC and 34F-CC. Preservation varies from good (in Samples 1H-Mudline, 1H-CC, 3H-CC, 4H-CC, and 5H-CC) to poor (e.g., Samples 359-U1466A-19H-CC and 359-U1466B-50R-CC). Poorly preserved specimens are mostly overgrown or cemented to other grains. Pliocene to Pleistocene ostracod faunas (Samples 359-U1466A-1H-CC to 8H-CC) are the most abundant and diverse and reflect outer neritic to upper bathyal depths of deposition based on the presence of Neonesidea, Bosasella, Paranesidea, Bradleya, Krithe, and Cytheropteron (Figures F27, F28, F29). Middle Miocene faunas are very rare. Only few specimens of Bradleya, Ambocythere, Paracytheridea, and Hemicytherura were found in Samples 16H-CC, 19F-CC, and 22H-CC. Only Sample 34F-CC contains numerous specimens of Loxoconcha, Loxocorniculum, Paracytheridea, Caudites, Ambocythere, and Aurila, and these taxa are indicative of inner to middle neritic paleoenvironments. All early Miocene samples examined are barren of ostracods except Sample 359-U1466B-50R-CC, where fragments of Cytherella were found. A summary of paleodepths inferred from ostracod assemblages is indicated in Figure F23.
Radiolarians
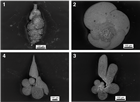
A total of 48 core catcher samples from Hole U1466A and 28 core catcher samples and 2 split-core samples from Hole U1466B were prepared for radiolarian analysis. We found radiolarians in 2 core catcher samples from Hole U1466A (11H-CC and 26F-CC); each of them has only one individual radiolarian. No radiolarians were found in the core catcher samples and split-core samples from Hole U1466B. However, 55 species were identified and counted from the mudline sample from Hole U1466A. The most common species was Tetrapyle octacantha Müller group, the warm-water subtropical species. In addition, a few warm-water species such as Dictyocoryne profunda Ehrenberg, Euchitonia furcata Ehrenberg, and Didymocyrtis tetrathalamus (Haeckel) and intermediate-water species such as Larcopyle butschlii Dreyer were also common in the mudline sample.
Mudline samples
A mudline core top sample was collected from Hole U1466A. This mudline sample is substantial in volume and abundant in both planktonic and benthic foraminifers and in ostracods, mollusks, pteropods, and echinoderm fragments. Species of planktonic foraminifers include abundant specimens of fragile Bolliella adamsi and of Globorotalia scitula and Orbulina suturalis. Benthic foraminiferal species included samples of Textularia spp., Uvigerina hispida, and miliolid species (Figure F30). Large pteropods were also collected from this sample in excellent condition. Further investigation is needed to determine the live and dead assemblage rate at this locality.
Geochemistry
Interstitial water chemistry
Interstitial water (IW) samples were taken from Hole U1466A using squeezed samples at a rate of one per core (recovery permitting) and Rhizon samplers over the upper ~40 m at a rate of two per section. As a result of the indurated nature of the rocks, only one IW sample was taken in Hole U1466B.
Applied squeezing pressures ranged from 8,000 to 35,000 psi, and the amounts of extracted IW ranged between 16 and 50 cm3. Splits of IW samples were taken and processed following methods outlined in Geochemistry in the Expedition 359 methods chapter (Betzler et al., 2017a). These splits were preserved for shore-based analyses of carbon, oxygen, sulfur, calcium, magnesium, and strontium isotopes. Concentrations of all species measured are presented in Table T7.
Table T7. Interstitial water chemistry, Site U1466. Download table in .csv format.
Chloride, bromide, and salinity
Concentrations of Cl– measured using titration with AgNO3 exhibit a steady increase from seawater values of ~550 mM at the seawater/sediment interface to between 580 and 590 mM at ~70 mbsf (Figure F31; Table T7), approximately coincident with the change from lithostratigraphic Unit II to Unit III (see Lithostratigraphy). Two samples obtained from the Rhizon samplers (Samples 359-U1466A-2H-1, 75 cm, and 3H-4, 50 cm) had lower Cl– concentrations similar to values in the mudline sample. This pattern is mirrored in salinity.
Concentrations of Cl– measured using ion chromatography (IC) are considerably more variable than those measured using titration, a problem attributed to dilution errors. In fact, no correlation is observed between titration and IC measurements (R2 = 0.017), which renders the concentration data on all ions obtained from IC data unusable. However, assuming that the error in the IC data is a result of dilution problems, it is possible to look at ratios of the elements relative to Cl– measured on the IC. In discussing the ratios of elements measured, Cl– measured using titration is used, except when ratios include ions measured using the IC.
Concentrations of Br– were measured using the IC and therefore suffered the same problems as Cl–. Nevertheless, a strong correlation between Cl– and Br– measured by this method (R2 = 0.97) supports the hypothesis that issues with the IC data are probably a result of dilution problems.
Sodium and potassium
Concentrations of Na+ range between 415 and 451 mM and exhibit an increase with depth similar to that observed in the Cl– data (Figure F31; Table T7). Although there is a correlation between Cl– and Na+ (R2 = 0.5), the relationship is not perhaps as strong as expected, given that these elements are normally considered to be conservative. Also, there is no correlation between Cl– and Na+ in either the shallow depth grouping (0–100 mbsf) that corresponds approximately to lithostratigraphic Units I and II and contains lower Cl– or the grouping of deeper samples that corresponds to lithostratigraphic Units III–VI and has slightly higher Cl– (Figure F32). The breakdown in correlation between these two elements is also manifested in a slight decrease in the Na+/Cl– ratio of the pore fluids with increasing depth.
The concentration profile of K+ is similar to that seen in the Na+ data, and K+ also exhibits a relatively poor correlation with both Na+ and Cl–.
Alkalinity, pH, and dissolved sulfate
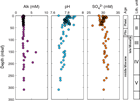
Alkalinity varies between 2.2 and 2.6 mM in the upper 50 mbsf (Figure F33; Table T7) with the exception of the two Rhizon samples mentioned above (Sample 359-U1466A-2H-1, 75 cm, and 3H-4, 50 cm) that contain low Cl– concentrations. Alkalinity decreases from 2.57 mM at 58.4 mbsf to approximately 2.31 mM at ~100 mbsf (97.6 mbsf). From this point, alkalinity steadily increases to 2.61 mM near the last sample taken in Hole U1466A (47F-1, 140–150 cm). The sample taken from Hole U1466B (25R-2, 140–150 cm) at 509.6 mbsf has an alkalinity of 4.34 mM. Although some anomalous samples have higher values, 4.34 mM is probably realistic, considering the trend.
The pH decreases steadily from approximately 7.8 in the upper portion of the core to ~7.7 at ~140 mbsf. At ~150 mbsf, pH sharply increases to 7.75 and then declines to the base of Hole U1466A (47F-1, 140–150 cm). See Geochemistry in the Expedition 359 methods chapter (Betzler et al., 2017a) regarding errors associated with pH measurements.
Samples 13H-4, 140–150 cm, 20F-2, 140–150 cm, and 28F-2, 141–151 cm, have anomalously elevated alkalinity values at 106.4, 153.2, and 195.8 mbsf, respectively. Removing these values results in an inverse correlation with pH and a positive correlation with Cl–.
Absolute concentrations of SO42– are marred by the poor precision of the IC; however, SO42–/Cl– ratios were used, assuming the issues that plagued the precision on the IC apply to both ions. The IC SO42– data were corrected by multiplying the SO42–/Cl– ratio obtained from the IC by the Cl– concentration obtained by titration. The mudline sample has a SO42–/Cl– ratio of 0.0515 mol/mol, close to the mean seawater value. This value increases to 0.055 mol/mol at approximately 8 mbsf and then gradually decreases to 0.0515 mol/mol at 40 mbsf. Below this depth, the ratio shows random variations between 0.0515 and 0.054 mol/mol.
Calcium, magnesium, strontium, and lithium
Concentrations of Ca2+ increase from seawater values of approximately 10.2 mM at the top of Hole U1466A to ~14 mM in the last sample taken (357-U1466A-47F-2, 140–150 cm). Between 50 and 100 mbsf they increase about 3 mM to ~13 mM. From 100 to 309 mbsf, Ca2+ increases by another 1 mM (Figure F34; Table T7). Over the same intervals, the Ca2+/Cl– ratio increases from 19 to ~25 mmol/mol.
Concentrations of Mg2+ increase slightly over the upper 40 mbsf from a seawater concentration of ~52 mM to 53 mM. Below this depth, they decline steadily from 53 to ~50 mM. These changes correspond to a steady decrease in the Mg2+/Cl– ratio from 95 mol/mol in the surface sediments to ~80 mmol/mol in the deepest sample analyzed (47F-1, 140–150 cm). As a result of both the increases in Ca2+ and decreases in Mg2+, the Mg2+/Ca2+ ratio in the pore fluids decreases below 50 mbsf from values near seawater (5.1 mol/mol) to values of 3.5 mol/mol at the bottom of Hole U1466A.
Concentrations of Sr2+ increase slowly over the upper 25 mbsf from seawater values around 90 µM to ~120 µM at ~25 mbsf. At this depth, concentrations rise steeply to 140 µM, remain constant to ~95 mbsf, and increase to 393 µM at 153 mbsf. Below this depth, they gradually increase to the bottom of the hole, reaching a maximum of 483 µM at 309.2 mbsf. Superimposed on this trend are several anomalous values at 1.99, 32.34, 39.39, and 186.39 mbsf (similar to those observed in the alkalinity data). These values are elevated compared to the general trend and are suspected to be contaminated, although the source is unclear.
Concentrations of Li+ increase from seawater values (29 µM) to 35 µM in Sample 32F-2, 140–150 cm, at 214.6 mbsf (Figure F34).
Manganese, iron, barium, boron, and silicon
Iron and manganese concentrations are higher close to the sediment/seawater interface (Fe = 0–7 µM; Mn = 0–0.7 µM) and decrease to below detection with increasing depth (Figure F35; Table T7).
Concentrations of Ba2+ are <1 µM throughout Hole U1466A, with the exception of one sample at 186.39 mbsf.
Boron has a very small but gradual increase throughout Hole U1466A, reaching more than 400 µM at the base. There are several anomalously high values at similar depths to anomalous values observed for other ions.
Silicon remains stable for the upper 120 mbsf and then increases to ~390 µM in the deepest sample squeezed.
Bulk sediment geochemistry
Calcium carbonate
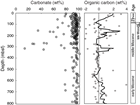
Carbonate content was determined at a rate of one sample per section, and carbon was determined at a rate of one per core. In total, 244 samples were analyzed. Calculated CaCO3 contents were corrected for the percentage of dolomite (see XRD data in the Laboratory Information Management System [LIMS] database) where applicable. Because the percentage of dolomite was not measured on every sample, its predicted percentage was calculated by extrapolation from the nearest sample on which the percentage had been measured. As this extrapolation does not take care of nonlinear changes in dolomite abundance, the procedure failed to correct all values in excess of 100 wt%. The correction reduced carbonate contents from between 14 and 103 wt% to between 14 and 101 wt%, with the majority of the data falling between 85 and 99 wt% (Figure F36; Table T8).
Table T8. Carbon and nitrogen, Site U1466. Download table in .csv format.
Organic carbon
Total organic carbon concentrations were measured on one sample per core and range between 0.1 and 0.6 wt%. Numerous samples have calculated organic concentrations less than zero, which is an artifact of the inadequate method of determining the amount of organic carbon in carbonate-rich sediments (see Geochemistry in the Expedition 359 methods chapter [Betzler et al., 2017a]). Maximum values in organic carbon occur at 175 and 310 mbsf. The upper portion of Hole U1466A has organic carbon values as high as 2 wt%.
Total organic nitrogen is low, averaging 0.09 wt% with a maximum of 0.14 wt%. As a result of the persistent negative percent carbonate, no attempt was made to calculate the C:N ratio.
X-ray diffraction
Mineralogy was determined at a rate of approximately one sample per core, with additional material supplied on an ad hoc basis. In the upper ~85 mbsf, the sediment consists of between 25% and 80% aragonite, with the remainder being composed of low-Mg calcite (LMC) (Figure F37; Table T9). Below this depth, dolomite concentrations increase below an erosional unconformity that produced a hiatus from 5–12 Ma (see Biostratigraphy). With increasing depth, dolomite decreases, and it disappears around 300 mbsf. This decrease is punctuated by several peaks in dolomite at 135, 171.6, 223.8, and 309.5 mbsf. Aragonite disappears between 85 and 148.5 mbsf but reappears below 148.5 mbsf and reaches a maximum of 20% at 223.82 mbsf. Lower in the section, aragonite still comprises a very minor portion of the sediment, varying between 0% and 3.6%. In the lower portion (below 309 mbsf), quartz is ubiquitous but never comprises more than 2% of the sediment.
Table T9. XRD results, Site U1466. Download table in .csv format.
Major, minor, and trace element composition
Minor and trace element composition was measured on all IW squeeze cakes from Hole U1466A and a selection of samples from Hole U1466B that were analyzed by XRD. The most important elements relevant to carbonate diagenesis (Sr, Mg, Fe, and Mn) are presented in Figure F38 as molar ratios relative to calcium. All data are presented in Table T10.
Table T10. Solids geochemistry, Site U1466. Download table in .csv format.
Manganese and iron
The Mn/Ca and Fe/Ca ratios are higher in the Pliocene–Pleistocene portion of the core (above 85 mbsf). They range from 0.08 to 0.10 mmol/mol (Figure F38) and then decrease to between 0.03 and 0.05 mmol/mol at 400 mbsf. Ratios increase below 400 mbsf.
Strontium and magnesium
The Sr/Ca ratios are high in the Pliocene–Pleistocene portion of the core and decrease downhole (Figure F38). The Mg/Ca ratio increases at approximately 100 mbsf and then decreases with increasing depth.
Volatile hydrocarbons
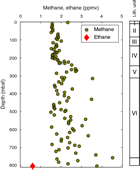
Headspace samples for the analysis of methane, ethene, ethane, propene, and propane were taken from every core in Holes U1466A and U1466B, generally from the top of Section 5 in each core when an IW sample was taken. Methane concentrations remain between 1.5 and 4.5 ppmv and increase slightly with depth (Figure F39; Table T11). Ethane is only present in measurable quantities (0.61 ppmv) in the last core taken from Hole U1466B (57R-CC).
Table T11. Headspace hydrocarbons, Site U1466. Download table in .csv format.
Discussion
Interstitial pore water
The minimal changes in the SO42–/Cl– ratio and alkalinity of interstitial fluids in the upper 85 mbsf indicate either relatively low rates of organic matter remineralization or rates of advection by bottom seawater that are faster than the rates of decomposition of organic matter. The increase in SO42–/Cl– in the pore fluids to ratios higher than those in seawater in the upper portion of the sedimentary column might explained by the release of SO42– from carbonates during dissolution of aragonite and high-Mg calcite (HMC). The slight decreases observed would therefore be a consequence of bacterial sulfate reduction (BSR). These low apparent rates of BSR are present in spite of apparently high concentrations of organic material and therefore suggest that significant fluid advection is taking place.
Carbonate diagenesis
At Site U1466, aragonite concentrations remain relatively high throughout the Pleistocene and Pliocene (0–85 mbsf), reflecting either variations in the input from adjacent platforms during changes in sea level or diagenetic change to LMC. Although the hypothesis that aragonite is not being neomorphosed in the upper 85 mbsf is supported by the absence of large increases in Sr2+ concentrations in the pore fluids (Figure F34), such as those seen at other periplatform sites in the Bahamas (Shipboard Scientific Party, 1997), Maldives (Shipboard Scientific Party, 1988), and Great Barrier Reef (Shipboard Scientific Party, 1991), the possibility also exists that relatively high rates of fluid advection are removing evidence of dissolution and precipitation reactions.
The unconformity at 85 mbsf represents a substantial time gap (5–12 Ma) (see Biostratigraphy) below which aragonite concentrations disappear and sediment contains up to 70% dolomite. Although the pore water profiles of Sr2+/Ca2+, Ca2+/Cl–, and Mg2+/Cl– (Figure F40) all change within this zone, the diagenesis that produced the large amount of dolomite and removed the aragonite is not reflected in the pore water geochemistry and therefore is not taking place at the present time. Instead, it is associated with the 7 My break in the sedimentary record mentioned previously. During this time, geochemical pore water gradients were probably significantly different than those measured at the present time. At some interval within the period represented by the unconformity, significant amounts of diffusion of ions into the sedimentary system occurred, providing not only cations such as Ca2+ and Mg2+ but also SO42– for the oxidation of organic material. This diffusion in turn would have promoted the formation of dolomite, and the mechanisms might be similar to the dolomitization associated with other hardgrounds (Swart and Melim, 2000). Below ~150 mbsf, dolomite concentrations decrease and up to 20% aragonite is present. The increasing Sr2+/Ca2+ ratio of the pore fluids in the interval below 150 mbsf suggests neomorphism of aragonite to LMC. Below 320 mbsf, dolomite disappears and is only barely detectable in trace concentrations through the remainder of the core. Aragonite is also present to 500 mbsf at concentrations less than 1%. Decreases in Mg2+/Ca2+ and increases in Sr2+/Ca2+ in the pore fluids within this interval suggest that dolomite is probably forming, albeit at very slow rates. This suggestion is supported by the XRD data, which documents less than 1 wt% dolomite in some intervals.
Minor elemental chemistry
Although variation in the Mg/Ca and Sr/Ca ratios seems to reflect variations in the percentage of aragonite and dolomite, respectively, some important differences might give clues to the timing of the diagenesis. In particular, the interval between 100 and 200 mbsf has minimal amounts of aragonite and an increase in Sr/Ca (from 100 to 200 mbsf). These ratios do not reflect precipitation from seawater with a normal Sr2+/2+ Ca ratio (~9 mmol/mol) but instead suggest precipitation from an evolved pore water fluid in which Sr2+ concentrations increased as a result of the formation of LMC and dolomite. Such a system might have been present during the period represented by the erosional unconformity. Similar increases in Sr content have been noted below other surfaces that experienced prolonged hiatuses (Swart and Melim, 2000). This observation strongly supports the theory that dolomitization and other diagenetic process are associated with the prolonged hiatus experienced between 5 and 12 Ma. As a result of the unexpected appearance of dolomite, standards for Mg were not prepared for inductively coupled plasma–atomic emission spectroscopy (ICP-AES) analysis with a high enough range. Therefore, the Mg concentrations reported are lower than theoretical values based on the dolomite concentrations present.
In contrast to Sr and Mg, changes in the Mn/Ca and Fe/Ca ratios may reflect variations in redox chemistry and incorporation of the reduced forms of these elements into diagenetic carbonates. For example, the pore water Mn concentration is elevated near the seawater/sediment interface, probably reflecting moderately reducing conditions that allowed reduction of Mn4+ to Mn2+ and Fe3+ to Fe2+. Because Mn2+ and Fe2+ are much more soluble than their oxidized forms, the pore fluids in this interval possessed higher Mn and Fe concentrations. These reduced Mn2+ and Fe2+ species were then incorporated into diagenetic calcites formed in this shallow burial zone, effectively removing the ions from the pore water. Therefore, concentrations of these elements declined. These processes do not appear to have occurred in the sediment below 85 mbsf, where concentrations of both elements are very low.
Chloride, sodium, potassium, and other elements
The phenomenon of increasing Cl– concentrations in the pore fluids with increasing depth has been noted by other workers in sediments deposited adjacent to carbonate platforms (Kramer et al., 2000) and is suggested to be a result of either (1) dissolution of metastable minerals such as aragonite and HMC that contain high Cl– and SO42– (Staudt et al., 1993) and/or (2) diffusion of Cl– from an underlying source. Such a mechanism would mean that Cl– is not conservative and help explain the relatively poor relationship between Cl– and Na+ (and K+).
Another possibility that might explain the poor correlation between elements such as K+, Na+, and Cl– is that K+ and Na+ are involved in clay mineral reactions. Although clay minerals were not identified in the XRD data at Site U1466, there is a persistent amount of noncarbonate material that is not quartz. In addition, the XRD profiles trend toward high values at low diffraction angles, usually characteristic of materials containing clay minerals, and there is an anomaly on the low-angle side of the LMC peak at 29.4, which is usually caused by the presence of the feldspar family of minerals (see XRD data in the LIMS database). The presence of quartz and small amounts of clay minerals may account for the increase in Si in the pore fluids (Figure F35).
Paleomagnetism
Pass-through magnetometer measurements were performed on the entire set of archive-half cores (359-U1466A-1H through 50X and 359-U1466B-2R through 57R) at 5 and 10 cm intervals and on 17 discrete samples (5 from Hole U1466A and 12 from Hole U1466B) collected from the working halves. Archive-half cores were subjected to stepwise alternating field (AF) demagnetization up to 30 mT and then measured in the pass-through superconducting rock magnetometer (SRM). Discrete samples were demagnetized up to 80 mT using the ASC D-2000 AF demagnetizer and measured with the AGICO JR-6A spinner magnetometer with the main objective of recognizing the characteristic remanent magnetization (ChRM).
Natural remanent magnetization of sedimentary cores
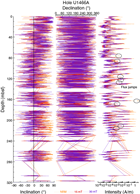
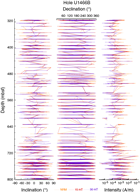
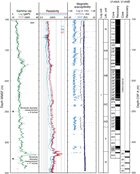
Natural remanent magnetization (NRM) intensity, inclination, and declination in Holes U1466A and U1466B (Figures F41, F42) were compared with intensity and inclination results obtained after demagnetization at 15 and 30 mT. NRM intensity varies greatly, and variations were maintained even after demagnetization at 30 mT. Hole U1466A NRM intensities range between 1.14 × 10⁻⁶ and 4.14 A/m with a mean of 3.27 × 10⁻² A/m. Typical peaks of high NRM intensity are located at the top of each core. The intensity of the NRM signal in Hole U1466B is somewhat lower than that of Hole U1466A (ranging from 3.33 × 10⁻⁶ to 2.08 × 10⁻¹ A/m). The strong visual correlation between the variations in magnetic susceptibility (MS) and the variations in NRM intensity (see Physical properties) suggest that they are the result of drilling artifacts or contamination with magnetic material that extends down several meters from the top of each core. Remanent magnetization in this highly magnetized interval is very unlikely to represent a record of the geomagnetic field.
Occasional “flux jumps” occurred in the magnetometer, mostly in the Y-axis superconducting quantum interference device (SQUID) sensor. These jumps affect the measurement of some core sections (see values in the middle of Hole U1466A in Figure F41), which have been removed from the measurements.
Magnetic measurements
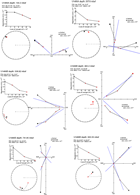
Magnetic measurements of archive-half cores were seriously affected by drilling artifacts or contamination. We demagnetized the core sections at 10, 15, 20, and 30 mT, measuring the magnetization every 5 or 10 cm and optimizing the measurement time according to the core flow. Most sediments recovered above ~62 mbsf are coarse-grained water-trenched grainstone. The NRM signal of these cores is randomly oriented, preferentially in the lower hemisphere, even after demagnetization at 30 mT (Figure F43). We hypothesize that the magnetic particles were subject to physical reorientation in the unconsolidated sediments during the coring process. Deeper sediments (Cores 359-U1466A-10H through 15H), although still coarse-grained, show NRM directions (after demagnetization at 30 mT) with preferential low inclinations; however, the scattering is still extremely large, and the Icefield MI-5 tool–corrected average declinations, which are available only for Cores 10H and 11H, are far from north (138° and 312°, respectively). A decrease in magnetization intensity from 3.72 × 10⁻² to 4.57 × 10⁻³ A/m and a shallowing of inclination values from 24.29° to 7.76° were mainly observed during demagnetization at 30 mT in Hole U1466A sediments (Figures F41, F42, F43). Inspections of vector plots show some well-behaved samples with the overprint usually removed at 10 mT; however, even directions computed with principal component analysis (PCA; Kirschvink, 1980) remain very scattered. Vector plots in the lower part (Units IV–VII) of Holes U1466A and U1466B, drilled in consolidated sediments, show slightly better paleomagnetic results in general, but a complete magnetostratigraphy is also hampered by the lack of core orientation and poor recovery.
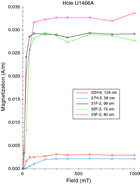
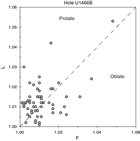
The more complete stepwise AF demagnetization performed in discrete samples did not produce better results. It was not possible to identify the ChRM in most of the discrete samples, and some samples could not be completely demagnetized at 80 mT, suggesting the presence of a relatively high coercivity mineral. Acquisition of isothermal remanent magnetization performed in the same set of samples, however, does not support the presence of any significant amount of hematite (Figure F44). The anisotropy of magnetic susceptibility (AMS) was measured on 60 discrete samples using the KLY 4S Kappabridge. The diamagnetic matrix dominates the magnetic susceptibility of these carbonate sediments. Nevertheless, they show AMS from 1% to 4% and are often associated to a prolate ellipsoid (Figure F45), suggesting that bottom currents or the depositional slope might affect grain orientation. The directions of the principal anisotropy axis show moderate inclinations, but at this stage the lack of core orientation prevents using anisotropy information to study paleocurrent directions.
Magnetostratigraphy
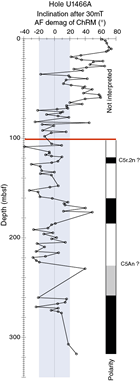
The Icefield MI-5 tool was used in most of the upper part of the sequence, which was drilled using the APC system, but did not give interpretable results. The rest of the site was drilled with rotary techniques, and no azimuthal orientation is available; therefore, magnetostratigraphy must rely only on information given by inclination. Given the extremely low quality of the paleomagnetic data in Hole U1466A, even after 30 mT “blanket” demagnetization, we removed all data points with intensity exceeding 1 × 10⁻⁴ A/m, which were regarded as possibly affected by drilling disturbance or contamination, and averaged the inclination of each core section to increase the signal-to-noise ratio. Each section was then treated as a single sample. The angular mean was considered adequate to compute the mean inclination, given the low latitude of the site and very large scattering in the data. Only the paleomagnetic inclinations of the sediments below 100 mbsf in Hole U1466A were tentatively interpreted, where we recognized five magnetozones defined as intervals with multiple, consecutive samples with the same polarity (Figure F46).
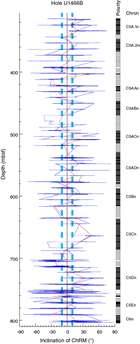
In Hole U1466B cores, given the slightly better quality of the NRM, we calculated paleomagnetic inclination using PCA. Here, 21 magnetozones were recognized using only the inclination data after smoothing it with a four-point moving average to reduce the noise, although the chron boundary could not be defined precisely because of the absence of sample continuity (Figure F47).
We stress that the determination of paleomagnetic polarity based only on inclination data for this site and its age interval is tenuous for several reasons: (1) the very low paleolatitude (the site is expected to have crossed the Equator during the mid-Miocene), (2) possible inclination anomalies due to a nondipole field (e.g., Schneider and Kent, 1988), and (3) most important, the poor data quality due to contamination and low recovery.
However, we tentatively interpret the series of magnetozones in Hole U1466B as the Chron C5A.1n–C5E series and C6 (following Gradstein et al., 2012), considering shipboard micropaleontological studies, which indicate that the core at the base of Hole U1466B is within the Zone NN1/NN2 and M1/M2 boundaries (early Miocene, Aquitanian; ~20 Ma) and the cores above have an age of Zone NN6 to M7–M8 (middle Miocene, Serravalian; ~13 Ma) (see Biostratigraphy) (Figure F46).
Physical properties
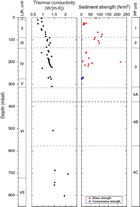
Physical properties measurements were performed on cores recovered from Holes U1466A (0–326 mbsf) and U1466B (316–822 mbsf) to obtain basic information on density, porosity, shear strength, natural gamma radiation (NGR), color reflectance, thermal conductivity, magnetic susceptibility, and P-wave velocity. Thermal conductivity was measured on the third section of 41 whole-round cores from Hole U1466A, and six measurements were done on discrete hard samples from Hole U1466B. Discrete measurements of P-wave velocity, bulk density, porosity, and shear strength were obtained. P-wave velocity was measured with the P-wave caliper (PWC) on split cores and discrete cylinder samples along the x-axis. Shear strength was determined only on soft sediments from Hole U1466A using the manual Torvane shear device. Bulk density and porosity measurements were conducted with a plastic syringe for soft sediments in every section from Hole U1466A and on discrete hard samples from Hole U1466B.
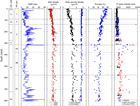
Results from the Whole-Round Multisensor Logger (WRMSL), Section Half Multisensor Logger (SHMSL), and discrete sample measurements from Holes U1466A and U1466B are shown in Figures F48, F49, and F50. Four petrophysical (PP) units were identified based on variation of gamma ray attenuation (GRA) and moisture and density (MAD) bulk density, P-wave velocity, and NGR measurements that were correlated at the same depth intervals. Unit 1 extends from 0 to 88.8 mbsf. The Unit 2/3 boundary is at 138.8 mbsf. Unit 4 below 317.4 mbsf consists of three subunits: Subunit 4A (317.4–372.78 mbsf), Subunit 4B (327.78–577.45 mbsf), and Subunit 4C (577.45–803.5 mbsf).
Natural gamma radiation
NGR generally increases from the seafloor to 88 mbsf (Figure F48). A sharp decrease in NGR (25 to 5 counts/s) at 88 mbsf marks the boundary between Units 1 and 2. NGR values remain low (5 to 15 counts/s) with low variability to 139 mbsf. Increasing NGR values mark the boundary between Units 2 and 3. Relatively high (>20 counts/s) and variable NGR defines Unit 3, which extends from 139 to 317 mbsf. Unit 4 (317–803.5 mbsf) starts with lower NGR but tends to increase downhole with greater variability.
Density and porosity
Density measurements were performed with GRA on whole-round cores and MAD on discrete samples (Figure F48). Through Units 1–3 (0–317 mbsf), both GRA and MAD bulk density generally increase from 1.5 to 2.1 g/cm3. Bulk density is relatively constant but with greater variability in Unit 4. Intervals of high density (>2.1 g/cm3) appear at 310–370, 460–470, 590–620, and 700–730 mbsf. Some abrupt changes in density coincide with changes in other physical properties, such as P-wave velocity and NGR. Grain density decreases slightly with depth, ranging from about 2.8 g/cm3 at the top to 2.7 g/cm3 at the bottom. This observation is consistent with the changing mineral composition downhole. In the upper ~300 m, aragonite (density = 2.93 g/cm3) and dolomite (density = 2.84 g/cm3) coexist with calcite (density = 2.711 g/cm3) (see Geochemistry). In the lower part of the core, only calcite is found.
Porosity is very high at the top of hole but decreases downcore in Unit 1 from 80% to 60% (Figure F48). In Units 2 and 3, porosity continues to decrease (60% to 40%) but at a slower rate relative to Unit 1. The top of Unit 4 is marked by a significant decrease in porosity (40% to 10%), and porosity remains low from 310 to 370 mbsf, defining Subunit 4A. Subunit 4B is marked by higher porosities (~50%) between 370 and 580 mbsf. Decreased porosity at 580 mbsf marks the top of Subunit 4C. Porosity remains around 40% to the target depth.
P-wave velocity
P-wave velocities were measured on all whole-round cores. P-wave velocity was also measured on section halves, discrete samples collected for paleomagnetic measurements, and split cores from Section 359-U1466A-9H-1 and Hole U1466B. The three techniques were compared on samples between ~250 and 300 mbsf. In general, WRMSL measurements were lower than discrete measurements due to poor coupling between the core and the liner.
P-wave velocities in Unit 1 are close to the velocity of seawater (about 1500 m/s), reflecting the high porosity of these sediments. P-wave velocity increases gradually with depth, reaching about 2000 m/s at 272.9 mbsf. Distinct increases in P-wave velocity mark the top of Units 2 and 4. Subunit 4A is distinguished by high velocities (>3000 m/s). Subunit 4B returns to lower velocities. In general, Subunit 4C has higher velocities, although not as high as Subunit 4A. P-wave velocity anisotropy was also tested on selected samples, with an average ratio of less than 3%.
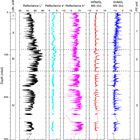
Color reflectance
Color reflectance results are displayed only for the upper 300 m (Figure F49). L* increases with depth in Unit 1 (0 to 89 mbsf). A distinct increase in L* marks the top of Unit 2, where values remain high down 139 mbsf. Unit 3 is characterized by a general decrease in L*. Reflectance a* shows no discernible trends and tends to decrease in variability downcore. b* tends to increase downcore with relatively higher variability in Unit 3.
Magnetic susceptibility
In Holes U1466A and U1466B, magnetic susceptibility measurements with the magnetic susceptibility loop (MSL or WRMSL MS) on whole-round core sections and the magnetic susceptibility point (MSP or SHMSL MS) method on split cores produced results with similar variations but different intensities. Magnetic susceptibility profiles record high values at each core’s top, which resulted from contamination. This phenomenon of high values at the tops of cores is especially noticeable in Hole U1466A (~20–500 IU with the MSL; ~20–400 IU with MSP).
Raw magnetic susceptibility data were filtered to remove artificial high values. Because of the low recovery rate below ~300 mbsf, only results from the upper 300 m are presented. Most MSL values range between –4 and 4 IU, and MSP values range between –15 and –5 IU (Figure F49). The “cleaned” profiles still contain relatively higher values at the tops of cores that were not filtered out. In general, MSL and MSP measurements slightly decrease to 40 mbsf and then remain constant to 300 mbsf.
Thermal conductivity
Thermal conductivity is reported as the average of three measurements at every measurement position (Table T12). Standard deviations of these three measurements vary from 0.1 to 0.117 W/(m·K). At this site, thermal conductivity ranges from 0.77 to 2.105 W/(m·K) with a mean of 1.228 W/(m·K) and a standard deviation of 0.032 W/(m·K). Values increase from 0.930 to 1.399 W/(m·K) in the upper ~310 mbsf. In Unit 4, thermal conductivity measurements are sparse but record the highest values with a peak of 2.1 W/(m·K) at 700 mbsf. In general, thermal conductivity increases with depth but with different gradients (Figure F50).
Table T12. Thermal conductivity, Site U1466. Download table in .csv format.
Shear strength
Shear strength measurements were performed from the seafloor to ~300 mbsf in the soft Pliocene–Pleistocene sediments and Miocene drift sediments (Figure F50). Measured values are scattered without a trend with depth. Only four compressional strength measurements were tested in the same interval and were low. Because of sediment lithification, shear strength was not measured in Unit 4.
Discussion
Similar trends in the physical properties in Units 1–4 roughly correlate to lithostratigraphic boundaries: the Pliocene–Pleistocene drift and moat-fill sequences, Miocene drift sequence, and Miocene carbonate platform clinoforms (see Lithostratigraphy).
Unit 1 is correlated to the Pliocene–Pleistocene sediments that were interpreted from the seismic reflection lines as drift and moat-fill sequences (see Seismic stratigraphy) (Lüdmann et al., 2013; Betzler et al., 2013b). Sediments from the drift and moat-fill sequences between 0 and 88 mbsf have high water content. Porosity within these sediments decreases from 80% to 60% with depth, and GRA and MAD bulk density increase from 1.5 to 1.7 g/cm3 with burial. P-wave velocity is constant with depth and affected by high water content, as shown by low density. Unit 2 roughly corresponds to the upper part of the Miocene drift sequence. In this interval, porosity decreases from 60% to 40% toward the bottom, and GRA and MAD bulk density increase from 1.7 to 1.8 g/cm3. P-wave velocities increase slightly within this interval, and sediments are highly saturated with water. Unit 3 is basically associated with the lower part of the Miocene drift sequence and the upper ~64 m carbonate platform clinoforms. This unit is characterized by increasing bulk density and P-wave velocity with depth, whereas porosities measured on discrete samples tend to decrease. In contrast to the higher porosity in Units 1 and 2, the decreasing porosity in this unit indicates compaction and cementation. Unit 4 corresponds to the distal clinoforms of the Miocene carbonate platform. Porosity and grain density are relatively scattered with some anomalous lows and highs, respectively. P-wave velocities also increase but with great variability. Contrasting porosity-velocity relationships indicate that diagenetic processes in these carbonates produce a variety of pore types that influence velocity in addition to porosity (Fabricius, 2007). The overall trends of porosity, density, and P-wave velocity with depth at Site U1466 are indicative of different depositional environments and diagenetic processes in different intervals.
Downhole measurements
Logging operations
Logging operations for Site U1466 began after completion of RCB coring in Hole U1466B to a total depth of 809.7 m drilling depth below seafloor (DSF) at 1150 h (local time) on 25 October 2015. In preparation for logging, a heavy mud sweep was circulated through the hole, the RCB bit was released, and the hole was displaced with 250 bbl of barite-weighted mud (10.5 lb/gal; 1.258 g/cm3). The heavy mud aimed to prevent cave-ins through suspect intervals of low core recovery. The drill pipe was raised to 106 m DSF for logging. As a result of concerns about hole stability based on coring operations in Hole U1466A, the triple combo tool string was run without a radioactive source. Seas were calm, with an average heave of 0.3 m peak-to-peak, so the wireline heave compensator was not used during logging operations.
The modified triple combo tool string, made up with gamma ray, density (for caliper only), electrical resistivity, and magnetic susceptibility tools, was rigged up and lowered into the hole at 1840 h. A downlog was started at 510 m wireline log depth below rig floor (WRF; 18 m above the seafloor) and continued to 894 m WRF (366 m wireline log depth below seafloor [WSF]), where the borehole was blocked by an obstruction (Figure F51). After multiple attempts to pass below the obstruction, the tool string was pulled back up through the open hole. High cable tension had to be employed to move the tool string through the majority of the open-hole interval above the obstruction, indicating that the borehole walls may have collapsed around the tool string and/or that loose material from shallower depths in the hole may have fallen in from above. An uplog was started at 873 m WRF (345 m WSF) and continued until the tool string was run into the pipe and up past the seafloor at 2040 h. The caliper was opened only briefly during the uplog and had to be closed immediately as a result of increasing cable tension. Given the nearly impassable state of the hole, a determination was made to finalize logging operations without attempting further deployments. The triple combo tool string was retrieved to the rig floor and rigged down by 2145 h, and logging operations were completed by 2210 h.
Downhole log data quality
During shore-based processing, all logging curves were depth-matched using the total gamma ray log from the downlog as a reference log and shifted to a seafloor depth reference, allowing a unified depth scale to be produced (wireline log matched depth below seafloor [WMSF]). Features in gamma ray logs from the uplog were aligned to the reference log to produce a complete depth-matched data set. Data were shifted to the WMSF scale based on the depth of the step increase in gamma ray that indicated the seafloor during the downlog, measured at 528 m WRF.
The quality of the downhole logs is typically affected by borehole diameter, which could not be consistently estimated by the hydraulic caliper on the Hostile Environment Litho-Density Sonde (HLDS). During the two attempts to open the HLDS caliper during the uplog, the borehole diameter was estimated at 17 inches (at 327 m WSF) and 8 inches (at 250 m WSF). An in-gauge hole drilled with the RCB system would be approximately 10 inches in diameter; so even these limited caliper measurements suggest a variable diameter through the logged section. As a result, the logging data may vary in quality. Gamma ray log quality may be reduced in intervals with a large borehole diameter because of the smaller depth of investigation of the gamma ray tools, whereas deeper reading measurements such as electrical resistivity may be more robust.
The quality of the downhole logs can also be assessed by comparison with measurements made on cores from the same site (Figure F52). Total natural gamma ray from the triple combo shows good agreement with natural gamma ray data from cores from the base of the pipe to ~320 m WMSF, including submeter-scale features. The comparison of logging and core data also clearly shows the depth offset between logging and core data depth scales, which is generally <2 m. Below ~325 m WMSF, the two measurements show different trends, but that separation may simply be due to poor hole conditions and limited core recovery. Magnetic susceptibility data from the triple combo indicate low susceptibility and no change with depth, which is consistent with magnetic susceptibility measurements on cores.
Logging units
Although there are characteristic trends in the logging data from Hole U1466B, there are not enough large-scale differences over the ~250 m interval of open hole to warrant division into multiple logging units. The entire logged interval was assigned to one logging unit (Figures F51, F52).
Logging Unit 1 (102–350 m WMSF) is characterized by slightly increasing total gamma ray trends with depth. The gamma ray profile shows low-amplitude, relatively high-frequency variations throughout the unit. Gamma ray values are moderate, averaging 27 American Petroleum Institute gamma radiation units (gAPI) over the logged interval. There are at least two localized regions of higher total gamma ray: 165–190 and 316–322 m WMSF. Spectral data indicate that uranium is the primary contributor to variability in total gamma ray, whereas potassium and thorium values remain low (Figure F53). Resistivity generally increases with depth (mean, true resistivity = 1.4 Ωm) with localized higher amplitude, higher resistivity features (e.g., ~125–130, ~174–178, and ~312–322 m WMSF). In addition, there are small but abrupt changes in resistivity in the interval between ~230 and 322 m WMSF that may reflect meter-scale variations in other physical properties.
Downhole logs and lithology
Downhole logs from Site U1466 reflect changes in sediment properties such as the amount of organic material and degree of lithification. The upper 14.5 m at Site U1466 is predominantly coarse-grained grainstone with a change to alternating grainstone and unlithified packstone at the lithostratigraphic Unit I/II boundary (see Lithostratigraphy). The packstone intervals appear to have higher NGR relative to the grainstone intervals, which may be due to slightly higher clay content in the matrix of the packstone or increased organic content. The pattern of high gamma ray values is seen in physical property measurements from Hole U1466A (Figure F54), which enables the downhole logs from Hole U1466B to be correlated to the core data from Hole U1466A with a slight depth offset on the order of a few meters.
Two intervals of elevated natural gamma ray values and high amplitude, high resistivity values in logs from Hole U1466B (165–190 and 316–322 m WMSF) (Figures F52, F53) correspond to depths of increased total organic carbon and decreased carbonate content (see Geochemistry). Peaks in uranium, the primary contributor to total gamma radiation in Hole U1466B logging data, are frequently associated with higher organic carbon, which is consistent with geochemical data from Site U1466. The deeper interval of elevated gamma ray values (316–322 m WMSF) corresponds to the lithostratigraphic Unit V/VI boundary.
Although not always coincident with higher gamma ray values, higher amplitude resistivity features deeper than 150 m WMSF often correspond with intervals of low or no core recovery. These resistivity features show meter- to submeter-scale variation compared to the physical properties of the surrounding borehole. P-wave velocity measurements from cores just above and below these features show increased velocity (see Physical properties), suggesting that there may be submeter-scale variations between high- and low-porosity material. This pattern most likely reflects the degree of cementation, with better cemented intervals having higher resistivity and velocity. Without core material to provide confirmation, the interpretation of these features remains untested.
Downhole temperature
Downhole temperature was measured using the APCT-3. Three measurements were attempted between 43.0 and 88.5 mbsf in Hole U1466A (Table T13).
Table T13. APCT-3 temperature measurements, Hole U1466A. Download table in .csv format.
All measurements were made in a good sea state (<1 m swell). The APCT-3 was stopped at the mudline for at least 5 min prior to each penetration. Mudline temperatures ranged from 12.7° to 13.5°C. Significant frictional heating occurred on all penetrations with the APCT-3, with temperature-time records exhibiting characteristic probe penetration and subsequent decay. Tool movement while the probe was in the sediment was minimal during two deployments at the bottoms of Cores 359-U1466A-5H and 10H, and the measurements from these deployments appear to be reliable. There was evidence of tool motion during the deployment at the base of Core 8H, and the usable section of the temperature-time series after the disturbance was not long enough for analysis. The resulting equilibrium temperature from that deployment is not considered reliable.
Mudline temperatures were several degrees higher than temperatures measured in sediment at Site U1466, and a linear temperature gradient with depth cannot be assumed. Geothermal gradient and heat flow could not be determined from only two reliable measurements.
Seismic stratigraphy
Site U1466 in the western part of the Kardiva Channel recovered the succession above the seismic reflection correlated to the Oligocene/Miocene boundary by Belopolsky and Droxler (2004) in Well Ari 1 (Betzler et al., 2013b), thus encompassing the undifferentiated lower Miocene platform sequences (PS) PS1–PS11, and the overlying drift sequences (DS) DS1–DS10 (Figures F55, F56). The site is just 1.5 km offshore of the edge of the drowned Kardiva platform. In this position, the cores penetrated the platform sequences through the distal slope and in the basinal facies. The platform sequences are onlapped and overlain by a thick drift succession mainly composed of DS1. Consequently, this site marks the crucial turning point from the prograding carbonate platform to the onset of drift sedimentation in the Maldives.
Time-depth conversion
To produce a time-depth model for Site U1466, we planned to run a vertical seismic profile (VSP) in Hole U1466B, but deteriorating hole conditions during the first logging run prevented downhole logging and deployment of the Versatile Seismic Imager (VSI) (see Downhole measurements). As a result, we used the P-wave measurements from half cores and discrete samples measured in the physical properties laboratory (see Physical properties) for an estimation of velocity in the stratigraphic intervals (Figure F56). High water content of the loosely packed and coarse uppermost sediments did not yield reliable data in the upper 80 mbsf. Thus, the following approach was taken. We adjusted the velocity model used for planning the site with the measured velocity. As a quality control, we compared the velocity breaks with the position of the lithologic changes. Figure F56 shows that high-velocity sections correspond with intervals of high-amplitude reflection, related to the high impedance contrast between high- and lower density sedimentary layers. Figure F57 shows the time-depth conversion for Site U1466, and Table T14 shows the computed depth values of platform and drift sequences and their corresponding two-way traveltime (TWT) ties.
Table T14. DS and PS boundaries, Site U1466. Download table in .csv format.
Seismic facies and geometries
At Site U1466, the platform sequences are represented by gently basinward-dipping continuous reflections with varying amplitudes. Cycles of alternating intervals of low and high amplitudes are typical. PS1–PS4 were defined in the platform interior more than 10 km west of Site U1466 by unconformities (Betzler et al., 2013b). At Site U1466, they are condensed and conformable, and the boundaries of PS1–PS3 and PS4/PS5 are amalgamated and below the resolution of the seismic data. The sequence boundaries of PS6–PS11 are characterized by strong reflections, and sequence internal reflections in general have lower amplitudes (Figure F55). The high amplitude of the sequence boundaries is most likely the combined effect of a change in composition between highstand and lowstand deposits and a significant diagenetic overprint in the form of extreme seafloor cementation of the lowstand top (Anselmetti et al., 2000; Malone et al., 2001; Eberli et al., 2010). Mostly pelagic sediment overlies the sequence boundaries during the subsequent sea level rise. These deposits contain the best biostratigraphic information to date about the sequences and sea level changes.
The seismic reflection pattern changes significantly above Sequence Boundary DS1, which is the lower bounding unconformity of the drift sequences at 972 ms TWT (Figure F55). Overlying this boundary is a thick, eastward-prograding sediment body built of large-scale sigmoid-shaped clinoform bundles forming a convex-up–shaped wedge typical of drift seismic facies (Faugéres et al., 1999; Lüdmann et al., 2013). The drift overlies the entire slope of PS11 below 845 ms TWT. In the western part of the drift, reflections are arranged in a parallel to subparallel or oblique-divergent way. Toward the Inner Sea, the reflection geometry changes to an oblique-tangential or sigmoidal pattern and finally thins into a basinal hemipelagic seismic facies with sediment waves that have a wavelength of 300–400 m and an amplitude of around 15 ms TWT (Figure F2). Core recovery above the DS1 boundary was good. This thick drift sequence, designated DS1 by Lüdmann et al. (2013), is truncated on top by an erosional unconformity that formed a moat between the drowned Kardiva platform in the west and the top of the drift in the east. This erosion removed DS2–DS4 so that the unconformity encompasses the amalgamated sequence boundaries of DS2–DS5. At Site U1466, the thin DS5 is approximately 13.5 ms TWT thick and pinches out below seismic resolution 1.5 km farther east. The same pattern applies for DS6 and DS7. DS5–DS7 fill the moat dipping westward parallel to the unconformity, whereas the layers of DS1 are oblique to it, inclining in the opposite direction and becoming younger toward the basin. DS8 and DS10 are horizontally layered and form a sheeted drift with a wavy reflection forming the top of DS10, the seafloor.
Core-seismic correlation
Hole U1466A retrieved sediments from the drift succession, which has a base at 254 mbsf in this hole based on the time-depth model. The base is in Cores 357-U1466A-38X through 39X, which had no recovery (Figure F56). The sheeted drift deposits of DS10 coincide with lithostratigraphic Unit I and part of Unit II. The DS9/DS10 boundary is within Core 4H, which yielded an age of 1.74 Ma. The upper part of DS8 is dated at 2.3 Ma. Thus, DS10 is Pleistocene–recent in age, DS9 is early Pliocene, and DS8 is early to late Pliocene. DS5–DS7 are unlithified packstone and grainstone packages. Nannofossils in Section 10H-4 place DS5 at 5.6 Ma in the late Miocene. DS1 is an unlithified dolomitized wackestone, packstone, and grainstone succession from lithostratigraphic Units III and IV. The boundary between the two units coincides with the first occurrence of high-amplitude reflections at 845 ms TWT above a continuous high-amplitude reflector at 860 ms TWT that separates a more transparent seismic facies with low-amplitude, discontinuous reflections from an underlying wedge with more continuous, sigmoidal reflections.
Cores at the base and top of DS1 do not contain age-diagnostic fossils, but the fossils within DS1 indicate a middle Miocene age for this first drift sequence. Nannofossils in Core 16H provide an age older than 12.2 Ma, whereas planktonic foraminifers within Core 36F give an age older than 11.7 Ma.
The DS1 sequence boundary is in the lower part of lithostratigraphic Unit IV at the Subunit IVC/IVD boundary. The underlying PS10/PS11 boundary coincides with the lithostratigraphic Unit V/VI boundary. Lithostratigraphic Unit V is an unlithified packstone and grainstone facies with benthic foraminifers, and lithostratigraphic Unit VI comprises cyclic alternation with variations in bioturbation changing downhole into a succession with turbidites and slumps. Such facies are typical for the lithologic content of bottomsets of prograding platforms and are likely formed by high-frequency sea level changes related to orbital precession (Eberli, 2000; Williams et al., 2002). Biostratigraphy brackets these sequences as younger than 19 Ma at the base (PS1) and at least as young as 13.5 Ma in sequence PS8 (i.e., in the Burdigalian to the Serravalian).
Application of the depth to two-way traveltime calibration in Figure F57 indicates that the Oligocene/Miocene boundary defined by Belopolsky and Droxler (2004) is just below the bottom of Hole U1466B. The seismic-stratigraphically undifferentiated lower Miocene thus corresponds to the lower part of lithostratigraphic Unit VI and to Unit VII.
References
Anselmetti, F.S., Eberli, G.P., and Ding, Z.-D., 2000. From the Great Bahama Bank into the Straits of Florida: a margin architecture controlled by sea-level fluctuations and ocean currents. Geological Society of America Bulletin, 112(6):829–844. http://dx.doi.org/10.1130/0016-7606(2000)112<0829:FTGBBI>2.3.CO;2
Belopolsky, A.V., and Droxler, A.W., 2004. Seismic expressions of prograding carbonate bank margins: middle Miocene, Maldives, Indian Ocean. In Eberli, G.P., Masaferro, J.L., and Sarg, J.F. (Eds.), Seismic Imaging of Carbonate Reservoirs and Systems. AAPG Memoir, 81:267–290. http://archives.datapages.com/data/specpubs/memoir81/CHAPTER12/CHAPTER12.html
Berggren, W.A., Kent, D.V., Swisher, C.C., III, and Aubry, M.-P., 1995. A revised Cenozoic geochronology and chronostratigraphy. In Berggren, W.A., Kent, D.V., Aubry, M.-P., and Hardenbol, J. (Eds.), Geochronology, Time Scales and Global Stratigraphic Correlation. Special Publication - SEPM (Society for Sedimentary Geology), 54:129–212. http://dx.doi.org/10.2110/pec.95.04.0129
Betzler, C., Eberli, G.P., Alvarez Zarikian, C.A., Alonso-García, M., Bialik, O.M., Blättler, C.L., Guo, J.A., Haffen, S., Horozal, S., Inoue, M., Jovane, L., Kroon, D., Lanci, L., Laya, J.C., Ling Hui Mee, A., Lüdmann, T., Nakakuni, M., Nath, B.N., Niino, K., Petruny, L.M., Pratiwi, S.D., Reijmer, J., Reolid, J., Slagle, A.L., Sloss, C.R., Su, X., Swart, P.K., Wright, J.D., Yao, Z., and Young, J.R., 2017a. Expedition 359 methods. In Betzler, C., Eberli, G.P., Alvarez Zarikian, C.A., and the Expedition 359 Scientists, Maldives Monsoon and Sea Level. Proceedings of the International Ocean Discovery Program, 359: College Station, TX (International Ocean Discovery Program). http://dx.doi.org/10.14379/iodp.proc.359.102.2017
Betzler, C., Eberli, G.P., Alvarez Zarikian, C.A., Alonso-García, M., Bialik, O.M., Blättler, C.L., Guo, J.A., Haffen, S., Horozal, S., Inoue, M., Jovane, L., Kroon, D., Lanci, L., Laya, J.C., Ling Hui Mee, A., Lüdmann, T., Nakakuni, M., Nath, B.N., Niino, K., Petruny, L.M., Pratiwi, S.D., Reijmer, J., Reolid, J., Slagle, A.L., Sloss, C.R., Su, X., Swart, P.K., Wright, J.D., Yao, Z., and Young, J.R., 2017b. Expedition 359 summary. In Betzler, C., Eberli, G.P., Alvarez Zarikian, C.A., and the Expedition 359 Scientists, Maldives Monsoon and Sea Level. Proceedings of the International Ocean Discovery Program, 359: College Station, TX (International Ocean Discovery Program). http://dx.doi.org/10.14379/iodp.proc.359.101.2017
Betzler, C., Fürstenau, J., Lüdmann, T., Hübscher, C., Lindhorst, S., Paul, A., Reijmer, J.J.G., and Droxler, A.W., 2013a. Sea-level and ocean-current control on carbonate-platform growth, Maldives, Indian Ocean. Basin Research, 25(2):172–196. http://dx.doi.org/10.1111/j.1365-2117.2012.00554.x
Betzler, C., Lüdmann, T., Hübscher, C., and Fürstenau, J., 2013b. Current and sea-level signals in periplatform ooze (Neogene, Maldives, Indian Ocean). Sedimentary Geology, 290:126–137. http://dx.doi.org/10.1016/j.sedgeo.2013.03.011
Betzler, C., Reijmer, J.J.G., Bernet, K., Eberli, G.P., and Anselmetti, F.S., 1999. Sedimentary patterns and geometries of the Bahamian outer carbonate ramp (Miocene–lower Pliocene, Great Bahama Bank). Sedimentology, 46(6):1127–1143. http://dx.doi.org/10.1046/j.1365-3091.1999.00268.x
Eberli, G.P., 2000. The record of Neogene sea-level changes in the prograding carbonates along the Bahamas Transect—Leg 166 Synthesis. In Swart, P.K., Eberli, G.P., Malone, M.J., and Sarg, J.F. (Eds.), Proceedings of the Ocean Drilling Program, Scientific Results, 166: College Station, TX (Ocean Drilling Program), 167–177. http://dx.doi.org/10.2973/odp.proc.sr.166.128.2000
Eberli, G.P., Anselmetti, F.S., Isern, A.R., and Delius, H., 2010. Timing of changes in sea-level and currents along Miocene platforms on the Marion Plateau, Australia. In Morgan, W.A., George, A.D., Harris, P.M., Kupecz, J.A., and Sarg, J.F. (Eds.), Cenozoic Carbonate Systems of Australasia. Special Publication - SEPM (Society for Sedimentary Geology), 95:219–242. http://dx.doi.org/10.2110/sepmsp.095.219
Eberli, G.P., Anselmetti, F.S., Kroon, D., Sato, T., and Wright, J.D., 2002. The chronostratigraphic significance of seismic reflections along the Bahamas Transect. Marine Geology, 185(1–2):1–17. http://dx.doi.org/10.1016/S0025-3227(01)00287-0
Eberli, G.P., Swart, P.K., Malone, M.J., et al., 1997. Proceedings of the Ocean Drilling Program, Initial Reports, 166: College Station, TX (Ocean Drilling Program). http://dx.doi.org/10.2973/odp.proc.ir.166.1997
Fabricius, I.L., 2007. Chalk: composition, diagenesis and physical properties. Bulletin of the Geological Society of Denmark, 55:97–128. http://www.2dgf.dk/xpdf/bull55-97-128wm.pdf
Faugères, J.-C., Stow, D.A.V., Imbert, P., and Viana, A., 1999. Seismic features diagnostic of contourite drifts. Marine Geology, 162(1):1–38. http://dx.doi.org/10.1016/S0025-3227(99)00068-7
Fisher, R., 1953. Dispersion on a sphere. Proceedings of the Royal Society of London, Series A: Mathematical, Physical and Engineering Sciences, 217(1130):295–305. http://dx.doi.org/10.1098/rspa.1953.0064
Fornaciari, E., and Agnini, C., 2009. Taxonomic note: Sphenolithus pseudoheteromorphus, a new Miocene calcareous nannofossil species from the equatorial Indian Ocean. Journal of Nannoplankton Research, 30(2):97–101. http://ina.tmsoc.org/JNR/online/30/Fornaciari & Agnini 2009 JNR 30-2.pdf
Fornaciari, E., Raffi, I., Rio, D., Villa, G., Backman, J., and Olafsson, G., 1990. Quantitative distribution patterns of Oligocene and Miocene calcareous nannofossils from the western equatorial Indian Ocean. In Duncan, R.A., Backman, J., Peterson, L.C., et al., Proceedings of the Ocean Drilling Program, Scientific Results, 115: College Station, TX (Ocean Drilling Program), 237–254. http://dx.doi.org/10.2973/odp.proc.sr.115.153.1990
Gerard, J., and Bromley, R., 2008. Ichnofabrics in Clastic Sediments: Application to Sedimentological Core Studied: Madrid (Jean R.F. Gerard).
Gradstein, F.M., Ogg, J.G., Schmitz, M.D., and Ogg, G.M. (Eds.), 2012. The Geological Time Scale 2012: Amsterdam (Elsevier).
Hilgen, F.J., Lourens, L.J., and Van Dam, J.A., 2012. The Neogene period. With contributions by A.G. Beu, A.F. Boyes, R.A. Cooper, W. Krijgsman, J.G. Ogg, W.E. Piller, and D.S. Wilson. In Gradstein, F.M., Ogg, J.G., Schmitz, M.D., and Ogg, G.M. (Eds.), The Geologic Time Scale: Oxford, United Kingdom (Elsevier), 923–978. http://dx.doi.org/10.1016/B978-0-444-59425-9.00029-9
Jorry, S.J., Hasler, C.-A., and Davaud, E., 2006. Hydrodynamic behaviour of Nummulites: implications for depositional models. Facies, 52(2):221–235. http://dx.doi.org/10.1007/s10347-005-0035-z
Kirschvink, J.L., 1980. The least-squares line and plane and the analysis of palaeomagnetic data. Geophysical Journal of the Royal Astronomical Society, 62(3):699–718. http://dx.doi.org/10.1111/j.1365-246X.1980.tb02601.x
Kramer, P.A., Swart, P.K., De Carlo, E.H., and Schovsbo, N.H., 2000. Overview of interstitial fluid and sediment geochemistry, Sites 1003–1007 (Bahamas transect). In Swart, P.K., Eberli, G.P., Malone, M.J., and Sarg, J.F. (Eds.), Proceedings of the Ocean Drilling Program, Scientific Results, 166: College Station, TX (Ocean Drilling Program), 179–195. http://dx.doi.org/10.2973/odp.proc.sr.166.117.2000
Kroon, D., Steens, T., and Troelstra, S.R., 1991. Onset of monsoonal related upwelling in the western Arabian Sea as revealed by planktonic foraminifers. In Prell, W.L., Niitsuma, N., et al., Proceedings of the Ocean Drilling Program, Scientific Results, 117: College Station, TX (Ocean Drilling Program), 257–263. http://dx.doi.org/10.2973/odp.proc.sr.117.126.1991
Lourens, L.J., Hilgen, F.J., Laskar, J., Shackleton, N.J., and Wilson, D., 2004. The Neogene period. In Gradstein, F.M., Ogg, J., et al. (Eds.), A Geologic Time Scale 2004: Cambridge, United Kingdom (Cambridge University Press), 409–440.
Lüdmann, T., Kalvelage, C., Betzler, C., Fürstenau, J., and Hübscher, C., 2013. The Maldives, a giant isolated carbonate platform dominated by bottom currents. Marine and Petroleum Geology, 43:326–340. http://dx.doi.org/10.1016/j.marpetgeo.2013.01.004
Maiorano, P., and Monechi, S., 1998. Revised correlations of early and middle Miocene calcareous nannofossil events and magnetostratigraphy from DSDP Site 563 (North Atlantic Ocean). Marine Micropaleontology, 35(3–4):235–255. http://dx.doi.org/10.1016/S0377-8398(98)00019-X
Malone, M.J., Slowey, N.C., and Henderson, G.M. 2001. Early diagenesis of shallow-water periplatform carbonate sediments, leeward margin, Great Bahama Bank (Ocean Drilling Progr. Leg 166) Geological Society of America Bulletin, 113(7):881–894. http://dx.doi.org/10.1130/0016-7606(2001)113<0881:EDOSWP>2.0.CO;2
Paul, A., Reijmer, J.J.G., Fürstenau, J., Kinkel, H., and Betzler, C., 2012. Relationship between late Pleistocene sea-level variations, carbonate platform morphology and aragonite production (Maldives, Indian Ocean). Sedimentology, 59(5):1540–1658. http://dx.doi.org/10.1111/j.1365-3091.2011.01319.x
Raffi, I., Backman, J., Fornaciari, E., Pälike, H., Rio, D., Lourens, L., and Hilgen, F., 2006. A review of calcareous nannofossil astrobiochronology encompassing the past 25 million years. Quaternary Science Reviews, 25(23–24):3113–3137. http://dx.doi.org/10.1016/j.quascirev.2006.07.007
Renema, W., and Troelstra, S.R., 2001. Larger foraminifera distribution on a mesotrophic carbonate shelf in SW Sulawesi (Indonesia). Palaeogeography, Palaeoclimatology, Palaeoecology, 175(1–4):125–146. http://dx.doi.org/10.1016/S0031-0182(01)00389-3
Reuning, L., Reijmer, J.J.G., and Betzler, C., 2002. Sedimentation cycles and their diagenesis on the slope of a Miocene carbonate ramp (Bahamas, ODP Leg 166). Marine Geology, 185(1–2):121–142. http://dx.doi.org/10.1016/S0025-3227(01)00293-6
Schneider, D.A., and Kent, D.V., 1988. Inclination anomalies from Indian Ocean sediments and the possibility of a standing nondipole field. Journal of Geophysical Research: Solid Earth, 93(B10):11621–11630. http://dx.doi.org/10.1029/JB093iB10p11621
Shackleton, N.J., 1985. Oceanic carbon isotope constraints on oxygen and carbon dioxide in the Cenozoic atmosphere. In Sundquist, E.T., and Broecker, W.S. (Eds.), The Carbon Cycle and Atmospheric CO 2: Natural Variations Archean to Present. Geophysical Monograph, 32:412–417. http://dx.doi.org/10.1029/GM032p0412
Shipboard Scientific Party, 1988. Introduction. In Backman, J., Duncan, R.A., et al., Proceedings of the Ocean Drilling Program, Initial Reports, 115: College Station, TX (Ocean Drilling Program), 5–15. http://dx.doi.org/10.2973/odp.proc.ir.115.102.1988
Shipboard Scientific Party, 1991. Introduction. In Davies, P.J., McKenzie, J.A., Palmer-Julson, A., et al., Proceedings of the Ocean Drilling Program, Initial Reports, 133: College Station, TX (Ocean Drilling Program), 5–30. http://dx.doi.org/10.2973/odp.proc.ir.133.101.1991
Shipboard Scientific Party, 1997. Introduction. In Eberli, G.P., Swart, P.K., Malone, M.J., et al., Proceedings of the Ocean Drilling Program, Initial Reports, 166: College Station, TX (Ocean Drilling Program), 5–12. http://dx.doi.org/10.2973/odp.proc.ir.166.101.1997
Staudt, W.J., Oswald, E.J., and Schoonen, M.A.A., 1993. Determination of sodium, chloride and sulfate in dolomites: a new technique to constrain the composition of dolomitizing fluids. Chemical Geology, 107(1–2):97–109. http://dx.doi.org/10.1016/0009-2541(93)90104-Q
Swart, P.K., 2008. Global synchronous changes in the carbon isotopic composition of carbonate sediments unrelated to changes in the global carbon cycle. Proceedings of the National Academy of Sciences of the United States of America, 105(37):13741–13745. http://dx.doi.org/10.1073/pnas.0802841105
Swart, P.K., and Eberli, G., 2005. The nature of the δ13 C of periplatform sediments: implications for stratigraphy and the global carbon cycle. Sedimentary Geology, 175(1–4):115–129. http://dx.doi.org/10.1016/j.sedgeo.2004.12.029
Swart, P.K., and Melim, L.A., 2000. The origin of dolomites in Tertiary sediments from the margin of Great Bahama Bank. Journal of Sedimentary Research, 70(3):738–748. http://dx.doi.org/10.1306/2DC40934-0E47-11D7-8643000102C1865D
Thompson, P.R., Bé, A.W.H., Duplessy, J.-C., and Shackleton, N.J., 1979. Disappearance of pink-pigmented Globigerinoides ruber at 120,000 yr BP in the Indian and Pacific Oceans. Nature, 280(5723):554–558. http://dx.doi.org/10.1038/280554a0
Veizer, J., Ala, D., Azmy, K., Bruckschen, P., Buhl, D., Bruhn, F., Carden, G.A.F., Diener, A., Ebneth, S., Godderis, Y., Jasper, T., Korte, C., Pawellek, F., Podlaha, O.G., and Strauss, H., 1999. 87 Sr/86 Sr, δ13 C and δ18 O evolution of Phanerozoic seawater. Chemical Geology, 161(1–3):592–88. http://dx.doi.org/10.1016/S0009-2541(99)00081-9
Wade, B.S., Pearson, P.N., Berggren, W.A., and Pälike, H., 2011. Review and revision of Cenozoic tropical planktonic foraminiferal biostratigraphy and calibration to the geomagnetic polarity and astronomical time scale. Earth-Science Reviews, 104(1–3):111–142. http://dx.doi.org/10.1016/j.earscirev.2010.09.003
Williams, T., Kroon, D., and Spezzaferri, S., 2002. Middle and upper Miocene cyclostratigraphy of downhole logs and short- to long-term astronomical cycles in carbonate production of the Great Bahama Bank. Marine Geology, 185(1–2):75–93. http://dx.doi.org/10.1016/S0025-3227(01)00291-2
Young, J.R., 1998. Neogene. In Bown, P.R. (Ed.), Calcareous Nannofossil Biostratigraphy: Dordrecht, The Netherlands (Kluwer Academic Publishing), 225–265.
Zijderveld, J.D.A., 1967. AC demagnetization of rocks: analysis of results. In Collinson, D.W., Creer, K.M., and Runcorn, S.K. (Eds.), Methods in Palaeomagnetism: Amsterdam (Elsevier), 254–286.
1 Betzler, C., Eberli, G.P., Alvarez Zarikian, C.A., Alonso-García, M., Bialik, O.M., Blättler, C.L., Guo, J.A., Haffen, S., Horozal, S., Inoue, M., Jovane, L., Kroon, D., Lanci, L., Laya, J.C., Ling Hui Mee, A., Lüdmann, T., Nakakuni, M., Nath, B.N., Niino, K., Petruny, L.M., Pratiwi, S.D., Reijmer, J.J.G., Reolid, J., Slagle, A.L., Sloss, C.R., Su, X., Swart, P.K., Wright, J.D., Yao, Z., and Young, J.R., 2017. Site U1466. In Betzler, C., Eberli, G.P., Alvarez Zarikian, C.A., and the Expedition 359 Scientists, Maldives Monsoon and Sea Level. Proceedings of the International Ocean Discovery Program, 359: College Station, TX (International Ocean Discovery Program). http://dx.doi.org/10.14379/iodp.proc.359.104.2017
2 Expedition 359 Scientists’ addresses.
This work is distributed under the Creative Commons Attribution 4.0 International (CC BY 4.0) license. 
- F1. Map of Site U1466, located in the Kardiva Channel 1880 m east of Site U1465.
- F2. Seismic Line P65 with locations and final penetration depths, Sites U1465, U1466, and U1468.
- F3. Lithostratigraphic summary, Holes U1466A and U1466B.
- F4. Solitary coral embedded in coarse-grained sediments.
- F5. Planktonic foraminiferal debris and pteropod fragments.
- F6. Cemented aggregated grains in Unit III.
- F7. Dolomite rhombs, aragonite needles, and calcite crystals.
- F8. Partially cemented skeletal wackestone.
- F9. Fine-grained wackestone with abundant bioclasts with moldic porosity.
- F10. Organic material.
- F11. Fine-grained packstone with common planktonic and benthic foraminifers with moldic porosity.
- F12. Very fine grained packstone to wackestone with abundant bioclasts and some planktonic and benthic foraminifers in a recrystallized micritic matrix.
- F13. Medium-grained packstone with abundant planktonic and benthic foraminifers and abundant bioclasts in a dense to clotted micritic matrix.
- F14. Fine-grained packstone with common planktonic foraminifers, few benthic foraminifers, some mollusk fragments, and abundant bioclasts in a micritic, partially recrystallized, and dolomitic matrix.
- F15. Recrystallized packstone with fragments of planktonic specimens.
- F16. Plate showing main ichnotaxa, Hole U1466B.
- F17. Coccoliths, aragonite needles, and calcite crystals.
- F18. Tunicate fragment, echinoid fragment, pyrite-infilled planktonic foraminifer with calcite rim, coccoliths with cross-extinction lines, aragonite needles, and calcite crystals.
- F19. Slumped interval.
- F20. Alternation of black organic-rich and white chalk alternation in Subunit VIIB.
- F21. Benthic foraminifers, Hole U1466B.
- F22. Organic material.
- F23. Biostratigraphic and paleoenvironmental summary, Site U1466.
- F24. Age-depth profile, Site U1466.
- F25. Preservation.
- F26. Plate of selected planktonic foraminifers, Site U1466.
- F27. Plate of Middle to Late Pleistocene ostracods, Site U1466.
- F28. Plate of early Pleistocene ostracods, Site U1466.
- F29. Plate of late Miocene to early Pliocene ostracods, Site U1466.
- F30. Plate of mudline sample, Hole U1466A.
- F31. IW Cl–, Na, and K+ concentrations, Holes U1466A and U1466B.
- F32. IW Na+ and Cl– correlation, Holes U1466A and U1466B.
- F33. IW alkalinity, hydrogen (pH), and SO42– concentrations, Holes U1466A and U1466B.
- F34. IW Ca2+, Mg2+, Sr2+, and Li+ concentrations, Holes U1466A and U1466B.
- F35. IW Mn, Fe, B, Ba2+, and Si concentrations, Site U1466.
- F36. Carbonate and organic carbon contents, Site U1466.
- F37. Relative concentrations of aragonite, calcium, dolomite, and quartz measured using XRD, Site U1466.
- F38. Mg/Ca, Sr/Ca, Mn/Ca, and Fe/Ca in sediments, Site U1466.
- F39. Headspace methane and ethane concentrations, Site U1466.
- F40. IW Sr2+/Ca2+, Mg2+/Ca2+, Ca2+/Cl–, and Mg2+/Cl–, Site U1466.
- F41. NRM inclination, declination, and intensity, Hole U1466A.
- F42. NRM inclination, declination, and intensity, Hole U1466B.
- F43. Representative vector endpoint diagrams from stepwise AF demagnetization, Site U1466.
- F44. Isothermal remanent magnetization, Hole U1466A.
- F45. AMS, Hole U1466B.
- F46. NRM inclination of Fisher (1953) mean of each section and attempt of magnetostratigraphy interpretation, Hole U1466A.
- F47. Inclination of ChRM and magnetostratigraphy, Hole U1466B.
- F48. NGR, bulk density, grain and dry density, porosity, and P-wave velocity, Site U1466.
- F49. Color reflectance and magnetic susceptibility, Site U1466.
- F50. Thermal conductivity and sediment strength, Site U1466.
- F51. Logging operations, Hole U1466B.
- F52. Triple combo logs, Hole U1466B.
- F53. NGR logs, Hole U1466B.
- F54. Correction of downhole natural gamma ray for attenuation through the BHA using a multiplier of 5, Site U1466.
- F55. Seismic section of drowned Kardiva platform and onlap and burial by drift sequences, Site U1466.
- F56. Correlation of seismic, core, and log data, Site U1466.
- F57. Time-depth conversion, Site U1466.
- T1. Site U1466 core summary.
- T2. Biostratigraphic events, Site U1466.
- T3. Nannofossil range chart, Holes U1466A and U1466B.
- T4. Planktonic foraminifer range chart, Hole U1466A.
- T5. Planktonic foraminifer range chart, Hole U1466B.
- T6. Benthic foraminifer range chart, Hole U1466B.
- T7. Interstitial water chemistry, Site U1466.
- T8. Carbon and nitrogen, Site U1466.
- T9. XRD results, Site U1466.
- T10. Solids geochemistry, Site U1466.
- T11. Headspace hydrocarbons, Site U1466.
- T12. Thermal conductivity, Site U1466.
- T13. APCT-3 temperature measurements, Hole U1466A.
- T14. DS and PS boundaries, Site U1466.


